identification of dosage-sensitive genes in saccharomyces cerevisiae using the genetic tug-of-war...
TRANSCRIPT

Research
Identification of dosage-sensitive genes in Saccharomycescerevisiae using the genetic tug-of-war methodKoji Makanae,1 Reiko Kintaka,2 Takashi Makino,3 Hiroaki Kitano,4,5,6 and Hisao Moriya1,7
1Research Core for Interdisciplinary Sciences, Okayama University, Okayama 700-8530, Japan, 2Graduate School of Natural Science
and Technology, Okayama University, Okayama 700-8530, Japan; 3Graduate School of Life Sciences, Tohoku University, Sendai 980-
8578, Japan; 4Sony Computer Science Laboratories, Tokyo 141-0022, Japan; 5The Systems Biology Institute, Tokyo 108-0071, Japan;6Okinawa Institute of Science and Technology Graduate University, Okinawa 904-0495, Japan
Gene overexpression beyond a permissible limit causes defects in cellular functions. However, the permissible limits ofmost genes are unclear. Previously, we developed a genetic method designated genetic tug-of-war (gTOW) to measure thecopy number limit of overexpression of a target gene. In the current study, we applied gTOW to the analysis of allprotein-coding genes in the budding yeast Saccharomyces cerevisiae. We showed that the yeast cellular system was robustagainst an increase in the copy number by up to 100 copies in >80% of the genes. After frameshift and segmentationanalyses, we isolated 115 dosage-sensitive genes (DSGs) with copy number limits of 10 or less. DSGs contained a significantnumber of genes involved in cytoskeletal organization and intracellular transport. DSGs tended to be highly expressed andto encode protein complex members. We demonstrated that the protein burden caused the dosage sensitivity of highlyexpressed genes using a gTOW experiment in which the open reading frame was replaced with GFP. Dosage sensitivities ofsome DSGs were rescued by the simultaneous increase in the copy numbers of partner genes, indicating that stoichiometricimbalances among complexes cause dosage sensitivity. The results obtained in this study will provide basic knowledgeabout the physiology of chromosomal abnormalities and the evolution of chromosomal composition.
[Supplemental material is available for this article.]
Intracellular biochemical parameters, such as gene expressionlevels and protein activities, are highly optimized to maximize theperformance of biological systems (Zaslaver et al. 2004; Dekel andAlon 2005; Wagner 2005). These parameters, however, have cer-tain permissive ranges to protect the function of the system againstperturbations such as environmental changes, mutations, andnoise in biochemical reactions. This robustness against fluctua-tions in parameters is considered a common design principle ofbiological systems (Alon et al. 1999; Little et al. 1999; von Dassowet al. 2000). When gene expression fluctuates beyond the robust-ness of cellular systems, various defects occur in the systems. How-ever, the differences in the expression limits of different genes andthe factors influencing these differences are unclear.
We previously developed the genetic tug-of-war (gTOW)method to measure the limit of gene overexpression (Moriya et al.2006, 2011, 2012). Using gTOW, we can assess the limit of geneoverexpression as the copy number limit (CNL) of the target gene asfollows. A target gene with its native regulatory sequences is clonedinto a plasmid for gTOW. The plasmid carries a 2-micron origin,URA3, and LEU2 with a truncated promoter (leu2d ). Yeast cells aretransformed by the plasmid, and the transformants are first se-lected in medium lacking uracil (!Ura). The cells are then trans-ferred into medium lacking both uracil and leucine (!Leu!Ura). Inthis medium, leu2d becomes a selection bias to increase the plas-mid copy number in the cells because the cells with higher leu2d(plasmid) copy numbers grow faster. As the copy number increases,the copy number of the target gene also increases, and the gene
becomes proportionally overexpressed according to the increasedcopy number. If the gene has an overexpression limit at whichcellular function is halted when the limit is crossed (i.e., inducingcellular death), then the plasmid copy number must be less thanthe limit, and the target gene becomes a selection bias to decreasethe plasmid copy number. Biases arising from leu2d (that increasesthe plasmid copy number) and the target gene (that decreases theplasmid copy number) determine the plasmid copy number in thecells (thus, we designated this method ‘‘genetic tug-of-war’’). Be-cause the bias to increase the plasmid copy number by leu2d isalways the same, the copy number should be associated with theCNL of overexpression of the target gene. The plasmid copynumber determined under the !Leu!Ura condition is consideredthe CNL of overexpression of the target gene if the copy number issignificantly lower than that of the empty vector control (whichis usually ;100 copies per haploid genome). As the plasmid copynumber and the cellular max growth rate under the !Leu!Uracondition are correlated with each other, max growth rate can alsobe an indicator of the CNL of the target gene. Ideally, in gTOW, theprotein level expressed from the target gene increases according tothe copy number increase. However, if the transcription factors forthe target gene are diluted or if there is feedback in expressionregulation, then the copy number increase might not be linearlyreflected in the protein level. In this study, we thus designated it onthe basis of the overexpression limit measured by gTOW as the‘‘CNL of overexpression’’ to distinguish the limit of protein over-expression. We previously determined the CNLs of cell cycle reg-ulatory genes in the budding yeast and fission yeast and found thattheir CNLs were diverse, ranging from less than two to more than100 (Moriya et al. 2006, 2011).
Several genome-wide analyses revealed the genes that causecellular dysfunction upon overexpression (Gelperin et al. 2005;Sopko et al. 2006). These analyses were performed using promoter
7Corresponding authorE-mail [email protected] published online before print. Article, supplemental material, and publi-cation date are at http://www.genome.org/cgi/doi/10.1101/gr.146662.112.Freely available online through the Genome Research Open Access option.
23:000–000 ! 2013, Published by Cold Spring Harbor Laboratory Press; ISSN 1088-9051/13; www.genome.org Genome Research 1www.genome.org
Cold Spring Harbor Laboratory Press on December 29, 2012 - Published by genome.cshlp.orgDownloaded from

swapping in which each target open reading frame (ORF)/proteinis highly expressed by the strong inducible GAL1 promoter. Theresults obtained by promoter swapping and gTOWare known to bedifferent (Moriya et al. 2006; Krantz et al. 2009) because the formertechnique causes absolute overexpression and the latter causesrelative overexpression from the native level. The promoter swap-ping approach is useful for determining what happens whena target protein abundantly exists within the cell. Conversely, it isdifficult to argue how much the target is overexpressed when cel-lular dysfunction is observed. As gTOW increases the copy numberof the target gene with its native promoter, this argument is pos-sible. We thus consider that gTOW is a useful method for evalu-ating the robustness of cellular systems by assessing how muchgene expression is fluctuated from the native level when the sys-tem halts (Moriya et al. 2012). The advantage of gTOW is that onecannot only isolate genes causing cellular dysfunctions uponoverexpression but also quantitate the limits of gene overexpres-sion that are associated with cellular robustness. In addition, weconsider that gTOW is useful for evaluating cellular dysfunctiontriggered by the fluctuation of the gene copy number.
In this study, we performed a genome-wide CNL measure-ment of genes of the budding yeast Saccharomyces cerevisiae usinggTOW to reveal the profile of CNLs of all genes in this organismand determine why the yeast cellular systems are sensitive to mi-nor increases in the copy numbers of those genes. First, we isolated786 genes with significantly low CNLs. Further, we isolated geneswith extremely low CNLs (10 or fewer copies per haploid genome),which we designated ‘‘yeast dosage-sensitive genes’’ (DSGs). Ourresults indicated that the yeast cellular system was robust againstcopy number variations (overexpression) in most genes but fragileagainst variations in a specific set of genes. Yeast DSGs tended to
encode protein complex components, as well as proteins involvedin cytoskeletal organization and intracellular transport. Our ex-perimental evidence suggested that protein burden and stoichio-metric imbalance are the primary causes of dosage sensitivity.These findings may have an interesting evolutionary implicationin that DSGs function to constrain and secure the integrity of eu-karyotic genomes during evolution.
Results
gTOW6000: Analysis of all protein-coding genes in S. cerevisiaeusing gTOWTo analyze all protein-coding genes in the S. cerevisiae genomeusing gTOW, we performed a series of experiments as summarizedin Figure 1 (for details, see the Methods). We amplified all protein-coding genes (5806) with their native regulatory regions in theyeast strain BY4741 chromosome using polymerase chain reaction(PCR) and then cloned the genes into pTOWug2-836 (Supple-mental Fig. S1; Moriya et al. 2012). Because not all promoter re-gions were identified, we cloned genes with their upstream anddownstream sequences up to their neighboring genes (as an ex-ample, see Supplemental Fig. S2A,B). Cells harboring the gTOWplasmids with each target gene were cultivated in !Ura and!Leu!Ura media. We then measured max growth rate under the!Leu!Ura condition using online monitoring of cellular growth,and the plasmid copy numbers under the !Ura and !Leu!Uraconditions using quantitative PCR. We analyzed at least two in-dependent plasmid clones for each gene. The reproducibility be-tween each duplicate is shown in Supplemental Figure S3. To thispoint, we have succeeded in analyzing >95% of the genes in the
Figure 1. Scheme of genome-wide analysis of protein-coding genes in S. cerevisiae with gTOW (gTOW6000). Each step of gTOW6000 is shown. Forsteps 2–7, the representative data of plate no. 13 are given as an example. The details of each step are described in Methods.
2 Genome Researchwww.genome.org
Makanae et al .
Cold Spring Harbor Laboratory Press on December 29, 2012 - Published by genome.cshlp.orgDownloaded from
yeast genome (the entire data can be found in Supplemental TableS1). Hereafter, we will refer to this analysis as ‘‘gTOW6000.’’
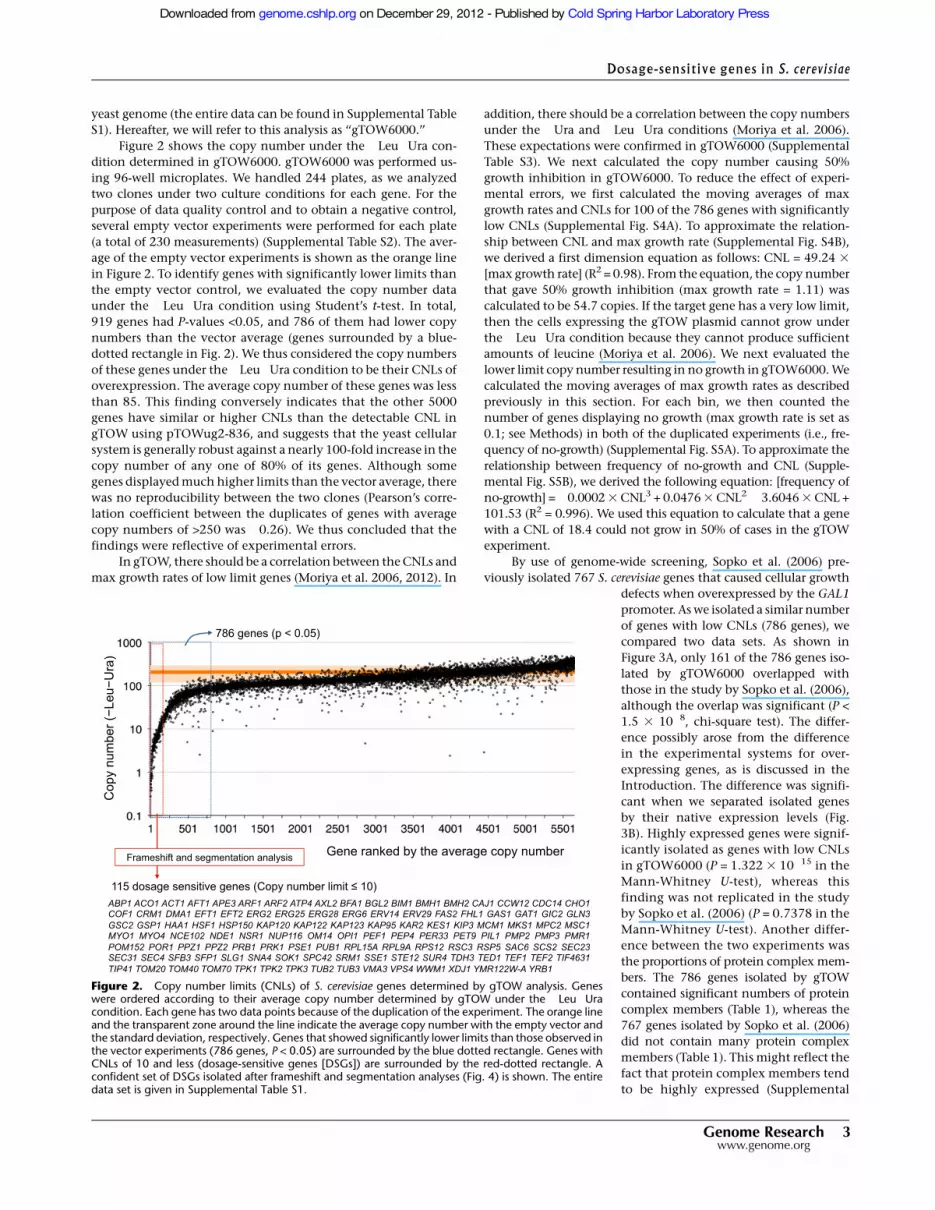
Figure 2 shows the copy number under the !Leu!Ura con-dition determined in gTOW6000. gTOW6000 was performed us-ing 96-well microplates. We handled 244 plates, as we analyzedtwo clones under two culture conditions for each gene. For thepurpose of data quality control and to obtain a negative control,several empty vector experiments were performed for each plate(a total of 230 measurements) (Supplemental Table S2). The aver-age of the empty vector experiments is shown as the orange linein Figure 2. To identify genes with significantly lower limits thanthe empty vector control, we evaluated the copy number dataunder the !Leu!Ura condition using Student’s t-test. In total,919 genes had P-values <0.05, and 786 of them had lower copynumbers than the vector average (genes surrounded by a blue-dotted rectangle in Fig. 2). We thus considered the copy numbersof these genes under the!Leu!Ura condition to be their CNLs ofoverexpression. The average copy number of these genes was lessthan 85. This finding conversely indicates that the other 5000genes have similar or higher CNLs than the detectable CNL ingTOW using pTOWug2-836, and suggests that the yeast cellularsystem is generally robust against a nearly 100-fold increase in thecopy number of any one of 80% of its genes. Although somegenes displayed much higher limits than the vector average, therewas no reproducibility between the two clones (Pearson’s corre-lation coefficient between the duplicates of genes with averagecopy numbers of >250 was !0.26). We thus concluded that thefindings were reflective of experimental errors.
In gTOW, there should be a correlation between the CNLs andmax growth rates of low limit genes (Moriya et al. 2006, 2012). In
addition, there should be a correlation between the copy numbersunder the !Ura and !Leu!Ura conditions (Moriya et al. 2006).These expectations were confirmed in gTOW6000 (SupplementalTable S3). We next calculated the copy number causing 50%growth inhibition in gTOW6000. To reduce the effect of experi-mental errors, we first calculated the moving averages of maxgrowth rates and CNLs for 100 of the 786 genes with significantlylow CNLs (Supplemental Fig. S4A). To approximate the relation-ship between CNL and max growth rate (Supplemental Fig. S4B),we derived a first dimension equation as follows: CNL = 49.24 3[max growth rate] (R2 = 0.98). From the equation, the copy numberthat gave 50% growth inhibition (max growth rate = 1.11) wascalculated to be 54.7 copies. If the target gene has a very low limit,then the cells expressing the gTOW plasmid cannot grow underthe !Leu!Ura condition because they cannot produce sufficientamounts of leucine (Moriya et al. 2006). We next evaluated thelower limit copy number resulting in no growth in gTOW6000. Wecalculated the moving averages of max growth rates as describedpreviously in this section. For each bin, we then counted thenumber of genes displaying no growth (max growth rate is set as0.1; see Methods) in both of the duplicated experiments (i.e., fre-quency of no-growth) (Supplemental Fig. S5A). To approximate therelationship between frequency of no-growth and CNL (Supple-mental Fig. S5B), we derived the following equation: [frequency ofno-growth] =!0.0002 3 CNL3 + 0.0476 3 CNL2! 3.6046 3 CNL +101.53 (R2 = 0.996). We used this equation to calculate that a genewith a CNL of 18.4 could not grow in 50% of cases in the gTOWexperiment.
By use of genome-wide screening, Sopko et al. (2006) pre-viously isolated 767 S. cerevisiae genes that caused cellular growth
defects when overexpressed by the GAL1promoter. As we isolated a similar numberof genes with low CNLs (786 genes), wecompared two data sets. As shown inFigure 3A, only 161 of the 786 genes iso-lated by gTOW6000 overlapped withthose in the study by Sopko et al. (2006),although the overlap was significant (P <1.5 3 10!8, chi-square test). The differ-ence possibly arose from the differencein the experimental systems for over-expressing genes, as is discussed in theIntroduction. The difference was signifi-cant when we separated isolated genesby their native expression levels (Fig.3B). Highly expressed genes were signif-icantly isolated as genes with low CNLsin gTOW6000 (P = 1.322 3 10!15 in theMann-Whitney U-test), whereas thisfinding was not replicated in the studyby Sopko et al. (2006) (P = 0.7378 in theMann-Whitney U-test). Another differ-ence between the two experiments wasthe proportions of protein complex mem-bers. The 786 genes isolated by gTOWcontained significant numbers of proteincomplex members (Table 1), whereas the767 genes isolated by Sopko et al. (2006)did not contain many protein complexmembers (Table 1). This might reflect thefact that protein complex members tendto be highly expressed (Supplemental
Figure 2. Copy number limits (CNLs) of S. cerevisiae genes determined by gTOW analysis. Geneswere ordered according to their average copy number determined by gTOW under the !Leu!Uracondition. Each gene has two data points because of the duplication of the experiment. The orange lineand the transparent zone around the line indicate the average copy number with the empty vector andthe standard deviation, respectively. Genes that showed significantly lower limits than those observed inthe vector experiments (786 genes, P < 0.05) are surrounded by the blue dotted rectangle. Genes withCNLs of 10 and less (dosage-sensitive genes [DSGs]) are surrounded by the red-dotted rectangle. Aconfident set of DSGs isolated after frameshift and segmentation analyses (Fig. 4) is shown. The entiredata set is given in Supplemental Table S1.
Dosage-sensitive genes in S. cerevis iae
Genome Research 3www.genome.org
Cold Spring Harbor Laboratory Press on December 29, 2012 - Published by genome.cshlp.orgDownloaded from

Fig. S6). From these results, we considered that gTOW6000 wouldprovide additional clues to understand the cellular effects of geneoverexpression, as this method isolated a different subset of genesfrom previous promoter swapping experiments. Of the 161 over-lapped genes (Fig. 3A), the highly expressed genes among the 786gTOW6000 genes were excluded (Fig. 3B), and the complex mem-bers of 767 genes isolated by Sopko et al. (2006) were enriched(Table 1), probably due to the characteristics of the opposite datasets.
Isolation of low limit genes (yeast DSGs)To further understand the characteristics of low limit genes, weperformed additional experiments to isolate a confident set ofgenes with CNLs of 10 or less. We introduced a frameshift mu-tation in each of the 182 genes to confirm whether the expressionof the protein but not that of the DNA and RNA elements de-termined the limit (Fig. 4A). Frameshift analysis could also deter-mine whether either of the bidirectionally overlapped genes was
the cause of the low CNL (for example,see Supplemental Fig. S7A). Among the155 genes with CNLs of 20 or less, theframeshift mutants of 140 of these genesdisplayed more than fivefold higherCNLs than the wild-type genes or theirCNLs increased to the vector level (;100copies) (Fig. 4B; Supplemental Table S4).We thus verified that the original targetORFs of these 140 genes determined theCNLs (denoted as ‘‘fs verified’’ in Supple-mental Tables S1, S4).
We further analyzed the 15 genes inframeshift mutants that did not exhibitincreased limits (12 of them are indicatedby red circles in Fig. 4B). They were cate-gorized as four different types of genes asfollows. (1) One of the overlapping ORFsappeared to cause the low limits. Thecloned regions contained two overlap-ping ORFs in cases of YFL010C/WWM1–
YFL010W-A/AUA1 and YGL167C/PMR1–YGL168W/HUR1. Be-cause the frameshift mutants of WWM1 and PMR1 displayed in-creased CNLs, we concluded that these genes were responsible forthe low CNLs. The result for YGL167C is shown in SupplementalFigure S7A as an example. (2) Because both clones containing oneof the two neighboring genes (YNL024C-A/KSH1–YNL025C/SSN8)exhibited low CNLs but the frameshift mutations did not in-crease the CNL of either gene (Supplemental Fig. S7B), we con-cluded that an RNA gene (NME1) caused the low limits. (3) Forgenes for which the frameshift mutations did not increase theirCNLs but the cause could not be ascertained from their genomeannotations, we segmented the fragments into 59 UTR and ORF-39UTR fragments and measured their limits (Fig. 4A). Both the 59and 39 segmented fragments of CPS1, FHL1, GRX3, HOM3, TPK1,and TPK3 (underlined in blue in Fig. 4C) displayed increasedcopy numbers. These ORFs may have been expressed from ATGsother than the annotated ones. (4) The segmented fragments(ORF-39 UTR) of ASE1, DIE2, IRC8, and SFP1 did not exhibit in-creased CNLs (underlined in red, Fig. 4C). For DIE2 and IRC8, we
Table 1. Characteristics of DSGs
Protein complexmembersa
Genes with no.of PPIs ‡1b
Genes with no.of PPIs ‡5b
Intrinsic proteindisorder (‡150)c
Yeastohnologsd
Essentialgenese
Yeast DSGf
(limit #10)69.6% (80/115) 75.7% (87/115) 36.5% (42/115) 23.5% (27/115) 34.8% (40/115) 26.1% (30/115)
P-value 9.05 3 10!7 7.80 3 10!10 1. 3 10!10 3.43 3 10!7 2.21 3 10!5 —gTOW6000 786
genes61.5% (483/786) 60.3% (474/786) 25.7% (202/786) 24.8% (195/786) 27.2% (214/786) 27.4% (215/786)
P-value <2.2 3 10!16 9.37 3 10!15 <2.2 3 10!16 <2.2 3 10!16 3.23 3 10!10 9.90 3 10!8
Overlapped 161genes
62.7% (101/161) 64.6% (104/161) 29.8% (48/161) 32.3% (52/161) 34.8% (56/161) 28.0% (45/161)
P-value 4.06 3 10!5 1.37 3 10!5 1.40 3 10!7 4.91 3 10!12 3.75 3 10!7 0.01705Sopko 767 genes 46.0% (353/767) 57.4% (440/767) 21.1% (162/767) 26.2% (201/767) 21.8% (167/767) 20.9% (160/767)P-value — 3.92 3 10!9 3.08 3 10!7 <2.2 3 10!16 3.91 3 10!2 —All genes 46.5% (2690/5783) 47.4% (2742/5783) 14.9% (863/5783) 13.6% (786/5783) 19.0% (1098/5783) 20.2% (1168/5783)
aProtein complex components (mips; ftp://ftpmips.gsf.de/yeast/catalogues/complexcat/complexcat_data_18052006).bProtein–protein interactions (dip; http://dip.doe-mbi.ucla.edu).cIntrinsic protein disorder (Vavouri 2009).dYeast ohnolog (http://wolfe.gen.tcd.ie/ygob/).eEssential genes (http://www-deletion.stanford.edu/YDPM/YDPM_index.html).fComplete data set for yeast DSGs is given in Supplemental Table S5.
Figure 3. Comparison of gTOW6000 data with data of another overexpression analysis performedusing promoter swapping. (A) Overlap of genes identified by the overexpression analyses performed bySopko et al. (2006) and in this study. (B) Distribution of genes identified by overexpression analysisordered by their native protein levels. Each bin contains genes ordered by their native protein levels(Ghaemmaghami et al. 2003). The protein abundance unit is molecules per cell. Error bars, SEM.
Makanae et al .
4 Genome Researchwww.genome.org
Cold Spring Harbor Laboratory Press on December 29, 2012 - Published by genome.cshlp.orgDownloaded from

performed additional segmentation analysis (Supplemental Fig.S8). The 39 regions of both genes had elements causing the lowlimits, although their functions are still unknown (SupplementalFig. S8).
By use of the aforementioned analysis, we isolated 115 DSGsby removing the overlapping genes (AUA1 and HUR1), the RNAgene (NME1), the genes for which their low limits were not causedby their annotated ORFs (DIE2 and IRC8), and a real-time PCRreference gene (LEU3) from the list of genes with CNLs of 10 orless (Fig. 2; Supplemental Table S5). Among the yeast DSGs, 88genes were previously isolated in screenings of genes causing
toxicity upon overexpression by promoterswapping (Liu et al. 1992; Espinet et al.1995; Akada et al. 1997; Stevensonet al. 2001; Boyer et al. 2004; Gelperinet al. 2005; Sopko et al. 2006; Niu et al.2008; Yoshikawa et al. 2011). According tothe Saccharomyces Genome Database (SGD;http://www.yeastgenome.org), the over-expression of ;1900 genes was reported tocause lethality or decreased cell growth.This study isolated another set of genescausing growth defects after only a minorincrease in copy number (overexpressionrelative to the native level). Jones et al.(2008) created a comprehensive overlapDNA library of the S. cerevisiae genomeusing a 2-micron–based multicopy vec-tor. They tested the toxicity of each cloneto yeast cells and identified 23 toxic DNAsegments. We can assume that the yeastDSGs isolated in our study are responsiblefor the toxicity of the DNA segments. Intotal, 12 of the 23 toxic clones actuallycontained DSGs isolated in this study(Supplemental Table S6). At present, it isunclear why clones without yeast DSGsare toxic. The toxicities of these clonesmight be explained by the additive effectof weak DSGs within the same clone, orwe may have failed to clone the promotersof target genes that were present beyondthe neighboring genes.
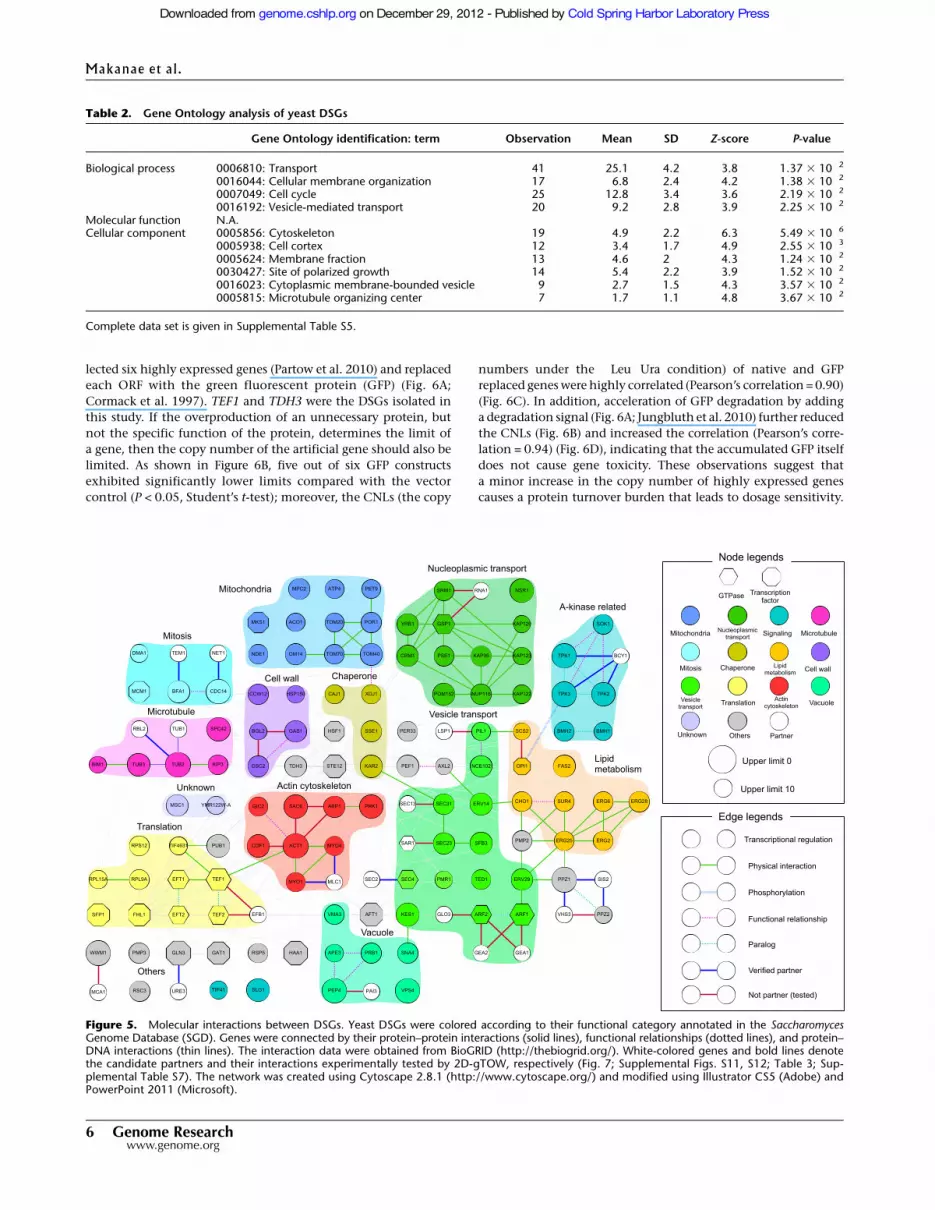
We next analyzed the characteristicsof isolated DSGs (Table 1). DSGs signifi-cantly contain protein complex members,proteins with many interaction partners,and proteins containing higher intrinsicdisordered regions. Although it was notsignificant, the percentage of essentialgenes among yeast DSGs was higher thanthat within the entire genome. DSGs alsotended to be highly expressed (P = 4.696 310!6 in the Mann-Whitney U-test) (Sup-plemental Fig. S9), as did the 786 low limitgenes (Fig. 3B). Yeast DSGs contain sig-nificantly higher percentages of genes inthe gene ontology categories of cytoskel-etal organization and intracellular trans-port (Table 2), whereas transcription fac-tors and signaling molecules (proteinkinase and phosphatase) were not con-
centrated (data not shown). Figure 5 presents a gene networkconstituted according to the functional category of each gene andtheir physical (protein–protein and protein–DNA) interactions thatwere described in SGD.
Protein burden causes dosage sensitivityThe fact that DSGs tended to be highly expressed suggests that theincreased copy number of a highly expressed gene exerts a burdenon protein turnover (Stoebel et al. 2008; Sheltzer and Amon 2011),which causes the dosage sensitivities of yeast DSGs. We thus se-
Figure 4. Frameshift and segmentation analyses of candidate low limit genes. (A) Structure of theplasmid used in frameshift analysis and segmentation analysis. (Red letters) The nucleotide inserted togenerate frameshift. The introduced FspI site in the mutant is underlined. (B) A scatter plot of the CNLs ofthe wild-type genes and the frameshift mutants of low limit genes. (Black circles) Genes that displayedincreased CNLs when frameshift was introduced. (Red circles) Genes that did not display increased CNLseven when frameshift was generated. Note that the frameshift mutants of AUA1, GAT1, and FHL1 couldnot be obtained, probably because their frameshift mutants also have very low limits. The raw data canbe found in Supplemental Table S4. (C ) CNLs of segmented genes. Genes underlined with a blue lineare those that displayed increased CNLs upon segmentation. Genes underlined with a red line indicategenes that did not display increased CNLs upon segmentation.
Dosage-sensitive genes in S. cerevis iae
Genome Research 5www.genome.org
Cold Spring Harbor Laboratory Press on December 29, 2012 - Published by genome.cshlp.orgDownloaded from
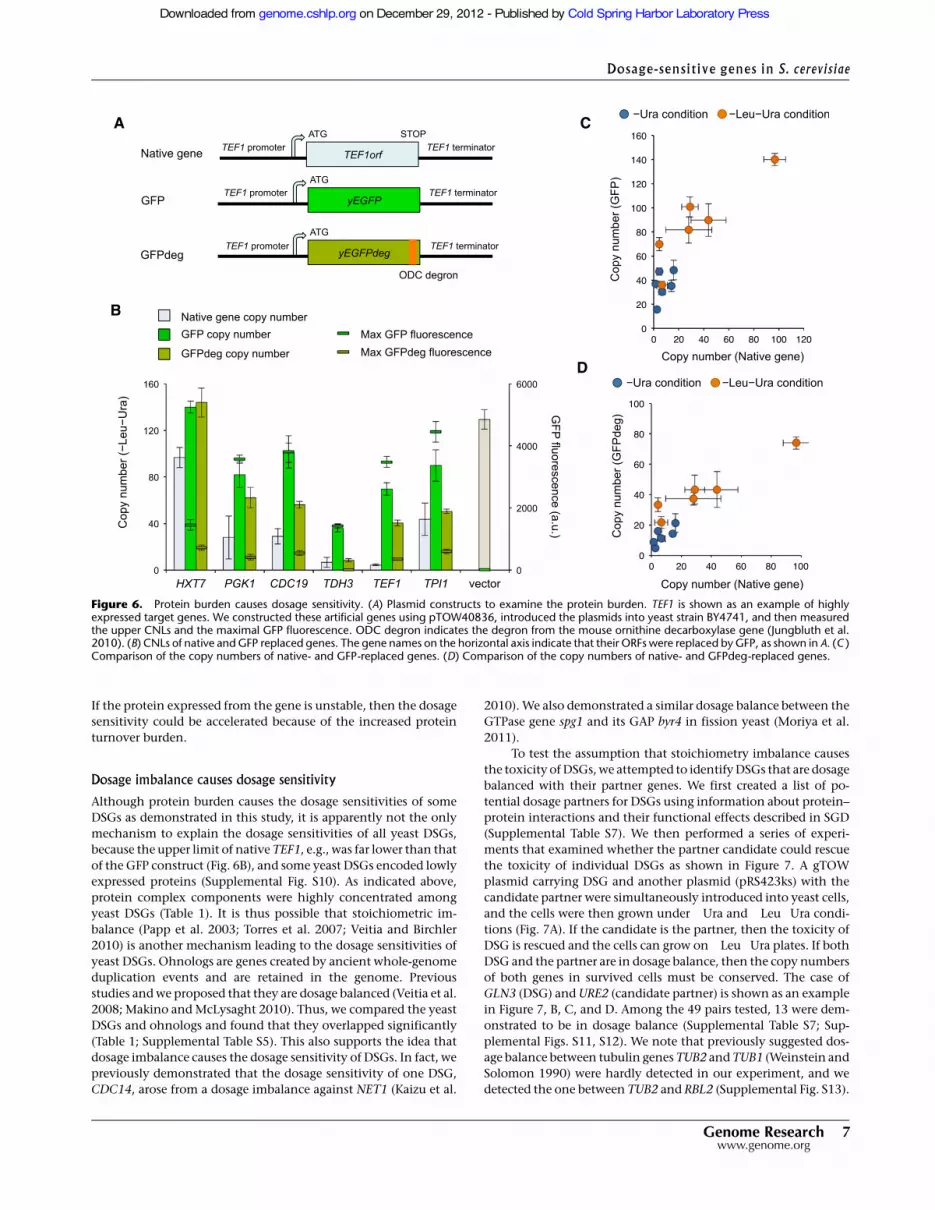
lected six highly expressed genes (Partow et al. 2010) and replacedeach ORF with the green fluorescent protein (GFP) (Fig. 6A;Cormack et al. 1997). TEF1 and TDH3 were the DSGs isolated inthis study. If the overproduction of an unnecessary protein, butnot the specific function of the protein, determines the limit ofa gene, then the copy number of the artificial gene should also belimited. As shown in Figure 6B, five out of six GFP constructsexhibited significantly lower limits compared with the vectorcontrol (P < 0.05, Student’s t-test); moreover, the CNLs (the copy
numbers under the !Leu!Ura condition) of native and GFPreplaced genes were highly correlated (Pearson’s correlation = 0.90)(Fig. 6C). In addition, acceleration of GFP degradation by addinga degradation signal (Fig. 6A; Jungbluth et al. 2010) further reducedthe CNLs (Fig. 6B) and increased the correlation (Pearson’s corre-lation = 0.94) (Fig. 6D), indicating that the accumulated GFP itselfdoes not cause gene toxicity. These observations suggest thata minor increase in the copy number of highly expressed genescauses a protein turnover burden that leads to dosage sensitivity.
Table 2. Gene Ontology analysis of yeast DSGs
Gene Ontology identification: term Observation Mean SD Z-score P-value
Biological process 0006810: Transport 41 25.1 4.2 3.8 1.37 3 10!2
0016044: Cellular membrane organization 17 6.8 2.4 4.2 1.38 3 10!2
0007049: Cell cycle 25 12.8 3.4 3.6 2.19 3 10!2
0016192: Vesicle-mediated transport 20 9.2 2.8 3.9 2.25 3 10!2
Molecular function N.A.Cellular component 0005856: Cytoskeleton 19 4.9 2.2 6.3 5.49 3 10!6
0005938: Cell cortex 12 3.4 1.7 4.9 2.55 3 10!3
0005624: Membrane fraction 13 4.6 2 4.3 1.24 3 10!2
0030427: Site of polarized growth 14 5.4 2.2 3.9 1.52 3 10!2
0016023: Cytoplasmic membrane-bounded vesicle 9 2.7 1.5 4.3 3.57 3 10!2
0005815: Microtubule organizing center 7 1.7 1.1 4.8 3.67 3 10!2
Complete data set is given in Supplemental Table S5.
Figure 5. Molecular interactions between DSGs. Yeast DSGs were colored according to their functional category annotated in the SaccharomycesGenome Database (SGD). Genes were connected by their protein–protein interactions (solid lines), functional relationships (dotted lines), and protein–DNA interactions (thin lines). The interaction data were obtained from BioGRID (http://thebiogrid.org/). White-colored genes and bold lines denotethe candidate partners and their interactions experimentally tested by 2D-gTOW, respectively (Fig. 7; Supplemental Figs. S11, S12; Table 3; Sup-plemental Table S7). The network was created using Cytoscape 2.8.1 (http://www.cytoscape.org/) and modified using Illustrator CS5 (Adobe) andPowerPoint 2011 (Microsoft).
Makanae et al .
6 Genome Researchwww.genome.org
Cold Spring Harbor Laboratory Press on December 29, 2012 - Published by genome.cshlp.orgDownloaded from
If the protein expressed from the gene is unstable, then the dosagesensitivity could be accelerated because of the increased proteinturnover burden.
Dosage imbalance causes dosage sensitivityAlthough protein burden causes the dosage sensitivities of someDSGs as demonstrated in this study, it is apparently not the onlymechanism to explain the dosage sensitivities of all yeast DSGs,because the upper limit of native TEF1, e.g., was far lower than thatof the GFP construct (Fig. 6B), and some yeast DSGs encoded lowlyexpressed proteins (Supplemental Fig. S10). As indicated above,protein complex components were highly concentrated amongyeast DSGs (Table 1). It is thus possible that stoichiometric im-balance (Papp et al. 2003; Torres et al. 2007; Veitia and Birchler2010) is another mechanism leading to the dosage sensitivities ofyeast DSGs. Ohnologs are genes created by ancient whole-genomeduplication events and are retained in the genome. Previousstudies and we proposed that they are dosage balanced (Veitia et al.2008; Makino and McLysaght 2010). Thus, we compared the yeastDSGs and ohnologs and found that they overlapped significantly(Table 1; Supplemental Table S5). This also supports the idea thatdosage imbalance causes the dosage sensitivity of DSGs. In fact, wepreviously demonstrated that the dosage sensitivity of one DSG,CDC14, arose from a dosage imbalance against NET1 (Kaizu et al.
2010). We also demonstrated a similar dosage balance between theGTPase gene spg1 and its GAP byr4 in fission yeast (Moriya et al.2011).
To test the assumption that stoichiometry imbalance causesthe toxicity of DSGs, we attempted to identify DSGs that are dosagebalanced with their partner genes. We first created a list of po-tential dosage partners for DSGs using information about protein–protein interactions and their functional effects described in SGD(Supplemental Table S7). We then performed a series of experi-ments that examined whether the partner candidate could rescuethe toxicity of individual DSGs as shown in Figure 7. A gTOWplasmid carrying DSG and another plasmid (pRS423ks) with thecandidate partner were simultaneously introduced into yeast cells,and the cells were then grown under !Ura and !Leu!Ura condi-tions (Fig. 7A). If the candidate is the partner, then the toxicity ofDSG is rescued and the cells can grow on!Leu!Ura plates. If bothDSG and the partner are in dosage balance, then the copy numbersof both genes in survived cells must be conserved. The case ofGLN3 (DSG) and URE2 (candidate partner) is shown as an examplein Figure 7, B, C, and D. Among the 49 pairs tested, 13 were dem-onstrated to be in dosage balance (Supplemental Table S7; Sup-plemental Figs. S11, S12). We note that previously suggested dos-age balance between tubulin genes TUB2 and TUB1 (Weinstein andSolomon 1990) were hardly detected in our experiment, and wedetected the one between TUB2 and RBL2 (Supplemental Fig. S13).
Figure 6. Protein burden causes dosage sensitivity. (A) Plasmid constructs to examine the protein burden. TEF1 is shown as an example of highlyexpressed target genes. We constructed these artificial genes using pTOW40836, introduced the plasmids into yeast strain BY4741, and then measuredthe upper CNLs and the maximal GFP fluorescence. ODC degron indicates the degron from the mouse ornithine decarboxylase gene (Jungbluth et al.2010). (B) CNLs of native and GFP replaced genes. The gene names on the horizontal axis indicate that their ORFs were replaced by GFP, as shown in A. (C )Comparison of the copy numbers of native- and GFP-replaced genes. (D) Comparison of the copy numbers of native- and GFPdeg-replaced genes.
Dosage-sensitive genes in S. cerevis iae
Genome Research 7www.genome.org
Cold Spring Harbor Laboratory Press on December 29, 2012 - Published by genome.cshlp.orgDownloaded from

Analyzed interactions and confirmed dosage-balanced interac-tions are indicated by bold lines and blue bold lines in Figure 5,respectively. We thus concluded that dosage imbalance was a causeof the dosage sensitivity of at least some yeast DSGs.
DiscussionIn this study, we applied gTOW to measure the CNLs of over-expression of nearly all protein-coding genes in S. cerevisiae andidentified 115 DSGs with CNLs of 10 or less. From the character-istics of the genes (e.g., they tended to be highly expressed andcomplex members), we speculated that protein burden and stoi-chiometry imbalance caused the dosage sensitivity of these genes.We further experimentally verified the hypothesis using gTOWexperiments. The results indicated that there are at least two dif-ferent causes of dosage sensitivity: specific and nonspecific causesrelated to gene function. We currently think that for some DSGs,the dosage imbalance by itself causes severe dosage sensitivities.We have isolated some DSGs where the dosage sensitivities weresuppressed by the simultaneous overexpressions of their partners(Table 3). The copy numbers of these DSGs can increase (theirproteins are further overexpressed) when their partners are abun-dant, and hence, their protein turnover does not appear to causetheir dosage sensitivities.
Disomy of any of the 16 S. cerevisiae chromosomes causes cel-lular growth defects resulting from the overexpression of particular
genes on the disomic chromosome (Torres et al. 2007). Severalpossible mechanisms by which aneuploidy can cause cellulardysfunction have been proposed (Sheltzer and Amon 2011). Be-cause disomy causes the duplication of all genes on the chromo-some, it is difficult to identify specific genes, and consequently thespecific mechanisms, causing dosage sensitivity. The mechanismscausing dosage sensitivity that were inspected in this study shouldhave some shared features with aneuploidy.
Although we focused on DSGs in this study, yeast cellularsystems were robust against ;100-fold overexpression in >80% oftheir genes (Fig. 2). According to the characteristics of DSGs foundin this study, genes with low expression without dosage balancewere conversely considered dosage insensitive. Genes with tightlycontrolled expression or enzymes with regulation that is not sub-unit dependent (e.g., regulated by intramolecular interactions) willbe robust against copy number increase. The domain organizationof proteins, e.g., a catalytic domain and a regulatory domain in thesame protein, could have evolved to avoid dosage sensitivity.
Why do DSGs remain in the present yeast genome? In addi-tion, why have not cellular systems evolved to avoid the existenceof DSGs? One possibility is that dosage sensitivity has its ownimportant function; if DSGs and their dosage partners are rea-sonably scattered around chromosomal regions, then they willconstitute a dosage balance network (the network identified in thisstudy is shown in Fig. 8). This network potentially constrains andsecures the composition of an organism’s chromosomes because
Figure 7. Testing dosage balance between DSGs and their candidate partners. (A) The experimental design of 2D-gTOW to determine whether twogenes are dosage partners (Kaizu et al. 2010). First, we transformed a yeast strain with two plasmids expressing DSG and its candidate partner and thentested whether the transformant could grow under the !Leu condition and whether both the plasmids were balanced. (B,C,D) Examples of 2D-gTOWexperiments with GLN3 (DSG) and its partner URE2. (B) Plate assay: High copy URE2 supports the growth of yeast cells with high-copy GLN3. (C ) Copynumbers of pTOW-GLN3 and pRS423ks-URE2 under the low-copy (!His!Ura) and high-copy (!His!Leu!Ura) conditions. (D) The copy numbers of GLN3and URE2 in 2D-gTOW experiments are balanced. Other experimental results can be found in Supplemental Figures S11, S12, and S13.
Makanae et al .
8 Genome Researchwww.genome.org
Cold Spring Harbor Laboratory Press on December 29, 2012 - Published by genome.cshlp.orgDownloaded from

chromosomal abbreviation in a cell disrupts the balance within thenetwork, which reduces the fitness of the cell. The reason why thegenomic composition of current organisms is stable could be thatthe dosage balance network functions as a sentinel of abnormality.This could explain how and why the eukaryotic chromosomeswere established and maintained during evolution in a relativelystable manner. If our hypothesis is true, the DSGs and their part-ners should be located on different chromosomes. In S. cerevisiae,all the DSGs and their partners identified in this study were ac-tually distributed on different chromosomes (Fig. 8). Analyzingthe distributions of DSGs and their partners in species related toS. cerevisiae (before and after genome duplication) is one way ofobtaining further evidence for this hypothesis.
Methods
Strains, growth conditions, and yeast transformationS. cerevisiae strain BY4741 (MATa his3D1 leu2D0 met15D0 ura3D0)(Brachmann et al. 1998) was used for gTOW6000 analysis. Yeastcultivation and transformation were performed as previouslydescribed (Amberg et al. 2005). Synthetic complete (SC) mediumwithout indicated amino acids were used for the cultivation ofyeast.
Plasmids used in this studypTOWug2-836 (Supplemental Fig. S1; Moriya et al. 2012) was usedfor gTOW6000 analysis. pTOW40836 (a pTOWug2-836 derivativebut it does not contain the GFP gene in the backbone) (Moriyaet al. 2012), was used for the GFP replacement experiments inFigure 6. pRS423ks, which was used to clone partner genes fortwo-dimensional gTOW experiments, is a derivative of pRS423(Christianson et al. 1992), and it has two additional primer sitesoutside the multicloning site (indicated as K_primer and S_primerin Supplemental Fig. S14). The K and S priming sites allowed us toselectively amplify the insert of pRS423ks from the cells harbor-ing pTOW and pRS423ks. gTOW6000 plasmid clones were con-structed as described below. The plasmids used for the frameshiftanalysis, the segmentation analysis, and the GFP replacementanalysis were constructed as shown in Supplemental Figures S15,S16, and S17, respectively. Primer sequences used to construct thegTOW6000 plasmids are listed in Supplemental Table S8. Otherprimer sequences are available upon request. Individual plasmid ingTOW6000 is available from National BioResource Project-Yeast(http://yeast.lab.nig.ac.jp/).
PCRAll DNA fragments were amplified byPCR using the high-fidelity DNA poly-merase KODplus (Toyobo) according tothe method described in the manufac-turer’s protocol.
DNA extraction and determinationof the plasmid copy numberDNA samples were prepared accordingto the method described previously(Moriya et al. 2006). The copy numbersof pTOWug2-836, pTOW40836 andpRS423ks were measured using real-timePCR according to the method describedpreviously (Moriya et al. 2006; Kaizuet al. 2010) using Lightcycler480 (Roche).
LEU2 (LEU2-2F: 59-GCTAATGTTTTGGCCTCTTC-39; LEU2-2R: 59-ATTTAGGTGGGTTGGGTTCT-39) and HIS3 primer sets (HIS3-1F:59-TTCCGGCTGGTCGCTAAT-39; HIS3-1R: 59-GCGCAAATCCTGATCCAAAC-39) were used to measure the copy numbers of pTOWvectors and pRS423ks, respectively. The LEU3 primer set (LEU3-3F:59-CAGCAACTAAGGACAAGG-39; LEU3-3R: 59-GGTCGTTAATGAGCTTCC-39) was used to amplify the genomic DNA. Because weused LEU3 as a reference gene for the genome in the copy numberdetermination using real-time PCR, the calculated CNL of LEU3 isalways one.
Measuring GFP fluorescenceGFP fluorescence of cell culture was measured using Infinite F200microplate reader (TECAN)
Construction of gTOW6000 clones and the analysisThe entire scheme of gTOW6000 analysis is shown in Figure 1. ThegTOW6000 analysis was separated into eight steps as follows.
Design primers to amplify each target gene (step1), and amplify the targetgenes using PCR (step 2)
In this study, we attempted to analyze all protein-coding genes onthe S. cerevisiae chromosome. To clone all genes with their regu-latory regions for ‘‘Characterized’’ and ‘‘Uncharacterized’’ ORFs, weamplified a DNA fragment containing each target ORF with up-stream and downstream regions spanning the neighboring ORFs.We ignored ‘‘Dubious ORF,’’ autonomous replicating sequence(ARS), and other RNA elements. Supplemental Figure S2A presentsan example of the analysis. Each region shown in blue was clonedinto individual pTOW plasmids. It is thus possible that the plasmidCNL is determined by the effect of non-ORF elements within eachclone instead of the cloned protein-coding genes. This possibilitywill be solved using a frameshift mutation analysis, as described inanother section. Supplemental Figure S2B shows the design of theprimers used to amplify the regions containing target genes byPCR. The primers consist of 23-bp priming sequences of theneighboring ORFs and 25-bp adaptor sequences of the vector forgap-repair cloning. The adaptor sequences of the up primer andthe down primer were 59-cggccgctctagaactagtGGATCC. . .-39 and59-attgggtaccgggccccccCTCGAG. . .-39, respectively. The sequencesshown in capital letters in the up and down primer sequences arethe BamHI and XhoI sites, respectively. The primer sequences ofpTOWug2-836 are shown in Supplemental Figure S1B. Accordingto the annotation of SGD (released on July 28, 2007), primers for
Table 3. Verified stoichiometric partners for DSGsa
DSG Upper limit Partner Reference Interaction reported
BFA1 3.5 TEM1 Park et al. 2004 Synthetic rescueGLN3 1.5 URE2 Palmer et al. 2009 Synthetic rescueMYO1 6.5 MLC1 — —MYO2 12.1 MLC1 Stevens and Davis 1998 Dosage rescueMYO4 6.5 MLC1 — —PPZ1 0.3 SIS2 Clotet et al. 1999 Dosage rescuePPZ1 0.3 VHS3 de Nadal et al. 1998 Synthetic rescuePPZ2 9.3 SIS2 BioGRID Physical interactionSEC4 5.2 SEC2 Ortiz et al. 2002 Dosage rescueTPK1 0.9 BCY1 BioGRID Physical interactionTPK2 2.1 BCY1 Nehlin et al. 1992 Dosage rescueTPK3 0.6 BCY1 Mazon et al. 1993 Phenotypic enhancementTUB2 2.7a RBL2 Abruzzi et al. 2002 Phenotypic suppression
aComplete data set is given in Supplemental Figures S11, S12, and S13 and Supplemental Table S7.
Dosage-sensitive genes in S. cerevis iae
Genome Research 9www.genome.org
Cold Spring Harbor Laboratory Press on December 29, 2012 - Published by genome.cshlp.orgDownloaded from

amplifying 5806 genes were designed using a Perl script. Each genewas amplified by PCR using each primer set and the BY4741 ge-nome as a template (first PCR). Via PCR, 98.4% of the obtained PCRproducts had the correct size. For the genes for which we could notobtain PCR products, we redesigned the primers. If the distance tothe neighboring gene was too large, then we shortened the lengthof the noncoding region to 1 kb. If the target ORF was too large, wedesigned primers as listed in Supplemental Table S9 to amplify seg-ments of the gene and connected the segments by gap repair (seebelow). We thus redesigned primers for 90 genes. The primer sets forgenes next to each of the 16 centromeres were first designed to
ensure that the amplified fragments contain the centromeres. Asexpected, all 32 of the DNA fragments containing centromeresexpressed one copy of the gTOW plasmid per cell (data not shown).We thus redesigned primers to remove the centromeres.
Transformation (gap-repair cloning; step 3 ) and selecting two independentclones for each gene (step 4)
The PCR products amplified using the aforementioned primersand pTOWug2-836 digested with BamHI and XhoI were simulta-neously introduced into BY4741 yeast cells. Each gene was inserted
Figure 8. Intrachromosomal interactions connected with DSGs and their partner genes. Locations of DSGs and their partner genes and their in-teractions identified in this study are visualized using Circos software (Krzywinski et al. 2009). The locations of 115 yeast DSGs are also shown.
Makanae et al .
10 Genome Researchwww.genome.org
Cold Spring Harbor Laboratory Press on December 29, 2012 - Published by genome.cshlp.orgDownloaded from
via the homologous recombination activity of yeast cells (gap-re-pair cloning) (Oldenburg et al. 1997). Each transformed colonycontained plasmids with an insert of the same target gene but anindependent PCR product (or self-ligated plasmids without anyinsert). Two independent colonies (clones) were thus selected andcultivated in SC medium without uracil (SC–Ura).
Measurement of growth (step 5 ) and measurement of plasmid copynumbers (step 6)
Each clone was cultivated as described in step 4 in both SC–Ura andSC–Leu–Ura at 30°C. The max growth rate of the clone cultivatedin SC–Leu–Ura was measured according to the method describedpreviously (Moriya et al. 2006). Strains for which no growth wasobserved were assigned a growth rate of 0.1 for descriptive pur-poses. After 50 h of cultivation, the plasmid copy number in thecultured cells was measured. From the principle of gTOW, theplasmid copy number determined in –Leu–Ura condition is con-sidered to be the CNL of overexpression of each target gene.
Validation of the inserts by PCR (Step 7 )
The insert of each clone was examined by PCR (insert-check PCR;icPCR) using primers OSBI0873 (59-GGCGAAAGGGGGATGTGCTG-39) and OSBI0870 (59-GGAAAGCGGGCAGTGAGCGC-39)(Supplemental Fig. S1B). The size of the insert was determinedusing Agarose gel electrophoresis. We validated the icPCR prod-ucts to ensure that the target genes were correctly cloned as fol-lows: ‘‘NI’’ meant the PCR product was the same size as the vector(No-Insert). In this case, we considered that the cloning was un-successful, and we did not adopt the max growth rate and copynumber data. ‘‘N’’ meant No PCR product was amplified. ‘‘W’’meant the PCR product had the wrong size (different from theexpected size). ‘‘D’’ meant two PCR products were amplified. Oneof them had the expected size. In these cases, we adopted the maxgrowth rate and copy number data because it was possible thatthere were problems with icPCR (e.g., the target was too large). Weobtained two independent clones for 88.9% of the genes in thefirst cycle.
Isolation of missing clones (step 8)
For genes for which we could not obtain two clones in step 7, weredesigned primers as described in step 1 or selected more coloniesas described in step 4. We finally obtained two clones for 5548genes (95.6%) and one clone for 203 genes (3.5%). We could notobtain any positive clones for 55 genes (5.5%).
Genes that were difficult to clone
We could not obtain any positive clones for YFL037W/TUB2 andYFL039C/ACT1, probably because they are too toxic. We thusmade plasmids with those genes in Escherichia coli and confirmedthat they were too toxic for the transformants to form colonies(data not shown). We thus concluded that they were very low limitgenes. In addition, for TUB2, we created a promoter-deletion seriesand obtained a TUB2 allele with a 100-bp promoter (tub2d-100, itsCNL was 2.7). We thus used these data for TUB2. As mentionedabove, we could not obtain any clones for 55 genes. Approximatelyhalf of them were retrotransposons and helicases encoded neartelomeres.
AcknowledgmentsWe thank Yuki Shimizu-Yoshida (Sony CSL), Kazunari Kaizu(Riken), Ayako Chino, and Masataka Sasabe (Okayama University)for valuable discussions about this work, and Naomi Fujimoto
(ERATO Kawaoka Project, JST) and Kazuko Matsubara (Keio Uni-versity, Medical School) for their experimental support. This workwas supported in part by the ERATO-SORST Kitano SymbioticSystems Project of the Systems Biology Institute, the PRESTOprogram of the Japan Science and Technology Agency, the SpecialCoordination Fund for Promoting Sciences and Technology,Grants-in-Aid for Scientific Research (B), and Grants-in-Aid forScientific Research on Innovative Areas of the Ministry of Educa-tion, Culture, Sports, Science, and Technology.
Author contributions: K.M. mainly performed the gTOW6000experiments. R.K. performed the partner-seeking experiments.T.M. performed bioinformatics analysis. H.K. supervised the project.H.M. mainly designed the experiments, analyzed the data, andwrote the paper.
References
Abruzzi KC, Smith A, Chen W, Solomon F. 2002. Protection from free b-tubulinby the b-tubulin binding protein Rbl2p. Mol Cell Biol 22: 138–147.
Akada R, Yamamoto J, Yamashita I. 1997. Screening and identification ofyeast sequences that cause growth inhibition when overexpressed. MolGen Genet 254: 267–274.
Alon U, Surette MG, Barkai N, Leibler S. 1999. Robustness in bacterialchemotaxis. Nature 397: 168–171.
Amberg DC, Burke D, Strathern JN. 2005. Methods in yeast genetics: A ColdSpring Harbor Laboratory Course Manual. Cold Spring Harbor LaboratoryPress, New York.
Boyer J, Badis G, Fairhead C, Talla E, Hantraye F, Fabre E, Fischer G,Hennequin C, Koszul R, Lafontaine I, et al. 2004. Large-scale explorationof growth inhibition caused by overexpression of genomic fragments inSaccharomyces cerevisiae. Genome Biol 5: R72.
Brachmann CB, Davies A, Cost GJ, Caputo E, Li J, Hieter P, Boeke JD. 1998.Designer deletion strains derived from Saccharomyces cerevisiae S288C: Auseful set of strains and plasmids for PCR-mediated gene disruption andother applications. Yeast 14: 115–132.
Christianson TW, Sikorski RS, Dante M, Shero JH, Hieter P. 1992. Multi-functional yeast high-copy-number shuttle vectors. Gene 110:119–122.
Clotet J, Garı E, Aldea M, Arino J. 1999. The yeast ser/thr phosphatases sit4and ppz1 play opposite roles in regulation of the cell cycle. Mol Cell Biol19: 2408–2415.
Cormack BP, Bertram G, Egerton M, Gow NA, Falkow S, Brown AJ. 1997.Yeast-enhanced green fluorescent protein (yEGFP): A reporter of geneexpression in Candida albicans. Microbiology 143: 303–311.
Dekel E, Alon U. 2005. Optimality and evolutionary tuning of theexpression level of a protein. Nature 436: 588–592.
de Nadal E, Clotet J, Posas F, Serrano R, Gomez N, Arino J. 1998. The yeasthalotolerance determinant Hal3p is an inhibitory subunit of the Ppz1pSer/Thr protein phosphatase. Proc Natl Acad Sci 95: 7357–7362.
Espinet C, de la Torre MA, Aldea M, Herrero E. 1995. An efficient method toisolate yeast genes causing overexpression-mediated growth arrest. Yeast11: 25–32.
Gelperin DM, White MA, Wilkinson ML, Kon Y, Kung LA, Wise KJ, Lopez-Hoyo N, Jiang L, Piccirillo S, Yu H, et al. 2005. Biochemical and geneticanalysis of the yeast proteome with a movable ORF collection. Genes Dev19: 2816–2826.
Ghaemmaghami S, Huh WK, Bower K, Howson RW, Belle A, Dephoure N,O’Shea EK, Weissman JS. 2003. Global analysis of protein expression inyeast. Nature 425: 737–741.
Jones GM, Stalker J, Humphray S, West A, Cox T, Rogers J, Dunham I, PrelichG. 2008. A systematic library for comprehensive overexpression screensin Saccharomyces cerevisiae. Nat Methods 5: 239–241.
Jungbluth M, Renicke C, Taxis C. 2010. Targeted protein depletion inSaccharomyces cerevisiae by activation of a bidirectional degron. BMC SystBiol 4: 176.
Kaizu K, Moriya H, Kitano H. 2010. Fragilities caused by dosage imbalance inregulation of the budding yeast cell cycle. PLoS Genet 6: e1000919.
Krantz M, Ahmadpour D, Ottosson LG, Warringer J, Waltermann C,Nordlander B, Klipp E, Blomberg A, Hohmann S, Kitano H. 2009.Robustness and fragility in the yeast high osmolarity glycerol (HOG)signal-transduction pathway. Mol Syst Biol 5: 281.
Krzywinski M, Schein J, Birol I, Connors J, Gascoyne R, Horsman D, Jones SJ,Marra MA. 2009. Circos: An information aesthetic for comparativegenomics. Genome Res 19: 1639–1645.
Little JW, Shepley DP, Wert DW. 1999. Robustness of a gene regulatorycircuit. EMBO J 18: 4299–4307.
Dosage-sensitive genes in S. cerevis iae
Genome Research 11www.genome.org
Cold Spring Harbor Laboratory Press on December 29, 2012 - Published by genome.cshlp.orgDownloaded from

Liu H, Krizek J, Bretscher A. 1992. Construction of a GAL1-regulated yeastcDNA expression library and its application to the identification of geneswhose overexpression causes lethality in yeast. Genetics 132: 665–673.
Makino T, McLysaght A. 2010. Ohnologs in the human genome are dosagebalanced and frequently associated with disease. Proc Natl Acad Sci 107:9270–9274.
Mazon MJ, Behrens MM, Morgado E, Portillo F. 1993. Low activity ofthe yeast cAMP-dependent protein kinase catalytic subunit Tpk3 is dueto the poor expression of the TPK3 gene. Eur J Biochem 213: 501–506.
Moriya H, Shimizu-Yoshida Y, Kitano H. 2006. In vivo robustness analysis ofcell division cycle genes in Saccharomyces cerevisiae. PLoS Genet 2: e111.
Moriya H, Chino A, Kapuy O, Csikasz-Nagy A, Novak B. 2011. Overexpressionlimits of fission yeast cell-cycle regulators in vivo and in silico. Mol SystBiol 7: 556.
Moriya H, Makanae K, Watanabe K, Chino A, Shimizu-Yoshida Y. 2012.Robustness analysis of cellular systems using the genetic tug-of-warmethod. Mol Biosyst 8: 2513–2522.
Nehlin JO, Carlberg M, Ronne H. 1992. Yeast SKO1 gene encodes a bZIPprotein that binds to the CRE motif and acts as a repressor oftranscription. Nucleic Acids Res 20: 5271–5278.
Niu W, Li Z, Zhan W, Iyer VR, Marcotte EM. 2008. Mechanisms of cell cyclecontrol revealed by a systematic and quantitative overexpression screenin S. cerevisiae. PLoS Genet 4: e1000120.
Oldenburg KR, Vo KT, Michaelis S, Paddon C. 1997. Recombination-mediated PCR-directed plasmid construction in vivo in yeast. NucleicAcids Res 25: 451–452.
Ortiz D, Medkova M, Walch-Solimena C, Novick P. 2002. Ypt32 recruits theSec4p guanine nucleotide exchange factor, Sec2p, to secretory vesicles;evidence for a Rab cascade in yeast. J Cell Biol 157: 1005–1015.
Palmer LK, Baptiste BA, Fester JC, Perkins JC, Keil RL. 2009. RRD1,a component of the TORC1 signalling pathway, affects anaestheticresponse in Saccharomyces cerevisiae. Yeast 26: 655–661.
Papp B, Pal C, Hurst LD. 2003. Dosage sensitivity and the evolution of genefamilies in yeast. Nature 424: 194–197.
Park JE, Park CJ, Sakchaisri K, Karpova T, Asano S, McNally J, Sunwoo Y,Leem SH, Lee KS. 2004. Novel functional dissection of thelocalization-specific roles of budding yeast polo kinase Cdc5p. Mol CellBiol 24: 9873–9886.
Partow S, Siewers V, Bjørn S, Nielsen J, Maury J. 2010. Characterization ofdifferent promoters for designing a new expression vector inSaccharomyces cerevisiae. Yeast 27: 955–964.
Sheltzer JM, Amon A. 2011. The aneuploidy paradox: Costs and benefits ofan incorrect karyotype. Trends Genet 27: 446–453.
Sopko R, Huang D, Preston N, Chua G, Papp B, Kafadar K, Snyder M, OliverSG, Cyert M, Hughes TR, et al. 2006. Mapping pathways and phenotypesby systematic gene overexpression. Mol Cell 21: 319–330.
Stevens RC, Davis TN. 1998. Mlc1p is a light chain for the unconventionalmyosin Myo2p in Saccharomyces cerevisiae. J Cell Biol 142: 711–722.
Stevenson LF, Kennedy BK, Harlow E. 2001. A large-scale overexpressionscreen in Saccharomyces cerevisiae identifies previously uncharacterizedcell cycle genes. Proc Natl Acad Sci 98: 3946–3951.
Stoebel DM, Dean AM, Dykhuizen DE. 2008. The cost of expression ofEscherichia coli lac operon proteins is in the process, not in the products.Genetics 178: 1653–1660.
Torres EM, Sokolsky T, Tucker CM, Chan LY, Boselli M, Dunham MJ, AmonA. 2007. Effects of aneuploidy on cellular physiology and cell division inhaploid yeast. Science 317: 916–924.
Vavouri T, Semple JI, Garcia-Verdugo R, Lehner B. 2009. Intrinsic proteindisorder and interaction promiscuity are widely associated with dosagesensitivity. Cell 138: 198–208.
Veitia RA, Birchler JA. 2010. Dominance and gene dosage balance in healthand disease: Why levels matter! J Pathol 220: 174–185.
Veitia RA, Bottani S, Birchler JA. 2008. Cellular reactions to gene dosageimbalance: Genomic, transcriptomic and proteomic effects. TrendsGenet 24: 390–397.
von Dassow G, Meir E, Munro EM, Odell GM. 2000. The segment polaritynetwork is a robust developmental module. Nature 406: 188–192.
Wagner A. 2005. Energy constraints on the evolution of gene expression.Mol Biol Evol 22: 1365–1374.
Weinstein B, Solomon F. 1990. Phenotypic consequences of tubulinoverproduction in Saccharomyces cerevisiae: Differences betweena-tubulin and b-tubulin. Mol Cell Biol 10: 5295–5304.
Yoshikawa K, Tanaka T, Ida Y, Furusawa C, Hirasawa T, Shimizu H. 2011.Comprehensive phenotypic analysis of single-gene deletionand overexpression strains of Saccharomyces cerevisiae. Yeast 28: 349–361.
Zaslaver A, Mayo AE, Rosenberg R, Bashkin P, Sberro H, Tsalyuk M, SuretteMG, Alon U. 2004. Just-in-time transcription program in metabolicpathways. Nat Genet 36: 486–491.
Received July 25, 2012; accepted in revised form October 22, 2012.
Makanae et al .
12 Genome Researchwww.genome.org
Cold Spring Harbor Laboratory Press on December 29, 2012 - Published by genome.cshlp.orgDownloaded from