ibaanalyzer-reportgenerator - iba ag
TRANSCRIPT
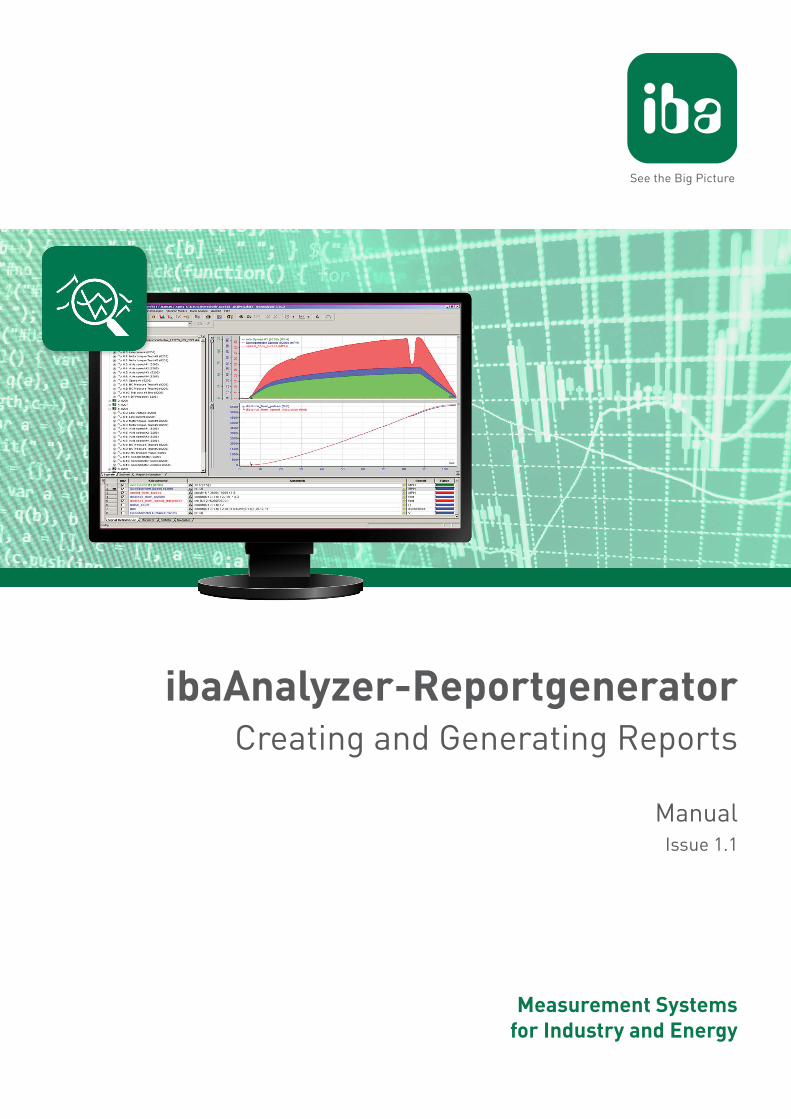
ibaAnalyzer-ReportgeneratorCreating and Generating Reports
ManualIssue 1.1
Measurement Systems for Industry and Energy
2
Manufacturer
iba AG
Koenigswarterstr. 44
90762 Fuerth
Germany
Contacts
Main office +49 911 97282-0
Fax +49 911 97282-33
Support +49 911 97282-14
Engineering +49 911 97282-13
E-mail [email protected]
Web www.iba-ag.com
Unless explicitly stated to the contrary, it is not permitted to pass on or copy this document, nor to make use of its contents or disclose its contents. Infringements are liable for compensation.
© iba AG 2018, All rights reserved.
The content of this publication has been checked for compliance with the described hardware and software. Nevertheless, discrepancies cannot be ruled out, and we do not provide guaran-tee for complete conformity. However, the information furnished in this publication is updated regularly. Required corrections are contained in the following regulations or can be downloaded on the Internet.
The current version is available for download on our web site www.iba-ag.com.
Version Date Revision - Chapter / Page Author Version SW
1.1 04-10-2018 Report example on DVD rm 6.10.4
Windows® is a brand and registered trademark of Microsoft Corporation. Other product and company names mentioned in this manual can be labels or registered trademarks of the corre-sponding owners.
3 Issue 1.1 3
ibaAnalyzer-Reportgenerator Content
Content
1 About this manual .............................................................................................................5
1.1 Target group and previous knowledge ..................................................................... 5
1.2 Notations .................................................................................................................. 5
1.3 Used symbols ............................................................................................................ 6
2 Introduction ......................................................................................................................7
2.1 What is ibaAnalyzer-Reportgenerator ...................................................................... 7
2.2 System Requirements and Installation ..................................................................... 8
3 The Data interface .............................................................................................................9
3.1 The "Report setup" window ................................................................................... 10
3.2 The "Info columns" window ................................................................................... 12
3.3 The "Computed columns" window ......................................................................... 15
3.4 The "Chart fields" window ...................................................................................... 19
3.5 The "Table data" window ........................................................................................ 22
3.6 The "Text variables" window .................................................................................. 25
3.7 The "Notifications" window .................................................................................... 26
3.8 The "E-mail Report" window .................................................................................. 27
4 The Report Designer ........................................................................................................30
4.1 The Project Wizard .................................................................................................30
4.2 The Report Designer window ................................................................................. 31
4.2.1 The toolbar ribbon ..................................................................................................31
4.2.2 The Objects, Layers, and Preview windows ............................................................ 33
4.2.3 The "Properties" window ....................................................................................... 35
4.2.4 The "Report view" window ..................................................................................... 35
4.2.5 The "Variables-/Field-List" window ........................................................................ 36
4.3 The report output ...................................................................................................38
4.3.1 Generating a report manually ................................................................................ 38
4.3.2 The "Report info" window ...................................................................................... 40
4.4 Command line options ........................................................................................... 41
4.4.1 Using the post-processing command ..................................................................... 42
5 Anexhaustiveexample ...................................................................................................44
5.1 Basic report definition ............................................................................................ 46
4 Issue 1.1
Content ibaAnalyzer-Reportgenerator
5.2 Adding data to the report ....................................................................................... 52
5.3 Layers and dynamic tables ...................................................................................... 64
6 Support and contact ........................................................................................................70
5 Issue 1.1 5
ibaAnalyzer-Reportgenerator About this manual
1 About this manualThis documentation describes the function and application of the software
ibaAnalyzer-Reportgenerator.
1.1 TargetgroupandpreviousknowledgeThis manual is aimed at qualified professionals who are familiar with handling electrical and electronic modules as well as communication and measurement technology. A person is regard-ed as professional if he/she is capable of assessing safety and recognizing possible consequenc-es and risks on the basis of his/her specialist training, knowledge and experience and knowl-edge of the standard regulations.
This documentation addresses in particular professionals who are in charge of analyzing mea-sured data and process data. Because the data is supplied by other iba products in data files the following knowledge is required or at least helpful when working with ibaAnalyzer-Reportgener-ator:
■ Operating system Windows
■ ibaAnalyzer (open and analyze iba data files)
1.2 NotationsIn this manual, the following notations are used:
Action NotationMenu command Menu Logic diagramCalling the menu command Step 1 – Step 2 – Step 3 – Step x
Example: Select the menu Logic diagram - Add - New function block.
Keys <Key name>
Example: <Alt>; <F1>Press the keys simultaneously <Key name> + <Key name>
Example: <Alt> + <Ctrl>Buttons <Key name>
Example: <OK>; <Cancel>File names, paths "Filename", "Path"
Example: "Test.doc"
6 Issue 1.1
About this manual ibaAnalyzer-Reportgenerator
1.3 Used symbolsIf safety instructions or other notes are used in this manual, they mean:
Danger!
Thenon-observanceofthissafetyinformationmayresultinanimminentriskofdeathorsevereinjury:
■ Observe the specified measures.
Warning!
Thenon-observanceofthissafetyinformationmayresultinapotentialriskofdeathorsevereinjury!
■ Observe the specified measures.
Caution!
Thenon-observanceofthissafetyinformationmayresultinapotentialriskofinjuryormaterialdamage!
■ Observe the specified measures
Note
A note specifies special requirements or actions to be observed.
Tip
Tip or example as a helpful note or insider tip to make the work a little bit easier.
Otherdocumentation
Reference to additional documentation or further reading.
7 Issue 1.1 7
ibaAnalyzer-Reportgenerator Introduction
2 Introduction
2.1 What is ibaAnalyzer-ReportgeneratoribaAnalyzer-Reportgenerator is an integral part of the software ibaAnalyzer and provides the user with the tools to create customized reports. These tools enable the free design and layout of analysis, quality, production and fault reports with different output formats.
An analysis report can be used to present the signal graphs from ibaAnalyzer as well as all kinds of process data (such as technostrings, calculated values, etc.). Graphic objects (squares, circles, pictures, etc.), diagrams, editable text fields, bar codes as well as charts and tables can also be generated.
A report can be compiled and prepared on a workpiece-related basis and can be subsequently printed or exported into a file (for example, pdf format). Furthermore, automatic generation and output of a report is also possible using ibaDatCoordinator or via a post-processing com-mand from ibaPDA.
The manual is divided into 3 major parts:
■ The description of the data interface between ibaAnalyzer and the combit "List & Label Re-porting Tool", see chapter ì The Data interface, page 9.
■ A short description of the combit "List & Label Reporting Tool Report Designer", see chapter ì The Report Designer, page 30.
■ A comprehensive example for the design of an individual report with exhaustive explanations for frequently used objects, see chapter ì An exhaustive example, page 44.
Otherdocumentation
A more comprehensive description of the combit "List & Label Reporting Tool Report Designer" can be found in combit’s online documentation;
see: https://www.combit.net/en/reporting-tool/royalty-free-designer/
Note
The iba AG offers standard training courses on ibaAnalyzer-Reportgenerator. Please visit our website for course times or contact your local iba representative.
8 Issue 1.1
Introduction ibaAnalyzer-Reportgenerator
2.2 SystemRequirementsandInstallationFor the usage of ibaAnalyzer-Reportgenerator the following is needed:
■ An installation of ibaAnalyzer
■ A standard printer driver must be installed on the computer.
Note
A separate installation of ibaAnalyzer-Reportgenerator is not required since it is installed automatically by the ibaAnalyzer installer.
9 Issue 1.1 9
ibaAnalyzer-Reportgenerator The Data interface
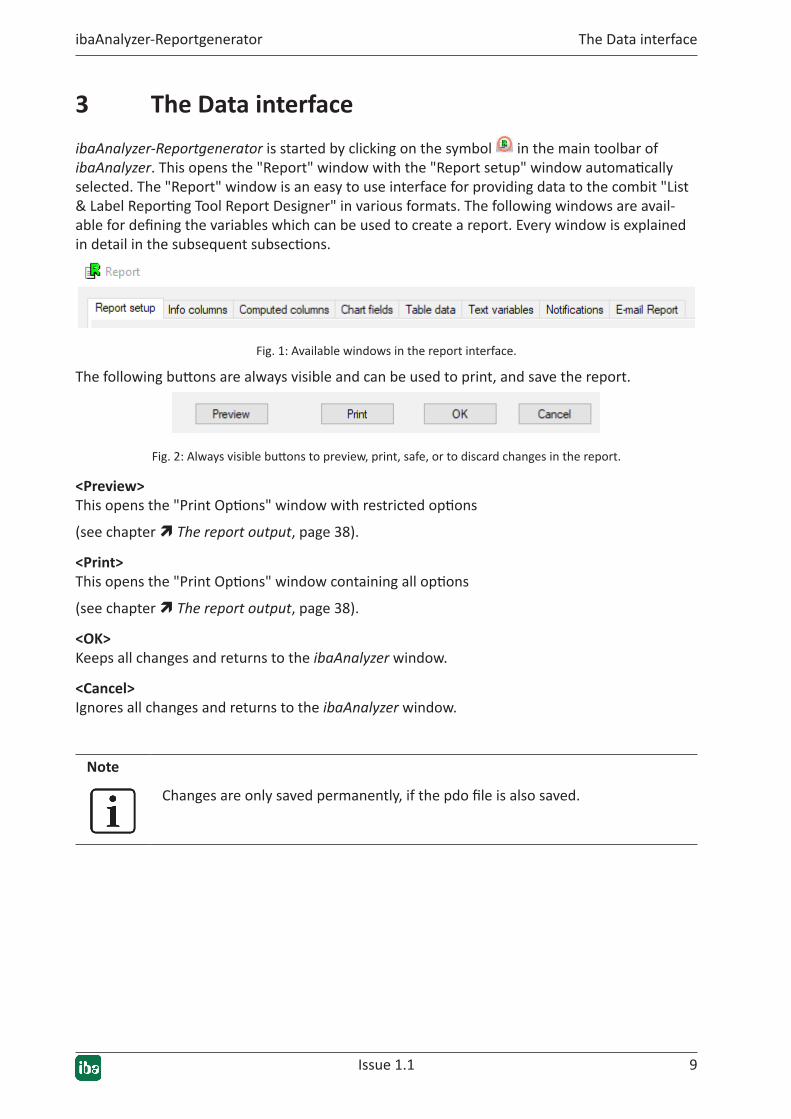
3 The Data interfaceibaAnalyzer-Reportgenerator is started by clicking on the symbol in the main toolbar of ibaAnalyzer. This opens the "Report" window with the "Report setup" window automatically selected. The "Report" window is an easy to use interface for providing data to the combit "List & Label Reporting Tool Report Designer" in various formats. The following windows are avail-able for defining the variables which can be used to create a report. Every window is explained in detail in the subsequent subsections.
Fig. 1: Available windows in the report interface.
The following buttons are always visible and can be used to print, and save the report.
Fig. 2: Always visible buttons to preview, print, safe, or to discard changes in the report.
<Preview>This opens the "Print Options" window with restricted options
(see chapter ì The report output, page 38).
<Print>This opens the "Print Options" window containing all options
(see chapter ì The report output, page 38).
<OK>Keeps all changes and returns to the ibaAnalyzer window.
<Cancel>Ignores all changes and returns to the ibaAnalyzer window.
Note
Changes are only saved permanently, if the pdo file is also saved.
10 Issue 1.1
The Data interface ibaAnalyzer-Reportgenerator
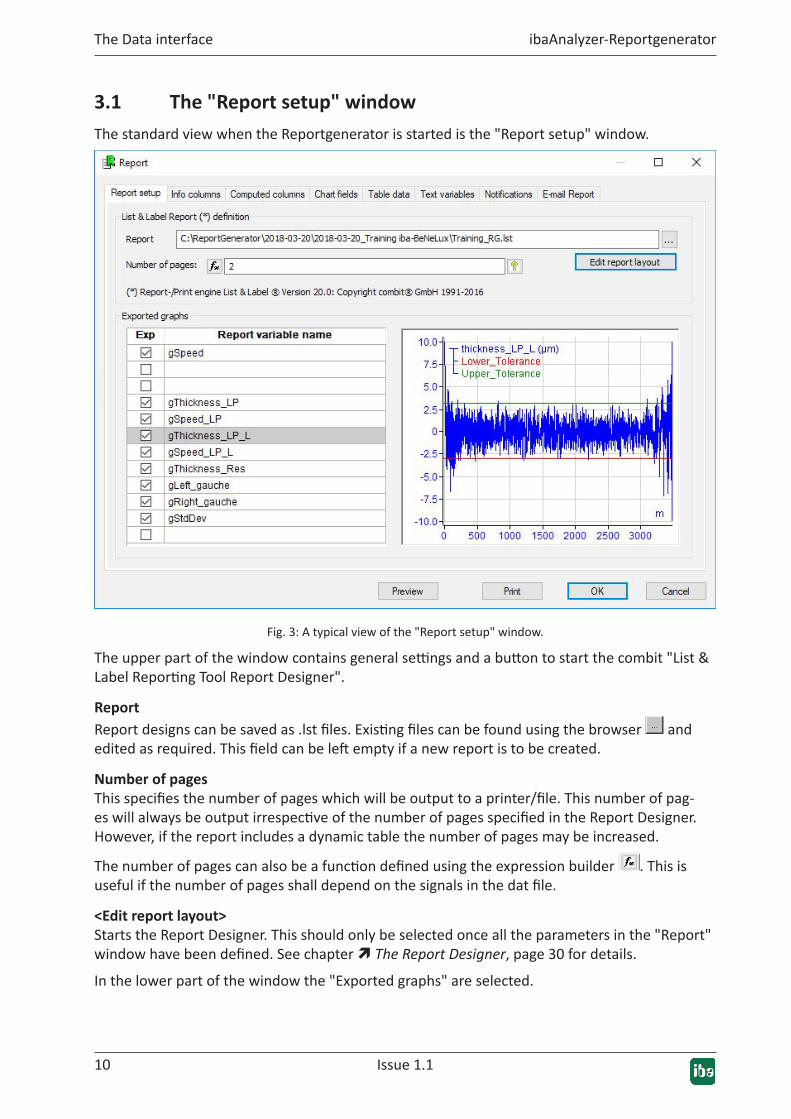
3.1 The"Reportsetup"windowThe standard view when the Reportgenerator is started is the "Report setup" window.
Fig. 3: A typical view of the "Report setup" window.
The upper part of the window contains general settings and a button to start the combit "List & Label Reporting Tool Report Designer".
ReportReport designs can be saved as .lst files. Existing files can be found using the browser and edited as required. This field can be left empty if a new report is to be created.
Number of pagesThis specifies the number of pages which will be output to a printer/file. This number of pag-es will always be output irrespective of the number of pages specified in the Report Designer. However, if the report includes a dynamic table the number of pages may be increased.
The number of pages can also be a function defined using the expression builder . This is useful if the number of pages shall depend on the signals in the dat file.
<Editreportlayout>Starts the Report Designer. This should only be selected once all the parameters in the "Report" window have been defined. See chapter ì The Report Designer, page 30 for details.
In the lower part of the window the "Exported graphs" are selected.
Issue 1.1 11
ibaAnalyzer-Reportgenerator The Data interface
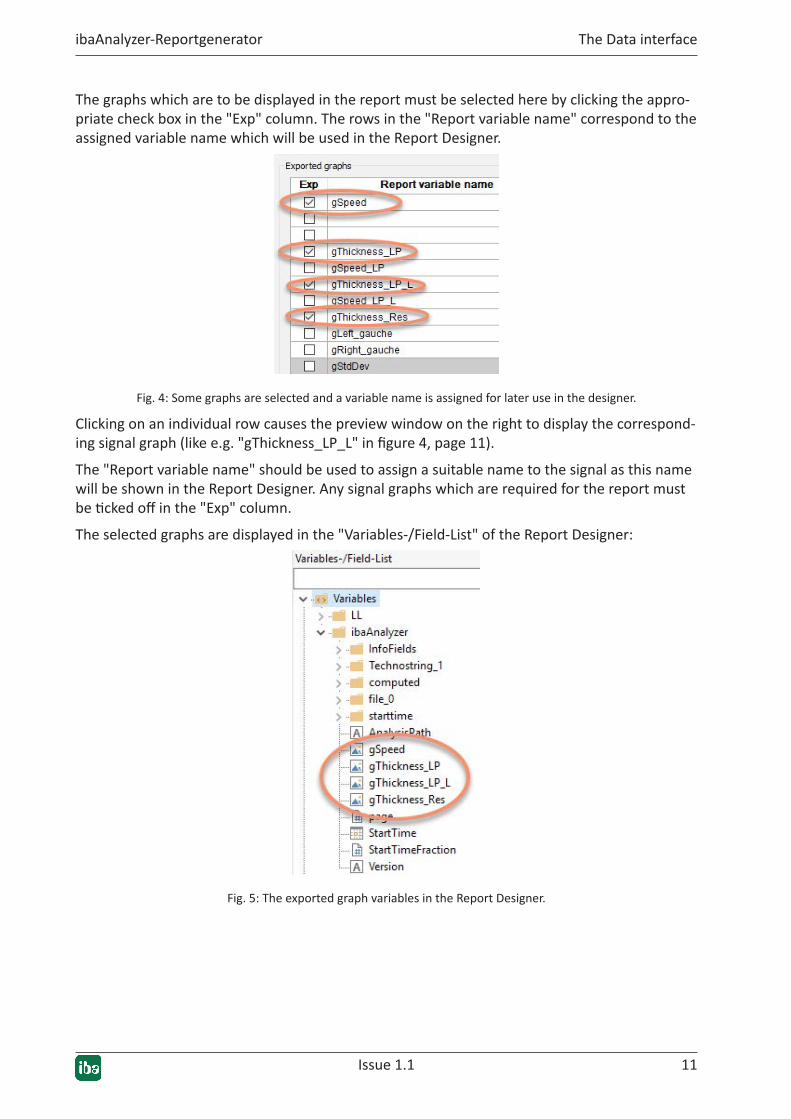
The graphs which are to be displayed in the report must be selected here by clicking the appro-priate check box in the "Exp" column. The rows in the "Report variable name" correspond to the assigned variable name which will be used in the Report Designer.
Fig. 4: Some graphs are selected and a variable name is assigned for later use in the designer.
Clicking on an individual row causes the preview window on the right to display the correspond-ing signal graph (like e.g. "gThickness_LP_L" in figure 4, page 11).
The "Report variable name" should be used to assign a suitable name to the signal as this name will be shown in the Report Designer. Any signal graphs which are required for the report must be ticked off in the "Exp" column.
The selected graphs are displayed in the "Variables-/Field-List" of the Report Designer:
Fig. 5: The exported graph variables in the Report Designer.
12 Issue 1.1
The Data interface ibaAnalyzer-Reportgenerator
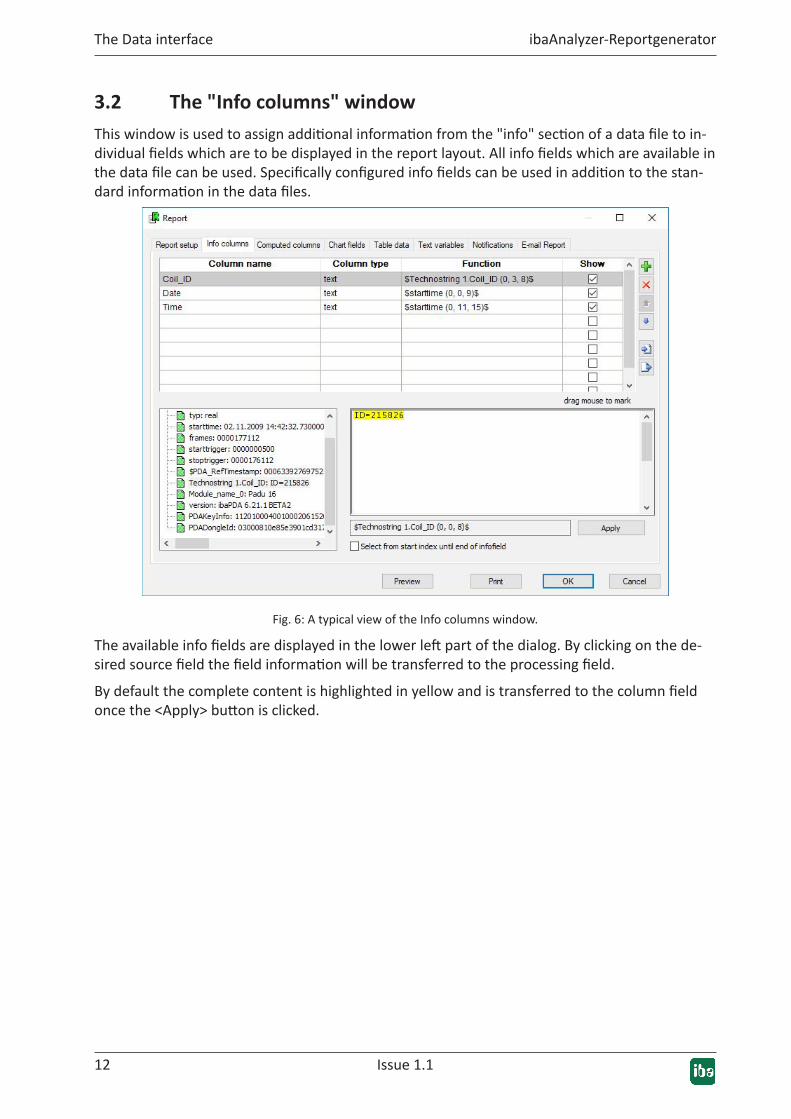
3.2 The"Infocolumns"windowThis window is used to assign additional information from the "info" section of a data file to in-dividual fields which are to be displayed in the report layout. All info fields which are available in the data file can be used. Specifically configured info fields can be used in addition to the stan-dard information in the data files.
Fig. 6: A typical view of the Info columns window.
The available info fields are displayed in the lower left part of the dialog. By clicking on the de-sired source field the field information will be transferred to the processing field.
By default the complete content is highlighted in yellow and is transferred to the column field once the <Apply> button is clicked.
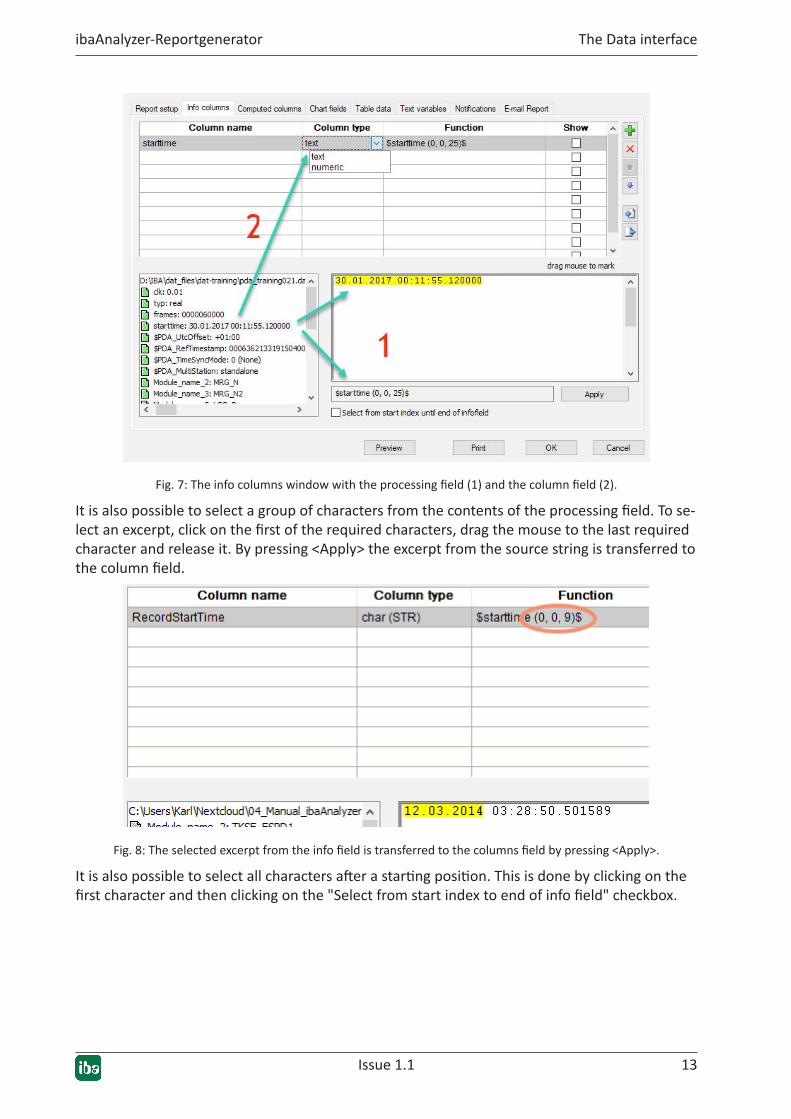
Issue 1.1 13
ibaAnalyzer-Reportgenerator The Data interface
Fig. 7: The info columns window with the processing field (1) and the column field (2).
It is also possible to select a group of characters from the contents of the processing field. To se-lect an excerpt, click on the first of the required characters, drag the mouse to the last required character and release it. By pressing <Apply> the excerpt from the source string is transferred to the column field.
Fig. 8: The selected excerpt from the info field is transferred to the columns field by pressing <Apply>.
It is also possible to select all characters after a starting position. This is done by clicking on the first character and then clicking on the "Select from start index to end of info field" checkbox.
14 Issue 1.1
The Data interface ibaAnalyzer-Reportgenerator
Note
In the "Show" column, the individual fields can be selected to be displayed in the "Report info" information window (see chapter ì The "Report info" window, page 40).
For faster processing it is also possible to double-click on the source field. The column line will be filled in addition to the processing field. The "Column type" can be selected from the drop-down list, which contains the available data types. The "Column name" can be renamed if re-quired. The range of characters within the "Function" can be altered in the processing window.
Note
For reports only "text" and "numeric" types will be available.
Blanks and hyphens will be converted to underscores in the Report Designer. If full stops "." are used the preceding text will specify a directory in the Re-port Designer (Example: see the chapter ì The "Computed columns" window, page 15).
Avoid special characters!
Caution
When marking the characters in the technostring area, be sure that the correct row in the table above has been selected. The last marked excerpt before leaving the row or closing the window is valid and will be kept.
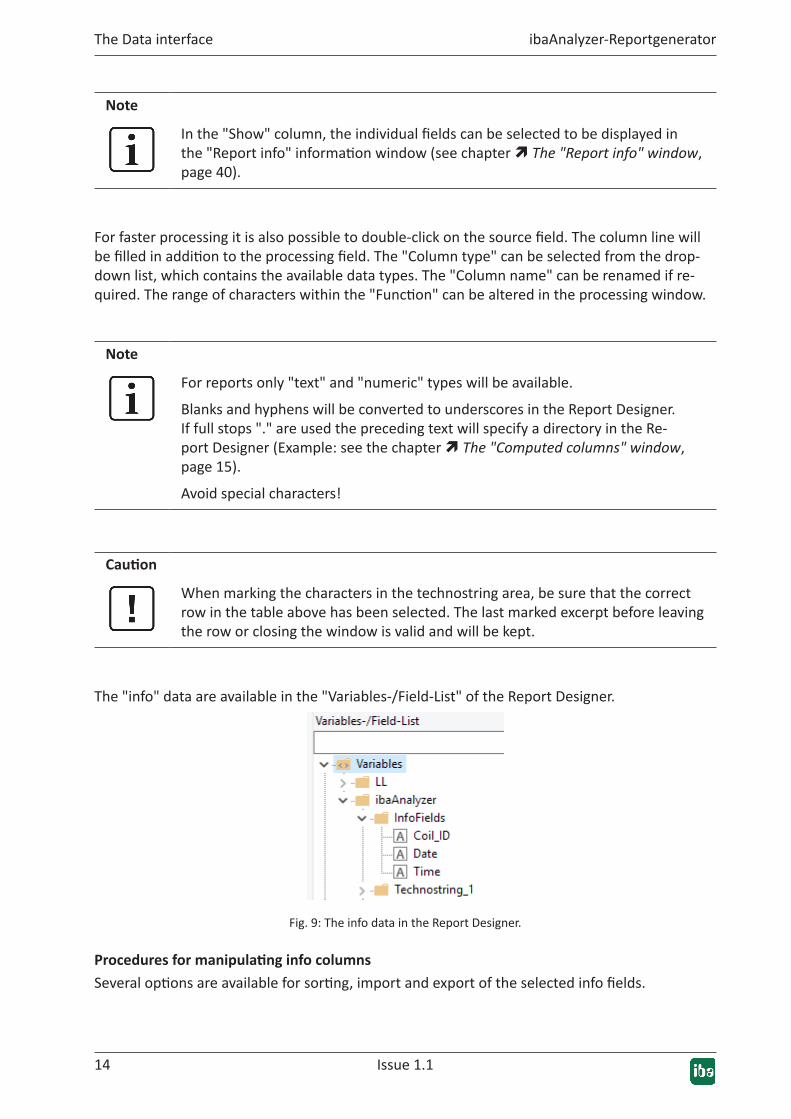
The "info" data are available in the "Variables-/Field-List" of the Report Designer.
Fig. 9: The info data in the Report Designer.
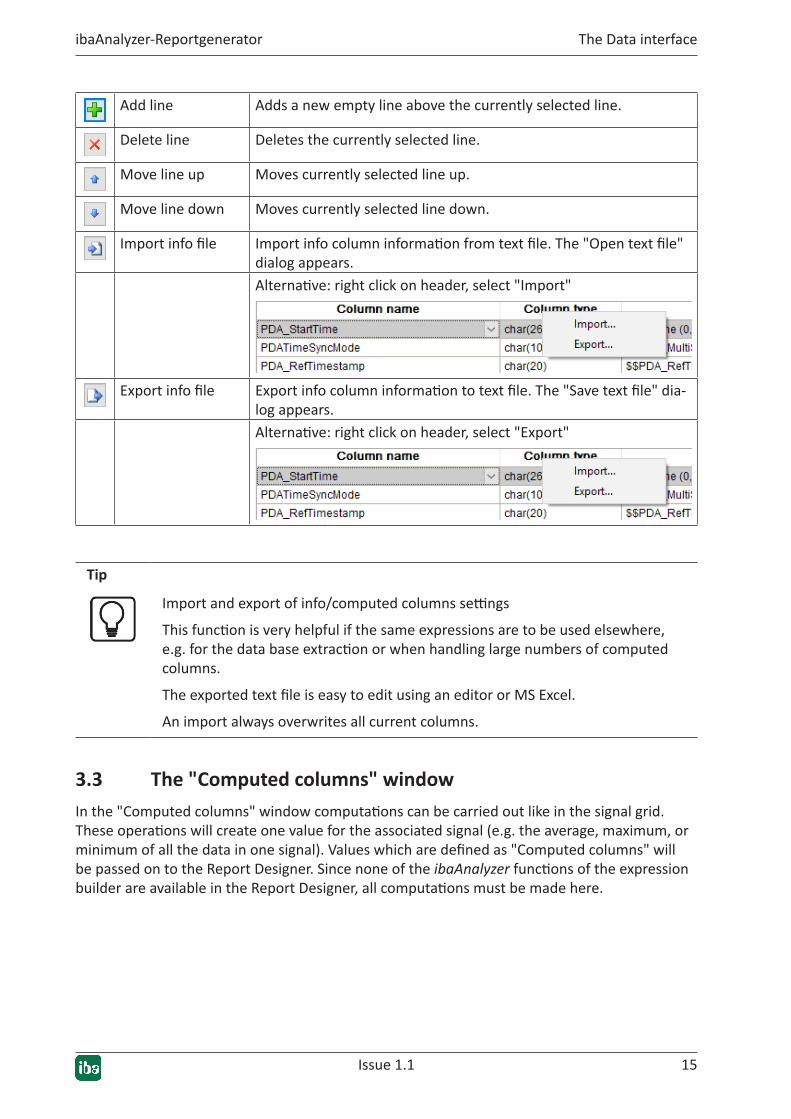
ProceduresformanipulatinginfocolumnsSeveral options are available for sorting, import and export of the selected info fields.
Issue 1.1 15
ibaAnalyzer-Reportgenerator The Data interface
Add line Adds a new empty line above the currently selected line.
Delete line Deletes the currently selected line.
Move line up Moves currently selected line up.
Move line down Moves currently selected line down.
Import info file Import info column information from text file. The "Open text file" dialog appears.Alternative: right click on header, select "Import"
Export info file Export info column information to text file. The "Save text file" dia-log appears.Alternative: right click on header, select "Export"
Tip
Import and export of info/computed columns settings
This function is very helpful if the same expressions are to be used elsewhere, e.g. for the data base extraction or when handling large numbers of computed columns.
The exported text file is easy to edit using an editor or MS Excel.
An import always overwrites all current columns.
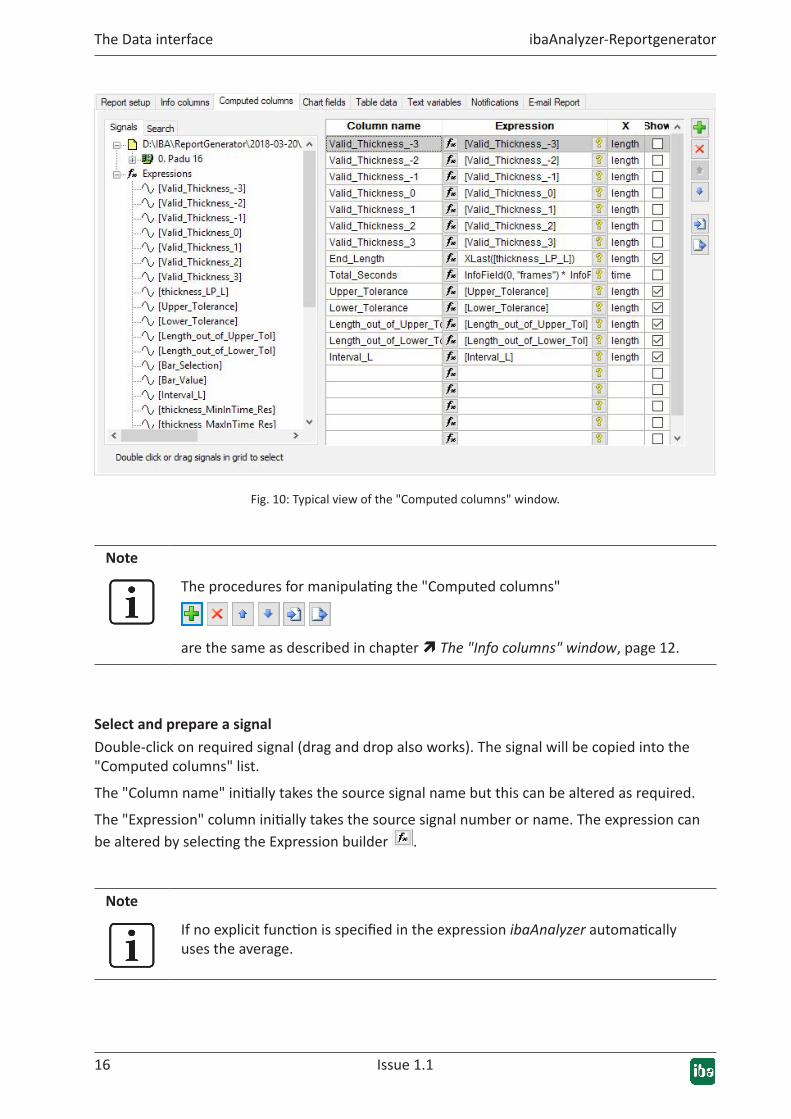
3.3 The"Computedcolumns"windowIn the "Computed columns" window computations can be carried out like in the signal grid. These operations will create one value for the associated signal (e.g. the average, maximum, or minimum of all the data in one signal). Values which are defined as "Computed columns" will be passed on to the Report Designer. Since none of the ibaAnalyzer functions of the expression builder are available in the Report Designer, all computations must be made here.
16 Issue 1.1
The Data interface ibaAnalyzer-Reportgenerator
Fig. 10: Typical view of the "Computed columns" window.
Note
The procedures for manipulating the "Computed columns"
are the same as described in chapter ì The "Info columns" window, page 12.
Select and prepare a signalDouble-click on required signal (drag and drop also works). The signal will be copied into the "Computed columns" list.
The "Column name" initially takes the source signal name but this can be altered as required.
The "Expression" column initially takes the source signal number or name. The expression can be altered by selecting the Expression builder .
Note
If no explicit function is specified in the expression ibaAnalyzer automatically uses the average.
Issue 1.1 17
ibaAnalyzer-Reportgenerator The Data interface
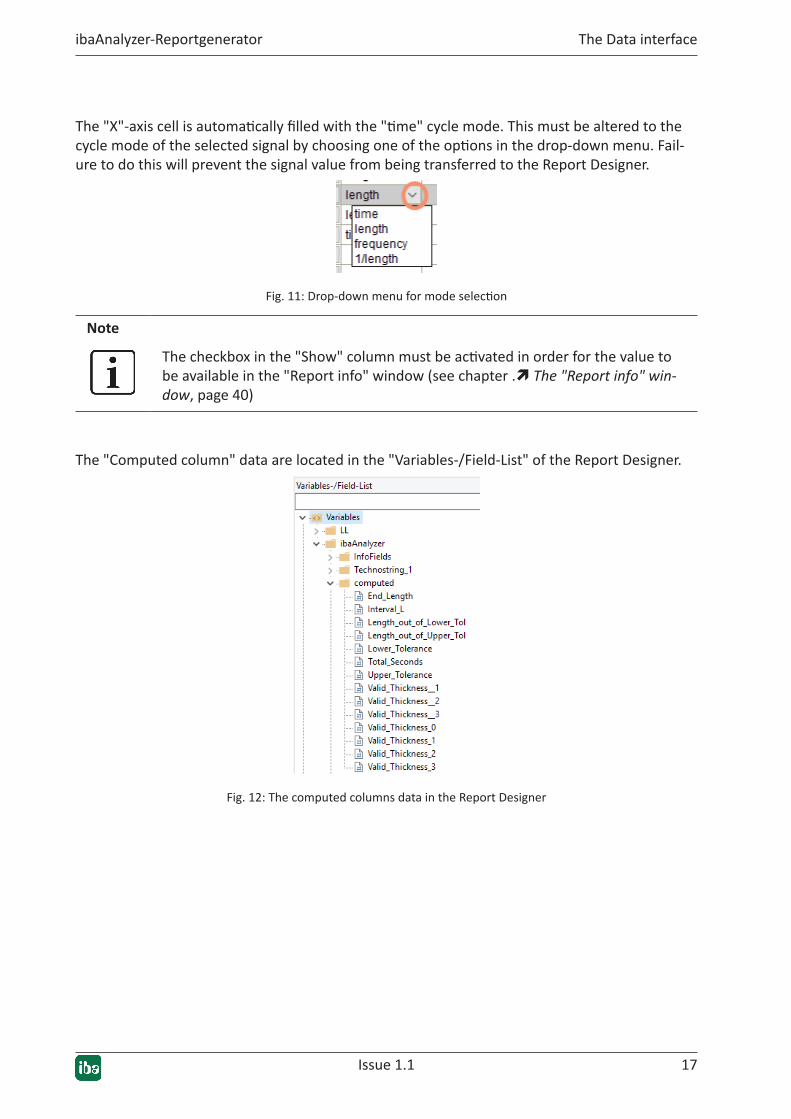
The "X"-axis cell is automatically filled with the "time" cycle mode. This must be altered to the cycle mode of the selected signal by choosing one of the options in the drop-down menu. Fail-ure to do this will prevent the signal value from being transferred to the Report Designer.
Fig. 11: Drop-down menu for mode selection
Note
The checkbox in the "Show" column must be activated in order for the value to be available in the "Report info" window (see chapter .ì The "Report info" win-dow, page 40)
The "Computed column" data are located in the "Variables-/Field-List" of the Report Designer.
Fig. 12: The computed columns data in the Report Designer
18 Issue 1.1
The Data interface ibaAnalyzer-Reportgenerator
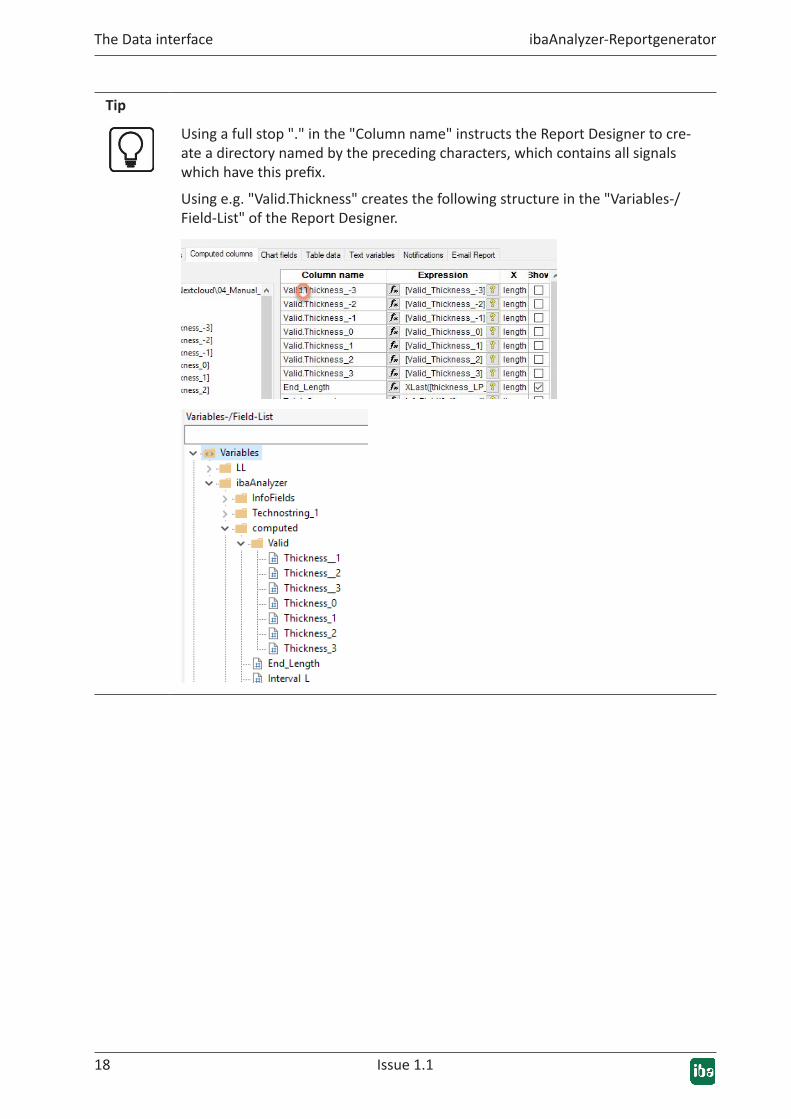
Tip
Using a full stop "." in the "Column name" instructs the Report Designer to cre-ate a directory named by the preceding characters, which contains all signals which have this prefix.
Using e.g. "Valid.Thickness" creates the following structure in the "Variables-/Field-List" of the Report Designer.
Issue 1.1 19
ibaAnalyzer-Reportgenerator The Data interface
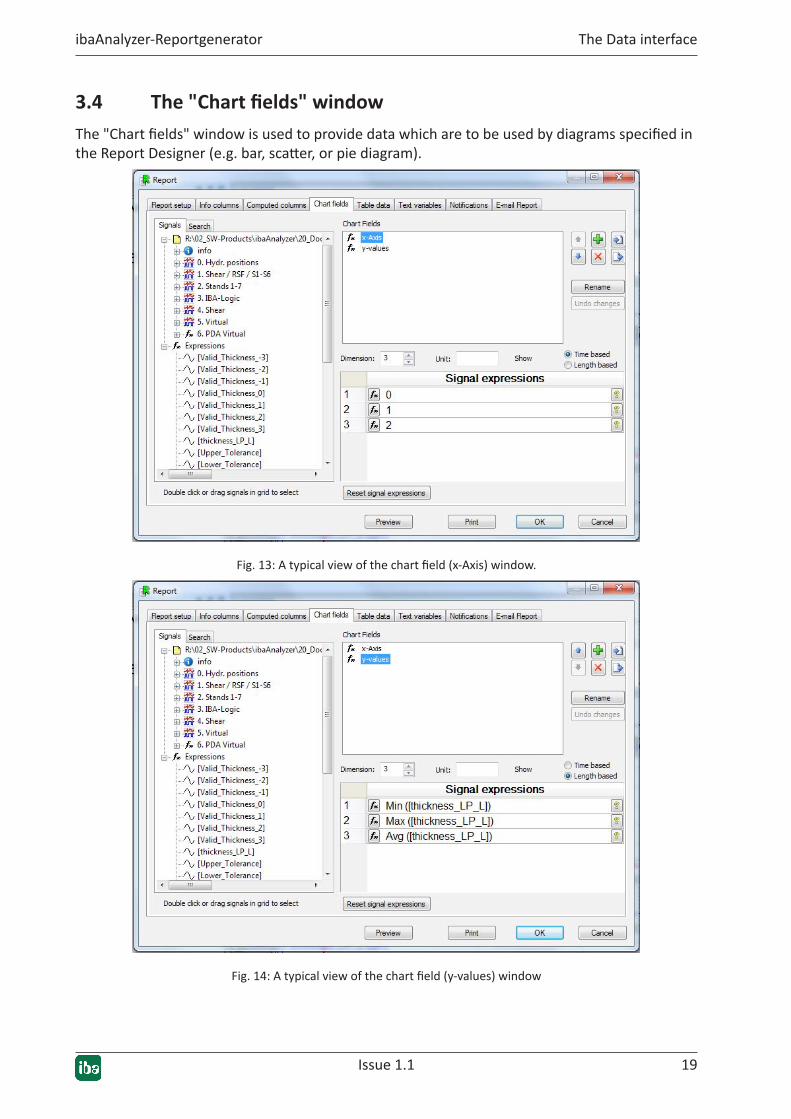
3.4 The"Chartfields"windowThe "Chart fields" window is used to provide data which are to be used by diagrams specified in the Report Designer (e.g. bar, scatter, or pie diagram).
Fig. 13: A typical view of the chart field (x-Axis) window.
Fig. 14: A typical view of the chart field (y-values) window
20 Issue 1.1
The Data interface ibaAnalyzer-Reportgenerator
For the creation of chart fields the signal tree of ibaAnalyzer is available in the left column. By default the "ChartField_001" is predefined and can be manipulated.
To the right of the "Chart field" window the usual buttons for manipulation are present. The button <Rename> permits the selected chart field name to be changed. With <Undo changes> any changes in the "Chart fields" window are discarded providing they have not been kept (this is indicated by a red exclamation mark).
For every chart field the "Dimension" and the "Unit" can be set manually. It is possible to distin-guish between time based and length based signals.
Based on the selected chart field, enter the expression for the data to be displayed. Each row corresponds to one data point. With the <Reset signal expressions> button all expressions will be deleted.
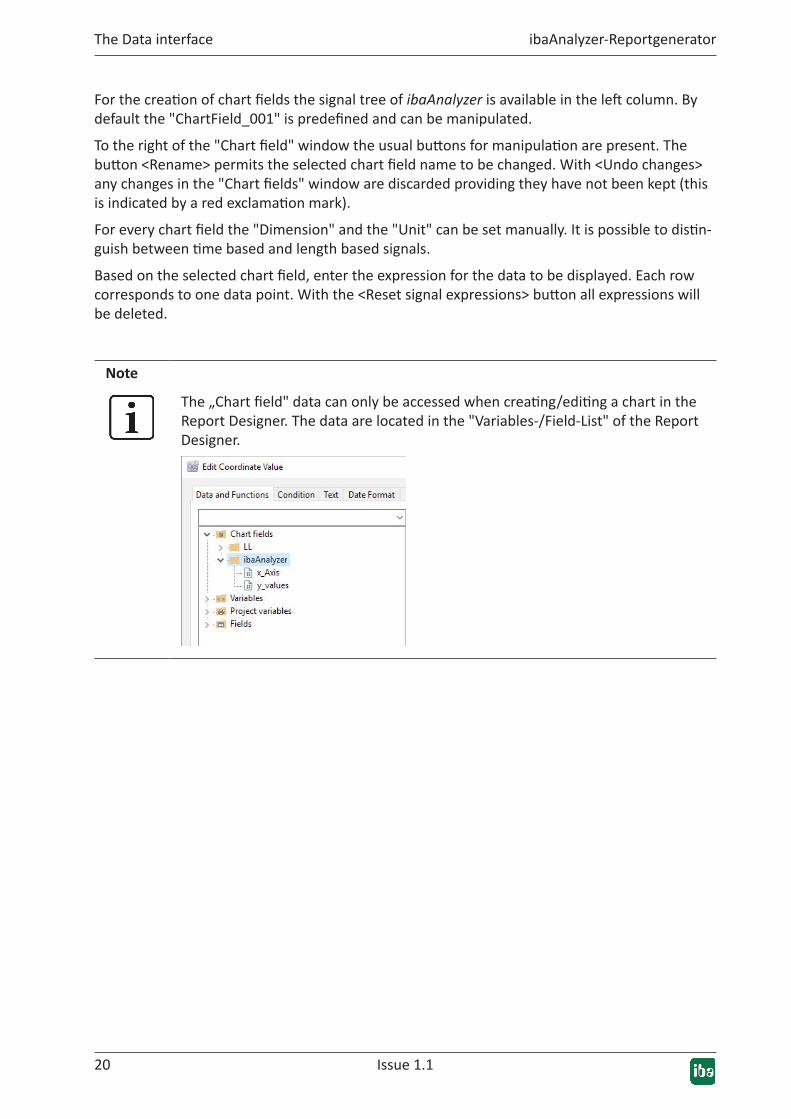
Note
The „Chart field" data can only be accessed when creating/editing a chart in the Report Designer. The data are located in the "Variables-/Field-List" of the Report Designer.
Issue 1.1 21
ibaAnalyzer-Reportgenerator The Data interface
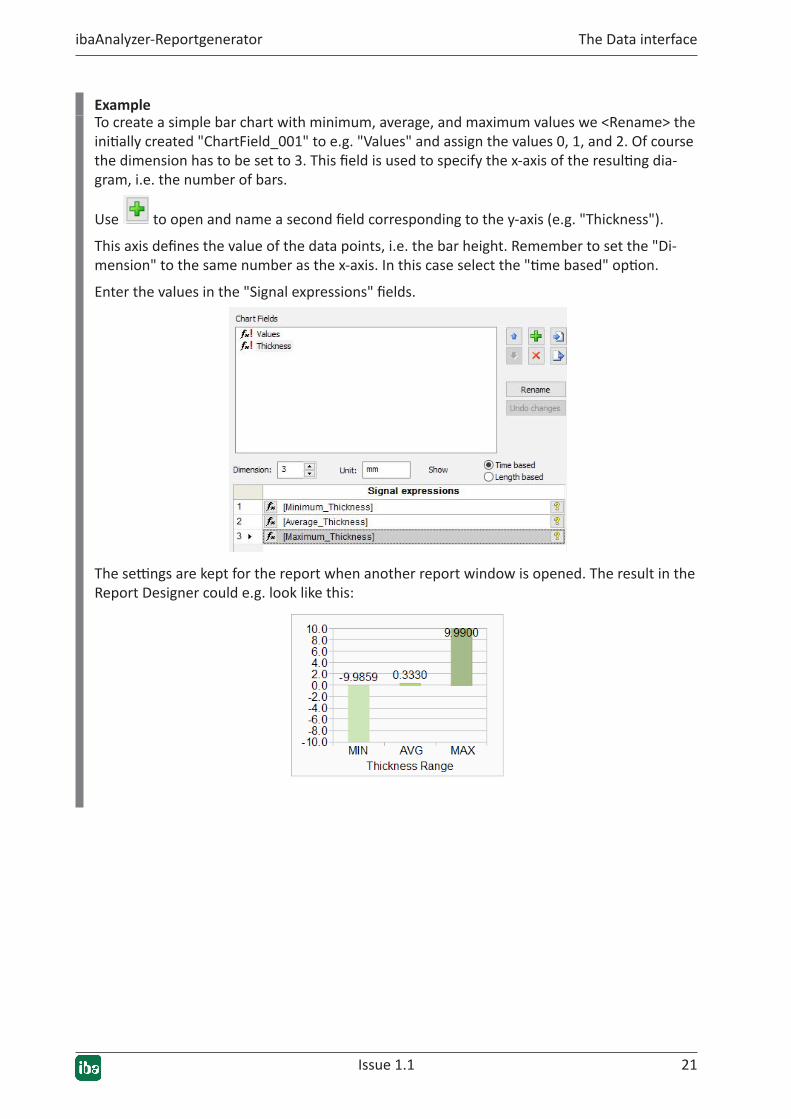
ExampleTo create a simple bar chart with minimum, average, and maximum values we <Rename> the initially created "ChartField_001" to e.g. "Values" and assign the values 0, 1, and 2. Of course the dimension has to be set to 3. This field is used to specify the x-axis of the resulting dia-gram, i.e. the number of bars.
Use to open and name a second field corresponding to the y-axis (e.g. "Thickness").
This axis defines the value of the data points, i.e. the bar height. Remember to set the "Di-mension" to the same number as the x-axis. In this case select the "time based" option.
Enter the values in the "Signal expressions" fields.
The settings are kept for the report when another report window is opened. The result in the Report Designer could e.g. look like this:
22 Issue 1.1
The Data interface ibaAnalyzer-Reportgenerator
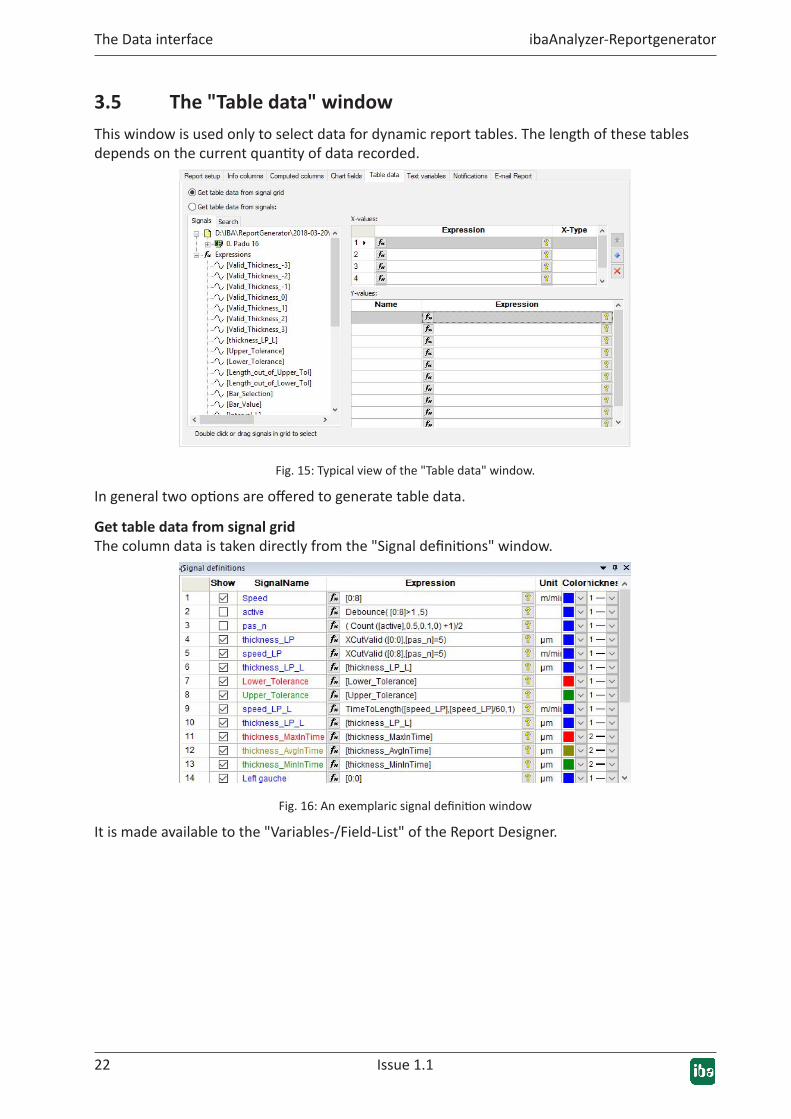
3.5 The"Tabledata"windowThis window is used only to select data for dynamic report tables. The length of these tables depends on the current quantity of data recorded.
Fig. 15: Typical view of the "Table data" window.
In general two options are offered to generate table data.
Get table data from signal gridThe column data is taken directly from the "Signal definitions" window.
Fig. 16: An exemplaric signal definition window
It is made available to the "Variables-/Field-List" of the Report Designer.
Issue 1.1 23
ibaAnalyzer-Reportgenerator The Data interface
Fig. 17: Column data in the Report Designer
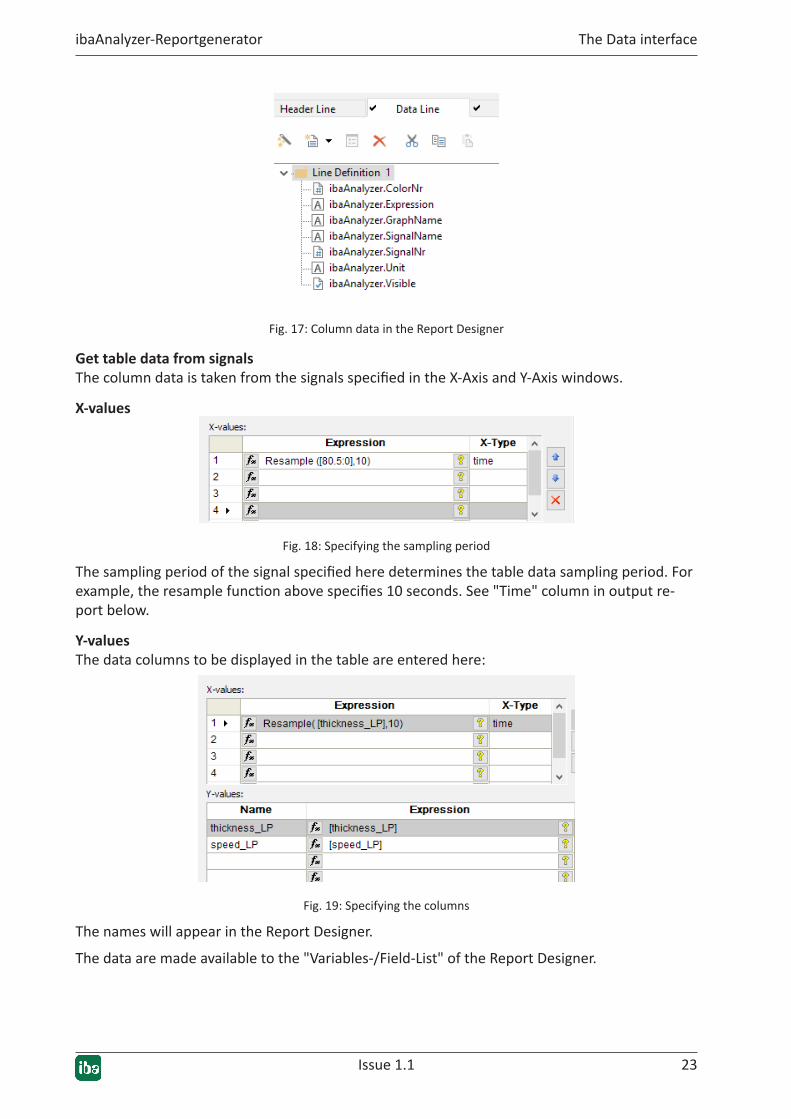
Get table data from signalsThe column data is taken from the signals specified in the X-Axis and Y-Axis windows.
X-values
Fig. 18: Specifying the sampling period
The sampling period of the signal specified here determines the table data sampling period. For example, the resample function above specifies 10 seconds. See "Time" column in output re-port below.
Y-valuesThe data columns to be displayed in the table are entered here:
Fig. 19: Specifying the columns
The names will appear in the Report Designer.
The data are made available to the "Variables-/Field-List" of the Report Designer.
24 Issue 1.1
The Data interface ibaAnalyzer-Reportgenerator
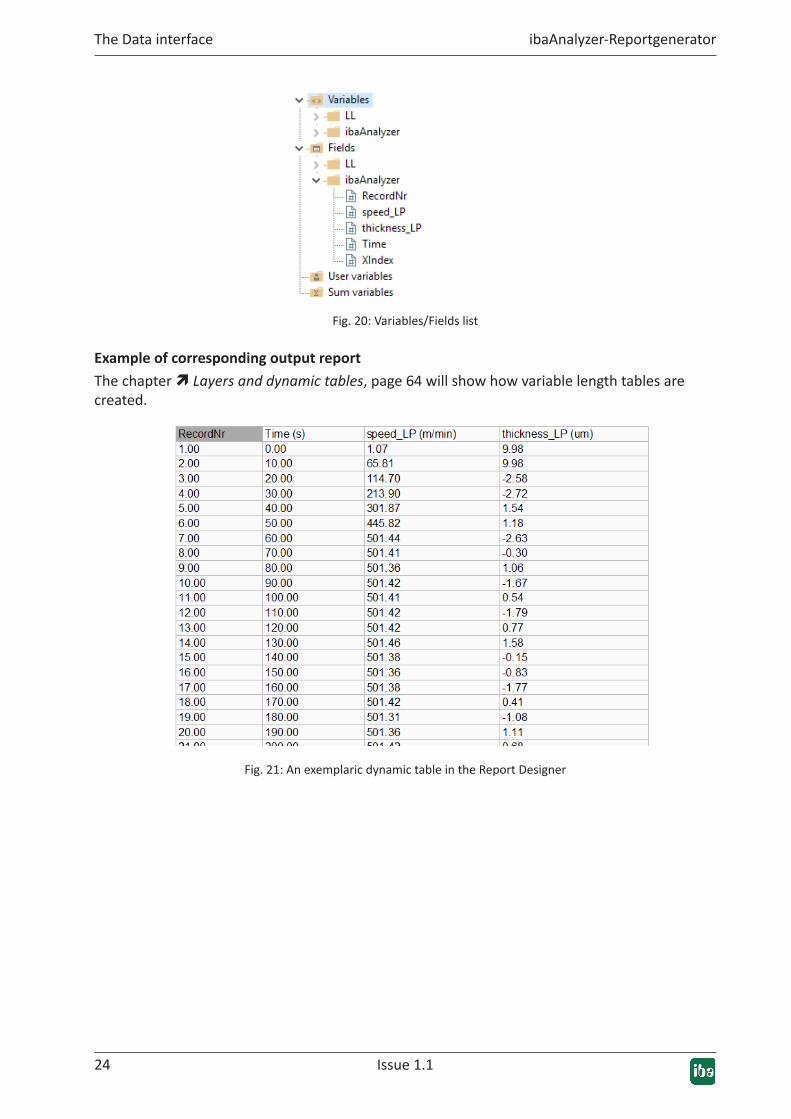
Fig. 20: Variables/Fields list
Example of corresponding output reportThe chapter ì Layers and dynamic tables, page 64 will show how variable length tables are created.
Fig. 21: An exemplaric dynamic table in the Report Designer
Issue 1.1 25
ibaAnalyzer-Reportgenerator The Data interface
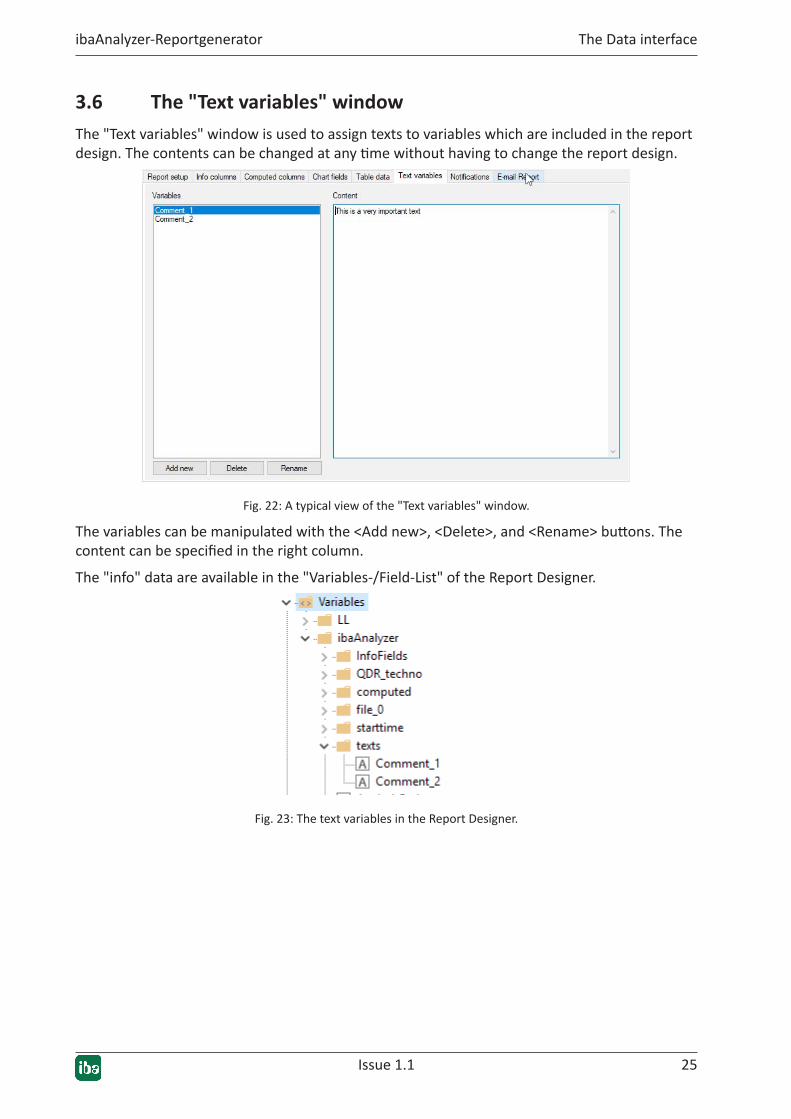
3.6 The"Textvariables"windowThe "Text variables" window is used to assign texts to variables which are included in the report design. The contents can be changed at any time without having to change the report design.
Fig. 22: A typical view of the "Text variables" window.
The variables can be manipulated with the <Add new>, <Delete>, and <Rename> buttons. The content can be specified in the right column.
The "info" data are available in the "Variables-/Field-List" of the Report Designer.
Fig. 23: The text variables in the Report Designer.
26 Issue 1.1
The Data interface ibaAnalyzer-Reportgenerator
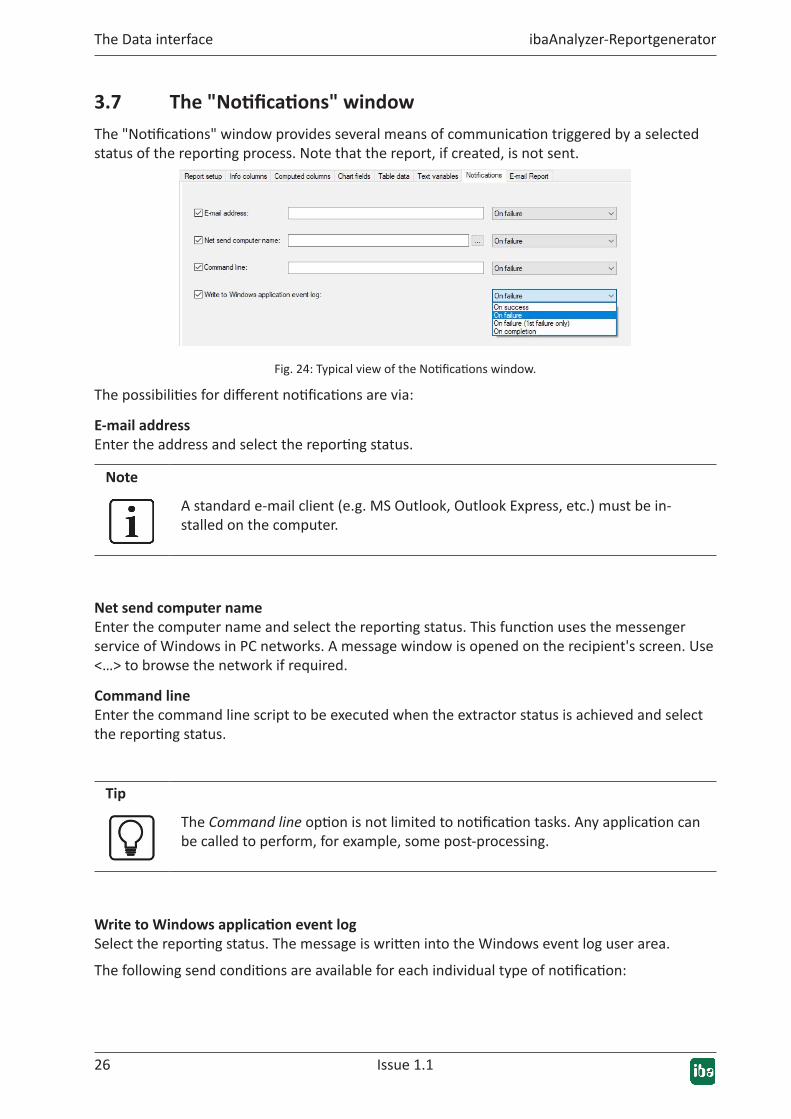
3.7 The"Notifications"windowThe "Notifications" window provides several means of communication triggered by a selected status of the reporting process. Note that the report, if created, is not sent.
Fig. 24: Typical view of the Notifications window.
The possibilities for different notifications are via:
E-mail addressEnter the address and select the reporting status.
Note
A standard e-mail client (e.g. MS Outlook, Outlook Express, etc.) must be in-stalled on the computer.
Net send computer nameEnter the computer name and select the reporting status. This function uses the messenger service of Windows in PC networks. A message window is opened on the recipient's screen. Use <…> to browse the network if required.
Command lineEnter the command line script to be executed when the extractor status is achieved and select the reporting status.
Tip
The Command line option is not limited to notification tasks. Any application can be called to perform, for example, some post-processing.
WritetoWindowsapplicationeventlogSelect the reporting status. The message is written into the Windows event log user area.
The following send conditions are available for each individual type of notification:
Issue 1.1 27
ibaAnalyzer-Reportgenerator The Data interface
■ On completion
Notification is made when the output procedure has been completed, success or failure is irrelevant.
■ On success
Notification is made when report output is successful.
■ On failure
Notification is made when any report output has failed.
■ On failure (1st failure only)
Notification is made when first report output has failed.
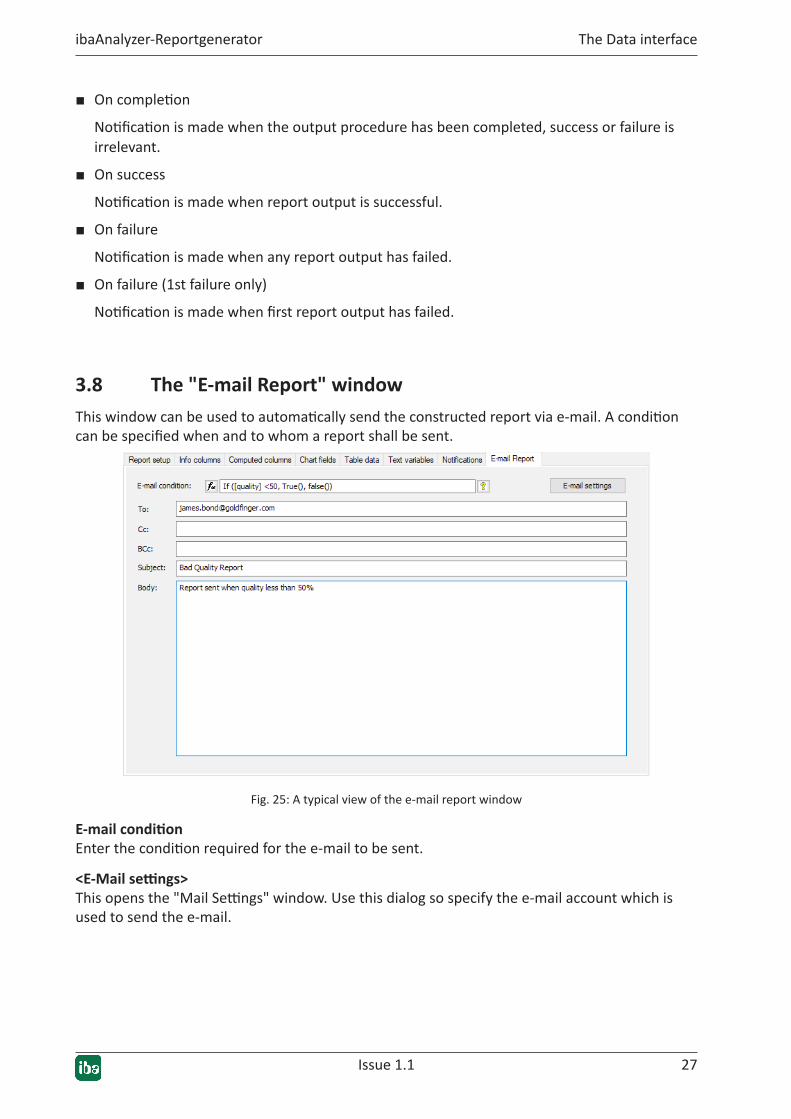
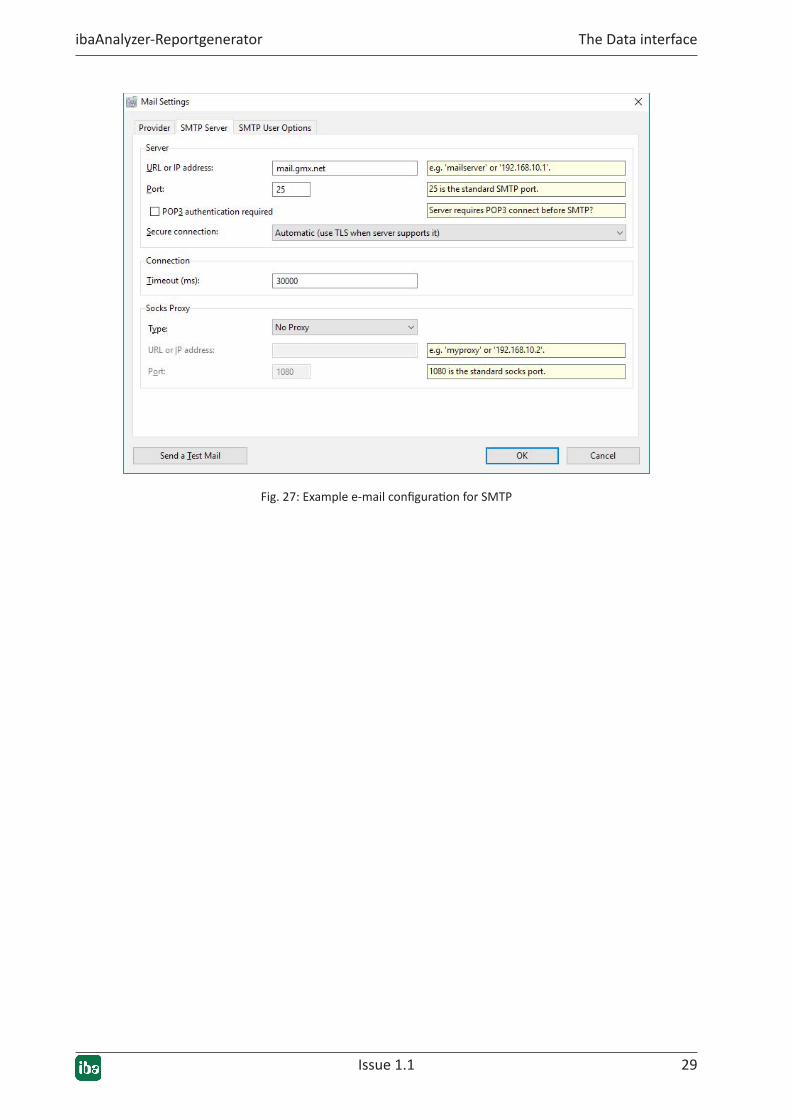
3.8 The"E-mailReport"windowThis window can be used to automatically send the constructed report via e-mail. A condition can be specified when and to whom a report shall be sent.
Fig. 25: A typical view of the e-mail report window
E-mailconditionEnter the condition required for the e-mail to be sent.
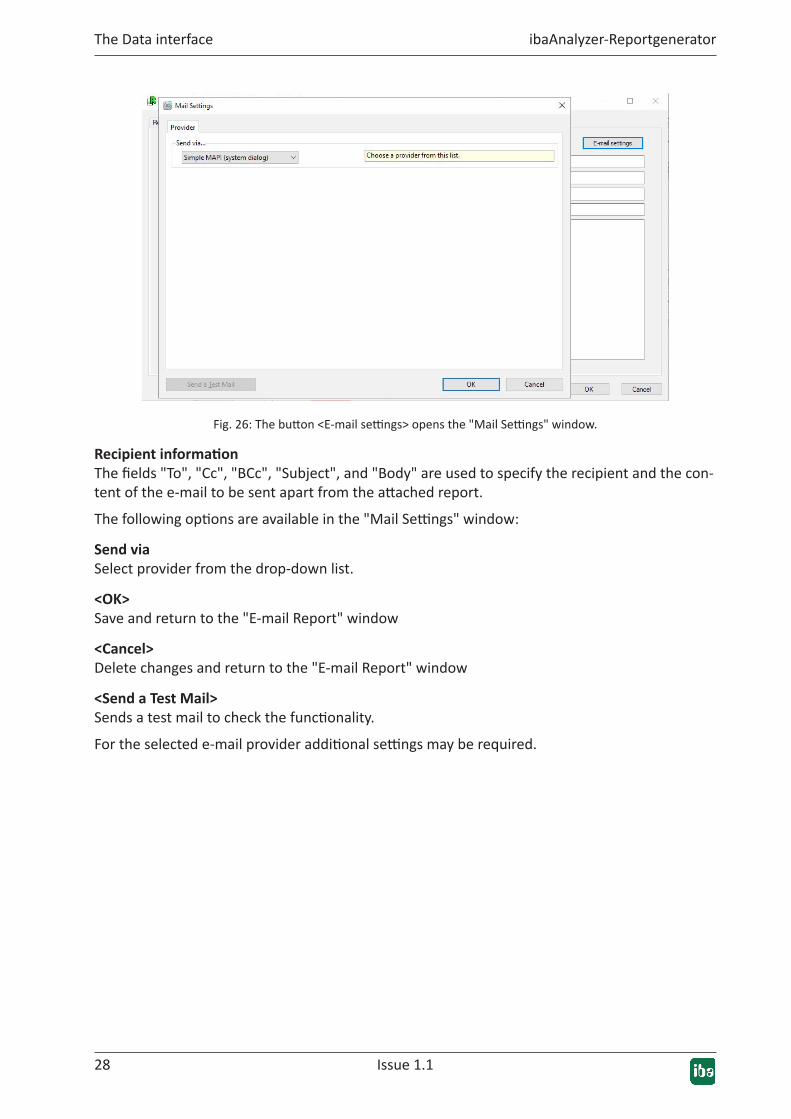
<E-Mailsettings>This opens the "Mail Settings" window. Use this dialog so specify the e-mail account which is used to send the e-mail.
28 Issue 1.1
The Data interface ibaAnalyzer-Reportgenerator
Fig. 26: The button <E-mail settings> opens the "Mail Settings" window.
RecipientinformationThe fields "To", "Cc", "BCc", "Subject", and "Body" are used to specify the recipient and the con-tent of the e-mail to be sent apart from the attached report.
The following options are available in the "Mail Settings" window:
SendviaSelect provider from the drop-down list.
<OK>Save and return to the "E-mail Report" window
<Cancel>Delete changes and return to the "E-mail Report" window
<SendaTestMail>Sends a test mail to check the functionality.
For the selected e-mail provider additional settings may be required.
Issue 1.1 29
ibaAnalyzer-Reportgenerator The Data interface
Fig. 27: Example e-mail configuration for SMTP
3030 Issue 1.1
The Report Designer ibaAnalyzer-Reportgenerator
4 The Report DesignerThe Report Designer is started by selecting <Edit report layout> in the "Report setup" window. Make sure that you have specified all information you want to use for the report design in the data interface of ibaAnalyzer-Reportgenerator.
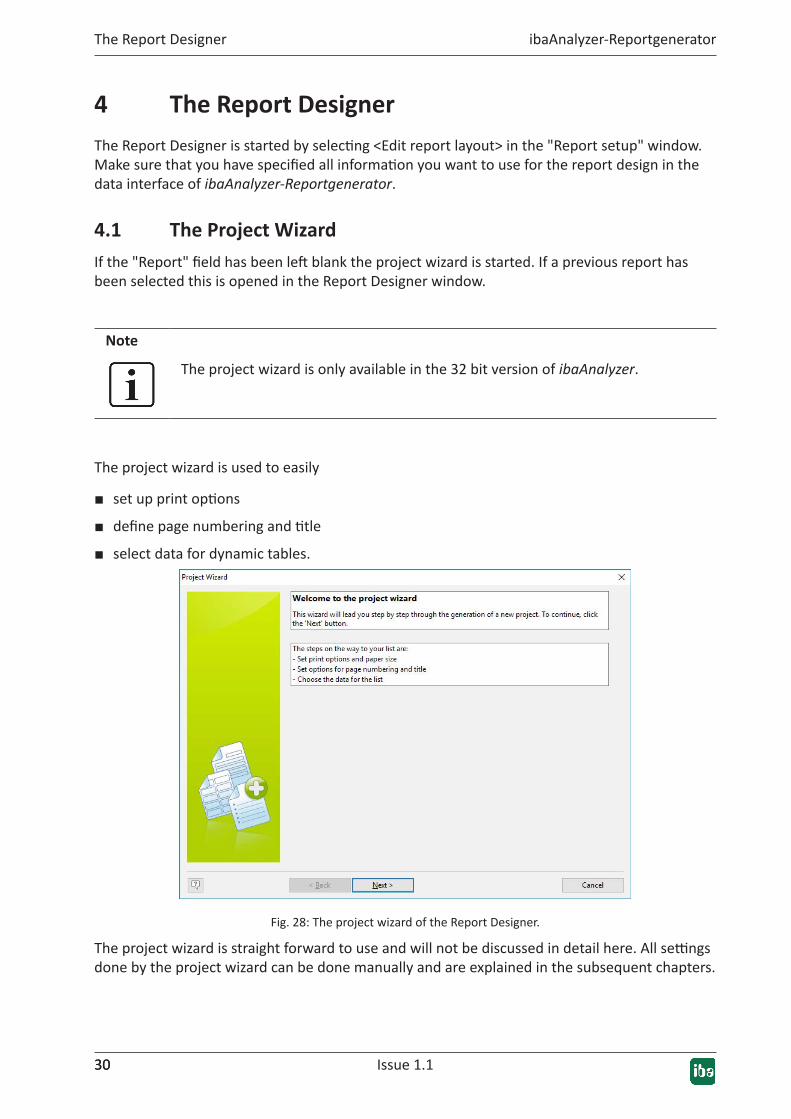
4.1 TheProjectWizardIf the "Report" field has been left blank the project wizard is started. If a previous report has been selected this is opened in the Report Designer window.
Note
The project wizard is only available in the 32 bit version of ibaAnalyzer.
The project wizard is used to easily
■ set up print options
■ define page numbering and title
■ select data for dynamic tables.
Fig. 28: The project wizard of the Report Designer.
The project wizard is straight forward to use and will not be discussed in detail here. All settings done by the project wizard can be done manually and are explained in the subsequent chapters.
Issue 1.1 31
ibaAnalyzer-Reportgenerator The Report Designer
Note
The project wizard can become handy if a dynamic table is required. The iba AG offers standard training courses on ibaAnalyzer-Reportgenerator where this can be explained in detail.
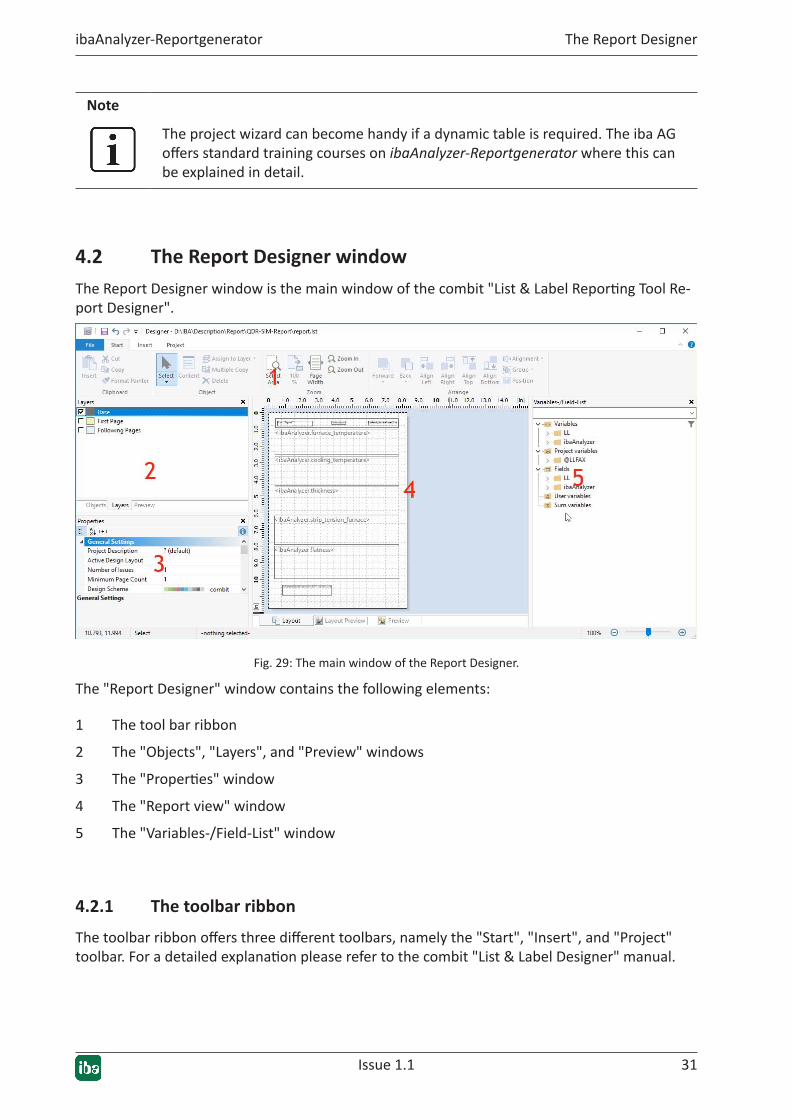
4.2 TheReportDesignerwindowThe Report Designer window is the main window of the combit "List & Label Reporting Tool Re-port Designer".
Fig. 29: The main window of the Report Designer.
The "Report Designer" window contains the following elements:
1 The tool bar ribbon
2 The "Objects", "Layers", and "Preview" windows
3 The "Properties" window
4 The "Report view" window
5 The "Variables-/Field-List" window
4.2.1 The toolbar ribbon
The toolbar ribbon offers three different toolbars, namely the "Start", "Insert", and "Project" toolbar. For a detailed explanation please refer to the combit "List & Label Designer" manual.
32 Issue 1.1
The Report Designer ibaAnalyzer-Reportgenerator
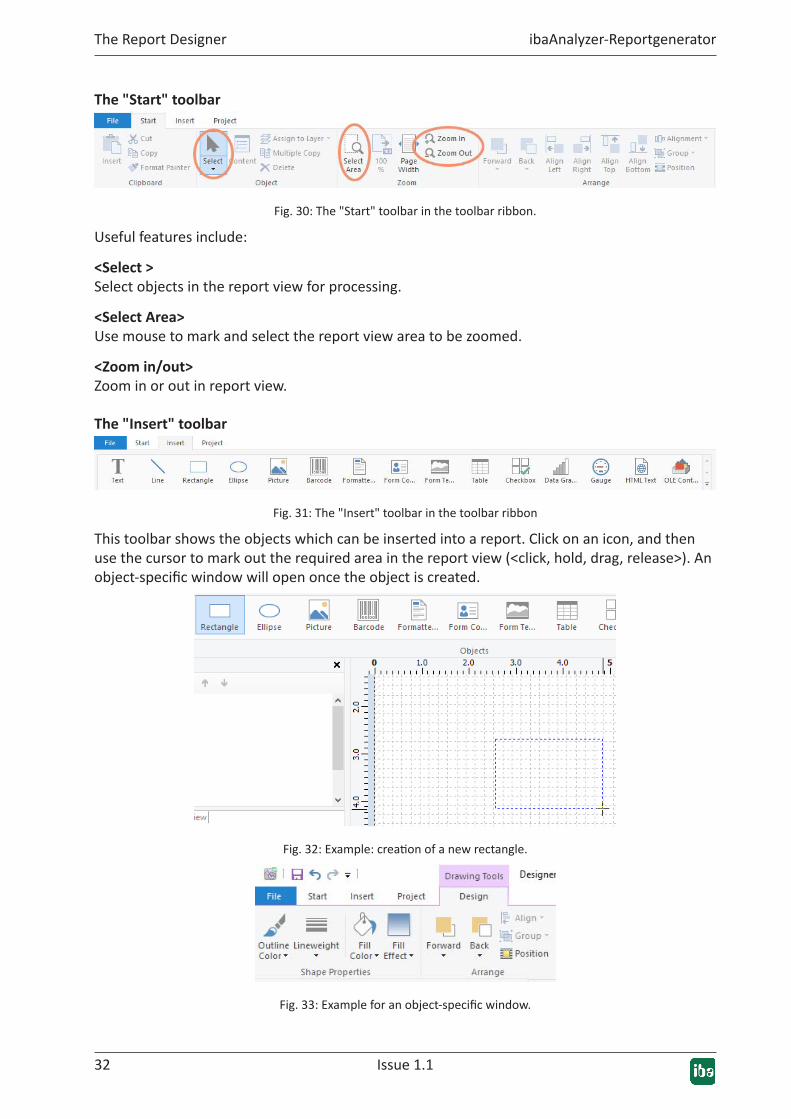
The "Start" toolbar
Fig. 30: The "Start" toolbar in the toolbar ribbon.
Useful features include:
<Select>Select objects in the report view for processing.
<SelectArea>Use mouse to mark and select the report view area to be zoomed.
<Zoomin/out>Zoom in or out in report view.
The "Insert" toolbar
Fig. 31: The "Insert" toolbar in the toolbar ribbon
This toolbar shows the objects which can be inserted into a report. Click on an icon, and then use the cursor to mark out the required area in the report view (<click, hold, drag, release>). An object-specific window will open once the object is created.
Fig. 32: Example: creation of a new rectangle.
Fig. 33: Example for an object-specific window.
Issue 1.1 33
ibaAnalyzer-Reportgenerator The Report Designer
The"Project"toolbar
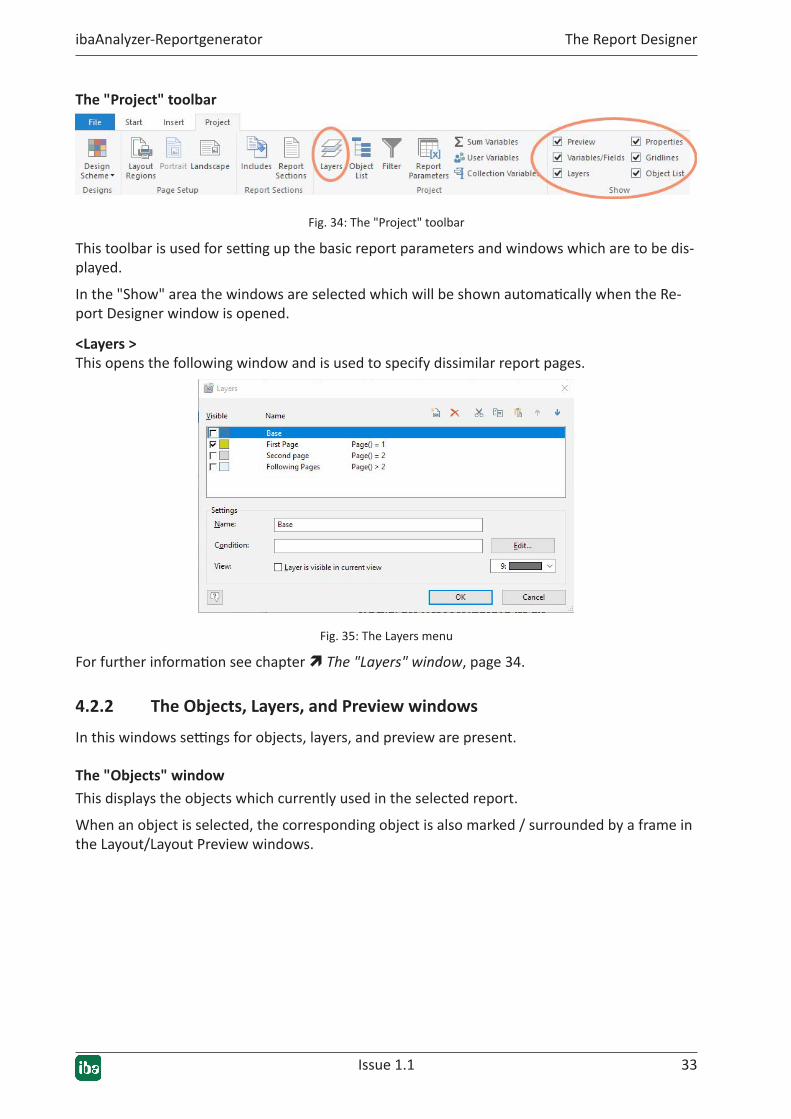
Fig. 34: The "Project" toolbar
This toolbar is used for setting up the basic report parameters and windows which are to be dis-played.
In the "Show" area the windows are selected which will be shown automatically when the Re-port Designer window is opened.
<Layers>This opens the following window and is used to specify dissimilar report pages.
Fig. 35: The Layers menu
For further information see chapter ì The "Layers" window, page 34.
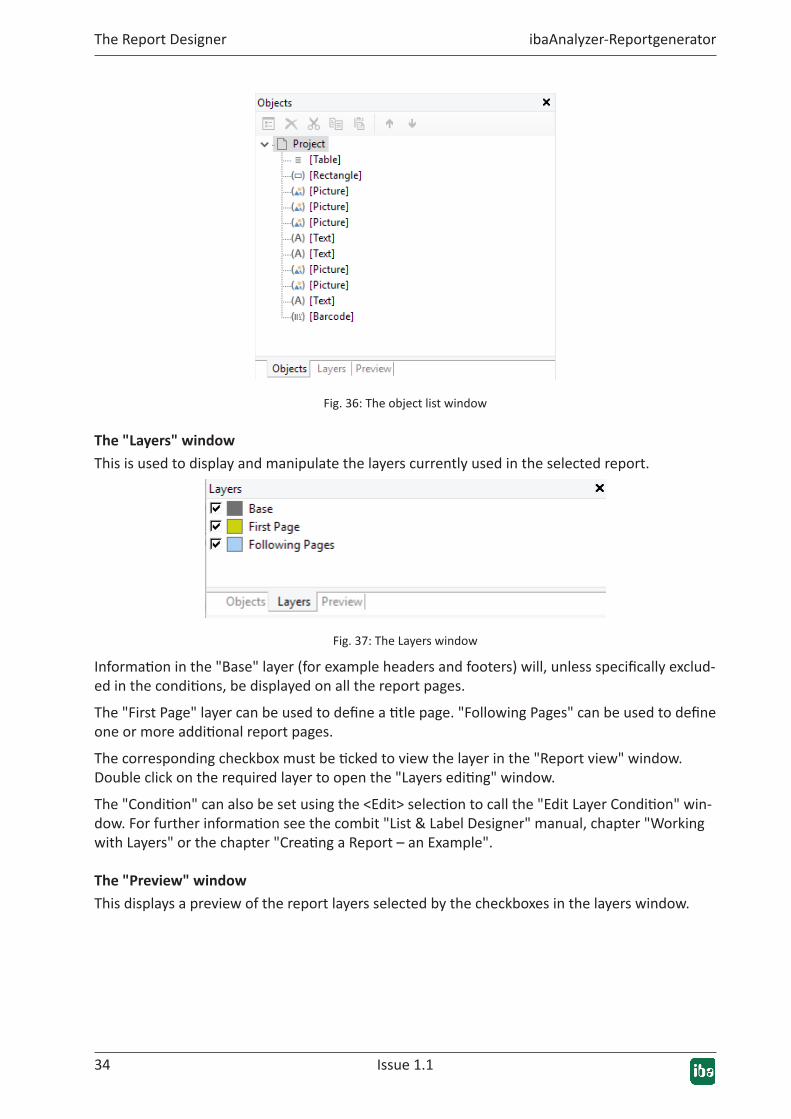
4.2.2 TheObjects,Layers,andPreviewwindows
In this windows settings for objects, layers, and preview are present.
The"Objects"windowThis displays the objects which currently used in the selected report.
When an object is selected, the corresponding object is also marked / surrounded by a frame in the Layout/Layout Preview windows.
34 Issue 1.1
The Report Designer ibaAnalyzer-Reportgenerator
Fig. 36: The object list window
The"Layers"windowThis is used to display and manipulate the layers currently used in the selected report.
Fig. 37: The Layers window
Information in the "Base" layer (for example headers and footers) will, unless specifically exclud-ed in the conditions, be displayed on all the report pages.
The "First Page" layer can be used to define a title page. "Following Pages" can be used to define one or more additional report pages.
The corresponding checkbox must be ticked to view the layer in the "Report view" window. Double click on the required layer to open the "Layers editing" window.
The "Condition" can also be set using the <Edit> selection to call the "Edit Layer Condition" win-dow. For further information see the combit "List & Label Designer" manual, chapter "Working with Layers" or the chapter "Creating a Report – an Example".
The"Preview"windowThis displays a preview of the report layers selected by the checkboxes in the layers window.
Issue 1.1 35
ibaAnalyzer-Reportgenerator The Report Designer
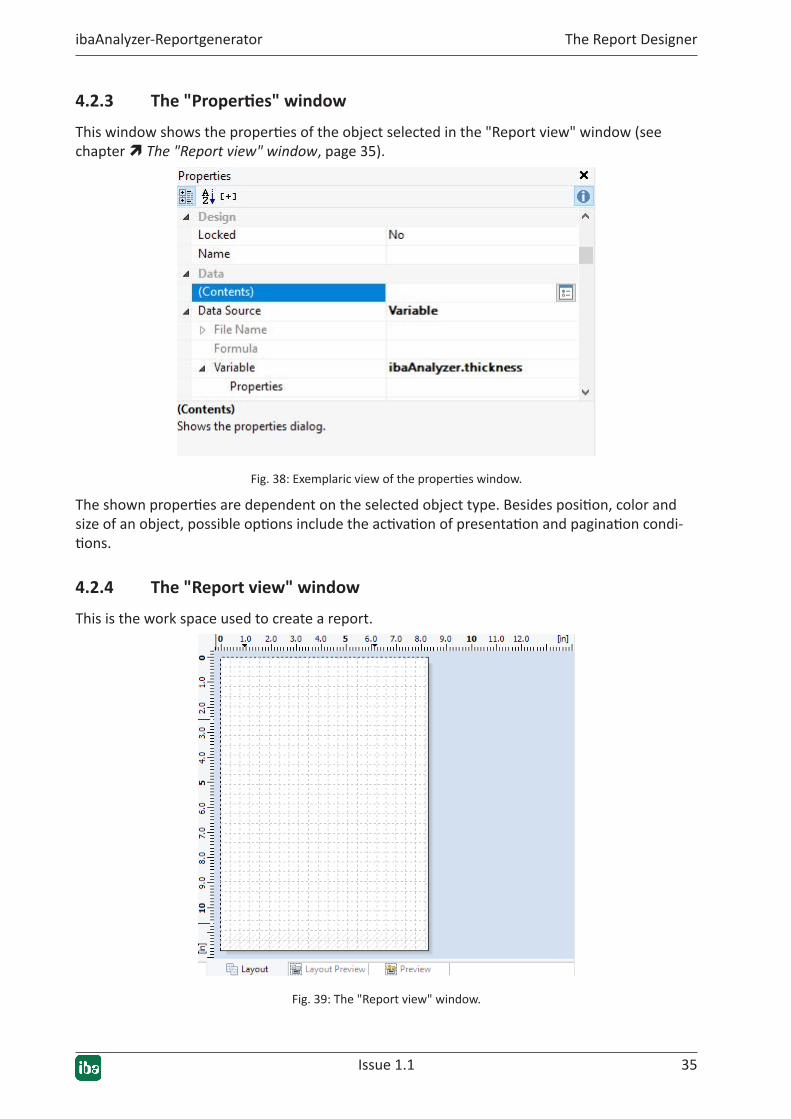
4.2.3 The"Properties"window
This window shows the properties of the object selected in the "Report view" window (see chapter ì The "Report view" window, page 35).
Fig. 38: Exemplaric view of the properties window.
The shown properties are dependent on the selected object type. Besides position, color and size of an object, possible options include the activation of presentation and pagination condi-tions.
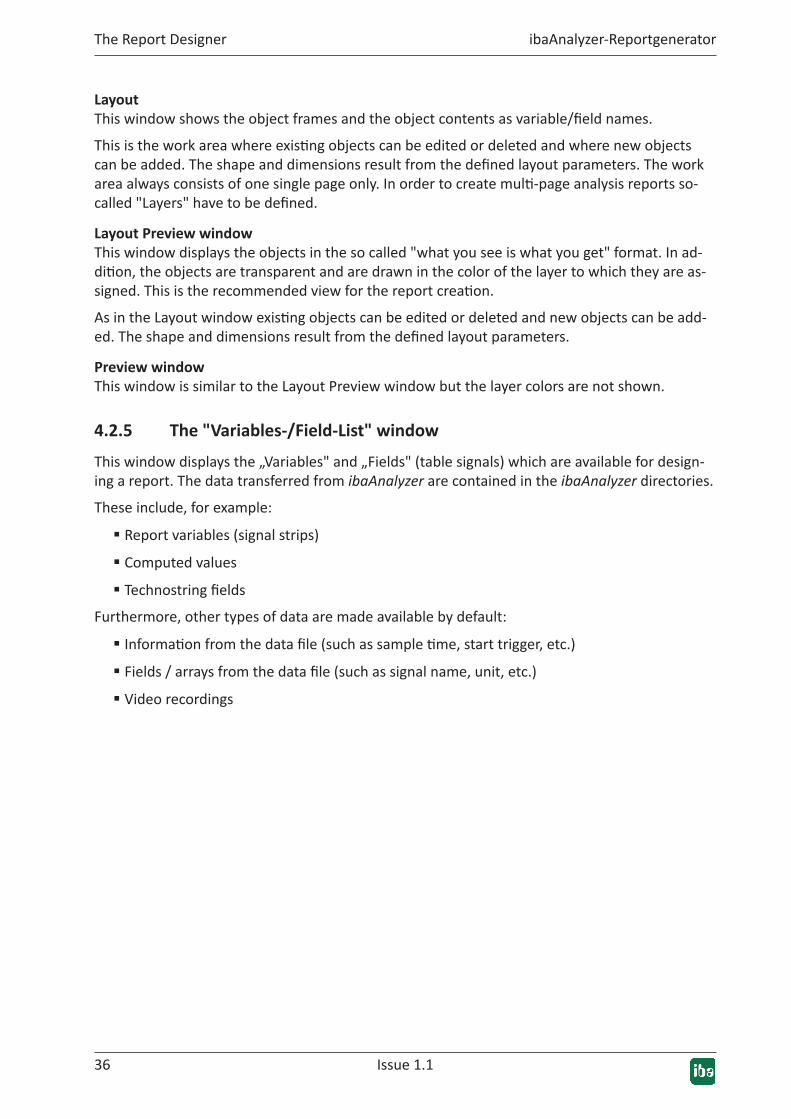
4.2.4 The"Reportview"window
This is the work space used to create a report.
Fig. 39: The "Report view" window.
36 Issue 1.1
The Report Designer ibaAnalyzer-Reportgenerator
LayoutThis window shows the object frames and the object contents as variable/field names.
This is the work area where existing objects can be edited or deleted and where new objects can be added. The shape and dimensions result from the defined layout parameters. The work area always consists of one single page only. In order to create multi-page analysis reports so-called "Layers" have to be defined.
LayoutPreviewwindowThis window displays the objects in the so called "what you see is what you get" format. In ad-dition, the objects are transparent and are drawn in the color of the layer to which they are as-signed. This is the recommended view for the report creation.
As in the Layout window existing objects can be edited or deleted and new objects can be add-ed. The shape and dimensions result from the defined layout parameters.
PreviewwindowThis window is similar to the Layout Preview window but the layer colors are not shown.
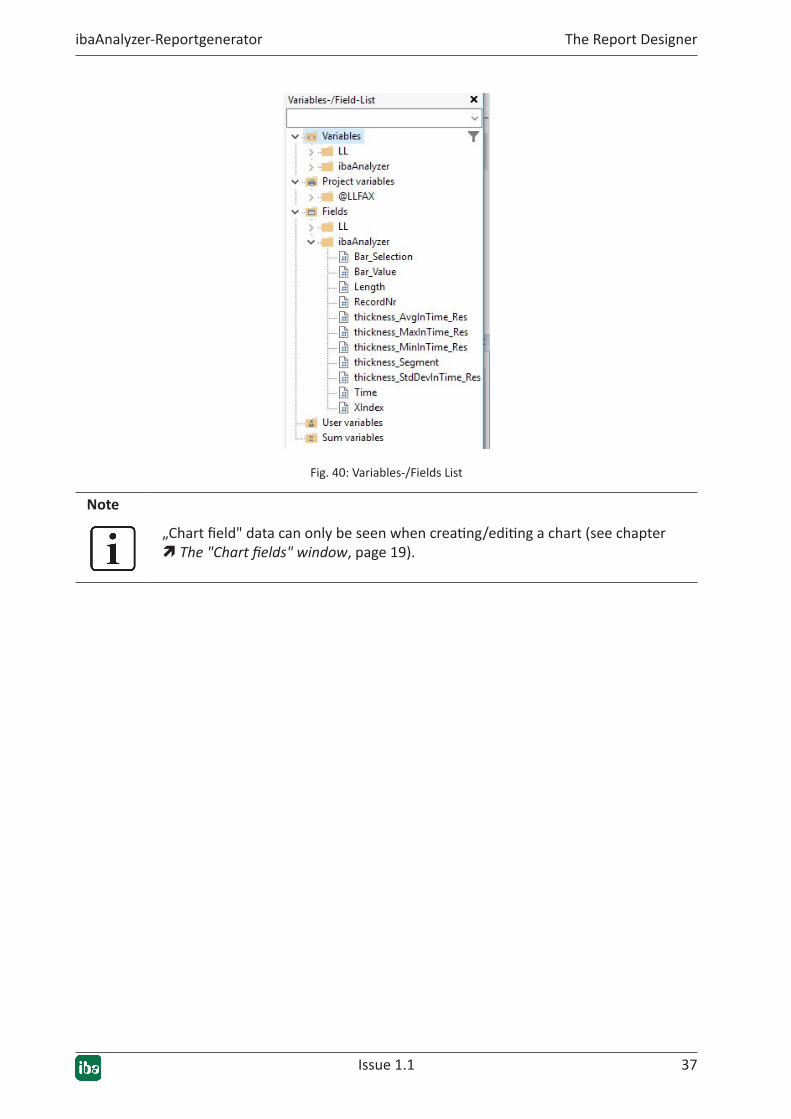
4.2.5 The"Variables-/Field-List"window
This window displays the „Variables" and „Fields" (table signals) which are available for design-ing a report. The data transferred from ibaAnalyzer are contained in the ibaAnalyzer directories.
These include, for example:
� Report variables (signal strips)
� Computed values
� Technostring fields
Furthermore, other types of data are made available by default:
� Information from the data file (such as sample time, start trigger, etc.)
� Fields / arrays from the data file (such as signal name, unit, etc.)
� Video recordings
Issue 1.1 37
ibaAnalyzer-Reportgenerator The Report Designer
Fig. 40: Variables-/Fields List
Note
„Chart field" data can only be seen when creating/editing a chart (see chapter ì The "Chart fields" window, page 19).
38 Issue 1.1
The Report Designer ibaAnalyzer-Reportgenerator
4.3 The report outputA report can be generated manually via the data interface or automatically via a command line (post-processing) from ibaPDA or by ibaDatCoordinator.
Other document
Note that separate documentation is available for ibaPDA and ibaDatCoordinator.
Tip
The report output dialog can be started directly in ibaAnalyzer. For this use the toolbar customization to add a "Print Report" icon.
4.3.1 Generatingareportmanually
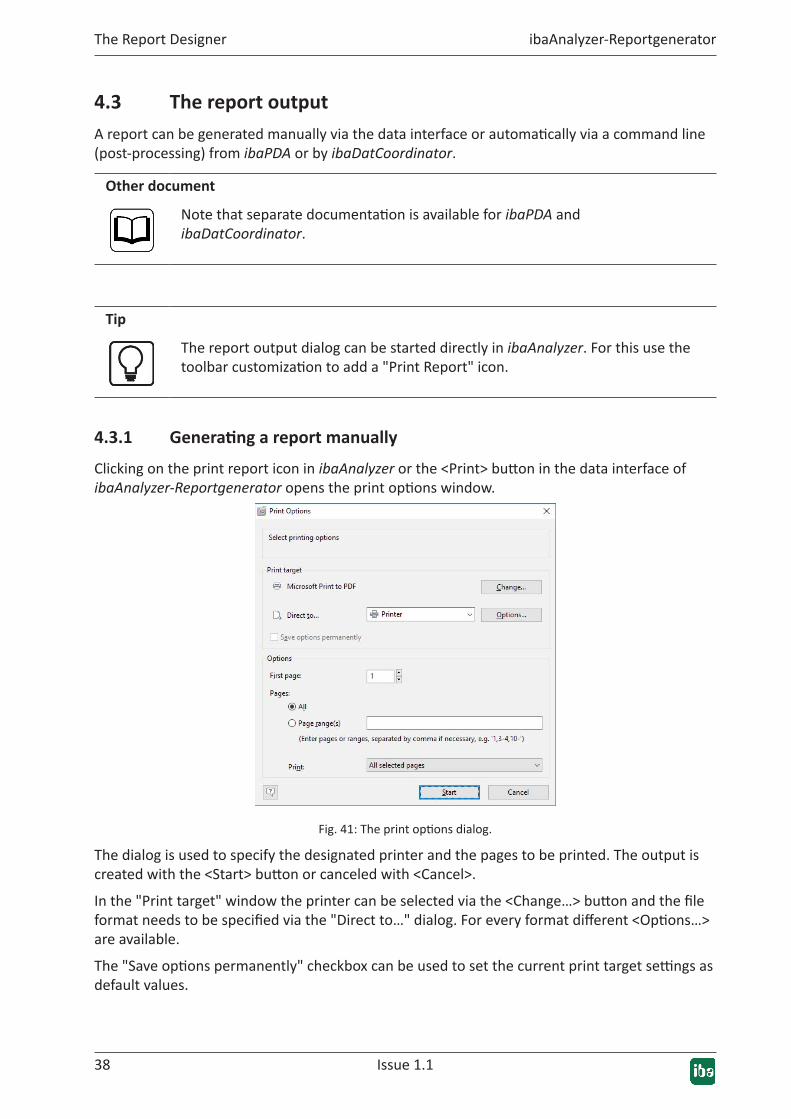
Clicking on the print report icon in ibaAnalyzer or the <Print> button in the data interface of ibaAnalyzer-Reportgenerator opens the print options window.
Fig. 41: The print options dialog.
The dialog is used to specify the designated printer and the pages to be printed. The output is created with the <Start> button or canceled with <Cancel>.
In the "Print target" window the printer can be selected via the <Change…> button and the file format needs to be specified via the "Direct to…" dialog. For every format different <Options…> are available.
The "Save options permanently" checkbox can be used to set the current print target settings as default values.
Issue 1.1 39
ibaAnalyzer-Reportgenerator The Report Designer
Note
By pressing the <Preview> button a similar dialog is opened. However, the out-put is not sent to the printer but rather a preview is opened.
In the lower part of the dialog only parts of the complete report can be selected to be sent to the printer or the specified file format.
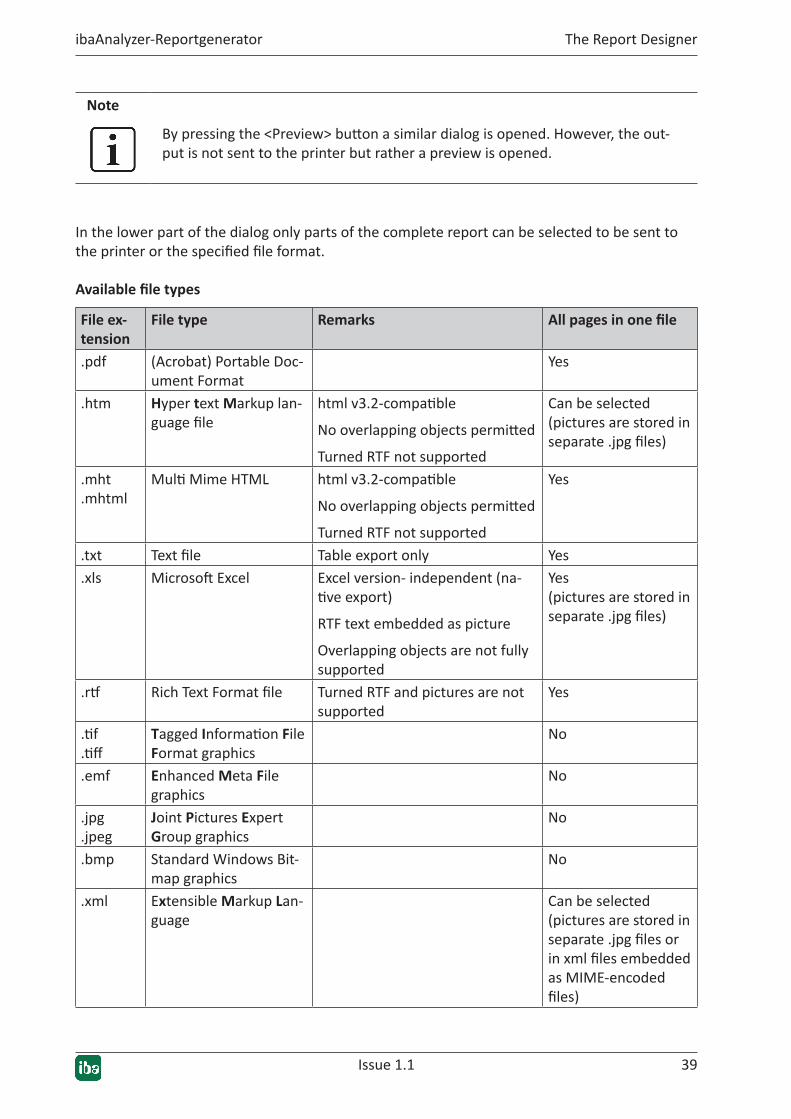
Availablefiletypes
File ex- tension
File type Remarks Allpagesinonefile
.pdf (Acrobat) Portable Doc-ument Format
Yes
.htm Hyper text Markup lan-guage file
html v3.2-compatible
No overlapping objects permitted
Turned RTF not supported
Can be selected (pictures are stored in separate .jpg files)
.mht
.mhtml Multi Mime HTML html v3.2-compatible
No overlapping objects permitted
Turned RTF not supported
Yes
.txt Text file Table export only Yes
.xls Microsoft Excel Excel version- independent (na-tive export)
RTF text embedded as picture
Overlapping objects are not fully supported
Yes (pictures are stored in separate .jpg files)
.rtf Rich Text Format file Turned RTF and pictures are not supported
Yes
.tif
.tiff Tagged Information File Format graphics
No
.emf Enhanced Meta File graphics
No
.jpg
.jpeg Joint Pictures Expert Group graphics
No
.bmp Standard Windows Bit-map graphics
No
.xml Extensible Markup Lan-guage
Can be selected (pictures are stored in separate .jpg files or in xml files embedded as MIME-encoded files)
40 Issue 1.1
The Report Designer ibaAnalyzer-Reportgenerator
4.3.2 The"Reportinfo"window
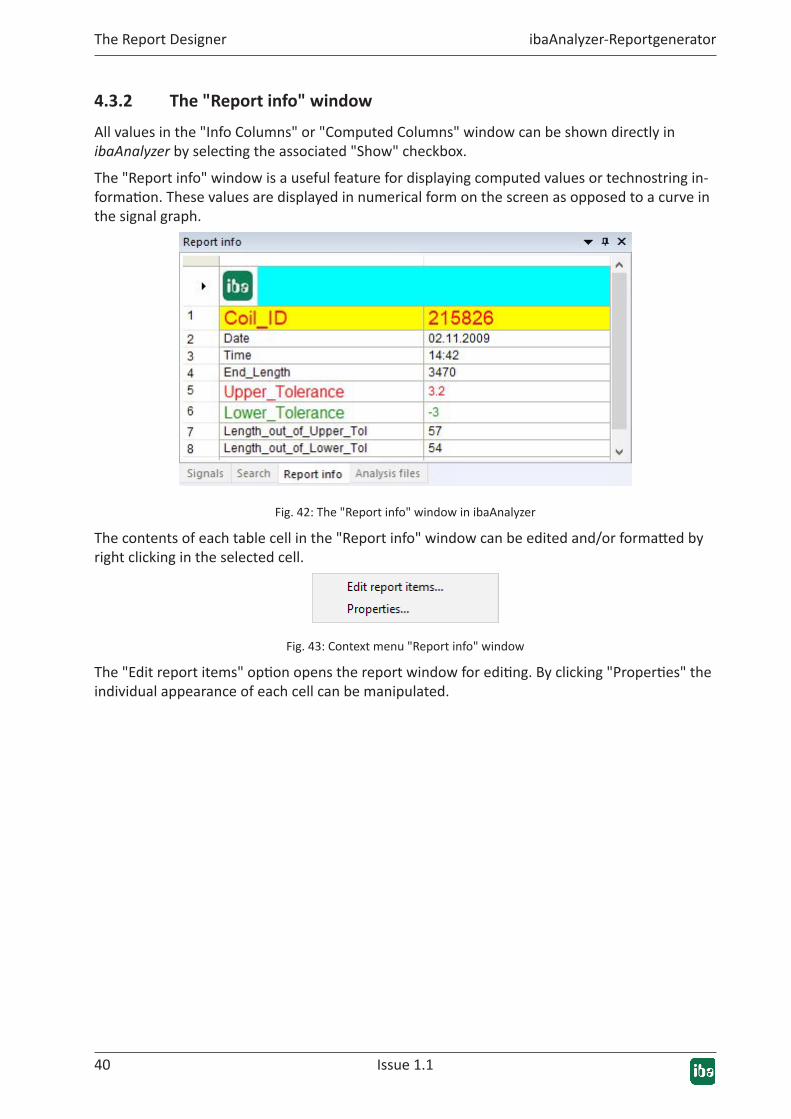
All values in the "Info Columns" or "Computed Columns" window can be shown directly in ibaAnalyzer by selecting the associated "Show" checkbox.
The "Report info" window is a useful feature for displaying computed values or technostring in-formation. These values are displayed in numerical form on the screen as opposed to a curve in the signal graph.
Fig. 42: The "Report info" window in ibaAnalyzer
The contents of each table cell in the "Report info" window can be edited and/or formatted by right clicking in the selected cell.
Fig. 43: Context menu "Report info" window
The "Edit report items" option opens the report window for editing. By clicking "Properties" the individual appearance of each cell can be manipulated.
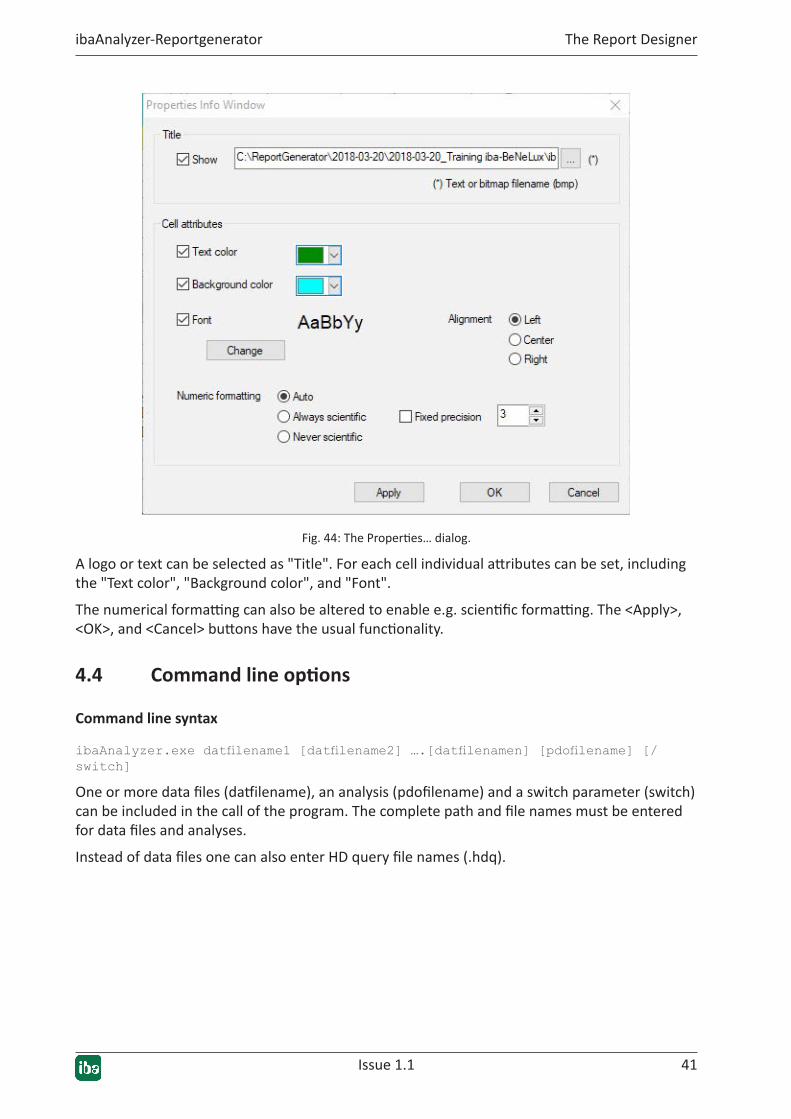
Issue 1.1 41
ibaAnalyzer-Reportgenerator The Report Designer
Fig. 44: The Properties… dialog.
A logo or text can be selected as "Title". For each cell individual attributes can be set, including the "Text color", "Background color", and "Font".
The numerical formatting can also be altered to enable e.g. scientific formatting. The <Apply>, <OK>, and <Cancel> buttons have the usual functionality.
4.4 Commandlineoptions
Command line syntax
ibaAnalyzer.exe datfilename1 [datfilename2] ….[datfilenamen] [pdofilename] [/switch]
One or more data files (datfilename), an analysis (pdofilename) and a switch parameter (switch) can be included in the call of the program. The complete path and file names must be entered for data files and analyses.
Instead of data files one can also enter HD query file names (.hdq).
42 Issue 1.1
The Report Designer ibaAnalyzer-Reportgenerator
Examples(Program path for ibaAnalyzer: c:\programs\iba\ibaAnalyzer\...)
1. Start ibaAnalyzer with three data files which are loaded at the same time:
...\ibaanalyzer.exe demo00.dat demo01.dat demo02.dat
2. Start with three data files and one analysis in order to have the data displayed immediately in the required form:
...\ibaanalyzer.exe demo00.dat demo01.dat demo02.dat analyse1.pdo
4.4.1 Using the post-processing command
Since post-processing is an automatic function which is controlled by a data acquisition pro-gram, such as ibaPDA, a placeholder must be used here instead of the data file name in order to access the most recent data file:
ibaAnalyzer.exe %f [pdofilename] [/switch]
%f: Last data file, complete path and file name (e.g. d:\dat\pda001.dat)
%g: Last data file, only data file name (e.g. pda001.dat)
%h: Last data file, file name without suffix (e.g. pda001)
Tip
For regular and automated calls of ibaAnalyzer depending on the data file gen-eration, we recommend using ibaDatCoordinator. Compared to the post-pro-cessing, the application free of charge offers higher ease of use as well as higher flexibility and functional reliability.
UsingtheswitchesinthecommandlineThe switches are particularly important in conjunction with post-processing because they can be used to automate complete analysis processes. It is, however, also possible to use the switches in conjunction with a manual program start.
Switch/report[:filename]With this switch, ibaAnalyzer starts, loads a specified data file and performs an analysis in accor-dance with the specified analysis rule. Thereafter, the integrated ibaAnalyzer-Reportgenerator is started and the data is printed on the Windows default printer using a report layout specified in the analysis rule if the [:filename] option was not used with the switch.
If the [:filename] switch option is used, the report can be written into a file rather than being printed. The desired file type is determined by the file name extension. Many custom formats are supported, including, for example, .pdf, .htm, .rtf, .tiff, .jpg, .xls, etc.
Issue 1.1 43
ibaAnalyzer-Reportgenerator The Report Designer
Program call syntax
...\ibaanalyzer.exe Datafile.dat Analyse.pdo /report[:File]
The data file(s) Datafile.dat must be available.
The analysis Analysis.pdo must be available. The configuration of the data interface as well as the link to a valid report layout file are saved in the analysis.
Example(Program path for ibaAnalyzer: c:\programs\iba\ibaAnalyzer\...)
1. Start with one data file and one analysis with report output on the printer
...\ibaanalyzer.exe c:\samples\reportsample.dat c:\samples\re-portsample.pdo /report
2. Start with one data file and one analysis with report output as a pdf file:
...\ibaanalyzer.exe c:\samples\reportsample.dat c:\samples\re-portsample.pdo /report:c:\report\pdf\test.pdf
4444 Issue 1.1
An exhaustive example ibaAnalyzer-Reportgenerator
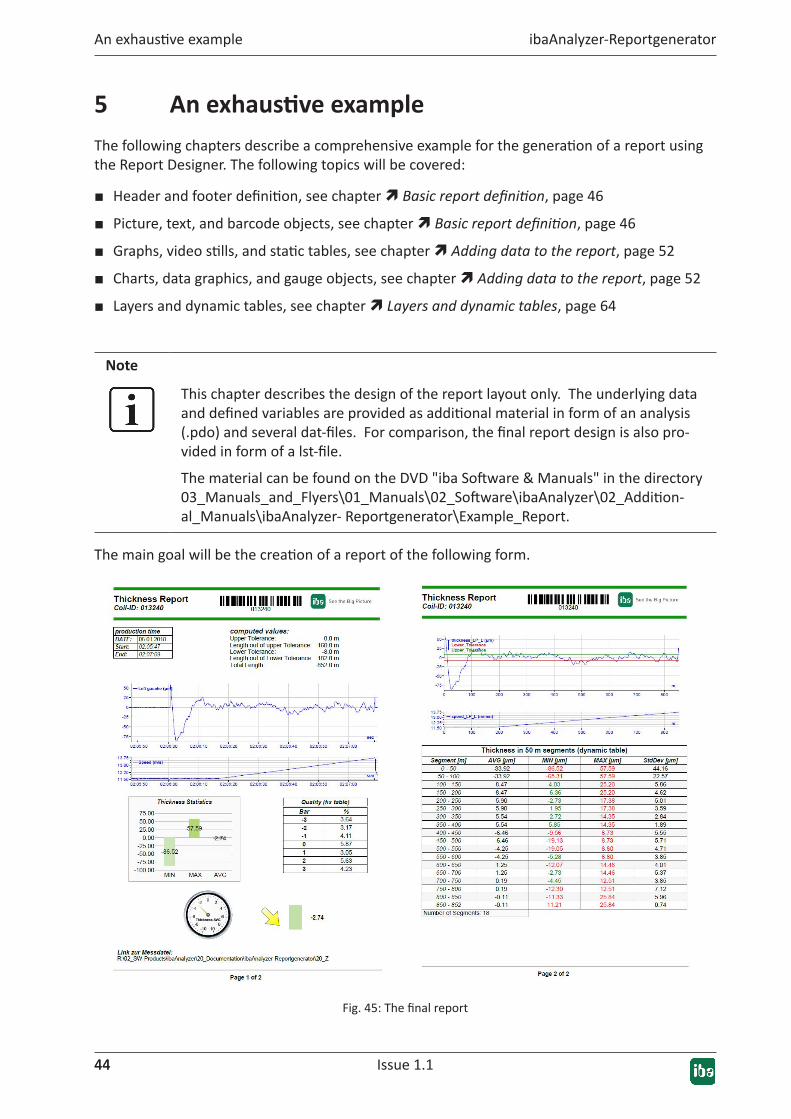
5 AnexhaustiveexampleThe following chapters describe a comprehensive example for the generation of a report using the Report Designer. The following topics will be covered:
■ Header and footer definition, see chapter ì Basic report definition, page 46
■ Picture, text, and barcode objects, see chapter ì Basic report definition, page 46
■ Graphs, video stills, and static tables, see chapter ì Adding data to the report, page 52
■ Charts, data graphics, and gauge objects, see chapter ì Adding data to the report, page 52
■ Layers and dynamic tables, see chapter ì Layers and dynamic tables, page 64
Note
This chapter describes the design of the report layout only. The underlying data and defined variables are provided as additional material in form of an analysis (.pdo) and several dat-files. For comparison, the final report design is also pro-vided in form of a lst-file.
The material can be found on the DVD "iba Software & Manuals" in the directory 03_Manuals_and_Flyers\01_Manuals\02_Software\ibaAnalyzer\02_Addition-al_Manuals\ibaAnalyzer- Reportgenerator\Example_Report.
The main goal will be the creation of a report of the following form.
Fig. 45: The final report
Issue 1.1 45
ibaAnalyzer-Reportgenerator An exhaustive example
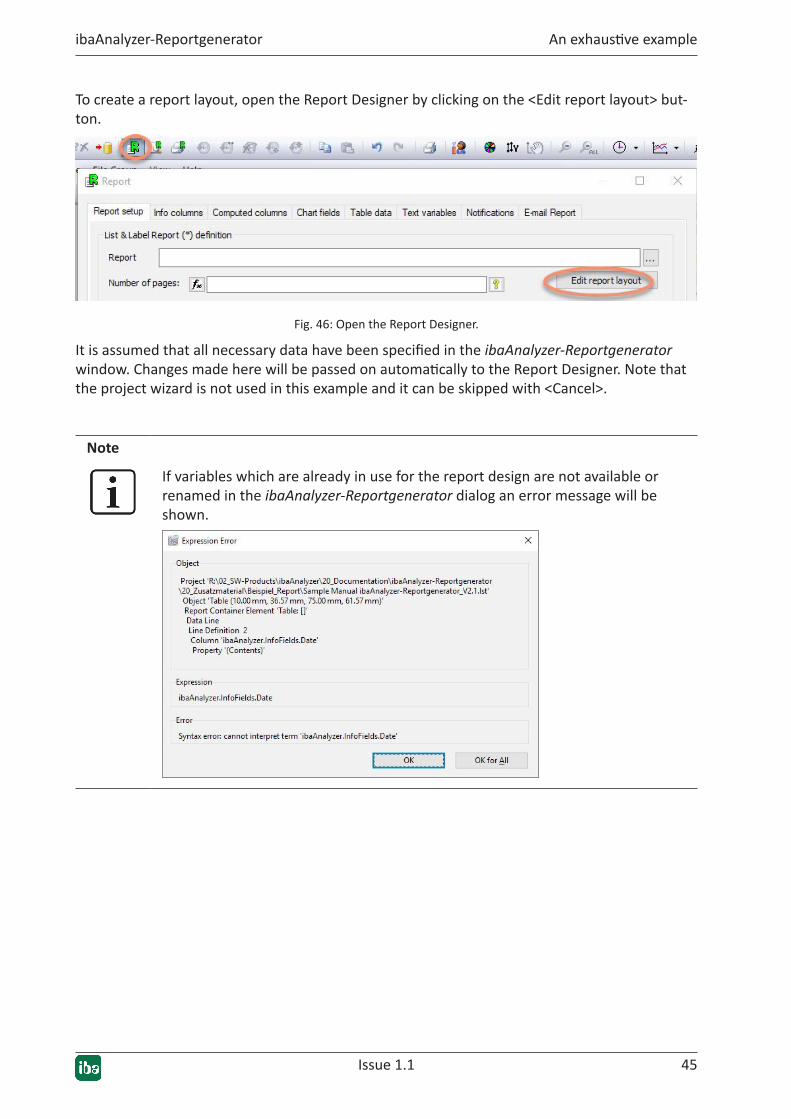
To create a report layout, open the Report Designer by clicking on the <Edit report layout> but-ton.
Fig. 46: Open the Report Designer.
It is assumed that all necessary data have been specified in the ibaAnalyzer-Reportgenerator window. Changes made here will be passed on automatically to the Report Designer. Note that the project wizard is not used in this example and it can be skipped with <Cancel>.
Note
If variables which are already in use for the report design are not available or renamed in the ibaAnalyzer-Reportgenerator dialog an error message will be shown.
46 Issue 1.1
An exhaustive example ibaAnalyzer-Reportgenerator
5.1 BasicreportdefinitionStart the design of the report with some basic elements. Those will serve as a general layout and are shown on every page of the report. Elements like page numbering can, however, also depend on the page number.
Note
Make sure to have the "Base" layer activated for the elements added in this section. For more detailed information on layers, refer to chapter ì Layers and dynamic tables, page 64.
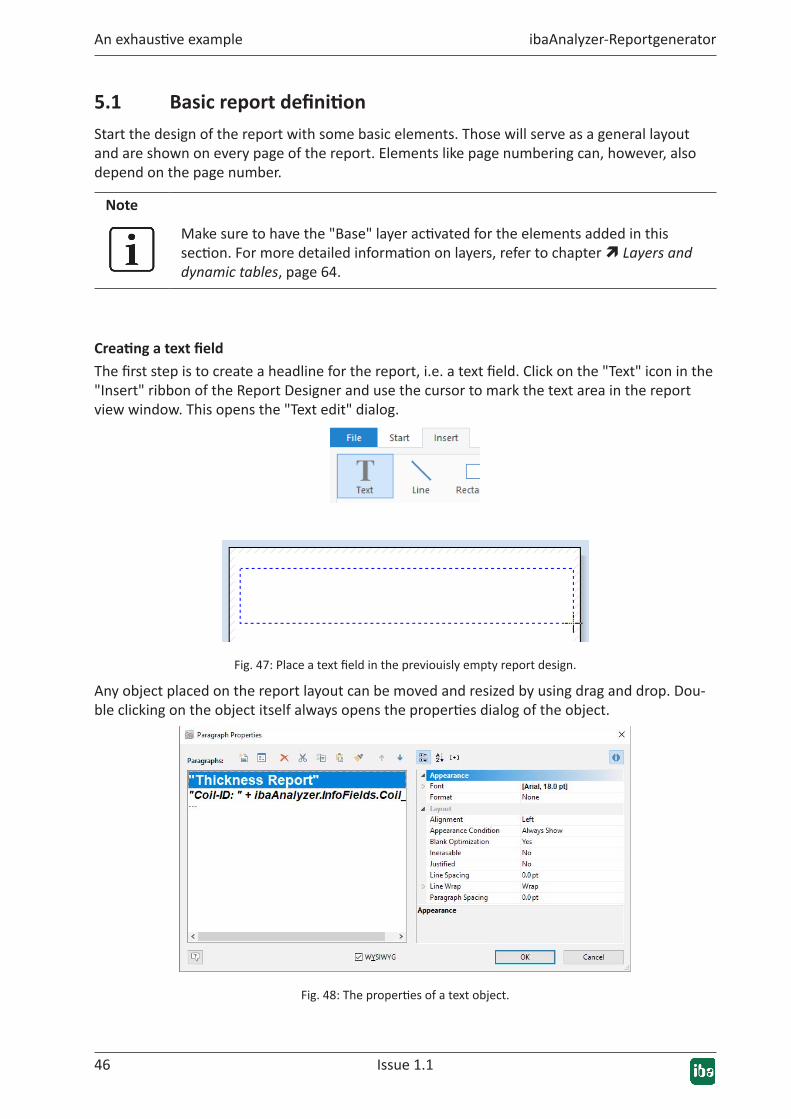
CreatingatextfieldThe first step is to create a headline for the report, i.e. a text field. Click on the "Text" icon in the "Insert" ribbon of the Report Designer and use the cursor to mark the text area in the report view window. This opens the "Text edit" dialog.
Fig. 47: Place a text field in the previouisly empty report design.
Any object placed on the report layout can be moved and resized by using drag and drop. Dou-ble clicking on the object itself always opens the properties dialog of the object.
Fig. 48: The properties of a text object.
Issue 1.1 47
ibaAnalyzer-Reportgenerator An exhaustive example
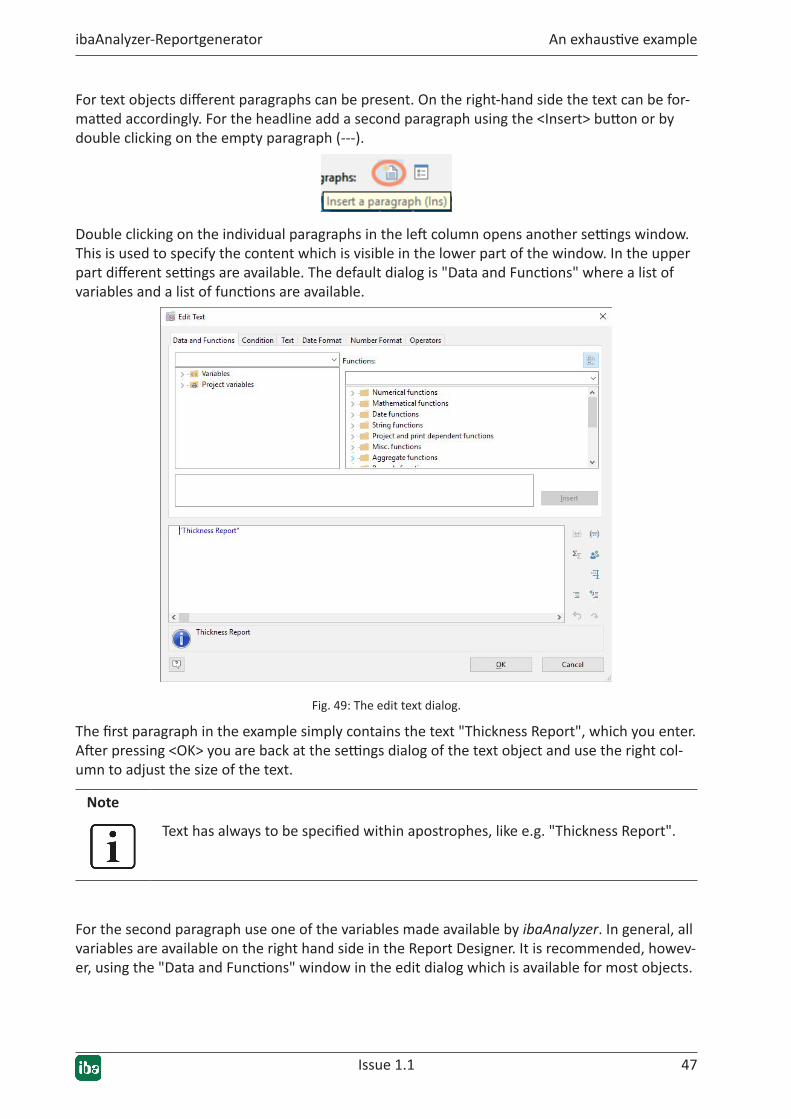
For text objects different paragraphs can be present. On the right-hand side the text can be for-matted accordingly. For the headline add a second paragraph using the <Insert> button or by double clicking on the empty paragraph (---).
Double clicking on the individual paragraphs in the left column opens another settings window. This is used to specify the content which is visible in the lower part of the window. In the upper part different settings are available. The default dialog is "Data and Functions" where a list of variables and a list of functions are available.
Fig. 49: The edit text dialog.
The first paragraph in the example simply contains the text "Thickness Report", which you enter. After pressing <OK> you are back at the settings dialog of the text object and use the right col-umn to adjust the size of the text.
Note
Text has always to be specified within apostrophes, like e.g. "Thickness Report".
For the second paragraph use one of the variables made available by ibaAnalyzer. In general, all variables are available on the right hand side in the Report Designer. It is recommended, howev-er, using the "Data and Functions" window in the edit dialog which is available for most objects.
48 Issue 1.1
An exhaustive example ibaAnalyzer-Reportgenerator
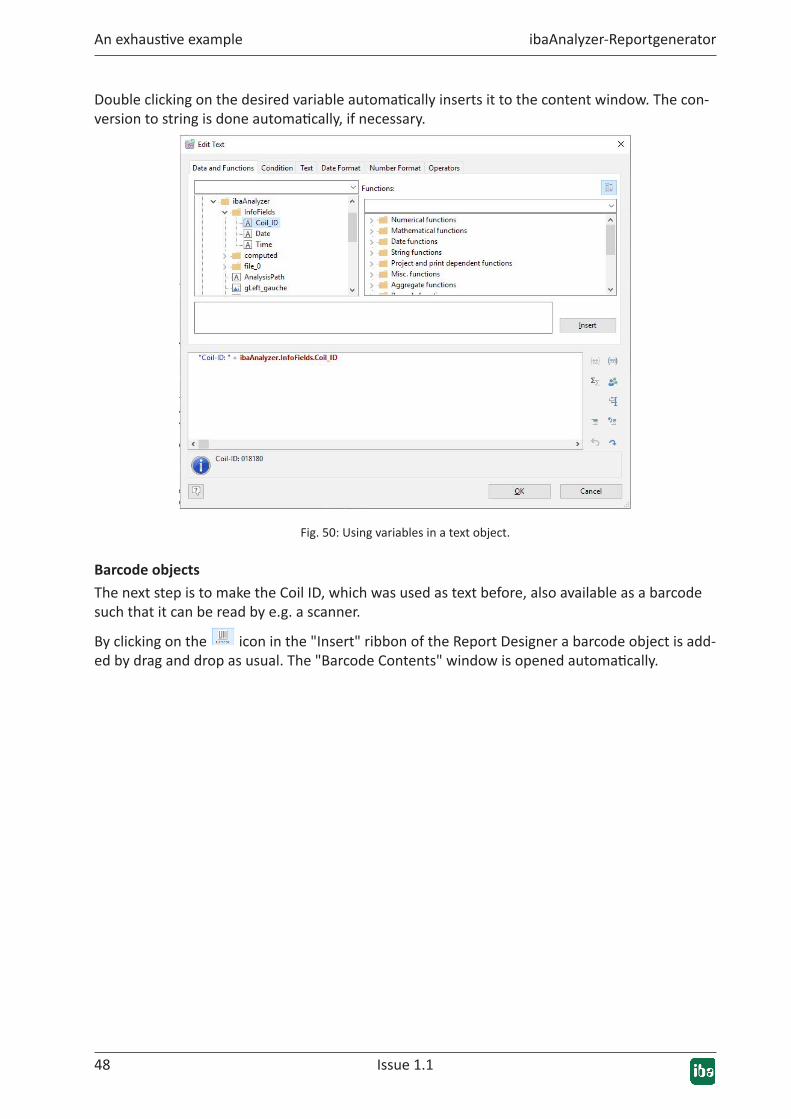
Double clicking on the desired variable automatically inserts it to the content window. The con-version to string is done automatically, if necessary.
Fig. 50: Using variables in a text object.
BarcodeobjectsThe next step is to make the Coil ID, which was used as text before, also available as a barcode such that it can be read by e.g. a scanner.
By clicking on the icon in the "Insert" ribbon of the Report Designer a barcode object is add-ed by drag and drop as usual. The "Barcode Contents" window is opened automatically.
Issue 1.1 49
ibaAnalyzer-Reportgenerator An exhaustive example
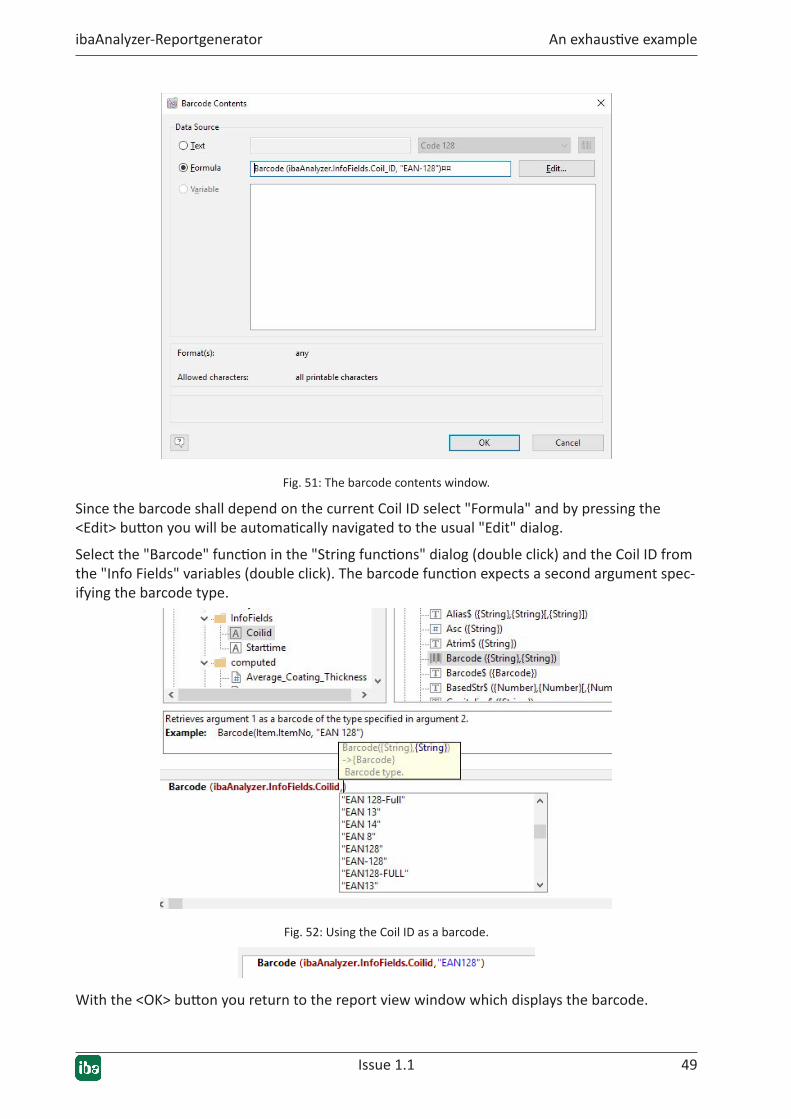
Fig. 51: The barcode contents window.
Since the barcode shall depend on the current Coil ID select "Formula" and by pressing the <Edit> button you will be automatically navigated to the usual "Edit" dialog.
Select the "Barcode" function in the "String functions" dialog (double click) and the Coil ID from the "Info Fields" variables (double click). The barcode function expects a second argument spec-ifying the barcode type.
Fig. 52: Using the Coil ID as a barcode.
With the <OK> button you return to the report view window which displays the barcode.
50 Issue 1.1
An exhaustive example ibaAnalyzer-Reportgenerator
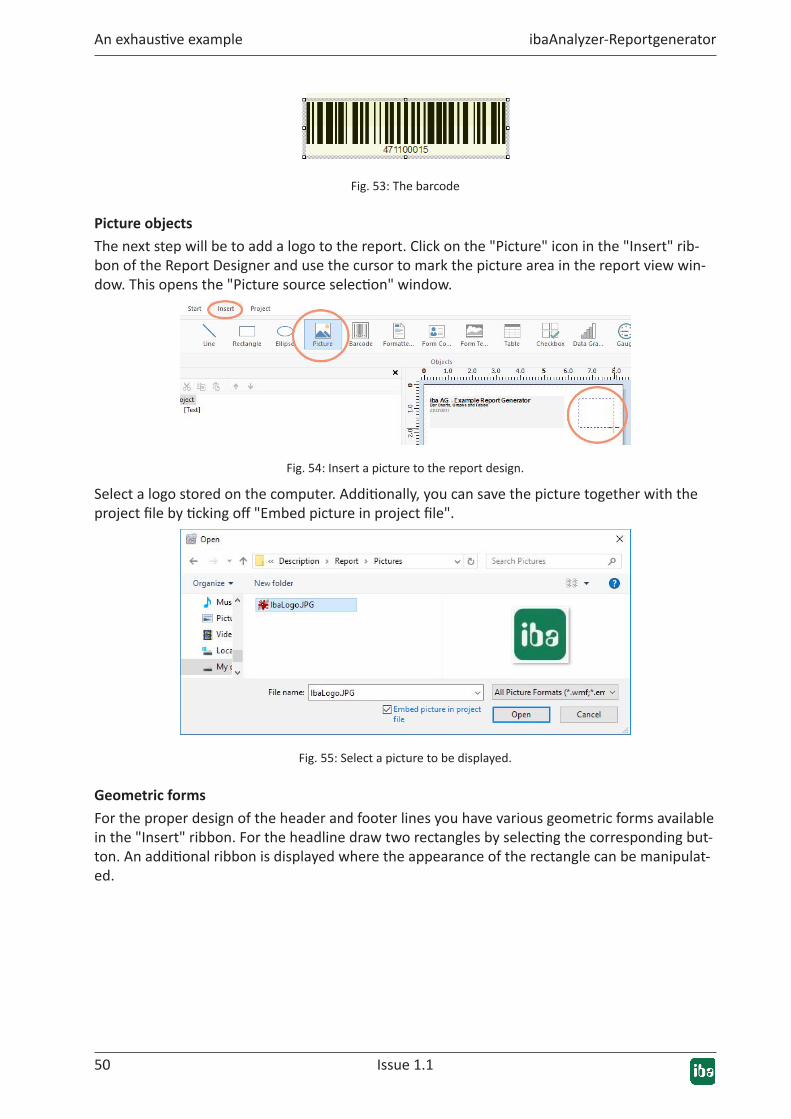
Fig. 53: The barcode
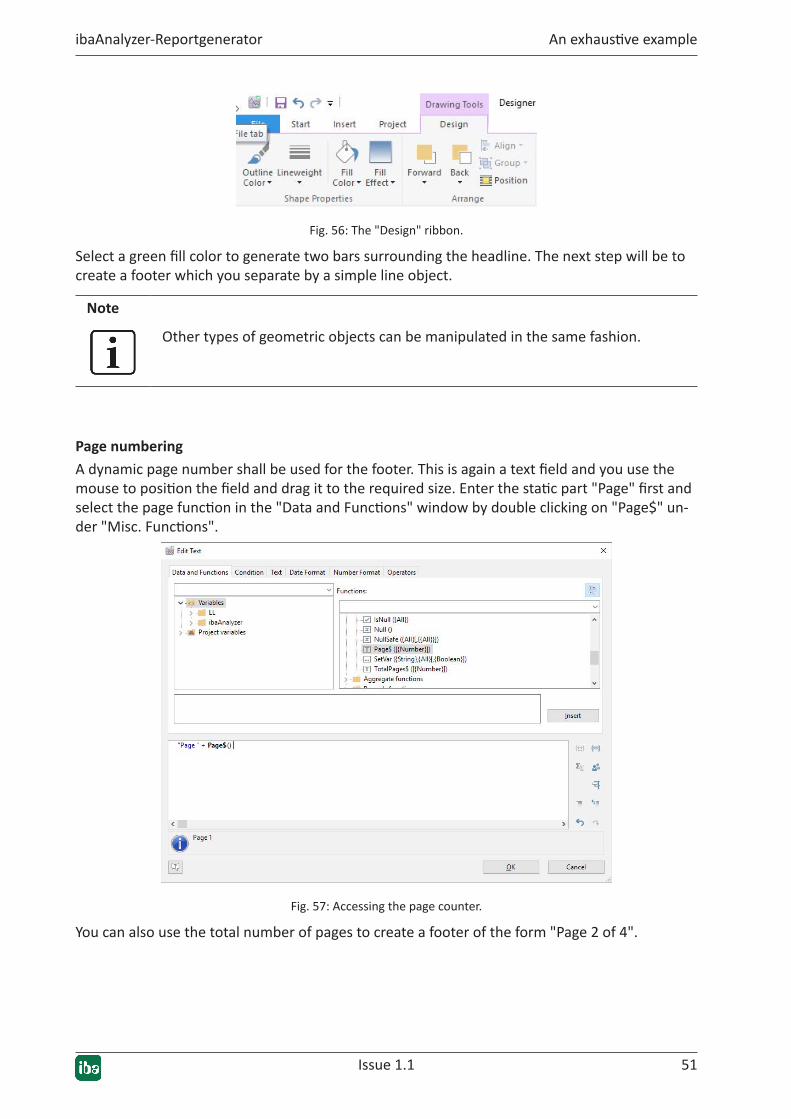
PictureobjectsThe next step will be to add a logo to the report. Click on the "Picture" icon in the "Insert" rib-bon of the Report Designer and use the cursor to mark the picture area in the report view win-dow. This opens the "Picture source selection" window.
Fig. 54: Insert a picture to the report design.
Select a logo stored on the computer. Additionally, you can save the picture together with the project file by ticking off "Embed picture in project file".
Fig. 55: Select a picture to be displayed.
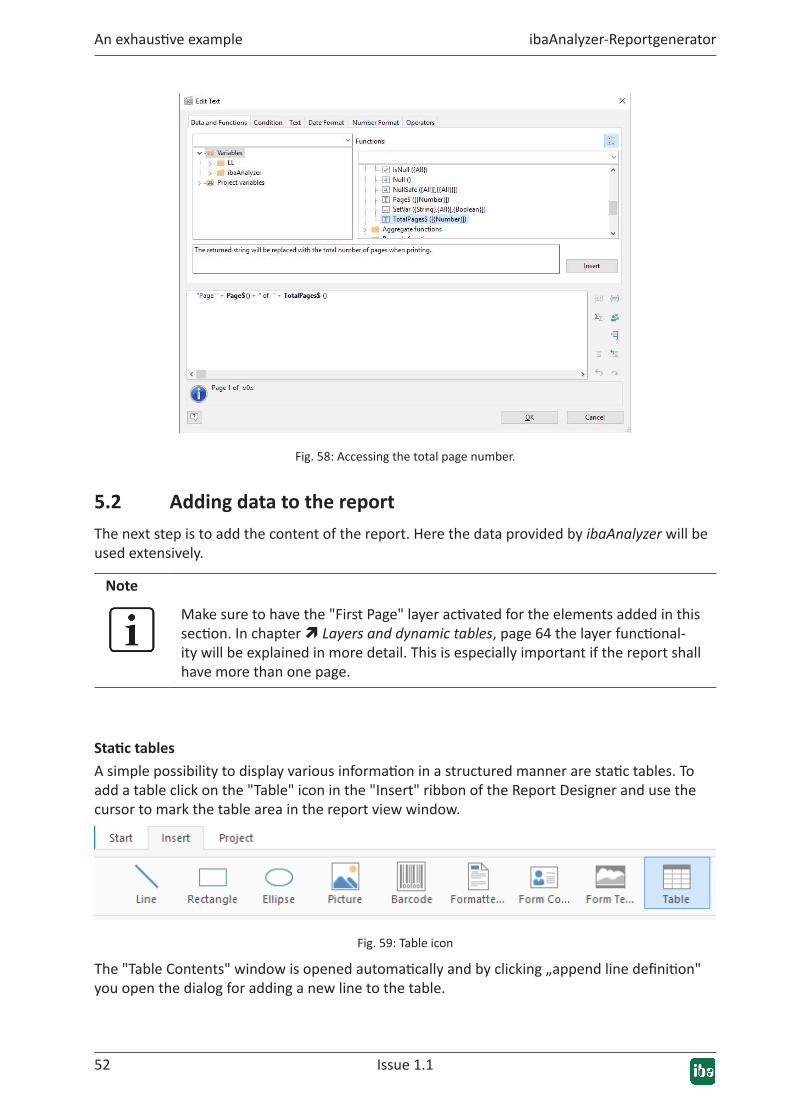
Geometric formsFor the proper design of the header and footer lines you have various geometric forms available in the "Insert" ribbon. For the headline draw two rectangles by selecting the corresponding but-ton. An additional ribbon is displayed where the appearance of the rectangle can be manipulat-ed.
Issue 1.1 51
ibaAnalyzer-Reportgenerator An exhaustive example
Fig. 56: The "Design" ribbon.
Select a green fill color to generate two bars surrounding the headline. The next step will be to create a footer which you separate by a simple line object.
Note
Other types of geometric objects can be manipulated in the same fashion.
Page numberingA dynamic page number shall be used for the footer. This is again a text field and you use the mouse to position the field and drag it to the required size. Enter the static part "Page" first and select the page function in the "Data and Functions" window by double clicking on "Page$" un-der "Misc. Functions".
Fig. 57: Accessing the page counter.
You can also use the total number of pages to create a footer of the form "Page 2 of 4".
52 Issue 1.1
An exhaustive example ibaAnalyzer-Reportgenerator
Fig. 58: Accessing the total page number.
5.2 Adding data to the reportThe next step is to add the content of the report. Here the data provided by ibaAnalyzer will be used extensively.
Note
Make sure to have the "First Page" layer activated for the elements added in this section. In chapter ì Layers and dynamic tables, page 64 the layer functional-ity will be explained in more detail. This is especially important if the report shall have more than one page.
StatictablesA simple possibility to display various information in a structured manner are static tables. To add a table click on the "Table" icon in the "Insert" ribbon of the Report Designer and use the cursor to mark the table area in the report view window.
Fig. 59: Table icon
The "Table Contents" window is opened automatically and by clicking „append line definition" you open the dialog for adding a new line to the table.
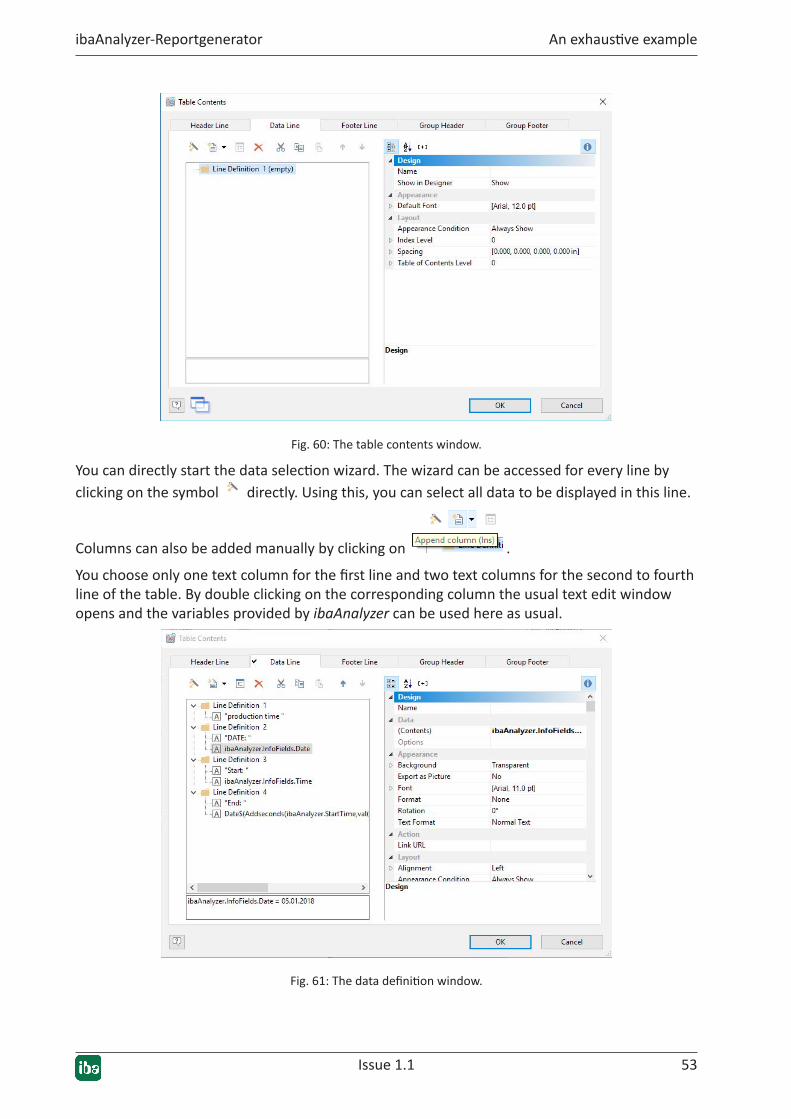
Issue 1.1 53
ibaAnalyzer-Reportgenerator An exhaustive example
Fig. 60: The table contents window.
You can directly start the data selection wizard. The wizard can be accessed for every line by clicking on the symbol directly. Using this, you can select all data to be displayed in this line.
Columns can also be added manually by clicking on .
You choose only one text column for the first line and two text columns for the second to fourth line of the table. By double clicking on the corresponding column the usual text edit window opens and the variables provided by ibaAnalyzer can be used here as usual.
Fig. 61: The data definition window.
54 Issue 1.1
An exhaustive example ibaAnalyzer-Reportgenerator
Note
Using the same steps also a separate header and footer line as well as a group header and footer can be specified. This is explained in more detail for dynamic tables in chapter ì Layers and dynamic tables, page 64.
Tip
Text or variable name alterations can be made directly in the expression window.
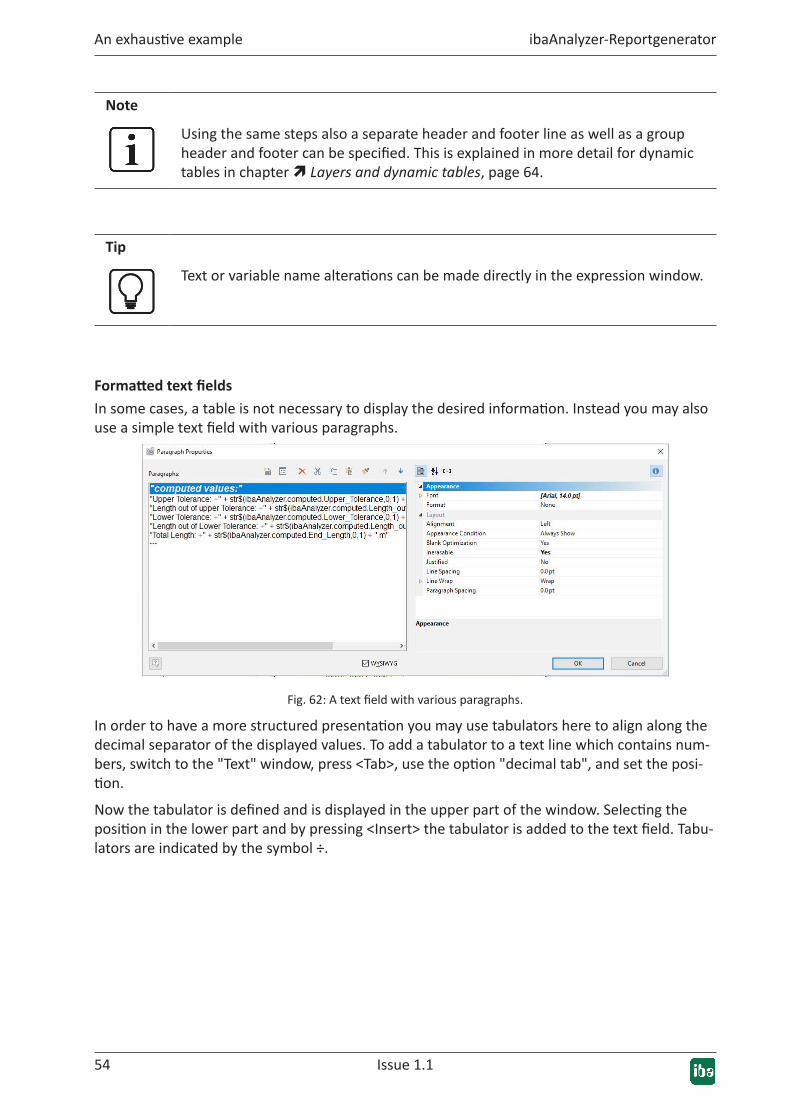
FormattedtextfieldsIn some cases, a table is not necessary to display the desired information. Instead you may also use a simple text field with various paragraphs.
Fig. 62: A text field with various paragraphs.
In order to have a more structured presentation you may use tabulators here to align along the decimal separator of the displayed values. To add a tabulator to a text line which contains num-bers, switch to the "Text" window, press <Tab>, use the option "decimal tab", and set the posi-tion.
Now the tabulator is defined and is displayed in the upper part of the window. Selecting the position in the lower part and by pressing <Insert> the tabulator is added to the text field. Tabu-lators are indicated by the symbol ÷.
Issue 1.1 55
ibaAnalyzer-Reportgenerator An exhaustive example
Fig. 63: Adding a tabulator.
In order to guarantee an alignment along the same imaginary vertical line, you need to set the same tabulator in every paragraph which shall be aligned.
Note
Only one tabulator can be used per paragraph.
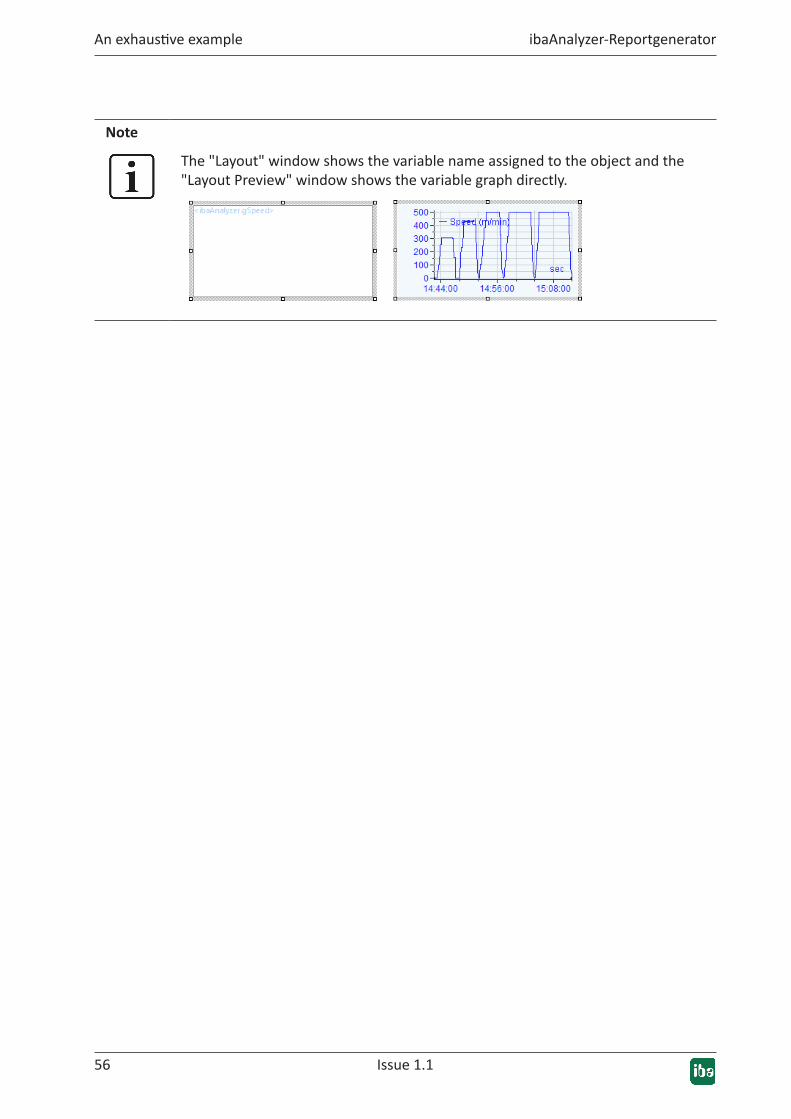
GraphvariablesThe variables/fields list shows all the graph variables available in the current report file. These are indicated by the symbol . Drag the chosen variable from the variables/fields list to the required location in the report view.
Fig. 64: Adding a graph by drag and drop.
56 Issue 1.1
An exhaustive example ibaAnalyzer-Reportgenerator
Note
The "Layout" window shows the variable name assigned to the object and the "Layout Preview" window shows the variable graph directly.
Issue 1.1 57
ibaAnalyzer-Reportgenerator An exhaustive example
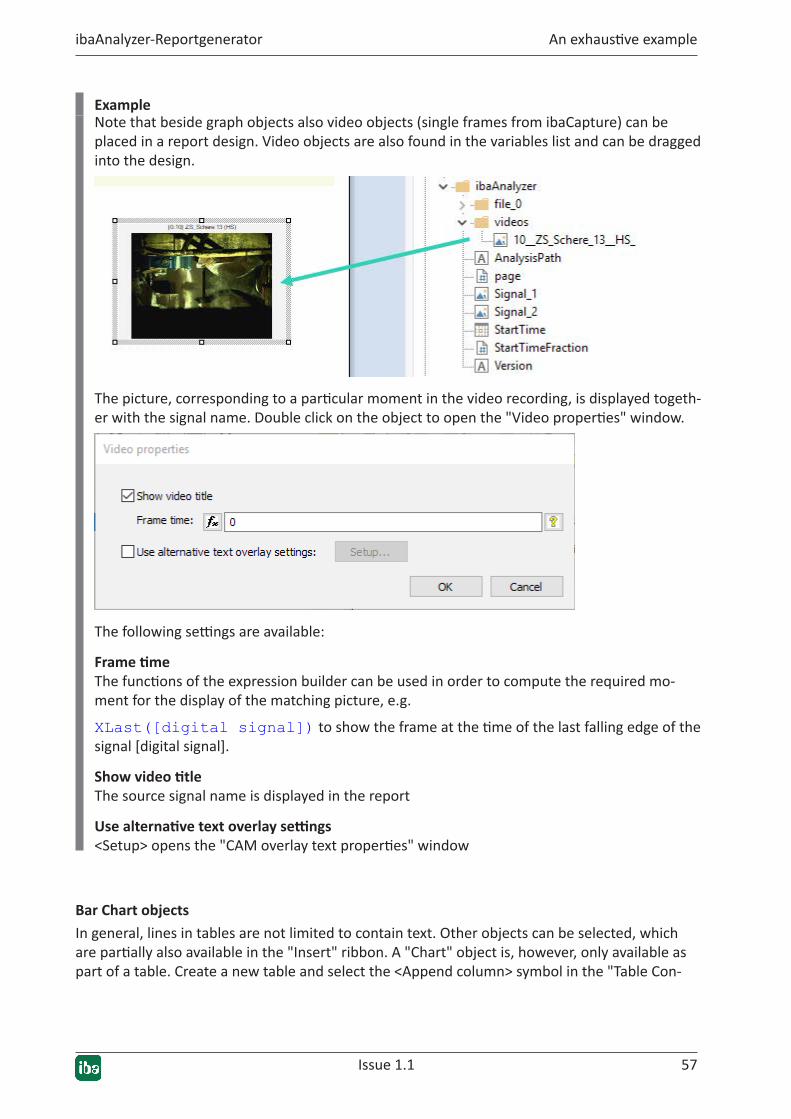
ExampleNote that beside graph objects also video objects (single frames from ibaCapture) can be placed in a report design. Video objects are also found in the variables list and can be dragged into the design.
The picture, corresponding to a particular moment in the video recording, is displayed togeth-er with the signal name. Double click on the object to open the "Video properties" window.
The following settings are available:
FrametimeThe functions of the expression builder can be used in order to compute the required mo-ment for the display of the matching picture, e.g.
XLast([digital signal]) to show the frame at the time of the last falling edge of the signal [digital signal].
ShowvideotitleThe source signal name is displayed in the report
Usealternativetextoverlaysettings<Setup> opens the "CAM overlay text properties" window
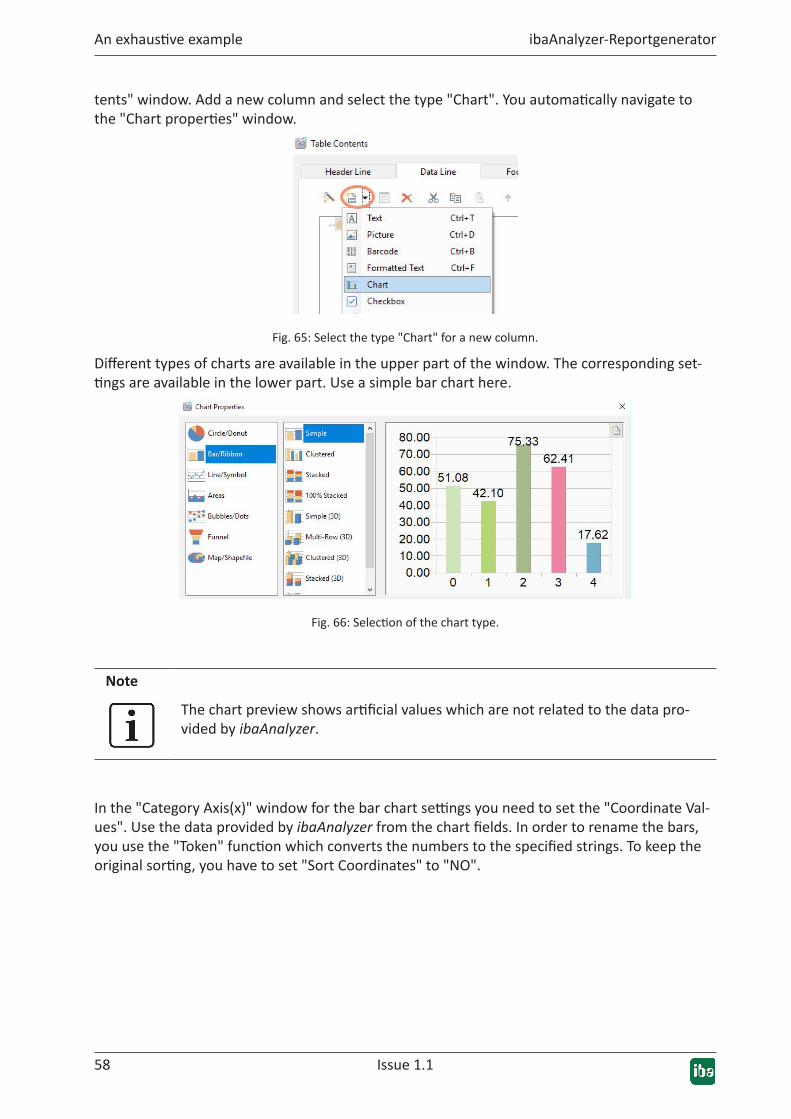
BarChartobjectsIn general, lines in tables are not limited to contain text. Other objects can be selected, which are partially also available in the "Insert" ribbon. A "Chart" object is, however, only available as part of a table. Create a new table and select the <Append column> symbol in the "Table Con-
58 Issue 1.1
An exhaustive example ibaAnalyzer-Reportgenerator
tents" window. Add a new column and select the type "Chart". You automatically navigate to the "Chart properties" window.
Fig. 65: Select the type "Chart" for a new column.
Different types of charts are available in the upper part of the window. The corresponding set-tings are available in the lower part. Use a simple bar chart here.
Fig. 66: Selection of the chart type.
Note
The chart preview shows artificial values which are not related to the data pro-vided by ibaAnalyzer.
In the "Category Axis(x)" window for the bar chart settings you need to set the "Coordinate Val-ues". Use the data provided by ibaAnalyzer from the chart fields. In order to rename the bars, you use the "Token" function which converts the numbers to the specified strings. To keep the original sorting, you have to set "Sort Coordinates" to "NO".
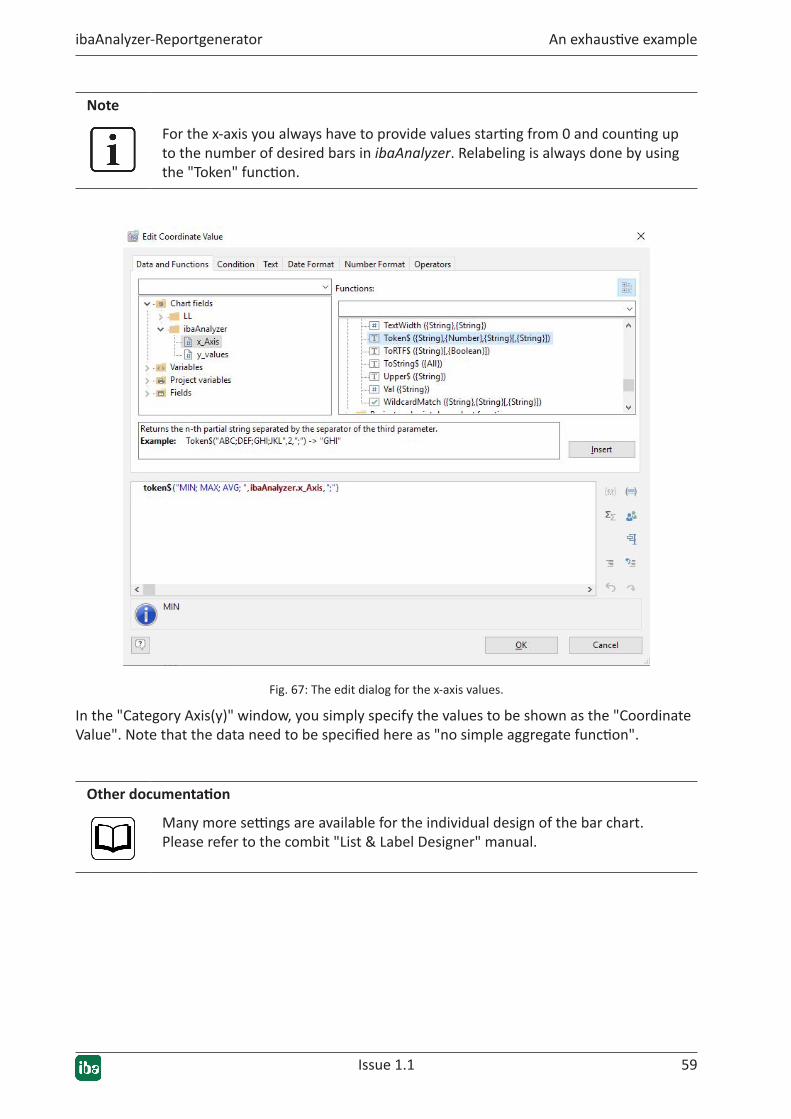
Issue 1.1 59
ibaAnalyzer-Reportgenerator An exhaustive example
Note
For the x-axis you always have to provide values starting from 0 and counting up to the number of desired bars in ibaAnalyzer. Relabeling is always done by using the "Token" function.
Fig. 67: The edit dialog for the x-axis values.
In the "Category Axis(y)" window, you simply specify the values to be shown as the "Coordinate Value". Note that the data need to be specified here as "no simple aggregate function".
Otherdocumentation
Many more settings are available for the individual design of the bar chart. Please refer to the combit "List & Label Designer" manual.
60 Issue 1.1
An exhaustive example ibaAnalyzer-Reportgenerator
Note
Make sure that the chart field on the report does not show a scroll bar. If this is the case, its size has to be increased. Otherwise the chart will not be printed reg-ularly.
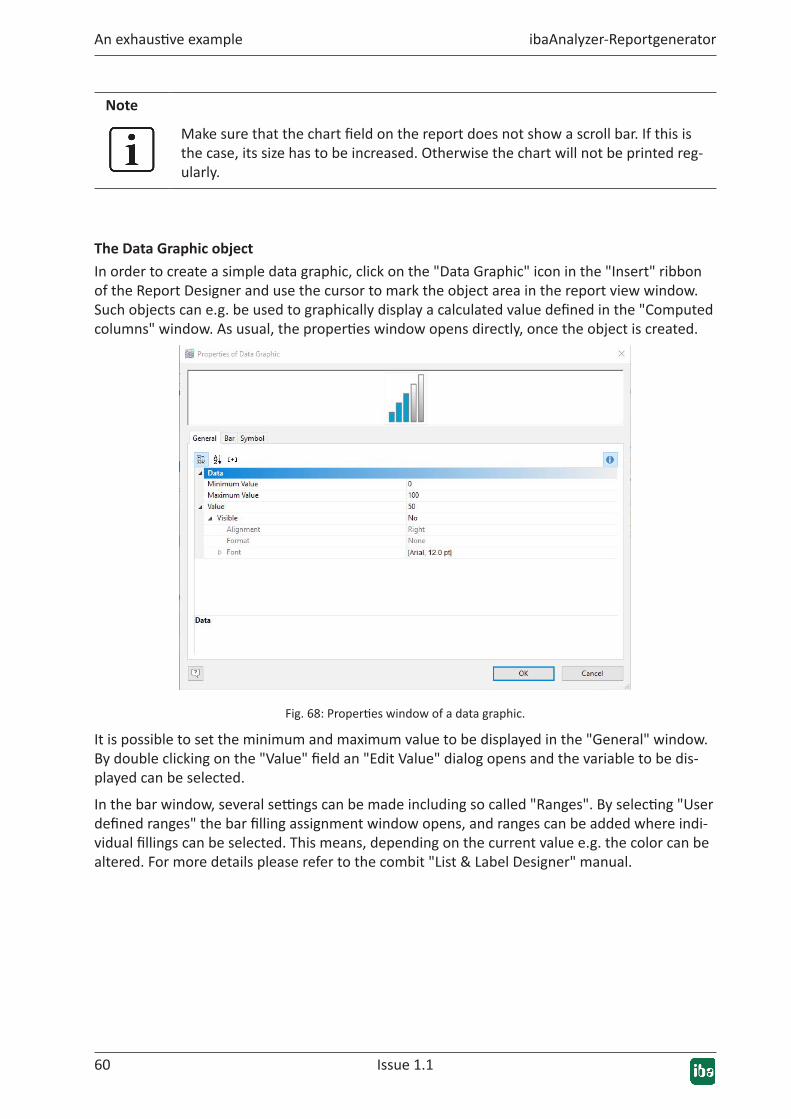
TheDataGraphicobjectIn order to create a simple data graphic, click on the "Data Graphic" icon in the "Insert" ribbon of the Report Designer and use the cursor to mark the object area in the report view window. Such objects can e.g. be used to graphically display a calculated value defined in the "Computed columns" window. As usual, the properties window opens directly, once the object is created.
Fig. 68: Properties window of a data graphic.
It is possible to set the minimum and maximum value to be displayed in the "General" window. By double clicking on the "Value" field an "Edit Value" dialog opens and the variable to be dis-played can be selected.
In the bar window, several settings can be made including so called "Ranges". By selecting "User defined ranges" the bar filling assignment window opens, and ranges can be added where indi-vidual fillings can be selected. This means, depending on the current value e.g. the color can be altered. For more details please refer to the combit "List & Label Designer" manual.
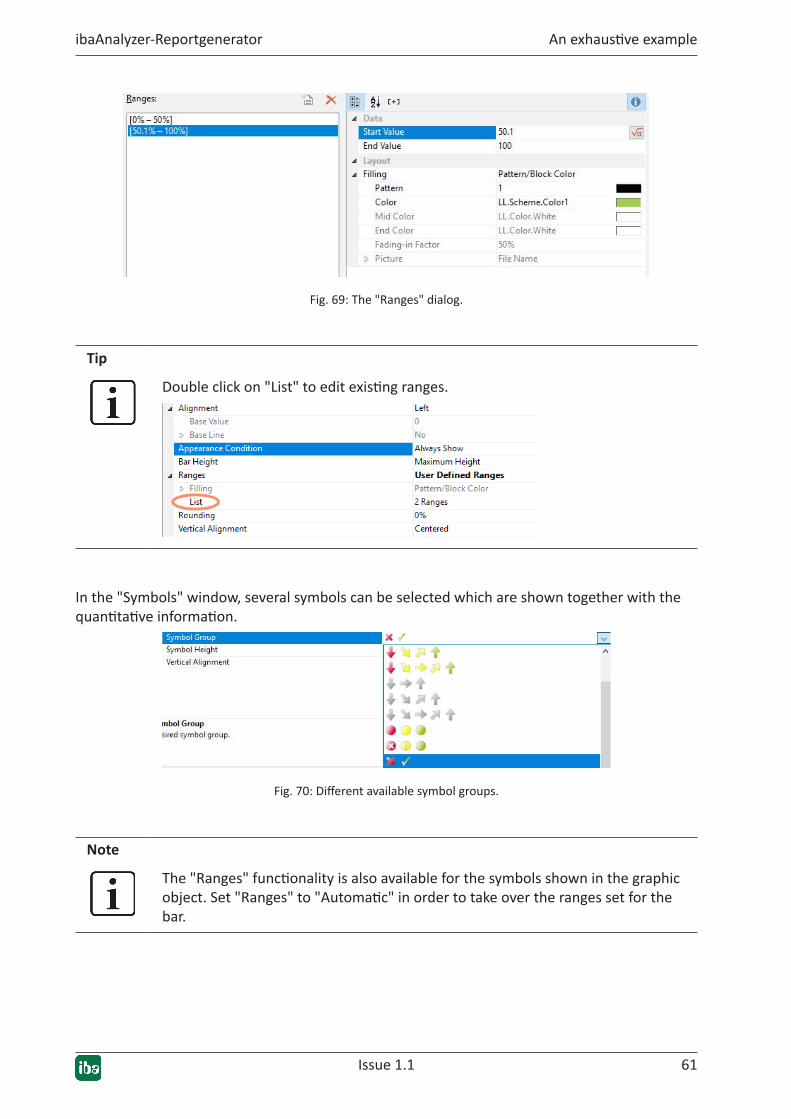
Issue 1.1 61
ibaAnalyzer-Reportgenerator An exhaustive example
Fig. 69: The "Ranges" dialog.
Tip
Double click on "List" to edit existing ranges.
In the "Symbols" window, several symbols can be selected which are shown together with the quantitative information.
Fig. 70: Different available symbol groups.
Note
The "Ranges" functionality is also available for the symbols shown in the graphic object. Set "Ranges" to "Automatic" in order to take over the ranges set for the bar.
62 Issue 1.1
An exhaustive example ibaAnalyzer-Reportgenerator
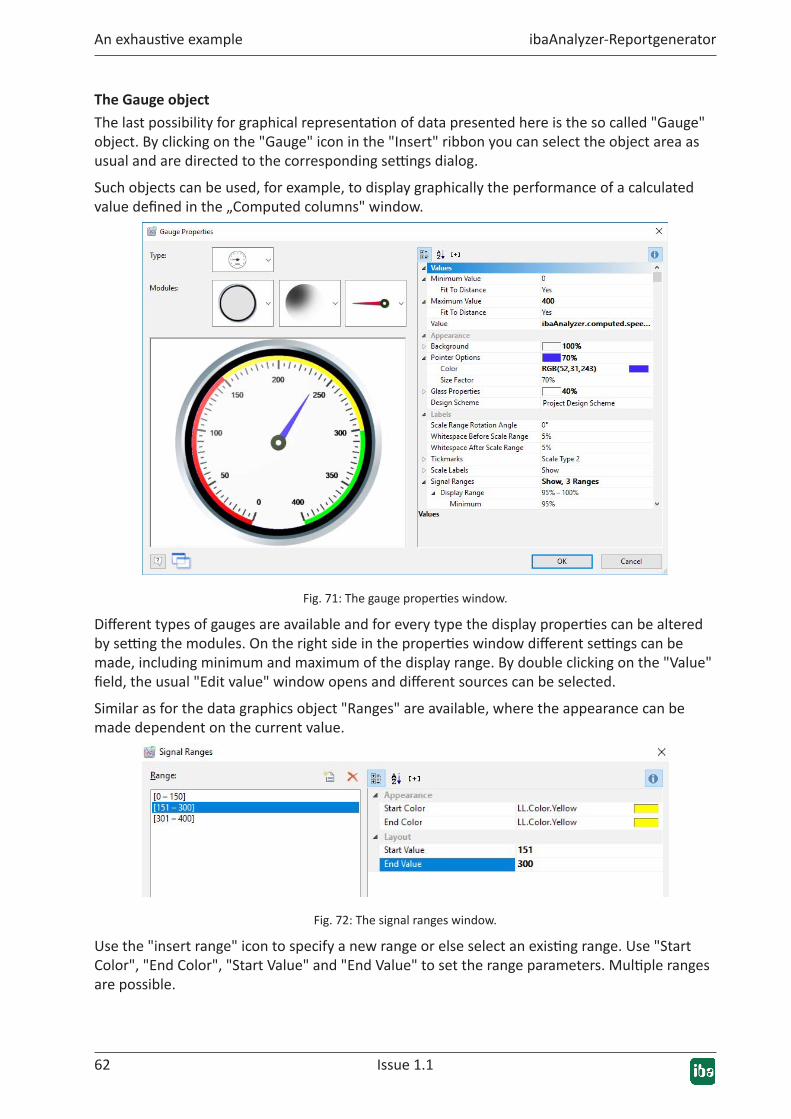
TheGaugeobjectThe last possibility for graphical representation of data presented here is the so called "Gauge" object. By clicking on the "Gauge" icon in the "Insert" ribbon you can select the object area as usual and are directed to the corresponding settings dialog.
Such objects can be used, for example, to display graphically the performance of a calculated value defined in the „Computed columns" window.
Fig. 71: The gauge properties window.
Different types of gauges are available and for every type the display properties can be altered by setting the modules. On the right side in the properties window different settings can be made, including minimum and maximum of the display range. By double clicking on the "Value" field, the usual "Edit value" window opens and different sources can be selected.
Similar as for the data graphics object "Ranges" are available, where the appearance can be made dependent on the current value.
Fig. 72: The signal ranges window.
Use the "insert range" icon to specify a new range or else select an existing range. Use "Start Color", "End Color", "Start Value" and "End Value" to set the range parameters. Multiple ranges are possible.
Issue 1.1 63
ibaAnalyzer-Reportgenerator An exhaustive example
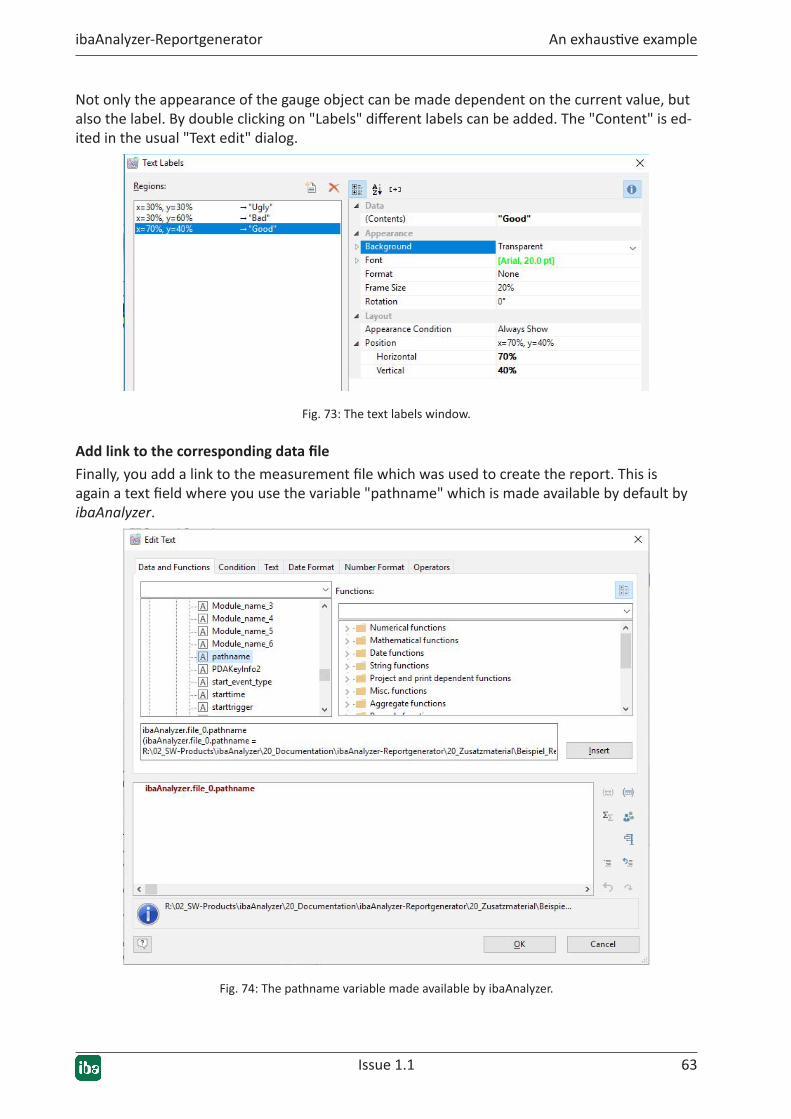
Not only the appearance of the gauge object can be made dependent on the current value, but also the label. By double clicking on "Labels" different labels can be added. The "Content" is ed-ited in the usual "Text edit" dialog.
Fig. 73: The text labels window.
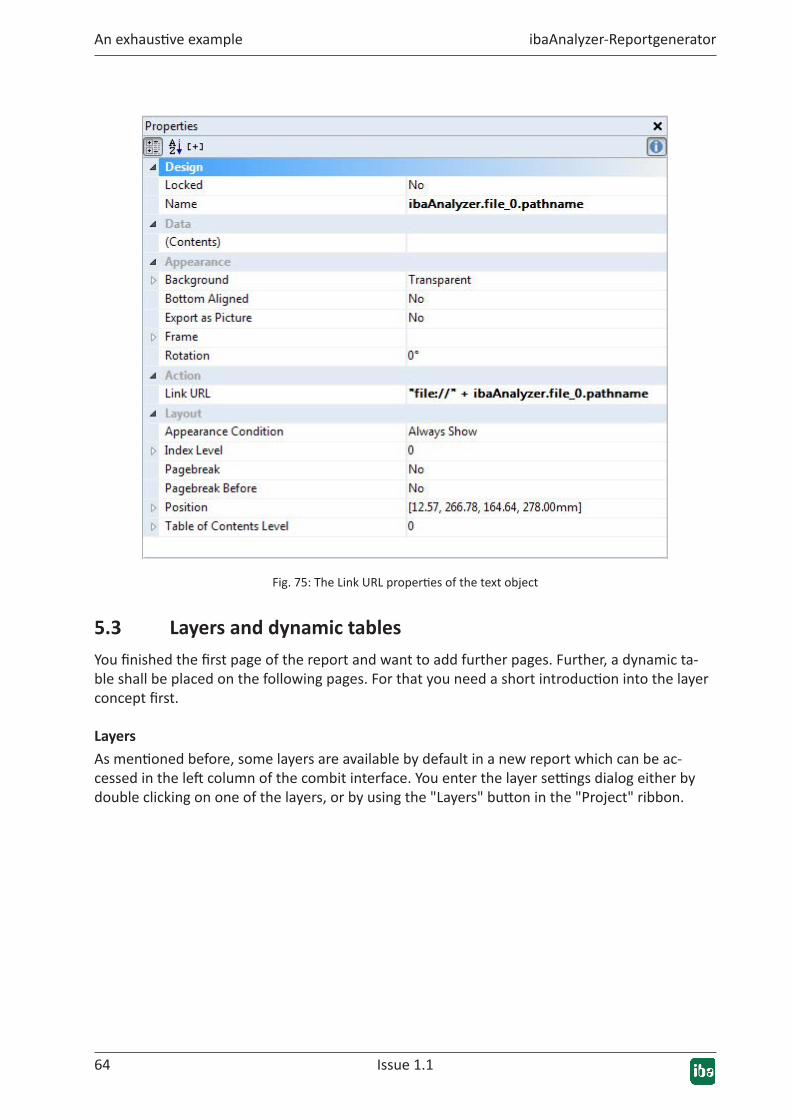
AddlinktothecorrespondingdatafileFinally, you add a link to the measurement file which was used to create the report. This is again a text field where you use the variable "pathname" which is made available by default by ibaAnalyzer.
Fig. 74: The pathname variable made available by ibaAnalyzer.
64 Issue 1.1
An exhaustive example ibaAnalyzer-Reportgenerator
Fig. 75: The Link URL properties of the text object
5.3 Layers and dynamic tablesYou finished the first page of the report and want to add further pages. Further, a dynamic ta-ble shall be placed on the following pages. For that you need a short introduction into the layer concept first.
LayersAs mentioned before, some layers are available by default in a new report which can be ac-cessed in the left column of the combit interface. You enter the layer settings dialog either by double clicking on one of the layers, or by using the "Layers" button in the "Project" ribbon.
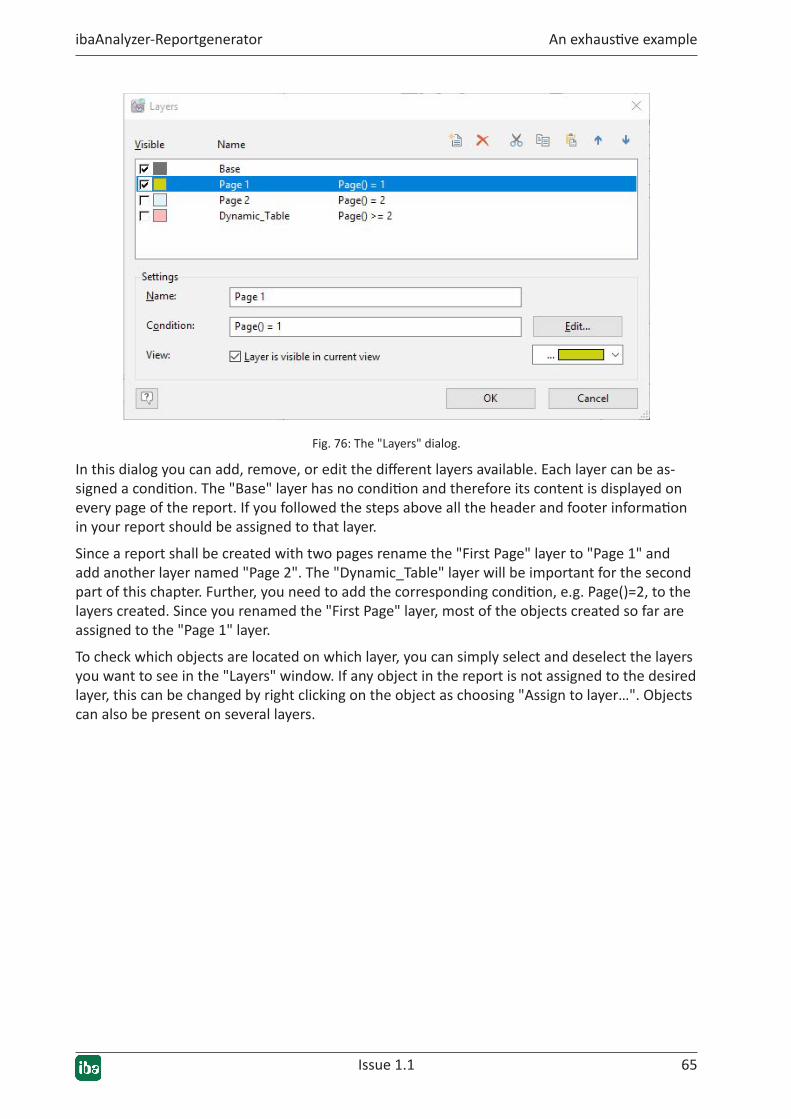
Issue 1.1 65
ibaAnalyzer-Reportgenerator An exhaustive example
Fig. 76: The "Layers" dialog.
In this dialog you can add, remove, or edit the different layers available. Each layer can be as-signed a condition. The "Base" layer has no condition and therefore its content is displayed on every page of the report. If you followed the steps above all the header and footer information in your report should be assigned to that layer.
Since a report shall be created with two pages rename the "First Page" layer to "Page 1" and add another layer named "Page 2". The "Dynamic_Table" layer will be important for the second part of this chapter. Further, you need to add the corresponding condition, e.g. Page()=2, to the layers created. Since you renamed the "First Page" layer, most of the objects created so far are assigned to the "Page 1" layer.
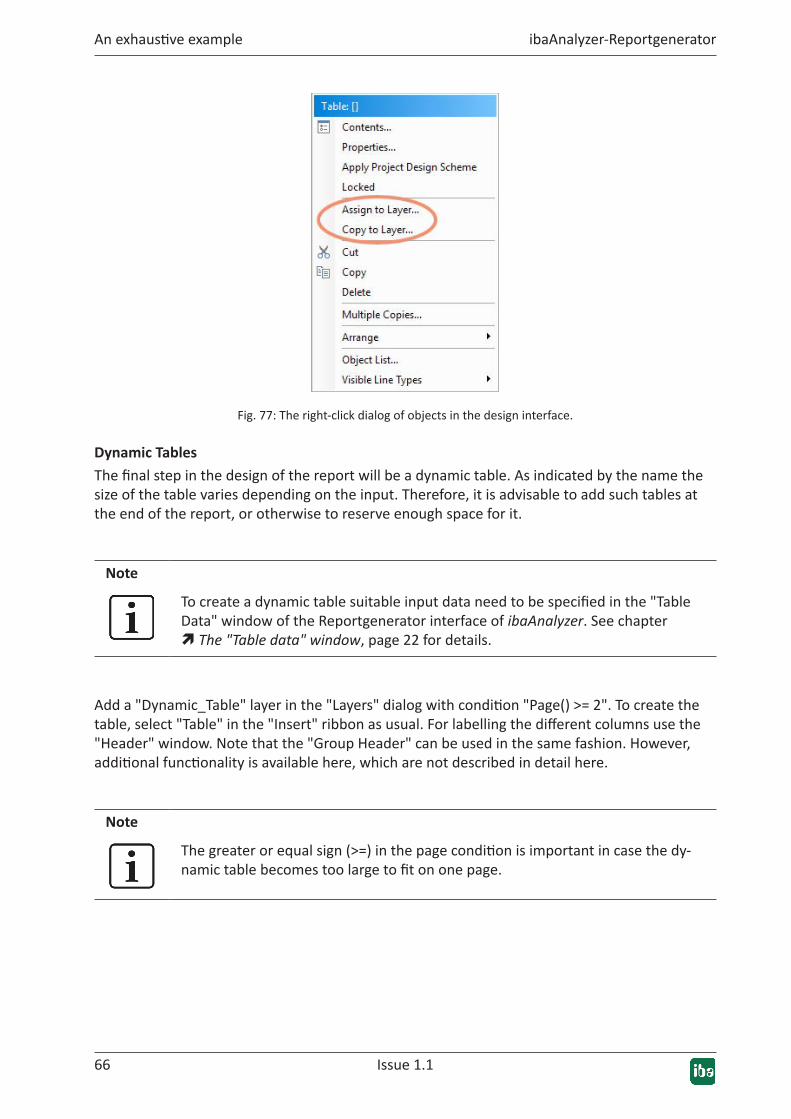
To check which objects are located on which layer, you can simply select and deselect the layers you want to see in the "Layers" window. If any object in the report is not assigned to the desired layer, this can be changed by right clicking on the object as choosing "Assign to layer…". Objects can also be present on several layers.
66 Issue 1.1
An exhaustive example ibaAnalyzer-Reportgenerator
Fig. 77: The right-click dialog of objects in the design interface.
Dynamic TablesThe final step in the design of the report will be a dynamic table. As indicated by the name the size of the table varies depending on the input. Therefore, it is advisable to add such tables at the end of the report, or otherwise to reserve enough space for it.
Note
To create a dynamic table suitable input data need to be specified in the " Table Data" window of the Reportgenerator interface of ibaAnalyzer. See chapter ì The "Table data" window, page 22 for details.
Add a "Dynamic_Table" layer in the "Layers" dialog with condition "Page() >= 2". To create the table, select "Table" in the "Insert" ribbon as usual. For labelling the different columns use the "Header" window. Note that the "Group Header" can be used in the same fashion. However, additional functionality is available here, which are not described in detail here.
Note
The greater or equal sign (>=) in the page condition is important in case the dy-namic table becomes too large to fit on one page.
Issue 1.1 67
ibaAnalyzer-Reportgenerator An exhaustive example
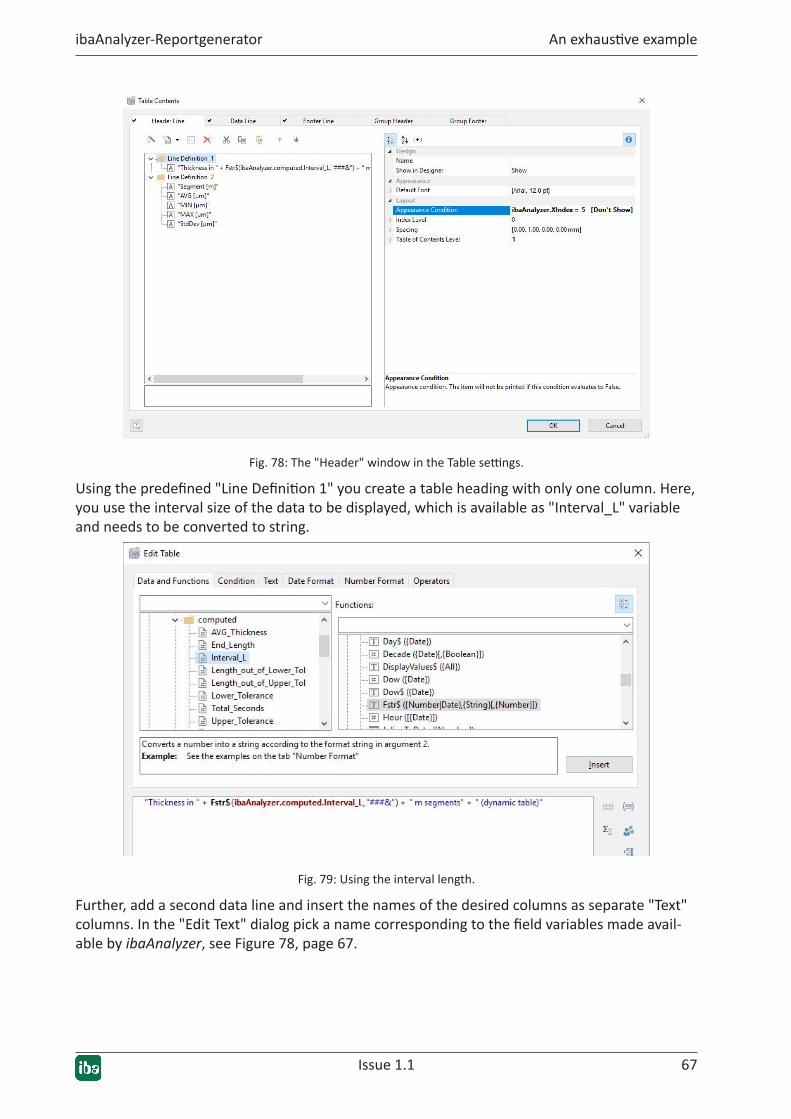
Fig. 78: The "Header" window in the Table settings.
Using the predefined "Line Definition 1" you create a table heading with only one column. Here, you use the interval size of the data to be displayed, which is available as "Interval_L" variable and needs to be converted to string.
Fig. 79: Using the interval length.
Further, add a second data line and insert the names of the desired columns as separate "Text" columns. In the "Edit Text" dialog pick a name corresponding to the field variables made avail-able by ibaAnalyzer, see Figure 78, page 67.
68 Issue 1.1
An exhaustive example ibaAnalyzer-Reportgenerator
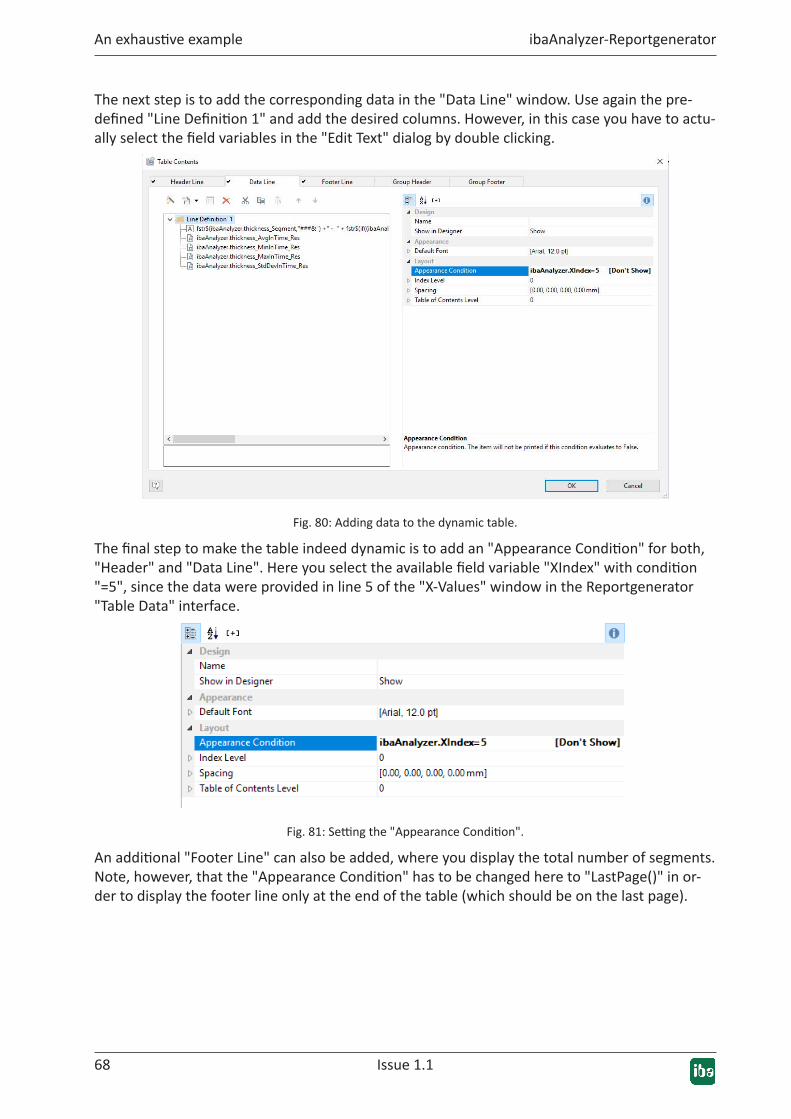
The next step is to add the corresponding data in the "Data Line" window. Use again the pre-defined "Line Definition 1" and add the desired columns. However, in this case you have to actu-ally select the field variables in the "Edit Text" dialog by double clicking.
Fig. 80: Adding data to the dynamic table.
The final step to make the table indeed dynamic is to add an "Appearance Condition" for both, "Header" and "Data Line". Here you select the available field variable "XIndex" with condition "=5", since the data were provided in line 5 of the "X-Values" window in the Reportgenerator "Table Data" interface.
Fig. 81: Setting the "Appearance Condition".
An additional "Footer Line" can also be added, where you display the total number of segments. Note, however, that the "Appearance Condition" has to be changed here to "LastPage()" in or-der to display the footer line only at the end of the table (which should be on the last page).
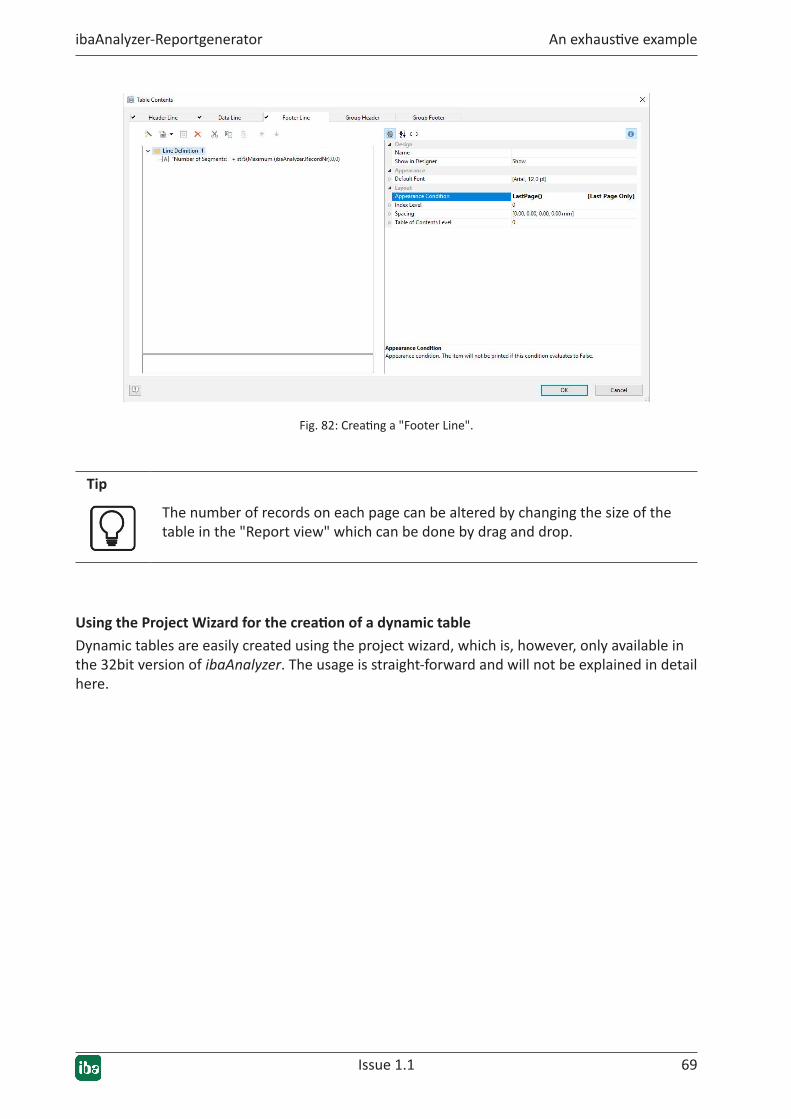
Issue 1.1 69
ibaAnalyzer-Reportgenerator An exhaustive example
Fig. 82: Creating a "Footer Line".
Tip
The number of records on each page can be altered by changing the size of the table in the "Report view" which can be done by drag and drop.
UsingtheProjectWizardforthecreationofadynamictableDynamic tables are easily created using the project wizard, which is, however, only available in the 32bit version of ibaAnalyzer. The usage is straight-forward and will not be explained in detail here.
70 Issue 1.1
Support and contact ibaAnalyzer-Reportgenerator
6 Support and contactSupport
Phone: +49 911 97282-14
Fax: +49 911 97282-33
Email: [email protected]
Note
If you require support, indicate the serial number (iba-S/N) of the product.
Contact
Headoffice
iba AG Koenigswarterstraße 44 90762 Fuerth Germany
Phone: +49 911 97282-0
Fax: +49 911 97282-33
Email: [email protected]
Contact: Harald Opel
RegionalandWorldwide
For contact data of your regional iba office or representative please refer to our web site
www.iba-ag.com.