hydrologic data for the big spring basin, clayton county, iowa
TRANSCRIPT
HYDROLOGIC DATA FOR THE BIG SPRING BASIN, CLAYTON COUNTY, IOWA, WATER YEAR 1989
By Stephen J. Kalkhoff and Ronald L. Kuzniar
U.S. GEOLOGICAL SURVEY
Open-File Report 91-63
Prepared in cooperation with
IOWA DEPARTMENT OF NATURAL RESOURCES
(GEOLOGICAL SURVEY BUREAU)
Iowa City, Iowa 1991
U. S. DEPARTMENT OF THE INTERIORMANUEL LUJAN, JR., Secretary
U.S. GEOLOGICAL SURVEYDallas L. Peck, Director
For additional information write to:
U.S. Geological Survey Water Resources Division Rm. 269, Federal Building 400 South Clinton Street Iowa City, LA 52244
Copies of this report can be purchased from:
Books and Open-File Reports U.S. Geological Survey Federal Center Box 25425 Denver, CO 80225
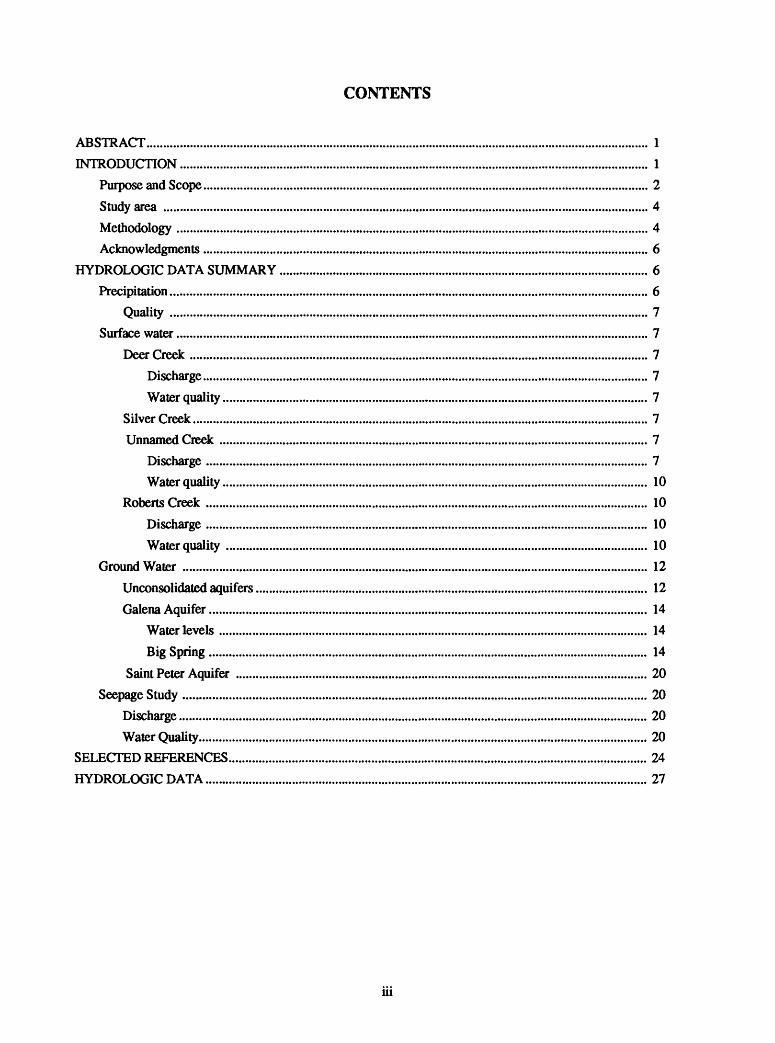
CONTENTS
ABSTRACT.................................................................................................................^ 1
INTRODUCTION............................................................................................................................................. 1
Purpose and Scope...................................................................................................................................... 2
Study area .................................................................................................................................................^ 4
Methodology.............................................................................................................................................. 4
Acknowledgments....................................................^^^ 6
HYDROLOGICDATA SUMMARY.............................................................................................................. 6
Precipitation......................................................^^^ 6
Quality ................................................^ 7
Surface water.............................................................................................................................................. 7
Deer Creek .......................................................................................................................................... 7
Discharge...................................................................................................................................... 7
Water quality................................................................................................................................ 7
Silver Ciwk...........................................................................................................................^ 7
Unnamed Creek ................................................................................................................................. 7
Discharge ..................................................................................................................................... 7
Water quality................................................................................................................................ 10
Roberts Creek ..................................................................................................................................... 10
Discharge ..................................................................................................................................... 10
Water quality ............................................................................................................................... 10
Ground Water ......................................................................................................................................... 12
Unconsolidated aquifers...................................................................................................................... 12
Galena Aquifer................................................................................................................................ 14
Water levels ................................................................................................................................. 14
Big Spring.................................................................................................................................... 14
Saint Peter Aquifer ............................................................................................................................ 20
Seepage Study......................................................................................................................................... 20
Discharge............................................................................................................................................. 20
Water QuaUty......................................^ 20
SELECTED REFERENOTS.................................................................................................................... 24
HYDROLOGICDATA.................................................................................................................................^ 27
ui
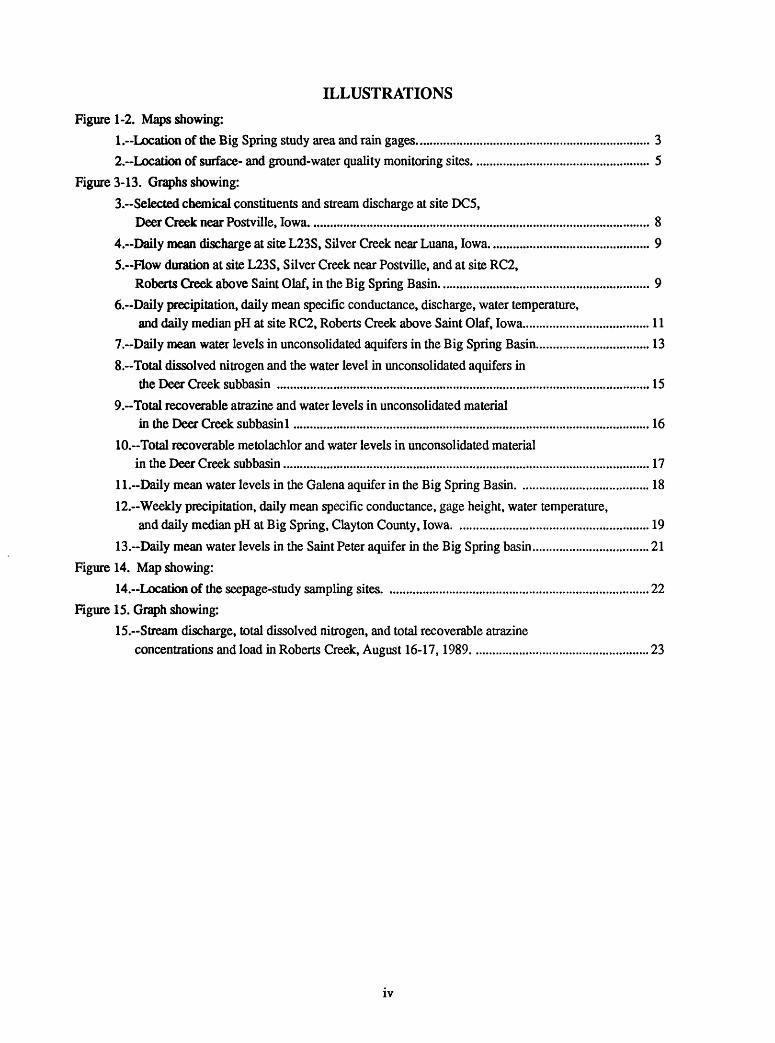
ILLUSTRATIONS
Figure 1-2. Maps showing:1. Location of the Big Spring study area and rain gages...................................................................... 32. Location of surface- and ground-water quality monitoring sites..................................................... 5
Figure 3-13. Graphs showing:3.~Selected chemical constituents and stream discharge at site DCS,
Deer Creek near Postville, Iowa...................................................................................................... 84.--Daily mean discharge at site L23S, Silver Creek near Luana, Iowa................................................ 95.~Flow duration at site L23S, Silver Creek near Postville, and at site RC2,
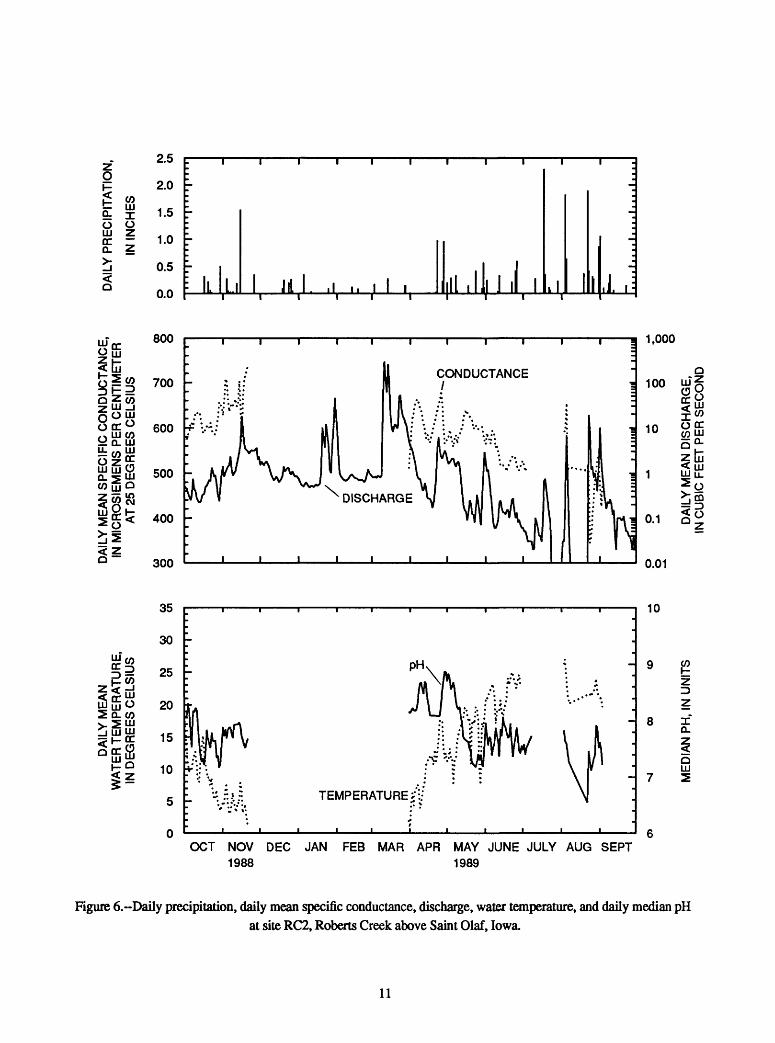
Roberts Creek above Saint Olaf, in the Big Spring Basin............................................................... 96.~Daily precipitation, daily mean specific conductance, discharge, water temperature,
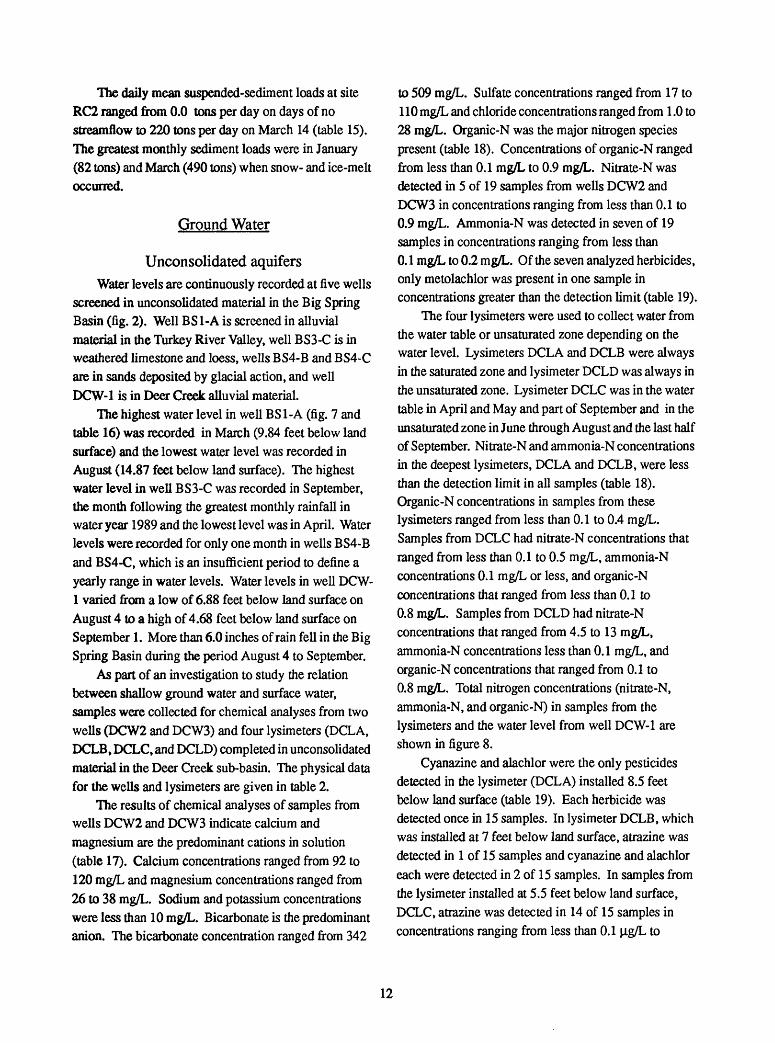
and daily median pH at site RC2, Roberts Creek above Saint Olaf, Iowa...................................... 117. Daily mean water levels in unconsolidated aquifers in the Big Spring Basin.................................. 13
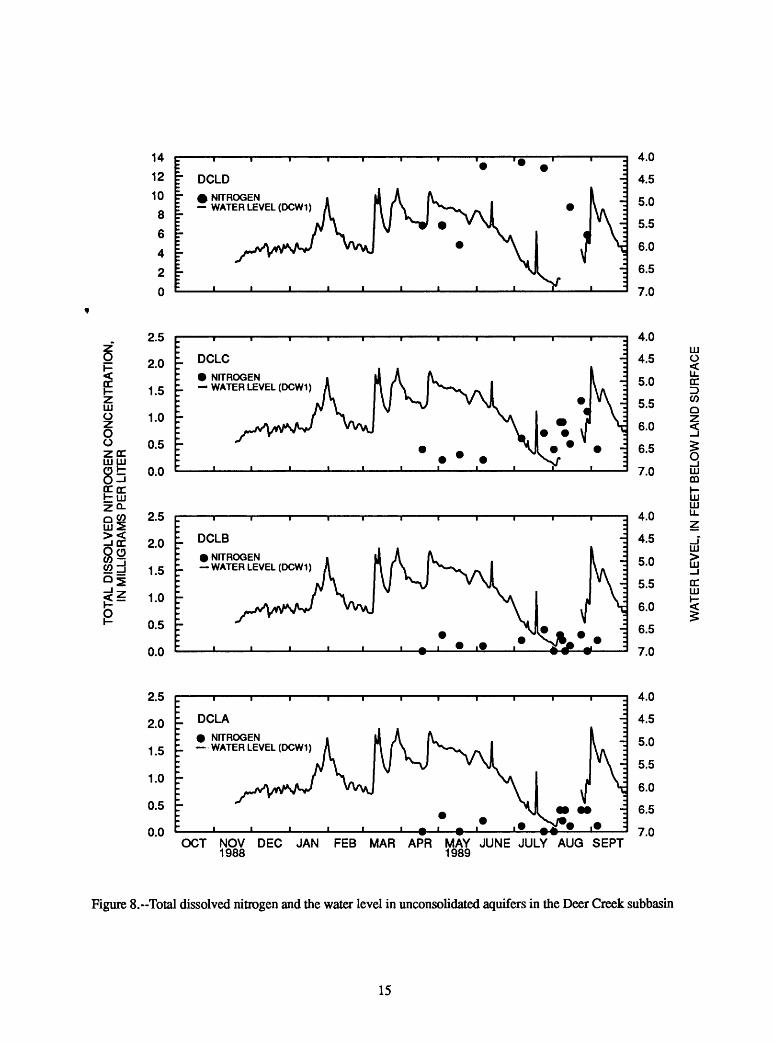
8.~Total dissolved nitrogen and the water level in unconsolidated aquifers inthe Deer Creek subbasin ................................................................................................................ 15
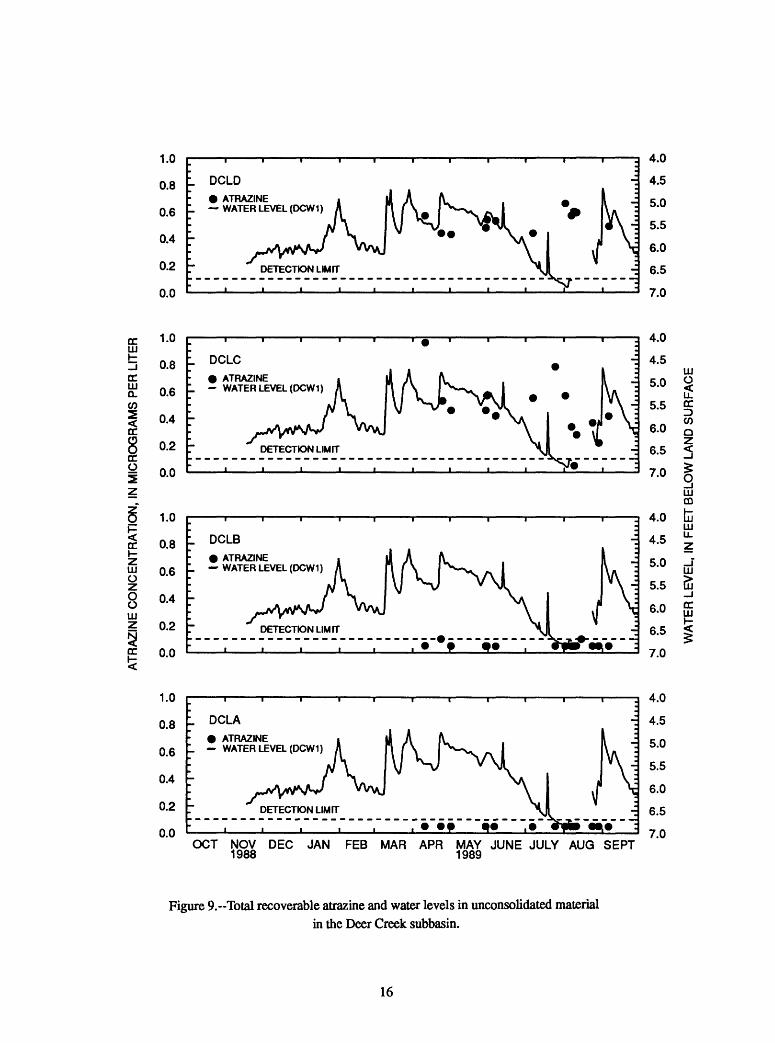
9.-Total recoverable atrazine and water levels in unconsolidated materialin the Deer Creek subbasinl........................................................................................................... 16
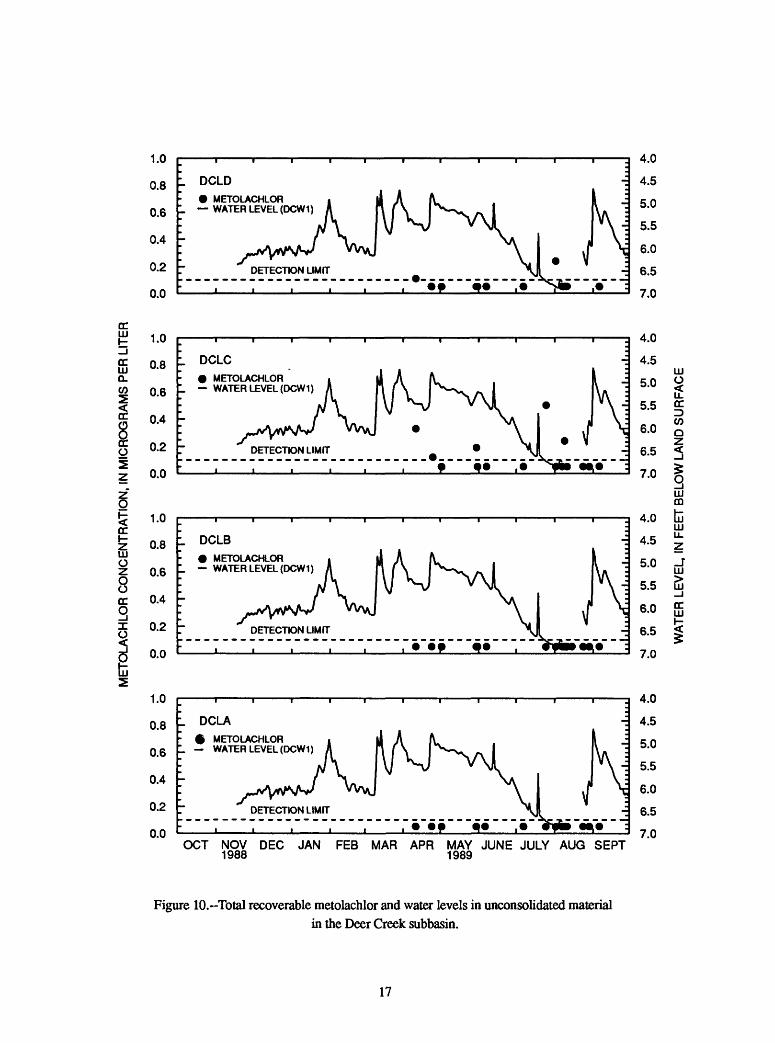
10.--Total recoverable metolachlor and water levels in unconsolidated materialin the Deer Creek subbasin.............................................................................................................. 17
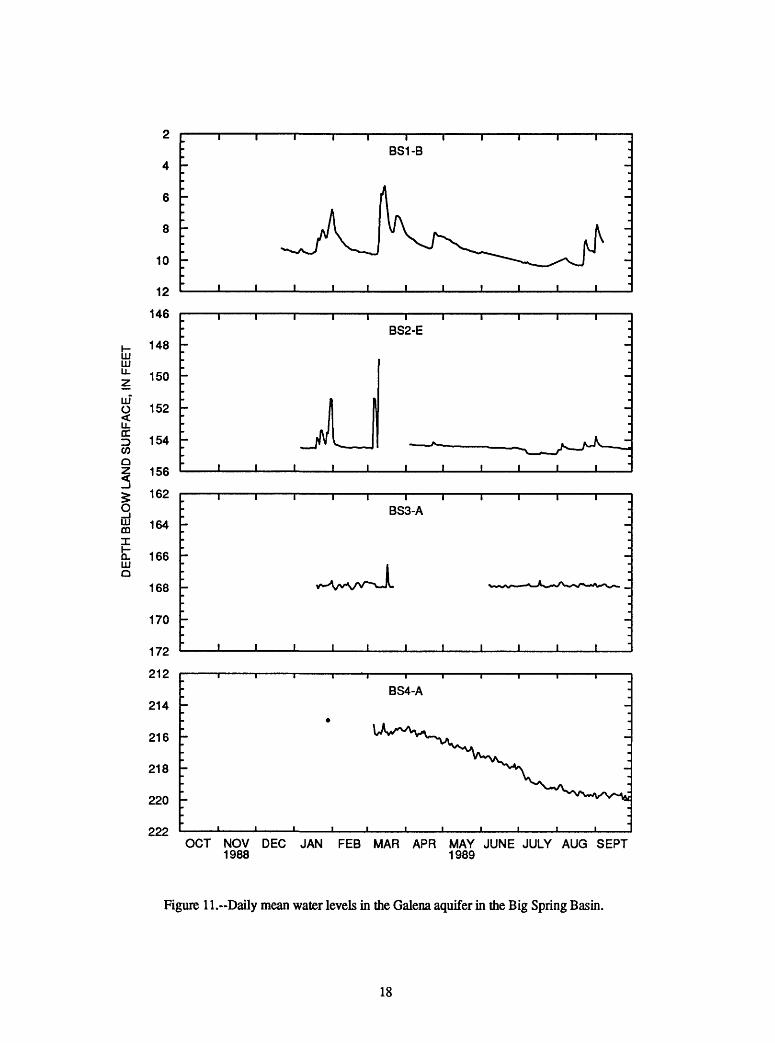
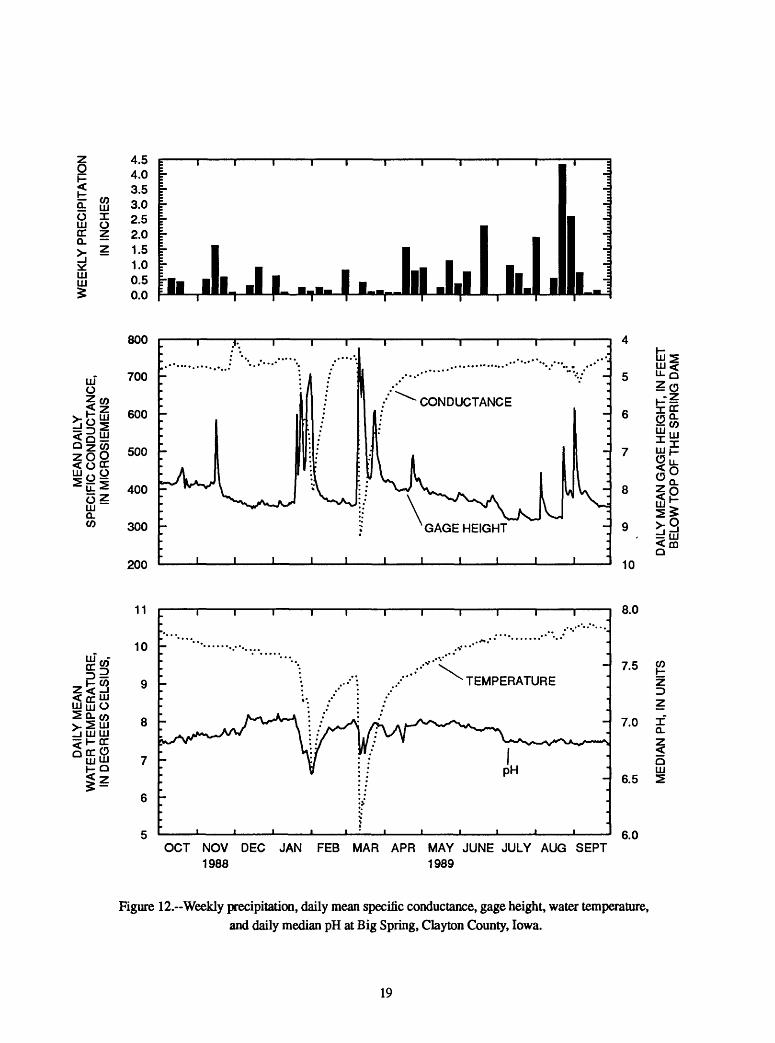
11. Daily mean water levels in the Galena aquifer in the Big Spring Basin. ...................................... 1812.--Weekly precipitation, daily mean specific conductance, gage height, water temperature,
and daily median pH at Big Spring, Clayton County, Iowa. ......................................................... 19
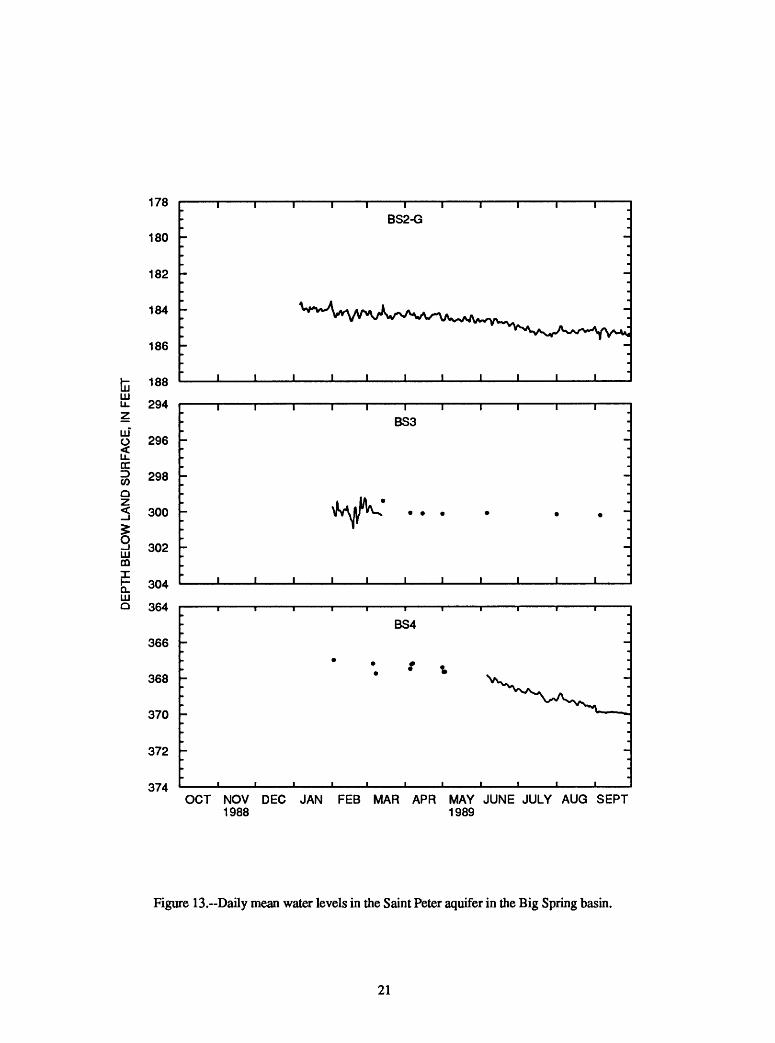
13. Daily mean water levels in the Saint Peter aquifer in the Big Spring basin................................... 21Figure 14. Map showing:
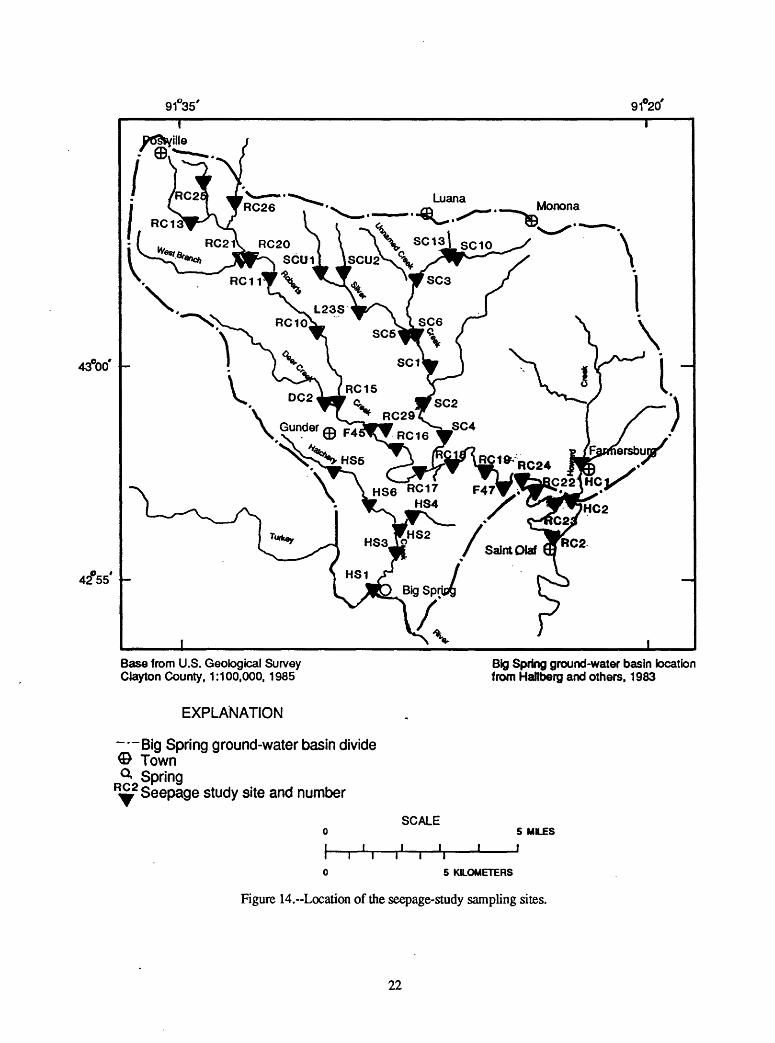
14. Location of the seepage-study sampling sites. .............................................................................. 22Figure 15. Graph showing:
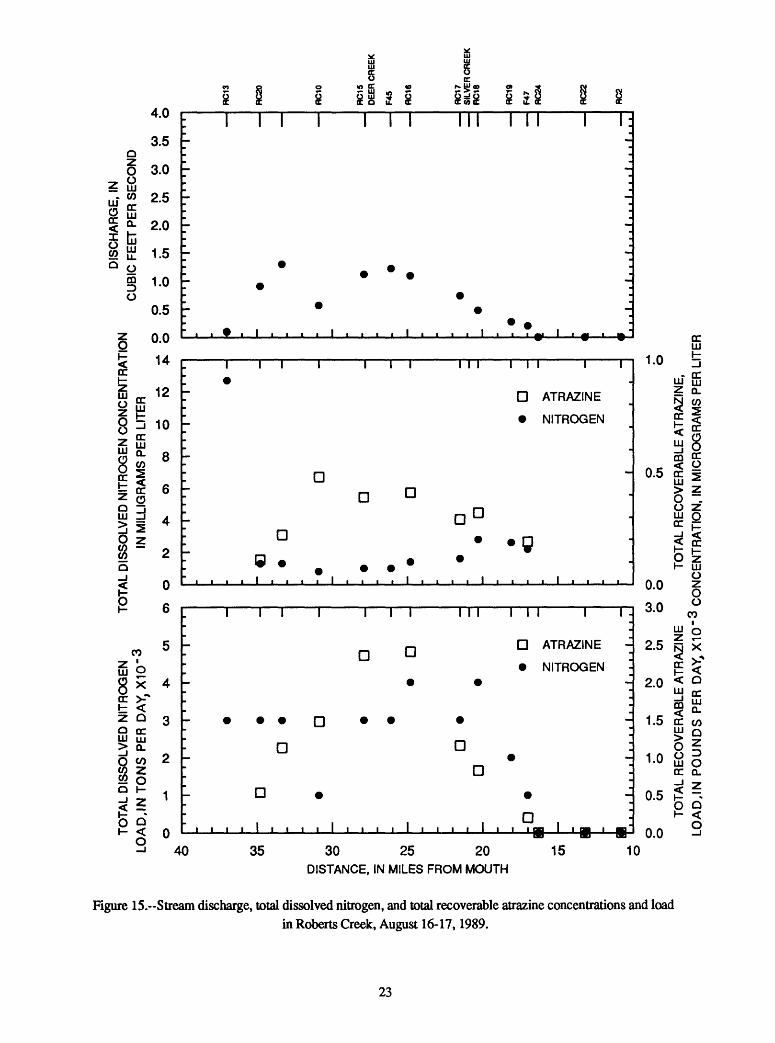
15.~Stream discharge, total dissolved nitrogen, and total recoverable atrazineconcentrations and load in Roberts Creek, August 16-17,1989..................................................... 23
IV
TABLES
Table 1. Records of monitoring sites in the Big Spring Basin, Clayton County, Iowa..................................... 292. Records of selected monitoring wells, lysimeters, and tile lines in the Big Spring Basin.................. 303. Location and drainage area of seepage-study sampling sites.............................................................. 314. Sample preparation and chemical analysis procedures....................................................................... 335. Statistical summary of precipitation quantity and quality at Big Spring, water year 1989................. 346. Accumulated daily rainfall, water year 1989...................................................................................... 357. Daily mean discharge at site DCS, Deer Creek near Postville, Iowa water year 1989....................... 368. Concentrations of major ions at selected surface-water sites in the Big Spring Basin....................... 379. Selected nitrogen, phosphorus and carbon species at surface-water sampling sites in
the Big Spring Basin........................................................................................................................ 3810. Selected herbicides at surface-water sites in the Big Spring Basin................................................... 39
11. Daily mean discharge at site L23S, Silver Creek near Luana, Iowa, water year 1989..................... 41
12. Daily mean discharge at site BOOGD, Unnamed Creek near Luana, Iowa, water year 1989.......... 4213. Daily mean discharge and specific conductance at site RC2,
Roberts Creek above Saint Olaf, Iowa, water year 1989................................................................ 4314. Daily mean water temperature and median pH at site RC2,
Roberts Creek above Saint Olaf, Iowa, water year 1989................................................................. 4415. Daily mean sediment load at site RC2, Roberts Creek above Saint Olaf, Iowa,
water year 1989...............................................................................................................................4516. Daily mean water levels in unconsolidated aquifers, Clayton County,
Iowa, water year 1989..................................................................................................................... 4617. Concentrations of major ions at selected ground-water sites in the Big Spring Basin..................... 4918. Selected nitrogen, phosphorus and carbon species at ground-water sites
in the Big Spring Basin................................................................................................................... 5119. Selected pesticides in ground water in the Big Spring Basin............................................................ 5520. Daily mean water levels in the Galena Aquifer, Clayton County, Iowa, water year 1989............... 5921. Daily mean specific conductance and water temperature at Big Spring, water year 1989............... 61
22. Daily median pH and daily mean suspended sediment concentrationat Big Spring, water year 1989......................................................................................................... 62
23. Daily mean water level in the Saint Peter aquifer, Clayton County, Iowa, water year 1989............ 63
24. Field measurements and chemical analysis of samples from streams in the Big Spring Basinduring low-flow conditions............................................................................................................. 65
25. Selected pesticides in samples from streams in the Big Spring Basinduring low-flow conditions.............................................................................................................. 66
CONVERSION FACTORS
For readers who prefer to use metric (International System) units, conversion factors for inch-pound units used in this report are listed below:
Multiply By To obtain
Lengthinch (in.) 25.4 millimeter foot (ft) 0.3048 meter mile (mi) 1.609 kilometer
Areaacre 4,047.0 square meter acre 0.4047 hectare square foot (ft2) 929.0 square centimeter
pound (Ib) .454 kilogramton, short .907 megagramtons per day (t/d) .907 megagrams per day
Water Year: A water year is a 12-month period, from October 1 through September 30, designated by the calendar year in which it ends. Years are water years in this report unless otherwise stated
VI
HYDROLOGIC DATA FOR THE BIG SPRING BASIN, CLAYTON COUNTY, IOWA, WATER YEAR 1989
By Stephen J. Kalkhoff and Ronald R. Kuzniar
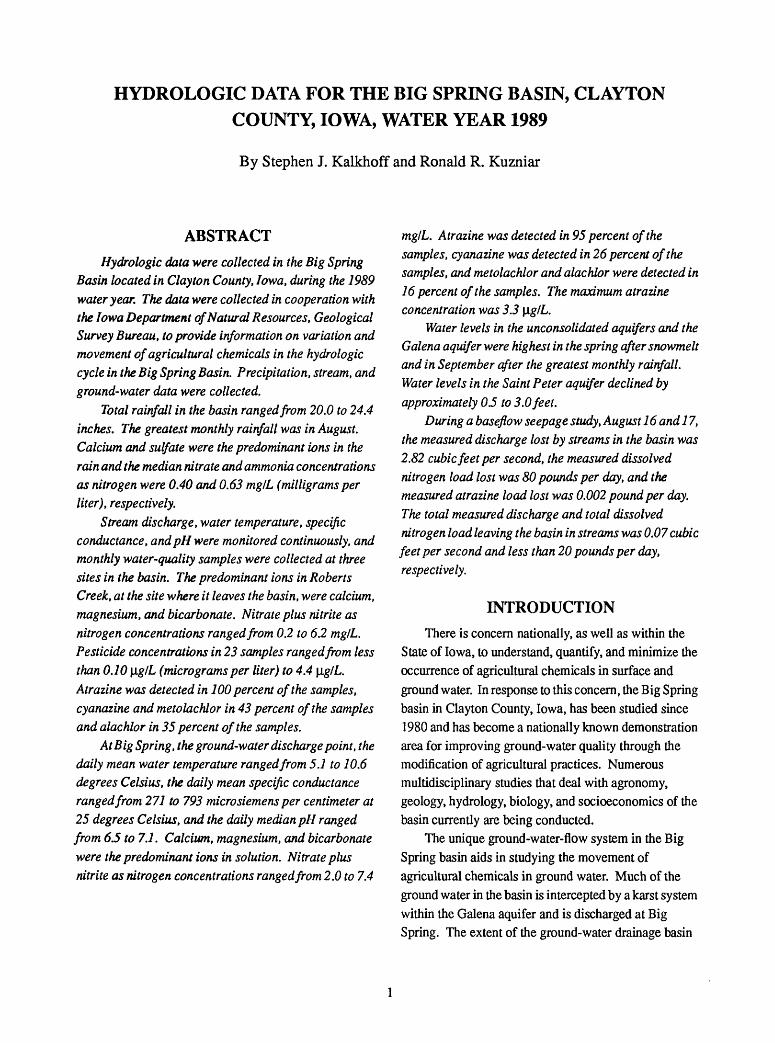
ABSTRACT
Hydrologic data were collected in the Big Spring Basin located in Clayton County, Iowa, during the 1989 water year. The data were collected in cooperation with the Iowa Department of Natural Resources, Geological Survey Bureau, to provide information on variation and movement of agricultural chemicals in the hydrologic cycle in the Big Spring Basin. Precipitation, stream, and ground-water data were collected.
Total rainfall in the basin ranged from 20.0 to 24.4 inches. The greatest monthly rainfall was in August. Calcium and sulfate were the predominant ions in the rain and the median nitrate and ammonia concentrations as nitrogen were 0.40 and 0.63 mg/L (milligrams per liter), respectively.
Stream discharge, water temperature, specific conductance, andpH were monitored continuously, and monthly water-quality samples were collected at three sites in the basin. The predominant ions in Roberts Creek, at the site where it leaves the basin, were calcium, magnesium, and bicarbonate. Nitrate plus nitrite as nitrogen concentrations ranged from 0.2 to 6.2 mg/L. Pesticide concentrations in 23 samples ranged from less than 0.10 [ig/L (micrograms per liter) to 4.4 [ig/L. Atrazine was detected in 100 percent of the samples, cyanazine and metolachlor in 43 percent of the samples and alachlor in 35 percent of the samples.
At Big Spring, the ground-water discharge point, the daily mean water temperature ranged from 5.1 to 10.6 degrees Celsius, the daily mean specific conductance ranged from 271 to 793 micro Siemens per centimeter at 25 degrees Celsius, and the daily median pH ranged from 63 to 7.1. Calcium, magnesium, and bicarbonate were the predominant ions in solution. Nitrate plus nitrite as nitrogen concentrations ranged from 2.0 to 7.4
mg/L. Atrazine was detected in 95 percent of the samples, cyanazine was detected in 26 percent of the samples, and metolachlor and alachlor were detected in 16 percent of the samples. The maximum atrazine concentration was 3.3 [ig/L.
Water levels in the unconsolidated aquifers and the Galena aquifer were highest in the spring after snowmelt and in September after the greatest monthly rainfall. Water levels in the Saint Peter aquifer declined by approximately 0 J to 3.0 feet.
During a baseflow seepage study, August 16 and 17, the measured discharge lost by streams in the basin was 2.82 cubic feet per second, the measured dissolved nitrogen load lost was 80 pounds per day, and the measured atrazine load lost was 0.002 pound per day. The total measured discharge and total dissolved nitrogen load leaving the basin in streams was 0.07 cubic feet per second and less than 20 pounds per day, respectively.
INTRODUCTIONThere is concern nationally, as well as within the
State of Iowa, to understand, quantify, and minimize the occurrence of agricultural chemicals in surface and ground water. In response to this concern, the Big Spring basin in Clayton County, Iowa, has been studied since 1980 and has become a nationally known demonstration area for improving ground-water quality through the modification of agricultural practices. Numerous multidisciplinary studies that deal with agronomy, geology, hydrology, biology, and socioeconomics of the basin currently are being conducted.
The unique ground-water-flow system in the Big Spring basin aids in studying the movement of agricultural chemicals in ground water. Much of the ground water in the basin is intercepted by a karst system within the Galena aquifer and is discharged at Big Spring. The extent of the ground-water drainage basin
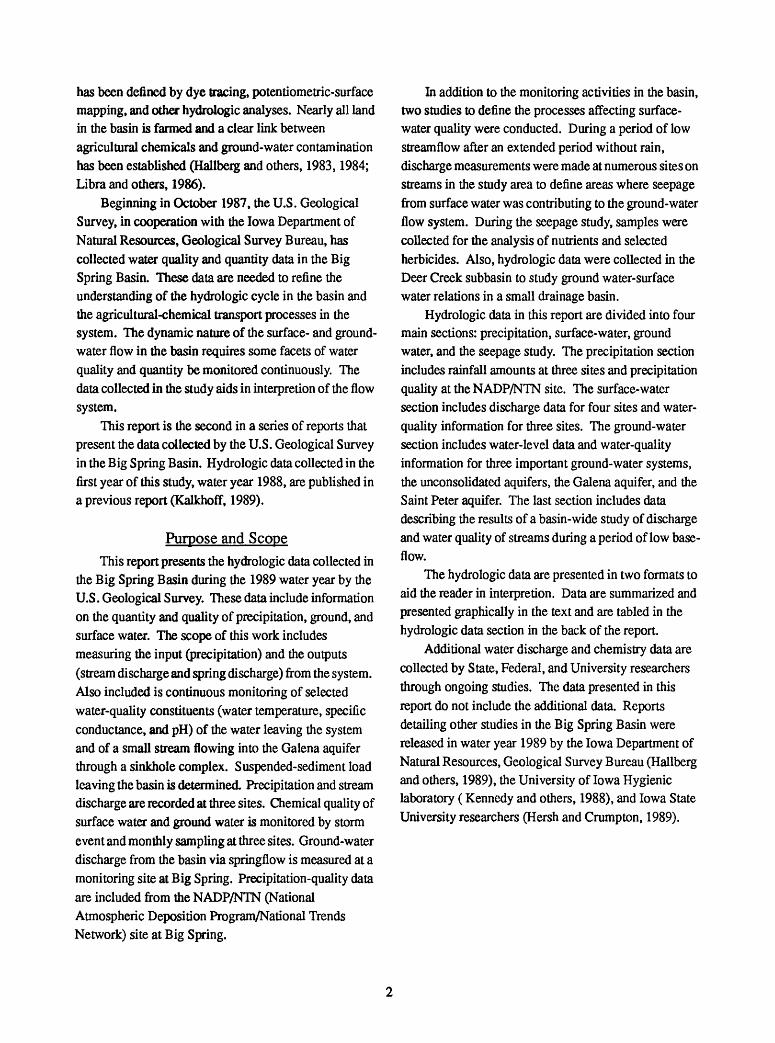
has been defined by dye tracing, potentiometric-surface mapping, and other hydrologic analyses. Nearly all land in the basin is fanned and a clear link between agricultural chemicals and ground-water contamination has been established (Hallberg and others, 1983,1984; Libra and others, 1986).
Beginning in October 1987, the U.S. Geological Survey, in cooperation with the Iowa Department of Natural Resources, Geological Survey Bureau, has collected water quality and quantity data in the Big Spring Basin. These data are needed to refine the understanding of the hydrologic cycle in the basin and the agricultural-chemical transport processes in the system. The dynamic nature of the surface- and ground- water flow in the basin requires some facets of water quality and quantity be monitored continuously. The data collected in the study aids in interpretion of the flow system.
This report is the second in a series of reports that present the data collected by the U.S. Geological Survey in the Big Spring Basin. Hydrologic data collected in the first year of this study, water year 1988, are published in a previous report (Kalkhoff, 1989).
Purpose and ScopeThis report presents the hydrologic data collected in
the Big Spring Basin during the 1989 water year by the U.S. Geological Survey. These data include information on the quantity and quality of precipitation, ground, and surface water. The scope of this work includes measuring the input (precipitation) and the outputs (stream discharge and spring discharge) from the system. Also included is continuous monitoring of selected water-quality constituents (water temperature, specific conductance, and pH) of the water leaving the system and of a small stream flowing into the Galena aquifer through a sinkhole complex. Suspended-sediment load leaving the basin is determined. Precipitation and stream discharge are recorded at three sites. Chemical quality of surface water and ground water is monitored by storm event and monthly sampling at three sites. Ground-water discharge from the basin via springflow is measured at a monitoring site at Big Spring. Precipitation-quality data are included from the NADP/NTN (National Atmospheric Deposition Program/National Trends Network) site at Big Spring.
In addition to the monitoring activities in the basin, two studies to define the processes affecting surface- water quality were conducted. During a period of low streamflow after an extended period without rain, discharge measurements were made at numerous sites on streams in the study area to define areas where seepage from surface water was contributing to the ground-water flow system. During the seepage study, samples were collected for the analysis of nutrients and selected herbicides. Also, hydrologic data were collected in the Deer Creek subbasin to study ground water-surface water relations in a small drainage basin.
Hydrologic data in this report are divided into four main sections: precipitation, surface-water, ground water, and the seepage study. The precipitation section includes rainfall amounts at three sites and precipitation quality at the NADP/NTN site. The surface-water section includes discharge data for four sites and water- quality information for three sites. The ground-water section includes water-level data and water-quality information for three important ground-water systems, the unconsolidated aquifers, the Galena aquifer, and the Saint Peter aquifer. The last section includes data describing the results of a basin-wide study of discharge and water quality of streams during a period of low base- flow.
The hydrologic data are presented in two formats to aid the reader in interpretion. Data are summarized and presented graphically in the text and are tabled in the hydrologic data section in the back of the report.
Additional water discharge and chemistry data are collected by State, Federal, and University researchers through ongoing studies. The data presented in this report do not include the additional data. Reports detailing other studies in the Big Spring Basin were released in water year 1989 by the Iowa Department of Natural Resources, Geological Survey Bureau (Hallberg and others, 1989), the University of Iowa Hygienic laboratory (Kennedy and others, 1988), and Iowa State University researchers (Hersh andCrumpton, 1989).
91°35' 91°20'
43°00' -
42*55' -
Monona
Base from U.S. Geological Survey Clayton County, 1:100,000,1985
Big Spring ground-water basin location from Hallberg and others, 1983
EXPLANATION
Big Spring ground-water basin divide <E> Town
Springin gage and site number
h-r
SCALE
i i i r
5 MILES
5 KILOMETERS
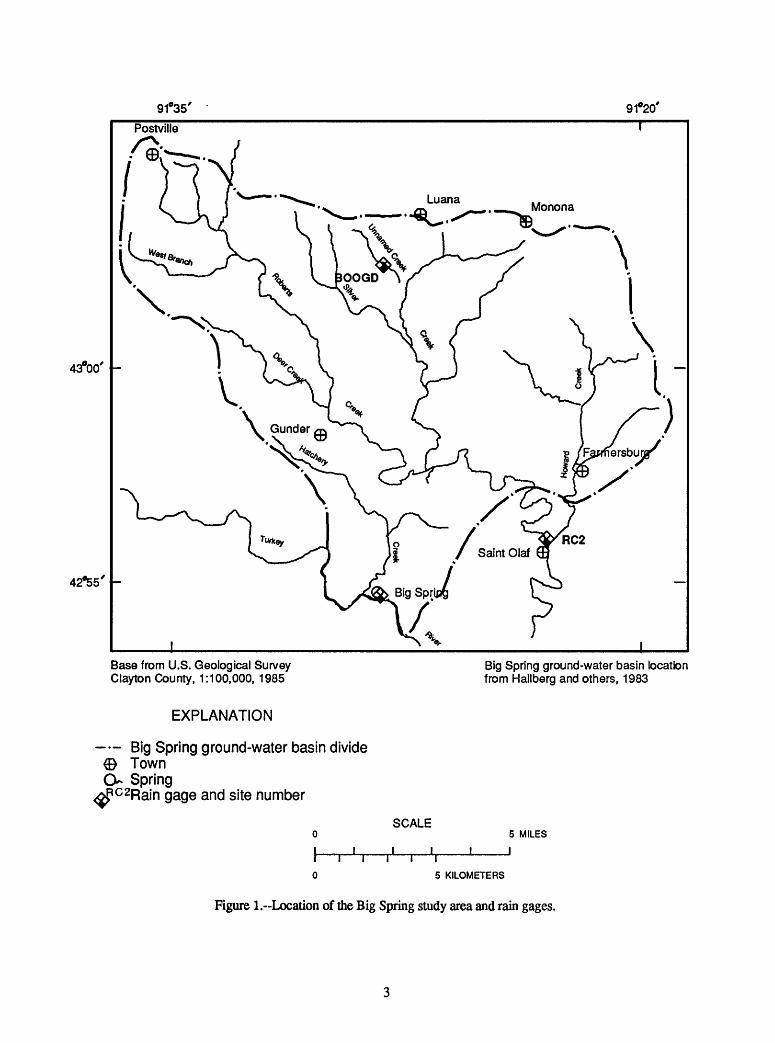
Figure 1.-Location of the Big Spring study area and rain gages.
Study areaThe study area (fig. 1), located in Clayton County in
northeastern Iowa is the 103 mi2 (square miles) ground- water basin that drains through Big Spring (Hallberg and others, 1983). Streams in the study area include Roberts Creek and its major tributary, Silver Creek, which together drain approximately 69 percent (70.7 mi2) of the area overlying the ground-water basin. The remaining area is drained by Howard Creek (approximately 18 mi2), and Hatchery Creek (8.8 mi2), and several small intermittent streams.
MethodologyPrecipitation was measured using standard tipping
bucket rain gages at three monitoring sites (fig. 1). At two sites, RC2 and BOOGD, precipitation was recorded digitally every 15 minutes. At Big Spring precipitation was recorded continuously with a weighing bucket gage
Precipitation-quality samples obtained at Big Spring were collected automatically with an Aerochem Metrics Wet/Dry Precipitation Collector1 . During periods of precipitation, a bucket was exposed to catch the rain. Between rain events the bucket was covered to avoid the collection of paniculate matter. Buckets were removed and the contents analyzed weekly. Site operations are described in detail in the National Atmospheric Deposition Program/National Trends Network instruction manual (1988).
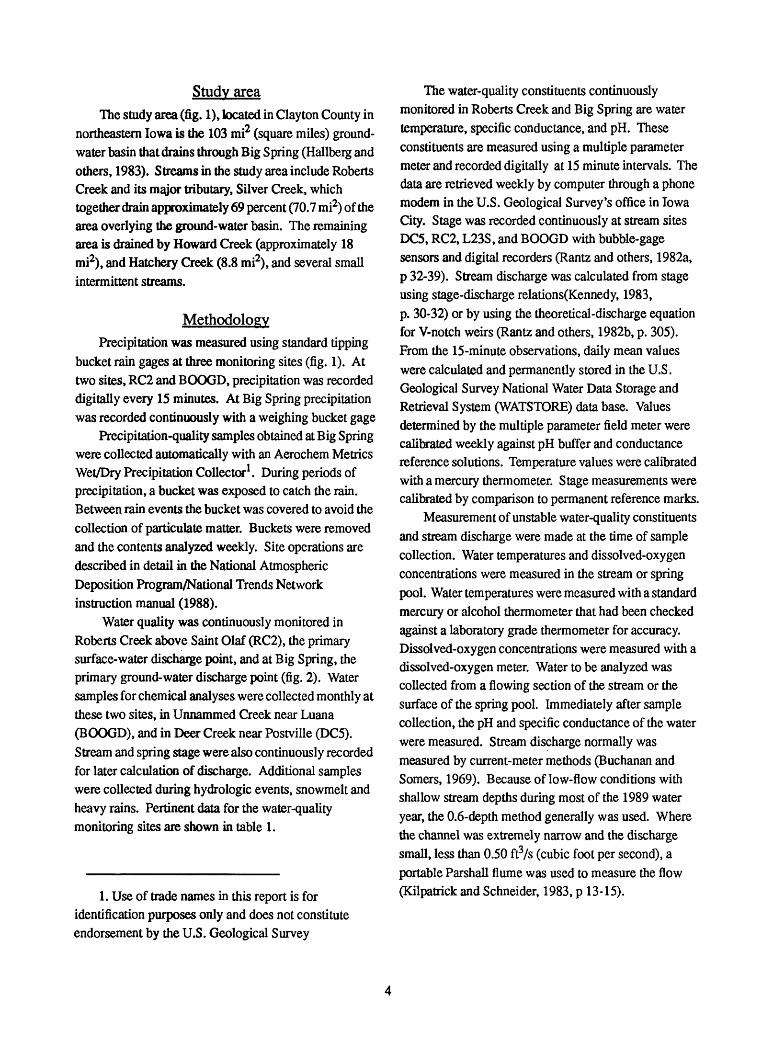
Water quality was continuously monitored in Roberts Creek above Saint Olaf (RC2), the primary surface-water discharge point, and at Big Spring, the primary ground-water discharge point (fig. 2). Water samples for chemical analyses were collected monthly at these two sites, in Unnammed Creek near Luana (BOOGD), and in Deer Creek near Postville (DCS). Stream and spring stage were also continuously recorded for later calculation of discharge. Additional samples were collected during hydrologic events, snowmelt and heavy rains. Pertinent data for the water-quality monitoring sites are shown in table 1.
1. Use of trade names in this report is for identification purposes only and does not constitute endorsement by the U.S. Geological Survey
The water-quality constituents continuously monitored in Roberts Creek and Big Spring are water temperature, specific conductance, and pH. These constituents are measured using a multiple parameter meter and recorded digitally at 15 minute intervals. The data are retrieved weekly by computer through a phone modem in the U.S. Geological Survey's office in Iowa City. Stage was recorded continuously at stream sites DC5, RC2, L23S, and BOOGD with bubble-gage sensors and digital recorders (Rantz and others, 1982a, p 32-39). Stream discharge was calculated from stage using stage-discharge relations(Kennedy, 1983, p. 30-32) or by using the theoretical-discharge equation for V-notch weirs (Rantz and others, 1982b, p. 305). From the 15-minute observations, daily mean values were calculated and permanently stored in the U.S. Geological Survey National Water Data Storage and Retrieval System (WATSTORE) data base. Values determined by the multiple parameter field meter were calibrated weekly against pH buffer and conductance reference solutions. Temperature values were calibrated with a mercury thermometer. Stage measurements were calibrated by comparison to permanent reference marks.
Measurement of unstable water-quality constituents and stream discharge were made at the time of sample collection. Water temperatures and dissolved-oxygen concentrations were measured in the stream or spring pool. Water temperatures were measured with a standard mercury or alcohol thermometer that had been checked against a laboratory grade thermometer for accuracy. Dissolved-oxygen concentrations were measured with a dissolved-oxygen meter. Water to be analyzed was collected from a flowing section of the stream or the surface of the spring pool. Immediately after sample collection, the pH and specific conductance of the water were measured. Stream discharge normally was measured by current-meter methods (Buchanan and Somers, 1969). Because of low-flow conditions with shallow stream depths during most of the 1989 water year, the 0.6-depth method generally was used. Where the channel was extremely narrow and the discharge small, less than 0.50 ft3/s (cubic foot per second), a portable Parshall flume was used to measure the flow (Kilpatrick and Schneider, 1983, p 13-15).
91°35' 91°20'
Monona
43°00'
42°55'
BS1
Base from U.S. Geological Survey Clayton County, 1:100,000,1985
EXPLANATION
Big Spring ground-water basin divide<I> Townex Spring
^RC2 Surface-water sampling site and number 4 ess Ground-water sampling site and number
Big Spring ground-water basin location from Hallberg and others, 1983
SCALE5 MILES
JI I
5 KILOMETERS
Figure 2.~Location of surface- and ground-water quality monitoring sites.
Suspended-sediment samples were collected periodically by local observers, technicians, and by automatic samplers during storms. The observers collected depth-integrated samples at one vertical using techniques described by Guy and Norman (1970). Samples were collected three times per week at Roberts Creek above Saint Olaf (RC2), intermittently at Unnamed Creek near Luana (BOOGD), and weekly at Big Spring.
Water levels in the principal water-supply aquifers in the basin were recorded at four well nests (table 2). At each well nest, water levels were recorded for the unconsolidated aquifers, the Galena aquifer, and the Saint Peter aquifer. Water levels were sensed by a float and then recorded hourly for subsequent storage in the WATSTORE database. Additional wells (DCW1, DCW2, and DCW3) were used to monitor the relation between water levels in the unconsolidated aquifer and flow in Deer Creek.
A seepage study was conducted during stable-flow conditions on August 16 and 17,1989. Discharge measurements were made and water samples were collected using techniques described previously for routine sampling. The location and drainage areas of the seepage study sites are given in table 3.
Samples for chemical analyses were prepared as described in table 4 for shipment to the laboratory. Analyses of water samples by the University of Iowa Hygienics Laboratories in Iowa City and Des Moines, Iowa, followed the analytical methods listed in table 4. The U.S. Environmental Protection Agency's (1983) method 81.40 for the analyses of pesticides was modified to use dual capillary columns.
Suspended-sediment concentrations were determined by the U.S. Geological Survey Sediment Laboratory in Iowa City, Iowa, using standard filtration and evaporation methods (Guy, 1969).
In this report, a shorthand terminology is used in describing the results of the chemical analyses of nitrogen species and herbicides. 'Nitrate-N' is used to report nitrate plus nitrite as nitrogen, 'ammonia-N' is used to report ammonia as nitrogen, and 'organic-N' is used to report organic nitrogen. Reported herbicide concentrations reflect the total recoverable concentrations and are not adjusted for recovery rates.
AcknowledgmentsThis project was supported, in part, by the Iowa
Department of Natural Resources, Geological Survey Bureau, through the Big Spring Basin Demonstration Project, with funds provided from the Iowa Groundwater Protection Act. George Hallberg, Coordinator of the Big Spring Basin Demonstration Project, and other members of the Iowa Department of Natural Resources, Geological Survey Bureau, Bob Libra, John Littke, Deb Quade, and Bob Rowden provided technical advice and field support. Darwin Evans, of the Geological Survey Bureau, drilled and installed the monitoring wells. Jerry Spykerman, manager of the Big Spring Fish Hatchery, provided support for data collection at the spring and collected NADP/NTN precipitation samples. Roger Koster, the Big Spring Project Coordinator for the Iowa State University Cooperative Extension Service, located landowners willing to cooperate in the small-basin study. Leon Dibble allowed installation of equipment on his property. Leann Hilgerson, Karen and Eugene Voss, and Jerry Koonze collected sediment samples. These people contributed significantly in collection of hydrologc data for the project.
HYDROLOGIC DATA SUMMARY
PrecipitationTotal rainfall at Big Spring for water year 1989 was
24.1 inches which was 9.3 inches less than the average for the area (National Oceanic and Atmospheric Administration, 1988, p. 3). The median weekly rainfall was 0.24 inch(table 5). Measurable precipitation of 0.01 inch or more fell during 44 of 52 weeks.
Precipitation at Unnamed Creek near Luana (BOOGD) and at Roberts Creek above Saint Olaf (RC2) are listed in table 6. The total rainfall measured for the 1989 water year was 20.0 inches (13.3 inches below average) at BOOGD and 24.4 inches (8.98 inches below average) at site RC2. The greatest monthly rainfall occurred in August when 7.15 and 6.62 inches fell at sites BOOGD and RC2, respectively. The greatest daily rainfall fell at site BOOGD on August 22,1989 (1.81 inches) and at site RC2 on July 18,1989 (2.29 inches).
QualityWeekly precipitation samples were collected when
measurable rainfall occurred at Big Spring. Results of chemical analyses of these samples are summarized in table 5 . The median concentration of the predominant cation, calcium, was 0.50 mg/L (milligrams per liter) and the median concentration of the predominant anion, sulfate, was 2.3 mg/L. The median concentrations of nitrate and ammonia were 0.40 and 0.63 mg/L as nitrogen, respectively. Maximum concentrations of all major ions except sulfate were less than 10 mg/L.
Surface water
Deer CreekDischarge and water-quality data were collected at
site DCS on Deer Creek near Postville (fig. 2) as part of a study to determine the relations between ground- and surface-water in a small drainage basin.
DischargeStream discharge was continuously recorded in part
of November and December, 1988, and from mid-May to the end of the water year (table 7). Daily mean discharge recorded at site DCS ranged from 0.14 ftVs on July 28 to an estimated 4.2 ft3/s on August 22 after the greatest daily rainfall in the basin. Median monthly discharge was approximately 0.30 ftVs in November and December 1988 and decreased through the summer from 0.27 ft3/s in May to 0.17 ft3/s in August. Median discharge then increased slightly in September to 0.26 ft^s.
Water qualityChemical analyses of dissolved constituents in
samples collected from site DCS on Deer Creek show that calcium and magnesium are the predominant cations in solution (table 8). Calcium and magnesium concentrations ranged from 10 and 3.3 mg/L, respectively, during snowmelt on March 11, to 87 and 28 mg/L, respectively, on September 7. Sodium concentrations were less than 10 mg/L and potassium concentrations were less than 20 mg/L. The predominant anion in solution was bicarbonate. Bicarbonate concentrations ranged from 54 mg/L during
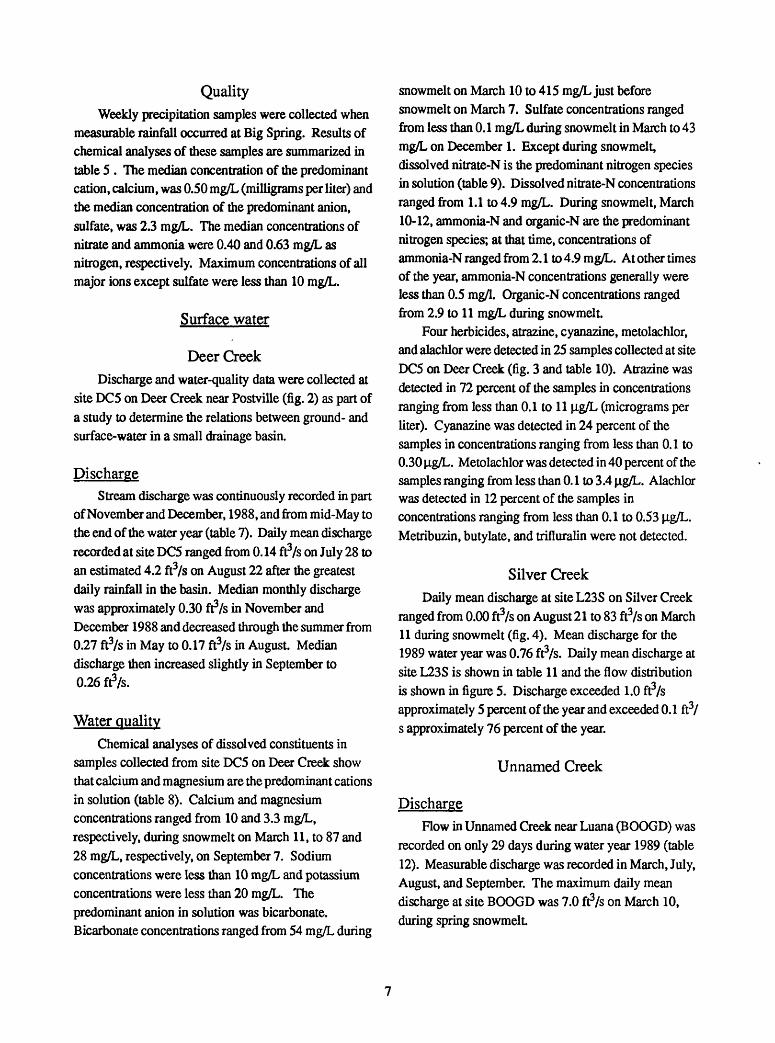
snowmelt on March 10 to 415 mg/L just before snowmelt on March 7. Sulfate concentrations ranged from less than 0.1 mg/L during snowmelt in March to 43 mg/L on December 1. Except during snowmelt, dissolved nitrate-N is the predominant nitrogen species in solution (table 9). Dissolved nitrate-N concentrations ranged from 1.1 to 4.9 mg/L. During snowmelt, March 10-12, ammonia-N and organic-N are the predominant nitrogen species; at that time, concentrations of ammonia-N ranged from 2.1 to 4.9 mg/L. At other times of the year, ammonia-N concentrations generally were less than 0.5 mg/l. Organic-N concentrations ranged from 2.9 to 11 mg/L during snowmelt.
Four herbicides, atrazine, cyanazine, metolachlor, and alachlor were detected in 25 samples collected at site DCS on Deer Creek (fig. 3 and table 10). Atrazine was detected in 72 percent of the samples in concentrations ranging from less than 0.1 to 11 ug/L (micrograms per liter). Cyanazine was detected in 24 percent of the samples in concentrations ranging from less than 0.1 to 0.30 jJ.g/L. Metolachlor was detected in 40 percent of the samples ranging from less than 0.1 to 3.4 jj.g/L. Alachlor was detected in 12 percent of the samples in concentrations ranging from less than 0.1 to 0.53 jig/L. Metribuzin, butylate, and trifluralin were not detected.
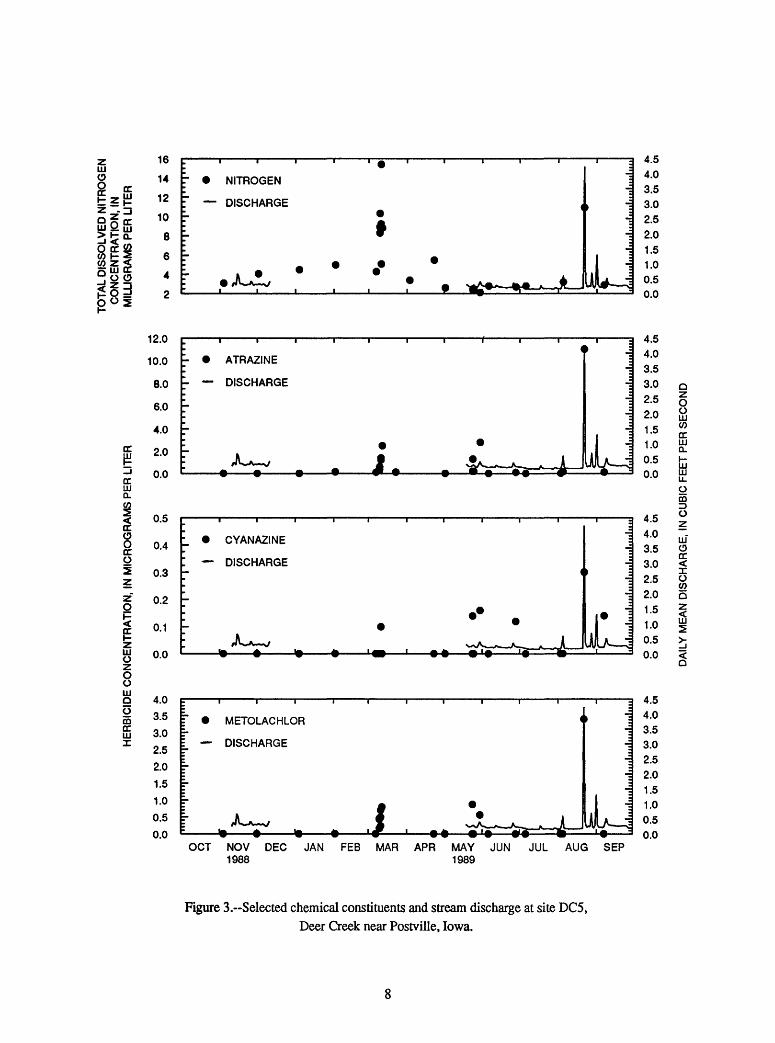
Silver CreekDaily mean discharge at site L23S on Silver Creek
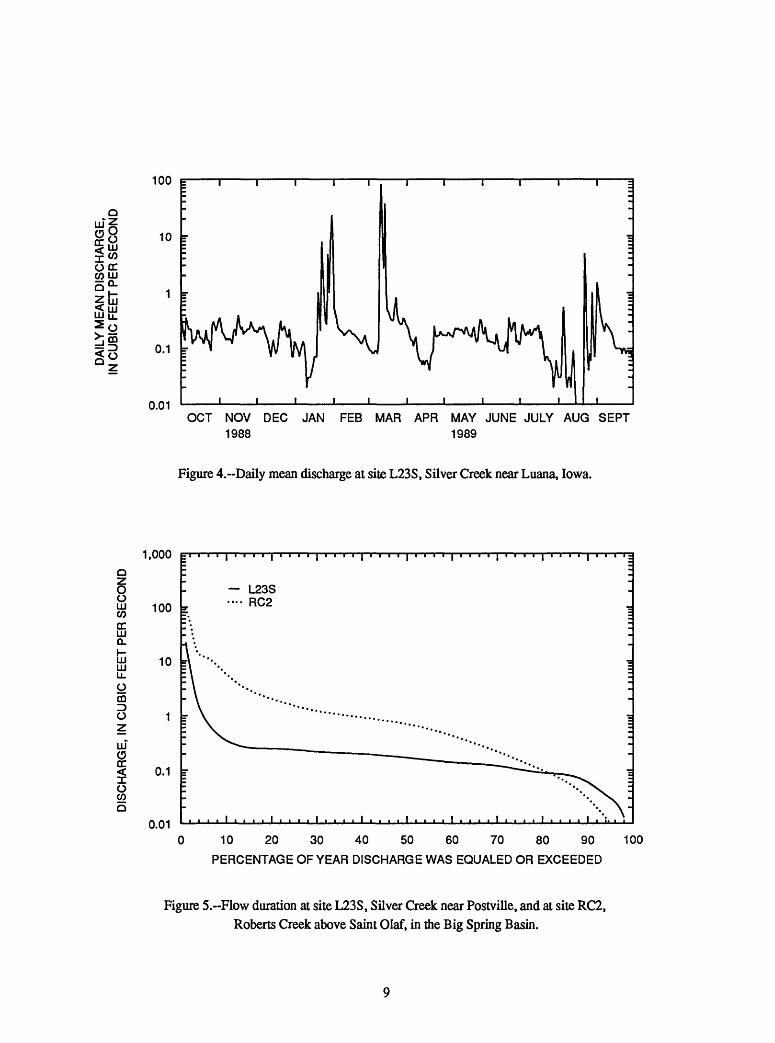
ranged from 0.00 ft3/s on August 21 to 83 ft3/s on March 11 during snowmelt (fig. 4). Mean discharge for the 1989 water year was 0.76 ft3/s. Daily mean discharge at site L23S is shown in table 11 and the flow distribution is shown in figure 5. Discharge exceeded 1.0 ft'Vs approximately 5 percent of the year and exceeded 0.1 ft3/ s approximately 76 percent of the year.
Unnamed Creek
DischargeFlow in Unnamed Creek near Luana (BOOGD) was
recorded on only 29 days during water year 1989 (table 12). Measurable discharge was recorded in March, July, August, and September. The maximum daily mean discharge at site BOOGD was 7.0 f£/s on March 10, during spring snowmelt.
UJOQ cctSn
o 5 cc ujOujj < °-O cc ^CO Z <5 uj cc ° 0 O
go s
cct
2JccUJa.COj>
oO ccg
zz"o<
^UJoOoUJo o00ccUJX
10
14
12
10
8
6
4
2
12.0
10.0
8.0
6.0
4.0
2.0
0.0
n *?U.O
0.4
0.3
0.2
0.1
0.0
4.0
3.5
3.0
2.5
2.0
1.5
1.0
0.5 nn
r NITROGEN
" ~ DISCHARGE (
[ I
' A^ * * ** *
i i i i i i i i i i<
- ATRAZINE
- DISCHARGE
-
-
*R^ _ fl 0 1
E * ̂ * 4-* » »»^ 9
' _ CYANAZINE
DISCHARGE(
_
9 *
A^»u->/ ^^ _ ^ 1i . A. i^. .^ i _^ i ^ ^ ^^iX'>>" "^TSf"^ ^J±~
f METOLACHLOR <
DISCHARGE
»
"
* ***** to * ./ . .* ^r-to-^A-
--
ij.
Jl)*-;
ii
-
_-
1In
UyL^ <
-
.i
1
jjnjl i
i : t
-
-
U
4.O
4.03.53.02.5 2.01.51.0 0.50.0
4.54.03.53.02.5 2.01.51.00.50.0
4.5 4.0 3.53.02.52.01.51.00.50.0
4.03.53.02.52.01.51.0 0.5 n n
0
8UJCOccUJa.HLU UJU_O0013Ozof occ
oCO0z
2><o
OCT NOV DEC JAN FEB MAR APR MAY JUN JUL AUG SEP 1988 1989
Figure 3.~Selected chemical constituents and stream discharge at site DCS, Deer Creek near Postville, Iowa.
o«r win
100
10
1
0.1 r
0.01OCT NOV DEC JAN FEB MAR APR MAY JUNE JULY AUG SEPT
1988 1989
Figure 4.-Daily mean discharge at site L23S, Silver Creek near Luana, Iowa.
o in wCC111O_
binLLOCOD Oz uls< o
1,000
100
10
0.1
0.01
L23S RC2
I T 1 I I I t 1^ 1 l-p
10 20 30 40 50 60 70 80 90 100
PERCENTAGE OF YEAR DISCHARGE WAS EQUALED OR EXCEEDED
Figure 5.~Flow duration at site L23S, Silver Creek near Postville, and at site RC2, Roberts Creek above Saint Olaf, in the Big Spring Basin.
Water qualityCollection of water-quality data was limited at
Unnamed Creek near Luana (BOOGD) due to lack of streamflow caused by less than normal rainfall in water year 1989. water-quality samples were collected only during spring snowmelt on March 10-12,1989. Concentrations of three nitrogen species and orthophosphorous were generally higher than 1.0 mg/L in five samples during spring snowmelt (table 9). Organic-N was the predominant nitrogen species present in concentrations that ranged from 3.9 to 5.8 mg/L. Dissolved nitrate-N concentrations ranged from 1.8 to 2.9 mg/L. Ammonia-N concentrations ranged from 2.0 to 3.4 mg/L. Concentrations of all dissolved nitrogen species as nitrogen ranged from 8.5 to 11 mg/L.
Four pesticides were detected in samples from site BOOGD (table 10). Atrazine was detected in all samples, cyanazine and metolachlor were detected in three of five samples, and alachlor was detected in one sample. Atrazine concentrations ranged from 1.5 to 3.5 ug/L, cyanazine concentrations ranged from less than 0.1 to 0.25 ug/L, metolachlor concentrations ranged from less than 0.1 to 0.63 ug/L, and alachlor concentrations ranged from less than 0.1 ug/L to
Roberts Creek
DischargeDaily mean discharge at Roberts Creek above Saint
Olaf (RC2) is listed in table 13 and illustrated in figure 6. The median discharge at site RC2 for the 1989 water year was 0.70 ft3/s. Maximum daily mean discharge (290 ft*/s) occurred on March 11 during spring snowmelt. Daily mean discharge then decreased through the rest of the spring and summer. There was no recorded discharge from July 25 through August 1 and from August 8 to August 22. Flow distribution is shown in figure 5. Discharge exceeded 0.1 ftVs approximately 80 per cent of the year, exceeded 1.0 frVs approximately 35 percent of the year, and exceeded 10 ft3/s approximately 7 percent of the year.
Water qualityThe maximum daily mean specific conductance of
740 uS/cm (microsiemens per centimeter at 25 degrees Celsius) was recorded in Roberts Creek above Saint Olaf (RC2) on the last day of monitor operation (November 21,1988) before instrumentation was removed for winter (table 13). The minimum daily mean specific conductance (344 uS/cm) was recorded on August 24. The daily mean water temperature varied from 0.9 degrees Celsius on April 1 to 27.0 degrees Celsius on August 4. Daily median pH varied from 7.12 on August 25 to 8.87 on April 29 (table 14).
Analyses of water-quality samples from site RC2 showed that calcium and magnesium generally were the predominant cations and bicarbonate was the predominant anion in solution (table 8). Sodium and potassium concentrations usually were 20 mg/L or less. During snowmelt, sulfate concentrations ranged from 2.3 mg/L to 61 mg/L and chloride concentrations ranged from 16 to 110 mg/L. Silica concentrations were 14 mg/L or less. Dissolved nitrate-N concentrations (table 9) ranged from 0.2 to 6.2 mg/L. Ammonia-N nitrogen was detected in 12 of 22 samples. Dissolved ammonia-N concentrations ranged from 1.0 to 4.2 mg/L from February 1 to April 4 and were less than 0.5 mg/L the rest of the year. Organic-N was the major nitrogen species during much of the water year. Dissolved organic-N concentrations ranged from 0.4 to 7.2 mg/L from February 1 to April 4 and concentrations ranged from 0.4 to 3.1 mg/L the rest of the year.
Four of seven analyzed herbicides were detected (concentration greater than 0.1 ug/L) in Roberts Creek above Saint Olaf (RC2). Atrazine was detected in all samples, cyanazine was detected in 10 of 23 samples, metolachlor was detected in 10 of 23 samples, and alachlor was detected in 8 of 23 samples (table 10). Metribuzin, butylate, and trifluralin were not detected. Atrazine concentrations ranged from 0.11 to 4.4 jj.g/L. Cyanazine concentrations ranged from less than 0.1 to 0.78 }J.g/L. Metolachlor concentrations ranged from less than 0.1 to 0.83 ug/L and alachlor concentrations ranged from less than 0.1 to 0.77 ug/L.
10
zOF 2.0
EL i 1.50 0g ^ 1.00- 2
^ 0.5
Q n n
L
'-
~
ll,
I
Ll
1 1 1 1 1
1 Jll 1 ,1 ,, 1 1 I
1 1
Jj
1
1
1
J 1
~
.
-^
-j
ll, 1 =
i-UJ
O°Wc 3 Oz ^^,N UJ Wy o. ujU. . yj
Qz^
800
700 -
600
500 -
400 -
300
1,000
0.01
s ffio- w
IJUJLU r? I- EC
35
30
25
20
15
10
5
* :
TEMPERATURE
10
zD Z
O LLJ
OCT NOV DEC JAN FEB MAR APR MAY JUNE JULY AUG SEPT 1988 1989
Figure 6.-Daily precipitation, daily mean specific conductance, discharge, water temperature, and daily median pHat site RC2, Roberts Creek above Saint Olaf, Iowa.
11
The daily mean suspended-sediment loads at site RC2 ranged from 0.0 tons per day on days of no streamflow to 220 tons per day on March 14 (table 15). The greatest monthly sediment loads were in January (82 tons) and March (490 tons) when snow- and ice-melt occurred.
Ground Water
Unconsolidated aquifersWater levels are continuously recorded at five wells
screened in unconsolidated material in the Big Spring Basin (fig. 2). Well BS1-A is screened in alluvial material in the Turkey River Valley, well BS3-C is in weathered limestone and loess, wells BS4-B and BS4-C are in sands deposited by glacial action, and well DCW-1 is in Deer Creek alluvial material.
The highest water level in well BS 1-A (fig. 7 and table 16) was recorded in March (9.84 feet below land surface) and the lowest water level was recorded in August (14.87 feet below land surface). The highest water level in well BS3-C was recorded in September, the month following the greatest monthly rainfall in water year 1989 and the lowest level was in April. Water levels were recorded for only one month in wells BS4-B and BS4-C, which is an insufficient period to define a yearly range in water levels. Water levels in well DCW- 1 varied from a low of 6.88 feet below land surface on August 4 to a high of 4.68 feet below land surface on September 1. More than 6.0 inches of rain fell in the Big Spring Basin during the period August 4 to September.
As part of an investigation to study the relation between shallow ground water and surface water, samples were collected for chemical analyses from two wells (DCW2 and DCW3) and four lysimeters (DCLA, DCLB, DCLC, and DCLD) completed in unconsolidated material in the Deer Creek sub-basin. The physical data for the wells and lysimeters are given in table 2.
The results of chemical analyses of samples from wells DCW2 and DCW3 indicate calcium and magnesium are the predominant cations in solution (table 17). Calcium concentrations ranged from 92 to 120 mg/L and magnesium concentrations ranged from 26 to 38 mg/L. Sodium and potassium concentrations were less than 10 mg/L. Bicarbonate is the predominant anion. The bicarbonate concentration ranged from 342
to 509 mg/L. Sulfate concentrations ranged from 17 to 110 mg/L and chloride concentrations ranged from 1.0 to 28 mg/L. Organic-N was the major nitrogen species present (table 18). Concentrations of organic-N ranged from less than 0.1 mg/L to 0.9 mg/L. Nitrate-N was detected in 5 of 19 samples from wells DCW2 and DCW3 in concentrations ranging from less than 0.1 to 0.9 mg/L. Ammonia-N was detected in seven of 19 samples in concentrations ranging from less than 0.1 mg/L to 0.2 mg/L. Of the seven analyzed herbicides, only metolachlor was present in one sample in concentrations greater than the detection limit (table 19).
The four lysimeters were used to collect water from the water table or unsaturated zone depending on the water level. Lysimeters DCLA and DCLB were always in the saturated zone and lysimeter DCLD was always in the unsaturated zone. Lysimeter DCLC was in the water table in April and May and part of September and in the unsaturated zone in June through August and the last half of September. Nitrate-N and ammonia-N concentrations in the deepest lysimeters, DCLA and DCLB, were less than the detection limit in all samples (table 18). Organic-N concentrations in samples from these lysimeters ranged from less than 0.1 to 0.4 mg/L. Samples from DCLC had nitrate-N concentrations that ranged from less than 0.1 to 0.5 mg/L, ammonia-N concentrations 0.1 mg/L or less, and organic-N concentrations that ranged from less than 0.1 to 0.8 mg/L. Samples from DCLD had nitrate-N concentrations that ranged from 4.5 to 13 mg/L, ammonia-N concentrations less than 0.1 mg/L, and organic-N concentrations that ranged from 0.1 to 0.8 mg/L. Total nitrogen concentrations (nitrate-N, ammonia-N, and organic-N) in samples from the lysimeters and the water level from well DCW-1 are shown in figure 8.
Cyanazine and alachlor were the only pesticides detected in the lysimeter (DCLA) installed 8.5 feet below land surface (table 19). Each herbicide was detected once in 15 samples. In lysimeter DCLB, which was installed at 7 feet below land surface, atrazine was detected in 1 of 15 samples and cyanazine and alachlor each were detected in 2 of 15 samples. In samples from the lysimeter installed at 5.5 feet below land surface, DCLC, atrazine was detected in 14 of 15 samples in concentrations ranging from less than 0.1 |ig/L to
12
DE
PTH
BE
LOW
LA
ND
SU
RF
AC
E,
IN F
EE
T
O
CO
O>
*.
CO
CO
O>
CO
I 5' B- t W
cw"
CO "8 era
Cd
B̂'
go C0< o
m
O m
m
CD
co
c
z
m c_
C O CO m
o
o i CD
CO CD 1,
CD
8"
CD a- 6"
CD O
, , ,r
0.96 ng/L, cyanazine was detected in two of 15 samples in concentrations from less than 0.1 ug.L to 1.4 jog/L, metolachlor was detected in 5 of 14 samples in concentrations from less than 0.1 to 0.5 Hg/L. Alachlor was detected in one sample at a concentration of 0.35 |ig/L. In samples from lysimeter DCLD, installed at 4.0 feet, below land surface, atrazine was detected in all 12 samples in concentrations ranging from 0.44 jog/L to 0.66 |ig/L, cyanazine was detected in 2 of 12 samples in concentrations from less than 0.1 ug.L to 0.23 |0.g/L, metolachlor was detected in two of 12 samples in concentrations from less than 0.1 to 0.24 |ig/L. Alachlor was detected in two samples in concentrations from less than 0.1 to 0.6 |0.g/L. Atrazine and metolachlor concentrations in lysimeter water samples and the water level in well DCW-1 are shown in figures 9 and 10.
Galena AquiferWater-quality data for the Galena aquifer were
collected at the discharge point, Big Spring, and water levels in the aquifer were recorded at four monitoring wells (BS1-B, BS2-E, BS3-A, and BS4-A) in water year 1989 (table 20). Daily water levels are shown in figure 11.
Water levelsTwo wells 3S1-B and BS2-E, located in the
southern and central part of the basin had the greatest range of water levels in the Galena aquifer. Water levels in BS1-B ranged from 5.29 feet below land surface on March 15 to 10.38 feet below land surface on July 20. Mean daily water levels in BS2-E ranged from 148.92 feet below land surface on March 10 to 154.89 feet below land surface on July 28. The water level in well BS4-A gradually decreased from 214.94 feet below land surface on January 29 to 219.99 feet below land surface on September 27.
Big SpringContinuous water-quality data collected at Big
Spring are shown as daily mean and median values in figure 12 and are listed in tables 21 and 22. Daily mean specific conductance values ranged from 271 |a.S/cm on March 12 during snowmelt to 793 p,S/cm on December 1,1988. Daily mean water temperatures ranged from 5.1
°C on March 12 during snowmelt to 10.6 °C during 8 days in September. The maximum daily median pH was 7.06 on December 12 and the minimum daily median pH was on 6.54 on February 1. Daily mean suspended- sediment concentrations ranged from 1 mg/L on numerous days in February and March to 840 mg/L on March 11 during snowmelt.
The predominant cations in solution at Big Spring were calcium and magnesium (table 17). Calcium concentrations ranged from 24 to 90 mg/L and magnesium concentrations ranged from 9.0 to 38 mg/L. Sodium and potassium concentrations were 25 mg/L or less. The predominant anion, bicarbonate, was present in concentrations that ranged from 115 to 382 mg/L. Sulfate concentrations ranged from less than 0.1 mg/L during snowmelt to 48 mg/L and chloride concentrations ranged from 8.5 to 38 mg/L. Silica concentrations were 15 mg/L or less. Dissolved nitrate-N generally was the predominant nitrogen species in solution (table 18). Nitrate-N concentrations ranged from 2.0 to 7.4 mg/L. Ammonia-N concentrations exceeded the detection limits in five samples collected during snowmelt. Dissolved ammonia-N concentrations in these samples ranged from 0.1 to 3.6 mg/L. Organic-N concentrations ranged from less than 0.1 to 3.5 mg/L, but were 2.0 mg/L or greater in four of five samples collected during the snowmelt period, February 1 to March 16. During the remainder of the year organic-N concentrations were 1.2 mg/L or less.
Four of seven analyzed herbicides were detected (concentration greater than 0.1 |ig/L) in samples from Big Spring (table 19). Atrazine was detected in 18 of 19 samples, cyanazine was detected in 5 of 19 samples, and metolachlor and alachlor were detected in 3 of 19 samples. Metribuzin, butylate, and trifluralin were not detected. Atrazine concentrations ranged from less than 0.1 on November 16 to 3.3 |0.g/L in a sample collected on March 16. Cyanazine concentrations ranged from less than 0.1 to 0.34 |0.g/L. Metolachlor concentrations ranged from less than 0.1 to 0.22 |ig/L. Alachlor concentrations ranged from less than 0.1 to 0.17 |ig/L.
14
TO
TA
L D
ISS
OLV
ED
NIT
RO
GE
N C
ON
CE
NT
RA
TIO
N,
IN M
ILLI
GR
AM
S P
ER
LIT
ER
oo e. a 3. OQ
O 3 a 5' 6 I I I a I I n K*
p bp
In-*
-*
ro
b
In b
w< o
m
O -n m
CD > 33 C_ C 2 m c_ C
0>
0>In b
p b
P
:*
r*
In
b
Inro
In
p>
Inp> b
en
Inen b
o>
o>
en
en
en b
en b
WA
TE
R L
EV
EL,
IN
FE
ET
BE
LOW
LA
ND
SU
RF
AC
E
AT
RA
ZIN
E C
ON
CE
NT
RA
TIO
N,
IN M
ICR
OG
RA
MS
PE
R L
ITE
R
TJ VO 5= i
B- ^
0 §
O
S"
o
o*1
as
i"1
£t
e
Sz »
rf
CBs
<sW
O
, 3'
c«
3- I I
p
bo
roop
*>
b>p
-*
bo
bp
bp KJ
p
b>p
-*
bo
bp
bp
ro
p
b>p
bop
bp
roo
p
'*>
b>p
-*
bo
b
K
m
CD > 3D z.
m c_
C O
CO m
^*i
a>
a>
w
01
_^.
^.
b
in
b
in
b
01
b01
si
o
o>
tn
tn
^
^
b
in
b
in
b
in
bo
tn
o
tn
o
tn
o
WA
TE
R L
EV
EL,
IN
FE
ET
BE
LOW
LA
ND
SU
RF
AC
E
p>
p»
en
01
in
b
in
boi
1.0
0.8
0.6
0.4
0.2
0.0
_ DCLD METOLACHLOR WATER LEVEL (DCW1)
4.0
4.5
5.0
5.5
6.0
6.5
7.0
cc LII
oc LII Q.to3oc
o22
III o
oc3O
III
1.0
0.8
0.6
0.4
0.2
0.0
1.0
0.8
0.6
0.4
0.2
0.0
1.0
0.8
0.6
0.4
0.2
0.0
_ DCLC METOLACHLOR WATER LEVEL (DCW1)
_ DCLB
METOLACHLOR WATER LEVEL (DCW1)
L DCLA
6 METOLACHLOR WATER LEVEL (DCW1)
OCT NOV DEC JAN FEB MAR APR MAY JUNE JULY AUG SEPT 1988 1989
4.0
4.5
5.0
5.5
6.0
6.5
7.0
4.0
4.5
5.0
5.5
6.0
6.5
7.0
4.0
4.5
5.0
5.5
6.0
6.5
7.0
LII
ocDto o
3LU CO
III
_r LULU_ioc IIII
Figure lO.-Total recoverable metolachlor and water levels in unconsolidated materialin the Deer Creek subbasin.
17
DEPTH BELOW LAND SURFACE, I
N FE
ET
roro
ro
oo
i I 5- f o 8- 5' f
w
o
o
«£>
Q
00
< O m
o m CD
oo
c
z
m c_
C Q
CO m
000>
l\3
l\3-s
io
O)
O)
00
O)
O)
01
IS)
O>
01
0101 o
«t
-p>.
00
O)
00
COCD
CO m
CD
CO CD
gQ.
coUJ
oUJ Occ zCL > ?
UJ UJ
4.5 4.0 3.5 3.0 2.5 2.0 1.5 1.0 0.5 0.0 1 I
UJO
800
700
600
Ip m2 E I 400
LU ~~
Q.
w 300
200
8
9
10
Q.
< -Icc"Juj O
11
10
9
8
7
6
8.0
7.5 [2 zD Z
7-° £
OCT NOV DEC JAN FEB MAR APR MAY JUNE JULY AUG SEPT 1988 1989
6.5
6.0
Q UJ
Figure 12.~Weekly precipitation, daily mean specific conductance, gage height, water temperature, and daily median pH at Big Spring, Clayton County, Iowa.
19
Saint Peter AquiferWater levels in the Saint Peter aquifer were
monitored at three sites (BS2-G, BS3, and 6S4) in the Big Spring Basin in water year 1989 (fig. 2). Water levels decreased at all three sites (fig. 13 and table 23). The greatest decrease, approximately 3.0 feet, was in well BS4 in which the water level declined from 366.97 on February 2 to 370.06 feet below land surface on September 30. The water level dropped 1.53 feet in well BS2-G and 0.33 feet in well BS3.
Seepage StudyStream discharge was measured at 38 sites (fig. 14)
on August 16 and 17 after an extended period without rain to determine areas where streamflow was being lost to the ground-water system through seepage and areas where water was flowing into the streams from shallow aquifers. Water samples were collected concurrently to document nutrient and herbicide inflow from ground water and outflow into the underlying aquifer. The results of the data collection are presented in tables 24 and 25. Discussion and interpretation of the results are beyond the scope of this report.
DischargeDischarge increased in Roberts Creek from
0.01 ft3/s at site RC13, the most upstream site, to 1.22 ft3/s at F45 approximately 11 miles downstream. Streamflow in this reach originated partially from two tributaries, West Branch Roberts Creek and Deer Creek, and from industrial discharge in the headwaters. West Branch Roberts Creek (RC21) contributed 0.31 f^/s, Deer Creek(DC2) contributed approximately 0.08 f^/s, and industrial discharge (RC26) contributed 0.56 ft3/s.
Discharge decreased downstream from 1.22 f^/s at site F45 to 0.0 tf/s at site RC2. Silver Creek joins Roberts Creek in this 15-mile reach of site, but during the seepage study it was dry.
Determination of seepage in Roberts Creek and Silver Creek is complicated by non-uniform point-source discharges in the headwaters of the streams. A municipal wastewater treatment plant discharges upstream of site SC10 and a creamery discharges wastewater upstream of site SC13. Discharges were 0.08 and 1.03 ft3/s at sites SC10 and SC13, respectively. Discharge at site L23S on
the main stem of Silver Creek was 0.05 f^/s. Downstream there was no flow at site SCI. During the seepage study Silver Creek did not contribute flow to Roberts Creek. The total measured discharge lost in the Silver Creek sub-basin was approximately 1.16 ft^s. In addition, approximately 0.18 ft3^ and 0.07 ft^s were lost from Hatchery and Howard Creek, respectively. The total measured discharge lost in the Big Spring Basin during the two day seepage study was 2.82 tf/s and the total measured stream discharge leaving the basin in streams was 0.07 f?/s.
Water QualityTotal dissolved nitrogen concentrations (nitrate-N,
ammonia-N, and organic-N) were generally less than 2.0 mg/L at sites on Roberts Creek upstream of site RC18 (fig 15). The predominant nitrogen species was nitrate. Organic nitrogen was the predominant nitrogen species at sampling sites downstream of site RC18.
Total dissolved nitrogen loads at sites on the main stem of Roberts Creek were 0.003 tons per day or less except at sites RC16 and RC18 (fig. 15). During the two- day seepage study, the measured total dissolved nitrogen load lost from Roberts Creek was 0.01 t/d (tons per day). No nitrogen left the basin through Roberts Creek streamflow because there was no flow at site RC2.
Total dissolved nitrogen concentrations, almost entirely as nitrate-N, were 33 mg/L at site SC10. Total nitrogen concentration decreased to 7.9 mg/1 at site SC3 on the east fork of Silver Creek, and was composed nearly equally of nitrate, ammonia, and organic nitrogen. Total dissolved nitrogen concentration at site L23S was 8.6 mg/L. The total dissolved nitrogen load was 0.02 tons per day at site SC3 and was 0.001 tons per day at site L23S. Combined total dissolved nitrogen loads as nitrogen at sites L23S and SC3 was 0.02 tons per day. There was no streamflow downstream of these two sites.
The nitrogen load also decreased from Hatchery and Howard Creeks. The total measured nitrogen load decreased 0.003 tons per day in Hatchery Creek and decreased approximately 0.0002 tons per day in Howard Creek. The total measured dissolved nitrogen load lost in the study area was approximately 0.03 tons per day and the dissolved nitrogen load leaving the Big Spring Basin in streams was less than 0.0004 tons per day.
20
DE
PT
H B
ELO
W L
AN
D S
UR
FA
CE
, IN
FE
ET
wW
*v
lro
W *vl
ow
en
oo
W en
enw
w
o
en
Aw
o
ro
0) o
oro (O oo
ro (O enro
-*
(O
00-i^
oo
oo
enCO ro
oo
ooo
tO (
=\
CO ^
Jco
< O
m
O -n
m CO c
z
m c_ C c
O CO m
03
CO
CO
03 8 6
91°35' 91°20'
43°00'
42°55*
Monona
Base from U.S. Geological Survey Clayton County, 1:100,000,1985
EXPLANATION
- Big Spring ground-water basin divide > Town^ Spring5£? Seepage study site and number
Big Spring ground-water basin location from Hadberg and others. 1983
SCALE
J____I____I____I
5 MILES
I
0 5 KILOMETERS
Figure 14.-Location of the seepage-study sampling sites.
22
c/a 8
Of
5?
32
. TO
s!
VO
P~ C
u I
TOTA
L D
ISS
OLV
ED
NIT
RO
GE
N
LO
AD
,IN
TO
NS
PE
R D
AY
, X
1CT
3T
OT
AL
DIS
SO
LVE
D N
ITR
OG
EN
CO
NC
EN
TRA
TIO
N
IN M
ILLI
GR
AM
S P
ER
LIT
ER
DIS
CH
AR
GE
, IN
CU
BIC
FE
ET
PE
R S
EC
ON
D
o CO g o m CO O
O
-*
l\>
CO
^
Ol
O
£ en -
D
D
D
CO
_
0
D
8 -
D
-
D
iv>
_
D
- o
!D
D
_
0
o
o
-*
-*
ro
ro
cO
O
l O
O
l O
O
l Cu
c
o c
3 C>
ro
^
05
co
o
ro
- c
.
D
D
D
-
D
D
D
- ci
D2
>
| ~
H
-J
3
: s
|3
m
i
3 O
3 01
4 - - - - - _ " - C
ao-t-trorococo-F
D
Oiboiboiboic
^k
^H
H
\
_
. «
'
[
i
k > RC
13
RC
20
RC
10
RC
15
DE
ER
CR
EE
K
F45
RC
16
RC
17
SIL
VE
R C
RE
EK
R
C18
RC
19
F47 RC
24
RC
22
RC
2
TOT
AL
RE
CO
VE
RA
BLE
ATR
AZI
NE
T
OT
AL
RE
CO
VE
RA
BLE
ATR
AZI
NE
, L
OA
D,I
N P
OU
ND
S P
ER
DA
Y> X
10
'3 C
ON
CE
NTR
ATI
ON
, IN
MIC
RO
GR
AM
S P
ER L
ITE
R
During the seepage study samples were collected at 19 sites for the analyses of selected herbicides (table 25). Atrazine was detected in 14 of the 19 samples in concentrations from less than 0.1 to 0.48 |ig/L. Cyanazine was detected in only one sample. Metolachlor, alachlor, metribuzin, butylate, and trifluralin were not detected. Proceeding downstream on Roberts Creek, atrazine concentrations increased from 0.11 ng/L at site RC20 to 0.48 jig/L at site RC10 and then decreased to 0.19 ng/L at site RC19 (fig. 15), the last site where flow was observed. The measured atrazine load also increased from 0.0005 Ib/d (pounds per day) at site RC20 to 0.002 Ib/d at site RC16 and then decreased to 0.0002 Ib/d at site RC19. The measured atrazine load lost from Roberts Creek during the seepage study was about 0.002 Ib/d. The total measured loss in the basin, including 0.0001 Ib/d from Hatchery Creek, was about 0.002 Ib/d.
SELECTED REFERENCES
Buchanan, TJ., and Somers, WP., 1969, Discharge mea surements at gaging stations: U.S. Geological Survey Techniques of Water-Resources Investi gations, Book 3, Chapter A8,65 p.
Guy, H.P., 1969, Laboratory theory and methods for sed iment analysis: U.S. Geological Survey Tech niques of Water-Resources Investigations. Book 5, Chapter Cl. 58 p.
Guy, HP., and Norman, V.W., 1970, Field methods for measurement of fluvial sediment: U.S. Geolog ical Survey Techniques of Water-Resources In vestigations, Book 3, Chapter C2,59 p.
Hallberg, G.R., Hoyer, B.E., Bettis, E.A., and Libra, R.D., 1983, Hydrogeology, water quality, and land management in the Big Spring Basin, Clayton County, Iowa: Iowa Geological Survey Bureau Open File Report 83-3,191 p.
Hallberg, G.R., Libra, R.B., Bettis, E.A., and Hoyer, B.E., 1984, Hydrogeologic and water quality investigations in the Big Spring Basin, Clayton County, Iowa: Iowa Geological Survey Bureau Open-File Report 84-4,231 p.
Hallberg, G.R., Libra, R.B., Quade, DJ., Littke, J., and Nations, B., 1989, Groundwater monitoring in the Big Spring Basin, 1984-1987: A summary review: Iowa Department of Natural Resources, Geological Survey Bureau Technical Informa tion Series 16,67 p.
Hersh, C.H., and Crumpton, W.G., 1989, Atrazine toler ance of algae isolated from two agricultural streams: Environmental Toxicology and Chem istry, v. 8, p. 327-332.
Kalkhoff, S J., 1989, Hydrologic data for the Big Spring Basin, Clayton County, Iowa, water year 1988: U.S. Geological Survey Open-File Report 89- 230,44 p.
Kennedy, D J., 1983, Computation of continuous records of streamflow: U.S. Geological Survey Tech niques of Water-Resources Investigations, Book 3, Chapter A13,53 p.
Kennedy, J.O., Ceilley, D.W., and Miller, J.G., 1988, A survey of the benthic macroin vertebrates and fishes of the Big Spring Basin, Iowa; University of Iowa Hygienic Laboratory Report No. 88-9, 100 p.
Kilpatrick, F.A., and Schneider, V.R., 1983, Use offlumes in measuring discharge: U.S. Geological Survey Techniques of Water-Resources Investi gations, Book 3, Chapter A14,46 p.
Libra, R.D., Hallberg, G.R., Hoyer, B.E., and Johnson, L.G., 1986, Agricultural impacts on ground water quality: The Big Spring Basin study, Iowa: Proceedings of the Agricultural Impacts on Ground Water Conference, p. 253-373.
National Atmospheric Deposition Program/ National Trends Network, 1988, Instruction Manual NADP/NTN site operation: Colorado State University Natural Resource Ecology Labora tory, Boulder Colorado.
24
National Oceanic and Atmospheric Administration, 1988, Climatological data annual summary, Iowa, 1987: U.S. Department of Commerce, v. 98, no. 13,30 p.
Porterfield, George, 1972, Computation of fluvial-sedi ment discharge: U.S. Geological Survey Tech niques of Water Resources Investigations, Book 3, Chapter C3,66 p.
Rantz, S.E., and others, 1982a, Measurement and com putation of streamflow: Volume 1. Measure ment of stage and discharge: U.S. Geological Survey Water-Supply Paper 2175, p. 1-284.
1982b, Measurement and computation of stream- flow: Volume 2. Computation of discharge: U.S. Geological Survey Water-Supply Paper 2175, p. 285-631.
U.S. Environmental Protection Agency, 1983, Methods for chemical analysis of water and wastes: Cin cinnati, Ohio, EPA-600/4-79-020.
Wood, W.W., 1976, Guidelines for collection and field analysis of ground- water samples for selected unstable constituents: U.S. Geological Survey Techniques of Water-Resources Investigations, Book 1, Chapter Dl, 24 p.
2527
HYDROLOGIC DATA
27
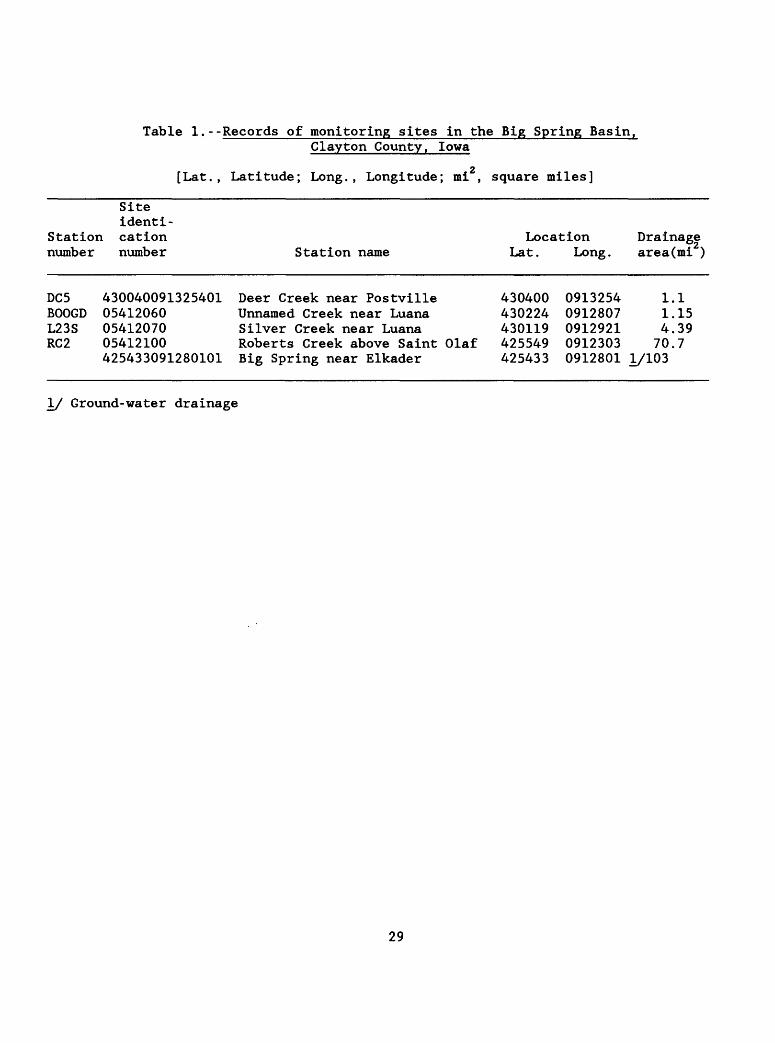
Table 1.--Records of monitoring sites in the Big Spring Basin.Clayton County. Iowa
2[Lat., Latitude; Long., Longitude; mi , square miles]
Site identi-
Station cation number number
DCSBOOGDL23SRC2
430040091325401054120600541207005412100425433091280101
Station name
Deer Creek near PostvilleUnnamed Creek near LuanaSilver Creek near LuanaRoberts Creek above Saint OlafBig Spring near Elkader
Location Lat . Long .
430400430224430119425549425433
09132540912807091292109123030912801
Drainage area(mi )
114
701/103
.1
.15
.39
.7
\J Ground-water drainage
29
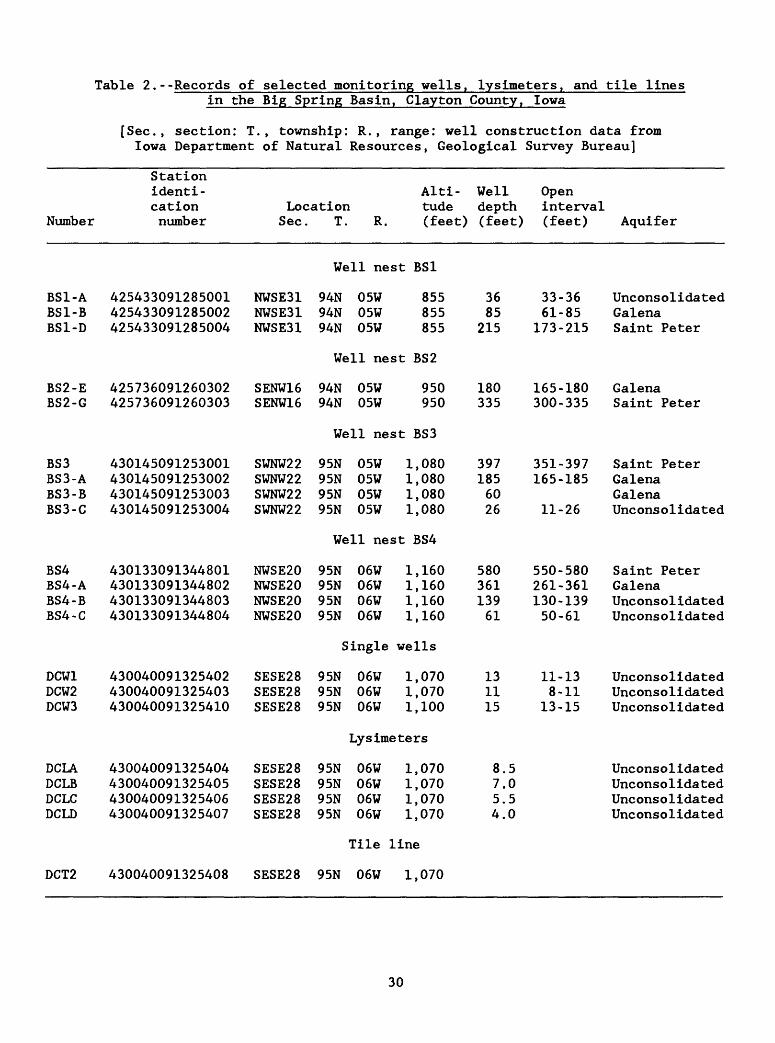
Table 2.--Records of selected monitoring wells, lysimeters, and tile linesin the Big Spring Basin,
[Sec., section: T. , township Iowa Department of Natural
Number
Station identi- cation number
Clay ton County, Iowa
: R. , range: well construction data from Resources, Geological Survey Bureau]
Location Sec. T. R.
Well nest
BS1-A BS1-B BS1-D
425433091285001 425433091285002 425433091285004
NWSE31 NWSE31 NWSE31
94N 94N 94N
05W 05W 05W
Well nest
BS2-E BS2-G
425736091260302 425736091260303
SENW16 SENW16
94N 94N
05W 05W
Well nest
BS3 BS3-A BS3-B BS3-C
430145091253001 430145091253002 430145091253003 430145091253004
SWNW22 SWNW22 SWNW22 SWNW22
95N 95N 95N 95N
05W 05W 05W 05W
1 1 1 1
Well nest
BS4 BS4-A BS4-B BS4-C
430133091344801 430133091344802 430133091344803 430133091344804
NWSE20 NWSE20 NWSE20 NWSE20
95N 95N 95N 95N
06W 06W 06W 06W
1 1 1 1
Alti- Well tude depth (feet) (feet)
BS1
855 855 855
BS2
950 950
BS3
,080 ,080 ,080 ,080
BS4
,160 ,160 ,160 ,160
36 85
215
180 335
397 185 60 26
580 361 139 61
Open interval (feet) Aquifer
33-36 61-85
173-215
165-180 300-335
351-397 165-185
11-26
550-580 261-361 130-139 50-61
Unconsolidated Galena Saint Peter
Galena Saint Peter
Saint Peter Galena Galena Unconsolidated
Saint Peter Galena Unconsolidated Unconsolidated
Single wells
DCW1 DCW2 DCW3
430040091325402 430040091325403 430040091325410
SESE28 SESE28 SESE28
95N 95N 95N
06W 06W 06W
1 1 1
,070 ,070 ,100
13 11 15
11-13 8-11
13-15
Unconsolidated Unconsolidated Unconsolidated
Lysimeters
DCLA DCLB DCLC DCLD
430040091325404 430040091325405 430040091325406 430040091325407
SESE28 SESE28 SESE28 SESE28
95N 95N 95N 95N
06W 06W 06W 06W
1 1 1 1
,070 ,070 ,070 ,070
8.5 7.0 5.5 4.0
Unconsol idated Unconsolidated Unconsolidated Unconsolidated
Tile line
DCT2 430040091325408 SESE28 95N 06W 1,070
30
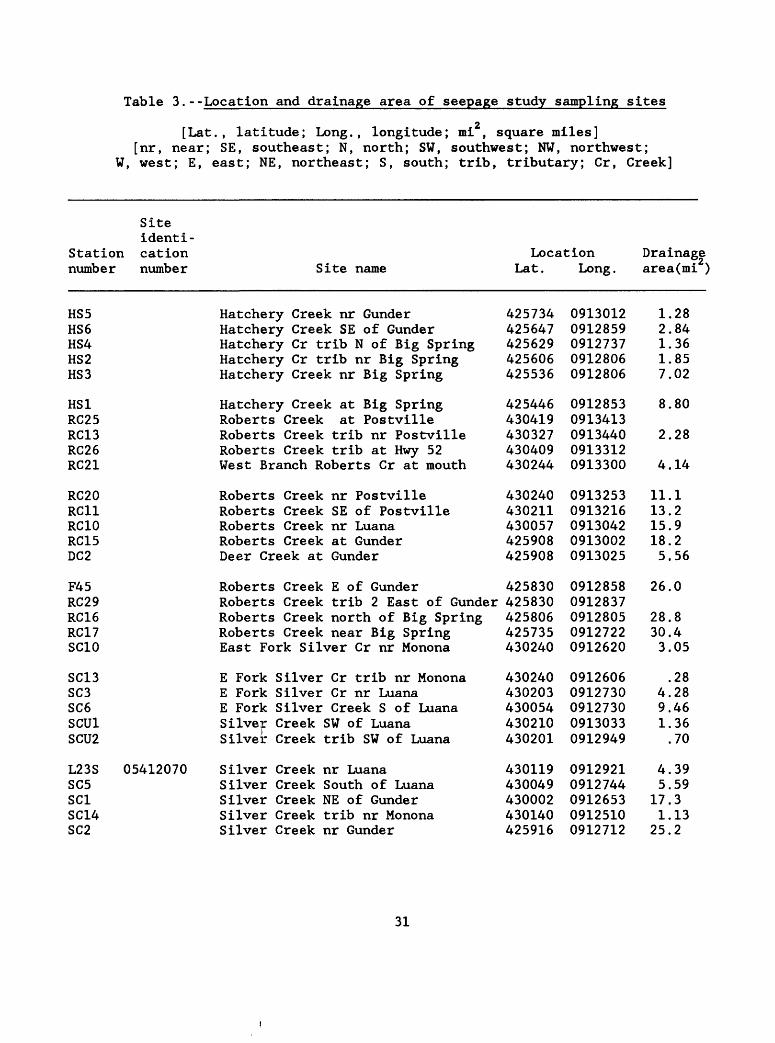
Table 3.--Location and drainage area of seepage study sampling sites
2[Lat., latitude; Long., longitude; mi , square miles][nr, near; SE, southeast; N, north; SW, southwest; NW, northwest;
W, west; E, east; NE, northeast; S, south; trib, tributary; Cr, Creek]
Site identi-
Station cation number number
HS5 HS6 HS4 HS2 HS3
HS1 RC25RC13RC26 RC21
RC20RC11RC10RC15DC2
F45RC29RC16 RC17 SC10
SC13SC3SC6SCU1 SCU2
L23S 05412070SC5SCISC14SC2
Site name
Hatchery Creek nr Gunder Hatchery Creek SE of Gunder Hatchery Cr trib N of Big Spring Hatchery Cr trib nr Big Spring Hatchery Creek nr Big Spring
Hatchery Creek at Big Spring Roberts Creek at PostvilleRoberts Creek trib nr PostvilleRoberts Creek trib at Hwy 52 West Branch Roberts Cr at mouth
Roberts Creek nr PostvilleRoberts Creek SE of PostvilleRoberts Creek nr LuanaRoberts Creek at GunderDeer Creek at Gunder
Roberts Creek E of GunderRoberts Creek trib 2 East of GunderRoberts Creek north of Big Spring Roberts Creek near Big Spring East Fork Silver Cr nr Monona
E Fork Silver Cr trib nr MononaE Fork Silver Cr nr LuanaE Fork Silver Creek S of LuanaSilver Creek SW of Luana Silver Creek trib SW of Luana
Silver Creek nr LuanaSilver Creek South of LuanaSilver Creek NE of GunderSilver Creek trib nr MononaSilver Creek nr Gunder
Location Lat . Long .
425734 425647 425629 425606 425536
425446 430419430327430409 430244
430240430211430057425908425908
425830425830425806 425735 430240
430240430203430054430210 430201
430119430049430002430140425916
0913012 0912859 0912737 0912806 0912806
0912853 091341309134400913312 0913300
09132530913216091304209130020913025
091285809128370912805 0912722 0912620
0912606091273009127300913033 0912949
09129210912744091265309125100912712
Drainage area(mi ]
1.28 2.84 1.36 1.85 7.02
8.80
2.28
4.14
11.113.215.918.25.56
26.0
28.8 30.4 3.05
.284.289.461.36 .70
4.395.59
17.31.13
25.2
31
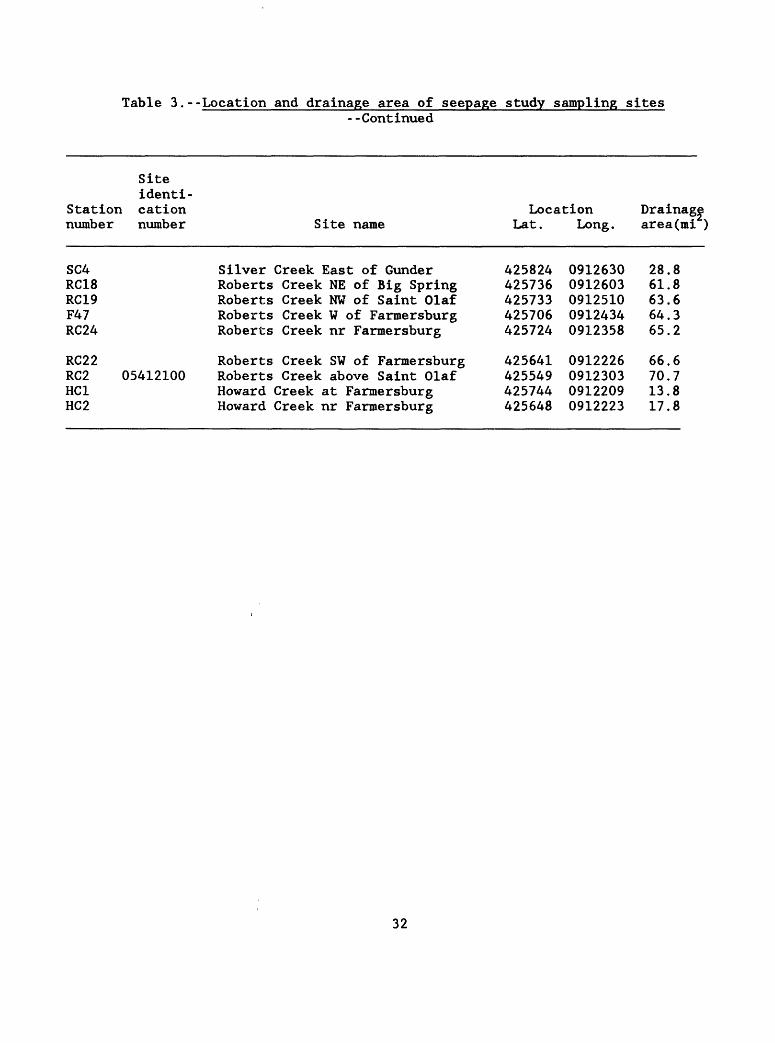
Table 3.--Location and drainage area of seepage study sampling sites--Continued
Site identi-
Station cation number number Site name
Location Lat. Long.
Drainage area(mi )
SC4RC18RC19F47RC24
RC22 RC2 HC1 HC2
05412100
Silver Creek East of Gunder Roberts Creek NE of Big Spring Roberts Creek NW of Saint Olaf Roberts Creek W of Farmersburg Roberts Creek nr Farmersburg
Roberts Creek SW of Farmersburg Roberts Creek above Saint Olaf Howard Creek at Farmersburg Howard Creek nr Farmersburg
425824425736425733425706425724
09126300912603091251009124340912358
28.861.863.664.365.2
425641 0912226 66.6425549 0912303 70.7425744 0912209 13.8425648 0912223 17.8
32
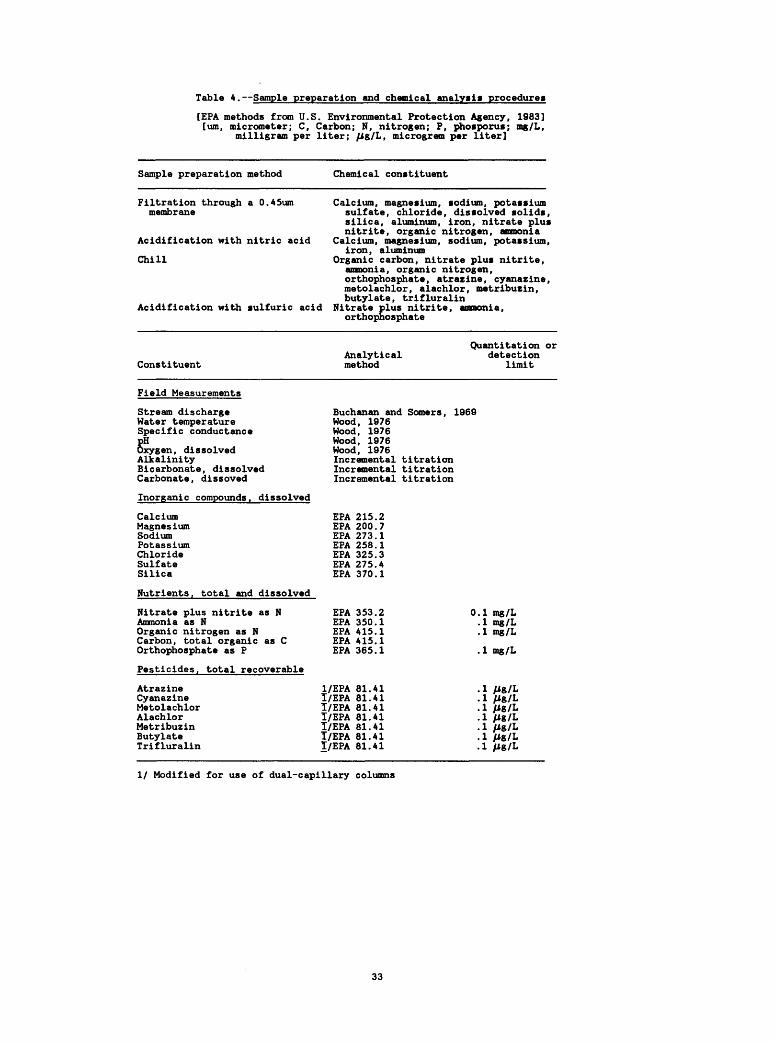
Table 4. Sample preparation and chemical analysis procedures
[EPA methods from U.S. Environmental Protection Agency, 1983][urn, micrometer; C, Carbon; N, nitrogen; P, phosporus; mg/L,
milligram per liter; /Ig/L, microgram par liter]
Sample preparation method Chemical constituent
Filtration through a 0.45um membrane
Acidification with nitric acid
Chill
Acidification with sulfuric acid
Calcium, magnesium, sodium, potassium sulfate, chloride, dissolved solids, silica, aluminum, iron, nitrate plus nitrite, organic nitrogen, ammonia
Calcium, magnesium, sodium, potassium, iron, aluminum
Organic carbon, nitrate plus nitrite, ammonia, organic nitrogen, orthophosphate, atrazine, cyanazine, metolachlor, alachlor, metribuzin, butylate, trifluralin
Nitrate plus nitrite, ammonia, orthophosphate
ConstituentAnalytical method
Quantitation or detection
limit
Field Measurements
Stream discharge Water temperature Specific conductance pHOxygen, dissolved AlkalinityBicarbonate, dissolved Carbonate, dissoved
Inorganic compounds, dissolved
CalciumMagnesiumSodiumPotassiumChlorideSulfateSilica
Nutrients, total and dissolved
Nitrate plus nitrite as N Ammonia as N Organic nitrogen as N Carbon, total organic as C Orthophosphate as P
Pesticides, total recoverable
Buchanan and Somers, 1969 Wood, 1976 Wood, 1976 Wood, 1976 Wood, 1976Incremental titration Incremental titration Incremental titration
EPA 215.2EPA 200.7 EPA 273.1 EPA 258.1 EPA 325.3 EPA 275.4 EPA 370.1
EPA 353.2 EPA 350.1 EPA 415.1 EPA 415.1EPA 365.1
1.1 mg/L .1 mg/L .1 mg/L
.1 mg/L
AtrazineCyanazineMetolachlorAlachlorMetribuzinButylateTrifluralin
1/EPA 81.41T/EPA 81.41T/EPA 81.41T/EPA 81.41T/EPA 81.41T/EPA 81.41T/EPA 81.41
.1 /ig/L
.1 /ig/L
.1 /ig/L
.1 /ig/L
.1 /*8/L
.1 /ig/L 1 /*8/L
I/ Modified for use of dual-capillary columns
33
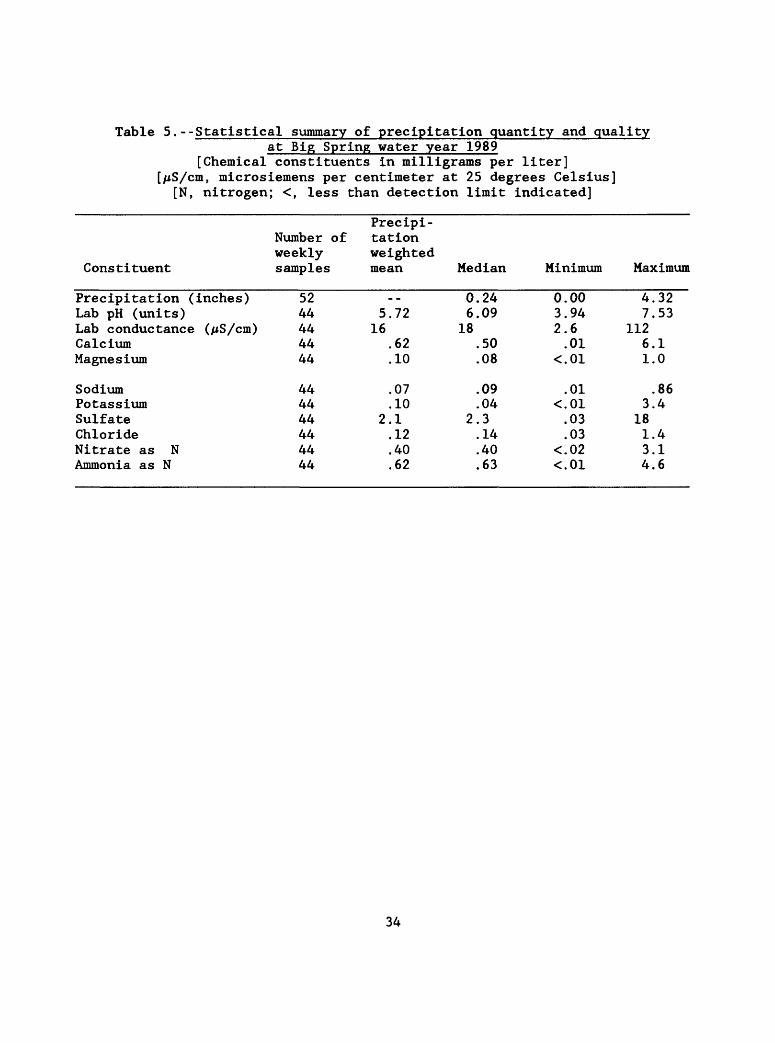
Table 5.--Statistical summary of precipitation quantity and qualityat Big Spring water year 1989
[Chemical constituents in milligrams per liter] [/iS/cm, microsiemens per centimeter at 25 degrees Celsius]
[N, nitrogen; < f less than detection limit indicated]
Constituent
Number ofweeklysamples
Precipi tation weighted mean Median Minimum
Sodium Potassium Sulfate Chloride Nitrate as N Ammonia as N
444444444444
.07
.10 2.1 .12 .40 .62
.09
.04 2.3 .14 .40 .63
.01<.01.03.03
<.02
Maximum
Precipitation (inches)Lab pH (units)Lab conductance (/iS/cm)CalciumMagnesium
5244444444
--5.72
16.62.10
0.246.09
18.50.08
0.003.942.6.01
<.01
4.327.53
1126.11.0
.863.4
181.43.14.6
34
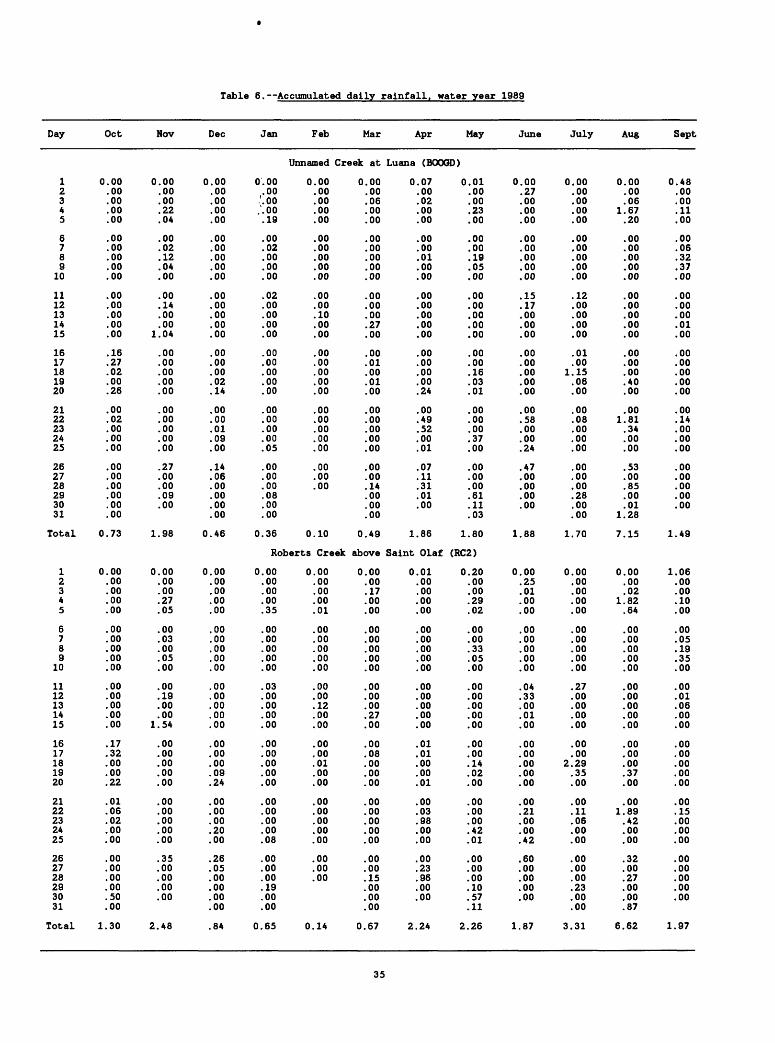
Table 6. Accumulated daily rainfall, water year 1989
Day Oct Nov Dec Jan Feb Mar
Unnamed Creek at
12345
6789
10
1112131415
1617181920
2122232425
262728293031
Total
0.00.00.00.00.00
.00
.00
.00
.00
.00
.00
.00
.00
.00
.00
.16
.27
.02
.00
.26
.00
.02
.00
.00
.00
.00
.00
.00
.00
.00
.00
0.73
0.00.00.00.22.04
.00
.02
.12
.04
.00
.00
.14
.00
.001.04
.00
.00
.00
.00
.00
.00
.00
.00
.00
.00
.27
.00
.00
.09
.00
1.98
0.00.00.00.00.00
.00
.00
.00
.00
.00
.00
.00
.00
.00
.00
.00
.00
.00
.02
.14
.00
.00
.01
.09
.00
.14
.06
.00
.00
.00
.00
0.46
0.00.00
,'.00.'.00.19
.00
.02
.00
.00
.00
.02
.00
.00
.00
.00
.00
.00
.00
.00
.00
.00
.00
.00
.00
.05
.00
.00
.00
.08
.00
.00
0.36
0.00.00.00.00.00
.00
.00
.00
.00
.00
.00
.00
.10
.00
.00
.00
.00
.00
.00
.00
.00
.00
.00
.00
.00
.00
.00
.00
0.10
Roberts Creek
12345
6789
10
1112131415
1617181920
2122232425
262728293031
0.00.00.00.00.00
.00
.00
.00
.00
.00
.00
.00
.00
.00
.00
.17
.32
.00
.00
.22
.01
.06
.02
.00
.00
.00
.00
.00
.00
.50
.00
0.00.00.00.27.05
.00
.03
.00
.05
.00
.00
.19
.00
.001.54
.00
.00
.00
.00
.00
.00
.00
.00
.00
.00
.35
.00
.00
.00
.00
0.00.00.00.00.00
.00
.00
.00
.00
.00
.00
.00
.00
.00
.00
.00
.00
.00
.09
.24
.00
.00
.00
.20
.00
.26
.05
.00
.00
.00
.00
0.00.00.00.00.35
.00
.00
.00
.00
.00
.03
.00
.00
.00
.00
.00
.00
.00
.00
.00
.00
.00
.00
.00
.08
.00
.00
.00
.19
.00
.00
0.00.00.00.00.01
.00
.00
.00
.00
.00
.00
.00
.12
.00
.00
.00
.00
.01
.00
.00
.00
.00
.00
.00
.00
.00
.00
.00
0.00.00.06.00.00
.00
.00
.00
.00
.00
.00
.00
.00
.27
.00
.00
.01
.00
.01
.00
.00
.00
.00
.00
.00
.00
.00
.14
.00
.00
.00
0.49
above
0.00.00.17.00.00
.00
.00
.00
.00
.00
.00
.00
.00
.27
.00
.00
.08
.00
.00
.00
.00
.00
.00
.00
.00
.00
.00
.15
.00
.00
.00
Apr May June July Aug Sept
Luana (BOOGD)
0.07.00.02.00.00
.00
.00
.01
.00
.00
.00
.00
.00
.00
.00
.00
.00
.00
.00
.24
.00
.49
.52
.00
.01
.07
.11
.31
.01
.00
1.86
Saint Olaf
0.01.00.00.00.00
.00
.00
.00
.00
.00
.00
.00
.00
.00
.00
.01
.01
.00
.00
.01
.00
.03
.98
.00
.00
.00
.23
.96
.00
.00
0.01.00.00.23.00
.00
.00
.19
.05
.00
.00
.00
.00
.00
.00
.00
.00
.16
.03
.01
.00
.00
.00
.37
.00
.00
.00
.00
.61
.11
.03
1.80
(RC2)
0.20.00.00.29.02
.00
.00
.33
.05
.00
.00
.00
.00
.00
.00
.00
.00
.14
.02
.00
.00
.00
.00
.42
.01
.00
.00
.00
.10
.57
.11
0.00.27.00.00.00
.00
.00
.00
.00
.00
.15
.17
.00
.00
.00
.00
.00
.00
.00
.00
.00
.58
.00
.00
.24
.47
.00
.00
.00
.00
1.88
0.00.25.01.00.00
.00
.00
.00
.00
.00
.04
.33
.00
.01
.00
.00
.00
.00
.00
.00
.00
.21
.00
.00
.42
.60
.00
.00
.00
.00
0.00.00.00.00.00
.00
.00
.00
.00
.00
.12
.00
.00
.00
.00
.01
.001.15.06.00
.00
.08
.00
.00
.00
.00
.00
.00
.28
.00
.00
1.70
0.00.00.00.00.00
.00
.00
.00
.00
.00
.27
.00
.00
.00
.00
.00
.002.29.35.00
.00
.11
.06
.00
.00
.00
.00
.00
.23
.00
.00
0.00 0.48.00 .00.06 .00
1.67 .11.20 .00
.00 .00
.00 .06
.00 .32
.00 .37
.00 .00
.00 .00
.00 .00
.00 .00
.00 .01
.00 .00
.00 .00
.00 .00
.00 .00
.40 .00
.00 .00
.00 .001.81 .14.34 .00.00 .00.00 .00
.53 .00
.00 .00
.85 .00
.00 .00
.01 .001.28
7.15 1.49
0.00 1.06.00 .00.02 .00
1 . 82 .10.64 .00
.00 .00
.00 .05
.00 .19
.00 .35
.00 .00
.00 .00
.00 .01
.00 .06
.00 .00
.00 .00
.00 .00
.00 .00
.00 .00
.37 .00
.00 .00
.00 .001.89 .15.42 .00.00 .00.00 .00
.32 .00
.00 .00
.27 .00
.00 .00
.00 .00
.87
Total 1.30 2.48 .84 0.65 0.14 0.67 2.24 2.26 1.87 3.31 6.62 1.97
35
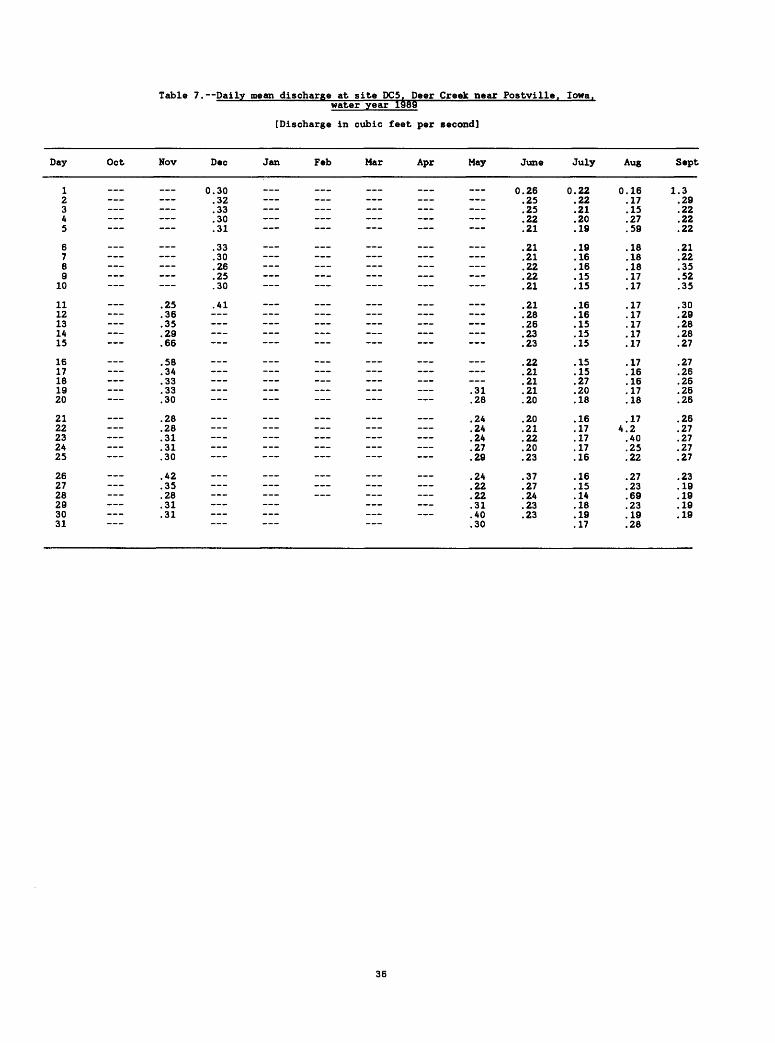
Table 7. Daily mean discharge at site DCS. Deer Creek near Postville. Iowa.
Day
12345
6789
10
1112131415
1617181920
2122232425
262728293031
Oct Nov
__ __
.25
.36
.35
.29
.66
.58
.34 .33
.33
.30
.28
.28
.31
.31 .30
.42
.35
.28
.31
.31
Dec
0.30.32.33.30.31
.33
.30
.26
.25
.30
.41
water year 1989
[Discharge in cubic feet per second]
Jan Feb Mar Apr May
_ _ __ __ __ ___
.31
.28
.2424.24.27.29
.242222.31.40.30
June
0.26.25.25.22.21
.21
.21
.22
.22
.21
.21
.28
.26
.23
.23
.22
.21
.21
.21
.20
.20
.21
.22
.20
.23
.37
.27
.24
.23
.23
July
0.22.22.21.20.19
.19
.16
.16
.15
.15
.16
.16
.15
.15
.15
.15
.15
.27
.20
.18
.16
.17
.17
.17
.16
.16
.15
.14
.18
.19
.17
Aug
0.16.17.15.27.59
.18
.18
.18
.17
.17
.17
.17
.17
.17
.17
.17
.16
.16
.17
.18
.174.2.40.25.22
.27
.23
.69
.23
.19
.28
Sept
1.3.29.22.22.22
.21
.22
.35
.52
.35
.30
.29
.28
.28
.27
.27
.26
.26
.26
.26
.26
.27
.27
.27
.27
.23
.19
.19
.19
.19
36
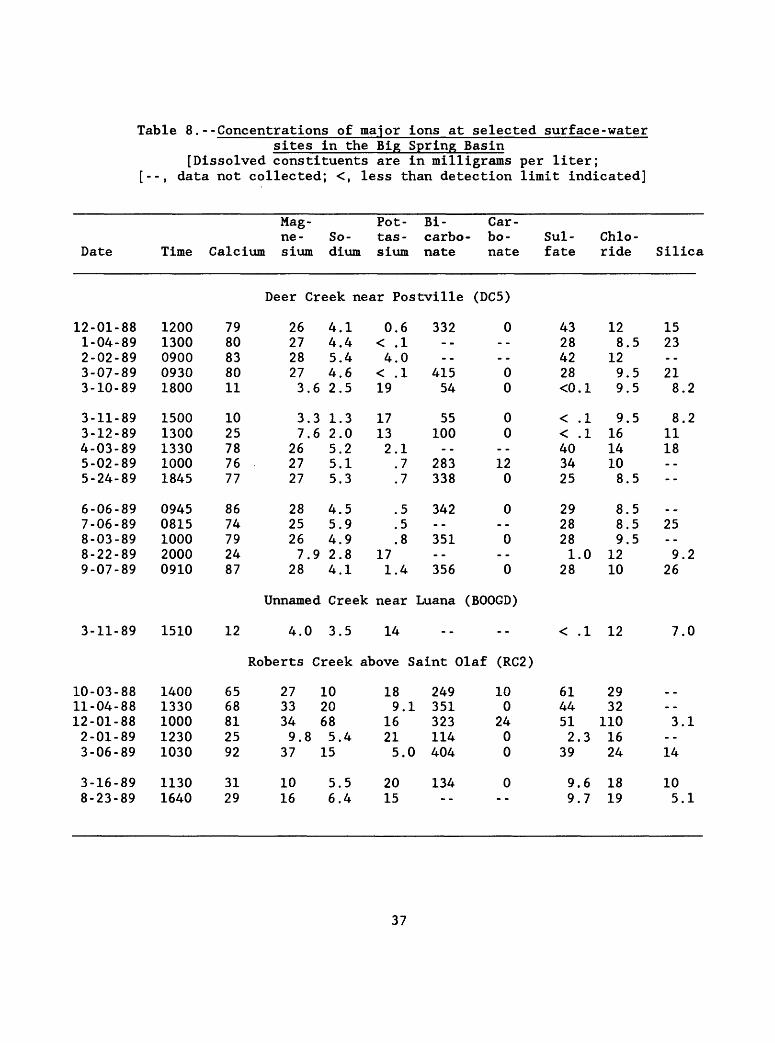
Table 8.--Concentrations of major ions at selected surface-watersites in the Big Spring Basin
[Dissolved constituents are in milligrams per liter; [--, data not collected; <, less than detection limit indicated]
Date Time Calcium
Mag ne sium
So dium
Pot- tas- sium
Bi carbo nate
Deer Creek near Postville
12-01-881-04-892-02-893-07-893-10-89
3-11-893-12-894-03-895-02-895-24-89
6-06-897-06-898-03-898-22-899-07-89
12001300090009301800
15001300133010001845
09450815100020000910
7980838011
1025787677
8674792487
262728273.6
3.37.6
262727
2825267.9
28
4.14.45.44.62.5
1.32.05.25.15.3
4.55.94.92.84.1
0.6< .14.0
< .119
17132.1.7.7
.5
.5
.8171.4
332
41554
55100
283338
342
351
356
Car bo nate
(DCS)
0
00
00
120
0
0
0
Sul- fate
43284228<0.1
< .1< .1403425
2928281.0
28
Chlo ride
128.5
129.59.5
9.51614108.5
8.58.59.5
1210
Silica
1523
218.
8.1118
--
_ _25
9.26
2
2
2
3-11-89 1510
10-03-8811-04-8812-01-882-01-893-06-89
3-16-89 8-23-89
Unnamed Creek near Luana (BOOGD)
12 4.0 3.5 14
14001330100012301030
11301640
6568812592
3129
Roberts Creek above Saint Olaf (RC2)
100
2400
27 1033 2034 689.8 5.4
189.1
1621
249351323114
37 15 5.0 404
1016
5.5 6.4
2015
134
< .1 12
61 2944 3251 1102.3 16
39 24
9.6 189.7 19
7.0
3.1
14
105.1
37
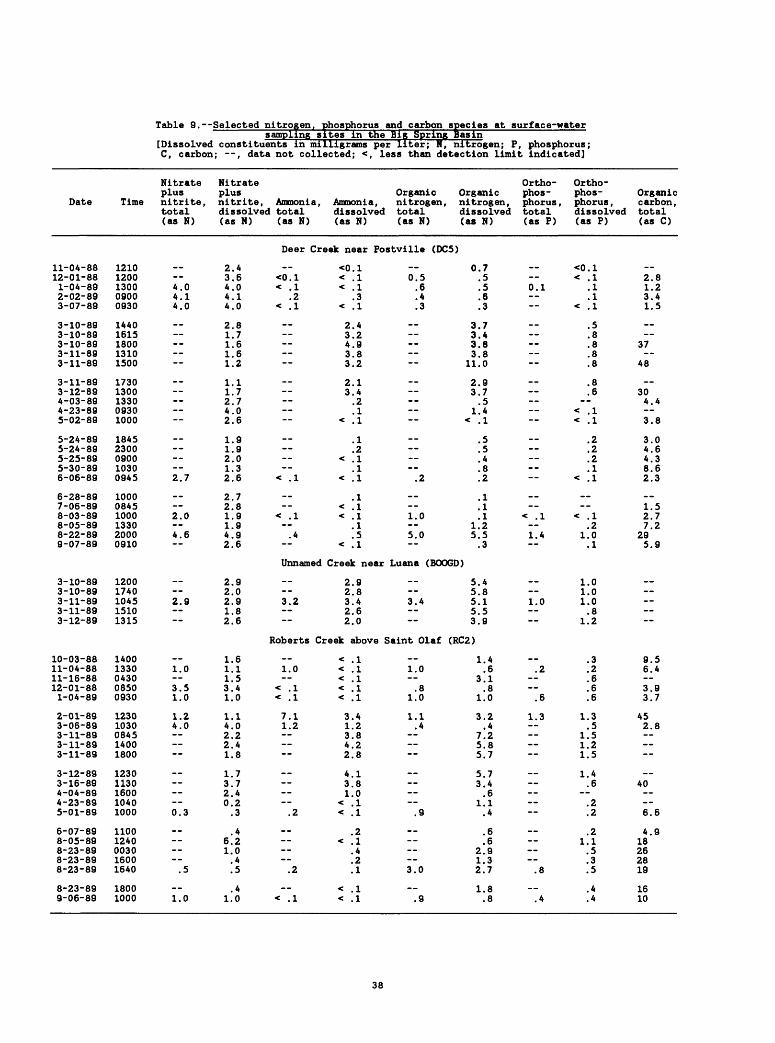
Table 9. Selected nitrogen, phosphorus and carbon
Date
11-04-8812-01-881-04-892-02-893-07-89
3-10-893-10-893-10-893-11-893-11-89
3-11-893-12-894-03-894-23-895-02-89
5-24-895-24-895-25-895-30-896-06-89
6-28-897-06-898-03-898-05-898-22-899-07-89
Time
12101200130009000930
14401615180013101500
17301300133009301000
18452300090010300945
100008451000133020000910
[Dissolved C, carbon
Nitrateplus nitrite, total(as N)
4.04.14.0
--
------2.7
2.0 4.6
species at surface-watersampling sites in the Big Spring Basin
constituents in milligrams ; , data not collected; <,
Nitrateplus nitrite, dissolved(as N)
2.43.64.04.14.0
2.81.71.61.61.2
1.11.72.74.02.6
1.91.92.01.32.6
2.72.81.91.94.92.6
per liter; N, nitrogen; P less than detection limi
Organic Ammonia, Ammonia, nitrogen, total dissolved total(as N)
Deer
<0.1< .1
.2< .1
--
--
----
< .1
--
< .1 .4
(as N)
Creek near
<0.1< .1< .1
.3< .1
2.43.24.93.83.2
2.13.4.2.1
< .1
.1
.2< .1
.1< .1
.1< .1< .1
.1
.5< .1
(as N)
Organic nitrogen, dissolved(as N)
, phosphorus ; t indicated]
Ortho-phos phorus , total(as P)
Ortho-phos phorus , dissolved(as P)
Organic carbon, total(as C)
Postville (DCS)
0.5.6.4.3
--
.2
1.0 5.0
0.7.5.5.6.3
3.73.43.83.8
11.0
2.93.7.5
1.4< .1
.5
.5
.4
.8
.2
.1
.1
.11.25.5.3
0.1
_
--
< .1 1.4
<0.1< .1
.1
.1< .1
.5
.8
.8
.8
.8
.8
.6--
< .1< .1
.2
.2
.2
.1< .1
--
< .1.2
1.0.1
2.81.23.41.5
37--
48
304.4 3.8
3.04.64.38.62.3
1.52.77.2
295.9
Unnamed Creek near Luana (BOOGD)
3-10-893-10-893-11-893-11-893-12-89
12001740104515101315
2.9
2.92.02.91.82.6
--3.2
Roberts
10-03-8811-04-8811-16-8812-01-881-04-89
2-01-893-06-893-11-893-11-893-11-89
3-12-893-16-894-04-894-23-895-01-89
6-07-898-05-898-23-898-23-898-23-89
8-23-899-06-89
14001330043008500930
12301030084514001800
12301130160010401000
11001240003016001640
18001000
1.0 3.51.0
1.24.0
0.3
--.5
1.0
1.61.11.53.41.0
1.14.02.22.41.8
1.73.72.40.2.3
.46.21.0.4.5
.41.0
1.0
< .1< .1
7.11.2
.2
.2
< .1
2.92.83.42.62.0
3.4
Creek above Saint Olaf
< .1< .1< .1< .1< .1
3.41.23.84.22.8
4.13.81.0
< .1< .1
.2< .1
.4
.2
.1
< .1< .1
1.0 .8
1.0
1.1.4
.9
---- 3.0
.9
5.45.85.15.53.9
(RC2)
1.4.6
3.1.8
1.0
3.2.4
7.25.85.7
5.73.4.6
1.1.4
.6
.62.91.32.7
1.8.8
1.0
.2 .6
1.3
.8
.4
1.01.01.0.8
1.2
.3
.2
.6
.6
.6
1.3.5
1.51.21.5
1.4.6 .2.2
.21.1.5.3.5
.4
.4
9.56.4 3.93.7
452.8
40 --6.6
4.918262819
1610
38
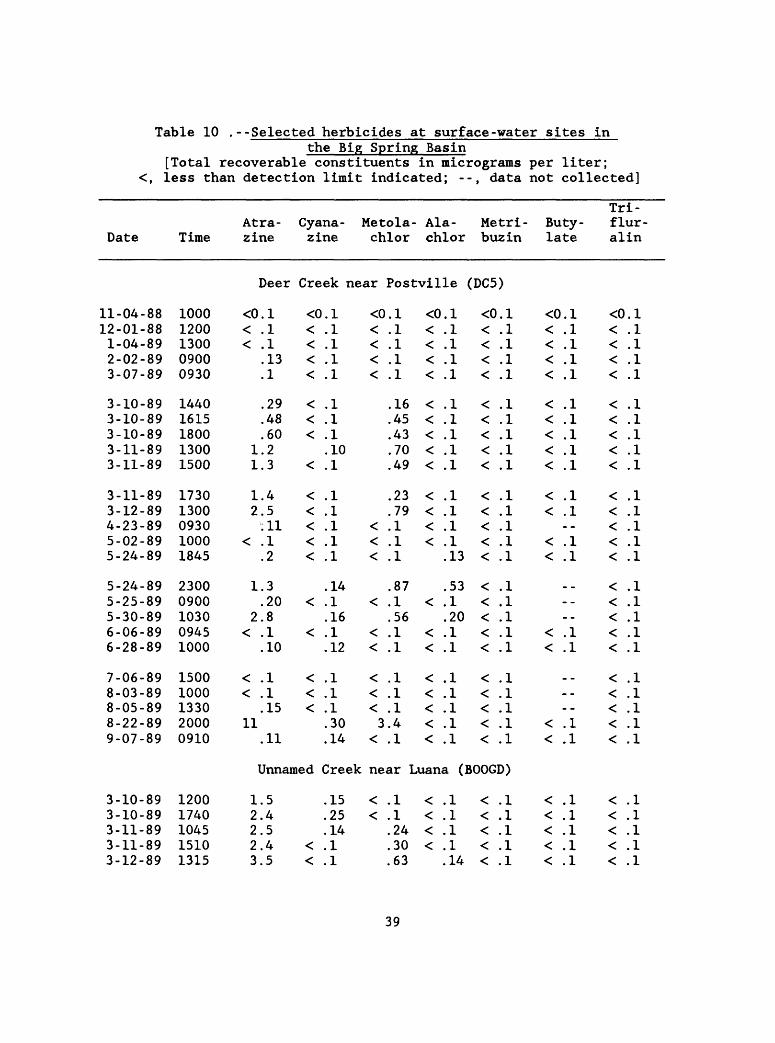
Table 10 .--Selected herbicides at surface-water sites inthe Big Spring Basin
[Total recoverable constituents in micrograms per liter; <, less than detection limit indicated; --, data not collected]
Date Time
Tri-Atra- Cyana- Metola- Ala- Metri- Buty- flur- zine zine chlor chlor buzin late alin
Deer Creek near Postville (DCS)
11-04-8812-01-881-04-892-02-893-07-89
3-10-893-10-893-10-893-11-893-11-89
3-11-893-12-894-23-895-02-895-24-89
5-24-895-25-895-30-896-06-896-28-89
7-06-898-03-898-05-898-22-899-07-89
10001200130009000930
14401615180013001500
17301300093010001845
23000900103009451000
15001000133020000910
<0 . 1 <0 . 1<<
11
12
<
1
2<
<<
11
.1 <
.1 <
.13 <
.1 <
.29 <
.48 <
.60 <
.2
.3 <
.4 <
.5 <
.11 <
.1 <
.2 <
.3
.20 <
.8
.1 <
.10
.1 <
.1 <
.15 <
.11
Unnamed
3-10-893-10-893-11-893-11-893-12-89
12001740104515101315
12223
.5
.4
.5
.4 <
.5 <
.1
.1
.1
.1
.1
.1
.1
.10
.1
.1
.1
.1
.1
.1
.14
.1
.16
.1
.12
.1
.1
.1
.30
.14
Creek
.15
.25
.14
.1
.1
<0.1< .1< .1< .1< .1
.16
.45
.43
.70
.49
.23
.79< .1< .1< .1
.87< .1
.56< .1< .1
< .1< .1< .13.4
< .1
<0.< .< .< .< .
< .< .< .< .< .
< .< .< .< .
< ..
< .< .
< .< .< .< .< .
near Luana
< .1< .1
.24
.30
.63
< .< .< .< .
%
I1111
11111
111113
5312011
11111
<(<<<<
<<<<<
<<<<<
<<<<<
<<<<<
).l.1.1.1.1
.1
.1
.1
.1
.1
.1
.1
.1
.1
.1
.1
.1
.1
.1
.1
.1
.1
.1
.1
.1
<0.1< .1< .1< .1< .1
< .1< .1< .1< .1< .1
< .1< .1
< .1< .1
_ _
< .1< .1
_ _
< .1< .1
<0.1< .1< .1< .1< .1
< .1< .1< .1< .1< .1
< .1< .1< .1< .1< .1
< .1< .1< .1< .1< .1
< .1< .1< .1< .1< .1
(BOOGD)
111114
<<<<<
.1
.1
.1
.1
.1
< .1< .1< .1< .1< .1
< .1< .1< .1< .1< .1
39
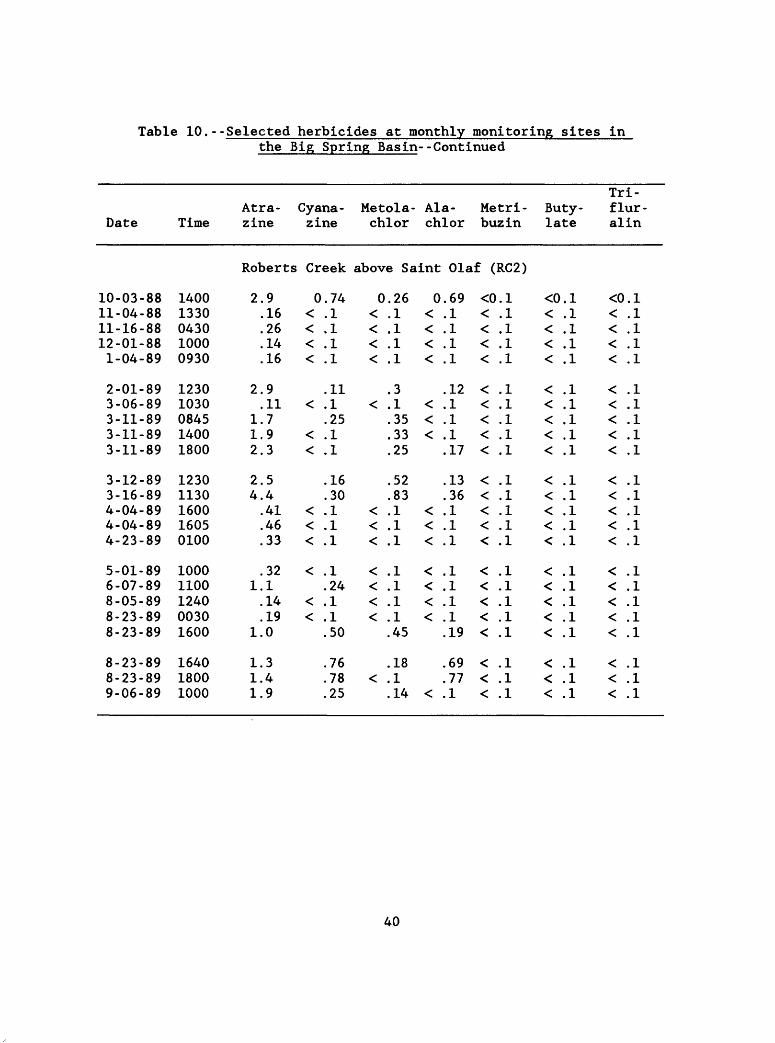
Table 10.--Selected herbicides at monthly monitoring sites in the Big Spring Basin--Continued
Tri-Atra- Cyana- Metola- Ala- Metri- Buty- flur-
Date Time zine zine chlor chlor buz in late alin
10-03-8811-04-8811-16-8812-01-881-04-89
2-01-893-06-893-11-893-11-893-11-89
3-12-893-16-894-04-894-04-894-23-89
5-01-896-07-898-05-898-23-898-23-89
8-23-898-23-899-06-89
14001330043010000930
12301030084514001800
12301130160016050100
10001100124000301600
164018001000
Roberts
2.9.16.26.14.16
2.9.11
1.71.92.3
2.54.4.41.46.33
.321.1.14.19
1.0
1.31.41.9
Creek above Saint Olaf
0.74< .1< .1< .1< .1
.11< .1
.25< .1< .1
.16
.30< .1< .1< .1
< .1.24
< .1< .1
.50
.76
.78
.25
0.26< .1< .1< .1< .1
.3< .1
.35
.33
.25
.52
.83< .1< .1< .1
< .1< .1< .1< .1
.45
.18< .1
.14
0.69 << .1 «< .1 << .1 «< .1 «
.12 << .1 «< .1 «< .1 «
.17 «
.13 «
.36 «< .1 «< .1 «< .1 «
< .1 << .1 << .1 << .1 <
.19 <
.69 <
.77 << .1 «
(RC2)
£0.1£ .1£ .1£ .1£ .1
£ .1c .1£ .1£ .1£ .1
C .1c .1C .1C .1C .1
: .1: .1: .1: .1: .1
: .1C .1: .1
<0.1< .1< .1< .1< .1
< .1< .1< .1< .1< .1
< .1< .1< .1< .1< .1
< .1< .1< .1< .1< .1
< .1< .1< .1
<0.1< .1< .1< .1< .1
< .1< .1< .1< .1< .1
< .1< .1< .1< .1< .1
< .1< .1< .1< .1< .1< .1< .1< .1
40
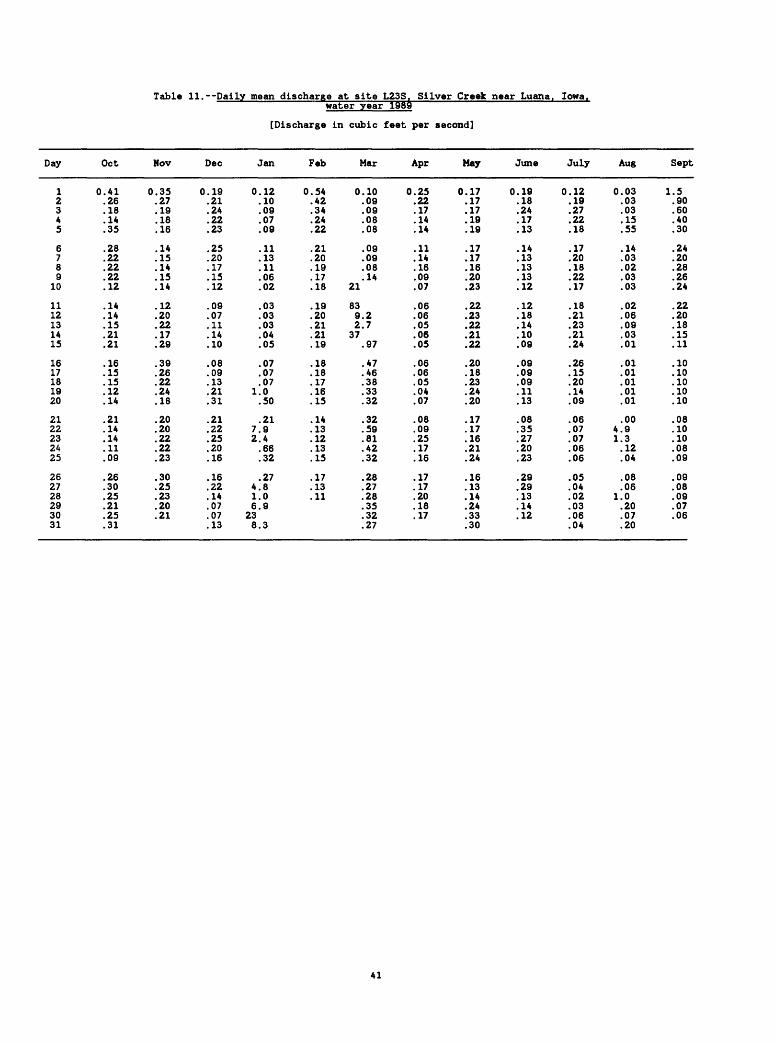
Table 11. Daily mean discharge at site L23S. Silver Creek near Luana.water year 1981?
Iowa,
[Discharge in cubic feet per second]
Day
12345
6789
10
1112131415
1617181920
2122232425
262728293031
Oct
0.41.26.18.14.35
.28
.22
.22
.22
.12
.14
.14
.15
.21
.21
.16
.15
.15
.12
.14
.21
.14
.14
.11
.09
.26
.30
.25
.21
.25
.31
Nov
0.35.27.19.18.16
.14
.15
.14
.15
.14
.12
.20
.22
.17
.29
.39
.26
.22
.24
.18
.20
.20
.22
.22
.23
.30
.25
.23
.20
.21
Dec
0.19.21.24.22.23
.25
.20
.17
.15
.12
.09
.07
.11
.14
.10
.08
.09
.13
.21
.31
.21
.22
.25
.20
.16
.16
.22
.14
.07
.07
.13
Jan
0.12.10.09.07.09
.11
.13
.11
.06
.02
.03
.03
.03
.04
.05
.07
.07
.071.0.50
.217.92.4.66.32
.274.81.06.9
238.3
Feb
0.54.42.34.24.22
.21
.20
.19
.17
.18
.19
.20
.21
.21
.19
.18
.18
.17
.16
.15
.14
.13
.12
.13
.15
.17
.13
.11
Mar
0.10.09.09.08.08
.09
.09
.08
.1421
839.22.7
37.97
.47
.46
.38
.33
.32
.32
.59
.81
.42
.32
.28
.27
.28
.35
.32
.27
Apr
0.25.22.17.14.14
.11
.14
.16
.09
.07
.06
.06
.05
.06
.05
.06
.06
.05
.04
.07
.08
.09
.25
.17
.16
.17
.17
.20
.18
.17
May
0.17.17.17.19.19
.17
.17
.16
.20
.23
.22
.23
.22
.21
.22
.20
.18
.23
.24
.20
.17
.17
.16
.21
.24
.16
.13
.14
.24
.33
.30
June
0.19.18.24.17.13
.14
.13
.13
.13
.12
.12
.18
.14
.10
.09
.09
.09
.09
.11
.13
.08
.35
.27
.20
.23
.29
.29
.13
.14
.12
July
0.12.19.27.22.18
.17
.20
.18
.22
.17
.18
.21
.23
.21
.24
.26
.15
.20
.14
.09
.06
.07
.07
.06
.06
.05
.04
.02
.03
.06
.04
Aug
0.03.03.03.15.55
.14
.03
.02
.03
.03
.02
.06
.09
.03
.01
.01
.01
.01
.01
.01
.004.91.3.12.04
.08
.061.0.20.07.20
Sept
1.5.90.60.40.30
.24
.20
.28
.26
.24
.22
.20
.18
.15
.11
.10
.10
.10
.10
.10
.08
.10
.10
.08
.09
.09
.08
.09
.07
.06
41
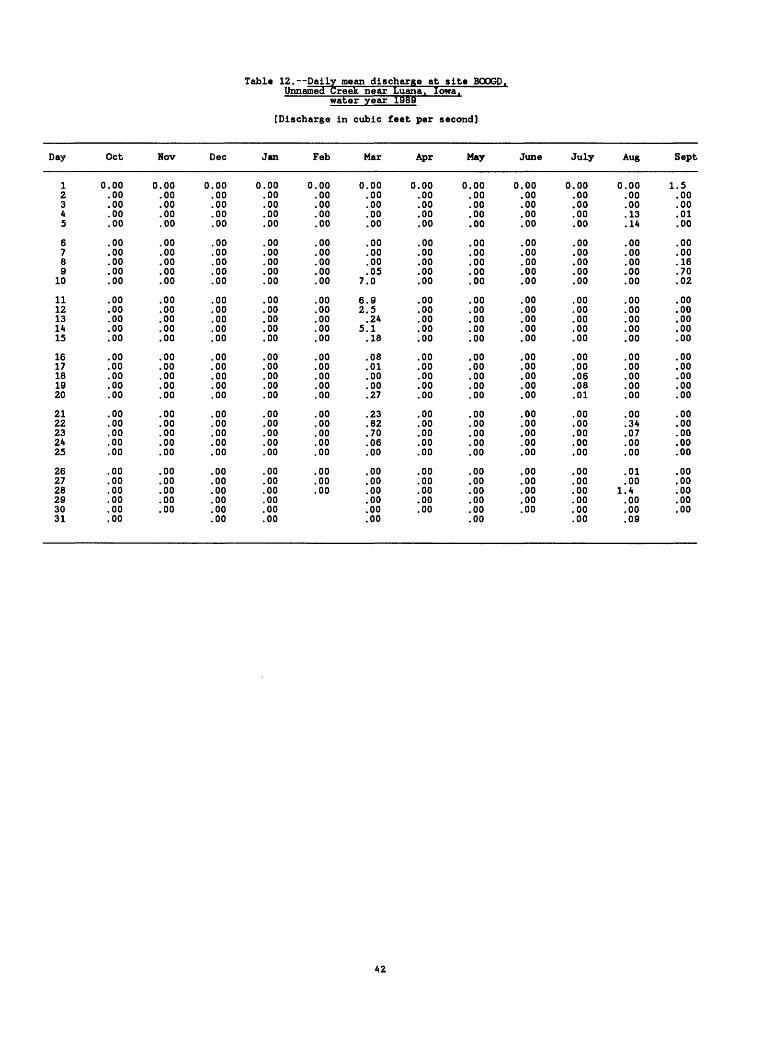
Table 12,. Daily mean discharge at site BOOGD,reek near Luana, Iowa,
water year 1989
[Discharge in cubic feet per second]
Day
12345
6789
10
1112131415
1617181920
2122232425
262728293031
Oct
0.00.00.00.00.00
.00
.00
.00
.00
.00
.00
.00
.00
.00
.00
.00
.00
.00
.00
.00
.00
.00
.00
.00
.00
.00
.00
.00
.00
.00
.00
Nov
0.00.00.00.00.00
.00
.00
.00
.00
.00
.00
.00
.00
.00
.00
.00
.00
.00
.00
.00
.00
.00
.00
.00
.00
.00
.00
.00
.00
.00
Dec
0.00.00.00.00.00
.00
.00
.00
.00
.00
.00
.00
.00
.00
.00
.00
.00
.00
.00
.00
.00
.00
.00
.00
.00
.00
.00
.00
.00
.00
.00
Jan
0.00.00.00.00.00
.00
.00
.00
.00
.00
.00
.00
.00
.00
.00
.00
.00
.00
.00
.00
.00
.00
.00
.00
.00
.00
.00
.00
.00
.00
.00
Feb
0.00.00.00.00.00
.00
.00
.00
.00
.00
.00
.00
.00
.00
.00
.00
.00
.00
.00
.00
.00
.00
.00
.00
.00
.00
.00
.00
Mar
0.00.00.00.00.00
.00
.00
.00
.057.0
6.92.5.24
5.1.18
.08
.01
.00
.00
.27
.23
.82
.70
.06
.00
.00
.00
.00
.00
.00
.00
Apr
0.00.00.00.00.00
.00
.00
.00
.00
.00
.00
.00
.00
.00
.00
.00
.00
.00
.00
.00
.00
.00
.00
.00
.00
.00
.00
.00
.00
.00
May
0.00.00.00.00.00
.00
.00
.00
.00
.00
.00
.00
.00
.00
.00
.00
.00
.00
.00
.00
.00
.00
.00
.00
.00
.00
.00
.00
.00
.00
.00
June
0.00.00.00.00.00
.00
.00
.00
.00
.00
.00
.00
.00
.00
.00
.00
.00
.00
.00
.00
.00
.00
.00
.00
.00
.00
.00
.00
.00
.00
July
0.00.00.00.00.00
.00
.00
.00
.00
.00
.00
.00
.00
.00
.00
.00
.00
.06
.08
.01
.00
.00
.00
.00
.00
.00
.00
.00
.00
.00
.00
Aug
0.00.00.00.13.14
.00
.00
.00
.00
.00
.00
.00
.00
.00
.00
.00
.00
.00
.00
.00
.00
.34
.07
.00
.00
.01
.001.4.00.00.09
Sept
1.5.00.00.01.00
.00
.00
.16
.70
.02
.00
.00
.00
.00
.00
.00
.00
.00
.00
.00
.00
.00
.00
.00
.00
.00
.00
.00
.00
.00
42
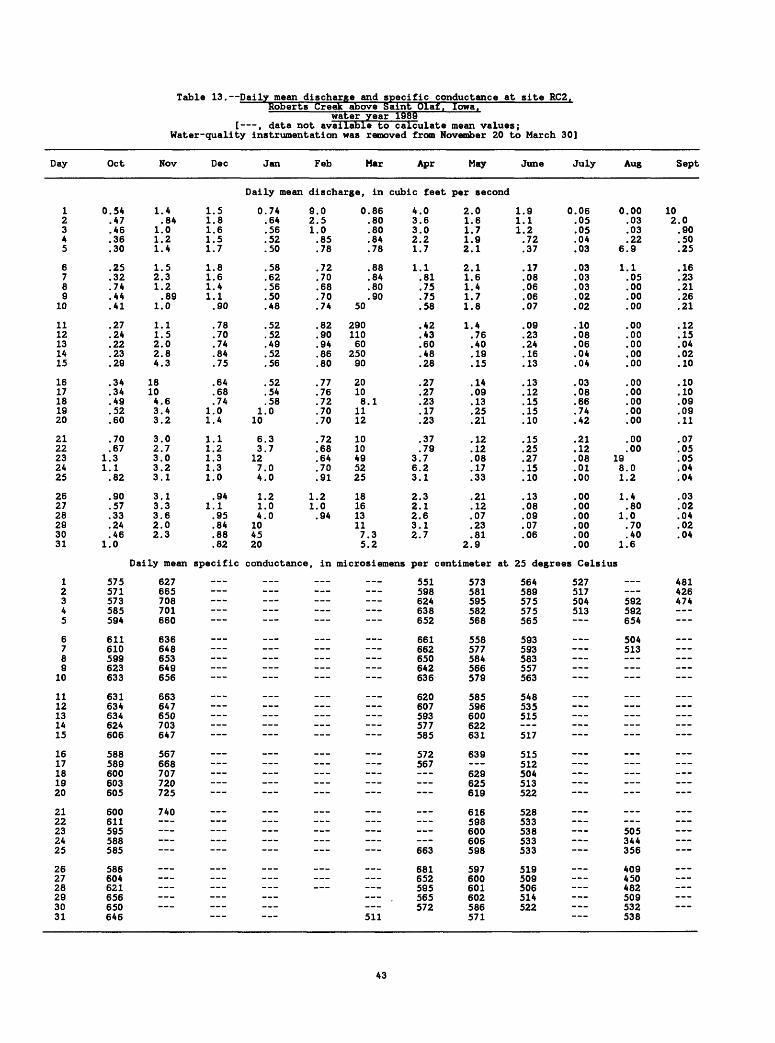
Table 13. Daily mean discharge and specific conductance at site RC2. Roberts Creek~above Saint Olaf. Iowa.
water year 1988[ , data not available to calculate mean values;
Water-quality instrumentation was removed from November 20 to March 30]
Day
12345
6789
10
1112131415
1617181920
2122232425
262728293031
12345
6789
10
1112131415
1617181920
2122232425
262728293031
Oct
0.54.47.46.36.30
.25
.32
.74
.44
.41
.27
.24
.22
.23
.29
.34
.34
.49
.52
.60
.70
.671.31.1.82
.90
.57
.33
.24
.461.0
575571573585594
611610599623633
631634634624606
588589600603605
600611595588585
586604621656650646
Nov
1.4.84
1.01.21.4
1.52.31.2.89
1.0
1.11.52.02.84.3
18104.63.43.2
3.02.73.03.23.1
3.13.33.62.02.3
Daily mean
627665708701660
636648653649656
663647650703647
567668707720725
740
Dec
1.51.81.61.51.7
1.81.61.41.1.90
.78
.70
.74
.84
.75
.64
.68
.741.01.4
1.11.21.31.31.0
.941.1.95.84.88.82
specific
___
___
___
Jan
Daily mean
0.74.64.56.52.50
.58
.62
.56
.50
.48
.52
.52
.49
.52
.56
.52
.54
.581.0
10
6.33.7
127.04.0
1.21.04.0
104520
conductance
Feb Mar
discharge, in
9.0 0.862.5 .801.0 .80.85 .84.78 .78
.72 .88
.70 .84
.68 .80
.70 .90
.74 50
.82 290
.90 110
.94 60
.86 250
.80 90
.77 20
.76 10
.72 8.1
.70 11
.70 12
.72 10
.68 10
.64 49
.70 52
.91 25
1.2 181.0 16.94 13
117.35.2
Apr
cubic feet
4.03.63.02.21.7
1.1.81.75.75.58
.42
.43
.60
.48
.28
.27
.27
.23
.17
.23
.37
.793.76.23.1
2.32.12.63.12.7
May
per second
2.01.61.71.92.1
2.11.61.41.71.8
1.4.76.40.19.15
.14
.09
.13
.25
.21
.12
.12
.08
.17
.33
.21
.12
.07
.23
.812.9
, in microsiemens per centimeter at
511
551598624638652
661662650642636
620607593577585
572567
663
681652595565572
573581595582568
558577584566579
585596600622631
639 629625619
616598600606598
597600601602586571
June
1.91.11.2.72.37
.17
.08
.06
.06
.07
.09
.23
.24
.16
.13
.13
.12
.15
.15
.10
.15
.25
.27
.15
.10
.13
.08
.09
.07
.06
July
0.06.05.05.04.03
.03
.03
.03
.02
.02
.10
.08
.06
.04
.04
.03
.08
.66
.74
.42
.21
.12
Aug
0.00.03.03.22
6.9
1.1.05.00.00.00
.00
.00
.00
.00
.00
.00
.00
.00
.00
.00
.00
.00.08 19.01.00
.00
.00
.00
.00
.00
.00
8.01.2
1.4.80
1.0.70.40
1.6
Sept
102.0.90.50.25
.16
.23
.21
.26
.21
.12
.15
.04
.02
.10
.10
.10
.09
.09
.11
.07
.05
.05
.04
.04
.03
.02
.04
.02
.04
25 degrees Celsius
564589575575565
593593583557563
548535515
517
515512504513522
528533538533533
519509506514522
527517504513
_._
592592654
504513
505344356
409450482509532538
481426474
43
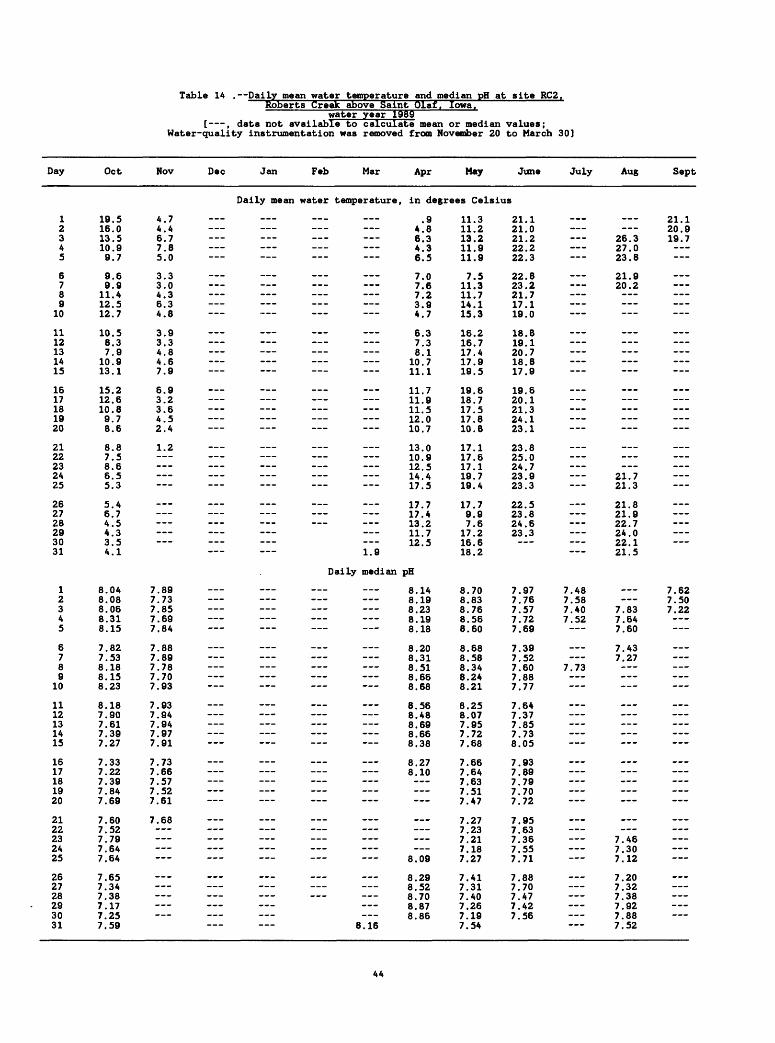
Table 14 . Daily mean water temperature and median pH at site RC2. Roberts Creek above Saint Olaf. Iowa.
water year 1983[ , data not available to calculate mean or median values;
Water-quality instrumentation was removed from November 20 to March 30]
Day
12345
6789
10
1112131415
1617181920
2122232425
262728293031
12345
6789
10
1112131415
1617181920
2122232425
262728293031
Oct
19.516.013.510.99.7
9.69.911.412.512.7
10.58.37.9
10.913.1
15.212.610.89.78.6
8.87.58.66.55.3
5.46.74.54.33.54.1
8.048.088.068.318.15
7.827.538.188.158.23
8.187.907.617.397.27
7.337.227.397.847.69
7.607.527.797.647.64
7.657.347.387.177.257.59
Nov
4.74.46.77.85.0
3.33.04.36.34.8
3.93.34.84.67.9
6.93.23.64.52.4
1.2
7.897.737.857.697.84
7.887.897.787.707.93
7.937.947.947.977.91
7.737.667.577.527.61
7.68
Dec Jan Feb Mar
Daily mean water temperature
_
-
___
_ _
__
_ _
1.9
Daily median
_
_
__ _ _ __ __
8.16
Apr May June July Aug Sept
, in degrees Celsius
.94.86.34.36.5
7.07.67.23.94.7
6.37.38.1
10.711.1
11.711.911.512.010.7
13.010.912.514.417.5
17.717.413.211.712.5
pH
8.148.198.238.198.18
8.208.318.518.668.68
8.568.488.698.668.38
8.278.10
__
8.09
8.298.528.708.878.86
11.311.213.211.911.9
7.511.311.714.115.3
16.216.717.417.919.5
19.618.717.517.810.8
17.117.617.119.719.4
17.79.97.617.216.618.2
8.708.838.768.568.60
8.688.588.348.248.21
8.258.077.957.727.68
7.667.647.637.517.47
7.277.237.217.187.27
7.417.317.407.267.197.54
21.121.021.222.222.3
22.823.221.717.119.0
18.819.120.718.817.9
19.620.121.324.123.1
23.825.024.723.923.3
22.523.824.623.3
7.977.767.577.727.69
7.397.527.607.887.77
7.647.377.857.738.05
7.937.897.797.707.72
7.957.637.367.557.71
7.887.707.477.427.56
__
7.487.587.407.52
7.73
_ _
26.327.023.8
21.920.2
__
21.721.3
21.821.922.724.022.121.5
7.837.647.60
7.437.27
7.467.307.12
7.207.327.387.927.887.52
21.120.919.7
__
7.627.507.22
__
44
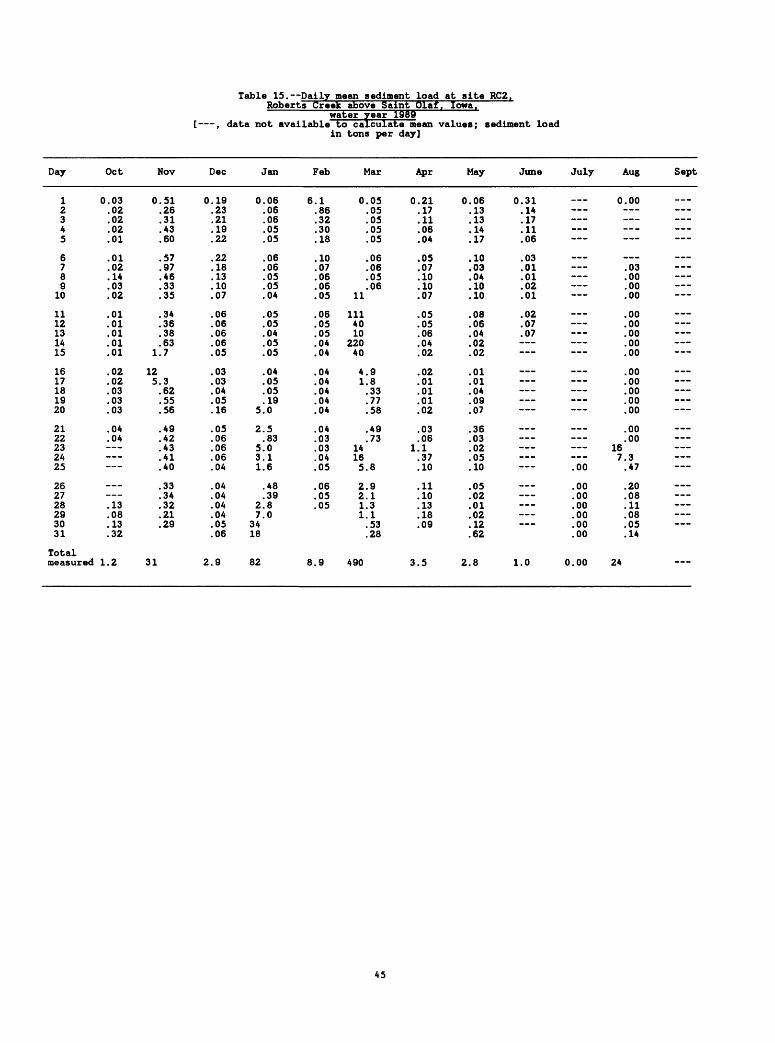
Table 15. Daily mean sediment load at site RC2.Roberts Creek above Saint Olaf, Iowa.
water year 1989[ , data not available to calculate mean values; sediment load
in tons per
Day
12345
6789
10
1112131415
1617181920
2122232425
262728293031
Totalmeasured
Oct
0.03.02.02.02.01
.01
.02
.14
.03
.02
.01
.01
.01
.01
.01
.02
.02
.03
.03
.03
.04
.04
.13.08.13.32
1.2
Nov
0.51.26.31.43.60
.57
.97
.46
.33
.35
.34
.36
.38
.631.7
125.3.62.55.56
.49
.42
.43
.41
.40
.33
.34
.32
.21
.29
31
Dec
0.19.23.21.19.22
.22
.18
.13
.10
.07
.06
.06
.06
.06
.05
.03
.03
.04
.05
.16
.05
.06
.06
.06
.04
.04
.04
.04
.04
.05
.06
2.9
Jan
0.06.06.06.05.05
.06
.06
.05
.05
.04
.05
.05
.04
.05
.05
.04
.05
.05
.195.0
2.5.83
5.03.11.6
.48
.392.87.0
3418
82
Feb
6.1.86.32.30.18
.10
.07
.06
.06
.05
.06
.05
.05
.04
.04
.04
.04
.04
.04
.04
.04
.03
.03
.04
.05
.06
.05
.05
8.9
Mar
0.05.05.05.05.05
.06
.06
.05
.0611
1114010
22040
4.91.8.33.77.58
.49
.7314165.8
2.92.11.31.1.53.28
490
day]
Apr
0.21.17.11.06.04
.05
.07
.10
.10
.07
.05
.05
.06
.04
.02
.02
.01
.01
.01
.02
.03
.061.1.37.10
.11
.10
.13
.18
.09
3.5
May
0.06.13.13.14.17
.10
.03
.04
.10
.10
.08
.06
.04
.02
.02
.01
.01
.04
.09
.07
.36
.03
.02
.05
.10
.05
.02
.01
.02
.12
.62
2.8
June
0.31.14.17.11.06
.03
.01
.01
.02
.01
.02
.07
.07
1.0
July
___
.00
.00
.00
.00
.00
.00
.00
0.00
Aug
0.00
.03.00.00.00
.00
.00
.00
.00
.00
.00
.00
.00
.00
.00
.00
.00167.3.47
.20
.08
.11
.08
.05
.14
24
Sept
__
_
-
45
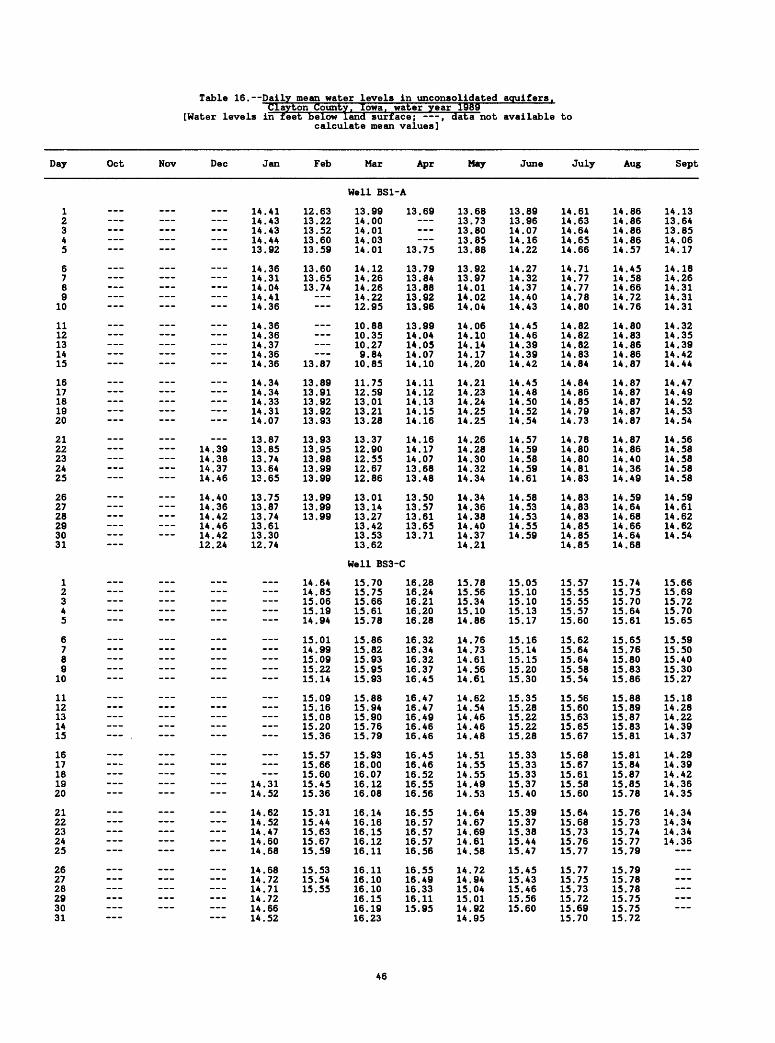
Table 16. Daily mean water levels in unconsolidated aquifers.Clayton County. Iowa, water year 198?
[Hater levels in feet below land surface; ---, data not available to calculate mean values]
Day Oct Nov Dec Jan Feb Mar Apr May June July Aug Sept
Hell BS1-A
12345
6789
10
1112131415
1617181920
2122232425
262728293031
__
-
14.3914.3814.3714.46
14.4014.3614.4214.4614.4212.24
14.4114.4314.4314.4413.92
14.3614.3114.0414.4114.36
14.3614.3614.3714.3614.36
14.3414.3414.3314.3114.07
13.8713.8513.7413.6413.65
13.7513.8713.7413.6113.3012.74
12.6313.2213.5213.6013.59
13.6013.6513.74
13.87
13.8913.9113.9213.9213.93
13.9313.9513.9813.9913.99
10 QQX<7 99
13.9913.99
13.9914.0014.0114.0314.01
14.1214.2614.2614.2212.95
10.8810.3510.279.84
10.85
11.7512.5913.0113.2113.28
13.3712.9012.5512.6712.86
13.0113.1413.2713.4213.5313.62
13.69
13.75
13.7913.8413.8813.9213.96
13.9914.0414.0514.0714.10
14.1114.1214.1314.1514.16
14.1614.1714.0713.6813.48
13.5013.5713.6113.6513.71
13.6813.7313.8013.8513.88
13.9213.9714.0114.0214.04
14.0614.1014.1414.1714.20
14.2114.2314.2414.2514.25
14.2614.2814.3014.3214.34
14.3414.3614.3814.4014.3714.21
13.8913.9614.0714.1614.22
14.2714.3214.3714.4014.43
14.4514.4614.3914.3914.42
14.4514.4814.5014.5214.54
14.5714.5914.5814.5914.61
14.5814.5314.5314.5514.59
14.6114.6314.6414.6514.66
14.7114.7714.7714.7814.80
14.8214.8214.8214.8314.84
14.8414.8614.8514.7914.73
14.7814.8014.8014.8114.83
14.8314.8314.8314.8514.8514.85
14.8614.8614.8614.8614.57
14.4514.5814.6614.7214.76
14.8014.8314.8614.8614.87
14.8714.8714.8714.8714.87
14.8714.8614.4014.3614.49
14.5914.6414.6814.6614.6414.68
14.1313.6413.8514.0614.17
14.1814.2614.3114.3114.31
14.3214.3514.3914.4214.44
14.4714.4914.5214.5314.54
14.5614.5814.5814.5814.58
14.5914.6114.6214.6214.54
Hell BS3-C
12345
6789
10
1112131415
1617181920
2122232425
262728293031
_ _ .
_ _ _
14.3114.52
14.6214.5214.4714.6014.68
14.6814.7214.7114.7214.6614.52
14.6414.8515.0615.1914.94
15.0114.9915.0915.2215.14
15.0915.1615.0815.2015.36
15.5715.6615.6015.4515.36
15.3115.4415.6315.6715.59
15.5315.5415.55
15.7015.7515.6615.6115.78
15.8615.8215.9315.9515.93
15.8815.9415.9015.7615.79
15.9316.0016.0716.1216.08
16.1416.1616.1516.1216.11
16.1116.1016.1016.1516.1916.23
16.2816.2416.2116.2016.28
16.3216.3416.3216.3716.45
16.4716.4716.4916.4616.46
16.4516.4616.5216.5516.56
16.5516.5716.5716.5716.56
16.5516.4916.3316.1115.95
15.7815.5615.3415.1014.86
14.7614.7314.6114.5614.61
14.6214.5414.4614.4614.48
14.5114.5514.5514.4914.53
14.6414.6714.6914.6114.58
14.7214.9415.0415.0114.9214.95
15.0515.1015.1015.1315.17
15.1615.1415.1515.2015.30
15.3515.2815.2215.2215.28
15.3315.3315.3315.3715.40
15.3915.3715.3815.4415.47
15.4515.4315.4615.5615.60
15.5715.5515.5515.5715.60
15.6215.6415.6415.5815.54
15.5615.6015.6315.6515.67
15.6815.6715.6115.5815.60
15.6415.6815.7315.7615.77
15.7715.7515.7315.7215.6915.70
15.7415.7515.7015.6415.61
15.6515.7615.8015.8315.86
15.8815.8915.8715.8315.81
15.8115.8415.8715.8515.78
15.7615.7315.7415.7715.79
15.7915.7815.7815.7515.7515.72
15.6615.6915.7215.7015.65
15.5915.5015.4015.3015.27
15.1814.2814.2214.3914.37
14.2914.3914.4214.3614.35
14.3414.3414.3414.36
46
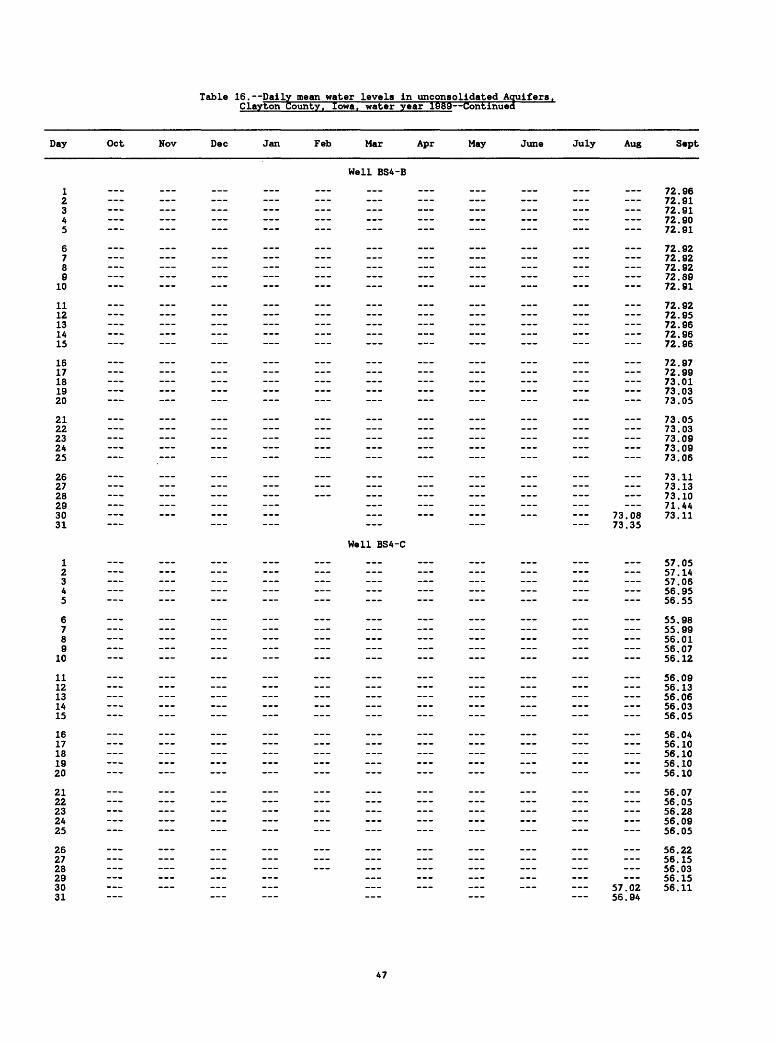
Day
12345
6789
10
1112131415
1617181920
2122232425
262728293031
12345
6789
10
1112131415
1617181920
2122232425
262728293031
Table 16. Daily mean water levels in unconsolidated Aouifers.Clayton County, Iowa, water year 1989 Continued
Oct Nov Dec Jan Feb Mar Apr May June July Aug
Well BS4-B
_ _ _ _
_ _ __ _ __ __ __ __ __ _ __ _
_ _ _ _ _ _
_ _ _ _ _ _
_ _ _ _ _ _ _
_ __ _ __ ___ _ _ ___ _ _ _ _
_ _ _ ___ _ _
- - _ _
73.0873.35
Well BS4-C
_ _ _ _ _ _ _ _ _ _ _ _ _ _
_ _
_ _
_ _
_ _ _ __ __ _ _
_ _ _ _ _
_
_ _ _ _
_ _ _ _ _
_ _ _ _ _ _ _ _ _ _ _
57.0256.94
Sept
72.9672.9172.9172.9072.91
72.9272.9272.9272.8972.91
72.9272.9572.9672.9672.96
72.9772.9973.0173.0373.05
73.0573.0373.0973.0973.06
73.1173.1373.1071.4473.11
57.0557.1457.0656.9556.55
55.9855.9956.0156.0756.12
56.0956.1356.0656.0356.05
56.0456.1056.1056.1056.10
56.0756.0556.2856.0956.05
56.2256.1556.0356.1556.11
47
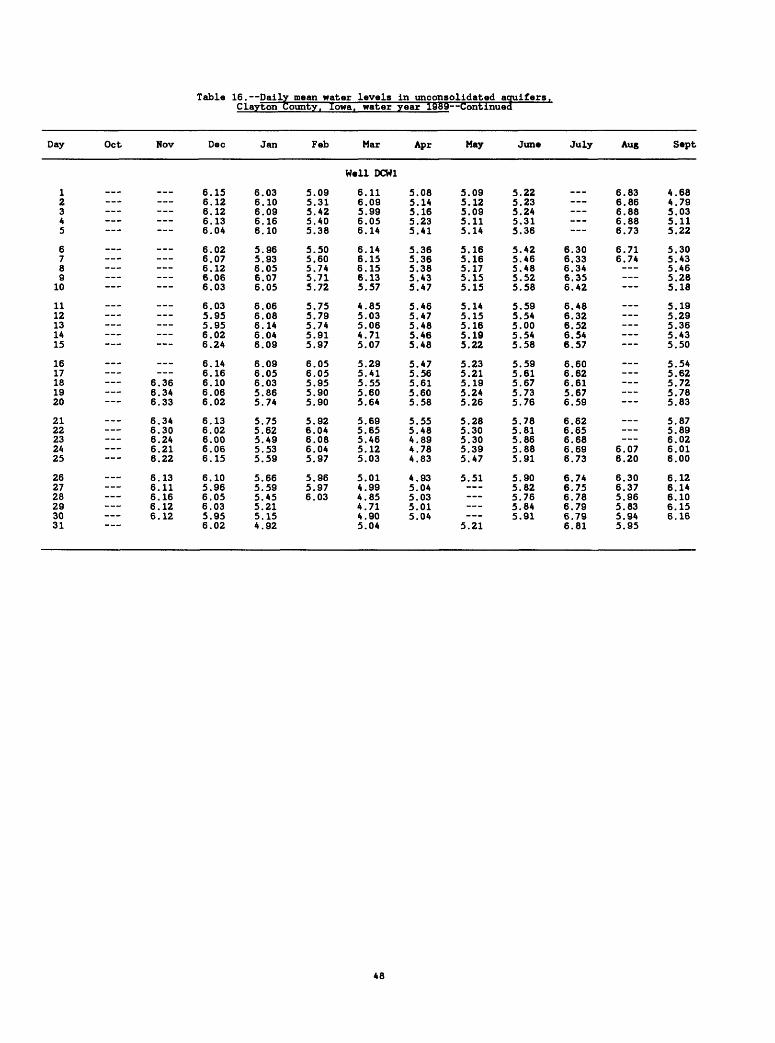
Table 16. Daily mean water levels in unconsolidated aquifers .Clayton County, Iowa, water year 1989 Continued
Day
12345
6789
10
1112131415
1617181920
2122232425
262728293031
Oct Nov
6.366.346.33
6.346.306.246.216.22
6.136.116.166.126.12
Dec
6.156.126.126.136.04
6.026.076.126.066.03
6.035.955.956.026.24
6.146.166.106.066.02
6.136.026.006.066.15
6.105.966.056.035.956.02
Jan
6.036.106.096.166.10
5.965.936.056.076.05
6.066.086.146.046.09
6.096.056.035.865.74
5.755.625.495.535.59
5.665.595.455.215.154.92
Feb
5.095.315.425.405.38
5.505.605.745.715.72
5.755.795.745.915.97
6.056.055.955.905.90
5.926.046.086.045.97
5.965.976.03
Mar
Hell DCW1
6.116.095.996.056.14
6.146.156.156.135.57
4.855.035.064.715.07
5.295.415.555.605.64
5.695.655.465.125.03
5.014.994.854.714.905.04
Apr
5.085.145.165.235.41
5.365.365.385.435.47
5.465.475.485.465.48
5.475.565.615.605.58
5.555.484.894.784.83
4.935.045.035.015.04
May
5.095.125.095.115.14
5.165.165.175.155.15
5.145.155.165.195.22
5.235.215.195.245.26
5.285.305.305.395.47
5.51
5.21
June
5.225.235.245.315.36
5.425.465.485.525.58
5.595.545.005.545.58
5.595.615.675.735.76
5.785.815.865.885.91
5.905.825.765.845.91
July
6.306.336.346.356.42
6.486.326.526.546.57
6.606.626.615.676.59
6.626.656.686.696.73
6.746.756.786.796.796.81
Aug
6.836.866.886.886.73
6.716.74
6.076.20
6.306.375.965.835.945.95
Sept
4.684.795.035.115.22
5.305.435.465.285.18
5.195.295.365.435.50
5.545.625.725.785.83
5.875.896.026.016.00
6.126.146.106.156.16
48
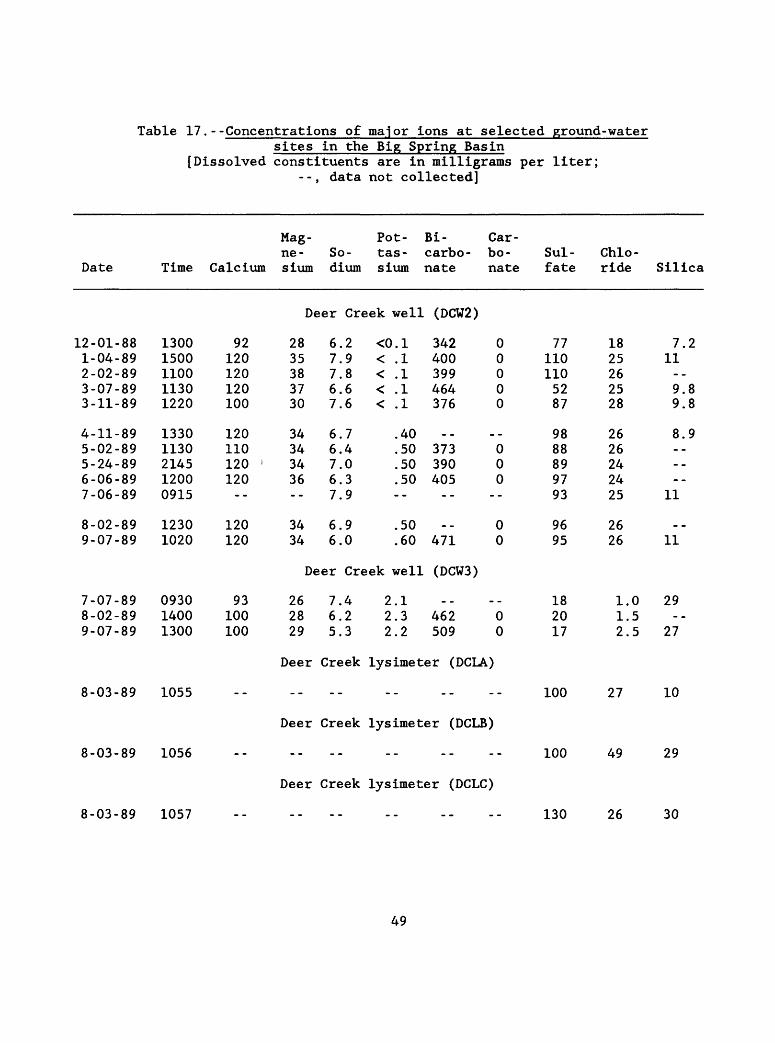
Table 17.--Concentrations of major ions at selected ground-watersites in the Big Spring Basin
[Dissolved constituents are in milligrams per liter; - -, data not collected]
Date
12-01-881-04-892-02-893-07-893-11-89
4-11-895-02-895-24-896-06-897-06-89
8-02-899-07-89
7-07-898-02-899-07-89
Time
13001500110011301220
13301130214512000915
12301020
093014001300
Calcium
92120120120100
120110120 '120--
120120
93100100
Mag- Pot- Bi ne- So- tas- carbo- sium dium sium nate
2835383730
34343436--
3434
262829
Deer
67767
66767
66
Deer
765
Creek well
.2 <0.
.9 < .
.8 < .
.6 < .
.6 < .
.7
.4
.0
.3
.9
.9
.0
11111
40505050-
5060
Creek well
.4 2.
.2 2.
.3 2.
132
(DCW2)
342400399464376
_ _373390405--
_ _471
(DCW3)
_ _462509
Car bo nate
00000
_ _000
--
00
_ _
00
Sul- fate
771101105287
9888899793
9695
182017
Chlo ride
1825262528
2626242425
2626
1.01.52.5
Silica
7.211
9.89.8
8.9
----
11
_ _11
29
27
8-03-89 1055
8-03-89 1056
8-03-89 1057
Deer Creek lysimeter (DCLA.)
Deer Creek lysimeter (DCLB)
Deer Creek lysimeter (DCLC)
100
100
130
27 10
49 29
26 30
49
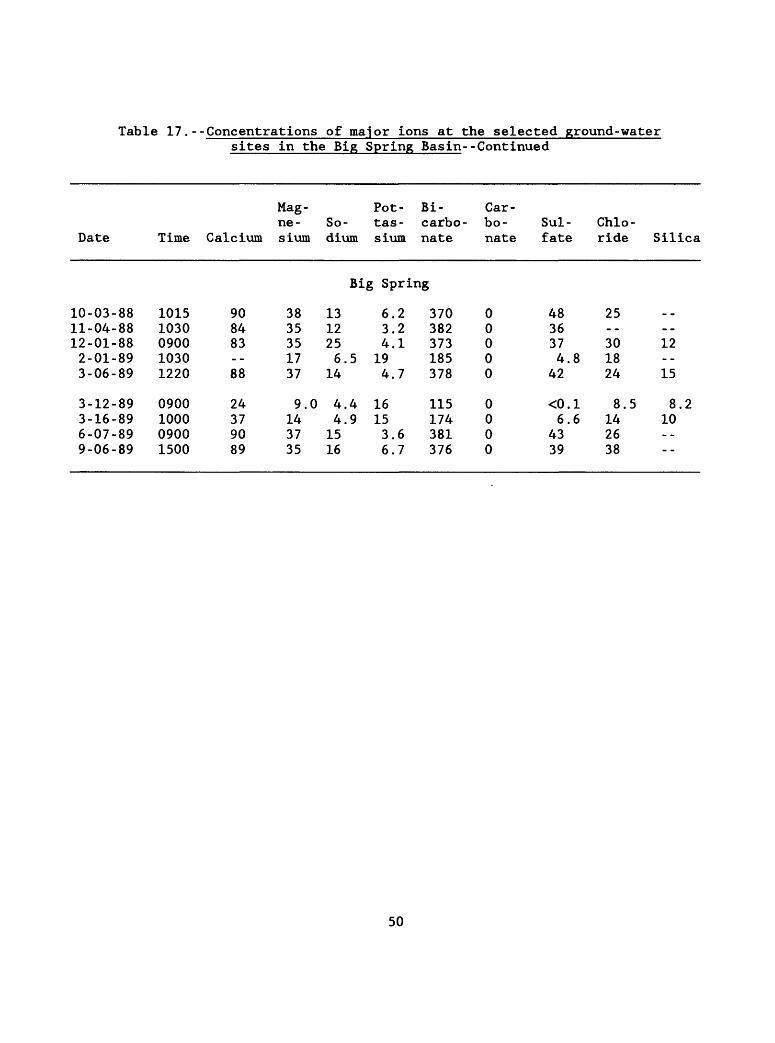
Table 17.--Concentrations of major ions at the selected ground-water sites in the Big Spring Basin--Continued
Date
Mag- Pot- Bi- Car-ne- So- tas- carbo- bo- Sul- Chlo-
Time Calcium slum dium sium nate nate fate ride Silica
Big Spring
10-03-88 1015 90 38 13 6.2 370 0 48 2511-04-88 1030 84 35 12 3.2 382 0 3612-01-88 0900 83 35 25 4.1 373 0 37 30 122-01-89 1030 -- 17 6.5 19 185 0 4.8 183-06-89 1220 88 37 14 4.7 378 0 42 24 15
3-12-89 0900 24 9.0 4.4 16 115 0 <0.1 8.5 8.23-16-89 1000 37 14 4.9 15 174 0 6.6 14 106-07-89 0900 90 37 15 3.6 381 0 43 269-06-89 1500 89 35 16 6.7 376 0 39 38
50
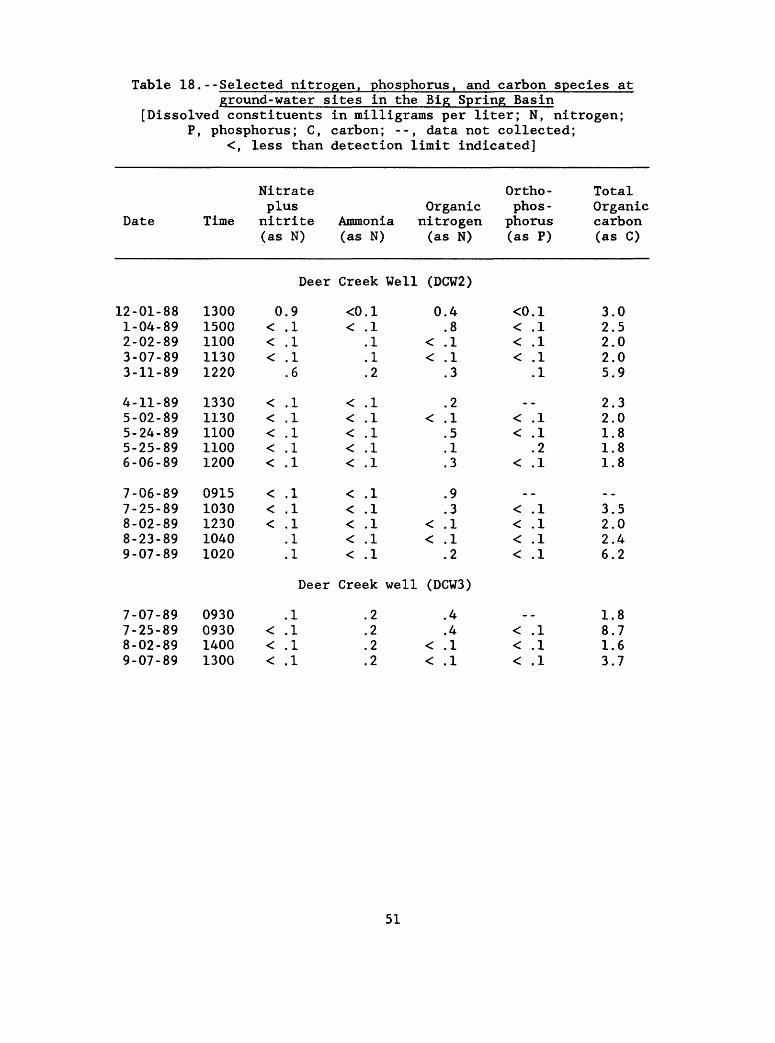
Table 18. --Selected nitrogen, phosphorus, andground-water sites in the
carbon species atBig Spring Basin
[Dissolved constituents in milligrams per liter; N, nitrogen; P, phosphorus; C, carbon; --, data not collected;
<, less than detection limit indicated]
Date
12-01-881-04-892-02-893-07-893-11-89
4-11-895-02-895-24-895-25-896-06-89
7-06-897-25-898-02-898-23-899-07-89
7-07-897-25-898-02-899-07-89
Time
13001500110011301220
13301130110011001200
09151030123010401020
0930093014001300
Nitrateplus nitrite (as N)
Deer
0.9< .1< .1< .1
.6
< .1< .1< .1< .1< .1
< .1< .1< .1
.1
.1
Deer
.1< .1< .1< .1
Ammonia (as N)
Creek Well
<0.1< .1
.1
.1
.2
< .1< .1< .1< .1< .1
< .1< .1< .1< .1< .1
Creek well
.2
.2
.2
.2
Organic nitrogen (as N)
(DCW2)
0.4.8
< .1< .1
.3
.2< .1
.5
.1
.3
.9
.3< .1< .1
.2
(DCW3)
.4
.4< .1< .1
Ortho -phos
phorus (as P)
<0.1< .1< .1< .1
.1
_ _< .1< .1
.2< .1
_ _< .1< .1< .1< .1
< .1< .1< .1
TotalOrganic carbon (as C)
3.02.52.02.05.9
2.32.01.81.81.8
_ _3.52.02.46.2
1.88.71.63.7
51
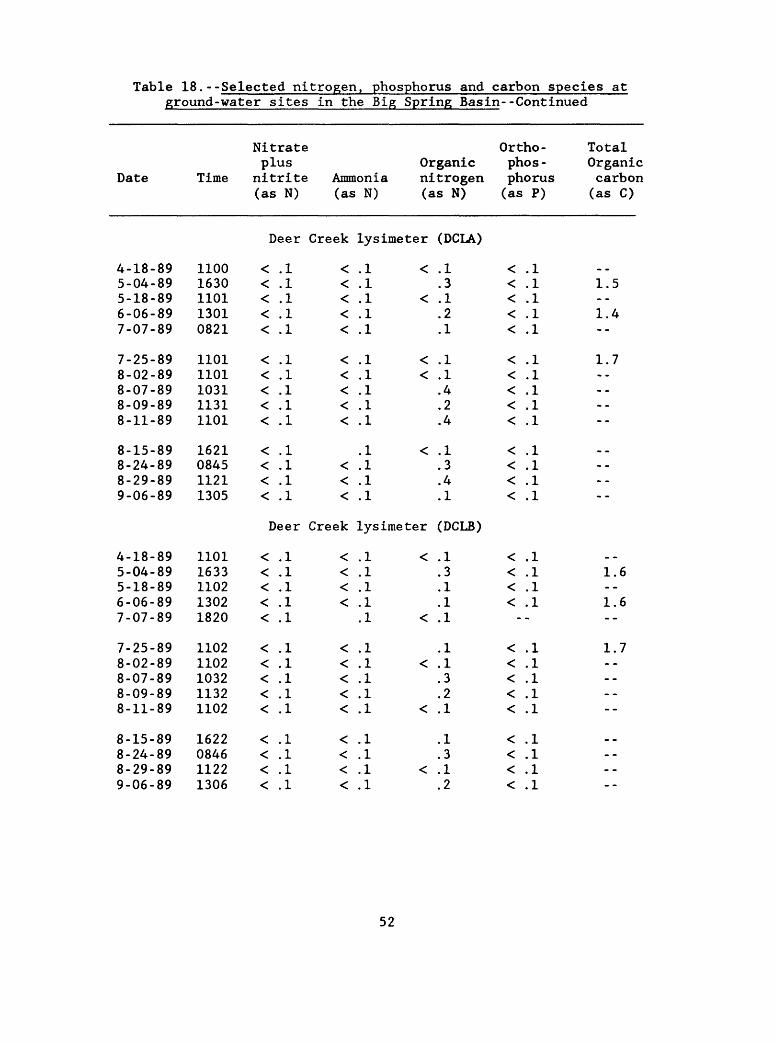
Table 18.--Selected nitrogen, phosphorus and carbon species atground-water sites in the Big Spring Basin --Continued
Nitrate plus Organic
Date
4-18-895-04-895-18-896-06-897-07-89
7-25-898-02-898-07-898-09-898-11-89
8-15-898-24-898-29-899-06-89
4-18-895-04-895-18-896-06-897-07-89
7-25-898-02-898-07-898-09-898-11-89
8-15-898-24-898-29-899-06-89
Time
11001630110113010821
11011101103111311101
1621084511211305
11011633110213021820
11021102103211321102
1622084611221306
nitrite Ammonia nitrogen(as N)
Deer
< .1< .1< .1< .1< .1
< .1< .1< .1< .1< .1
< .1< .1< .1< .1
Deer
< .1< .1< .1< .1< .1
< .1< .1< .1< .1< .1
< .1< .1< .1< .1
(as N) (as N)
Creek lysimeter
< .1 << .1< .1 << .1< .1
< .1 << .1 << .1< .1< .1
.1 << .1< .1< .1
Creek lysimeter
< .1 << .1< .1< .1
.1 <
< .1< .1 << .1< .1< .1 <
< .1< .1< .1 << .1
(DCLA)
.1
.3
.1
.2
.1
.1
.1
.4
.2
.4
.1
.3
.4
.1
(DCLB)
.1
.3
.1
.1
.1
.1
.1
.3
.2
.1
.1
.3
.1
.2
Ortho- phos-phorus(as P)
< .1< .1< .1< .1< .1
< .1< .1< .1< .1< .1
< .1< .1< .1< .1
< .1< .1< .1< .1--
< .1< .1< .1< .1< .1
< .1< .1< .1< .1
Total Organiccarbon(as C)
_ _1.5
1.4--
1.7
--
_ _
--
_ _1.6--1.6--
1.7
--
--
52
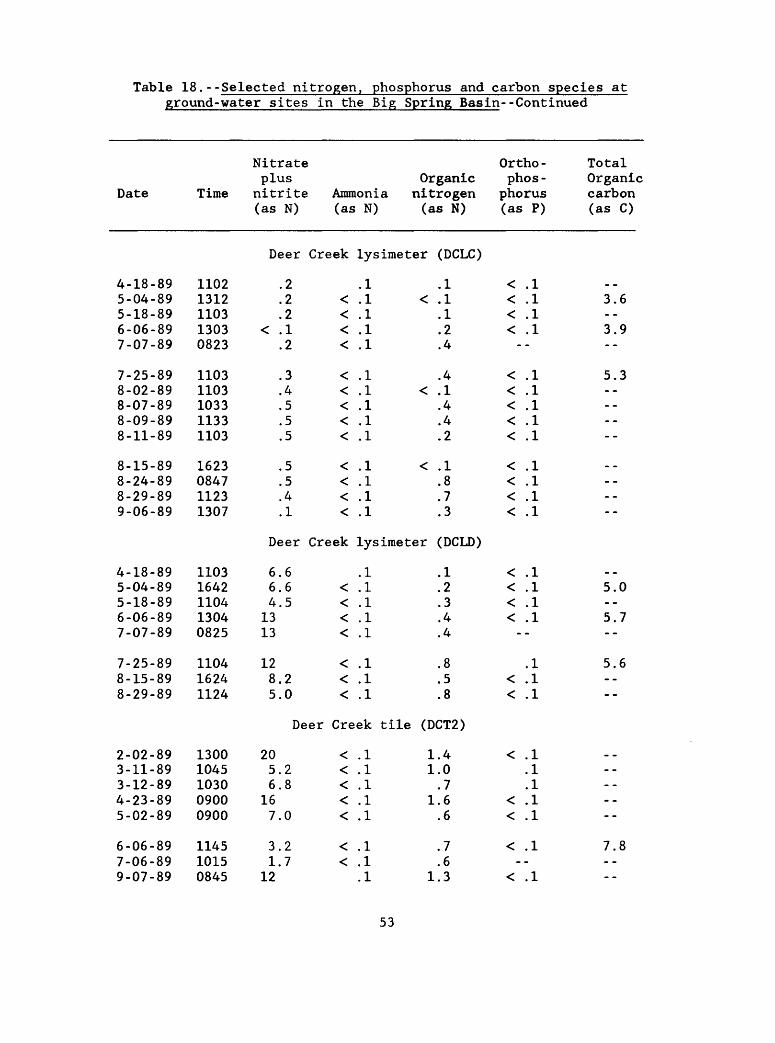
Table 18.--Selected nitrogen, phosphorus and carbon species atground- water sites in the Big Spring Basin --Continued
Date
4-18-895-04-895-18-896-06-897-07-89
7-25-898-02-898-07-898-09-898-11-89
8-15-898-24-898-29-899-06-89
4-18-895-04-895-18-896-06-897-07-89
7-25-898-15-898-29-89
Time
11021312110313030823
11031103103311331103
1623084711231307
11031642110413040825
110416241124
Nitrateplus
nitrite(as N)
Deer
.2
.2
.2< .1
.2
.3
.4
.5
.5
.5
.5
.5
.4
.1
Deer
6.66.64.5
1313
128.25.0
OrganicAmmonia nitrogen(as N) (as N)
Creek lysimeter (DCLC)
.1 .1< .1 < .1< .1 .1< .1 .2< .1 .4
< .1 .4< .1 < .1< .1 .4< .1 .4< .1 .2
< .1 < .1< .1 .8< .1 .7< .1 .3
Creek lysimeter (DCLD)
.1 .1< .1 .2< .1 .3< .1 .4< .1 .4
< .1 .8< .1 .5< .1 .8
Ortho-phos-
phorus(as P)
< .1< .1< .1< .1
< .1< .1< .1< .1< .1
< .1< .1< .1< .1
< .1< .1< .1< .1
.1< .1< .1
TotalOrganiccarbon(as C)
3.6
3.9--
5.3
--
--
--
5.0--5.7--
5.6--
Deer Creek tile (DCT2)
2-02-893-11-893-12-894-23-895-02-89
6-06-897-06-899-07-89
13001045103009000900
114510150845
205.26.8
167.0
3.21.7
12
< .1 1.4< .1 1.0< .1 .7< .1 1.6< .1 .6
< .1 .7< .1 .6
.1 1.3
< .1.1.1
< .1< .1
< .1--
< .1
_ _--
--
7.8
53
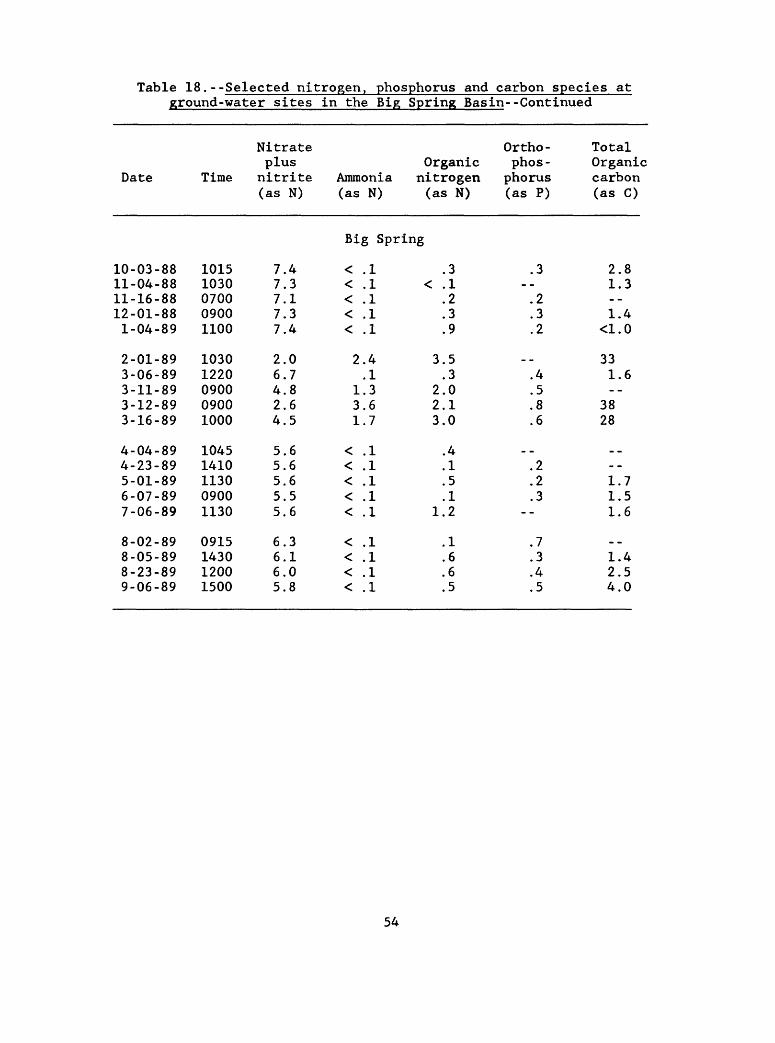
Table 18.--Selected nitrogen, phosphorus and carbon species atground-water sites in the Big Spring Basin --Continued
Date Time
Nitrateplus
nitrite(as N)
Ammonia(as N)
Organicnitrogen(as N)
Ortho-phos-
phorus(as P)
TotalOrganiccarbon(as C)
Big Spring
10-03-8811-04-8811-16-8812-01-881-04-89
2-01-893-06-893-11-893-12-893-16-89
4-04-894-23-895-01-896-07-897-06-89
8-02-898-05-898-23-899-06-89
10151030070009001100
10301220090009001000
10451410113009001130
0915143012001500
7.47.37.17.37.4
2.06.74.82.64.5
5.65.65.65.55.6
6.36.16.05.8
< .1< .1< .1< .1< .1
2.4.1
1.33.61.7
< .1< .1< .1< .1< .1
< .1< .1< .1< .1
.3< .1
.2
.3
.9
3.5.3
2.02.13.0
.4
.1
.5
.11.2
.1
.6
.6
.5
.3
.2
.3
.2
_ _.4.5.8.6
_ _.2.2.3
--
.7
.3
.4
.5
2.81.3
1.4<1.0
331.6--
3828
_ _--1.71.51.6
_ _1.42.54.0
54
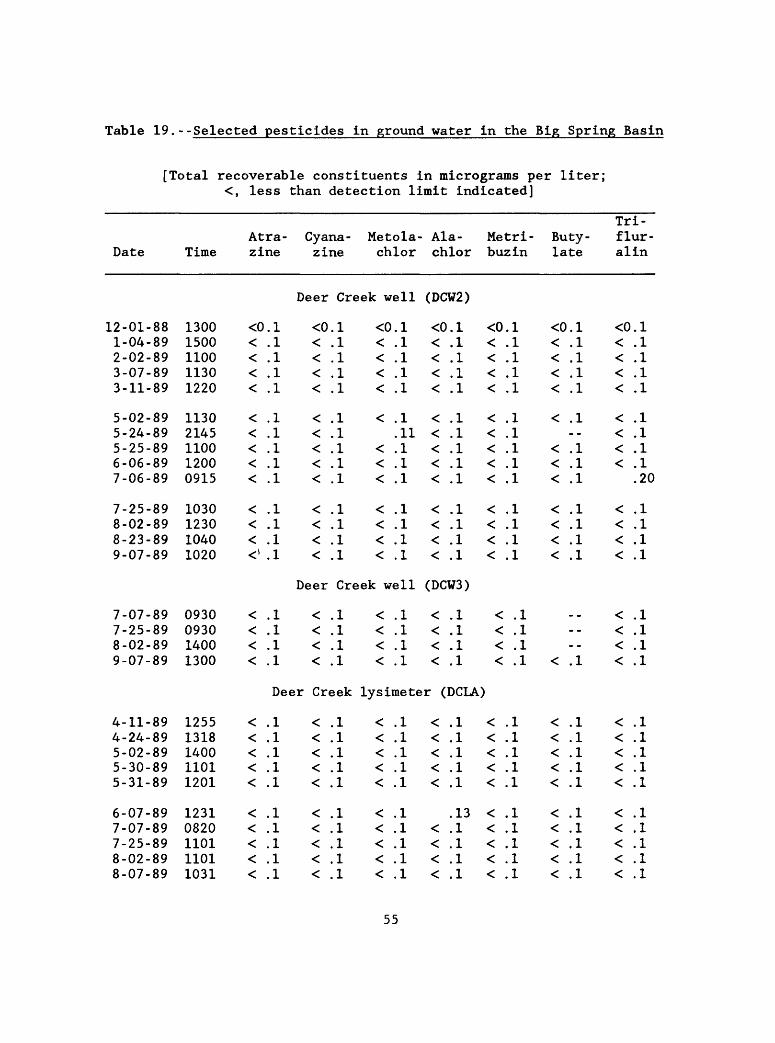
Table 19.--Selected pesticides in ground water in the Big Spring Basin
[Total recoverable constituents in micrograms per liter; <, less than detection limit indicated]
_____
Atra- Cyana- Metola- Ala- Metri- Buty- flur- Date Time zine zine chlor chlor buz in late alin
Deer Creek well
12-01-881-04-892-02-893-07-893-11-89
5-02-895-24-895-25-896-06-897-06-89
7-25-898-02-898-23-899-07-89
13001500110011301220
11302145110012000915
1030123010401020
<0.1< .1< .1< .1< .1
< .1< .1< .1< .1< .1
< .1< .1< .1< l .1
<0.1< .1< .1< .1< .1
< .1< .1< .1< .1< .1
< .1< .1< .1< .1
<c<<<<
<
<<<
<<<<
).l.1.1.1.1
.1
.11
.1
.1
.1
.1
.1
.1
.1
Deer Creek well
7-07-897-25-898-02-899-07-89
0930093014001300
< .1< .1< .1< .1
< .1< .1< .1< .1
Deer Creek
4-11-894-24-895-02-895-30-895-31-89
6-07-897-07-897-25-898-02-898-07-89
12551318140011011201
12310820110111011031
< .1< .1< .1< .1< .1
< .1< .1< .1< .1< .1
< .1< .1< .1< .1< .1
< .1< .1< .1< .1< .1
<<<<
.1
.1
.1
.1
(DCW2)
<<<<<
<<<<<
<<<<
0.1.1.1.1.1
.1
.1
.1
.1
.1
.1
.1
.1
.1
<0.1< !l< .1< .1< .1
< .1< .1< .1< .1< .1
< .1< .1< .1< .1
<0.1< .1< .1< .1< .1
< .1--
< .1< .1< .1
< .1< .1< .1< .1
<c<<<<
<<<<
<<<<
).l.1.1.1.1.1.1.1.1.20
.1
.1
.1
.1
(DCW3)
<<<<
lysimeter
<<<<<
<<<<<
.1
.1
.1
.1
.1
.1
.1
.1
.1
.1
<<<<<
<<<<
.1
.1
.1
.1
(DCIA)
.1
.1
.1
.1
.1
.13
.1
.1
.1
.1
< .1< .1< .1< .1
< .1< .1< .1< .1< .1
< .1< .1< .1< .1< .1
--< .1
< .1< .1< .1< .1< .1
< .1< .1< .1< .1< .1
<<<<
<<<<<
<<<<<
.1
.1
.1
.1
.1
.1
.1
.1
.1
.1
.1
.1
.1
.1
55
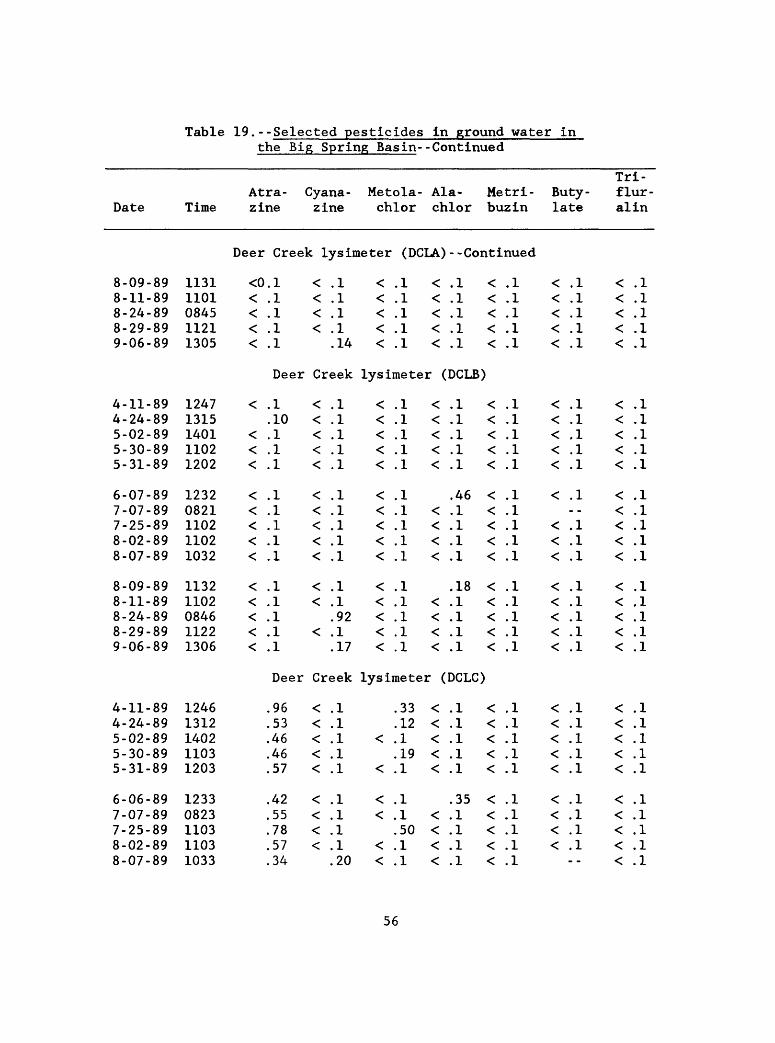
Table 19.--Selected pesticides in ground water in the Big Spring Basin--Continued
____
Atra- Cyana- Metola- Ala- Metri- Buty- flur- Date Time zine zine chlor chlor buz in late alin
Deer Creek lysimeter (DCLA)--Continued
8-09-898-11-898-24-898-29-899-06-89
11311101084511211305
<C<<<<
).l.1.1.1.1
< .1< .1< .1< .1
.14
< .1< .1< .1< .1< .1
< .1< .1< .1< .1< .1
< .1< .1< .1< .1< .1
< .1< .1< .1< .1< .1
<<<<<
.1
.1
.1
.1
.1
Deer Creek lysimeter (DCLB)
4-11-894-24-895-02-895-30-895-31-89
6-07-897-07-897-25-898-02-898-07-89
8-09-898-11-898-24-898-29-899-06-89
12471315140111021202
12320821110211021032
11321102084611221306
< .1.10
< .1< .1< .1
< .1< .1< .1< .1< .1
< .1< .1< .1< .1< .1
< .1< .1< .1< .1< .1
< .1< .1< .1< .1< .1
< .1< .1
.92< .1
.17
< .1< .1< .1< .1< .1
< .1< .1< .1< .1< .1
< .1< .1< .1< .1< .1
< .1< .1< .1< .1< .1
.46< .1< .1< .1< .1
.18< .1< .1< .1< .1
< .1< .1< .1< .1< .1
< .1< .1< .1< .1< .1
< .1< .1< .1< .1< .1
< .1< .1< .1< .1< .1
< .1
< .1< .1< .1
< .1< .1< .1< .1< .1
< .1< .1< .1< .1< .1
< .1< .1< .1< .1< .1
< .1< .1< .1< .1< .1
Deer Creek lysimeter (DCLC)
4-11-894-24-895-02-895-30-895-31-89
6-06-897-07-897-25-898-02-898-07-89
12461312140211031203
12330823110311031033
.96
.53
.46
.46
.57
.42
.55
.78
.57
.34
< .1< .1< .1< .1< .1
< .1< .1< .1< .1
.20
.33
.12< .1
.19< .1
< .1< .1
.50< .1< .1
< .1< .1< .1< .1< .1
.35< .1< .1< .1< .1
< .1< .1< .1< .1< .1
< .1< .1< .1< .1< .1
< .1< .1< .1< .1< .1
< .1< .1< .1< .1
< .1< .1< .1< .1< .1
< .1< .1< .1< .1< .1
56
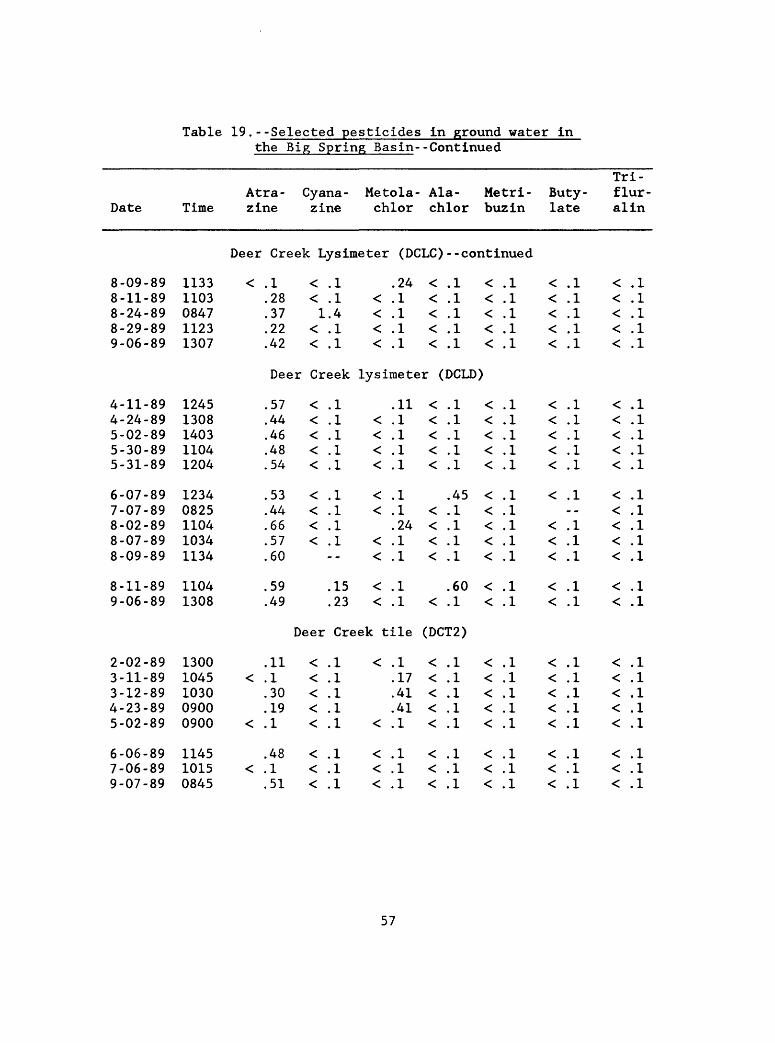
Table 19.--Selected pesticides in ground water inthe Big Spring Basin- -Continued
Date TimeAtra- Cyana- zine zine
Metola- Ala- chlor chlor
Metri- buzin
Buty- late
Tri- flur- alin
Deer Creek Lysimeter (DCLC) --continued
8-09-898-11-898-24-898-29-899-06-89
4-11-894-24-895-02-895-30-895-31-89
6-07-897-07-898-02-898-07-898-09-89
8-11-899-06-89
11331103084711231307
12451308140311041204
12340825110410341134
11041308
< .1.28.37.22.42
Deer
.57
.44
.46
.48
.54
.53
.44
.66
.57
.60
.59
.49
< .1< .11.4
< .1< .1
Creek
< .1< .1< .1< .1< .1
< .1< .1< .1< .1
--
.15
.23
.24< .1< .1< .1< .1
<<<<<
lysiraeter
.11< .1< .1< .1< .1
< .1< .1
.24< .1< .1
< .1< .1
Deer Creek tile
2-02-893-11-893-12-894-23-895-02-89
6-06-897-06-899-07-89
13001045103009000900
114510150845
.11< .1
.30
.19< .1
.48< .1
.51
< .1< .1< .1< .1< .1
< .1< .1< .1
< .1.17.41.41
< .1
< .1< .1< .1
<<<<<
<<<<
<
.1
.1
.1
.1
.1
(DCLD)
.1
.1
.1
.1
.1
.45
.1
.1
.1
.1
.60
.1
<<<<<
<<<<<
<<<<<
<<
.1
.1
.1
.1
.1
.1
.1
.1
.1
.1
.1
.1
.1
.1
.1
.1
.1
< .1< .1< .1< .1< .1
< .1< .1< .1< .1< .1
< .1--
< .1< .1< .1
< .1< .1
<<<<<
<<<<<
<<<<<
<<
.1
.1
.1
.1
.1
.1
.1
.1
.1
.1
.1
.1
.1
.1
.1
.1
.1
(DCT2)
<<<<<
<<<
.1
.1
.1
.1
.1
.1
.1
.1
<<<<<
<<<
.1
.1
.1
.1
.1
.1
.1
.1
< .1< .1< .1< .1< .1
< .1< .1< .1
<<<<<
<<<
.1
.1
.1
.1
.1
.1
.1
.1
57
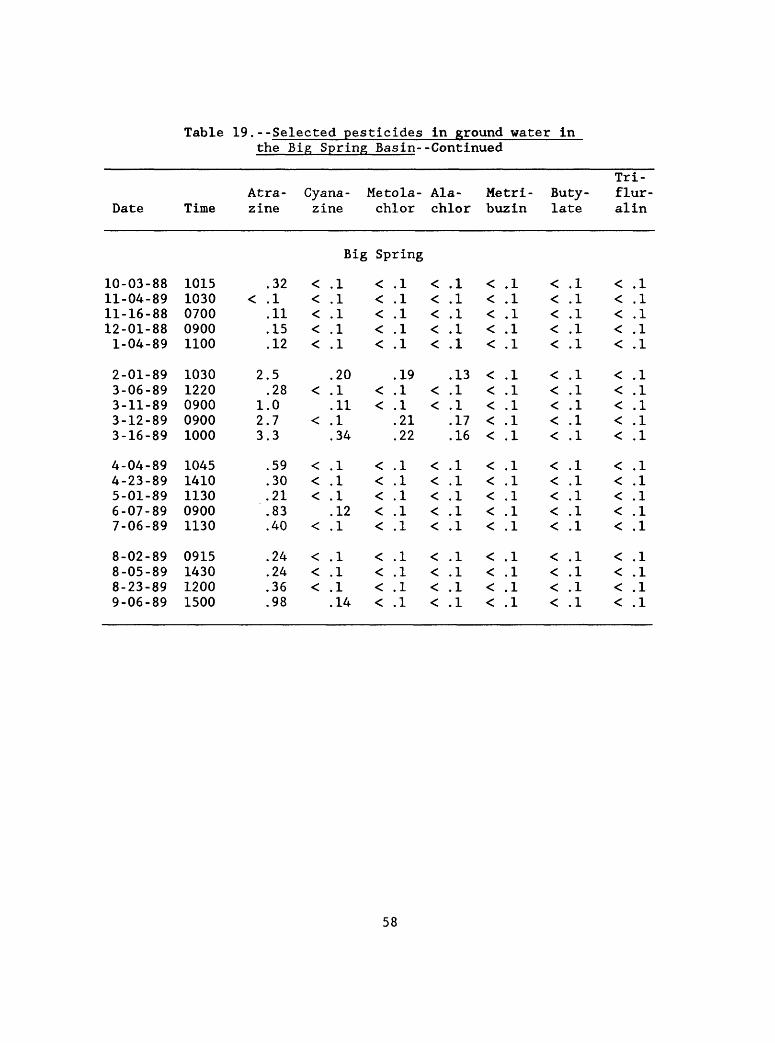
Table 19.--Selected pesticides in ground water in the Big Spring Basin--Continued
___
Atra- Cyana- Metola- Ala- Metri- Buty- flur- Date Time zine zine chlor chlor buzin late alin
Big Spring
10-03-8811-04-8911-16-8812-01-881-04-89
2-01-893-06-893-11-893-12-893-16-89
4-04-894-23-895-01-896-07-897-06-89
8-02-898-05-898-23-899-06-89
10151030070009001100
10301220090009001000
10451410113009001130
0915143012001500
.32< .1
.11
.15
.12
2.5.28
1.02.73.3
.59
.30
.21
.83
.40
.24
.24
.36
.98
< .1< .1< .1< .1< .1
.20< .1
.11< .1
.34
< .1< .1< .1
.12< .1
< .1< .1< .1
.14
< .1< .1< .1< .1< .1
.19< .1< .1
.21
.22
< .1< .1< .1< .1< .1
< .1< .1< .1< .1
< .1< .1< .1< .1< .1
.13< .1< .1
.17
.16
< .1< .1< .1< .1< .1
< .1< .1< .1< .1
< .1< .1< .1< .1< .1
< .1< .1< .1< .1< .1
< .1< .1< .1< .1< .1
< .1< .1< .1< .1
< .1< .1< .1< .1< .1
< .1< .1< .1< .1< .1
< .1< .1< .1< .1< .1
< .1< .1< .1< .1
< .1< .1< .1< .1< .1
< .1< .1< .1< .1< .1
< .1< .1< .1< .1< .1
< .1< .1< .1< .1
58
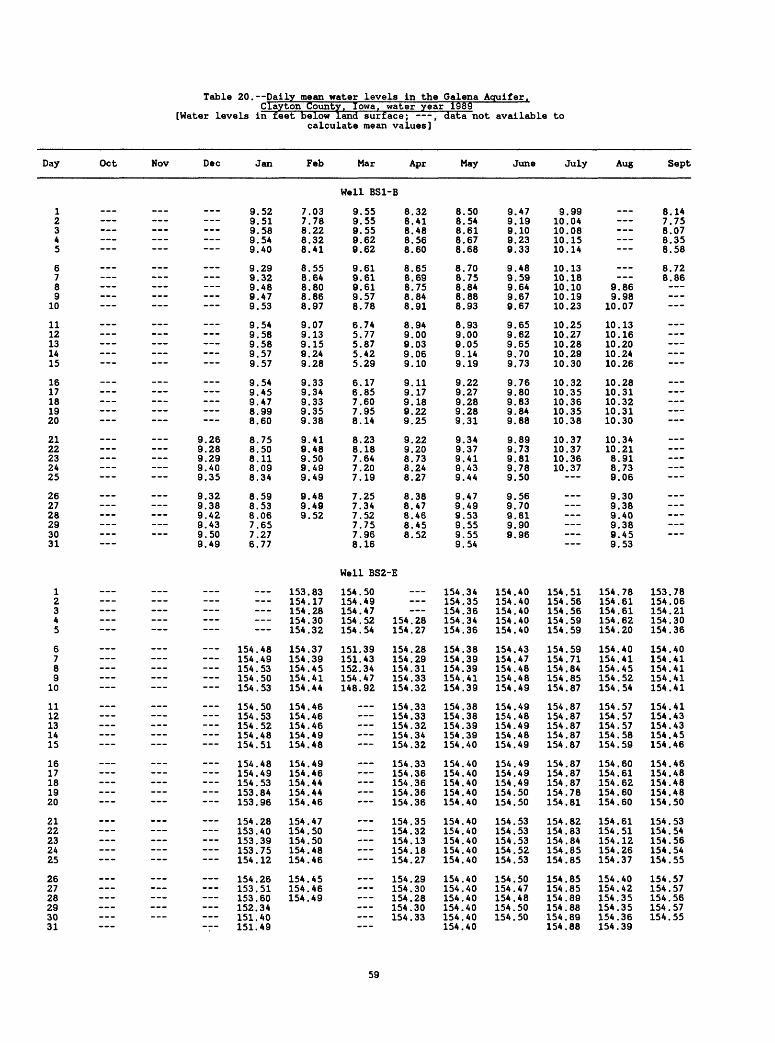
Table 20. Daily mean water levels in the Galena Aquifer.
[Water levels i
Day Oct Nov Dec
Clayton County, Iowa, water year 1989n feet below land surface; ,
calculate mean values]
Jan Feb Mar Apr
, data no1
May
* available to
June July Aug Sept
Well BS1-B
12345
6789
10
1112131415
1617181920
2122232425
262728293031
___
9.269.289.299.409.35
9.329.389.429.439.509.49
9.9.9.9.9.
9.9.9.9.9.
9.9.9.9.9.
9.9.9.8.8.
8.8.8.8.8.
8.8.8.7.7.6.
5251585440
2932484753
5458585757
5445479960
7550110934
595306652777
7.037.788.228.328.41
8.558.648.808.868.97
9.079.139.159.249.28
9.339.349.339.359.38
9.419.489.509.499.49
9.489.499.52
9.559.559.559.629.62
9.619.619.619.578.78
6.745.775.875.425.29
6.176.857.607.958.14
8.238.187.647.207.19
7.257.347.527.757.968.16
8.328.418.488.568.60
8.658.698.758.848.91
8.949.009.039.069.10
9.119.179.189.229.25
9.229.208.738.248.27
8.388.478.468.458.52
8.508.548.618.678.68
8.708.758.848.888.93
8.939.009.059.149.19
9.229.279.289.289.31
9.349.379.419.439.44
9.479.499.539.559.559.54
9.479.199.109.239.33
9.489.599.649.679.67
9.659.629.659.709.73
9.769.809.839.849.88
9.899.739.819.789.50
9.569.709.819.909.96
9.9910.0410.0810.1510.14
10.1310.1810.1010.1910.23
10.2510.2710.2810.2910.30
10.3210.3510.3610.3510.38
10.3710.3710.3610.37
___
9.869.98
10.07
10.1310.1610.2010.2410.26
10.2810.3110.3210.3110.30
10.3410.218.918.739.06
9.309.389.409.389.459.53
8.147.758.078.358.58
8.728.86
Well BS2-E
12345
6789
10
1112131415
1617181920
2122232425
262728293031
___
_
___ ___
___ _
___ ___
_----
154.154.154.154.154.
154.154.154.154.154.
154.154.154.153.153.
154.153.153.153.154.
154.153.153.152.151.151.
----
4849535053
5053524851
4849538496
2840397512
265160344049
153.83154.17154.28154.30154.32
154.37154.39154.45154.41154.44
154.46154.46154.46154.49154.48
154.49154.46154.44154.44154.46
154.47154.50154.50154.48154.46
154.45154.46154.49
154.50154.49154.47154 . 52154.54
151.39151.43152.34154.47148.92
---
___
154.28154.27
154.28154.29154.31154.33154.32
154.33154.33154.32154.34154.32
154.33154.36154.36154.36154.36
154.35154.32154.13154.18154.27
154.29154.30154.28154.30154.33
154.34154.35154.36154.34154.36
154.38154.39154.39154.41154.39
154.38154.38154.39154.39154.40
154.40154.40154.40154.40154.40
154.40154.40154.40154.40154.40
154.40154.40154.40154.40154.40154.40
154.40154.40154.40154.40154.40
154.43154.47154.48154.48154.49
154.49154.48154.49154.48154.49
154.49154.49154.49154.50154.50
154.53154.53154.53154 . 52154.53
154.50154.47154.48154.50154.50
154.51154.56154.56154.59154.59
154.59154.71154.84154.85154.87
154.87154.87154.87154.87154.87
154.87154.87154.87154.78154.81
154.82154.83154.84154.85154.85
154.85154.85154.89154.88154.89154.88
154.78154.61154.61154.62154.20
154.40154.41154.45154.52154.54
154.57154.57154.57154.58154.59
154.60154.61154.62154 . 60154.60
154.61154.51154.12154.26154.37
154.40154.42154.35154.35154.36154.39
153.78154.06154.21154.30154.36
154.40154.41154.41154.41154.41
154.41154.43154.43154.45154.46
154.46154.48154.48154.48154.50
154.53154.54154.56154.54154.55
154.57154.57154.56154.57154.55
59
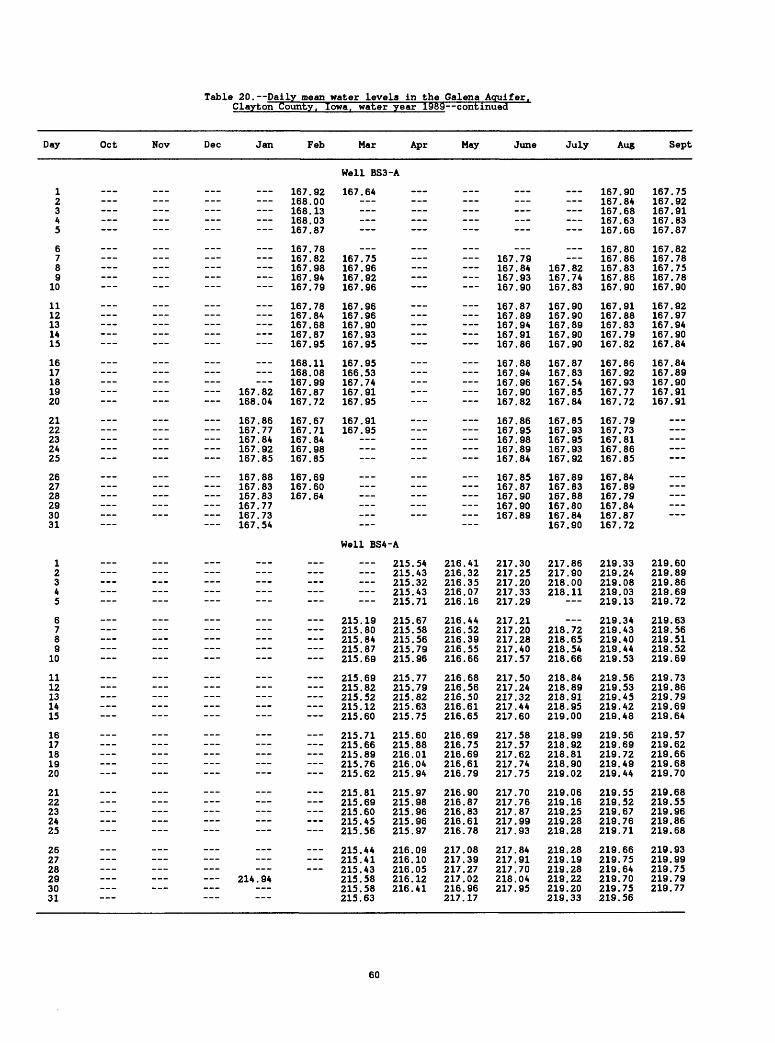
Table 20. Daily mean water levels in the Galena Aquifer,Clayton County, Iowa, water year 1989 continued
Day Oct Nov Dec Jan Feb Mar Apr May June July Aug Sept
Well 8S3-A
12345
6789
10
1112131415
1617181920
2122232425
262728293031
___ ___ ___ ___ --- ---
___ ___ ___---
___ ______ ___
___ ___ ___
___ ___--- ---
--- ---
--- --- --- --- --- --- ---
167.82168.04
167.86167.77167.84167.92167.85
167.88167.83167.83167.77167.73167.54
167.92168.00168.13168.03167.87
167.78167.82167.98167.94167.79
167.78167.84167.68167.87167.95
168.11168.08167.99167.87167.72
167.67167.71167.84167.98167.85
167.69167.60167.64
167.64______
___167.75167.96167.92167.96
167.96167.96167.90167.93167.95
167.95166.53167.74167.91167.95
167.91167.95
---___
___
--- ___
______
---
---
___ ______
___
___
---
---
------
___
------------
___
167.79167.84167.93167.90
167.87167.89167.94167.91167.86
167.88167.94167.96167.90167.82
167.86167.95167.98167.89167.84
167.85167.87167.90167.90167.89
_____
167 . 82167.74167.83
167.90167.90167.89167.90167 . 90
167.87167.83167.54167.85167.84
167.85167.93167.95167.93167 . 92
167.89167.83167.88167.80167.84167.90
167.90167.84167.68167.63167.66
167.80167.86167.83167.86167.90
167.91167.88167.83167.79167.82
167.86167.92167.93167.77167.72
167.79167.73167.81167.86167.85
167.84167.89167.79167.84167.87167.72
167.75167.92167.91167.83167.87
167.82167.78167.75167.78167.90
167.92167.97167.94167.90167.84
167.84167.89167.90167.91167.91
___
Well 8S4-A
12345
6789
10
1112131415
1617181920
2122232425
262728293031
--- --- - - ---
___ ___ ___
___ ___ ___ ___--- --- ---
--- ------ ---
--- ---
___ ___ ___ ___--- --- ---
--- --- --- --- --- -
--- ---
--- --- ---___ ___ ___
___ ___ ___ ______ ___ ___ ___
______ ___ _ ___--- --- ---
___ ___ ______ ___ ___ ______ ___
214.94___ ___
______---___
__
___
215.19215.80215.84215.87215.69
215.69215.82215.52215.12215.60
215.71215.66215.89215.76215.62
215.81215.69215.60215.45215.56
215.44215.41215.43215.58215.58215.63
215.54215.43215.32215.43215.71
215.67215.58215.56215.79215.96
215.77215.79215.82215.63215.75
215.60215.88216.01216.04215.94
215.97215.98215.96215.96215.97
216.09216.10216.05216.12216.41
216.41216.32216.35216.07216.16
216.44216.52216.39216.55216.66
216.68216.56216.50216.61216.65
216.69216.75216.69216.61216.79
216.90216.87216.83216.61216.78
217.08217.39217.27217.02216.96217.17
217.30217.25217.20217.33217.29
217.21217.20217.28217.40217.57
217.50217.24217.32217.44217.60
217.58217.57217.62217.74217.75
217.70217.76217.87217.99217.93
217.84217.91217.70218.04217.95
217.86217.90218.00218.11
218.72218.65218.54218.66
218.84218.89218.91218.95219.00
218.99218.92218.81218.90219.02
219.06219.16219.25219.28219.28
219.28219.19219.28219.22219.20219.33
219.33219.24219.08219.03219.13
219.34219.43219.40219.44219.53
219.56219.53219.45219.42219.48
219.56219.69219.72219.49219.44
219.55219.52219.67219.76219.71
219.66219.75219.64219.70219.75219.56
219.60219.89219.86219.69219.72
219.63219.56219.51219.52219.69
219.73219.86219.79219.69219.64
219.57219.62219.66219.68219.70
219.68219.55219.96219.86219.68
219.93219.99219.75219.79219.77
60
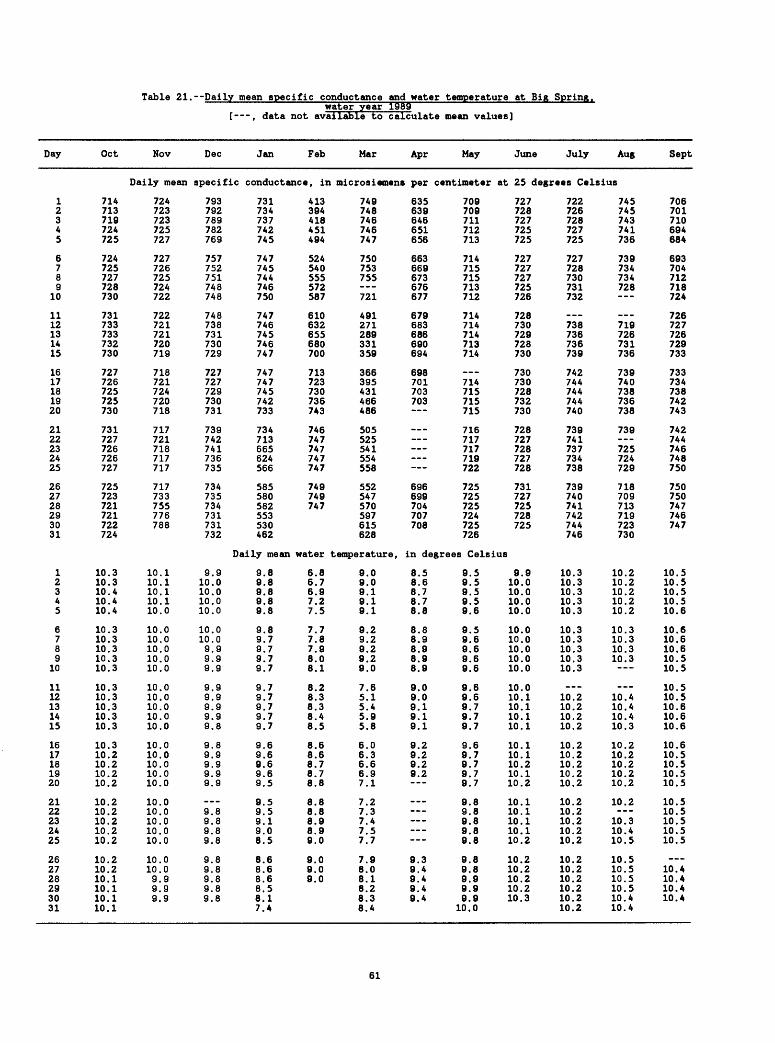
Table 21. Daily mean specific conductance and water temperature at Big Spring.water year 1955
[ , data not available to calculate mean values]
Day Oct
1 7142 7133 7194 7245 725
6 7247 7258 7279 728
10 730
11 73112 73313 73314 73215 730
16 72717 72618 72519 72520 730
21 73122 72723 72624 72625 727
26 72527 72328 72129 72130 72231 724
1 10.32 10.33 10.44 10.45 10.4
6 10.37 10.38 10.39 10.3
10 10.3
11 10.312 10 . 313 10.314 10.315 10.3
16 10.317 10.218 10.219 10.220 10.2
21 10.222 10.223 10.224 10.225 10.2
26 10.227 10.228 10.129 10.130 10.131 10.1
Nov
Daily mean
724723723725727
727726725724722
722721721720719
718721724720718
717721718717717
717733755776788
10.110.110.110.110.0
10.010.010.010.010.0
10.010.010.010.010.0
10.010.010.010.010.0
10.010.010.010.010.0
10.010.09.99.99.9
Dec Jan Feb Mar
specific conductance, in microsiemens
793792789782769
757752751748748
748738731730729
727727729730731
739742741736735
734735734731731732
9.910.010.010.010.0
10.010.09.99.99.9
9.99.99.99.99.8
9.89.99.99.99.9
___9.89.89.89.8
9.89.89.89.89.8
731734737742745
747745744746750
747746745746747
747747745742733
734713665624566
585580582553530462
Daily mean
9.89.89.89.89.8
9.89.79.79.79.7
9.79.79.79.79.7
9.69.69.69.69.5
9.59.59.19.08.5
8.68.68.68.58.17.4
413394418451494
524540555572587
610632655680700
713723730736743
746747747747747
749749747
water
6.86.76.97.27.5
7.77.87.98.08.1
8.28.38.38.48.5
8.68.68.78.78.8
8.88.88.98.99.0
9.09.09.0
749748746746747
750753755___721
491271289331359
366395431466486
505525541554558
552547570597615628
temperature,
9.09.09.19.19.1
9.29.29.29.29.0
7.65.15.45.95.8
6.06.36.66.97.1
7.27.37.47.57.7
7.98.08.18.28.38.4
Apr
per
635639646651656
663669673676677
679683686690694
698701703703
696699704707708
May June July
centimeter at 25
709709711712713
714715715713712
714714714713714
714715715715
716717717719722
725725725724725726
727728727725725
727727727725726
728730729728730
730730728732730
728727728727728
731727725728725
Aug Sept
degrees Celsius
722726728727725
727728730731732
738736736739
742744744744740
739741737734738
739740741742744746
745745743741736
739734734728
719726731736
739740738736738
739___725724729
718709713719723730
706701710694684
693704712718724
726727726729733
733734738742743
742744746748750
750750747746747
in degrees Celsius
8.58.68.78.78.8
8.88.98.98.98.9
9.09.09.19.19.1
9.29.29.29.2___
9.39.49.49.49.4
9.59.59.59.59.6
9.59.69.69.69.6
9.69.69.79.79.7
9.69.79.79.79.7
9.89.89.89.89.8
9.89.89.99.99.9
10.0
9.910.010.010.010.0
10.010.010.010.010.0
10.010.110.110.110.1
10.110.110.210.110.2
10.110.110.110.110.2
10.210.210.210.210.3
10.310.310.310.310.3
10.310.310.310.310.3
10.210.210.210.2
10.210.210.210.210.2
10.210.210.210.210.2
10.210.210.210.210.210.2
10.210.210.210.210.2
10.310.310.310.3___
10.410.410.410.3
10.210.210.210.210.2
10.2
10.310.410.5
10.510.510.510.510.410.4
10.510.510.510.510.6
10.610.610.610.510.5
10.510.510.610.610.6
10.610.510.510.510.5
10.510.510.510.510.5
10.410.410.410.4
61
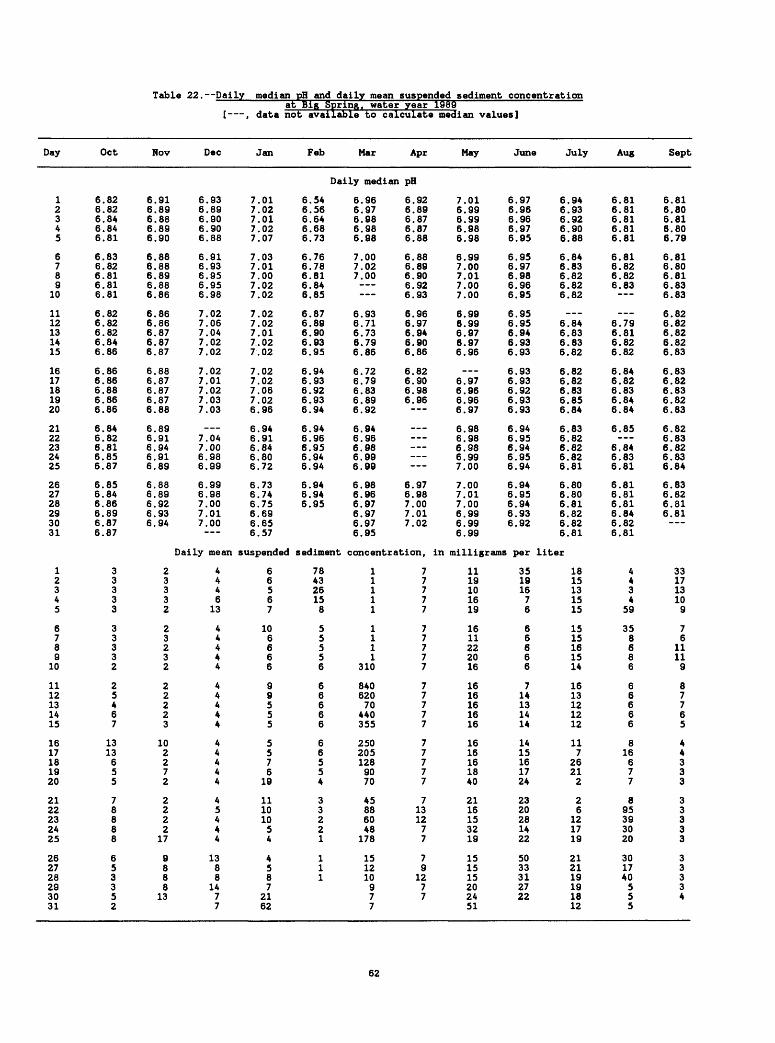
Table 22. Daily median pH and daily mean suspended sediment concentrationat Big Spring, water year 1989
[ , data not available to calculate median values]
Day
12345
6789
10
1112131415
1617181920
2122232425
262728293031
12345
6789
10
1112131415
1617181920
2122232425
262728293031
Oct
6.826.826.846.846.81
6.836.826.816.816.81
6.826.826.826.846.86
6.866.866.886.866.86
6.846.826.816.856.87
6.856.846.866.896.876.87
33333
33332
25467
1313655
78888
653352
Nov
6.916.896.886.896.90
6.886.886.896.886.86
6.866.866.876.876.87
6.886.876.876.876.88
6.896.916.946.916.89
6.886.896.926.936.94
23332
23232
22223
102272
2222
17
9888
13
Dec
6.936.896.906.906.88
6.916.936.956.956.98
7.027.067.047.027.02
7.027.017.027.037.03
7.047.006.986.99
6.996.987.007.017.00
Daily mean
4446
13
44444
44444
44444
45444
1388
1477
Jan
7.017.027.017.027.07
7.037.017.007.027.02
7.027.027.017.027 . 02
7.027.027.067.026.96
6.946.916.846.806.72
6.736.746.756.696.656.57
suspended
66567
106666
99555
5576
19
11101054
4587
2162
Feb
6.546.566.646.686.73
6.766.786.816.846.85
6.876.896.906.936.95
6.946.936.926.936.94
6.946.966.956.946.94
6.946.946.95
Mar
Daily median
6.966.976.986.986.98
7.007.027.00
6.936.716.736.796.86
6.726.796.836.896.92
6.946.966.986.996.99
6.986.966.976.976.976.95
Apr
pH
6.926.896.876.876.88
6.886.896.906.926.93
6.966.976.946.906.86
6.826.906.986.96
6.976.987.007.017.02
sediment concentration.
784326158
55556
66666
66554
33221
111
11111
1111
310
84062070
440355
2502051289070
45886048
178
151210977
77777
77777
77777
77777
7131277
79
1277
May
7.016.996.996.986.98
6.997.007.017.007.00
6.996.996.976.976.96
6.976.966.966.97
6.986.986.986.997.00
7.007.017.006.996.996.99
in milligrams
1119101619
1611222016
1616161616
1616161840
2116153219
151515202451
June
6.976.966.966.976.95
6.956.976.986.966.95
6.956.956.946.936.93
6.936.936.926.936.93
6.946.956.946.956.94
6.946.956.946.936.92
per
35191676
66666
714131414
1415161724
2320281422
5033312722
July
6.946.936.926.906.88
6.846.836.826.826.82
6.846.836.836.82
6.826.826.836.856.84
6.836.826.826.826.81
6.806.806.816.826.826.81
liter
1815131515
1515161514
1613121212
117
26212
26
121719
212119191812
Aug
6.816.816.816.816.81
6.816.826.826.83
6.796.816.826.82
6.846.826.836.846.84
6.85
6.846.836.81
6.816.816.816.846.826.81
4434
59
358686
66666
816677
895393020
301740555
Sept
6.816.806.816.806.79
6.816.806.816.836.83
6.826.826.826.826.83
6.836.826.836.826.83
6.826.836.826.836.84
6.836.826.816.81
331713109
76
11119
87765
44333
33333
33334
62
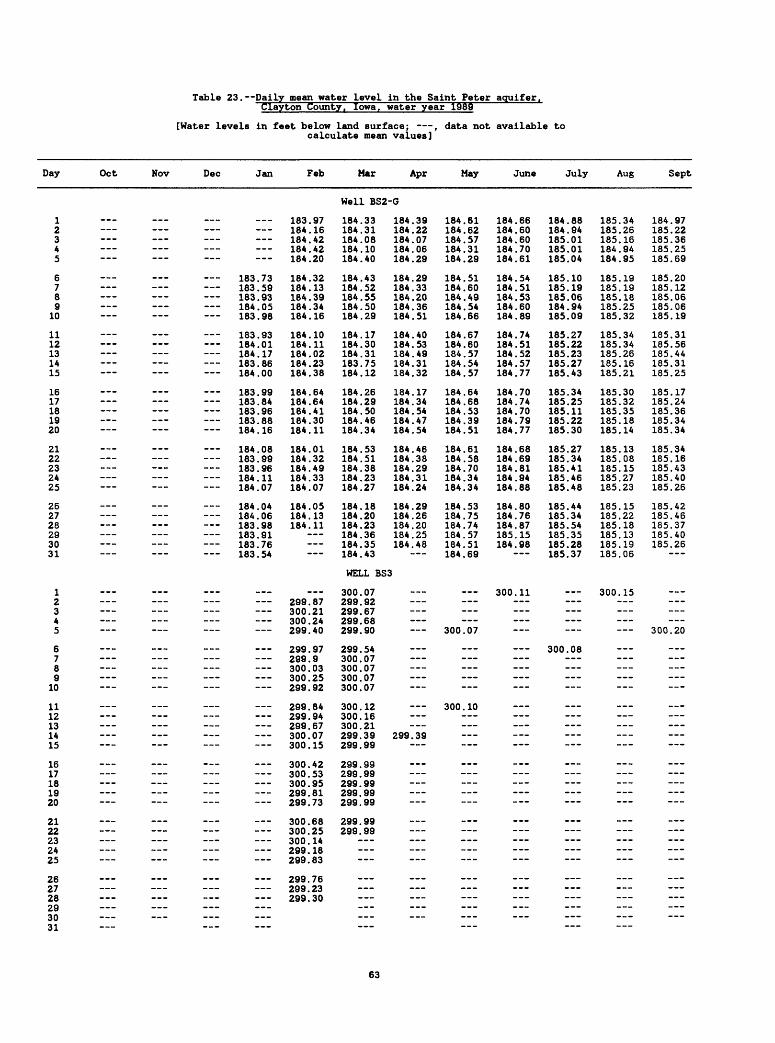
Table 23. Daily mean water level in the Saint Peter aquifer. Clayton County. Iowa, water year 1989
[Water levels in feet below land surface; , data not available to calculate mean values]
Day Oct Nov Dec Jan Feb Mar Apr May June July Aug Sept
Well BS2-G
12345
6789
10
1112131415
1617181920
2122232425
262728293031
12345
6789
10
1112131415
1617181920
2122232425
262728293031
183.73183.59183.93184.05183.98
183.93184.01184.17
___ __ loo oe J.OJ . OO184.00
183.99183.84183.96
183.88184.16
184.08183.99183.96184.11184.07
184.04184.06183.98i o o fli XOO . 0X
__ 1 Q Q TCXO<7 * / O183.54
_
_ _
_
_
_ _
_
_
183.97184.16184.42184.42184.20
184.32184 . 13184.39184.34184.16
184.10184.11184.02184.23184.38
184.64184.64184.41184.30184.11
184.01184.32184.49184.33184.07
184.05184.13184.11
299.87300.21300.24299.40
299.97299.9300.03300.25299.92
299.84299.94299.67300.07300.15
300.42300.53300.95299.81299.73
300.68300.25300.14299.18299.83
299.76299.23299.30
184.33184.31184.08184.10184.40
184.43184 . 52184.55184.50184.29
184.17184.30184.31183.75184.12
184.26184.29184 . 50184.46184.34
184 . 53184.51184.38184.23184.27
184.18184.20184.23184.36184.35184.43
WELL BS3
300.07299.92299.67299.68299.90
299.54300.07300.07300.07300.07
300.12300.16300.21299.39299.99
299.99299.99299.99299.99299.99
299.99299.99
184.39184.22184.07184.06184.29
184.29184.33184.20184.36184.51
184.40184.53184.49184.31184.32
184.17184.34184 . 54184.47184.54
184.46184.38184.29184.31184.24
184.29184.26184.20184.25184.48
299.39 -
184.61184.62184.57184.31184.29
184.51184.60184.49184.54184.66
184.67184.60184.57184.54184 . 57
184.64184.68184.53184.39184.51
184.61184.58184.70184.34184.34
184.53184.75184.74184.57184.51184.69
300.07
300.10
184.66184.60184.60184.70184.61
184.54184.51184.53184.60184 . 89
184.74184.51184.52184.57184.77
184.70184.74184.70184.79184.77
184.68184.69184.81184.94184.88
184.80184.76184.87185.15184.98
300.11
184.88184.94185.01185.01185.04
185.10185.19185.06184.94185.09
185.27185.22185.23185.27185.43
185.34185.25185.11185.22185.30
185.27185.34185.41185.46185.48
185.44185.34185.54185.35185.28185.37
300.08
___
185.34185.26185.16184.94184.95
185.19185.19185.18185.25185.32
185.34185.34185.26185.16185.21
185.30185.32185.35185.18185.14
185.13185.08185.15185.27185.23
185.15185.22185.18185.13185.19185.06
300.15
___
184.97185.22185.36185.25185.69
185.20185.12185.06185.06185.19
185.31185.56185.44185.31185.25
185.17185.24185.36185.34185.34
185.34185.16185.43185.40185.26
185.42185.46185.37185.40185.26
300.20
___
___
63
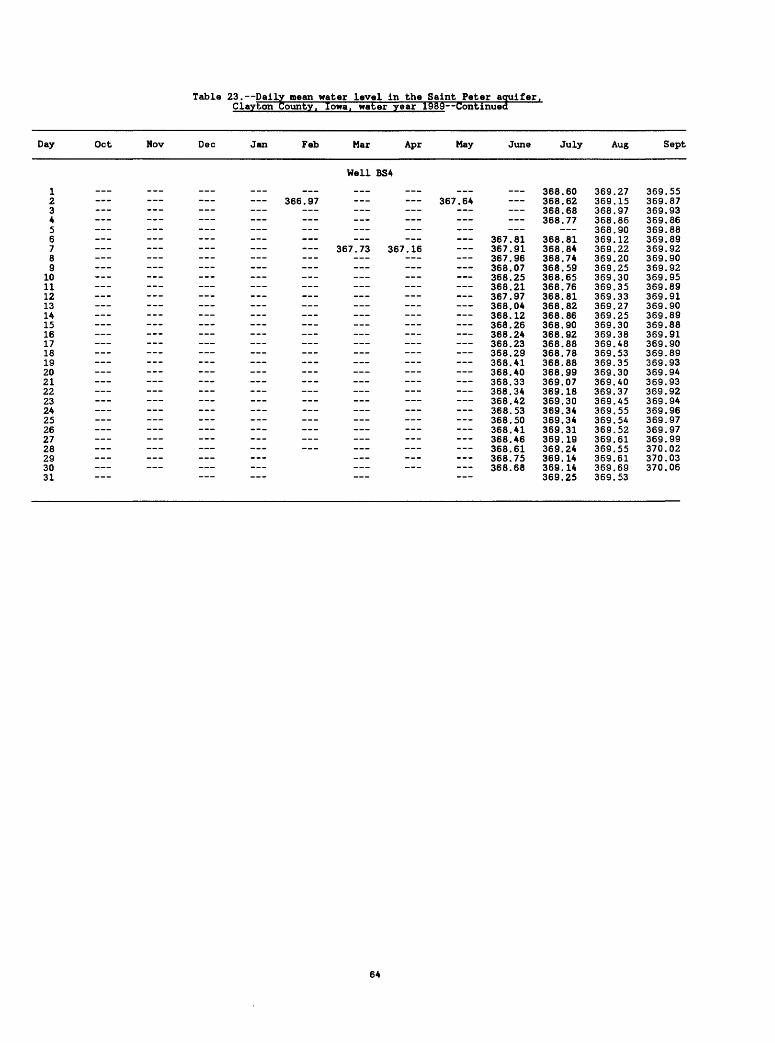
Day
123456789
10111213141516171819202122232425262728293031
Table 23. Daily mean water level in theClay ton County, Iowa, water year
Oct Nov Dec Jan Feb Mar Apr
Well BS4
_ 366.97
___ ___ _ _ _ ___ ___ 367.73 367.16 _ ___
___ _ _ --- --- --- --- _ ___ ___ _ ___ _ _ _ _ --- - _ _ ___ ___ ___ _ _ _ ___ _ _ ___ ___ _ _ _ _ ___ _ ___ _ ___ _ ___ _
Saint Peter aquifer1989- -Continued
May
367.64
___
____________
June
367.81367.91367.96368.07368.25368.21367.97368.04368.12368.26368.24368.23368.29368.41368.40368.33368.34368.42368.53368.50368.41368.46368.61368.75368.68
July
368.60368.62368.68368.77
368.81368.84368.74368.59368.65368.76368.81368.82368.86368.90368.92368.88368.78368.88368.99369.07369.18369.30369.34369.34369.31369.19369.24369.14369.14369.25
Aug
369.27369.15368.97368.86368.90369.12369.22369.20369.25369.30369.35369.33369.27369.25369.30369.38369.48369.53369.35369.30369.40369.37369.45369.55369.54369.52369.61369.55369.61369.69369.53
Sept
369.55369.87369.93369.86369.88369.89369.92369.90369.92369.95369.89369.91369.90369.89369.88369.91369.90369.89369.93369.94369.93369.92369.94369.96369.97369.97369.99370.02370.03370.06
64
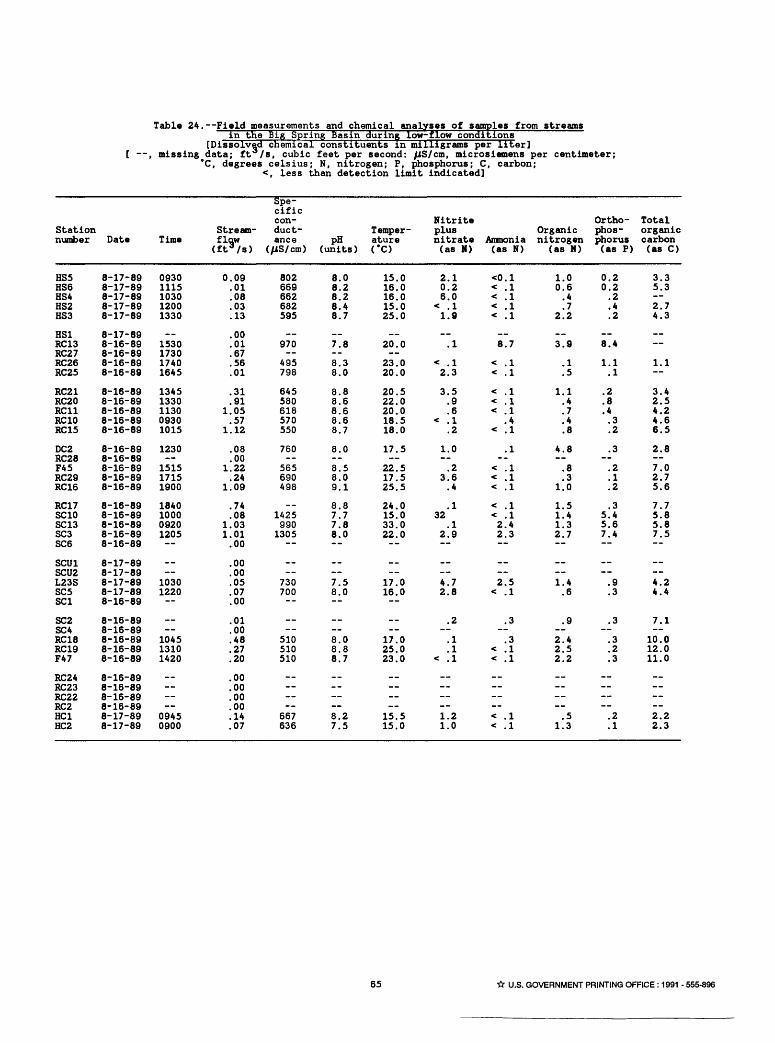
Table 24. Field measurements and chemical analyses of samples from streamsin the Big Spring Basin during low-flow conditions
[Dissolved chemical constituents in milligrams per liter] [ , missing data; ft /s, cubic feet per second: /JS/cm, microsiemens per centimeter;
'C, degrees Celsius; N, nitrogen; P, phosphorus; C, carbon; <, less than detection limit indicated]
Stationnumber
HS5HS6HS4HS2HS3
HS1RC13RC27RC26RC25
RC21RC20RC11RC10RC15
DC2RC28F45RC29RC16
RC17SC10SC13SC3SC6
SCU1SCU2L23SSC5SCI
SC2SC4RC18RC19F47
RC24RC23RC22RC2HC1HC2
Date
8-17-898-17-898-17-898-17-898-17-89
8-17-898-16-898-16-898-16-898-16-89
8-16-898-16-898-16-898-16-898-16-89
8-16-898-16-898-16-898-16-898-16-89
8-16-898-16-898-16-898-16-898-16-89
8-17-898-17-898-17-898-17-898-16-89
8-16-898-16-898-16-898-16-898-16-89
8-16-898-16-898-16-898-16-898-17-898-17-89
Time
09301115103012001330
1530173017401645
13451330113009301015
1230
151517151900
1840100009201205
10301220
104513101420
09450900
Stream-flaw(ft3 /s)
0.09.01.08.03.13
.00
.01
.67
.56
.01
.31
.911.05.57
1.12
.08
.001.22.24
1.09
.74
.081.031.01.00
.00
.00
.05
.07
.00
.01
.00
.48
.27
.20
.00
.00
.00
.00
.14
.07
Spe cific conductance
(/JS/cm)
802669662682595
970
495798
645580618570550
760
565690498
14259901305
730700
510510510
667636
pH(units)
8.08.28.28.48.7
7.8 8.38.0
8.88.68.68.68.7
8.0 8.58.09.1
8.87.77.88.0
7.58.0
8.08.88.7
__ 8.27.5
TemperatureCO
15.016.016.015.025.0
20.0
23.020.0
20.522.020.018.518.0
17.5
22.517.525.5
24.015.033.022.0
17.016.0
17.025.023.0
15.515.0
Nitriteplusnitrate(as N)
2.10.26.0
< .11.9
.1
< .12.3
3.5.9.6
< .1.2
1.0 .2
3.6.4
.132
.12.9
4.72.8
.2 .1.1
< .1
1.21.0
Ammonia(as N)
<0.1< !l< .1< .1< .1
8.7
.1
.1
.1
.1
.1
.4< .1
.1 .1.1.1
.1
.12.42.3
2.5
< .1
.3 .3
< .1< .1
< .1< .1
Organicnitrogen
(as N)
1.00.6.4.7
2.2
3.9
.1
.5
1.1.4.7.4.8
4.8 .8.3
1.0
1.51.41.32.7
1.4.6
.9 2.42.52.2
.5
1.3
Ortho-phosphorus(as P)
0.20.2.2.4.2
8.4
1.1.1
.2
.8
.4.3.2
.3 .2.1.2
.35.45.67.4
.9.3
.3 .3.2.3
.2.1
Totalorganiccarbon(as C)
3.35.3 2.74.3
1.1
3.42.54.24.66.5
2.8 7.02.75.6
7.75.85.87.5--
--4.24.4
7.1--10.012.011.0
----2.22.3
65 ft U.S. GOVERNMENT PRINTING OFFICE : 1991 - 555-896
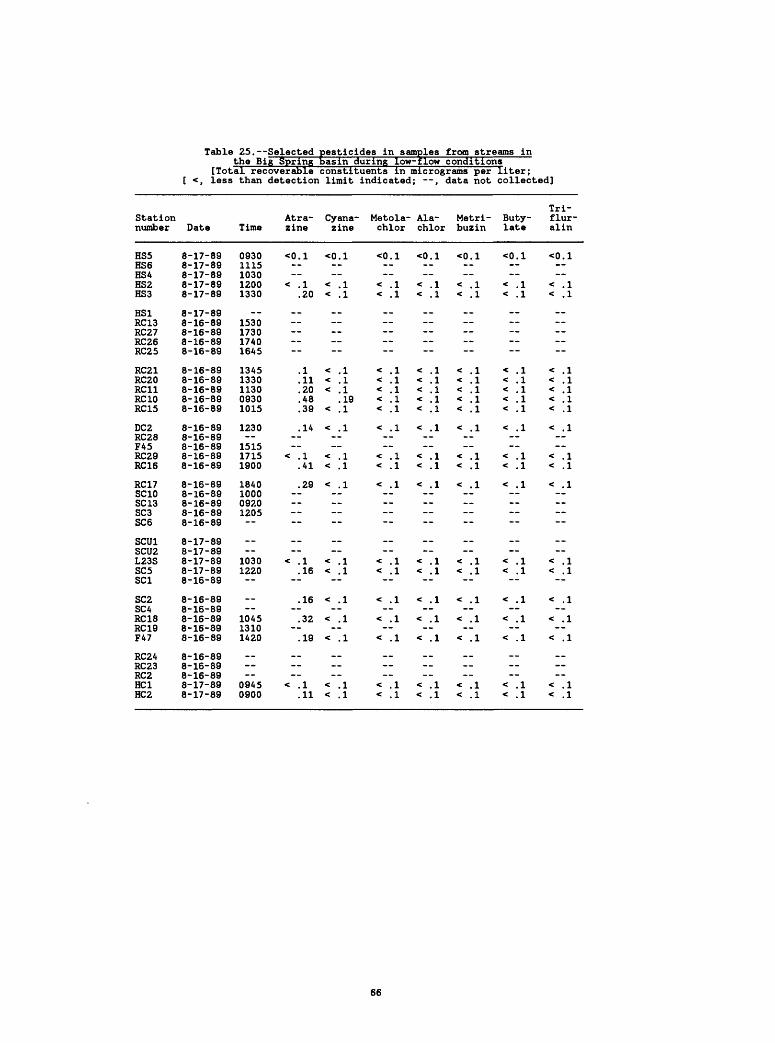
Table 25. Selected pesticides in samples from streams inthe Big Spring 1>asin during low-flow conditions
[Total recoverable constituents in micrograms per
Stationnumber
HS5HS6HS4HS2HS3
HS1RC13RC27RC26RC25
RC21RC20RC11RC10RC15
DC2RC28F45RC29RC16
RC17SC10SC13SC3SC6
SCU1SCU2L23SSC5SCI
SC2SC4RC18RC19F47
RC24RC23RC2HC1HC2
[ <, less
Date
8-17-898-17-898-17-898-17-898-17-89
8-17-898-16-898-16-898-16-898-16-89
8-16-898-16-898-16-898-16-898-16-89
8-16-898-16-898-16-898-16-898-16-89
8-16-898-16-898-16-898-16-898-16-89
8-17-898-17-898-17-898-17-898-16-89
8-16-898-16-898-16-898-16-898-16-89
8-16-898-16-898-16-898-17-898-17-89
than
Time
09301115103012001330
1530173017401645
13451330113009301015
1230 151517151900
1840100009201205
10301220
104513101420
09450900
detection
Atra-zine
<0.1
< .1.20
__
.1
.11
.20
.48
.39
.14
< .1.41
.29 --
__
< .1.16
.16 .32 .19
< .1.11
limit
Cyana-zine
<0.1
< .1< .1
__
< .1< .1< .1
.19< .1
< .1
< .1< .1
< .1
< .1< .1
< .1--
< .1
< .1
--
< .1< .1
indicated;
Metola-chlor
<0.1
< .1< .1
< .1< .1< .1< .1< .1
< .1
< .1< .1
< .1
--
< .1< .1
< .1
< .1
< .1
< .1< .1
; ",
Ala-chlor
<0.1
< .1< .1
< .1< .1< .1< .1< .1
< .1
< .1< .1
< .1--
< .1< .1
< .1
< .1
< .1
< .1< .1
data not
Metri-buzin
<0.1
< .1< .1
< .1< .1< .1< .1< .1
< .1
< .1< .1
< .1
< .1< .1
< .1
< .1
< .1
< .1< .1
liter;collected]
Buty-late
<0.1
< .1< .1
--
< .1< .1< .1< .1< .1
< .1
< .1< .1
< .1
< .1< .1
< .1
< .1
< .1
< .1< .1
Tri-flur-alin
<0.1
< .1< .1
--
< .1< .1< .1< .1< .1
< .1
< .1< .1
< .1
< .1< .1
< .1
< .1--
< .1
< .1< .1
66