hydrogeological and hydrochemical framework of regional aquifer system in kali-ganga sub-basin,...
TRANSCRIPT
Cases and solutions
602 Environmental Geology 40 (4-5) February 2001 7 Q Springer-Verlag
Hydrogeological and hydrochemicalframework of regional aquifersystem in Kali-Ganga sub-basin,IndiaAsad Umar 7 Rashid Umar 7 M.S. Ahmad
Received: 2 March 2000 7 Accepted: 3 July 2000
A. Umar 7 R. Umar (Y) 7 M.S. AhmadDepartment of Geology, A.M.U., Aligarh, IndiaFax: c91-571-400528
Abstract The central Ganga Basin is one of themajor groundwater reservoirs in India. The Kali-Ganga sub-basin is a micro watershed of the cen-tral Ganga Basin, containing a number of produc-tive aquifers. A detailed hydrogeological investiga-tion was carried out, which reveals the occurrenceof a single-tier aquifer system down to 163 m bgl(metres below ground level), but at places it is in-terleaved with clay layers; thus imparting it a two-to three-tier aquifer system. These aquifers are un-confined to confined in disposition. The transmis-sivity, storage coefficient and hydraulic conductivi-ty are determined as 2178 m2/day, 1.12!10–5 and120 m/day, respectively. The groundwater of the ba-sin is fresh, of an alkali-bicarbonate type and issuitable for irrigation and domestic use. However,in certain areas, extensive agricultural activities,and domestic and industrial effluents have causedsome deterioration of groundwater quality. Thisstudy contains data of where the concentration ofFe, Pb, Cd, Cr and Ni are higher than the permissi-ble limits, which may be hazardous to publichealth.
Keywords Aquifer parameter 7 Aquifer system 7Kali-Ganga 7 Water quality
Introduction
India, with its agricultural economy, depends heavily onthe availability of water to meet its irrigational demands.Rainfall is characterized by seasonal and annual varia-tions and is not a very reliable source of water supply.Availability of groundwater is therefore a major asset thatcan greatly influence agriculture.
However, the evaluation and management of groundwat-er resources require an understanding of hydrogeologicaland hydrochemical properties of the aquifer. In Kali-Gan-ga sub-basin, the aquifers are of major importance be-cause they are the main source of water supply. The de-velopment of water resources in the area during the pasttwo decades has produced a mixed result of a decliningwater table in the top aquifers and waterlogging condi-tions in the canal command areas. This paper aims to de-scribe the regional aquifers, their hydrological character-istics and give a quality assessment. The paper is basedon actual field data collected from 1996–1998 as part of aDoctoral thesis of Asad Umar.
Description of the area
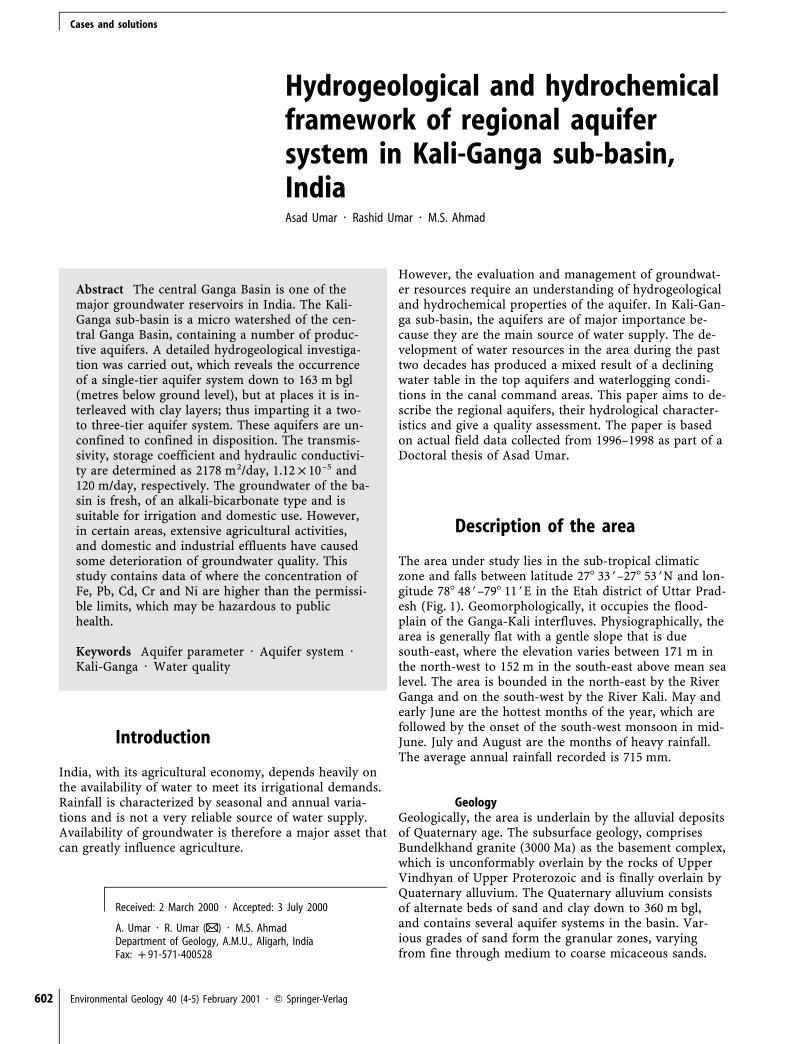
The area under study lies in the sub-tropical climaticzone and falls between latitude 277 33b–277 53bN and lon-gitude 787 48b–797 11bE in the Etah district of Uttar Prad-esh (Fig. 1). Geomorphologically, it occupies the flood-plain of the Ganga-Kali interfluves. Physiographically, thearea is generally flat with a gentle slope that is duesouth-east, where the elevation varies between 171 m inthe north-west to 152 m in the south-east above mean sealevel. The area is bounded in the north-east by the RiverGanga and on the south-west by the River Kali. May andearly June are the hottest months of the year, which arefollowed by the onset of the south-west monsoon in mid-June. July and August are the months of heavy rainfall.The average annual rainfall recorded is 715 mm.
GeologyGeologically, the area is underlain by the alluvial depositsof Quaternary age. The subsurface geology, comprisesBundelkhand granite (3000 Ma) as the basement complex,which is unconformably overlain by the rocks of UpperVindhyan of Upper Proterozoic and is finally overlain byQuaternary alluvium. The Quaternary alluvium consistsof alternate beds of sand and clay down to 360 m bgl,and contains several aquifer systems in the basin. Var-ious grades of sand form the granular zones, varyingfrom fine through medium to coarse micaceous sands.
Cases and solutions
Environmental Geology 40 (4-5) February 2001 7 Q Springer-Verlag 603
Fig. 1Location map showing sampling sites, boreholes andhydrograph stations
Hydrogeology
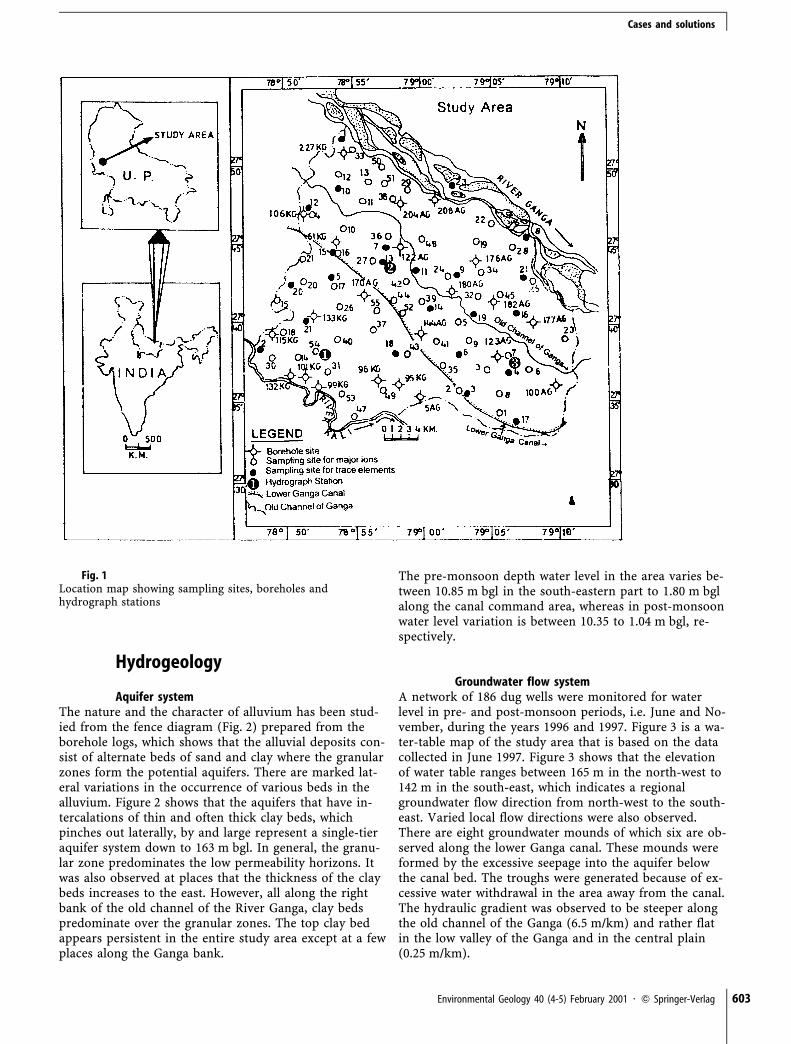
Aquifer systemThe nature and the character of alluvium has been stud-ied from the fence diagram (Fig. 2) prepared from theborehole logs, which shows that the alluvial deposits con-sist of alternate beds of sand and clay where the granularzones form the potential aquifers. There are marked lat-eral variations in the occurrence of various beds in thealluvium. Figure 2 shows that the aquifers that have in-tercalations of thin and often thick clay beds, whichpinches out laterally, by and large represent a single-tieraquifer system down to 163 m bgl. In general, the granu-lar zone predominates the low permeability horizons. Itwas also observed at places that the thickness of the claybeds increases to the east. However, all along the rightbank of the old channel of the River Ganga, clay bedspredominate over the granular zones. The top clay bedappears persistent in the entire study area except at a fewplaces along the Ganga bank.
The pre-monsoon depth water level in the area varies be-tween 10.85 m bgl in the south-eastern part to 1.80 m bglalong the canal command area, whereas in post-monsoonwater level variation is between 10.35 to 1.04 m bgl, re-spectively.
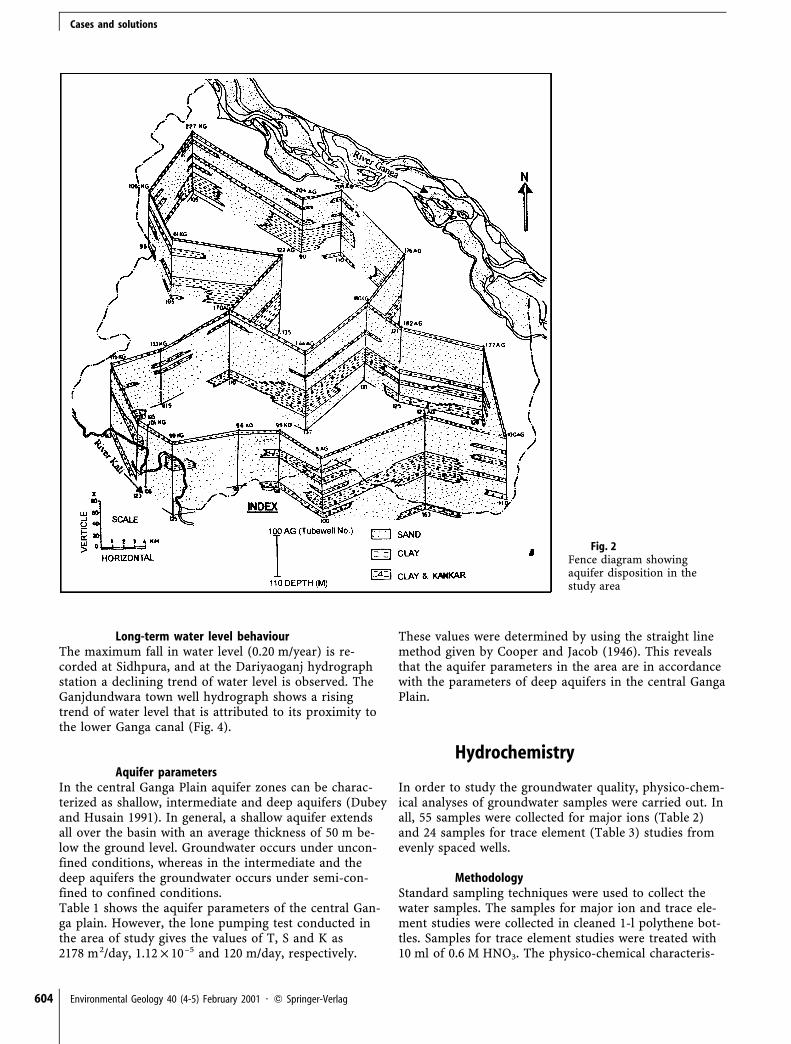
Groundwater flow systemA network of 186 dug wells were monitored for waterlevel in pre- and post-monsoon periods, i.e. June and No-vember, during the years 1996 and 1997. Figure 3 is a wa-ter-table map of the study area that is based on the datacollected in June 1997. Figure 3 shows that the elevationof water table ranges between 165 m in the north-west to142 m in the south-east, which indicates a regionalgroundwater flow direction from north-west to the south-east. Varied local flow directions were also observed.There are eight groundwater mounds of which six are ob-served along the lower Ganga canal. These mounds wereformed by the excessive seepage into the aquifer belowthe canal bed. The troughs were generated because of ex-cessive water withdrawal in the area away from the canal.The hydraulic gradient was observed to be steeper alongthe old channel of the Ganga (6.5 m/km) and rather flatin the low valley of the Ganga and in the central plain(0.25 m/km).
Cases and solutions
604 Environmental Geology 40 (4-5) February 2001 7 Q Springer-Verlag
Fig. 2Fence diagram showingaquifer disposition in thestudy area
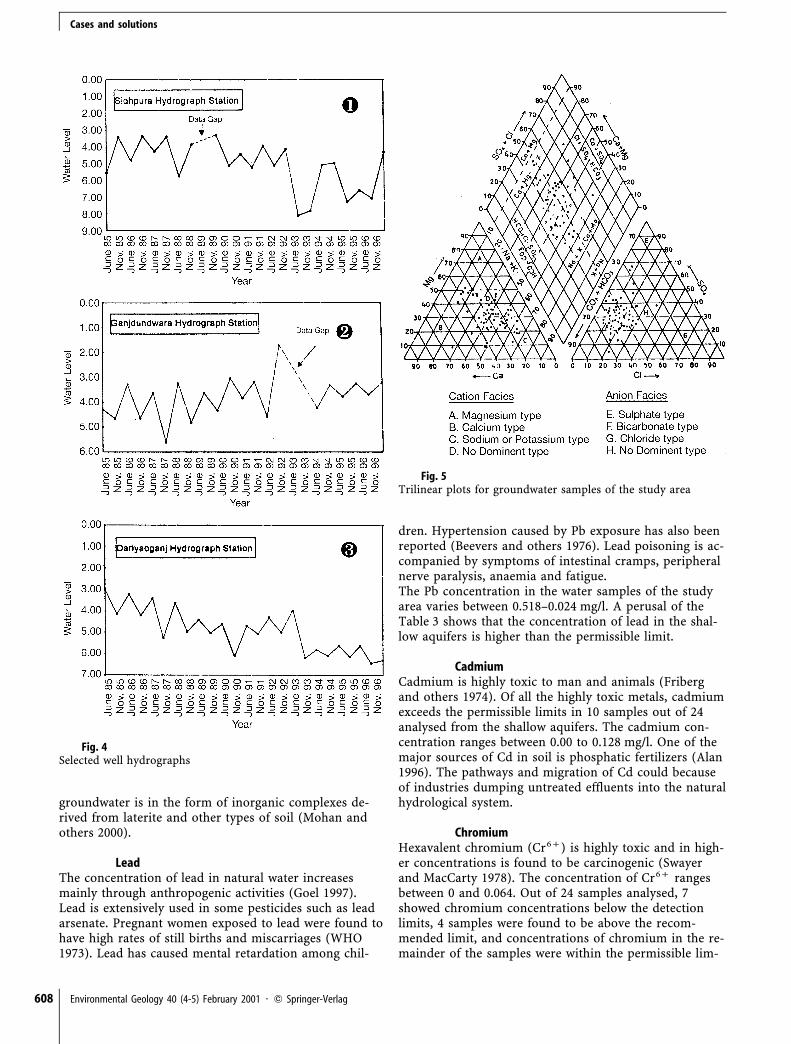
Long-term water level behaviourThe maximum fall in water level (0.20 m/year) is re-corded at Sidhpura, and at the Dariyaoganj hydrographstation a declining trend of water level is observed. TheGanjdundwara town well hydrograph shows a risingtrend of water level that is attributed to its proximity tothe lower Ganga canal (Fig. 4).
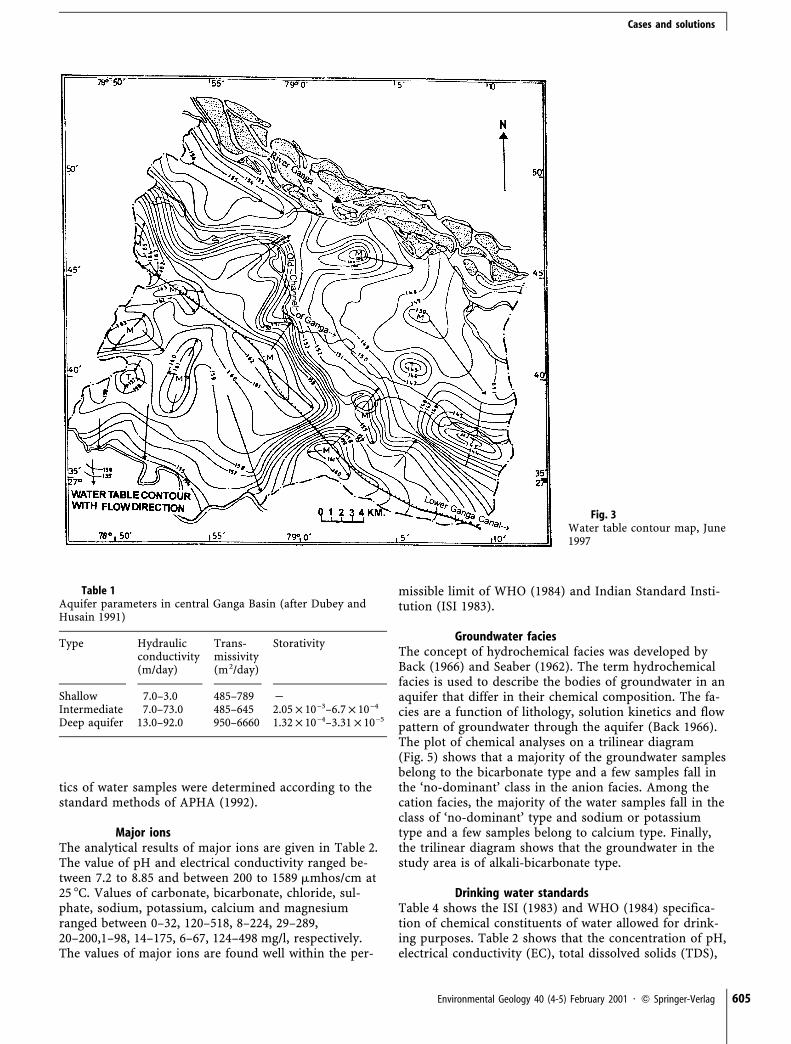
Aquifer parametersIn the central Ganga Plain aquifer zones can be charac-terized as shallow, intermediate and deep aquifers (Dubeyand Husain 1991). In general, a shallow aquifer extendsall over the basin with an average thickness of 50 m be-low the ground level. Groundwater occurs under uncon-fined conditions, whereas in the intermediate and thedeep aquifers the groundwater occurs under semi-con-fined to confined conditions.Table 1 shows the aquifer parameters of the central Gan-ga plain. However, the lone pumping test conducted inthe area of study gives the values of T, S and K as2178 m2/day, 1.12!10–5 and 120 m/day, respectively.
These values were determined by using the straight linemethod given by Cooper and Jacob (1946). This revealsthat the aquifer parameters in the area are in accordancewith the parameters of deep aquifers in the central GangaPlain.
Hydrochemistry
In order to study the groundwater quality, physico-chem-ical analyses of groundwater samples were carried out. Inall, 55 samples were collected for major ions (Table 2)and 24 samples for trace element (Table 3) studies fromevenly spaced wells.
MethodologyStandard sampling techniques were used to collect thewater samples. The samples for major ion and trace ele-ment studies were collected in cleaned 1-l polythene bot-tles. Samples for trace element studies were treated with10 ml of 0.6 M HNO3. The physico-chemical characteris-
Cases and solutions
Environmental Geology 40 (4-5) February 2001 7 Q Springer-Verlag 605
Fig. 3Water table contour map, June1997
Table 1Aquifer parameters in central Ganga Basin (after Dubey andHusain 1991)
Type Hydraulicconductivity
Trans-missivity
Storativity
(m/day) (m2/day)
Shallow 7.0–3.0 485–789 PIntermediate 7.0–73.0 485–645 2.05!10–3–6.7!10–4
Deep aquifer 13.0–92.0 950–6660 1.32!10–4–3.31!10–5
tics of water samples were determined according to thestandard methods of APHA (1992).
Major ionsThe analytical results of major ions are given in Table 2.The value of pH and electrical conductivity ranged be-tween 7.2 to 8.85 and between 200 to 1589 mmhos/cm at25 7C. Values of carbonate, bicarbonate, chloride, sul-phate, sodium, potassium, calcium and magnesiumranged between 0–32, 120–518, 8–224, 29–289,20–200,1–98, 14–175, 6–67, 124–498 mg/l, respectively.The values of major ions are found well within the per-
missible limit of WHO (1984) and Indian Standard Insti-tution (ISI 1983).
Groundwater faciesThe concept of hydrochemical facies was developed byBack (1966) and Seaber (1962). The term hydrochemicalfacies is used to describe the bodies of groundwater in anaquifer that differ in their chemical composition. The fa-cies are a function of lithology, solution kinetics and flowpattern of groundwater through the aquifer (Back 1966).The plot of chemical analyses on a trilinear diagram(Fig. 5) shows that a majority of the groundwater samplesbelong to the bicarbonate type and a few samples fall inthe ‘no-dominant’ class in the anion facies. Among thecation facies, the majority of the water samples fall in theclass of ‘no-dominant’ type and sodium or potassiumtype and a few samples belong to calcium type. Finally,the trilinear diagram shows that the groundwater in thestudy area is of alkali-bicarbonate type.
Drinking water standardsTable 4 shows the ISI (1983) and WHO (1984) specifica-tion of chemical constituents of water allowed for drink-ing purposes. Table 2 shows that the concentration of pH,electrical conductivity (EC), total dissolved solids (TDS),
Cases and solutions
606 Environmental Geology 40 (4-5) February 2001 7 Q Springer-Verlag
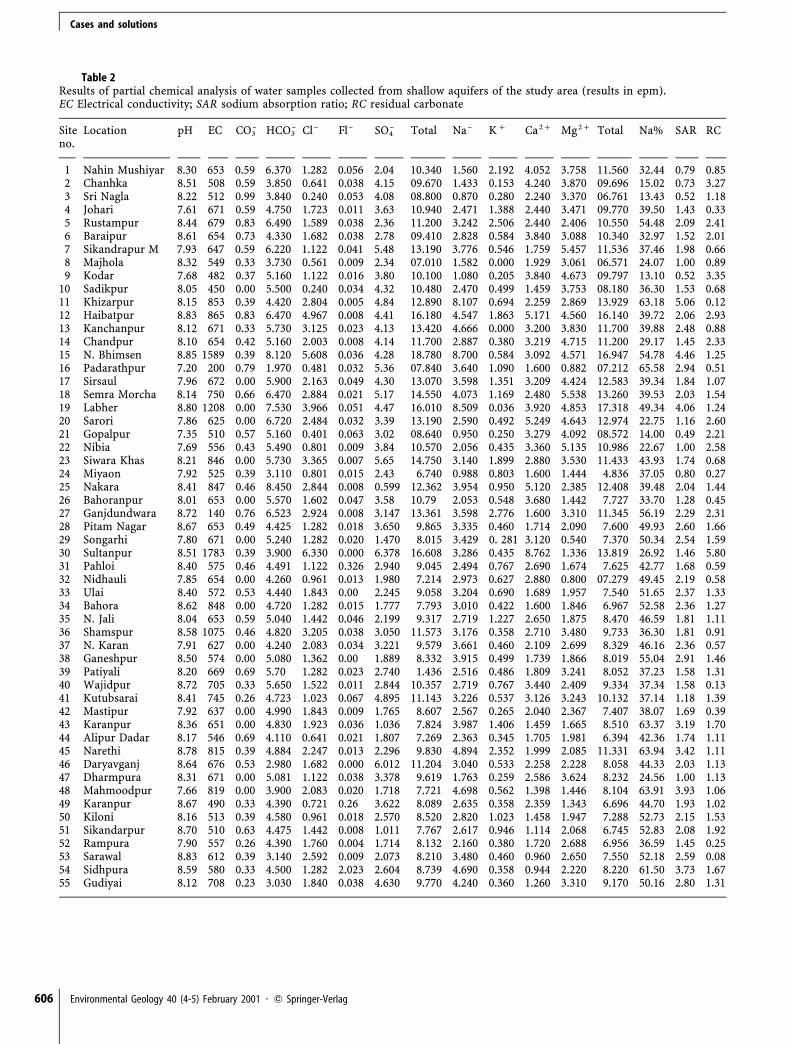
Table 2Results of partial chemical analysis of water samples collected from shallow aquifers of the study area (results in epm).EC Electrical conductivity; SAR sodium absorption ratio; RC residual carbonate
Siteno.
Location pH EC CO3– HCO3
– Cl– Fl– SO4– Total Na– Kc Ca2c Mg2c Total Na% SAR RC
1 Nahin Mushiyar 8.30 653 0.59 6.370 1.282 0.056 2.04 10.340 1.560 2.192 4.052 3.758 11.560 32.44 0.79 0.852 Chanhka 8.51 508 0.59 3.850 0.641 0.038 4.15 09.670 1.433 0.153 4.240 3.870 09.696 15.02 0.73 3.273 Sri Nagla 8.22 512 0.99 3.840 0.240 0.053 4.08 08.800 0.870 0.280 2.240 3.370 06.761 13.43 0.52 1.184 Johari 7.61 671 0.59 4.750 1.723 0.011 3.63 10.940 2.471 1.388 2.440 3.471 09.770 39.50 1.43 0.335 Rustampur 8.44 679 0.83 6.490 1.589 0.038 2.36 11.200 3.242 2.506 2.440 2.406 10.550 54.48 2.09 2.416 Baraipur 8.61 654 0.73 4.330 1.682 0.038 2.78 09.410 2.828 0.584 3.840 3.088 10.340 32.97 1.52 2.017 Sikandrapur M 7.93 647 0.59 6.220 1.122 0.041 5.48 13.190 3.776 0.546 1.759 5.457 11.536 37.46 1.98 0.668 Majhola 8.32 549 0.33 3.730 0.561 0.009 2.34 07.010 1.582 0.000 1.929 3.061 06.571 24.07 1.00 0.899 Kodar 7.68 482 0.37 5.160 1.122 0.016 3.80 10.100 1.080 0.205 3.840 4.673 09.797 13.10 0.52 3.35
10 Sadikpur 8.05 450 0.00 5.500 0.240 0.034 4.32 10.480 2.470 0.499 1.459 3.753 08.180 36.30 1.53 0.6811 Khizarpur 8.15 853 0.39 4.420 2.804 0.005 4.84 12.890 8.107 0.694 2.259 2.869 13.929 63.18 5.06 0.1212 Haibatpur 8.83 865 0.83 6.470 4.967 0.008 4.41 16.180 4.547 1.863 5.171 4.560 16.140 39.72 2.06 2.9313 Kanchanpur 8.12 671 0.33 5.730 3.125 0.023 4.13 13.420 4.666 0.000 3.200 3.830 11.700 39.88 2.48 0.8814 Chandpur 8.10 654 0.42 5.160 2.003 0.008 4.14 11.700 2.887 0.380 3.219 4.715 11.200 29.17 1.45 2.3315 N. Bhimsen 8.85 1589 0.39 8.120 5.608 0.036 4.28 18.780 8.700 0.584 3.092 4.571 16.947 54.78 4.46 1.2516 Padarathpur 7.20 200 0.79 1.970 0.481 0.032 5.36 07.840 3.640 1.090 1.600 0.882 07.212 65.58 2.94 0.5117 Sirsaul 7.96 672 0.00 5.900 2.163 0.049 4.30 13.070 3.598 1.351 3.209 4.424 12.583 39.34 1.84 1.0718 Semra Morcha 8.14 750 0.66 6.470 2.884 0.021 5.17 14.550 4.073 1.169 2.480 5.538 13.260 39.53 2.03 1.5419 Labher 8.80 1208 0.00 7.530 3.966 0.051 4.47 16.010 8.509 0.036 3.920 4.853 17.318 49.34 4.06 1.2420 Sarori 7.86 625 0.00 6.720 2.484 0.032 3.39 13.190 2.590 0.492 5.249 4.643 12.974 22.75 1.16 2.6021 Gopalpur 7.35 510 0.57 5.160 0.401 0.063 3.02 08.640 0.950 0.250 3.279 4.092 08.572 14.00 0.49 2.2122 Nibia 7.69 556 0.43 5.490 0.801 0.009 3.84 10.570 2.056 0.435 3.360 5.135 10.986 22.67 1.00 2.5823 Siwara Khas 8.21 846 0.00 5.730 3.365 0.007 5.65 14.750 3.140 1.899 2.880 3.530 11.433 43.93 1.74 0.6824 Miyaon 7.92 525 0.39 3.110 0.801 0.015 2.43 6.740 0.988 0.803 1.600 1.444 4.836 37.05 0.80 0.2725 Nakara 8.41 847 0.46 8.450 2.844 0.008 0.599 12.362 3.954 0.950 5.120 2.385 12.408 39.48 2.04 1.4426 Bahoranpur 8.01 653 0.00 5.570 1.602 0.047 3.58 10.79 2.053 0.548 3.680 1.442 7.727 33.70 1.28 0.4527 Ganjdundwara 8.72 140 0.76 6.523 2.924 0.008 3.147 13.361 3.598 2.776 1.600 3.310 11.345 56.19 2.29 2.3128 Pitam Nagar 8.67 653 0.49 4.425 1.282 0.018 3.650 9.865 3.335 0.460 1.714 2.090 7.600 49.93 2.60 1.6629 Songarhi 7.80 671 0.00 5.240 1.282 0.020 1.470 8.015 3.429 0. 281 3.120 0.540 7.370 50.34 2.54 1.5930 Sultanpur 8.51 1783 0.39 3.900 6.330 0.000 6.378 16.608 3.286 0.435 8.762 1.336 13.819 26.92 1.46 5.8031 Pahloi 8.40 575 0.46 4.491 1.122 0.326 2.940 9.045 2.494 0.767 2.690 1.674 7.625 42.77 1.68 0.5932 Nidhauli 7.85 654 0.00 4.260 0.961 0.013 1.980 7.214 2.973 0.627 2.880 0.800 07.279 49.45 2.19 0.5833 Ulai 8.40 572 0.53 4.440 1.843 0.00 2.245 9.058 3.204 0.690 1.689 1.957 7.540 51.65 2.37 1.3334 Bahora 8.62 848 0.00 4.720 1.282 0.015 1.777 7.793 3.010 0.422 1.600 1.846 6.967 52.58 2.36 1.2735 N. Jali 8.04 653 0.59 5.040 1.442 0.046 2.199 9.317 2.719 1.227 2.650 1.875 8.470 46.59 1.81 1.1136 Shamspur 8.58 1075 0.46 4.820 3.205 0.038 3.050 11.573 3.176 0.358 2.710 3.480 9.733 36.30 1.81 0.9137 N. Karan 7.91 627 0.00 4.240 2.083 0.034 3.221 9.579 3.661 0.460 2.109 2.699 8.329 46.16 2.36 0.5738 Ganeshpur 8.50 574 0.00 5.080 1.362 0.00 1.889 8.332 3.915 0.499 1.739 1.866 8.019 55.04 2.91 1.4639 Patiyali 8.20 669 0.69 5.70 1.282 0.023 2.740 1.436 2.516 0.486 1.809 3.241 8.052 37.23 1.58 1.3140 Wajidpur 8.72 705 0.33 5.650 1.522 0.011 2.844 10.357 2.719 0.767 3.440 2.409 9.334 37.34 1.58 0.1341 Kutubsarai 8.41 745 0.26 4.723 1.023 0.067 4.895 11.143 3.226 0.537 3.126 3.243 10.132 37.14 1.18 1.3942 Mastipur 7.92 637 0.00 4.990 1.843 0.009 1.765 8.607 2.567 0.265 2.040 2.367 7.407 38.07 1.69 0.3943 Karanpur 8.36 651 0.00 4.830 1.923 0.036 1.036 7.824 3.987 1.406 1.459 1.665 8.510 63.37 3.19 1.7044 Alipur Dadar 8.17 546 0.69 4.110 0.641 0.021 1.807 7.269 2.363 0.345 1.705 1.981 6.394 42.36 1.74 1.1145 Narethi 8.78 815 0.39 4.884 2.247 0.013 2.296 9.830 4.894 2.352 1.999 2.085 11.331 63.94 3.42 1.1146 Daryavganj 8.64 676 0.53 2.980 1.682 0.000 6.012 11.204 3.040 0.533 2.258 2.228 8.058 44.33 2.03 1.1347 Dharmpura 8.31 671 0.00 5.081 1.122 0.038 3.378 9.619 1.763 0.259 2.586 3.624 8.232 24.56 1.00 1.1348 Mahmoodpur 7.66 819 0.00 3.900 2.083 0.020 1.718 7.721 4.698 0.562 1.398 1.446 8.104 63.91 3.93 1.0649 Karanpur 8.67 490 0.33 4.390 0.721 0.26 3.622 8.089 2.635 0.358 2.359 1.343 6.696 44.70 1.93 1.0250 Kiloni 8.16 513 0.39 4.580 0.961 0.018 2.570 8.520 2.820 1.023 1.458 1.947 7.288 52.73 2.15 1.5351 Sikandarpur 8.70 510 0.63 4.475 1.442 0.008 1.011 7.767 2.617 0.946 1.114 2.068 6.745 52.83 2.08 1.9252 Rampura 7.90 557 0.26 4.390 1.760 0.004 1.714 8.132 2.160 0.380 1.720 2.688 6.956 36.59 1.45 0.2553 Sarawal 8.83 612 0.39 3.140 2.592 0.009 2.073 8.210 3.480 0.460 0.960 2.650 7.550 52.18 2.59 0.0854 Sidhpura 8.59 580 0.33 4.500 1.282 2.023 2.604 8.739 4.690 0.358 0.944 2.220 8.220 61.50 3.73 1.6755 Gudiyai 8.12 708 0.23 3.030 1.840 0.038 4.630 9.770 4.240 0.360 1.260 3.310 9.170 50.16 2.80 1.31
Cases and solutions
Environmental Geology 40 (4-5) February 2001 7 Q Springer-Verlag 607
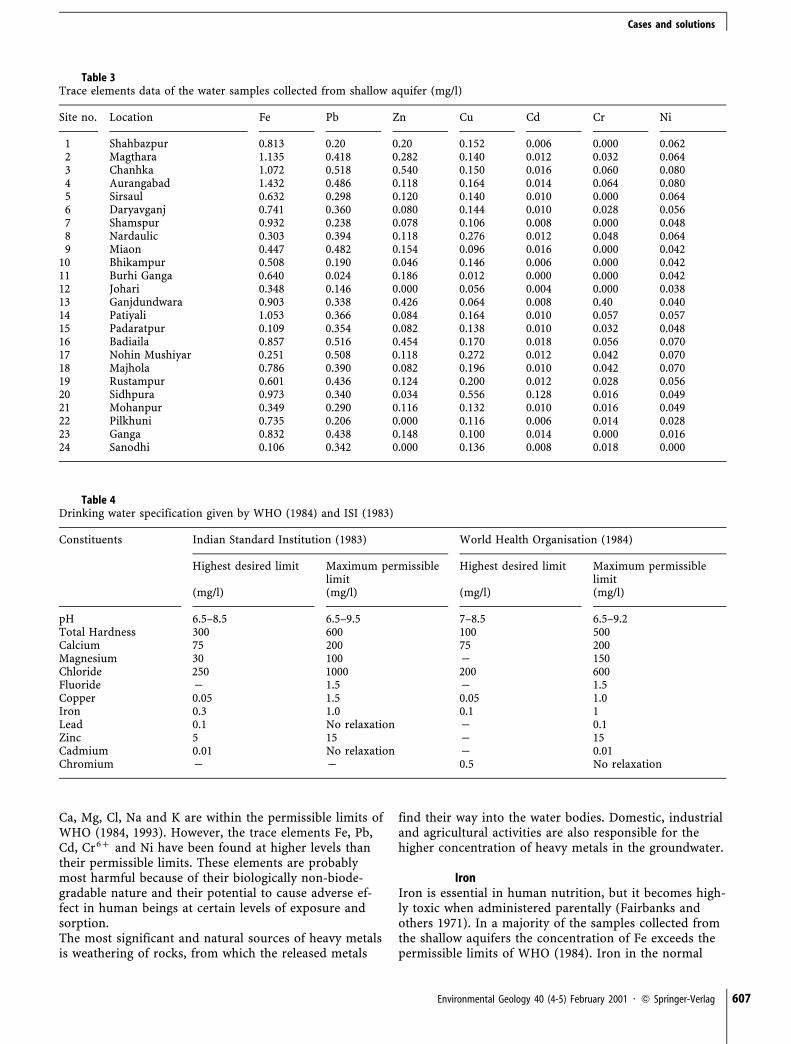
Table 3Trace elements data of the water samples collected from shallow aquifer (mg/l)
Site no. Location Fe Pb Zn Cu Cd Cr Ni
1 Shahbazpur 0.813 0.20 0.20 0.152 0.006 0.000 0.0622 Magthara 1.135 0.418 0.282 0.140 0.012 0.032 0.0643 Chanhka 1.072 0.518 0.540 0.150 0.016 0.060 0.0804 Aurangabad 1.432 0.486 0.118 0.164 0.014 0.064 0.0805 Sirsaul 0.632 0.298 0.120 0.140 0.010 0.000 0.0646 Daryavganj 0.741 0.360 0.080 0.144 0.010 0.028 0.0567 Shamspur 0.932 0.238 0.078 0.106 0.008 0.000 0.0488 Nardaulic 0.303 0.394 0.118 0.276 0.012 0.048 0.0649 Miaon 0.447 0.482 0.154 0.096 0.016 0.000 0.042
10 Bhikampur 0.508 0.190 0.046 0.146 0.006 0.000 0.04211 Burhi Ganga 0.640 0.024 0.186 0.012 0.000 0.000 0.04212 Johari 0.348 0.146 0.000 0.056 0.004 0.000 0.03813 Ganjdundwara 0.903 0.338 0.426 0.064 0.008 0.40 0.04014 Patiyali 1.053 0.366 0.084 0.164 0.010 0.057 0.05715 Padaratpur 0.109 0.354 0.082 0.138 0.010 0.032 0.04816 Badiaila 0.857 0.516 0.454 0.170 0.018 0.056 0.07017 Nohin Mushiyar 0.251 0.508 0.118 0.272 0.012 0.042 0.07018 Majhola 0.786 0.390 0.082 0.196 0.010 0.042 0.07019 Rustampur 0.601 0.436 0.124 0.200 0.012 0.028 0.05620 Sidhpura 0.973 0.340 0.034 0.556 0.128 0.016 0.04921 Mohanpur 0.349 0.290 0.116 0.132 0.010 0.016 0.04922 Pilkhuni 0.735 0.206 0.000 0.116 0.006 0.014 0.02823 Ganga 0.832 0.438 0.148 0.100 0.014 0.000 0.01624 Sanodhi 0.106 0.342 0.000 0.136 0.008 0.018 0.000
Table 4Drinking water specification given by WHO (1984) and ISI (1983)
Constituents Indian Standard Institution (1983) World Health Organisation (1984)
Highest desired limit Maximum permissiblelimit
Highest desired limit Maximum permissiblelimit
(mg/l) (mg/l) (mg/l) (mg/l)
pH 6.5–8.5 6.5–9.5 7–8.5 6.5–9.2Total Hardness 300 600 100 500Calcium 75 200 75 200Magnesium 30 100 P 150Chloride 250 1000 200 600Fluoride P 1.5 P 1.5Copper 0.05 1.5 0.05 1.0Iron 0.3 1.0 0.1 1Lead 0.1 No relaxation P 0.1Zinc 5 15 P 15Cadmium 0.01 No relaxation P 0.01Chromium P P 0.5 No relaxation
Ca, Mg, Cl, Na and K are within the permissible limits ofWHO (1984, 1993). However, the trace elements Fe, Pb,Cd, Cr6c and Ni have been found at higher levels thantheir permissible limits. These elements are probablymost harmful because of their biologically non-biode-gradable nature and their potential to cause adverse ef-fect in human beings at certain levels of exposure andsorption.The most significant and natural sources of heavy metalsis weathering of rocks, from which the released metals
find their way into the water bodies. Domestic, industrialand agricultural activities are also responsible for thehigher concentration of heavy metals in the groundwater.
IronIron is essential in human nutrition, but it becomes high-ly toxic when administered parentally (Fairbanks andothers 1971). In a majority of the samples collected fromthe shallow aquifers the concentration of Fe exceeds thepermissible limits of WHO (1984). Iron in the normal
Cases and solutions
608 Environmental Geology 40 (4-5) February 2001 7 Q Springer-Verlag
Fig. 4Selected well hydrographs
Fig. 5Trilinear plots for groundwater samples of the study area
groundwater is in the form of inorganic complexes de-rived from laterite and other types of soil (Mohan andothers 2000).
LeadThe concentration of lead in natural water increasesmainly through anthropogenic activities (Goel 1997).Lead is extensively used in some pesticides such as leadarsenate. Pregnant women exposed to lead were found tohave high rates of still births and miscarriages (WHO1973). Lead has caused mental retardation among chil-
dren. Hypertension caused by Pb exposure has also beenreported (Beevers and others 1976). Lead poisoning is ac-companied by symptoms of intestinal cramps, peripheralnerve paralysis, anaemia and fatigue.The Pb concentration in the water samples of the studyarea varies between 0.518–0.024 mg/l. A perusal of theTable 3 shows that the concentration of lead in the shal-low aquifers is higher than the permissible limit.
CadmiumCadmium is highly toxic to man and animals (Fribergand others 1974). Of all the highly toxic metals, cadmiumexceeds the permissible limits in 10 samples out of 24analysed from the shallow aquifers. The cadmium con-centration ranges between 0.00 to 0.128 mg/l. One of themajor sources of Cd in soil is phosphatic fertilizers (Alan1996). The pathways and migration of Cd could becauseof industries dumping untreated effluents into the naturalhydrological system.
ChromiumHexavalent chromium (Cr6c) is highly toxic and in high-er concentrations is found to be carcinogenic (Swayerand MacCarty 1978). The concentration of Cr6c rangesbetween 0 and 0.064. Out of 24 samples analysed, 7showed chromium concentrations below the detectionlimits, 4 samples were found to be above the recom-mended limit, and concentrations of chromium in the re-mainder of the samples were within the permissible lim-
Cases and solutions
Environmental Geology 40 (4-5) February 2001 7 Q Springer-Verlag 609
Fig. 6Sodium adsorption ratio (SAR) andsalinity hazard plot
its of ISI (1983). This shows that, except in a few sam-ples, the concentrations of chromium were generallywithin recommended limits.
NickelThe concentration of nickel in drinking water is normallyless than 0.02 mg/l (WHO 1993). High concentrations ofnickel as both soluble and sparingly soluble compounds,are now considered to be a human carcinogen when re-lated to pulmonary exposure (WHO 1993). The concen-tration of nickel ranges from below detection level to ashigh as 0.08 mg/l. Generally, higher concentration ofnickel are observed in the study area.
Copper and zincAlthough average concentration of Cu in the groundwaterrange from 0.064 to 0.554 mg/l, that of Zn varies from be-low the detection level to 0.54 mg/l. These values are
within the permissible limits of ISI (1983) and WHO(1984). Because both elements are essential for plant andanimal metabolism, their limited occurrence in ground-water is useful from the point of view of water quality.Thus, it is evident from the groundwater chemistry thatif the concentration of heavy metals exceeds the permis-sible levels recommended by ISI (1983) and WHO (1984),they may entail various health hazards.
Irrigation water standardsParameters such as sodium absorption ratio (SAR), per-cent sodium (%Na) and residual sodium carbonate (RSC)were estimated to assess the suitability of water for irri-gation purposes. The total dissolved content measured interms of specific electrical conductance, gives the salinityhazard of irrigation water. The salt present in the water,besides affecting the growth of plants directly also affectssoil structure permeability and aeration, which indirectly
Cases and solutions
610 Environmental Geology 40 (4-5) February 2001 7 Q Springer-Verlag
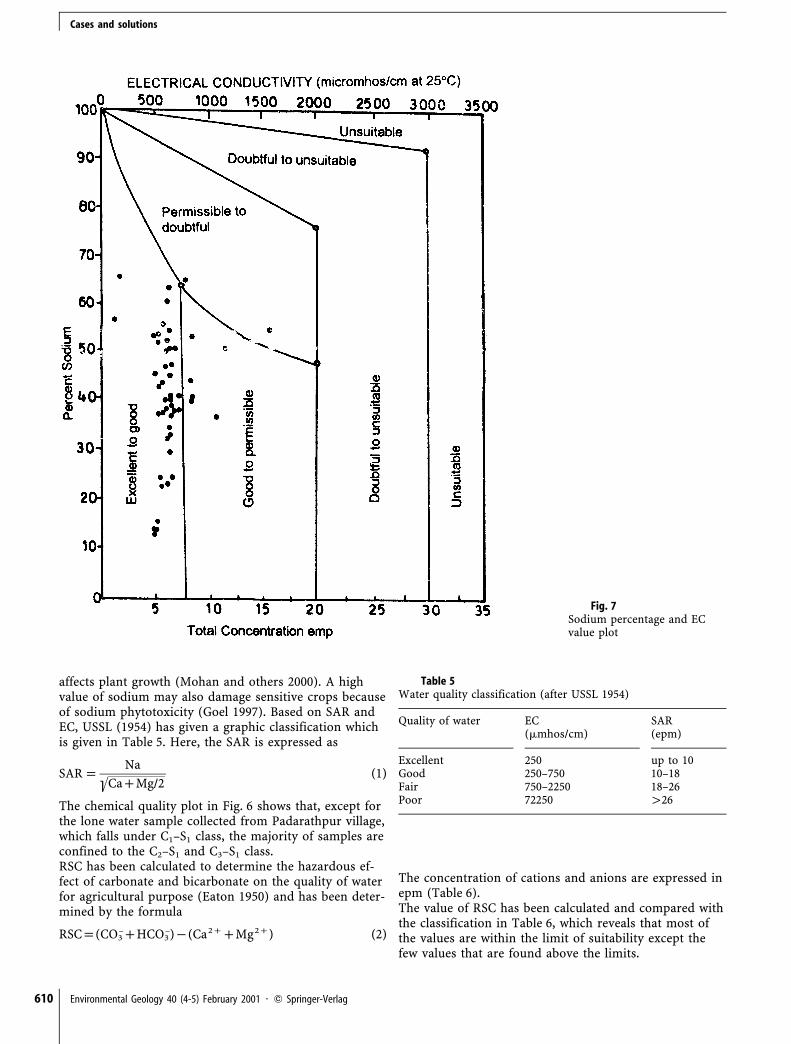
Fig. 7Sodium percentage and ECvalue plot
Table 5Water quality classification (after USSL 1954)
Quality of water EC SAR(mmhos/cm) (epm)
Excellent 250 up to 10Good 250–750 10–18Fair 750–2250 18–26Poor 72250 126
affects plant growth (Mohan and others 2000). A highvalue of sodium may also damage sensitive crops becauseof sodium phytotoxicity (Goel 1997). Based on SAR andEC, USSL (1954) has given a graphic classification whichis given in Table 5. Here, the SAR is expressed as
SARpNa
;CacMg/2(1)
The chemical quality plot in Fig. 6 shows that, except forthe lone water sample collected from Padarathpur village,which falls under C1–S1 class, the majority of samples areconfined to the C2–S1 and C3–S1 class.RSC has been calculated to determine the hazardous ef-fect of carbonate and bicarbonate on the quality of waterfor agricultural purpose (Eaton 1950) and has been deter-mined by the formula
RSCp(CO3–cHCO3
–)P(Ca2ccMg2c) (2)
The concentration of cations and anions are expressed inepm (Table 6).The value of RSC has been calculated and compared withthe classification in Table 6, which reveals that most ofthe values are within the limit of suitability except thefew values that are found above the limits.
Cases and solutions
Environmental Geology 40 (4-5) February 2001 7 Q Springer-Verlag 611
Table 6Water quality classification on the basis of residual sodiumcarbonate (RSC)
Quality RSC
Excellent P1.25Good ~1.25Fair 1.25–2.5Poor 12.5
A perusal of Wilcox’s (1955) diagram (Fig. 7) shows that20% of the samples fall within the permissible quality,whereas the remainder fall under excellent to good quali-ty, with a few exceptions that lie in the permissible todoubtful category. The above discussions show that thegroundwater quality of the study area is suitable for irri-gation.
Conclusion
The data collected from open wells, and shallow and deeptube wells in Kali-Ganga sub-basin were analysed to gainan insight into the hydrogeology and water quality of thebasin. The study reveals that, in general, there occur twoto three-tier aquifer systems, which finally merge witheach other and behave as a single-bodied aquifer system.The aquifers are unconfined to confined in nature. Thetransmissivity storage coefficient and hydraulic conduc-tivity is computed as 2178 m2/day, 1.12!10–5 and 120 m/day, respectively.The groundwater of the basin is alkali-bicarbonate typeand is suitable for domestic and irrigation use. In certainareas, higher concentrations of heavy toxic trace metalsare observed, which may entail various health hazards. Itis recommended that the use of such wells be avoided.
Acknowledgement The authors acknowledge the help and co-operation of Professor S.M. Zainuddin, Chairman Dept of Geo-logy, A.M.U., Aligarh.
References
Alan W (1996) Soil and environment. Cambridge UniversityPress, Cambridge
APHA (1992) Standard Method for the examination of waterand waste water, 18th edn. American Public Health Associa-tion, Washington, DC, pp 10–137
Back W (1966) Hydrochemical facies and groundwater flowpatterns in northern part of Atlantic in Coastal Plain. USGeological Survey Professional Paper 498-A
Beevers DG, Erskine E, Robertson M, Beattie AD, Camp-
bell BC, Goldberg A, Moore MR, Hawthrone VM (1976)Blood lead to hypertension. Lancet 2 : 1–3
Cooper HH Jr, Jacob CE (1946). A generalised graphic methodfor evaluating formation constant and summarizing well yieldhistory. Trans Am Geophys Union 27 : 526–534
Dubey VK, Hussain A (1991) Hydrogeology, geology andgroundwater resources of Uttar Pradesh Central groundwaterBoard (northern region) Report
Eaton FM (1950) Significance of carbonate in irrigation water.Soil Sci 69(2):123–133
Fairbanks VF Fahey JL, Bentler E (1971) Clinical disorderof iron metabolism, 2nd edn. Grune and Stratton, New York
Friberg L, Piscator M, Nordberg GF, Kjellstrom TT
(1974) Cadmium in the environment, 2nd edn. CRC Press,Cleveland
Goel PK (1997) Water pollution causes, effects and control.New Age International Publishers
Indian Standard Institution (1983) Drinking water stand-ards, Table-I, Substance or characteristic affecting the accept-ability of water for domestic use, IS:10500, pp 1–22
Mohan Rahul, Singh AK, Tripathi JK, Choudhary GC
(2000) Hydrochemistry and quality assessment of groundwat-er in Naini industrial area, Allahabad District, Uttar Pradesh.J Geol Soc India 55 : 77–89
Sawyer CN, McCarty PL (1978) Chemistry of environmentalengineering, 3rd edn. Series in Water Resources and Environ-mental Engineering. McGraw–Hill, New York
Seaber PR (1962) Cation hydrochemical facies of groundwaterin the English town Formation, New Jersey. US Geol SurvProf Paper 450-B, pp 124–126
US Salinity Laboratory Staff (USSL) (1954) Diagnosis andimprovement of salinity and alkaline soils. USDA Handbookno 60
Wilcox IV (1955) Classification and use of irrigation water. USDepartment of Agriculture, Circ. 696. Washington, DC
World Health Organization (1973) Technical report series:trace elements in human nutrition. Report of a WHO ExpertCommittee, no 532
World Health Organization (1984) Guidelines for drinkingwater quality, vol 2. Health criteria and other supporting in-formations. WHO, Geneva
World Health Organization (1993). Guidelines for drinkingwater quality, 2nd edn, vol 1. WHO, Geneva