hydrazine-based synergistic ti(iii)/n doping of surfactant-templated tio2 thin films for enhanced...
TRANSCRIPT

Electronic Supplementary Information
Hydrazine-based Synergistic Ti(III)/N Doping of Surfactant-Templated TiO2 Thin Films for Enhanced Visible Light Photocatalysis Syed Z. Islam and Stephen E. Rankin,*
Department of Chemical and Materials Engineering, University of Kentucky, Lexington, KY,
40506-0046
*Corresponding author:
Prof. Stephen E. Rankin, Tel: 859-257-9799, E-mail: [email protected]

Fig. S1. Photograph of the experimental set-up for methylene blue degradation reaction
measurements.

Fig. S2. Spectra of (a) UVLED and (b) BLED reproduced from Thorlabs.

Fig. S3. Cross sectional bright-field STEM image of the F127-templated TiO2 film after
calcination and without hydrazine treatment.
Fig. S4. HRTEM image of undoped TiO2 film.

Fig. S5. SAED pattern of undoped TiO2 film.

Fig. S6. Tauc plots of (a) undoped TiO2 (0 h) (b) Ti3+-N-TiO2 _5 h (c) Ti3+-N-TiO2 _10 h (d)
Ti3+-N-TiO2 _15 h and (e) Ti3+-N-TiO2 _20 h. Extrapolation of the linear portion of each curve
to the horizontal axis gives the band gap.
2.0 2.4 2.8 3.2 3.6 4.0 4.40.00
0.04
0.08
0.12
0.16
0.20
(h
1/2
h(eV)
0 h(a)
2.0 2.4 2.8 3.2 3.6 4.0 4.40.00
0.05
0.10
0.15
0.20
(h
h(eV)
5 h(b)
2.0 2.4 2.8 3.2 3.6 4.0 4.40.00
0.05
0.10
0.15
0.20
(h
h(eV)
20 h(c)
2.0 2.4 2.8 3.2 3.6 4.0 4.40.00
0.05
0.10
0.15
0.20
(h
h(eV)
15 h(d)
2.0 2.4 2.8 3.2 3.6 4.0 4.40.00
0.05
0.10
0.15
0.20
(h
h(eV)
20 h(e)

Fig. S7. (a) XPS Ti 2p spectra (after 45 second etching) of undoped TiO2 and 5 h_Ti3+-N-TiO2
films with peak fitting of (b) undoped TiO2 and (c) 5 h_Ti3+-N-TiO2 films.

Fig. S8. (a) Measurement of methylene blue adsorption on undoped TiO2 films in the dark
confirming that steady state adsorption is reached within 30 min, and (b) fitting of first order
kinetics for the MB decomposition reaction with undoped TiO2, Ti3+-N-TiO2 films and without
films (photolysis).
0 50 100 150 200 2500.0
0.2
0.4
0.6
0.8
1.0
N
orm
aliz
ed C
onc.
(C
/C0)
Adsorption Time (min)
(a)
0 50 100 150 200 2500.0
0.2
0.4
Photolysis 0 h 5 h 10 h 15 h 20 h
Ln
(C0/
C)
Time (min)
(b)

Fig. S9. Plan view SEM images of (a) undoped TiO2, (b) 5 h_Ti3+-N-TiO2, (c) 10 h_Ti3+-N-
TiO2, and (d) 20 h_ Ti3+-N-TiO2 films (Scale bar width = 86 nm).

0 50 100 150 200 2500.0
0.1
0.2
0.3
0.4
0.5
350 C 400 C 450 C
Ln(
C0/
C)
Reaction Time (min)
(a)
0 50 100 150 200 2500.0
0.1
0.2
0.3
0.4
0.5
10 min 60 min 120 min
Ln
(C0/
C)
Reaction Time (min)
(b)
0 50 100 150 200 2500.0
0.2
0.4
0.6
0.8
1.0
0 h_BLED 10 h_BLED 0 h_UVLED 10 h_UVLED
Ln
(C0/
C)
Reaction Time (min)
(c)

Fig. S10. Fitting of first order kinetics for the MB decomposition reaction with 10 h_Ti3+-N-
TiO2 films (a) calcined at varying temperature for 10 min, (b) calcined at 350 °C for varying
time; and (c) calcined for 10 min at 350 °C but with two light sources (BLED and UVLED).
Fig. S11. Dark current density vs. time for undoped TiO2 and Ti3+-N-TiO2 films and fitting of 4th
order polynomials to each data set.
The following are the equations found from fitting the dark current in Fig. S5.
For 0 h: y=15.27-0.025x+2.43E-5x2-8.4E-9x3+5.429E-13x4 S1
For 5 h: y=180.44-0.42x+4.79E-4x2-2.44E-7x3+4.56E-11x4 S2
For 10 h: y=361.355-0.779x+8.016E-5x2-3.87E-7x3+7.054E-11x4 S3
For 20 h: y=505.29-1.288x+0.0015x2-7.815E-7x3+1.518E-10x4 S4
0 400 800 1200 16000
50
100
150
200
250
Experimental (0 h) Model
Dar
k J
(nA
/cm
2 )
Time (s)
(a)
0 400 800 1200 16000
50
100
150
200
250
Experimental (5 h) Model
Dar
k J
(nA
/cm
2 )
Time (s)
(b)
0 400 800 1200 1600
50
100
150
200
250
Experimental (20 h) Model
Dar
k J
(nA
/cm
2 )
Time (s)
(d)
0 400 800 1200 16000
50
100
150
200
250
Experimental (10 h) Model
Dar
k J
(nA
/cm
2 )
Time (s)
(c)
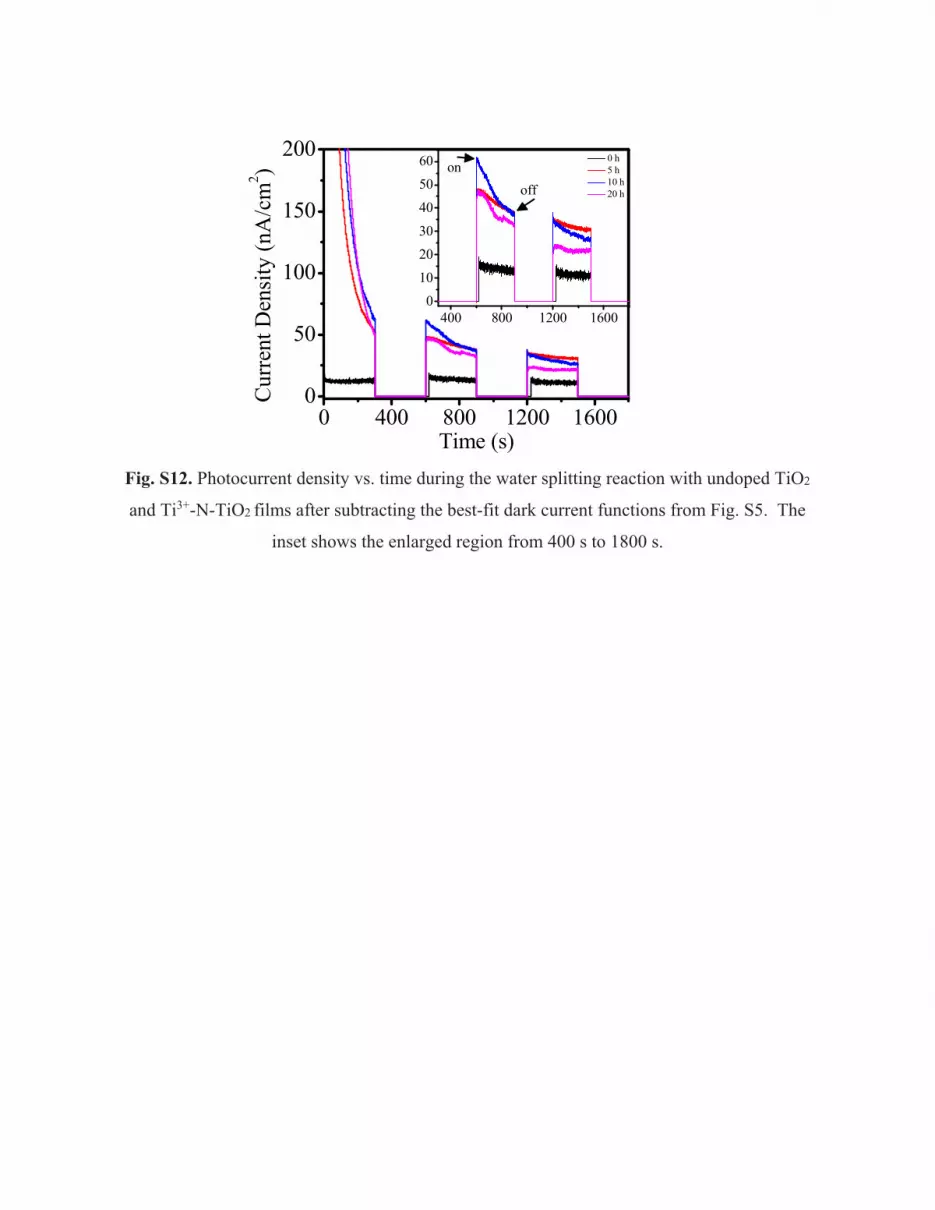
Fig. S12. Photocurrent density vs. time during the water splitting reaction with undoped TiO2
and Ti3+-N-TiO2 films after subtracting the best-fit dark current functions from Fig. S5. The
inset shows the enlarged region from 400 s to 1800 s.
0 400 800 1200 16000
50
100
150
200
Cur
rent
Den
sity
(nA
/cm
2 )
Time (s)
400 800 1200 16000
10
20
30
40
50
60 on
0 h 5 h 10 h 20 hoff

Fig. S13. Flat band potential estimation using Mott-Schottky plots for each mesoporous thin film
sample by extrapolating the linear part of the curves to the horizontal axis.
-1.6 -1.4 -1.2 -1.0 -0.8 -0.6 -0.4 -0.20
40
80
120
160
0 h
C-2
(F-2
)10
8
Potential (V) vs Ag/AgCl
(a)
-1.6 -1.4 -1.2 -1.0 -0.8 -0.6 -0.4 -0.20
40
80
120
160
5 h
C-2
(cm
4 F-2)
108
Potential (V) vs. Ag/AgCl
(b)
-1.6 -1.4 -1.2 -1.0 -0.8 -0.6 -0.4 -0.20
40
80
120
160
10 h
C-2
(cm
4 F-2)
108
Potential (V) vs Ag/AgCl
(c)
-1.6 -1.4 -1.2 -1.0 -0.8 -0.6 -0.4 -0.20
40
80
120
160
20 h
C-2
(cm
4 F-2)
108
Potential (V) vs Ag/AgCl
(d)