hydraulic-unit-based fuzzy model to predict permeability from well logs and core data of a...
TRANSCRIPT

©2015MULTI-SCIENCE PUBLISHING CO. LTD.26 Eldon Way, Hockley, Essex SS5 4AD, United Kingdom
ENERGYEXPLORATION
& EXPLOITATIONVolume 33 2015
Number 4
Hydraulic-unit-based Fuzzy Model to predictpermeability from well logs and core data of a multi-
layer sandstone reservoir in Ulleung Basin, South Korea
Jongyoung Jun, J.M. Kang, Ilsik Jang, Changhyup Park
by
reprinted from
ENERGY EXPLORATION & EXPLOITATION · Volume 33 · Number 4 · 2015 pp. 533–554 533
Hydraulic-unit-based Fuzzy Model to predictpermeability from well logs and core data of a multi-
layer sandstone reservoir in Ulleung Basin, South Korea
Jongyoung Jun1, J.M. Kang2, Ilsik Jang3*, Changhyup Park4
1E&P Asset Management Office, SK Innovation, Seoul, Republic of Korea2Department of Energy Systems Engineering, Seoul National University, Seoul,
Republic of Korea3Department of Energy and Resources Engineering, Chosun University, Gwangju,
Republic of Korea4Department of Energy and Resources Engineering, Kangwon National University,
Chuncheon, Republic of Korea*Corresponding author. E-mail: [email protected]
(Received 11 March 2015; Accepted 16 June 2015)
AbstractThis paper presents a method to predict permeability of an offset well using welllogs and core data from a multi-layer sandstone reservoir with variousdepositional environments. Many studies have been conducted to predictpermeability but limited to wells drilled in a formation with a single depositionalenvironment. This study implements fuzzy models to predict the FZI (flow zoneindicator) and permeability, and applied HU (hydraulic unit) grouping toclassify the rock properties of various depositional environments in terms of thecorrelation between permeability and porosity. Then, an individual fuzzy modelis developed for each HU group. A field application confirms that the methodcan be applied to permeability prediction using well data from variousdepositional environments. A comparative study shows that HU grouping playsa key role in grouping cores of similar flow characteristics in the case of coredata from multiple layers with various depositional environments.
Keywords: Permeability prediction, Fuzzy, Hydraulic unit, Flow zoneindicator, Multi-layer, Depositional environment
1. INTRODUCTIONPermeability is one of the fundamental rock properties, and it reflects the flow abilityin an oil and gas reservoir (Su et al., 2014). This property must be measured orestimated for reservoir characterization. Although permeability can be measureddirectly from cores, it is practically impossible to take cores from every producinginterval of every well in a field because of the huge cost and time needed. To avoidthese expenses, the common practice is to take cores in some important wells,
particularly in the prominent productive zones, and then extrapolate the coreinformation to other wells or other intervals of the same well using petrophysical welllogs (Finol et al., 2001).
Large efforts have been made by many researchers in the area of permeabilityestimation in heterogeneous media. Empirical models and statistical multivariatetechniques were first introduced in this area. However, empirical models based on thecorrelation between permeability and other reservoir characteristics require a largenumber of reservoir representative samples, and become unreliable when theheterogeneity of the well is high (Yao and Holditch, 1993). A statistical technique isconsidered to be a better choice, providing a potential solution through regressionanalysis. Its main drawback is the need to exhaustively identify all the factors affectingpermeability, and then establish a linear or non-linear model that best represents theinteractions of such factors (Shokir, 2004).
Artificial intelligent techniques such as ANN (artificial neural networks) and fuzzylogic were introduced as alternatives, and many studies have shown improvements inpermeability prediction compared to empirical models and statistical techniques.Mohaghegh et al. (1997) presented a comparison of empirically determined models,multiple variable regressions, and ANN, and showed that ANN resulted in betterperformance than the other methods. Lim and Kim (2004) demonstrated that fuzzylogic and ANN can be utilized as a powerful tool to determine reservoir propertiesfrom well logs. Lim et al. (2006) also introduced a hybrid method combining PNN(polynomial network) and GA (genetic algorithm) as a new neural network approach.Kumar (2012) used well logs and seismic data as the input parameters for ANN, andhighlighted the efficiency of ANN in obtaining nonlinear systems and models forreservoir characterization problems. Shokir (2004) developed a TSK(Takagi–Sugeno–Kang) fuzzy model to predict the permeability of uncored wells andshowed that this fuzzy model is not only accurate but also insightful in the nonlinearrelationship represented by the model. Maximiano and Carrasquilla (2011)demonstrated the feasibility of simulating the parameters of an NMR (nuclear-magnetic-resonance) log using fuzzy logic.
Although the fuzzy logic and ANN approaches enhance the permeabilityprediction, heterogeneity can make their degree of accuracy and certainty decrease.Permeability is controlled by both depositional characteristics such as the grain sizeand sorting, and by diagenetic features. Grouping reservoir rock into HUs (hydraulicunits) with similar flow characteristics can be a solution to the problem ofheterogeneity. A concept strongly related to HUs is the FZI (flow zone indicator),which is measured based on the porosity and permeability of cores.
Permeability prediction by HU and FZI was introduced by Amaefule et al. (1993).Abbaszadeh et al. (1996) presented an HU grouping method using FZI, and predictedthe permeability of an uncored interval using HU grouping and Bayesian inference.They used two different sample cases: a channel-type carbonate reservoir and asandstone reservoir. Soto et al. (2001) developed a fuzzy model that predictedpermeability using FZI and HU grouping, and showed its improved predictionaccuracy. Shahvar et al. (2009) predicted permeability using several ANN modelsdeveloped for different rock types grouped by FZI. Their target was the Sarvak
534 Hydraulic-unit-based Fuzzy Model to predict permeability from well logsand core data of a multi-layer sandstone reservoir in Ulleung Basin, South Korea
formation in southwestern Iran. Xiao et al. (2013) estimated permeability from NMRlogs by applying HU grouping using FZI. Many studies have successfully predictedthe permeability of uncored wells using ANN or fuzzy models with HU groups, butthe models have been applied to uncored intervals or wells with the same depositionalenvironment as the core data.
The depositional environment controls the grain size and sorting of the sedimentaryrock, which has an influence on the permeability. Therefore, it is reasonable to predictthe permeability by grouping HUs from the core data based on the depositionalenvironment. In the case of multi-layer reservoirs, cores are selectively sampled foreach layer to characterize the reservoir properties of each zone. In some cases, thedepositional environment is the same for all the layers, but in other cases, each layershows a different depositional environment. If the target field has multi-layerreservoirs with various depositional environments, the permeability prediction for anuncored interval in a certain layer or well could be conducted based on the core dataof the same layer with the same depositional environment. However, if the availablecore data are limited, and model construction is unreliable because of this lack of data,it is necessary to use core data from different layers and different depositionalenvironments. Therefore, there is a need to investigate whether the prediction could bevalid in a case where the core data from various depositional environments are used.This study investigates the application of a fuzzy model with HU groups to a multi-layer reservoir with various depositional environments. The study field is an offshoregas field within Ulleung Basin, South Korea.
2. THEORETICAL BACKGROUND2.1. Fuzzy model and fuzzy clustering2.1.1. Fuzzy ModelsThe fuzzy theory, with its fuzzy logic and fuzzy sets, was introduced by Zadeh (1965).While a crisp set allows only full membership or no membership for every element ofa universe of discourse, a fuzzy set allows for partial membership. The membership ofan element x in the crisp set A is represented by the characteristic function µA of A,
(1)
Fuzzy sets extend this partial membership concept by increasing the range ofvariability of the characteristic function from the two-point set {0,1} to the wholeinterval [0, 1]:
, (2)
where U refers to the universe of discourse defined for a specific problem. If U is afinite set U = {x1,x2,...,xn}, then fuzzy set A in this universe U can be represented bylisting each element and its degree of membership in set A as
µ →U: [0,1]A
µ ( ) = ∈∉
x
x A
x A
1,if
0,if A
ENERGY EXPLORATION & EXPLOITATION · Volume 33 · Number 4 · 2015 535

(3)
Fuzzy theory allows vague concepts such as “low porosity” or “very highpermeability” to be formulated mathematically and processed by computers. Rule-based fuzzy modeling can be classified into three categories: the linguistic, relationalequation, and TSK model. Among these, the TSK model is easier to identify becauseit requires fewer rules, and its parameters can be estimated from numerical data usingoptimization methods such as least-square algorithms (Shokir, 2004). This studyfocuses on a rule-based TSK fuzzy model, which was proposed by Takagi and Sugeno(1985) as a framework for generating fuzzy if-then rules from numerical data.
2.1.2. TSK Fuzzy ModelA fuzzy if-then rule is normally written in the canonical form “x is A”, where A is afuzzy set expressing a qualitative attribute such as low, medium, or high. In the TSKmodel, the antecedent is made up of fuzzy sets, and the consequence consists of linearequations. The fuzzy model is made of a set of fuzzy rules, which describe local linearinput-output relationships:
,
where Ri is the ith rule; x1,x2,...,xn are the input variables; Ai1,Ai2,...,Ain are the fuzzysets assigned to corresponding input variables; yi represents the value of the ith rule’slocal output; and ai1,ain and ai0 are the model’s consequent parameters.
2.1.3. Fuzzy ClusteringIn order to define the number of rules to be generated by a TSK fuzzy model, fuzzyclustering should first be performed. This study used the FCM (fuzzy C-means)clustering method (Fukuyama and Sugeno, 1989). Eq. (4) is the objective function tobe minimized for the fuzzy clustering that divides the whole data set X = {X1,X2,...,Xn}
into “c” clusters of .
(4)
where V = {V1,V2,....,Vc} is a set of the center vector of the clusters, is the
distance between the kth datum and the center of the ith cluster, µik is membershipvalue, m is the weighting exponent, and U(t) is the tth iteration of the partition matrix
−X Vk i
∑∑ µ( ) ( )= −= =
J U V X X V, :mt
i
c
k
n
ik
m
k i( )
1 1
2
= …F F F Fˆ { ˆ , ˆ , , ˆ }c1 2
= …i K1,2, ,
… = + +…+ R x A x A x A y a a x a x: is and is and and is then ,i i i n in i i i in n1 1 2 2 0 1 1
µ µ µ( ) ( ) ( )= ………A x x x x x x{ : , : , , : }A A n A n1 1 2 2
536 Hydraulic-unit-based Fuzzy Model to predict permeability from well logsand core data of a multi-layer sandstone reservoir in Ulleung Basin, South Korea
that consists of the membership values, that is, . FCM
clustering uses an iterative algorithm. After selecting the number of clusters “c” (2 ≤c ≤n) and a weighting exponent “m” larger than the unit value, the initial matrix of U(0)
is set from random values. Then, the center vector of cluster Vi at the (t+1)th iterationis calculated using Eq. (5), and µik is updated using Eq. (6).
(5)
(6)
The iteration is kept running until is satisfied, where δ is the
termination tolerance.The number of clusters “c” can be determined using the fuzzy validity measure S(c)
as shown in Eq. (7) (Fukuyama and Sugeno, 1989).
(7)
where X–
is the average of the data. The optimum number of clusters is determined tobe the minimum of S(c) as “c” varies.
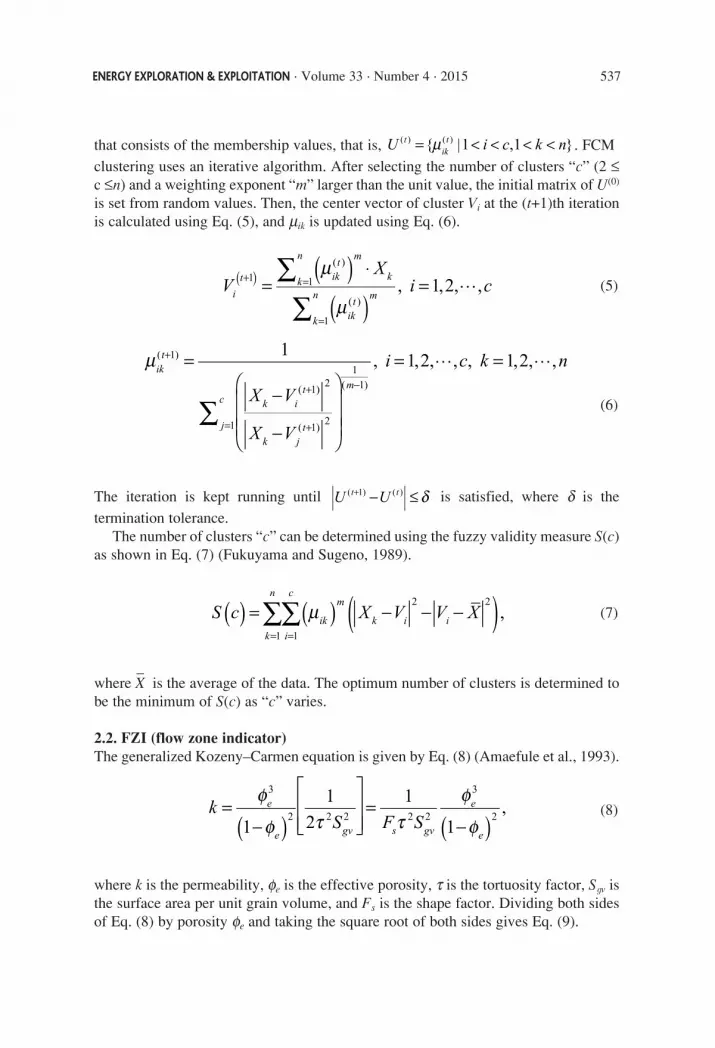
2.2. FZI (flow zone indicator)The generalized Kozeny–Carmen equation is given by Eq. (8) (Amaefule et al., 1993).
(8)
where k is the permeability, φe is the effective porosity, τ is the tortuosity factor, Sgv isthe surface area per unit grain volume, and Fs is the shape factor. Dividing both sidesof Eq. (8) by porosity φe and taking the square root of both sides gives Eq. (9).
φ
φ τ τφ
φ( ) ( )=
−
=−
kS F S1
1
2
1
1,e
e gv s gv
e
e
3
2 2 2 2 2
3
2
∑∑ µ ( )( ) ( )= − − −= =
S c X V V X ,k
n
i
c
ik
m
k i i
1 1
2 2
δ− ≤+U Ut t( 1) ( )
� �
∑
µ =
−
−
= =+
=
+
+
−
X V
X V
i c k n1
, 1,2, , , 1,2, ,ikt
j
c k it
k jt
m
( 1)
1
( 1)2
( 1)2
1( 1)
�∑
∑µ
µ
( )( )
=⋅
=( )+ =
=
VX
i c, 1,2, ,i
t k
n
ikt
m
k
k
n
ikt
m
1 1
( )
1
( )
µ= < < < <U i c k n{ |1 ,1 }tikt( ) ( )
ENERGY EXPLORATION & EXPLOITATION · Volume 33 · Number 4 · 2015 537

(9)
Because it is impossible to obtain an exact value of τ, Sgv, or Fs from field data,Amaefule et al. (1993) introduced the RQI (reservoir quality index) and FZI byassuming that Fsτ2 is a variable “constant,” which varies between HUs, but is constantwithin a given unit. Defining RQI as Eq. (10) and combining Eq. (9) and Eq. (10), FZIis obtained as Eq. (11).
(10)
(11)
where φz is defined as the pore volume-to-grain volume ratio .
3. METHODOLOGY3.1. WorkflowThe workflow in this study consists of three parts: (1) FZI prediction using a fuzzymodel, (2) HU grouping by FZI, and (3) permeability prediction using an individualfuzzy model for each HU group. Figure 1 shows the workflow in detail. First, the FZIs
φφ−1e
e
τ φ φ φ= = =
F S
RQI kFZI
10.0314
1,
s gv z z e
φ= k
RQI 0.0314 ,e
φφ
φ τ=
−
k
F S11
e
e
e s gv
538 Hydraulic-unit-based Fuzzy Model to predict permeability from well logsand core data of a multi-layer sandstone reservoir in Ulleung Basin, South Korea
Figure 1. Method to predict permeability.
of training wells are calculated from their core data. Then, a fuzzy model is developedto predict the FZI using the well log data of the training wells. This fuzzy model isused to predict the FZIs of a target well from its well log data. Second, the calculatedFZIs of the training wells are grouped into HUs. The predicted FZIs of the target wellare also grouped into HUs using the same grouping criteria as the training wells.Finally, an individual fuzzy model to predict permeability values for the training wellsis developed for each HU. These models predict the permeability of each HU data setof the target well.
3.2. FZI calculation and HU groupingHere, Eq. (11) is used to calculate an FZI value. The calculated FZIs are then groupedinto HU groups. Among the many possible grouping methods, the graphical clusteringmethod presented by Abbaszadeh et al. (1996) is applied. Each HU group can beidentified by drawing piecewise straight lines on the cumulative probability plot of log(FZI). The number of HU groups is dependent on how many piecewise straight linescan be drawn.
3.3. Selection of input parameters for fuzzy model generationIn order to develop fuzzy models for FZI and permeability prediction, it is necessaryto select appropriate well logs for input parameters. Spearman’s rank correlationcoefficient is utilized in this work to investigate the correlations between various welllog data and core data (Spearman, 1904), and logs with high rank correlationcoefficient are selected.
Spearman’s rank correlation calculates the degree of correlation between a set ofmeasurements on two variables. The number of well logs to be used for developing afuzzy model is rather subjective, but generally those with high correlation numbersshould be used. The rank correlation number between ranks of two variables X and Yis computed from
(12)
where Xi and Yi are the ranks of variables X and Y, respectively, and n is the numberof data points.
3.4. Fuzzy model generation for FZI and permeability predictionThis study used a TSK rule-based fuzzy model. It is easy to evaluate the performanceof a TSK fuzzy model using the least-square method, and it requires fewer rules thanother models such as fuzzy relational models, linguistic models, or neural network-based models. After conducting clustering for each input parameter using the FCMmethod, the TSK model selects a membership function for each parameter, whichrepresents the probability of being included in each cluster. After training the modelwith the data set using the least-square method and back propagation algorithm, the
∑ρ ( )
( )= −
−
−=
X Y
n n1
6
1,i
n
i i1
2
2
ENERGY EXPLORATION & EXPLOITATION · Volume 33 · Number 4 · 2015 539
TSK model finally generates several linear if-then rules.
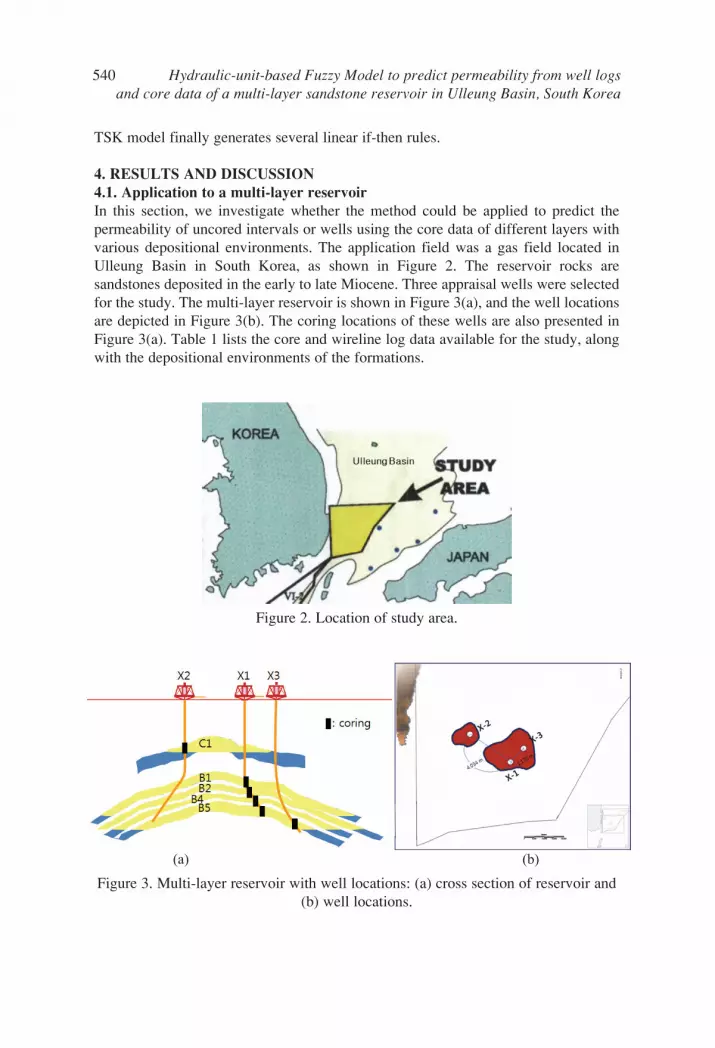
4. RESULTS AND DISCUSSION4.1. Application to a multi-layer reservoirIn this section, we investigate whether the method could be applied to predict thepermeability of uncored intervals or wells using the core data of different layers withvarious depositional environments. The application field was a gas field located inUlleung Basin in South Korea, as shown in Figure 2. The reservoir rocks aresandstones deposited in the early to late Miocene. Three appraisal wells were selectedfor the study. The multi-layer reservoir is shown in Figure 3(a), and the well locationsare depicted in Figure 3(b). The coring locations of these wells are also presented inFigure 3(a). Table 1 lists the core and wireline log data available for the study, alongwith the depositional environments of the formations.
540 Hydraulic-unit-based Fuzzy Model to predict permeability from well logsand core data of a multi-layer sandstone reservoir in Ulleung Basin, South Korea
Figure 3. Multi-layer reservoir with well locations: (a) cross section of reservoir and(b) well locations.
Figure 2. Location of study area.
(a) (b)
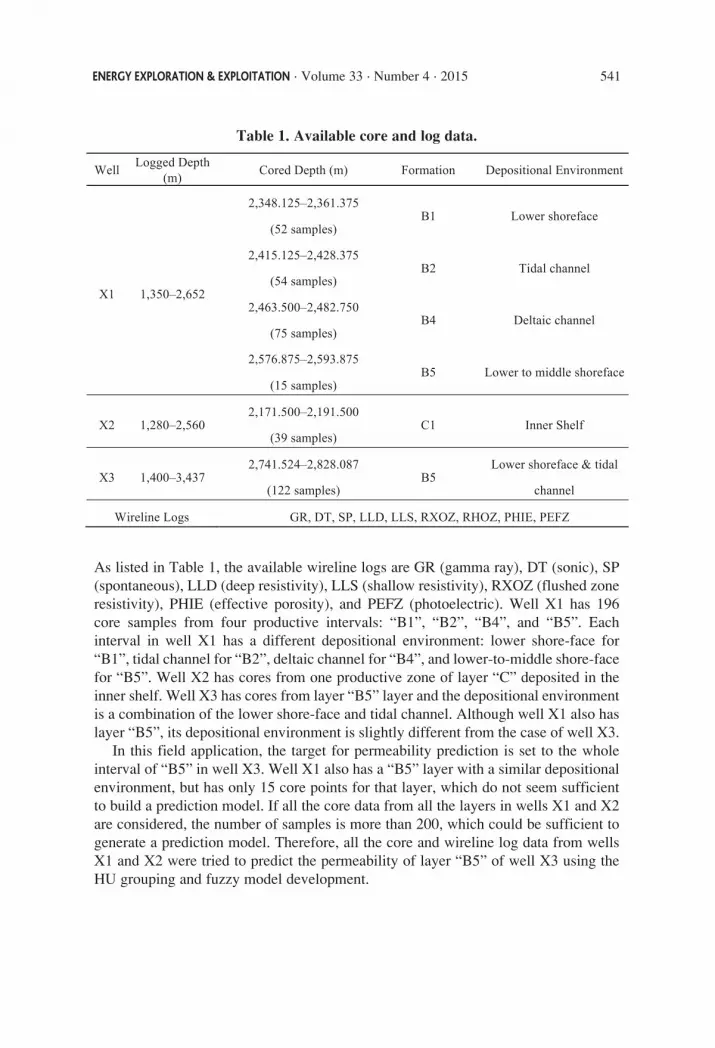
As listed in Table 1, the available wireline logs are GR (gamma ray), DT (sonic), SP(spontaneous), LLD (deep resistivity), LLS (shallow resistivity), RXOZ (flushed zoneresistivity), PHIE (effective porosity), and PEFZ (photoelectric). Well X1 has 196core samples from four productive intervals: “B1”, “B2”, “B4”, and “B5”. Eachinterval in well X1 has a different depositional environment: lower shore-face for“B1”, tidal channel for “B2”, deltaic channel for “B4”, and lower-to-middle shore-facefor “B5”. Well X2 has cores from one productive zone of layer “C” deposited in theinner shelf. Well X3 has cores from layer “B5” layer and the depositional environmentis a combination of the lower shore-face and tidal channel. Although well X1 also haslayer “B5”, its depositional environment is slightly different from the case of well X3.
In this field application, the target for permeability prediction is set to the wholeinterval of “B5” in well X3. Well X1 also has a “B5” layer with a similar depositionalenvironment, but has only 15 core points for that layer, which do not seem sufficientto build a prediction model. If all the core data from all the layers in wells X1 and X2are considered, the number of samples is more than 200, which could be sufficient togenerate a prediction model. Therefore, all the core and wireline log data from wellsX1 and X2 were tried to predict the permeability of layer “B5” of well X3 using theHU grouping and fuzzy model development.
ENERGY EXPLORATION & EXPLOITATION · Volume 33 · Number 4 · 2015 541
Table 1. Available core and log data.
Well Logged Depth
(m) Cored Depth (m) Formation Depositional Environment
X1 1,350–2,652
2,348.125–2,361.375
(52 samples) B1 Lower shoreface
2,415.125–2,428.375
(54 samples) B2 Tidal channel
2,463.500–2,482.750
(75 samples) B4 Deltaic channel
2,576.875–2,593.875
(15 samples) B5 Lower to middle shoreface
X2 1,280–2,560 2,171.500–2,191.500
(39 samples) C1 Inner Shelf
X3 1,400–3,437 2,741.524–2,828.087
(122 samples) B5
Lower shoreface & tidal
channel
Wireline Logs GR, DT, SP, LLD, LLS, RXOZ, RHOZ, PHIE, PEFZ
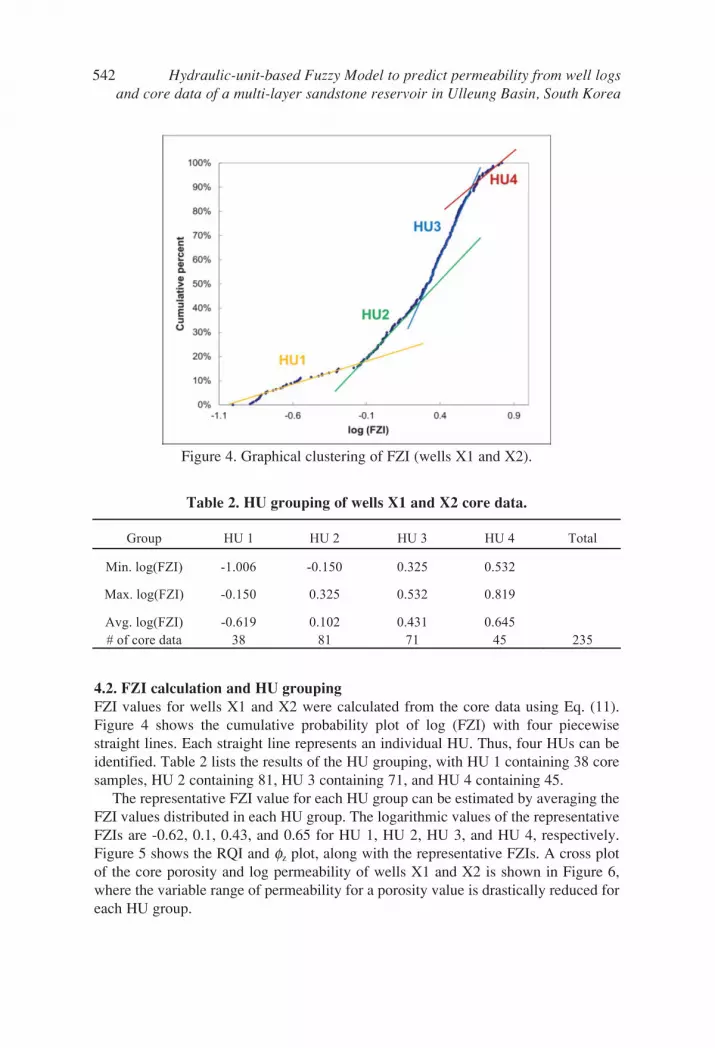
4.2. FZI calculation and HU groupingFZI values for wells X1 and X2 were calculated from the core data using Eq. (11).Figure 4 shows the cumulative probability plot of log (FZI) with four piecewisestraight lines. Each straight line represents an individual HU. Thus, four HUs can beidentified. Table 2 lists the results of the HU grouping, with HU 1 containing 38 coresamples, HU 2 containing 81, HU 3 containing 71, and HU 4 containing 45.
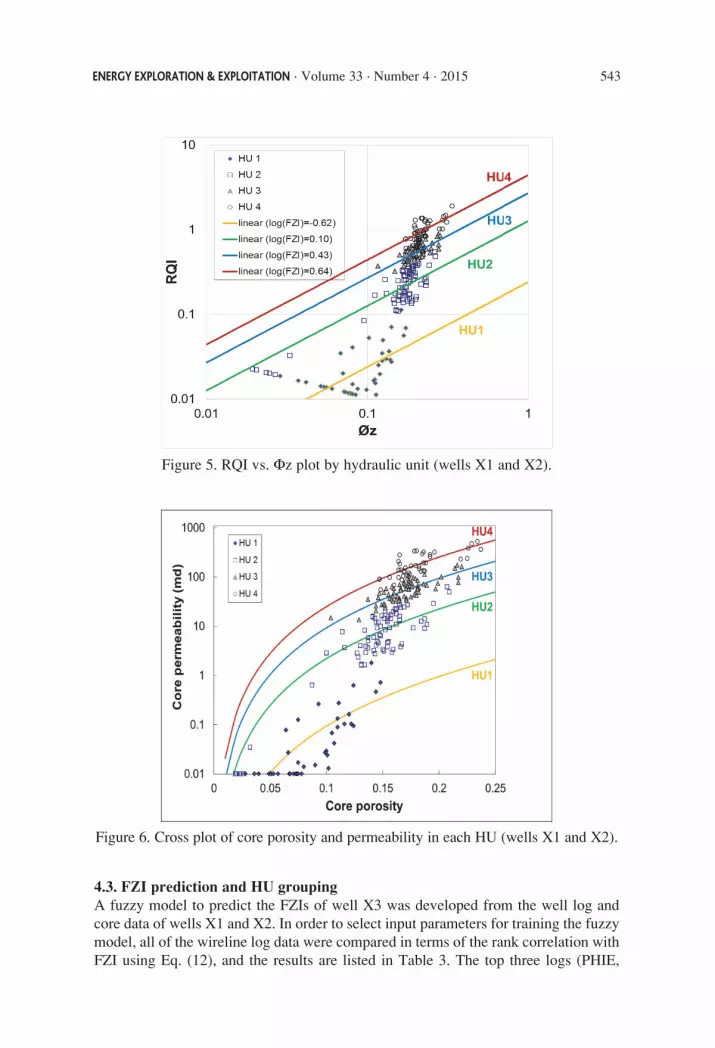
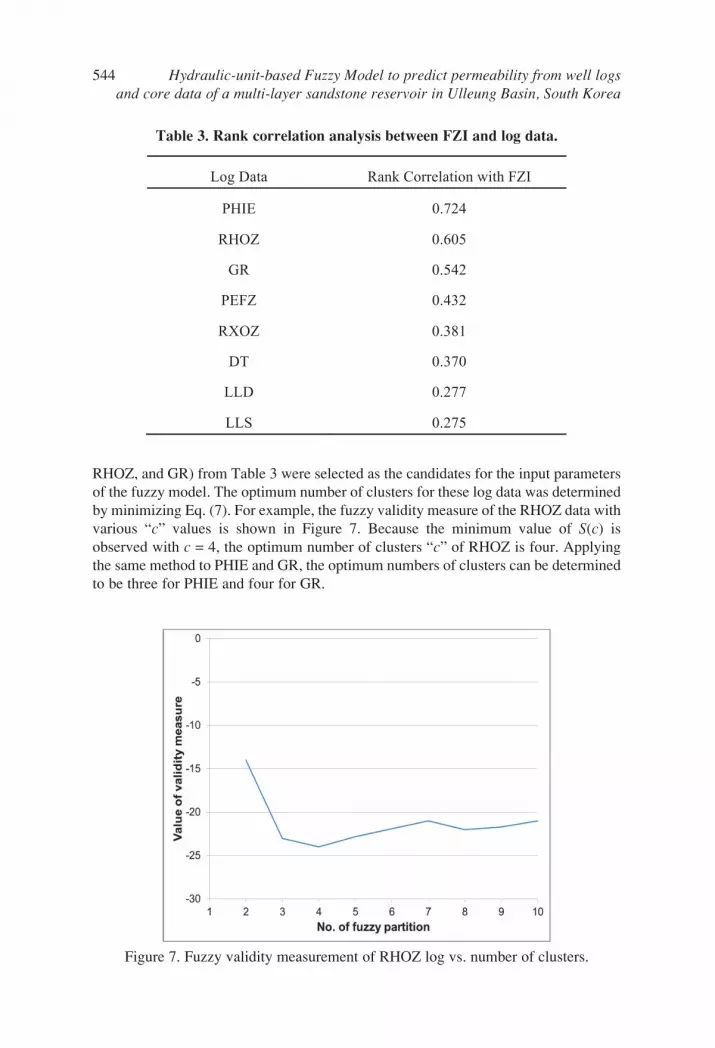
The representative FZI value for each HU group can be estimated by averaging theFZI values distributed in each HU group. The logarithmic values of the representativeFZIs are -0.62, 0.1, 0.43, and 0.65 for HU 1, HU 2, HU 3, and HU 4, respectively.Figure 5 shows the RQI and φz plot, along with the representative FZIs. A cross plotof the core porosity and log permeability of wells X1 and X2 is shown in Figure 6,where the variable range of permeability for a porosity value is drastically reduced foreach HU group.
542 Hydraulic-unit-based Fuzzy Model to predict permeability from well logsand core data of a multi-layer sandstone reservoir in Ulleung Basin, South Korea
Figure 4. Graphical clustering of FZI (wells X1 and X2).
Table 2. HU grouping of wells X1 and X2 core data.
Group HU 1 HU 2 HU 3 HU 4 Total
Min. log(FZI) -1.006 -0.150 0.325 0.532
Max. log(FZI) -0.150 0.325 0.532 0.819
Avg. log(FZI) -0.619 0.102 0.431 0.645 # of core data 38 81 71 45 235
4.3. FZI prediction and HU groupingA fuzzy model to predict the FZIs of well X3 was developed from the well log andcore data of wells X1 and X2. In order to select input parameters for training the fuzzymodel, all of the wireline log data were compared in terms of the rank correlation withFZI using Eq. (12), and the results are listed in Table 3. The top three logs (PHIE,
ENERGY EXPLORATION & EXPLOITATION · Volume 33 · Number 4 · 2015 543
Figure 5. RQI vs. Φz plot by hydraulic unit (wells X1 and X2).
Figure 6. Cross plot of core porosity and permeability in each HU (wells X1 and X2).
544 Hydraulic-unit-based Fuzzy Model to predict permeability from well logsand core data of a multi-layer sandstone reservoir in Ulleung Basin, South Korea
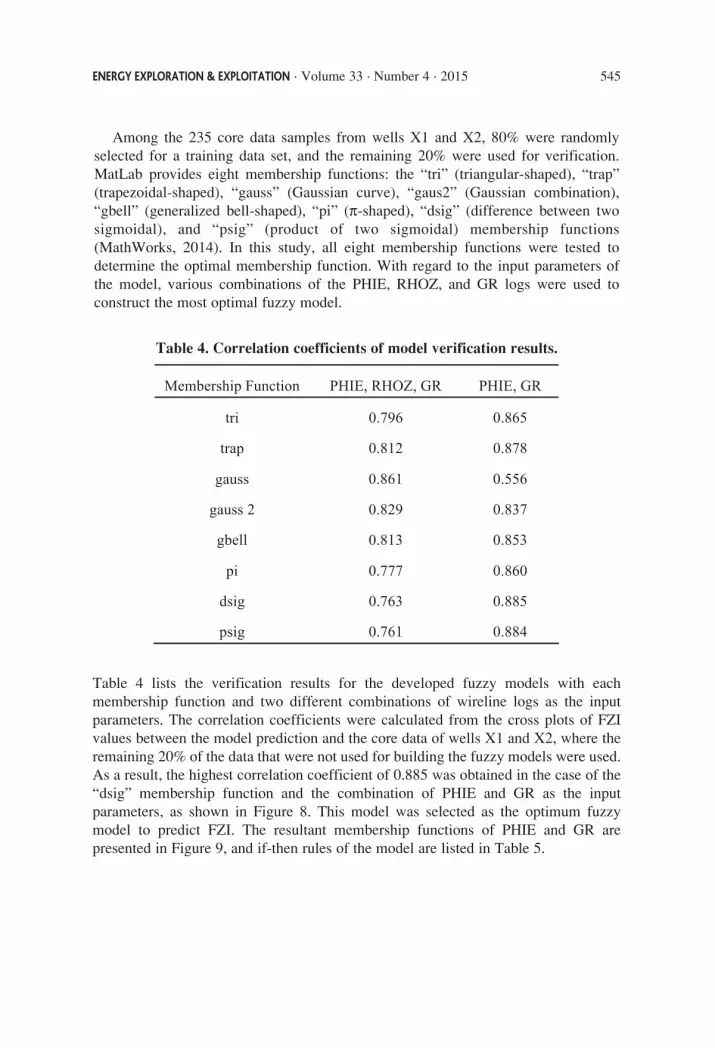
RHOZ, and GR) from Table 3 were selected as the candidates for the input parametersof the fuzzy model. The optimum number of clusters for these log data was determinedby minimizing Eq. (7). For example, the fuzzy validity measure of the RHOZ data withvarious “c” values is shown in Figure 7. Because the minimum value of S(c) isobserved with c = 4, the optimum number of clusters “c” of RHOZ is four. Applyingthe same method to PHIE and GR, the optimum numbers of clusters can be determinedto be three for PHIE and four for GR.
Log Data Rank Correlation with FZI
PHIE 0.724
RHOZ 0.605
GR 0.542
PEFZ 0.432
RXOZ 0.381
DT 0.370
LLD 0.277
LLS 0.275
Table 3. Rank correlation analysis between FZI and log data.
Figure 7. Fuzzy validity measurement of RHOZ log vs. number of clusters.
Among the 235 core data samples from wells X1 and X2, 80% were randomlyselected for a training data set, and the remaining 20% were used for verification.MatLab provides eight membership functions: the “tri” (triangular-shaped), “trap”(trapezoidal-shaped), “gauss” (Gaussian curve), “gaus2” (Gaussian combination),“gbell” (generalized bell-shaped), “pi” (π-shaped), “dsig” (difference between twosigmoidal), and “psig” (product of two sigmoidal) membership functions(MathWorks, 2014). In this study, all eight membership functions were tested todetermine the optimal membership function. With regard to the input parameters ofthe model, various combinations of the PHIE, RHOZ, and GR logs were used toconstruct the most optimal fuzzy model.
ENERGY EXPLORATION & EXPLOITATION · Volume 33 · Number 4 · 2015 545
Table 4. Correlation coefficients of model verification results.
Membership Function PHIE, RHOZ, GR PHIE, GR
tri 0.796 0.865
trap 0.812 0.878
gauss 0.861 0.556
gauss 2 0.829 0.837
gbell 0.813 0.853
pi 0.777 0.860
dsig 0.763 0.885
psig 0.761 0.884
Table 4 lists the verification results for the developed fuzzy models with eachmembership function and two different combinations of wireline logs as the inputparameters. The correlation coefficients were calculated from the cross plots of FZIvalues between the model prediction and the core data of wells X1 and X2, where theremaining 20% of the data that were not used for building the fuzzy models were used.As a result, the highest correlation coefficient of 0.885 was obtained in the case of the“dsig” membership function and the combination of PHIE and GR as the inputparameters, as shown in Figure 8. This model was selected as the optimum fuzzymodel to predict FZI. The resultant membership functions of PHIE and GR arepresented in Figure 9, and if-then rules of the model are listed in Table 5.
546 Hydraulic-unit-based Fuzzy Model to predict permeability from well logsand core data of a multi-layer sandstone reservoir in Ulleung Basin, South Korea
Table 5. Developed TSK fuzzy rules for FZI prediction.
Condition Linear Relationship
if PHIE is low and GR is low then, log FZI = -21.19 PHIE + 0.01241GR – 0.2947
if PHIE is low and GR is mid then, log FZI = -11.75 PHIE + 0.00967GR – 0.7044
if PHIE is low and GR is high then, log FZI = 82.79 PHIE + 0.03321GR – 6.562
if PHIE is low and GR is very high then, log FZI = -0.0007702 PHIE – 1.287GR – 0.00821
if PHIE is mid and GR is low then, log FZI = 6.525 PHIE - 0.02026GR + 0.7109
if PHIE is mid and GR is mid then, log FZI = 13.33 PHIE - 0.01142GR – 0.8793
if PHIE is mid and GR is high then, log FZI = 13.99 PHIE - 0.005268GR – 1.472
if PHIE is mid and GR is very high then, log FZI = 0.8028 PHIE - 0.0001276GR – 0.09694
if PHIE is high and GR is low then, log FZI = -4.113 PHIE + 0.004224GR + 1.219
if PHIE is high and GR is mid then, log FZI = 15.74 PHIE - 0.01308GR – 1.923
if PHIE is high and GR is high then, log FZI = 7.509 PHIE - 0.4057GR + 42.99
if PHIE is high and GR is very high then, log FZI = 0.0006789 PHIE + 0.5193GR + 0.004259
Figure 8. Cross plot of predicted log (FZI) vs. core log(FZI) of wells X1 and X2.
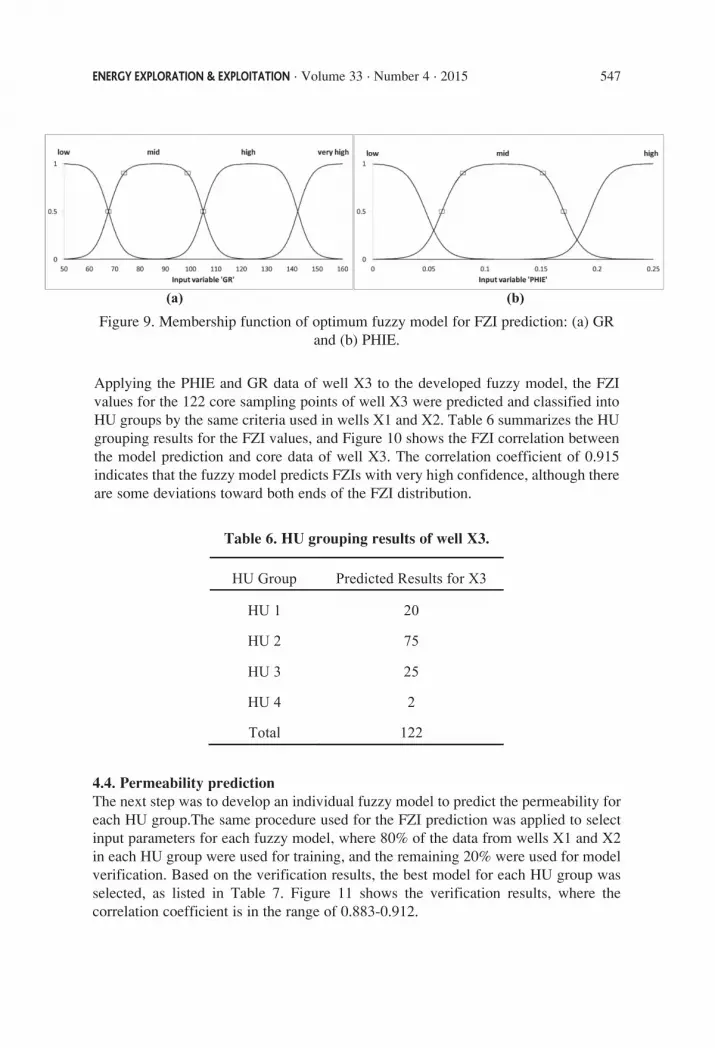
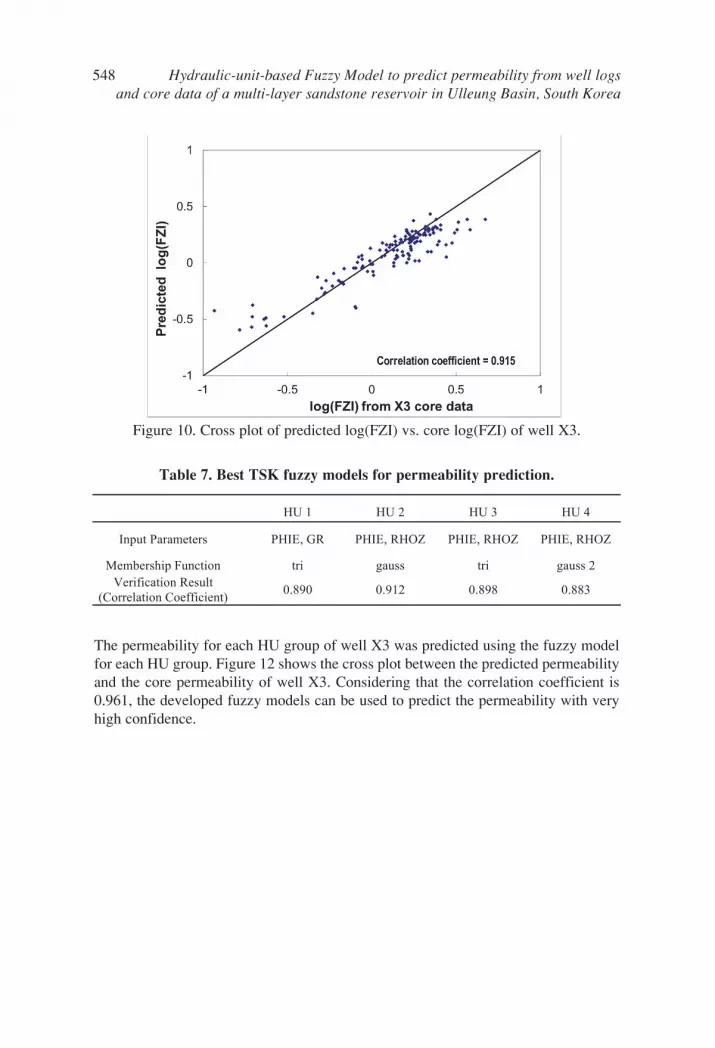
Applying the PHIE and GR data of well X3 to the developed fuzzy model, the FZIvalues for the 122 core sampling points of well X3 were predicted and classified intoHU groups by the same criteria used in wells X1 and X2. Table 6 summarizes the HUgrouping results for the FZI values, and Figure 10 shows the FZI correlation betweenthe model prediction and core data of well X3. The correlation coefficient of 0.915indicates that the fuzzy model predicts FZIs with very high confidence, although thereare some deviations toward both ends of the FZI distribution.
ENERGY EXPLORATION & EXPLOITATION · Volume 33 · Number 4 · 2015 547
(a) (b)
Figure 9. Membership function of optimum fuzzy model for FZI prediction: (a) GRand (b) PHIE.
Table 6. HU grouping results of well X3.
HU Group Predicted Results for X3
HU 1 20
HU 2 75
HU 3 25
HU 4 2
Total 122
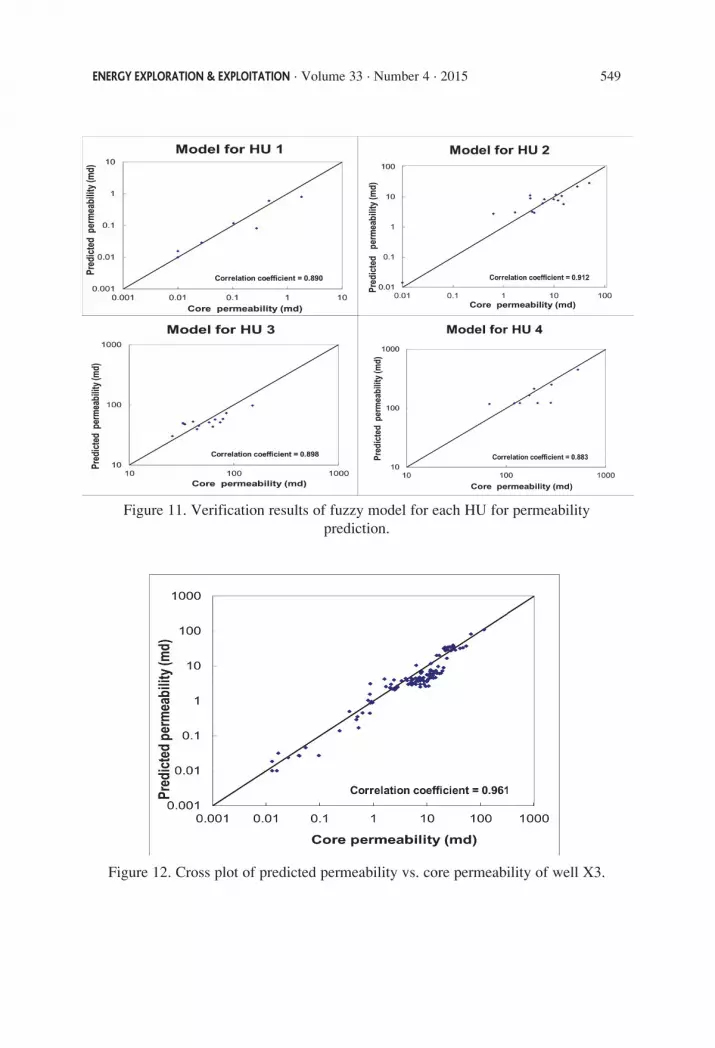
4.4. Permeability predictionThe next step was to develop an individual fuzzy model to predict the permeability foreach HU group.The same procedure used for the FZI prediction was applied to selectinput parameters for each fuzzy model, where 80% of the data from wells X1 and X2in each HU group were used for training, and the remaining 20% were used for modelverification. Based on the verification results, the best model for each HU group wasselected, as listed in Table 7. Figure 11 shows the verification results, where thecorrelation coefficient is in the range of 0.883-0.912.
The permeability for each HU group of well X3 was predicted using the fuzzy modelfor each HU group. Figure 12 shows the cross plot between the predicted permeabilityand the core permeability of well X3. Considering that the correlation coefficient is0.961, the developed fuzzy models can be used to predict the permeability with veryhigh confidence.
548 Hydraulic-unit-based Fuzzy Model to predict permeability from well logsand core data of a multi-layer sandstone reservoir in Ulleung Basin, South Korea
Figure 10. Cross plot of predicted log(FZI) vs. core log(FZI) of well X3.
Table 7. Best TSK fuzzy models for permeability prediction.
HU 1 HU 2 HU 3 HU 4
Input Parameters PHIE, GR PHIE, RHOZ PHIE, RHOZ PHIE, RHOZ
Membership Function tri gauss tri gauss 2 Verification Result
(Correlation Coefficient) 0.890 0.912 0.898 0.883
ENERGY EXPLORATION & EXPLOITATION · Volume 33 · Number 4 · 2015 549
Figure 11. Verification results of fuzzy model for each HU for permeabilityprediction.
Figure 12. Cross plot of predicted permeability vs. core permeability of well X3.
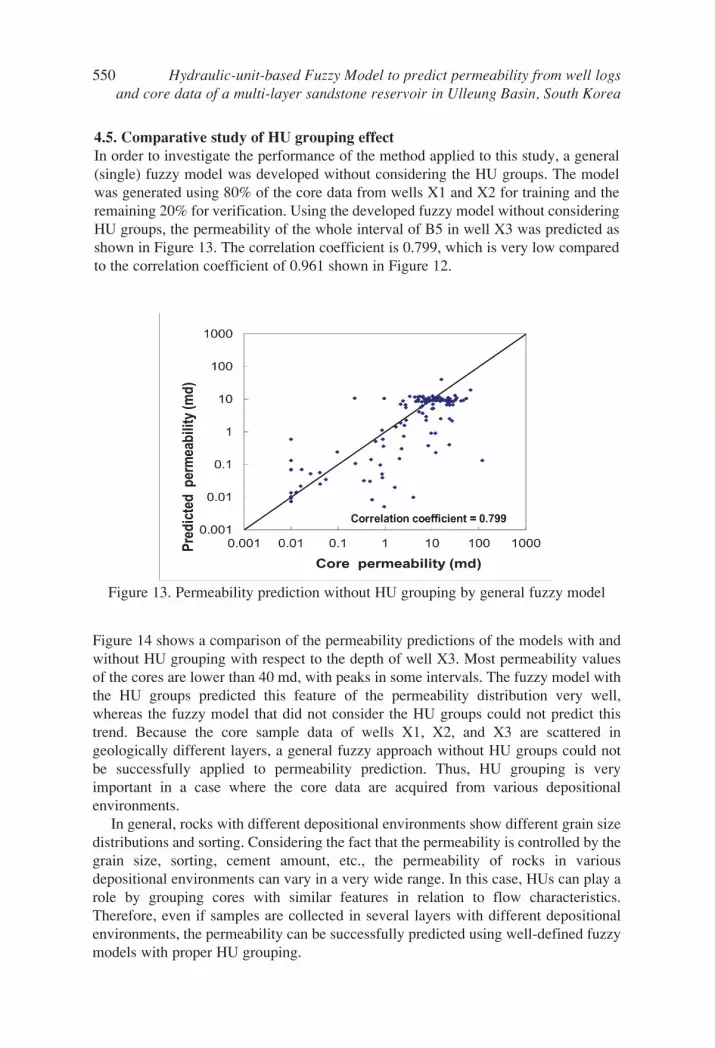
4.5. Comparative study of HU grouping effectIn order to investigate the performance of the method applied to this study, a general(single) fuzzy model was developed without considering the HU groups. The modelwas generated using 80% of the core data from wells X1 and X2 for training and theremaining 20% for verification. Using the developed fuzzy model without consideringHU groups, the permeability of the whole interval of B5 in well X3 was predicted asshown in Figure 13. The correlation coefficient is 0.799, which is very low comparedto the correlation coefficient of 0.961 shown in Figure 12.
550 Hydraulic-unit-based Fuzzy Model to predict permeability from well logsand core data of a multi-layer sandstone reservoir in Ulleung Basin, South Korea
Figure 13. Permeability prediction without HU grouping by general fuzzy model
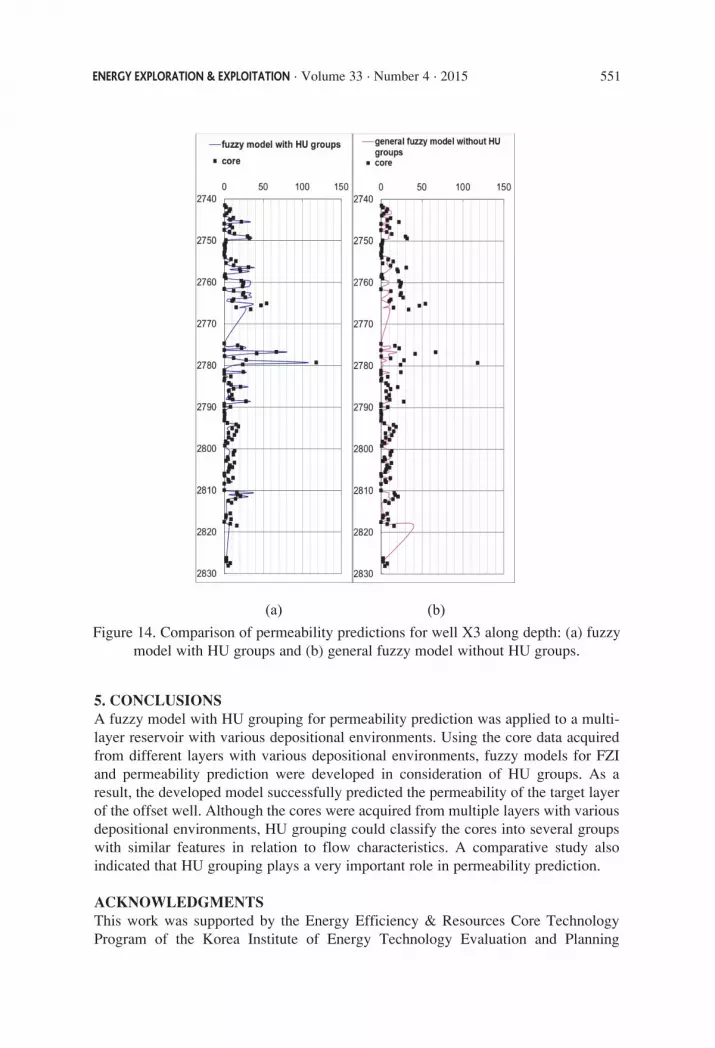
Figure 14 shows a comparison of the permeability predictions of the models with andwithout HU grouping with respect to the depth of well X3. Most permeability valuesof the cores are lower than 40 md, with peaks in some intervals. The fuzzy model withthe HU groups predicted this feature of the permeability distribution very well,whereas the fuzzy model that did not consider the HU groups could not predict thistrend. Because the core sample data of wells X1, X2, and X3 are scattered ingeologically different layers, a general fuzzy approach without HU groups could notbe successfully applied to permeability prediction. Thus, HU grouping is veryimportant in a case where the core data are acquired from various depositionalenvironments.
In general, rocks with different depositional environments show different grain sizedistributions and sorting. Considering the fact that the permeability is controlled by thegrain size, sorting, cement amount, etc., the permeability of rocks in variousdepositional environments can vary in a very wide range. In this case, HUs can play arole by grouping cores with similar features in relation to flow characteristics.Therefore, even if samples are collected in several layers with different depositionalenvironments, the permeability can be successfully predicted using well-defined fuzzymodels with proper HU grouping.
5. CONCLUSIONSA fuzzy model with HU grouping for permeability prediction was applied to a multi-layer reservoir with various depositional environments. Using the core data acquiredfrom different layers with various depositional environments, fuzzy models for FZIand permeability prediction were developed in consideration of HU groups. As aresult, the developed model successfully predicted the permeability of the target layerof the offset well. Although the cores were acquired from multiple layers with variousdepositional environments, HU grouping could classify the cores into several groupswith similar features in relation to flow characteristics. A comparative study alsoindicated that HU grouping plays a very important role in permeability prediction.
ACKNOWLEDGMENTSThis work was supported by the Energy Efficiency & Resources Core TechnologyProgram of the Korea Institute of Energy Technology Evaluation and Planning
ENERGY EXPLORATION & EXPLOITATION · Volume 33 · Number 4 · 2015 551
Figure 14. Comparison of permeability predictions for well X3 along depth: (a) fuzzymodel with HU groups and (b) general fuzzy model without HU groups.
(a) (b)
(KETEP), granted financial resource from the Ministry of Trade, Industry & Energy,Republic of Korea. (No. 2013251010005B)
REFERENCESAbbaszadeh M., Fujii H. and Fujimoto F., 1996. Permeability prediction by hydraulic
flow units- Theory and applications. SPE Formation Evaluation 11(4), 263-271.
Amaefule J.O., Altunbay M., Tiab D., Kersey D.G. and Keelan D.K., 1993. Enhancedreservoir description: Using core and log data to identify hydraulic flow unitsand predict permeability in uncored intervals/wells. In SPE Annual TechnicalConference and Exhibition., Houston, Texas, October 3-6, 1993. Society ofPetroleum Engineers. pp. 16.
Finol J., Guo Y.K. and Jing X.D., 2001. A rule based fuzzy model for the predictionof petrophysical rock parameters. Journal of Petroleum Science and Engineering29(2), 97-113.
Fukuyama Y. and Sugeno M., 1989. A new method of choosing the number of clustersfor fuzzy c-means method. Proceedings of the 5th Fuzzy System Symposium,Japan.
Kumar A., 2012. Artificial neural network as a tool for reservoir characterization andits application in the petroleum engineering. Presented at the OffshoreTechnology Conference, Houston, Texas, USA, April 30-May 3, 2012. OffshoreTechnology Conference, pp. 12.
Lim J.S. and Kim J., 2004. Reservoir porosity and permeability estimation from welllogs using fuzzy logic and neural networks. In SPE Asia Pacific Oil and GasConference and Exhibition, Perth. October 18-20, 2004. Society of PetroleumEngineers, pp. 9.
Lim J.S., Park H.J. and Kim J., 2006. A new neural network approach to reservoirpermeability estimation from well logs. In SPE Asia Pacific Oil and GasConference and Exhibition, Adelaide, Australia. September 11-13, 2006. Societyof Petroleum Engineers, pp. 5.
MathWorks Inc. and Wang W. C., 1998. Fuzzy Logic Toolbox: for Use withMATLAB: User’s Guide. Mathworks, Incorporated. pp. 235.
Maximiano C. and Carrasquilla A., 2011. Simulation of parameters derived fromnuclear magnetic resonance log using conventional well logs and fuzzy logic.Presented at the Brazil Offshore Conference and Exhibition, Macae, Brazil, June14-17, 2011. Society of Petroleum Engineers, pp. 4.
Mohaghegh S., Balan B. and Ameri S., 1997. Permeability determination from welllog data. SPE formation evaluation 12(03), 170-174.
Shahvar M.B., Kharrat R. and Mahdavi R., 2009. Incorporating fuzzy logic andartificial neural networks for building a hydraulic unit-based model forpermeability prediction of a heterogeneous carbonate reservoir. In InternationalPetroleum Technology Conference. Doha, Qatar. December 7-9, 2009.International Petroleum Technology Conference, pp. 16.
552 Hydraulic-unit-based Fuzzy Model to predict permeability from well logsand core data of a multi-layer sandstone reservoir in Ulleung Basin, South Korea
Shokir E.M., 2004. A novel model for permeability prediction in uncored wells. SPEReservoir Evaluation and Engineering 9(03), 266-273.
Soto R.B., GarciaJ. C., Torres F. and Perez G. S., 2001. In SPE Annual TechnicalConference and Exhibition, New Orleans, Louisiana. September 30-October 3,2011. Society of Petroleum Engineers, pp. 9.
Spearman C., 1904. The proof and measurement of association between two things.The American Journal of Psychology 15(1), 72-101.
Su B.Y., Jingcun Yu, Shucai Liu and Jianbo Zhang, 2014. Pseudo-PercolationThreshold Theory in evaluation of low-porosity and low-permeability oilreservoir. Energy Exploration and Exploitation 32(4), 621-634.
Takagi, T. and Sugeno, M., 1985. Fuzzy identification of systems and its applicationsto modeling and control. Systems, Man and Cybernetics, IEEE Transactions on15(1), 116-132.
Xiao L., Zou C., Mao Z., Liu X., Hu X. and Jin Y., 2013. Tight-gas-sand permeabilityestimation from nuclear-magnetic-resonance (NMR) logs based on thehydraulic-flow-unit (HFU) approach. Journal of Canadian PetroleumTechnology 52(4), 306-314.
Yao C.Y. and Holditch S.A., 1993. Estimating permeability profiles using core and logdata. SPE Eastern Regional Meeting, Pittsburgh, Pennsylvania. November 2-4,1993. Society of Petroleum Engineers, pp. 6.
Zadeh L.A., 1965. Fuzzy sets. Information and Control 8(3), 338-353.
ENERGY EXPLORATION & EXPLOITATION · Volume 33 · Number 4 · 2015 553