hybrid tracking loop architectures for the galileo e5 signal
TRANSCRIPT
Hybrid Tracking Loop Architectures for the
Galileo E5 Signal
Nagaraj C Shivaramaiah, Andrew G. Dempster and Chris Rizos
School of Surveying & Spatial Information Systems
University of New South Wales, Sydney 2052, Australia
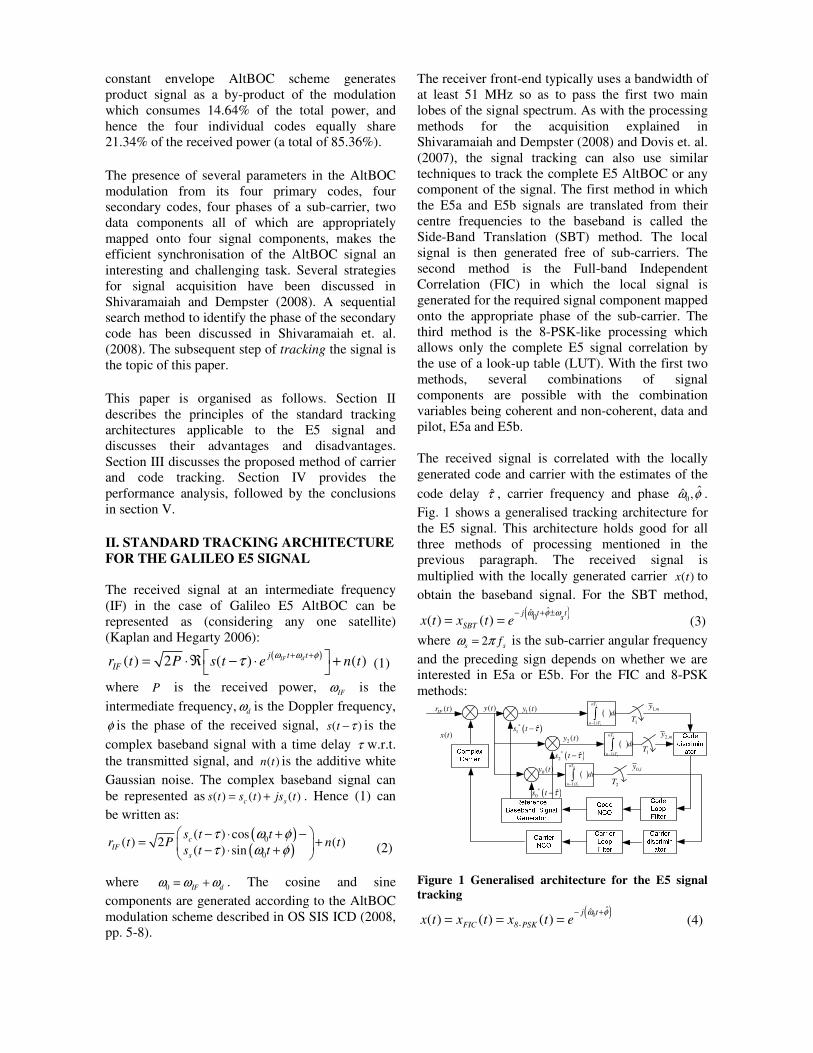
BIOGRAPHY
Nagaraj C Shivaramaiah is currently a doctoral
student within the GNSS receiver design group in
the School of Surveying & Spatial Information
Systems at the University of New South Wales
(UNSW), Australia. He has a Masters degree in
Electronics Design and Technology from the Indian
Institute of Science, Bangalore, India. He has been
involved in GNSS related research since the late
1990s. Prior to joining UNSW, he worked at
Freescale Semiconductors, Bangalore and Accord
Software and Systems, Bangalore. His research
interests include GNSS receiver design, baseband
signal processing, baseband ASIC design,
embedded and reconfigurable hardware design and
software defined radios. He is a student member of
the IEEE and of the U.S. Institute of Navigation.
Andrew G Dempster has a BE (1984) and MEngSc
(1992) in Electrical Engineering from the UNSW
and PhD (1995) in Signal Processing from
Cambridge University, UK. He has worked for STC
in Sydney as a Telecommunications Design
Engineer, for Auspace Limited in Canberra as a
Systems Engineer and Project Manager, and for
University of Westminster in London as a Lecturer,
Senior Lecturer and Senior Academic. He is
currently Director of Research in the School of
Surveying and Spatial Information Systems at the
UNSW. His current research interests cover satellite
navigation receiver design, interference effects,
weak-signal GNSS, new positioning technologies,
integration of location technologies, and software
defined radio.
Prof. Chris Rizos is currently the Head of the
School of Surveying & Spatial Information
Systems, UNSW. Chris has been researching the
technology and applications of GPS since 1985, and
established over a decade ago the Satellite
Navigation and Positioning group at UNSW, today
the largest and best known academic GPS and
wireless location technology R&D laboratory in
Australia. Chris is the Vice President of the
International Association of Geodesy (IAG), and a
member of the Governing Board and Executive of
the International GNSS Service (IGS). Chris is a
Fellow of the IAG and a Fellow of the Australian
Institute of Navigation.
ABSTRACT
Due to their structure, Galileo E5 signals offer a
number of ways to synchronise the signal and to
demodulate the data. In this paper the authors
describe the architectures required, and discuss the
pros and cons of several of these methods, for
tracking the E5 signal. It is shown that the trade-offs
in tracking individual components of the E5 signal
can be converted to advantages thereby improving
the tracking jitter performance in low signal strength
environments.
I. INTRODUCTION
Galileo E5 signals are the most sophisticated signals
in the GNSS spectrum employing a special class of
Complex Double Binary Offset Carrier (CDBOC)
modulations known as AltBOC (Alternate Binary
Offset Carrier) modulation. The signal comprises
four tiered codes each with chipping rate fc = 10.23
MHz. These are combined with in-phase and
quadrature components of specially chosen sub-
carrier waveforms of frequency fs = 15.345 MHz,
resulting in constant envelope AltBOC(15,10)
modulation, which resembles an 8-PSK. Like other
offset carrier modulations, AltBOC modulation also
splits the spectrum into two halves which are called
E5a and E5b. The main lobes of the separated
signals occupy a total bandwidth of ~51 MHz
around the centre frequency of 1191.795 MHz.
Unlike other GNSS offset carrier modulations the
two lobes each carry two distinct signals. Of the
four tiered codes modulated onto the E5 signal,
which are referred to as E5a-I, E5a-Q, E5b-I and
E5b-Q, only the in-phase signals carry the data; the
quadrature-phase signals are pilot signals. The
constant envelope AltBOC scheme generates
product signal as a by-product of the modulation
which consumes 14.64% of the total power, and
hence the four individual codes equally share
21.34% of the received power (a total of 85.36%).
The presence of several parameters in the AltBOC
modulation from its four primary codes, four
secondary codes, four phases of a sub-carrier, two
data components all of which are appropriately
mapped onto four signal components, makes the
efficient synchronisation of the AltBOC signal an
interesting and challenging task. Several strategies
for signal acquisition have been discussed in
Shivaramaiah and Dempster (2008). A sequential
search method to identify the phase of the secondary
code has been discussed in Shivaramaiah et. al.
(2008). The subsequent step of tracking the signal is
the topic of this paper.
This paper is organised as follows. Section II
describes the principles of the standard tracking
architectures applicable to the E5 signal and
discusses their advantages and disadvantages.
Section III discusses the proposed method of carrier
and code tracking. Section IV provides the
performance analysis, followed by the conclusions
in section V.
II. STANDARD TRACKING ARCHITECTURE
FOR THE GALILEO E5 SIGNAL
The received signal at an intermediate frequency
(IF) in the case of Galileo E5 AltBOC can be
represented as (considering any one satellite)
(Kaplan and Hegarty 2006):
( )( ) 2 ( ) ( )IF dj t t
IFr t P s t e n tω ω φ
τ+ + = ⋅ℜ − ⋅ +
(1)
where P is the received power, IFω is the
intermediate frequency, dω is the Doppler frequency,
φ is the phase of the received signal, ( )s t τ− is the
complex baseband signal with a time delay τ w.r.t.
the transmitted signal, and ( )n t is the additive white
Gaussian noise. The complex baseband signal can
be represented as ( ) ( ) ( )c ss t s t js t= + . Hence (1) can
be written as:
( )( )
0
0
( ) cos( ) 2 ( )
( ) sin
cIF
s
s t tr t P n t
s t t
τ ω φτ ω φ
− ⋅ + −= + − ⋅ +
(2)
where 0 IF dω ω ω= + . The cosine and sine
components are generated according to the AltBOC
modulation scheme described in OS SIS ICD (2008,
pp. 5-8).
The receiver front-end typically uses a bandwidth of
at least 51 MHz so as to pass the first two main
lobes of the signal spectrum. As with the processing
methods for the acquisition explained in
Shivaramaiah and Dempster (2008) and Dovis et. al.
(2007), the signal tracking can also use similar
techniques to track the complete E5 AltBOC or any
component of the signal. The first method in which
the E5a and E5b signals are translated from their
centre frequencies to the baseband is called the
Side-Band Translation (SBT) method. The local
signal is then generated free of sub-carriers. The
second method is the Full-band Independent
Correlation (FIC) in which the local signal is
generated for the required signal component mapped
onto the appropriate phase of the sub-carrier. The
third method is the 8-PSK-like processing which
allows only the complete E5 signal correlation by
the use of a look-up table (LUT). With the first two
methods, several combinations of signal
components are possible with the combination
variables being coherent and non-coherent, data and
pilot, E5a and E5b.
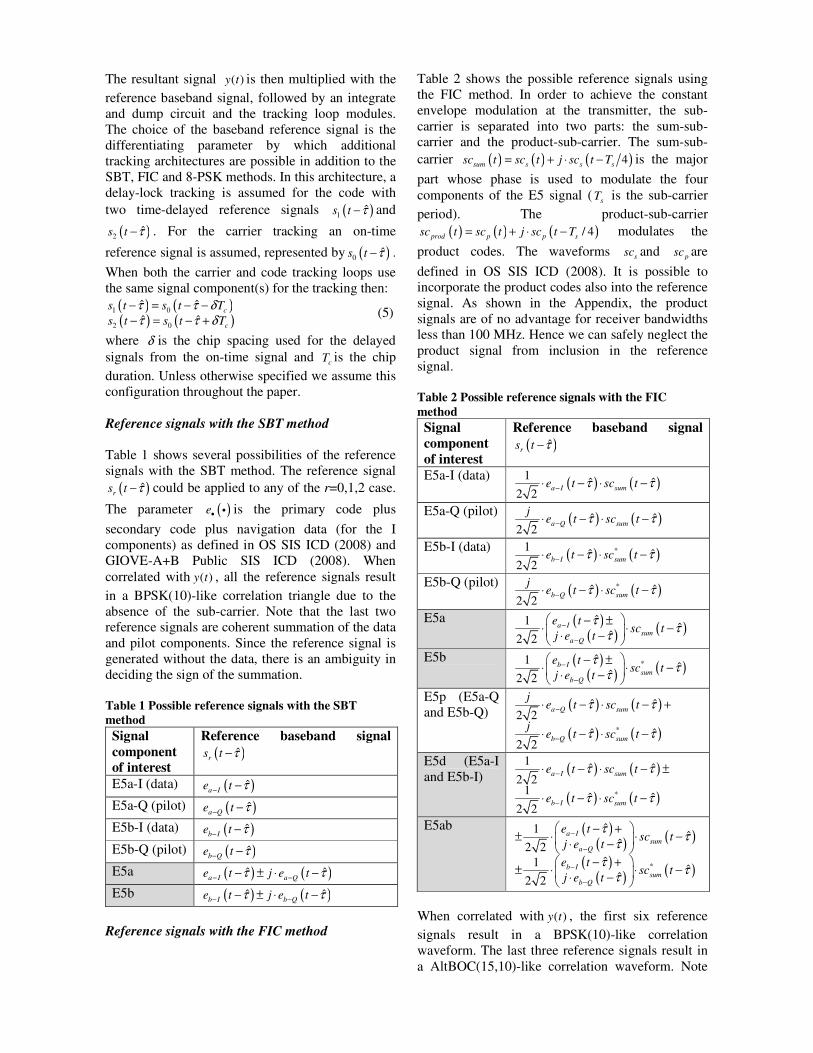
The received signal is correlated with the locally
generated code and carrier with the estimates of the
code delay τ̂ , carrier frequency and phase 0ˆˆ ,ω φ .
Fig. 1 shows a generalised tracking architecture for
the E5 signal. This architecture holds good for all
three methods of processing mentioned in the
previous paragraph. The received signal is
multiplied with the locally generated carrier ( )x t to
obtain the baseband signal. For the SBT method,
( )ˆˆ0( ) ( )
j t ts
SBTx t x t eω φ ω− + ±
= = (3)
where 2s sfω π= is the sub-carrier angular frequency
and the preceding sign depends on whether we are
interested in E5a or E5b. For the FIC and 8-PSK
methods:
( )IFr t 1,my1( )y t
2 ( )y t( )x t
( )y t( )
1
1( 1)
nT
n T
dt
−
∫1
T
1T
2,my( )*
1ˆs t τ−
( )*
2ˆs t τ−
( )*
0ˆs t τ−
0 ( )y t( )
2
2( 1)
nT
n T
dt
−
∫0,ly
2T
( )1
1( 1)
nT
n T
dt
−
∫
Figure 1 Generalised architecture for the E5 signal
tracking
( )0ˆˆ
( ) ( ) ( )j t
FIC 8-PSKx t x t x t eω φ− +
= = = (4)
The resultant signal ( )y t is then multiplied with the
reference baseband signal, followed by an integrate
and dump circuit and the tracking loop modules.
The choice of the baseband reference signal is the
differentiating parameter by which additional
tracking architectures are possible in addition to the
SBT, FIC and 8-PSK methods. In this architecture, a
delay-lock tracking is assumed for the code with
two time-delayed reference signals ( )1ˆs t τ− and
( )2ˆs t τ− . For the carrier tracking an on-time
reference signal is assumed, represented by ( )0ˆs t τ− .
When both the carrier and code tracking loops use
the same signal component(s) for the tracking then:
( ) ( )( ) ( )
1 0
2 0
ˆ ˆ
ˆ ˆc
c
s t s t T
s t s t T
τ τ δτ τ δ
− = − −
− = − + (5)
where δ is the chip spacing used for the delayed
signals from the on-time signal and cT is the chip
duration. Unless otherwise specified we assume this
configuration throughout the paper.
Reference signals with the SBT method
Table 1 shows several possibilities of the reference
signals with the SBT method. The reference signal
( )ˆrs t τ− could be applied to any of the r=0,1,2 case.
The parameter ( )e• i is the primary code plus
secondary code plus navigation data (for the I
components) as defined in OS SIS ICD (2008) and
GIOVE-A+B Public SIS ICD (2008). When
correlated with ( )y t , all the reference signals result
in a BPSK(10)-like correlation triangle due to the
absence of the sub-carrier. Note that the last two
reference signals are coherent summation of the data
and pilot components. Since the reference signal is
generated without the data, there is an ambiguity in
deciding the sign of the summation.
Table 1 Possible reference signals with the SBT
method
Signal
component
of interest
Reference baseband signal
( )ˆrs t τ−
E5a-I (data) ( )ˆa Ie t τ− −
E5a-Q (pilot) ( )ˆa Qe t τ− −
E5b-I (data) ( )ˆb Ie t τ− −
E5b-Q (pilot) ( )ˆb Qe t τ− −
E5a ( ) ( )ˆ ˆa I a Qe t j e tτ τ− −− ± ⋅ −
E5b ( ) ( )ˆ ˆb I b Qe t j e tτ τ− −− ± ⋅ −
Reference signals with the FIC method
Table 2 shows the possible reference signals using
the FIC method. In order to achieve the constant
envelope modulation at the transmitter, the sub-
carrier is separated into two parts: the sum-sub-
carrier and the product-sub-carrier. The sum-sub-
carrier ( ) ( ) ( )4sum s s ssc t sc t j sc t T= + ⋅ − is the major
part whose phase is used to modulate the four
components of the E5 signal ( sT is the sub-carrier
period). The product-sub-carrier
( ) ( ) ( )/ 4prod p p ssc t sc t j sc t T= + ⋅ − modulates the
product codes. The waveforms ssc and psc are
defined in OS SIS ICD (2008). It is possible to
incorporate the product codes also into the reference
signal. As shown in the Appendix, the product
signals are of no advantage for receiver bandwidths
less than 100 MHz. Hence we can safely neglect the
product signal from inclusion in the reference
signal.
Table 2 Possible reference signals with the FIC
method
Signal
component
of interest
Reference baseband signal
( )ˆrs t τ−
E5a-I (data) ( ) ( )
1ˆ ˆ
2 2a I sume t sc tτ τ−⋅ − ⋅ −
E5a-Q (pilot) ( ) ( )ˆ ˆ
2 2a Q sum
je t sc tτ τ−⋅ − ⋅ −
E5b-I (data) ( ) ( )*1
ˆ ˆ2 2
b I sume t sc tτ τ−⋅ − ⋅ −
E5b-Q (pilot) ( ) ( )*ˆ ˆ
2 2b Q sum
je t sc tτ τ−⋅ − ⋅ −
E5a ( )( ) ( )
ˆ1ˆ
ˆ2 2
a Isum
a Q
e tsc t
j e t
ττ
τ−
−
− ±⋅ ⋅ − ⋅ −
E5b ( )( ) ( )*ˆ1
ˆˆ2 2
b Isum
b Q
e tsc t
j e t
ττ
τ−
−
− ±⋅ ⋅ − ⋅ −
E5p (E5a-Q
and E5b-Q) ( ) ( )
( ) ( )*
ˆ ˆ2 2
ˆ ˆ2 2
a Q sum
b Q sum
je t sc t
je t sc t
τ τ
τ τ
−
−
⋅ − ⋅ − +
⋅ − ⋅ −
E5d (E5a-I
and E5b-I) ( ) ( )
( ) ( )*
1ˆ ˆ
2 21
ˆ ˆ2 2
a I sum
b I sum
e t sc t
e t sc t
τ τ
τ τ
−
−
⋅ − ⋅ − ±
⋅ − ⋅ −
E5ab ( )( ) ( )
( )( ) ( )*
ˆ1ˆ
ˆ2 2
ˆ1ˆ
ˆ2 2
a Isum
a Q
b Isum
b Q
e tsc t
j e t
e tsc t
j e t
ττ
τ
ττ
τ
−
−
−
−
− +± ⋅ ⋅ − ⋅ −
− +± ⋅ ⋅ − ⋅ −
When correlated with ( )y t , the first six reference
signals result in a BPSK(10)-like correlation
waveform. The last three reference signals result in
a AltBOC(15,10)-like correlation waveform. Note
that as we are combining the data and pilot signals
without considering the data bit in the reference
signal, E5a, E5b, E5d and E5ab will have
ambiguities for the sign of the coherent summation.
Reference signals with the 8-PSK-like method
Table 3 shows the reference signal with the 8-PSK-
like tracking method. The parameter siT is the
quantised sub-carrier phase ( )k t and is the output of
the look-up-table (called here as the function L)
defined in the OS SIS ICD (2008). Again the data
ambiguity exists in terms of the E5a or E5b data
component. It should be noted that unlike the FIC
method, the product signal can not be separated
from the sum signal. This reference signal when
correlated with ( )y t , produces a AltBOC(15,10)
correlation triangle.
Table 3 Possible reference signals with the 8-PSK-like
method
Signal
component
of interest
Reference baseband signal
( )ˆrs t τ−
E5 ˆexp ( )
4j k tπ
τ
−
with ( )k t =
( ) ( ) ( ) ( )( ), , , ,a I a Q b I b Q sL e t e t e t e t iT− − − −
Issues related to the signal tracking with the
different architectures
Each of the reference signals yield an architecture to
track the signal listed in the left column of the
Tables 1, 2 and 3. It is well known that the tracking
performance measured in terms of carrier phase
jitter and code phase jitter is directly dependent on
the signal strength of the received signal (e.g.
Kaplan and Hegarty 2006); the more the signal
strength the better the performance. Hence it is wise
to combine the different components of the signal in
order to extract as much power from the received
signal as possible.
The data-bit ambiguity and the non-coherent
combination
Because of data bit ambiguity coherent combination
is not possible in many cases, indicated with a
shaded region in Tables 1, 2 and 3. Note that the
only coherent combination possible is the E5a and
E5b pilot signal combination which results in the E5
pilot signal combination. In the SBT and FIC
methods, the alternate combination (for the data bit
flip-over) can be represented by changing the sign
of the summation between E5a and E5b
components. On the other hand, for the 8-PSK-like
tracking, the alternate combination is not directly
possible due to the LUT type of implementation.
The classical solution to the data-bit ambiguity,
which is the non-coherent combination during the
correlation process, does not directly serve the
purpose of achieving a better tracking since the
phase of the signal is lost during the combination
process (the phase information is required as an
input to the tracking loop modules so as to provide
feedback to the NCO).
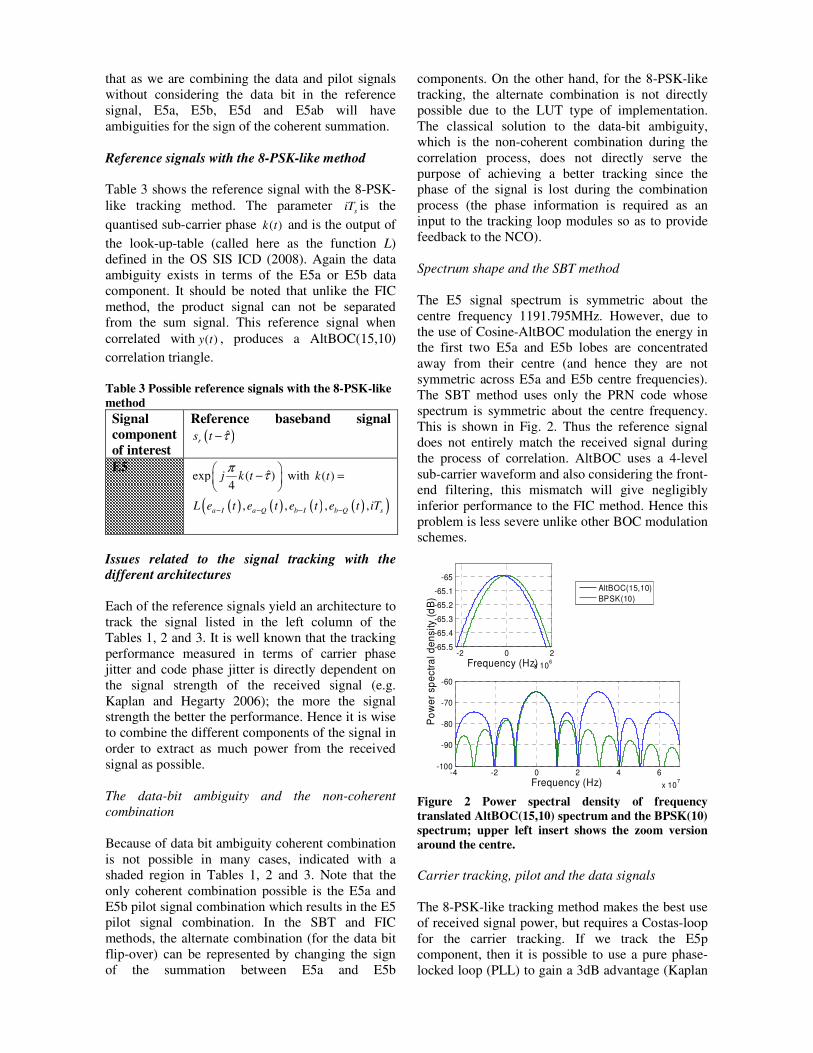
Spectrum shape and the SBT method
The E5 signal spectrum is symmetric about the
centre frequency 1191.795MHz. However, due to
the use of Cosine-AltBOC modulation the energy in
the first two E5a and E5b lobes are concentrated
away from their centre (and hence they are not
symmetric across E5a and E5b centre frequencies).
The SBT method uses only the PRN code whose
spectrum is symmetric about the centre frequency.
This is shown in Fig. 2. Thus the reference signal
does not entirely match the received signal during
the process of correlation. AltBOC uses a 4-level
sub-carrier waveform and also considering the front-
end filtering, this mismatch will give negligibly
inferior performance to the FIC method. Hence this
problem is less severe unlike other BOC modulation
schemes.
-2 0 2
x 106
-65.5
-65.4
-65.3
-65.2
-65.1
-65
Frequency (Hz)
-4 -2 0 2 4 6
x 107
-100
-90
-80
-70
-60
Frequency (Hz)
Po
we
r sp
ectr
al d
en
sity (
dB
)
AltBOC(15,10)
BPSK(10)
Figure 2 Power spectral density of frequency
translated AltBOC(15,10) spectrum and the BPSK(10)
spectrum; upper left insert shows the zoom version
around the centre.
Carrier tracking, pilot and the data signals
The 8-PSK-like tracking method makes the best use
of received signal power, but requires a Costas-loop
for the carrier tracking. If we track the E5p
component, then it is possible to use a pure phase-
locked loop (PLL) to gain a 3dB advantage (Kaplan
and Hegarty 2006) over the E5 signal. The E5p pilot
tracking will still be short of 3dB compared to the
maximum achievable gain that can be obtained
when a combination of E5 signal and a pure PLL is
used. On the other hand, the pilot signal tracking
can cater for more signal dynamics.
Code tracking linear range
The code tracking linear range directly depends on
the sharpness of the underlying correlation function.
The E5 signal tracking with the AltBOC(15,10)
correlation output has a much sharper main peak
compared to the architectures which produce
BPSK(10)-like correlation output. On the other
hand, as discussed in previous paragraphs, the 8-
PSK-like tracking method gives the best received
signal-to-noise ratio among all the architectures. The
carrier aiding of the code loop lessens the effect of
the code loop dependency, but does not completely
eliminate it, especially at lower sampling
frequencies. The authors have proposed a novel
method of combining the BPSK(10) and AltBOC
discriminator outputs to overcome this problem
(Shivaramaiah and Dempster 2009).
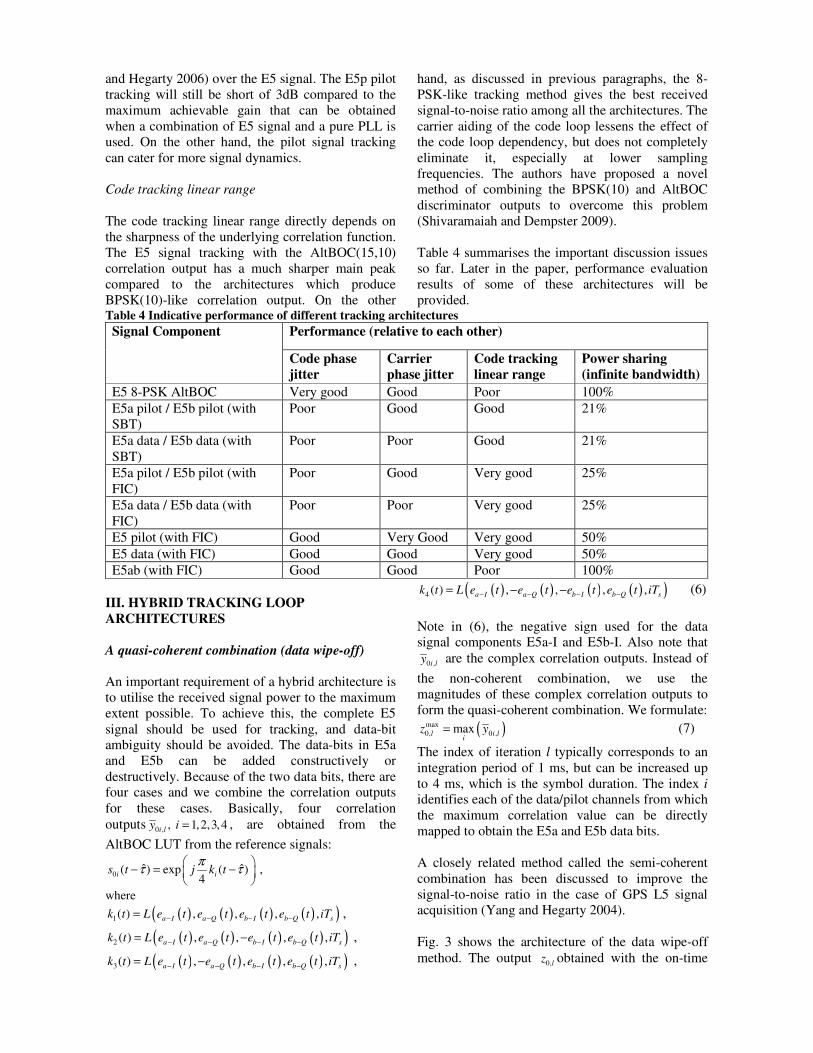
Table 4 summarises the important discussion issues
so far. Later in the paper, performance evaluation
results of some of these architectures will be
provided. Table 4 Indicative performance of different tracking architectures
Signal Component Performance (relative to each other)
Code phase
jitter
Carrier
phase jitter
Code tracking
linear range
Power sharing
(infinite bandwidth)
E5 8-PSK AltBOC Very good Good Poor 100%
E5a pilot / E5b pilot (with
SBT)
Poor Good Good 21%
E5a data / E5b data (with
SBT)
Poor Poor Good 21%
E5a pilot / E5b pilot (with
FIC)
Poor Good Very good 25%
E5a data / E5b data (with
FIC)
Poor Poor Very good 25%
E5 pilot (with FIC) Good Very Good Very good 50%
E5 data (with FIC) Good Good Very good 50%
E5ab (with FIC) Good Good Poor 100%
III. HYBRID TRACKING LOOP
ARCHITECTURES
A quasi-coherent combination (data wipe-off)
An important requirement of a hybrid architecture is
to utilise the received signal power to the maximum
extent possible. To achieve this, the complete E5
signal should be used for tracking, and data-bit
ambiguity should be avoided. The data-bits in E5a
and E5b can be added constructively or
destructively. Because of the two data bits, there are
four cases and we combine the correlation outputs
for these cases. Basically, four correlation
outputs 0 , , 1,2,3,4i ly i = , are obtained from the
AltBOC LUT from the reference signals:
0ˆ ˆ( ) exp ( )
4i is t j k t
πτ τ
− = −
,
where
( ) ( ) ( ) ( )( )1( ) , , , ,a I a Q b I b Q sk t L e t e t e t e t iT− − − −= ,
( ) ( ) ( ) ( )( )2 ( ) , , , ,a I a Q b I b Q sk t L e t e t e t e t iT− − − −= − ,
( ) ( ) ( ) ( )( )3( ) , , , ,a I a Q b I b Q sk t L e t e t e t e t iT− − − −= − ,
( ) ( ) ( ) ( )( )4 ( ) , , , ,a I a Q b I b Q sk t L e t e t e t e t iT− − − −= − − (6)
Note in (6), the negative sign used for the data
signal components E5a-I and E5b-I. Also note that
0 ,i ly are the complex correlation outputs. Instead of
the non-coherent combination, we use the
magnitudes of these complex correlation outputs to
form the quasi-coherent combination. We formulate:
( )max
0, 0 ,max l i li
z y= (7)
The index of iteration l typically corresponds to an
integration period of 1 ms, but can be increased up
to 4 ms, which is the symbol duration. The index i
identifies each of the data/pilot channels from which
the maximum correlation value can be directly
mapped to obtain the E5a and E5b data bits.
A closely related method called the semi-coherent
combination has been discussed to improve the
signal-to-noise ratio in the case of GPS L5 signal
acquisition (Yang and Hegarty 2004).
Fig. 3 shows the architecture of the data wipe-off
method. The output 0,lz obtained with the on-time
reference signal is used for the carrier tracking. The
combination which maximises the on-time output is
also used to select the output of the early and late
correlator outputs 1,mz and 2,mz . Observe that we use
two different notations for the integration duration
because the code and carrier tracking may have
different integration durations.
( )IFr t 1 ,i my1iy
2iy( )0
ˆˆ
( )j t
x t eω φ− +
=
( )y t( )
1
1( 1)
nT
n T
dt
−
∫1T
1T
2 ,i my
*
1is
*
2is
*
0is
0iy
( )2
2( 1)
nT
n T
dt
−
∫0 ,i ly
2T
( )1
1( 1)
nT
n T
dt
−
∫
1, 2,,m mz z 0,lz
Figure 3 A quasi-coherent (data wipe-off) architecture
This method has a trade-off. Increasing the
integration duration for the carrier and code tracking
beyond the symbol duration of 4 ms is not straight
forward as we would encounter several
combinations of the data-bits. This is not a
significant problem because the minimum user
received power of the E5 signal, -155 dBm (OS SIS
ICD, GIOVE-A+B Public SIS ICD 2008) is on the
high side compared to other Open Service (or
Civilian) signals.
Hardware considerations
The second issue is that of the hardware. If we don’t
perform the data wipe-off combination, then the
tracking loop architecture requires a minimum of 5
complex correlators, three for carrier and code
tracking and two for data-bit demodulation. With
the data wipe-off architecture we require 12
correlators for a real-time operation (software
receivers can buffer the input signal and repeatedly
act on it, hence memory and processing time can be
traded-off). The good thing is that since the
reference signal and the look-up table are already
available, a code mixer and an accumulator are the
only additions to the hardware. Nevertheless this
increases the hardware requirements.
Coherent pilot signal tracking and aiding the data
demodulation
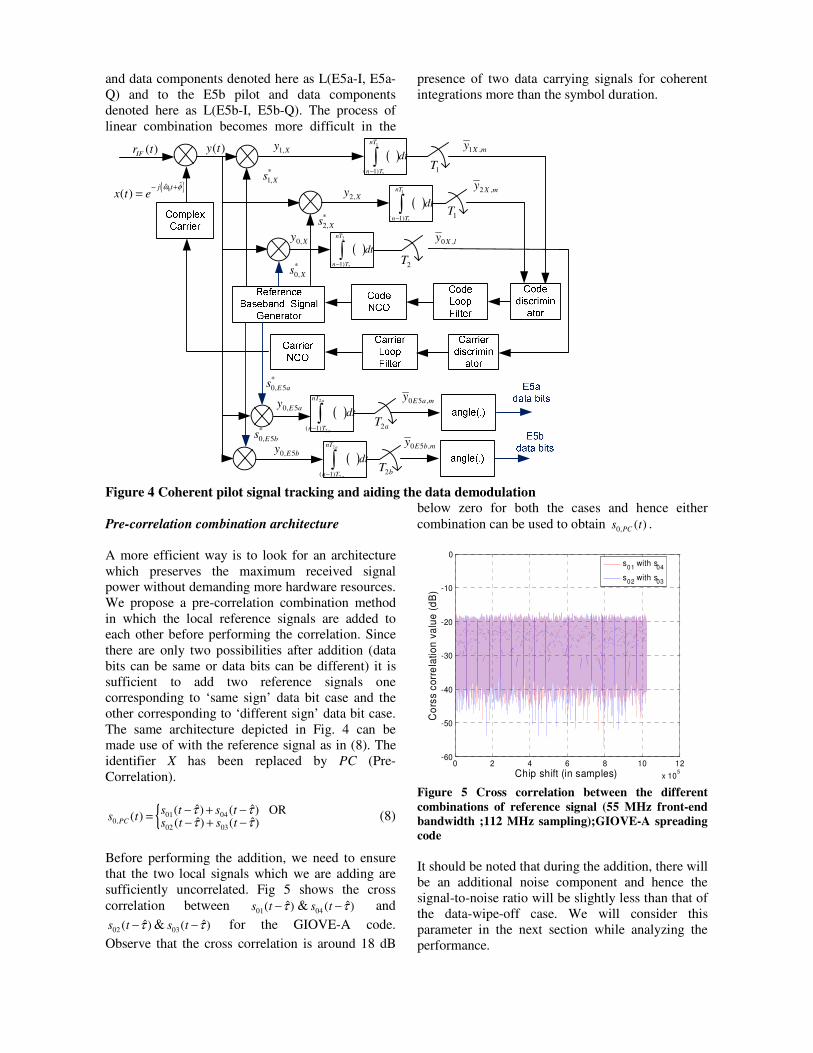
Fig. 4 shows the architecture of the coherent pilot
tracking method. The reference signal for the carrier
and code tracking correspond to the E5p signal
component mentioned in Table 2. The X in the Fig.
4 which indicates the reference signal type should
be replaced by E5p to obtain the specific
architecture. Since this component is free of data,
integration time is only limited by the loop time
constant and the signal dynamics that need to be
catered for. The data-bits are demodulated using the
E5a and E5b components. The reason for using E5a
and E5b components instead of E5a-I and E5b-I
components is this. Whether it is E5a or E5a-I, the
phase change due to the data-bit transition is ± 180
deg because there is only one data component.
However, using E5a for the data-bit demodulation
provides us with 3dB advantage over the E5a-I. The
same argument holds for using the E5b component
instead of E5b-I.
Note that the carrier frequency and code delay
estimates are used from the pilot tracking and hence
no tracking loop is required for the E5a and E5b
components. The angles of the complex correlation
vales 0 5 ,E a my and 0 5 ,E b my are mapped to E5a and E5b
data-bits correspondingly. The trade-off in this
architecture is the received signal power, which is
3dB below the maximum achievable, as explained
in section II.
Post-correlation combination methods
The signal components can be combined after the
correlation process, at the discriminator stage. These
methods have been explored in Hegarty (1999),
Tran (2004), Tran and Hegarty (2002) for the GPS
L5 and L2C signals. Basically a weighted
combination of the discriminator outputs is used as
the carrier phase and code delay estimates. These
methods can be applied separately to the E5a pilot
and data components denoted here as L(E5a-I, E5a-
Q) and to the E5b pilot and data components
denoted here as L(E5b-I, E5b-Q). The process of
linear combination becomes more difficult in the
presence of two data carrying signals for coherent
integrations more than the symbol duration.
( )IFr t 1 ,X my1,Xy
2,Xy( )0ˆˆ
( )j t
x t eω φ− +
=
( )y t( )
1
1( 1)
nT
n T
dt
−
∫1T
1T
2 ,X my
*
1,Xs
*
2,Xs
*
0,Xs
0,Xy( )
2
2( 1)
nT
n T
dt
−
∫0 ,X ly
2T
( )1
1( 1)
nT
n T
dt
−
∫
0 5 ,E a my
0, 5E by
( )2
2( 1)
a
a
nT
n T
dt
−
∫2aT
2bT
0 5 ,E b my
( )2
2( 1)
a
a
nT
n T
dt
−
∫
0, 5E ay
*
0, 5E bs
*
0, 5E as
Figure 4 Coherent pilot signal tracking and aiding the data demodulation
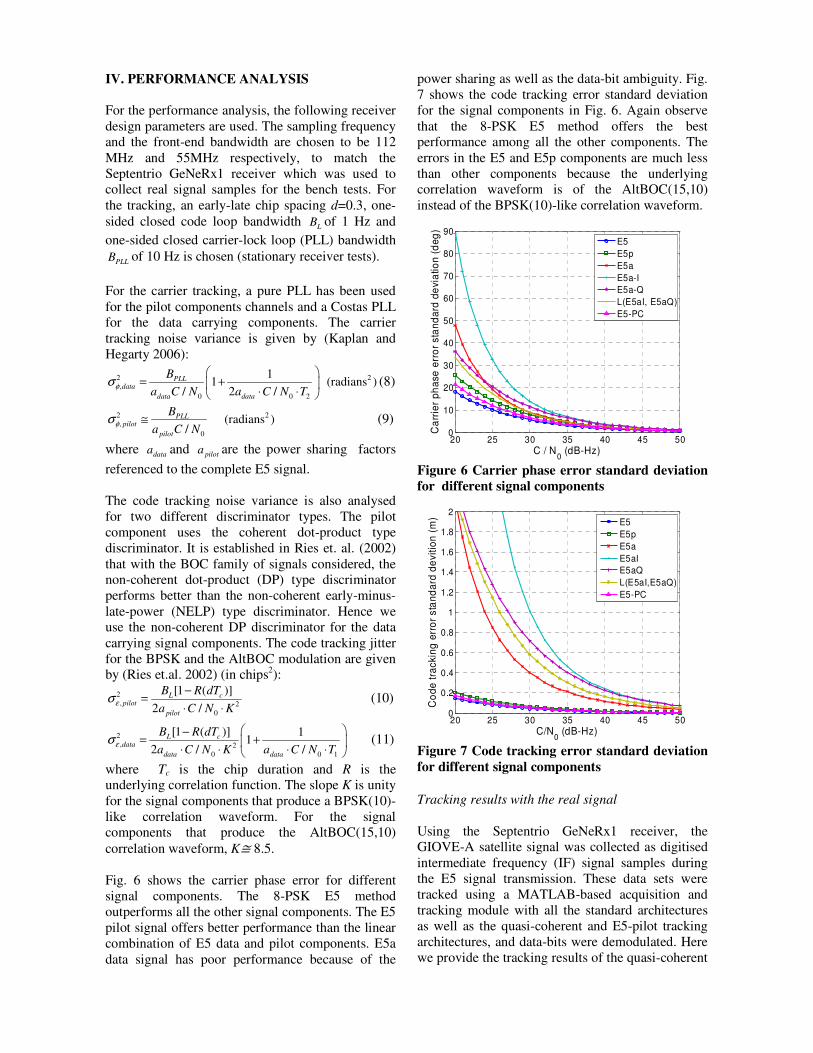
Pre-correlation combination architecture
A more efficient way is to look for an architecture
which preserves the maximum received signal
power without demanding more hardware resources.
We propose a pre-correlation combination method
in which the local reference signals are added to
each other before performing the correlation. Since
there are only two possibilities after addition (data
bits can be same or data bits can be different) it is
sufficient to add two reference signals one
corresponding to ‘same sign’ data bit case and the
other corresponding to ‘different sign’ data bit case.
The same architecture depicted in Fig. 4 can be
made use of with the reference signal as in (8). The
identifier X has been replaced by PC (Pre-
Correlation).
{ 01 040,
02 03
ˆ ˆ( ) ( ) OR( ) ˆ ˆ( ) ( )PC
s t s ts t
s t s tτ ττ τ
− + −=
− + − (8)
Before performing the addition, we need to ensure
that the two local signals which we are adding are
sufficiently uncorrelated. Fig 5 shows the cross
correlation between 01ˆ( )s t τ− & 04
ˆ( )s t τ− and
02ˆ( )s t τ− & 03
ˆ( )s t τ− for the GIOVE-A code.
Observe that the cross correlation is around 18 dB
below zero for both the cases and hence either
combination can be used to obtain 0, ( )PCs t .
0 2 4 6 8 10 12
x 105
-60
-50
-40
-30
-20
-10
0
Chip shift (in samples)
Co
rss
co
rre
latio
n v
alu
e (
dB
)
s01
with s04
s02
with s03
Figure 5 Cross correlation between the different
combinations of reference signal (55 MHz front-end
bandwidth ;112 MHz sampling);GIOVE-A spreading
code
It should be noted that during the addition, there will
be an additional noise component and hence the
signal-to-noise ratio will be slightly less than that of
the data-wipe-off case. We will consider this
parameter in the next section while analyzing the
performance.
IV. PERFORMANCE ANALYSIS
For the performance analysis, the following receiver
design parameters are used. The sampling frequency
and the front-end bandwidth are chosen to be 112
MHz and 55MHz respectively, to match the
Septentrio GeNeRx1 receiver which was used to
collect real signal samples for the bench tests. For
the tracking, an early-late chip spacing d=0.3, one-
sided closed code loop bandwidth LB of 1 Hz and
one-sided closed carrier-lock loop (PLL) bandwidth
PLLB of 10 Hz is chosen (stationary receiver tests).
For the carrier tracking, a pure PLL has been used
for the pilot components channels and a Costas PLL
for the data carrying components. The carrier
tracking noise variance is given by (Kaplan and
Hegarty 2006):
2 2
,
0 0 2
11 (radians )
/ 2 /
PLLdata
data data
B
a C N a C N Tφσ
= +
⋅ ⋅ (8)
2 2
,
0
(radians )/
PLLpilot
pilot
B
a C Nφσ ≅ (9)
where dataa and pilota are the power sharing factors
referenced to the complete E5 signal.
The code tracking noise variance is also analysed
for two different discriminator types. The pilot
component uses the coherent dot-product type
discriminator. It is established in Ries et. al. (2002)
that with the BOC family of signals considered, the
non-coherent dot-product (DP) type discriminator
performs better than the non-coherent early-minus-
late-power (NELP) type discriminator. Hence we
use the non-coherent DP discriminator for the data
carrying signal components. The code tracking jitter
for the BPSK and the AltBOC modulation are given
by (Ries et.al. 2002) (in chips2):
2
, 2
0
[1 ( )]
2 /
L cpilot
pilot
B R dT
a C N Kεσ
−=
⋅ ⋅ (10)
2
, 2
0 0 1
[1 ( )] 11
2 / /
L cdata
data data
B R dT
a C N K a C N Tεσ
−= +
⋅ ⋅ ⋅ ⋅ (11)
where Tc is the chip duration and R is the
underlying correlation function. The slope K is unity
for the signal components that produce a BPSK(10)-
like correlation waveform. For the signal
components that produce the AltBOC(15,10)
correlation waveform, K≅ 8.5.
Fig. 6 shows the carrier phase error for different
signal components. The 8-PSK E5 method
outperforms all the other signal components. The E5
pilot signal offers better performance than the linear
combination of E5 data and pilot components. E5a
data signal has poor performance because of the
power sharing as well as the data-bit ambiguity. Fig.
7 shows the code tracking error standard deviation
for the signal components in Fig. 6. Again observe
that the 8-PSK E5 method offers the best
performance among all the other components. The
errors in the E5 and E5p components are much less
than other components because the underlying
correlation waveform is of the AltBOC(15,10)
instead of the BPSK(10)-like correlation waveform.
20 25 30 35 40 45 500
10
20
30
40
50
60
70
80
90
C / N0 (dB-Hz)
Ca
rrie
r p
ha
se e
rro
r sta
nd
ard
de
via
tio
n (
de
g)
E5
E5p
E5a
E5a-I
E5a-Q
L(E5aI, E5aQ)
E5-PC
Figure 6 Carrier phase error standard deviation
for different signal components
20 25 30 35 40 45 500
0.2
0.4
0.6
0.8
1
1.2
1.4
1.6
1.8
2
C/N0 (dB-Hz)
Co
de
tra
cki
ng
err
or
sta
nd
ard
de
vitio
n (
m)
E5
E5p
E5a
E5aI
E5aQ
L(E5aI,E5aQ)
E5-PC
Figure 7 Code tracking error standard deviation
for different signal components
Tracking results with the real signal
Using the Septentrio GeNeRx1 receiver, the
GIOVE-A satellite signal was collected as digitised
intermediate frequency (IF) signal samples during
the E5 signal transmission. These data sets were
tracked using a MATLAB-based acquisition and
tracking module with all the standard architectures
as well as the quasi-coherent and E5-pilot tracking
architectures, and data-bits were demodulated. Here
we provide the tracking results of the quasi-coherent
(data wipe-off) and the pilot signal tracking
experiments.
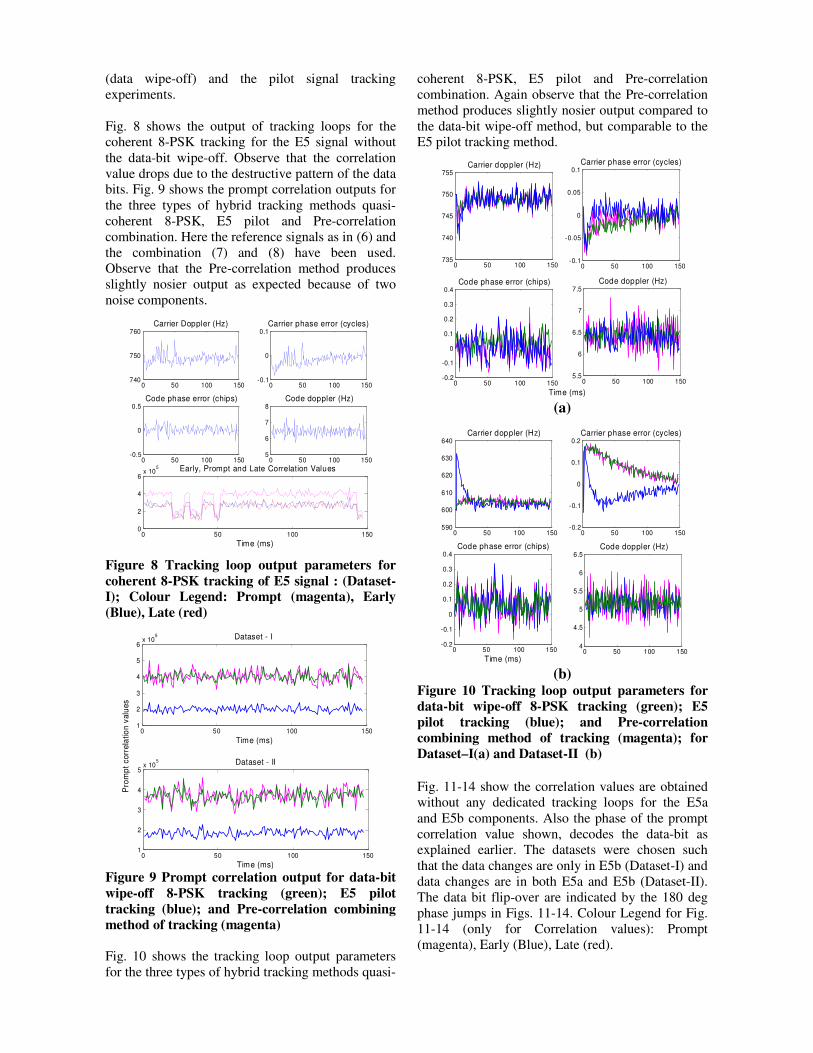
Fig. 8 shows the output of tracking loops for the
coherent 8-PSK tracking for the E5 signal without
the data-bit wipe-off. Observe that the correlation
value drops due to the destructive pattern of the data
bits. Fig. 9 shows the prompt correlation outputs for
the three types of hybrid tracking methods quasi-
coherent 8-PSK, E5 pilot and Pre-correlation
combination. Here the reference signals as in (6) and
the combination (7) and (8) have been used.
Observe that the Pre-correlation method produces
slightly nosier output as expected because of two
noise components.
0 50 100 150740
750
760Carrier Doppler (Hz)
0 50 100 150-0.1
0
0.1Carrier phase error (cycles)
0 50 100 150-0.5
0
0.5Code phase error (chips)
0 50 100 1505
6
7
8Code doppler (Hz)
0 50 100 1500
2
4
6x 10
5
Time (ms)
Early, Prompt and Late Correlation Values
Figure 8 Tracking loop output parameters for
coherent 8-PSK tracking of E5 signal : (Dataset-
I); Colour Legend: Prompt (magenta), Early
(Blue), Late (red)
0 50 100 1501
2
3
4
5x 10
5
Time (ms)
Pro
mp
t co
rre
latio
n v
alu
es
Dataset - II
0 50 100 1501
2
3
4
5
6x 10
5
Time (ms)
Dataset - I
Figure 9 Prompt correlation output for data-bit
wipe-off 8-PSK tracking (green); E5 pilot
tracking (blue); and Pre-correlation combining
method of tracking (magenta)
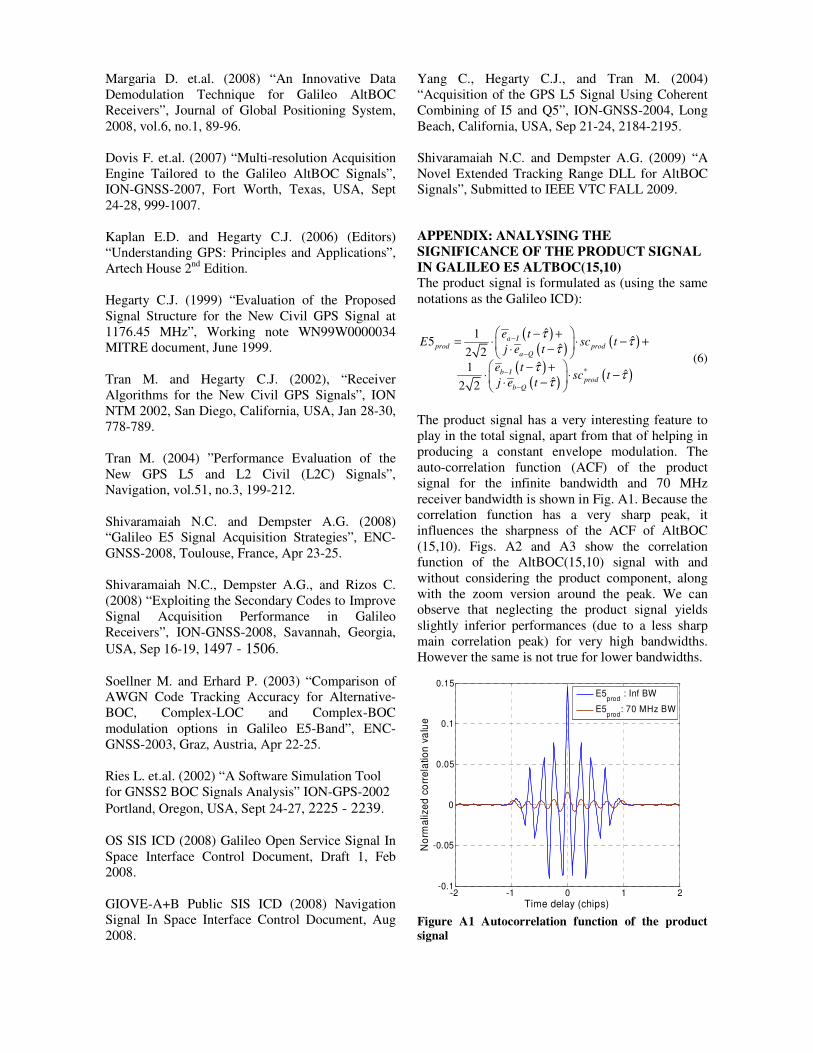
Fig. 10 shows the tracking loop output parameters
for the three types of hybrid tracking methods quasi-
coherent 8-PSK, E5 pilot and Pre-correlation
combination. Again observe that the Pre-correlation
method produces slightly nosier output compared to
the data-bit wipe-off method, but comparable to the
E5 pilot tracking method.
0 50 100 150735
740
745
750
755Carrier doppler (Hz)
0 50 100 150-0.1
-0.05
0
0.05
0.1Carrier phase error (cycles)
0 50 100 150-0.2
-0.1
0
0.1
0.2
0.3
0.4Code phase error (chips)
Time (ms)
0 50 100 1505.5
6
6.5
7
7.5Code doppler (Hz)
(a)
0 50 100 150-0.2
-0.1
0
0.1
0.2
0.3
0.4Code phase error (chips)
Time (ms)
0 50 100 150590
600
610
620
630
640Carrier doppler (Hz)
0 50 100 150-0.2
-0.1
0
0.1
0.2Carrier phase error (cycles)
0 50 100 1504
4.5
5
5.5
6
6.5Code doppler (Hz)
(b)
Figure 10 Tracking loop output parameters for
data-bit wipe-off 8-PSK tracking (green); E5
pilot tracking (blue); and Pre-correlation
combining method of tracking (magenta); for
Dataset–I(a) and Dataset-II (b)
Fig. 11-14 show the correlation values are obtained
without any dedicated tracking loops for the E5a
and E5b components. Also the phase of the prompt
correlation value shown, decodes the data-bit as
explained earlier. The datasets were chosen such
that the data changes are only in E5b (Dataset-I) and
data changes are in both E5a and E5b (Dataset-II).
The data bit flip-over are indicated by the 180 deg
phase jumps in Figs. 11-14. Colour Legend for Fig.
11-14 (only for Correlation values): Prompt
(magenta), Early (Blue), Late (red).
0 50 100 1500.5
1
1.5
2
2.5x 10
5Correlation values (E5a)
0 50 100 150-2.2
-2
-1.8
-1.6
-1.4
-1.2angle (Prompt), E5a
0 50 100 1501
1.5
2
2.5
3x 10
5
Time (ms)
Correlation values (E5b)
0 50 100 150-2
-1
0
1
2angle (Prompt), E5b
Figure 11 Data-bit demodulation, showing the
magnitude and the phase of the correlation
values; E5-pilot tracking method: (Dataset-I)
0 50 100 1500.5
1
1.5
2
2.5x 10
5Correlation value (E5a)
0 50 100 150-2
-1.8
-1.6
-1.4
-1.2angle(Prompt),E5a
0 50 100 1501
1.5
2
2.5
3x 10
5Correlation value (E5b)
0 50 100 150-2
-1
0
1
2angle(Prompt),E5b
Time (ms)
Figure 12 Data-bit demodulation, showing the
magnitude and the phase of the correlation
values; Pre-correlation combination tracking
method: (Dataset-I)
V. CONCLUDING REMARKS
In this paper the authors discussed several tracking
architectures that are possible for tracking the E5
signal and its components which make use of
different local reference signals. The advantages and
disadvantages of the standard tracking architecture
are discussed and two types of hybrid tracking
architectures are described. Performance of the
different tracking loop architectures were analysed,
as well as the tracking results of the GIOVE-A E5
signal. It is concluded that the two best architectures
are the quasi-coherent 8-PSK tracking for the E5
signal and the E5-pilot tracking. In addition, data
demodulation methods were also presented with
these two architectures. Further investigation
0 50 100 1500.5
1
1.5
2x 10
5Correlation value (E5a)
0 50 100 150-4
-2
0
2
4angle (Prompt), E5a
0 50 100 1501
1.5
2
2.5
3x 10
5
Time (ms)
Correlation Value (E5b)
0 50 100 150-4
-2
0
2
4angle (Prompt), E5b
Figure 13 Data-bit demodulation, showing the
magnitude and the phase of the correlation
values; E5-pilot tracking method: (Dataset-II)
0 50 100 1500.5
1
1.5
2x 10
5Correlation value (E5a)
0 50 100 150-3
-2
-1
0
1
2angle(Prompt),E5a
0 50 100 1501
1.5
2
2.5
3x 10
5Correlation value (E5b)
0 50 100 150-3
-2
-1
0
1
2angle(Prompt),E5b
Time (ms) Figure 14 Data-bit demodulation, showing the
magnitude and the phase of the correlation
values; Pre-correlation combination method:
(Dataset-II)
involves analysing the benefits of interference
mitigation with the hybrid tracking architectures.
ACKNOWLEDGEMENT
The authors would like to acknowledge that this
research work has been carried out under the
Australian Research Council (ARC) Discovery
Project DP0556848.
REFERENCES
Sleewaegaen J.-M. et.al. (2004), “Galileo AltBOC
Receiver” ENC-GNSS-2004, Rotterdam, The
Netherlands, May16-19.
Margaria D. et.al. (2008) “An Innovative Data
Demodulation Technique for Galileo AltBOC
Receivers”, Journal of Global Positioning System,
2008, vol.6, no.1, 89-96.
Dovis F. et.al. (2007) “Multi-resolution Acquisition
Engine Tailored to the Galileo AltBOC Signals”,
ION-GNSS-2007, Fort Worth, Texas, USA, Sept
24-28, 999-1007.
Kaplan E.D. and Hegarty C.J. (2006) (Editors)
“Understanding GPS: Principles and Applications”,
Artech House 2nd
Edition.
Hegarty C.J. (1999) “Evaluation of the Proposed
Signal Structure for the New Civil GPS Signal at
1176.45 MHz”, Working note WN99W0000034
MITRE document, June 1999.
Tran M. and Hegarty C.J. (2002), “Receiver
Algorithms for the New Civil GPS Signals”, ION
NTM 2002, San Diego, California, USA, Jan 28-30,
778-789.
Tran M. (2004) ”Performance Evaluation of the
New GPS L5 and L2 Civil (L2C) Signals”,
Navigation, vol.51, no.3, 199-212.
Shivaramaiah N.C. and Dempster A.G. (2008)
“Galileo E5 Signal Acquisition Strategies”, ENC-
GNSS-2008, Toulouse, France, Apr 23-25.
Shivaramaiah N.C., Dempster A.G., and Rizos C.
(2008) “Exploiting the Secondary Codes to Improve
Signal Acquisition Performance in Galileo
Receivers”, ION-GNSS-2008, Savannah, Georgia,
USA, Sep 16-19, 1497 - 1506.
Soellner M. and Erhard P. (2003) “Comparison of
AWGN Code Tracking Accuracy for Alternative-
BOC, Complex-LOC and Complex-BOC
modulation options in Galileo E5-Band”, ENC-
GNSS-2003, Graz, Austria, Apr 22-25.
Ries L. et.al. (2002) “A Software Simulation Tool
for GNSS2 BOC Signals Analysis” ION-GPS-2002
Portland, Oregon, USA, Sept 24-27, 2225 - 2239.
OS SIS ICD (2008) Galileo Open Service Signal In
Space Interface Control Document, Draft 1, Feb
2008.
GIOVE-A+B Public SIS ICD (2008) Navigation
Signal In Space Interface Control Document, Aug
2008.
Yang C., Hegarty C.J., and Tran M. (2004)
“Acquisition of the GPS L5 Signal Using Coherent
Combining of I5 and Q5”, ION-GNSS-2004, Long
Beach, California, USA, Sep 21-24, 2184-2195.
Shivaramaiah N.C. and Dempster A.G. (2009) “A
Novel Extended Tracking Range DLL for AltBOC
Signals”, Submitted to IEEE VTC FALL 2009.
APPENDIX: ANALYSING THE
SIGNIFICANCE OF THE PRODUCT SIGNAL
IN GALILEO E5 ALTBOC(15,10) The product signal is formulated as (using the same
notations as the Galileo ICD):
( )( ) ( )
( )( ) ( )*
ˆ1ˆ5
ˆ2 2
ˆ1ˆ
ˆ2 2
a Iprod prod
a Q
b Iprod
b Q
e tE sc t
j e t
e tsc t
j e t
ττ
τ
ττ
τ
−
−
−
−
− += ⋅ ⋅ − + ⋅ −
− +⋅ ⋅ − ⋅ −
(6)
The product signal has a very interesting feature to
play in the total signal, apart from that of helping in
producing a constant envelope modulation. The
auto-correlation function (ACF) of the product
signal for the infinite bandwidth and 70 MHz
receiver bandwidth is shown in Fig. A1. Because the
correlation function has a very sharp peak, it
influences the sharpness of the ACF of AltBOC
(15,10). Figs. A2 and A3 show the correlation
function of the AltBOC(15,10) signal with and
without considering the product component, along
with the zoom version around the peak. We can
observe that neglecting the product signal yields
slightly inferior performances (due to a less sharp
main correlation peak) for very high bandwidths.
However the same is not true for lower bandwidths.
-2 -1 0 1 2-0.1
-0.05
0
0.05
0.1
0.15
Time delay (chips)
No
rma
lize
d c
orr
ela
tion
va
lue
E5prod
: Inf BW
E5prod
: 70 MHz BW
Figure A1 Autocorrelation function of the product
signal
-2 -1 0 1 2-0.8
-0.6
-0.4
-0.2
0
0.2
0.4
0.6
0.8
1
Time delay (chips)
No
rma
lize
d c
orr
ela
tio
n v
alu
e
W ith E5prod
W ithout E5prod
-0.1 -0.05 0 0.05 0.10.5
0.55
0.6
0.65
0.7
0.75
0.8
0.85
0.9
0.95
1
Time delay (chips)
No
rma
lize
d c
orr
ela
tion
va
lue
W ith E5prod
W ithout E5prod
Figure A2 Auto correlation function of the
AltBOC(15,10) signal with and without the product
signal with infinite bandwidth (top); Zoom version
around the peak (bottom).
Because the product sub-carrier frequency is thrice
that of the sum-sub-carrier (6 zero crossings as
against 2 of the sum sub-carrier), the product signal
energy will be concentrated around +/- 45 MHz
from the centre. Hence a 70 MHz filtering (i.e. +/-
35 MHz) will filter out the product signal. Due to
this reason, the ACF of AltBOC (15,10) in 70 MHz
bandwidth with and without considering the product
signal will be very close to each other, as observed
in Fig. A3.
-2 -1 0 1 2-0.8
-0.6
-0.4
-0.2
0
0.2
0.4
0.6
0.8
1
Time delay (chips)
No
rma
lize
d c
orr
ela
tio
n v
alu
e
W ith E5prod
W ithout E5prod
-0.1 -0.05 0 0.05 0.10.5
0.55
0.6
0.65
0.7
0.75
0.8
0.85
0.9
0.95
1
Time delay (chips)
No
rma
lize
d c
orr
ela
tion
va
lue
W ith E5prod
W ithout E5prod
Figure A3 Auto correlation function of the
AltBOC(15,10) signal with and without the product
signal with 70 MHz bandwidth (top); Zoom version
around the peak (bottom).