how to optimize student learning using student models that
TRANSCRIPT
How to optimize student learning using student models that adapt rapidly to individual
differences
Luke G. Eglington1 & Philip I. Pavlik Jr2
1Amplify Education, Inc.
Brooklyn, NY, USA 2Institute for Intelligent Systems
University of Memphis
Memphis, TN, USA
Email correspondence: Luke G. Eglington, [email protected]
This manuscript has been published in the International Journal of Artificial
Intelligence in Education. Please cite that version:
https://link.springer.com/article/10.1007/s40593-022-00296-0.
Eglington, L.G., Pavlik, P.I. (2022). How to Optimize Student Learning Using Student
Models That Adapt Rapidly to Individual Differences. International Journal of
Artificial Intelligence in Education. doi: 10.1007/s40593-022-00296-0

1
Abstract
An important component of many Adaptive Instructional Systems (AIS) is a ‘Learner Model’
intended to track student learning and predict future performance. Predictions from learner models
are frequently used in combination with mastery criterion decision rules to make pedagogical
decisions. Important aspects of learner models, such as learning rate and item difficulty, can be
estimated from prior data. A critical function of AIS is to have students practice new content once
the AIS predicts that they have ‘mastered’ current content or learned it to some criterion. For
making this prediction, individual student parameters (e.g., for learning rate) are frequently
unavailable due to having no prior data about a student, and thus population-level parameters or
rules-of-thumb are typically applied instead. In this paper, we will argue and demonstrate via
simulation and data analysis that even in best-case scenarios, learner models assuming equal
learning rates for students will inevitably lead to systematic errors that result in suboptimal
pedagogical decisions for most learners. This finding leads us to conclude that systematic errors
should be expected, and mechanisms to adjust predictions to account for them should be included
in AIS. We introduce two solutions that can adjust for student differences “online” in a running
system: one that tracks systemic errors of the learner model (not the student) and adjusts
accordingly, and a student-level performance adaptive feature. We demonstrate these solutions’
efficacy and practicality on six large educational datasets and show that these features improved
model accuracy in all tested datasets.
Keywords: Adaptive instructional systems, learner models, systematic error, individual
differences, tutoring
2
Introduction
Adaptive Instructional Systems (AIS) are intended to help students acquire knowledge and skills
( Park & Lee 2004). This instruction is generally achieved by adapting to the students’ performance
and adjusting instruction accordingly to increase practice efficacy. The basic premise is for the
AIS to act as a tutor and use student practice history and information about the content domain
(the learning materials) to make pedagogical decisions (e.g., practicing something again vs.
progressing to new content). There is substantial evidence that students vary in their learning rate
(McDermott and Zerr 2019; Zerr et al. 2018; Unsworth 2019). Thus tailoring the instruction
sequence may improve learning efficiency by varying the pace at which new content is introduced
(or old content repeated for slower students). Although AIS can also improve learning by
adaptively adjusting how much scaffolding is provided to help a student, the present article's focus
is how practice sequencing is influenced by AIS design. There is evidence supporting this
approach: human tutoring dramatically improves learning outcomes (VanLehn 2011; Bloom
1984). An insightful tutor can move more skilled students to new content as soon as their aptitude
is recognized and emphasize additional practice for slower students before they continue to new
content. However, human tutoring is not available to everyone. AISs have shown promise to fill
this gap. For instance, Anderson, Conrad, and Corbett (1989) demonstrated how their adaptive
LISP tutor could benefit learning programming skills (or “production rules”) to create working
LISP code. The tutor provided remedial instruction when students were incorrect and customized
the feedback according to the type of error when possible. The tutor ended practice for a skill when
the estimated probability that they knew the skill (according to their Bayesian model) had reached
“mastery” at 95% or greater. AIS have been successfully developed for learning geometry
(Smallwood 1962; Feng et al. 2006), algebra (Koedinger and Corbett 2006), physics (Gertner and

3
VanLehn 2000), Chinese tones (Liu et al., 2011), and vocabulary and language learning (Pavlik
Jr. and Anderson 2008; Pashler et al. 2003; Lindsey et al. 2014; Eglington and Pavlik Jr 2020;
Atkinson 1972).
Despite these promising findings, we will demonstrate that typical implementations of AIS
inherently lead to inefficiency. In short, scheduling practice according to predictions from a model
fit with population-level parameters (e.g., one parameter representing the amount learned from
attempting a problem used for all students) can lead to inefficiency for most students if they vary
in learning rate. This issue has been discussed before in the context of Bayesian Knowledge
Tracing (Lee and Brunskill 2012; Yudelson et al. 2013; Pardos and Heffernan 2010). However,
often adaptive models do not include features to account for student-level variability and instead
focus on Knowledge Components (KCs) (Pavlik Jr. et al. 2009; Galyardt and Goldin 2015; Ritter
et al. 2007). In other words, learner models features implicitly assume that KCs vary in difficulty
and but students do not vary in ability. Without features to accommodate this issue, systematic
errors result. However, the issue is broader than any specific learner model or instructional policy.
The issue exists in any AIS in which pedagogical decisions are made based on learner models’
predictions that do not account for individual learning rates or lack a mechanism to correct for
systematic prediction errors. To motivate the issue, below, we begin by describing several
important components of AISs. Subsequently, we will explain how the interactions among those
components lead to inefficiency. Then we will demonstrate the issue via simulation, introduce
some candidate solutions, and demonstrate their efficacy on existing datasets. Both of our
suggested solutions can adjust to student differences “online” in a running system using data that
are frequently available in AIS already (prior correctness and prior learner model predictions).
Related Work
AIS share several critical components relevant to our discussion. The most important components
are the learner model, the Pedagogical Decision Rule (PDR), and the student. Another important
aspect of AIS are how individual practice items or steps are mapped to higher level procedural
skills or concepts that are relevent within the knowledge domain. This mapping is frequently
referred to as a KC model, in which each KC is a distinct skill or concept. We will not elaborate
on this aspect of AIS in the present work and as we will show the inefficiencies that arise for not
accounting for student-level individual differences exist independently of the KC model
specification. Our approach in this work takes the KC model specification as static.
Learner Models. The intended purpose of learner models is to estimate student knowledge. The
task for the learner model is to estimate expertise for each KC. These models take many forms and
are inspired by psychological theories to varying degrees. Some learner models, coming from the
cognitive science domain, are quite elaborate and are strongly informed by theories of human
learning and are intended to explain known phenomena such as spacing and memory decay (Pavlik
Jr. and Anderson 2005, 2008; Mozer et al. 2009; Lindsey et al. 2014; Walsh et al. 2018; Eglington
and Pavlik Jr 2020). Despite this variety, simpler models are the norm, such as Bayesian
Knowledge Tracing (BKT) (Corbett and Anderson 1995), which are more loosely connected to
4
learning theories. BKT represents student knowledge of a KC in a hidden markov model as a
binary variable (known or unknown). As is typical for most learner models, BKT has parameters
for each KC (not each student). BKT is particularly popular in the literature due to its simplicity
and historical precedence.
Despite the popularity of BKT, standard implementations frequently do not predict student
performance as accurately as competitor models (Khajah et al. 2014). One popular example is
Performance Factors Analysis (PFA)(Pavlik Jr. et al. 2009). This logistic regression model uses
counts of prior attempts to predict future correctness probability, and differentiates between counts
of successes and failures, with separate parameters for each per KC. The full PFA model also has
intercepts and slopes for KCs. The intercepts are intended to account for initial difficulty, while
the slopes are intended to account for differential rates of change in performance as a function of
practice across KCs. PFA and other logistic regression models have been shown to fit educational
data better than BKT (Gervet et al. 2020). There is also an improved version of PFA named Recent
Performance Factors Analysis (RPFA) in which recent attempts are weighted more heavily than
more distant attempts (Galyardt and Goldin 2015). This model has been shown to fit significantly
better than PFA (Galyardt and Goldin 2015; Pavlik Jr et al. 2020a). Due to the evidence that PFA
and RPFA can fit better than BKT, we will use logistic regression models in our examples.
However, the general problems of using population-level parameters remain for other models like
BKT in the absence of adjustments for individual differences (Dourodi & Brunskill, 2019).
Pedagogical Decision Rules. A critical complement to learner models’ knowledge estimates are
the PDRs that dictate, for the purpose of the instructional sequence decisions, what should be
practiced based on the learner model predictions (Katz and Albacete 2013). For instance,
Anderson, Conrad, and Corbett (1989) had students proceed to a new KC once their learner
model predicted the probability of solving problems for a KC exceeded 95%. Some AIS do not
express PDR as probabilities (Heffernan and Heffernan 2014; Canfield 2001) instead opting for
rules-of-thumb such as dropping content from practice once the student has correctly answered
three times in a row. Although this method does not invoke a specific probability, it is still
implicitly applying a general heuristic rule that would be optimal for some and suboptimal for
others (by being too little or too much for some learners). Thus, using such a non-model-based
PDR does not avoid the systematic errors that are the focus of this article, unless such a PDR
were sensitive to student individual differences.
Student Individual Differences. One of the most fundamental issues in education is that
students vary in aptitude and prior knowledge (e.g., Liu & Koedinger 2017). Adaptive education
research exists in large part due to this reality. We start with the assumption that the critical
student variables for AIS are the student's learning rates and prior knowledge. Prior research has
demonstrated how individual learning rate differences can have substantial impacts on learner
model accuracy. For instance, Lee and Brunskill (2012) found that many students will over- or
under-practice skills when BKT parameters are not estimated for the individual. They noted they
5
had only tested this on one dataset, and further research was needed. However, they may have
been overly cautious because there is overwhelming evidence that individual students vary in
learning rate (Unsworth 2019). Yudelson, Koedinger, and Gordon (2013) also found that
accounting for individual differences in BKT improved model fits. Interestingly, they found that
accounting for individual learning rates was more important for improving model fit than student
a priori knowledge. Corbett and Anderson (1995) also found that systematic error could be
reduced by using initial student practice to fit an additional regression model that adjusted
subsequent predictions and reduced error due to individual differences. The problem appears to
be general and we believe that all learner models will suffer from this problem in AIS if the AIS
does not account for systematic errors induced by using population parameters to trace
individual students. One approach to address this issue is clustering students. Clustering students
based on residual model errors can indeed improve fit (Liu and Koedinger 2015). However,
assigning students to clusters is itself error prone and is unlikely to eliminate systematic error
(students still vary around their respective cluster means). Another alternative is to use pretest or
some other form of prior data from students to estimate individual parameters at the beginning of
each curriculum section using regression (e.g., Corbett & Anderson, 1995). This approach
introduces numerous additional issues. Perhaps most importantly it is not truly online, since it
doesn’t start working immedeately after the first observation for each student. A lag in
responsivty at the beginning of adaptive practice may induce anxiety and demotivate the student
depending on how difficult it is and its duration (England et al. 2019; Zimmerman and
Dibenedetto 2008). The pretesting itself is time consuming and thus the benefit must be weighed
against the time cost of having the student complete the pretest instead of using the AIS. Finally,
even if these issues were ignored, a pretest would still result in systematic error unless it was
perfectly accurate (which would require no measurement error and for the learning rate itself to
not vary over time). In the simulations and data analysis below, we demonstrate the
pervasiveness of this problem and how accounting for individual differences can improve model
fit, the relevance of doing so in AIS, and finally how it can be partially resolved in AIS. Notably,
our approach can work at the individual level with a single parameter, does not require clustering
students or pretesting to estimate student attributes, and is robust to student parameters changing
over time. Our proposed additional features to learner models can work “online” in running
systems (Pavlik Jr et al. 2020b; Pavlik Jr and Eglington 2021).
The Problem
Assuming equal learning rate or prior ability among students can lead to inefficiency but such an
assumptions are commonly made because the information needed to estimate student-level
parameters is frequently unavailable; a student may have never used the system before or may be
using it to learn new content. In those situations, estimates of individual prior knowledge or
learning rate will not be known. and AIS frequently must make pedagogical decisions for new,
never-before-seen students. Given this limitation, learner models use population-level estimates
of learning rate and prior knowledge (i.e., assume all student have the same values). Using
6
population-level estimates for learning rate and prior knowledge lead to systematic errors and
suboptimal performance if an individual varies from the mean (Liu & Koedinger, 2017), as
shown in psychological research (Unsworth 2019) and in educational data mining research (Liu
and Koedinger 2015; Lee and Brunskill 2012; Doroudi & Brunskill, 2019). In short, if AIS use
pedagogical decision rules that use population-level parameter values (either explicitly with a
learner model or implicitly in model-free systems with fixed heuristics e.g., 3 correct in-a-row),
then the AIS will necessarily be inaccurate for most students.
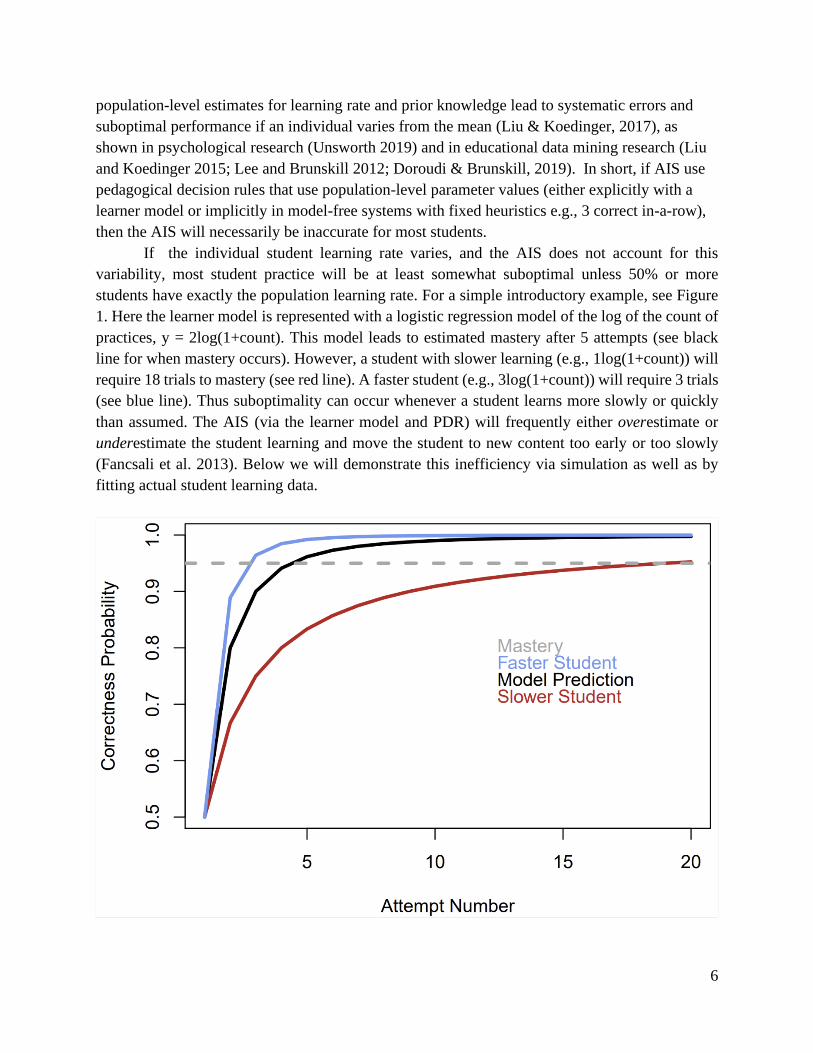
If the individual student learning rate varies, and the AIS does not account for this
variability, most student practice will be at least somewhat suboptimal unless 50% or more
students have exactly the population learning rate. For a simple introductory example, see Figure
1. Here the learner model is represented with a logistic regression model of the log of the count of
practices, y = 2log(1+count). This model leads to estimated mastery after 5 attempts (see black
line for when mastery occurs). However, a student with slower learning (e.g., 1log(1+count)) will
require 18 trials to mastery (see red line). A faster student (e.g., 3log(1+count)) will require 3 trials
(see blue line). Thus suboptimality can occur whenever a student learns more slowly or quickly
than assumed. The AIS (via the learner model and PDR) will frequently either overestimate or
underestimate the student learning and move the student to new content too early or too slowly
(Fancsali et al. 2013). Below we will demonstrate this inefficiency via simulation as well as by
fitting actual student learning data.

7
Figure 1. Correctness probability from a population-parameter model (black), a slower student
(red), and a faster student (blue). Dashed line denotes a typical criterion for mastery (95%). Note
that the model output has been converted from logit to probabilities.
Simulating Practice Inefficiency due to Ignoring Individual Differences
We first begin by simulating the consequences of tracking student learning with a model that uses
population-level parameters to make predictions for individual students whose individual
attributes vary around those population values. This simulation requires two models, one
representing the students (the “true” model) and the other representing the learner model for the
AIS, which only has population-level parameters. In this example, both models are variations of
the PFA model. First, there is a hypothetical “true” learner model named PFAT in which there are
student-level intercepts θ𝑖, KC intercepts θ𝑗 and student-level slopes γ𝑖𝑗 for Sijt prior counts of
successes tracked for a student i for each KC jand as well as separate student-level slopes 𝜌𝑖𝑗 for
𝐹𝑖𝑗𝑡 prior counts of failures to predict trial t:
PFAT 𝑙𝑜𝑔𝑖𝑡(𝑝𝑖𝑗𝑡) = γ𝑖𝑗𝑆𝑖𝑗𝑡 + 𝜌𝑖𝑗𝐹𝑖𝑗𝑡 + θ𝑗 + θ𝑖 (1)
Note that in this simple simulation there is only one KC, but see code at
https://github.com/lukeEG/Systematic-Model-Error that allows for this to be extended to multiple
KCs. In other words, individual student variability was known and quantified and PFAT is intended
to create the “real” data that the other model needs to predict. The second model PFAP (Equation
2) does does not have student-level information and only uses population-level estimates for
intercepts and slopes (a realistic situation if prior data on the student is unavailable):
PFAP 𝑙𝑜𝑔𝑖𝑡(𝑝𝑖𝑗𝑡) = γ𝑗𝑆𝑖𝑗𝑡 + 𝜌𝑗𝐹𝑖𝑗𝑡 + θ𝑗 (2)
PFAP represents a model developed by a hypothetical researcher intended to track the data
generated by PFAT. All learner models in this paper use the logarithm of counts of successes and
failures as predictors due to evidence that it is more representative of student learning (Chi et al.
2011). The PFAT generates data of students learning a single KC across 100 trials. Simulated
students learning rates from success and failures varied, as did their individual intercepts. Means
and standard deviations for student coefficients (slopes) for counts of successes and failures and
student intercepts were sampled from normal distributions (See Table 1 for statistics. The
correlation among success and failure coefficients was chosen based on the median found when
fitting several math learning datasets (Assistments, Cognitive Tutor). The parameters are
somewhat arbitrary for the demonstration, chosen to ensure some reasonable variability among
students and so that a majority achieved mastery in under 30 trials.. However, if student parameters
vary from population parameters, a learner model that uses population parameters will have
systematic errors for many students if it does not have features that make adjustments for those
8
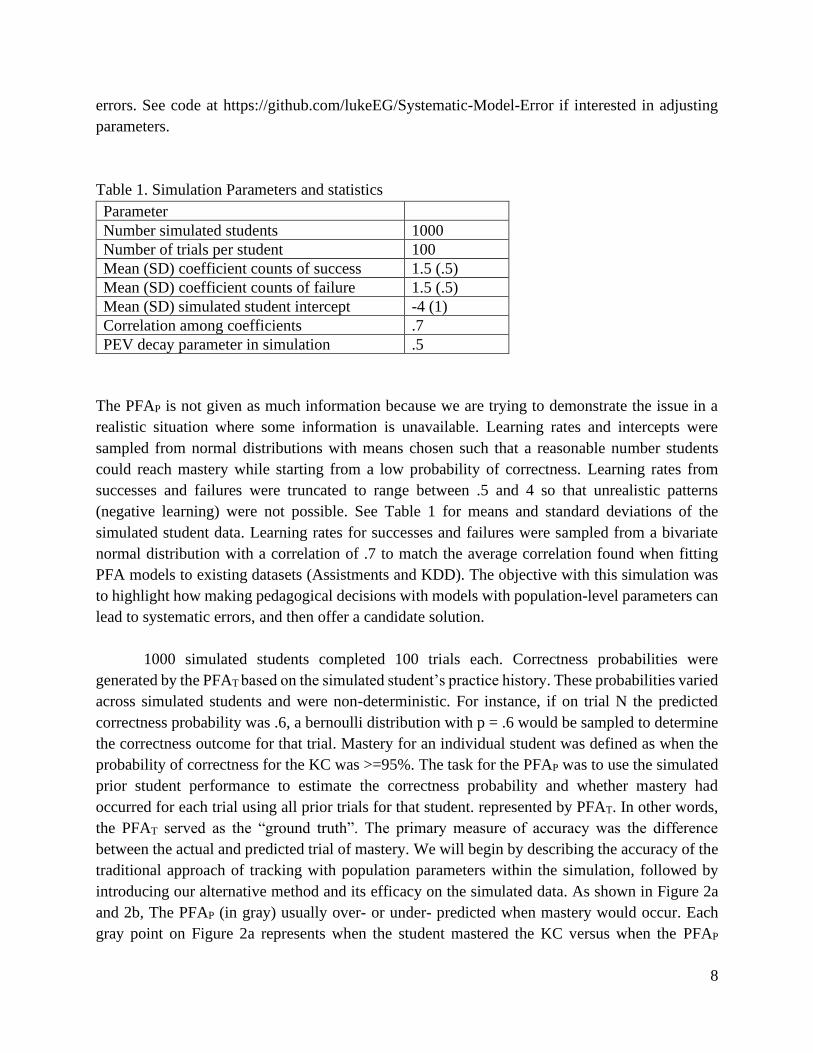
errors. See code at https://github.com/lukeEG/Systematic-Model-Error if interested in adjusting
parameters.
Table 1. Simulation Parameters and statistics
Parameter
Number simulated students 1000
Number of trials per student 100
Mean (SD) coefficient counts of success 1.5 (.5)
Mean (SD) coefficient counts of failure 1.5 (.5)
Mean (SD) simulated student intercept -4 (1)
Correlation among coefficients .7
PEV decay parameter in simulation .5
The PFAP is not given as much information because we are trying to demonstrate the issue in a
realistic situation where some information is unavailable. Learning rates and intercepts were
sampled from normal distributions with means chosen such that a reasonable number students
could reach mastery while starting from a low probability of correctness. Learning rates from
successes and failures were truncated to range between .5 and 4 so that unrealistic patterns
(negative learning) were not possible. See Table 1 for means and standard deviations of the
simulated student data. Learning rates for successes and failures were sampled from a bivariate
normal distribution with a correlation of .7 to match the average correlation found when fitting
PFA models to existing datasets (Assistments and KDD). The objective with this simulation was
to highlight how making pedagogical decisions with models with population-level parameters can
lead to systematic errors, and then offer a candidate solution.
1000 simulated students completed 100 trials each. Correctness probabilities were
generated by the PFAT based on the simulated student’s practice history. These probabilities varied
across simulated students and were non-deterministic. For instance, if on trial N the predicted
correctness probability was .6, a bernoulli distribution with p = .6 would be sampled to determine
the correctness outcome for that trial. Mastery for an individual student was defined as when the
probability of correctness for the KC was >=95%. The task for the PFAP was to use the simulated
prior student performance to estimate the correctness probability and whether mastery had
occurred for each trial using all prior trials for that student. represented by PFAT. In other words,
the PFAT served as the “ground truth”. The primary measure of accuracy was the difference
between the actual and predicted trial of mastery. We will begin by describing the accuracy of the
traditional approach of tracking with population parameters within the simulation, followed by
introducing our alternative method and its efficacy on the simulated data. As shown in Figure 2a
and 2b, The PFAP (in gray) usually over- or under- predicted when mastery would occur. Each
gray point on Figure 2a represents when the student mastered the KC versus when the PFAP
9
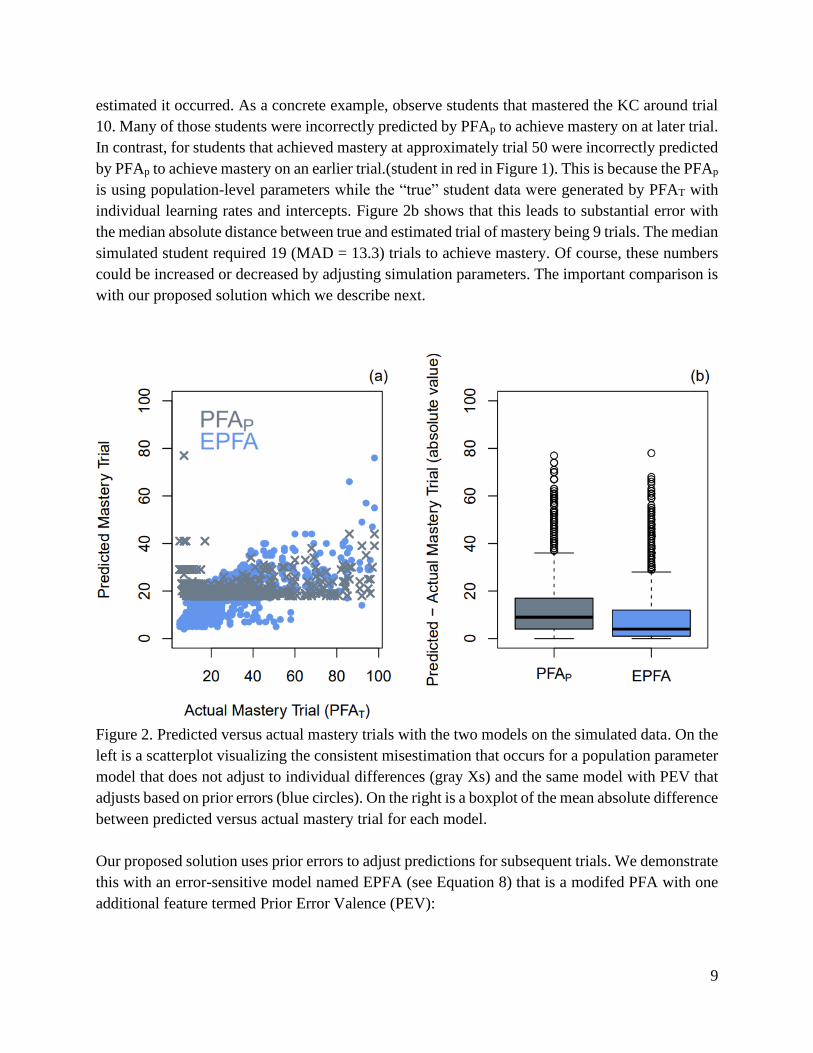
estimated it occurred. As a concrete example, observe students that mastered the KC around trial
10. Many of those students were incorrectly predicted by PFAp to achieve mastery on at later trial.
In contrast, for students that achieved mastery at approximately trial 50 were incorrectly predicted
by PFAp to achieve mastery on an earlier trial.(student in red in Figure 1). This is because the PFAp
is using population-level parameters while the “true” student data were generated by PFAT with
individual learning rates and intercepts. Figure 2b shows that this leads to substantial error with
the median absolute distance between true and estimated trial of mastery being 9 trials. The median
simulated student required 19 (MAD = 13.3) trials to achieve mastery. Of course, these numbers
could be increased or decreased by adjusting simulation parameters. The important comparison is
with our proposed solution which we describe next.
Figure 2. Predicted versus actual mastery trials with the two models on the simulated data. On the
left is a scatterplot visualizing the consistent misestimation that occurs for a population parameter
model that does not adjust to individual differences (gray Xs) and the same model with PEV that
adjusts based on prior errors (blue circles). On the right is a boxplot of the mean absolute difference
between predicted versus actual mastery trial for each model.
Our proposed solution uses prior errors to adjust predictions for subsequent trials. We demonstrate
this with an error-sensitive model named EPFA (see Equation 8) that is a modifed PFA with one
additional feature termed Prior Error Valence (PEV):

10
𝑃𝐸𝑉𝑖𝑡 = ∑ 𝑤𝑡𝑙𝛦𝑖𝑙
𝑡−1
𝑙=1
(3)
Eil is the signed error defined as the model predictions of correctness probability (between 0 to 1)
minus the student i response (0 if incorrect, 1 if correct), and t is the current trial. 𝑤𝑡𝑙 is an
exponential smoothing kernel that downweights errors on prior trials according to a decay
parameter d:
𝑤𝑡𝑙 =𝑑𝑡−𝑙
∑ 𝑑𝑡−𝑙𝑡−𝑙𝑙=1
(4)
In short, PEV is a recency-weighted cumulative moving average of the signed model error on all
prior trials for the student. PEV is an adaptation of the recency-weighted proportional success
feature (henceforth referred to as R when it will aid readability) developed by Galyardt and Goldin
(2015):
𝑅𝑖𝑗𝑡 = ∑ 𝑤𝑡𝑙𝑋𝑖𝑗𝑙
𝑡−1
𝑙=(1−𝑔)
(5)
The primary difference is that instead of the E input with PEV the proportional success
feature uses binary correctness Xijl of the prior trial sequence as input where i is the student and j
is the KC. One other difference between PEV and the proportional decay feature is that the
proportional decay feature requires “ghost” attempts g that are added to student practice
sequences (Galyardt & Goldin, 2015). These attempts allow proportions to be computed on
initial attempts when there is no prior practice history (and thus otherwise the proportion would
be undefined). When we fit this feature we included two ghost attempts g for all model fitting,
one incorrect and one correct, since this centers the measure at .5 allowing it to adapt upwards or
downwards. PEV does not require ghost attempts but they could be used.
The logic underlying EPFA is that if the average signed error is not approximately 0, then
systematic errors have been made by the model for the respective student, and an adjustment must
be made. If the average error is below 0, then the student’s performance is being underestimated
and the estimate should be adjusted. Adding the inverse of the error will increase the predicted
correctness probability. Conversely, if the error is positive, the student performance is being
overestimated, and the correction will be downward. This feature will only make corrections if
there is systematicity in the error. If the average signed error is approximately zero, there is
presumably no systematic error, and no correction will be made.
As shown in Figures 2a and 2b, predicting simulated performance with EPFA reduced
systematic error towards zero as practice accumulated. This may lead to EPFA more accurately
estimating when the student has mastered content, thereby improving practice efficiency. The
preceding simulation was intended to demonstrate the fundamental problem with using population-
level parameters without including a compensatory mechanism. The original PFAP had much of
the information that could be reasonably expected: the population parameter estimate for each

11
feature, the item intercepts, and population-level intercept. Nevertheless, over- or under-
estimation was present for most students, resulting in either too much or too little practice. In this
simulation, the median absolute difference between predicted and actual trial of mastery (i.e.,
predicting when correctness probability >=.95) for the PFAP was 9 vs. 4 for EPFA. In other words,
the predicted trial when mastery occurred was closer to the truth with EPFA. Figure 2a also shows
how predicted and actual trials of mastery are much more strongly correlated with EPFA than
standard PFAp.
Of course, the simulation was simple. We hope this simplicity helps illustrate our point that
systematic error due to individual variability can lead to inefficient pedagogical decisions. Below
we provide stronger evidence for our claims by evaluating how attempting to account for
systematic error can improve model fits on six diverse educational datasets. Keep in mind that
demonstrating these issues via simulations with unbiased parameters may also be highly
conservative. Learner model parameters estimated by fitting to educational datasets will be biased
by the process that generated that data (Pelánek et al. 2016). For instance, datasets generated from
Assistments or Cognitive Tutor AIS are biased by the selection mechanism underlying practice.
Easier content is dropped from practice sooner than harder content, by design. Of course these
mechanisms are beneficial features of the systems, not errors. However, this leads to the data being
biased. Thus any learning rate parameter estimated with that data that does not address selection
effects issues may underestimate learning rates in the resultant learner model.
Evaluating Proposed Solutions on Real Datasets
The first model is PFAp (see Equation 1), which is a modified PFA (Chi et al. 2011) using
the log of counts of successes and failures per KC per student as predictors, with separate slopes
and intercepts per KC. The second is RKCPFA (Galyardt and Goldin 2015) in which counts of
failures, a proportional decay measure, and KC intercepts are used to predict correctness:
RKCPFA 𝑙𝑜𝑔𝑖𝑡(𝑝𝑖𝑗𝑡) = 𝜌𝑗𝐹𝑖𝑗𝑡 + 𝛿𝑗𝑅𝑗𝑡 + θ𝑗 (7)
Galyardt & Goldin convincingly demonstrated with their RKCPFA model that adding a
proportional measure that weighted recent attempts more heavily (see Equation 3) could
significantly improve model fit relative to a standard PFA model. The typical formulation of this
omits counts of successes due to their redundancy with the proportional decay feature. They
computed these recency-weighted running averages at the KC-level. The third model is the
modified EPFA, is a PFA model plus the PEV feature:
EPFA 𝑙𝑜𝑔𝑖𝑡(𝑝𝑖𝑗𝑡) = γ𝑗𝑆𝑖𝑗𝑡 + 𝜌𝑗𝐹𝑖𝑗𝑡 + 𝛼𝑃𝐸𝑉𝑖𝑡 + θ𝑗 (8)
The fourth model is the RKC,SPFA, which is the RKC,SPFA plus an additional proportional decay
feature tracking performance at the level of the student but not at the KC level:

12
RKC,SPFA 𝑙𝑜𝑔𝑖𝑡(𝑝𝑖𝑗𝑡) = 𝜌𝑗𝐹𝑖𝑗𝑡 + 𝛿𝑗𝑅𝑗𝑡 + 𝜎𝑅𝑖𝑡 + θ𝑗 (9)
This additional R feature is very similar to the original formulation, simply changing the counts to
be tracked at the level of the student:
𝑅𝑖𝑡 = ∑ 𝑤𝑡𝑙𝑋𝑖𝑙
𝑡−1
𝑙=(1−𝑔)
(10)
In this role, we hypothesized that this additional feature could stand in for student learning
differences as well as learning transfer across KCs (because our version computes the recency-
weighted average across KCs). Finally, our final model (Equation 11) included all features from
models 8 and 9, PEV and student-level proportional decay (see Equations 3 and 10):
RKC,SEPFA 𝑙𝑜𝑔𝑖𝑡(𝑝𝑖𝑗𝑡) = 𝜌𝑗𝐹𝑖𝑗𝑡 + 𝛿𝑗𝑅𝑗𝑡 + 𝜎𝑅𝑖𝑡 + γ𝑃𝐸𝑉𝑖𝑡 + θ𝑗 (11)
All datasets were filtered so that there were at least 25 observations for each student and 200 trials
for each KC within each dataset. Proportional decay features typically append “ghost” attempts to
user practice sequences (Galyardt and Goldin 2015) to allow prediction early in practice. We
included two ghost attempts when we fit recency-weighted proportional success features, one
failure and one success. For datasets in which students were given hints and additional attempts
immediately after answering incorrectly, only the first attempts were included. See Table 2 to
compare the models and inspect how they differ to varying degrees.
Table 2. Logistic Regression Model Variants
Student
Ability
KC
Difficulty
Success
Count
Failure
Count
Recent
Proportion
Correct
(student)
Recent
Proportion
Correct
(KC)
Prior
Error
Valence
PFAP θ𝑗 𝛼𝑗𝑆𝑖𝑗𝑡 𝜌𝑗𝐹𝑖𝑗𝑡
PFAT θ𝑖 θ𝑗 𝛼𝑖𝑗𝑆𝑖𝑗𝑡 𝜌𝑖𝑗𝐹𝑖𝑗𝑡
RKCPFA θ𝑗 𝜌𝑗𝐹𝑖𝑗𝑡 𝛿𝑗𝑅𝑖𝑗𝑡
EPFA θ𝑗 𝛼𝑗𝑆𝑖𝑗𝑡 𝜌𝑗𝐹𝑖𝑗𝑡 γ𝑃𝐸𝑉𝑖𝑡
RKC,SPFA θ𝑗 𝜌𝑗𝐹𝑖𝑗𝑡 𝜎𝑅𝑖𝑡 𝛿𝑗𝑅𝑖𝑗𝑡
RKC,SEPFA θ𝑗 𝜌𝑗𝐹𝑖𝑗𝑡 𝜎𝑅𝑖𝑡 𝛿𝑗𝑅𝑖𝑗𝑡 γ𝑃𝐸𝑉𝑖𝑡

13
Our first goal was to compare EPFA to original PFAP and RKCPFA. The second was to
evaluate whether adding an additional recency-weighted feature in addition to that used in at the
student level could provide similar benefits, which we refer to as RKC,SPFA. This additional feature
would be identical to the feature developed by Galyardt and Goldin (2015) except that the recency-
weighted proportion would be tracked at the level of the student (not the KC). This additional
feature would adjust to student performance in general across different KCs, and is somewhat
analagous to including a continously updating adjustment for the student based on their overall
performance. Improvement in fit was important, but we were also interested in reducing bias,
which we measured in terms of mean signed error. Finally, we also evaluated how such models
would hypothetically influence pedagogical decisions, operationalized as when mastery would
have been considered to occur.
Six datasets were fit from Andes tutoring system in which students learned physics
(Schulze et al. 2000), Assistments tutoring system in which students learned mathematics(Razzaq
et al. 2005), a Chinese tone learning dataset (Liu et al 2011), data from McGraw Hill’s education
system in which students learned about nutrition using an app, a subset of data from the KDD cup
in which students learned mathematics (Stamper and Pardos 2016), and finally experimental data
of students completing cloze (filling in missing words in sentences) practice items learning
statistics concepts. All datasets with the exception of the McGraw Hill dataset are publicly
available at https://memphis.datashop.edu and https://pslcdatashop.web.cmu.edu/. All fitting was
accomplished using the LKT R package (Pavlik Jr et al. 2020a). Datasets were filtered to only
include students with at least 25 observations and KCs with at least 200 observations (across
students). For datasets with multistep problems, only the first step within a problem was included.
Although only including first-step observations may somewhat reduce the difficulty of the
remaining practice items in the dataset, we are not concerned about it influencing the validity of
our general claims. We chose this approach to enable easier comparison across datasets, since half
of the datasets had either no multistep problems (cloze and McGraw Hill) or very few (tones). Our
goal was to show that the issue of systematic error is general as well as our proposed solutions,
and thus we wanted to make the data processing and interpretation as similar as possible across
datasets. There are other practical and theoretical reasons for only analyzing first attempts across
datasets as described in Pavlik, Eglington, and Harrell-Williams (2021). For instance, for some
observations there was a multiple-choice format. After an initial incorrect answer, feedback would
be provided that they were incorrect which would result in an increased chance of correctness on
sequent steps potentially due to the process of elimination. Hints are also sometimes progressively
stronger, leading to the correct answer eventually. Modeling students' benefit from these
interventions is important but beyond the scope of the present work.
Datasets
Andes. 66 students learned physics using the Andes tutoring system, generating 345,536
observations. Participants were given feedback on their responses as well as solution hints.
Additionally, participants were asked qualitative “reflective” questions after feedback (Katz et al.

14
2007). Only first attempts on the first steps of problems were included for analysis, which included
36% of the original dataset. i.e., a problem could be practiced more than once by an individual,
but each time correctness was determined by performance on first attempt on first step. The default
KC model provided in the dataset was used, and there were 94 KCs.
Assistments. The Assistments dataset included 580,785 observations from 912 middle school
students learning mathematics, collected across 2004/2005. The Assistments tutoring system
assists students when they answer questions incorrectly by breaking down the original problem
into multiple simpler problems. Only first attempts on the first steps of problems were included
for analysis, ultimately retaining 23% of the original dataset. The WPI Apr 2005 KC model
provided in the dataset was used, with 56 KCs.
Cognitive Tutor. We also used a subset of the n the 2005/2006 KDD cup training dataset, in which
middle school students also practiced multistep mathematics problems. The data were originally
collected using the Cognitive Tutor system (Stamper and Pardos 2016). A subset of 120 students
from the dataset were used, generating 216263 observations with 74 KCs using the default KC
model column provided in the dataset. Only first attempts from first steps of problems were
analyzed, which included 61% of the dataset.
Chinese Tones. The Chinese tone learning dataset included 48,443 observations from 97 adult
participants enrolled in their first Chinese language course in a US university. Data were collected
via an automated tutoring system that provided access to hints after errors (hint requests were
treated as incorrect in the following analyses). Only first attempts on the first steps of a problem
being presented were included for analysis, ultimately retaining 47% of the original dataset. The
default KC model provided in the dataset was used, with a KC for each of the five tones.
McGraw Hill. The McGraw Hill dataset contained 124,387 observations from 1047 adult
participants. Participants were college students taking coursework on fitness and nutrition. The
data were collected from an intelligent tutoring system that accompanied the coursework delivered
via an app that could be accessed via a phone or computer. Questions in the tutoring system had
multiple-choice or multiple-answer formats, and corrective feedback was provided immediately
regardless of their correctness. There were 111 KCs.
Statistics Cloze Practice. Statistics cloze dataset included 58,316 observations from 478
participants who learned statistical concepts by reading sentences and filling in missing words.
Participants were adults recruited from Amazon Mechanical Turk. There were 144 KCs in the
dataset. The number of times specific cloze items were presented was manipulated, as well as the
temporal spacing between presentations (narrow, medium, or wide). A final was either after 2
minutes, 1 day, or 3 days (manipulated between students).
As shown in Equations 5 through 10, datasets were fit with slopes for successes and failures for
KCs, intercepts, as well as slopes for proportional correctness at the KC-level when appropriate.
Optimal parameter values for PEV and proportion decay (for R-PFA models) were estimated via
gradient descent. Reported RMSE are from test folds from a 10-fold student-stratified cross-
validation procedure.
Results from Student Data Analysis

15
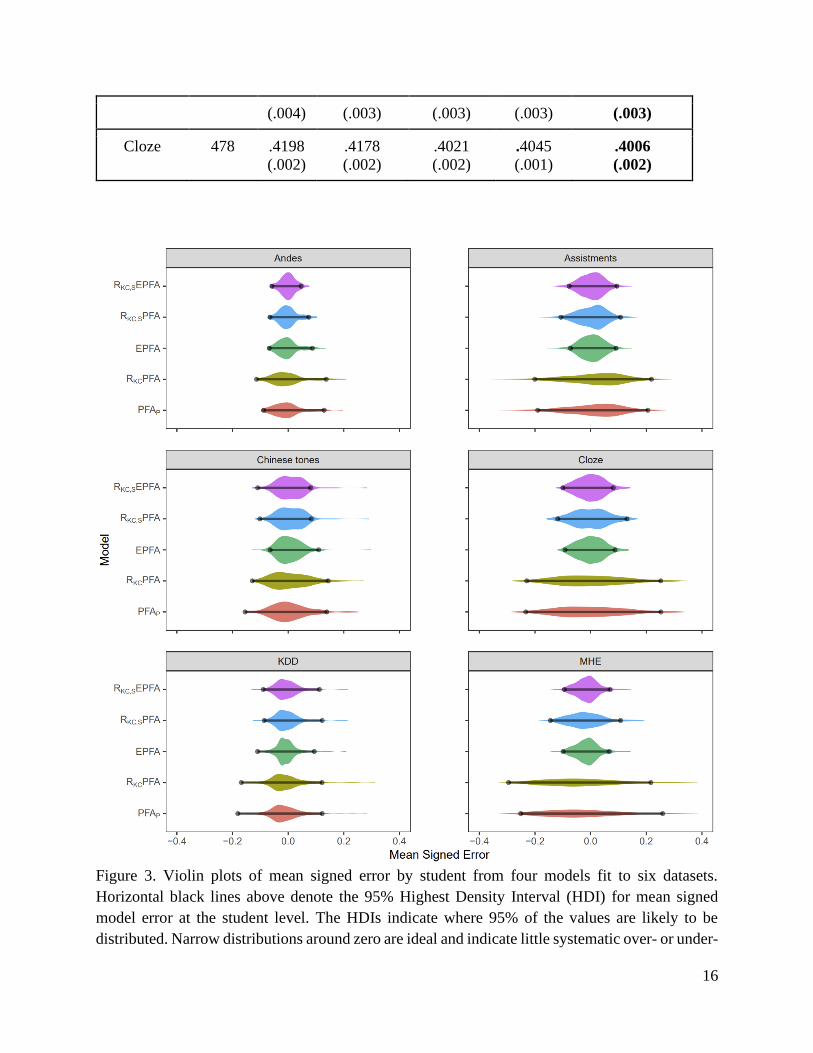
Overall, models that included features to adjust for individual differences improved fit relative to
PFAP or RKCPFA in terms of student-stratified cross-validated RMSE (see Table 2). We also found
a benefit of RKCPFA over PFAP in 4 of 6 datasets. However, the distributions of mean signed error
were only reduced with models that included features to track individual differences (EPFA,
RKC,SPFA, RKC,SEPFA). In other words, students were over- or under-predicted less often with
those models. Students with signed error approximately zero indicates model error was relatively
unbiased. Students with signed error substantially greater or less than zero indicates that the model
regularly under- or over-estimated their performance (which has consequences for estimating
mastery). It is important to note that PFAP and RKCPFA distributions have similar wide distribution
of systematic error in Figure 3, even though RKCPFA does indeed fit all of the datasets better. This
is because while RKCPFA better tracks knowledge than PFAP, KC-level proportional correctness
does not account for systematic errors at the level of the individual student. Thus, many students
were still consistently over- or under-predicted. In contrast, including PEV and student-level
recency-weighted success proportion features for these individual differences and substantially
reduce signed error (and improve overall fit in all datasets). Both features can be used in a running
system to make adjustments for students based on their prior performance and systematic error.
We have implemented a version of student-level recency weight proportion correct in a running
system (Pavlik Jr and Eglington 2021).
Reduction in systematic error was also evaluated by comparing the student-level absolute
values of the error across models within students using paired t-tests. Adding PEV to PFAP (i.e.,
EPFA) or student-level proportional correctness to RKCPFA reduced absolute value of error
relative to RKCPFA or PFAP in all six of the datasets we evaluated, ts > 6.57, ps < .0001. In other
words, systematic under- or over-estimation was reduced in all datasets when PEV or student-level
proportional decay was included in the model. The benefit provided by either approach was quite
similar, as can be seen in Figure 3.
Table 2. Average 10-fold student-stratified RMSE performance on educational datasets.
Bold indicates model fit with lowest error on held-out samples. Standard errors are in parentheses.
N
Students
PFAP RKCPFA EPFA RKC,SPFA RKC,SEPFA
Andes 66 .4111
(.004)
.4107
(.004)
.3985
(.004)
.3964
(.004)
.3954
(.004)
Assistments 857 .4670
(.001)
.4674
(.001)
.4554
(.001)
.4564
(.001)
.4554
(.001)
Tones 94 .3853
(.007)
.3847
(.007)
.3805
(.006)
.3818
(.006)
.3821
(.006)
MHE 1047 .4577
(.001)
.4578
(.001)
.4353
(.002)
.4406
(.002)
.4351
(.002)
KDD 120 .3938 .3901 .3891 .3866 .3866
16
(.004) (.003) (.003) (.003) (.003)
Cloze 478 .4198
(.002)
.4178
(.002)
.4021
(.002)
.4045
(.001)
.4006
(.002)
Figure 3. Violin plots of mean signed error by student from four models fit to six datasets.
Horizontal black lines above denote the 95% Highest Density Interval (HDI) for mean signed
model error at the student level. The HDIs indicate where 95% of the values are likely to be
distributed. Narrow distributions around zero are ideal and indicate little systematic over- or under-
17
prediction. In all datasets, the 95% HDI were narrower with models that attempted to adjust for
systematic error (EPFA, RKC,SPFA, or RKC,SEPFA).
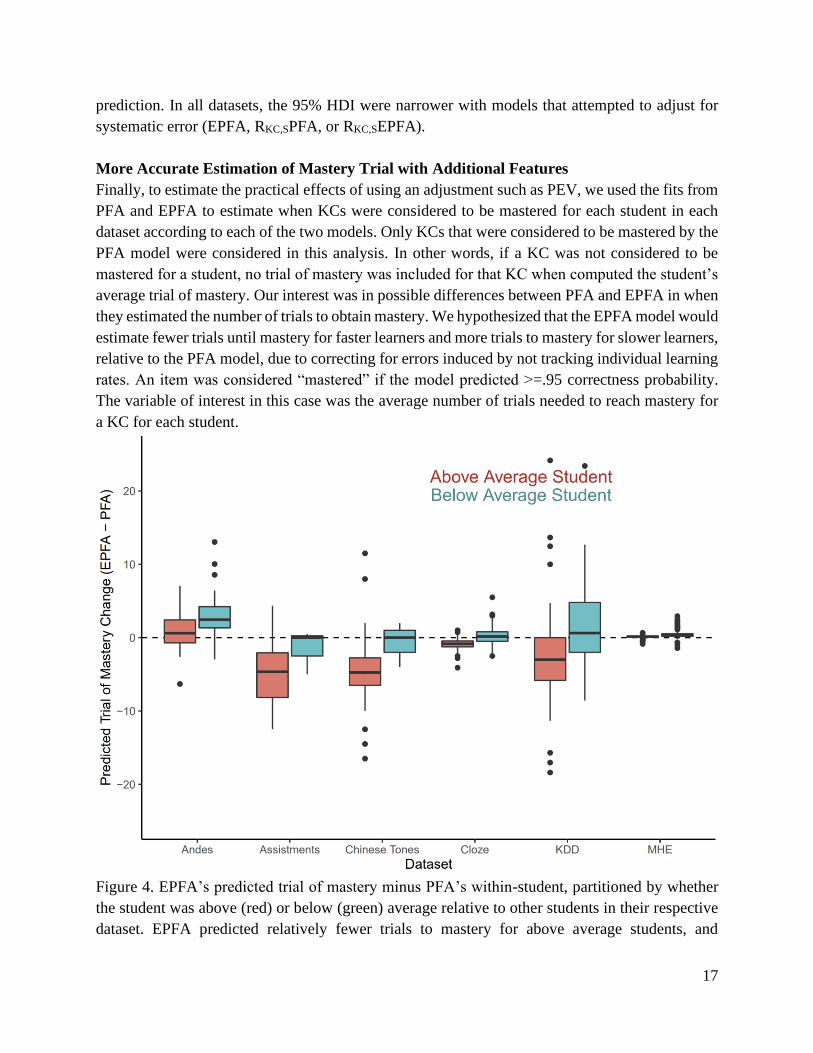
More Accurate Estimation of Mastery Trial with Additional Features
Finally, to estimate the practical effects of using an adjustment such as PEV, we used the fits from
PFA and EPFA to estimate when KCs were considered to be mastered for each student in each
dataset according to each of the two models. Only KCs that were considered to be mastered by the
PFA model were considered in this analysis. In other words, if a KC was not considered to be
mastered for a student, no trial of mastery was included for that KC when computed the student’s
average trial of mastery. Our interest was in possible differences between PFA and EPFA in when
they estimated the number of trials to obtain mastery. We hypothesized that the EPFA model would
estimate fewer trials until mastery for faster learners and more trials to mastery for slower learners,
relative to the PFA model, due to correcting for errors induced by not tracking individual learning
rates. An item was considered “mastered” if the model predicted >=.95 correctness probability.
The variable of interest in this case was the average number of trials needed to reach mastery for
a KC for each student.
Figure 4. EPFA’s predicted trial of mastery minus PFA’s within-student, partitioned by whether
the student was above (red) or below (green) average relative to other students in their respective
dataset. EPFA predicted relatively fewer trials to mastery for above average students, and

18
relatively more trials for lower performing students. For the Assistments dataset the mastery
criterion was set to 85% (instead of 95% for other datasets) because relatively few students reached
95% according to the PFAP model, limiting data analysis. This is probably partly because in the
Assistments system practice for a KC is typically ended after a few correct attempts (the
Assistments decision rule) in combination with PFA being the least accurate and least adaptive (in
terms of its features) of the models.
For each of the two models, the average number of trials needed to obtain mastery of the
KC was estimated for each student in each dataset. Students were also labelled above or below
average depending on whether their overall performance was above or below average within their
respective dataset. Figure 4 depicts the change in the number of trials until mastery (EPFA minus
PFA) as a function of student performance. The measure indicates how the two models differ in
their estimation of when mastery would occur. Positive numbers indicate EPFA would predict
more trials than PFA, negative indicate fewer trials are predicted to be needed. Students were
partitioned within each dataset according to whether they performed above or below average (in
terms of average proportion correct) relative to other students in the dataset.
As seen in Figure 4, on average EPFA estimated relatively fewer trials to mastery for above
average students than for below average students than PFAP. EPFA estimated that more trials were
needed for less knowledgeable students and fewer for more knowledgeable students, relative to
the standard PFA model. EPFA may improve efficiency for faster learners, but may benefit slower
learners because they would not graduate to new content before they were adequately prepared.
This could prevent future errors due to the student practicing content before they were ready, as
well as possibly reducing frustration.
It is also worth emphasizing that EPFA doesn’t simply imply fewer trials to mastery, the
effect of using EPFA on trials to mastery depends on the performance of the student. For instance,
the average better-performing student in the KDD dataset was estimated to need 2.7 fewer trials
to mastery per KC on average, and the average lower-performing student was estimated to need
2.2 more trials to achieve mastery per KC on average. Over a semester of use, these differences
could add up to significantly impact individual students. These results indicate that having a model
feature that adjusts for systematic error has the potential to be highly useful in practical situations.
Discussion and Conclusions
In the present work, we described a fundamental issue in AIS — personalized practice scheduling
requires accounting for individual differences. We aimed to make two broad points with this paper.
For one, given significant evidence that individuals vary in learning rate (McDermott & Zerr 2019;
Unsworth 2019; Zerr et al 2018) we sought to demonstrate via simulation the consequences of
assuming equal learning rates. This assumption is common in AIS that use population-level
parameters that estimate learning from practice or use mastery heuristics that do not vary across
individuals such as 3 corrects in a row (Heffernan & Heffernan, 2014). Our simulation confirmed
prior work and showed that systematic error was likely even when the learner model was a close
19
estimation of the true underlying student learner model (e.g., Corbett & Anderson, 1995; Doroudi
& Brunskill, 2019). Even when considerable information was available (e.g., accurate population-
level learning rate and prior knowledge, item difficulties), the simulation suggested significant
practice inefficiency was inevitable.
Second, we wanted to show that these issues could be addressed to some extent by adding
features to the learner model. Anderson and Corbett (1995) showed that using an initial practice
set of data for each student, an additional four parameter model could be fit that individualized
predictions and reduced systematic over- and under-estimation. We sought to reduce this issue
with additional model features that would not have to be estimated for individual students with
fewer additional parameters. We suggested some candidate solutions that involved tracking the
error patterns that would emerge and showed how they could be effective. Next we demonstrated
with real datasets how on-the-fly accounting for individual learning rates with our provisional
solutions improved model fits (see Table 2) and reduced systematic bias (see Figure 3). Our
solutions showed multiple ways in which such individual differences can be accounted for using
data that is already present in many AIS (prior outcomes and prior predictions). Not only do our
solutions improve fit, but our solutions allow progressive identification and model improvement
for student-level differences in a running system (in contrast with post-hoc fits of individual
student intercepts and slopes). Our new suggested features may also help to more accurately
estimate when mastery has occurred and make the AIS more efficient (Figure 4).
Student-level proportional decay and PEV both provided similar benefits in terms of
reducing systematic error (see Table 2 and Figure 3). For proportional decay, parititioning the KC-
and student-specific effects by having two proportion measures allowed faster and slower students
to have their differential performance be tracked and adjusted around the average, somewhat
reducing the systematic error. For PEV, the systematic error itself was directly tracked and used
as an input to the model for future trials. The effect on RMSE was similar, although the model
with both features included typically outperformed either separately (rightmost column, Table 2)
which implies they do not have the same effects. Some clues are present in the distribution of
systematic errors (see Figure 3): sometimes PEV clearly is superior (narrower spread), other times
not. We believe this is due to PEV tracking systematic error from any source, including possible
model misspecification. For instance, the model with PEV provides more of a benefit for Cloze
and MHE practice. These are the two datasets in which recency and spacing effects are most
relevant, due to the episodic nature of the practice content. It may be that the present models are
making systematic errors due to model misspecification, the models need additional features
tracking recency and spacing, and counts and proportions end up creating systematic errors that
are better dealt with by the PEV feature. However, this is speculative and needs to be explored
further.
There also may be indirect consequences of overly difficult or easy practice that extend
beyond the learning effects on an individual trial or practice session. Student anxiety may be
increased by overly difficult content (England et al. 2019), which can have many negative
consequences including reduced learning. Either overly difficulty or easy practice can also induce
20
mindwandering (Seli et al. 2016). Finally, miscalibrated practice difficulty may lead to students
dropping out entirely (Agarwal et al. 2017; Alamri et al. 2019). In short, there are significant
potential consequences to miscalibrated practice difficulty and mastery estimation.
However, we do not claim that our suggested model adjustments completely resolve the
issue. It is necessary to verify that these methods are tractable in practice with experiments. We
are also investigating methods to directly estimate individual learning rates. In contrast, the
proposed solutions in our present work attempted to account more broadly for bias systematic
model error in the data. Student-level learning parameters were not directly estimated on the fly.
However, recent advances in estimation methods such as AdaGrad (Duchi et al. 2011) may allow
for fast and direct estimation of individual learning rates in real-time. We are currently
investigating how this could be achieved, with promising preliminary results.
In sum, we hope we conveyed the importance of thinking of an AIS as a system with
multiple interacting parts in which the construction of the learner model can influence the
appropriateness of the chosen PDR. Additionally, learner models within these systems produce
output predictions that when combined with outcomes can serve as error signals to adjust the
overall system performance. Practical issues such as not having individual student parameters can
result in systematic problems even if the learner model is well-fit and the PDR is principled, and
error signals must be utilized to avoid creating AIS that are suboptimal for most students. We also
hope that we convincingly demonstrated that while population-level parameters may be found to
maximize fit or PDRs to typically improve performance, they cannot be optimal unless the AIS
includes mechanisms to account for individual learning rates. Learner model fit statistics in
isolation do not imply which models may be used in practice.
Declarations
Funding. Funding has been provided by the Schmidt Futures Foundation, the Institute of
Educational Sciences (award #R305A190448), and the Learner Data Institute at University of
Memphis (NSF; award #1934745).
Conflicts of interest. The authors declare no conflicts of interest.
Availability of data. All datasets are available at datashop.memphis.edu with the exception of the
McGraw Hill Education dataset (not authorized to make public).
Code availability. Model fitting and simulation code is available at
https://github.com/lukeEG/Systematic-Model-Error.
References
Agarwal, T., Burghardt, K., & Lerman, K. On quitting: Performance and practice in online game play. In Proceedings of the International AAAI Conference on Web and Social Media, 2017 (Vol. 11, Vol. 1)
Alamri, A., Alshehri, M., Cristea, A., Pereira, F. D., Oliveira, E., Shi, L., et al. Predicting MOOCs dropout using only two easily obtainable features from the first week’s activities. In International Conference on Intelligent Tutoring Systems, 2019 (pp. 163-173): Springer

21
Anderson, J. R., Conrad, F. G., & Corbett, A. T. (1989). Skill acquisition and the LISP tutor. Cognitive Science, 13(4), 467-505.
Atkinson, R. C. (1972). Optimizing the learning of a second-language vocabulary. Journal of Experimental Psychology, 96(1), 124-129.
Bloom, B. S. (1984). The 2 sigma problem: The search for methods of group instruction as effective as one-to-one tutoring. Educational Researcher, 13(6), 4-16.
Canfield, W. (2001). ALEKS: a Web-based intelligent tutoring system. Math. Comput. Educ., 35(2), 152–158.
Chi, M., Koedinger, K. R., Gordon, G., Jordan, P., & VanLehn, K. Instructional Factors Analysis: A cognitive model for multiple instructional interventions. In M. Pechenizkiy, T. Calders, C. Conati, S. Ventura, C. Romero , & J. Stamper (Eds.), 4th International Conference on Educational Data Mining, Eindhoven, The Netherlands, 2011 (pp. 61-70)
Corbett, A. T., & Anderson, J. R. (1995). Knowledge tracing: Modeling the acquisition of procedural knowledge. User Modeling and User-Adapted Interaction, 4(4), 253–278.
Duchi, J., Hazan, E., & Singer, Y. (2011). Adaptive subgradient methods for online learning and stochastic optimization. Journal of machine learning research, 12(7).
Doroudi, S., & Brunskill, E. (2019, March). Fairer but not fair enough on the equitability of knowledge tracing. In Proceedings of the 9th international conference on learning analytics & knowledge (pp. 335-339).
Eglington, L. G., & Pavlik Jr, P. I. (2020). Optimizing practice scheduling requires quantitative tracking of individual item performance. npj Science of Learning, 5(1), 15, doi:10.1038/s41539-020-00074-4.
England, B. J., Brigati, J. R., Schussler, E. E., & Chen, M. M. (2019). Student anxiety and perception of difficulty impact performance and persistence in introductory biology courses. CBE—Life Sciences Education, 18(2), ar21.
Fancsali, S., Nixon, T., & Ritter, S. Optimal and worst-case performance of mastery learning assessment with bayesian knowledge tracing. In S. D’Mello, Calvo, R., Olney, A. (Ed.), Proceedings of the 6th International Conference on Educational Data Mining, 2013 (pp. 35-42)
Feng, M., Heffernan, N. T., & Koedinger, K. R. Addressing the Testing Challenge with a Web-Based E-Assessment System that Tutors as it Assesses. In Fifteenth International World Wide Web Conference, New York, NY, 2006 (pp. 307-316): AMC Press
Galyardt, A., & Goldin, I. (2015). Move your lamp post: Recent data reflects learner knowledge better than older data. Journal of Educational Data Mining, 7(2), 83-108.
Gertner, A. S., & VanLehn, K. Andes: A Coached Problem Solving Environment for Physics. In Berlin, Heidelberg, 2000 (pp. 133-142, Intelligent Tutoring Systems): Springer Berlin Heidelberg
Gervet, T., Koedinger, K., Schneider, J., & Mitchell, T. (2020). When is Deep Learning the Best Approach to Knowledge Tracing? JEDM| Journal of Educational Data Mining, 12(3), 31-54.
Heffernan, N. T., & Heffernan, C. L. (2014). The ASSISTments Ecosystem: Building a Platform that Brings Scientists and Teachers Together for Minimally Invasive Research on Human Learning and Teaching. International Journal of Artificial Intelligence in Education, 24(4), 470-497, doi:10.1007/s40593-014-0024-x.
Katz, S., & Albacete, P. L. (2013). A tutoring system that simulates the highly interactive nature of human tutoring. Grantee Submission, 105(4), 1126-1141.
Katz, S., Connelly, J., & Wilson, C. (2007). Out of the Lab and into the Classroom: An Evaluation of Reflective Dialogue in Andes. In Frontiers in artificial intelligence and applications (Vol. Volume 158: Artificial Intelligence in Education, pp. 425-432).

22
Khajah, M. M., Huang, Y., González-Brenes, J. P., Mozer, M. C., & Brusilovsky, P. Integrating knowledge tracing and item response theory: A tale of two frameworks. In CEUR Workshop Proceedings, 2014 (Vol. 1181, pp. 7-15): University of Pittsburgh
Koedinger, K. R., & Corbett, A. (2006). Cognitive tutors: Technology bringing learning sciences to the classroom. In R. K. Sawyer (Ed.), The Cambridge handbook of: The learning sciences. New York, NY, US: Cambridge University Press.
Lee, J. I., & Brunskill, E. (2012). The Impact on Individualizing Student Models on Necessary Practice Opportunities. International Educational Data Mining Society.
Lindsey, R. V., Shroyer, J. D., Pashler, H., & Mozer, M. C. (2014). Improving Students' Long-Term Knowledge Retention Through Personalized Review. Psychological Science, 25(3), 639-647, doi:10.1177/0956797613504302.
Liu, & Koedinger, K. R. (2015). Variations in Learning Rate: Student Classification Based on Systematic Residual Error Patterns across Practice Opportunities. International Educational Data Mining Society.
Liu, R., & Koedinger, K. R. Towards Reliable and Valid Measurement of Individualized Student Parameters. In International Educational Data Mining Society, 2017
Liu, Y., Wang, M., Perfetti, C. A., Brubaker, B., Wu, S., & MacWhinney, B. (2011). Learning a Tonal Language by Attending to the Tone: An In Vivo Experiment. Language Learning, 61(4), 1119-1141, doi:https://doi.org/10.1111/j.1467-9922.2011.00673.x.
McDermott, K. B., & Zerr, C. L. (2019). Individual Differences in Learning Efficiency. Current Directions in Psychological Science, 28(6), 607-613.
Mozer, M. C., Pashler, H., Cepeda, N. J., Lindsey, R. V., & Vul, E. (2009). Predicting the optimal spacing of study: A multiscale context model of memory. In Y. Bengio, D. Schuurmans, J. Lafferty, C. K. I. Williams, & A. Culotta (Eds.), Advances in Neural Information Processing Systems (Vol. 22, pp. 1321-1329). La Jolla, CA: NIPS Foundation.
Pardos, Z. A., & Heffernan, N. T. Modeling individualization in a bayesian networks implementation of knowledge tracing. In International Conference on User Modeling, Adaptation, and Personalization, 2010 (pp. 255-266): Springer
Park, O.-c., & Lee, J. (2004). Adaptive Instructional Systems. In D. H. Jonassen (Ed.), Handbook of research on educational communications and technology (2nd ed.). Mahwah, NJ, US: Lawrence Erlbaum Associates Publishers.
Pashler, H., Zarow, G., & Triplett, B. (2003). Is temporal spacing of tests helpful even when it inflates error rates? Journal of Experimental Psychology: Learning, Memory, and Cognition, 29(6), 1051–1057.
Pavlik Jr, P. I., & Eglington, L. G. The Mobile Fact and Concept Textbook System (MoFaCTS) Computational Model and Scheduling System. In iTextbooks@ AIED, 2021 (pp. 93-107)
Pavlik Jr, P. I., Eglington, L. G., & Harrell-Williams, L. M. (2020a). Logistic Knowledge Tracing: A constrained framework for learner modeling. arXiv preprint arXiv:2005.00869.
Pavlik Jr, P. I., Olney, A. M., Banker, A., Eglington, L., & Yarbro, J. The Mobile Fact and Concept Textbook System (MoFaCTS). In iTextbooks@ AIED, 2020b (pp. 35-49)
Pavlik Jr., P. I., & Anderson, J. R. (2005). Practice and forgetting effects on vocabulary memory: An activation-based model of the spacing effect. Cognitive Science, 29(4), 559–586.
Pavlik Jr., P. I., & Anderson, J. R. (2008). Using a model to compute the optimal schedule of practice. Journal of Experimental Psychology: Applied, 14(2), 101–117.
Pavlik Jr., P. I., Cen, H., & Koedinger, K. R. (2009). Performance factors analysis -- A new alternative to knowledge tracing. In V. Dimitrova, R. Mizoguchi, B. d. Boulay, & A. Graesser (Eds.), Proceedings of the 14th International Conference on Artificial Intelligence in Education (pp. 531–538). Brighton, England.
Pelánek, R., Rihák, J., & Papoušek, J. (2016, April). Impact of data collection on interpretation and evaluation of student models. In Proceedings of the sixth international conference on learning analytics & knowledge (pp. 40-47).
23
Razzaq, L., Feng, M., Nuzzo-Jones, G., Heffernan, N. T., Koedinger, K. R., Junker, B., et al. (2005). The Assistment Project: Blending Assessment and Assisting. In C. K. Looi, G. McCalla, B. Bredeweg, & J. Breuker (Eds.), Proceedings of the 12th International Conference on Artificial Intelligence In Education (pp. 555-562). Amsterdam: ISO Press.
Ritter, S., Anderson, J. R., Koedinger, K. R., & Corbett, A. (2007). Cognitive Tutor: Applied research in mathematics education. Psychonomic Bulletin & Review, 14(2), 249-255.
Schulze, K. G., Shelby, R. N., Treacy, D. J., Wintersgill, M. C., Vanlehn, K., & Gertner, A. (2000). Andes: An intelligent tutor for classical physics. Journal of Electronic Publishing, 6(1).
Seli, P., Risko, E. F., & Smilek, D. (2016). On the necessity of distinguishing between unintentional and intentional mind wandering. Psychological Science, 27(5), 685-691.
Stamper, J., & Pardos, Z. A. (2016). The 2010 KDD Cup Competition Dataset: Engaging the machine learning community in predictive learning analytics. Journal of Learning Analytics, 3(2), 312-316.
Unsworth, N. (2019). Individual differences in long-term memory. Psychol Bull, 145(1), 79-139, doi:10.1037/bul0000176.
VanLehn, K. (2011). The Relative Effectiveness of Human Tutoring, Intelligent Tutoring Systems, and Other Tutoring Systems. Educational Psychologist, 46(4), 197-221, doi:10.1080/00461520.2011.611369.
Walsh, M. M., Gluck, K. A., Gunzelmann, G., Jastrzembski, T., Krusmark, M., Myung, J. I., et al. (2018). Mechanisms underlying the spacing effect in learning: A comparison of three computational models. Journal of Experimental Psychology: General, 147(9), 1325-1348, doi:10.1037/xge0000416.
Yudelson, M. V., Koedinger, K. R., & Gordon, G. J. Individualized Bayesian Knowledge Tracing Models. In Berlin, Heidelberg, 2013 (pp. 171-180, Artificial Intelligence in Education): Springer Berlin Heidelberg
Zerr, C. L., Berg, J. J., Nelson, S. M., Fishell, A. K., Savalia, N. K., & McDermott, K. B. (2018). Learning efficiency: Identifying individual differences in learning rate and retention in healthy adults. Psychological Science, 29(9), 1436-1450.
Zimmerman, B. J., & Dibenedetto, M. K. (2008). Mastery learning and assessment: Implications for students and teachers in an era of high‐stakes testing. Psychology in the Schools, 45(3), 206-216.