how much gas can we get from grass.pdf
TRANSCRIPT
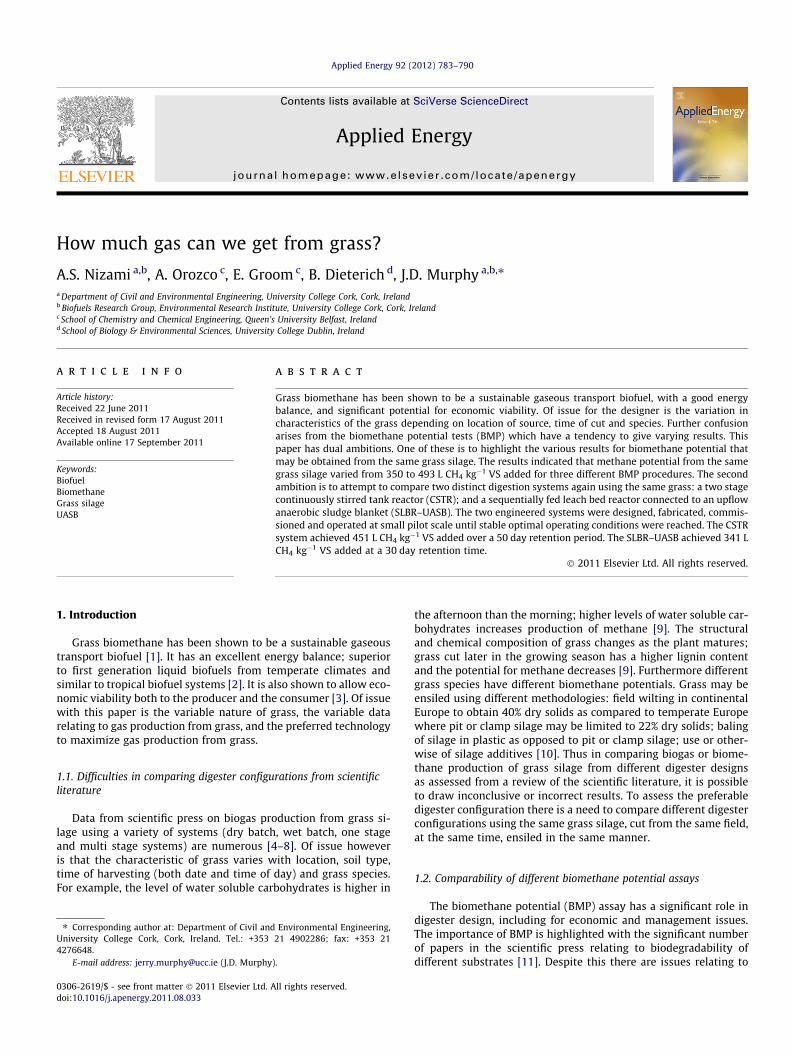
Applied Energy 92 (2012) 783–790
Contents lists available at SciVerse ScienceDirect
Applied Energy
journal homepage: www.elsevier .com/locate /apenergy
How much gas can we get from grass?
A.S. Nizami a,b, A. Orozco c, E. Groom c, B. Dieterich d, J.D. Murphy a,b,⇑a Department of Civil and Environmental Engineering, University College Cork, Cork, Irelandb Biofuels Research Group, Environmental Research Institute, University College Cork, Cork, Irelandc School of Chemistry and Chemical Engineering, Queen’s University Belfast, Irelandd School of Biology & Environmental Sciences, University College Dublin, Ireland
a r t i c l e i n f o
Article history:Received 22 June 2011Received in revised form 17 August 2011Accepted 18 August 2011Available online 17 September 2011
Keywords:BiofuelBiomethaneGrass silageUASB
0306-2619/$ - see front matter � 2011 Elsevier Ltd. Adoi:10.1016/j.apenergy.2011.08.033
⇑ Corresponding author at: Department of Civil andUniversity College Cork, Cork, Ireland. Tel.: +3534276648.
E-mail address: [email protected] (J.D. Murphy
a b s t r a c t
Grass biomethane has been shown to be a sustainable gaseous transport biofuel, with a good energybalance, and significant potential for economic viability. Of issue for the designer is the variation incharacteristics of the grass depending on location of source, time of cut and species. Further confusionarises from the biomethane potential tests (BMP) which have a tendency to give varying results. Thispaper has dual ambitions. One of these is to highlight the various results for biomethane potential thatmay be obtained from the same grass silage. The results indicated that methane potential from the samegrass silage varied from 350 to 493 L CH4 kg�1 VS added for three different BMP procedures. The secondambition is to attempt to compare two distinct digestion systems again using the same grass: a two stagecontinuously stirred tank reactor (CSTR); and a sequentially fed leach bed reactor connected to an upflowanaerobic sludge blanket (SLBR–UASB). The two engineered systems were designed, fabricated, commis-sioned and operated at small pilot scale until stable optimal operating conditions were reached. The CSTRsystem achieved 451 L CH4 kg�1 VS added over a 50 day retention period. The SLBR–UASB achieved 341 LCH4 kg�1 VS added at a 30 day retention time.
� 2011 Elsevier Ltd. All rights reserved.
1. Introduction
Grass biomethane has been shown to be a sustainable gaseoustransport biofuel [1]. It has an excellent energy balance; superiorto first generation liquid biofuels from temperate climates andsimilar to tropical biofuel systems [2]. It is also shown to allow eco-nomic viability both to the producer and the consumer [3]. Of issuewith this paper is the variable nature of grass, the variable datarelating to gas production from grass, and the preferred technologyto maximize gas production from grass.
1.1. Difficulties in comparing digester configurations from scientificliterature
Data from scientific press on biogas production from grass si-lage using a variety of systems (dry batch, wet batch, one stageand multi stage systems) are numerous [4–8]. Of issue howeveris that the characteristic of grass varies with location, soil type,time of harvesting (both date and time of day) and grass species.For example, the level of water soluble carbohydrates is higher in
ll rights reserved.
Environmental Engineering,21 4902286; fax: +353 21
).
the afternoon than the morning; higher levels of water soluble car-bohydrates increases production of methane [9]. The structuraland chemical composition of grass changes as the plant matures;grass cut later in the growing season has a higher lignin contentand the potential for methane decreases [9]. Furthermore differentgrass species have different biomethane potentials. Grass may beensiled using different methodologies: field wilting in continentalEurope to obtain 40% dry solids as compared to temperate Europewhere pit or clamp silage may be limited to 22% dry solids; balingof silage in plastic as opposed to pit or clamp silage; use or other-wise of silage additives [10]. Thus in comparing biogas or biome-thane production of grass silage from different digester designsas assessed from a review of the scientific literature, it is possibleto draw inconclusive or incorrect results. To assess the preferabledigester configuration there is a need to compare different digesterconfigurations using the same grass silage, cut from the same field,at the same time, ensiled in the same manner.
1.2. Comparability of different biomethane potential assays
The biomethane potential (BMP) assay has a significant role indigester design, including for economic and management issues.The importance of BMP is highlighted with the significant numberof papers in the scientific press relating to biodegradability ofdifferent substrates [11]. Despite this there are issues relating to
784 A.S. Nizami et al. / Applied Energy 92 (2012) 783–790
relevance and compatibility of the results. The protocols (ratio ofinoculum to substrate; liquid and headspace volumes; pH; head-space pressure; and measurements tools) differ from test to test.
First-phase(Sequencing Batch Leach bed )
Leachate tank
Gas flow meter
Sight glass
Digester 2Heating element
Feeding (a)
(b)
(c)
(d)
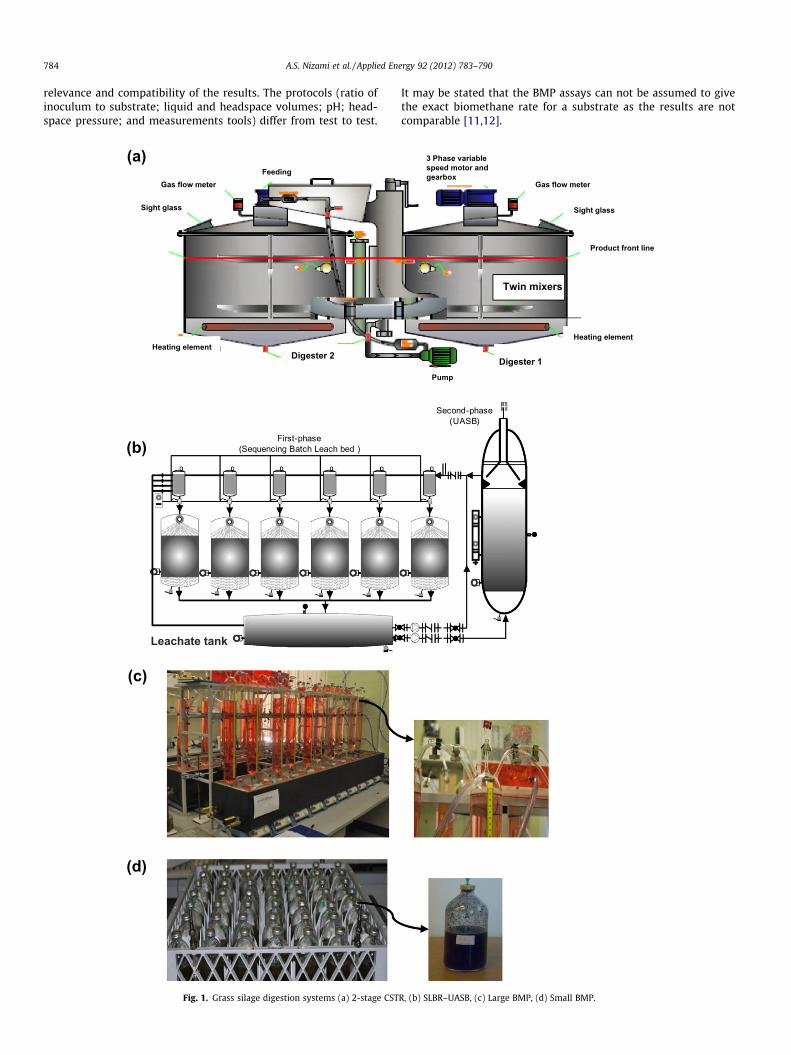
Fig. 1. Grass silage digestion systems (a) 2-stage CST
It may be stated that the BMP assays can not be assumed to givethe exact biomethane rate for a substrate as the results are notcomparable [11,12].
Second-phase(UASB)
Product front line
Sight glass
Gas flow meter
3 Phase variable speed motor and gearbox
Twin mixers
Heating element
Pump
Digester 1
R, (b) SLBR–UASB, (c) Large BMP, (d) Small BMP.
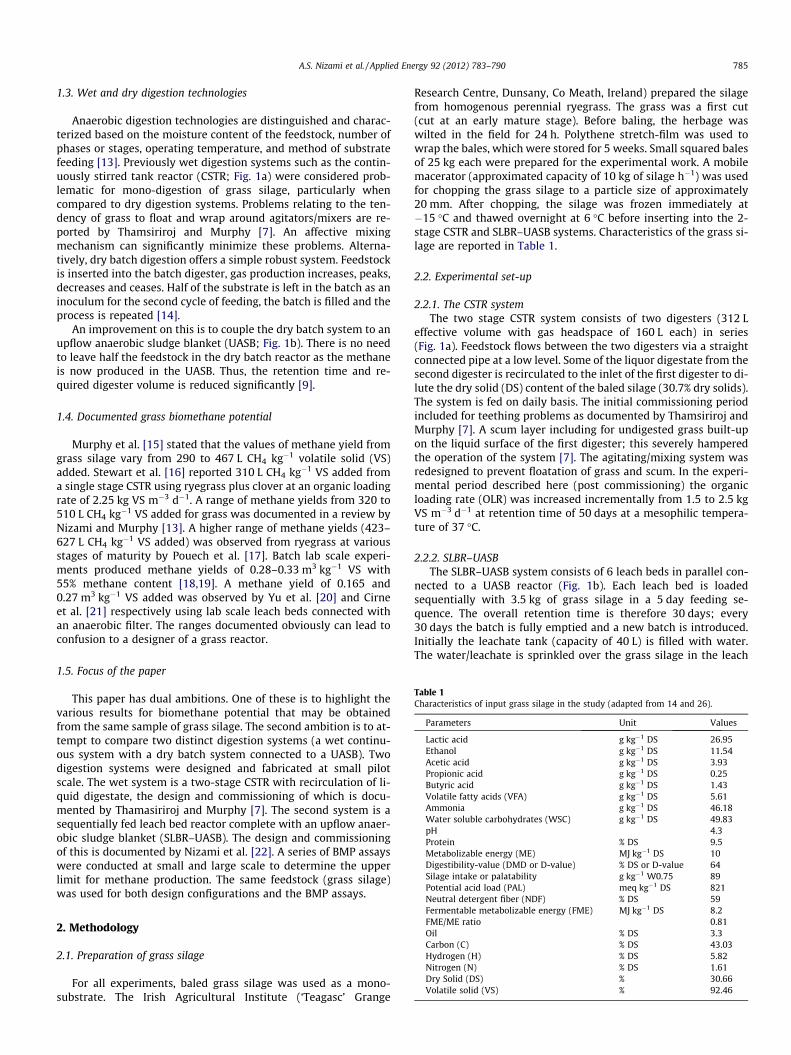
Table 1Characteristics of input grass silage in the study (adapted from 14 and 26).
Parameters Unit Values
Lactic acid g kg�1 DS 26.95Ethanol g kg�1 DS 11.54Acetic acid g kg�1 DS 3.93Propionic acid g kg�1 DS 0.25Butyric acid g kg�1 DS 1.43Volatile fatty acids (VFA) g kg�1 DS 5.61Ammonia g kg�1 DS 46.18Water soluble carbohydrates (WSC) g kg�1 DS 49.83pH 4.3Protein % DS 9.5Metabolizable energy (ME) MJ kg�1 DS 10Digestibility-value (DMD or D-value) % DS or D-value 64Silage intake or palatability g kg�1 W0.75 89Potential acid load (PAL) meq kg�1 DS 821Neutral detergent fiber (NDF) % DS 59
A.S. Nizami et al. / Applied Energy 92 (2012) 783–790 785
1.3. Wet and dry digestion technologies
Anaerobic digestion technologies are distinguished and charac-terized based on the moisture content of the feedstock, number ofphases or stages, operating temperature, and method of substratefeeding [13]. Previously wet digestion systems such as the contin-uously stirred tank reactor (CSTR; Fig. 1a) were considered prob-lematic for mono-digestion of grass silage, particularly whencompared to dry digestion systems. Problems relating to the ten-dency of grass to float and wrap around agitators/mixers are re-ported by Thamsiriroj and Murphy [7]. An affective mixingmechanism can significantly minimize these problems. Alterna-tively, dry batch digestion offers a simple robust system. Feedstockis inserted into the batch digester, gas production increases, peaks,decreases and ceases. Half of the substrate is left in the batch as aninoculum for the second cycle of feeding, the batch is filled and theprocess is repeated [14].
An improvement on this is to couple the dry batch system to anupflow anaerobic sludge blanket (UASB; Fig. 1b). There is no needto leave half the feedstock in the dry batch reactor as the methaneis now produced in the UASB. Thus, the retention time and re-quired digester volume is reduced significantly [9].
1.4. Documented grass biomethane potential
Murphy et al. [15] stated that the values of methane yield fromgrass silage vary from 290 to 467 L CH4 kg�1 volatile solid (VS)added. Stewart et al. [16] reported 310 L CH4 kg�1 VS added froma single stage CSTR using ryegrass plus clover at an organic loadingrate of 2.25 kg VS m�3 d�1. A range of methane yields from 320 to510 L CH4 kg�1 VS added for grass was documented in a review byNizami and Murphy [13]. A higher range of methane yields (423–627 L CH4 kg�1 VS added) was observed from ryegrass at variousstages of maturity by Pouech et al. [17]. Batch lab scale experi-ments produced methane yields of 0.28–0.33 m3 kg�1 VS with55% methane content [18,19]. A methane yield of 0.165 and0.27 m3 kg�1 VS added was observed by Yu et al. [20] and Cirneet al. [21] respectively using lab scale leach beds connected withan anaerobic filter. The ranges documented obviously can lead toconfusion to a designer of a grass reactor.
1.5. Focus of the paper
This paper has dual ambitions. One of these is to highlight thevarious results for biomethane potential that may be obtainedfrom the same sample of grass silage. The second ambition is to at-tempt to compare two distinct digestion systems (a wet continu-ous system with a dry batch system connected to a UASB). Twodigestion systems were designed and fabricated at small pilotscale. The wet system is a two-stage CSTR with recirculation of li-quid digestate, the design and commissioning of which is docu-mented by Thamasiriroj and Murphy [7]. The second system is asequentially fed leach bed reactor complete with an upflow anaer-obic sludge blanket (SLBR–UASB). The design and commissioningof this is documented by Nizami et al. [22]. A series of BMP assayswere conducted at small and large scale to determine the upperlimit for methane production. The same feedstock (grass silage)was used for both design configurations and the BMP assays.
Fermentable metabolizable energy (FME) MJ kg�1 DS 8.2FME/ME ratio 0.81Oil % DS 3.3Carbon (C) % DS 43.03Hydrogen (H) % DS 5.82Nitrogen (N) % DS 1.61Dry Solid (DS) % 30.66Volatile solid (VS) % 92.46
2. Methodology
2.1. Preparation of grass silage
For all experiments, baled grass silage was used as a mono-substrate. The Irish Agricultural Institute (‘Teagasc’ Grange
Research Centre, Dunsany, Co Meath, Ireland) prepared the silagefrom homogenous perennial ryegrass. The grass was a first cut(cut at an early mature stage). Before baling, the herbage waswilted in the field for 24 h. Polythene stretch-film was used towrap the bales, which were stored for 5 weeks. Small squared balesof 25 kg each were prepared for the experimental work. A mobilemacerator (approximated capacity of 10 kg of silage h�1) was usedfor chopping the grass silage to a particle size of approximately20 mm. After chopping, the silage was frozen immediately at�15 �C and thawed overnight at 6 �C before inserting into the 2-stage CSTR and SLBR–UASB systems. Characteristics of the grass si-lage are reported in Table 1.
2.2. Experimental set-up
2.2.1. The CSTR systemThe two stage CSTR system consists of two digesters (312 L
effective volume with gas headspace of 160 L each) in series(Fig. 1a). Feedstock flows between the two digesters via a straightconnected pipe at a low level. Some of the liquor digestate from thesecond digester is recirculated to the inlet of the first digester to di-lute the dry solid (DS) content of the baled silage (30.7% dry solids).The system is fed on daily basis. The initial commissioning periodincluded for teething problems as documented by Thamsiriroj andMurphy [7]. A scum layer including for undigested grass built-upon the liquid surface of the first digester; this severely hamperedthe operation of the system [7]. The agitating/mixing system wasredesigned to prevent floatation of grass and scum. In the experi-mental period described here (post commissioning) the organicloading rate (OLR) was increased incrementally from 1.5 to 2.5 kgVS m�3 d�1 at retention time of 50 days at a mesophilic tempera-ture of 37 �C.
2.2.2. SLBR–UASBThe SLBR–UASB system consists of 6 leach beds in parallel con-
nected to a UASB reactor (Fig. 1b). Each leach bed is loadedsequentially with 3.5 kg of grass silage in a 5 day feeding se-quence. The overall retention time is therefore 30 days; every30 days the batch is fully emptied and a new batch is introduced.Initially the leachate tank (capacity of 40 L) is filled with water.The water/leachate is sprinkled over the grass silage in the leach
786 A.S. Nizami et al. / Applied Energy 92 (2012) 783–790
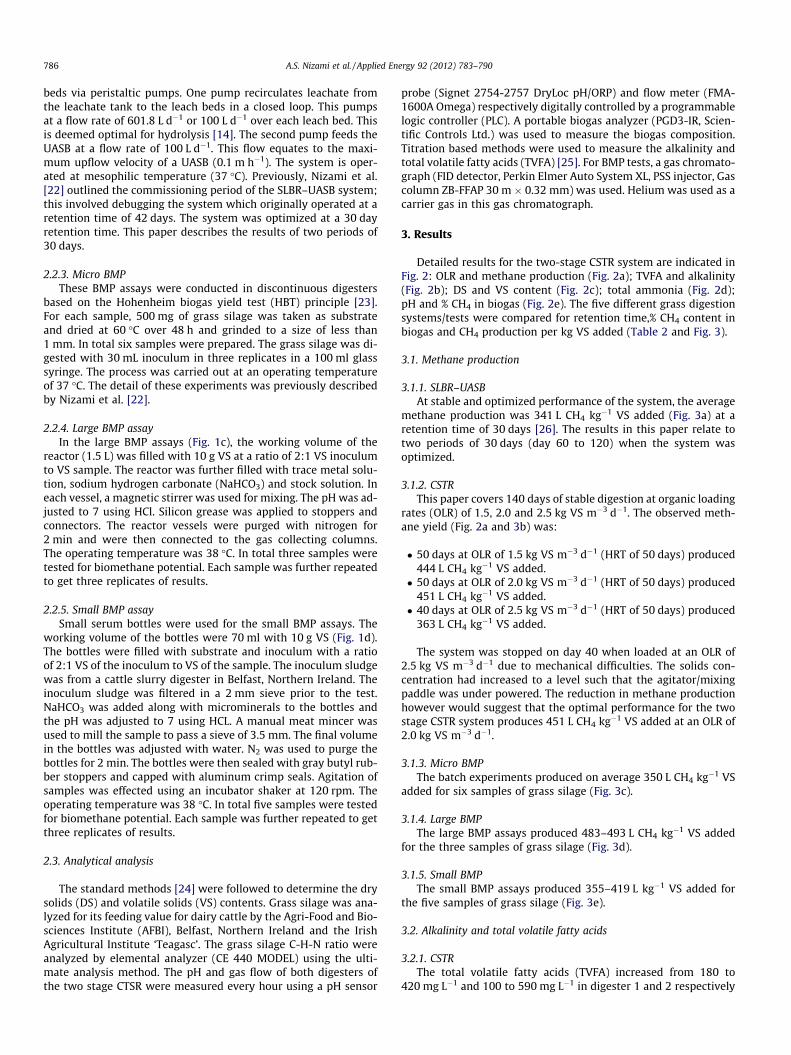
beds via peristaltic pumps. One pump recirculates leachate fromthe leachate tank to the leach beds in a closed loop. This pumpsat a flow rate of 601.8 L d�1 or 100 L d�1 over each leach bed. Thisis deemed optimal for hydrolysis [14]. The second pump feeds theUASB at a flow rate of 100 L d�1. This flow equates to the maxi-mum upflow velocity of a UASB (0.1 m h�1). The system is oper-ated at mesophilic temperature (37 �C). Previously, Nizami et al.[22] outlined the commissioning period of the SLBR–UASB system;this involved debugging the system which originally operated at aretention time of 42 days. The system was optimized at a 30 dayretention time. This paper describes the results of two periods of30 days.
2.2.3. Micro BMPThese BMP assays were conducted in discontinuous digesters
based on the Hohenheim biogas yield test (HBT) principle [23].For each sample, 500 mg of grass silage was taken as substrateand dried at 60 �C over 48 h and grinded to a size of less than1 mm. In total six samples were prepared. The grass silage was di-gested with 30 mL inoculum in three replicates in a 100 ml glasssyringe. The process was carried out at an operating temperatureof 37 �C. The detail of these experiments was previously describedby Nizami et al. [22].
2.2.4. Large BMP assayIn the large BMP assays (Fig. 1c), the working volume of the
reactor (1.5 L) was filled with 10 g VS at a ratio of 2:1 VS inoculumto VS sample. The reactor was further filled with trace metal solu-tion, sodium hydrogen carbonate (NaHCO3) and stock solution. Ineach vessel, a magnetic stirrer was used for mixing. The pH was ad-justed to 7 using HCl. Silicon grease was applied to stoppers andconnectors. The reactor vessels were purged with nitrogen for2 min and were then connected to the gas collecting columns.The operating temperature was 38 �C. In total three samples weretested for biomethane potential. Each sample was further repeatedto get three replicates of results.
2.2.5. Small BMP assaySmall serum bottles were used for the small BMP assays. The
working volume of the bottles were 70 ml with 10 g VS (Fig. 1d).The bottles were filled with substrate and inoculum with a ratioof 2:1 VS of the inoculum to VS of the sample. The inoculum sludgewas from a cattle slurry digester in Belfast, Northern Ireland. Theinoculum sludge was filtered in a 2 mm sieve prior to the test.NaHCO3 was added along with microminerals to the bottles andthe pH was adjusted to 7 using HCL. A manual meat mincer wasused to mill the sample to pass a sieve of 3.5 mm. The final volumein the bottles was adjusted with water. N2 was used to purge thebottles for 2 min. The bottles were then sealed with gray butyl rub-ber stoppers and capped with aluminum crimp seals. Agitation ofsamples was effected using an incubator shaker at 120 rpm. Theoperating temperature was 38 �C. In total five samples were testedfor biomethane potential. Each sample was further repeated to getthree replicates of results.
2.3. Analytical analysis
The standard methods [24] were followed to determine the drysolids (DS) and volatile solids (VS) contents. Grass silage was ana-lyzed for its feeding value for dairy cattle by the Agri-Food and Bio-sciences Institute (AFBI), Belfast, Northern Ireland and the IrishAgricultural Institute ‘Teagasc’. The grass silage C-H-N ratio wereanalyzed by elemental analyzer (CE 440 MODEL) using the ulti-mate analysis method. The pH and gas flow of both digesters ofthe two stage CTSR were measured every hour using a pH sensor
probe (Signet 2754-2757 DryLoc pH/ORP) and flow meter (FMA-1600A Omega) respectively digitally controlled by a programmablelogic controller (PLC). A portable biogas analyzer (PGD3-IR, Scien-tific Controls Ltd.) was used to measure the biogas composition.Titration based methods were used to measure the alkalinity andtotal volatile fatty acids (TVFA) [25]. For BMP tests, a gas chromato-graph (FID detector, Perkin Elmer Auto System XL, PSS injector, Gascolumn ZB-FFAP 30 m � 0.32 mm) was used. Helium was used as acarrier gas in this gas chromatograph.
3. Results
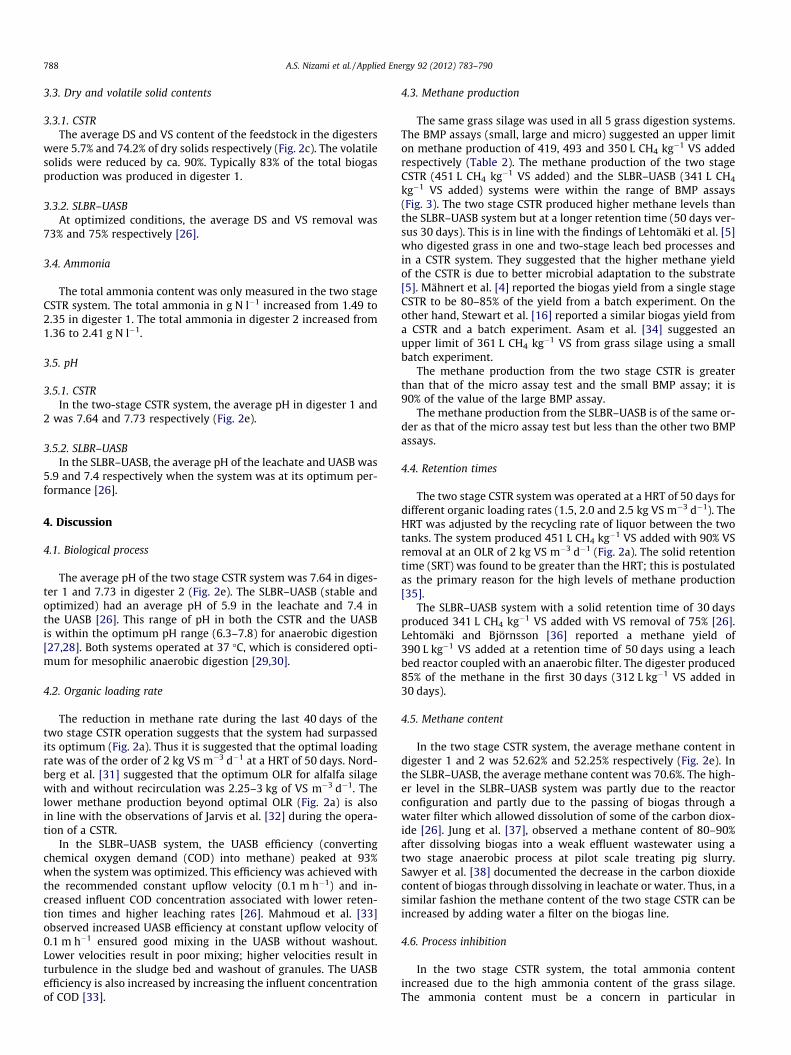
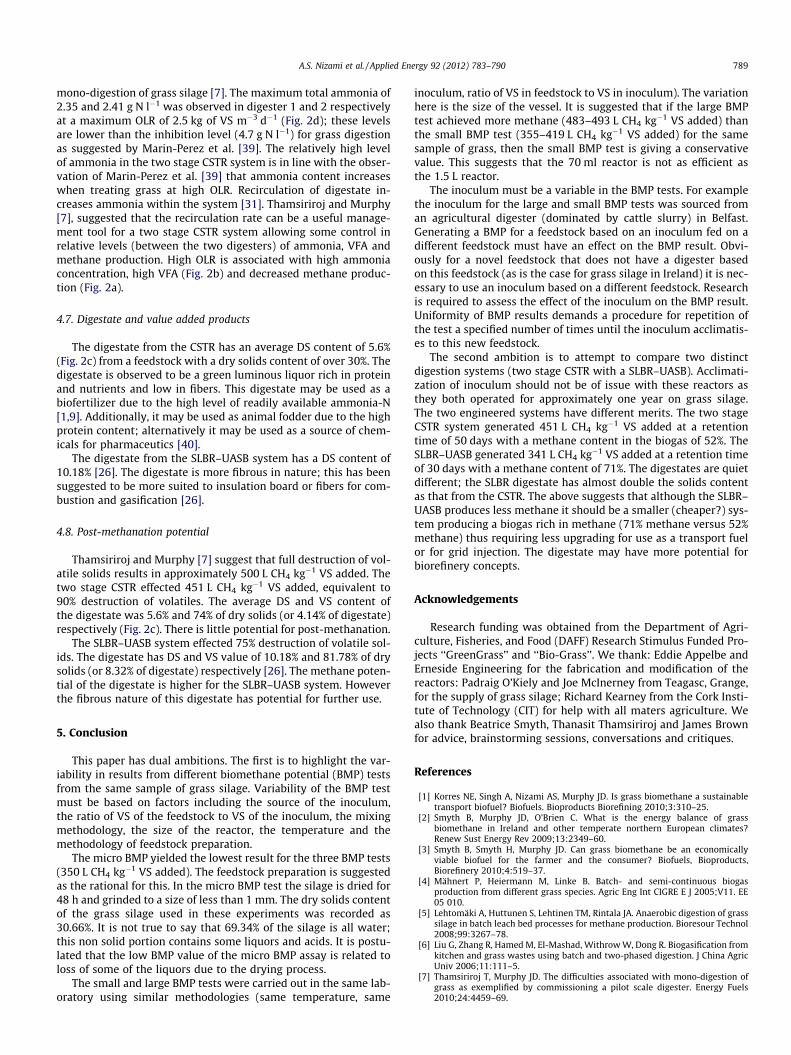
Detailed results for the two-stage CSTR system are indicated inFig. 2: OLR and methane production (Fig. 2a); TVFA and alkalinity(Fig. 2b); DS and VS content (Fig. 2c); total ammonia (Fig. 2d);pH and % CH4 in biogas (Fig. 2e). The five different grass digestionsystems/tests were compared for retention time,% CH4 content inbiogas and CH4 production per kg VS added (Table 2 and Fig. 3).
3.1. Methane production
3.1.1. SLBR–UASBAt stable and optimized performance of the system, the average
methane production was 341 L CH4 kg�1 VS added (Fig. 3a) at aretention time of 30 days [26]. The results in this paper relate totwo periods of 30 days (day 60 to 120) when the system wasoptimized.
3.1.2. CSTRThis paper covers 140 days of stable digestion at organic loading
rates (OLR) of 1.5, 2.0 and 2.5 kg VS m�3 d�1. The observed meth-ane yield (Fig. 2a and 3b) was:
� 50 days at OLR of 1.5 kg VS m�3 d�1 (HRT of 50 days) produced444 L CH4 kg�1 VS added.� 50 days at OLR of 2.0 kg VS m�3 d�1 (HRT of 50 days) produced
451 L CH4 kg�1 VS added.� 40 days at OLR of 2.5 kg VS m�3 d�1 (HRT of 50 days) produced
363 L CH4 kg�1 VS added.
The system was stopped on day 40 when loaded at an OLR of2.5 kg VS m�3 d�1 due to mechanical difficulties. The solids con-centration had increased to a level such that the agitator/mixingpaddle was under powered. The reduction in methane productionhowever would suggest that the optimal performance for the twostage CSTR system produces 451 L CH4 kg�1 VS added at an OLR of2.0 kg VS m�3 d�1.
3.1.3. Micro BMPThe batch experiments produced on average 350 L CH4 kg�1 VS
added for six samples of grass silage (Fig. 3c).
3.1.4. Large BMPThe large BMP assays produced 483–493 L CH4 kg�1 VS added
for the three samples of grass silage (Fig. 3d).
3.1.5. Small BMPThe small BMP assays produced 355–419 L kg�1 VS added for
the five samples of grass silage (Fig. 3e).
3.2. Alkalinity and total volatile fatty acids
3.2.1. CSTRThe total volatile fatty acids (TVFA) increased from 180 to
420 mg L�1 and 100 to 590 mg L�1 in digester 1 and 2 respectively
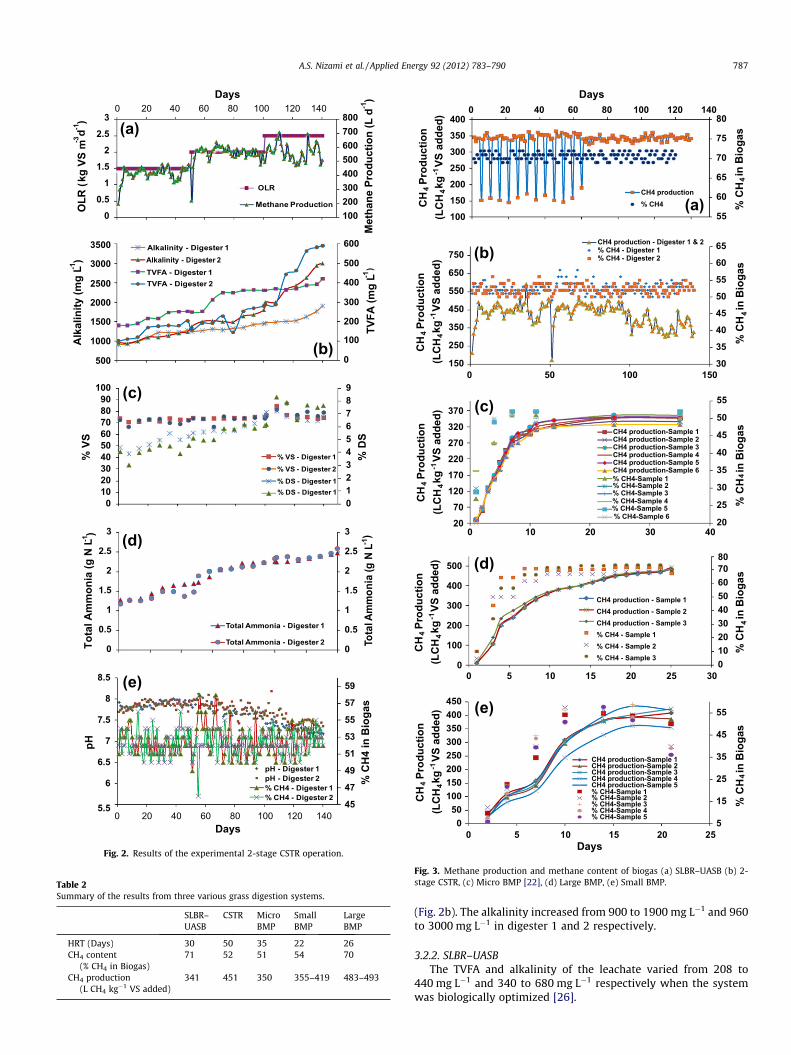
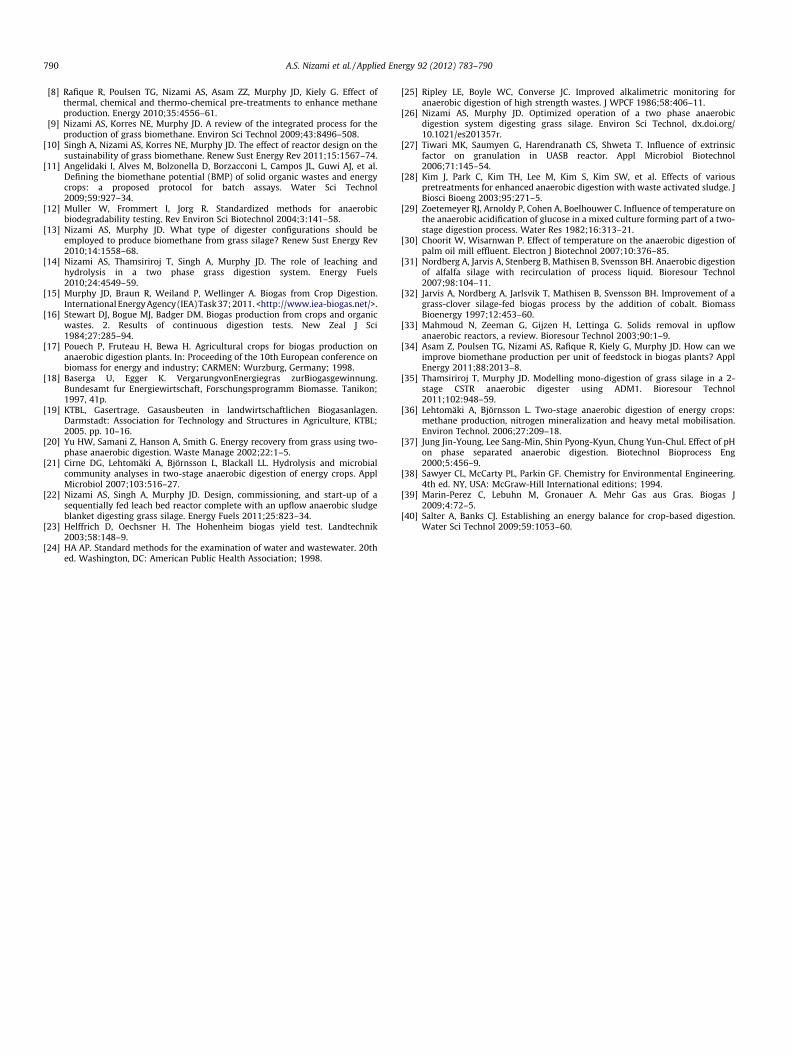
Table 2Summary of the results from three various grass digestion systems.
SLBR–UASB
CSTR MicroBMP
SmallBMP
LargeBMP
HRT (Days) 30 50 35 22 26CH4 content
(% CH4 in Biogas)71 52 51 54 70
CH4 production(L CH4 kg�1 VS added)
341 451 350 355–419 483–493
20
25
30
35
40
45
50
55
2070
120170220270320370
0 10 20 30 40
CH4 production-Sample 1CH4 production-Sample 2CH4 production-Sample 3CH4 production-Sample 4CH4 production-Sample 5CH4 production-Sample 6% CH4-Sample 1% CH4-Sample 2% CH4-Sample 3% CH4-Sample 4% CH4-Sample 5% CH4-Sample 6
5
15
25
35
45
55
050
100150200250300350400450
0 5 10 15 20 25
CH
4
(LC
H4k
g-1
VS a
dded
)
Days
0 20 40 60 80 100 120 140
55
60
65
70
75
80
100150200250300350400
Days
% C
H4in
Bio
gas
CH4 production% CH4
01020304050607080
0
100
200
300
400
500
0 5 10 15 20 25 30
30
35
40
45
50
55
60
65
150
250
350
450
550
650
750
0 50 100 150
CH4 production - Digester 1 & 2 % CH4 - Digester 1 % CH4 - Digester 2
CH4 production - Sample 1 CH4 production - Sample 2 CH4 production - Sample 3 % CH4 - Sample 1 % CH4 - Sample 2 % CH4 - Sample 3
CH4 production-Sample 1CH4 production-Sample 2CH4 production-Sample 3CH4 production-Sample 4CH4 production-Sample 5% CH4-Sample 1% CH4-Sample 2% CH4-Sample 3% CH4-Sample 4% CH4-Sample 5
Prod
uctio
nC
H4
(LC
H4kg
-1VS
add
ed)
Prod
uctio
nC
H4
(LC
H4k
g-1
VS a
dded
)Pr
oduc
tion
CH
4
(LC
H4k
g-1
VS a
dded
)Pr
oduc
tion
CH
4
(LC
H4k
g-1
VS a
dded
)Pr
oduc
tion
% C
H4in
Bio
gas
% C
H4in
Bio
gas
% C
H4in
Bio
gas
% C
H4in
Bio
gas
(a)
(b)
(c)
(d)
(e)
Fig. 3. Methane production and methane content of biogas (a) SLBR–UASB (b) 2-stage CSTR, (c) Micro BMP [22], (d) Large BMP, (e) Small BMP.
100200300400500600700800
0 20 40 60 80 100 120 140
00.5
11.5
22.5
3
Met
hane
Pro
duct
ion
(L d
-1)Days
OLR
(kg
VS
m-3d-1
)
TVFA
(mg
L-1)
Alk
alin
ity (m
g L-1
)
0123456789
0102030405060708090
100
% D
S
% V
S
% VS - Digester 1 % VS - Digester 2 % DS - Digester 1
0
0.5
1
1.5
2
2.5
3
0
0.5
1
1.5
2
2.5
3
Tota
l Am
mon
ia (g
N L-1
)
Tota
l Am
mon
ia (g
N L-1
)
Total Ammonia - Digester 1
Total Ammonia - Digester 2
45
47
49
51
53
55
57
59
5.5
6
6.5
7
7.5
8
8.5
0 20 40 60 80 100 120 140
% C
H4
in B
ioga
s
pH
Days
pH - Digester 1 pH - Digester 2 % CH4 - Digester 1 % CH4 - Digester 2
OLR
Methane Production
Alkalinity - Digester 1
TVFA - Digester 1 Alkalinity - Digester 2
TVFA - Digester 2
500
1000
1500
2000
2500
3000
3500
0
100
200
300
400
500
600
(a)
(b)
(c)
(d)
(e)
% DS - Digester 1
Fig. 2. Results of the experimental 2-stage CSTR operation.
A.S. Nizami et al. / Applied Energy 92 (2012) 783–790 787
(Fig. 2b). The alkalinity increased from 900 to 1900 mg L�1 and 960to 3000 mg L�1 in digester 1 and 2 respectively.
3.2.2. SLBR–UASBThe TVFA and alkalinity of the leachate varied from 208 to
440 mg L�1 and 340 to 680 mg L�1 respectively when the systemwas biologically optimized [26].
788 A.S. Nizami et al. / Applied Energy 92 (2012) 783–790
3.3. Dry and volatile solid contents
3.3.1. CSTRThe average DS and VS content of the feedstock in the digesters
were 5.7% and 74.2% of dry solids respectively (Fig. 2c). The volatilesolids were reduced by ca. 90%. Typically 83% of the total biogasproduction was produced in digester 1.
3.3.2. SLBR–UASBAt optimized conditions, the average DS and VS removal was
73% and 75% respectively [26].
3.4. Ammonia
The total ammonia content was only measured in the two stageCSTR system. The total ammonia in g N l�1 increased from 1.49 to2.35 in digester 1. The total ammonia in digester 2 increased from1.36 to 2.41 g N l�1.
3.5. pH
3.5.1. CSTRIn the two-stage CSTR system, the average pH in digester 1 and
2 was 7.64 and 7.73 respectively (Fig. 2e).
3.5.2. SLBR–UASBIn the SLBR–UASB, the average pH of the leachate and UASB was
5.9 and 7.4 respectively when the system was at its optimum per-formance [26].
4. Discussion
4.1. Biological process
The average pH of the two stage CSTR system was 7.64 in diges-ter 1 and 7.73 in digester 2 (Fig. 2e). The SLBR–UASB (stable andoptimized) had an average pH of 5.9 in the leachate and 7.4 inthe UASB [26]. This range of pH in both the CSTR and the UASBis within the optimum pH range (6.3–7.8) for anaerobic digestion[27,28]. Both systems operated at 37 �C, which is considered opti-mum for mesophilic anaerobic digestion [29,30].
4.2. Organic loading rate
The reduction in methane rate during the last 40 days of thetwo stage CSTR operation suggests that the system had surpassedits optimum (Fig. 2a). Thus it is suggested that the optimal loadingrate was of the order of 2 kg VS m�3 d�1 at a HRT of 50 days. Nord-berg et al. [31] suggested that the optimum OLR for alfalfa silagewith and without recirculation was 2.25–3 kg of VS m�3 d�1. Thelower methane production beyond optimal OLR (Fig. 2a) is alsoin line with the observations of Jarvis et al. [32] during the opera-tion of a CSTR.
In the SLBR–UASB system, the UASB efficiency (convertingchemical oxygen demand (COD) into methane) peaked at 93%when the system was optimized. This efficiency was achieved withthe recommended constant upflow velocity (0.1 m h�1) and in-creased influent COD concentration associated with lower reten-tion times and higher leaching rates [26]. Mahmoud et al. [33]observed increased UASB efficiency at constant upflow velocity of0.1 m h�1 ensured good mixing in the UASB without washout.Lower velocities result in poor mixing; higher velocities result inturbulence in the sludge bed and washout of granules. The UASBefficiency is also increased by increasing the influent concentrationof COD [33].
4.3. Methane production
The same grass silage was used in all 5 grass digestion systems.The BMP assays (small, large and micro) suggested an upper limiton methane production of 419, 493 and 350 L CH4 kg�1 VS addedrespectively (Table 2). The methane production of the two stageCSTR (451 L CH4 kg�1 VS added) and the SLBR–UASB (341 L CH4
kg�1 VS added) systems were within the range of BMP assays(Fig. 3). The two stage CSTR produced higher methane levels thanthe SLBR–UASB system but at a longer retention time (50 days ver-sus 30 days). This is in line with the findings of Lehtomäki et al. [5]who digested grass in one and two-stage leach bed processes andin a CSTR system. They suggested that the higher methane yieldof the CSTR is due to better microbial adaptation to the substrate[5]. Mähnert et al. [4] reported the biogas yield from a single stageCSTR to be 80–85% of the yield from a batch experiment. On theother hand, Stewart et al. [16] reported a similar biogas yield froma CSTR and a batch experiment. Asam et al. [34] suggested anupper limit of 361 L CH4 kg�1 VS from grass silage using a smallbatch experiment.
The methane production from the two stage CSTR is greaterthan that of the micro assay test and the small BMP assay; it is90% of the value of the large BMP assay.
The methane production from the SLBR–UASB is of the same or-der as that of the micro assay test but less than the other two BMPassays.
4.4. Retention times
The two stage CSTR system was operated at a HRT of 50 days fordifferent organic loading rates (1.5, 2.0 and 2.5 kg VS m�3 d�1). TheHRT was adjusted by the recycling rate of liquor between the twotanks. The system produced 451 L CH4 kg�1 VS added with 90% VSremoval at an OLR of 2 kg VS m�3 d�1 (Fig. 2a). The solid retentiontime (SRT) was found to be greater than the HRT; this is postulatedas the primary reason for the high levels of methane production[35].
The SLBR–UASB system with a solid retention time of 30 daysproduced 341 L CH4 kg�1 VS added with VS removal of 75% [26].Lehtomäki and Björnsson [36] reported a methane yield of390 L kg�1 VS added at a retention time of 50 days using a leachbed reactor coupled with an anaerobic filter. The digester produced85% of the methane in the first 30 days (312 L kg�1 VS added in30 days).
4.5. Methane content
In the two stage CSTR system, the average methane content indigester 1 and 2 was 52.62% and 52.25% respectively (Fig. 2e). Inthe SLBR–UASB, the average methane content was 70.6%. The high-er level in the SLBR–UASB system was partly due to the reactorconfiguration and partly due to the passing of biogas through awater filter which allowed dissolution of some of the carbon diox-ide [26]. Jung et al. [37], observed a methane content of 80–90%after dissolving biogas into a weak effluent wastewater using atwo stage anaerobic process at pilot scale treating pig slurry.Sawyer et al. [38] documented the decrease in the carbon dioxidecontent of biogas through dissolving in leachate or water. Thus, in asimilar fashion the methane content of the two stage CSTR can beincreased by adding water a filter on the biogas line.
4.6. Process inhibition
In the two stage CSTR system, the total ammonia contentincreased due to the high ammonia content of the grass silage.The ammonia content must be a concern in particular in
A.S. Nizami et al. / Applied Energy 92 (2012) 783–790 789
mono-digestion of grass silage [7]. The maximum total ammonia of2.35 and 2.41 g N l�1 was observed in digester 1 and 2 respectivelyat a maximum OLR of 2.5 kg of VS m�3 d�1 (Fig. 2d); these levelsare lower than the inhibition level (4.7 g N l�1) for grass digestionas suggested by Marin-Perez et al. [39]. The relatively high levelof ammonia in the two stage CSTR system is in line with the obser-vation of Marin-Perez et al. [39] that ammonia content increaseswhen treating grass at high OLR. Recirculation of digestate in-creases ammonia within the system [31]. Thamsiriroj and Murphy[7], suggested that the recirculation rate can be a useful manage-ment tool for a two stage CSTR system allowing some control inrelative levels (between the two digesters) of ammonia, VFA andmethane production. High OLR is associated with high ammoniaconcentration, high VFA (Fig. 2b) and decreased methane produc-tion (Fig. 2a).
4.7. Digestate and value added products
The digestate from the CSTR has an average DS content of 5.6%(Fig. 2c) from a feedstock with a dry solids content of over 30%. Thedigestate is observed to be a green luminous liquor rich in proteinand nutrients and low in fibers. This digestate may be used as abiofertilizer due to the high level of readily available ammonia-N[1,9]. Additionally, it may be used as animal fodder due to the highprotein content; alternatively it may be used as a source of chem-icals for pharmaceutics [40].
The digestate from the SLBR–UASB system has a DS content of10.18% [26]. The digestate is more fibrous in nature; this has beensuggested to be more suited to insulation board or fibers for com-bustion and gasification [26].
4.8. Post-methanation potential
Thamsiriroj and Murphy [7] suggest that full destruction of vol-atile solids results in approximately 500 L CH4 kg�1 VS added. Thetwo stage CSTR effected 451 L CH4 kg�1 VS added, equivalent to90% destruction of volatiles. The average DS and VS content ofthe digestate was 5.6% and 74% of dry solids (or 4.14% of digestate)respectively (Fig. 2c). There is little potential for post-methanation.
The SLBR–UASB system effected 75% destruction of volatile sol-ids. The digestate has DS and VS value of 10.18% and 81.78% of drysolids (or 8.32% of digestate) respectively [26]. The methane poten-tial of the digestate is higher for the SLBR–UASB system. Howeverthe fibrous nature of this digestate has potential for further use.
5. Conclusion
This paper has dual ambitions. The first is to highlight the var-iability in results from different biomethane potential (BMP) testsfrom the same sample of grass silage. Variability of the BMP testmust be based on factors including the source of the inoculum,the ratio of VS of the feedstock to VS of the inoculum, the mixingmethodology, the size of the reactor, the temperature and themethodology of feedstock preparation.
The micro BMP yielded the lowest result for the three BMP tests(350 L CH4 kg�1 VS added). The feedstock preparation is suggestedas the rational for this. In the micro BMP test the silage is dried for48 h and grinded to a size of less than 1 mm. The dry solids contentof the grass silage used in these experiments was recorded as30.66%. It is not true to say that 69.34% of the silage is all water;this non solid portion contains some liquors and acids. It is postu-lated that the low BMP value of the micro BMP assay is related toloss of some of the liquors due to the drying process.
The small and large BMP tests were carried out in the same lab-oratory using similar methodologies (same temperature, same
inoculum, ratio of VS in feedstock to VS in inoculum). The variationhere is the size of the vessel. It is suggested that if the large BMPtest achieved more methane (483–493 L CH4 kg�1 VS added) thanthe small BMP test (355–419 L CH4 kg�1 VS added) for the samesample of grass, then the small BMP test is giving a conservativevalue. This suggests that the 70 ml reactor is not as efficient asthe 1.5 L reactor.
The inoculum must be a variable in the BMP tests. For examplethe inoculum for the large and small BMP tests was sourced froman agricultural digester (dominated by cattle slurry) in Belfast.Generating a BMP for a feedstock based on an inoculum fed on adifferent feedstock must have an effect on the BMP result. Obvi-ously for a novel feedstock that does not have a digester basedon this feedstock (as is the case for grass silage in Ireland) it is nec-essary to use an inoculum based on a different feedstock. Researchis required to assess the effect of the inoculum on the BMP result.Uniformity of BMP results demands a procedure for repetition ofthe test a specified number of times until the inoculum acclimatis-es to this new feedstock.
The second ambition is to attempt to compare two distinctdigestion systems (two stage CSTR with a SLBR–UASB). Acclimati-zation of inoculum should not be of issue with these reactors asthey both operated for approximately one year on grass silage.The two engineered systems have different merits. The two stageCSTR system generated 451 L CH4 kg�1 VS added at a retentiontime of 50 days with a methane content in the biogas of 52%. TheSLBR–UASB generated 341 L CH4 kg�1 VS added at a retention timeof 30 days with a methane content of 71%. The digestates are quietdifferent; the SLBR digestate has almost double the solids contentas that from the CSTR. The above suggests that although the SLBR–UASB produces less methane it should be a smaller (cheaper?) sys-tem producing a biogas rich in methane (71% methane versus 52%methane) thus requiring less upgrading for use as a transport fuelor for grid injection. The digestate may have more potential forbiorefinery concepts.
Acknowledgements
Research funding was obtained from the Department of Agri-culture, Fisheries, and Food (DAFF) Research Stimulus Funded Pro-jects ‘‘GreenGrass’’ and ‘‘Bio-Grass’’. We thank: Eddie Appelbe andErneside Engineering for the fabrication and modification of thereactors: Padraig O’Kiely and Joe McInerney from Teagasc, Grange,for the supply of grass silage; Richard Kearney from the Cork Insti-tute of Technology (CIT) for help with all maters agriculture. Wealso thank Beatrice Smyth, Thanasit Thamsiriroj and James Brownfor advice, brainstorming sessions, conversations and critiques.
References
[1] Korres NE, Singh A, Nizami AS, Murphy JD. Is grass biomethane a sustainabletransport biofuel? Biofuels. Bioproducts Biorefining 2010;3:310–25.
[2] Smyth B, Murphy JD, O’Brien C. What is the energy balance of grassbiomethane in Ireland and other temperate northern European climates?Renew Sust Energy Rev 2009;13:2349–60.
[3] Smyth B, Smyth H, Murphy JD. Can grass biomethane be an economicallyviable biofuel for the farmer and the consumer? Biofuels, Bioproducts,Biorefinery 2010;4:519–37.
[4] Mähnert P, Heiermann M, Linke B. Batch- and semi-continuous biogasproduction from different grass species. Agric Eng Int CIGRE E J 2005;V11. EE05 010.
[5] Lehtomäki A, Huttunen S, Lehtinen TM, Rintala JA. Anaerobic digestion of grasssilage in batch leach bed processes for methane production. Bioresour Technol2008;99:3267–78.
[6] Liu G, Zhang R, Hamed M, El-Mashad, Withrow W, Dong R. Biogasification fromkitchen and grass wastes using batch and two-phased digestion. J China AgricUniv 2006;11:111–5.
[7] Thamsiriroj T, Murphy JD. The difficulties associated with mono-digestion ofgrass as exemplified by commissioning a pilot scale digester. Energy Fuels2010;24:4459–69.
790 A.S. Nizami et al. / Applied Energy 92 (2012) 783–790
[8] Rafique R, Poulsen TG, Nizami AS, Asam ZZ, Murphy JD, Kiely G. Effect ofthermal, chemical and thermo-chemical pre-treatments to enhance methaneproduction. Energy 2010;35:4556–61.
[9] Nizami AS, Korres NE, Murphy JD. A review of the integrated process for theproduction of grass biomethane. Environ Sci Technol 2009;43:8496–508.
[10] Singh A, Nizami AS, Korres NE, Murphy JD. The effect of reactor design on thesustainability of grass biomethane. Renew Sust Energy Rev 2011;15:1567–74.
[11] Angelidaki I, Alves M, Bolzonella D, Borzacconi L, Campos JL, Guwi AJ, et al.Defining the biomethane potential (BMP) of solid organic wastes and energycrops: a proposed protocol for batch assays. Water Sci Technol2009;59:927–34.
[12] Muller W, Frommert I, Jorg R. Standardized methods for anaerobicbiodegradability testing. Rev Environ Sci Biotechnol 2004;3:141–58.
[13] Nizami AS, Murphy JD. What type of digester configurations should beemployed to produce biomethane from grass silage? Renew Sust Energy Rev2010;14:1558–68.
[14] Nizami AS, Thamsiriroj T, Singh A, Murphy JD. The role of leaching andhydrolysis in a two phase grass digestion system. Energy Fuels2010;24:4549–59.
[15] Murphy JD, Braun R, Weiland P, Wellinger A. Biogas from Crop Digestion.International Energy Agency (IEA) Task 37; 2011. <http://www.iea-biogas.net/>.
[16] Stewart DJ, Bogue MJ, Badger DM. Biogas production from crops and organicwastes. 2. Results of continuous digestion tests. New Zeal J Sci1984;27:285–94.
[17] Pouech P, Fruteau H, Bewa H. Agricultural crops for biogas production onanaerobic digestion plants. In: Proceeding of the 10th European conference onbiomass for energy and industry; CARMEN: Wurzburg, Germany; 1998.
[18] Baserga U, Egger K. VergarungvonEnergiegras zurBiogasgewinnung.Bundesamt fur Energiewirtschaft, Forschungsprogramm Biomasse. Tanikon;1997, 41p.
[19] KTBL, Gasertrage. Gasausbeuten in landwirtschaftlichen Biogasanlagen.Darmstadt: Association for Technology and Structures in Agriculture, KTBL;2005. pp. 10–16.
[20] Yu HW, Samani Z, Hanson A, Smith G. Energy recovery from grass using two-phase anaerobic digestion. Waste Manage 2002;22:1–5.
[21] Cirne DG, Lehtomäki A, Björnsson L, Blackall LL. Hydrolysis and microbialcommunity analyses in two-stage anaerobic digestion of energy crops. ApplMicrobiol 2007;103:516–27.
[22] Nizami AS, Singh A, Murphy JD. Design, commissioning, and start-up of asequentially fed leach bed reactor complete with an upflow anaerobic sludgeblanket digesting grass silage. Energy Fuels 2011;25:823–34.
[23] Helffrich D, Oechsner H. The Hohenheim biogas yield test. Landtechnik2003;58:148–9.
[24] HA AP. Standard methods for the examination of water and wastewater. 20thed. Washington, DC: American Public Health Association; 1998.
[25] Ripley LE, Boyle WC, Converse JC. Improved alkalimetric monitoring foranaerobic digestion of high strength wastes. J WPCF 1986;58:406–11.
[26] Nizami AS, Murphy JD. Optimized operation of a two phase anaerobicdigestion system digesting grass silage. Environ Sci Technol, dx.doi.org/10.1021/es201357r.
[27] Tiwari MK, Saumyen G, Harendranath CS, Shweta T. Influence of extrinsicfactor on granulation in UASB reactor. Appl Microbiol Biotechnol2006;71:145–54.
[28] Kim J, Park C, Kim TH, Lee M, Kim S, Kim SW, et al. Effects of variouspretreatments for enhanced anaerobic digestion with waste activated sludge. JBiosci Bioeng 2003;95:271–5.
[29] Zoetemeyer RJ, Arnoldy P, Cohen A, Boelhouwer C. Influence of temperature onthe anaerobic acidification of glucose in a mixed culture forming part of a two-stage digestion process. Water Res 1982;16:313–21.
[30] Choorit W, Wisarnwan P. Effect of temperature on the anaerobic digestion ofpalm oil mill effluent. Electron J Biotechnol 2007;10:376–85.
[31] Nordberg A, Jarvis A, Stenberg B, Mathisen B, Svensson BH. Anaerobic digestionof alfalfa silage with recirculation of process liquid. Bioresour Technol2007;98:104–11.
[32] Jarvis A, Nordberg A, Jarlsvik T, Mathisen B, Svensson BH. Improvement of agrass-clover silage-fed biogas process by the addition of cobalt. BiomassBioenergy 1997;12:453–60.
[33] Mahmoud N, Zeeman G, Gijzen H, Lettinga G. Solids removal in upflowanaerobic reactors, a review. Bioresour Technol 2003;90:1–9.
[34] Asam Z, Poulsen TG, Nizami AS, Rafique R, Kiely G, Murphy JD. How can weimprove biomethane production per unit of feedstock in biogas plants? ApplEnergy 2011;88:2013–8.
[35] Thamsiriroj T, Murphy JD. Modelling mono-digestion of grass silage in a 2-stage CSTR anaerobic digester using ADM1. Bioresour Technol2011;102:948–59.
[36] Lehtomäki A, Björnsson L. Two-stage anaerobic digestion of energy crops:methane production, nitrogen mineralization and heavy metal mobilisation.Environ Technol. 2006;27:209–18.
[37] Jung Jin-Young, Lee Sang-Min, Shin Pyong-Kyun, Chung Yun-Chul. Effect of pHon phase separated anaerobic digestion. Biotechnol Bioprocess Eng2000;5:456–9.
[38] Sawyer CL, McCarty PL, Parkin GF. Chemistry for Environmental Engineering.4th ed. NY, USA: McGraw-Hill International editions; 1994.
[39] Marin-Perez C, Lebuhn M, Gronauer A. Mehr Gas aus Gras. Biogas J2009;4:72–5.
[40] Salter A, Banks CJ. Establishing an energy balance for crop-based digestion.Water Sci Technol 2009;59:1053–60.