hormonal regulation of mannan-binding lectin synthesis in hepatocytes
TRANSCRIPT

Clinical and Experimental Immunology
© 2006 British Society for Immunology,
Clinical and Experimental Immunology
,
145:
173–182
173
doi:10.1111/j.1365-2249.2006.03101.x
et al.
Accepted for publication 27 March 2006
Correspondence: Dr Steffen Thiel, Department
of Medical Microbiology and Immunology,
University of Aarhus, 8000 Aarhus, Denmark.
E-mail: [email protected]
OR IG INAL ART I C L E
Hormonal regulation of mannan-binding lectin synthesis in hepatocytes
C. M. Sørensen,* T. K. Hansen,
‡
R. Steffensen,
†
J. C. Jensenius* and S. Thiel*
*Department of Medical Microbiology and
Immunology, University of Aarhus, Aarhus,
†
Department of Clinical Immunology, Aalborg
Hospital, Aalborg, and
‡
Immunoendocrine
Research Unit, Medical Department M,
Aarhus University Hospital, Aarhus, Denmark
Summary
Activation of the complement system via the plasma protein mannan-bindinglectin (MBL) provides a first line of defence against infections. The plasmalevel of MBL is, in part, determined genetically, but may also be influenced bydifferent hormones
in vivo
. Here we study the hormonal regulation of MBLsynthesis from the human hepatocyte cell line HuH-7. Cells were exposed tomedium with growth hormone (GH), hydrocortisone, insulin-like growth fac-tor (IGF)-1, insulin, interleukin (IL)-6 or thyroid hormones (T3 or T4). After3 days the concentration of MBL in the culture supernatants was determinedand the amount of mRNA for MBL was measured, relative to mRNA for
ββββ
2microglobulin. GH, IL-6, T3 and T4 significantly increased MBL synthesis ina dose-dependent manner, while hydrocortisone, insulin and IGF-1 had noeffect. T3 caused a fourfold increase at 1 n
M
of T3 (
P
<<<<
0·001) and at 100 n
M
of T3 the production was increased more than eightfold. The effect of T4 wasless potent, reaching an eightfold increase at 1
µµµµ
M
of T4 (
P
<<<<
0·001). GH aug-mented the production of MBL threefold at a concentration of 100 ng/ml(
P
====
0·018) with no further effect up to 10
µµµµ
g/ml, whereas IL-6 caused only avery weak increase in MBL production. MBL mRNA levels were stable duringthe first 24 h of T3 stimulation but increased significantly between 24 and48 h. The results suggest that MBL synthesis in humans may be increased bythyroid hormone and GH, whereas it does not exhibit a classical IL-6-dependent response.
Keywords:
complement system, hormone, mannose-binding lectin, mRNAsynthesis, protein synthesis
Introduction
The ability to distinguish between self, altered self or non-self is of paramount importance for the immune system. Theimmune system may be divided into innate and adaptiveimmune systems, where the complement system is animportant part of the innate immune system [1,2]. Activa-tion of the complement system via the plasma proteinmannan-binding lectin (MBL, also referred to as mannose-binding lectin) occurs when MBL recognizes patterns ofcarbohydrates, such as that presented on many microorgan-isms. This is a beneficial activity, but many of the differentproducts produced during such activation are potentiallyharmful for the body itself. Thus, the system is under tightcontrol, on the level of a balanced activity of activators andinhibitors of the system and on the level of synthesis of the
proteins involved in the system [1,2]. We expect that synthe-sis of components of the complement system may be underhormonal influence, and in the present investigation weexamined the influence of a series of hormones on the syn-thesis of MBL.
MBL is a soluble protein produced mainly by hepatocytes.MBL is an oligomeric protein composed of subunits, whereeach subunit is assembled from three identical polypeptidechains [3]. In plasma MBL exists in sizes from a single sub-unit up to an oligomer of six or more subunits [4,5]. WhenMBL binds to a suitable carbohydrate surface, e.g. on micro-organisms, complement activation may be initiated throughthe activation of MBL-associated serine proteases (MASP-1,MASP-2 and MASP-3) [6].
MBL deficiency is the most common congenital immun-odeficiency, with a prevalence of 10% in the normal
C. M. Sørensen
et al.
174
© 2006 British Society for Immunology,
Clinical and Experimental Immunology
,
145:
173–182
population [3,7]. Low levels of MBL result in deficiency inopsonic activity, i.e. less complement is deposited and killingis thus less efficient [8]. From an evolutionary viewpoint, thehigh prevalence of gene mutations among otherwise healthyindividuals points to a balanced role of MBL in the sense thatMBL deficiency in certain situations may confer some selec-tive advantages. Experimental data have demonstrated thatMBL is involved in complement-mediated injuries inducedby altered self tissues, i.e. after ischaemia and reperfusion ofkidney, heart or intestinal tissue [9–11]. Clinical findingsalso indicate that the proinflammatory effects of high con-centrations of MBL may be a pathogenic factor in the devel-opment of complications in patients with type 1 diabetes[12,13].
The plasma concentration of MBL varies between less than10 ng/ml up to 10 000 ng/ml [3,7]. This level is largely deter-mined genetically by the presence of three single nucleotidepolymorphisms, named alleles B, C and D, in exon 1 of thegene encoding MBL (
MBL
2). The level of MBL is also influ-enced by polymorphisms in the promoter region. However,despite identical MBL genotypes one can still find up to a 10-fold interindividual difference in the plasma concentration ofMBL [3,7]. It has been noted previously that the promoterregion is characterized by sequences common to promoters ofacute phase proteins and elements common to genes of otherproteins produced by hepatocytes [14,15]. However, clinicalinvestigations have reported only a minor, sluggish increasewith regard to acute phase responses, i.e. a twofold increaseafter 1–2 weeks [16]. In clinical trials it has been observed thatgrowth hormone and thyroid hormones influence the con-centration of MBL in plasma [17,18]. Otherwise, little isknown about factors that influence MBL levels and that mayexplain the differences in MBL concentrations between indi-viduals with identical genotypes.
We hypothesize that different hormones might influencethe activity of the innate immune system and in the presentstudy we investigated whether different hormones couldinfluence the synthesis of MBL from hepatocyte cell lines.
Materials and methods
Cell lines
The cell lines HepG2 and Chang liver cells were purchasedfrom LGC Promochem, Boras, Sweden [American Type Cul-ture Collection (ATCC) cat. no. HB-8065 and CCL-13,respectively], while HuH-7, HuH-1 and HLF were obtainedfrom Health Science Research Resources Bank, Sennan-shi,Japan (cat. no. JCRB0403, JCRB0199 and JCRB0405,respectively).
MBL2
genotyping
Genomic DNA was extracted from frozen cells using theQIAamp DNA blood mini kit (Qiagen, Hilden, Germany).
As described previously, LightCycler-based real-time poly-merase chain reaction (PCR) assay with fluorescent hybrid-ization probes was used for genotyping the cell lines atcodons 52 (D), 54 (B) and 57 (C) in exon 1 of the
MBL2
geneand promoter variants at positions
−
550 (H/L),
−
221 (X/Y)and
+
4 (P/Q) [19]. Because the three polymorphic sites inthe promoter are in linkage disequilibrium with the struc-tural gene mutations, the genotype is expressed by the hap-lotypes LYPB, HYPD and LYQC, together with four wild-type (A variant) haplotypes LYPA, HYPA, LYQA and LXPA.
Hormones and interleukin (IL)-6
A series of different hormones were purchased: growth hor-mone (GH) (Humatrope, Lilly, Indianapolis, IN, USA);hydrocortisone (Solu-Cortef, Pfizer, Cambridge, MA, USA);insulin-like growth factor (IGF)-1 (Peprotech, London, UK);insulin (Actrapid, Novo Nordisk, Bagsværd, Denmark);3,3
′
,5
′
-triiodo-
l
-thyronine sodium salt (T3) (T5516, Sigma-Aldrich, St Louis, MO, USA);
l
-thyroxine sodium salt pen-tahydrate (T4) (T 0397, Sigma-Aldrich); and IL-6 (R&DSystems, Oxon, UK; cat. no. 38220000). Two different lots ofeach hormone preparation were tested to reduce the theo-retical risks of biased results originating from possible endot-oxin contamination.
Growth and stimulation conditions
The cell lines were cultured in 5% CO
2
and 95% atmosphericair at 37
°
C in Dulbecco’s modified Eagle’s medium (DMEM)supplemented to complete culture medium with NaHCO
3
,HEPES (5·938 g/l), 10% (v/v) heat-inactivated fetal calfserum (cat. no. 10270–106, Invitrogen, San Diego, CA,USA), 1% (v/v) glutaMAX (cat no. 35050–038, Invitrogen),penicillin (50 international units/ml) and streptomycin(0·5 mg/ml). When cells were divided for subculture theywere washed with 140 m
M
NaCl, 2·7 m
M
KCl, 1·5 m
M
KH
2
PO
4
, 8·1 m
M
Na
2
HPO
4
, pH 7·4 [phosphate-bufferedsaline (PBS)] and detached with PBS containing 10 m
M
eth-ylenediamine tetraacetic acid (EDTA) and 0·05% (w/v)trypsin (cat no. 15090–046, Invitrogen).
Measurements of protein synthesis
Cells in logarithmic growth phase were seeded in six-wellplates (9·4 cm
2
bottom surface) (TPP, Trasadinge, Switzer-land) at 20 000 per cm
2
, with 2 ml of medium per well. After5 days 100% confluence was reached and the medium waschanged to medium, with hormone added at concentrationscovering a wide range from very low to supraphysiologicallevels. After an additional 3 days of growth the cells weredetached with EDTA and trypsin, as above, and the numberof cells was counted using a haemocytometer. The mediumwas used for measurements of protein production. The syn-thesis is given as production per 10
6
cells to compensate for
Hormones and MBL synthesis
© 2006 British Society for Immunology,
Clinical and Experimental Immunology
,
145:
173–182
175
possible increased or decreased numbers of cells in the wellsafter the 3-day period.
Measurement of human serum albumin (HSA)
The concentration of HSA in the culture supernatants wasmeasured using an inhibition assay in the format of a time-resolved immunofluorometric assay (TRIFMA). Microtitrewells were coated with 500 ng HSA (Statens Serum Institut,Copenhagen, Denmark) per well (in 100
µ
l) and residualbinding sites blocked with 200
µ
g of bovine serum albumin(BSA) (cat. no. A-4503, Sigma-Aldrich) diluted in 100
µ
l10 m
M
Tris, 145 m
M
NaCl, 15 m
M
NaN
3
and pH 7·4 [Tris-buffered saline (TBS)]. The wells were washed subsequentlyin TBS containing 0·05% Tween 20 (TBS/Tw); all the fol-lowing washes and incubation buffers were TBS/Tw. Thesamples were diluted in buffer with 0·1% (w/v) BSA andrabbit anti-human albumin antibodies (cat. no. A001,DakoCytomation, Glostrup, Denmark) added to a finalconcentration of 0·156
µ
g/ml. After incubation in the wellsand wash, the amount of anti-albumin antibodies bound tothe HSA coat was detected with biotinylated donkey anti-rabbit Ig (cat. no. RPN 1004, Amersham Bioscience, Upp-sala, Sweden) followed by europium-labelled streptavidin(PerkinElmer, Boston, MA, USA). The amount of europiumbound was measured by time-resolved fluorometry on a1232 Delfia fluorometer (Perkin Elmer). A standard curvewas made from signals obtained when adding a 3·5-folddilution series of HSA starting at 350
µ
g per ml and endingat 0·005
µ
g per ml.
Measurement of MBL
The MBL concentration was determined by a TRIFMA, asdescribed previously [7]. In brief, microtitre wells coatedwith mannan were used to catch MBL in the sample. Subse-quently, bound MBL was detected using europium-labelledmonoclonal anti-MBL antibody. The detection limit was30 pg/ml.
Measurement of cytokines
The concentrations of IL-2, -4, -6, -8 and -10, tumournecrosis factor (TNF)-
α
, interferon (IFN)-
γ
and granulo-cyte–macrophage colony-stimulating factor (GM-CSF)were quantified on a Luminex
®
2000 by means of assaysfrom Bio-Rad Laboratories, Hercules, CA, USA (cat. no.171-A11080). The detection limit for the cytokines was2 pg/ml.
Measurement of C-reactive protein (CRP)
CRP measurements was performed with the use of a kitfrom Bender MedSystems, Vienna, Austria (cat. no.BMS288INSTCE). The detection limit was 78 pg/ml.
Sodium dodecyl sulphate–polyacrylamide gel electrophoresis (SDS-PAGE) and Western blotting
To analyse the oligomeric state of MBL in the culture super-natants, MBL from 500
µ
l of supernatant was purified onfive microtitre wells coated with anti-MBL antibody (131-1,Immunolex, Copenhagen, Denmark). After incubation ofsupernatant in the wells and wash, the MBL was eluted with15 m
M
Tris, 70 m
M
NaCl, 1·5% (w/v) SDS, 4
M
urea, 0·5%(v/v) glycerol and 0·0005% (w/v) bromphenol blue. Thesamples were boiled for 3 min, and analysed non-reduced ona 4–20% polyacrylamide gel. The All-blue precision plusprotein standard (Bio-Rad) was used as a marker. After elec-trophoretic transfer of proteins onto a 0·45
µ
m polyvinyldifluoride (PVDF) membrane (Hybond-P; AmershamBiosciences), the membrane was developed with biotinylatedmonoclonal anti-MBL antibody (131-1) followed by horse-radish peroxidase-labelled streptavidin (P0397, DakoCyto-mation). Subsequently, luminescence reaction was producedusing the Supersignal
®
West Dura kit (cat. no. 37071, PierceBiotechnology Inc., Rockford, IL, USA) and the signal wasrecorded with a Kodak Image Station 1000. MBL was alsopurified from 2·8
µ
l serum (diluted with 500
µ
l of completeculture medium) from a person with a genotype matchingthe HuH-7 cells.
Quantitative real-time reverse transcriptase–polymerase chain reaction (RT–PCR)
The
MBL2
mRNA expression levels were quantified using atwo-step RT–PCR based on detection of a fluorescent signalproduced proportionally during the amplification of a PCRproduct, employing
Taq
Man chemistry and the ABI Prism7000 Sequence Detection System (Applied Biosystems, Fos-ter City, CA, USA). For the measurement of mRNA contents,total RNA was extracted from cells with the RNeasy mini kit(Qiagen) followed by DNAse treatment with deoxyribonu-clease I, amplification grade (Invitrogen). SubsequentlycDNA synthesis was performed using a first-strand cDNAsynthesis kit from Roche Molecular Biochemicals (Man-nheim, Germany) using oligo-d(T) 18 primers. Assay-on-demand gene expression products from Applied Biosystemswere used for quantitative real-time PCR gene expressionfor
MBL2
mRNA (cat. no. Hs01551501_m1) using beta 2microglobulin (
β
2m) mRNA (cat. no. Hs99999907_m1) asa housekeeping gene for normalization of the system. Theamount of cDNA is expressed as the threshold cycle (Ct),which is the number of cycles needed to gain 50% of maxi-mal fluorescence.
To express the production of
MBL2
mRNA as the numberof copies, we initially calibrated against a plasmid containinginserted
MBL2
cDNA. We found this approach suboptimaldue to the highly purified nature of the plasmid compared tocDNA produced from the cells.
C. M. Sørensen
et al.
176
© 2006 British Society for Immunology,
Clinical and Experimental Immunology
,
145:
173–182
Mononuclear cells were isolated from blood from aHYPA/LYQA individual on Ficoll-Paque (cat. no. 17-1440-02, Amersham Biosciences) using the manufacturer’s proce-dure. Monocytes were isolated from the mononuclear cellsby allowing the monocytes to adhere for 3 h to the walls of acell culture flask. RNA was purified from the monocytes aswell as from whole blood using the procedure used above forthe cultured cells. The presence of MBL mRNA was tested,again with
β
2m mRNA as positive control, using proceduressimilar to those used for cultured cells.
Measurement of thyroid hormones and MBL in plasma samples
MBL concentrations were measured as described previously[7] in samples from 17 healthy controls with the
MBL2
gen-otype HYPA/LYQA. Thyroid hormones (total T3 and totalT4) and thyroid-stimulating hormone (TSH) were measuredby immunofluorescent methods (Immulite, DPC, Los Ange-les, CA, USA). Free thyroid hormones thyroxin (fT4) and tri-iodothyronine (fT3) were measured by ultrafiltration andRIAs as described previously [13].
Statistical analysis
Data are expressed as means
±
s.e.m.
P
-values refer tounpaired
t
-tests, and
P
<
0·05 was considered significant.
Results
MBL
genotypes and MBL production of hepatocyte cell lines
Five different hepatocytic cell lines were analysed initially forMBL synthesis and
MBL
genotype. The genotypes of the celllines were determined to be HYPA/HYPA for HuH-7, LYPB/LYQA for HuH-1, HYPA/LYQA for HLF and LYPB/LYQC forChang liver. The genotype of HepG2 cells has been deter-mined previously to be A/B for the structural polymor-phisms [20]. For unknown reasons, it was not possible todetermine the genotype of the HepG2 cells using the methoddescribed in the present report.
When testing the growth media for the presence of MBLwe observed measurable production of MBL from only thecell lines HuH-7 and HuH-1. From HuH-7 the productionresulted in a concentration of 0·75
±
0·06 ng/ml after 3 days’growth and in HuH-1 the concentrations were only justabove background. We consequently chose to use HuH-7cells in the following experiments.
Hormonal influence on MBL production in HuH-7 cells
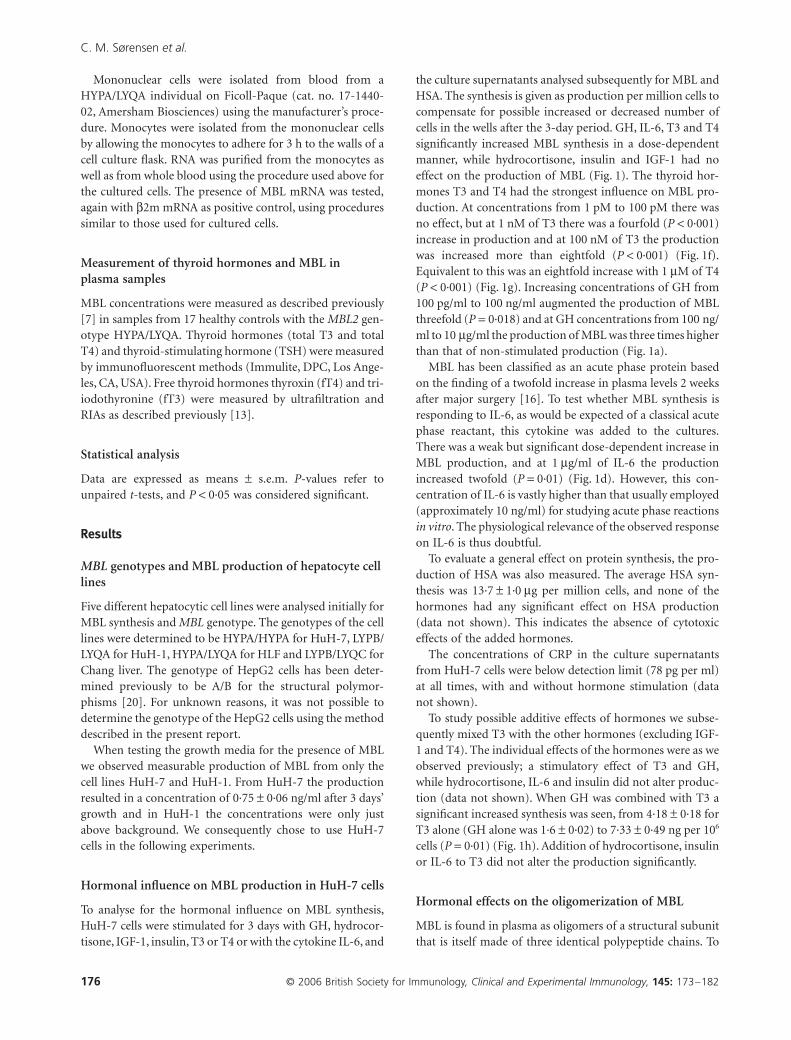
To analyse for the hormonal influence on MBL synthesis,HuH-7 cells were stimulated for 3 days with GH, hydrocor-tisone, IGF-1, insulin, T3 or T4 or with the cytokine IL-6, and
the culture supernatants analysed subsequently for MBL andHSA. The synthesis is given as production per million cells tocompensate for possible increased or decreased number ofcells in the wells after the 3-day period. GH, IL-6, T3 and T4significantly increased MBL synthesis in a dose-dependentmanner, while hydrocortisone, insulin and IGF-1 had noeffect on the production of MBL (Fig. 1). The thyroid hor-mones T3 and T4 had the strongest influence on MBL pro-duction. At concentrations from 1 p
M
to 100 p
M
there wasno effect, but at 1 n
M
of T3 there was a fourfold (
P
<
0·001)increase in production and at 100 nM of T3 the productionwas increased more than eightfold (
P
<
0·001) (Fig. 1f).Equivalent to this was an eightfold increase with 1
µ
M
of T4(
P
<
0·001) (Fig. 1g). Increasing concentrations of GH from100 pg/ml to 100 ng/ml augmented the production of MBLthreefold (
P
=
0·018) and at GH concentrations from 100 ng/ml to 10
µ
g/ml the production of MBL was three times higherthan that of non-stimulated production (Fig. 1a).
MBL has been classified as an acute phase protein basedon the finding of a twofold increase in plasma levels 2 weeksafter major surgery [16]. To test whether MBL synthesis isresponding to IL-6, as would be expected of a classical acutephase reactant, this cytokine was added to the cultures.There was a weak but significant dose-dependent increase inMBL production, and at 1
µ
g/ml of IL-6 the productionincreased twofold (
P
=
0·01) (Fig. 1d). However, this con-centration of IL-6 is vastly higher than that usually employed(approximately 10 ng/ml) for studying acute phase reactions
in vitro
. The physiological relevance of the observed responseon IL-6 is thus doubtful.
To evaluate a general effect on protein synthesis, the pro-duction of HSA was also measured. The average HSA syn-thesis was 13·7
±
1·0 µg per million cells, and none of thehormones had any significant effect on HSA production(data not shown). This indicates the absence of cytotoxiceffects of the added hormones.
The concentrations of CRP in the culture supernatantsfrom HuH-7 cells were below detection limit (78 pg per ml)at all times, with and without hormone stimulation (datanot shown).
To study possible additive effects of hormones we subse-quently mixed T3 with the other hormones (excluding IGF-1 and T4). The individual effects of the hormones were as weobserved previously; a stimulatory effect of T3 and GH,while hydrocortisone, IL-6 and insulin did not alter produc-tion (data not shown). When GH was combined with T3 asignificant increased synthesis was seen, from 4·18 ± 0·18 forT3 alone (GH alone was 1·6 ± 0·02) to 7·33 ± 0·49 ng per 106
cells (P = 0·01) (Fig. 1h). Addition of hydrocortisone, insulinor IL-6 to T3 did not alter the production significantly.
Hormonal effects on the oligomerization of MBL
MBL is found in plasma as oligomers of a structural subunitthat is itself made of three identical polypeptide chains. To

Hormones and MBL synthesis
© 2006 British Society for Immunology, Clinical and Experimental Immunology, 145: 173–182 177
characterize the appearance of the MBL produced by HuH-7 cells and to study if any of the hormones altered theoligomerization of MBL, Western blot analyses usingnon-reduced samples from the cell cultures were performed(Fig. 2). In each lane MBL from 500 µl of cell culture
medium, purified on an anti-MBL-coated surface, wasapplied. MBL was also purified under identical conditionsfrom serum from a subject with a MBL2 genotype (HYPA/HYPA) matching the HuH-7 cells. The MBL from the culturesupernatants was seen in all cases as a band at larger than
Fig. 1. Influence of hormones on mannan-
binding lectin (MBL) production from the
hepatocyte-like cell line HuH-7. The production
of MBL (ng per million cells) after 3 days of syn-
thesis is shown on the ordinate, while the concen-
tration of hormone added is depicted on the
abscissa. The bars represent the mean plus the
standard error of the mean of two separate exper-
iments and each concentration of hormone was
tested in duplicate. (a) growth hormone (GH);
(b) hydrocortisone; (c) insulin-like growth factor
(IGF)-1; (d) interleukin (IL)-6; (e) insulin; (f)
thyroid hormone T3; (g) T4; and (h) combina-
tions of T3 (100 nM), GH (100 ng/ml), hydrocor-
tisone (10 µg/ml), insulin (10 mU/ml) and IL-6
(10 ng/ml). Note the changed scale on the ordi-
nate in (h).
0
1
2
3
4
5
6(a)
MB
L (n
g/10
6 ce
lls)
0 0·1 1
GH (ng/ml)
IGF-1 (ng/ml) IL-6 (ng/ml)
T3 (nM)
Hydrocortisone (ng/ml)
10 100
1000
10 0
00
0
1
2
3
4
5
6(c)
MB
L (n
g/10
6 ce
lls)
0 1 10 100
1000
10 0
00
Insulin (µU/ml)
0
1
2
3
4
5
6(e)
MB
L (n
g/10
6 ce
lls)
0 1 10 100
1000
10 0
00
0
1
2
3
4
5
6(d)
MB
L (n
g/10
6 ce
lls)
0 10.
10.
01 10 100
1000
0
1
2
3
4
5
6(f)
MB
L (n
g/10
6 ce
lls)
0 10.
10.
010.
001 10 10
0
T4 (nM)
0
1
2
3
4
5
6
*
**
*
**
*
(g)
MB
L (n
g/10
6 ce
lls)
0 10.
10.
01 10 100
1000
0
2
4
6
8
10(h)
MB
L (n
g/10
6 ce
lls)
Med
ium T3
T3 +
GH
T3 +
Hydro
cor.
T3 +
Insu
lin
T3 +
IL-6
0
1
2***
3
4
5
6(b)
MB
L (n
g/10
6 ce
lls)
00·
1 1 10 100
1000
10 0
00

C. M. Sørensen et al.
178 © 2006 British Society for Immunology, Clinical and Experimental Immunology, 145: 173–182
250 kDa, corresponding to MBL-II [21] and the addition ofhormones did not change this pattern. MBL purified fromserum is seen as three bands representing MBL-I, MBL-IIand MBL-III, as described previously by us [21]. MBL-I andMBL-II represent trimer and tetramer of the structural sub-unit, respectively [22].
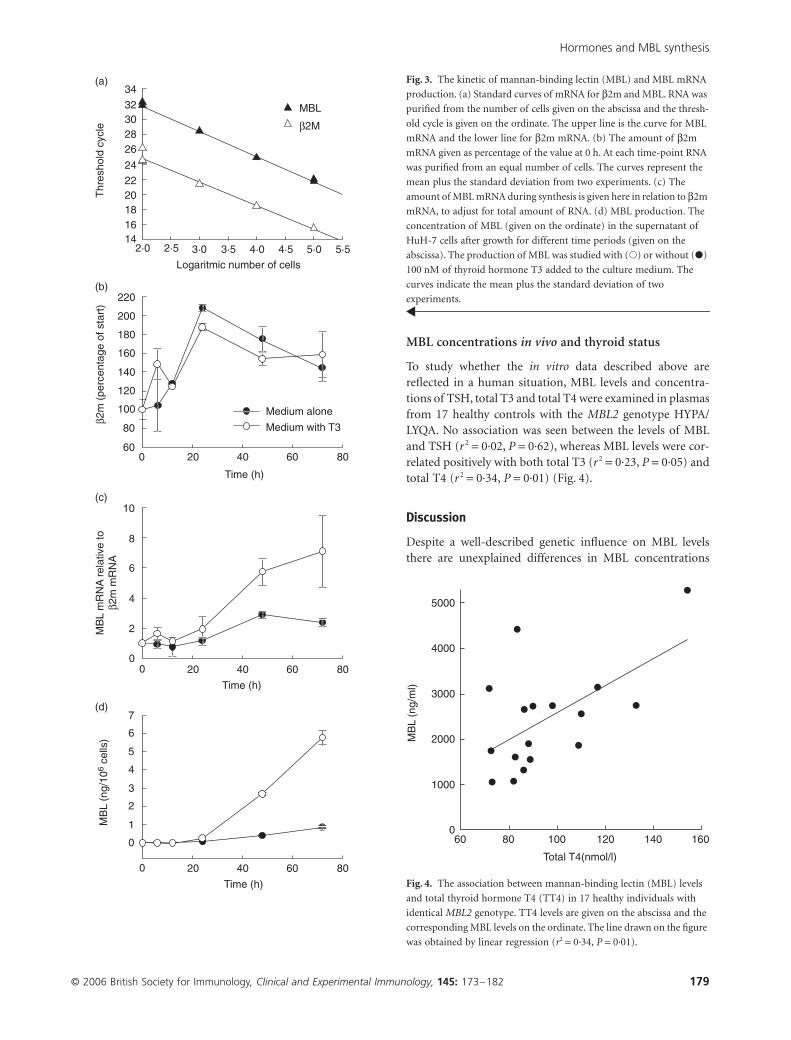
Kinetics of MBL and MBL mRNA production
To investigate whether T3 influences MBL mRNA levels andto study the kinetics of MBL production from HuH-7 cellsthe supernatant and cells were harvested 6, 9, 12, 24, 48 and72 h after addition of medium alone or medium with100 nm of T3. RNA was extracted from the harvested cellsand used in a real-time quantitative RT–PCR analysis. Thenumber of cells was counted and an equal amount of cellswere used for the RNA purification. Following cDNA syn-thesis the amount of products were measured by TaqManchemistry during the amplification. β2m was used ashousekeeping gene to adjust for amount of added RNA. Inorder to examine the suitability of this approach RNA waspurified from dilutions of HuH-7 cells (grown without hor-mones added). The dilution curves (Ct versus cell number)of the two mRNAs were found to be parallel, indicating thatit is relevant to use the ratio between the two mRNAs
(Fig. 3a). The production of β2m mRNA increased twofoldafter the first 24 h, and from 24 to 72 h there was a modestdecline (Fig. 3b). This development in β2m mRNA amountwas not influenced by the addition of T3 (Fig. 3b). It wasconcluded that β2m, in accordance with other publishedfindings [23] was appropriate as the housekeeping gene.The ratio between MBL mRNA and β2m mRNA was stableduring the first 24 h, whether or not the cells were underthe influence of T3. Between 24 and 48 h there was anincrease in the MBL/β2m mRNA ratio (Fig. 3c). Thisincrease was larger under the influence of T3, and thus cre-ated a significant difference in the MBL2/β2m mRNA ratio(Fig. 3c). From 48 h and onwards to 72 h after the start ofsynthesis this ratio remained constant. With regard to theconcentration of MBL in the culture medium, it was belowthe sensitivity of the MBL assay (30 pg/ml) during the first12 h. From 24 h to 72 h there was a gradual increase in MBLup to 16 pg per hour per 106 cells from cells grown inmedium only, while the addition of 100 nM T3 increasedthe production to 115 pg per hour per 106 cells (Fig. 3d).The concentration of HSA was also followed, and no differ-ence in HSA production was seen between medium with orwithout T3 added.
It has been suggested previously that MBL might be syn-thesized from monocytes [24], but we did not find anyMBL mRNA to be present in monocytes or in RNA iso-lated from full blood (the presence of β2m mRNA wasused as positive control) from a person with wild-typegenes.
Cytokine production
The influence of hormones on the synthesis of the cytokinesIL-2, -4, -6, -8, -10, GM-CSF, IFN-γ and TNF-α from theHuH-7 cell line was investigated. A stable level of IL-8 wasobserved, with concentrations between 300 and 750 pg/ml inthe supernatants (not shown). None of the hormones hadany effect on the IL-8 levels.
There was a barely detectable production of IL-6 with aconcentration of just above 2 pg/ml in the supernatants. Thisproduction was unaffected by addition of any of the hor-mones. This was a several-fold lower concentration than theconcentration reached when IL-6 was added directly to themedium, e.g. when 100 000 pg/ml of IL-6 was added to thewells (4800 pg/ml was detected after 3 days of culture). Thisindicates that the increased MBL production from GH, T3and T4 was not secondary to stimulation of IL-6 productionfrom the cells.
In general, the production of IL-2, -4 and -10, GM-CSF,IFN-γ and TNF-α was below the detection limit. Theexception was when supraphysiological concentrations (seeabove) of IL-6 was added to the culture medium, in whichcase there was a dose-dependent increase in production ofIL-4 to 7·2 pg/ml, TNF-α to 7·6 pg/ml, GM-CSF to 6·5 pg/mland IFN-γ to 35 pg/ml, respectively.
Fig. 2. The effect of hormones on the oligomerization of MBL polypep-
tide chains. Mannan-binding lectin (MBL) purified by antibody-based
affinity purification from 500 µl culture supernatant, or from 2·8 µl or
0·28 µl serum was applied to the well of a sodium dodecyl sulphate–
polyacrylamide gel electrophoresis (SDS-PAGE) gel. The hormones
used for stimulating synthesis are given at the top of the figure, as also
are the amounts of MBL present in the different supernatants. After
electrophoresis and blotting the membrane was developed with anti-
MBL antibody. Molecular weight markers (kDa) are given on the left
and the positions of the serum forms of MBL are indicated.
MBL-IIIMBL-II
MBL-I250
150
100
75
50
37
Ser
um: 1
0 ng
Ser
um: 1
ng
Med
ium
: 0.4
ng
Hyd
roco
rt: 0
.4 n
g
Insu
lin: 0
.5 n
g
IGF
-1: 0
.5 n
g
IL-6
: 1.2
ng
GH
: 1.5
ng
T4:
3.4
ng
T3:
3.5
ng
Hormones and MBL synthesis
© 2006 British Society for Immunology, Clinical and Experimental Immunology, 145: 173–182 179
MBL concentrations in vivo and thyroid status
To study whether the in vitro data described above arereflected in a human situation, MBL levels and concentra-tions of TSH, total T3 and total T4 were examined in plasmasfrom 17 healthy controls with the MBL2 genotype HYPA/LYQA. No association was seen between the levels of MBLand TSH (r2 = 0·02, P = 0·62), whereas MBL levels were cor-related positively with both total T3 (r2 = 0·23, P = 0·05) andtotal T4 (r2 = 0·34, P = 0·01) (Fig. 4).
Discussion
Despite a well-described genetic influence on MBL levelsthere are unexplained differences in MBL concentrations
MBL
(a)
(b)
(c)
Thr
esho
ld c
ycle
34
32302826
242220181614
2·0
220
200
180
160
140
120
100
80
β2m
(pe
rcen
tage
of s
tart
)
600
00
2
4
MB
L m
RN
A r
elat
ive
toβ2
m m
RN
A
6
8
10
20 40
Time (h)
Time (h)
Medium alone
Medium with T3
60 80
20 40 60 80
0
0
1
2
3
4
5
6
7(d)
MB
L (n
g/10
6 ce
lls)
Time (h)
20 40 60 80
2·5 3·0 4·0 5·0 5·54·53·5
Logaritmic number of cells
β2M
Fig. 3. The kinetic of mannan-binding lectin (MBL) and MBL mRNA
production. (a) Standard curves of mRNA for β2m and MBL. RNA was
purified from the number of cells given on the abscissa and the thresh-
old cycle is given on the ordinate. The upper line is the curve for MBL
mRNA and the lower line for β2m mRNA. (b) The amount of β2m
mRNA given as percentage of the value at 0 h. At each time-point RNA
was purified from an equal number of cells. The curves represent the
mean plus the standard deviation from two experiments. (c) The
amount of MBL mRNA during synthesis is given here in relation to β2m
mRNA, to adjust for total amount of RNA. (d) MBL production. The
concentration of MBL (given on the ordinate) in the supernatant of
HuH-7 cells after growth for different time periods (given on the
abscissa). The production of MBL was studied with (�) or without (�)
100 nM of thyroid hormone T3 added to the culture medium. The
curves indicate the mean plus the standard deviation of two
experiments.
Fig. 4. The association between mannan-binding lectin (MBL) levels
and total thyroid hormone T4 (TT4) in 17 healthy individuals with
identical MBL2 genotype. TT4 levels are given on the abscissa and the
corresponding MBL levels on the ordinate. The line drawn on the figure
was obtained by linear regression (r2 = 0·34, P = 0·01).
5000
4000
3000
2000MB
L (n
g/m
l)
1000
060 80 100 120 140 160
Total T4(nmol/l)

C. M. Sørensen et al.
180 © 2006 British Society for Immunology, Clinical and Experimental Immunology, 145: 173–182
between individuals with the same genotype [7]. We testedthe impact of a range of different hormones and IL-6 onMBL production from the HuH-7 cell line and found thatthyroid hormones in particular, but also GH and to a lesserextent IL-6, influence production. These findings are in linewith recent clinical data showing significant variations inMBL levels with variations in GH and thyroid hormone sta-tus [17,18].
We studied hepatocyte cell lines as MBL production inhealthy humans has been confirmed mainly in liver cells,although the presence of MBL mRNA and of MBL wasindicated in biopsies from intestinal tissue from patientswith coeliac disease [25], and low levels of MBL2 mRNAwas also reported in RNA from the small intestine and intestis [26]. The expression levels in the latter tissues wereless than 1% of the MBL mRNA levels from liver cells.Confirming the hepatic origin of MBL, by studying livertransplantations it was found that plasma MBL levels werestrictly dependent upon the genotype of the donor liver[27]. It has been suggested previously that MBL might besynthesized from monocytes [24], but we did not find anyMBL mRNA to be present in monocytes or in RNA isolatedfrom full blood.
We identified MBL production from the hepatoma celllines HuH-7 and HuH-1. The production was higher inHuH-7 in accordance with the fact that the genotype of thiscell line was HYPA/HYPA, known to be associated with highMBL levels, compared to the genotype LYPB/LYQA (which isassociated with medium levels of MBL) for HuH-1. Therewas no measurable MBL production in any of the otherscreened cell types. This may be expected for Chang livercells, as they have a genotype expected to give low levels ofMBL, but not of HLF, where a genotype was found associ-ated normally with higher MBL levels.
It has been reported previously that addition of 20 ng/mlIL-6 or 0·4 µg/ml dexamethasone to HuH-7 cells results inup-regulation of MBL mRNA, whereas the addition of IL-1results in a down-regulation of MBL mRNA synthesis [28].The changes in mRNA were measured after 12–24 h of stim-ulation via RT–PCR followed by Southern blot hybridiza-tion, a technique that lacks the precision of today’s real-timequantitative PCR. In the present report we do see a relativeincrease in MBL mRNA levels, but not until after 24 h ofstimulation, and we do not find MBL protein production tobe influenced by 100 ng/ml IL-6 or from 10 µg/ml of hydro-cortisone (equivalent to 0·38 µg/ml dexamethasone).
We have reported previously that GH, but not IGF-1,administration to humans increased the concentration ofMBL [17]. Patients with an increased production of GH(acromegaly) were found to have a higher MBL concentra-tion than normal individuals, and this concentration waslowered when they were treated with a GH-receptor antag-onist. The stimulatory effect of GH is also seen when treatingpatients with Turner syndrome [29]. In the present report wefound a significant increase in MBL production when
stimulating the HuH-7 cells with GH (100 ng/ml), whileIGF-1 had no effect. GH may thus act directly on the hepa-tocytes in vivo. In vivo the concentration of GH fluctuatesbetween 0·05 and 50 ng/ml.
In the present study the glucocorticoid, hydrocortisoneand insulin showed no effect on MBL production. In oneprevious study another glucocorticoid, dexamethasone, wasreported to down-regulate the activity of the MBL promoter[15]. In another study where MBL mRNA was measured,dexamethasone resulted in an up-regulation of MBL mRNA[28]. With regard to insulin, no previous in vitro studiesexist, but we [30] and others [31] have reported that patientswith insulin-dependent (type 1) diabetes have approxi-mately 1·3-fold higher MBL levels than healthy people. Wehave speculated that this could be due to lower hepatic insu-lin levels in diabetics, i.e. that insulin depresses the produc-tion of MBL. In another study, the MBL levels of patientsadmitted to intensive care, where half of them were selectedfor intensive insulin treatment, was followed [32]. Duringthe stay at the intensive care unit, the MBL levels increased ingeneral, but the insulin-treated group had a slightly (but sig-nificant) smaller increase in MBL levels. We found no effectof adding insulin to the HuH-7 cells either alone or in com-bination with T3, suggesting that MBL production is notinfluenced directly by insulin.
When IL-6 was added to the cell culture, we observed onlya very modest increase in synthesis of MBL and only whenusing IL-6 at 1 µg/ml. This is considerably more than the50 ng/ml systemic IL-6 concentrations associated with anacute phase response. In the literature MBL is often referredto as an acute phase protein [33], and we have published pre-viously that MBL levels in patients undergoing hip opera-tions increased approximately twofold, but not until 2 weeksafter the operation [16], and in a study of 451 critically illpatients MBL levels were increased two- to threefold 7 daysafter the patients were admitted to intensive care [32]. Incomparison, a classical acute phase protein, CRP, peakedwith 10–100-fold increased concentrations several days ear-lier. Another study found that in patients with sepsis andseptic shock, the majority of patients do not display an MBLacute phase response [34]. These results, together with thefindings in the present report, underscore that viewing MBLas a classical acute phase protein greatly stimulated by IL-6 ismisleading rather than revealing. However, it may be that themodest increase in MBL during an acute phase response isdue to hormonal changes. During acute illness there is anincreased production of hormones from the pituitary gland,e.g. the GH level is increased [35].
The strongest hormonal influence we observed wasinduced by the thyroid hormones T3 and T4, indicating thatthey have an important role in regulating the MBL produc-tion. It has been reported recently that hyperthyroid patientshad significantly higher MBL levels before than after treat-ment for the disease [18]. Hypothyroid patients, on the otherhand, had low MBL levels during disease, which increased

Hormones and MBL synthesis
© 2006 British Society for Immunology, Clinical and Experimental Immunology, 145: 173–182 181
after T4 substitution. The in vitro data in the present studysuggest a direct effect on the liver cell by thyroid hormones asthe explanation to the in vivo findings. We found that a com-parable effect of T4 was seen at a concentration 100 timeshigher than that needed of T3, which is in concordance withT3 being the most potent of the two in vivo [36]. The con-centration of T3 (1 nM) and T4 (100 nM) significantlyincreasing the MBL levels, are similar to the levels of total T3and T4 found in plasma, i.e. approximately 2 nM and100 nm, respectively. The stimulatory effect of thyroid hor-mones on MBL level is not unique to MBL; for example,cDNA microarray analysis and in vitro protein measure-ments have revealed that a broad range of other plasma pro-teins are also influenced in a stimulatory or inhibitorymanner by thyroid hormones [36,37].
While thyroid hormones may explain part of theintragenotype variation, they may also provide an explana-tion to other changes of MBL levels; for example, duringpregnancy thyroid hormone levels are increased [38], and ithas been described that the MBL levels increase twofold dur-ing pregnancy [39].
We analysed whether there was a synergistic effect of otherhormones on the T3-mediated effect, and we found that thestimulatory effect on MBL production by T3 was augmentedby addition of GH to the medium. This indicates that thestimulatory mechanisms of T3 and GH were either unsatur-ated or independent of each other.
The promoter region of MBL2 was studied by Madsen andcolleagues [40] and recently in more detail by Naito andcoworkers [15]. It contains a TATA box, a CAAT box, type 1and type 2 IL-6 response elements, a glucocorticoid responseelement and hepatocyte nuclear factor 3 (HNF-3) recogni-tion sites. To analyse the activity of the MBL2 promoter,Naito et al. made a reporter gene construct which they trans-fected into the human hepatoma cell line HepG2. Observingthe effect of deletion of parts of the promoter they found thatin particular deletion of some of the HNF-3 sites had a neg-ative effect on the promotor activity. In cows GH has a strongstimulatory effect on HNF-3 production [41], and it may bethat the same is true in humans. MBL production may thusbe promoted via an up-regulation of HNF-3, but the mech-anism by which GH and thyroid hormones affect the MBLpromoter remains to be elucidated.
The stimulatory effect of T3 on MBL levels was reflected inan increase in MBL mRNA, indicating that the effect was dueto an effect on transcription. The MBL mRNA/β2m mRNAratios rose with and without T3 in the time-span from 24 to48 h after start of the cell culture, while an increase in β2mmRNA was seen from 12 to 24 h. This increase in β2mmRNA synthesis is induced probably by stress caused by thechange in medium. The time lapse before increase in MBLmRNA synthesis is seen indicates that the effect of the hor-mones is not a direct effect on assembly of transcription fac-tors. Rather, the hormones are probably stimulating up- ordown-regulation of other factors.
With regard to cytokine production by HuH-7 cells onlyIL-8 could be detected at levels above the detection limit ofthe assays, and the level was not influenced by the presence ofhormones or IL-6. The exception was when IL-6 was addedto the culture supernatant in very high concentrations,which resulted in a marginal but dose-dependent and statis-tically significant increase in IL-2, -4, TNF-α, GM-CSF andIFN-γ. IL-6 production was barely increased to a detectablelevel when stimulating with GH, T3 and T4, indicating thatthe increased MBL production was not secondary to stimu-lation of hepatic IL-6 production.
When looking at one isolated genotype, e.g. HYPA/LYQA, an interindividual fivefold variation in MBL levelswas seen previously [7]. Environmental or hormonal influ-ences on this variation have been suggested logically, buthave not yet been explored. We investigated whether thy-roid hormone levels are associated with MBL levels inhealthy people with an identical genotype. We found MBLlevels ranging from 1050 ng/ml to 5168 ng/ml and a signifi-cant positive correlation between MBL levels and both totalT3 and T4. Larger study groups may be relevant, but thedata indicate that variations in total T4 may explain 34% ofthe observed variation in MBL levels in healthy subjectswith identical genotypes.
Our in vitro findings confirm clinical observations ofhormonal influence on MBL synthesis. Compared to thestrong impact of MBL2 genotypes these hormonal inputsmay, in healthy individuals, merely represent a fine-tuningof circulating levels, although the fluctuations in MBL lev-els seen in patients with hyper- and hypothyroidism aresubstantial. Rather than being attributable to a classical IL-6-dependent acute phase response, the slow and modestincrease in MBL levels seen in critically ill patients and aftermajor surgery may well be secondary to changes in hor-mone levels.
Acknowledgements
We are grateful for the excellent technical help provided byAnnette Hansen and Lisbeth Jensen. The work was sup-ported by the Danish Research Council.
References
1 Walport MJ. Complement. First of two parts. N Engl J Med 2001;
344:1058–66.
2 Walport MJ. Complement. Second of two parts. N Engl J Med
2001; 344:1140–4.
3 Turner MW. The role of mannose-binding lectin in health and dis-
ease. Mol Immunol 2003; 40:423–9.
4 Lipscombe RJ, Sumiya M, Summerfield JA, Turner MW. Distinct
physicochemical characteristics of human mannose binding pro-
tein expressed by individuals of differing genotype. Immunology
1995; 85:660–7.
5 Garred P, Larsen F, Madsen HO, Koch C. Mannose-binding lectin
deficiency − revisited. Mol Immunol 2003; 40:73–84.

C. M. Sørensen et al.
182 © 2006 British Society for Immunology, Clinical and Experimental Immunology, 145: 173–182
6 Thiel S, Vorup-Jensen T, Stover CM et al. A second serine protease
associated with mannan-binding lectin that activates complement.
Nature 1997; 386:506–10.
7 Steffensen R, Thiel S, Varming K, Jersild C, Jensenius JC. Detec-
tion of structural gene mutations and promoter polymorphisms
in the mannan-binding lectin (MBL) gene by polymerase chain
reaction with sequence-specific primers. J Immunol Meth 2000;
241:33–42.
8 Super M, Thiel S, Lu J, Levinsky RJ, Turner MW. Association of
low levels of mannan-binding protein with a common defect of
opsonisation. Lancet 1989; 2:1236–9.
9 Kristensen MM, Wang W, Ruseva M et al. Mannan-binding lec-
tin recognizes structures on ischaemic reperfused mouse kidneys
and is implicated in tissue injury. Scand J Immunol 2005;
61:426–34.
10 Hart ML, Ceonzo KA, Shaffer LA et al. Gastrointestinal ischemia-
reperfusion injury is lectin complement pathway dependent with-
out involving C1q. J Immunol 2005; 174:6373–80.
11 Walsh MC, Bourcier T, Takahashi K et al. Mannose-binding
lectin is a regulator of inflammation that accompanies myocar-
dial ischemia and reperfusion injury. J Immunol 2005;
175:541–6.
12 Hansen TK, Tarnow L, Thiel S et al. Association between mannose-
binding lectin and vascular complications in type 1 diabetes.
Diabetes 2004; 53:1570–6.
13 Saraheimo M, Forsblom C, Hansen TK et al. Increased levels of
mannan-binding lectin in type 1 diabetic patients with incipient
and overt nephropathy. Diabetologia 2005; 48:198–202.
14 Taylor ME, Brickell PM, Craig RK, Summerfield JA. Structure and
evolutionary origin of the gene encoding a human serum man-
nose-binding protein. Biochem J 1989; 262:763–71.
15 Naito H, Ikeda A, Hasegawa K et al. Characterization of human
serum mannan-binding protein promoter. J Biochem 1999;
126:1004–12.
16 Thiel S, Holmskov U, Hviid L, Laursen SB, Jensenius JC. The con-
centration of the C-type lectin, mannan-binding protein, in
human plasma increases during an acute phase response. Clin Exp
Immunol 1992; 90:31–5.
17 Hansen TK, Thiel S, Dall R et al. GH strongly affects serum con-
centrations of mannan-binding lectin: evidence for a new IGF-I
independent immunomodulatory effect of GH. J Clin Endocrinol
Metab 2001; 86:5383–8.
18 Riis ALD, Hansen TK, Thiel S et al. Thyroid hormone increases
mannan-binding lectin levels. Eur J Endocrinol 2005; 153:643–
9.
19 Steffensen R, Hoffmann K, Varming K. Rapid genotyping of MBL2
gene mutations using real-time PCR with fluorescent hybridisation
probes. J Immunol Meth 2003; 278:191–9.
20 Dumestre-Perard C, Ponard D, Colomb MG. Analysis of low
molecular weight intracellular associations of a human mannan
binding lectin (MBL). Mol Immunol 2004; 40:795–801.
21 Dahl MR, Thiel S, Matsushita M et al. MASP-3 and its association
with distinct complexes of the mannan-binding lectin complement
activation pathway. Immunity 2001; 15:127–35.
22 Teillet F, Dublet B, Andrieu JP, Gaboriaud C, Arlaud GJ, Thielens
NM. The two major oligomeric forms of human mannan-binding
lectin: chemical characterization, carbohydrate-binding proper-
ties, and interaction with MBL-associated serine proteases. J
Immunol 2005; 174:2870–7.
23 Joste V, Goitom Z, Nelson BD. Thyroid hormone regulation of
nuclear-encoded mitochondrial inner membrane polypeptides of
the liver. Eur J Biochem 1989; 184:255–60.
24 Downing I, Koch C, Kilpatrick DC. Immature dendritic cells pos-
sess a sugar sensitive receptor for human mannan-binding lectin.
Immunology 2003; 109:360–4.
25 Bonitto M, Radillo O, Braida L et al. Detection of MBL-2 gene
expression in intestinal biopsies of celiac patients by in situ reverse
transcription polymerase chain reaction. Eur J Histochem 2003;
47:177–80.
26 Seyfarth J, Garred P, Madsen HO. Extra-hepatic transcription of
the human mannose-binding lectin gene (mbl2) and the MBL-
associated serine protease 1–3 genes. Mol Immunol 2005; 43:962–
71.
27 Bouwman LH, Roos A, Terpstra OT et al. Mannose binding lectin
gene polymorphisms confer a major risk for severe infections after
liver transplantation. Gastroenterology 2005; 129:408–14.
28 Arai T, Tabona P, Summerfield JA. Human mannose-binding pro-
tein gene is regulated by interleukins, dexamethasone and heat
shock. Q J Med 1993; 86:575–82.
29 Gravholt CH, Leth-Larsen R, Lauridsen AL et al. The effects of GH
and hormone replacement therapy on serum concentrations of
mannan-binding lectin, surfactant protein D and vitamin D
binding protein in Turner syndrome. Eur J Endocrinol 2004;
150:355–62.
30 Hansen TK, Thiel S, Knudsen ST et al. Elevated levels of mannan-
binding lectin in patients with type 1 diabetes. J Clin Endocrinol
Metab 2003; 88:4857–61.
31 Saevarsdottir S, Oskarsson OO, Aspelund T et al. Mannan binding
lectin as an adjunct to risk assessment for myocardial infarction in
individuals with enhanced risk. J Exp Med 2005; 201:117–25.
32 Hansen TK, Thiel S, Wouters PJ, Christiansen JS, Van den Berghe
G. Intensive insulin therapy exerts antiinflammatory effects in
critically ill patients and counteracts the adverse effect of low
mannose-binding lectin levels. J Clin Endocrinol Metab 2003;
88:1082–8.
33 Ezekowitz RA, Day LE, Herman GA. A human mannose-binding
protein is an acute-phase reactant that shares sequence homology
with other vertebrate lectins. J Exp Med 1988; 167:1034–46.
34 Dean MM, Minchinton RM, Heatley S, Eisen DP. Mannose bind-
ing lectin acute phase activity in patients with severe infection. J
Clin Immunol 2005; 25:346–52.
35 Van den Berghe G. Novel insights into the neuroendocrinology of
critical illness. Eur J Endocrinol 2000; 143:1–13.
36 Lin KH, Lee HY, Shih CH et al. Plasma protein regulation by thy-
roid hormone. J Endocrinol 2003; 179:367–77.
37 Lin KH, Chen CY, Chen SL et al. Regulation of fibronectin by thy-
roid hormone receptors. J Mol Endocrinol 2004; 33:445–58.
38 Burrow GN, Fisher DA, Larsen PR. Maternal and fetal thyroid
function. N Engl J Med 1994; 331:1072–8.
39 Kilpatrick DC. Mannan-binding lectin concentration during nor-
mal human pregnancy. Hum Reprod 2000; 15:941–3.
40 Madsen HO, Garred P, Thiel S et al. Interplay between promoter
and structural gene variants control basal serum level of mannan-
binding protein. J Immunol 1995; 155:3013–20.
41 Eleswarapu S, Jiang H. Growth hormone regulates the expression
of hepatocyte nuclear factor-3 gamma and other liver-enriched
transcription factors in the bovine liver. J Endocrinol 2005;
184:95–105.