historical landmarks of the management of
TRANSCRIPT
Vol. 14, No. 1 2020
DOI: 10.14232/analecta.2020.1.1-8
1
HISTORICAL LANDMARKS OF THE MANAGEMENT OF MAJOR URBAN
LOGISTICS PROJECTS IN IMPERIAL TIMISOARA
1Somkereki Andreea-Eva,
2Petrișor Ioan
1Department of Management, West University of Timisoara, J. H. Pestalozzi street, nr. 16, 300115 Timișoara, România, e-mail: [email protected]
2 Department of Management, West University of Timisoara, J. H. Pestalozzi street, nr. 16, 300115 Timișoara, România,
e-mail: [email protected]
ABSTRACT
This article follows a holistic-complete approach[1] to the management of the major urban logistics projects of
Imperial Timisoara. The research and studies conducted so far have been based on unilateral approaches: either
exclusively historical or engineering. Research of such projects requires multi-scientific and multidisciplinary
treatment angles. Our investigative optics is a managerial-holistic-complete one, which aims to integrate, besides the
historical, technical / technological aspects, the architectural aspects, along with the multicultural, socio-human, ethnic,
anthropological. In this sense, the strategic references of urban essence are related to the potential of Timisoara city and
its ability to carry out such projects, in the contexts specific to the different periods of its logistic development. The
multitude of researched data sources, information and documents enables us to innovate the analytical approach of
major urban logistics projects, using the logic of public management, in a holistic-complete, integrative vision. This
research is part of a comprehensive study on general urban public management. We are convinced that such research,
in such a way, will contribute substantially to a deeper understanding of Timisoara's contribution to its own
Europeanization and the region it was part of, the Imperial Historical Banat.
Keywords: urban logistics, urban public management, holistic approach, historical logistics projects, historical
Timisoara
1. INTRODUCTION
Generally speaking, people certainly have been influencing and will influence the process of change,
transformation and innovation in a society and implicitly in its various fields. However, we can distinguish
different levels of involvement in these processes, so we highlight the important role of some society
members whose contribution is significantly more to the development of their society and, implicitly, of
the physical space, the city or town, in which the society exists. Thus, we described the indissoluble link
between physics and metaphysics in the process of urban development, namely between humans and
resources and their relationship. We believe that people, through attitudes, levels of involvement and
specific administration-management modalities, can create a difference between the level of development
of two societies and the urban space in which they live.
2. MATERIALS AND METHODS
This research aims at creating a record or collection of the main historical events in the area of urban
logistics projects management. The research methodology used in this study is a combination between the
historical and managerial research methodology. Among the research objectives is also the comparison of
Timisoara's urban public management performance in relation to the public management carried out in
different areas of the Empire or in Europe in order to bring to the world information about the primacy of
the research result. The difficulties of the research were due to the large sum of data existing in the national
archives and the relatively short time. Thus, only the most important projects (important from the
perspective of the Imperial or European primacy) were surprised in the creation of an eloquent image of
Timisoara's urban development between 1716 and 1914.
In the particular case, we selected for research some facts, historical events as historical landmarks of
Timisoara city management, from the most dense periods in terms of technological progress, in order to
Vol. 14, No. 1 2020
DOI: 10.14232/analecta.2020.1.1-8
2
prove that it had personalities from the field of administrative-public management, who through specific
attitudes, implications and processes (strategic approach) managed to positively and constructively
influence Timisoara in the development process of the Imperial period.
3. RESULTS AND DISCUSSION
The administrative change in 1716 meant for the city of Timisoara a new beginning, a whole new approach
in terms of public administration. The period under review reflects a new start and in terms of progress and
development potential and is characterized by an abundance of urban management premiere and not only at
local, regional and European level owing to a new way of original management of the territories annexed
to the Empire. The Banat region and the Timisoara town were administered by Imperial structures such as
the Crown and the Imperial Chamber, through the Aulic Forces in Vienna[2] (the Aulic Chamber and the
Aulic War Council) under the institutional structure of the Provincial Imperial Administration[3] of the
Banat region. At the regional level, the direct, administrative lead of the Provincial Administration was the
General Command. At the level of Timisoara city, the German Magistrate[4][5] and then the Serbian
Magistrate represented major local administrative institutions subordinated to the Provincial
Administration[6]. Division of territory by administrative units called districts[7] run by an administrator.
In each village there was a sub-administrator, as the head of each village was a principal or mayor. The
administrators were subordinate to the General Command.
The Provincial Administration has contributed to the development of the region by developing general
reorganization framework plans[8], providing already functional institutional structures at the level of the
Empire and implementable in the region and implicitly in the city of Timisoara. The General Command
and the Magistrates in the city benefited from the flexibility and financial support of the Provincial
Administration for the planned and developed urban projects at the local level.
In addition to the central and local administrative institutions, leaders, who initiated urban managerial
projects, have maintained institutional relations which contributed to the successful implementation and
finalization of these projects.
The first person who initiated, planned and implemented the Timisoara strategic Reconstruction Plan was
Claudius Florimund Mercy, he was the Governor of Banat after the administrative change from Ottoman to
Imperial. Mercy has initiated many, not only large and successful logistics projects by applying urban
management similar to what we call today modern public management. This also reflects a premiere for
urban management, for the analyzed period of time.
Mercy addressed the issue of administration, being governed by the idea of participative urban
democracy[9]. Perceived by the inhabitants as their friend and acknowledged among them for his
knowledge and experience. Thus, we can categorize the governor's behaviour into the category of leader
that involves and invites the population to make decisions about the reorganization of the city. This attitude
can be assimilated to a public managerial behaviour characterized by a participative leadership style and
constituting an innovation in the field of governance, administration, urban management for that period,
through the constitution of the first elements of participatory urban democracy. Rigorousness[10] and
structuring played an important role in the whole process of reorganization of Timisoara, consisting of a set
of priorities embodied in urban plans and projects.
Mercy's priorities, reorganization strategies, strategic intentions, and the order of their planning highlight a
profound process of analyzing, anticipating and assessing needs, public needs, and prioritizing their
satisfaction in generating the most benefits and optimizing losses, costs associated with the proposed
changes. From the point of view of urban management, logistics projects are part of it due to the fact that
the whole reorganization process can be assimilated to the urban planning process, which is composed of
cadastral, hydrological, emergency, calamity, public construction projects and private, construction
standards, internal and external transport, urban aesthetics, utilities, green areas and parks, households,
recreation areas at regional, district or residential level, industrial parks, factories, enterprises, preservation,
institutions, continuous development. [11]
Vol. 14, No. 1 2020
DOI: 10.14232/analecta.2020.1.1-8
3
The continuous concern of the local urban administration over the dangers has contributed to the urban
logistics development of the city of Timisoara. For example, the drinking water piping system [12] together
with the hydraulic pump is a first-ever, and is among the first such systems in Europe. This system is an
important element of the development of urban logistics and is an exceptional result that has the ability to
distinguish the city of Timisoara from other known, developed cities of the world, at least in terms of the
drinking water distribution system. However, this result derives not only from the existence at a given
point in time of an urban logistics project for water distribution but is due to the constant concern to
eliminate or reduce the impact of a fire, regardless of the nature of its source. Ever since the Ottoman
administration, the Timisoara fortress had a water tower. This tower was rebuilt in another location (to
ensure good visibility on the surroundings - so the tower was the physical observation, monitoring and
control tool) and gradually assigned multiple uses. Due to the fact that the fortress was built in the
marshland it was protected from possible enemies found difficult or almost impossible to access.
This geological feature and the ability to control the flow of the Timis and Bega rivers to flood the territory
outside the city contributed to the formation of a unique defense capability that became a strong
competitive advantage throughout the fortress's history (the city being conquered only by 2 times). This
advantage was also a risk due to the fact that it influenced the air quality in the city and its surroundings,
allowing the disease to spread more rapidly. Thus, the first preventive measures consisted in the process of
draining the area, improving the quality of the drinking water and its accessibility through the development
of the hydraulic machine. The administrative project for the drainage of the marshland marked the
beginning of the development of the internal and external logistics of the city. Dry land maintenance has
allowed the construction of bridges, roads, railways, urban rail transport, tramway infrastructure, road
infrastructures, Bega sewerage and short- and long-distance river transport. Many of the above examples
are at local, regional, European level. Important aspects will be presented in detail below and also
represent the urban logistics complexity achieved through the major urban logistics projects.
The separate development process of the old town area of the suburban area has acted as a catalyst for the
development of terrestrial logistics[13], especially the infrastructure of the rivers and bridges system that
ensured the connection between the two areas. This distance between the town and suburban areas was
important due to the geo-strategic location of the city. The defense system was based on the marshland,
increasing the safety[14] of the inhabitants and activities of the city. The vision for the development of
logistics in the future puts in the market the maintenance of safety based on geological features or the
renunciation of this advantage in order to initiate and develop new projects. So, a decision was taken on
initiating administrative project draining swamps and marshlands and opening the town. Once the old town
walls where opened the local administration had initiated many projects of urban logistics resulting in the
construction of bridges connecting dry land by roads, reducing the distance between the city and suburbs,
forming the nucleus of local urban terrestrial logistic system and resulting logistically interconnected city
having already common governing structure, both the old town and the suburban areas as well.
(1) Building new bridges requires ministerial approvals, being considered important from the point of
view of the security of the region and the empire. The difficulty and temporal inefficiency of the process of
obtaining opinions has determined the degree of similarity between bridges, and the same plans are used to
build more bridges and superstructures. Originality in this area was concretized through a local premiere,
the first road bridge in the region built from cast steel - the Golden Anchor Bridge. Important events that
influenced urban re-development / construction of bridges in the city: the transformation of the Bega canal
waterway across the territory of the city, 1898 establishment Tramvaie- Society S.A., hydropower plant
construction, the opening of new streets. The interference of these events and the beneficial, developer-like
effect on the construction of bridges actually reflect the systematic and sustained[15] development of the
entire infrastructure of urban logistics.
(2) Exploitation, storage and capitalization of natural resources can be regarded as another urban
logistic development imbold. Several natural resources, such as wood, an important resource for
construction and a certain period without substitutes, were found in the territory of Banat. The geological
features and an underdeveloped road network did not allow it to be capitalized. The existence of the urban
public administration's concern for forest management is due to the existence of regulatory documents
Vol. 14, No. 1 2020
DOI: 10.14232/analecta.2020.1.1-8
4
regarding the price, the quality of these resources[16]. Thus, in order to capitalize natural resources, it was
necessary to develop access routes which were materialized by the construction of river or terrestrial
infrastructure. The discovery of the opportunities and the necessary action to obtain the benefits from them
as well as the cost-benefit analysis are basic activities in private enterprises, so we can state that some
urban projects have an oeconomic and not only administrative orientation[17]. The channeling of the Bega
River, as a project for external river logistics of the city, provided the most economic way through which
the wood/timber was transported[18] to Timisoara. The personalization of the logistics projects and the
sequential construction of these projects has enabled the results to be as efficient as possible and did not
jeopardize the integrity or functionality of the project as a whole. In terms of strategic management, we can
name these ways of streamlining by personalizing logistics projects and urban logistics customization
strategies. The fact that the Bega Channel was built in the most straight lines is the goal of streamlining
river logistics, and the construction of multiple small sewers with locks, wood/timber storehouses right
next to the Fabric suburb is the desideratum of customizing logistics to make wood transport more
efficient. The desideratum of the development of the infrastructure needed for foreign trade to Central
Europe has been shaped by the development of local agriculture and crafts. Thus, in terms of strategic
management, we wanted to capitalize on the craft and trade potential. This priority was achieved in the first
phase by channeling the Bega River, thus obtaining a connection through Tisa to the Danube and the
Danube to central Europe. This channel was to be called Mercy Navigable Canal. And from this project
can be inferred both a commercial and relational orientation (transport of persons) to the markets, the
European cities. This ambitious project constituted the beginning of domestic and foreign urban logistics
through the transport of goods and passengers both in the city and gradually over longer distances between
cities. Among the works adjacent to the sewerage can be mentioned: the first channel to begged on Bega
(Timişul Mic), between Faget and Timisoara is made in 1718, and until 1732 by Zrenjanin to reach
Pancevo by fluvial vessel. The second major work is represented regular river transport of passengers and
cargo on the Bega Canal, a regional premiere, turned out to be the first in the region of Banat. From the
description of a historical document[19] on the regulation of trade[20] in food made by foreigners on
foreign commercial vessels that stop in the so-called Mercy Navigable Canal, public management is
revealed, the public use of the canal under the supervision of a police committee (Policey Comißsion) to
generate public benefits and to maintain the quality of the goods transported. It is possible to detach from
this description the orientation to what we call today quality management in urban and interurban river
transport and another orientation towards the rigorous organization of urban and interurban river transport,
in fact, an efficient urban and interurban public management of river logistics focused on supporting the
quality of these public services and creating public benefits. The continuous development of river transport
and the need to develop it can also be linked to the existence of a register of minutes of the German City
Magistrate, Sessio in Publicis et Oeconomicis, 1764[21] and 1768[22]) containing, information on the
development and maintenance of relations trade with different countries, problems related to the supply of
the city, the purchase and export of gold and silver, import of various special commodities (coffee and
sugar surrogates).
(3) Elements of anticipation and forecasting. The second personality that made a significant contribution
to the development of urban logistics was Baron Iosif de Brigodo, the governor of Banat. Compared with
the visionary Mercy, Brigodo was a more pragmatic ruler. Prior to reaching the Banat region, Brigodo
hired Francesco Griselini to conduct research on the natural and historical potential of Banat. Among its
priorities for urban logistics was the formal institutionalization of the urban or interurban logistics
infrastructure development processes, based on a plan submitted to the Vienna Court (administrative
structure with strategic interest and control power) of a structural entity under the form of a Caesar-Royale
Construction Office. The area of competence of this office was a complex and complete one for urban and
interurban logistics projects. Concern for financial management of costs by financing the Office's annual
operation was provided by central tax administration. The desideratum of the operation of the institution
was the creation of a scientific propagation environment, led by professional people.
The fact that Brigodo requested the research and analyzed it, and then developed plans and implemented
them, means in terms of contemporary management that Brigodo has non-deliberately exercised multiple
Vol. 14, No. 1 2020
DOI: 10.14232/analecta.2020.1.1-8
5
management functions (Planning– the plan advanced to the court at Vienna, based on forecasting in the
form of research, Organization– Establishment of the Caesar-Kingdom Office, Implementation–
Coordination of Logistics Projects, Control– Regulations on Urban Logistics). Thus, we can say that
Brigodo had, as a governor, the qualities of an urban public leader.
(4) Public utilities, street lighting. The existence of efficient and effective cooperation relations between
the representatives of the public environment, the public administration through the developed urban
projects and the private environment or the inhabitants of the fortress, in order to generate a common
benefit. This common good has materialized in the development of the public lighting network. In this area
the city of Timisoara starts with a premiere at Imperial level, being in 1760, the best illuminated city of the
Empire. The maintenance and maintenance costs of this network had no costs due to the 100 street lanterns
donated by the city's inhabitants. The evolution of this network continues with the onset of the gas plant
that began its activity in 1857. The gas was used for street lighting (through 200 lamps). The system
becomes difficult and expensive to maintain. Another first in continental Europe marks the technological
progress of street lighting utilities, namely Timisoara becomes in 1884 the first city with a public street
lighting network.
(5) Terrestrial urban transport carries the most pronounced and consistent results of technological
progress in logistics due to good management of the logistics organization of the city. After the
introduction of public transport along a 949-meter route, the Omnibus with horses in 1856, the city's first
off-road tramline in South-East Europe developed in 1869. In 1896 it was transformed from animal traction
into electrical traction of trams from the city and in 1901 new lines or considerable extensions of existing
ones were created.
(6) The development of network structures announces the development of the city at the level of
European cities. In 1854, the Vienna-Timisoara-Sibiu telegraph line is inaugurated, creating a first high-
speed connection with both Central Europe and Transylvania. In close connection with the telegraphic line,
we also mention the historical event that marks the obtaining of the license for the installation of the first
urban telephone station, even from Thomas Edison in 1879. In 1881 we mark the introduction of the
telephone network and the first telephone exchange in Timisoara.
Although not entirely part of the exclusively urban logistics, we considered it absolutely necessary to
review the elements of interurban logistics, these relations[23] between the cities contributing to the
completion of their logistic infrastructure. The railways, both the commercial and passenger transport
network has been developed following two major directions[24]. On the one hand there were short-distance
railways linking Timisoara to nearby towns, on the other hand there was a preoccupation of the city and
administration of Vienna for the development and maintenance of relations with the outside of the region,
or of the empire. The location of the city at the crossroads of many important commercial roads was a
determining factor for the volume of investment in terrestrial infrastructure, both rail and ground. Here is
the factual exposure of the double detectable orientation to multiple logistics projects. One of the factors
inhibiting the development of interurban land logistics was the status and physical shape of the fortress,
well protected by multiple rows of walls. The positioning of the gates and bridges has led to the direction
of the construction of terrestrial roads, so from Timisoara the roads have developed pointing to all major
cardinal points. The first main road was built to Szeged. In total, in 1848, 8 postal roads and 9 commercial
roads started from Timisoara. Progress in this area has been provided by both local[25] and central
funding. Good management and rigorous planning at the level of local government allowed for a
construction and maintenance offer for 75 new roads in 1894. Many of these works have been entrusted to
companies outside the region[26].
Among the main categories of urban logistics and significant premieres of the city of Timisoara we can list
urban mobility logistics projects (1732- Bega Canal, 1869- First Horse pulled Trams of South-Europe
[27]), Logistics and Public Utilities (1723- Hydraulic system and pipeline drinking water distribution
system, are among the first such systems in Europe[28], 1884- the first city with a public street lighting
network in Continental Europe[29]), telecommunication logistics and terrestrial transport infrastructure
(railways[30] and urban[31] and commercial roads).
Vol. 14, No. 1 2020
DOI: 10.14232/analecta.2020.1.1-8
6
4. CONCLUSIONS
From the enumeration we can deduce the rigorous logic of the hierarchy, the prioritization of the urban
logistic projects, in correlation with both the nearby and the distant surroundings. The pioneering state of
urban logistics has been supported by the multitude of urban logistics projects that, through good planning,
organization and implementation, have managed to become outstanding at local, regional, Imperial or
European level.
The multitude of significantly important projects reveals clear signs of the establishment of urban public
management structures, which have supported good management and control of public institutions that
have been set up and have proved to be performing. Some of the major projects benefited from an assured
and supervised financial management from Vienna but others were financed from local budgets. The
existence of a reorganization framework plan developed by the Central Authorities had been acting as a
support and basis for the projects developed at the local level. Due to the fact that some large projects
required a long time to complete, it is not natural to assign them the mandate of a single governor or leader.
Regardless of the leading personality, the important projects have been completed, most of which resulted
from them. The importance of progress has not been influenced by personal behaviours and goals but by
capitalizing on opportunities and creating public benefits.
REFERENCES
[1] Holistic or complete approach it is the result of combining factors derived from PEST analysis and
specific ones, relevant to this research.
[2] C. Feneșan, Administrație și fiscalitate în Banatul Imperial 1716-1778, Editura de Vest, Timișoara,
1997, pp.19-20
[3] County Department of National Archives (CDNA), Fund 2: Town Hall of Timisoara, inventory
no.141, document no. 3/1718, tabs 1-2: Report of Timisoara City Magistrate to the Landes
Administration regarding the use of fake weights and measures by Serbian merchants and the need to
unify weights and measurements.
[4] CDNA, Fund 2: Town Hall of Timisoara, inventory no. 141, document no. 1/1718, tabs 1-6:
Provisions issued by the Imperial Commission for the organization of the city of Timisoara from an
administrative, economic, political, religious, and legal point of view.
[5] CNDA, Fund 2: Town Hall of Timisoara, inventory no. 141, document no. 6 / 1772- The President of
the Count P. Brigodo Administration tells the Serbian Magistrate that Mehala suburb is removed from
his administration and moves to one of the newly created perceptions (Rentӓmter). Innovating the
structures of local administrative institutions by adding suburban ones.
[6] CNDA, Fund 2: Town Hall of Timisoara, inventory no.141, document no2 / 1758, tabs 1-2: Copies-
Provincial Administration communicates to the Serbian Magistrate the empress's approval regarding
the construction of a town hall, the conditions. or CNDA, Fund 2: Town Hall of Timisoara, inventory
no 141, document no.2 / 1759, tabs 1-2: The Administration communicates to the Serbian Magistrate
the approval of the following points: re-conferring jurisdiction, approving the name Magistrate,
building or buying a building for the Magistrate.
[7] Between 1716-1776, during Banat training, it was divided into 13 districts, all of which had the same
administrative regulations of operation. (K. Vicze, Az vég Temesvárban…,Marineasa, Timișoara,
2006, pp.202-203)
[8] CNDA, Fund 2: Town Hall of Timisoara, inventory no. 141, document no. 1/1718, tabs 1-6: Provisions
issued by the Imperial Commission for the organization of the city of Timisoara from an
administrative, economic, political, religious, and legal point of view. Turkish bath transformed into
City Hall.)
Vol. 14, No. 1 2020
DOI: 10.14232/analecta.2020.1.1-8
7
[9] Mercy's vision of the future of Timisoara confirms its orientation towards progress, development and
well-being, which can be inferred from Griselini's description (1984, p. 128) in which Mercy declares
that he wants to achieve results not only to satisfy the public needs but also to create well-being and
luxury. In terms of strategic management, we can make an analogy between the ones outlined above as
elements of the strategy (mission, vision) with a transformative effect on the city.
[10]CNDA, Fund 2: Town Hall of Timisoara, inventory no. 141, document no. 3/1718, tabs 1-2: Report of
the Timisoara magistrate to the Landes Administration regarding the use of false loads and measures
by Serbian merchants and the necessity of unification of weights and measurements.
[11] CNDA, Fund 2: Town Hall of Timisoara, inventory no. 141, document no. 3/1770, file1-8: The list of
the orders of the Administration given by the Serbian Magistrate in 1770. In total 210 orders for one
year. Another document attesting to the frequency and rigurosity of organization is the German
Magistrates' Sessions record (approximately 72 sessions per year) derives continuity and
administrative rigor. CNDA, Fund 2: Town Hall of Timisoara, inventory no. 141, document no.4 /
1764, tabs 1-427: Registry of minutes of the meetings of the German Magistrate of Timisoara with the
following issues: economic, administrative, judicial, criminal. Dated from the beginning of 1764 to 27
Aug. 1768.
[12] The existence of the document, which includes a situation of the assets and liabilities of the city of
Timisoara for 1770 and in 1774 the hydraulic machine, is an important part of the drinking water
distribution system. This change is a premiere for the city and has the capacity to serve the entire
population. CNDA, Fund 2: Town Hall of Timisoara, inventory no. 141, document no. 4/1770, tabs 1-
28: The active and passive Satan of the privileged royal city of St. Mary 1770-1776.
[13] Á. Jancsó, Istoricul podurilor din Timișoara, Mirton, Timișoara, 2010, pp.24-25.- The existence since
1552 of a long bridge of approx. 948 meters.
[14] Fortress security and public administration control function. CNDA, Fund 2: Town Hall of
Timisoara, inventory no. 141, document no 3/1728, tabs 1-2: Nominal specification of the German
Jews in Timisoara - a list of Spanish Jews appears in the list. On the reverse, the resolution of the
Administration regarding the punishment of arresting offenders who would sneak into the city - The
first sentence of punishment.
[15] The reciprocal development of projects and logistical projects also derives from its description
(Jancsó, 2001, pp.63-65) regarding the financial contributions of the Tram Company to the creation of
the infrastructure needed to carry out its activity. The amount of the contribution of 25% of the costs
of 4 bridges.
[16] CNDA, Fund 2: Town Hall of Timisoara, inventory no. 141, document no.5 / 1755, tabs 1-4:
Provisions of the Administration given to the German Magistrate on the price of fuel wood. Price
regulation. Forest management elements
[17] F. Griselni, Attempt of Political and Natural History of Banat Timisoara, Ed. Facla, Timișoara, 1984,
pp.130-131. These statements are also confirmed by Griselini describing the process of wood
harvesting in forests near Timisoara, claiming that forests could supply wood for factories,
construction but also for economic purposes.
[18] The legacy of the construction of this channel was attested by Griselini (1984, p.131), considering the
canal as comparable to a masterpiece of ancient Rome!
[19] I. Haţegan, M. Pîrşe, Premierele şi priorităţile Timişorene, Volumul 1, 100 de premiere şi priorităţi
până la 1900, Banatul şi Artpress, Timișoara, 2009, pp.5-10
[20] CNDA, Fund 2: Town Hall of Timisoara, inventory no. 141, document no. 2/1756, Filings 1-8:
Provisions of the Administration to the Magistrate, and a Magistrate's Report on the regulation of
food trade made by foreigners on foreign commercial vessels that stop in the so-called "Navigable
Mercy Canal."
[21] CNDA, Fund 2: Town Hall of Timisoara, inventory no. 141, document No. 2/1756, tabs 1-8:
Administration's provisions to the magistrate and a report of the magistrate on the regulation of food
trade made by foreigners on foreign commercial vessels stopping in the so-called "Navigable Canal
Mercy".
Vol. 14, No. 1 2020
DOI: 10.14232/analecta.2020.1.1-8
8
[22] CNDA, Fund 2: Town Hall of Timisoara, inventory no. 141, document no. 4/1764, tabs 1-427
Registry of minutes of the sessions of the German Magistrate of the city of Timisoara (Sessiones in
Publicis, Politicis et Oeconomicis), containing the following issues: supplying the city with food,
links with Arabia, etc.
[23] CNDA, Fund 2: Town Hall of Timisoara, inventory no. 141, document no. 13/1768, tabs 1-40 The
word CONTROLOR first appears. Registry of minutes of meetings of the German Magistrate of the
city of Timisoara (Sessio in publicis et oeconomicis), comprising the following: economic: acquisition
and export of gold and silver, import of coffee and sugar surrogates, rents (butchering, wine flow,
etc.), craftsmen (reception as craftsmen and citizens, school litigation against lice, litigation, calf
litigation, etc.), measures related to the heredity of the monetary subject, etc., introduction of the
lottery in Banat.
[24] CNDA, Fund 2: Town Hall of Timisoara, inventory no. 141, document no. 22/1895: Acts relating to
the construction of the Timisoara-Serbia railway line.
[25] Compared to other cities on the same map, for example Cluj-Napoca in 1848, which did not have, at
the same time as Timisoara, developed roads to only three cardinal points and significantly less
secondary terrestrial roads.
[26] CNDA, Fund 2: Town Hall of Timisoara, inventory no. 141, document no.10 / 1768, sheets 1-6:
receipts for salaries of employees of the Serbian Magistrate; receipts related to paved streets spending
in the Fabric Advanced Ward and paid for 10 years.
[27] CNDA, Fund 2: Town Hall of Timisoara, inventory no. 141, document no.6 / 1890: Hungarian
company for asphalting roads.
[28] I. Haţegan, M. Pîrşe, 2009, pp.15-23
[29] CNDA, Fund 2: Town Hall of Timisoara, inventory no. 141, document no. 22/1782 tabs 1-2:
Inventory of hydraulic machine requisites with takeover clause from Magistrate
[30] CNDA, Fund 2: Town Hall of Timisoara, inventory no. 141, document no 8/1884: Contract between
Timisoara City Administration and Abgb-Austrian Brush Electrical Limited Company for the
introduction of electric lighting on the streets of the city.
[31] CNDA, Fund 2: Town Hall of Timisoara, inventory no. 141, document No 22/1895: Documents
relating to the construction of the Timisoara-Szerbia railway line.
[32] CNDA, Fund 2: Town Hall of Timisoara, inventory no. 141, document no. 9/1768, tab 1: Statement
of expenditure for repairing the main street of Fabric zone.
Vol. 14, No. 1 2020
DOI: 10.14232/analecta.2020.1.9-18
9
ADDITIVE MANUFACTURING IN THE OIL AND GAS INDUSTRIES - A REVIEW
Babatunde Olamide Omiyale, P. K. Farayibi
Department of Industrial and Production Engineering, Federal University of Technology, Akure, Nigeria.
e-mail: [email protected]
ABSTRACT
Additive manufacturing (AM), also known as 3D printing, is a process for creating prototypes and functional components
achieved by consolidation of material layer upon layer. Applications of AM technologies have been witnessed in the healthcare,
automotive, architecture, power generation, electronics and aviation industries. Some of the main benefits of AM include
effective material utilisation, new design possibilities, improved functionality of the products and flexible production. The
opportunities for the applications of additive manufacturing in the oil and gas industries are only just being explored. In this
study, a review of the potential opportunities of AM technologies in oil and gas industries was reported. The adoption of the AM
technologies necessitated the need for a rethink on design for manufacture and assembly of oil and gas component parts such as
high-tech end burners, metal fuel nozzles, and submersible pump components amongst others. The possibility of employing AM
technologies on-site for the production of spare parts for replacement of damage components in oil and gas equipment and
facilities is commendable, as this brings about reduction in production downtime and replacement cost. The future of AM in the
oil and gas industries is highly promising, however before AM can actualize its full-fledged potentials in these industries, further
research is required in the area of new materials development and processing, improved surface finish of AM fabricated parts,
enhanced fabrication speed and parametric optimisation to improve the mechanical properties of the fabricated components.
Keywords: Additive Manufacturing, Oil and gas industry, 3D printing, Product design.
1 INTRODUCTION
Additive manufacturing (AM) is a solid free-form fabrication technique which allows the development of any
component from its 3D model by consolidation of materials layer upon layer with no tooling required [1]. Owing to
the nature of the layer-upon-layer addition of material in the AM process, new design features and enhanced
topology optimisation have become possible [2]. Hence, with AM, geometries and other design features in materials
that were previously impossible to produce with conventional manufacturing owing to production constraints are
now possible. Additive manufacturing offers the ability to produce complex shapes at no extra cost [2]. This
indicates the more complex the product or part, the more suitable additive manufacturing is, as opposed to
conventional techniques. The generic advantages of additive manufacturing include: free production cost for part
complexity, low cost of small batch size production, component fabrication as and when and wherever needed with
near zero-inventory cost and cost-effective material utilisation amongst others [3]. The oil and gas (O&G) industries
have begun adopting additive manufacturing technologies into its regular workflow in several key areas, especially
for the production of valuable tools and spare parts for replacement of damaged ones [4]. Additive manufacturing
has found prominent applications in the area of healthcare, automotive, architecture, power generation, electronics
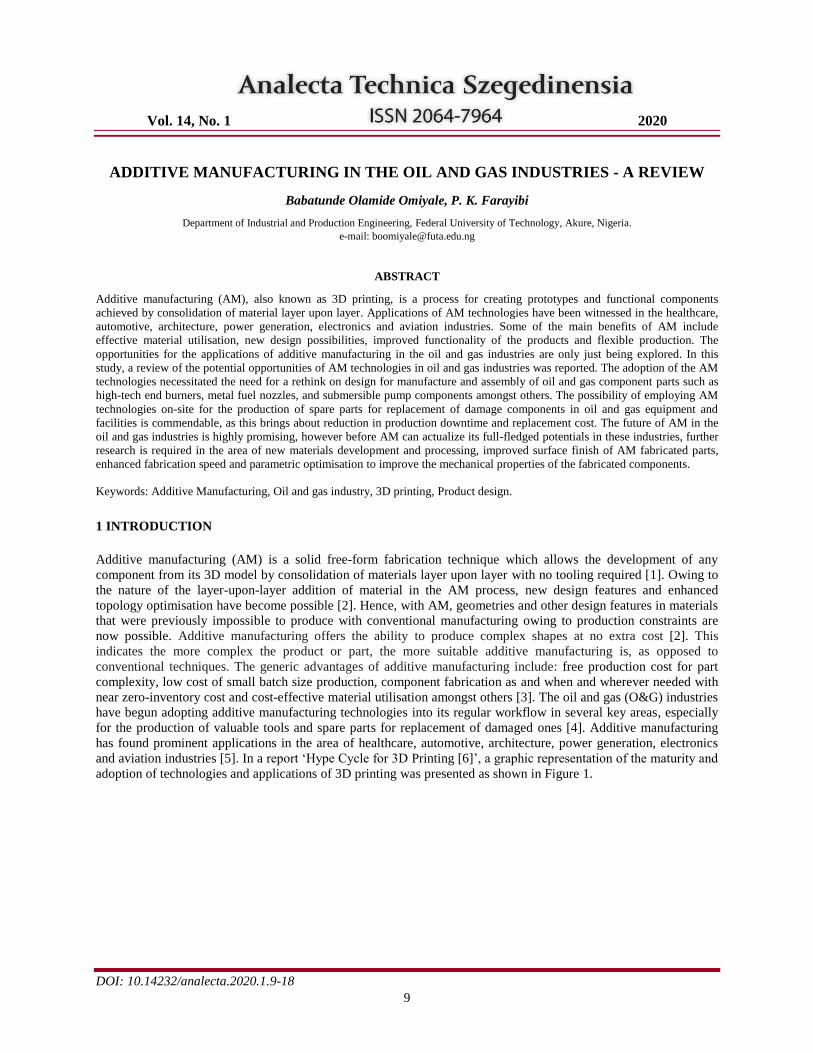
and aviation industries [5]. In a report ‘Hype Cycle for 3D Printing [6]’, a graphic representation of the maturity and
adoption of technologies and applications of 3D printing was presented as shown in Figure 1.
Vol. 14, No. 1 2020
DOI: 10.14232/analecta.2020.1.9-18
10
Figure 1- The status of 3D printing applications in the Gartner hype curve [6]
The Gartner hype curve shows that 3D printing for prototyping in oil and gas industries is at the stage of slope of
enlightenment which indicates the heightened level of awareness of AM technology for production of
prototypes/visual aids for the construction of facilities in this sector. However, the adoption of AM techniques for
production of functional parts to be used in oil and gas industries has just began as this is being triggered by the
innovation AM processes can bring to their product development. This implies that more research work is required
to be done in the area of 3D printing applications in oil and gas industries to enhanced component part design for
high performance, to improve product quality and rapid tooling for production. The limitations of additive
manufacturing among the stakeholders within the oil and gas industries are the lack of required strength and
potential failure of parts fabricated via the AM techniques. To enhance the effectiveness of additive manufacturing
technologies in the oil and gas industries, the characterization of the materials such as functional metal, ceramics and
polymer being used in 3D printing should be researched upon in order to determine the best mechanical properties
which will be well suited with the international standard in the oil and gas equipment facilities. This will prevent
sudden equipment failure resulting from the use of replacement parts fabricated via additive manufacturing
technologies. Recently, the three most common uses in AM are for prototyping, product development, and
innovation [7]. Hence, this paper discusses some key areas in which additive manufacturing technology has been
used for the production of prototypes/functional parts, identifies challenges facing the adoption of AM in order to
meet their pressing demands and also proffer possible solution to promote the deployment of AM functional parts in
oil and gas industries. This study was structured to serve as guide to researchers with interest in the application of
additive manufacturing in the oil and gas industries.
2. TECHNOLOGIES FOR ADDITIVE MANUFACTURING
It is of paramount importance to define different AM processes that can be of advantage to oil and gas industry of
producing functional parts. The American Society for Testing and Materials (ASTM) has classified AM into seven
technologies as presented in Table 1.
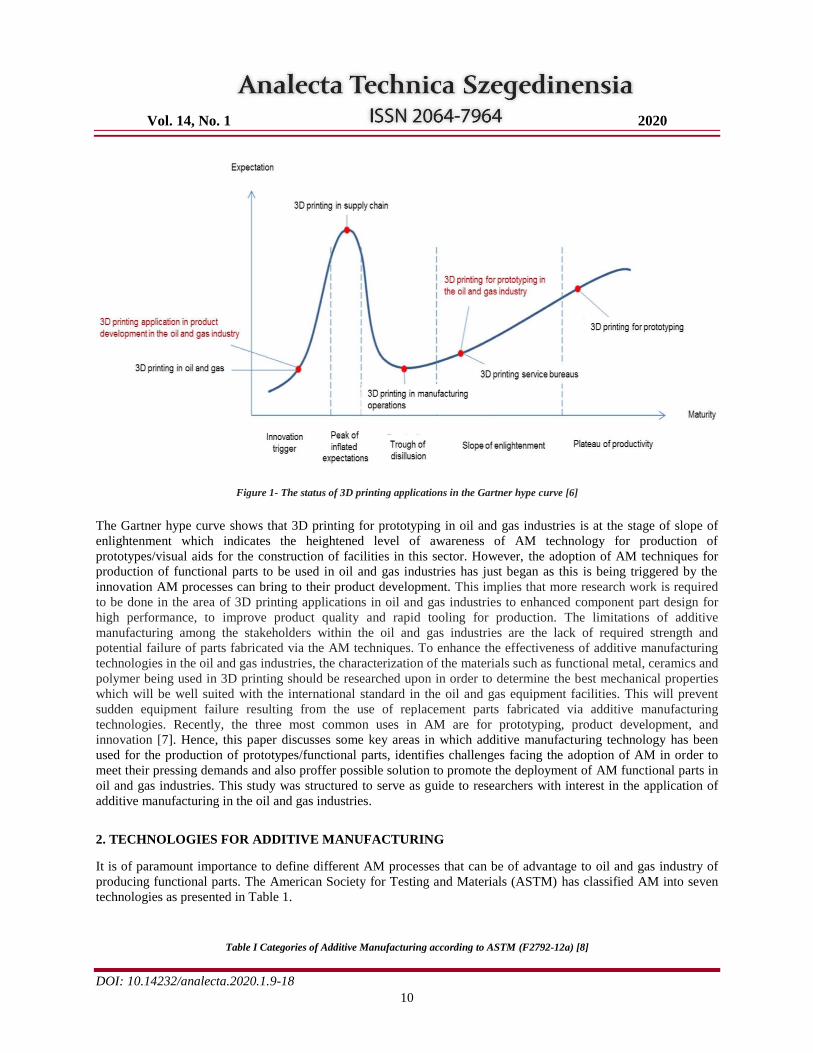
Table I Categories of Additive Manufacturing according to ASTM (F2792-12a) [8]
Vol. 14, No. 1 2020
DOI: 10.14232/analecta.2020.1.9-18
11
AM Printing Technology – Definition Materials Typical Market
Vat polymerization/
Stereolithography (SLA), digital light
processing (DLP)
An AM process in which liquid
photopolymer in a vat is selectively cured by
light activated polymerization.
Photopolymers
Prototypes
Jewellery
Industry
Material jetting/
Multijet modeling (MJM)
An AM process in which droplets of build
material are selectively deposited.
Polymers
Waxes
Biomaterial
Prototypes
Moulds for
castings
Jewellery
industry
Binder jetting/
Powder bed and inkjet head (PBIH), plaster-
based 3-D printing (PP)
An AM process in which a liquid bonding
agent is selectively deposited to join powder
materials
Gypsum
Foundry sand
Polymers
Metals
Prototypes
Patterns for
castings
Creative
industries
Final parts
(metals)
Sheet lamination/
Laminated object manufacturing (LOM),
ultrasonic consolidation (UC)
An AM process in which sheets of material
are bonded to form an object.
Metals
Paper
Prototypes
Tooling
Final part
(metals)
Material extrusion/
Fused deposition modeling (FDM)
An AM process in which material is
selectively dispensed through a nozzle or
orifice.
Polymers
Prototypes
Consumer goods
Tooling
Final parts
Powder bed fusion/
Electron beam melting (EBM), selective
laser sintering (SLS), selective heat sintering
(SHS), and direct metal laser sintering
(DMLS)
An AM process in
which thermal energy selectively fuses
regions of a powder bed.
Polymers
Metals
Prototypes
Tooling
Final parts

Vol. 14, No. 1 2020
DOI: 10.14232/analecta.2020.1.9-18
12
Direct energy deposition/
Laser metal deposition (LMD)
An AM process in which focused thermal
energy is used to fuse materials by melting
as they are being deposited.
Metals
Final parts
Refurbishment
and repair
3. APPLICABILITY OF ADDITIVE MANUFACTURING IN OIL AND GAS INDUSTRY
Additive manufacturing technologies are playing a vital role in the oil and gas industry research and facility
development, these trends are expected to spread into all organs of oil and gas equipment facilities such as oil field
service, power generation plant, subsea equipment services, and turbomachinery equipment service amongst others.
With the advent of additive manufacturing, oil and gas companies will no longer need to wait for replacement parts,
but will have the capability to additively fabricate parts at the location where such replacement or spare parts is
promptly needed [4]. The availability of 3D printing technologies on the various oil field service sites will annihilate
unnecessary delay in area where standard parts are urgently requested for. Full implementation of 3D printing
techniques in oil and gas industries will eliminate over-dependency of these industries on imported replacement
parts to maintain oil and gas equipment facilities. According to Scott J Grunewald [4], on-site 3D printing can be
deployed to fabricate new parts for use in drilling for oil and gas exploration, where flexibility and adaptability are
both important to the successful extraction of the petroleum products.
4. METALLIC-BASE ADDITIVE MANUFACTURING METHODS
3D printing in additive manufacturing can be used to produce some spare parts in oil and gas industries, theses
functional parts can be built using various metallic-base additive manufacturing technology methods such as Direct
Metal Laser Sintering (DMLS), Electron Beam Melting (EBM), and Direct Metal Deposition (DMD).
4.1 Direct Metal Laser Sintering (DMLS)
Direct Metal Laser Sintering (DMLS) is an additive manufacturing technology that operates by sintering very fine
layers of metal powders layer-by-layer from the bottom up until the build is complete. The available materials for
direct metal laser sintering include titanium, aluminium, cobalt-chrome, stainless steel, Inconel 625 and Inconel 718
amongst others.

Vol. 14, No. 1 2020
DOI: 10.14232/analecta.2020.1.9-18
13
Figure 2: A typical schematic of Direct Metal Laser Sintering [9]
4.2 Electron Beam Melting (EBM)
Electron Beam Melting (EBM) is a type of additive manufacturing which is similar to selective laser sintering as
they both print on a 3D printer powder bed. The metal powder or wire is put under a vacuum and fused from heating
by an electron beam. A high energy beam comprising of electrons is used to solidify the metal. The available
materials include nickel super alloys, stainless steel, tools steels, aluminium, titanium and copper.
Figure 3: A typical of Electron Beam Melting (EBM) [10]
Vol. 14, No. 1 2020
DOI: 10.14232/analecta.2020.1.9-18
14
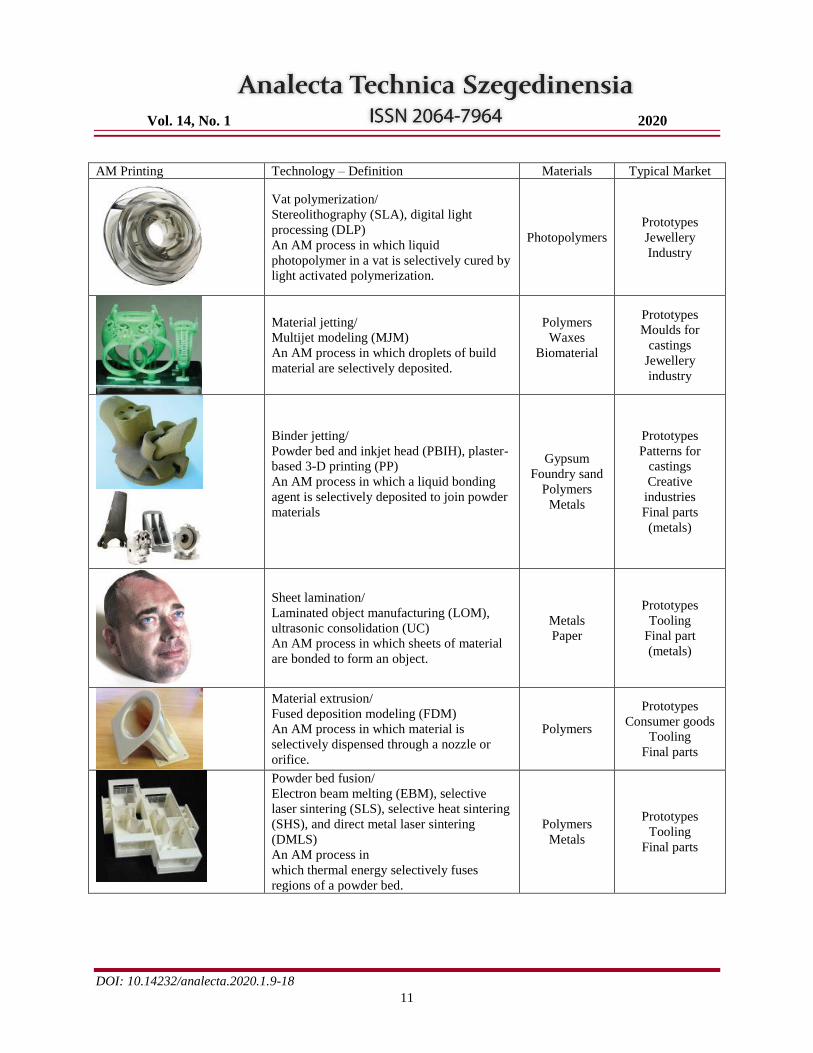
4.3 Direct Metal Deposition (DMD)
The Direct Metal Deposition is an additive manufacturing technology using a laser to melt metallic powder. This
process is similar to Fused Deposition Modelling as the nozzle can move to deposit the fused metal. Direct Metal
Deposition extrudes fully dense, functional parts from CAD model by depositing metal powders layer by layer using
laser melting.
Figure 4: A typical Direct Metal Deposition system showing a component being built layer by layer [11]
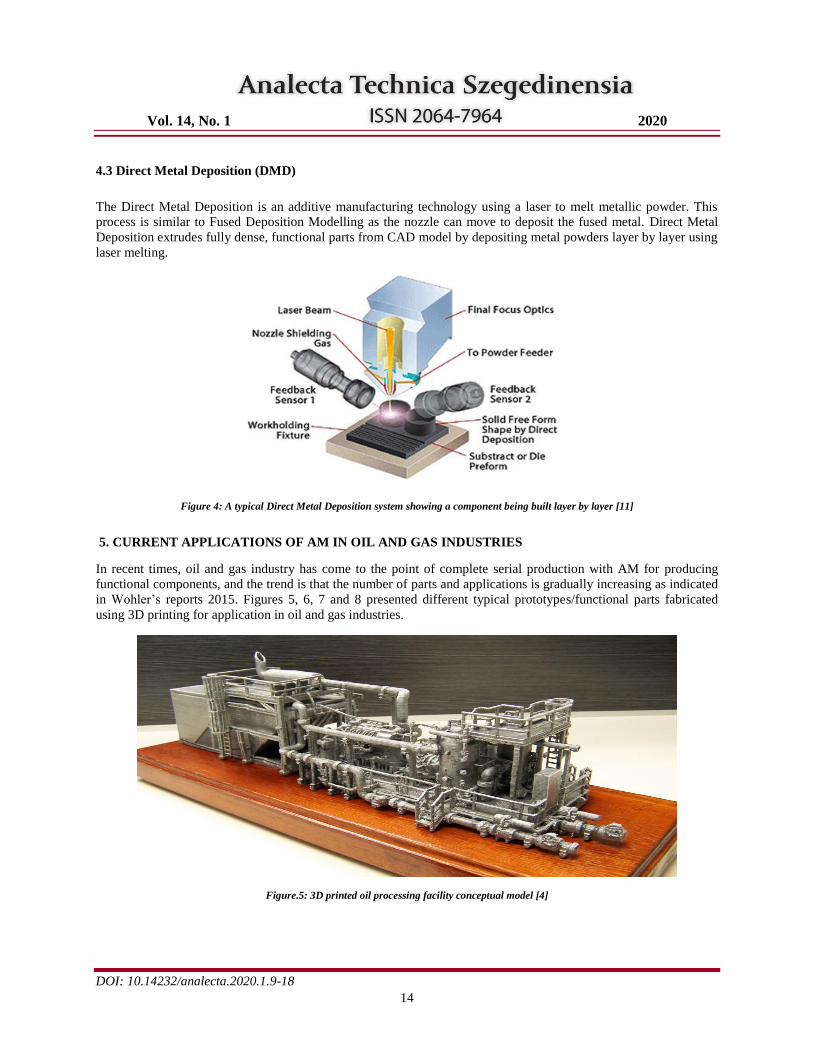
5. CURRENT APPLICATIONS OF AM IN OIL AND GAS INDUSTRIES
In recent times, oil and gas industry has come to the point of complete serial production with AM for producing
functional components, and the trend is that the number of parts and applications is gradually increasing as indicated
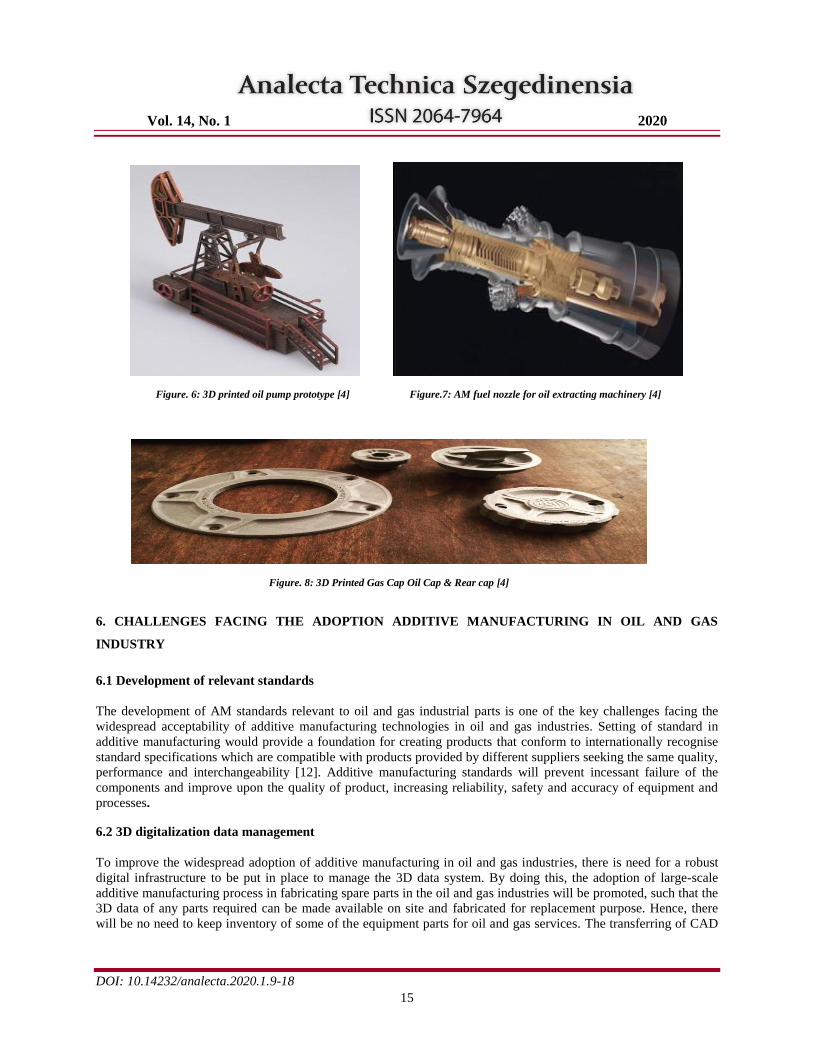
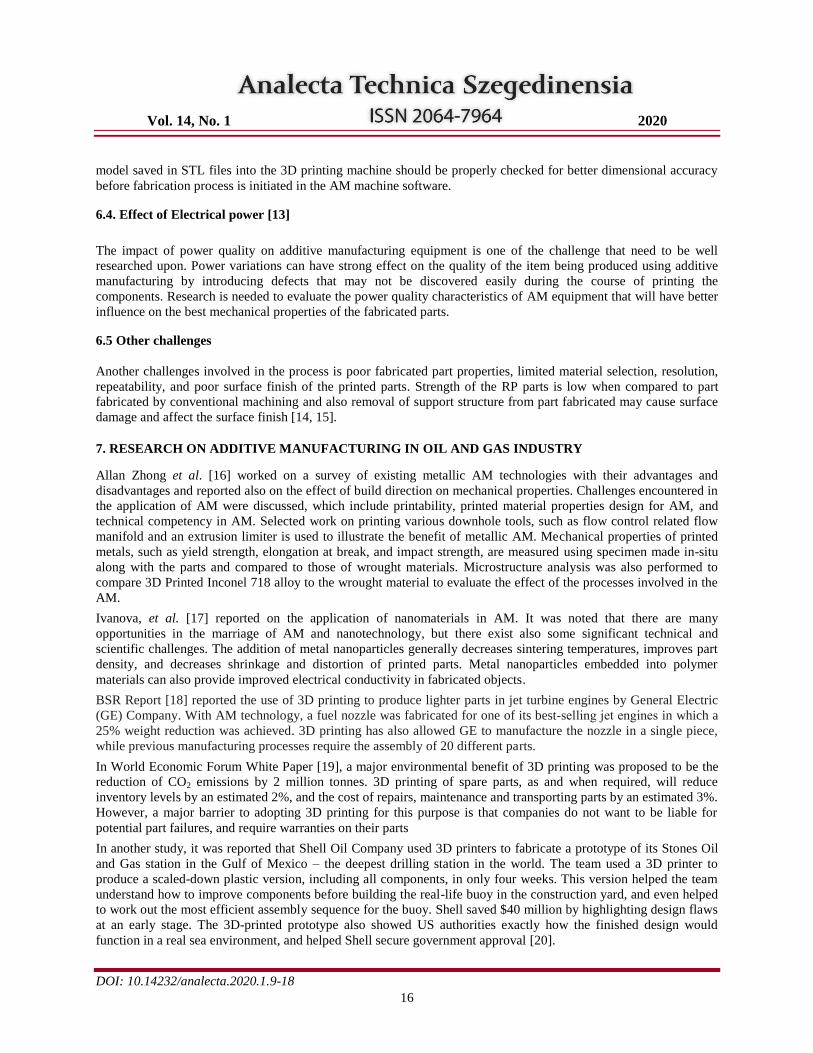
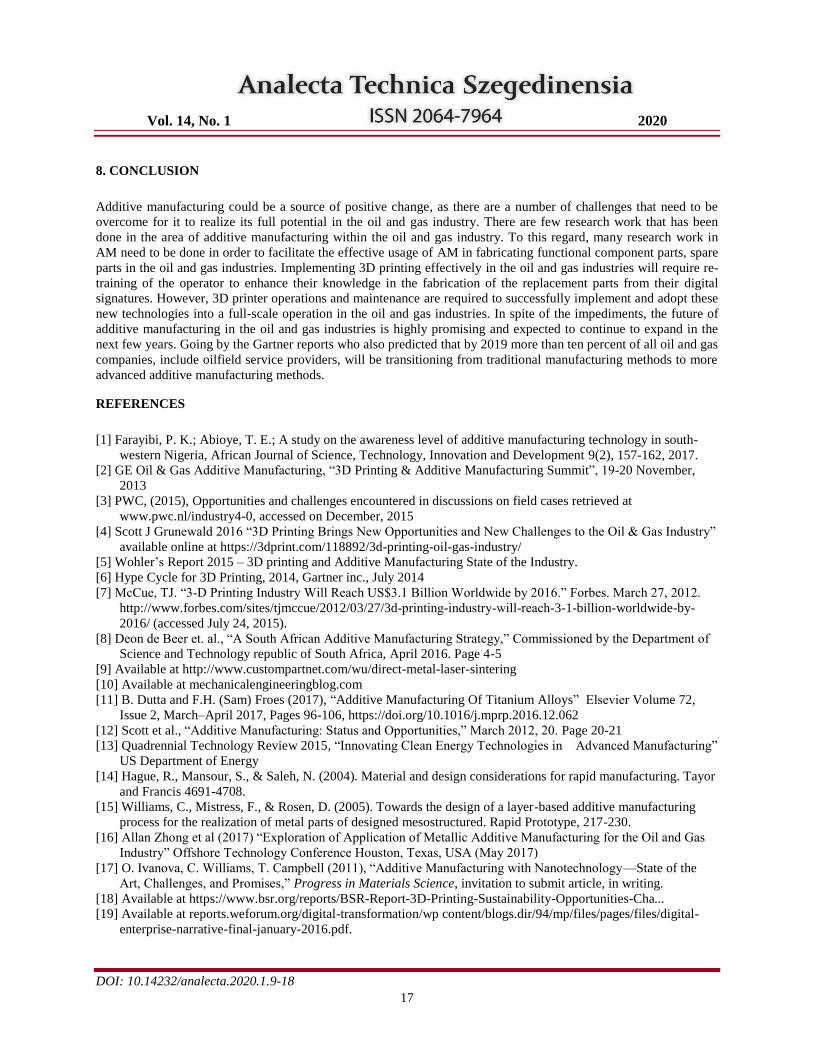
in Wohler’s reports 2015. Figures 5, 6, 7 and 8 presented different typical prototypes/functional parts fabricated
using 3D printing for application in oil and gas industries.
Figure.5: 3D printed oil processing facility conceptual model [4]
Vol. 14, No. 1 2020
DOI: 10.14232/analecta.2020.1.9-18
15
Figure. 6: 3D printed oil pump prototype [4] Figure.7: AM fuel nozzle for oil extracting machinery [4]
Figure. 8: 3D Printed Gas Cap Oil Cap & Rear cap [4]
6. CHALLENGES FACING THE ADOPTION ADDITIVE MANUFACTURING IN OIL AND GAS
INDUSTRY
6.1 Development of relevant standards
The development of AM standards relevant to oil and gas industrial parts is one of the key challenges facing the
widespread acceptability of additive manufacturing technologies in oil and gas industries. Setting of standard in
additive manufacturing would provide a foundation for creating products that conform to internationally recognise
standard specifications which are compatible with products provided by different suppliers seeking the same quality,
performance and interchangeability [12]. Additive manufacturing standards will prevent incessant failure of the
components and improve upon the quality of product, increasing reliability, safety and accuracy of equipment and
processes.
6.2 3D digitalization data management
To improve the widespread adoption of additive manufacturing in oil and gas industries, there is need for a robust
digital infrastructure to be put in place to manage the 3D data system. By doing this, the adoption of large-scale
additive manufacturing process in fabricating spare parts in the oil and gas industries will be promoted, such that the
3D data of any parts required can be made available on site and fabricated for replacement purpose. Hence, there
will be no need to keep inventory of some of the equipment parts for oil and gas services. The transferring of CAD
Vol. 14, No. 1 2020
DOI: 10.14232/analecta.2020.1.9-18
16
model saved in STL files into the 3D printing machine should be properly checked for better dimensional accuracy
before fabrication process is initiated in the AM machine software.
6.4. Effect of Electrical power [13]
The impact of power quality on additive manufacturing equipment is one of the challenge that need to be well
researched upon. Power variations can have strong effect on the quality of the item being produced using additive
manufacturing by introducing defects that may not be discovered easily during the course of printing the
components. Research is needed to evaluate the power quality characteristics of AM equipment that will have better
influence on the best mechanical properties of the fabricated parts.
6.5 Other challenges
Another challenges involved in the process is poor fabricated part properties, limited material selection, resolution,
repeatability, and poor surface finish of the printed parts. Strength of the RP parts is low when compared to part
fabricated by conventional machining and also removal of support structure from part fabricated may cause surface
damage and affect the surface finish [14, 15].
7. RESEARCH ON ADDITIVE MANUFACTURING IN OIL AND GAS INDUSTRY
Allan Zhong et al. [16] worked on a survey of existing metallic AM technologies with their advantages and
disadvantages and reported also on the effect of build direction on mechanical properties. Challenges encountered in
the application of AM were discussed, which include printability, printed material properties design for AM, and
technical competency in AM. Selected work on printing various downhole tools, such as flow control related flow
manifold and an extrusion limiter is used to illustrate the benefit of metallic AM. Mechanical properties of printed
metals, such as yield strength, elongation at break, and impact strength, are measured using specimen made in-situ
along with the parts and compared to those of wrought materials. Microstructure analysis was also performed to
compare 3D Printed Inconel 718 alloy to the wrought material to evaluate the effect of the processes involved in the
AM.
Ivanova, et al. [17] reported on the application of nanomaterials in AM. It was noted that there are many
opportunities in the marriage of AM and nanotechnology, but there exist also some significant technical and
scientific challenges. The addition of metal nanoparticles generally decreases sintering temperatures, improves part
density, and decreases shrinkage and distortion of printed parts. Metal nanoparticles embedded into polymer
materials can also provide improved electrical conductivity in fabricated objects.
BSR Report [18] reported the use of 3D printing to produce lighter parts in jet turbine engines by General Electric
(GE) Company. With AM technology, a fuel nozzle was fabricated for one of its bestselling jet engines in which a
25% weight reduction was achieved. 3D printing has also allowed GE to manufacture the nozzle in a single piece,
while previous manufacturing processes require the assembly of 20 different parts.
In World Economic Forum White Paper [19], a major environmental benefit of 3D printing was proposed to be the
reduction of CO2 emissions by 2 million tonnes. 3D printing of spare parts, as and when required, will reduce
inventory levels by an estimated 2%, and the cost of repairs, maintenance and transporting parts by an estimated 3%.
However, a major barrier to adopting 3D printing for this purpose is that companies do not want to be liable for
potential part failures, and require warranties on their parts
In another study, it was reported that Shell Oil Company used 3D printers to fabricate a prototype of its Stones Oil
and Gas station in the Gulf of Mexico – the deepest drilling station in the world. The team used a 3D printer to
produce a scaled-down plastic version, including all components, in only four weeks. This version helped the team
understand how to improve components before building the real-life buoy in the construction yard, and even helped
to work out the most efficient assembly sequence for the buoy. Shell saved $40 million by highlighting design flaws
at an early stage. The 3D-printed prototype also showed US authorities exactly how the finished design would
function in a real sea environment, and helped Shell secure government approval [20].
Vol. 14, No. 1 2020
DOI: 10.14232/analecta.2020.1.9-18
17
8. CONCLUSION
Additive manufacturing could be a source of positive change, as there are a number of challenges that need to be
overcome for it to realize its full potential in the oil and gas industry. There are few research work that has been
done in the area of additive manufacturing within the oil and gas industry. To this regard, many research work in
AM need to be done in order to facilitate the effective usage of AM in fabricating functional component parts, spare
parts in the oil and gas industries. Implementing 3D printing effectively in the oil and gas industries will require re-
training of the operator to enhance their knowledge in the fabrication of the replacement parts from their digital
signatures. However, 3D printer operations and maintenance are required to successfully implement and adopt these
new technologies into a full-scale operation in the oil and gas industries. In spite of the impediments, the future of
additive manufacturing in the oil and gas industries is highly promising and expected to continue to expand in the
next few years. Going by the Gartner reports who also predicted that by 2019 more than ten percent of all oil and gas
companies, include oilfield service providers, will be transitioning from traditional manufacturing methods to more
advanced additive manufacturing methods.
REFERENCES
[1] Farayibi, P. K.; Abioye, T. E.; A study on the awareness level of additive manufacturing technology in south-
western Nigeria, African Journal of Science, Technology, Innovation and Development 9(2), 157-162, 2017.
[2] GE Oil & Gas Additive Manufacturing, “3D Printing & Additive Manufacturing Summit”, 19-20 November,
2013
[3] PWC, (2015), Opportunities and challenges encountered in discussions on field cases retrieved at
www.pwc.nl/industry4-0, accessed on December, 2015
[4] Scott J Grunewald 2016 “3D Printing Brings New Opportunities and New Challenges to the Oil & Gas Industry”
available online at https://3dprint.com/118892/3d-printing-oil-gas-industry/
[5] Wohler’s Report 2015 – 3D printing and Additive Manufacturing State of the Industry.
[6] Hype Cycle for 3D Printing, 2014, Gartner inc., July 2014
[7] McCue, TJ. “3D Printing Industry Will Reach US$3.1 Billion Worldwide by 2016.” Forbes. March 27, 2012.
http://www.forbes.com/sites/tjmccue/2012/03/27/3dprinting-industrywillreach-3-1-billion-worldwide-by-
2016/ (accessed July 24, 2015).
[8] Deon de Beer et. al., “A South African Additive Manufacturing Strategy,” Commissioned by the Department of
Science and Technology republic of South Africa, April 2016. Page 4-5
[9] Available at http://www.custompartnet.com/wu/direct-metal-laser-sintering
[10] Available at mechanicalengineeringblog.com
[11] B. Dutta and F.H. (Sam) Froes (2017), “Additive Manufacturing Of Titanium Alloys” Elsevier Volume 72,
Issue 2, March–April 2017, Pages 96-106, https://doi.org/10.1016/j.mprp.2016.12.062
[12] Scott et al., “Additive Manufacturing: Status and Opportunities,” March 2012, 20. Page 20-21
[13] Quadrennial Technology Review 2015, “Innovating Clean Energy Technologies in Advanced Manufacturing”
US Department of Energy
[14] Hague, R., Mansour, S., & Saleh, N. (2004). Material and design considerations for rapid manufacturing. Tayor
and Francis 4691-4708.
[15] Williams, C., Mistress, F., & Rosen, D. (2005). Towards the design of a layer-based additive manufacturing
process for the realization of metal parts of designed mesostructured. Rapid Prototype, 217-230.
[16] Allan Zhong et al (2017) “Exploration of Application of Metallic Additive Manufacturing for the Oil and Gas
Industry” Offshore Technology Conference Houston, Texas, USA (May 2017)
[17] O. Ivanova, C. Williams, T. Campbell (2011), “Additive Manufacturing with Nanotechnology—State of the
Art, Challenges, and Promises,” Progress in Materials Science, invitation to submit article, in writing.
[18] Available at https://www.bsr.org/reports/BSR-Report-3D-Printing-Sustainability-Opportunities-Cha...
[19] Available at reports.weforum.org/digital-transformation/wp content/blogs.dir/94/mp/files/pages/files/digital-
enterprise-narrative-final-january-2016.pdf.

Vol. 14, No. 1 2020
DOI: 10.14232/analecta.2020.1.9-18
18
[20] Dutta, Kunal, “Grand Designs: How 3D Printing Could Change our World”, Shell Global,
http://www.shell.com/ inside-energy/how-3d-printing-is-changing-the-world.html.
[21] Available at http://www.oilandgastechnology.net/news/3d-printing-additive-manufacturing-peek-parts-oil-gas-
industry
Vol. 14, No. 1 2020
DOI: 10.14232/analecta.2020.1.19-23
19
INVESTIGATING THE CHANGE OF SOIL RESISTENCE AND
MOISTURE CONTENT IN THE CASE OF PRE-CROPS AND SOIL
TILLAGE SYSTEMS
Rita Tury, Szilárd Tóth, Réka Láposi, László Fodor
Eszterházy Károly University, Faculty of Agricultural Sciences and Rural Development, Gyöngyös3200 Mátrai út 36. Hungary,
ABSTRACT
The experiments were set up in large parcels at the Fleischmann Rudolf Research Institute of Eszterházy
Károly University located in Kompolt. We carried out measurements by using a Penetronik penetrometer
(electrical soil cone penetrometer) at the experimental site, where brown grassland soil as well as clay
washed brown forest soil are the typical soil types. The device used primarily serves to investigate the
physical and water management properties of soils suitable for agricultural cultivation. The instrument is a
hand-operated tool for registering soil mechanical resistance in Newtons (0-1000 N) and also the moisture
content of the topsoil (%) at the same time. The recording of the location of the measurement is made by
the built-in GPS, and the results of the measurements are saved to the SD card of the device. The device’s
data acquisition unit allows direct reading of measurement results, serial measurements and computer
processing of results (0-70 cm). Taking our objectives into consideration, we defined the location of
measuring points with various numbers according to the properties of the examined fields. Besides
designating measuring points at a distance of 0, 5, 10, 15, 20 and 30 m from the edge of the fields, we
designated two more in the middle of each field in all cases. The examined crop species included sand oats
(Avena strigosa), baltacim (Onobrychis viciifolia) as well as common vetch (Vicia sativa L.) with oats as a
companion crop. Summing up the measurement results, we have made the following statements: Low soil
resistance (127-131 N) was experienced after soil loosening and oat-vetch with higher, well-preserved soil
moisture content observed at each level, where the 50% moisture content of the soil started at the layer of
27 cm depth. Moderate soil resistance values (150-168 N) were manifested in the case of soil tillage with
loosening and ploughing after sand oats. In this case, the 50 % soil moisture content was observed at the
layer of 38 cm depth. Higher soil resistance values were found (171-196 N) in the case of 2 and 3-year-old
crops of baltacim, respectively, where the 50 % soil moisture content was recorded from the layer of 58 cm
depth. Based on the results, we consider it important to develop and improve soil tillage systems.
Keywords: soil resistance, penetrometer, guard band, soil tillage, pre-crop effect, soil moisture content [%]
1. INTRODUCTION
Water is also of great importance from the agricultural point of view. It affects the biological activity of the
soil, the material flow of the plants and the yield. Determining the water content of soil is useful for several
reasons. Knowing this, we can determine the best time to cultivate the soil, the optimal sowing time and the
type of crop to be grown, as well as we can get information about the soil moisture content that can be
expected after various pre-crops.
Soil resistance, moisture content, and bulk density are among the most commonly examined soil physical
parameters [1].
Electronic systems started to be used in agriculture in the mid-1960s [2]
Vol. 14, No. 1 2020
DOI: 10.14232/analecta.2020.1.19-23
20
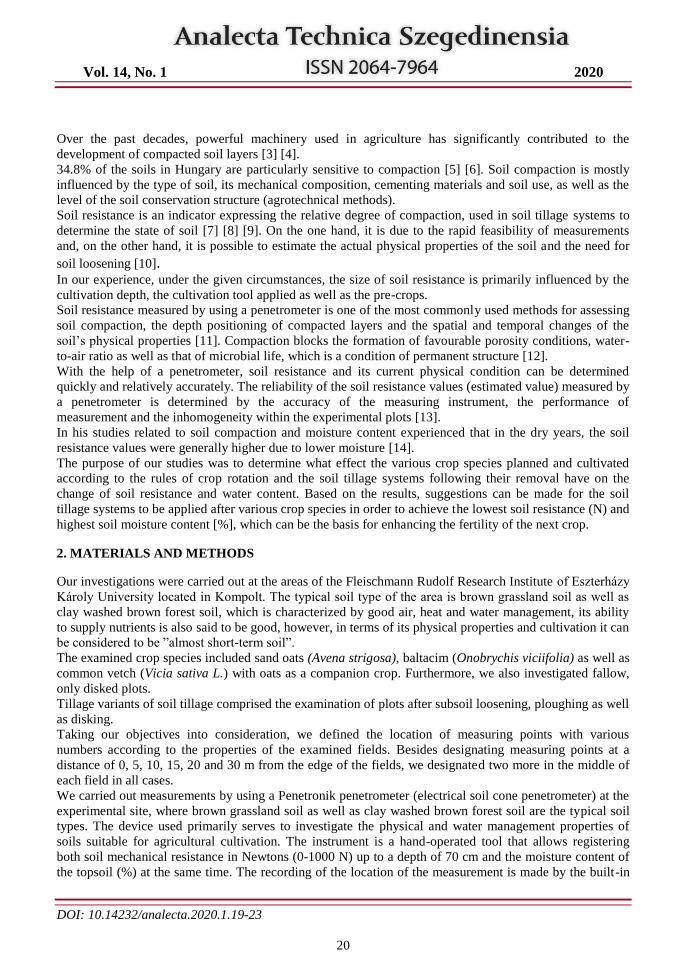
Over the past decades, powerful machinery used in agriculture has significantly contributed to the
development of compacted soil layers [3] [4].
34.8% of the soils in Hungary are particularly sensitive to compaction [5] [6]. Soil compaction is mostly
influenced by the type of soil, its mechanical composition, cementing materials and soil use, as well as the
level of the soil conservation structure (agrotechnical methods).
Soil resistance is an indicator expressing the relative degree of compaction, used in soil tillage systems to
determine the state of soil [7] [8] [9]. On the one hand, it is due to the rapid feasibility of measurements
and, on the other hand, it is possible to estimate the actual physical properties of the soil and the need for
soil loosening [10]. In our experience, under the given circumstances, the size of soil resistance is primarily influenced by the
cultivation depth, the cultivation tool applied as well as the pre-crops.
Soil resistance measured by using a penetrometer is one of the most commonly used methods for assessing
soil compaction, the depth positioning of compacted layers and the spatial and temporal changes of the
soil’s physical properties [11]. Compaction blocks the formation of favourable porosity conditions, water-
to-air ratio as well as that of microbial life, which is a condition of permanent structure [12].
With the help of a penetrometer, soil resistance and its current physical condition can be determined
quickly and relatively accurately. The reliability of the soil resistance values (estimated value) measured by
a penetrometer is determined by the accuracy of the measuring instrument, the performance of
measurement and the inhomogeneity within the experimental plots [13].
In his studies related to soil compaction and moisture content experienced that in the dry years, the soil
resistance values were generally higher due to lower moisture [14].
The purpose of our studies was to determine what effect the various crop species planned and cultivated
according to the rules of crop rotation and the soil tillage systems following their removal have on the
change of soil resistance and water content. Based on the results, suggestions can be made for the soil
tillage systems to be applied after various crop species in order to achieve the lowest soil resistance (N) and
highest soil moisture content [%], which can be the basis for enhancing the fertility of the next crop.
2. MATERIALS AND METHODS
Our investigations were carried out at the areas of the Fleischmann Rudolf Research Institute of Eszterházy
Károly University located in Kompolt. The typical soil type of the area is brown grassland soil as well as
clay washed brown forest soil, which is characterized by good air, heat and water management, its ability
to supply nutrients is also said to be good, however, in terms of its physical properties and cultivation it can
be considered to be ”almost short-term soil”.
The examined crop species included sand oats (Avena strigosa), baltacim (Onobrychis viciifolia) as well as
common vetch (Vicia sativa L.) with oats as a companion crop. Furthermore, we also investigated fallow,
only disked plots.
Tillage variants of soil tillage comprised the examination of plots after subsoil loosening, ploughing as well
as disking.
Taking our objectives into consideration, we defined the location of measuring points with various
numbers according to the properties of the examined fields. Besides designating measuring points at a
distance of 0, 5, 10, 15, 20 and 30 m from the edge of the fields, we designated two more in the middle of
each field in all cases.
We carried out measurements by using a Penetronik penetrometer (electrical soil cone penetrometer) at the
experimental site, where brown grassland soil as well as clay washed brown forest soil are the typical soil
types. The device used primarily serves to investigate the physical and water management properties of
soils suitable for agricultural cultivation. The instrument is a hand-operated tool that allows registering
both soil mechanical resistance in Newtons (0-1000 N) up to a depth of 70 cm and the moisture content of
the topsoil (%) at the same time. The recording of the location of the measurement is made by the built-in
Vol. 14, No. 1 2020
DOI: 10.14232/analecta.2020.1.19-23
21
GPS, and the results of the measurements are saved to the SD card of the device. The device’s data
acquisition unit allows direct reading of measurement results, serial measurements and computer
processing of results.
3. RESULTS AND DISCUSSION
Based on our investigations, in the case of the different soil tillage systems after the change of the various
crop species our plots can be classified into 3 categories:
Category I includes the plots with subsoil loosening after the seed production of common vetch (Vicia
sativa L.). The fallow disked areas were also classified into this category. As a result of complex effects,
soil resistance in this group showed low values (169,2 N).
Category II includes the plots ploughed after sand oats as pre-crop (Avena strigosa), where the average
values of soil resistance were already higher (210,8 N).
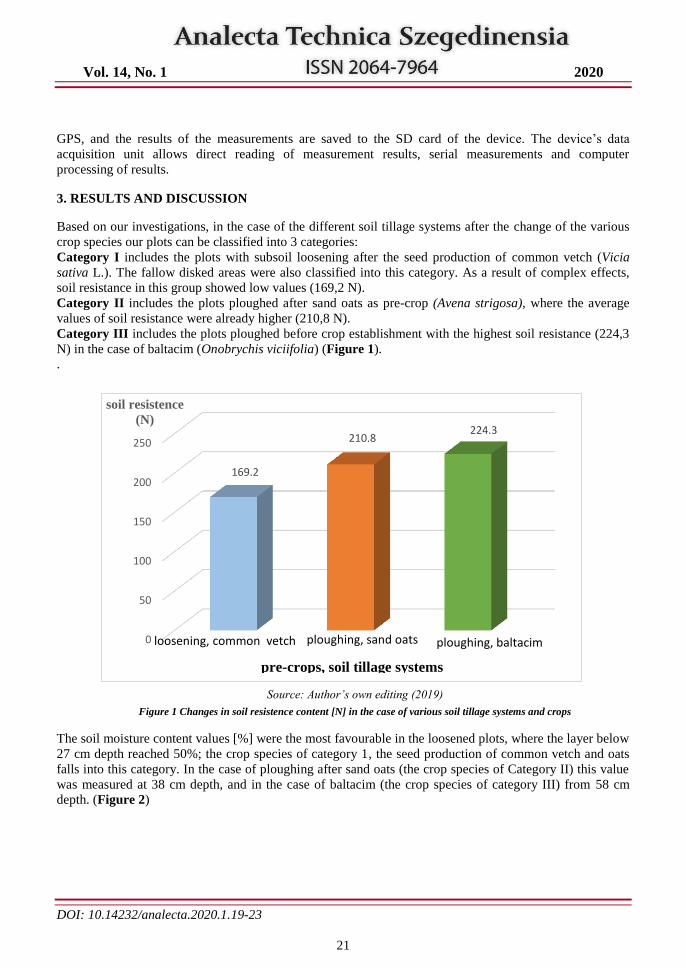
Category III includes the plots ploughed before crop establishment with the highest soil resistance (224,3
N) in the case of baltacim (Onobrychis viciifolia) (Figure 1).
.
Source: Author’s own editing (2019)
Figure 1 Changes in soil resistence content [N] in the case of various soil tillage systems and crops
The soil moisture content values [%] were the most favourable in the loosened plots, where the layer below
27 cm depth reached 50%; the crop species of category 1, the seed production of common vetch and oats
falls into this category. In the case of ploughing after sand oats (the crop species of Category II) this value
was measured at 38 cm depth, and in the case of baltacim (the crop species of category III) from 58 cm
depth. (Figure 2)
0
50
100
150
200
250
169.2
210.8 224.3
soil resistence
(N)
loosening, common vetch ploughing, sand oats ploughing, baltacim
pre-crops, soil tillage systems
Vol. 14, No. 1 2020
DOI: 10.14232/analecta.2020.1.19-23
22
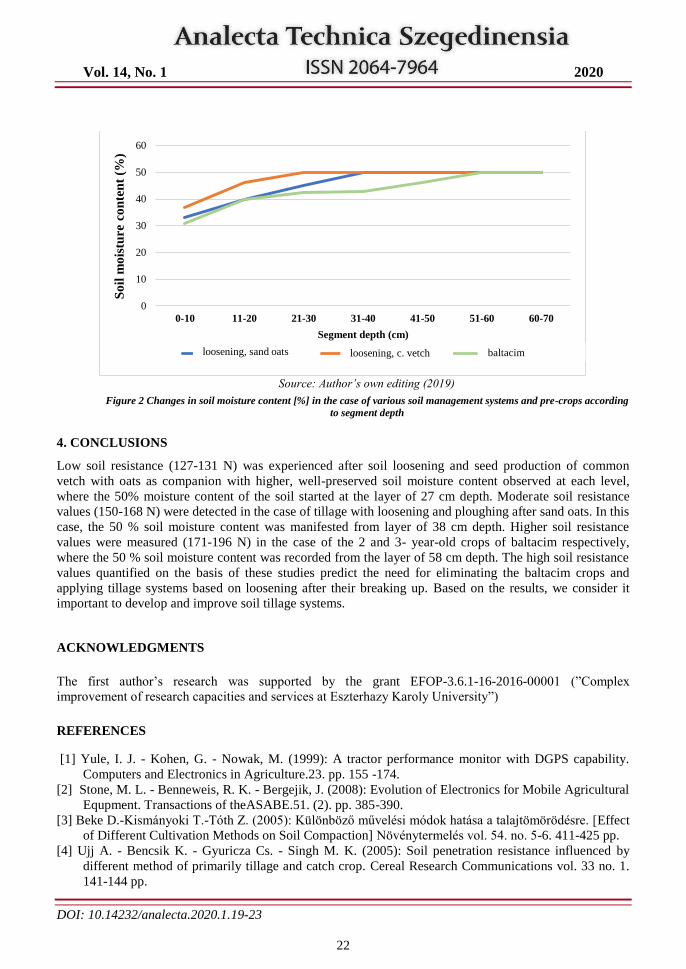
Source: Author’s own editing (2019)
Figure 2 Changes in soil moisture content [%] in the case of various soil management systems and pre-crops according
to segment depth
4. CONCLUSIONS
Low soil resistance (127-131 N) was experienced after soil loosening and seed production of common
vetch with oats as companion with higher, well-preserved soil moisture content observed at each level,
where the 50% moisture content of the soil started at the layer of 27 cm depth. Moderate soil resistance
values (150-168 N) were detected in the case of tillage with loosening and ploughing after sand oats. In this
case, the 50 % soil moisture content was manifested from layer of 38 cm depth. Higher soil resistance
values were measured (171-196 N) in the case of the 2 and 3- year-old crops of baltacim respectively,
where the 50 % soil moisture content was recorded from the layer of 58 cm depth. The high soil resistance
values quantified on the basis of these studies predict the need for eliminating the baltacim crops and
applying tillage systems based on loosening after their breaking up. Based on the results, we consider it
important to develop and improve soil tillage systems.
ACKNOWLEDGMENTS
The first author’s research was supported by the grant EFOP-3.6.1-16-2016-00001 (”Complex
improvement of research capacities and services at Eszterhazy Karoly University”)
REFERENCES
[1] Yule, I. J. - Kohen, G. - Nowak, M. (1999): A tractor performance monitor with DGPS capability.
Computers and Electronics in Agriculture.23. pp. 155 -174.
[2] Stone, M. L. - Benneweis, R. K. - Bergejik, J. (2008): Evolution of Electronics for Mobile Agricultural
Equpment. Transactions of theASABE.51. (2). pp. 385-390.
[3] Beke D.-Kismányoki T.-Tóth Z. (2005): Különböző művelési módok hatása a talajtömörödésre. [Effect
of Different Cultivation Methods on Soil Compaction] Növénytermelés vol. 54. no. 5-6. 411-425 pp.
[4] Ujj A. - Bencsik K. - Gyuricza Cs. - Singh M. K. (2005): Soil penetration resistance influenced by
different method of primarily tillage and catch crop. Cereal Research Communications vol. 33 no. 1.
141-144 pp.
0
10
20
30
40
50
60
0-10 11-20 21-30 31-40 41-50 51-60 60-70
So
il m
ois
ture
co
nte
nt
(%)
Segment depth (cm)
lazítás, homoki zab lazító, t.bükköny baltacimloosening, sand oats loosening, c. vetch baltacim
Vol. 14, No. 1 2020
DOI: 10.14232/analecta.2020.1.19-23
23
[5] Várallyay Gy. (2005): Talajvédelmi Stratégia az EU-ban és Magyarországon. [Soil Conservation
Strategy in the European Union and in Hungary.] Agrokémia és Talajtan, 54. (1-2) pp. 203-216.
[6] Stefanovics P. (1997) Talajvédelem, környezetvédelem. [Soil protection, environmental protection.]
Mezőgazdasági kiadó, Budapest
[7] Gyuricza CS. - Farkas Cs. - Baráth Csné - Birkás M. - Murányi A. (1998): A penetrációs ellenállás
vizsgálata talajművelési tartamkísérletben gödöllői barna erdőtalajon. [Studies on Penetration
Resistance in a Long-term Soil Tillage Experiment on Brown Forest Soil in Gödöllő].
Növénytermelés, 47: (2) 199-212. p.
[8] Birkás, M. (2001): Talajművelés a fenntartható mezőgazdaságban. [Soil Tillage in Sustainable
Farming] ISBN 963 9256 307. pp. 47-57.
[9] Bikás M., Stingli A., Farkas CS., Botlik, L. (2009): Összefüggés a művelés eredetű tömörödés és a
klímakárok között. [Relationship between Tillage-induced Compaction and Climate-induced
Damage.] Növénytermelés 58. 3. 5-26.
[10] Murer H., Werner A., Reshkin S., Wurin F. & Biber J. (1991): Cellular mechanisms in proximal
tubular reabsorption of inorganic phosphate. American Journal of Physiology 260, C885–889.
[11] Szőllősi, I. (2003): A 3T SYSTEM készülékkel mért penetrációs ellenállás és nedvességtartalom
összefüggése vályog fizikai féleségű talajokon. [The Relationship between Penetration Resistance and
Moisture Content Measured with a 3T SYSTEM Instrument on Adobe Soils.] Agrokémia és
Talajtan.52.pp. 263-274.
[12] Schmidt R. - Szakál P. - Kerekes G. - Bene L. (1998): A talajtömörödöttségi viszonyok vizsgálata
művelőutas cukorrépa termesztési technológia alkalmazása esetén. [An Investigation of Soil
Compaction Conditions in the Case of Sugar Beet Production Technology with Cultivation Route.]
Cukorrépa 16: (1) 8-14. p
[13] Rátonyi T. (1999): A talaj fizikai állapotának penetrométeres vizsgálata talajművelési
tartamkísérletben. [A Penetrometric Investigation of the Physical Condition of Soil in Long-term
Tillage Experiments] Doktori (PhD) értekezés. Debrecen
[14] Beke D. (2006): Talajtömörödés és nedvességtartalom vizsgálat szántóföldi tartamkísérletekben. [Soil
Compaction and Soil Moisture Studies in Long-term Field Experiments.] Doktori (PhD) értekezés.
Keszthely
Vol. 14, No. 1 2020
DOI: 10.14232/analecta.2020.1.24-33
24
SIMULATION OF ACACIA GASIFICATION PROCESS
István Bodnár
Institute of Physics and Electrical Engineering, Egyetemi út 1, 3515 Miskolc-Egyetemváros, Hungary
e-mail: [email protected]
ABSTRACT
This electronic document presents the thermokinetical modelling of the gasification process done on
acacia-tree with variable operating conditions and different humidity levels. Gasification does not produce
flue gas, but due to imperfect burning, synthesis gas appears which is rich in flammable components (CO2
and H2). The chemical structure of this gas depends on the components of the fuel and the humidity level,
but greatly affected by the technological parameters too, such as pressure and temperature, as well as the
air-ratio. The study shows the change in the amount of the fuel and the reaction efficiency, caused by
varying gasification temperature and pressure. Rising temperature results in improved efficiency, while
higher pressure worsens reaction efficiency. However, at higher temperature intervals, the effect of the
pressure is neglectable.
Keywords: acacia, gasification, pressure, temperature, air-ratio, reaction efficiency
1. INTRODUCTION
Nowadays one of the most important research fields is the energetics, which includes the production of
energy, the consumption of energy and the improvement of the efficiency of the process. We can often hear
about the gasification technology and wood-gas boilers taking part in heat-energy production. Gasification
technology is not only able to produce heat, but electricity too, as the main product of the gasification
process is the combustible synthesis gas, which can be utilized by gas engines and turbines with high
efficiency. The poor calorific value and low-grade quality of gas can decrease efficiency and power of the
gas powered machines, so the examination of wood gasification is inevitable due to the gas composition.
Besides these facts, wood gasification gives a great opportunity to build wood and biomass fueled quick-
start power plants, which would be able to provide a solution for the changing energy demand.
2. HISTORICAL REVIEW OF GASIFICATION
Gasification is one of the oldest processes used to convert solid fossils and renewable fuels into
combustible synthesis gas and liquid fuel. This technology was first used by Thomas Shirley, who
produced hydrogen in 1659. Robert Gardner filled the first patent in 1788 and the spread of gasification
process began. Its industrial application is associated with William Murdoch and began in 1798 in England
and France [1].
At the beginning, combustible gases (wood and carbon gas) were produces from wood and coal, and were
mainly used for heating and public lighting purposes. By 1850, technology reached a level of development
that allowed 75% of London’s public lighting to be solved with the help of gases, produced this way. Some
years later, the gasification technology appeared in the United States too, and by 1920, it was used in most
of the cities for heating and public lighting [2].
Following the discovery of Texas oil fields, the first natural gas pipeline was built in Denver, which
eliminated the predominance of synthesis gas. After discovering the oil field under the North Sea, gas
plants went into oblivion in Europe over time too. Although the last one was unveiled in England in 1970,
we can still find some functioning systems in the third world countries [1].
With the appearance of internal combustion engines, the gasification process was also used to generate
alternative fuels. The first wood-gas powered car was designed and built by Thomas Hugh Parker in 1901,
Vol. 14, No. 1 2020
DOI: 10.14232/analecta.2020.1.24-33
25
but it was widespread only thirty years later. In the 1930s, the rapid development of military industry and
the Second World War caused the use of alternative materials in the fuel industry.
During the Second World War, the Allies and the Soviet Union did not supply crude oil to European
countries that were occupied by the Germans. The local small-scale exploitation was used by the German
army (Wehrmacht). Since there was not enough fuel for the military industry, the Wehrmacht also
experimented with wood-gas powered tanks, which were finally not applied because of their difficult and
complicated operation. By the end of the Second World War, there were about a half million wood-gas
powered vehicles only in Germany [1]. There were more than a million of such vehicles in Europe. In the
occupied Denmark, 95% of civilian and agricultural vehicles were wood-gas powered [2].
The chemical composition and the energy content of the synthesis gas, produced during the gasification of
wood, was appropriate to be the fuel of the rudimentary internal combustion engines [1]. Some decades
later, the further developed gasification technology was used in waste management and power plant
energetics. Special workshops had been set up to transform traditional cars into gas-powered ones, and fuel
filling stations have been built, where people were able to buy firewood of the right size.
Gasification is a process based on the rapid heat dissipation of materials with partial oxidation, which has a
smaller oxygen demand compared to the theoretical oxygen required for the perfect combustion. During
the partial oxidation of the organic compounds found in the parent material synthesis gas is released, which
can be utilized either as raw material, chemical synthesis or as fuel [1].
Due to the sensitivity of the process, it is important, that the characteristics (size, moisture content,
consistency) of the fuel supplied remain within certain predetermined limits [3]. The effect of sensitivity
typically occurs in energetic and environmental efficiency.
The main purpose of the process is to achieve the highest gas output and achieve optimum energetic
efficiency. The synthesis gas, produced during the gasification process is a gas mixture, rich in hydrogen
and carbon monoxide, which depends on the gasifying medium and contains energetically inert
components. The most commonly occurring non-combustible components are the carbon dioxide and water
steam, which take part in the operation, but leave the reactor as ballast. The gasifying medium significantly
influences the chemical composition and energy content of the resulting synthesis gas. The gasifying
medium helps to break down the solid carbon and the higher molecular weight carbon hydrogens resulting
in the release of hydrogen and carbon monoxide [2]. Most commonly air, steam and pure oxygen are used,
but a good ratio of carbon dioxide and oxygen can also yield good results. Incorrectly selected auxiliary
gas can cause the fail of the technology.
It is recommended to cool the synthesis gas before the utilization and subjected to a complex purification
process to remove harmful and corrosive substances. The purified synthesis gas is usually used to produce
heat-energy and electricity by burning it in a gas-engine or in a gas-turbine. Gasification is a non-existent
technology by its own, because in a reactor, formed for this purpose pyrolysis and combustion zones are
both formed. However, the name is correct, because in case of thermodynamic equilibrium the reactions,
which are taking place, with the exception of radiation losses, results a self-sustaining process [1]. In a
thermodynamic equilibrium state, the system does not cool and does not heat up, therefore it does not
require heat input (pyrolysis) or heat loss (combustion) and produces combustible synthesis gas. The
gasification is carried out in four steps, which happens on different temperatures and stoichiometric
proportions in the reactor. The relationship between the reactors are determined by the type of the reactor
[2, 7].
Gasification is the only thermal treatment technology which can be an endothermic or an exothermic
process too, depending on the excess air factor and on the temperature. When applying gasification, the
main goal is to achieve a self-sustaining process. This only occurs, if the reactor, considering the radiation
and heat losses, is in thermodynamic equilibrium state. After the start, the system reaches its steady state
after a 5 - 20 minutes long transient. The thermodynamic equilibrium state is significantly affected by the
moisture content of the dispersed war material. The excess air factor value can be determined basing on the
moisture content and the thermal loss of the reactor [7].
Vol. 14, No. 1 2020
DOI: 10.14232/analecta.2020.1.24-33
26
3. BASIC EQUATIONS OF THERMOKINETICAL MODEL EXAMINATION
During thermokinetical model investigation, the chemical and energetic properties of gases, produced from
different materials are determined. The thermokinetical model is used for the modelling of processes,
which is basing on the law of energy conservation [1]. By applying this model, approximate estimates of
the chemical composition, viscosity and other properties of the produces gas can be given.
As the essence of the model is to make the calculations faster and easier, some ingredients, such as
nitrogen oxide and ethylene, acetylene compounds were neglected during writing the simplified model
equations. The model equation is written for the hydrogen and oxygen content of the fuel in one mole of
carbon content [1, 5, 6].
Model examinations were carried out by using the equilibrium constants with predetermined gas
composition at fixed temperature and operating pressure. The equilibrium constant method at the given
temperature is the equation conversion. Its essence is to determine the composition of the produced product
using the principle of Gibbs’s free energy minimization. For the analyses, we used a software, called
Gaseq, which is based on a NASA method. It was developed by Chris Morley and it is accessible for
everyone, and can be used for educational and non-profit purposes. It is mainly used for solving equations
describing interaction of gas reactants. In the case of the rate of the theoretical and practically used molar
oxygen demand equals one (λ=1), or it is higher than one, than we get the combustion equations back.
The expanded model equation, basing on the molar theoretical content may be written as the following:
CHkOl+nm·H2O+m·O2+(3.76·m+an)·N2=
x1·H2+x2·CO+x3·H2O+x4·CO2+x5·CH4+x6·O2+x7·NO+x8·NO2+x9·N2+x10·N2O+xi·CdHfOg
(1)
where:
nm: is the moisture content of the fuel per mole of carbon content,
a: is the nitrogen content of the fuel,
x1: is the molar hydrogen content of the produced raw synthesis gas,
x2 is the content of carbon-monoxide;
x3: is the content of water steam,
x4: is the content of carbon-dioxide,
x5: is the content of methane,
x6: is residual oxygen content,
x7: is the nitrogen-monoxide,
x8: is the content of nitrogen-dioxide,
x9: is content of nitrogen,
x10: is the dinitrogen-oxide content,
x11: is the residual solid carbon,
xi: is the molar amount of other constituents that are formed (e.g.: ethylene, acetylene).
Model examinations were made to determine the chemical composition of the produced gas product to be
able to determine the parameters and properties characterizing the technological and energetic efficiencies.
Applying the parametric basic equations is necessary, because we have built up the model examinations by
using them. To determine the right side of Equation (1), e.g. to determine the unknown quantities, we have
chosen the equilibrium constant method, by knowing the input compositions and the resulting product [1,
6].
We applied the equilibrium constant method, for which we first wrote the molar material equation for each
component, than we checked if the molar material retention met. In the end, the equilibrium conditions
were determined [1, 6].
Vol. 14, No. 1 2020
DOI: 10.14232/analecta.2020.1.24-33
27
The value expressed in molar amounts of the resulting products is indicated by the equilibrium mole
number (x). The equilibrium number shows how the resulting component is generated compared to other
product components.
Gibbs’s free energy can be written according to equation numbers pressure and temperature in accordance
with Equation (2) [1, 8].
G
R · T= ∑ (
xi ∙ Gi0
R ∙ T+ xi ∙ ln
xi
∑ xi
+ xi ∙ ln p)
n
i=1
(2)
where:
G: the Gibbs free energy,
Gi0: is the specific saturation energy of the i-th material with respect to 1 mole of material at
atmospheric pressure,
R: is the universal gas constant,
T: is the temperature of the system,
p: is the pressure of the system,
xi: is equilibrium mole number of component i, so the material quantity of the i-th parent material in the
blend,
n: is the number of chemical elements,
∑xi: is the sum of the equilibrium numbers of the final product, the amount of the blend materials.
In case of thermodynamical state, the main purpose is to minimize the G/RT rate, which is determined by
the elemental composition.
During the model examinations, we applied the equilibrium constant method at the pressure and the
temperature fixed in the Gaseq software to solve the model equations. The software was created for
analyzing chemical equilibrium processes, so applying it helps in the examination of thermic treatment
technologies. During the simulations of gasification processes, we were able to see, how the variable input
parameters determine the composition of the gas, produced during the gasification, which composition is
really important to know to determine the efficiency of power and heat production, using the produced gas.
4. REACTION EFFICIENCY EXAMINATION
Energy efficiency is one of the central topics of our days. Energy efficiency policy is closely related to
commercial, industrial and energy security activities, but environmental benefits have become increasingly
important as one of the basic tools for reducing carbon emissions [3, 4]. Many conventional and non-
conventional measurements are known and applied to determine the efficiency of energy conversion. The
following non-conventional parameters are presented.
The reaction, or the chemical efficiency Equation (3) shows us what part of the energy content of the solid
fuel is in the produced gas product [9, 10]. By knowing the reaction efficiency, the parameter that
characterizing the perfection of combustion can be determined. Its calculation method is shown in Equation
(4). According to these [4]:
ηr =Mgt ∙ Fgt
Mszt ∙ Fszt
(3)
ηé = 1 - ηr, (4)
where:
Ƞr: is the reaction efficiency,
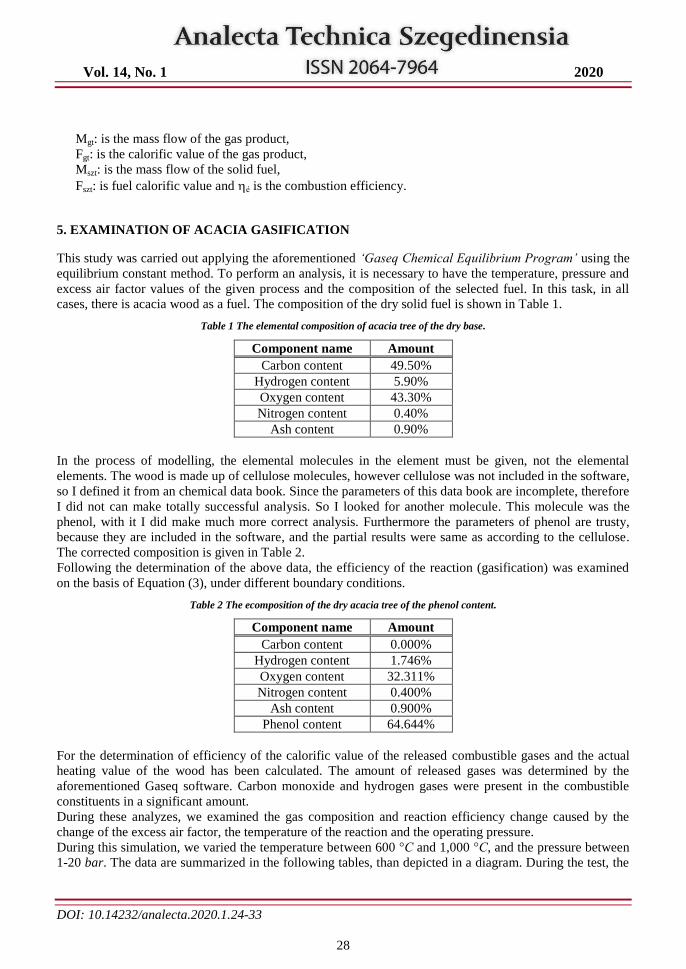
Vol. 14, No. 1 2020
DOI: 10.14232/analecta.2020.1.24-33
28
Mgt: is the mass flow of the gas product,
Fgt: is the calorific value of the gas product,
Mszt: is the mass flow of the solid fuel,
Fszt: is fuel calorific value and é is the combustion efficiency.
5. EXAMINATION OF ACACIA GASIFICATION
This study was carried out applying the aforementioned ‘Gaseq Chemical Equilibrium Program’ using the
equilibrium constant method. To perform an analysis, it is necessary to have the temperature, pressure and
excess air factor values of the given process and the composition of the selected fuel. In this task, in all
cases, there is acacia wood as a fuel. The composition of the dry solid fuel is shown in Table 1.
Table 1 The elemental composition of acacia tree of the dry base.
Component name Amount
Carbon content 49.50%
Hydrogen content 5.90%
Oxygen content 43.30%
Nitrogen content 0.40%
Ash content 0.90%
In the process of modelling, the elemental molecules in the element must be given, not the elemental
elements. The wood is made up of cellulose molecules, however cellulose was not included in the software,
so I defined it from an chemical data book. Since the parameters of this data book are incomplete, therefore
I did not can make totally successful analysis. So I looked for another molecule. This molecule was the
phenol, with it I did make much more correct analysis. Furthermore the parameters of phenol are trusty,
because they are included in the software, and the partial results were same as according to the cellulose.
The corrected composition is given in Table 2.
Following the determination of the above data, the efficiency of the reaction (gasification) was examined
on the basis of Equation (3), under different boundary conditions.
Table 2 The ecomposition of the dry acacia tree of the phenol content.
Component name Amount
Carbon content 0.000%
Hydrogen content 1.746%
Oxygen content 32.311%
Nitrogen content 0.400%
Ash content 0.900%
Phenol content 64.644%
For the determination of efficiency of the calorific value of the released combustible gases and the actual
heating value of the wood has been calculated. The amount of released gases was determined by the
aforementioned Gaseq software. Carbon monoxide and hydrogen gases were present in the combustible
constituents in a significant amount.
During these analyzes, we examined the gas composition and reaction efficiency change caused by the
change of the excess air factor, the temperature of the reaction and the operating pressure.
During this simulation, we varied the temperature between 600 °C and 1,000 °C, and the pressure between
1-20 bar. The data are summarized in the following tables, than depicted in a diagram. During the test, the
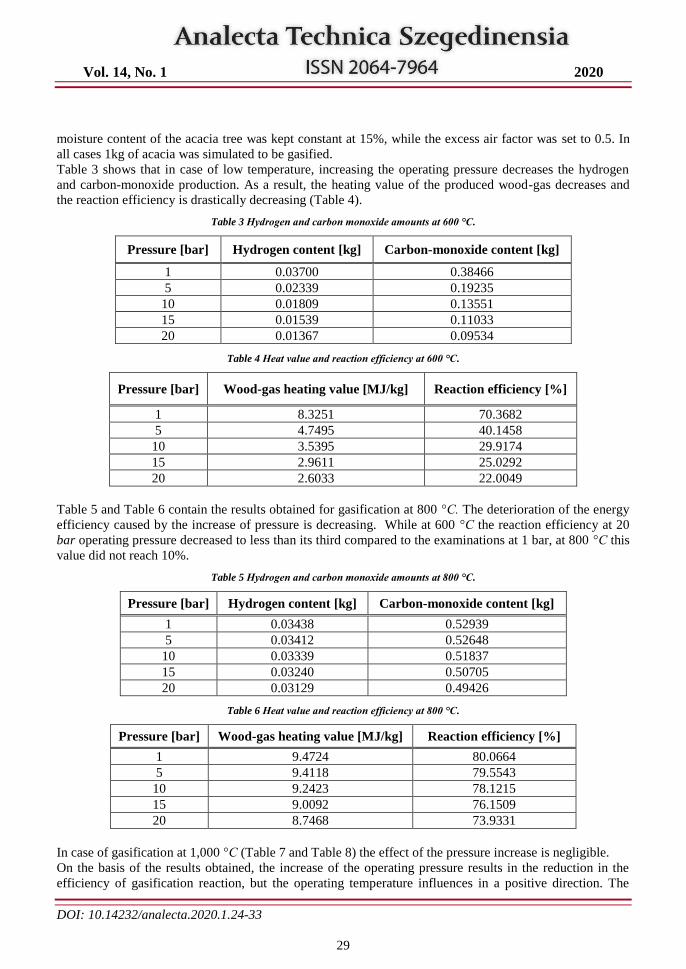
Vol. 14, No. 1 2020
DOI: 10.14232/analecta.2020.1.24-33
29
moisture content of the acacia tree was kept constant at 15%, while the excess air factor was set to 0.5. In
all cases 1kg of acacia was simulated to be gasified.
Table 3 shows that in case of low temperature, increasing the operating pressure decreases the hydrogen
and carbon-monoxide production. As a result, the heating value of the produced wood-gas decreases and
the reaction efficiency is drastically decreasing (Table 4).
Table 3 Hydrogen and carbon monoxide amounts at 600 °C.
Pressure [bar] Hydrogen content [kg] Carbon-monoxide content [kg]
1 0.03700 0.38466
5 0.02339 0.19235
10 0.01809 0.13551
15 0.01539 0.11033
20 0.01367 0.09534
Table 4 Heat value and reaction efficiency at 600 °C.
Pressure [bar] Wood-gas heating value [MJ/kg] Reaction efficiency [%]
1 8.3251 70.3682
5 4.7495 40.1458
10 3.5395 29.9174
15 2.9611 25.0292
20 2.6033 22.0049
Table 5 and Table 6 contain the results obtained for gasification at 800 °C. The deterioration of the energy
efficiency caused by the increase of pressure is decreasing. While at 600 °C the reaction efficiency at 20
bar operating pressure decreased to less than its third compared to the examinations at 1 bar, at 800 °C this
value did not reach 10%.
Table 5 Hydrogen and carbon monoxide amounts at 800 °C.
Pressure [bar] Hydrogen content [kg] Carbon-monoxide content [kg]
1 0.03438 0.52939
5 0.03412 0.52648
10 0.03339 0.51837
15 0.03240 0.50705
20 0.03129 0.49426
Table 6 Heat value and reaction efficiency at 800 °C.
Pressure [bar] Wood-gas heating value [MJ/kg] Reaction efficiency [%]
1 9.4724 80.0664
5 9.4118 79.5543
10 9.2423 78.1215
15 9.0092 76.1509
20 8.7468 73.9331
In case of gasification at 1,000 °C (Table 7 and Table 8) the effect of the pressure increase is negligible.
On the basis of the results obtained, the increase of the operating pressure results in the reduction in the
efficiency of gasification reaction, but the operating temperature influences in a positive direction. The
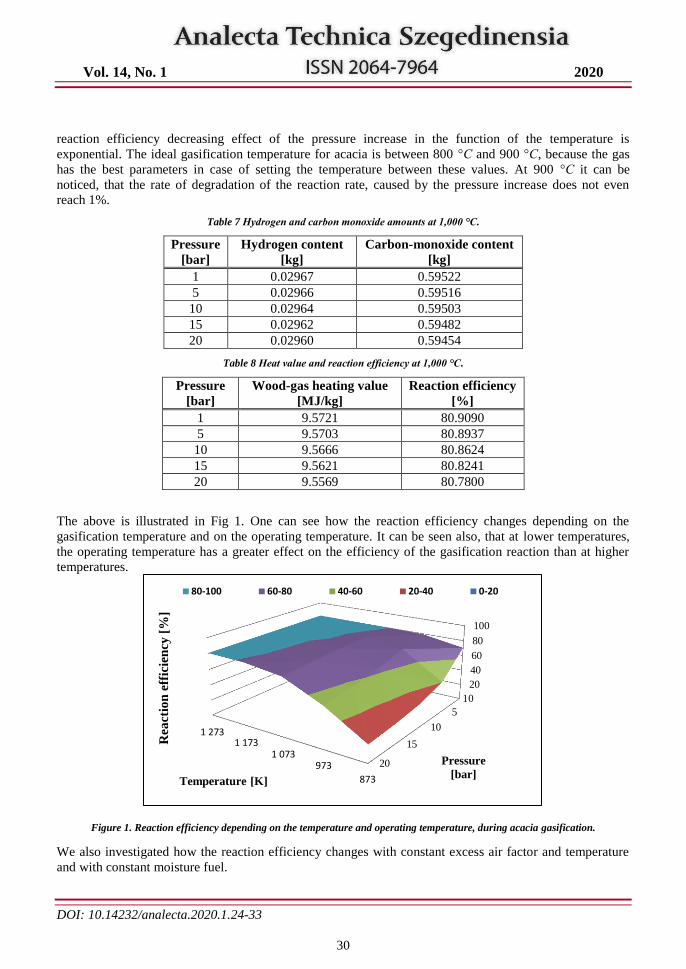
Vol. 14, No. 1 2020
DOI: 10.14232/analecta.2020.1.24-33
30
reaction efficiency decreasing effect of the pressure increase in the function of the temperature is
exponential. The ideal gasification temperature for acacia is between 800 °C and 900 °C, because the gas
has the best parameters in case of setting the temperature between these values. At 900 °C it can be
noticed, that the rate of degradation of the reaction rate, caused by the pressure increase does not even
reach 1%.
Table 7 Hydrogen and carbon monoxide amounts at 1,000 °C.
Pressure
[bar]
Hydrogen content
[kg]
Carbon-monoxide content
[kg]
1 0.02967 0.59522
5 0.02966 0.59516
10 0.02964 0.59503
15 0.02962 0.59482
20 0.02960 0.59454
Table 8 Heat value and reaction efficiency at 1,000 °C.
Pressure
[bar]
Wood-gas heating value
[MJ/kg]
Reaction efficiency
[%]
1 9.5721 80.9090
5 9.5703 80.8937
10 9.5666 80.8624
15 9.5621 80.8241
20 9.5569 80.7800
The above is illustrated in Fig 1. One can see how the reaction efficiency changes depending on the
gasification temperature and on the operating temperature. It can be seen also, that at lower temperatures,
the operating temperature has a greater effect on the efficiency of the gasification reaction than at higher
temperatures.
Figure 1. Reaction efficiency depending on the temperature and operating temperature, during acacia gasification.
We also investigated how the reaction efficiency changes with constant excess air factor and temperature
and with constant moisture fuel.
1
5
10
15
20
0
20
40
60
80
100
873
9731 073
1 1731 273
Pressure
[bar]
Rea
ctio
n e
ffic
ien
cy [
%]
Temperature [K]
80-100 60-80 40-60 20-40 0-20
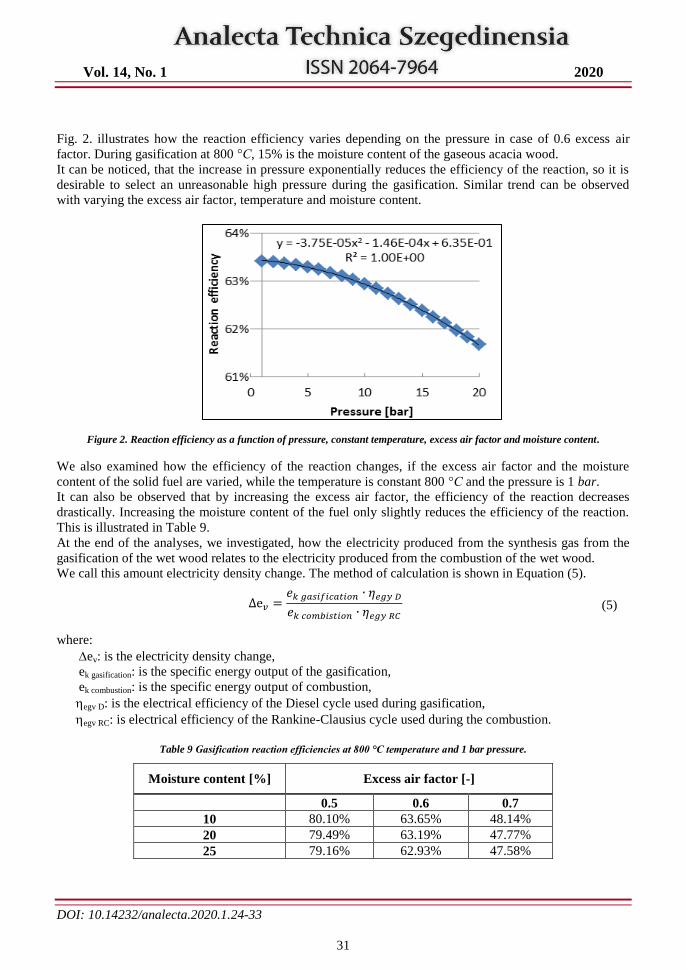
Vol. 14, No. 1 2020
DOI: 10.14232/analecta.2020.1.24-33
31
Fig. 2. illustrates how the reaction efficiency varies depending on the pressure in case of 0.6 excess air
factor. During gasification at 800 °C, 15% is the moisture content of the gaseous acacia wood.
It can be noticed, that the increase in pressure exponentially reduces the efficiency of the reaction, so it is
desirable to select an unreasonable high pressure during the gasification. Similar trend can be observed
with varying the excess air factor, temperature and moisture content.
Figure 2. Reaction efficiency as a function of pressure, constant temperature, excess air factor and moisture content.
We also examined how the efficiency of the reaction changes, if the excess air factor and the moisture
content of the solid fuel are varied, while the temperature is constant 800 °C and the pressure is 1 bar.
It can also be observed that by increasing the excess air factor, the efficiency of the reaction decreases
drastically. Increasing the moisture content of the fuel only slightly reduces the efficiency of the reaction.
This is illustrated in Table 9.
At the end of the analyses, we investigated, how the electricity produced from the synthesis gas from the
gasification of the wet wood relates to the electricity produced from the combustion of the wet wood.
We call this amount electricity density change. The method of calculation is shown in Equation (5).
Δe𝑣 =𝑒𝑘 𝑔𝑎𝑠𝑖𝑓𝑖𝑐𝑎𝑡𝑖𝑜𝑛 ∙ 𝜂𝑒𝑔𝑦 𝐷
𝑒𝑘 𝑐𝑜𝑚𝑏𝑖𝑠𝑡𝑖𝑜𝑛 ∙ 𝜂𝑒𝑔𝑦 𝑅𝐶
(5)
where:
ev: is the electricity density change,
ek gasification: is the specific energy output of the gasification,
ek combustion: is the specific energy output of combustion,
egv D: is the electrical efficiency of the Diesel cycle used during gasification,
egv RC: is electrical efficiency of the Rankine-Clausius cycle used during the combustion.
Table 9 Gasification reaction efficiencies at 800 °C temperature and 1 bar pressure.
Moisture content [%] Excess air factor [-]
0.5 0.6 0.7
10 80.10% 63.65% 48.14%
20 79.49% 63.19% 47.77%
25 79.16% 62.93% 47.58%
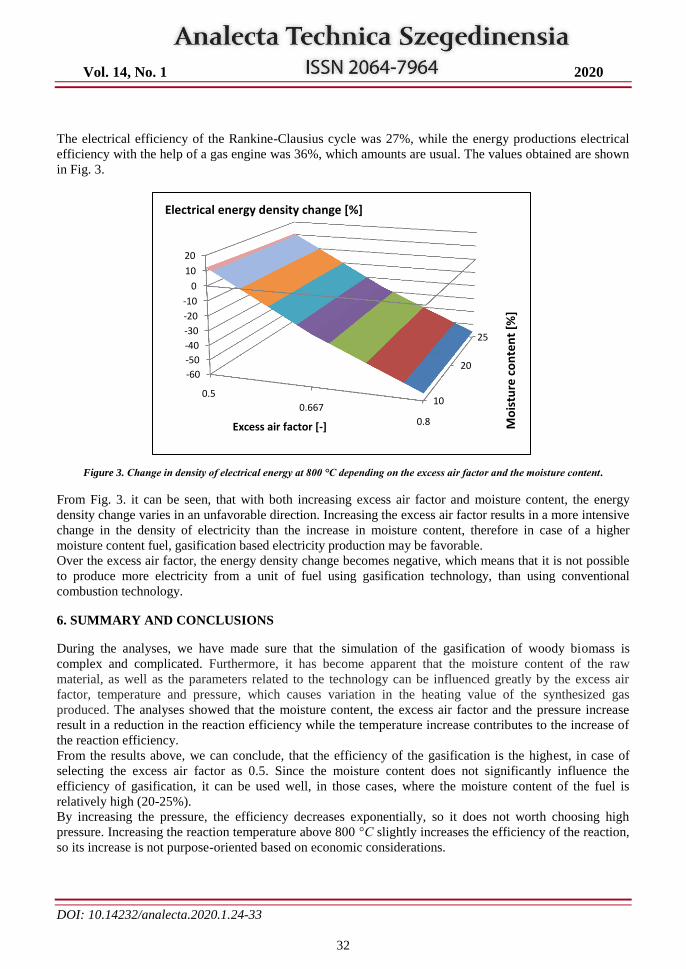
Vol. 14, No. 1 2020
DOI: 10.14232/analecta.2020.1.24-33
32
The electrical efficiency of the Rankine-Clausius cycle was 27%, while the energy productions electrical
efficiency with the help of a gas engine was 36%, which amounts are usual. The values obtained are shown
in Fig. 3.
Figure 3. Change in density of electrical energy at 800 °C depending on the excess air factor and the moisture content.
From Fig. 3. it can be seen, that with both increasing excess air factor and moisture content, the energy
density change varies in an unfavorable direction. Increasing the excess air factor results in a more intensive
change in the density of electricity than the increase in moisture content, therefore in case of a higher
moisture content fuel, gasification based electricity production may be favorable.
Over the excess air factor, the energy density change becomes negative, which means that it is not possible
to produce more electricity from a unit of fuel using gasification technology, than using conventional
combustion technology.
6. SUMMARY AND CONCLUSIONS
During the analyses, we have made sure that the simulation of the gasification of woody biomass is
complex and complicated. Furthermore, it has become apparent that the moisture content of the raw
material, as well as the parameters related to the technology can be influenced greatly by the excess air
factor, temperature and pressure, which causes variation in the heating value of the synthesized gas
produced. The analyses showed that the moisture content, the excess air factor and the pressure increase
result in a reduction in the reaction efficiency while the temperature increase contributes to the increase of
the reaction efficiency.
From the results above, we can conclude, that the efficiency of the gasification is the highest, in case of
selecting the excess air factor as 0.5. Since the moisture content does not significantly influence the
efficiency of gasification, it can be used well, in those cases, where the moisture content of the fuel is
relatively high (20-25%).
By increasing the pressure, the efficiency decreases exponentially, so it does not worth choosing high
pressure. Increasing the reaction temperature above 800 °C slightly increases the efficiency of the reaction,
so its increase is not purpose-oriented based on economic considerations.
10
20
25
-60
-50
-40
-30
-20
-10
0
10
20
0.5
0.66670.8
Mo
istu
re c
on
ten
t [%
]
Excess air factor [-]
Electrical energy density change [%]
0.5
0.667
0.8
Vol. 14, No. 1 2020
DOI: 10.14232/analecta.2020.1.24-33
33
In our opinion, the efficient operation of a power plant, using gasification technology requires a very
complex process, and requires careful engineering work, but it worth dealing with this technology. By
applying gasification technology, we are able to build quick-start power plants to produce electricity with
higher efficiency, than in case of conventional incineration.
ACKNOWLEDGMENT
“The described article was carried out as part of the EFOP-3.6.1-16-2016-00011 “Younger and Renewing
University – Innovative Knowledge City – institutional development of the University of Miskolc aiming
at intelligent specialisation” project implemented in the framework of the Szechenyi 2020 program. The
realization of this project is supported by the European Union, co-financed by the European Social Fund.”
REFERENCES
[1] Z.A. Zainal, R. Ali, C.H. Lean, K.N. Seetharamu, Prediction of performance of a downdraft gasifier
using equilibrium modelling for different biomass material, Energy Conversion and Management, vol.
42. 2001. pp. 1499−1515.
[2] T.B. Red, A. Das, Handbook of biomass downdraft gasifier engine systems, Solar Energy Research
Ins., 1988. p. 148.
[3] T. Hill, S. Dowen, Pyrolysis and gasification. Briefing (Draft 2), UK Without Incineration Network
(UK WIN), 2010. p. 9.
[4] M.G. Patterson, What is energy efficiency? Concepts, indicators and methodological issues, Energy
Policy, vol. 24, No. 5. 1996. pp. 377−390.
[5] Y. Wang, C.M. Kinoshita, Kinetic model of biomass gasification, Solar Energy, vol. 51. no. 1. 1993.
pp. 19−25.
[6] A. Mountouris, E. Voutsas, D. Tassios, Solid waste plasma gasification: equilibrium model
development and exergy analysis, Energy Conversion and Management, vol. 47. 2006. pp.
1723−1737.
[7] K.S. Hatzilyberis, Design of an indirect heat rotary kiln gasifier, Fuel Processing Technology, vol. 92.
2011. pp. 2429−2454.
[8] C. Morly, Method for calculating equilibrium compositions at specified temperature, Gaseq, a
chemical equilibrium program for windows. www.gaseq.co.uk, 2001. p. 6.
[9] K.A. Rajvanshi, Biomass gasification, Alternative Energy in Agriculture, vol. 2. no. 4. 1986. pp.
83−102.
[10] G. Schuster, G. Löffer, K. Weigel, H. Hofbrauer, Biomass steam gasification – an extensive
parametric modeling study, Bio resource Technology, vol. 77. 2001. pp. 71−79.
Vol. 14, No. 1 2020
DOI: 10.14232/analecta.2020.1.34-42
34
THE OPTIMIZATION OF TECHNOLOGICAL FACTORS DURING
PRODUCTION OF HUMMUS SPREAD
Ivana Nikolić, Ljubica Dokić ,Aleksandar Takači ,Zita Šereš ,Dragana Šoronja–Simović, Nikola
Maravić
1University of Novi Sad, Faculty of Technology Novi Sad, Bulevar cara Lazara 1, 21000 Novi Sad, Serbia
e–mail: [email protected]
ABSTRACT
The traditional hummus spread is obtained of cooked and grinded chickpeas, blended with susame paste
(tahini), olive oil, lemon juice and spices. Hummus spread is a rich source of dietary fibers,
polyunsaturated fatty acids, vitamins A, E and C, folate, minerals Mg, K and Fe. During production of such
kind of spreadable food product, many factors can have influence on product behavior trough the all phases
of production and to the final product quality. In this work, the influence of different technological factors
on rheological, textural and sensory properties of hummus spreads made by certain recipes were examined,
in the aim to achieve the maximum quality of final product. The way of preparation of raw materials, the
composition of the spreads and the amount of water phase have been varied in the aim to define optimal
rheological and textural parameters, to increase the production efficiency and in order to obtain desired
sensory properties of final spread product.
Keywords: hummus spreads, technological factors, rheology, texture and sensory properties
1. INTRODUCTION
The Chickpeas (Cicer arietinum L.) is one of the oldest and most widespread legumes, usually available in
tropical and subtropical areas. Chickpea seeds are round and large, similar to soybean and pea seeds, with
light brown color and specific by high amount of carbohydrates (~ 47 %) and proteins (~ 23 %). Starch is
the most abundant carbohydrate component in the chickpea seeds, in amount about 83.9 %. Also, in
chickpea seed are present vegetable oil (4–5 %), cellulose (3–5 %), vitamins of B–group (pyridoxine,
riboflavin, thiamine and niacin), minerals (Na, K, Ca, Mg, P, Mn, Zn, Cu , Fe, Se), essential amino acids
(isoleucine, lysine, phenylalanine, tyrosine, tryptophan), carotenoids, flavonoids, phenols and antioxidants
[1, 2, 3].
The Chickpea seeds are consumed cooked or baked, alone or in combination with other foods. The most
commercial application of chickpea seeds is in the production of the increasingly popular humus spread,
which was initially intended primarily for vegetarians. The traditional humus spread, which is originally
from the Middle East, is made from cooked and grinded chickpea seeds, and then mixed with tahini paste
(sesame paste), olive oil, lemon juice, garlic and spices. Therefore, humus is an excellent source of
proteins, fibers, polyunsaturated fatty acids, vitamins, minerals, especially folate, calcium, magnesium and
potassium. Four tablespoons (~ 100 kcal) of traditional humus spread daily compensate about 2 cups of
legumes a week and about 25 g of dietary fibers. Humus also contains bioactive components such as phytic
acid, sterols, tannins, carotenoids, and other polyphenols. Several studies confirm the positive impact of
humus consumption on weight control, on glucose control, insulin response, positive effect on
cardiovascular disease and cancer [4].
Spread–making process is very demanding process, because good quality of the final product strongly
depends on the chosen factors, such as firstly the nature of applied main components and their quantities
and certainly the applied technological processes. The aim of this paper is to investigate the influence of
different technological parameters on the physical and sensory properties of humus spreads and to adjust
these parameters in order to obtain maximum quality of the final product. For that purpose, the rheological,
textural and sensory properties of observed humus spreads, depending on the varied technological factors
during production, were examined.
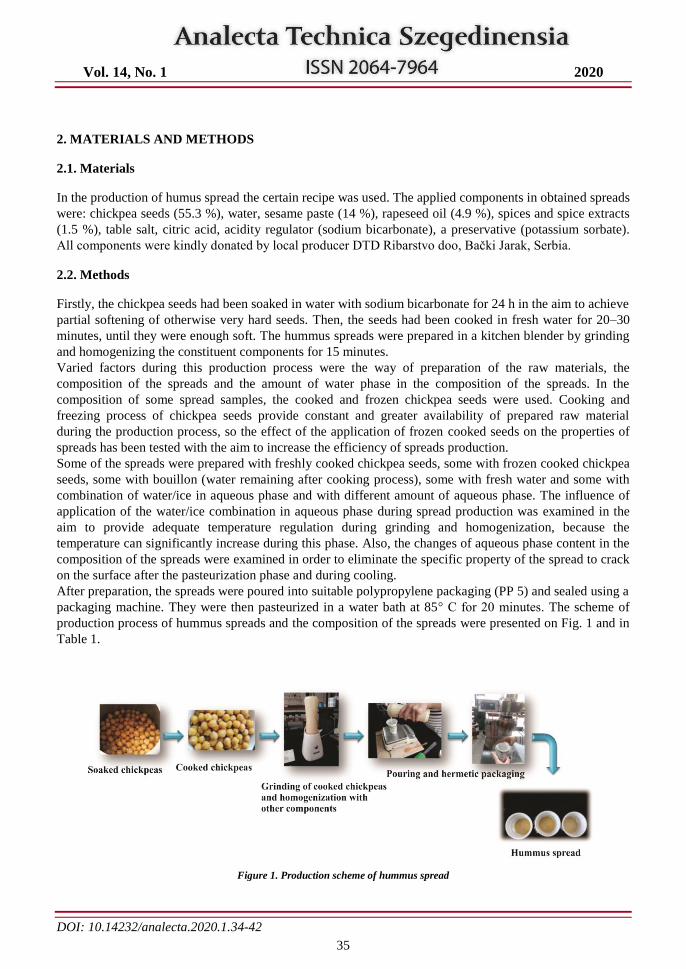
Vol. 14, No. 1 2020
DOI: 10.14232/analecta.2020.1.34-42
35
2. MATERIALS AND METHODS
2.1. Materials
In the production of humus spread the certain recipe was used. The applied components in obtained spreads
were: chickpea seeds (55.3 %), water, sesame paste (14 %), rapeseed oil (4.9 %), spices and spice extracts
(1.5 %), table salt, citric acid, acidity regulator (sodium bicarbonate), a preservative (potassium sorbate).
All components were kindly donated by local producer DTD Ribarstvo doo, Bački Jarak, Serbia.
2.2. Methods
Firstly, the chickpea seeds had been soaked in water with sodium bicarbonate for 24 h in the aim to achieve
partial softening of otherwise very hard seeds. Then, the seeds had been cooked in fresh water for 20–30
minutes, until they were enough soft. The hummus spreads were prepared in a kitchen blender by grinding
and homogenizing the constituent components for 15 minutes.
Varied factors during this production process were the way of preparation of the raw materials, the
composition of the spreads and the amount of water phase in the composition of the spreads. In the
composition of some spread samples, the cooked and frozen chickpea seeds were used. Cooking and
freezing process of chickpea seeds provide constant and greater availability of prepared raw material
during the production process, so the effect of the application of frozen cooked seeds on the properties of
spreads has been tested with the aim to increase the efficiency of spreads production.
Some of the spreads were prepared with freshly cooked chickpea seeds, some with frozen cooked chickpea
seeds, some with bouillon (water remaining after cooking process), some with fresh water and some with
combination of water/ice in aqueous phase and with different amount of aqueous phase. The influence of
application of the water/ice combination in aqueous phase during spread production was examined in the
aim to provide adequate temperature regulation during grinding and homogenization, because the
temperature can significantly increase during this phase. Also, the changes of aqueous phase content in the
composition of the spreads were examined in order to eliminate the specific property of the spread to crack
on the surface after the pasteurization phase and during cooling.
After preparation, the spreads were poured into suitable polypropylene packaging (PP 5) and sealed using a
packaging machine. They were then pasteurized in a water bath at 85° C for 20 minutes. The scheme of
production process of hummus spreads and the composition of the spreads were presented on Fig. 1 and in
Table 1.
Figure 1. Production scheme of hummus spread
Vol. 14, No. 1 2020
DOI: 10.14232/analecta.2020.1.34-42
36
Table 1. Composition of observed humus spreads
The influences of technological factors and their changes during production on the physical and sensory
properties of obtained spreads were examined by adequate rheological, textural and sensory methods of
analysis. The rheological measurements defined the flow curves of the spreads and the viscoelastic
properties of the spreads. Obtained flow curves of the spreads were defined by rheological parameters: the
yield stress τ0 (Pa) and the hysteresis loop area A0 (Pa/s). The viscoelastic properties of the spread were
defined by the modulus of elasticity G' and the modulus of viscosity G" and their ratio, the value Tan δ =
G"/G'. All measurements were performed by a Haake RheoStress RS600 rotary viscometer (Thermo
Electron Corporation, Karlsruhe, Germany) with equipment plate-to-plate PP60 Ti (plate diameter is 60
mm and gap between plates 1 mm).
Textural measurements determined the firmness of spreads, the work of shear, the stickiness and the work
of adhesion. The texture method Spreadability/Softness of spread was applied using the Texture Analyzer
TA.HD Plus (Stable Micro Systems, Godalming, UK) with adequate equipment.
The sensory characteristics of the spreads were analyzed by a quantitative descriptive method (QDA
method) under adequate determination conditions defined by ISO standards. The coded samples were
analyzed under appropriate conditions [5] by a six–member expert panel [6] using a numerical scale with
seven rating levels for each sensory characteristic [7]. Also, each sensory property had its factor of
significance on a scale from 0 to 1. Sensory parameters for appearance were: color uniformity (1), lightness
(0.5), color intensity (0.5), and surface appearance (1). The sensory parameters for the texture of the
spread were: hardness (1), spreadability (1), adhesiveness (0,7) and graininess. Also, the odor (1), taste
(1), salinity (0.7) and acidity (0.7) were determined and at the end of the sensory analysis, the general
acceptability (1) of the spreads was also evaluated.
The applied statistical method for analysis of obtained results was the ANOVA, using 5 % level of
significance, and statistically significant differences were determined using the Tukey's post hoc test, also
with 5 % level of significance. The approximation of the sensory characteristics of the spreads to the
optimum desired values was determined by applying the ranking function, which was formed as equation
(1):
𝑓(𝜔𝑖 , 𝑠𝑖) = ∑ 𝜔𝑖13𝑖=1 ∙ 𝑠𝑖
(1)
Where ωi is the relative significance of observed characteristic compared to other characteristics (1 is the
maximum and 0 is the minimum). Si is the mean square deviation of the arithmetic mean compared to the
optimal value. Between some individual variables the mutual correlations were determined and expressed
by Pearson's correlation coefficient-r, using Statistica 12.0 software package (Statsoft, Tulsa, USA).
Obtained hummus spread with optimal properties was observed by optical microscope (TP-1001C Topica
Ccd Camera (Kruss)) at magnification of x 40 and x 100.
Sample Sample composition
1 Freshly cooked chickpeas / chickpea bouillon / 24 % W
2 Freshly cooked chickpeas / water / 24 % W
3 Frozen cooked chickpeas / water-ice / 24% W
4 Frozen cooked chickpeas / water-ice / 28% W
5 Frozen cooked chickpeas / water-ice / 32% W
6 Frozen cooked chickpeas / water-ice / 36% W
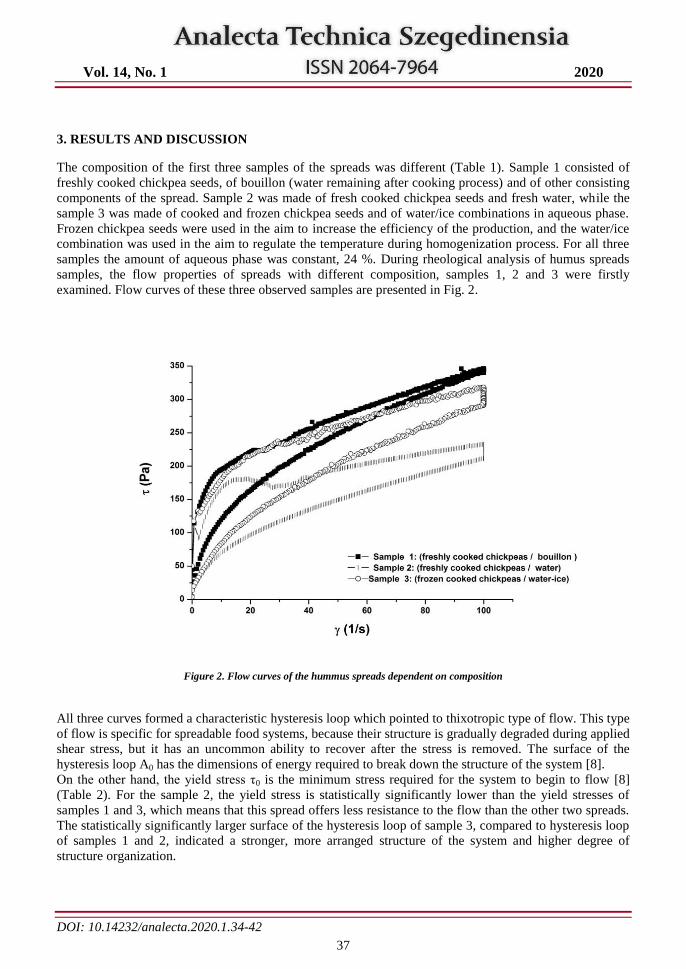
Vol. 14, No. 1 2020
DOI: 10.14232/analecta.2020.1.34-42
37
3. RESULTS AND DISCUSSION
The composition of the first three samples of the spreads was different (Table 1). Sample 1 consisted of
freshly cooked chickpea seeds, of bouillon (water remaining after cooking process) and of other consisting
components of the spread. Sample 2 was made of fresh cooked chickpea seeds and fresh water, while the
sample 3 was made of cooked and frozen chickpea seeds and of water/ice combinations in aqueous phase.
Frozen chickpea seeds were used in the aim to increase the efficiency of the production, and the water/ice
combination was used in the aim to regulate the temperature during homogenization process. For all three
samples the amount of aqueous phase was constant, 24 %. During rheological analysis of humus spreads
samples, the flow properties of spreads with different composition, samples 1, 2 and 3 were firstly
examined. Flow curves of these three observed samples are presented in Fig. 2.
Figure 2. Flow curves of the hummus spreads dependent on composition
All three curves formed a characteristic hysteresis loop which pointed to thixotropic type of flow. This type
of flow is specific for spreadable food systems, because their structure is gradually degraded during applied
shear stress, but it has an uncommon ability to recover after the stress is removed. The surface of the
hysteresis loop A0 has the dimensions of energy required to break down the structure of the system [8].
On the other hand, the yield stress τ0 is the minimum stress required for the system to begin to flow [8]
(Table 2). For the sample 2, the yield stress is statistically significantly lower than the yield stresses of
samples 1 and 3, which means that this spread offers less resistance to the flow than the other two spreads.
The statistically significantly larger surface of the hysteresis loop of sample 3, compared to hysteresis loop
of samples 1 and 2, indicated a stronger, more arranged structure of the system and higher degree of
structure organization.
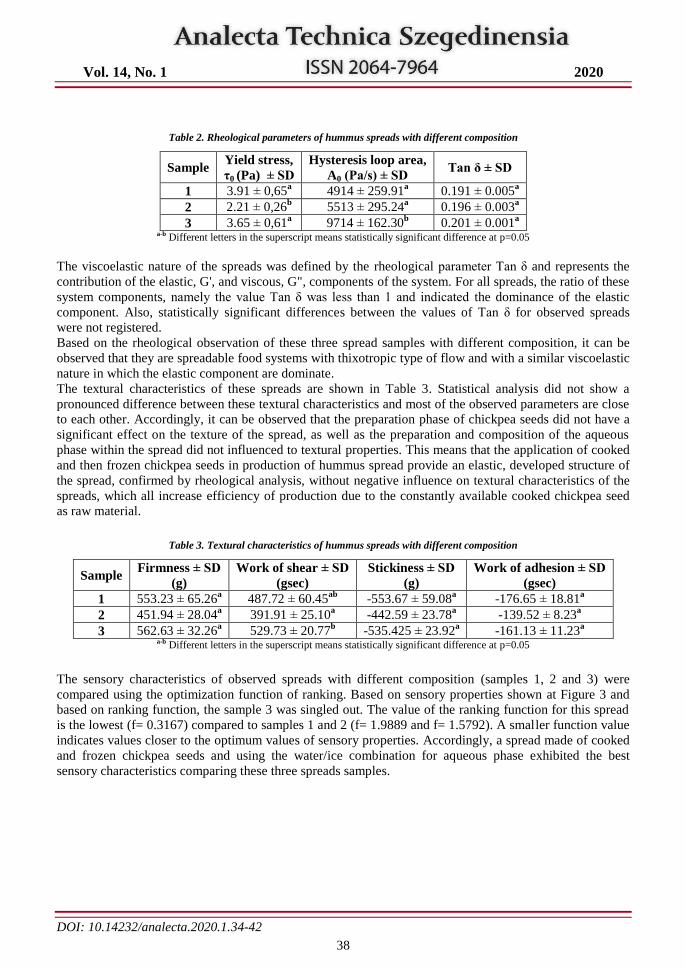
Vol. 14, No. 1 2020
DOI: 10.14232/analecta.2020.1.34-42
38
Table 2. Rheological parameters of hummus spreads with different composition
Sample Yield stress,
τ0 (Pa) ± SD
Hysteresis loop area,
A0 (Pa/s) ± SD Tan δ ± SD
1 3.91 ± 0,65a
4914 ± 259.91a
0.191 ± 0.005a
2 2.21 ± 0,26b
5513 ± 295.24a
0.196 ± 0.003a
3 3.65 ± 0,61a
9714 ± 162.30b
0.201 ± 0.001a
a-b Different letters in the superscript means statistically significant difference at p=0.05
The viscoelastic nature of the spreads was defined by the rheological parameter Tan δ and represents the
contribution of the elastic, G', and viscous, G", components of the system. For all spreads, the ratio of these
system components, namely the value Tan δ was less than 1 and indicated the dominance of the elastic
component. Also, statistically significant differences between the values of Tan δ for observed spreads
were not registered.
Based on the rheological observation of these three spread samples with different composition, it can be
observed that they are spreadable food systems with thixotropic type of flow and with a similar viscoelastic
nature in which the elastic component are dominate.
The textural characteristics of these spreads are shown in Table 3. Statistical analysis did not show a
pronounced difference between these textural characteristics and most of the observed parameters are close
to each other. Accordingly, it can be observed that the preparation phase of chickpea seeds did not have a
significant effect on the texture of the spread, as well as the preparation and composition of the aqueous
phase within the spread did not influenced to textural properties. This means that the application of cooked
and then frozen chickpea seeds in production of hummus spread provide an elastic, developed structure of
the spread, confirmed by rheological analysis, without negative influence on textural characteristics of the
spreads, which all increase efficiency of production due to the constantly available cooked chickpea seed
as raw material.
Table 3. Textural characteristics of hummus spreads with different composition
Sample Firmness ± SD
(g)
Work of shear ± SD
(gsec)
Stickiness ± SD
(g)
Work of adhesion ± SD
(gsec)
1 553.23 ± 65.26a
487.72 ± 60.45ab
-553.67 ± 59.08a
-176.65 ± 18.81a
2 451.94 ± 28.04a
391.91 ± 25.10a
-442.59 ± 23.78a
-139.52 ± 8.23a
3 562.63 ± 32.26a
529.73 ± 20.77b
-535.425 ± 23.92a
-161.13 ± 11.23a
a-b Different letters in the superscript means statistically significant difference at p=0.05
The sensory characteristics of observed spreads with different composition (samples 1, 2 and 3) were
compared using the optimization function of ranking. Based on sensory properties shown at Figure 3 and
based on ranking function, the sample 3 was singled out. The value of the ranking function for this spread
is the lowest (f= 0.3167) compared to samples 1 and 2 (f= 1.9889 and f= 1.5792). A smaller function value
indicates values closer to the optimum values of sensory properties. Accordingly, a spread made of cooked
and frozen chickpea seeds and using the water/ice combination for aqueous phase exhibited the best
sensory characteristics comparing these three spreads samples.
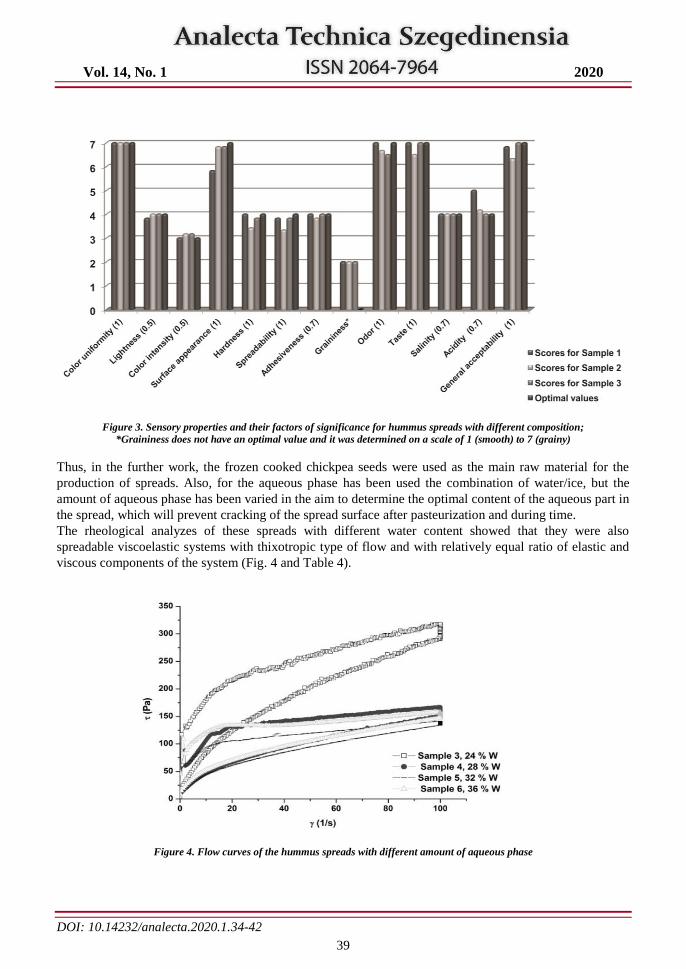
Vol. 14, No. 1 2020
DOI: 10.14232/analecta.2020.1.34-42
39
Figure 3. Sensory properties and their factors of significance for hummus spreads with different composition;
*Graininess does not have an optimal value and it was determined on a scale of 1 (smooth) to 7 (grainy)
Thus, in the further work, the frozen cooked chickpea seeds were used as the main raw material for the
production of spreads. Also, for the aqueous phase has been used the combination of water/ice, but the
amount of aqueous phase has been varied in the aim to determine the optimal content of the aqueous part in
the spread, which will prevent cracking of the spread surface after pasteurization and during time.
The rheological analyzes of these spreads with different water content showed that they were also
spreadable viscoelastic systems with thixotropic type of flow and with relatively equal ratio of elastic and
viscous components of the system (Fig. 4 and Table 4).
Figure 4. Flow curves of the hummus spreads with different amount of aqueous phase
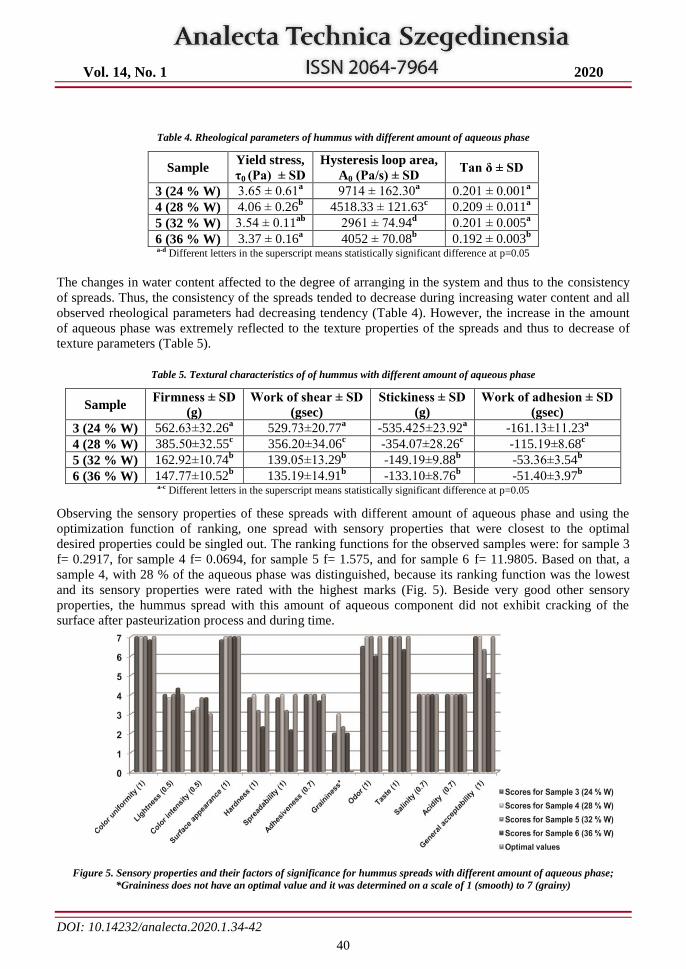
Vol. 14, No. 1 2020
DOI: 10.14232/analecta.2020.1.34-42
40
Table 4. Rheological parameters of hummus with different amount of aqueous phase
Sample Yield stress,
τ0 (Pa) ± SD
Hysteresis loop area,
A0 (Pa/s) ± SD Tan δ ± SD
3 (24 % W) 3.65 ± 0.61a
9714 ± 162.30a
0.201 ± 0.001a
4 (28 % W) 4.06 ± 0.26b
4518.33 ± 121.63c
0.209 ± 0.011a
5 (32 % W) 3.54 ± 0.11ab
2961 ± 74.94d
0.201 ± 0.005a
6 (36 % W) 3.37 ± 0.16a
4052 ± 70.08b
0.192 ± 0.003b
a-d Different letters in the superscript means statistically significant difference at p=0.05
The changes in water content affected to the degree of arranging in the system and thus to the consistency
of spreads. Thus, the consistency of the spreads tended to decrease during increasing water content and all
observed rheological parameters had decreasing tendency (Table 4). However, the increase in the amount
of aqueous phase was extremely reflected to the texture properties of the spreads and thus to decrease of
texture parameters (Table 5).
Table 5. Textural characteristics of of hummus with different amount of aqueous phase
Sample Firmness ± SD
(g)
Work of shear ± SD
(gsec)
Stickiness ± SD
(g)
Work of adhesion ± SD
(gsec)
3 (24 % W) 562.63±32.26a
529.73±20.77a
-535.425±23.92a
-161.13±11.23a
4 (28 % W) 385.50±32.55c
356.20±34.06c
-354.07±28.26c
-115.19±8.68c
5 (32 % W) 162.92±10.74b
139.05±13.29b
-149.19±9.88b
-53.36±3.54b
6 (36 % W) 147.77±10.52b
135.19±14.91b
-133.10±8.76b
-51.40±3.97b
a-c Different letters in the superscript means statistically significant difference at p=0.05
Observing the sensory properties of these spreads with different amount of aqueous phase and using the
optimization function of ranking, one spread with sensory properties that were closest to the optimal
desired properties could be singled out. The ranking functions for the observed samples were: for sample 3
f= 0.2917, for sample 4 f= 0.0694, for sample 5 f= 1.575, and for sample 6 f= 11.9805. Based on that, a
sample 4, with 28 % of the aqueous phase was distinguished, because its ranking function was the lowest
and its sensory properties were rated with the highest marks (Fig. 5). Beside very good other sensory
properties, the hummus spread with this amount of aqueous component did not exhibit cracking of the
surface after pasteurization process and during time.
Figure 5. Sensory properties and their factors of significance for hummus spreads with different amount of aqueous phase;
*Graininess does not have an optimal value and it was determined on a scale of 1 (smooth) to 7 (grainy)
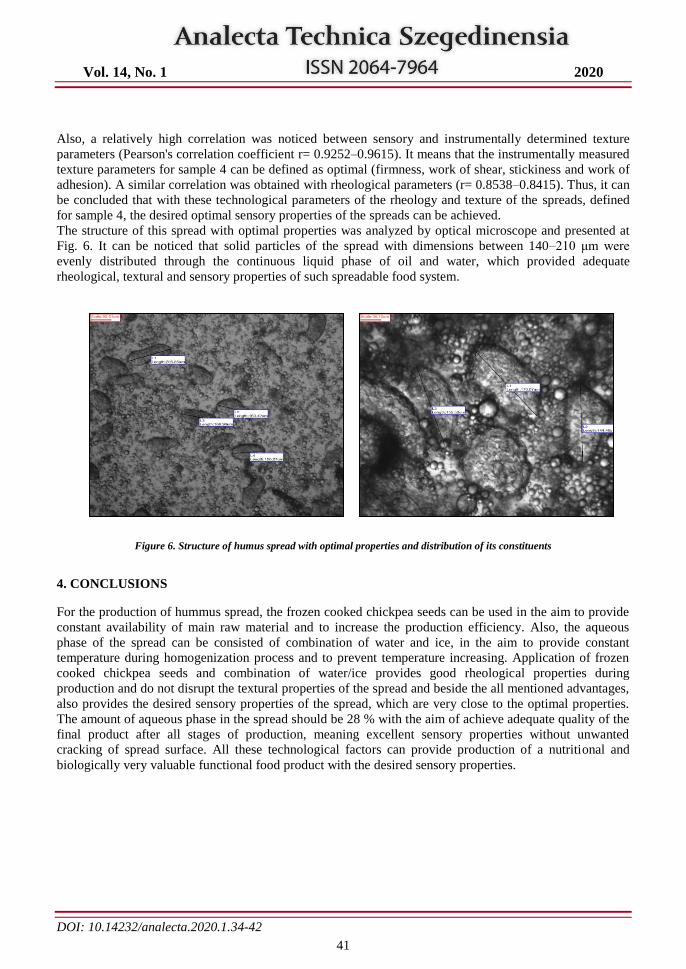
Vol. 14, No. 1 2020
DOI: 10.14232/analecta.2020.1.34-42
41
Also, a relatively high correlation was noticed between sensory and instrumentally determined texture
parameters (Pearson's correlation coefficient r= 0.9252–0.9615). It means that the instrumentally measured
texture parameters for sample 4 can be defined as optimal (firmness, work of shear, stickiness and work of
adhesion). A similar correlation was obtained with rheological parameters (r= 0.8538–0.8415). Thus, it can
be concluded that with these technological parameters of the rheology and texture of the spreads, defined
for sample 4, the desired optimal sensory properties of the spreads can be achieved.
The structure of this spread with optimal properties was analyzed by optical microscope and presented at
Fig. 6. It can be noticed that solid particles of the spread with dimensions between 140–210 μm were
evenly distributed through the continuous liquid phase of oil and water, which provided adequate
rheological, textural and sensory properties of such spreadable food system.
Figure 6. Structure of humus spread with optimal properties and distribution of its constituents
4. CONCLUSIONS
For the production of hummus spread, the frozen cooked chickpea seeds can be used in the aim to provide
constant availability of main raw material and to increase the production efficiency. Also, the aqueous
phase of the spread can be consisted of combination of water and ice, in the aim to provide constant
temperature during homogenization process and to prevent temperature increasing. Application of frozen
cooked chickpea seeds and combination of water/ice provides good rheological properties during
production and do not disrupt the textural properties of the spread and beside the all mentioned advantages,
also provides the desired sensory properties of the spread, which are very close to the optimal properties.
The amount of aqueous phase in the spread should be 28 % with the aim of achieve adequate quality of the
final product after all stages of production, meaning excellent sensory properties without unwanted
cracking of spread surface. All these technological factors can provide production of a nutritional and
biologically very valuable functional food product with the desired sensory properties.
Vol. 14, No. 1 2020
DOI: 10.14232/analecta.2020.1.34-42
42
ACKNOWLEDGMENT
This research was done within the project financed by the Ministry of Education, Science and
Technological Development of the Republic of Serbia, Project No. 451-03-68/2020-14/ 200134. The
Authors especially thank to company DTD Ribarstvo doo, Bački Jarak, Serbia for donation of raw
materials.
REFERENCES
[1] S.A. Alajaji, T.A. El–Adawy, Nutritional composition of chickpea (Cicer arietinum L.) as affected by
microwave cooking and other traditional cooking methods, Journal of Food Composition and
Analysis, 19 (2006), pp. 806–812.
[2] D. Thavarajah, P. Thavarajah, Evaluation of chickpea (Cicer arietinum L.) micronutrient composition:
Biofortification opportunities to combat global micronutrient malnutrition, Food Research
International, 49 (2012), pp. 99–104.
[3] R.S. Attia, A. M. EI–Tabey Shehata, M. E. Aman, M. A. Hamza, Effect of cooking and decortication
on the physical properties, the chemical composition and the nutritive value of chickpea (Cicer
arietinum L.), Food Chemistry, 50 (1994), pp. 125-131.
[4] T.C. Wallace, R. Murray, K.M. Zelman, The Nutritional Value and Health Benefits of Chickpeas and
Hummus, Nutrients, 8, (2016),766, doi:10.3390/nu8120766.
[5] ISO 8589, (2007), Sensory analysis–General guidance for the design of test rooms. Geneva,
Switzerland: International Organization for Standardization (ISO).
[6] ISO 8586-2, (2008), Sensory analysis–General guidance for the selection, training and monitoring of
assessors-Part 2: Expert sensory assessors. Geneva, Switzerland: International Organization for
Standardization (ISO).
[7] ISO 4121, (2003), Sensory analysis–Guidelines for the use of quantitative response scales. Geneva,
Switzerland: International Organization for Standardization (ISO).
[8] M. T. Ghannam, M. N. Esmail, Rheological properties of carboxymethyl cellulose, Journal of Applied
Polymer Science, 64 (2) (1997), pp. 289–301.
Vol. 14, No. 1 2020
DOI: 10.14232/analecta.2020.1.43-49
43
ENZYME ACTIVITIES IN SOIL AT INCREASING METAL (CU, NI, PB)
DOSES AND TIME-DEPENDENCE IN A MODELL EXPERIMENT
1Klára Czakó-Vér,
2Dávid Somfai,
2Erzsébet Suhajda,
1Csilla Sipeky,
1Gyula Árvay,
2Anita Dolgosné
Kovács ,2Ernő Dittrich
1Institute of Biology, Faculty of Sciences, University of Pécs, Ifjúság útja 6., H-7624, Pécs, Hungary, 2Department of Environmental Engineering,, University of Pécs, Boszorkány út 2., H-7624 Pécs, Hungary,
email: [email protected]
ABSTRACT
Aim of this paper is to examine the effect of spiked copper (Cu), nickel (Ni) and lead (Pb) metal salts on
the dehydrogenase (oxydo-reductase) and phosphatase (hydrolase) enzyme activities in a characteristic
Hungarian soil, the pseudomycelliar chernozem. Pot-experiment was performed with a soil, originating
from a spot of the Hungarian soil-information-monitoring (TIM) system of Bicserd. The added metal salts
were used in water soluble forms and incorporated uniformly to the soil. Soils were treated with increasing
metal concentrations to give the following metal amounts: 0, 50, 200, and 800 kg.ha-1
. Enzyme activities of
the soil were analysed at the 0th
, 7 th
, 14 th
, and 28th
days after the metal addition. The laboratory model-
experiment has been set up in three replicates.
Effects of metal salts were largely dependent on the chemical and physical properties of pseudomycelliar
chernozem soil, the applied heavy metal-types, the doses of used metals and the elapsed time after the
pollution. Considering the different metals, the copper prowed to be the most toxic one on the studied
enzyme activities, whereas the lead induced those. By comparison with copper the nickel affected a smaller
decrease in the soil microbial activity. The dehydrogenase, oxydo-reductase enzyme was found to be more
sensitive parameter in comparison with the phosphatase, hydrolase enzyme among the studied condition.
Studied enzymes and used methods are suggested, as fast and rather reliable tools for estimating the soil-
resilience capacities at heavy metal pollution.
Keywords: soil, metal, contamination, phosphatase, dehydrogenase.
1. INTRODUCTION
Soil is the most important renewable natural resource. Protection of the soils in the Earth is one of the
inevitable task nowadays and might be the key-issue of the sustainable agricultural practices [1]. For this
reason on the basis of the UNESCO decision, 2015 is the annual year of the soils in the World. It is rather
evident for nowadays, that soil-functioning is largely dependent on the soil biota, among them the soil-
microorganisms. The activity of rarely measured microbial parts is resulted from the interactions among
soil-physical-chemical- and biological parameters.
Metal pollutions can alter those soil-biological activities, and can reduce the soil-fertility and function. The
use of soil biological markers related to microbial activity, for instance microbial biomass, enzyme
activities are the most wide-spread [2] [3].Those parameters can be correlated with the soil quality and
function. The soil-enzymology with other methods can contribute to better understanding of substance
circulation in soil. Many studies reported about the effects influences the enzyme activities [4].
Metal contaminations might influence on the quantity indicators of the soil-biological activities and might
affecting on the enzyme activities, as well. Since the enzyme activities of the soils are determined by the
organisms living in the soil, alterations in the enzyme activities could indicate the biological activity and
the real functioning of the soil. Thus, the current biological activity of soils could represent therefore the
values of soil-quality, among them the status of metal pollutions.
Severity of metal pollution might be highly dependent on the binding form and availability of metals in the
soils. The physico-chemical properties of metals and their affinity to the soil-particles are known to be
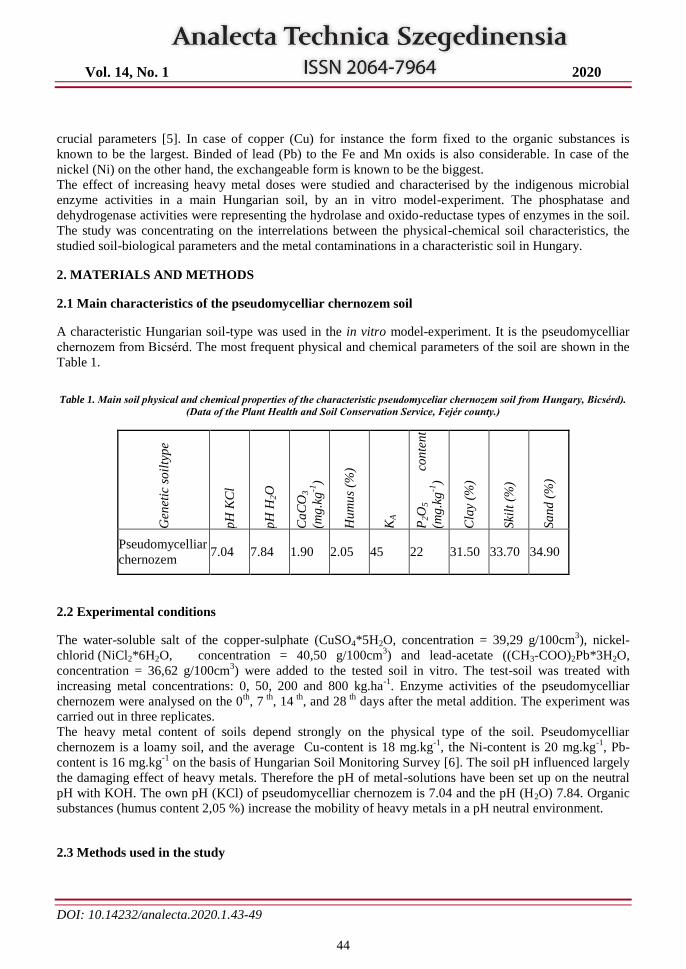
Vol. 14, No. 1 2020
DOI: 10.14232/analecta.2020.1.43-49
44
crucial parameters [5]. In case of copper (Cu) for instance the form fixed to the organic substances is
known to be the largest. Binded of lead (Pb) to the Fe and Mn oxids is also considerable. In case of the
nickel (Ni) on the other hand, the exchangeable form is known to be the biggest.
The effect of increasing heavy metal doses were studied and characterised by the indigenous microbial
enzyme activities in a main Hungarian soil, by an in vitro model-experiment. The phosphatase and
dehydrogenase activities were representing the hydrolase and oxido-reductase types of enzymes in the soil.
The study was concentrating on the interrelations between the physical-chemical soil characteristics, the
studied soil-biological parameters and the metal contaminations in a characteristic soil in Hungary.
2. MATERIALS AND METHODS
2.1 Main characteristics of the pseudomycelliar chernozem soil
A characteristic Hungarian soil-type was used in the in vitro model-experiment. It is the pseudomycelliar
chernozem from Bicsérd. The most frequent physical and chemical parameters of the soil are shown in the
Table 1.
Table 1. Main soil physical and chemical properties of the characteristic pseudomyceliar chernozem soil from Hungary, Bicsérd).
(Data of the Plant Health and Soil Conservation Service, Fejér county.)
Gen
etic
so
ilty
pe
pH
KC
l
pH
H2O
Ca
CO
3
(mg
.kg
-1)
Hu
mu
s (%
)
KA
P2O
5
con
ten
t
(mg
.kg
-1)
Cla
y (%
)
Ski
lt (
%)
Sa
nd
(%
)
Pseudomycelliar
chernozem 7.04 7.84 1.90 2.05 45 22 31.50 33.70 34.90
2.2 Experimental conditions
The water-soluble salt of the copper-sulphate (CuSO4*5H2O, concentration = 39,29 g/100cm3), nickel-
chlorid (NiCl2*6H2O, concentration = 40,50 g/100cm3) and lead-acetate ((CH3-COO)2Pb*3H2O,
concentration = 36,62 g/100cm3) were added to the tested soil in vitro. The test-soil was treated with
increasing metal concentrations: 0, 50, 200 and 800 kg.ha-1
. Enzyme activities of the pseudomycelliar
chernozem were analysed on the 0th
, 7 th
, 14 th
, and 28 th
days after the metal addition. The experiment was
carried out in three replicates.
The heavy metal content of soils depend strongly on the physical type of the soil. Pseudomycelliar
chernozem is a loamy soil, and the average Cu-content is 18 mg.kg-1
, the Ni-content is 20 mg.kg-1
, Pb-
content is 16 mg.kg-1
on the basis of Hungarian Soil Monitoring Survey [6]. The soil pH influenced largely
the damaging effect of heavy metals. Therefore the pH of metal-solutions have been set up on the neutral
pH with KOH. The own pH (KCl) of pseudomycelliar chernozem is 7.04 and the pH (H2O) 7.84. Organic
substances (humus content 2,05 %) increase the mobility of heavy metals in a pH neutral environment.
2.3 Methods used in the study
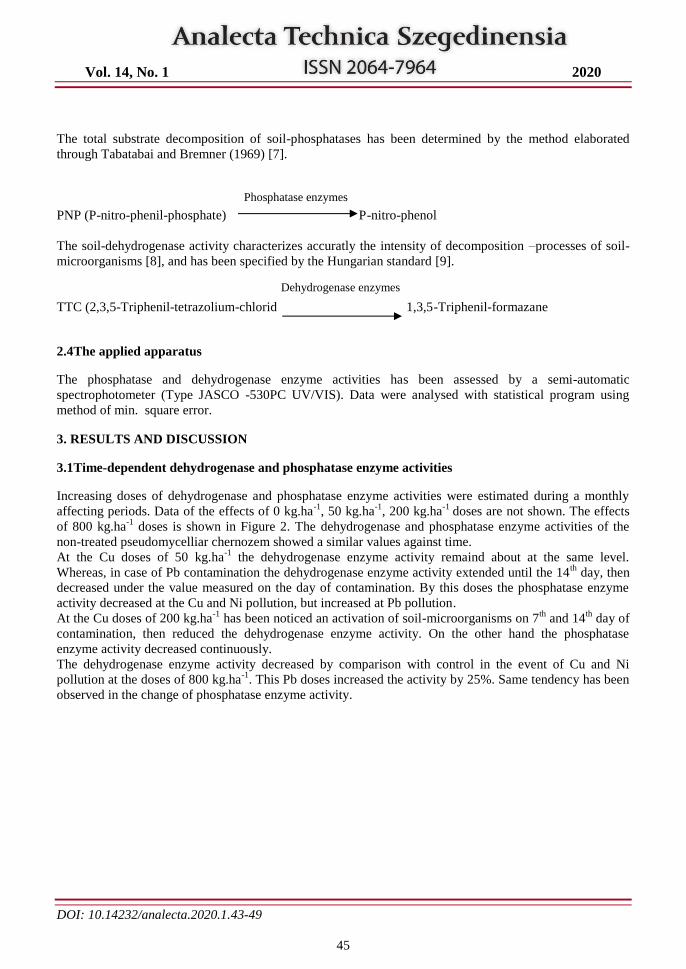
Vol. 14, No. 1 2020
DOI: 10.14232/analecta.2020.1.43-49
45
The total substrate decomposition of soil-phosphatases has been determined by the method elaborated
through Tabatabai and Bremner (1969) [7].
PNP (P-nitro-phenil-phosphate) P-nitro-phenol
The soil-dehydrogenase activity characterizes accuratly the intensity of decomposition –processes of soil-
microorganisms [8], and has been specified by the Hungarian standard [9].
TTC (2,3,5-Triphenil-tetrazolium-chlorid 1,3,5-Triphenil-formazane
2.4The applied apparatus
The phosphatase and dehydrogenase enzyme activities has been assessed by a semi-automatic
spectrophotometer (Type JASCO -530PC UV/VIS). Data were analysed with statistical program using
method of min. square error.
3. RESULTS AND DISCUSSION
3.1Time-dependent dehydrogenase and phosphatase enzyme activities
Increasing doses of dehydrogenase and phosphatase enzyme activities were estimated during a monthly
affecting periods. Data of the effects of 0 kg.ha-1
, 50 kg.ha-1
, 200 kg.ha-1
doses are not shown. The effects
of 800 kg.ha-1
doses is shown in Figure 2. The dehydrogenase and phosphatase enzyme activities of the
non-treated pseudomycelliar chernozem showed a similar values against time.
At the Cu doses of 50 kg.ha-1
the dehydrogenase enzyme activity remaind about at the same level.
Whereas, in case of Pb contamination the dehydrogenase enzyme activity extended until the 14th
day, then
decreased under the value measured on the day of contamination. By this doses the phosphatase enzyme
activity decreased at the Cu and Ni pollution, but increased at Pb pollution.
At the Cu doses of 200 kg.ha-1
has been noticed an activation of soil-microorganisms on 7th
and 14th
day of
contamination, then reduced the dehydrogenase enzyme activity. On the other hand the phosphatase
enzyme activity decreased continuously.
The dehydrogenase enzyme activity decreased by comparison with control in the event of Cu and Ni
pollution at the doses of 800 kg.ha-1
. This Pb doses increased the activity by 25%. Same tendency has been
observed in the change of phosphatase enzyme activity.
Phosphatase enzymes
Dehydrogenase enzymes
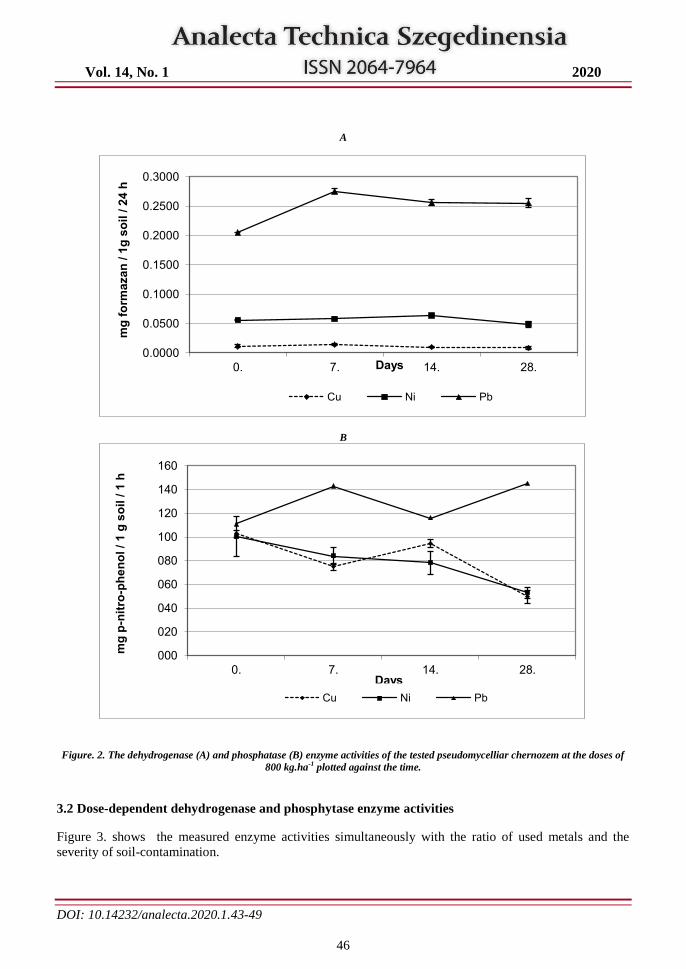
Vol. 14, No. 1 2020
DOI: 10.14232/analecta.2020.1.43-49
46
A
B
Figure. 2. The dehydrogenase (A) and phosphatase (B) enzyme activities of the tested pseudomycelliar chernozem at the doses of
800 kg.ha-1 plotted against the time.
3.2 Dose-dependent dehydrogenase and phosphytase enzyme activities
Figure 3. shows the measured enzyme activities simultaneously with the ratio of used metals and the
severity of soil-contamination.
0.0000
0.0500
0.1000
0.1500
0.2000
0.2500
0.3000
0. 7. 14. 28.
mg
fo
rma
za
n / 1
g s
oil
/ 2
4 h
Days
Cu Ni Pb
000
020
040
060
080
100
120
140
160
0. 7. 14. 28.
mg
p-n
itro
-ph
en
ol /
1 g
so
il / 1
h
Days
Cu Ni Pb
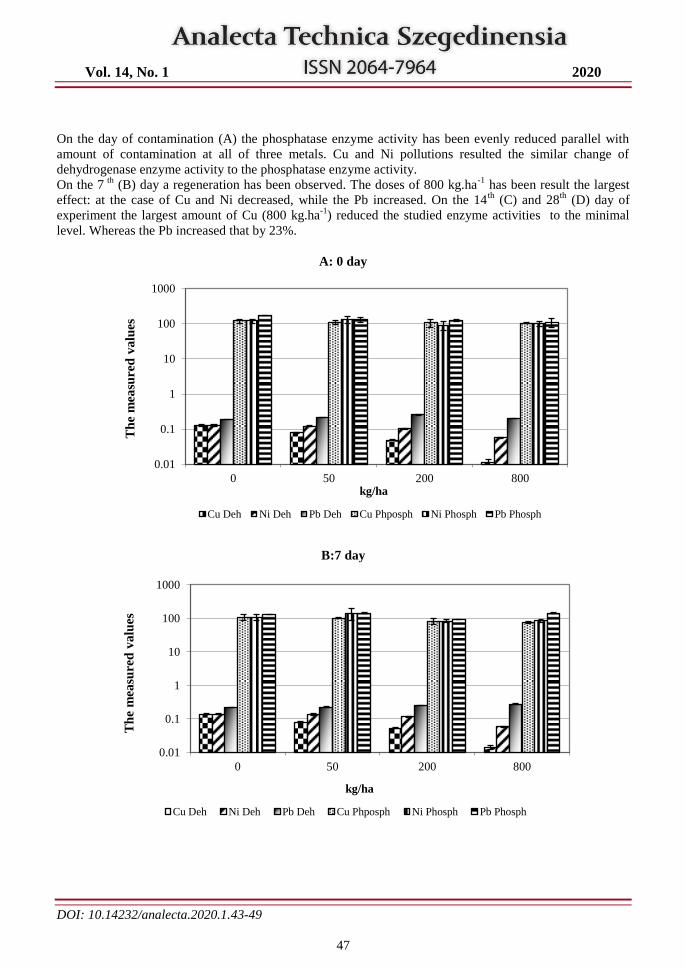
Vol. 14, No. 1 2020
DOI: 10.14232/analecta.2020.1.43-49
47
On the day of contamination (A) the phosphatase enzyme activity has been evenly reduced parallel with
amount of contamination at all of three metals. Cu and Ni pollutions resulted the similar change of
dehydrogenase enzyme activity to the phosphatase enzyme activity.
On the 7 th
(B) day a regeneration has been observed. The doses of 800 kg.ha-1
has been result the largest
effect: at the case of Cu and Ni decreased, while the Pb increased. On the 14th
(C) and 28th
(D) day of
experiment the largest amount of Cu (800 kg.ha-1
) reduced the studied enzyme activities to the minimal
level. Whereas the Pb increased that by 23%.
A: 0 day
B:7 day
0.01
0.1
1
10
100
1000
0 50 200 800
Th
e m
easu
red
va
lues
kg/ha
Cu Deh Ni Deh Pb Deh Cu Phposph Ni Phosph Pb Phosph
0.01
0.1
1
10
100
1000
0 50 200 800
Th
e m
easu
red
va
lues
kg/ha
Cu Deh Ni Deh Pb Deh Cu Phposph Ni Phosph Pb Phosph
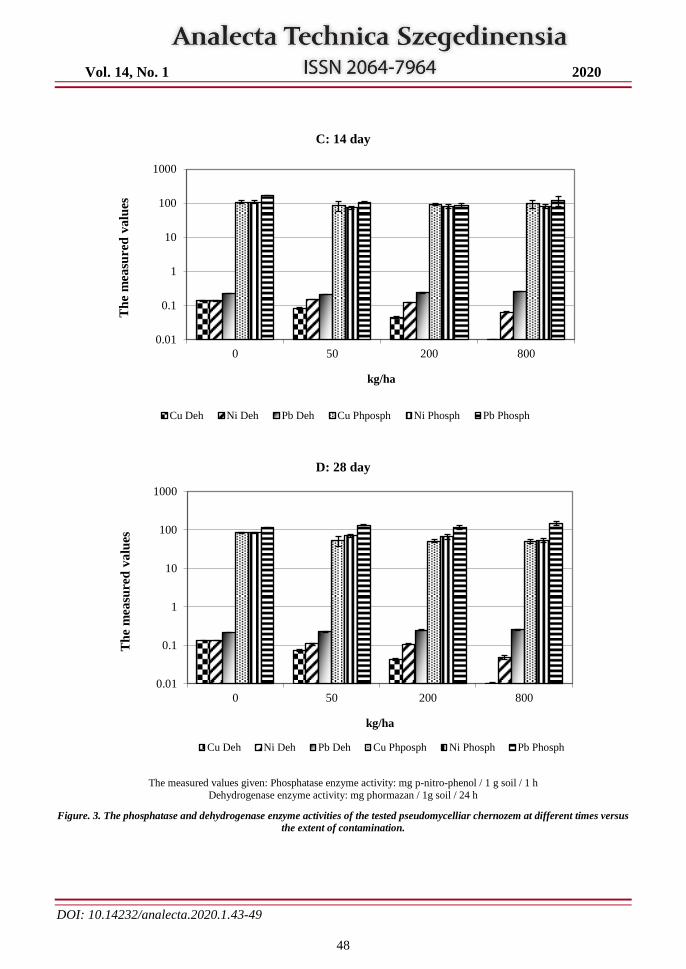
Vol. 14, No. 1 2020
DOI: 10.14232/analecta.2020.1.43-49
48
C: 14 day
D: 28 day
The measured values given: Phosphatase enzyme activity: mg p-nitro-phenol / 1 g soil / 1 h
Dehydrogenase enzyme activity: mg phormazan / 1g soil / 24 h
Figure. 3. The phosphatase and dehydrogenase enzyme activities of the tested pseudomycelliar chernozem at different times versus
the extent of contamination.
0.01
0.1
1
10
100
1000
0 50 200 800
Th
e m
easu
red
va
lues
kg/ha
Cu Deh Ni Deh Pb Deh Cu Phposph Ni Phosph Pb Phosph
0.01
0.1
1
10
100
1000
0 50 200 800
Th
e m
easu
red
va
lues
kg/ha
Cu Deh Ni Deh Pb Deh Cu Phposph Ni Phosph Pb Phosph
Vol. 14, No. 1 2020
DOI: 10.14232/analecta.2020.1.43-49
49
Three metals used in the experiment resulted different changes in the activity of soil-microorganisms. The
copper was toxic on dehydrogenase and phosphatase enzyme activities in all cases, while the lead
increased the two enzyme activities in 90% of variations of exposition times and treatments. The nickel
effected a similar, but smaller change in the microbial activity of soil.
Increasing doses of Cu2+
and Ni2+
extended the dehydrogenase and phosphatase activity-changes, but
proportionally to the amount of metals. In the event of Pb2+
dose-dependent has been found only by
dehydrogenase activity.
The oxido-reductase-type dehydrogenase enzyme system proved to be more sensitive than the hydrolase-
type phosphatase enzyme system in case of soils with large adsorption capacity.
4. CONCLUSIONS
The change of the enzyme activities of psedudomycelliar chernozem was very sensitive to the
environmental conditions, and much faster to detect, as the quantitative change in the number of the
microorganisms. The method of the determination of enzyme activities in case of metal pollutions were
suitable to estimate the soil-toxicity. These experiments help us to establish a model for the natural ability
of self-cleaning of soils and to detect the efficiency of remediation of the metal pollution.
ACKNOWLEDGEMENTS
Our work was created as part of the project "Sustainable Raw Material Management
Thematic Network— RING 2017" EFOP-3.6.2-16-2017-00010 within the Programme
SZECHENYI2020, supported by the European Union, co-financed by the European Social
Fund.
REFERENCES
[1] Biró, B., 2002. Soil- and rhizobiological tools for the sustainable agriculture and environmental
protection. Acta Agronom. Hung. 50. 77-85.
[2] Nannipieri, P., 1994. The potential use of soil enzymes as indicators of productivity, sustainability and
pollution. In: Pankhurst, CE, Doube BM, Gupta VVSR, Grace PR (eds). Soil biota: management in
sustainable farming systems, CSIRO Australia. pp. 238-244.
[3] Garcia, C., Hernandez, M.T., & Costa, F., 1997. Potential use of dehydrogenase activity as an index of
microbial activity in degraded soils. Commun. Soil. Sci. Plant. Anal. 28. 123-134.
[4] Anton, A., Máthé, P., Radimszky, G., Füleky, G. & Biczók, G., 1994. Effects of environmental factors
and Mn, Zn, Cu trace elements on the soil phosphomonoesterase and amidase activity. Acta Biologica
Hungarica. 45 (1). 39-50.
[5] Kabata-Pendias, A. & Adriano, D. C., 1995. Trace Metals. Chapter 4. In: Rechcigl J. E. (ed.): Soil
amendments and environmental quality. New York, London, Tokyo. pp. 139-167.
[6] Kádár, I., 2001. Consideration of soil-properties in applying of limit-system of soil-contamination (In
Hungarian). RISSAC HAS , 9. 48-49.
[7] Tabatabai, M.A. & Bremner, J.M., 1969. Use of p-nitrophenil phosphatase for assay of soil
phosphatase activity. Soil Biol. Biochem. 1. 301-307.
[8] Benefield, C. B., Howard, P. J. & Howard, D. M.,1977. The estimation of dehydrogenase activity in
soil. Soil Biology and Biochemistry. 9. 67-70.
[9] MSZ-08-1721/3-86: Soil analysis of agricultural treated with sewage and sludge. Analysis of soil
biological activity by method of dehydrogenase enzyme activity.
Vol. 14, No. 1 2020
DOI: 10.14232/analecta.2020.1.50-60
50
EFFECTS OF SOLAR PANELS ON ELECTRICAL NETWORKS
1Péter Bencs,
1Mohammed Al-Ktranee,
2Károly Marcell Mészáros
1University of Miskolc, Department of Fluid and Heat Engineering, Miskolc-Egyetemváros, HU-3515, Miskolc, Hungary, 2MAVIR Ltd., Secondary Service, Bába utca 1., HU-3599, Sajószöged, Hungary,
e-mail: [email protected]
ABSTRACT
Today, the increasing use of solar energy contributes to the EU's energy policies. Increasing use of
renewable energy sources reduces pollutant emissions, dependence on fossil fuels and improves air quality.
Globally, installed photovoltaic capacity has reached 400 GW by the end of 2017, and is projected to reach
4,500 GW by 2050. In the context of this research, we would like to present a detailed presentation of the
possibilities and effects of integrating solar systems into electricity networks. The integration of renewable
energies into networks is of paramount importance to researchers because of current energy demand and
the depletion of fossil fuel reserves and environmental impacts. In this study, we highlight the effects of
solar network integration on both the solar system and the public utility service. We also report on the
opportunities and impacts of integration in Hungary in connection with our research. Today, solar panels
are the cornerstone of sustainable development.
Keywords: solar panel, PV, integration, electricity network
1. INTRODUCTION
In a brief historical review, we would like to highlight the importance of integrating solar systems into the
electrical grid. Standardized integration of photovoltaic systems enables optimum use of photovoltaic (PV)
systems. Optimized use improves the efficiency of the photovoltaic system, reduces operating costs and
provides added value for both the consumer and the service provider. The integration of solar systems is a
widespread practice in countries around the world as there is a growing need for alternative clean energy to
fossil fuels. Integration uses smart network technology (smart systems), which senses and responds to
different states of the network system. Intelligent technologies offer opportunities to increase network
stability during integration and to operate solar systems more cost-effectively. The use of smart grid
technology is essential if the integration of renewable energy sources into the electricity grid exceeds 30%
[1]. Due to the predictability of renewable energy sources, there are many integration challenges. The
various systems and measures provide opportunities to maintain the stability of the electricity network.
2. SOLAR PANEL PRODUCTION
Photovoltaic (PV) power generation is one of the most advanced technologies for renewable energy
production. Solar technology is currently the world's third most important renewable energy source after
water and wind. Solar energy produces low-carbon energy. Solar PV energy consumption has increased in
the last few decades. 2017 was an outstanding year for the photovoltaic industry. Solar energy has
delivered more new capacities than nuclear and fossil fuels (see Fig. 1) [2].
To reduce manufacturing costs, the production of large-area PV units is a new trend. In 2018, Saudi Arabia
launched a bid for a 300 MW power plant to produce the world's lowest price ($ 0.0234 / kWh) [3]. Due to
the development of solar technologies, the cost of production is constantly falling. China led the world in
solar generation in 2017 and installed 50% of the world's new solar generation capacity. Solar production
capacity in Europe has grown at a slower rate, which was only 30% higher than a year earlier. By the end
of 2022, global solar power generation capacity may increase to 1270.5 GW, and solar power will exceed
1 TW (TWh).
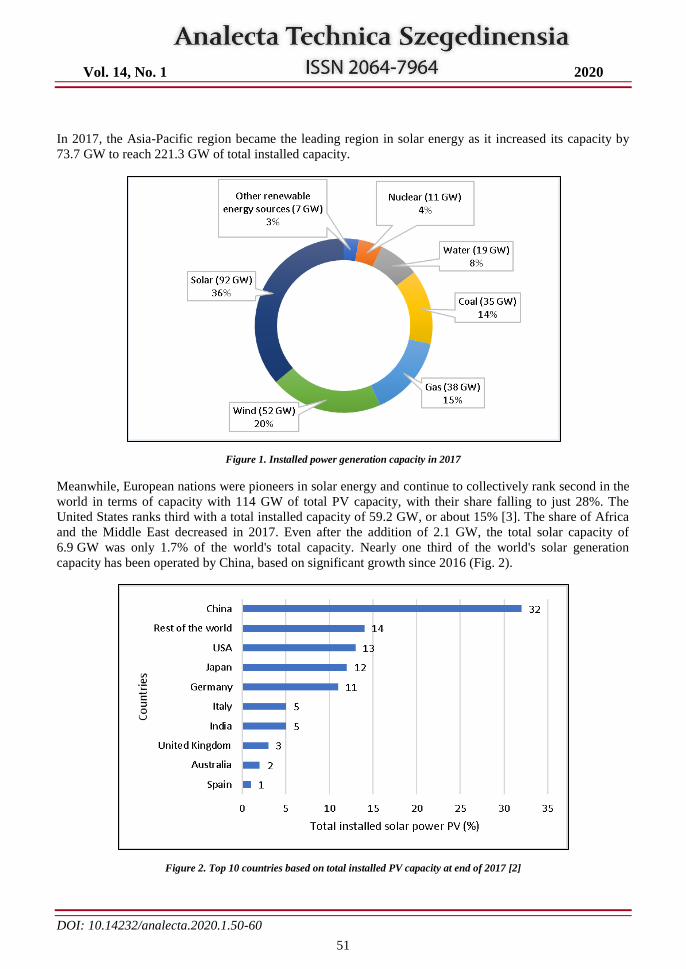
Vol. 14, No. 1 2020
DOI: 10.14232/analecta.2020.1.50-60
51
In 2017, the Asia-Pacific region became the leading region in solar energy as it increased its capacity by
73.7 GW to reach 221.3 GW of total installed capacity.
Figure 1. Installed power generation capacity in 2017
Meanwhile, European nations were pioneers in solar energy and continue to collectively rank second in the
world in terms of capacity with 114 GW of total PV capacity, with their share falling to just 28%. The
United States ranks third with a total installed capacity of 59.2 GW, or about 15% [3]. The share of Africa
and the Middle East decreased in 2017. Even after the addition of 2.1 GW, the total solar capacity of
6.9 GW was only 1.7% of the world's total capacity. Nearly one third of the world's solar generation
capacity has been operated by China, based on significant growth since 2016 (Fig. 2).
Figure 2. Top 10 countries based on total installed PV capacity at end of 2017 [2]
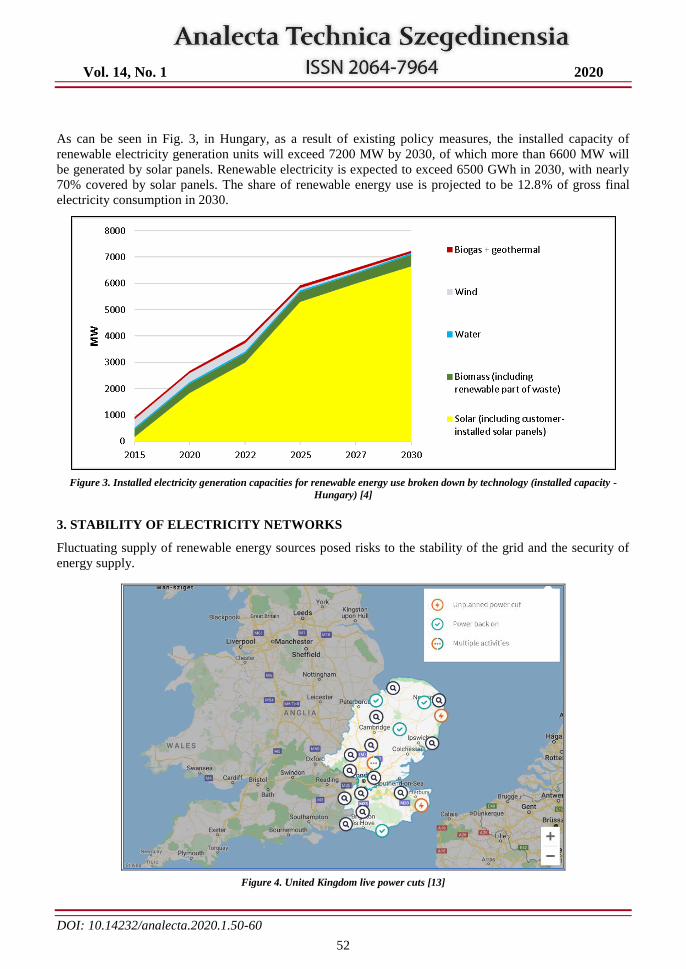
Vol. 14, No. 1 2020
DOI: 10.14232/analecta.2020.1.50-60
52
As can be seen in Fig. 3, in Hungary, as a result of existing policy measures, the installed capacity of
renewable electricity generation units will exceed 7200 MW by 2030, of which more than 6600 MW will
be generated by solar panels. Renewable electricity is expected to exceed 6500 GWh in 2030, with nearly
70% covered by solar panels. The share of renewable energy use is projected to be 12.8% of gross final
electricity consumption in 2030.
Figure 3. Installed electricity generation capacities for renewable energy use broken down by technology (installed capacity -
Hungary) [4]
3. STABILITY OF ELECTRICITY NETWORKS
Fluctuating supply of renewable energy sources posed risks to the stability of the grid and the security of
energy supply.
Figure 4. United Kingdom live power cuts [13]
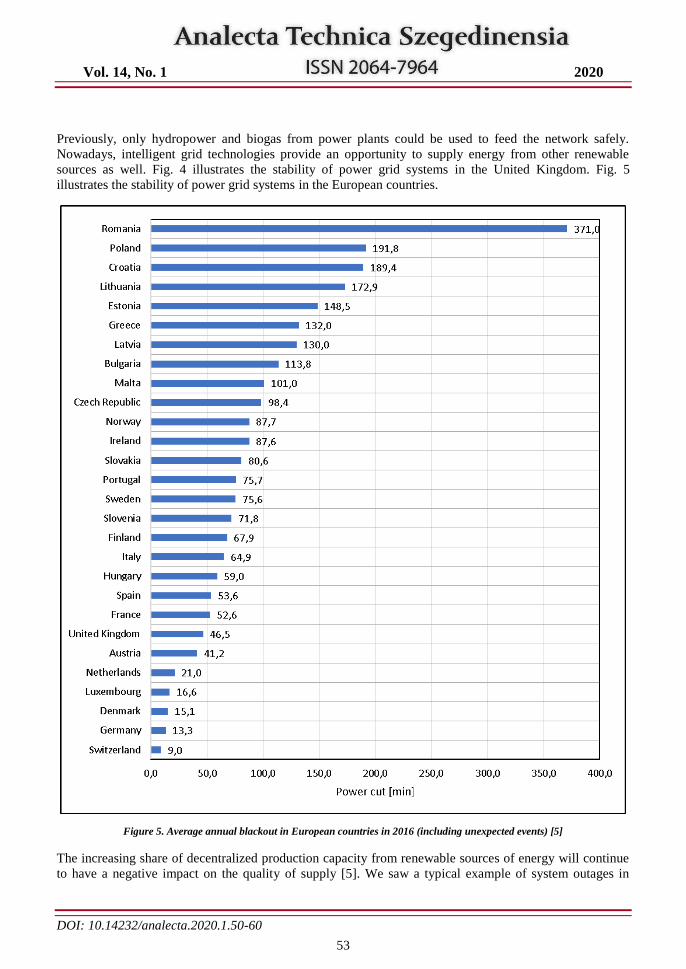
Vol. 14, No. 1 2020
DOI: 10.14232/analecta.2020.1.50-60
53
Previously, only hydropower and biogas from power plants could be used to feed the network safely.
Nowadays, intelligent grid technologies provide an opportunity to supply energy from other renewable
sources as well. Fig. 4 illustrates the stability of power grid systems in the United Kingdom. Fig. 5
illustrates the stability of power grid systems in the European countries.
Figure 5. Average annual blackout in European countries in 2016 (including unexpected events) [5]
The increasing share of decentralized production capacity from renewable sources of energy will continue
to have a negative impact on the quality of supply [5]. We saw a typical example of system outages in
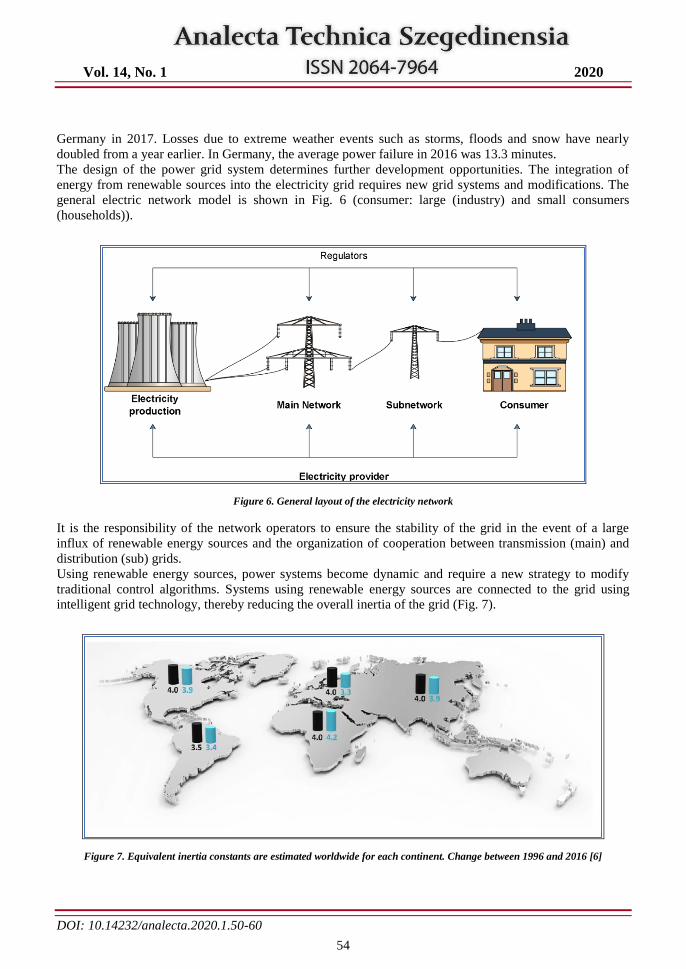
Vol. 14, No. 1 2020
DOI: 10.14232/analecta.2020.1.50-60
54
Germany in 2017. Losses due to extreme weather events such as storms, floods and snow have nearly
doubled from a year earlier. In Germany, the average power failure in 2016 was 13.3 minutes.
The design of the power grid system determines further development opportunities. The integration of
energy from renewable sources into the electricity grid requires new grid systems and modifications. The
general electric network model is shown in Fig. 6 (consumer: large (industry) and small consumers
(households)).
Figure 6. General layout of the electricity network
It is the responsibility of the network operators to ensure the stability of the grid in the event of a large
influx of renewable energy sources and the organization of cooperation between transmission (main) and
distribution (sub) grids.
Using renewable energy sources, power systems become dynamic and require a new strategy to modify
traditional control algorithms. Systems using renewable energy sources are connected to the grid using
intelligent grid technology, thereby reducing the overall inertia of the grid (Fig. 7).
Figure 7. Equivalent inertia constants are estimated worldwide for each continent. Change between 1996 and 2016 [6]
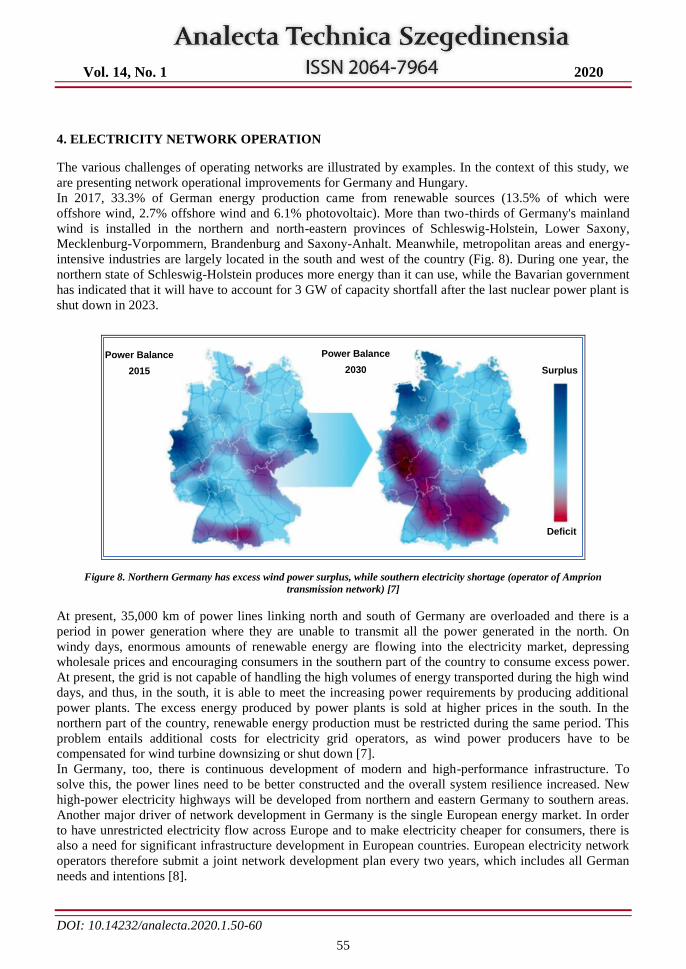
Vol. 14, No. 1 2020
DOI: 10.14232/analecta.2020.1.50-60
55
4. ELECTRICITY NETWORK OPERATION
The various challenges of operating networks are illustrated by examples. In the context of this study, we
are presenting network operational improvements for Germany and Hungary.
In 2017, 33.3% of German energy production came from renewable sources (13.5% of which were
offshore wind, 2.7% offshore wind and 6.1% photovoltaic). More than two-thirds of Germany's mainland
wind is installed in the northern and north-eastern provinces of Schleswig-Holstein, Lower Saxony,
Mecklenburg-Vorpommern, Brandenburg and Saxony-Anhalt. Meanwhile, metropolitan areas and energy-
intensive industries are largely located in the south and west of the country (Fig. 8). During one year, the
northern state of Schleswig-Holstein produces more energy than it can use, while the Bavarian government
has indicated that it will have to account for 3 GW of capacity shortfall after the last nuclear power plant is
shut down in 2023.
Figure 8. Northern Germany has excess wind power surplus, while southern electricity shortage (operator of Amprion
transmission network) [7]
At present, 35,000 km of power lines linking north and south of Germany are overloaded and there is a
period in power generation where they are unable to transmit all the power generated in the north. On
windy days, enormous amounts of renewable energy are flowing into the electricity market, depressing
wholesale prices and encouraging consumers in the southern part of the country to consume excess power.
At present, the grid is not capable of handling the high volumes of energy transported during the high wind
days, and thus, in the south, it is able to meet the increasing power requirements by producing additional
power plants. The excess energy produced by power plants is sold at higher prices in the south. In the
northern part of the country, renewable energy production must be restricted during the same period. This
problem entails additional costs for electricity grid operators, as wind power producers have to be
compensated for wind turbine downsizing or shut down [7].
In Germany, too, there is continuous development of modern and high-performance infrastructure. To
solve this, the power lines need to be better constructed and the overall system resilience increased. New
high-power electricity highways will be developed from northern and eastern Germany to southern areas.
Another major driver of network development in Germany is the single European energy market. In order
to have unrestricted electricity flow across Europe and to make electricity cheaper for consumers, there is
also a need for significant infrastructure development in European countries. European electricity network
operators therefore submit a joint network development plan every two years, which includes all German
needs and intentions [8].
Power Balance
2015
Power Balance
2030
Deficit
Surplus
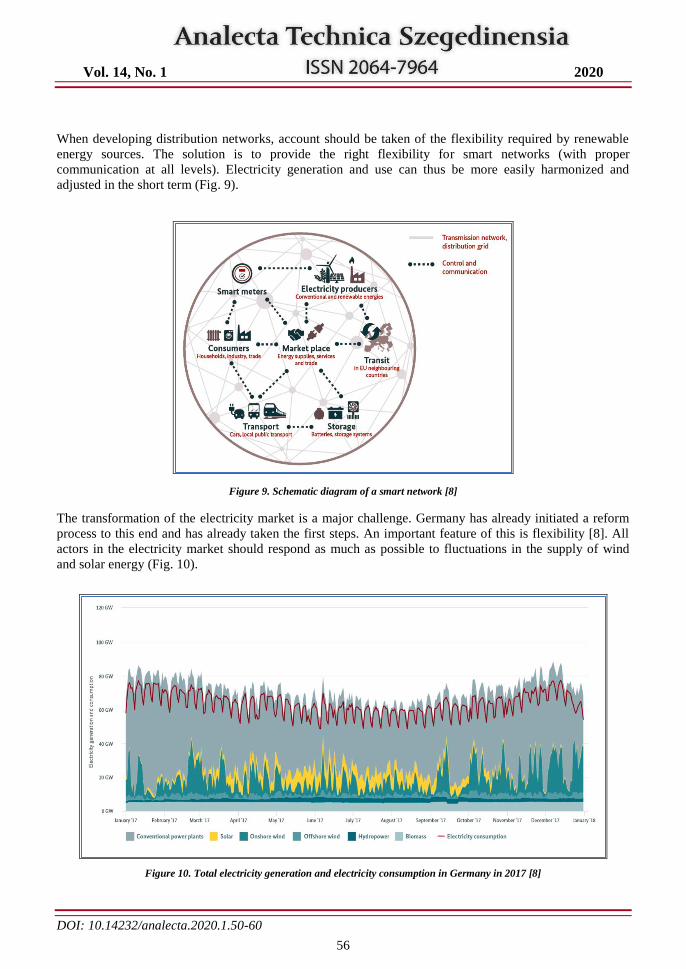
Vol. 14, No. 1 2020
DOI: 10.14232/analecta.2020.1.50-60
56
When developing distribution networks, account should be taken of the flexibility required by renewable
energy sources. The solution is to provide the right flexibility for smart networks (with proper
communication at all levels). Electricity generation and use can thus be more easily harmonized and
adjusted in the short term (Fig. 9).
Figure 9. Schematic diagram of a smart network [8]
The transformation of the electricity market is a major challenge. Germany has already initiated a reform
process to this end and has already taken the first steps. An important feature of this is flexibility [8]. All
actors in the electricity market should respond as much as possible to fluctuations in the supply of wind
and solar energy (Fig. 10).
Figure 10. Total electricity generation and electricity consumption in Germany in 2017 [8]
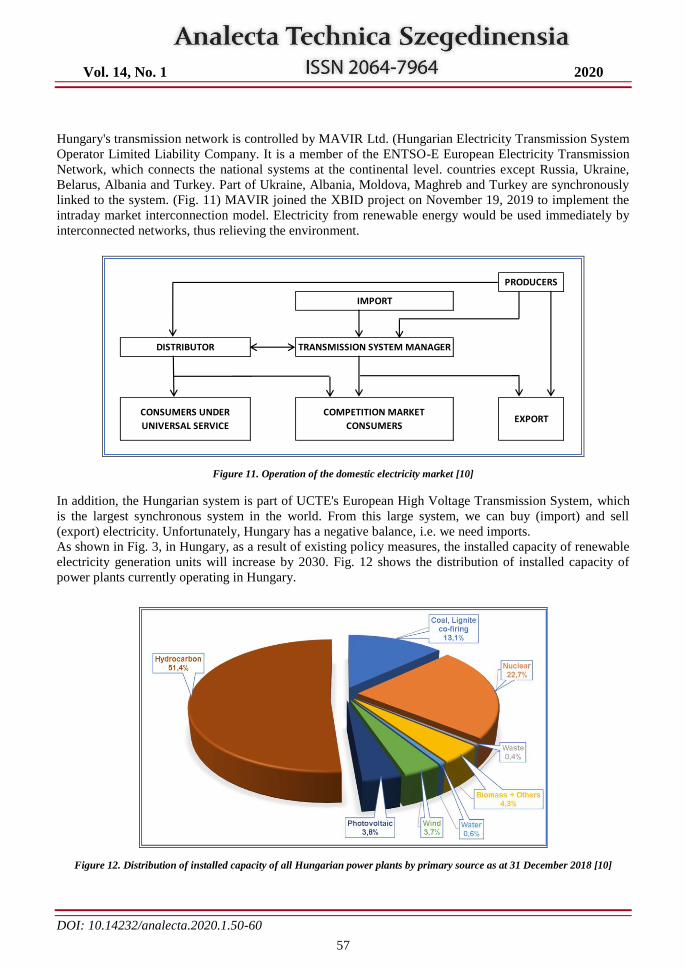
Vol. 14, No. 1 2020
DOI: 10.14232/analecta.2020.1.50-60
57
Hungary's transmission network is controlled by MAVIR Ltd. (Hungarian Electricity Transmission System
Operator Limited Liability Company. It is a member of the ENTSO-E European Electricity Transmission
Network, which connects the national systems at the continental level. countries except Russia, Ukraine,
Belarus, Albania and Turkey. Part of Ukraine, Albania, Moldova, Maghreb and Turkey are synchronously
linked to the system. (Fig. 11) MAVIR joined the XBID project on November 19, 2019 to implement the
intraday market interconnection model. Electricity from renewable energy would be used immediately by
interconnected networks, thus relieving the environment.
Figure 11. Operation of the domestic electricity market [10]
In addition, the Hungarian system is part of UCTE's European High Voltage Transmission System, which
is the largest synchronous system in the world. From this large system, we can buy (import) and sell
(export) electricity. Unfortunately, Hungary has a negative balance, i.e. we need imports.
As shown in Fig. 3, in Hungary, as a result of existing policy measures, the installed capacity of renewable
electricity generation units will increase by 2030. Fig. 12 shows the distribution of installed capacity of
power plants currently operating in Hungary.
Figure 12. Distribution of installed capacity of all Hungarian power plants by primary source as at 31 December 2018 [10]
PRODUCERS
IMPORT
DISTRIBUTOR TRANSMISSION SYSTEM MANAGER
CONSUMERS UNDER
UNIVERSAL SERVICE
COMPETITION MARKET
CONSUMERSEXPORT
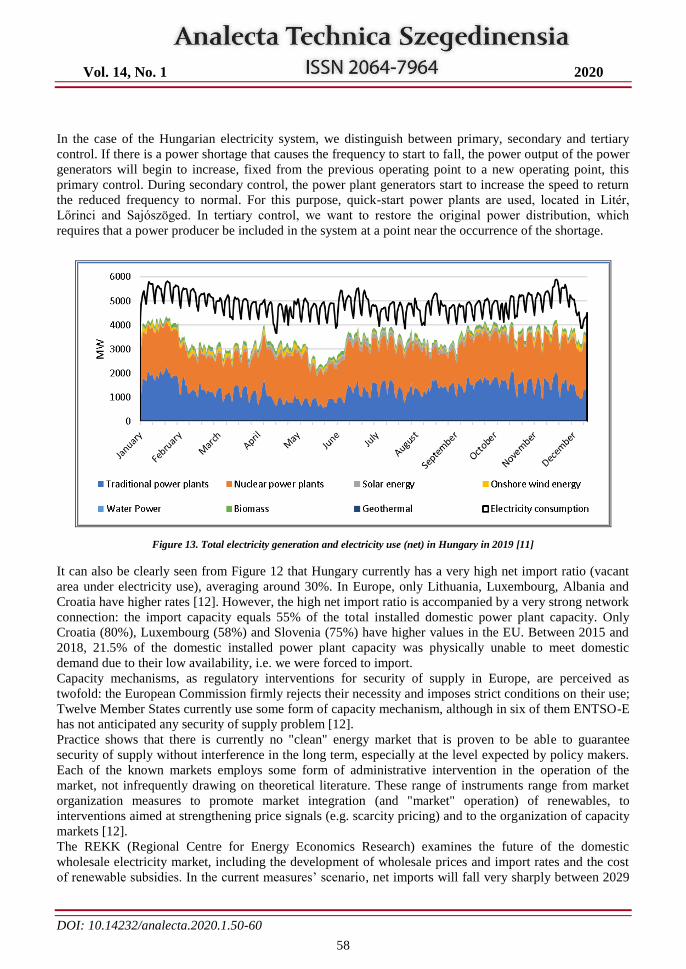
Vol. 14, No. 1 2020
DOI: 10.14232/analecta.2020.1.50-60
58
In the case of the Hungarian electricity system, we distinguish between primary, secondary and tertiary
control. If there is a power shortage that causes the frequency to start to fall, the power output of the power
generators will begin to increase, fixed from the previous operating point to a new operating point, this
primary control. During secondary control, the power plant generators start to increase the speed to return
the reduced frequency to normal. For this purpose, quick-start power plants are used, located in Litér,
Lőrinci and Sajószöged. In tertiary control, we want to restore the original power distribution, which
requires that a power producer be included in the system at a point near the occurrence of the shortage.
Figure 13. Total electricity generation and electricity use (net) in Hungary in 2019 [11]
It can also be clearly seen from Figure 12 that Hungary currently has a very high net import ratio (vacant
area under electricity use), averaging around 30%. In Europe, only Lithuania, Luxembourg, Albania and
Croatia have higher rates [12]. However, the high net import ratio is accompanied by a very strong network
connection: the import capacity equals 55% of the total installed domestic power plant capacity. Only
Croatia (80%), Luxembourg (58%) and Slovenia (75%) have higher values in the EU. Between 2015 and
2018, 21.5% of the domestic installed power plant capacity was physically unable to meet domestic
demand due to their low availability, i.e. we were forced to import.
Capacity mechanisms, as regulatory interventions for security of supply in Europe, are perceived as
twofold: the European Commission firmly rejects their necessity and imposes strict conditions on their use;
Twelve Member States currently use some form of capacity mechanism, although in six of them ENTSO-E
has not anticipated any security of supply problem [12].
Practice shows that there is currently no "clean" energy market that is proven to be able to guarantee
security of supply without interference in the long term, especially at the level expected by policy makers.
Each of the known markets employs some form of administrative intervention in the operation of the
market, not infrequently drawing on theoretical literature. These range of instruments range from market
organization measures to promote market integration (and "market" operation) of renewables, to
interventions aimed at strengthening price signals (e.g. scarcity pricing) and to the organization of capacity
markets [12].
The REKK (Regional Centre for Energy Economics Research) examines the future of the domestic
wholesale electricity market, including the development of wholesale prices and import rates and the cost
of renewable subsidies. In the current measures’ scenario, net imports will fall very sharply between 2029
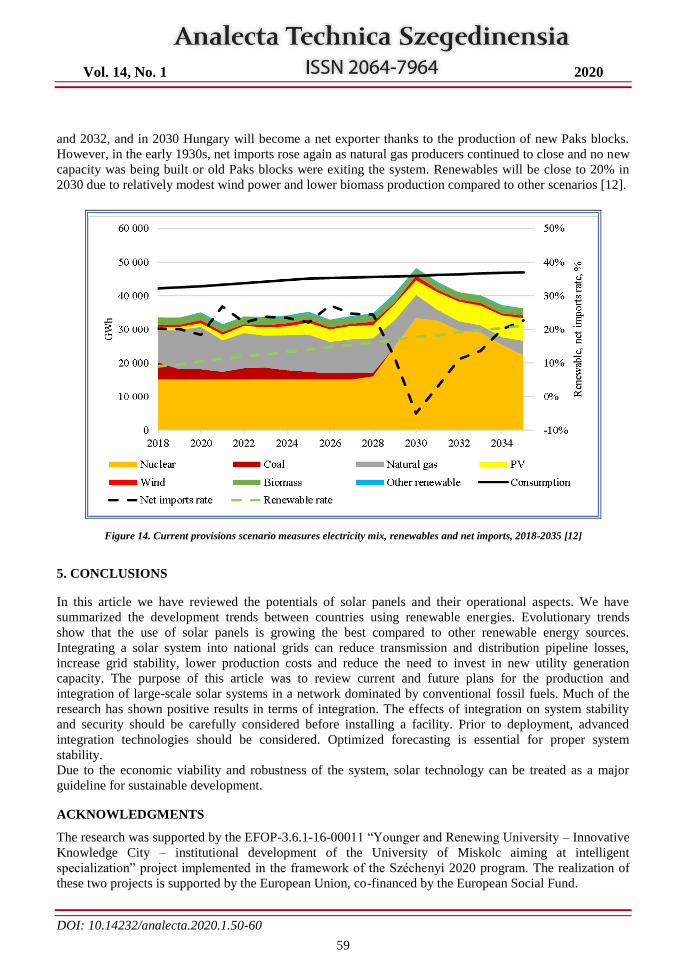
Vol. 14, No. 1 2020
DOI: 10.14232/analecta.2020.1.50-60
59
and 2032, and in 2030 Hungary will become a net exporter thanks to the production of new Paks blocks.
However, in the early 1930s, net imports rose again as natural gas producers continued to close and no new
capacity was being built or old Paks blocks were exiting the system. Renewables will be close to 20% in
2030 due to relatively modest wind power and lower biomass production compared to other scenarios [12].
Figure 14. Current provisions scenario measures electricity mix, renewables and net imports, 2018-2035 [12]
5. CONCLUSIONS
In this article we have reviewed the potentials of solar panels and their operational aspects. We have
summarized the development trends between countries using renewable energies. Evolutionary trends
show that the use of solar panels is growing the best compared to other renewable energy sources.
Integrating a solar system into national grids can reduce transmission and distribution pipeline losses,
increase grid stability, lower production costs and reduce the need to invest in new utility generation
capacity. The purpose of this article was to review current and future plans for the production and
integration of large-scale solar systems in a network dominated by conventional fossil fuels. Much of the
research has shown positive results in terms of integration. The effects of integration on system stability
and security should be carefully considered before installing a facility. Prior to deployment, advanced
integration technologies should be considered. Optimized forecasting is essential for proper system
stability.
Due to the economic viability and robustness of the system, solar technology can be treated as a major
guideline for sustainable development.
ACKNOWLEDGMENTS
The research was supported by the EFOP-3.6.1-16-00011 “Younger and Renewing University – Innovative
Knowledge City – institutional development of the University of Miskolc aiming at intelligent
specialization” project implemented in the framework of the Széchenyi 2020 program. The realization of
these two projects is supported by the European Union, co-financed by the European Social Fund.
Vol. 14, No. 1 2020
DOI: 10.14232/analecta.2020.1.50-60
60
REFERENCES
[1] NWAIGWE, K. N.; MUTABILWA, P.; DINTWA, E. An overview of solar power (PV systems)
integration into electricity grids. Materials Science for Energy Technologies, 2019.
[2] CHOWDHURY, Md Shahariar, et al. An overview of solar photovoltaic panels’ end-of-life material
recycling. Energy Strategy Reviews, 2020, 27: 100431.
[3] EUROPE, SolarPower. Global Market Outlook for Solar Power 2018–2022. Solar Power Euro-pe:
Brussels, Belgium, 2018.
[4] Magyarország Nemzeti Energia- és Klímaterve (2018) - Magyarország, Budapest
[5] CEER Benchmarking Report 6.1, 2018 – Brussels, Belgium
[6] FERNÁNDEZ-GUILLAMÓN, Ana, et al. Power systems with high renewable energy sources: A
review of inertia and frequency control strategies over time. Renewable and Sustainable Energy
Reviews, 2019, 115: 109369.
[7] Amprion GmbH Netzausbau 2018.
[8] Federal Foreing Office: The German Energiewende, Berlin, 2019.
[9] KOCH, Christopher; HIRTH, Lion. Short-term electricity trading for system balancing: An empirical
analysis of the role of intraday trading in balancing Germany's electricity system. Renewable and
Sustainable Energy Reviews, 2019, 113: 109275.
[10] A Magyar Villamosenergiarendszer (VER) 2018. évi adatai, 2018. Magyarország, Budapest
[11] MAVIR.hu Adatpublikáció » Aktuális VER adatok » Rendszerterhelés 2020.02.08.
[12] REKK: A hazai nagykereskedelmi villamosenergia-piac modellezése és ellátásbiztonsági elem-zése
2030-ig különböző erőművi forgatókönyvek mellett, Budapest, 2019.
[13] UK Power Networks: Live power cuts, 2020.03.01. https://www.ukpowernetworks.co.uk/power-
cut/map
Vol. 14, No. 1 2020
DOI: 10.14232/analecta.2020.1.61-66
61
MODELLING OF HYDRODYNAMIC CAVITATION FOR TREATMENT OF
WASTEWATER IN A VENTURI TUBE
Betti Bolló
Department of Fluid and Heat Engineering, University of Miskolc, 3515 Miskolc, Hungary
e-mail: [email protected]
ABSTRACT
Treatment of municipal effluents has long been a challenge for modern technologies combining high
effectiveness of degradation of pollutants with low costs of the process. Hydrodynamic cavitation is a
promising application in wastewater treatment due to its simple reactor design. In this work, for a system
available in the laboratory a hydrodynamic reactor is designed based on literature recommendations. On
the designed Venturi tube, two-dimensional numerical simulations were investigated by the means of CFD
computations using the commercial software package, Ansys Fluent. The resulting cavitation bubbles were
analysed at different inlet pressures.
Keywords: hydrodynamic cavitation, Venturi, cavitation number, CFD.
1. INTRODUCTION
Nowadays the treatment and utilization of the ever-increasing sewage sludge is a major environmental
problem. The amount of sewage sludge generated in Hungary is projected to increase from ~179 thousand
tons registered in 2013 to ~250 thousand tons by 2027, therefore a unified strategy for efficient treatment
and utilization of sewage sludge has been established (Sewage Sludge Management and Recovery Strategy
2014-2023, [1]). Most importantly, sewage sludge should not be considered as waste to be disposed of, but
as a secondary raw material for soil fertilising or renewable energy source. This is the main idea of the
ongoing research at University of Miskolc [2].
Wastewater and sewage sludge are transformed into micronutrients and macronutrients that are easily
absorbed by plants, and their organic matter content improves many soil properties. Wastewater can
contain toxic heavy metals, drug residues, which are non-degradable substances that may enter the food
chain through uptake or erosion, thereby endangering the environment and human health. Only wastewater
stabilized by aerobic, anaerobic, chemical treatment or stored for 3-6 months may be applied to agricultural
land. Many new chemical and biological methods have been proposed in the literature, one of these
promising new disinfection technologies is the use of cavitation, which has the great advantage of not
introducing new chemicals into the water.
Cavitation is a physical phenomenon when the pressure of a liquid is reduced to a pressure of saturated
water vapour and a vapour phase appears in the liquid, as so-called cavitation bubbles. When the cavitation
bubble collapses, where condensation and vapour compression occur, this energy is released. When the
bubble collapses, thousands of kelvin temperatures occur (theoretically), but they last for a very short time
(~ 1 µs), during which time the temperature drops to the temperature of the surrounding liquid [3]. These
conditions are suitable for breaking the cell wall of the organic material. Through sludge treatment, they
increase biodegradability and increase anaerobic digestion, resulting in higher biogas production, less
retention time and reduced sludge.
There are two types of cavitation methods: acoustic (ultrasonic) and hydrodynamic cavitation. Acoustic
cavitation is induced by the presence of pressure waves that propagate through the liquid region. Acoustic
cavitation is most often used for the treatment of industrial wastewater [4-6]. The problem with ultrasonic
cavitation devices is that cavitation effects only occur near the vibrating surface, which reduces the ability
to treat the entire wastewater. According to Dular et al. (2016) [7], the application of hydrodynamic
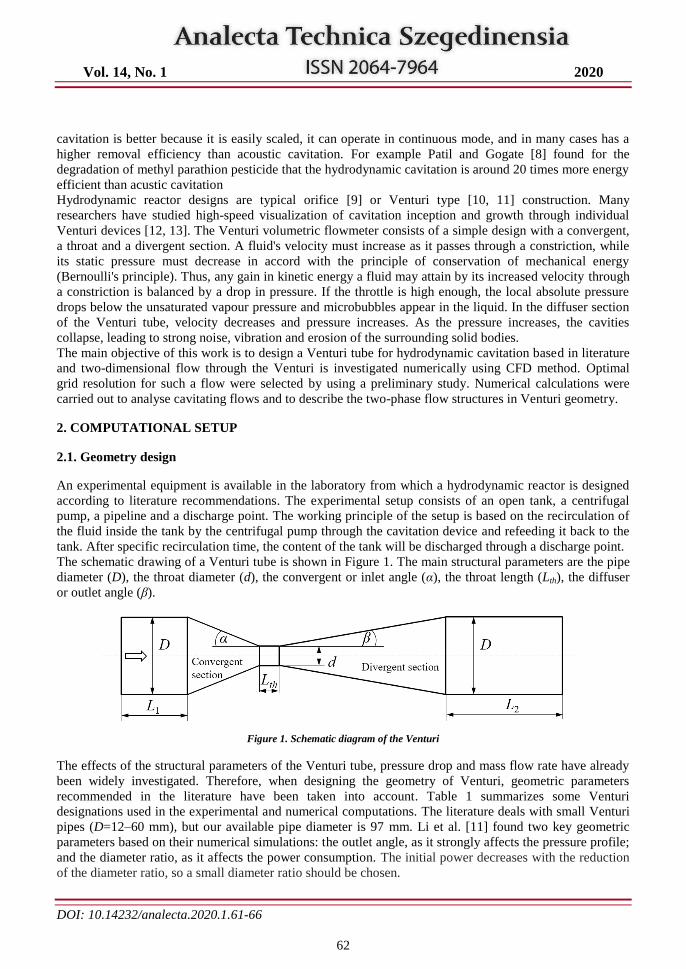
Vol. 14, No. 1 2020
DOI: 10.14232/analecta.2020.1.61-66
62
cavitation is better because it is easily scaled, it can operate in continuous mode, and in many cases has a
higher removal efficiency than acoustic cavitation. For example Patil and Gogate [8] found for the
degradation of methyl parathion pesticide that the hydrodynamic cavitation is around 20 times more energy
efficient than acustic cavitation
Hydrodynamic reactor designs are typical orifice [9] or Venturi type [10, 11] construction. Many
researchers have studied high-speed visualization of cavitation inception and growth through individual
Venturi devices [12, 13]. The Venturi volumetric flowmeter consists of a simple design with a convergent,
a throat and a divergent section. A fluid's velocity must increase as it passes through a constriction, while
its static pressure must decrease in accord with the principle of conservation of mechanical energy
(Bernoulli's principle). Thus, any gain in kinetic energy a fluid may attain by its increased velocity through
a constriction is balanced by a drop in pressure. If the throttle is high enough, the local absolute pressure
drops below the unsaturated vapour pressure and microbubbles appear in the liquid. In the diffuser section
of the Venturi tube, velocity decreases and pressure increases. As the pressure increases, the cavities
collapse, leading to strong noise, vibration and erosion of the surrounding solid bodies.
The main objective of this work is to design a Venturi tube for hydrodynamic cavitation based in literature
and two-dimensional flow through the Venturi is investigated numerically using CFD method. Optimal
grid resolution for such a flow were selected by using a preliminary study. Numerical calculations were
carried out to analyse cavitating flows and to describe the two-phase flow structures in Venturi geometry.
2. COMPUTATIONAL SETUP
2.1. Geometry design
An experimental equipment is available in the laboratory from which a hydrodynamic reactor is designed
according to literature recommendations. The experimental setup consists of an open tank, a centrifugal
pump, a pipeline and a discharge point. The working principle of the setup is based on the recirculation of
the fluid inside the tank by the centrifugal pump through the cavitation device and refeeding it back to the
tank. After specific recirculation time, the content of the tank will be discharged through a discharge point.
The schematic drawing of a Venturi tube is shown in Figure 1. The main structural parameters are the pipe
diameter (D), the throat diameter (d), the convergent or inlet angle (α), the throat length (Lth), the diffuser
or outlet angle (β).
Figure 1. Schematic diagram of the Venturi
The effects of the structural parameters of the Venturi tube, pressure drop and mass flow rate have already
been widely investigated. Therefore, when designing the geometry of Venturi, geometric parameters
recommended in the literature have been taken into account. Table 1 summarizes some Venturi
designations used in the experimental and numerical computations. The literature deals with small Venturi
pipes (D=12–60 mm), but our available pipe diameter is 97 mm. Li et al. [11] found two key geometric
parameters based on their numerical simulations: the outlet angle, as it strongly affects the pressure profile;
and the diameter ratio, as it affects the power consumption. The initial power decreases with the reduction
of the diameter ratio, so a small diameter ratio should be chosen.
Vol. 14, No. 1 2020
DOI: 10.14232/analecta.2020.1.61-66
63
Simpson and Ranade [10] investigated the influence of two geometric parameters such as the length of
Venturi throat and diffuser angle on the inception and extent of cavitation. They suggested an optimum
configuration, which offers a minimum power input with a low diffuser angle (β=7.5°) and a low ratio of
throat length to diameter (Lth/d=1).
Based on literature recommendations, the following parameters are selected: for the Venturi tube diameter
(D= 97mm) the diameter ratio is d/D=0.18, the convergent angle is α=22.5°, the length of the throat is
equal to the diameter of the throat (Lth=d) and the outlet angle is β=7°. The walls of the converging and
diverging section are straight. An additional length of 250 mm (L1) before inlet and L2=400 mm after outlet
is added in the CFD model to obtain a fully developed flow and to avoid any entrance or exit effects.
Table 1 Presents various structural parameters of the Venturi model with other studies
Authors Method D [mm] d [mm] d/D Lth [mm] α [°] β [°]
Abdulaziz [12] EM 20 3.6 0.18 9 6.2 6.2
Brinkhorst et al. [13] CFD 25.5 11.2 0.439 11.2 10.5 3.5
Bertoldi et al. [14] EM 16 4 0.25 3 20 7
Dastane et al. [15] CFD 20 2 0.1 0 22.61 6.4
Li et al. [11] CFD 9 2-4.5 0.167-0.5 5; 10; 20 5-45 5-90
Simpson & Ranade [10] CFD 12 2 0.167 0; 2; 4; 6 22.5 7.5-12.5
Wang [16] EM 50 16 0.32 16 22.5 5 (CFD – Computational Fluid Dynamics, EM – experimental measurement)
2.2. Numerical solution
In this study two-dimensional, unsteady flow has been carried out using Ansys Fluent commercial software
based on the Finite Volume Method (FVM). The FVM is a numerical technique that transforms the partial
differential equations representing conservation laws over differential volumes into discrete algebraic
equations over finite volumes (or elements or cells). Most researchers [10, 11, 15] recommend the k-ω SST
model for modelling cavitation flow, therefore this turbulence model was used. Pressure velocity coupling
was solved using SIMPLE algorithm, with the PRESTO! discretization scheme applied for pressure. The
First Order Discretization scheme was used for the momentum, turbulent quantities and vapour transport.
The numerical simulations were carried out considering a homogeneous mixture of liquid water and water
vapour. A mixture model was used to model the cavitation flow, where the liquid is assumed to be
incompressible and the slip between the two phases is neglected. The fluid properties are constant.
The flow boundary conditions were defined in terms of inlet pressure and outlet pressure. The inlet
pressure values were varied from 1.05 bar to 5 bar, while the outlet was maintained at atmospheric
pressure. The walls of the Venturi were considered to have a no-slip condition.
2.3. Mesh independence study
In addition to the implementation of boundary conditions and the quality of the numerical solutions, the
grid resolution in the domain is important for the reliability of the numerical results. The solution of the
problem should be tested on different grid resolutions and by means of this process, the optimum grid
should be determined for the calculations. The computations were performed for four different mesh size
with 68k, 97k, 141k, 185k elements. The grid test was performed under the same boundary conditions,
where no cavitation flow has yet occurred. Comparison of pressure distribution at the centre of the Venturi
and velocity profile at the throat are shown in Fig. 2. It was found that the solution was mesh independent
beyond 141k elements, and hence this mesh was used for all further simulations.
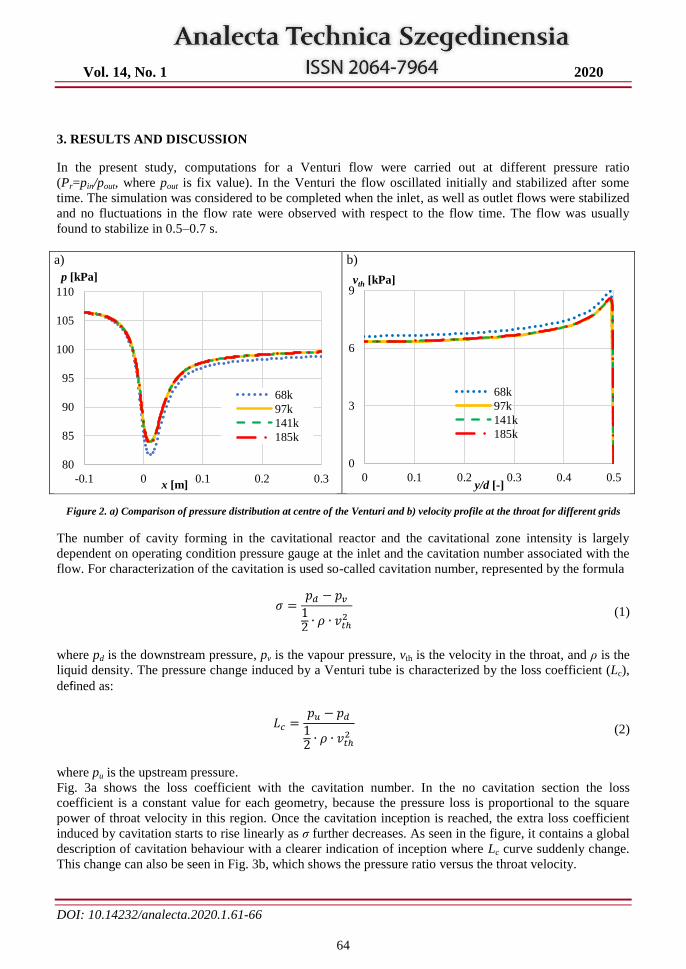
Vol. 14, No. 1 2020
DOI: 10.14232/analecta.2020.1.61-66
64
3. RESULTS AND DISCUSSION
In the present study, computations for a Venturi flow were carried out at different pressure ratio
(Pr=pin/pout, where pout is fix value). In the Venturi the flow oscillated initially and stabilized after some
time. The simulation was considered to be completed when the inlet, as well as outlet flows were stabilized
and no fluctuations in the flow rate were observed with respect to the flow time. The flow was usually
found to stabilize in 0.5–0.7 s.
a)
b)
Figure 2. a) Comparison of pressure distribution at centre of the Venturi and b) velocity profile at the throat for different grids
The number of cavity forming in the cavitational reactor and the cavitational zone intensity is largely
dependent on operating condition pressure gauge at the inlet and the cavitation number associated with the
flow. For characterization of the cavitation is used so-called cavitation number, represented by the formula
𝜎 =𝑝𝑑 − 𝑝𝑣12∙ 𝜌 ∙ 𝑣𝑡ℎ
2
(1)
where pd is the downstream pressure, pv is the vapour pressure, vth is the velocity in the throat, and ρ is the
liquid density. The pressure change induced by a Venturi tube is characterized by the loss coefficient (Lc),
defined as:
𝐿𝑐 =𝑝𝑢 − 𝑝𝑑12∙ 𝜌 ∙ 𝑣𝑡ℎ
2
(2)
where pu is the upstream pressure.
Fig. 3a shows the loss coefficient with the cavitation number. In the no cavitation section the loss
coefficient is a constant value for each geometry, because the pressure loss is proportional to the square
power of throat velocity in this region. Once the cavitation inception is reached, the extra loss coefficient
induced by cavitation starts to rise linearly as σ further decreases. As seen in the figure, it contains a global
description of cavitation behaviour with a clearer indication of inception where Lc curve suddenly change.
This change can also be seen in Fig. 3b, which shows the pressure ratio versus the throat velocity.
80
85
90
95
100
105
110
-0.1 0 0.1 0.2 0.3
p [kPa]
x [m]
68k
97k
141k
185k
0
3
6
9
0 0.1 0.2 0.3 0.4 0.5
vth [kPa]
y/d [-]
68k
97k
141k
185k
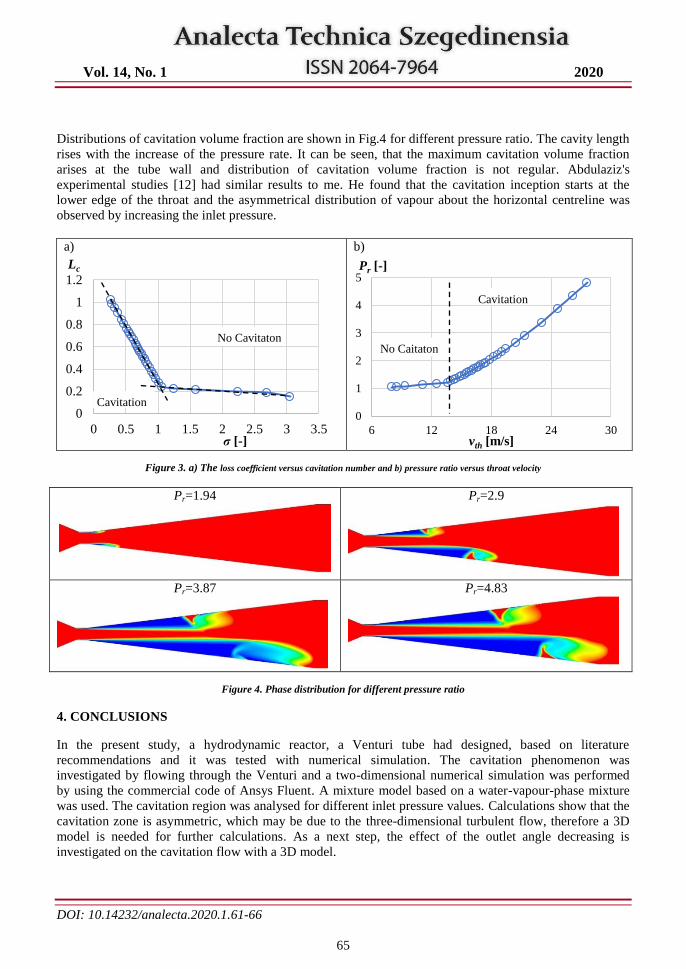
Vol. 14, No. 1 2020
DOI: 10.14232/analecta.2020.1.61-66
65
Distributions of cavitation volume fraction are shown in Fig.4 for different pressure ratio. The cavity length
rises with the increase of the pressure rate. It can be seen, that the maximum cavitation volume fraction
arises at the tube wall and distribution of cavitation volume fraction is not regular. Abdulaziz's
experimental studies [12] had similar results to me. He found that the cavitation inception starts at the
lower edge of the throat and the asymmetrical distribution of vapour about the horizontal centreline was
observed by increasing the inlet pressure.
a)
b)
Figure 3. a) The loss coefficient versus cavitation number and b) pressure ratio versus throat velocity
Pr=1.94
Pr=2.9
Pr=3.87
Pr=4.83
Figure 4. Phase distribution for different pressure ratio
4. CONCLUSIONS
In the present study, a hydrodynamic reactor, a Venturi tube had designed, based on literature
recommendations and it was tested with numerical simulation. The cavitation phenomenon was
investigated by flowing through the Venturi and a two-dimensional numerical simulation was performed
by using the commercial code of Ansys Fluent. A mixture model based on a water-vapour-phase mixture
was used. The cavitation region was analysed for different inlet pressure values. Calculations show that the
cavitation zone is asymmetric, which may be due to the three-dimensional turbulent flow, therefore a 3D
model is needed for further calculations. As a next step, the effect of the outlet angle decreasing is
investigated on the cavitation flow with a 3D model.
0
0.2
0.4
0.6
0.8
1
1.2
0 0.5 1 1.5 2 2.5 3 3.5
Lc
σ [-]
Cavitation
No Cavitaton
0
1
2
3
4
5
6 12 18 24 30
Pr [-]
vth [m/s]
Cavitation
No Caitaton
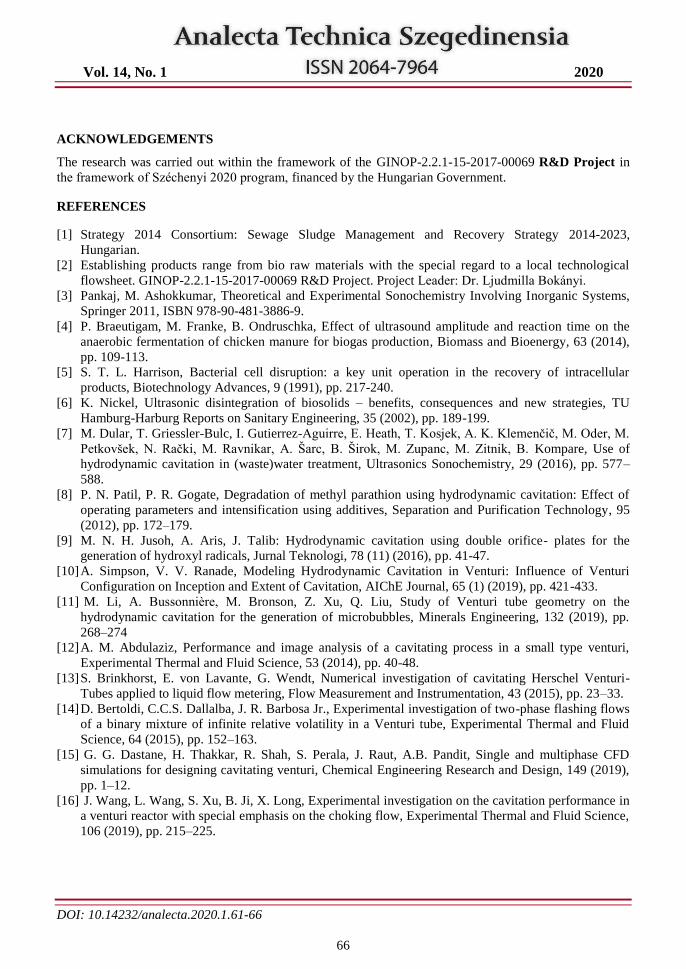
Vol. 14, No. 1 2020
DOI: 10.14232/analecta.2020.1.61-66
66
ACKNOWLEDGEMENTS
The research was carried out within the framework of the GINOP-2.2.1-15-2017-00069 R&D Project in
the framework of Széchenyi 2020 program, financed by the Hungarian Government.
REFERENCES
[1] Strategy 2014 Consortium: Sewage Sludge Management and Recovery Strategy 2014-2023,
Hungarian.
[2] Establishing products range from bio raw materials with the special regard to a local technological
flowsheet. GINOP-2.2.1-15-2017-00069 R&D Project. Project Leader: Dr. Ljudmilla Bokányi.
[3] Pankaj, M. Ashokkumar, Theoretical and Experimental Sonochemistry Involving Inorganic Systems,
Springer 2011, ISBN 978-90-481-3886-9.
[4] P. Braeutigam, M. Franke, B. Ondruschka, Effect of ultrasound amplitude and reaction time on the
anaerobic fermentation of chicken manure for biogas production, Biomass and Bioenergy, 63 (2014),
pp. 109-113.
[5] S. T. L. Harrison, Bacterial cell disruption: a key unit operation in the recovery of intracellular
products, Biotechnology Advances, 9 (1991), pp. 217-240.
[6] K. Nickel, Ultrasonic disintegration of biosolids – benefits, consequences and new strategies, TU
Hamburg-Harburg Reports on Sanitary Engineering, 35 (2002), pp. 189-199.
[7] M. Dular, T. Griessler-Bulc, I. Gutierrez-Aguirre, E. Heath, T. Kosjek, A. K. Klemenčič, M. Oder, M.
Petkovšek, N. Rački, M. Ravnikar, A. Šarc, B. Širok, M. Zupanc, M. Zitnik, B. Kompare, Use of
hydrodynamic cavitation in (waste)water treatment, Ultrasonics Sonochemistry, 29 (2016), pp. 577–
588.
[8] P. N. Patil, P. R. Gogate, Degradation of methyl parathion using hydrodynamic cavitation: Effect of
operating parameters and intensification using additives, Separation and Purification Technology, 95
(2012), pp. 172–179.
[9] M. N. H. Jusoh, A. Aris, J. Talib: Hydrodynamic cavitation using double orifice- plates for the
generation of hydroxyl radicals, Jurnal Teknologi, 78 (11) (2016), pp. 41-47.
[10] A. Simpson, V. V. Ranade, Modeling Hydrodynamic Cavitation in Venturi: Influence of Venturi
Configuration on Inception and Extent of Cavitation, AIChE Journal, 65 (1) (2019), pp. 421-433.
[11] M. Li, A. Bussonnière, M. Bronson, Z. Xu, Q. Liu, Study of Venturi tube geometry on the
hydrodynamic cavitation for the generation of microbubbles, Minerals Engineering, 132 (2019), pp.
268–274
[12] A. M. Abdulaziz, Performance and image analysis of a cavitating process in a small type venturi,
Experimental Thermal and Fluid Science, 53 (2014), pp. 40-48.
[13] S. Brinkhorst, E. von Lavante, G. Wendt, Numerical investigation of cavitating Herschel Venturi-
Tubes applied to liquid flow metering, Flow Measurement and Instrumentation, 43 (2015), pp. 23–33.
[14] D. Bertoldi, C.C.S. Dallalba, J. R. Barbosa Jr., Experimental investigation of two-phase flashing flows
of a binary mixture of infinite relative volatility in a Venturi tube, Experimental Thermal and Fluid
Science, 64 (2015), pp. 152–163.
[15] G. G. Dastane, H. Thakkar, R. Shah, S. Perala, J. Raut, A.B. Pandit, Single and multiphase CFD
simulations for designing cavitating venturi, Chemical Engineering Research and Design, 149 (2019),
pp. 1–12.
[16] J. Wang, L. Wang, S. Xu, B. Ji, X. Long, Experimental investigation on the cavitation performance in
a venturi reactor with special emphasis on the choking flow, Experimental Thermal and Fluid Science,
106 (2019), pp. 215–225.
Vol. 14, No. 1 2020
DOI: 10.14232/analecta.2020.1.67-75
67
MEASUREMENT OF TURBULENCE PROPERTIES
Dávid Faragó, Péter Bencs
University of Miskolc, Department of Fluid and Heat Engineering, Miskolc-Egyetemváros, HU-3515, Miskolc, Hungary,
e-mail: [email protected]
ABSTRACT
The aim of the research is to investigate anisotropic turbulence intensities, id est to investigate the
distribution of Reynolds stresses and energy spectra in a square cross-section channel, downstream of a
semi-active jet turbulence grid generating anisotropic turbulent airflow. In addition to the semi-active jet
turbulence grid, another type of turbulence grid was developed and experimentally investigated. This grid
contains vertical, flexible strips of aluminum (in this case, there are no perpendicular (horizontal) grid
elements), which vibrate at a frequency depending on the velocity of the main airflow. Besides the
investigation of the velocity- and turbulence intensity distributions, another main objective of the research
is to measure the von Kármán energy spectrum when the turbulence cannot be considered isotropic. This
aspiration of ours is justified by the knowledge gap present in the literature in this specific field. Monin has
carried out a theoretical study to extend and generalize the von Kármán – Howarth isotropic principal
stress equation to the anisotropic regime. The proposed new experimental work aims to provide a solid
experimental background for verifying and validating the physical correctness of the Monin equation,
which may result in a new theoretical understanding and perception of the major issues and the nature of
anisotropic turbulence. Since the anisotropic energy spectra are expected to exhibit different characteristics
from the isotropic Kolmogorov spectra, these new experimental results may contribute to the development
of new anisotropic and engineering turbulence models that can be used in industrial applications.
Keywords: turbulence, measurement, Reynolds, boundary-layer
1. INTRODUCTION
There are different types of turbulence grids (active, passive, semi-active, etc.) facilitated in laboratory
wind tunnels to generate appropriate turbulence. These grids are usually placed upstream of the
measurement section of the wind tunnel to produce the appropriate flow parameters. Investigations can
occur where the base airflow is already turbulent, in which cases turbulence grids can be used to improve
turbulent properties, such as the turbulent kinetic energy. A passive turbulence grid is a non-moving grid
placed in a wind tunnel. In a general dynamic sense, however, they can also be considered active grids [1]:
e.g. the layers within the boundary layer possess uncertain motions. In the study of isotropic turbulence, the
first (probably [2]), which began several decades earlier, occurred in a passive form of a turbulence
generating grid. The role of contraction in the isotropy of passive grid-induced turbulence was investigated
by Comte-Bellot & Corrsin [3]. The publication of Comte-Bellot is probably the most important one on
grid experiments [4]. Flow measurements in grid-generated turbulence are the most important experiments
in the theory of turbulence that provide appropriate boundary conditions and proper data to validate
turbulence models. The Reynolds number of the grid (or Taylor Reynolds number) depends on the
dimensions of the passive grid and largely on the generated turbulence [5]. It is important to mention that
experiments with active grids that facilitate moving borders ([6] vibrating grids), or grids capable of
increasing the average momentum of the flow have become more prominent in the last few decades [7].
Additionally, turbulence grids called "jet grids", which change the average flow rates through secondary
jets, have promising potential among active grids. Jet grids generate high intensity turbulence, and at the
same time they can maintain an appropriate level of homogeneity. This results in higher Reynolds numbers
and thus makes the broadening of existing experiments feasible [8]. The motivation of the presented work
was to achieve an almost homogeneous flow with a medium mean velocity (about 3 m / s) and a relatively
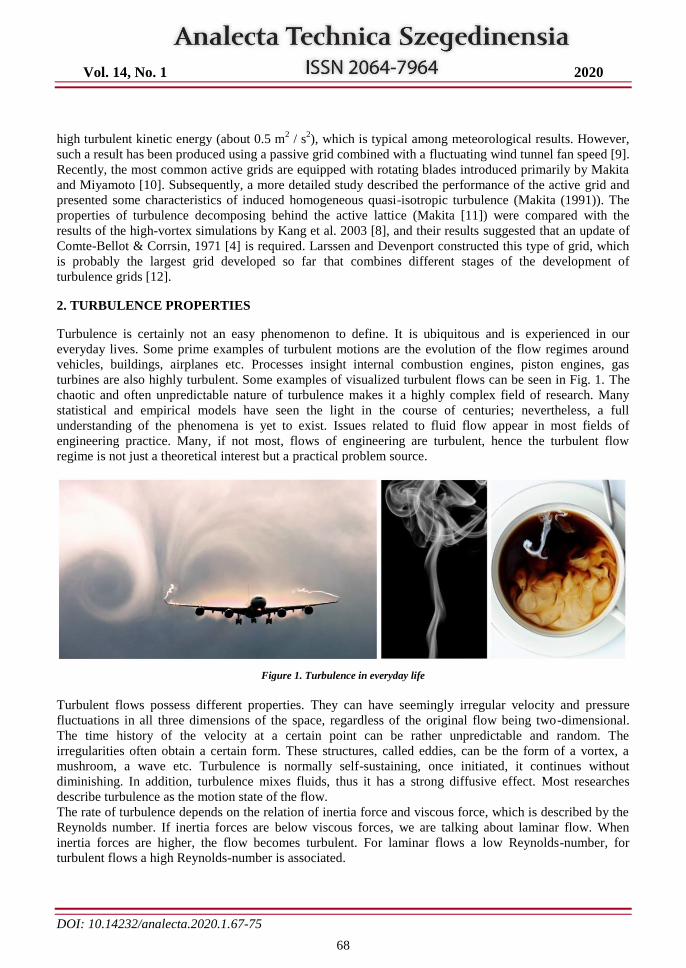
Vol. 14, No. 1 2020
DOI: 10.14232/analecta.2020.1.67-75
68
high turbulent kinetic energy (about 0.5 m2 / s
2), which is typical among meteorological results. However,
such a result has been produced using a passive grid combined with a fluctuating wind tunnel fan speed [9].
Recently, the most common active grids are equipped with rotating blades introduced primarily by Makita
and Miyamoto [10]. Subsequently, a more detailed study described the performance of the active grid and
presented some characteristics of induced homogeneous quasi-isotropic turbulence (Makita (1991)). The
properties of turbulence decomposing behind the active lattice (Makita [11]) were compared with the
results of the high-vortex simulations by Kang et al. 2003 [8], and their results suggested that an update of
Comte-Bellot & Corrsin, 1971 [4] is required. Larssen and Devenport constructed this type of grid, which
is probably the largest grid developed so far that combines different stages of the development of
turbulence grids [12].
2. TURBULENCE PROPERTIES
Turbulence is certainly not an easy phenomenon to define. It is ubiquitous and is experienced in our
everyday lives. Some prime examples of turbulent motions are the evolution of the flow regimes around
vehicles, buildings, airplanes etc. Processes insight internal combustion engines, piston engines, gas
turbines are also highly turbulent. Some examples of visualized turbulent flows can be seen in Fig. 1. The
chaotic and often unpredictable nature of turbulence makes it a highly complex field of research. Many
statistical and empirical models have seen the light in the course of centuries; nevertheless, a full
understanding of the phenomena is yet to exist. Issues related to fluid flow appear in most fields of
engineering practice. Many, if not most, flows of engineering are turbulent, hence the turbulent flow
regime is not just a theoretical interest but a practical problem source.
Figure 1. Turbulence in everyday life
Turbulent flows possess different properties. They can have seemingly irregular velocity and pressure
fluctuations in all three dimensions of the space, regardless of the original flow being two-dimensional.
The time history of the velocity at a certain point can be rather unpredictable and random. The
irregularities often obtain a certain form. These structures, called eddies, can be the form of a vortex, a
mushroom, a wave etc. Turbulence is normally self-sustaining, once initiated, it continues without
diminishing. In addition, turbulence mixes fluids, thus it has a strong diffusive effect. Most researches
describe turbulence as the motion state of the flow.
The rate of turbulence depends on the relation of inertia force and viscous force, which is described by the
Reynolds number. If inertia forces are below viscous forces, we are talking about laminar flow. When
inertia forces are higher, the flow becomes turbulent. For laminar flows a low Reynolds-number, for
turbulent flows a high Reynolds-number is associated.
Vol. 14, No. 1 2020
DOI: 10.14232/analecta.2020.1.67-75
69
By definition, the Reynolds number can be written as:
𝑅𝑒 =𝜌 ∙ 𝑣 ∙ 𝐿
𝜇
Where 𝜌, 𝑣, 𝐿, 𝜇 stand for fluid density, characteristic velocity, a characteristic length scale and dynamic
viscosity respectively.
The main properties of turbulent flows are:
I. Irregularities. The effects of turbulence make the flow seemingly irregular and even random. A
complete description of the flow using deterministic approach is extremely complicated, therefore they
are usually described statistically. Turbulent flows are always chaotic, but not every chaotic flow can
be called turbulent.
II. Diffusivity. The diffusivity of the turbulence results in enhanced mixing and increased impulse-,
heat- and mass-transfer rates.
III. High Reynolds numbers. Turbulent flows almost always occur at high Reynolds numbers.
IV. Three-dimensional. Turbulent flows rotate and are three-dimensional. There are non-zero vortexes
and a high degree of volatility is typical of them. Mechanisms such as stretching three-dimensional
vortexes play a key role in turbulence.
V. Dispersion. Turbulent flows are always dissipative. Kinetic energy is converted to heat due to
viscous shear stresses. Turbulent energy dissipates quickly with lack of an energy source.
VI. Continuum. Turbulence is a continuity phenomenon that is governed by the equations of fluid
dynamics.
3. ANISOTROPIC TURBULENCE
Anisotropic turbulence raises a knowledge gap when it comes to reliable measurement data. John Laufer
[13, 14] put a circular cross-channel under investigation. The working medium in case of his investigations
was air, and he measured the awakening Reynolds stresses near the wall, but the range of Reynolds-
numbers he used is too tight to draw reliable statistical data from for developing turbulence models. He
used Hot Wire Anemometry (HWA) to execute the flow measurements at Re = 50 000 and at Re =
500 000.
Nikuradse [15] investigated the flow evolution in a circular cross section pipe with different relative
roughness walls. The working medium in his investigations was water, and observations were made on the
loss of head, velocity distribution, discharge quantity and water temperature. Nikuradse, however, did not
measure the Reynolds-stresses; therefore, his results can solely be used to compare diff erent velocity
profiles.
The question might arise: why would having a broader knowledge with more results be important? Since
then, diff erent investigations – involving Laser Doppler Velocimetry, Laser Doppler Anemometry etc. –
were executed, however the range of Reynolds-numbers is rather tight.
Therefore, it would be expedient for us to measure the velocities and the velocity fluctuations at as many
Reynolds numbers with varying wall roughness as possible. First, the Reynolds numbers at which Laufer
did his investigations is going to be in focus, so to check how much his results correlate to ours. Then the
Reynolds-numbers that were observed by Nikuradse in a circular channel will be investigated, but instead
in a rectangular cross channel. Quantities necessary to determine the Reynolds stress tensor and the near-
wall energy spectrum will be measured and recorded in every case; namely the average velocities and
velocity fluctuations in 3D.
This is where the anisotropy of the flow will become significant; we measure the velocity fluctuations 𝑢1′ ,
𝑢2′ , 𝑢3
′ and determine 𝑢1 𝑎𝑣𝑒𝑟𝑎𝑔𝑒′ , 𝑢2 𝑎𝑣𝑒𝑟𝑎𝑔𝑒
′ , and 𝑢3 𝑎𝑣𝑒𝑟𝑎𝑔𝑒′ . At the wall, these averages will be diff erent.
Near the wall, there is a peak value perceived by many investigations. It is not yet clear whether this peak
really exists, or is an indefinite measurement error. Many simulations – including Large Eddy Simulations,
Direct Numerical Simulations – were executed to estimate the behaviour of fluids near walls, however,
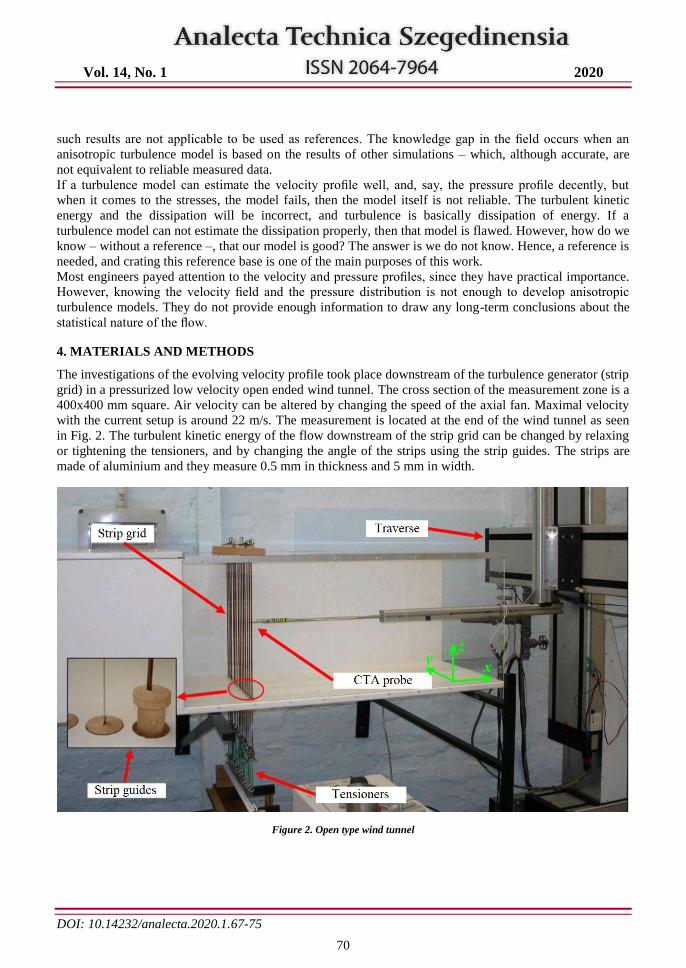
Vol. 14, No. 1 2020
DOI: 10.14232/analecta.2020.1.67-75
70
such results are not applicable to be used as references. The knowledge gap in the field occurs when an
anisotropic turbulence model is based on the results of other simulations – which, although accurate, are
not equivalent to reliable measured data.
If a turbulence model can estimate the velocity profile well, and, say, the pressure profile decently, but
when it comes to the stresses, the model fails, then the model itself is not reliable. The turbulent kinetic
energy and the dissipation will be incorrect, and turbulence is basically dissipation of energy. If a
turbulence model can not estimate the dissipation properly, then that model is flawed. However, how do we
know – without a reference –, that our model is good? The answer is we do not know. Hence, a reference is
needed, and crating this reference base is one of the main purposes of this work.
Most engineers payed attention to the velocity and pressure profiles, since they have practical importance.
However, knowing the velocity field and the pressure distribution is not enough to develop anisotropic
turbulence models. They do not provide enough information to draw any long-term conclusions about the
statistical nature of the flow.
4. MATERIALS AND METHODS
The investigations of the evolving velocity profile took place downstream of the turbulence generator (strip
grid) in a pressurized low velocity open ended wind tunnel. The cross section of the measurement zone is a
400x400 mm square. Air velocity can be altered by changing the speed of the axial fan. Maximal velocity
with the current setup is around 22 m/s. The measurement is located at the end of the wind tunnel as seen
in Fig. 2. The turbulent kinetic energy of the flow downstream of the strip grid can be changed by relaxing
or tightening the tensioners, and by changing the angle of the strips using the strip guides. The strips are
made of aluminium and they measure 0.5 mm in thickness and 5 mm in width.
Figure 2. Open type wind tunnel
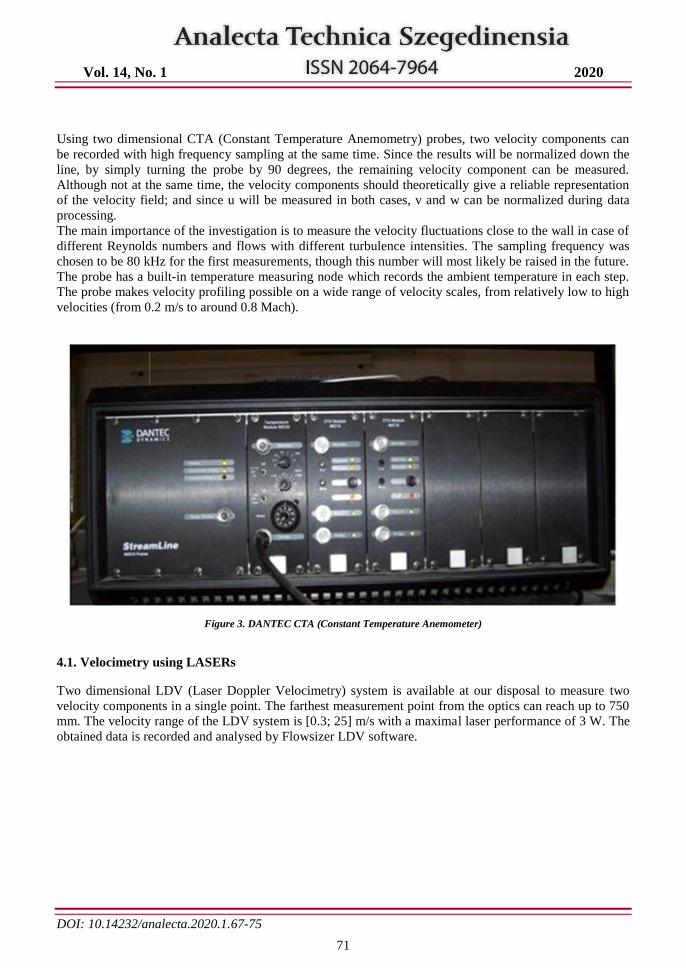
Vol. 14, No. 1 2020
DOI: 10.14232/analecta.2020.1.67-75
71
Using two dimensional CTA (Constant Temperature Anemometry) probes, two velocity components can
be recorded with high frequency sampling at the same time. Since the results will be normalized down the
line, by simply turning the probe by 90 degrees, the remaining velocity component can be measured.
Although not at the same time, the velocity components should theoretically give a reliable representation
of the velocity field; and since u will be measured in both cases, v and w can be normalized during data
processing.
The main importance of the investigation is to measure the velocity fluctuations close to the wall in case of
different Reynolds numbers and flows with different turbulence intensities. The sampling frequency was
chosen to be 80 kHz for the first measurements, though this number will most likely be raised in the future.
The probe has a built-in temperature measuring node which records the ambient temperature in each step.
The probe makes velocity profiling possible on a wide range of velocity scales, from relatively low to high
velocities (from 0.2 m/s to around 0.8 Mach).
Figure 3. DANTEC CTA (Constant Temperature Anemometer)
4.1. Velocimetry using LASERs
Two dimensional LDV (Laser Doppler Velocimetry) system is available at our disposal to measure two
velocity components in a single point. The farthest measurement point from the optics can reach up to 750
mm. The velocity range of the LDV system is [0.3; 25] m/s with a maximal laser performance of 3 W. The
obtained data is recorded and analysed by Flowsizer LDV software.
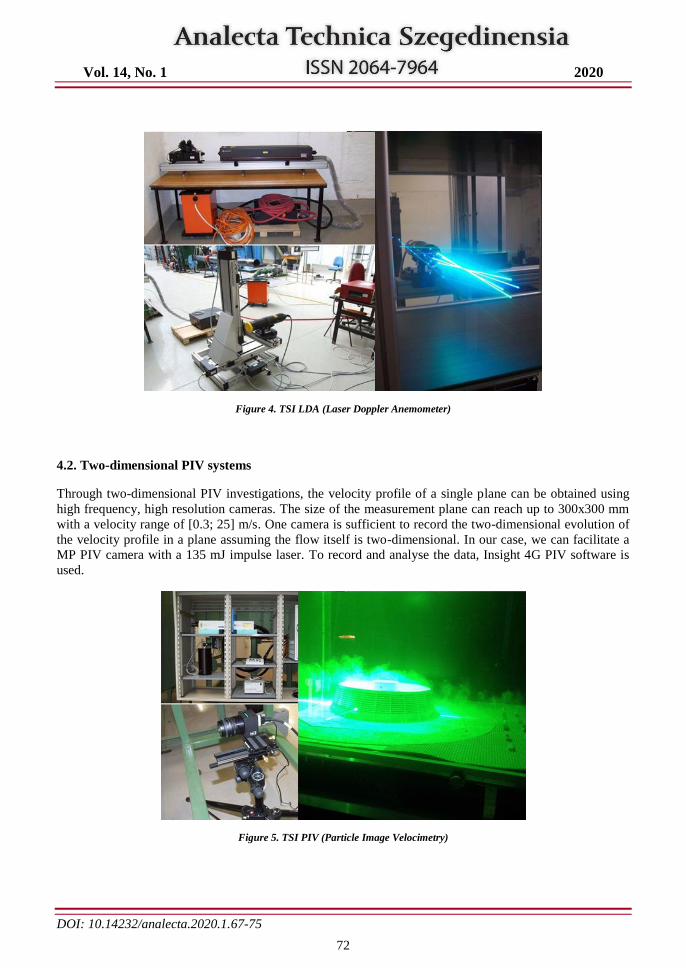
Vol. 14, No. 1 2020
DOI: 10.14232/analecta.2020.1.67-75
72
Figure 4. TSI LDA (Laser Doppler Anemometer)
4.2. Two-dimensional PIV systems
Through two-dimensional PIV investigations, the velocity profile of a single plane can be obtained using
high frequency, high resolution cameras. The size of the measurement plane can reach up to 300x300 mm
with a velocity range of [0.3; 25] m/s. One camera is sufficient to record the two-dimensional evolution of
the velocity profile in a plane assuming the flow itself is two-dimensional. In our case, we can facilitate a
MP PIV camera with a 135 mJ impulse laser. To record and analyse the data, Insight 4G PIV software is
used.
Figure 5. TSI PIV (Particle Image Velocimetry)
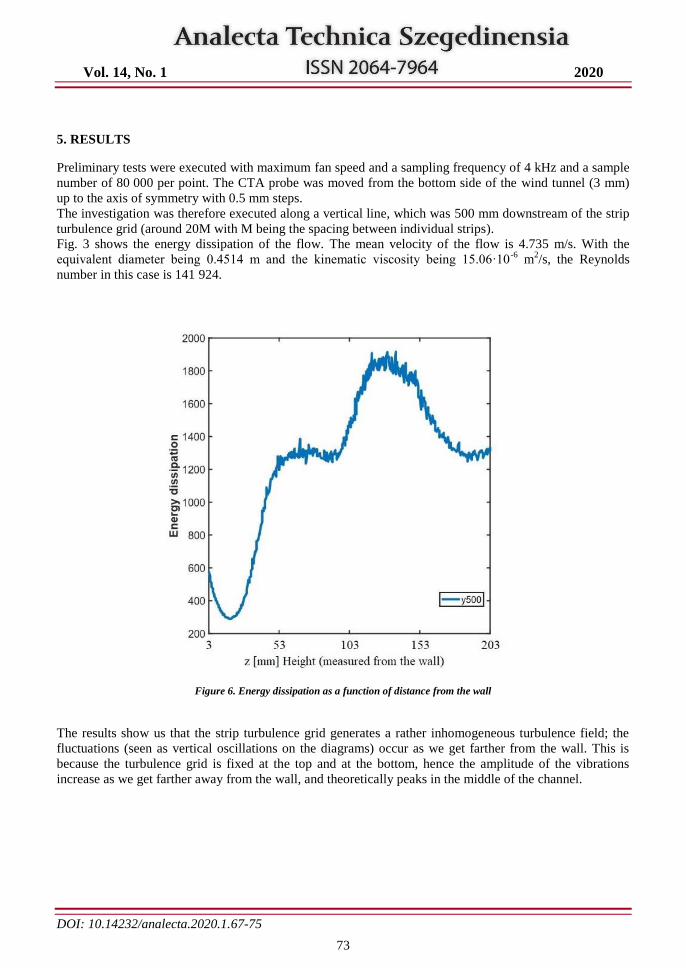
Vol. 14, No. 1 2020
DOI: 10.14232/analecta.2020.1.67-75
73
5. RESULTS
Preliminary tests were executed with maximum fan speed and a sampling frequency of 4 kHz and a sample
number of 80 000 per point. The CTA probe was moved from the bottom side of the wind tunnel (3 mm)
up to the axis of symmetry with 0.5 mm steps.
The investigation was therefore executed along a vertical line, which was 500 mm downstream of the strip
turbulence grid (around 20M with M being the spacing between individual strips).
Fig. 3 shows the energy dissipation of the flow. The mean velocity of the flow is 4.735 m/s. With the
equivalent diameter being 0.4514 m and the kinematic viscosity being 15.06·10-6
m2/s, the Reynolds
number in this case is 141 924.
Figure 6. Energy dissipation as a function of distance from the wall
The results show us that the strip turbulence grid generates a rather inhomogeneous turbulence field; the
fluctuations (seen as vertical oscillations on the diagrams) occur as we get farther from the wall. This is
because the turbulence grid is fixed at the top and at the bottom, hence the amplitude of the vibrations
increase as we get farther away from the wall, and theoretically peaks in the middle of the channel.
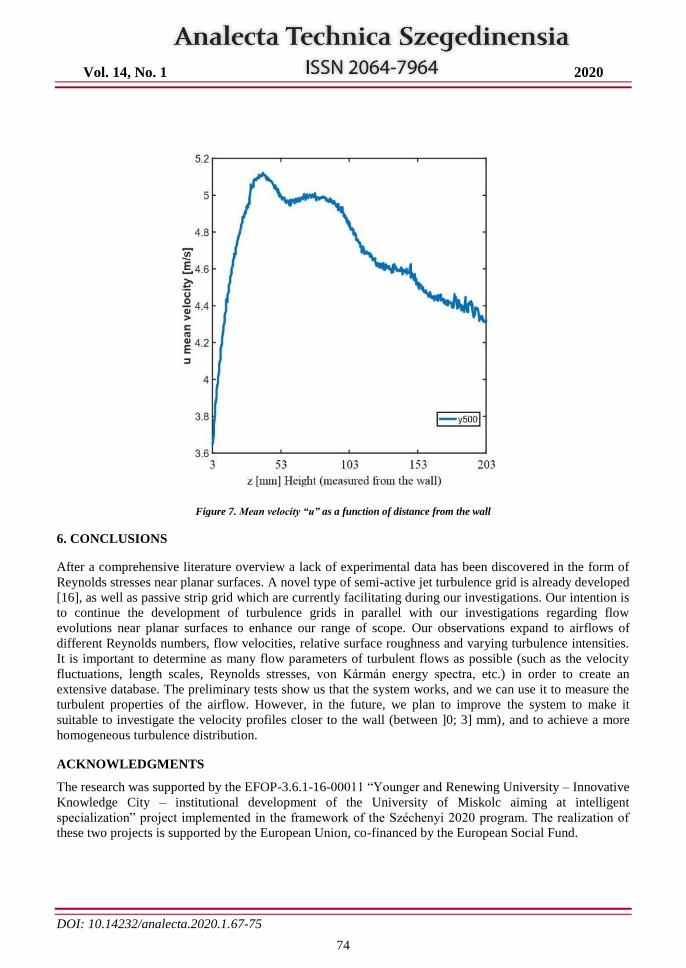
Vol. 14, No. 1 2020
DOI: 10.14232/analecta.2020.1.67-75
74
Figure 7. Mean velocity “u” as a function of distance from the wall
6. CONCLUSIONS
After a comprehensive literature overview a lack of experimental data has been discovered in the form of
Reynolds stresses near planar surfaces. A novel type of semi-active jet turbulence grid is already developed
[16], as well as passive strip grid which are currently facilitating during our investigations. Our intention is
to continue the development of turbulence grids in parallel with our investigations regarding flow
evolutions near planar surfaces to enhance our range of scope. Our observations expand to airflows of
different Reynolds numbers, flow velocities, relative surface roughness and varying turbulence intensities.
It is important to determine as many flow parameters of turbulent flows as possible (such as the velocity
fluctuations, length scales, Reynolds stresses, von Kármán energy spectra, etc.) in order to create an
extensive database. The preliminary tests show us that the system works, and we can use it to measure the
turbulent properties of the airflow. However, in the future, we plan to improve the system to make it
suitable to investigate the velocity profiles closer to the wall (between ]0; 3] mm), and to achieve a more
homogeneous turbulence distribution.
ACKNOWLEDGMENTS
The research was supported by the EFOP-3.6.1-16-00011 “Younger and Renewing University – Innovative
Knowledge City – institutional development of the University of Miskolc aiming at intelligent
specialization” project implemented in the framework of the Széchenyi 2020 program. The realization of
these two projects is supported by the European Union, co-financed by the European Social Fund.
Vol. 14, No. 1 2020
DOI: 10.14232/analecta.2020.1.67-75
75
REFERENCES
[1] Mohamed Gad-el Hak and Stanley Corrsin. Measurements of the nearly isotropic turbulence behind a
uniform jet grid. Journal of Fluid Mechanics, 62(01):115–143, 1974.
[2] LFG Simmons and C Salter. Experimental investigation and analysis of the velocity variations in
turbulent flow. Proceedings of the Royal Society of London. Series A, Containing Papers of a
Mathematical and Physical Character, pages 212–234, 1934.
[3] Genevieve Comte-Bellot and Stanley Corrsin. The use of a contraction to improve the isotropy of grid-
generated turbulence. Journal of Fluid Mechanics, 25(04):657–682, 1966.
[4] Genevieve Comte-Bellot and Stanley Corrsin. Simple eulerian time correlation of fulland narrow-band
velocity signals in grid-generated, isotropic turbulence. Journal of Fluid Mechanics, 48(02):273–337,
1971.
[5] Thomas Kurian and Jens HM Fransson. Grid-generated turbulence revisited. Fluid dynamics research,
41(2):021403, 2009.
[6] SC Ling and CA Wan. Decay of isotropic turbulence generated by a mechanically agitated grid.
Physics of Fluids (1958-1988), 15(8):1363–1369, 1972.
[7] Shigehira Ozono, Hiromori Miyagi, and Kazuhiro Wada. Turbulence generated in active grid mode
using a multi-fan wind tunnel. Journal of Fluid Science and Technology, 2(3):643–654, 2007.
[8] Hyung Suk Kang, Stuart Chester, and Charles Meneveau. Decaying turbulence in an active-grid-
generated flow and comparisons with large-eddy simulation. Journal of Fluid Mechanics, 480:129–
160, 2003. 94
[9] Róbert Bordás, Thomas Hagemeier, Bernd Wunderlich, and Dominique Thévenin. Droplet collisions
and interaction with the turbulent flow within a two-phase wind tunnel. Physics of Fluids (1994-
present), 23(8):085105, 2011.
[10] Hideharu Makita and Shinji Miyamoto. Generation of high intensity turbulence and control of its
structure in a low speed windtunnel. In Proceedings of 2nd Asian congress on fluid mechanics, pages
101–106, 1983.
[11] Makita Hideharu. Realization of a large-scale turbulence field in a small wind tunnel. Fluid Dynamics
Research, 8(1-4):53, 1991.
[12] Jon V Larssen and William J Devenport. On the generation of large-scale homogeneous turbulence.
Experiments in fluids, 50(5):1207–1223, 2011.
[13] John Laufer. Investigation of turbulent flow in a two dimensional channel. National Advisory
Committee for Aeronautics, 1951.
[14] John Laufer. The structure of turbulence in fully developed pipe flow. National Bureau of Standards,
1952.
[15]Johann Nikuradse. Strömungsgesetze in rauen Rohren, Forschung auf dem Gebiete des
Ingenieurwesens, 1933.
[16] Norbert Szaszák, Cristoph Roloff, Róbert Bordás, Péter Bencs, Szilárd Szabó, Dominique Thévenin.
A novel type of semi-active jet turbulence grid. Heliyon 4, 2018.
Vol. 14, No. 1 2020
DOI: 10.14232/analecta.2020.1.76-81
76
THE APPLICATION OF BIOGAS FERMENTATION DIGESTATE AS SOIL
FERTILIZER
1Klára Czakó-Vér,
2Dávid Somfai,
2Erzsébet Suhajda,
1Márk Strasszer,
1Gyula Árvay,
2Anita Dolgosné
Kovács, 2Ernő Dittrich
1Institute of Biology, Faculty of Sciences, University of Pécs, Ifjúság útja 6., H-7624, Pécs, Hungary,
2Department of Environmental Engineering, University of Pécs, Boszorkány út 2., H-7624 Pécs, Hungary, e-mail: [email protected]
ABSTRACT
As organic manure is becoming less available, using different materials as soil fertilizers and the
application of the inorganic fertilizers raises many questions. Therefore, it is increasingly important to use
compost and biogas digestate to improve soil quality. The activity of the microbial communities ensures
the fertility of the soil. One of the most important enzymes is dehydrogenase. This enzyme group catalyses
the hydrogen transfer in the process of biological oxidation. Our aim was to examine the effect of biogas
digestate on dehydrogenase enzyme activity (DHA) in 3 different types of soil. Hungarian standard method
was used to evaluate DHA. The applied biogas digestate was obtained from the Kaposvár Sugar Factory of
Hungarian Sugar Ltd. The dose is equal to 16,7 m3ha-1 and 533 kg organic matterha-1. The treatment was
performed in three different groups of soil: brown forest soil, calcereous chernozem and carbonate meadow
soil. The results showed an increase in DHA in all types of soil. DHA values were the highest in case of the
carbonate meadow soil, specifically 0.337 mg formazan/1 g soil/24 h immediately after the treatment and
0.410 after 28 days. A critical aspect to consider during the construction of biogas plants is the soil
protection agency’s ban on using soil fertilizers during the winter months. Analysis carried out according
to the protocol of sewage sludge examination revealed that biofermentate produced during biogas
generation does not contain any environmentally harmful components. After the elaboration of a soil
protection plan, the recommended way to apply biogas digestate to arable land is via injectors.
Keywords: biogas, digestate, fertilizer, soil, activity,
1. INTRODUCTION
Arable land can be defined as a complex system of materials and energy in terms of agriculture and
forestry. Its physical properties and limitations depend on the soil, the climate and hydrological cycles. The
value and quality of arable land is characterized by achievable yield or yields achieved in the past.
Extremes in climate (stress resulting from heat and excessive precipitation) highlight the errors of previous
soil cultivating practices that included procedures detrimental to soil health. Soil cultivation faces
important tasks, involving the realisation of the effects and symptoms of global climate change, reduction
of climate risk in terms of summer soil cultivation and developing and applying techniques to prevent
draught, water loss and stress from heat and precipitation. [1] The VAHAVA report, that ended the
Hungarian National Academy of Sciences’ and the Hungarian Ministry of Environmental Protection and
Water’s joint project titled Effects of global climate change in Hungary and the appropriate answers:
Change-Effect-Answer, brought about an important step forward in relation to soil protection. Quality and
climate sensitivity of soil were classified as essential factors influencing the future chance of crop growth
in agriculture. [2]
Fertilizer demand is 0, if the yield is proportionate to the soil’s momentary nutrient providing capability,
if we want to maintain or increase the yield, using fertilizer on soil is needed. [2]
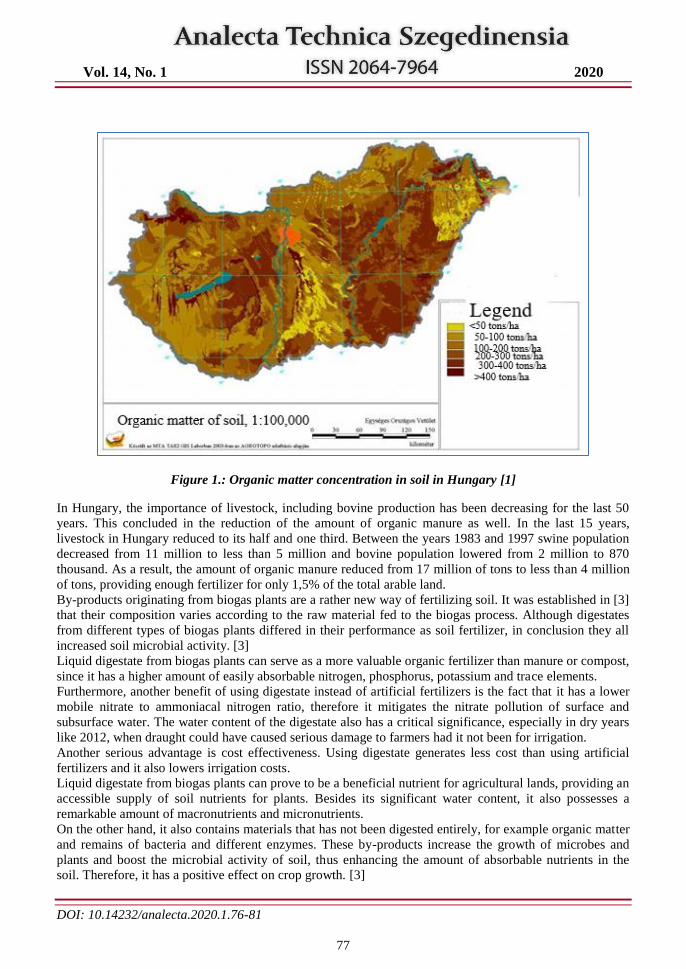
Vol. 14, No. 1 2020
DOI: 10.14232/analecta.2020.1.76-81
77
Figure 1.: Organic matter concentration in soil in Hungary [1]
In Hungary, the importance of livestock, including bovine production has been decreasing for the last 50
years. This concluded in the reduction of the amount of organic manure as well. In the last 15 years,
livestock in Hungary reduced to its half and one third. Between the years 1983 and 1997 swine population
decreased from 11 million to less than 5 million and bovine population lowered from 2 million to 870
thousand. As a result, the amount of organic manure reduced from 17 million of tons to less than 4 million
of tons, providing enough fertilizer for only 1,5% of the total arable land.
By-products originating from biogas plants are a rather new way of fertilizing soil. It was established in [3]
that their composition varies according to the raw material fed to the biogas process. Although digestates
from different types of biogas plants differed in their performance as soil fertilizer, in conclusion they all
increased soil microbial activity. [3]
Liquid digestate from biogas plants can serve as a more valuable organic fertilizer than manure or compost,
since it has a higher amount of easily absorbable nitrogen, phosphorus, potassium and trace elements.
Furthermore, another benefit of using digestate instead of artificial fertilizers is the fact that it has a lower
mobile nitrate to ammoniacal nitrogen ratio, therefore it mitigates the nitrate pollution of surface and
subsurface water. The water content of the digestate also has a critical significance, especially in dry years
like 2012, when draught could have caused serious damage to farmers had it not been for irrigation.
Another serious advantage is cost effectiveness. Using digestate generates less cost than using artificial
fertilizers and it also lowers irrigation costs.
Liquid digestate from biogas plants can prove to be a beneficial nutrient for agricultural lands, providing an
accessible supply of soil nutrients for plants. Besides its significant water content, it also possesses a
remarkable amount of macronutrients and micronutrients.
On the other hand, it also contains materials that has not been digested entirely, for example organic matter
and remains of bacteria and different enzymes. These by-products increase the growth of microbes and
plants and boost the microbial activity of soil, thus enhancing the amount of absorbable nutrients in the
soil. Therefore, it has a positive effect on crop growth. [3]
Vol. 14, No. 1 2020
DOI: 10.14232/analecta.2020.1.76-81
78
Although other countries, for example Sweden, elaborated a separate certification system for biogas
residues [3], in Hungary the application of digestate to arable lands faces serious legal barriers to this day.
[4] The main complication is the fact that digestate does not constitute an independent legal category,
therefore it is treated as sewage sludge in official procedures. [4]
However, as opposed to sewage sludge, digestate does not contain harmful industrial waste. Besides, the
exact composition of materials entering the biogas plant is known.
Currently there are several regulations regarding soil fertilizers and yield enhancers, nevertheless liquid
digestate from biogas plants does not play a role in any of them.
Ecological demands of biogas production
Its advantages compared to fossil fuels are that no excess CO2 enters the atmosphere, and that during
fermentation emission of CH4, a gas with high greenhouse gas potential, is prohibited.
The anaerobic digestion of organic manure provides an end-product characterized by reduced smell
intensity and high fertilization potential thanks to its optimal C:N ratio and the mineralization of nitrogen
and phosphorus. This can lead to decreased artificial fertilizer usage.
Most pathogen microorganisms found in manure decease during fermentation and preparation, diminishing
the amount of substances harmful to human health applied to arable land.
Regulation 90/2008. (VII.18.) of the Ministry of Agriculture imposes the creation of a soil protection plan
to permit the use of manure and waste on arable lands. [4] Organic manure is excepted from this rule.
A simplified soil protection plan is necessary in case of the use of sewage sludge compost or non-
hazardous agricultural waste. Liquid digestate from biogas plant classifies as, non-agricultural, non-
hazardous waste. This means that in order to get a permission to use it on arable land, the elaboration of a
detailed and more expensive soil protection plan is needed. In order to fully map the potential of digestate
in agriculture, further experiments are required, involving different types of soils and biogas plants.
Use of liquid digestate from biogas plants is economical and the significance of this can grow in the future.
Therefore, the construction and development of biogas plants are beneficial, because they do not only
produce biogas, but also provide a valuable nutrient supply for crop growth.
During the anaerobic fermentation of biogas production, the original material’s composition undergoes
significant changes (for example in ammonium content, pH, C:N ratio) until it reaches its final state. This
possesses a great significance in its later use on arable land regarding the macronutrients and
micronutrients available for plants [3].
Digestate can be applied directly as fertilizer or it can be divided into liquid and solid phase before its
utilization. The solid phase can be composted, dried or incinerated. The liquid phase can be diluted to later
use as a nutrient solution, or it can be concentrated by applying filter or membrane technologies.
After fermentation, the end product has a higher ammoniacal nitrogen to total nitrogen ratio and a higher
pH value than the original material. However, it experiences a decrease in total organic matter, total and
organic carbon, biological oxygen demand (BOD), C:N ratio and viscosity. The fermented material’s
ammoniacal nitrogen has a direct link to the original matter’s total nitrogen content. Easily degradable
materials, like wheat or chicken and swine manure have a high ammoniacal nitrogen to total nitrogen ratio
and low C:N ratio. Nevertheless, bovine manure or materials low in nitrogen (for example maize silage)
have a low ammoniacal nitrogen to total nitrogen ratio.
In the biogas plant of Nyírbátor, agricultural plant wastes, animal by-products (primarily manure) and the
waste of a poultry slaughterhouse are utilized.
Pot experiments, small parcel experiments and industrial experiments were carried out to determine the
green mass and yield enhancing capacity of digestate. Its effect on soil, specifically biological activity and
nutrient content of soil were also assessed.
As a control group, untreated control samples and samples irrigated with water instead of digestate were
used. Moreover, the effects of several different types of nutrient replacing methods were compared,
including using digestate, bentonite, sewage sludge compost and Phylazonit MC bacterial manure.
Vol. 14, No. 1 2020
DOI: 10.14232/analecta.2020.1.76-81
79
Makádi et al. [5] stated that as a result of applying digestate to agricultural parcels and especially due to the
water contribution aspect of digestate treatment, maize (Zea mays var. saccharata) grew bigger, more
robust and healthier ears. Administering digestate lead to an increase in the mass of corn ears. Furthermore,
plants treated with digestate suffered less damage from environmental and climatic fluctuations than plants
in control pot experiments.
Digestate treatment on sandy soil resulted in a significant change of yield. However, it had no statistically
significant effect on pasture soil characterized by greater nutrient content and better water retention ability.
A critical aspect to consider during the construction of biogas plants is the soil protection agency’s ban on
using yield enhancing materials during winter months. Hence biogas plants must have enough storage
capacity to be able to store 4 months’ worth of digestate. [6]
2. MATERIALS AND METHODS
For our in vitro model experiment, we chose 3 types of soil, all three characteristic to the Southern part of
Transdanubia. These significantly differ in their components and chemical parameters, like pH, CaCO3
and humus content and KA.
The most frequent physical and chemical parameters of the soil types are shown in Table 1.
The activity of the microbial communities ensure the fertility of the soil. One of the most important
enzyme is dehydrogenase. This enzyme group catalyses the hydrogen transfer in the metabolism of
biological oxidation [7]. For the determination of the dehydrogenase enzyme activity (DHA) Hungarian
standard method was used [8]. The DHAs were measured 0, 7, 14 and 28 days following treatment in
samples and controls.
The applied biogas digestate derived from Kaposvár Sugar Factory of Hungarian Sugar Ltd. The dose is
equal to 16,7 m3ha
-1 and 533 kg organic matter ha
-1. The chemical parameters of the digestate are shown in
Table 2.
Table 1. Main soil physical and chemical properties of the characteristic types of soil from Hungary
(Data of the Plant Health and Soil Conservation Service, Fejér county.)
Gen
etic
so
ilty
pe
pH
H2O
Ca
CO
3
(mg
.kg
-1)
Hu
mu
s (%
)
KA
Lo
am
(%
)
Mu
d (
%)
Sa
nd
(%
)
Brown forest
soil 5.65 0.00 0.88 28 15.30 25.5 59.30
Pseudomycelliar
chernozem 8.29 16.0 2.29 37 22.2 63.1 14.7
Meadow soil 7.49 1.9 3.56 71 35.9 61.7 2.5
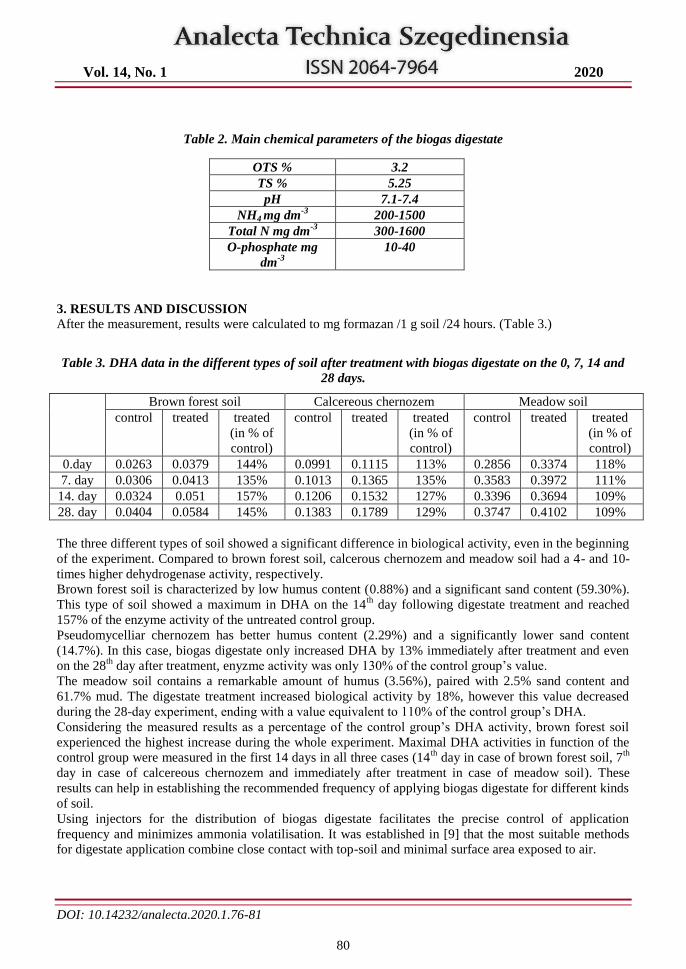
Vol. 14, No. 1 2020
DOI: 10.14232/analecta.2020.1.76-81
80
Table 2. Main chemical parameters of the biogas digestate
OTS % 3.2
TS % 5.25
pH 7.1-7.4
NH4 mg dm-3
200-1500
Total N mg dm-3
300-1600
O-phosphate mg
dm-3
10-40
3. RESULTS AND DISCUSSION
After the measurement, results were calculated to mg formazan /1 g soil /24 hours. (Table 3.)
Table 3. DHA data in the different types of soil after treatment with biogas digestate on the 0, 7, 14 and
28 days.
Brown forest soil Calcereous chernozem Meadow soil control treated treated
(in % of
control)
control treated treated
(in % of
control)
control treated treated
(in % of
control)
0.day 0.0263 0.0379 144% 0.0991 0.1115 113% 0.2856 0.3374 118%
7. day 0.0306 0.0413 135% 0.1013 0.1365 135% 0.3583 0.3972 111%
14. day 0.0324 0.051 157% 0.1206 0.1532 127% 0.3396 0.3694 109%
28. day 0.0404 0.0584 145% 0.1383 0.1789 129% 0.3747 0.4102 109%
The three different types of soil showed a significant difference in biological activity, even in the beginning
of the experiment. Compared to brown forest soil, calcerous chernozem and meadow soil had a 4- and 10-
times higher dehydrogenase activity, respectively.
Brown forest soil is characterized by low humus content (0.88%) and a significant sand content (59.30%).
This type of soil showed a maximum in DHA on the 14th
day following digestate treatment and reached
157% of the enzyme activity of the untreated control group.
Pseudomycelliar chernozem has better humus content (2.29%) and a significantly lower sand content
(14.7%). In this case, biogas digestate only increased DHA by 13% immediately after treatment and even
on the 28th
day after treatment, enyzme activity was only 130% of the control group’s value.
The meadow soil contains a remarkable amount of humus (3.56%), paired with 2.5% sand content and
61.7% mud. The digestate treatment increased biological activity by 18%, however this value decreased
during the 28-day experiment, ending with a value equivalent to 110% of the control group’s DHA.
Considering the measured results as a percentage of the control group’s DHA activity, brown forest soil
experienced the highest increase during the whole experiment. Maximal DHA activities in function of the
control group were measured in the first 14 days in all three cases (14th
day in case of brown forest soil, 7th
day in case of calcereous chernozem and immediately after treatment in case of meadow soil). These
results can help in establishing the recommended frequency of applying biogas digestate for different kinds
of soil.
Using injectors for the distribution of biogas digestate facilitates the precise control of application
frequency and minimizes ammonia volatilisation. It was established in [9] that the most suitable methods
for digestate application combine close contact with top-soil and minimal surface area exposed to air.
Vol. 14, No. 1 2020
DOI: 10.14232/analecta.2020.1.76-81
81
4. CONCLUSIONS
Our measurements revealed that the highest increase in biological activity by biogas digestate treatment
can be achieved in soil characterized by low humus content and high sand content.
Since the examined biogas plant uses sugar beet press pulp as its substrate, and this raw material does not
contain any environmentally harmful components, the application of the plant’s biogas digestate as a soil
fertilizer can be recommended, especially in case of brown forest soil. If the digestate’s solid and liquid
phase is separated, the solid phase can be applied to the land by manure spreading spray tables. The liquid
component of the digestate can be administered by injectors.
Using liquid biogas digestate also implies applying extra moisture to the soil, contributing to the
advantages of using biogas digestate as soil fertilizer.
ACKNOWLEDGEMENT
Our work was created as part of the project "Sustainable Raw Material Management
Thematic Network— RING 2017" EFOP-3.6.2-16-2017-00010 within the Programme
SZECHENYI2020, supported by the European Union, co-financed by the European
Social Fund.
REFERENCES
[1] Várallyai,G., Szabóné Kele,G., Berényi Üveges,J., Marth, P., Karkalik,A., Thury,I., 2006. (Szerk.:
Juhász,I. ) Magyarország talajainak állapota. FVM, Budapest.
[2] Bíró, B., A talaj mint a mikroorganizmusok élettere. In: A talajok jelentősége a 21. században.
(Szerk.:Stefanovits,P., Micheli,E.) 2005. MTA TKI, Budapest. pp.141-1658.
[3] Adubaker et al., 2012. Biogas residues as fertilisers. Effect on wheat growth and soil microbial
activities. Appl. Energy 99. 126-134.
[4] Barczi,A., Szalai,D., Nagy, V. 2017. The legislative background of the application of fermentation
residues to agricultural lands in Hungary. Analecta Techn. Szegedinensia 11. 26-35.
[5] Makádi,M., Tomócsik,A., Orosz,V., Lengyel,J., Bíró,B., Márton,Á. 2007. Effect of digestate and
Phylazonit MC on the yield of silage maize and the biological acivity of the soil. (In Hungarian)
Agrokémia és Talajtan, 56. 367-378.
[6] Kátai,J., Vágó,I., Tállai, M., Makádi,M. 2009. A biogáz gyártás melléktermékének hatása a talaj
néhány mikrobiológiai tulajdonságára. Talajvédelem (S) 417-422.
[7] Kiss, I. 2004. A mikroorganizmusokkal beoltott talajok enzimológiája. Scientia Kiadó, Kolozsvár pp.
[8] MSZ-08-1721/3-86: Soil analysis of agricultural treated with sewage and sludge. Analysis of soil
biológia activity by method of dehydrogenase enzyme activity.
[9] Lukehurst C. T., Frost P., Al Seadi T. 2010 Utilisation of digestate from biogas plants as biofertiliser.
IEA Bioenergy.
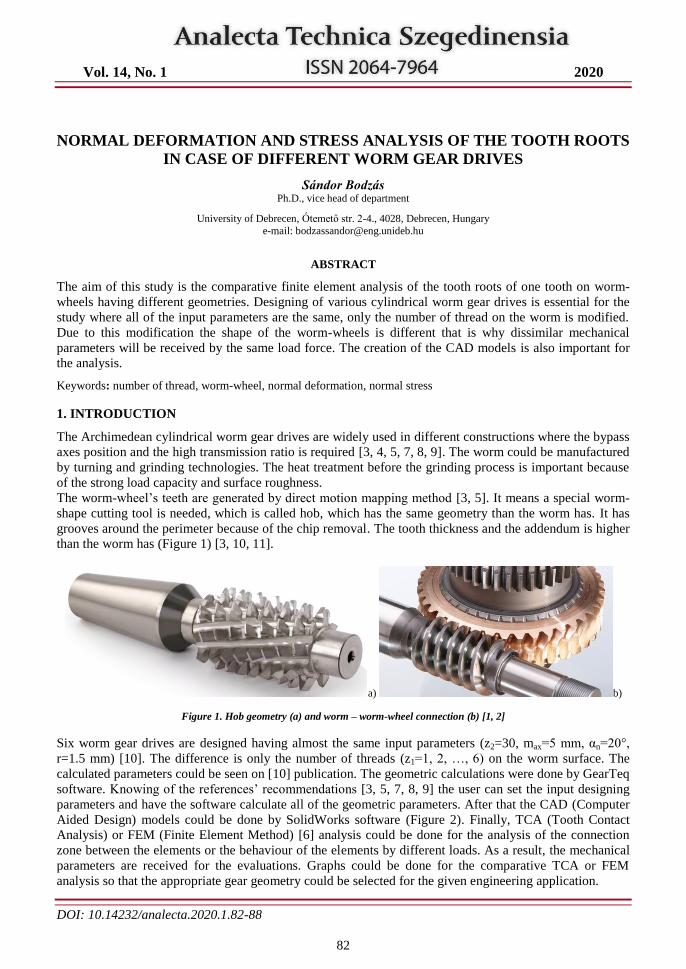
Vol. 14, No. 1 2020
DOI: 10.14232/analecta.2020.1.82-88
82
NORMAL DEFORMATION AND STRESS ANALYSIS OF THE TOOTH ROOTS
IN CASE OF DIFFERENT WORM GEAR DRIVES
Sándor Bodzás Ph.D., vice head of department
University of Debrecen, Ótemető str. 2-4., 4028, Debrecen, Hungary
e-mail: [email protected]
ABSTRACT
The aim of this study is the comparative finite element analysis of the tooth roots of one tooth on worm-
wheels having different geometries. Designing of various cylindrical worm gear drives is essential for the
study where all of the input parameters are the same, only the number of thread on the worm is modified.
Due to this modification the shape of the worm-wheels is different that is why dissimilar mechanical
parameters will be received by the same load force. The creation of the CAD models is also important for
the analysis.
Keywords: number of thread, worm-wheel, normal deformation, normal stress
1. INTRODUCTION
The Archimedean cylindrical worm gear drives are widely used in different constructions where the bypass
axes position and the high transmission ratio is required [3, 4, 5, 7, 8, 9]. The worm could be manufactured
by turning and grinding technologies. The heat treatment before the grinding process is important because
of the strong load capacity and surface roughness.
The worm-wheel’s teeth are generated by direct motion mapping method [3, 5]. It means a special worm-
shape cutting tool is needed, which is called hob, which has the same geometry than the worm has. It has
grooves around the perimeter because of the chip removal. The tooth thickness and the addendum is higher
than the worm has (Figure 1) [3, 10, 11].
a) b)
Figure 1. Hob geometry (a) and worm – worm-wheel connection (b) [1, 2]
Six worm gear drives are designed having almost the same input parameters (z2=30, max=5 mm, αn=20°,
r=1.5 mm) [10]. The difference is only the number of threads (z1=1, 2, …, 6) on the worm surface. The
calculated parameters could be seen on [10] publication. The geometric calculations were done by GearTeq
software. Knowing of the references’ recommendations [3, 5, 7, 8, 9] the user can set the input designing
parameters and have the software calculate all of the geometric parameters. After that the CAD (Computer
Aided Design) models could be done by SolidWorks software (Figure 2). Finally, TCA (Tooth Contact
Analysis) or FEM (Finite Element Method) [6] analysis could be done for the analysis of the connection
zone between the elements or the behaviour of the elements by different loads. As a result, the mechanical
parameters are received for the evaluations. Graphs could be done for the comparative TCA or FEM
analysis so that the appropriate gear geometry could be selected for the given engineering application.
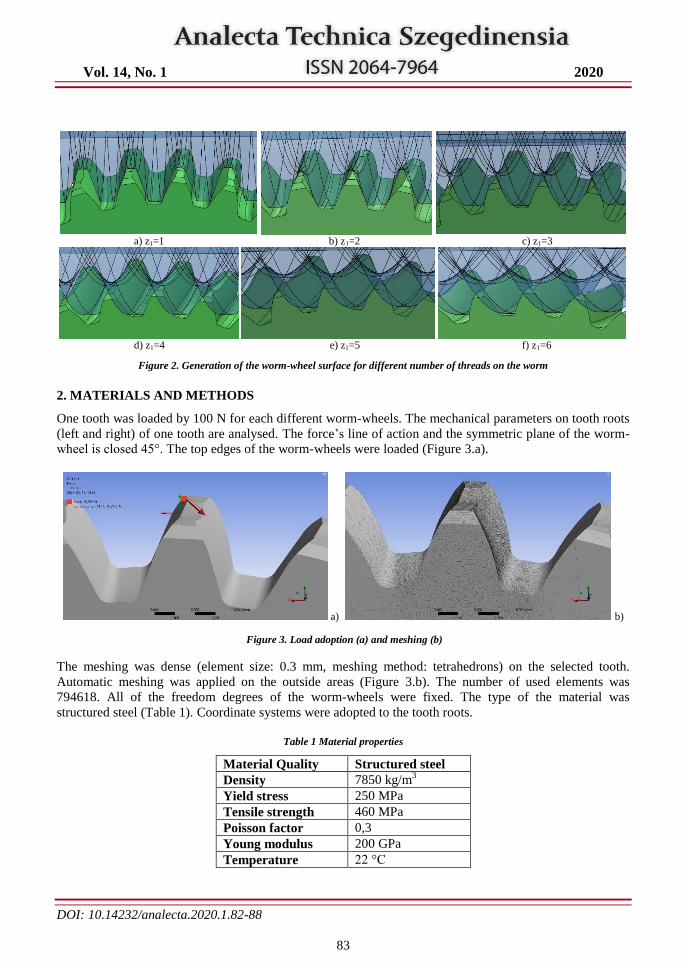
Vol. 14, No. 1 2020
DOI: 10.14232/analecta.2020.1.82-88
83
a) z1=1 b) z1=2 c) z1=3
d) z1=4 e) z1=5 f) z1=6
Figure 2. Generation of the worm-wheel surface for different number of threads on the worm
2. MATERIALS AND METHODS
One tooth was loaded by 100 N for each different worm-wheels. The mechanical parameters on tooth roots
(left and right) of one tooth are analysed. The force’s line of action and the symmetric plane of the worm-
wheel is closed 45°. The top edges of the worm-wheels were loaded (Figure 3.a).
a) b)
Figure 3. Load adoption (a) and meshing (b)
The meshing was dense (element size: 0.3 mm, meshing method: tetrahedrons) on the selected tooth.
Automatic meshing was applied on the outside areas (Figure 3.b). The number of used elements was
794618. All of the freedom degrees of the worm-wheels were fixed. The type of the material was
structured steel (Table 1). Coordinate systems were adopted to the tooth roots.
Table 1 Material properties
Material Quality Structured steel
Density 7850 kg/m3
Yield stress 250 MPa
Tensile strength 460 MPa
Poisson factor 0,3
Young modulus 200 GPa
Temperature 22 °C
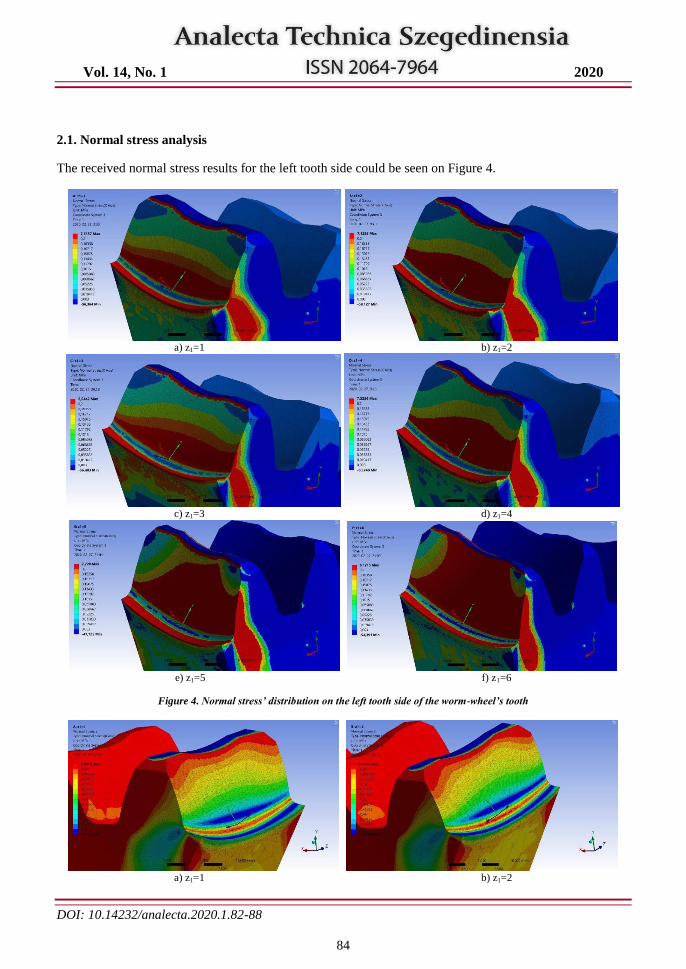
Vol. 14, No. 1 2020
DOI: 10.14232/analecta.2020.1.82-88
84
2.1. Normal stress analysis
The received normal stress results for the left tooth side could be seen on Figure 4.
a) z1=1 b) z1=2
c) z1=3 d) z1=4
e) z1=5 f) z1=6
Figure 4. Normal stress’ distribution on the left tooth side of the worm-wheel’s tooth
a) z1=1 b) z1=2
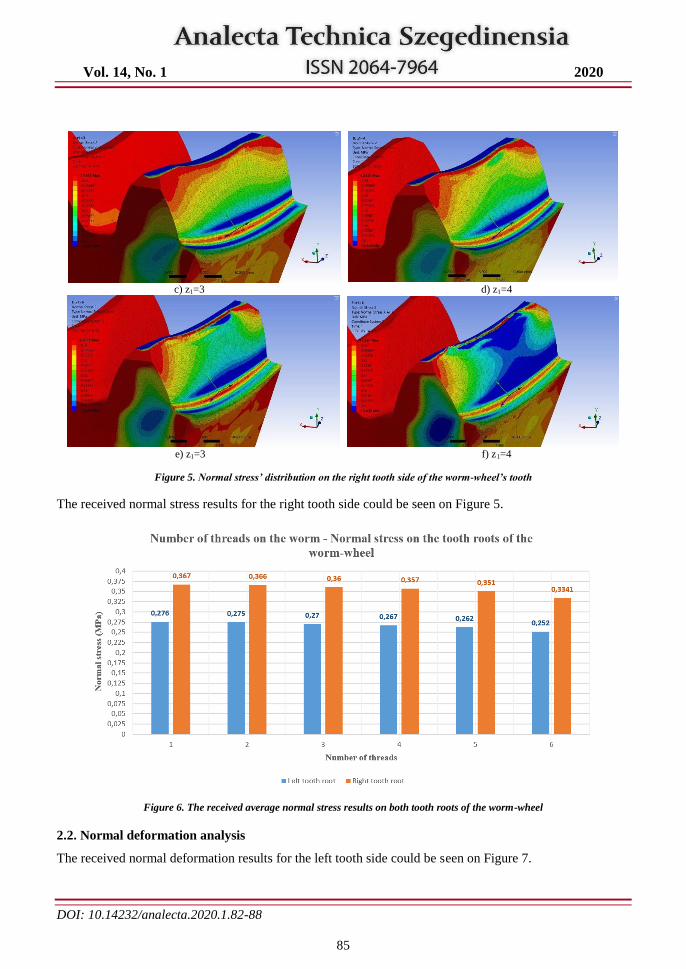
Vol. 14, No. 1 2020
DOI: 10.14232/analecta.2020.1.82-88
85
c) z1=3 d) z1=4
e) z1=3 f) z1=4
Figure 5. Normal stress’ distribution on the right tooth side of the worm-wheel’s tooth
The received normal stress results for the right tooth side could be seen on Figure 5.
Figure 6. The received average normal stress results on both tooth roots of the worm-wheel
2.2. Normal deformation analysis
The received normal deformation results for the left tooth side could be seen on Figure 7.
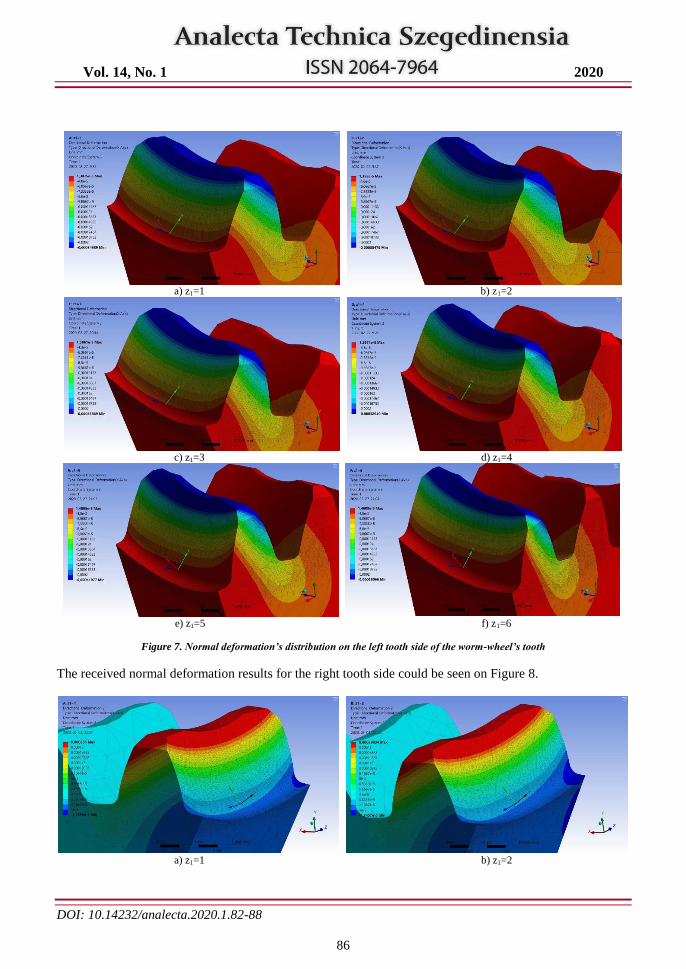
Vol. 14, No. 1 2020
DOI: 10.14232/analecta.2020.1.82-88
86
a) z1=1 b) z1=2
c) z1=3 d) z1=4
e) z1=5 f) z1=6
Figure 7. Normal deformation’s distribution on the left tooth side of the worm-wheel’s tooth
The received normal deformation results for the right tooth side could be seen on Figure 8.
a) z1=1 b) z1=2
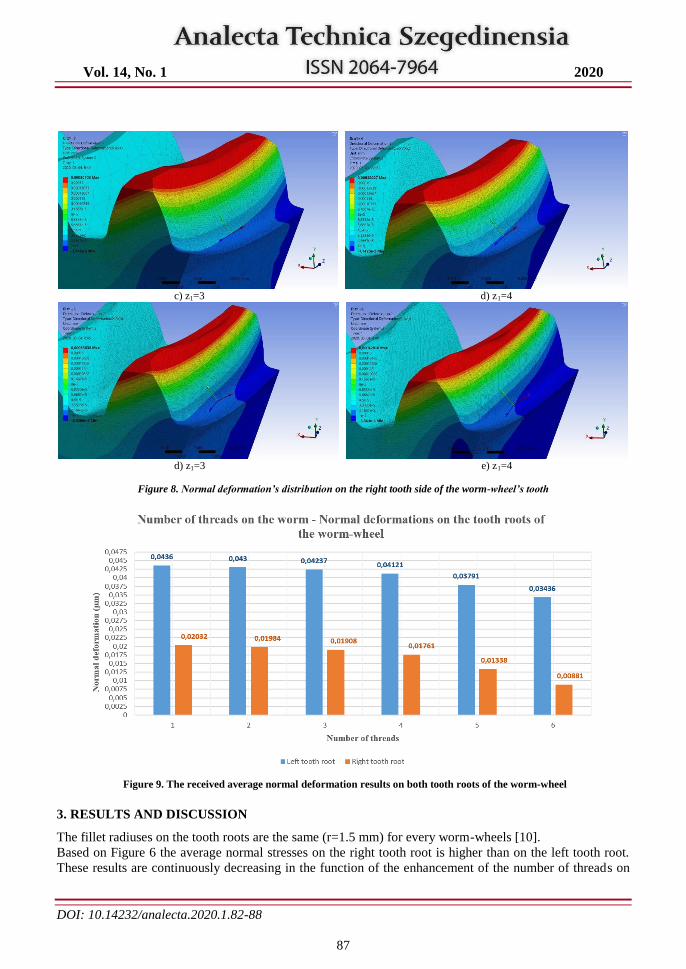
Vol. 14, No. 1 2020
DOI: 10.14232/analecta.2020.1.82-88
87
c) z1=3 d) z1=4
d) z1=3 e) z1=4
Figure 8. Normal deformation’s distribution on the right tooth side of the worm-wheel’s tooth
Figure 9. The received average normal deformation results on both tooth roots of the worm-wheel
3. RESULTS AND DISCUSSION
The fillet radiuses on the tooth roots are the same (r=1.5 mm) for every worm-wheels [10].
Based on Figure 6 the average normal stresses on the right tooth root is higher than on the left tooth root.
These results are continuously decreasing in the function of the enhancement of the number of threads on
Vol. 14, No. 1 2020
DOI: 10.14232/analecta.2020.1.82-88
88
the worm. The decreasing interval is quite low between the prisms. Consequently, the lowest normal stress
results are received in case of z1=6 number of threads.
Based on Figure 9 the normal deformations on the right tooth root is higher than on the left tooth root.
These results are continuously decreasing in the function of the enhancement of the number of thread on
the worm. The decreasing interval is quite low between the prisms. Consequently, the lowest normal stress
results are received in case of z1=6 number of threads.
As a result, the higher the number of threads on the worm is, the lower normal stress and deformation
results on the tooth roots of the worm-wheel’s tooth are.
4. CONCLUSIONS
The purpose of this study is the determination of the correlations between the mechanical parameters on
the tooth roots of the worm-wheel’s tooth and the number of threads on the worm. Six pieces of cylindrical
worm gear drives were designed with different number of threads on the worm. Due to this changing the
tooth shape of the worm-wheel is also different after the generation. The geometric designing was done by
GearTeq software considering the references’ recmmendations. Knowing of the geometric parameters the
CAD models could be generated by SolidWorks software. After that the one tooth of the worm-wheels is
loaded by the same load force. The stiffness and the flexibility of one tooth were analysed by Ansys FEM
software. It means we analysed the behaviour of the tooth roots on both tooth sides. Based on the results
graphs could be made for the determination of the consequences. We received if we increase the number of
threads around the worm the mechanical parameters on the tooth root of the worm-wheel will be decreased.
ACKNOWLEDGEMENT
This research was supported by the János Bolyai Research Scholarship of the Hungarian Academy of
Sciences.
REFERENCES
[1] https://www.spn-drive.de/en/spn-drive-solutions/gear-components-to-the-spn-standard/worm-
drives.html
[2] https://www.star-su.com/cutting-tools/gear-cutting-tools/hobs/involute/worm-gear-hobs/
[3] I. Dudás, The Theory and Practice of Worm Gear Drives, Penton Press, London, 2000, ISBN
1877180295
[4] L. Dudás, Modelling and simulation of a new worm gear drive having point-like contact, Engineering
with Computers, Engineering with Computers: Volume 29, Issue 3, 2013., pp. 251-272, ISSN 0177-
0667
[5] F. L. Litvin, A. Fuentes, Gear Geometry and Applied Theory, Cambridge University Press, 2004,
ISBN 978 0 521 81517 8
[6] S. Moaveni, Finite Element Analysis, Theory and Application with ANSYS, Pearson Education
Limited, 2015, ISBN 10: 0-273-77430-1, p. 928
[7] Z. Terplán, Gépelemek IV., Kézirat, Tankönyvkiadó, Budapest, 1975., p. 220.
[8] S. P. Radzevich, Dudley’s Handbook of Practical Gear Design and Manufacture, Third edition, CRC
Press, p. 656, ISBN 9781498753104
[9] T. Nieszporek, R. Gołębski, L. Soos, Analysis of the worm-wheel toothing accuracy, 2017, Technical
Gazette, 24(4), 993-1000., https://doi.org/10.17559/TV-20160422094400
[10] S. Bodzás, Tooth contact analyis of Archimedean worm gear drives for the modification of the
number of threads on the worm helical surface, Facta Universitatis, Series: Mechanical Engineering,
2020, ISSN 0354-2025 (during publication)
[11] S. Bodzás, I. Dudás, Designing and modelling of worm gear hob, Doktoranduszok Fóruma 2011,
Miskolci Egyetem Innovációs és Technológia Transzfer Centrum, Miskolc, 2011, pp. 12-17.
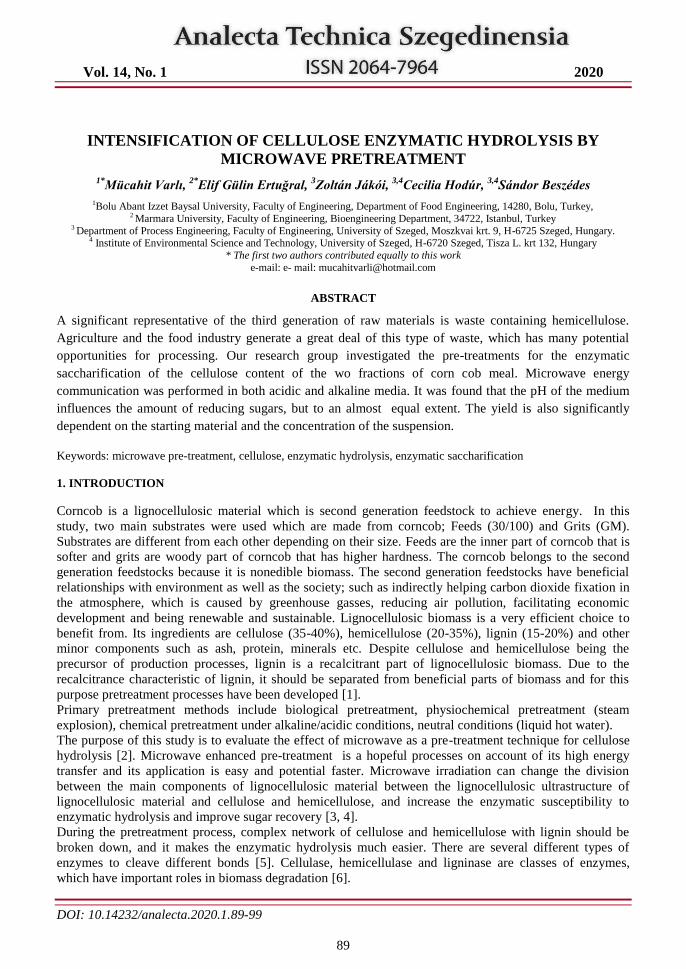
Vol. 14, No. 1 2020
DOI: 10.14232/analecta.2020.1.89-99
89
INTENSIFICATION OF CELLULOSE ENZYMATIC HYDROLYSIS BY
MICROWAVE PRETREATMENT
1*Mücahit Varlı,
2*Elif Gülin Ertuğral,
3Zoltán Jákói,
3,4Cecilia Hodúr,
3,4Sándor Beszédes
1Bolu Abant Izzet Baysal University, Faculty of Engineering, Department of Food Engineering, 14280, Bolu, Turkey, 2 Marmara University, Faculty of Engineering, Bioengineering Department, 34722, Istanbul, Turkey
3 Department of Process Engineering, Faculty of Engineering, University of Szeged, Moszkvai krt. 9, H-6725 Szeged, Hungary. 4 Institute of Environmental Science and Technology, University of Szeged, H-6720 Szeged, Tisza L. krt 132, Hungary
* The first two authors contributed equally to this work
e-mail: e- mail: [email protected]
ABSTRACT
A significant representative of the third generation of raw materials is waste containing hemicellulose.
Agriculture and the food industry generate a great deal of this type of waste, which has many potential
opportunities for processing. Our research group investigated the pre-treatments for the enzymatic
saccharification of the cellulose content of the wo fractions of corn cob meal. Microwave energy
communication was performed in both acidic and alkaline media. It was found that the pH of the medium
influences the amount of reducing sugars, but to an almost equal extent. The yield is also significantly
dependent on the starting material and the concentration of the suspension.
Keywords: microwave pre-treatment, cellulose, enzymatic hydrolysis, enzymatic saccharification
1. INTRODUCTION
Corncob is a lignocellulosic material which is second generation feedstock to achieve energy. In this
study, two main substrates were used which are made from corncob; Feeds (30/100) and Grits (GM).
Substrates are different from each other depending on their size. Feeds are the inner part of corncob that is
softer and grits are woody part of corncob that has higher hardness. The corncob belongs to the second
generation feedstocks because it is nonedible biomass. The second generation feedstocks have beneficial
relationships with environment as well as the society; such as indirectly helping carbon dioxide fixation in
the atmosphere, which is caused by greenhouse gasses, reducing air pollution, facilitating economic
development and being renewable and sustainable. Lignocellulosic biomass is a very efficient choice to
benefit from. Its ingredients are cellulose (35-40%), hemicellulose (20-35%), lignin (15-20%) and other
minor components such as ash, protein, minerals etc. Despite cellulose and hemicellulose being the
precursor of production processes, lignin is a recalcitrant part of lignocellulosic biomass. Due to the
recalcitrance characteristic of lignin, it should be separated from beneficial parts of biomass and for this
purpose pretreatment processes have been developed [1].
Primary pretreatment methods include biological pretreatment, physiochemical pretreatment (steam
explosion), chemical pretreatment under alkaline/acidic conditions, neutral conditions (liquid hot water).
The purpose of this study is to evaluate the effect of microwave as a pre-treatment technique for cellulose
hydrolysis [2]. Microwave enhanced pre-treatment is a hopeful processes on account of its high energy
transfer and its application is easy and potential faster. Microwave irradiation can change the division
between the main components of lignocellulosic material between the lignocellulosic ultrastructure of
lignocellulosic material and cellulose and hemicellulose, and increase the enzymatic susceptibility to
enzymatic hydrolysis and improve sugar recovery [3, 4].
During the pretreatment process, complex network of cellulose and hemicellulose with lignin should be
broken down, and it makes the enzymatic hydrolysis much easier. There are several different types of
enzymes to cleave different bonds [5]. Cellulase, hemicellulase and ligninase are classes of enzymes,
which have important roles in biomass degradation [6].
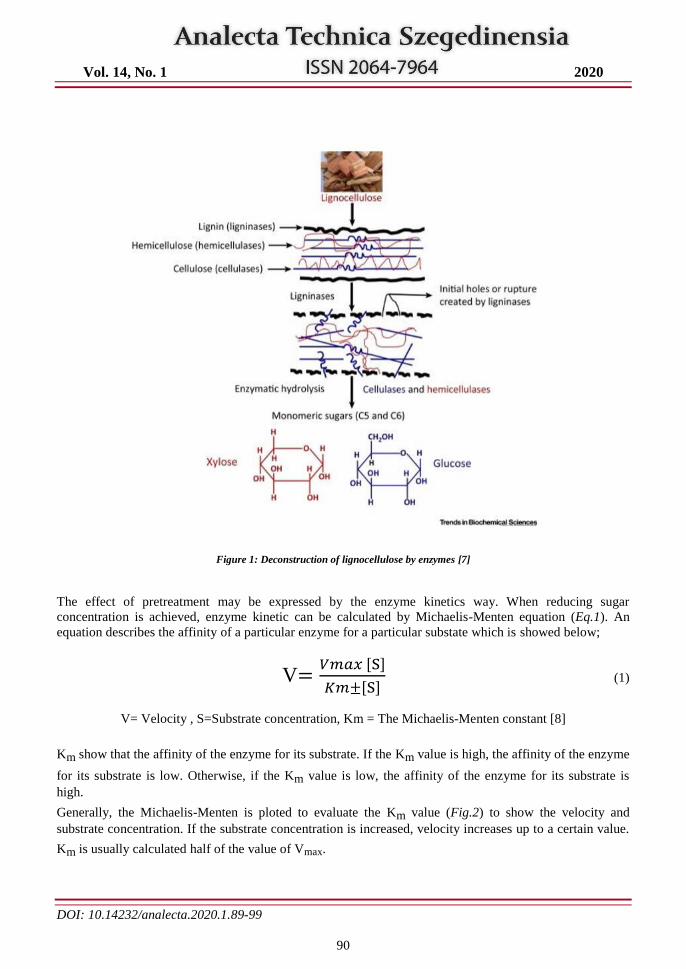
Vol. 14, No. 1 2020
DOI: 10.14232/analecta.2020.1.89-99
90
Figure 1: Deconstruction of lignocellulose by enzymes [7]
The effect of pretreatment may be expressed by the enzyme kinetics way. When reducing sugar
concentration is achieved, enzyme kinetic can be calculated by Michaelis-Menten equation (Eq.1). An
equation describes the affinity of a particular enzyme for a particular substate which is showed below;
V=𝑉𝑚𝑎𝑥 [S]
𝐾𝑚±[S] (1)
V= Velocity , S=Substrate concentration, Km = The Michaelis-Menten constant [8]
Km show that the affinity of the enzyme for its substrate. If the Km value is high, the affinity of the enzyme
for its substrate is low. Otherwise, if the Km value is low, the affinity of the enzyme for its substrate is
high.
Generally, the Michaelis-Menten is ploted to evaluate the Km value (Fig.2) to show the velocity and
substrate concentration. If the substrate concentration is increased, velocity increases up to a certain value.
Km is usually calculated half of the value of Vmax.
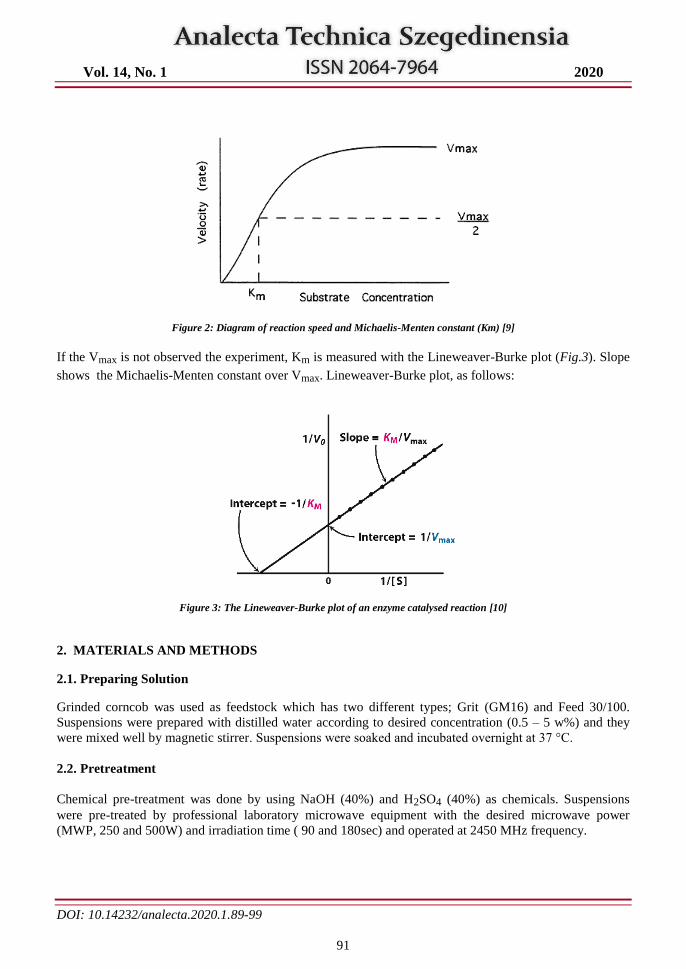
Vol. 14, No. 1 2020
DOI: 10.14232/analecta.2020.1.89-99
91
Figure 2: Diagram of reaction speed and Michaelis-Menten constant (Km) [9]
If the Vmax is not observed the experiment, Km is measured with the Lineweaver-Burke plot (Fig.3). Slope
shows the Michaelis-Menten constant over Vmax. Lineweaver-Burke plot, as follows:
Figure 3: The Lineweaver-Burke plot of an enzyme catalysed reaction [10]
2. MATERIALS AND METHODS
2.1. Preparing Solution
Grinded corncob was used as feedstock which has two different types; Grit (GM16) and Feed 30/100.
Suspensions were prepared with distilled water according to desired concentration (0.5 – 5 w%) and they
were mixed well by magnetic stirrer. Suspensions were soaked and incubated overnight at 37 °C.
2.2. Pretreatment
Chemical pre-treatment was done by using NaOH (40%) and H2SO4 (40%) as chemicals. Suspensions
were pre-treated by professional laboratory microwave equipment with the desired microwave power
(MWP, 250 and 500W) and irradiation time ( 90 and 180sec) and operated at 2450 MHz frequency.
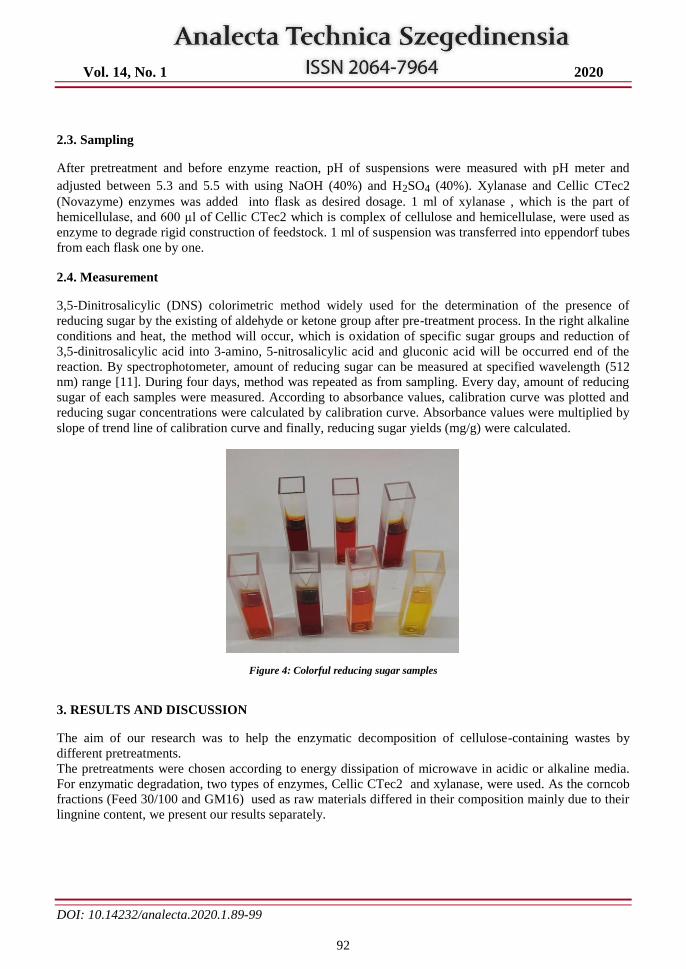
Vol. 14, No. 1 2020
DOI: 10.14232/analecta.2020.1.89-99
92
2.3. Sampling
After pretreatment and before enzyme reaction, pH of suspensions were measured with pH meter and
adjusted between 5.3 and 5.5 with using NaOH (40%) and H2SO4 (40%). Xylanase and Cellic CTec2
(Novazyme) enzymes was added into flask as desired dosage. 1 ml of xylanase , which is the part of
hemicellulase, and 600 µl of Cellic CTec2 which is complex of cellulose and hemicellulase, were used as
enzyme to degrade rigid construction of feedstock. 1 ml of suspension was transferred into eppendorf tubes
from each flask one by one.
2.4. Measurement
3,5-Dinitrosalicylic (DNS) colorimetric method widely used for the determination of the presence of
reducing sugar by the existing of aldehyde or ketone group after pre-treatment process. In the right alkaline
conditions and heat, the method will occur, which is oxidation of specific sugar groups and reduction of
3,5-dinitrosalicylic acid into 3-amino, 5-nitrosalicylic acid and gluconic acid will be occurred end of the
reaction. By spectrophotometer, amount of reducing sugar can be measured at specified wavelength (512
nm) range [11]. During four days, method was repeated as from sampling. Every day, amount of reducing
sugar of each samples were measured. According to absorbance values, calibration curve was plotted and
reducing sugar concentrations were calculated by calibration curve. Absorbance values were multiplied by
slope of trend line of calibration curve and finally, reducing sugar yields (mg/g) were calculated.
Figure 4: Colorful reducing sugar samples
3. RESULTS AND DISCUSSION
The aim of our research was to help the enzymatic decomposition of cellulose-containing wastes by
different pretreatments.
The pretreatments were chosen according to energy dissipation of microwave in acidic or alkaline media.
For enzymatic degradation, two types of enzymes, Cellic CTec2 and xylanase, were used. As the corncob
fractions (Feed 30/100 and GM16) used as raw materials differed in their composition mainly due to their
lingnine content, we present our results separately.
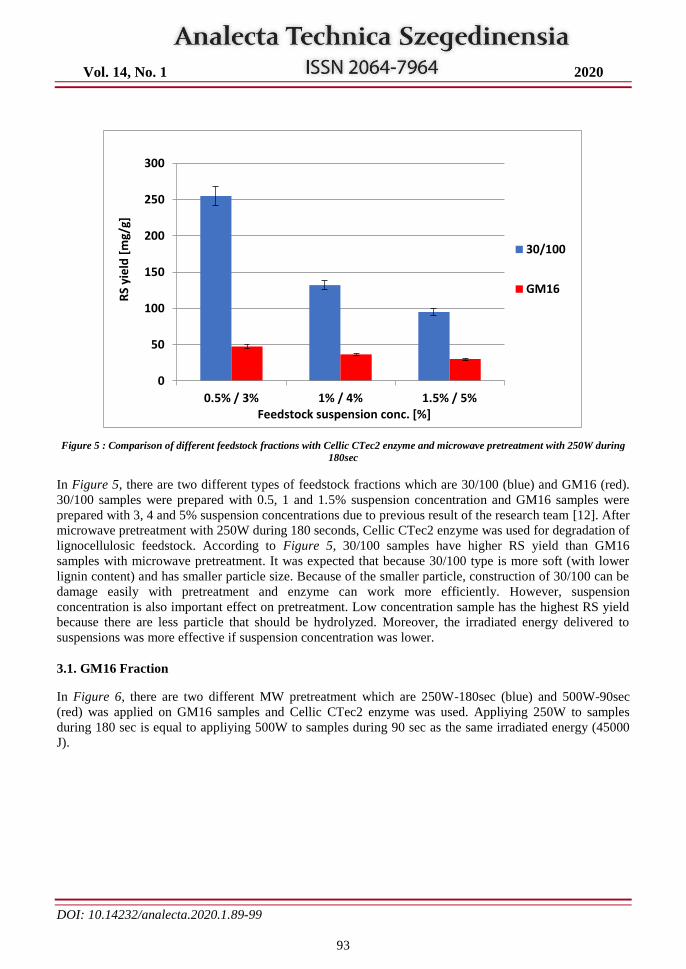
Vol. 14, No. 1 2020
DOI: 10.14232/analecta.2020.1.89-99
93
Figure 5 : Comparison of different feedstock fractions with Cellic CTec2 enzyme and microwave pretreatment with 250W during
180sec
In Figure 5, there are two different types of feedstock fractions which are 30/100 (blue) and GM16 (red).
30/100 samples were prepared with 0.5, 1 and 1.5% suspension concentration and GM16 samples were
prepared with 3, 4 and 5% suspension concentrations due to previous result of the research team [12]. After
microwave pretreatment with 250W during 180 seconds, Cellic CTec2 enzyme was used for degradation of
lignocellulosic feedstock. According to Figure 5, 30/100 samples have higher RS yield than GM16
samples with microwave pretreatment. It was expected that because 30/100 type is more soft (with lower
lignin content) and has smaller particle size. Because of the smaller particle, construction of 30/100 can be
damage easily with pretreatment and enzyme can work more efficiently. However, suspension
concentration is also important effect on pretreatment. Low concentration sample has the highest RS yield
because there are less particle that should be hydrolyzed. Moreover, the irradiated energy delivered to
suspensions was more effective if suspension concentration was lower.
3.1. GM16 Fraction
In Figure 6, there are two different MW pretreatment which are 250W-180sec (blue) and 500W-90sec
(red) was applied on GM16 samples and Cellic CTec2 enzyme was used. Appliying 250W to samples
during 180 sec is equal to appliying 500W to samples during 90 sec as the same irradiated energy (45000
J).
0
50
100
150
200
250
300
0.5% / 3% 1% / 4% 1.5% / 5%
RS
yie
ld [
mg/
g]
Feedstock suspension conc. [%]
30/100
GM16
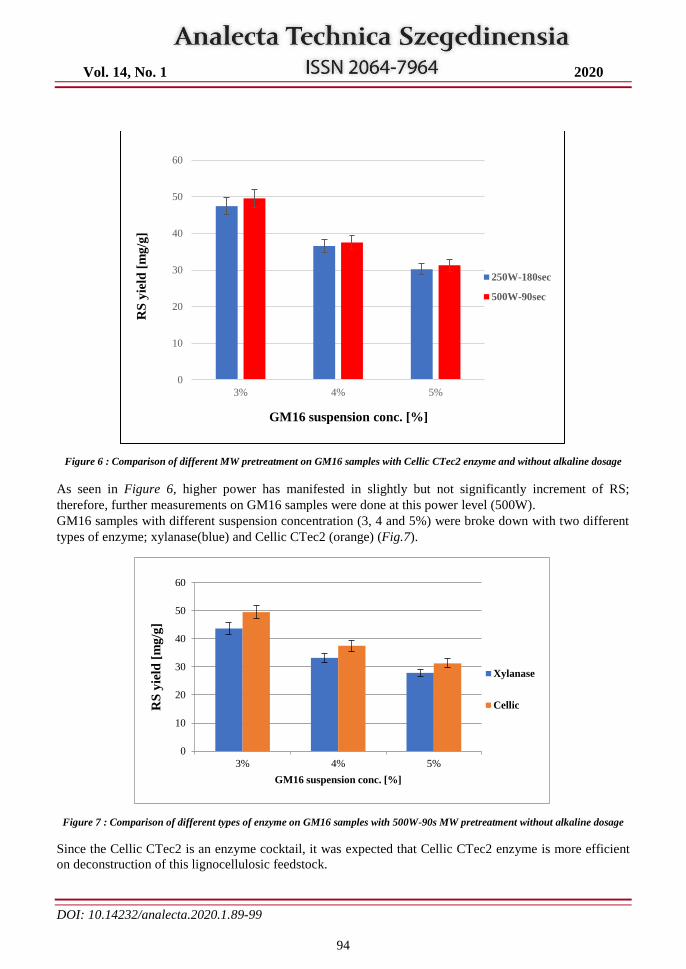
Vol. 14, No. 1 2020
DOI: 10.14232/analecta.2020.1.89-99
94
Figure 6 : Comparison of different MW pretreatment on GM16 samples with Cellic CTec2 enzyme and without alkaline dosage
As seen in Figure 6, higher power has manifested in slightly but not significantly increment of RS;
therefore, further measurements on GM16 samples were done at this power level (500W).
GM16 samples with different suspension concentration (3, 4 and 5%) were broke down with two different
types of enzyme; xylanase(blue) and Cellic CTec2 (orange) (Fig.7).
Figure 7 : Comparison of different types of enzyme on GM16 samples with 500W-90s MW pretreatment without alkaline dosage
Since the Cellic CTec2 is an enzyme cocktail, it was expected that Cellic CTec2 enzyme is more efficient
on deconstruction of this lignocellulosic feedstock.
0
10
20
30
40
50
60
3% 4% 5%
RS
yie
ld [
mg
/g]
GM16 suspension conc. [%]
250W-180sec
500W-90sec
0
10
20
30
40
50
60
3% 4% 5%
RS
yie
ld [
mg
/g]
GM16 suspension conc. [%]
Xylanase
Cellic
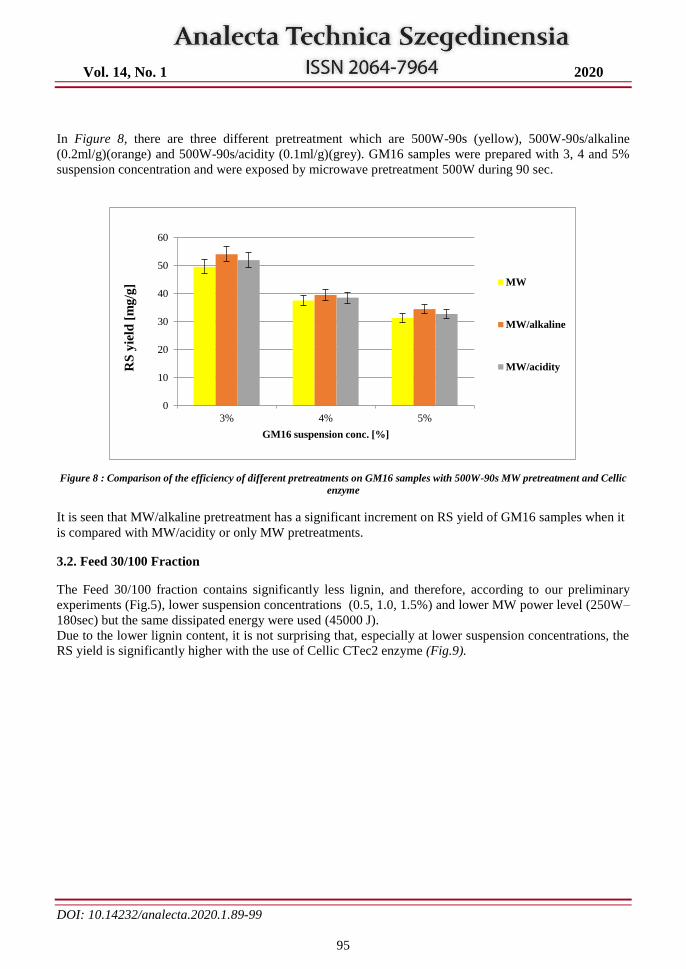
Vol. 14, No. 1 2020
DOI: 10.14232/analecta.2020.1.89-99
95
In Figure 8, there are three different pretreatment which are 500W-90s (yellow), 500W-90s/alkaline
(0.2ml/g)(orange) and 500W-90s/acidity (0.1ml/g)(grey). GM16 samples were prepared with 3, 4 and 5%
suspension concentration and were exposed by microwave pretreatment 500W during 90 sec.
Figure 8 : Comparison of the efficiency of different pretreatments on GM16 samples with 500W-90s MW pretreatment and Cellic
enzyme
It is seen that MW/alkaline pretreatment has a significant increment on RS yield of GM16 samples when it
is compared with MW/acidity or only MW pretreatments.
3.2. Feed 30/100 Fraction
The Feed 30/100 fraction contains significantly less lignin, and therefore, according to our preliminary
experiments (Fig.5), lower suspension concentrations (0.5, 1.0, 1.5%) and lower MW power level (250W–
180sec) but the same dissipated energy were used (45000 J).
Due to the lower lignin content, it is not surprising that, especially at lower suspension concentrations, the
RS yield is significantly higher with the use of Cellic CTec2 enzyme (Fig.9).
0
10
20
30
40
50
60
3% 4% 5%
RS
yie
ld [
mg
/g]
GM16 suspension conc. [%]
MW
MW/alkaline
MW/acidity
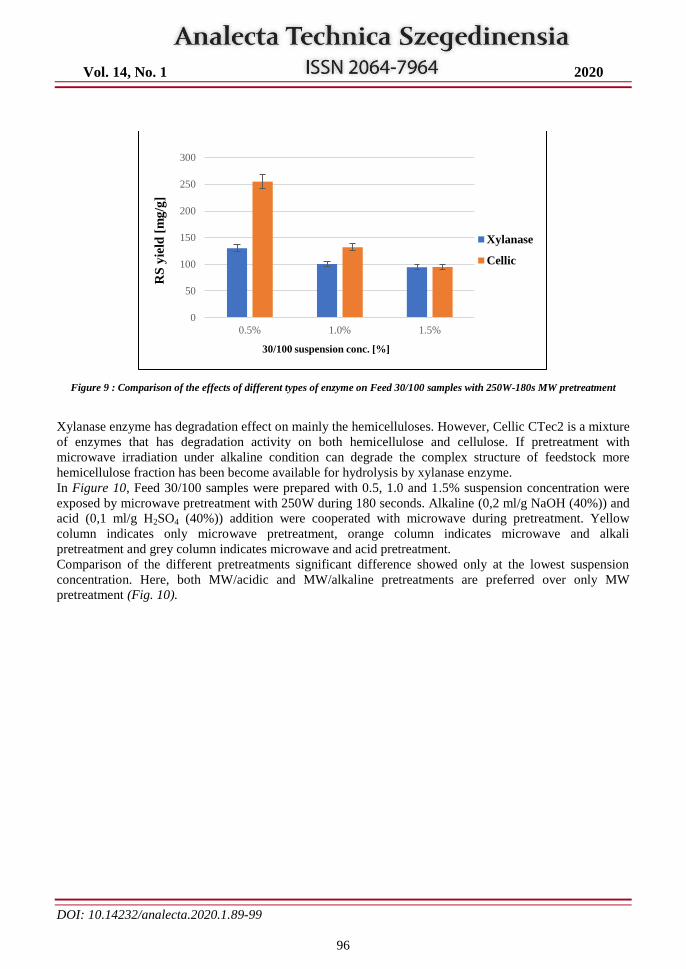
Vol. 14, No. 1 2020
DOI: 10.14232/analecta.2020.1.89-99
96
Figure 9 : Comparison of the effects of different types of enzyme on Feed 30/100 samples with 250W-180s MW pretreatment
Xylanase enzyme has degradation effect on mainly the hemicelluloses. However, Cellic CTec2 is a mixture
of enzymes that has degradation activity on both hemicellulose and cellulose. If pretreatment with
microwave irradiation under alkaline condition can degrade the complex structure of feedstock more
hemicellulose fraction has been become available for hydrolysis by xylanase enzyme.
In Figure 10, Feed 30/100 samples were prepared with 0.5, 1.0 and 1.5% suspension concentration were
exposed by microwave pretreatment with 250W during 180 seconds. Alkaline (0,2 ml/g NaOH (40%)) and
acid (0,1 ml/g H2SO4 (40%)) addition were cooperated with microwave during pretreatment. Yellow
column indicates only microwave pretreatment, orange column indicates microwave and alkali
pretreatment and grey column indicates microwave and acid pretreatment.
Comparison of the different pretreatments significant difference showed only at the lowest suspension
concentration. Here, both MW/acidic and MW/alkaline pretreatments are preferred over only MW
pretreatment (Fig. 10).
0
50
100
150
200
250
300
0.5% 1.0% 1.5%
RS
yie
ld [
mg
/g]
30/100 suspension conc. [%]
Xylanase
Cellic
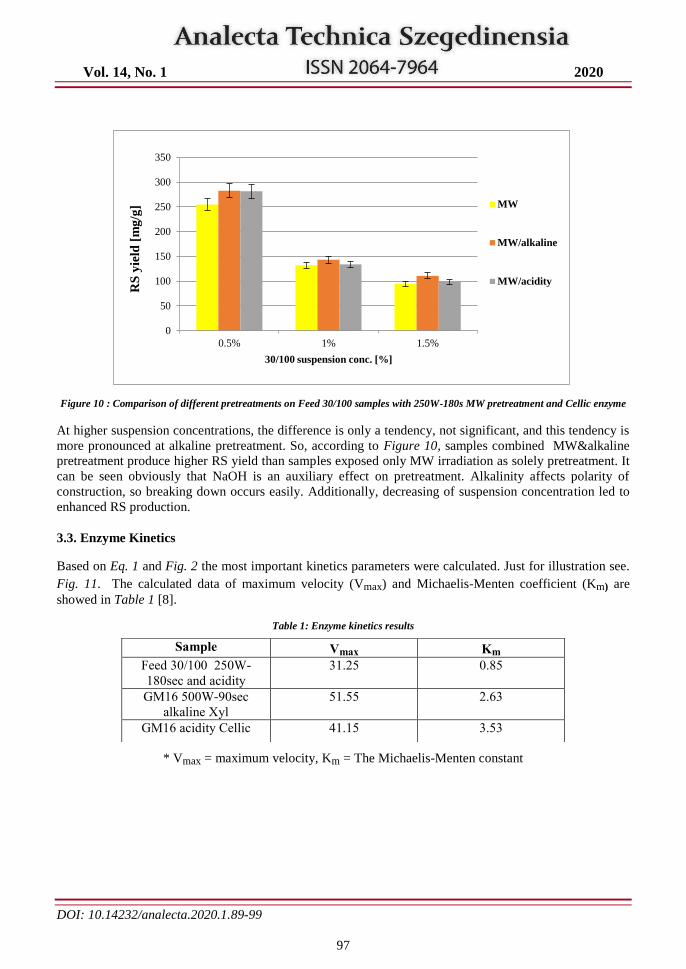
Vol. 14, No. 1 2020
DOI: 10.14232/analecta.2020.1.89-99
97
Figure 10 : Comparison of different pretreatments on Feed 30/100 samples with 250W-180s MW pretreatment and Cellic enzyme
At higher suspension concentrations, the difference is only a tendency, not significant, and this tendency is
more pronounced at alkaline pretreatment. So, according to Figure 10, samples combined MW&alkaline
pretreatment produce higher RS yield than samples exposed only MW irradiation as solely pretreatment. It
can be seen obviously that NaOH is an auxiliary effect on pretreatment. Alkalinity affects polarity of
construction, so breaking down occurs easily. Additionally, decreasing of suspension concentration led to
enhanced RS production.
3.3. Enzyme Kinetics
Based on Eq. 1 and Fig. 2 the most important kinetics parameters were calculated. Just for illustration see.
Fig. 11. The calculated data of maximum velocity (Vmax) and Michaelis-Menten coefficient (Km) are
showed in Table 1 [8].
Table 1: Enzyme kinetics results
* Vmax = maximum velocity, Km = The Michaelis-Menten constant
0
50
100
150
200
250
300
350
0.5% 1% 1.5%
RS
yie
ld [
mg
/g]
30/100 suspension conc. [%]
MW
MW/alkaline
MW/acidity
Sample Vmax Km Feed 30/100 250W-
180sec and acidity
31.25 0.85
GM16 500W-90sec
alkaline Xyl
51.55 2.63
GM16 acidity Cellic 41.15 3.53
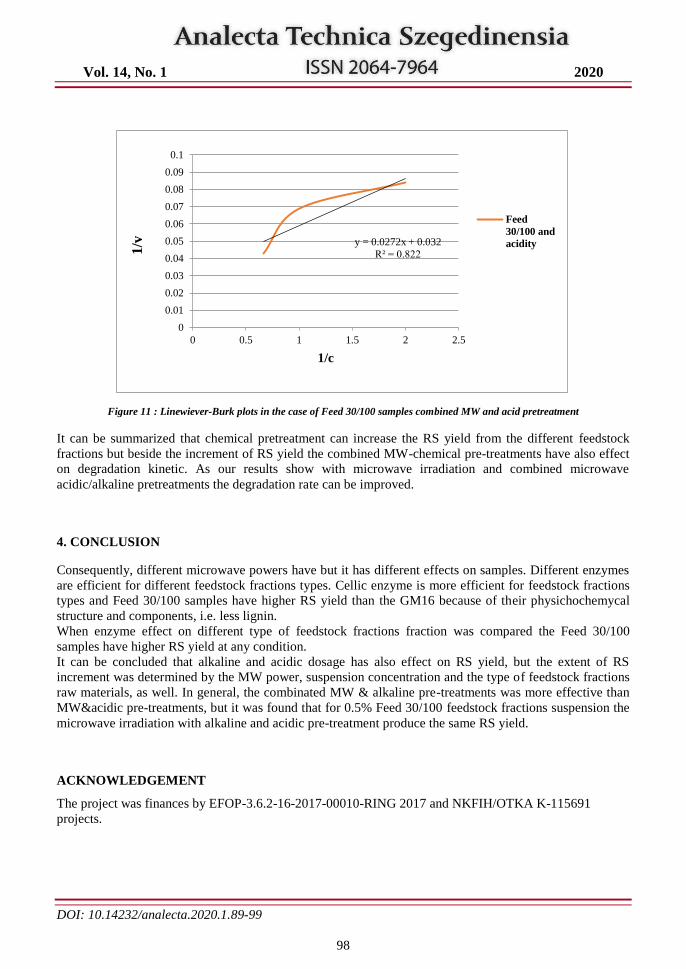
Vol. 14, No. 1 2020
DOI: 10.14232/analecta.2020.1.89-99
98
Figure 11 : Linewiever-Burk plots in the case of Feed 30/100 samples combined MW and acid pretreatment
It can be summarized that chemical pretreatment can increase the RS yield from the different feedstock
fractions but beside the increment of RS yield the combined MW-chemical pre-treatments have also effect
on degradation kinetic. As our results show with microwave irradiation and combined microwave
acidic/alkaline pretreatments the degradation rate can be improved.
4. CONCLUSION
Consequently, different microwave powers have but it has different effects on samples. Different enzymes
are efficient for different feedstock fractions types. Cellic enzyme is more efficient for feedstock fractions
types and Feed 30/100 samples have higher RS yield than the GM16 because of their physichochemycal
structure and components, i.e. less lignin.
When enzyme effect on different type of feedstock fractions fraction was compared the Feed 30/100
samples have higher RS yield at any condition.
It can be concluded that alkaline and acidic dosage has also effect on RS yield, but the extent of RS
increment was determined by the MW power, suspension concentration and the type of feedstock fractions
raw materials, as well. In general, the combinated MW & alkaline pre-treatments was more effective than
MW&acidic pre-treatments, but it was found that for 0.5% Feed 30/100 feedstock fractions suspension the
microwave irradiation with alkaline and acidic pre-treatment produce the same RS yield.
ACKNOWLEDGEMENT
The project was finances by EFOP-3.6.2-16-2017-00010-RING 2017 and NKFIH/OTKA K-115691
projects.
y = 0.0272x + 0.032
R² = 0.822
0
0.01
0.02
0.03
0.04
0.05
0.06
0.07
0.08
0.09
0.1
0 0.5 1 1.5 2 2.5
1/v
1/c
Feed
30/100 and
acidity
Vol. 14, No. 1 2020
DOI: 10.14232/analecta.2020.1.89-99
99
REFERENCES
[1] V. Balan, “Current Challenges in Commercially Producing Biofuels from Lignocellulosic Biomass”,
ISRN Biotechnology, 2014, 1-31, 2014.
[2] S. Ethaib, R. Omar, M. Mazlina, A. Radiah, S. Syafiie, and M. Y. Harun, “Effect of Microwave-
assisted Acid or Alkali Pretreatment on Sugar Release from Dragon Fruit Foliage”, International Food
Research Journal 23(Suppl): S149-S154, December 2016.
[3] J. Fan, M.D. Bruyn, Z. Zhu, V. Budarin, M. Gronnow, L.D. Gomez, J. Clark, “Microwave-enhanced
Formation of Glucose from Cellulosic Waste”, Chemical Engineering and Processing: Process
Intensification, 71, 37-42. doi:10.1016/j.cep.2013.01.004, 2013
[4] J. Xu, H. Chen, Z. Kádár, A.B. Thomsen, J.E.Schmidt, H. Peng , “Optimization of Microwave
Pretreatment on Wheat Straw for Ethanol Production”, Biomass and Bioenergy, 35(9), 3859-3864.
doi:10.1016/j.biombioe.2011.04.054, 2011.
[5] Somerville, C., Bauer, S., Brininstool, G., Facette, M., Hamann, T., Milne, J., Vorwerk, S. Toward a
systems approach to understanding plant cell walls. Science, 306(5705), 2206-2211, 2004.
[6] Z. Zhang, A. A. Donaldson, and X. Ma, “Advancements and Future Directions in Enzyme Technology
for Biomass Conversion,” Biotechnology Advances, vol. 30, no. 4, pp. 913–919, 2012.
[7] V. K. Gupta, C. P. Kubicek, J. Berrin, D. W. Wilson, M. Couturier, A.,Berlin, T. Ezeji, “Fungal
Enzymes for Bio-Products from Sustainable and Waste Biomass,” Trends in Biochemical Sciences,
41(7), 633-645. doi:10.1016/j.tibs.2016.04.006, 2016
[8] A. Nath, “Michaelis-Menten Kinetics and Briggs-Haldane Kinetics”, Departments of Medicinal
Chemistry and Pharmaceutics, University of Washington, December 2007, from
http://depts.washington.edu/wmatkins/kinetics/michaelis-menten.html
[9] N. Sturm, “Enzymes: Catalysis and Kinetics”, College of Medicine, University of Arizona, 2014, from
[10] K. Ahern, “Enzymes - Basic Concepts and Kinetics”, Oregon State University, 2012, from
http://oregonstate.edu/instruct/bb450/450material/lecture/enzymesoutline.html
[11] K. S. Başkan, E. Tütem, E. Akyüz, S. Özen, R. Apak, “Spectrophotometric Total Reducing Sugars
Assay Based on Cupric Reduction”, Talanta, 147, 162-168. doi:10.1016/j.talanta.2015.09.049, 2016.
[12] B. Lemmer; Z, Jákói ; S, Beszédes ; G, Keszthelyi-Szabó ; C, Hodúr (2017) Microwave enhanced
enzymatic hydrolysis of corncob residues In: Magó, László; Kurják, Zoltán; Szabó, István (szerk.)
“SYNERGY - Engineering, Agriculture and Green Industry Innovation” : ABSTRACTS of the V.
International Conference of CIGR Hungarian National Committee and the Szent István University,
Faculty of Mechanical Engineering and the XXXVIII. R&D Conference of Hungarian Academy of
Sciences, Committee of Agricultural and Biosystems Engineering, Gödöllő, Hungary, 16 – 19.
October 2017.
Vol. 14, No. 1 2020
DOI: 10.14232/analecta.2020.1.100-108
100
OVERVIEW OF THE HYBRID SOLAR SYSTEM
Mohammed Al-ktranee, Péter Bencs
University of Miskolc, Department of Fluid and Heat Engineering, Miskolc-Egyetemváros, HU-3515, Miskolc, Hungary
e-mail: [email protected] , e-mail: [email protected].
ABSTRACT
This paper investigates the uses of solar energy systems in various applications to define the most
appropriate system that has highly efficient and reliable. Most of the urban even rural areas that suffer from
lack of continuous power supplies it prefers to depend on hybrid systems like solar/wind systems,
solar/geothermal system, and solar/diesel-battery systems. Investigation indicates that hybrid systems could
meet the required loads in different proportions depending on the operating conditions and components of
the hybrid system compare with the separate system but has complexity regarding their components of the
system with the high initial cost. Moreover, utilize hybrid solar/thermal system is more sufficient than had
systems that mentioned as a result of the improvements at his parts to increase the overall efficiency by
using phase change material (PCM), nanofluid or a mix of PCM - nanofluid as cooling the photovoltaic
(PV) panel to keep the efficiency of the solar cells and increase thermal energy. Thus, hybrid solar/thermal
systems had proven effective to meet the required loads of electric energy and good capacity to provide
thermal energy simultaneously without toxic emissions with a negligible complexity of its components.
Keywords: Irradiation, Hybrid system, PCM, Nanofluid
1. INTRODUCTION
Growing of human population growth and the associated industrial revolution leads to increasing energy
demand constantly where fossil fuels are the main source of energy which causes by a huge of carbon
dioxide emissions due to electricity generation. Many feasibility studies have conducted to determine the
systems that work as environmental friendly systems (renewable energy systems) that has a long life
operation with high reliability and efficiency, these systems have selected as an alternative to fossil fuel
systems [1], adopting alternative energy sources as non-conventional sources such as wind energy,
hydropower, biogas, biomass energy and solar photovoltaic. As a reason for the increasing demand for
electricity, other causes like increasing global warming and fluctuate of oil price and gas emission [2], In
this context, utilize new environmental friendly systems that called hybrid system to be a viable alternative
for a single system where the hybrid system has a suitable ability to fulfill the energy demands of
consumers in isolated areas [3]. A hybrid system is a combination of two or more systems that depend on
energy sources to generate efficient power that could supply stable power. Many scientists found that
solar/geothermal system represents a suitable option for achieving a stable energy source because it has a
good feature allows to operate without emissions and work with steady-state. Converting the excess heat
energy gained from the sun during the day by units stored energy to use it during the night to meet the
required energy demands [4]. Hybrid solar/wind system is preferred especially at the rural area, where
there is no benefit could get from the grid supply due to rise the demand for electricity which lead to
heading toward the renewable. Feature of solar and wind energies is intermittent for this reason adopting
hybrid systems became a good feature to ensure the energy supply even with the absence of one of its
sources like sun or wind and thus, achieve the maximum capacity to benefit from it [5]. Combine
conventional with eco-friendly system represented by hybrid solar/diesel system that used as a solution for
areas that have to lack a grid system where select hybrid solar/diesel- battery system has a reliable with
suitable efficiency to supply the power without considerable interruption although it is a product of toxic
emissions [6], adopting on solar radiation as clean energy sources that use with a different type of the
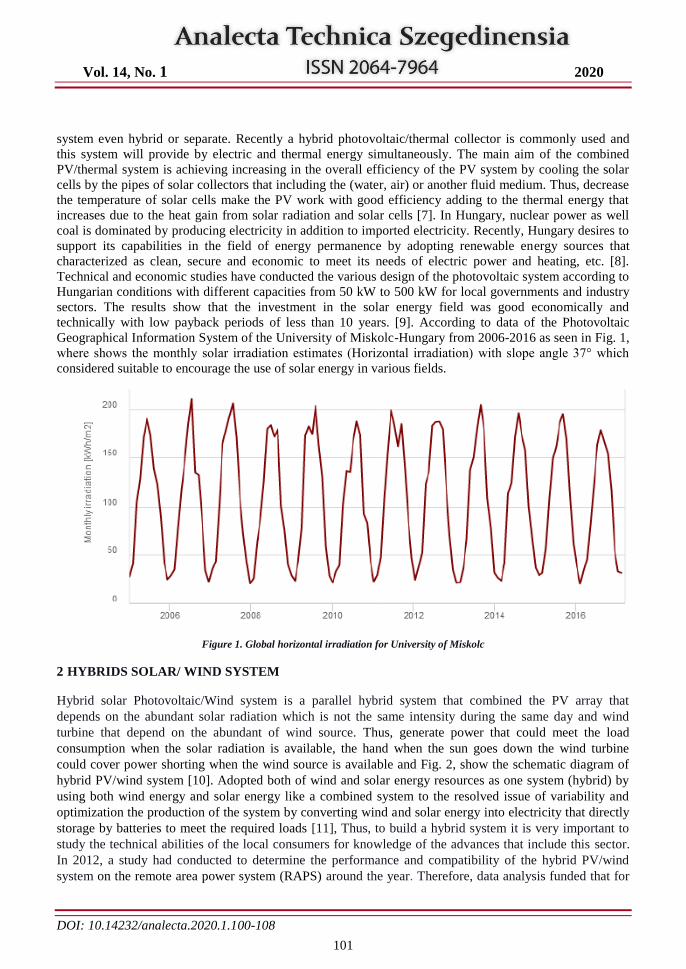
Vol. 14, No. 1 2020
DOI: 10.14232/analecta.2020.1.100-108
101
system even hybrid or separate. Recently a hybrid photovoltaic/thermal collector is commonly used and
this system will provide by electric and thermal energy simultaneously. The main aim of the combined
PV/thermal system is achieving increasing in the overall efficiency of the PV system by cooling the solar
cells by the pipes of solar collectors that including the (water, air) or another fluid medium. Thus, decrease
the temperature of solar cells make the PV work with good efficiency adding to the thermal energy that
increases due to the heat gain from solar radiation and solar cells [7]. In Hungary, nuclear power as well
coal is dominated by producing electricity in addition to imported electricity. Recently, Hungary desires to
support its capabilities in the field of energy permanence by adopting renewable energy sources that
characterized as clean, secure and economic to meet its needs of electric power and heating, etc. [8].
Technical and economic studies have conducted the various design of the photovoltaic system according to
Hungarian conditions with different capacities from 50 kW to 500 kW for local governments and industry
sectors. The results show that the investment in the solar energy field was good economically and
technically with low payback periods of less than 10 years. [9]. According to data of the Photovoltaic
Geographical Information System of the University of Miskolc-Hungary from 2006-2016 as seen in Fig. 1,
where shows the monthly solar irradiation estimates (Horizontal irradiation) with slope angle 37° which
considered suitable to encourage the use of solar energy in various fields.
Figure 1. Global horizontal irradiation for University of Miskolc
2 HYBRIDS SOLAR/ WIND SYSTEM
Hybrid solar Photovoltaic/Wind system is a parallel hybrid system that combined the PV array that
depends on the abundant solar radiation which is not the same intensity during the same day and wind
turbine that depend on the abundant of wind source. Thus, generate power that could meet the load
consumption when the solar radiation is available, the hand when the sun goes down the wind turbine
could cover power shorting when the wind source is available and Fig. 2, show the schematic diagram of
hybrid PV/wind system [10]. Adopted both of wind and solar energy resources as one system (hybrid) by
using both wind energy and solar energy like a combined system to the resolved issue of variability and
optimization the production of the system by converting wind and solar energy into electricity that directly
storage by batteries to meet the required loads [11], Thus, to build a hybrid system it is very important to
study the technical abilities of the local consumers for knowledge of the advances that include this sector.
In 2012, a study had conducted to determine the performance and compatibility of the hybrid PV/wind
system on the remote area power system (RAPS) around the year. Therefore, data analysis funded that for
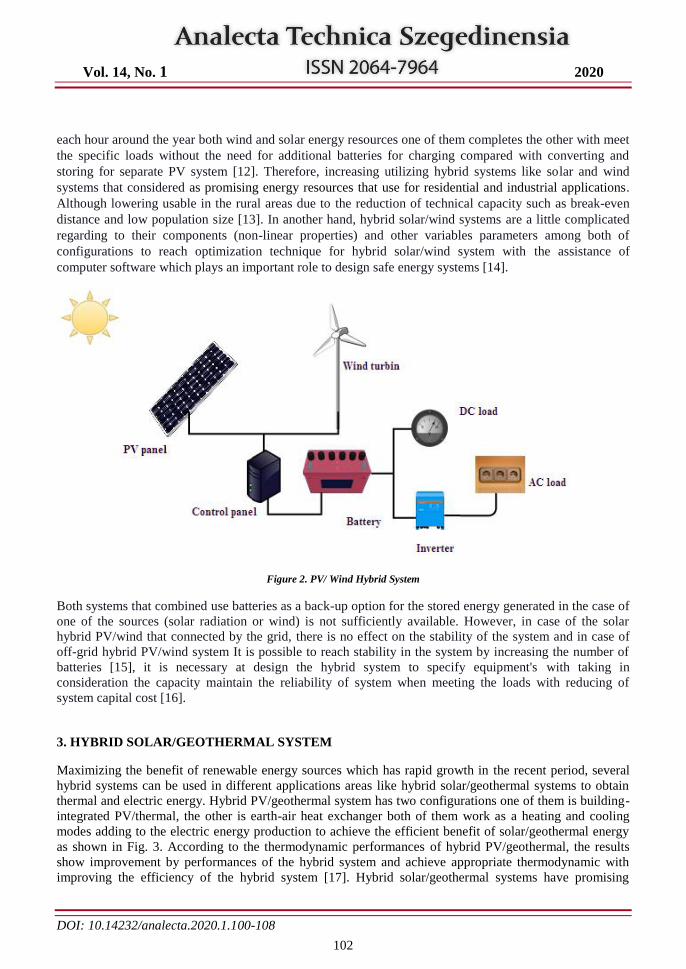
Vol. 14, No. 1 2020
DOI: 10.14232/analecta.2020.1.100-108
102
each hour around the year both wind and solar energy resources one of them completes the other with meet
the specific loads without the need for additional batteries for charging compared with converting and
storing for separate PV system [12]. Therefore, increasing utilizing hybrid systems like solar and wind
systems that considered as promising energy resources that use for residential and industrial applications.
Although lowering usable in the rural areas due to the reduction of technical capacity such as break-even
distance and low population size [13]. In another hand, hybrid solar/wind systems are a little complicated
regarding to their components (non-linear properties) and other variables parameters among both of
configurations to reach optimization technique for hybrid solar/wind system with the assistance of
computer software which plays an important role to design safe energy systems [14].
Figure 2. PV/ Wind Hybrid System
Both systems that combined use batteries as a back-up option for the stored energy generated in the case of
one of the sources (solar radiation or wind) is not sufficiently available. However, in case of the solar
hybrid PV/wind that connected by the grid, there is no effect on the stability of the system and in case of
off-grid hybrid PV/wind system It is possible to reach stability in the system by increasing the number of
batteries [15], it is necessary at design the hybrid system to specify equipment's with taking in
consideration the capacity maintain the reliability of system when meeting the loads with reducing of
system capital cost [16].
3. HYBRID SOLAR/GEOTHERMAL SYSTEM
Maximizing the benefit of renewable energy sources which has rapid growth in the recent period, several
hybrid systems can be used in different applications areas like hybrid solar/geothermal systems to obtain
thermal and electric energy. Hybrid PV/geothermal system has two configurations one of them is building-
integrated PV/thermal, the other is earth-air heat exchanger both of them work as a heating and cooling
modes adding to the electric energy production to achieve the efficient benefit of solar/geothermal energy
as shown in Fig. 3. According to the thermodynamic performances of hybrid PV/geothermal, the results
show improvement by performances of the hybrid system and achieve appropriate thermodynamic with
improving the efficiency of the hybrid system [17]. Hybrid solar/geothermal systems have promising
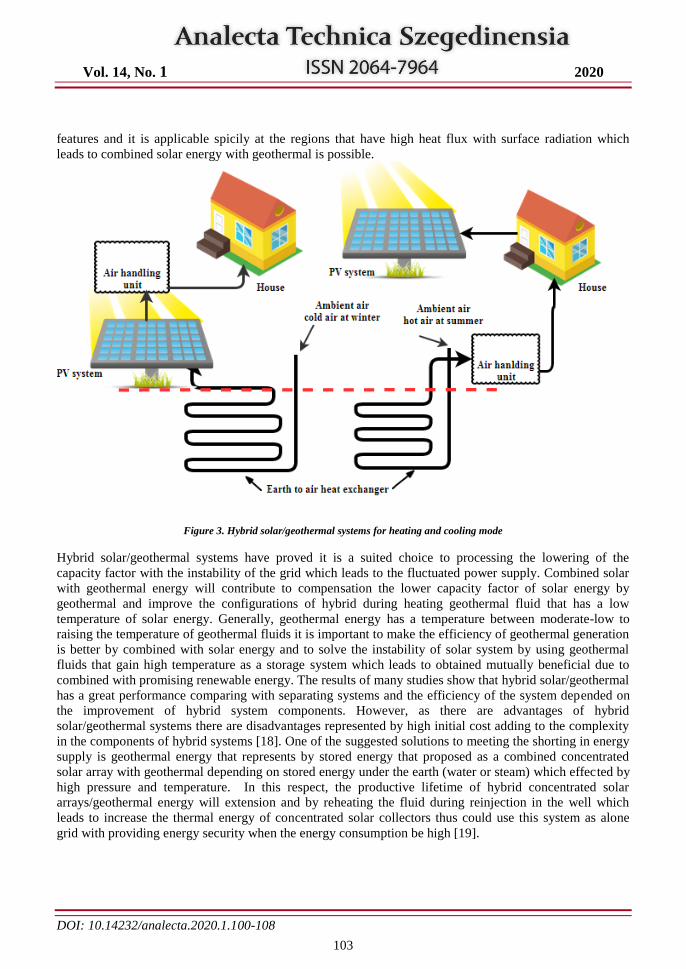
Vol. 14, No. 1 2020
DOI: 10.14232/analecta.2020.1.100-108
103
features and it is applicable spicily at the regions that have high heat flux with surface radiation which
leads to combined solar energy with geothermal is possible.
Figure 3. Hybrid solar/geothermal systems for heating and cooling mode
Hybrid solar/geothermal systems have proved it is a suited choice to processing the lowering of the
capacity factor with the instability of the grid which leads to the fluctuated power supply. Combined solar
with geothermal energy will contribute to compensation the lower capacity factor of solar energy by
geothermal and improve the configurations of hybrid during heating geothermal fluid that has a low
temperature of solar energy. Generally, geothermal energy has a temperature between moderate-low to
raising the temperature of geothermal fluids it is important to make the efficiency of geothermal generation
is better by combined with solar energy and to solve the instability of solar system by using geothermal
fluids that gain high temperature as a storage system which leads to obtained mutually beneficial due to
combined with promising renewable energy. The results of many studies show that hybrid solar/geothermal
has a great performance comparing with separating systems and the efficiency of the system depended on
the improvement of hybrid system components. However, as there are advantages of hybrid
solar/geothermal systems there are disadvantages represented by high initial cost adding to the complexity
in the components of hybrid systems [18]. One of the suggested solutions to meeting the shorting in energy
supply is geothermal energy that represents by stored energy that proposed as a combined concentrated
solar array with geothermal depending on stored energy under the earth (water or steam) which effected by
high pressure and temperature. In this respect, the productive lifetime of hybrid concentrated solar
arrays/geothermal energy will extension and by reheating the fluid during reinjection in the well which
leads to increase the thermal energy of concentrated solar collectors thus could use this system as alone
grid with providing energy security when the energy consumption be high [19].
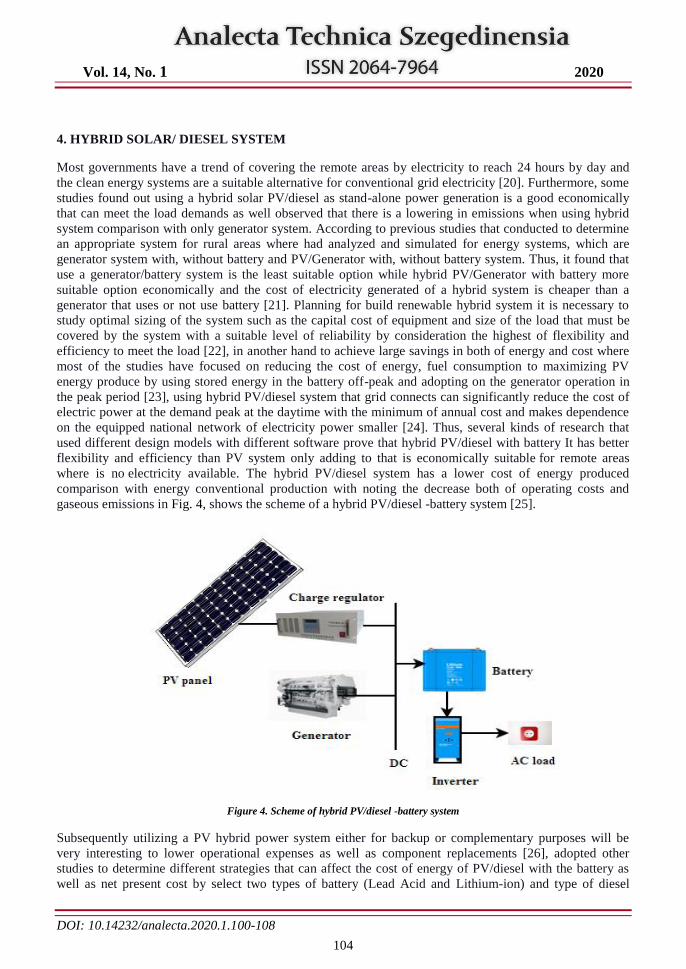
Vol. 14, No. 1 2020
DOI: 10.14232/analecta.2020.1.100-108
104
4. HYBRID SOLAR/ DIESEL SYSTEM
Most governments have a trend of covering the remote areas by electricity to reach 24 hours by day and
the clean energy systems are a suitable alternative for conventional grid electricity [20]. Furthermore, some
studies found out using a hybrid solar PV/diesel as stand-alone power generation is a good economically
that can meet the load demands as well observed that there is a lowering in emissions when using hybrid
system comparison with only generator system. According to previous studies that conducted to determine
an appropriate system for rural areas where had analyzed and simulated for energy systems, which are
generator system with, without battery and PV/Generator with, without battery system. Thus, it found that
use a generator/battery system is the least suitable option while hybrid PV/Generator with battery more
suitable option economically and the cost of electricity generated of a hybrid system is cheaper than a
generator that uses or not use battery [21]. Planning for build renewable hybrid system it is necessary to
study optimal sizing of the system such as the capital cost of equipment and size of the load that must be
covered by the system with a suitable level of reliability by consideration the highest of flexibility and
efficiency to meet the load [22], in another hand to achieve large savings in both of energy and cost where
most of the studies have focused on reducing the cost of energy, fuel consumption to maximizing PV
energy produce by using stored energy in the battery off-peak and adopting on the generator operation in
the peak period [23], using hybrid PV/diesel system that grid connects can significantly reduce the cost of
electric power at the demand peak at the daytime with the minimum of annual cost and makes dependence
on the equipped national network of electricity power smaller [24]. Thus, several kinds of research that
used different design models with different software prove that hybrid PV/diesel with battery It has better
flexibility and efficiency than PV system only adding to that is economically suitable for remote areas
where is no electricity available. The hybrid PV/diesel system has a lower cost of energy produced
comparison with energy conventional production with noting the decrease both of operating costs and
gaseous emissions in Fig. 4, shows the scheme of a hybrid PV/diesel -battery system [25].
Figure 4. Scheme of hybrid PV/diesel -battery system
Subsequently utilizing a PV hybrid power system either for backup or complementary purposes will be
very interesting to lower operational expenses as well as component replacements [26], adopted other
studies to determine different strategies that can affect the cost of energy of PV/diesel with the battery as
well as net present cost by select two types of battery (Lead Acid and Lithium-ion) and type of diesel
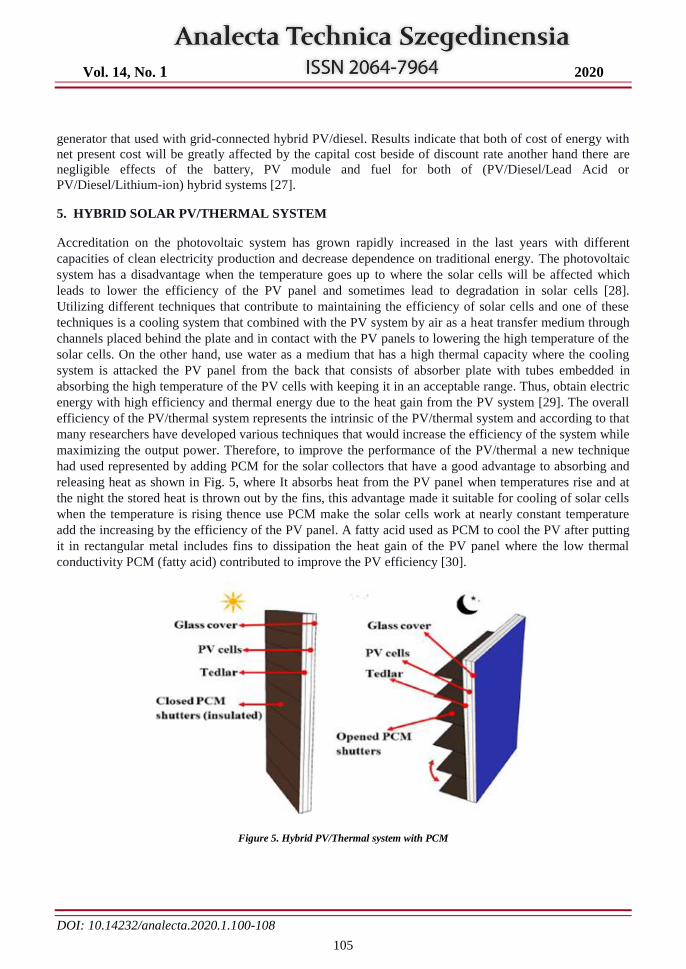
Vol. 14, No. 1 2020
DOI: 10.14232/analecta.2020.1.100-108
105
generator that used with grid-connected hybrid PV/diesel. Results indicate that both of cost of energy with
net present cost will be greatly affected by the capital cost beside of discount rate another hand there are
negligible effects of the battery, PV module and fuel for both of (PV/Diesel/Lead Acid or
PV/Diesel/Lithium-ion) hybrid systems [27].
5. HYBRID SOLAR PV/THERMAL SYSTEM
Accreditation on the photovoltaic system has grown rapidly increased in the last years with different
capacities of clean electricity production and decrease dependence on traditional energy. The photovoltaic
system has a disadvantage when the temperature goes up to where the solar cells will be affected which
leads to lower the efficiency of the PV panel and sometimes lead to degradation in solar cells [28].
Utilizing different techniques that contribute to maintaining the efficiency of solar cells and one of these
techniques is a cooling system that combined with the PV system by air as a heat transfer medium through
channels placed behind the plate and in contact with the PV panels to lowering the high temperature of the
solar cells. On the other hand, use water as a medium that has a high thermal capacity where the cooling
system is attacked the PV panel from the back that consists of absorber plate with tubes embedded in
absorbing the high temperature of the PV cells with keeping it in an acceptable range. Thus, obtain electric
energy with high efficiency and thermal energy due to the heat gain from the PV system [29]. The overall
efficiency of the PV/thermal system represents the intrinsic of the PV/thermal system and according to that
many researchers have developed various techniques that would increase the efficiency of the system while
maximizing the output power. Therefore, to improve the performance of the PV/thermal a new technique
had used represented by adding PCM for the solar collectors that have a good advantage to absorbing and
releasing heat as shown in Fig. 5, where It absorbs heat from the PV panel when temperatures rise and at
the night the stored heat is thrown out by the fins, this advantage made it suitable for cooling of solar cells
when the temperature is rising thence use PCM make the solar cells work at nearly constant temperature
add the increasing by the efficiency of the PV panel. A fatty acid used as PCM to cool the PV after putting
it in rectangular metal includes fins to dissipation the heat gain of the PV panel where the low thermal
conductivity PCM (fatty acid) contributed to improve the PV efficiency [30].
Figure 5. Hybrid PV/Thermal system with PCM
Vol. 14, No. 1 2020
DOI: 10.14232/analecta.2020.1.100-108
106
Different percentages of nanofluids had mixed with the fluid as a new technique with the PV as a heat
transfer agent that has a high thermal conductivity compare by base fluid and it is widely used in heat
exchangers as well the PV/T system [31]. The ability to integrate more than one technique that contributes
to increasing overall efficiency and improving system performance is meaningful. Mixing certain
percentage of nanofluid with PCM that aims to increase thermal conductivity where the PV module will
connection with heat storage tank in the backside of PV panel and the tank that include copper tubes that
will be filled by PCM-nanofluid that works to the absorbed high temperature of the PV panel thus the tank
will cool by recycling nanofluid by an external heat exchanger. Increase thermal efficiency of PV/thermal
respectively with electric energy and economy of the system which made it promising in the future [32].
6. CONCLUSION
Accreditation on various resources of renewable energy that could ensure energy supply sustainability by
meets the load demand continuously. Adoption of the solar energy systems that have efficiency with
reliability as an alternative resource of conventional energy contributes to reducing emission and
conventional energy. This paper seeks to identify the suited hybrid system t for general applications by
studying a different type of hybrid system. Adopting hybrid solar/wind could meet the required loads but it
has a little complicated regarding their components (non-linear properties) with the assistance of computer
software that has an important role to design safe energy systems. Using a hybrid solar/geothermal system
has great performance comparing with separation systems and efficiency depends on system components
which is complexity with the high initial cost. However, hybrid solar PV/Generator with battery more
suitable option economically that could meet the load demands for rural areas but it does not evacuate from
a certain value of toxic emissions result by using it with little effects of the battery. While Hybrid solar
PV/thermal system experiencing significant growth with improvements at his parts to increase the overall
efficiency of the system by use PCM, nanofluid or a mix of PCM-nanofluid as cooling the PV panel to
keep the efficiency of the solar cells and increase thermal energy. Utilizing a hybrid solar/thermal system
has proven effective to meet the required loads of electric energy and good capacity to provide thermal
energy simultaneously without toxic emissions with a little complicated component.
7. ACKNOWLEDGMENTS
The research was supported by the EFOP-3.6.1-16-00011 “Younger and Renewing University – Innovative
Knowledge City – institutional development of the University of Miskolc aiming at intelligent
specialization” project implemented in the framework of the Széchenyi 2020 program. The realization of
these two projects is supported by the European Union, co-financed by the European Social Fund.
REFERENCES
[1] Makbul A. M. Ramli, Ayong Hiendro, Ssennoga Twah, Economic analysis of PV/diesel hybrid system
with flywheel energy storage, Renewable Energy, 78 (2015) 398-405.
[2] Tripti Gupta and Swapnil Namekar, Harmonic Analysis and Suppression in Hybrid Wind & PVSolar
System. International Conference on Electrical, Electronics, doi.org/10.1063/1.5031987.
[3] Yashwant Sawle, S.C. Gupta and Aashish Kumar Bohre, PV-wind hybrid system, A review with case
study, Cogent Engineering, (2016) 3, 1189305. DOI: 10.1080/23311916.2016.1189305.
[4] K.H.M. Al-Hamed and I. Dincer, Investigation of a Concentrated Solar-Geothermal Integrated System
with a Combined Ejector-Absorption Refrigeration Cycle for a Small Community, International
Journal of Refrigeration, 106(2019)407–426.
[5] Rajesh Ka, D Kulkarnib, T.Ananthapadmanabha, Modeling and Simulation of Solar PV and DFIG
Based Wind Hybrid System, Procedia Technology, 21 ( 2015 ) 667 – 675.
Vol. 14, No. 1 2020
DOI: 10.14232/analecta.2020.1.100-108
107
[6] Miriam Madziga ID, Abdulla Rahil, IDand Riyadh Mansoor, Comparison between Three Off-Grid
Hybrid Systems (Solar Photovoltaic, Diesel Generator and BatteryStorage System) for Electrification
for GwakwaniVillage. South Africa, Environments, 2018 5-57.
[7] Mostafa M. Abd El-Samie, Xing Ju, Zheyang Zhang, Saadelnour Abdueljabbar Adam, XinyuPan,
Chao Xu: Three-dimensional numerical investigation of a hybrid low concentrated
photovoltaic/thermal system. Energy, doi: https://doi.org/10.1016/j.energy.2019.116436.
[8] Viktor Miklos Kiss, Zsolt Hetesi, Tibor Kiss, Issues and solutions relating to Hungary's electricity
system, Energy 116 (2016) 329-340.
[9] Henrik Zsiborács, Nóra Hegedűsné Baranyai, Szilvia Csányi, András Vincze and Gábor Pintér,
Economic Analysis of Grid-Connected PV System Regulations, A Hungarian Case Study, Electronics,
2019 8 149; doi:10.3390/electronics 8020149.
[10] Ritesh Dash, Pratik Ranjan Behera, Dr. S.M Ali, HYBRID SYSTEM FOR MEETING GLOBAL
ENERGY DEMAND WITH SOLAR PV AND WIND SYSTEM, 2014 International Conference on
Control, Instrumentation, (ICCICCT).
[11] Zahnd Alexa, Angel Clark, Wendy Cheung, Linda Zou, Prof. Jan Kleissl, Minimizing the Lead-Acid
Battery Bank Capacity through a Solar PV - Wind Turbine Hybrid System for a high-altitude village in
the Nepal Himalayas. Energy Procedia, 57 (2014 ) 1516 – 1525, USA.
[12] RIDS-Nepal, a Nepali, not for profit local NGO, www.rids-nepal.org, 28th 2016.
[13] Bawah, Addoweesh, Eltamaly, Comparative study of economic viability of rural electrification using
renewable energy resources versus diesel generator option in Saudi Arabia, J. Renew. Sustain. Energy
5 (4) 42701–427017, http://dx.doi.org/10.1063/1.4812646 2013.
[14] Connolly, Lund, Mathiesen, Leahy, 2010, A review of computer tools for analysing the integration of
renewable energy intovarious energy systems. Appl Energy 87 (4)1059–1082.
http://dx.doi.org/10.1016/j.apenergy.2009.09.026.
[15] Ritesh Dash, Pratik Ranjan Behera, Dr. S.M Ali, HYBRID SYSTEM FOR MEETING GLOBAL
ENERGY DEMAND WITH SOLAR PV AND WIND SYSTEM, 2014 International Conference on
Control ,Instrumentation (ICCICCT).
[16] Sasan Moghaddam, Mehdi Bigdeli, Majid Moradlou & Pierluigi Siano, Designing of stand-alone
hybrid PV/wind/battery system using improved crow search algorithm considering reliability index,
International Journal of Energy and Environmental Engineering, Springer,
https://doi.org/10.1007/s40095-019-00319. 2019.
[17] Masoud Afrand, Amin Shahsavar, Pouyan Talebizadeh Sardari, Kamaruzzaman Sopian, Hamzeh
Salehipour, Energy and exergy analysis of two novel hybrid solar photovoltaic geothermal energy
systems incorporating a building integrated photovoltaic thermal system and an earth air heat
exchanger system. Solar Energy 188 (2019) 83–95.
[18] SystemsKewen Li, Changwei Liu, Shanshan Jiang
and Youguang Chen, Review on Hybrid
Geothermal and Solar Power, Journal of Cleaner Production, (2019) Elsevier.
doi.org/10.1016/j.jclepro.2019.119481.
[19] Bonyadi, N, Johnson. E, Baker. D, Technoeconomic and exergy analysis of a solar geothermal hybrid
electric power plant using a novel combined cycle. Energy Convers. Manag, (2018.) 156 542–554.
https://doi.org/10.1016/j.enconman.2017.11.052.
[20] Abdu Muhaimin Mahmud, Richard E. Blanchard, Assessing a system performance analysis on 11
solar PV-diesel hybrid systems, IEEE 2016 4th International Conference on the Development in the in
Renewable Energy Technology, Dhaka, Bangladesh.
[21] Muyiwa S. Adaramola, Samuel S. Paul, OlanrewajuM, Oyewola, Assessment of decentralized hybrid
PV solar-diesel power system for applications in Northern part of Nigeria, Energy for Sustainable
Development, (2014).
Vol. 14, No. 1 2020
DOI: 10.14232/analecta.2020.1.100-108
108
[22] A. Yahiaouia, F. Fodhilb, K. Benmansoura, M. Tadjinec, N. Cheggagab, Grey wolf optimizer for
optimal design of hybrid renewable energy system PV-Diesel Generator-Battery, Application to the
case of Djanet city of Algeria, Solar Energy 158 (2017) 941–95.
[23] Sam M. Sichilalu, Xiaohua Xia, Optimal energy control of grid tied PV–diesel–battery hybrid system
powering heat pump water heater, South Africa, Solar Energy 115 (2015) 243–254.
[24] Takahiro Kushida, Rikiya Abe, Optimal design of a grid connected PV-diesel hybrid system, IEEE
2016 IEEE, 16th International Conference on Environment and Electrical Engineering.
[25] A. Yahiaoui, K. Benmansour, M. Tadjine, Control analysis and optimization of hybrid PV-Diesel-
Battery systems for isolated rural city in Algeria, Algeria, Solar Energy, 137 (2016) 1–10.
[26] Caroline Bastholm, Frank Fiedler, Techno-economic study of the impact of blackouts on the viability
of connecting an off-grid PV-diesel hybrid system in Tanzania to the national power grid, Sweden,
Energy Conversion and Management,171(2016) 647-658.
[27] Barun K. DAS, Forhad Zaman, Performance Analysis of a PV/Diesel Hybrid System for a Remote
Area in Bangladesh: Effects of Dispatch Strategies, Batteries, and Generator Selection. Energy,
(2018), doi: 10.1016/j, energy, 2018.12.014.
[28] Rasmus Luthander, Joakim Widén, Daniel Nilsson, Jenny Palm, Photovoltaic self-consumption in
buildings, A review, Applied Energy, 142 (2015) 80–94.
[29] Taher Maatallah, Richu Zachariah, Fahad Galla, Al-Amria, Exergo-economic analysis of a serpentine
flow type water based photovoltaic thermal system with phase change material (PVT-PCM/water),
Solar Energy, 193 (2019) 195–204.
[30] Hongtao Xu, Chenyu Zhang, Ning Wang, Zhiguo Qu, Shuanyang Zhang a, Experimental study on the
performance of a solar photovoltaic/thermal system combined with phase change material, china, Solar
Energy, 198 (2020) 202–211.
[31] Ali H A Al-Waeli, Miqdam T Chaichan, Hussein A Kazem, K. Sopian, Evaluation and analysis of
nanofluid and surfactant impact on photovoltaic-thermal systems, Case Studies in Thermal
Engineering, https://doi.org/10.1016/j.csite.2019.100392.
[34] Ali H. A. Al-Waeli, Hussein A. Kazem, Miqdam T. Chaichan, K. Sopian, Experimental investigation
of using nano-PCM/nanofluid on a photovoltaic thermal system (PVT). technical and economic study,
Thermal Science and Engineering Progress, doi: https://doi.org/10.1016/j.tsep.2019.04.002.
Vol. 14, No. 1 2020
DOI: 10.14232/analecta.2020.1.109-117
109
THE CORRELATIONS OF THE OF THE PARTICLE SIZE, CALORIFIC
VALUE, MOISTURE- AND ASH CONTENT OF WASTE DERIVED FUEL, AND
EXAMINATION OF ITS HEAVY METAL CONTENT
Csaba Leitol,
Alexandra Győrfi, Tibor Kiss
University of Pécs, Faculty of Engineering and Information Technology, Boszorkány u. 2. 7624 Pécs, Hungary,
e-mail: [email protected]
ABSTRACT
Significant development has taken place in the field of waste management recently in the preparation of the
energetic exploitation of recyclable, non-hazardous municipal solid waste. With mechanical-biological
waste treatment, 35-40% of the weight of this waste can be made appropriate for energetic exploitation,
mainly for co-incineration in cement factories and power plants.
The recoverability of waste derived fuel produced in mechanical-biological waste treatment plants highly
depends on the burning and combustion technological properties of the mixture, and on its compounds
influencing burning and different emissions. Waste recovery facilities do not take over fuel below a
specific calorific value and over a given heavy metal, halogen and pollutant content.
In our research we were looking for correlations in the particle size, calorific value, moisture-, ash- and
heavy metal content of waste derived fuel. On the basis of the measurement results, the connection
between the particle size fractions and the fuel properties can clearly be stated. The fractions of smaller
particle size have higher moisture-, ash- and heavy metal content, while the fractions of bigger particle size
have higher calorific value.
Keywords: mechanical-biological waste treatment plant, RDF, SRF, particle size, calorific value, ash content, heavy
metal content
1. INTRODUCTION
WDF (waste derived fuels) from non-hazardous waste, produced through mechanical-biological waste
treatment of mixed residual waste remaining from selective waste collection, are refuse derived fuel (RDF)
and solid recovered fuel (SRF).
According to the research report of Ecoprog, the amount of the RDF/SRF produced within the EU
(European Union) is continuously growing. By 2025, the expected mechanical biological treatment (MBT)
capacity will have reached 65 million tons. [1] 25 MBT facilities were established in Hungary between
2010 and 2015. In 2017 there were 31 MBT facilities, having an overall capacity of 1.65 million tons. [2]
RDF/SRF typically consists of plastic, paper, textile and other combustible materials [3]. It is characterized
by higher calorific value, more homogeneous physical-chemical composition, easier storage, handling and
transport, and lower pollutant emissions compared to the energetic exploitation of mixed municipal solid
waste (MSW). [4] The quality of waste derived fuel is generally characterized by homogeneity,
composition, energy efficiency, calorific value, moisture-, ash-, sulphur- and chlorine content and heavy
metals. [5] [6] Moisture content is a critical parameter that affects all other SRF quality-characteristics, but
mainly calorific value. [7] The removal of interfering substances or not combustible materials, such as
glass and inert matter, however, has a positive effect on calorific value. [8]
Fuel generated in the course of mechanical treatment is handed over for energetic exploitation through
incineration or gassing. Handling temperature shows significant difference between the two technologies.
Incineration takes place at 850-1000 °C, gassing at 1200-1400 °C. Heavy metals in the fuel undergo a
transformation in the process of incineration, and they get into the waste gas and ash generated in the
course of energetic exploitation. To ensure their safe and effective usage, appropriate disposal or treatment
procedures should be applied. [9] [10] [11]
Vol. 14, No. 1 2020
DOI: 10.14232/analecta.2020.1.109-117
110
In addition to the above-mentioned technologies, fuel is also used in cement factories for co-incineration
all around Europe, where incineration takes place at 1400 °C. In these cases, ash is incorporated in the
finished product, so it is of particular importance that the incorporating substance does not downgrade the
quality of the finished product. [3] [12]
In practice, the exploitation of RDF/SRF can take place in other various ways. The possible environmental
impact of residual-ash incorporated in roadbeds was examined, compared to dumping broadly considered
as the worst option. [13] To these alternative forms of utilization, it is also necessary to have a detailed
examination of the treated ash to know its chemical properties (metal content, pH), since it is often used in
the ground-level where migration and leak characteristics are also of great importance. [10] [14]
Test measurements were also made to bond metals in the fuel in chemical or physical form using added
substances in the course of utilization; but four out of the tested elements could not be bonded with any of
the substances, and they all got to the ash. [15] These properties are determined not just by the fuel
production technology, but also the composition and quality of the incoming material of the mechanical
treatment plays a significant role in it. [3] [16] Additives, coatings and alloys of packaging materials and
hazardous waste have the biggest effect on the heavy metal content. [17] [17] [19] One part of these wastes
is collected separately in an ideal case, but due to the residents they often get to municipal waste, and they
significantly affect the parameters of the generated fuel. [16]
In Hungary, several researches were done over the last few years to ensure a higher quality of waste
derived fuel. In Miskolc, experiments were carried out in the fields of developing fractions of high calorific
value, separating metals more efficiently and pelleting fuel. [20] Some other research teams examined the
composition of the incoming mixed residual waste at MBT, its particle size distribution, weight
distribution, composition ratio and calorific value. [21] [21] [23] [24] Also, the development and testing of
some combined separation equipment suitable for the increase of the efficiency of fuel production is in
progress. [25]
2. MATERIALS AND METHODS
In Pécs, mechanical-biological waste treatment procedures are applied for the non-hazardous mixed
municipal solid waste (MSW). The research was carried out in the mechanical-biological waste treatment
plant at the Regional Waste Management Centre of Pécs-Kökény, and we studied the waste-derived fuel
generated there.
From the residual, mixed MSW of SRF production, interfering substances are removed by manual pre-
selection and then the waste is shredded to particle size of less than 350 mm with the help of a pre-
shredder. The waste stream contains recyclable, combustible and inherently biodegradable components.
From the shredded stream of material, magnetic metal is detached, then the fraction of high biological
content is separated through a trommel with a mesh of 60 mm. From the upper fraction of the trommel
(>60 mm) magnetic and non-magnetic metal is separated by the eddy current separator. The remaining
stream of material goes through an air classifier that separates not combustible inert (stone, brick, concrete,
glass) and other heavy materials. The combustible stream of material is then transferred to the post
shredder where it is shredded to an average particle size of <60 mm. After shredding, a final magnetic
metal separation takes place, and RDF/SRF is placed in the buffer container or directly transported.
In our experiments, the freshly generated fuel was divided into five different particle size ranges: <10 mm,
10 mm – 20 mm, 20 mm – 30 mm, 30 mm – 40 mm, >40 mm. In the measurements the ranges were
examined separately. In each case, the measurement series was carried out on an original sample without
sifting. When selecting the research categories and parameters, we used the physical and chemical
parameters of Annex “A” of Standard EN 15359 as the basis. Among others moisture content, calorific
value, ash content and heavy metal content of 11 elements were examined.
Vol. 14, No. 1 2020
DOI: 10.14232/analecta.2020.1.109-117
111
2.1. Moisture content
The moisture content measurement was carried out by using the drying oven method. Representative
samples were taken from the separated particle size fractions and from the raw unsifted material (<60mm),
and the samples were dried to constant weight for 24 hours in a drying oven type POL-EKO-APARTURA
SLW 400 STD. Further measurements were taken on the dried samples obtained.
2.2. Calorific value
For measuring the calorific value, bomb calorimetry method was used. To ensure the representativeness of
the samples, the reduction of the particle size was needed. To improve the accuracy of measurement, the
samples chopped to particle size of <10 mm were measured after pelleting. The wet and dry calorific value
was calculated according to the requirements of the standard MSZ EN 15400:2011 using hydrogen
correction.
2.3. Ash content
The ash content measurement was carried out according to the standard MSZ EN 15403:2011 using muffle
furnace method. For the measurements the dried samples were chopped to an average particle size of <1
mm to ensure homogeneity, and they were put into a muffle furnace in heat-resistant ceramic cups. The
calcination of the samples took place in two steps with the parameters given in the standard: first at 250 °C
for 60 minutes, then at 550 °C for 120 minutes.
2.4. Heavy metal content
During the measurements, the heavy metal content of the fuel was determined by using the method of
inductively coupled plasma optical emission spectrometry (ICP-OES). The samples of waste derived fuel
were dried to constant weight (when its mass is constant) and chopped to an average particle size of 0.25
mm to ensure homogenisation. Through chemical degradation, 0.25 g sample was put into solution by
using ultra-pure chemicals. During the measurements, we derogated from the standards in so far as we not
only used hydrochloric acid (HCl) and nitric acid (HNO3) as reagents but also hydrogen peroxide (H2O2) so
that the oxidation of organic matter can take place easier. The mixture of the same chemicals was used at
the blind samples in order to get as accurate test results as possible. After degradation the aqueous
solutions were diluted, and ICP-OES measurements were done on these for the following 11 heavy metals:
antimony (Sb), arsenic (As), cadmium (Cd), chrome (Cr), cobalt (Co), copper (Cu), lead (Pb), manganese
(Mn), nickel (Ni), thallium (Tl), vanadium (V). The concentration found in the aqueous solution was then
calculated back referring to mg/kg dry SRF.
3. RESULTS AND DISCUSSION
3.1. Moisture content
Figure 1. shows the average result of the 49 samplings. The measurement results clearly indicate that the
moisture content is inversely proportional to the particle size. The moisture content of the fraction with the
smallest average particle size is twice as high as that of the fraction with the biggest average particle size,
because they contain high levels of biodegradable organic material. The original sample without sifting
showed similar quantities to the results of the sample with average particle size of 20-30 mm.
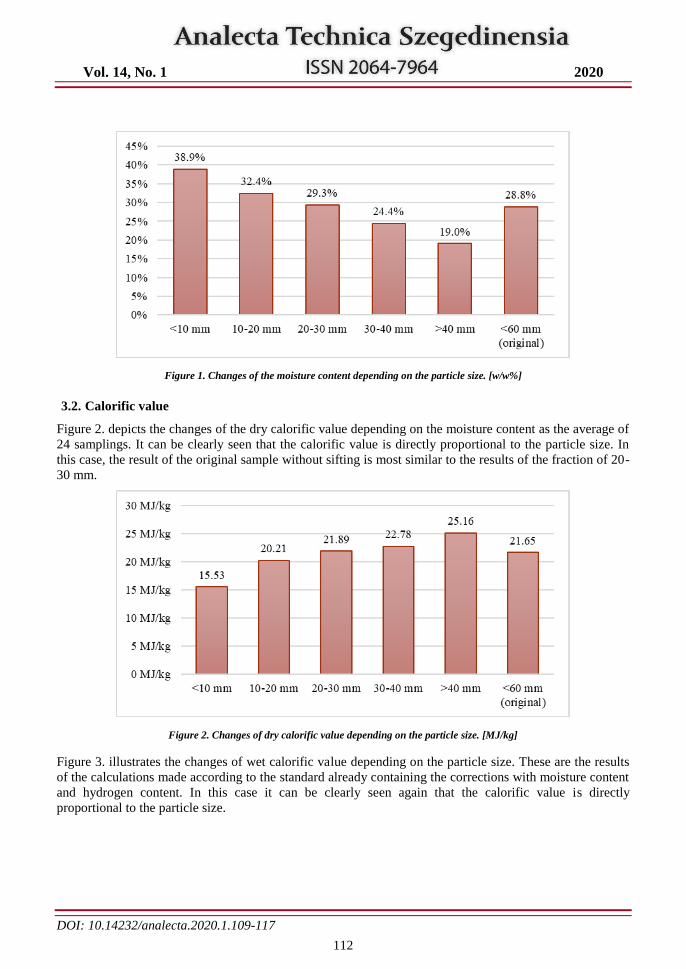
Vol. 14, No. 1 2020
DOI: 10.14232/analecta.2020.1.109-117
112
Figure 1. Changes of the moisture content depending on the particle size. [w/w%]
3.2. Calorific value
Figure 2. depicts the changes of the dry calorific value depending on the moisture content as the average of
24 samplings. It can be clearly seen that the calorific value is directly proportional to the particle size. In
this case, the result of the original sample without sifting is most similar to the results of the fraction of 20-
30 mm.
Figure 2. Changes of dry calorific value depending on the particle size. [MJ/kg]
Figure 3. illustrates the changes of wet calorific value depending on the particle size. These are the results
of the calculations made according to the standard already containing the corrections with moisture content
and hydrogen content. In this case it can be clearly seen again that the calorific value is directly
proportional to the particle size.
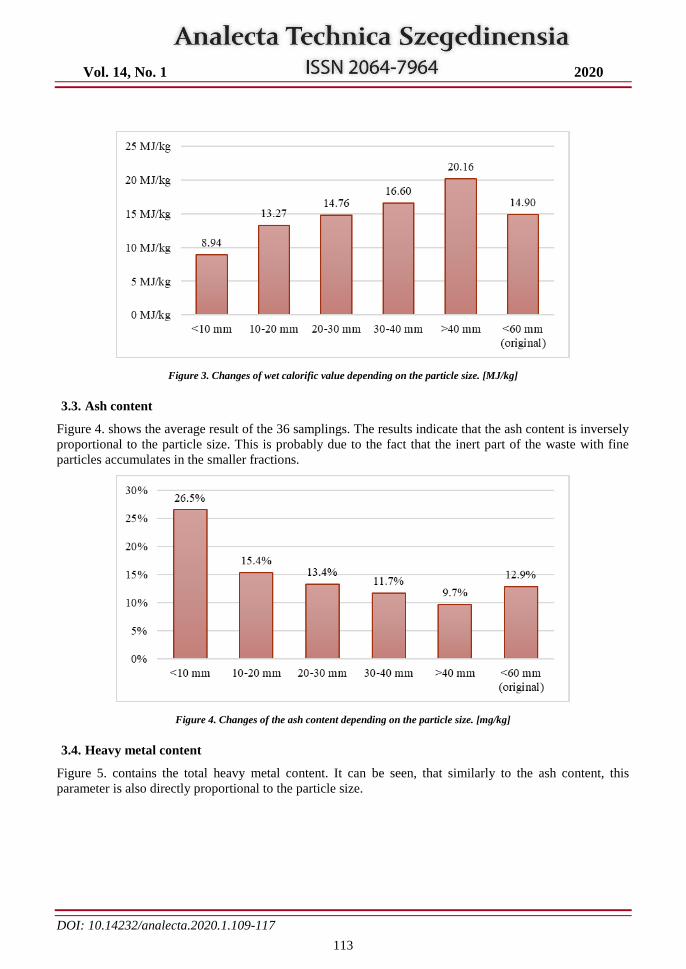
Vol. 14, No. 1 2020
DOI: 10.14232/analecta.2020.1.109-117
113
Figure 3. Changes of wet calorific value depending on the particle size. [MJ/kg]
3.3. Ash content
Figure 4. shows the average result of the 36 samplings. The results indicate that the ash content is inversely
proportional to the particle size. This is probably due to the fact that the inert part of the waste with fine
particles accumulates in the smaller fractions.
Figure 4. Changes of the ash content depending on the particle size. [mg/kg]
3.4. Heavy metal content
Figure 5. contains the total heavy metal content. It can be seen, that similarly to the ash content, this
parameter is also directly proportional to the particle size.
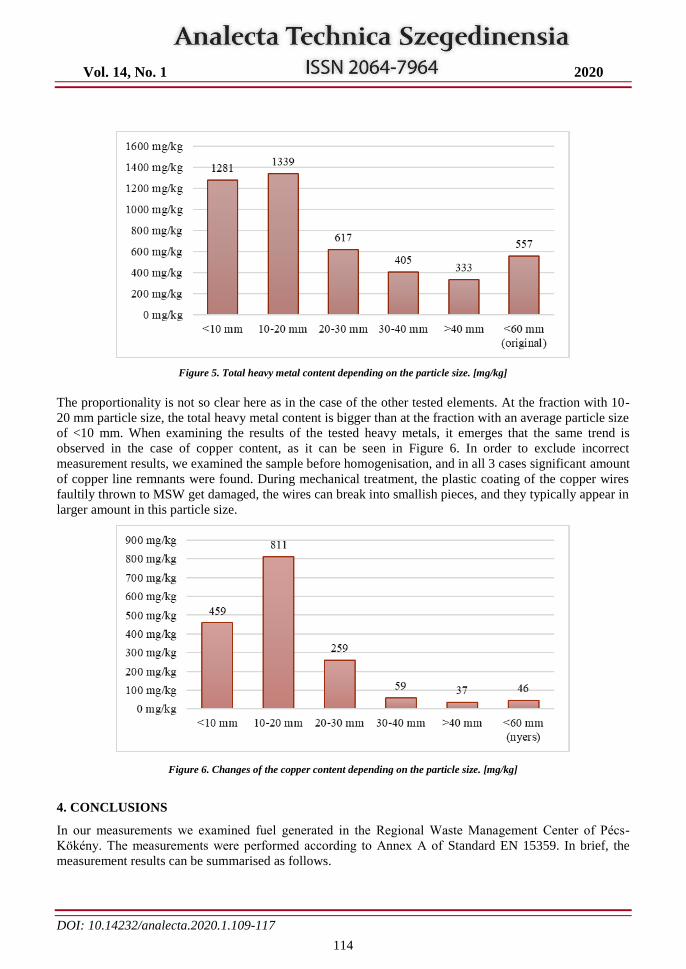
Vol. 14, No. 1 2020
DOI: 10.14232/analecta.2020.1.109-117
114
Figure 5. Total heavy metal content depending on the particle size. [mg/kg]
The proportionality is not so clear here as in the case of the other tested elements. At the fraction with 10-
20 mm particle size, the total heavy metal content is bigger than at the fraction with an average particle size
of <10 mm. When examining the results of the tested heavy metals, it emerges that the same trend is
observed in the case of copper content, as it can be seen in Figure 6. In order to exclude incorrect
measurement results, we examined the sample before homogenisation, and in all 3 cases significant amount
of copper line remnants were found. During mechanical treatment, the plastic coating of the copper wires
faultily thrown to MSW get damaged, the wires can break into smallish pieces, and they typically appear in
larger amount in this particle size.
Figure 6. Changes of the copper content depending on the particle size. [mg/kg]
4. CONCLUSIONS
In our measurements we examined fuel generated in the Regional Waste Management Center of Pécs-
Kökény. The measurements were performed according to Annex A of Standard EN 15359. In brief, the
measurement results can be summarised as follows.
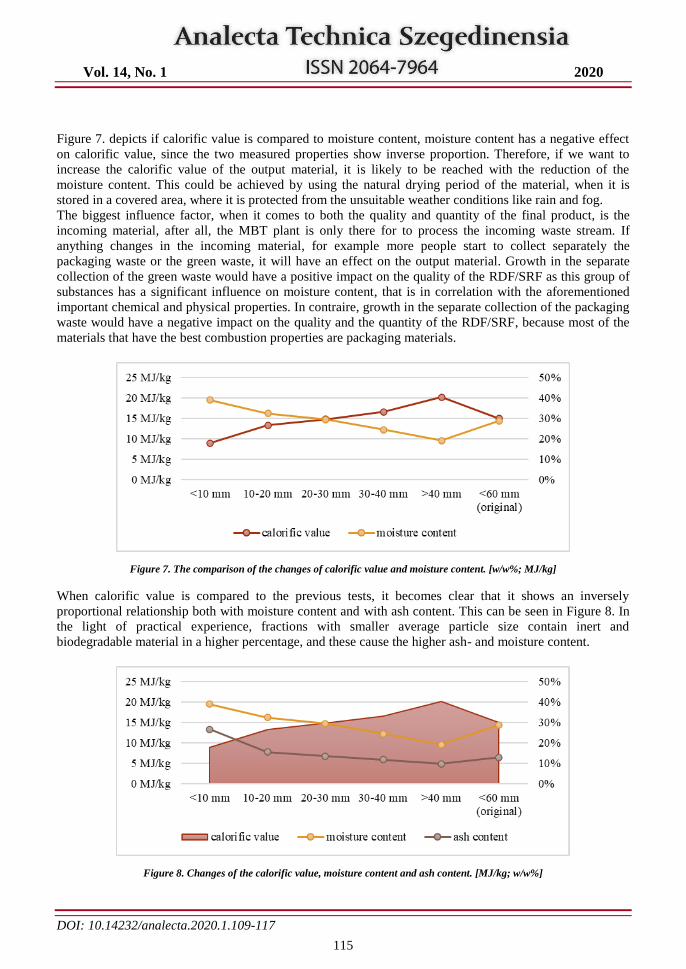
Vol. 14, No. 1 2020
DOI: 10.14232/analecta.2020.1.109-117
115
Figure 7. depicts if calorific value is compared to moisture content, moisture content has a negative effect
on calorific value, since the two measured properties show inverse proportion. Therefore, if we want to
increase the calorific value of the output material, it is likely to be reached with the reduction of the
moisture content. This could be achieved by using the natural drying period of the material, when it is
stored in a covered area, where it is protected from the unsuitable weather conditions like rain and fog.
The biggest influence factor, when it comes to both the quality and quantity of the final product, is the
incoming material, after all, the MBT plant is only there for to process the incoming waste stream. If
anything changes in the incoming material, for example more people start to collect separately the
packaging waste or the green waste, it will have an effect on the output material. Growth in the separate
collection of the green waste would have a positive impact on the quality of the RDF/SRF as this group of
substances has a significant influence on moisture content, that is in correlation with the aforementioned
important chemical and physical properties. In contraire, growth in the separate collection of the packaging
waste would have a negative impact on the quality and the quantity of the RDF/SRF, because most of the
materials that have the best combustion properties are packaging materials.
Figure 7. The comparison of the changes of calorific value and moisture content. [w/w%; MJ/kg]
When calorific value is compared to the previous tests, it becomes clear that it shows an inversely
proportional relationship both with moisture content and with ash content. This can be seen in Figure 8. In
the light of practical experience, fractions with smaller average particle size contain inert and
biodegradable material in a higher percentage, and these cause the higher ash- and moisture content.
Figure 8. Changes of the calorific value, moisture content and ash content. [MJ/kg; w/w%]
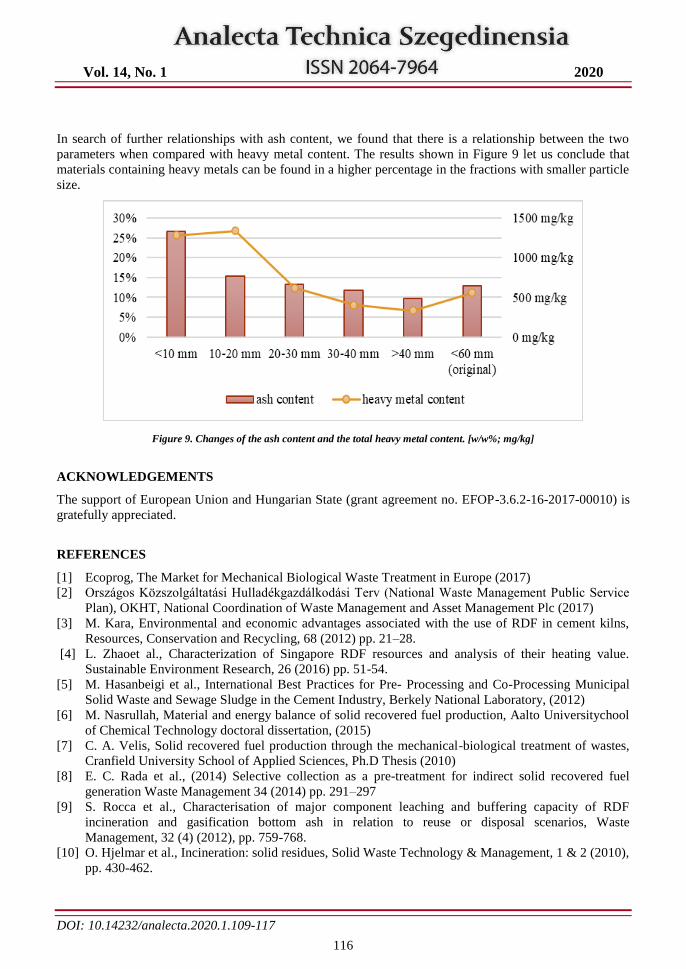
Vol. 14, No. 1 2020
DOI: 10.14232/analecta.2020.1.109-117
116
In search of further relationships with ash content, we found that there is a relationship between the two
parameters when compared with heavy metal content. The results shown in Figure 9 let us conclude that
materials containing heavy metals can be found in a higher percentage in the fractions with smaller particle
size.
Figure 9. Changes of the ash content and the total heavy metal content. [w/w%; mg/kg]
ACKNOWLEDGEMENTS
The support of European Union and Hungarian State (grant agreement no. EFOP-3.6.2-16-2017-00010) is
gratefully appreciated.
REFERENCES
[1] Ecoprog, The Market for Mechanical Biological Waste Treatment in Europe (2017)
[2] Országos Közszolgáltatási Hulladékgazdálkodási Terv (National Waste Management Public Service
Plan), OKHT, National Coordination of Waste Management and Asset Management Plc (2017)
[3] M. Kara, Environmental and economic advantages associated with the use of RDF in cement kilns,
Resources, Conservation and Recycling, 68 (2012) pp. 21–28.
[4] L. Zhaoet al., Characterization of Singapore RDF resources and analysis of their heating value.
Sustainable Environment Research, 26 (2016) pp. 51-54.
[5] M. Hasanbeigi et al., International Best Practices for Pre- Processing and Co-Processing Municipal
Solid Waste and Sewage Sludge in the Cement Industry, Berkely National Laboratory, (2012)
[6] M. Nasrullah, Material and energy balance of solid recovered fuel production, Aalto Universitychool
of Chemical Technology doctoral dissertation, (2015)
[7] C. A. Velis, Solid recovered fuel production through the mechanical-biological treatment of wastes,
Cranfield University School of Applied Sciences, Ph.D Thesis (2010)
[8] E. C. Rada et al., (2014) Selective collection as a pre-treatment for indirect solid recovered fuel
generation Waste Management 34 (2014) pp. 291–297
[9] S. Rocca et al., Characterisation of major component leaching and buffering capacity of RDF
incineration and gasification bottom ash in relation to reuse or disposal scenarios, Waste
Management, 32 (4) (2012), pp. 759-768.
[10] O. Hjelmar et al., Incineration: solid residues, Solid Waste Technology & Management, 1 & 2 (2010),
pp. 430-462.
Vol. 14, No. 1 2020
DOI: 10.14232/analecta.2020.1.109-117
117
[11] M. C. Samolada et al., Energetic valorisation of SRF in dedicated plants and cement kilns and
guidelines for application in Greece and Cyprus, Resources, Conservation and Recycling, 83 (2014)
pp. 34–43.
[12] Cs. Leitol et al., The correlations between the particle size, calorific value, moisture- and ash- content
of waste derived fuel, III. Sustainable Raw Materials Conference Book – proceedings, Sopron,
Hungary: University of Sopron, (2019) pp. 272-281.
[13] M. Di Gianfilippo et al., LCA of management strategies for RDF incineration and gasification bottom
ash based on experimental leaching data, Waste Management, 47 (B) (2016), pp. 285-298.
[14] R. Baciocchi et al., Accelerated carbonation of different size fractions of bottom ash from RDF
incineration, Waste Management, 30 (7) (2010), pp. 1310-1317.
[15] K. Jagodzinska et al., The impact of additives on the retention of heavy metals in the bottom ash
during RDF incineration, Energy, 183 (2019), pp. 854-868.
[16] A. Győrfi et al., Experimental study of the correlation between the particle size and heavy metal
content of waste derived fuel, III. Sustainable Raw Materials Conference Book – proceedings,
Sopron, Hungary: University of Sopron, (2019) pp. 301-306.
[17] V. Intrakamhaeng et al., Antimony mobility from E-waste plastic in simulated municipal solid waste
landfills, Chemosphere, 241, (2020) 125042.
[18] K. Ono, Past and future cadmium emissions from municipal solid-waste incinerators in Japan for the
assessment of cadmium control policy, Journal of Hazardous Materials, 262 (2013), pp. 741– 747.
[19] H. Zhang et al., Source Analysis of Heavy Metals and Arsenic in Organic Fractions of Municipal
Solid Waste in a Mega-City (Shanghai), Environmental Science & Technology, 42 (2008), pp. 1586-
1593.
[20] Nagy S. et al., Experimental Study of the Further Development of MBT Products of High Calorific
Value, Hulladék Online, (2012)
[21] A. Győrfi et al., Study of the correlation between the particle size and the moisture content of waste
derived fuel, II. Sustainable Raw Materials Conference Book - International Project Week and
Scientific Conference, Szeged, Hungary: University of Szeged, (2019) pp. 154-159.
[22] Cs. Leitol et al., Particle size analysis of waste derived fuel, the relation of individual particle size
fractions and calorific value, II. Sustainable Raw Materials Conference Book - International Project
Week and Scientific Conference, Szeged, Hungary: University of Szeged, (2019) pp. 160-167.
[23] J. Faitli et al., Detailed Sampling Protocol for the Analysis of Residual Municipal Solid Wastes,
Moustakas K., Loizidou M. (eds.) Proceedings of the 7th International Conference on Sustainable
Solid Waste Management. Herakleion, Greek: Hellenic Mediterranean University, Session XXIII.
(10) (2019) pp. 1-10.
[24] A. Sarkady et al., RDF, Refuse Derived Fuel, Possibilities in the North-Balaton Regional waste
management system, Pollack Periodica An International Journal for Engineering and Information
Sciences, 9 (2014) pp. 23–30.
[25] J. Faitli et al., Developing the combined magnetic, electric and air flow (KLME) separator for RMSW
Vol. 14, No. 1 2020
DOI: 10.14232/analecta.2020.1.118-129
118
CHALLENGES OF SUSTAINABLE FOOD TECHNOLOGY - A REVIEW
1Anita Tolnay,
2Arijit Nath,
2Andras Koris
1 Szent István University, Faculty of Economics and Social Sciences, Dept. of Quality Management, Páter Károly St. 1, H-2100 Gödöllő, Hungary
2 Szent István University, Faculty of Food Science, Dept. of Food Engineering, Ménesi St. 44, H-1118 Budapest, Hungary
e-mail: [email protected]
ABSTRACT
Over the last decades due to rapid development of human civilization along with revolution in technology,
some burning issues about generation of environmental contaminant, management of by-products from
technologies, high consumption of natural resources and conservation of natural resources have been
dramatically raised. Without any contradiction, impacts in overall ecosystem as well as human civilization
have negative effects. These evoked lots of scientific and industrial researches, and implemented several
stricter environmental legislations on the development of sustainable ecosystem. Thus, sustainability has
become an emerging topic all over the world, as evidenced by the growing body of scientific publications
in the last 20 years with one order of magnitude increase since the start of the new century. The study
attempts to perform a review of the sustainable development from the food industry’s perspective. At
present, the agro-food sector produces high amount of carbon dioxide, food waste, packaging waste,
wastewater, etc. and it is still consuming a lot of water, land, oxygen and energy. Furthermore, taken into
consideration the increasing number of the world’s population, there has been an enhancing interest
experienced towards sustainable development among food manufacturers in the last decades. The article
highlights the paramount areas of sustainable production, which offers new directions towards the
increasing number of human beings for the future survival. The paper also gives an overview of the main
perspectives contra constraints of sustainable food production, offers innovative food products from
sustainable food waste and by-product, and focuses on the growing importance of sustainable food
production in life cycle assessment methodology as well.
Keywords: Sustainable food technology, LCA method, Protein, Waste valorisation
1.INTRODUCTION
Social and economic importance of natural resources is unquestionable at all times from the aspect of
humanity. Economical management of resources against wasteful and careless utilization – which is able
to protect the decrease of biodiversity – became an essential topic on corporate, national, regional and
global levels. In the early periods of economics natural resources were considered as permissible goods
exposed unlimitedly to the society. Fig 1. summarizes the social and environmental aspects and economic
costs of emergent foods for evaluating long-term sustainability [1]. The accelerated pace of population growth and the intensified production and growing consumption in the
20th
century, increased the utilization of natural resources exponentially [2]. Concern about climate change
and scarcity of resources has brought environmental and sustainability issues into focus both on political
agenda and in the consciousness of the general public [3]. Sustainable development such as the decreasing
of the emission of greenhouse effect gases, protection of forests, saving and caring of biological diversity
and the management of energy resources should be in focus [4]. Sustainable development is a sort of
development which ensures the satisfaction of present generation’s demands without the threat of
endangering future generations’ chances to satisfy their demands [5].
Vol. 14, No. 1 2020
DOI: 10.14232/analecta.2020.1.118-129
119
2. MATERIALS AND METHODS
Most relevant scientific publication have been collected and used in the study, proceeding towards
scientific literature synthesis throughout the work as methodology. Furthermore examination of the set of
hypothesis discussed in the following chapter for the different topics in the article was carried out.
Hypothesis
Nulhypothesis are being set in the different chapters of the article to determine whether the following
statements are veridical or not concerning the context of the different areas in food production.
Hypothesis 1.
Waste minimalization and valorisation are significant methods in order to ensure sustainable food
production on an economic, environmental as well as social level.
H0= The statement is acceptable. Waste minimalization and valorisation are significantly applicable
methods for sustainable food production.
H1= These methods are not significant for sustainable food production according to some previous
researches.
Hypothesis 2.
Alternative protein sources are needed for future sustainability, other than animal-based protein sources
with negative impact on the environment.
Current research has been moving towards new directions of protein sources from animal-based through
plant-based to insect-based due to a more sustainable environment.
H0= The statement is true. The plant-based protein has a positive effect on environmental, as well as new
researches can be found as an additional protein source of insects for human.
H1= Animal-based protein source is sufficient for a long time for human nutrition.
Hypothesis 3.
There is an increasing need for laboratory measurements, to meet sustainability, safety and health
requirements in the field of food production, especially in protein analysis. Intensive growth in numbers of
private laboratories providing external measurements can be experienced in the market.
H0= There is a strong connection to be detected between laboratory measurements and safety as well as
health requirements in the food industry.
H1= There is no connection between laboratory research activities and safety requirements.
2.1. The perspectives and constraints of sustainable food production
The long-term prospects for sustainable food production are being questioned increasingly by resource and
policy analysts [6]. The world population is expanding rapidly and is likely to grow from 6 billion to 10
billion by 2050. It leads to exploitation of natural resources by greenhouse gas emissions, water
consumption and deforestation, contributing to world’s ecological insufficiency and climate change. There
is an urgent need for a change of global food and agriculture systems in order to sustainably increase food
production.
The food sector has been reported to utilize around 30% of the World’s total energy consumption and 22%
of total Greenhouse Gas emissions [7]. The water resources of our Earth are also reducing drastically, and
Vol. 14, No. 1 2020
DOI: 10.14232/analecta.2020.1.118-129
120
require us to restructure our diet. The amount of the needed water to produce 1 kg of food is 13000 l in
case of cattle; 5520 l in case of chicken; while only 50 l in case of peas or lentils [8]. So it leads to a
significant increase in the price of food of animal origin, which implies to significantly reduce the
proportion of these in our diet.
Food security, sustainable agriculture has limited availability of further water resources, arable land and
crop yields.
Especially in the developing countries, poor soil fertility, soil erosion and low level of mineral nutrient in
soil are major constraints contributing to food security, also the well-being of humans without harming the
environment [9]. Climatic change can ultimately threaten the long-term adequacy of food production
systems as well [10].
The conclusions are to maintain yield while protecting the environment, conserving natural resources and
the need for agricultural expansion and productivity growth are so important [11] [1] .
Plant nutrition research provides sustainable ways as main priorities to meet human needs for food.
Brklacich and co-workers [12] drew the attention that environmental degradation, competition for
resources, increasing food demands, and the integration of agriculture into the international economy
threaten the sustainability of many food production systems.
According to Hekstra and Liverman [10] the concept of sustainable food production technology systems
remains unclear, and recent attempts to appraise sustainability have been hampered by conceptual
inconsistencies and the absence of workable definitions. In their work six perspectives were introduced and
considered individually to underpin the concept, namely:
1. environmental accounting
2. sustained yield
3. carrying capacity
4. production unit viability
5. product supply and security
6. equity.
These perspectives provide a basis for proposing a comprehensive definition of sustainable food production
systems. Van der Goot [13] emphasized that the current way of producing food is not sustainable due to
inefficiencies in food production, increased use of products of animal origin, inefficient use of food
products once produced, and the current set-up of food process.
According to Jagustovica et al. [14] climate-smart-agriculture (CSA) is seen as a relevant solution for
tackling sustainable increases in food production. CSA integrates the social, economic and environmental
dimension of food production and aims to simultaneously achieve the triple goals of (a) ensuring food
security through a sustainable increase in productivity and income, (b) adapting to climate change and (c)
reducing greenhouse gas emissions. New technologies, as better alternatives than conventional methods,
improve quality attributes as well as shelf life, contribute to resource savings and also to decreasing energy
consumptions [15] [16]. According to Töpfl and co-workers [17] more than half of the population in
developed countries do not prefer highly processed foods and lean towards organic production and food
produced locally rather than obtain products from global food flows.
Fig.1. summarizes the social and environmental aspects and economic costs of emergent foods for
evaluating long-term sustainability.
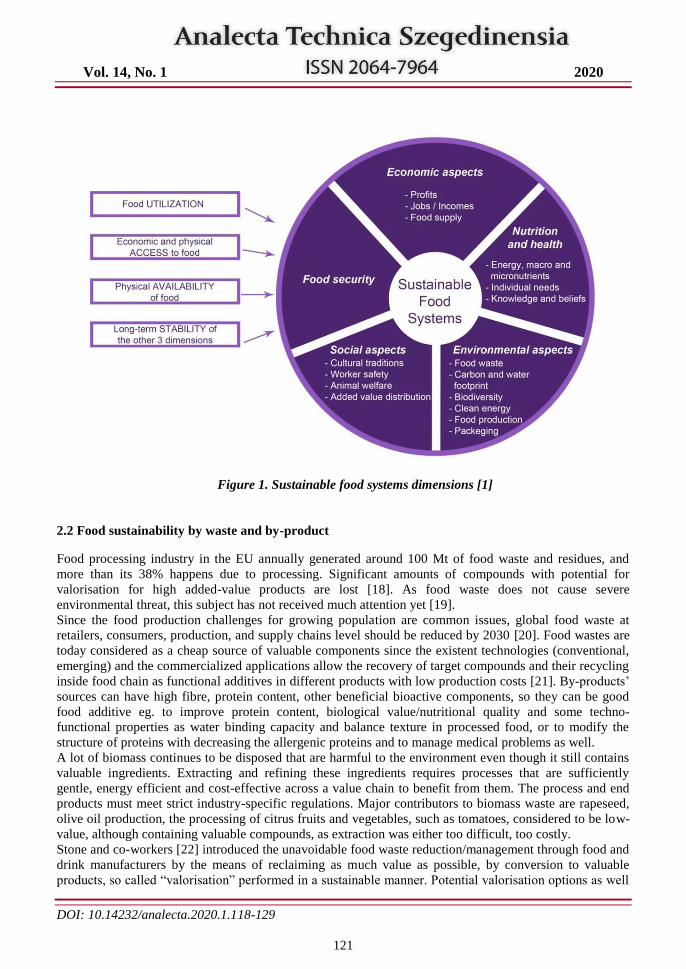
Vol. 14, No. 1 2020
DOI: 10.14232/analecta.2020.1.118-129
121
Figure 1. Sustainable food systems dimensions [1]
2.2 Food sustainability by waste and by-product
Food processing industry in the EU annually generated around 100 Mt of food waste and residues, and
more than its 38% happens due to processing. Significant amounts of compounds with potential for
valorisation for high added-value products are lost [18]. As food waste does not cause severe
environmental threat, this subject has not received much attention yet [19].
Since the food production challenges for growing population are common issues, global food waste at
retailers, consumers, production, and supply chains level should be reduced by 2030 [20]. Food wastes are
today considered as a cheap source of valuable components since the existent technologies (conventional,
emerging) and the commercialized applications allow the recovery of target compounds and their recycling
inside food chain as functional additives in different products with low production costs [21]. By-products’
sources can have high fibre, protein content, other beneficial bioactive components, so they can be good
food additive eg. to improve protein content, biological value/nutritional quality and some techno-
functional properties as water binding capacity and balance texture in processed food, or to modify the
structure of proteins with decreasing the allergenic proteins and to manage medical problems as well.
A lot of biomass continues to be disposed that are harmful to the environment even though it still contains
valuable ingredients. Extracting and refining these ingredients requires processes that are sufficiently
gentle, energy efficient and cost-effective across a value chain to benefit from them. The process and end
products must meet strict industry-specific regulations. Major contributors to biomass waste are rapeseed,
olive oil production, the processing of citrus fruits and vegetables, such as tomatoes, considered to be low-
value, although containing valuable compounds, as extraction was either too difficult, too costly.
Stone and co-workers [22] introduced the unavoidable food waste reduction/management through food and
drink manufacturers by the means of reclaiming as much value as possible, by conversion to valuable
products, so called “valorisation” performed in a sustainable manner. Potential valorisation options as well
Vol. 14, No. 1 2020
DOI: 10.14232/analecta.2020.1.118-129
122
as selecting appropriate indicators for environmental, social and economic performance are indentified,
using Cost-Benefit Analysis (CBA), Life Cycle Assessment (LCA), and Variation on Multi-Criteria
Decision Analysis (MCDA), respectively. The given results highlighted that overall valorisation strategy is
optimal for offering superior economic return, environmental performance as well as technological
readiness level.
Ekman et al. [3] examined the contingency of the transition to a bio-economy by the efficient utilisation of
biomass resources – e.g from wastes and by-products - with good environmental performance in bio-
refineries in order to generate extra value (energy, chemicals) [23].
Summarizing the highlighted articles and research works in this section, it can be clearly stated that
Hypothesis 1. is an acceptable as food waste reduction and by-product valorisation are significant methods
in sustainable food production.
2.3. Towards emergent food proteins
Finding solutions for sustainable food production is an increasingly pressing task nowadays. One possible
direction is to exploit the potential of non-conventional raw materials. The increasing demand for animal
protein cause serious concerns. Resources were needed to convert vegetable matter into animal-derived
proteins, such as meat or milk proteins. The adaptation of a more sustainable production of conventionally
used proteins and by that, starting to rebalance the contributions between animal and plant proteins, thus
contributing to the sustainability of food systems and to a more efficient distribution of high quality
proteins for the entire world population has a key role. Europe has a protein deficit that should be increased
by production of plant- rather than animal-based proteins as the latter leave a large carbon foot-print [17].
There has been an increasing demand for sustainable and alternative protein sources, such as vegetables
(beans, peas, broad beans, lentils, etc). According to Henchion et al. [24] there has been an increased
demand for animal-based protein in particular which was expected to have negative environmental impact,
generating greenhouse gas emissions, requiring more water and more land. Different vegetable protein
sources make a positive contribution to the environment and climate change. If the nitrogen-binding
properties of legumes are used differently, they require 30-70% less synthetic fertilizer, furthermore
increase soil strength and have a beneficial effect on soil. It is also known that due to nutrient
transformation losses, for the production of 1 kg of animal protein min. 6-16 times more hectares of arable
land are needed. In addition, the carbon footprint of the production of foods of animal origin, especially
beef-based food, is about 10- times that of plant-based foods. Henchion et al.’s research [25] emphasizes
the role of livestock as part of the solution to greenhouse gas emissions, and indicates that animal-based
protein has an important role as part of a sustainable diet and as a contributor to food security.
Plant-based foods have lower greenhouse gas emissions and tend to be less resource-intensive and
environmentally destructive than animal husbandry. In addition, vegetable proteins reduce the risk of
spreading diseases [26]. Besides plant-based protein source, there is greater focus on identifying less
expensive and less resource-intensive alternatives, including non-GMO options, which yield proteins
without the use of extensive heat, solvents and harmful chemicals.
It is worth to mention that other alternative protein sources nowdays in attention as sustainable protein
sources: single-cell proteins from microorganisms (microalgae, yeasts, filamentous fungi, bacteria),
seaweeds in saltwater, duckweed species on the freshwater surface and various insect species from
different stages of their development. The protein content of each source can vary significantly, depending
on the species and cultivation technology and nutrient supply. Novel proteins require the development of
new value chains, and attention to issues such as production costs, food safety, scalability and consumer
acceptance [24].
The European food consumption structure characterized by 59% of the daily protein intake is originated
from animal protein sources (meat, fish, milk) and only 41% is from plant-based proteins. More than 50%
of the latter is wheat protein, while the intake of legumes (including soy protein) is only 3%. As a result,
Vol. 14, No. 1 2020
DOI: 10.14232/analecta.2020.1.118-129
123
some cereals (wheat, corn, rice) may have become staple foods, leading to geographical homogeneity of
foods, dietary homogeneity, and nutritional imbalances, increasing micronutrient deficiencies, overweight,
and pathological obesity, as well as the risk of NCDs (Non-Communicable Diseases), including
cardiovascular disease, stroke, cancer, and diabetes [27].
Based on all this, it is becoming increasingly important to map and study plant and other alternative protein
sources that can contribute to meeting the protein needs of an increasing number of humanity and to
addressing their unbalanced nutritional status.
More recently, insects have been identified as an alternative source of protein for the Western world [28]
supported by the European Commission. Insects as food and feed are receiving much attention lately. The
academic interest of using insects as food or feed is exponentially increasing. This is exemplified by the
increasing numbers of scientific publications and private enterprises engaged in producing insect products
[28]. Significantly, they argue that insects do not compete for land, require less water and emit lower levels
of greenhouse gases and NH3 than regular livestock. They can be reared on organic side-streams thus
creating value from and reducing waste products [29]. Many insects also have a favourable nutritional
profile for humans, with most being highly digestible (77–98%), high in protein (crude protein 40–75% on
a dry weight basis) [30] and a good source of essential amino acids, high in vitamins B1, B2 and B3 and the
minerals iron and zinc [31].
On the basis of processed articles we can confirm that Hypothesis 2 H0 is accepted. Insects can be an
alternative source for humans in the future, with less environmental impact.
2.4. Evaluation sustainability for food processing technologies (LCA method)
There are several tools and methods for evaluating sustainability for food processing technologies in order
to source food ingredients produced by best practice, reducing food loss in the processing line. Meynard
and co-workers [32] offered that the improvement of technology in the food process is a possible option to
reduce sustainability footprint. Woodhouse and co-workers [33] introduced a tool of a qualitative
sustainability checklist, based on Life Cycle Assessment (LCA) theory. LCA is a standardized
methodology, the most recognised environmental assessment method, which allows quantifying the
environmental impacts of a product, a process or a service along its whole life cycle. The approach is
widely used for food production systems [34]. Woodhouse and co-workers’ article was a pioneer research
study from the aspect of using qualitative sustainability checklist for food processing development. Their
publication was structured to cover the three pillars of sustainability: environmental, social and economic,
all in a life cycle approach. Silva and Sanjuán [35] also highlighted the importance of applying LCA in
food processing. The authors attempted to examine - through case studies - the technological developments
from some methodological aspects in food processing. According to them, the improvement made in food
processing in the last decades, are under two axes: plurality (conventional technologies co-existing with
new alternatives) and sustainability (jointly with efficiency, quality and safety). LCA was recognised to be
a powerful method permitting the assessment of the environmental load of food products throughout their
entire life cycle, confirmed by a high number of scientific studies published. Silva and Sanjuán [35]
classified the examined LCA studies, in their systematic literature review of LCA in alternative food
processing technologies publication, into two main types of LCA, namely attributional and consequential.
While most of the LCA studies apply an attributional perspective (A-LCA), with reference to a steady state
of the internal flows of a specific production system, the consequential LCA (C-LCA) aims to evaluate the
environmental consequences of a decision, quantifying the indirect effects of the decision. According to
Huit [25] a life cycle assessment is a widely accepted method to quantify greenhouse gas (GHG)
emissions, and other environmental parameters, such as land or fossil energy use. Parameters are then
quantified along the entire life cycle of a product. This is called an attributional life cycle analysis. Insects-
based protein source determination, referring to section 2.3 is also using a life cycle analysis approach,
Vol. 14, No. 1 2020
DOI: 10.14232/analecta.2020.1.118-129
124
research revealed that mealworm had lower greenhouse gas emissions, and used less land and water than
common production animals [36] [37].
Another approach by Stone and co-workers [22] seeks to extend LCA principles of measuring the
environmental life cycle impact of a product to include impacts on people and prosperity, which brings
LCA in line with the Brundtland Report [1987]. The authors pointed out that there are several publications
in which LCA tenets had been applied to selection of food waste valorisation strategies, such as explore the
suitability of vegetable waste produced by food industry for use as animal feed.
2.5. Transition towards sustainability through information and communication technologies
Food sustainability transition refers to transformation processes to move towards sustainable food system
[38]. One of the most important ongoing transformation processes is digitalization. The authors explored
the contribution of information and communication technologies (ICTs) to transition towards sustainability
in food production by providing new ways of measuring impacts, communicating necessary changes and
connecting food chain actors. The role of ICTs in increasing system efficiency is a central theme and has
been used to improve resource efficiency and productivity in food systems.
2.6. Methodology in the laboratory field
2.6.1. The essential role of laboratory field in the support of food industry
Food laboratories have high responsibilities for ingredients compliance in analytical method process for
sustainable food products as well as the evaluation of the environmental impact might caused by the raw
material used in the production. Secchi et al. [39] review in their survey that R&D acitivities in the field of
food and pharmaceutical ingredients have been focusing on sustainable environmental development of the
final products. The study reveals that food and pharmaceutical ingredients producers’ activities have
significantly more environmental impacts than basic chemical production in a kilogram-per-kilogram basis.
2.6.2. Analytical laboratory instruments and measurements in food industry
ÉMI-TÜV SÜD has decades of analytical experience in the food industry. The services are in full
compliance with the requirements of the Hungarian National Food Standards – Codex Alimentarius
Hungaricus and the applicable legal regulations. The services are based on laboratory tests, which are
performed in a laboratory equipped with modern methods and instrumentation. The laboratory also acts as
the TÜV SÜD Group's competence center in Central and Eastern Europe. The experienced experts perform
the tests in a laboratory accredited according to the MSZ EN ISO / IEC 17025: 2005 standard.
Multinational food companies have their own research laboratories, while smaller companies from the
small and medium-sized enterprises sector (SME) either having smaller laboratories, not so well equipped,
with some basic, general laboratory devices, or outsourcing their analytical measurements to contract
laboratories. Several private as well as governmental research laboraties (in Hungary: Balint Analitika,
Wessling Hungary, part of the Wessling-Group, SGS Hungaria Kft. National Food Chain Safety Office
(NÉBIH) has an extensive laboratory network) are responsible for carrying out external contractual
measurements or executing research activities having less negative environmental impact, more safety for
humans, less damage to the environment, revealed by the authors through deep interviews carried out by
laboratory managers.
Laboratory measurements can be classified according to the type of examination:
chemical measurements;
physical tests
microbiology measurements;
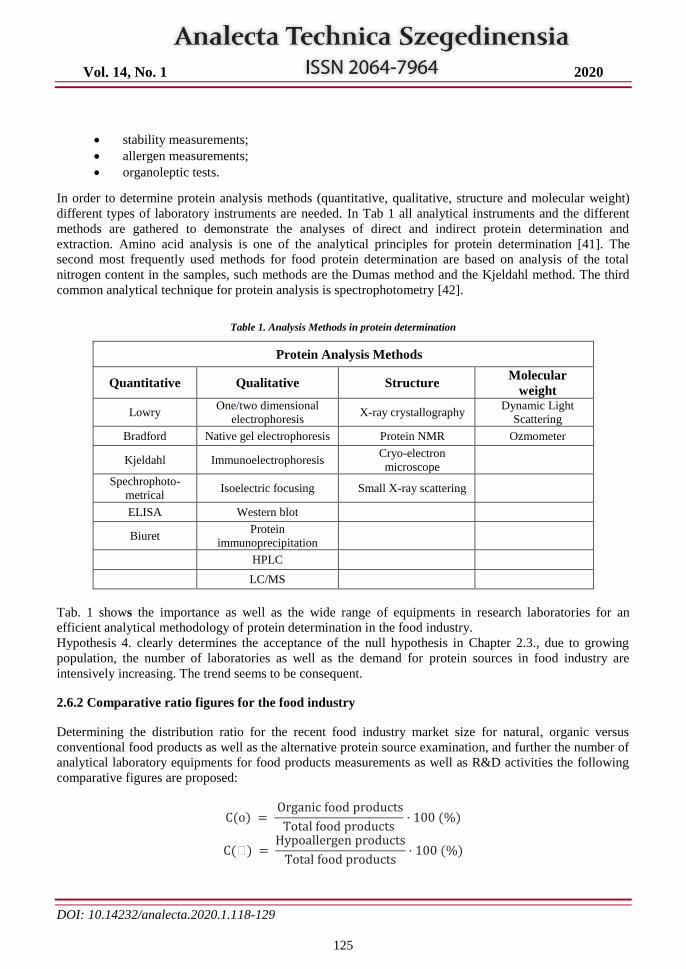
Vol. 14, No. 1 2020
DOI: 10.14232/analecta.2020.1.118-129
125
stability measurements;
allergen measurements;
organoleptic tests.
In order to determine protein analysis methods (quantitative, qualitative, structure and molecular weight)
different types of laboratory instruments are needed. In Tab 1 all analytical instruments and the different
methods are gathered to demonstrate the analyses of direct and indirect protein determination and
extraction. Amino acid analysis is one of the analytical principles for protein determination [41]. The
second most frequently used methods for food protein determination are based on analysis of the total
nitrogen content in the samples, such methods are the Dumas method and the Kjeldahl method. The third
common analytical technique for protein analysis is spectrophotometry [42].
Table 1. Analysis Methods in protein determination
Protein Analysis Methods
Quantitative Qualitative Structure Molecular
weight
Lowry One/two dimensional
electrophoresis X-ray crystallography
Dynamic Light
Scattering
Bradford Native gel electrophoresis Protein NMR Ozmometer
Kjeldahl Immunoelectrophoresis Cryo-electron
microscope
Spechrophoto-
metrical Isoelectric focusing Small X-ray scattering
ELISA Western blot
Biuret Protein
immunoprecipitation
HPLC
LC/MS
Tab. 1 shows the importance as well as the wide range of equipments in research laboratories for an
efficient analytical methodology of protein determination in the food industry.
Hypothesis 4. clearly determines the acceptance of the null hypothesis in Chapter 2.3., due to growing
population, the number of laboratories as well as the demand for protein sources in food industry are
intensively increasing. The trend seems to be consequent.
2.6.2 Comparative ratio figures for the food industry
Determining the distribution ratio for the recent food industry market size for natural, organic versus
conventional food products as well as the alternative protein source examination, and further the number of
analytical laboratory equipments for food products measurements as well as R&D activities the following
comparative figures are proposed:
C(o) = Organic food products
Total food products· 100 (%)
C(ℎ) = Hypoallergen products
Total food products· 100 (%)
Vol. 14, No. 1 2020
DOI: 10.14232/analecta.2020.1.118-129
126
C (o) and C(h) ratios define the market presence in percentage of organic and hypoallergen food products.
C(p, p) = Plant − based protein source
Total protein source· 100 (%)
C(p, i) = Insects − based protein source
Total protein source· 100 (%)
C (p,p) and C(p,i) ratios examine the alternative protein source possibilities for the fast growing world
population.
C(lab) = Laboratory equipments for food measurements
Total laboratory eqipments· 100 (%)
C(research) = R&Đ in food industry field
Total R&Đ· 100 (%)
C(lab) and C(research) ratios determine the growing importance of research activities in food industry by
the increasing number of laboratories, supporting the production of organic as well as food waste and by-
product in food production.
3. FUTURE OUTLOOK: AWARENESS AND SOLUTIONS Food systems need a radical transformation to become sustainable. Reviewing a great body of scientific
publications on food production sustainability contrasting different technologies, it can be determined that
the technological approach plays an important role in the challenge of seeking the environmental
sustainability of food processing [35]. There is an urgent need for a change of global food and agriculture
systems in order to sustainably increase food production, in view of today's 795 million hungry and the
additional 2 billion people expected by 2050 [43]. According to Jagustovica et al. [14] climate-smart-
agriculture (CSA) is seen as a relevant solution for tackling sustainable increases in food production. CSA
integrates the social, economic and environmental dimension of food production and aims to
simultaneously achieve the triple goals of
a) ensuring food security through a sustainable increase in productivity and income
b) adapting to climate change
c) reducing greenhouse gas emissions.
New technologies, as better alternatives than conventional methods, improve quality attributes as well as
shelf life, contribute to resource savings and also to decreasing energy consumptions [14] [16]. New
technologies do not always imply an environmental improvement and reducing the environmental impact
does not necessarily imply changing the technological base (which implicitly entails the need for large
capital investments [35]. El Bilali and Sadegh Allahyari [38] denoted that ICTs can contribute to food
sustainability transition by providing new ways of measuring impacts, communicating necessary changes
and connecting food chain actors. Actions in policy, science and innovation are necessary to encourage the
development of affordable, locally appropriate, and sustainable ICT infrastructure and applications.
Following examination and careful consideration of the set hypothesis the results give a clear indication on
the food industry trends concerning several aspects. The results of the set hypothesis show a reflection
towards problematic field of food market to be solved, such as carrying out complex survey on alternative
protein sources by the ever growing number of population, concerning sustainable environment as well as
human safety. The introduced comparative ratio figures for the food industry in Section 2.8.3 could be
appropriate for deeper investigation on the constitutions of food industry. Data collection is needed for
further examination.
Vol. 14, No. 1 2020
DOI: 10.14232/analecta.2020.1.118-129
127
3. CONCLUSION
Especially in the last century the intensive and uncontrolled food production caused serious damages in the
environment, but the processed publications in current work present many new endeavours concerning
food production towards sustainability taking into account the perspective of the three main indicators of
sustainability, such as economic, social and environmental. However, there are still much more
improvements as well as researches to be left for a more sustainable way of food production. Therefore
sustainable food industry deserves to get prime attention. The change has begun on both the producers and
consumers side although financial support and tender opportunities can be help of food manufacturers to
follow sustainability during production. There are also several new directions to be found in processing
waste food and by-product which leads to less environmental loading, as well as taking into consideration
the fast growing population, new approaches are found for alternative protein sources with less footprint,
such as insects-based sources. However this new sector is still in starting phrase, with new emerging
investment thrive by innovations [44]. As well, analytical laboratories play key role in regard of new
research technology for analytical methods in the food production procedure. The authors introduced the
range of laboratory instruments for protein analysis, which is one of the main research directions in the
food industry today. Yet, numerous studies show that each new research of organic components in food
industry towards sustainable production has to be evaluated from all aspects of any environmental, social
and economic impacts. Therefore, more complex laboratory researches must be carried out in the future in
order to assist sustainable food innovation on a higher level align with more sophisticated laboratory
equipments as well as developing new analytical methods on a wider scale in the food research.
REFERENCES
[1] Fasolin, L.H., Pereira, R.N., Pinheiro, A.C., Martins, J.T., Andrade, C.C.P., Ramos, O.L. & Vicente,
A.A. (2019): Emergent food proteins – Towards sustainability, health and innovation., Food Research
International, 125, 1-16.
[2] Bora, Gy. & Korompai, A. (2003): The economy and geography of natural resources, Aula Publisher,
Budapest
[3] Ekman, A., Campos, M., Lindahl, S., Co, M., Börjesson, P., Nordberg Karlsson, E. & Turner, C.
(2013): Bioresource utilisation by sustainable technologies in new valueadded biorefinery concepts -
two case studies from food and forestindustry., Journal of Cleaner Production, 57, 46-58.
[4] Szlávik, J. (2013): Sustainable economics (Fenntartható gazdálkodás), Wolters Kluwer Kiadó, Budapest
[5] Brundtland committee (1987): Report of the World Commission on Environment and Development.
Our Common Future, Annex to document A/42/427 - Development and International Cooperation:
Environment, United Nations.; https://sustainabledevelopment.un.org/content/documents/5987our-
common-future.pdf
[6] Brown, B., Hanson, M., Liverman, D. & Merideth, R. (1987): Global sustainability: toward definition,
Environmental Management 11 (6), 713-719.
[7]United Nations The Sustainable Development Goals Report (2018)
https://unstats.un.org/sdgs/files/report/2018/TheSustainableDevelopmentGoalsReport2018-EN.pdf
[8] NÉBIH (2016): https://portal.nebih.gov.hu/-/huvelyesek-nemzetkozi-eve-2016
[9] Cakmak, I. (2002): Plant nutrition research: Priorities to meet human needs for food in sustainable
ways., Plant and Soil,247, 3-24.
[10] Hekstra, G. & Liverman, D. (1986): Global food futures and desertification., Climate Change, 9 (1,2);
59-68.
[11] Gaffney, J., Bing, J.W., Byrne, P.F., Cassman, K.G., Ciampitti, I.A., Pierson Delmer, D., Habben,
J.E., Lafitte, H.R., Lidstrom, U.E., Porter, D., Sawyer, J.E., Schussler, J., Setter, T.L., Sharp R.E.,
Vol. 14, No. 1 2020
DOI: 10.14232/analecta.2020.1.118-129
128
Vyn T.J. & Warner, D. (2019): Science-based intensive agriculture: Sustainability, food security, and
the role of technology; Global Food Security, 23, 236-244.; (DOI:10.1016/j.gfs.2019.08.003)
[12] Brklacich, M., Bryant, C. & Smit, B. (1991): Forum: Review and Appraisal of Concept of Sustainable
Food Production Systems., Environmental Management (Springer-Verlag New York Inc.), 15 (1), 1-
14.
[13] Van der Goot, A.J. (2017): Directions towards more sustainable food production, Targeted
Technologies for Sustainable Food Systems: Outcomes from the EFFoST Annual Meeting Vienna,
Austria., Trends in Food Science & Technology, 62, 228-233.
http://dx.doi.org/10.1016/j.tifs.2017.01.006
[14] Jagustovića, R., Zougmoréb, R. B., Kesslera, A., Ritsemaa, C. J., Keesstraa S., Reynoldsca, M.,
(2019) Contribution of systems thinking and complex adaptive system attributes to sustainable food
production: Example from a climate-smart village, Agricultural Systems 171, pp.65-75
[15] Jermann, C., Koutchma, T., Margas, E., Leadley, C. & Ros-Polsk, V. (2015): Mapping trends in novel
emerging food processing technologies around the world. Innovat. Food Sci. Emerg. Technol., 31, 14-
27., https://doi.org/10.1016/j.ifset.2015.06.007.
[16] Knorr, D., Froehling, A., Jaeger, H., Reineke, K., Schlueter, O. & Schoessler, K. (2011): Emerging
technologies in food processing. Annu. Rev. food Sci. Technol., 2, 203-235.
[17] Töpfl, S., Smetana, K., Aganovic, C., Pernutz, L., Van Campenhout, A., Mathys, H., Katz, N.
Gianotten, V. Heinz (2016): Insects as a more sustainable source of feed and food proteins: modelling
supply chains through the lens of Life Cycle Assessment, Targeted Technologies for Sustainable Food
Systems: Outcomes from the EFFoST Annual Meeting Vienna, Austria., Trends in Food Science &
Technology, 62, 228-233.; http://dx.doi.org/10.1016/j.tifs.2017.01.006
[18]Horizon (2016): BIO BASED INDUSTRIES PPP, Call ID:H2020-BBI-JTI-2016
https://ec.europa.eu/info/funding-tenders/opportunities/portal/screen/opportunities/topic-details/bbi-
2016-f01
[19] Arcadis (2009): Assessment of the Options to Improve the Management of Bio-waste in the European
Union, Annex D: Industrial Biowaste. ARCADIS Project number – 11/004759, Version A. European
Commission DG Environment, Brussels, Belgium;
https://ec.europa.eu/environment/waste/compost/pdf/ia_biowaste%20-%20final%20report.pdf
[20] Yue, A.S., Munira, I.U., Hyderb, S., Nassanic, A.A., Moinuddin Qazi Abroc, M., Zamand, K. (2020):
Sustainable food production, forest biodiversity and mineral pricing: Interconnected global issues,;
Resources Policy, 65, 101583, 1-10.
[21] Galanakis, C.M. (2012). Recovery of high added-value components from food wastes: Conventional,
emerging technologies and commercialized applications. Trends in Food Science & Technology,
26(2), 68–87. (doi:10.1016/j.tifs.2012.03.003)
[22] Stone, J., Garcia-Garcia, G. & Rahimifard, S. (2019): Development of a pragmatic framework to help
food and drink manufacturers select the most sustainable food waste valorisation strategy, Journal of
Environmental Management, 247, 425-438. https://doi.org/10.1016/j.jenvman.2019.06.037
[23] Laufenber, G., Kunz, B. & Nystroem, M. (2003): Transformation of vegetable waste into value added
products; (A) the upgrading concept; (B) practical implementation., Bioresour. Technol., 87., 167-198.
[24] Henchion M., Hayes M, Mulle A.M., Fenelon M, Tiwari B. (2017) Future Protein Supply and
Demand: Strategies and Factors Influencing a Sustainable Equilibrium Journal of Insects as Food and
Feed, 6 (1)- Pages: 27 – 44, ISSN: 2352-4588
[25] Henchion, M.; De Backer, C.; Hudders, L. (2017) Ethical and sustainable aspects of meat production;
Consumer perceptions and system credibility. In Meat Quality Aspects: From Genes to Ethics;
Purslow, P., Ed.; Elsevier: Cambridge, MA, USA, 2017.
[26] Elzoghby, A.O., Samy, W.M. & Elgindy, N.A. (2012): Protein-based nanocarries as promosing drug
and gene delivery systems., Journal of Controlled Release, 161(1), 38-49.;
https://doi.org/10.1016/j.jconrel.2012.04.036
Vol. 14, No. 1 2020
DOI: 10.14232/analecta.2020.1.118-129
129
[27] Sudarshan R. Nadathur, Janitha P.D. Wanasundara and Laurie Scanlin (2016) Sustainable Protein
Sources, Academic Press, ISBN 978-0-12-802778-3, https://doi.org/10.1016/C2014- 0- 03542-3
[28] Van Huis, A.; Van Itterbeeck, J.; Klunder, H.; Mertens, E.; Halloran, A.; Muir, G.; Vantomme, P.
(2013) Edible Insects: Future Prospects for Food and Food; Food and Agriculture Organisation of the
United Nations: Rome, Italy
[29 Smetana, S.; Palanisamy, M.; Mathys, A.; Heinz, V. (2016) Sustainability of insect use for feed and
food: Life Cycle Assessment perspective. J. Clean. Prod., 137, 741–751. (Google Scholar)
[30] Klunder, H.C.; Wolkers-Rooijackers, J.C.M.; Korpela, J.M.; Nout, M.J.R. (2012) Microbiological
aspects of processing and storage of edible insects. Food Control, 26, 628–631.
[31] Belluco, S.; Losasso, C.; Maggioletti, M.; Alonzi, C.C.; Paoletti, M.G.; Ricci, A. (2013) Edible insects
in a food safety and nutritional perspective: A critical review. Compr. Rev. Food Sci. Food Saf., 12,
296–313.
[32] Meynard, J.M., Jeuffroy, M.H., Le Bail, M., Lefèvre, A., Magrini, M.B. & Michon, C. (2017):
Designing coupled innovations for the sustainability transition of agrifood systems., Agric.Syst., 157,
330–339.
[33] Woodhouse, A., Davis, J., Pénicaud, C. & Östergren, K. (2018): Sustainability checklist in support of
the design of food processing.; Sustainable Production and Consumption, 16, 110–120.;
https://doi.org/10.1016/j.spc.2018.06.008
[34] Roy, P., Nei, D., Orikasa, T., Xu, Q.Y., Okadome, H., Nakamura, N. & Shíina T. (2009) A review of
life cycle assessment (LCA) on some food products, J. Food Eng,.90., 1-10.
[35] Silva, V.L. & Sanjuán, N. (2019): Opening up the black box: A systematic literature review of life
cycle assessment in alternative food processing technologies., Journal of Food Engineering, 250, 33-
45.; https:/doi.org/10.1016/j.foodeng.201901.010
[36] Miglietta, P.P., Leo, F.D., Ruberti, M. and Massari, S., 2015. Mealworms for food: a water footprint
perspective. Water 7: 6190-6203
[37] Oonincx, D.G.A.B., Van Huis, A. and Van Loon, J.J.A.,(2015) Nutrient utilisation by black soldier
flies fed with chicken, pig, or cow manure. Journal of Insects as Food and Feed 1: 131-139.
https://doi.org/10.3920/JIFF2014.0023
[38] El Bilali, H. & Sadegh Allahyari, M. (2018): Transition towards sustainability in agriculture and food
systems: Role of information and communication technologies., Information processing in agriculture,
5, 456-464.; http://doi.org/10.1016/j.inpa.2018.06.006
[39] Secchi M., Collina E., Castellani V., Mirabelly N., 2017., Assessing eco-innovations in green: LCA of
a cosmetic product with a bio-based ingredient, Journal of Cleaner Production, April 2016, DOI:
10.1016/jclepro.2016.04.073
[40] Internet 1: https://www.emi-tuv.hu/elelmiszerek-laboratoriumi-vizsgalata-es-tanusitasa
[41] Mæhre, H.K, Dalheim, L, Edvinsen G.K, Elvevoll, E.O, Jensen, I-J. (2018) Protein Determination—
Method Matters Foods; 7(1): 5. doi: 10.3390/foods7010005
42] Bollag D.M, Rozycki M.D, Edelstein S.J (1996.) Protein Methods, 2 ed., Wiley Publishers. ISBN 0-
471-11837-0
[43] UN (2016) https://www.un.org/sustainabledevelopment
[44] A. van Hui (2019) Insects as food and feed, a new emerging agricultural sector: a review, Journal of
Insects as Food and Feed, 2020; 6(1): 27-44 Wageningen Academic Publishers, SPECIAL ISSUE:
Insects to feed the world
Vol. 14, No. 1 2020
DOI: 10.14232/analecta.2020.1.130-141
130
EFFECT OF SHORT TERM STORAGE ON WHEAT QUALITY PARAMETERS
Ernő Gyimes, Dóra Csercsics, Zoltán Magyar
University of Szeged, Faculty of Engineering, Department of Food Engineering, 6725 Moszkvai krt. 5-7., Szeged, Hungary
e-mail: [email protected]
ABSTRACT
Eleven samples of registered wheat varieties of bread with diverse technological qualities were used in this
study. The samples were devided into two groups. The first group including all the 11 variety were stored for 3
months, while the second group of the samples were stored for 9 months at an ambient temperature. The results
of quality evaluation showed that 5 soft wheat varieties (GK Csongrád, GK Garaboly, GK Hattyú, GK Holló,
GK Nap) and 6 hard wheat varieties (GK Ati, GK Békés, GK Élet, GK Kalász, GK Petúr, GK Verecke) were
involved in the study. Further, the flour yield, the gluten index and the water absorbance capacity has
significantly decreased after 9 months storage time when compared to 3 months storage interval.
Keywords: wheat quality, Hungarian wheat varieties, short term storage
1. INTRODUCTION
The wheat is the most valuable cereal. It is grown in 240-250 m acre all over the world [1], [2]. Cereal grains and
wheat in particular, are among the most important crops globally [3]. The quality of wheat is of primary
importance, since it determines the excellence of the products processed from it. The different consumption
habits do require diverse quality, and thus the quality behaviour must be permanent. To maintain this
permanency in biological system is far too difficult, since different conditions, i.e. the agricultural land use, the
wheather, etc. have all significant role in variance of quality factors. Körmöczi et al. genetically analysed the
wheat species, to improve further the crop quality and quantity [4]. Very important parameter of wheat kernel is
the hardness of the kernel. It determines the consumption and the parameters of the technology especially that
the hardness of the kernel changes as a result of debranning [5]. In Hungary wheat is usually not processed after
harvesting, but it is stored for short term. Storage in this sense is of primary importance, since its aim is to keep
the quality of the cereals.
There is a requirement to ensure the organoleptic quality of crops to ensure good commercial returns and safety
of the product [6]. Wheat produces different volatiles with changing storage time. Grain quality maintenance has
traditionally been the responsibility of grain storekeepers who rely on measurements of grain or its milled
products and on implicit knowledge gained through scientific results, common sense and job experience. The
wheat grist is changing during the storage [7]. The quality of the grain is significantly affected by the kernel
hardness already mentioned. In this way, wheat varieties can be classified into several groups [8]. It has a good
adaptability, and it has a lot of variety, and the demand of these varieties is widespread. The consumer demand is
high for cereals, since it is widely used in different food industry sectors such as the confectionary or the baking
industry. The wheat flour is an excellent base for bakery products and offers many new developments (for
example: fiber-enriched products) [9]. The wheat is good feedstock also, and these secondary products have high
value, due to the fact that wheat bran contains significant amount of protein, the wheat bran contains a lot of
protein. The straw is a good litter. [10], [11].
The storage of the cereals is a very complex task, because in this early stage it is an active material, it has not
reached the full ripening stage, but it can be infected by microorganisms, by insects or murine infection if nt
properly handled. To maintain grain quality during storage, grain must be protected from the growth and
reproduction of insects, mites and fungi [12], [13]. Young larvae of this species frequently feed on the germ of
whole kernels and on fine material in the grain [14]. So to the professional storage, we have to know the biology,
biochemical changes that may occur, and a state/of/art technology [15]. The tendency of the last time is to
increase the size of the silos intended for storage of the wheat. Lukow and White [16] studied the changes of the
milling and baking parameters of wheat produced in the USA. The storage of the wheat was also studied by
Wilcke et al [17] during a 15 months time interval at temperatures in the range of –4°C and 25°C, and air
humidity in the range of 28% and 73%.
The wheat after the harvest is live; the manifestation of it is the organic content biochemical transformation. It
depends of the moisture, the temperature, the health of the wheat, etc. The biochemical transformation causes
some end-product. The enzyme activity causes the fermentation, alcohol and organic acid formation.

Vol. 14, No. 1 2020
DOI: 10.14232/analecta.2020.1.130-141
131
Criterion of wheat quality:
Problem of the storage and processing, depend on the raw material, economic process
The end-product reference specific
The quality of the end-product, the appearance of the product, satisfy the consumer demand (generally and
specifically)
Hrušková and Machová [18] examined the sort term storage and its effect to the flour quality. The changes in the
moisture contents depended on the short time storage conditions and had a different time course in the individual
locations. Wet gluten content tended to decrease with time but the differences did not seem to be significant for
the flour quality.
The first aim of the storage is to keep the quality of the wheat [19], [20]. If the storage is safe, the wheat quality
will be well maintained e.g. physical, chemical state, technological behaviours, nutritive, hygiene [21]. The
quality of the wheat is determined by external and the internal component of the kernel. The internal component
is the protein, starch, lipid, cellulose, minerals, etc. content. The dough properties also depend on the hardness of
the wheat as published by Szabo [22]. The environmental effects determine the cultural plant quality, although
the composition of wheat is determined by a genetic factor.
2. MATERIALS AND METHODS
In this study our aim was to investigate the short term storage on the wheat quality including 11 varieties.
2.1. Materials
Eleven different registered wheat varieties of bread with diverse technological qualities were used in this study.
The samples were provided by the Cereal Research NPC, Szeged, in Hungary, and included the following
varieties:
GK Garaboly
GK Békés
GK Kalász
GK Verecke
GK Holló
GK Ati
GK Petur
GK Nap
GK Élet
GK Csongrád
GK Hattyú
The samples were harvested in two different seasons (Bem. 2. and Bem. 3.). The weather parameters was
different in the harvest time. The samples of the 11 varieties were devided into two parts, the first part was stored
for 3 months and examined afterwards (autumn research). The second part was stored for 9 months. The
temperature of storage in both case was an ambient temperature.
2.2. Methods
Hardness index: Wast to test using Perten SKCS 4100 (Perten Instruments, Sprinfield, Illinois, USA). This
machine reports the average force for crushing 300 kernels, in terms of a hardness index (HI).
Milling test: Brabender ® Quadrumat ® Senior (Brabender GmbH & Co. KG, Duisburg, Germany) laboratory
mill was used to determine the milling properties and the flour yield of the different types of wheat.
Ash content: According to AACC methods using OH63 (Labor-MIM Budapest, Hungary) equipment
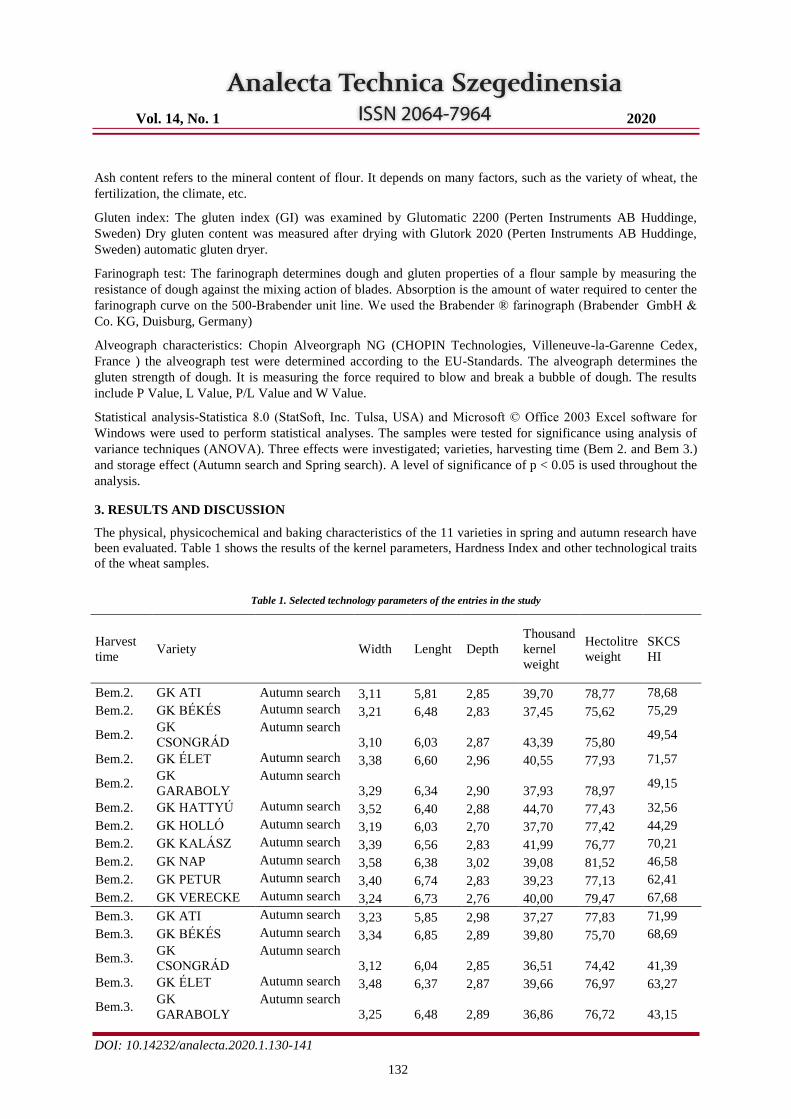
Vol. 14, No. 1 2020
DOI: 10.14232/analecta.2020.1.130-141
132
Ash content refers to the mineral content of flour. It depends on many factors, such as the variety of wheat, the
fertilization, the climate, etc.
Gluten index: The gluten index (GI) was examined by Glutomatic 2200 (Perten Instruments AB Huddinge,
Sweden) Dry gluten content was measured after drying with Glutork 2020 (Perten Instruments AB Huddinge,
Sweden) automatic gluten dryer.
Farinograph test: The farinograph determines dough and gluten properties of a flour sample by measuring the
resistance of dough against the mixing action of blades. Absorption is the amount of water required to center the
farinograph curve on the 500-Brabender unit line. We used the Brabender ® farinograph (Brabender GmbH &
Co. KG, Duisburg, Germany)
Alveograph characteristics: Chopin Alveorgraph NG (CHOPIN Technologies, Villeneuve-la-Garenne Cedex,
France ) the alveograph test were determined according to the EU-Standards. The alveograph determines the
gluten strength of dough. It is measuring the force required to blow and break a bubble of dough. The results
include P Value, L Value, P/L Value and W Value.
Statistical analysis-Statistica 8.0 (StatSoft, Inc. Tulsa, USA) and Microsoft © Office 2003 Excel software for
Windows were used to perform statistical analyses. The samples were tested for significance using analysis of
variance techniques (ANOVA). Three effects were investigated; varieties, harvesting time (Bem 2. and Bem 3.)
and storage effect (Autumn search and Spring search). A level of significance of p < 0.05 is used throughout the
analysis.
3. RESULTS AND DISCUSSION
The physical, physicochemical and baking characteristics of the 11 varieties in spring and autumn research have
been evaluated. Table 1 shows the results of the kernel parameters, Hardness Index and other technological traits
of the wheat samples.
Table 1. Selected technology parameters of the entries in the study
Harvest
time Variety Width Lenght Depth
Thousand
kernel
weight
Hectolitre
weight
SKCS
HI
Bem.2. GK ATI Autumn search 3,11 5,81 2,85 39,70 78,77 78,68
Bem.2. GK BÉKÉS Autumn search 3,21 6,48 2,83 37,45 75,62 75,29
Bem.2. GK
CSONGRÁD
Autumn search
3,10 6,03 2,87 43,39 75,80 49,54
Bem.2. GK ÉLET Autumn search 3,38 6,60 2,96 40,55 77,93 71,57
Bem.2. GK
GARABOLY
Autumn search
3,29 6,34 2,90 37,93 78,97 49,15
Bem.2. GK HATTYÚ Autumn search 3,52 6,40 2,88 44,70 77,43 32,56
Bem.2. GK HOLLÓ Autumn search 3,19 6,03 2,70 37,70 77,42 44,29
Bem.2. GK KALÁSZ Autumn search 3,39 6,56 2,83 41,99 76,77 70,21
Bem.2. GK NAP Autumn search 3,58 6,38 3,02 39,08 81,52 46,58
Bem.2. GK PETUR Autumn search 3,40 6,74 2,83 39,23 77,13 62,41
Bem.2. GK VERECKE Autumn search 3,24 6,73 2,76 40,00 79,47 67,68
Bem.3. GK ATI Autumn search 3,23 5,85 2,98 37,27 77,83 71,99
Bem.3. GK BÉKÉS Autumn search 3,34 6,85 2,89 39,80 75,70 68,69
Bem.3. GK
CSONGRÁD
Autumn search
3,12 6,04 2,85 36,51 74,42 41,39
Bem.3. GK ÉLET Autumn search 3,48 6,37 2,87 39,66 76,97 63,27
Bem.3. GK
GARABOLY
Autumn search
3,25 6,48 2,89 36,86 76,72 43,15
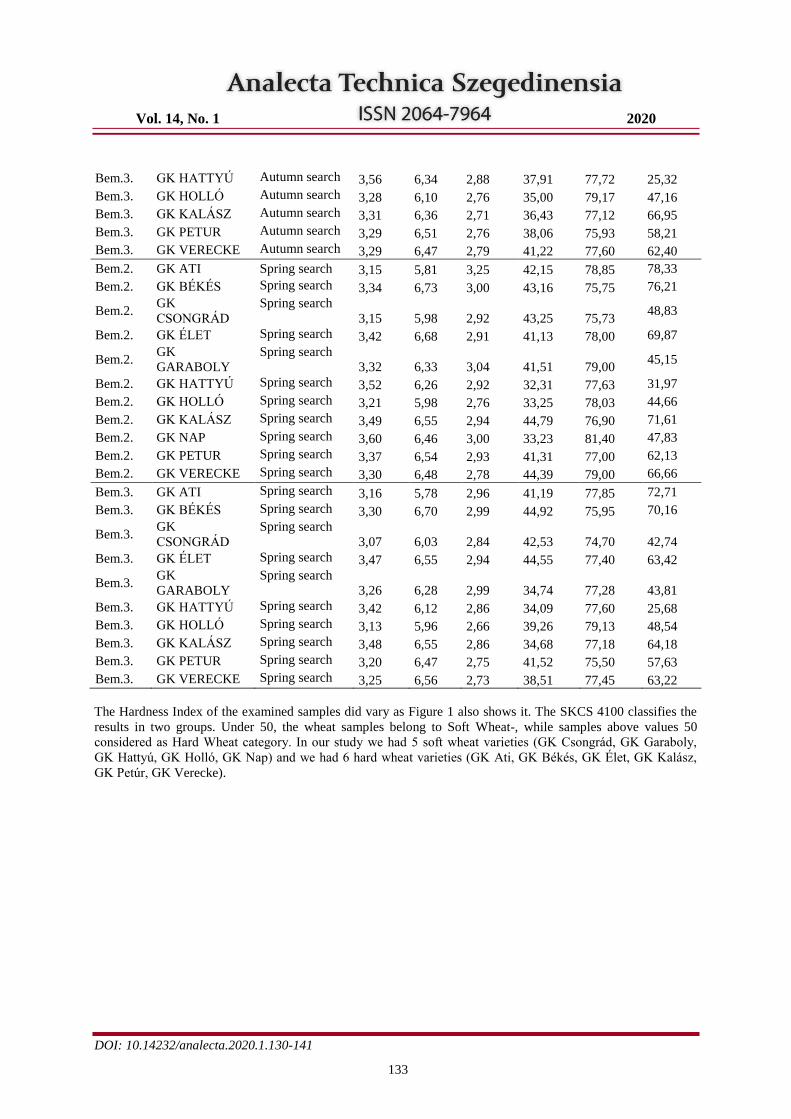
Vol. 14, No. 1 2020
DOI: 10.14232/analecta.2020.1.130-141
133
Bem.3. GK HATTYÚ Autumn search 3,56 6,34 2,88 37,91 77,72 25,32
Bem.3. GK HOLLÓ Autumn search 3,28 6,10 2,76 35,00 79,17 47,16
Bem.3. GK KALÁSZ Autumn search 3,31 6,36 2,71 36,43 77,12 66,95
Bem.3. GK PETUR Autumn search 3,29 6,51 2,76 38,06 75,93 58,21
Bem.3. GK VERECKE Autumn search 3,29 6,47 2,79 41,22 77,60 62,40
Bem.2. GK ATI Spring search 3,15 5,81 3,25 42,15 78,85 78,33
Bem.2. GK BÉKÉS Spring search 3,34 6,73 3,00 43,16 75,75 76,21
Bem.2. GK
CSONGRÁD
Spring search
3,15 5,98 2,92 43,25 75,73 48,83
Bem.2. GK ÉLET Spring search 3,42 6,68 2,91 41,13 78,00 69,87
Bem.2. GK
GARABOLY
Spring search
3,32 6,33 3,04 41,51 79,00 45,15
Bem.2. GK HATTYÚ Spring search 3,52 6,26 2,92 32,31 77,63 31,97
Bem.2. GK HOLLÓ Spring search 3,21 5,98 2,76 33,25 78,03 44,66
Bem.2. GK KALÁSZ Spring search 3,49 6,55 2,94 44,79 76,90 71,61
Bem.2. GK NAP Spring search 3,60 6,46 3,00 33,23 81,40 47,83
Bem.2. GK PETUR Spring search 3,37 6,54 2,93 41,31 77,00 62,13
Bem.2. GK VERECKE Spring search 3,30 6,48 2,78 44,39 79,00 66,66
Bem.3. GK ATI Spring search 3,16 5,78 2,96 41,19 77,85 72,71
Bem.3. GK BÉKÉS Spring search 3,30 6,70 2,99 44,92 75,95 70,16
Bem.3. GK
CSONGRÁD
Spring search
3,07 6,03 2,84 42,53 74,70 42,74
Bem.3. GK ÉLET Spring search 3,47 6,55 2,94 44,55 77,40 63,42
Bem.3. GK
GARABOLY
Spring search
3,26 6,28 2,99 34,74 77,28 43,81
Bem.3. GK HATTYÚ Spring search 3,42 6,12 2,86 34,09 77,60 25,68
Bem.3. GK HOLLÓ Spring search 3,13 5,96 2,66 39,26 79,13 48,54
Bem.3. GK KALÁSZ Spring search 3,48 6,55 2,86 34,68 77,18 64,18
Bem.3. GK PETUR Spring search 3,20 6,47 2,75 41,52 75,50 57,63
Bem.3. GK VERECKE Spring search 3,25 6,56 2,73 38,51 77,45 63,22
The Hardness Index of the examined samples did vary as Figure 1 also shows it. The SKCS 4100 classifies the
results in two groups. Under 50, the wheat samples belong to Soft Wheat-, while samples above values 50
considered as Hard Wheat category. In our study we had 5 soft wheat varieties (GK Csongrád, GK Garaboly,
GK Hattyú, GK Holló, GK Nap) and we had 6 hard wheat varieties (GK Ati, GK Békés, GK Élet, GK Kalász,
GK Petúr, GK Verecke).
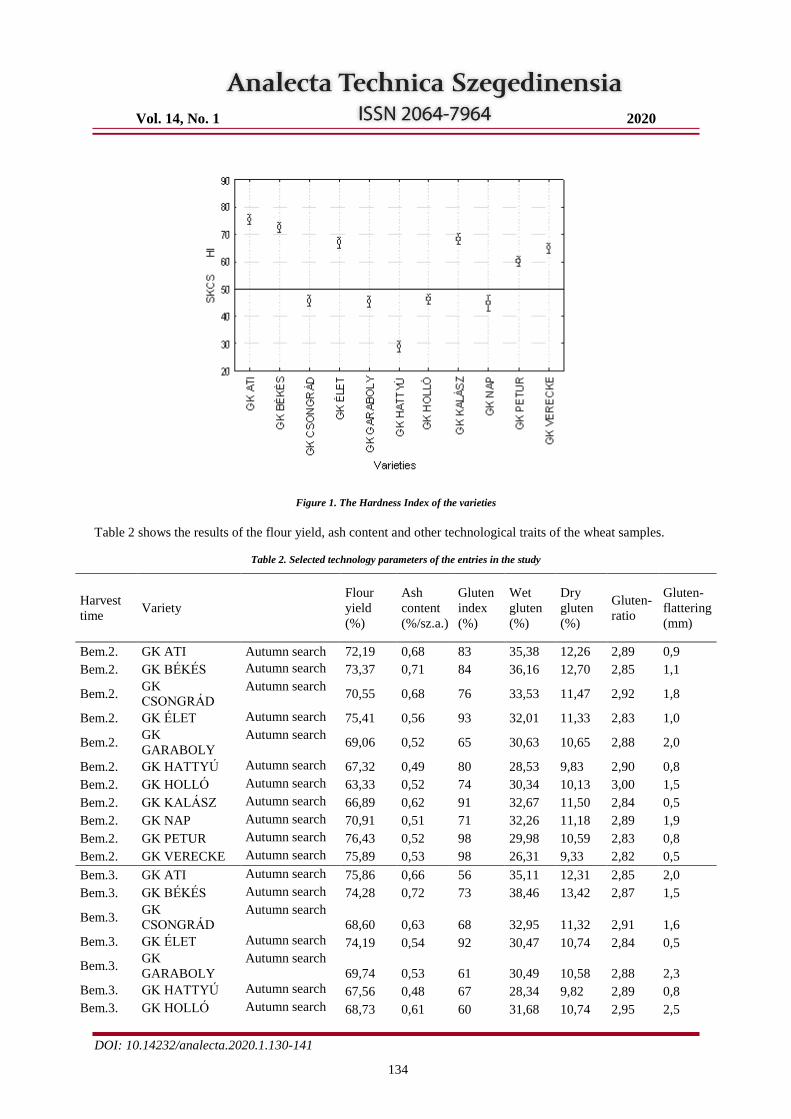
Vol. 14, No. 1 2020
DOI: 10.14232/analecta.2020.1.130-141
134
Figure 1. The Hardness Index of the varieties
Table 2 shows the results of the flour yield, ash content and other technological traits of the wheat samples.
Table 2. Selected technology parameters of the entries in the study
Harvest
time Variety
Flour
yield
(%)
Ash
content
(%/sz.a.)
Gluten
index
(%)
Wet
gluten
(%)
Dry
gluten
(%)
Gluten-
ratio
Gluten-
flattering
(mm)
Bem.2. GK ATI Autumn search 72,19 0,68 83 35,38 12,26 2,89 0,9
Bem.2. GK BÉKÉS Autumn search 73,37 0,71 84 36,16 12,70 2,85 1,1
Bem.2. GK
CSONGRÁD
Autumn search 70,55 0,68 76 33,53 11,47 2,92 1,8
Bem.2. GK ÉLET Autumn search 75,41 0,56 93 32,01 11,33 2,83 1,0
Bem.2. GK
GARABOLY
Autumn search 69,06 0,52 65 30,63 10,65 2,88 2,0
Bem.2. GK HATTYÚ Autumn search 67,32 0,49 80 28,53 9,83 2,90 0,8
Bem.2. GK HOLLÓ Autumn search 63,33 0,52 74 30,34 10,13 3,00 1,5
Bem.2. GK KALÁSZ Autumn search 66,89 0,62 91 32,67 11,50 2,84 0,5
Bem.2. GK NAP Autumn search 70,91 0,51 71 32,26 11,18 2,89 1,9
Bem.2. GK PETUR Autumn search 76,43 0,52 98 29,98 10,59 2,83 0,8
Bem.2. GK VERECKE Autumn search 75,89 0,53 98 26,31 9,33 2,82 0,5
Bem.3. GK ATI Autumn search 75,86 0,66 56 35,11 12,31 2,85 2,0
Bem.3. GK BÉKÉS Autumn search 74,28 0,72 73 38,46 13,42 2,87 1,5
Bem.3. GK
CSONGRÁD
Autumn search
68,60 0,63 68 32,95 11,32 2,91 1,6
Bem.3. GK ÉLET Autumn search 74,19 0,54 92 30,47 10,74 2,84 0,5
Bem.3. GK
GARABOLY
Autumn search
69,74 0,53 61 30,49 10,58 2,88 2,3
Bem.3. GK HATTYÚ Autumn search 67,56 0,48 67 28,34 9,82 2,89 0,8
Bem.3. GK HOLLÓ Autumn search 68,73 0,61 60 31,68 10,74 2,95 2,5
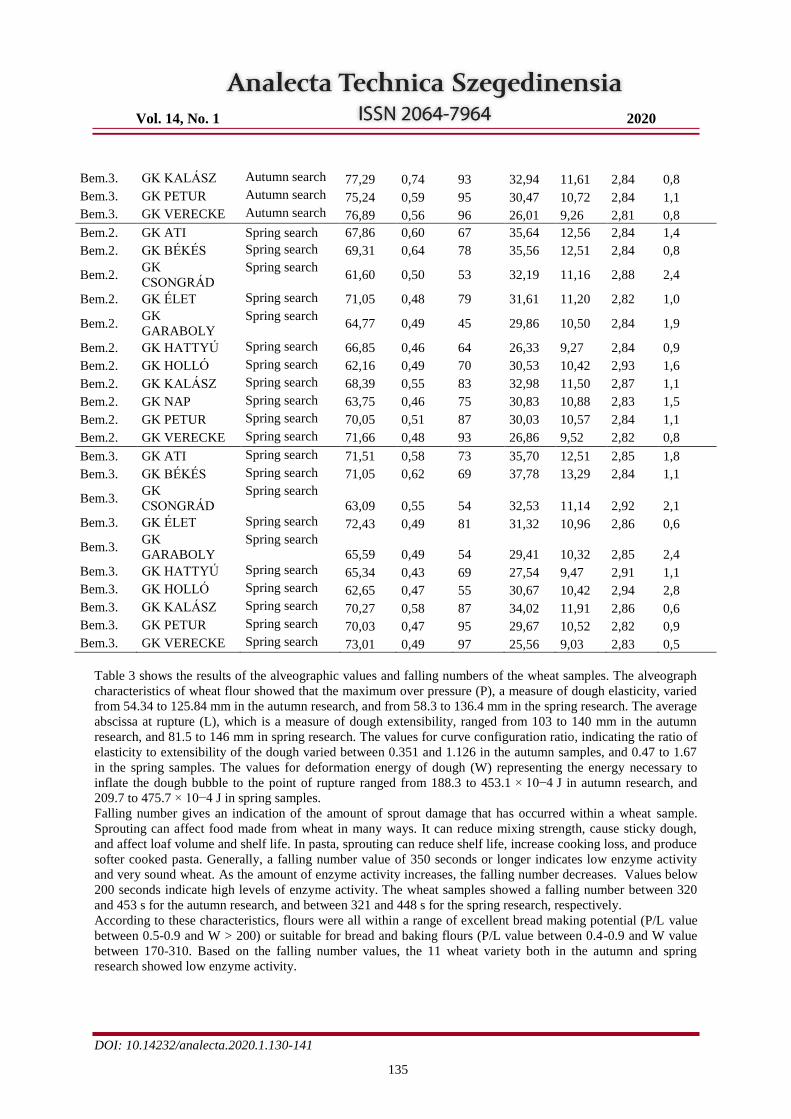
Vol. 14, No. 1 2020
DOI: 10.14232/analecta.2020.1.130-141
135
Bem.3. GK KALÁSZ Autumn search 77,29 0,74 93 32,94 11,61 2,84 0,8
Bem.3. GK PETUR Autumn search 75,24 0,59 95 30,47 10,72 2,84 1,1
Bem.3. GK VERECKE Autumn search 76,89 0,56 96 26,01 9,26 2,81 0,8
Bem.2. GK ATI Spring search 67,86 0,60 67 35,64 12,56 2,84 1,4
Bem.2. GK BÉKÉS Spring search 69,31 0,64 78 35,56 12,51 2,84 0,8
Bem.2. GK
CSONGRÁD
Spring search 61,60 0,50 53 32,19 11,16 2,88 2,4
Bem.2. GK ÉLET Spring search 71,05 0,48 79 31,61 11,20 2,82 1,0
Bem.2. GK
GARABOLY
Spring search 64,77 0,49 45 29,86 10,50 2,84 1,9
Bem.2. GK HATTYÚ Spring search 66,85 0,46 64 26,33 9,27 2,84 0,9
Bem.2. GK HOLLÓ Spring search 62,16 0,49 70 30,53 10,42 2,93 1,6
Bem.2. GK KALÁSZ Spring search 68,39 0,55 83 32,98 11,50 2,87 1,1
Bem.2. GK NAP Spring search 63,75 0,46 75 30,83 10,88 2,83 1,5
Bem.2. GK PETUR Spring search 70,05 0,51 87 30,03 10,57 2,84 1,1
Bem.2. GK VERECKE Spring search 71,66 0,48 93 26,86 9,52 2,82 0,8
Bem.3. GK ATI Spring search 71,51 0,58 73 35,70 12,51 2,85 1,8
Bem.3. GK BÉKÉS Spring search 71,05 0,62 69 37,78 13,29 2,84 1,1
Bem.3. GK
CSONGRÁD
Spring search
63,09 0,55 54 32,53 11,14 2,92 2,1
Bem.3. GK ÉLET Spring search 72,43 0,49 81 31,32 10,96 2,86 0,6
Bem.3. GK
GARABOLY
Spring search
65,59 0,49 54 29,41 10,32 2,85 2,4
Bem.3. GK HATTYÚ Spring search 65,34 0,43 69 27,54 9,47 2,91 1,1
Bem.3. GK HOLLÓ Spring search 62,65 0,47 55 30,67 10,42 2,94 2,8
Bem.3. GK KALÁSZ Spring search 70,27 0,58 87 34,02 11,91 2,86 0,6
Bem.3. GK PETUR Spring search 70,03 0,47 95 29,67 10,52 2,82 0,9
Bem.3. GK VERECKE Spring search 73,01 0,49 97 25,56 9,03 2,83 0,5
Table 3 shows the results of the alveographic values and falling numbers of the wheat samples. The alveograph
characteristics of wheat flour showed that the maximum over pressure (P), a measure of dough elasticity, varied
from 54.34 to 125.84 mm in the autumn research, and from 58.3 to 136.4 mm in the spring research. The average
abscissa at rupture (L), which is a measure of dough extensibility, ranged from 103 to 140 mm in the autumn
research, and 81.5 to 146 mm in spring research. The values for curve configuration ratio, indicating the ratio of
elasticity to extensibility of the dough varied between 0.351 and 1.126 in the autumn samples, and 0.47 to 1.67
in the spring samples. The values for deformation energy of dough (W) representing the energy necessary to
inflate the dough bubble to the point of rupture ranged from 188.3 to 453.1 × 10⁻⁴ J in autumn research, and
209.7 to 475.7 × 10⁻⁴ J in spring samples.
Falling number gives an indication of the amount of sprout damage that has occurred within a wheat sample.
Sprouting can affect food made from wheat in many ways. It can reduce mixing strength, cause sticky dough,
and affect loaf volume and shelf life. In pasta, sprouting can reduce shelf life, increase cooking loss, and produce
softer cooked pasta. Generally, a falling number value of 350 seconds or longer indicates low enzyme activity
and very sound wheat. As the amount of enzyme activity increases, the falling number decreases. Values below
200 seconds indicate high levels of enzyme activity. The wheat samples showed a falling number between 320
and 453 s for the autumn research, and between 321 and 448 s for the spring research, respectively.
According to these characteristics, flours were all within a range of excellent bread making potential (P/L value
between 0.5-0.9 and W > 200) or suitable for bread and baking flours (P/L value between 0.4-0.9 and W value
between 170-310. Based on the falling number values, the 11 wheat variety both in the autumn and spring
research showed low enzyme activity.
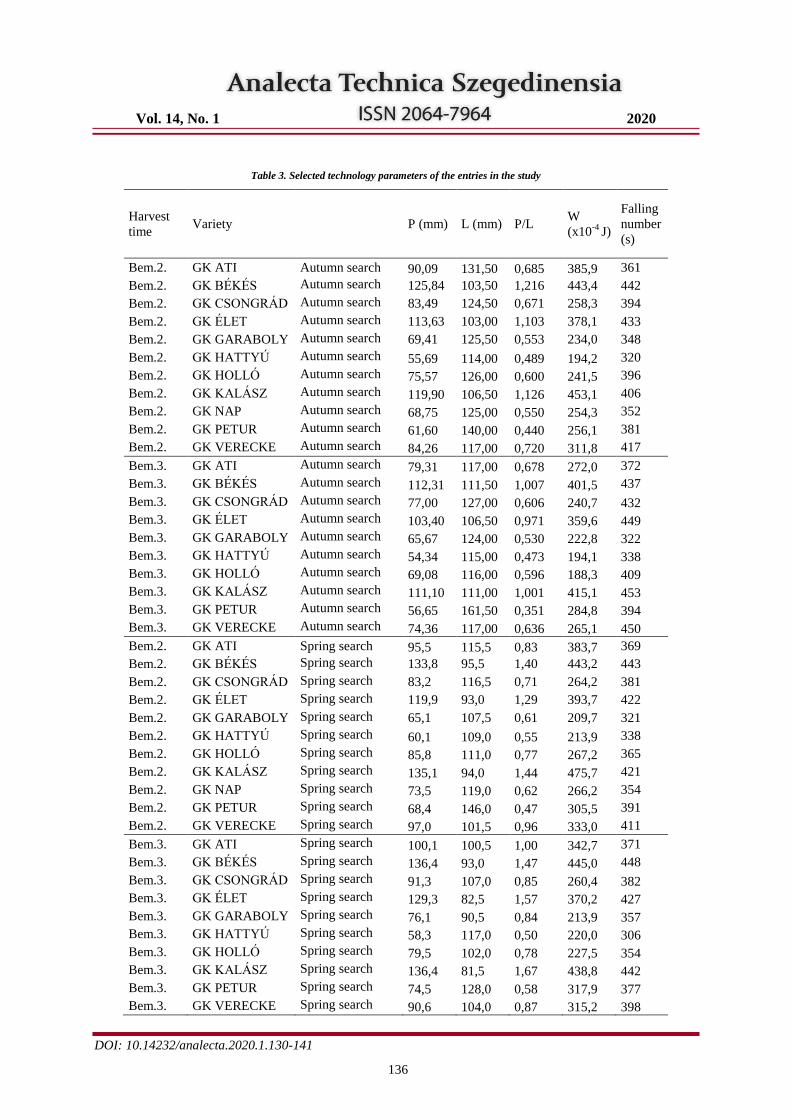
Vol. 14, No. 1 2020
DOI: 10.14232/analecta.2020.1.130-141
136
Table 3. Selected technology parameters of the entries in the study
Harvest
time Variety P (mm) L (mm) P/L
W
(x10-4
J)
Falling
number
(s)
Bem.2. GK ATI Autumn search 90,09 131,50 0,685 385,9 361
Bem.2. GK BÉKÉS Autumn search 125,84 103,50 1,216 443,4 442
Bem.2. GK CSONGRÁD Autumn search 83,49 124,50 0,671 258,3 394
Bem.2. GK ÉLET Autumn search 113,63 103,00 1,103 378,1 433
Bem.2. GK GARABOLY Autumn search 69,41 125,50 0,553 234,0 348
Bem.2. GK HATTYÚ Autumn search 55,69 114,00 0,489 194,2 320
Bem.2. GK HOLLÓ Autumn search 75,57 126,00 0,600 241,5 396
Bem.2. GK KALÁSZ Autumn search 119,90 106,50 1,126 453,1 406
Bem.2. GK NAP Autumn search 68,75 125,00 0,550 254,3 352
Bem.2. GK PETUR Autumn search 61,60 140,00 0,440 256,1 381
Bem.2. GK VERECKE Autumn search 84,26 117,00 0,720 311,8 417
Bem.3. GK ATI Autumn search 79,31 117,00 0,678 272,0 372
Bem.3. GK BÉKÉS Autumn search 112,31 111,50 1,007 401,5 437
Bem.3. GK CSONGRÁD Autumn search 77,00 127,00 0,606 240,7 432
Bem.3. GK ÉLET Autumn search 103,40 106,50 0,971 359,6 449
Bem.3. GK GARABOLY Autumn search 65,67 124,00 0,530 222,8 322
Bem.3. GK HATTYÚ Autumn search 54,34 115,00 0,473 194,1 338
Bem.3. GK HOLLÓ Autumn search 69,08 116,00 0,596 188,3 409
Bem.3. GK KALÁSZ Autumn search 111,10 111,00 1,001 415,1 453
Bem.3. GK PETUR Autumn search 56,65 161,50 0,351 284,8 394
Bem.3. GK VERECKE Autumn search 74,36 117,00 0,636 265,1 450
Bem.2. GK ATI Spring search 95,5 115,5 0,83 383,7 369
Bem.2. GK BÉKÉS Spring search 133,8 95,5 1,40 443,2 443
Bem.2. GK CSONGRÁD Spring search 83,2 116,5 0,71 264,2 381
Bem.2. GK ÉLET Spring search 119,9 93,0 1,29 393,7 422
Bem.2. GK GARABOLY Spring search 65,1 107,5 0,61 209,7 321
Bem.2. GK HATTYÚ Spring search 60,1 109,0 0,55 213,9 338
Bem.2. GK HOLLÓ Spring search 85,8 111,0 0,77 267,2 365
Bem.2. GK KALÁSZ Spring search 135,1 94,0 1,44 475,7 421
Bem.2. GK NAP Spring search 73,5 119,0 0,62 266,2 354
Bem.2. GK PETUR Spring search 68,4 146,0 0,47 305,5 391
Bem.2. GK VERECKE Spring search 97,0 101,5 0,96 333,0 411
Bem.3. GK ATI Spring search 100,1 100,5 1,00 342,7 371
Bem.3. GK BÉKÉS Spring search 136,4 93,0 1,47 445,0 448
Bem.3. GK CSONGRÁD Spring search 91,3 107,0 0,85 260,4 382
Bem.3. GK ÉLET Spring search 129,3 82,5 1,57 370,2 427
Bem.3. GK GARABOLY Spring search 76,1 90,5 0,84 213,9 357
Bem.3. GK HATTYÚ Spring search 58,3 117,0 0,50 220,0 306
Bem.3. GK HOLLÓ Spring search 79,5 102,0 0,78 227,5 354
Bem.3. GK KALÁSZ Spring search 136,4 81,5 1,67 438,8 442
Bem.3. GK PETUR Spring search 74,5 128,0 0,58 317,9 377
Bem.3. GK VERECKE Spring search 90,6 104,0 0,87 315,2 398

Vol. 14, No. 1 2020
DOI: 10.14232/analecta.2020.1.130-141
137
The wheat was tested for significance using analysis of variance techniques (ANOVA).
Table 4. Results of analysis of variance (level of significance of p < 0.05)
Methods Connection
Flour Yield S. ↓
Flour Ash S. ↓
Gluten Index S. ↓
Wet Gluten N.S. ↓
Dry Gluten N.S. ↓
Gluten Ratio N.S. ↓
Gluten Flattering N.S. ↑
Falling Number N.S. ↓
Water Absorption Capacity S. ↓
Value Number S. ↑
P S. ↑
L S. ↑
P/L S. ↑
W S. ↑ S.- Significant
N.S.- Non Significant
Figure 2 shown that the flour yield is decreased, the statistical behaviour show it.
The gluten index is very important parameter behaviour of the flour; its value is a criteria defining whether the
gluten quality is weak, strong or normal. The Gluten Index Method can be used for detection of heat and insect
damage. Excessive heating will cause protein denaturation and decrease the wet glutein/protein ratio or destroy
the ability to form gluten. Insects that damage wheat produce an enzyme that weakens the gluten bonds. During
the storage, it is decreased (4 %).
Figure. 2. Flour yield at a confidence interval of 0,95
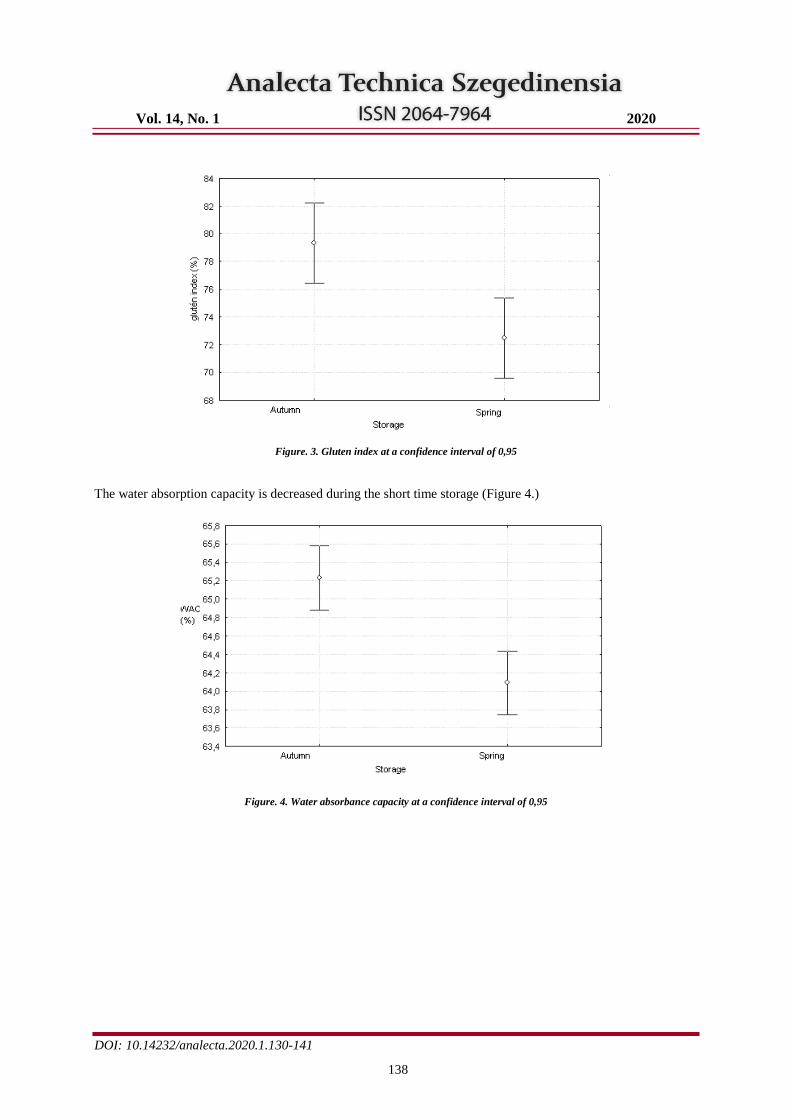
Vol. 14, No. 1 2020
DOI: 10.14232/analecta.2020.1.130-141
138
Figure. 3. Gluten index at a confidence interval of 0,95
The water absorption capacity is decreased during the short time storage (Figure 4.)
Figure. 4. Water absorbance capacity at a confidence interval of 0,95
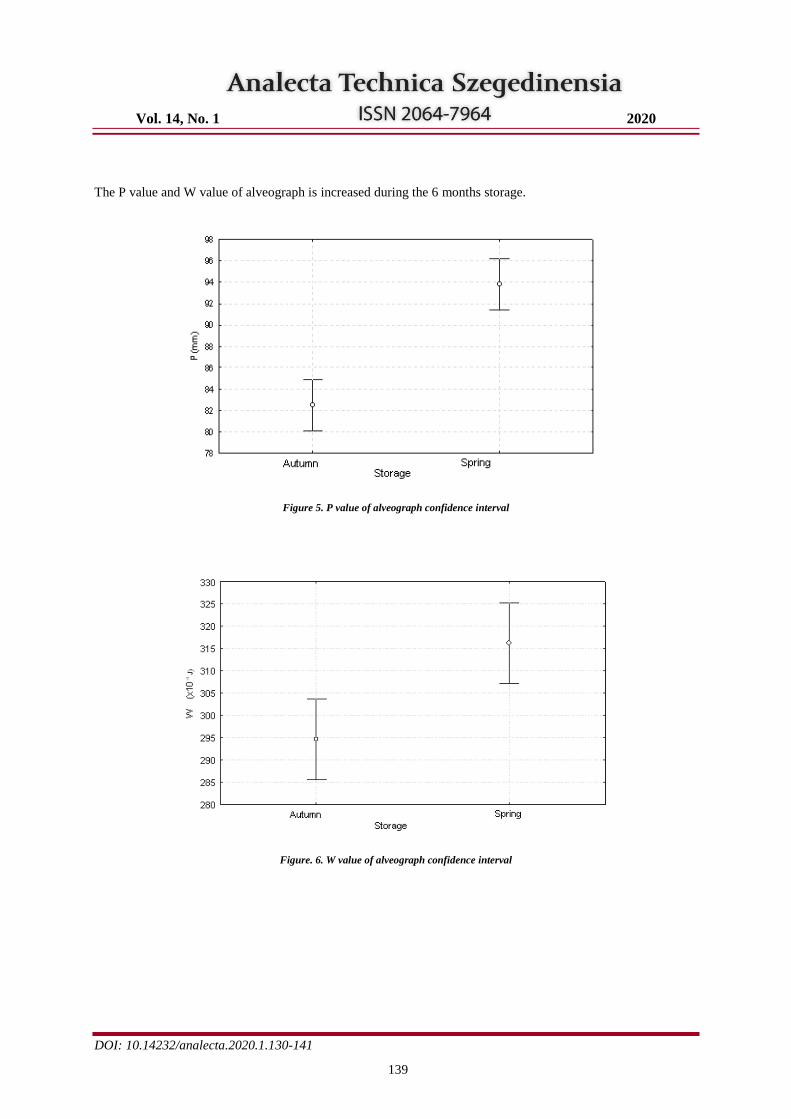
Vol. 14, No. 1 2020
DOI: 10.14232/analecta.2020.1.130-141
139
The P value and W value of alveograph is increased during the 6 months storage.
Figure 5. P value of alveograph confidence interval
Figure. 6. W value of alveograph confidence interval
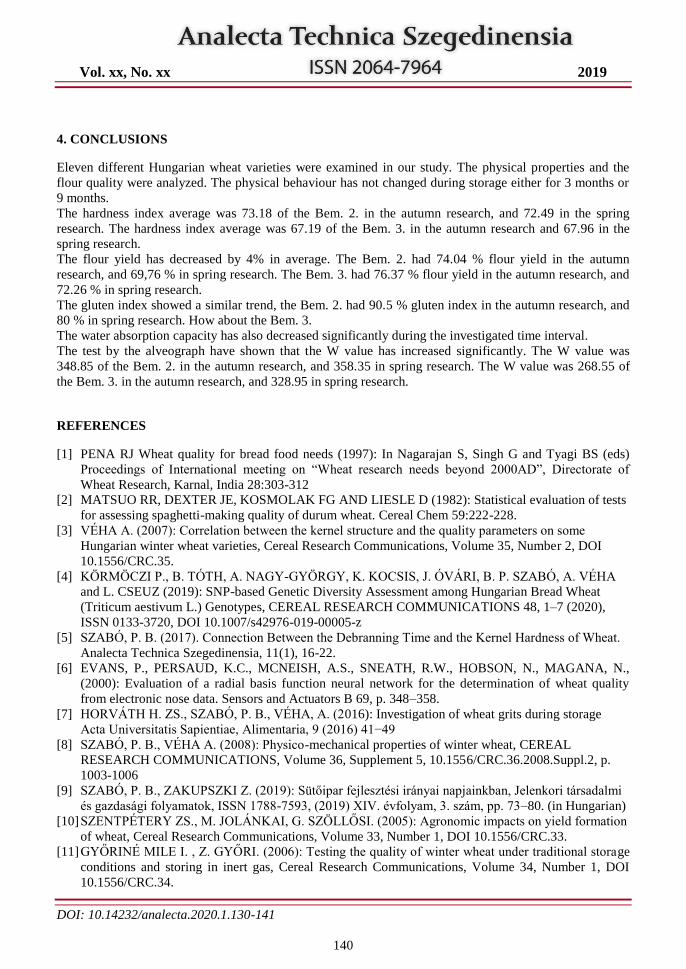
Vol. xx, No. xx 2019
DOI: 10.14232/analecta.2020.1.130-141
140
4. CONCLUSIONS
Eleven different Hungarian wheat varieties were examined in our study. The physical properties and the
flour quality were analyzed. The physical behaviour has not changed during storage either for 3 months or
9 months.
The hardness index average was 73.18 of the Bem. 2. in the autumn research, and 72.49 in the spring
research. The hardness index average was 67.19 of the Bem. 3. in the autumn research and 67.96 in the
spring research.
The flour yield has decreased by 4% in average. The Bem. 2. had 74.04 % flour yield in the autumn
research, and 69,76 % in spring research. The Bem. 3. had 76.37 % flour yield in the autumn research, and
72.26 % in spring research.
The gluten index showed a similar trend, the Bem. 2. had 90.5 % gluten index in the autumn research, and
80 % in spring research. How about the Bem. 3.
The water absorption capacity has also decreased significantly during the investigated time interval.
The test by the alveograph have shown that the W value has increased significantly. The W value was
348.85 of the Bem. 2. in the autumn research, and 358.35 in spring research. The W value was 268.55 of
the Bem. 3. in the autumn research, and 328.95 in spring research.
REFERENCES
[1] PENA RJ Wheat quality for bread food needs (1997): In Nagarajan S, Singh G and Tyagi BS (eds)
Proceedings of International meeting on “Wheat research needs beyond 2000AD”, Directorate of
Wheat Research, Karnal, India 28:303-312
[2] MATSUO RR, DEXTER JE, KOSMOLAK FG AND LIESLE D (1982): Statistical evaluation of tests
for assessing spaghetti-making quality of durum wheat. Cereal Chem 59:222-228.
[3] VÉHA A. (2007): Correlation between the kernel structure and the quality parameters on some
Hungarian winter wheat varieties, Cereal Research Communications, Volume 35, Number 2, DOI
10.1556/CRC.35.
[4] KÖRMÖCZI P., B. TÓTH, A. NAGY-GYÖRGY, K. KOCSIS, J. ÓVÁRI, B. P. SZABÓ, A. VÉHA
and L. CSEUZ (2019): SNP-based Genetic Diversity Assessment among Hungarian Bread Wheat
(Triticum aestivum L.) Genotypes, CEREAL RESEARCH COMMUNICATIONS 48, 1–7 (2020),
ISSN 0133-3720, DOI 10.1007/s42976-019-00005-z
[5] SZABÓ, P. B. (2017). Connection Between the Debranning Time and the Kernel Hardness of Wheat.
Analecta Technica Szegedinensia, 11(1), 16-22.
[6] EVANS, P., PERSAUD, K.C., MCNEISH, A.S., SNEATH, R.W., HOBSON, N., MAGANA, N.,
(2000): Evaluation of a radial basis function neural network for the determination of wheat quality
from electronic nose data. Sensors and Actuators B 69, p. 348–358.
[7] HORVÁTH H. ZS., SZABÓ, P. B., VÉHA, A. (2016): Investigation of wheat grits during storage
Acta Universitatis Sapientiae, Alimentaria, 9 (2016) 41−49
[8] SZABÓ, P. B., VÉHA A. (2008): Physico-mechanical properties of winter wheat, CEREAL
RESEARCH COMMUNICATIONS, Volume 36, Supplement 5, 10.1556/CRC.36.2008.Suppl.2, p.
1003-1006
[9] SZABÓ, P. B., ZAKUPSZKI Z. (2019): Sütőipar fejlesztési irányai napjainkban, Jelenkori társadalmi
és gazdasági folyamatok, ISSN 1788-7593, (2019) XIV. évfolyam, 3. szám, pp. 73–80. (in Hungarian)
[10] SZENTPÉTERY ZS., M. JOLÁNKAI, G. SZÖLLŐSI. (2005): Agronomic impacts on yield formation
of wheat, Cereal Research Communications, Volume 33, Number 1, DOI 10.1556/CRC.33.
[11] GYŐRINÉ MILE I. , Z. GYŐRI. (2006): Testing the quality of winter wheat under traditional storage
conditions and storing in inert gas, Cereal Research Communications, Volume 34, Number 1, DOI
10.1556/CRC.34.
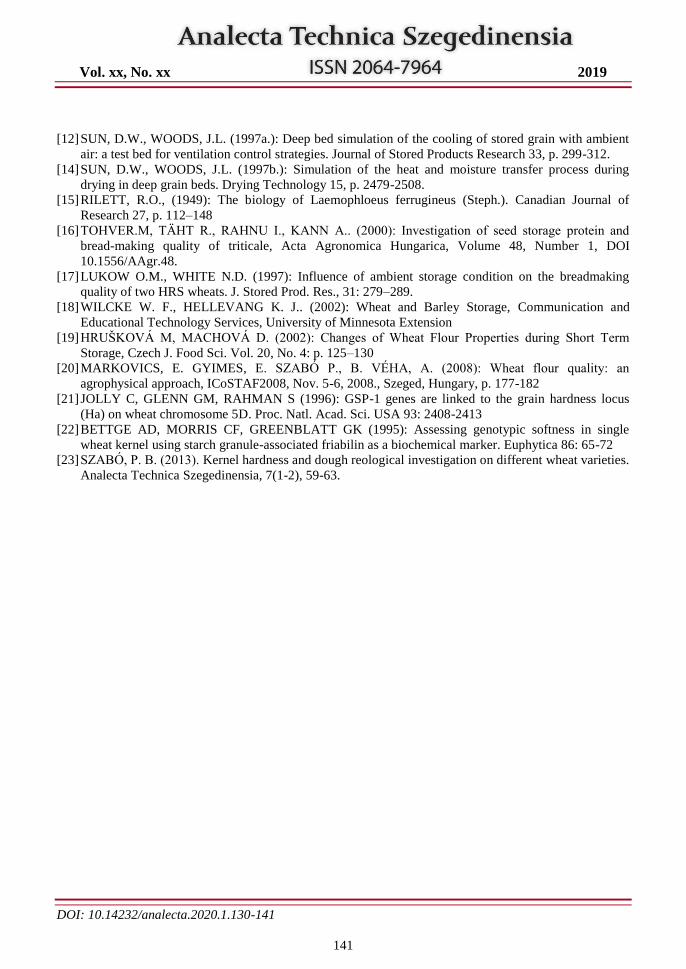
Vol. xx, No. xx 2019
DOI: 10.14232/analecta.2020.1.130-141
141
[12] SUN, D.W., WOODS, J.L. (1997a.): Deep bed simulation of the cooling of stored grain with ambient
air: a test bed for ventilation control strategies. Journal of Stored Products Research 33, p. 299-312.
[14] SUN, D.W., WOODS, J.L. (1997b.): Simulation of the heat and moisture transfer process during
drying in deep grain beds. Drying Technology 15, p. 2479-2508.
[15] RILETT, R.O., (1949): The biology of Laemophloeus ferrugineus (Steph.). Canadian Journal of
Research 27, p. 112–148
[16] TOHVER.M, TÄHT R., RAHNU I., KANN A.. (2000): Investigation of seed storage protein and
bread-making quality of triticale, Acta Agronomica Hungarica, Volume 48, Number 1, DOI
10.1556/AAgr.48.
[17] LUKOW O.M., WHITE N.D. (1997): Influence of ambient storage condition on the breadmaking
quality of two HRS wheats. J. Stored Prod. Res., 31: 279–289.
[18] WILCKE W. F., HELLEVANG K. J.. (2002): Wheat and Barley Storage, Communication and
Educational Technology Services, University of Minnesota Extension
[19] HRUŠKOVÁ M, MACHOVÁ D. (2002): Changes of Wheat Flour Properties during Short Term
Storage, Czech J. Food Sci. Vol. 20, No. 4: p. 125–130
[20] MARKOVICS, E. GYIMES, E. SZABÓ P., B. VÉHA, A. (2008): Wheat flour quality: an
agrophysical approach, ICoSTAF2008, Nov. 5-6, 2008., Szeged, Hungary, p. 177-182
[21] JOLLY C, GLENN GM, RAHMAN S (1996): GSP-1 genes are linked to the grain hardness locus
(Ha) on wheat chromosome 5D. Proc. Natl. Acad. Sci. USA 93: 2408-2413
[22] BETTGE AD, MORRIS CF, GREENBLATT GK (1995): Assessing genotypic softness in single
wheat kernel using starch granule-associated friabilin as a biochemical marker. Euphytica 86: 65-72
[23] SZABÓ, P. B. (2013). Kernel hardness and dough reological investigation on different wheat varieties.
Analecta Technica Szegedinensia, 7(1-2), 59-63.
Vol. 14, No. 1 2020
DOI: 10.14232/analecta.2020.1.142-146
142
POSSIBILITIES FOR DETECTION OF THE CHANGE OF
BIODEGRADABILITY OF WASTEWATER BY DIELECTRIC CONSTANT
MEASUREMENTS
Laura Haranghy, Réka Dobozi, Zoltán Jákói, Sándor Beszédes
University of Szeged Faculty of Engineering, Department of Process Engineering, Moszkvai krt. 9, H-6725 Szeged, Hungary.
E- mail: [email protected]
ABSTRACT
Nowadays, the development of rapid and non-destructive measurement methods have high importance.
The dielectric measurement is a promising technique to detect the chemical and physicho-chemical change
of different materials. The dielectric behavior of pure water is widely investigated for decades, but there is
very few information available related to the dielectric parameters of wastewater. Our study aims to
investigate the applicability of dielectric measurements for the detection of the change of biodegradability
of wastewater. In the experiments the change of organic matter solubility and biodegradability of sugar
beet processing wastewater, meat processing wastewater, dairy industry wastewater and municipal
wastewater was examined. Our results show that dielectric constant - measured at the frequency of 2400
MHz - has a strong linear correlation with the soluble chemical oxygen demand (SCOD), which makes
possible the fast detection of disintegration efficiency of different wastewater and sludge treatment
processes, or the organic matter removal efficiency of wastewater purification technologies. Furthermore,
our results verified that the change of aerobic biodegradability (expressed in BOD5/SCOD ratio) show also
good linear correlation with the dielectric constant. These preliminary results enable to develop a dielectric
behavior based detection method for the estimation of the efficiency of wastewater treatment processes.
Keywords: dielectric measurements, wastewater, biodegradability, solubility
1. INTRODUCTION
A dielectric material is a non-conducting material which stores electrical charges. In order to characterize
how a certain dielectric material behaves when placed in an electromagnetic field, it is necessary to know
the so-called dielectric properties of it. These properties can offer information about the occurring
interaction between the material and the electromagnetic field itself [1]. Dielectric behavior of materials is
influenced by the frequency, temperature and the physicochemical structure of the materials.
One of the most important properties is the relative permittivity, which primarily describes those features
that affect the reflection of electromagnetic waves on the boundary surface of the material, and the
energetic loss that happens when the wave is absorbed inside the material. The relative complex
permittivity can be calculated as follows:
𝜀 = 𝜀′ − 𝑗𝜀" (1)
In the equation 𝜀𝑟′ represents the dielectric constant, 𝜀𝑟
" is the dielectric loss factor, and j is the imaginary
unit.
The dielectric constant describes the energy-absorbing ability of a given dielectric material when put in an
electromagnetic field, and affects the phase of the wave that goes inside and/or through the material. The
dielectric constant can be calculated as the product of free space permittivity and the relative permittivity:
𝜀′ = 𝜀0 ∙ 𝜀𝑟′ (2)
The dielectric loss factor (𝜀") is a measure of the loss of energy in a dielectric material due to conduction,
slow polarization currents, heat-transformation and other dissipative phenomena.
Vol. 14, No. 1 2020
DOI: 10.14232/analecta.2020.1.142-146
143
As mentioned earlier, a dielectric material is a solid, liquid or gaseous material that behaves as a non-
conductor in terms of electricity, i.e. contains no free charges. The bound charges in a material can be
presented in two different orientations: sphere-symmetric and dipole-like. In a sphere-symmetric
orientation, the electric field only occurs inside the atoms/molecules, but not in the
interatomic/intermolecular field. During dipole-orientation, the center point of the two different charges
does not overlap, therefore the electric field is presented between the molecules too – however, it is not
lasting, i.e. the undisposed molecular diploes cancels each other’s electric field out.
The field-strength of the electric field that comes off inside the material is weaker than the strength of the
electromagnetic field that covers it, because the direction of the diploe’s electric field inside the material is
the exact opposite than that of the covering electromagnetic field. Therefore a dielectric material weakens
the field-strength of the electromagnetic field that it is placed in, according to Eq2.
Since at a given frequency, most of the dielectric parameters depend on the temperature and
physicochemical structure of the material, the measurement of these properties can be used to detect certain
physical and chemical changes inside the material [2].
Applicability of dielectric measurement covers lot of different materials: starting from ingredients of food
(and food itself) in order to detect change in their structure, it can also be used in wastewater treatment as
an example. In a 2012 study it has been shown however that dielectric properties vary significantly with
moisture/solid-content ratio and with frequency, therefore for proper result, these factors should be taken
into account. [3]
Dielectric measurements can be applied in various industries as well – in foresting they are used to identify
how much moisture is contained in wood and paper, while in mining, it is used to analyze the content of
oil. [4]. It can be also used to estimate the permittivity of coal and limestone as well [5]. The dielectric
parameters govern the microwave energy absorption into the materials. If materials have a dielectric loss
factor below 0.01 high energy needed for heating. In general, the high frequency electromagnetic filed is
suitable for lower penetration depth, therefore industry scale microwave equipment operate at lower
frequency (915 MHz) to achieve higher penetration depth and higher energy absorption in continuously
flow operation and/or solid materials with higher geometric dimensions (above 10 cm). It is verified, that
in capillary-porous structured materials, such as food and raw materials of food processing, higher energy
in needed to evaporate the bounded water than that of needed for free water in capillaries. The porosity of
granulated materials and particles, furthermore the fiber orientation has also effect on the heating efficiency
[6].
Dielectric measurements are suitable to detect enzymatic and chemical reactions, as well. Depending on
the frequency range of dielectric parameters, the non-enzymatic browning reactions [7] and organic matter
removal efficiencies of wastewater treatment processes [8] are also detectable.
Our research focused on the investigation of the correlation between the change of biodegradability
indicators of wastewater and the dielectric parameters measured at the frequency range of 200-2400 MHz.
The main aim of the research is to develop rapid and non-destructive measurement technique to detect the
change of organic matter solubilization, disintegration degree and biodegradability which is suitable to
estimate the efficiency of different pre-treatment process before wastewater and sludge utilization
technologies.
2. MATERIALS AND METHODS
For the dielectric measurements municipal wastewater (MUWW), dairy industry wastewater (DWW), meat
processing wastewater (MPWW) and sugar beet processing wastewater (SCWW) was used.
The wastewater samples were pre-treated by microwave irradiation at power intensity of 1.5-5 W/mL, for
irradiation time of 5-30 minutes to achieve higher organic matter solubility and biodegradability.
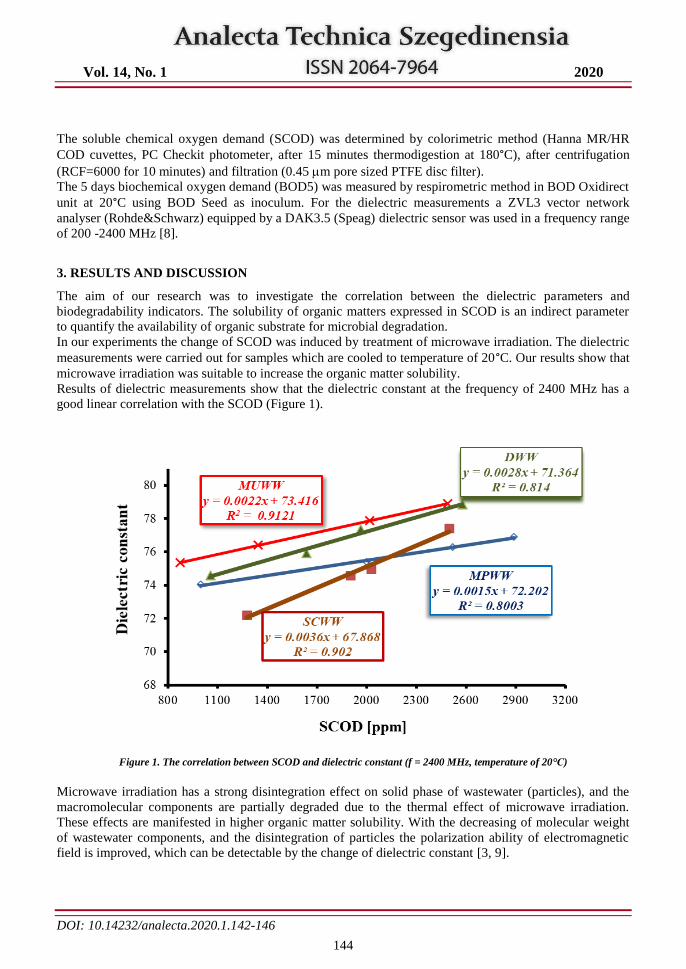
Vol. 14, No. 1 2020
DOI: 10.14232/analecta.2020.1.142-146
144
The soluble chemical oxygen demand (SCOD) was determined by colorimetric method (Hanna MR/HR
COD cuvettes, PC Checkit photometer, after 15 minutes thermodigestion at 180°C), after centrifugation
(RCF=6000 for 10 minutes) and filtration (0.45 m pore sized PTFE disc filter).
The 5 days biochemical oxygen demand (BOD5) was measured by respirometric method in BOD Oxidirect
unit at 20°C using BOD Seed as inoculum. For the dielectric measurements a ZVL3 vector network
analyser (Rohde&Schwarz) equipped by a DAK3.5 (Speag) dielectric sensor was used in a frequency range
of 200 -2400 MHz [8].
3. RESULTS AND DISCUSSION
The aim of our research was to investigate the correlation between the dielectric parameters and
biodegradability indicators. The solubility of organic matters expressed in SCOD is an indirect parameter
to quantify the availability of organic substrate for microbial degradation.
In our experiments the change of SCOD was induced by treatment of microwave irradiation. The dielectric
measurements were carried out for samples which are cooled to temperature of 20°C. Our results show that
microwave irradiation was suitable to increase the organic matter solubility.
Results of dielectric measurements show that the dielectric constant at the frequency of 2400 MHz has a
good linear correlation with the SCOD (Figure 1).
Figure 1. The correlation between SCOD and dielectric constant (f = 2400 MHz, temperature of 20°C)
Microwave irradiation has a strong disintegration effect on solid phase of wastewater (particles), and the
macromolecular components are partially degraded due to the thermal effect of microwave irradiation.
These effects are manifested in higher organic matter solubility. With the decreasing of molecular weight
of wastewater components, and the disintegration of particles the polarization ability of electromagnetic
field is improved, which can be detectable by the change of dielectric constant [3, 9].
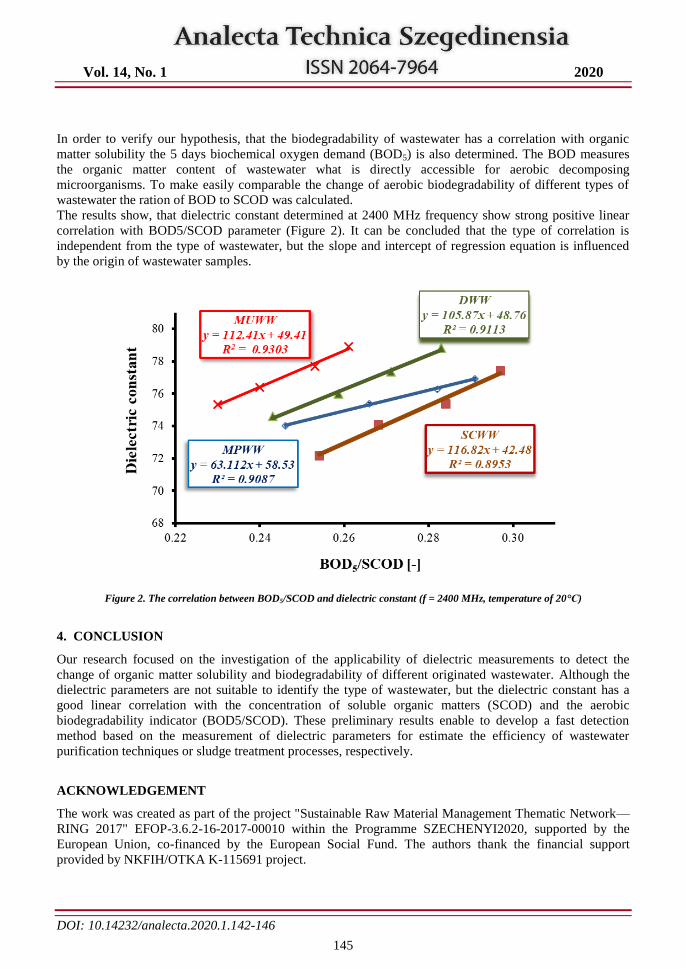
Vol. 14, No. 1 2020
DOI: 10.14232/analecta.2020.1.142-146
145
In order to verify our hypothesis, that the biodegradability of wastewater has a correlation with organic
matter solubility the 5 days biochemical oxygen demand (BOD5) is also determined. The BOD measures
the organic matter content of wastewater what is directly accessible for aerobic decomposing
microorganisms. To make easily comparable the change of aerobic biodegradability of different types of
wastewater the ration of BOD to SCOD was calculated.
The results show, that dielectric constant determined at 2400 MHz frequency show strong positive linear
correlation with BOD5/SCOD parameter (Figure 2). It can be concluded that the type of correlation is
independent from the type of wastewater, but the slope and intercept of regression equation is influenced
by the origin of wastewater samples.
Figure 2. The correlation between BOD5/SCOD and dielectric constant (f = 2400 MHz, temperature of 20°C)
4. CONCLUSION
Our research focused on the investigation of the applicability of dielectric measurements to detect the
change of organic matter solubility and biodegradability of different originated wastewater. Although the
dielectric parameters are not suitable to identify the type of wastewater, but the dielectric constant has a
good linear correlation with the concentration of soluble organic matters (SCOD) and the aerobic
biodegradability indicator (BOD5/SCOD). These preliminary results enable to develop a fast detection
method based on the measurement of dielectric parameters for estimate the efficiency of wastewater
purification techniques or sludge treatment processes, respectively.
ACKNOWLEDGEMENT
The work was created as part of the project "Sustainable Raw Material Management Thematic Network—
RING 2017" EFOP-3.6.2-16-2017-00010 within the Programme SZECHENYI2020, supported by the
European Union, co-financed by the European Social Fund. The authors thank the financial support
provided by NKFIH/OTKA K-115691 project.
Vol. 14, No. 1 2020
DOI: 10.14232/analecta.2020.1.142-146
146
REFERENCES
[1] Sosa-Morales M .E. , Valerio-Junco L., López-Malo A. , García H. S. (2010): Dielectric properties of
foods: Reported data in the 21st Century and their potential applications, LWT - Food Science and
Technology 43 pp.:1169-1179.
[2] Tiitta M., Kainulainen P., Harju A. M., Venäläinen M., Manninen A., Vuorinen M., and Viitanen H.
(2003): Comparing the effect of chemical and physical properties on complex electrical impedance of
Scots pine wood, Holzforschung. 57(4), pp.: 433-439
[3] Bobowski J. S., Johnson T., and Eskicioglu C. (2012) Permittivity of Waste- Activated Sludge by an
Open-Ended Coaxial Line, Progress in Electromagnetics Research Letters. 29, pp.: 139-149
[4] Salas W. A., Ranson J. K., Rock B. N., Smith K.T. (1994): Temporal and spatial variations in dielectric
constant and water status of dominant forest species from New England, Remote Sensing of
Environment, 47(2), pp.: 109-119
[5] Nelson S.O. (1996): Determining Dielectric Properties of Coal and Limestone by Measurements on
Pulverized Samples, Journal of Microwave Power and Electromagnetic Energy, 31(4), pp.: 215-220
[6] Holtz E., Ahrné L., Rittenauer M., Rasmuson A. (2010): Influence of dielectric and sorption properties
on drying behaviour and energy efficiency during microwave convective drying of selected food and
non-food inorganic materials, Journal of Food Engineering 97, pp.: 144–153
[7] Lievonen S.M., Roos Y.H. (2003): Comparison of dielectric properties and non-enzymatic browning
kinetics around glass transition, Innovative Food Science and Emerging Technologies 4, pp.: 297–305
[8] Jákói Z., Hodúr C., László Z., beszédes S. (2018): Detection of the efficiency of microwave–oxidation
process for meat industry wastewater by dielectric measurement, Water Science & Technology 78(10),
pp.: 2141-2148
[9] Kovács V.P., Lemmer B., Keszthelyi-Szabó G., Hodúr C., Beszédes S. (2018): Application of dielectric
constant measurement in microwave sludge disintegration and wastewater purification processes,
Water Science & Technology 77(9), pp.: 2284-2291