highland isr wdeq permit no. 633, update, appendix d-6
TRANSCRIPT
It 7 ? 0 I I 7 8 I1 ~ I
___U 0_ N .14W -W R73V Tm__
It ~~~ ~ ~ ~ 1 Is pIm.-wp s 17 i 4 1 7 1
18 It a II 1 I 8 8 I 4 JO
x 18 a a8 3S a a7 34 a
T3 74W TA 73 Tigj RM7
IS 6 la 10 Il 2 7 a to1
1fr is ai 1 Is 13 to 17 i s 8 1
- -~-- 18Cameco
TABLE OF CONTENTS
APPENDIX D-6
HYDROLOGY
1.0 GENERAL
2.0 SURFACE WATER
2.1 Surface Water Quantity
2.2 Surface Water Quality
2.3 Surface Water Rights
3.0 GROUND WATER
3.1 General
3.2 Ground Water Quality
3.3 Hydrogeologic Units
3.4 Potential Ground Water Impacts
3.5 Pump Testing and Analysis
3.6 Aquifer Piezometric Surfaces
3.7 Confining Unit Characteristics
3.8 Ground Water Rights
4.0 REFERENCES
LIST OF TABLES
Table D6-1: Sage Creek Peak Stream Flow ValuesTable D6-2: Smith Ranch Surface Water Quality DataTable D6-3: Surface Water Rights SR-HUP/Reynolds + 3 Mile BufferTable D6-4: Smith Ranch Pump Test SummaryTable D6-5: Smith Ranch-Reynolds Ranch Water Quality Data - MO WellsTable D6-6: Smith Ranch-Reynolds Ranch Water Quality-Data - M WellsTable D6-7: Smith Ranch-Reynolds Ranch Water Quality Data - MU WellsTable D6-8: Smith Ranch-Reynolds Ranch Water Quality Data - MIP WellsTable D6-9: Smith Ranch Baseline Water Quality ComparisonTable D6-10: Ground Water Rights SR-HUP/Reynolds +3 Mile Buffer
LIST OF FIGURES
Figure D6-1: Surface Water Drainage MapFigure D6-2: Surface Water & Ground Water Collection PointsFigure D6-3: Index Map Appendix D6
Smith Ranch Permit D6-i Revised - April 2011
LIST OF PLATES
Plate D6-1: Surface Water RightsPlate D6-1A: Potentiometric Surface M Sands (10 Sands)Plate D6-1B: Potentiometric Surface 0 Sands (30/40/50 Sands)Plate D6-1C: Potentiometric Surface Q Sands (90 Sands)Plate D6-1D: Potentiometric Surface S Sands (100 Sands)Plate D6-2: Ground Water Rights
LIST OF ADDENDA
ADDENDUM D-6 Al: SMITH RANCH TABLES
Table D-6.1: Description of the Project Hydrogeologic Units in the Vicinity Area
Table D-6.2: Inventory of Wells in Permit Area and On Adjacent Lands
Table D-6.4: Inventory of Wells Used in 0 and Q-Sand Pump Tests and Pilots
Table D-6.5: Q-Sands Wellfield Baseline Data and Restoration Targets
Table D-6.6: O-Sands Wellfield Baseline Data and Restoration Targets
Table D-6.7: Baseline Water Quality Data, Converse County WY: Well No. 2-295
Table D-6.8: Baseline Water Quality Data, Converse County WY: Well No. 2-296
Table D-6.9: Baseline Water Quality Data, Converse County WY: Well No. 8-136
Table D-6.10: Baseline Water Quality Data, Converse County WY: Well No. 17-421
Table D-6. 11: Baseline Water Quality Data, Converse County WY: Well No. 17-422
Table D-6.12: Baseline Water Quality Data, Converse County WY: Well No. 25-583
Table D-6.13: Baseline Water Quality Data, Converse County WY: Well No. 25-584
Table D-6.14: Baseline Water Quality Data, Converse County WY: Well No. 25-585
Table D-6.15: Baseline Water Quality Data, Converse County WY: Well No. 25-586
Table D-6.16: Baseline Water Quality Data, Converse County WY: Well No. 25-589
Table D-6.17: Baseline Water Quality Data, Converse County WY: Well No. 25-590
Table D-6.18: Baseline Water Quality Data, Converse County WY: Well No. 25-591
Table D-6.19: Baseline Water Quality Data, Converse County WY: Well No. 25-592
Table D-6.20: Baseline Water Quality Data, Converse County WY: Well No. 26-834
Table D-6.21: Baseline Water Quality Data, Converse County WY: Well No. 26-83 5
Table D-6.22: Baseline Water Quality Data, Converse County WY: Well No. 26-836
Table D-6.23: Baseline Water Quality Data, Converse County WY: Well No. 26-837
Table D-6.24: Baseline Water Quality Data, Converse County WY: Well No. 27-316
Table D-6.25: Baseline Water Quality Data, Converse County WY: Well No. 30-376
Table D-6.26: Baseline Water Quality Data, Converse County WY: Well No. 34-528
Smith Ranch Permit D6-ii Revised - April 2011
Table D-6.27: Baseline Water Quality Data, Converse County WY: Well No. 34-529
Table D-6.28: Baseline Water Quality Data, Converse County WY: Well No. 35-738
Table D-6.29: Baseline Water Quality Data, Converse County WY: Well No. 35-739
Table D-6.30: Baseline Water Quality Data, Converse County WY: Well No. 35-740
Table D-6.31: Baseline Water Quality Data, Converse County WY: Well No. 35-741
Table D-6.32: Baseline Water Quality Data, Converse County WY: Well No. 35-744
Table D-6.33: Baseline Water Quality Data, Converse County WY: Well No. 36-1045
Table D-6.34: Baseline Water Quality Data, Converse County WY: Well No. 36-1046
Table D-6.35: Baseline Water Quality Data, Converse County WY: Well No. 36-1047
Table D-6.36: Baseline Water Quality Data, Converse County WY: Well No. 36-1048
Table D-3.37: Data used for Construction of Piezometric Surface Contours
ADDENDUM D-6 A2: SMITH RANCH FIGURES/PLATES
Figure D-6. 1: Well Numbering System
Figure D-6.4: Baseline Well & Pump Test Sites
Figure D-6.5: In-Situ R&D Project Well Pattern - Q Sand Deposit
Figure D-6.6: In-Situ R&D Project Well Pattern - 0 Sand Deposit
Figure D-6.7: Water-Level Elevation for the M, 0, Q and S Aquifers
ADDENDUM D-6 A3: SMITH RANCH SUPPLEMENTAL INFORMATION
D-6 Attachment A: Bill Smith Mine Pump Test
D-6 Attachment B: Q Sand Pilot Pump Test
D-6 Attachment B APPENDIX B: Aquifer Pump Test Data and Data Plots
D-6 Attachment C: 0 Sand Pilot Pump Test
D-6 Attachment D: Section 25 AND Section 35 Pump Tests
D-6 Attachment D Appendix A: Compression and Porosity Tests on Shale Cores
D-6 Attachment D Appendix B: Pumping Tests Data
D-6 Attachment D Appendix C: Transmissivity and Storage Coefficient Calculations
D-6 Attachment D Appendix D: Application of Ratio Method to K' Calculations
ADDENDUM D-6 BI: HIGHLAND TABLES
Table D-6.1: Box Creek Streamflow Data, 1956-1957
Table D-6.2: Box Creek Streamflow Data, 1956-1958
Table D-6.3: Surface Water Quality Data
Smith Ranch Permit D6-iii Revised - April 2011
Table D-6.4: Aquifer Characteristics at Highland Uranium Project
Table D-6.5: Confining Unit Average Vertical Permeabilities
Table D-6.6: Potable Water Quality Data Summary
Table D-6.7: Shallow Wells Water Quality Data Summary
Table D-6.8: Average Premining Ground Water Quality Based in Baseline Sampling of WellsMP-1 through MP-5
Table D-6.9: Average Pre-injection Ground Water Quality Based on Baseline Sampling of WellsMP- 11 through MP-31
ADDENDUM D-6 B2: HIGHLAND FIGURES/PLATES
Figure D6-1: Location of Monitoring and Sampling Stations
Plate D6-1: 40 Sand Potentiometric Surface Map
Plate D6-2: 50 Sand Potentiometric Surface Map
Plate D6-3: 60 Sand Potentiometric Surface Map
Plate D6-4: Highland Uranium Project West Highland Amendment Oil Well, Ground Water &Surface Water Location Map
ADDENDUM D6 B3: HIGHLAND SUPPLEMENTAL INFORMATION
NOTE: This Addendum contains no Supplemental Information; therefore tab B3 has beenremoved.
ADDENDUM D-6 Cl: REYNOLDS RANCH TABLES
Table D-6.1: Description of Hydrogeologic Units in the Vicinity of the Proposed SiteTable D6-2: Existing Stock and Domestic Wells-Reynolds Ranch Permit Amendment Area + 1/2 MileTable D6-3: Surface Water Rights Reynolds ranch Permit Amendment Area + 1/12 MileTable D6.4: Potentiometric Surface Monitor Well Information and Water Levels
ADDEBDYN D-6 C3: REYNOLDS RANCH SUPPLEMENTAL INFORMATION
Attachment D6-1: O-Sand and U/S-Sand Pumping Tests
Smith Ranch Permit D6-iv Revised - April 2011
APPENDIX D-6
HYDROLOGY
1.0 GENERAL
The Smith Ranch Project consists of approximately 40,000 acres and is located in the southern portion of
the Powder River Basin. The Powder River Basin is bounded on the west by the Bighorn Mountains and
the Casper Arch and on the south by the Laramie Range-Hartville Uplift. The northern and eastern
margins of the basin are less distinct. The broad Black Hills Uplift forms the eastern demarcation, and the
Miles City Arch forms the northern boundary. The topography in the permit area is characterized by
gently rolling upland areas and broad stream valleys that are dissected by numerous draws with relatively
steep slopes and rounded ridge crests (Plate D6-4 of Addendum D-6 B2). The streams within the project
area are all ephemeral and many areas drain internally to small playas. Small stock ponds have been
constructed on some of the ephemeral streams. Surface waters in the area are used for stock watering and
are utilized by wildlife.
Underlying the permit area are several thousand feet of sedimentary deposits. The shallow strata, which
relate to this ISR application includes the Fort Union Formation, which consists of alternating beds of
claystones, siltstones, and sandstones. These claystones, siltstones, and sandstones are usually
discontinuous and lenticular over larger areas. The individual sandstone units are, depending on thickness
and areal extent, considered aquifers in the area. Ground water obtained from these sandstones can be
used for stock watering purposes and a few domestic uses. These ground water resources have historically
also been used for uranium mining related (industrial) uses and were dewatered as part of historical
underground and open pit mining.
2.0 SURFACE WATER
2.1 Surface Water Quantity
The permit area is located in the southern part of the Powder River Basin in the Sage Creek
drainage of the North Platte River drainage system and the Box Creek, Duck Creek, Willow
Creek, and Brown Springs Creek drainages of the Cheyenne River drainage system (Figure
D6-1). The local topography and drainage system are shown on Plate D6-4 of Addendum D-6
B2. All streams are ephemeral and flow only in response to snow melt and heavy thunderstorms.
There are no gauging stations within the drainages. Therefore, quantities are not measured.
A considerable portion of the area encompassed by the project site is internally drained to playas.
The project site receives approximately 12 inches of precipitation annually (see Appendix D4 for
Ah additional climate information). Stock ponds constructed in many of the ephemeral streams
Smith Ranch Permit D6-1 Revised - April 2011
draining the area collect some runoff for watering livestock; however these ponds are dry much
of the time. Additionally, there are numerous playas present which hold runoff water during
times of abundant precipitation. Tables D6-1 and D6-2 in Addendum D-6 Bi, which contain
USGS stream flow records for Box Creek, downstream of the permit area (drainage area = 109
mi 2) show the lack of runoff and stream flow in the area and the ephemeral nature of the stream
system.
Sage Creek runs through the southwest portion of the permit boundary. The USGS
maintained a stream gage near Orpha, Wyoming, approximately 1.6 miles southeast of the
southeast corner of the permit boundary (USGS Gage No. 06648780). Peak streamflow
values were recorded from 1965-1984 (Table D6-1). The data indicate that Sage Creek is
highly variable as annual peak flow rates range from 0 to 229 cfs. Sage Creek is also
ephemeral, as five out of nineteen years were dry.
2.2 Surface Water Quality
The land along Box Creek and the Middle and East Forks of Willow Creek is predominantly
rangeland and surface water, when collected, is used for livestock and wildlife watering. The
drainages are ephemeral and flow only in response to. snow melt or major precipitation
events. Exxon regularly analyzed water samples from selected points in the Box Creek drainage
during operation of surface mining activities. The data, which historically have been considered
to be representative of surface water quality from the entire permit area, are included in Table
D6-3 of Addendum D-6 B1. Sampling locations are shown on Figure D6-1 of Addendum D-6
B2. These data indicate that water quality in these surface waters does not meet Wyoming
domestic water use suitability standards (Class I) or EPA public health standards for chloride,
sulfate, and total dissolved solids. These waters do meet Wyoming livestock use suitability
standards (Class III) and are suitable for stock and wildlife consumption.
Surface water at the Reynolds Ranch area of the permit is also limited to snow melt and
runoff from major precipitation events. A working stock pond, which is supplied primarily
by a shallow well, is located within the area. Surface water quality results for the Reynolds
Ranch area are presented in Attachment D6-2 of Addendum C.
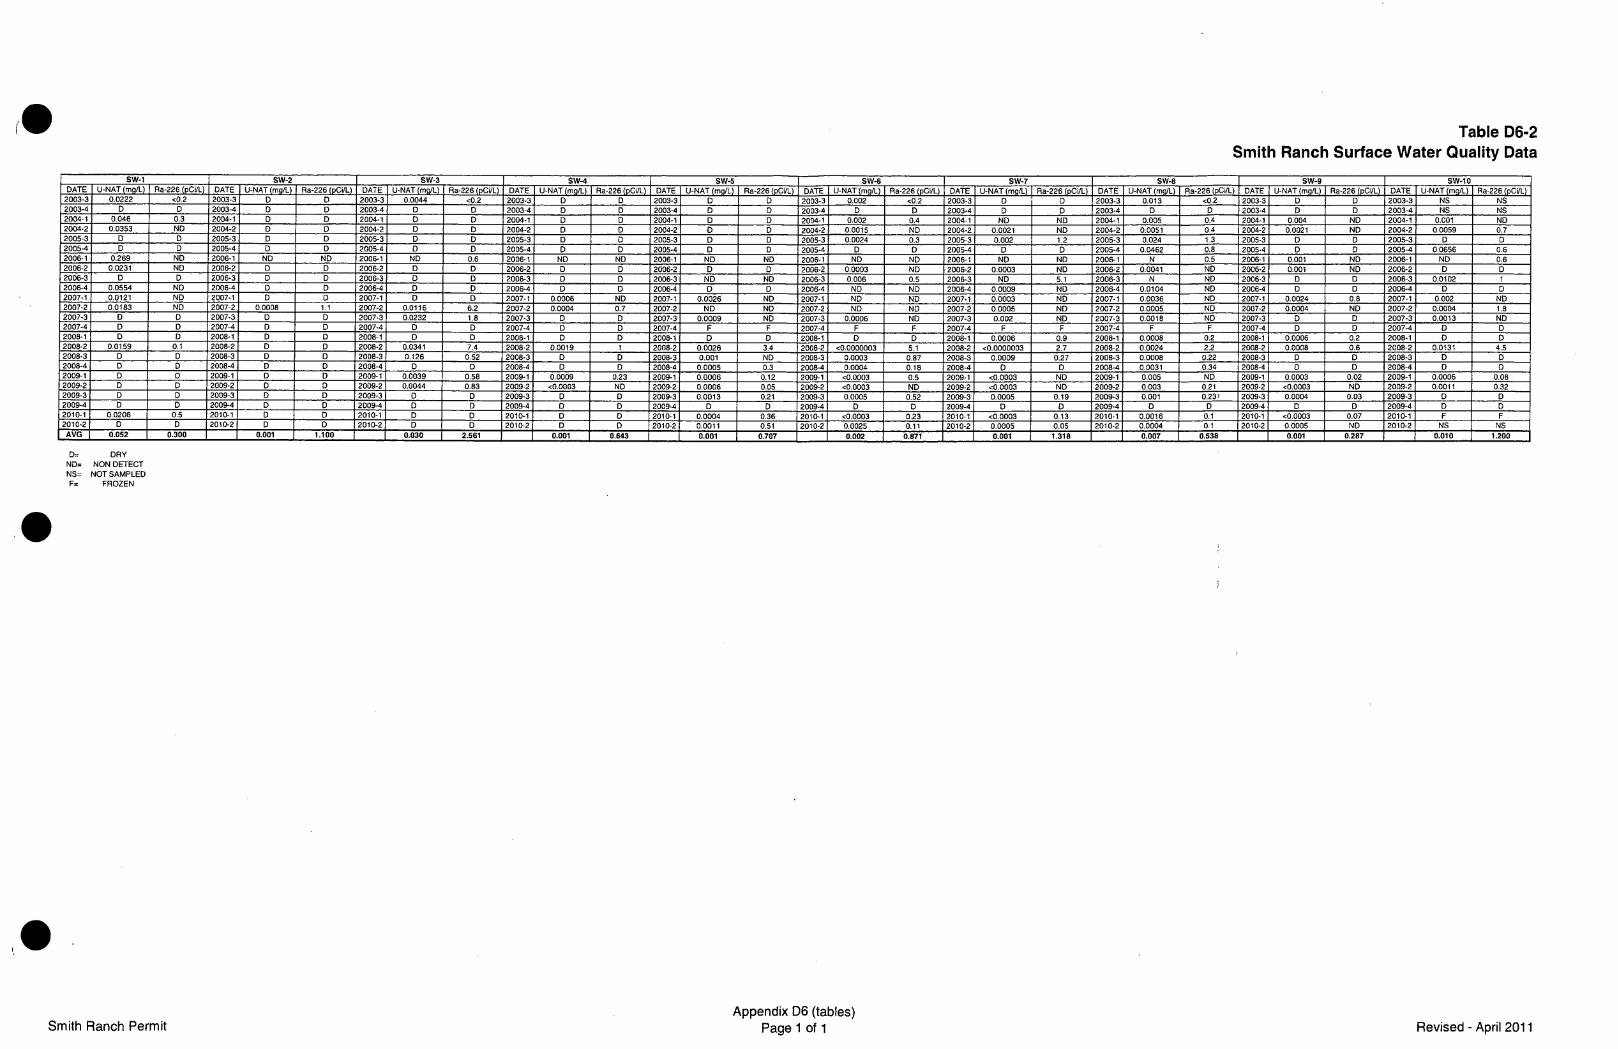
Sampling for radiological constituents have been collected at select surface water points
within the Smith Ranch permit area since 2003 (see Figure D6-2). The results are
summarized in Table D6-2.
Smith Ranch Permit D6-2 Revised - April 2011
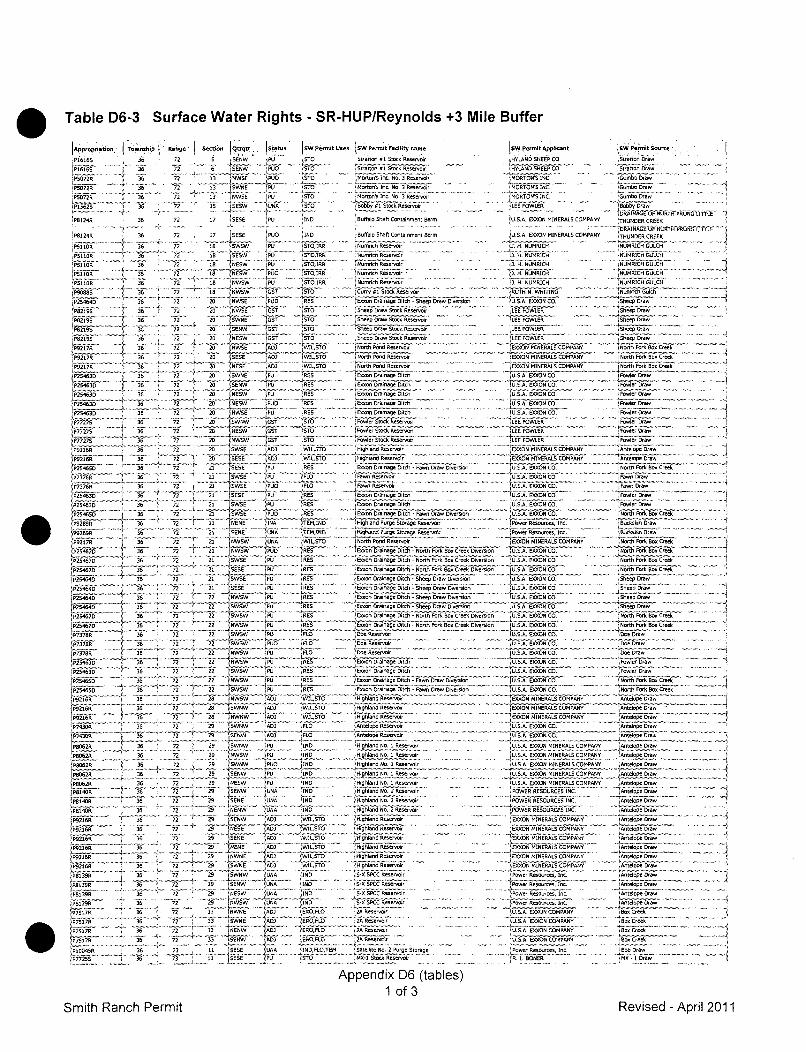
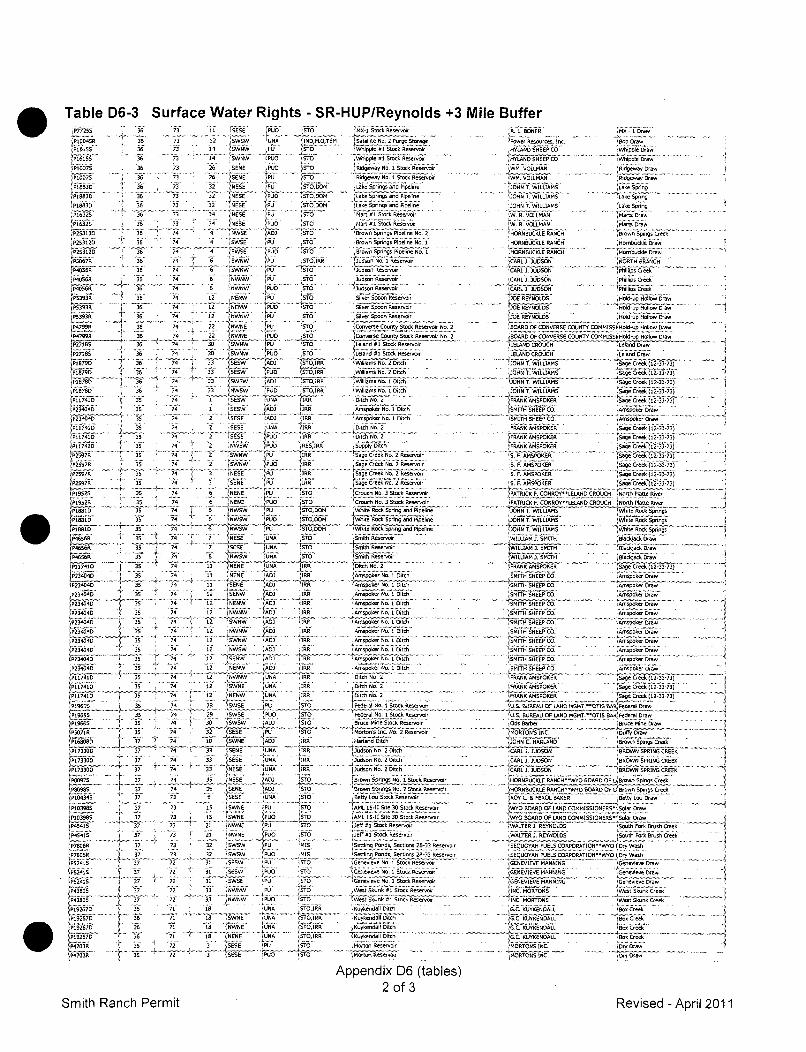
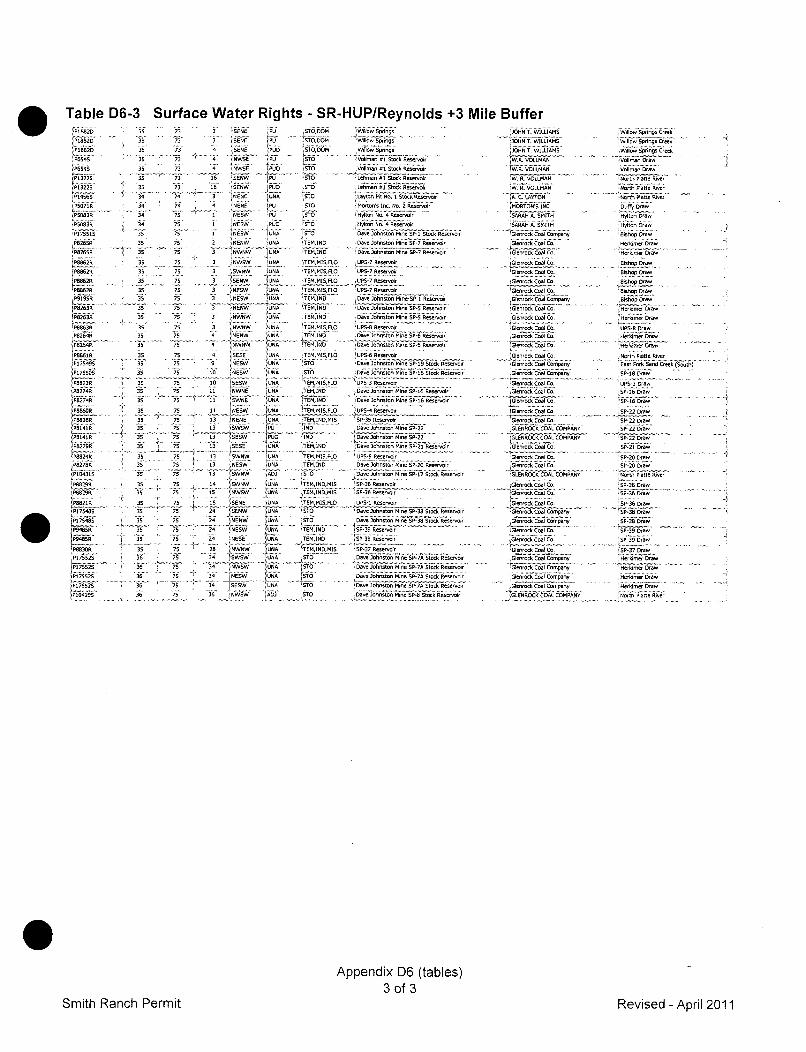
2.3 Surface Water Rights
A list of all surface water rights within the permit area and on adjacent lands, as of March 2011
is included in Table D6-3. The locations of the surface water rights are shown on Plate D6-1.
The majority of surface water rights are limited to small stock ponds and associated ditches.
3.0 GROUND WATER
3.1 General
Descriptions of the geologic-formations of the Powder River Basin and their hydrologic
properties have been discussed in numerous publications (Hodson et al., 1973; Hodson, 1971,
Whitcomb et al., 1958; Huntoon, 1976; Davis, 1976) and are summarized in Appendix D-5
(Geology). The hydrologic units beneath the permit area and in the general vicinity include the
following: Holocence-age alluvial deposits, the Eocene-age Wasatch Formation, the Paleocene-
age Fort Union Formation, and the Cretaceous-age Lance and Fox Hills Formations (Table D-6.1
of Addendum D-6 Al). Individual sandstones within these units may be classified as aquifers
depending on their hydrologic characteristics and potential yield to wells and/or springs. Previous
reports for the individual sandstone units within the permit area have used different nomenclature
for the different delineated sandstone (Smith Ranch vs. Highland) units. This historic
nomenclature is maintained throughout this document in an effort to preserve the sampling,
testing and mining history. For the purposes of correlation, the M sands, which are present on the
Smith Ranch property side are equivalent to the 10 sands on the Highland property side; the 0 1,
02, 03 and 04 Sands on the Smith Ranch property side are equivalent to the 20/30, 40/50, 60/70
and 80 sands, respectively on the Highland property side. In addition, The Q and S sands on the
Smith Ranch property side are equivalent to the 90 and 100 sands, respectively on the Highland
property side. A schematic sandstone correlation chart for Highland, Smith Ranch, and
Reynolds Ranch is included in Appendix D-5.
Wells drilled for conducting pump tests and/or collecting baseline data for the ISR project,
including the two ISR pilot projects, are listed on Table D-6.4 of Addendum D-6 Al and are
located as shown on Figures D-6.4, D-6.5, and D-6.6 of Addendum D-6 A2.
3.2 Ground Water Quality
Extensive ground water quality data have been collected from each of the two ISR pilot sites in
the western portion of the permit area and were previously submitted to NRC and WDEQ in the
NRC License Applications and LQD Quarterly reports. Baseline water quality data for the
production zones in the pilot projects are summarized in Addendum D-6 Al, Tables D6-5 and
D6-6 for the Q-Sand and O-Sand pilots, respectively.
Smith Ranch Permit D6-3 Revised - April 2011
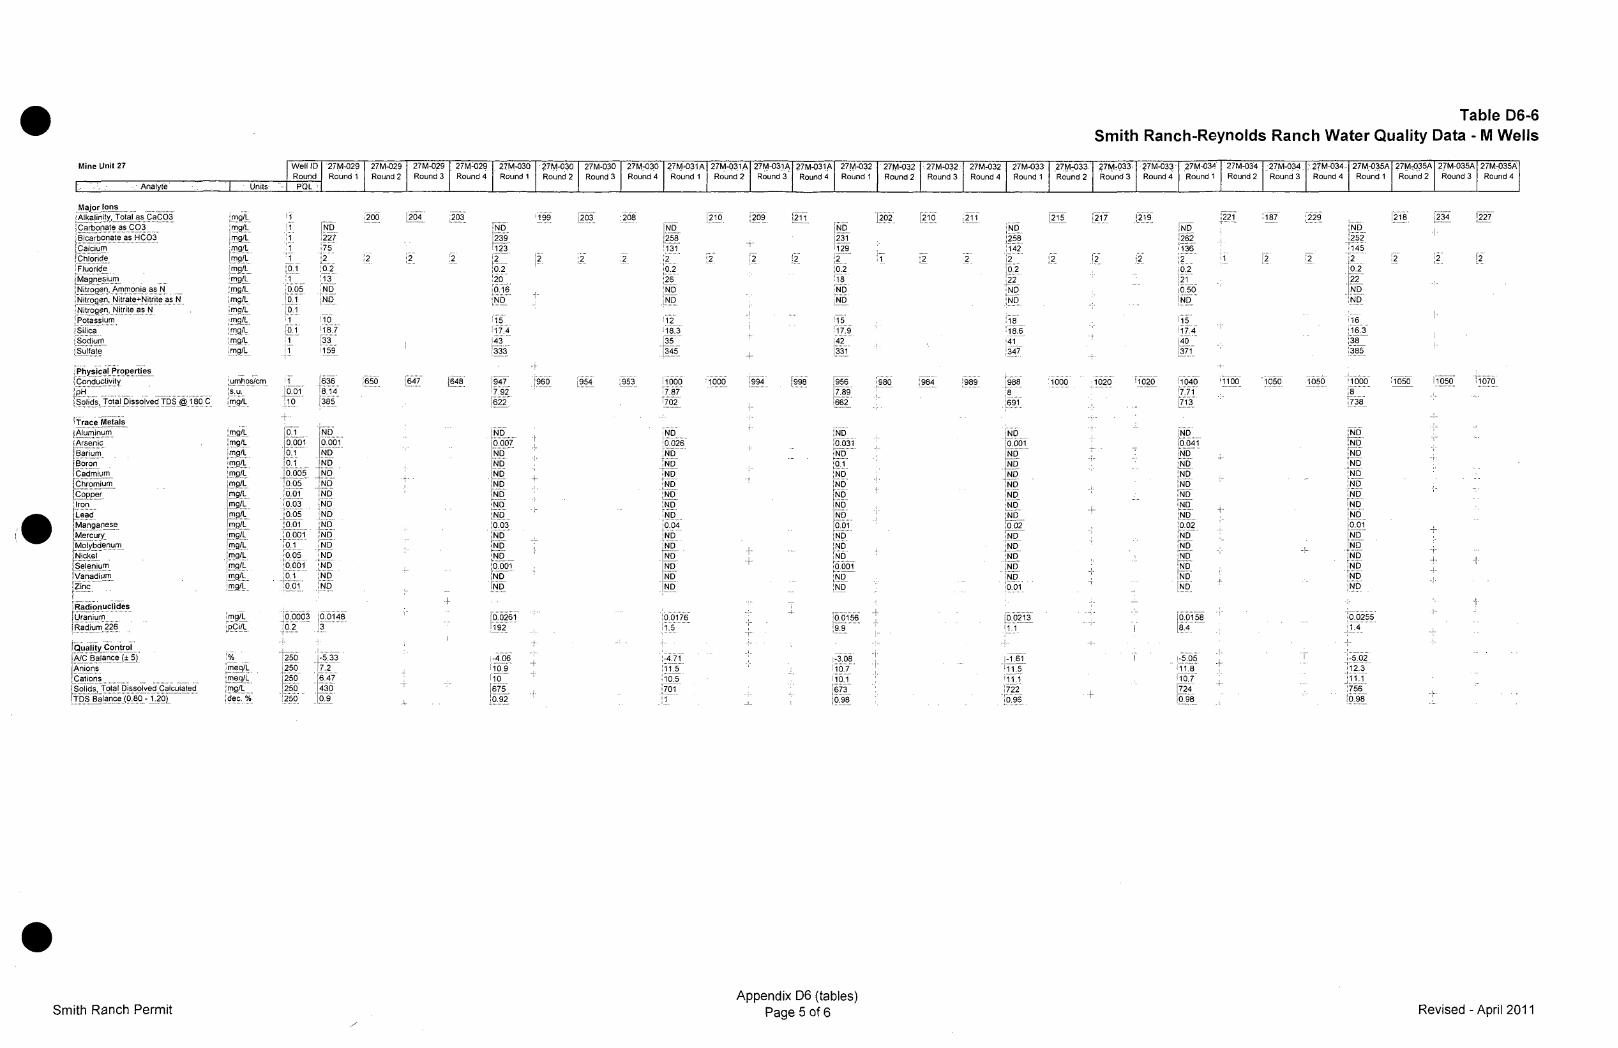
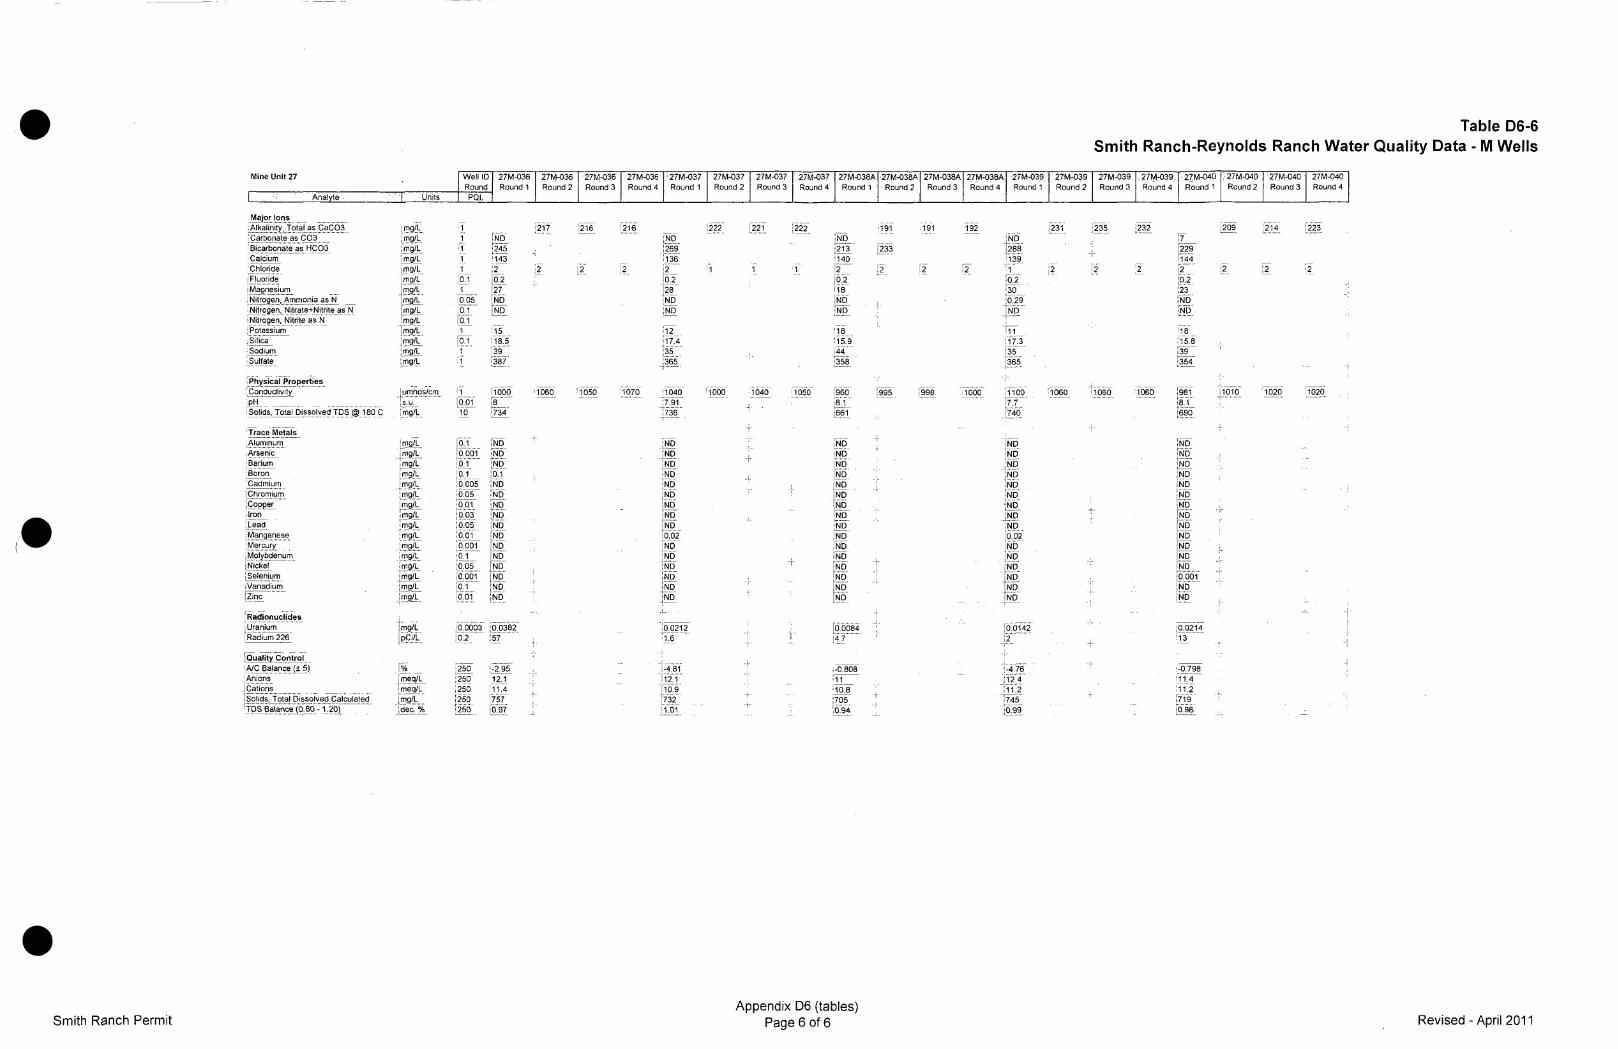
In addition to sampling at the pilot sites, baseline water quality data has also been collected from
about thirty of the other wells listed on Table D-6.4 of Addendum D-6 Al, to provide an
indication of the water quality to be expected in the permit area. Typically five samples were
collected from each well over a period of six to nine months and analyzed for the full list of
parameters. These data are included in Tables D-6.7 through D-6.36 of Addendum D-6 Al. In
general, the water quality is similar to that seen at the pilot sites; however, detailed evaluations or
consolidation of the data at this time would be of limited value, as the wells are completed in
different sand units within the lower Wasatch and Upper Fort Union formations and there
are only a limited number of wells in any one projected mine unit.
Baseline ground water quality data from the eastern portion of the permit area was submitted with the
original Highland permit application and is limited to data collected at:
* four Exxon water supply wells completed in the Highland ore sand aquifer, outside of the orezones;
" the Numrick livestock well;• the Fowler Ranch water well; and" the Vollman Ranch water well.
The latter three wells are completed in the intermediate sand zone which lies stratigraphically above the
local ore sand aquifer. This aquifer has not, nor is it anticipated to be affected by mining activities. The
locations of these wells are shown on Figure D6-1 of Addendum D-6 B2. A summary of the water
quality data are included in Tables D6-6 and D6-7 of Addendum D-6 Bi.
A vast amount of baseline ground water quality data have been collected since ISR activities started in
the eastern (Highland) portion of the permit area. Baseline ground water quality data have been collected
from the A, B, C, D, E, F, H, I, and J-wellfield areas as part of required wellfield development activities
at the Highland Project section. Numerous water quality samples have been collected from the 10, 20,
30, 40, 50 and 60-sands to document baseline conditions within this portion of the property. These data
are on file with both the WDEQ and NRC.
In general the baseline ground water quality in these eastern (Highland) area sandstone aquifers usually
meets Class I-Domestic use suitability standards (WQD R&R's Chapter 8) except in proximity of the ore
zones where radium concentrations can greatly exceed the domestic, agriculture and livestock standard
of 5 pCi/l. Total dissolved solids concentrations sometimes exceed the domestic standard of 500 mg/1.
Tables D6-8 and D6-9 of Addendum D-6 B1 provide a sumnary of the baseline water quality data for
the 20 and 30-sands, respectively, in the A and B mine unit areas. This data summary is representative of
baseline ground water quality conditions throughout the project site.
Smith Ranch Permit D6-4 Revised - April 2011
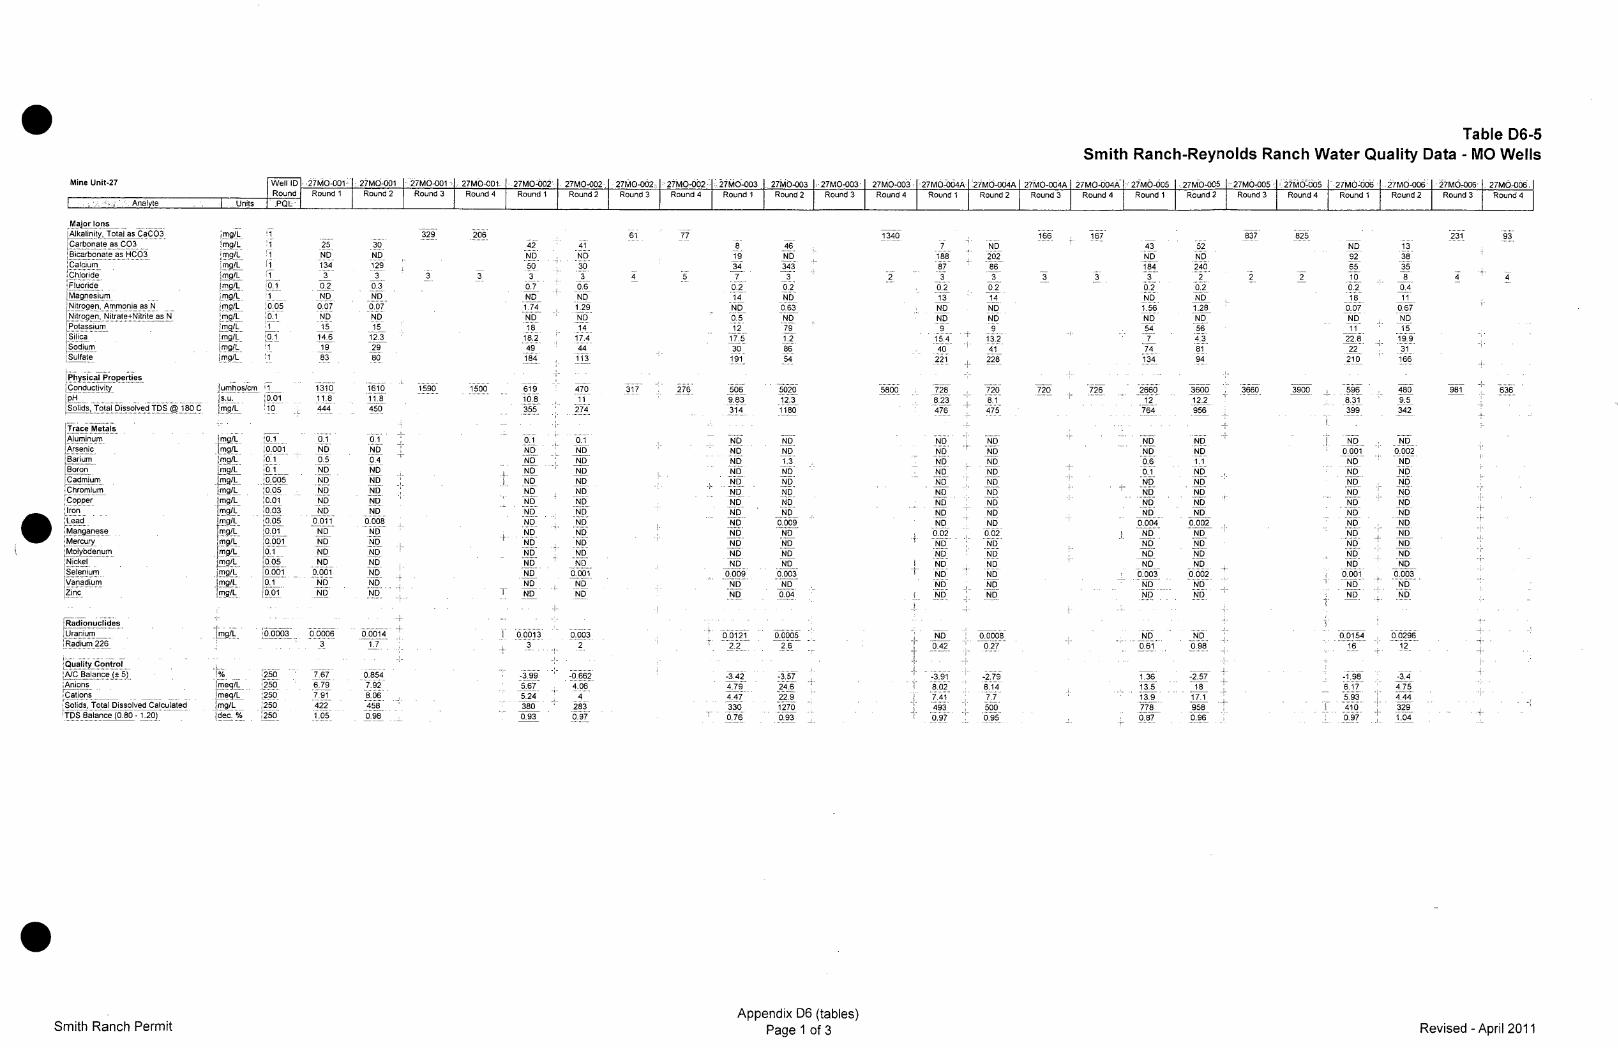
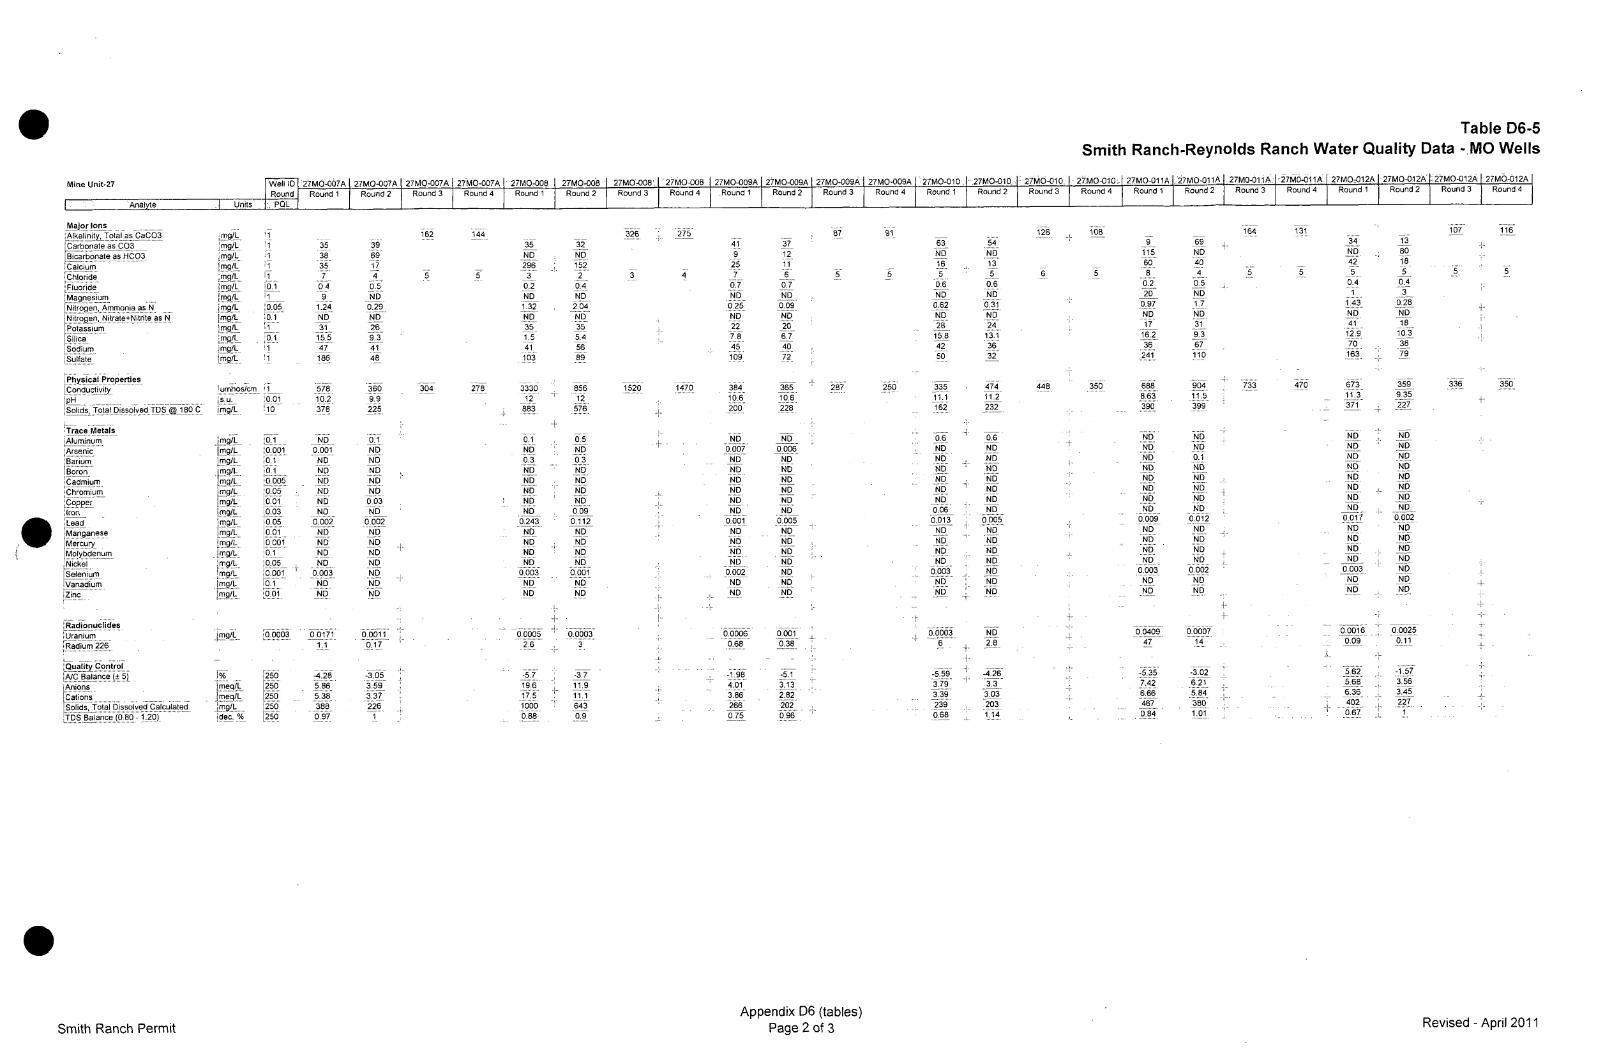
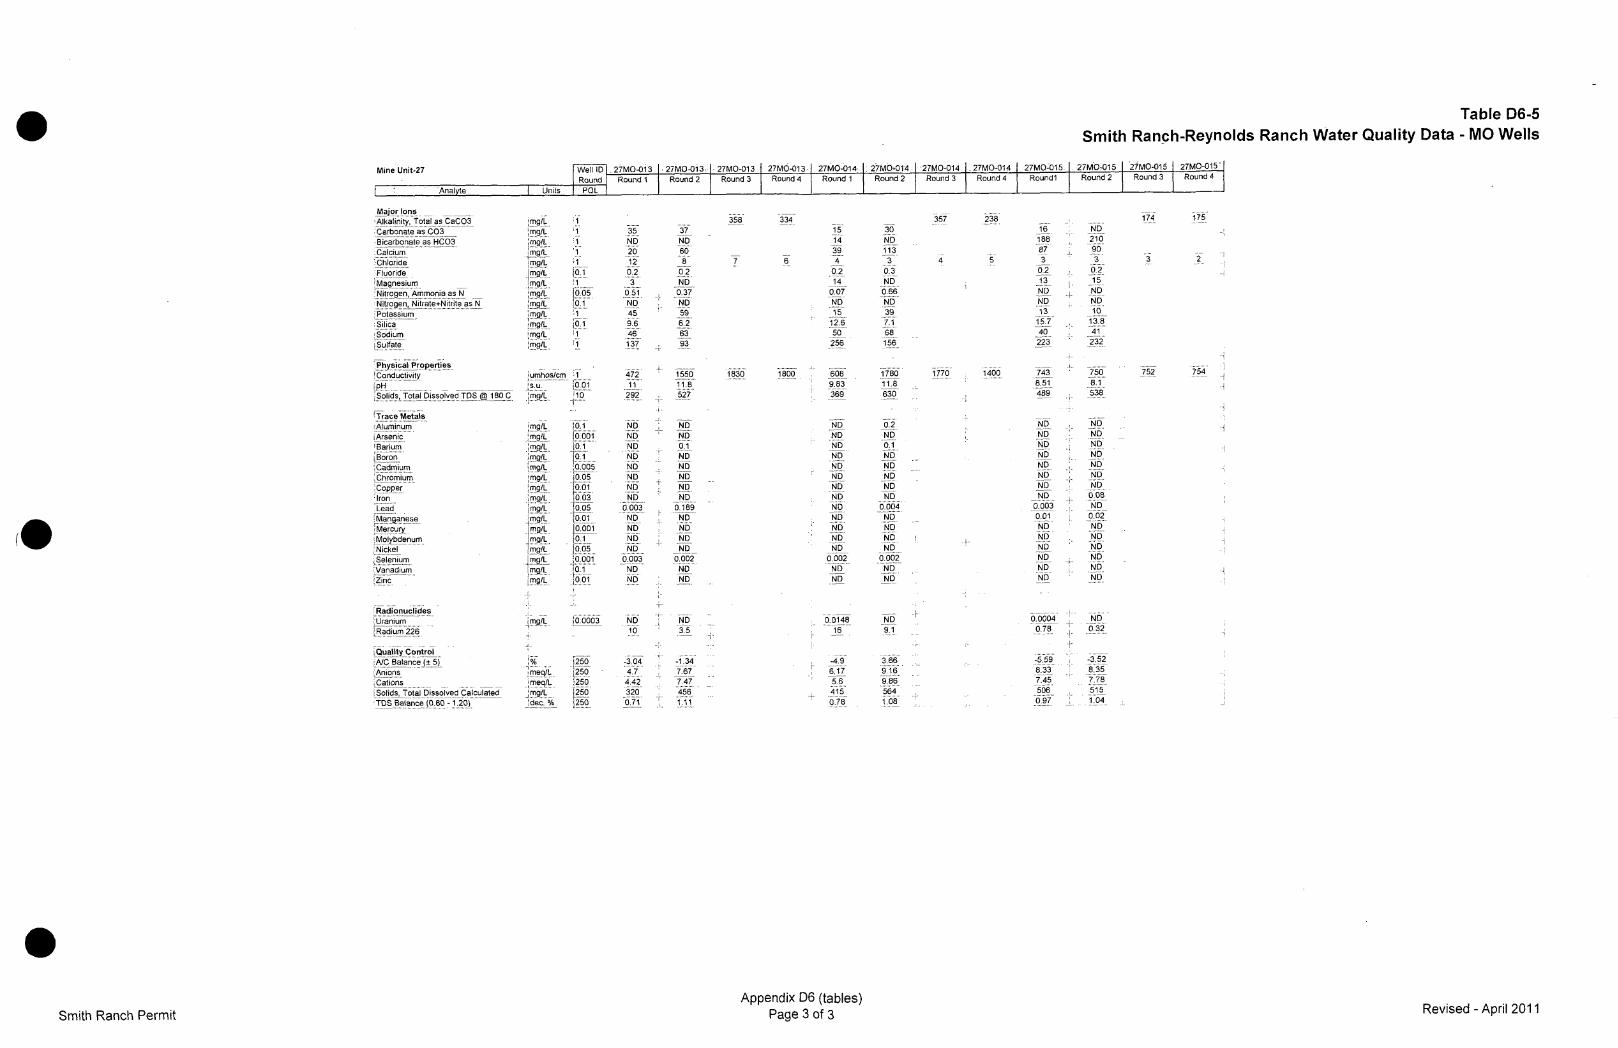
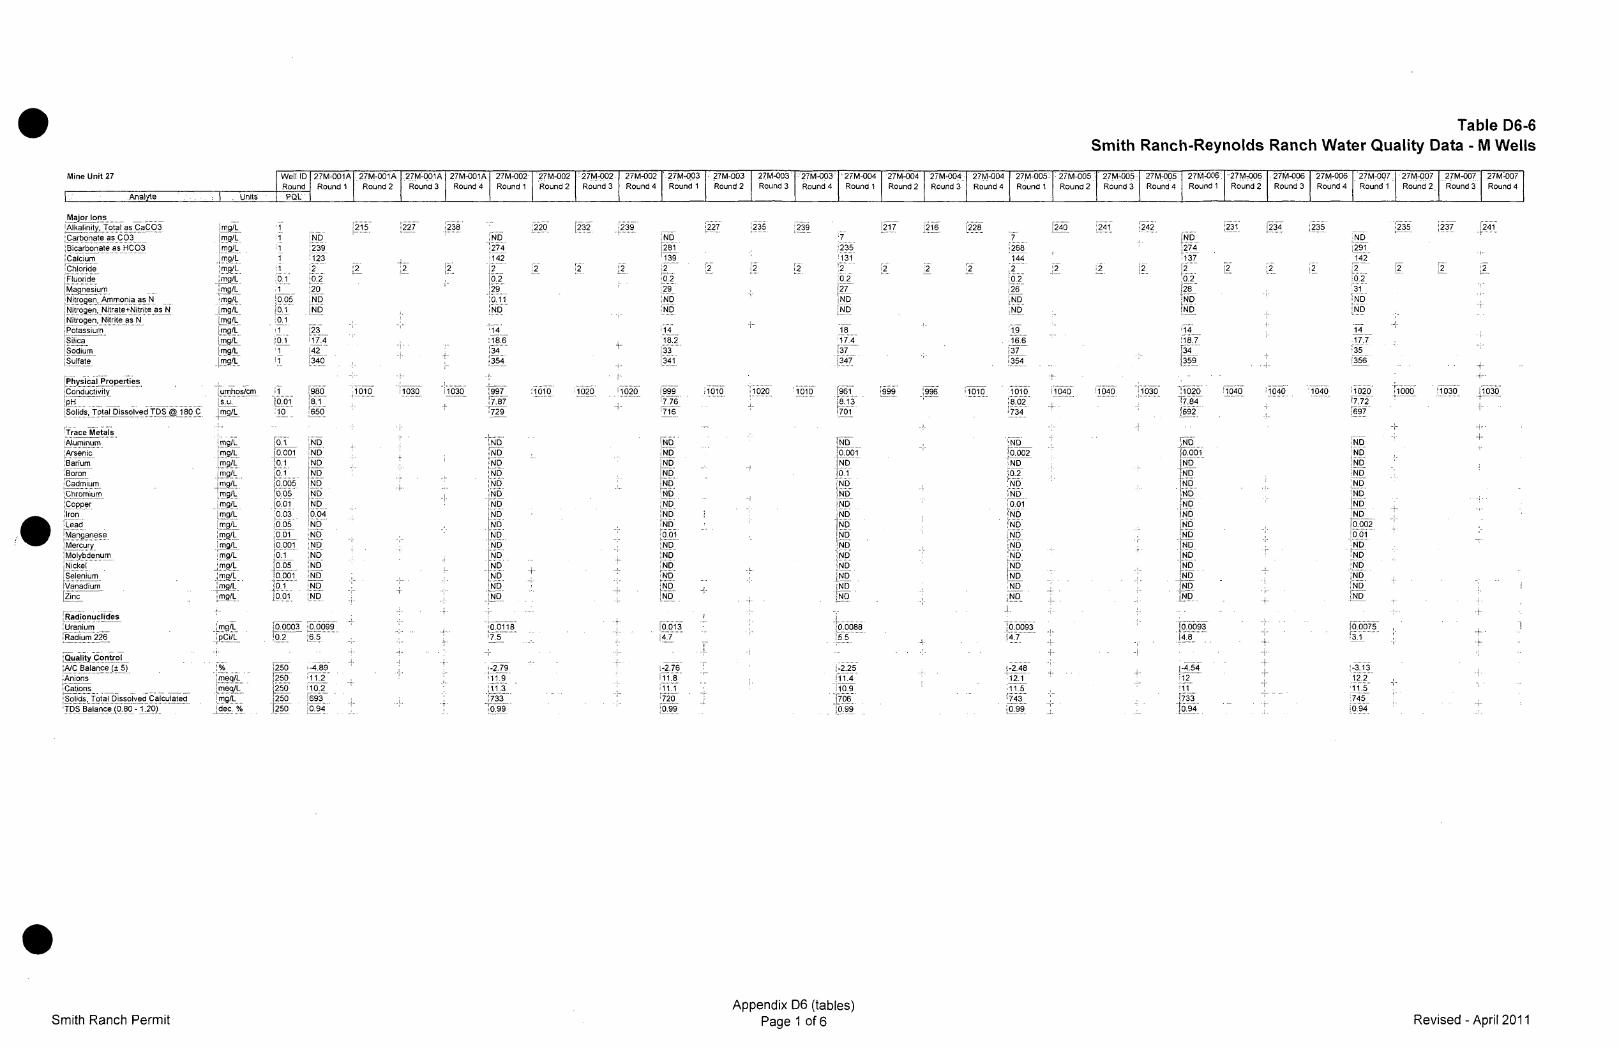
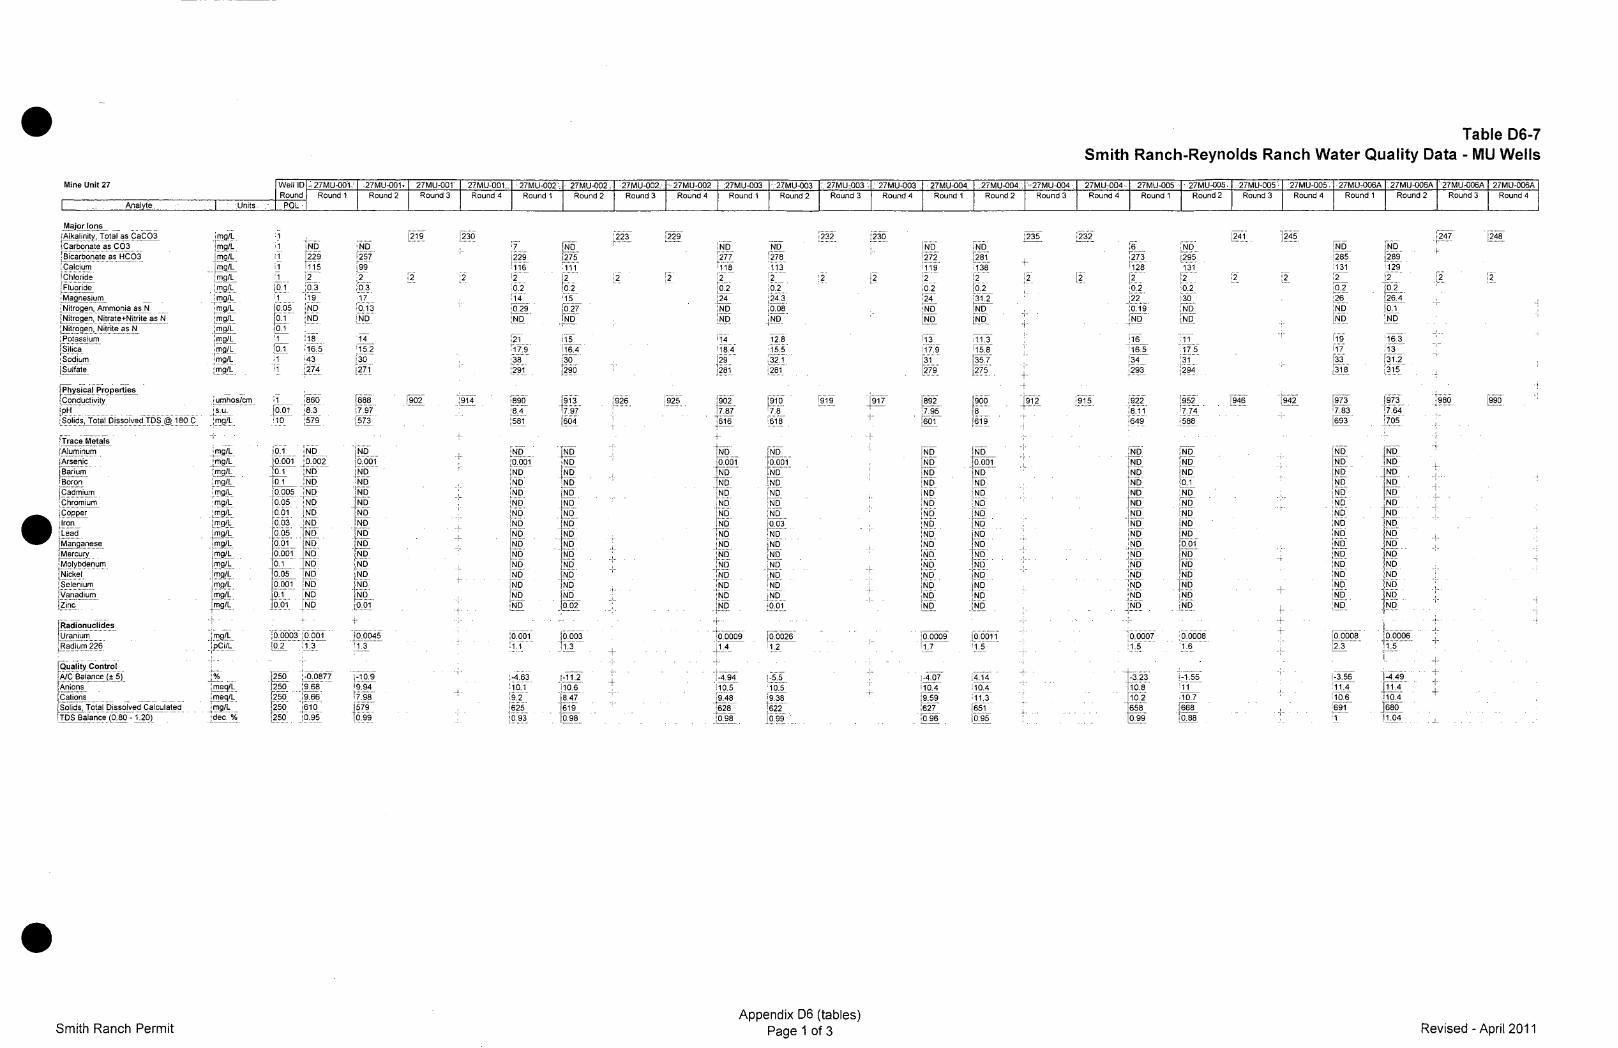
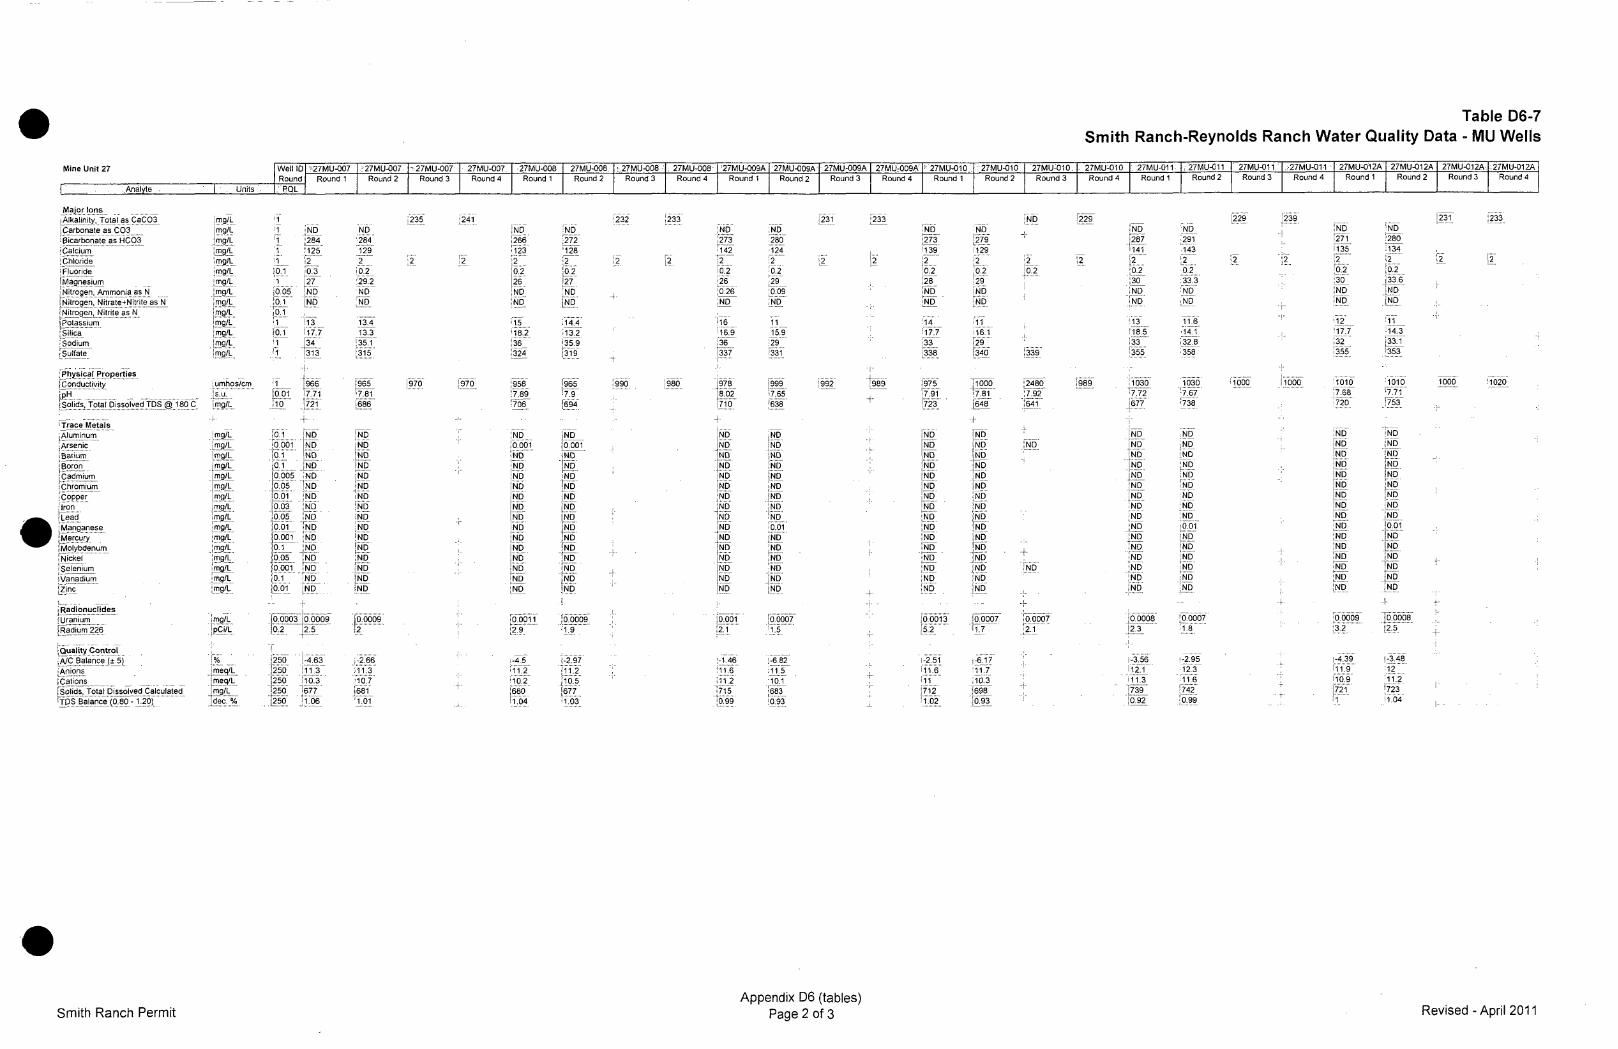
Extensive ground water quality data were previously collected by Solution Mining Corporation
for the Reynolds Ranch area. The water quality data collected were from the planned production
zones and potential potable or existing stock water sources. This baseline water quality data are
presented in Attachment D6-2 of Addendum D-6 C. A well location map is also presented in
Addendum D-6 C as Figure D6-1. Additional water quality data collected from the proposed
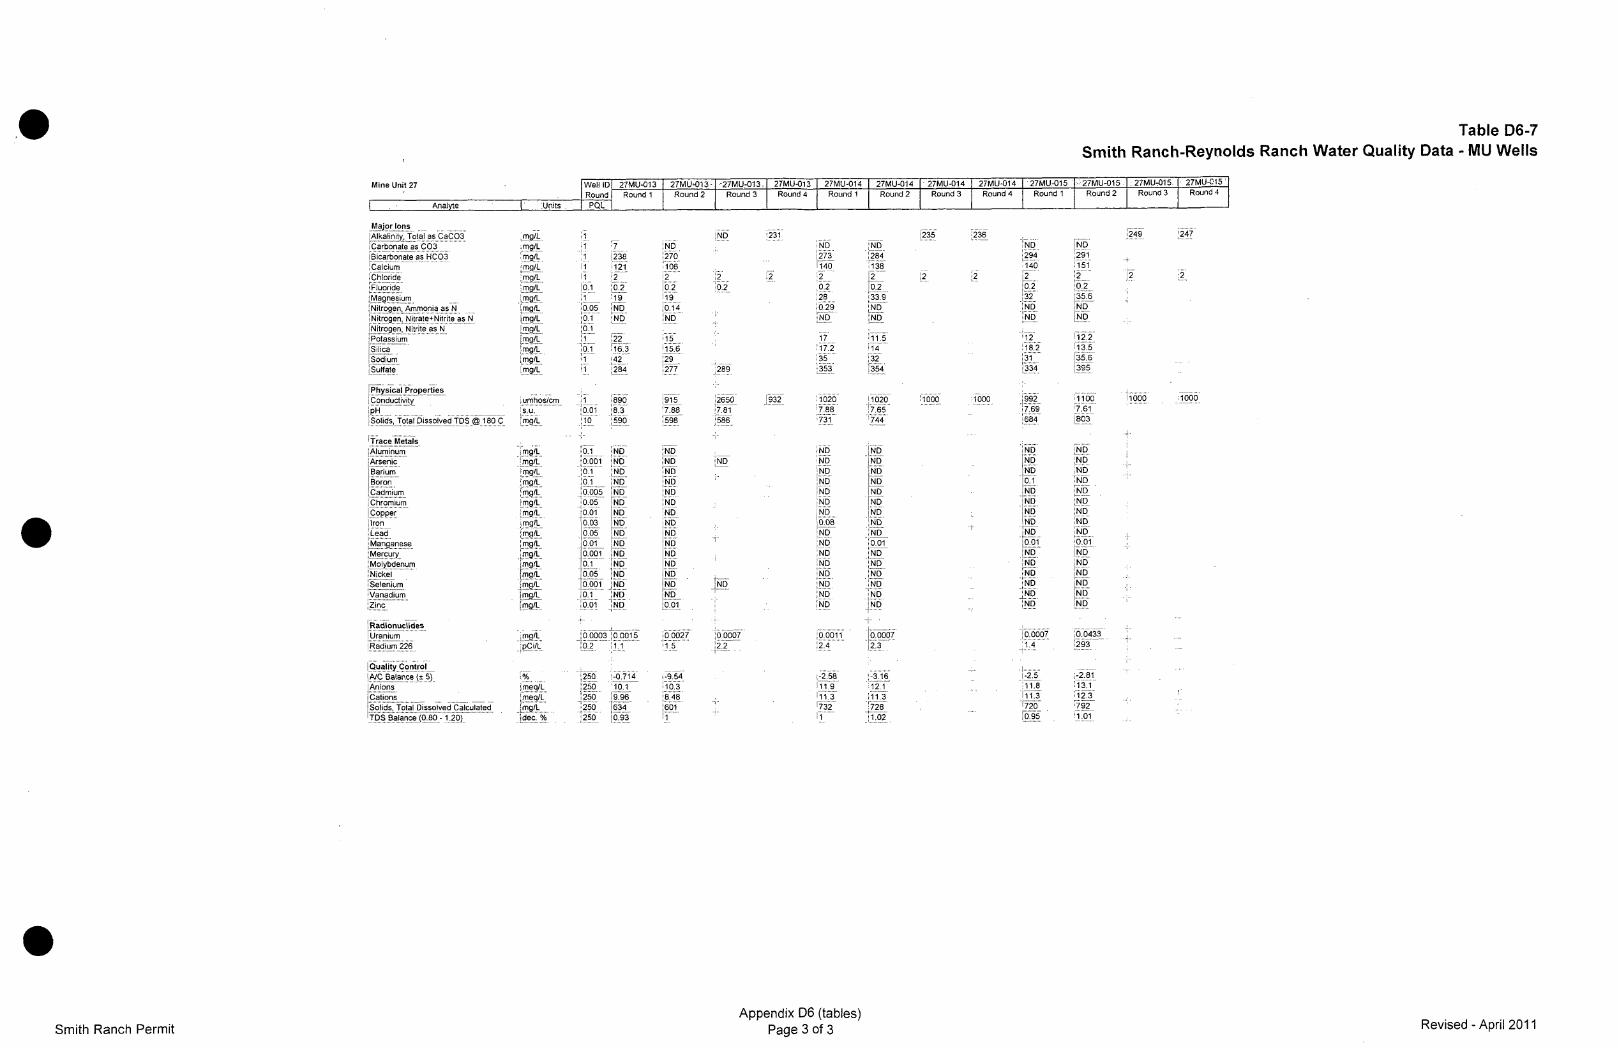
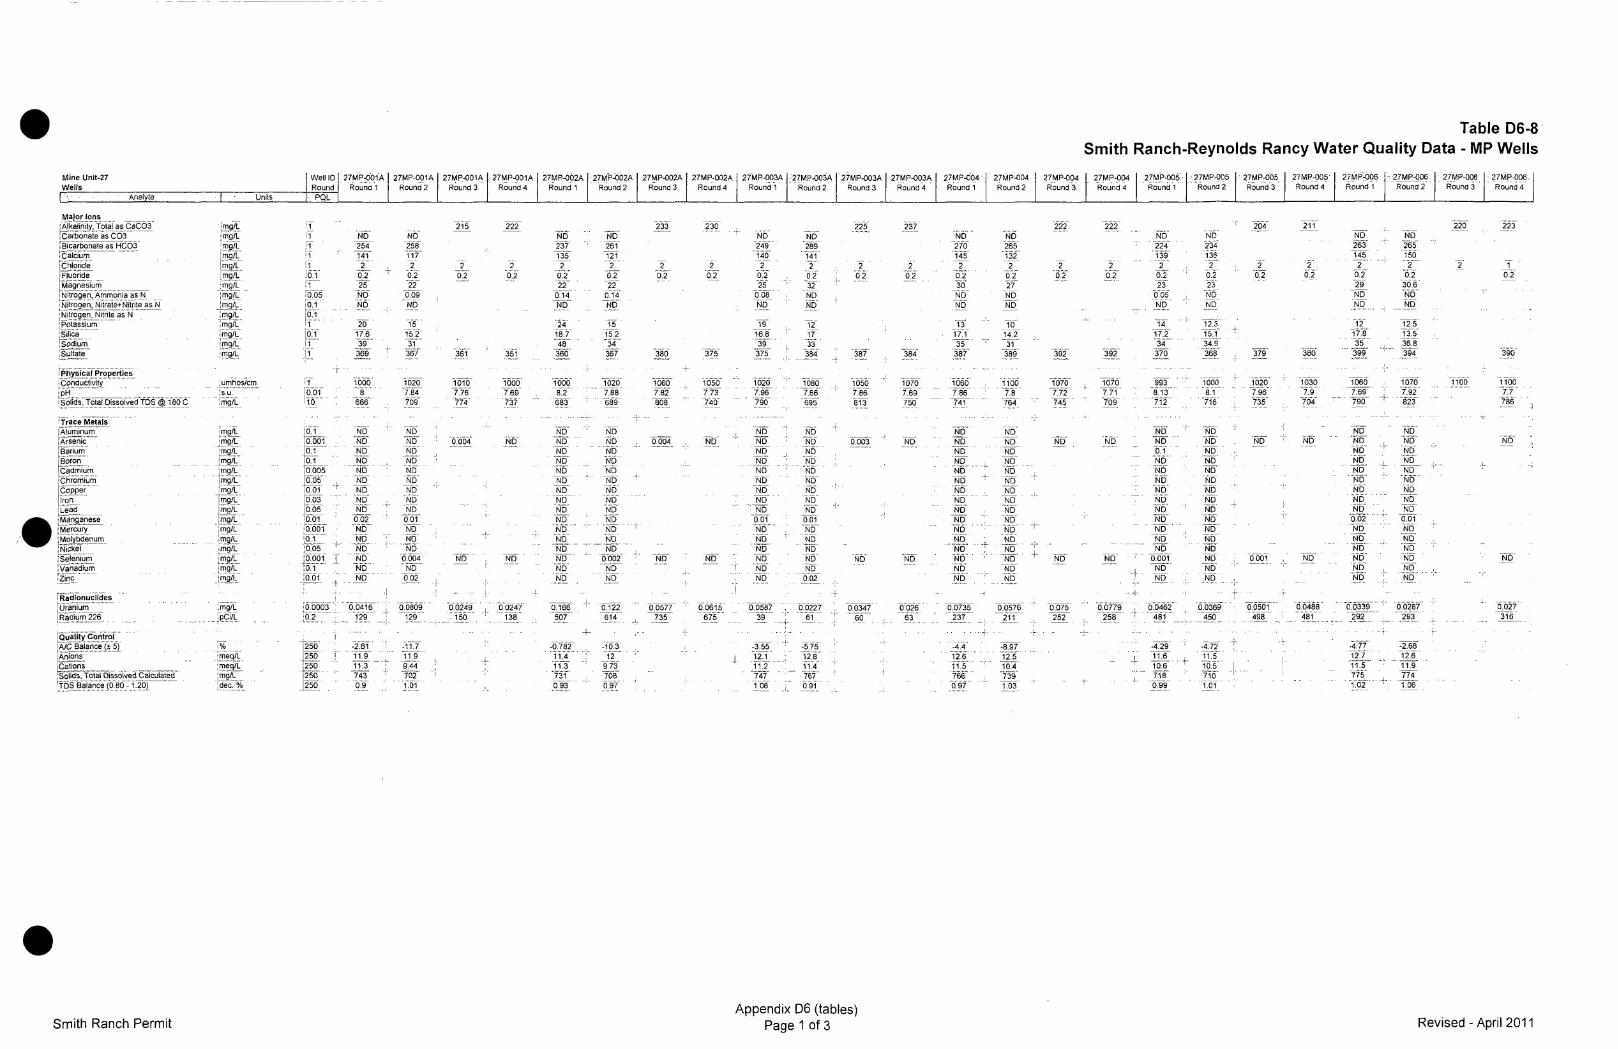
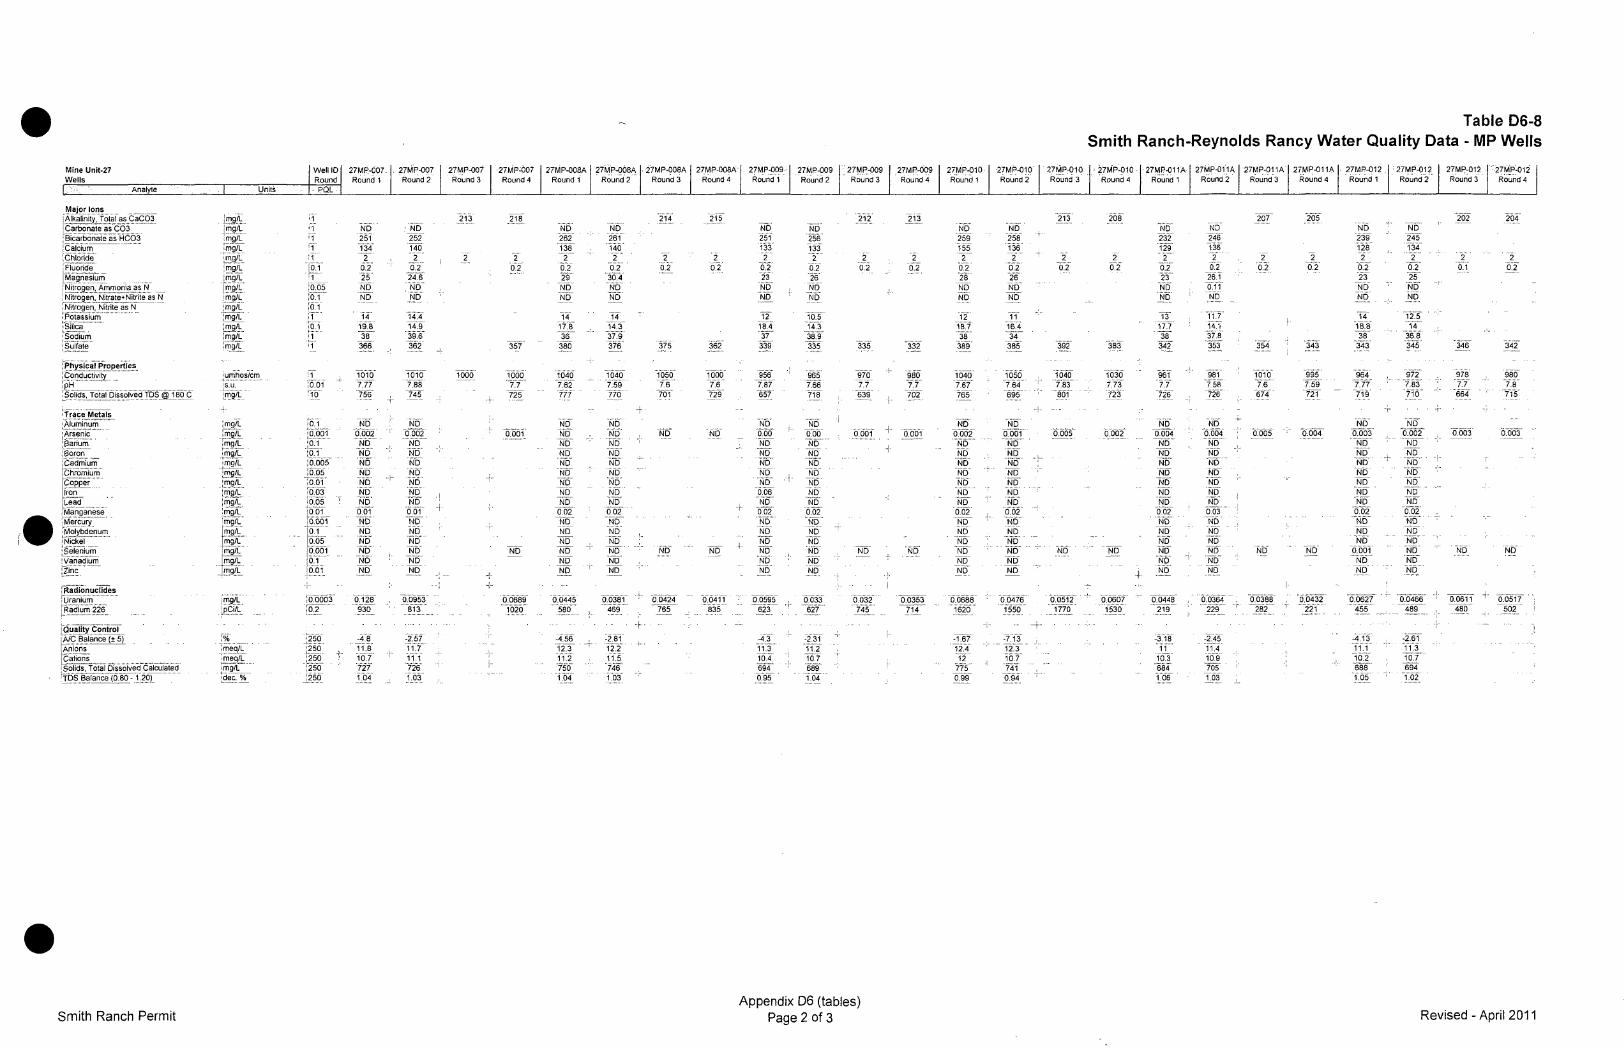
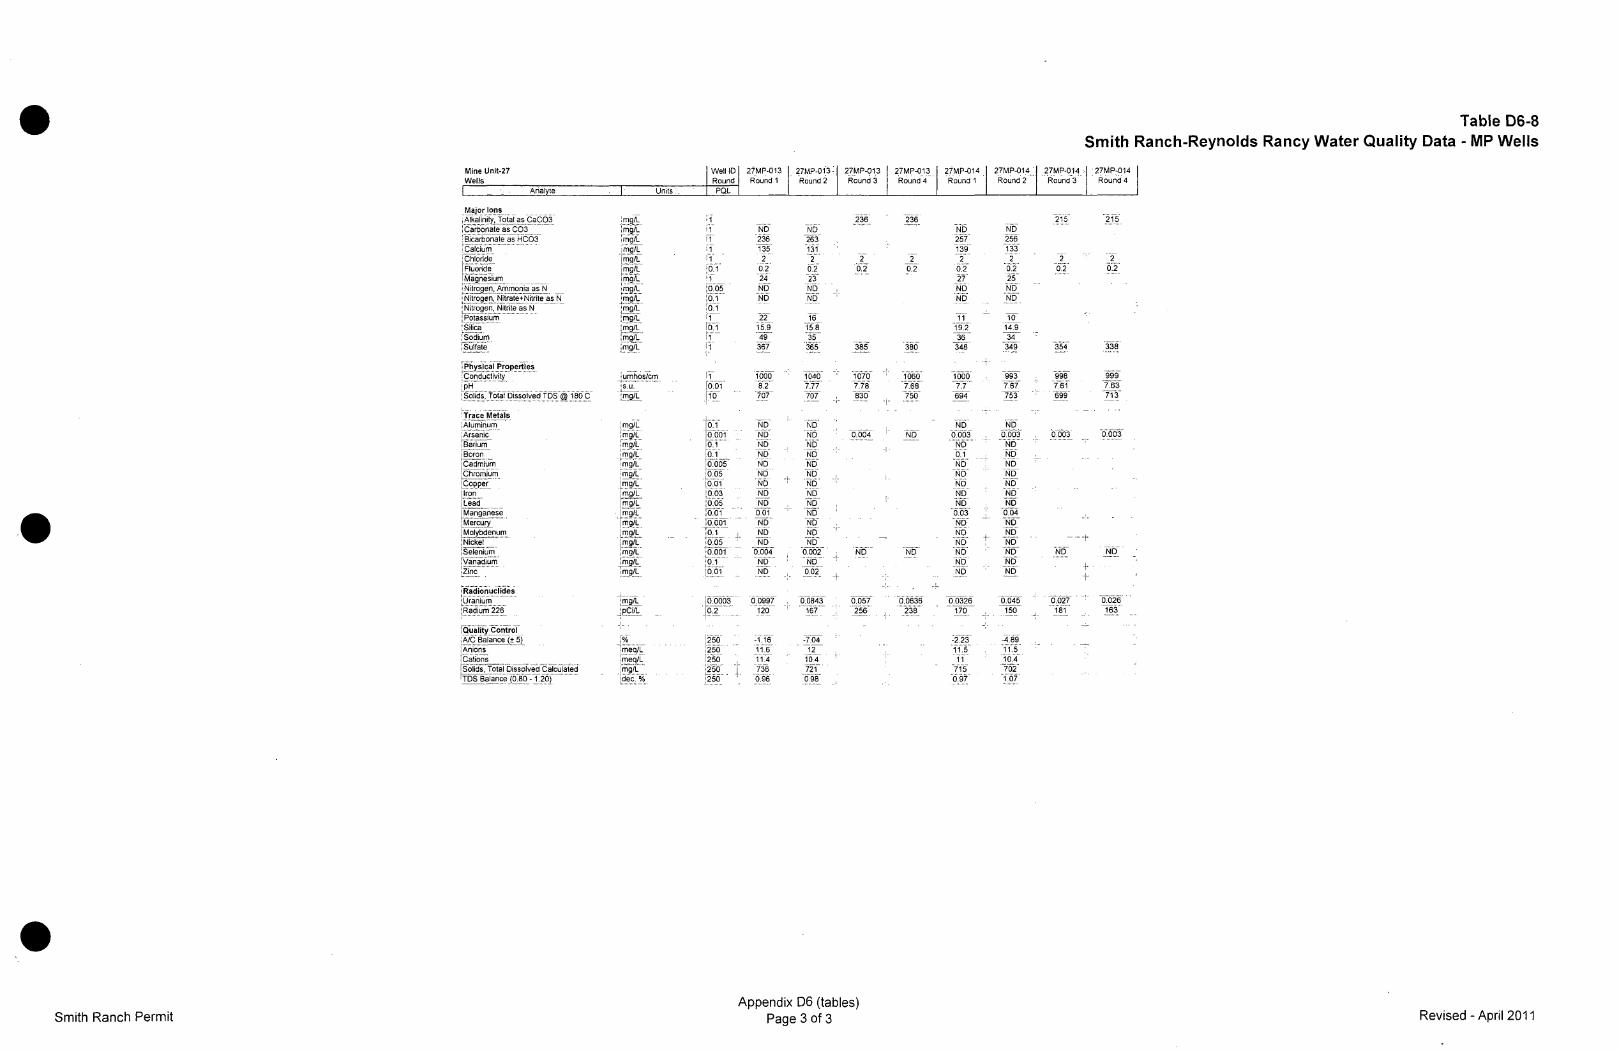
Mine Unit 27 in 2004 is presented in Table(s) D-6-5, D6-6, D6-7, and D6-8.
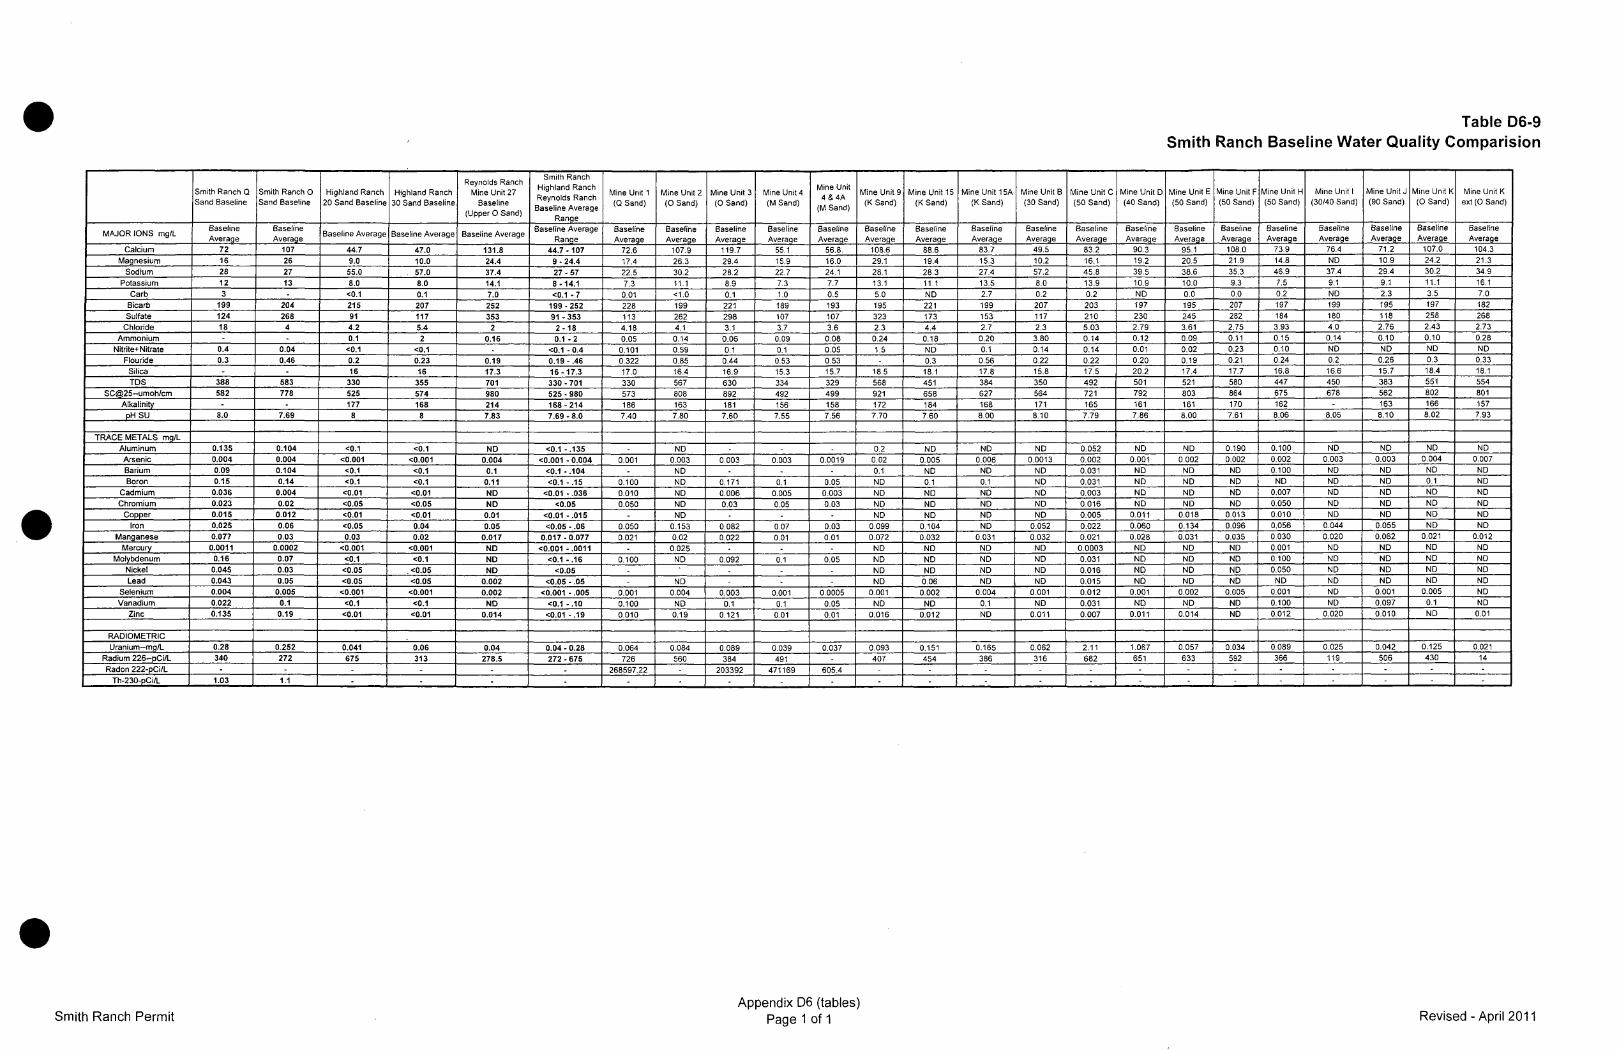
A baseline water quality comparison was conducted using Smith Ranch, Highland and Reynolds
Ranch historical water quality data. Average concentrations of constituents from Smith Ranch
and Highland (Tables D6-5 and D6-6 of Addendum D-6 Al; Tables D6-8 and D6-9 of
Addendum D-6 Bi) were combined with averages from Reynolds Ranch Mine Unit 27 (Table D6-
9). An average baseline range of parameters were created using Smith Ranch, Highland, and
Reynolds Ranch data and compared to the approved mine unit baseline data. Averages for
approved mine unit baseline data was developed from MP wells (i.e., interior production zone
wells). A summary of water quality data previously mentioned above is presented in Table D6-9.
Comparing the approved mine unit data to the baseline average range of parameters, 98
outliers were identified from the hundreds of analyses that were performed. The majority of
outliers were just outside the minimum or maximum average. Of note are uranium values
for Mine Units C and D which exceed the average range of concentrations with values of
2.11 and 1.07 pCi/L, respectively.
The average water quality results for the approved mine units compared favorably to the baseline
water quality range from Smith Ranch, Highland, and Reynolds Ranch. Overall, the water
quality is dominated by Calcium-Sodium-Bicarbonate-Sulfate water.
3.3 Hydrogeologic Units
Alluvium. The alluvium in the permit area consists of thin, unconsolidated, poorly stratified
clays, silts, sands, and gravels. The total thickness of these deposits is estimated to range from
less than 1 foot to 30 feet. Small amounts of precipitation infiltrate the alluvium during part of the
year and intermittent flows across the alluvium may provide some recharge. The water table is
typically more than 100 feet below the land surface throughout most of the permit area.
Therefore, most of the recharge flows through the lower portion of the alluvium. The potential for
future development of alluvial groundwater supplies in the permit area is considered very poor.
A local geology map is presented on Figure D5-3.1 in Appendix D-5.
Smith Ranch Permit D6-5 Revised - April 2011
Wasatch Formation. The Wasatch Formation typically is lenticular, fine- to coarse-grained
sandstones with interbedded claystones and siltstones. This formation underlies all except the
southwestern and extreme western portions of the permit area and ranges in thickness from 0 to
approximately 500 feet. The Wasatch Formation is one of the more important shallow aquifers in
the Powder River Basin.
Properly constructed wells penetrating the Wasatch Formation in the vicinity of the Smith
Ranch Central Processing Plant generally yield from 5 to 15 gallons per minute (gpm). A water
supply well (WW-103) completed in the Wasatch near the former Bill Smith Mine initially
produced 140 gpm; however, production was from a composite thickness of approximately 120
feet of sandstone including four separate sandstone units commingled within the well. This 474
foot deep well taps the Wasatch Formation in one of its thicker zones in the permit area. The
discharge permit for this well has been cancelled for years, ever since the Bill Smith mine
shaft was sealed.
For the most part, groundwater in the Wasatch Formation exists under water table (unconfined)
conditions and its primary use in the permit area includes low-yielding wells used for watering
livestock. Artesian (confined) zones near the base of the formation are separated from near-
surface deposits and from each other by impermeable shale layers.
The Wasatch Formation is considered to have good potential for possible development as a
future water supply. Hodson et al, 1973 could not quantify its hydrologic characteristics
adequately to estimate the maximum amount of groundwater that could be available from the
permit area.
Fort Union Formation. The Fort Union Formation underlies the Wasatch Formation in the permit
area. The top of the Fort Union Formation is exposed at the surface in the southwestern and
western portions of the Smith Ranch area, but may be at depths of 500 feet or more in the eastern
and northeastern part of the Smith Ranch area. Typically, the Fort Union is comprised of
lenticular fine- to coarse-grained sandstones with interbedded claystones, siltstones, and coal.
The formation is as much as 3000 feet thick beneath the permit area.
The Fort Union Formation is an important aquifer in the Powder River Basin, and as shown on
Table D-6.4 of Addendum D-6 Al, nearly all of the project's wells are completed in this
formation. While most of the wells are designated for limited yields (5 to 30 gpm of water), wells
completed in the Fort Union Aquifer associated with the former Bill Smith Mine dewatering
Smith Ranch Permit D6-6 Revised - April 2011
program produced as much as 560 gpm (Table D-6.2 of Addendum D-6 Al). Substantial
volumes of groundwater can be produced from the Fort Union Formation over extended periods,
as demonstrated by the various historical and current mining operations in the Southern Powder
River Basin.
Lance and Fox Hills Formations. The Lance and Fox Hills Formations underlie the Fort Union
Formation at depths of approximately 3500 feet and 5500 feet, respectively beneath the proposed
plant site. The formations are comprised of fine-to medium-grained sandstones, interbedded
sandy shales and claystones. Well yields from these formations are not expected to exceed 100
gpm, and the groundwater reserves may be limited. Little is known of the hydrologic
characteristics of the Lance and Fox Hills Formations as no water wells tap these aquifers in the
vicinity of the permit area. Because of the depths of these formations and the availability of
water from other shallow aquifers, it appears unlikely that these formations will be tapped for
water supplies in the future in the permit area.
3.4 Potential Ground Water Impacts
Of the formations described above, aquifers in the Wasatch and the Fort Union are of greatest
importance to the proposed mining activities since they can yield substantial amounts of fresh
water and are the aquifers that could potentially be impacted by the ISR operation. Impact to the
Wasatch could occur if there were an excursion of leach solution to an overlying aquifer due to
an injection well casing failure. The impact would be limited to the volume of water, which must
be removed in an effort to restore the groundwater quality. Should this happen, the excursion
would be short term and controlled. Excursion prevention and control measures are described in
the Operations Plan of this application.
The economic uranium mineralization in the permit area occurs within the Fort Union Formation
and as such, this geologic formation is most likely to be impacted by ISR activities. The impact
will be of limited areal extent and will occur only for the duration of the mining and restoration
program. The magnitude of the impact to the regional groundwater supply will be much less than
has previously occurred during dewatering of conventional mining operations. The ability to
restore groundwater quality within an ISR mine unit was demonstrated in the Q-Sand pilot
restoration program, followed by the mining and restoration of the A- and B- Well Fields. In
conclusion, CR does not expect any long term impact on groundwater quality,
Smith Ranch Permit D6-7 Revised - April 2011
3.5 Pump Testing and Analysis
A total of five baseline pump tests were conducted in the western portion (Smith Ranch) of the
permit area to evaluate the baseline hydrologic characteristics of the mineralized zones. The first
pump test was conducted in 1974 to evaluate what was to be expected in sinking and developing
the Bill Smith Mine (Harshbarger and Associates) and is discussed in Attachment "A" of
Addendum D-6 A3. The second pump test was conducted at the Q-sand ISL pilot site to
document the suitability of the site for solution mining and is discussed in Attachment "B" of
Addendum D-6 A3. The third pump test was conducted at the O-Sand ISL pilot site and is
discussed in Attachment "C" of Addendum D-6 A3. To provide additional aquifer
characteristic data, pump tests were also conducted in two additional areas, Sections 25 and 35,
and a report including the results and analysis of these pump tests is included as Attachment
"D" of Addendum D-6 A3.
Additionally, since 1987, more than 17 pump tests have been performed across the permit area as
part of the hydrologic testing program for new mine units. The results of these tests can be found
in Volume III-A through JJ of this combined permit 633. All pump tests conducted to date have
demonstrated that the mineralized formations have acceptable permeability and transmissivity
characteristics for ISR, and all confining units tested have proven to be effective aquitards for
controlling the vertical movement of leach solutions.
A total of two pump tests were conducted in the Reynolds Ranch area of the permit. The
tests were conducted in January 1989 in areas of future potential production. These sand
zones include the U/S sand and the 0 sand. The pump tests conducted at Reynolds Ranch
are discussed in Addendum D6 C.
3.6 Aquifer Piezometric Surfaces
Piezometric surface contours have been constructed for aquifers which could potentially be
affected by mining activities. These aquifers are the M-Sand, O-Sand, Q-Sand and S-Sand
(deepest to shallowest) in the western portion of the permit area and the 40, 50, and 60-sands in
the eastern portion. The contour map for the western portion of the permit area was constructed
by Hydro-Engineering using available wells within the permit area and water levels collected
during February, 1991. In the eastern portion of the permit area, maps were constructed with
water level data collected on, or near August 15, 1990. A schematic sandstone correlation
chart for Highland, Smith Ranch, and Reynolds Ranch is included in Appendix D-5.
Smith Ranch Permit D6-8 Revised - April 2011
Figure D-6.7 of Addendum D-6 A2 presents the piezometric surfaces for the M, 0, Q and S
aquifers in the western portion of the permit area. The circle, square, triangle and star symbols
show locations for the M, 0, Q and S wells respectively. Wells TW-1, TW-2, OWD-1 and
OWD-4 are completed in both the M and 0 sands. Therefore, their symbol is a combination of a
square and circle. Some of these wells are completed over only a portion of these sands, and
where the sand is very thick, a fair amount of head difference can exist from the top to the bottom
of the sand. The contours on Figure D-6.7 of Addendum D-6 A2 are Hydro-Engineering's
interpretation of average head conditions in each of these sands and, therefore, some points are
not given as much weight as others. Table D-6.37 of Addendum D-6 Al, provides the basic well
information used for construction of the piezometric contours. It should be noted that the shaft,
located at the Bill Smith mine site, was being pumped at a rate of approximately 200 gpm at the
time all water levels were taken. The shaft has since been filled and sealed. Updated
potentiometric surface maps of the M, 0, Q, and S sand are provided on Plates D6-1A
through D6-1D.
Water levels from wells M-136, M-421, M-422, M-310, M-295, M-'296, M-528, M-736, M-741,
M-744 and OMM-1 were used to develop the potentiometric surface contours for the M sand
aquifer in the western portion of the permit area. Groundwater in the M sand is flowing to the
east-northeast and most of it presently converges to the mine shaft due to pumping at the time of
measurement. The average groundwater velocity is estimated to be 1.3 ft/yr based on a
permeability of 0.3 ft/day, an average gradient of 0.0012 ft/ft and an effective porosity of 0.1. The
permeability was obtained from Section 35-739 multi-well pump test and is thought to be low due
to the overall flat gradient in this aquifer. An updated potentiometric surface of the M sand is
provided on Plate D6-1A.
The 0 sand multi-well pump tests at OP-2 and Section 25-584 yielded average permeabilities of
4.0 and 10.1 ft/day respectively. An average permeability of 7.0 ft/day, an average gradient of
0.0015 ft/ft and an effective porosity of 0.1 indicate that the average velocity in the 0 sand is 38
ft/year. An updated potentiometric surface of the 0 sand is provided on Plate D6-1B.
The hydrologic conditions of the Q sand have been defined in only Section 36. The small dashed
lines in Figure D-6.7 of Addendum D-6 A2 represent the potentiometric surface of the Q sand in
this area at the time of measurement. The contours yield an average gradient of 0.0036 ft/ft and
the Section 35-739 multi-well test produced an average permeability of 4.5 ft/day. These
properties indicate that groundwater is moving to the north-northwest at 59 ft/yr in the Q sand.
Smith Ranch Permit D6-9 Revised - April 2011
Additionally, Mine Units, 1, 2, 3, 15, 15A, J, and K have characterized the Q sand in the
western portion of the permit area. An updated potentiometric surface of the Q sand is
provided on Plate D6-1C.
The S sand potentiometric contours are represented with the small solid lines on Figure D-6.7 of
Addendum D-6 A2. These contours yield a steep gradient of 0.05 ft/ft. The groundwater is
estimated to be moving to the north at 180 ft/yr based on this gradient and an estimated
permeability of one foot/day. An updated potentiometric surface of the S sand is provided on
Plate D6-1D.
Potentiometric surface maps for the 40, 50, and 60-sands in the eastern portion of the permit area
are included as Plates D6-1, D6-2 and D6-3 of Addendum D-6 B2, respectively. These maps
were constructed with water level data collected on, or near August 15, 1990. Potentiometric
surface maps for the 20 and 30-sands are not representative of baseline conditions as water level
data are limited to and affected by the A and B-wellfield areas which were in production at the
time measurements were taken. Due to the lack of potential impacts to sands overlying the 60-
sand and the corresponding lack of wells in these units, there is insufficient data to construct
potentiometric surface maps for these units. It can be assumed that direction and gradients in
these units are similar to those determined for the 40, 50 and 60-Sands.
A review of Plates D6-1, D6-2, and D6-3 of Addendum D-6 B2, shows that in areas unaffected
by ISR activities or past underground mine dewatering, the general direction of ground water
flow is from the southwest to the northeast. Unaffected water level gradients are approximately
.008 ft/ft for the 40-sand, .003 ft/ft for the 50-sand and .002 ft/ft for the 60-sand.
Past underground mining activities have affected 40-sand water levels near wells CMU-1, CMU-
2, CMU-3A, CMU-7, CMU12 and CMU-13. These wells are completed in ore drifts within the
40-sand. The deflection of the potentiometric surface in the area covered by these wells show that
water levels are depressed as a result of underground mining and dewatering activities which
were halted in 1980. Data obtained during and prior to the detailed hydrology tests in the C and
D-wellfields show that these depressed water levels are rising as a result of recharge from
surrounding areas. Data collected during the Exxon R&D project show that water levels in the
R&D area rose approximately 50 feet in six years.
Smith Ranch Permit D6-1 0 Revised - April 2011
Water level data for the 40-sand in the A and B-wellfield during the period of this data collection
demonstrates that flow was towards the Exxon Highland Pit. The Exxon Highland Pit was a
ground water sink (local cone of depression) with ground water flow towards the pit.
Although past underground mine dewatering activities also affected the 50-sand within the C-
wellfield, the two cones of depression evident on Plate D6-2 of Addendum D-6 B2, result from
ISR production activities which were in progress during the time that water level data were
collected.
The 60-sand is not affected by production activities. The two cones of depression evident on
Plate D6-3 of Addendum D-6 B2 result from past dewatering of the two TVA shafts which have
been sealed and reclaimed.
Figures D6-2 and D6-3 of Addendum D-6 C present the piezometric surfaces for the U/S
and 0 aquifers in the Reynolds Ranch portion of the permit area. The water levels were
taken on November 6, 2004. Production sand water levels were measured at six existing
wells installed by Solution Mining Company and at five wells installed by PRI. Table D6-4
of Addendum D-6 C lists these wells and associated water level monitoring results.
3.7 Confining Unit Characteristics
Characterization of the confining layers was completed for the eastern portion of the permit area
and is considered representative of the entire permit area. Low permeability confining units
(aquitards) are present between the various sandstone aquifers. These units are typically 20 to 45
feet in thickness, but may be thicker in areas where the sandstone pinches out. These siltstone
and claystone units are usually continuous over relatively large areas. Where individual
sandstone units converge (facies change), the previous overlying claystone is non-existent.
Geologic cross-sections which show the thickness and extent of confining units are included in
Appendix D-5.
Vertical permeability of confining units has been determined in the laboratory from actual cored
material and from pump test results utilizing the Neuman-Witherspoon Method. Table D6-5 of
Addendum D-6 B1 contains estimates of the vertical permeability of the confining units. These
vertical permeabilities should be representative of conditions found throughout the permit area in
similar units.
Smith Ranch Permit D6-11I Revised -April 2011
3.8 Ground Water Rights
A list of all ground water rights within the permit area and adjacent lands, as of March 2011 is
included in Table D6-10. The locations of the ground water rights for the combined permit area
are shown on Plate D6-2.
There are more than 3,000 ground water rights within the permit area and within a three mile
area of the permit boundary. The vast majority of these ground water rights are for wells
installed for hydrologic monitoring or dewatering purposes at decommissioned conventional
uranium mining operations and ISR activities at the Smith Ranch Project. A small number of
the ground water rights are associated with wells installed for livestock water. The majority of
these wells are less than 200 feet in depth and should not be impacted by ISR activities at the site.
There are two additional wells located in the NE quarter of Section 12, T35N, R74W that
are used for irrigation of an alfalfa field.
Three ground water rights are for wells used intermittently for domestic supply. One well serves
the Fowler Ranch. This well is located north of the northeast comer (Highland) of the permit area.
The well is 212 ft in depth. The second domestic well is associated with the Vollman Ranch
house, which is located near the center (Smith Ranch) of the permit area. This well is 180 ft in
depth. The third domestic well is located at the Sundquist Ranch site, approximately 2.6
miles south of the SR CPP.
No adverse impacts are expected to any of the stock wells or domestic wells as the domestic wells
and majority of the stock wells are screened in zones above the sandstones which contain
uranium ore and are in situ mined at the project site.
A 2011 search of the WSEO files indicated that most of the wells within the permit area and
adjacent lands that were operated by previous operators have either been abandoned or
transferred to Power Resources/Cameco Resources. Figure D6-3 provides the complete
permit boundary, including the proposed Reynolds Ranch Amendment area. Notes on the
index map indicate when individual plates and figures for Smith Ranch, Highland or
Reynolds can be found in the addenda.
4.0 REFERENCES
Davis, R.W. 1976. Hydrologic factors related to coal development in the eastern Powder River
basin. In Guidebook, Wyoming Geological Association, 2 8th Annual Field Conference, p. 203-
207
Smith Ranch Permit D6-12 Revised - April 2011
Harshburger & Associates, 1974, Analysis of Constant Yield Tests of Wells TW-2 and TW-1, Bill
Smith Mine, Converse County, Wyoming.
Hodson, W.G., Pearl, R.H., and Druse, S.A. 1973. Water resources of the Powder River basin and
adjacent areas, northeastern Wyoming. U.S. Geological Survey Hydrologic Investigations Atlas
HA- 465. Washington, D.C.: U.S. Geological Survey.
Hodson, W.G. 1971. Chemical analyses of ground water in the Powder River basin and adjacent
areas, northeastern Wyoming. Cheyenne, WY: Wyoming Department of Economic Planning
and Development.
Huntoon, P.W. 1976. Permeability and groundwater circulation in the Madison aquifer along the
eastern flank of the Bighorn Mountains of Wyoming. In Guidebook Wyoming Geological
Association, 28th Annual Field Conference, p. 283.290.
USGS Water Data for the Nation http://waterdata.us$s.gov/nwis
Whitcomb, H.A. , Morris, D.A., Gordon, E.D., and Robinove, C.J. 1958. Occurrence of ground
water in the eastern Powder River basin and western Black Hills, northeastern Wyoming, in
Powder River basin. Wyoming Geological Association Guidebook, 13th Annual Field
Conference, 1958, p. 245- 260.
Smith Ranch Permit D6-13 Revised - April 2011
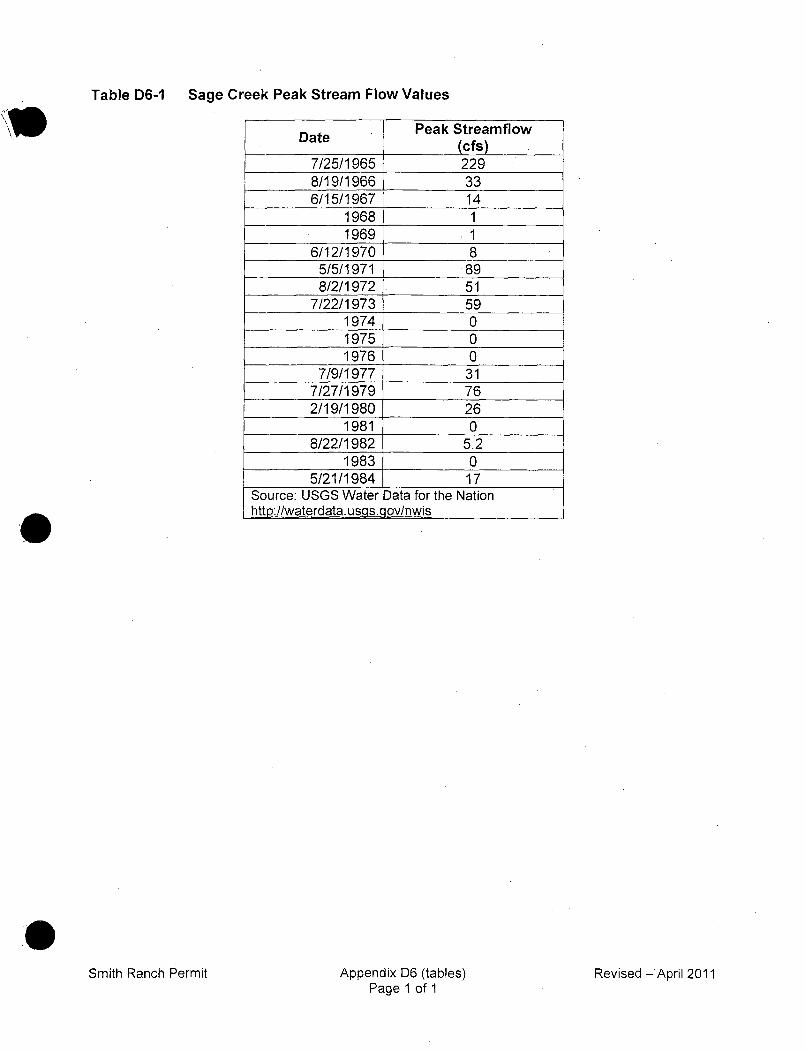
Table D6-1 Sage Creek Peak Stream Flow Values
Peak Streamflow(cfs)
7/25/1965 2298119/1966 336/15/1967 14
1968 11969 1
6/12/1970 85/5/1971 .898/2/1972 51
7/22/1973 591974 01975 01976 0
7/9/1977 317/27/1979 762/19/1980 26
1981 08/22/1982 5.2
1983 05/21/1984 17
Source: USGS Water Data for the Nationhttp:/lwaterdata.usgs.qov/nwis
Smith Ranch Permit Appendix D6 (tables)Page 1 of 1
Revised -April 2011


. Table D6-3 Surface Water Rights - SR-HUP/Reynolds +3 Mile Buffer
A proprtaia T.mi Rage Batc 19ýtt s~tatu Bvermet os- .W Pemi Faiiyh W Permte Applicant S Bei~oo
ýPI616S -36 72 6 . iSEOW POD TO Strattor Al1 Stock Reservoir 'HYLAND SHEEP CO Strton Draw
P5076 3 22O S3,SEy iG550 M rto s In. o. eevi HROSIC So ot' Draw
,1S072R 36 7 3 ON P 0 otnsn.N.3RarorMORTON'S INC. iulwDa
36K 72A -LEEPFOWLER Bobby raw
:P81216 36 72 17 OBOSE PU ND BRuffalo Shaft Containmient Berm U.S.A. MOND MINERALS COMPANY THUNDER CREEKP50 ND " ~ f1 hf Cotanmn S, PA' W TUD ER C6tPIREEK etS'it
ZPSt34 36 72 17 LESE Bufal Sla otr o Us .5.6. MIDON MINERALS COMPN TUDE CRK
PolleR~i 36 72 18 51W PU SiSFEkR 1,Nur~nc Reservoi 2. A. NiUMRCNMEHDUHPSOIR' 36 72 lB
7SDSW PU 500-,16 NrRhRsrvi .. NMIH UR' UT .
0036 72 16 N$ESW P0 15000 flurcceecl . H, NUMR0CN :NDHOOCO GULCH "rPSi10DR 36 72 18 NESW FULL 550J kR% Nunroth;C Resercair 21. H. UM-RIC UMI UC
rrPi11bv 36 72 ""'18 NIS.W PU EF0,10ý N~uerich Resercair'26 UNC URC OC
P905 1 36 7i2 18 NIS, 601 010 Cut 01 Stock Reseroi 60C611. WHOIOM 'Numeh -Gulch <"P565 36 72 03 NW'SE PU1C RE[)co 7DaiaeDtch - Sheep Dr~aw Divioroc .ý.EONC.SepDa
.620 36, 7 20 NWSE 601 01 he rwSokR~rorLEE POWLER<SepDaP82095 36 72' 20 OWINE 1001 i701 s"' P twt EE 0C1020 Sheep Draw
P620901 , 6 72 2 EOW <101 010 . hee Draw Stoc Reeroi tLEE POWLER Sheep Draw
AP27 36 72) 20 swocL'M Por esiervoi ýEKXON -IsERALSýCOMPANY 8c1 e o re""" 60 t-Z' 1 North111NE F6I 257R 3 72 20 SESEP A) Io 1 rPn eevi ON IEOSCMAYNrl s80Ce
P907 < 36 72"R2 NESE Aol WIL 00 o on Reservoi 'EI-cN MINERL COMAN NrPokL Bo. Creek-36 72 20 ONE PU RLEE !lnoc Drainae Dtcn006`30 D olrDa
PE25430 36 72 20 ýSNE P7. nRSEoc Drainage Ditch U S A6 01009 CO. PolrOe
P254830 36 72 20 NESW POD iE io Daisag DitchU ¶S.A. 63008 CO.raP254630 36 72 20 6106 PUD <RES Exxcoon Drainage DOr ?U.5A EXXON CO. Bowlýer Draw "
P7727Sý 36 7'2 '20 51015W 00 01DolrToc eevi LEE POWLER Draw '1'4 36 72 20 NEW 001 010 <Boler Stock Resrvir E OLRPooe os<
Pf!7727 36 72 26 NW 10 00<olrSokRsrorLE POWEERBwerDa
P9216R 36 72 i0` SWE Aol WILS010' H19ýighladdRese siW~ON MINERALS COMPAOOAtloeDaP5208-R ""'"'"l 36 72- 26- AS 0000 Highland Reservir <4 E-cNMOEAL OMAYAntelorpe Osew-
1494-65D 36 72i "21- IPu RE ErnorDraisa'ge Ditch 'Pw rwDcric'...EONC.Nrth Bork Boo Crek
177R ' 6 7 1 SS P L anRsrorU.S.A. FrO O awn Da
p25460 36 72 21 ýSESE IPU FRES tE.-Conrasge Ditch U.S.A EOO O olrDa
NP25463D 36 72 ' 20 SWUE PU RES <E ,o-Daiag Ditch U.S.A. E ON CO. Bowler, Draw
4P25465 - "<j 30 72 21 J S -PO RES IrotDairg ich'Pw rw Diversion IL.S.A. EXXONt CO' North PrkE BooCrek--
<P4592B9 36 73""" 21 "MENE <INA 1TOM INc tHighlan~dPugSwaeRsroroeresrcIn.Bc nDw
1P9299 36 72 25 SER 0116 EM [NO SHr and Po ge rag Reservir pc erR-sor-, Ic uccrcSe<9207R 36 7 21 801 UA<srtPodRevir"'EIDION MINERALSCOMPAN Nort Be BoCeek
2?4 36 214PU D RE Ioný Drainag; DG chTnShee DrOo0 Dceto S RO O ~ r oIN72ý D 3 2 21 SWSE 45 RES Uiro DriaeDc'100Br re icso US.A ECON CO. Noch Pork BOo Creek
72 20 ~~~SESE PU RES 0Woc~E Draisage Ditch North okBo rekD!ron USA.001C.Nrh okBo re
2466 3 2 21 iSS U HES E-Aon Drainage Ditch ' Sheep Drawi Deroori, US.A. EIOKON CO. Sheep Draw
P246D ' 22 NVSVonRE -Drarooge Ditch ' Sheep Draw Doiertioo- <VS.006CThepDaAS-36 72 ""~ 22 ý.SWSW PUi HES" Roon Drainage- Ditch 'Sheep Drw-Dicrern- UV.S.A. 0011 CD Sheep Draw
P2S467 36 72 2 WW PU RE ro rang ic Not okOoCre ieao i.SA ExION CO6o BokBo7reP254670 72 2~2 EAoo D;raiag-e Ditch'- North Ber Boc Creek Dinrer-nV SAEONO." ~ '~a re
i3776 72 NSWW U.SES .A. EOOON CO. DeDa-36 22 22 PciV t" L DokRsrvc
P77036 72 '22" CAi 'o eer ... 050 Doe Draw
P7378R 36 72 ' 22 oWSW PU P LO <Do, Hes 6..0 008CO Doe Draw<P543D 36C '7 7 = 22101 U 6 -oo Dhae1rc 4U.5. 001CKNCO. BFower Draw
P:245-D3 72 .5 S10 Pu RES tExono Drainage Ditch <.. 501COBolrDa
7 S ;W Resaervioir6'F- Draw
IRES D, Fawn Draw Di-o
P0062 36 72 28 iWOW PU 49EihadN.1Rsror556 01 INRL SCMAY ntlpDro29 'S6 rPU WVIN iIglnDo.)Rsror ... 00 MINERALS COMPANY thele Draw
iPOOO2R~AD 36L 29 1RSW PU 19 ighlad' NwEXesrorUX..ON M1INERAL O COPAY 'Antelope Draw
P4314R r 36 72 i 29 S AD'UN FLeD USghA 8.RerviPO ERXO RSUCEO. ICA oeDa
IPI4R 6 72 29 A5 Reevi PO ER EOUCH N ntlpeDa
P862P0 36 72 29. ..... W UN INDR HIgln No 2 Reevi SyP0WER RS URE INFýýCCIA Antelope Draw'1<9t6R36 72 29 lSEN <6 Ut00 ghland N.IResersir U ElAO O N MINERALCOPN'Atop Draw" I
'P216 6 2 2 'NEE AD WL 10,Jgh nU Ieesi 00011 MIN ERALS COMPANY Anteope Draw
esD2PA 36 7 29 PEN AH WI 10 1~hland N.IReseew r r WON MINERALS COMPAN Y Antelope DrawP91R i 36 72 UN"" 29diNooNE <AD <W-tS HiglandRESOeRCoi
k' 72 7- 2§ ýSEE 11000ari1N MOI NEP RALSC E ICOMPANY elsp~e Draw
PB4R36 72 29 'HENW tUNA1 ND S-Il SPOC R <IP01398 36" 72 29 NEOW 656 IND,6 Sc'U PýCCR;eservir Lýowe 'MNReLSoucs IOPN Y !Antope Draw
P009R216317 29 'ENWS 060 1115, is'0 ~6 SPCRsror oe eorosIclnelope Draw
56 7 33i' jWN <Aol VIER PO '3Heser 0O MUISERA000 COMPANY Boo ree ;-
P75176 3 72 29 33 ON Aol ERO PLO '03 Rec 0 U MS NERALSO COMPANY .o re19fi-6V0 __-.1 - .. 1- X -- -
inP 507 1 36 72 33 166010 ADJ EHOLSO 20 Reeroir P-01A 011CMA YBoCre
W ~ ~ ~ ~ ~ ~ 2 'P04R "3 7< 1 rSEWN look IN1D<POE aelt 1 ug trg 'Power Resoures, Inc. RDDa139R"".""""'""."""''"'"''''"""'.'"'"' i-C 'iLO ER£..<.''......"<..
p72S -4 36- -73 't 01g SESE P 01 60 c-1Sok Reservo . Da
i9-R 4 5j-- 2 'NESW U44 I Append ij;xi D6 (tables)1... of....3
Smith Ranch Permit Revised - April 2011
aTable D6-3 Surface Water Rights - SR-HUP/Reynolds +3 Mile BufferI ýP7725ss . B .10 6 +
"1 36
36"
•P106ss 3.. 6
3P1683D 361P 16630, 4 36
P253120 3612•31" i 36
P40566 36
P45636
3P4656 36
P5i356 36
P SO3 36__..... . . ..
,P479.D 36
1P2S7R65 36
•P39E2S 1 36
P1676 36
.;••... S. .
P I7410 3533111
1I117410.
• 3•
P251 . . . . 35
* K'~o .... 4"• +
P46566 3
[P1741 " 35
IP234043
P240140D 35
jP23 40 3 5
,P234040-- 35
Y23ý404 351115 35
I~la~alO 35ip 3 5 745
P1966S
Jý.1..66 ..ij . 36•P5071R 35
_P86R • 37
P13300 37
P438 4S 37
P1066 1 .. .. . 2.........:
P44637
P44537
~P766R '37
IT'l~S 37
P541,60 37P43606 37,!26,06 37
P192670 3
73555
JPA .... ...... • - -35•. .....
73 01 3SE5 IPUS ýSTO MX-I Stock Reservoi
73 142 sg p 5n0 WTipl113 14 SwvNW HPUY sT... . Whipple e1 Stock Reservoir
73 26 .5NE PU 50 Rldgewap No. 1" Stork Reservo
73 32 "NESE PU 570, DO Lake Springs and Pipeline
73 32 PU AD 5-0 06&W Lake Sporg and PIp-na73 32 INSE PU ST0 DOM Lake Sprngs and Piplone
73 34 6606 PU 570 Mart HI Stor Reservoi
73" 34 65" E III 0S7TO Mart ,L k •R-;oeno
74 " 4 NW )6 .. .. -570 6r pi s Pipeln'eNo. 2
74 4 SWSE P5 570 Brown Sp;ngs Pipelin No. 14 4 SWSIE PU0 570 Brown Sprigs Ppln o
74L 6 NWNW1 ~ PS STO5iR Juoog eoroi
sý- ..... ..... --" '7........fo . ... -• . ...... .ý)udo• '; " P, ~ ,• . & . ... ... . . .
74 6 INWNW !PUO 570 buoson Reservoir
12 06 )P50Sle SponReeoi
7 22 IspNWN PU STO iConoerse County Stock Reservoir No. 2... 3•. .... .•..... .. .. . ......... ... ..~.. ............. ....74 22 4 1 WN yu 570 Cover~e County Stork ReNaor No.
74 30 ~SW6 PU 57 ieland #1 Stock Reservi
74 30 ....... P0 570. . .... ..........74 . .33 , .S.O
4 . . . 1 .....
74 33 ,NWSW •PUD 570 RR Williams No. 1 DitohPOD 570S1 IRA EEOlia--,. ~i
7 1 ..W... 602 i . ..s....... .rs er o.. D
74 2 56ESW 100 16R Arsopoker No. 1 Ditch
74 2 SESWO w)0 DitchNo2
2.1 SE1. UNA ýIoNac No. 22 5065W RES' 160 %kt
74 +'[ " 3 2 NSW IRP Sage Creek NO. 2 Reservoir
74ýV'A P50 1166 Sage Creelk No. 2 Resevoi74q NOSE Pji Hi66ý; Creek No. 2 Reseroi
5067P466~ Sage CekN.2Reeoi
4 6 ENE 0 50 Crouch No. 3 tok Reservoir
6 iNWOW PS 1000 ieRcSpngAndPpln74 57tR ing and PIope•n•• •' • '• I• .~~ri-....I.- -l• • .. :?n••• . ...74 6 ~WSW 1PU -570DM IWSeRoo Spongand Pipelin
74 7 NWSW mNA- 570 Smaiar Reservoir
74 II NONE 50 16 3!¶!?74 Ni pitl AD02 _ oneý orMpoke N. 1'Ditch
'i • 11 NTi ENE A IRR . Anpoker No.- •Ditc
74 126 E" AJ IRAnp11 .. I0U74 12 ]ScNW Z56 166 Anrspoiken No. IDtc.7 112 SEW . . . A....... iR. . poker . No. 6 Ditch .
74 12.3NwNPý 602 166' Anrapoker Nol74 . 12 1SWNW 3A63 IRR -ASpker NO. I Ditch
74 12 NWNW All2 IR Aspoker No. 1 Ditch74. . .• :/ 12 6065 ...0.2 lR .. .. poko" No[5Ot
7 4 5. 2 NE N W 1 0 0 2 iIR R A rm s p ok e r N o . 1 D itc h
74 t 22 NWNW .UNA !RR DPitch No, 2
74 12 iWNENR UNA IR6 Ditch No.2
"-... 1'5.1;11.. .... • . .8a••" ;....
74 20 SWSE 0AD] jIRR rn Dtch
7 24 S3 SESE IPSO 57RR Fuder No. 2 Ditch
74. .U -1 W5 62 f~ tn.1111. 1 1- ... 1..
11~ C143 1602 ,W IRR Hrad Ditch _
74 33 NESE 1UNA - 66R bJudson No. 2 Ditch
74. 35 .N. .R r... 3 • Brown SpringsNo. ." tc . Re.. servo
-56 SESE UNA 4
-0 ' Betty Lou Stock Reservor
73 15 SW NE P 7ST0 t1AL 15-1t Site 30 Stor k Re oir
"'•'•w•"~~~~~~~~~~~~~~~~~.. .... ....... !•............ 'G<• '•••;.......
1 1 SNE A1 0 AML 15-I Site 3D Stock Reservoir
73 . 11N11NE 1jN I STO, 11 RR KuyenalDt
ii 2 1
1N•N PE 570 ue n i Sock
72 31 SESW P U 'Unse e reNo. 0Stoc Resv ir
72 30 556 eP, 5c No 1 StorkResrvoir72 33 SiNWN PU 50wa SoncnoSokReevi72 33 N W IPSO
157Q
ts 4i Siu~ 1 Stock RS--uw
71 16 N1 60 57016 Kcaken al Sitcti ca
SB 60660 UNA 570166 . K~ycjyall EL1i NWN- U4..........
71 uIX 5gOW NOE UA 500 K uplrendall Ditch
72 3 iSESE IUD 57 ora Rsrvi
6. B ONER 145 1 Draw
,rt7LND SHREP CO Vonipple DrawRYADSHREP CO' W ppte Draw
0WM. VOLLMAN Ridgewan Draw
2OHN T. WILLIAMS Lake Spring
06. 6N T WLLIANMaesPo
VW 6A SOýLIMAN Mare1Dra
iHSRNSS-iSLE 660 BonSpns re
NHORNBUCKLO 665 CrHouceCa
?CARL). JUDSON Phillips Creek
CuRL '.OSON i•Phillips Ceek
CARL 2.ISOSONPhilips Crek...... .. I.l.1.lT 11... .. . .. ... . . '-i ; . .. . . . .. . .
256 RENOLDS Hold-up Hollow, Draw
'B06OPR CONOVERSO COUNTYCMISIHd pnilwDaBOARD OF CONVERSE COUNTY COMMI•1SSlI Hold-vp olltow Draw i
=LLN CROC, iLtn DraNOLN CR00 Lle Dra1.1-1-o.. 11,16l• . . .. •....l1161111il11111l1'll111 .-,
.20H67. WILLIASMS Sage Creek (12-33-73)
U30667. WILLIAMSSaeC66323-3JOHN 7. WILLIAMS Sage Creek 3 12-33-7 3)
FANKRSPOKER Sage Crek (I12-33-73)
lSMITH SHEEP CO. :Amscker Draw
~FRANK AMSPOORR Sae 3,V,12-33 -73)
.Sa0 Creek 312-3 3-73)
5F SPOKR S ognC".nek32S ....
iS. F. AMSPOKER Sage Creek (12-33-73)
S.F AMSPDKER SaeCra(12-3-733)
PATRICK F, CONROY)LELAND CROUCH North PlaCa Ricer
PATRICK F. CONO*rLELRN CROC NocU ltt ie-....... N7. 7WILA•. .S RiseRock Springs
OH .WILLIAMS ic oc pig.... N.7. WILIAM White RoSp•nng . .. 111
WILLIAM). 5 . ..M B c Bro w.....
ILLI .MWIOLtA SHERC. 014DM, 0,-ka Da
SMITH SHEEP CO. Arespeker Draw111115576StoP C. Anspker Draw
SMITH SHEEP CO. -nw-ke Draw-4
SI4ITHSHEEP S. urnPoker Draw 1
!SMITH SHEEP CO. Amspoker DrawI~sooco noop CO.kipoe Draw
SMITrIREEd oP LAND MT" OSBAnspokera Draw
SMITRH SHEEP CO. A•spokar DCRa
SMITH OP CO MSIO RSpoker Draw
SMITH S "EEP C.. . . .an"p•aker Draw
SE5U9YAHRFEPS CORPOA AIN espokerDr Drawh
hNO, AMSIOPORR SwSaue Creek .12-33-73)IFRANRunSPOER
3Sge Creek 312--33-73)
FRANK AFISPOKER SBox Creek 323-3
US BUREAU OF LAND MOOT. OTIS BAn Federal Draw'
jnORTOtcS INC. " ut'p Draw
. JO.HN C. ARLAND Brown 'ping CreekiCAML 2.26UD0N0 BROWN SPRING CR5.K
I1 CARC .JUDSO6N BROWN SPRIN CREEiK "
IHOBNBIJCRLE RANCHW6O BOARD OF LBrown S1)ng~s Ceek,$517C. BPRRL 6666 etty Lor Draw
WY0 BOARD OP LAND COMMISSIONERS" So1lar ra.6000 F LAN CMMSSIONERS- Sstai Dra
W ALTER2 REYNOLDS7 SouW Fork Brvýh Ceeik
.55076 OLS C0RPORLATION - 0 f Drv asiSEQUOOAN FUELS CORPORATION- 600 Org Wash..
50665060 MNNINSGcenevieve Draw 1
(INC. MDRTONSWwSknCreINC, MORTONS Ws kn re
8. ..~REDL Boo .Cree, .k
h G.C. KIUrRENDALL onCreek
.MORTONS INC. Org Draw
Appendix D6 (tables)2 of 3
Smith Ranch Permit Revised - April 2011
a Table D6-3 Surface Water Rights - SR-HUP/Reynolds +3 Mile BufferWPnzw1 2 35 73 3 SENE Pu S. S. ......... M ....... • .... Sp.......nns WL AMSP18825 3s 73 3 SENE PUD STO DON IiOcn%•;,n -JD~Tf.'T iAMS'
l ...... .............. .
•....... .
............. .....Ps4S 3 S 73......... " " • 4 ... ..' T NWSE "••x PU .. ET ivot. man •;• ;Al Stock Rocet oir .. . ..... . , VO...LNANo
IP8O 2R S 35 . 3 4PO ETC Voli.•m s1 Stock Reservoir a ALcNA
35 73 S5ENW PAD ECLhaUOSokRee~i WR CIA
PISS3 74 3 iNEND lANA ES Lto Pit No 'K Stc ennoAC.LAYTONi............... . .P5712R 34 .7 4. N E PA• ETCWM..ton'sAIns.Eno.2 Reservoir NR TON'SRINCiP5083R 34 75 1 NESW PA ETC 'Hylto No.4 ReevorSARAH A. SM ITH
P5036PU ETC S t-- .- SARH A: SMfITH54 75 311 055 71yt.n Reorvon .
P17551S 35 7 . rNASW, U1AA ETCO Dane Joltnto NieS- tc eevi ~ , Coal Company
2PM SN EN15 Dave Johnston Mine SP- ReGvo lenrok Coal Co.
p83 " 3 5'. 75 . NWNW ANA TEM IND SDave Johnston Mine SP-7 Reservoir Ulenok Coal Co.
ýP8BB3R 35 WNW UN
P8562R 35 7S 3 WNWSW iUA iTEMMISPLO iUPS-7 Reservoir Glenrock Coal Co.IP8862R 7 5 3 SWNWY ION TNN FC OP-Rerv,.Slenrcc.k .1CIo ,atI Co.
P8862R 35 75 3 LESW USA TEN MISFLO UPS-? Reservoir iGlenrock Coal Co..S .. .........
PHN1ESR 311 75 3 2 NESW -UNA iTEM INSD D.oeJ.rno..........-..Reservoi S!veObnot CompanyP152S { 35 75 3UNA 'TEN N ave.Johnston Mine SP-S Reservoir Ulestock Coal Co.
s3 35 75, lANA TEN I.NS D a .ve J ohnsto n -M .in..e SP .-.,5 -R .eserv N.o .ir Gleorok Coal Co.
P8V8 s3.. . .35 7 3 " WOW A TEN NJ" FLO UPo Sk'"erv"r Ulenro-k coal Co.P0264R 35 75 4 NENP UNA TEN IN Sav Jo hnston Mine Sr-S Rervir6 ienokCaC.
`P`8 -4R-7S 4 3WS 5UA TEN INS S0o Iottlr Mn SSReevorSlnsk-c C ooC.
P17549S - 35 75 N ESW UNA ETC Dave Johnston Nine SP-1N Stock Reservoir Glenrork Coal CompanyP17 ' 35.. . . 75 10. . NESW USA ETC -Dave"Johntn i ner -tO: Stock ear voir .. nr. Coal Company
1P883R 35 5 1 ~5SW UA TN MIPLO YE'-S tecenoiri1lsrok Coal Compn
t.....5 11 4ES IN T ND MI ULC 'P- Res Mervoi iulenock Coal Co.
4 3Y7 13 A ISWS PS MINS San Johnoton Nine SP-12 SLl ENrock Coal CoMPN
PO27R 35 L' J5 13 SS S esrolenronk Coal Co.
P07075 13 SEVSW ENA TENIND D ave Johnston'Wn SP-20 4 lnrck Coal Co.
i~5 3 75 14 SWNW USA TE!,ND SEMIS SP-3A !! Re eP'1 eervoirSerckCa o
IP882H . 5 .75 - 5 N SW SA TNINEM I 'lq USP-S ResrvirtseokColo
IP17545 . 3 75 2 SESW Us4A ETCND l Spveonn6 i Min SP38Stc Rsevor-Sen k Cool Comana P~S8S2]R 35 75 24 NESW ýUSA TETCNDMt SOON6 Johsto- ieS-0SokRsror ~ nokCo opn3585 SIN ?1.24 57W NA iTENI L ND ISP-3HReoervir .i.t..rook .Coal.Co.
P4S35 75 24 -NESEcWýG USA Tý-e NDcW~ )S-NR;evi -leorok Coal Co.pn
P152 NEN Y134 ~ OrlTCSveJhnstoni Mine SP-7B Stocki Reservoir Ca opn
P9485R2 8 ' 7 3 4 NWSWý IEO a eJorston; MieO-A tc esrorUenrok Coal Compn
3652 75 ETC Dave, 2ofinton Mine SP-2A Stock Reservoir Senrock CoalCompany
P17520 i 36 75 34 SES USA ECDone Jocoston Mine SP-7A-Stook Reeroir Glenrock Coal Company
PI4H 36 75 36 WSWS -A ETC Save Jonnsto Min Sr-SA Stock RýesevinSWR5SCA OPN
iwlono Springs Creek
WHillon Springs CreekWilIonw SPrings Creekn
.Voliman Eran
North Plate River
£ . a..w.... .. ... .....SNorth Nonect,
Hylon Draw
Hylton Draw'Orishop Scan
Herkimer Draw
Bishop Draw
Bishop Draw
......... .. ... .. ...Bistop cDaw
:Herkimer Draw
LHeJ mer Dran
SP-16• ."6 ; D .. ..... . . .
NSP-22 Draw
ES •P0o '•an Creek.(Sooth)
SP 18SpaUPS 3 Dram
%SP IS Dron
SP-22 Dram.SP 22 DramSP-21 Dr n
ýSP 20 Spai
SP 30c Dram
Appendix D6 (tables)3 of 3
Smith Ranch Permit Revised - April 2011
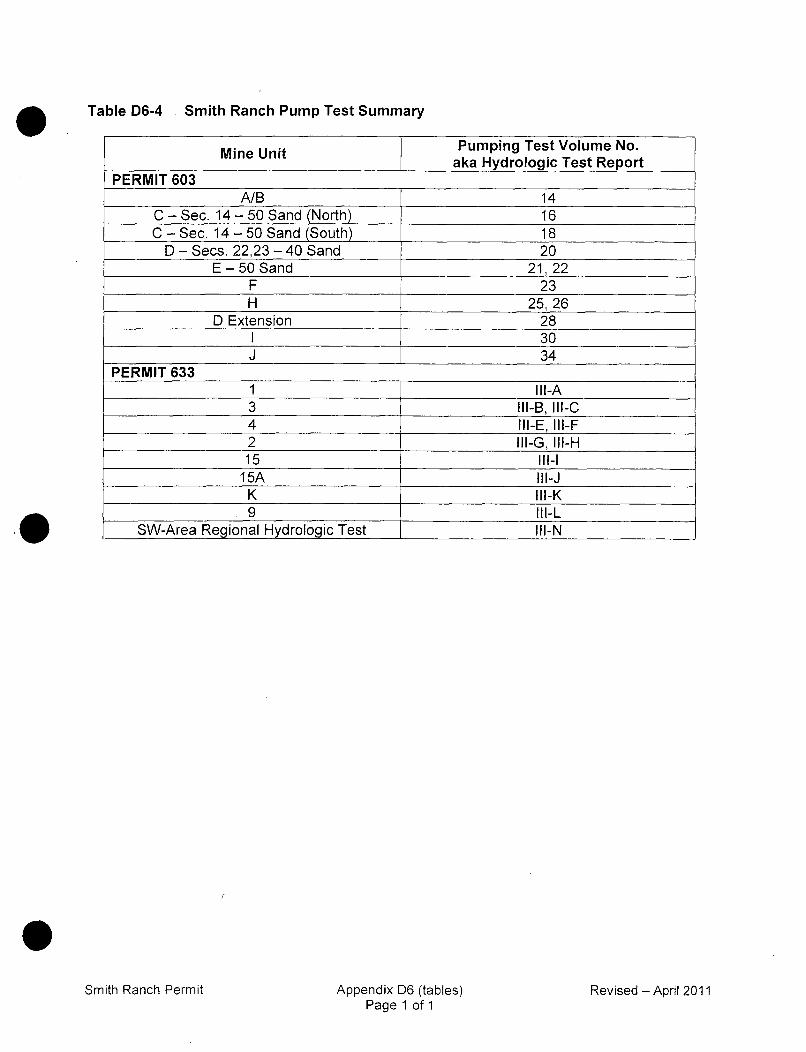
Table D6-4 Smith Ranch Pump Test Summary
Mine Unit Pumping Test Volume No.aka Hydrologic Test Report_
PERMIT 603A/B 14
C - Sec. 14- 50 Sand (North) 16C - Sec. 14 - 50 Sand (South) 18
D - Secs. 22,23 - 40 Sand 20E- 50 Sand 21,22
F 23H 25, 26
D Extension 28I _30J 34
PERMIT 6331 Il-A3 Ill-B, 111-C
4 III-E, Ill-F2 IlI-G, Ill-H15 II1-1
15A III-JK Ill-K9 IlI-L
SW-Area Regional Hydrologic Test Ill-N
Smith Ranch Permit Appendix D6 (tables)Page 1 of 1
Revised - April 2011
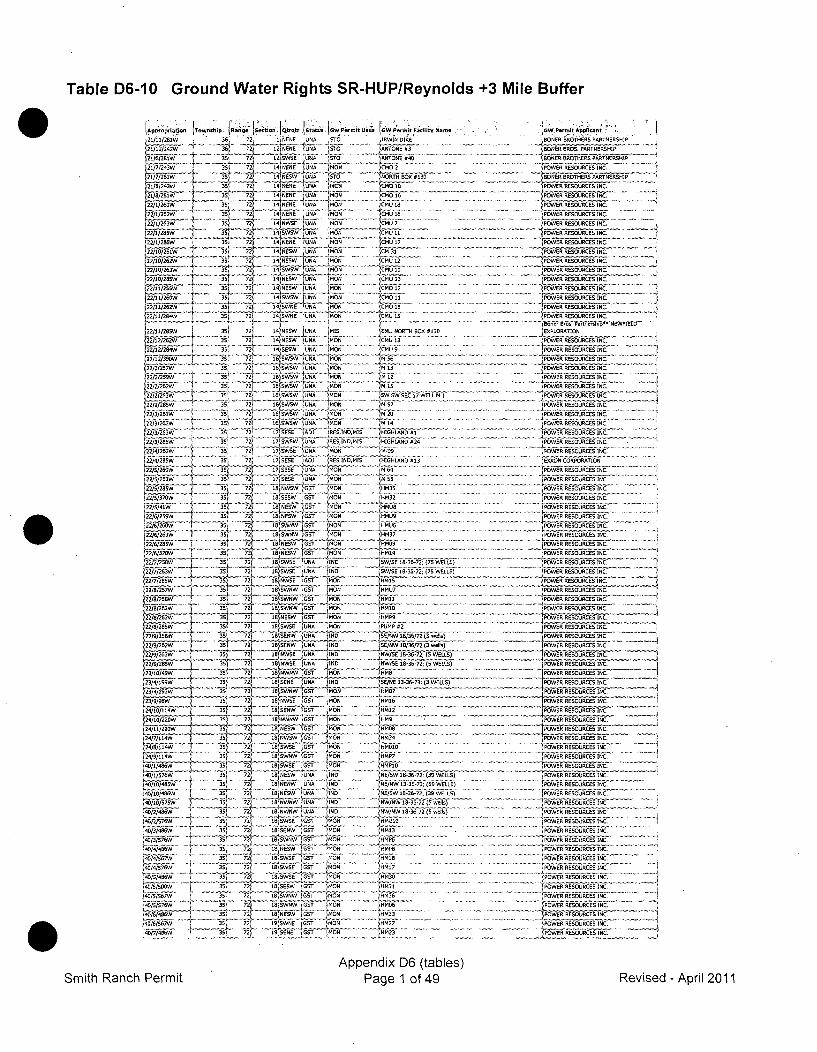
Table D6-10 Ground Water Rights SR-HUP/Reynolds +3 Mile Buffer
LA'fprophiaStin Township. .Ra " t St. Gw Permit Uses IGW' P-(twF.A6ity N.-
'2/121 36 72 lIIENE D NA ST0 . IRWIN DIKE
'2/2/!W6 5 72 O21NENE tJi
K43Wl 35 t72 1 1'DA M17E CODNE i
21/)203 Z 35 722 1HNDNE DNA /ROON jCMD 2N
2/1/8253W 35i 721 IA4)JENE UNA
3MON (D1
22/1/25w 351 '6) z}~iS jy4 RON COD 73187=8 72' 4'5/5W MO
122/1/256W 35, 73 14NONE 0N. ON.141
I' ' ' L ;............... i - • . .._• .... .. . '"••.. ... .... ....1ThD2AW6 33? 72, 14 NWEW DNA ('MON C F1"~ii/sw"" 35 72 14 NENW UDNA :MON COD 12
122/10/263 3,7' 74 1.WW DA MON C 7 IU2/10/2810 351j 72 1 4 4W DN MOCMO 313
j65 2 /211/2 s 35. 72 11EW DA MON 'C MO 1
j42/ 0/263W { 35/ 1SWSW DNA 7l 'MO1
1/25W 351 72 1•NSW DNA (MON cr . .. ..1 2(1/5W K 72 I..~~tNE 'DN 1 IIA (MON1 1CM 15
22/11/262W 35( 72 1 EW DA I N.NflSND#3(6)1225w 7' 35 72' 1NEW DA (MON COD 134,,1/4 35 7i2" 14 NE DUNA /MON CMU N5
221/8W351 733 14 NSW IOtNA "'MIS MONLNI RY
2/127/262W 35 72 16,ESWW UNA 1005 'NI 13
22/2/254W1
35 l 72E1VIN DNA 'MON 12Uý
,22/12/239W 7"A3 7 6"" Si WiW 'DMON MI56
72212/t23W 3 725 ""16 SWSW / UNA MON SW SW SEC 17 WELL MI
54//26W3
5 XtSWWINA MONI M~~
2//2W 2 35' 72, 16 SW1SW 1 NA CMON M14" .
(2//53 5 72 1- 500K 'AD) RED INC MIS HIDOLND H
'22/3/285W 35 722 11,SWSW( UNA '005 INS MIS HIGHL-AND #24224/5W 5 72 7 15 DNA 405F 111N
2,ý22/4/285W 35 72 "- S2!. ~AOJ RES INS MIS /HIOHLRND t1322/5/20 '35 7 17SEHE INA "Or M 64. . .
12/ 3ý 7 17565KE DNA MON 1.155S
L22/5/2W -35 72G1 NWhS7 MO0N 4435
12/1 370W . . . .......... .......... 21 ..... i I P ........ GS t--10 11""I ' i..... . ........" ... . ... .. ..............
22/5/470W 35 72f 1S;SESW_ý III MON 03
22/6/2W"1 35 721 18[NESWjDGST lioN 3
M
•s6 7- I G- HM- .......
22/6/7W "1 35 72,1 1N/SWNW G57 (Or, HM37
"22/6/28 ' 3S 7- 18)NENW..S.. MON•• -.....22/6370
3 3' 7) INESW OST "MON 0014
ý22/7/,2F58 35 72) INWS DN NS SW/SE 18-36'72; (75 WELLS)
22/2 W l 72 1 SWSE DONA I1ND 1 /SD I0'35'72, (75 WELLS'22//8SI35"' 72 18NN 'T'642 "WO 0 1 '''
(22//2157W 3S 7 N855 'SOT MOND
22/8/5WS " '' 1l$4'TS (MON HP
22/8/265W 35, 72" 185 SWSE -DN '54 7MP
22525W3 71, SRS- DN-A.t " • • -,• '25" .......... ... 55/3......72 ...3 ..w......)
23/9/75W '4)) 72 15 NSEW'DA N ENW 18/5/7 72wels
22/9/283W 352 72, 18NS NA INS NA iS3'2 ;(WLS
72 15 NWSE DNA INN 6-S S'572; (S WELLS)....... = ..... . . -"t - - - -' -t' - N .8 ..... . . -] .. . ... . . . ... ..
23/4/199W 1 352 72 D89 N A WIDS/E1-5-3 3WLS
22/4/293W "4' 35 72 15 SWNW 52'O 05
-4/I514 ±1 "' '3) 15 8N ýiSS MON 101
241[22W_ 72' 18 NWNW 852 ~MON IROS
/11/2•w "-"' 3S 72 18 NEESW - o (MON ..OD24/7/11W ...... i1F" IS 48 T "W GST . .... ' . . . ...
24/8/114W 34' -251" L SWE 1 MN 01
I4D/1145W " " -351 72 a Ios 'T MON
'40/1/576W 35S 72 18jNDSW D NA 1 NE/SW 18-36-72, (39 WELLS)40/15/85W 7' 25 s'1 86W .DA 2ND_ NE/NW. 13-35'73; S WLO
441/7 4444'' 46 72)...." E - 1 8'SE.... DNA ii 'i I NS"i~l NE... ... SW.. 11-35-7 (39....... WELLS)........
40'/18/87 --W 35.. " 72..... - " ThhZWN i "'DNAT= "(55... ...... 1
5W/w ... .............(Swell.......)
____3 7 I2s" 18 NWNWW JNA IND NW/N 1S36'72 (Swls
,40/2/486W' 36 72' 150W SEE 4MONW 1894 -63 7
~§2:~7 .1 35 724, ISE MN OP
3S 2 15'NSWN 'MON A0, MPS
'/4/07W~i "..... '.......i [..... i .... i Il' IX .7l 72.. ......5T MO iMI..... ~ ~ t)•'i ii ""....
ff .C ''- ''it" " N'--F 184"W ... "ON 0031
/4/557W - 35' 721 I 1S(SWNW DST "ON (5
7" """'3)'72( I'47SWNE GlST /001 452
35 -2 8 S .W ....... ON H .. .. . .
4748W ' 357 72/ 1 Si.'E ESSI MION '0023
BONER IROFTHERS PARTNERSHIP
s =PARTIIERNIP -
POWER RESOURCES INC.
POER RSOSOURCES INC.
POER RESOONCES INC.
JPOWER RESOURCES INC.POWER RESODRCEN INC.'
POWERREHSO-URCES INC.POWER RESOURCES INC. 'POWER RESODEC-EN INCPOW ERr REORCESINC.POW R REORES INC.
'POWER RESODRCES INC.tPOWER RESOURCES INC.
(POWR -RESOURCEES -INC.
POý_WER RESOUCES -INC.
7fEXPLORATIONPOWER RESODOi CES INC._4,POWER RESOURCES INC.
POWER RESOURCES INC.
POWER RESARCES INC.
POWER RRSODýRCES INCtPOWER RESOURCES INC, '
POWER RESOURCES INC.
•".T5/'E4'444DCrEg6HS I-NC-PSOWER RESOURCES INC.(POWRR RESOURCES INC.
4 POWER-RESOURCES INC.
POWE~R rESODRCES INC_-POW6ýER RsODRCES -INC.
POý0WER RESOURCES INC.
(POWER RESOURCRS INC.i POWER RESOURCES INC.ýPOER _RESOUCE IC
FAPOWER RE ORCES IC
POE SROURCES INC
IPOWER RESOURCES INC.PW R RESORCESINC.
I POWER -RESOURCES -INC.
POWER RESOURCES -INC.
POWER RESOURCES INC.4/5/HER R-ESOURCES INC.
POWER RESOURCES INC2'POWER _RESOURCES -INC.
,POWER RESOURCES INC.
jPOWER -RESOURCES INC-
fPLOWER RESOURCES INC. ""
POWER RESOSOCES INC
IPEWO REORS INC2 WE, RESOURCESINC.
JOW R RESOURCES IC
PW-R RESOURCES INC.POE EORES -INC.
POWER RESOURCES INC.POWVER RESOURCE "INPASE IRESOURCES INC.
(POWER RESODfECE NLPOWER RESO0URCESINrC.
tPOWERERESOURCE-SIC.
POWER RESO'URCES INC-
P1OWER RESOURCES INCý
7POWEIR RýESOURCES INCPO'WER RESOURCES INC.
............ ... (P646 RES•£' oSCES-• INC ..........
PO"WEER RESOURCES INC.
". S S Y i'RESOURCES INC . 2 T....... POWER RESOURCES INC,
" POWER RRSOURCES INC.
. .. ... .POWER RESOURCES INC.
Smith Ranch PermitAppendix D6 (tables)
Page 1 of 49 Revised - April 2011
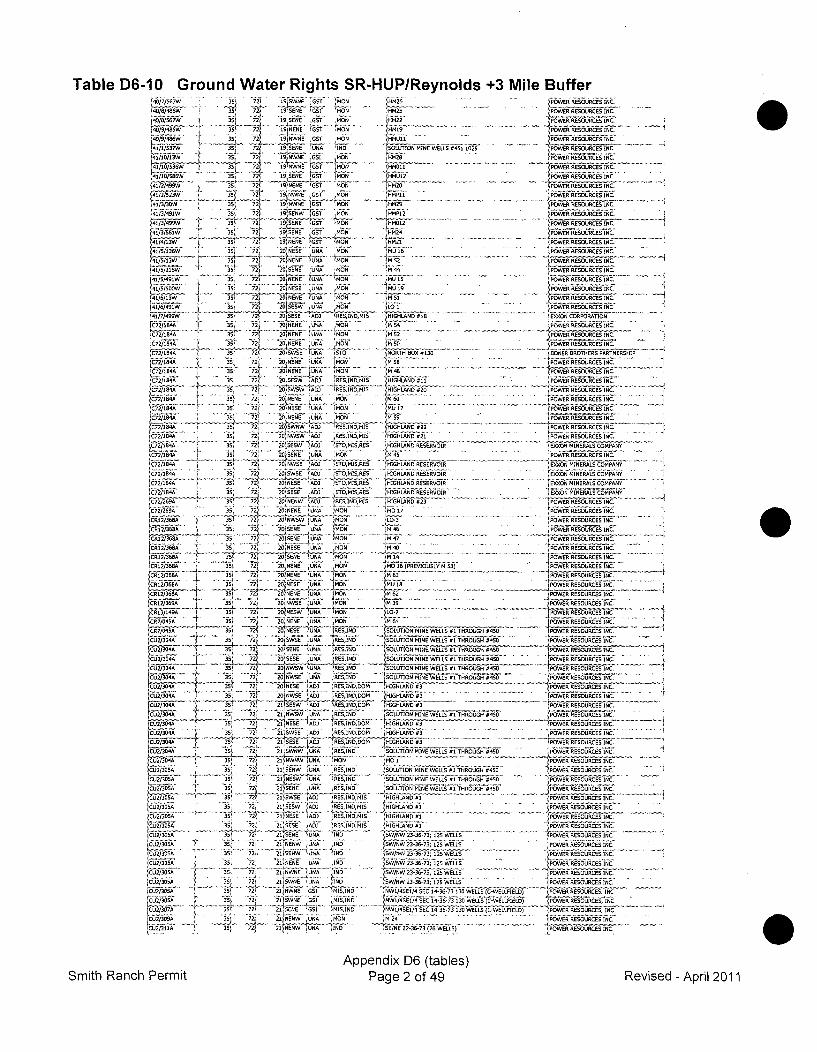
Table D6-1O Ground Water Rights SR-HUP/Reynolds +3 Mile Buffer
I.T 91GENE i51 MON1 L52 POWER RESOS19 NNE 751 M09 SMI POWER RESOURC
140/9/485W . . 35 72PW 19RNK51~ O7551 MOWE. ýRESOSRE
45/2!137 35_9SN N IEWLS#451 15625gPWR 55VI __ U. -RR SORU5/1/13 t5'72 POWE RESUR
ýL-1 J5 O _ 524110/55 35~ 72 19NNE '6MON 5011I _'ji&JOER RE505URC
72 ... ..sf..MiV_ -!4/2/49N 9 2 1 EE ~ - S
112/53 72 19 NWNE .51 MN 5~ OE ESCUES413/0 72+
453/5W 5 72 9SNE 01 .9 524POWER RESOURC
755 SEN 7 oil ,POER RESOURC45iT/4/5W +-~' NS13 45/5135 31 72 6ý *i /br OE EOR
bIA/3 MU 72 25NR T MNPOWERREUC
35i 721 2SSNESW 4U95 P0146N ~OERRSR272 '1 POWER 5550050_F
.C2/55 5 72 _23tNENE UN-A 54051 POWýERESSRE07/14 3) 72 -20 NWENE 095 -- MON- 55 POWER RESOURC
jtl/7/499 39 72 2 959 09 ON-11 -SPWERSO
721 84 3 5L 72' 2I NEN E A5 9 MO N /5 8 . . . . . . P W ER RRESO U1RIC~0721R 35t 72, 20 SESW UA mýýý_R-RSU
_1A553NE! LN RESNI HIHLN 511 ý.. . PW65ER ESRC307/141 4' 35' 73 20 SWSW UNAO 75IST MI NOT B 20 #1A~ B •&Y5T
C72/3845 35 72 20 NENE UN95 MON MR1 5'POWER REES6UR
&V72i84 35 7' 0NESEF 095 MON 5517 POWER 5550553ý
17/SA' 2ý 20SJSWNW /ioi RESINOMIG HIGHLAND 522 POWER 5550050R0C7ý2//_184 35 72 ... 1/NWSWC HIGHLAND #21 )6W&5ECRkE~b6C
'C72/114A ?F!' 72 25755 15.52 !GQSISE HIGONN RESERHIR
! V& 2/I 8 4 A 35 72 2 0 7 SE N E 5 9 5 M H O N 5 4 5 P O W;E R S E S O S R CC72/154 357 72 20 DW ) Is I' S 1MISD,REýS HIGHLAND RESERVOIRý_LX
.-..-2ý 35 20.- NE751O MINERALSMS IGL~6ý)on/INSS~~~~~~PWE 2055EESTSISU )IHLN RSRVI
3572 H54 35 72 20 NESE 503 STO.MIS,RES HIGHLAND RESERVOIR702184 35 72 20 SESE UNA3 510, M 1, RA IHADRSRVI 9MNRL
'072259 39 727 20 NRNW A03 )RSOjlMIG 7 HIGHLAND #23 7 POWER REGORCSS2553 72, 2 NENE R Sý MSe 7509_ý 507 OWR ESURC2/AT351 72 AGIW ) STJJSI S ' H' 'L03 . . . . . . POE REESOSA
ZI'2IN 35 72 3D GEN I9 n4 POWE RESOSRC
[C72/269A 35: 72, 2ONESE AD UN S jND2,.... 71HA448 j23POWER RESURS7/3~~M F 4 72TSEET5 . MN '14 POERREOR
jIl -. 3 12 20 NENE UNt, ' 409 L0M 3 15 PREIOULY iJ
+R 2 IfE 1j 5 27 25'NWS# UN CO OE RESOUR
C53/49 f 35 72 20 W 'IS MON 1402 POWERIRESOURC
CR72/048A 35. 227 20NG'UV EG10O 5&M TRUH#5 WER RES56URO05 R2/O8A 35 721 25'WG!E NS RESINS I"L!O MIEnWELLSý 81TROG5456WE-RREk R
Cui2/304Ak 35; 721. 20 NN 405ý Ifý NS 75L1 IEWLL 1TRUH#50PWRRSSR+S/34 ss A 2 WW SN E N tO5 NMN WLS# HOGH#5!/WRERSOSC
CR12/368A 35, 2 2NS N RE M90 'SL1008 IEWLSR 507 8S POWER RESOURC
-Est--4 - 3 ST 724 SDJ! 85ONS 00 ,IGHA #3I OWR RESOU~lRC35"36 727 5NG 0 E N 0
!12/369A 35: 72! 21
3W A3 'RS 90 5 __ý POW ý R-ESO!R[HGLN 13 2/. ýMN U- ER FE§OR
C7035 72. 21 NWSW IONA 55579 551109 MINE WELLS *1 THROUG.H #40 OERRDORCU2/304A 5 35 ' TES-E M A N. h M!N111- !I-" T'-'. j0
35, 5 SWE ,DJ*~SRI' RIALAN #3POWER RESOUSOC152/3045 30 EISG IHAD# OE EOR
I_ 2/30_24]O MINE WELLS #1 THROUGH #450 POERi RESOUR
21304Ak 3 72, 21 S IW N! RESINS 75000540 MINE WELLG #1 THROUGH #450 7POWER RESOLRC
7 NS RSI ISL1ONMN W #LL 1 THROUGH 8455E 05UR
CU2/3OSS 35, 2 21.NSWG [D RESINSO M IS HIGHLAND #3 OE Eb~__i 71lE ;II{SM 595. jHIGHLAND RIPO3 EO
CU2/3OSS 35 -. -Aý .. )i '`1N_ ... RESSEF 21'34 3 2 707 n $RS,06MI HIHAD8 OER REFUOURC
35) 27 1)S95 UNA NS W/N 2335 7 12 WELS POWER SESOURO
002rr/11304A!5 72. N5 SW/NW_ 2353 2 WLS OE
6,i002/3 AS33 74 21,/N E 5ONA .ESN S W/W~ N MIE 2 5 7 2 WE LLS '!7-POW ER RRSOURO
35 ) 2<WNE[EN SID 0WNW 3353 15 WLLSPOWERERESOURC0U2/305A 355+' ISLLO MIN WPE143 9513
0EL&G t- ULIr'6
1052/309A 5 7 2 71 ,95WS A02 POE 55505,50S HGHAD 140 ýF " 19 'SE/E 3573/7 WELS). . . . POWER RESOURO
'$[[I 5 72 21 SIENS UNS 22ND
cuj~~~~~~iEAp en ix D2 2 E, Uý ýoSC4I2 6 (tables)
Smt a ch Peritii P3 , 2 EN N N ageN 23 of73 49 1GfC
E5S INC.
ES INC.
:ES INC.
ES INC.
ES INC.
ES INC--
ES INC.
ES INC.
ES INC. -
ES INC.
ES INC.
ES INC.
:5SINC.
:ES INC.
:FS INC.
ES INC.
E• INC.
:L5 INC:55 INC.
ES INC.
:S, INC.:ES, INC.
ES INC,
COMPANY
:5IN'C ........
.COMPSN......V
COMPANY .................
COMPANY.. ..
ES INC. .. . .7
ES 6INC i7. ........... ....
OS INC [
55190'g......... "'•
:ES INC.
=ES INC.
3ES INC,
E:liS INC . ...
ES'gi ' IN ....... ......55190'7;.... ..
55190{.... .........
0
Revised - April 2011
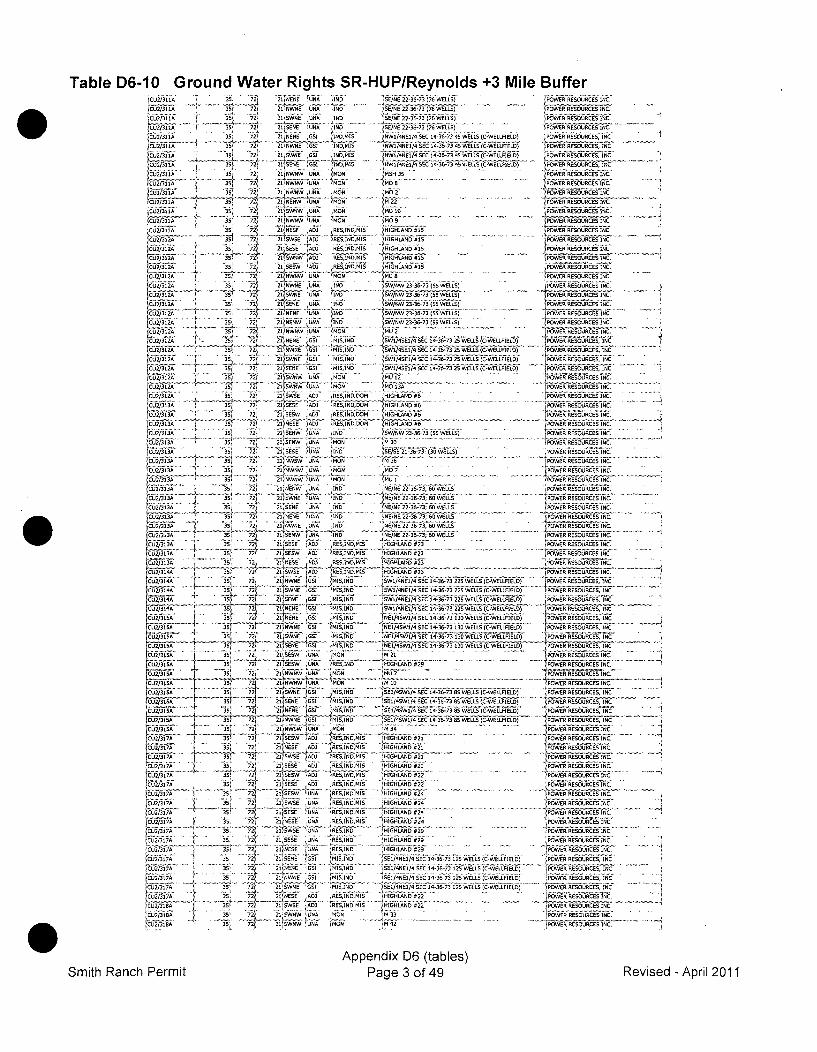
Table D6-10 Ground Water Rights SR-HUP/Reynolds +3 Mile BufferICU2/311A35 72 21WN UA IS
* 35P 72'1,I -N UA INS
2 35ý 721 21,1555 USNA INS
rC23T11A 25 72 N 2SAE GSI INS MIS
(CU2/'31 351 721 21INWNA 552 ISS,MIS~Z23ii4 +t2i!jE NE GSI NAPEIS
,C2 3 1 1A 32 72 21D SAS SI t~ mlsiCU2/311 AD 35 72 51gyNW UNA MON
f&2/311A _3 I4 7 21 NWSW UNA tibACU2/311U 72 21 5-S UA .0
35 7224NN 'USA 555OV
35 -17-7 --31/ A 2_5 72 2I4NESE ýAS) ,RES,1NSISý
SUI2I$313 72 21-55W ARE RESINSNIS
C5/1U3 72 214NWNE UNA INOFCýU2/312A 3B. 7? 14S S N
j~i1s D 21 DEN U LA .S1,K
S2J 21E5555 U A IND
25312 72- 2 NWNW USA, M6 N
10,1/312A 31j - . -1 AWE IS[ C52312A ' 3 !7 21 SANE GUI MSN
CU2/312A. . 35, 7 15-N S O
4-52/312A 35 722 21 SWnW ILRU MNON
- 21 E5 5 A S) R ES IN D S O
2C52/313A Sk RES ,INSSOM35) 9 -'2 AD PSS2V 2 D/5J1
/31 5 72. 21IISEW 1ANA INS~l4,
ICU2/313 . 1.... 31 72 21 SENW USA MON~ictIj 3A 35 72 21: SEW (USA -INS
3 5 72 21 WSWS USA tS-C52313 3S '2 21 54-NW USA MON
CU2-/313A 351 72 21 N54-SW UNA- "ON
..4/D 25 7 .... ' 2 2' NENW UNA INS
359-i.. -1 21 SWNE U1IS IND-CU2/313 35 72ý 2 1 SANS UNA INS
--I-2/3 3l 71 AA /N
LC2 4 '3 72h 21 NWNA ANA INS)CU2/313A --- 31 22/EWAA -N
I " 3512 21 55Ejý A)-5lrINC~
(CU231A 31g 72 21,SESE
- t% j'2CU233 35 Z3 iR ESUJSO,MIS
6-U13/34A 35 72ý 21 NSWE AJ tRES.IND MIS-- 3-1CU2/314A 72 21 .1.... E
5U23_4 721 21 SWEN -Al MISINS
CU2/31AA __ ~ , )SS _I -'y ,1
cAD/SISA - ( 35 72 -"21/- W -S O
ýý-1372j 2-1 NWNW USA DCU/DED- 315 72 21 IWNE_ (55 E1-1
-~ - -'-- -M-- _lNDE52/311 31 72 1 NENE GUS, I415,75
CA/1A31 7 21,NWNE GSI MICSRINS
~CU2/3iSA 35172 21SU USA MO( C U 2/3 1 72A TS2~ 2 1 5W A S ý t S IN S ; M IS
'CU2/17'A 1 35 2 215 5 ASE WASINS MI
bjiU E P V '- 3.. 9.... .I . 7 J- - 5I 1 W i O I R S I NI
jCU2/3S7A I 35 -771- 21,SESW DNA RSN I
LD2-/31SA 35j 74i, -, SU .USA RESIMN, I
' =U2/1A 31- 722 21 NASA UAN RAISMS
U _ 3 1 7 2 I S W U E D N A R E I NP2C2317IA - 35 7 21,ES USW AS NCU2/317A 2 31 -71 2SAS S EIS -
55131A 5 21 21SEýNS iSSICU2/hSA 3 M2ISIND
,aý5_ _1 31 72 21 NWN UNA MS N
C 2/3 7 352 72=21 S W E S - M IM O N O
k5UN1A 35: 72i 214NSWSES RESINDSMIS
C52/3SNA 35 21 2RI-W S O
31, 72 j 1 S S S O
SE/SE 22 3573 /7WELLS) SPOWER RESOURCES INC.SE/NE) 236 73 .(75 WELL IS) bi -~~ -e P~~E1 ~SS INC.
.SE/NA 22.36.73. ..6WELS) (P06 ES b'RESOSAC IN. .
Nh/NE 22 3 . ..3 275 WL) POWER RESOURCES INC.
WHiS/LE1/4 SEC 14 35-734 WELLS C-WELLPISLS) ER RESOURCES, INC
W/4NW-/A USC 1435 673WELLS CLL WERRESURCES INC. W
'5 /441SE)1/4 SEC 14 -36-73 5 WELLS )C-WELLFIELO) - (IOWAN RSUACES, INC -
IMU •5 POWER RESOURCES INC.
Hm6 2 IPOWER RESOURCES INC.45 22 .POWER RESOURCES INC
..-.-- . . ..-... --. ... .-
'MON ER RE SOURCES INC.
HIHAD#15---------ESOUIRCES INC.
AISNIANE -POWER RESOURCES INC.ESUALASS #15 POWER RESOURCES INC.
1 NIS A A N S A S ~P O E R R E O U R C E S I N Ce.'
"-~~~~~~~~ ~~~~~~~ ~~~~~~~~ .i'4• "i ............ ................. !•"•fk'i~e• .......... >.
I-W NSA E 1 --5LF (POWER RESOURCES INC.SW/NW 23-36-73 (55 WIELLS) (PIOWEN ý EEOUCEIIIC
1SWNWN,' 23-3673 5 EL)C1E RESOURCES INC.(54-254-23-3573(55 WIELLS) POWER RESOURCES INC.(SW/NW 23-36-73 (55 WJELLU) 2POWER RSOURCESINCik
MI 22------PWER RES-OURýCE fIlNC.(SWI//4EEL$ EEC14373 '4SWE/4551/4 SEC 14 36-73 25 WELLS (C-WELLFSAO PWR EOUCS N
..... ~ ~ ~ ~ ~ ~ ~ ~ ~ ........ .';'T U -':••i £T:T••6" .•; • '' . .......
15W1/4551/4 SEC 14-35-73 21 WELLS )C-WELLAIELD/ N h?424? ~SWE/451/4 SEC 14-6-73 25 WELLS (C-WELLAIELD) POWER RESOURCES, INCMU 12 -POWER RESOUNRCESIN.'
...... ~ ~ ~ ~ ~ ..... ..• ... ... ... . .. . .. ... .t•• . . ........ -
MOQ 13A- - - -fWERSUCSIC
.HIS R,,N,6 NDCPOER RESOURCES INC.2NISRLANO #t, POWER RESOURCESINC.
hl B~ •'6 "14 .... io76i'{.............
iNULN" A3-3f •S---- WEL) PWER RESOURCES INC.
A.. IMN3iS' . .,WE RiESOURCES INC.... W A RESOURCES INC.SES 1373, (30 WVELLS) _ POWER RESOURCESINC._
-------- POWEr RSORCSN4 M0 & 7 -POSURSOURCES INC.
NE/NE 22-3563R WELLS- PWR RESUCSIC
NE/NE 22317 RAELLS (PWR RESURESIC
NEN -235-73; 60 WALLS (PWRREORE INC.NE/NE 223573. AUWLSPOWERPRkESOURCE-S INC.
>NE/NE 22-31-73;W AS WALLSW'AN 'RESO0UR-CES INAEIIGH'ýL12ý_POWER RESOURCES INC,
HIGHLASND #23 -IPOWER RE-SOURCES INC.
HAIGHLASO 523 POWER6 RESOUýRCES INC.
.SIUESN #2 (ILSC-EUIED OWAN RESOUNCES, INC.-- ,fW1/4551/4 SEC 14-36-73 221 WLSC-LLIL( POER RESOURCES, INC
1541/4514 SC 1-3-7322 WELLS )C-WEE LLASST&RASUCS NSW/S4 SECi 14357 25WELLS (C-WELLESELS( POWE5R RESOURCES, INC7I 54-1461/4SEC 1436-302 WELLS (-ELIL( (OE EORE N
,NES/45W1/4 SEC 14-35-73135 WEISS C-ýWLLAiELS)- IOWRRESOURCE-SINC
1N51/45W1/4 ~E SE 43-310WLS(-ALIL) PWRE RSURCES, INC-NES1/4SWS/4 SUC14-36-73 -130-- WELLS )CWLLILS-PE REORCS INNE/W/4SC4-5713 WELLS (C-WELLAIELS( POE RSOURCS!NC-
21-- ----- POW4EN RESOURCES INC.,MULI #2 OER REOURCE INC.107 PWR RESOURCES INC.
- W .L--------------- ----- -0w-R WERRGESORESI-NC
(51/45W1/4 SEC 14-35-73185 WELLIS (CWLPIL) PWERENSIEE Nw SIASEC 14-31-73185 WELLS )C-WELLPISLS( 'POWER RESOURCES, INC
US/4OW1/4 SEC 14-36-7385 WFSLLS (C-WSLLAIELS JPOWaiRESOURCESIN-C
AISALNI #21 'POWER RESOSCES IýCNC
NIANGLANSD #21 POW;61E1R RESOURCES INCHI GIH LA N #P21 -IWA ES RCSN.
AIS.ELRND#2i POWE-R RESUCE N
RISELANS #24 jPOWEE RESOURCES INC.-4RESOURCSI.
RIS1ILANO #24 POW;ER 4-6Rf REAISALANO #2 POWER RESOURkCES INCeHISA[LANO #29 POWIER RFESOUCES INC6AISALANO #29POEREUCSIN
EAI/HLNEOUDSECI 67 2 'ýS( EL:- POWER RESOURES INC,AEMNISALASEC1O67 2 EL CW #29ELC POWER RESOUNEESiNC.k-SES/4N51/4 SEC 14-36-73 125 WUELLS (C-WSLLFEILS) 0 RESORES N'SSS/45E1/4 USC 14-3A7' 121 WELLLS )C-WELLPIELS) (POWER RESOURCES, INC
SEC143-73125WELS )-WRLAILO/ POWER SESDURCE Sl NC
(AIGNLANS22 67EiRSORESIC
-~ý E POWE RESOURCES INC.
Appendix D6 (tables)Page 3 of 49Smith Ranch Permit Revised - April 2011
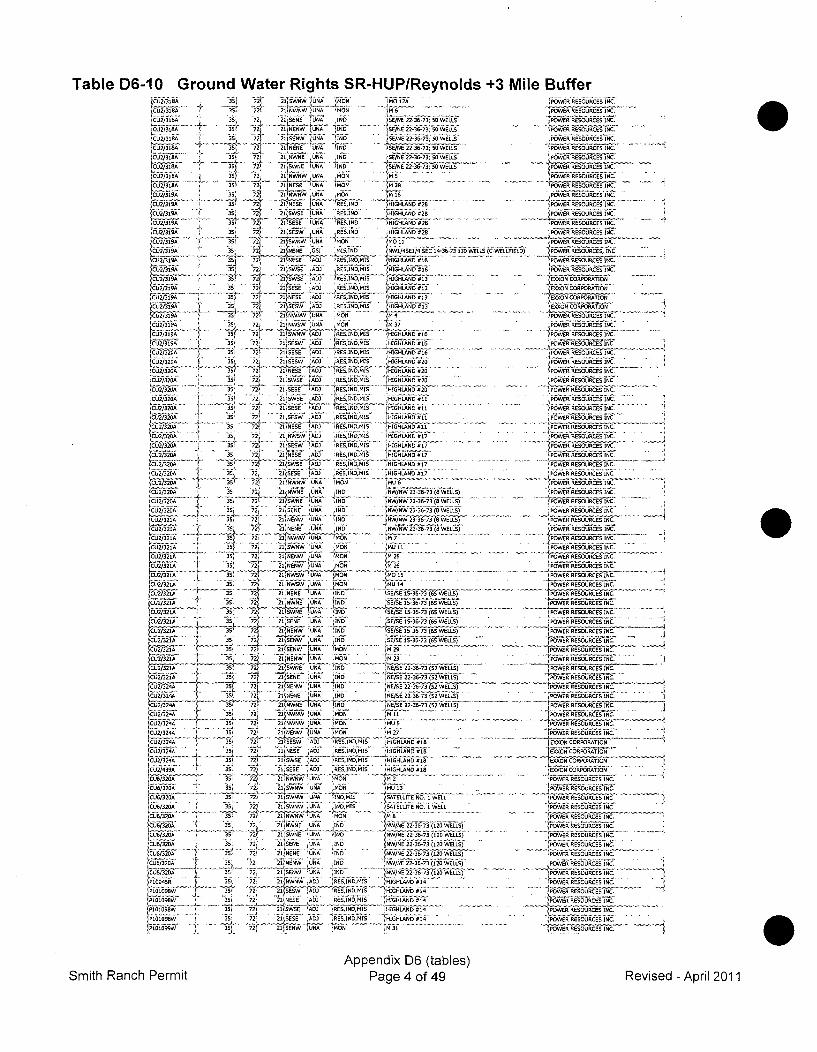
Table D6-10 Ground Water Rights SR-HUPIReynolds +3 Mile Buffer1C-U27j3NA 35 7ij (US JA M4 _ o1A POWER RESOURCES INC.
21 2 SENE W .WUA 2O2-3673 5PWE RESORCE INC.jSCU2/318A 3S Z 2 21 REE TI N EN 2367;5 EL PWR
CU23SR 31 71 51NE//A NA INS ISEINE 22-36-73; 50 WELLS POWEE RESOECE INC.O(TG NAý SEINS 2T 65,'iW C!POWER RESOURCES INC.
ICU2/318A - 35; 2 21SN SE/NE 2-67;5 ELCU-2/315A 35 7 1 NENE UNA INkS/NE 22436 73; 50 WELLS IOWR RESOURCES INC._
CU_2/3E1_A - 3-351' 72i 21 WNES UNA -. INS mS/E2-67;5 EL POWER RESOURCES INC.1:/UB 35 1 N LUNA MON 1MIO.ERESOURCES INC.
~ NV IN/ IM16 POER RESO RCETNC.RESINS HIGHLAND 6268PWRRSUCSIC(Cu23LA 72 _ 4Uý E /~SER REOUREOIC~SI2/3INA31 721 21,SS UNA RSN HULND68_ OE RSUCSIC
35'315 77 E A ýR ,N HIGHLAND 6268OE EOUCSIC
CU2131.RN 2 21WN US -MN. . . . . . RS RCSI.
hi/3R 35 7ý2 j21 ENARN14S1` SSECN -731 1135 WELLS iC-WELLPIEL( Pwe R RSOURCS INC351319 721 21.6661,MI -47ýN i, -- -POWrqEEREUCES INC.
CU2iIH A-DSY iREINOMIS HIGHLAND 656'
FLU2/3IRA_ 2 1 SS AD) IRESINS MIS HIGHLAND 613 ESCION CO PRATIONCU2/319A 35 7 211SESE I'ED INS MIS (HINLEND 613ý 00ON CORPORATION-
CU2/3RA 3~ 72 21/NESE 62 1656 I HIGLAN 613 SI OPRTOCU'2/3lNrA 35 72 M 21_SR AD) ýRESINS MIS HIGHLAND 613 EXKON CORPORATIONCU2/13lHA 335," 2 1 0AW-fiS) N-S
4hS MON _RESORgCES IAT__NC.-
LC12 3j1A 35 751 2 SWNW hA3 ASISMI HGLN 66IOE ESUCSIC!C23H5 72ý 2i165 165 4RES IFNFWS MIS NIULAND616 POWER RESOURCES INC.C. --- 13 IPOWE RESORCE INC.q§ A H~6 16
ýCU2/320A 72r 21 SEDE lADS TRESINS MiIS HIGHLAND 61 0~. . .Z j S2FESE 'AS) R.ES IND,1S MI IHSS2 POWER RESOURCES INC.
jC.21320A 3 24 21 SESS AD) SESINS MIS HIGHLAND 620 POWER 6 RESUR ES NC
CU235 35 7.. 2ý 21 SWSE ADS RES IRS MIS HIGHLAND 62#OER IC
ICU21320A 35 2 21 SWSE1 AD) RESIND "is HIGHLAND #11 POWER RESOURCES.IN
CU/30 33 721 21 NEE . US A )RES INOMHIS HIGIHLAND 1 O E ESUCSIC1CLQ/320A 2s 21,SESW ASS, RES INOMiS
1HIGHLAND#1I .POWERREOREIC
3uj2J 5 72 21 NESS ~ADI RESINOMIS HIGHL-AND t11' P/O ER RE ,SOURCES1 INC.3U/2G 5 72 21S1 WSE C . SI!ýT HISHL.AND 617 POWSER RESOURCES INC.
(CU2/320A 1 31 72 21,SESW ASS RES INDMIS HIGHLAND 617 KY PWERt RESOURCES INC.
MiCU2/325 "'- 35 7 2E U NAD RESNSI HIHLND6 1 POWER RESOURCES INC.ICU2/325k 1 5 35 2 21 NWNE UNAD RIND MI HIGHLAN 2-617i*i POWýER RESOURC'ESINC.
cc6-i_ 5 7ý 2 SENS5 UNAM R IND NMIS w.;);. .k:
1CU2 21 NEN 35ý IND s,.,..N1 2336'F POWER RESOURCES INC.
A MON UE POER RESOURCES INC.CU2/2GA35 72ý 21 NWNE L US4A I6NS NWNh33 38WLS OE EORE C
)CU2/3SGA 5 35 72 ~21 SENE UNSA IN+N/W2.67( ELS OE EORE N
CU2/321A 42! 2,_ 2/W W lNG MNN7POWER RESOURCES INC.c2 21OW ýNW UN POWER RESOURCES INCCU/21 S 2 1IEW S MON
1M25 (PWRRSORE NC.CýU2/31A35 72 2I1NENW US O M 26CU/31A3 71 1NW15IUNA MON 1S POWER RESOURCES INC.
C1231 5 71 2 WWUAMON MUIR -ýPOElRSUCSIC6U231 1 35! 721 2 1;N 1 UNA (S 5/E1 67 6 WELLS) POWR ESUCSI.CU-2/31 35 SE/SE 15-63 (A EL)PWER RESO5URCES _INC.
CU2/32A 72 2SWNE UA IS1-36-73 (65 WELLS) RSUCSICCU2/321A 35 72J 2ý1 NEW NA LIND ISE/SE 153-3(I WLSSPWRRSUCSIC
CA/21 5 _E USA IS S/E i~ POWER RESOURCES INC.CU2/321A 35 72_ .ý1 -_ - - - . - . jCU/31A ~ 5~ 2 USNE UA ISO NE/SE 22-36-73(652 WELLS) LPOWERRIESOURCEDINC.
CU-2/32 311 72 21 SEN UA N ES 23 35 EL)PW R RSUCSICCU2/32RA~ 35 7L1NN N N ESE 223673(12 WLLS)t POWE. ;ýR RESORCE INC.421p SlE~NEA7 USA IN E(E2373SWLS) - . . P ERRESOURCESINC.*ICU2/32-SA T 35: N N N/E237(2WLS 74WE RSOURCES IC
35 7 2 WW USA MON ,M 291tZ~iY _1 35: 21iSNEW UNA -MON HUE(PWER RESOURCES INC.EU-2/321A 351 72ý 21,61WN US1M1M 7 O ER RESO5URCES IC
35MT 72t 21NS 6 EINOMI HIGHLAN 2-6183 i;- -E kE1015CSPOiRA'j2 ENE U A5 N(4S 2iý 73 SE(AJRSIDMSHSL 6 S2. . . . . ..) COw~RPSOURCESINC
5CUZ/320A 351 21IS NW2 GNU7 MON POWER_ AiESURCES INC.1C6532 iUA 3. 72. 2 1 WNW USA MN 4G1 POWi~ER ESURCES INC.CU6/325A_ 35 724 2TkSW-NW ýUSA INMI SAELTNO1WLPWRRSUCSIC
,CS2A35 7 21 WNWN jUN IN6 NWN5 23 310WLS h~RRSUCSIC
CU6/324A 15'2
NECU32A35 7_2 21 SENW USA I~ND , NW/NE 22 36 73(12 WELL P E.E OURE ICr cClu6/3i 2 !A ̂ J5 72 2 N N SA I SRE /E2 E O 36 7C10 W L SOW R POR ATSOUNCE)CU2/324A 35 7 21 66625 USAD REND "S H]GHL/6622 i 36 7312 WELS) - - - - . 0.. R.-A.- -. ONP10HSR - - - - -2 t WN 60 RES INDMI1S H!ISALANOD 614 POW R SUCSICP10098 35 2 2 EW AS E N I HGLN 1 OER RESOUCES INC.21, NES$E AS5 HIHAN _1_PWRREORESIC
'PUOE. .5 72' 'hiSESE.03.rESIM .SHSEAN P AH.........------
(P111116W 35.. 21,SENW USA MON HS 3AE17 POWE wULR RESOURCES INC.
Apeni D6 (tb8s
Smith Ranch Permit Page 4 of 49 Revised - April 2011
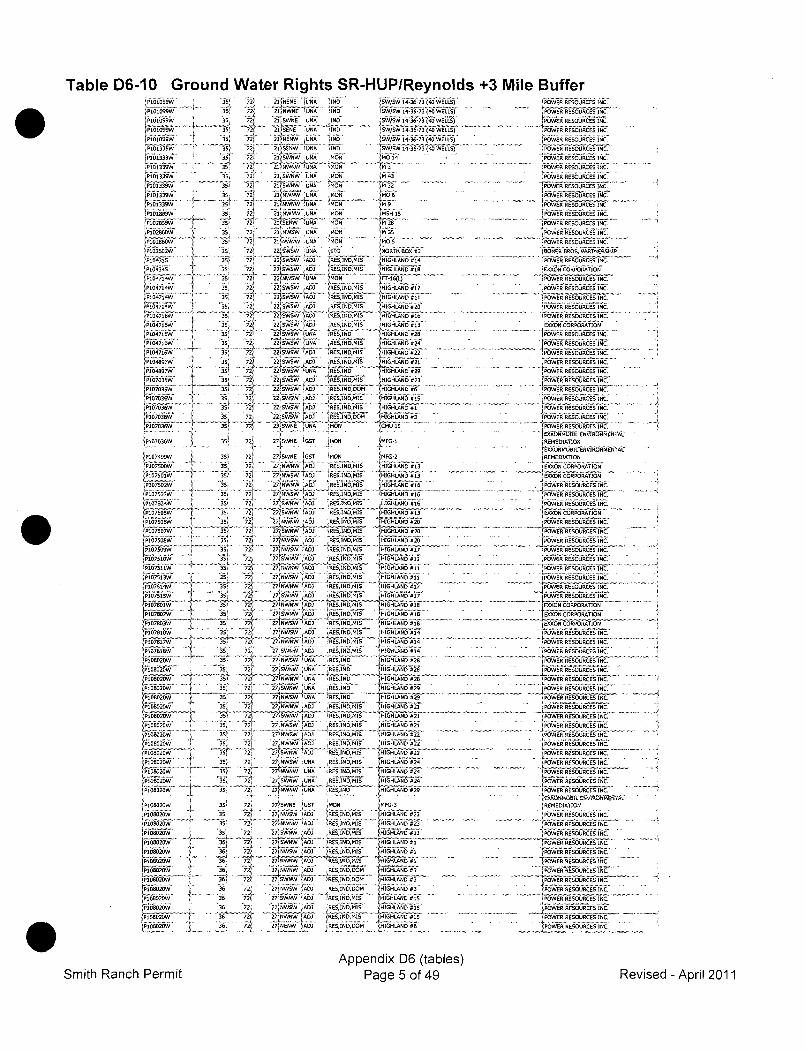
Table D6-10 Ground Water Rights SR-HUP/Reynolds +3 Mile Buffer
P101099W 35, 721 21 NENE UNA 1G (S/W1-6-34 EL
OD109 35N 72 2(WE10 9 1 SW/SIN 14-36-73 (40 WELLS)
P169W35 72 -21- EWiI jUNA INS SW/SW 14-36-73 (40 WELLS)
31101 72[ j,5qW 1iA 11D SW'3 SW 1436-34 WVELL1 35 7 12 0W S
P1339 3 2 Z1[S9W USA MON 94014
...... .. .. 11 '11 '3I. . i • ,• • 8.. .i i~ •• {• • ~
P1039 35 2( 21,SWIVW U A MO 9432{ 10139W' 35 712 21(9999W 503ý MON 11MON
P10133W 3 72) 1NWNWUNA -ME m90 9R .. I ...N-... ' A.
P101989W 35ý 72 21 NWNW UNA MO 991
S4- 721 22,SV•EE . .. ý7 .. .•
PI1028n59Wj3 5 MN
12D2SE0W 4EID, 1]-N ,, -35 72UI MON H
[P076WO 72ý 22.599-SW.UAD 000ID~i HIORLAH 800 9
P1S3IS35) 72 22 j SWI 83 65 NS MIS - IIGHANID #14
P10434•35 72, 23 SWIW AD)j RESINOMIS 1H WNSR
;P•O ~ w ,,,. ,..+,,,,,.,. ,,,...... .. ,,,
31'7 4 25 i 22 N WS W1 0 9 6 E 1 11 1 1 (M O N1 1 P 1 16(
$04 4w• 3" 72 12SWSW AD)) ,•6•0uID 4 (O6"LAND .. 7
P104714W -5 21ISWSW+AO 905 IEýNS I HIrH`6WI91
'10714 -7 22ý11 SWSW AD WEISS DMIS No1 oil.• • ' .. ...... 15,? --.2 ...... lsw "-- •g u:---' -- .... ....
6--Irz AD] R h-•s 20,1 M IS HIGLN 1
P141W [ 35 72, 22 lSWOW AS) R505 NSMIS HIGHLAND -Eli
P141W3 2 L2tSWSW USAD RESINDMS' ,I G HEND'#283
3ý5 72( 22 5S44N 05ISMI IHLN 2
3 ~ 724 22 SWS 90 1 ISMS HSLN 2
35 71 1si1 22S 6ý RSIN4I351 s oj PESINEO HIGHLAND #29
jP1070)5 I 6W - 29 72, .22 SWA JAS 80 IN MI H IGH A D 2
1P1D0736W 351 72 1 2721N 5W5 AD) REISD M [HGHENS#
P1703 - 31 72i 22 SWW Ao 0 ISMI HGHLNO#
315036 , 2 31
06 tU'ý NWAqý ESIDM I jURA 15~ j~
75 - 39 2 27WG jAD) RESI1900094 [HIGHLAND #3 -
rPS5SW $ 3 72[ 27)59990 A ET t [M Niý4S M -1iHACj(P157 .5. .s 3 '1 2 7sv
1"5W ' 5D) 1•9409 9 " .. .
(P107590W 1 35 72, 27,N H JS S EE1 INSl MI (HIGHLN #12170W [ 5 3 27SNW5W (AD) RESINS MIS HkIGHLAND 1
P1O7SS26W 3S 2 2 7,1NWHW AD3 AESJI6O`MIS W1HIGLAND #160IP107507W [ 31 72 3 2i-NNWS 'AD) 1940010 MIS HIN g
5070s4W 35 73 27'WNW AS•)" "RES,OMIS .I .HLANO #.16..
[lPISS 35 7 - 27IsWNW 5901 RESINSHIS' ~HIGHLAND 913
351o51s 7 -, 2 e7 I .. U 6,wD I•S •H 4IG "
..1.7. . .W 25 72 277 N.... . . ..• .. . .. . ... .... S .. 5,..S
J0109?N 35 72 271 N W AS RSIN,4S jIGL 1
PI019W 35/ 72 27TSWNEW AS M IS F-
!P1O7500w .......... .. ). . .... 35, ... 72, .. ... 27I NWIAW " D] .......... 0.................. RES INOMIS ............HIGHLAND 9411
P10753W 2 72 7(NWW 'A) RSNO MIS HIGHLAND #17'
P071W35 72$ -7599W Aol 00190 MIS H!IGHAN #17P107801 D, 5/ 7 27N W AD SISMIS !HIGHLAND #18
...... I ...... 35 ... .....
O 9 4 35 7, 2 -- 77NW.W AD 6050 ND,MIS HIGHLAND #19.
[Pi10916W9 1 25 72. 2 7
W . .WAAUN RES INS HIS THIGHLAN. . #18
P1O751DW 35 731 271
1 WSW . A.) 190N MIS 'HIGHLAND #14
P1078W 71- 71 274WWW ILIN, fA R'- - - - D#2
$91074189 . .... .. 4 55 72.. •77•9 , AS)' 0001909410" RIHLANONS4'
!P10020W ) 351 721 379NW93W UNA RES IND HIGHLAND #28
PE0802OW 35 72) 27 NW WUNA RES ND $HIGRLAND #29P108020W - 3E5 72 W71W9W A60 SAESIND, MIS HIGHLAND #21
(/56112/99~O 5, 1.6/iM HGHLAND #21P108020W'"' ES2,OMA -HIGHLAND #21
P108020W 35 72[ 27 NWNW AS) 065 INS MI PIGSLN 2
(P158022W [Z3.7 , 37 NWS US RESIND,HIS (HIGHLAN *24
[P002W351 70 2(WW UA -0,NI HIGALAND #24
j[P1082025 35 72 27 5999W NAD ,AES,IND,MIS jHIGHLANS #24
P182W 4 35 72 27 NWNW UNA RESINS11 fHi0HLG&ANS #29
+ ~~~~~~~~~....... .i !.... ;• , ; ..... .{,s...[P108020W 35: 72 27 SWN _SP MN.A
P1200 35 7 N N7WW UAD (RJES,INDS (HIGHLAND #23
(P108020W 3S1 72 27 NWNW }AD) RES, INDMIS :HIGHLAND #23
(P10802oW 35 72 27 SWNW4 AD) RE65,150941 HI'll~aNS #23
31 70 27 SWNWý AD) - (ES,INO,941 (HIGHLAND #13[4ou'W [ 361 72 27 9Sl.N [603 (RESJN,IN.S 94/DWi/D
4/So2W9 723 37199959 Po RESNMI HIHA ND 8172-"W11D' "sr"Rý (~~
P10026 13 72, 27 -WNW AD) (1909 4 HIG-HLUND #3ii(1085a25W -36 72 07 SWNW.1 ~ADJ 600,190,0099 HISHLANSU #3
S~US2W36 72 27 NSWW ;AD) 81 ,566,M04 [IGLND#-
I P 10820 1 35 7 27 SWlNW AS) .RS,IN0,MIS- HIGHLAN #1[P000 0 72; 271NWSWI AD) ý, Ad4 A--155 1155/l
II.852W 36 73ý 17 IWlW0 A03 RESIDI jIHLN #5jP1II• W . 36, 7Y2, ..... j.AD. .RES.IN.OM 'HIG. LAN 6 ... ............
Appendix D6 (tables)Smith Ranch Permit Page 5 of 49
(POWER RESOURCES INC.
P EOURCES INC.'POWER RESORCES INC.
........ . 0•6+af RESSU'CES NC.
PCFRESOURCES INC.POWER, RESýOURCES INC.
- POWER RESOURkCES INC.(POWER RES-OURCES INC.
,POER RESOURCES INC.
RPOWER RESOURCES INC.
$ POWER RESOURCES I NC.POWR RSOURCESý INCý
... .... ... . .. .. . . .. . ..'POWER RESOURCES INC.
ýPOWER RESOURCES INC.
PAOW-ER REISIO-URCES 1INC
:EW.N CORPORATION
.. .......... ....• i''6 ''•' .... ..(POWER RESOURCES INC.
ýPOWER RESOURCES INC,
POWER RESOURCES INC.
REMEDIAOTION
RWMEDIATION
. ..... •.6) A6..••i6.,
POWER RESOURCES INC
[,POWER RESOURCES INC,
ýPOWER RESOURCES INC.
[26//E65OURCES IN.
tPOWER RESOURCES INC.
jPOWER RESOURCES INC.
jPOWER RESOURCES INC.
J... .WEi'REoURCWSINC.
. . .... .... .' ... ....... i•E
-POWER RESOURCES INC.
,JOWER RESOURCES INC.
POWER RESOURCES INC.
POWER RESOURCES INC.
POWER RESOURCES INC.
POWER6 RESOURCES iNC.
POWER RESOURCES INC.
POW~ER RESOURCESIN
P - %V!IE#7kSOURCES INC.(POWE RýE-SOURCES IC
(POWER RESOURCES INC.fP.W. R RESDURCES IC . .
(POW .ER RESOS-U .RCES . INC.
,POWER RESOURCES INC.
POWE RESOURCES IN C, -
ROWER RESOURCES INC.
Revised - April 2011
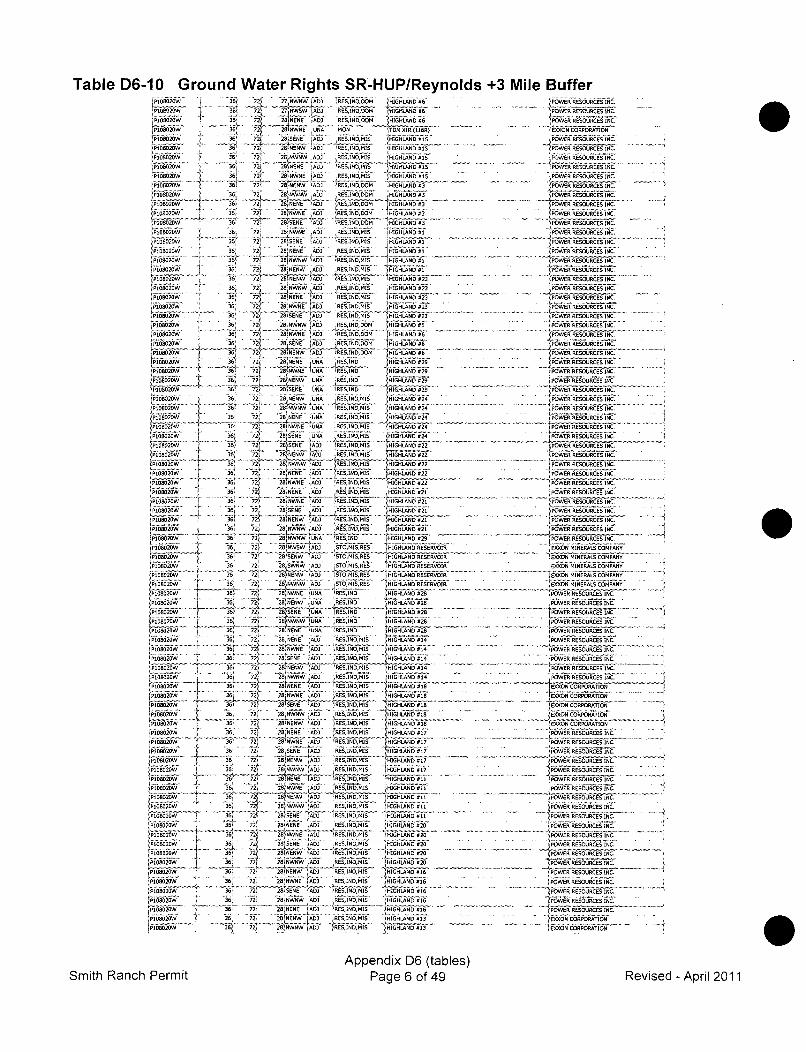
Table D6-10 Ground Water Rights SR-HUP/Reynolds +3 Mile BufferP "LE Zý*436
'P108020W 36
z P o-•o-.- ...... i !P108020W 36
, P)OSD20w 36
1P108030W 36
;Pi 36
1P108020W '- 36
0P108020W 36,
P008020W36
P9108020W 38,P18020W 36
............ 36
P108020W . 36
361P108020W 36s
P1820 . . 36P108020GW 36,
,P18020W 36
P08020W 3
:..08020W
rP10800W -1 36ý10181W .. .. 36.
1P(18020W 36
PlOaO20W 36
'P108020W 1 360
'36'
P108020W 36
~P10800W 17 36
Pi080••26W '36
P00820W . .3636
PFO02O3W 0~38
P168020W 1 36
*,26w 361
-36
P1080208036oJPI08020Wý
36
P108P0WP80820W 36P108002-W3.
,P108020W 36
6 36'
iP108020W 36
P108020W36
36
P10,R)DW 366P008 - - ' . .361P10800W 4 36
ýP108028W 36
36.P IO20 W'36
P108020WV 30-
PI 8080W JV 3636
36,
72, . iiENE iADJ72j 28 86881 080320 28, 88080 666
..... 0g.......... ..' ' •
720 28 NW6NE 6AD
22 2861
NNW 60072 __28.6806W AD)
721 28 NEN AD60"72' 280806 1600AD
28608W 0603
721 28 8•800 6A072' 28 0888 AD32 28 88068 600720 2ýS88 68072 28 NNE 600
72 28888Wr 600
720 2 I •72 0 ADO72 28 8808 60
720 2 800888 A D )
72 IS'N8 E UNA
72Z 280888N 6-A320 281688W UrA
_261 ENE-jý...... ,,....... NW" 086•, ..
72 2888 N86
72 280NE NA72 _28888 16
" -,..•)• g i' ....
2 '28E8 W 63AS 2'NWNA
72 . 288NEN8E ý721 2',8808 ADJ
.• .. ..... ..- -.1
12 28 088 60E E_72t 2i8188880 F60
72 28, NWN AD72 N'86W 08
... i "8 N;ý
20 2jWSW 68AD20 2 N8W N68
2 28WN ADO
!2 28t88N '0i'
'21 2i[~N`8~ 06ý72 28 888W UNA27 28088'N
• _ý ............-- NW. • •
21 28 88088 S 6,20 28 8888E 008
72 28114'W88 AD)
72 28 0888 60072. 28886WIA 'AD)
721 2 hi70WF AX721 2818808 680
7~F' 28006 060072 .28 8808W A0072 29 I'3ENIFW AD)721 28 P888 ADr2
721 28, 808W '6D)
72 2868886'
72 218 AD) 6072 2818888 600J
72L 3SNE ~AD)
72 2nN8 jAD)720 28 NW8 0603AC72 28,N 8808060
721 2 8088 60
72 2.jNN AD)
721 28 60880" 0600
0800;INDbOO jOIGHUANO 86
68,66,8M 1Hl-ISAfNb jMON TM .. .01 ..011. .
,RE,•N.MIS&• .810•'•60.688"
M5018.1 HIOLAND 815.RS0ND,,MIS ýHIGHLAND #15
RE80,N6,0Mj HIGHLAND 83j"EA,'& ;IG.L"ý6_1 ' --•~ i .. ..
R 9, IN , -OM ,HIGAL6NO 83" • ., 'o- .... RS f ' . ..............jRES1IDO8 HIGHLAND 83
801006 HIGHLAND 83'
RES, IS' OHIGONAN816ijRjbj HIGOILANC #1
RES,IND,MIS IHIGHLHNO #8
488 8 .0IS IGHLAND ..1
R"l')SIND,•6l5 '61•08L0 823IG0.8,MO 8i8LA6 P2
",S,IN-,MIS 'HIGHLAND 823
•gi~~~i~d;•i•~ • li'i• .... ......
iRES,INOMI 0HIGHLAND 823
RES,IN0,MIS HIGHLAND 823
M0,8,0 'IGHIDAND 864
'880 NDMI jHIGHLAND 826"'~N J1111A60 82
8RES,,5 160 IHIONL52••29
- IGHLAND 828
PF5,188,M HIGHLAND 824.680.IND,MIS HHLN82
.680,IND.MIS 'HIGHLAND 824
k0f6 ..0.MIS ,I608 6"# 824
S7' ':',M g'Rff ' I• • • H ....LA45iiiWii
180,N,MISE 060081660822Zi
t88,188,MiS IHIGHLAND 822V(jý
88,8,1 IGHLNDRE822 OI
,80,IND 11S H IGHLAD 82
880,iNOMI HIGHLAND 282
880160 MIS H1IG16.APD #2
RES, IND,MIS HIGHLAN ALA
R'ESjNDS H•IGHLA'D . .29
RETO4,MISR ~HIGHI-AND 688014RTO,INIS,88 HIGHLAND 6808600
RES, IND, MIS' HIGHLAND 820
RES,IND,MIS HIGHLAND #18
..6 •'i..,0. .~'6•i•.,, ...
ORES,GIN, MIS HINIGHLANO#28 .
'885,180 ,MI H 0)
IH LA0 828 ýRES,1IN0.Mi5 IG ý17P8GIESN0,MIS ~HIGHLAND I'14R8G,INE0,MI 'HIGHLAND 814
•~~~ 11F&M' ... ..G4 • "... .....
680,180,610 0HIGHLANO 814
RE80,1ID0I MI HIGHLAND 884
,HES.N I ~HIGHLAND 818
Pageý , of 49
RHES IND MIS H~iIGHLAND 818S.- . - .. ..........
I8,8,1 H IGHLAND 818
iRES,INO,MIS 0HIGHLAND #28
REG,IND,610S HIGHLAND #16.RE0,IND,HIS ~HIGHLAND 817ýRE0,IND, MIS HIGHLAND #87
88Sg,1ND,Ml0is HIGHLAND 8876
'R8GE .IN . ,HM.is . HIGH1LAND 811
0880,INGMIS- 1jHI'GHLAN'D 8201
Appendixf D6GH (tabl828
PageNDMI 6MGLN 8204
ER RESOURCES INC.• . • ......... •g.£ýPOWERES 500080 NC.
POWER RESOURCES INC.POWER RESOURCES INC.
POWER RESOROCES INC.
POWER RESOURCES INC.
.POWER RESOURCES INC.
pOW RESOURCES INC.
'jDPOER RESOUR6ES INC.
R~h ESOURCES INC.
... ...... . SýE I.6g Bu• INS,
. . . .P W ER RES U R C E S IN C .
POWER RESOURCES INC.P080R iN888000808 INC.A
1POWER 800•066065 'iN
POWER RESOURCES INC.
.W.. I•o•E•E 080008080 INC.
. . ...... ...... ... ......•• ' • :.... .
'POWNER 880006080 INC.
POWER RESOURCES INC.
,POWER RESOURCES INC.
POWER RESOURCES INC.
8000808 IIEASOPNC.
PVONWER 880006080 080
POWER ki80068080180.
POWER R80060080 INC.
POWER RESOURCES INC.
.. . . . .............IN . .
..... ............. iiý~ l-we".-'&
POWER 880008088 IC.'
1,POWER PESOIReýS INC.
__POWEFR1 680008080 INC.
POWER R~68506880180
0800 MINRALS ICOMAN- R S~8 O UMNRCES IC.MA
'EWI(ON CORP0 O MPATI NY80100O CORP0 ORPATINY
-1
,¸¸4
Smith Ranch Permit Revised - April 2011
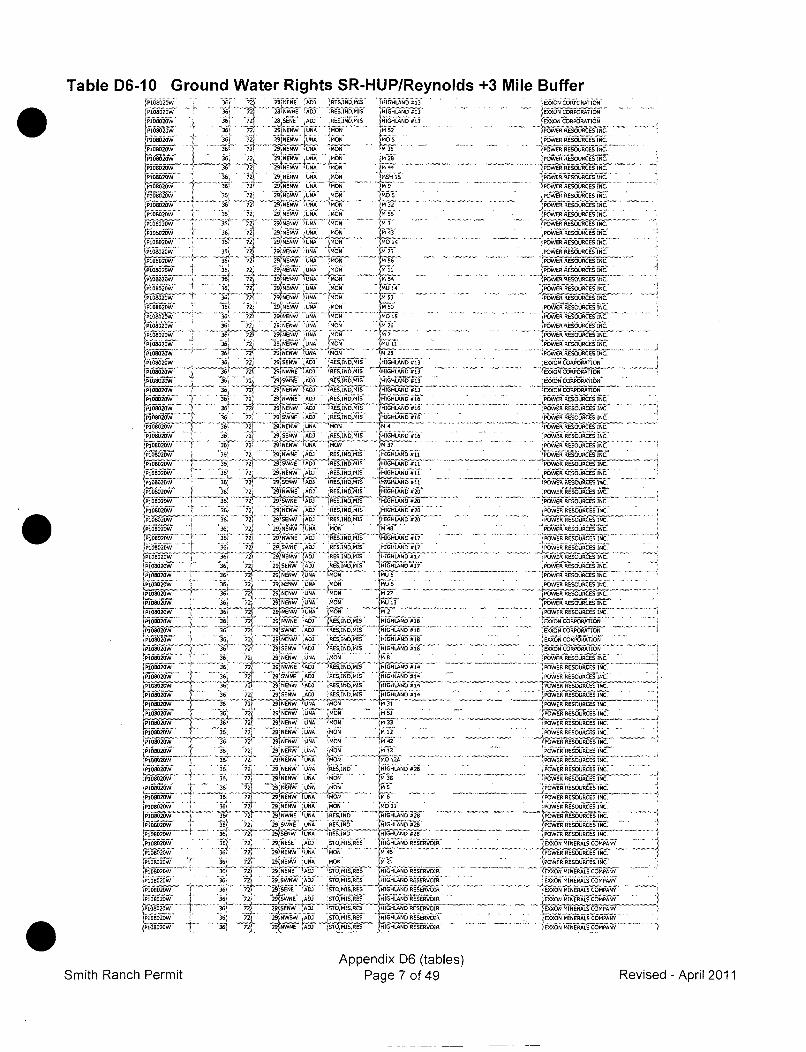
Table D6-10 Ground Water Rights SR-HUP/Reynolds +3 Mile Buffer
hPiUA29v> 36P108020W 36
iPICS0O. 30o
FP00602080 36+
[Pl08020W 36if
30ý
1P1000 36
P1080W J 6
P00802W 36
P108020W --
P1085020W
ýPI08026'W36
SP 1 0 8 0 2 0 W >1 3 6
P108020W 360
6636P08020W -36
OW~~b 36,
P108020W> 36
36P0_08620=W 361
P808020W368
P1080280 ** 368
[P108020W 360
36.
[ P080-20W, 36
36>
Pr108020W, 36:
1P10 020W 36-P........36.[P108020W 8
182W '36
F1>08-0201>W 36
P1_08020W _ 36'1P10TO2W 36>
jP108208036j
kP108026W0
P108020_36>ýP108020W 36,
P10802WW '36P008020W36
P108020W 36>P108020 3P108020W 3
P108020W 3
P10600 1 3
36
3EP108020W36
'P1080F0W 36
P108020W 736P0800W3
72: 281680 63 6A0D RES,IN0, MIS tHIGHLAND #13
", ' 28 16 • 0 6ISjý , 1S I N'
72: 296 W 906N 61C, M52
72 2 91NENW MON 160 So
72 20606 W UNA6 MON 02834.... , ... .. A•" x "- .. .. .721 i9NNW >666M MO
7 29 606NW 066 606N fH 11
.... -J " -9 •'-A" ""'M ' T" ' ......
721 29 "Ell. AD EN MI 32'9 N6~
29 NENW oA M0N ' MO
008606 806 06 014
I 26NIhW UNA ,MON 6 wS
• Z L .,9 "..,• ". ..)....... ....... , ,v .,, ; ..~ ..... .
72 29 6FNW 066 MON 656
290'NLN 066 MON M. 5NE4 1 1A'6
72: 2q NEIW 8UN MO 83
. 29 .... • N) -. 'UNA jMON ....... . w . ..........
20 NENW 0 A6 ES,6IND ! N #10
72j 2•;W6 )AD SJUO , MISE )HIGHLUAND .13ROI
' `ri w•• D ET' i 4hE- *!l• 8
. 20...... .. W 066•, 0.0,.. , . 272 N60NW UNA M0N 487S
722 29 1 680 60 006Z M6 16' HIHAND 013-
_21 29600 63 010MS HIGHLAND #137, 2910EW6 A03 606160 DMIS HIGLAH 813#
'721 >3li 8OW 0016 MBIS IGLAD129 9806 60 000860 MIS NGIHLAN6O#06
7.ý 29.58060 603J R0SJ6DMIS HIGH0LAND 816
708 29606NW 666 606O 6
72 29>06 >0
72 . 291NEW0 603 RES 160 MIS I
ill 0NE 160 SRS6817 29161680>UN :056MIS 1H1260 1
721 29,86000 86086HI 045N06 811
72 29 SN6E 603 ROKINGMI 'IGH-LUAND 182
2 0>606WV .603 IAOSI6DlS' HIGHLAND #82
2966889 MON 14
72.29 NWNE AXi HOSING MIS t..56NS0172 G9Týl IE D) 6080 I HIGLN
N016 611 fHIGHLAND 612
29>1680 >60 60 86 MI HIHlýLAND 012
71 29>606W UN66 O '06 3161- " , -, _ - - -- 1. - > .
72 291606W "66 8N0 332
2 26 6068 066 06 1017Z 29 60680 8666 M061
22_96890 62 111N>6 l 1HI4L6 !28i
7 _ 29jŽN06 03 601061 >
IHLNA1
721 29ýNN 60680 06 6ls
7i2 29AýW 68060 MON2 >1666 MIS TH i .HA 8
2950680_ 603N 616ý 010
»ThI1>1>iiW>>4066 RSTOINS Nf.GHLANDRERVI
- '-
728 26:60680 066J 608.1"E >6 N 33 EROI
2 9 NONW ;A66 STMONkr 412NIE~b
721 29 R06W >006ýIU 8106 88 83l
-129 608 06 010 HIG .ILA.ORSEVI[ 9 600W 0186 , >90 65RE
080806 CORPORATION
08806 CRPO6RTION
180RESOURCES INC.
,POWER RESOURCES INC.
PONRRESOURCES INC.
8603000kRESOURCES INC.PO6WER'kRESOU RC1ES 46'1
08 06RSURCES INC
. .......... ............ .. . .... ..•'% '. .. ... .. ...
P000 RESO96URWCES IC.
POWER RE0050 IC
POWR EUURCED IN1C,,
EWK•5 q• .....
POWER 615000506 IW.1POWER RESOURCES INC.'
POjWEnE RSOU RCE 6 IN CPOWER. REOOORCE SINCI._
POWER RESOURCES INCP0OWER RESORC-ES IN-C.
>O>6E>o1 RESOURCES iC.'
INC.
iPOWER 0010005>01 iN.,PODWE R RESOURCES INC.
0 .9 >
bsEON-CES RIO
POWER6>0O9SO
......... ...... .L!ýL _T . ........ .. ........ . ..... . .POWER RESOURCES INC.
'OWE0, R.Rs60606CE6 INC'
POWER RESOURCES INC.
....... i .." ..b 'N.......
> POWER RESOURCES INC.
IPOWE-R R~0060005>0 INC.
PO'_WER RFESOURCES INC.E>POWIAIES66R5>EWOWC
EXXON CORPORATION'
EEOWERAcoý6TINC
POWER E-SOURCES INC.
....... >1'>106111101>>1>
POWER RESOURCES INC.
... . . . P080006."000>06' i NC.
jPODWER RESOU3RCES INC
'POWER RESURCES INC:
POWER RESOURCES INC.
P00800 RESOURCES INC,POE 100>6INC.
IPWRREjýSOUO5>ESINC.
POWER RESOURCES INC.
6POWER ROUEGPAS R.IO
ThIXON COIRAL OMPAINY
.... .. . .. .' ' ( " • .. ..... . ...
.. ... .. .. •~P80000060005>6 1W65>i...... .
EbOWE RIESOURCES INC
POWCER MINERALS COMPANY
POWER RESOURCES INC.
P• OWER RESOURCES INC.
11806N0106ERALS ICOAN
.. ...... T " POWER RESOURC•ES -INC...
A
Appendix D6 (tables)Page 7 of 49Smith Ranch Permit Revised - April 2011
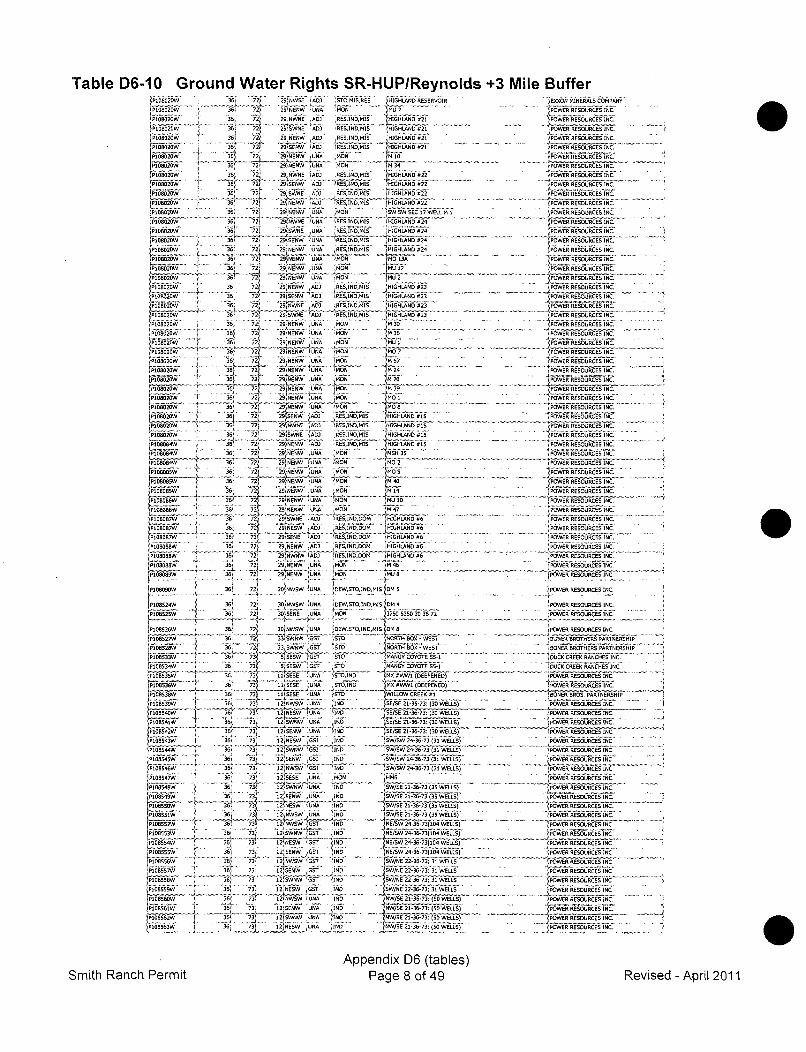
Table D6-10 Ground Water Rights SR-HUP/Reynolds +3 Mile BufferP108020W
P108020W
P108020
Pl0.
P108020W
Pi08020W°$10020W -
P108020W
P108020W
P 1080-2 0W
P108020W
6P109.020W
P0020W
ýPI08020W
A-08u A
PG80802W
46i0800W-
rP100020W
P-10802W
I-a%P I108087W
P108080WP8080686W
IP1608086W
(P.00.8.W .
P08080
,P10853"
<P108536W
ýFý6" . ....... } ....
FaOý..o2W--o.. .
1P108090W
'PI08520W
P0108020Wi
P108529W
PlP00520W . ..
~P1O0853W
P008524W •
P108528W
P108S02W
[P108055W •
(P108558W
'f108E59w +
P108062W J''l
32 721
29 PNENW.UN U MON P1 , -M"2i.....•+ ,• •+,s:• •''•EE, ... ..4I0AO2
361 72 29 NWNE 802 0001M0, #21
94ýi ° .... •9 -LA L RE.. ',S ,IZ .........MS , ~ • ...... .....36J 722[" 29•SWN OA3 +ES, INDMIS HIGWLAND 821 . .. .. ... .. ....
300 721 29050NW AD] RESIND,MIS G HILND 2
3630) 72 29UNEW 0N5A MON
362 72( 29jNWNE 0AD0 REINDMIS HIGHLAND I24
30 72 r)) RSSNE 9110 IRHSI00,MIS .
36 . ... 2 9! # N U- x A s+. RE', . . ......... ......
360 NINE A > Si6,ws 5
3 72 29' SN UNA HER ES DM.6A0 .ig' " ...
30 7 39000WV UNA <MON M0
36;"" 72 29NENW 088 <MON M02 .
... ......... ........38 72 29SWnO 802 VESIOD,MS ~HIGHLAND 023
38 72,. 290 W UEV NA ,80N. 3r36 72t 29 NE11W UNA MON l1
'++p~~~~~~~~~~~~~ '+ ... . ++ •}'' •<'':a+.. .+~+a• +........ ..........
3 i 29 NENOW"IUNA "7
M730, 72 9 EN UNA MON386 i2~ 29 NENW 008 MENM00
300 2 73 2-9 080WVV UNA PI0N '1820-'7 2 - NE4'7 UNA'0NW 96 0 . . . . 3 .... .. ..
h,• 72 29 EN0W UNA 1MON MY8
30, 39 0Z8N0 0 .RESIIS HIGHLAND #015- .... ...Y6 -72 2H<INESW AD R ,EEI NO, 1 HIGHLAND 015
30 7 9,000W AC) :R05IND810`- ý-6-&7i30 72N 2'00 06 0 MSH 35301 72 2<OW00 O . 0
.... ... .... :+.1:- "- -".... ... -J... ........ ... ........,..,+
360 72ý 29±NENW 9UNA MON m09281.60-- ' 'W .- """ -
30 7~ 26ýtNE 80 ESI0O8 HGLAD0
32 72 2915000 1ý 00 20SIDD M <HGLAD030 72 29<000 HNA R'MON 000 HIHLN 1
Tn --.1 .o+ ia utToo....+~36. 72 <802
36 72 29 006W A0] <8
361 72 301 00 EST6NMS
30< , s w-N ....... . o
30 77 3)WNW 530) R000TH 805-600
30 72 33 SWOW GOTA 570 (NR 800WS
36 732 5NSESW <GOT STO 88A03 COYOTE 05-1
36. 521 11 00500 0080 3010 1886 61 72EEH
4 . -. ...............
38 73' 12.NWSW 980 .10 80/0163(0WLS
30 73 3 0 380N 5 S ,r
36< 73 120001 UNA 100 SE/SE 213 3( 30 WELS )3 ,73 25W OSI 10 V0/S 24 3033NWLS
38 73 ~ 1FSW- E;NW 001 IND N SW/W 2387 (31EP WELL)
38 73< 12SS 0000 <98 .0D0038 73< 2S<RNW 908 '<0 _ 0W/SE 1 367)3DEL LS).... 1i V - -.. . 1.-.g - 1 . .S .. . .. ......- - .. . .... .. . ..... ..
'6 7 12<SEN1W UNA 080 SW/SE 20-36-73 (35 WELLS)30 73 66(EW ("00 <J0 SW /SE 20 36-73)3580 WE.5)
306 !ND2 WW 8 < SW/SE 21-. 3 -6 -73 (31 WELLS)736 1"WW OT -0 N/W 23 304WLS3 73 12OWNW G57 100 21 /SW 24 38-73)(10 WELLS)
36~ 73< 1250W I ND ES 4-30-73)0041 WELLS)
38 3 12 SESW 057 18 SW/E2363 0WEL
36 73VGN I2NDW07 0 SW/NE 22 36-73 (38 WELLS)
S, -73, 1 2 E00W 90 100ý SW/SE 21 36-73 (350 WELLS)
•~ ~ ~ ~~~~~-I 5ff ... ji-W ..',•• +a ,E••:•+,+•
36 73" RI80 88 . WSE 21 30 3 4SDWELLS)
36' "W < SE S .I . .NW/SO 212073- 4 (OW LLS) .
36• 731 S12WN G•3 - IND SWN 23-73; 31 WELLS
36} 73 12Nsw +UNA IND NW/S-E 13-:(S W LS
36+ %3 I2,SEWW' 'UPNA :i•• •k+7Z--• •.. ..
36< 7j:•+,:,•[• • _+.•:+ ......WN ":*.U+N7:•:!•• !}: ._k2q 5YA......
-00309 MiNERALSeCO04PA
POWER R EOURCE,
POWER RESOURCES INC.
66O661Eso0RES6k6 INC.<POWER RESOURCES INC.
(POWERý RESOURCES INC._POWER RESOURCES INC.
POWE-R RESURCES -INCT.
<POWER RC1ESOURCESýINC.POWER RESOURCES INC.
POWER kjSOURCES -INC.
POWER RESOURCES INC.
<POWER RESOU0 RCES INC.¶IT666EIýS RCES IRCP6OWR RESOUC~rES -INC.<POWER RESOURCEiS INC.
POWER RPESOURCES INC.
'POWER RESOURCES INC.
. 6W•R•R6ESOURCES REi " 'NC
(POWER RESOURCES INC.<POWER RESOURCES INC.
I POWER RESOURCES INC.
(POWER RESOURCES INC.
- bOCWERý RESURCES INC.- --
POWER EORCSICPOWýER RESOURE INC.
4POWO RESOURCE IC
POWER -RESOURCES' INC.
IYOWER6RESUCES N-C.- OWýER RESOURCES INC.~POWFA RESOURCES INC(POWVER RESOURCE-SINC.
POW'ER RESOURCiESINC.<POWER RESURE INC.
POWER RESOUOCES INC.<POWER RESOURCES INC.
P6VE ER`EINC.
POWER RESOURCES INC.
"POWER RESOURCES INC.
- - 1 11..... ......'• 7....... .. ..POWER RESOURCES INC.
'POWER RESOURCS NCý,
OWER BROTESORCS IARNC. SIP
POERRSOURCES INC.
POWE RSOUR CES IC..
.... =ER RESOURCES INCSPWERRESOURCES INC.
<POWER RESOURCES INC.
! 8ONER BRoTrPERO PARTNERSHIP
,OEREORACHES INC
<DOCK CR0E01 RANCHES INC,
<POWER RESOURCES INC.HPOWER REESOU.RCESýINC-
,POWER RESOURCES INCZIWER -RESOUrRCES INC.-POWERiRE-SOURCESINC.POWER RESOURCES INC.
POWER RESOURCES INC
PDOER RESOURCES INC.
(POW ER RESOURCES INC
<POWER RESOURCES INC
POWER RESOURCES INC.
..=P E"ES•URCES ..
POWER RESOURCES INC
1.. . -. +r• .. .
....
Appendix D6 (tables)Page 8 of 49Smith Ranch Permit Revised - April 2011
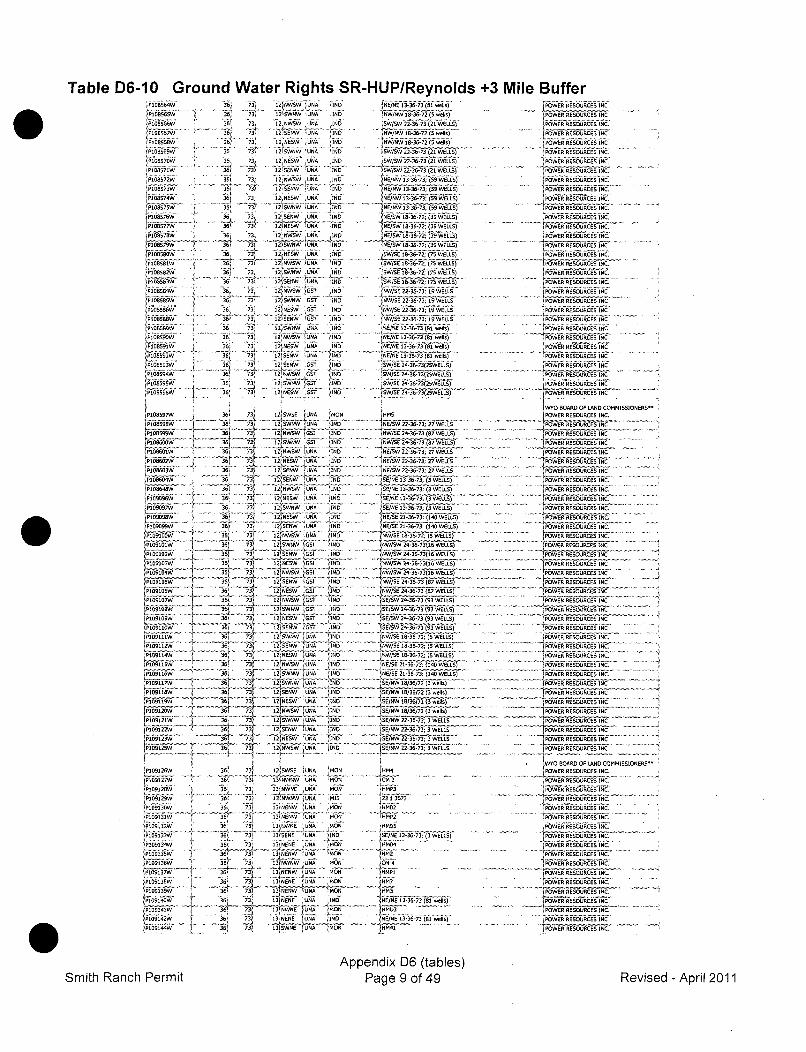
Table D6-10 Ground Water Rights SR-HUP/Reynolds +3 Mile Buffer
Ti8SS 36, 73 2 9W 06 ISOP1E066EW • 36i 73 12 SWNW L8NA INDP l l . .. .. ig i t i l " " I
'3'•6 ' 73 1I2 5,"1 U 'SA 1I80
P1085708W 36 73 12 ILW UNSA IND
P108576W 36, 73 12 16NW 0UNA .18
•P1671W • 36/ 73 12 1NEW UNA IND
P10852W- 368 73 12 NESWI UA INQ
iPi6s84~s6j 36 j73 12 N. UNA .180PI-59 36. 73J, 12W W '0861 18A0N
P1052W" 36ý 73 .. . N " U " I06N0
_P!0892WW 6 7 121 NW '8NA IND
36 1215W" USA.... " ••• .280Ti 6985W36z 731, !26 SIAIN G S' N
1 301s i6' 73 12{WS 0086,ý' G ISlP88236 73 12090WI USA IND
36, 73 . 3•' S• W 0'N ' ..
P188W3 73 12,NWVSW (00A 180P19' - 4 2 NN01 5
[P108585- 36' 73 12'SWSW GU 'SOI N
P100541" 36. 73 13--••. '1805W SOT" IND
•' ....................... -2 °"% .. .... .... .....
PiP16 W ,Ao' 36 731 12 NESW SOT .180
1P108597W. 361 73 52SWW SA 08
P 936 731 12,SENW (UNA 18N
P10 2W 36, 73, 1I4
NSW USA PC
P1089)W "• 36- 731 10 SWNW '•D57 I"
361 731 12,WNWGStOT •IND
(PI8860W *" 36ý i2 S65WIN
P190859W - 361 73 • 12WSW5E USNA OND
Si£•ii&i....... ," ...... 4 4. .§ ' '' - ,uX •T• '
P 10899 73, 12'8WSW U51 NED
•P,009 91"i 1 ..... ! ... 36ý 7J S;ENW U{NA' I ND...
F• •'•w ......... r .......... :' - 1,2 .... --P.7
P10860W36 ~ l2,S6W 0001 !,ND
PI 3 860Wp108602w 36t 73, 12:NWNW 'USA I
36, GSI~ IND23,
1ii°6/ P. ..... 12'"7 'SENW/ IG •0/ IND
.P109107 " 36 73. 13 SW8W USA '380
P10 '036 73 12 UES A D N6-1 Z 12-65 SEV, GF N
361 _73, 121 W 088I ' 1 50IN
P60W !E 36731 02 SW6W 01251 1-0
.II" "' 14 "S --H- 4 !ND
jT00w 36 73 12568WW UNA 'll
1 p0 4W 1 5-l 73ý 12, SWW 051 UN 180N
!P109005W 36 73, 32 SLE1W, UNAi /18[PI11910W 36 "6[ 1 6W 601 1
S.P109121W ." 35, 3 } 12 iWW0' 1 'IN 6"
('/i'OsIal..... ....,.'..1'80•"""•7•...
~P10iL1W361 7' 12W5 '!!! 'IND
36, 73 t2 l ,t '
P10?9115W 36' ,3 r' ioilo M18 O'8
1P109168W 36 73, 13 NWNW v v86 18
PIC1o80, 3 "''AW3S1WT'LNA 'INS.'13- 36' 734 " N ,W
OPOOSOOSW ' 3[ 73 12 068 .086 'Iý
jPE091o 36 12-I ~E W988 08 6 -[N
~P0322 31 12 068WT02A 118
360-r 74"'6ý 12 865W USA PEO03~OSSj 36'0 1 WWUNA ('180
lPsS1ol 6 3 (31WW08 N0
[P0010"3 3 13I 868W U A 60
P1901WW 303' 13 868Wý 086 MON
36' 1 .4. - IN'P169134W 36~~,73 1380UA MO
466/81 13-38-7 (8S wells)NW/sW 18•36-72 l5 5•0.)
SW/SW 20-36-70 (21 WELLS)5W/OW 22-38-73 )2 ELL)
OWO 23-3(1W'ELLS)-
,SW)SW 00-36-73; (01 WELLS)
[SW/NW 18-36-72; (59 WELLS)
- 81L•/•ý K13-36-73; (59 WELLS)4-SE/SW 18 r3_672(3-9RWELLS
......... .. .............•) .. . .
5W/SE 18 36 72 (87 WELLS)ISW/SE 18-38-72; (75 WELLS)
•W.SE 1831272 (75 WELLS)
9Wr/SE 3-31-73; 19 WELLS
8NW/SE 22-36-73 09 •WELLS.
186/NE 13-36-73 (80 wels)
'SW/SE 24'36-23)2SW6LLES)
5NE/SE 24-36-73(2SPJCELLS)...... 4-36 1-732SWEL.LS)• S .
" V// 22-36-73; 2 WELLS. NW/SE 24-36-73 (87 WELLS)'4WjE3/0 ' 60 -36 --78 E-LLS)ill/S! 22-36-70 03 WELLS
'8R/SW 23'7;2 WEL
06/86 13-36-73; (3 WELLS)
o/NE 13-36--73;(-3 WLS
6/8 13-3673 (3 WE -LLS)
21-36-73,(19 WELLS)
08:IW/W 214-36-~73)6 WELLS)
3 3(16NW/SW 24-36-73 (16 WELLS)N8W/jSE24-36-7-3 (8-7 WiELL)
[S/SW 24-36-73 (93WELLS-)
(8W/SE 18-31-72; (SWELLS)
8W/8SE SE-36-75; (S WELLS86/06 21-3-3 10WLS
-(NE/SýE 21-36-73: (140 WELLS)I'5/8W 1/6/72 (3 w-ells(SE/NW 18/36/72 (3 wells)
jOE/NW i1836/72(3 wels
,SE/NW 22-36-73; 3 WELLS
056NW 2-36-73; 3 WELLS
962[UMP2....... E'•" .......... 'sE-1L~
A603
CHMO{ O3'
INIE13-36-73 (81 weall~s). 1..... , 3-36-73 (, , we -
POWER RESOURCES INC
POWER RESOURCES INC
P98RESOURCES 18NC....... ..... ... '• q~ i"•g 8di '•'i ? . .......... ... .......'POWER RESOURCES INC.
L POWER RESOURCES INC.
4POER -RESOURCES
PO6ER RESOURCES INC.,
... .POWER ESORCiWeS .,POWER RESOURCES INC.
POERRSOU.RCE ..S .I .POWER RESOURCES INC.
.POWER RESOURCES INC.
"POWER RESOURCES INC.
POWE REORCES INCPOW-ER RE-SOURCES IC
(POWER RESOURCES INC
. PO ER RESOURCES INC,P 6SR RESOURCES(N
:Y B OAR. O LAND COMMISSIONERS"
POWER RESOURCES ENC.
[/6/kREýSOURCES (NC,.(POWER RESOUIRCESIN
POWER REOURCES iNC
.8ý RESO URCES INC,
POWER RESOURCES INC.
'POWER RESOURCES INC.
'POWE-R ESOURZC6S INCL POWER -RESOURCES IN-C
POSWER -RESOURCES INC.-
POWER RESOURCES INC.'PweR RE SO5URCES IrFC.POER RESOURCES INC.
EPOWRRESOURCE SINC.
PO6WE-R RESCS INC6PWR RESOURCES INC~ OER RESOERCES INC
POWER RESOURCESINCPOWER RESOURCES INCPOWER REORES INC,
POWVER RESOURCES INCPWRRSUCSINC
[POdW-ERRESO6URCES LINC.
[PW!! RESOURCES INC.
JPOWES RESOURCES
INC.h OER RESOURCES INC
POWEREOREINRESOURCES INC
....................... .t., r r . ..... ..........
POWER RESOURCEE INCPOW ERR••ESuRES INCPOWER RESOURCES INC
"POWER RESOURCES INC.
'90608OARD OP LAND) COMMISSIONERS-PO ER REORES INC.
POWER RESOURCES INC.
POWER RESOURCES INC
[..........POwER REoIJOS'P.........
.POlWERRESOU•RCES IN.C.
vOWER RESUCSIC
9068 REiSOURkCESINC
,POWER RESOURCES INC.
. . ... .. ... - 1,- - ... ..... ... .. ... ....
POWER RESOURCES INC,
[POWER RESOURCES .NC .
P(OWER RESOURCES INC.
'POWER RESOURCE.S :NC.[POWER RESOURCES INC.
Appendix D6 (tables)Page 9 of 49Smith Ranch Permit Revised - April 2011
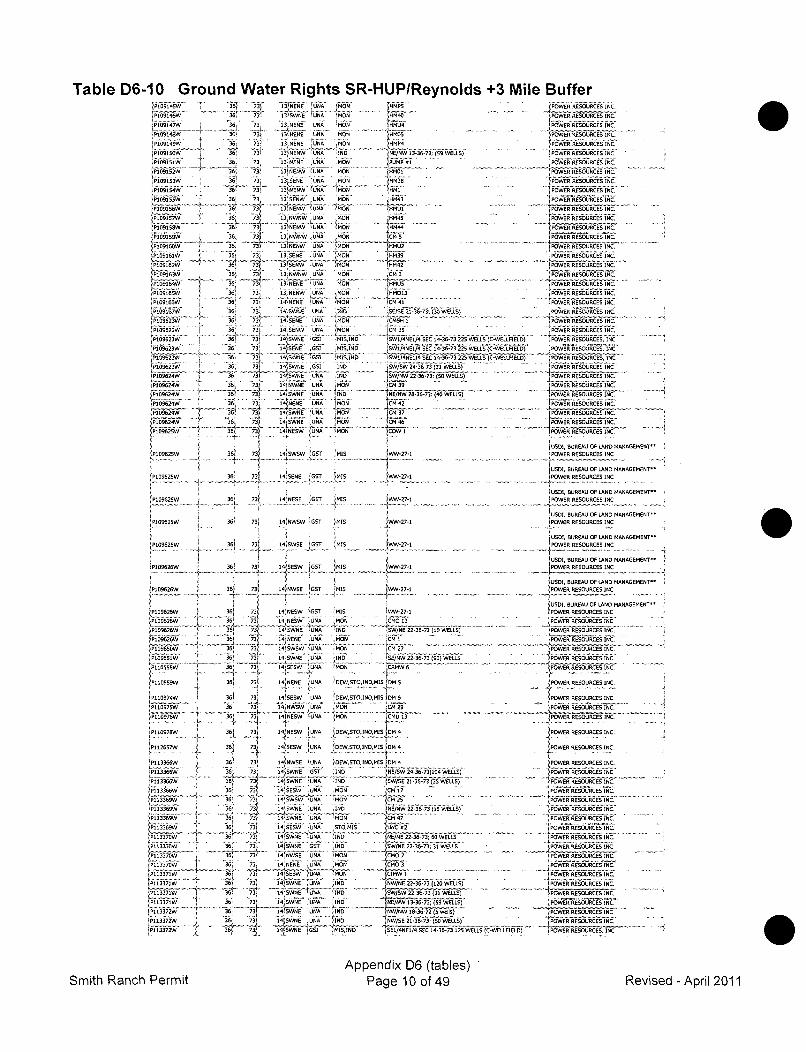
Table D6-10 Ground Water Rights SR-HUP/Reynolds +3 Mile Buffer'P609 .. .. 36' 7•z I3FNENE• EiSA j'/.6ON .. .//'•,' E"'%•X .i i•......D"W A M N .... ES- 6OURC0ES IN .............
3.6.. . -•. . " WNE UN' W5WE .. . OIECE I"P10147 ',ý 6140 POE ESOURCES INC
• i •' i W .. .... .. F . .... .... 7 3I 133 f S E'• N E U S A'-- " M ON'6 .. . .. . .. . ... . . . .7' ' " g • i C . . . ... . . . . . ... .... ...... U R C R S I N C.•1ý!7 36 3 3 NE 0N6 MON $HMU4
3 L 3; 1 3 NENE UN MO POWER RESOURCES INC.P10915s0W, 36 731 13ESN UNA NO6 NE/NW 1337;(5'9 WELLS) POWER RESOURCES INC./T"•hbiw 3.. .6 73 E3WEN A MON MUM• P A• I". . POWERRE RCES INC.
P109152W 36[ 73; 13 SEPW5 AMO . POWER RESOURCES INC,
1•m• ..... ... 6 ... •...•••0a>N.. .••..... . ........ .- ••0e•'V
P10 3W 36 7 1 SENE SA MON W N E 4- 25WPOWER RESOURCES INC.
P,9124W v 136-_' _73" S 13NNW 5U'6A tQMS HMlV0 C9OWER RESOURCES INC.
P509655W 36" 73 13 WNEW UNA MO6ND -N1 2I-: WOWER iRESOURCES INC.
PIQ6` 5w . ... { 36. -7h 13• '• NWNIV UN oA . .. ... •.. .. . ... ....... ..... .
P1091- 6 73 . . ...... . . . . .. .. .RSOU RC S .P1092ssW 36 73 131WNW 0T6 .W- AM4- IPOWER RESOURCES INC.
`90955 36, 73 . 63 AWEEW.USA RO0 1'CR S__.4 ) POWER RESOURCE S INC.1P09160W i 3.6 .. US O MU IGER RESORCES INC.
1096g5W 36 734 13;SENE UNA MON A-2139 POWER RESOURCES INC3 7 " U O. iPWRRSOBURCESU O AN I3ANCGU. ENTH4
P10963W 36; 73) 13,NWNWE UNA'[ MONS {WC -73'POWER RESOURCES INC,
7 ? i3?NENE 'UNA MON HM5 UP RESOURCES INC.
PIOMSR2W 36 73 13;4ENWSW M S 0A1-2131 POWRR RESOURCES INC.
36 73 1 NENE UNA 'MON CNM41
........... ....16 ... ...5W - . . .}... .. . ... .- ........ . -. .. ..... .... ....... .... ......... POWER RI .ESOUR CE IN .. ..... .. .
36 70 4 WNE .RE 16D SE SSEI,-36-70 (3 C LS) .POWE RURE S INC'.
'P1096231V 36 4 S A MON C-2- I POWER RESOURCES INCe'P19623W 4 7 14ENW S US A MON CM W2 'POWER RESOURCES INC
S N A MI INO W 1/ 4 SEC 14-36-73 35 WELLS (C-WELLIEL'PO WER RESOURCES' INC
ýP109633W 3614EN 333WEL CELIL)jSE4E1/4 SECý 14-36-7 2 Uý POWER RESOURCES, INC1P!3~ 14t SWE .EŽ. I S, i2i-
9 . SWS)4NE1)q SEC 1436 i'7325WELLS CC'WELLPEl6D_) )OE EOREK096266 36 73 "1",'SWNE GUI IND SW/OW 24-36-73 (31 WELLS) OE EQRE NP110964W 36 73 14SSW UNA INS I O W/NW -37 (WESPOWER RESOURCES INC.
P096W36 73 14=,W - USA MO 'M 39ý POWER RESORCES INC.! 36t"6 '4 1'4OWNE U IN D ... ...../W 36-673(40WELLS)PfW •R RCES" .
36.. . .}. .. 73 14 NEE UA 'MO. ... ,N ~ '>o ....... -....--. . . . ..
--- - 361 73 1!EE .UA 14 POWER 6RLE ES IZ
P10663Wý 36 -731 14 SWNE USA MON1 CR 37 POWER RESOURCES INC.P0`978W 3" 3 + I 14 SWR U DET ,'4POWER RESOURCES INC.1-0"2 L . 056L. MON C4P...... . 4 36)B 734 04(ESW USA "WER SOURCES INC.
193W 36 3 14 NSWSW UN MISN 1 'OE RSUCE N
1 (USD1, BUREAU OF LRN 0 MANAGEMENT~
P096325W 361 73' 14SWENE SUNT MINs ./N-37-1 W. POWER RESOURCES INC
36l 1W : MIS 1 37.1 POWER RESOURCES INC,
'0501 BUREAU OP LAND MANAGEMENT~P109625W1 36' 73) 14'N 'SETI 'Mrs5 W -37-1 POWER RESOURCES INC
1 ' ISDIo BUREAU OP LAND MANAGEMENT~'109625W 36 7 4SS 0K 'IS 31PWEREOURCES INC
IO -3 !'ý G ýTý
USD1, BUREAU OF LAND MARNAGEMENT~
~ j 2 E W OU jMIS27 1POWER RESOURCES INC
1 1 USD1. BUREAU OF LAND MANAGEMENT~Ill.626W 361i 7 '4SS 4. IWW-27-1 ' . . . POWER RESOURCES INC
1P 1461WS 05 REMISIN
0501, ýBUREU OP LAND MANAGEMENT"
!P109626W 361 73' 14 NESW 651r' MIS IWE-27.1 POWER REROURCES INC10 5? NESW'' UN 1. . .O E REORESIC
'P19626W 4 6 3 1 EWUA OER1Smith "1, 4IWNE _US INS SW/NE 33m36-73 (10 WELLS) PW 49RSUCSI
½"' ~7 IEIA ENE USA MON "C3 . . . OE RESOURCSIC'PIO9RRW 36 73' I4WSW 'USA 'MON C PWER RESOURCES INC.
P109551W 36 ',3 14 SWNE USA 'ISD LNW 0i&'ý73 0) WVL1j1SE15ORESIC
.7150556W 1"" 36, 73( 14 ESW, UNA '140N CR1456 PWRRSUCSIC'1''. 11 1 14 .ý I :
PI10559W 36' 73 S4'NENE UNA DEWSTOIMDMIS S54 IPOWER RESOURCES INC.
361974 731 4SS USA D sT,IN,M. S POWER RESOURCES INC.
36"4. 14jeWSW US A M49 N 412 '~~'" OWER RESOU RCES INLC
:P1075 ~ JR 7j 14'NESW UNA 1DEWSTO.1N6MISjDM 4 1POWER RESOURCES INC.PI P1S267W~ 36 .3 .45S US O W5OID~ ~j~..4.. fP9 WER RLESOURCER5 INC.
(P11366W361 731 14lNWSE (USA 'DEWTIDI M POWER RESOURCES INC.191133E5W 3 73 14SWNE G7 IND JNE/SW 24-36-73(1041 WELLS) (OER RESOURCS NP113i366W, 361 734 14' SWNE USA ISO WS/E3-67 3 EL)- OE EOR ESIC
36 73 140 MNR 1 O ER REOURCES INCP!13396`W 36 l SIRIRW USA1 11. F.. . . . - WEirRESOURCESINC.
P136W36 73j I 514 WE UNA IND NE/NW 3336ý73(11 WELS) POO EORE NC.g13UW36 731 14'SWNE ,NA -ION CR 47 PO+ WER RESOURCES i NC.
Pu03369W 3E ;:'iS U , i0,is -y # POWER RESOURCiES INC36 4 RESW USA TIND TSCy,
P11370W 6 73) 14'SWN UA 10'NE Eý 333673 60WLS vOE RESORCES INC.
36. 73 4(NWSR USA MON CR0 7 '[POWER R TESORCSINCýP! -- 0V36. 73 14:NENE USA moNc 't61 POWER RESOURCES INC.
P11331 36` 73 E 'UNA 145 - IWI "' ~ - "" ~' ~ POE ERLRCES NC36 73: 141SWNE USA R[D 'WN 3307 68WLS
361 73ý 14 sWNEI 696 .110 BE/NW 13-36-73; (59 WELLS) POWER RESOURCSINC.
FP11337""'-'I""~i"' 1tS6696iw 'LkA 4r6 'kW_/NWI-3&'72 _(5 Wdels) "''POWER RESOURCES INC(P833 6i 73( 14'SWN UNA _____!
' 5 J ND S~~W/SE 31-36-73: (50 WELLS) POER RSUCSIC
P13372W '1i,6 E/614SC1-67 13WELL (C'WELALPLD PWE RESOURCES, INC
Appendix D6 (tables)Smith Ranch Permit Page 10 of 49 RevisEed - April 2011
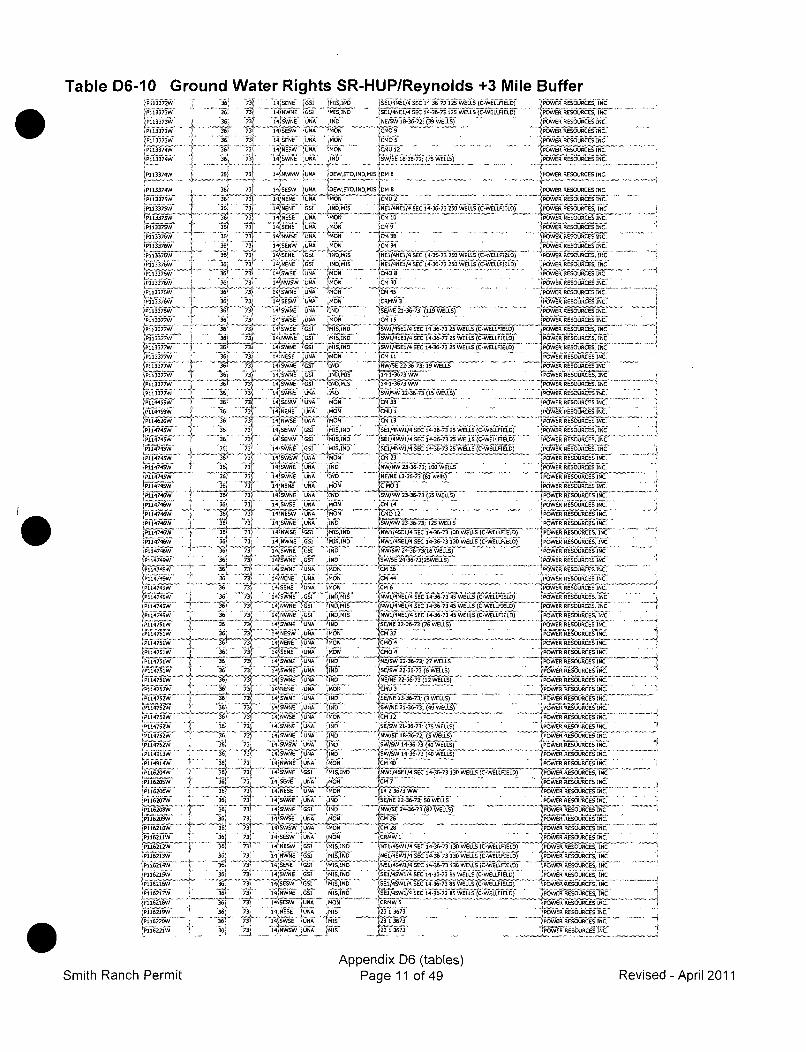
Table D6-10 Ground Water Rights SR-HUP/Reynolds +3 Mile BufferP 13372W 36' 73'P11 7W• 36...... "• 731....
P113373
}P113373W '' 36! 73
PP113373W 36 73P11334W 3 73
.P113374W 3j6 73
..... . .W 361 7,3P13-13371W ' 36, 73)
P1135 36 73,
P113376W 3 36 73C
",).3376 . . 36 73[,1.61 ý 6 731
P113376W }" 36 73
36 '731
P113376WV 351 73)[133W 36 73
.1133W 36 7331
............ . . . ... {
336 73i
'P113376W 36E 73'
3.
EP113377W 3E6, 73
..~ .'[ .........i
[P117377W
36 73)
P113772W 36 73
f~l~liW36 73
{Pi337 . t' 36.. . 7*"'
*P1337W36 7 31715W
fsns37mW 36 73)
P11459W '• 36... . - 73/P114049W 36. 73
'P114620 , ' 6 36171 36 '731
P144W 363 73/P114 746. 3 73ýP114746W 36e 7$3
....' ... ... ... i .... • 1
P I1175 36, 73j
?114745W• 36• "•
P114754W ! _ 36 73P11 7•
(P11474W . 36 73 "
[ 47114 6W73
W36: 7P114746W "~'31iP14742W 36 3
34 3P1144W36ý 73C
P 11417453 731
p1i74WJ6: 73'
(P11445W 3 73
P11451W36, 73)
P114 75 W "
P1141120W 3 3
P116712036 7~P114751W,7336p 73;
ýP114757W' 3 73
11,21'1361 73
,PINPSW36 73
'P1472W36ý 73
36ý 73
ýP11 4 6 36 73P`11624 6 3
'P116206 61 74
P11259 36, 3
4 SEANE
14 SE5W
"'1""'' ..
14' INE0
I4I53690
USIA IND
'UN 'MONf•
0211' 1110
[51/0N1/4SEC 14-36-73 125 WELLS (C'WELLPIELS/
NES 3'2 39W WEL LS)
CM1U 12
14/NWNW 'UNA 'DEW,STOINDMIS (DM 8
14505SW 266A 1030INS MIS DM6814NONE 0116 'MON CMU 2
"-]• I(•797•E°"• "~ ~~~~ ....... ... .................... ...10151ENE /GS4 6IS 1/N!RtSEC 14-36-73 250 WELLS (C-WELLIEL0)
R 'SE UNA ;MON CM 15
'i N A : 4U-ia i•.. . . . i" " .. . .
14S01 [1766 ?
14 509W 2UNA MO01 . CM 34
14'NONE 051 m1N0MIS, ,NO/4SEI/4 SEC 14-3673 21 WELLS (C-WOLLPIELS)
'ia• "~~~~~~~~~~~~~ ....... b .. • i '•£••}i °' •. ... .....
14kWSWE ",A 1
54/6N CM
14 SINE 2116 MON" 44
14
ENW USA MON CM UNA
14 5W110V USA -IND SE6/NE 21'36'73:(19WLS
I4NN S 5 'IF 6f MISJND 5W1 49 1/4 SEC 14'36-73 29 WELLS (C'WELLPFIEL0)
1`I'SWINE G .S I 0511 (5W1/4S01/4 SEC 141.36-73 25 WELLS ( C'WELLPIELO)
14 NESE 0UNA N ii" .14 SWNEGS INO 'NW/SO 22-36-73; 19 WELL
14961061 INOMIS 414V'1'37 3 WW
144'5 3660691 11110 IS 14137
14 VWNE 0116 110 W/NW 22-36-73 (IS WELLS)
1,¶I6W 016Uý1 406 1 3M 33
1415 0119 IMON ýCM 1
14450NW' 69 I 5 SE1/411W1/4 SEC 14'36-73 25 WELLS (C'WELLFIELS)
1•41
W5W 'NA MON ýN C 3
14 SW1E 0110 AND N1W/NW 23-36-73; 100 WELLS
14 5WNE 0116 'Ip N/N 3367 61wls
1[£ , Ug2 i X_ _• : ... ....... ........... ..14'6E110}~a 06 101 ... . Ei'o'T]:•''••C
,NN 23G3S5•36-7 3 ( WELS
'ii~ ~~f !•f•L"~ ...,.... .. ]•q • • .i•• !<.c'#. ..........
14 NW11N SI 5
IS 1110 S NW1/4S1/4 SEC 14-36-73 135 WELLS (C-WELLPFIE )
1453110 95NE 1110 'lW/W 24'57(6WLS
14 SINE G STC INS' [5W/SE 241'36'731(2SWI ELLS)
14 SWNE "UNA, ,ON 0 C. 3
14 NONE 06A MON Ci 44
14'SESE ' 1401 CM6,
14 SWANE GS! 10MISC gýll/41101/4 SE 14'36'73 '45WEL(CWLIE)
141NINE'IS 110,41 /1136/46014 SEC 14'36'73 45WEL)CWLIL)
14 113611 .091 ,,NOMIS 411W/4101/4I SEC 14'36'73 41 WLSCWELLPIELO)
IIS1N1
OWN 'UNA 'IS NE/N 22-36'73 (76 WELLS)
14'NE5W 066 R01 1M 3flNENE UINA [ON TCO
124'SENE '011 ;MON- U04
14~SWN '011 INS NE/OW 22'36'73; 27 WELL
14' SINE '596 ' - SE-/SWY 22316'73 (-6 WELLS)'
i NEN 22'36'7 U12 WELLS
14<110110 011 MOýN SO14I31t SINr' UNA 110ý SýW2 67 7
1 SWNME LINA 'INS SW/NE 2183673, (S9 WELLS)
14 53611 'ONE IND SE/O'W 21 9673 (79 rWELS
14NSINE 1UNA /111 '
1WSE1 36 72 (S0WELLS)
141W5 N 11E MONC !W1i CM 40141310 SI MS/NO6 'jWVI/45_114 EEC 14 36 73 130 WELLS ('ELPES
14/SOME ONE (C0 _C,,,,,,,,
14,100 611 EgE ~ (1423673
14 360 11 1 10, ýSE/N 22'31'73f; SO WELLS
14OW1164 ""SI [1( IN NW/SE 24-36-73 (67WELLS7)
14 SWOW $011 "(MN '[M2
14 S0WS' 06 MN R96
14 S GS)9 651 JN 1919111 /110/4961/ SEC 1436'73 130 WELS (C'WIELLPIELS)
ý14NWNE 051 9191110 11149 I/ SEC 1367 130 WLLS )C'WVELLPIELS(
14 0060 '91 MIS/NOý ýNES/49Wl/4 SEC 14-35-73 130 WELLS (CA.WELL-I----
14 936110 0/ 9/1110Y' 5E1/45W1/4 SEC14.36-73 SWESLLS (C-WELLFISLE)
14'SSW 091 919110 5014031/4 EC 4'3'75 5 WLLS(C'ELLPIELO)
lI ýNWNE 691 MIS/NO (061/41361/4 SEC 14-36-70 89 WELLS )C'WELLFIELO)
14 SEOW ;o6 ON CEW
1I NESS [1211 Mi 231-t1ý F 3673
_ýN1 N4WS 0115 3( 1 3 6 11, 3
POWER RESOURCES, INC~POWER RESOURCES, INC
POWER SESO)USCES INC.
(POWER RESOURACES INC'
FPOWERSRESOOEZCES INC.
IPOWER RESOURCES INC.
WJEIR RERSOURCES INC.
t POWER RESOURCES INC.POWER RESOURCES INC.
'455955~ R-ESOURC-ES NC.
[POWER WSOPCES INC.
POWER RESOURCES INC.' RE694'NboCS INC.
POWER RESOURCESW-NC
IPOWER RESOURCEý INCI
POWER RESOURCES INC0P pWEIE ""NC
POWER RESOURCES, INCPOWVER RESOURCES, INC
POWER RESOURCES INC
POWER RESOURCES INC,'POWER RESOURCES, INC.
REISJ SON'URCES, INC.''N14NWEiR SCES6fg, INC.'POWER RESOURCES, INC.
P'POWER RESQRLPI
OOF CSURCES INC.
POWER RESOURCES INC
'POREOUCE9 iNt:.. ....
POWER RESOURCES, .INCPOWER RESOURCES INC.
POWER RESOURCS .INC-.POWER RESOURCES INC.
POWER RESOURCES INC.
(SSWER RESOURCES _INC.
'POWESR RESOURCES INC.POWDIIE IR -RESOURCES. INC-
'POWER RESOUCE IN
POWER RESOURCES INC.'POWER RESOURCES INC.POWER QESOUSCES INC.
FPWRRESOURCES INC.
PO6WER-§RcESORCS INCPOWER RESOURCES INC.
POWER RESOUSCES INC.
PWRRSURCES INC.POE REOUCE INC. "
,PWRERSOURCES, INC'POERREOSCEO IN4C4 060 ESOURPCES1 INC_
IPOWER RESOURCESINC.
POWER EESOEIRCES INC.
"t'NiESOU'RCE INC.'
POWER RESOURCES INC.
jPWE EEORES IC'IPWRREORESIC
Appendix D6 (tables)Page 11 of 49Smith Ranch Permit Revised - April 2011
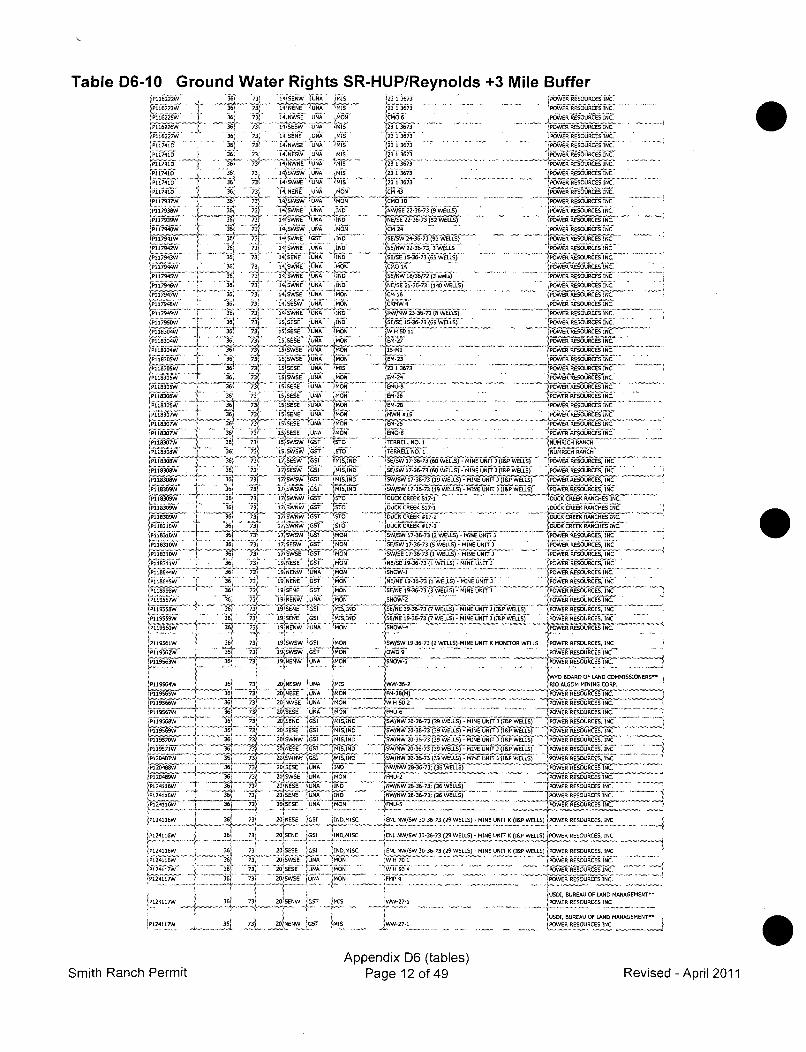
Table D6-10 Ground Water Rights SR-HUP/Reynolds +3 Mile Buffer,P16-222W. . .36.73•
P11I6225W 26, 73~P1E6226W 1 36• 73•
36 73(
T171 6 73P11741 36. 3~Pi174210. )tý
36 73,
1P11I7938W 36i 73
P11739Wfi T6 36 734 I4
P117942W 36.
P117943'W r 36 7
P1145 '36 73
P117947W 36 7P1796W36 7,
P117950W 6
P1630 4W 7 6
36 1 11 7'jllO34W j
L P`1168305Wi 36: 73!
P11630W T 36 73'
361" 73
P11183061% 36t "
P16i308W 36 73•
P 11630 7W 36 73,
P118307 36+ 73,
P118310W r 3
P11606W 36• 73
P116300W .2 ~ 36 73.
$'iiii9oiW' '36 ~ 73'
T&TW',,4,, 36ý 731P11309 36 731
ýP119610W 36 73
P1621W 6 _73T
[I139563W '36' 73.ý
'P119631W 1" 361 7
P!16316W 3 73•
(P1864W 3,ý 73'P1 196S=5 313 ~ '"
P116396W- 7' 36• 73'
'P119S715 36 731P11957- ' 361" 72
P1111 361 723
'PN11962W 361L 7
JP1195L63W 36i 73
1P195WE 36! 73
P11965W 36 73j"P121156W 36• 73
P11971W36 73
36 73}
A 91 SNJfN:123 13673 WER RESOURCES INC.
'.... 'r•g i"' T hW"""* i •ii"'T• ''".. .... ........ . ..... pioW•ER REROUSE•S "INCe. .... .14NWE 66 MON C M6 NE IPOWER IRESOURCES INC.
1400WN 666 'MIS 2313673POWER RESOURCESINC.14.SENE UN6 MIlS •23 1 3673 4PWR RESORCES IN0
14 . .SEN RA. M.• '"'' PO •6"WER RESOURCES INC.
1414SEE "UNA 'IS 1233673 6 LPER RESOURCES INC..66 MIS, 'ýf23 1 367 3 P OW ER RESO URCES INC .1 jSW5W'UI 1AS I.33 3673 '7 ER RESiOURCESiC
S 14'W6 U696 MIS 23.
14 66SEINA IMON CM 41 4POWER RESOURCES INC
14 SWSW '666 ~MON TCMOL -0 PWRESiRCE INC.R .... . ... RES..OURCES.. INC . .
,:4'I5W6E' 064 J190 '6W/SE 22'36-73 (S WELLS) PWRRS~d14WINE ""rA-NU'IN iWtE32.36.73 (52WELLS)-
14)SWEW 666 .ON 1CMO24 POWER RESOURCES INC.14 INE 5 456 6 1? , 1. 1 2/-W 24 -.36-73 (.93 WELLS 5 .P) W [POER RESOURCES NC.
14 WNE 666 J0 ]SE/NW 22-36-73; 3 WELLS IiRs/ REýI'6Jk INC14 5 S6 6 tIN ESE/SE 1-36'73 (61 WELLS) - MN UPOWIR RESOURCES INC.
14 SWNE UNA MND CR0 14.. . POI&WER RESOURCES INC14 SWENE 6'IND NE"""". NE ' )POWER RESOURCES IN'C14 089 SINUE I'l 9ON5 m POWER RESOURCES IRC.
14SWSEN 6UNA MON CSMW 1 POWER RESOURCES INC.ý1 SRE 6- EER RESOURCES INC.
14 'ESE 696 MON ICWN 54 1
01543
NE 6UNA •190 RWW 23-36-3M(SWELLCS)P0
1 "".S 5. PROWER RESOURCES INC.
I{s SS 696 IS" "?1• .......... E/SE.. S5'36'7 ... 6.... ....WELLS) ............. . 6(POWER RUSOSIR•CES • IN ...............
IS SEýSE '7SA "M09 EM-6231 POER RESOURCES INC.15 SESE 666A MONI 6E4'7i
7O RS U CE N
15168666 lENA ~ M N 11!PM PO E R RES OURCES INC.
1I ftSR USýA, ! :OR 24,4 'OER RESOURCES INC.'
15 SESE IUNA MISN 123 183673 (POWER RESOURCES INC.15 5WSE 596X MO M2PWRRSUCES IC.
is'SESE •66 •0 ., . ER RESOURCES INC.15 NSSE UNA MOND_ M2 #S POWER RESOURCES INC1500 6146 1906 EM2MOWRRSURENN
I'SESE UNA MION 695POWER RESOURCES INC:
I15SI 0W5W 6' STD -CRREELL NO, I !NUMRIC9 R-CH
170SEN GSI 1D MIS SR EN/SW 17 36-73 )O WELLS) - MINE UN6 T KI&P WELLS) POWER RESOURCES, INC
'17 SS' G5965 SR/SW 17 36 7360 WELL) IN 9f)(S WELLS) PWRRESOURCES, INC17SE GSl IMISINDO S E6W/SW 17-36-73 (19 WELLS -MINE UN6f 3 )IP WELLS) (POWER RESOURCES, INC
17 SWS S •15 19 GS TSiN i5W)5W 17 37(SWEL)-UMINE 69f )I&P WLS PWERSUCS N
1759869 96 1N 861CR~ ICkREEK RACHES INC.S7,5W86 "lST 90 tOUK CR66 81 2 RCK CR66 RNCESIN
17 5WNW 696P .960 066KCRCREEK 817-2 [0UCK CREEK RANCHRS INC.6756W jSTOl DUCK CREEK #17 3632 WELS 'MIE 9f)POEEK RESOURES, INC
1755 696S~ MON 56SW 173jý_673 (5 WELLýS-)'MINEZ66ff) ~ POWER RESOURCES, INC'17(STS^E •66`MON •5W/SE 1736 73) WELLS)' 919669ff) POWER; RESOURCES, INC719 NESE GUT MPON •NE/SE 6936 73)1 WELLS) 'MINEJNUTFf POWER RESOURCES, INC19 96W 69.'O SNOW 1 (POWER RESOURCES INC.
19 REE GD MON E,"EPOWER RESOURFES19 SENE 696 MON SR/E 19E236 733 WEýLLS MINE URFf) I OEESOURCES,IN
19••'8 696 M.RN N2 POWER.. .... ESOURCES INC.19 SEE4E G"SS 916• 1S6/NE 19'36'73 (7 WELLS) ' MINE 69ff) (IRE WELLS) POWER RESOURCES, INC
,19 SNS 1GIN JM R/NE6 1936ý-73(7 WEL)AIE6f))& EL) PWER'RESOURCES. INC(EWURN.A O ]yOW4 WERRiýUSOURCRES INC.
1915WSW '601 ROýN. 45,W/SW 19'36-73 (2 WELLS('MINR 69ff K MONITOR WELLS .POWER RESOURCES, INC.IO "''D 9~ ' " - POWER RESOUJRCýESINC
19(NENW .M6 SNW)PCWER RESOSECES INC.
'MIS ~WEO B0660 OF LAND COMMISSIONERS-20865WRI (6ESALSOM MINING CORP.
2065 76"MON "'"""'''M-3eu( 1WRREORESIC
20.86 •696 'MO 8650 POCWER RESOURCES INC.
36(SESE '96 MOIN- _ PMU" (~uýPOWER RESOURCES INC.20N 566 SI "IS,9 IND W/9W2V0 36 73)(39 WELLS) 'MINE 69ff) )I &P WEL LS) POWER RESOURCES, INC
20 5606 GSI.'J5N SkW/NWO 203673 (39 WELLS)' MINE 66ff) (I&RE WE LLS) POWER RESOURCES, INC20 5W1NW GSSI Wi(,IN •8/62036-73)(39 WELLS) 'MINE 69ff) (SEP WELLS) POWER RESOURCES, INC20 NESR 'OSI .MSIO 5/W20 36 73)(39 WELLS) t'MINEN 66f (SEP WLS"'PWER RESOURCES, INC
20 SWW 60 1916160 5W/N 26 3673) 39 WELL) "MN 69f (SEPe WELLS_)J!2POWRR REOREINC20•SESE JUNA '19N (/628-367ý3 (36 WELLS) .POWER RESOURCES INC.20SWISS USNA FLQ-'" FM2t 2PO~WER RESWuRCES INC.20 666•66 (55 N/N 867 (36A WELLS TWE RESOUCESINC.720 5696 696 4180 NW/NW 263673 (36WrELLS) POWER RESOURCES _INC._20(56 696ý MON P96 5 4P R RESOURCE IN
20 UESE 55T 1INOMISC •RNL 986/58630-36-73 (29 WELLS)'- MINE UNIT K (IEP WELLS) !POWER RESOURCES, INC
3206
t 661E 'GI NRMISC IENI NW/SW 30-36-73 (2 EL)-MINE Ur IPWELLS) !POWER RESOURCES, INC
20 SESR 06 IN0,ISC [N NWSW 30'3673(29 WELLS) - MINE 69ff 6 (IRE WELLS) 'POWER RESOURCES, INC
204~• PVSE m UNA '864i H701 POWER RESOURCSI.205656 INA 1ON W 69D •0 'O~WER`R'E`S6URCRRSIRC. ""20 6W4'& 'UNA MON PMPP'4 POWER RESOURCES INC.
iP124117W
ýP124117W
36' 73• 206SENW (G96 iMIS SWW-27-16USDI, BUREAU OF LAND MANAGEMENT-
(POWER RESOURCES INC
6U8DI, BUREAU OF LAND MANAGEMENT-(POWIER RESOURCES INC2ý 71 20 669W 596S !RIS [69-S
Smith Ranch PermitAppendix D6 (tables)
Page 12 of 49 Revised - April 2011
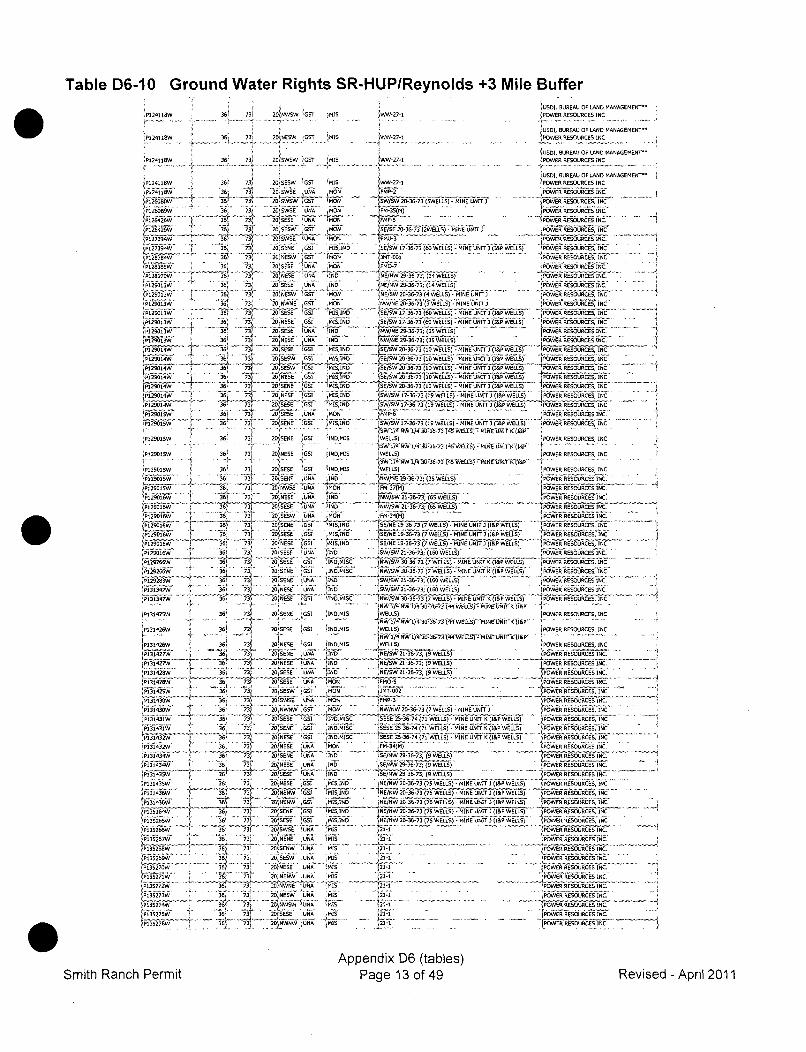
Table D6-10 Ground Water Rights SR-HUP/Reynolds +3 Mile Buffer73/ USDI, BUREAU OF LAND MANAGEMENT'
iP124118W 36: 73 201NWSW GST MIS 'WWN27-1 POWER RESOURCES NC
USDI, BUREAU OF LAND MANAGEMENT~
ýPI24118W 35' 7'/ 20iSWSW iGST 'MIS .27-1 POWER RESOURCES INC
USDI, BUREAU OF LAND MANAGEMENT~'P124BW • 36i 73! 20SWSW 'GUT I-27-1 POWER RESOURCES INC
USD1I BUREAU OP LAND MANAGEMENT"'P124118W 36. 73 2UISEUW • ýMN F -37-1 IPOWER RESOURCES INC
jri5Th/S 36 73 _20 5801 SNA MON FMP-2 POWR RSORCES 1INC.
36. 73 205W6 666 OB 1F035(M VwR RESOURCES. INCý
4i4W4' 38k 731 2C1E5 SM N MON1 I'ME-S(M POER RESOURCES INC.2-426W 361 3 20 SEE UWi CUT 4 MO S/S 2-367 2EL) IE6f)PWRRSUCS N
ý!! ~ ~ - 31. 2 SE
P02786W~ 258/iE SA MO (ES-SPOWER RESOURCES, INC.ýP127_39A4 _361''i 20SWENE OS IBN S/W173-7 6
2)1886 6 731 2E N EUW '557 IN 1808ý 87 - i&51 MIEUI' EL) POWER RESOURCES, INCP126285W36T 23 2USES EO(OERRSUCSIC
P138870w " 361 73 20NESE UNA '180 NE/NW 29-36-73; 14 WELLS) . .. .P O W•E 6R RS rC INC•P181W36 73 OSESE 1 PN2863(4 WELL S) POUVER id RSUCSINC
36 31 20165 NSOT M~ ON .NE/5W1 38731 ,IN
'A803 'II10ý:(4WELLS)- MINE UNO)t POWER RESOURCES IN
36 73 20UNWN E ZSET MON INW/NEI 2038673 (3 WIELLS) MIN E UINIT 3 PWERSO CSINClP120613W 36' 73 20 SE Si 551 818,15 (SE/SW 173673 (60 WELLS) - MINE UNIT )I&P WELLS) 'POWER RESOURCES, INC
7•£& "•T " ..... )• "" ... 7 "•• - •?... ..... .., . -.. -.-.?•ihg "• 2f 5.,'E ..".... . -.k• i•. .........
PB014W I 3B 73 20 N5E fG~l - MIS, IND EISW 17-36-73 (66 WELLS) -RIMNE UNIT) )IBP WELLS) (POWER BESOURCES, INC1129 )I D) "EE-lMIN
WS81W36 7' 2) 8155 UNA' 180 INW/E 280673(1 ELS POWER RESOURCES INC.jPI2O3( 2 73 20 SEER /Si .MSNS {ESk0 631 ELLS-MINEUI)(R EE) 1OE _REOURES, NC`
P12904W 361 73 20 SEWE (SI Sg NDMISM WELLS) POWER RESOURCES, INC
P24W 36 731 2SSE , SE/SW 2L6373 (B WELLS) -MINE UNIT) (IP WELLS) POWER RESOURCES, INC
• • •• .. .3.. ..• ..... "3. .. i'••4i• :E .,, .,~ .. " R• : :ii 77..... .• ~ '•.. . .
P12014W 38 73 lOSENE ' MS 10 JDSE/SW 203-73' (80 WELLS) - &WELLS) POWER RESOURCES INC
P.29.14W 36' 731 20 SESE GSII MIS 185 SW/SW 10-36-73 (17 WELLS) - MINE UNI) (lP WELLS) POWER RESOURCES, INCP128015W_ _ 38 '$ lOSS UNA MO iz.P. POWER ESOURCE INC
P1285W ! 36 73~ 20[SENE GSI MISINO SW/SW 17-36-73 (19 WELLS) -MINE EN) )(I&P WELLS) ;POWER RESOURCES, INC
P129801W 36 73• 20SENE i5 2 ISO MIS WELLS) 'POWER RESOURCES INC.
'P12501W 36' 73/ 20/NSNE GSI 'INS MIS WEELLS) POWER RESOURCES. INC
I ';"W 14 U.NW 1/478.5U 04'-7 48 AS)- NE'O•.I 1wp . . . . .
1P129012W ) 36' 73 20.SESE 1GSI ]INSMIS
1WELLS) POWER RESOURCES, INC
L12341SW 136 73 i 2NESE GS IND,18 IS r - -LLS) WPOWER RESOURCES INC.P12801SWýW 3 73 2(WEII 4O P37M . . . . PWRRESOURCES, INC.
P129162W 361 731 2•NE . UNA 'IND 4E/SW21-36-73; (5 WELLS) WPOWER RESOURCES INC.
P121W -36 73; Z0SESE WUNA ",, NW/SW 21-36-73; (85 WELLS) INC162j.6 E 38A 731X 20- 4E3W7UN POWAER RESOURCES INC.
U .. . MON WFM-34M)P120143W t 36T 73f '~ibfE/5.P20 (W' 'MI 18 JUE/N 80-36-73(7 WELLS) -MINE UNIT l W) OWER RESOURCES, INC'W 36 20 2OSEEGI MlISINS 'SIS1-3-3( ELLS) - ONEýNTJ (i&P WELLS) POWER RESOURCES, INC
, P12NDIBW )' 36 38 73 20S/NESS SI NMIS 180 SE/NE 18-36-73 (71 WELLS) - MINE UNIT) (I&P WELLS) POWER RESOURCES, INC
2ý SEX 19 3b'73 (7 ýN ' ........ j (ý SF ER RE_ -. -IN
1P129016W 1 36i 74 20 SESE ;UNU IND SWI/SW 21-36-73; (1B0 WELLS)POERSUCSIN{P131356W "T 16 73) - - 20,5SE(G3 .051 C MISC O NE/sW 30-36-73)7 WELLS) MNEUNT(IPWES) POWER RESOURCES, INC
P132726W 36 73 I0SSEES UNS 1N0 MISC N/SW UPOWER RESOURCES, INC.73 2 -N UN i_ 3' 'POWER RESOURCES INC.
,P31223W 6 ý 20 8NESE LN N WS 21-3b-73; (1180 WELLS)O E ESUC~k
P 13i1347W _36 73/ 2 0 NESE SSI /180 MISC (NW/SW 3U-36-73 (7 WELLS) -MINE UNITEK (lAP WELLS) (POWER RESOURCES, INC
WEUN1451)~)(44 WELL-f MiNE`0NITAk (IR P
jP13S425W 361 73( USESE .U N S MIS 'WELS jPOWER RESOURCES, INC
N WEISj'NW1/'JU4-IE7S ]ý(7.8 WECLS)'t
MINE"I~lil'RI&K16PP131426W 36! 73 ,SESE 'S I iNSMIS WENLS 14U3J 'ýl/'IC~R(R OWER RESOURCES, INC
1mt Rac Pemi Pag 13 of- 49 Reie -U Nili 2011
tPB1 426 36'S 73,4, 2805001 NSMIS INWELL4S)4 POWER RESOURCES, N_13L3I1427-W / 2-3-7; 8 ELS) -POWE REOUCE .. NC_
5.1314W 1_i U 3 205/NEE UNA '4/80 NES5 1-67;(NWLS POWER RESOURCES INC.
P3428 [w3 7 20 SESE UNU 1160 ;NE/UW 21-38-73; (8 WELLS) POWER RESOURCES INC.
P662W' ose~LA MB 1MO-S0 POWUR RESOURCES INC.
1314379W 36 73 2 0, S E .UNG MON PM-(POWER RESOURCRS, INC.
, 1OW36 75 20 NWNW GOT MON- NWN 03-3( EL)MN IEOV4
R4 5 4 6
5/i~iE,' INC.(P131431W '1~ 38 73 20-IPSO '051 IND MISC SUSB 2-36-73 (71 WELLS) -MINE UNIT7IPEL(PWEESUCS3N
P131431W 3627 2SERNE Gi 10MS SE 2-67 7 EL)-MINE UNPIT K1OP WELLS) (POWER RESOURCES, INCP131432W 36' 73 USNESE 'coi- IDMISC iSESE 25-36-74 (71 WELLS) -MINE UNITE )INPWELL) POE RSURE, N
'P131432W~~~~ ~. 'g 36 71T21S UU'O . . .PWER RESOURCES INCiP131432W 3 ' 73' 20 NICEEE UNA6 18 EN 8-67;( WLR PW EORE INC.
415314380 36 20 SNES UNA0 180 S/W 29-36-73; (SWIELLS) POEEEURE IN36 731'1 "ý / (SE/NA INj NW2 2838-73; (8 WEILLS) POWER RESOURCES INC.
'P13843SWji 36 20 2O ESE USS MI INS- NTE/NW 20-36-73, (78 WELLS(-IEUI))6)EL) PWSRSUCS N'P`131438W7 '0N S SI G MIS 18 jNE/NW 20-3673 (78 WELLS) -MINE UNIT)I (IBP WELLS) POWER RESOURCES, INC
fP1N352BW 361 3ý 1 20(SENE 5 IWSI 'R50 180/W 20 36 73 )8WLR IEUI)(6 EL) PWRRSUCS N1P13525SW ~ ~ ~ ~ ~ ~ jK 36 73 25 01N/W3-37 ELLS) MINE UNrTO (lPý WLS POER RESO)URCES.INC
20 NNE UU (MS 2POWER RESOURCES, INC~PI3S26BW .... 38 73'0SN N IS I - . . tOSRRIORMSICP1326W 3 7K 2 SSW UNU MIS WI27 'POWER R,(6ESORESIC
'r_5 270 361! 73-1_... 20 SNE G'SE EN 5 -INE REOUCE INC.
P1327W ~73 20 NIEW 2NU 1 POWER RESOURCES INC.-/P135274W 36' 704 206800W 'UNA 'MIS 2' POERSO CSIN
4/1352786 6 7 20 SESE UNA' MIS 4/.,POW`ER RESOURCES INC,
,P135276W 736 ~~ 20L NEW UNA ~MS 3 OER RSURCE INC.
Appendix D6 (tables)Smith Ranch Permit Page 13 of 49 Revised - April 2011
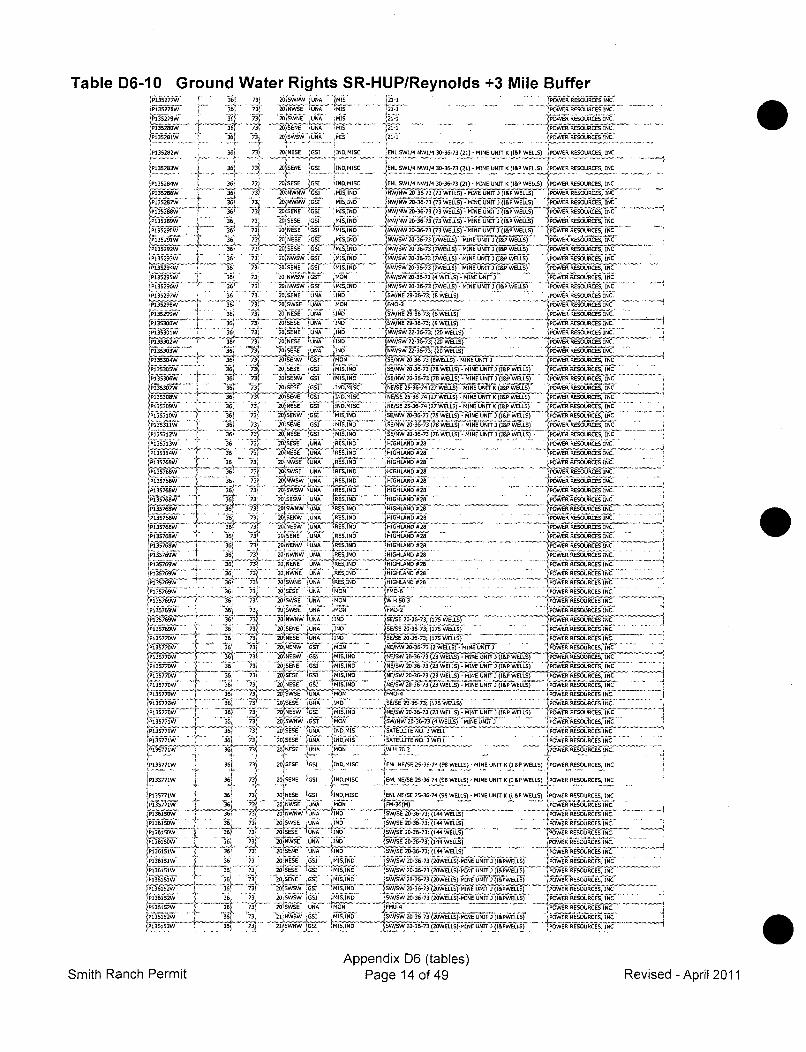
Table D6-10 Ground Water Rights SR-HUP/Reynolds +3 Mile Buffer!•Ps35277W .. .. id6 '4(1P1i3I278W 36 73'
PI35279W 136 73/
Pi135285W 36, 7P1352816W 36 73
P1352821w 36? 731
PI~i 3 . .2 ...... .. 36' 5•
P135283W 367 733
&T 6- • ......... .. 36i .. - •
P 135294W 361ý
P135'9 7
FPL35213W 36: 731
A13 5296W t 71r "!L,9 1
36 73
ýPi3576W t 36, 73
Prj'j• w`" ...... ' .. . ." ' "b " 7
51352398W 2 7
P13531OW 36 73.
isdd(6W 73363 ý6 73
P135371W 36 73
iP13573Wý 36 7,1
P 13 ! "
(PL3S77W 36! 73
P I ý36-'-4
1P135167W 364 73
PL3S•LW ( 36 735
3) 73,,
P135362W 36' 73
P135313W 36 73
P 4 36691 73
P5lI576W ,j 36 73_36,. 73
P135?76W F 364 73
P535762W 36i I
ýP13578 + 3b6 73;73
P13569W36 73
~t, W 't 361 73
(P1357619W 36 73
38: 7313569W36E 73
P135769W 38j 73)IP135770W 36''[' 713
'P135771W 36! 73)
361 731so
~4tS75W36ý 73'[P136577VW 36ý 73(P135775W1" -' 361 73
36 73~
/P136571W 38 73
3i 'I_- ' ' ý 7
IP136577W36
_36 5 3W-,-,4- -36L
36 73
2 ISW UNA jMIS [2 •- POWER RESOURCES INC.
2W U .NE UG1I •2•-1 POWER RESOURCES INC2p SW' N is0,pEUCEIC
25 NESS GSl IND,MISC -ENL SWS/4 NWS/4 35-36-73 (21) -919NE55SF K (IEP WELLS) 'POWER RESOURCES, INC
020 SENS GSl 'INC, MISC 1ENL SWt/4 NW1/4 30-36-73 (21) - MINE UNrr K (ISP WELLS) 3POWER RESOURCES, INC
20 SESE 8GSI INEMISC :ENL SW114 NW1/4 30-36-73 (21) MINE UNIT K lISP WELLS) POWER RESOURCES, INC
25 NWNW'85 91516 M!/N 25-6-373WELLS) - MINE UNIT ) )IEP WELLS) POWER RESOURCES, INC20 65ESE WGS1 MIS, IND SNW/NW 20-36-73 (73 WELLS) - MINE 89I8 I(I&P WELLS) jPOWER RESOURCES, INC2ONSEN SI 91IS NW/NW 20-36-73 (73 WELLS) - MINE UNIT) (ISP WELLS) P(WEE RESOURCES INC20 SESE G51 P1IS,160 NW/SW 28-36-73 (73 WELLS) - MINE UNIT 2 (I&P WELLS) }POWER RESOURCES, INC2ONESS 'S5 II,IND 7 NW/NW 2D-36-73 (73 WELLS) -MINE UN6T 3 (l&P WELLS) 3POWER RESOURCES, INC20! NESS 5UNA 81IN6 .NW/SW 25-36 - WELS -MINE 8f) I ) OWER RE SOURCES INC20&SEIE 6UF' INO 'NW/SW 25"36 73 LI&P WELLS)(POWER RESOURCES INC28 SWSW 811 M85,6
TMW/5W21 3673)WELS
20 SENE GSIl MISIND NW/SW 20-36-73 (7WELLS) -MINE UNIT I (I&P WELLS) POER RESOURCES, INC
25iSeCT GS" SION . . tSW 20-36-73 (A WELLS)S MINE UNIT)(ISP WELLS) POWER RESOURCSE .. .20 NWSW 883 N MiO C -N/SW 20 36-73 ( WELLS) -MINE UNIT) ( POWER RESOURCES, INC
20 SWU-145j'MSIO, - - ,.'-.'."'.-"-•R• • I- • , .-.-.... -- ......
NW SENE /N INC SW 29 36-73 :7WELLS) - MINE UNIT )IEP WELLS) -ER RESOURCES, INC28 SWSE 'UNA MON1 IMTO 3PWE RESORCESINC
20 NESE US 160 jIW/NEW293673 (SWELLS) MEOWEL RESOURCES I,.6
20SSESE 'UNA S SW/NE 29I36-73; (SWELLS) 'POWER RESOURCES INC.INS t ý&4_ 6 N1W'/'SW 2_2-3'6-7_3 (20 AEL`LS) PERESUCSIC
21NESE '898 EIND 9HW/SW 22673(20 WELLS) (POWER RESOURCES INC-
2I SESE UNA IES, ND 6W/NS 22 POWER RESOURCES INC. W2O1NESW -RS, [ND -HGH 673 (SWELLS) -MNE UTPOWER RESOURCES INC
20 ! SEE 81 MSNO 5E/NW 2D-36 7)8WLS IE88 IPWLS PWRRSUCS N
2. 5E E.S. . MIES.IND . .. _ ___-" -2EEL/NW #206 .73)78WEllS) - .MINE UNIT) (IEPWELLS) P)OWER RESOURCES, INC.20 SEE 0 1 ,INSMIýSC , N!/S!,25-36-779)27 WLS IEUIE( EL) PWRRSUCS N
253E '5 )NSMIR 8/E 5 3 7427WELLS) -MINE UNITEK )16P WELLS) (POWERRESOURCES, INC
2'0 NESE 851 IN-.MISC .EE 2 7S I2O(SENW E SI MISINO 'SENW 20 36-73)783 WELLS) - MINE UNIT 3 (I&P WELLS) 'POWER RESOURCES, INC20 8898 88 1,6 EN 0 36 73) 78 WELLS) -MINE UNIT) IP EMLLS) POW.ERRESOURCES, INC2,0 NESE S G MIS,INE SE/NW 20-36-73 (78 WELLS) - MINE UNIT ) (I&P WELLS) . POVER RESOURCESý,INC20,SESE USNA RESISO [IPLN82'POWER RESOURCES INC:
'DESE IUHIGHLAND 8#258 POWER RESOURCES INC05 NWSE REG IN. HIGHLAND 828 ,POWER RESOURCES INC203E 5 RESINS )8SMATES 628 'POWER RESOURCES INC
20SWEE 568. RESISNDs (HIGHLAND 282 LPOWER RESOURCES INC.
25 SW1W3
NE EGS l NOMS HIILAN/SE $28 -367 9 EL)*MN NrK( PW POWER RESOURCES INC
. .. • .. .... .. .. ....... . i ... . . ..
2U,=SESW66 RESL. !•D.MINS HIHLND #•/.28-6Ttp PEL;MNUI •.PWIL,.(OWER RESOURCES' INC ..
20NEWSW UNA EES IND• -HAN6D2 POWER RESOURCES INC.
20SWSEN UNA RES IN HIGHLAND 825-67;(1!W )POWER RESOURCES INC.
"oSNEOW UEN 3RES8
16E:F6 HEPAN 2 RESOUCES INC.
2RESI HL POWER RESOURCES INC -20 NSWNE USA iRES,IND HIGHLAND 828 - U P POWER RESOURCES INC2O0IWNE ENS (MONRD HIH-N 8POWER RESOURCES INC.20 GESEV USA MOSN [jlPOWER RESOURCES INC.
20 SWSNE UNA'' 1406 -7
W 3553- - - - - -ICWR ESURESIN - '
20 SWSE U96 MON N1802 3 OER ERSOURCEG INC.2U'W1 -11ENJA 116 45/E203-3 15 EL
473R RESOURCES INC.4
2038ENE 46 f ,IND ;S/E 0367 (175 WELLS) fPOWER RESOURCES INC,E 'SINS (INS S!E/SEý-ý 2563(75 WELLS) N284E2t_7 TE66IN ~ ,EN 21 37)2WLS-MIEUT)POERSESOURECES, INC.
25)559W 881A MiS ISD SE/SW 20-36-73; (23 ELS) IN NTS(S WLS )OSRRSUC N
20_I~ SENE G D NEISW 2038 732 WELLS) - MINE UNIT) (ISPWLS POWER RESOURCES, INC
20 NESE :SS I 1
MS 0 ,E/W2863(2 ELS MINE UNIT) (ISPWELLS) POWERRSUCS& N
20 LES UGSAIN SE 20-36-73 (171 WELLS)ý-EUI PRS211f 5JEW11 I N NE/S 20 64 737(2 3 WELLS) -MINE -UNIT)J(ISP WELLS)- POWE IR RESOURCES, N
20'sW 1 IT G3 N SWN4206s3(4WLL) MIN NT. . WREOEEN20 SESE
34'NAIS MIS /SATELLITE NO (3 WELLS jPOWER RESOURPCES, INC
23SSESE (USA 906 W 670E2C POWE REOUCSN
20 SESE 881 15 MISCY [EL6/SE 25 38-74)8WLS3 IEUI IP EL)PWRRSUCS N
11 'W1-1 'IT. . . .20 SENE '551 1160 MIS ENs NAE/SE 2NO7(9 WELLS)-MN NTEI6WL POWNER RESOURCES, INC
20 NESE GSSI IINS,MISC JESL NE/SE 25-38 74 (98 WELLS) - MINE 8SFF K (IS&P WELLS) 1POWER RESOURCES, INC
-463
46W476-FU2S-36-74O5(987WEL2R)36I73 (144 K &P W ELS) PWER RESOURCSIC
Ni NESý INDMSC 1GW/NESE 25-36-73 (948 WLSMIEUrK (I V WPLS OWER RESOURCES. NC. 4
-W4NA .INS WS 20-36-73; (144 WELLS) 'OE EORE N20.NEE INS 60 SW/S 3636-7- (44 WLLS.(PWER RESOURCES INC.
2- ,WEý-S-- WELLS)28'SENE'! ý '/8/S 2373, '1144 'POWER RESOURCES INC.3o#6& 85 MISND W/SW 203?673; 2WEL-MNUIT)WELL EG ýPOWE RESORCEI_
2C NVSEE.4 MIIN tSW/SW 20 35-73 )2WLS-MI UIJ)&WLS ,POWERý RESOURCES, INC
2 0 O DE NE 0 5! M I I N ,S W /S W 2 5 3 1 7 3 )2 OW E L L S )-M I SE U N I T )3 (I SP W E L L S ) P O W E R R E S O U R C E S , IN C'k'SSW751 'MSID SW/SW 20 36 73 )2OWELLS)-MISERUNITJ(ISPAWLLS) POWER RESOURCES, INC
21SEE ý1 _ýýJNý ,ý/S Z J 7 (UELLS)-MINE UNIT) )ISPWELES) 'POWER RESOURCES N
20SS S MIIINS (S/W2-6-3)OEL)-MINE UNIT) )ISP1WESILS) POWER RESOURCES , INC-
21)WRFGS II - :1,155N S/ 25-36-73 )2OWELLS)-MINE UNIT) )ISPWEELS) 3 OEUESUCS N
Appendix D6 (tables)Page 14 of 49Smith Ranch Permit Revised - April 2011
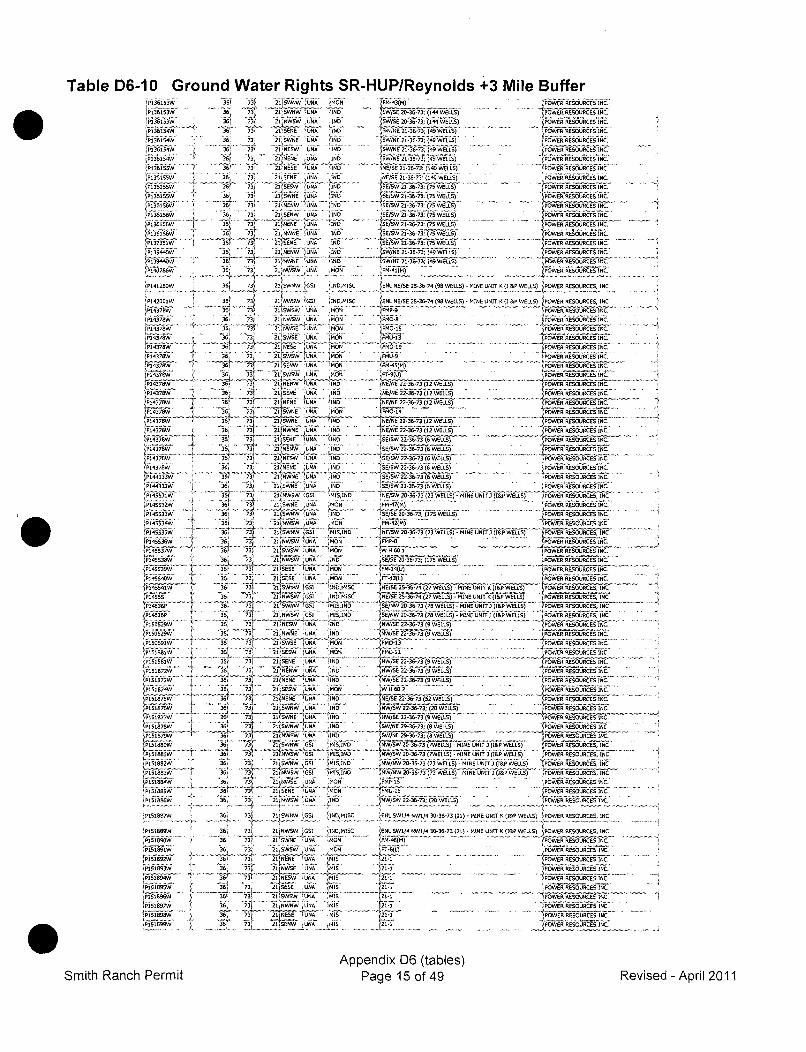
Table D6-1O Ground Water Rights SR-HUP/Reynolds +3 Mile BufferP 1361 5 3W 36 73 24 U`MN (M4()-POWER RESOURCES INC.
(pS6L5W 3 73 21SW1W 06 IS 5W/U2036-3;(14" WELLS) jPWER RESOURCES 'INC,
36F 70 21 NWOW U"A D9 (SWISS 20-36-73; (14-,4 WELLiS) OE EOUCSIC
21NESSE 566 INS 45W/NE 21-36-73; (49 WELLS) PWERSUCSIC
SP3154WV 36) 73 21A'~ 1 INS ~ SW/6E 23673; (49 WELLS)POERSUCS C
P136155W'ý 36 73 21 NESE /56 ;NDESE2-6-3(46WLS
plgsW36ý 73 21 NSE UNE 66 INED 1 67 10WEL)PWRREORE N/P136155W 36 73/ 2155W 666 INS E/SW 21-36-73:(75 WELLS) PWRRSUCSIC
36 ý33 21 SEINE JC IDWUI ISE/S 21-36733 (75C WELL S) POWER ........ .E.R ESN..
P13156 21 61W ES~ INA INS i'E/SW21-36 73. (75 WhELLS) POETEOUCSIC6 SV--. j" 1I. + P .ER RESOURCES INC.
(P1 36156W 1 36) '3I ULRNEN (UNU INS SRS 2 6 3(7 ELS POYWER RESOURCES INC.1 - -O'S' --
t' ..P53736W 73 21/SNE 06 INS SE/SW 21-36.73 (75 WELLS) POE RSURE ICP1356W 1 361 73ý 21 NERW UA E IS/N 213 3(9WLSOER RESUCSIC
(P03 46) IND 4 O ERR RSOURCES INC.. - 21)i4?IN; 9AWN 21-36-73: (75 WELLS)S}--( . A. 7, I-
S... - POWER5 RSOUCS6 -7-3 WSENE MOA N P-9 ~POWER RESOURCES INC.
7i ...ON..~- - .....36; _73 KUNt.;A MNý t!W(W46 2-3&19 . POWE RESURESLNC
171476W 6 73 ~ 7A/U ON JU-NPOWER RESOURCES INC.4 I3-6)
73J 21 .EN UN.ON.....(OERRSORESIC
211NNE -N AD SINENE 22-36-73; (12 WELLS)
LIN N. POWER RESO-U-RCErS INC.
P14124 7 '~ ISWE UNAj;S ID C ENEý!/NE 22-36-73(12 WELLS) -MN ~rK( lWLS POWER RESOURCES, INC.
731378 jOWS 3621 G¶EJ INDýSC 'N NE/N E 22-36-73 (12 WELLS) -MNP1438W -,-.-..-.--.---U--.-----'----------- -'--~--- - OWE RESOURCES, INC1 36 73. 21SR UN NS 'E)W20S73(WLS
.-..-- - -,,-.-ER RESOURCES INC.
ý1P4333W 36 1/SNE
1EUNA N ES 23-36WLS
P14S31W 6f 211SWW1 005 1 MI S MINS NES 03-3(3WLS IEUI)(E EL) )PWER RESOURCES, INCýP1453 7WN 36)731 2L1 SWEý CUNA MON FM5)4(M).- . . OE EORE N
P5534 - 06 MN 84)) OE RESOURCES INC,- MIS INS "'W U 1NE/SWU
6 --73 1 NEP -4 ID WN 22-36-73 (123 WELLS)-MIEUI)IPWLS) OER EORCINP145536. 36 2- 1 W- - N MO P8- 8ý . POW E-R REOU RCE S N-C;N~IN E/SE 20-367 (1 ELLS) .- w kt.. 7 1 2IN
j 7ý 2 E R N5 EE236-31`WLLj POWER RESOURCES INC.
jP4S3N8W 73) U1S6EMN 'P-S)U OWE-R RESO-URCES INC.74 6 3 21EE UNA MON'6
0POWER.3:I RESOURCES INC
P14565 ) 36 4~ 21(WSW ( INS MS jNE/UE 22-36-74 (127 EL)-MN NTK(R WELLS) POWER RSUCSIl
734635 36 731 . NSW.SI MI IN S SE/SW 22-36-73 (76 WELLS) -MN UNT)R WEL) POWER RESOURCES, INC.
41505)9W - 36 73 21,NEAEW UNA INS 4
WSEI 22-36-73)96 WELLS) PWRRSREEEC(P150529JW1 36 D1 ½EWE 9 5 N/SE 22-36-73 (9 WELLS) jPOWER RESORCESIN
P5555W21 NEOW .6 MO E -1PWERESOURCSSC73 21 t'"" UNA IN -5V1-P3C6VELFýA ICP/19W361 73 21 0E NE NW/NCSESV 22-36-73 (9 WELLS) PWRRSUCSIC
21182 -- ; 361 MPNEW ,INS 4Ný,ýW/r 22-6-73(9 WLLS) `AI POWER RESORCE IN
4P56 8 731' 21 1 1FS 696 M,0N W) 602 POWER RESOURCES INC.2117W 6 S-NEN lANA INO NE/SE 22-36-73; (172 WELLS) POWER RESOURCES INC.
'IP1576 73j -.----.-.----..-' --- WER- REOUCS-N/ 36 211 SNWs SNA 1105 NWS 22-36-73;~c (20WELS
1Pý5535677 36 73) 25
1SWN E s "I 6 INS "7WR 2S 3( EL)PWRRSUCSIC
'I P69 9029-36-73; (63WLS IE ~rI(& WELLS) POWER RESOURCES, INC.21 SW- E 001ý MSL IN
4NW/SW 203-3(WEL(-IE 9)(S WLS OER RESO-URCES.INC -
P151891W 2/PWW MSIS 1WS 2-67 ?EL)-MNEUI)(S EL) PWER RESOURCES, INC.
jP562 36 73 21 NSWW ;UNA (I NE/NW 20-3673 (1735EL)-MN N WELLS) WLS 1POWER RES OURCES. INC.
6SS6S 21NWER UNA ýMON OEMP-(USSER RESOURCES INC.2! - - .1 -,q.--- - .- -- I . '.
-72 -i ... (- -SE1 13 2SS NW IG51 INI,4S C MI JE53-4(7 ELýMDE IPWRREOREI
-1-S
(P155667W
jPISIS84W
[Pi11897
P161692W
36 731 Y1W5W 1G01 ýINSMIS
36j 7 21 SWNE 066 MON
36ý 73 2,15WSE 096N MON
36 73 21 NWSW NaU • ....
36? 31 21 NESSE0638 73 21SESE 696
361 734" 2(SIWSW UA MIS
.. .. ,o .....- -36) 2 NAS 066 MIS
36 73) 2IJSEN.W )UNA I
S NL SWI/4 NWS/4 30-36-733(21)- MINE UNIT K (lEE WELLS (POWR RESOURCES, INC
S NL SWIM4 NEW14 30-36-73)(21) - MINE UNITEK (114P WELLS (POW-ER RESOURCES.I INC
7O!ELRESOURCES INC.
Fl 'POWER RES OURCESI]NC.
S- - ---- .POER RESO0URC ER INC(POWE'R RESREU INC
..... . . .. POWER RESOURCES INC.
Smith Ranch PermitAppendix D6 (tables)
Page 15 of 49 Revised - April 2011
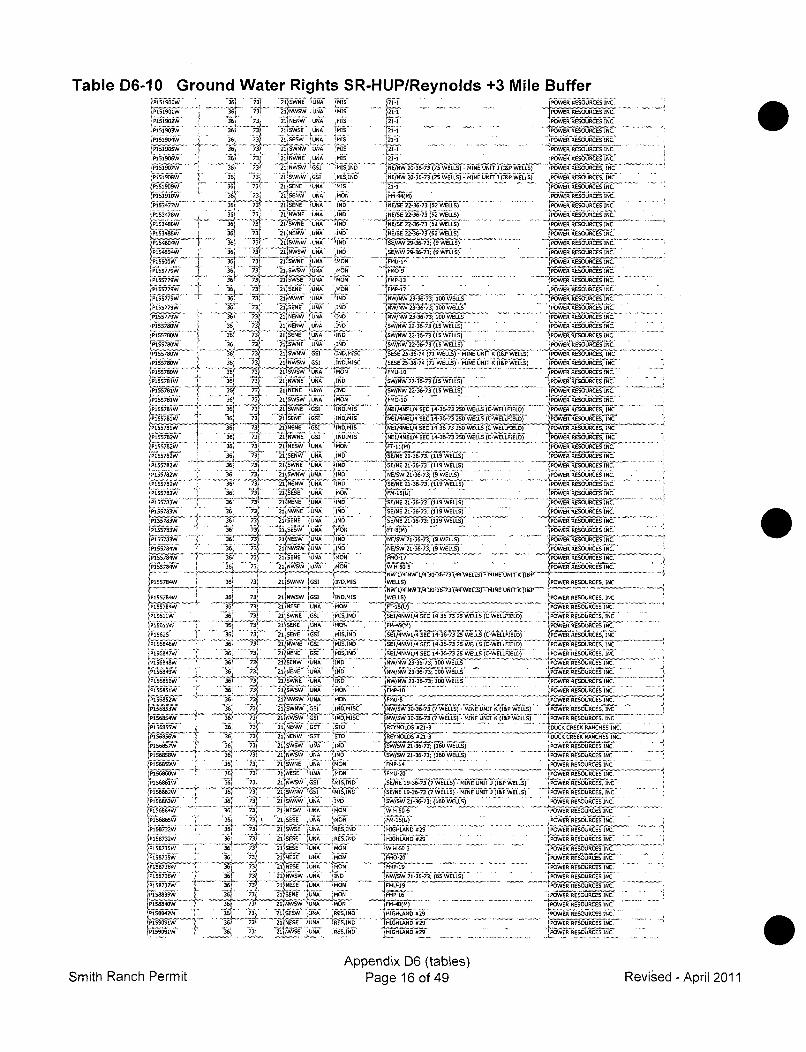
Table 036-10 Ground Water Rights SR-HUP/Reynolds +3 Mile Buffer1.P .1 .5 1..9 .0..0 W -3 .61 7_ 21SWNE
1UNR 1MIS 21,1, PO ER RESOURCRES INC.
36 73'pijil69 3; 7; 2SEW UNA ýMIS POWER RESOURCES INC.
1P51S903W 36 7 SW N W USA M I S -2 S-11E RESO U RCES INC.
3,~~t IfNS US IOWER RESOURCES INC.P1519S6W 36 73 .21-1' , MIP15197Wý 3- 73 21 NWS US MIID2-R-3(5WLL)-MNNC)(S ELS OEESOURCES, INC
36 -3 21 NENE USA HIS__ 21 1 .,- 1POWER RESOURCES INC
;P1LROW 6 3 21'NSESW UNA MISOND EP-M TPW` REORESI6US IS ))tEý 22-36-73 (2WELLS) N"1NtNF(iWL~r V~FýGiff1C.
,1Ei)w361 73) 21tS\ENE II EISN-P15 6 36 3. 21 SWNE URA INIS -E, 23-3 5 EL)POWER RESOURCES INC.
P101RW 6 73 ' 2 2110905 USA 'ISU0/E24R7 52WLS POWER RESOURCES INC
,P54UW - 6 73ý 21 NESWE UNA INS SNE/SE 22-36-73 (52 WELLS) k1POWER R ESO RCESN
P15?468W 36 21 SWNW UNA - .R 602-3-73 (WELS IC .1P1S4SU4! j936 731 2 NJWSW USA J46,1j91W 293673; (SWELLS) POWER RESOU'RCES INC
,PiSSSOOW 1 364 73, 21 EWNE SNA-N MON jfMU-14 POWS) i ER RESOrRCES IJNC
~Pi SI S79W- 3..6 . 731 _21SNWSW '5NA MO1-O-.OER46RCSIC
P63537W 36 2 SENE UNA EON 'P -IP OE ESUCSIC14.577.V WWErR0Ua~~
Piý7W3, 7. 21'SWSE UNA IN - W/SW 23-36-73; 100 WELLS (POWER RESOURCES INC.(P1377W 3~ 7 2 SESE USAI NNWS 236-;10WEL- POWAER RESOURCESIC
455779W 36~ 73 21 NESW UA IN WNW- . 23-- 36-- 73 10 ELSP R--b~i
P1557BOW 36 73 21 SENW' USE .15 SW/NW 22-36-73 (SR WE~LLS)PWRRSUCSIC(P5557805W7 36N ,j-.,. I'D- WLELLS) PWRRSORE NC.
731 1'SNE UE IS ;W/NWV73 21(SWNE UNA NS/W2-673D5WLS
41570 36 73 1506 SI IOMS ESEý 25-36-74 /71 WiELLS)-MIEUTK(IPWLS (OER EOEC ,INL3 ..... 4 .S1. .... . . . .-
PisS7U 3/ý 2SWW SI INSC SESE 26-36-74 (71 WELLS) - MINE UNITEK (ISP WELLS) PO ERREOUCS IN
36 - .,.--..-. UN 'O /POWER RESOURCES INC.1 36 ISA IN _ -SW/NW223-2(5WLS
3P571 6. 73, 21;S9SW USA ;MON FMO-10 . .. .. POWERSRESOURCES INC.
-_73"_+__ 1N 361 36 ý, SC1-36-73 230 WELL C-LLIED POER RESOURCES, INCL SS7_W36 73. 21 EN S 12,EI/45E1/4 ECl 1-6-7 250 WELLS (CWELLP-IELE( POWER RESURCES INCP1571 36l"E1 73 2OEE 'SIP1571 21f5W5E ,N1E1/451/ SEC 14-36-73 250 WELLS )C-WELLP-IELD) POWER RESOURCES, INC
P155762W 73 ____~~CS ,IRD,MLS tNEl/4561/4 SEC 14-36-320WLSCWELIL( P ERRORESIN36Pý -73 215E0 WEUNS T9-10 P1-11(M POWER RESOURCES, INC
P155782W 36 73'T 1SN UNA IS M/E 13-3 (1 EL) OE EOUCSIC
(P555762 36 731 21SWNE USA INDSE/SE 21-36-73: (119 WELLS) PWRRSUCSIC(P155782W 36 73, 20 SWWN USA (INSD (NE/SW 21-36-73. (SWELLS) POWERRRESOURCES I ,N C. -
(P135763W 36 73/ 21/SEER ~UNA MON P536)-.163 3' 7 21,5E5E US INS SE/N 2136U 73(19ELS'OERR RESORC ES I1NC.
'P1 55763W 36 73 21 SWNE UNA INSD S/E2-67 19WLS POWER RUSOURCES INC.
'P155763W 36'1SN '3,USA ISO 'S/SEi 1-67 (19 WE"LLS) PWRRSUCSIC4Pi55snw 35 73, 21NES IND0 -S6M 7PWRRSORE
'~ I 3R( IEC EW US N SE/SW 213-73: (S19WEELLS) ýFPWER RESOU6RCES INC.-
P15574 36 4 21WWUA N N/W2 6 3(WLS PwER"ESOURCES INC.,4PSS7W 1 3R 73) 2 h3NE US ,A MOND 0E 1 OE REOURCE INC.
(155784.W 361 73 2/WSWV UNAU MON NA'6So POWER3 9 ELS RtES.OURCES INC
(ps~~ 3~ 73 21,5, SWN MOI NS MIS- 7WL POWER RESOURCES, INC.
P157h j732160W GISI JINE,MIS WELLS) 4POWER RESOUCES, INC
P155SSS4W 36 1 "IT 21 1"SE USA MON P 15(U) rPOWRR RESOURCES, INC.-P156014W 36 7/ 21 WNES 61 MRREý/NI4SC 43-35WLS)-ELPES WRRSUCS N
P1SRSW 6- 7 lIA 'ON (M-4)M)POWER RESOURCES INC.
36, 731 -21/SINE G15 I/D SI4W/ E 1ý4 3-7325 WELLS (C-WELLPIELO) )P[aEOUCS N'C'
P156646W 36 ~731 21SNDN G1/S (MiSINE SE1/45W1/4 SEC 1436-73 25 WELLSl (CWELILS P ER EOUCINP15cs6647 . 36 73 21,SEVNE SSI 19415,155 SE1/ý4W/4CISEC 14-36-73 25 WELLS (C-WELLFIELU( POWER R~ESORES,"INC
P1666W3RT 7 21 NENW USA tAs"D . -SW~4V/NW 233-3 100 3 3WELLS (PWRRs6UCSIC`164w36 73 21 RENEV USA IN (D 10 vr INC.
(P156651W 36 73 2 USA IOND 1PMP1U 10 .. .. .. ER RESOURCES INC.P1,56652W 21js90Es90 /N 25 3-6 -7 OW36, i 2160WN UNA PIOND PO_ L Wý - "_' _' WER RESOURCES INC."
rP656853W 36: 73 21SRW 31 IISMS W/SW 0-673 i (7 WELLS)' -IE' U IT i(6 WELLS) POWER RESOUCES, INC"
P156654W 5/ 73 311190590 SI ISSMISC iNW/SWW30-673"(7%WELLS) - MINE UNITE (I&P WULLS) .PWRESUCIN
PSS6SSW36 7 21NENW SOT .5N (RYNLES63-3 TODUCK CREEK LRANCHES INC.
lP156656W / 3 21INENW 533 CEO (REYNOLDS 621-3 DEUCK CREEK RANCHES INC.
36-- 11421S!0S_ USEA INR_ . .. .4!nl! 2136-7 163 WEL)PWR RESORCES Ir.C..
36n2t 73ý 21SWNE UNA.(SON PFMP-14 - POER RESO.RES INC(P156960W 4 36 U 1SS S IN YM-0- - - -PWRRSUCSIC
P156661W 31 73, 21,1690W UCSI .MISINS "1/N 19-67 (7ELS - IEU IT) )IPELLS) (POERW66RESORES, INC21,SWNW -SSI MISINO (SE/NE 19-6-73 (7WELLS) -MINE UNIT IPWLS OWRRRUCU N
166W36) 73 2lJSWNW UNE IND (SW/SW 21-36-73; (160 WELLS) -POWER RESOURCES INC.
36 73 21 SESE USA MON IPM- r)U POE RESOURCES IN-C.
P15632W36' 731 21SS-SH'EISLRND6W29_ 'POWER RESOURCES INC.4PLSR732W 36ý 73 21'SESE .06A RESIRD1 j61S6LArN 629 J~~POWER REROURCES INC.~~Pi~i735W / 36 73/ U BEDE UNA MON 'W RSP EEEOUCSI.'P1S67SW3 7 31 2lSS S MN - PM - - - POWE RESOURCES INC.
(P373W 4 6 3 11/ETNU MON F9P OER RESORE N
/1 / 1
736 - I I6 ~j 2ONS UEIS!N!!.13-7;(5 EL). . .OWRRSURCES INCJP15677 36b4 73" 21NSESA MON4 MPU-I9 (POWERESUCSI.
_j,P156R4 3 73 2 WS S REIS 6519 69'POWER RESOURCES INC.
P15951W ) 3' 73 21NES 'US (RSIN 615USD#29RESOURCES INC.
IPSSUSI / 3) 71 2lNWS -UA 65,15 915USD629POWER RESOURCES INC
Appendix D6 (tables)Smith Ranch Permit Page 16 of 49 Rev ised - April 2011
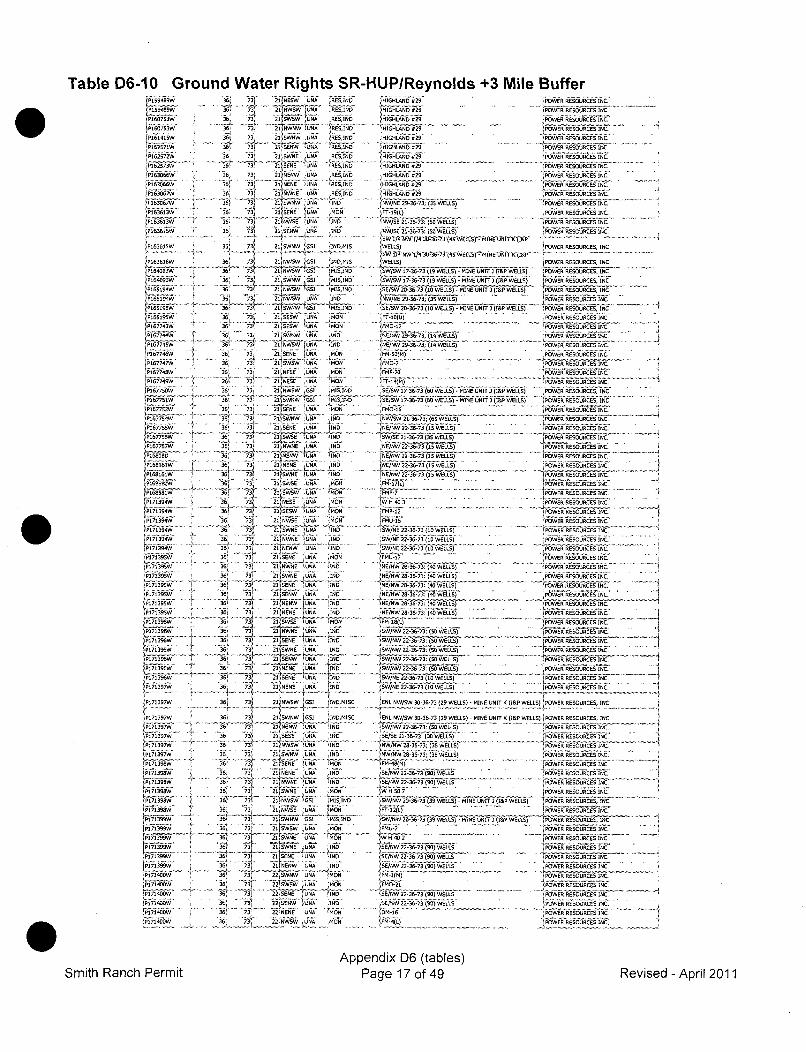
Table D6-10 Ground Water Rights SR-HUP/Reynolds +3 Mile Buffer
P;11607513W
IP160753W
ýP15257-1W
[P1313!W-
P1640(93W
P165194W
rP160914-W
3P167743W
P1I67705W,167746W
P167797WV
iP157751.1
P167752W'
P167754W
P1766
P171394WP1L7J6395w
[A P71395W
P11395W
P1713'W
Pý7
.179W
(P171396W
PT71396
,P171393W
P1ý71397W
'171'396W
P17136
AP17139
P171406iW
365 733 21'NESW.UNA 6636 73," 2136W5W fUNA RE5,1ND
0. 7 21 NWNWR 066 0
33 731 21, ~SNW 1NA196 66,150
26 2SŽ2.A i. 6,160
36 73 213,66W 6UN6 RES,1'0
3t, 733 2136W6 096 RES IND36' -7N' .4.N..,.
1 3 .
6, 21536 UNA 190
36, ~ SWSRW 655 3760,D75
36! 73MIS[W5 61
36 73 21SWROW G57 'ILSIN D
36 373 211 509W U51 ~I1SIS3 3.6 23 KwtIN UrA sNO
36S 73, 21 SlEW 696A ]6036 73, 2!,5650 'UN6 M1ON36. 73 21 SW6W, N596 0
36 73 21B 5 U9 4A9 906
36; 21 6666 ý696 MON
36 73 UNA96 T~ -I116
36, 73ý 21 5WE6 096 :906
_36. 734 21INC .9
36: 737 d5 09 s6"'3NA6 116673 1NWNE 66 6
36" 7 21 6666 666 ý6"4
77 21 50996 766 IN6
316 73z 21;SNWNE U66 IND
3E. 3 Žs'ýtNE UNA IND
36, 737 169676 6
367 73 2'I;SNEW U66 5636 73' -f 25,661 IRRND
36, 73 21150961 4666 7N07 36/ 73' 21 5666 666 .760
36 73N1569 66 736~ 7437 24%NWE 666 7160
36 73N 2166666 .636 73 21 A 5051 66' '90
36i 73 25 60996 666A 160l'I L IN736 731 21INS 666 66 3IN0MS
36S 73 21750960 I61 10,45
36: 73 'fNENW 1266 3760D
36 73, 1 1776 '0
36 73136 73 2 17wws 915,160N
3 MO
36 906
'I 36A 73 WN W,361 3 21-'-~E N9 6
655 73 21566 7666 '761,36 7 .. . 3 2136669 566 716
36 73j 2206 66 MND363
36ý 7ý33 '22WW ,61a MHON
'HIGHLAND0629
6O29
HIGHLAND #29
HIGHLAND 629'IGHLAND0#29
6W/NE 29-36-73: 7350 WELLS)
.N /52167 (50096/3,7,57
7PW00E REOURCE-S INC.
POWER 65166 N
P6,6oR RESOURCES INC.
3POW6R RESOURCES UINC}POWER RESOURC6S r- INC. '
POWER RESOURCES INC.POWER RESOURCES INC.
'POWER RESOURCES INC.POWER RESOURCES INC.POWEqR RESOrURCES INC
WELLS) POWVER RESOURCES, INC
IIELS) 11ýl I URýSINCýVSW/S 17-36-73 319 WE-LLS) - MINE UNIT) 71[&P WELLS) POWER6 RESOURCES, INCSWV/SW 17-36-73 (19 WELLS) - MINE UNIT)3 )I&P WELLS. P06 6606ROES, NC
/S~iW 2-iý36-73(10W-ECLLS) -MINEUNIT-) )16P WELLS) 3650969RESOURCES, INCI609/6E 29-36-3 735,(ý WE LLS) PWER RESOURCES ICSE/SW 26-36-73 (10 WELLS) -MINE UNIT) )I6(P WELLS) POWER ESSCS N
P7-16U). . . . . . . . ER RESOURCES INC.SRESOURCES INk
NE/NW 29-36-73 (14 WELLS) -POWER RESOURCES INC.-
'1450-71 POWER RESOURCES INC'FPMP-2L POWNER RESOURCES INC.
'PW R RSOURCES INC, '
SE/SW ~ ~ ~ ~ pif V3W7 (6 WELLS) :IUIT)PW R . POWERRSUCS NS5E/SW 17-36-73(6 WEL)-IND UNIT )160WELLS) 3,OWER REROU6CES, INC
,F90-16 POWER R650ERCES INC.'NW/SNW 21-36-73; (65 WELLS) 3POWER RESOURCES INC.3....-.---,-.----- .. ,r~-.V-.~-. ... RRESOURC0E-S INC
LIEIW/5 2 2-36 -7 3 735 WELLS) 5rERSOU-RCES INC'
NE/6NW 22-36-73 (15 WEL-LS) 3OE EORE N1-!t - -'- . .PW R REOUCS INC.
NE/NW 22-36-73 (1SWELLS)
Flý7 POWER RESOURCES INC.W/ 3 715 WELSHOWEE RESOURCES INC.
FMP12 OWER RESOIJACS INC
FMP-7S fPOWEFR RESOURES I'NC
SW//NE 22-36-73 710 WELLS) 'PWER RESOURE INC.SW/NE 22-36-73 710 WELLS) POWER RESOURCES INC.SW/NE 22367310WELSPWE RESOURSCES INC.
II/'09 6 :ý 17 WIS .00096R RESOURCES INNE/N 26367 74 WELS)POWER RESOURCES INC.-
NE/NW 26- 367ý3740 E-LLS) POWER RESOURCESNINC.:N E/ NW 26 36 3 (6 ELLS) POWER RESOURCES INC.
NE/NWN 26-36-73: (40) WELLS)7NE'/N4W 26 3673740 W-ELLS)-' * I POWER RESOURCES INC.NE/NW 26-36-73 (50 WELLS)
3,Pt S REORESIC3)9 16(7.) -- - -'. . RESURE INC. --
SW/6 2236-73: (SO WELLS) 4POWErRESOURCRS INC.-
SW/NW 22-36-737 (10 WELLS) iPOWER RESO6URCES INC.
SN W/NW 2 0-36-73: (55 WELLS) -MN K]PWEL)'OER RESOUECES, INC.
509/6 22, 3-36-73: (2)5 L)6 IEUNTK(& WELLS) POWER RESOURCES, INC.
SW/NE 22-36-7a 3)10 WLLS 4 NC
SW/N- 82-16 73, (10 WELLS) POWER REEOUE`CES-INC.
ENLNWSW 0-6-3 (9 ELS) 966UNI K)IP WLL) POWER RESOS6C~iESIN
SW/N 22-Sý36-7 : SOW EýL LS( _ P2 P W ER RESOUC ES I CSE/SE 22-36-73 (30) WELLS) POWERI RESOURCSS INC.
NW,/N!W 20-36-73; (396EL)-MN NT3(&P WELS) POWER RESOURCES, INC.T-12L '' . . .. POWErRRESOURCES INC.
DSE/NWO2-36-7 7907 WNELLS)WN F3 iý POWER RESý9OURCES INC.
SEF/NW 22-36-73 7907 WELLS /PO;WER RJESOURCES INýC.'
SWE/NW 22-36-73 7390WLS) MN NT WELLS WLS POE RESOUREiS.INC
'P7-1 22L ' {POWE R RESOURCES INC.2S7N 20-6-337909 WELLS) MN 67 IPWLS POWER RESOURCES, INC.
DI, 1'POWER RESOU3RCESWIN
/S/N 2-367396 WLL POWýER RESOURCES NC,
Smith Ranch PermitAppendix D6 (tables)
Page 17 of 49 Revised - April 2011
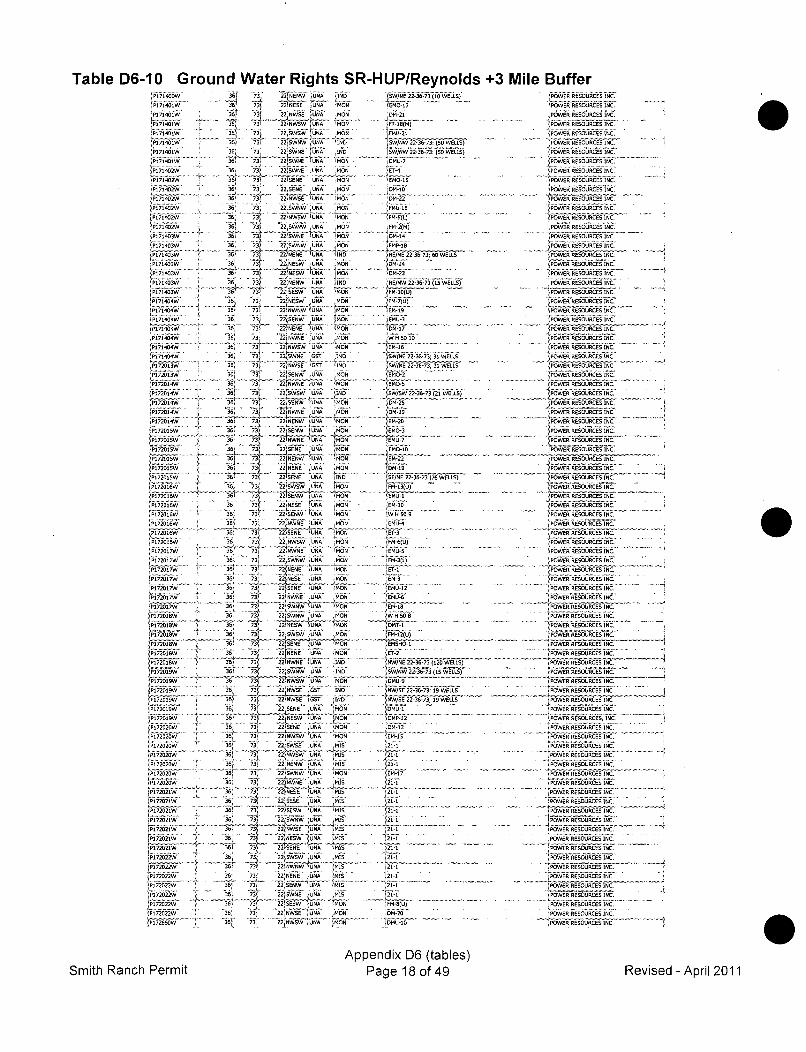
Table D6-10 Ground Water Rights SR-HUP/Reynolds +3 Mile Buffer
P1714T0W
P171401W
'P171401WV
PP171402W
P1 P71402WN
'P171403W
)P171•43WP171403W
'P•.ll-F ..3....1P172143WP171404W
P172013W
P172014W
P172014W
P 1720,14A
Pý172014WI
P172011. W
P172011W
{P1206W
P172010WP017201W
P172016W
1P72012w
P172017We
P172018W
V•iig6iiW ...
1SI-720•1•,.P1-72016%WP172010W
JP1?369WP175201W
'P1722019
P172020WV
P172020W
4P172020W'
P17-2020
1P172021W
P1172021W
PYi7ioioW'
P17FD2022
172ý0-22W-
I-1i72122
P172022W
11 72660W
36 7• 22 SWNE UA .MON
•~~~~~ ~~~ .......... ... ...... ..!•t•7'367 73 20 SWNW UNA IOND361 7+ 2 'UW N N9 100
36J 73 22 OWNS 19A ",ON
36' 73, 22fNWNE IUNA M1OR
36, 72 22RSINE 095 - 9MC
36ý 73 22tNWE •UNA '690
36 73 22NENE S UNA 0 MON
36 73 22 WNEW 0U90 MON2Aj iNE , tUNA. N6136 7 22;146W ,UN6 N690
36 73 22 E d09 .V60-4 -441 24 ? 22NSWNW UNA iMON
31 73 22 S EN W U N A 5 4O N
39 73 22I~~ trC lO 146W36, 7i 22 NW Ii49'6 . 0 .
36 71 22795 096 C 09
.3 22NWSNE 57 '1 06
ý 6 3• 22 SENE ' UNA ", ON
36 73/ 2219W0NE UNA NSO36, 2 220 .W 346 90
3 73 22/29 1090 90
36i 73 22 UwNO 090 1,93 3 73 •?2290 096 UN 409
36 733 2i)S9 096UZ N'36 1 73 22'-NEN UNA 6409
36 2 2E461126 I673436 2109 096 190
22)WS ý19A MO9
3 3ý 22 NESW-- -09 6 N31 73' 2 EW UNA 9409
36 731 22 WSEW 090 MO92' 73ý ' 2219 2091, T 096A N69
36 _73 22529 096S 909C36 737 22t909E 7urZ."O
-36 73A 2250 5w07 036 731 220091 1196 1690
• . .. . ....... .. .. ..... •.. ,-z--
73 ' 3"• 22PSE iWWUNA 690936 7, 21W~ N O
344n5 22INSWW 116.60
36 73 22 SENE N19 9036ý 73 22919 116 O90
361 737 NW 19A 0
' 3 3 2 .WOW 0 .ii0"9 .31 31 2 WO :UNA IND391 731 22
144W1105 9
361 73, ''Z '13 221 5 11,9 I 'N
36, 73 227119 UINA MONQ4-l
75 221NES1W '11UNA 7436 73 722 UNA 19 MIS36' -34 22 9WSWf 116A P4lE36 73 22 9W 19 :69
36 7 3 229W E!92 "
36 734 2251 'MON91363 -4 22
4F5 M756 IS
36 737 22 OW920E-UN 1196
+ 397 3 22 019 1Es 9 MIS
36 73, 22134W4W 096 ýMI361 At 27'2 "WN FLN i'36i 73 2 2. 9196 1190 9S
'36. 73, 22,51WN 119361 73_ E910624 221115W UNA4 50
36 77 22 9EW0 UN P 6909
3 73 22,I9W5W 1196 16909
44W/NE 22-36-73:7(0 WEF •T 10769)
45W/NW 22-36-73: 7500
0469 7
190 15,
.4i'ýi- .....
069 10
'I 91/91 22 -367;62
91/W 2-36-3(0W
190-1070
'DA19'1
169O-16
'SE/NE 23-36-73 316 WIL
Wi~
77FM-1O
E$ 1922
1....I!,[ ... .i T_
-99SH-19
EDM-2
'ET- 223673(13
'969 2-6-ý1 670
FM 13/)
21i'ii-i ii.i.i
'iTO21-9
2111
NW/E2 6 7310
-•.:'70W9W22.-36-73 (10 P
0909 ... .. ...........
'NW/S 22-36-73........ 09...W..
15"W/M0I 22.36.3...W
09•'•:~. 13...... ..
.. 69 00i 'Ii-i'I
21 0ii
21. 0ii.... . ......
210 i i :i"... ....... ....169 17g
120. 1'i~ ' ..........
'121'i. ...
!211 . ... . .
- i~ .. ..11.
969- 87 . ....7
06920 .......... .
069-1 10 ..
.LLS) " 00 E1'1 INC.
'POWER 6600116(10 INC
EELS'POWER SE SOUR0CES INC.l51-)...POWER 11000(15 ICsR---'S- R SURCE . I. .........
'POWER RESOURCES INC.
......... .. .- '•s e.•T....
'POWER 010106 INC.Zý'POWER RESOURCES INC.
POWER RESOURCES IN,
POWER 1S0000(10 INC.POWER 1150118(10INC
POWER RESOORES INC.
C rsP0WS 1 150-(1 I IOUC NC.POWER RESOURCES INC.
AS POWIER RESOURCES INC.-POWER RESOURCES INC.
POE 103(0INC.
;POWER RESOURCES INC.
POWER RESOURCES INcý
.L. .S''4 POWER RESORCs iNiC'POWER RESOURCES INC.ISO POWER RESOURCES INC
5 .. .. . POWER RESOURCES INCPOWER RES OURCES IN C.
POWER RESOURCES INC.
ILLS. .. .. ........... POER, RESOURCES IN . . ..... ..
POWER RESOURCES INC.
POýWERRrESO-URCES INC.*,POWEýR RESOU7RCESINC'POWE!R RESOURCES INC.
'CýE!,Rý0OURCES :~ -SPOWER RESOURCES INC.
FPWýrR 4400RCES INC'POWER RE5CROOCIS INC.-
POWER REODURCESIN..$0W46'6kESOOZo(1 INC.
POWEW6-dsV- -'
POWER RESOURCESINCPOWER R06ESUCESINWC.'POWER RESOURE• S iNC.
"'" =__, Pdii'S6616'iE V'"
'POWER RESOURCES INC.-
............................. .... ..,,,.,....,__ _ _ .. _. .... ..
7POWER RESOURCES INC.
POWER RESOURCES IRNC.
POWER RESOURCES INC.
.12~ EORCES INC.V7S7 POER E RCES INC.11107 /POWER RESOURCESINC..LSSOWER.. ...WE.SRCES
POWER RESOURCES INC.Ito ~~~~POWERRSOREIN7115POWEE R ESOURCE S INC.
POWER RESOURCE-SINC.
POWER RESOU6RCES INC.'P'OW0R RESOURCES INC.~POWER RESOURCES INC
;POWER RESO5URES NC, -~7POWER RESOURCES INC.
4POWER RESOURECES INC.-,POWER R6jESORES INC.
.7POW`ER RESOURCES INC.
,POWER'RESOURCES INC.
1POWER RESOURCES INC.
lPOWER RESOURCES INC.
'. .. ....... RRRESiOUR CES~WCi-ii[...... ..1
POWER RESOURCESINl'C.
POWERfRESUSECES INC.
its " .... ................. POWER.. RESOORCES•] i IN ........ ...
........... ............... 'POWER.... RESOURCES IN ......... . ...'4iOWER RESOURC~ iiES .........C
Smith Ranch PermitAppendix D6 (tables)
Page 18 of 49 Revised - April 2011
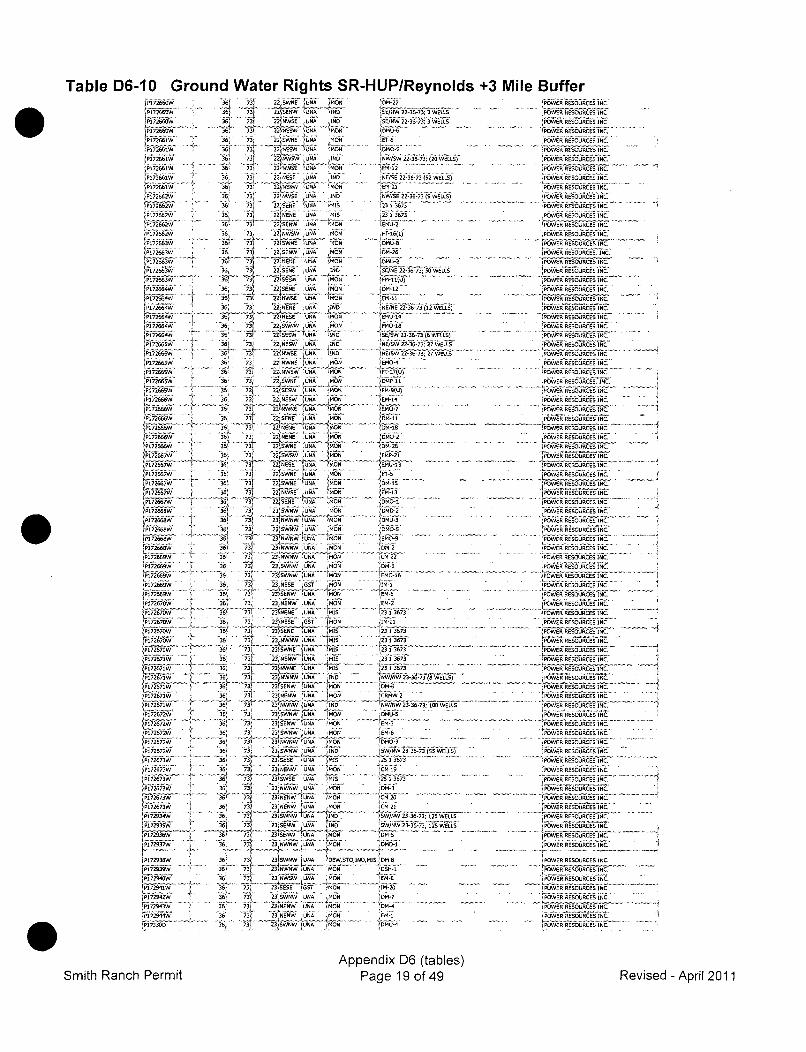
Table D6-10 Ground Water Rights SR-HUP/Reynolds +3 Mile BufferIP17266OW
P172661W
P1"72661 W
,P172566W1w-'P172662wP172662w~
1P, 172663W
jP172663W
P172664W
iP67266ý,WP072664WP172665W1
PI 72666W
P1765
~172666WPi 5172-66-6WP172666W
3P17ý2666
P172667W
ýP172667W
P1l=72667W
P726687W
'P172 66 9WP672666W17P172669W"
1!P11716W
P172666W
P1-7266W
P172670W
FP172671W-
'P1I72672WP172672W
P!172672W'P172673W
P11726731
;P172673Wfýl72673W
ýP172673W
P17-29'6-W
P172939W
P172F944WP470ww
3( 331 22 56WN '596 319
5 6 7 3 1 2 2 N r W S E 2 6 6 IN S3 6. .6, 73• iESW . 1296 0 9 ... ..36 73 225.rNW UN 1 I6.
{ ..... .+33 ... 4.. "~i..wC'•" • . ...
36' 731 22 t605W 1590 '1409
36 73' 22';ESE 12NA '0
363 73 229NE6W 2UNA 'I40
6. 3 73 '7 2' MW5N 56 "1236, '713 2,61 19 11
36 47 22666. 59 'M7 .365 73 22M9WNE UNA 5 MON
36j 73..2 59W U5 9 ý MON.36ý 73 2(6W 59 41
"'i95 MON
36 2223696UNA O
36 • 7 3. 22iN... 5.. •N•.36ý 731 22 UW 129 K 1409
36j 73) 2;SNW= ;UNA fMON
36 73 22012 512SW 6
k .. . ý 3 . ... :I. .. • ". •/ - . .... .
36..)} • 2 N•~" 4.40
73 3 2O1E 11 26 MOND
39 73 22N 166 A 9 M0N
36 73 22 9WSW 6UNA IMON
26 73 22365 LIN5A22!SE
W9 MON.
36: 73 22NSE 12 6 W340
365 73 2iNSESE 1UNA 1M45
36e '7 .... .. U M N '5 . .
J16
. 73ý 3 NE 9 10
36. 731 22W• 9W 1266 ' 1 40"
3. . 6 731 2333W6W• .16 1459'
'" ' -.•' ,-".. "..... "-', --. ""5 .. .
36, 73 23 'NE 0 UNA IMON
'7 ! MON
36 73 23 9NW .56 O
36 73 23 9SWNW '696 MIS
36 7) 23 9NNW 59 -1416
36 74 23 NWNW 126 'NC
' 391 73t 4436W '696 349
36i73I IO
36j '73 321'E 3140
364 73 23WW 596ýý 140
2356 '12636. 731 23 N1WN UNA (MOS
36ý 73 2312WNW UNA 1409 -
36' 731.23346NWNEUNA 1409
36ý 73' 33(96W SA96 14097
393 73 23567N"W 59UN 19N36 73, 'i3 IEO44" (666 1409
36 ?3 23SVN1 J4 NW9 126 O4"36 74 2315EW9W 696 15W 7 16
36 73, 23'NWSW1 96ý 1406
36 73 23 1-631 U5S7 '10636 73 '23 SWNW UNA MOND
36 73 2S 9 1296 1409436 73 '43'44$44 UNA1 1459
36ý 73 243 N9W UNA9 ý1406
.69-27
1E2/9W 22-36-73! 3 WELLS
N/W2244367 (25WELS)F11412 '
'61 2!
21-363.'23 i 3673
S.59-26-ý,5WEL
F-5-12(U614-11
,E/SW 22-36-73127 WELLS)
'6$145-14... ... .... . .
.56S/9W 22-36-73 (6 WELLS)
E140-4
OMP-iW
'014-2
CM- -0114.-2-9
'IM-21
,231 364•..
EM3.
012 ,1367
0D 2'CM
014 9f
UH14
ý0M-21
E U-3 ....3673 . . ..
3139....
3 1 397
23•j:. 13673 ........ .....
3231397 .. ..... ...........W/W• 23-6-3).WELS
'9/N 23-36-73;100WELL
(5W/NW 23-36-73; (55 WELLS)
"iiiR9-2..... .... . .'C9 5; 19 ....... ... . .... ...34 sw6•,3673 .. 4.,~i...
(SW/NW)• 23.....39 ....73 ....125 .....WELLS .....IWS 2 67316 EL
145i ' 1 . .. .... ... .... . . .... .. .
1i49353•"• 1 ... ........... .. . . ...... .
09124 '
ýPOWER RESOURCES INC.• 6RRS.IURCIES INC. POWER R6SOU'"CES . ..
POWER RESOURCES INC.
- VIEi REiO' 'tg'R.. .
POWER 3603CSIC
POWER RESOURCES kNC
POWER S66 ONiCE : I
POWER RESOURCES INC.PWRRSUCSINC.
POER RESOURCES, fIN
'POWER RESOURCES INC.
POWER RSUCSIC
POWER RESOURCES INC.'
jPOWER RESOURCES INC.
(POWER RESOECES -INCE
(P.OWER RESOURCES INC.
'POWER RSUCSIC
'pWIvsRESOURCES, INC.'POWER RESOURCES INC.
'p 1444RESOURCES (NC.
3 . .-. k•6~•''".....-.... .. "
POWER RESOURCES INC.
POWER RESOURCES INC.'
. .. ",. .,'-.- ..-..... ....
jPOWER RESOURCES INC,
I RRSOURCES INC.
-7:7~~ ~ ~ ~~ ......... .......•: .- .
.. ........•7. . ..
POWER RESOURCES INC.5POWER RESOURCES INC. '
.. ... W ii•s2u-REE- "RE
POWER RESOURCES INC.
4- -1----- -"-. "RE7T~'634414""".
POWER RESOURCES INC.
.POWER RESOURCES INC.
'POWER RESOSECES INC.POW"ER RESOURCES INC
FPOW'ER RESOURCES INC.~PWERESOUJRCES INC.POWVER R ESOURCES INC.''POWER EESOURCES INC.POWER RESOURCES INC.
POWER RESOURCES INC.
,POWER RESOURCES INC.
POW!-ýER RESOUR-CES INC.'POWE RWE665032565 /1k0ýPOWER RESOURCES INC."POWER REiSOiURCSiNC
(POWER RSURCES INC(POWER RESOURCES INC.3POWRR RýESOURCESINC.POWER RESOUREINPOWER RESOSJRCES INC.'POWER RESOURCESINC
""". itfI IIO 15R5j65 N.-
Smith Ranch PermitAppendix D6 (tables)
Page 19 of 49 Revised - April 2011
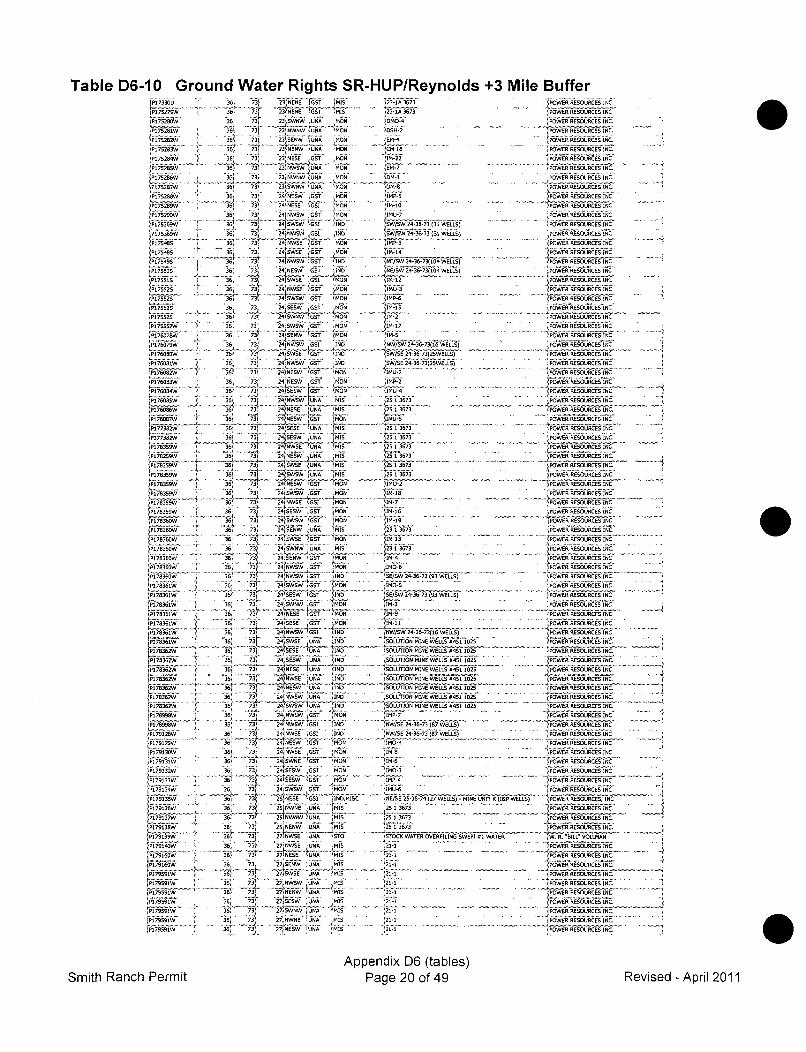
Table D6-10 Ground Water Rights SR-HUP/Reynolds +3 Mile Buffer
P`173308w
V,75283WP!175288W7Pl75281W
Pi75ý284Wý
P17ý52 88 ,WP17F5289W'
P17589W1
;P8IS5485
IP175501
'P175525
"'PI00'
P1 76083W
P,1 768884P1 768681LP1768A87P1i77382W'
[P1-78359 W
P178359IW
4P178359W
P178388W
FP178 3601
P178381W7'F36NP178361W
-3183D211
44178362W
P178998W
P179131W1
P179134W
P17i135W
,P179137W
P179560W
79179591W
IP179591W.
1ýi44799wý
rP179591w
*36: 3 2~W8 8 MON.3 773 23 NWIIW CA 'MON5
''36 4 '23 9E9W 596 MON36. 73 239856E CST 1,
367 737 237NW9W 888 11036 73- 23 NWýNW 1588 905
36' 73 2479E5WV CIT PO0N
36' 731 24'955E 'CCI MON
36: 73s 24 8W CS 07S"j""4jl 2".iSWsW USSI '190
36 77 2:90 C367 71 2 491 CIGT MO N
3: 73, 24G1ECT 0367 3 241W5W- 1830r 'IMNS813,6 '.7 3 24 955 CI :744' ý6
26 7-734 224fNW"SýE,7
O
36' 731" 2858CITI1903(" 71 24FSWSW CIT MON3 73 24,SWEW CST MON3 73 2'SWW CI 909
36i 71 24 5 CSW M;ON
36 731 24MoS.CT 9361 73 245SE5W 153 MO
36 73z 24958W- '65! '7.43435 3 24k5WSE [85! 1909
38 73:.... 249ý'N!SW9W 169661
36 737 215519 I36 73 SS 24958433 MON
66 731
36 73 24455588896 N!36 _731 -WiWIS 24795 1188"(74"
36 73 3416159) LM' 7675"E ""--A....361" 73 24 5855[Tu" 17
'6 7 24 SI 86 77
38 73 2141 95W 165 438-ý 73 24SWWCIA .0
36_3 4 NWK 05 O36 73 _2, 4S- 55W 'UNA MLS7
36. 73' N24 8w5 [iIT MON31 73 24SEWSW 896. Os
36 ' 7?1 245W CT 0
'365L 24'SWýSW [CIT MON
36 7CST PION8
36 73[ ...2P Sr.4. G S MON36 73' 24151 CIIT MON
36 753 245 S IN6D19
36 7' 24, SEIW 89 7198OI- -Y '.' 4 .'W 'sr .''
36 77 249555E 7596 7890
361 724"' 24G1 696 N36: 73 !LAM GS896.IND36ý 73f 247S885W U769 IN4
36, 24,98W CITA IND0
36 73 24NW9 1851 190
36 73 241SWW5 UNA INS
35 73[ 2491WSs CIT MOND
36 7 2498855 GOT MON36' 73 :4'SWNSE "CT 'MON
35 3r 24S5, 3 MON
3,, 73; 24CSESW CSIT MON,
36 73) 2.4 5888W- CIT 7909
36 73 1189566 Ni.36 EMISC
35 73G1S5W86 14436i 731 275m 55 UNA"ENSO
36, W? 7785 696 MI
36- -77 24M.5W.9 M1T2 WE I 7-,"''
27988W il. .E975A_ l
36 73 271NE9598 '1496 MI5
36z ý3 87381 89 "IS
35 73' 2 ....770889 '7.71MI
-35-' 73 27.9885 896.MS341. 73 2'I5W:86 1
23-1A 3673 !POWER RESOURCES INC
231 3!A73' . POWER RESOURCES INC
. ... . . POWER RESOURCES I1NC.MiPOWER RESOURCES IC
Cm0-1 POWER RESOURCES INC.
II0:ii P.WERE RESOURCE•SIkC'IMP S POWIER RESOURCES 156
C9 1-8 POWER RESOURCES INC::
MP1 3 POWER RESOURCES INC
"1914 POWER RESOURCES INC.
INE/SW 24 -36 73184 ELLS [40"55RESOSIRCES INC
795/SW MD3'75 WELS POE R REOUCES IN'~f' C319 12 '~"" ~ . . .POWER RESORE N
4198 /&ER REOULRCES INC
119 }}"6, .... ..... ... .RESOURCES IC:
9S 13673 POWER RESOURCES INC
119, 2..POWER RESOURCES INC
IMO-6 5 POWER RESOURCES INCE
N / 235.. ....3.. ..... W S )POWER RESOURCES INC7
IM- 2 POWER RESOURCES INC
IMP 3 POWER RESOURCES INC"
S196-4 67(5 E L .US) OWER RESOURCýES INCM-25137 POWER RESO.C.RýS4
IM 2 POW'ER RESOURCES INC.
['645- POWJER RESOURCES INC
251 3673 44OWER RESOURCES INC.
R25 1 3673 RompOE RESOURCES, INC.
EW 251-3673 1POWER RESOURCES INC
25 1 3673 V . . . 'BPO R RESOURc ES .135--W -35-73 8EPOWER RESOURCES INC.
S 13673 (WL UPOWER RESOURCES INC.
IPOWER RESOURCES INC.
j25 1......R. . .OURCES.INC.
12"1 [POWER RESOURCES INC
.23 18 363POWER RESOURCES INC.
... 7;, ..'...'..".........' ....... ........ . . . . ............ . WER- .•• RESOURCES ... ........
lI •. .. .. ' s INC23 1 3673 POWER RESOURCES INC.Im- jPOWSER RESOURCES INC'"
10N -POWER RESOURCE S I NC
190- POWER RESOURCES INS. .M64ý,POWER RESOURCES INC
[us" ~ -. ~ POWER RESOURCES INC
719-11~~ý PWRRSUCS INC''18WSW 24-35-73 (16 WELLS) 'POWE REO RCEINSOLTIO MIEWLS84112,POWER RESOUR-CESINC.
'IiLIIONMIE WLL 841 825'PW`ER ýRESO-URCE-S-INC.'(OUINMNE WELL 843. . .
TORESOURCES IN.
'SO-LUTIONMINE WELLS 8451 1025 [POER RESOURCES INC.
SOLUION MINE WELLS 845ý125 'POWEýR RESOURCES INC.:'SOLUTION MINEWELLS 8451 1025 "_"OWRRSORESICSOLUTION0 MINE WELLS 8451 1025. . 'OE!ESUCSIC
SOLUTION~~~~ 919 WEL 84112 PWR RESOURCES INC.5?ap's.' "".. V%!. 0!5 102 POWER RESOUCS N
NWS 243 38 EL)~POWER RESOURCES IN4C-N/SE 24-36.73(87 WELS POWER RESOURCES INC.
190 POWER RESOURCESIN19-W6 POWER RESOURCES N
."....ROWE R RESOURCES INC
I74 1I1POtER RESOURCES INC798 -6 7POWE R RESOURCES INC'NE/SE 25-36-74 (27 WELLS) -MINE UNITEK (I&P WELLS) (POWER RESOURCES, INC251 3673 (POWER RESOURCERINC.
1 373 .' 1 WER RESOULRCESINC.725 1 3673 4POWER RESOURCES INC.
(SOISREORRILN WEPI 8-1 WRTE R f.. 81LSLLRWATER POWER RESURESNC
.354' 'PO.WERESOURCES fINC.
31-1 'POWER RESOURCESIC131' ." """"'~""'.."'"''"." 'PO"WER RESOURCES INC.
-j- rPWER RESOURCES INC
~211 O5WER RESOURCES INC,
If'
Appendix D6 (tables)Page 20 of 49Smith Ranch Permit Revised - April 2011
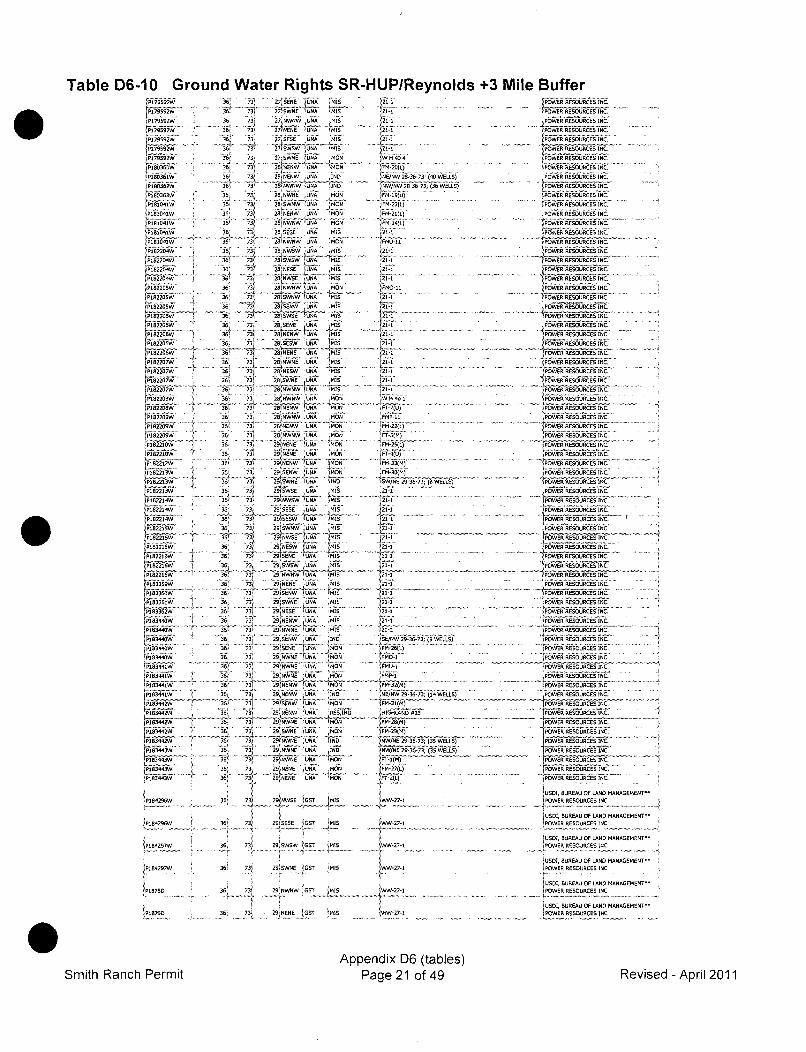
Table D6-10 Ground Water Rights SR-HUP/Reynolds +3 Mile Buffer
P1i79S92W
•i'8"" .....
.. ag .......
ýP179592W
P181031W
P181041W
tP1810911
P182209W
'P182204WP182204W
P182205W
P182285Wa
P182205W
P182213W
fi'!2ý14'
4-'-
P182209W
kP1822095W.
pfh"6"
P1_82214W
P182289W
P18343 W
P18221W.
PI83-H2W
P184295W
P1-84296W
36. 73~ 27.WE 66 'MIS
38 7' 24775 UNA ,iS36' 73, 1~
361WS 72 UNA MS
387 7 27 iWNE AN" MON... i• "'•1........"• •' ýU'• A". ••.. ........
38s "731 "0818E9W 7U286• INiSiITT __ ............• • •'a .... .36 73 2J 18 i NE UNA EO38 73 .28'W9W 'UNA IN
36 73 USA MON
36 731 28 U5 77A 1901
36 7 3 098 MONUN
36 72 2815a .696 815MI
'36 73 3SNESE 11TUNA MIS
36 73) 2BWS~t
36A 73436 73. 28W6 '76
36 73 269 SEN UNA ýI36' 737 f""Pýý 1916 if36, 72 2i9865W 096
- 1 .* "- S•- r~A- ' M
73, 28)58'E9. 886' ' "
'31 .. .... .i UNA 'MIS
367 731 7658 686N I361 73 28 5 UNW U775 MON
36, 73 W 28W 7789A MON37 73 2888W 60 MON
V ,28k NEW t- .......36 73j 29 NWNW .N0A 'MON26 '734 29~.'5~S 0
36' 737 29'SE 7766
36, 73ý 29jSENW 0UNA 108
_3_6 i73 I4WEUNA f.36 73 2'SWS 778 19I7S
36' 73 . . IS+•ii UNA TMIS
36 73, s' W , IS3 3 291555'UN I
36 73 2 4WW 8 I
36 '3I ' E4 UNA15 Mr) IS'
-36 74- 29,985W [586 MIS
36 734 2958NE8W UNA 'lIN29, 73 955 76 1136 73'- 2S S(159W • D' T...
26 37 09,65 7786 'MIS37 7' 29 88WN 'N68 ' ,C74(
36 73" 29 NWNE UNA MON
... 6 '3• 29 NWN'i " TJW "' ý40...
36 734 2945 F7786ýN Mý36 73 28,Ng8W 86J MIS
329441558 7 756N• - A
36 73 25 79 56 77
26 73, 29 IE 756 0
36 _3q 29 N 81588 778 'ND0
36? 73 29 8159 68 MON
36 7, 297885W UNA ION.
36 73 2t SW777
21 1
21-8214
'21-.1WH 9509
FM -2 3 . . . .
IP",-24(L)
2141
21-
21-1
21-1
(21-i
'21-1
1.iiii.- - - -... .
2 1-1
I" if . . .
P9 P-I 1)
r-2i
IWW217-1
t21-1 . .... ... ... .. . . ....
1•.-.'...,21-1 "
I1i'411 ..... .
•21-1
.21-1
5851291673-1 WLS
9fi 26 .. ...... ......)...
MOi 1..
.8"8i/NW, 29-36-73;• (19 WE+LLS...'-½---- 7 ..... [.....-..-
'FMO-1)9
....... 7 b-2( . ......... ..... ...
-4' i . ... . .
"{ ii'27-1 i"'iiii..
J)4d 5'2-1i'ii....... ... ..........
IFrE-27L)
POE REORES INC,POWER RESOURCES I. ..
POWER RESOURCES INC.(.. .. POWER RESOURCES INC.
( P O W E R R E S S E E I C
POWER RESOURCES INC.
464/4 R iESUCESIN
,PiiOWER"•ROUCES INC.(POWER RESOURCES INC,(POW0ý-ER RSOURCES INC.-
P!_tR RESOSECESINC.,
(POEiRR! RSURCES INC.PWERESOUCECS INC.
.. ' -RESOURCES IN.CPWRESOUR CEUIC
POER RESOUýRCES INC.jPOWER RESOURCES INC.
JPOWER .RE .SOU IR CES INC.
(POWER RESOURCES INC
POWER RESOURCEES INC.
''"'' lVh4ER EOSCfiACES INC.
INC.4 POWER RSUCSIC
1801568.R EOES : INC.
POWER RESOURCES INC.
,POWER RESOURCES INC.
PO15ER RESOUECU'IR KfINC,
'POWER RESOURCES INC.
., P.•bWf-RN,•s61 ES NC•i
.... ... ...... ..... .. ..... . .. ........ 1 - ... .... ... .... . ...
(POWER RESOURCES INC.
78058 RSOU ERCE IC
IPOWER RESOURCES I NC.
iEwR RESOURCESIN'ýP EICOOCES INC.
POWER RESOURCES INC.
JPOWER RESOURCES INCS
rPOWERESOURCES INC.
('OWER RESORE NPOE RESOURCES NC.I POWER REOR ESIC
PO'WER-RESOURCES INCPOWER RESOURCES INC.1POW-Ek ESOECES -INC.
..i POWERESURCE £ INC'
'POYWER RESOURCES INC.
"i/ER BRESUOURCES MNAEMNT
I.iREOURCES INC.TPOWEREBURCEAU IFLNC.AAEMN'POWER REOCSIN
JPOWER!RESOURIOI-CES , INC. _.
. . . .. , [ BUR EA O. .. . .. .
POWER RESOURCES INC.
( P O W E R B R E S UO U R E IA N CM N G E E T
IPOWER RESOURCES INC.
PWRRESOURCES INC
POWER RESOURCES INC.
( POWER RESOURCES INC.
USOSI, BUREAU OP LAND MANAGEMENT"
IPWRRESOURCES INC
USSI, BUREAU OP LRNS MANAGEMENT'POWER RESOURCES INC
USD1, BUREAU OF URNS MANAGEMENT'*
............ ...... POE RESOURCES•{-• IC...........
USD1, BUREAU OP URNS MANAGEMENT=7(POWER RESOURCEU INC
(USD1. BUREAU OP LASS MANAGEMENT=
IPOWER RESOURCES INC
IUSSI, BUREAU OP LASS MANAGEMENT88
t
P189296W 36' 73 291SESE GST 'MIS
36. 731 29/... .. 08' .MIS O 2-
P1$4297W
P18780
P18290
367 73, 29 1SWNE 'Gs6 -MIS 7V-27-1
361 73 29ýNWNW ýGli MI W -2741
36 73' 29NENE ! MIS -27-1
Appendix D6 (tables)Page 21 of 49Smith Ranch Permit Revised - April 2011
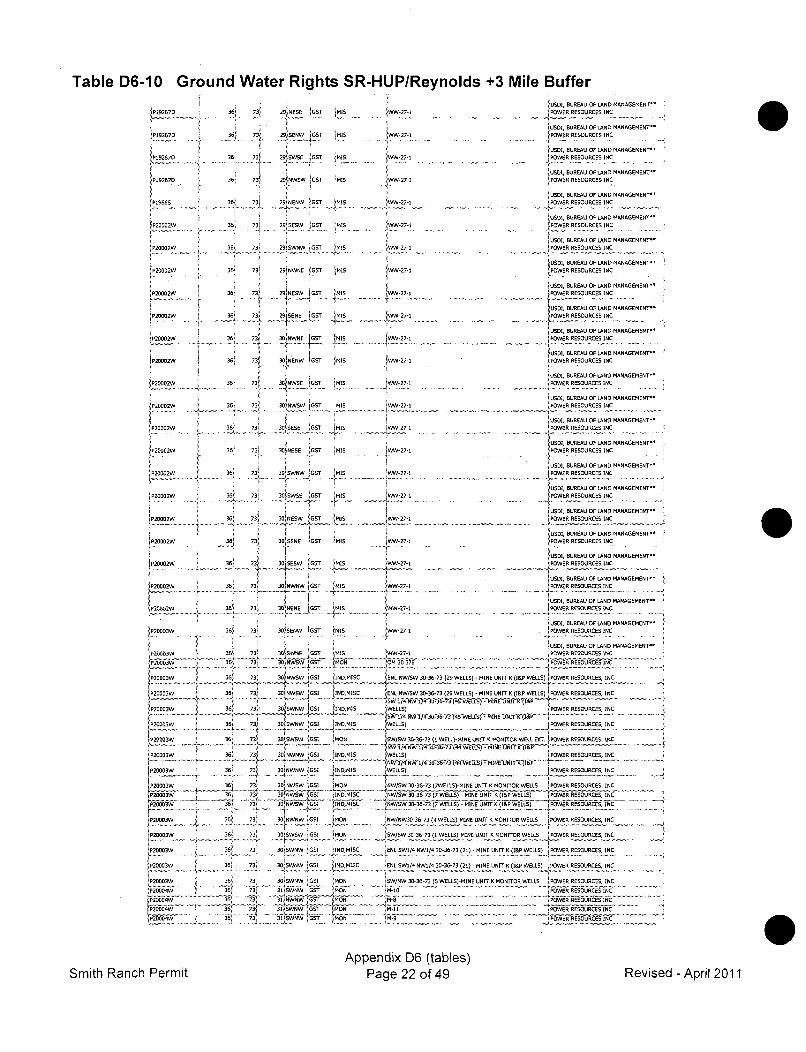
Table D6-10 Ground Water Rights SR-HUP/Reynolds +3 Mile Buffer'USDI, BUREAU OF LAND MANAGEMENT~'
9PIR267D 36s 2IIIE$ NEI GUT 27 PWERR URCESINC
* . F TUSD1 BUREAU OF LAND MANAGEMENT"'
iP192736 73$+ 29jSRNW k MS iw27i 5PWRREORCES INC
iUSDI, BUREAU OF LAND MANAGEMENT"[P1E267 29 E GT I-2 POWER REUOURCES INC
.USDI, BUREAU OP LAND MANAGEMENT"=
FP1S27D 36: 73) 291NWSW IGUT .MmI $I-27-I FPOWER RESOURCES INC
7 1 INW SE MUSD1, BUREAU OP LAND MANAGEMENT"P200W 36; 71 2,, ESW G MWW-27- P PWER RESOURCES INC
rWUSO. BUREUU OP LAND MANAGEMENTG"
P. .... . ..... ... ..2W. ....36 ... ... 73 2 UUSW GU .. . I... 77.... . . .. .... . ... . . . .. POWER RESGURCES INC
USDI BUREAU OF LAND MANAGEMENT"3$3000w ?5ý 2•MS9/5WN UT , 271 FOWER RESOURCES INC
.USD, BUREAU OF LAND MANAGEMENT~!P20002W 361 73 2NE MIS -..27- PO PWER RESOURCES INC
.. . .. .....
I USDl1 BUREAU OF LAND MANAGEMENT"
/P20002W 36: 731 2R9jNEW GST MIS !UWW-27-1 !POWR RESOURCES INC
-USD1, BUREAU OF LAND MANAGEMENT"iP200U2W 36j 734, jYESW .1T [~S,. ... Jt?1... POWER RESOURCES INC
USDI, BUREAU OF LAND MANAGEMENT'
.P2002W 36$ 7 3NN..AN.MIS . 2. - POWER RESOURCES INC
USD , BUREAU OF LANG MANAGEMENT"
270 1 OEEORCES INC
P20002W 36i 73 30 NW0W GST MIS -WW 27-1 POWE; RESOURCES INC
_UGDI BUREAU OP LAND MANAGEMENT"
P2o02W 'I 36o7 3 1 ,IMS -2-1 ESOURCESINCt ; i •: IUSDI, UREAUOF LANE) MANAGEMENT"'
j ' -1o NSE 31 IS ,,,. - 71 POER RESOURCESINC
S-ow--i-"- ... ••N G I' •' .. .O.SORESN1USDI, BUREAU OF LAND MANAGEMENT"
P20002W 36 73: 30/NESE GUT MIS WW-27-1 POWER RESOURCES INC
USDI, BUREAU OF LAND MANAGEMENT"
/P20002W 36i 731 3OWNEWN 'GST I10S $WW-27-1 POWER RESOURCES INC
P20o~w 31 71 •¢SENEIG USDI BUREAU OF LAND MANAGEMENT"'36 3 0- W!ST IMIS ',n-27-1 iO E EORE N
.................. .,. ,,.......INC......
USDI, BUREAU OF LAND MANAGEMENT"
IP20002W 36$ 731 3!WI SEW M IWW-27 S POWER RESOURCES INC
USDI, BUREAU OF LAND MANAGEMENT."P361 73 30NE'' IGT L --S ER RESOURCES INC
.: • USD1, BUREAU OF LAND MANAGEMENIT' $2o0020W 36s 73/ 30SENE oUt 915MIS WW--27-1 POWER RESOURCES INC
I , $ lusot, BUREAU OP LAND MANAGEMENT3Ob02 31 ESW -GS IMS-7,-i~
1 36' 73 30NWNW MIS nNI NPOWER RESOURCES INC1 $ USD1, AUR.U ULAND MANAGEMENT"
P2o000w 1 36! 731 30)NWNWN IGUT MS 27-1 1,WER RSOURCES I.NUSD1 BREAU OP LAND MANAGEMENT"1
P20502W __ 36$ 73 30 NSENE JGNT ýMIS '-27-1 4POWESRESO URCSI INCM
fUSD1, BUREAU UP LAND MANAGEMENT"
'P20003W t 36 731 30GSWNE GUST MIS 1WE-LS POWER RESOURCES INC
d6003 36 73 0'NWSW GNTr 9GM $09 30 376 'POWERRESdGURCES INCS,.... ~ ..............
P20003W 36' 73' 320 NWr GUI NMIUC ENL NW/SW 30-36-73 (29 WELLS) -MINE UNITEK (lAP WELLS) POWER RESOURCES, INC
IP20003W_ - A O1
WWGI 11N0,mISC ELNW'SW 30-36-73 (29 WELLS)/-MINE UNIT K (lAP WELLS) POWER RESOURCES, INC
p2OOO3W 1UL6..N GSI INDMIS WELLS) POWER RESOURCES, INC+6 1U IC----- - - ------ -
f....( -MN 'W/SW 130-26-73 k1, WELL/-MINE UNIXKMrTOWt EX.-PWRRESOURCES, INP20003WW111'N 36ý JU 3?JWN GUI'C[ýF D $IDI WEL)I PWRRSUCS N
r P 2 03 W 3 6 w 7 3 3 N G U I NW, L L S ) P O W E R R E S O U R C E S .I N C
------ -N..-
P2003W " " . . . 3 73 + G UI 1IN D , M I U C SW /SW 30 -36 -73 )7• W E LLS) -M IN E' U N IT K /I NP W ELLS) "" P OW ER R ESO U R C E G, I A CS ... . . . .
jP20003W 36- 73 30 NWSW US MON jW/SW 30-36-73 7 WELLS)-MINE UNIT K MOTR WELLS POWER RESOURCES, INC
2000W3A 73 0W GUI /N9 M ENLSWl/4 NW3D3/34 WLLF30-33 MINE UNIT K ITO WELLS) POWER30,wNw -KSR•) RESOURCES, INC
6P20003W 36 73 30SWNW GUI MON SW/NW30-36-73(1 WELLS)-MINE UNIT K MONITOR WELLS POWER RESOURCES, NC
IP200. 03.W.. . . 36 73 3 1 WNW.GUI NM C ENL51/4.. 30-36-73 ( 2 1E- .)- MINE UNIT K M WE LLS I POWER... . . .. . . .. .... .
P20003W 26 73$ 30 SW- US INOMIUC ENE SWS/14 9000/30-36-73 /21/ -MINE UNIT K ( EL)J !RfIUCS N
36 7 30S1111,1Gsi 11C"is, ENLSWI1 ý./43036-3 (2)E-MINEUN WER RESOURCES, INC -
P00W36 7 _0SNW 'GUI MION, SW/NW 303 73)6!ý WELLS/-MINE UNITEK MONITOR WELLS POWER RESOURCES, INCP20004W 36/ 73, 31NWNW GUT MON M- T..M 1POWE! RESOURCES INCF 20004WN 36 73 31 NWNW~E GUT U--....- - - . . .POWER UESOURCES INC
'i,'•+++o+4+ ........... . + .... ++: '#+.. ."3iI• ++' + N . .. . .. . . ........ 11-............. .............. . -.-........ • ,++f fiii~iT i•.................P26004W~44 ' 6 3 3 WW'U OER RESOUR CESINC-
DP004 36 7 i3 - /SNW IGUT 6ON .'N . . . .. PWREUESIC
Appendix D6 (tables)Smith Ranch Permit Page 22 of 49 Revise d - April 2011
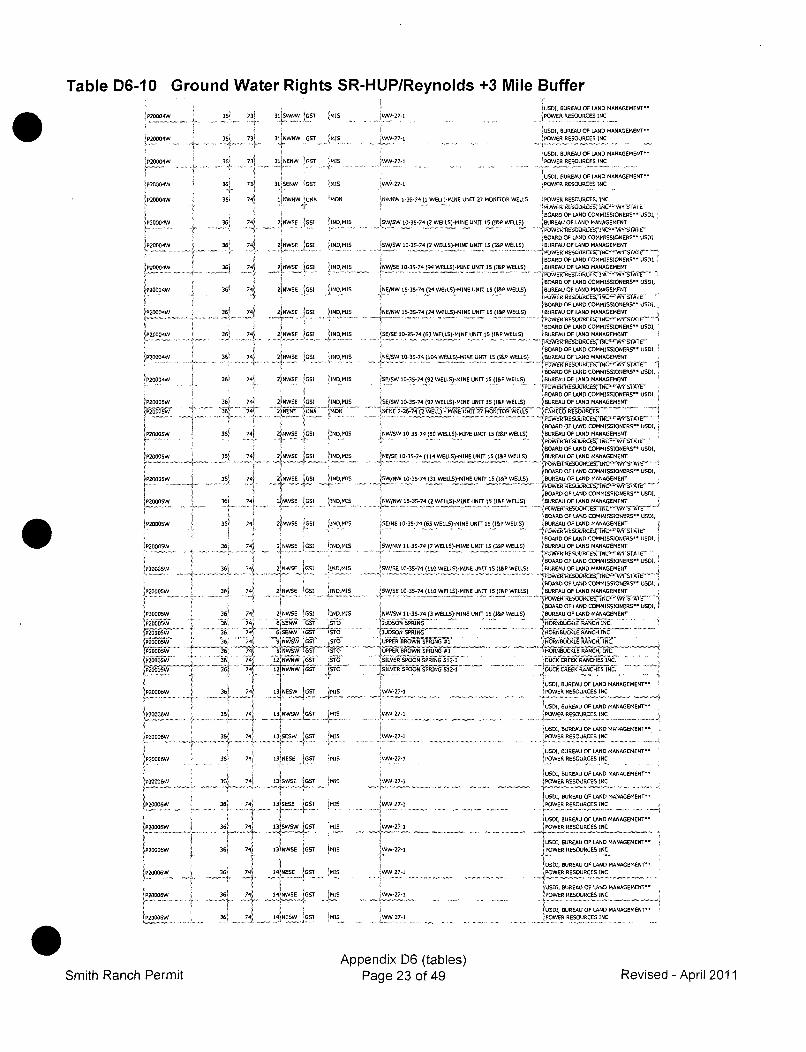
Table D6-10 Ground Water Rights SR-HUP/Reynolds +3 Mile Buffer
ZýP20 004
'P20004W
P20004W
P20004W
IP20004W
1P20004W
P20004W
)P2B004w
ýP20004W
'P20000W
P20005W
IP20005W
jP20005W
[P20000W
'P20005W
P2005W
P20005-W
ýP20005W
[P20006W
P200M6W
>20005W
F20006W
iP20006W
)P2OOOEW
36ý 23 31IOWNW 'GOT ýMIS
361 7 31 3jNWNW GST MIS
36t 731 31'NENW 'G0T MIS
36ý 751 Oý ýSENW iGOT MIS
36S 74k 5NWNW 0UNA MON
36z. 741 2,NWSE iGSI INOMIS
36 741 21NWSE 001I .INO.MIS
74 fWE '051 ,INDMIS
36s 74$ 2fNWE 1061 116.M.
3' 21NWSE IGS, _INI
........ 7 ........ 2ý ! . .JG I I sDM360 74i 21NWSE 001I INPIMIS
3Ei 74, 2 NWSE iGS0 ýINDMIS
361 741 2)NWSE '05 1INO MIS
36i 74) 24NWSE 1GS IND MIS
36E; 74) 2INWOE GS IND.MIS
36! 1 I 2 ISE JIND6MISN
361 74) 21NWSE GS1 iNDMS
36) 741 2?kWSE GSI ýINDMIS
36............ .. ! ........ ........... x ' ' ...... .. ; . .N ........36ý 7, O1NWO 01V iINo,MIS
36, 7 2 1rNWSE (GS1 IND,OMIS
30 74'ý 21NWGE lOSI IBOMIS
S 36 74 6 GESW .GS0 2036 656 61 '0
36 7) NiWSW os f
3 74$[ 12'NWNW GO T 50
$ $
361 1 L32NWSW G MIS
36' 74 4 I3IUESW IGST ýMIS
36ý 74, 03ýNESE 1550 ýMIS
36 74,3. S E.,. IGOT !MISS
1USDI, BUREAU OF LAND MANAGEMENT"-,W-27-1 1POWER RESOURCES INC
'USDI, BUREAU OF LAND MANAGEMENT"
-27-1 POWER RESOURCES INC
USDI, BUREAU OF LAND MANAGEMENT"'VWW-27-1 POWER RESOURCES INC
,USDI, BUREAU OF LAND MANAGEMENT'".OW-Z7-1- POWER RESOURCES INC
hNWNW 1-36-74 (1 WELL)-MINE UNIT 27 MONITOR WELLS ýPO*ER RESOURCES, INC
-*V)Wps EoýuuRkCES;NC'ý wo SI~'BOARD OF LAND COMMISSIONERS" USSI,
SW/SSW 10-35-74 (2 WELLS)-MINE UNIT 15 (S&P WELLS) >BUREAU OF LAND MANAGEMENT
6IOARD OF LAND COMMISSIONERS" USDI,S.W/SW 10-35-74 (2 WELLS)-MINE UNIT 15 (I&P WELLS) OE BUAUPLAND MANAGEMENT
POWER X RUUUAUtC"'I6 -BOARD OF LAND COMMISSIONERS~" USDI,
NW/SE 10-35-74 (94 WELLS)-MINE UNIT 15 (IP WELLS) 'BUREAU UPLAND MANAGEMENT
BOARD OF LAND COMMISSIONERS" USDI,
INE/NW 15-35-74 (04 WELLS$-MINE UNIT IS)16P WELLS) 1BUREAU OF LAND MANAGEMENT
SBOARD UP LAND COMMISSIONERS" USD1,NE/NW 1S-35-74 (24 WELLS)-MINE UNIT 15 ($IP WELLS) 1UREAU OF LAND MANAGEMENT
.-~* - - PUWSRUEwUNUAESiN7INL'WPUAIA --BOARD OF LAND COMMISSIONERS" USDI,
fSE/SE 00-35-74 (63 WELLS)-MINE UNIT 15 (1S WELLS) BUREAU OF LAND MANAGEMENT
BOARD OF LAND COMMISSIONERS" USDI,NE/SW 50-30-74 (100 WELLS)-MINE UNIT I5 (lIP WELLS) O UREAO LAND MANAGEMENT
> OARD OF LAND COMMISSIONERS" USDI,
SE/SW 10-35-74 (92 WELLS)-MINE UNIT 15 (ISP WELLS) 'BUREAU OF LAND MANAGEMENT
BOARD OF LAND COMMISSIONERS" USDI,GE/UW 10-35-74 (92 WELLS)-MINE UNIT 15 (lAP WELLS) BUREAU UF LAND MANAGEMENT
NEýNE 2-36-74 (2 WELL) - MINE UNIT 27 MONITORwd WEL CEMSCO RESOURCES
BOARD UOFLAND COMMISSIONERS" USOI,
NEW/SW 10-35-74 (50 WELLS)-MINE UNIT 15 (ISP WELLS) BUREAU U LAND MANAGEMENT
IBOARD OF LAND COMMISSIONERS" USDI,
.NE/UE 10-35-74 (014 WELLS)-MINE UNIT 15 (ISP WELLS) BUREAU OF LAND MANAGEMENT
BOARD OF LAND COMMISSIONERS'" USDI,
1W/NW 10-35-74 (31 WELLS)-MINE UNIT I1 (IP WELLS) BUREAU OF LAND MANAGEMENT
'BOARD OF LAND COMMISSIONERS'~ USDI,
N5W/NW 1S-35-74 (0 WELL)-MINP 063115 (lIP WELLS) BUREAU OF LAND MANAGEMENT
ROARD OF LAND COMMISSIONERS" USDI,
GESW/NE 10-35-74 (Q5 WELLS)-MINE UNIT 15 (lIP WELLS) BUREAU OF LAND MANAGEMENT
BOARD OF LAND COMMISSIONERS" USDI, -
'W/NW 10-35-74 () WELLS)-MINE UNIT 15 (lIP WELLS) BUREAU OF LAND MANAGEMENT
" • •i1i -... ... .. ... .'P.Si RGUUUACUSINLd""• ...........
NS )E , 1 0-3 5-7 4 )1 1 0 W E LL S )-M IN E U N IT 1 5 ( lAP W E L L S) 10B UR E U PL A N D M INS O EM E N T5/E0-5710WL I BUREAUOLAND MANAGEMENT
V 6N627- EPOER RESOURCES INCBOARDI BUREA LAND CUMMANAGNEMEN T.D4
WW-57-L UPAOWERHRASUC RACH INC.
6656SRN HUSD]BUCELE RFANCH IANC. MET"
PE-R- BOWWNSPRENG #BE RAC INC
JUPPER BROWN SPikNS;_ NRINC- SILUER SPOON SPRING 002-I )DUKCAEIORANCHES INC.sILUER SPOONS'PRING -S12-1- 'DUCECAEEE RANCHES INC.
1USDI, BUREAU OF LAND MANAGEMENT--
WW-27-I (POWER RESOURCES INC
USDI, BUREAU OF LAND MANAGEMENT"
NW-27-O 1POWER RESOURCES INC
U1050, BUREAU UP LAND MANAGEMENT'"
.WW-27-1 POWER RESOURCES INC
USDI, BUREAU OF LAND MANAGEMENT"
07 W .-21 ..... .POWER.. RE.OU.C.S INC...........
ýUSDI, BUREAU OF LAND MANAGEMENT"
USDW, BUREAU UP LAND MANAGEMENT'"
- -37- -POWER RESOURCES INC
USDI, BUREAU OF LAND MANAGEMENT"
. 5-27-I1 .POWER RESOURCESI NCIUSD1, BUREAU UP LAND MANAGEMENT'"
1USDI, BUREAU UP LAND MANAGEMENT'"
27 1 POWER RESOURCES INC
USDI, BUREAU UP LAND MANAGEMENT"vw27 1 POWER RESOURCES INC
'USD1, BUREAU UP LAND MANAGEMENT"'OW-7- POW ER RES OU RCESIN
361
36i
361
36'
36ý
74) 131NWSE lOOT fRIS
M 1
74 AINWEE fOOT >IS
- !1- 14N
Appendix D6 (tables)Page 23 of 49Smith Ranch Permit Revised - April 2011
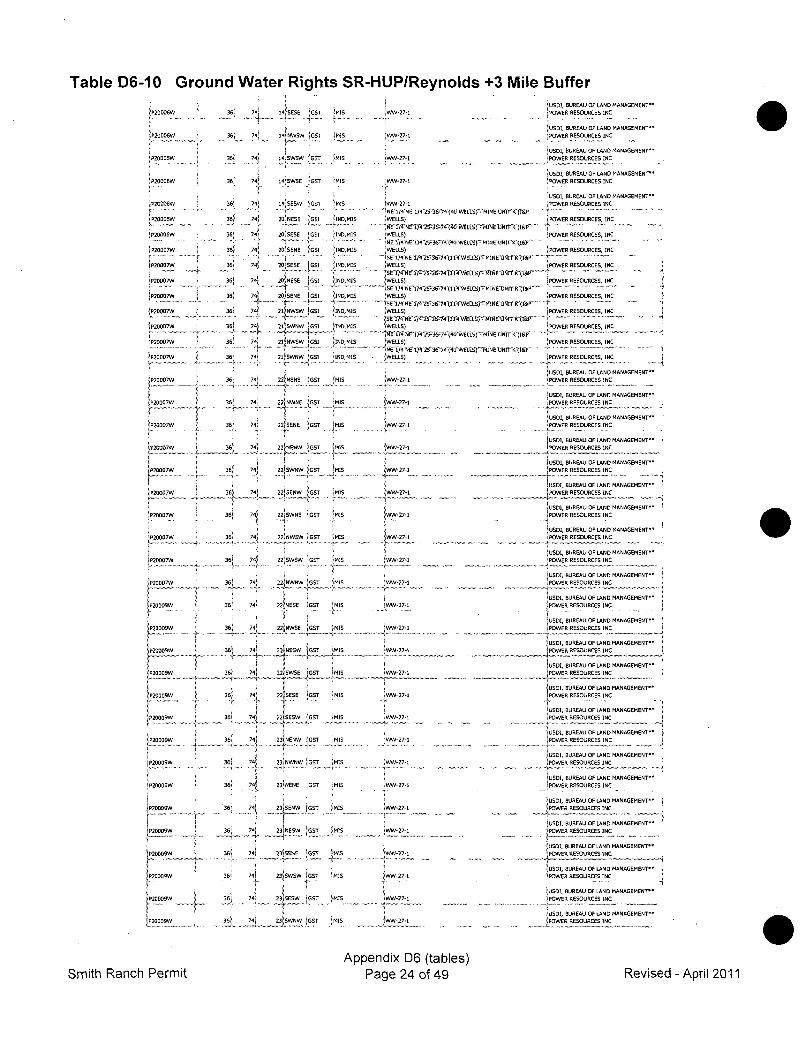
Table D6-10 Ground Water Rights SR-HUP/Reynolds +3 Mile Buffer
ýP20006W
P20006W
P20006W
36k 74, 14SEEE 0GS iMIS VW-27-1
36! 1..•' 4I,16wCw MI•s .. 2-1
351 741 14;SWs :G5 ýMIS
36' 74 141SWSE GOT ýMIS ,WW-27-1
P2S•wSW 35' 74 SINSESw S0 11SM 17w-27-1
INE1/4 NEPD06W 365 74 20 NESS CS) INS MIS
iP201?6W 36) 74! 20ESSSE GSI |ND, I MIS " ELLS)
IF !I' 1EP20007W 36! 741 20 SESE I GS .INDMI.S W WELLS)
i ~ E0)4 NE1P2S0007 35) 74J 20)NESE 6S1 IINDMIS •WELLS)
.. .. " "¢• ... ...-"t ... . .... *...................... SE J4"NEIP20007W 361 74 1 T z
•P2DD7 i 61 4• %IS N GS I N,] •WELLS)!TE2OSENE01~NI
IP20007W 36 74t 21tNWSW OGSI INDOMIS IWELLS)
P20007W 36i 7142 N2 SI IINDMIS • WELLS)
P20007W 361N 71 22ENN ýGST HIS 1WWL7-
+P20007W 367, 2 SNWsw I GSO INMIS WELLW)
ZP20007W 361 74 21NENE !CST 4IS WW-27-1
. . . . . . .. . . . . .. ..... ... . I . W EL. S)
P20007W 36) 741 22 SENS IG57 S WW-27-1
36.......MIS .. W.27-.
ý!74 2jSWNW fCT 11
54 7l 22105EW IfGET :1M4
.!.2000W 35, 74 ý22WNE 0GsT !MIs
P20036W1 7 2INWOW CO IS
P 36....741 -R 25W5W ?GO "MIs• 2 • o .. ... .. • .. .. .. .. .. . ...... . ,w ýG _IM `S
P20D07W 3!L "P25000W 35) 74, 2)NESE O ST MIS
74. 22NWSOE T is
.2D09 3¶ i 4ESSjOS 111
IP2OO53W 36 4 741 221
WNE IMIS
1P200ow 36ý Q4 2 SESE 1GST ýMIS
P20009W 2!1 74 G- II
P209oo 's6 71" 031ENW 'OST "Us
P20009W 36) 74 23 NWNW KST MIS
IP20009W 35)ý 741 231NENE ,GOT MIs
SP20009W __ 36 741 23 SENW CGT 11IS
36, 741 2SWNW .GO .. ...
r-P20009W 35 741 231SWSW COST iMIS
P200W35 74' 23lISESW 'SOT IMIS
1P-009W 361 74ý " 23500NW JoST ýMIS
1W-27-1
jWW-27-1
ýWW-27-1
Iw-27-1
IWW-27-1
1WW-27-I
W -27,-
jý,,W V-27 -I
7WW-27-1
,WW-27-1
IWW-27-1
i•27-5
fW-27-I
-~w27-I
iW-27-1
"USD1, BUREAU OF LAND MANAGEMENT~POWER RESOURCES INC
ýUSDI1 BUREAU OF LAND MANAGEMENT~
!POWER RESOURCES INC
USD1, BUREAU OF LAND MANAGEMENT7POWER RESOURCES INC
ýUSDI, BUREAU OF LAND MANAGEMENT~
ýPOWER RESOURCES INC
ýUSDI, BUREAU OF LAND MANAGEMENT~
POWER RESOURCES INC
T POWER RESOURCES, INC
1 ./4,26-.'_ y•.(•WELLS,) tMIrN Dt -1 . .......... .
POWER RESOURCES, INC
T'WI4 ) RMELL tEESnNI I).
iPOWER RESOURCES, INC
LMLP OWERRESOURCES,- NC -
1POWER RESOURCES, INC
174 7 E74 OELSfPOWERCRESOURCESINC I Ii ". .. . .
POWER RESOURCES, INC4NE(P -
POWER RESOURCES, INC
, 2 C 4.K4W E C. S f T N . ON f R. I&P I. _ _.. .. ... .. . .. ,
POWER RESOURCES, INC
.POWER RESOURCES INCIPOWER REOUCES, INCj
U SD4, BUREAU 0 F LAND MANAGEMENT1-,POWER RESOURCES INC
USDI, BUREAU OF LAND MANAGEMENT"
POWER RESOURCES INC
USD1, BUREAU OF LAND MANAGEMENT"jPOWER RESOURCES INC
JUSDI, BUREAU OF LAND MANAGEMENT~"IPOWER RESOURCES INC
USDI, BUREAU OF LAND MANAGEMENT"
!POWER RESOURCES INC
IUSDI, BUREAU OF LAND MANAGEMENT"
'I POWER RESOURCES INC
ýUSDE, BUREAU OF LAND MANAGEMENT"POWER RESOURCES INC
USD1, BUREAU OF LAND MANAGEMENT""
IPOWER RESOURCES INC
'USDI, BUREAU OF LAND MANAGEMENT"
ýPOWER RESOURCES INC,USD1, BUREAU OP LANE MANAGEMENT~
ýPOWER RESOURCES INC
USDI, BUREAU OF LAND MANAGEMENT'"POWER RESOURCES INC
USD1, BUREAU OP LAND MANAGEMENT""jPCWER RESOURCES INC
'USD1, BUREAU P LAND MANAGEMENT..
,POWER RESOURCES INC
,USDI, BUREAU OF LANE MANAGEMENT""
iPOWER RESOURCES INC
USD1 BUREAU OF LAND MANAGEMENT-"
POWER RESOURCES INC
ESDI, BUREAU OF LAND MANAGEMENT"-
POWER RESOURCES INC
'USDI, BUREAU OF LAND MANAGEMENT""
POWER RESOURCES INC
USDI, BUREAU OF LAND MANAGEMENT'"
POWER RESOURCES INC
USDI, BUREAU OF LAND MANAGEMENT""
POWER RESOURCES INC
USDI, BUREAU OF LAND MANAGEMENT~"POWER RESOURCES INC
USD, BUREAU OF LAND MANAGEMENT-"
POWER RESOUJRCES INC
'USDE BUREAU OF LAND MANAGEMENT~"!POWER RESOURCES INC-
USDI, BUREAU OF LAND MANAGEMENT~'
)POWER RESOURCES INC
1USDI, BUREAU OF LAND MANAGEMENT"
POWER RESOURCES INC
0
Appendix D6 (tables)Page 24 of 49Smith Ranch Permit Revised - April 2011
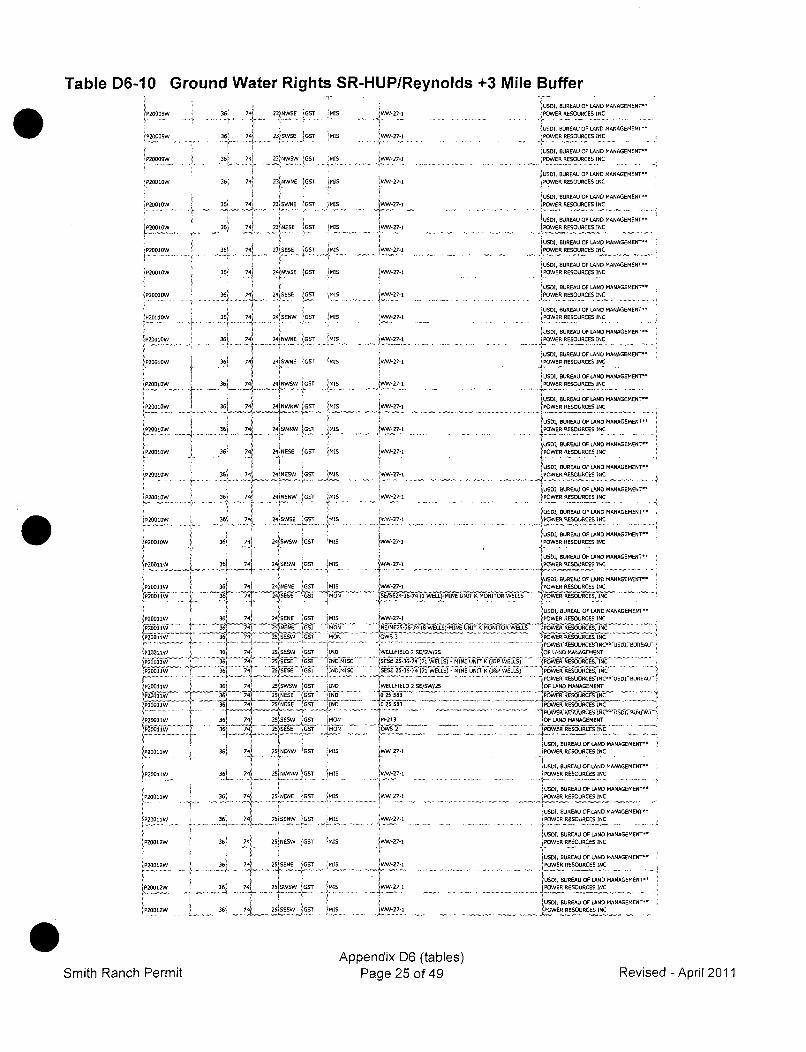
Table D6-10 Ground Water Rights SR-HUP/Reynolds +3 Mile BufferJP0 UD BUREAU OF LAND MANAGEMENT~
0009W 36: 741 23 NW5E iGST iMIS •-27-1 POWER RESOURCES INC
74.,V........ i•USDI, BUREAU Of LAND MANAGEMENT~
P.....W 36 ...... S UE J MID271 POWER RESOURCES INC
USDI, BUREAU OF LAND MANAGEMENT~
P20009W 36' 741 23NWUW LGST MIS 37 POWER RESOURCES INC
F USDI, BUREAU OF LAND MANAGEMENT .RP2UUSW 36s 74+ 23W NE ;UST MS -27-1 .POWER RESOURCES INC
USOi, BUREAU OF LAND MANAGEMENT~
236! 74 23IWNE UST, WM2731 POWER RESOURCES INC
1 UJSDI, BUREAU UF LAND MANAGEMENT"
P20 0DW 36J 741 O3lNEUE UST JMIS )W-27-i POWER RESOURCES INC
2 W6 4E GST MIS W-27-1 JIS DI, BUREAU OP LAND MANAGEMENT**P2 IO.W 36i 74.... . .. E.. ST .MIS... ..... OWER RESOURES INC
JUSID, BUREAU OP LAND MANAGEMENT**-P20010WS 351 741 24 NWSE IGST MIES WW-27-1 JPOWER RESOURCES INC
- . I . -USD1, BUREAU OF LAND MANAGEMENT~jP20010W 36' _741" . 4155E -GS MI 21 1PWI EORCES INC
1USDI, BUREAU OF LAND MANAGEMENT~24 S 4ýENW MIS INCýW-7- ý
P2001OW 36 UST MS -27-1 -POWER RESOURCES NC
JUSDI, BUREAU OP LAND MANAGEMENT~
iPUDS 3...6o O,4NWNE SGST 1MN,-21 POWERRESOURCESINC
10USD0 BUREAU OF LAND MANAGEMENT~
i i , :! UsD,, BUREAU UP LAND MANSAENT....'P20010W 36 74 2NW EIýST ?-27-W
,s 4 li ... •oT •,S iW~. USD1 BUREAU UPLANDMANASSMENT"
IW N 3jUT IPOWER RESOURCES INC
1 361 1 USDI, BUREAU OP LAND MANAGEMENT"fSoo-w i 24. ISWRW jST "MIS JVV-27-1 .POWER RESOURCES INC
1 •tUSD1I, BUREAU PLAND MANAGEMENT~
,P20010W 36' 4 24'NRNW JUST :MIS 6W-27-1 POWER RESOURCES INC
AUSDI, BUREAU OF LAND MANAGEMENT~
1P2SSSRW 6, 34 ... 24NSW ST MIS .... 27-1 5POWER RESOURCES INC
1USSI, BUREAU OF LAND MANAGEMENT"
P2DDODW 351 74, 24JNENW 55 ,IU271
,!2010 6iS !WS W•-27-+ POWER RESOURCES INC
.. oo iwB.... •Y!X!J% 0US5I, BUREAU OF LAND MANAGEMENT"
1920910W 3R 70) 04 C5EUT ,MIS 1 270 -1RSOSE N
'. . "USDI, BUREAU OP LAND MANAGEMENT~)P2o.. 36 4 24, NENW IU S MIS 1-27 1....WE RESOURCESINC
MI IjUSOD BUREAU OP LAND MANAGEMENT"
jP30555w 4 361 74~ 2415E5W jOST *:. !W-•- tPOWER RESOURCES INC
- 1 SODl, BUREAU OP LAND PSSN6URMEITr
P2001W 36' 7 241
ESW NEST :MIS WW-27 P OWER RESOURCED INC
P20011W i 36 74 '051 MON SE/S52467 WElS-MINES UNITMONITORWELLS RE SANAGEMENT
241 MIS -1PWRRESOURCES INC
74J 2ISENESD! IIN-271000 BUREAU UP LAND MANUSEMRN
iP01W31 4 24 NENE 1ENT LE2UýE I
P20013K -i- 2tNE01 MN 2+/NUS36-741!.RWELLU)MINE UNITEMNUWLL POR RESOUCSIN7 SIEU US4k1e''ýC MO lOWS 3 POWER RESOURCES, INC
P20011W 361 74- 2' SPW GST iINS .WRLLFIEL 2 SESW2 L EAUOP LAND M NMANAGEMENT
P20011W • 36 74. 2SESNE0 IGST MIS IWW-2741 IPOWER RESOURCES INC
lP2OO-lW-' 361 74' 251NWNW IGSS Im5 A-2-!GAUO'BUEUF NDMAGMI-
2 3 7 1P0W ' 36 B7FSW LUT IS WELNIELD U SEMSW/25U
P200013W 6 7 25)NESE GT •MIS W270] POWER RESOURCES INC120011W~ NSE 'GUI SoS 25 53,WREURE N
P20E 361 7 2 1USD!, BUREAU OP LAND MANAGEMENTM
Noi '9"_74+j 20 11SEUWJS LMUN IM-2 UPLAND MRNSOREMEINC
(P2d011W J N 74 W 30..ON oW- 2 POWER RESOURCES INC.- - -1---- -- -.-- 1-..t+.-----. .-- ..... E BRAU'
~P22W ! 36! 74 25NENW UST MIS 1M-27-1 POWER RESOURCED INC
i ~ ~ S j S•,BRA OF LAND MANAGEMENT '
25~LE REE',INSOURCS INC
1USDI, BUREAU OF LAND MANAGEMENT"
20011W 36) 741 251 NWNW JUST MIS AWS-27-1 POWER RESOURCES INC
I . ( ,USD1, BUREAU OF LAND MANAGEMENT"jP2UDSSW - 361 741 'SiNNWS UST ýMIS IW27-1 IPOWR RESOURCES INC
US1BUREAU UP LAND MANAGEMENT~1F20011W 3E 74, 25)SENW 'GUT 'MIS -W-27-1 PWER RESOURCES INC
1 ' BUR1EAU UP LAND MANAGEMENT"
ýP20012W 1 61 74) 25SENSW GUST MIS -WW27-1 POWE RESOURCES INC
LP~91?~. . 3J 7J SjS~ 02 MS Ž tUSD1, BUREAU UP LAND MUSRSRMENT"'-20012---6----------------------------------OER RESOURCES INC
JUUDI, BR.EAU UP LAND MNANGEMENT.
PH1ý G MS IW27 VPWE RESOURCES INCI ~SDI BREAU UP LAND MANAGEMENT.
P2DO12W 361 ; 7 jS!SW JUGST 'll P2O 40WER RESOURCES INC
Appendix D6 (tables)Smith Ranch Permit Page 25 of 49 Revised - April 2011
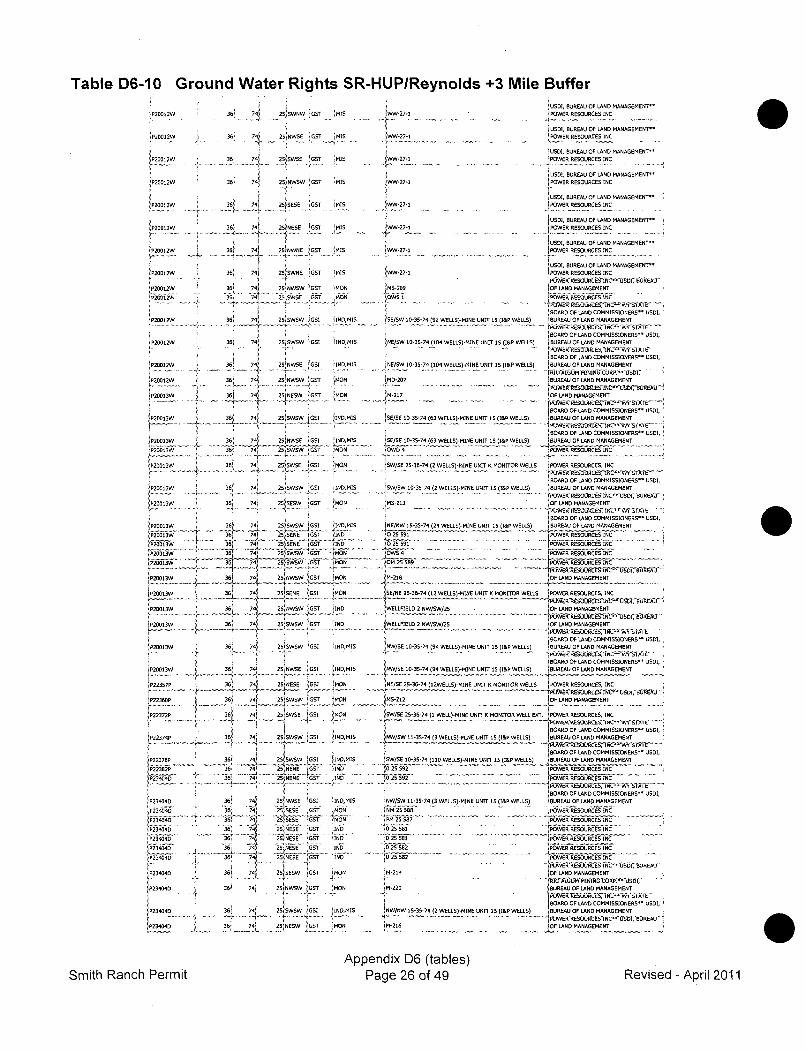
Table D6-10 Ground Water Rights SR-HUP/Reynolds +3 Mile Buffer
P20012W
IP20012W
P20012W!P.o1?W
(P20012W
1P20012W
[P20012W
*P25012W
P20012W
IP20012W
!P20012W
P2001SW
[FP20013W
0P20013W
P20013W
!P20()tSWP20013W
ýP20023W
[P0013W
IP20013W
iP20037W
'P20013WP20013W
270013W
W P236013
rp223;D
[P220013
P20013W
.
P22357P
P22360P
F2 41P2372P[
P223740
P22370P6
,P234040
P23404D
,P234046
[P23-D4
361 74, 2SSWNW GST MIS
36* 741 251NWSE GST 'MIS
36: 7 I2WSI G ,,MIS
V30 74R 25NWSW ýGST MIS
36. i 2iSSESE (GOT ýMIS
36' 741 25swwNE GST 'IS
.4. ..2 LT{ 250NWNE GoT' 115...
361 7411 2S1!SWNE GOTr ,is
316 741 2SNWSW 1GT MON
36s~ 741 25NE URGE .140
36' 74 7 2[ s GSI 1 , NO MIS
36ý 701 25SWSE IGSI INOMIS
0 361 4 25'N!WSE [051 lOODMIS
7-G4 1mo
36) 74 27 .. GSE 001 ,OMIS
36'.... 25 SE7, !GS ýMON36 74
25 SWSE GSI ,MON
36o 7,4 25sWSW• 61l•' MIS.
36ý 74e 21 SEW GOT !MON
361 740 2SIWsW!]s jOSI OMIS
J. 36) 74 250SENE GT ih
36 74 25[SN (SOTF-
0• 36 741 25 'WSW GST (MON
........ ........ ? .,.. 25_. 'sENR [551 (MON
36 74t 25WSW OST S
36 74 21 W GST IND
: 36! 74' 251SWSW 1GSI ýIND ,MIS
36ý 744 25 *NWSE L9SI 01ND, IS
741 25sNESw GSI 00M1
361 74 25SE~sw . NT MON.T
361 ,[ 25555W lSI ,[IO
36! 71 251SWSW 01 INOI
36 741 25~ N ENS [GO J6N
360 74' 25'NWSE 0GS1 INDMIS
36 74* 25 SESE CST MON
S 36. 74 2 SNESE GST I5N36 74 2sEsE GOT 1IN.S
26 71 20 NESE SOT IND
36[ 4 1 *MO
74 251 NESW GST
361 74! 25[NWSW j9OT ýMON
360 4..,2}-WS S N11
36 74 20 NE3W LST MON
USDI, BUREAU OF LAND MANAGEMENT~*,_-27-1 POWER RESOURCES INC
.USDI, BUREAU OF LAND MANAGEMENT~
'WW-27-1 'POWER RESOURCES INC
-USDI, BUREAU OF LAND MANAGEMENT~IWW-27-1 POWER RESOURCES INC
USDI, BUREAU OF LAND MANAGEMENT"WW-27-1 POWER RESOURCES INC
USDI, BUREAU OF LAND MANAGEMENT~0 -27-1 PO ER RESOURCES INC
USDI, BUREAU OF LAND MANAGEMEN-T'
* -27-1 POWER RESOURCES INC
JUSDI1 BOREAU OP LAND MANAGEMENT-
[5555-27-s. _ PO ER REORCES INC... . !• v2 2 . ... ............ ... .. . ..... ... ... .., ...LOW ..R.... •..... ....- -1 .I.,.......... .
DI, BUREAU OF LAND MANAGEMENT--[WW-27-1 t.POWR RESOURCES INC
A'W-27-1 VUNRSR NL JUIB
'MS-209 OF LrAND MANAGEMENT
0 1OF LAND COMMISSIONERSC U5DI,E/SW 10-35"74 (9O2 WELLS)-MINE UNT 15 (l&P WELS) [8URER O0 LAND MANAGEMENT
BOARD OF LAND COMMISSIONERS- USDI,SNE/SW 10-30-74 (924 WSLLS)-MINE UNIT 1S (ISP WELLS) 'BUREAU OP LAND MANAGEMENT
-~v~i - .- 0UcSNUdU6L'ASNCý IAIS
100000 OP LAND COMMISSIONERS- USD1,
(NE/SW 10-35-74 (104 WELLS)-MINE UNIT 15 (I&P WELLS) )BUREAU OF LAND MANAGEMENT1M-076BUREAU OF LAND MANAGEMENT
..20 ..........
M-217 !OELND .....GEMENTBOARD OF LAND COMMISSIONERS" USD1,
SEN/U 10-35-74 (63 WELLS)-MINE UNIT 15 (I&P WELLS) )BUREAU OP LAND MANAGEMENT
-BOARD OF LAND COMMISSIONERS USD1,
ISE/SE 10-35-74 (63 WELLS)-MINE UNIT 15 (I&P WELLS) 1BUREAU OF LAND MANAGEMENT D
SWS 53-4(2 WELLS)-MINE UNIT K MONITOR WELTS =OER 1RESOURCES, INC
'BOARD OF LAND COMMISSIONERS" USD1,SE/SW 10-35-74 (2 WELLS)-MINE UNIT 15 (I&P WELLS) BUREAU OF LAND MANAGEMENT
MS-213 4OF LAND MANAGEMENT
-BOARD OF LAND COMMISSIONERS~ USDI,SNE/NW 15-35-74 (24 WELLS)-MINE UNIT 15 (I&P WELLS) BUREAU OF LAND MANAGEMENT
-i -1 ý i500 ' RSOURCES01M~lUI NRE t
*M-218 OP LAND MANAGEMENT
SNE252-367 (12 WELLa-INTUNI K MONITOR WELLS POWER RESOURCES, INC
1WELLFIELD 2 NW/SW/25 OF LAND MANAGEMENT
... ..... .... ..... ................... - . .................. ..- ,4IWAWAU0R U/AO$• S NC" S0,0,-04*6
IWELLFIELD 2 NW/SW/25 OF LAND MANAGEMENTBOARD OF LAND COMMISSIONERS= USDI,
NW/SE 10-35-74 (91
WELLS)-MINE UNIT S (1&P WELLS) BEAU OF LAND MANAGEMECNT
BOARD OF LAND COMMISSIONERS" USDI,NW/E10-35-7(9WELLS)-MINE UNIT 15 (I&P WELLS) BUREAU OF LAND MANAGEMENT
NE/SE 25-36-74 (12WELLS)-MINE UNIT K MONITOR WELLS POWER RESOURCES, INC
O E 25-3B 7 OEW-M.N NT MONTORWELL EXT POER RESOURCES, INC
-A OF LANDECOMMISSIONERS~DUSDREBUREAU OF LAND MANAGEMENT
WL WOARDOF = O LANEMANE IONEM " USDIEN(SWISE 10-35-74 (110 WELLS)-MINE UNIT 15 (I&P WLS EUR FUF AN M ANAGEMENT
BOARD OF LAND COMMISSIONERS~ USDI,1NW/SE 1-35-74 (3 WELLS)-MINE UNIT 15 (I&P WELLS) BUREAU OF LAND MANAGEMENT
) ~25 BUýREAUOFLND MANCGMN
PUW6R!UiARLGU;6 (NLW6 %A*
i BROARS OP LAND COMMISSIONERS" USD1
16W/SE1-57N9W WLU-IEUI 15" (ISP WELLS) BUREAU OP LAND MANAGEMENT
NES 25-6- M M POWE MAAGURCESINTC
.,d -.-.- '_ -- -POW-R`RRE'S-URLRG INCtOD1BRU
IRS-DOD OP LAND MANAGRMENT
* BOARD OF LAND COMMISSIONERS~ USSI,
[SW/SE 15-35-74 (11 WELLS)-I4INE UNIT 15 (ISP WELLS) BUREAU OP LAND MANAGEMENIT
P5UWIORR ES0U1 INC-U113RA-IM-2~~W .- 6 MI '
Appendix D6 (tables)Page 26 of 49Smith Ranch Permit Revised - April 2011
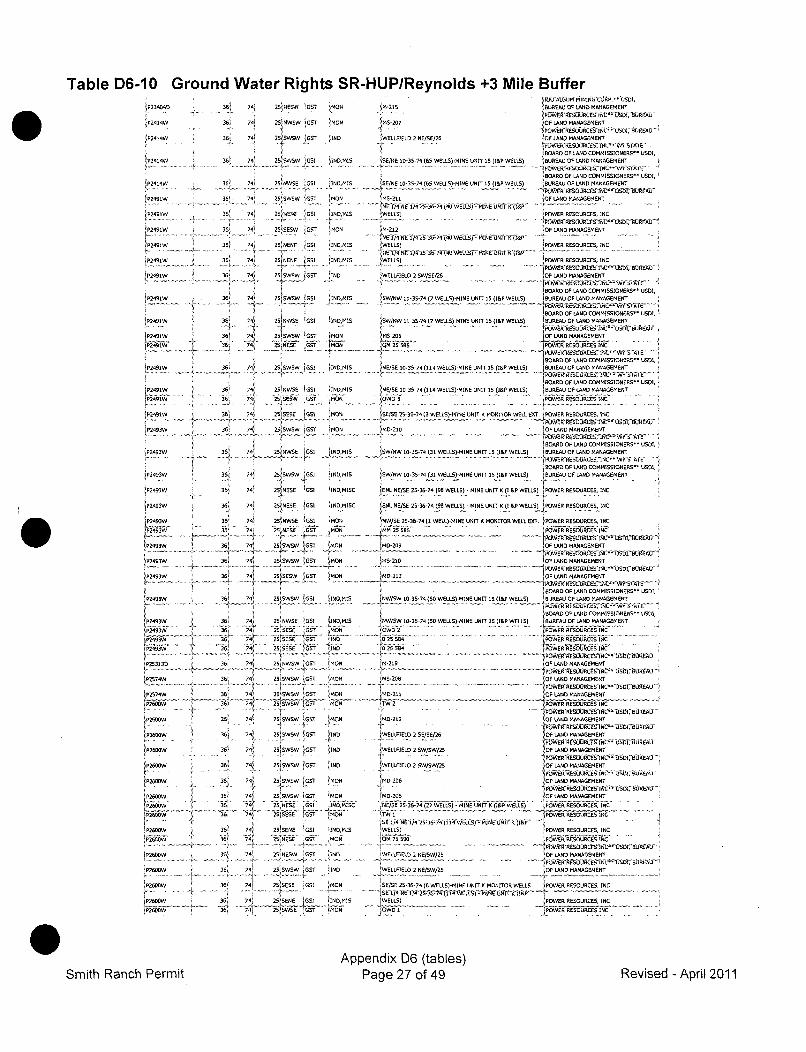
Table D6-10 Ground Water Rights SR-HUP/Reynolds +3 Mile BufferjP23404O
iP2414W
jP2414W
62414W
P2491W
P2491W
P2491W
P2491W
1P2491W
jP2491W
[P24.1W
1P2441W
P2491W
(P2491W
LP2493W
1P2493W
P2493W
P2493W
>2493
P2493W
,r .. .... .. .
P2574W
P2602W
1P260OW
ýP2600W
P260OW
P2602W
jP2600W
!P2600W
iP2602W
362
36;
741
365 74
36.
362
36•
36'
36~
36,
741
7*
_74174i
7 4
36• 742
36ý 74"
362' 74
36ýý36ý
36!
74-742
79.
36[ 74
30 74ý
36e 74'
3W 74f
391 74
36 74362 44-
36 74)
361 7436 7
.........
36 7436
36* 74
36i 74
36' 74'
36i 74
36, 74
36
36' 741
36 7
36 74
36 74
W.. iOAuf MINING LCUIP:., SI-25 NESW 9GCT MON IM-215 1BUR.AU OF LAND MANAGEMENT
269NWS0W (GST /M9N IMS-207 ,OF LAND MANAGEMENT
I/UWE!RAESOSCES HJC"ýUO BRA25SWSW 1GST (IND 1WELLFIELD 2 NE/SE/26 OFP LAND MANAGEMENT
fBOARD OF LAND COMMISSIONERS" USD1,2S SW •1GS1 IND MIS .SE/NE 1D-35-73 (65 WELLS)-MINE 0N919 I (lP WELLS) 9B0REAU OF LAND MANAGEMENT
.-.. ,,BOARD OF LAND COMMISSIONERS~ USDI,
25NWSE 'GSD ý]ND, MIS SE/NE 10-3S-74 (6F WELLS)-MINE UNIT 15 (I&P WELLS) 'BLURAU OF LAND MANAGEMENT
25259 CSW T j9-N 20- OP LAND MAAGEMENT
NOE* 1/41 NI C/A 5 /1526:4)ALLS/?MINE UNIT K(I&P'
2- NENE G19 ýINDMIS WELLS) W REDOIURCES, INC
25)SESW CGDT MON 9-212 'OF LAND MANAGEMENT
25NENE G51 2ND, MIS WELLS) POWER RESOURCES, INC
.9 654NS/3-S7 4WELLS(ý'MII1E 1697 N//OP ..........
2SINENE G9I N1, MIS WELLS) POWER RESOURCES, INC
2 SW 'IND IWELLIELLD 2 SW/SE/26 OF LAND MANAGEMENT""•'• ... ~~~.. . . . . .. ...".. ... ""................. "...............-....."''O••RS••E•~L''VS''• -
BOARD OF LAND COMMISSIONERS- USDI,2S1SWSW IGSI IND,MIS ýSW/NW 11-35-74 (7 WELLS)-MINE UNIT 15 (l&P WELLS) BUREAU OF LAND MANAGEMENT
BOARD OF LAND COMMISSIONERS~ USDI,
2ESfWSE GSI IIND, MIS /NEW 110-35-74 (7 WELLS)-MINE UNIT 1S (I&P WELLS) BUREAU OF LAND MANAGEMENT--. .. . . . . . .PSWEARESFUUNLESVINCs6US61. 6-06026
'251500 GW CT MON ~ M-S OF LAND MANAGEMENT2S1 NSE CT 196 .9 25SRS ~ . ~ POWR RESOSECEG INC
BOARD Of LAND COMMISSIONERS~ USD1,25
1SWSW jSSI IND MIS ,NE/SE 10-35-74 (114 WELLS)(-INE UNIT 15 (I&P WELLS) BUREAU OF LAND MANAGEMENT
IBOARD OP LAND COMMISSIONERS" USD1,25/NW fS E GCDI 'INDMIS (NE/SE 10-35-74 (1 14 WELLS(-MNINE UNIT 15 (1I&P WELLS) BUREAU OP LAND MANAGEMENT
s........ .. .. . -... ....... -- . . . .2SfSESE jOSI MON SE/SE 25-36-74 (3 WELLS)-MINE UNIT 6 MON9TOR WELL ET.POWER RESOURCES, INC
. .. ..... .. . ..... . ..... /P6 •WRWE5e4 O 4NC&-S/,SBUREAU U 'S25)05 CDT N /99 -210 (OP LAND MANAGERENT4---L.- ...--. ..- G, INI S W0..... ,... -MEUTE ..... OSE/60652/D0/&FoOY/NOCO MAN ASW•SEiOENTR
(60042 OP LAND COMMISSIONERS" 5521,'N"'S MIS "'"/IW 10-35-,74 3 WELMNE UNI 1l EL) BREAU OP LAND MANAGEMENT2
Si~W.-~K '"-.-.--. .- -. '-- j U 90SO EK 1CES/4 NYSi A,&EBOARD OF LAND COMMISSIONERS.. USOI
25005W 65 1 I SW/NW 10-35-74 (31 WELLS)-MINE UNIT 15 I&P WELLS) BUREAU OF LAND MANAGEMENT
,ýNEDSE 51 16.....C ENL NE/SE 25-3674)(08 WELLS) -MINE UNIT •(I AP WELLS) POWER RESOURCES, INC
/5NS JG IIND.MISC ELNE/SE 25-36-74 (NB WELLS) - MINE UNITE (2 ~ ~ ~ ( &............ P WEULLS) JPOWER ILES QURES, IN
251NWSE (GS) 'MON 1NW/SE 2S-36-74 (I WELL)-MINE UNIT K MONITOR WELL EXT. IPOWER RESOURCES, INC
" -5-NMM 25.N.: '2 586 . ...... .. POWER RESOURCES INC
25jSWSW GST IMoN 1M-20 0 OFLAND MANAGEMENT
I MON T95-213 O LANG MANAGEMENT
S- - , - - BOARD OF LAND COMMISSIONERS; USDI,25SEWSW JGSI OINDMIS I•1•3 (MI U (I&P ILLS) BUREAU OF LAND MANAGEMENT
i 'BOARD OP LAND COMMISSIONERS~ USDI,
25 NWSE GSSI IN=MIS NW/SW 10-35-74 /50 WELLS)-MINE UNIT 15 (I&P WELLS) BUREAU •F LAND MANAGEMENT
25 SESE GS-F 11OD OW 2& WV6 ..... ... '•"R k'U 'SIN/S-ý G 56OAADý21 OP LAND MAAGMEISINET 5
3S NWSE T 6 MON 9-219L ) OF LAND MANAGEMENT
2 5 50WSW1. G~r M!40 N jO22 PWRRSUCSI2 SESWE'GCT IMON 6-.212 Of LANDTMANRGEMENTC
25sEsE 6CrS IIND 025564 SIS12 O LAND6 MANAGEMEUNC
...... ,.................- .............. ....................... . . . . . . . . . ................. ..... . • •• USO~E•i•••D(7AU4LAU -,
25)SW5 WCD5T MOND jW 9 D 2( OF LAND MANAGEMENT
.-fO/0.900//CCEWkS INV4WUSDiV-6UREAIJ..
2509 CD MON.....S-DSB. . . . . . .lo LANS MANAGEMENT4,,.--_'w PS 3WERL•EO•ES,• ...... .. '055'CJ2 ''00E••A. ACREUENT~lSC0R
25i SWSW IGST !IND IWELLFI ELD 2 SW/SWV/25 OF LAND .... AGEMENT
25)SWSW DT !MON IMD-206 OF LAND MANAGEMENT
2SI ..... C.. MO ... . 2.POWE R)wES'~e•OURCES INCOsl'BRO..
2S1SWSW
1GST jMON OMD-268 OF LAND MANAGEMENT
'5 "ESE 'GT MON "•OM -5E95 . ... ..,FCIOWER RESOURCIS INC
... ..... P.J'IOOR••L'E215 01.SBURE.AU26 NESW CGST 'ND
1WELLFIELD 2 NEWSW/25 OF LAND MANAGEMENT
2S1SWSW 10ST r N2 WELLFIELD 2 NE/SW/25 •OF LAND MANAGEMENT
220250 CDTE GS MON '9-D FLNDMNGMN
25 6650 61 OND MISC 6SE/SE 25-36-74 (6 WELLS)-MNE UNIT K MON-0 OR WELLS POWER R6.OURCE0 , INC
......... E ....... DT.. ... MO ......... ... ..... . . . . ..'';i'•• • C•-)•f• • '' • *•. . .. . INC.. ...................
2SSEND 'GSI '162, MIS WELLS) 2POWER RESOURCES, INC
26/NOSE CDST ýMON 0w25 IC POWR RESOURCES INC"- ½P)2WE...... 0AAEOU.. .. .... ....... . CE• sT6 " ..................25 S CD .NO WEL.F.. LD.2. . E. .W.2 .. 'O LAN MANAGEMENT ... ...
Appendix D6 (tables)Page 27 of 49Smith Ranch Permit Revised - April 2011
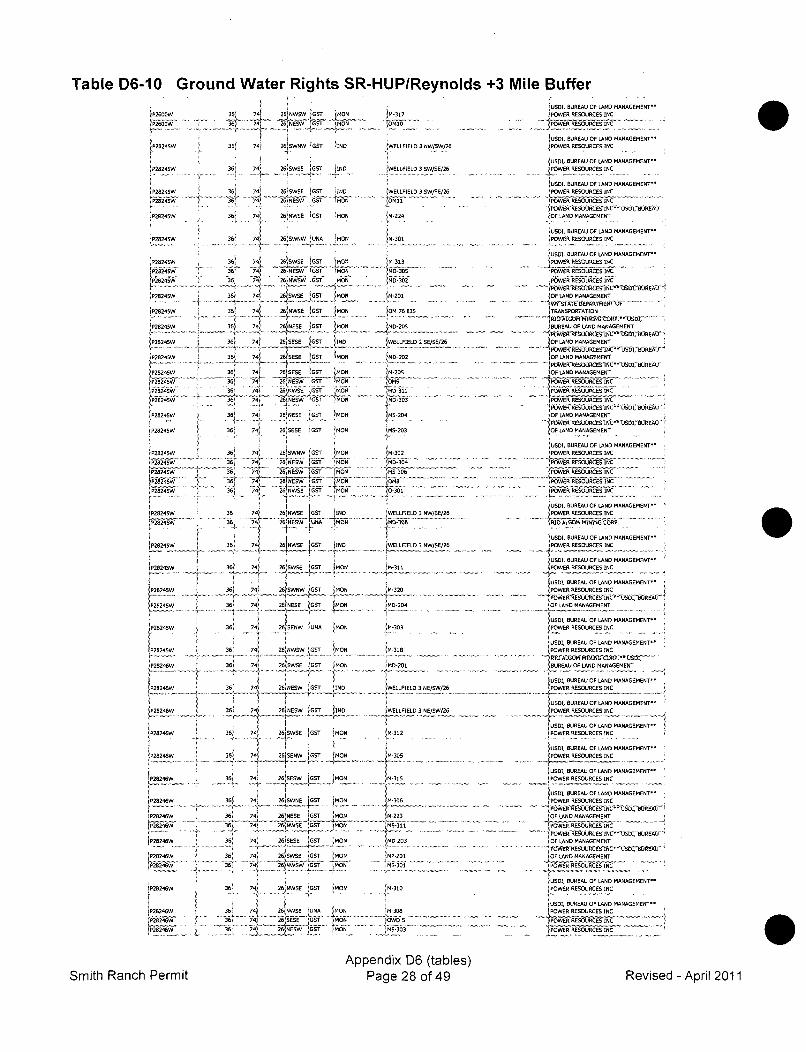
Table D6-10 Ground Water Rights SR-HUP/Reynolds +3 Mile Buffer
iP26DOW 36i 741 2E6NWSW GST MONEP1260OW 361 3- 26iNESW 051 IMON
LPF, , 1.6 '-7f 2I
!P28245W 36 74i 26ISWNW 51.. INO
IP2845W. 36 74 2A1SWSE jGST IND
iP•E321,W 31L 741 ýO.SE IGS" INDP28245W 74 26 . W. E 05 -' . ...
P28245W 36 74/ 26 NWSE 0GsT 'MON
P28245W 36 7 261SWNW UNA IMON
,??82ýsw 70s! , Is-,,SE ST ýMONP2824OW 36 7, jo'NES M
1P28245W 36 74! 26 N EE MO
P28245W 364 74 26QSESE Is' ,MOLP28245W 36, j7,ý 265ES15 IO
P2824SW i! 36 745 26 8WNS IGS IMON
P28245W 36 74 26 NWSE GST IMON
k2824sw .. ..5 1 74 FwES f b~
P28245W 361 74t 26NW GST l MON
P28245W 36 26 S MON
'P28245W 36 74 26SNWSW GST IMON
P28124W 36i 74 26iswSE "I7 MON
P282:I.6 ! t 7 G IE ST iN
1R28246W 1 361 74t2jr651SW 'GT N
P74 261NWSE T MON
P28245W 38, 74j 26JWENW 0GST I"ON
r24sw 435 7t,, 268lWSE GST iMON
IP28245W ... 36 744 26SWW ,2.1Eý ,4N2!,
VmSWý 41A 26ýEELo MON
jP28245W 36 74j UNA MO
IP28245W 36i 74 i 26 WSWN W IGST MON
..............i............. t° .. -... ---t .. . .............. .. ..
ý' t26SWEý os MON
P28246W 36ý 74 26NESEW 5GT IMON
12PRW 36 72j J•YWB JGS ! ONjP28246W 36 74 26 SWSE '75T MON1P28246W ___ 381 7416'EN ot i .
P8246W 361 7 6SS 67 'O
P28246W 36' 74 261NWSE 'GST IMON
.. . .... . .. . 6.. .... .. . JM ON1[P2426W 36 11 261SWNE I,7 O
ýP26246W 36~ 74' 0650 5 O36 74 ,S 'MONG
P282416W 36 741 26 NWSE los jMON
P28246W 356 741 26!NWSE IUNU !MON
P2824W 3 6' 74 26066 571t36124 74 26,4NESW o I' O
8-1US, BUREAU OF LAND MANAGEMENT-!M-317 !POWER RESOURCES INC
U5I0, BUREAU OF LAND MANAGEMENT~
ýWELPFIELD 3 NWISW/26 POWER RESOURCES INC
SUSDI, BUREAU OF LAND MANAGEMENT"
WELLIELD POR EURCES INC
IUSE, BUREAU OF LAND MANAGEMENT-'
IWELLFIELD 3 SW/SE/26 POWE RESOURCES
- PU6G'iRREAOURCESINC OUSIDU BUU'M-224 :OF LAND MANAGEMENT
UjSDI, BUREAU OP LAND MANAGEMENT
M-301 'POWER RESOURCES INC
6SD1, BUREAU OF LAND MANAGEMENT~
M-33 jPOW6R RESOURCES INC
I'D N-305 - r ,RE I SURCS5EZ N
DD-302 POWER RESOURCES INC
IM-2B IOF LAND MANAGEMENT
1OM 76 83S TRANSPORTATION
MO-20 5 BUREAU OF LUND MANAGEMENT
IWELLPIELD 2 SE/SE/26 OF LAND MANAGEMENT.,,..,,.---'' - - -,. . POWElRt+3ýUkCES'5NC-'toO1,'6URE8AS
1MD-202 OF LAND MANAGEMENT
.................................. WE RES•SCES NL'SIU08 UREAS-
NM-3D5 OF LAND MANAGEMENT
M .3.,..................... . . .- POWER......RESOURCES .....I..C
3, POWER RESOURCESIN-. POWER RESOURCES INC
iMS-2U4 OF LAND MANAGEMENT
OMS-2D3 OF LAND MANAGEMENT
LpUSDI, BUREAU OF LAND MANAGEMENT"
8M-302 OWER RESOURCES INC
R6-464 . .POWER RESOURCES INC
-IM°S°E.. ..... .... ...088 POWER RESOURCESINCO-301 POWER RESOURCES INC
JUSDI, BUREAU OF LAND MANAGEMENT".WELLPIELD 3 NW/SE/26 POWER RESOURCES INC
F7.536 - - - - 1'• MININ 6 CORP
USDI, BUREAU OF LAND MANAGEMENT"
_WELLPIEL 3ý NW/E/26 ]POWRR RESOURCES INC.......~~~~~~~ ~ ~ ~~~~~ .21 .. .................. ............... .•.•3 • ., ...............
USDI, BUREAU OF LAND MANAGEMENT~
M-___2__ __jOWER RESOURCES INC
lUSDI, BUREAU OP LAND MANAGEMENT~'8-320 POWER RESOURCES INC
1 USD1, BUREAU OP LAND MANAGEMENTCNM-3D POWER RESOURCES INC
USDI, BUREAU OF LAND MANAGEMENT-'WM 318 POWER RESOURCES INC
iRISALUON MIN'LRA-507-RDC 201 BUREAU OF LAND MANAGEMENT
USD1, BUREAU OF LAND MANAGEMENT"ELPIELD3 POWER RESOURCES INC
IUSDI, BUREAU OF LAND MANAGEMENT~
LIELD3
POWER RESOURCES INC
USDI, BUREAU OF LAND MANAGEMENT~,M-312 POWER RESOURCES INC
"USDI, BUREAU OF LAND MANAGEMENT'M-31P W POWER RESOURCES INC
USMI, BUREAU UPLAND MANAGEMENT"M-306 POWER RESOURCES INC
'MD-221OOLND NGMN~USD4, 8UREAU OP LUND MANASEMENT"'
$ 3311 POWER RESOURCES INC- - -~' "'- - - - - -CR¶6LA6 BIC U567 REAU'
Nlf 223 OP LARD MANASEMENT
'MD 203 UP LAND MANAGEMENT
USDI, BUREAU OF LAND MANAGEMENT"
1USD1, BUREAU OP LAND MANAGEMENT-N -358 POWER RESOURCES INC
....W. S P, RESOURCES INC
MSSOS jOER EORE N
Smith Ranch PermitAppendix D6 (tables)
Page 28 of 49 Revised - April 2011
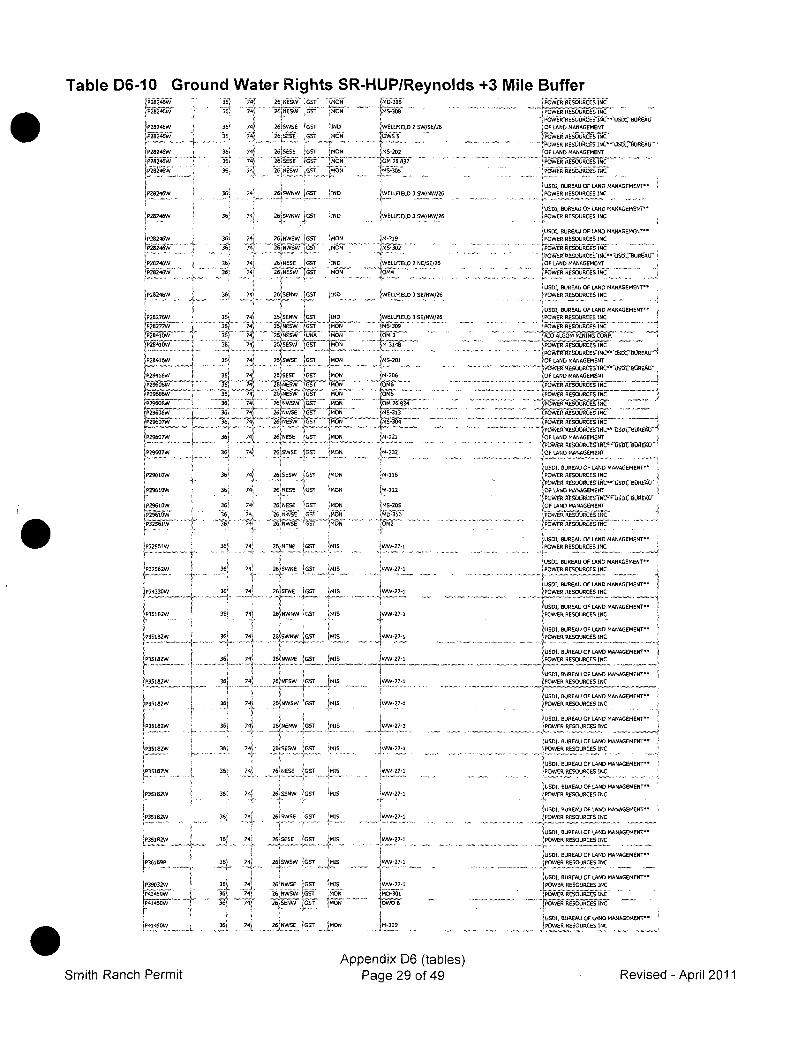
Table D6-10 Ground Water Rights SR-HUP/Reynolds +3 Mile Buffer
1P26246W36? 741 26;NE6 W .GT /MON3ý6- 74•' .... 656 05 MO" N
~MG-3G6.645-368
1)P26246w1 36, 7
36. 7
!P28246W 'A6i
36e 7
JP28246W 36i 744
t P28246W 361 74
P28246W 361 7
P2624W 36. 741P2'82,I6W 36 74
P28246W 36j 2
P2466W 36
P28466W I 6 74?361
P2-9606WO 36 74/
VP29606W 36Pý29667W 36 7
--- 361 741
P,29612W 36Z 74
36ý 74
36 74
'P32566 36 2
P3306W 361 74ý
[P35682W ' 36' 2
---1 36i 741
1P. . 12 361 241
~P362 36f 741
P382W 36, 74ý
265SWSE 66ST 11N6 IWELLFIELD 2 •W/SE/26
26 50E 50T 108 DN 5
261SESE 1GE. MON jMS-202
"iot VTra .MON I2M6"837-
2,6iSWNW GIST 8IND WELEFIELD 3 OW/NW/26
26jSWNW JGST I2ND -WELLFIELD 3 SW/NW/26
26NWSW 0G2T -MON IM-319.. .. ... N' 's "•. , ........ •. ....... M•• 7......:I : 'Z ... .26 6NESE G3" IND EW6LLFIE)D 2 NE/SE/26
26 665EW on M . .064
26/36NW rSET 1182 WELLFIELO 3 SE/NW/26
26/568W S o N IwE•WEOLSEW2 WW2
26 865 o - 9O 196-309
264NS 168 ' 6"MO
2'S'SE 1GT !Mh N O /6-3640
26" •' Ion 1608 i. iM-206
S2NE•W 'o MON .064 .. ..2E6ýEW Gs-r MON - 0626/NWSI oMON fO Iia3' ----
2 .2BVSEW KG-r !ONr316_
26/89606157 60 jM-6
26 6E 6 GST jon MON IM9-222
2, wS..... ÷i -G ... .
260E60W onT !M0N 64-216
2E6N8656G[Tn ;MON ýM222
268656 onT MON 1645-2652685 0 M 1631
26iNESW. .G r MS . .. ......
26 NW56 onT MON 0642
26 NENE on 6460 IM-27-1
2615W8E 6F on MI 6415 271
2610686 Ion; §615 ~ 2
T-26jffW8W '551 MIS 49-2-
26MWN 1
onT 1M- ~4S 46-
6 jNWNE lo IS J646527-6
26 .8ESW !MIS 1140 -27-1
261sNWsW on sMIS 9662. ..- .
26/NENW onT ýMS
26iSEswiSW on l 6645 V0-27-6
POWER• RESOURCES INC 6
'OF LAND MAAGE6EN6
........... ... " g J ~ • .... .. ....l;POWER RESOURCES INC
POWER 66500-060180
US'0, BUR86U OF LAND MANAGEMENT"
POWER RESOUR6ES INC
IUS1, BUREAU OF LAND MANAGEMENT"POWER RESOURCES INC
'O0, 8UREAU OP LAND MANAGEMENT"
POWER 66SOURCES INC
!USI, BURA U OFA6N D MAAGMET
0USD, BUREAU OP LAND MANAGEMENT"
!POWER RESOURCES 6NC
/1 06L006 MINI O LNG CORP EM NT
- PWER RESOURCES INC.
1PO k'R60tU0R6EsE'NC' 'U5SOI^I8t8REAoJ
OF LAND MANAGEMENT
,OP LAND MANAGEMENT
POW ER 6620606 680 -I
POWER R6SOURCES INC
'POWER RESOURCES INC --
101 LAND 64866EMENT6
O1E LAND MANAGEMENT
0u0I, BUREAU OF LAND MANAGEMENT9"
POWER RESOURCES INC
OF UAN MANAGEMN
OF LAND MANAGEMENT
POWER RE6C60060ESNC I .. .
USDI, BUREAU OF LAND MANAGEMENT~'
PýOWER RESOURCES INC ..... ,E.,
IUSDI, BUREAU OF LANE) MANAGEMENT--POWER RESOURCES INC
U5OI, BUREAU OP LAND MANAGEMENT"
POWER R6S6U5CE001C
US2I, BUREAU OF LAND MANAGEMENT"
POWER RESOURCES INC
JUSDI, BUREAU OF LAND MANAGEMENT'-
1USDI, BUREAU OF LAND MANAGEMENT"
M0SO, BUREAU OF LAND MANAGEMENT'.iPOWER RESOURCES I69
lUSDI, BUREAU OF LAND MANAGEMENT"
POWER RESOURCES INC
USDI, BUREAU OF LAND MANAGEMENT"
.PWRRSUCS IIIN .C
ýUSDI, BUREAU OF LAND MANAGEMENT~"- }POWR RESOURCES INC680
0USD2, BUREAU OF LAND MANAGEMENT" i
POWER RESOURCES I68
USDI, BUREAU OF LAND MANAGEMENT"
POWER RESOURCES INC
IUsDI, BUREAU OF LAND MANAGEMENT96
IPOWER RESOURCES INC
/0US0, BUREAU OF LAND MANAGEMENT9POWER RESOURCES INC
oUSO;, BUREAU OF LAND MANAGEMENT"
. OWER RESOURCES INCwER RESOURCES INC
WUSDI BUREAU OF LAND MANAGEMENT-6
I POWER RESOURCES INC
... .. W... t .R3ESOURCES. 6 .... ......
/P35182W 36t 74ý, 26E ESE iGon MIS
IP35182W
iP35182W
P P36169 P
P4845GW-
IP46450W -
36' 74'
36i 74ý
361 74ý
36. 741,
3/ 741
36i 7
26 SENW GGs 'M65
26SWSS 9 G0 T o MIS
26!SESE oGSn ýMIS
261 WOW ,007
26'NWSE IGST 9M0SR}'EN JiGST• 1M•i
~-27-1
ý-2 7-Iww27 1
6WW-27-1
WW-27-1
.MG-S0S
MD,ý
Appendix D6 (tables)Page 29 of 49Smith Ranch Permit Revised - April 2011
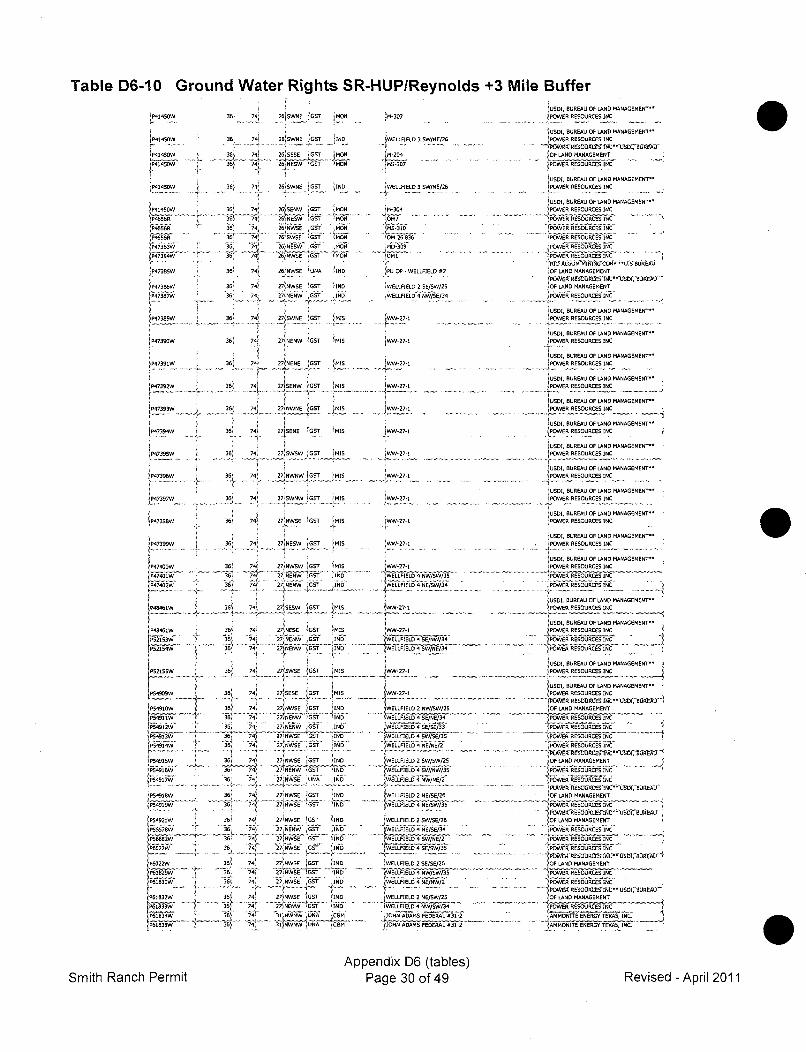
Table D6-10 Ground Water Rights SR-HUP/Reynolds +3 Mile Buffer
4P14SOW 36e
IP41450W 36.
P42450W36i
[P4145OW 36i
P465R66
P47385W 36
P47386W 36'4277W i 36
P4739OW 361
P47392W 3d/
[P47390W 36i
[P47392W
P47396W 36ý
tP4736w i 36'
JP47397W 36
JP4739896 36
t747400W 36
Pf47462W 3 36/
A11L -. 3P49460W 36,
[P52153W ~ 36,
[,P52905W 36
P 5218W 9
-~36
fIP54910W 31
'P04913w "i 3'o
/P54916W 36[PS4917` 30
P54918W36
0 P5,41~S~o36,
75S4921W6 36I[P5 55 78 W. . .
P '5608W z63
A--T' 36~
iP6022W 3
[P61629W __!36_36?
[P6.,s,3w 4 36s
P618349WP6123W 3 '36'
74i
74!
74!
241
74/
74
74'
74
71/
741
74,
741
74ý
_74'
721.
74'
74
743
74'
74ý
741
74/
74'
74P
74/74'
7,
741
74P
74.
74'
74'
26/SWNE 'GOT MON 'M-307
2 6 OSWNE 05 , 3060 FEL 35SW N8E026
26SESE 5 GST 67 ON 0M-204
, . .... .... .. . . .26 NWN (SOT aMON S06-307
261SWNE I[GO I0D WLOLFPELD 3E 6 /9/26
26NW GSr IN5 IM0L'9/304
ý6 NSF 109
267•SWE 6GT .9S (SM 268 36
26 NESW AGGT 9013 90W-309
26100 3357E G M-ON'
26 69656 066 'IND PU OP -WELLFOELD #2
279W1SEW /GST INS 'WELLIELD 2 56/-W/25
27 966NW GOT .06 WELLPIELD 9 W/5E/34
2 ýNWNE jGSr 'I.S •w•.
27WNENW GST ,MIS jWW-2 7
-1
27ASWNW 1GST 1MIS VN-27-1
2196W '057 95 [-27-1
276NWSE /GST [M0S IWW-27-1
2715ESW 0GST OMIS IW-27-]
27 NW8N 6 GST !MIS 0WW-27-1
27f5696 1GS '905 [WW-27-1
27,WSE9W GST [MS iWW-27-1
i
27NESW 0GST 9MIS 'WW-27-1
27,'NN5W L057 ,Ms W 2701
27" NEiW Gs"r iND, ." WELLFoELO 49963j/N/35
'/6ssL .0 WFD 4ww i, 3
279N IE I OT GS IN 4ELL0E6D .... NW/SW/34271969-W [GO N09 WELLFO-EL0 4-N 09/634
"0' :..."'iw•............•"[iiT/, i.............2715656 4057 1MIS 969-27-1
271NWSE IGST 096 !WELLFIELD 2 NW/SW/25
27 9699W .S7 30IND WELLFIELD 4 SW/0E/33
2799656WS57 [19G[j WELLFIELD 2 SE/SE//227/99 GO E 09 WGLIL 6963
27 99606 08 09 1D WELLFIELD 4 9W/SW/32
27 99606 07 '09 W6Lo6LD 2 96/08/26
2'7990 3057 /19 'WELLFIELD 2596/56/26
27 36996 GOT 09 0 6rFEL 96/06/34
27990 %V 7 09 GILLIELD 4596/66/2
27395 /057 [09 [ID WELLIFELD 206E/56/26
20 89606 ff700 5 LU~iELO 496/9W/2
27i Y.A.LE 090T WELLFORL0 2,96/96/2-270/96996 3557 '096 WEOLLFOELD 49/563
3509639 C89 ''59 66ý95A FO-D ERKO. 830-2T31INWNW !UNA "''.8TeO9 6636EDRL 3-
6US0, BUREAU OF LAND MANAGEMENT6"
!POWER RESOURCES INC
IUSDo, BUREAU OF LAND 95ANAGEMEN6"
POWER RESOURCES INC
OF LAND MANAGME ENT
POWER RESOURCES INC
"USD0, BUREAU OF LAND MANAGEMENT"
POWER RESOURCES INC
USDI BUREAU OF LAND MANAGEMENT,"
,POWER RESOURCES INC.......... POWER 66SOU9C85 INC ............
POWER RESOURCES INC
. FOWER RESOURCES INC
POWER RESOURCES INC
OF LAND MANAGEMENT
OF LAND MANAGEMENT
POWER RESOURCES IC
USDI, BUREAU OF LAND MANAGEMENT"
POE RSURCES INC
0USDI, BUREAU OP LAND MANAGEMENT9'[POWER RESOURCES INC
USDI, 8UREAU OF LAND MANAGEMENT"
[POWER RESOURCES INC
IUSD0, BUREAU OF LAND MANAGEMENT"
POWER RESOURCES INC
[USDE, BUREAU OF LAND MANAGEMENT"'/POWER RESOURCES INC
[USDI, BUREAU OF LAND MANAGEMENT"
oPOWER RESOURCES INC
USDI, BUREAU OF LAND MANAGEMENT-
POWER RESOURCES INC
'USDI, BUREAU OF LAND MANAGEMENT"POWER RESOURCES INC
1OJUSDI, UEUOF LANDMANAGEMENT".USDI, BUREAU OF LAND MANAGEMENT" -
,POWER RESOURCES INC
USDI, BUREAU OF LAND MANAGEMENT"
POWER RESOURCES INC
USDI, BUREAU OF LAND MANAGEMENT"
OWER RESOURCES INC
POWER RESOURCES INC
'POWER RESOURCES INC
JUSD], BUREAU OF LAND MANAGEMENT-'
POWER RESOURCES/INC0
.--'-'.._•._-'---'.. ..--'. -"......'USDI, BUREAU OF LAND MANAGEMENT"
POWER RESOURCES INC[POUE RESUCES INC
1POWER. RESOURCES INC ' I
;POWER RESOURCES INC
0USD!, BUREAU OF LAND AANAGEMENT-
1POWER RESOURCES INC
I6500, BUREAU OP LAND MANAGEMENT"0POWER RESOURCES INCý
' W[O"/JWER 6I6G RCEG 'INC- 100/80EA"'i' OF LAND MANAGEMENT
PO&WlýERESURCES -INC'
POWER RESOURCES RINC
'P•OER RESOURCES INC - -'APOWER RESOURCES INC
OF LAND MANAGEMENT'4~0"PsoRs INC UK-UeL
POWER RESOURCES INC
POWER RESOURCES INC
OF LAND MANAGEMENT
POWER RESOURCES INC- OE EORES INC
POWER RESOURCES INC-10-BRN
NOP LAND MANAGEMENT
ThýR RSOUGRCES RENC.AMMONITE ENERGY TEAS, INC.
....... ... ýIZ-NT6HE .* % E -I
Appendix D6 (tables)Page 30 of 49Smith Ranch Permit Revised - April 2011
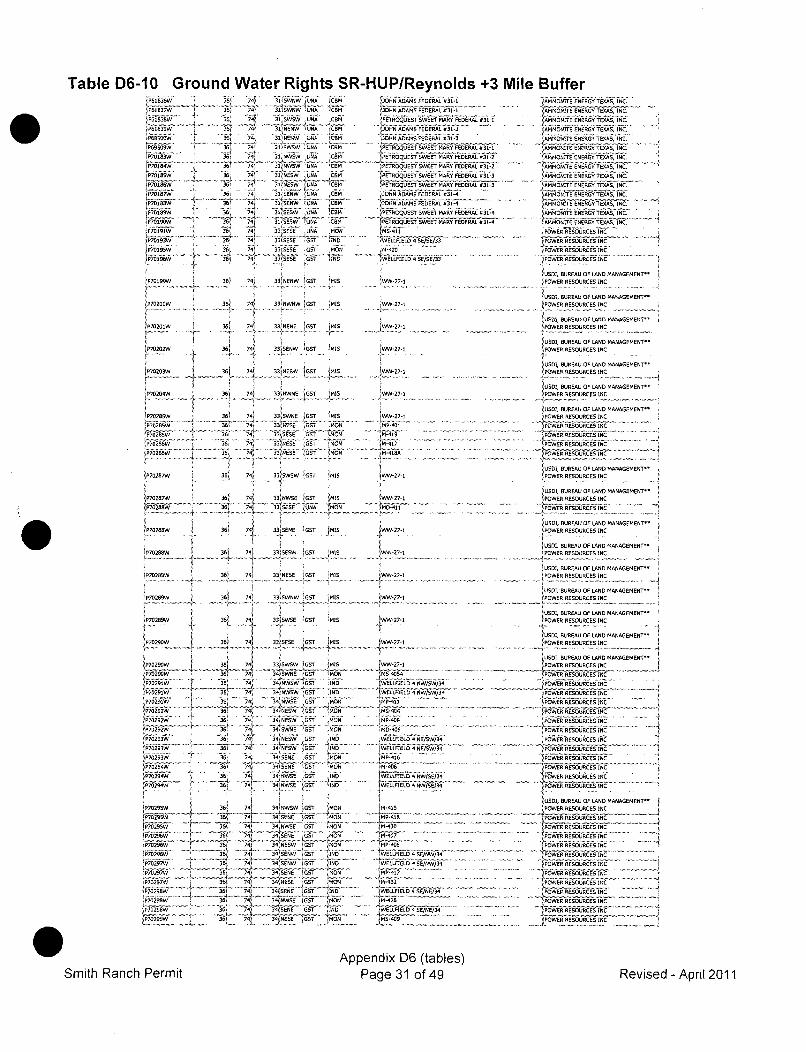
Table D6-10 Ground Water Rights SR-HUP/Reynolds +3 Mile Buffer
P701836WP7018W
PF70187W
4-.
..... .. 6•i~
36
36
36?
36,38ý
36ý3'S
747
71!
71
74
71
74E
71~
74$
Ji swkwý ERA CB8M3lENRNWUNA ICBM
31'ý +NEN1W 7j3I'WS 068 C6
194N- 7C8M
31 N655W 1358 `C6MiitoýSw UNA Cam
31.588W $6 6
33'SE SE ;U NA 0
335SERF GOT MON3375iEU 805 Thb
33,888W SO5T ýMIS
337NWNW 'GOT 'MIS
JOHN ADAMS FEDERAL 8JI1j1
JOHIN~dsr ADAMS bb PEDNAi71-
JOAN ADAMS FEDERAL 831-3
PR0 SEiTSEET` MARY FEDERAL 831-IPETOOQUESýT SWERT MARY FEEA#31-2PETROQUEST SWýEET MARY f EDERAL 83-2'
I5PETCROQU ST.SW"EET.MARY F6tEDEA 3PETROQUEST SWEET MANY PESERAL '#31'3
[068~~ ~~ ADM EEA 31-4
fQE$EOQSRGY SWNEET MARY FEDERAL .31-4
451LC E/SD/33
~M-42D S/3
7ANMOSNETENERGY.T5A'A mt:
AMMONITE ENERGY TEXAS, INC,
,AMMONITE ENERGY TEXAS, INC.
6AA414r1TE ENURGY TEXAS, INC.
A MMONITE ENERGY TEXAS, INC.
AMPIKONTE ENERYTC8,IC
tAIPOWER RENSRRCES INC
SUSO1, BUREAU OF LAND MANAGEMENT~=POWER RESOURCES INC
6SDI, BUREAU Of LAND MANAGEMENT"AMNWEER RES URCES INC
USDI, BUREAU Of LAND MANAGEMENTCPOWER RESOURCES INC
USOI, RUREAUROC LAND MANAGEMENT
POWER RESOURCES INC
1.USSI, 8UREAU OP LAND MA NASENME NTIPOWER RESOURCES INC
IUSDI, BUREAU OF LAND MANAGEMENT"
POWER RESOURCES INC
'P70194W 360 747WW-27-I
PD020DW 36 747
P70201W 38! 74 3.9NFNF6
ýCGY
7P70252W 36j 747l 133'S W ' GET $Ims
• . ,
V. .. ... 4. 4.........S.
1P70204W 1 361 1"~
'P70388W 38$ 747
P7083W36 74
P7088W38 74
7P7038W E6 38 7
ES3 WNE jGIT MIS
33/NESS , I.33 NESE dfST "lot,
3376858 GOT MON
2WV'•7-1
7VRW-27-1
NM-41IS
'I-27-1
USD1, BUREAU OF LAND MANAGEMENT~POWER RESOURCES INC
IOWER EýSOLRCs INC .
,POWER RESOURCES INCI POWER RESOURCES INC........
USD1, BUREAU OF LAND MANAGEMENT"
POWER RESOURCES INC1P70287W 38$ 74$ 33SWSW 855 76Is
SP70287w 36 741P70289W 368 74
2Y70EEW 38 74ý
P70289W 36t 7
S.. . ... . .. ....1
iP7ý22Ow 26r -7P70289W 7 3ý6 71
R 71P0729W I 38 7j.. ," ...... "i} ...
P70290W 38
, $roi$•3w 368 "74
36i 7%94Wr~" 11, 74,
!P02S 361 74~
38'1P7D2953W ' -386 74
P7029-W 38 74$
38 7
,P7R284W 7 36~ 4
P7048W36: 74.
33PRYE oGYIMS $-27-133 SESE !UNA . Aý'2L ,,,, 41i.
33ESENE 7G S
33,NESR 7oGS HIS
o3s"WNW ..... . ..
33$SWSE SO1T iMIS
.7 -27-1-•27-1
{W-27-1
$ -27-1
33SWSWE IGST IMIS ýWW-27-1
SMON t 4 N'• " •"• -• -V.............. .....•,-•.....34 1115 '1I 18 +WELLFIEDLO48/W3
A421
$$SW 167+- AN WEELFIELD 4 NW/SW/3434 WSES 5,5 MON MP-ASS34 NESW "SIT 'MON IMS-404
34SNES" ITF ON
34 lWNE .GIT NON MP-AUE34 S W~ GOT WELIEDNEN(7$
3• 'Eir OSý 'MON ýM-Qfi .I•.
34 888WýSIT i00 WELEFIELD 4 NE/SW/34l
143 4,IND. GGYPIMON M4-415
31 SESR7
CST NON 4II-40634
7NSEN USS IND 7ELFRD986753
*"44"NW VtG,7+ IN jWEýLLIRLD 4 NWSE7N,134
34'WS ¶8OE G17 MON314ESEE GF1 MO RAS
4NWISE CIT NON1 $M-43
C 4 ....... 4..• -' ................ . .
34'SENW SIT L WELLFIEL0 4 SEINW/.4
34 NWSE SEIT MON 0M-428
"USDI, BUREAU OF LAND MANAGEMENT~$POWER RESOURCES INC
............ .IUSDI, BUREAU OF LAND MANAGEMENT-*
POWER RESOURCES INC
USOI, BUREAU OF LAND MANAGEMENT'.
POWER RESOURCES INC
USD1, BUREAU OF LAND MANAGEMENT~SoWER RESOURCES INC
jUSODI BUREAU OF LAND MANAGEMENT.-IPOWER RESOURCESINC
IPOWIER RESOURCES cE. -
POWER RESOURCES INCUSDI, BUREAU OF LAND MANAGEMENT"
{USO, BRESOURCESLN I'INC GMN'
'[POWER RESORE N
POWER RESOURCES INC
POWER RESOURCES INC
USDIR BUREOUR C ESN .MANAGEMENT~
-- [POWER RESOURCES INC
POWER RE6SOURCES INC
JPOWER REXOARSCES INCIPOWER RESOURCES INCPOWER RESOURCES INC
IPOWER RESOURCES INC
.USL. BUREAU OF LAND MANAUEMENT"POWER RESOURCRS INC
RSUCSINC
POWER RESOURCES INC4-
ýPOWBAREFSOURCES INC
_,RESORES INC
JPOWER RESOURCES INC
POWER rESORCeS INC
0 Appendix D6 (tables)Page 31 of 49Smith Ranch Permit Revised - April 2011
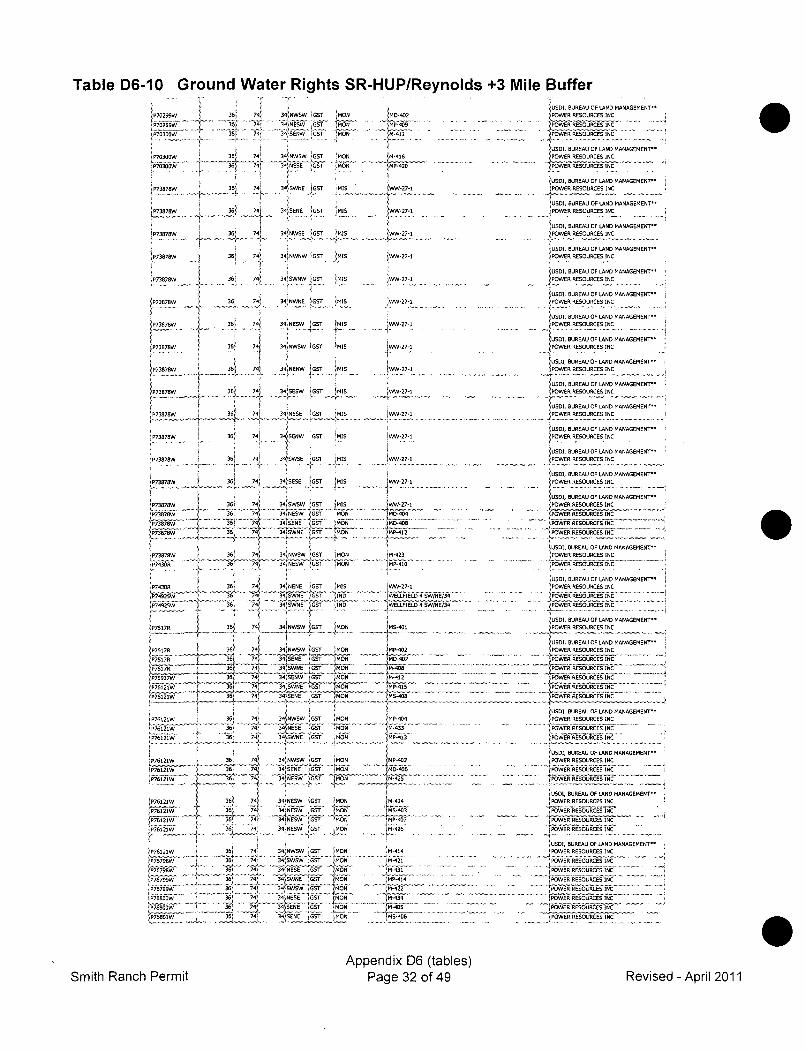
Table D6-10 Ground Water Rights SR-HUP/Reynolds +3 Mile Buffer
P70299W
P70300W
P73878W
1P73878W
tP73878W
36
J 361
361
38!
36i
341,!
74
74
741741
741
741741
34iNWSW lGST
3INW5W ýGST
34ISWNE IGST
341NWS CGST
341NWNW GOT
34SWNW GOT
34fiNWNE 'GST
MON"..TM06
!MON
MON
MIS
iMIS
IMIS
ýMs
MISP73878W 436
P73878W . 361 74<
<P7387W _3 351
1P73878W 7
P73878W 3
P73878W 36! 741j
P73878W 36! 741
P73878W 361 W
1P73878W 361 74i
P73878W .. . .
, -49-jW- 7iP7387W 3 741P75 A 36 7
P751O7R 36 7Rj
=P7421W ""<' 6' " 74P74925
1 3P7W87 351
'P75176W
'361 741
P7617821W 6 4
P7617R . t< 74'1P75937W 361 741
_P21B-, W 36i 71:
61361 27
ýP76121W 368 74
741
36 7%
P76821W 38 74<
jP76121W 361 741
:P767192 36 74<2P76800W 361 74•P76739W '1 361 74•
4NESW LOST ,
3 ..W. . IGSOT MIS
34INENW IGSOT MIS
341SESW GOT MIS
34ýNESE iOST MIS
341SE6W 'GST ýMIS
341SWSE GST MIS
3!jSESE cOT 1919
3'41NWSW GO1sT <MIS
SO4TEN IGS MOWN-348696 SOT1
34,NWSW GST ýMON
344496 'GOT ',MIS
34 SWVNE GE~T IND0
341NWSW ISOT
34 SEN6 SG7 jMON
34 SENE G OT MON_
34158W GEOT MON34 WNE lSE '1534 GEN4E GOT 4MON
31INESEý SOT 'MON
34 NE SOGST MON
341NW5W lOOT MON
34 NESW GST MON
34 965W GST 'MON
o,-wi , 1 =..ONS EGOT MON
3ý4 ISUWW G ST
34' ESS 'GOT tI-NJ34
SENS GOT '1190
MD-452
1M-416
IMP-420
1W-27-1
ffPW'27-1
NW27-1
WW-27-1
-27-1
WW27 1
WW-27-1
iý27-1
iWW-27-1
WW-27-1
6W-27-1
WW-27-1
90D-408
MP-412
1WELLIEO7-/1 /3
....... ... .. ... .[ .i b•• ,•• .... .
MS-401
IMP-402
• MP 415
<MP-404
OM 433RP 413,
_144
<M-421
MP-0
.... 9-422 ..... .... _ .
...... .. .... 9• - 406 . . ... ....
USDI, BUREAU OF LAND MANAGEMENT"
POWERRSUR CE N
POWERP RESOURCES INC.. •6ER'RESOURCES I NC
0501, BUREAU OP LAND MANAGEMENT"POWER RESOURCES INC
ýUSDI, BUREAU OF LAND MANAGEMENT"
POWER RESOURCES INC
USDI, BUREAU OF LAND MANAGEMENT"~
'POWER RESOURCES INC
5USOI, BUREAU OF LAND MANAGEMENTRPOWER RESOURCES INC
USOI, BUREAU OF LAND MANAGEMENTMPOWER RESOURCES INC
<USDI, BUREAU OP LAND MANAGEMENT**
POWER RESOURCES INC
USDT, BUREAU OF LAND MANAGEMENT-
POWER RESOURCES INC
6US0I, BUREAU OF LAND MANAGEMENT"POWER RESOURCES INC
USD1, BUREAU OF LAND MANAGEMRENT ,POWER RESOURCES INC
USOI, BUREAU OF LAND MANAGEMENT~POWER RESOURCES INC
BUREAU OF LAND MANAGEMENT"'
POWER RESOURCES INC
jUSSI, BUREAU OF LAND MANAGEMENT'"POWER RESOURCES INC
USD1I, BUREAU UF LAND MANAGEMENT"
POWER RESOURCES INC
USDI, BUREAU OF LAND MANAGEMENT"POWER RESOURCES INC
USDI, BUREAU PF LAND MANAGEMENT"
POWER RESOURCES INC
USOD, BUREAU OF LAND MANAGEMENT"
1 POWER RESOURCES INC
VUSD1 BUREAU UOPLAN MANASEM
POWER RESOURCES INCPOWER RESOURCES INC~
IUSDI, BUREAU OF 1AN0 MAAGEMENT6PUWER RESOURCES INC
POWER.RESOURCES.INC
USD1, BUREAU OF LAND MANAGEMENT"
POWER RESOURCES INCESOURCES INC
..... ........... ........ ~ ..• 3 "E } ' "............. ........ .POWER RESOURCES INC
1 USDI, BUREAU OF LAND MANAGEMENT"
POWER RESOURCES INC
USDI, BUREAU OF LAND MANAGEMENT"POWER RESOURCES INC
USDI, BUREAU OF LAND MANAGEMENT"
PPOWER RESOURCES INC
D'5o, BUREAU UPLAND MANAGEMENT"
'POWR RESORCELSAINC"TPOW ER RSOURCES INCPO0WER RES1OURCES NC
.US.I, BUREAU UP.LAND MANAGEMENT"POWER RESOURCES INC
POWýER RESOURCES INC"
POWER RESOURCESINCPOWER RESOURCES INC-
.US.. .BUREAU.P.LAE.......MiEN T"6
POWVER RESOURCES INC
1IVýi1ESORCBS INC
<POWER....... REGOURCEii Siiii INC ................................ POWER... RES'ii i16OURCES •' INC..
....... ..... W.R.RESOURCE •Ii II6 WINC .....
Appendix D6 (tables)Page 32 of 49Smith Ranch Permit Revised - April 2011
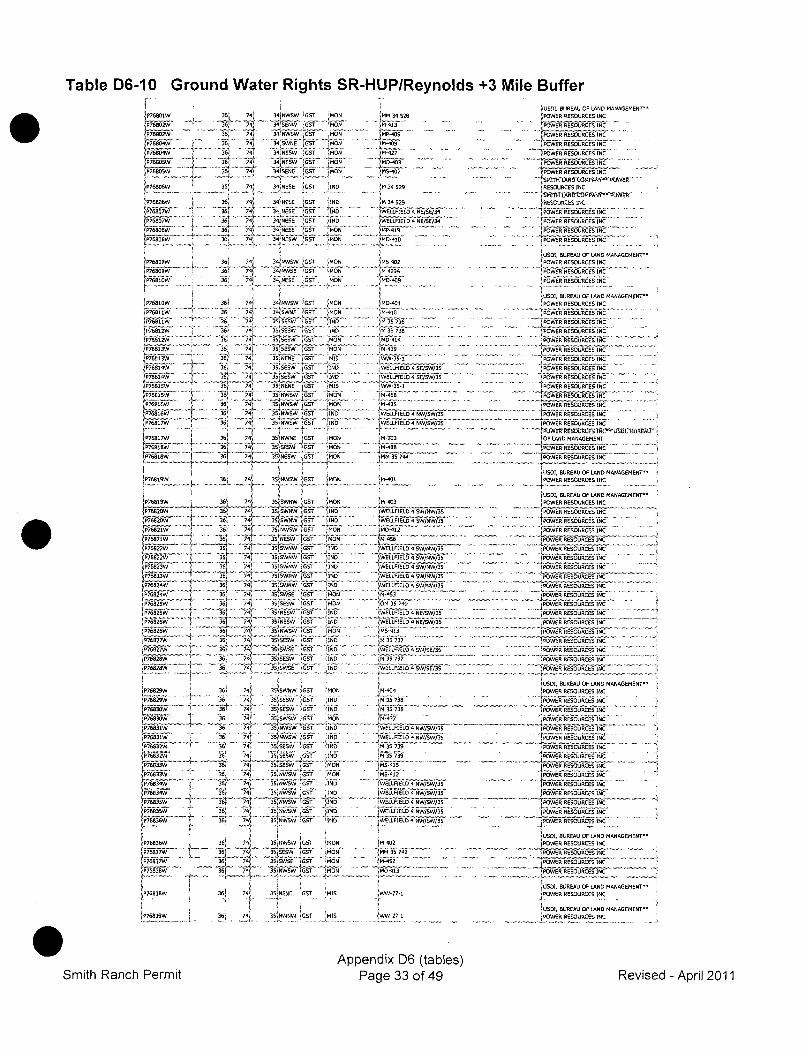
Table D6-10 Ground Water Rights SR-HUP/Reynolds +3 Mile Buffer
363 74 341NW6W 657 4108P76802W '74 34 NWISW 0G6 MON
•7ow # 34'NMSW 6SF MON'P764W 36 7; 3 i43,NWE C MON
P76805W 5 36, 7q , 44 SW 3 GST NOuNP76855W 355 74' 343ENR 6F O
. .. . . . . .. T[ .. . ... E 6
'P76806W j 36 741 34.•NSE IGS. . N14..
•P76807W 36' 741 34 ESE GST 'iN1
P[768W 34,S 4666 IND44P76_.W 3, 34 NES G55 MO N
3 J45',NWsw ~GOT 'MON
P76819W 36 74 4 NW GTT 'MON
74 SI6NE G5 MON1r
P7612 361v G__js INS
36 " " . 'OT '.MO .Pl!l36 74 3S
3365W 657 .CI
35 354EE MON
P7664W 3 74' 35 ,65W 66S7 14D
T-' 2SNS 65 MONP7616W 36~ 74 3StSWH SWT66 1140N
36 71 3S NWSW GF 1IND
P76817W , 3674[ 35INWýNE IT 6 CMNLP7688 21 34SWC" 3'OP76818W 3617P 35N -P MON
1P768136 363 741 31[8WSW 163S 58084
P381W36 74 53 W1W 1667 MON
; ..... ........ ' 14t " '_6
•P- r .. ... t..... 4 • •.....••• • ;
P76821W [ 36; 74 35S NW GST f DMONS.... ..2_. ...2 -
P788"3,. 38... , 74• ' 334.•! SW.... W .637'%•' ;'146•'
P76833W 36, 74 3S5WNWW GS6 MION
P7843-~ 36 74, 31557 SINN G 146N[P624W [ 6t 7 5666~3 O
P76823W 5 36 7 4' 3536N5 W ST INMD
.. . 3•8. 74.3.. .. 6 DT 14
44474 35,41 637 143
P382W38 7' 35'NW6W 5637 MON
16' 7456 35 36W6E 667 .146BP628W 36 74' 35SNESW' CST 146
,6 6, , 1136, 74, 3S ,6WEI 5=6 I'DP76834W 36 743 35SWSW C6ST MON
[P"2W . 3 74ý 31 E,6ES 667 .166
P6830W r 5 38 74' 35(66 t '037 C 31I6L763W J 36 74 33 6766W 637 I'MO
[9935.... 36 7 585W67'4IP76829W , 381 74 5 355WNW 657r 166
_ 21
783W 7 36 7 3 5 637 ST J'ýI 3516W 15
aP6832W 36, 74 33INW67 43636ý,_ý L 74, 35SIE6W tCST MONý
[P6833W _36 74 35 8865W b637 1406P76832W + 36± 74> , 35836W'57 1P76834W 38 7 35 8365W 667 146
P .76835W 36 4 556W 667 ;IE
P768337MO
P76034W 36 371 WS N 3 O
1P76836W _384 74 3514646 66T MIND
IL611! 7A'MIS
5MM 34378
M-483
..... 427 -•, ~-, -7 T, ...8134579
8 341529
MS-402
441296... ... .
USDI, BUREAU OF LAND MANAGEMENT"
,POWER RESOURCES INC
(POWER RESOURCES INC
Z6WER-RESOU1RCES INC
3PWRRSUCSINC
]RESOURCES INC-- '~~'SMIF6C6N5`kOMES6Y'- PWUER
ýRESOURCES INC
IPOEE ESURCES INC
SOL, BUREAU OF LAND MANAGEMENT~POWER RESOURCES INC
POWER RESOURCES INC
USDI, BUREAU OF LAND MANAGEMENT6"86'401
3POWER RESOURCES INC
M 410 POWER RESOURCES INCM POWER RESOURCES`INC
81337ý,36 .PWNRSUCSINC
"I43 'OWER RESOURCES INC
WELLFIEL6 4 SE/SW/355POERSUCSINWEV!Eý - lPwRESOURCES1 INC
_W35_1 5POWRRSURE N8-ASS POWER RESOURCES INC
-435 POWER RESOURCES INCWELLIEL 4 W35335POWER Ri:ESOURES INC
WELLPIL6 4 W/SW/3 POWE RRSUCEO INC1- ~ . .- ~PUWEU66SO5)RCE6 INC USO4, BUREAUM-203 OP1 3.686 MANASEMENT,
~MM 35744POWER RESOURCES INC
.. ... ..... .i • ' .... ..... ..... ..... .. .. . .... .. .... .. ...... .. . . . .......T • " : 6 ' "i . . .. .. .. . .
5661, 8688AU OF LAND MANAGEFMENTý'
IusoI. BUREAU OP LAND MANAGEMENT"!-403 jPOWER RESOURCES INC
EUFILD 44W3N535 POWER _RESOURCES INCIWELLFIýELS 4SW3N~W(3S POWý.ER RESOURESNC
MD41 PWR RESOURCES INC
-456 POWR `RESOURCES INC
ELIUFIELD 4 SW(NW/35 3 OE EORE N
riM z mwi POWER RESOURCES INC -
WME3PIL 4, SNW35POWER RESOURCES INC
VELLPIEL .6 'I NW4W POWER RE'SOURCE INC............ •. .... . ....... ....... . O .... . ........ . C.....
IELLFIELD 4NE/SW/35 5POWER RESOURCES INC
W-451 5 POWER RESOURCES INC
.-.... ----........ ............ ....... .... ...... ....... ... .. w "-- -- -- ....... .... ......
EMMFIRLO 4 SWS55POWER RESOURCES INC
LISDI, BUREAU OF LAND MANAGEMENT~"
M-4. . -.- ER RESOURCES INC
USD1, BUREAU OF LAND MANAGEMENT*=
38-464POWER RESOURCESInCk
35 738 POWER ESOURCES INC-437 POWER RESOURCES INC
- ELLIDLD4 NW/W/355 POER REOOUCES NIELIPIELD 4 NW/SW/35 (POWER REO3JCES INC353 PWE RSSOURC' INC_
IL4FIEPOWER REORE INC0-412 POWER RESOURCES INC
IELLPIEED 4 NW/SW/31 OESEORE N
WELEPFELD 4 47/NW6/3S POW... [[ER RESOURCES INC. ..
5 552053.54 NW3SW/35 [OE
[USD1, BUREAS OF LAND MANUGEMENT~"18-42 POWER RESOURCES INC
jMI 3574- POEREOREIN.84i2 4 POWER R.ESO0URC'ES INC
'8641 PWER RE~SOURCESINC__
iUSD3, BUREAU OF LAND MANAGEMENT'"27 1
5POWER RESOURCES IC
'USD1, BUREAU OP LAND 868NAGE647'"
27.. ..• " L• •t ,s•W' "wf• 1.... ............... .......... W...•% ER• RESOURiCES° 3 INC ..........
Lrim..w 1 361 74ý 3S[NWNW 7GST . MIS
Appendix D6 (tables)Page 33 of 49Smith Ranch Permit Revised - April 2011
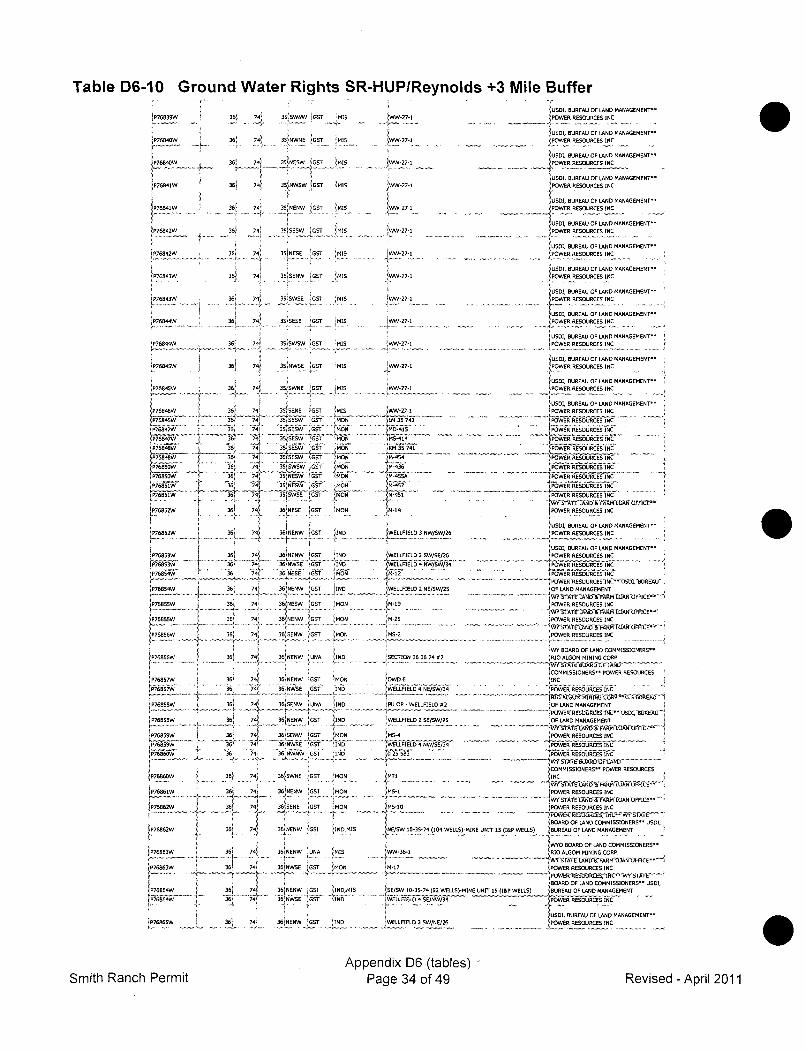
Table D6-10 Ground Water Rights SR-HUP/Reynolds +3 Mile Buffer
IP76839W
P76841W
IP76841W
P76842W
IP76842W
ýP76843W
36z
36'
361
361
361
3ý1
36'
361
P76844W 361
36
P76845W 36
f768346SW 361
P76846W36
p76848W 365
P7648W 36P76855W 36i
NP785W 1i "B
iP76851W _..3,61
P783 361
rP685244 6
P76854W 36
1P76855W 36
P76854W 36
Pi 1ý ...... 363Ejf6!! 38
P76855W 361
P76868W 3 6
IB6W 36s
1P76856 63W
P 76862W 3638
LPSBS8
Wý 36f
P76859W 361
[P7686•w 1 3.4
74 35 iW8W 7GST 1MIS
74 35NWNE G MIS
741 351NESW 1557 imIS
741 3S1 NWSW GS 'MIS
74' 35,688W 1557 'MIS
74 351
6S5W 65 MIS
74 35INESE 657 MIS....) .. ........ ... . ...... .;.. . . . .
74' 35.. ENWW 1GS 'MIS
74 35SWSE :G0T MIS
74' 351SESE Gs' i MIS
74 37'SWSW !G'5 S MIS
74: 35NWSE T MIS
7a4 35 SWNE [GST [MIS
74 351SENE G67 'MIS
74 .35 SESW 057 MON74 35 SESW1 G 657 MI)
3j, 3ES--' .6••, ON
74' " 35 ESW 657 MON7 3SSElNW 1G67 MON
741 35 88EW 651 MON
345 3SSWSE ; 'MON
.L1 36[NESE 557T ;MON
i 361NENW 'A IND
7$ý 36INWSE '657 ;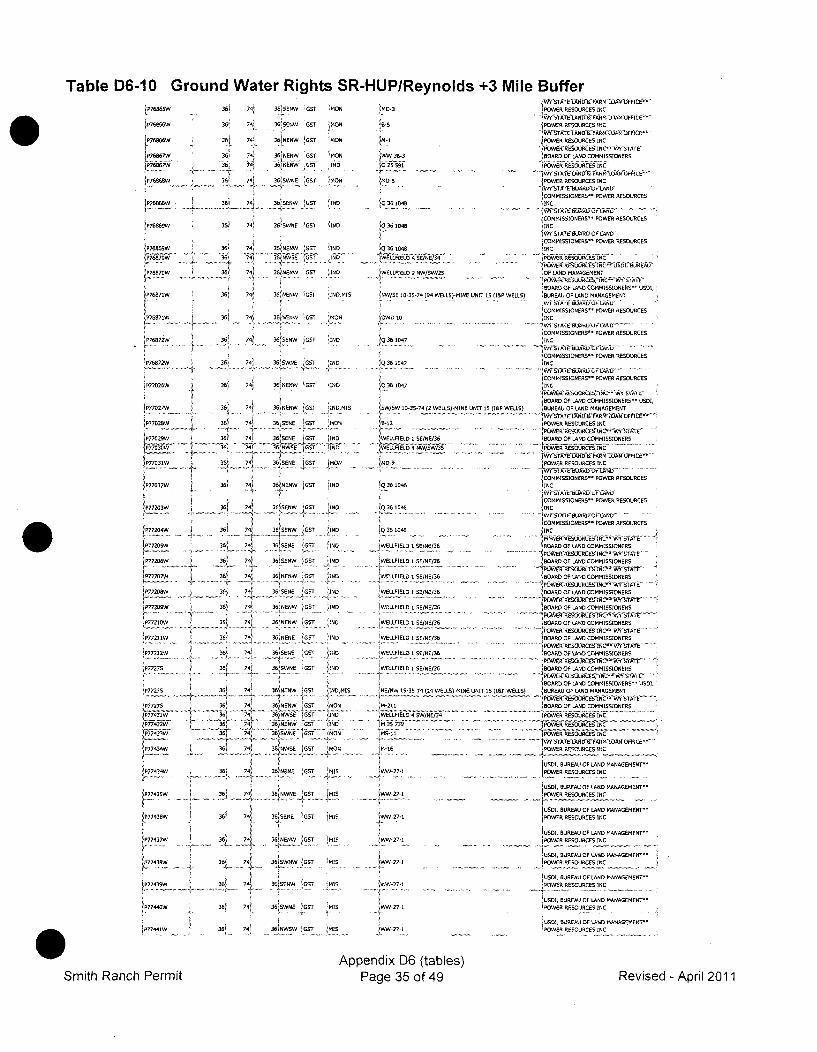
Table D6-10 Ground Water Rights SR-HUP/Reynolds +3 Mile BufferJP7686SW
IP76866W
P76866W
tP76867W
167666w
IP7686BW
P76870W
'P76870W
IP77D20 IW
1'.....•...... .P77025W
P77120W
S.. . .. . ... .. ....7 7. . .. . .. ..P772W11
iP7727W
'I'7
P7727S
jP770275
P77026W
.V-77 .....
iP703W
361 i 74 S 36'ENW 'GST ýMON
363
361
36ý
36!
36i
36f
361363
363
361
36Ž
743 i74Z
74i
741
74"
741
7 4
74'
,,71 ..
71i
3ý3
EENW "G5 MON
361NENW 5G0 MON
36 ýNEW SGST IND
36 SVNE 2 ST 1M6N
:A SENW iGSr 'Io
36SWNE 0s7 MOND
3týNERW rS'r ýIND
36 NENW SOT %IND
36 NENW Gl 1IND6MIS
366NENW SGOT MON
3616ENW ýGST MND
361 741 36(6NEW ýGST IND
adi 74' 36162NW 100 160N36t 741 36•6ENW (Sl INO.8
36K 71 356SENE 6 GST "0ON
361 74 361SEN0 GOT IND
36: 741' 36NW0 460 'N64.
361 741 36(6ENW jGST !IND
36i 656 t
36; 74J 365W! ... 160..... .... . .. . . ... . ... . .....IT . . ... .
2ý •i •tENW GST hIND361 741! 36ASENE GST 16ND
361 741 36ENW GOT 16ND
G6o 74 36.NENW 0G0T 6IN
36 74i 36 0ENE 507 160
3.61 74 1 h66N 1 007A 160'IN
36' 74 36 N626 1
GcT 'IND
36 74 36 5262 007 (IN
36 74 363NENW 5G01 16N0,MIS
36 743 366NENW 60T MON
36i ; : ....... ..... ......ýý -36, 74 3636EW0 CSOT 360
316T"66 60 MON36, 74"ONW2 O
361 t 74 NEN G36626
j/ "S',TAL 2•6 7"ARMI LOAN OFFLCE'".HD-3
1 POWER RESOURCES INC
3. 100 TATE 26606 FARM LOAN GIFFICE"
- IPOWER 6ESOURCES INC
M-1 1POWER RESOURCES INC
.i'36'L 18066 OF LAND COMMISSIONERS
10 2S ¶POWER RESOURC66 INC
COMMISSIONERS" POWER RESOURCES..Q.360046 INC
'COMMISSIONERS" POWER RESOURCES.03616 lt IINCi"- I •V' WSIAI'E" 6OAXYU 'A•" N.
ICOMMI0SIONERS" POWER RESOURCESQ3601046B6
-/WER R2UCES WC-
.WELL7IELO 2 NWISW/25 1072660 MANASEMENT
ROARD 01 7N6 COMMISSIONERS- USDI,(NW/SE 10-35-74 (94 WELLS)MINE UNIT 15 (I&P WELLS) 1BUREAU OF LAN0 MANAGEMENT
.. :355 OMSO.ERsS" OWv.....COMMISSIONERSO= POWER RESOURCES
S360107 _ INC
IQ 3610COMMISSIONERS" POWER RESOURCES
,Q360047INC
~COMMISSIONERS-- POWER RESOURCESQ 361047 1NC
COMMISSIONERS" POWER RESOURCESQ 360047INC
BOARDOFLAND COMMISSIONERS~ USDI,SW/W 10035-74 (2 WELL)MINE UN6T15 (1WELLS) BUREAU OF LAND MANAGEMENT
W2- N 3 POWER RESOAU CES INC
" 7" . . POWER RESOURCES INC
COMMISSIONERSC" POWER RESOURCESWQ 3E 104• INC
COMMISSIONERS" POWER RESOURCESIQ 36 1046 INC
COMMISSIONERS" POWER RESOURCES
S36 10465 jNC
.-WELFIELD I SEWNE/36 ROAR O1LAN LNG
CEL EINOMMRIO ES PADCOMWE ERS3WE4LFIE6D SE/NE/36 BOARD OF LAND COMMISSIONEIS
T, I'l'"" --I , - I , 1 11 -11, - 656C RE3U.CES INC~ WI b! ATE'
WELLFIELD S SE/NE/36 BOARD OF LAND COMMISSIONERS
.". ',. " ... •PUW, ..C.U.I..c ..tA .T'
WELLFIELD I SE/NE195 BOARD OF LAND COMMISSIONERSWELLFIELD 1 0E/NE/36 BOARD OF LAND COMMISSIONERS
"''PI1Ž'EURCIEA gsiNL'M WY SATmE'
WELLFIELO I SENE/A3 iBOARD OF LAND COMMISSIONERS
WELLFIELO 1 S/NE/36 BOARD OF 26ND COMMISOIONERS
..",8I .'.J01 -'tO.'A(/12 INC~"1/UY&TAT
BOARD OF LAND COMMISSIONER$- USD].
NIEJNW 15-3S-74 (24 WELLSI-MINE UNIT 1S (I&P WELLS) BURPEAU OF LAND MANAGEMENT
LM-2 1 S/BO6RD 60 LAND COMMISSIONERS
" ...... ........ ... .. ...............""" . " '"'"3P FARTEocoUNa I CF WV'IOANTUOE' ....
.POWER RESOURCES I W A
MLL-25 U3 E/I,3BURESA COMISNAER
....... . ...... . . POWER RESOURCESIC
WELL16L1OEE/6BAD020 COMOION R
tUNSS3D7, BUREAU 06 LAND MANAGEMENT~3OWER RESOURCES INC
USDI, BUREAU OF LAND MANAGEMENT"=
JUSDI, BUREAU 0F LAND MANAGEMENT==
MVAW-1 7-1 POWER RESOURCES INC
1USDI, BUREAU OF LAN0 MANAGEMENT"'WW-27-1 'POWER RESOURCES INC30001. BAEREAU OP LARD MANAGEMENT"
JPWR 6OURCR' INC _ "
3US501 BUREAU 072660D MANAGEMENT"'W-771 jPOWER RESOURCES INC
USD1, BUREAUAO072660 MANAGEMENT'IWW27-1
11POWER RESOURCES INC
1677430W36 74 36W2G7 MI
3777436W 3A¶ 74i 36NSENE CGOT (MIS
iP77437W ) 31 74 3636204 1007 81Is
t 111 7. 7$ "SWNW "OT 'MIS
RP77438W 36 761 3652W
1P77440W 3 36ý 74/ 36'SWNE 007T MIS
/ 3.
177741W 1 3B~ 7 43 36kNWSW 1G07 (MIS
Appendix D6 (tables)Page 35 of 49Smith Ranch Permit Revised - April 2011
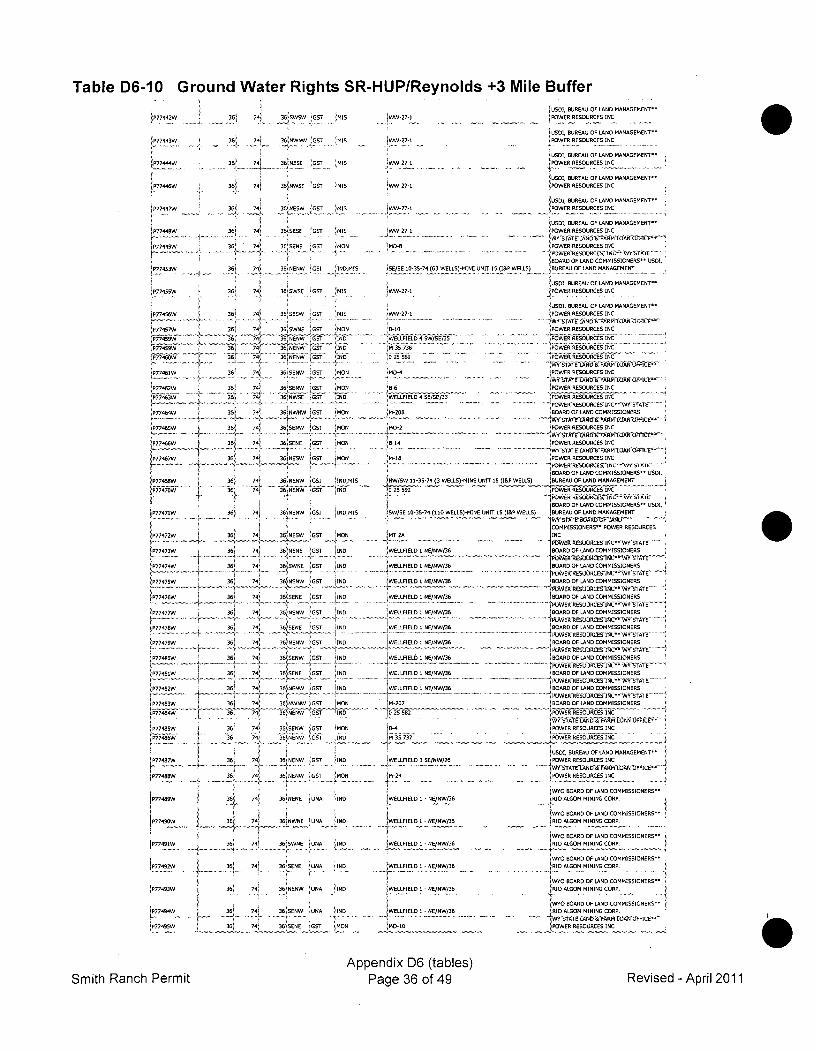
Table D6-10 Ground Water Rights SR-HUP/Reynolds +3 Mile Buffer
IP77442W 36' 74j ••W!S3A! 741 3SNWSW UST
mIS V VN-7- I
;MIS JW-27-1
1US0I, BUREAU OF LAND MANAGEMENT--
iPOWER RESOURCES INC
!USDI, BUREAU OF LAND MANAGEMENT-"
!POWER RESOURCES INC
JP77444W
JP77446
p77447W
P77453W
IP77455W
0USDI, BUREAU OF LAND MANAGEMENTR
36! 741 36jNUSE ;OsT 1MIS ;WW-27-I 1POWER RESOURCES INC
36 7USDI, BUREAU OP LAND MANAGEMENT .
361 741 36'NWSE OT MIS -•-27-1 POWER RESOURCES INC
6 i EWUSDI, BUREAU OP LAND MANAGEMENT-
361 74 36RSESE OGST ýMIS WW-27-1 POWER RESOURCES INC
36 7 36 S BE OUT .MON . M. -B POWER RESOURCES INC
1I I I BOARD OP LAND COMMISSIONERS- USD1,361 ,74! 36 NENW 1051 IND,61 5E/SE 103S-74 (63 WELLS)-MINE UNIT 15 (I&P WELLS) BUREAU OF LAND MANAGEMENT
361 740 36USWSE IGST NMIS EWW-27-1
77456W 36 74 3SESW LUT "IS
3P7 744 336SWNE OGT MON
;77!5W 3A 74 O6 NENWV OUG INP7 ....... .. 74 361 ,W W O T
A. 4 6 7 36%"ElW G U INC
36 741 36ý SENW OUT MON
jP77462W 36 74i 36 SENW 1UT MON
7F ,... 71 36 NWSE OU Iý NS
P77462W 36 74' 36NSENW GST MON4,.w • . 4 ,K-7 3AjEB .. ST ,i• MON
1P777466 74, 361SENE OST IMON
P774W 1 36ý 74 36NNWS INS MIS
4 741 Oj6NENW OGST INS
1P.77471W, o 361 NENW OS IND MIS• !.7 ... i• - •s! ? ...... • ... ........... ..MON ..
36 74k
P7747TW W 361 74
P77475W 361 74i
P77478W 361 741
P77476W 36 74
P774 MUW 36 741
P774VVW 36 71P77462 361 1
1P743 I 361 741
,P77484W j 36' 74
jfr . ... ...... i. . . .. . . ... ,.P 36w 741P7746 74.
P7486W 1 361j 4
L[P7746W3 4
fP7741M35
jP774NSW 1 36, 71
______ 36 74i
36SWNE DGST
36ENENE • G•T
36 SWNE IUST
36 UENE OGT
3AINENW OST
36'UE6E OUT
36 NENWA OUT7
36 E}N E 455
36 NENW1 GSUT
36'NWNW GOUT
36,NENW GST
361SENW OGST
'MON
IND
IND
IND
IND
'INSIND
IND
IND
MON
MIND
ýMON
IND
,-27-I
6B-10
WELPFIELO 4 SW/SE/35
WELLFIELD 4 SE/SE/33i
6B-14
'M-1
iNW/SW 11-35-74 (3 WELLS)-MINE UNIT 15 (I&P WEI
'5W/SE 10-35-74 (110 WELLS)-MINE UNIT 15 (I&P WI
IWELLFIELD 1 NE/NW/36
WELLFIELD I NE/NW/36
WELLFIELD 1 NE/NW/36
WELLFIELD I NE/NW/36
VWELLFIELD 1 NE/NW/36
WELLFIELD 1 NE/NW/36
•M-207
IM-24
USDI, BUREAU OF LAND MANAGEMENT"
POWER RESOURCES INC
USDI, BUREAU OP LAND MANAGEMENT"
POWER RESOURCES INC
ATE'~LAND5 &SPREM LOA6OPP--~POWER RESOURCES INC
POWER RESOURCES INC..
[POWER RESOURCES INC
POWER RESOURCES INCW~rUA5O6JiCES
. .POWER'RESUORCESINCE IWYSTATE
BOARD OF LAND COMMISSIONERS. POWER R5-ESU•,•SAPASf , INC CECE IN-
POWER RESOURCES INC
POWER RESOURCES INC
POWERRESOURCES1INC
BOARD OF LAND COMMISSIONERS- USDI,.LS) BUREAU OF LAND MANAGEMENTOC
POWER RESOURCES INC
BOARD OF LAND COMMISSIONERS- USDI,jWLS) BUREAU OF LAND MANAGEMENT
COMMISSIONERS- POWER RESOURCES
INC R
BOARD OF LAND COMMISSIONERS
5) BURAUD UPLAND CMANSMESINTRPOWER RESOURCES INC-W ;xE
BOARD OF LAND COMMISSIONERS D1
BOARD OF LAND COMMISSIONERS
BOARD OF LAND COMMISSIONERS R
BOU.ARD OF LND COMMISSIONERS
ý'OWE EUUACIIL 4/PT
BOARD OF LAND COMMISSIONERU
BOARD OF LAND COMMISSIONERSPOWERE Al UAND iCOMS O TE"
BOARD OF LAND COMMISSIONERS-POWEESOURCESINC',WP STAtUE
BOARD OF LAND COMMISSIONERS
POWER RESOURCESiNC T
POWER RESOURCES INCWYO BOARD OF LAND COMMISSIONERS
POWER ARESOURCES INCO.
- BOfVARD t~rR UPLAN COMMISIONER1POWER6RESOURCES DINC" TT
WYO BOARD OF LAND COMMISSIONERS-
.... R/.CM MININ WRP. .. .T
W-0 BOARD OF LAND COMMISSION ERS*.
RIO ALGOM MINING CORP.
WYOARD U LAND COMMISSIONERS "
BIO ALD UMININD CORP. S
IMBOARD UP LAND COMMISSIONERS-POWE RESOURCESNINGCOP
363 NENW GST ND
OB3NENW ;SUT MON
361NENE 1UNA INS
3B1NWNE !UNA INS
JP774 191T
IP77493W
[P774N4W 1 .77, I•P..!!! j
74j Iut iIND36!1741 36jSWNE 1UN, I11•B 4 361ŽENE SONA ND.....
365 741 36SENW jUNA IND
361 74' 36 SENE OGT 1MON
I WELLPIESO SI NE/NW/OS
JWELLFIELD 1 - NE/NW/36
WELLFIELD 1 - NE/NW/3O
1WELLFIELD 1 - NE/NW/36....... .. ...........
WSLLFIELD I - NE/NW/OS
WYA BOARD OF LAND COMMISSIONERS-RIO ALGOM MINING CORP.
1WY0 BOARD OF LAND COMMISSIONERS-RIO ALGOM MINING CORP.
JPOWER RESOURCES INC
Appendix D6 (tables)Smith Ranch Permit Page 36 of 49 Revised - April 2011
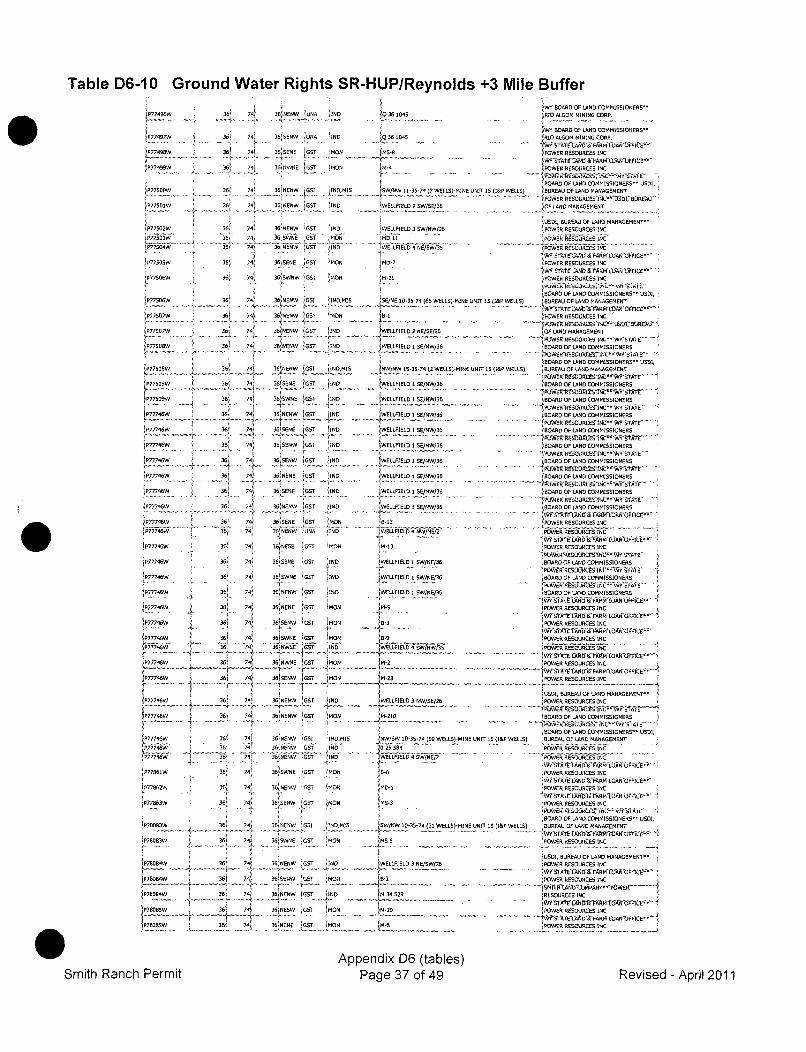
Table D6-10 Ground Water Rights SR-HUP/Reynolds +3 Mile Buffer
777496W
1IP774NMW
jP7750SW
iP77502W
P77500W
177750W
360 741 301408W 10NA 1W
36i
361
361
74
741
36ý .. W tUNA
361SENE SIT
36(8NNE IjoT
-IND
-MON
IMON
1?3,? I .!t. (M....
Q 361045
76S 74i 360NENW Gs0 1INSMIS kyN/NW 11-35-74 7 WELLS)-MINE UNIT 15 (IP WELLS)
-3% I 4( - i 356W 057 160 1WEELPIELD 2 SW/SE/26
36'30
365
36i
74,741741
741
.569N6W ýGST•isv' oWG .i'
36 SFNE 'G5 3
3ý swNw iGST
ýP7750W
r7707W1
1P777506W
jP77508W
IP77746W
IP77746W
jP77746W
P77746W
IP77746W
177746W1
P77746W
P7776W
P77746W
fr77746w
1P7;746W
.P77740W
jP777486W
IP77862W
ýP77863W
4 .. ,
1-....
70. 7, 36 AEW 155J
36 1 71 36iNRNW 'GOT
36 74 36SNENW lUST
36! 741 36 NENW LGST35, 74, 35105w OS"
361 741 34ŽWNE 100
361 741 Sn J36f 741 366SWNE oGST
365 74 36ýNENW G
36 74 1 ý 61
ENE GOT1..1.. 3G, . • ~wIG ,
36 74 36,SENE 0GST
76 74 36 NeW 166
36 7' 3616000 1007
36 74, 36SENE 007
361 74' 36 SW.N E loss
361 77 1 5E6w571 00
301 741 35'NEN .E I GOT53 6
f 74' 361SEW GoST
3s6 741 's30WNE 007
'7 36' WE 675 GOT
361 741 3615WNE J•
1sT
36! 741 361NENW [GS
36s 74, 3616ENW 1G00
•BI 7•i •SIS-NSI•S
1601•IND
-MON
MON
'IND, MIS
!MON
IND
"IND
!INOMIS
IN8
,IN
1IND
IMON
•OND
ýMND
!IND
• INO
1MN
.'160
MON
sON
'IN0
MON
(MON
(MON
ýMON
1GE/NE 10-35-74 (65 WELLS)-MINE UNIT IS (lOP WELLS)
WELFIELO 2 6E67E026
.WELLFIELO 1 06/1W/36
N N -55-74 (0 WELLE)-MINE UNIT 15 (IfP WELLS)
IWELLFIEL0 1 SE/NW/36
1WELLFIELD I SE/NW/36
WELLFIELO I SE/NW/36
1WELLFIELD I SE/NW/36
(WELLFIELD 1 SE(NW(35
WELLFIELD I SE/NW/35
VWLLFIELD I SE/NW136
,WOLLPIELO D 66158-13
WEULFIELDS SW4/NE/36
.EWELLFI.ELD I.SW"NE/36
WELLFIELO I SW/NE/36
B-3B- I
!M-23
WELLFIELD 3 NW/SE/25
.1-210
INWISW 10-35-74 (50 WELLS)-MINE UNT15(108 WELLS)
0E25584,W5LLPL 4i, SiW/NR/2
1MS-3
1WELFI ELD 3 SW/NW/26!1'• ........
D-7
IWY BOARD OF LAND COMMISSIONERS"
RIO ALGOM MINING CORP.
WY BOARD Of LAND COMMISSIONERS"
RIO ALGOM MINING CORP.
}PWTA RESOURCES INC
IPOWER RESOURCES INC
(POWER RESOURCES INC
1PLSOWERRESOURC7S7(NCD.-II
BOAR7 OF LAND COMMISSIONERS' USDI,6BUREAUOF LAND MANAGEMENT
I ANGA60600666
.U.. I, BUR• R OSF LAND MANAGEMENT~
(POWER RESOURCES INCýPbwso RESOURCES INC
IBOARD OF LAND COMMISSIONERS" USDI,
BUREAU OF LAND MANAGEMENT,5YOSTARE O1AND06 66M6SLOAN 1177E1S
'POWER RESOURCES INC
1OLATD AMEANDAGEMMISATONER
IPUA4ER/SUCikE005JN1ISS(115&648 5101
18000 O P LAND COM M ISSIO NERS
80060607F LANG MANAGEMENT1WYSTAI ELIG34PO0RML AA07E"
(P. "iOWER ~ tRESORCG NC "••," ...
,BOARD OF LAND COMMISSIONERS 1
(BO AR OF74 MANAGEOMENT IO ER
..... WEi'RE5S3CMC0.(N1,• W"OS'iE' ......
8BOARD OF LAND COMMISSIONERS
BOARD OF LAND COMMISSIONERS
BOARD OF LAND COMMISSIONERS
BCRURA OP LANG COMISNIOEMEN
BOARD OF LAND COMMISSIONERS
E4OARD OF LAND COMMISSIONERS
066 07F O LAND COMMISSIONERS
POWER RESOURCES RNC E
!POWER RESOURCES INC
1BOARDOF LAND COMMISSIONERS
BOARD OB LAND COMMISSIONERS
BOARD OP LAND COMMISSIONERS
!POWER RESOURCES INC,
1800000 LANG LOMM AINGR5IC
4 TPOWER RESOURCES INC
'POWER RESOURCES INC
SP4C~OURCES INC
IPOWER RESOURCES INC
' POWER RESOURCES CNC.USDI, BUREAU OF LAND MANAGEMENTRS
(PUUWER RESURCES INC 0
ýBOARD OF LAND COMMISSIONERS
BOARD OF LAND COMMISSIONERS~ USDI,
: RBUREAU OF LAND MAN'AGAMENT
IPOWEýRREOREIN
(POWER RESOURCES INC
'--I.•ALELANDISOFARKI LUAOPI J1CE'
POWER RESOURCES INC
'POWER REGOURCES INC
(POWER RESOURCES INC
-RESURCE IN --CCE
IIN
'OUSD RSUREAU OF LAN MANAEMENT(POWER RESOURCES INC
MITIowo sNCO05 U R T t
f lt
1PW1RRESOURCES INC
ýPOWER RESOURCES INC
W t "71 LAND M 6700 AN"h,'71CIV"
36,3Aý
361ý
74(
74.7'1
36 NENW
36. NENW
36ANENW
36 NENW
36 SENW
ýGSI
iGST
OST
P780 ..3W.. 361 71, 76 ý6N0 51 160 MIS 1sw/Nwýo 1-3-74 (31 WELLS)-MINE UNIT IS (I8, WELLS)
Ps8o83w 1 36' 74ý 36SGWNE 0Gs ýMON MS-N
80B4W36W 74ý 360NENW GST ýINO IWELLFIELD 3 NE/SW/26
(P78U4w , 30( 741 36SENW !GST jMON JB-2
1P77854W 61 301 74J 36iNENW 'GO3T INO lM 524
(P78085W 30' 741 361NESW 0GST MON 1620
~URSW 501 741 ,.36ENE 0 MON IM ".
0 Appendix D6 (tables)Page 37 of 49Smith Ranch Permit Revised - April 2011
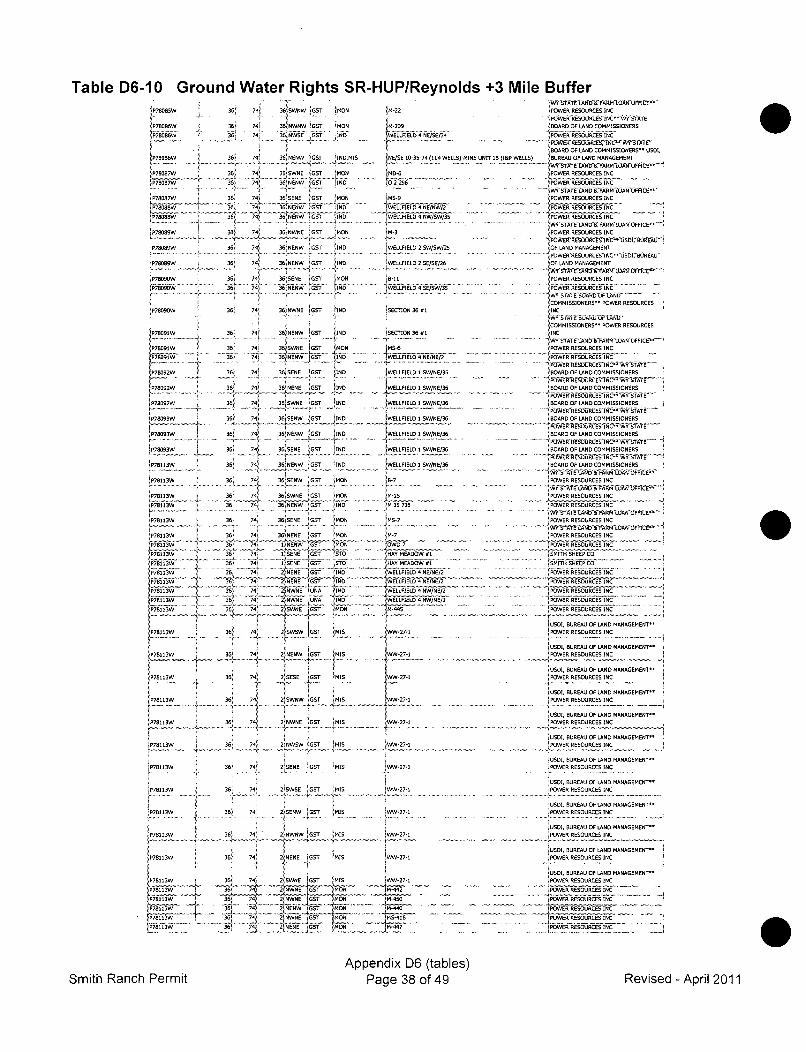
Table D6-10 GrouitP7808SW
P780...8P78086W
IP78087W
P78088W
P78089W
P78089W
P P78090W
IP78090W
P78091W
P78092W
P78092W
1P78092W_
P78093W
P78083W _
IP78093W
P78113W
P780I13W
P78113W
ja!I'WiN.......
'P78183W
P78113W
P78 113W
iBLL '•'• .....
-"7..
-C-.
-v
-- 4.,
4
nd Water Rights SR-HUP/Reynolds +3 Mile Buffer36i 741 361SWIW ST !MON 122 [POWER RESOURCES INC
36: 741 368EWNW 1SOT IMON M-0 f80680 OP LAND COMMISSIONERS36i 74, 'kAEn GST jIND WSLLPIELDw 61/SE/UN
.,j•" . .p)-E R•sjRc•-i 5-. 6372T
8 'BOARD OF LAND COMMISSIONERS~ USD8,36! 74J 361NENW 058 OINDMIS NE/SE 10-35-7 (114 WELLS)-MINE UNIrr s (I&P WELLS) 906UREA OP LAND MANAGEMENE
....... .... . . . ......... .............. ................ .y AUOFLNDMA • AG•M•NT
360 1 36 OWNE O MON ' MD-6 .POWER RESOURCES INC
36 7', 36 SENE 61 ST 8860 iMS-9 POWER RESOURCES INC
.....3F••...... 741........ 36 'NENW G.............. GS'7 "AND ..... ... .... ... . .. . ... "I EL IEL U6 N ýW/SWI35 .. ...... ........ .. ...... ..... . ... 1$OWE RESOURCE IN "t
36 74. 36ENWNE -GST 0MON IM-3 POWER RESOURCES INC
36. 74 36NENW 1"T I4NS W ELLPRLD YW/7N/•25 [F RE SOURCGEMENT36: 74IPWERRýESOIJECES INC"Ot,8RA
36 74' 361NENW -GST IND WELLFIELD 2 SE/SE/26 3OF5LA MANAGEMENT
.......... .... ... ..•i E L • . . °.. .. .................. .- - .. ...... ... ....... ...... .. ... . ... .. ... .L..OAN U P/ICE-- .... ... ... . ....
36 740 36ENWE OUT MOIND W-3 0POWER RESOURCES INC
-PUWERE650RLEI&-JD:UEU-N... ... •. .... ..•... ........• ......... .... .... i. . . .. .. W 5M 5 ... ..... ... . .. .... . ..... .. .... . . . . . . . . . . 4..... " 'A • O . ... . ...
32 7 4
T 4WOEISSEONERS2 POWER RESOURCESPW36 7 3 WN GS ]N SECTION 36 #1 INC
6 36[WNEW ;G . ...40IAD AASM
4 COMMISSIONERS" POWER RESOURCES
6 _741 36 ENW SIOT ND SE 36ON31I36 74, SETO INCO C!JC
TOMISONR POWER RESOURCESIN
368 744 36INE.NW , J!N, , WELLFIELD I SW/NE/36 BOARD OF LAND COMMISSIONERS
; ' •~ ~- .............................. ....... ...... ........- W•OSTATE 'lANDUFARM LANCT ' 'E
361 36 OWNE 7GO IRNG '.5-6 OLPOEREOURCESSINC
368 ' 36SWNE I ST •N TWELLFIELID 4IWNE/36 (POARD OF W ND COMMISSIONERS.4.- . I.6- . -- 4G7_j.N USERDOFN CEOMMISSIN072T6ERS
36f 78 30SENE SOT jIN 4WE.LLELD 1 N 4 BOARD OF LAND COMMISSIONERS
36B 744 3RNENE iGST 8IND IWELLFIELD 1 SW/NE136 BOARD OF LAND COMMISSIONERS
. .. ...... 7.. . . . 5 ....... " -.... .. • .......... .. "--..-.. . ............... ...... . . .....~.. .. .. .. ......... "iI, R (ELj.• •t i 90725/A•yE•
361 7,1 36SENE GTWELLPIELD I SW/NE/36 'BOARD OF LAND COMMISSIONERS
368 .... 74 ..... . W.. E {.......T. fIND.... ............... ................... . . . . . . ..... .. .. . ..... . . . O LAND•. • #COMMISSION,~tERS ,,
36, 74 35SýW ý(? 7POW0ERRESOUJRCES INC'A6T36 741 3EWELIELD 1 SWGNE36 B3oARD OP LAND COMMISSIONERSC
36i 74 6S ,0S736!SENW S GST N IB7 POEREOURCESINC........ . . .. . . . . . . . . .......... ...... . . . . Rft .
36 74 360
EW OCT IWON ME 1 POWER RLSOMRMSSONERS
30 74 1 360
ENW GSO IO -7. POWER RESOURCES INC36: 74' 36 SWNE SOT !MON IM"1 POWERBRESOURCESINC
36. 74 1 SENE ;GST SNOD MO I 7SMITH SHEEP CO. I
.... > " • ........ S r .".T• ''•'6. ................... H • B ... ................. ................. O•?ITA• • "AN ............... ...N..U........ -:
36 74 26NENE SOT N 7WELLE POWER RESOURCES INC
36. 74 36NENE SOOT :I0C WL7 4 POWER RESOURCES INC
S 4 1 S USDI, BUREAU OF LAND MANAGEMENTS"36 74' 2
1SWSW WGELL/IWL- 4POWER RESOURCES INC
~~~. .~0-- .,......
• i ; " • USDI, BUREAU OF LANE) MANAGEMENT"360 74 2SNE 666 IGST WE!LPIEL.V4,' W/NE/3 POWER RESOURCES INC'. 4_ ....-....,....-..-.. ....... ..
SUSDI, BUREAU OF LAND MANAGEMENT~364 74 420SESE GST 0M0S IWW-27-1 POW!R RESOURCESIC
46474 "USDI, BUREAU OF LAND MANAGEMENT36 74 24SESE OUT MIS RAN-27-1 POWER RESOURCES INC
4 iUSDI, BUREAU OF LAND MANAGENT"361 74 2 SWNE ST MIS -27-POWER EESOURCES INC
4NWNE POWER RESOURCES INC
0 USD1 BUREAU OF LAND MANAGEMENT036 74 2 NWSW 2 0C ,IS POWER RESOURCES INC
5501I BUREAU UP LAND MANAGEMENT"36 748 21SENE GST IMIS WW-27-1 'POWER RESOURCES INC
0USD0, BUREAU OF LAND MANAGEMENT~36ý 7 SWSE MIS 1.,- 'POWER RESOURCES INC
IUSD1, BUREAU UP LAND MANAOEMENT36. 74r 2....W. 1. .2.. ... -7-1 i POWER RESOURCES INC
• "• -"""• ° - ••? •N--• • ' 'I o• ........... .. • - • ... .. ............ ... ....I • E-- -• UR E-- T N'• ........... ... ...
5501, BUREAU UP LAND MANAGEMENT"368 74, 2
0SWNW 10CC ýMIS IVVW-27-1 'POWER RESOUCES INC
S0 USD8 BUREAU OF LAND MANAGE•ENT~ 0368 74ý 2.4NENE SOT MIS 1. 271" POWER RESOURCES INC 0
jUSD1, BUREAU UP LAND MANAGEMENT"364 741 2 OWNE TC MIS WW-2P-i POWE R RESOURCSIN
71~. 2oNWNE 'GOT MO~N 042 POWER RESOURCES INC
36pen i 76 2(tables) II
---4-O 4006 !-40 POWER RESOUR ES INC341 74t ST MCI 0-E PWE RESOURCES INC14 - 17" t+N .00-416 POWER RESOURCES INC
Page 38 of 49 Revised
LP78113OW
"P78113W
LP78113W
P78113W
P78113W
P78113W
.... ..........!....
1p..1w 1:
Smith Ranch Permit - April 2011
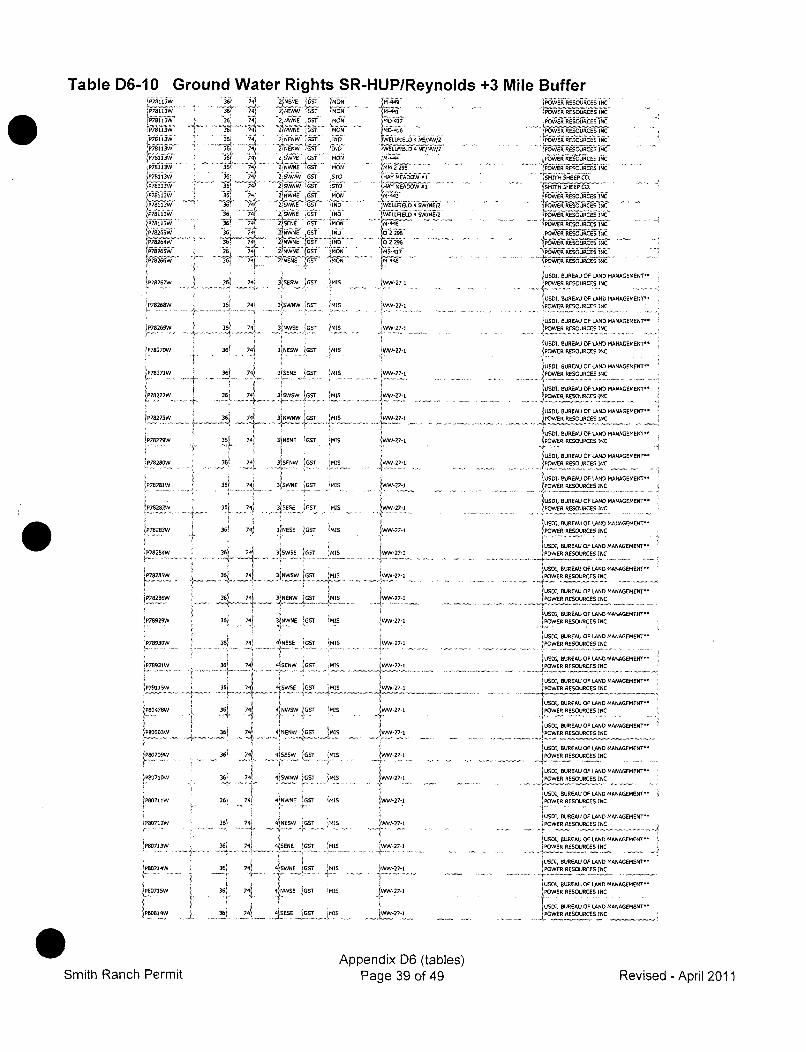
Table D6-10 Ground Water Rights SR-HUP/Reynolds +3 Mile Buffer
P78113W
P78113W
P718113W
P78113P78113W1ý
ýP78264W
'P78269W
IP7827ow
P78271W
38, 741
38 7
386 74138636 74'36 741
38. 74'
361 744
38 74ý
36 74ý
36.. . ..
381 744
36ý 74i
74
361 74ý
36 74LL
381 74"
361 741
44.. . ....
364 74
2 62EW 1GS1 MO.N M-44 .
2 NWNE CST MON
2 86416 SST IND 1WULPIELU4 Ni/NW/U
2 WNE1 C-T MON -442 WVN6 CIT MO 1 M 24
2 1SWNW I'OAT HAY MEADO6W El
2 NWN1E GO MO 7742 SWNE G9 IND 'WELLPIELD 4 SWINEO2
2 OWNE 651 1ý6 IWELIPELD4SWNUtSEtNE CIT MON N-446
CWN CIT 180 10_2 296
7'NENE ~ ~ I 61 MO M448
3'SESW 'CIT ýMIS WW27-1
3JSWNW ;SIT 27 1
3'NWSE CIT ýMIS VW27-1
3,625W 1617 'MIS W-27-1
312NE 1617` ;MIS 1 27-1
31SWSW CT1 145 1 2
316260 617T '41 i-27-1
+E5NW 'GSIT I W-27-1
3iSWNE 017T MIS WW27-1
.. 5 'SIAESE i . .T MIS . ...27.1
3'NESE IGSTE6 " 'MIS 37 2-1
3 ISW5E ST :MIS 4 271
3' WSW !G67 MIS iww-27-1
4P78272W,
1P78273W
1P78279W
1P78280W
P78281W
IP78282W
;P78285W
fP7828SW
4P782 86W
4P78929W
p78930W
P78931W
jP791ISW
P80478W
IPBD503W
-P80711W
P807132W
iP80713W
4 P602 4W
POWER RESOURCES INC
POWER RESOIRCES
INC
POWER REOUiRCES INC
POWER RESOURCES INC
POWER RESOURCES INC
USIER RESOURCES IN E
POWER RESOURCES INC
POWER RESOURCES INC
POWER RESOURCES INC
USPOWER RESOURCES INC
USDI, BU6AU OF LAND MANAGEMENT~
1POWER RESOURCES INC
ýUSDI, BUREAU OF LAND MANAGEMENT"!P~OER RESOURCES INC
6US0, BUREAU OF LAND MANAGEMENT"
.POWER RESOURCES INC
1USDI, BUREAU OF LAND MANAGEMENT--
4POWE RESOURCES INC
1551j, BUREAU OP LAND MANAGEMENT"
POWER RESOURCES INC
(US1I, BUREAU OF LAND MANAGEMENT=4POWER RESOURCES INC
JUS B50.UREAU OP LAND MANAGEMENT~
j.PO.!ER RE.SýRCES INC
IUSOI, BUREAU OF LAND MANAGEMENT~4POWER RESOURCES INC
USDI, BUREAU OF LAND MANAGEMRNT1*POWER RESOURCES INC
USDI, BUREAU Of LAND MANAGEMENT~
POWER RESOURCES INC
USD1, BUREAU OF LAND MANAGEMENT~
POWER RESOURCES INC
USDI, BUREAU Of LAND MANAGEMENT--POWER RESOURCES INC
USDI, BUREAU OP LAND MANAGEMENT~POWER RESOURCES INC
USDI, BUREAU OF LAND MANAGEMENT'
POWER RESOURCES INC
US01, BUREAU OF LAND MANAGEMENT"
IPOWER RESOURCES INC
6USDI, BUREAU OF LAND MANAGEMENT"
4POWER RESOURCES INC
'POWER RESOURCED INC
USDI, BUREAU OF LAND MANAGEMENT~JPOWER RESOURCES INC
4USOD, BUREAU OF LAND MANAGEMENT"POWER RESOURCES INC
USDS, BUREAU OP LARD MANAGEMENT'
POWER RESOURCES INC
-USD1, BUREAU OF LAND MANAGEMENT"
tPOWER RESOURCES INC6501., BUREAU OP LAND MANAGEMENT~'4 POWER RESOUCES INC
tUI, BUREAU OP LAND MANAUEMENT'"JPOWER RESOURCES INCIUSD1, BUREAU OP LAND MANAGEMENT~,POWER RESOURCES INC
65S01, BUREAU OP LAND MANAGEMENT"
POWER RESOURCES INC
IUDBUREAU OP LAND MANAGEMENT"POWER RESOURCES INC
JUSD1. BUREAU OP LAND MANAGEMENIT"POE RSUýRCES INC
...4o
--4-
3 4 .... 3,NENW 017 S36 744 3(IWNE IGST 'M is
I74 4"NESE IGST '111
35 74 4NSENW 'GST MIS
68 74! 4sESW •SIT MIS
36-1 1 GT
36. 74j INENW G7 ý4M4S
381 7, 445WW 1GST MIS
361 74 41SENE •GS'T 'MIS
36f 74t 4,SWNESST MIS36• 741 . ..41ANWE 017 ,MIS
36 1 741 4jN4WSE 4617S ';MIS
36 4 SESE jGST 1415
IWW-27-I
-27-1
AWW-27-S
IWVV-27-1
...- 37-I
• '' -27- 1
WW271}
WW-27-1
W-27-I
W -27-1
.IAw-27-1PE1071W
SPROBPit
Smith Ranch PermitAppendix D6 (tables)
Page 39 of 49 Revised - April 2011
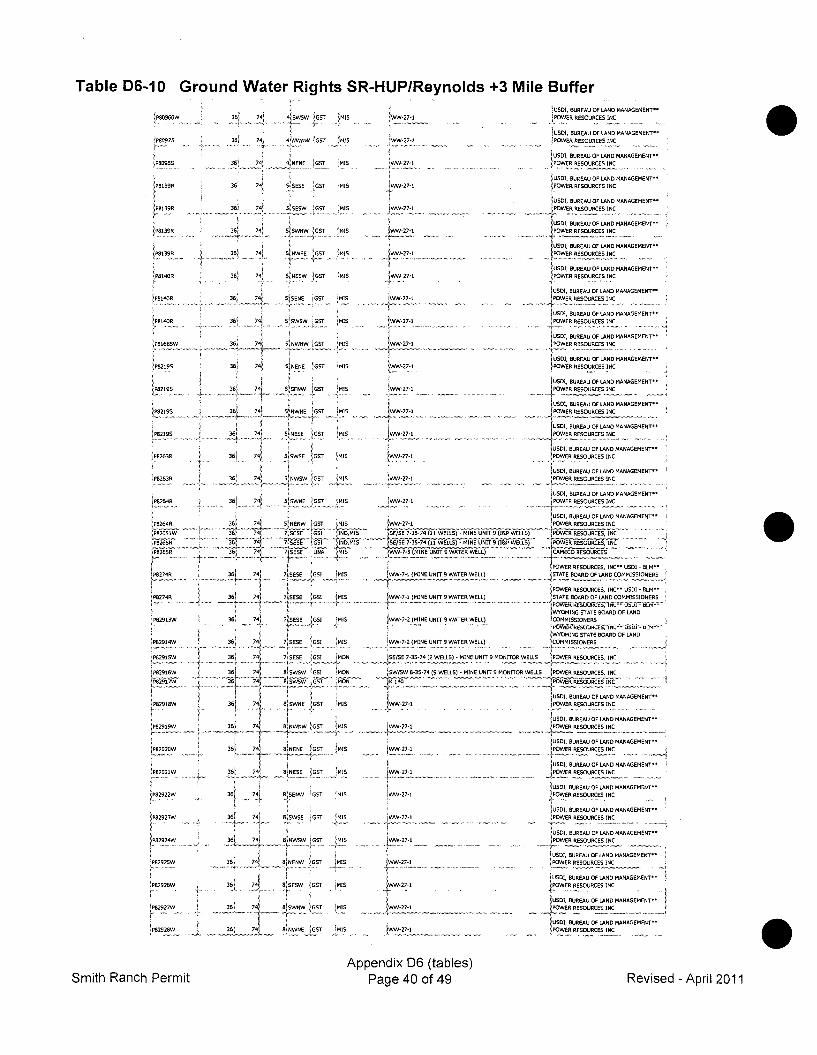
Table D6-10 Ground Water Rights SR-HUP/Reynolds +3 Mile Buffer
!P80960W
P8097s
P8139S
P8139R
P814OR
•P81885W
P8219S
2S..
P826313
,P8263R
1'PB264R
P82654P8265W
H. -
P•2913W
P82914W
1P82915W
IP82916W
'P82917W
IP82989W
P82922W
iP8291
?'1
ýP82922W
P82923W
[P82924W
iP82925W
!P82926W
P82927W
682928W
36s 741 4'SWSW GS'
33s 74 -N'YWW -S7
38' 74 4 9ENE lsET
368 742 55555E'GST
836 74 S 5ESW GST
38 74 5 SWNW 1SST
38, 74, 5NWSE IGST
368' 74 S NESW 55ST
387 74) SSNENE G8387. 74; S~5EBW 7IT
385 74) 5NWNW 5G5
381 741 5"NESE !GS7
S4.. ..38, 72 S ES NWW 5GST
7 3813 74 SNWNE GST
36 74 5WENWE GST
38... , 74I 7 .. 8. 5536! 74 7 5INWSW 2GsT
3f 74i 5N8E UGST
38 74 77585 [W 5
1 7.75ES Gs1
36, 74 7 SESE GS
74/ 75ESE GSI
36 74 71SESE GS1" 361 74i 8SWSW GSI
7 3.. ! 74 B. SWSW . .!
36. 74 8ýSWNE GST
361 74' SINENE GST
474 1 ESE 7GST
387. 741 BISENW 7GST2 9
L
9MIS WW-27-1
1M4S -27.1
'MIS ,8WW-27-1
ýMIS iW-27-1
iMIS *W-27-1
NIsS W-27-1
iMIS WW-27-1
'MIS
!MIS IOW'27-1_
!MIS VWW-27-1
8128 IW-27-1
ýMIS ýWW-27-1
$6;ir'r3:j~zll rt). NI(1I1 WELLS) -AELrIMIS S -3- (11 WAEL ' EU ( W
"is, JWW-•7-1 MN NT9 AE EL
;MIS jWW -2/I-L NI ATRWE~
MIS 7W-7-2(MIN UNITSWATERWELL)S............. -"-'~....... ... ...
MIiS 1WW-7-1 (MINE uJNrr9 WATE88 WELL)
IS )WW-7-37 (MINE UNIT 9 WATER WELL)
•MIS .5.WW-7-2.(.188 UNIT N WVATER WELL).
!MIS lI'v-7- 2)MINE UNIT9EWATER WELL)
1MON SE/SE 7-38-74 (9 WELLS) - MINE UNIT 9 MONITOR WELLS
....... ~ J• Y,:7•<- .. .,.......... .41 ~.. 40.1-,. ..,..,.
MIS WW-27-1
MIS WW-27-1
. ......... .. ................
MIS W-27-S
5USDI, BUREAU OF LAND MANAGEMENT~
PO W ER RESOURCES INC
USDI, BUREAU OF LASD MANAGEMENT"
POWER RESOURCES INC
1U8D1, BUREAU OP LAND MANAGEMENT~
POWER RESOURCES INC
USDI, BUREAU OF LAND MANAGEMENT~
POWER RESOURCES INC
tUSD1, BUREAU OF LAND MANAGEMENT~
POWER RESOURCES NCI 8801, BUREAU OF LAND MANAGEMENT~
POWER RESOURCES INC
USD2I BUREAU OF LAND MANAGEMENT..
WER RESOURCES INC
USDI, BUREAU OP LAND MANAGEMENTW
POWER RESOURCES INC
USI, 88REAU OF LAND MANAGEMENT~
4POWIER!RESORCES INC.
JUSD2, BUREAU OF LAND MANAGEMENT..
POWER RESOURCES INC
USDI, BUREAU OF LAND MANAGEMENT"I POWER RESOURCES INC
jUSSI, BUREAU SF LAND MANAGEMENT
POWER RESOURCES INC
.WERRESOURCES INCUSO l, BURE AU OF LSAJN D MANAGEMENT~
4USDI, BUREAU OF LAND MANAGEMENT~
POWER RESOURCES INC
USD1, BUREAU OF LAND MANAGEMENT."
POWER RESOSRCES INC
18681, BUREAU OP LAND MANAGEMENT'POWER RESOURCES INC
USDI, BUREAU OF LAND MANAGEMENT-2
POWER RESOURCES INC
USDI, BUREAU OF LAND MANAGEMENT"
,.POWER RESOURCES INC
USD1, BUREAU OF LAND MANAGEMENT~POWER RESOURCES INC
(PWR RESOURCES, N C
"P.ER RESOURCES, INC- USDI BLM'"
i STATE OUARD OF LAND COMMISSIONERS
IPOWER RESOURCES, INC" USDI - BLM..
157875 BOURD OF LAND COMMISSIONERS
WYOMING STATE BOARD OF LAND
COMMISSIONERS
WYOMING STATE BOARD OF LAND
COMMISSIONERS 2
ýPOWER RESOURCES, INC
POWER RESOURCES, INC
iPOWER RESOURCES
INC
USD1, BUREAU OF LAND MANAGEMENT"POWER RESOURCES INC
SUSDI, BUREAU OF LAND MANAGEMENT"
POWER RESOURCES INC
IUSD1, BUREAU OF LAND MANAGEMENT~
POWUR RESUORCES INC
8USDI, BUREAU OF LAND MANAGEMENT--
1 POWER RESOURCES INC
IUUDI, BUREAU SF LAND MANAGEMENT"
RPOWER RESOURCES INC
DUSQI, BUREAU OF LAND MANAGEMENT"
POWER BESOURCES INC
UUSI, BUREAU OF LAND MANAGEMENT"
JOWER RESOURCES INC
USD1, BUREAU OF LAND MANAGEMENT"*
.C.ER RESoURCES INC
IUSDI, BUREAU OF LAND MANAGEMENT"
POWER RESOURCES INC
USDI, BUREAU DR LAND MANAGEMENT"
_ROWRBESOURCES INC
0
361 741 NSWSE
741 87RWSW
,B , INENW
6 4 B2SESW
3 _ 741 BSWNW
6 4 8.NWNE.
GST
GSr
GST
GST
GSr
GST
MIS
ýMIS
-"'MIS
JWW-1.2 7-1
WW-27-1
4
WW27-1
Appendix D6 (tables)Smith Ranch Permit Page 40 of 49 Revised - April 2011
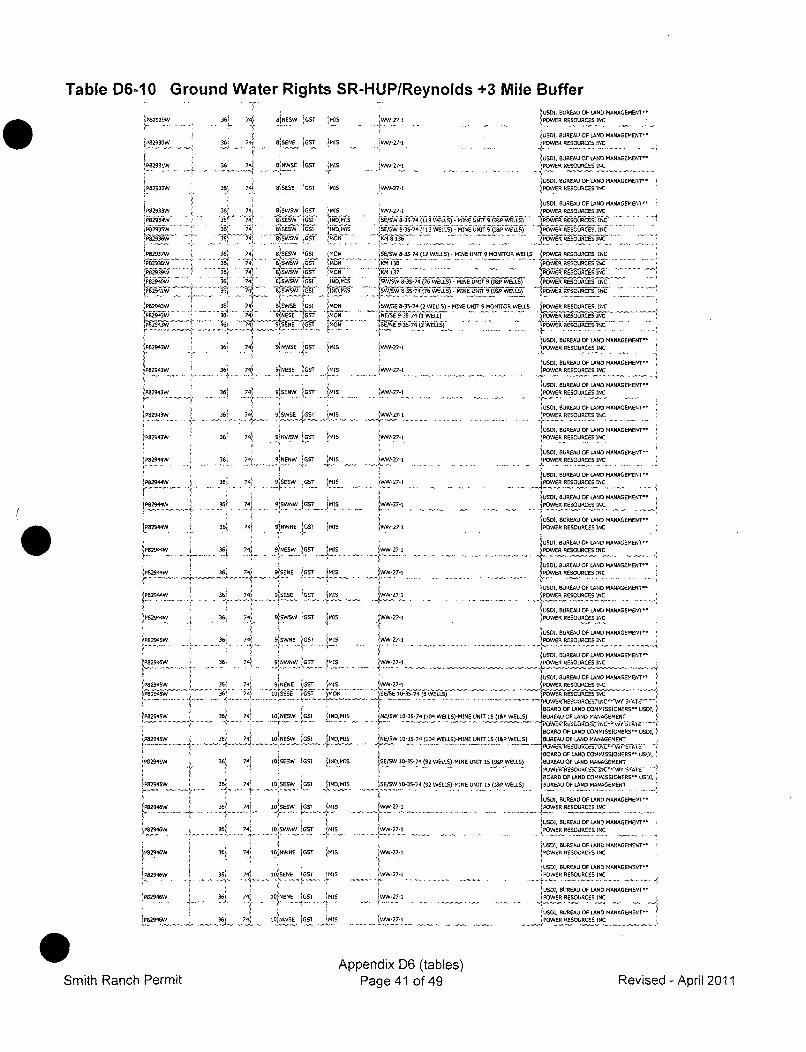
Table D6-10 Ground Water Rights SR-HUP/Reynolds +3 Mile Buffer
P82929W
P8293OW
.Pq2933WP82994W
tPSUN3&W
9 P8293 7W
P182939W
P82943W
! 82943W
[829433
IP82943W
ýP32943W
1!82944W
!P829P4W
pjP 2N441W
P82944W
8294SWFPB2945WIP82945W
IP8294SW
IP62945W
1P82948W.
P82945W
IP82946W
P82946w
!P8294•W
iPh ermiW
Smith Ranch Permit
36ý 74j
36 74ý
36 74
36, 74
38 74
369 74
36 . 7?36, 7,4
36ý
36' 74i
81NE9W !G5T M
818656 1557 NM
2[NWf IGS .•MI8WSEE loi ;M
8,5wsw iS iM•
8SESW •GS1 [11GS5)6 '557 G 1M8 5WSW 557 '
895E SWW 9G5ESwSW .GST M59SESW 97Sf 95
.G.
9 NEISW GET .9.M5
9jENWE j'GS _,j,
9SWNE8E jGS-
?!NWNW tGs- ými
0NEESW jGST IN9
S1NW5E IGSi ýMl
91ONEW 65I MIN
9S5W5W S Ow T (t
9J9,ýWNE IGS jM
9ýU9ESW 1I5
919365W 12DI (M
74'
749
74)
749
9 pUSD7, BUREAU 8 9 LAND MANAGEMENT**
0USDI, BUREAU OF LAND MANAGEMENT"is !WW-27-1 POWER RESOURCES INC
)USsI, BUREAU OF LAND MANAGEMENT"is jWW,27-9 !POWER RESOURCES INC
USDI, BUREAU OP LAND MANAGEMENT'*
IS fW-279. POER RESOURCES INC
USDI, BUEAU OF LAND MANAGEMENT~i9 s vw27-1 POWER RESOURCES INC
",EIS )SEW 8-35-74 (!13 WELLS) -MINEUN[T9(I&P WELLS) j OWER RESOURCES, INC
,995 'SE/SW 9-35-79 (113 WELLS), -MIN8 UNT9 MONIOP WELLS (POWER RESOURCES, INC
9 1SWSE 8-35-74 (12 WELLS) -9496_E UNIT 9 MONITOR WELLS POWER RESOURCES, INC25 691318W- M1,POW6 RESOURCES, INCON ) 'POWER RESOURCES INC
S / B3-i 74(76 WELLS) -MINE UNIT N I.P WELLS) .POWER RESOURCES, INCC
-- rUSDI.ff -U MIN 2 WELLS) POWRRESOU RES, INC
ON SWISE 8-35-74)(2 WELLS) -MINE UNIT N MONITOR WELLS jPOWER RESOURCES, INC
W- 9-35-74(1 WELL)RESOURCES INCq. J SE9NE 9-35-74)(2 WELLS) )OE EORE N
)USDI, BUREAU OF LAND MANAGEMENT"is -27-1 POWER RESOURCES INC
USD9, BUREAU OF LAND MANAGEMENT"s *W-27-I poPwER RESOURCES INC
iuSDI, BUREAU OF LAND MANAGEMENT"5 .A , -27- 7, PWER RESOURCES INC
USD1, 6UREAU OF LAND MANAGEMENT"S -B7-1 POWER RESOURCES I..N.C E
IUSDI, BUREAU OF LAND MANAGEMENT~S j679-37-1
5POWER RESOURCES INC
USDI, BUREAU OP LAND MANAGEMENT~6S 527-1 POWER RESOURCES INC
JUSUl, BUREAU Of LAND MANAGEMENT"[S )WW-27-1 (POWER RESOURCES INC
5uso1, BUREAU OF LAND MANAGEMENT"S WW27-1 POWER RE SURCES INC
1USD!, BUREAU 85 LAND MANAGEMENT~",IVW-327-1 POWER RESOURCES INC
USD9 BUREAU OF LAND MANAGEMENT"1 WW-27-1 EPOWER RESOURCES INC
1,USDI, BURE8UOF LAND MANAGEMENT'IS hW-27-1 POWER RESOURCES INC
)USDI, BUIREAU UP LAND MANAGEMENT"
(S2I, BUREAU OF LAND MANAGEMENT"N 'SSE0-37-9 WPOWER RESOURCES INC
1,926•N UREAU OF LAND M ANAGEMENT
0S919 BUREAU OF LAND MANAG EMENT"W9-327- W POWR RESOURCESSINC
,URE1, BUREAU OF LAND MANAGEMENT.-4~~-27-1 ~POWERREOCSIN
29 )UEISD 10-35-74)(8 WELLS) tPOWER RESOURCES INC
-... . ... ... . ......... ,.... . - - - - - - - - - N -4,WSICR E2U A e7IC'W r97IA9E--- --E. ...
BOARD OF LAND COMMISSIONERS~ USDI,OMIS NSE/SW 10-35-74 (184 WELLS)-MINE UNIT I9 (I&P WELLS) BUREAU OF LAND MANAGEMENT
BOARD OP LAND COMMISSIONERS'- USD1,DIL 19/W 10-35-71 (104 WELLS)-MIRE UNIT 90 (ISP WELLS) BUREAU UP LAND MANAGEMENIT
ROARD UP LAND COMMISSIONERS*- USD9,10PS 903S-74A (92 WELL[)-MINR UNIT 1S 9I&P WELLS) BUEUOLADMNGET
BOARD UP LAND COMMISSIONERS" USD9.D,995 1SEISW 98-35-74 (92 WELLS)-MINE UNIT I5 )IRP WELLS) 8UR56U OP LAND MANAGEMENIT
USDI, BUREAU OF LAND MANAGEMENT"S IWW-27-1 POWER RESOURCES INC
S WW-27-I ,POWER RESOURCES INC
USDI, BUREAU UF LAND MANAGEMENT**
-27-1 POWER RESOURCES INC
USD9. BUREAU OF LAND MANAGEMENT--
s POWER RESOURCES INC
(USD9, BUREAU OF LAND MANAGEMENT"U WW÷27-1 IPOWER RESOURCES INC
)USDI, BUREAU OF LAND MANAGEMENT"S ..... 27- ..... POWER RESOURCES INC
Appendix D6 (tables)Page 41 of 49 Revise
7,'
74
74). •
;~..
361 749 90)SESW IGS
36 1 10DSESW oGS
36) 7,4' ISWN JGT
36 7ý4 I9NWNE 657
36' 74 10SENE "GS
A 0
JONl
)MI
'MI
94'I
d - April 2011
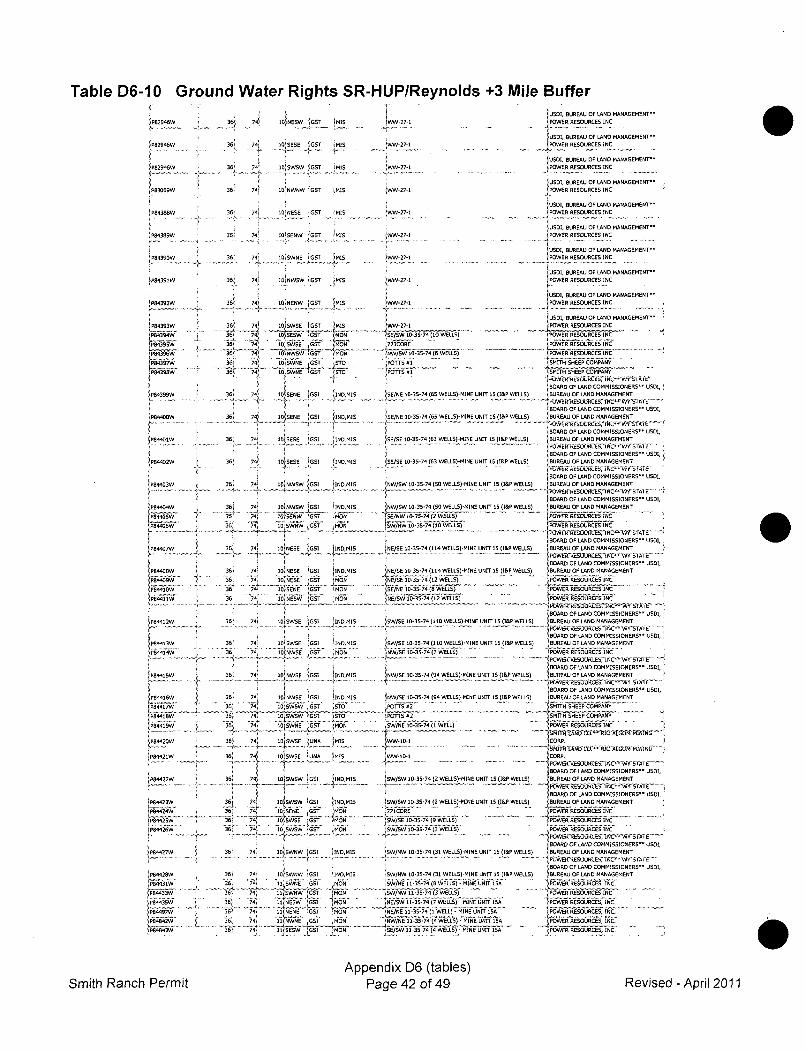
Table D6-10 Ground Water Rights SR-HUP/Reynolds +3 Mile Buffer
1P82946W
"P8299W
P84388W
7P84389W
IP84391W
1P84392W
1 P84393W
P843BEW
1P84398W
P84399W
P84402W
fP84404W
P84412W
IP84403W
P84404W
IF.
j844827W
;P844823W
[P84429W
'P4428W
P84243W
P84423W
P8'24WV 281333P84433wP8F443W
36z, 74iI •iNEW 1GST (MIS36' 741 WiES loST ¶615
36 ' 74 ' 1010SWSW 'G T ;MIS... . + ,- - ....................... .. . .........
36? 74' 10 NWNW 'GST LMIS
36 74 13 NESE G•T MIS
368 74 18 SENW $8 ý-M1S
365 74$ 3 N9 jG . .IS
36; 74 IOjNWSW $G57 ,63S
3 74J 83 NENW $037 HI
36, 74 1 31SWS (GOT IMIS
' • .. .• • . '-',..
5 I 180380 G
36 74 1~OWSEN GST $00 M0
36 74$ 10 S8NE iG. . 1D,6187'"4-. -
38 74$ 130008, 331l 493,..1.
3o6 13,SE8E 00B' IN.MI.
36$ 741 13 NWSW GSI 3INDM]S
38ý 74$1 0183 057 :6036' 741 13N•N83 GS] [INDO3IS
'36.t .......
6 N356 74$ IWNESE 0GSI IND, MIS
36: 74 13 0SEN iGo-r iMONC•GST ' .. .
3? 741 131
0380SE 031 393 630S
1 E ..... '.S
36 74 13 1 NW 0 M
36 74 1019SWS GS 0 IND,MIS
38: 74 1 0 S5W 003 4'~
38 74 18 SWSE -. 1 M0E0
I, G!7'.. MON
- V.9 OBLNWOE iBA jM3S ...
36 74, W 10 GsT N MON .•......• .... . .. '..........'.. !..... ....361 741 104SWSW GSI 3IND,MIS
i i WE
35 743 1309SE GOT 'MON
38i 74! 1303SWNW $003 19N, MIS
....... •• •I....... .4 "•.....
368 74$ 01 NWNE 303 •MON
l9W-27-1 1USDI, BUREAU OF LAND MANAGEMENT"WPOW RESOURCES INC
WW 27-1 USS33, BUREAU OF LAND MANAGEMENT~
37.. 1 .. . . ... 4" R RESOU6C08 1 INC
0S03,UREAU 0OF LAND MANAGEMENT'
$W 27-1 j~8 980039880 INC
3U3DI, BUREAU OF LAND MANAGEMENT~
VW-27-1 POWER RESOURCES INC
2U7DI, 3U8EAU OF LAND MANAGEMENT'
WW-27-1 ' POWER RESOURCES INC
USDI, BUREAU OF LAND MANAGEMENT"
27,,7-1 P R RESOURCESN•.C
USD1, BUREAU OF LAND MANAGEMENT$ 71PC38 98!_E00881.8 INC
0USD0 BUREAU OF LAND MANAGEMENT"
803!,IBUREAU OF LAND MANAGEMENT"
-773C0R 'POWER RESOURCES INC
$93/OW 10-35-74 (65 WELLS) POWER REOOURCEO ICN
UA OTF LAN MAAEMNýPOTTS 81 0633$ SHE~EP5 CMANY
09BOARD OF LAND COMMISSIONERSY USDl,
SýE/NE I0-35-74 (65 WEtLS)-MINE UNriT 5(I&P WELLS) BUREAU OF LAND MANAGEMENT
BOARD OF LAND COMMISSIONERS~ USI,
1SE/SE 10-35-74 (63 WELLS)-MINE UNIT 1 (I&P WELLS) .JBUREAU OF LAND MANAGEMENT
'80583 OF LAND COMMISSIONERS" USDI,
..... S/SEO-•S74(3WELS?:INENIT5(!&WELS!, BUREAU OF L-AND MANAGEMENT
, ~BOARD OF -AD COMMAISSIONERS-- USDI,'08/SE 10-35-74 (05 WELLO)-MINE UNIT 15 (I&P WELLS) BUREAU OF LAND MANAGE8E9NT8
BOARD OF LAND COMMISSIONERS" USDI,1NW/SW 10-53'74 (53 WELLS)'MINE UNIT 15 (I&P WELLS) BUREAU OF LAND MANAGEMENT
BOARD OF LAND COMMISSIONERS'- USD,0N.0/S 1'035'74 (53 WELLS)'MINE UNIT 15 (I&P WELLS) BUREAU OF LAND MANAGEMENT
$,NV 103 -J1S1 WLL) ESCU.4J-IA.rLNŽA A
BOARD OF LAND COMMISSIONERS" USDI,
'NE/SE 10-35-74 (114 WELLS)-MINE UNIT IS (I&P WELLS) BUREAU OF LAND MANAGEMENT
1BOARD OF LAND COMMISSIONERSO U8D3,NW/OW 1'35-74 (WELLS)-MINE UNIT 15 (I&P WELLS) BUREAU OF LAND MANAGEMENT
NW/OSE 10-35,74 (12 WELLS)POE R RESO5URCESIWC
~7~t 3 ' 5 Th'46Pow~ jWER RESOGURCES INCý
BOARD OF LAND COMMISSIONERS" USDI,98/08 1D'3S'74(118 WELLO)'MINE 69T170 (IUP WELLS) 8UREAU OF LAND MANAGEMENT
BOARD OF LAND COMMISSIONERS~ USDI,NW/SE 10-35-74 (814 WELLS)-MINE UNIT1 (ISP WELLS) BUREAU OF LAND MANAGEMENT
t: NBOARD OF LAND COMMISSIONERS" USWI,08SW/SE 10-35-74 (B WELLS)-MINE UNIT IS (I&P WELLS) BUREAU OF LAND MANAGEMENT
BOARD OF LAND COMMISSIONERS" USDI,OW/SE 10-35'74 (91 WELLS)-MINE UNIT 15 (I&P WELLS) BUREAU OF LAND MANAGEMENT
"i•6 i WELLS.......)....... . ' ..
.g~ -'"•''•,".' .''.." "kow• 6•5 su•."isvs"..'..SiE
(1 BOARDOFLANDCOMMiSSIONEASW"U003,
19W/E 1'35"4 (4 WELO(MIN 093 3036738 BUR0) A839830 LAND MANAGEMENT
."".".Pw'E16"3CUACES7II)C"'wAIY I tr-lA"
BOARD OF LAND COMMISSIONERS" US0I,
SW/SW 10-35-74 (94 WELLS)-MINE UNIT 115(37P WELLS) BUREAU OF LAND MANAGEMENT
.707082P 091711074887 COMPANY'
OW/NE 13-35-74 (1 WELL) 3POWER RESOURCES INC
.'......IEMIY/)OF LANDCOMMISSIO.ERS~MININ
!BOARD 078693D COMMISSIONERS~ 0083,19W/oW 10'35'74 (21 WELES)'MINE UNT1700(367 WELLS) ýBUREA"U OP LAND MANAGEMENT
:'#NIRE POWER RESURESIN
1,ýjETCRA (lýHQ'WIHNTT15APOWER RESOURCES, INC.
SW/OWN 1D'35-74 (3 WELLS) MIEUI15 PRR CSI-EE N
Smith Ranch PermitAppendix D6 (tables)
Page 42 of 49 Revised - April 2011
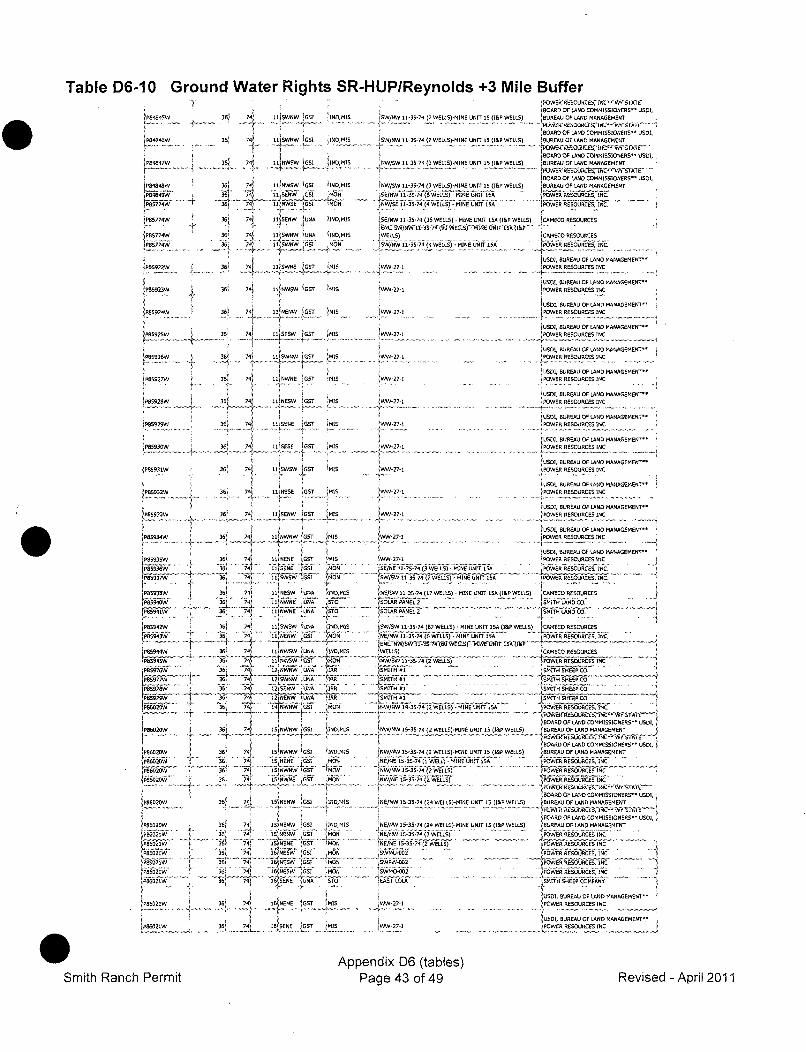
Table D6-10 Ground Water Rights SR-HUP/Reynolds +3 Mile Buffer.. . .. . .. . . ... . . .. .... ......... W-k.RSSUu•LEA.S-,%. ,
"BOARD OF LAND COMMISSIONERS" USOD,INW, 36!ý 2115WNW!74 N INMS )SW/NW 11-35-74 (7 WELLS))MINE UN & U. BUREAU OF LAND MANAGEMENTNW
i : ! BOPARD OF LAND COMMISSIONERS" USDI,
(PB4W4W SGS] 74i B. S ., ], 11-35-74 (1 WELLS)-MINE UNIT I5 (L&P WELLS) BUREAU OF LAND MANAGEMENT
BOARD OF LAND COMMISSIONERS' USD1,
SW 7 IINSWW GUI MIND IS ANW/SW L I-35-74 (3 WELLN)-MINE UNIT 15 ([&P WELLS) BUREAU OF LAND MANAUEMENT1, 4..- .... " L .......-. '•" " •i--•• •L: .... . jPUAERIEOIC:I,<.S ......I (ROAND OF LAND COMMISSIONERS" USD1,
'PB4774W R36 74) )I! USNn IU IND MIS ISW'/W IA-S5-74 3WELLS)-MINEUNIT 15A (IPWELLS) B ARESORDMANAEMENT
t 4. .. . . -... . ..I W w 'rs•• . •I .. . '!I ,", l •'•? (S W L )I'uwtE UULR ILA, R LCE NIA
I {soBOABD oP LAN C..M....E. E UDI-SRI. 741 --MINE UNIT ISA POWER RESOURCES, INC.
sPs5774W 3 74i ]S' U ,FNWU UEF SI ,NMO ANW/SEWNNC
. .... i" # , OWER ~so.4.s N...
IPAN7P4WLLS SR-4 IDI MINE UNIT ISA (lAýP WELLS), RDURCE
F. •= ; ~~15EC RUSO O URUOESAOAAEE-
IA)ARNWL lUNG WELLS)~ MINE UNISA)&I1S74 XWNW AG (INDRMIS (WELLS)
SUN.......... 7 I EWNW MZ N / 5-74 (4 WELLS) - MINE NT ECOWR RESOURCE S...
ýPa ..... .. . . .. ..... ...... ....... .... .. ;.. ..... ... U D, BUREAU OF LAND MANAGEMENT"=
ERRESOURCES INC.
U IWE RUSD1, BUREAU OP LAND MANAGEMENT"-.WGSwWUW 74 ,t-NW7s-T !IS • ...... POWER RESOURCES INC
IPRUNDS11,1551, BUREAU OF LAND MANAGEMENT"
1!.S924W 36) 24 1 L•WN GT !M"S JWV-27-1 POWER RESOURCES INC
1815 ) 27 USDI BUREAU OF LAND MANAGEMENT'"
IP B R2 4W .G If S.. 1 N E R SW _ G . iS -i . .P W E R R E O RR C ESO
PENSW74 'I iUSDI BUREAU OF LAND MANAGEMENT~9W3I 7, L] S I M S 271 POWER RESOURCES INC
(USD1, BUREAU OF LAND MANAGEMENT "iPBS29RW 3UN 74) 11SEWNE IGST '5MIS -27-1 POWER RESOURCES INC
(USDI, BUREAU OF LAND MANAGEMENT"
(P8192W _S36! 74) LERSUW UST MIS 271 POWER RESOURCES INC(USD1 BUREAOFLNRRSMET
IUSDI, BUREAU OF LAND MANAGEMENT"P8S93GW R36 74ý ti ESE GT MIS WW27 1 POWER RESOURCES INC
1 5151I BUREAU OF LAND MANAGEMENT"(FRNS SR 74 11(SF5/ W IUST MISF ým 27-1 PO ERRSSURCES INC
1AUwDI, BUREAU OF LAND MANAGEMENT"P WR 74 11E GT MIS 1 271 POWER RESOURCES INC
WUSOI BUREAU OF LAND MANAGEMENT"
7P'134W SR 74 11, NWNW jGST tHIS W,27- W RO C INC !E..... ...... ... .. . 1 . .. ... . .•. ....... ..... .. .. 6. ... .. ........ .•.... .. ... .. .... ..... ........ .. .. .. . . .. . . .. . .. ......... . . .. . .4 .. . .. .. . .. . ... ...... . . .... C€
MIS iUSDI, BUREAU OF LAND MANAGEMENT"
JPBS93SW SRI 74 ILNENE UST 'MIS kw -27- I POWER RESOURCES INC .
( ( 8$ 9 3 GW S.. . . . . . . R.. . ..3 ( . . .. . . . . . . . .7 4 4 I iS E N E U . . . . . . . . . .• S I P IO NUS... .. . . . S E / N E 1 1.. . . .. . . 5 74.. . .. .( S W E L L S ).. .. . .. .. .. ..MI N E . .. . . . ..UN IT. ( W L LI SAI N U I T IP O W E RR R S O R C S , RES.. .. . . . .. .. . . . .. . . .. . . ... ..
l•"~ ~ ... .," ........ ... .. ... . ."NS I "... . ................ ,. .... , ..., . ... .... .4 .. ,....!AEORSLRE(P817W SN 7, 5 , .GI M..S .W.W.-2 - UNIT ELOW SURC
I I N D .. * IS N) 11-37(1 7 WELLS)P'MINEUNIT SA(IPELLS) ICMCRESOURCESPSR9(6W 741 .Si4NESW IUNR ,. WEL) JITEMEROhNSOUCES INC
3•P 4. SR '• 4 '-:S.h.-' h•.57S (SOLAR PA NEL r -IS.., ER R ... ... ROP85978W 741 1NW ýUNA
4'SMOTLARP ... . . SMITH NS CO.
PBSD SR 74 11158M US i INDO RDMISLND'SMMS/SWER"'N P'
' '36 7 N 11-35-74(27 WELLS) 'MINE UNIT ISA (&P WELLS) CUMEC REOU RCLES
[ý . ..... ..... 7 ... .. .. ........ _1 I..... "T ' • •F. .. .. ;... ............. )....... .... ................... ......... .... ........ ........ .mr o c :r =• ' • "J'
(P19020W • SR 74 II)NENW 1551 (NON NE/NW 1I-S-74 (R WELLS)-MINE UNIT IR E POWE -URESOU RCES LA N C.69 1'4 'y 63ý 71 I WEý N-- 0 '1' 5C(RW St21.Nl7sIWCSCIMV( E SMTH LADC.
8594.W .. S. . 74 .... 1 SW fUNA JIN! MIS WELLS)!ACMEC . RceL!) AMPnS4w1 74 j. FNWSWlGST iMt NSW 1-35-74(2 WELLS) -POWER RESOURCES INCP8587GW ~ ~I 31 74 1 WNW UNA (IRALLSM)R8 PIT RE
.. ............... .... :............ ..........................PSR7W S 7 1 USNW U ýRN IN SMITHH SHI C6M
P5 , ,A 'SMITA SHEEP CO.
P8EBDýW SR 74 14 N/NW GUI 5408 S NW/NW 14-35-74 (SWELLS)' MINE UNIT ISA W POWER RESOURCES, INC.
(NW/NW BOARD OF LAND COMMISSIONERS~ USDI73J 74 (NN INS MIS NNW1-5-74(2 WELLS'MINE UNIT IS P WELLS) BUREAU OF LAND MANAGEMENT
F• •W '!. .. }•.. .. I. . • • ] d i• . . ..I• 6 ... .. ... /L W5ST SUUS'58C .. . .......
W 7ISJNWNW 1BOARD Of LAND COMMISSIONERS~ USD1YPS7I NDMIS (WNW 1'-74 (2 WELLU)-MINE UNIT 15 (IEP WELLS) ý BUR EAU O F LAND M ANAGEME NT
P8AD2W 36! 74 I I6ENWNW iGSST MON WW 1-7 4 (POWER RESOURCES INC
3 711 MSNN 5' lON ((W/NE 15-35-74 (2 WELLS) ".,,'.-',.'
.... .. .. ............• ..... ... . ..... . .... ...T .. ..... ... .... .... ... ... .. -............ ... ... .' .. .. ..... .... . ..... .... . . . .... .L...........E .... ...... ... .. .. . ..... .. ....... .. .. .. .
PERIDW R1
7) S(NSN ¶G1 IE/NW13-5-74(24WELS)-MNE NIT 5 (SP OARD OF LAND COM4MISSIONERS~ 550!,S{ INS M I, WELLS) DEUREA U OF LAND MANA GEMENT
wBOARD OF LAND COMMIRSIONERS~ U...,P!±62GW SR 74ý 1S)NENW !SSI 'INS MIS ýNE/AM 15'-35-74 (24 WELLS)-MINE UNIT IS (IEP WELLS) (BUREAU OF LAND MANAGEMENT
PEASSIWJ GA 7 N O EB~S3-ASUIU. . . POWER RESOURCES INC(Pa8, 1 21W SRI 74 15 NENE (557 MONk NE/NE 15-55-7 (SWELLS) POWER RESOURCES INIC
I 6, I_ .R.S INC 4_-_iRINESW GUI MOLWM'L
(P5551A 'Sir 74 IR)NSSW 'IS S; N WDl5 POER RESOUJRCES, INCP8521 16 ~ NEDW% CIT MON 5W140'CIO" POWVER RES OUNCES 14C
~FRGS21W S 74 S4
ENE 'USA SW MST6L SHEEP COMPANY"
~PBRSIW , (I 15D1, BUREAU OF LANE) MANAURMENT"
_1 RL 7 ILEE GT MS27-1 (POWER RESOURCES INC
16 is - USD1, BUREAU OF LAND MANAGEMENT'.(PB U1 IB) 74'1MIS 1 M27-1 JPOWER RESOURCES INC
A
SSmith Ranch Permit
Appendix D6 (tables)Page 43 of 49 Revised - April 2011
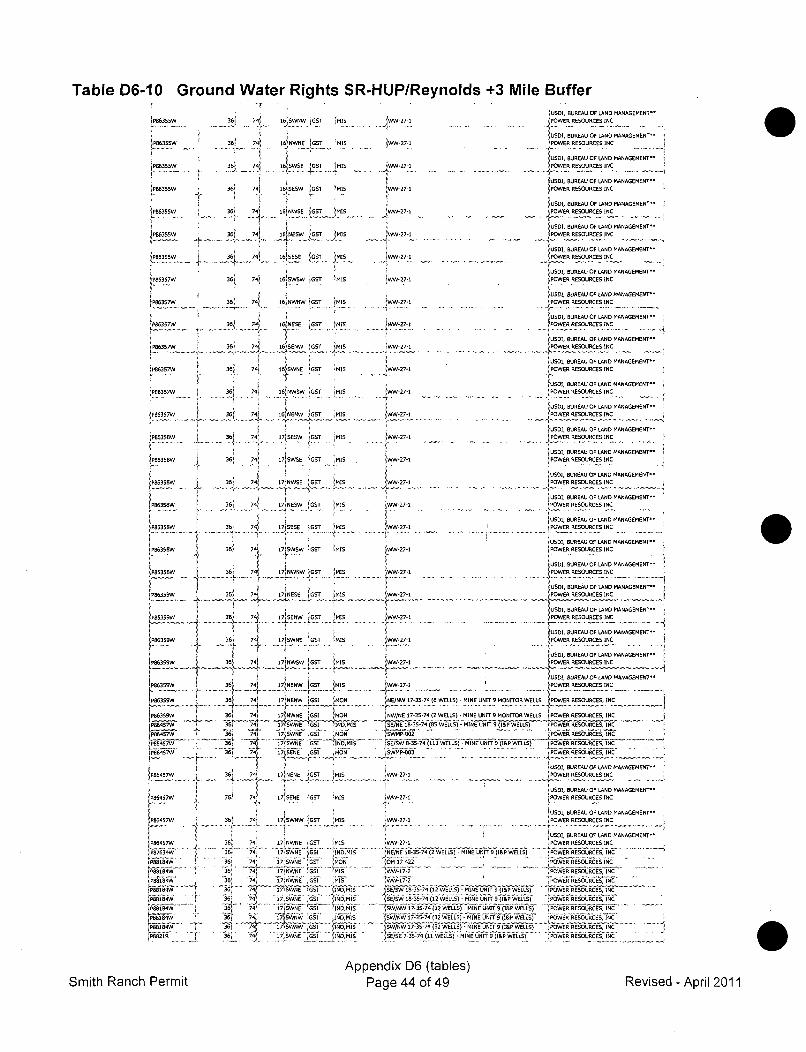
Table D6-10 Ground Water Rights SR-HUP/Reynolds +3 Mile BufferJUSDI, BUREAU OF LAND MANAGEMENT-
!Ps63.5W 361 74 16SWW UGSE MIS 27-1POWER RESOURCES INC
3!' 47 ISIWN LU 21 PWER RESOU .RCES INCUSDI, BUREAU OF LAND MANAGEMENT"
IPS6355W 361 74] 1RS)WNE JUSE IMIS WW-27-1 jPOWER RESOURCES INC
36 7 : ... : ...... ...... .•" . ........ ... SDI, BUREAU OF LAND MANAGEMENT~-
IUSDI, BUREAU OF LAND MANAGEMENT'-
1-63SSW 36' 741 16.SE.W 1 UT MIS .- 27-1 POWER RESOURCES INC1PB63W 36....IIWUSD1, BUREAU OF LAND MANAGEMENT-
. 355 7S• S_21L.T IMIS _ WW-27-1 DOWER RESOURCES INC
wJS EI, BUREAU OF LAND MANAGEMENT
t JSDl , B UREAU OF 4 1ND
MANAG EMENTM
Sw GUT 2 1W-2-1 ER RESOURCESINC
....... :4....... •NWWIG M, • •-• . . -. .. ..... , E...? .. .... ...........IUSDI, BUREAU OF LAND MANAGEMENT-"
IP86357W 36 74 1 16NSWE RGST 'MIS VVW-27-1 POWERRESOURCES INC
WUSD, BUREAU OF LAND MANAGEMENT"
'P86357W 36 741 16NWSWW UGST MIS -27-1 POWER RESOURCES INC
SUSD1, REREAU OP LAND MANAGEMEN7T'
36157W) 11NWNWUSE 'MIS WW-27-1POWER RESOURCES INC
)PRS7 . , .............. . ' .... .. .... . . . .....
8USD, BUREAU OF LAND MANAGEMENT~- - .. .; 2TNWE G ps •v -7-8 POW RESOURCESINC
P6357W 36 14ISESE 1USE /MIS 4W271POWER N
wUSDI, BUREAU OULAND MANAGEMENT~PRS-361 741 16'UE USE MIS 27-1 POWER RESOURCES INC
-P 7W - --," --, -.",.. tS USDI, RUREAU OF LAND MANAGEMENTff
P86358W , 36 74 S WNE USE MIS W -27-1 POWER RESOURCES INCI . .lUSOI BUREAU UL .N ... ...GE.E .
IP86357W ! 3 74, 16 NWOW 'USE MHIS VVW-27-1 -.- _ POWER RESOURCES INC
S1 JUSDI, BUREAU OF LAND MANAGEMENT-
PBR3W ' 36ý 7 N G MIS IWW27-1 •POWER RESOURCES INC
1 rIENW4DSE •JUSDI, BUREAU OF LAND MANAGEMENT-
P863W 36 1 17 SEUW USE MIS -27- POWER RESOURCES INC
USID, BUREAU OF LAND MANAGEMENT-
!.B3SB 6 1 7 -17,5W5E USE MIS -27 . . POWER RESOURCES INC
.USDI, BUREAU OF LAND MANAGEMENT-
LP,!,S: 4 63 4' 7ýNWSE UGSE MIS ' -27-S- - -- - POWER RESOURCES MANACI4
SUIDI, BUREAU OPLN AAEET
P86358W 36, 7471 17NWSW !MIT MS WW-27-1 POWER RESOURCES INC
1 BUREAU OF LAND MANAGEMENT~
ýP3SUW 361 741 17SESE USE MIS ' 27-1 WER RESOURCES INC
5551I, BUREAU UP LAND MANAGEMENT-
lPR63RW7 171iSNW UGEl MIS i W 7-- OWER RESOURCES INC
1 1 SUSRI, BUREAU UP LAND MANAAUEMENT-
P63W 74 171NWNE UGSE I N W-27-1 POWER RESOURCES INC. .-.... .... -.......... .
1 -- )USSI, BUREAU OF LAND MANAGEMENT-"W67 74) 17)NENE UE 1M1S iWW-27-1 POWER RESOURCES INC
6 7E - USD, BUREAU OF LAND MANAGEMENT -
kB63S212 3 , FNE G•S MIS OWW-27-1 POWER RESOURCES INC- lUSDI, BUREAU OF LAND MANAGEMENT"
P86359W 36 71 17 SW USE IMIS IWW-27-1 POWER RESOURCES INC
)PUU 36 7 USD, REAU OF LAND MANAGEMENT~I W•,-W•7-- POWER RESOURCES INC
36)~~~~ 'MON - BNE/NW 17-35-74 (8 WELLS) - MINE UNIT 9 MONITOR WELLS PWRRSUCS N
10017,,. POWER.-WELS $' RESOURCES, INC
P8657W 1 W 7 1 UWE SI IMON )SWMP 1U2
3 74 1 S iN 5 O S M 0 A POWER R S U CES IiNC
7 C 151 URA PLR
"I' Am' ,u - -SD-,-BUREA PLN AARP86417W 74 NDEN 'USEN MIS-42 WEL 27N 1NI 9
1OWLL) ER RESOURCE IN
)~~~~S7W~ _ 6 7 ~ I4W WGT MIS 271- -. , -1---- - - PO E RESURESIN
FP86457 36 741 17 NWNE-00 USIMSPOE RESOURCES IC
.. .... . .... .. I...........-......
P76,4 7 1. 17 7WNE U 1 INMI NE/N iR_ 357) WELLS)-fIN UNS& WELLS) PO-WER RiLESORES, NC
36647W 3 ' b JGSW T IRE S POWER71 RESOURCESINC[p• '•... . • i "7'• • : ; i • : -i o ' ••'; ........IýP..36f 7 17/AWNE UGSI 1MSW -7 2 'POWER RESOURCES, INC
LPBBIR4W 36! 74 IISWBE 'GSS INSMIS - R-274)2WLS JMN.NTS IPWLS POWER RESOURCESINC
36 744 17 UWN. ;SIT N MIS UE/W 1 357 4)1 WLS-MIENTN)&P EL) OWR ESOURCES INCP864 36 18014) SW/NW 17-3174 (32 WELLS) - MINE UNITS9(I&P WELLS) POWER RESOURCES, INC
'P86184W1 3 .6) 74ý 17(SW'ýNWE US' MONM 'SW/N 17 1 S7)2j WEL)-MN NTN(R ELS PWRRSUCS N'ITT!_W 1 7- SW NW.GI I..MIS SW/SW 17 35 73• 1 (2 WELLS) - MINE UNI • )•IP WELLS) POWERRESOURCES, INC... 1
7P88 R .. . 17 ND MIS SE/SE 7. 3.5 74 )1 WELLS) - NINE UNIS 9 (I-P WELLS) 'CW ,ETS''
3 W SR ;N 751ý`(1VEL)MNUNT(&ýLS POWER RESOURCES, RE. .
0
Appendix D6 (tables)Page 44 of 49Smith Ranch Permit Revised - April 2011
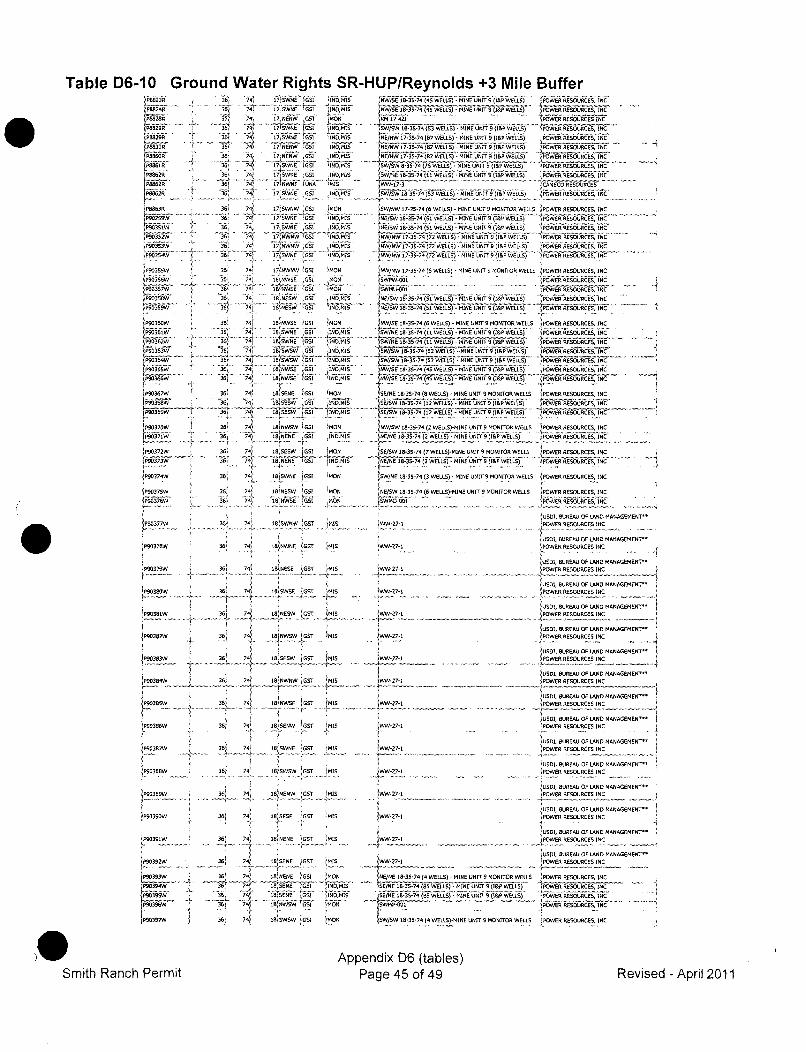
Table D6-10 Ground Water Rights SR-HUP/Reynolds +3 Mile Buffer
PM62R
iPS853R
•P90358W
P90360W0
fP90367W
P903626
jP9D372w
P90372W
090374W
1P"0377W
JP9037BW
iP90379W
.3.... .iP90363W`
P90382W
17/9SWNE 6GSI .0 D MIS
17.SWNE IGSI INO, MIS
176sNEN O GS M O56N
1 7tSINS N -i INS -MIS
17NRE0R9 GS 19A0MIS
1_7Lý9w .GS1 INSMIS
17LN W C Gal riRDON
1795W 01 lOI
10 NWNE 1096 RMiS
:7SSNVVS 'G51 'MON
1785NWE 0GS1 IND,MIS
iý "•" I d .Gsl T'•D=W"
17 N0909W 001 6 01
1E'lS E I GS1 O
S-WNE. GS1 MON
07/NESWIA 00 1 MON
is NWWSE G0I iMON
16990 01 'MON
lE'6OW 00 INO'MIO
18 SWNE 00S1 1ý05,9116s09096 001 iINOMIS
OOLSIWSW loot ýMO11890 00NE G1 ISMI
is SCWO i/foi .191,91
i IVN 0696 iOl MON
isNtIIWOW 1151 /MON
is 99005, 501 .MONý
!!./SE 0-30-74 (45 WELLS) -oMINE 00ff 9(1. WKM9 17 121199263065IN
OSWISW 18"5S-74 (S3 WELLS) - MINE UNIT 9 (lIP WELLS) 3POWER RESOURCES, INC
6/O ..7-3574 (07W )-MN 0f 1 -- . ESRCE
NES/NW 17-35-74 /17 WELLS) - MINE UN0f 9 (169'WELL) r RESRC6, INC
Ne/NW 17-35-74 (572 ELI'i- MIE 09ff N (I&P WELLS) (VOER RE'6RJEiOU UR "
!OW/NW 1-3-74 (7 WELLS) - MINE UNIT 9 ON(IO WELLS) POWE6 RESOURCES, INC
W/ -7 ( WELLS POWER RESOURCES, INC
. ... . °••.......................... .. ............. ' ,• 3 ....... ..'lOW/OW, 10-35-74 03 WELLS) -NINE• 0fN(IOPSOELLS;i lkb/2/O4£E/26/ioSTii....
'OW/N/W 17-3-74(6 WELLS) - MINE 09ff 9 MI&P WELLS) -9WER RESOURCES, INC
NE/OW 18-3S-74 (51 WELLS) - MINE UNff 9 WELLS) POWER RE0OURCES, INC
INWINW 17-35-74 (72 WELLS) - MINE UN9I 9 )I1P WELLS) PFOWER RESOURCES, INC
W/NW 17-35-74(72 w6LO -19 M UNITS 9(JE WELLSý .9OS RE6SOUR6C .INC
NW/NW 17-35-74 (6 WELLS) - MINE UNIT 9 MON9TOR WELLS /PWER RESOURCES, INC
MU-01909009 RES~OVECES, INC
103-7 51WLL)-MiINEu 099)6 ý ,WCELS) 905 665006665kesnw, IN
NW/•E 18-35-74 (6 WELLS) - MINE UNIT 9 MONITOR WELLS IPOWER RESOURCES, INC
OW/NE 10-3S-74 (10 WELLS), -MINE 0901UWN L) tbS RESOURCES, INC90/NE 18--39-4)11 WSLLS) - NIN 9919WLS WRRSUCS N
SW/W I0s-3-4/ WELLS): MINE UNIT! 5)19 WELLS) (5wER RESOURCES INC[ O/SW 10-35--74 (53 WELS)-0 MINE UNIT 9)169 WEýLLS) -PWRE CSIC
9N0/SE 10-35-74 (4 WELLS) - 7NINE UNIT 9069! WELLS POWER RESOURCES, INC~NW/SE 10-30-741 (49 WELLS) - MINE UNIT N )I&P WELLS) IPOWER RiESOSRCS, INC
.-•" ..... ..... .--- -hk• ~~•
6/E1-674(EL~LS)... MIRE..N INMONR WELLS POWER RESOURCES, INC6/OW 10-39-74 (12 WELLS) - MINE UNITSMO )ITR9WELLS) 'POWER RESOURCES, INC
+ 6SE1W 15-39-74 (12 WELLS) - MINE UNITS9 (169 WELLS), 19ORREOU CES N
N/O 9-740 L-N0fS O WLSWR RSOURCES, INC
[iE/E-w-274- (12 W -w iNE U (I&P WELLS) EOWER RESOURCESS INS
(SE/Sw 18-3N-74 (7 WELLS)-MINE UNIT N MONITOR WELLS 'OERSUCSINC
6/N EY E10S- 3-74)(2 WELLS) -MINE 69IT0 (IRE WELLS) POWVER RESOURCES, INC
10W/NE 10-.39-74( WELLS9) - MIN E UNITS9 MONITOR WELLS IPOWER RESOURCE S, INC
NE/SW 18-39-74)06 WELLS)-MINE UNIT 9909NI06 WELLS 1POW6R RESSUOCES, INC
30001, BUREAU OF LAND MANAGEMENT~027-1 POWER RESORCES INC
jUSOL, BUREAU OP LAND MANAGEMENT"327-1 P9OWER RESOURCES INC
39ý 74 I00SWNW 'GST (MIS
....i!9, 74ý I0IWNE jGST MIS
6 743 10"NESW 'GST MIS
363 1 180!9S6w lST IMIS
36M 74) IINWNW jGST MIS
36 74 10 SW oi 119.
36) 74/ 181NWSE 1GS" !MIS
361, 74 i 1,0mw 052 :9110
364 7,4 10 I9,09 SGT MIS
jPS13N3W
LPNE386W
(P90300W
3991 360
y
iW-27-1
'V-27-1 -
JW6-u-I
1OW&7E
(USDI, BUREAU Of LAND MANAGEMENT~1POWSR RESOURCES INC
USDI, BUREAU OF LAND MANAGEMENT"
POWER RESOURCES INC
0US01, BUREAU OF LANS MANAGEMENT"POWEE RESOURCES INC
IUSD1, 6UREAU OF LAND MANAGEMENT"
F9OER RESOURC LINC
0USSI, BUREAU OF LAND MANAGEMENT~
0US09, BUREAU OF LAND MANAGEMENT"(POWER RESOURCES INC
hL5DI, BUREAU OF LAND MANAGEMENT~IPOWER RESOURCES INC
USD1, 009660 DFELANO MNAGAEMENT~POWER RESOURCES INC
POWER RESOURCES INCPOWER BRESOURCESLINC AAEMN'
USOI, BUREAU OF LAND MANAGEMENT~30WER RESOURCES INC
1SDI, BUREAU OF LAND MANAGEMENT'"
POWER RESOURCES INC
36, 791 190SWSW SOT (MiS
74 18 NENW SOT MIS -..... . . . ¾.... .... . ....
74 8105656 'SO- iMIS
VWW-27-1
l.0392w
tP9039eW .
1Piý'3i6W! 4,
Smith Ranch Permit
36 74 19 NENE SGT 'MIS
36ý 74j 1819969 0G01 'MON
36 74 1015E96 OGSI NOIS
OUSI BUREAU OF LAND MANAGEMENT"'WW-27-I
3POWER RESOURCES INC
'US00, 1UREAU OF LAND MANAGEMENT~,WW-27-1 iPOWER RESOURCES INC
9NE/NE 18-35-74 (4 WELLS) 0MINE UNIT 9 MONITOR WELLS POWER RESOURCES, INC~S/E19-35-74 (99906330) -MINE UNIT 95/lOP WELLS) POWER RESOURCES, INC99 918-35-74)065 WELLS) M IT 1 WELLS) I,06iiR iRS CE INC
W Pf WL U MNOW 'POWER RESOURCES, INC
jOtW/OW10-39-74)4 WELLS)-MINE UNITS MONITOR WELL U.5 POWER RESOURCES, INC
Appendix D6 (tables)Page 45 of 49 Revised - April 2011
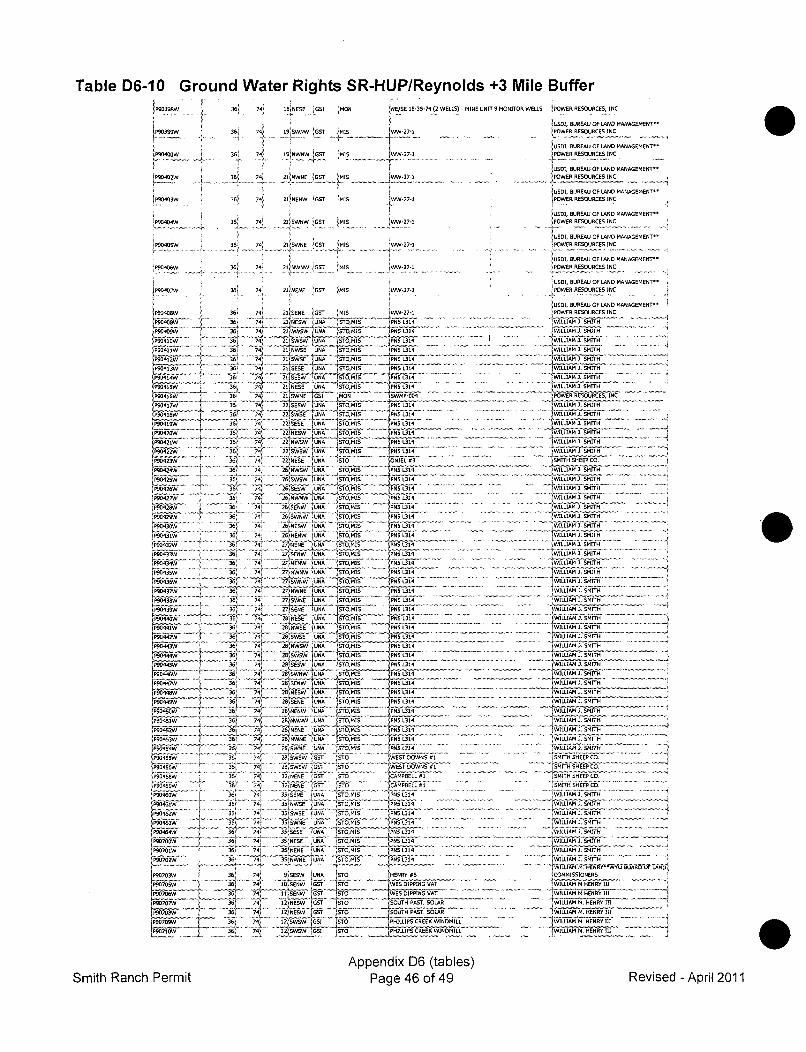
Table D6-10 Ground Water Rights SR-HUP/Reynolds +3 Mile Buffer
iP90400W
'P90404W
I11N? 2W . .. W . .
P98405W
P90407W
P90408W
P90,12 ......... .11
PO,tg
P9O413W
-- P9244W_
P94157
P90416W
P90421W "'fr90429W
P90423W1
.... ........" ..7;:4 W"
&9929W
fr9043 W
[P90439WrP9044011W1
P904•1W
P90403W
019449
P9-0458W
IP90449W
-C-
P904703WP90490W _
P90707W
_P90_091W11_
P9 ..... ...40 .... ...
.......
30 7 1891NESE0 iGS1 MON 6NE/SE 18-35-74 (2 WELLS) - MINE UNIT 9 MONITOR WELLS POWER RESOURCES, INC
9 NW TUSDM, BUREAU OF LAND M
361 74J 19 N-WRWO jwIS 27 IPOWER RESOURCES INC
1U5W1, BUREAU OP 14.06
36' 74 219906 007 MIS ,JWW-1004 POWER RESOURCES INC.USDI BUREAU OF LAND
3A 7 2NNW 0 MIBU POW REAU OR LANI M36 , • 71ý NEN ýGST tMS PO•- 'WER RESOURCESINC
0ANAGEMEfT"
ANAGEMENT"
ANAGEMENT"
ANAGEMENT"
ANAGEMENT"
36: 74N 21.SWNW ýGST !MIS
356 741 217
0WNE 1GST 7-MIS
316 74> 21INWNW GOT MIS
36' 74ý 249290E 007T 1941
WW.27-0
lW12701
POWE;R RESOURCEýS INC
36'
36
36.3A636
36
363A36'36
361
361:A36)
30
303636136
36
361363036736136
36.36
3643030
309013636)36736>3630
36363636
36730361
261
36
36~
36
361
36,
74'
71
74',7174
74
74
74l
74.
7A
747
74
747
74)
1..
747
7A6
74A
7'
71
747
741
74
74t
7A'
7A•4
2ISN .57 MS ~ -27-12IjNESW UNA fST-OMIS P65 1314_
-1TWO76 4ý00.1 P65 L314
2IGSE UN-A STOMIS P60 1314
21 50W UNA 'TMS P51121 NESO UNA .070,91 IPNS5 L314
22 5.95F0UNA 707.9400I P95 L314
2i UNO 117,91 P0314
22ESC UA~ T MIS 1PS71
P20{NWoSWW UNA IT MI P6 014--257190590 W (UNA RR A7,1 S L134
26 50590 UNA ,.00MST 7P6L #31
2090WA1"09 (0I 70,9415 ,PS 130
26)5906W UN6 070.9413S PN5 L314
26609 060" l STOMIS
O25"NENWý PN5 L"~4i' 314
27 606E UNA ISTOM 5 (P931427 109W UNA 7T070911ý P65 L31427.NENW "066A STOMIS P5L127 NN 1IJA 070rMx P60 L31427'SW,11A NWA6 0091 P51127 NWNNE UNA6- TSTo.,Ms P6_' F5 134__
231"SEIIE"(hIA j'STO.MIS PN5 1314
28 NESE IUS h07
O'15
" _P 134-21iOWUE 06U 00NA 7 P60 1314
60 STOMI UNAP6 51314281590W 06 j~TOMIS P5 1314
t8SS 060 "STOMIS P55 L314
2BS6 06 07,1 P8 1314
ST, P65 0314
2890W .00 jO,MIS 4P50 L314
20 NSEN US STO.MIS 4N5 L31425 6000 UNA1( '090 P5 13-14
23590590 L0 070ýi WEST DWS0289N5 007 07 WEST DOWS14328 NONE 00U 70 CMPELA1
3266 507117 J-CAMPBELL #1
35 NS0lI 7260 41.%41? ,. .6.L314
35 -WUE (090 5 07,970 VNS 1314351,CW90 UNA JST0 M1IS NL3
35 P65 0314
30 5000 090 S070941 (PAIS131435~ NONE 060 07W1 "PLL
30 69060 UNA 070941 LPS314
I ~ESW 090, 1070 HENRY #0
U SlE W' G WES DIPPING VAT
02'NS 90190 ('0 f'O 00076 FPAFST. SOLA
12 100W 55 HILLIP9 CR000 WINDMILLY
39f6WS F14 00 PILLIPS CR-EE0 WIND'MILLC__
1USDI, BUREAU OF LAND MANAGEMENT"
'POWER RESOURCES INC
USDI, BUREAU OF LAND MANAGEMENT"
!POWER RESOURCES INC
*US01, BUREAU OF LAND MANAGEMENT-
POOWE RESOUREES INC
USDI, BUREAU OF LAND MANAGEMENT-POWER RESOURCES INC
+0111 -IA63., SMITH
'i ILIAM3 SMITHIWILLIM. S MITH...... ..~~~~ ~~~....... • i5 f' .. .. ............. .
SWILLIAM 3. SMITH(WILLIAM3.971(WILLIAM43041
_WILUrAM 3SMITH
WILLIAM.SMTWILLIAM 3. SMITH
J,. IA 90119. SMITH
WILLIAM 3. SMITHWILLIAM3. SMITH'WILLIAM). SMITHtWILLIAR 3. SMITH
90111693.:SMITH_
90706943 SrMITH
WILLIAM 3.1MITWILLIAM]J. SMITH
WE01I7M54. SMITH'WILLIAM)J. SMITHWILLIAM. 0940117-
WILLIAM "'0164.SMITH
WILLIAM)J. SMITH
WILLIAM 3.19016 -'_
7N901111M93. SMITH
WILLIAM)J. SMITH
WILLIAM 3.19019H
WLIM.SMITH SEPC
WMILUM .SMIHEE
19010693 SMIH 'A6'WILLIAM)J. SMITH
~W LLIA 3. SMITHý
.190M1. SHEEVCO
3.r SMITH
WILLIAM ). SMITH
'COMMISSIONERS
i WLLIAM 94 ENRY ill
'ILLIAM M. HE'NRY IIIICC10AM 94. HENR yI
(WILLIAM 94.HENRYTE -- ---
Appendix D6 (tables)Page 46 of 49Smith Ranch Permit Revised - April 2011
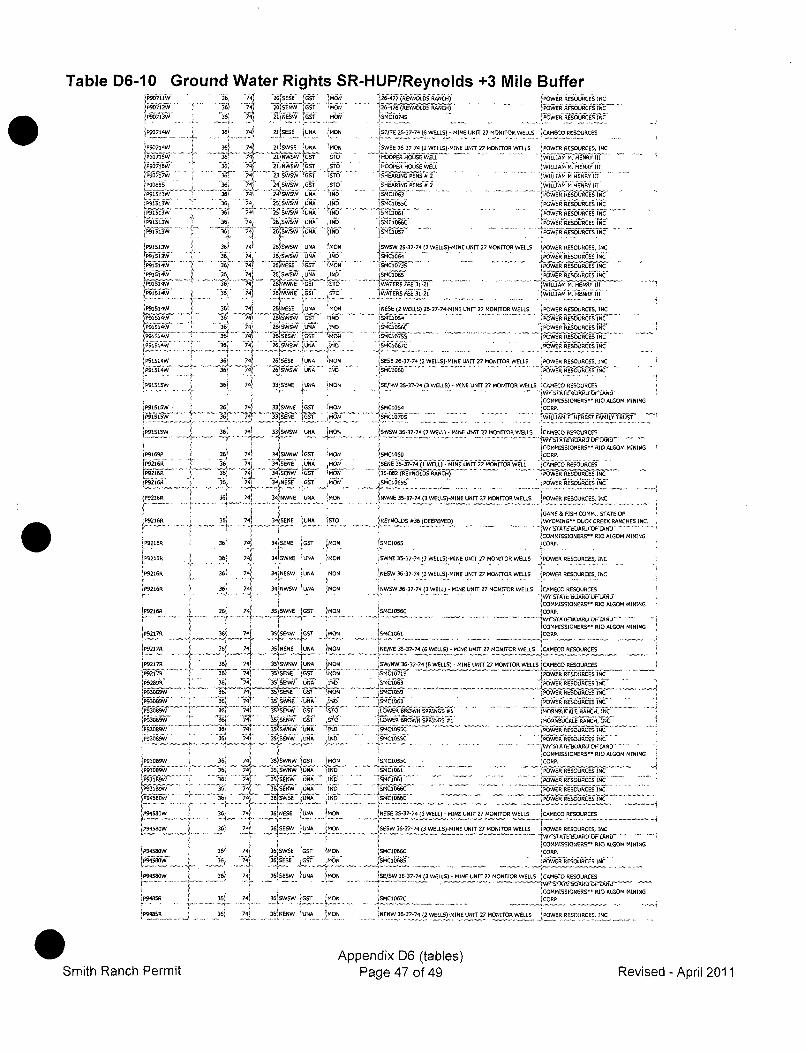
Table D6-10 Ground Water Rights SR-HUP/Reynolds +3 Mile Buffer
)P39713W
P6'a 71 4WAP90714W
P91717WP9599w
•P91313W
ýP9L13W
P9513W
P91514W
T9P9RIsW
,L.
36 ~ 4 ST MON
36 7' 2)95 5 MON
391" '74 21 SESE iUNA 'MON
"'•s •- ... . 2LsY ,G .'MON36 74) 2 1,IWSW NSIT DTO36 74 319W1TIt
36 74 245 sVW GST ITO
39 71 45WSW UONA 1]ND
36 74 2S6SWSW U6NA '16
36, 7_4 %NWSW I~ 9
361 79) N95095 1190 MON
36: 74 .i6"•WSW UNA .. ND
369 74t Ž'SWSW 2 UNA N1
.... S•'"•'Sf'N • • ' .6w361 74 6IEWNE 1NA ITON
36 74! 3519959 1U96 MON
1L5W" 36, 741 SwNE iGST :MONfP9ss5151 36 T. -'---'pet' MO
IP91515R i 36 741 331SNSW 1UNA 1O0
•P92199 316 741 34INW TW 1ST MON
P92_96 1 36 74 )69 1STN MONA
.. . ..9..36. 74 34... 656... ... . 90.. .
P 9 1 69L R 3 6 1 1 - - ' S3 5 9 1 0 9 6 oP9319 36 7/ 3199 S MN
?P9216R 1 361 74 3SW 1196 '3409MON
36ý .. .. .... . ... ..i .. ... ... sG ýs ;•
P9216R 361 741 34[?617;GT, ,M09
P9219 1 391 741 31 SWRW iUNA 3O4
pS°1921 WR 361 741 3SjSWNE 'NST 9MON
P9216R 391 74f .EI tE iUST IMON
1P93576 1 ; 39j .74 3 599 SIT 30
P9297RW 361 74, 35N6ENEf UNA .19NfP93217R 36I 74 5169 S
"RE .. .5 ... ... 5....T O19R3099W 39E 74' 3S4SWN, 0106 1E0
3& 3. ' 7 ......... MO1
P93199R 1 36 74/ 355WNE1W 1
NUN 11N
P919 6 744 351599W 096 sI6P1 J1 5tE.9 W 09NA 19
ýP9-35)9W 36' 741 39HE9E 109 13409
JP9489GW 3 39 741 5SN, NA IC
P9458DW 36 74) 36'1W06 13406iE5
ITS11ow 361 74') ýýýNA
(P945 80W 1 3 ' 741 3516 5 1090 13409ýM N
jP9485R 36 74i 39/9353 /l$ 40
.56 7..-,,,-. .ýM
29. --4 .77(96 -E. N.0.L .0 19 999R) .N C POWER RESOURES IN
ISMC1074S POWER 9650U.ii
15616 76-37-74)(6 WELLS) - MINE UNIT 27 MONITOR WELLS CAMECO RESOURCES
SWSE 26-37-74 (2 WELLS)-MINE UNIT 27 MONITOR WELLS POWER RESOURCES, INC
HOOPEHOSWELWLIM3HERII
00560 HO4USEWELLC WILA 4 601iki'fi
HEARING ~ ~w[L P695 2 ILA 9 111 I
POWER RESOURCES INCSMCO IISC POWER RESOURCES INC
15"Cf -. jPOWER RESOURRCE INC'53456666: POWER REORENC
/UMCIIS7 )POWER RESOURCES INC
:WSW.25'37-74 (2 WELLS)-MINE UNIT 27 MONITOR WELLS PWER RSOURCES, INC.... 11-• .. .. . ... .... . ...... ........ i / .• • % .. ..19,07 POWER RESOURCES INC
/53C1073OWRSSOIC~ N
'WTERS FEE 31-21 1WCCIAM 3 9941
.WATEE 321 IWILLIAM M HENRY I...
656(2 WELLS) 2-637-74-MINE UNIT 27 MON3OR WELLS POWER RESOURCES, INC
S 54 ss RES.. ....... .... REOURCES INC"'C1156C ~s 40 69 p RESOURCEiSINC
39C55755 iPOER RESOURCES INC
SESE 26-37-74 (2 WELLS)-MINE UNIT 27 MONITOR WELLS 'OWER RESOURCES, INC
l534C16061 POWER REUSURCES INC
6SE/NW 35-37-79 (3 WELLS) - MINE UN3 T 27 MONITOR WELLS CAMECO RESOURCES
COMMISSIONERS- RIO ALGOM MINING'SCI064 ICORP.
SVNNW36-37-74(2 WELL) , MINE UrIT 27 MONITOR WELLS CAMNEO RESOURCES-. ........... ... . ...... ..... ..................... . .Iw CWi. RI•i.T.05-HUIJO'.OU) .. ....•
1COMMISSIONERS" RIO ALGOM MININGISMC1060'CRP Ss-.-0. . . 1--...ýSENE 35-37-74(1 WELL) - MINE UIiT27 MONITOR WELL, CýARECOESOUCES:35-982 45 =RDLS RANCH) -POWER RESOURCES INC
INWNE 3S-37-74 (3 WELLS(-MINE UNIT 27 MONITOR WELLS IPOWER RESOURCES, INC
1GAME & FISH COMM., STATE OPIREYNOLDS #36 (DEEPENED) IWEOMING*- DUCK CREEK RANCHES INC... .. . . . . . .... .. ...... ... # ..... B• i ; L• ...... ............
COMMISSIONERS- RIO ALGOM M3NINGSMC0SS ' CORP.
SWSE 35-37-74 (3 WELLS)-MINE UNIT 27 MONITOR WELLS POWER RESOURCES, INC
.NESW 36-37-74 )2 WELLS()MINE UNIT 27 MONITOR WELLS 'POWER RESOURCES, INC
/NWSW 36-37-74 (3 WELL) - MINE UNIT 27 MONITOR WELLS CAMECO RESOURCES
1COVMISSIONE9S9 PIO ALGOM 3I1ING9SMCI056C 'CORP
.' j'"LR I .. . . .. . . . , -, AkLO - L
(COMMISSIONERSG- RIO ALGOM MININGSMC1G6I ( CORP•
NE/NE 35-37-74(6 WELLS) -MINE UNIT 27 MONITOR WELLS CAMECO RESOURCES ]
SW/NW 36-37-74)(6 WELLS) - MINE UNIT 27 MONITORn WELS1CMCREOCS
34MC5071S POWER RESOURCES INC
• C1RE3 ...... IP oWE • ... ... .
SP4553 IPWEREOUCE INC
•SMCS0SSC POWER RESOURCES INC
.53415150 OWERRESOURC-ES IRE.
,COM34ISSISNERS" RIO ALGO MINING3 0SMC1OSSC CORP.
,MC1I6IV /POWE Hb.ESURE INCe."P. . . 1ThWE R&ESOURCE-S6-E IN
jOWýER -RESOORIRSICfTd_ - _
/NESE 35-37-74 (3 WELL) - MINE UNIT 27 MONITOR WELLS ICAMECO RESOURCES
SW 36-37-74)(3 WELLS)-MINE UNIT 27 MONITOR WELLS 4POWER RESOURCES, INC
sCOMMISONEEST RIO 61.603 MININGHMC1E96C CORPPMtC11685 POW'ER RESOURCES INC6
SE/SW 36-37-74 (3 WELLS) - MINE UNIT 27 MONITOR WELLS )CAMECO RESOURCES
COMMISSIONRERS RIO ALGOM MININGSMC1067C CORP.
NENW36-37-74 (2 WELLS)-MINE UNIT 27 MONITOR WELLS 'POWER RESOURCES, INC
SSmith Ranch Permit
Appendix D6 (tables)Page 47 of 49 Revised - April 2011
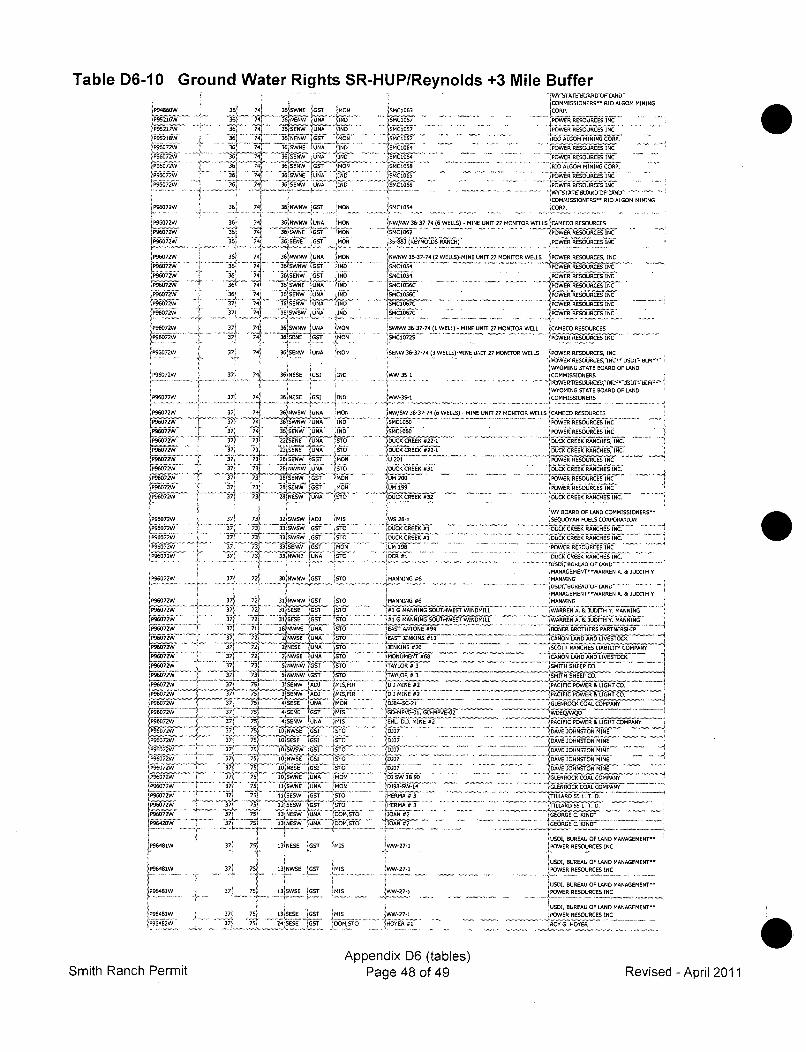
Table D6-10 Ground Water Rights SR-HUP/Reynolds +3 Mile Buffer
P94856W
P952-17W
P96072W
P96072W
I9672W
IP96072W
P96072W
P9972W
4P96072W
ýP96072W
P96072Wý
P96C027
36' 74 9LWYNEI- 'YMON9K4 36 NENW ,19 1160
60 74 3ATSNW' '~UNA 19D36E _4$ 6NENW '[SOT MON
36 71 356 W E UNA IN0
36K 7ý f LNW 16 IND
36i 'I 2 SRNW jUST MON"(t 74 36 OWVNE 096 1'D
36', 7'1 26069W UNA :1ND
36N r 2 +KNWNW GOT
361 74i4 6NfWtNWý JUNA !MON
361 , ý1 36.WW~S 190
3 -61 74 36 OWNE UN NC1146'36 74T 36ONW 06 9
3656R "14 SW 4037 3
7; 44 6599WUNA MON
36 S!!I*N i.
3ý'_ 4 36)066NW 696A KMON
377 71. 3444656 (oSI I'
1SMCI063
(5MC0007
SMC1064
KSM C 10 6
SMUO 069
'WY i Al tE626A962 LAN•'
COMMIRRIONERS*" RIO A1GOM MININGCORP.
R0'E ESOURCES INC
t POWER RESOURCES INCIOM ALROM MINING CORP
'POWER RESOURCESINCVPOWER RESOURCES INCRIO ALSOM MINING CORP.rPOWER RESOURCES INCrPOWER RESOURCES INC_WI IRKA II'K'6'KJ UP 1690ýCOMMISSIONERS" RIO 61009 MINING
SMC1054 CORP.
NW/NW 36-37-74 (6 WELLS) - MINE UNIT 27 MONITOR WELLS CAMECO RESOURCES
11MCS16 2POWER RESOURCES INC
30-603(REYNOLDS RANCA POWERESORCES IN
NWNW 36-37-74 (2 WELLS)-MINE UNIT 27 MONITOR WELLS 'POWER RESOURCES, INC
•SMC1OS,4 POWER RESOURCES INC$"SMCSO6 ~POWER RESOURCES INC
A-CE =06FPOWER RESOURCES INCSMC1567C ý kPOWER RSOUCESINCS5MC1067C Pi-_6_CSiR
.. . ..06 C P6KFR iRESOURCES INC
KSWNW 36-37-74 (1 WELL) - MINE UNIT 27 MONITOR WELL 'CAMECO RESOURCES
C2 POW.... . .ER RESOURCESi •N'
LSENW 36-37-74,3 WELLS)-MINE UNIT 27 MONITOR WELLS POWER RESOURCES, INC
WYOMING STATE ROARD OF LAND'WW-3S-1 COMMISSIONERS
KWYOMING STATE BOARD OF LAND
.WW3E-30 •COMMISSIONERS
9NW/SW 36-37-74 (6 WELLS) - MINE UNIT 27 MONITOR WELLS (CAMECO RESOURCES7SMCS060 ' POWER RESOURCES INC
SCUCK KREEPOWER #RESOARCES INC
OýCKCEEE #22-1 DUK CREEK RANCHES INC.60CR CREJEK 922IiK DUCK CREEK RANCHES, INC.UD201 "'fK. . . .$PWE RESOURCES .INC
31JDUCK CREEK #3 1_ RANHE IN. .....
Uý zooPOWER RESOURCES INC$594 199 PWRRSORE N
D'UC-K CREEK- #3-2 DCKREKACMSINC.
ýP972W1 37 74 3JNESE OGSI 19
P9672W 3 4 6NS S O37K 74 3n569tKUNA lIDN
ý196372W 7 71 3659 9 IND
(P96072W 3773 22lSENE UNA NTO
[P172 7 73 22fSENE*USA 510$44441729 17 i3:'1$EW GI f-O
(P96072W 37ý 73$ 28 6 4W UA 1 tU
& 334 7r'1)ijiENW$~S )0KP96O2W 37 73 209W GOT MON
49672W 371 K-$-K 51NE UN-13i4
'P96072W
P96072W.
P96072W
P96072
P46072W
P96672W
1 P672W
kP96072
Pý6072W
('K ' ".."- - ..
KP672W7KK149072W
(P96072W
P9672WP96072W1
P95072W
Pf96072W
[P96420W
K 96481W
Smith Ranch Permit
37' 73! 32SWSW AD2 MIS
37 7 , -7; 33' WSW oSTO (5"'ir Gi)~.OT CI
37 77' 4SENVW ost MON37 731" 33oNWwE 9 UNA OTO
37 721 3ENWNW 'GET STO
37) 714 31 6W9 WST STO
37' 72S - 31 SESE• GO T T ....71oi70: 2 166 AMA 7NTO
. . . 7•s 8 ....K 2 NWNE UNA MON.
Ki 272 2 NESE 6
77s{ L2NWSE UGN_. .SI37939W USTOTO37) 73 5SNWNW GOT 43
37K 75 31E S ASE GT ISPR
37. ........ S UNA "MON.."""
37 75 14 SENE GST MIS37) 75. 4K SNW UNA MIS377 79;5 KWE 5 T
37 7; 4SSE GUI STO37 75 5045965W III 510
37 75' 10 NWSE Gi ý
371 7S( I LUNEUE"K-$16 SOT0
37" !T _UNA M09
37 7""i1ESW"41E Uý OTN
37K 75) S2KEW (GOT KOT0
37 7S I3
NE U96 009 ST
37K ~ ?!ý 74-29Dt O" 09STO,
37i 75$ 13(NESE SOT ýMIS
371I 751 1315WSE IGOT MIS
37 7f, 1(SS OS I
34 ' 24SESE "5UT OMSTO6
•WS 26-I
'DUCKCREEK 91.
DUCK CREEK 91
SM 199
. .• 't ... ...... ...... ..... .. ....'...OCR 9
'MANNING #6
141 06GMNNN SOUTHWEST WINDMILL
p ~ i'• •6 .. ......... ..... ........ .. .. ..(KEAST JENKINS 913
JENKIS 2
MONUMENT 96
TAYLOR # 37
TIYLR 9#
02 MINE 9#2
GD-MPSE- UB SD-MPVE-G2
R9L 62 MINE 92KD 0217 2
02 D99"SW-14
D)-HERMAb993
jOANt 92
W-27-1
VWW-27-1
KWW-2
?1-
WM E27-1
IWY BOAR OF LAND COMMISSIONERS"
SEqUOYAH RUELS CORPORATION
60CR CREEK RANCHES INC
MDUCKCREEK RNCHES INC.
POWER RESOURCESIN KKKK-"6K'
DUCK CEKRNHSIC
MANASEMENT"WARREN 6.98 JUDITM Y.MANNLINGK
......... 1....• JO L " N ... ... .....
MANASEMENT"•WARREN A. & JUDITH Y.!MANNING
WARREN"A. & JUDITH Y MANNING
WARREN AR JUDITH Y. MANNING
LONER BOHR ATESI
SCOT RANCHES LIABILITY COMPANY
'CANON LAND ANDLIVESTC
"SMITH -SHEEP Co........ "-K-KK--KK- o7•. ...K--KKK....... ... .......)
(PACIFIC POWER & LIGHT CO.
PACIPiC POWER & LIGHT COMPANY KJDAVE JOHNSTON MINE
DASE JOHNSTON INEl
DAVE JOHNSTON MINE7CAVE JOHNSTON MINAE
DAVE JOHNSTON MINE
GLENROCK COAL COMPANY .
UGLEUROCK COALA C MPANAY
TILLAROL 50 .T.0
TLLERD RSOURL. TIN0(GEORGE C. KINDT
GEORGE- C KINDT-
USDI, BUREAU OF LAND MANAGEMENT"POWER RESOURCES INC
lUSDIK BUREAU OF LAND MANAGEMENT"1POWER RESOURCES INC
KUODI, BUREAU OP LAND MANAGEMENT")POWER RESOURCES INC
ýUSD1, BUREAU OP LAND MANAGEMENT"
POWER RESOURCES INC
AD RS. .MOSER
Revised - April 2011Appendix D6 (tables)
Page 48 of 49
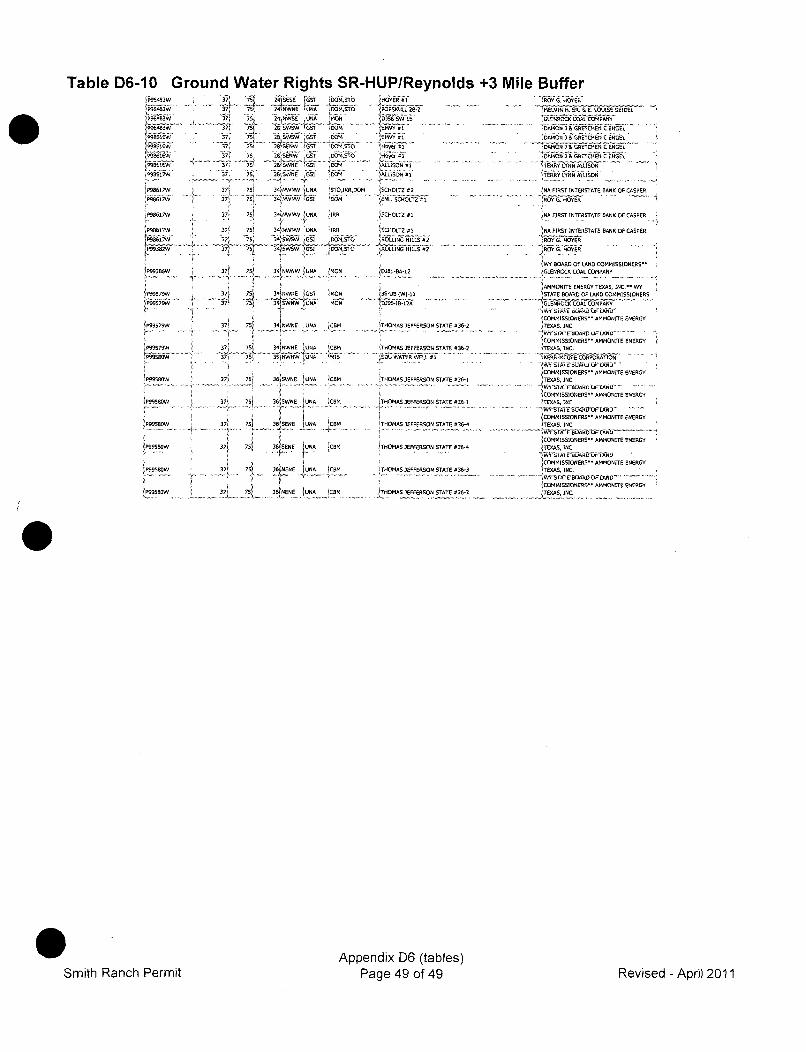
Table D6-10 Ground Water Rights SR-HUP/Reynolds +3 Mile Buffer
.. .. ....... ... .. .... ... . ..•. .. . ..
iP98513•A/ 7 75• 3RSEVNW 1U5A GSOIRRY ISNYRIHOTI 2!AFRTITRSAEBN FC•E
V..7. . 'n AMON) &8 GRETCHEN C ENGELIPSEASAW 37 7S 3SENW CI ,OT ANC 1
37ý 75 2R79WNC ISSI Rýll IALisON El TERYNALSONINý 2;S SWN E CCI 5014 ALISO IS TERY .LYN .N -AlLLISON 1
ELRA17W 37 75 34HNWNW 1UNA ýOIRRE OH SCHOLTZ E2 NA FIRST INTERSTATE BANK OF CASPER
P98617VV7 G 34iNWNW ERUA ýIRE ISCNOLTZ #1 N4A FIRST INTERSTATE RANK OF CASPER
)NA FIRST INTERSTATE RANK OF CASPER
'69i 66A 3 IROY G. HOYSR
PNN3R2WJ 3, 3''3AWW110 OMýSTO JROLLING HILLS #2RROTC. MOYERI.%&y BOARD Of LAND CO ISS.N
ý9N3RA 7! 7%..6NNW MN jJRA2ISLENROCK COAL COMPANY OES
j:9 JAMMON.ITE ENERGY TEXAS, INC:,'- WY
.......... 37 7; "I4NNR.... b " ...." -- -... --.- ....•bNN7"W I 37,
7 43PWIEWj)UNA HON "I -~SAROCK COAL COMPANY
: COMMY IAS IAIOERS.1 LAMNAT NEG
SA TATE 2iCOMMISSIONERS" AMMONITE ENERGY
CP99579W TA37 7 .WE UNA CBM OMAS JEFFERSON STATE E3R-2 TEXAS, INC.
P•9357W 37} 71 3H3NWNEW ENA AISSUWTR EL# E AR• •EAREOUFLR .......
/P9980W : 3 75 S SNE NA :SH HOMS 3FFESON TAT #3"i TE'XAS, INC.COMMISSIONERS" AMMONITE ENERGY
PN9580W 3 7 IN CRB THOMAS JEFFERSON STATE #36- TEXAS, INC.37 3i 5 GNWNE AUNA TEA
3- 5 i.COMMISSIONERS" AMMONITE ENERGY
PH....RW , 371 753 3SWNE .uNA ýCBM THOMAS JEFFERSON STATE #36-1 TEXAS, INC.
i w A, N . ...
CTOMMISSIONERS" AMMONITE ENERGYPHNSRW 37 7S . 3~It¶.YA CR4 THOMAS JEFFERSON STATE E36-S COOS, INC. A
PHG580W 37 751 3 ENE jNA "C ITHOMAS JEFFERSON STATE #36-4COMMSSIS AMMONITE ENERGI I1 IjCOMMISSIONERS" AMMONITE ENERGY
IP98-O ~3 .7! . 75[ jSNE JUA CRM ýTROMAS JEFFERSON STATE #363 TEXAS INC.
jCOMMISSIONERS" AMMONITE ENERGYIP995 oW 37 A ~ CMTXS
71 COMMISSIONERS" AMMNOT ENERGYN!ýLEýE3,
Appendix D6 (tables)Smith Ranch Permit Page 49 of 49 Revise d - April 2011
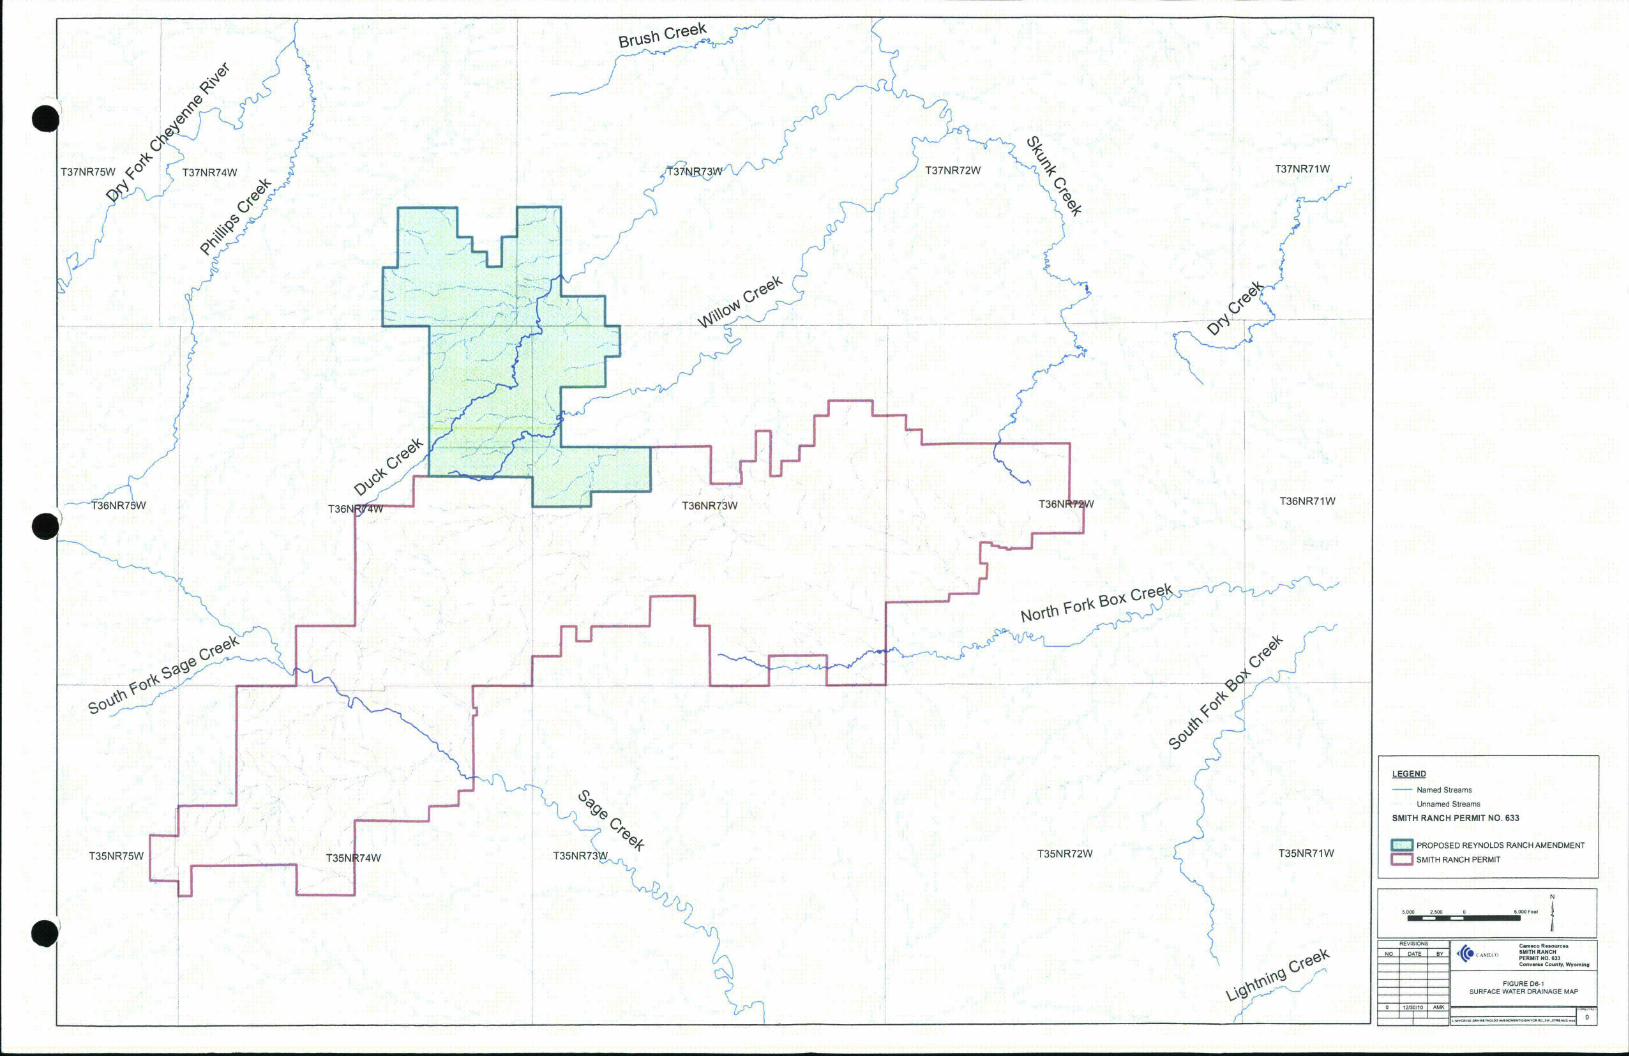
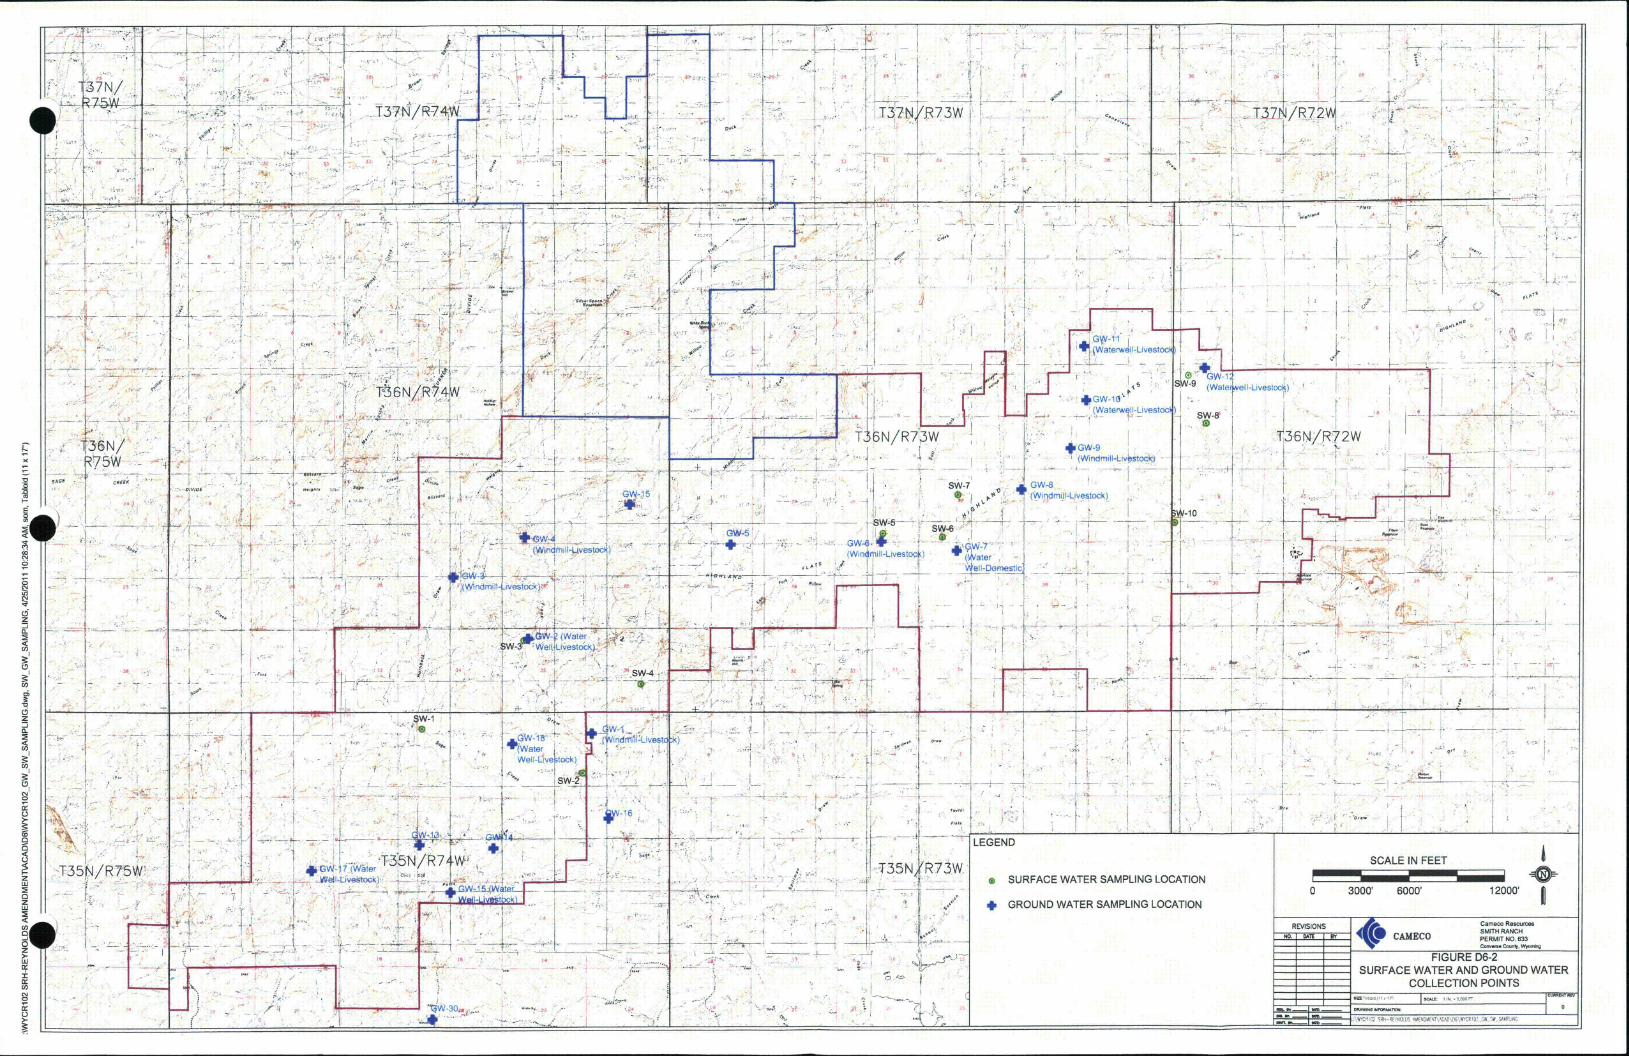
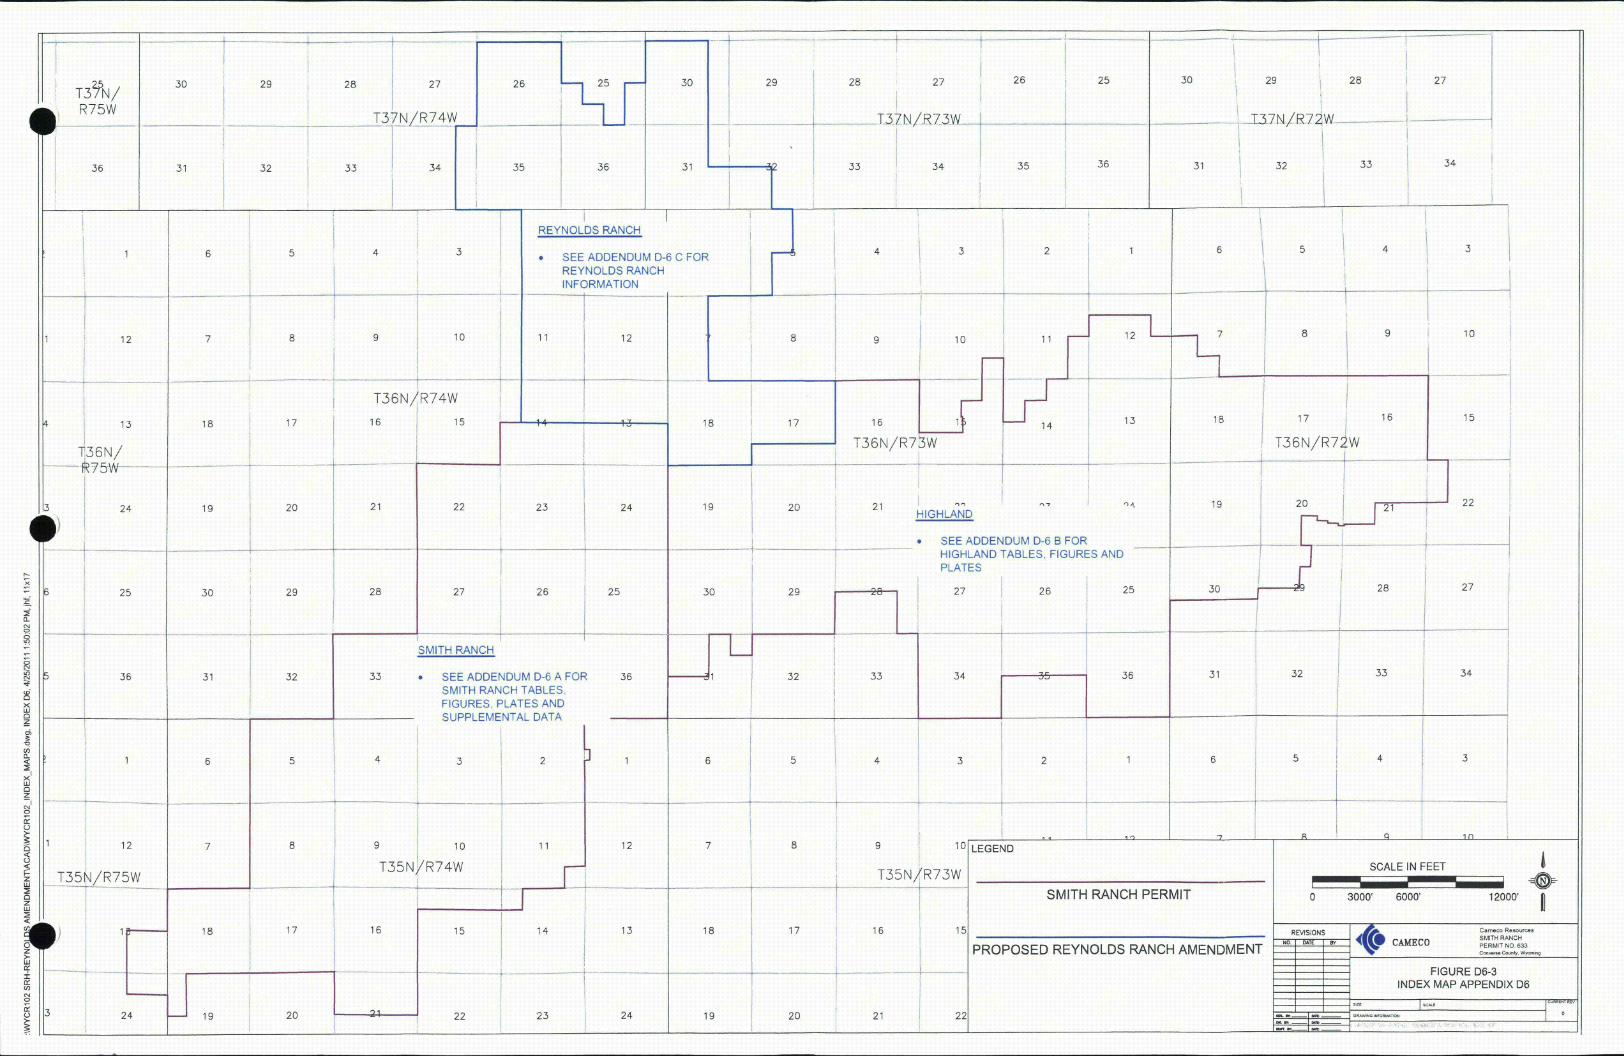

The following 6 Drawingsspecifically referencedAppendix D6 Table ofContents have beenprocessed into ADAMS.
These drawings can beaccessed within the ADAMSpackage or by performing asearch on theDocument/Report Number.
D-139 to D-144
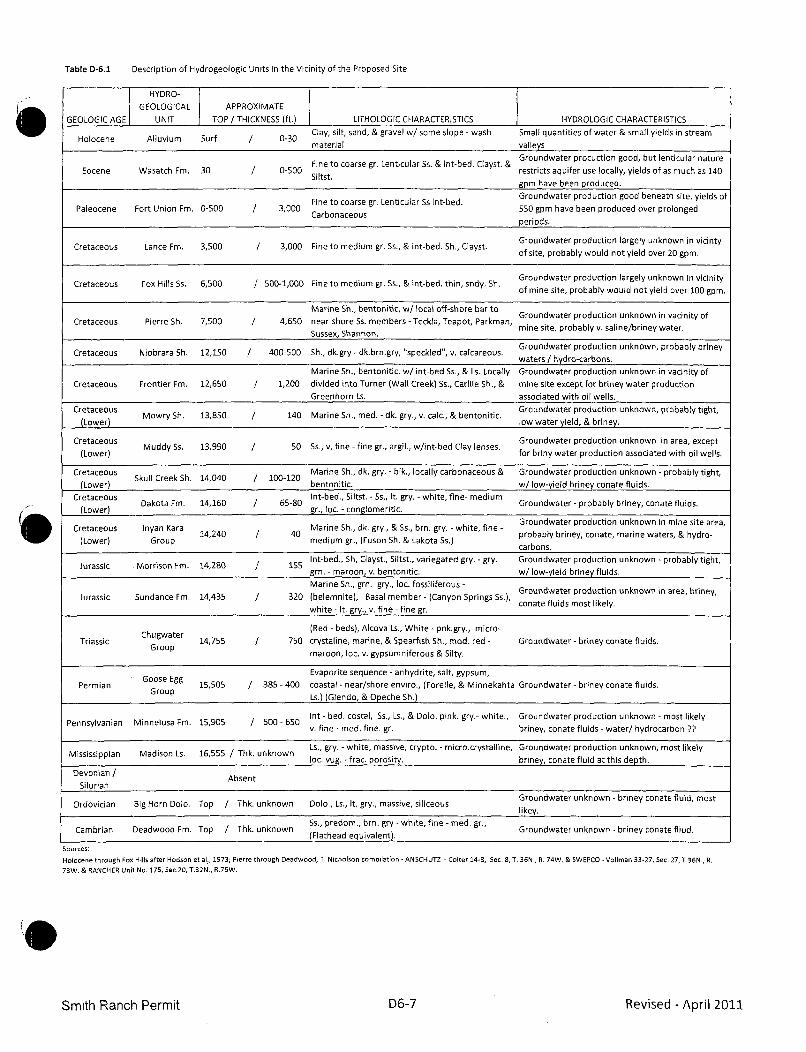
Table D-6.1 Description of Hydrogeologic Units in the Vicinity of the Proposed Site
HYDRO-
GEOLOGICAL APPROXIMATE
GEOLOGIC AGE UNIT TOP /THICKNESS (ft.) LITHOLOGIC CHARACTERISTICS HYDROLOGIC CHARACTERISTICS
Holocene Alluvium Surf. 0-3D Clay, silt, sand, & gravel w/ some slope - wash Small quantities of water & small yields in stream
material valleys
Fine to coarse gr. Lenticular Ss. & int-bed. Clayst. & Groundwater procuction good, but lenticular nature
Eocene Wasatch Fm. 30 0-500 restricts aquifer use locally, yields of as much as 140gpm have been produced.
Fine to coarse gr. Lenticular Ss int-bed. Groundwater production good beneath site, yields of
Paleocene Fort Union Fm. 0-500 3 550 gpm have been produced over prolonged
periods.
Groundwater production largely unknown in vicintyCretaceous Lance Fm. 3,500 I 3,000 Fine to medium gr. Ss., & int-bed. Sh., Clayst. ofnsite, probaby ion yield ove 20 gpm.
of site, probably would not yield over 20 gpm.
Groundwater production largely unknown in vicinityCretaceous Fox Hills Sn. 6,500 / 500-1,O00 Fine to medium gr. Ss., & int-bed, thin, sndy. Sh.
of mine site, probably would not yield over 100 gpm.
Marine Sh., bentonitic, w/ local off-shore bar to Groundwater production unknown in sacinity ofCretaceous Pierre Sh. 7,500 / 4,650 near-shore Ss. members - Teckla, Teapot, Parkman, mine site, probably v. saline/briney water.
Sussex, Shannon.
Cretaceous Niobrara Sh. 12,150 I 4D0-500 Sh., dk.gry - dk.brn.gry, "speckled", v. calcareous. Groundwater production unknown, probably briney
waters / hydro-carbons.
Marine Sh., bentonitic, w/ int-bed Ss., & Ls. Locally Groundwater production unknown in vacinity of
Cretaceous Frontier Fm. 12,650 / 1,200 divided into Turner (Wall Creek) Ss., Carlile Sh., & mine site except for briney water production
Greenhorn Ls. associated with oil wells.
Cretaceous Mowry Sh. 13,850 140 Marine Sh., med.- dk. gry., v. calc.,& bentonitic. Groundwater production unknown, probably tight,
(Lower) low water yield, & briney.
Cretaceous Muddy Ss. 13,990 / 50 Ss., v. fine - fine gr., argil., w/int-bed Clay lenses. Groundwater production unknown in area, except
(Lower) for briny water production associated with oil wells.
Cretaceous Skull Creek Sh. 14,040 100-120 Marine Sh., dk. gry. - blk., locally carbonaceous & Groundwater production unknown - probably tight,
(Lower) bentonitic. w/ low-yield briney conate fluids.
Cretaceous Dakota Fm. 14,160 / 65-80 nt-bed., SlIst. -Ss., It. gry. - white, fine- medium Groundwater - probably briney, conate fluids.
(Lower) gr., loc. - conglomeritic.Groundwater production unknown in mine site area,
Cretaceous Inyan Kara Marine Sh., dk. gry., & Ss., brn. gry. - white, fine - probably brne ucon mar ine s, & re-(oe) Gop 14,240 / 40 meimg. FsnS.&Lkt s)probably briney, conate, marine waters, & hydro-
(Lower) Group medium gr., (Fuson Sh. & Lakota Ss.) croscarbons.
Jurassic Morrison Fm. 14,260 1S5 Int-bed., Sh, Clayst., Siltst., variegated gry. - gry. Groundwater production unknown - probably tight,
grn. - maroon, v. bentonitic. w/ low-yield briney fluids.
Marine Sh., gin. gry., loc. fossiliferous - Groundwater production unknown in area, briney,
Jurassic Sundance Fm. 14,435 / 320 (belemnite), Basal member - (Canyon Springs Ss.), conate fluids most likely.
white - It. gry., v. fine - fine gr.
c Chugwater (Red - beds), Alcova Ls., White - pnk.gry., micro-
Triassic 14,755 750 crystaline, marine, & Spearfish Sh., mod. red - Groundwater - briney conate fluids,maroon, loc. v. gypsumniferous & Silty.
Goose Egg Evaporite sequence - anhydrite, salt, gypsum,Permian Group 15,505 / 385 -400 coastal - near/shore enviro., (Forelle, & Minnekahta Groundwater - briney conate fluids.
Group Ls.) (Glendo, & Opeche Sh.)
Pennsylvanian Minnelusa Fm. 15,905 600-650 Int - bed. costal, Ss., Ls., & Dolo. pink. gry.- white., Groundwater production unknown - most likelyv. fine - med. fine. gr. briney, conate fluids - water/ hydrocarbon ??
Mississippian Madison Ls. 16,555 /Thk. unknown Ls., gry. - white, massive, crypto. - micro.crystalline, Groundwater production unknown, most likely
loc. vug. - frac. porosity. briney, conate fluid at this depth.
Devonian Absent
Silurian
Ordovician Big Horn Dolo. Top / Thk. unknown Dolo., Ls., It. gry., massive, siliceous Groundwater unknown - briney conate fluid, most
likey.
Cambrian Deadwood Fm. Top / Thk. unknown Ss., predom., bin. gry - white, fine - med. gr., Groundwater unknown - briney conate fliud.(Flathead equivalent).
Sources:
Holocene through Fox Hills after Hudson et al. 1973; Pierre through Deadwood, T. Nicholson compilation - ANSCHUTZ - Colter 14-8, Sec. 8, T. 36N., R. 74W. & SWEPCO - Vollman 33-27, Sec. 27, T.36N., R.73W. & RANCHER Unit No. 175, Sec.20, T.32N., R.75W.
Smith Ranch Permit D6-7 Revised - April 2011
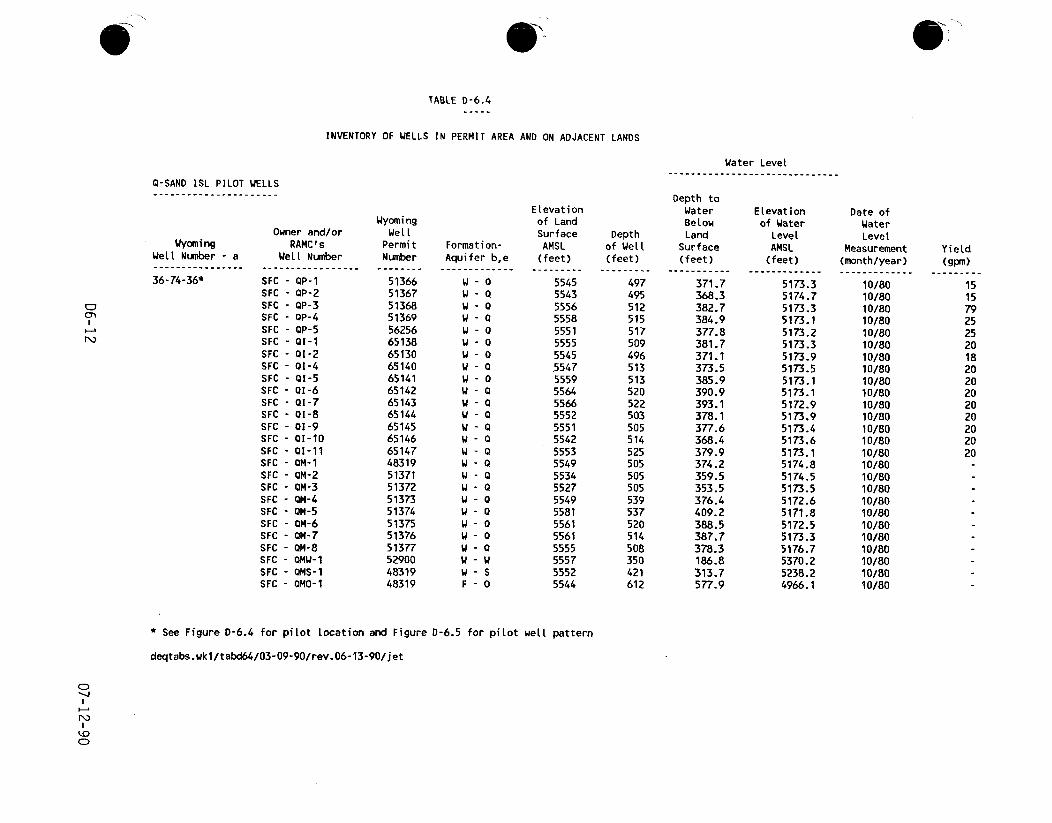
TABLE D-6.4
INVENTORY OF WELLS IN PERMIT AREA AND ON ADJACENT LANDS
Water Level..............................
0-SAND ISL PILOT WELLS----------------------
WyomingWell Number - a
36-74-36*
q=CI Y
Owner and/orRAMC's
Well Number
SFC - QP-ISFC - QP-2SFC - QP-3SFC - QP-4SFC - QP-5SFC - QI-1SFC - 01-2SFC - QI-4SFC - 01-5SFC - 01-6SFC - QI-7SFC - QI-8SFC - 01-9SFC - Q0-10SFC - 01-11SFC - OM-1SFC - QM-2SFC - QM-3SFC - OM-4SFC - QM-5SFC - QM-6SFC - QM-7SFC - QM-8SFC - QMW-1SFC - QMS-1SFC - QMO-1
WyomingWelt
PermitNumber
5136651367513685136956256651386513065140651416514265143651446514565146651474831951371513725137351374513755137651377529004831948319
Formation-Aquifer b,e
W-0W- QW- QW- 0W-OW- 0W-QW- QW- QW -QW- QW -0W-QW- QW- QW -0W-QW- 0
W- QW -0W- 0W-0
W- WW- SF -0
Elevationof LandSurface
AMSL(feet)
5545554355565558555155555545.5547555955645566555255515542555355495534552755495581556155615555555755525544
Depthof Welt(feet)
497495512515517509496513513520522503505514525505505505539537520514508350421612
Depth toWaterBelowLand
Surface(feet)
371.7368.3382.7384.9377.8381.7371.1373.5385.9390.9393.1378.1377.6368.4379.9374.2359.5353.5376.4409.2388.5387.7378.3186.8313.7577.9
Elevationof Water
LevelAMSL
(feet)
5173.35174.75173.35173.15173.25173.35173.95173.55173.15173.15172.95173.95173.45173.65173.15174.85174.55173.55172.65171.85172.55173.35176.75370.25238.24966.1
Date ofWaterLevel
Measurement(month/year)
10/8010/8010/8010/8010/8010/8010/8010/8010/8010/8010/8010/8010/8010/8010/8010/8010/8010/8010/8010/8010/8010/8010/8010/8010/8010/80
Yield(gpm)
151579252520182020202020202020
* See Figure D-6.4 for pilot location and Figure D-6.5 for pilot welt pattern
deqtabs.wkl/tabd64/03-09-90/rev.06-13-90/jet
CD9
N)
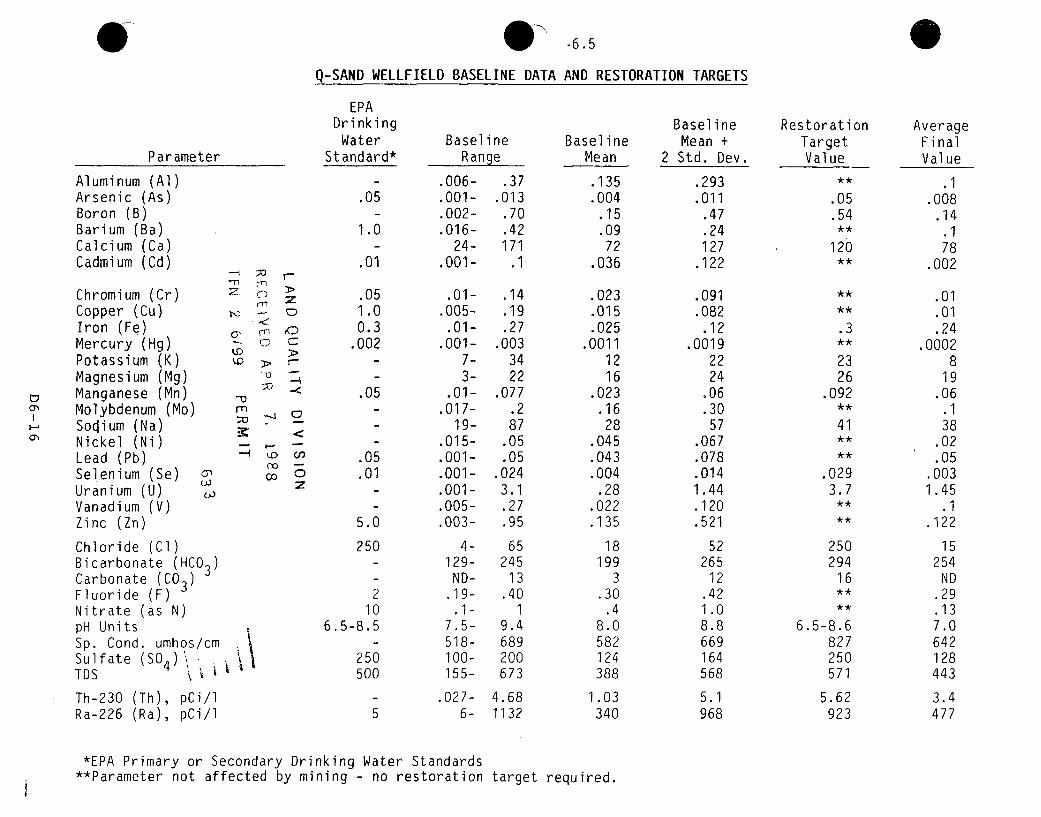
-6.5
Q-SAND WELLFIELD BASELINE DATA AND RESTORATION TARGETS
Parameter
Aluminum (Al)Arsenic (As)Boron (B)Barium (Ba)Calcium (Ca)Cadmium (Cd)
Chromium (Cr)Copper (Cu)Iron (Fe)Mercury (Hg)Potassium (K)Magnesium (Mg)Manganese (Mn)Molybdenum (Mo)Sodium (Na)Nickel (Ni)Lead (Pb)Selenium (Se)Uranium (U)Vanadium (V)Zinc (Zn)
EPADrinking
WaterStandard*
.05
1.0
.01
BaselineRange
Z:i
mn
r'i C)
--
-4
a,
z0GJ)
co
.051.00.3
.002
.05
.05
.01
5.0
250
210
6.5-8.5
250500
.006-
.001-
.002-
.016-24-
.001-
.01-.005-
.01-.001-
7-3-
.01-.017-
19-.015-.001-.001-.001-.005-.003-
4-129-
ND-.19-
.I-7.5-518-100-155-
.37.013
.70
.42171.1
.14
.19
.27.003
3422
.077.287
.05
.05.0243.1.27.95
65245
13.401
9.4689200673
BaselineMean
.135.004
.15
.0972
.036
.023.015.025
.00111216
.023.16
28.045.043.004
.28.022.135
18199
3.30
.48.0582124388
1.03340
BaselineMean +
2 Std. Dev.
.293
.011.47.24127
.122
.091
.082.12
.00192224
.06
.3057
.067
.078
.0141.44.120.521
52265
12.421.08.8669164568
5.1968
RestorationTargetValue
.05
.54
120
.3
2326
.092
41
.0293.7
250294
16
6.5-8.6827250571
5.62923
AverageFinalValue
.1.008
.14.178
.002
.01.01.24
.00028
19.06.138
.02.05
.0031.45.1
.122
15254
ND.29.137.0642128443
3.4477
Chloride (Cl)Bicarbonate (HCO 3 )Carbonate (CO3 )Fluoride (F)Nitrate (as N)pH UnitsSp. Cond. umhos/cmSulfate (SO4 ) ý-ýTDS '
Th-230 (Th), pCi/lRa-226 (Ra), pCi/l 5
.027- 4.686- 1132
*EPA Primary or Secondary Drinking Water Standards**Parameter not affected by mining - no restoration target required.
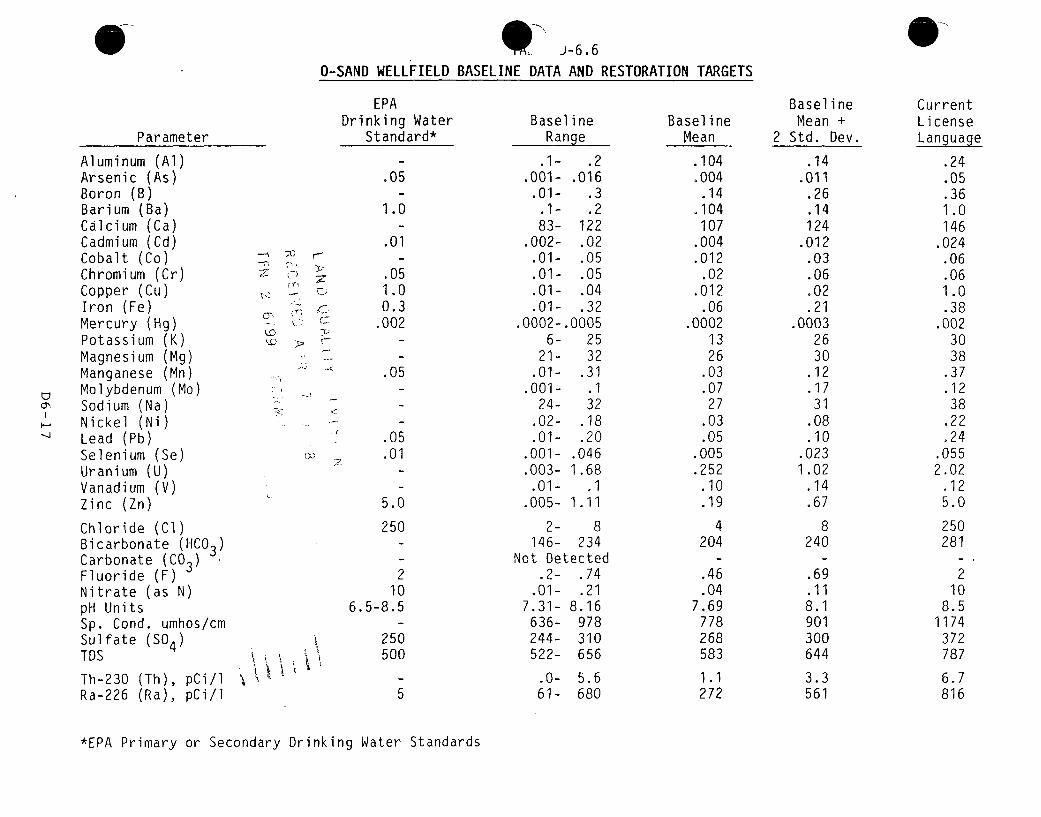
O-SAND WELLFIELD BASELINE DATA AND RESTORATION TARGETS
Parameter
-I
Aluminum (Al)Arsenic (As)Boron (B)Barium (Ba)Calcium (Ca)Cadmium (Cd)Cobalt (Co)Chromium (Cr)Copper (Cu)Iron (Fe)Mercury (Hg)Potassium (K)Magnesium (Mg)Manganese (Mn)Molybdenum (Mo)Sodium (Na)Nickel (Ni)Lead (Pb)Selenium (Se)Uranium (U)Vanadium (V)Zinc (Zn)
Chloride (Cl)Bicarbonate (HCO3)Carbonate (C03 )Fluoride (F)Nitrate (as N)pH UnitsSp. Cond. umhos/cmSulfate (SO4 )TDS
Th-230 (Th), pCi/lRa-226 (Ra), pCi/l
(y~
fi
EPADrinking Water
Standard*
.05
1.0
.01
.051.00.3
.002
.05
Basel i neRange
.1- .2.001- .016
.01- .3.1- .283- 122
.002- .02.01- .05.01- .05.01- .04.01- .32
.0002- .00056- 25
21- 32.01- .31
.001- .124- 32
.02- .18
.01- .20.001- .046.003- 1.68
.01- .1.005- 1.11
2- 8146- 234
Not Detected.2- .74
.01- .217.31- 8.16
636- 978244- 310522- 656
.0- 5.661- 680
BaselineMean
.104
.004.14
.104107
.004
.012.02
.012.06
.00021326
.03
.0727
.03
.05.005.252
.10
.19
4204
.46
.047.69
778268583
1.1272
BaselineMean +
2 Std. Dev.
.14.011
.26.14124
.012.03.06.02.21
.00032630
.12.1731
.08
.10.0231 .02
.14
.67
8240
.69
.118.1901300644
3.3561
CurrentLicenseLanguage
.24
.05
.361.0146
.024.06.061.0.38
.0023038
.37
.1238
.22
.24.0552.02
.125.0
250281
210
8.51174372787
6.7816
(X,-
.05
.01
5.0
250
210
6.5-8.5
250500
5
*EPA Primary or Secondary Drinking Water Standards

TABLE D-6.7
BASELINE WATER QUALITY DATACONVERSE COUNTY, WYOMING
/0 Well No. 2-295, Sec. 2, T35N, R74W
1/2/86 1/30/86 3/13/86 5/27/86 7/30/86
Dissolved Solids (TDS) 323 359 322 334 351
Sodium (Na) 25 27 26 26 26Potassium (K) 11 8 8 7.9 8Calcium (Ca) 59 64 59 56 58Magnesium (Mg) 12 10 15 16 16
Sulfate (SO ) 98 111 106 126 98Chloride (Ci) 11 9 9 5.1 10Carbonate (CO) 0 0 0 0 0Bicarbonate (AC0 3 ) 185 195 195 187 193
Major Cations, meq 5.30 5.38 5.50 5.46 5.54Major Anions, meq 5.10 5.65 5.65 5.86 5.49Nitrate (as N) 0.05 0.17 0.07 0.02 0.10Floride (F) 0.36 0.45 0.45 0.50 0.34
Roron (B) 0.14 0.16 0.05 < .01 0.05iminum (Al) < .10 < .10 < .10 < .01 < .10enic (As) < .001 < 0.001 < .001 < 0.001 0.008
®rium (Ba) < .10 < .10 < .10 < 0.1 < .10
Cadmium (Cd) < .002 < .002 < .002 < 0.01 < .002Cobalt (Co) < .10 < .01 < .10 < 0.01 < .01Chromium (Cr) < .01 < .01 < .01 < 0.05 < .01Copper (Cu) < .01 < .01 < .01 < 0.01 < .01
Iron (Fe) < .01 < .01 0.01 < 0.05 0.03Lead (Pb) < .05 < .05 < .05 < 0.05 < .05Manganese (Mn) < .01 0.01 0.02 < 0.02 < .01Mercury (Hg) < .0002 < .0002 < .0002 < 0.001 < .0002
Nickel (Ni) < .02 < .02 < .02 < 0.05 < .02Selenium (Se) < .001 0.001 < .001 0.002 0.002Zinc (Zn) 0.265 0.220 0.593 0.65 0.585Molybdenum (Mo) < .10 < .10 < .10 < 0.1 < .10
Uranium (U) 0.292 0.026 0.028 0.065 0.028Vanadium (V) < .10 < .10 < .10 < 0.10 .10
Radium-226 (Ra-226) 5.0 10.2 29.2 91.8 10.2Thorium-230 (Th-230) 2.3 5.4 1.8 18.4 3.5
"ec. Cond - umhos 524 582 393 497 506* perature *F 14 15 15 16 16W- Units 7.70 7.39 7.33 7.35 7.36
*Ra-226 and Th-230 are in pCi/l. All other values are mg/l, except where noted.

TABLE D-6.8
BASELINE WATER QUALITY DATACONVERSE COUNTY, WYOMING
Well No. 2-296, Sec. 2, T35N, R74W
1/2/86 2/03/86 3/12/86 6/03/86 8/05/86
Dissolved Solids (TDS) 349 343 326 346 308
Sodium (Na) 27 27 27 26 26.4Potassium (K) 14 11 11 9 7.7Calcium (Ca) 61 59 50 56 52.5Magnesium (Mg) 10 12 14 16 12.3
Sulfate (SO ) 97 105 106 116 103Chloride (CH) 10 9 8 8 4.3Carbonate (CO) 0 0 0 0 0Bicarbonate (ACO 3) 188 185 173 185 168Major Cations, meq 5.39 5.38 5.10 5.47 5.00Major Anions, meq 5.38 5.46 5.27 5.67 5.05
Nitrate (as N) 0.07 .05 0.07 .05 0.03Floride (F) 0.45 0.51 0.51 0.33 0.47
Boron (B) 0.11 0.04 0.18 0.21 < 0.10(uminum (Al) < .10 < .10 < .10 < .10 < 0.10
W enic (As) < .001 < 0.001 0.001 0.002 0.001rium (Ba) < .10 < .10 < .10 < .10 < 0.10
Cadmium (Cd) < .002 < .002 < .002 < .002 < 0.01Cobalt (Co) < .10 < .01 < .01 < .01 < 0.01Chromium (Cr) < .10 < .01 < .01 < .01 < 0.05Copper (Cu) < .10 < .01 < .01 < .01 < 0.01
Iron (Fe) 0.05 < .01 0.04 0.02 < 0.05Lead (Pb) < .05 < .05 < .05 < .05 < 0.05Manganese (Mn) < .01 0.01 0.04 0.03 0.02Mercury (Hg) < .0002 < .0002 < .0002 < .0002 < 0.001
Nickel (Ni) < .02 < .02 .02 < .02 < 0.05Selenium (Se) < .001 0.001 0.001 0.001 < 0.001Zinc (Zn) 0.151 0.143 0.010 0.140 0.59Molybdenum (Mo) < .10 < .10 < .10 < .10 < 0.10
Uranium (U) 0.081 0.049 0.046 0.044 0.030Vanadium (V) < .10 < .10 < .10 < .10 < 0.10
Radium-226 (Ra-226) 306 190 282 257 28.7Thorium-230 (Th-230) 28 8.2 52 1.1 21.8
-'ec. Cond - umhos 549 521 523 516 4960 iperature °F 14 15 15 17 18
- Units 8.10 7.62 8.42 7.55 7.44
*Ra-226 and Th-230 are in pCi/l. All other values are mg/l, except where noted.
D6-19

TABLE D-6.9
BASELINE WATER QUALITY DATACONVERSE COUNTY, WYOMING
Well No. 8-136, Sec. 8, T35N, R74W
1/27/86 2/17/86 3/17/86 5/27/86 7/31/86
Dissolved Solids (TDS) 630 632 658 612 599
Sodium (Na) 25 24 26 26 22Potassium (K) 8 8 8 8 8Calcium (Ca) 120 124 120 114 116Magnesium (Mg) 34 37 37 35 37
Sulfate (SO ) 279 299 296 214 290Chloride (Ci) 7 7 7 1.9 9Carbonate (CO ) 0 0 0 0 0Bicarbonate (AC0 3 ) 220 222 229 207 210
Major Cations, meq 10.07 10.47 10.36 9.97 9.99Major Anions, meq 9.61 10.06 10.12 10.01 9.72Nitrate (as N) 0.08 < .05 0.09 < 0.01 < .05Floride (F) 0.51 0.51 0.45 0.46 0.34
Boron (B) 0.22 0.08 0.16 < 0.1 0.23Uminum (Al) < .10 < .10 < .10 < 0.1 <.10senic (As) 0.002 < .001 0.002 0.003 0.002
rium (Ba) < .10 < .10 < .10 < 0.1 < .10
Cadmium (Cd) 0.008 < .002 < .002 < 0.01 < .002Cobalt (Co) < .01 < .01 < .10 < 0.01 < .01Chromium (Cr) < .01 < .01 < .01 < 0.05 < .01Copper (Cu) < .01 < .01 < .01 < 0.01 < .01
Iron (Fe) < .01 0.17 0.88 < 0.05 0.16Lead (Pb) < .05 < .05 < .05 < 0.05 < .05Manganese (Mn) 0.10 0.10 0.13 0.19 0.04Mercury (Hg) < .0002 < .0002 < .0002 < 0.001 < .0002
Nickel (Ni) < .02 < .02 < .02 < 0.05 < .02Selenium (Se) < .001 0.001 0.001 0.008 0.010Zinc (Zn) 0.224 0.608 0.718 0.85 1.58Molybdenum (Mo) < .10 < .10 < .10 < 0.1 <.10
Uranium (U) 1.823 2.078 0.390 2.265 2.600Vanadium (V) < .10 < .10 < .10 < 0.10 < .10
Radium-226 (Ra-226) 420 552 279 443.6 399Thorium-230 (Th-230) 99 5.8 1.3 197.9 6.8
ec. Cond - umhos 864 930 873 849 8770*perature 'F 13 15 15 18 18
- Units 6.67 7.05 6.94 7.07 7.10
*Ra-226 and Th-230 are in pCi/l. All other values are mg/l, except where noted.
D6-20

TABLE D-6.10
BASELINE WATER QUALITY DATACONVERSE COUNTY, WYOMING
Well No. 17-421, Sec. 17, T35N, R74W
1/27/86 2/17/86 3/17/86 5/27/86 7/31/86
Dissolved Solids (TDS) 855 968 849 858 896
Sodium (Na) 31 30 30 34 29Potassium (K) 13 13 12 13.5 13Calcium (Ca) 152 168 148 140 164Magnesium (Mg) 41 46 54 51 51
Sulfate (SO ) 448 510 436 483 444Chloride (Ci) 8 7 7 4.4 7Carbonate (CO ) 0 0 0 0 0Bicarbonate (AC0 3 ) 183 220 232 235 254
Major Cations, meq 12.63 13.80 13.45 13.52 13.96Major Anions, meq 12.55 14.42 13.07 14.07 13.61Nitrate (as N) 0.07 0.11 0.24 0.11 0.12Floride (F) 0.51 0.57 0.51 0.52 0.35
Boron (B) 0.27 0.10 0.10 < .01 0.38(iminum (Al) < .10 < .10 < .10 < 0.1 < .10W enic (As) < .001 0.001 0.002 0.012 0.002Wium (Ba) < .10 < .10 < .10 < 0.1 < .10
Cadmium (Cd) 0.012 0.004 < .002 < 0.01 < .002Cobalt (Co) < .01 < .01 < .10 < 0.01 < .01Chromium (Cr) < .01 < .01 < .01 < 0.05 < .01Copper (Cu) < .01 < .01 < .01 < 0.01 < .01
Iron (Fe) 0.02 < .01 0.01 < 0.05 0.15Lead (Pb) < .05 < .05 < .05 < 0.05 < .05Manganese (Mn) 0.14 0.11 0.14 0'.13 0.12Mercury (Hg) < .0002 < .0002 < .0002 < 0.001 < .0002
Nickel (Ni) < .02 < .02 < .02 < 0.05 < .02Selenium (Se) 0.039 0.38 0.139 0.219 0.125Zinc (Zn) 0.662 1.40 2.14 1.53 1.67Molybdenum (Mo) < .10 < .10 < .10 < 0.1 < .10
Uranium (U) 0.139 0.095 0.079 6.795 0.079Vanadium (V) < .10 < .10 < .10 0.10 < .10
Radium-226 (Ra-226) 194 324 401 319 386Thorium-230 (Th-230) 26.1 40 3.1 170.1 32
"ec. Cond - umhos 1027 1169 1147 1158 1103t erature 'F 16 15 14 17 22
Units 7.33 7.23 7.19 7.17 7.26
*Ra-226 and Th-230 are in pCi/l. All other values are mg/l, except where noted.
n6-21

TABLE D-6.11
BASELINE WATER QUALITY DATACONVERSE COUNTY, WYOMING
0 Well No. 17-422, Sec. 17, T35N, R74W
1/27/86 2/20/86 4/10/86 6/24/86 8/28/86
Dissolved Solids (TDS) 307 311 291 272 375
Sodium (Na) 24 24 25 29 32Potassium (K) 9 9 10 10.5 7Calcium (Ca) 51 50 50 49 59Magnesium (Mg) 12 12 13 13.3 11
Sulfate (SO ) 98 109 110 99.6 86Chloride (CH) 10 9 9 2.6 9Carbonate (CO) 0 0 0 0 0Bicarbonate (ACO 3 ) 142 146 151 160 200
Major Cations, meq 4.80 4.76 4.92 5.09 5.41Major Anions, meq 4.65 4.91 5.02 4.80 5.32Nitrate (as N) 0.07 0.08 0.13 0.06 0.15Floride (F) 0.65 0.57 0.57 0.54 0.40
Boron (B) 0.11 0.04 < .01 .01 0.13jminum (Al) < .10 < .10 < .10 < .01 < .10enic (As) 0.002 0.002 0.002 0.002 0.003
*r ium (Ba) < .10 < .10 < .10 < .01 < .10
Cadmium (Cd) < .002 0.004 < .002 < 0.01 < .002Cobalt (Co) < .01 < .01 < .01 < 0.01 < .01Chromium (Cr) < .01 < .01 < .01 < 0.05 < .01Copper (Cu) < .01 < .01 < .01 < 0.01 < .01
Iron (Fe) < .01 0.01 < .01 < 0.05 0.02Lead (Pb) < .05 < .05 < .05 < 0.05 < .05Manganese (Mn) 0.02 < .01 0.01 < 0.01 0.03Mercury (Hg) < .0002 < .0002 < .0002 < 0.001 < .0002
Nickel (Ni) < .02 < .02 < .02 < 0.05 < .02Selenium (Se) 0.022 0.011 0.028 0.02 0.017Zinc (Zn) 0.741 1.33 0.786 1.24 1.095Molybdenum (Mo) < .10 < .10 < .10 < 0.10 < .10
Uranium (U) 2.247 1.866 1.87 2.700 2.120Vanadium (V) < .10 < .10 < .10 < 0.10 < .10
Radium-226 (Ra-226) 17.3 91 91 100.7 43Thorium-230 (Th-230) 17.4 11.6 3.0 21.5 3.6
ec. Cond - umhos 464 45Q 495 458 496' perature OF 14 15 15 17 17
W- Units 7.29 7.40 7.33 7.25 7.28
*Ra-226 and Th-230 are in pCi/l. All other values are mg/l, except where noted.

TABLE D-6.12
BASELINE WATER QUALITY DATACONVERSE COUNTY, WYOMING
Well No. 25-583, Sec. 25, T36N, R74W
2/12/86 3/13/86 4/10/86 6/24/86 8/28/86
Dissolved Solids (TDS) 610 587 510 506 537
Sodium (Na) 30 27 30 31 31Potassium (K) 9 9 9 9.7 7Calcium (Ca) 104 104 104 102 96Magnesium (Mg) 32 32 29 27.9 27
Sulfate (SO ) 264 260 272 260 240Chloride (Cl) 8 8 7 2.1 9Carbonate (CO ) 0 0 0 0 0Bicarbonate (C0 3) 205 203 207 192 190
Major Cations, meq 9.36 9.22 9.11 9.02 8.54Major Anions, meq 9.08 8.97 9.25 8.64 8.36Nitrate (as N) 1.37 0.25 0.06 0.04 0.06Floride (F) 0.36 0.40 0.40 0.32 0.30
Boron (B) 0.11 0.14 0.20 < 0.1 0.10("uminum (Al) < .10 < .10 < .10 < 0.1 < .10
enic (As) 0.001 0.001 0.002 0.003 0.004Orium (Ba) < .10 < .10 < .10 < 0.1 .10
Cadmium (Cd) < .002 < .002 < .002 < 0.01 < .002Cobalt (Co) < .01 < .10 < .01 < 0.01 < .01Chromium (Cr) < .01 < .01 < .01 < 0.05 < .01Copper (Cu) < .01 < .01 < .01 < 0.01 < .01
Iron (Fe) 0.05 0.07 < .01 < 0.05 0.01Lead (Pb) < .05 < .05 < .05 < 0.05 < .05Manganese (Mn) 0.02 0.02 0.02 0.03 0.03Mercury (Hg) < .0002 < .0002 < .0002 < 0.001 < .0002
Nickel (Ni) < .02 < .02 < .02 < 0.05 < .02Selenium (Se) 0.008 0.001 < .001, < 0.001 0.002Zinc (Zn) 0.081 0.090 < .005 0.19 0.056Molybdenum (Mo) < .10 < .10 < .10 < 0.10 .10
Uranium (U) 0.051 0.024 0.022 0.047 0.017Vanadium (V) < .10 < .10 < .10 < 0.10 < .10
Radium-226 (Ra-226) 106 88 169 76.8 75Thorium-230 (Th-230) 1.5 1.2 1.7 5.7 1.2
nec. Cond - umhos 811 636 850 651 790< perature 'F 16 15 15 17 17
W- Units 7.23 7.24 7.20 7.16 7.30
*Ra-226 and Th-230 are in pCi/l. All other values are mg/l, except where noted.
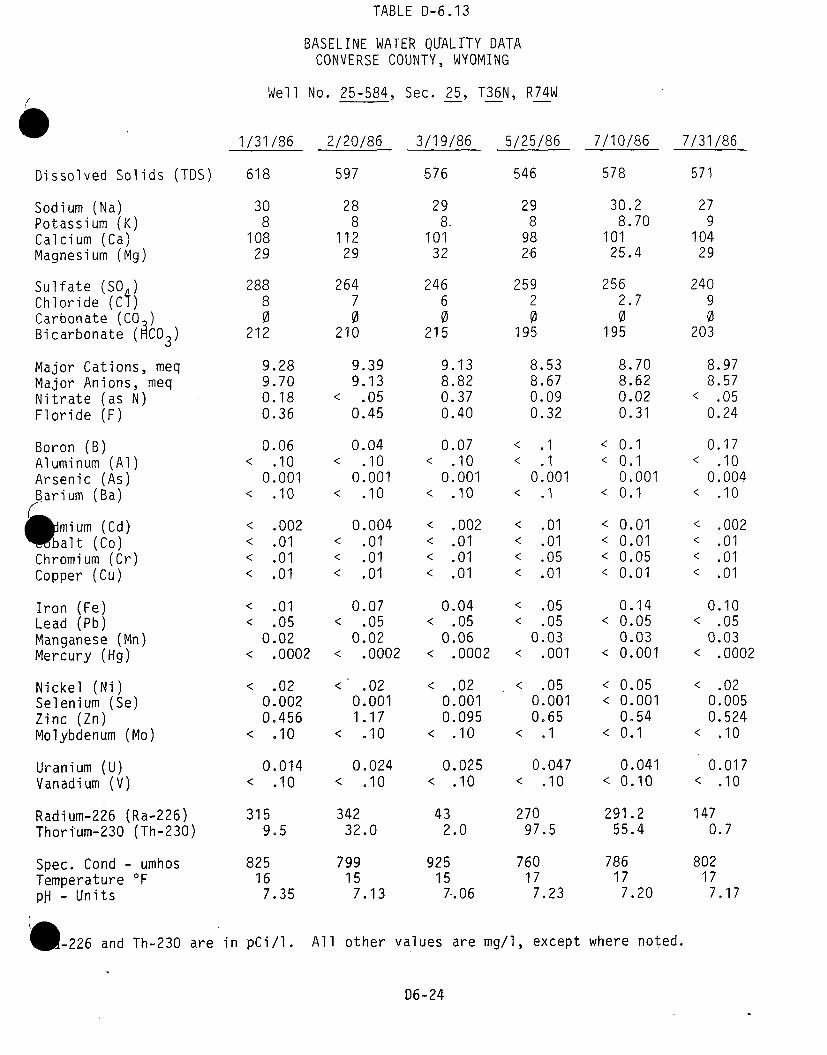
TABLE D-6.13
BASELINE WATER QLFALITY DATACONVERSE COUNTY, WYOMING
Well No. 25-584, Sec. 25, T36N, R74W
1/31/86 2/20/86 3/19/86 5/25/86 7/10/86 7/31/86
Dissolved Solids (TDS) 618 597 576 546 578 571
Sodium (Na) 30 28 29 29 30.2 27Potassium (K) 8 8 8 8 8.70 9Calcium (Ca) 108 112 101 98 101 104Magnesium (Mg) 29 29 32 26 25.4 29
Sulfate (SO ) 288 264 246 259 256 240Chloride (Ci) 8 7 6 2 2.7 9Carbonate (CO) 0 0 0 0 0 0Bicarbonate (ACO 3 ) 212 210 215 195 195 203
Major Cations, meq 9.28 9.39 9.13 8.53 8.70 8.97Major Anions, meq 9.70 9.13 8.82 8.67 8.62 8.57Nitrate (as N) 0.18 < .05 0.37 0.09 0.02 < .05Floride (F) 0.36 0.45 0.40 0.32 0.31 0.24
Boron (B) 0.06 0.04 0.07 < .1 < 0.1 0.17Aluminum (Al) < .10 < .10 < .10 < .1 < 0.1 < .10Arsenic (As) 0.001 0.001 0.001 0.001 0.001 0.004Barium (Ba) < .10 < .10 < .10 < .1 < 0.1 < .I0
mium (Cd) < .002 0.004 < .002 < .01 < 0.01 < .002O'balt (Co) < .01 < .01 < .01 < .01 < 0.01 < .01
Chromium (Cr) < .01 < .01 < .01 < .05 < 0.05 < .01Copper (Cu) < .01 < .01 < .01 < .01 < 0.01 < .01
Iron (Fe) < .01 0.07 0.04 < .05 0.14 0.10Lead (Pb) < .05 < .05 < .05 < .05 < 0.05 < .05Manganese (Mn) 0.02 0.02 0.06 0.03 0.03 0.03Mercury (Hg) < .0002 < .0002 < .0002 < .001 < 0.001 < .0002
Nickel (Ni) < .02 < .02 < .02 < .05 < 0.05 < .02Selenium (Se) 0.002 0.001 0.001 0.001 < 0.001 0.005Zinc (Zn) 0.456 1.17 0.095 0.65 0.54 0.524Molybdenum (Mo) < .10 < .10 < .10 < .1 < 0.1 < .10
Uranium (U) 0.014 0.024 0.025 0.047 0.041 0.017Vanadium (V) < .10 < .10 < .10 < .10 < 0.10 < .10
Radium-226 (Ra-226) 315 342 43 270 291.2 147Thorium-230 (Th-230) 9.5 32.0 2.0 97.5 55.4 0.7
Spec. Cond - umhos 825 799 925 760 786 802Temperature 'F 16 15 15 17 17 17PH - Units 7.35 7.13 7-.06 7.23 7.20 7.17
* !-226 and Th-230 are in pCi/l. All other values are mg/l, except where noted.
06-24
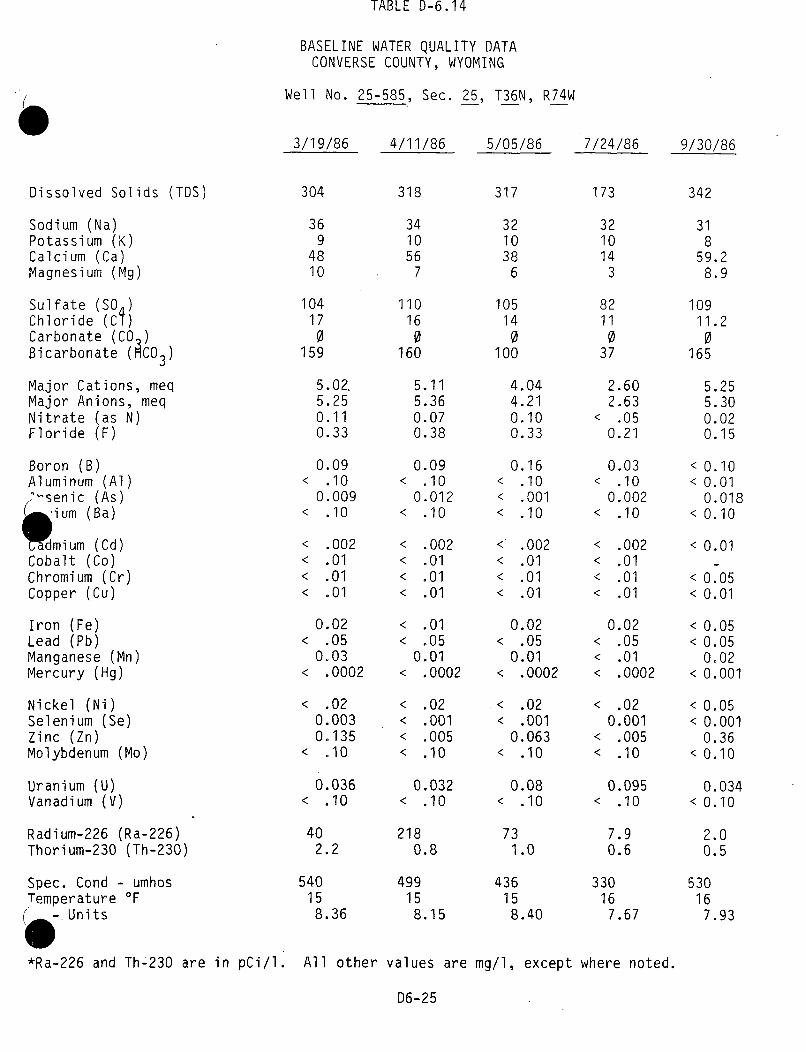
TABLE D-6.14
BASELINE WATER QUALITY DATACONVERSE COUNTY, WYOMING
Well No. 25-585, Sec. 25, T36N, R74W
3/19/86 4/11/86 5/05/86 7/24/86 9/30/86
Dissolved Solids (TDS) 304 318 317 173 342
Sodium (Na) 36 34 32 32 31Potassium (K) 9 10 10 10 8Calcium (Ca) 48 56 38 14 59.2Magnesium (Mg) 10 7 6 3 8.9
Sulfate (SO) 104 110 105 82 109Chloride (Ci) 17 16 14 11 11.2Carbonate (CO) 0 0 0 0 0Bicarbonate (ACO 3) 159 160 100 37 165
Major Cations, meq 5.02. 5.11 4.04 2.60 5.25Major Anions, meq 5.25 5.36 4.21 2.63 5.30Nitrate (as N) 0.11 0.07 0.10 < .05 0.02Floride (F) 0.33 0.38 0.33 0.21 0.15
Boron (B) 0.09 0.09 0.16 0.03 < 0.10Aluminum (Al) < .10 < .10 < .10 < .10 < 0.01.- senic (As) 0.009 0.012 < .001 0.002 0.018
( ium (Ba) < .10 < .10 < .10 < .10 < 0.10
amium (Cd) < .002 < .002 < .002 < .002 < 0.01Cobalt (Co) < .01 < .01 < .01 < .01 _Chromium (Cr) < .01 < .01 < .01 < .01 < 0.05Copper (Cu) < .01 < .01 < .01 < .01 < 0.01
Iron (Fe) 0.02 < .01 0.02 0.02 < 0.05Lead (Pb) < .05 < .05 < .05 < .05 < 0.05Manganese (Mn) 0.03 0.01 0.01 < .01 0.02Mercury (Hg) < .0002 < .0002 < .0002 < .0002 < 0.001
Nickel (Ni) < .02 < .02 < .02 < .02 < 0.05Selenium (Se) 0.003 < .001 < .001 0.001 < 0.001Zinc (Zn) 0.135 < .005 0.063 < .005 0.36Molybdenum (Mo) < .10 < .10 < .10 < .10 < 0.10
Uranium (U) 0.036 0.032 0.08 0.095 0.034Vanadium (V) < .10 < .10 < .10 < .10 < 0.10
Radium-226 (Ra-226) 40 218 73 7.9 2.0Thorium-230 (Th-230) 2.2 0.8 1.0 0.6 0.5
Spec. Cond - umhos 540 499 436 330 530Temperature 'F 15 15 15 16 16
-. Units 8.36 8.15 8.40 7.67 7.93
*Ra°226 and Th-230 are in pCi/l. All other values are mg/l, except where noted.
D6-25
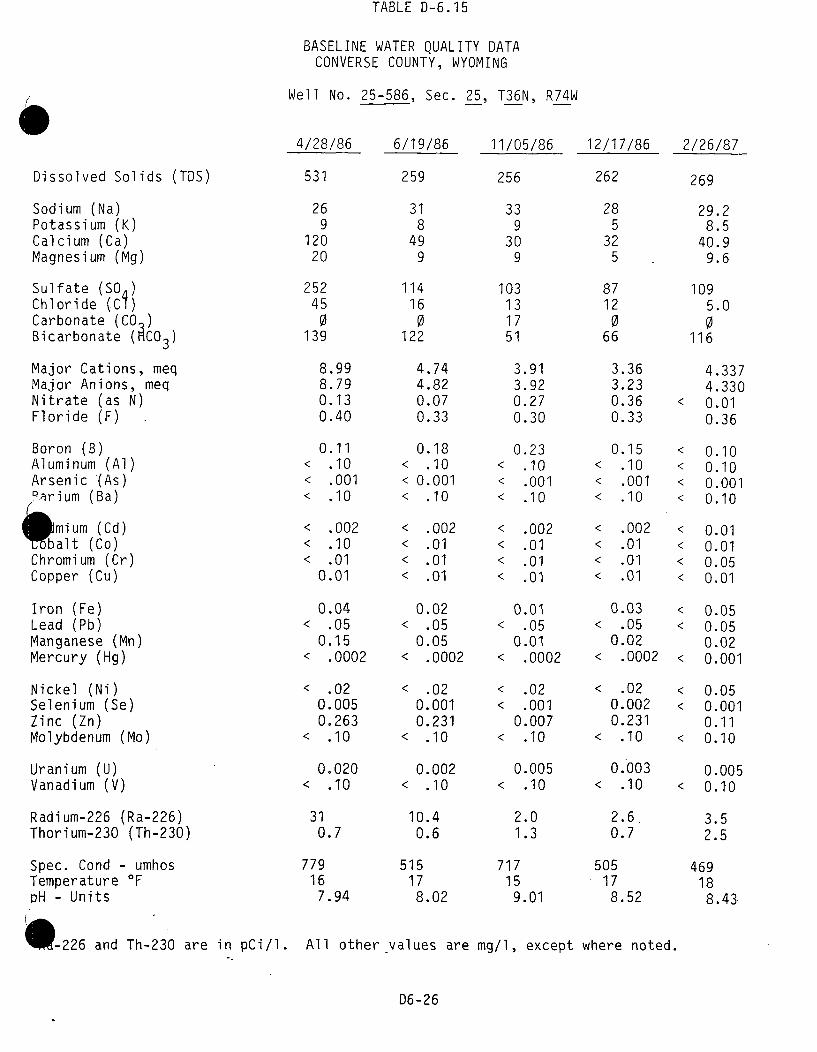
TABLE D-6.15
BASELINE WATER QUALITY DATACONVERSE COUNTY, WYOMING
Well No. 25-586, Sec. 25, T36N, R74W
4/28/86 6/19/86 11/05/86 12/17/86 2/26/87
Dissolved Solids (TDS)
Sodium (Na)Potassium (K)Calcium (Ca)Magnesium (Mg)
Sulfate (SO )Chloride (Ci)Carbonate (COBicarbonate (ACO3)Major Cations, meqMajor Anions, meq
Nitrate (as N)Floride (F)
Boron (B)Aluminum (Al)Arsenic (As)"arium (Ba)
* mium (Cd)oba lt (Co)
Chromium (Cr)Copper (Cu)
Iron (Fe)Lead (Pb)Manganese (Mn)Mercury (Hg)
Nickel (Ni)Selenium (Se)Zinc (Zn)Molybdenum (Mo)
Uranium (U)Vanadium (V)
Radium-226 (Ra-226)Thorium-230 (Th-230)
Spec. Cond - umhosTemperature *FpH - Units
0-226 and Th-230 are
531
269
12020
252450
139
259
318
499
114160
122
256
339
309
103131751
262
285
325
8712066
269
29.28.5
40.99.6
1095.00
116
8.998.790.130.40
0.11.10.001.10
4.744.820.070.33
0.18.10
0.001.10
<<
<
<
<
<
3.913.920.270.30
0.23.10.001.10
.002
.01
.01
.01
< .002< .10< .01
0.01
0.04< .05
0.15< .0002
< .020.0050.263
< .10
0.020< .10
310.7
779167.94
< .002< .01< .01< .01
0.02< .05
0.05< .0002
< .020.0010.231
< .10
0.002< .10
10.40.6
515178.02
<
<
<
<
0.01< .05
0.01< .0002
< .02< .001
0.007< .10
0.005< .10
2.01.3
717159.01
3.363.230.360.33
0.15< .10< .001< .10
< .002< .01< .01< .01
0.03< .05
0.02< .0002
< .020.0020.231
< .10
0.003< .10
2.6.0.7
505178.52
4.3374.330
< 0.010.36
< 0.10< 0.10< 0.001< 0.10
< 0.01< 0.01< 0.05< 0.01
< 0.05< 0.05
0.02< 0.001
< 0.05< 0.001
0.11< 0.10
0.005< 0.10
3.52.5
469188.43
in pCi/l. All other values are mg/l, except where noted.
D6-26

TABLE D-6.16
BASELINE WATER QUALITY DATACONVERSE COUNTY, WYOMING
0 Well No. 25-589, Sec. 25, T36N, R74W
1/16/86 1/28/86 3/07/86 5/25/86 7/30/86
Dissolved Solids (TDS) 584 600 522 518 583
Sodium (Na) 29 30 29 30 26Potassium (K) 9 9 10 10 9Calcium (Ca) 109 108 82 91 103Magnesium (Mg) 20 27 20 26 24
Sulfate (SO ) 223 251 242 259 252Chloride (Ci) 8 9 8 2.9 9Carbonate (CO) 0 0 0 0 0Bicarbonate (CO 3 ) 207 207 142 181 205
Major Cations, meq 8.57 9.15 7.25 8.28 8.47Major Anions, meq 8.26 8.86 7.59 8.47 8.85Nitrate (as N) < .05 0.07 < .05 0.01 0.06Floride (F) 0.45 0.40 0.45 0.39 0.33
-•on (B) 0.13 0.16 0.10 < 0.1 0.09minum (Al) < .10 < .10 < .10 < 0.1 < .10
i enic (As) < .001 0.001 0.001 0.001 0.005Barium (Ba) < .10 < .10 < .10 < 0.1 .10
Cadmium (Cd) < .002 0.004 0.006 < 0.01 < .002Cobalt (Co) < .01 < .01 < .01 < 0.01 < .01Chromium (Cr) < .01 < .01 < .01 < 0.05 < .01Copper (Cu) < .01 < .01 < .01 < 0.01 < .01
Iron (Fe) 0.14 < .01 0.02 < 0.05 0.05Lead (Pb) < .05 < .05 < .05 < 0.05 < .05Manganese (Mn) < .01 0.01 0.02 < 0.02 < .01Mercury (Hg) < .0002 < .0002 < .0002 < .0001 < .0002
Nickel (Ni) < .02 < .02 < .02 < 0.05 < .02Selenium (Se) < .001 < .001 < .001 < 0.001 < .001Zinc (Zn) 0.025 0.089 0.139 0.29 0.443Molybdenum (Mo) .10 < .10 < .10 < 0.1 < .10
Uranium (U) 0.019 0.012 0.014 0.031 0.015Vanadium (V) < .10 < .10 < .10 < .10 .10
Radium-226 (Ra-226) 166 145 48 225.8 162Thorium-230 (Th-230) 24.1 7.1 5.6 101.2 1.8
( c. Cond - umhos 795 944 688 776 769erature `F 16 15 15 16 16
'* - Units 7.18 7.26 7.58 7.27 7.28
*Ra-226 and Th-230 are in pCi/l. All other values are mg/l, except where noted.
n~ - 1-

TABLE D-6.17
BASELINE WATER QUALITY DATACONVERSE COUNTY, WYOMING
Well No. 25-590, Sec. 25, T36N, R74W
12/17/85 1/28/86 3/05/86 5/13/86 7/23/86
Dissolved Solids (TDS) 613 606 603 616 586
Sodium (Na) 30 30 31 25 31.6Potassium (K) 10 9 9 8 8.9Calcium (Ca) 98 107 112 112 109Magnesium (Mg) 37 29 37 32 25.6
Sulfate (SO ) 196 213 254 278 239Chloride (C#) 9 9 7 7 2.7Carbonate (CO) 0 0 0 0 0Bicarbonate (ACO3) 281 264 254 224 234.9
Major Cations, meq 10.20 9.26 10.21 9.51 9.19Major Anions, meq 8.69 9.01 9.65 9.65 8.93Nitrate (as N) < .05 < .05 < .05 < .05 0.07Floride (F) 0.36 0.36 0.33 0.38 0.30
Roron (B) 0.10 0.22 0.21 0.05 <0.1( lminum (Al) < .10 < .10 < .10 < .10 0.1
nic (As) 0.010 0.003 0.001 0.001 0.002i um (Ba) < .10 < .10 < .10 < .10 < 0.1
Cadmium (Cd) < .002 < .002 < .002 < .002 < 0.01Cobalt (Co) < .01 < .01 < .01 < .01 < 0.01Chromium (Cr) < .01 < .01 < .01 < .01 <0.05Copper (Cu) < .01 < .01 < .01 < 0.01 < 0.01
Iron (Fe) 0.69 1.58 0.96 1.88 1.95Lead (Pb) < .05 < .05 < .05 < .05 <0.05Manganese (Mn) 0.07 0.08 0.14 0.11 0.13Mercury (Hg) < .0002 < .0002 < .0002 < .0002 <0.001
Nickel (Ni) < .02 < .02 < .02 < .02 <0.05Selenium (Se) < .001 < .001 0.001 < .001 <0.001Zinc (Zn) 0.643 0.440 0.100 0.788 0.82Molybdenum (Mo) < .10 < .10 < .10 < .10 < 0.10
Uranium (U) 0.008 0.013 0.013 0.008 0.029Vanadium (V) < .10 < .10 < .10 < .10 < 0.10
Radium-226 (Ra-226) 32.8 38 53 32 13Thorium-230 (Th-230) 9.1 2.2 3.7 1.1 3.8
-'c. Cond - umhos 795 846 700 825 814( erature °F 16 15 16 16 17W-Units 7.18 6.89 6.83 7.05 7.20
*Ra-226 and Th-230 are in pCi/l. All other values are mg/l, except where noted.
D6-28

TABLE D-6.18
BASELINE WATER QUALITY DATACONVERSE COUNTY, WYOMING
Well No. 25-591, Sec. 25, T36N, R74W
1/22/86
Dissolved Solids (TDS)
Sodium (Na)Potassium (K)Calcium (Ca)Magnesium (Mg)
Sulfate (SO )Chloride (CI)Carbonate (COBicarbonate (ACO 3 )
Major Cations, meqMajor Anions, meqNitrate (as N)Floride (F)
Boron (B)iminum (Al)
Lenic (As)Wium (Ba)
Cadmium (Cd)Cobalt (Co)Chromium (Cr)Copper (Cu)
Iron (Fe)Lead (Pb)Manganese (Mn)Mercury (Hg)
Nickel (Ni)Selenium (Se)Zinc (Zn)Molybdenum (Mo)
Uranium (U)Vanadium (V)
Radium-226 (Ra-226)Thorium-230 (Th-230)
500
30118429
21560
205
8.168.000.120.45
0.14< .10
0.007< .10
1/29/86
509
299
9227
21290
210
8.308.100.050.40
0.22< .10
0.007< .10
< .002< .01< .01< .01
< .01< .05
0.02< .0002
< .020.0110.385
< .10
0.157< .10
743.5
3/05/86
530
289
8829
23070
224
8.228.65
< .050.40
0.13< .10
0.007< .10
< .002< .01< .01< .01
.04< .05
0.03< .0002
< .020.0020.575
< .10
0.509< .10
10323
5/13/86
550
259
10027
23670
220
8.538.72
< .050.36
0.27< .10
0.001< .10
< .002< .01< .01
0.01
0.20< .05
0.03< .0002
< .020.0010.513
< .10
0.259< .10
631.0
7/23/86
530
30.39.7
98.426.5
2282.80
231.7
8.698.650.090.28
< 0.1< 0.1
0.005< 0.1
< 0.01< 0.01< 0.05< 0.01
0.11< 0.05
0.02< 0.001
< 0..05< 0.001
0.44< 0.10
0.266< 0.10
81.314.3
<<
<
<
.002
.01
.01
.01
0.07< .05
0.01< .0002
< .020.0030.766
< .10
0.232< .10
10636.2
-.c. Cond - umhosperature 'F
SUnits
*Ra-226 and Th-230 are in pCi/l.
807157.30
737167.28
64016
7.13
729167.18
755177.28
All other values are mg/l, except'where noted.
nA-2Q

TABLE D-6.19
BASELINE WATER QUALITY DATACONVERSE COUNTY, WYOMING
Well No. 25-592, Sec. 25, T36N, R74W
1/22/86 1/29/86 3/05/86 5/13/86 7/23/86
Dissolved Solids (TDS) 636 608 635 662 636
Sodium (Na) 29 29 29 29 31.9Potassium (K) 10 9 9 9 10.5Calcium (Ca) 112 110 104 128 114Magnesium (Mg) 34 32 37 24 31.4
Sulfate (SO ) 282 270 296 308 274Chloride (CH) 8 8 7 6 2.3Carbonate (CO) 0 0 0 0 0Bicarbonate (ACO 3 ) 217 210 210 220 222
Major Cations, meq 9.90 9.61 9.72 9.85 9.83Major Anions, meq 9.66 9.29 9.80 10.19 9.43Nitrate (as N) 0.09 < .05 < .05 < .05 0.11Floride (F) 0.40 0.36 0.40 0.38 0.27
BRoron (B) 0.23 0.20 0.11 0.15 < 0.1iminum (Al) < .10 < .10 < .10 < .10 < 0.1enic (As) 0.001 0.001 < .001 < .001 0.002
rium (Ba) < .10 < .10 < .10 < .10 < 0.1
Cadmium (Cd) < .002 0.003 < .002 < .002 < 0.01Cobalt (Co) < .10 < .01 < .01 < .01 < 0.01Chromium (Cr) < .01 < .01 < .01 < .01 < 0.05Copper (Cu) < .01 < .01 < .01 0.01 < 0.01
Iron (Fe) 0.02 < .01 0.02 0.01 < 0.05Lead (Pb) < .05 < .05 < .05 < .05 < 0.05Manganese (Mn) 0.01 0.02 0.03 0.02 0.02Mercury (Hg) < .0002 < .0002 < .0002 < .0002 < 0.001
Nickel (Ni) < .02 < .02 < .02 < .02 < 0.05Selenium (Se) < .001 < .001 0.003 < .001 < 0.001Zinc (Zn) 0.881 0.498 1.34 1.096 0.83Molybdenum (Mo) < .10 < .10 < .10 < .10 < 0.10
Uranium (U) 0.026 0.026 0.032 0.029 0.066Vanadium (V) < .10 < .10 < .10 < .10 < 0.10
Radium-226 (Ra-226) 60 73 141 104 101.1Thorium-230 (Th-230) 11.1 4.1 27 1.6 24.9
iec. Cond - umhos 933 888 830 883 861O perature OF 16 16 16 16 17
W- Units 7.20 7.19 7.08 7.18 7.21
*Ra-226 and Th-230 are in pCi/l. All other values are mg/l, except where noted.

TABLE D-6.20
BASELINE WATER QUALITY DATACONVERSE COUNTY, WYOMING
Well No. 26-834, Sec. 26, T36N, R74W
1/15/86 1/30/86 3/10/86 5/13/86 7/23/86
Dissolved Solids (TDS) 619 661 628 611 634
Sodium (Na) 29 30 29 30 31.9Potassium (K) 10 10 10 11 10.1Calcium (Ca) 110 120 110 109 118Magnesium (Mg) 29 29 34 27 29.7
Sulfate (SO ) 264 308 268 278 254Chloride (Ci) 8 8 8 7 1.8Carbonate (CO) 0 0 0 0 0Bicarbonate (ACO 3) 215 217 229 224 249.5
Major Cations, meq 9.39 9.94 9.80 9.25 10.02Major Anions, meq 9.25 10.20 9.56 9.65 9.52Nitrate (as N) .05 0.11 0.06 < .05 0.11Floride (F) 0.40 0.40 0.51 0.45 0.42
Boron (B) 0.11 0.20 0.12 0.10 < 0.1'uminum (Al) < .10 < .10 < .10 < .10 < 0.1
enic (As) < .001 0.001 0.001 0.001 < 0.001ium (Ba) < .10 < .10 < .10 < .10 < 0.10
Cadmium (Cd) < .002 < .002 < .002 < .002 < 0.01Cobalt (Co) < .01 < .01 < .01 < .01 < 0.01Chromium (Cr) < .01 < .01 < .01 < .01 < 0.05Copper (Cu) < .01 < .01 < .01 0.01 < 0.01
Iron (Fe) 0.19 < .01 0.05 0.07 0.17Lead (Pb) < .005 < .05 < .05 < .05 < 0.05Manganese (Mn) < .01 0.01 0.02 0.01 0.02Mercury (Hg) < .0002 < .0002 < .0002 < .0002 < 0.001
Nickel (Ni) < .02 < .02 < .02 < .02 < 0.05Selenium (Se) < .001 0.005 0.003 < .001 < 0.001Zinc (Zn) 0.042 0.007 0.183 0.033 0.02Molybdenum (Mo) < .10 < .10 < .10 < .10 < 0.10
Uranium (U) 0.075 0.023 0.038 0.022 0.095Vanadium (V) < .10 < .10 < .10 < .10 < 0.10
Radium-226 (Ra-226) 318 303 306 378 317.7Thorium-230 (Th-230) 115 11.2 90 1.8 67.6
- ec. Cond - umhos 906 904 958 808 873perature 'F 17 15 17 17 17- Units 7.30 7.27 7.26 7.26 7.20
*Ra-226 and Th-230 are in pCi/l. All other values are mg/l, except where noted.
D6-31

TABLE D-6.21
BASELINE WATER QUALITY DATACONVERSE COUNTY, WYOMING
Well No. 26-835, Sec. 26, T36N, R74W
12/19/85 1/30/86
Dissolved Solids (TDS)
Sodium (Na)Potassium (K)Calcium (Ca)Magnesium (Mg)
Sulfate (SO )Chloride (CI)Carbonate (CO )Bicarbonate (ACO 3 )
Major Cations, meqMajor Anions, meqNitrate (as N)Floride (F)
Boron (B)(•uminum (Al)A•Lenic (As)W•ium (Ba)
Cadmium (Cd)Cobalt (Co)Chromium (Cr)Copper (Cu)
Iron (Fe)Lead (Pb)Manganese (Mn)Mercury (Hg)
Nickel (Ni)Selenium (Se)Zinc (Zn)Molybdenum (Mo)
Uranium (U)Vanadium (V)
Radium-226 (Ra-226)Thorium-230 (Th-230)
640
279
12429
26470
246
9.979.72
< .050.45
0.13< .10
0.003< .10
< .002< .10< .01< .01
0.53< .05
0.04< .0002
< .02< .001< .005< .10
0.018< .10
9.80.9
666
298
12432
28870
242
10.2810.160.050.45
0.22< .10
0.001< .10
3/11/86
609
268
11237
26470
242
9.969.660.100.40
0.14< .10< .001< .10
< .002< .01< .01< .01
0.10< .05
0.05< .0002
< .02< 0.001
0.133< .10
0.005< .10
9.52.0
5/13/86
648
248
12037
30870
234
10.2710.45
< .050.40
0.11< .10
0.001< .10
< .002< .01< .01< .01
0.74< .05
0.04< .0002
< .02< .001
0.542< .10
0.016< .10
110.6
874167.20
7/23/86
638
29.38.8
11925.9
2582.00
246.1
9.619.510.130.35
< 0.1< 0.1
0.002< 0.10
<
<
.002
.01
.01
.01
<<
<
<
0.010.010.050.01
* .01* .05
0.02* .0002
* .02* .001
0.005* .10
0.016* .10
9.86.8
0.53< 0.05
0.04< 0.001
< 0.05< 0.001
0.46< 0.10
0.041< 0.10
20.417.1
85017
7.19
-ec. Cond - umhos0 perature OF
- Units
*Ra-226 and Th-230 are in pCi/l.
880147.11
873157.12
997157.22
All other values are mgil, except where noted.
D6-32
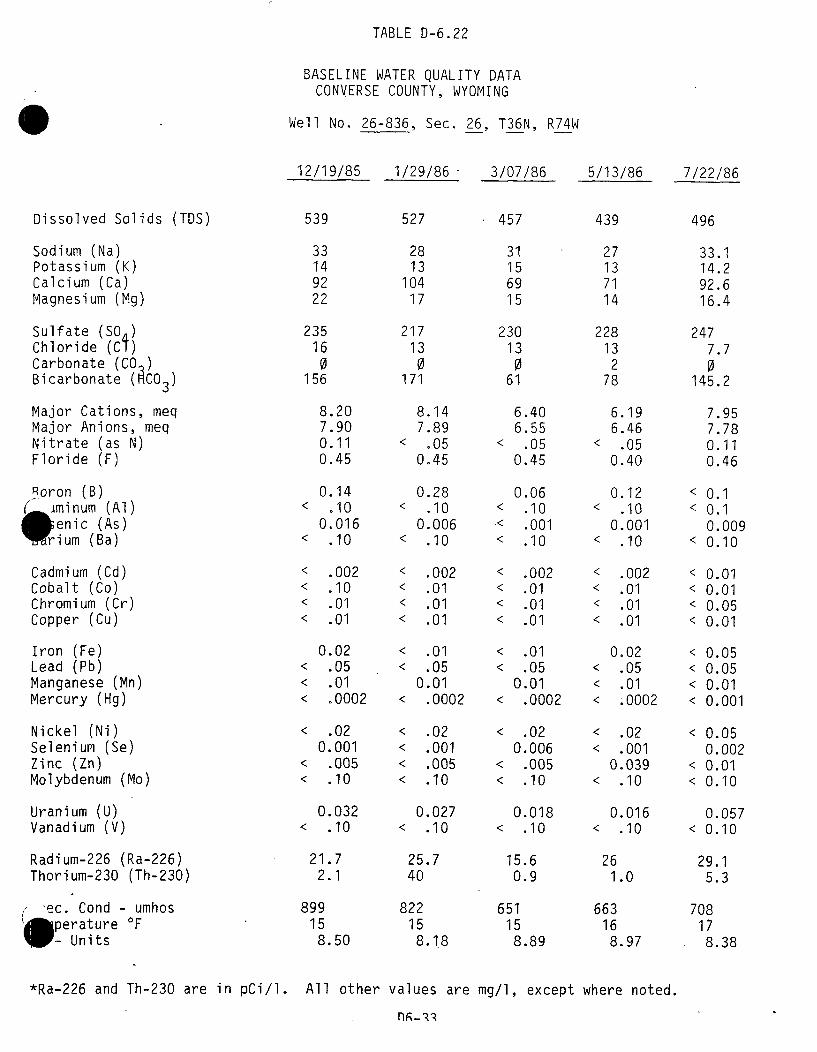
TABLE D-6.22
BASELINE WATER QUALITY DATACONVERSE COUNTY, WYOMING
Well No. 26-836, Sec. 26, T36N, R74W
12/19/85 1/29/86 3/07/86 5/13/86 7/22/86
Dissolved Solids (TDS) 539 527 457 439 496
Sodium (Na) 33 28 31 27 33.1Potassium (K) 14 13 15 13 14.2Calcium (Ca) 92 104 69 71 92.6Magnesium (Mg) 22 17 15 14 16.4
Sulfate (SO ) 235 217 230 228 247Chloride (Ci) 16 13 13 13 7.7Carbonate (CO ) 0 0 0 2 0Bicarbonate (C0 3) 156 171 61 78 145.2
Major Cations, meq 8.20 8.14 6.40 6.19 7.95Major Anions, meq 7.90 7.89 6.55 6.46 7.78Nitrate (as N) 0.11 < .05 < .05 < .05 0.11Floride (F) 0.45 0.45 0.45 0.40 0.46
Roron (B) 0.14 0.28 0.06 0.12 < 0.1iminum (Al) < .10 < .10 < .10 < .10 < 0.1enic (As) 0.016 0.006 < .001 0.001 0.009ium (Ba) < .10 < .10 < .10 < .10 < 0.10
Cadmium (Cd) < .002 < .002 < .002 < .002 < 0.01Cobalt (Co) < .10 < .01 < .01 < .01 < 0.01Chromium (Cr) < .01 < .01 < .01 < .01 < 0.05Copper (Cu) < .01 < .01 < .01 < .01 < 0.01
Iron (Fe) 0.02 < .01 < .01 0.02 < 0.05Lead (Pb) < .05 < .05 < .05 < .05 < 0.05Manganese (Mn) < .01 0.01 0.01 < .01 < 0.01Mercury (Hg) < .0002 < .0002 < .0002 < .0002 < 0.001
Nickel (Ni) < .02 < .02 < .02 < .02 < 0.05Selenium (Se) 0.001 < .001 0.006 < .001 0.002Zinc (Zn) < .005 < .005 < .005 0.039 < 0.01Molybdenum (Mo) < .10 < .10 < .10 < .10 < 0.10
Uranium (U) 0.032 0.027 0.018 0.016 0.057Vanadium (V) < .10 < .10 < .10 < .10 < 0.10
Radium-226 (Ra-226) 21.7 25.7 15.6 26 29.1Thorium-230 (Th-230) 2.1 40 0.9 1.0 5.3
Sec. Cond - umhos 899 822 651 663 7080 perature 'F 15 15 15 16 17W- Units 8.50 8.1.8 8.89 8.97 8.38
*Ra-226 and Th-230 are in pCi/l. All other values are mg/l, except where noted.

TABLE D-6.23
BASELINE WATER QUALITY DATACONVERSE COUNTY, WYOMING
Well No. 26-837, Sec. 26, T36N, R74W
12/19/85 1/30/86 3/10/86 5/13/86 7/23/86
Dissolved Solids (TDS) 571 540 522 503 463
Sodium (Na) 27 28 28 25 27.9Potassium (K) 9 .8 9 8 8.5Calcium (Ca) 108 92 92 92 89.7Magnesium (Mg) 24 29 27 24 22.3
Sulfate (SO ) 247 256 222 238 199Chloride (Ci) 6 7 7 7 3.2Carbonate (CO) 0 0 0 0 0Bicarbonate (ACO 3 ) 190 183 198 185 191.1
Major Cations, meq 8.76 8.39 8.26 7.85 7.77Major Anions, meq 8.43 8.52 8.07 8.18 7.41Nitrate (as N) 0.07 0.14 0.06 < .05 0.22Floride (F) 0.45 0.45 0.45 0.40 0.46
Roron (B) 0.09 0.23 0.11 0.12 < 0.1( ,minum (Al) < .10 < .10 < .10 < .10 < 0.1
enic (As) 0.001 < .001 < .001 < .001 < 0.001Wium (Ba) < .10 < .10 < .10 < .10 < 0.1
Cadmium (Cd) < .002 < .002 < .002 < .002 < 0.01Cobalt (Co) < .10 < .01 < .01 < .01 < 0.01Chromium (Cr) < .01 < .01 < .01 < .01 < 0.05Copper (Cu) < .01 < .01 < .01 < .01 < 0.01
Iron (Fe) 0.08 < .01 0.06 0.13 0.13Lead (Pb) < .05 < .05 < .05 < .05 < 0.05Manganese (Mn) 0.01 0.01 0.02 0.01 0.02Mercury (Hg) < .0002 < .0002 < .0002 < .0002 < 0.001
Nickel (Ni) < .02 < .02 < .02 < .02 < 0.05Selenium (Se) < .001 < .001 0.001 < .001 0.002Zinc (Zn) 0.220 0.116 1.11 0.130 0.01Molybdenum (Mo) < .10 < .10 < .10 < .10 < .10
Uranium (U) 0.011 0.007 0.006 0.008 0.033Vanadium (V) < .10 < .10 < .10 < .10 < 0.10
Radium-226 (Ra-226) 16.5 24 40 63 82.6Thorium-230 (Th-230) 6.8 2.1 6.8 1.4 15.6
* c. Cond - umhos 745 757 713 699 699(, erature OF 15 15 15 17 16
Units 7.28 7.38 7.41 7.39 7.40
*Ra-226 and Th-230 are in pCi/l. All other values are mg/l, except where noted.

TABLE D-6.24
BASELINE WATER QUALITY DATACONVERSE COUNTY, WYOMING
Well No. 27-316, Sec. 27, T36N, R74W
1/10/86 1/31/86 3/11/86 5/22/86 7/30/86
Dissolved Solids (TDS) 371 315 302 296 301
Sodium (Na) 23 21 18 19 19Potassium (K) 8 6 63 6.1 7Calcium (Ca) 63 59 53 54 56Magnesium (Mg) 20 12 16 15 14
Sulfate (SO ) 122 95 85 107 70Chloride (Ci) 8 8 7 3.3 9Carbonate (CO) 0 0 0 0 0Bicarbonate (C0 3) 188 185 188 170 190
Major Cations, meq 5.98 4.99 4.89 4.93 4.95Major Anions, meq 5.85 5.24 5.05 5.14 4.83Nitrate (as N) 0.06 < .05 0.08 0.01 0.06Floride (F) 0.57 0.51 0.51 0.64 0.40
Roron (B) 0.14 0.05 0.12 < 0.1 0.05( iminum (Al) < .10 < .10 < .10 < 0.1 < .10lenic (As) 0.002 0.001 0.002 < 0.001 0.003W* ium (Ba) < .10 < .10 < .10 < 0.1 < .10
Cadmium (Cd) < .002 < .002 < .002 < 0.01 < .002Cobalt (Co) < .01 < .01 < .01 < 0.01 < .01Chromium (Cr) < .01 < .01 < .01 < 0.05 < .01Copper (Cu) < .01 < .01 < .01 < 0.01 < .01
Iron (Fe) 0.15 < .01 0.04 0.08 0.02Lead (Pb) < .05 < .05 < .05 < 0.05 < .05Manganese (Mn) < .01 0.02 0.03 0.03 0.02Mercury (Hg) < .0002 < .0002 < .0002 < 0.001 < .0002
Nickel (Ni) < .02 < .02 < .02 < 0.05 < .02Selenium (Se) 0.006 < .001 0.001 < 0.001 0.001Zinc (Zn) 0.075 0.125 0.050 0.31 0.265Molybdenum (Mo) < .10 < .10 < .10 < 0.1 < .10
Uranium (U) 0.704 0.049 0.020 0.071 0.069Vanadium (V) < .10 < .10 < .10 < 0.1 < .10
Radium-226 (Ra-226) 111 240 284 269.5 132Thorium-230 (Th-230) 69 8.8 51 53.10 3.7
-c. Cond - umhos 497 526 499 473 461(• _erature OF 16 15 15 16 18
Units 7.18 7.31 7.15 7.26 7.37
*Ra-226 and Th-230 are in pCi/l. All other values are mg/l, except where noted.

TABLE D-6.25
BASELINE WATER QUALITY DATACONVERSE COUNTY, WYOMING
Well No. 30-376, Sec. 30, T36N, R73W
1/22/86 1/29/86 3/10/86 5/13/86 7/23/86
Dissolved Solids (TDS) 545 575 552 568 546
Sodium (Na) 28 33 29 26 30Potassium (K) 9 8 9 8 8.7Calcium (Ca) 100 104 100 109 98.2Magnesium (Mg) 27 22 29 25 22.6
Sulfate (SO ) 227 226 240 258 226Chloride (Ci) 6 8 7 8 2.0Carbonate (CO) 0 0 0 0 0Bicarbonate (kCO 3 ) 215 210 217 210 218.6
Major Cations, meq 8.66 8.64 8.86 8.82 8.51Major Anions, meq 8.42 8.37 8.75 9.04 8.37Nitrate (as N) 0.27 0.11 0.07 < .05 0.03Floride (F) 0.40 0.40 0.45 0.36 0.32
nnron (B) 0.15 0.18 0.13 0.07 < 0.1minum (Al) < .10 < .10 < .10 < .10 < 0.1enic (As) 0.002 < .001 0.009 < .001 < 0.001
arium (Ba) < .10 < .10 < .10 < .10 < 0.1
Cadmium (Cd) < .002 0.003 < .002 < .002 < 0.01Cobalt (Co) < .10 < .01 < .01 < .01 < 0.01Chromium (Cr) < .01 < .01 < .01 < .01 < 0.05Copper (Cu) < .01 < .01 < .01 < .01 < 0.01
Iron (Fe) 0.50 < .01 0.05 0.14 0.92Lead (Pb) < .05 < .05 < .05 < .05 < 0.05Manganese (Mn) 0.001 0.03 0.05 0.07 0.09Mercury (Hg) < .0002 < .0002 < .0002 < .0002 < 0.001
Nickel (Ni) < .02 < .02 < .02 < .02 < 0.05Selenium (Se) < o001 < .001 < .001 < .001 < 0.001Zinc (Zn) 0.114 0.041 0.007 0.706 0.39Molybdenum (Mo) < .10 < .10 < .10 < .10 < 0.10
Uranium (U) 0.014 0.012 0.017 0.011 0.025Vanadium (V) < .10 < .10 < .10 < .10 < 0.10
Radium-226 (Ra-226) 16.5 19.0 8.3 23 22.4Thorium-230 (Th-230) 7.6 0.8 2.7 1.9 7.9
( c. Cond - umhos 799 810 835 790 732perature 'F 15 15 15 16 17
'p- Units 7.21 7.14 7.11 7.15 7.25
*Ra-226 and Th-230 are in pCi/l. All other values are mg/l, except where noted.
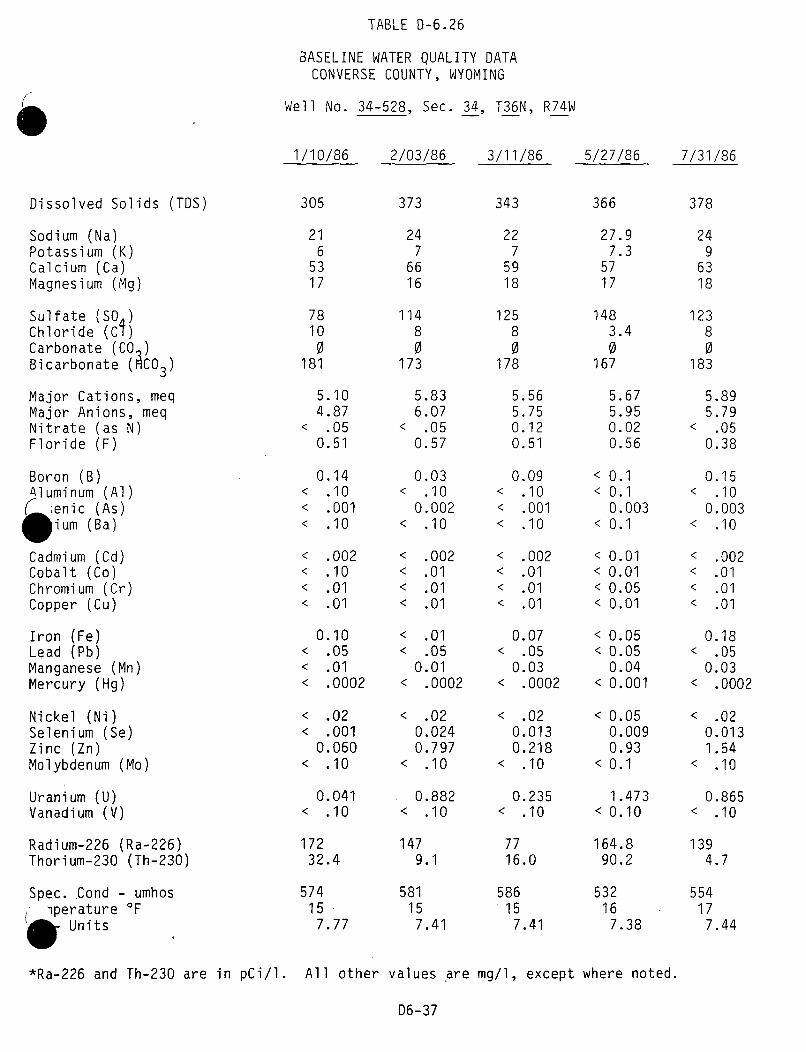
TABLE D-6.26
BASELINE WATER QUALITY DATACONVERSE COUNTY, WYOMINGe-Well No. 34-528, Sec. 34, T36N, R74W
1/10/86 2/03/86 3/11/86 5/27/86 7/31/86
Dissolved Solids (TDS) 305 373 343 366 378
Sodium (Na) 21 24 22 27.9 24Potassium (K) 6 7 7 7.3 9Calcium (Ca) 53 66 59 57 63Magnesium (Mg) 17 16 18 17 18
Sulfate (SO ) 78 114 125 148 123Chloride (Ci) 10 8 8 3.4 8Carbonate (CO) 0 0 0 0 0Bicarbonate (ACO 3 ) 181 173 178 167 183
Major Cations, meq 5.10 5.83 5.56 5.67 5.89Major Anions, meq 4.87 6.07 5.75 5.95 5.79Nitrate (as N) < .05 < .05 0.12 0.02 < .05Floride (F) 0.51 0.57 0.51 0.56 0.38
Boron (B) 0.14 0.03 0.09 < 0.1 0.15Aluminum (Al) < .10 < .10 < .10 < 0.1 < .10
;enic (As) < .001 0.002 < .001 0.003 0.003* ium (Ba) < .10 < .10 < .10 < 0.1 < .10
Cadmium (Cd) < .002 < .002 < .002 < 0.01 < .002Cobalt (Co) < .10 < .01 < .01 < 0.01 < .01Chromium (Cr) < .01 < .01 < .01 < 0.05 < .01Copper (Cu) < .01 < .01 < .01 < 0.01 < .01
Iron (Fe) 0.10 < .01 0.07 < 0.05 0.18Lead (Pb) < .05 < .05 < .05 < 0.05 < .05Manganese (Mn) < .01 0.01 0.03 0.04 0.03Mercury (Hg) < .0002 < .0002 < .0002 < 0.001 < .0002
Nickel (Ni) < .02 < .02 < .02 < 0.05 < .02Selenium (Se) < .001 0.024 0.013 0.009 0.013Zinc (Zn) 0.060 0.797 0.218 0.93 1.54Molybdenum (Mo) < .10 < .10 < .10 < 0.1 < .10
Uranium (U) 0.041 0.882 0.235 1.473 0.865Vanadium (V) < .10 < .10 < .10 < 0.10 < .10
Radium-226 (Ra-226) 172 147 77 164.8 139Thorium-230 (Th-230) 32.4 9.1 16.0 90.2 4.7
Spec. Cond - umhos 574 581 586 532 554iperature *F 15 15 15 16 17
Units 7.77 7.41 7.41 7.38 7.44
*Ra-226 and Th-230 are in pCi/l. All other values are mg/l, except where noted.
D6-37

TABLE D-6.27
BASELINE WATER QUALITY DATACONVERSE COUNTY, WYOMING
Well No. 34-529, Sec. 34, T36N, R74W
1/10/86 1/31/86 3/11/86 5/22/86 7/30/86
Dissolved Solids (TDS) 310 319 264 308 297
Sodium (Na) 24 24 22 24 22Potassium (K) 8 7 8 7.1 8Calcium (Ca) 56 55 40 48 50Magnesium (Mg) 13 17 15 16.2 16
Sulfate (SO ) 74 95 81 108 74Chloride (C1 ) 9 9 9 5.0 8Carbonate (CO) 0 0 0 0 0Bicarbonate (CO 3) 190 195 159 172 185
Major Cations, meq 5.10 5.36 4.39 4.97 4.98Major Anions, meq 4.91 5.43 4.54 5.24 4.80Nitrate (as N) 0.05 0.32 0.18 0.01 < .05Floride (F) 0.57 0.57 0.51 0.58 0.40
Roron (B) 0.13 0.08 0.13 < 0.1 0.05( minum (Al) < .10 < .10 < .10 < 0.1 < .10L enic (As) 0.002 0.002 0.001 0.003 0.005
ium (Ba) < .10 < .10 < .10 < 0.1 < .10
Cadmium (Cd) < .002 < .002 < .002 < 0.01 < .002Cobalt (Co) < .01 < .01 < .01 < 0.01 < .01Chromium (Cr) < .01 < .01 < .01 < 0.05 < .01Copper (Cu) < .01 < .01 < .01 < 0.01 < .01
Iron (Fe) 0.07 < .01 < .01 < 0.05 0.02Lead (Pb) < .05 < .05 < .05 < 0.05 < .05Manganese (Mn) < .01 < .01 0.01 < 0.02 0.02Mercury (Hg) < .0002 < .0002 < .0002 < 0.001 < .0002
Nickel (Ni) < .02 < .02 < .02 < 0.05 < .02Selenium (Se) < .001 0.034" 0.001 < 0.001 0.001Zinc (Zn) 0.151 0.203 0.254 0.41 0.491Molybdenum (Mo) < .10 < .10 < .10 < 0.1 .10
Uranium (U) 0.025 0.025 0.016 0.016 0.022Vanadium (V) < .10 < .10 < .10 < 0.1 < .10
Radium-226 (Ra-226) 101 54 52 72.8 137Thorium-230 (Th-230) 25.8 4.4 10.3 12.50 1.1
-ac. Cond - umhos 420 520 461 443 483erature 'F 16 16 15 16 17Units 7.47 7.40 7.65 7.42 7.44
*Ra-226 and Th-230 are in pCi/l. All other values are mg/l, except wh&re noted.

/AbLL U-b.ŽZ3
BASELINE WATER QUALITY DATACONVERSE COUNTY, WYOMING
Well No. 35-738, Sec. 35, T36N, R74W
3/18/86 4/10/86 5/05/86 7/10/86 9/16/86
Dissolved Solids (TDS) 319 313 343 406 260
Sodium (Na) 23 24 22 26.9 22Potassium (K) 7 7 7 7.8 8Calcium (Ca) 61 61 63 66 63Magnesium (Mg) 15 15 13 15.9 16
Sulfate (SO) 102 110 103 143 82Chloride (Ci) 9 9 9 3 12Carbonate (CO) 0 0 0 0 0Bicarbonate (ACO 3) 200 190 195 184 195Major Cations, meq 5.45 5.49 5.35 5.99 5.62Major Anions, meq 5.65 5.49 5.35 6.10 5.25
Nitrate (as N) < .05 < .05 0.06 <0.01 < .05Floride (F) 0.40 0.51 0.45 0.46 0.57
Boron (B) 0.08 0.13 0.18 <0.1 0.17Aluminum (Al) < .10 < .10 < .10 <0.1 < .10Arsenic (As) < .001 0.001 0.001 <0.001 <0.002•-ium (Ba) < .10 < .10 < .10 <0.1 < .10
ium (Cd) < .002 < .002 < .002 <0.01 < .002Cobalt (Co) < .01 < .01 < .01 <0.01 < .01Chromium (Cr) < .01 < .01 < .01 <0.05 < .01Copper (Cu) < .01 < .01 <0.01 <0.01 < .01
Iron (Fe) 0.26 < .01 0.06 0.07 0.02Lead (Pb) < .05 < .05 < .05 <0.05 < .05Manganese (Mn) 0.03 0.02 0.03 0.02 0.02Mercury (Hg) < .0002 < .0002 < .0002 <0.001 < .0002
Nickel (Ni) < .02 < .02 < .02 <0.05 < .02Selenium (Se) < .001 < .001 0.001 <0.001 0.001Zinc (Zn) 0.097 0.010 0.346 0.07 0.129Molybdenum (Mo) < .10 < .10 < .10 <0.1 < .10
Uranium (U) 0.034 0.051 0.028 0.059 0.050Vanadium (V) < .10 < .10 < .10 <0.10 < .10
Radium-226 (Ra-226) 436 25 413 679 486Thorium-230 (Th-230) 5.6 4.2 3.1 578 0.8
Spec. Cond - umhos 530 502 528 544 602Temperature 'F 15 15 15 16 15
6 - Units 7.35 7.31 7.48 7.30 7.25
p*0a-226 and Th-230 are in pCi/l. All other values are mg/l, except where noted.
D6-39

TABLE D-6.29
BASELINE WATER QUALITY DATACONVERSE COUNTY, WYOMING
Well No. 35-739, Sec. 35, T36N, R74W
1/31/86 2/14/86 3/18/86 5/25/86 7/30/86
Dissolved Solids (TDS) 346 326 316 320 346
Sodium (Na) 26 24 23 25 24Potassium (K) 7 7 7 7 8Calcium (Ca) 56 58 59 55 59Magnesium (Mg) 17 17 16 15 14
Sulfate (SO ) 102 99 97 100 98Chloride (Ci) 9 8 7 4.5 8Carbonate (CO ) 0 0 0 0 0Bicarbonate (AC0 3 ) 193 195 203 192 198
Major Cations, meq 5.50 5.51 5.44 5.27 5.33Major Anions, meq 5.54 5.49 5.55 5.38 5.52Nitrate (as N) 0.06 < .05 < .05 0.02 0.12Floride (F) 0.51 0.51 0.51 0.50 0.36
Roron (B) 0.12 0.04 0.10 < 0.1 0.12iminum (Al) < .10 < .10 < .10 < 0.1 <.0
Penic (As) < .001 < .001 < .001 0.001 0.002ium (Ba) < .10 < .10 < .10 < 0.1 < .10
Cadmium (Cd) < .002 < .002 < .002 < 0.01 < .002Cobalt (Co) < .01 < .01 < .01 < 0.01 < .01Chromium (Cr) < .01 < .01 < .01 < 0.05 < .01Copper (Cu) < .01 < .01 < .01 < 0.01 < .01
Iron (Fe) < .01 < .01 0.01 < 0.05 0.02Lead (Pb) < .05 < .05 < .05 < 0.05 < .05Manganese (Mn) 0.02 0.02 0.02 0.02 0.02Mercury (Hg) < .0002 < .0002 < .0002 < 0.001 < .0002
Nickel (Ni) < .02 < .02 < .02 < 0.05 < .02Selenium (Se) < .001 < .001 < .001 < 0.001 0.001Zinc (Zn) 0.481 0.665 0.675 0.42 0.488Molybdenum (Mo) < .10 < .10 < .10 < 0.1 .I0
Uranium (U) 0.023 0.031 0.036 0.055 0.031Vanadium (V) < .10 < .10 < .10 < 0.10 .10
Radium-226 (Ra-226) 353 254 503 371.6 312Thorium-230 (Th-230) 7.1 6.8 3.2 57.6 2.6
,ec. Cond - umhos 550 640 .518 507 531(!perature OF 15 15 15 17 16
Units 7.40 7.46 7.42 7.36 7.32
*Ra-226 and Th-230 are in pCi/l. All other values are mg/l, except where noted.
D6-40

TABLE D-6.30
BASELINE WATER QUALITY DATACONVERSE COUNTY, WYOMING
Well No. 35-740, Sec. 35, T36N, R74W
1/24/86 2/14/86 3/13/86 5/25/86 7/30/86
Dissolved Solids (TDS) 374 403 385 364 374
Sodium (Na) 23 26 23 25 24Potassium (K) 7 7 7 8 10Calcium (Ca) 77 77 71 67 66Magnesium (Mg) 14 14 20 18 18
Sulfate (SO ) 118 140 125 133 114Chloride (Ci) 8 9 8 4.3 9Carbonate (CO ) 0 0 0 0 0Bicarbonate (CO 3) 203 203 198 190 198Major Cations, meq 6.17 6.30 6.36 6.14 6.07Major Anions, meq 6.01 6.30 6.36 6.14 5.87
Nitrate (as N) < .05 0.07 0.07 0.03 < .05Floride (F) 0.45 0.57 0.51 0.61 0.40
Roron (B) 0.19 0.05 0.10 < 0.1 < .01iminum (Al) < .10 < .10 < .10 < 0.1 < .10
Ienic (As) < .001 0.002 0.001 0.003 0.004W ium (Ba) < .10 < .10 < .10 < 0.1 < .10
Cadmium (Cd) < .002 < .002 < .002 < 0.01 < .002Cobalt (Co) < .01 < .01 < .10 < 0.01 < .01Chromium (Cr) < .01 < .01 < .01 < 0.05 < .01Copper (Cu) < .01 < o01 < .01 < 0.01 < .01
Iron (Fe) 0.01 0.01 0.01 < 0.05 0.05Lead (Pb) < .05 < .05 < .05 < 0.05 < .05Manganese (Mn) 0.02 0.02 0.04 0.03 0.02Mercury (Hg) < .0002 < .0002 < .0002 < 0.001 < .0002
Nickel (Ni) < .02 < .02 < .02 < 0.05 < .02Selenium (Se) 0.001 < .001 0.001 < 0.001 0.001Zinc (Zn) 0.146 0.261 0.244 < 0.01 0.427Molybdenum (Mo) < .10 < .10 < .10 < 0.1 < .10
Uranium (U) 0.013 0.183 0.017 0.036 0.021Vanadium (V) < .10 < .10 < .10 < 0.10 < .10
Radium-226 (Ra-226) 0.4 3.7 4.0 238.4 3.6Thorium-230 (Th-230) 1.2 0.6 1.6 46.4 0.6
-c. Cond - umhos 592 640 450 578 605q erature OF 15 15 15 15 15Units 7.25 7.46 7.15 7.24 7.27
*Ra-226 and Th-230 are in pCi/l. All other values are mg/l, except where noted.
06-41
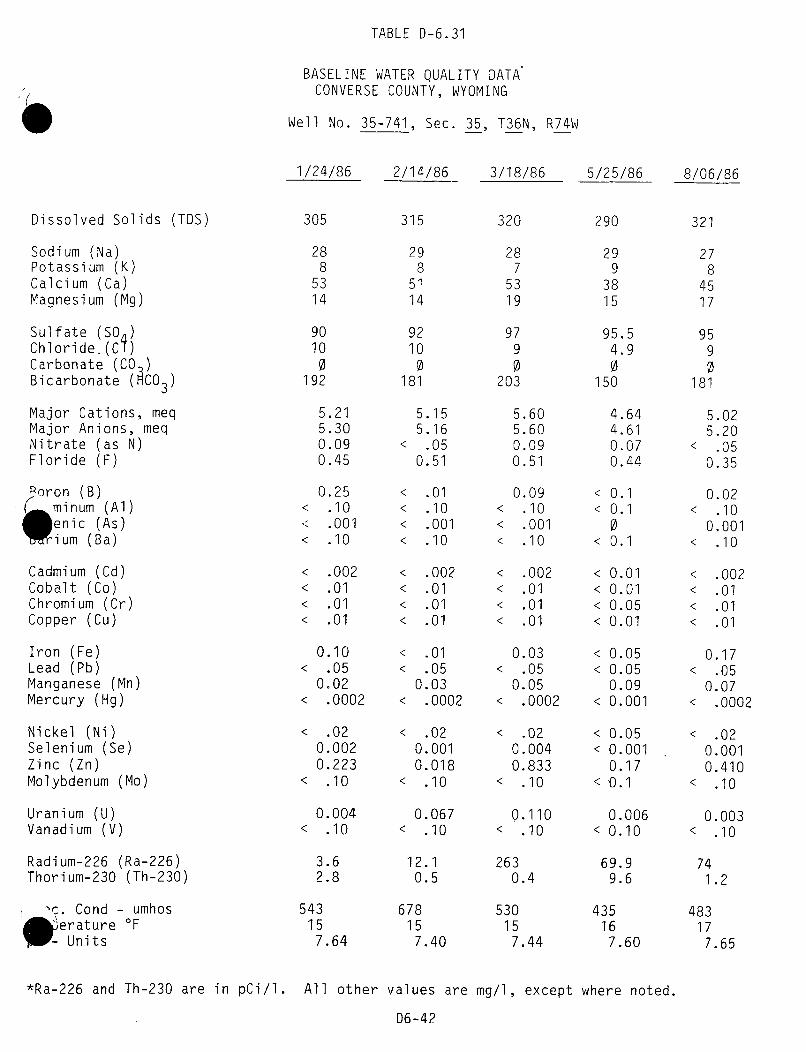
TABLE D-6.31
BASELINE WATER QUALITY DATACONVERSE COUNTY, WYOMING
Well No. 35-741, Sec. 35, T36N, R74W
1/24/86 2/14/86 3/18/86 5/25/86 8/06/86
Dissolved Solids (TDS) 305 315 320 290 321
Sodium (Na) 28 29 28 29 27Potassium (K) 8 8 7 9 8Calcium (Ca) 53 51 53 38 45Magnesium (Mg) 14 14 19 15 17
Sulfate (SO ) 90 92 97 95.5 95Chloride.(Ci) 10 10 9 4.9 9Carbonate (CO) 0 0 0 0 0Bicarbonate (ACO 3) 192 181 203 150 181Major Cations, meq 5.21 5.15 5.60 4.64 5.02Major Anions, meq 5.30 5.16 5.60 4.61 5.20Nitrate (as N) 0.09 < .05 0.09 0.07 < .05
Floride (F) 0.45 0.51 0.51 0.44 0.35
oron (B) 0.25 < .01 0.09 < 0.1 0.02ninum (Al) < .10 < .10 < .10 < 0.1 < .10
*enic (As) .001 .001 < .001 0 0.001O ium (Ba) < .10 < .10 < .10 < 0.1 < .10
Cadmium (Cd) < .002 < .002 < .002 < 0.01 < .002Cobalt (Co) < .01 < .01 < .01 < 0.01 < .01Chromium (Cr) < .01 < .01 < .01 < 0.05 < .01Copper (Cu) < .01 < .01 < .01 < 0.01 < .01
Iron (Fe) 0.10 < .01 0.03 < 0.05 0.17Lead (Pb) < .05 < .05 < .05 < 0.05 < .05Manganese (Mn) 0.02 0.03 0.05 0.09 0.07Mercury (Hg) < .0002 < .0002 < .0002 < 0.001 < .0002
Nickel (Ni) < .02 < .02 < .02 < 0.05 < .02Selenium (Se) 0.002 0.001 0.004 < 0.001 0.001Zinc (Zn) 0.223 0.018 0.833 0.17 0.410Molybdenum (Mo) < .10 < .10 < .10 < 0.1 < .10
Uranium (U) 0.004 0.067 0.110 0.006 0.003Vanadium (V) < .10 < .10 < .10 < 0.10 < .10
Radium-226 (Ra-226) 3.6 12.1 263 69.9 74Thorium-230 (Th-230) 2.8 0.5 0.4 9.6 1.2
-c. Cond - umhos 543 678 530 435 483* erature OF 15 15 15 16 17
W-Units 7.64 7.40 7.44 7.60 7.65
*Ra-226 and Th-230 are in pCi/l. All other values are mg/l, except where noted.
D6-42

TABLE D-6.32
BASELINE WATER QUALITY DATACONVERSE COUNTY, WYOMING
Well No. 35-744, Sec. 35, T36N, R74W
1/02/86 1/31/86 3/13/86 5/22/86 7/24/86
Dissolved Solids (TDS) 289 314 277 294 282
Sodium (Na) 25 27 24 27 25Potassium (K) 10 9 9 10.3 9Calcium (Ca) 48 50 46 46 48Magnesium (Mg) 11 11 12 11 14
Sulfate (SO ) 70 83 79 103 86Chloride (CH) 11 11 9 5.1 9Carbonate (CO ) 0 0 0 0 0Bicarbonate (CO 3 ) 168 168 176 160 171
Major Cations, meq 4.65 4.80 4.56 4.65 4.87Major Anions, meq 4.53 4.80 4.78 4.94 4.84Nitrate (as N) 0.06 0.07 0.09 < 0.01 0.07Floride (F) 0.51 0.51 0.51 0.52 0.34
"oron (B) 0.15 0.04 0.10 < 0.1 0.18iminum (Al) < .10 < .10 < .10 < 0.1 < .10
• enic (As) < .001 < .001 < .001 < 0.001 < .001W ium (Ba) < .10 < .10 < .10 < 0.1 < .10
Cadmium (Cd) < .002 < .002 < .002 < 0.01 < .002Cobalt (Co) < .10 < .01 < .10 < 0.01 < .01Chromium (Cr) < .01 < .01 < .01 < 0.05 < .01Copper (Cu) < .01 < .01 < .01 < 0.01 < .01
Iron (Fe) 0.05 < .01 < .01 < 0.05 0.01Lead (Pb) < .05 < .05 < .05 < 0.05 < .05Manganese (Mn) < .01 < .01 0.01 < 0.02 < .01Mercury (Hg) < .0002 < .0002 < .0002 < 0.001 < .0002
Nickel (Ni) < .02 < .02 < .02 < 0.05 < .02Selenium (Se) < .001 0.001 0.001 < 0.001 < .001Zinc (Zn) 0.151 0.073 0.351 0.18 0.373Molybdenum (Mo) < .10 < .10 < .10 < 0.1 < .10
Uranium (U) 0.081 0.026 0.023 0.009 0.017Vanadium (V) < .10 < .10 < .10 < 0.1 < .10
Radium-226 (Ra-226) 47 39 5.5 4.7 12.3Thorium-230 (Th-230) 3.6 2.2 0.7 4.50 0.8
/c . Cond - umhos 460 520 365 472 469perature 'F 14 16 15 15 15- Units 7.60 7.75 7.54 7.70 7.55
*Ra-226 and Th-230 are in pCi/l. All other values are mg/l, except where noted.
D6-43
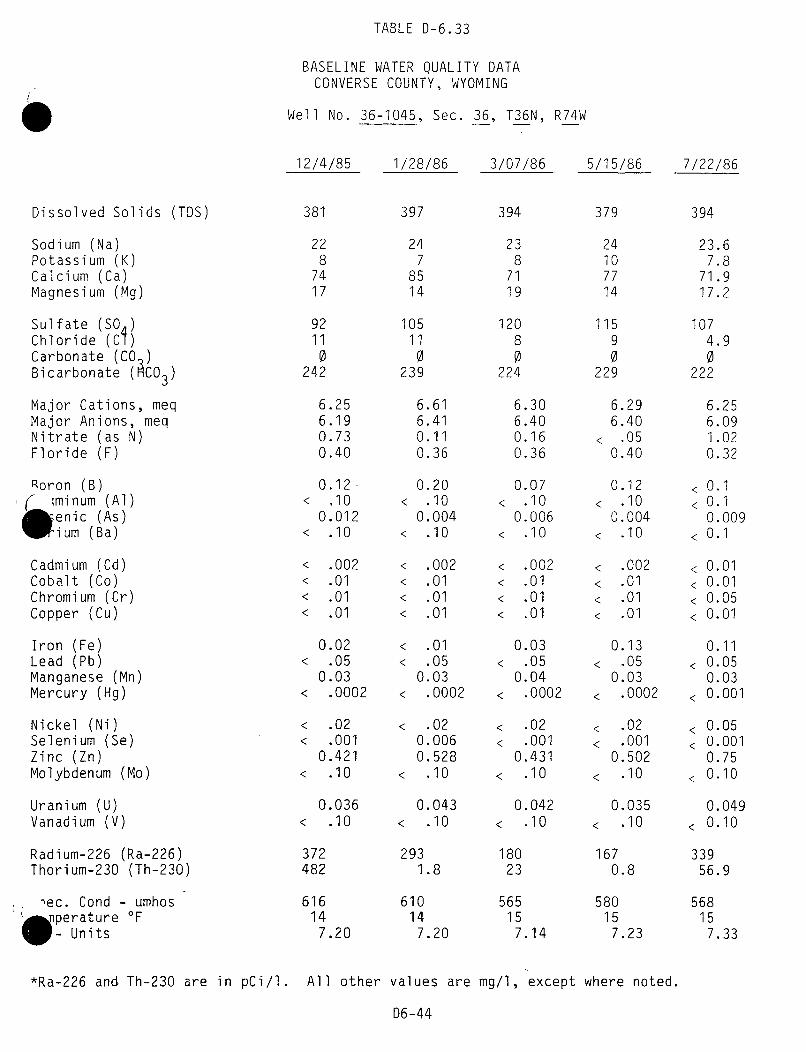
TABLE D-6.33
BASELINE WATER QUALITY DATACONVERSE COUNTY, WYOMING
Well No. 36-1045, Sec. 36, T36N, R74W
12/4/85 1/28/86 3/07/86 5/15/86 7/22/86
Dissolved Solids (TDS) 381 397 394 379 394
Sodium (Na) 22 24 23 24 23.6Potassium (K) 8 7 8 10 7.8Calcium (Ca) 74 85 71 77 71.9Magnesium (Mg) 17 14 19 14 17.2
Sulfate (SO ) 92 105 120 115 107Chloride (Ci) 11 11 8 9 4.9Carbonate (CO ) 0 0 0 0 0Bicarbonate (kCO 3) 242 239 224 229 222
Major Cations, meq 6.25 6.61 6.30 6.29 6.25Major Anions, meq 6.19 6.41 6.40 6.40 6.09Nitrate (as N) 0.73 0.11 0.16 < .05 1.02Floride (F) 0.40 0.36 0.36 0.40 0.32
Roron (B) 0.12 0.20 0.07 0.12 < 0.1iminum (Al) < 010 < .10 < .10 < .10 < 0.1
kenic (As) 0.012 0.004 0.006 0.004 0.009ium (Ba) < .10 < .10 < .10 < .10 < 0.1
Cadmium (Cd) < .002 < .002 < .002 < .002 < 0.01Cobalt (Co) < .01 < .01 < .01 < .01 < 0.01Chromium (Cr) < .01 < .01 < .01 < .01 < 0.05Copper (Cu) < .01 < .01 < .01 < .01 < 0.01
Iron (Fe) 0.02 < .01 0.03 0.13 0.11Lead (Pb) < .05 < .05 < .05 < .05 < 0.05Manganese (Mn) 0.03 0.03 0.04 0.03 0.03Mercury (Hg) < .0002 < .0002 < .0002 < .0002 < 0.001
Nickel (Ni) < .02 < .02 < .02 < .02 < 0.05Selenium (Se) < .001 0.006 < .001 < .001 < 0.001Zinc (Zn) 0.421 0.528 0.431 0.502 0.75Molybdenum (Mo) < .10 < .10 < .10 < .10 < 0.10
Uranium (U) 0.036 0.043 0.042 0,035 0.049Vanadium (V) < .10 < .10 < .10 < .10 < 0.10
Radium-226 (Ra-226) 372 293 180 167 339Thorium-230 (Th-230) 482 1.8 23 0.8 56.9
'ec. Cond - umhos 616 610 565 580 568.poerature 'F 14 14 15 15 15
Units 7.20 7.20 7.14 7.23 7.33
*Ra-226 and Th-230 are in pCi/l. All other values are mg/l, except where noted.
D6-44
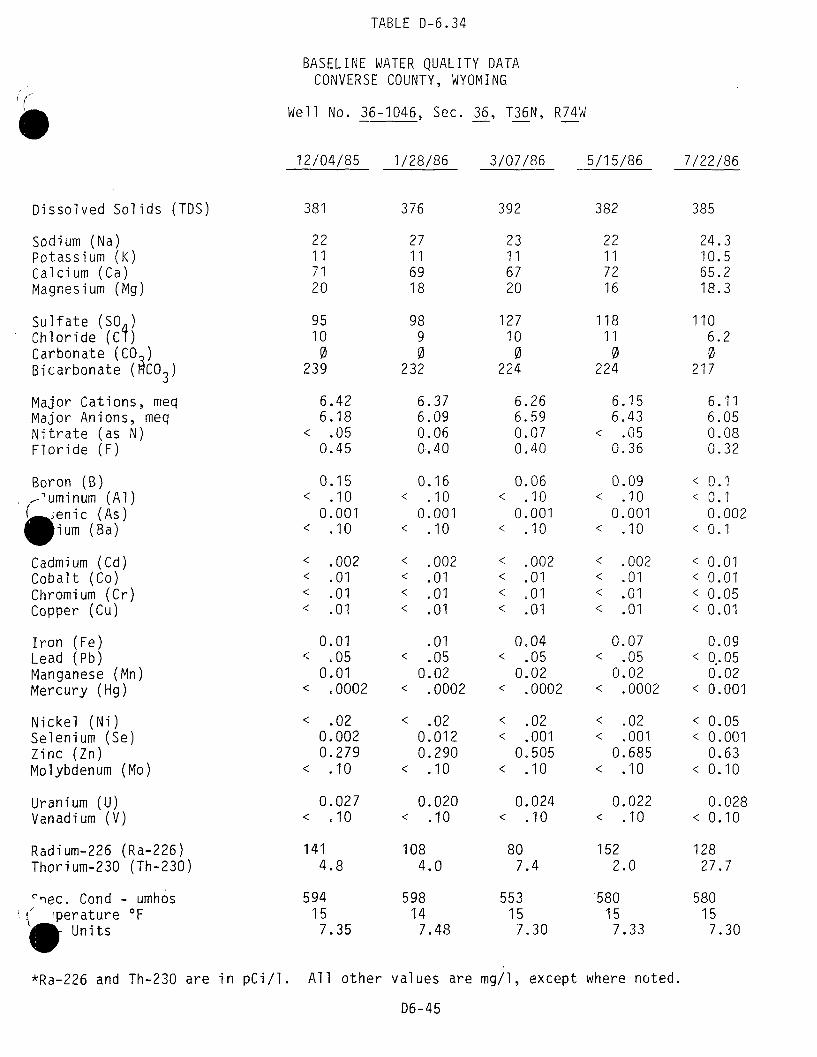
TABLE D-6.34
BASELINE WATER QUALITY DATACONVERSE COUNTY, WYOMING
Well No. 36-1046, Sec. 36, T36N, R74W
12/04/85 1/28/86 3/07/86 5/15/86 7/22/86
Dissolved Solids (TDS) 381 376 392 382 385
Sodium (Na) 22 27 23 22 24.3Potassium (K) 11 11 11 11 10.5Calcium (Ca) 71 69 67 72 65.2Magnesium (Mg) 20 18 20 16 18.3
Sulfate (SO ) 95 98 127 118 110Chloride (Ci) 10 9 10 11 6.2Carbonate (CO ) 0 0 0 0 0Bicarbonate (ACO 3 ) 239 232 224 224 217
Major Cations, meq 6.42 6.37 6.26 6.15 6.11Major Anions, meq 6.18 6.09 6.59 6.43 6.05Nitrate (as N) < .05 0.06 0.07 < .05 0.08Floride (F) 0.45 0.40 0.40 0.36 0.32
Boron (B) 0.15 0.16 0.06 0.09 < 0.1luminum (Al) < .10 < .10 < .10 < .10 < 0.1( uenic (As) 0.001 0.001 0.001 0.001 0.002*ium (Ba) < .10 < .10 < .10 < .10 < 0.1
Cadmium (Cd) < .002 < .002 < .002 < .002 < 0.01Cobalt (Co) < .01 < .01 < .01 < .01 < 0.01Chromium (Cr) < .01 < .01 < .01 < .01 < 0.05Copper (Cu) < .01 < .01 < .01 < .01 < 0.01
Iron (Fe) 0.01 .01 0.04 0.07 0.09Lead (Pb) < .05 < .05 < .05 < .05 < 0..05Manganese (Mn) 0.01 0.02 0.02 0.02 0.02Mercury (Hg) < .0002 < .0002 < .0002 < .0002 < 0.001
Nickel (Ni) < .02 < .02 < .02 < .02 < 0.05Selenium (Se) 0.002 0.012 < .001 < .001 < 0.001Zinc (Zn) 0.279 0.290 0.505 0.685 0.63Molybdenum (Mo) < .10 < .10 < .10 < .10 < 0.10
Uranium (U) 0.027 0.020 0.024 0.022 0.028Vanadium (V) < .10 < .10 < .10 < .10 < 0.10
Radium-226 (Ra-226) 141 108 80 152 128Thorium-230 (Th-230) 4.8 4.0 7.4 2.0 27.7
Thec. Cond - umhos 594 598 553 580 5804/ perature 'F 15 14 15 15 15. Units 7.35 7.48 7.30 7.33 7.30
*Ra-226 and Th-230 are in pCi/l. All other values are mg/l, except where noted.
D6-45
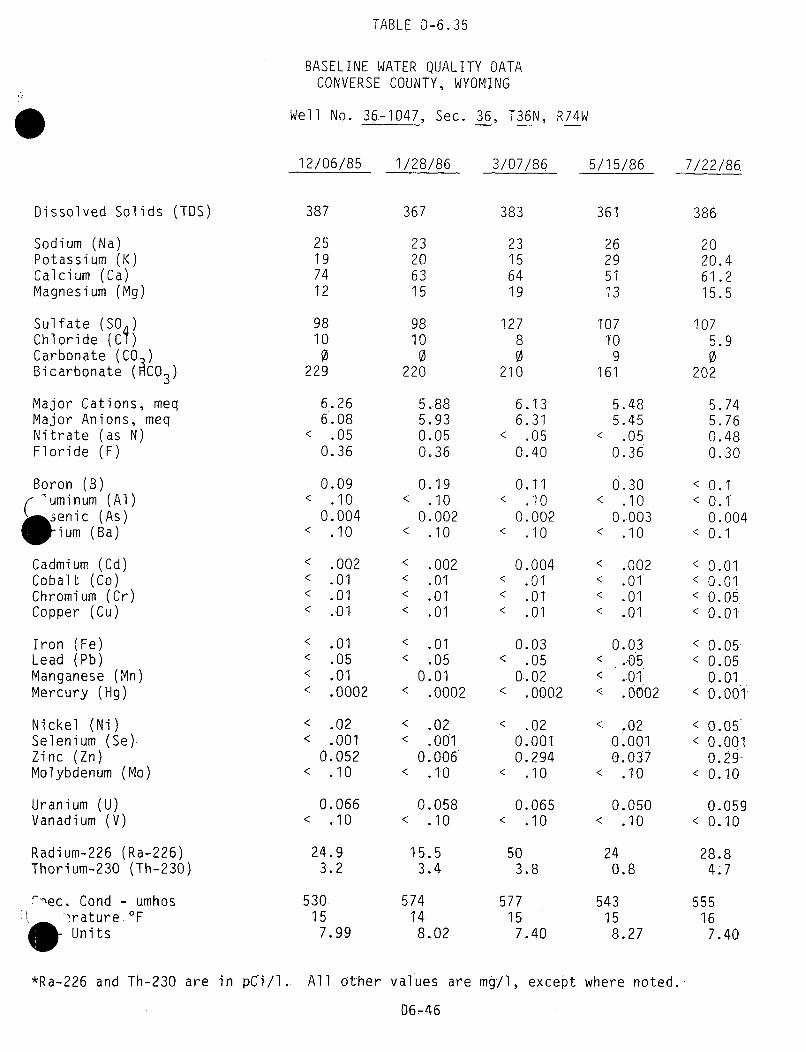
TABLE D-6.35
BASELINE WATER QUALITY DATACONVERSE COUNTY, WYOMING
Well No. 36-1047, Sec. 36, T36N, R74W
12/06/85 1/28/86 3/07/86 5/15/86 7/22/86
Dissolved Solids (TDS) 387 367 383 361 386
Sodium (Na) 25 23 23 26 20Potassium (K) 19 20 15 29 20.4Calcium (Ca) 74 63 64 51 61.2Magnesium (Mg) 12 15 19 13 15.5
Sulfate (SO ) 98 98 127 107 107Chloride (Ci) 10 10 8 10 5.9Carbonate (CO) 0 0 0 9 0Bicarbonate (CO 3 ) 229 220 210 161 202
Major Cations, meq 6.26 5.88 6.13 5.48 5.74Major Anions, meq 6.08 5.93 6.31 5.45 5.76Nitrate (as N) < .05 0.05 < .05 < .05 0.48Floride (F) 0.36 0.36 0.40 0.36 0.30
Boron (B) 0.09 0.19 0.11 0.30 < 0.1( uminum (Al) < .10 < .10 < .10 < .10 < 0.1
enic (As) 0.004 0.002 0.002 0.003 0.004ium (Ba) < .10 < .10 < .I0 < .10 < 0.1
Cadmium (Cd) < .002 < .002 0.004 < .002 < 0.01Cobalt (Co) < .01 < .01. < .01 < .01 < 0.01Chromium (Cr) < .01 < .01 < .01 < .01 < 0.05Copper (Cu) < .01 < .01 < .01 < .01 < 0.01
Iron (Fe) < e01 < .01 0.03 0.03 < 0.05,Lead (Pb) < .05 < .05 < .05 < ..05 < 0.05Manganese (Mn) < .01 0.01 0.02 < .01 0.01Mercury (Hg) < .0002 < .0002 < .0002 < .0002 < 0.001ý
Nickel (Ni) < .02 < .02 < .02 < .02 < 0.05Selenium (Se) < .001 < .001 0.001 0.001 < 0.00.1Zinc (Zn) 0.052 0.006. 0.294 0.037 0.29Molybdenum (Mo) < .10 < .10 < .10 < .10 < 0.10
Uranium (U) 0.066 0.058 0.065 0.050 0.059Vanadium (V) < .10 < .10 < .10 < .10 < 0.10
Radium-226 (Ra-226) 24.9 15.5 50 24 28.8
Thorium-230 (Th-230) 3.2 3.4 3.8 0.8 4.7
rlec. Cond - umhos 530 574 577 543 555
( rature OF 15 14 15 15 16Units 7.99 8.02 7.40 8.27 7.40
*Ra-226 and Th-230 are in pCi/l. All Other values are mg/l, except where noted.
D6-46

TABLE D-6.36
BASELINE WATER QUALITY DATACONVERSE COUNTY, WYOMING
Well No. 36-1048, Sec. 36, T36N, R74W
1/16/86 1/28/86 3/07/86 5/15/86 7/22/86
Dissolved Solids (TDS) 378 388 375 385 380
Sodium (Na) 24 30 23 28 23.1Potassium (K) 8 7 9 9 8.3Calcium (Ca) 75 71 67 74 69Magnesium (Mg) 14 18 18 15 16.6
Sulfate (SO ) 92 107 125 123 112Chloride (Ci) 9 9 9 9 5.2Carbonate (CO ) 0 0 0 0 0Bicarbonate (ACO 3 ) 224 232 214 229 212
Major Cations, meq 6.13 6.51 6.05 6.37 5.95Major Anions, meq 5.83 6.28 6.36 6.57 5.99Nitrate (as N) < .05 0.14 < .05 < .05 0.21Floride (F) 0.45 0.40 0.40 0.36 0.34
Boron (B) 0.14 0.15 0.15 0.22 < 0.1iminum (Al) < .10 < .10 < .10 < .10 < 0.1enic (As) < .001 0.001 0.001 0.003 0.003ium (Ba) < .10 < .10 < .10 < .10 < 0.1
Cadmium (Cd) < .002 < .002 .003 < .002 < 0.01Cobalt (Co) < .01 < .01 < .01 < .01 < 0.01Chromium (Cr) < .01 < .01 < .01 < .01 < 0.05Copper (Cu) < .01 < .01 < .01 < .01 < 0.01
Iron (Fe) 0.04 < .01 0.02 0.03 < 0.05Lead (Pb) < .05 < .05 < .05 < .05 < 0.05Manganese (Mn) 0.01 0.02 0.03 0.02 0.02
Mercury (Hg) < .0002 < .0002 < .0002 < .0002 < 0.001
Nickel (Ni.) < .02 < .02 < .02 < .02 < 0,05Selenium (Se) < 0.001 < .001 < .001 0.002 < 0.001Zinc (Zn) 0.062 0.026 0.106 0.100 0.28Molybdenum (Mo) < .10 < .10 < .10 < .10 < 0.10
Uranium (U) 0.027 0.027. 0.028 0.267 0.033Vanadium (V) < .10 < .10 < .10 < .10 < 0.10
Radium-226 (Ra-226) 150 82 113 203 140.4Thorium-230 (Th-230) 31.1 3.5 14 1.6 17.1
'c. Cond - umhos 641 622 614 568 555*(eratur~e 'F 14 14 15 15 15
Units 7.09 7.28 7.08 7.12 7.10
*Ra-226 and Th-230 are in pCi/lo All other values are mg/l, except where noted.
nrI-&7
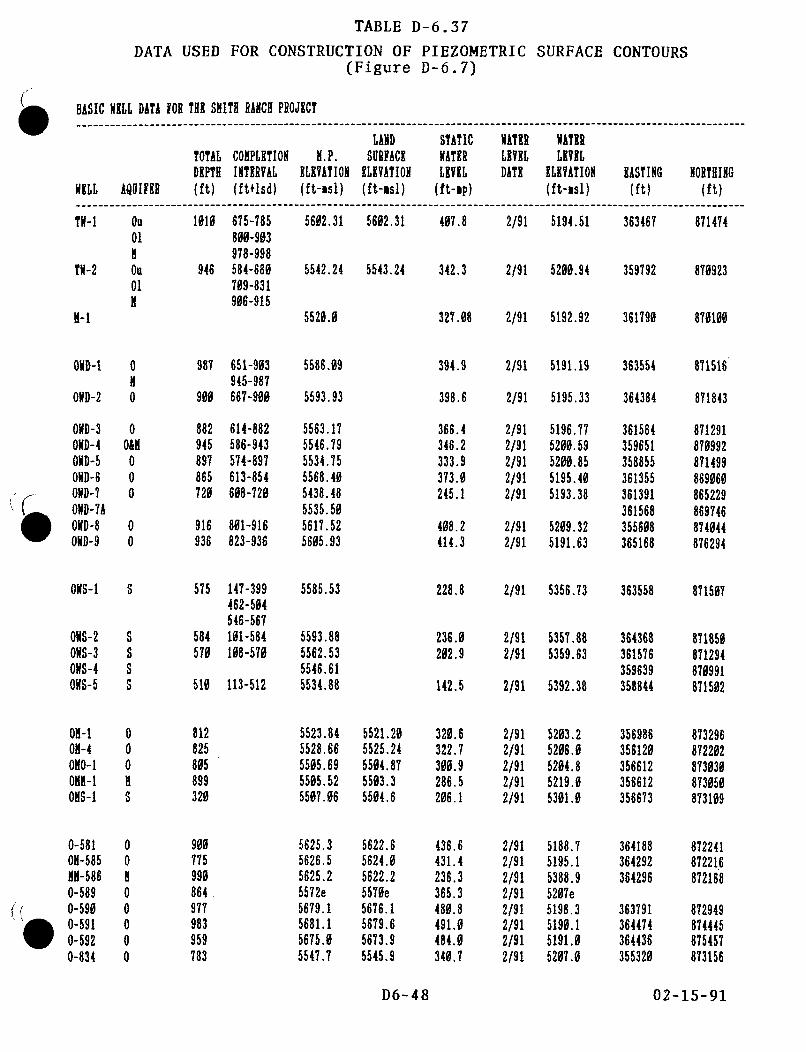
TABLE D-6.37
DATA USED FOR CONSTRUCTION OF PIEZOMETRIC SURFACE CONTOURS(Figure D-6.7)
BASIC WELL DATA FOR THI SMITH RANCH PROJECT
TOTALDEPTH
WELL AQUIFER (ft)
COHPLETIONINTERVAL(ftflsd)
H.P.ELEVATION(ft-ms1)
LANDSURFACE
ELEVATION(ft-msl)
STATICWATERLEVEL
(ft-up)
WATRLEVELDATE
WATER
ELEVATION(ft-msl)
lASTING NORTHING(ft) (ft)
TW-i Ou
TN-2 Ou01
H-I
OWB-1 0M
OWD-2 0
1010 675-785806-903978-998
946 584-680709-831906-915
5602.31 5602.31 407.8
5542.24 5543.24 342.3
2/91 5194.51 363467
2/91 5200.94 359792
OWD-3OWD-4OWD-5OWD-6OWD-7OWD-7AOWD-6OWD-9
0O&M000
987 651-903945-987
900 667-900
882 614-882945 586-943897 574-897865 613-854720 608-720
916 801-916936 823-936
575 147-399462-504546-567
584 101-584570 108-570
5520.0
5586.09
5593.93
5563.175546.795534.755568.405438.485535.505617.525605.93
5585.53
00
327.08 2/91 5192.92 361790
ONS-1 S
OWS-2OWS-3OWS-4ONS-5
OH-IO0-4ONO-IONN-1OHS-1
0-581O0-585IN-5860-5890-5900-5910-5920-834
SSS
S
000
S
5593.885562.535546.61
510 113-512 5534.88
394.9
398.6
366.4346.2333.9373.0245.1
408.2414.3
228.8
236.0202.9
142.5
320.6322.7300.9286.5206.1
436.6431.4236.3365.3480.8491.0484.0340.7
2/91 5191.19 363554
2/91 5195.33 364384
2/91 5196.77 3615842/91 5200.59 3596512/91 5200.85 3588552/91 5195.40 3613552/91 5193.38 361391
3615682/91 5209.32 3556082/91 5191.63 365168
2/91 5356.73 363558
2/91 5357.88 3643682/91 5359.63 361576
3596392/91 5392.38 358844
871474
870923
870100
871516
871843
871291870992871499869060865229869746874044876294
871507
871850871294870991871502
873296872202873030873050873109
872241872216872168
872949874445875457873156
00H00000
812825805899320
900775990864977983959783
5523.845528.665505.695505.525507.06
5625.35626.55625.25572e5679.15681.15675.05547.7
5521.205525.245504.875503.35504.6
5622.65624.05622.25570e5676.15679.65673.95545.9
2/912/912/912/912/91
2/912/912/912/912/912/912/912/91
5203.25206.05204.85219.05301.0
5188.75195.15388.95207e5198.35190.15191.05207.0
356986356120356612356612356673
364188364292364296
363791364474364436355320
D6-48 02-15-91
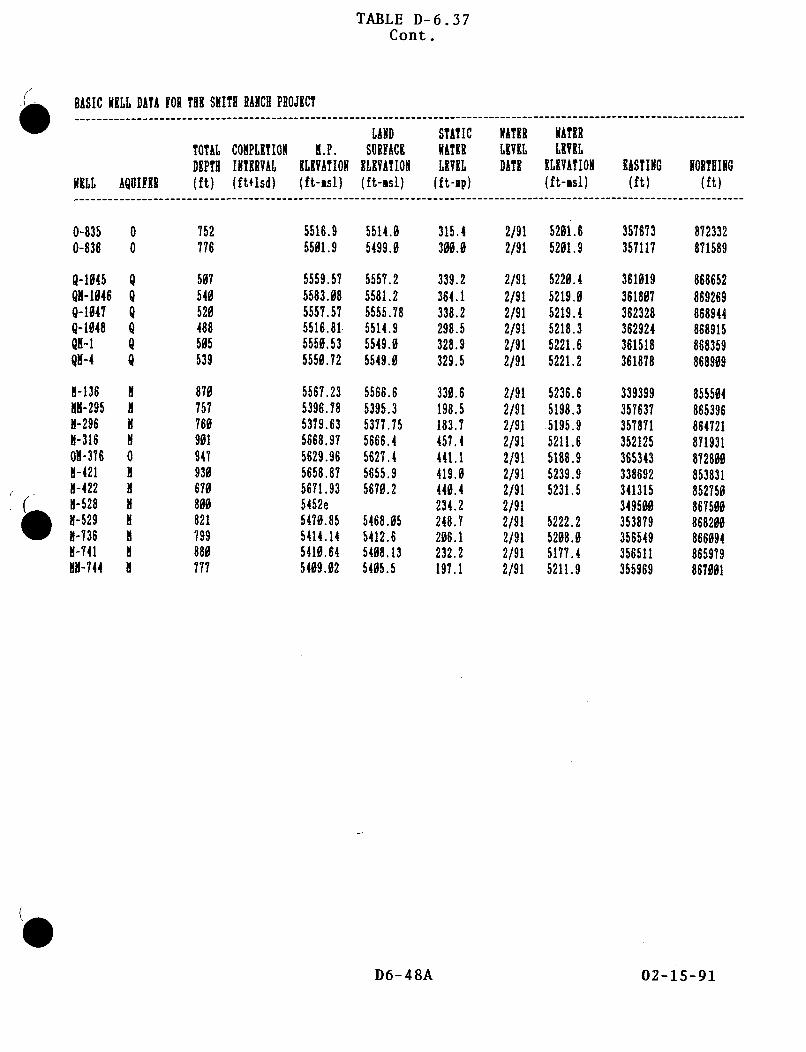
TABLE D-6.37Cont.
S BASIC WILL DATA FOR THE SNITH RANCH PROJECT
-- A-n - - - - - -VAY- -VAY-
TOTAL COMPLETION 9.P. SURFACE MATER LEVEL LEVELDEPTH INTERVAL ELEVATION ELEVATION LEVEL DATE ELEVATION(ft) (ftflsd) (ft-asi) (ft-asl) (ft-np) (ft-asl)
RASTING NORTHING(ft) (ft)WELL AQUIFER
0-835 00-836 0
Q-1045 QQN-1046 Q0-1047 QQ-1048 QQN-1 QQN-4 Q
H-136 M11-295 N1-296 MM-316 N0-376 0M-421 NN-422 N
( 8-528 N8-529 N8-736 N8-741 N11-744 N
752776
507540520488505539
870757760901947930670800821799880777
5516.9 5514.0 315.45501.9 5499.0 300.0
5559.57 5557.25583.08 5581.25557.57 5555.785516.81 5514.95550.53 5549.05550.72 5549.0
5567.23 5566.65396.78 5395.35379.63 5377.755668.97 5666.45629.96 5627.45658.87 5655.95671.93 5670.25452e5470.85 5468.055414.14 5412.65410.64 5408.135409.02 5405.5
339.2364.1338.2298.5328.9329.5
330.6198.5183.7457.4441.1419.0440.4234.2248.7206.1232.2197.1
2/91 5201.82/91 5201.9
2/91 5220.42/91 5219.02/91 5219.42/91 5218.32/91 5221.62/91 5221.2
2/91 5236.62/91 5198.32/91 5195.92/91 5211.62/91 5188.92/91 5239.92/91 5231.52/912/91 5222.22/91 5208.02/91 5177.42/91 5211.9
357673357117
361019361807362328362924361518361878
339399357637357871352125365343338692341315349500353879356549356511355969
872332871589
868652869269868944868915868359868909
855504865396864721871931872800853831852750867500868200866094865979867001
D6-48A 02-15-91
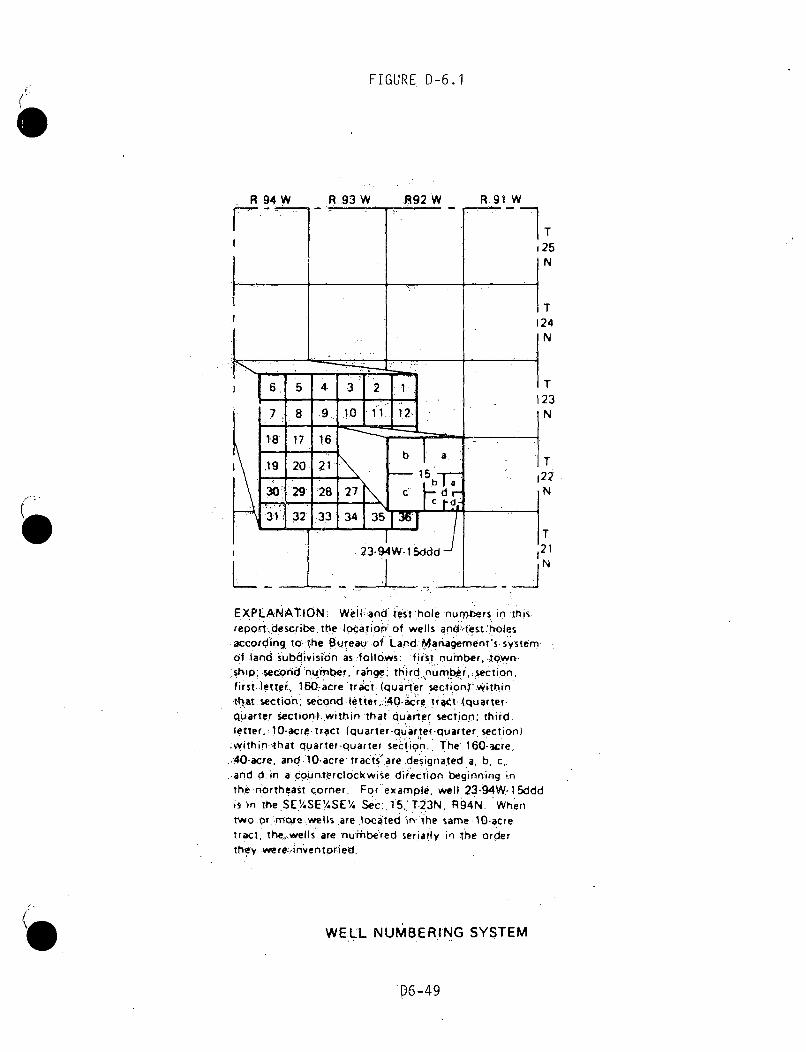
FIGURE D-6.1
•23-94W-15ddd --'
EXPLANATION. Well and test hole numbiers in thisreport ý,describe. the loca-tion: of wells and',.test.'holes.accotding toý the Bureau of Land.- Management's systemof land subaIvision as follows: first number, .town-,sh.ip. second "nu-mber, range; third numbr,,seCtion,first letter., 160-acre tra•t (quart'r section) vWithin•t~at section; second .letter.4::,-*acre trct. (quarter-quarter section).withtin that quarter section; third.letter, 1 0-acre. tract (quarter-quarter-quarter section)
.within -that quarter-quarter section.. The 160-acre,.,40-acre, and 10-acre tracts are designated a, b, c,and d in a coun.t.rclockwise direction beginning i nthe northeast corner. For example, well 23-94W-15dddis in the SE,%SSE¼%SE% Sec. 15,'T23N R94N. Whentwo or mqre wells are located in the same 10-acretract, the, wells are numibeired serially in the orderthey were•invent oried.
WELL NUMBERING SYSTEM
D6-49
The following 1 Drawingspecifically referencedAppendix D6 Table ofContents have beenprocessed into ADAMS.
These drawings can beaccessed within the ADAMSpackage or by performing asearch on theDocument/Report Number.
D-145
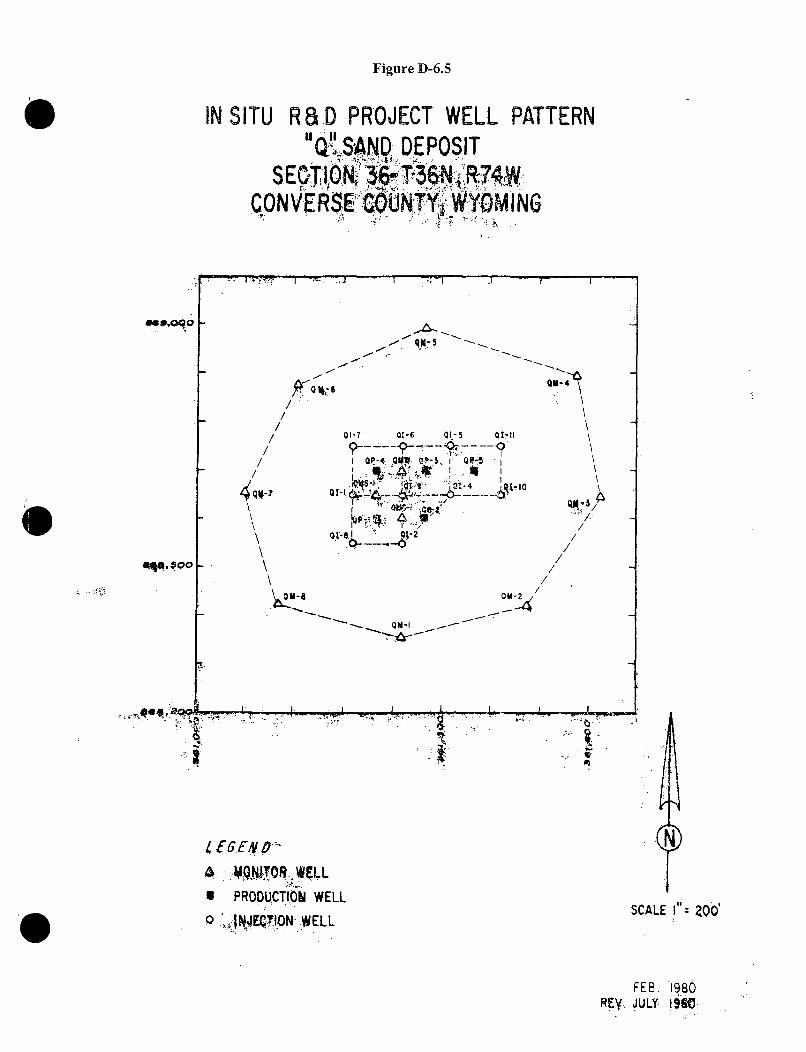
Figure D-6.5
IN SITU R&D PROJECT WELL PATTERNU"QIISA ND DEPOSIT
OVSEQT ON. 3'T3 1 -74WCONVERSE G0UN'T:Y;WYQMNG
I 4i-1 -1 -- F I
.4s.Qqo-
---. ws
WgG
/Q-4~
//
/
//
4
01-7 01-6 QL-5 01-11
I OP-4 0MV P~IO-
01 iS 1
Qt's I //
/t
///
/
I L __________________ I~ Ium -•lJ,,,t
I A, ii.44 6EFN P
6 MANTO WELL*PRODUCTI.ON WELL
Q J TtJ~!ON- WELLSCALE :200
FEB. 19,8REV, JULY. !ito
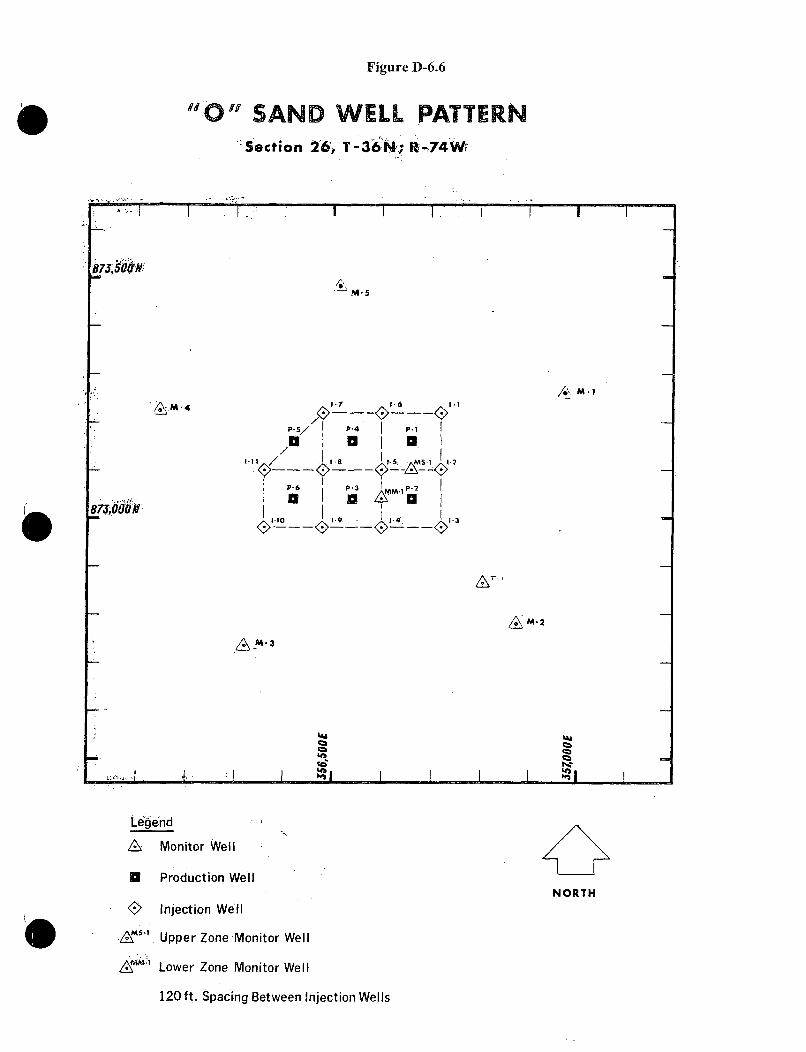
Figure D-6.6
"0" SAND WELL PATTERNSection 26,y T-36 N'; R-74W•
I I I I I
273,500 N•M-5
/•,_ M•1
b1-7 1461.
87.3;00a1
,ýýM-2
I4"
4 ,..I -- ~ I II Cm
UA
T
Le4end
A• Monitor Well
U Production Well
<K5 Injection Well
*Ž•d5.l Upper Zone Monitor Well
zAM1 Lower Zone Monitor Well
120 ft. Spacing Between Injection Wells
NORTH

The following 2 Drawingsspecifically referencedAppendix D6 Table ofContents have beenprocessed into ADAMS.
These drawings can beaccessed within the ADAMSpackage or by performing asearch on theDocument/Report Number.
D-146 to D-147
Hydrology
Attachment 'A'
Bill Smith Mine Site Pump Test
Pump testing was conducted at the Bill Smith Mine site
in 1974 by Harshbarger and Associates and a copy of
Harshbarger's report is attached. The locations of the test
wells used in the Harshbarger study are shown on Figure Ir in
the report. The primary purpose of pump tests conducted at
well sites TW-1 and TW-2 was to obtain quantitative hydrologic
data necessary for designing a mine dewatering and water level
monitoring network. The tests were conducted during separate
periods of time at TW-1 and TW-2 using a pumping well, five
shallow observation wells, and five deep observation wells.
All observation well sites shown in. Figure 1 include one shallow
and one deep observation well. The depths, completion
intervals, and distances of the observation wells from the pump
well are given on page 10 of the attached report.
The shallow observation wells penetrated approximately
500 feet of the unconfined Wasatch formation. The pumping wells
and deeper observation wells penetrated the confined Fort Union
aquifer. Near the Bill Smith Mine the aquitard between the
shallow and the deeper observation wells ranges from 40 to 75
feet thick, but it is less than 5 feet thick near well site
TW-2.
From the data it was estimated that the average
transmissivity of the confined aquifer ranged from about 8000
gpd/ft in the vicinity of wells OWD-3 and OWD-5 to 5000 gpd/ft
at wells OWD-l and OWD-2. The storage coefficient ranged from
0.0001.5 to 0.00035.
D-6 Att. A-I
No noticeable changes in the water levels in the shallow
observations wells were noted, even though pumping lowered the
water levels in the aquifer beneath the aquitard below the top
of the confined aquifer in areas adjacent to wells TW-I and
TW-2.
D-6 Att. A-2
REPORT
R-WI301-75-2
November 10, 1975
ANALYSIS OF CONSTANT YIELD TESTS OF WELLS TW-2 AND TW-I
BILL SMITH MINE, CONVERSE COUNTY, IiYOMING.t
.I.*•
Prepared For
KERR McGEE NUCLEAR CORPORATIONP.O. Box 2855
Casper, Wfyoming 82601
Mr. J. D. LandonManager
Prepared By
HARSHBARGER AND ASSOCIATESCONSULTANTS IN HYDROLOGY
TUCSON, ARIZONA
D-6 Att. A-3
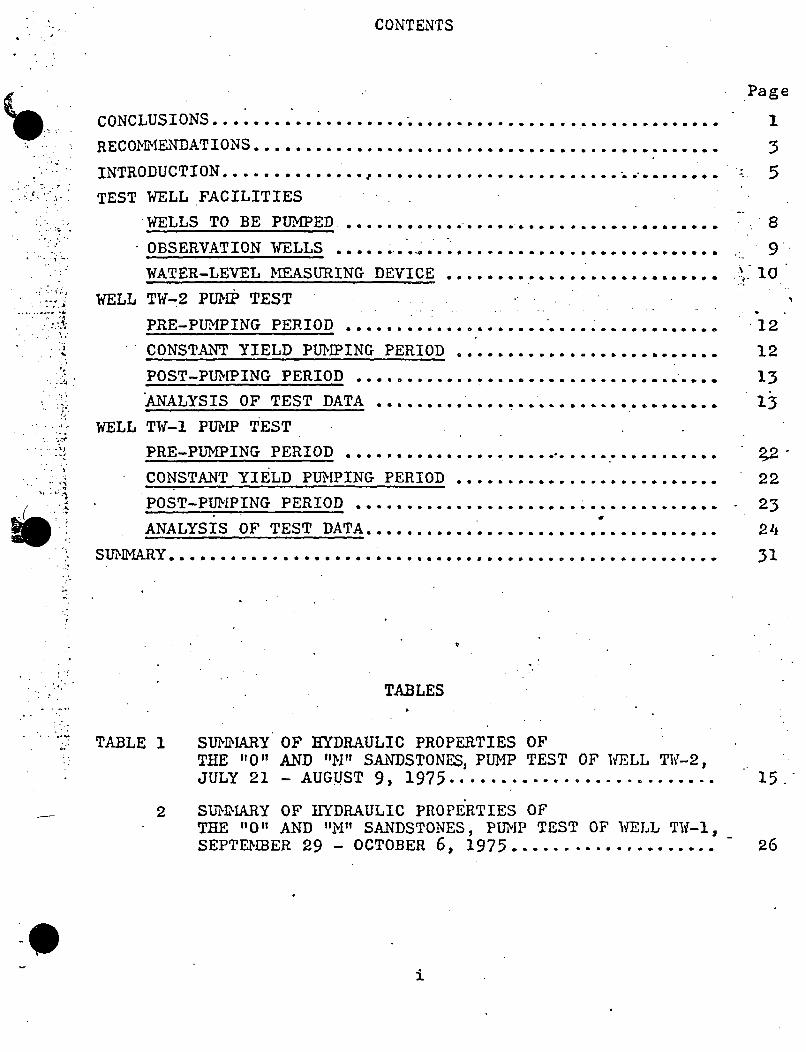
CONTENTS
,. -
CONCLUSIONS ............................................... ....
REC O MENDATIONS ... ... . ... ......... .................
INTRODUCTION ........ * ....... ......
TEST WELL FACILITIES
WELLS TO BE PUMPED ............
OBSERVATION WTELLS ...... ............
WATER-LEVEL MEASURING DEVICE ....... ..............
WELL TW-2 PUP TEST ....
PRE-PUMPING PERIOD ......... ..........
CONSTANT YIELD PUMPING PERIOD ........................
POST-PUMPING PERIOD .... ........ ........
ANALYSIS OF TEST DATA .......... ...............
WELL TW-1 PUMP TEST
PRE-PUIMPING PERIOD .......... ......... ........................
CONSTANT YIELD PUMPING PERIOD ... ............
POST-PU1[PING PERIOD .................... .................
Page
35
8
9
1.2
12
13
13
22
23
ANALYSIS OF TEST DATA ...................................SU• vIARY... . . . . . . .....oa.ae ......... .. ............... a....
TABLES
TABLE I SUNIT!NARY OF HYDRAULIC PROPERTIES OFTHE "0" AND "N" SANDSTONES, PUMP TEST OF WELL TV-2,JULY 21 - AUGUST 9, 1975 ..........................
2 SUMMARY OF HYDRAULIC PROPERTIES OF
THE I"0 AND "i4" SANDSTONES, PUMP TEST OF WELL TW-I,
SEPTE?[BER 29 - OCTOBER 6, 1975 .....................
15.-
i
LIST OF ILLUSTRATIONS
FIGURE 1 •AP OF BILL SMITH MINE AREA AND TEST WELL LOCATIONS V
2 HYDROGRAPHS WATER LEVEL IN OBSERVATION WELLS IN /WATER TABLE AQUIFER, JULY 15 - AUGUST 9, 1975
3 SEMI-LOGARITHMIC GRAPH OF DRAWD0WN AND RECOVERYIN WELL TW-2:
4 SEMII-LOGARITIBIIC GRAPH OF DRAlWDO0WN IN WELLS OWD-1,OWD-2, OWD-3, OWD-4, AND OWD-5; WELL TW-2 TEST
5 SEMI-LOGARITHMIC GRAPH OF RECOVERY IN WELLS OlID-1,OWD-2, OWD-3, OWD-4, AND OWD-5; WELL TW-2 TEST
6 LOGARITHMIC GRAPH OF DRAWDOWN AND RECOVERY INWELLS OWD-1, OWD-3, OWD-4, AND OWD-5; WELL TW-2 TEST
7 DISTANCE-DRAIWD01WN GRAPH FOR WELLS IN BILL SMITH MINEAREA: WELL TW-2 TEST
8 HYDROGRAPHS WATER LEVEL IN OBSERVATION WELLS IN WATERTABLE AQUIFER, SEPTEMBER 29 - OCTOBER 6, 1975
9 SEII-LOGARITHMIC GRAPH OF DRAWDOWN AND RECOVERYIN WELL TW-1
10 SEMI-LOGARITHMIC GRAPH OF DRAWDOWN IN WELLS OW1D-I,OWD-2, OWD-3, OWD-4, AND OWD-5; WELL TW-1 TEST
11 SEMI-LOGARITH14IC GRAPH OF RECOVERY IN WELLS OWD-1AND OWD-2; WELL TW-1 TEST
12 LOGARITHMIC GRAPH OF DRAWDOWN AND RECOVERY IN WELLSOWD-IJ, OWD-2, OIWD-3, 01M-4, AND OUTD-5; WELL TW-1 TEST
13 DISTANCE-DRANDOWN GRAPH FOR WELLS IN BILL SMITH MINEAREA, WELL TW-1 TEST
14 MAP OF BILL SMITH MINE AREA AND DEWATER WELLLOCATIONS
ii
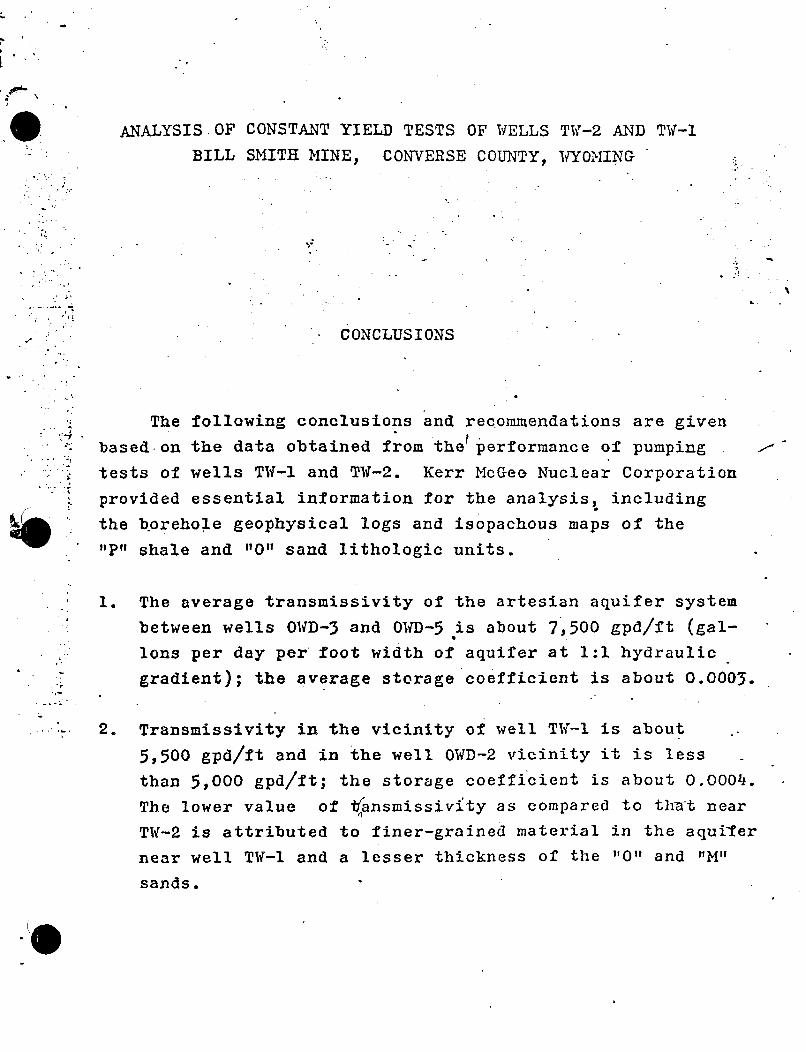
W. ANALYSIS OF CONSTANT YIELD TESTS OF WELLS TW-2 AND TW-IBILL SMITH MINE, CONVERSE COUNTY, WYOMING
CONCLUSIONS
The following conclusions and recommendations are givenbased-on the data obtained from thee performance of pumping
tests of wells TW-l and TW-2. Kerr McGee Nuclear Corporation
provided essential information for the analysis, including
S the borehole geophysical logs and isopachous maps of the
"P" shale and "0" sand lithologic units.
1. The average transmissivity of the artesian aquifer system
between wells OWD-3 and OWD-5 is about 7,500 gpd/ft (gal-
Ions per day per foot width of aquifer at 1:1 hydraulic
gradient); the average storage coefficient is about 0.0003.
2. Transmissivity in the vicinity of well TW-I is about
5,500 gpd/ft and in the well OWD-2 vicinity it is less .
than 5,000 gpd/ft; the storage coefficient is about 0.O004.
The lower value of tfansmissivity as compared to th-at near
TW-2 is attributed to finer-grained material in the aquifer
near well TW-1 and a lesser thickness of the "O" and "m"
sands.
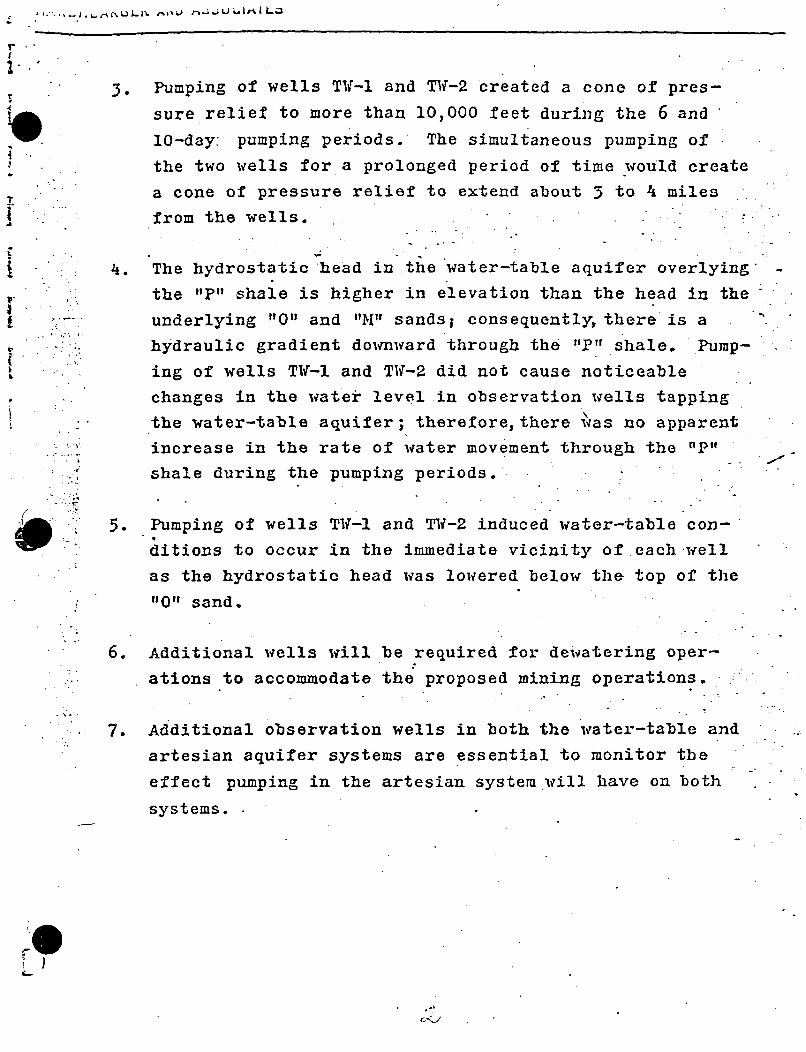
3. Pumping of wells TW-l and TW-2 created a cone of pres-
sure relief to more than 10,000 feet during the 6 and
10-day: pumping periods. The simultaneous pumping of
the two wells for a prolonged period of time would create
" a cone of pressure relief to extend about 3 to 4 miles
from the wells.
4. The hydrostatic head in the water-table aquifer overlying
the "P" shale is higher in elevation than the head in the
underlying "0" and "M" sands; consequently, there is a
hydraulic gradient downward through the "J?" shale. Pump-
ing of wells TY-l and TW-2 did not cause noticeable
changes in the water level in observation wells tapping
the water-table aquifer; therefore,there was no apparent
increase in the rate of water movement through the "P")
shale during the pumping periods.
5. Pumping of wells TW1-1 and TW-2 induced water-table con-
ditions to occur in the immediate vicinity of each well
as the hydrostatic head was lowered below the top of the
"0" sand.
6. Additional wells will be required for dewatering oper-
* ations to accommodate the proposed mining operations.
• 7. Additional observation wells in both the water-table and
artesian aquifer systems are essential to monitor the
effect pumping in the artesian system will have on both
systems.
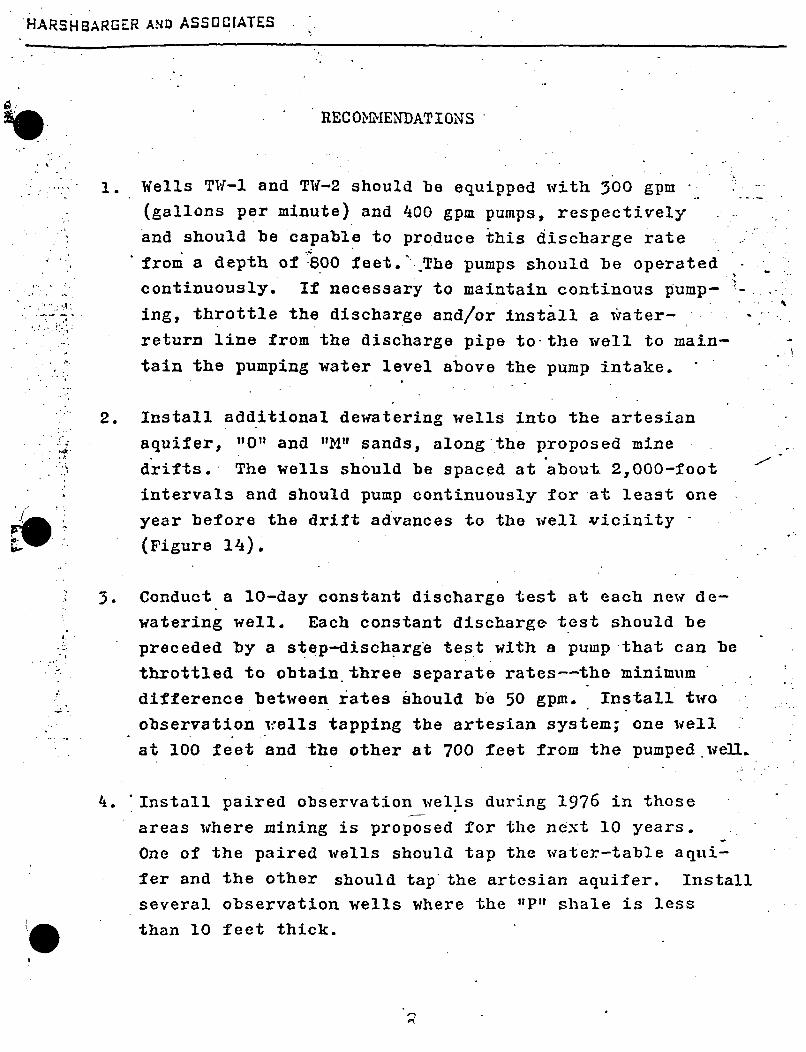
HARSHBARGER AND ASSOCIATES
RECONIENDATIONS
.. Wells TW-I and TW-2 should be equipped with 300 gpm
. (gallons per minute) and 400 gpm pumps, respectively
and should be capable to produce this discharge rate
' from a depth of 800 feet.".The pumps should be operated. continuously. If necessary to maintain continous pump-
- ing, throttle the discharge and/or Install a water-
* return line from the discharge pipe to-the well to main-
S• tain the pumping water level above the pump intake.
2. Install additional dewatering wells into the artesianaquifer, "0" and "M" sands, along the proposed mine
drifts. The wells should be spaced at about. 2,000-foot
intervals and should pump continuously for at least one
year before the drift advances to the well vicinity
(Figure l4).
3. Conduct a 10-day constant discharge test at each new de-
watering well. Each constant dischargeý test should bepreceded by a step-discharge test with a pump that can be
*throttled to obtain three separate rates--the minimum
" difference between rates should be 50 gpm. Install two
observation wells tapping the artesian system; one well
at 100 feet and the other at 700 feet from the pumped well.
4. Install paired observation wells during 1976 in those
areas where mining is proposed for the next 10 years.
One of the paired wells should tap the water-table aqui-
fer and the other should tap the artesian aquifer. Install
several observation wells where the "P" shale is less
than 10 feet thick.
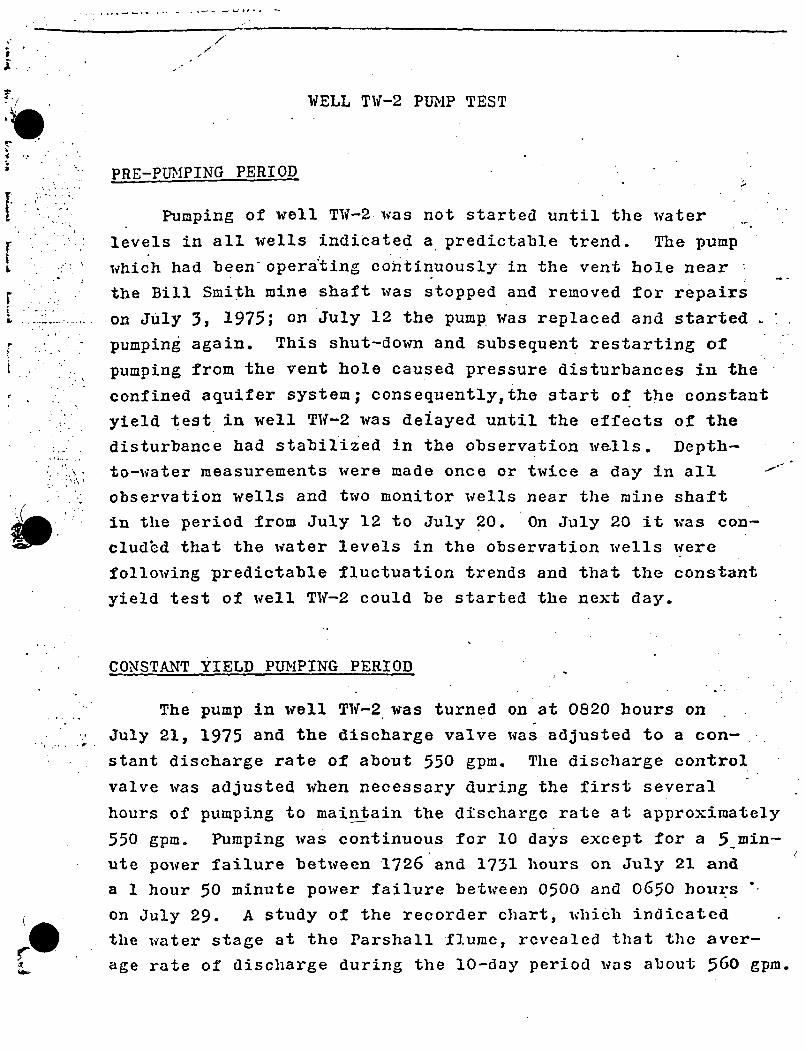
A
WELL TW-2 PUMP TEST
PRE-PUMPING PERIOD
I. Pumping of well TW-2 was not started until the water
levels in all wells indicated a predictable trend. The pump
which had been operating continuously in the vent hole near
the Bill Smith mine shaft was stopped and removed for repairs
on July 3, 1975; on July 12 the pump was replaced and started
pumping again. This shut-down and subsequent restarting of
pumping from the vent hole caused pressure disturbances in the
confined aquifer system; consequently,the start of the constant
yield test in well TW-2 was delayed until the effects of the
.- disturbance had stabilized in the observation wells. Depth-
to-water measurements were made once or twice a day in all
observation wells and two monitor wells near the mine shaft
in the period from July 12 to July 20. On July 20 it was con-
cludbd that the water levels in the observation wells were
following predictable fluctuation trends and that the constant
yield test of well TW-2 could be started the next day.
CONSTANT YIELD PUMPING PERIOD
The pump in well T'W-2 was turned on at 0820 hours on
July 21, 1975 and the discharge valve was adjusted to a con-
stant discharge rate of about 550 gpm. The discharge control
valve was adjusted when necessary during the first several
hours of pumping to maintain the discharge rate at approximately
550 gpm. Pumping was continuous for 10 days except for a 5 min-
ute power failure between 1726 and 1731 hours on July 21 and
a I hour 50 minute power failure between 0500 and 0650 hours"
on July 29. A study of the recorder chart, which indicated
the water stage at the Parshall flume, rcvealed that the aver-
age rate of discharge during the 10-day period was about 560 gpm.
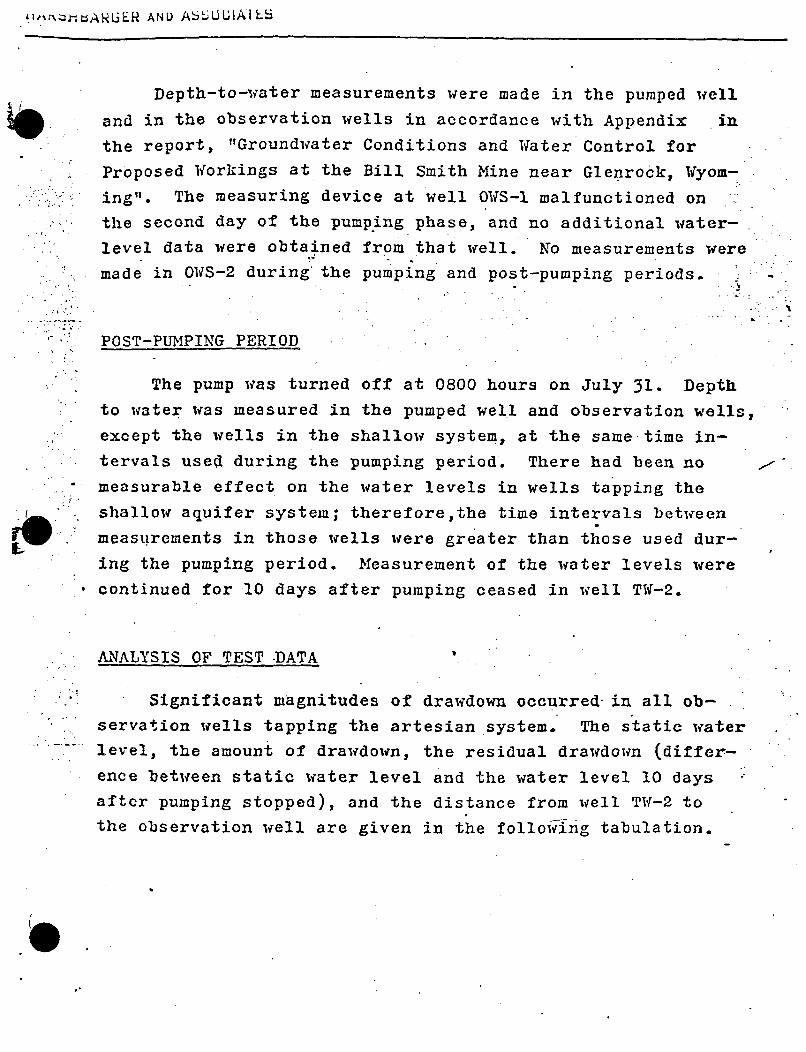
'R~2Jj~AU~f~ANU Ab!JUUIAILS
Depth-to-water measurements were made in the pumped well
and in the observation wells in accordance with Appendix in
the report, "Groundwater Conditions and Water Control for
Proposed Workings at the Bill Smith Mine near Glenrock, Wfyom-
ing". The measuring device at well OWS-I malfunctioned on
the second day of the pumping phase, and no additional water-
level data were obtained from that well. No measurements were
made in OWS-2 during* the pumping and post-pumping periods.
POST-PUMPING PERIOD
The pump was turned off at 0800 hours on July 31. Depth
to water was measured in the pumped well and observation wells,
except the wells in the shallow system, at the same time in-
tervals used during the pumping period. There had been no
measurable effect on the water levels in wells tapping the
shallow aquifer system; therefore,the time intervals between
' measturements in those wells were greater than those used dur-
ing the pumping period. Measurement of the water levels were
, continued for 10 days after pumping ceased in well TW-2.
ANALYSIS OF TEST -DATA
Significant magnitudes of drawdown occurred in all ob-
servation wells tapping the artesian system. The static water
level, the amount of drawdown, the residual drawdown (differ-
ence between static water level and the water level 10 days
after pumping stopped), and the distance from well TW-2 to
the observation well are given in the following tabulation.
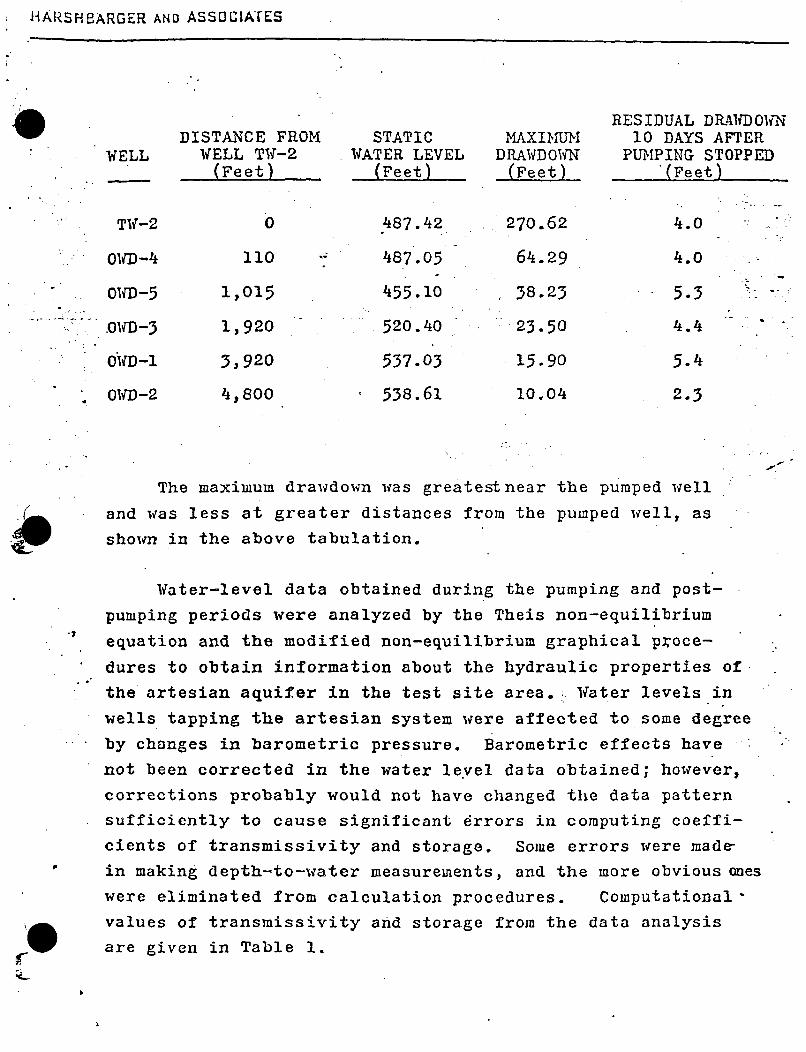
IARSH8ARGER AND ASSOCIATES
RESIDUAL DRPN0WNIDISTANCE FROM STATIC MAXINUIM 10 DAYS AFTER
WELL WELL TW-2 WATER LEVEL DRAWDOWNI PUMPING STOPPED(Feet) (Feet) (Feet) (Feet)
TW-2 0 487.42 270.62 4.0
OW•D-4 110 487.05 64.29 4.0
O0D-5 1,015 455.10 38.23 5.3
, 0MD-3 1,920 520.40 23.50 4.4
0WD-1 3,920 537.03 15.90 5.4
01MD-2 4,800 538.61 10.04 2.3
The maximum drawdown was greatest near the pumped well
and was less at greater distances from the pumped well, as
shown in the above tabulation.
Water-level data obtained during the pumping and post-
pumping periods were analyzed by the Theis non-equilibrium
equation and the modified non-equilibrium graphical proce-
dures to obtain information about the hydraulic properties of
the artesian aquifer in the test site area. ; 1fater levels in
wells tapping the artesian system were affected to some degree
. by changes in barometric pressure. Barometric effects have
not been corrected in the water level data obtained; however,
corrections probably would not have changed the data patternsufficiently to cause significant drrors in computing coeffi-
cients of transmissivity and storage. Some errors were made-
in making depth-to-water measurements, and the more obvious ones
were eliminated from calculation procedures. Computational*
* values of transmissivity and storage from the data analysis
are given in Table 1.
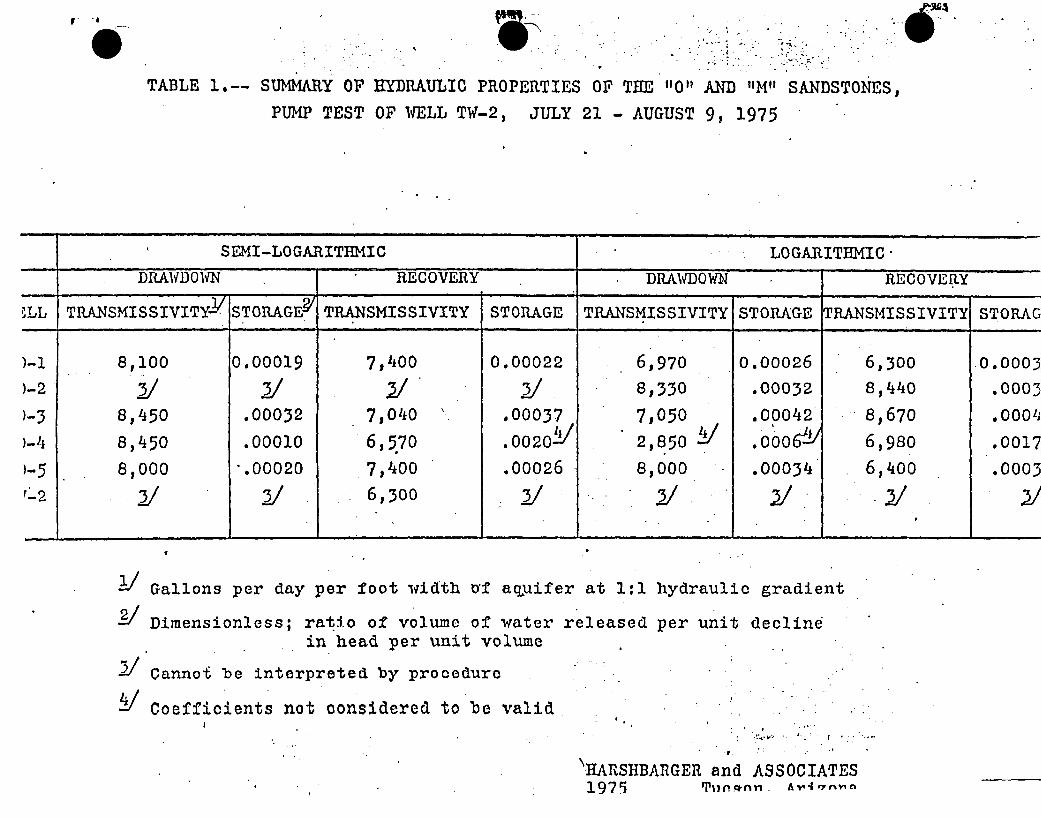
1*
TABLE 1.-- SUMMARY OF HYDRAULIC PROPERTIES OF THE "0" AND "M" SANDSTONES,
PUMP TEST OF WELL TW-2, JULY 21 - AUGUST 9, 1975
SEMI-LOGARITHMIC LOGARITHMIC-
DRAWDOWN RECOVERY DRAWDOWN RECOVERY
PLL TRANSMISSIVITYw / J TRANSMISSIVITY STORAGE TRANSMISSIVITY STORAGE TRANSMISSIVITY STORAG
8,100 0.00019 7,400 0.00022 6,970 0.00026 6,300 0.00033/ 3/ 3// 2 8,330 .00032 8,440 .0003
)-3 8,450 .00032 7,040 .00037 7,050 .00042 8,670 .0001,
)-4 8,450 .00010 6,570 . 0 0 2 0 .- 2,850 / .00.6y/ 6,980 .0017
)-5 8,000 .00020 7,400 .00026 8,000 .00034 6,400 .0003
3 2/ 6,300 -3/ 32/ 3/
l_ Gallons per day per foot width o'f aquifer at 1:1 hydraulic gradient
Dimensionless; ratio of volume of water released per unit declinein head per unit volume
3/ Cannot be interpreted by procedure
Coefficients not considered to be valid.
\HARSIBARGER and ASSOCIATES1975 'r•,,% n r^n.-o 4,7 r
0-vI-z~iPWANRER ANu ASSOCIATES
The transmissivity and storage values given in Table 1,
within the various categories, are in good agreement. Trans-
missivity values range from 6,300 to 8,450 gpd/ft (gallons per
day per foot). It is considered that a reasonable average
value would be 7,500 gpd/ft. Storage coefficient values range
from 0.00010 to 0.00046 and average 0.00030. Computation
based on distance-drawdown graph (Figure 7) indicates the trans-
missivity and storage values: are about 7,700 gpd/ft and
.. 0.0022 respectively.
Figure 2 is a hydrograph of water levels in wells OWS-l,OWS-2, OWS-3, OWS-4, and OWS-5 tapping the water table aquifer
system. Pumping of well TW-2 caused no apparent change in
water level in those wells, and, therefore, it could be con-
eluded that no appreciable increase in movement of water
occurred from the water table aquifer to the artesian aquifer
through the "P" shale aquitard. The hydrostatic head in the
'water tableaquifer is higher than the head in the artesian
aquifer; consequently, there is a hydraulic gradient downward
from the water table aquifer to the artesian aquifer system.
The vertical permeability of the "P" shale is low and the
downward movement of water is very slow; thus, the amount of.
water moving through the "P" shale is small per unit area,
particularly in areas where the shale is thick.
An isopach map of the "P" shale shows the approximate thick-
ness of the shale at the sites of the observation wells to be:
OWS-1, 45 feet; OfS-2, 45 feet; OWS-3, 40 feet; OWS-4, 75 feet;
and OWS-5, 75 feet. However, the s.ame map reveals areas with-
in 600 feet of well TW-2 where the "P" shale is less than
5 feet thick. These areas are small and probably could be
classed as "windows" in the shale if the shale-is missing en-
tirely. The drawdown curve of the pumped well does not ex-
hibit a shape that would indicate leaky aquifer conditions.
It is cunciuded that there was little or no increase in the
downward'movement of water through the "P", shale during the
pumping period. The increase in the amount of water that
might move downward through the "rP" shale during a prolonged
period of pumping cannot be calculated from the available
data.
Figure 3 is a semi-logarithmic graph of water-level draw-
down and recovexyversus time *after pumping started (drawdown
curve) and time after pumping stopped (recovery curve) for
well TW-2. Some of the irregularities in the drawdown curve
were caused by changes in pumping rate when the discharge
control valve was adjusted; two stoppages of pumping by power
failures also caused additional irregularities in the curve.
A change from artesian to water-table conditions probably
occurred in the vicinity of well TW-2 during the pumping period,.
and should have caused a decrease in the downward slope of the
drawdown curve. However, if that effect occurred, it cannot
be identified on the drawdown curve with certainty. The water
level in well TW-2 was drawn down to about the 757-foot level
below measuring point or about 755 feet below land surface.
At that level, the water in the well probably was more than
100 feet below the hydrostatic head in the aquifer at the
aquifer-well interface. Data are insufficient to determine
the exact position of the head in the aquifer at the aquifer-
well interface. The head in the aquifer at the aquifer-well
interface would drop below the top of the "0" sand, which is
at a depth of about 580 feet below land surface,, when the
change from artesian to water table conditions occurs. A
tentative interpretation is that the head at the aquifer-well
interface dropped below the top of the "10" sand at well TW-2,
and might have declined several feet below that level.. Addi-
tional information on this question is given later in a dis-
cussion of Figure 7.
•.oi•hbLk AND A:-ULIAILS
Water-level recovery data were used to compute trans-
missivity only; storage was not computed because the effec-tive radius of the pumped well was not determinable.
Figure 4 is a semi-logarithmic graph of water-level
drawdown versus time after pumping started for observation
wells 01MD-1, 01D-2, 01%D-3, :0WD-4, and 01D-5. If the aquifer
• . were ideal (homogeneous, isotropic, infinite areal extent, and -
instantaneous release of water fgom storage) and the pumping
" rate remained constant, the latter part of the drawdown curves*
for observation wells tapping that aquifer would become par-
allel; thus, the rate of water level decline in all wells
9 would reach a common value. Less than ideal aquifer conditions
and a short pumping period would result in drawdown curves not
attaining an absolute parallel pattern. The curve for well OWD-4
(well is 110 feet from well TW-2) contains several changes in
slope, some being attributed to adjustments in pumping rate
and others to local geological conditions near wvell TN-2.
Well OWD-4 is close to the pumped well and the water level in
well OWD-4 reacts more readily to local conditions around the
pumped well than the water levels do in the more remote ob-
servation wells. Drilling mud probably is entrained in the
aquifer near well TW-2 because of the long time the well was
under construction. Some of the mud could be partially block-
ing some sand intervals, thereby causing anomalous head dif-
ferences in the aquifer adjacent to the well which decrease
in effect as distance from the pumped well increase. The
effects of change from artesian to water-table conditions at
the pumped well would extend to well OWD-4 several hours be-
fore such effect would reach the more distant observation wells.
If the pumping period had been several tens of days, the draw-
down curves in the observation wells would have attained a
more nearly parallel pattern.
• dARS~iHEARGER AND AQS-0IATES
It is not possible to positively identify an inflection
0 *. on the drawdown curve of well 01WD-4., or any of the other
observation wells, and be sure that the inflection is a re-
sponse to the change from artesian to water-table, conditions.-
near well TW-2. It is believed that the effect would reach
well OWD-4 in the first several hundred minutes after pump-
- ing started and extend to well 0WD-5 probably no later than
several thousand minutes after-pumping started, but it cannot
be identified from the curves on Figure 4.
Values for transmissivity and storage were computed using
drawdown data for wells OWD-l, O0D-3, 0WD-4, and OWD-5. Values
were not computed from drawdown data for the other observation
wells as the pumping period was insufficient to meet the con-
ditions of the computational procedure.
_ Figure 5 is a semi-logarithmic graph of water-level re-covery versus time after pumping stopped for wells Own-1i,
O0D-2,'01f-3, OWD-4, and OWD-5. The recovery curves, particu-
larly that for well OWD-4, exhibit less irregularities than
their companion curves in Figure 4. Irregularities caused
by changes in pumping rate did not affect the recovery data;
the water levels respond to a uniiorm.rate of recharge to the
cone of depression created during the pumping period. The
effect of a change from water table to artesian condition at
-..- ,:. well TW-2 apparently reached wellOWID-4 prior to 200 minutes
after pumping stopped.. The reason for the anomaly in the
recovery curve of well OWD-4 between the elapsed recovery
time of 1,000 and 1,800 minutes is -not readily apparent. It
might have been caused by the dislocation of a metal marker_
on the cable of the water-level measuring device.
Figure 6 is a logarithmic graph of water-level draivdoiwn.00 and recovery after pumping started (drawdown curve) or stopped
(recovery curve) for wells 0WD-1, WD-3, OWD.--', and 0hD-5.
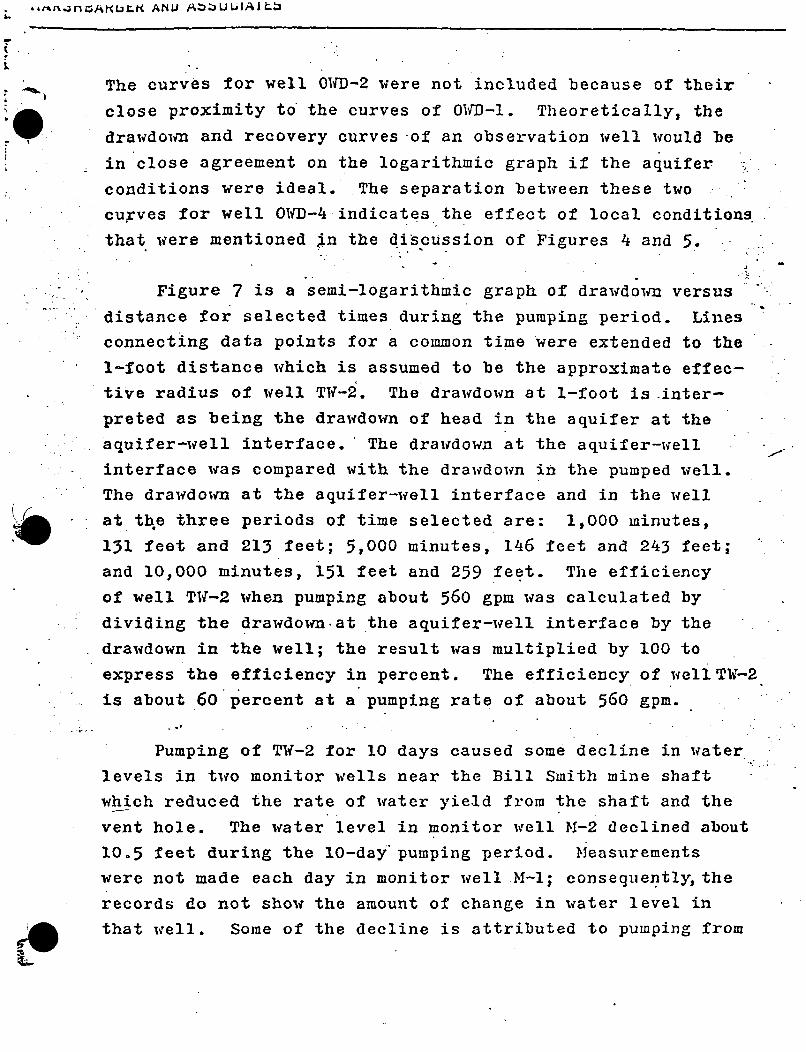
* "''-flZ4(L3K~ ANOL Ap.ýZUUaIAiL:
The curves for well O0WD-2 were not included because of their
close proximity to the curves of O0D-1. Theoretically, the
drawdown and recovery curves -of an observation well would be
in close agreement on the logarithmic graph if the aquifer
conditions were ideal. The separation between these two
curves for well O•WD-4 indicates the effect of local conditions.
that were mentioned In the discussion of Figures 4 and 5.
Figure 7 is a semi-logarithmic graph of drawdown versus
distance for selected times during the pumping period. Linesconnecting data points for a common time were extended to the
1-foot distance which is assumed to be the approximate effec-
tive radius of well TW-2. The drawdown at 1-foot is .inter-
preted as being the drawdown of head in the aquifer at the
aquifer-well interface. The drawdown at the aquifer-well
interface was compared with the drawdown in the pumped well.
The drawdown at the aquifer-well interface and in the well
at the three periods of time selected are: 1,000 minutes,
131 feet and 213 feet; 5,000 minutes, 146 feet and 243 feet;
and 10,000 minutes, 151 feet and 259 feet. The efficiency
of well TW-2 when pumping about 560 gpm was calculated by
dividing the drawdown-at the aquifer-well interface by the
drawdown in the well; the result was multiplied by 100 to
express the efficiency in percent. The efficiency of wellTW-2
is about 60 percent at a pumping rate of about 560 gpm.
Pumping of TW-2 for 10 days caused some decline in water
levels in two monitor wells near the Bill Smith mine shaft
which reduced the rate of water yield from the shaft and the
vent hole. The water level in monitor well M-2 declined about
10.5 feet during the 10-day" pumping period. Measurements
were not made each day in monitor well M-1; consequently, the
records do not show the amount of change in water level in
that well. Some of the decline is attributed to pumping from
the shaft and the vent hole; however, most is attributed to
pumping of well TW-2. The combined rate of discharge from
the shaft and the vent hole decreased about 110 gpm during
the pumping period of well TIT-2.
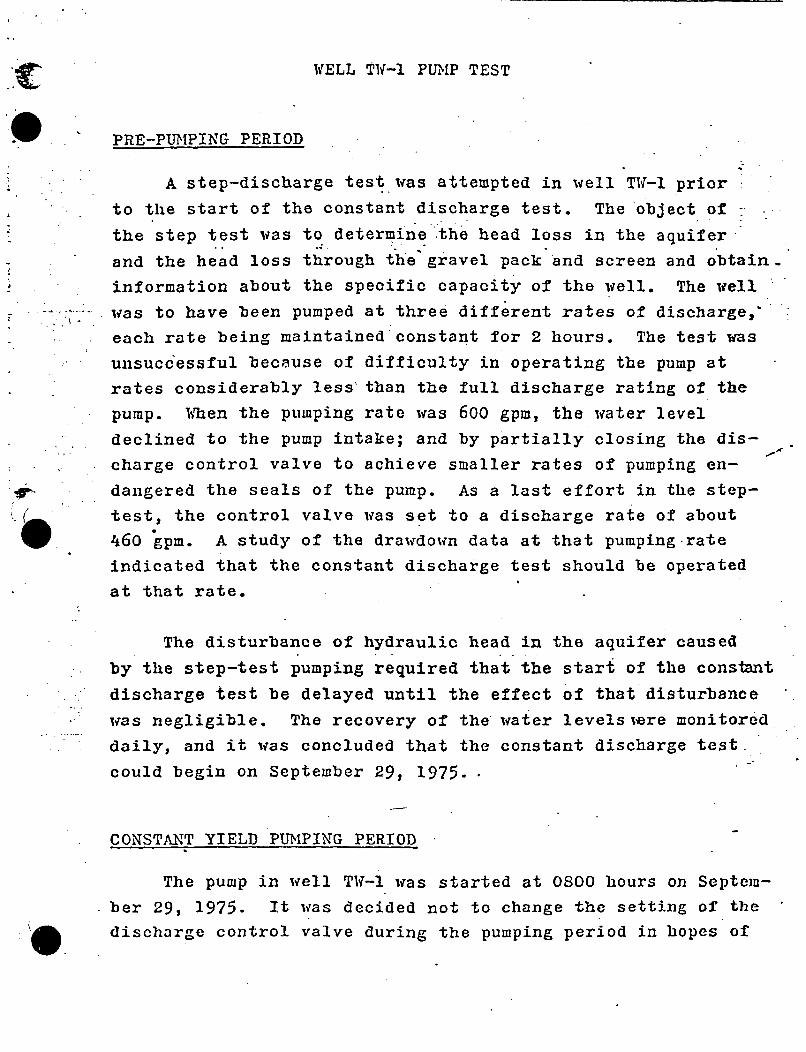
WELL TW-1 PUMP TEST
. "PRE-PUMPING PERIOD
A step-discharge test was attempted in well TW-I prior
to the start of the constant discharge test. The object of
the step test was to determine the head loss in the aquifer
and the head loss through the gravel pack and screen and obtain.
information about the specific capacity of the well. The well
was to have been pumped at three different rates of discharge,.
each rate being maintained constant for 2 hours. The test was
unsuccessful because of difficulty in operating the pump at
rates considerably less' than the full discharge rating of the
pump. Wshen the pumping rate was 600 gpm, the water level
declined to the pump intake; and by partially closing the dis-
charge control valve to achieve smaller rates of pumping en-
dangered the seals of the pump. As a last effort in the step-
test, the control valve was set to a discharge rate of about
460 gpm. A study of the drawdown data at that pumping rate
indicated that the constant discharge test should be operated
at that rate.
The disturbance of hydraulic head in the aquifer caused
by the step-test pumping required that the start of the constant
discharge test be delayed until the effect of that disturbance
* was negligible. The recovery of the water levelsiere monitored
daily, and it was concluded that the constant discharge test.
could begin on September 29, 1975..
CONSTANT YIELD PUMPING PERIOD
The pump in well T11-1 was started at 0800 hours on Septem-
ber 29, 1975. It was decided not to change the setting of the
discharge control valve during the pumping period in hopes of
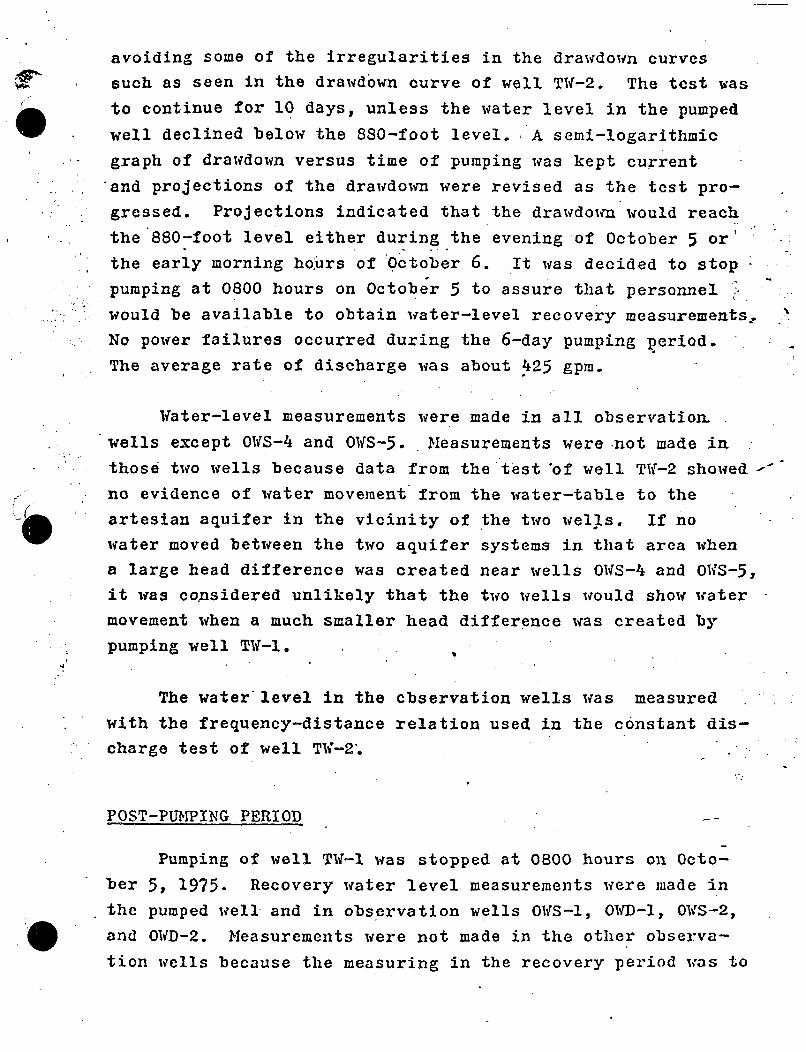
avoiding some of the irregularities in the drawdown curvessuch as seen in the drawdown curve of well TW-2. The test was
to continue for 10 days, unless the water level in the pumped
well declined below the 880-foot level.: A semi-logarithmic
graph of drawdown versus time of pumping was kept current
and projections of the drawdown were revised as the test pro-
gressed. Projections indicated that the drawdown would reach
the 880-foot level either during the evening of October 5 or
the early morning ho*urs of October 6. It was decided to stop
pumping at 0800 hours on October 5 to assure that personnel
*.: would be available to obtain water-level recovery measurements,
No power failures occurred during the 6-day pumping period.
The average rate of discharge was about 425 gpm.
Water-level measurements were made in all observation.
wells except 0WS-4 and OWS-5. Measurements were not made in
those two wells because data from the test *of well TW-2 showed •
no evidence of water movement from the water-table to the
artesian aquifer in the vicinity of the two wells. If no
water moved between the two aquifer systems in that area when
a large head difference was created near wells OWS-i and OWS-5,
it was copsidered unlikely that the two wells would show water
movement when a much smaller head difference was created by
pumping well TW-l.
The water level in the cbservation wells was measured
with the frequency-distance relation used in the constant dis-
. charge test of well TW-2.
POST-PUMPING PERIOD
Pumping of well TW-l was stopped at 0800 hours on Octo-
ber 5, 1975. Recovery water level measurements were made in
the pumped well and in observation wells OWS-I, OWD-l, 0WS-2,
and OWD-2. Measurements were not made in the other observa-
tion wells because the measuring in the recovery period was to
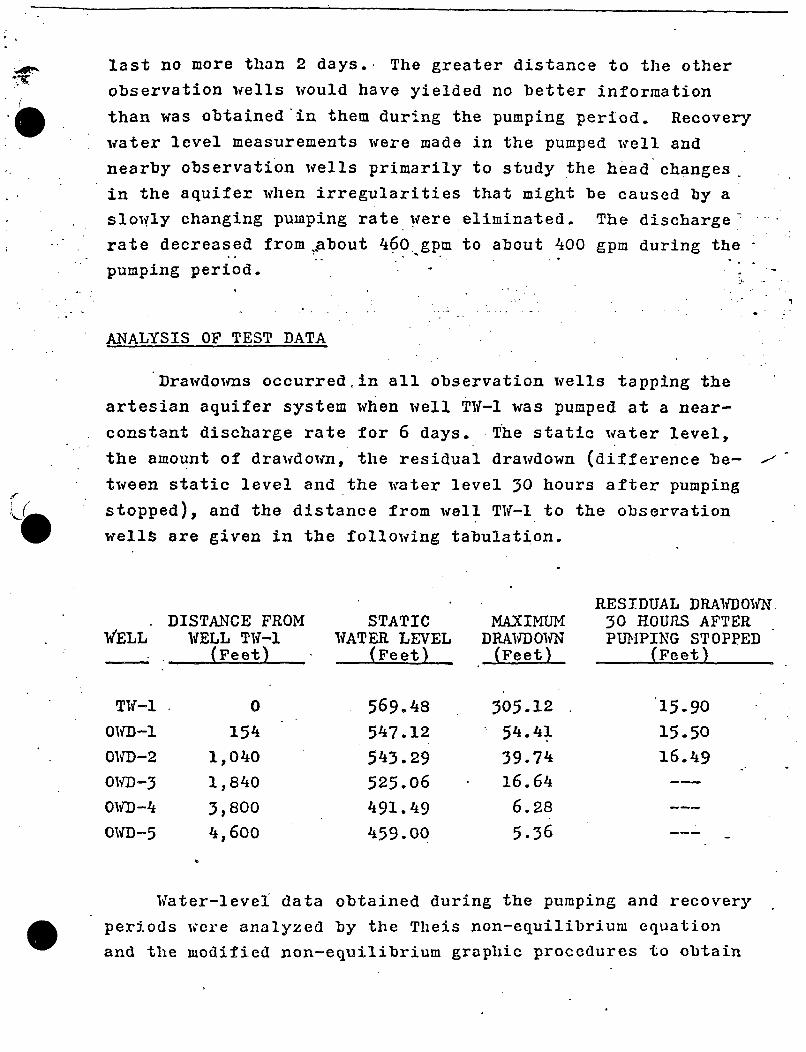
last no more than 2 days. The greater distance to the other
observation wells would have yielded no better information
than was obtained in them during the pumping period. Recovery
water level measurements were made in the pumped well and
nearby observation wells primarily to study the head changes-
in the aquifer when irregularities that might be caused by a
slowly changing pumping rate were eliminated. The discharge.
rate decreased from jabout 460 gpm to about 400 gpm during the
pumping period.
ANALYSIS OF TEST DATA
Drawdowns occurredin all observation wells tapping the
artesian aquifer system when well TW-l was pumped at a near-
constant discharge rate for 6 days. The static water level,
the amount of drawdown, the residual drawdown (difference be- -
tween static level and the water level 30 hours after pumping
stopped), and the distance from well Tif-l to the observation
wells are given in the following tabulation.
RESIDUAL DRAWDOWNDISTANCE FROM STATIC MAXIMUM 30 HOURS AFTER
WELL WELL TW-l WATER LEVEL DRAVDOWN PUMhPING STOPPED(Feet) (Feet) (Feet)- (Feet)
TW-I 0 569.48 305.12 15.90
OWD-i 154 547.12 54.41 15.50
OWD-2 1,040 543.29 39.74 16.49
OWD-3 1,840 525.06 16.64 -
OWD-4 3,800 491.49 6.28
OWD-5 4,600 459.00 5.36
Water-level data obtained during the pumping and recovery
periods were analyzed by the Theis non-equilibrium equation
and the modified non-equilibrium graphic proccdures to obtain
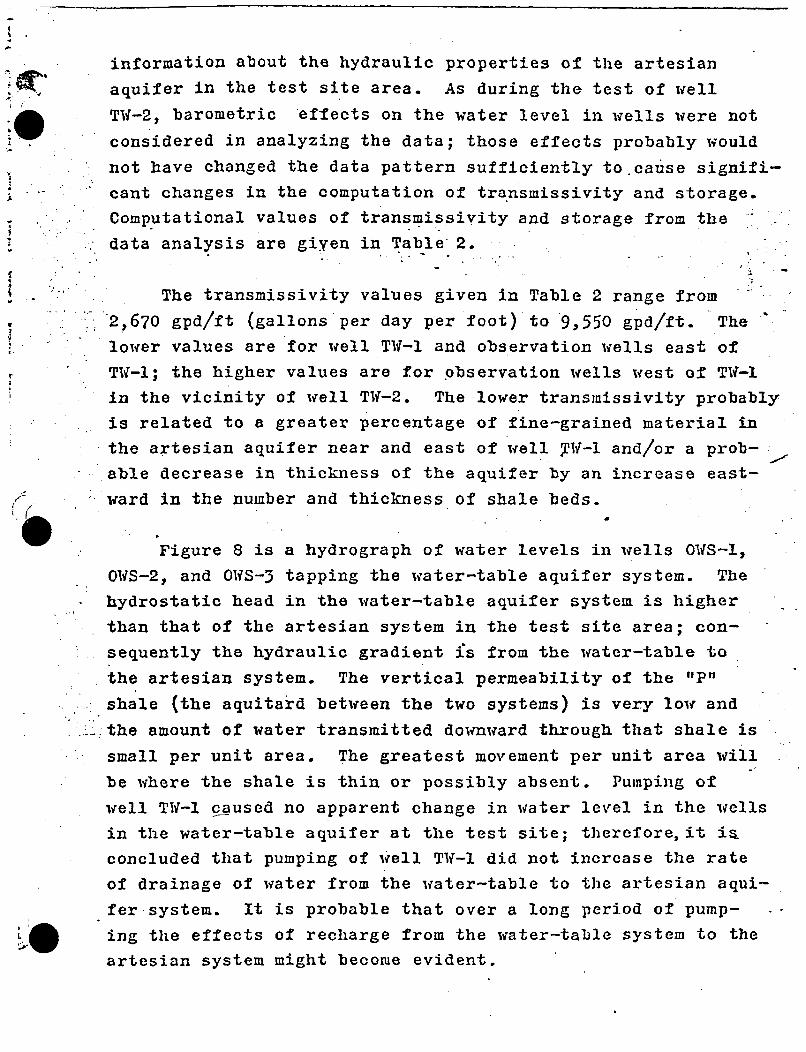
information about the hydraulic properties of the artesian
aquifer in the test site area. As during the test of well
TW-2, barometric effects on the water level in wells were not
* considered in analyzing the data; those effects probably would
a not have changed the data pattern sufficiently to.cause signifi-
cant changes in the computation of transmissivity and storage.
Computational values of transmissivity and storage from the --
data analysis are giyen in Table 2.
The transmissivity values given in Table 2 range from
2,670 gpd/ft (gallons per day per foot) to 9,550 gpd/ft. The
lower values are for well TW-1 and observation wells east of
TW-I; the higher values are for Pbservation wells west of TW-l
in the vicinity of well TW-2. The lower transinissivity probably
is related to a greater percentage of fine-grained material in
the artesian aquifer near and east of well TW-I and/or a prob-
"..able decrease in thickness of the aquifer by an increase east-
ward in the number and thickness of shale beds.i;"
Figure 8 is a hydrograph of water levels in wells OWS-l,
OWS-2, and OWS-3 tapping the water-table aquifer system. The
hydrostatic head in the water-table aquifer system is higher
than that of the artesian system in the test site area; con-
sequently the hydraulic gradient is from the water-table to
the artesian system. The vertical permeability of the "IP"
shale (the aquitard between the two systems) is very low and
.1... the amount of water transmitted downward through that shale is
small per unit area. The greatest movement per unit area will
be where the shale is thin or possibly absent. Pumping of
well T11-I caused no apparent change in water level in the wells
in the water-table aquifer at the test site; therefore, it iz
concluded that pumping of well TW-1 did not increase the rate
of drainage of water from the water-table to the artesian aqui-
fer-system. It is probable that over a long period of pump-
L@ ing the effects of recharge from the water-table system to the
artesian system might become evident.
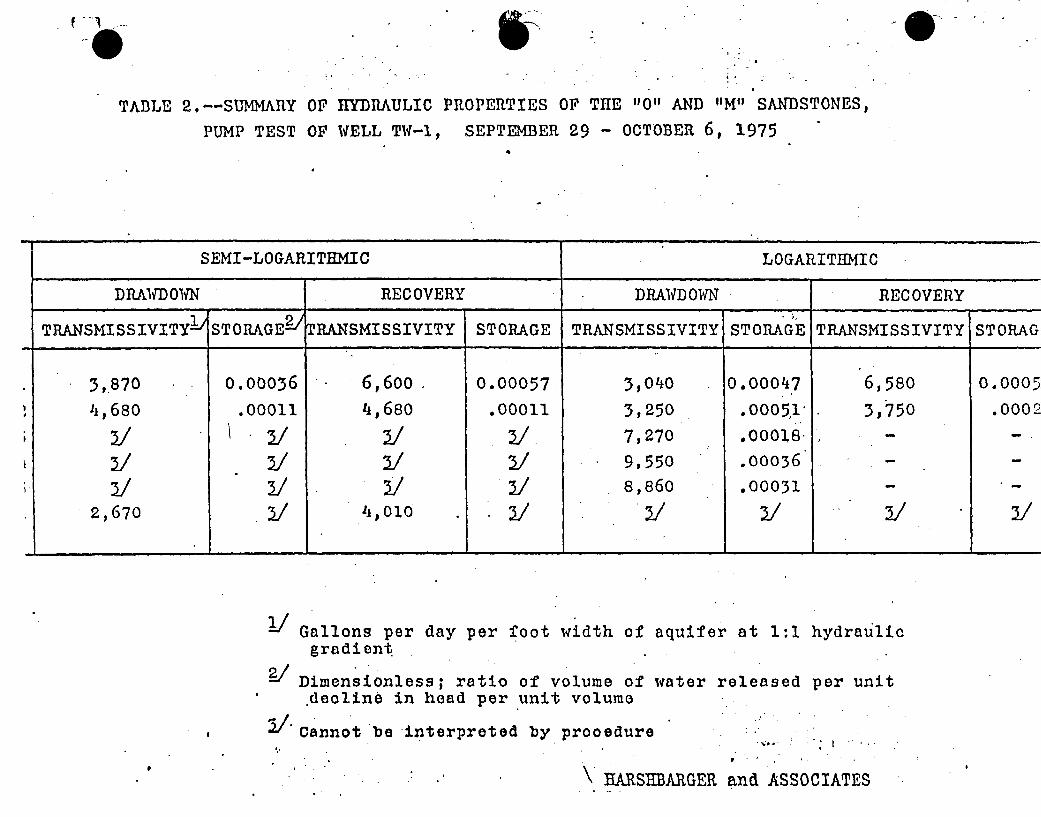
I' Sv
TABLE 2.--SUMMARY OF HYDRAULIC PROPERTIES OF THE "0" AND] "M" SANDSTONES,
PUMP TEST OF WELL TW-I, SEPTEMBER 29 - OCTOBER 6, 1975
SEMI -LOGARITHMJI C LOGARITHMIC
D[-AWDOWN RECOVERY DRANDOWN RECOVERY
TRANSMISS IVITY- STORAGE2 sRANSMISSIVITY STORAGE TRANSMISSIVITY STORAG.GE TRANSMISSIVITY STORAG
3 3,870 0.00036 6,600. 0.00057 3,040 0.00047 6,580 0.000511,6S0 .00011 4,680 .00011 3,250 .0005,1' 3,750 .0002
3/ / 3./ 3/ / 7,270 .00018 -
3/' 3 3/ 3/ 9,550 .00036 -
3/ 3/ / ~3/ 8,860 .00031 -
. 2,670 3_/ J0,oio -1 3 3 3_/
Gallons per day per foot width of aquifer at 1:1 hydraulicgradient
Dimensionless; ratio of volume of water released per unit.decline in head per unit volume
Cannot be interpreted by prooedure
HARSIBARGFR and ASSOCIATES
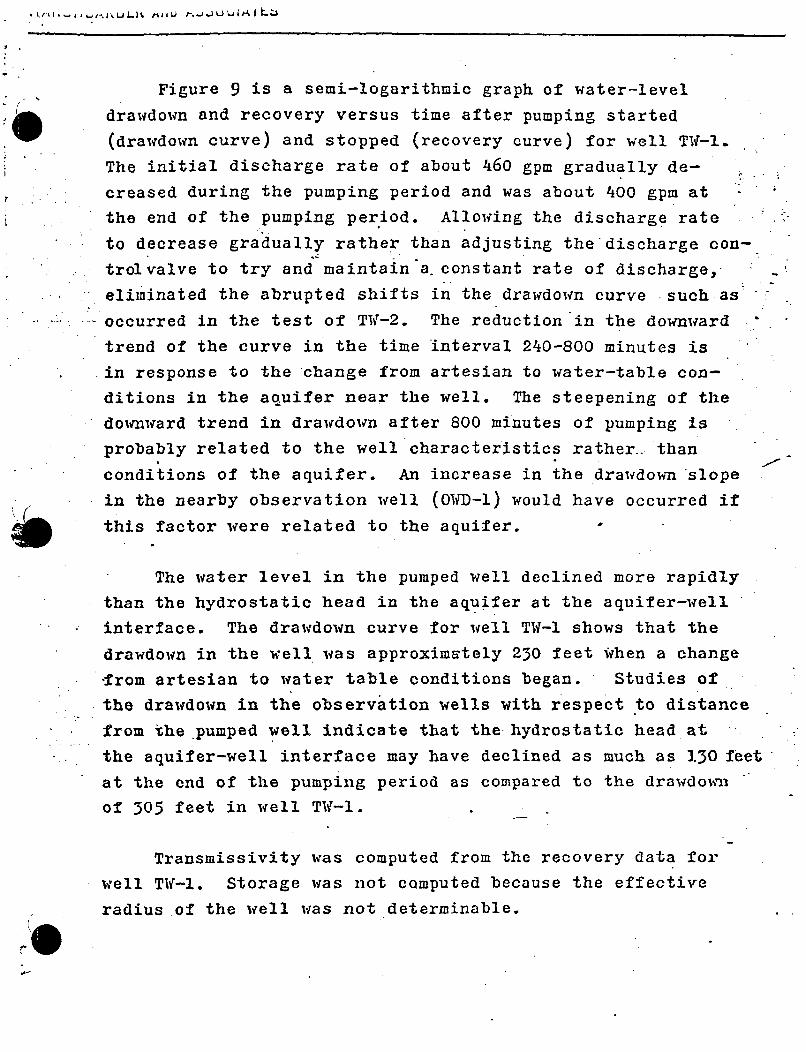
Figure 9 is a semi-logarithmic graph of water-level
p drawdown and recovery versus time after pumping started
(drawdown curve) and stopped (recovery curve) for well TW-1.
The initial discharge rate of about 460 gpm gradually de-
creased during the pumping period and was about 400 gpm at
the end of the pumping period. Allowing the discharge rate
to decrease gradually rather than adjusting the'discharge con-
trolvalve to try and maintain a. constant rate of discharge, -
eliminated the abrupted shifts in the drawdown curve such as'
.. . occurred in the test of TW-2. The reduction in the downward
trend of the curve in the time interval 240-800 minutes is
in response to the change from artesian to water-table con-
ditions in the aquifer near the well. The steepening of the
downward trend in drawdown after 800 minutes of pumping is
probably related to the well characteristics rather.. than
conditions of the aquifer. An increase in the drawdown slope
in the nearby observation well (OWD-l) would have occurred if
this factor were related to the aquifer.oo
The water level in the pumped well declined more rapidly
than the hydrostatic head in the aquifer at the aquifer-well
interface. The drawdown curve for well TW-I shows that the
drawdown in the well was approximately 230 feet ivhen a change
-from artesian to water table conditions began. Studies of
the drawdown in the observation wells with respect to distancefrom the pumped well indicate that the hydrostatic head at
the aquifer-well interface may have declined as much as 3.30 feet
at the end of the pumping period as compared to the drawdowun
of 305 feet in well TW-l.
Transmissivity was computed from the recovery data for
well TW-I. Storage was not computed because the effective
radius of the well was not determinable.
IIAN1'lHBARGER AND ASSOCPIATES
Figure 10 is a semi-logarithmic graph of water-level
drawdown versus time after pumping started for wells OWD-l,OWD-2, OWD-3, 0WD-4, and OWD-5. The non-parallel nature of
the curves, one to the other, indicates a difference in thehydraulic properties of the aquifer within the test site.*
The curves for wells OfD-l and OWD-2 have some similarity in--
shape; whereas, the cprves for wells OWD-3, OWD-4, and OWD-5
have a similarity in shape. sComputations of transmissivity -
* 7 given in Table 2 show higher values for the wells near TW-2and lower values for wells near TW-l.
The change in slope of the drawdown curve for well OUD-lafter 200-300 minutes of pumping is in response to the change
from artesian to water table conditions near well TW-I. Achange in slope of the drawdown curve.for well OWD-2 also isapparent, but the time of the change cannot be determinedprecisely for well OWD-l. Changes in slope in the drawdown
curvps for tile other three observation wells are not apparent.
The slope of the drawdown curve for well O10-1 after the
effect of the change from artesian to water table occurs re-
mains constant and does not shift to an increase in slope asdid the drawdown curve of the pumped well. This lack ot
change in slope is interpreted as indicating that the increase
in rate of drawdown in. well TW-1 is related to the hydraulic
. characteristic of the pumped well and not to the aquifer.
Values for transmissivity and storage were not computed
from drawdown data for wells 0WD-•3,. OWD-4., and 01D-5 usingthe modified non-equilibrium graphic procedures because the-
time of pumping was not long enough to cause sufficient draw-down in those wells to create conditions prescribed for the
procedures.
HIARSPHARGER AND ASSOCIATES
Figure 11 is a semi-logarithmic graph of water level
recovery for wells OWD-1 and OWD-2. These are the only
observation wells tapping the artesian aquifer system from
which recovery data were collected. The change from water
table to artesian conditions in the aquifer near well TW-1
is not apparent in either of these curves. The greater part
of the curves reflec.t artesian conditions in the aquifer.
Figure 12 is a logarithmic graph of water level drawdolwn
and recovery versus time after pumping started (drawdown
curves) or stopped (recovery curves) for wells OWD-l and O1M-2;
drawdown curves also are shown for wells OWD-3, 01%D-4, and
OWD-5. No recovery data were obtained for the latter three
wells. The difference in shape between the drawdown and re-
covery curves for well OWD-I and also those, for OW1D-2 reflect
the change from artesian to water table and back "to artesian
conditions as well as the non-homogeneity of the aquifer.
Figure 13 is a semi-logarithmic graph of water level
drawdown in the observation wells versus distance from well
TW-l for selected periods of time. Lines drawn along data
plots for each common time were extended to the 1-foot dis-
tance, which is assumed to be the'aquifer-well interface.
The intersection of the lines at the 1-foot distance approxi-.. mates the drawdown of the hydrostatic head at the aquifer-
well interface. The 300-minute and 1,000-minute lines are
.parallel; however, there is doubt that part of the line for
1,000 minutes should be parallel at distances less than
100 feet from the pumped well. The change from artesian towater table conditions at the pumped well altered the rate of
drawdown near the pumped well. The 8,600-niinute line slopes
toward the other lines and shows the effect of the change in
conditions in the aquifer.. Data plots of 1,000 minutes and
* 8,600 minutes for well O1D-2 are displaced from the lines as
HARSHBARGER AND ASSOCIATES
a result of the artesian to water table change. If the
change from artesian to water table conditions occurred near
the pumped well after about 240 minutes of pumping, as dis-
cussed previously, then the effect of the change began radi-; ating outward from the pumped well at that time. As a con-
sequence, the rate of lowering of the .hydrostatic head in
the aquifer would decrease at thepumped well.
The transmissivity and storage computed from the slope
of the 300 and 1,000-minute lines, are 6,000 gpd/ft and '
0.00084, respectively; the transmissivity computed for the
8,600-minute line is 6,300 gpd/ft. It is believed a trans-
missivity of about 5,500 gpd/ft would be representative for.
the artesian aquifer in the well TW-I locality.
HARSHBARGER AND ASSOCIATES
SUMMARY
The performance of pumping tests on wells TW-l and TW-2
accommodated with five paired observation wells (Figure 1)
provides definitive data on the artesian aquifer system be-
neath the "P" shale aquitard. The analysis of each pump test
':,indicates that the asymptotic portion of the depression cone
!, --;of the potentiometric surface extended at least two miles at
* the end of the pumping period (Figures 7 and 13). This ex-
* tent and a computed coefficient of storage of about 3 x 10-
clearly demonstrate the existence of artesian hydraulic con-
ditions in the "0" and "M" sands. The areal extent of the
• depression cone is not known beyond the outlying observation
:.wells "OWD-2 and OWD-5. However, study of the isopachous
•maps of the "P"1 shale aquitard indicates continuity over an
area of about 3 square miles. In the vicinity Qf the obser-
vation wells, the aquitard ranges from 40 to 75 feet thick;
but at two locations, about 600 feet from well TW-2, the "P"
shale is less 'than 5 feet thick. The water level in an ob-
servation well in the water table aquifer above such a thin
shale section might have been affested by pumping of well'
* TW-2; however, these are small areas and may not have signifi-
cant influence on the gross system.
The water level data obtained from the observation wells
which penetrated only the shallow water table aquifer above
the "P" shale did not show any influence of pumping from
wells T11-1 and TW-2 (Figures 2 and 8). Although the vertical
permeability of the "P" shale is not known, the non-influence
of pumping response on the water table aquifer indicates a
relatively low vertical coefficient of permeability. 'The
magnitude of potential leakage via the "P" shale is depen-
dent upon the thickness, vertical permeability, the hydraulic
head differential between the water table aquifer and the
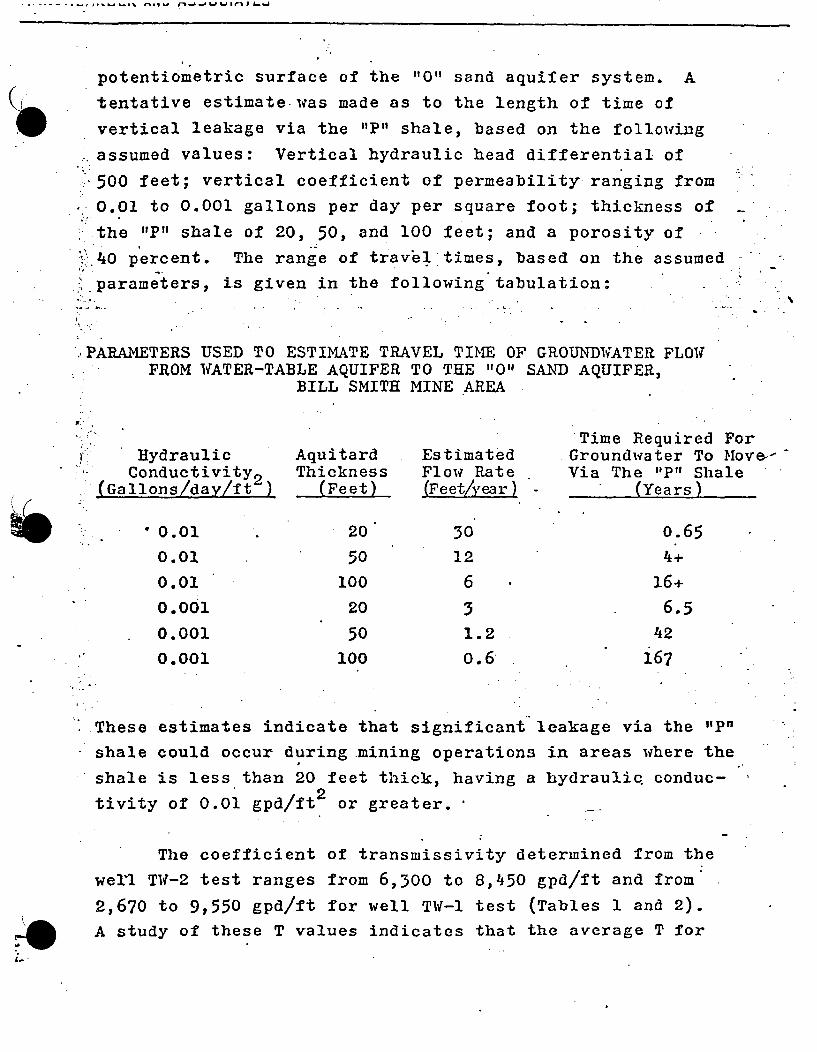
potentiometric surface of the "0" sand aquifer system. Aj tentative estimate-was made as to the length of time of
vertical leakage via the "P" shale, based on the following
.. assumed values: Vertical hydraulic head differential of
.'500 feet; vertical coefficient of permeability ranging from
• 0.01 to 0.001 gallons per day per square foot; thickness of
the "P" shale of 20, 50, and 100 feet; and a porosity of
40, percent. The range of travblVtimes, based on the assumed -
-parameters, i.s given in the following tabulation:
.,PARAMETERS USED TO ESTIMATE TRAVEL TIME OF GROUNDIWATER FLOWPROM WATER-TABLE AQUIFER TO THE "0' SAND AQUIFER,
BILL SMITH MINE AREA
Time Required ForHydraulic Aquitard Estimated Groundwater To Move--
Conductivity2 Thickness Flow Rate Via The "P" Shale(Gallons/day/ft ) (Feet) (Feet/year) (Years)
* . 0.01 20 30 o.65
0.01 50 12 4+
0.01 100 6 16+
0.001 20 3 6.5
0.001 50 1.2 42
0.001 100 0.6 167
These estimates indicate that significant leakage via the "P"
shale could occur during .mining operations in areas where the
shale is less than 20 feet thick, having a hydraulic. conduc-
tivity of 0.01 gpd/ft2 or greater.
The coefficient of transmissivity determined from the
well TW-2 test ranges from 6,300 to 8,450 gpd/ft and from
2,670 to 9,550 gpd/ft for well TW-1 test (Tables 1 and 2).
A study of these T values indicates that the average T for
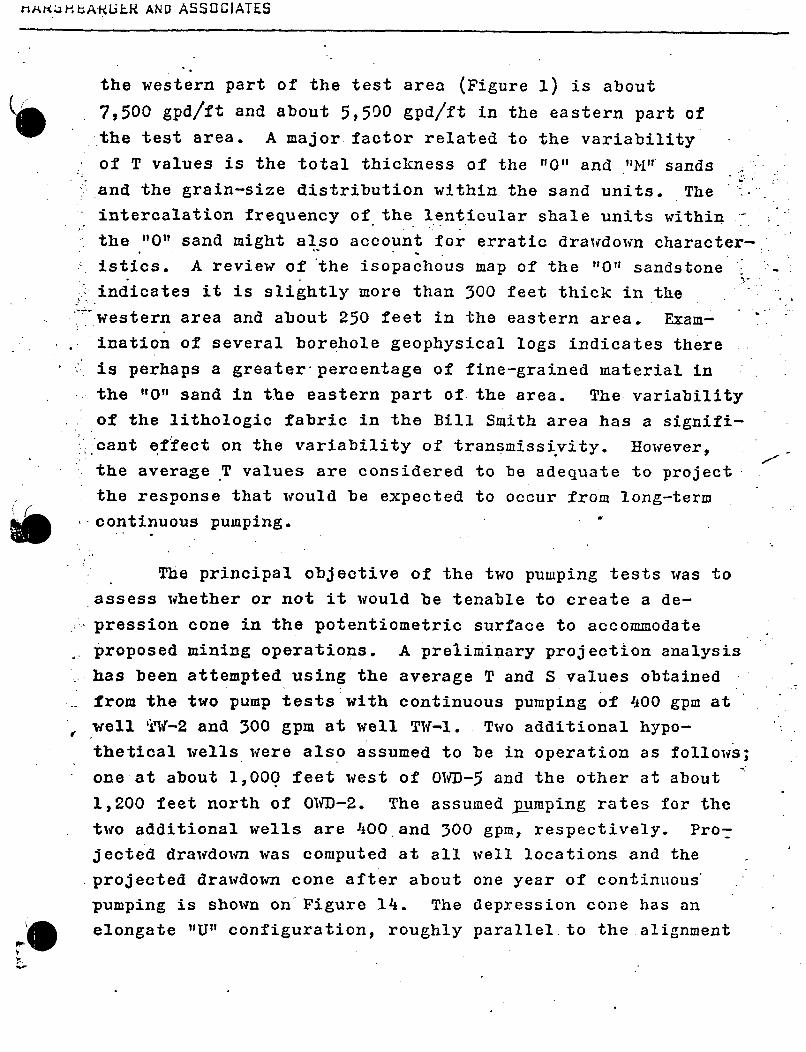
n,.dA-R.,LR AND ASSOCIATES
the western part of the test area (Figure 1) is about
S 7,500 gpd/ft and about 5,500 gpd/ft in the eastern part of
the test area. A major factor related to the variability
of T values is the total thickness of the 110"f and "1" sands
and the grain-size distribution within the sand units. The
intercalation frequency of the lenticular shale units within
the "01" sand might also account for erratic drawdown character-
istics. A review of the isopachous map of the "0" sandstone
indicates it is slightly more than 300 feet thick in the
"western area and about 250 feet in the eastern area. Exam-
. ination of several borehole geophysical logs indicates there
* is perhaps a greater-percentage of fine-grained material in
the "0" sand in the eastern part of the area. The variability
. of the lithologic fabric in the Bill Smith area has a signifi-
,.cant effect on the variability of transmissi.vity. However,the average T values are considered to be adequate to projectthe response that would be expected to occur from long-term
/,continuous pumping.
The principal objective of the two pumping tests was to
assess whether or not it would be tenable to create a de-
pression cone in the potentiometric surface to accommodate
proposed mining operations. A preliminary projection analysis
has been attempted using the average T and S values obtained. from the two pump tests with continuous pumping of 400 gpm at
well 'il-2 and 300 gpm at well TW-1. Two additional hypo-
thetical wells were also assumed to be in operation as follows;
one at about 1,000 feet west of 0WD-5 and the other at about
1,200 feet north of 01WD-2. The assumed pumping rates for the
two additional wells are 400 and 300 gpm, respectively. Pro-jected drawdown was computed at all well locations and the
projected drawdown cone after about one year of continuous'
pumping is shown on Figure 14. The depression cone has an
a elongate "U" configuration, roughly parallel. to the alignment
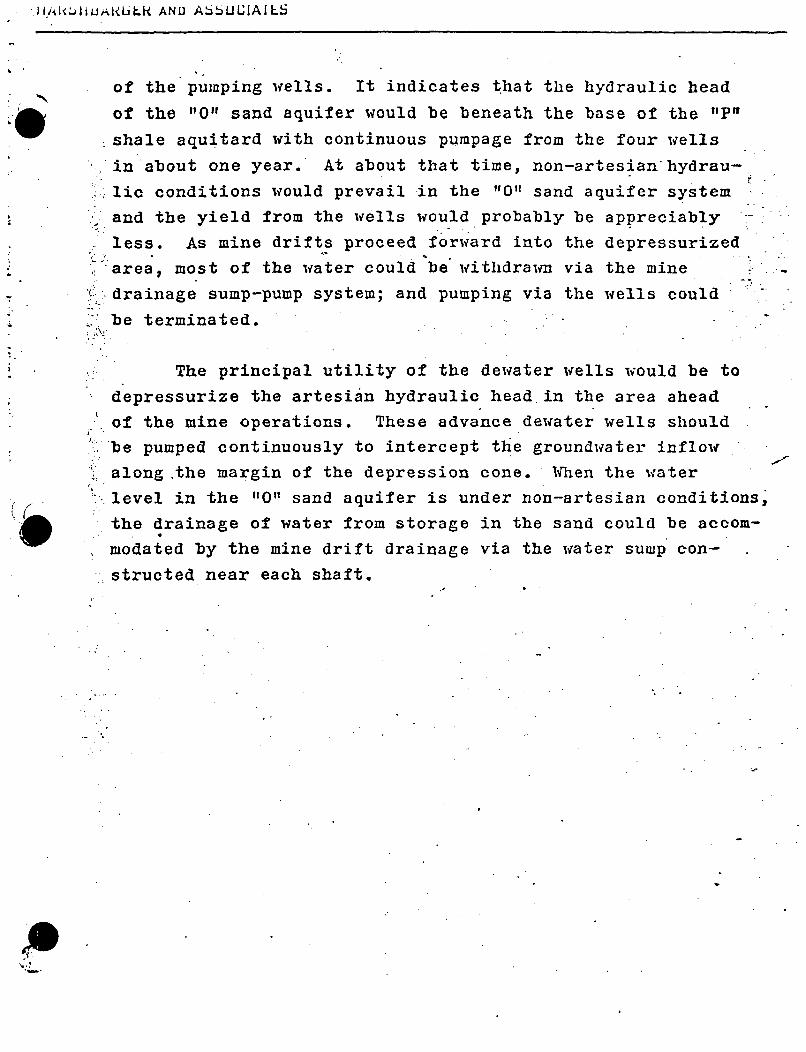
H .•A•.juAIWL- ANDI ASiUUIAIL.5
of the pumping wells. It indicates that the hydraulic head
of the "0" sand aquifer would be beneath the base of the "P"
shale aquitard with continuous pumpage from the four wells
in about one year. At about that time, non-artesianhydrau-
lie conditions would prevail in the "0" sand aquifer system
, and the yield from the wells would probably be appreciably -
less. As mine drifts proceed forward into the depressurized
-area, most of the water could be withdrawn via the mine
drainage sump-pump system; and pumping via the wells could
be terminated.
• The principal utility of the dewater wells would be to
depressurize the artesian hydraulic head, in the area aheadof the mine operations. These advance dewater wells should
* be pumped continuously to intercept the groundwater inflow
along .the margin of the depression cone. When the water
level in the "0" sand aquifer is under non-artesian conditions,
the drainage of water from storage in the sand could be accom-
modated by the mine drift drainage via the water suwp con-
structed near each shaft.
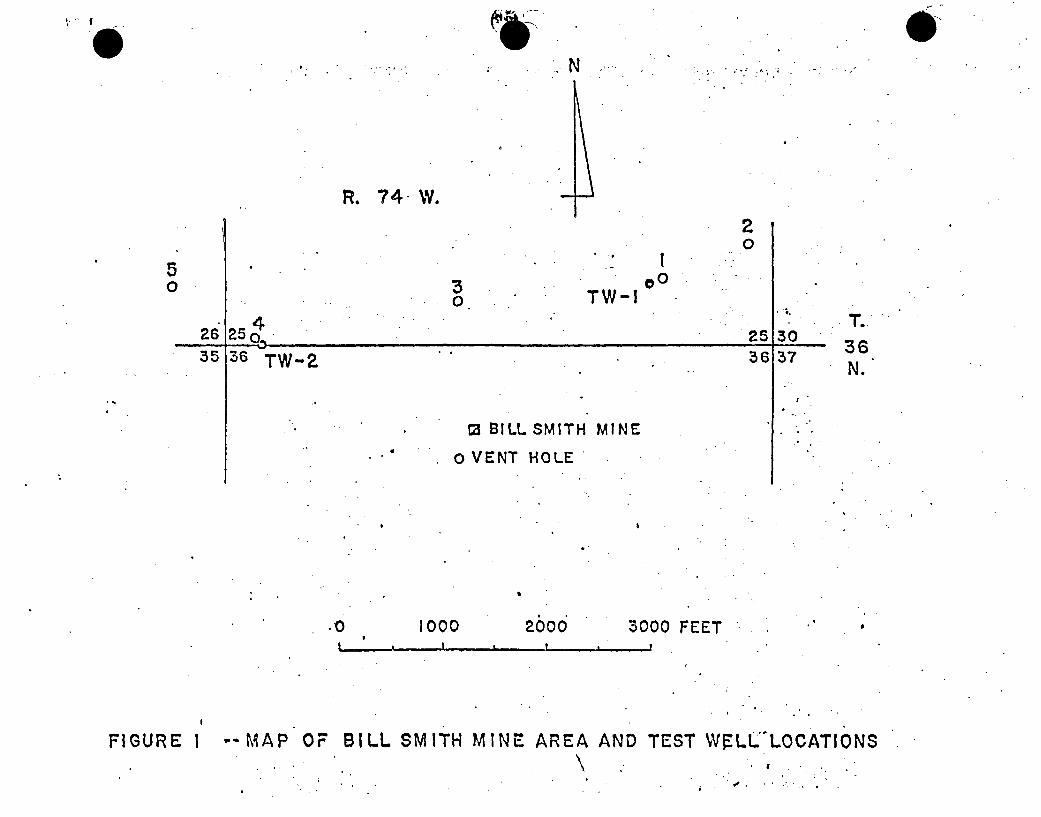
R. 74W.
20
50
2635
30
00TW-I
3036
I-25
T.
36N.
1~~~
TW-Z 36137
a
13 BILL SMITH MINE
0 VENT HOLE,0
.0 1000I
p26000I(o 3000 FEET
FIGURE 1 ,MAP OF BILL SMITH MINE AREA AND TEST WFLL"LOCATIONS
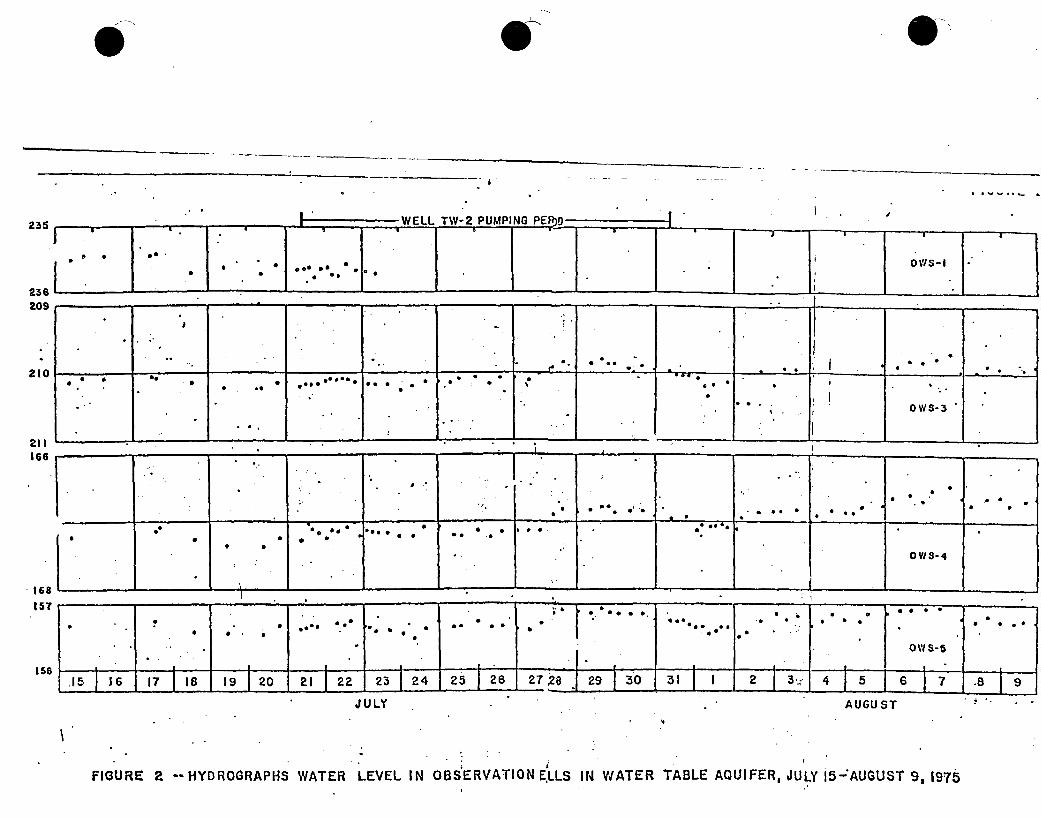
h *,~.
235
236209
168I 5T
158
'9
FIGURE 2 -- HYDROGRAPHS WATER LEVEL IN OBSýERVATION ELLS IN WATER TABLE AQUIFER, JULY i5-AUGUST 9, 1975
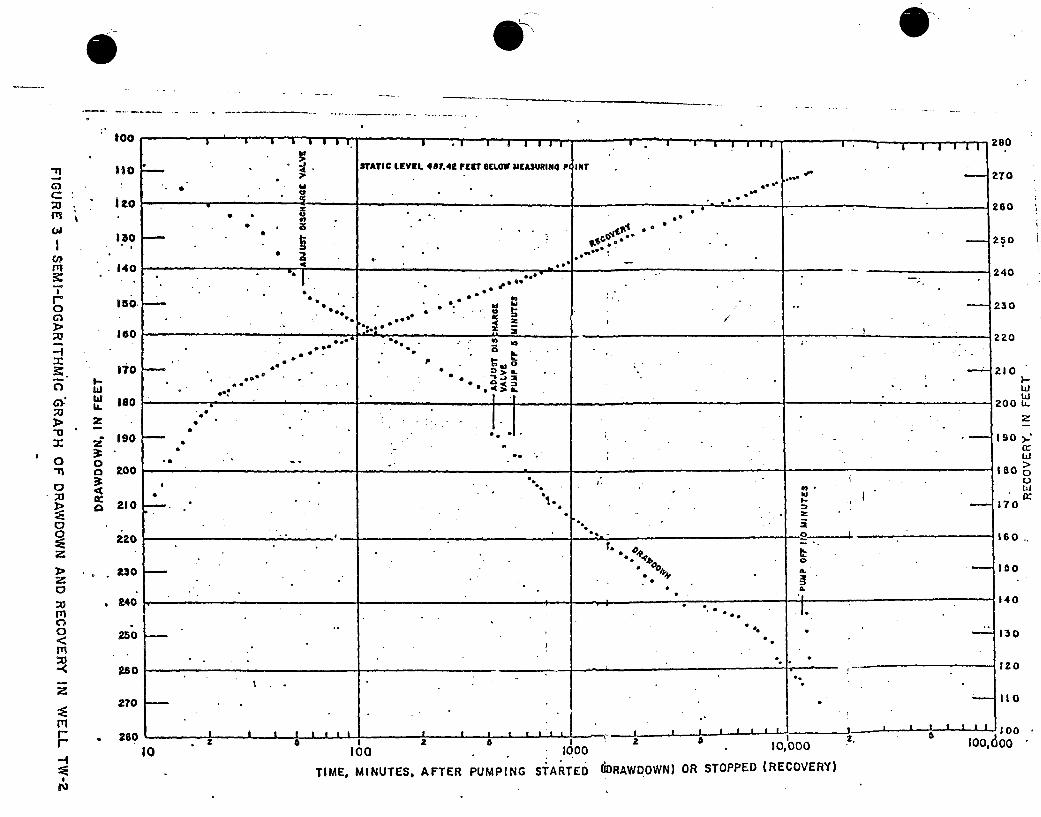
~1
U,)
~3
0
:0
zz
0al
m
r1
* . STATIC LEVRL 40f.42 F19T BELOW &I(ASURING N 114T
ito *I-*-**
140
I--
ka.
z
0
Li200 i
190 >-:
10
1570
140
130
120
Ito
IUU .Ju u-' -
TIME, MINUTES. AFTER PUMPING STARTED 0DRAVIDOWN) OR STOPPED (RECOVERY)
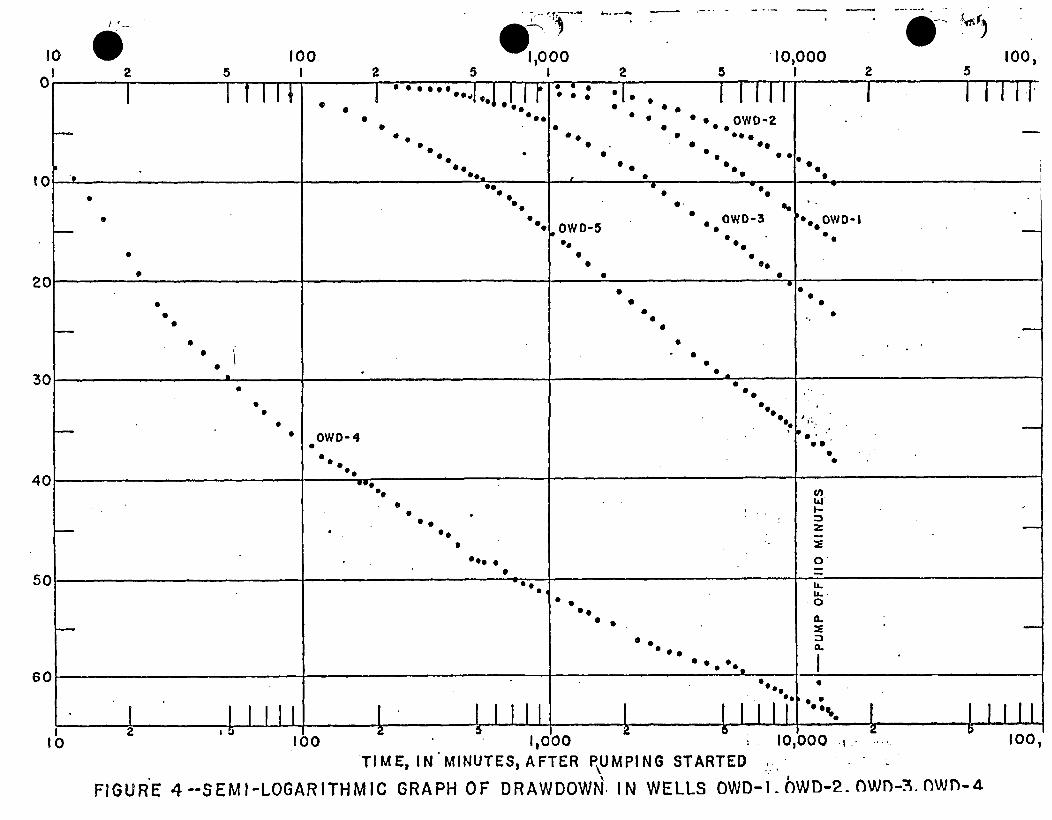
io00
6-. --- n -~
- 0< ~ti~r~
I0-I
100.I
10, 100,12 5 2 5 2 5
0.000
aa 0
14
2'0
0
06a
0
00
e30
0 go
6'00
00
(0
0
eO
9
O*0 0
5,
z
.0a-
gi.so
o0
0 0
I 1600 1,000 10,000
TIME, IN MINUTES, AFTER PUMPING STARTED
FIGURE 4--SEMI-LOGARITHMIC GRAPH OF DRAWDOWN. IN WELLS OWD-I. bWD-2. W1l-3. OW -l-4
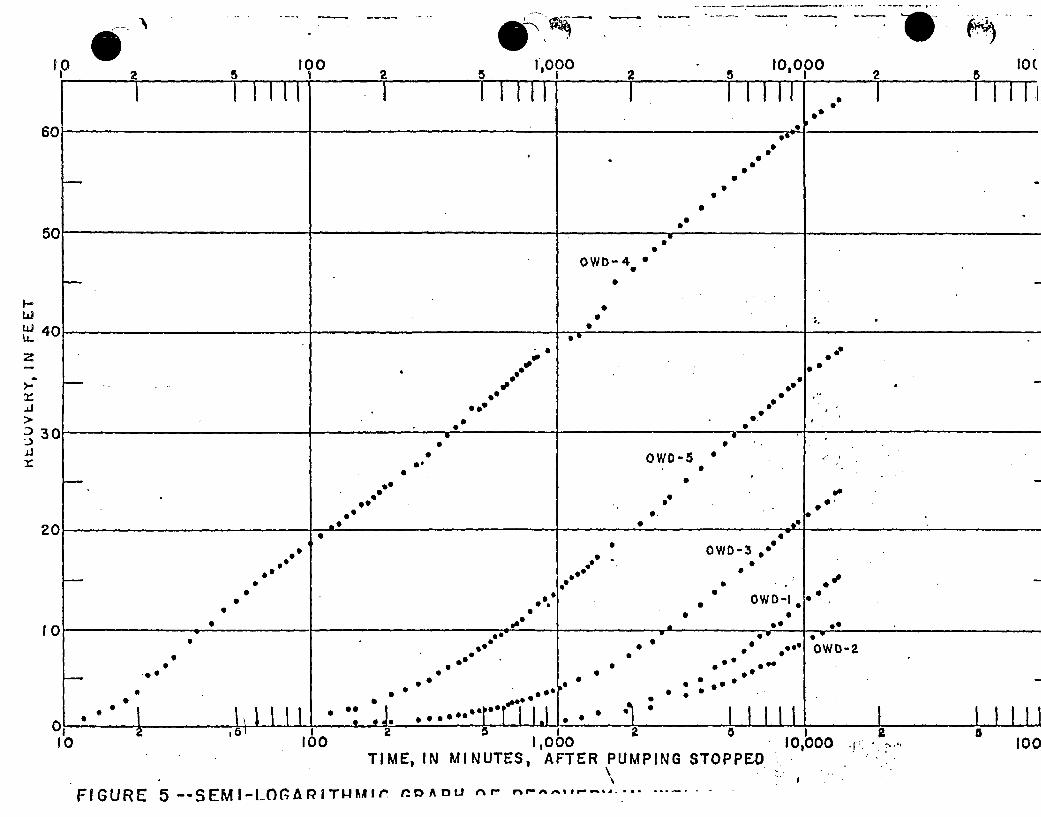
028,o 100 1,000 I0,OpO IO(
SJ 2 2
-ii I f I III IIj I 1 II . I II 2ii60
50
.3 -
0a
S0
S9
S
SS
I .t -iS
OWD-4*
S•
t 1~~ I
e00S
'p*0
S
.0
0so
00
f . ' ''"
0I
0O.*
*9
OWD-5
SC
SS
9I
20 B.4 - ~1-
SS
00S
C..0
0
e09•0
0 ee* •• OW D-I0
m•
1 111- I I - -0,I 0
0
S..
90
0
*0Ik
IIIII
OWD-2
SS
60
bogr gee
I liii I I 1111I.
10aDj
100 11000TIME, IN MINUTES, AFTER PUMPING STOPPED
10,0001I00
I
FIGURE 5--SEMI-LOGAflITWKI-•, .f.DDU ^r--
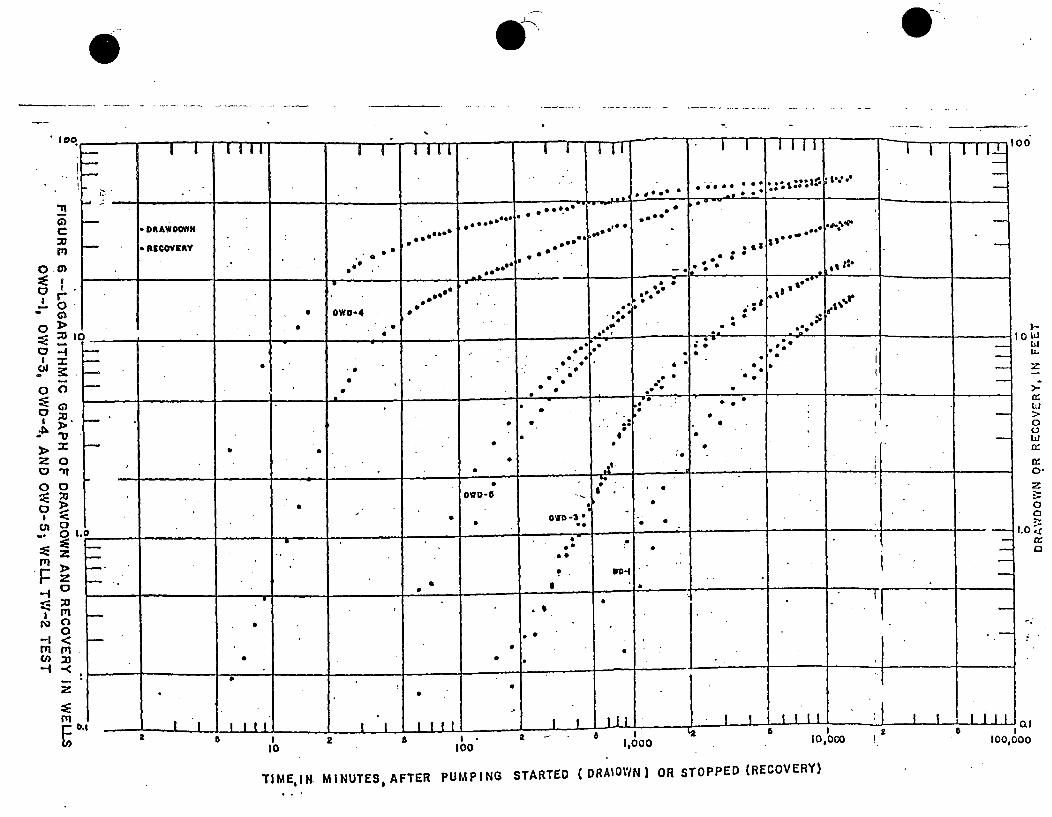
I 10-rr 0i 0
0
0
0r
W
-4
*?10
r0.
0
o3
:0
00'
TIME, IN MINUTESAFTER PUMPING STARTED (DRAIOWN) OR STOPPED (RECOVERY)
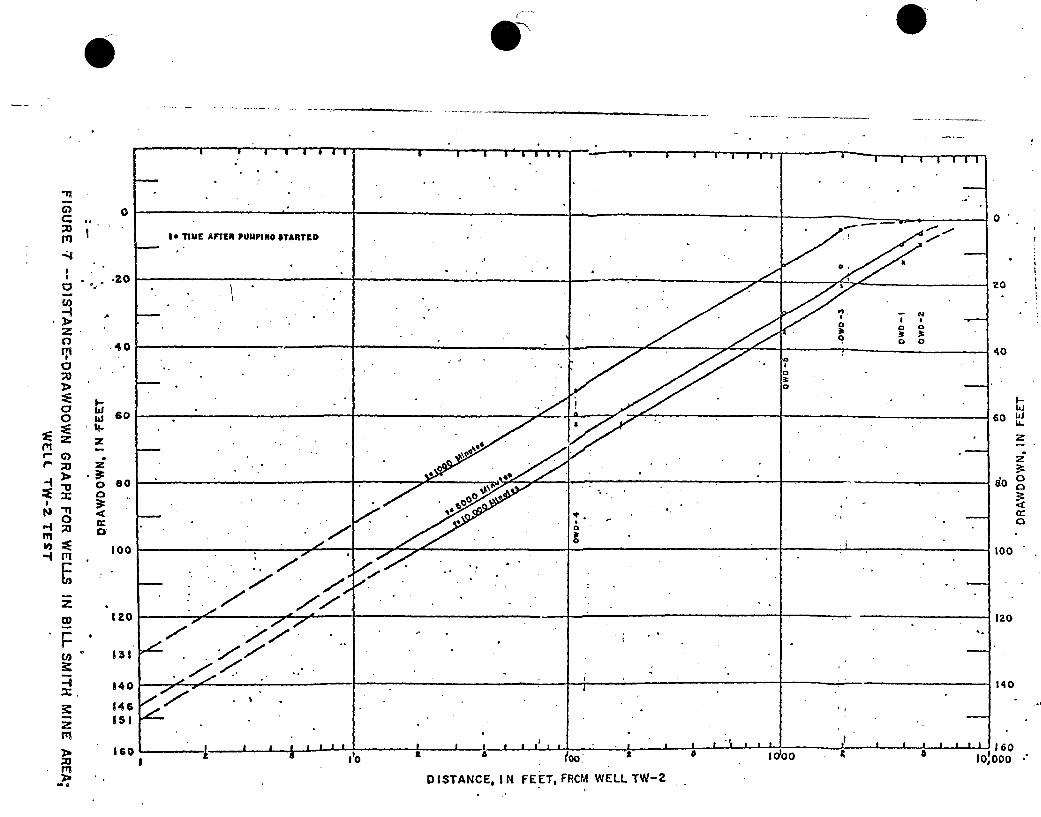
-4
z
;o
0
;a'
0o
wS
FW,
X'
M
0
-20
.40
b-w
z
0a
Ixa~
60
80
100
120
131
140
146151
ISO
DISTANCE, I N FEET, FRCM WELL TW-2
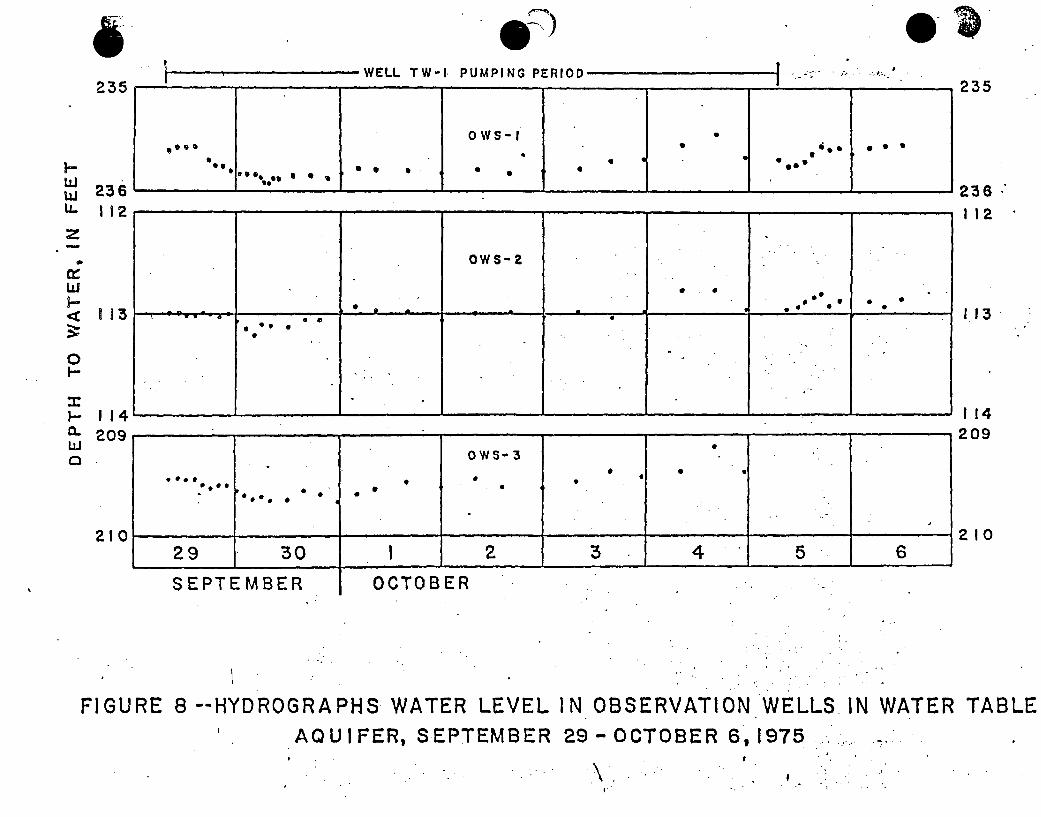
2
235
OF) 0- W1 WELL TW-f- PUMPING PERI 101)
I-LUILU
-
w
.-
0
I-
a-
236112
113
114209
210
00 W 1 61I
OWS- 2
0 e
235
236112
113
114209
210
FIGURE 8 -- HYDROGRAPHS WATER LEVEL
AQUIFER, SEPTEMBER
IN29
OBSERVATi ON WELLS IN WATER TABLE- OCTOBER 6, 1975 -
.\ I
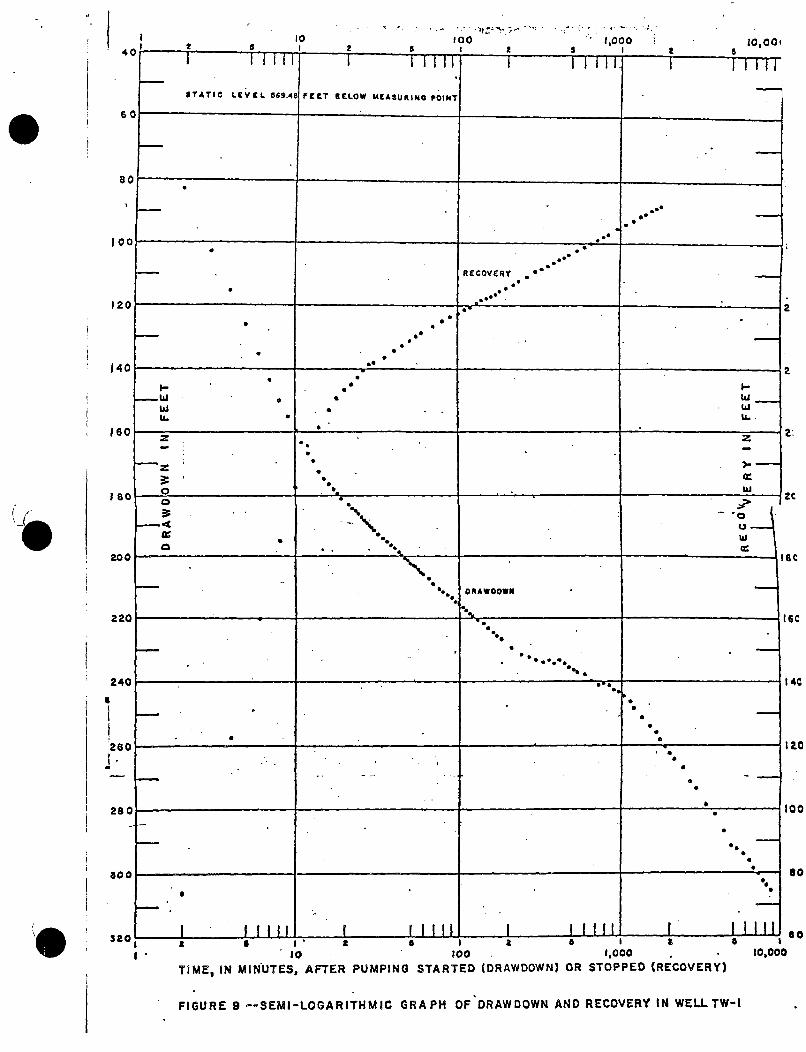
I0 900 1,000 10,00(0 m
40 - IIIH I p 1 z aI iliTI I I11 I111 I 11111
STATIC LtVEl. 569,48 FEET BELOW MEASURING PO'INT
60
s0
'00
E
II.0
RECOVERY
I'
I'
20
400
04
1&I * I.
2
2,
so z
'Iw
•V
a:
ONAWOOWN
240 140
280 lac
300 % S
280 *so
320e
I.0 t00 1,000
TIME, IN MINUTES, AFTER PUMPING STARTED (DRAWDOWN) OR STOPPED (RECOVERY)
FIGURE 9 -- SEMI-LOGARITHMIC GRAPH OF DRAWDOWN AND RECOVERY IN WELLTW-I
10,000
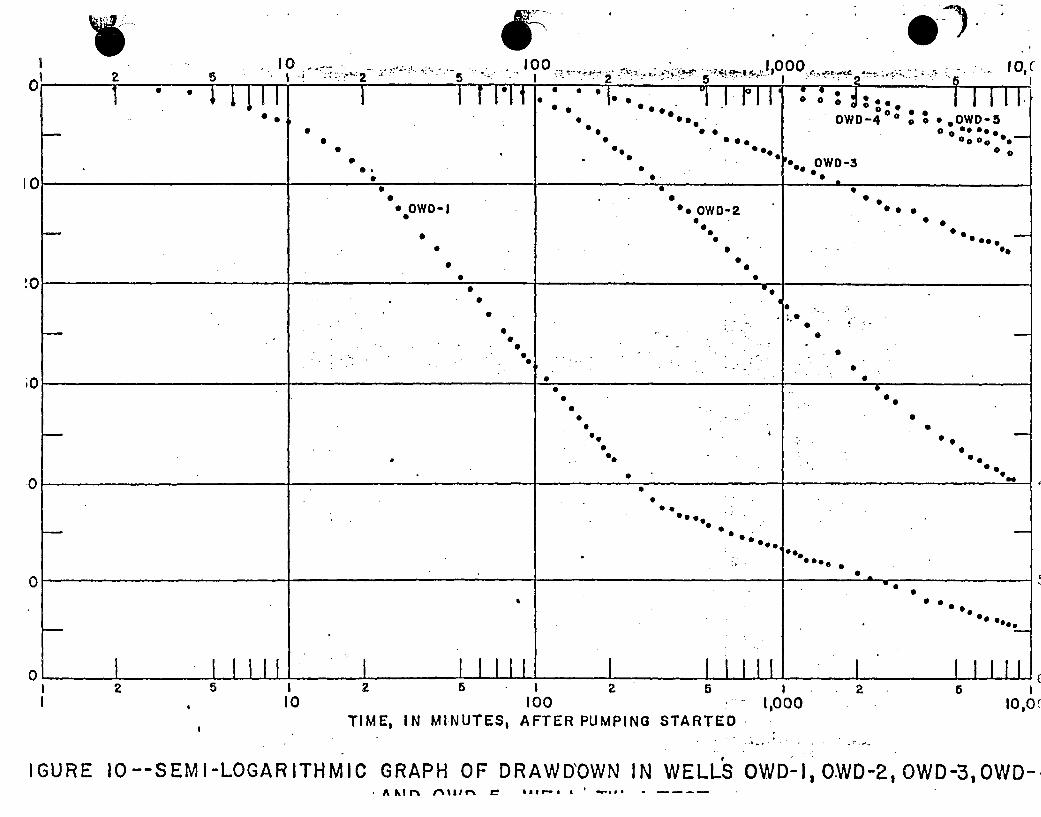
)6 fAý10 100 to • 01I ,(
0I. *i * ri ii~I
0 **
%o
S S Sog*000 0
* 6 0
000000
0 0.
00 000 0 0 5 *
0 S0
' '
0
0
0 _ _ _ __ _ _ __ _ _ _ L 0 _ __ _ __ _ __ _ __ _
f2 5
I02 5 1
100TIME, IN MiNUTES, AFTER
2 5 I011000 2 5 I0,0
PUMPING STARTED
IGURE 10--SEMI-LOGARITHMIC GRAPH OF DRAWD'OWN IN WELLS OWD-I,O.WD-2,0WD-3,0WD-. A K r ^ %lr% frfll' i a s r- -6 a ' , - 4.. .
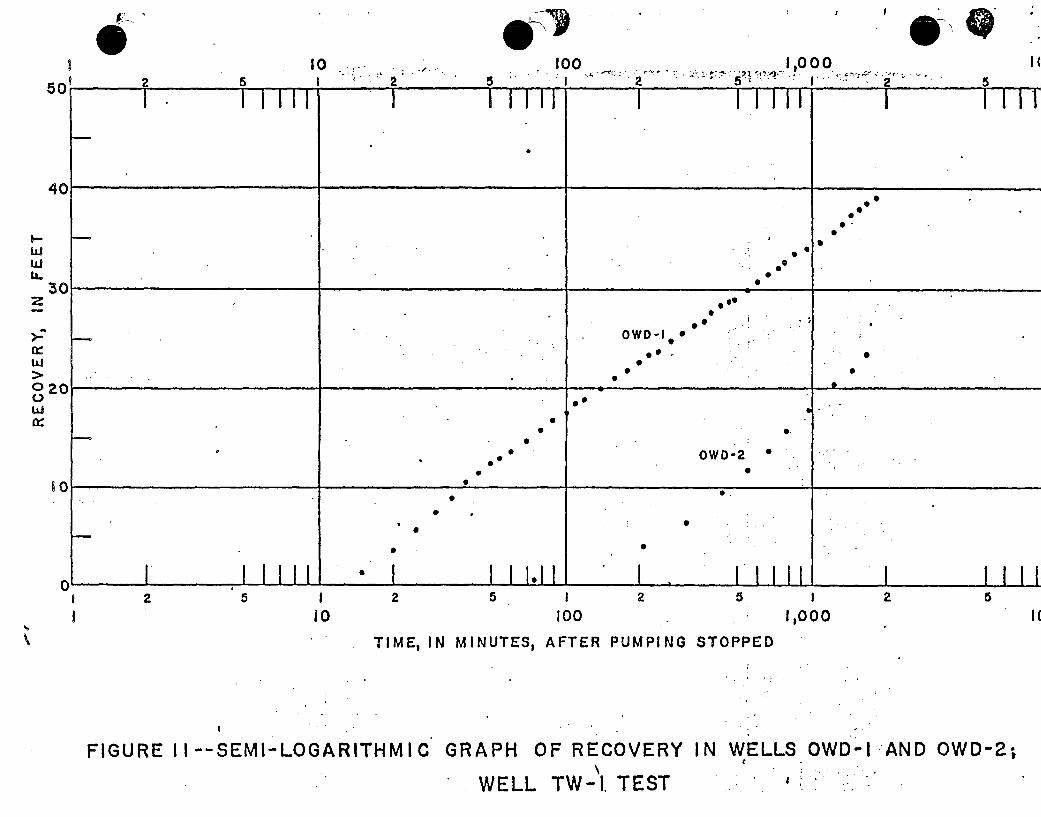
100I I0
2. . '. ~ --I-?2 5 5 .' Is
5'
4
3
C0
00
0*S
SS
SS
SS
0 S ___________
S
*5SOWD-I S
S
- S0
* SS
o p* S.
S
* S.* S
0* OWD-2 *S
5 0
____________________ 0 ____________________ ___________________
0?w
Ig V
0
0
I' I1 11 SI
0
I 1 1.11 I I* I III I I I I I0
2 5 I10
2 5 I100
2 513000
2 5
I (TIME, IN MINUTES, AFTER PUMPING STOPPED
FIGURE I I--SEMI-LOGARITHMIC GRAPH OF RECOVERY IN WELLS OWD-I AND OWD-2;f -
WELL TW-I. TEST° •I
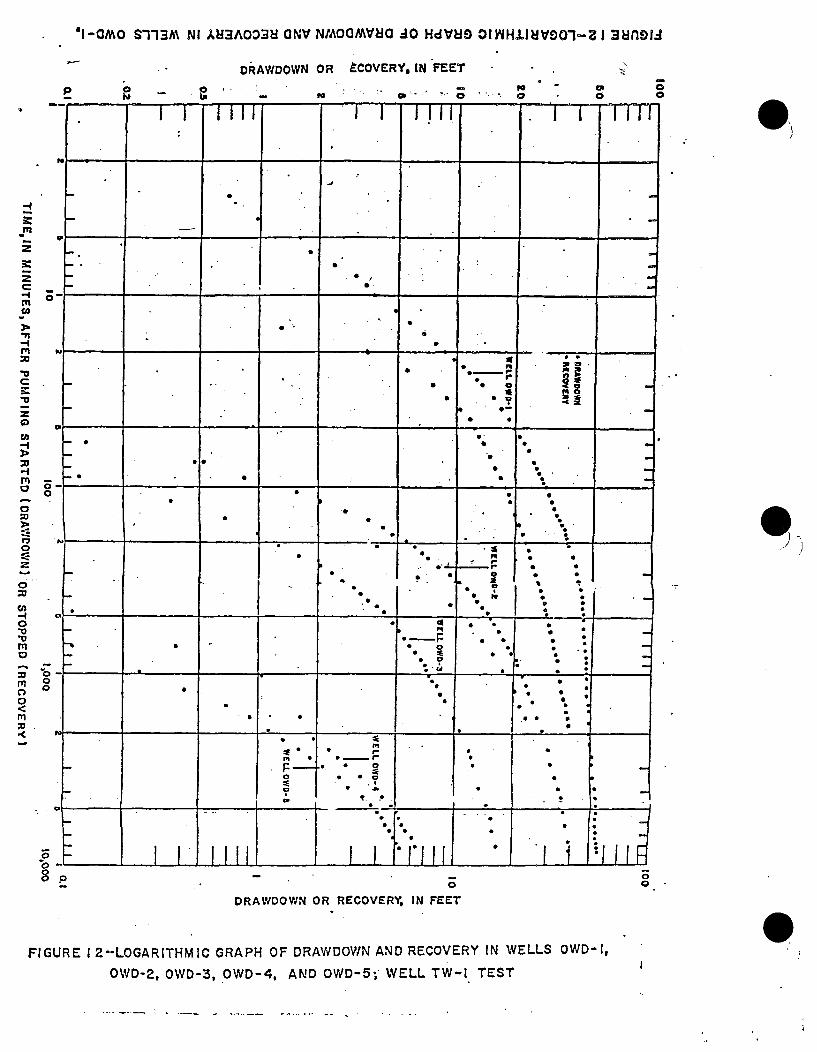
al-aMO S-1-3FA NI ;.HAO03U IONV NMOOMV8IQ .40 HdVHJ9 oi w ivoI- i 3uns
DRAWDOWN OR tCOVERY, IN FEET00
00 o
DRAWDOWN OR RECOVERS IN FEET
FIGURE I 2--LOGARITHMIC GRAPH OF DRAWDOWN AND RECOVERY IN WELLS OWD-I,
OWD-2, OWD-3, OWD-4, AND OWD-5; WELL TW-I TEST I
~
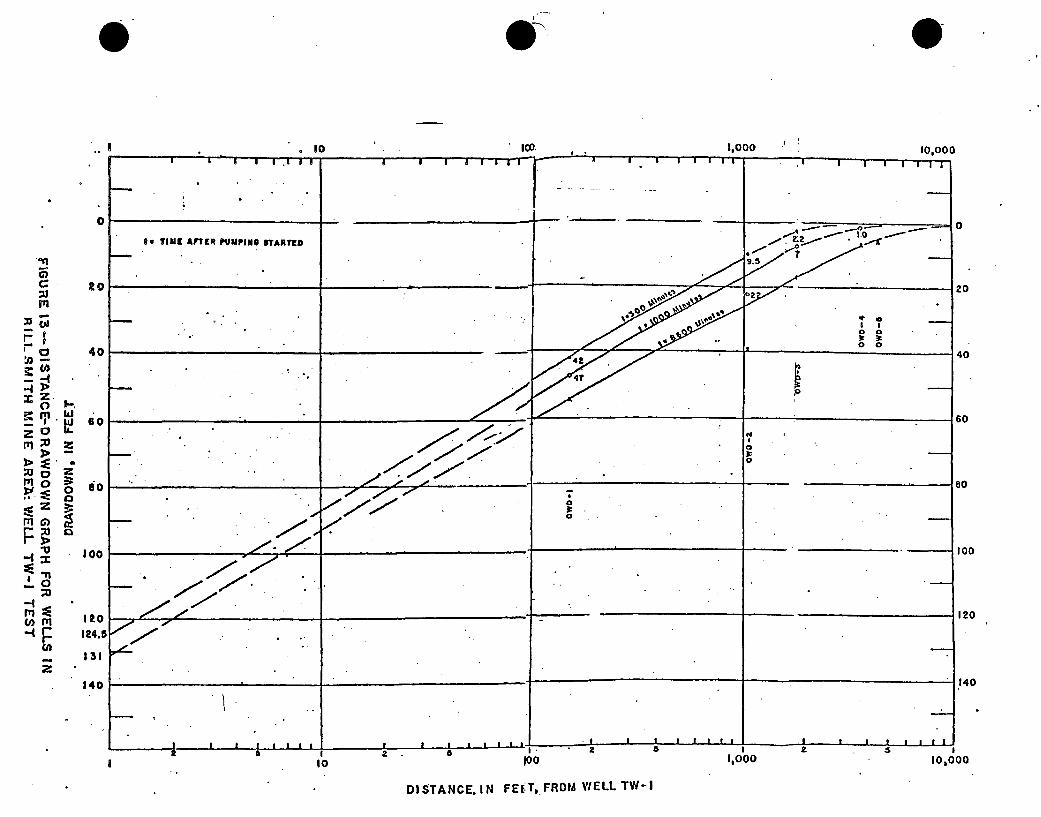
Iii
tz.
z
z00
0
DISTANCE. IN FE:T, FROM WELL TW-I
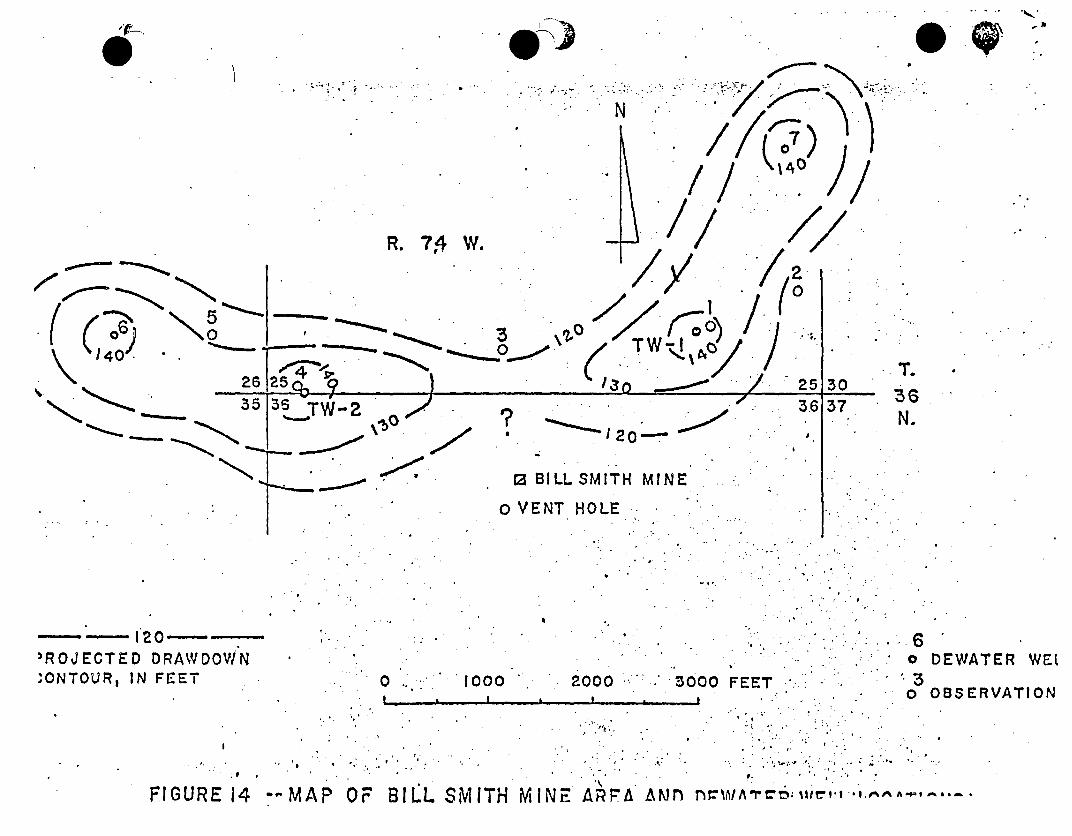
4->) eqN
/1/1 4
/
(140.%q35
R. 7?4W.
T.
N6N.
I
-C--..
?
a BILL SMITH MINE
o VENT HOLE
-1 - 0--'ROJECTED DRAWDOWN:ONTOUR, IN FEET
FGR 1
FIGURE 14
oDEWIo. ; 1000 00 . -O FEET . . .
* OOBSE
- O .. B r * I'4 rI .. .
t • " °:."
'MA '.O BI'L SITH.MI. ARPAANEf,
,TER WEI
:RVATION
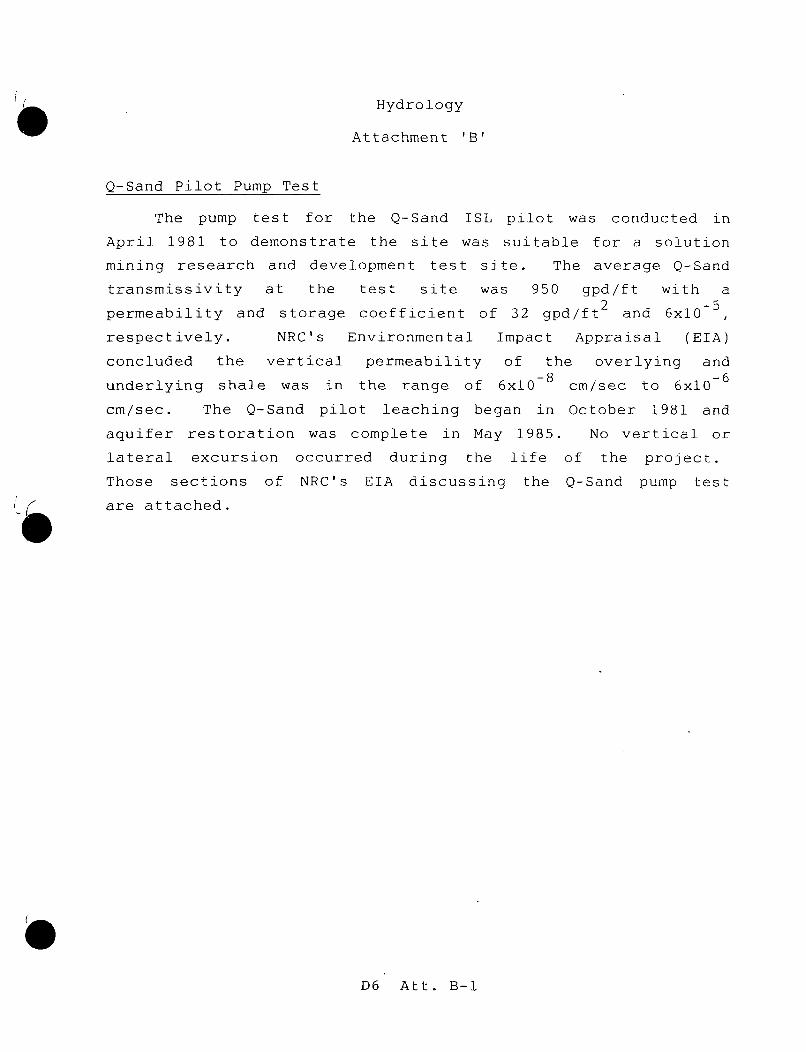
Hydrology
Attachment 'B'
Q-Sand Pilot Pump Test
The pump test for the Q-Sand ISL pilot was conducted in
April 1981 to demonstrate the site was suitable for a solution
mining research and development test site. The average Q-Sand
transmissivity at the test site was 950 gpd/ft with a
permeability and storage coefficient of 32 gpd/ft2 and 6x10⁻⁵,
respectively. NRC's Environmental Impact Appraisal (EIA)
concluded the vertical permeability of the overlying and-8 -
underlying shale was in the range of 6x10 cm/sec to 6x10 6
cm/sec. The Q-Sand pilot leaching began in October 1981 and
aquifer restoration was complete in May 1985. No vertical or
lateral excursion occurred during the life of the project.
Those sections of NRC's EIA discussing the Q-Sand pump test
are attached.
D6 Att. B-I
T.
UNITED STATES NUCLEAR REGULATORY COMMISSION
ENVIRONMENTAL IMPACT APPRAISAL
BY THE
DIVISION OF WASTE MANAGEMENT
IN CONSIDERATION OF THE ISSUANCE OF
SOURCE MATERIAL LICENSE NO. SUA-1387 FOR THE
KERR-M,•cGEE NUCLEAR CORPORATION
SOUTH POWVDER RIVER BASIN "Q" SAND SOLUTION MINING PROJECT
DOCKET NO. 40-S768
Dated: June 1981
D6 Att. B-2
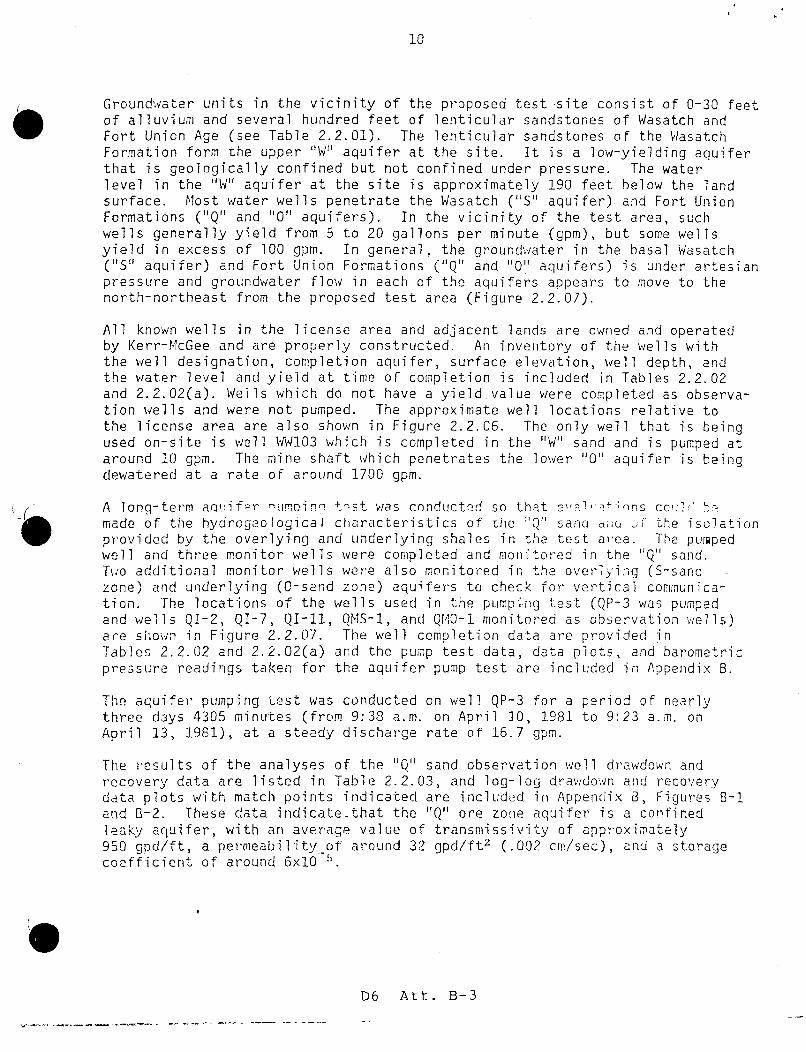
10
Groundwater units in the vicinity of the proposed test-site consist of 0-30 feetof alluvium and several hundred feet of lenticular sandstones of Wasatch andFort Union Age (see Table 2.2.01). The lenticular sandstones of the V/asatchFormation form the upper "W" aquifer at the site. It is a low-yielding aquiferthat is geologically confined but not confined under pressure. The waterlevel in the "W" aquifer at the site is approximately 190 feet below the landsurface. Most water wells penetrate the Wasatch ("S" aquifer) and Fort UnionFormations ("Q" and "0" aquifers). In the vicinity of the test area, suchwells generally yield from 5 to 20 gallons per minute (gpm), but some wellsyield in excess of 100 gpm. In general, the groundwater in the basal Wasatch("S" aquifer) and Fort Union Formations ("Q" and "0" aquifers) is under artesianpressure and groundwater flow in each of the aquifers appears to move to thenorth-northeast from the proposed test area (Figure 2.2.07).
All known wells in the license area and adjacent lands are owned and operatedby Kerr-McGee and are properly constructed. An inventory of the wells withthe well designation, completion aquifer, surface elevation, well depth, andthe water level and yield at time of completion is included in Tables 2.2.02and 2.2.02(a). Wells which do not have a yield value were completed as observa-tion wells and were not pumped. The approximate well locations relative tothe license area are also shown in Figure 2.2.06. The only well that is beingused on-site is well WW103 which is completed in the "W" sand and is pumped ataround 10 gpm. The mine shaft which penetrates the lower "0" aquifer is beingdewatered at a rate of around 1700 gpm.
A long-term a,.•ifer numcnina t-st was conducted so that ePP,'.•-ns cc',ld Vmade of the hydrogeological characteristics of Lhe "Q" san Y.u &[ the isolationprovided by the overlying and underlying shales in the test area. The pumpedwell and three monitor wells were completed and monitored in the "Q" sand.Tw'o additional monitor wells were also monitored in the overlying (S-sandzone) and underlying (0-sand zone) aquifers to check for vertical communica-tion. The locations of the wells used in the pumping test (QP-3 was pumpedand wells QI-2, QI-7, QI-11, QMS-1, and QMO-1 monitored as observation wells)are shown in Figure 2.2.07. The well completion data are provided inTables 2.2.02 and 2.2.02(a) and the pump test data, data plots, and barometricpressure readings taken for the aquifer pump test are included in Appendix B.
The aquifer pumping test was conducted on well QP-3 for a period of nearlythree days 4305 minutes (from 9:38 a.m. on April 10, 1981 to 9:23 a.m. onApril 13, 1981), at a steady discharge rate of 16.7 gpm.
The results of the analyses of the "Q" sand observation well drawdown andrecovery data are listed in Table 2.2.03, and log-log drawdown and recoverydata plots with match points indicated are included in Appendix B, Figures B-1and B-2. These data indicate.that the "Q" ore zone aquifer is a confinedleaky aquifer, with an average value of transmissivity of approximately950 gpd/ft, a permeability..of around 32 gpd/ft 2 (.002 cm/sec), and a storagecoefficient of around 6x10 5.
D6 Att. B-3
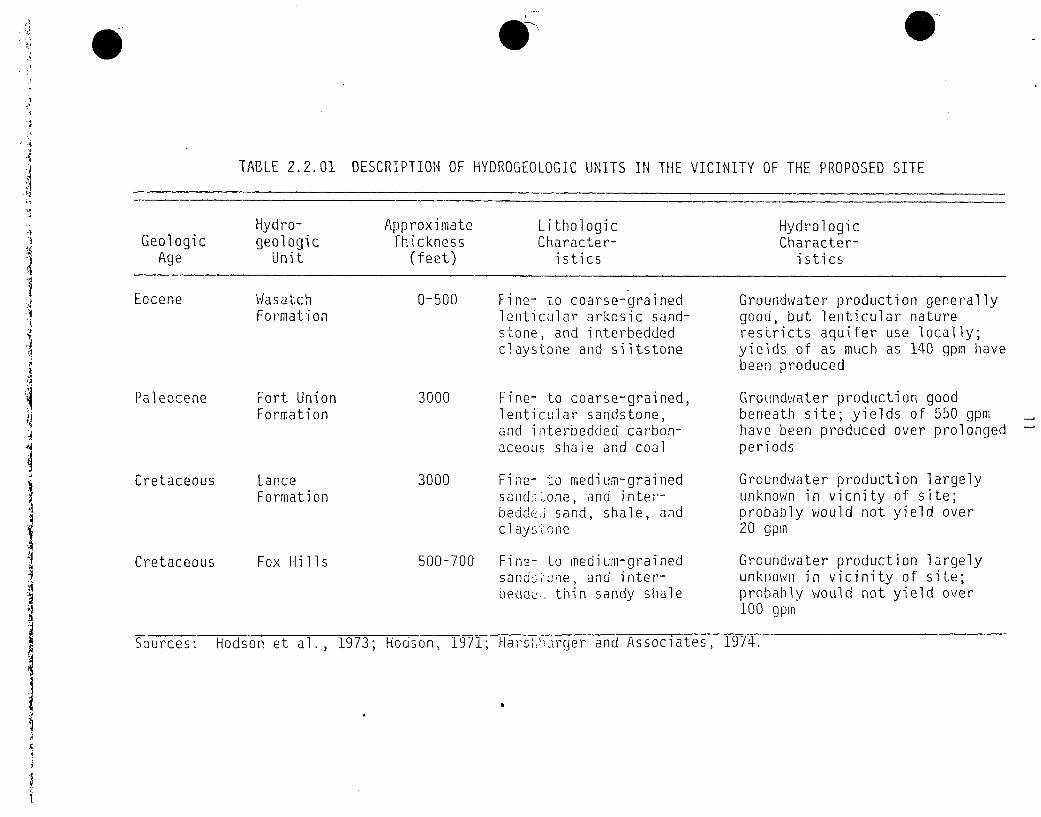
TABLE 2.2.01 DESCRIPTION OF HYDROGEOLOGIC UNITS IN THE VICINITY OF THE PROPOSED SITE
Hydro- Approximate Lithologic HydrologicGeologic geologic Thickness Character- Character-
Age Unit (feet) istics istics
Eocene Wasatch 0-500 Fine- to coarse-grained Groundwater production generallyFormation lenticular arkosic sand- good, but lenticular nature
stone, and interbedded restricts aquifer use locally;claystone and siltstone yields of as much as 140 gpm have
been produced
Paleocene Fort Union 3000 Fine- to coarse-grained, Groundwater production goodFormation lenticular sandstone, beneath site; yields of 550 gpm
and interbedded carbon- have been produced over prolongedaceous shale and coal periods
Cretaceous Lance 3000 Fine- to medium-grained Groundwater production largelyFormation sandnone, and inter- unknown in vicnity of site;
bedde. sand, shale, and probably would not yield overclaystone 20 gpm
Cretaceous Fox Hills 500-700 Fin0- to medium-grained Groundwater production largelysandcýane, and inter- unknown in vicinity of site;bedda. thin sandy shale probably would not yield over
100 gpm
Sources: Hodson et al., 1973; Hodson, 1971; Ha.rsLKarger and Associates, 1974.
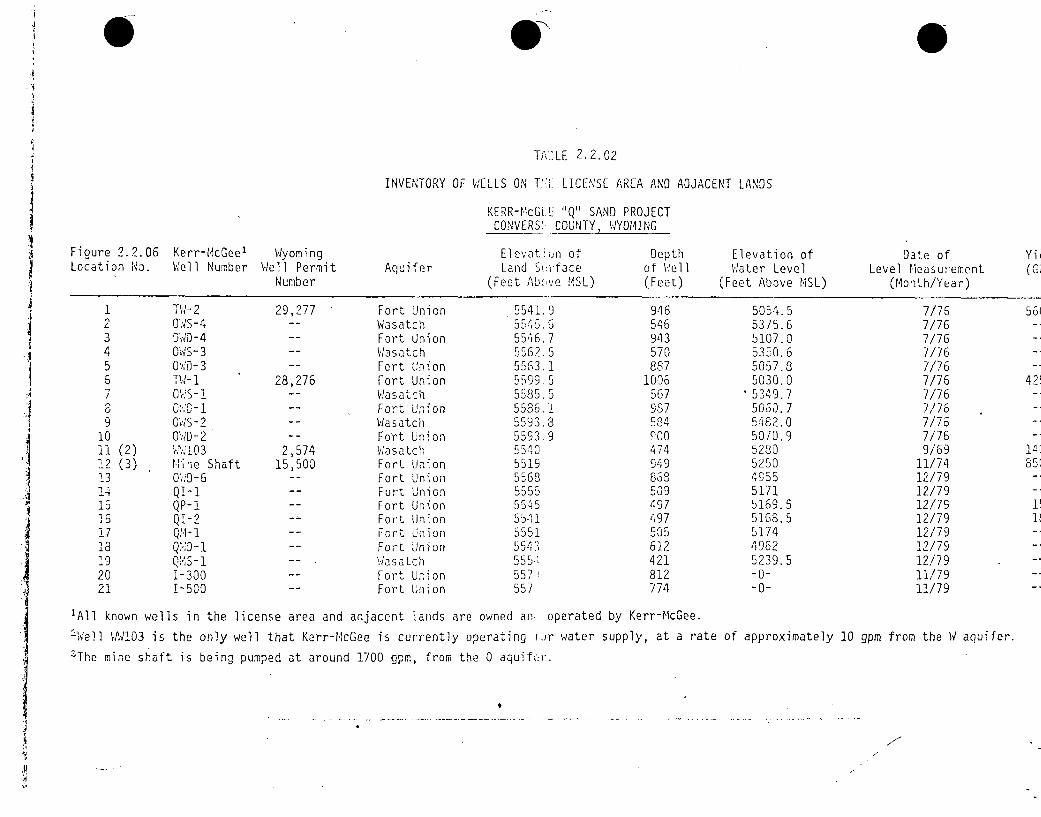
0
T,:XLE 2.2.02
INVENTORY OF WELLS ON Tl';ý LICENSE AREA AND ADJACENT LANDS
KERR-McG. U "Q" SAND PROJECTCONVERS. COUNTY, WYOMING
Fioure 2.2.06Location No.
Kerr-McGee'Weil Number
WyomingWell Permit
NumberAquifer
Elevation ofLand S,:vface
(Feet AbLove MSL)
Depthof Well(Feet)
Elevation ofWater Level
(Feet Above MSL)
Date ofLevel Measurement
(Month/Year)
Yb(( G;
12
34557
9
10il12
13
1516171319
2021
(2)(3)
Tvi' 20', -24
OWS-30',',0- 3TWI- 1C 10 -.S- !
0o'S S- 2
OMD- 2' ',.,:103Mrie ShaftO'.- 5-6
QP-1QI-2
01, VIs- 11-300!-500
29,277
28,276
2,57415,500
Fort UnionWasatchFort UnionWasatchFort UnionFort UnionWasatchFort UnionWasatchFort Union,/asatchFort UnionFort UnionFort UnionFort UnionFort UnionFort UnionFort UnionWa satchFort UnionFort Union
5541. 9554. *554,6.75562. 555 63. 15599.55585.55586. 15593.35593.955405519556855555545S55.11
5551
555-i557 !557:
946546943570887
10065679S75849O04749498635094974975G5612421812774
5054. 55375.65107.05350.6
5057.85030.0
"5349.75060. 75182.05070.952805250495551715169.55168. 5517449625239.5-0--0-
7/767/767/767/767/767/767/767/767/767/769/69
11/7412/7912/7912/7912/7912/7912/7912/7911/7911/79
'All known wells in the license area and adjacent lands are owned an operated by Kerr-McGee."Well W,1103 is the only well that Kerr-McGee is currently operating :-•r water supply, at a rate of approximately 10 gpm from the W aquifer.
SThe mine shaft is being pumped at around 1700 gpm, from the 0 aquifc:r.
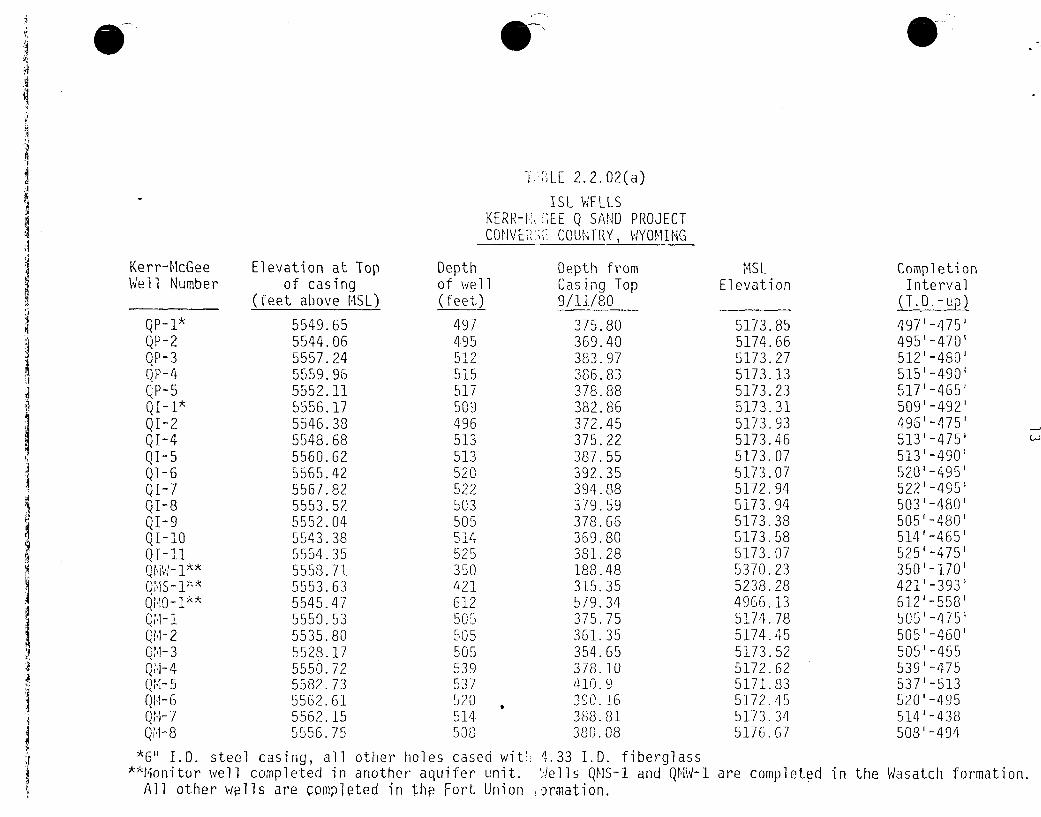
-i ,'LE 2.2.02(a)
ISL WELLSKERR-i>2 -EE Q SAND PROJECTCOHVERP. COUNTRY, WYOMING
Kerr-McGeeWell Number
QP-1*QP-2OP-3
QP-5
QI-1*QI-2QI-4QI-5QI-6QI-7Q1-8QI-9QI-10QI-li
Q1,1- 1;k*
614-2
Q,1- 4Qml- 5Q1,1-6QM'l- 7Q,,-18
Elevation at Topof casing
(feet above MSL)
5549.655544.065557.245559.965552.115556.175546.385548.685560.625565.425567.825553.525552.045543.385554.355558.715553.635545.475550.535535.805528.175550.725582.735562.615562.155556.75
Depthof well(feet)
497495512515517509496513513520522503505514525350421612505505505539537J5U0514508
Depth fromCasing Top9/11/80
375.80369.40383.97386.8337.388382.86372.45375.22387.55392.35394.88379.59378.66369.80331.28183.48315.35579.34375.75361.35354.65378.10410.9390.16388. 81380.08
MSLElevation
5173.855174.665173.275173.135173.235173. 315173.935173.465173.075173.075172.945173.945173.385173.585173.075370.235238.284966 135174.785174. 455173. 525172.625171.835172.455173. 345176.67
CompletionInterval
(T.D.-up)497'-475'
495'-470'512'-480'515'-490'517'-465'509'-492'496-475'513'-475'513'-490520'-495'522'-495503'-480505'-480'514'-465'525'-475'350'-170'421'-393'6121-558'5051-475'505'-460'505'-455539'-475537'-513520'-495514'-438508'-494
*6" I.D. steel casing, all other holes cased wit:',. -. 33 I.D. fiberglass*",Monitor well completed in another aquifer unit. 'Jells QMS-1 and QMN1-1
All other wells are completed in thP Fort Union ,)rmation.are completed in the Wasatch formation.
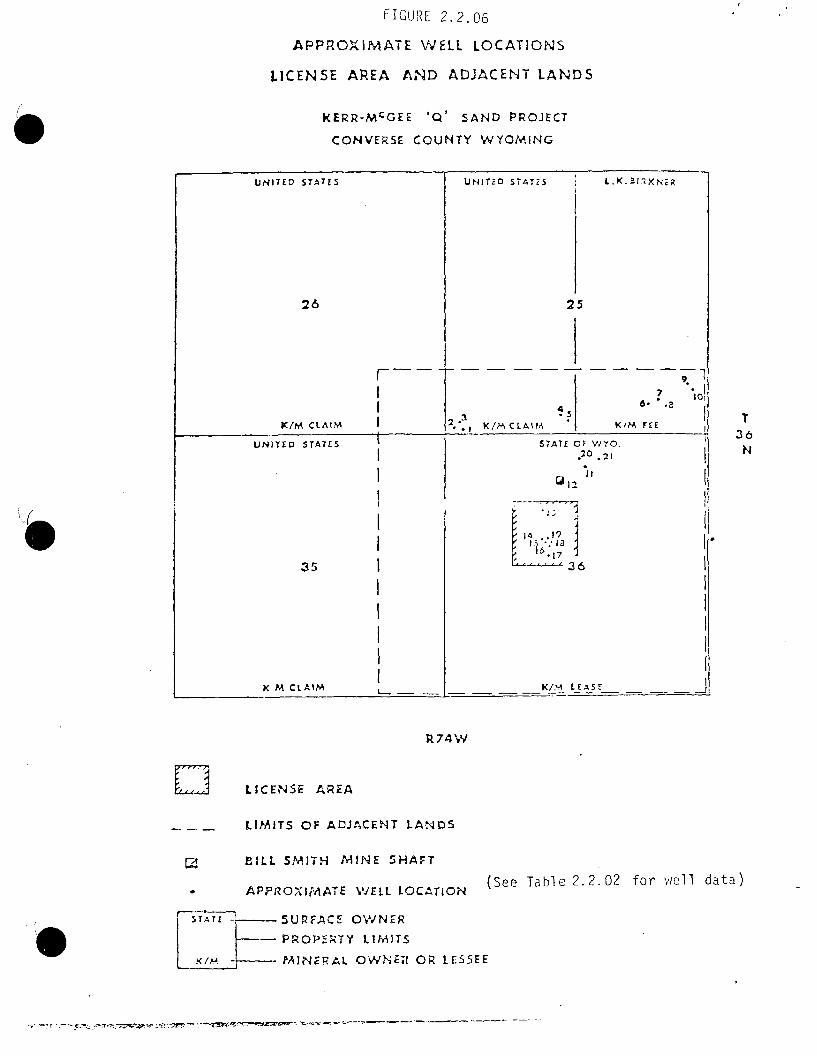
FIGURE 2.2.06
APPROXIMATE WELL LOCATIONS
LICENSE AREA AND ADJACENT LANDS
KERR-MCGEE 'Q' SAND PROJECT
CONVERSE COUNTY WYOMING
UNITED STATES
26
KIM CLAIM I
UNITED STAT.S
25
4
I? K/M CLAIM K/m FEE T36N
UNITED STATES
35
K PA CLAI/M
STATE OF VITO..20 21
31
14 .1.9 jK 3"-6
-jKIM LEASE
R74W
L] LICENSE AREA
LIMITS OF ADJACENT LANDS
BILL SMITH MI1NE SHAFT
APPROX'IMATE WELL LOCATIONLt•,TE _r 7SURFACE OWNER
PROPERTY LIMITS
S_ PAINERAL OWNER Lr55E
(See Table 2.2.02 for well data)
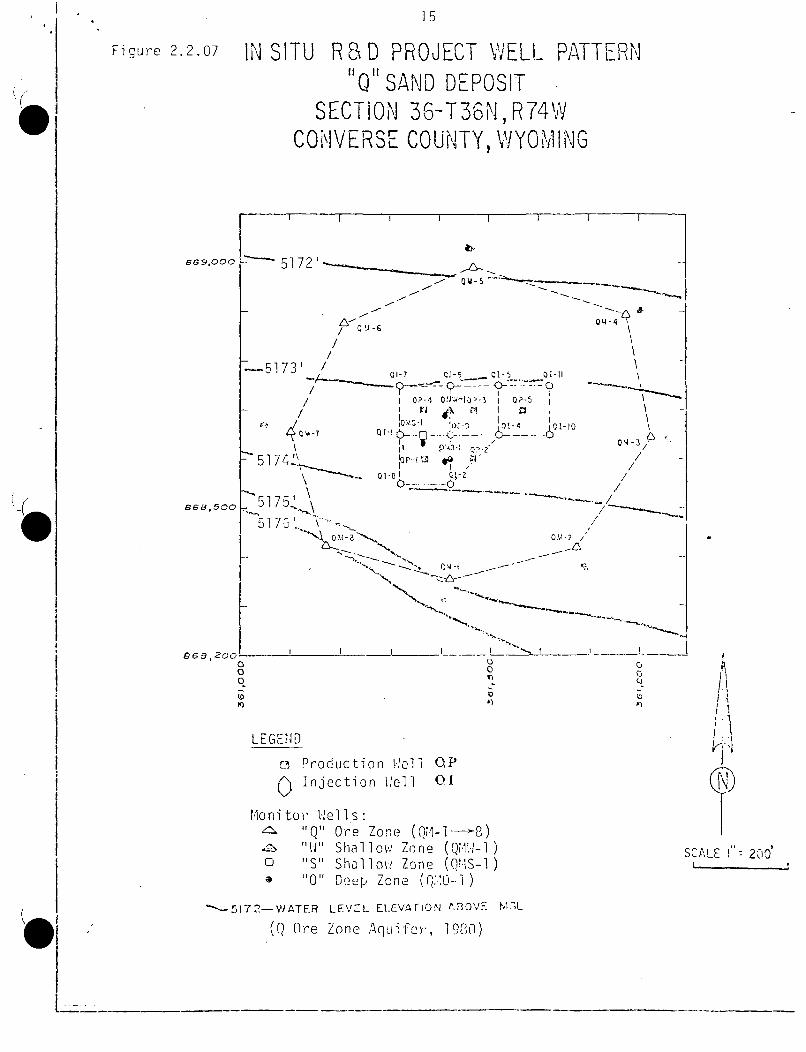
15
Figure 2.2.07 IN SITU R B&D PROJECT W/ELL PATTERN"Q" SAND DEPOSIT
SECTION 36-T3SN,)R74WCONVERSE COUNTY, WYOTillNG
5 5172-"-'-"Q. 51 2 5i--BS69,000
668,500
/ Q!I-6
/ ?-4 VW-10P-3 Q?-5
40 -7 Q0~~ ~
5174 p
5175-'
17 -3OM 2
QV-4
0' -
0 \--/
//
/
//I
I I I
a0010oc
I _I___ __
0 ci0 ci
(I
o cia) 'S.)
- A
IA
SCALE I" "t u
LEGEND
c_ Production Mell OPInjection llell 01
M'onitor Wells:z "Q" Ore Zone (Q.I-l---)8)
"W" Shallow Zone (QMM.-1)O "S" Shollow Zone (eMS-i0 "0" Deep Zcne (e'.m-i
-- 5172-ViATER LEVE~L El-CvAriN , 3',ý - MISL
(Q Ore Zone Aquifer, 1930'),
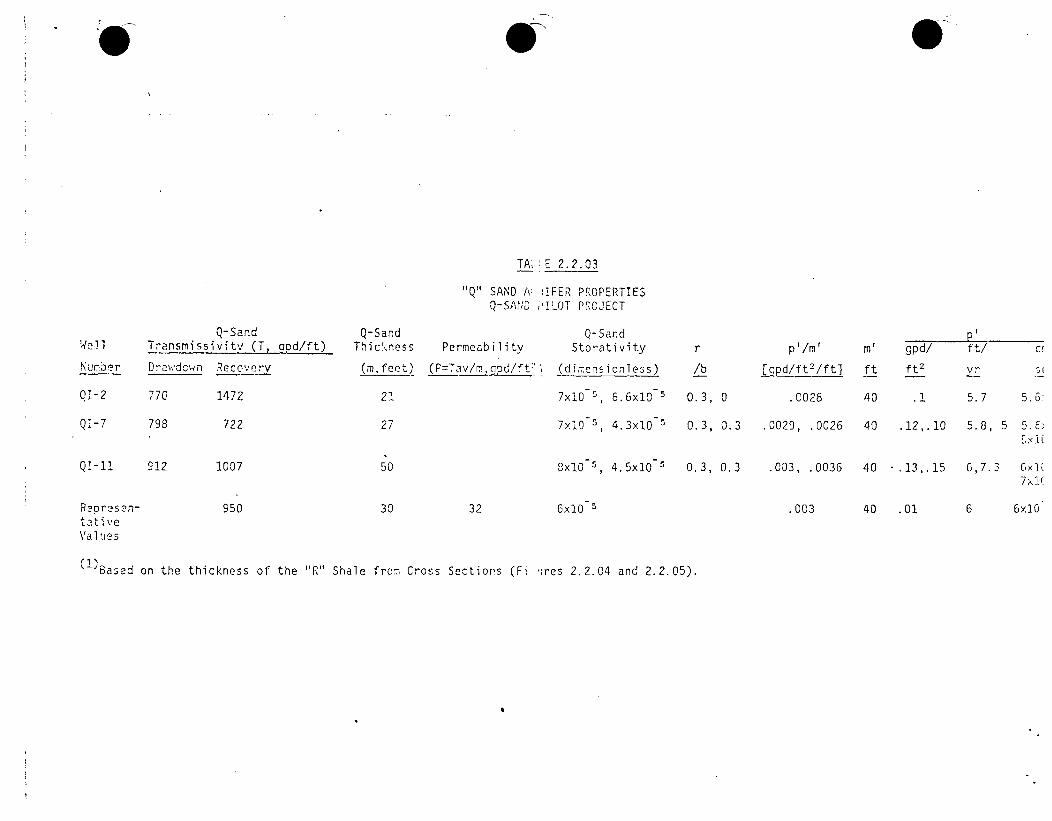
TAH,,E 2.2.03
"tQ, SAND N ITFER PROPERTIES
Q-SAND} 1ý1LOT PRCJECT
Q-SandTransmissivitv (T, aod/ft)
Q-SandThicknessWell Permeability
Q-SandStorativity r p I/MnI
.[Spd/ ft2/ft]
01
m gpd/ ft/ cU
ft ft 2 vrNumber Drawdo•wn Rccoverv (mfeet) (P=Tav/m,2pd/ft?`) (dimensionless)
0 T-2
Q T-7
770
798
1472
722
1007
21
27
50
30
7x10 5, 6.6xl10 5
7x10 5 , 4.3x10 5
8x10 5 , 4.5x10 5
0.3, 0 .C026 40 .1 5.7 5.6:
0.3, 0.3 .0029, .0026 40 .12,.10 5.8, 5 5.6"Lxi(
Q,-I! 912 0.3, 0.3 .003, .0036 40 .13,.15
6 6xIORepresen-tat iv eVal ucs
950 32 6xIO- .003 40 .01
'-Based on the thickness of the 'R" Shale from Cross Sections (FH -;res 2.2.04 and 2.2.05).
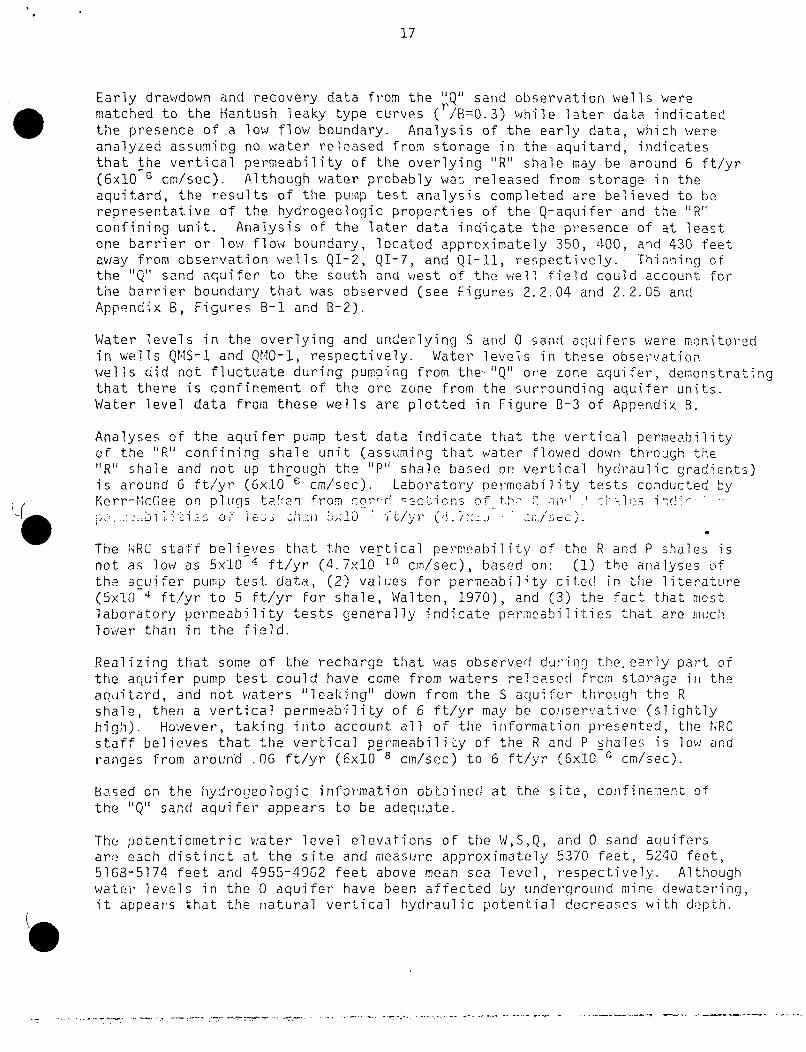
17
Early drawdown and recovery data from the IQ" sand observation wells werematched to the Hantush leaky type curves (r/B=0. 3 ) while later data indicatedthe presence of a low flow boundary. Analysis of the early data, which wereanalyzed assuming no water released from storage in the aquitard, indicatesthat the vertical permeability of the overlying "R" shale may be around 6 ft/yr(6xI0 6 cm/sec). Although water probably was released from storage in theaquitard, the results of the pump test analysis completed are believed to berepresentative of the hydrogeologic properties of the Q-aquifer and the "R"confining unit. Analysis of the later data indicate the presence of at leastone barrier or low flow boundary, located approximately 350, 400, and 430 feetaway from observation wells QI-2, QI-7, and QI-11, respectively. Thinning ofthe "Q" sand aquifer to the south and west of the well field could account forthe barrier boundary that was observed (see Figures 2.2.04 and 2.2.05 andAppendix B, Figures B-1 and B-2).
Water levels in the overlying and underlying S and 0 sand aquifers were monitoredin wells QNS-1 and Q0O-1, respectively. Water levels in these observationwells did not fluctuate during pumping from the-"Q" ore zone aquifer, demonstratingthat there is confinement of the ore zone from the surrounding aquifer units.Water level data from these wells are plotted in Figure B-3 of Appendix B.
Analyses of the aquifer pump test data indicate that the vertical permeabilityof the "R" confining shale unit (assuming that water flowed down through the"R" shale and not up through the "P" shale based on vertical hydraulic gradients)is around 6 ft/yr (GxIO 6 cm/sec). Laboratory permeability tests conducted byKerr-M'IcGee on plugs ta`.'n from core r' -rclions of th2 i -" -" :s i-! ."
.>., "'•ili. iti.:. o7- le~ •'.:w !<10 '-iL/yr (,4..-i",j •;l'e
The NRC staff believes that the vertical permeability of the R and P shales isnot as low as 5x10 4 ft/yr (4.7x10 o cn/sec), based on: (1) the analyses ofthe aguifer pump test data, (2) values for permeabil 4 ty cited -in the literature(5x10 I ft./yr to 5 ft/yr for shale, Walton, 1970), and (3) the fact that mostlaboratory permeability tests generally indicate prnrmeabilities that are muchlow./er than in the field.
Realizing that some of the recharge that was observed during the. early part ofthe aquifer pump test could have come from waters released from storage inl theaquitard, and not waters "leaking" down from the S aquifer through the Rshale, then a vertical permeability of 6 ft/yr may be conservative (slightlyhigh). However, taking into account all of the information presented, the NRCstaff believes that the vertical permeabiliLy of the R and P shales is low andranges from around .06 ft/yr (6x10 8 ca/sec) to 6 ft/yr (6x10 r cm/sec).
Based on the hydrogeologic information obtained at the site, confinement ofthe "Q" sand aquifer appears to be adequate.
The potentiometric water level elevations of the W,S,Q, and 0 sand aquifersare each distinct at the site and measure approximately 5370 feet, 5240 feet,5168-5174 feet and 4955-4962 feet above mean sea level, respectively. Althoughwater levels in the 0 aquifer have been affected by underground mine dewatering,it appears that the natural vertical hydraulic potential decreases with depth.

B-1
APPENDIX B
AQUIFER PUMP TEST DATA AND DATA PLOTS
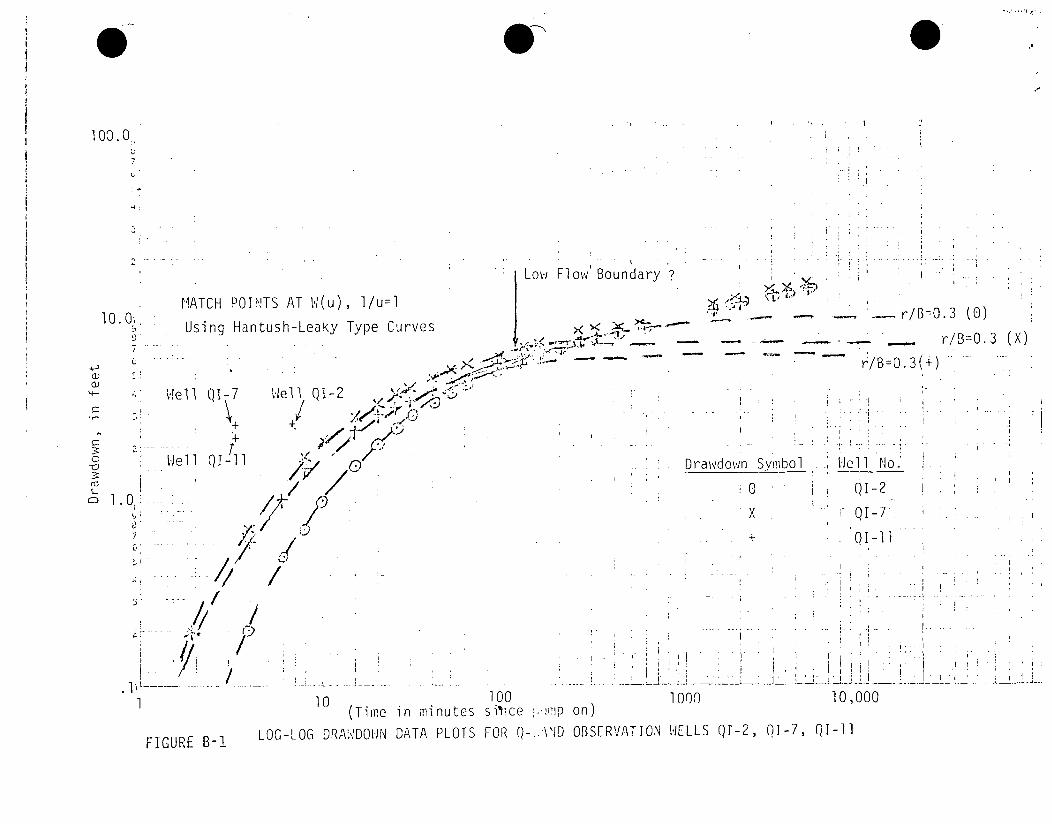
0
I00.0
U.
Low Flow' Boundary .?):Q.Vzi~)
- -
' Ti
10.0,
1.
4)
CD
U
MATCH POINTS AT W(u), l/u=l
Using Hantush-Leaky Type Curves
I I QI-7 Well QI-2
+ ~ $r.
- -- - -- " - --• • ---- /B=0.3(+)
r/B=0.3 (0)
We
1.0-
/
l
W1e 1 Q I - 11 Drawdown S,/mbol . i Well No.'
0 (QI-2-X -7- -
r/B=O.3 (x)
+ QI-ll
//4
p./C)
A 0 0 I
10,000
A.00
1O000
, i
10(Time in minutes
100since ,.-wip on)
LOG-LOG DRAWDOWN DATA PLOTS FOR Q-..:\ND OBSERVATION WELLS Qr-2, QI-7, QI-llFIGURE B-1
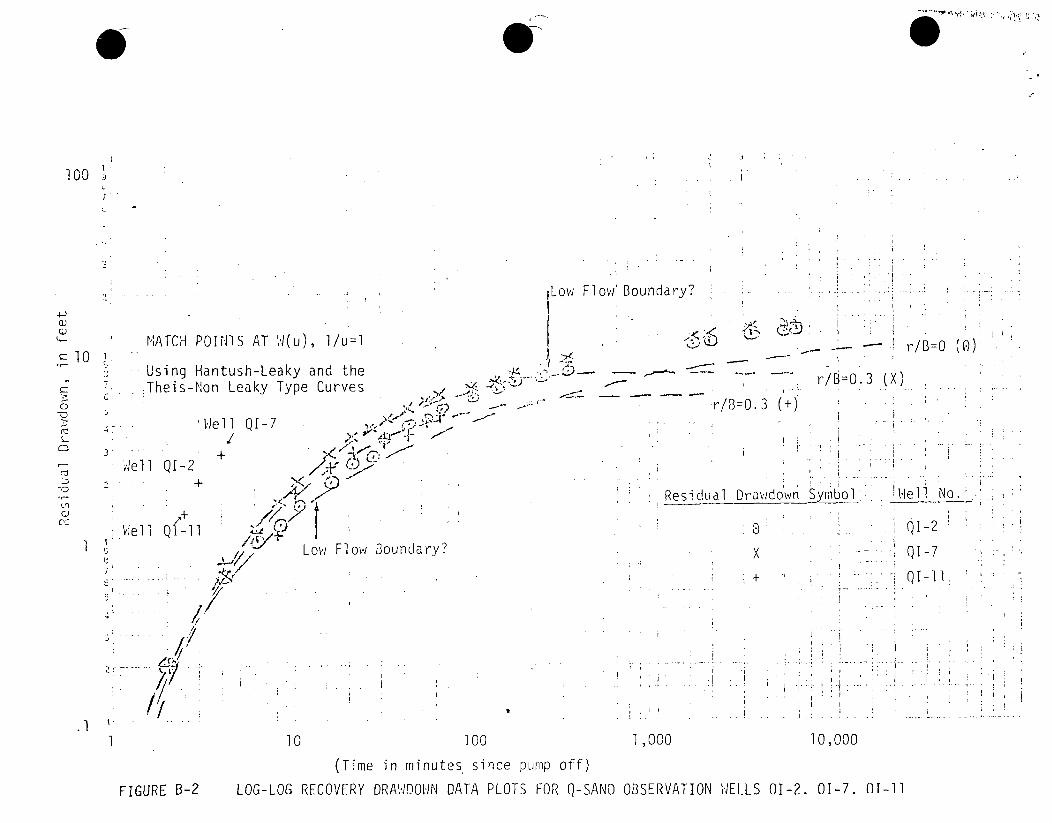
0
100
4-:wC)
~1- ~
0
(~I
0
(AC)
. . iLow Flow' Boundary?
MATCH POINTS AT W(u) l/u=l -6.i
Using Hantush-Leaky and the , ..: X. -
Theis-Non Leaky Type Curves , j, -•.-- r,--S-
Well QI-7 ... .
vlel I Q1-2+ . .r
,' Residua
- Low Flow Boundary?
2'b•1
r/B=0.3 (X)
/B=O.3 (+)
r/B=O (0)
1 Drrawdo'wn Symbol . HWell No.
o QI-2
X . . QI-7+ " 0.. .iQ-Il
I
6': /i i
1 ,0O0I 10 100
(Time in minutes since pump off)
10,000
FIGURE B-2 LOG-LOG RECOVERY DRAWDOIN DATA PLOTS FOR Q-SAND OBSERVATION WELLS 01-2. 01-7. 01-11
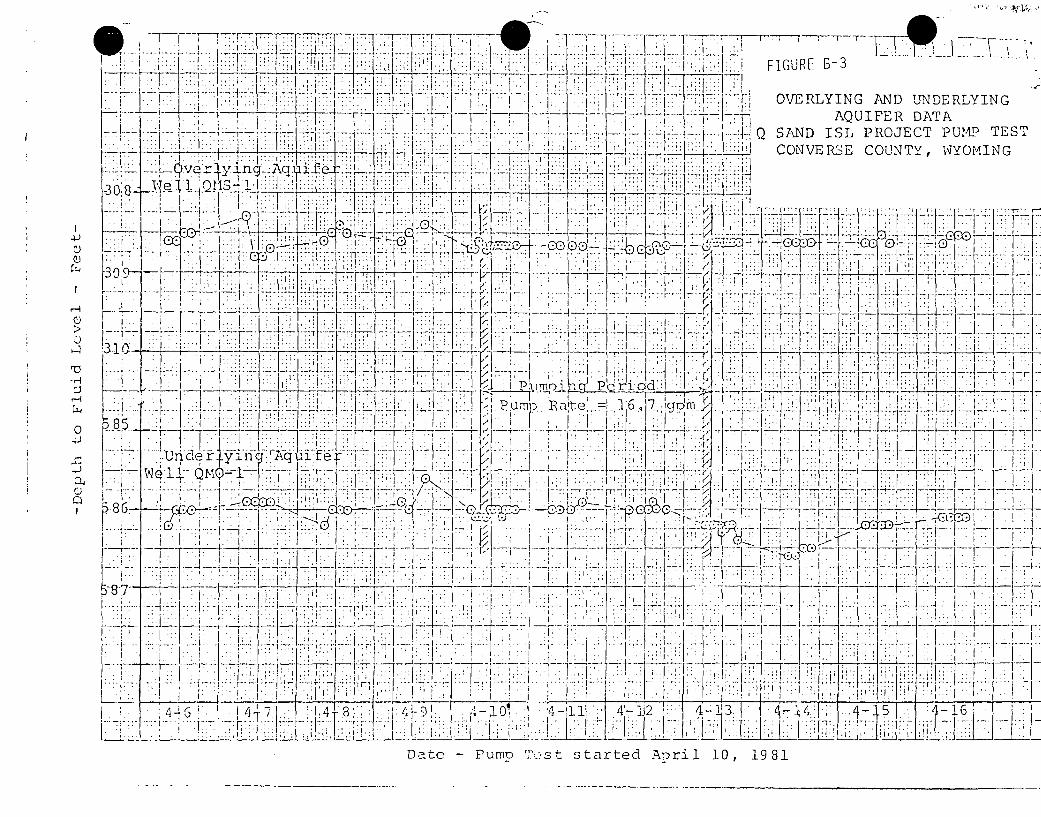
7 K -777 1 :777 J 4 :.
I . . . j !
f r- - ----F- 7-- ---,...
K i l FIGURE B-3
.. -.... 1. OVE RLY IN G AN D UN DE RLY IN GAQUIFER DATA
SAND ISL PROJECT PUMP TESTr:~>WJ CONVERSE COUTNTY, WJYOMING
-3 08 I~ ~~~~~~7 .7 777.17 Y7T7t7I.
-j tttI •p
I--- +ý - 1. --- 4
.1
"4J
-4
7...~~o I~ 7 ; .. ý 7
- 7 -: 7 - --- 7 r ! - I - i i .7
I V I
I. -r-777' ~ ~ ~ JF,..I...-.- 177.-
31 -7 7-IknL~&~11 ~qV F IEte177I ~~urnL.J~ o gd rn '
1e t
______ I.... ... . iV
-- I~ 1-- 77 1-7
f77~7[ I ~ -:7- -- -,-- zo 1-v
i~-7' 7uI *11
D4t 14 71 e !1ri 10 1981 4, !-12
I 7- ,
K
m:
-7-4~ 1
F Fr
U - T4..
~V-KIG -I
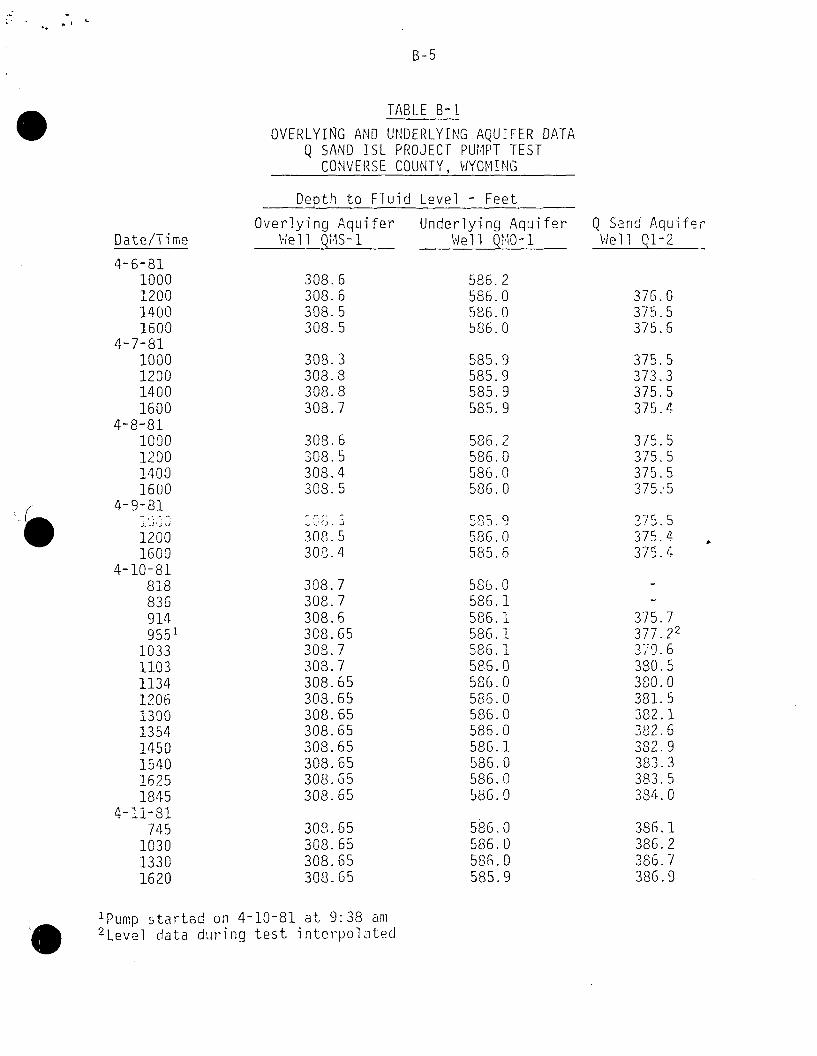
8.1
B-5
TABLE B-1
OVERLYING AND UNDERLYING AQUIFER DATAQ SAND ISL PROJECT PUNIPT TEST
CONVERSE COUNTY, WYOMING
Depth to Fluid Level - Feet
Date/Time
4-6-811000120014001600
4-7-811000120014001600
4-8-811000120014001600
4-9-81
12001600
4-10-818188369149551
1033110311341206130013541450154016251845
4-11-81745
103013301620
Overlying AquiferWell Q1S-1
308.6308.6308.5308.5
308.3308.8308.8308.7
308.6308.5308.4308.5
308.5308.4
'308.7308.7308.6308.65308.7308.7308.65308.65308.65308.65308.65308.65308.65308.65
308.65308.65308.65308.65
Underlying AquiferWell QIO-1
586.2586.0586.0586.0
585.9585.9585.9585.9
586.2586.0586.0586.0
5H5.9586.0585.6
586. 0586.1586.1586. 1586. 1586.0586.0586.0586.0586.0586. 1586.0586.0586.0
586.0586.0586.0585.9
Q Sand AquiferWell 01-2
376.0375.5375.6
375.5373.3375.5375.4
375.5375.5375.5375.5
75.5375.4 o375.4
375.7377.223709.6330.5380.0381.5382.1382.6382.9383.3383.5384.0
386.1386.2386.7386.9
'Pump startad on 4-10-81 at 9:38 am2 Level data during test interpolated
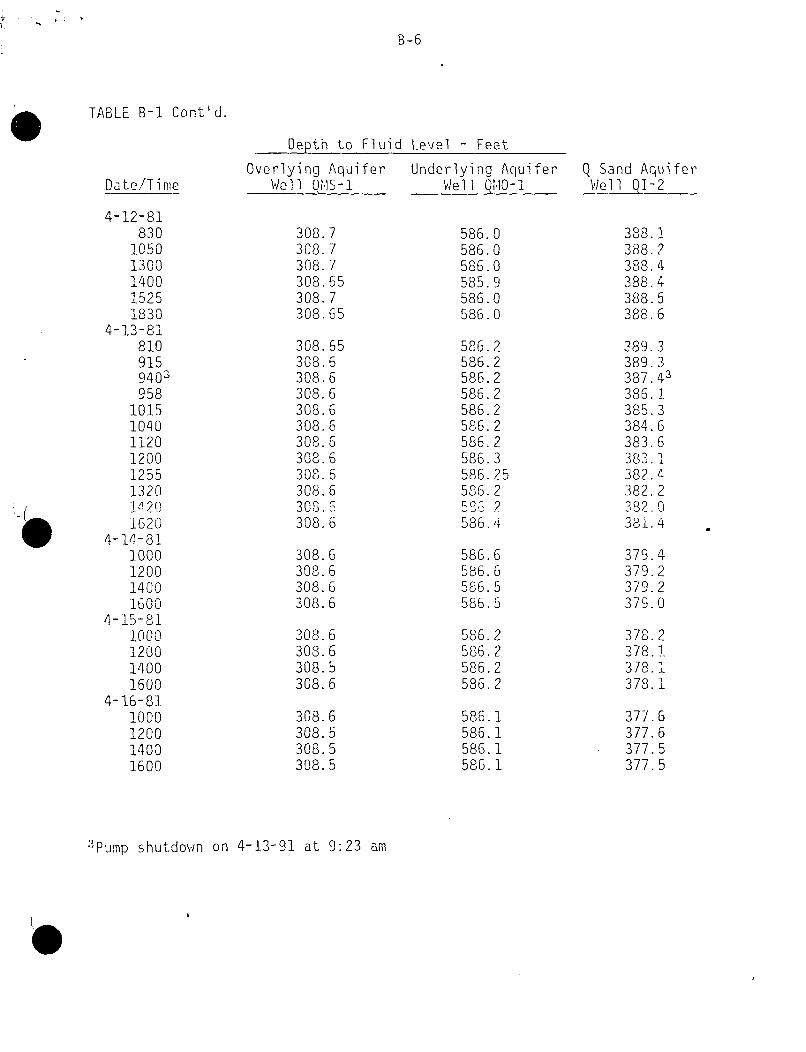
B-6
TABLE B-1 Cont'd.
Depth to Fluid Level - Feet
Date/Ti me
4-12-81830
10501300140015251830
4-1.3-818109159403
9581015104011201200125513201420
16204-14-81
1000120014001600
4-15-811000120014001600
4-16-81.1000120014001600
Overlying AquiferWell QflS-1
308.7308.7308.7308.65308.7308.65
308. 65308.6308. 6308. 6308.6308. 6308. 6308. 6308. 6308. 630. G308. 6
308.6308.6308.6308.6
308.6308.6308.5308.6
308.6308.5308.5308.5
Underlying AquiferWell QWO-1
586.0586.0586.0585.9586.0586.0
586.2586.2586.2586.2586.2586.2586.2586.3586.25586.25r . 2586.4
586.6586.6586.5586.5
586.2586.2586.2586.2
Q Sand AquiferWell Q1-2
388.1388.2388.4388.4388.5388.6
389.3389.3387.43386.1385.3384.6383.6383.1382.4382.2382.038i.4
379.4379.2379.2379.0
378.2378. 1378.1378.1
586.1586.1586.1586. 1
377.6377.6377.5377.5
3Pump shutdown on 4-13-91 at 9:23 am
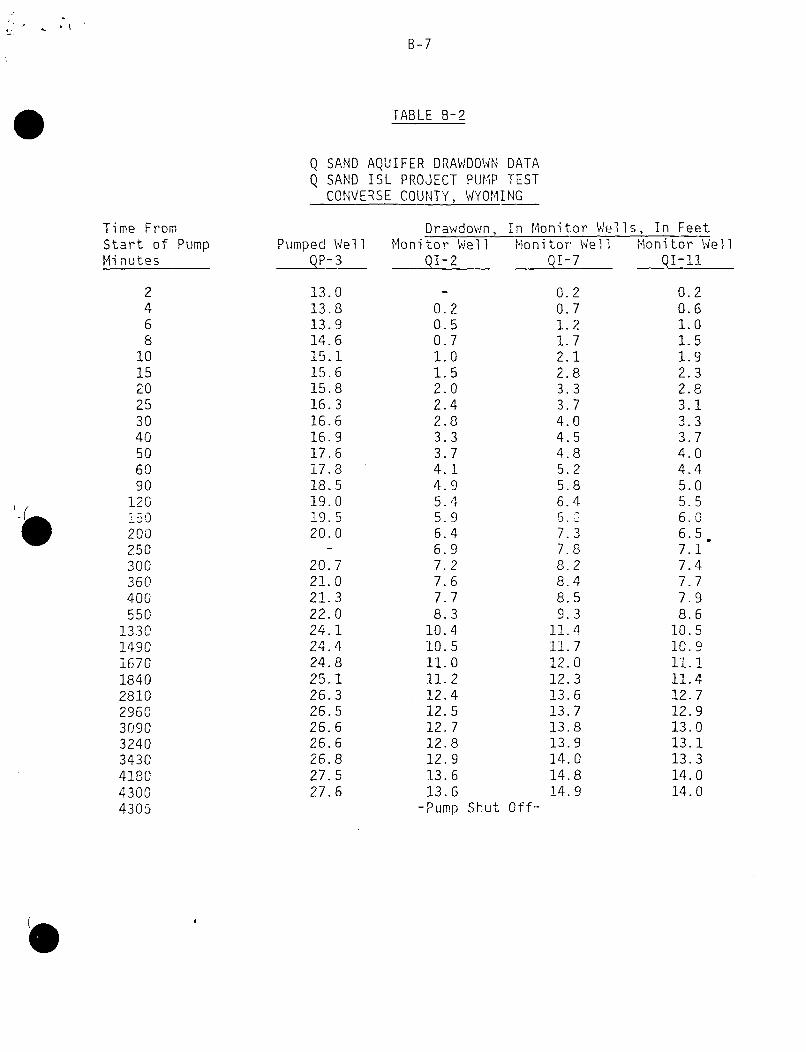
B-7
TABLE B-2
Q SAND AQUIFER DRAWDOWN DATAQ SAND ISL PROJECT PUMP TEST
CONVERSE COUNTY, WYOMING
Time FromStart of PumpMinutes
Pumped WellQ -3
Drawdovwn, In Monitor Wells, In FeetMonitor Well Monitor Well Monitor Well
QI-2 QI-7 QI-11
2468101520253040506090
120
200250300360400550
133014901670184028102960309032403430418043004305
13.013.813.914.615.115.615.816.316.616.917.617.818.519.019.520.0
20.721.021.322.024.124.424.825.126.326.526.626.626.827.527.6
0.20.50.71.01.52.02.42.83.33.74.14.95. 45.96.46.97.27.67.78.3
10.410.511. 011.212.412.512. 712.812.913.613.6
-Pump
0.20.71.21.72.12.83.33.74.04.54.85.25.86.45.2
7.37.88.28.48.59.3
11.411.712. 012. 313. 613.713.813.914.014.814.9
0.20.61.01.51.92.32.83.13.33.74.04.45.05.56.06.57.17.47.77.98.6
10.510.911. 111.412.712.913.013.113.314.014.0
Shut Off-
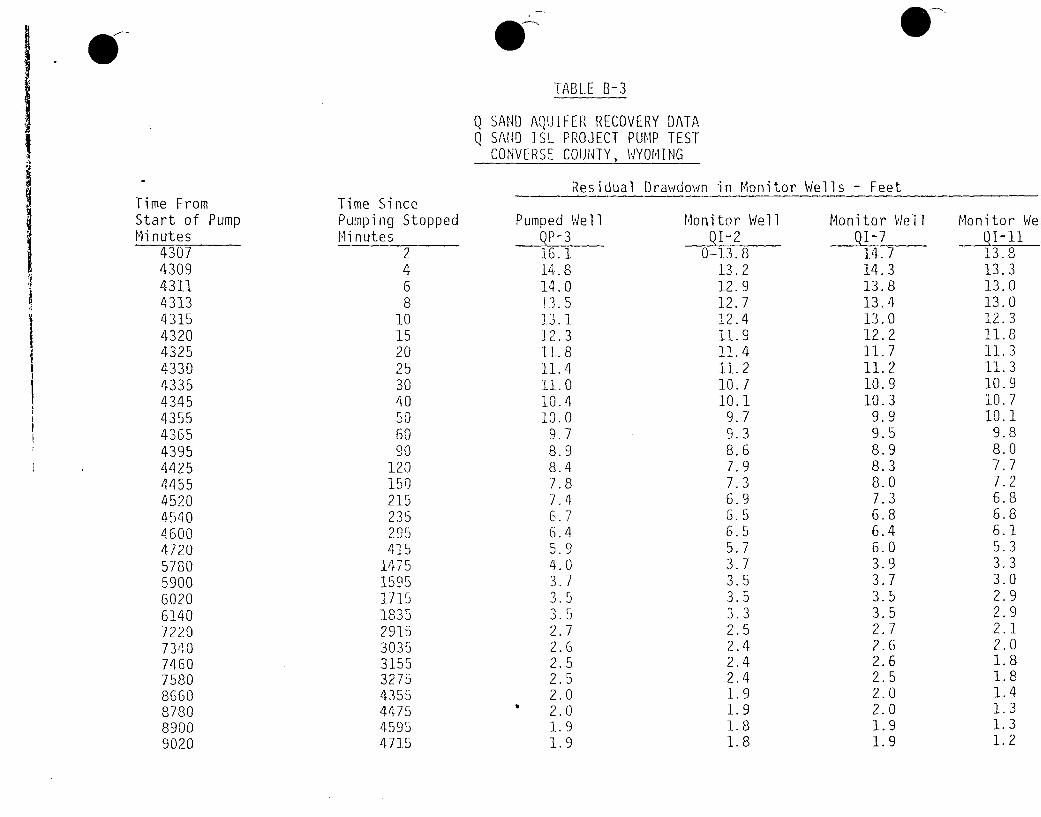
TABLE B-3
SAND AQUIFER RECOVERY DATASAND ISL PROJECT PUMP TESTCONVERSE COUNTY, WYOMING
Residual Drawdown in Monitor Wells - FeetTime FromStart of PumpMinutes
4307430943114313431543204325433043354345435543654395442544554520454046004720578059006020614072207340746075808660878089009020
Time SincePumping StoppedMinutes
2
468
101520253040506090
120150215235295415
147515951715183529153035315532754355447545954715
Pumped WellQP-316.114.814.013.51.3. 1
12.311.811.411.010.410.09.78.98.47.87.46.76.45.94.03.73.5.53
2.72.62.52.52.02.01.91.9
Mlonitor WellI-2
0=13. 813.212. 912. 712.411. 911.411.210.710.19.79.38.67.97.36.96.56.55.73.73.53.53.32.52.42.42.41.91.91.81.8
Monitor WellQ1-714.714. 313.813.413.012.211. 711.210.910.39.99.58.98.38.07.36.86.46.03.93.73.53.52.72.62.62.52.02.01.91.9
Monitor WeqI-1113.813.313.013.012.311.811.311.310.910.710.1
9.88.07.77.26.86.86.15.33.33,02.92.92.12.01.81.81.41.31.31.2
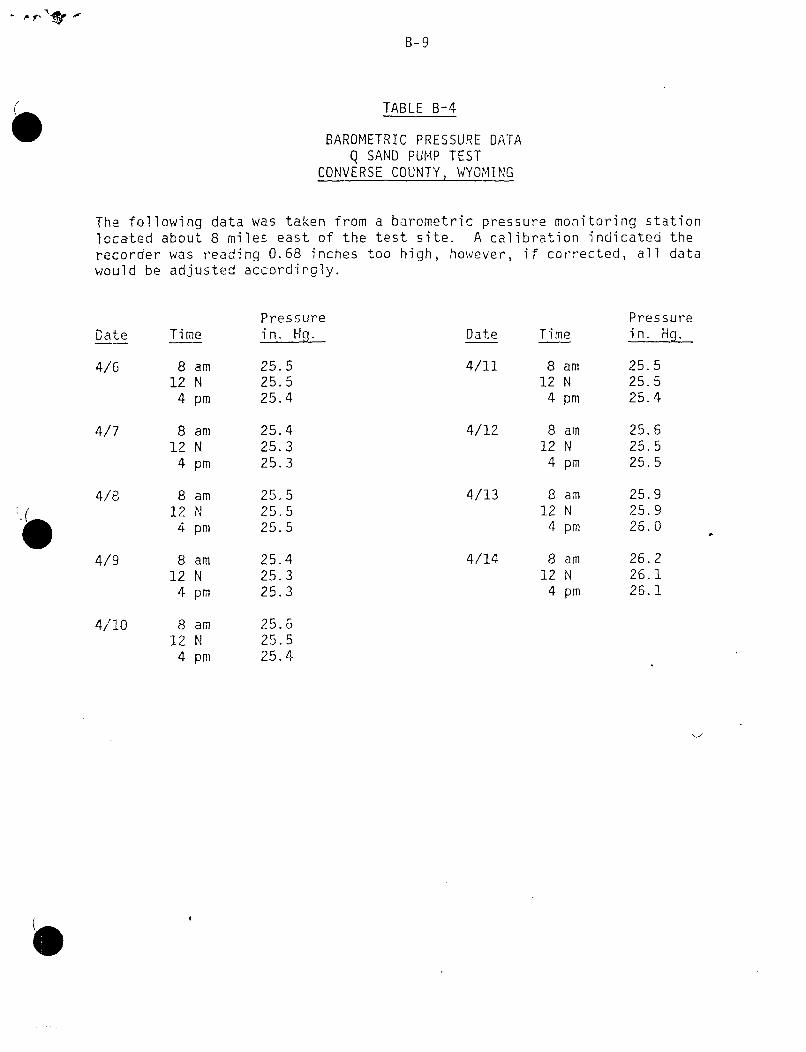
B-9
TABLE B-4
BAROMETRIC PRESSURE DATAQ SAND PUMP TEST
CONVERSE COUNTY, WYOMING
The following data was taken from a barometric pressure monitoring stationlocated about 8 miles east of the test site. A calibration indicated therecorder was reading 0.68 inches too high, however, if corrected, all datawould be adjusted accordingly.
Pressure PressureDate Time in. Hg. Date Time in. Hg.
4/6 8 am 25.5 4/11 8 am 25.512 N 25.5 12 N 25.5
4 pm 25.4 4 pm 25.4
4/7 8 am 25.4 4/12 8 am 25.612 N 25.3 12 N 25.5
4 pm 25.3 4 pm 25.5
4/8 8 am 25.5 4/13 8 am 25.912 N 25.5 12 N 25.9
4 pm 25.5 4 pm 26.0
4/9 8 am 25.4 4/14 8 am 26.212 N 25.3 12 N 26.1
4 pm 25.3 4 pm 26.1
4/10 8 am 25.612 N 25.5
4 pm 25.4

Hydrology
Attachment C
O-Sand Pilot Pump Test
The pump test at the O-Sand pilot site was conducted to
demonstrate the site was suitable for the ISL pilot project..
Multiple tests and analysis methods were utilized in responding
to NRC and DEQ questions regarding the lower '0' shale as a
confining layer. The calculated O-Sand transmissitivity values
varied from 3000 gpd/ft to 7000 gpd/ft with storage coefficients
averaging about 2x10 4. To monitor the effectiveness of the
thin lower 0 shale a monitor well was completed in the lower
O-Sand and sampled at two week intervals. Leaching operations
began in July 1984 and to date there has been no indication
of leach solution movement through the thin lower O-shale, nor
have there been any other leach solution excursions at the pilot
site. A copy of the O-Sand pump test evaluation as published
by NRC in the Environmental Impact Appraisal, except for the
tabulated fluid level data, is attached.
D6 Att. C-1
UNITED STATES NUCLEAR REGULATORY COMMISSION
ENVIRONMENTAL IMPACT APPRAISAL
BY THE
URANIUM RECOVERY FIELD OFFICE
IN CONSIDERATION OF THE ISSUANCE OF
AN AMENDMENT TO
SOURCE MATERIAL LICENSE NO. SUA-1387 FOR THE
SEQUOYAH FUELS CORPORATION
SOUTH POWDER RIVER BASIN "C011 SAND RESEARCH & DEVELOPMENT
IN SITU LEACH PROJECT
DOCKET NO. 40-8768
D6 Att. C-2
PUMP TEST REVIEWAND NRC POSITION
D6 Att. C-3
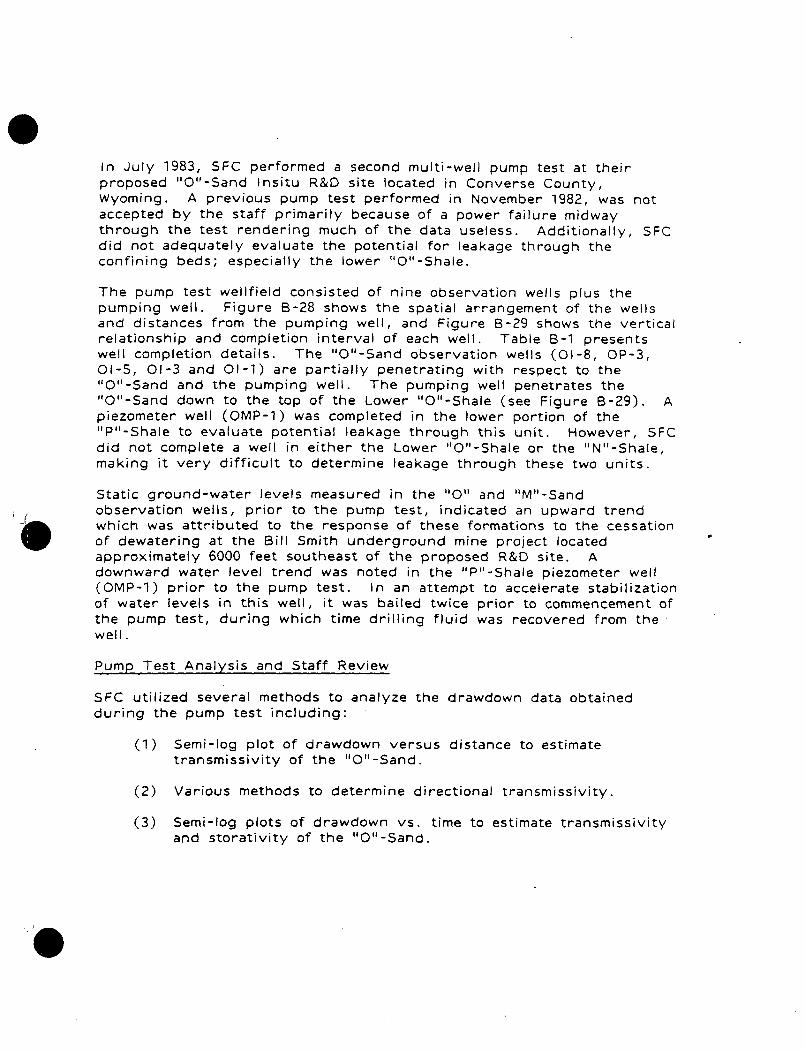
In July 1983, SFC performed a second multi-well pump test at theirproposed "O"-Sand Insitu R&D site located in Converse County,Wyoming. A previous pump test performed in November 1982, was notaccepted by the staff primarily because of a power failure midwaythrough the test rendering much of the data useless. Additionally, SFCdid not adequately evaluate the potential for leakage through theconfining beds; especially the lower "O"-Shale.
The pump test wellfield consisted of nine observation wells plus thepumping well. Figure B-28 shows the spatial arrangement of the wellsand distances from the pumping well, and Figure B-29 shows the verticalrelationship and completion interval of each well. Table B-1 presentswell completion details. The "O"-Sand observation wells (01-8, OP-3,01-5, 01-3 and 01-1) are partially penetrating with respect to the"O"-Sand and the pumping well. The pumping well penetrates the"'O"-Sand down to the top of the Lower "O"-Shale (see Figure B-29). Apiezometer well (OMP-1) was completed in the lower portion of the"P"-Shale to evaluate potential leakage through this unit. However, SFCdid not complete a well in either the Lower "O"-Shale or the "N"-Shale,making it very difficult to determine leakage through these two units.
Static ground-water levels measured in the "0" and "M"-Sandobservation wells, prior to the pump test, indicated an upward trendwhich was attributed to the response of these formations to the cessationof dewatering at the Bill Smith underground mine project locatedapproximately 6000 feet southeast of the proposed R&D site. Adownward water level trend was noted in the "P"-Shale piezometer well(OMP-1) prior to the pump test. In an attempt to accelerate stabilizationof water levels in this well, it was bailed twice prior to commencement ofthe pump test, during which time drilling fluid was recovered from thewell.
Pump Test Analysis and Staff Review
SFC utilized several methods to analyze the drawdown data obtainedduring the pump test including:
(1) Semi-log plot of drawdown versus distance to estimatetransmissivity of the "O"-Sand.
(2) Various methods to determine directional transmissivity.
(3) Semi-log plots of drawdown vs. time to estimate transmissivityand storativity of the "O"-Sand.
(4) Matching of log-log plots of drawdown vs. time to delayedyield type curves (Boulton, 1963) for unconfined aquifers andto Hantush (1963) type curves for nonsteady flow in aninfinite leaky artesian aquifer. These methods were used toanalyze for boundary conditions and leakage, respectively.
(5) Log-log plots of drawdown vs t// 2 (time/the square of theradial distance of observation well from pumping well) werematched to Hantush and Jacob (1955) leaky type curves todetermine "O"-Sand transmissivity and storativity, and verticalhydraulic conductivity (Kv') of the Lower "O"-Shale.
(6) The Neuman and Witherspoon (1972) ratio method was used todetermine the vertical hydraulic conductivity of the "P"-Shale.
Most of the methods used by SFC to analyze the pump test data were notdirectly applicable to geohydrologic conditions present at the projectsite, as discussed below.
The log-log method which incorporated the Boulton method for analysisof delayed yield from unconfined aquifers, by definition, is notapplicable to the confined conditions existing in the "O"-Sand. Valuesof transmissivity and storativity estimated for the "O"-Sand by thismethod would, therefore, be erroneous.
The semi-log method used by SFC to compute transmissivity andstorativity of the "O"-Sand ignored the early time drawdown data whichhas the same effect as ignoring leakage altogether resulting in erroneoustransmissivity estimates.
In calculating the vertical hydraulic conductivity of the "P"-Shale, SFCused the ratio method of Neuman and Witherspoon (1972). This methodrequires that a fully penetrating well be located in the pumped aquiferat the same radial.distance from the pumping well as the aquitard well.If such a well does not exist, the method allows for developingdistance-drawdown plots for all wells in the pumped aquifer to determinewhat the drawdown would be at an imaginary well located at the sameradial distance from the pumping well as the aquitard well at the timedrawdown was noted in the _quitard well. SFC used the drawdown datafrom Well 01-5 to calculate / (ratio of drawdown in aquitard well todrawdown in pumped aquifer well, both wells being the same radialdistance from the pumped well). This well does not meet the radialdistance requirement, thus invalidating the method. Also, SFC used atransmissivity value derived from the semi-log method in their calculationof tD (dimensionless time unit for the pumped aquifer) for the ratio
method. For the reasons described above, use of this transmissivityvalue further enhanced the potential for error in the calculation.
The Hantush and Jacob (1955) method for leaky aquifer analysis wasused by SFC to estimate transmissivity and storativity of the "O"-Sandand vertical hydraulic conductivity of the Lower "O"-Shale. Of all themethods used by SFC to analyze the pump test data, this methodpresents the most defensible values for the 'O"-Sand. However, SFCdid not correct the water level data for the rising water level trend.
Table B-2 presents a summary of the hydraulic properties of the"O"-Sand, "P"-Shale and the Lower "O"-Shale as determined by SFC forall the methods. As can be seen, transmissivity values varyconsiderably depending upon the method of analysis used.
At the request of the staff, SFC reanalyzed the pump test data, usingthe Hantush and Jacob method, correcting for the pre-test water leveltrend, and provided a worst case model of potential leakage through the"N"-Shale. Additionally, the staff requested that "O"-Sandtransmissivity and storativity be recalculated utilizing a method whichaccounts for leakage. Using the new,transmissivity value and theproportional method for determining s/ , SFC was to recalculate thevertical hydraulic conductivity of the ","-Shale.
SFC attempted to use the modified Hantush (1960) method, but becauseof difficulties in matching early time data and obtaining unrealisticallylow transmissivity values, the method was not considered to be useful.SFC then applied corrected drawdown data to the Hantush and Jacob(1955) method and computed transmissivities resulting in a range of"O"-Sand transmissivity values of 2977 to 4256 gal/day/ft. The staffperformed independent analyses of the pump test data utilizing the earlydrawdown data and the Hantush and Jacob (1955) method, resulting in arange of transmissivity values for the "O"-Sand of 3200 to 4400gal/day/ft. (see Table B-3).
SFC re-evaluated the vertical hydraulic conductivity of the loweraquitard system on a worst case basis using the Hantush and Jacob(1955) method on two separate, assumed situations:
Situation No. 1
SFC assumed that the Lower "O"-Sand was nonexistent and that the"N"-Shale extended to the top of the Lower "O"'-Shale giving an effective"N"-Shale thickness of 130 feet. This 4resulted in "N"-Shale 3verticalpermeabilities ranging from 2.55 x 10 cm/sec to 1.23 x 10 cm/sec.
Situation No. 2
SFC assumed that the Lower "O"-Shale was nonexistent and that the
effects of partial penetration were negligible. For this situation, SFCused the true "N"-Shale thickness (60 ft). J 4esulting values of"N"-Shale permeability ranged from 1.1 x 10 cm/sec to9.4 X 10. cm/sec.
The staff performed two separate independent evaluations to confirmSFC's reported maximum vertical hydraulic conductivity values. In the
first evaluation, the modified Hantush (1960) method was used. Late
drawdown data (after 500 minutes) of Wells 01-8 and 01-1 were matchedwith beta type curves. These two wells were used in the evaluationbecause they were farthest from the pumping well and should be affectedleast by the effects of partial penetration. Assuming a thickness of60 feet for the "N"-Shale, the staff then solved for the maximum"N"-Shale vertical hydraulic conductivity. These values are shown inTable B-3 and agree favorably with the maximum possible valuescalculated by SFC.
The staff's second evaluation was an attempt to calculate vertical
hydraulic conductivity values for the Lower "O"-Shale. Early drawdown
data for each well was fitted to Hantush and Jacob (1955) r curves, andvertical hydraulic conductivity was then calculated resulting in a 6 rangeof Lower "O"-Shale vertical hydraulic conductivities of 2.5 x 10 cm/sec
to 1.1 x 10 cm/sec (see Table B-3).
NRC FINAL POSITION
Based on SFC's re-evaluation of the pump test data and the staff'sindependent evaluations, the staff's final pgsition is as follows: 1) itappears that 3500 gal/day/ft and 1.8 x 10 are reasonable and
conservative estimations of average transmissivity and storativity of the
"O"-Sand; 2) the "P"-Shale should provide adequate confinementbecause of its low permeability (4.2 x 10 cm/sec) and its thickness(approximately 170 feet); and 3) from available data, it appears unlikelythat the vertical hydraulic conductivity of the "N"-Shale would begreater than about 10 cm/sec. Referring to Table B-4, this wouldclassify the unit as a silt to silty sand. The staff calculated verticahyc.raulic conductivities for the Lower "O"-Shale in the range of 10 to10 cm/sec. Since the geology indicates the Lower "O"-Shale to besandier and less competent than the "N"-Shale, it is probable that thetrue value f. verticpl hydraulic conductivity of the "N"-Shale is in therange of 10 to 10 cm/sec which, together with its thickness, shouldprovide adequate confinement. However, because the pump test design
did not allow for accurate definition of "N"-Shale permeability, SFC will
be required to monitor both the Lower "O"-Sand and the "M"-Sand
throughout the life of the operation.
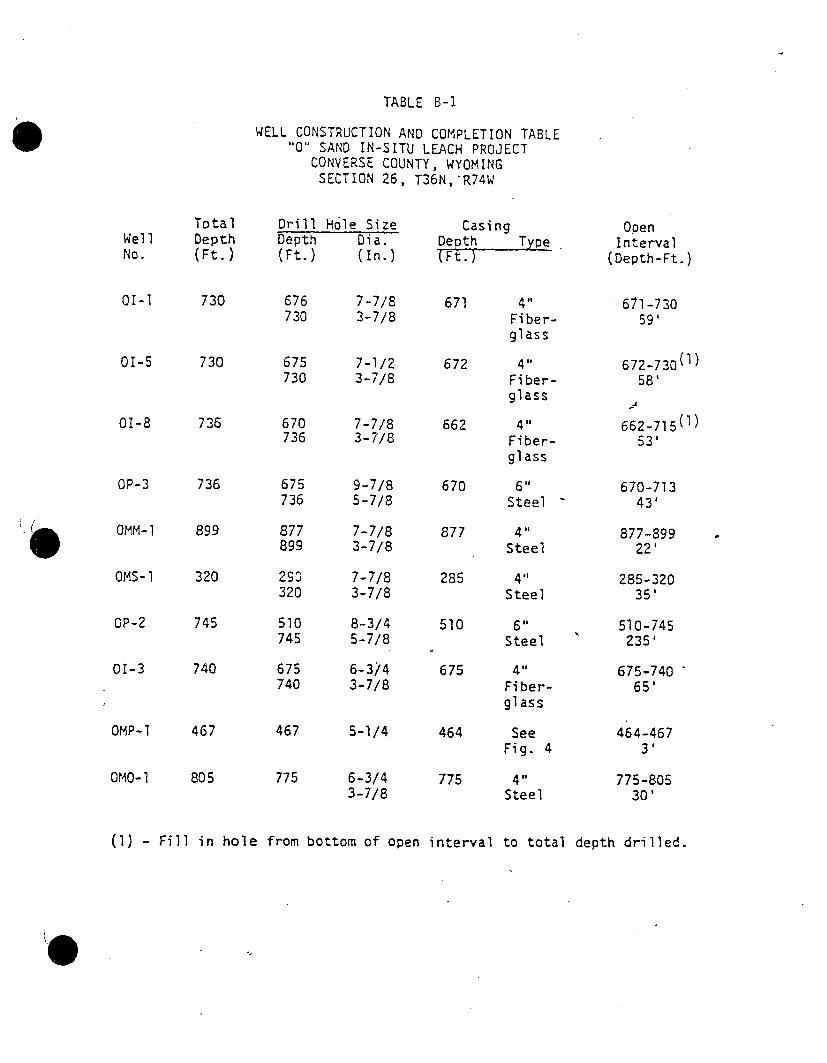
TABLE B-1
WELL CONSTRUCTION AND COMPLETION TABLE"0" SAND IN-SITU LEACH PROJECT
CONVERSE COUNTY, WYOMINGSECTION 26, T36N,'R74W
WellNo.
01-1
TotalDepth(Ft.)
730
Drill Hole SizeDepth Dia.(Ft.) (In.)
CasingDepth TypeFt.
01-5
01-8
OP-3
OMM-I
OMS-I
OP-2
01-3
OMP-l
OMO-I
730
736
736
899
320
745
740
467
805
676730
675730
670736
675736
877899
290320
510745
675740
467
775
7-7/83-7/8
7-1/23-7/8
7-7/83-7/8
9-7/85-7/8
7-7/83-7/8
7-7/83-7/8
8-3/45-7/8
6-3/43-7/8
5-1/4
6-3/43-7/8
671
672
662
670
877
285
510
675
464
775
4"Fiber-glass
4"'Fiber-glass
4"Fiber-glass
6 "Steel
4"Steel
4"Steel
6"Steel
4"Fiber-gl ass
SeeFig. 4
41"Steel
OpenInterval
(Depth-Ft.)
671-73059'
672-730(l)58'
4
662-715(l)53'
670-71343'
877 -89922'
285-32035'
510-745235'
675-74065'
464-4673'
775-80530'
(1) - Fill in hole from bottom of open interval to total depth drilled.
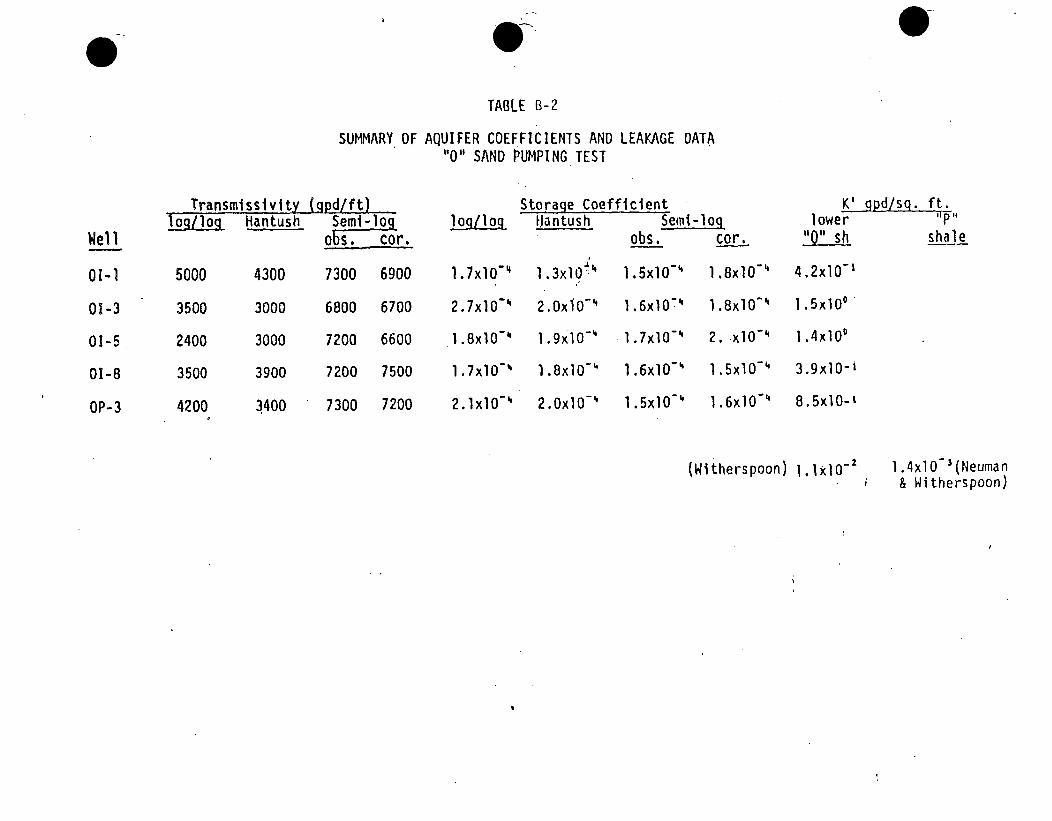
TABLE B-2
SUMMARY OF AQUIFER COEFFICIENTS AND LEAKAGE DATA"0" SAND PUMPING TEST
Transmissivitylog/log Hantush
Wel I
01-1
01-3
01-5
01-8
OP-3
5000
3500
2400
3500
4200
4300
3000
3000
3900
3400
(qpd/ft)Semi-log
o cor.
7300 6900
6800 6700
7200 6600
7200 7500
7300 7200
Storage CoefficientIog/log Iantush Semi-log
obs. cot,
1.7xl0-' 1.3x1004 15x10"4 1.8x1O"0
2.7x10"N 2.OxIO"4 1.6xl0'4 1.8xl0O"
1.8xl0"W l.9xlo"W 1.7xl0- 2..xl00-4
l.7xlO"% 1.8xl0-4 1.6xl0- 1.5xlO-4
2.lxlO"4 2,0xO-'4 .5x10-' 1.6x] 0-4
lower lP"11011 S shale
4.2xl10'
I .5xl00
1.4xl00
3.9x10-i
8.5xl0-t
(Witherspoon) lAxl02 1.4xlO- 3 (Neuman& Witherspoon)
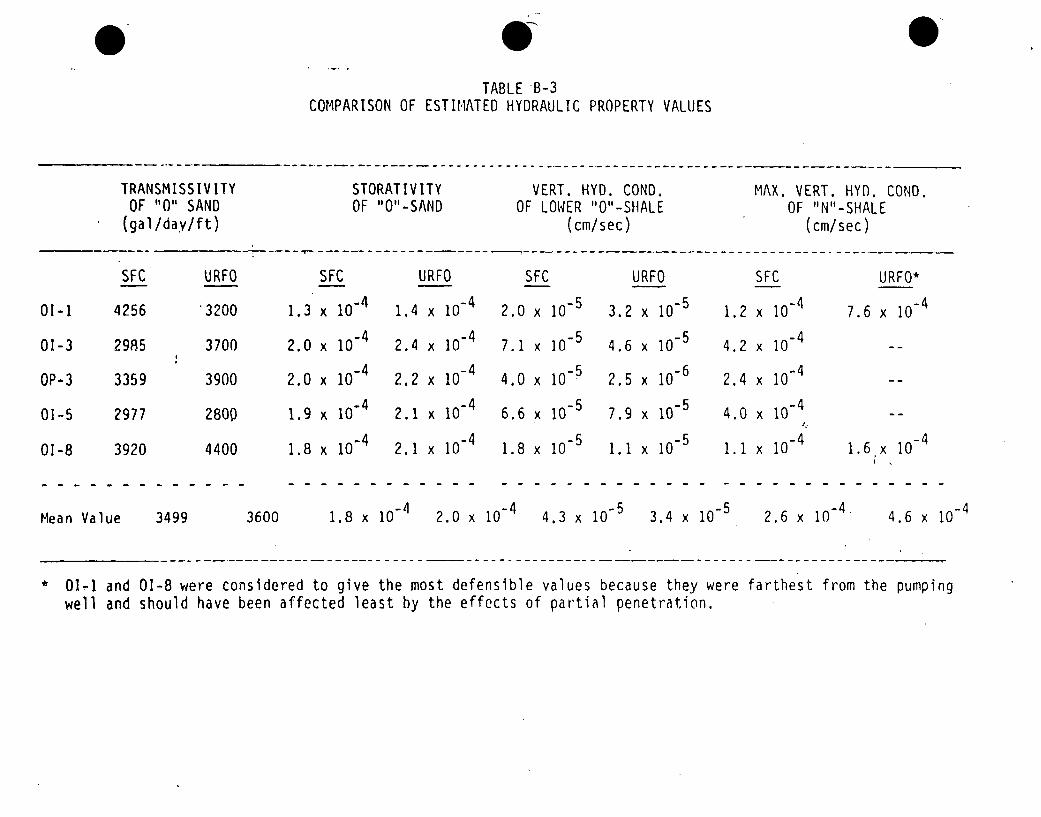
TABLE B-3COMPARISON OF ESTIMATED HYDRAULIC PROPERTY VALUES
TRANSMISSIVITY STORATIVITY VERT. HYD. COND. MAX. VERT. HYD. COND.OF "0" SAND OF "O"-SAND OF LOWER "O"-SHALE OF "N"-SHALE
(gal/day/ft) (cm/sec) (cm/sec)
---------- ------------- ----------i-- - - - -
SFC URFO SFC URFO SFC URFO SFC URFO*
01-1 4256 3200 1.3 x 10⁻⁴ 1.4 x 10⁻⁴ 2.0 x 10⁻⁵ 3.2 x 10⁻⁵ 1.2 x 10⁻⁴ 7.6 x 10⁻⁴
01-3
OP-3
01-5
01-8
2985
3359
2977
3920
3700
3900
2800
4400
2.0 x 10⁻⁴
2.0 x 10⁻⁴
1.9 x 10⁻⁴
1.8 x 10⁻⁴
2.4 x 10⁻⁴
2.2 x 10- 4
2.1 x 10⁻⁴
2.1 x 10⁻⁴
7.1 x 10⁻⁵
4.0 x 10⁻⁵
6.6 x 10⁻⁵
1.8 x 10⁵
4.6 x 10⁻⁵
2.5 x 10⁻⁶
7.9x10⁻⁵
1.1 x i0-5
4.2 x 0-4
2.4 x10⁴
4.0 x 0-4
1.1 x 0-4 1.6 x 10⁴
Mean Value 3499 3600 1.8 x 10⁻⁴ 2.0 x 10⁻⁴ 4.3 x 10"5 3.4 x 10⁻⁵ 2.6 x 10-47 4.6 x 10-4
* 01-1 and 01-8 were considered to give the most defensible values because they were farthest from the pumping
well and should have been affected least by the effects of partial penetration.
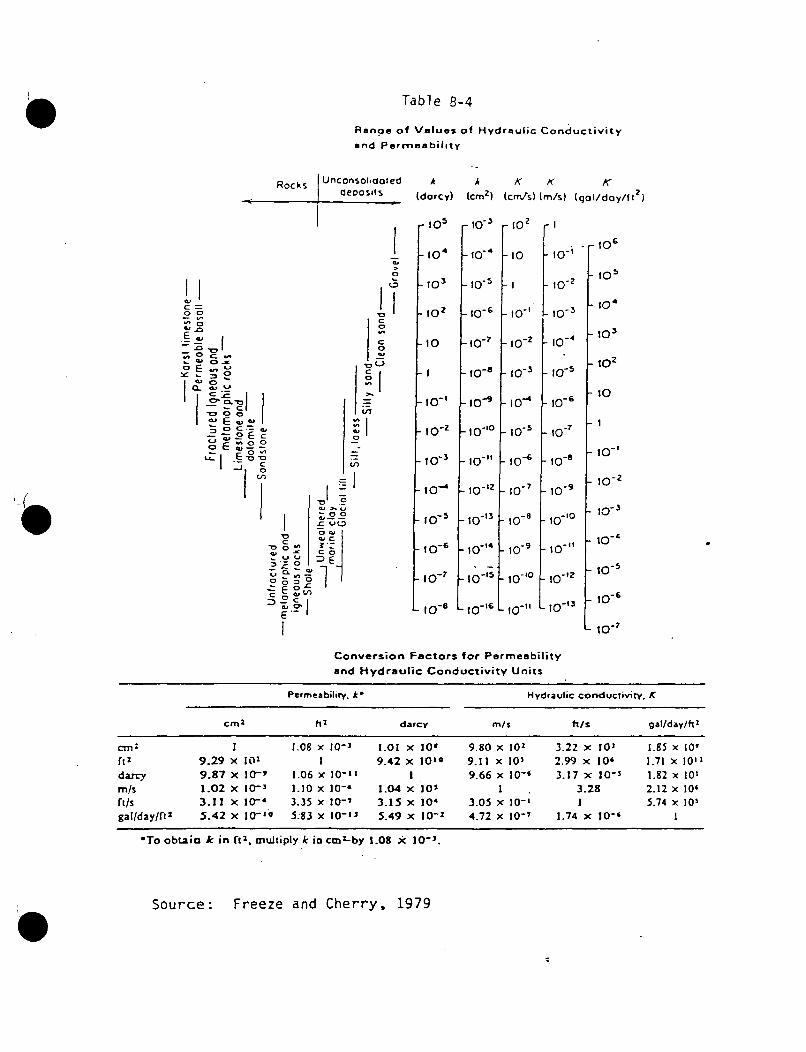
Table B-4
Range of Values of Hydraulic Conductivity
and Permeability
Rocks UnconsolihoaedCeposits
-E
c3 E
CC-
C
C,w
C-
w a,C 0
E 00
ww
IE
A(dorcy)
I104
-102
-to-,
-10-3
-0'-'
I 0 5
_10-6
-10"
-10-1
A(cm2)
-10-4
210-5~
_10-6
_10-7
10-8
_10-9
K K K
(crrJs) (m/s) (gol/day/ft
-0to I
,0 -0 -Io
10I
- I i0"2 -0
-t0- to 0_i0-2 10-3
So-Z 0-4 10
102- 10 -3 o0 "5
- 6I - 8 10-
-10' -o I
-to- - 109 - 0-2
.10-9- to IO - j -
.10-o -10-12 - o10 -i 10a -10-'
- 10-" 10 - t3
- l0-14
to-16
Conversion Factors for Permeabilityand Hydraulic Conductivity Units
Permeability. k'
cm2
fh2
darcy
C12 1 1.08 x 10⁻³ 1.01 x 10'
ft2 9.29 x IO1 i 9.42 x 10'0darcy 9.87 x 10-' 1.06 x 10⁻¹IMIs 1.02 X 10⁻³ 1.10 x 10-' 1.04 x 10Irt/s 3.11 x 10⁻⁴ 3.35 x 10⁻⁷ 3.15 x 10⁴
gal/day/Il2 5.42 x 10⁻¹⁰ 5.83 x 10⁻¹³ 5.49 x 10⁻²
*To obtain k in Wt., multiply k in cm=L-by 1.08 x 10⁻³.
Hydraulic conductivity. K
m/S his gal/day/lh2
9.80 x 10² 3.22 x 10³ 1.85 x 10'9.11 x 10⁵ 2.99 x 10⁶ 1.71 x 10129.66 x 10-6 3.17 x 10⁻³ 1.82 x 10l
1 3.28 2.12 x 10'3.05 x 10⁻¹ 1 5.74 x 1054.72 x 10-7 1.74 x 10⁻⁶ 1
Source: Freeze and Cherry, 1979
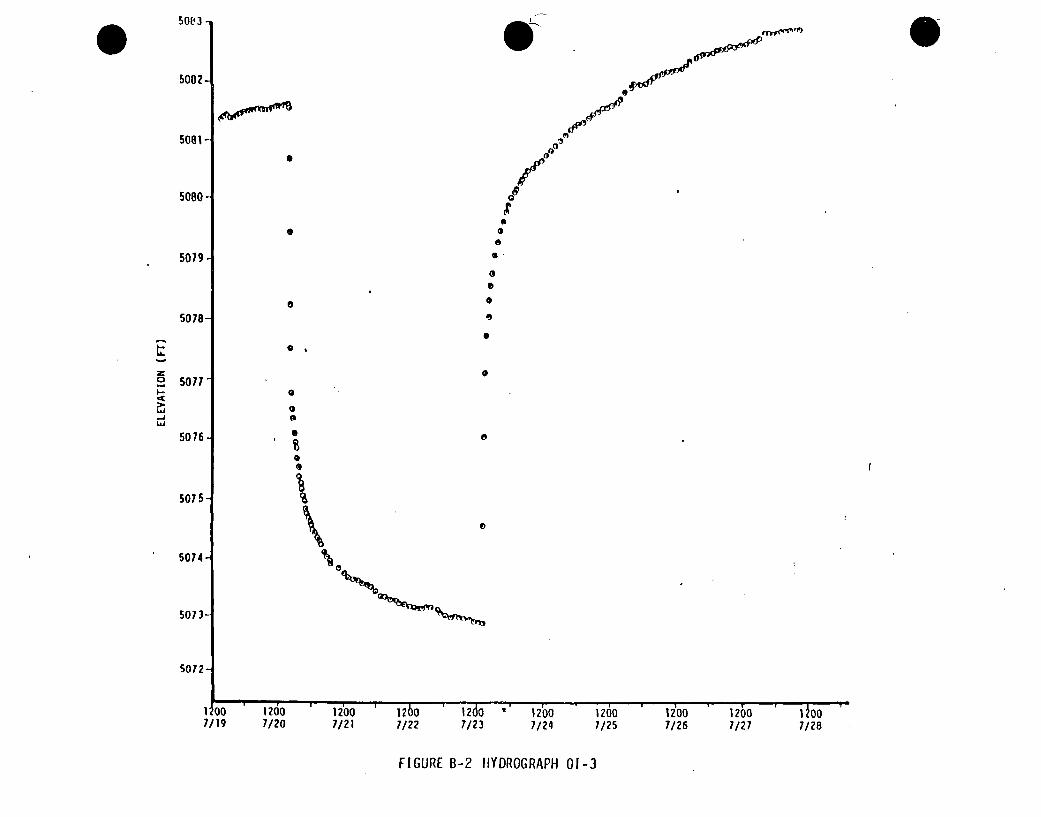
5002
5081-
50801
50179 -5
S
5078-
5 071-5073-
5075-5014
5074-3
5072-
1 0o 120 1 ioo ' 1260 12do 12bo 1260 1 ioo 12600 1hoo7/19 7/20 7/21 7/22 7/23 7/24 7/25 7/26 7/27 7/28
FIGURE B-2 HYDROGRAPH 01-3
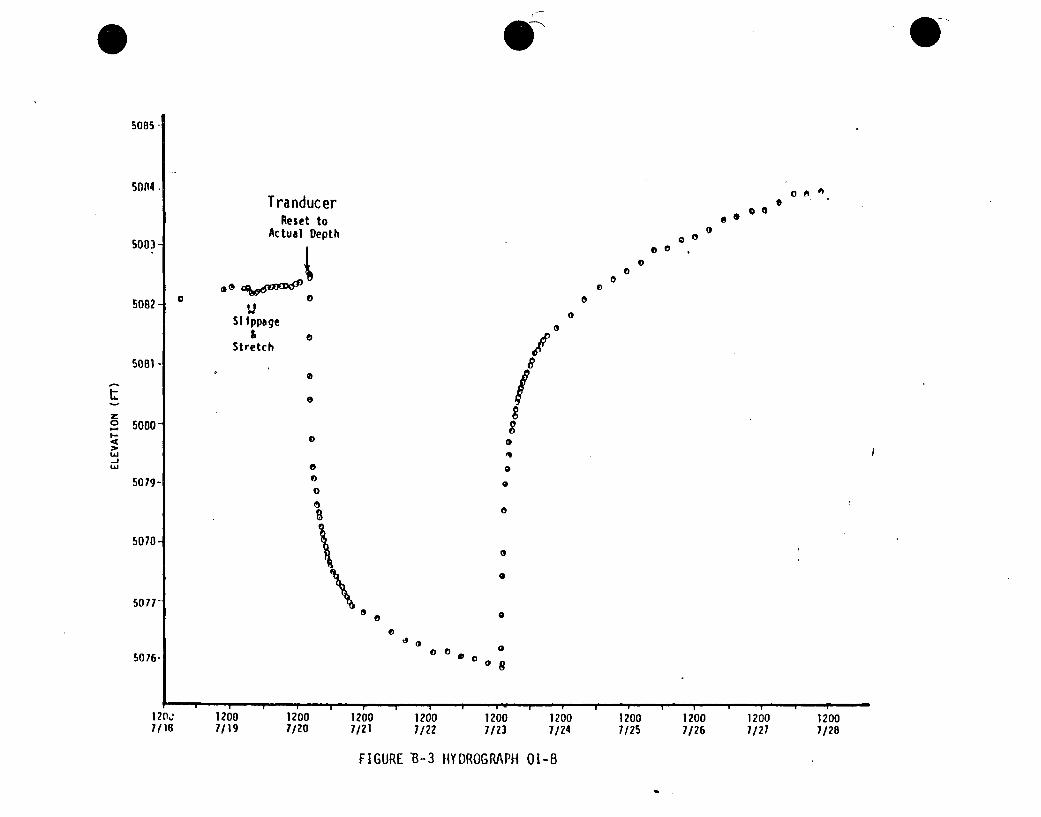
5085 -
5004.
5003-
5082-
50B -
TranducerReset to
Actual Depth
Sl Ippage& S
Stretch
0
0
0
S
0
000 0a
00 0
0a
00
00
0
0
0
w-Al.A
5000
S
/
/g
0
q
0
0
0
S
S
0
I5079-
5070-
5017-
5076-
1 (i
7/18
a
0
0 0 0008
I I f I I I
12607/19
12007/20
12607/21
120071/22
12007/23
120071/24
120o7/25
12007/26
12607127
12007/28
FIGURE 1B-3 IIYDROGRAPH 01-8
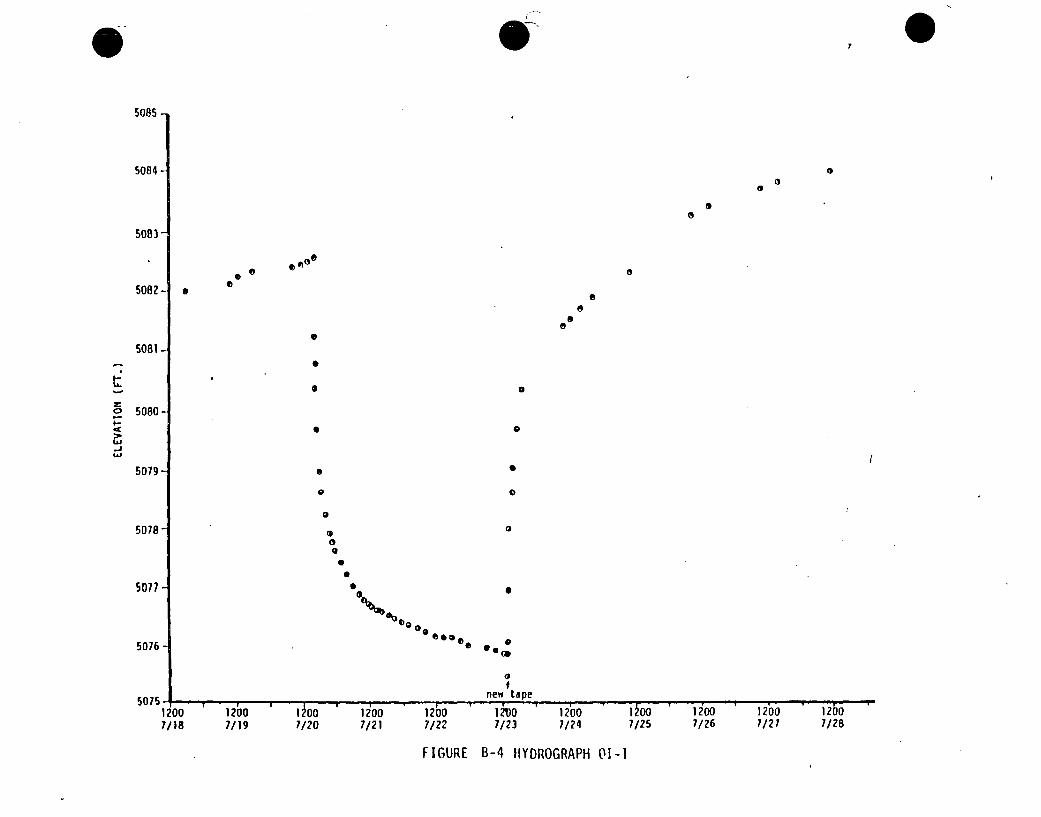
0
5085 -
5084 -
5083-
5082-
5081-
a0
a
0a
a
0a
a
SES
E0
9-
-a
0
0a
5080-
0
I5079-
5078-
5077-
5076-
S
0 0
0
S00
00
S
0., *~,
a
0
0Sg
0
new tine1M00 v20 10 ~ 0 10
12007/18
1200 i1ho7/19 7120
I i/7121120 120 12 ýD •1 .-
7122 7/23 7124 7/25 7/26
FIGURE B-4 HYDROGRAPH 01-I
12007127
1 2bo7128
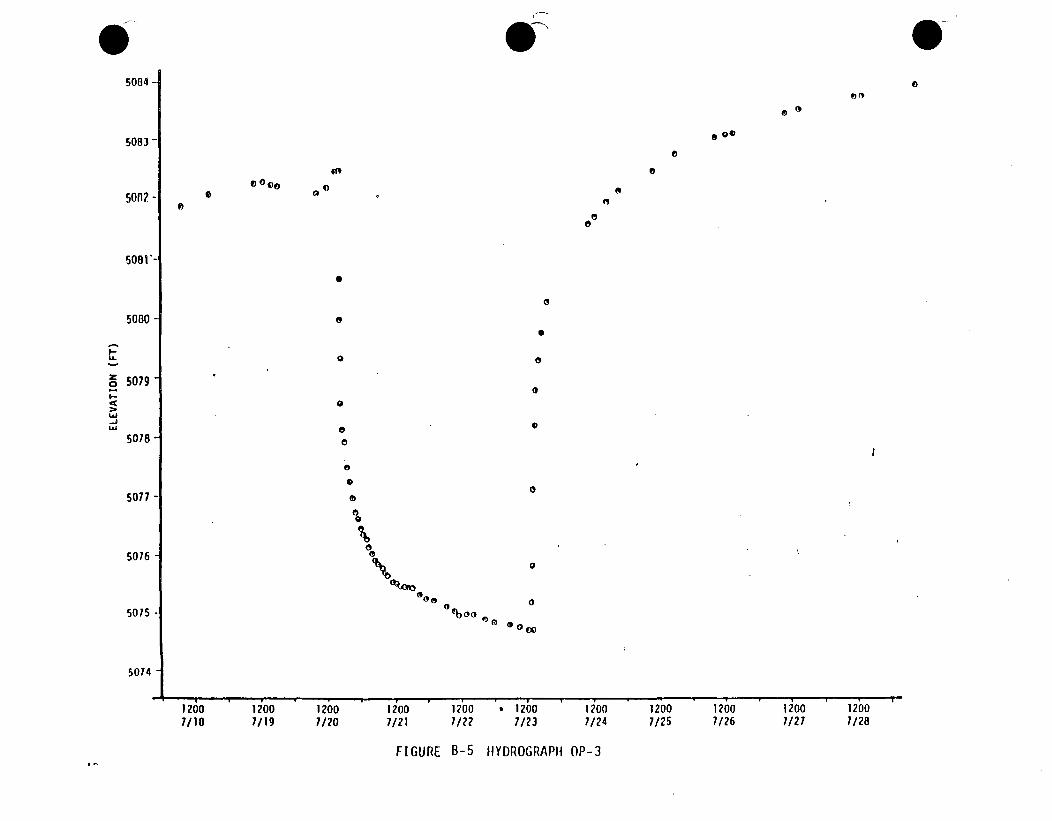
5004
5083 -
0EW0 0
508?'- 50
5081 -So
5078"-5080
S076 -
I..-'". 0
o 5079
.--
L.J 05078 0
S0
5076
5015 *0oo 00
5074
1260 1200 1200 1200 1200 , 1200 1200 1200 1200 1200 12007118 7/19 7/20 7/21 7/22 7/23 7/24 7/25 7/26 7/27 7/28
6
FIGURE B-5 ttYDROGRAPIt OP-3
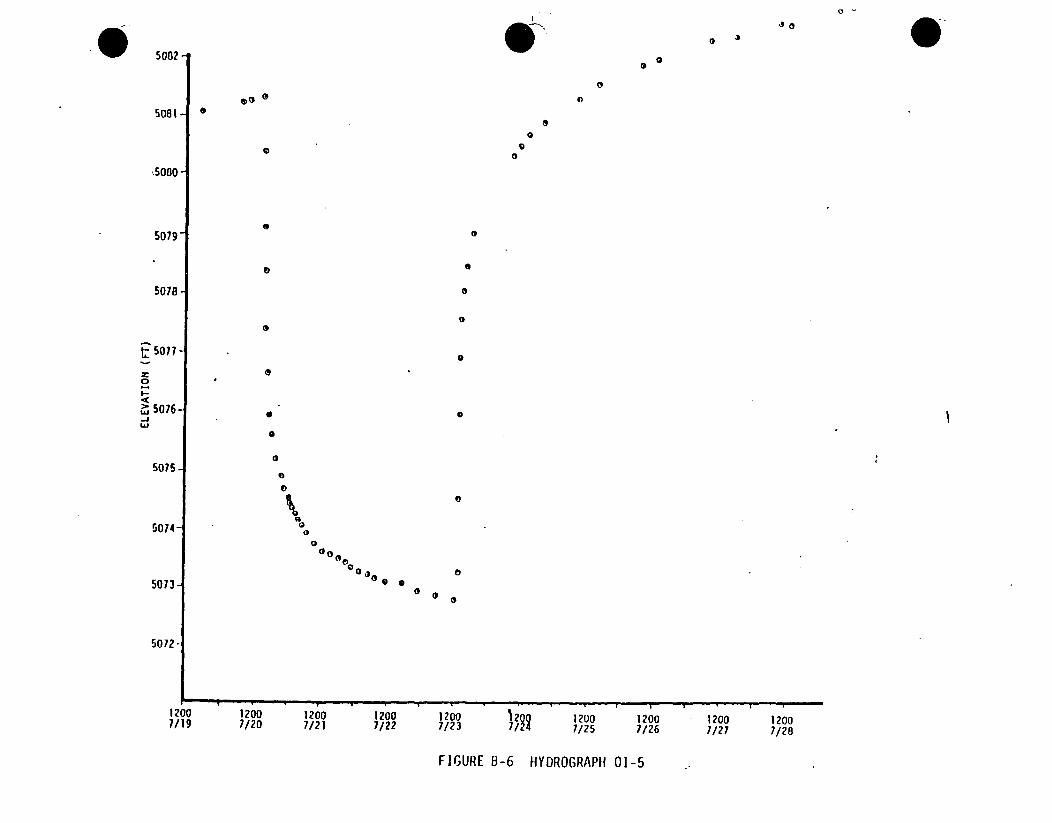
I -
e •° 0
5002 .
5081S
0
%5000-
5079-
5078 -
S5077-z0
Eo "
5075
I5-5076, '
5075- 0
0
5074-00
00000
5073- 0 • •
5072
1200 1200 1200 1200 1200 12 1200 1200 1200 12007/19 7/20 7/21 7/22 712 7/25 7/26 7/21 7/28
FIGURE B-6 HYDROGRAPH 01-5
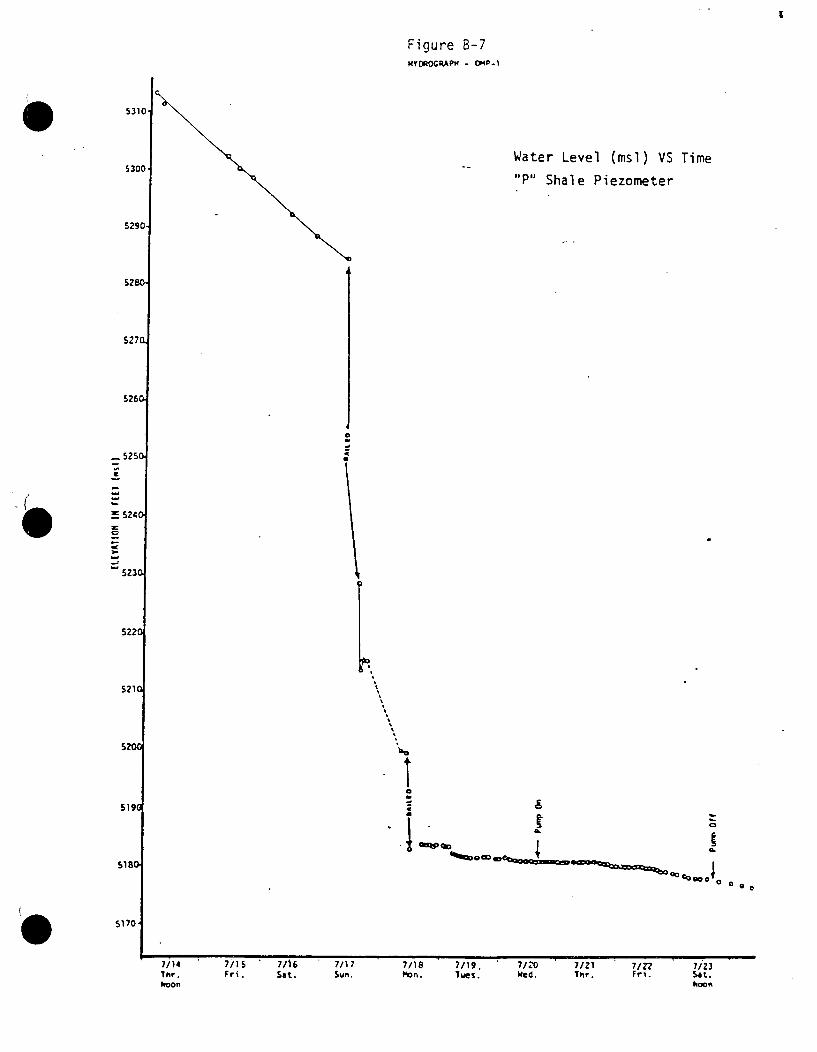
5310
5300
SZ90
5280'
527CI
5260.
5250a
S5240
523n
5220
521C
519•
5180
5170
0
S
Figure B-7HYDROGRAP - MP-)
Water Level (msl) VS Time
"P" Shale Piezometer
0
McpI* ft w o o~~a c c w q oj* 0
7/147 hr.Noon
7/1 ' 7/16 7/17Fri. Sat. Sun.
7/18 7/19, 7/20 7/21 7/22Pon. Tues. Wed. Thr. Fri.
7/23
hoon
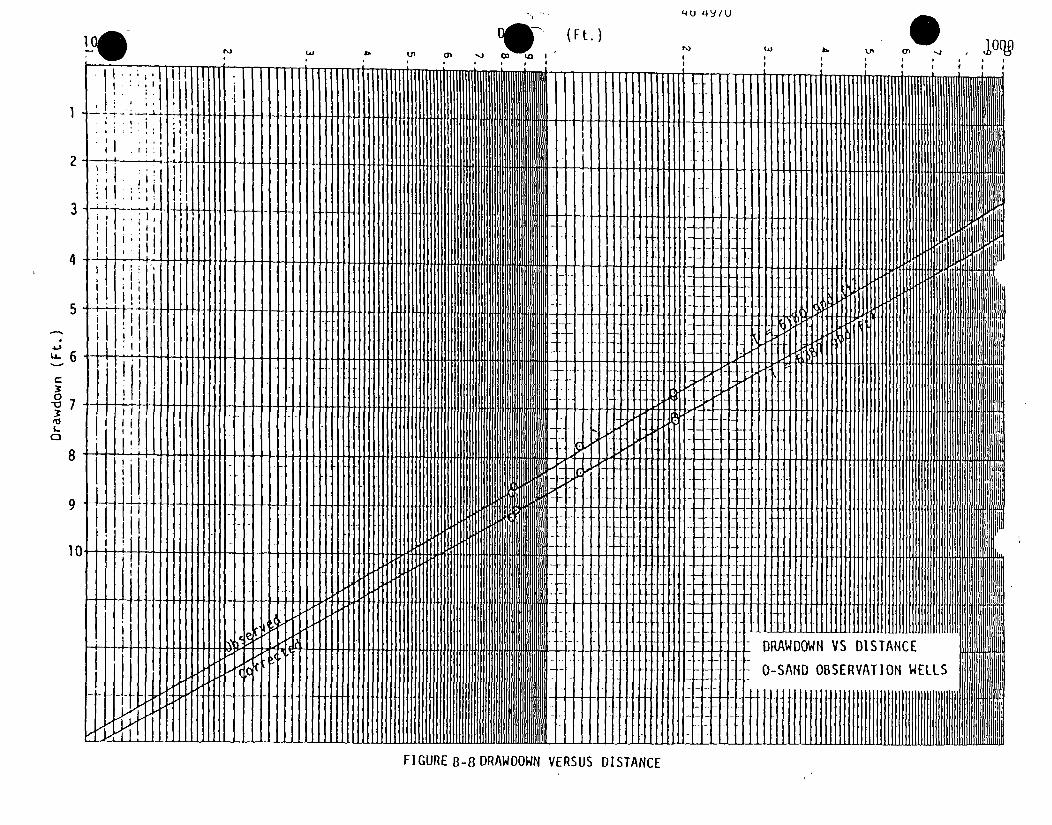
qu 14viv
21-
4]
5-
~.0@
It
H
-Fl-iII21
II .1.1
~ll
I I
ii ~ I
* _ , ( F t -I 1
13' Cr0
TBI III IK~EEN~ IF I A-1 I I I I I I I I I I Ml I 11 F-T-1- " T-T-1 1 1 1 1 1 1 1 1 1 1 1 1 1 1 1 .1 ..... .ni ...
i
1-i-l--t-f-1--f--tt- fli f III II I I ll l------4I-I44-- R41 EI4Mf I I
I l lIlIl1 ll11 111 1 1 ! f H-f+4444*ýýýý
E lIIIILII flflT[1TUFTrMM~~TI I • 1 1 I 1 1 1 • I I I i I I I I I I I I I I I I I I I I I I IIIIIIIIIIIIIIIt I I .
11 f FTT l 11 i 1 H ., 111, 1, 1I i i i i i i i i i i i i i i i ! ! ! i i i i ! ! i itI 1.~
0to
LC3
fill0
IIIII
7 ----
II II
9.
10 TII If I
lil -ý4illlATl
SeDRAWDOWN VS DISTANCE
O-SAND OBSERVATION WELLS
wL7
FIGURE B-8 DRAWDOWN VERSUS DISTANCE
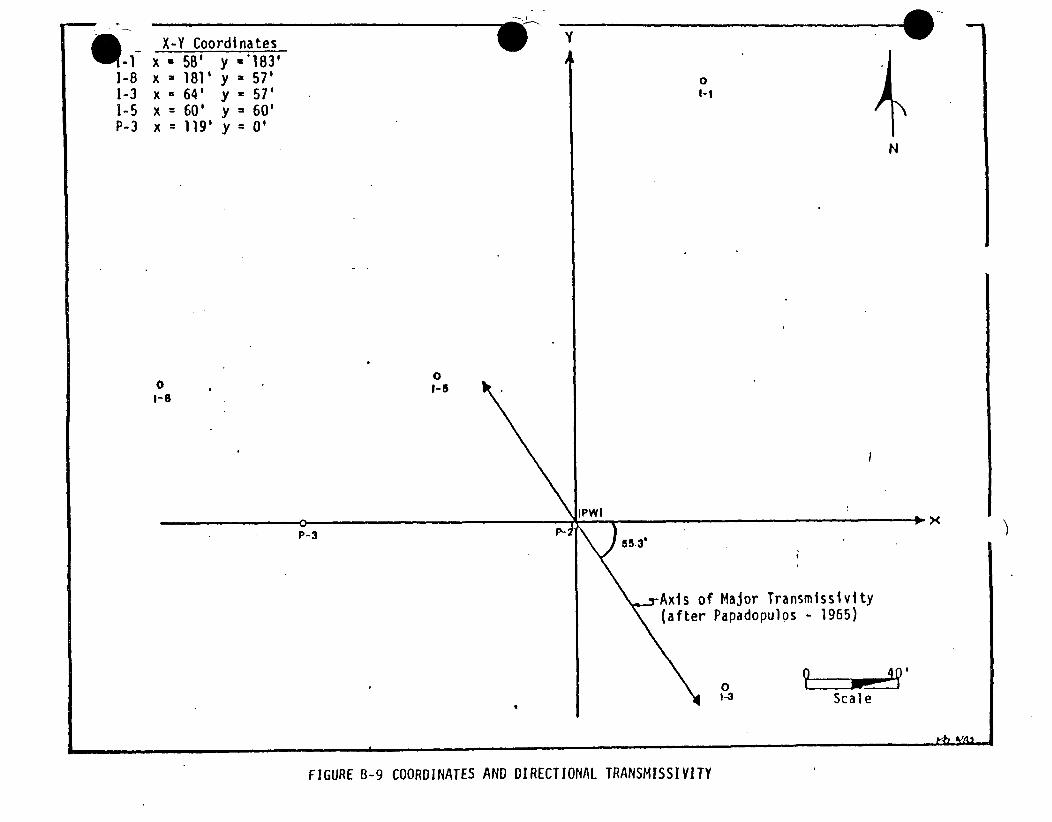
X-Y Coordinates y0 -1- x - 58' y -'183' .
1-8 x - 181' y - 57' o1-3 x = 64' y = 57' I-k1-5 x = 60' y = 60'P-3 x = 119' y = 0' N
N
0 0-0 .I-
IPWIwl 00 X
-Axls of Major Transmissivlty(after Papadopulos - 1965)
•-a Scale
FIGURE B-9 COORDINATES AND DIRECTIONAL TRANSMISSIVITY
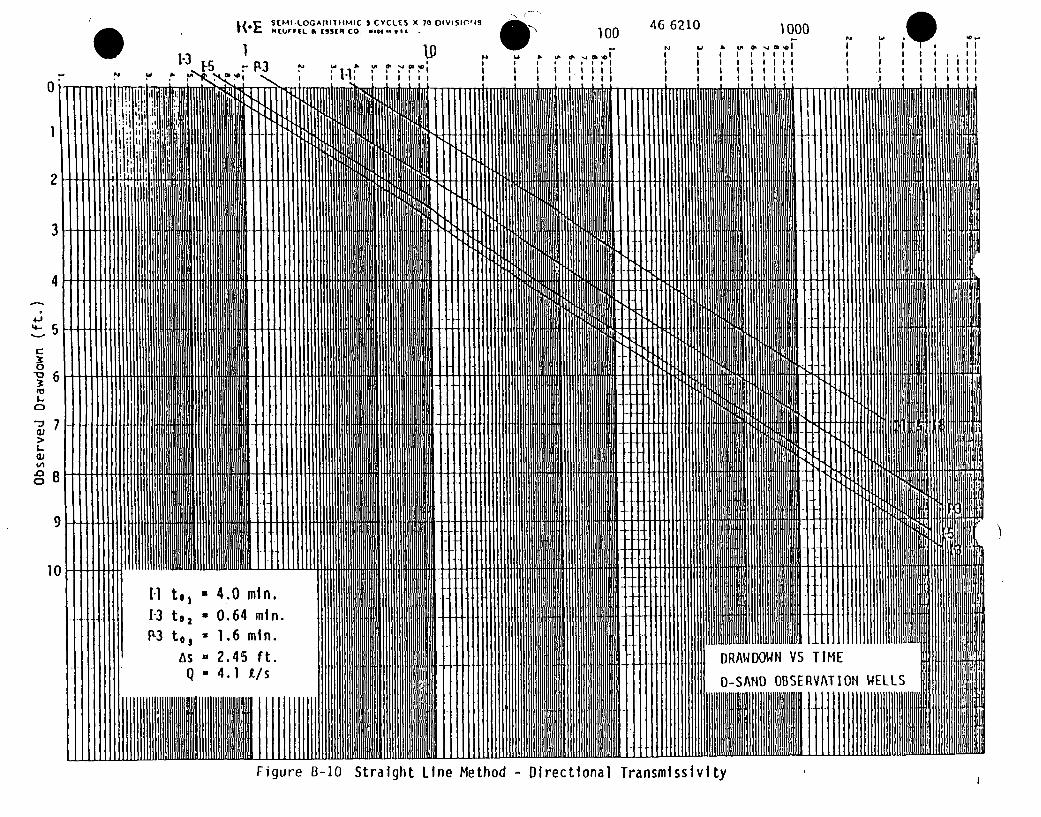
I(-1
SEMI-LOGAfITIIMIC s CYCLES X 70 oIVISIC'15 46 6210KE,,,O,,,. &ESE CO, c M ......... . 10O0 1000lut . . . N •' , , ,
uO" , .'4.,=rI• •8i ,, , I , , ,N I I I I I 11111 I I I I I I III
I I I I I I I I ,I I I 11I I
n| n.
.iin.
ft. DRANDOWN VS TIME
&/s O-SAHD OBSERVATION WELS
Figure B-IO Straight Line Method - Directional Transmisslvlty
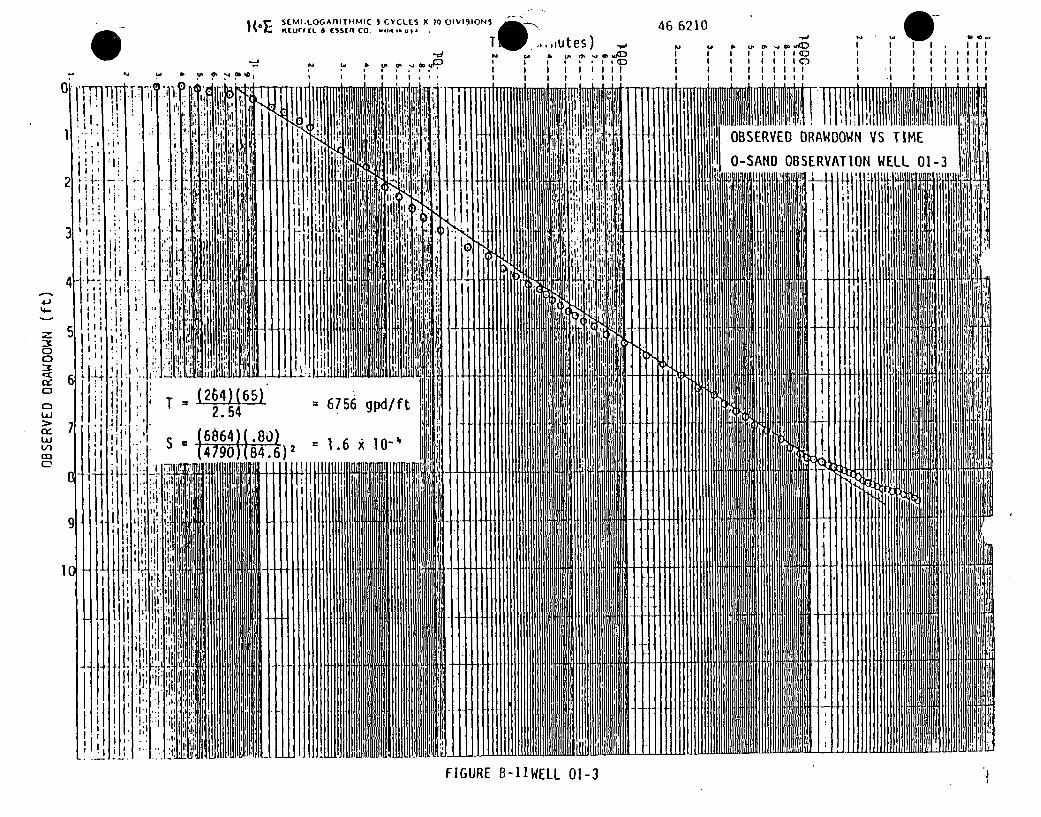
W(E KEU, .LOGAfIIIIIMIC 3 CYCLES X( 70 01VISIONSr[L 6TESSEReCO 46 6210
!JI II I
w!I!
III!
I!II
I I Ir
I I I I I. IllI I I I 11111I I I I 11111I I I I I liiiI I I 1111 I
RAWDOWN VS TIMEOBSERVED 0
O-SAND OBSERVATION WELL 01-3
4J3
0
ww)
-I
FIGURE B-11WELL 01-3
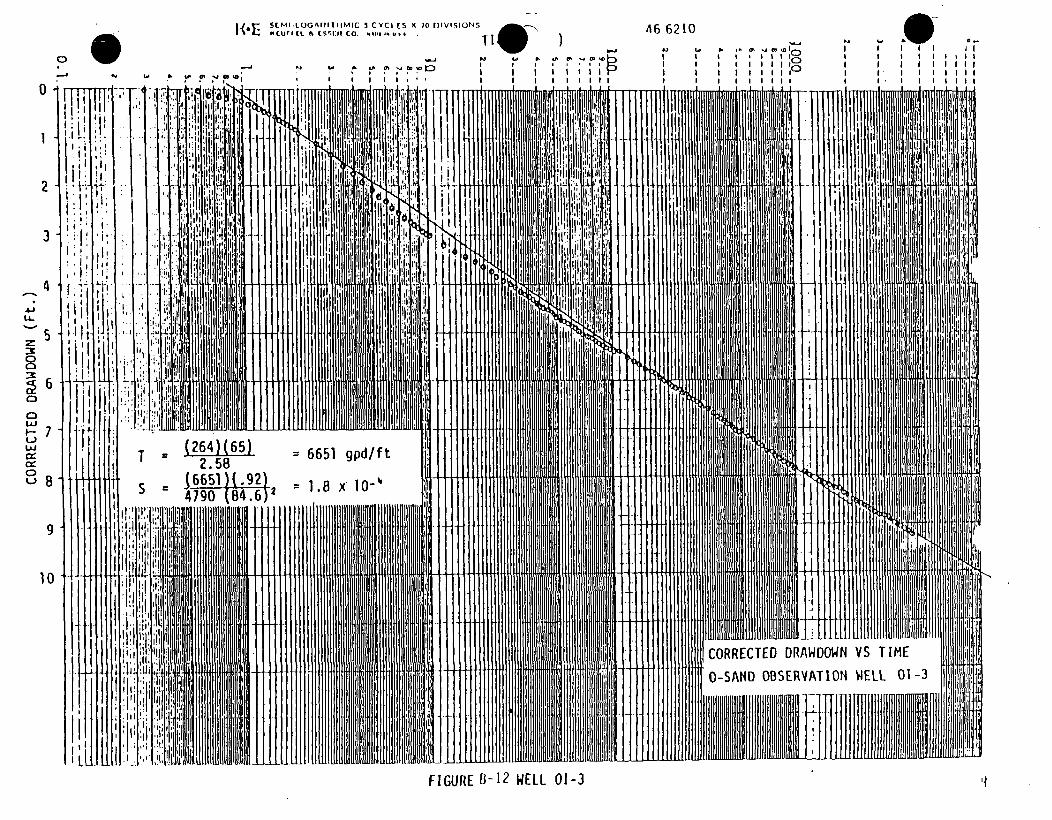
[email protected] I IMIC 3 CYCLES X( to LIVgSIONSH t~fD(L f E51.1I :1 O. ... ,.. T., .
*J 1
46 6210
C, 0'
I I
-J
p,I|I
"I ~ ICc,
I I I I 123I I iIiP
|I!!U' A.
0-
2-
3-
4.
5J
6
7
C)
9
10
TV
'U'I
= 6651 gpd/ft I= 1.8 X 10-"
fIl]I
U'CORRECTED DRAWDOWN VS TIMEO-SAND OBSERVATION WELL 01-3
I
FIGURE 6-12 WELL 01-3
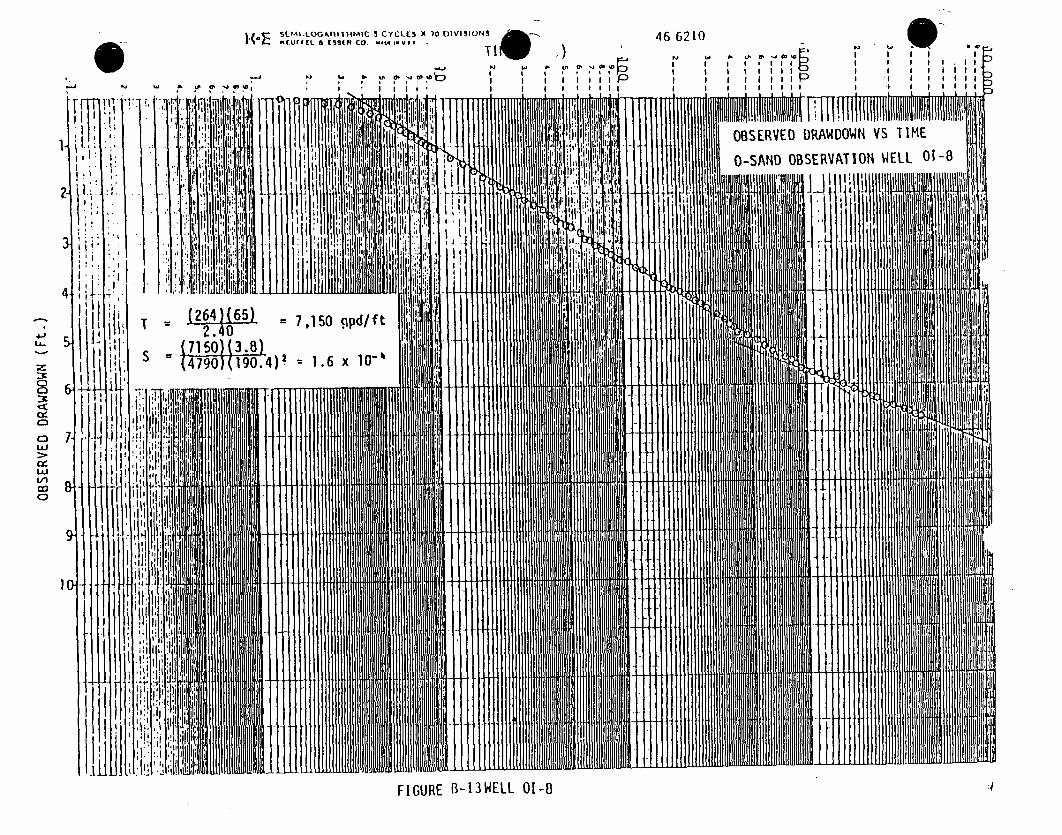
-A
~StMVI.LODGAP1~TV4MIC 5 CYCLES XC 70 DIVISIONS
HCUFI ESSE CO 1-u
I g
yi
46 621(b U' ~
I I. II~I I 1111I I I I I II I I I I I I I
IIII
0
n11
• I!!IiII!I~iI~ll I',I I I !I III IIIII!I~IIIIIIII',IIIIIIIIIiIIOBSERVED DRAWDOWN VS TIME
O-SAND OBSERVATION WELL 01-8
Kill
d/ft
t
:3C
0:
LAJ
Lio
C0
T
S
(264)(65) = 7,150 p
17550)(3.8 1 )2(7-90)(190.4)2 = 1.6 x 10-"
K
I 1t~I1iI
I-1
IIFIGURE B-13WELL 01-8
I-1
I]]
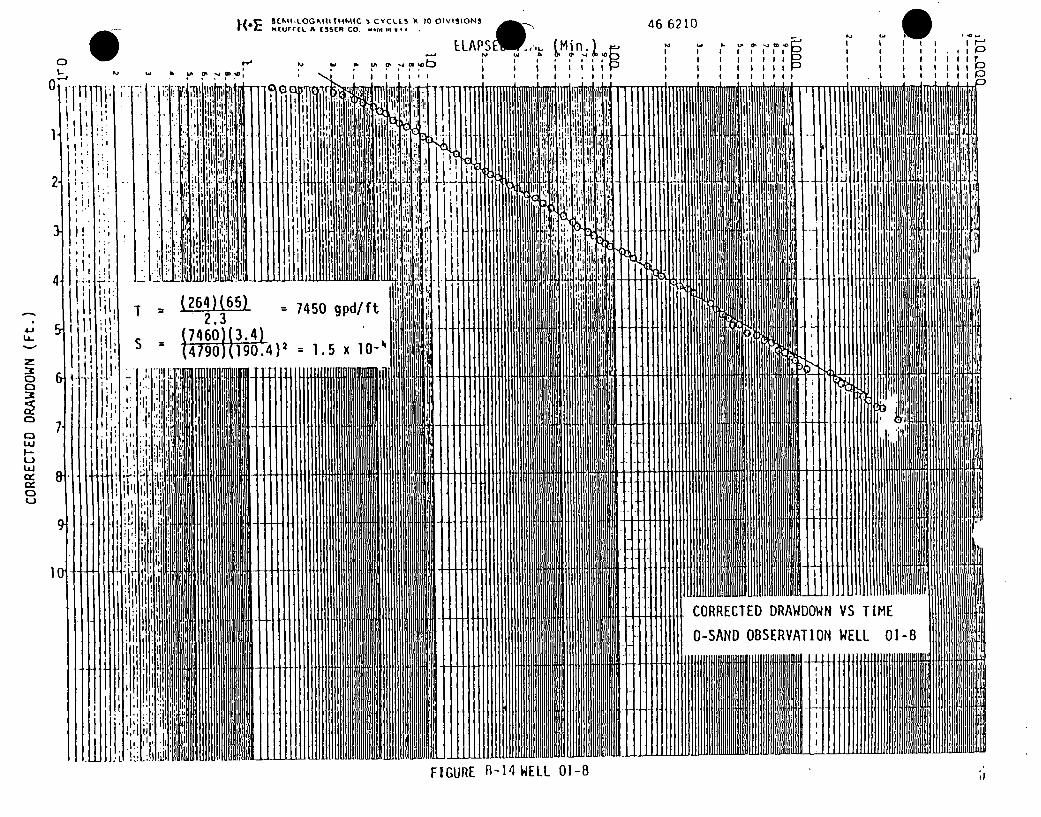
K(Urr(L A ESSER CO. wlA b I" v I A
I I a-Iwr•1 ' I I I I I ' I I I I I , I I
46 6210
I I I I I I gI I I IIlI II
I I I I I I I I I
III!
'7II1
01-- - b
Pm1 2-Ti~
II
T
S
= (264)(65)2.3
(7460)(3.4)(4790(1 90.4
IL i m i
I[= 7450 gpd/ft
)2 = 1.5 x 10-" mlI
tI'II
-I t111 CORRECTED DRAWDOWN VS TIME
O-SAND OBSERVATION WELL 01-8
FIGURE B-14WELL 01-8liuhlilt
I)
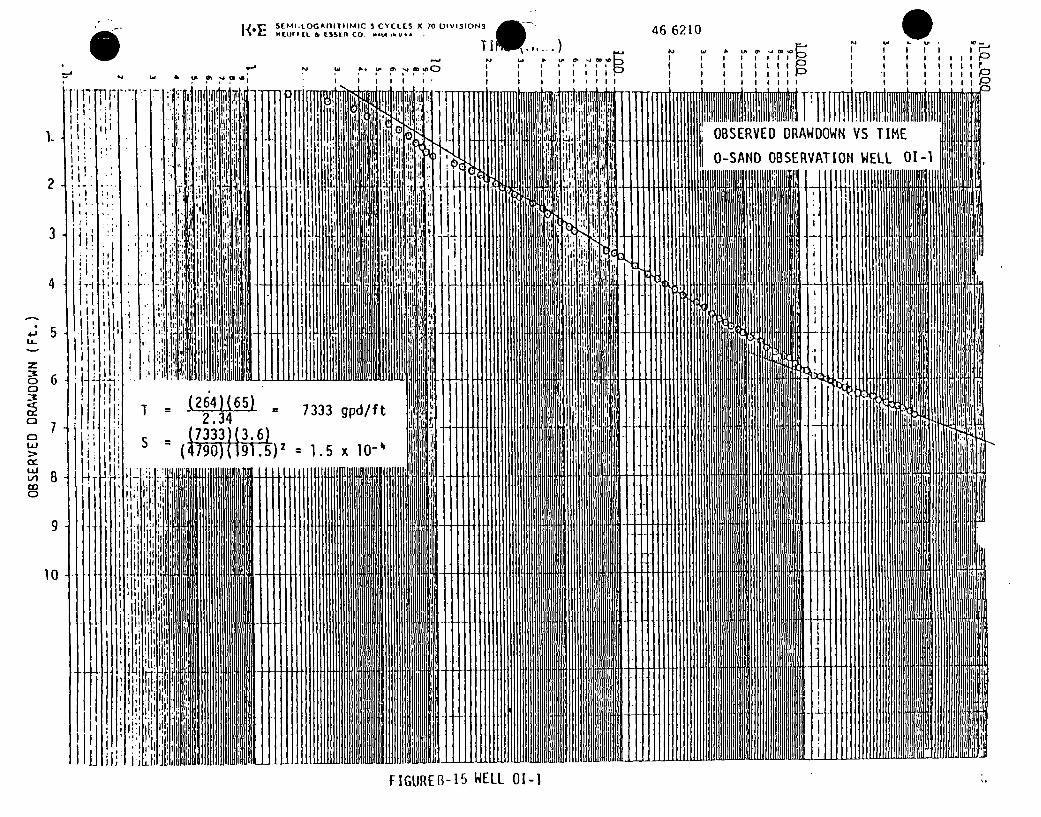
S(MI-LOGAMIT IMIC 3 CYCLES X 70 DIVISIONSK4. -E~FL6 SE OIiL ilriL. LS~f C.T1...
46 6210
N 6C & CJ
- N Id S.
I I
I.
2
3
4
U' ~
II1~LI Ii
till ~ 1**1I t~!I ii ~Iii ii
I I
I I I I II I I II
N!II
A I I
I II I fill
I OBSERVED DRAWDOWN VS TIME
!IIi
O-SAND OBSERVATION WELL 01-1
I11T
5 =
8
(264)(65) -
2.34(7333) (3.6)
(4790)(191.5)'
7333 gpd/ft
= 1.5 x 10-'"III14
-4
I'
9
1011 14
ILI
H.FIGUJREB3-15 WELL 01-1
ii
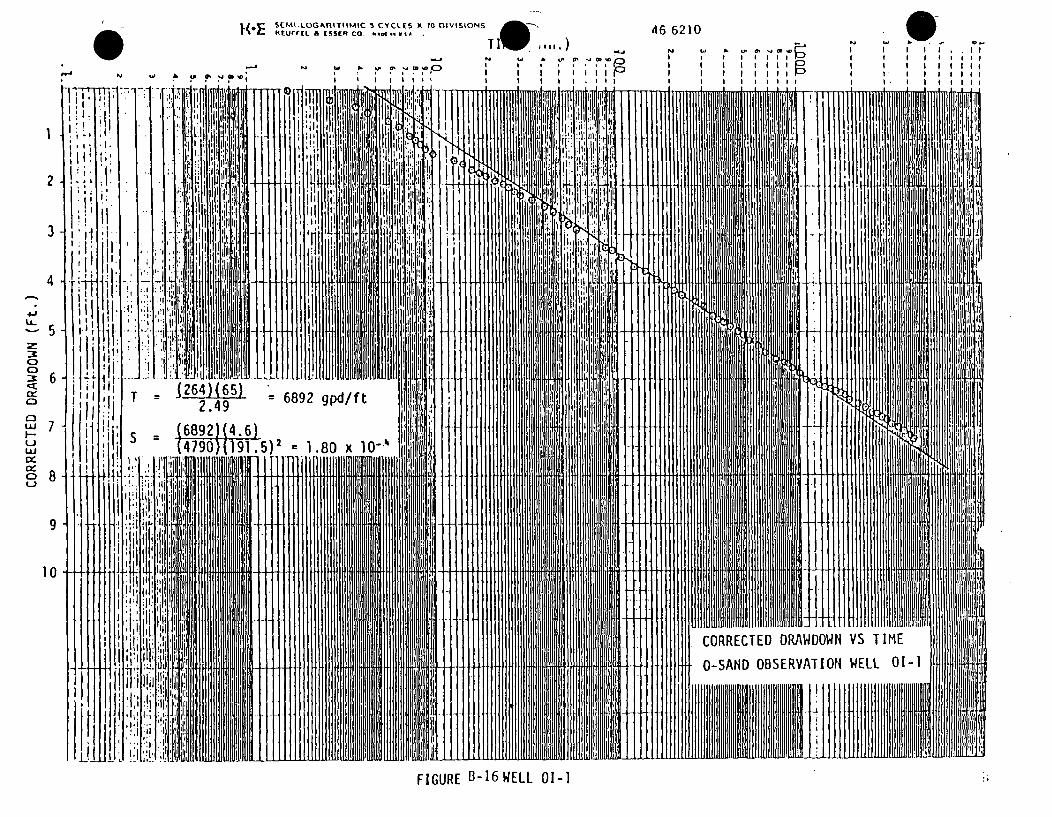
SEMI -LOGAIIITI4MIC 3 CYCtES X 10 DIVISIONSWE Xt Uu,(La A SSER CO. .."oI s
101 1 1 0 0
mil.) -p
;;;p.
46 6210
I II I
* U' 0'I I III~-'
I I I II I I III
0I I I I.I I II
I I I II I I g I II I I III
2
5
6
7
8
9
10
m1mAL*
TF
ILLi 'I
*11Tj
.1 1gpd/ft 1I I= 1.80 x 1O"-
I*1
Ii-1
I
HIIEI IIIIICORRECTED DRAWDOWN
O-SAND OBSERVATION
IIIVS TIME
WELL 01-1
III
FIGURE B-16 WELL 01-1
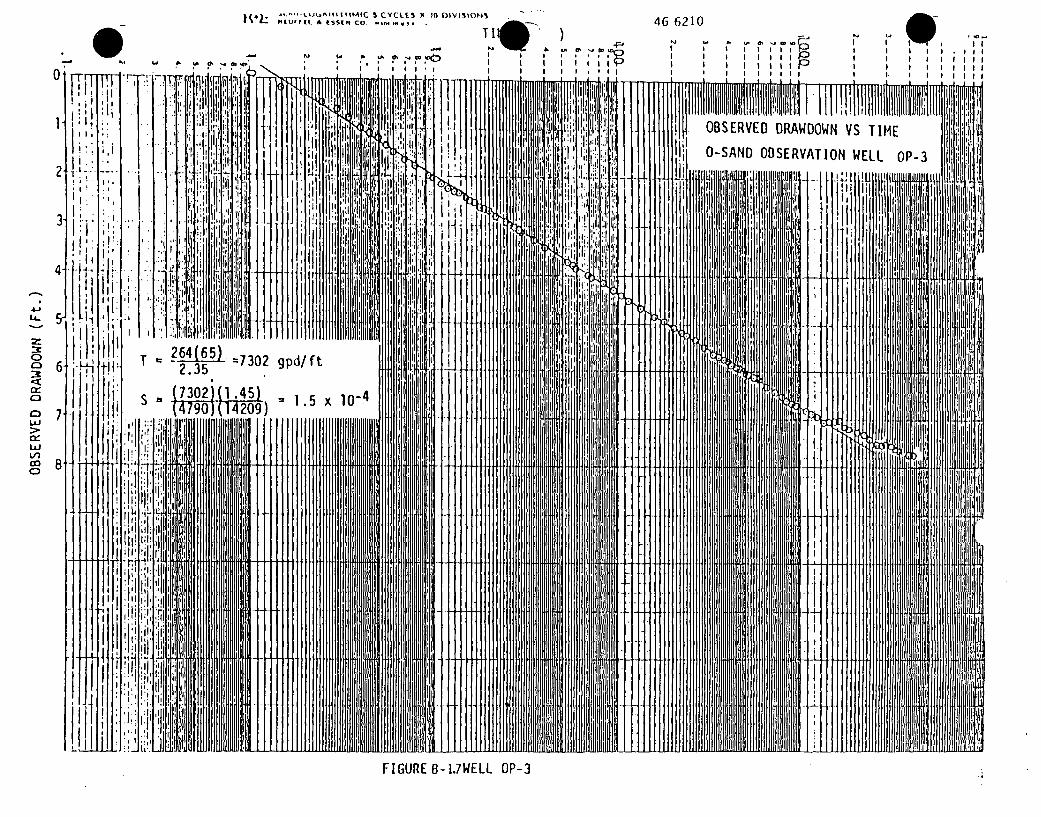
ze.5sr o II CYCLCS A )I) [OIVIIONS
U Ft A I "Co
TI l
46 6210I II II I
* U. 0' -~jmo~II III~~~
I II III~I wwH
I III
I II I I I II I I II
I I II
II III III I
N 4b
OBSERVED DRAWDOWN VS TIME
O-SAND OBSERVATION WELL OP-3Ii
p64(65). '7302 gpd/ft2.35
5 x 10- 4
FIGURE 8-1.7WELL OP-3
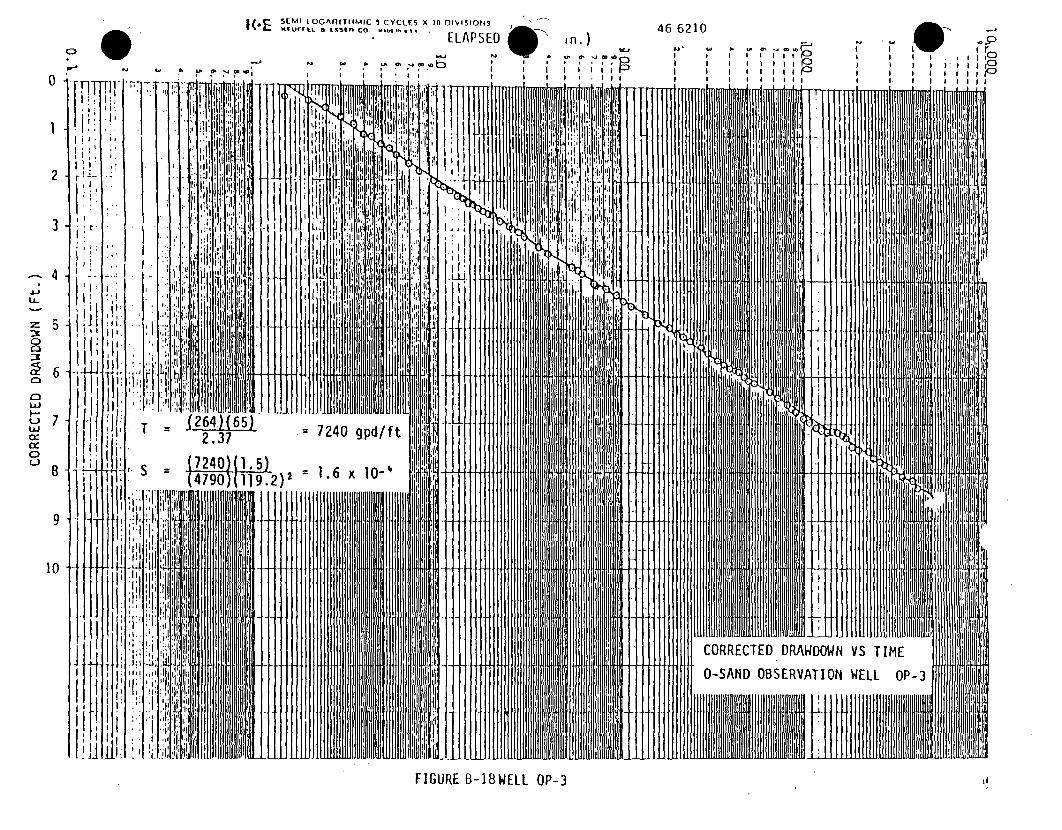
( ES(MI-LOGAnI1TIMIC ICYCLES X 70 DIVISIONJS
- L~L B S5IP CO*ELAPSED
all -
d
!
n.)
S , I ! I
0 7 .
I;t4 I
;:.I l
5 t
2 - J lit1 I' A
T 5 I **3.3 = 7240I gpd/f'ti I i!
mill III~IFG R B-8W L 11O lii .1
I'
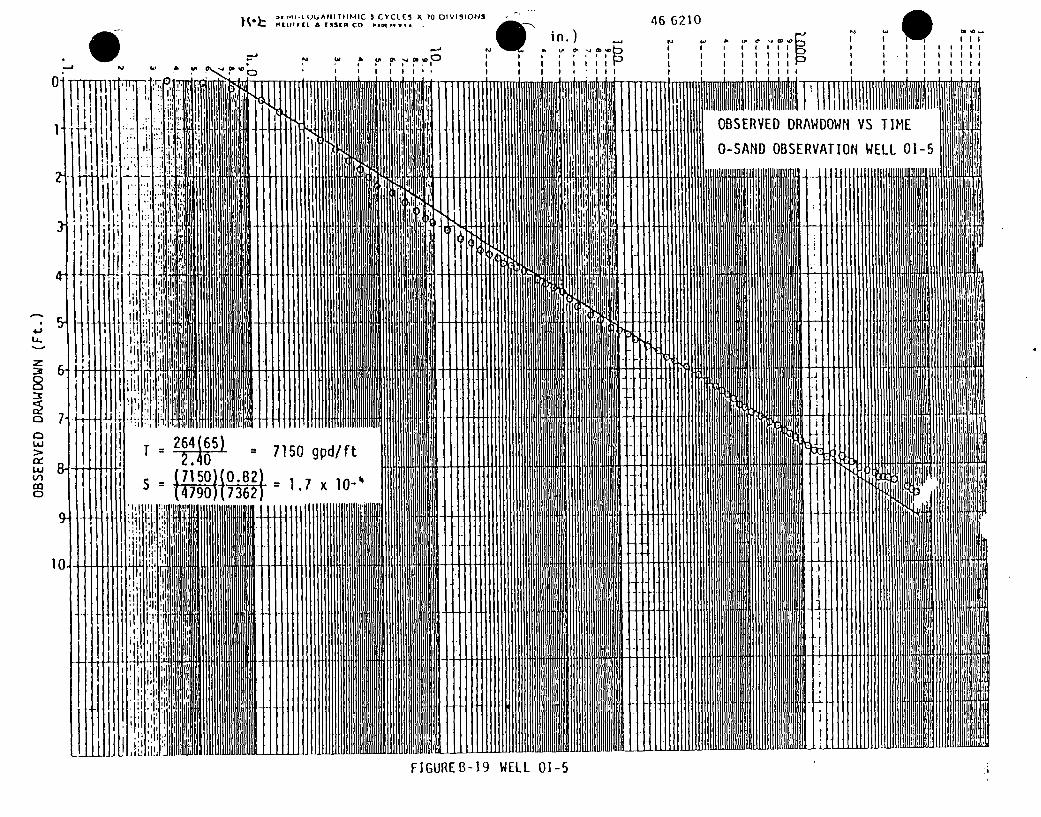
-,,r1AU1JAItI 'TIIMIC 5 CYCLES X 70 DIVISIONHC (SS& tER CO,
A
46 6210in.) _ I, _ I __jI -0
7
FIGUREB-19 WELL 01-5 -I
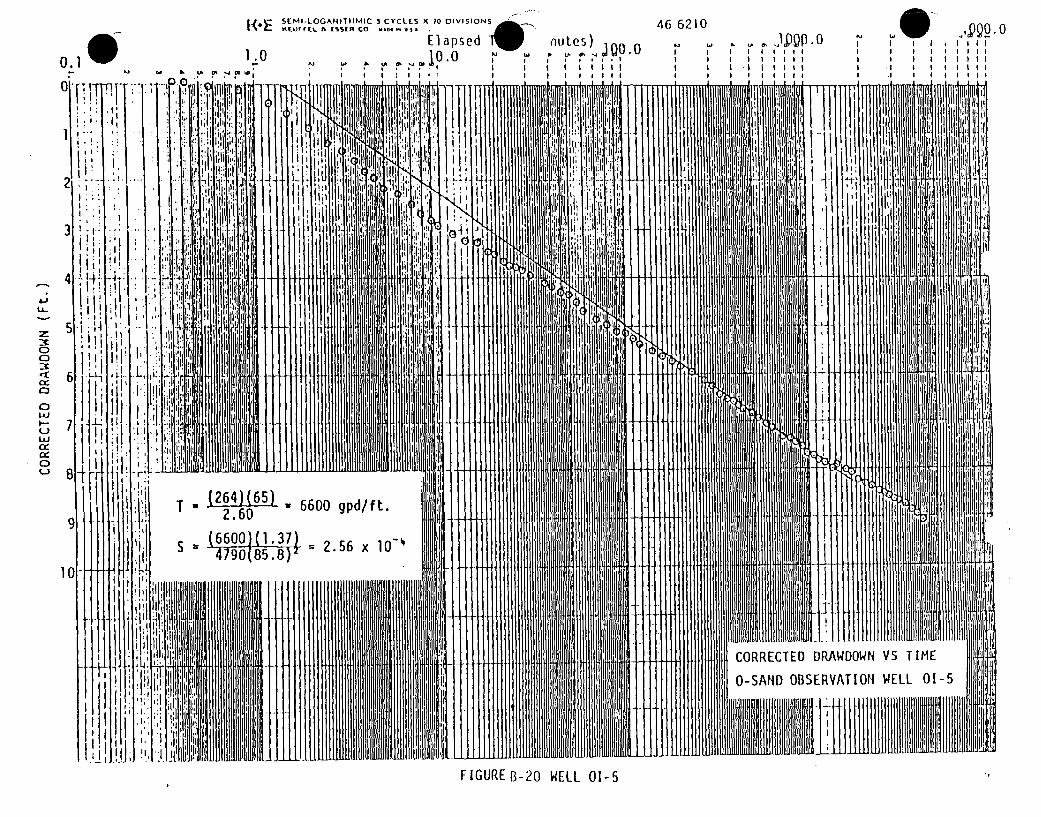
0.10I-(,E SEMI-LOGARITDIMIC 3 CYCLES X 70 DIVISIONSElapsed
1.0 0-. I - I t.ý F": !
nutes46 6210
I I
I I
S t. *I II III *I II I I
I I I
11111
.0-I
.1I II I
A~.0I I III I III I III I II I II
C.)
0
Lijcx.
0oC)
71I1
T- (26465) - 6600 gpd/ft.
S = 6600(1.3 = 2.56 x 10"'
II
CORRECTED DRAWDOWN VS TIME
O-SAND OBSERVATION WELL 01-5
j'11FIGURE B-20 WELL 01-5
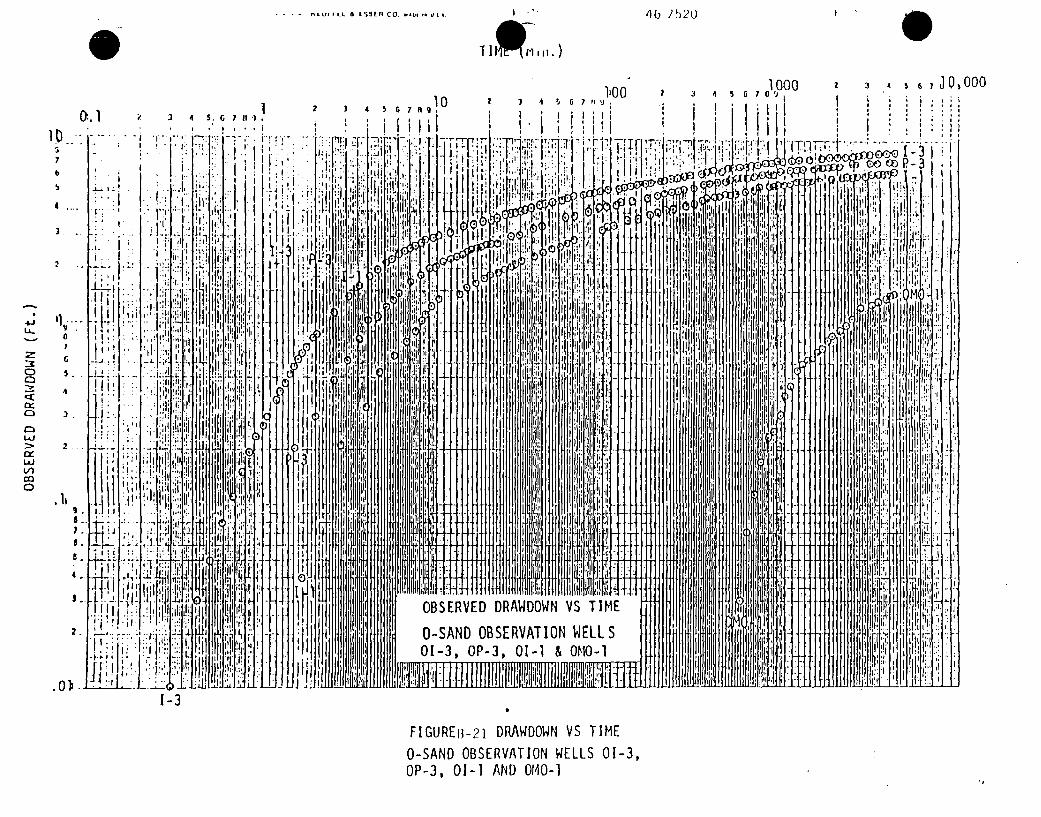
- 1 1 LL 6 &Sl O I 4- -16 1520
T I w -Ill.)
3 456 7O19902 3 A 56710, 000
7
4 ...
'lva
6.
5-
4
3.
,I
.0)•I-3
FIGURED-21 DRAWDOWN VS TIMEO-SAND OBSERVATION WELLS 01-3,OP-3, 01-1 AND OMO-1
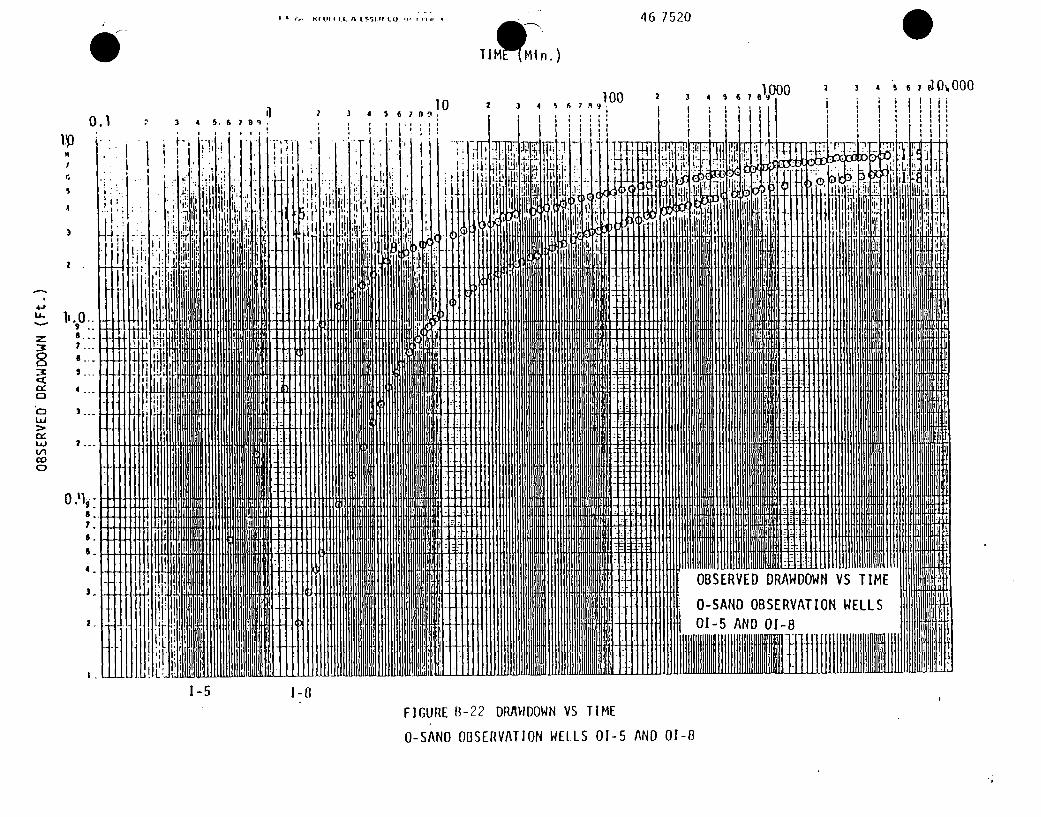
"( t 1 r . 1-. n~ I SSIM CO 46 7520
T I MOMin.)
2 3 1 s 6 1 01.000
0.1
'4
4
3I
3 4. 1011 2i I 3 4 5 6 0i
3 4 5. 6' 1 a
L t ~
8L
C3
LAJ
"i
vi
11.90.."9.-.
S,..
7-...
6...i
6..7.S.
S.
4-
2.
I.
FIGURE B-22 DRAVIDOWN VS TIME
O-SAND OBSERVATION WELLS 01-5 AND 01-8
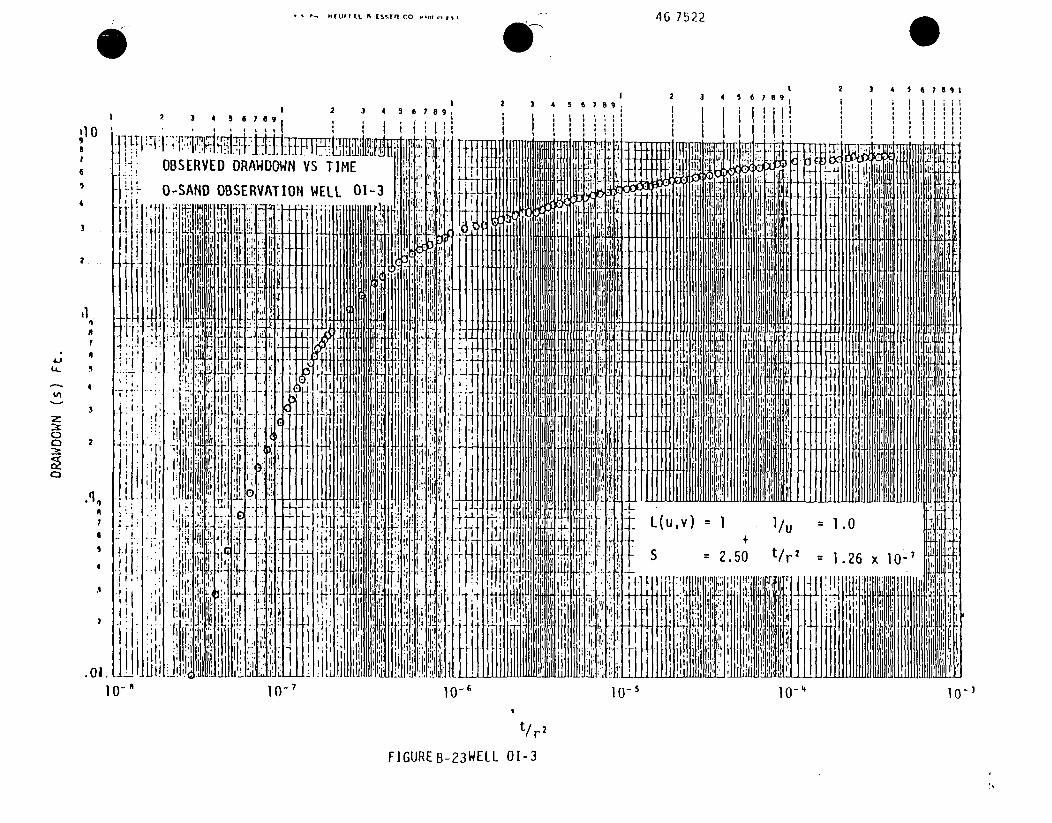
HE- E CEsrn Co 46 7522
a 2 3 4 5 67 1 3 9 67
2 3 5 6 7a
6 ~~OBSERVED DRAWDOWN VS TIME ' i ~~1
: ] o-SAND OBSERVATION WELL 01-3 Al o' II
H4 r 111P4i
A. A A. L~ l II1ai ~ ~ W
*114
II'
I'll, I '~~ii~[III~ I 1111wD 101+ 1 4
FIGURE B-23WELL 01-3
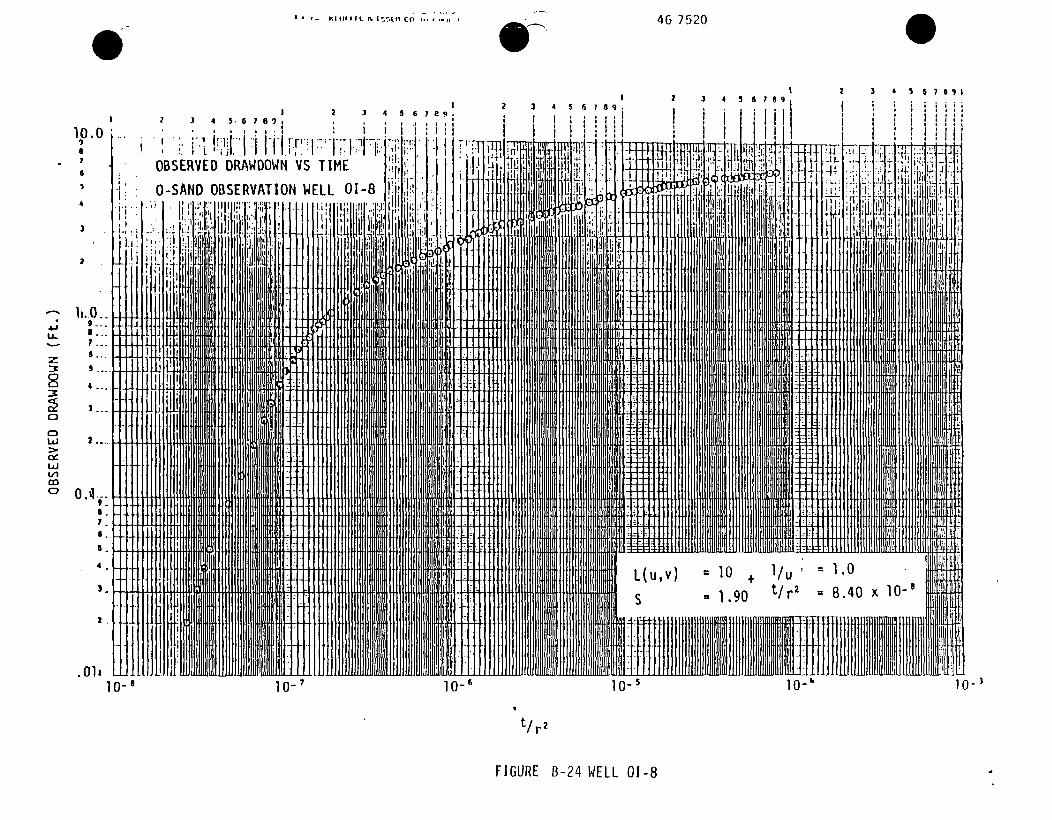
46 7520
2 3
10.0n7
6
4
.1
'I- z
il-i.
2 3 4 5.076 19,
OBSERVED DRAWDOWN VS TIME
O-SAND OBSERVATION WELL 01-8
liiiI 1,* I ' '' I i~ h ~ h
4-2
U-
C3C3
IAJ
vi
S...!
3..-
2 .....1
nI1'a". 9
e7S
S
4
3
I1o-~
2
.011
it
FIGURE B-24 WELL 01-8 8
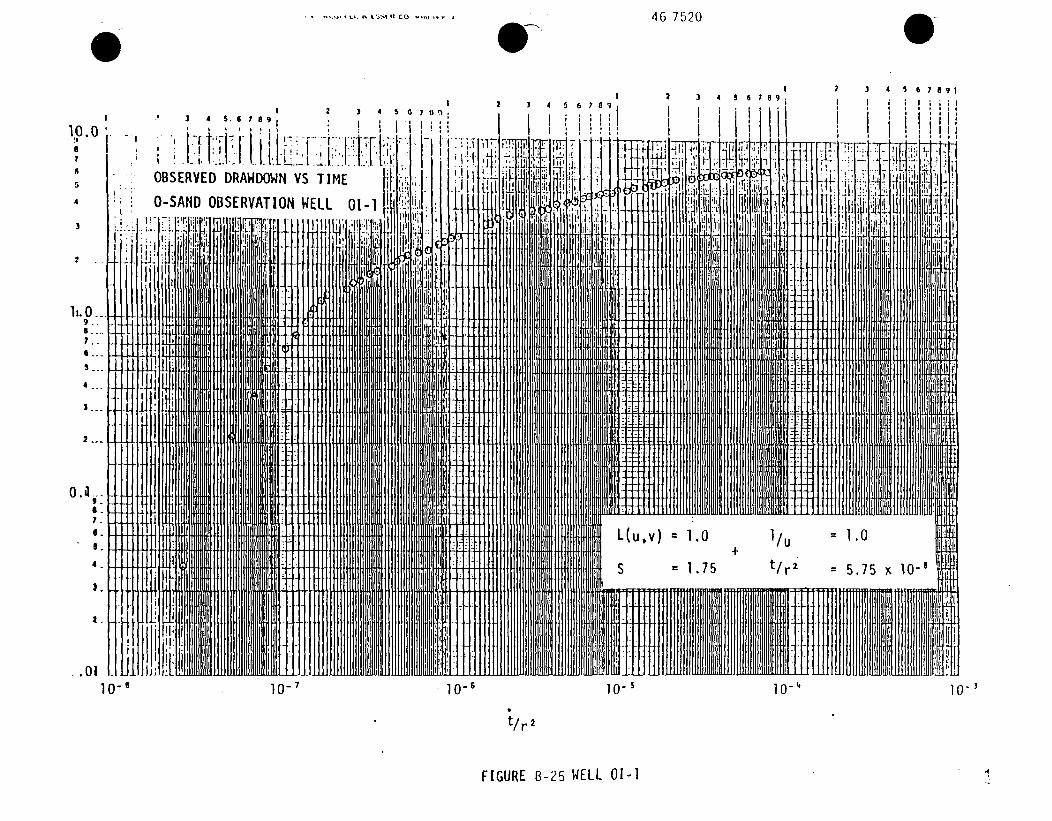
. .. . .•.. c . . 46 7520
I 3 4 5 67a I
34 4 89. 2 6 I II 5'3'4 5.e' legI : 3 4 SGi A I I' !I ! !!I!1~i:ii•. P i, T,"'1 9. 0'. .. , .
OBSERVED DRAWDOWN VS TIME
O-SAND OBSERVATION WELL 01-1A. I
-Ii ....
S.._
4-.. I .-
11.0
0.4 _
7 _. i /7= 7j . L u v) 1 .0 I u- 1.0
S. 4.Ii
.S 1.75 t/rz 5.75 x 10-
. .0110- 1 I0- 7 10- 1 10- 1 10-I 10- 1
t/r 2
FIGURE B-25 WELL 01-1 .4
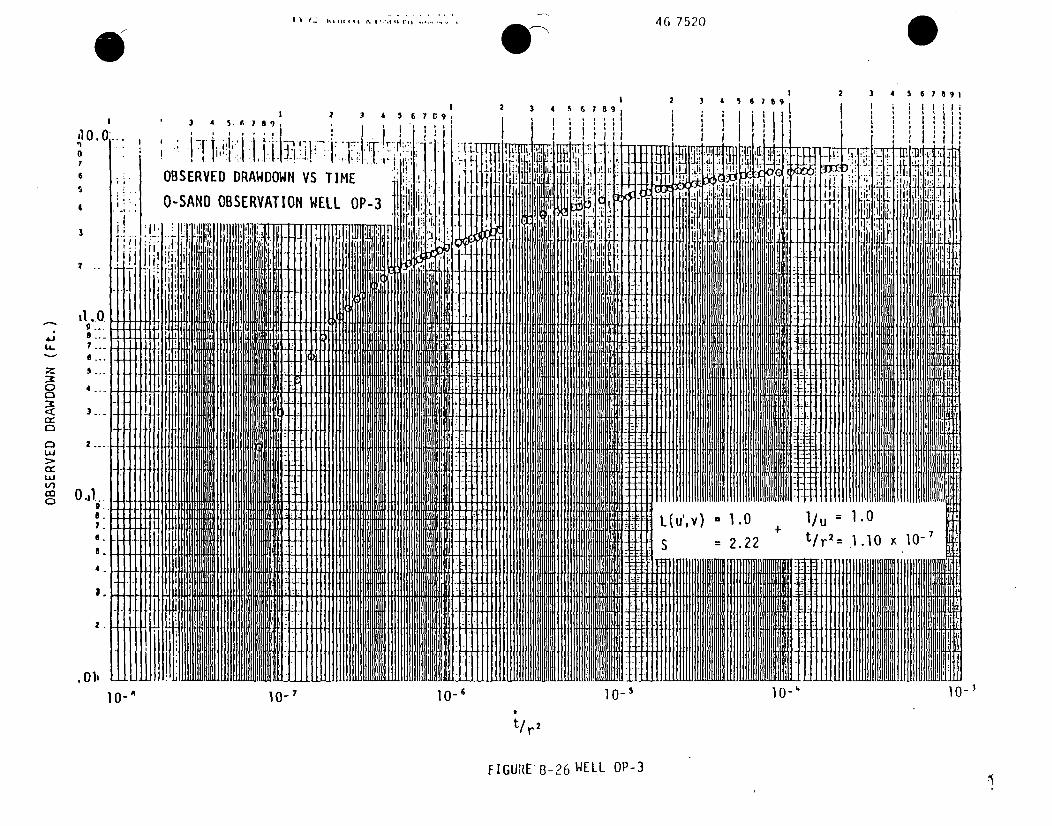
I• z ....... . . ., ... :........ .. .4 6 7520
69 2 3 4 5 61 a9 1
3 4 s 6 7 a 2 3
11 . 7' 177 " .ir-,,,,I I I Ei1
6 OBSERVED DRAWDOWN VS TIME J.I11i'j IIO-SAND OBSERVATION WELL OP-3
I I I I
IA m
T~Iiitl .0.II
Lot --- ----6" l...S....
U.1cr
L(u',v) 1.0 1 .0-io 2.
:- I-
4.
I.
S .2 tr 1 o
• 01' I 0I-
1o-ft 10- 10-1 1'- 10-4 10-1
'/r 2
FIGURE B-26 WELL OP-3
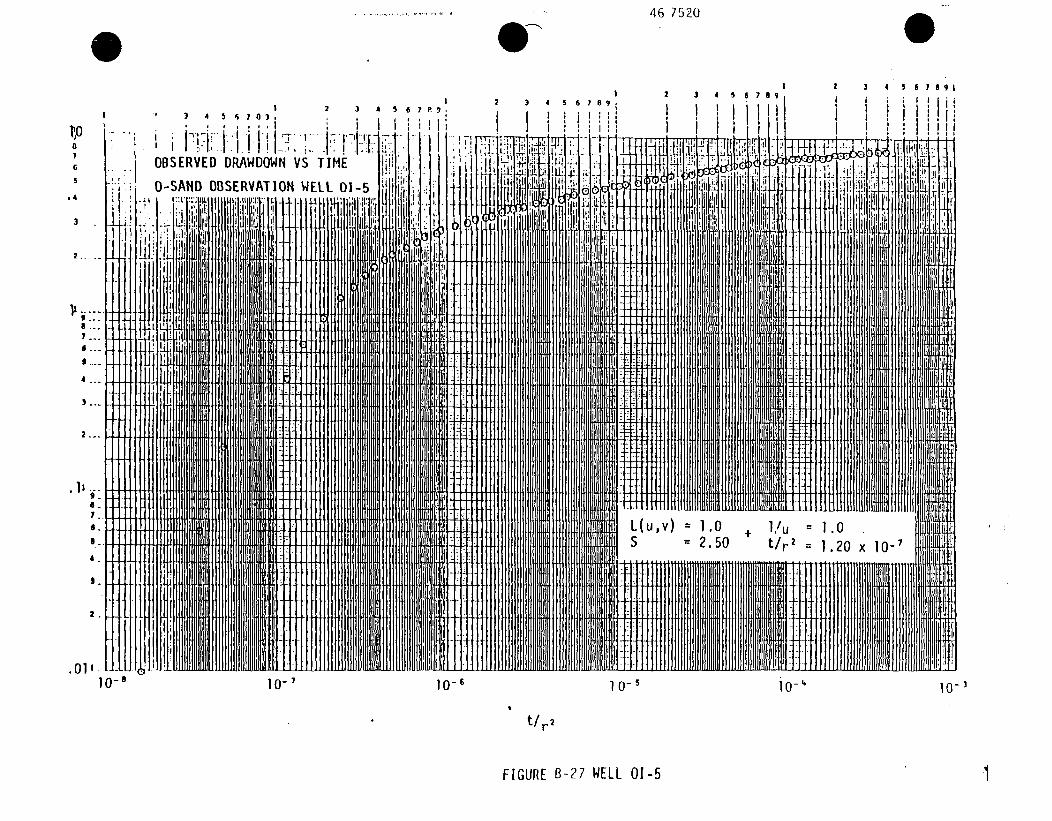
46 7520
4 # 7 2 3 5 62P. 3 4 5 6 7 9 2 3 4 5 57 12 3 4 5 6 7S 91
COBSERVED DRAWDOWN VS TIME !v. 7f if itt4~. I 141: ~*
0-SAND OBSERVATION WELL 01-5 ¶ '
3 , -_i
I : i l 'I: i
1 1 :tII
, i
2 .. ' , , ,'. , , '• , '
',ii ': IiI'I l
ll .I 4 t
N~~
~
~ ri:.•-
4 1
7 -7 - ..
2...
6 ..
-- Hu9-
L(u,v) - 10 + i./u = 1.0.- S . 2.50 t/r2 = 1.20 x 10-'
.01W
10-8 10-7 101 1 o-t io-" 10-
t/r 2
FIGURE B-27 WELL 01-5 ~1
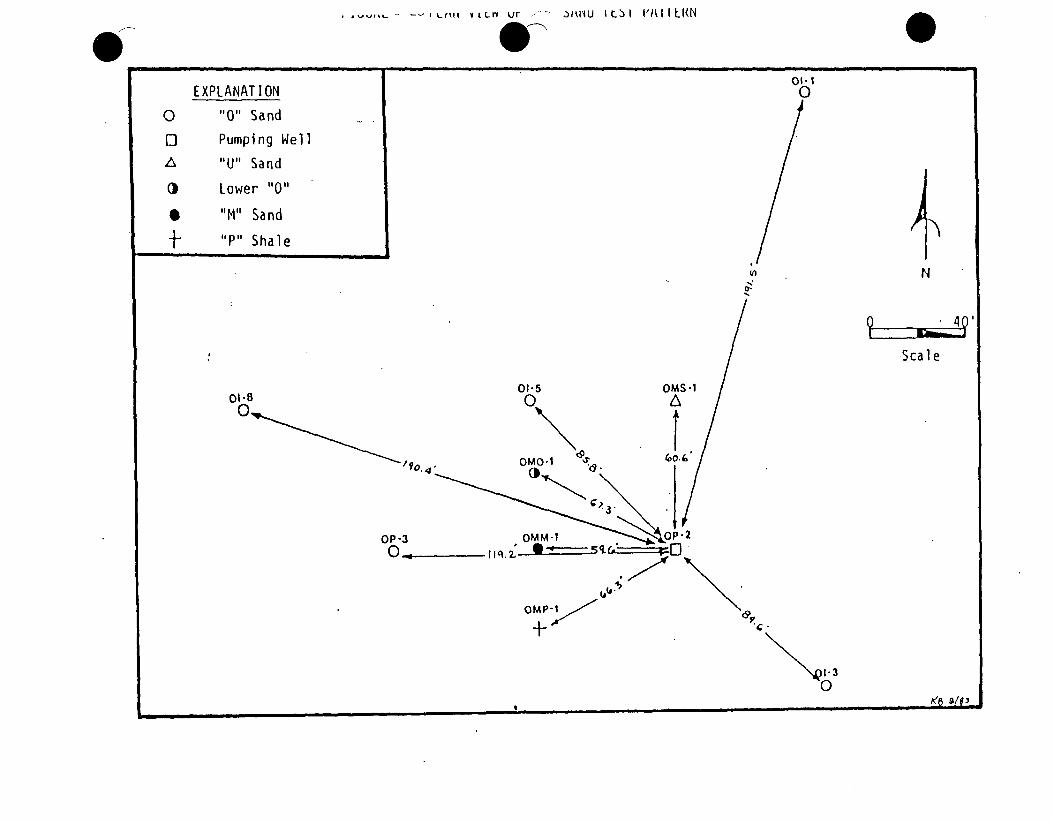
......... i l ilR1I-• I Lrf v r yrJ I I I' I I M
OI-1
EXPLANAT ION 00 "0" Sand
C] Pumping Well
A "U" Sand
0 Lower "0"
"P" Shale
N
00-
Scale
01-5 OCMS.101-8
0
0..0M- 0*
OMP-1
-1-
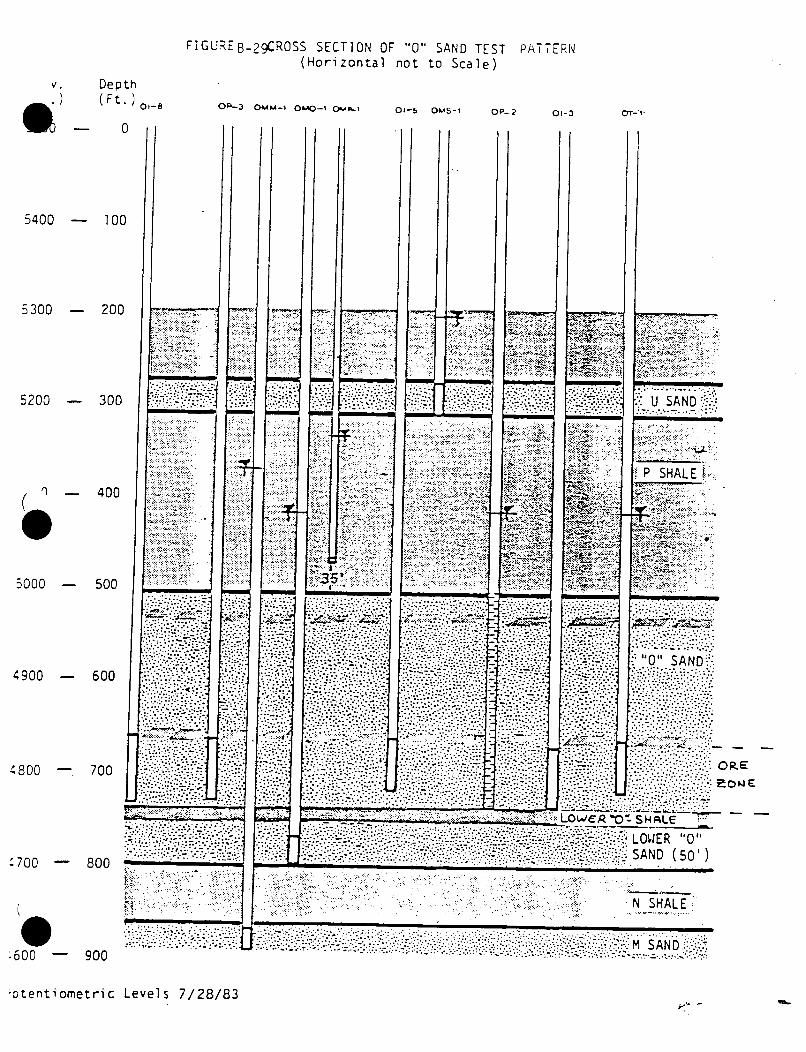
FIGUREB-29CROSS SECTION OF "0" SAND TEST PATTERN(Horizontal not to Scale)
V. Depth( Ft. ) 0o-8
09'-3 O#AM-1 OMO-1 0ý,, 01-f. OMS-1 OP-2 01-3 Or.I"-
0
5400 - 100
5300
5200
-- 200
-- 300
-- 400
-- 500
-- 600
-- 700
: P SHALE
._
"0" SAND-:
O•, . -E
-•~ ~~ 0, W" E "';• ••• :•?i••
4900
4800
....... -~. -' t'II.JA~ f*~ ~L~I ~
:700 - 800
600 - 900
":';•.•:'.,-.:-2 •-.'.:' ;• •••.•• ....;.; '•..:.;••..; : • :` -. ' • : O IE.'.:,:- •-. : ......'... ....- •: .'...•:• .•;. .? '•:•£ .•• •LOWER' • ••• . :•::::- .: :";-'!:,T .' -i-•.•" -"-.!;.. :• .:•;...•.: v i. .? •!.•.• •i>?:.:•..:. :: .;.:. •:7 ::.>••`}.A N.D " ( S-o'--'; -"
•• ••• ....: .::•.:;`` ..•.-.•:.: ....• -`•. ..:••: .• •.• ..:.../• •... .- S HAN D L E 0
•i ~ ~~~~~~ ~ ~~~~~~~ SAND. . .. .. , "i..." ' " , """' '
ýotentiometric Levels 7/28/83
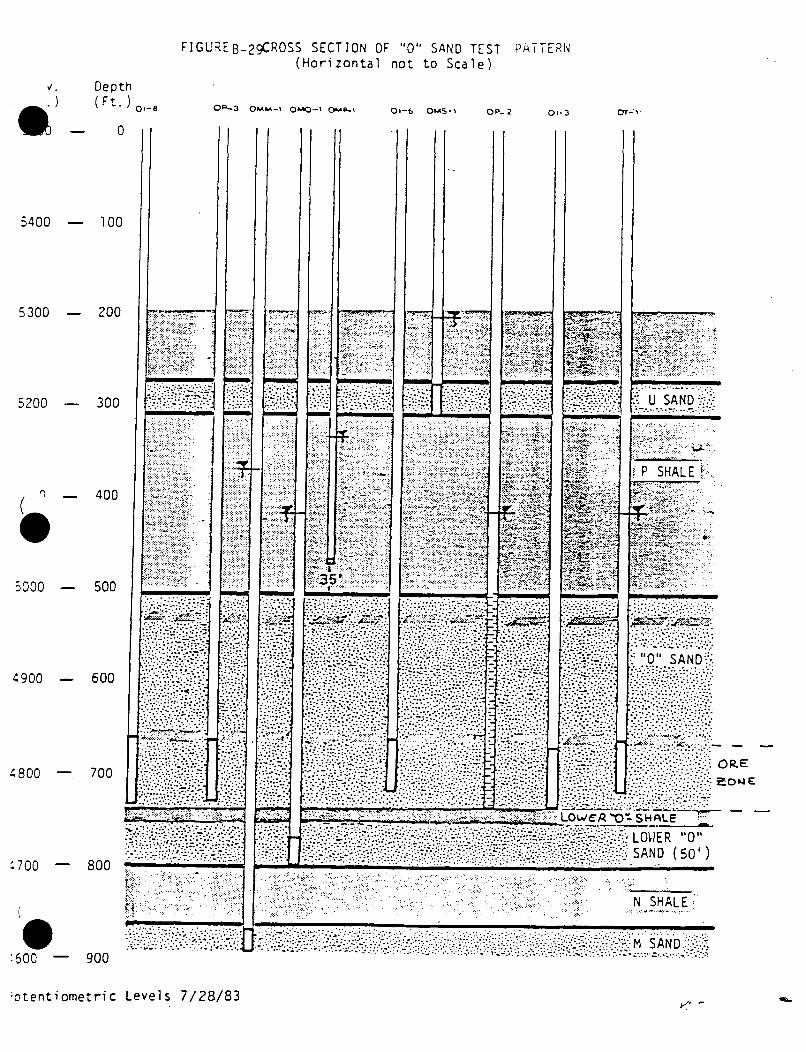
FIGUREB-29CROSS SECTION OF "0" SAND TEST PATTERN(Horizontal not to Scale)
Depth(Ft.) o,-8
OP'-3 0MM-I 0Ob.-' 0 0I-01-5 OSAS-i 0P- 2 01-3 CT-Iý-
0
5400
5300
5200
- 100
- 200
- 300
-- 400
5000 - 500
-.....
k......
~U SAND
f ~ P SHAL E... : .-.... .. .......
LO35 -O HL
f LOWER O"0SAND (o0')
4900 - 600
4800 - 700
"700 - 800
0'600 -- 900
.' N SHALEI.. . . .........• •!!,:~i •T .•• i•!!i~;• ::,,•:•:••:•,.: .• , : ::•:• .... ••: :•. :: :,.• M ... A ND,
•otentiometric Levels 7/28/83
Hydrology
Attachment 'D'
Section 25 and Section 35 Pump Tests
In the Projected Development Schedule, the initial
development will include mining units in Section 25 and Section
35 in addition to mining units in the two pilot test areas.
In support of this development plan aquifer pumping tests were
conducted in Section 25 and Section 35. The tests were
designated to determine characteristics of the production zone
and the overlying and underlying shale boundaries. The test
results were evaluated and analyzed by Kerr-McGee Hydrology
and a copy of the report which includes the field data and
analysis is attached.
D6 Att. D-I
AQUIFER TEST ANALYSESIN SITU LEACH PROJECT
SEQUOYAH FUELS CORPORATIONSOUTH POWDER RIVER BASINCONVERSE COUNTY, WYOMING
Prepared By:
Wyndal M. GoodmanSenior Hydrologist
Engineering Services DivisionKerr-McGee Corporation
March 25, 1988
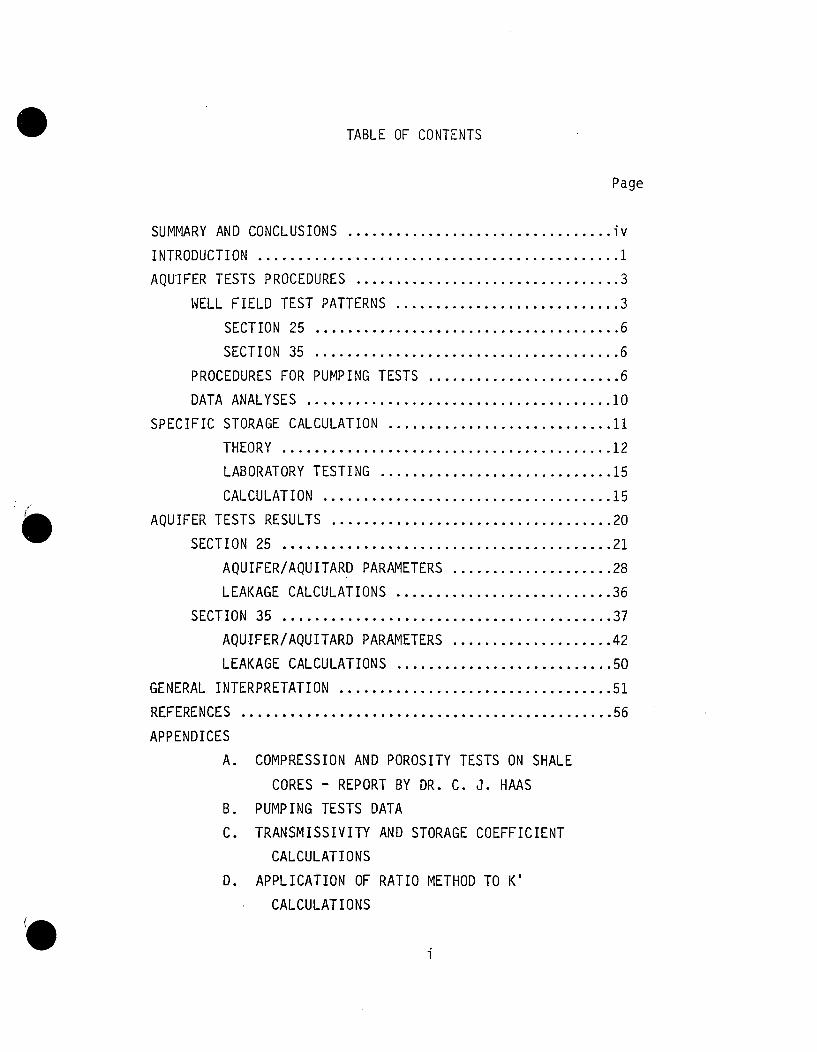
TABLE OF CONTENTS
Page
SUMMARY AND CONCLUSIONS ................................. iv
INTRODUCTION ............................................. 1
AQUIFER TESTS PROCEDURES ................................. 3
WELL FIELD TEST PATTERNS ............................ 3
SECTION 25 ...................................... 6
SECTION 35 ...................................... 6
PROCEDURES FOR PUMPING TESTS ........................ 6
DATA ANALYSES ...................................... 10
SPECIFIC STORAGE CALCULATION ............................ 11
THEORY ......................................... 12
LABORATORY TESTING ............................. 15
CALCULATION .................................... 15
AQUIFER TESTS RESULTS ................................... 20
SECTION 25 ......................................... 21
AQUIFER/AQUITARD PARAMETERS .................... 28
LEAKAGE CALCULATIONS ........................... 36
SECTION 35 ......................................... 37
AQUIFER/AQUITARD PARAMETERS .................... 42
LEAKAGE CALCULATIONS ........................... 50
GENERAL INTERPRETATION .................................. 51
REFERENCES .............................................. 56
APPENDICES
A. COMPRESSION AND POROSITY TESTS ON SHALE
CORES - REPORT BY DR. C. J. HAAS
B. PUMPING TESTS DATA
C. TRANSMISSIVITY AND STORAGE COEFFICIENT
CALCULATIONS
D. APPLICATION OF RATIO METHOD TO K'
CALCULATIONS
i
LIST OF FIGURES
FIGURES PAGE
1. Location of '0' and 'M' Sand Test Sites
2. Cross-Section of '0' Sand Test Pattern,
Section 25 .............................
3. Cross-Section of 'M' Sand Test Pattern,
Section 35 .............................
4. Map View of '0' Sand Test Pattern,
Section 25 .............................
5. Map View of 'M' Sand Test Pattern,
Section 35 .............................
6. Stress-Strain Curve of Core Sample .......
7. Stress-Strain Curve of Core Sample .......
8. Hydrograph of Well 25-584 ................
9. Hydrograph of Well 25-581 ................
10. Hydrograph of Well 25-582 ................
11. Hydrograph of Well 25-583 ................
........... 2
........... 4
........... 5
........... 7
.... 8
... 17
... 18
... 22
... 23
... 24
... 25
12.
13.
14.
15.
16.
17.
18.
19.
20.
Hydrograph of Wells 25-585 and 25-586 ..........
Hydrograph of Wells 25-582 'A' and 25-593 ......
Log-Log Plot of Observed Drawdowns in
Section 25 '0' Sand ..........................
Log-Log Plot of Well 25-581 ....................
Semi-Log Plot of Well 25-581 ...................
Log-Log Plot of Well 25-582 ....................
Semi-Log Plot of Well 25-582 ...................
Log-Log Plot of Well 25-583 ....................
Semi-Log Plot of Well 25-583 ...................
.... 26
.... 27
.... 29
.... 30
.... 31
.... 32
.... 33
.... 34
.... 35
ii
21. Hydrograph of Wells 35-738 and 35-739 .............. 38
22. Hydrograph of Wells 35-737, 35-740 and 35-741 ...... 39
23. Hydrograph of Wells 35-736 and 35-737 'A' . ......... 40
24. Hydrograph of Well 35-742 .......................... 41
25. Log-Log Plots of Observed Drawdowns in
Section 35 'M' Sand .............................. 43
26. Log-Log Plot of Well 35-736 ........................ 44
27. Semi-Log Plot of Well 35-736 ....................... 45
28. Log-Log Plot of Well 35-737 ........................ 46
29. Semi-Log Plot of Well 35-737 ....................... 47
30. Log-Log Plot of Well 35-738 ........................ 48
31. Semi-Log Plot of Well 35-738 ....................... 49
32. Illustration of Geologic Conditions ............... 55
iii
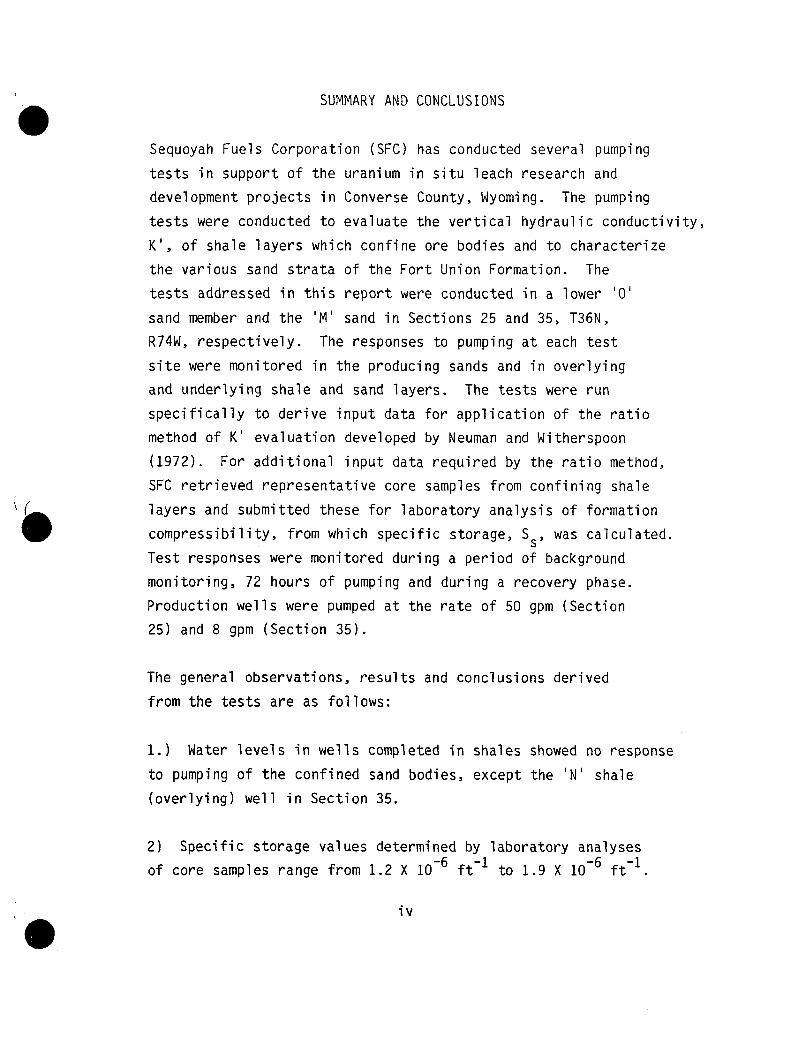
SUMMARY AND CONCLUSIONS
Sequoyah Fuels Corporation (SFC) has conducted several pumping
tests in support of the uranium in situ leach research and
development projects in Converse County, Wyoming. The pumping
tests were conducted to evaluate the vertical hydraulic conductivity,
K', of shale layers which confine ore bodies and to characterize
the various sand strata of the Fort Union Formation. The
tests addressed in this report were conducted in a lower '0'
sand member and the 'M' sand in Sections 25 and 35, T36N,
R74W, respectively. The responses to pumping at each test
site were monitored in the producing sands and in overlying
and underlying shale and sand layers. The tests were run
specifically to derive input data for application of the ratio
method of K' evaluation developed by Neuman and Witherspoon
(1972). For additional input data required by the ratio method,
SFC retrieved representative core samples from confining shale
layers and submitted these for laboratory analysis of formation
compressibility, from which specific storage, Ss, was calculated.
Test responses were monitored during a period of background
monitoring, 72 hours of pumping and during a recovery phase.
Production wells were pumped at the rate of 50 gpm (Section
25) and 8 gpm (Section 35).
The general observations, results and conclusions derived
from the tests are as follows:
1.) Water levels in wells completed in shales showed no response
to pumping of the confined sand bodies, except the 'N' shale
(overlying) well in Section 35.
2) Specific storage values determined by laboratory analyses
of core samples range from 1.2 X 106 ft 1 to 1.9 X 10 6 ft-.
iv
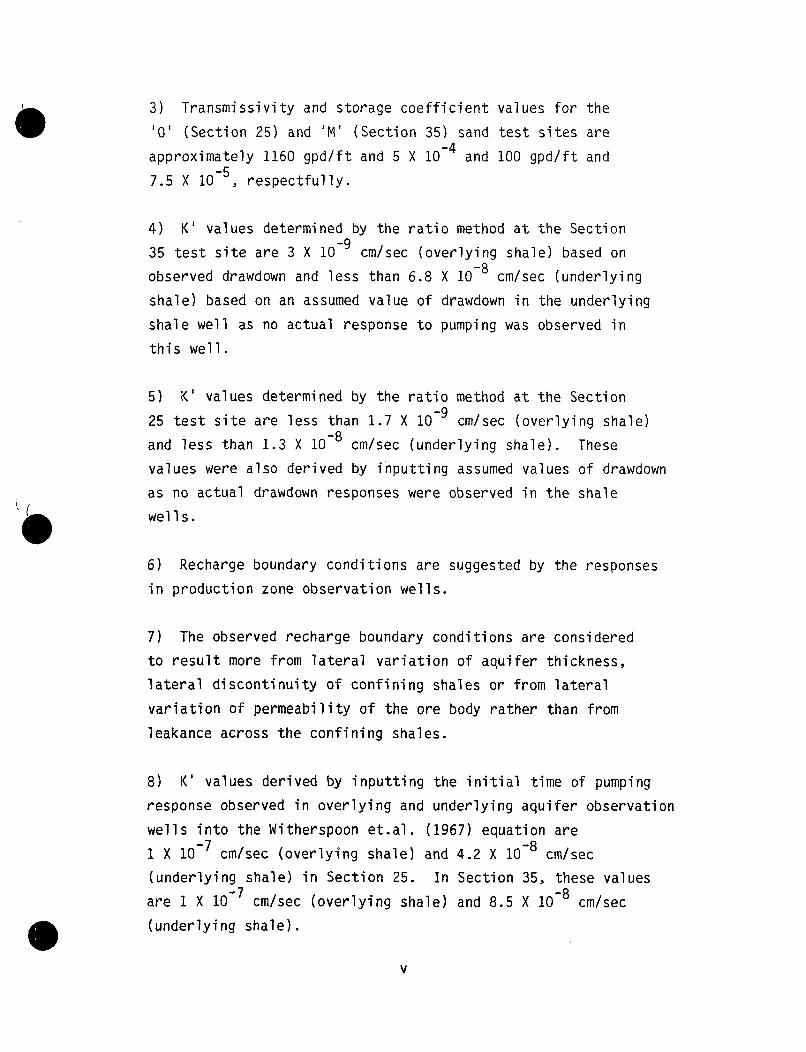
3) Transmissivity and storage coefficient values for the
'0' (Section 25) and 'M' (Section 35) sand test sites are
approximately 1160 gpd/ft and 5 X 10⁻⁴ and 100 gpd/ft and
7.5 X 10- 5, respectfully.
4) K' values determined by the ratio method at the Section
35 test site are 3 X 10⁻⁹ cm/sec (overlying shale) based on
observed drawdown and less than 6.8 X 10- 8 cm/sec (underlying
shale) based on an assumed value of drawdown in the underlying
shale well as no actual response to pumping was observed in
this well.
5) K' values determined by the ratio method at the Section
25 test site are less than 1.7 X 10⁻⁹ cm/sec (overlying shale)
and less than 1.3 X 10- 8 cm/sec (underlying shale). These
values were also derived by inputting assumed values of drawdown
as no actual drawdown responses were observed in the shale
wells.
6) Recharge boundary conditions are suggested by the responses
in production zone observation wells.
7) The observed recharge boundary conditions are considered
to result more from lateral variation of aquifer thickness,
lateral discontinuity of confining shales or from lateral
variation of permeability of the ore body rather than from
leakance across the confining shales.
8) K' values derived by inputting the initial time of pumping
response observed in overlying and underlying aquifer observation
wells into the Witherspoon et.al. (1967) equation are
i X 10-7 cm/sec (overlying shale) and 4.2 X 10⁻⁸ cm/sec
(underlying shale) in Section 25. In Section 35, these values
are 1 X 10⁻⁷ cm/sec (overlying shale) and 8.5 X 10⁻⁸ cm/sec
(underlying shale).
v
9) Based on the overall response to the two aquifer tests
and the various methods of data analysis, it is concluded
that the shale layers provide effective barriers to the vertical
migration of fluids in the area.
vi
AQUIFER TEST ANALYSISIN SITU LEACH PROJECT
SEQUOYAH FUELS CORPORATIONSOUTH POWDER RIVER BASINCONVERSE COUNTY, WYOMING
INTRODUCTION
Sequoyah Fuels Corporation (SFC) owns and operates uranium
mining operations in the South Powder River Basin of Converse
County, Wyoming (Figure 1). Uranium ores at the Bill Smith
Mine, in Section 36, T36N, R74W, were mined by underground
methods in 1977 and 1978. The mine was then put on standby
until mid 1982, at which time flooding of the mine was allowed
to occur and alternative mining methods were pursued. SFC
initiated an in situ-leach (ISL) pilot program in the '0'
sand member of the Fort Union Formation in 1983 as an alternative
to deep shaft mining of '0' sand ore bodies. In an effort
to quantify ISL operational parameters, and to determine the
potential for the vertical migration of leach fluids through
shale layers which confine ore bodies in the '0' sand, SFC
conducted pumping tests in the '0' sand member in 1983 (Figure
1). The results of these tests were submitted to the U. S.
Nuclear Regulatory Commission (NRC) and the Wyoming Department
of Environmental Quality (DEQ) in reports submitted in support
of an amendment to NRC Source Material License SUA-1387, Docket
40-8768 and for a revision to Wyoming DEQ Land Quality Division
Permit 304C. These reports are titled "Aquifer Pump Test,
'0' Sand In Situ Leach Project" and "Addendum to-Aquifer Pump
Test, '0' Sand In Situ Leach Project" and were submitted in
September, 1983 and February, 1984, respectively.
Based on the pilot experience, SFC decided to proceed with
licensing a commercial ISL project and SFC conducted two additional
pump tests to further investigate the vertical hydraulic conductivity
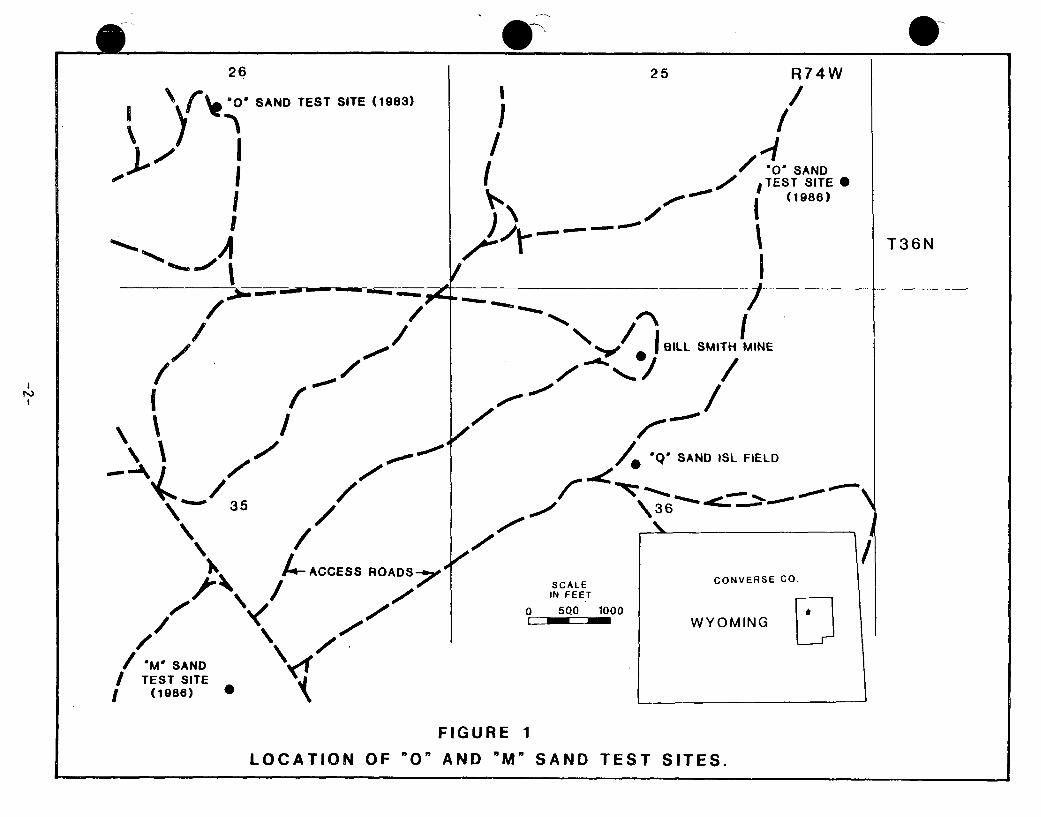
26 25 R74W
\ 0
,-J" I
ISAND TEST SITE (1983) /
I // ..4
III wmoo0-0
/ '0' SANDTEST SITE 0( (1986)
A I T36N
I IaA
- - - - - - r -t
/ -~- - -
/-mm/ PL
0 'Amft* ft-ift //
///\ •, 0 BILL
/0
ISMITH MINE
I- //
/0 Q" SAND ISL FIELD
00-01, 00-00 .00, 9
/35 //
p / ".4 " --.
\3 6' N
/ ISCALEIN FEET
0 50.0 1000
0
FIGURE 1
LOCATION OF "0" AND "M" SAND TEST SITES.
of confining shale layers by field test methods, specifically
the ratio method developed by Neuman and Witherspoon (1969,
1969 and 1972). To determine the hydraulic properties of
shales, or any confining medium, by the ratio method, the
specific storage of the medium must also be quantified as
input data for the ratio analysis. Therefore, the objectives
of this additional investigation have been to: 1) determine
the specific storage (Ss) for overlying and underlying shale
layers which confine ore bodies in intervening sand layers,
and 2) determine the vertical hydraulic conductivity (K')
for these shale layers.
This report details the results of these investigations which
quantify the shale layer properties of specific storage and
vertical hydraulic conductivity of the two additional sites
in the Fort Union section. The areas selected as test locations
are referenced as Section 25 and Section 35 (Figure 1).
AQUIFER TESTS PROCEDURES
Pumping tests were conducted at two locations for the purpose
of defining the vertical hydraulic conductivity, K', of shale
layers which bound ore bodies in the Fort Union Formation.
These locations are referenced as Section 25 and Section 35
(Figure 1). A lower '0' sand member and confining shale beds
were monitored during the pumping tests in Section 25 (Figure
2). In Section 35, the 'M' sand member and confining shale
beds comprised the subject test zone (Figure 3).
Well Field Test Patterns
In both test locations, wells were installed and completed
across the test interval to isolate formation pressures and
respondent water levels in, ascending order: 1) the underlying
sand aquifer, 2) the underlying confining shale, 3) the production
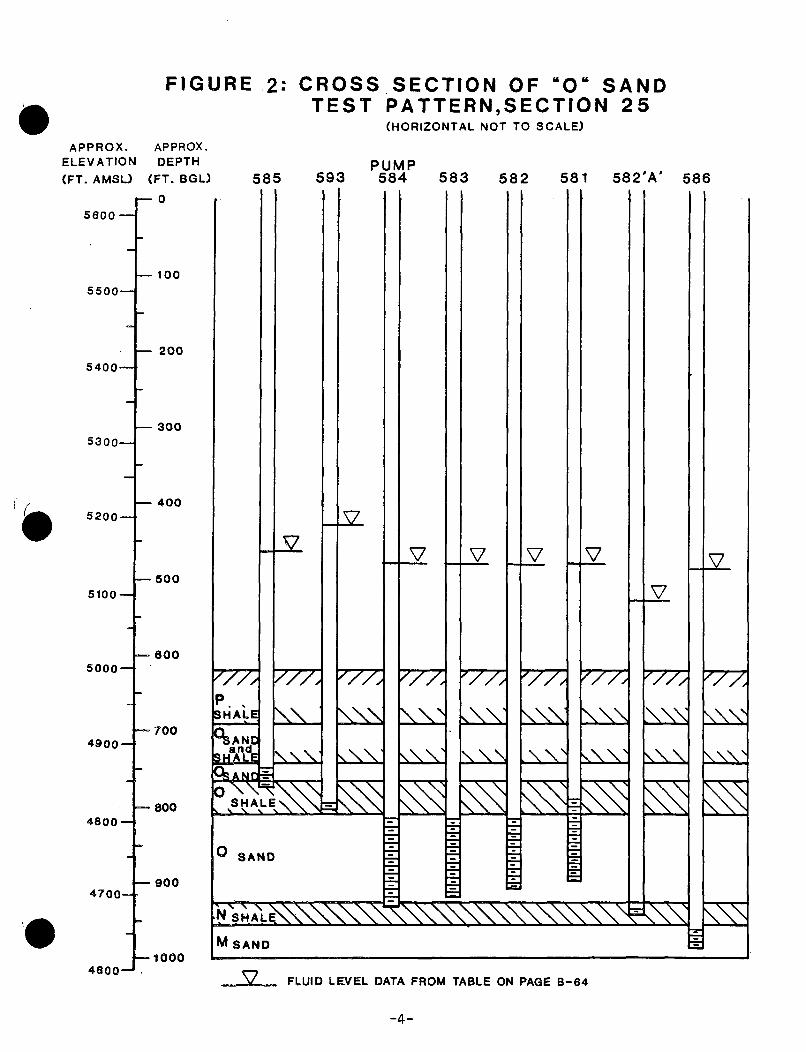
FIGURE 2: CROSS SECTION OF "0" SANDTEST PATTERN,SECTION 25
(HORIZONTAL NOT TO SCALE)
APPROX. APPROX.ELEVATION DEPTH
(FT. AMSL) (FT. BGL)
1- 05600-
585 593I I
PUMP584 583 582 581 582'A' 586
5500-
5400-
5300-
5200-
5100-
5000-
100
200
-300
-400
- 500
- 600
/7
7777,
'7
777,7,
V
7777
'7
4 9 00 - - 700
SHALE
OS ANandA
SHALE\
777 ~77I 777
4800--800 I
iO SAND
4700-
4600-1710
N SHALE
M SAND
S FLUID LEVEL DATA FROM TABLE ON PAGE B-64
-4-
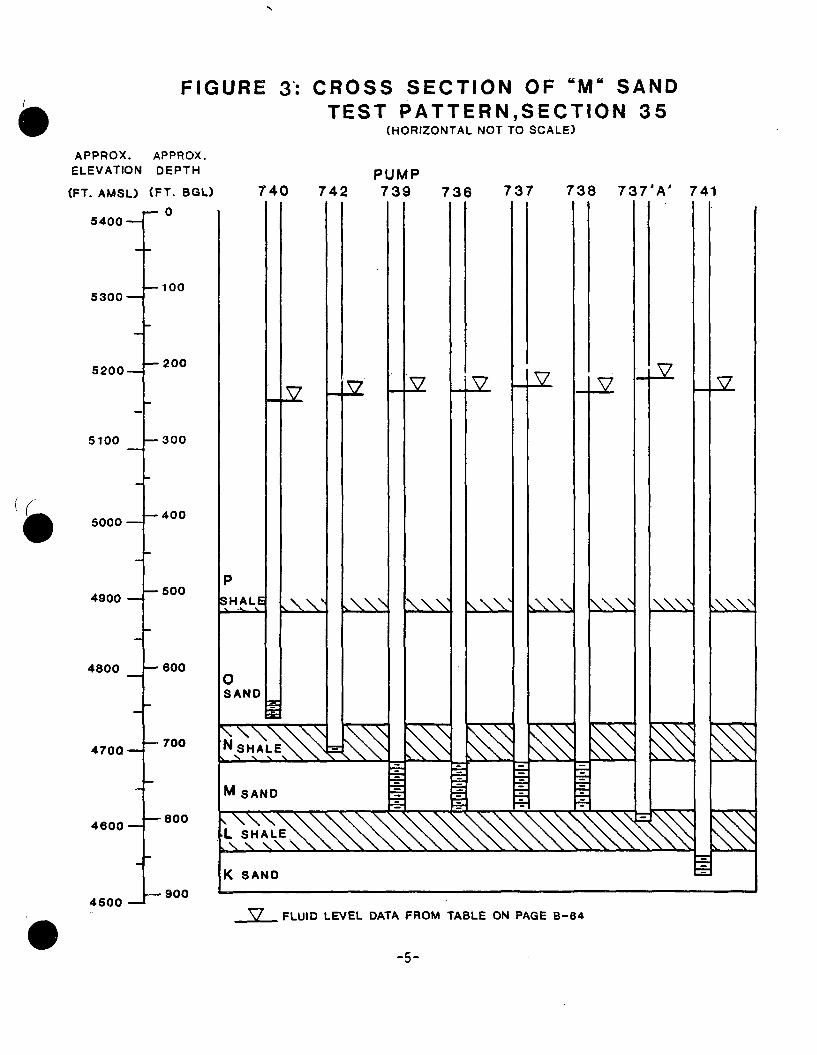
FIGURE 3": CROSSTEST
SECTION OF "M" SANDPATTERN,SECTION 35
HORIZONTAL NOT TO SCALE)
APPROX. APPROX.ELEVATION DEPTH
(FT. AMSL) (FT. 8GL)
PUMP740 742 739 736 737 738 737'A' 741
54000
5300--
5200
5100
-100
- 200
- 300
5000 --r 40
4900
4800
4700-.
4600-
- 500
- 600
- 700
-800
II II
t-- 900
45007 FLUID LEVEL DATA FROM TABLE ON PAGE B-64
-5-
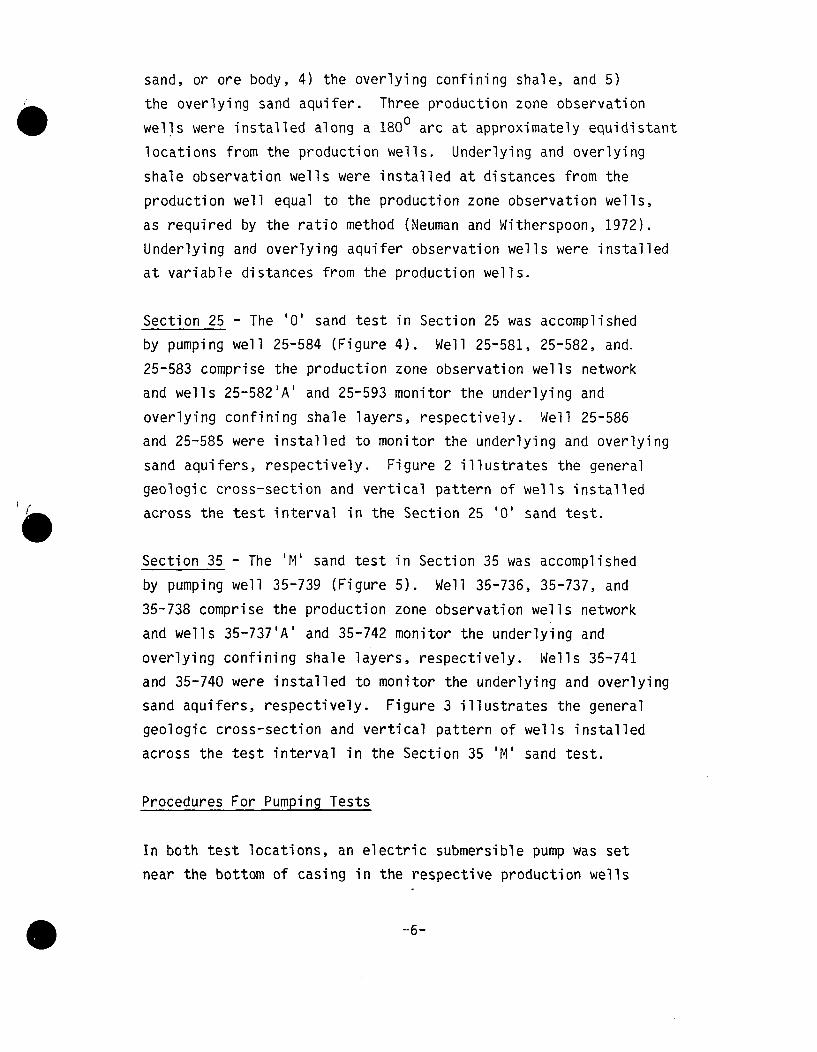
sand, or ore body, 4) the overlying confining shale, and 5)
the overlying sand aquifer. Three production zone observation
wells were installed along a 1800 arc at approximately equidistant
locations from the production wells. Underlying and overlying
shale observation wells were installed at distances from the
production well equal to the production zone observation wells,
as required by the ratio method (Neuman and Witherspoon, 1972).
Underlying and overlying aquifer observation wells were installed
at variable distances from the production wells.
Section 25 - The '0' sand test in Section 25 was accomplished
by pumping well 25-584 (Figure 4). Well 25-581, 25-582, and.
25-583 comprise the production zone observation wells network
and wells 25-582'A' and 25-593 monitor the underlying and
overlying confining shale layers, respectively. Well 25-586
and 25-585 were installed to monitor the underlying and overlying
sand aquifers, respectively. Figure 2 illustrates the general
geologic cross-section and vertical pattern of wells installed
across the test interval in the Section 25 '0' sand test.
Section 35 - The 'M' sand test in Section 35 was accomplished
by pumping well 35-739 (Figure 5). Well 35-736, 35-737, and
35-738 comprise the production zone observation wells network
and wells 35-737'A' and 35-742 monitor the underlying and
overlying confining shale layers, respectively. Wells 35-741
and 35-740 were installed to monitor the underlying and overlying
sand aquifers, respectively. Figure 3 illustrates the general
geologic cross-section and vertical pattern of wells installed
across the test interval in the Section 35 'M' sand test.
Procedures For Pumping Tests
In both test locations, an electric submersible pump was set
near the bottom of casing in the respective production wells
-6-
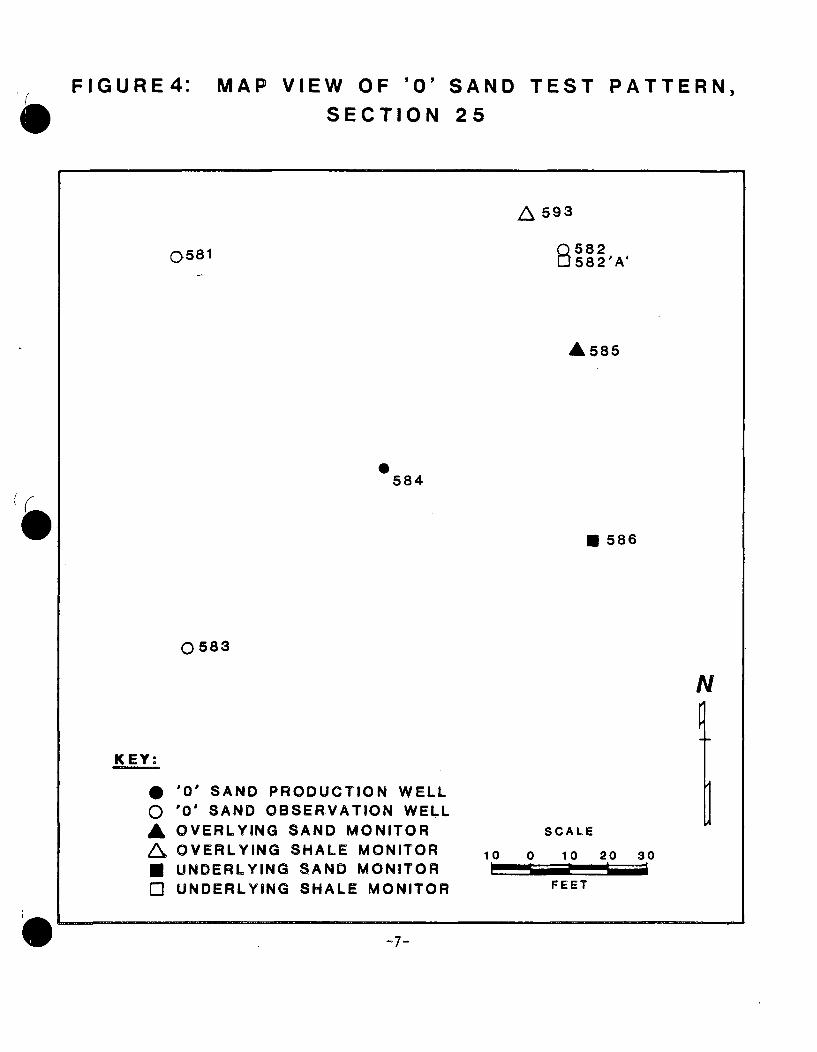
F I GURE 4: MAP VIEW OF '0' SAND TEST PATTERN,
SECTION 25
A• 593
Q581 582582'A'
& 585
0584
0 586
0583
N
KEY:
0
A
C3
'0' SAND PRODUCTION WELL'0' SAND OBSERVATION WELLOVERLYING SAND MONITOROVERLYING SHALE MONITORUNDERLYING SAND MONITORUNDERLYING SHALE MONITOR
ISCALE
10 0 10 20 30
FEET
-7-
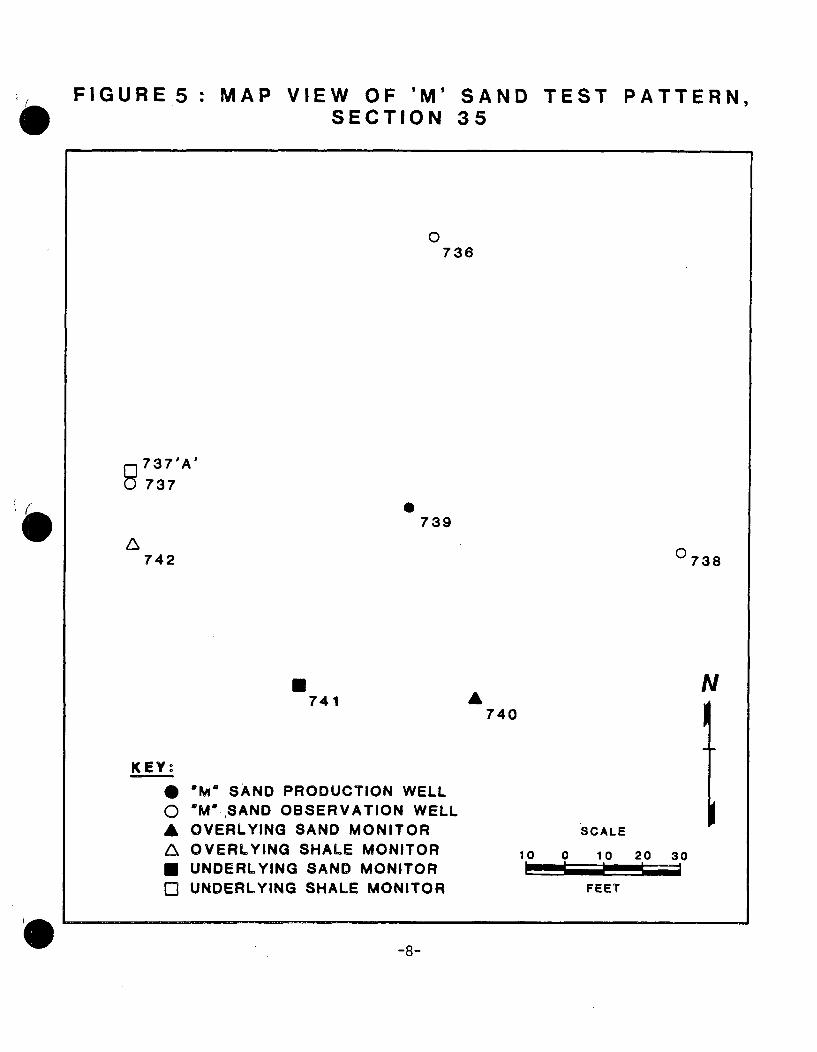
FIGURE 5 : MAP VIEWSE
OFCT
IMOION
SAND35
TEST PATTERN,
0736
737'A'
9 737
742
0739
0738
U741
740
N
KEY:
0
A
C3
•M" SAND PRODUCTION WELL"MO.SAND OBSERVATION WELLOVERLYING SAND MONITOROVERLYING SHALE MONITORUNDERLYING SAND MONITORUNDERLYING SHALE MONITOR
ISCALE
10 0 10 20 30
FEET
-8-
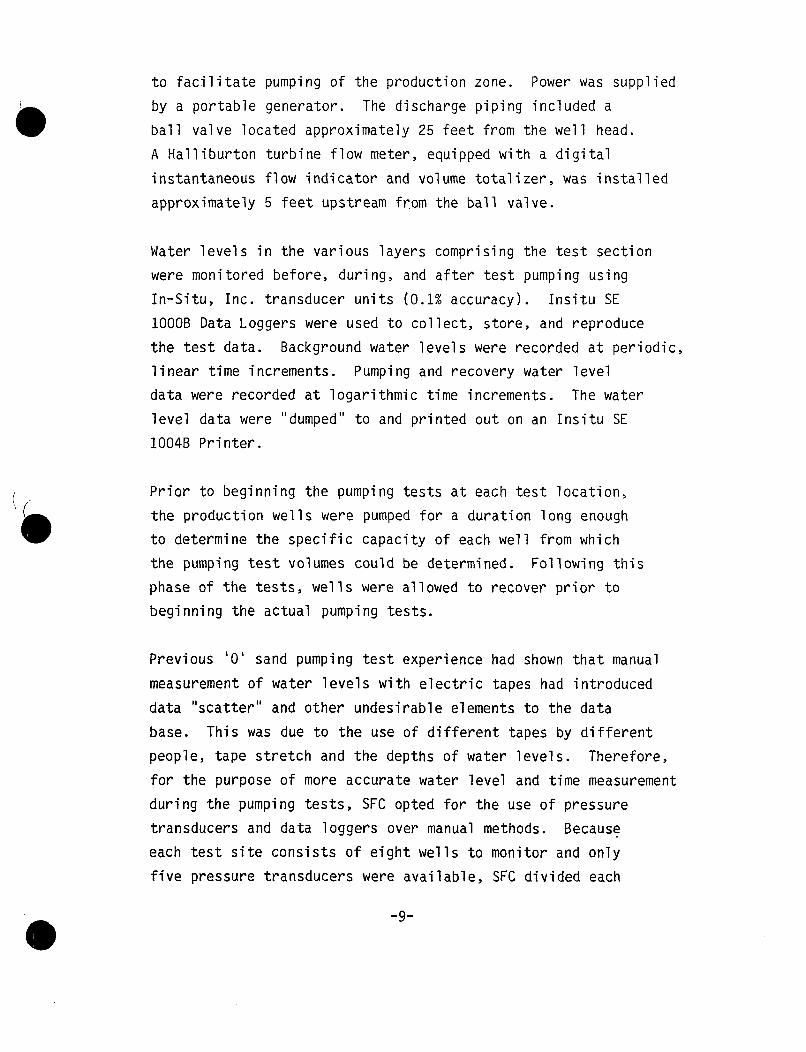
to facilitate pumping of the production zone. Power was supplied
by a portable generator. The discharge piping included a
ball valve located approximately 25 feet from the well head.
A Halliburton turbine flow meter, equipped with a digital
instantaneous flow indicator and volume totalizer, was installed
approximately 5 feet upstream from the ball valve.
Water levels in the various layers comprising the test section
were monitored before, during, and after test pumping using
In-Situ, Inc. transducer units (0.1% accuracy). Insitu SE
IO00B Data Loggers were used to collect, store, and reproduce
the test data. Background water levels were recorded at periodic,
linear time increments. Pumping and recovery water level
data were recorded at logarithmic time increments. The water
level data were "dumped" to and printed out on an Insitu SE
1004B Printer.
Prior to beginning the pumping tests at each test location,
the production wells were pumped for a duration long enough
to determine the specific capacity of each well from which
the pumping test volumes could be determined. Following this
phase of the tests, wells were allowed to recover prior to
beginning the actual pumping tests.
Previous '0' sand pumping test experience had shown that manual
measurement of water levels with electric tapes had introduced
data "scatter" and other undesirable elements to the data
base. This was due to the use of different tapes by different
people, tape stretch and the depths of water levels. Therefore,
for the purpose of more accurate water level and time measurement
during the pumping tests, SFC opted for the use of pressure
transducers and data loggers over manual methods. Because
each test site consists of eight wells to monitor and only
five pressure transducers were available, SFC divided each
-9-
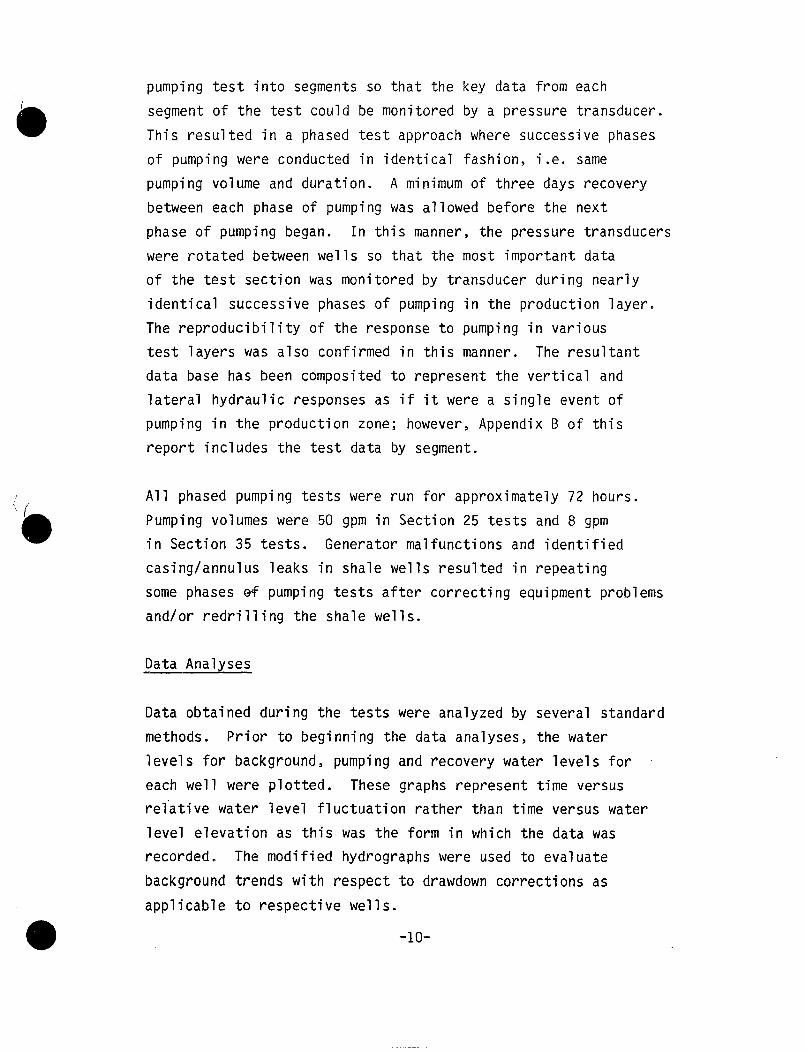
pumping test into segments so that the key data from each
segment of the test could be monitored by a pressure transducer.
This resulted in a phased test approach where successive phases
of pumping were conducted in identical fashion, i.e. same
pumping volume and duration. A minimum of three days recovery
between each phase of pumping was allowed before the next
phase of pumping began. In this manner, the pressure transducers
were rotated between wells so that the most important data
of the test section was monitored by transducer during nearly
identical successive phases of pumping in the production layer.
The reproducibility of the response to pumping in various
test layers was also confirmed in this manner. The resultant
data base has been composited to represent the vertical and
lateral hydraulic responses as if it were a single event of
pumping in the production zone; however, Appendix B of this
report includes the test data by segment.
All phased pumping tests were run for approximately 72 hours.
Pumping volumes were 50 gpm in Section 25 tests and 8 gpm
in Section 35 tests. Generator malfunctions and identified
casing/annulus leaks in shale wells resulted in repeating
some phases ef pumping tests after correcting equipment problems
and/or redrilling the shale wells.
Data Analyses
Data obtained during the tests were analyzed by several standard
methods. Prior to beginning the data analyses, the water
levels for background, pumping and recovery water levels for
each well were plotted. These graphs represent time versus
relative water level fluctuation rather than time versus water
level elevation as this was the form in which the data was
recorded. The modified hydrographs were used to evaluate
background trends with respect to drawdown corrections as
applicable to respective wells.
-10-
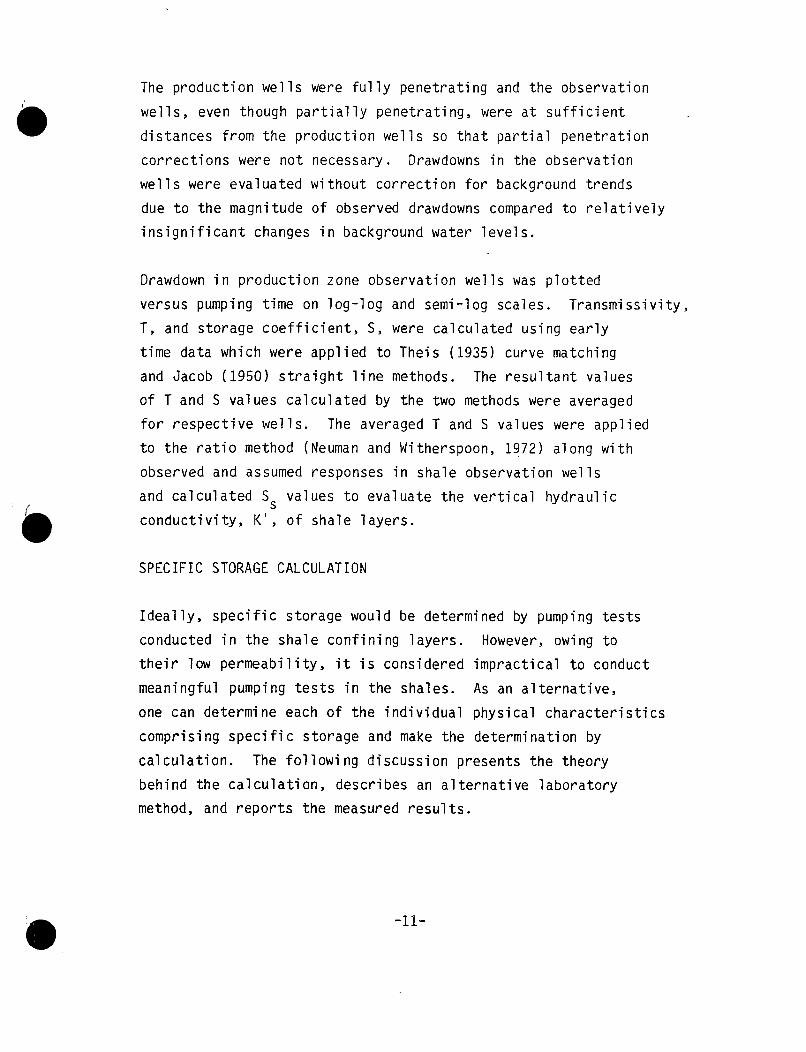
The production wells were fully penetrating and the observation
wells, even though partially penetrating, were at sufficient
distances from the production wells so that partial penetration
corrections were not necessary. Drawdowns in the observation
wells were evaluated without correction for background trends
due to the magnitude of observed drawdowns compared to relatively
insignificant changes in background water levels.
Drawdown in production zone observation wells was plotted
versus pumping time on log-log and semi-log scales. Transmissivity,
T, and storage coefficient, S, were calculated using early
time data which were applied to Theis (1935) curve matching
and Jacob (1950) straight line methods. The resultant values
of T and S values calculated by the two methods were averaged
for respective wells. The averaged T and S values were applied
to the ratio method (Neuman and Witherspoon, 1972) along with
observed and assumed responses in shale observation wells
and calculated Ss values to evaluate the vertical hydraulic
conductivity, K', of shale layers.
SPECIFIC STORAGE CALCULATION
Ideally, specific storage would be determined by pumping tests
conducted in the shale confining layers. However, owing to
their low permeability, it is considered impractical to conduct
meaningful pumping tests in the shales. As an alternative,
one can determine each of the individual physical characteristics
comprising specific storage and make the determination by
calculation. The following discussion presents the theory
behind the calculation, describes an alternative laboratory
method, and reports the measured results.
-11-
Theory
Storage coefficient, S, of a saturated formation is defined
as the volume of water that a unit volume of the formation
releases from storage under a unit decline in hydraulic head.
Specific storage, SS, is the amount of water per unit volume
of saturated formation that is stored or released from storage
due to the compressibility of the mineral skeleton and the
pore water. Storage coefficient is related to specific storage
by the formation thickness, b, by: S = bS . Lowering the
water level in a well decreases the aquifer fluid pressure,
p, and increases the effective stress, a e' which is borne
by the formation solid skeleton. Each of these related changes
results in release of water from storage. Therefore, S is
a function of the compressibility of water, c , and the compressibility
of the aquifer skeleton, a , and the porosity of the formation.
Specific storage is defined by the expression:
Ss = Pg( +an8 ) (L -1)
Where:
Pg is density of water (F/L )
n is porosity of the aquifer (unitless fraction)
a is compressibility of the aquifer (L2 /F)
B is compressibility of water (L.2 /F)
Pumping tests typically are preferred for determining specific
storage, but are considered impractical in low permeability
-12-
formations such as the shales of the Fort Union Formation.
An alternative approach is to determine formation porosity
and compressibility in the specific storage equation and
calculate S
The compressibility and density of water cover a relatively
small range of values under the conditions normally found
in aquifers. Thus, assumed values can be used for pg and
ý, leaving only a and n as unknowns. Porosity is a relatively
insensitive parameter in the determination due to its narrow
range of variation as compared to the aquifer compressibility.
Therefore, the greatest effort should be expended in estimating.
The usual techniques for determining a utilizes a consolidometer,
a device in which the material is loaded uniaxially in a laterally
confined chamber (Jorgensen, 1980). Measurements of sample
compression at various loads plot as a stress-strain curve.
The inverse of the slope tangent at the in situ stress level
is the compressibility of the aquifer skeleton, a . There
are, however, several reasons why consolidation tests may
be unsuitable for rock materials. Firstly, in many cases,
the stress levels required to simulate in situ conditions
cannot be attained with standard soil consolidometers. Secondly,
the material sample must be trimmed to completely fill the
consolidometer chamber. The additional sample consolidation
caused by a failure to completely fill the chamber is interpreted
as actual vertical compression. This would bias the compressibility
toward a higher value. Normally, this effect is acceptably
low for higher compressible materials such as soil, but may
represent a major error by percentage in less compressible
rock samples. Thirdly, consolidation tests are performed
on saturated samples which may exhibit substantial swell prior
to reloading. The initial sample expansion causes increased
compressibility during sample reload.
-13-
For these reasons, an alternative to consolidometer testing
was followed. The core samples were subjected to unconfined
compressive tests in which axial and lateral strains were
recorded. While the test conditions do not directly simulate
field conditions, sufficient data can be collected to translate
the test conditions to the field situation.
As previously mentioned, a is the reciprocal of the tangent
slope of the consolidometer stress-strain curve. The tangent
slope or modulus is referred to as the constrained modulus,
D, due to the confined or constrained test conditions. Thus,a
= 1/D. Geomechanical studies have shown that the moduli for
varying test conditions are related by Poisson's ratio, P
the ratio of strain in the lateral directions to the strain
in the axial (vertical) direction. The relationship between
the constrained modulus and Young's modulus of elasticity,
E, is as follows (Lambe and Whitman, 1969):
D= E (1 -P)
(1 +iu) (1 - 2 )
Young's modulus, E, is determined in unconfined uniaxial loading.
Thus, an unconfined uniaxial compressive test, with measurement
of vertical and horizontal strain to determine Poisson's ratio,
, gives sufficient information to calculate D and therefore,
the aquifer compressibility, as follows:
= 1
D
1 (I + P) (1 2 i. )
E (1 - 1)
-14-
Since the remaining parameters in the specific storage equation
are known or can be easily measured in the laboratory, the
specific storage can be determined without the attendant problems
associated with consolidometer tests.
Laboratory Testing
The laboratory testing performed by Dr. Charles J. Haas &
Associates at the Rock Mechanics and Explosives Research Center
of the University of Missouri-Rolla are presented in Appendix
A. Four core samples of two-foot length were received but
only two samples of sufficient length for strength testing
remained intact.
For each of the four samples received, the porosity was measured
on three sub-samples with a helium porosimeter. The measured
values and related parameters are presented in Tables A-2
and A-3. The porosity ranges between 14% and 23%, with an
average for all twelve tests of 18.6%. The dry density averages
2.18 g/cm3 (136 lbs/ft. 3).
The compression tests were performed on samples LM-35-743
(depth 810 feet) and NM-35-742 (depth 718 feet). Plots of
the stress-strain data are presented in Appendix A of Dr.
Haas's report. Note that a scale change and change of plotter
paper were required when the plotter pens pegged out.
Calculation
The aquifer compressibility, as previously mentioned, can
be calculated from Poisson's ratio and the Young's modulus.
These two parameters are derived from the stress-strain curve
at the effective stress level encountered in the aquifer.
The in situ effective stress conditions may be estimated knowing
-15-
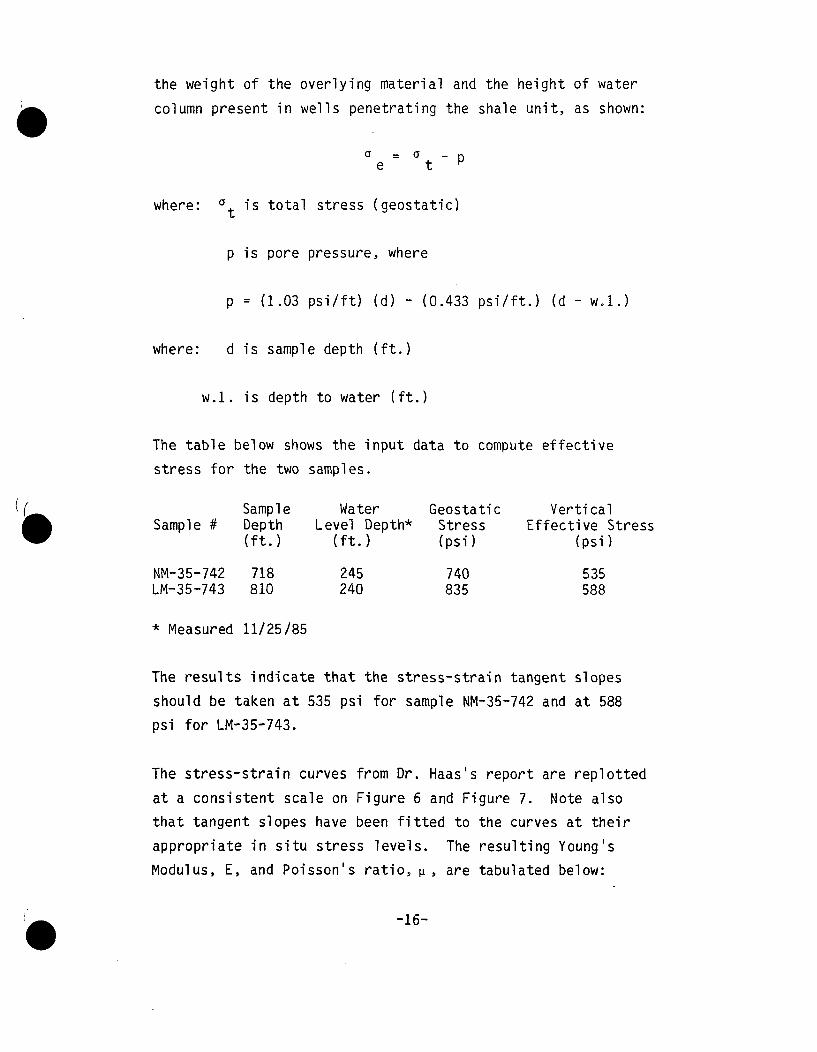
the weight of the overlying material and the height of water
column present in wells penetrating the shale unit, as shown:
e t P
where: 0 is total stress (geostatic)t
p is pore pressure, where
p = (1.03 psi/ft) (d) - (0.433 psi/ft.) (d - w.1.)
where: d is sample depth (ft.)
w.l. is depth to water (ft.)
The table below shows the input data to compute effective
stress for the two samples.
Sample Water Geostatic VerticalSample # Depth Level Depth* Stress Effective Stress
(ft.) (ft.) (psi) (psi)
NM-35-742 718 245 740 535LM-35-743 810 240 835 588
* Measured 11/25/85
The results indicate that the stress-strain tangent slopes
should be taken at 535 psi for sample NM-35-742 and at 588
psi for LM-35-743.
The stress-strain curves from Dr. Haas's report are replotted
at a consistent scale on Figure 6 and Figure 7. Note also
that tangent slopes have been fitted to the curves at their
appropriate in situ stress levels. The resulting Young's
Modulus, E, and Poisson's ratio, 4, are tabulated below:
-16-
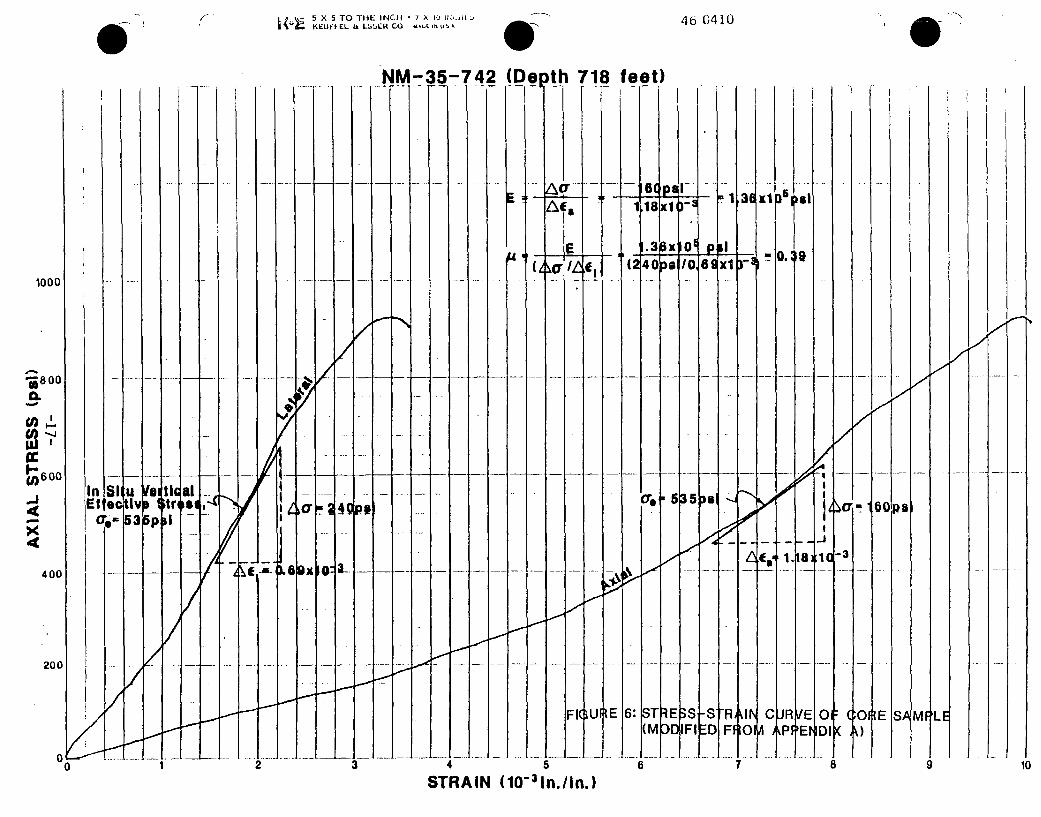
/ bF. ~ 2 46 0410e ,KEUV-÷ EL Lk LSSR CO M4&UEf. OTEICI-7X1 tl•,u l 4 0 1
NM-35-742 (Do 718 feet)
. .. . . .. . . .. . . . . . .. .. .. . . . . . . . . .. ... . . . . 6 a r .. ..Afa 1.181 -1 .1
SE ,. :lx of po1
(z w , (240 )a/0 xl0 ....
.i~oI
M
STRAIN (10- 3 1n./in.)
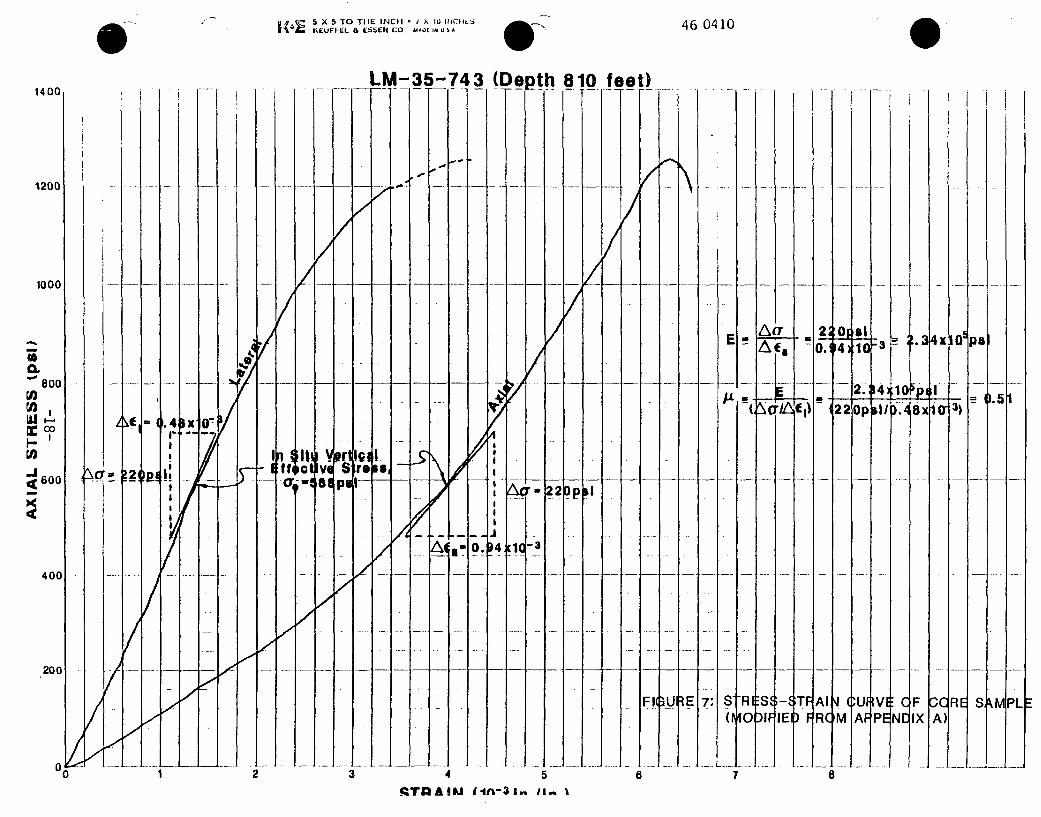
5 X 5 TO THE INCHI ° x 1o ItJCAIIS' ,KEUFFEL &"5C CO. W IN U S A
46 0410
14001LM-35-743 (Dth 810 feet)-F-.jiKLV.V.i.B
N1200
1000
800
V)V)'rc 00-I-,
600
400
200
/ /!/
V/ // /
7.4
/t
\cy - !20p I!
2'/,
0~
I -I pot 1vopri,S
I/re
I-
E/
'!G'I
/
S /4
1422
(c
AuT• i
0.6414
E
:10
2.;0pl22
14;ill
'10 I-.31I0" =)1 r).5
op
I- ..3 4xlO~p&l
il
A0. 11C
/ L/
-3
]// 7
ov0o
1/ -4
CCA)
7/I/ FIOU
.-4S,Ul
1S= R- TFAI PEUIlvE"CNC
RE S \!PL-
3 4 5 6 7 8_•TIIAIK Itn , /I", w
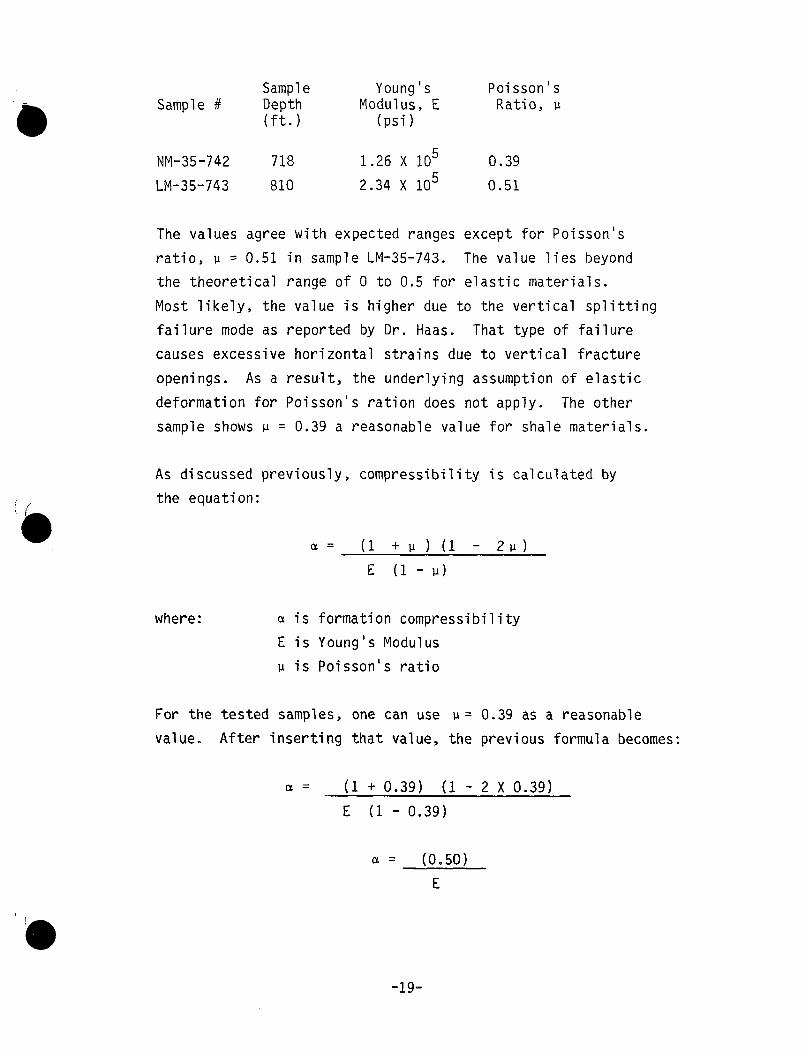
Sample Young's Poisson'sSample # Depth Modulus, E Ratio, 4
(ft.) (psi)
NM-35-742 718 1.26 X 10⁵ 0.39
LM-35-743 810 2.34 X 10⁵ 0.51
The values agree with expected ranges except for Poisson's
ratio, A = 0.51 in sample LM-35-743. The value lies beyond
the theoretical range of 0 to 0.5 for elastic materials.
Most likely, the value is higher due to the vertical splitting
failure mode as reported by Dr. Haas. That type of failure
causes excessive horizontal strains due to vertical fracture
openings. As a result, the underlying assumption of elastic
deformation for Poisson's ration does not apply. The other
sample shows P = 0.39 a reasonable value for shale materials.
As discussed previously, compressibility is calculated by
the equation:
= (1 + • ) (1 - 2v)
E (1- 4)
where: a is formation compressibility
E is Young's Modulus
4 is Poisson's ratio
For the tested samples, one can use ui= 0.39 as a reasonable
value. After inserting that value, the previous formula becomes:
S= (1 + 0.39) (1 - 2 X 0.39)
E (1 - 0.39)
a = (0.50)
E
-19-
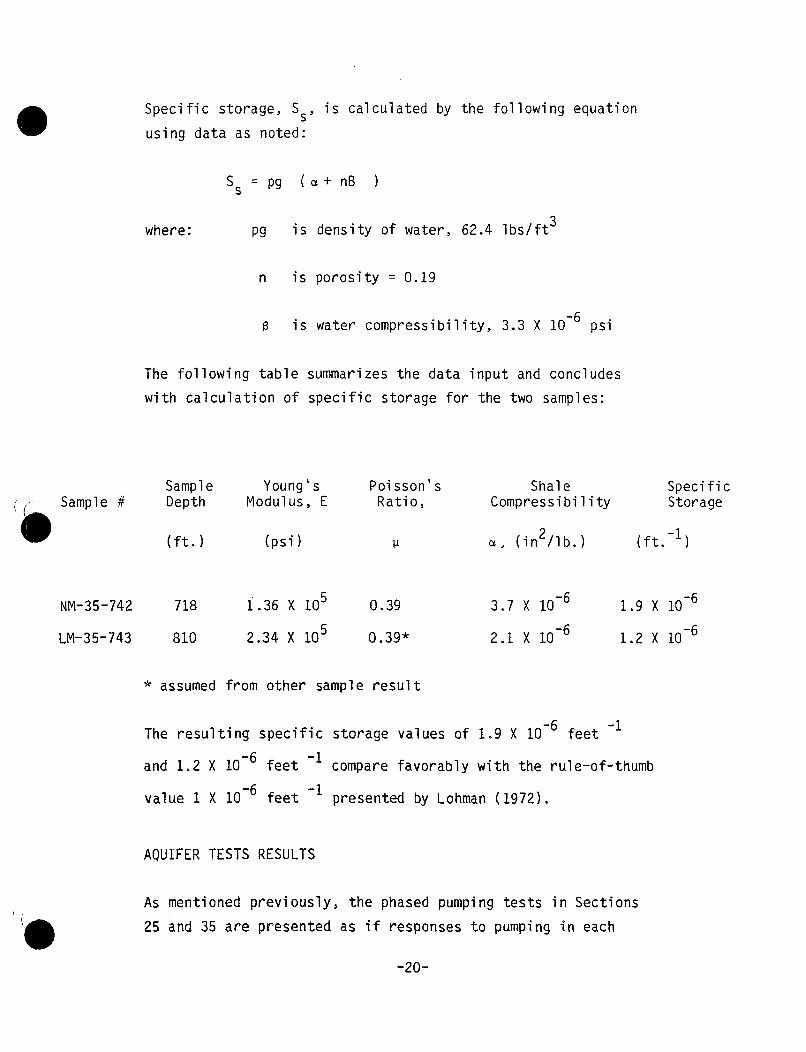
Specific storage, Ss, is calculated by the following equation
using data as noted:
Ss = pg (a+ nB)
where: pg is density of water, 62.4 lbs/ft 3
n is porosity = 0.19
s is water compressibility, 3.3 X 10⁻⁶ psi
The following table summarizes the data input and concludes
with calculation of specific storage for the two samples:
Sample #SampleDepth
(ft.)
Young 'sModulus, E
(psi)
Poisson'sRatio,
4-
ShaleCompressibility
a, (in 2/lb.)
SpecificStorage
(ft.-I)
NM-35-742
LM-35-743
718 1.36 X 10⁵ 0.39 3.7 X 10- 6 1.9 X 10⁻⁶
810 2.34 X 10⁵ 0.39* 2.1 X 10-6 1.2 X 10⁻⁶
* assumed from other sample result
-6 -1The resulting specific storage values of 1.9 X 10 feet
and 1.2 X 10⁻⁶ feet -1 compare favorably with the rule-of-thumb
value I X 10-6 feet -I presented by Lohman (1972).
AQUIFER TESTS RESULTS
As mentioned previously, the phased pumping tests in Sections
25 and 35 are presented as if responses to pumping in each
-20-
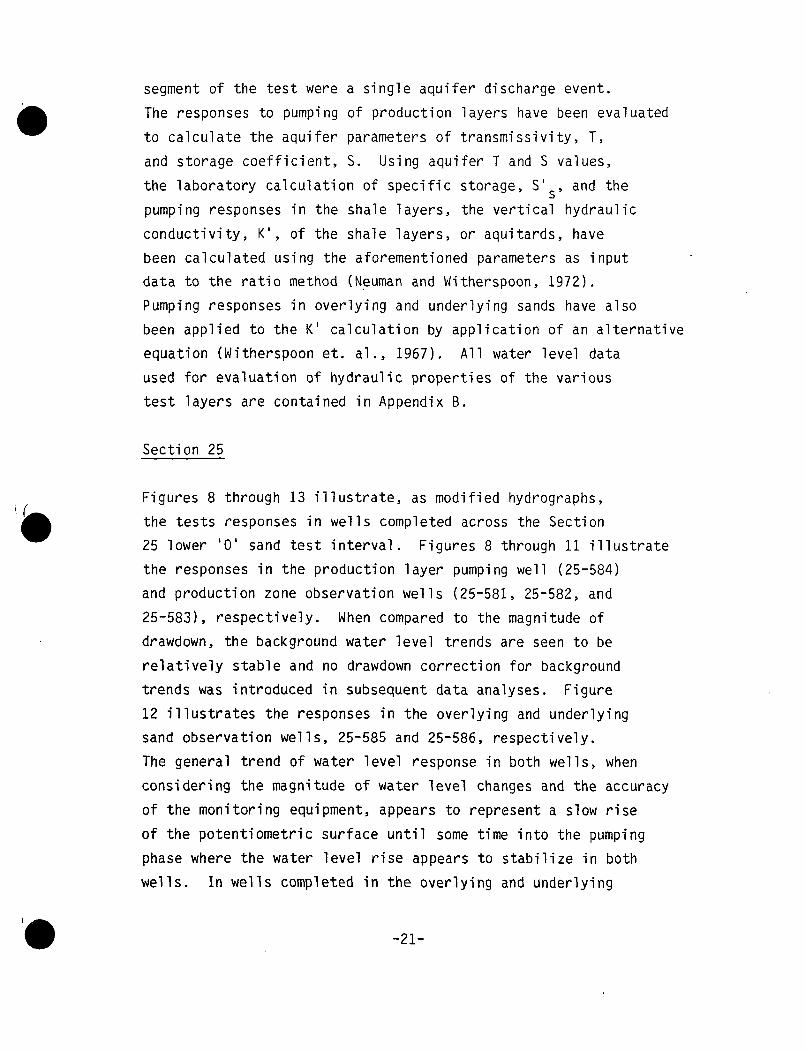
segment of the test were a single aquifer discharge event.
The responses to pumping of production layers have been evaluated
to calculate the aquifer parameters of transmissivity, T,
and storage coefficient, S. Using aquifer T and S values,
the laboratory calculation of specific storage, S's, and the
pumping responses in the shale layers, the vertical hydraulic
conductivity, K', of the shale layers, or aquitards, have
been calculated using the aforementioned parameters as input
data to the ratio method (Neuman and Witherspoon, 1972).
Pumping responses in overlying and underlying sands have also
been applied to the K' calculation by application of an alternative
equation (Witherspoon et. al., 1967). All water level data
used for evaluation of hydraulic properties of the various
test layers are contained in Appendix B.
Section 25
Figures 8 through 13 illustrate, as modified hydrographs,
the tests responses in wells completed across the Section
25 lower '0' sand test interval. Figures 8 through 11 illustrate
the responses in the production layer pumping well (25-584)
and production zone observation wells (25-581, 25-582, and
25-583), respectively. When compared to the magnitude of
drawdown, the background water level trends are seen to be
relatively stable and no drawdown correction for background
trends was introduced in subsequent data analyses. Figure
12 illustrates the responses in the overlying and underlying
sand observation wells, 25-585 and 25-586, respectively.
The general trend of water level response in both wells, when
considering the magnitude of water level changes and the accuracy
of the monitoring equipment, appears to represent a slow rise
of the potentiometric surface until some time into the pumping
phase where the water level rise appears to stabilize in both
wells. In wells completed in the overlying and underlying
-21-
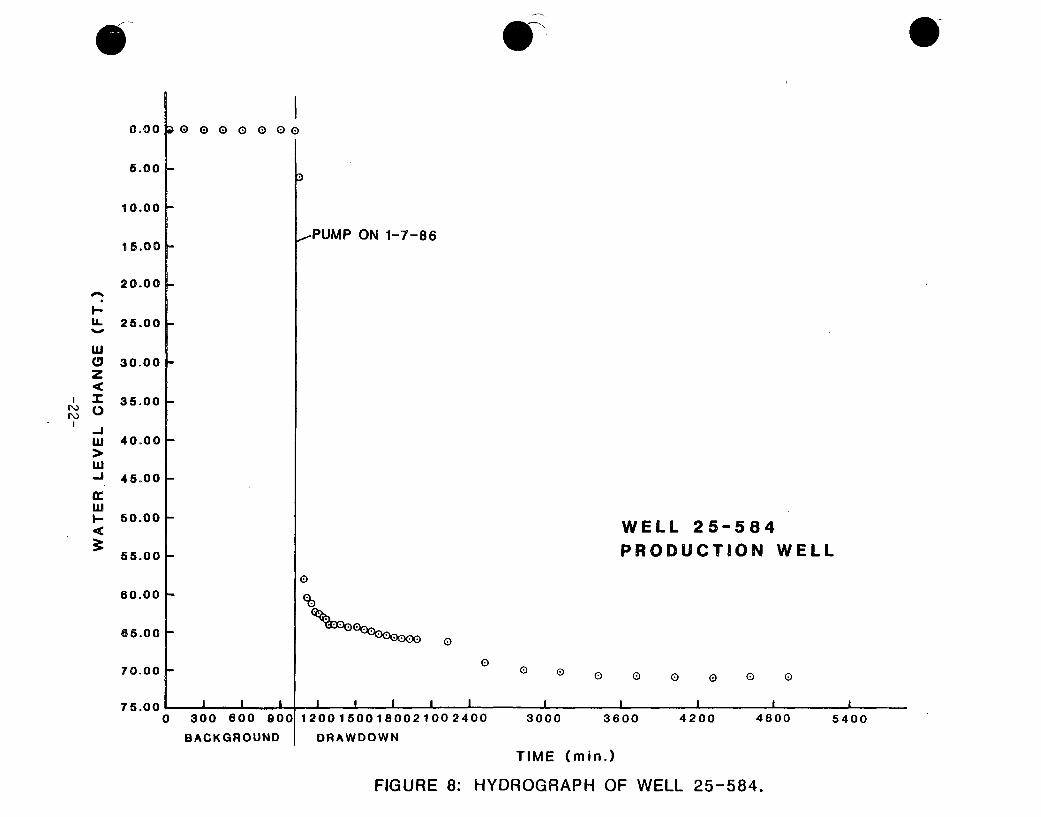
00
I'-
U.%.oJw
z,,I
-J
Mw-J
I-J
0.00
5.00
10.00
15.00
20.00
25.00
30.00
35.00
40.00
45.00
50.00
55.00
60.00
65.00
70.00
75.00
0 0 0 0 0
! ! I
,.PUMP ON 1-7-86
WELL 25-584PRODUCTION WELL
0
~G~c~ooo
0
00 0 0 0 0 0 0
I I I I I I I I I I
0 300 600 900
BACKGROUND
12001500
DRAWD(
1180021002400 3000 3600 4200 4
3WN
TIME (min.)
FIGURE 8: HYDROGRAPH OF WELL 25-584.
800 5400
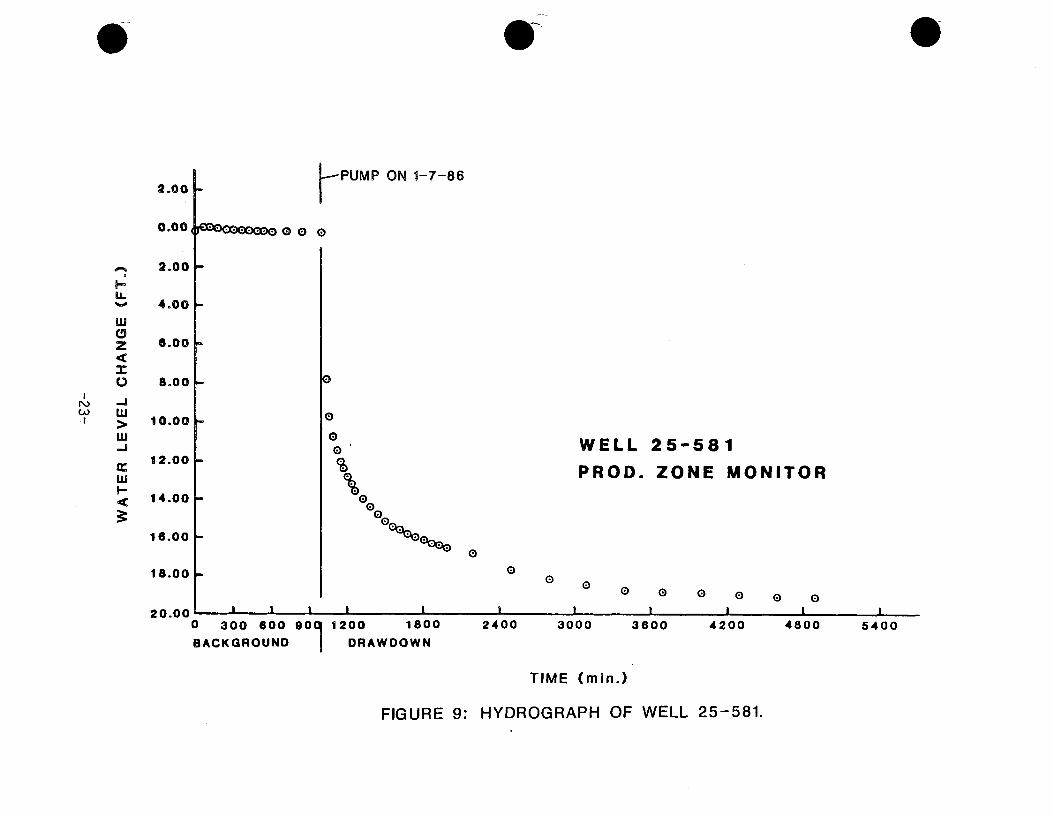
2.00 -KPUMP ON 1-7-86
0.004fr0co 0ao o
rlI
U-
wa
iCl,
z3:
ww-J
w"r
2.00
4.00
6.00
8.00
10.00
0
0
0
12.00
14.00
16.00
18.00
20.000 300 600
BACKGROUND
WELL 25-581
PROD. ZONE MONITOR
0
00
00 0 0 0 @ 0
-_ II I IB B m B & I901 1200 1800
DRAWDOWN
2400 3000 3600 4200 4800 5400
TIME (min.)
FIGURE 9: HYDROGRAPH OF WELL 25-581.
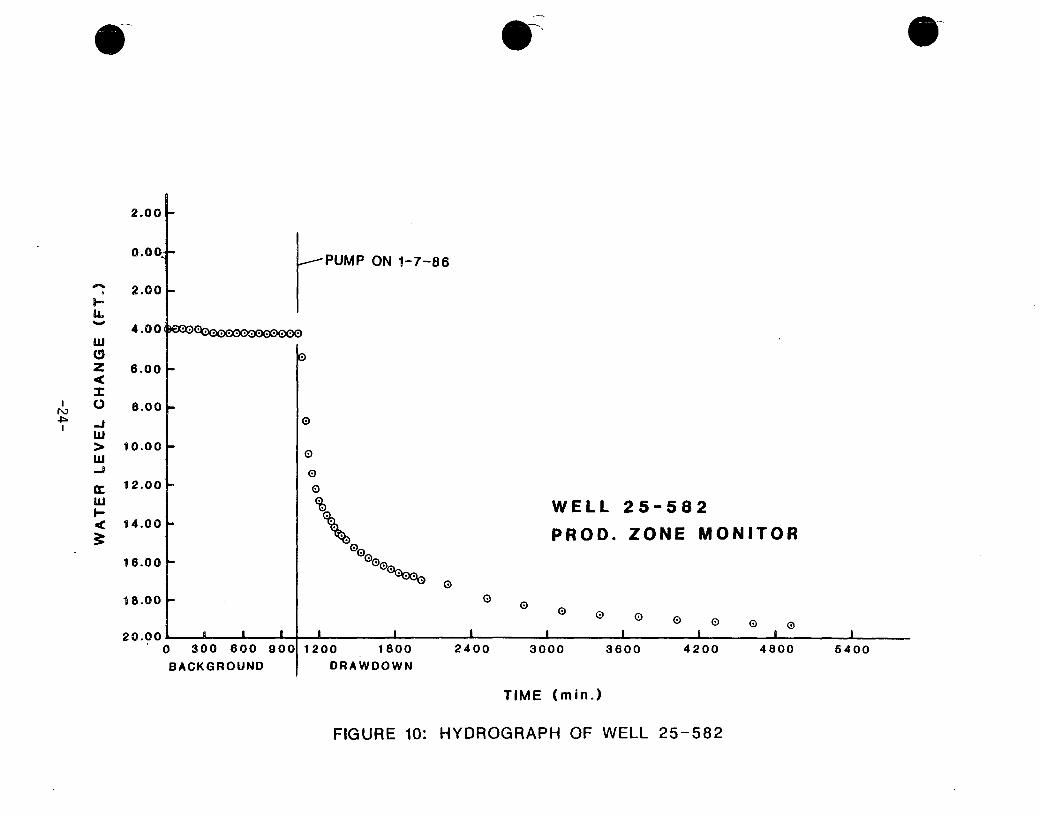
0
I4:::.
I
I-
IL
w
0
-J
crwu
2.00
0.00.
2.00
4.00
6.00
8.00
10.00
12.00
14.00
16.00
18.00
20.000 300 600 9
BACKGROUND
-PUMP ON 1-7-86
0
0
00 00 '0 0
"30
WELL 25-582
PROD. ZONE MONITOR
0 0 0 0 0 0 00
0
1200 1800
DRAWDOWN
2400 3000 3600 4200 4800 5400
TIME (min.)
FIGURE 10: HYDROGRAPH OF WELL 25-582
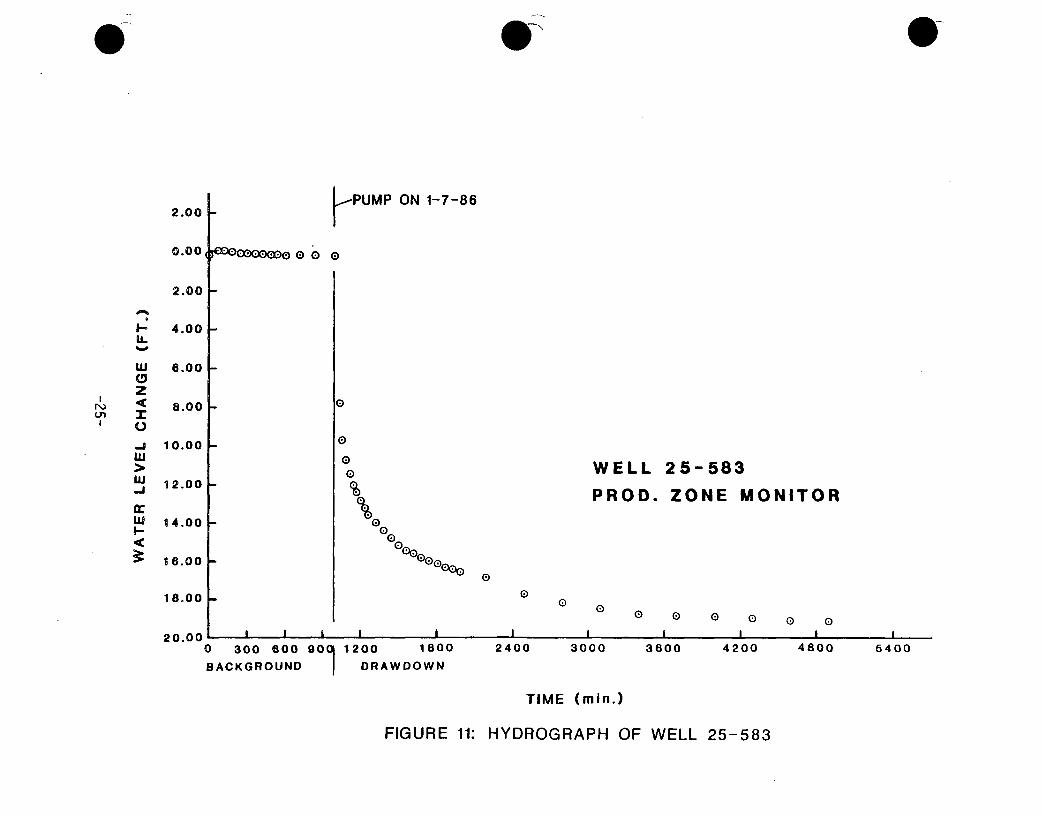
0- 0
U,I
IL
wz
0
-Jwwi-J
I-
2.00
0.001
2.00
4.00
6.00
8.00
10.00
12.00
14.00
16.00
18.00
20.00
PUMP ON 1-7-86
rM00o000oo o 0 0
0
00
00
0~eo
0®
WELL 25-583
PROD. ZONE MONITOR
00 0 0 0 0 0 0 0
i i 2 i ! i |i
0 300 600 901 1200 1800
BACKGROUND DRAWDOWN
2400 3000 3600 4200 4800 5400
TIME (min.)
FIGURE 11: HYDROGRAPH OF WELL 25-583
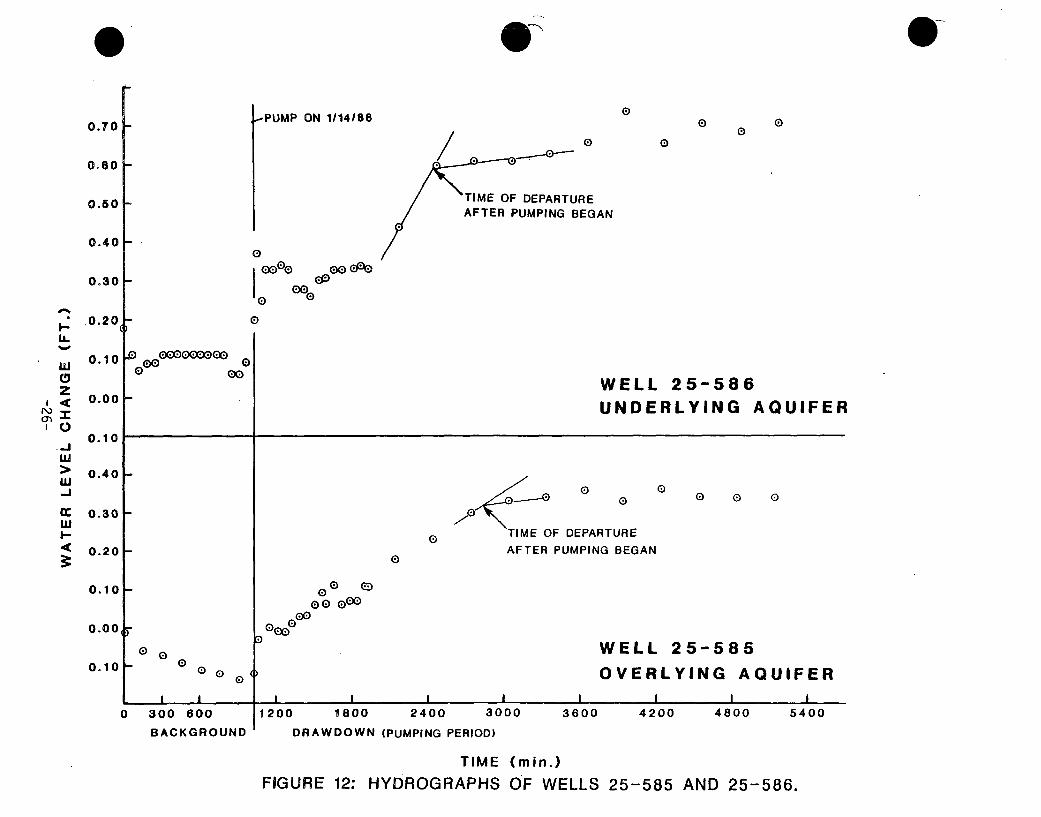
0
I--
1i..ILl
0z
i -
uJ
crI-J
0.70
0.60
0.50
0.40
0.30
0.20
0.10
0.00
0.10
0.40
0.30
0.20
0.10
0.004
0.10
S--PUMP ON 1/14/86 0 O
/ 0O
TIME OF DEPARTURE
AFTER PUMPING BEGAN
0
.0 000000000Gc(0 M0
0eo% o
'0 00
00 (p
0
WELL 25-586UNDERLYING AQUIFER
'101 .-- 0 0 G
TIME OF DEPARTURE
AFTER PUMPING BEGAN
0 0 0
0
o0 0000
00000
0 00o0
WELL 25-585
OVERLYING AQUIFERI I II I i I I
0 300 600
BACKGROUND
1200 1800 2400 3000 3600 4200 4800 5
DRAWDOWN (PUMPING PERIOD)
TIME (min.)
FIGURE 12: HYDROGRAPHS OF WELLS 25-585 AND 25-586.
400
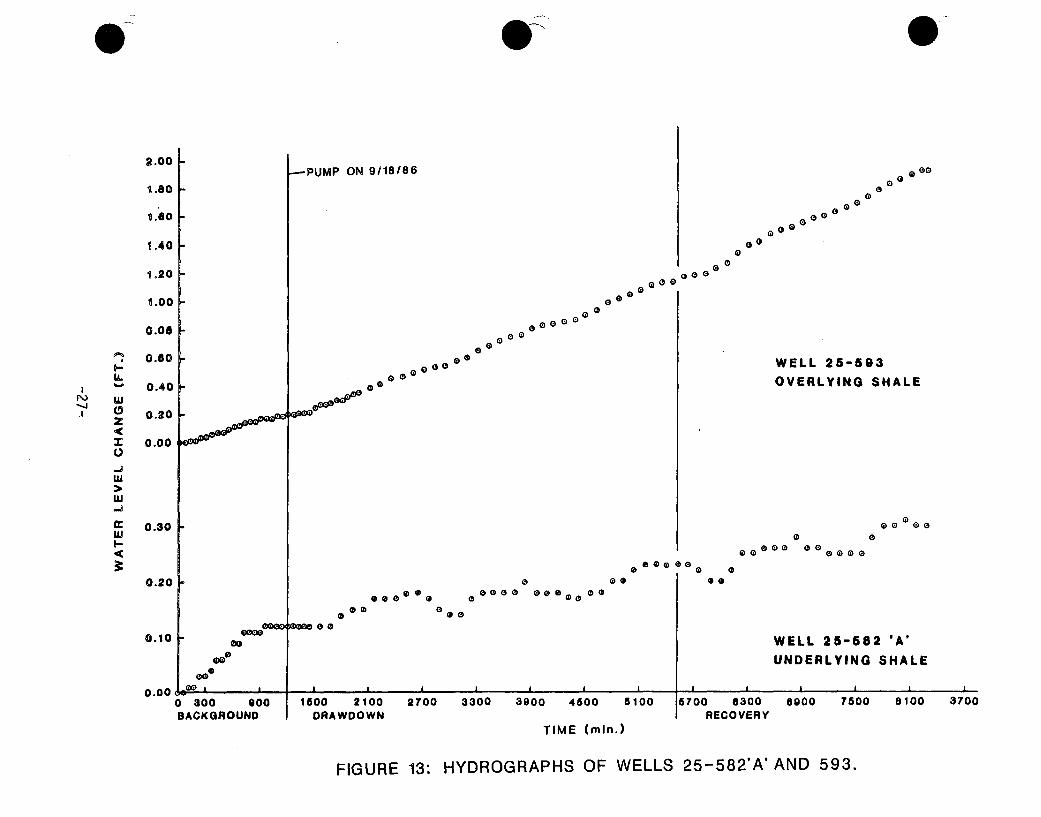
2.00,PUMP ON 9/18/86 a a 0
,.60
1.40
1.20
1.00 00
0.08 6
0' 0.60 0I-coU,. 00000
% 0 0.40
0.20z
Z 0.00U
-J
-LJ
CC 0.30w
0.20 0 0fa e a a 000000go O o 00oea
000 0.000
0.10 - c
000
0.00 0( A I I0 300 g00 1500 2100 2700 3300 3900 4600BACKGROUND DRAWDOWN
TIME (min.)
000
.0
00
00°
000
WELL 25-593OVERLYING SHALE
0
00 0000
000 00 000 000
0 0SQ 00
WELL 25-582 'A'UNDERLYING SHALE
1100 5700 8300RECOVERY
6900 7500 8100 3700
FIGURE 13: HYDROGRAPHS OF WELLS 25-582'A'AND 593.
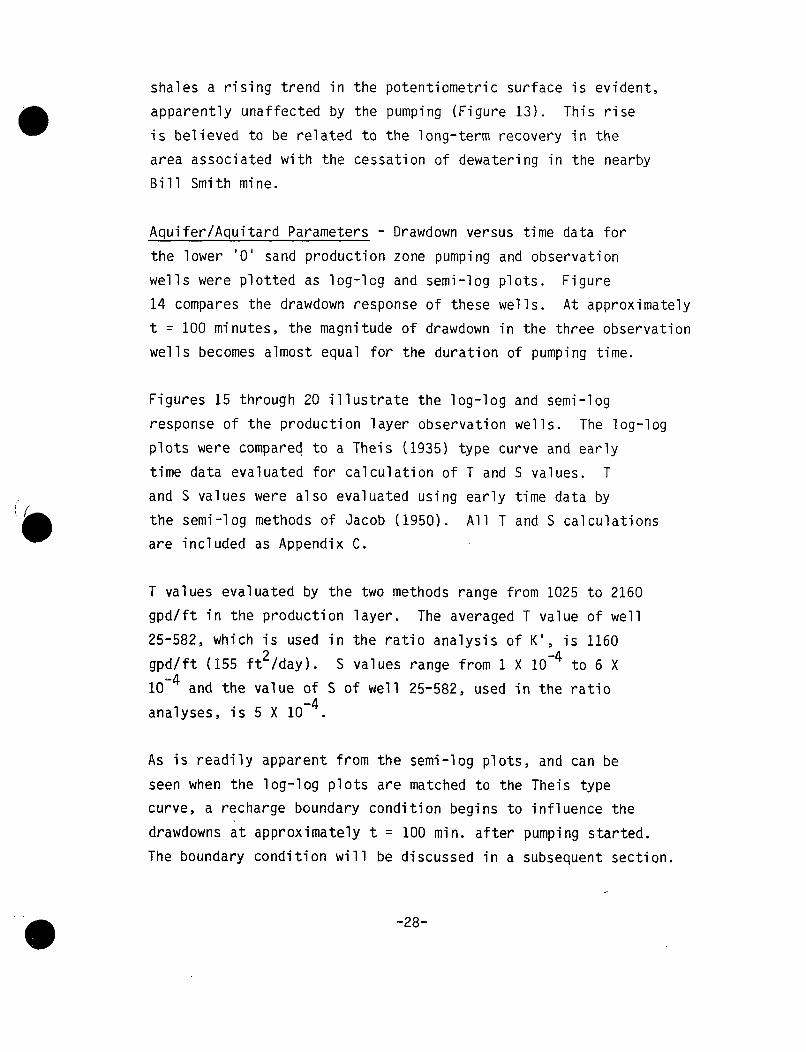
shales a rising trend in the potentiometric surface is evident,
apparently unaffected by the pumping (Figure 13). This rise
is believed to be related to the long-term recovery in the
area associated with the cessation of dewatering in the nearby
Bill Smith mine.
Aquifer/Aquitard Parameters - Drawdown versus time data for
the lower '0' sand production zone pumping and observation
wells were plotted as log-log and semi-log plots. Figure
14 compares the drawdown response of these wells. At approximately
t = 100 minutes, the magnitude of drawdown in the three observation
wells becomes almost equal for the duration of pumping time.
Figures 15 through 20 illustrate the log-log and semi-log
response of the production layer observation wells. The log-log
plots were compared to a Theis (1935) type curve and early
time data evaluated for calculation of T and S values. T
and S values were also evaluated using early time data by
the semi-log methods of Jacob (1950). All T and S calculations
are included as Appendix C.
T values evaluated by the two methods range from 1025 to 2160
gpd/ft in the production layer. The averaged T value of well
25-582, which is used in the ratio analysis of K', is 1160
gpd/ft (155 ft2/day). S values range from 1 X 10⁻⁴ to 6 X
i0-4 and the value of S of well 25-582, used in the ratio
analyses, is 5 X 10⁻⁴.
As is readily apparent from the semi-log plots, and can be
seen when the log-log plots are matched to the Theis type
curve, a recharge boundary condition begins to influence the
drawdowns at approximately t = 100 min. after pumping started.
The boundary condition will be discussed in a subsequent section.
-28-
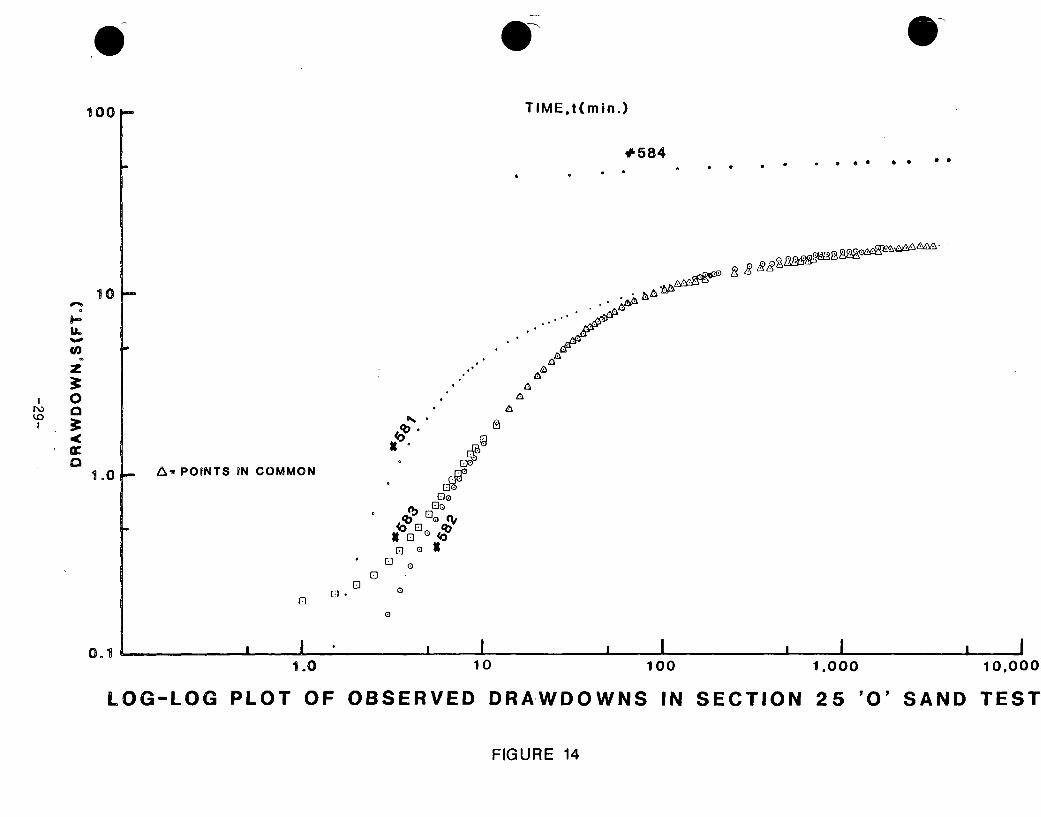
100 TIME.t(min.)
#584# S * S S * *
0 *
•'t• • •°•8
b/a
U-003
10
1.0
'.0
A- POINTS IN COMMON
', 000
Qo
0
a- 00
a
I I I I I I I I a I0.1I1.0 10 100 1.000 10,000
LOG-LOG PLOT OF OBSERVED DRAWDOWNS IN SECTION 25 '0' SAND TEST
FIGURE 14
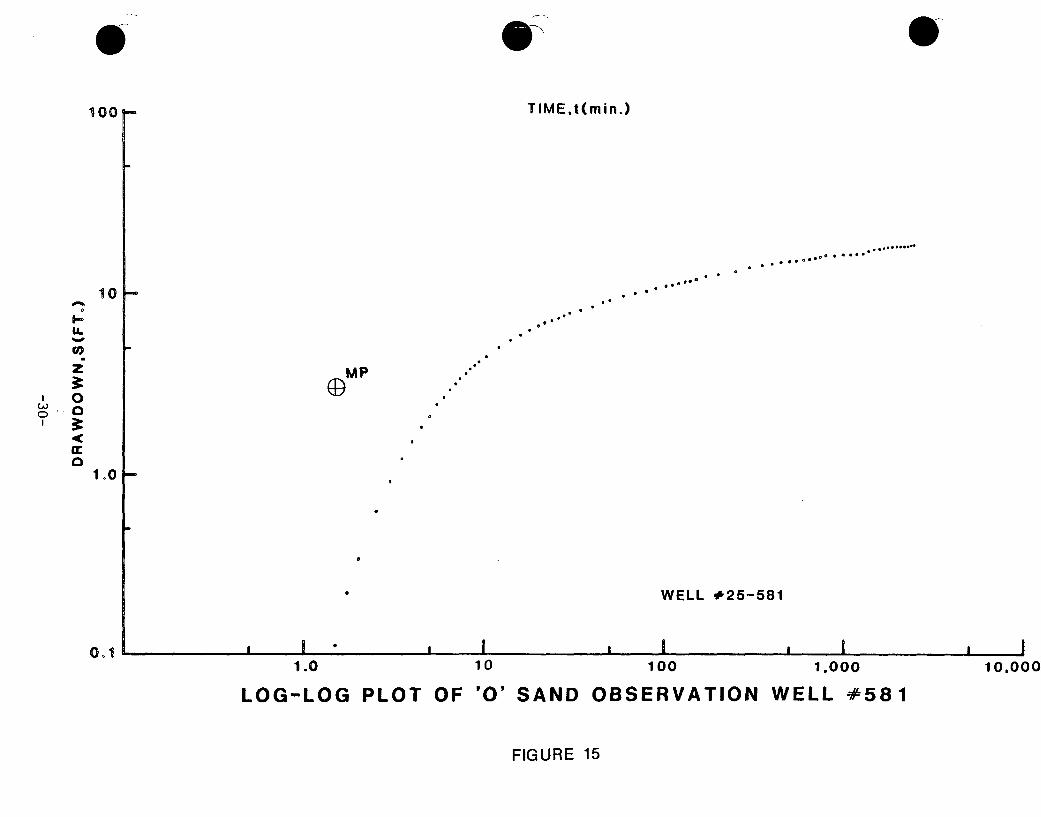
100
10
0)
00
0(
TIMEt(min.)
WELL #25-581
GMPIr,•
0 'I
1.0
0.11.0 10 100 1,000
OBSERVATION WELL #581
10,000
LOG-LOG PLOT OF '0' SAND
FIGURE 15
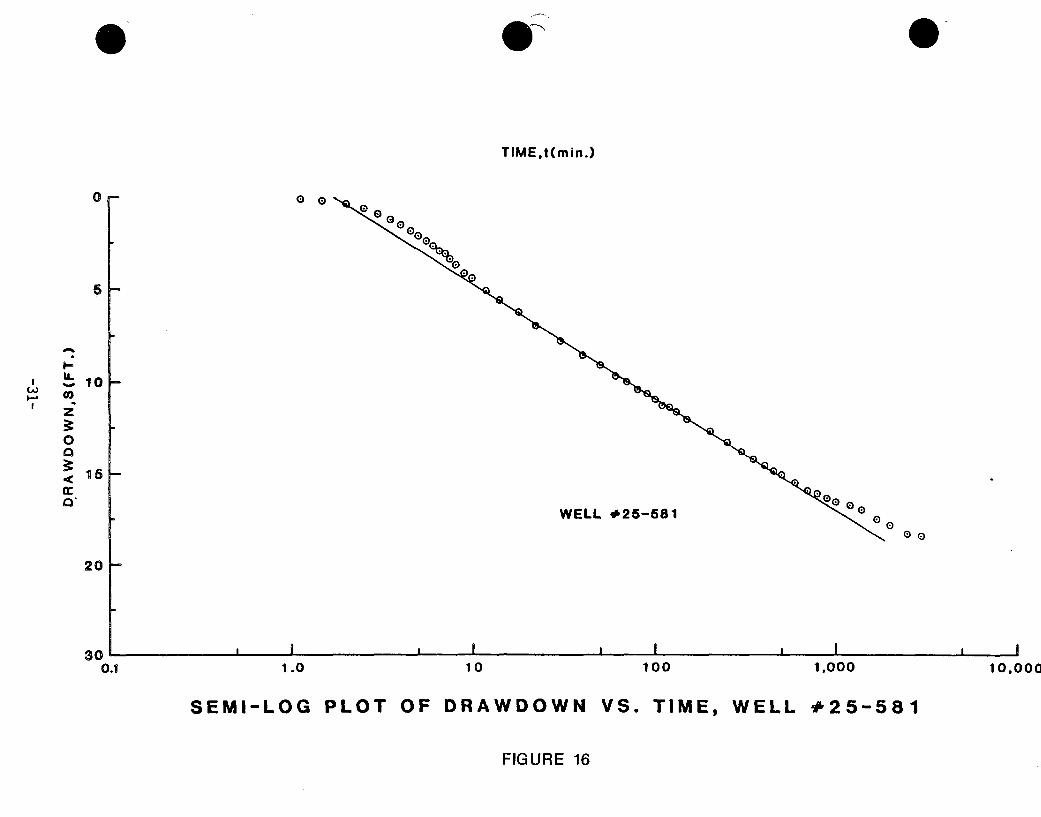
TIME.t(m in.)
0r0
5
U-
0
10
15 -
00WELL #25-581
20H
I I a I I I I I I30'
0.11 1.0 10 100 1.000 10,000
SEMI-LOG PLOT OF DRAWDOWN VS. TIME, WELL #25-581
FIGURE 16
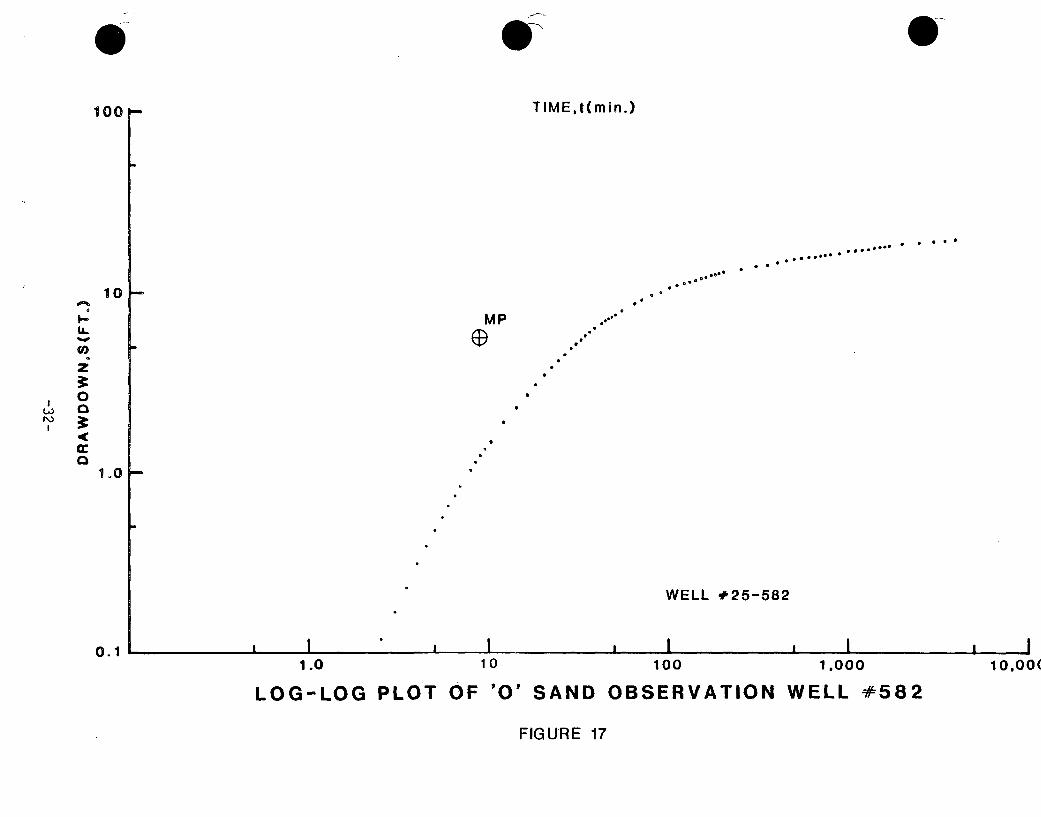
0
100 - TIME~tmin..)
• .... . . ... ... ... ... .... ... ... ... ... ... ..
0.09*****
10
U-
z
0
I0
a
MP
c-&
WELL #25-582
I I I I i I a I I I0.11.0 10 100 1.000 10,00(
LOG-LOG PLOT OF '0' SAND OBSERVATION WELL #582
FIGURE 17
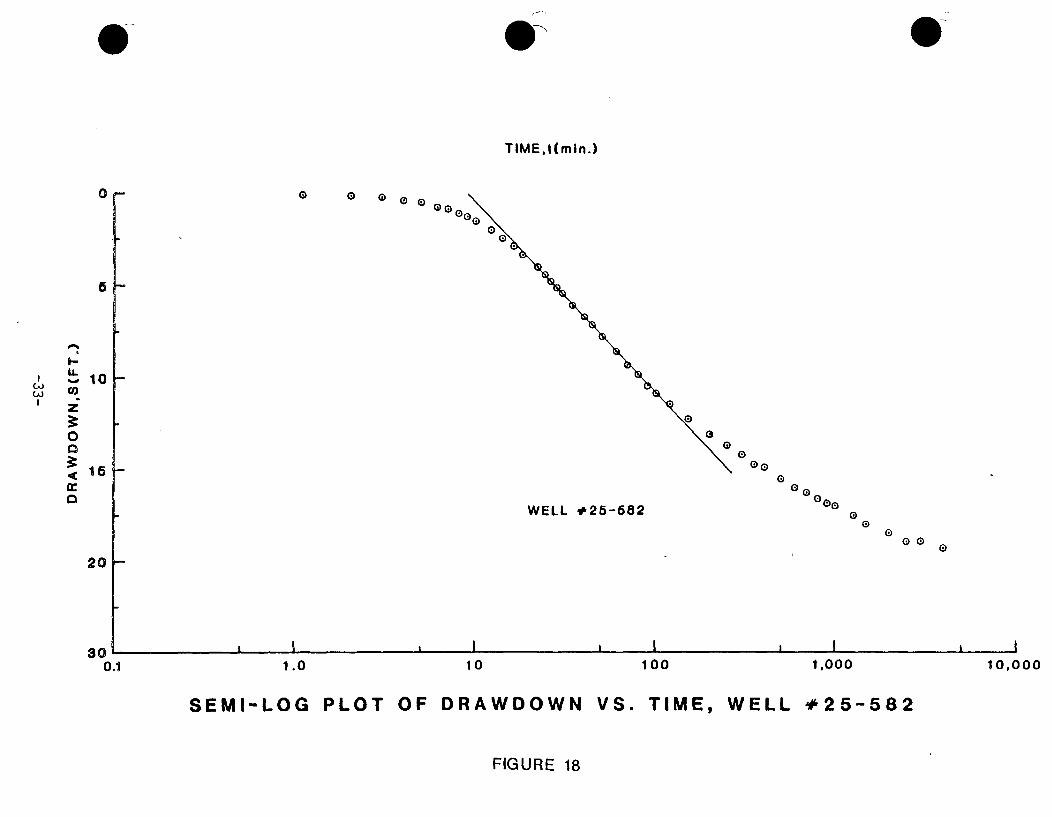
TIMEAt(mln.)
0
5
10
0
<15cr
0 0 0 ~
Go0
a0
0
0 0000
WELL #25-682 030D
0 0
20 H
a I I I i I I I I30'
0.*I 1.0 10 100 1,000 10,000
SEMI-LOG PLOT OF DRAWDOWN VS. TIME, WELL +25-582
FIGURE 18
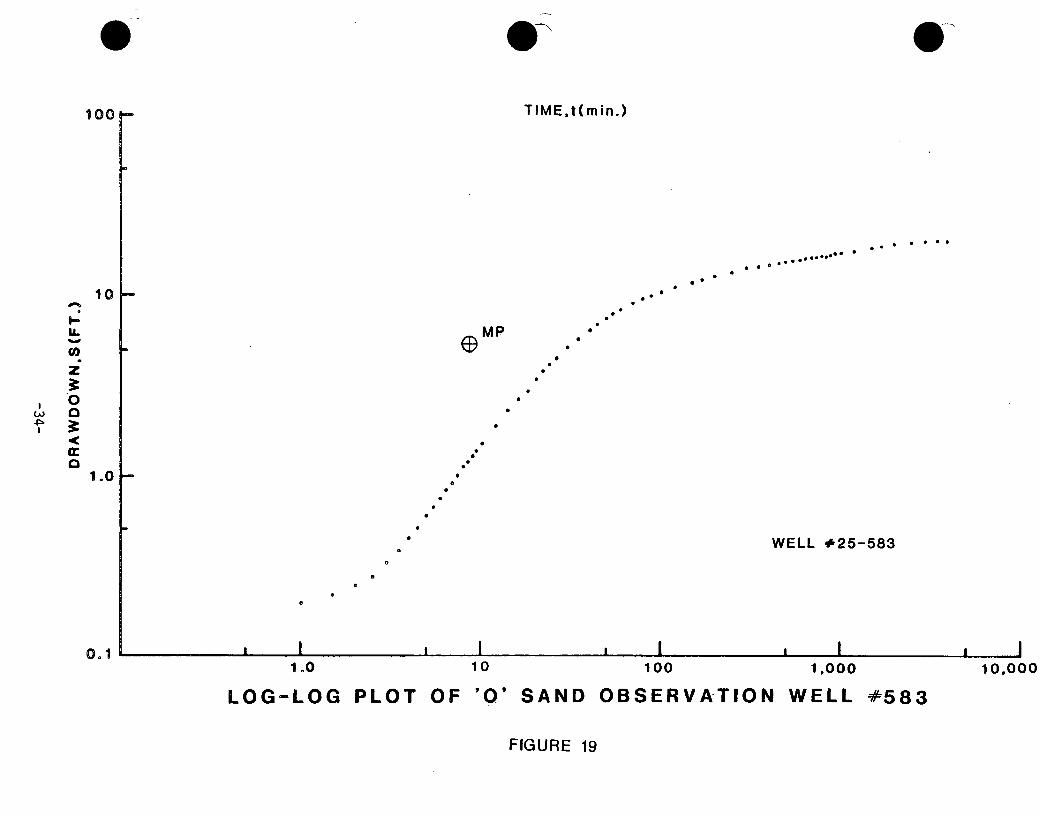
1001- TIME,t(min.)
0 * * * *
*00000**S*0. *
.00
0*
lo0ý
I--
U.M.
0)
0
Or/
0
(DMP
4(=
1.01-
WELL #25-583O
a I I I I I I I I I0.1 m
1.0 10 100 1,000 10,000
LOG-LOG PLOT OF '0' SAND OBSERVATION WELL #583
FIGURE 19
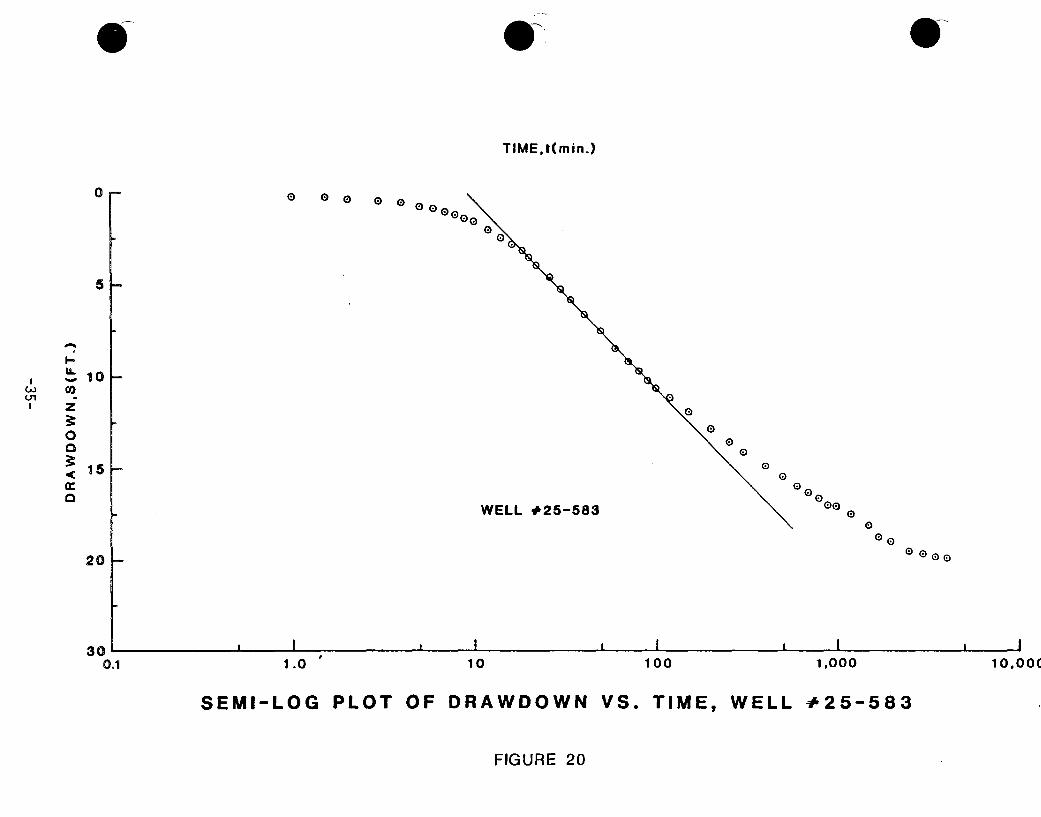
TIME,t(min.)
0
5
0 0
U-%.o
co
0a
,0
10-
0 0o N\000
00
0
15 - 00
00 00Q
0WELL #25-5830
00
20000
I I I I I I30'
0.1 1.0 10 100 1,000 1 0,00C
SEMI-LOG PLOT OF DRAWDOWN VS. TIME, WELL #25-583
FIGURE 20
The laboratory calculation of specific storage, Ss, was found
to be 1.9 X 10⁻⁶ ft-1 for the overlying shale layer and 1.2
X 10- 6 ft-1 for the underlying shale layer. These values
have been shown to be well within the range for shales and
are considered to be representative for the shale layers within
the Fort Union Formation.
Leakage Calculations - Vertical hydraulic conductivity, K',
has been evaluated for the overlying and underlying shale
layers by the ratio method of Neuman and Witherspoon (1972).
The input data are defined and the calculations are shown
in Appendix D. The ratio method does not require curve matching;
however, a drawdown or departure from trend response in water
levels in the confining shale wells is required for the analysis.
As no response to pumping was noted in either shale well (25-582'A'
and 25-593), an assumed drawdown response at a given time
was introduced to the analyses for both confining layers.
Resultant K' values of less than 1.7 X 10⁻⁹ and 1.3 X 10⁻⁸
cm/sec were calculated for the overlying and underlying shale
layers, respectively, for an assumed 0.5 feet of drawdown
after two days of pumping the aquifer at 50 gpm. Therefore,
leakage across the shales is considered negligible and the
boundary conditions noted in aquifer test data are considered
to be due to a source other than leakage.
In contrast to the shale wells, a possible response attributable
to pumping was noted in the overlying and underlying aquifer
wells 25-585 and 25-586, respectively. According to Witherspoon
et. al. (1967), the effects of pumping in an aquifer will
not reach the top or bottom of an overlying or underlying
aquitard if t < 0.1 S ' b' 2 /K', where:
t is time after pumping started (days)
b' is aquitard thickness (ft)
-36-
S s is aquitard specific storage (ft-1 )
K' is aquitard vertical hydraulic conductivity (ft/day)
Using the time of departure from rising water level trends
in wells 25-585 and 25-586 (Figure 12) of t = 1.21 days (1740
min) and t = 0.90 days (1250 min.), respectively, the K' values
would be as follows:
Overlying shale K' = 0. (1.9 X 10⁻⁶ )(43) 2/(1.21) =
3 X 10⁻⁴ ft/day = IX 10-7 cm/sec
and
Underlying shale K' = 0.1 (1.2 X 10- 6)(28)2/(0.90)
1 X 10- 4 ft/day = 4.2 X 10⁻⁸
Considering that no response to pumping was noted in either
shale well, these values of K' are conservatively high for
leakage across the shale layers. Some drawdown or departure
from trend in the shale wells should have been noted if these
responses in the overlying and underlying aquifers were a
result of leakage.
Section 35
Figures 21 through 24 illustrate, as modified hydrographs,
the responses of the various layers monitored in the Section
35 'M' sand test interval. Figure 21 illustrates the response
of production well 35-739 (pumped at 8 gpm) as compared to
the response of 'M' sand observation well 35-738. Figure
22 compares the response of 'M' sand observation well 35-737
to '0' sand and 'K' sand observation wells 35-740 and 35-741,
respectively. The '0' and 'K' sand observation wells illustrate
-37-
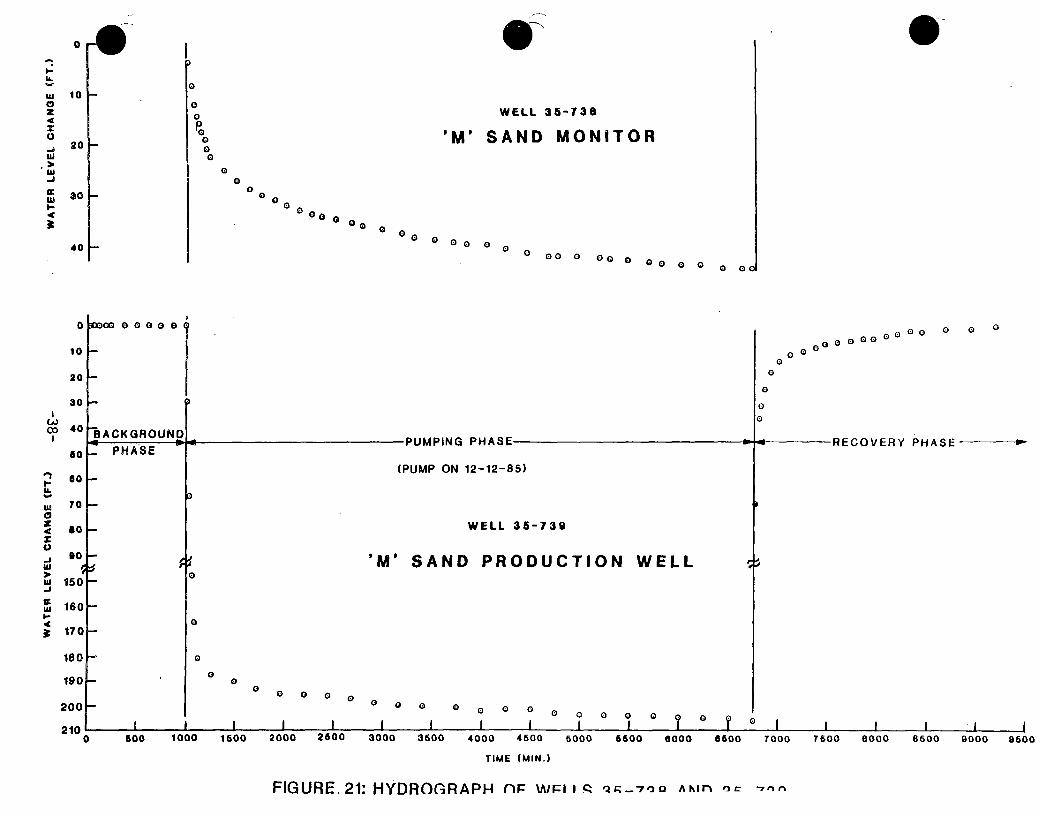
I-
0z
-A
0@
[0
00
0
0
0020
30
40
a0
0
WELL 35-738
'M' SAND MONITOR
0
0 0 00 0 0 00
00 0 0 0 o
I-
U-
wI0z
.J
I-cc
a
10
20
30
40
60
60
To
90
150
160
170
180
190
200
210
-a00 0 0 0 0 0
BACKGROUNO
I0 0 00000
0 0 0
00
00
0
PHASE
p
-PUMPING PHASE-
(PUMP ON 12-12-85)
RECOVERY PHASE - -
WELL 35-739
I.I.
,
0
0
0 0 0
'M' SAND PRODUCTION WELL
0 0 0
I I0 0 0 0 0 0 0 0 0I I i I J0 ,• 0 • o0I I I I I I
( 600 1000 1600 2000 2600 3000 3600 4000 4600 6000 6600 6000 6600 7000 7600 8000 8600 9000 9600
TIME (MIN.)
FIGURE, 21: HYDROGRAPH (F wF:I Q _-713o ^•,n ,c -7'Al
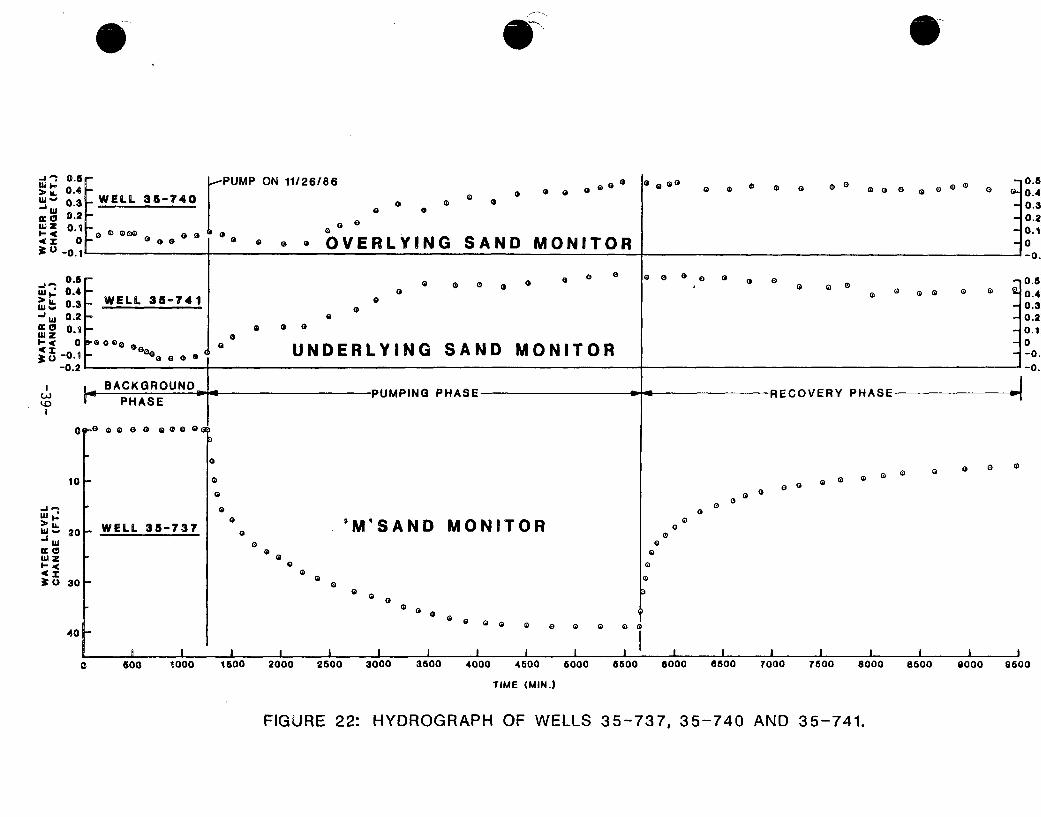
W"
>-IL
w z0-
IUMP ON 11/26/86a * 0 a a0 0 Go 0 e a 0 G 0 00 0 a 0 0 0 0 0
WELL 35-740 00 0 a 00
00O0
RLYING SAND-0.
O.50..
w• 0.3i_j-
w 0.20.1
-0.1
• Q 0 00 00Q
00
0 UNDERLYING SAND MONITOR
0.50.40.30.20.10-0.
-0.
I~ ERY PHASE
01 .0 0 a 0 0 000 0,
0 0
o a 0 G 0
10F 00 0 0 0
0 0
> IL
w zX-
00
20k WELL 35-737 'M'SAND MONITOR a0
00 0
0
00
0
301- 0000
0 o *0 0 0 0 0 040
I 1 1 I I I I I I I I I i I i i I I
0 600 1000 1500 2000 2500 3000 3500 4000 4500 8000 5500 6000 8600 7000 7500 8000 8600 0000 0500
TIME (MIN.)
FIGURE 22: HYDROGRAPH OF WELLS 35-737, 35-740 AND 35-741.
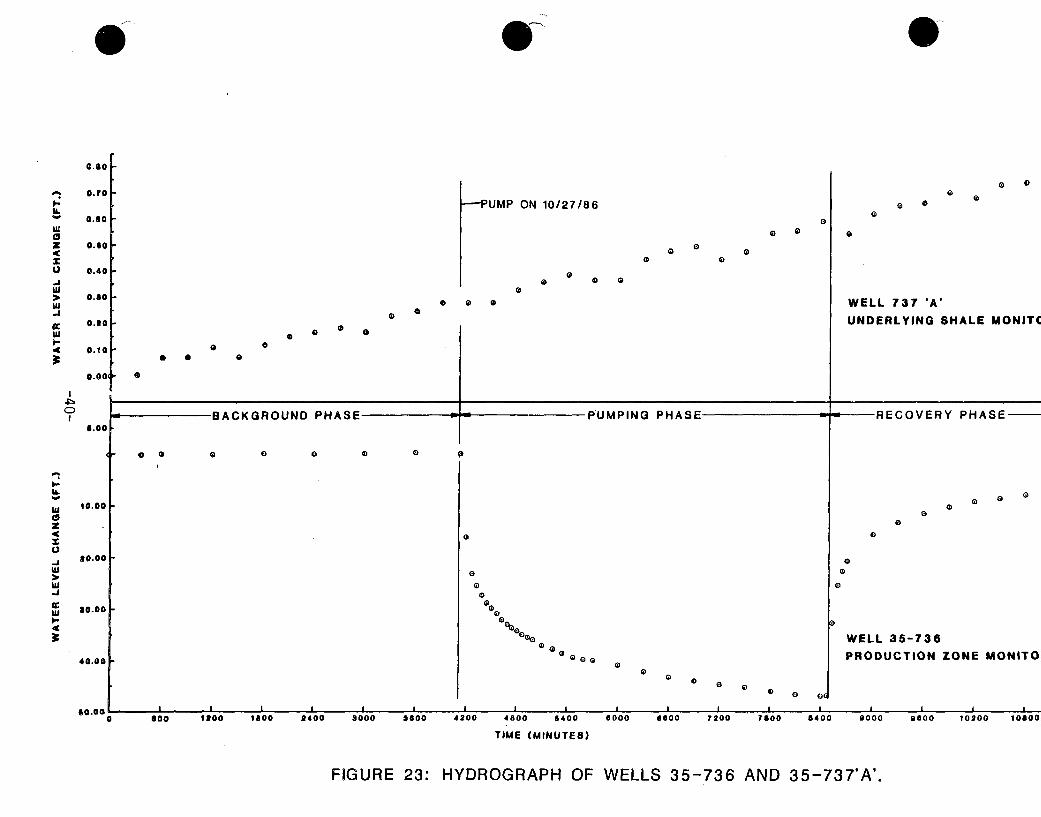
0.20
0 a
U-
0zthe
z.J
w.1
aI,-4c
I
w
US
.www1-
w
0.70
0.60
0.60
0.40
0.80
0.30
0.10
0.00(
6.00
G
-PUMP ON 10/27/86 Q 00
0
0 0
0 0a 0
0 C 00
0 0 0
G
WELL 737 *A'UNDERLYING SHALE MONITC
00
S 0
BACKGROUND PHASE w.'Iim&I' IN(4 PHASE- RECOVERY PHASE
- 0 0 a 0 0
G 0 0
10.00 n. 0
0
0
0.O00 F
lO.0o -
0
0C
000
oe~,000o
C
WELL 35-736
PRODUCTION ZONE MONITO40.00 F
0a
• 00 0 1G
60.800 600 1200 1100 2400 3000 3600 4200 4600 6400
TIME (MINUTES)
6000 6600 7200 ' 7800 6400 0000 0800 10200 10800
FIGURE 23: HYDROGRAPH OF WELLS 35-736 AND 35-737'A'.
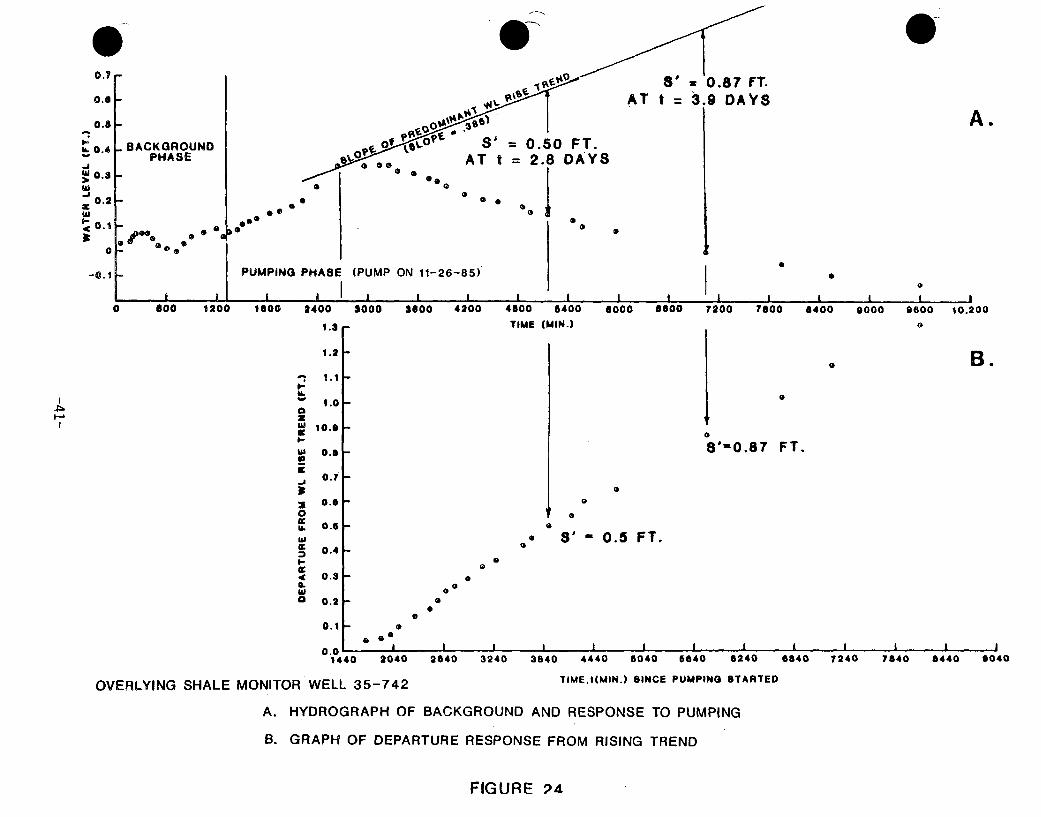
0.7
0.6
0.8
0.-
.0.4
%u• 0.3
0.2w
0.1 -
0
-0.1
AT t=30.87 FT.
.9 DAYSA.•
BACKGROUNDPHASE
o o 0 a a
S' = 0.50 FT.AT t = 2.8 DAYS
@ •
0. 0
to.. s, 0 0ea
4b
*00 e
PUMPING
I
PHASE (PUMP ON 11-26-85)
i I I I I I I I I
0@
0
a aI
IJ•
i
0 000 1200 1800 2400 3000 3800 4200 4800 8400 6000 6600 7200 7800
1.3 TIME (MIN.)
1.2
-~1.1
1.0azw 10I.9 -
0o.8- W -0.87 FT.
0.7-J.
0mU. 0.6us S' 0.5 FT.* 0.4
0.3 0S.
a 0.2 0
0 s1 o.00.o0 I i a I I Iaa
1440 2040 2640 3240 3840 4440 6040 5640 6240 OS4C
OVERLYING SHALE MONITOR WELL 35-742 TIME.I(MIN.) SINCE PUMPING STARTED
A. HYDROGRAPH OF BACKGROUND AND RESPONSE TO PUMPING
B. GRAPH OF DEPARTURE RESPONSE FROM RISING TREND
8400 0000 eo00G
10.200
B.•a
i i & i
I I I7240 7640 8440 0040
FIGURE 24
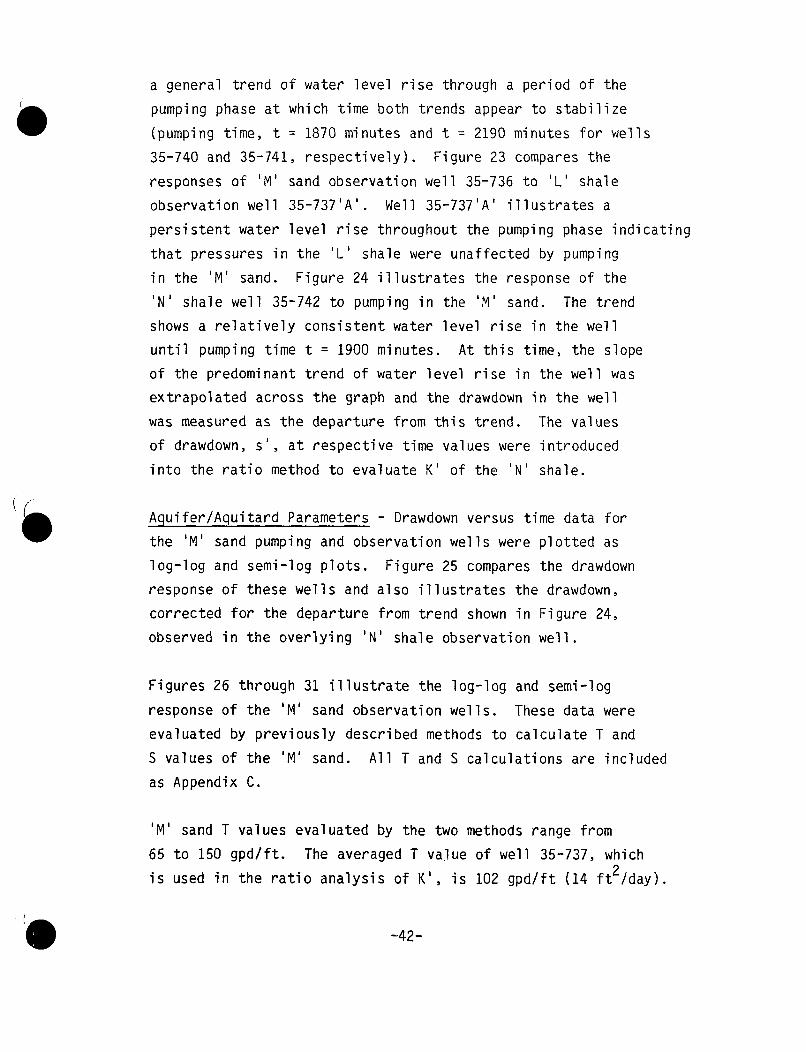
a general trend of water level rise through a period of the
pumping phase at which time both trends appear to stabilize
(pumping time, t = 1870 minutes and t = 2190 minutes for wells
35-740 and 35-741, respectively). Figure 23 compares the
responses of 'M' sand observation well 35-736 to 'L' shale
observation well 35-737'A'. Well 35-737'A' illustrates a
persistent water level rise throughout the pumping phase indicating
that pressures in the 'L' shale were unaffected by pumping
in the 'M' sand. Figure 24 illustrates the response of the
'N' shale well 35-742 to pumping in the 'M' sand. The trend
shows a relatively consistent water level rise in the well
until pumping time t = 1900 minutes. At this time, the slope
of the predominant trend of water level rise in the well was
extrapolated across the graph and the drawdown in the well
was measured as the departure from this trend. The values
of drawdown, s', at respective time values were introduced
into the ratio method to evaluate K' of the 'N' shale.
Aquifer/Aquitard Parameters - Drawdown versus time data for
the 'M' sand pumping and observation wells were plotted as
log-log and semi-log plots. Figure 25 compares the drawdown
response of these wells and also illustrates the drawdown,
corrected for the departure from trend shown in Figure 24,
observed in the overlying 'N' shale observation well.
Figures 26 through 31 illustrate the log-log and semi-log
response of the 'M' sand observation wells. These data were
evaluated by previously described methods to calculate T and
S values of the 'M' sand. All T and S calculations are included
as Appendix C.
'M' sand T values evaluated by the two methods range from
65 to 150 gpd/ft. The averaged T value of well 35-737, which
is used in the ratio analysis of K', is 102 gpd/ft (14 ft 2 /day).
-42-
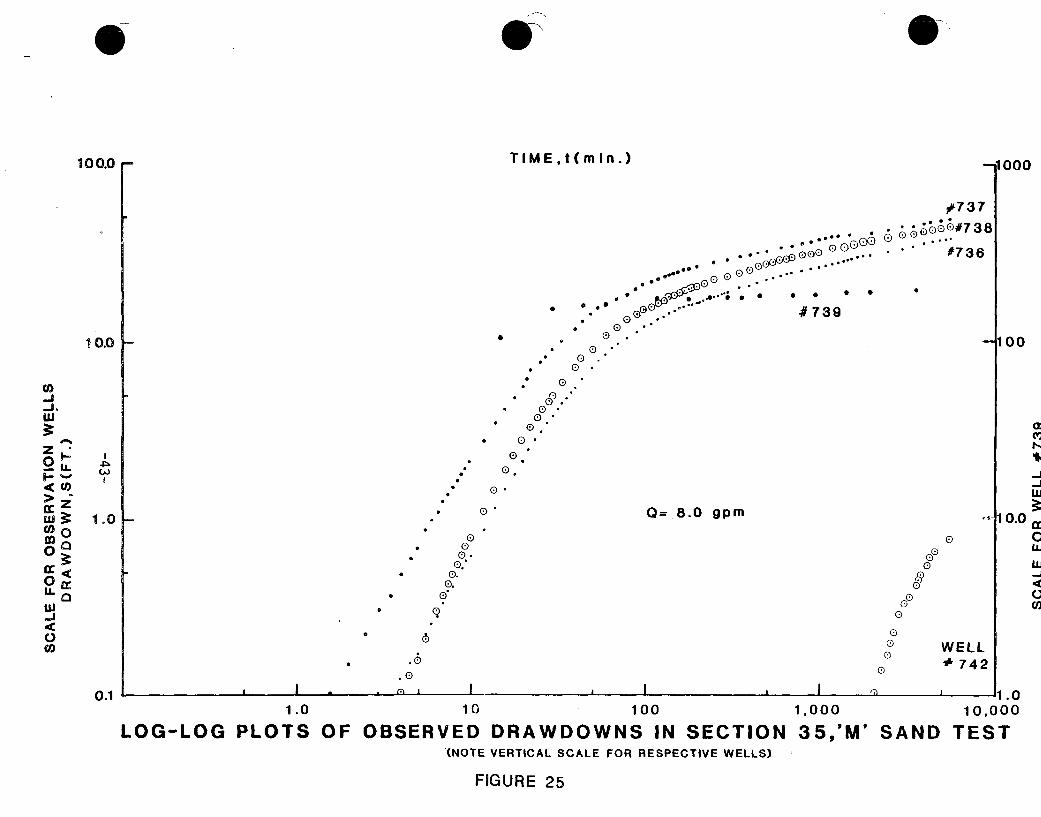
TIMEot(min.)100.0 r -t1,000
#737
~ #736
000 ;39
10.0 1-
-Jý
z.
2 u-cLii-J
uV3.Co
0.
0'(D.
w -100
41
D
1.01- Q= 8.0 gpm -110.0
* 0.
0 .
* 0"
900®
0
o WELL~* 742.0
.0
i I I a I !
0.1|
1.0
PLOTSLOG-LOG10 100
OF OBSERVED DRAWDOWNS IN SECTION(NOTE VERTICAL SCALE FOR RESPECTIVE WELLS)
I n I JI1.01,000 10,000
35,'M' SAND TEST
FIGURE 25
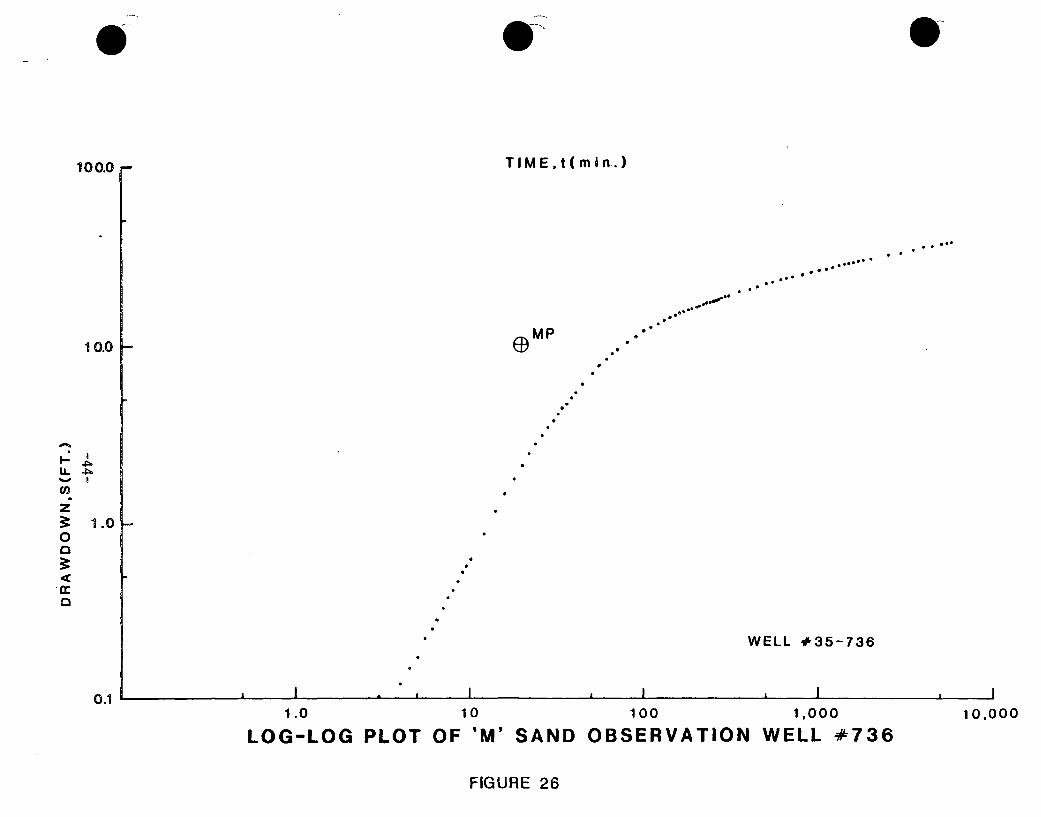
TIMEt(min.)100.0
* ****
(DMp10.0 F_
I-
U.
0
a
41-P.I
1.0 ý
ii@
WELL #35-736
iI , I . I , I I0.1
1.0
LOG-LOG PLOT10
OF 'M'100 1.000
SAND OBSERVATION WELL #73610.000
FIGURE 26
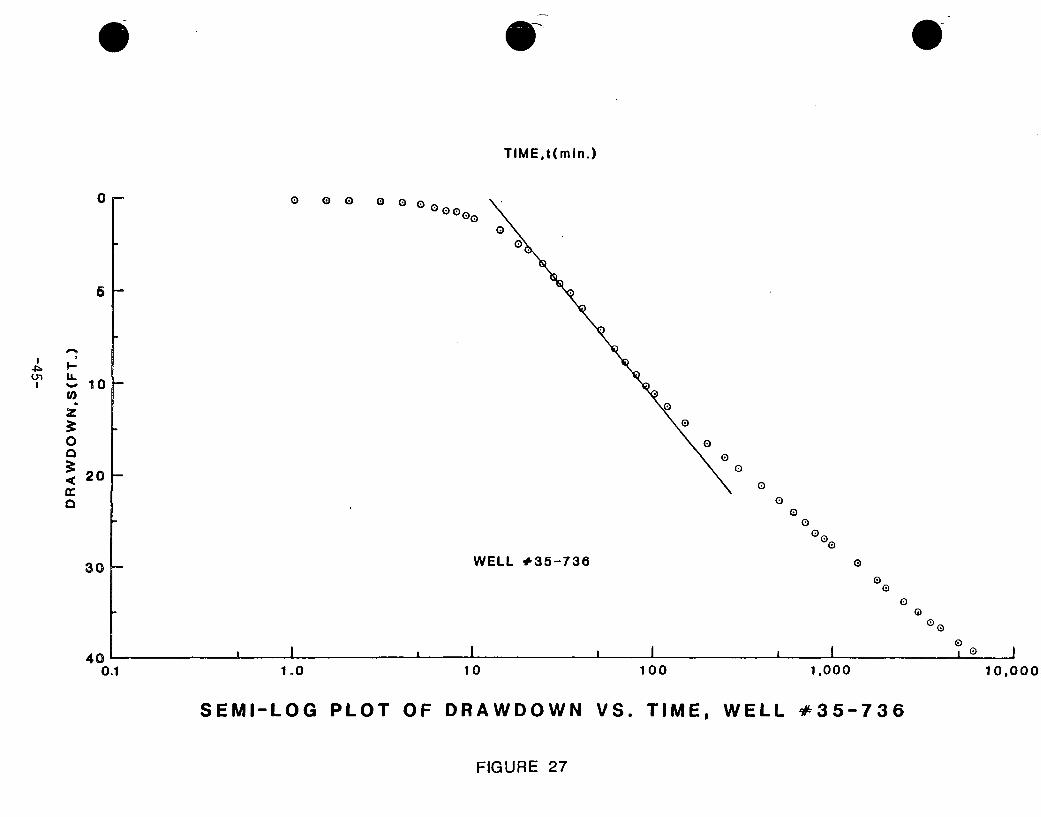
TIME,t(min.)
0r- 0 0 0 0 0 0 0 0
0
5
I-.U. 10
0
220
i0
t-
'0
00
0
00
0Q00
30 - WELL 635-736 0
0
0
0 0
a I i I I I? 0
I40
0.°I 1.0 10 100 1,000 10o000
SEMI-LOG PLOT OF DRAWDOWN VS. TIME, WELL #35-736
FIGURE 27
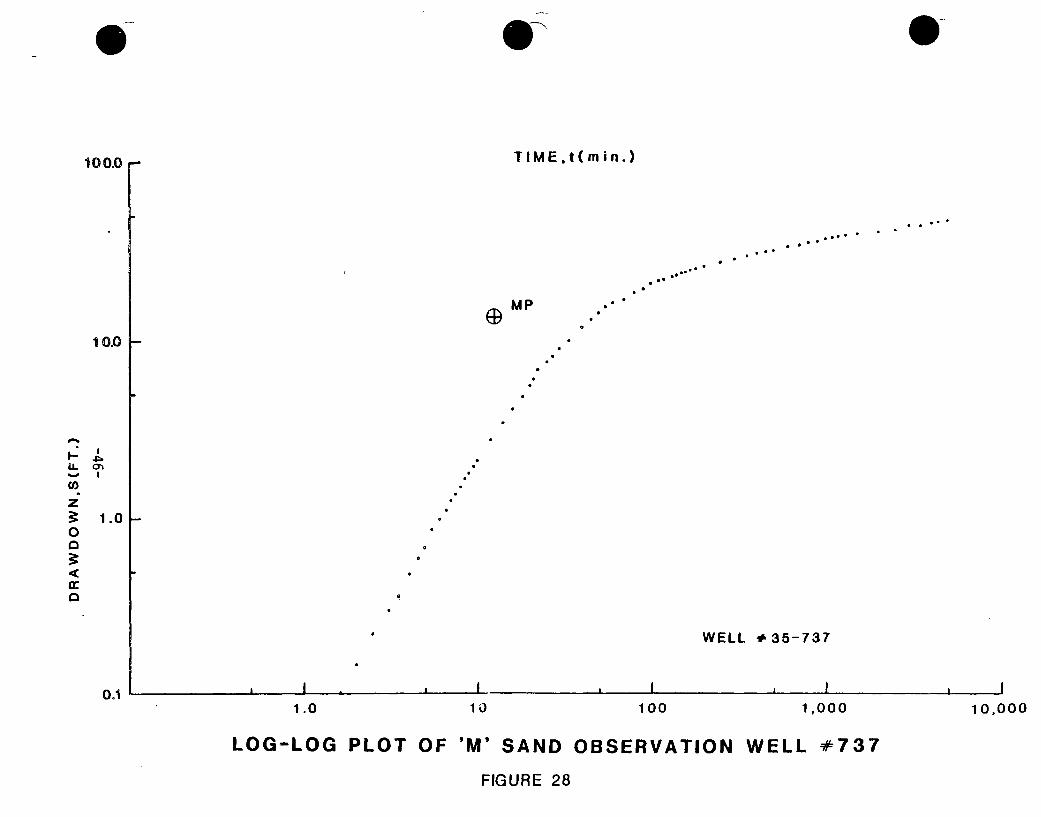
TIME~t(min.)100.0 r-
* **• ••e
(9)MP1 0.0 F
A-
LL0-C)
0<
I.01
1 .0
WELL #35-737
I II , I , I I0.1
1.0 10 100 1,000 10,000
LOG-LOG PLOT OF 'M' SAND OBSERVATION WELL +737
FIGURE 28
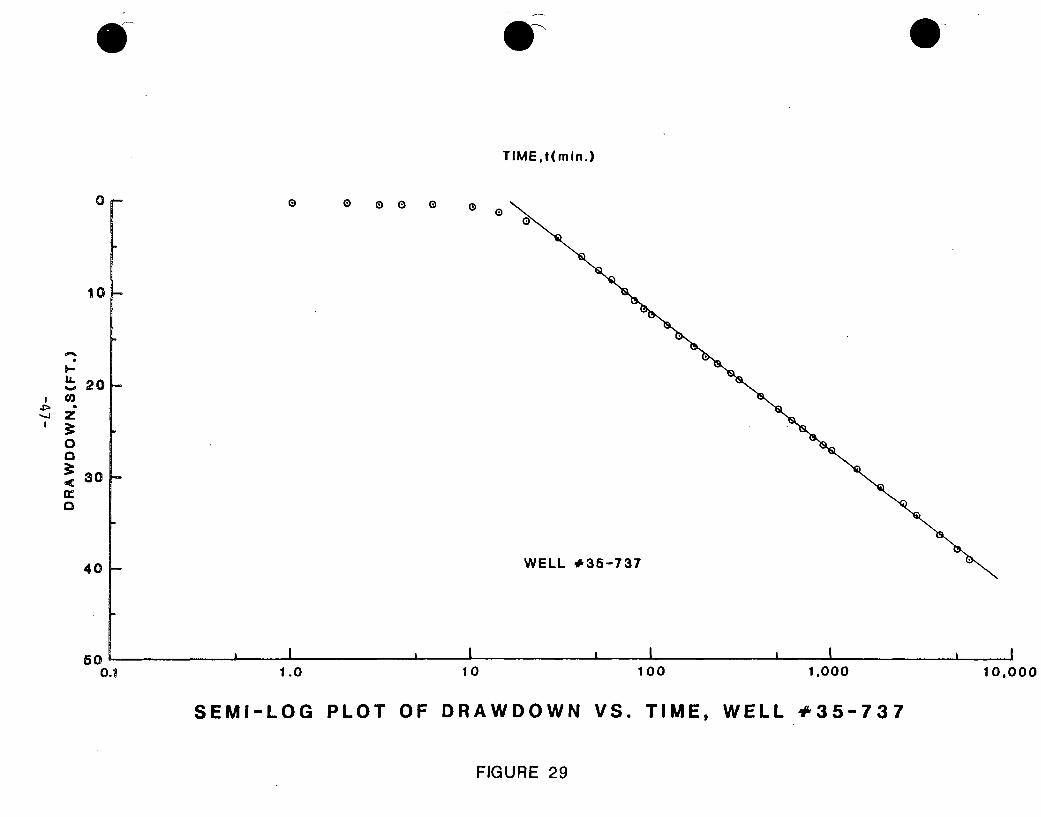
TIME.t(min.)
0
10
K0 0 00 0 00
-4:
I--
L&.
Co
0
0
a
20H
301-
WELL #35-73740
A I q I I I I I i I500.1 1.0 10 100 1,000 10.000
SEMI-LOG PLOT OF DRAWDOWN VS. TIME, WELL #35-737
FIGURE 29
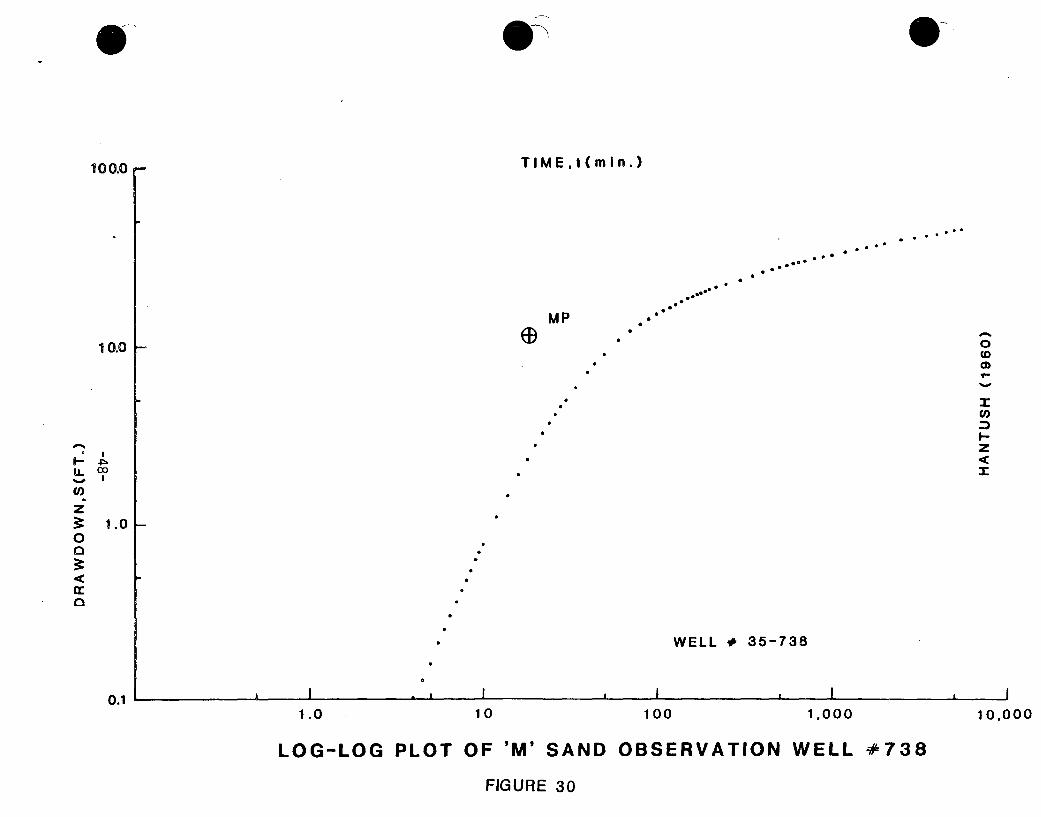
TIME,t(min.)100.0 ,-
MP
10.0 (D
'a-
zI.-
z
0al
1.0
1.0
WELL # 35-738
I0
I .I A I I I0.1 I
1.0 10 100 1.000 10,000
LOG-LOG PLOT OF 'M' SAND OBSERVATION WELL +738
FIGURE 30

(
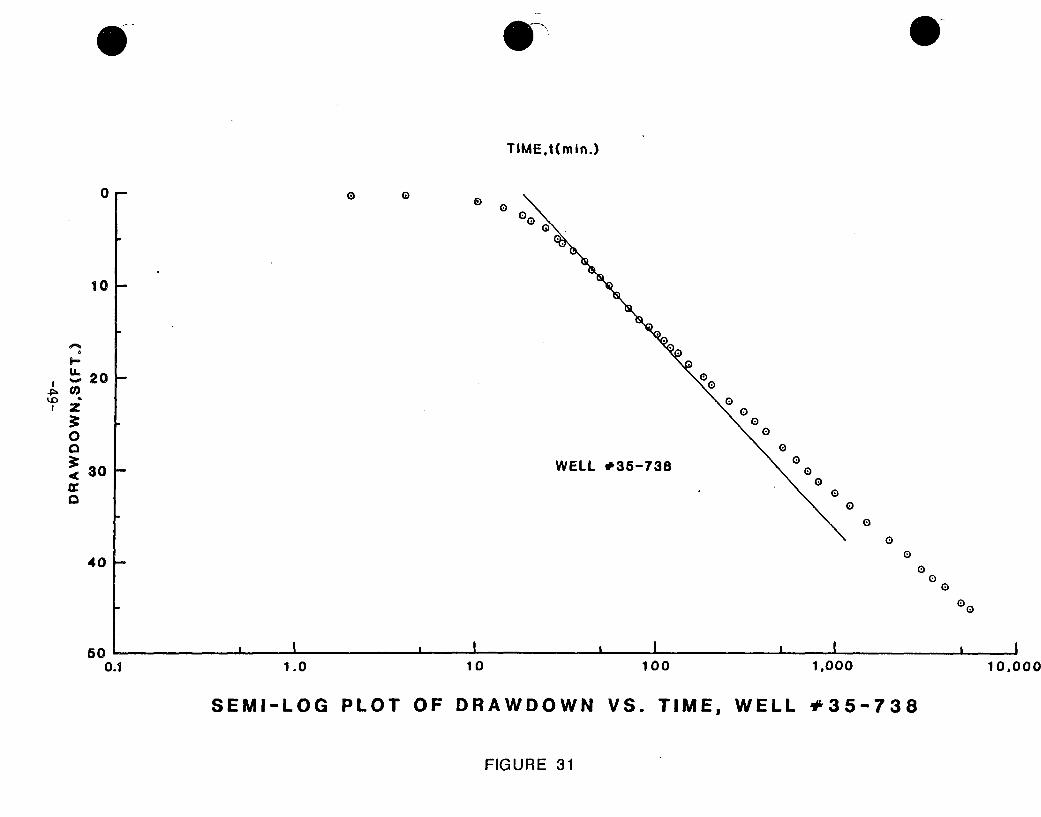
TIME.t(m in.)
0r 0 00
0o
10I
•L,f,
9U.U,-
-.0 20
0
30
0•
I-_0
00
0
0
WELL #35-738 0
00
0
0
00
40
50
00
0
00
I I i I , I I I i
0.1 1.0 10 100 1.000 10.000
SEMI-LOG PLOT OF DRAWDOWN VS. TIME, WELL #35-738
FIGURE 31
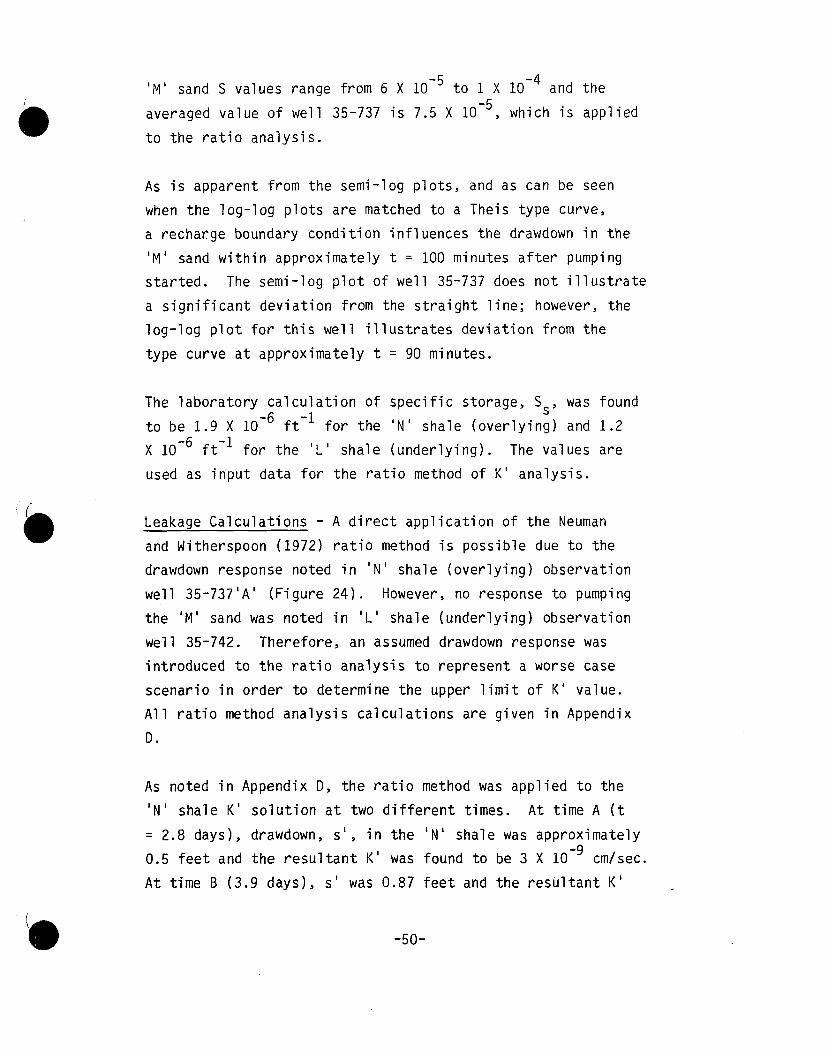
'M' sand S values range from 6 X 10⁻⁵ to 1 X 10⁻⁴ and the
averaged value of well 35-737 is 7.5 X 10 , which is applied
to the ratio analysis.
As is apparent from the semi-log plots, and as can be seen
when the log-log plots are matched to a Theis type curve,
a recharge boundary condition influences the drawdown in the
'M' sand within approximately t = 100 minutes after pumping
started. The semi-log plot of well 35-737 does not illustrate
a significant deviation from the straight line; however, the
log-log plot for this well illustrates deviation from the
type curve at approximately t = 90 minutes.
The laboratory calculation of specific storage, Ss, was found
to be 1.9 X 10- 6 ft-1 for the 'N' shale (overlying) and 1.2
X lo-6 ft-1 for the 'L' shale (underlying). The values are
used as input data for the ratio method of K' analysis.
Leakage Calculations - A direct application of the Neuman
and Witherspoon (1972) ratio method is possible due to the
drawdown response noted in 'N' shale (overlying) observation
well 35-737'A' (Figure 24). However, no response to pumping
the 'M' sand was noted in 'L' shale (underlying) observation
well 35-742. Therefore, an assumed drawdown response was
introduced to the ratio analysis to represent a worse case
scenario in order to determine the upper limit of K' value.
All ratio method analysis calculations are given in Appendix
D.
As noted in Appendix D, the ratio method was applied to the
'N' shale K' solution at two different times. At time A (t
= 2.8 days), drawdown, s', in the 'N' shale was approximately
0.5 feet and the resultant K' was found to be 3 X 10⁻⁹ cm/sec.
At time B (3.9 days), s' was 0.87 feet and the resultant K'
-50-
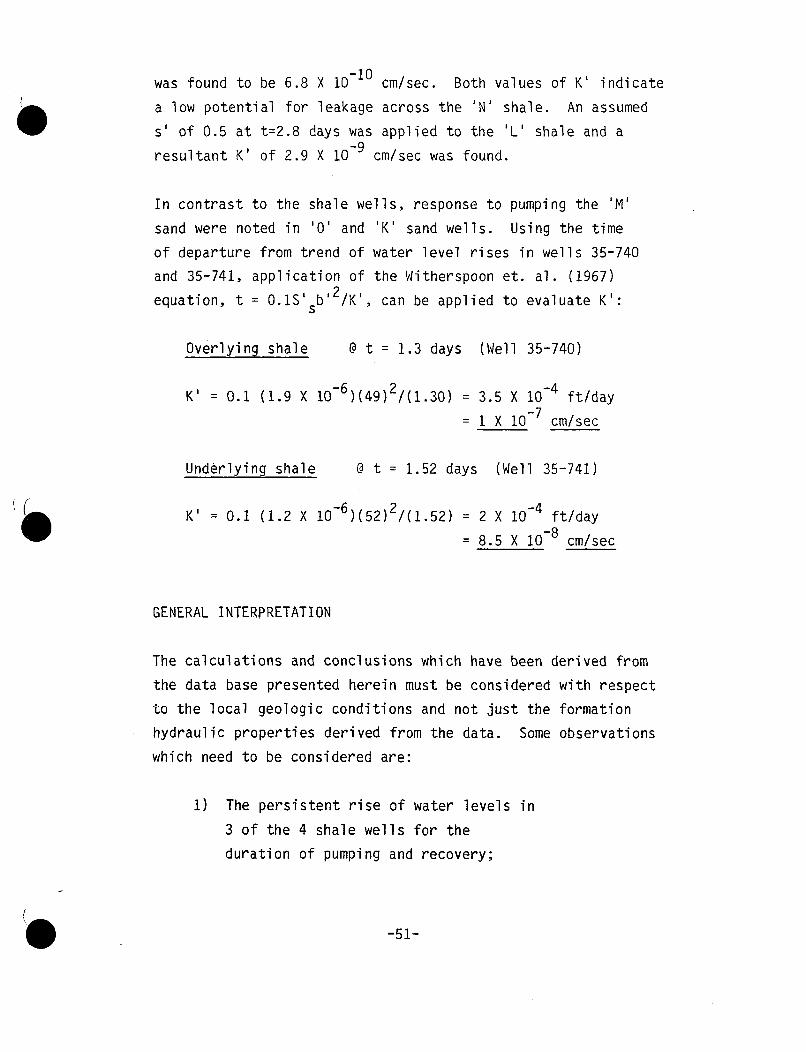
was found to be 6.8 X 10⁻¹⁰ cm/sec. Both values of K' indicate
a low potential for leakage across the 'N' shale. An assumed
s' of 0.5 at t=2.8 days was applied to the 'L' shale and a
resultant K' of 2.9 X 10⁻⁹ cm/sec was found.
In contrast to the shale wells, response to pumping the 'M'
sand were noted in '0' and 'K' sand wells. Using the time
of departure from trend of water level rises in wells 35-740
and 35-741, application of the Witherspoon et. al. (1967)
equation, t = O.iS' sb' 2 /K', can be applied to evaluate K':
Overlying shale @ t = 1.3 days (Well 35-740)
K' = 0.1 (1.9 X 10⁻⁶)(49)2/(1.30) = 3.5 X 10⁻⁴ ft/day
= I X 10-7 cm/sec
Underlying shale @ t = 1.52 days (Well 35-741)
K' = 0.1 (1.2 X 10⁻⁶)(52)2/(1.52) = 2 X 10⁻⁴ ft/day
= 8.5 X 10⁻⁸ cm/sec
GENERAL INTERPRETATION
The calculations and conclusions which have been derived from
the data base presented herein must be considered with respect
to the local geologic conditions and not just the formation
hydraulic properties derived from the data. Some observations
which need to be considered are:
1) The persistent rise of water levels in
3 of the 4 shale wells for the
duration of pumping and recovery;
-51-
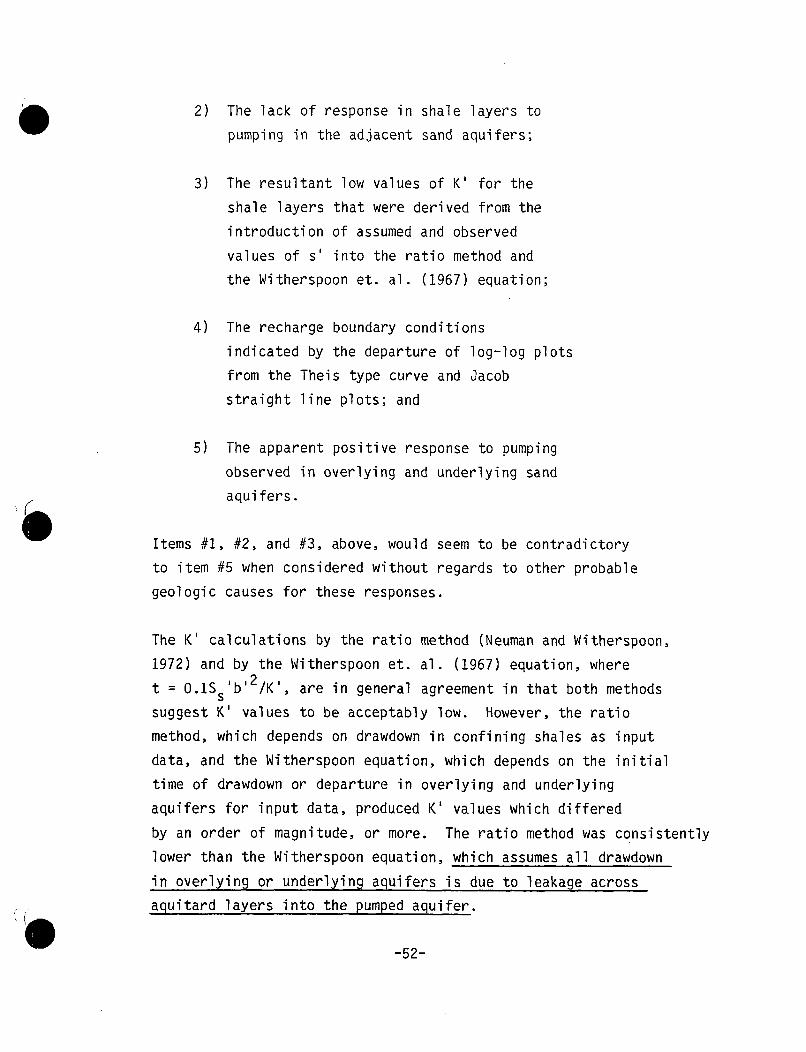
2) The lack of response in shale layers to
pumping in the adjacent sand aquifers;
3) The resultant low values of K' for the
shale layers that were derived from the
introduction of assumed and observed
values of s' into the ratio method and
the Witherspoon et. al. (1967) equation;
4) The recharge boundary conditions
indicated by the departure of log-log plots
from the Theis type curve and Jacob
straight line plots; and
5) The apparent positive response to pumping
observed in overlying and underlying sand
aquifers.
Items #1, #2, and #3, above, would seem to be contradictory
to item #5 when considered without regards to other probable
geologic causes for these responses.
The K' calculations by the ratio method (Neuman and Witherspoon,
1972) and by the Witherspoon et. al. (1967) equation, where
t = 0.1S 'b' 2 /K', are in general agreement in that both methods
suggest K' values to be acceptably low. However, the ratio
method, which depends on drawdown in confining shales as input
data, and the Witherspoon equation, which depends on the initial
time of drawdown or departure in overlying and underlying
aquifers for input data, produced K' values which differed
by an order of magnitude, or more. The ratio method was consistently
lower than the Witherspoon equation, which assumes all drawdown
in overlying or underlying aquifers is due to leakage across
aquitard layers into the pumped aquifer.
-52-
With respect to these considerations, the following comments
and explanations are offered:
1.) Wells drilled into shales, for the purpose of pumping
test monitoring and applications to the ratio method, may
need months or years to completely stabilize. This is especially
true for thick, indurated shales occurring at depths as occur
in the current test areas.
2.) Results from the application of the ratio method to the
current tests are probably the most accurate for the portion
of the formations intersected by the shale wells. However,
due to the limited area of response for the screened shale
formation, the results may not be indicative of the hydraulic
properties of the shale formation on an extended areal basis.
However, the totality of the data support the conclusion that
the shale layers act as adequate barriers to the vertical
migration of leach fluids over the mineralized area when shown
to be laterally continuous.
3.) Recharge boundary conditions noted in the aquifer test
data are the result of lateral changes in formation characteristics
and not due to leakage across the confining shale layers.
Boundary analyses were performed at each well for the time
departure noted from log-log plots. Distances to image wells
from the observation wells were computed and arcs scribed
at each observation well with radii equal to the respective,
computed distances. The failure of arcs to intersect at a
common point (or to intersect at all) supports the contention
that a point or line source of recharge does not exist. Although
leakage is one possible explanation for this recharge effect,
it is inconsistent with the responses noted in the shale wells.
The lateral variations near but outside the well field are
the probable sources for recharge effects and not leakage
-53-
across the confining shales. Figure 32 illustrates two geologic
conditions known to exist in the area which would .cause leaky
type responses in the aquifer tests: 1) laterally discontinuous
shale layers which result in greater aquifer thickness by
direct interconnection of sand bodies, or 2) a lateral change
of formation permeability as a result of a "dirty", less permeable
ore body grading laterally to "clean", more permeable sand.
Due to the limited variations in the responses of the production
zone monitor wells in the test patterns, other analyses,
such as directional transmissivity, were not possible. However,
as shown in previous SFC reports and by the small variability
in the monitor well responses in these tests, directional
transmissivity in the Fort Union sands in this area appears
to be a minor factor. The orientation of the axis of major
transmissivity and the preferred direction of groundwater
flow will be more accurately determined from operational data
as the well fields are developed.
-54-
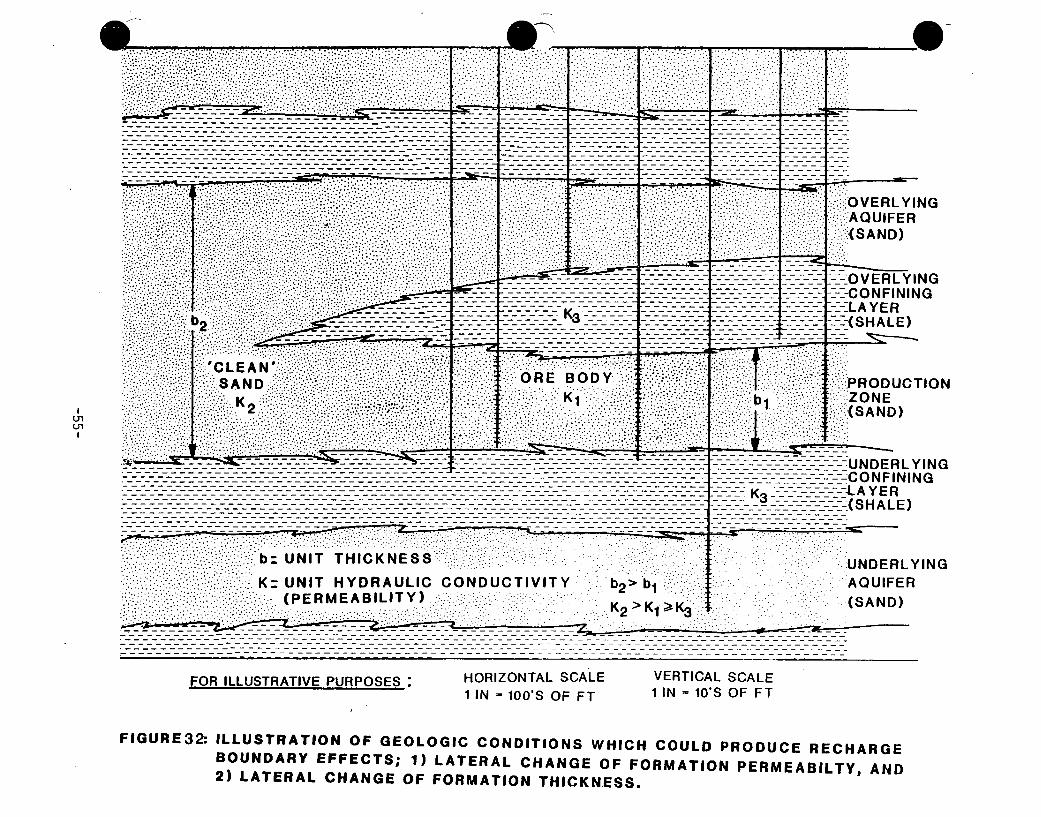
-_--_--- - --_---- . .. - ... - -. . . ..- - -- _ -- _ - _ --_ . . .-_ "- -. . .- - - - -__ - __ - ---- _---- -- - - - - - - - - - ----- - -- - - --_--- _ 7 7 . . . ._ - - -- - - - -- -
--.- __ - -- _ - --.-- __-. ..- -__ - - . . . . . . -__ ...• - - -- - - - - - - - - - - - - - " _- -- - - - . . . . --- -- "- - - Z . - - .. . . . . . . . . . . . . . . . . . . . . . . . . . . . . . . . . . --_.- -_---_ _-.--._-- _- -- -- --- -- - _ - - _ .- - - - -.-- -- - - --..-- - .-- - -- -......- - -- -- - -- -- -- -- -:- -_ -_ _ - - _- -
------------------------ ------ ----- -------- -- - -- -- - -- - -- -- - -- - - _-- --- .- ---- - -- - ---- -- -7-7-:-.7-7-7-:: :-: : - A E-, _ _ -- -- ---- _: -. . .-- -- -- -- -- --. .-- - - --.---- H A LE-
.. ........ . . ....- -.-.
•:!,:i.-..:.!:!-:•::;i: S A N D )
:"•~~~~~ ~~ ....... ----...-------------- - U DE-Y N• -- -- -'_-_ -- -- -_ - -_-._- -- ----- ----- -- -] - -- - - --: - _- -- _- : - -- N I
...................... ................................----------- K3IAYE"---:--------:--:-: • ---- -------• . . . .------ K.. . • ---------------- •--: --;--.- -:----------="~~- - - -- - - - - - 3-.- A - -".. "i. -.' " -: -'" --- (S H A LE)..:.}...'--7•7: _ ý. _ 7ý 7 7 : -7 :7----- ---- ---
.2 ----- -- ---- ---- --- ---- -N-':::"" "" """"'"::; """ (P E M E A IL--I-: :-:' . ...-:------------------------------ . .. ""
•_ _-::----: • ::::-:::::::-... ..-: - ----:: --::::::- •-- --- :•• • ::::
2)~~OR BAEA CHNG OF: FOMTINTHCNES
REFERENCES
Jacobs, C. E., 1950, Flow of Groundwater, in Rouse, Hunter, EngineeringHydraulics: New York, John Wiley, Chapter 5, p. 321-386.
Jorgensen, Donald G., Relationship between Basic Soils - EngineeringEquations and Basic Ground-Water Flow Equations, U. S. Geological SurveyWater - Supply Paper 2064, 1980.
Lambe, T. William and Robert V. Whitman, Soil Mechanics, 1969, p. 153.
Lohman, S. W., Ground-Water Hydraulics, U. S. Geological SurveyProfessional Paper 708, 1972, p. 53.
Neuman, Shlomo P., and Paul A. Witherspoon, Field Determination of theHydraulic Properties of Leaky Multiple Aquifer Systems, Water Resource ResearchVol. 8, No. 5, October, 1972.
Theis, C. V., 1935, The Relation Between the Lowering of the Piezometric Surfaceand the Rate and Duration of Discharge of a Well Using Ground-Water Storage;Transactions of the American Geophysical Union, V. 16, p. 519-524.
Witherspoon, P. A., et. al., 1967, Interpretation of Aquifer Gas Storage Conditionsfrom Water Pumping Tests, American Gas Association, N.Y., 273 p.
APPENDIX ACompression and Porosity Tests on Shale CoresReport by Dr. C. J. Haas
COMPRESSION AND POROSITY TESTS ON SHALE
CORE FROM SOUTH POWDER RIVER BASIN - WYOMING
by
Dr. Charles J. Haas, P. E.
Charles J. Haas & Associates
308 Christy Drive
Rolla, Missouri 65401
Report Prepared for
Kerr-McGee Corporation
Kerr-McGee Center
P. 0. Box 25861
Oklahoma City, Oklahoma 73125
November 11, 1985
TABLE OF CONTENTS
Page
Introduction 1
Specimen Preparation 2
Compression Tests - Procedure and Results 3
Porosity and Saturation Tests -
Procedure and Results 7
Summary Discussion 9
Appendix, Stress-Strain Curves 15
COMPRESSION AND POROSITY TESTS ON SHALE
FROM SOUTH POWDER RIVER BASIN - WYOMING
INTRODUCTION
On September 10, 1985, four 2-ft lengths of shale drill core
from the South Powder River Basin-Wyoming were delivered to the
University of Missouri-Rolla for testing by Charles J. Haas &
Associates. The core was sent by Mr. E. G. Orrell from Sequoyah
Fuels Corporation, Glenrock, Wyoming.
The drill hole numbers and depths were as follows:
Drill Hole No. Depth, ft.
PM-25-587 795-797
NM-25-588 939-941
NM-35-742 717-718.7
LM-35-743 809-811
For shipment each core length had been sealed in Polyethylene
Layflat tubing to preserve its natural moisture state. The core
lengths were then wrapped in several layers of foam plastic and
shipped by United Parcel Service. According to Mr. Orrell the
core lengths were intact before shipping, however they were quite
badly broken when they arrived at UMR. There was no apparent
damage to the box. It is not known why the samples deteriorated
so much during shipment because they were very well wrapped and
insulated from shock and vibration. As a result of this deter-
ioration it was not possible to obtain an intact core specimen
of sufficient length for the compression tests on Drill Holes
2
PM-25-587 and NM-25-588. The porosity tests were performed on
small cubes cut from all four core lengths.
Each core length was a sandy shale and had a moist feel when
taken from the tubing, indicating that some or all of the natural
moisture remained.
The required tests were: uniaxial compressive strength,
stress-strain plots, Young's modulus, and Poisson's ratio, all
determined on the same compression specimen; and apparent porosity,
density, and degree of saturation, all determined on a small cube
specimen.
SPECIMEN PREPARATION
Intact core specimens approximately 5.8 in. long were desired
for the compression tests to give a length-to-diameter ratio of
2.0 for the 2.9-in. diameter core as specified by the ASTM stand-
ards for these tests. This requirement had to be relaxed since
the available material only permitted specimen lengths of 2.1,
2.8, and 5.3 in. The shortest specimen was too short for a valid
stress-strain plot so it was used to obtain a preliminary value
of the strength before the other two complete tests were performed.
The ends of the compression specimens were surface ground
while being supported by two machinist V-blocks held by the mag-
netic chuck on the grinding machine. After both ends had been
ground, the specimen was stored in sealed plastic tubing until
testing.
It was requested by Kerr-McGee that the porosity and sat-
3
uration be determined by water saturation methods when practi-
cable. Since the shale appeared so weak, it was decided to use
a helium porosimeter to determine the pore volume. This method
is more accurate for low permeability rock and does not risk
sample deterioration during water saturation. One test on each
core length was requested, however three were performed for
quality assurance for the data.
One porosity specimen was cut from each end of the 2-ft core
length while the other was cut from near the midpoint. These
were rectangular specimens approximately 0.7 X 0.7 X 1.0 in; these
specimens did not have to be perfectly shaped since the bulk
volumes were determined by a mercury displacement method. As
soon as the specimens were cut they were sealed in plastic tubing
so that the initial moisture state would be preserved until testing.
All specimen cutting for the compression and porosity test
specimens was done with a diamond cut-off saw with no coolant to
prevent further specimen deterioration.
COMPRESSION TESTS - PROCEDURE AND RESULTS
The uniaxial compressive strength and the stress-strain plots
were determined on the same compression specimen. ASTM Standard
D2938 was followed for the compressive strength test, and ASTM
Standard D3148 was followed for the stress-strain ploiEs and deter-
mination of Young's modulus and Poisson's ratio. Load was applied
with a Tinius Olsen Super "L" testing machine with 120,000 lbs
capacity. The load ranges used were 3,000 and 12,000 lbs. The
4
loading rate was 4 psi/sec.
Axial and lateral strains were measured with a clamp-on LVDT
deformation jacket with three axial and three lateral sensors.
The axial gage length was 2.0 in. and the lateral gage length was
the radius of the test specimen. Both the axial and lateral
stress-strain curves were simultaneously plotted versus load with
the two-pen XYY' recorder. Young's modulus is herein defined as
the tangent modulus at a stress equal to one half of the ultimate
strength. Poisson's ratio is taken as the ratio of the slope of
the axial stress-strain curve to the slope of the lateral stress-
strain curve, both slopes being taken at the same percentage of
the ultimate strength. Since the lateral stress-strain curves
are often nonlinear, a large range of values for Poisson's ratio
could be obtained, depending on the stress level chosen.
The moisture state of the three compression specimens was
partially saturated, as received.
The first compression test (Drill Hole LM-35-743, depth
809.9 ft) was for strength only since its length was too short
for valid stress-strain plots. Stress-strain plots were obtained
for the other two compression specimens, a second one for Drill
Hole LM-35-743 and one from Drill Hole NTM-35-742 (Appendix A).
With the limited number of available specimens and the apparent
weak character of the rock it was not possible to accurately
choose the proper load and deformation ranges before the test
was begun. So that data would not be lost due to unexpected weak-
ness of the rock, the instrumentation was initially set on sensi-
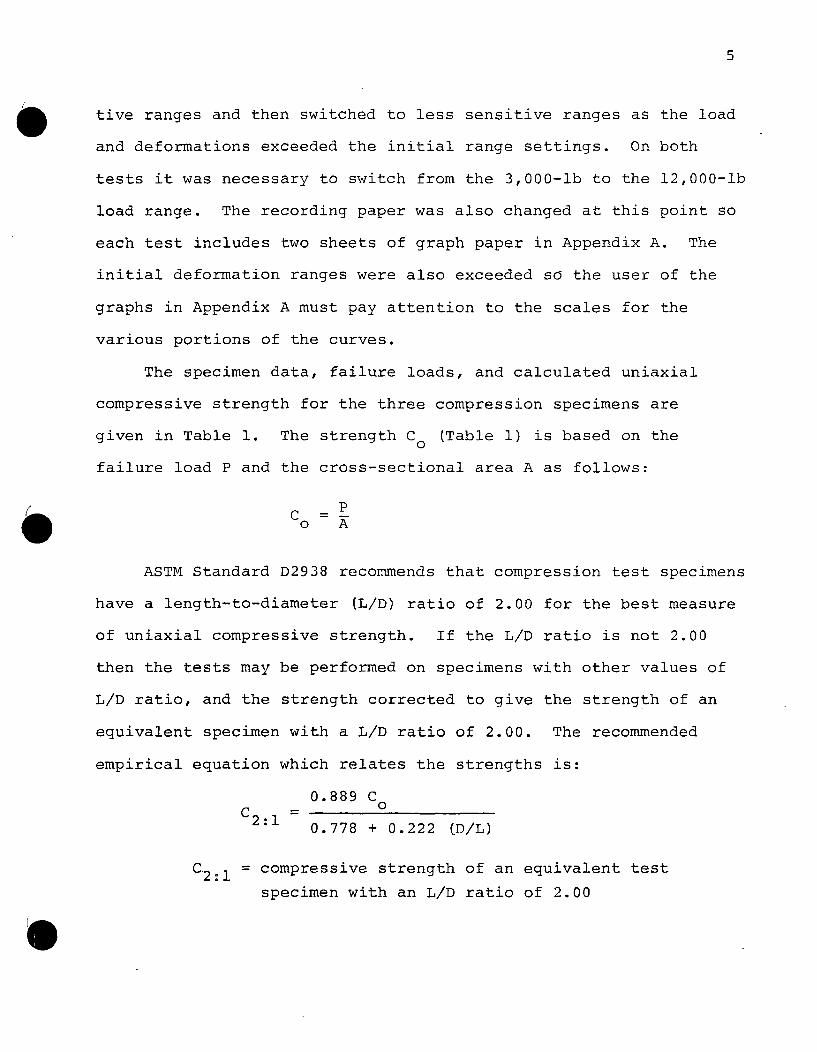
5
tive ranges and then switched to less sensitive ranges as the load
and deformations exceeded the initial range settings. On both
tests it was necessary to switch from the 3,000-lb to the 12,000-lb
load range. The recording paper was also changed at this point so
each test includes two sheets of graph paper in Appendix A. The
initial deformation ranges were also exceeded so the user of the
graphs in Appendix A must pay attention to the scales for the
various portions of the curves.
The specimen data, failure loads, and calculated uniaxial
compressive strength for the three compression specimens are
given in Table 1. The strength C (Table 1) is based on the0
failure load P and the cross-sectional area A as follows:
C P0 A
ASTM Standard D2938 recommends that compression test specimens
have a length-to-diameter (L/D) ratio of 2.00 for the best measure
of uniaxial compressive strength. If the L/D ratio is not 2.00
then the tests may be performed on specimens with other values of
L/D ratio, and the strength corrected to give the strength of an
equivalent specimen with a L/D ratio of 2.00. The recommended
empirical equation which relates the strengths is:
0.889 CC 2 :1 0.778 + 0.222 (D/L)
C2:1 = compressive strength of an equivalent test
specimen with an L/D ratio of 2.00
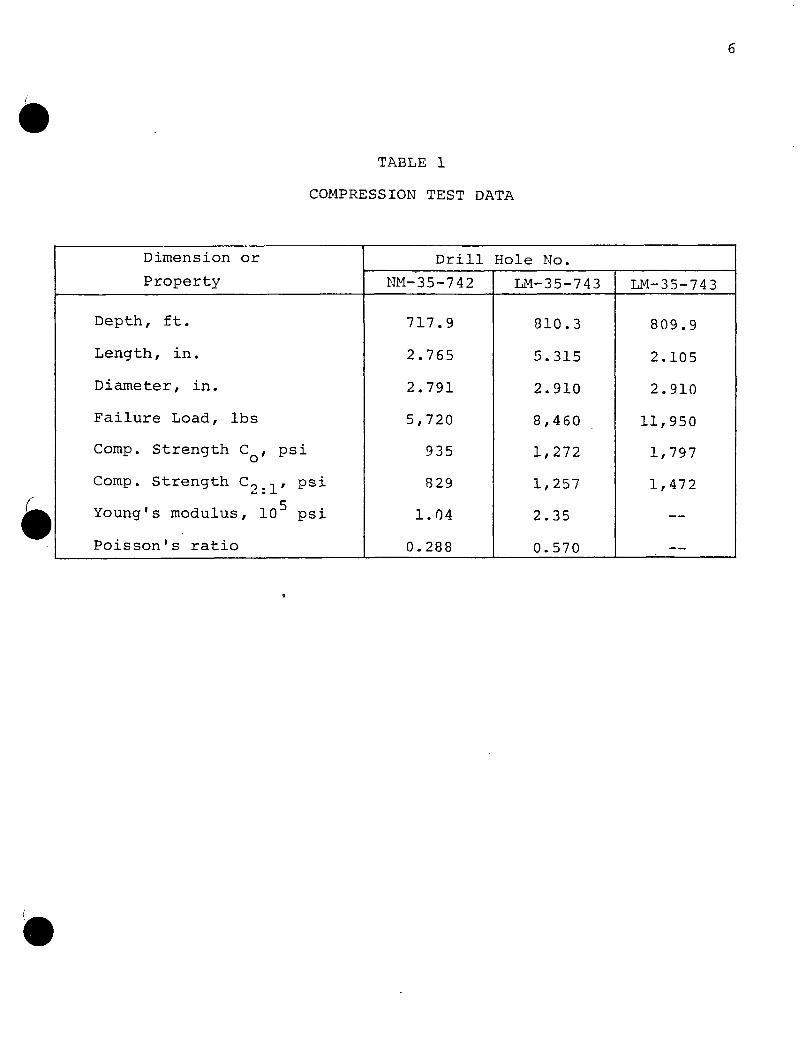
6
TABLE 1
COMPRESSION TEST DATA
Dimension or Drill Hole No.Property NM-35-742 LM-35-743 LM-35-743
Depth, ft. 717.9 810.3 809.9
Length, in. 2.765 5.315 2.105
Diameter, in. 2.791 2.910 2.910
Failure Load, lbs 5,720 8,460 11,950
Comp. Strength C0 , psi 935 1,272 1,797
Comp. Strength C 2 1 ' psi 829 1,257 1,472
Young's modulus, 105 psi 1.04 2.35 --
Poisson's ratio 0.288 0.570
7
C0 = compressive strength of actual test specimen
with diameter D and length L
The equivalent compressive strengths C2:1 are also given in
Table 1. The C2:1 strength values are the ones which should be
used for comparison purposes and design calculations.
The values of Young's modulus and Poisson's ratio given in
Table 1 were taken from calculations based on the slopes of the
axial and lateral stress-strain curves in Appendix A.
POROSITY AND SATURATION TESTS -
PROCEDURE AND RESULTS
The porosity and saturation tests were performed by Mr.
Ralph Roesler, a graduate student in Petroleum Engineering at
UMR, using equipment in the Petroleum Engineering Department.
The required results were dry density, apparent or effective
porosity, and percent water saturation in the initial or as-
received moisture state. The required measurements to calculate
these quantities are the initial weight of each specimen, its
oven-dry weight, its grain volume, and its bulk volume.
The test specimens were cubical in shape, approximately 0.7
X 0.7 X 1.0 in. They ranged from fragile but consolidated to very
soft and friable. Due to the delicate nature of the specimens it
was difficult to avoid losing a few of the grains, especially for
the very friable specimens.
A test was begun by removing the specimen from the sealed
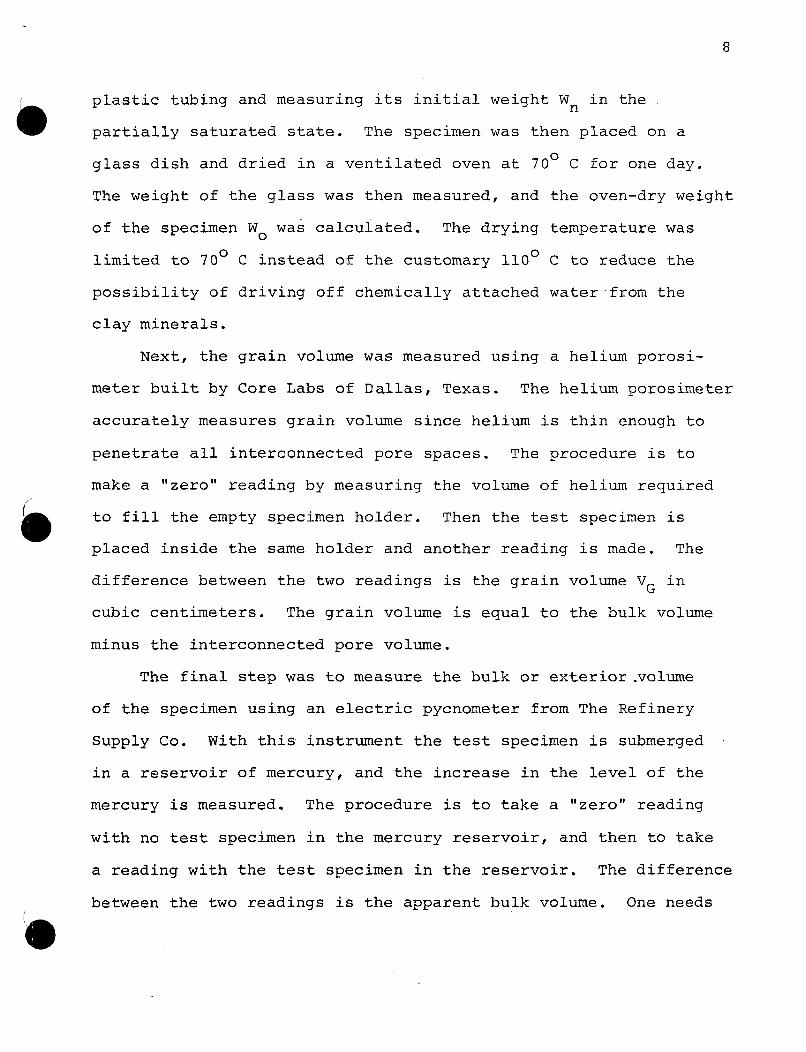
8
plastic tubing and measuring its initial weight Wn in the
partially saturated state. The specimen was then placed on a
glass dish and dried in a ventilated oven at 700 C for one day.
The weight of the glass was then measured, and the oven-dry weight
of the specimen W0 was calculated. The drying temperature was
limited to 700 C instead of the customary 1100 C to reduce the
possibility of driving off chemically attached water from the
clay minerals.
Next, the grain volume was measured using a helium porosi-
meter built by Core Labs of Dallas, Texas. The helium porosimeter
accurately measures grain volume since helium is thin enough to
penetrate all interconnected pore spaces. The procedure is to
make a "zero" reading by measuring the volume of helium required
to fill the empty specimen holder. Then the test specimen is
placed inside the same holder and another reading is made. The
difference between the two readings is the grain volume VG in
cubic centimeters. The grain volume is equal to the bulk volume
minus the interconnected pore volume.
The final step was to measure the bulk or exterior .volume
of the specimen using an electric pycnometer from The Refinery
Supply Co. With this instrument the test specimen is submerged
in a reservoir of mercury, and the increase in the level of the
mercury is measured. The procedure is to take a "zero" reading
with no test specimen in the mercury reservoir, and then to take
a reading with the test specimen in the reservoir. The difference
between the two readings is the apparent bulk volume. One needs
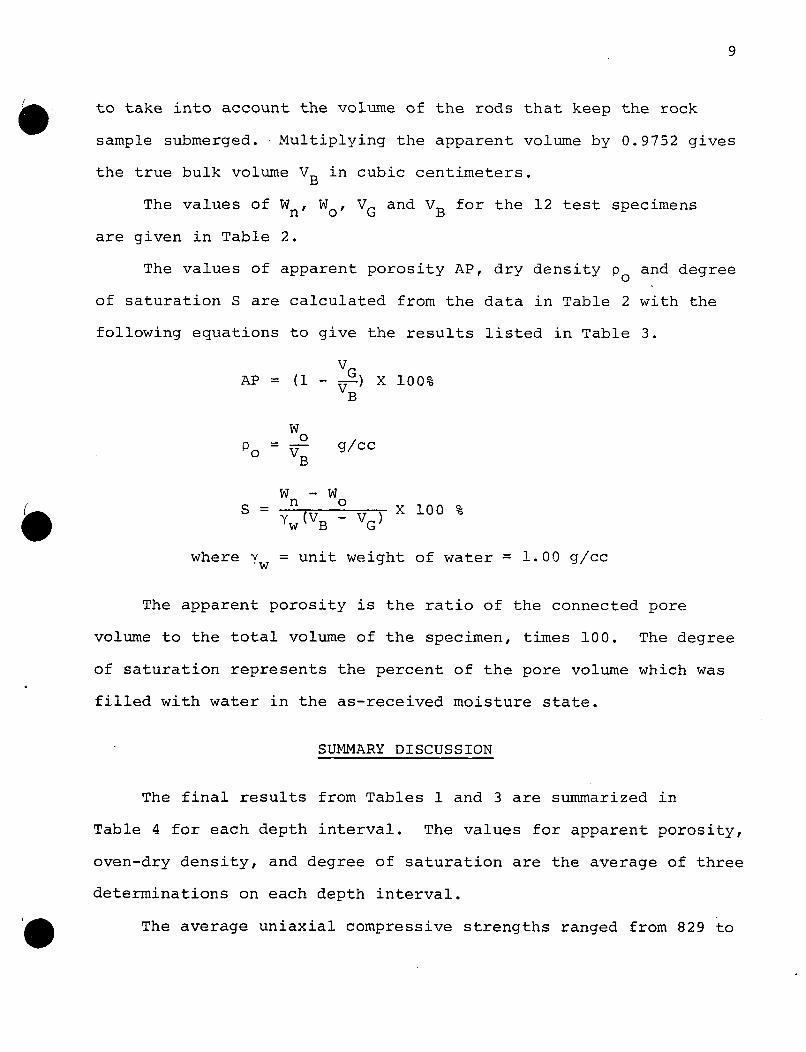
9
to take into account the volume of the rods that keep the rock
sample submerged. Multiplying the apparent volume by 0.9752 gives
the true bulk volume VB in cubic centimeters.
The values of Wn, W0 , VG and VB for the 12 test specimens
are given in Table 2.
The values of apparent porosity AP, dry density po and degree
of saturation S are calculated from the data in Table 2 with the
following equations to give the results listed in Table 3.
VGAP = (1 - -) X 100%
VB
W_0
P0 = g/cco VB
W -WS n (VB VG) X 100 %
w B G
where yw unit weight of water = 1.00 g/cc
The apparent porosity is the ratio of the connected pore
volume to the total volume of the specimen, times 100. The degree
of saturation represents the percent of the pore volume which was
filled with water in the as-received moisture state.
SUMMARY DISCUSSION
The final results from Tables 1 and 3 are summarized in
Table 4 for each depth interval. The values for apparent porosity,
oven-dry density, and degree of saturation are the average of three
determinations on each depth interval.
The average uniaxial compressive strengths ranged from 829 to
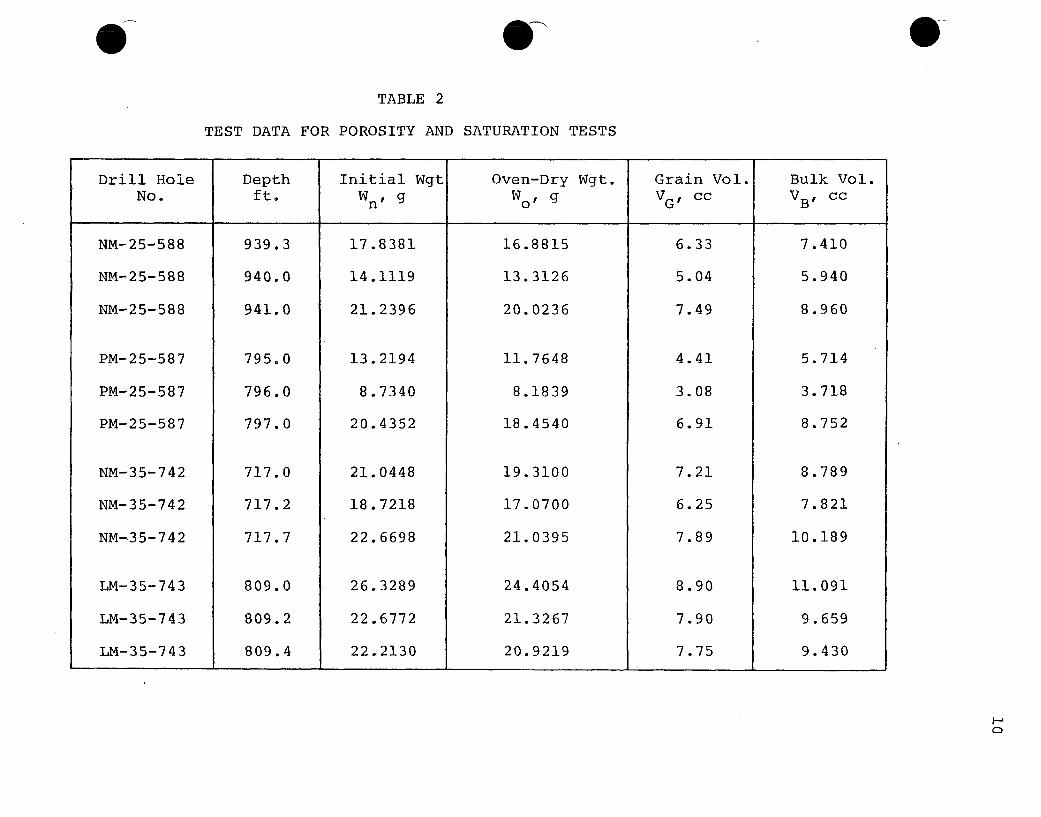
TABLE 2
TEST DATA FOR POROSITY AND SATURATION TESTS
Drill Hole Depth Initial Wgt Oven-Dry Wgt. Grain Vol. Bulk Vol.No. ft. Wn, g W g VG, cc VB, cc
NM-25-588 939.3 17.8381 16.8815 6.33 7.410
NM-25-588 940.0 14.1119 13.3126 5.04 5.940
NM-25-588 941.0 21.2396 20.0236 7.49 8.960
PM-25-587 795.0 13.2194 11.7648 4.41 5.714
PM-25-587 796.0 8.7340 8.1839 3.08 3.718
PM-25-587 797.0 20.4352 18.4540 6.91 8.752
NM-35-742 717.0 21.0448 19.3100 7.21 8.789
NM-35-742 717.2 18.7218 17.0700 6.25 7.821
NM-35-742 717.7 22.6698 21.0395 7.89 10.189
LM-35-743 809.0 26.3289 24.4054 8.90 11.091
LM-35-743 809.2 22.6772 21.3267 7.90 9.659
LM-35-743 809.4 22.2130 20.9219 7.75 9.430
HD
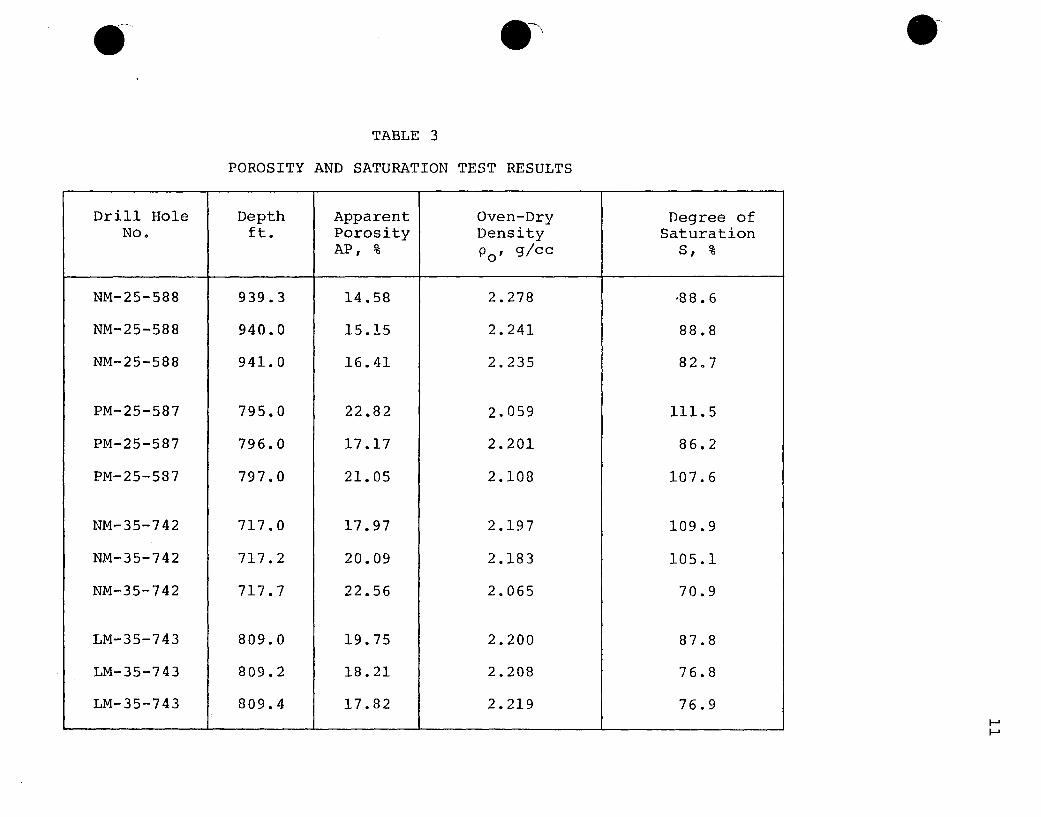
eTABLE 3
POROSITY AND SATURATION TEST RESULTS
Drill Hole Depth Apparent Oven-Dry Degree ofNo. ft. Porosity Density Saturation
AP, % Po' g/cc S, %
NM-25-588 939.3 14.58 2.278 '88.6
NM-25-588 940.0 15.15 2.241 88.8
NM-25-588 941.0 16.41 2.235 82.7
PM-25-587 795.0 22.82 2.059 111.5
PM-25-587 796.0 17.17 2.201 86.2
PM-25-587 797.0 21.05 2.108 107.6
NM-35-742 717.0 17.97 2.197 109.9
NM-35-742 717.2 20.09 2.183 105.1
NM-35-742 717.7 22.56 2.065 70.9
LM-35-743 809.0 19.75 2.200 87.8
LM-35-743 809.2 18.21 2.208 76.8
LM-35-743 809.4 17.82 2.219 76.9HH
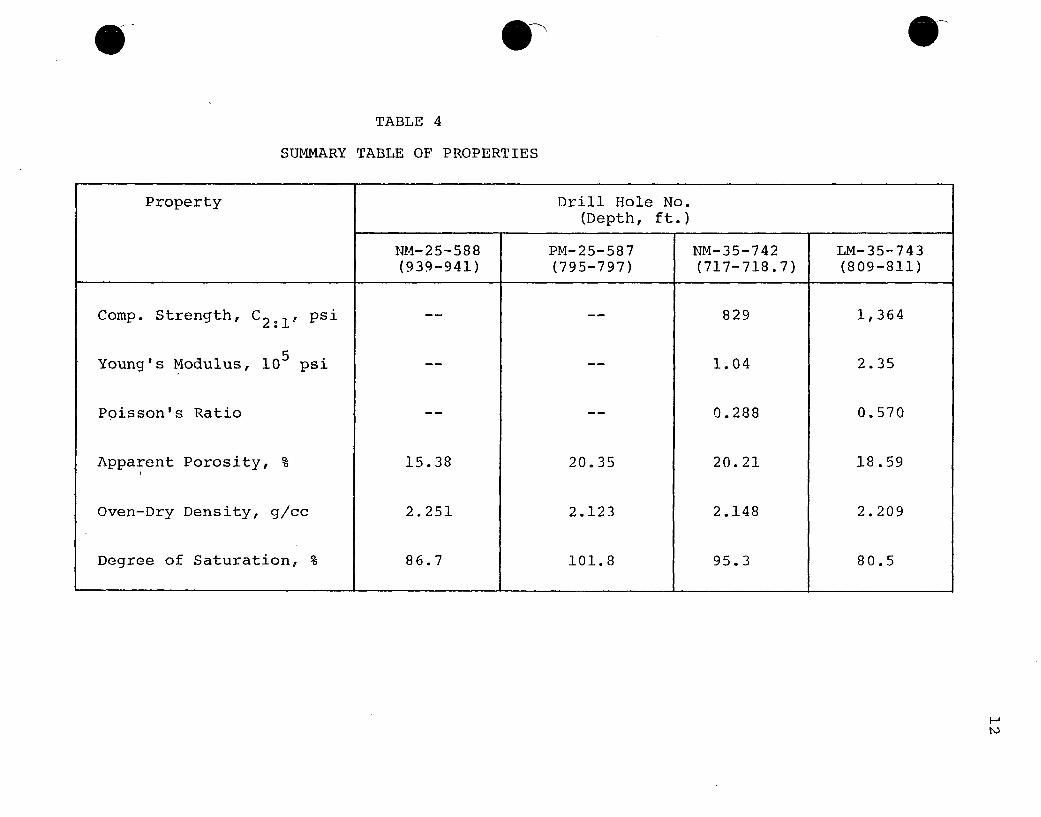
TABLE 4
SUMMARY TABLE OF PROPERTIES
Property Drill Hole No.(Depth, ft.)
NM-25-588 PM-25-587 NM-35-742 LM-35-743(939-941) (795-797) (717-718.7) (809-811)
Comp. Strength, C2: 1, psi 829 1,364
Young's Modulus, 105 psi 1.04 2.35
Poisson's Ratio 0.288 0.570
Apparent Porosity, % 15.38 20.35 20.21 18.59
Oven-Dry Density, g/cc 2.251 2.123 2.148 2.209
Degree of Saturation, % 86.7 101.8 95.3 80.5
H
13
1364 psi (Table 4). These strengths indicate that the rock is
very weak, which corresponds to the observations during specimen
preparation and testing. Extreme care had to be exercised to
maintain the integrity of the few intact core pieces. The values5
of Young's modulus, 1.04 and 2.35 X 10 psi, at a stress level of
50 percent of the ultimate strengths are low as expected for this
weak rock. The stress-strain curves (Appendix A) are fairly
linear considering the weak character of the rock. It is noted
that the higher Young's modulus was for the specimen with the
higher strength which is expected.
One of the values of Poisson's ratio, 0.288, is in the
theoretical elastic range for Poisson's ratio between 0 and 0.5.
The other value, 0.570,is outside the theoretical range. Micro-
fracturing in the specimen as the load is increased allows the
specimen to expand more than normal in the lateral direction, re-
sulting in abnormally high values of Poisson's ratio as the stress
level increases. This behavior is more pronounced for weak rocks.
The apparent or effective porosity of the rock is high with
average values ranging from 15.38 to 20.35 percent as given in
Table 4. The oven-dry densities ranged from 2.123 to 2.251 g/cc,
also as given in Table 4. These densities are reasonable for
rocks with porosities in the range of 15 to 20 percent.
The degree of saturation (Tables 3 and 4) represents the
percent of the connected pore volume which was filled with water
in the initial as-received moisture state. The average percents
saturation from Table 4 show that the rock was nearly saturated
14
when received, with values ranging from 80.5 to 101.8 percent.
It was surprising that four of the 12 measurements of degree of
saturation listed in Table 3 were greater than 100 percent.
Experimentally this could occur if too much water were driven off
during the drying process, or if the measured pore volume were
too small. The water which may have been driven off may have been
chemically bound to some minerals in the shale, or it may have been
from some unconnected pore space in the specimen. The low drying
temperature of 700 C was believed to be low enough that such loss
would not occur. There may also be minerals of unexpected types
in the shale which may decompose upon heating. The pore volume
is the difference between the bulk volume and the grain volume.
If the measured bulk volume were too low, the calculated pore
volume would be too small, resulting in too high a degree of
saturation. This may well have been the case because some of the
friable specimens crumbled slightly under the force of the hold-
down supports in the mercury reservoir. With material which
crumbles this easily one must not view the results as though they
are very precise.
The degree of saturation as measured here is a function of
the in-situ moisture state, probable moisture gain during drilling,
loss during storage, and loss during specimen preparation and test-
ing. No water was used in the sawing and grinding processes to
minimize the change in the moisture state. Storage in sealed
plastic tubing also helped maintain the initial moisture state.
APPENDIX A
STRESS-STRAIN CURVES
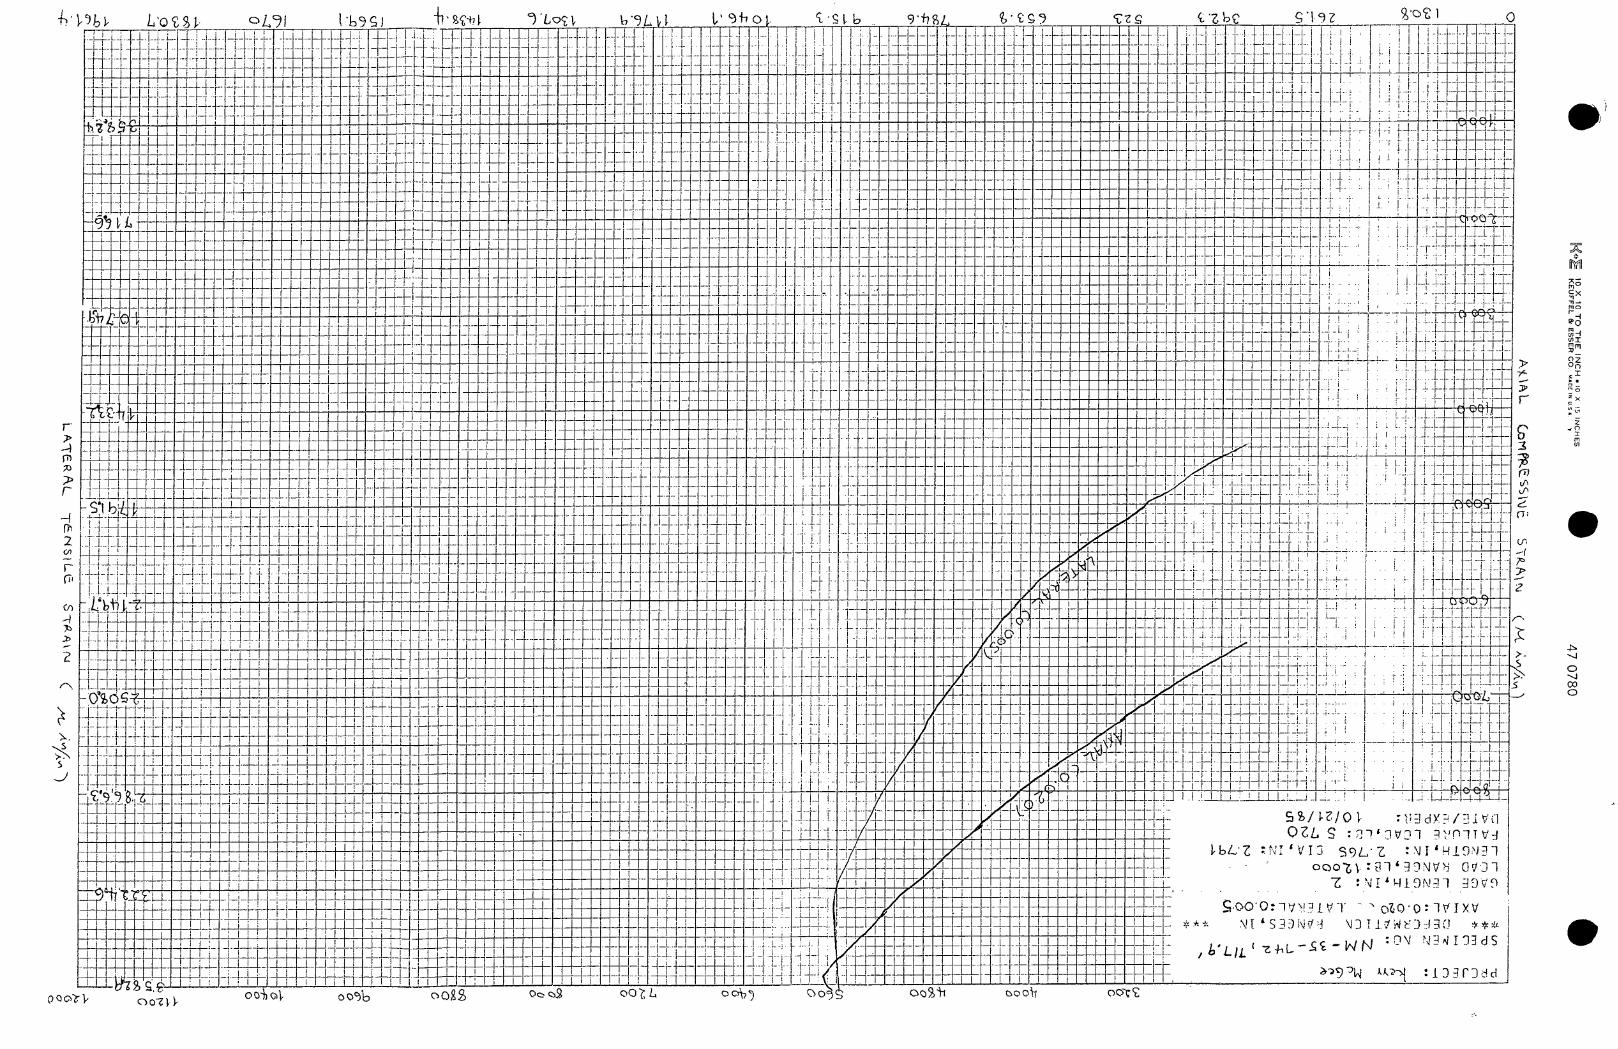
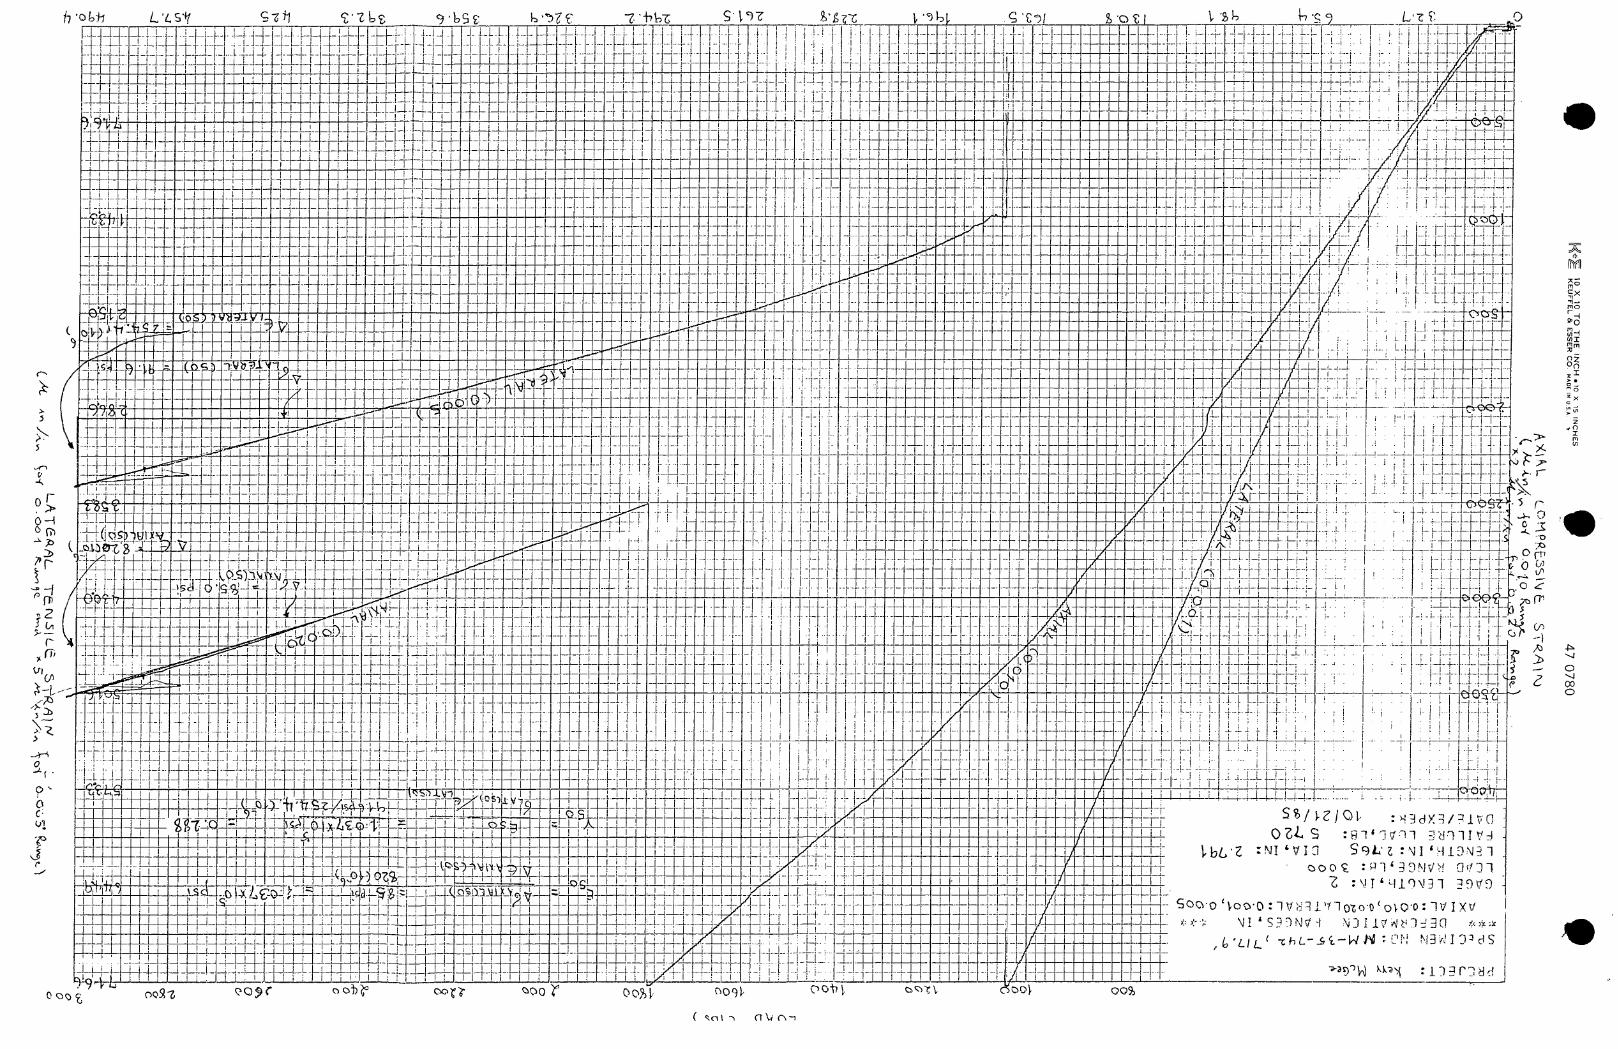
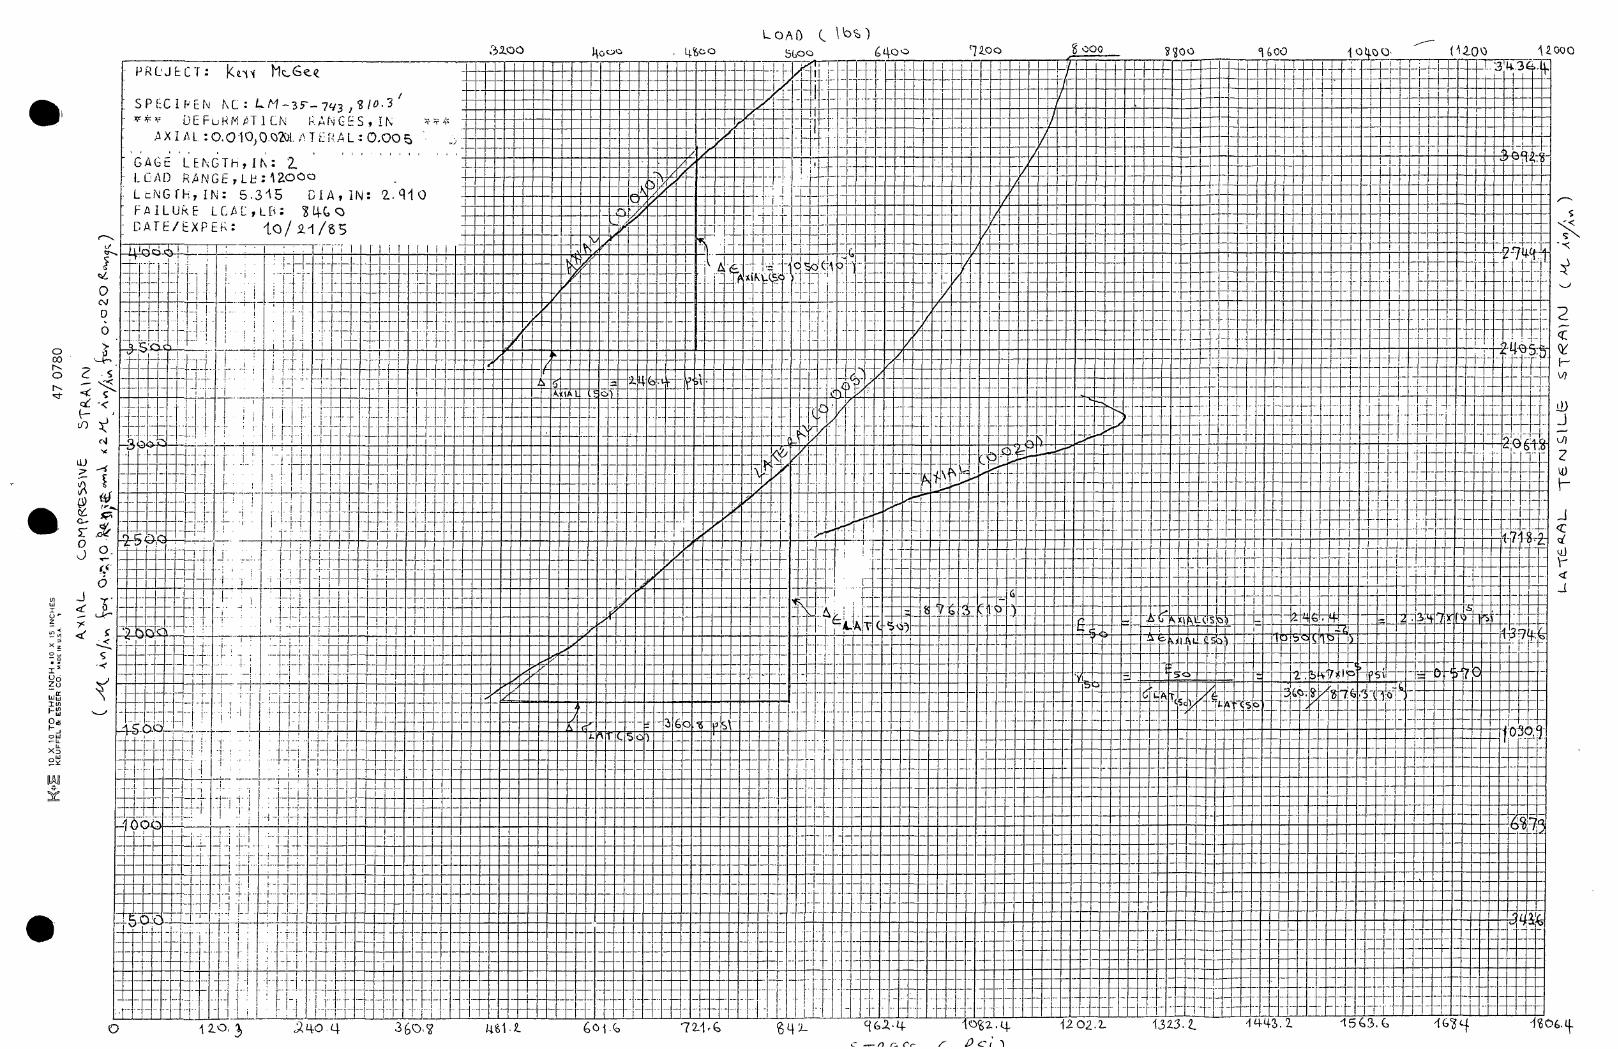
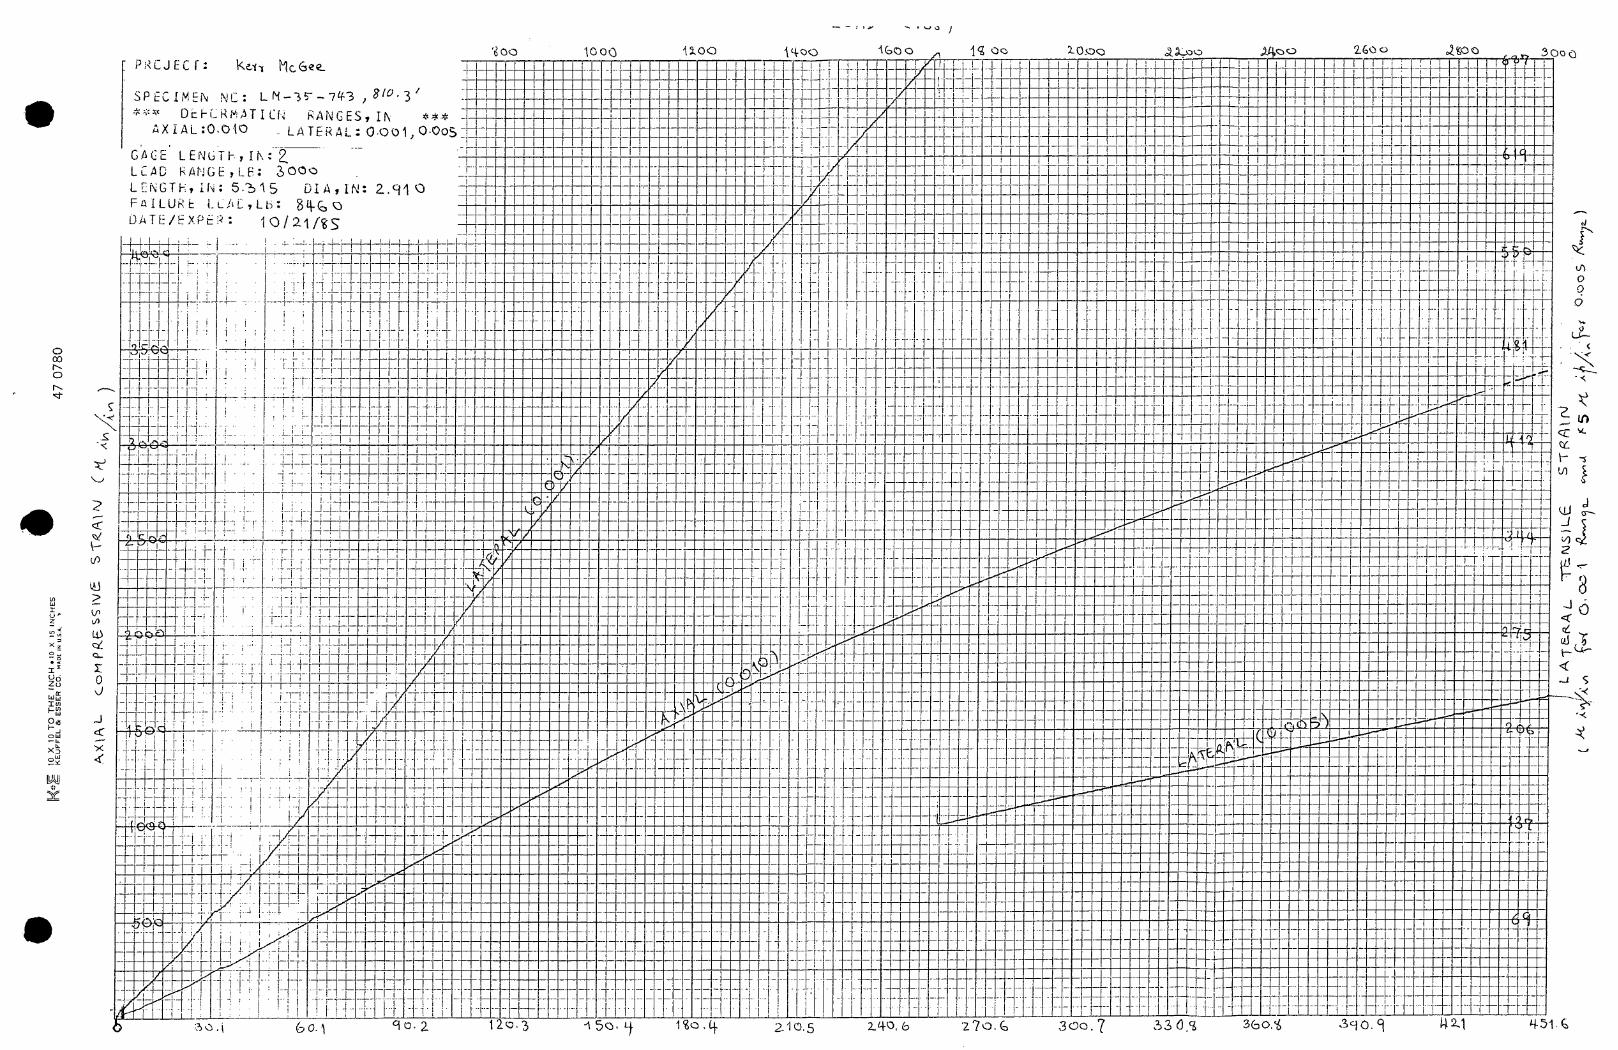


APPENDIX B
PUMPING TESTS DATA
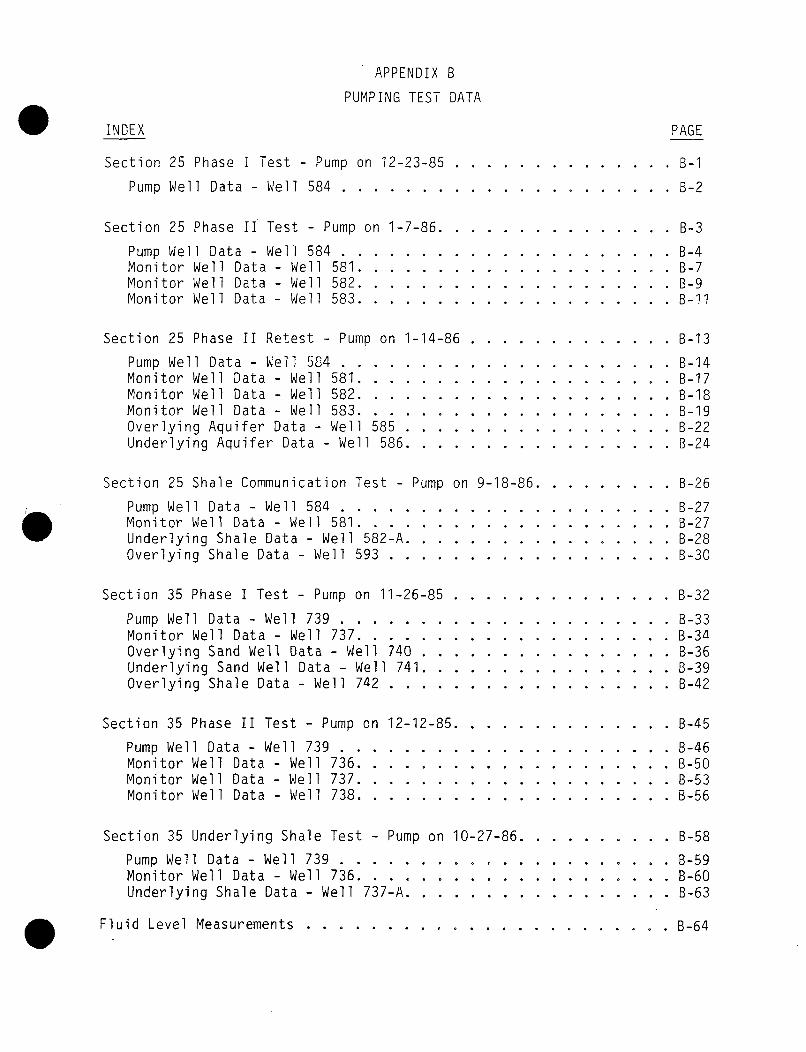
APPENDIX B
PUMPING TEST DATA
INDEX PAGE
Section 25 Phase I Test - Pump on 12-23-85 .
Pump Well Data - Well 584 ............
Section 25 Phase II Test - Pump on 1-7-86. .
Pump Well Data - Well 584 ............Monitor Well Data - Well 581 .........Monitor Well Data - Well 582 .........Monitor Well Data - Well 583 .........
Section 25 Phase II Retest - Pump on 1-14-86
Pump Well Data - Well 584 ............Monitor Well Data - Well 581 .........Monitor Well Data - Well 582 .........Monitor Well Data - Well 583 .........Overlying Aquifer Data - Well 585 ....Underlying Aquifer Data - Well 586 ....
. . . . . . . . . . . . . B-1
. . . . . . . . . . . . . B-2
B B-3
* B-4B-7B-98-11
. . . . . . . . . . . . . B-13
. . . . . . . . . . . . . B-14
. . . . . . . . . . . . . B-17
. . . . . . . . . . . . . B-18. . . . . . . . . . . . . B-19. . . . . . . . . . . . . B-22. . . . . . . . . . . . . B-24
Section 25 Shale Communication Test - Pump
Pump Well Data - Well 584 ...........Monitor Well Data - Well 581 ........Underlying Shale Data - Well 582-A...Overlying Shale Data - Well 593 . ...
on 9-18-86 . . . . . B-26
. . . . . B-27
. . . . . B-27
. . . . . B-28
. . . . . B-30
Section 35 Phase I Test - Pump on 11-26-85 ..... ............... B-32
Pump Well Data - Well 739 .......... ...................... B-33Monitor Well Data - Well 737 ......... .................... .. B-34Overlying Sand Well Data - Well 740 ...... ................. B-36Underlying Sand Well Data - Well 741 ....... ................ 8-39Overlying Shale Data - Well 742 .......... .................. B-42
Section 35 Phase II Test - Pump on 12-12-85 ...... .............. B-45
Pump Well Data - Well 739 ............ ..................... 8-46Monitor Well Data - Well 736 ......... .................... .. B-50Monitor Well Data - Well 737 ......... ..................... B-53Monitor Well Data - Well 738 ....... ..................... B-56
Section 35 Underlying Shale Test - Pump on 10-27-86 .............. B-58
Pump Well Data - Well 739 ...... ........................... B-59Monitor Well Data - Well 736 ......... .................... .. B-60Underlying Shale Data - Well 737-A ..... ................... B-63
Fluid Level Measurements . . . . . l . . .................. B-64
Section 25 Phase I Test
The Phase I test was to demonstrate the isolating characteristics
of the overlying and underlying shales; however, an equipment
malfunction shutdown the pump after only 17 hours of pumping and none
of the Phase I data was used in the analyses. Data did indicate an
isolated pressure source significantly higher than the test formation
in the overlying shale well and a seal problem on the underlying shale
well completion. Both shale wells were subsequently abandoned after
attempts to repair them were unsuccessful. Data on the pump well
flow rate and drawdown for Phase I is attached.
B-I
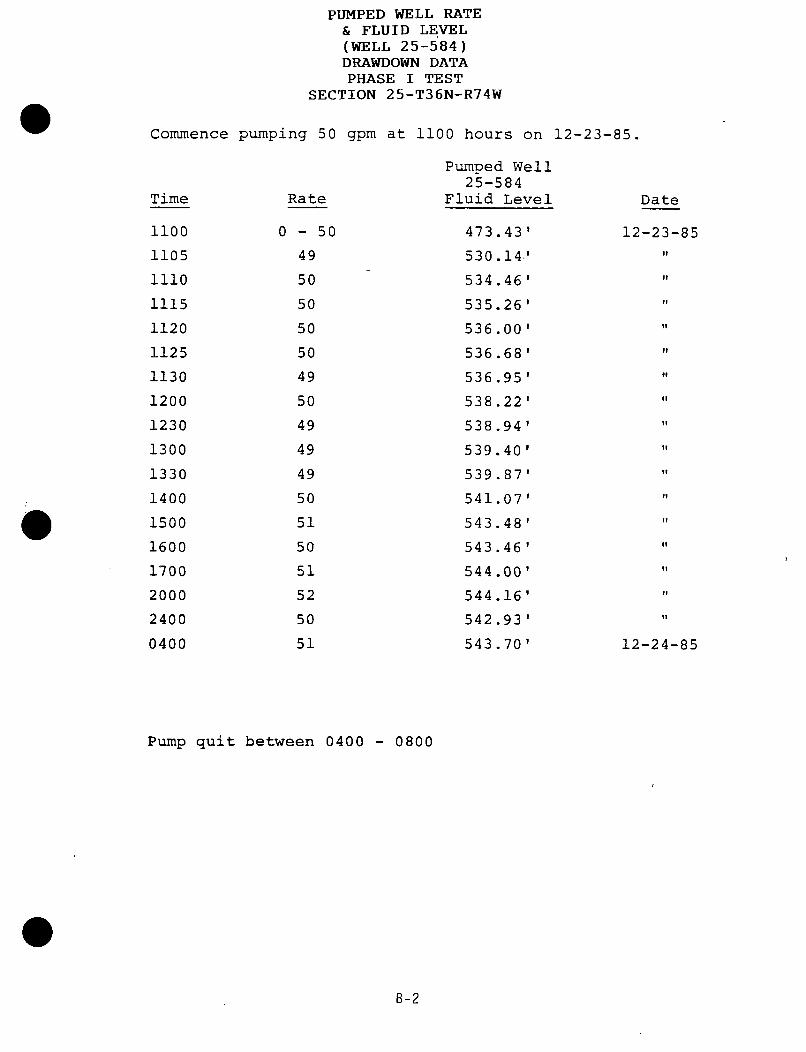
PUMPED WELL RATE& FLUID LEVEL(WELL 25-584)DRAWDOWN DATAPHASE I TEST
SECTION 25-T36N-R74W
Commence pumping 50 gpm at 1100 hours on 12-23-85.
PumDed Well25-584
Fluid LevelTime
1100
1105
1110
1115
1120
1125
1130
1200
1230
1300
1330
1400
1500
1600
1700
2000
2400
0400
Rate Date
0 - 50
49
50
50
50
50
49
50
49
49
49
50
51
50
51
52
50
51
473.43'
530 .14-'
534.46
535.26536.00'
536.68'
536.95538.22'
538.94'
539.40'
539.87'
541.07'
543.48'
543.46'
544.00'
544.16'
542.93'543 .70'
12-23-85it
it
if
it
11
if
1 4
'F
'I
12-24-85
Pump quit between 0400 - 0800
8-2
Section 25 Phase II Test
In the Section 25 Phase II Test production zone monitor wells 581,
582 and 583, pumped well 584, and the reworked underlying shale well
were monitored with transducers. The Phase II test was conducted
to provide data in the production zone characteristics and check the
repair to the underlying shale well. The generator malfunctioned
and shutdown after 2.8 days of pumping and no meaningful aquifer
recovery data was collected in this test segment. Repairs to the
underlying shale well were not successful and the well was
subsequently abandoned. Background and drawdown data on wells 581,
582, 583, and 584 are attached.
The Section 25 Phase II Retest was conducted to obtain aquifer
recovery data which could not be collected when the generator
malfunctioned in the initial phase II test and to monitor the
overlying and underlying aquifers for possible response to pumping
from the production zone. Transducers were placed in the production
zone wells 583 and 584 for background and drawdown data to ensure
a similar drawdown situation was created prior to collecting the
recovery data and in the wells 585 and 586 completed in the overlying
and underlying aquifers.
After drawdown was established by pumping well 584 for three days,
transducers were removed from overlying and underlying aquifer wells
585 and 586 and placed in production zone monitor wells 581 and 582
to collect recovery data for the production zone aquifer. Data for
the wells monitored in the Phase II Retest follow well data from the
Phase II test.
B-3
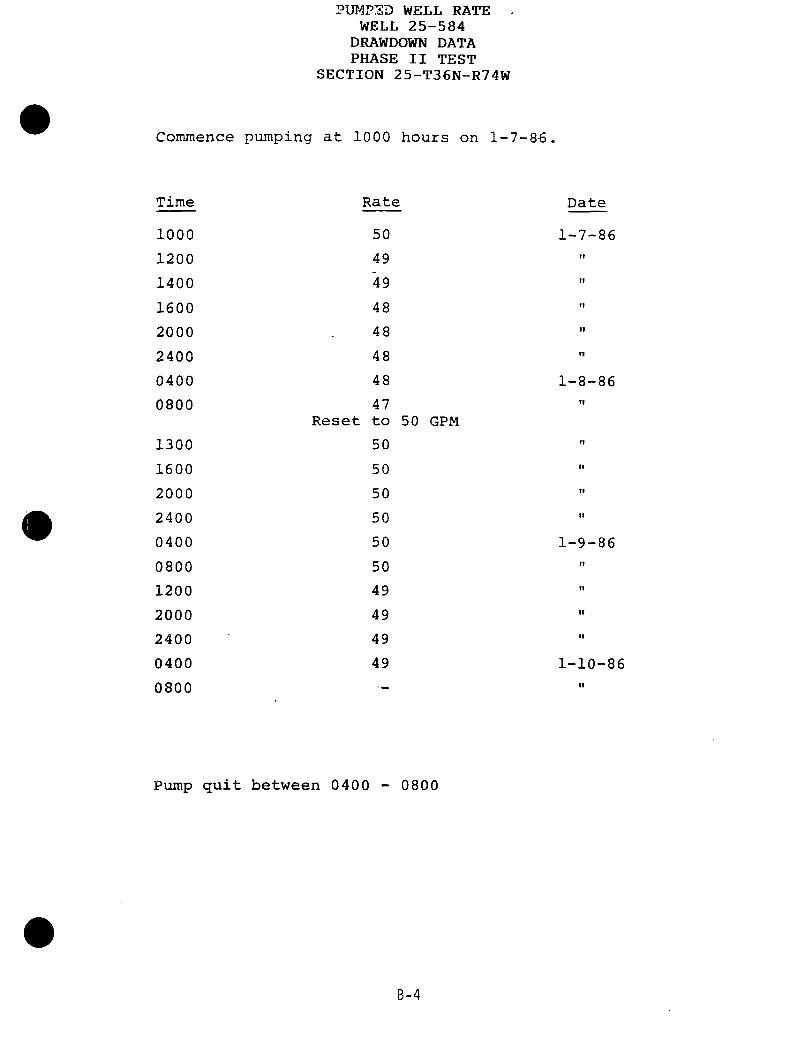
PUM4PD WELL RATEWELL 25-584
DRAWDOWN DATAPHASE II TEST
SECTION 25-T36N-R74W
Commence pumping at 1000 hours on 1-7-86.
Time Rate Date
1000 50 1-7-86
1200 49 "
1400 49 it
1600 48
2000 48
2400 48
0400 48 1-8-86
0800 47Reset to 50 GPM
1300 50
1600 50
2000 50
2400 50
0400 50 1-9-86
0800 50
1200 49
2000 49
2400 49
0400 49 1-10-86
0800 To
Pump quit between 0400 - 0800
B-4
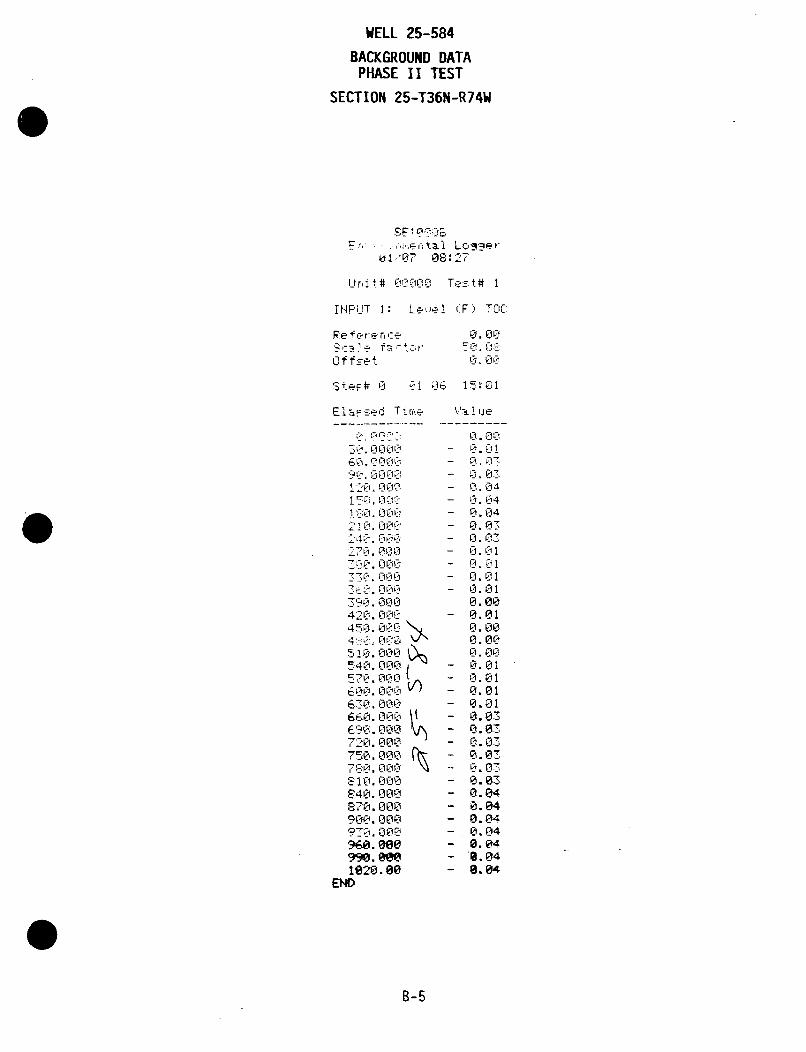
WELL 25-584
BACKGROUND DATAPHASE II TEST
SECTION 25-T36N-R74W
Frn - ..,,,entai Lo_'er01/07 08:27
ri t# 0I!A--L000;i Test# I
INPUT 1: Le,..el (F1:, TOC
Re fere rnceOScae fse ,rOffset
0. 000.iTh ;0
SteF# 0 Of1 E6 15: 01
ElapFed Time
30.0000E
120.0009150}.000E180.0008
2407. 000E270.000. E7001. 000
Li Li C l 0
360. 000390. 000420.000450.000!i'L
510. 000 ON)54. 00 Ci(
570. 000600. 00cV
60.i000
720. 000750. O0378,-0.,000S 10. 000840. 000870. 000900. 9000
960. 000990.000I020. 00
END
Va I ue
0 . C1 ý0
0 .04
-0.04
LI Li0
- 0. W,-0 010.00
Li0. 1
Li 1.14
0.00
-i ,14
0. 000.000. 0 I
-0. 01-0.01
-0.03-0.03- 1. 03:-0.07- . 037-0.03
0 . 04-0.04
0 . 04-0.04-0.04
- 0S.04- i.04
B-5
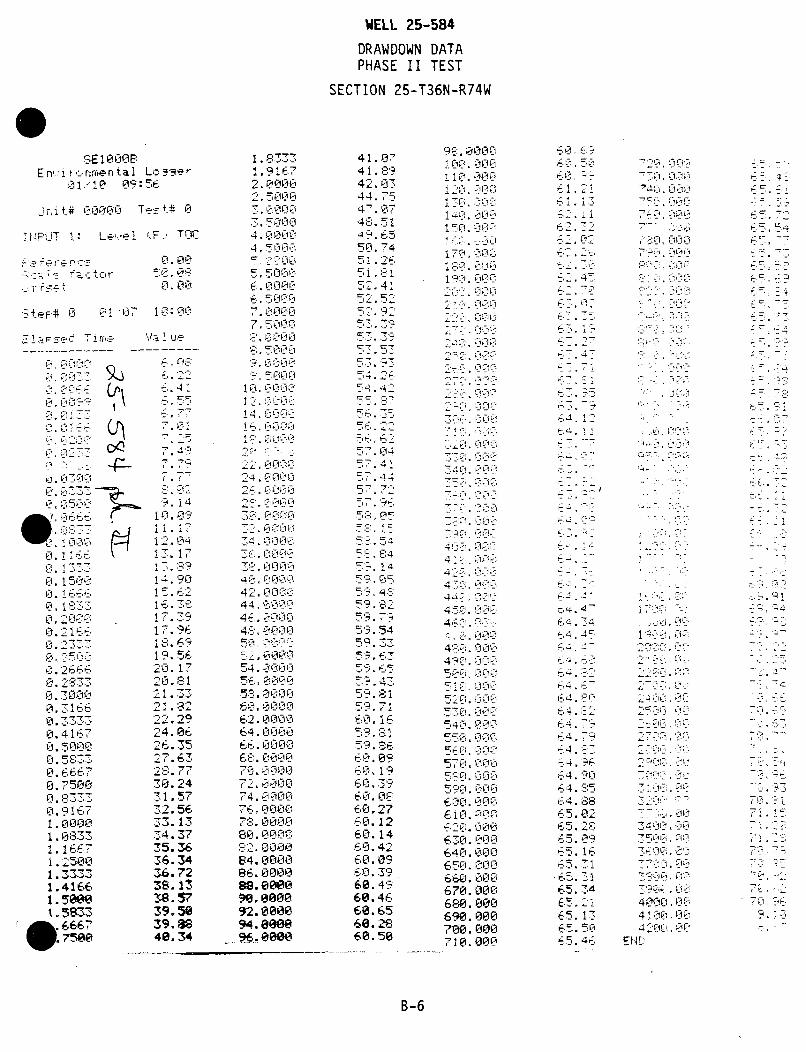
WELL 25-584DRAWDOWN DATAPHASE II TEST
SECTION 25-T36N-R74W
SEI1. 0i00En'.. ironmental Lc.-:3er
o1-1.0 09: 56
irjt# rrir¶riu; Te<J + 0
.1' Lw d e 1 -'
tac t clr172. &D~
0i. 00
St&FA '3 f-"1~T 10sThCi
-.1"g.•..- Ti. - .-
1,7, 01 -
cl -, 050.
_h. 1 t
0. !
0.0.
1. errz
5P73-
1.46
1.150031. 1 666
7w. 2500
1. 333301.4166
I . 5833
. 266F27.2-W3
23
A--
}
ell-° .- :
91
t 5',
14. ;901£.0
21 32-
24. 9r
-15.1
26.3 3527.63
!, 7,79
310. 24
32.56323. 1324.3735.3636.3436.7238. V!
39.50392.840.34
1. 0000
4 fl. 0 j,
4 '7 0101J
tr C-l 17'
e-$0L10CIOj.4l-
141
14-4
17-1711ýlr
544.1-710135E1 C
- al OP
64l .000
b4 . ll i0flI
84. 000086.0000o9.88.00092.0800994. W@e96. oeo0
41. 07,41.18'42'. c3744. =7
4,--. 5149.5
C4i. -'. 541
-7. 4 1
1 14
58 -'.j
14
57-I
54
...-,. 86,
,. 60.
17.4
60. 4-
60.4660. 16
6e'. 28=
60.33
459.6
50 '. 125
60,.0950, 39
60.46
68.2860.98
'.D;. 0001
110•. CO0 0
-l?.go0.14 l. 0
7'1!"4', '14.1,
- -%, =. -
74
* j7. -1,1
4'- ' L - 1:'
C--"- =' '--"-n-
"-1- a?, w0 ,'
wIlY
5 'r I . i 0 -l
b4L-, 0.-l0
6bl Uin
6-7-t-1 0141
6 2:. 000
640. 000
E. 5 C, - 0 0
700. 00047'.I. 000
5590. 000
550,000
0.51
L4,
'2
4
17--
e.1
4.
4.
r4.
-. 976r . I-'
64.288
5.C 71
6t. 1
r9F 1-
5-- 4r
7A
4144'
L 11-1
-7a
7w: 7,
f5. f
4',. 4.4,
4 0! 0 •0 0w,,
4 14
E f-, IiLL
27Stl;. 11144 I',; o iO
-_4 ,jt;, I-j27EN :.T
B-6
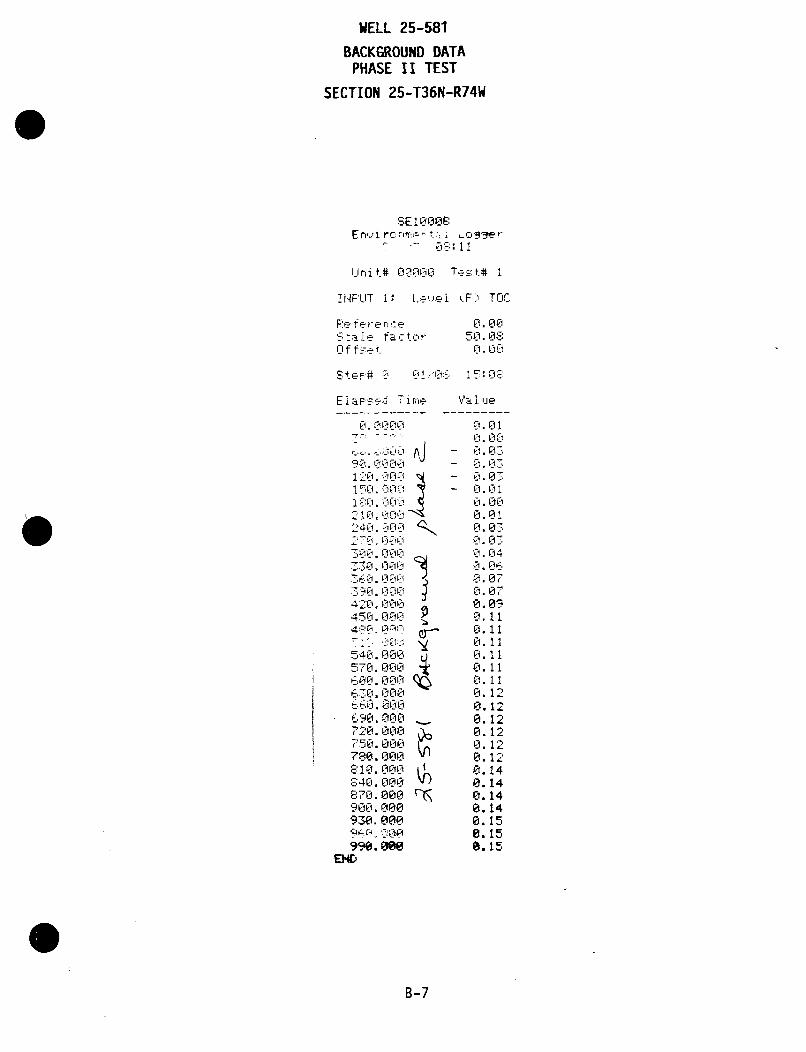
WELL 25-581
BACKGROUND DATAPHASE II TEST
SECTION 25-T36N-R74W
SE1O3F00:En..iroi r, ... t:i L
-- -7 8: 11
Unit# 0000I02 Test# 1
INFUT 1: Le.,ei (F) TOC
R:e fe ren eScle, factorOf f-et.
0.0050.08
0. 0
Step# 0 01_-*06 1"h5:0-
Eia5sid Time
Li4 LIEi•l c-
150 0• !
180.000
4210. 0002450.000
27. .... 000300. 000Z3Xi. E000
490. _ 00 .i .
420. 000450. 000
540. 0-00570. 000 •E8o0. n00c6-70. 000 r'00. 0009I-. - 080At-
720.000750.000780.000810.000S40.0L06I
900.000 e93100. i909300 o
END
L I ue
0. 00
0.01
0.04
00707
090
0.11
0.110. 120.110.110.110.120.120.120.120.120.120.14
0.158.150.15
B-7
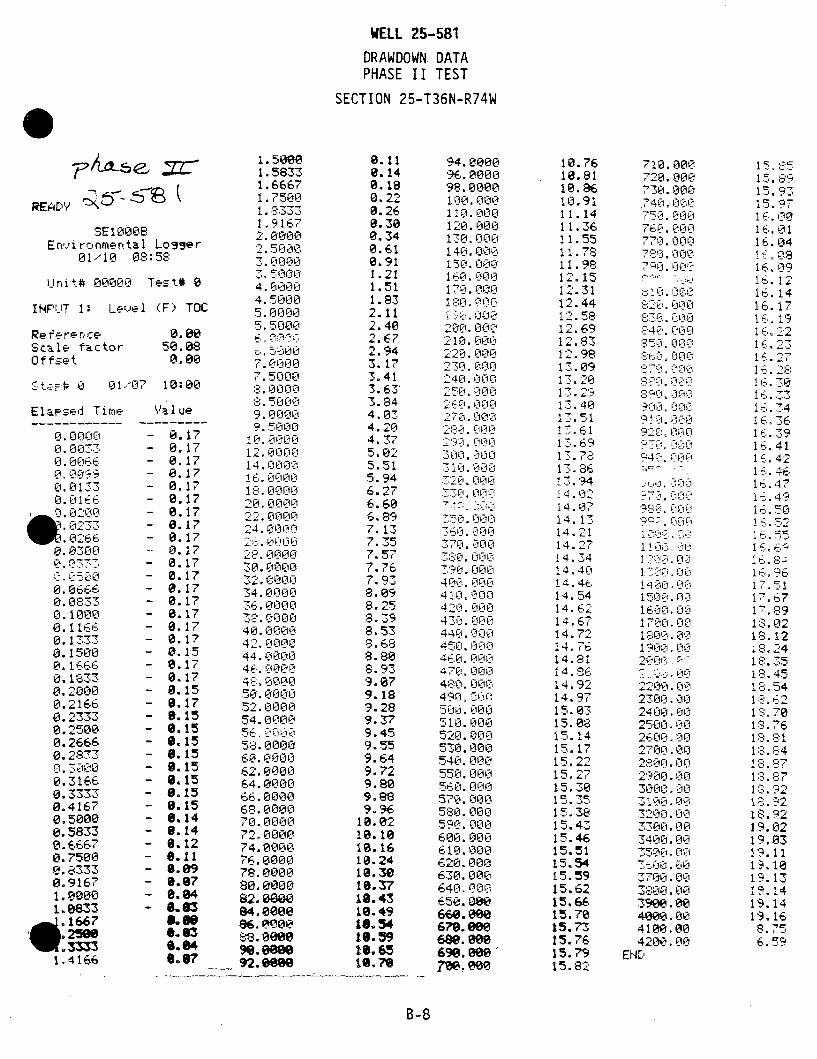
WELL 25-581
DRAWDOWN. DATAPHASE II TEST
SECTION 25-T36N-R74W
REA~DY 'XC CS~SE1000E
Environmental LojSer01/10 08:58
Unit# 00000 Test# 0
INPUT 1: Leel (F) TO
ReferenceScale factorOffset
tep=# L 01.'07
Elapsed Time
0. 0000
0.)066
0.•9
0.0133 -
0.10100
,oww.o2-
0. 11t. 6
0.1737,
0.1500
0.16660. 18330.1000 -
0.2166 -
0.1333 -
0.25000.2666,
0.18337.
0.20 -
0.3166 -
0.3333 -
0.4167 -
0.5000 -
0.5833 -
0.61667 -
0.7500 -
0.9333
0.4167 -
1.500001.08333
16. 1667
1,4166
0.0050.080.00
10:00
Va I ue
- 0.17- 0.17- 0.17- 0.17- 0.17- 0.17- 0.17- 0.17- 0.17- 0.17* 0.17- 0.17- 0.17- 0.17- 0.17- 0.17* 0.17- 0.15* 0.17- 0.17
0 6.15* 0.17* 9.15* 0.15
0 8.150.15
- 9.15* 9.15* 0.15- 0.15* 6.14* 9.14
0.12- 0.11
- 8.099.87-10.04& 0.3
0.93
9.07
I. 500W1. 58331.66671.75001. 83331.9167
2. 00003. 00•zs
1715000
4. 0 CIO4. 5030
C 5. 00005, 5000
C, -,1000
7.0noo
8. 000'.: 000095 000
9.5000010. 0000
112. 000 0
-' 4 , 0 LC3
14-. 1700008ir. 00000000
'-. OL~InL22.0Lni0
2400000. 0 01Li
1 ?. 0000
30. 0000
4.000034.0A00
8.0000
C: ILiLIA
40. 00004 0000
44. 00004t. 'I0L004'-=, 0 00 050o. o000052 . 0000
4. 0 0 0 0
58. 0000'4,0.10 0101062. 000064. 000066. 0000
68. 000070. 0000
74. 0000OF76. 000078. 000080.000082. @ON64. 0000
86. 00000
FINS.0000
76. 000
92.88OM4.60096•. 00
0.110.140.180.220.260.300.340.610.911.211.511.832..11
.402.672.943.173.413.633.844.034.204.375.025.515.946.276.606.897.137.357.577.768.09
8.25o.398.538.688.808.939.079.189.289.379.459.559.649.729.809.889.96
10.0210.1010.1610.2410.3010.3718.4310.4910.5416.5910.6516.710
94.8000096. 000098.0000100.00011 0. 000120. 000130. 000140. 303150. 0001E.. nn00170. 000
200. 0002 10 0.O0
'22 0. E0 0023.000
240. 00025 0. ,0 0.
*'4I 00171ur. 0 0l0
27, *P1 .i,390. 000
P0c. 171
7510. 000E20. 000
7 17 0. 0 C100
0 LI • .LiL*50 n no
410. Li 117107. 0n0r0
4 F1i 0 ýifl
440. 000
4 5 CD, 00 010.00g
4 0. 71F 00480. 0490 01 0
51I. 010 0
520. OOC0570. 000
540. 000550. 000
570. 000580. 000590. 00056017. 000
5,80. 000
60:-0. 0006130. ON06240 . 0 00,66 000
640. Se•3650. ON0
S 0 woo
.14 n0o
59. @000
5.-i00:i
b9l. 00w
10.7610.8110.8610.9111.1411.3611.5511.7811.981-.1512.3112.4412.5812.6912.8312.9817.091 .20
132917.4017.511 .611 3.69
1 .86137,5941 4. 0214. 0:.14.1'14. 2114.2"14.3414.4014. 4,14.5414.6214.6714.7214.7614.8114.S614.9214.9715.0315.0815.1415.1715.2215. 2715. 3015.3515.3815.4315.4615.5115.5415.5915.6215.6615.7015.7315.7615.7915.82
710. 000720. 000730. 001740. 100760. 000-'770. Nfl0
1770. 0007'-.• 001
C;:j 10710
80 . 01C"00
f'1.000
90. 0 0
12,'t 0 0 0
184100 0001- 0 ý-. . Cl
29',0, 000
rL i . LIL-I
71500. 00
16000.00Z1700,100
1900.00
77300,1002400.00
26000
4 71 NEI.00
4200. 00
EN Li.I i
Li0 . 1i
32e,.0i-3300.jL0
'-4-'0*.-0
35001 I'
1 '0i. -1'3700.00i
31400.i39on.on400w0.0€i•
4100.0042Th10 o4LlNii
16.0CI16'.014
19= x'-
14.01. 17
16 14116.174
16.4211 127Ed. 149
1i.. .i 18.
18.12
1-218- 45
1S. E!
1S-. 7"-
1 S. *t
1 9=2
1 9.2-
18.92
19' "9
1" 7.5
19',.03
19.12
18.3
1 451 ,U. 54i8, 4218.94
18.8
138.92
18.92
19.0t'219.8319. 1119.1i019. 1319.1419. 1419. 168.7'S6.59
B-8
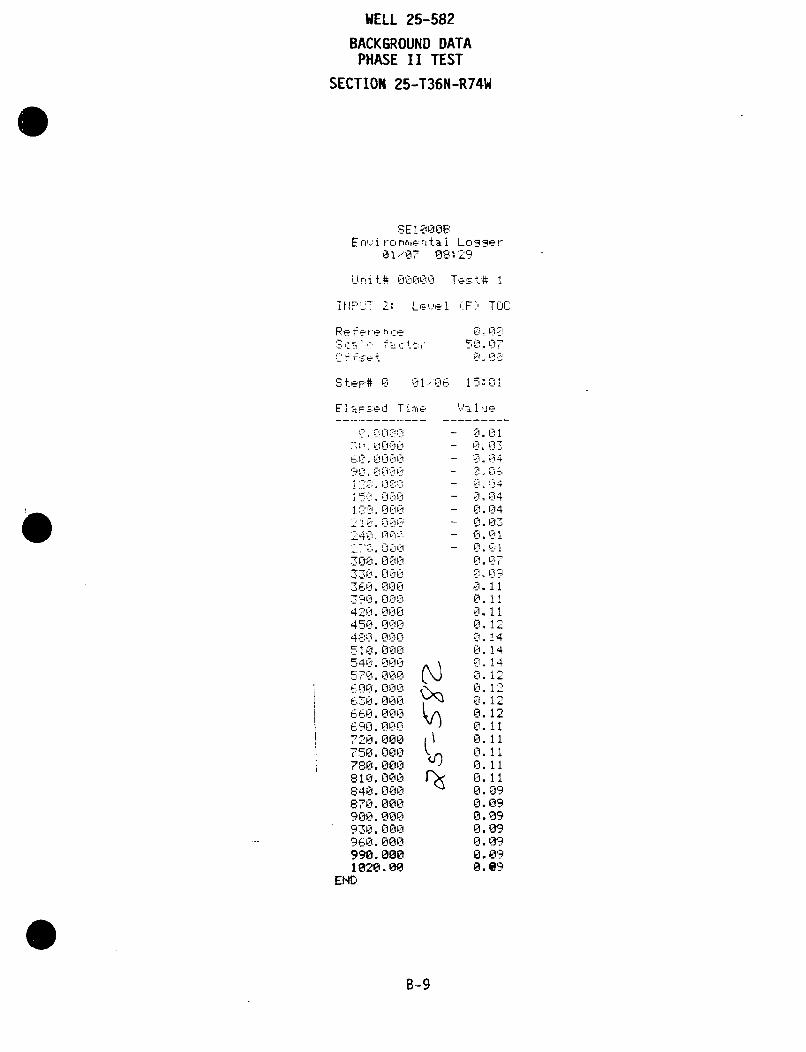
WELL 25-582
BACKGROUND DATAPHASE II TEST
SECTION 25-T36N-R74W
SE 1000BEnironrental Loggser
01/07 08:29
Unit# 00000 Test# I
INPFU!T 2: Leve (F) TO0
Reference"ci factor,:.-f '..Fe , 50. 07
0 .c0rIC
Step# 0 01/06 15:01
Elapsed Time Va lue
:SOz 0 00L- ,iL @09
790. 00804.20:. LICI @4 5 0 0108'0
5 j'---i 0 0C
540,.0001
570.000
3660. 0006'90. 000720. 000750. 1090
.510. 000540}. 000870,. 000
900. 0009'70. 000720. 000
990. 00010810. 000
84. D
87..00
900. fl0i931 q000
960 Li U0-'94 . A0l
40 ii04E( Vlf
0, 1,D
Ci. 0,4
C1. 04
0. 070. 0?0.1I
0.70.11
Li i4
0.120. 140. 14
14
. 2
012
0I 1'
6 iL
0i11
0.090.090.09.
,090.09
O. @
Q5
B-9
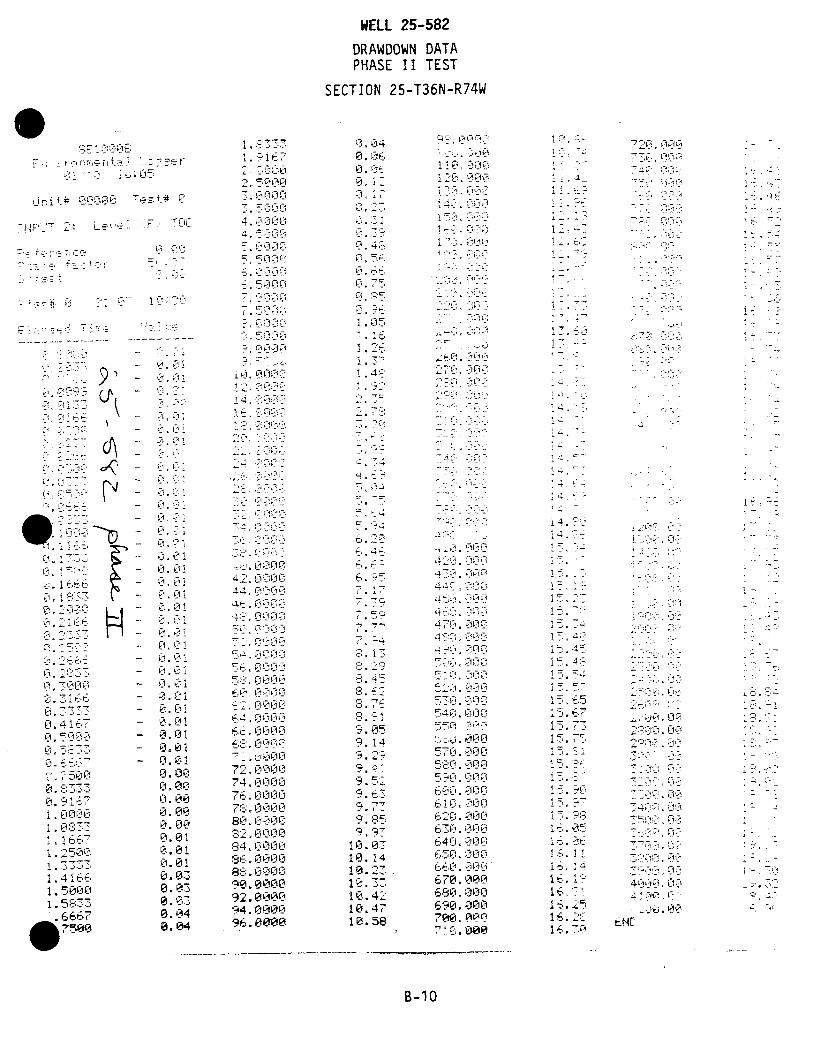
WELL 25-582DRAWDOWN DATA
PHASE II TEST
SECTION 25-T36N-R74W
S E ;:- % E :i •:1 -%,8 7 7 0 .,0 4 9 ,• q - ,=.-7 2 0. 0 0 0 :SE 1 50 1,9 .7 0. A•,]<_,;J@!::- -
.. 5 0 0 0 0 ,- - j 40 4 4,•,G Q.
TN * 24 Le F .0011 1.7 150.050ii
-4 Sr 44Q
-Q 11'ý 00: 4
T- 4~i a -. 5
P, H-2. ...' 315 0. 7:"
957 " .IlT1i 4 3 2.• 2
V1''
714 1h-., .• .. ..I
'.,0 0. I M PL i..A .000
44 . 00 '.-, 4M 0 1". -1
0.0 44110
7-' 1-• .. 00- _74
I- A .: --'I ! • :. 1 'H •l -. 2 . S ".: '>- :::.3 4 . ' . .--
W.: .7< i. Lii I:-, L14-1'i .4..4" : 1 .:L__ :"• LjL•
0.ic- 7.~1 *+4-
a2i1
?. <:--7 T - -... 01..4 . -'. i , : -ý <s .i7 --.. %.- 6 .1 -- 4, ' '_".'7. "1.:.1 , 4 5- "- _
',7 . O f'3 ": 5 1 0 0 0 1 5.. 7 0 .00q0 • : 4 . . . . .
'", :1445-..5- 7"" --Li- 01i 57V coo 5. ... .I -Y' 7. 51410421
0. 4 167 r. 01114 15.-L71-i0.5 0. LI".01 9 C,. r:i 570. I00. 5.0 70 1.
Lih u6 f-t :•. 0 4 1 I, L 58 005.L
4, i : :: .3 g L i L J 4 4 1 , i - O'-4-"L - , " a i ,i l .. . . . .. . .'. ' .) : 1
1', : ',I i . - L . g~ 1-, 441144$ • 7 . ."' a S .: *r 'r ri 1 • -. : :. . p:
j. '91 146I -1 Li-,I." . . . .. i. " ..... 4 '" L.i.8"i.. :1,
4
Li2.- !iA i 1 14 0 i•l' ,i. 00 1 :"
2%1 r0 0.0 74. 00 9.53 59L0.00i isL- -il4 -4
C1. 9U.L, 0 P!. % n' i A 06t L- -90Q1L-"00-
- 7::-. 09.7 610 000 .: 1 -0
Lb 1 84000 10.0 587ri .0
1.3333 0:6 01 8. 0000.. .. 10-.14 6 .6 0. 0.,•, 0 2,"•}, 7.•I! - 0. 88.00 i10-,::1z -,.•- ..2 160 :9 ,!,. 0 0: :"
1,:.41,61€€,0- 0. '710• •,3 • .6 2-.00 16q•i .'r 4000.•••..0 0. 32 :.:
1.5833 0.0 6B-i0 .001E.
i . 6. 6 67, 0. P-, 4 9,2 . 0 0 1 0.3• ',- 7 00q • . 0 t o-•T E NE.= :,.U7 5 _* 7 _0 -1 _ . --.Wl:.. .. : .:., : :
0.4i67 •-Z!.@ _,•, .......- 10 ... ... ¢••ra .,,
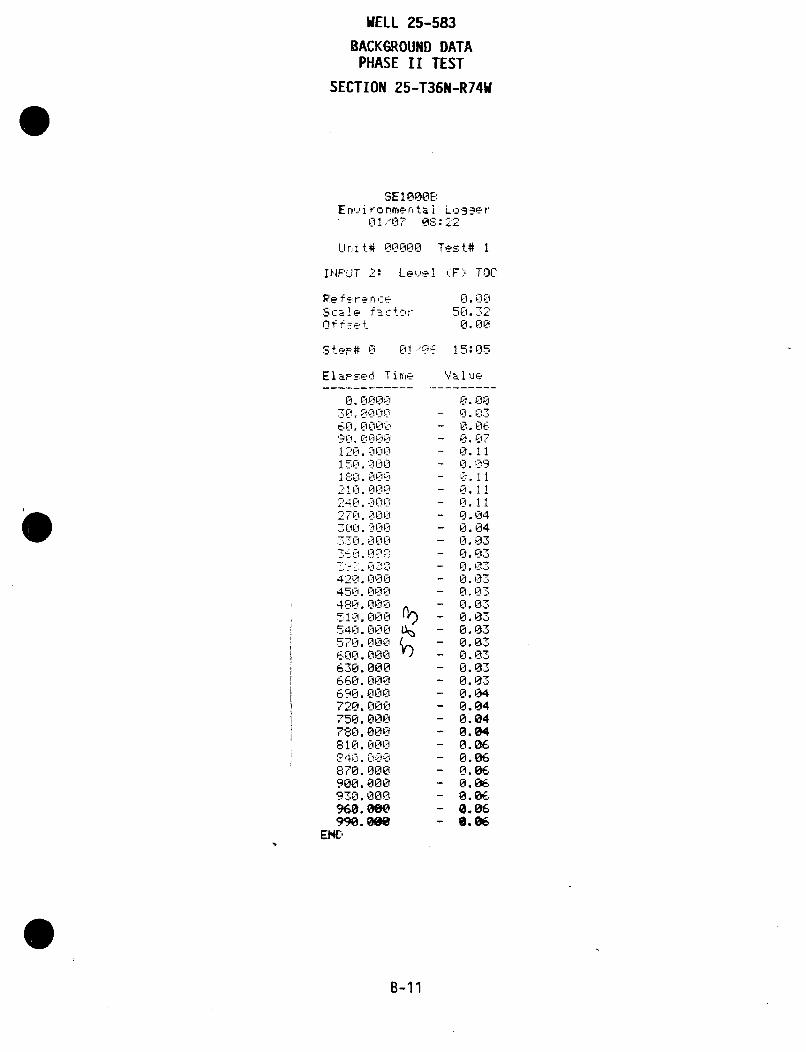
WELL 25-583
BACKGROUND DATAPHASE II TEST
SECTION 25-T36N-R74W
SEOO0E:En-aironmertal L':'95er
01"'07 06;:-2
Urit# 00000 Test# I
IhF'UT 2: Leoel (*F)', TOC
Re fe re :,-eScale tact:rO f f,-t
Ul. UU1ý7
50.320.00
SteF# 0i 01 .- %S 15:05
Elapsed Time
120 0ii
1 c L i 17 -il150. 100
480.000
2J1. c000
L00.000
630. 000660.000
420. 000720.000750.000780. 000 0510.00570. 000 •600.000630.000960. we
we.000720.0wi
LI5I.i0i0LI80.000
81000
Li0,000
930.000
680.000
.00.000930.00
Va I ue
0.0J- 0.04- 0.04- 0.07- 0.11-0. ,- 0.0i- 0.11- 0.11- 0.04- 0.04- 0.03- 0.03- 0.03- 0.03
- 0.03- 0.03- 0.03- 0.03- 0.03- 0. 03- O. 03- 0.04- 0,0.4- 0,84- O,.04- 0,06- 0.86- 0,86- 0.86- 0,06- 6.06- 6,86
B-11
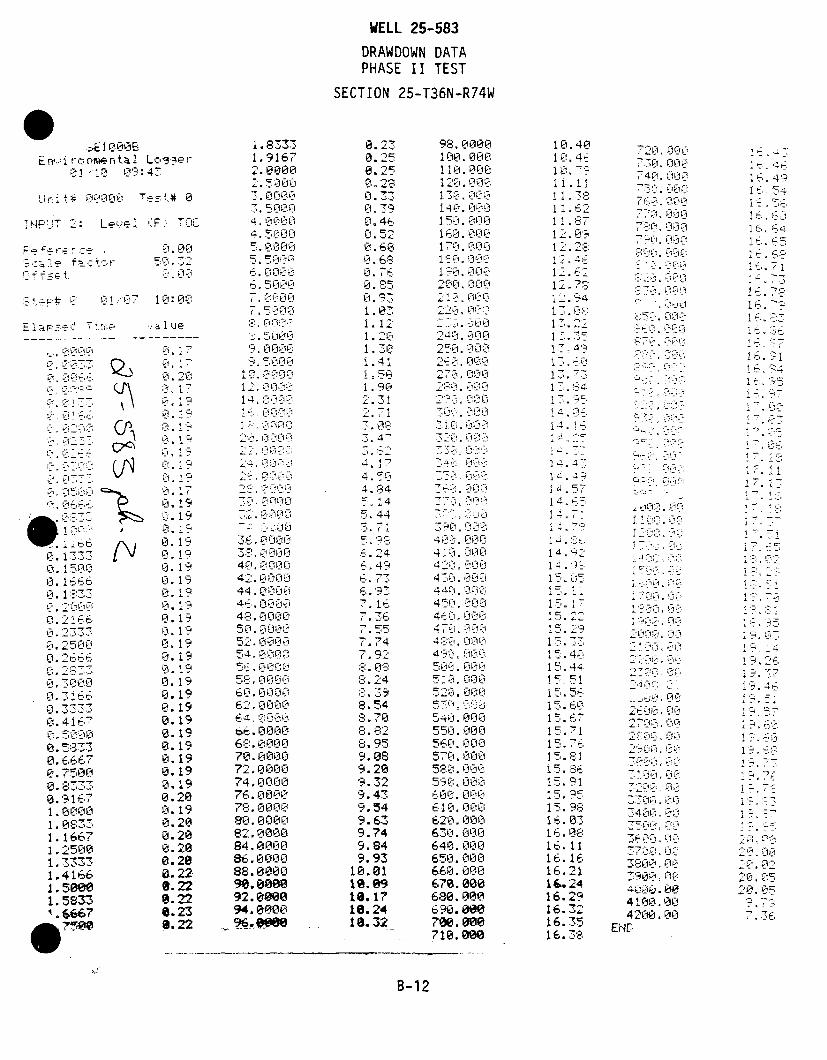
0T ., ir o ,p tfl 4, e
Urjnit ' 0 ififl Te # Z
UIHF'T 2: L-' i ':F> T~il
f~.ctcv'------4
00
rS#e17Ci :170 ~: 0 0
E I ,r.-. T i. ,•
S- {: % •L' CL Li•
tLi
5
i • - 10.::_
(
25C
51"-: "D6a
Li 1-":':
0.615'300.1E750,
0.1 E3
•I 1667
1.2500-•. 533,
0. 9513?
0.75W0
1.0000
1. 166?1.25001,33331.4166
1. 5833.6667
-I"
2/2'
'p
a I ue
l 19O. 19
0~ 1?0l.1
c-. 19
L i. 19
l. 19
C,. 19
0. 190. 190. 19
0.19
Li 190 19
0. 190.290.190.190.190.190.19
0.190.190.190.200.190.200.20
0.20
0.28
a. 228.22
a.228.238.22
1. 83331.91672. 0000
2.500E
4 0t0jt0t)
7. 50IQi
17. 5000 Cý
4 c. 07cl 0 ,?
4::!. 175i l009, 000.
7 .1 r '4
t.o )t. 000c
2 Li ti ,10 l
6 ."-: . . ... .C
T.- C1% " 1 ''
70, .'--000
17F• Lt:lC Ci,1
7*--. 0000i:
74.•l•0007.a, 0000
40. 0000
84,. 0000BI--. 0c00080.0C000
92. "0000
9- 4.0 iL
4t• ,-m_
4=,: Li ieil.6''i0l'
4
61-pi00',
46 0000
Li. 000it
7L0.0iP'iL72U 0
74.0000I~76. 000PIL
80. jA0i082. 0000
92. 000694. 8000
WELL 25-583DRAWDOWN DATAPHASE II TEST
SECTION 25-T36N-R74W
0.25 1 C. 00(00. "•8-' 1PA, PF0P,_
07 7'9 140. 0L0
Cl. 41;-z5 1 . 701 ý1r
0. 6- Li LL. Ci
O. 6 17. 0000.68- 1T' I-j OLI'
0.7w, 1 0. LUl',
Il iZ i-' l t= '-ie
1.10 -= 0i .42 ' .itiPi
!2 5 270. 00 04 . L5 LILIL
2.71 3(7 N%
4.- I-i 3 :-,AA
'74 0 cI,
494C4
-. 14 -. 0:
4 ý7.5 , 444 ''•0 -!. ;.4 4 0100
4 D. it
6.7 4 ,-..a •
1w9 4 L Hit•
7.16 40 FE5h 4 0
7. 4 4-:. 1 0! 4111
8' . 08 50• cl l,.82 550. 000
8. 95 5-50. 0017-9.08 5 F7l071
9.20 580. .1 ,LiLC9.32 59 Li l3t
9. 4., r00. ON,9.54 6t 1. 0009.63 620. 0009.74 630. 0009.84 640.0009.93 650. 000
10.01 660. 00010.09 670.00018.17 680.00016.24 690.8of18.32 7?00.00
710. O00
121. 7S,
10.410.4
1i.12
1 7.
1 c5ý F!
15
15
15. 9 -
15. 9="
1
122
12o
12.9
1 El. 03
1i. 16
16.29
1 -
17, '4
14. .
SI.e '•2
15.957
15.29
16`. 1616.5116.24
16-. 3.5,16.3i
4 fg.1 00
4o,'.U C4 0-:•F
i 0 iC3l
42'00. C40!
.N , ; 1_ i
. L . 4.- 1G !
, I . - ¶4. . _
*.:!'7 '-.-- Li'':
4-,.-'• Lo i"O
'-dI? -I F'.l
4'ni I -lI-i 0;S ..I .-
16. '
Li L, ,:
B-12
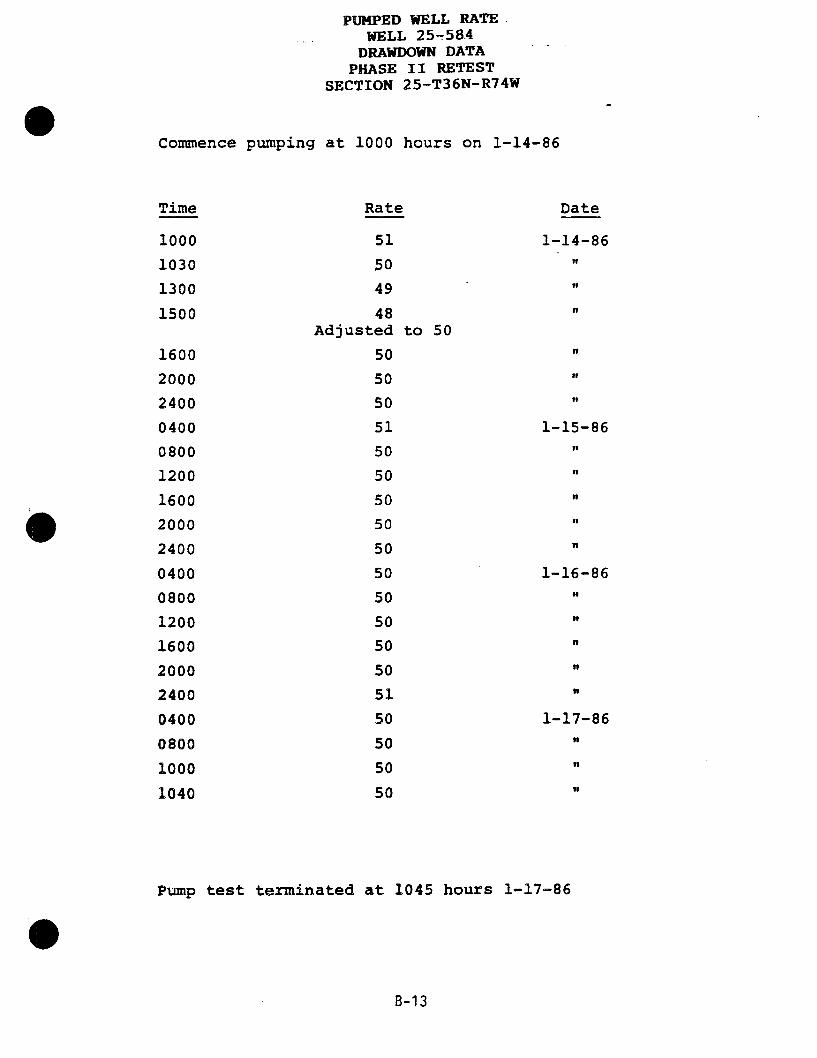
PUMPED WELL RATE.WELL 25-58.4
DRAWDOWN DATAPHASE II RETEST
SECTION 25-T36N-R74W
Commence pumping at 1000 hours on 1-14-86
Time
1000
1030
1300
1500
1600
2000
2400
0400
0800
1200
1600
2000
2400
0400
0800
1200
1600
2000
2400
0400
0800
1000
1040
Rate
51
50
49
48Adjusted to 50
50
50
50
51
50
50
5o
50
50
5o
50
50
50
50
51
50
50
50
50
Date
1-14-86If
If
it
!I
1-15-86if
If
Io
of
1-16-86
nn
n
1-17-86N
If
11
Pump test terminated at 1045 hours 1-17-86
B-13
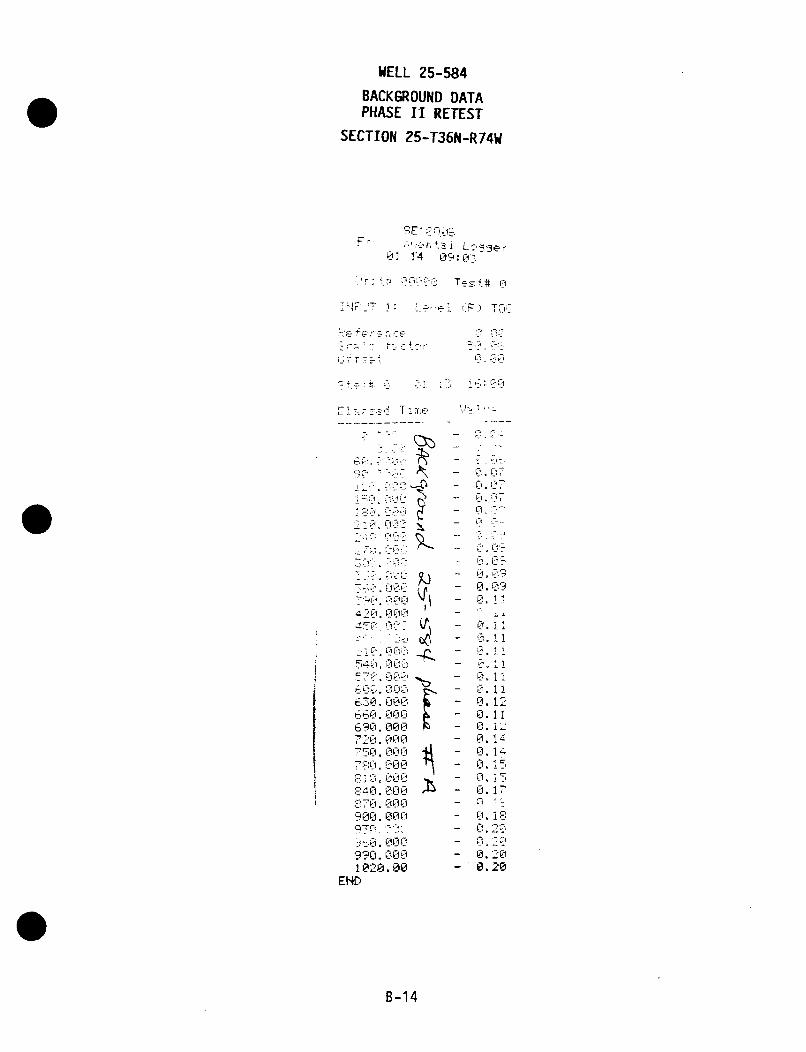
WELL 25-584
BACKGROUND DATAPHASE II RETEST
SECTION 25-T36N-R74W
c ., Pt; -=:-W• 1"4 flZ: *rc
- it - -.- .r- - .
T 1-
L- ji
54
4",
I- fl 0t
10 u
END
L~ " I _
:7 .. 7
0' 14
i171
_ L.
a- " 7 20
B-14
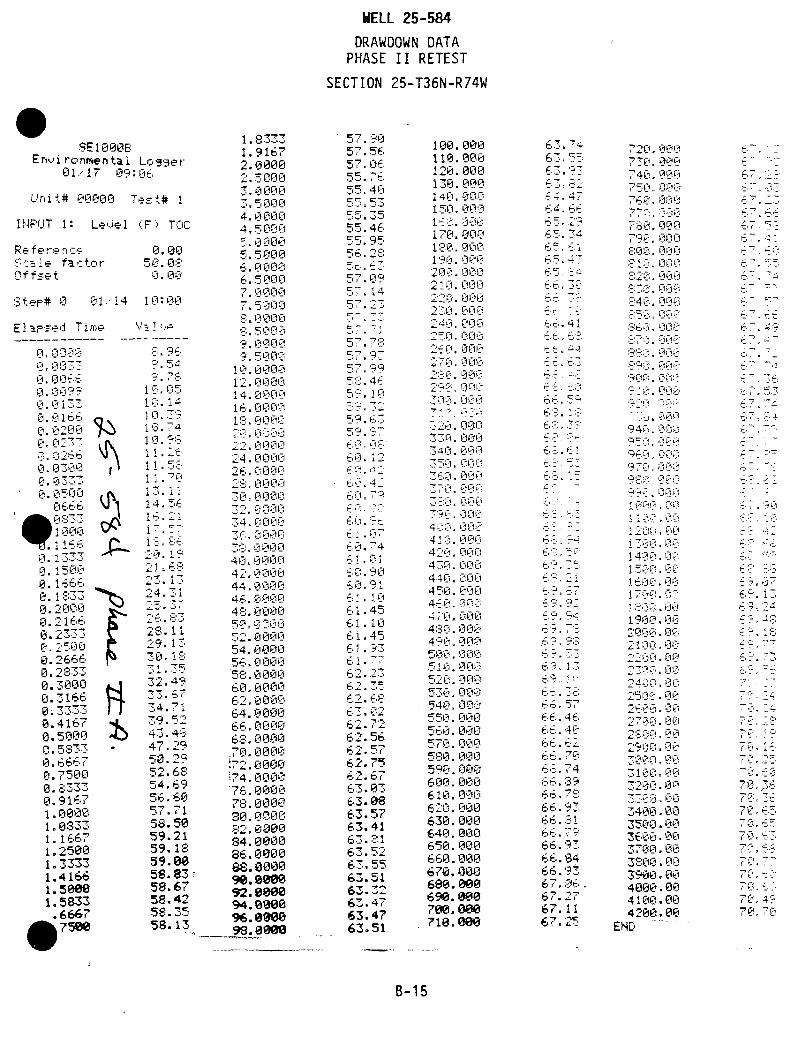
WELL 25-584
DRAWDOWN DATAPHASE II RETEST
SECTION 25-T36N-R74W
SE 00061Envi ronmental Lc-'-3er
;1,'17 09:06
ULnit# 00000 Tes t# I
INPUT 1: Leu.el (F" TOC
P.efIerFe r c•.-- ale factorof fse t
0.0050,•. 0$=
0.00
Step* 01..4 10:00
Elapsed Time
,093
01 4Llt-i
0,I 66
0. 099-
41 5t10
0. 1i33.E
0.203000. 2316ci4111 7
0. 6663- Oj'0
0. i333ý
o.15r0
0.3000
0.4167
0
0.75000.26
10°2333
1.25000
1.33331.41661.50001.58330.6667
0.750e
,91, 7
0.1666
1. 3333
1i.4166
0. 5000
0.663.7500
7'~"1pp
I
\- 1 (, e
10 141 .
I. 2 -'11. '6
1 .1
16o2i D
2. 4 '74
" 72. A7
791
423. 15
-0. '21C;4158.50
59.21341 e-
C9O00
9". 6,
59.2159. 58
9.00.
58.6?58.4258.35
58. 13
1. 8333 C..1.9167 57.562.30000 57.16
2.5000 95 7
3.4000 . 4Li
-10 C 714. 0f00 55.4E4,5C9w 55.46
5, L- 005.95
5. 5i000_.Eb. 1.41 1 0-.6 . 5 0170 j" 01-
0 Q1310 57 147.5 c•ri .=;-.2
.0000 5- '7,
-i 0CW Cl cm5 t
!14. 0000 5 c.'71 "1 i t t11 t , .-
14C 4IL) 9 i0 C
16. 0 0 09 0-
7" .l 0 0 0'? C7
22. r@oon,. ci2.000016.2e, 0 00 4~ •
49. 0000-0.-
4- E, AP . c!-- '-0 .0 6 7:445
54.,0000 6".1.
41 L01LIL
4.0000 6.92 . q•, 00 C, .!
64,. 0000 02 .4
5 I ~ hi' If1.11
'=' c '7 *.56
5 14.0 111 t ii• 4-
b40. ON 6 . *
560. 00006i.7
4. i- lII)
F19 0 r-l6.75
54.0000 E, 2. "6QC. 0000 6,. 01
tO,. 0OO'O -l3 '--C
6- 0000 E..2
mo. 0oo 6,2.57
t4 0000 63.41t7.r 0.000 62.725
84.0000 62.686.0000 63.7.548 3000•- 62.6?60 0000 63.03
82. 0000 63.68
84. 0000 63.2186. 0000 63.52'
88.0000 63. 5590.0800 63.5192.8 63. 3294.0900 63.47
96. O00 63.4798.6ewe 63.,51
100 .000110. 000120. 000130. g001440 .",O15 0.1101
I<.•.i
170. C 11;
C1 .4 non,
L ' i 4tc171L
34 110.,11
24 000
441-. 000
4 1.L .i lUf
Li 1111'24:K.000
2.000
i 2 117 1 11 C
5T L'0 0101
571clr
'27.00
580. 000
630.000
640.000
1 ,111111
650.000
660. 000
4Zv14.111
420.000
4,90.000
500.006
710. ON
4451.l8il
4rL00570.800I
4580.000590.0n0li600.00LaI61 I.14iI 44. I0i0
i30.000
9411.00II
600. 000
610. 30
6 -4.
C. t.
HC
Er 4
4o4
67. 1•
t-r 42
..t , r.
,641
6it. 434
6b(-. d
67:'. 25,:
73. I L0
c7jiI L10.113
liv
'1ill~_
2 5 C1 C!
7800@
7 j ;I 4141
3600. 00
40.00 -0I870i. L00
4800. 000END i:
*l0 Li6
'~I I@@ 11I i1 9111012t; 114
4 000.00
4100.00 04200.001790 C
-7
-7
B-15
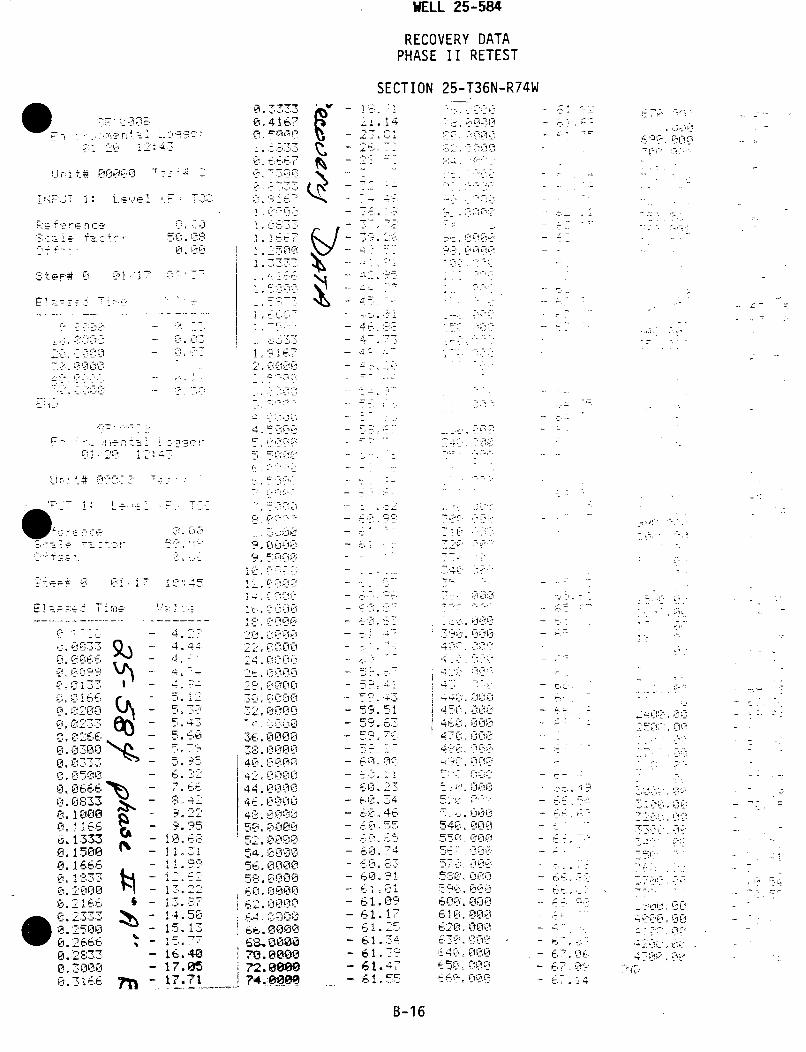
WELL 25-584
RECOVERY DATAPHASE II RETEST
SECTION 25-T36N-R74W
un~it# 00020jE "r7s.1 1
i¢,P"J7 1 : Lev..el V,g 7 3;
Referenrce '-'ci'.ý )
50.08a;0.0
Step#C0 0h1Q7
107-
1.9167
if - i* w-7 >'I
4t
V -•, AGOG<
• 7 ,;
7-,- ••
ý1 i.-71{
07 :.-
FI
£., It97" fl
.S, Sao2& WOO70. 5000ý40,000-ý&. 000-
E0
- '., 47-
01-2 72 41e
I'-- a 9 j 701-'-. .
Pý7 1: '7ý
;7ave fl:tar 50cif 2S -'. 0
AM 0 01 17 10
Els-.-st Time
-? '"2K '.P
1411too 01U. C5.-3
0.1666
0. 2000
;. 2333
0•. 2666
e. :83:0. 300z _4.J_, 7'T
44
5
5
14
11
- 16- 17- 17
%454
.41 ~ f 22 i0
24.000
A. 030
.90 A R M
.12 10.200
.32 ~ ~ 12.0
.6 44.V I'll
.95~ 150.00 '
C.8 112.00
.500,c~000
I0 72.0000.71 Ir..eeee04
5 ?, 7j:
5i . ;fl
:59, ,17
613.17
60q. TF
W, .05
61.0960.91
0.061.0961.-1761.25
6. 4:
4t'. 11,1
520 'l7
7 0 0
540.000
550 01
507157h
620' .000l
67?. L -LI
::• .4t '" L.
6 7
11. ,
14",O
yon-1' -I,..
:Too.I
4 7 2Q
B-16
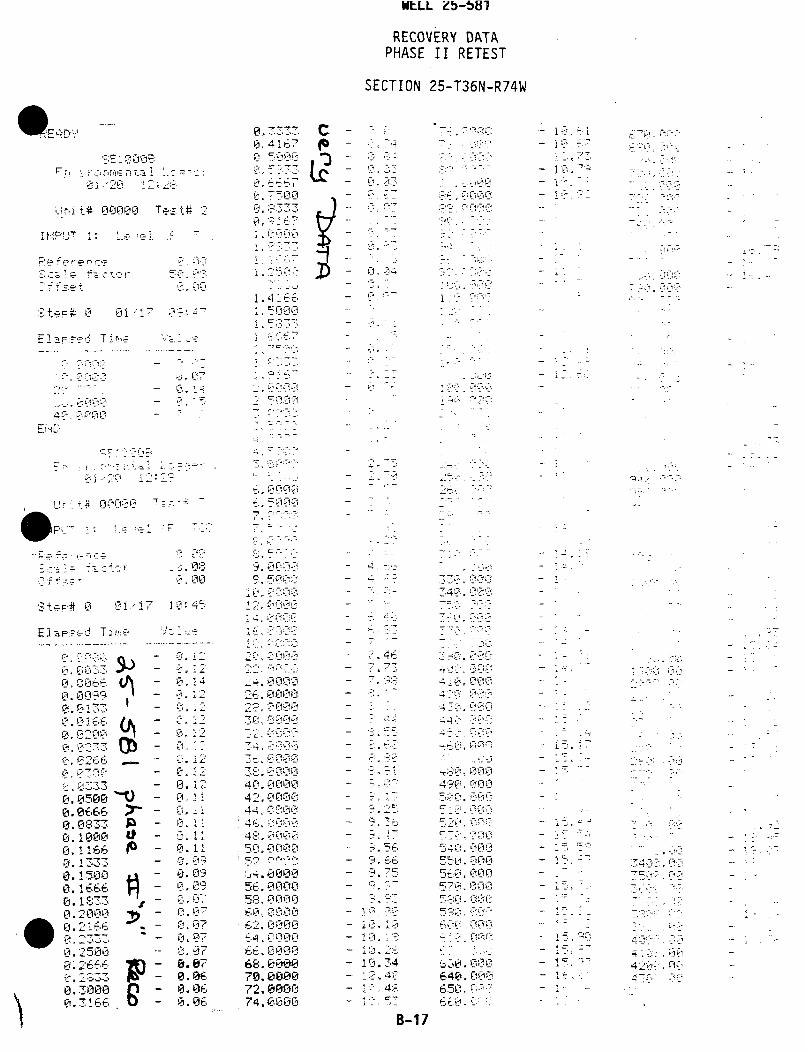
WLLL Zb-b81
RECOVERY DATAPHASE II RETEST
SECTION 25-T36N-R74W
111ED 0,770.o4167 • 10 0.74q -. :717 .•• .9 :"
0 ..-20 1028 7o6667 -'.0 .. 00...................- 7:"c
Unit* 0g000 Test# 1 837bll &W
. 4166 -",
-. .. o
0.1.
-. Log - T R •
El r T -?'''•:•,57$7..I0 20 l 1 l •
..j_ . , - . ._-
• - L' V i "1
-' ) -.. . . "
r'ý wi0001) -
of 9f r - C IO' 9. 5 - r4; f30l0f
w -J.. 6... . -
0. -,6 0.0b14 ~ tt 4400 4 10.000 4" 4
. - a 0. 12 7' 6.e r-0 - 42-.- - .
.Oi c, 7- - - -. - " ' -4 ,..i-
0.02,66 - .12 St. 000-21," - A-,-0",070.0, CC - 2 38,l• 4 .,0000:-, - S.5"1• =-,.,C~c 00 15 • .
0.0500.0., "z. I ._ý00 5 .00 ., 0-
0I. O 'q37,." 0 :. _ý17•, 4 • I .' ,.7 'f-- 2- .-,, t.# = ---' i.--•
0. !000 UPt - 0.1 A, M %•@• 9.17.. 52•, Wo " =.<-. :
0.1500 • - 0.09 124.0000 9 .75 5", 65 0.-00" 750, . 000.13661 - 0.09 56.•9• 00- Iq,.n 570.00 7":.
0.83-5.00?? 8,0
0: '7000 P. 7000B19.5
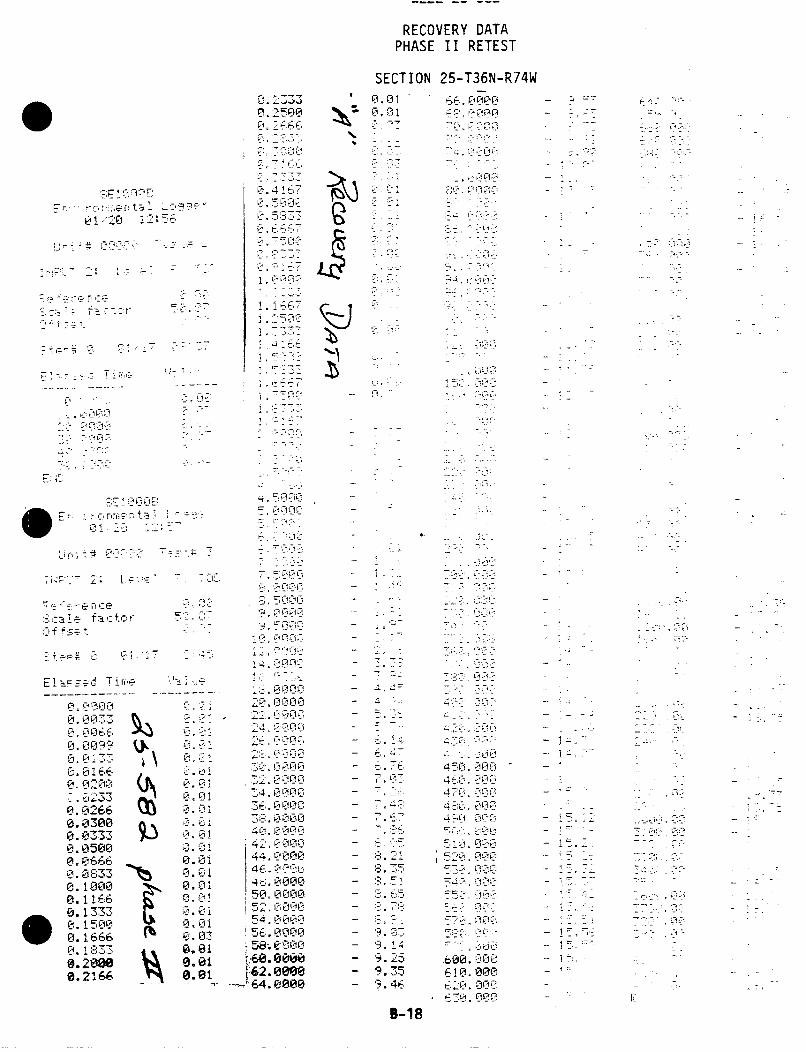
RECOVERY DATAPHASE II RETEST
i~ij ri
-J,-
)7
L7,,-7h
SECTION 25-T36N-R74W' .331 00
Af~z
tzi
0
1 -,
0 ,_ .7 .,
•-.. ,r.•_. ta.
--; !. 'i -'4
E
:-• l o f ctr.; :_,=
-. teI U' -!.
EI1.•ed~i Tie
0.0300
0.0133317i2330,02660.03000,0333
0.05000.,0666
0.16330. 100
0.12660.1lb36
6.2808.2166
C,
9%
I'
5:
Pt.
bPtPt
171171
-I 1-10 -0t-
1* .1 ,71
-, I-tiI-l-4 L00 0jL--
44. LII-CIL-4
03 5E. 0,006
61 i2.0008
9. 2.5-
9.75-. 4t_
'-4
4~Th L1i'
*1
r-~-
LII-.
44~
t.~~kI 1.14
btII Opt'
F I'
44 L~47
1 : : fIL.7
B-18
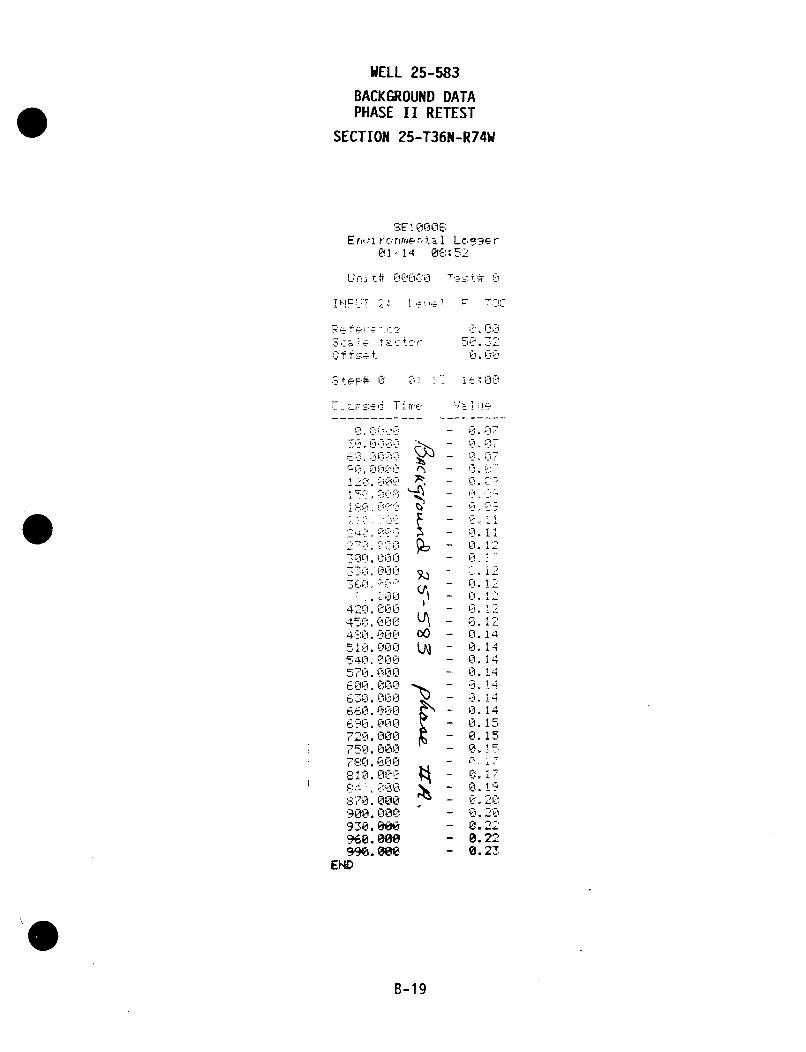
WELL 25-583
BACKGROUND DATAPHASE II RETEST
SECTION 25-T36N-R74W
SEA 0006Ernvi rcornrmer ta-• LoC3er
0.-/14 0. .:52
U00 t0f O0iTiciC Test# C
,F ;T 2 Lo e .F,.,,-- .. T
Scale fat~ctor
St~ep# V
FILsedTim-- - -, - - - - - -
20.0 Q
180.ox_212.9A 9
100.0001L
480.00(0 0510 L000 L54L1.ff00
570.00rL00.000
rw000
660 01--1I06.P
1K 00.0
720 000145u0.0
-ý,O.00ulu. 00C.
* @0.00900.000930i. se960.000e990. see
END
0
0. 00
0. 112
AI 11
C1. 07
0. 7
0. 12-
0.121
0. 14
0.15~
0.2
- 0.22- 0.2
B-19
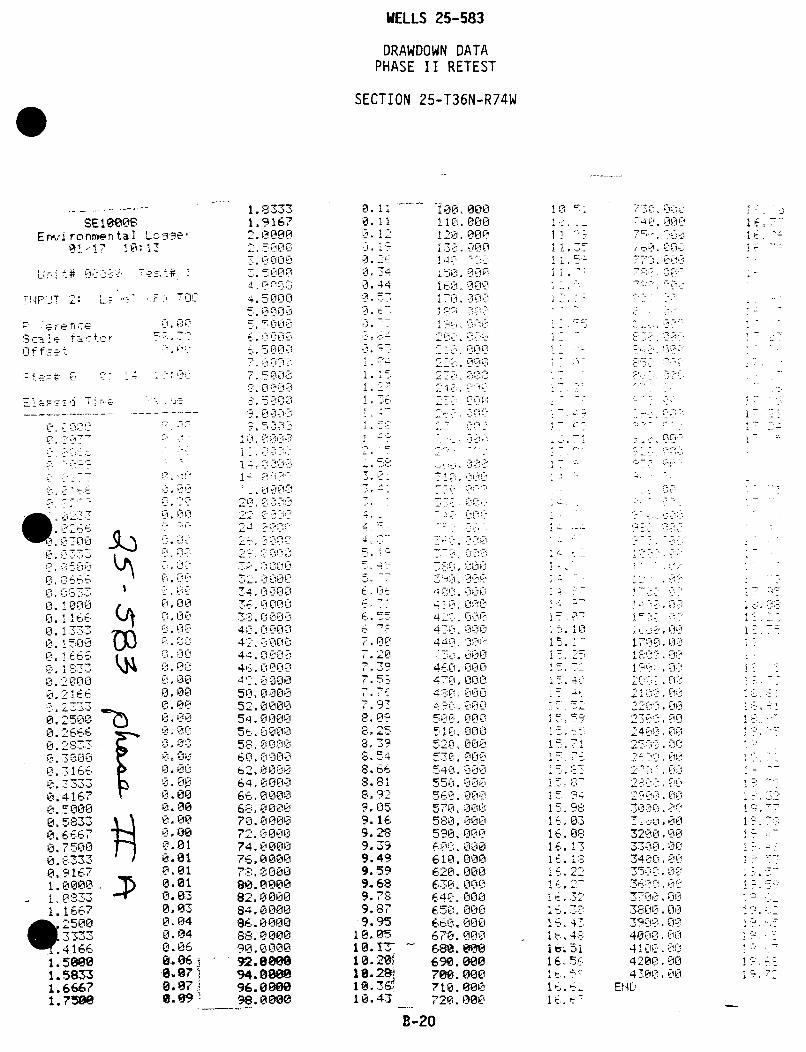
WELLS 25-583
DRAWDOWN DATAPHASE I RETEST
SECTION 25-T36N-R74W
SE I 0008Environmental 033e,
01,17 103: -
. ... 00. , ,jP! 2:L0 n O
scal-•e fac=to-rOffaet
o ' L-
T , -.& -5 --*,
0,2665_. 2690
ie. l., 3 Ii
0i 1000
0.1160. 15RiE
0.21 666
rL.I ':Li-l
0. 21660. 283:70.500•0.16660.' .- - -,
0.41670.50000.508330,66670.75000.83330,91671. 0000.
1, 1667
.4166
1. 58331.66•671. 730
Q'
-- - -- - -
r J
,00
:3
0.00
0.00
&Zi 00
0. 00
0.01C1. 01
0.010.01& Ws
0. O0i0.04
'C.o
0.04, 070.060.06•
1. 83331.91672. 0ope2.5000E•3. 0000-•Z. 5000O
5.50005.5E000
6.5000
.* , . -I
7,5-0007_-.50}00
S •. 090- "- D(,
2d1, T-&K-
4.2i000
44-, 9 0i
.14 , n I,-46.0000
56. •0000
4 i000
62.0 000
56. 80000
96, 'i0000
60. OO072.0000O
74.000076.00007,.000080.000082.000084.000086.000088.000090.000092.800094.080896.000098.0000
8.1, i .. . 0 o00
0.12 120.000i0. ii II P.OLI0. is 120. 0000. 24. 14 173.,-O
0. 34 1 50. o000.44 160.I 00
057 170 " 0-0-0,A, i Dol
: '. 17 -40. '5
o. •d--i i-l. l?,n
1-, va !D . _.- (t _<'
1. 15 2T.3001. 27 240:. ?!.. 6 2_-.' r:, i !(k•
-". '< -2- - } :
.. :" ( '
d A:-..._ 11111
1. 5 57:1 - .i3. :- T- P PP."'`
9.68 -. • Li -.LII
9C7 660. 000
.... : 5:770, 000'
15.5 700.000
58.20 6798.008
6. _0, 7-. -000G. ! 1000,
10.45 420.000
- 20 , .-"7.00' 442, GOP;•7.20 <'k• so. 00
7. 7 40.000.F~rg
8. 25 510.000l& 39 520.8008.54 530.000<8.66 540.008.81 550.0008.92 569 .0009.05 570.000l~9.16 580.000O9.28 590.000•9.39 ,'00.,0009.49 610.000l9.59 620. 0009.68 630.000e9.7 64.09.87 650,.000}.9.95 660. 000108.05 670. 0001,.I'T. A - se.,0
10O.2,01 690. 00018•.280 709.000e
1 0. 41 720. 0e0
B-20
i0
0i
74.0, 0000
f--,0'. 002
-•1;? -44 [i l?7 L.0-0
;-5?S>Q.
PTAv O.N'
L..
i!.?
1b.
£ .7.
153
1. M.Y,
1-. 13
15.1-
.1, E. 32
1 ._
16 5, '-
i 6. Y:
ir 0
16.481 ,'- 4
1 '4:31695.
16r.-7,16i 4-
icon
10- 06l
200 I. 0
1 .4 00 1 0
2"T.p 00200C.
340&0
7,5,I H.0
3;i00 'ii
4 .!,_1 ' I-i'. !-
END1
17 Qý
S. 7-
K
1 3219. 77
Is'. 7:_-ý
7;7
16. 7v
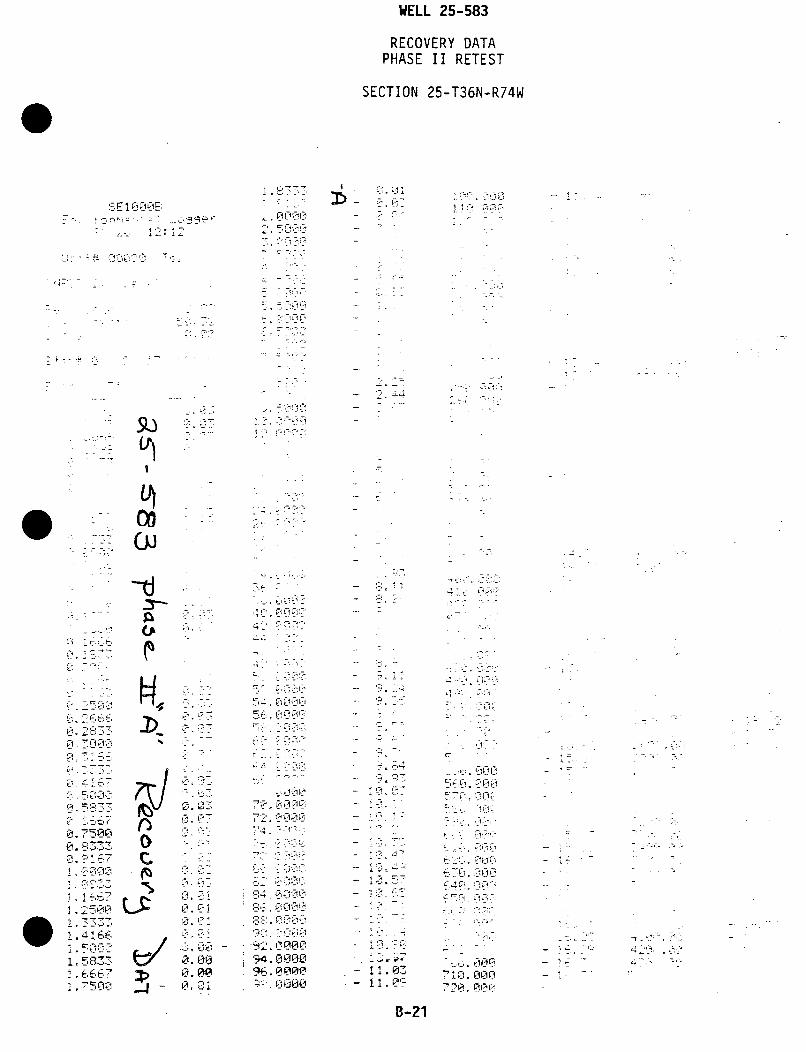
WELL 25-583
RECOVERY DATAPHASE II RETEST
SECTION 25-T36N-R74W
0? E
93)
cc
I-I ~ii ft
ci -tIS7
1. 4 166f7. - '-
6.58t
6 *->
k.1Vp
eSS
IV1&
9 C4 0H0I0Oe
11 7•1-1,.
64-
p ýj 7
7 100, 17,9";.. -"
8-21
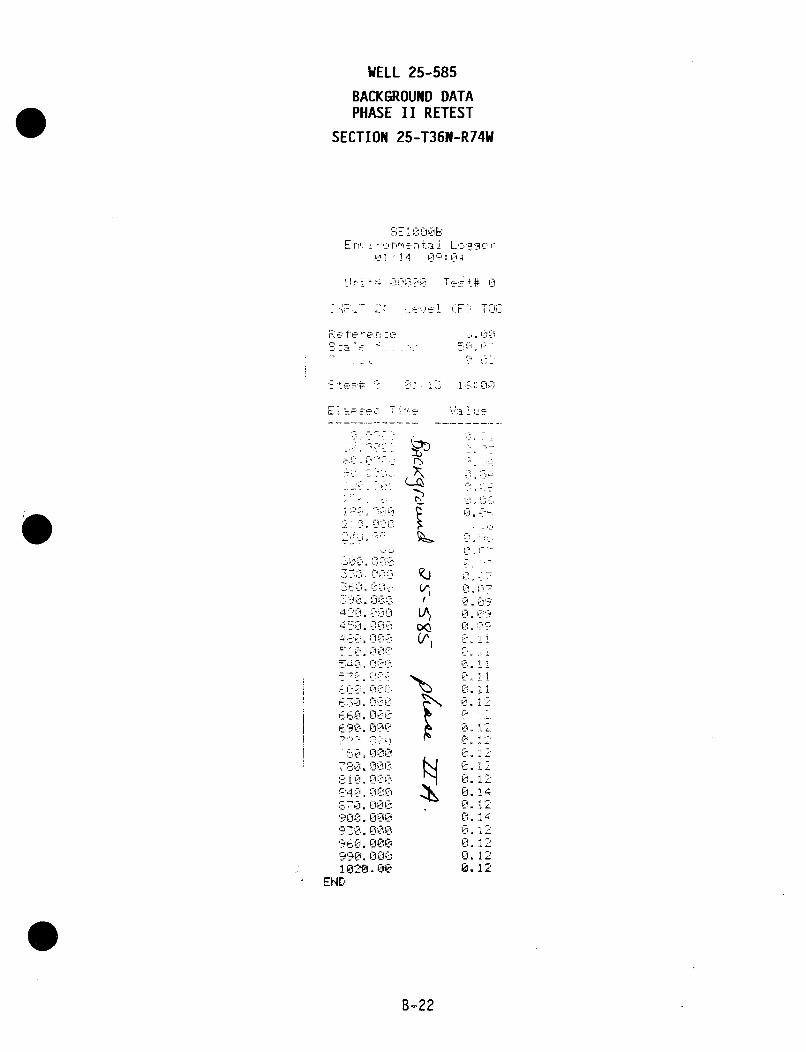
WELL 25-585
BACKGROUND DATAPHASE II RETEST
SECTION 25-T36N-R74W
SE1000P9••E
E, rcr~r', t-i ( Lr -.ieRL._) ].•!4 gzP •,
•.•,•_- ; <i=.{; ,:F : - ..
Ref erene
-.- '-* r7
ZOO. 01-_-
E6.-0C-i& n
. 15.000 15 12
780.000 0.1-
81T-L L00 0.L2
W.000 0.4i Zb 4
'-0.- 0lL00 0. 12
10210 Do 0.12
B-22
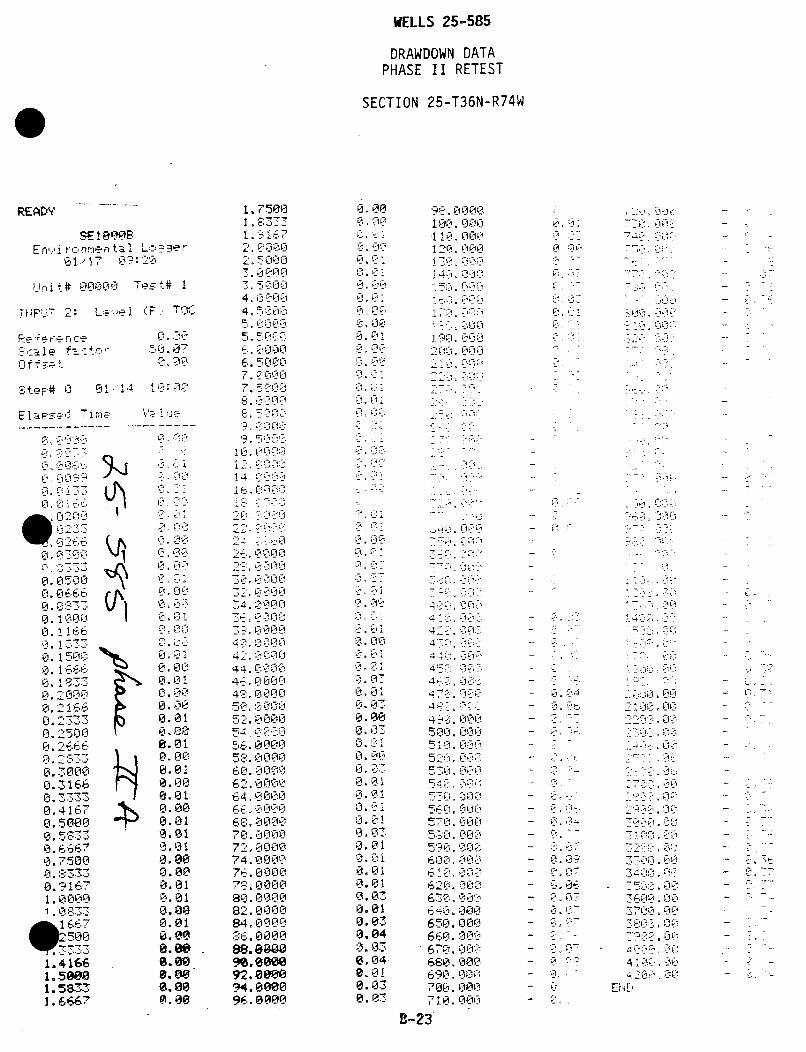
WELLS 25-585
DRAWDOWN DATAPHASE II RETEST
SECTION 25-T36N-R74W
READY
Envi r,-,nmen ta•1 Lo-,-ger01/¶7 09:20
Unit# 00000 Test# I
TNPF'UT 2: Lev.el (F) TfC
Referen rceScale f-actor
t t:e--t50.07
OC IN
Step# 0 01M14 00-t;F
El- 1 sed Time
0,0059
+.1 : =1.% ,a 0200.~~02 • q33
0. !¢03000,033-6
0.08 33L. i 000
0. 1 1'60 '.1-C,
L. 154111'.
0. 2 C4 00
0.2160. 2 3330. 2500lC'.2666
0. .0000.31660. 3333
0. 41670.50000. 58330,.66670.175000. ',33:3
0.9 1671. 00001. 0836
1667500
1. 41661.50001.58331.6667
'a AL Ii
r
L .
I.-d Ljt
0.01
0,0
0.-. 0ý
0}. 00,
0. 0i<
0.010.010. 010.000.00
0.000.010.00
0. 0018.000.01'
0.00
0. 00
WI.li
L.0Pt L'
0.00
1,75001.831.91672.0•0002. 5000
"3 =00004,500
4.5•000= 5 ".0K
5.52,:-0026.50007. Cý C#, C! C
7.5•,000
9. TO.+ ,.%•
19. 0000S1. t.0' 000
'15,7772 " .: 0
'2- 2 < -, "995?
26.0000vZ2:-2 ,00003010000O
6, 1000'
3-M 000300 , 0 0. -
42. •000044.0 o-
46. C-000048.:-' 0000
52.0000
5 4 t -, 0 1-i56.0001
58. 000060.-. 000062.000064,060006E., 0000
7e.: 0000
72, 000074. •000076. 00007+S. 0000so. 000082. 000084. 0001186:. 0000
90. 0000
9r2.0808O94. 00I0
000,. R C0C
L011
0. 00
0.01
0. A:
SLI
0.03v
., 1_
L•. 8$
0.00
0, 03
0.01
0.03
o.'-j
0.010.030.010.03
0.830.840.81
9- .0000100. 000•110. 0001 20. 000
ý 40. 0-0;3.'A ....... i
-I K.1 boo
.i T Li.i-i '-
190. ,;00200 ._- 000
2 10, 0O~
00'.
I-7 i"l, -i
Too. Id ._
5'-'L'( AL',
so. -&.-
• 0. ' 00. .'
40+. 007::
40. ??#:z+ ?!T
r-4 , 2.i~
6 ,kL. ILI, 3t i
650 0 0'nI
7:0-.' 002"
67 ,- .l 9:-
6900~
170.000lL
71. 3d00d-
,0.000
62,0•:. 000-530. 000
670,7.100580.-m000
690.00yO
6700.000
710. 000
B-23
0i. OAI
0.' Lfr
0.06A~
0.1
S.1
I5 i/ ] I ll ''
4 -_,. oo-i WE: •}
yI 'Al,
.77
(ýn.
77ý71S
ROD, G&L"0 12. 00ý:
S20 OW00
-- 9.1
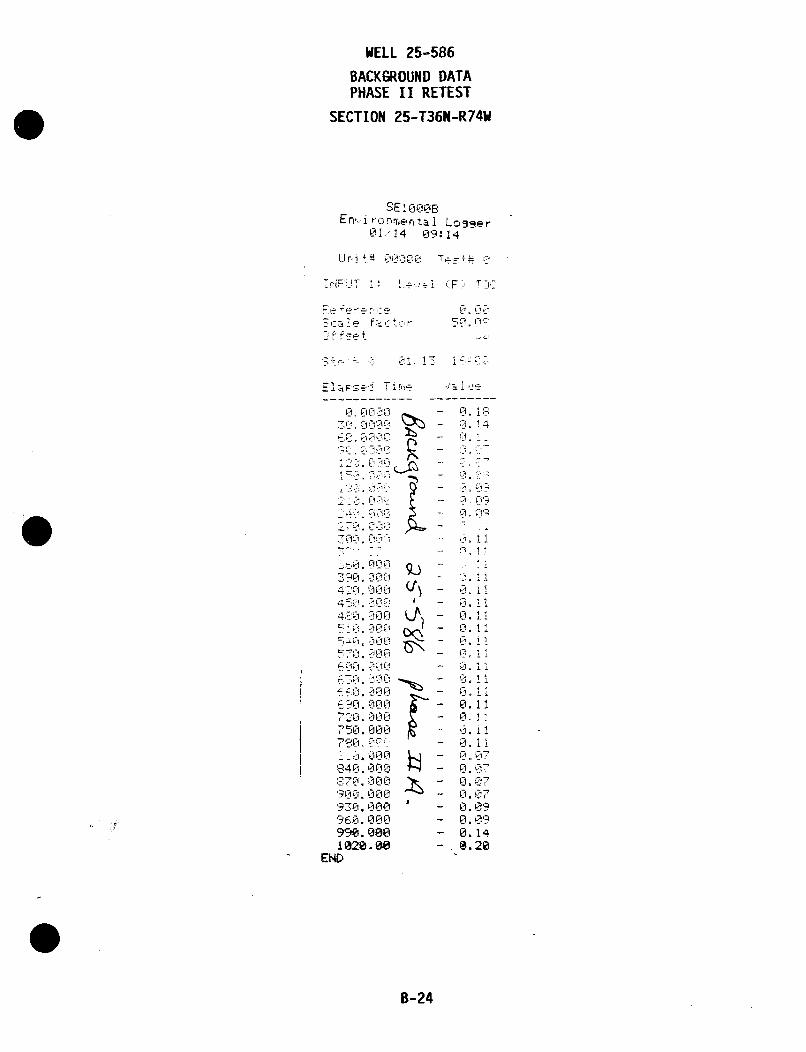
WELL 25-586
BACKGROUND DATAPHASE II RETEST
SECTION 25-T36N-R74W
SE: '%EOErn,!irc rnmernta Liogqer
U T ri .i ÷-.',p 1 :F-, :
I PT : _ P
T T,
[1 L%
~Ct
Ehr~ T i r~i i; u
~ ~ I
7¶ hI1 (f l c 1. C.,
E141
B-24
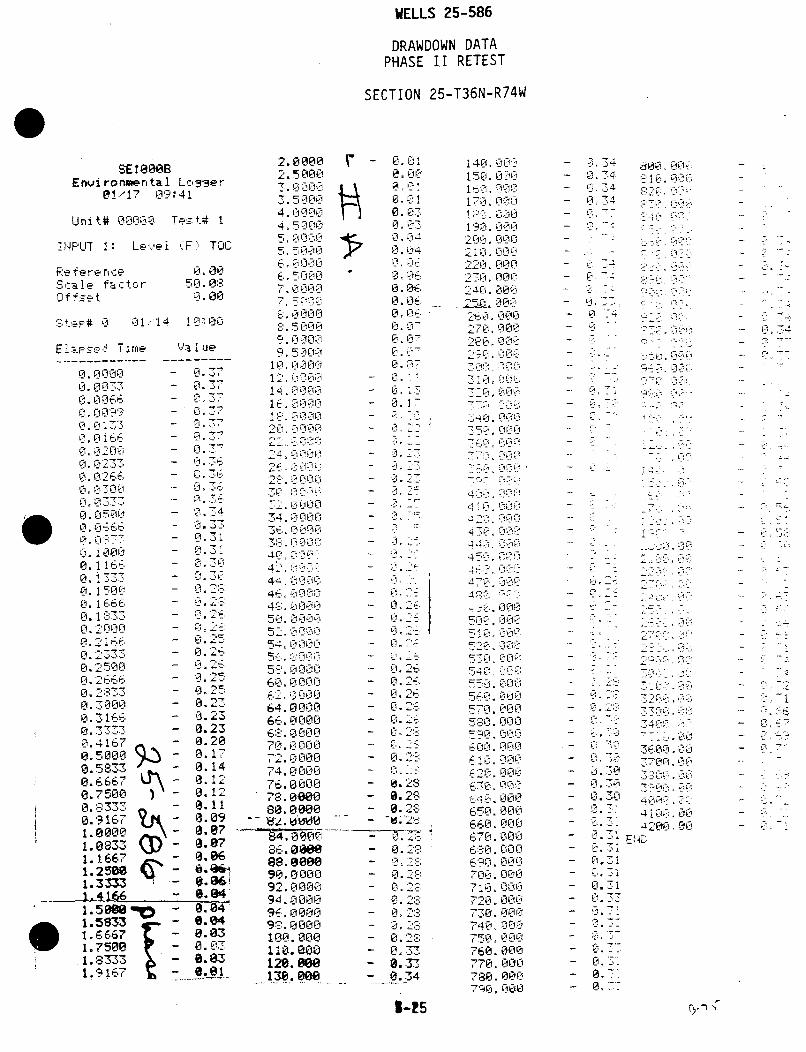
WELLS 25-586
DRAWDOWN DATAPHASE II RETEST
SECTION 25-T36N-R74W
-SE teaseEnvi ronmental Lo,,,er
01.-17? 09:41
Unit# 0•30 Test# I
INPUT 1: Leve1 ,F'TGC
Re fere nce 0.00Scale factor 5_. 08Offset D.00
0 0• 14 I LD r 13*Q
Ela I ._ets Tirhe ',a ue
Li.-0i 0 - 0i. 7L- ---- --- h - -- - - -0, 00 -.0
f.00L.,6 - 11 3
L , 01 - .,
0• 06 -CID
0i 1 2 0
. ......a . - . 300,2- E.j6
o, 10 -500C45 -
LI . IlL -0 0H -.t- - 0.3Li ._"..5 1 - ' , "'
0.12 - Li29
H,1--3 - -,2
0.23-o. 43i - 0.200: 509 - 01.230i 5673 - ý3. 14
,- N .230.7500 - 0.23a 000A z 0.17
. 5 833 --. .141.1667 .• i,12O , 7 5 09 ) l - , .1 2
1.-333 - 0.11
0.9166 - i3.091. 005M 0.071. 0833 0.071. 1667 0.61.2 7500 01.3333 - 0.86=1.4166 - 8.0I58 - 0.041,.5833 r - 8.0431. 7500 - .r.-i-
•1.916? - 6.81
2. 0000
2., 5230 0
5 , •• ,,i0=! 7, lL -'i
,,l 171;,"11
9. L31.0
J_. 000
.340 000
I::-. 0 00 0
514. ;z• ý_ 0 01
.5 ý%c ,-,'lcl 0
-,64 .0, 0 0
34. 0000
7 4'. 0 0 0":0,
4Eo .I-j. j•:i•i*
14 !- ' '- i7: .
_, -., . _;
4R. F, 00.c,:-
80.0 000
54 ,00,0
5L8,0 00090. 0•000
9ý. •: 0000
64.00.
9e. 0000
9?. P-1 0 0100. 0000
1 , 0.000
120. 0000
-10. ON,0_
92, -IE9s,0L i
9 L. 00L0g98,0E
100i0l
4 iLI.00I6'-kI0.L
18, 8600
0.01
0 0,3l
4 OE
Cl
0 7i;
0.02
2,0.
0.34
-o ii"
- (9-1
- Li t-
- L.1
- g. cc'
- Li 2
U..
- Li3!
- Li :-
- C,,--,- O. 2- L. -.
- U.: -
- O. :7
- 9• 3'- 0.34
14(. 0.00150. C11-lO
170, ., 171 .- D Ll
190. 0;01L1i, n1111
cL i ili
47"0. .:
4 7 '
2 i .-1; j :i
29 .L-lP
0 1
I.2 tý-,-' L
4, 4 ID . . ..
•-"--, - .' •'
•i . 0,
ci"
660. Li cl l
q4.000
---v.07i-
47, 0 o: cl7 0 ;:. Q- 3.
4ci 0LILIt,-i r'l CI
530. oi• j
770. 000.r130. 00p,
00.0 fii
C20 1000
b.UL3 000778. L.000
'3Pi0 000-90 006t
0 , "34- Li3
- Cl--
-- •:, .iI
5ii CiV
7 hi-
km - iLmI'
tiU
- 7L
- 71
- a
1 7
7
-- n . - :
l-15
Section 25 Overlying and Underlying Shale Communication Test
As previously stated both of the original shale wells were abandoned
after attempts to repair them were unsuccessful and new shale wells,
wells 593 and 582-A were completed for the overlying and underlying
shales, respectively. The shale communication test monitoring
included wire line probing of the pumped well 584 and production zone
well 581 to document the production zone drawdown and transducers
in shale wells 593 and 582-A. After background data collection for
20 hours, the pump was turned on and run for 3 days, then shut off.
Fluid level monitoring in the shale wells continued two days after
pump shut off before the transducers were removed. Data from this
phase of the test follows this page.
B-26
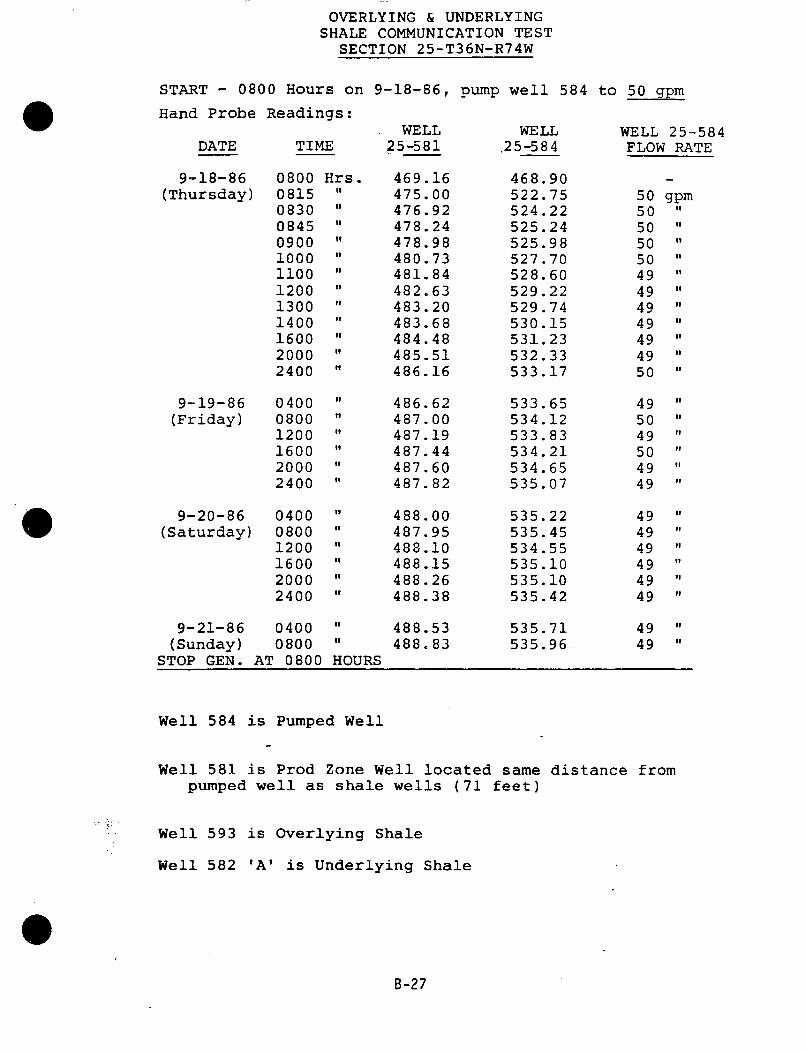
OVERLYING & UNDERLYINGSHALE COMMUNICATION TEST
SECTION 25-T36N-R74W
START - 0800 Hours on
Hand Probe Readings:
9-18-86,
WELL25-581
pump well 584 to 50 gpm
DATE TIME
9-18-86(Thursday)
9-19-86(Friday)
9-20-86(Saturday)
0800081508300845090010001100120013001400160020002400
040008001200160020002400
040008001200160020002400
Hrs.it
if
of
it
to
to
is
it
of
of
of
it
it
is
of
of
'I
to
to
to
it
of
't
of
469.16475.00476.92478.24478.98480.73481.84482.63483.20483.68484.48485.51486.16
486.62487.00487.19487.44487.60487.82
488.00487.95488.10488.15488.26488.38
488.53488.83
WELL.25-584
468.90522.75524.22525.24525.98527.70528.60529.22529.74530.15531.23532.33533.17
533.65534.12533.83534.21534.65535.07
535.22535.45534.55535.10535.10535.42
535.71535.96
505050505049494949494950
495049504949
494949494949
4949
gpmto
IT
3'
'I
to
'o
'f
to
it
If
To
WELL 25-584FLOW RATE
9-21-86(Sunday)
STOP GEN.
04000800
AT 0800
H'
HOURS
it
we
Well 584 is Pumped Well
Well 581 is Prod Zone Well located same distance frompumped well as shale wells (71 feet)
Well 593 is Overlying Shale
Well 582 'A' is Underlying Shale
B-27
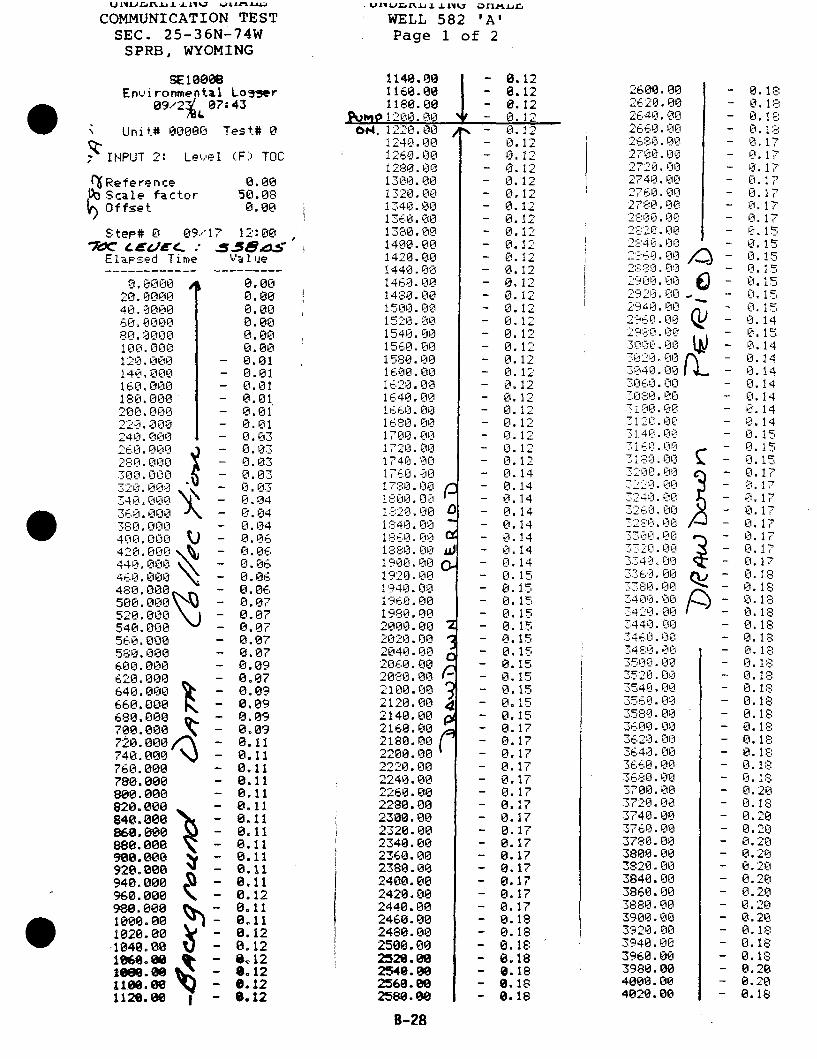
U 4• Jr .J,.Lu .LL1'2,% J .J1fL14
COMMUNICATION TESTSEC. 25-36N-74W
SPRB, WYOMING
SE 10008Environmental Lo55er
09/2t& 07:43
Unit# 00000 Test# 0
INPUT 2: Le,.vel (F. TOC
U1.J tJrflfl a .Lfl'3 Ofltl/-.~'
WELL 582 'A'Page 1 of 2
1140.001160.001180.00
0.120.120.12
Referencet0 Scale factor
Offset
0.0050.030.00
Step# 0 09'17 12:00
Elapsed Time Value
0.0000140. C00040.0000
100. 0000
14C.0-001- E1II01 0
210.,000-20.,000..40.,000
180. 00
2.000
20.008
3400.000\
2A .OIIMII
440, 000
480.000\500.000 ki
520. 000•840. 000k,,
5620.000580.000vJ600.0006210. 000
640.000660.000680.000700.000 _720.000x740.000•760.000780.000800.000820.000840.000860.000880.o00920.000940.000T960.000L80.000 LM109-0.00 AL
1020.00 '104e. 00
L 12.00 | 0
112e.i 00jI
0.000.00
0.000.000. 000.010.010.010.010.010.010.030.0K0.030.030.4 o3_:0.040. 040.040.060. nt,
0.60. 060.060.070.070.070.070.070.090.07
0.090.090.090.110.110.110.110.110.110.110.110.110.110.110.110.120.11
0.128.120.12
8.120.128.12
1240. 001260.001280.001300.001320. C01340.001360.081380.001400. 001420. O101440. 00
146 0. 001480. CII
J15CI. 00IJ CIO.0
14 .'1. MCO1 560. LI01 80. CI
16000192110.00
16140.0CI
16t'0. 00I1700. O0-1720. 00
1740. OC1760. CO017::_::3. 00I-0 . 001720.001740.00I 760.0017:-:80.0 01900. CIO
1920. 00I1960. 001 -80. LIO
2000.00210210.i CI
2040.C002060. -002"080.002ý100. 00,i120. CI2 140. 002160. 002188.0 10
22800.002220. 00H_40. 002260. 002280.002300.002320.002340.002360. 002380.002400.002420. 002440.0CI2460.002480.002500.00
2520.002540.00
2580.009-4i8
0. 10.120.120.120. 120.1
0.12
0.1!20. I2ý0.120. 120.121
0.1
0.12
0. 120.120.1i
0.14
0.120 120 140.140 V10 14
0.150.150.1i0.150.120.120.140.140.140.150.140.150.140.140.150.150.150.150.150.150.170.170.170.170.170.170.170.170.170.170.170.17
0.17'0.170.17
0.180.180.188.180.18
0.188.18
268C.002620.002E'40.002660.002630.002700.00- •.00
27,40. I,, . .00
2:-:0 00
Th', i CIL
-LI:£ 41130
29~00 O
i ..D40 00
"760 0,0CI210,t.0 0i0
3010. 00
C10.035740. C0
J',.00
Li'._::0i0i
il0. C10
1 11 Liii1
C -13. CIO
:13 I0. 00
34000
S110.00
3441 .ii
3 160. LI
3700.00
-3740k. 00
5440.00
3780. 003o00. o03020 00
3840.0CI3860.00
3880.- 00
3900.001 379220.0 0
3940.O03960. 003980.004000. 00
460. 00S380.00
3800.003920.00
3848.008960.00
3980.00
3400.00
4028.O08
0
0. 10.L10. 10.170.178.170. 140. 170.170.17
0.170.150.150.150.150. 150.1750.140.150.140.140. 140. 140.140. 140. 140. 150.15
0. 170. 17
0. 170.170.170.170.170.170.180.180. 120.180.130.180.130.130. 120. 180.130.130.130.138.13:0. 180.130.20
0.18
10.2
0.200.130.180.130.208.208.18
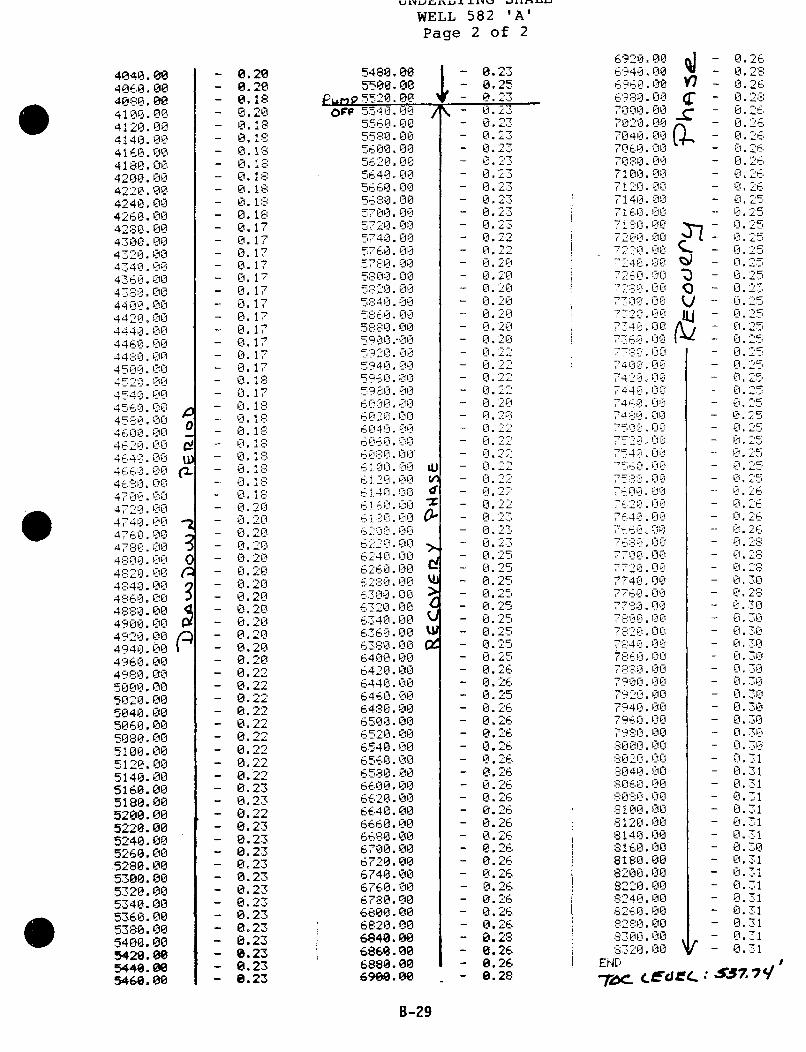
WELL 582 'A'Page 2 of 2
4040.004060. 004080.04100.004120. 00O4140.004160.00
4180.0C4200. 004,21-1D.00424 0 . Lil
42260. 00421,30. 004.00.00
4 .0.00
4 i [60 .084 "@ 0044006. 04420I. Cl0`
444. Oci44' 0.00
44:: 0. 0L450 , 0Z
454?. 0l C-Sil
4~ AlI .A~
-1 1r C.i .l i41
4740. 00
4 i-l l ,
45:%0" 0 .0
4 21 o. 0 04840. 01ý14 610 . CO0418113D01. CIO
490i. 1410
4,'70. 0L-1
4940. 00474t0.0Fi4980. On
45-000. 0i
45--220. O00
48n0.00404. 00
5080. CO0
4510. 01•
~i0 051?40.0105160.005080n00500. 005`2. 00
5240.00
5280.005200.005120.005860.005380. 005300.005420.00
5340.065360.00
5400.005428.08.5449.085468.08
0
30l
0.208.200.180.20Ol. 2100.18
0. 1i0.180.180.180. 10.170.170.170.170.1,170.170. 170.170.170.170.170.17U. 17
0. 1,0.180. 17U. I0. 1
0.180ni
LI i
0. 200.200.200.200. 200.,20
0.200O. 2l'0
0.-,0
0.220.220.220.22Ei.-
0. '"
0.220. 220.220.23,0.230.220.230.230.230.230.230.230.230.230.230.230.230.230.23
5480.00556.00 0C,...=o• 55000
• w''" 223Z - ,T
59,-0. 00 P5• 554 -0 - 0
550. 001;.0- 00it-t.00562S0. OLD
5640 00
5660 .l00
56:9 0057-2-0.00
5140. 00
9qý-Li.n Fil
076r,. 005:-t'20. CO0
.. a,44 -1 ti0J588-1 . O07 ýA
59L0.'I592 'il 0-l05:'74!0ý'.00J
7,i. tIlO
Li 4 1clI
t Z, n 10j0 F. ,71
L1i, [i0
r., ~i' LIL.001 l ClLA 0 . .1A
E:224.41 0l062160.0CI
67"00.0CI
5-T0I. fiLl
6440.0064410. C064-0.00r44'.0.00
650-. 006540.0065E0. 006580.00
6600.0CI66240. 00t 4140.006660. 006hi-80. 00
6720.006ttz40.006760. 006780.006800.00
6820.006840.00686e.00
6880.0069.9.08
tUd0
d
0.'20.
0. 2_"0.23
0. 23
Cl. "D"ri
0.-c
-C.
0.2 -
0.20. 2nL. 2n
0.2f0.n2
0. 260. 2>60.26
0. 26
0. 2E:
O. 26
LI2
0.22,
0.260.-/ 26 .
0.26
0.2604.28
Li.
0.260. 29
0. 260.28
0.2
0.260 6
0.260.26
0.260.260.28
0.230.250A '•7
692'*0.00 0] '.269-40.0 Us•1-02
7''0.900 A 'F22r, W00 -L70'n.LI [Ll LIý2
0400706 0 LD "l 0 -7-J
70171:0 00 - 0.7 0 0 -71ýL L.2
7i0 E.10 0 i.-708 CIO Li, 71:
-140 00 - i. 25-7 - .1 7•E1 1"r - 7-E,
7 14 ... n -- . '25ý7i1 0 - 0 25CLi 01 Cl L i. '7
7 72 .00,71 025=73" C; C11 .V '7,5-
L:- , 0 Li " .7Z8•0V -i .2 5
-7-2i0 il CL i .2'_2
LiL 0i
4 ;30 0 -l 0.5
77:_::.00 - 0.25740 1Ci 00 - .25
7 2 gI -- 0,Li
_ Al Li 9 -.
24 a . OC - 0. i247-5. L0 - 0.25
0.70i-= -,,T ALA - I '-'t "
7 00. 1 -- -.26
* j 4 I20 0 - 0
7820.00 -02
01 0- ._ L .7 7-4r'. [r•1W Li F','--
77 40 -I.00- .
47L.1 0 il 0 . 0
79:40].8-IO 0. 3 0
780l0L - L.30
7 0 ,00 - 0.71037920-I-.8 CI C. 30-
140. Li0i - .i3 'L
7960:~ll.0 CI 0.31
-8 .00 I il 0.I 1
J00 .00r- 0.3 180120,0 . CI .7131404 . 00 - .31
6 L.00 0.L 18-410.00 - 7 .1
8i8.00 - Li.31-,,nO 00• Li 4.
8140.00 I 0.71
o160. ~ e 71 038140.00 - Li31
CIO. 00 0 1. 18o7,O C.' - 0.L 1324CIOi - 0.18160.00 - .LI18180.00 - i .182000 M Li 0.
8220.0 - 0.L3 1
END
-pc d CCJC S37 7 9
B-29
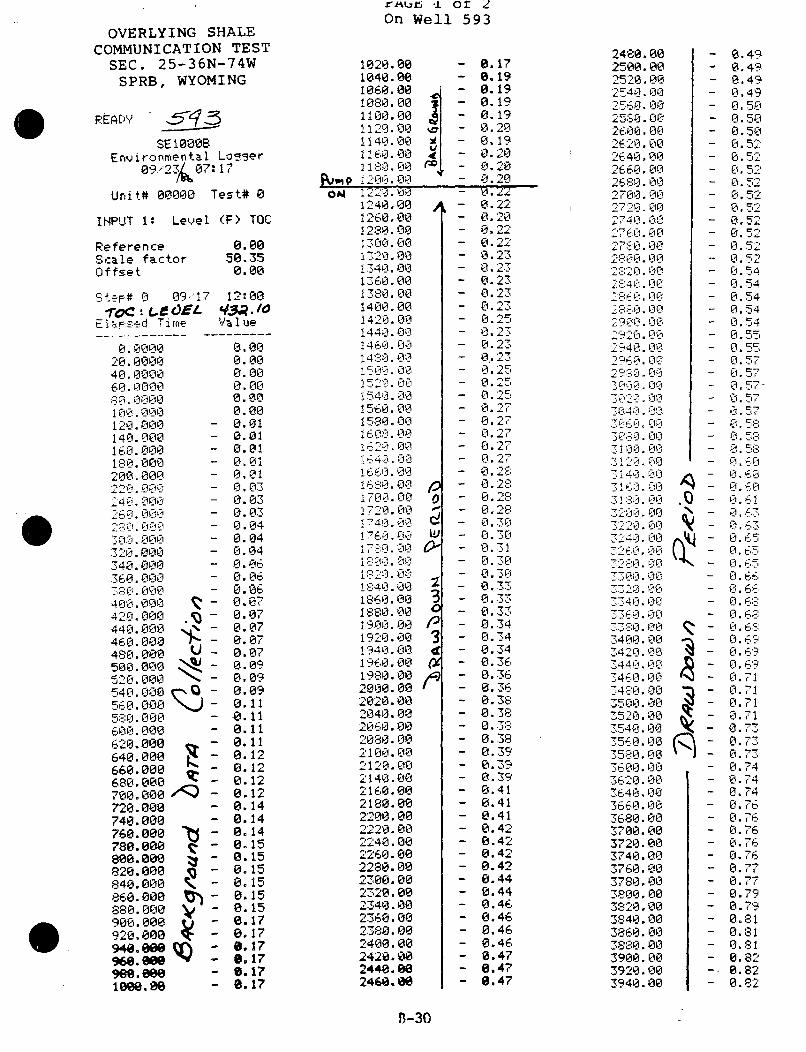
OVERLYING SHALECOMMUNICATION TEST
SEC. 25-36N-74WSPRB, WYOMING
RED-:5
SE 1000BEnvironmental Lo"5er
09-,23707:17
Unit# 00000 Test# 0
INPUT 1: Level (F) TOC
Reference 0.00Scale factor 50.35Offset 0.00
Ster# 0 09.,17 12:00-roc - ýerOEt qQ.i/0
ElaF sed Time Value
0.3000 0.0020.k,.)00 0.0040.0000 0.0060.0000 0.00
ilI. 2000 0.00102.000 0.00120.000 - 0.01140.000 - 0.01160l A 0 - 0.011%90.000 - 0.01200000 - 0.01
0- 0.032p 11141 - 0.03
20 0 L - 0.032 14.1 0 - 0.04
i• fi0i0i - 0.0420. 000 - 0.04
340. 00 - 0.06360.000 - 0.0630.000 - 0.06400.000 T - 0.07420.000 .• - 0.07440.000 %x - 0.07480.000 u - 0.07500.000 U - 0.07
500.000 - -0. 0950.000 - 0.09540.0000 " - 0.09600.000 - 0.11
k.0.000 - 8.11640.000 - 0.12660.000 01ý2680.000 -0:12
700.000 /: 8.12720.000 8.14748.000 - 8.14760.000 - 0.14780.000 - 8.15800.8000 - 0.15820.000 - 0.15840.000 - 8.15860.000 - 8.15880.000 - 8.15900.000 - e.17
920.000 - 8.1794. OW - 8.17960. we • - 8.179g0.a00 - 8.1710o. 08 - 8.17
rfturz *i or 2On Well 593
1020.00 - 0.1040•.0 - 0.1060.00 - 0.1080.00 0.1100.00 - 01120.00 - 01140.00 - 0
1160.00 01130.00 - 0.
Pa,,9 ff200.00 - U.oI f -'. -CO.
1240. 00 - 0.1260.00 - 0.
1 20.00 - 0.1240.00 - 0.1360.00 - 0.13...0• 00 - 0.1400.00 - 014 0.00 - 0.1440.00 - 0.143680. - 0.1400.00 - C.!50L9.0 40 - 0.1460. - 0.
54i1 1.0 - 0.
1580.lg - 0.11-L"1.lL0 - 0.i 1 140 - 0.
!4 .00 - 016647 0.00 - 0.!6-i-: ti0 l - 0.
L) o.0 - 0.'1744 4 0 -CI.!7'20.0 413 - 0.746.00. - 0.
17. hH0 Li - 0,0.00 • - 0.
±18'C.@0 - 0.
I-4000 - 0.1740.00 3 - 0.19863.00 - 0.18i80.K / - O.2000000'3 - 0.2020.00 - 0,
1940.00 - 0.1980.00f - 0,
20060.00' - 0,2020.00 - 0.2040.00 - 082060.00 - 0,2080.00 - 0.2100.00 - 0,220.00 - 0.2140.00 - 0,2160.00 - 0,2180.00 - 0,2200.00 - 0,2220.00 - 0,2240.00 - 0.2260.00 - 0,2288.88 - 0.2300.00 - 0.2320.08 - 0,2340.00 - 0,2360.00 - 0,2038. 00 - 8,2408.•00 - 0,2420.003 - 0,2440.08 - 0,2461a.8 - 0,
.171919
.1919520
.1920
•20•20
22
20
23
23
•25
.2`7
237
.34
.25
* Lcm
36,C
I.2
3 27--2 7
.28
•28
7\9
.30•30.31.30
.42
.34'34.34. 36436
.46
.38•38
' 38
.39
.41
.41
.41•.42.42.42.42.44•.44.46.46•46.46.47.47. 47
2480.002500.-005 2 0- . 0132920.00
2C-4O - 00460. 00
26270• 00a-40. 002660. 00e 80.00
400. 0027 4 . 00
0026.00
i-H.00
2i 41.00
2'-1-01. 00
Io. 100
1.00'220. 00
i. CI002968-. 00
011-. 00
-4 40. 30
* ~CIO¾ i
3400. CI31-1
?A;-0. 00
I4A. 11110
lý i-I 0
3!0:0. 00j500 CIO
7-540. 00•
1 /EE -10.
7-560. 00
445 1 Li. 0i
328817. 00
39,20. 00
74'40. 0II
3660. 00
3680.00
3-7_40.00
3460. 00
378--0.00
3400.003240.003460.0039-60. 003900.00
3920.00
3940.00300.00
37213.00r74i. 00376R. 003780.003800. 003820. 003840. 003860.003880.0039013.003920.003940.00
.0
0.490. 490.490.490.500.500.500. 520.52
0. 520. 52
0.520.52
0.52
0. 540.,540.540. 54
0. 55
0. 570. 5
0. 570. 5,4
60,5
0.I
0. 69
0. 690.
0.714
0.71
A.6
0.60.74
0,6
0.76,
0.66
Li
,i
0.
0.89
0. 8 1
0.710.820.720.7811
LI7Vi.73-
LI.73LLi.74V.7-
Li i-Li.7-Li.7-0.76-LI.76iLii76L.7-0,77
0.810.82
0.8
B-30
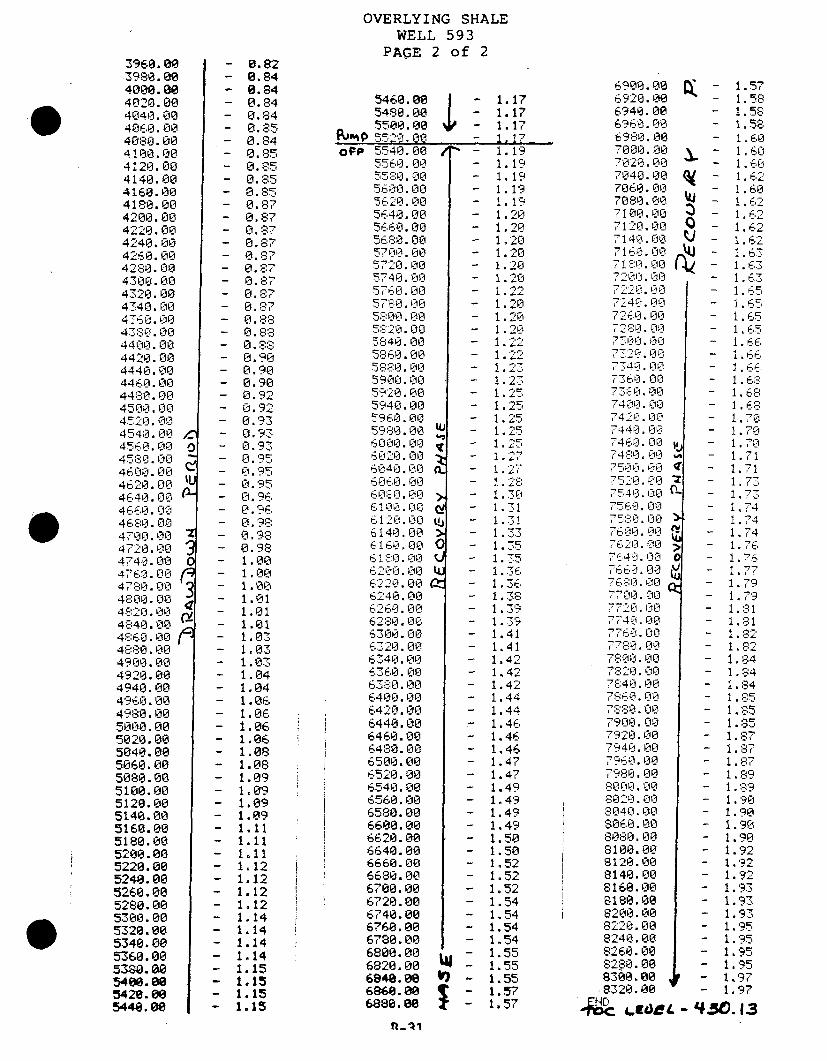
OVERLYING SHALEWELL 593
PAGE 2 of 23968.003980.004000. 8e4020.004040.004068.004080.004188.004120.004140.004160.004180.004200.004220.004240.004260.00
4 3U0. 00430. 004 •*-40. LiJ47.60. 00,4ý:-_1. 004400. 0044-i10 Ll0
4440.i.91044iE3. flfl448i0. 0i4500. n04'5 '20.0045403. L-0
45648.004600.004620.004640.004660. O0468:0. rCp]472I. O04720. CO0
4740.00476:0. 00
4rli- CfIOn48 LI.00L48-20. O0I48413.934860r.J0048890. 004900. 004920. 004940.004960. 004980.005000.005020.005040. 005060.005080.005100.O005120.O005140.005160.005180.005200.005220.005240.005260.005280.005300.005320.005340.005360.005380.005400.005420.0054440.00
/_10
euA_.
2
30
3C(2
0.820.840.840.840.840.350.840.850.350.850.35ý0.8?0.3?0.870.87
0.870. 870.870.0
0.900.3?0.830.830.33
0.900.900.90
0.920.95
0.9 •3
0.960.980.950.950.93
0.981 .001 .001.001.011.011.011. 0311.031. 031.041.041 .841.061.061.061.08
1.081.091.091.091 .1
1.111 121.121.121.121.141.141.141.14
1.151.151.151.15
5460.805488.00_ 500.00
Ai2mp noPP 5540 n00
5560. 0055;:_:@. 005600. 005620. 1D L056E40. 005660. 005680.00
5740. CI"D 0 . 0u
57F6 0.CIO58000
58417. 00580.. 005: D; - fti7.
59¢017. Oct5-91-1. CIO5940. 005960. 005980 CIO
6040.0l 0Rflvlf Lifil
b! 4O.006860.00
610.00
6140.00Rjf i :-l.0
6.200A. 003
6ýý,240. 00.
6260. C'IO•6218:0.006300. 0063z210. 006340. 00E76Z. 171. CI638:0. 006400. 0066420. 006440.006460.O006480. 006500.0065'20. 006540.00•6560.006580.006600.006620. 006640.006660. 006680. 006700.006720.006740.006760.006780.O006800.006820.00
686.0 O6880.08e
C.
0-
1. 19i. ic?1. 191.191.191.19
1 .201 . 20
1.201. 221.2-1.201 .21.22l
1.1. 251.*'
1.2._,
1.25
1.
1 7.51. -F
1.27]1. 301.30
1.331.7c:
1.31.36
1.34
1I. 4291. 4'1.411.411.441.42
1 . 421. 441 .44
1.461. 461.461.491.471.491I. 491.491.491I. 581I. 501.521.521.521. 541.541. 541.541.551.551.551.571.57
'It1.171.171.171.17
690o.8 8 1.576920.00 - 1.586940.00 1 .586960.0 1.586918.800 1. 607000.00 1 iroIo 8 L "- - I.,rn740.00 17040. CI - . 6.fl:7080e.i U. IAn
7ii . n2 - 1.6
,14ni. n - 1 2
71L:O.O1- 1.63
7240.00 - 1.65
422:. nf IO
ri. 0f i - 1 '5721 Lin 1 b.64':_0 . ;0 LD . ,
7 7 C. O0 1 -,:
4 20. 0 . -CI. '@
74 2 L) 1, .Li7340.400 l 1 .i
7 4It0 . O0 0 .:'
742 n . , 1 171C44. 00 | -i.74
746i [hi 4] 1 1.7=
4 .f~~l1 - . 71
76f;lD. 0n21 - 1 4rLII Il 1. 74
ý7.4 I. A0 1.81
4,00. 00 1.
ý01-T0. CIOlf ] - 1 q
78 I - 1.8147 I4o o0i 1 I.'•
77AA.fl Li 1 .1,
7740.00 1.047980.00 171800.00 1 4
8040. C10/ - 1.905
732:-0. 00 - 1. 47:,48.uu 1 4 :
7808.00 - 1.,907980.00l -i.,
1000.00 - 1.9
8120.00l -I.•
8140.00 - 1..K
8160.00 1 1.',•
8o80.00 1. 1 9'
6200.fi00 1.;93
8Ofli0. 0 0 1.951Sur o 00 - 1 .,f_810 .0 08 - 1,92
8120.00 1.958148.08/ - 1. •
821O. 00 1 .8188.00 1 i.'
8290.00 1.95832A.-0 1.97• 323.00 - - 1.99.831208.00 1.97
LEOL -'30. 13
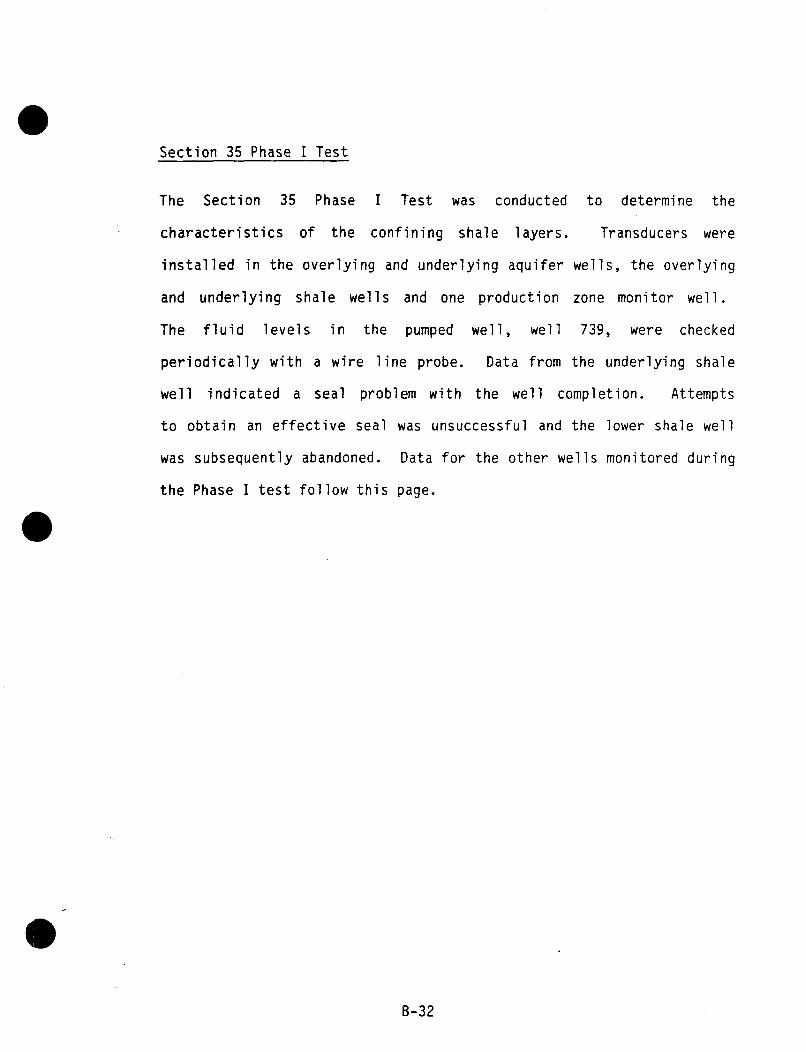
Section 35 Phase I Test
The Section 35 Phase I Test was conducted to determine the
characteristics of the confining shale layers. Transducers were
installed in the overlying and underlying aquifer wells, the overlying
and underlying shale wells and one production zone monitor well.
The fluid levels in the pumped well, well 739, were checked
periodically with a wire line probe. Data from the underlying shale
well indicated a seal problem with the well completion. Attempts
to obtain an effective seal was unsuccessful and the lower shale well
was subsequently abandoned. Data for the other wells monitored during
the Phase I test follow this page.
B-32
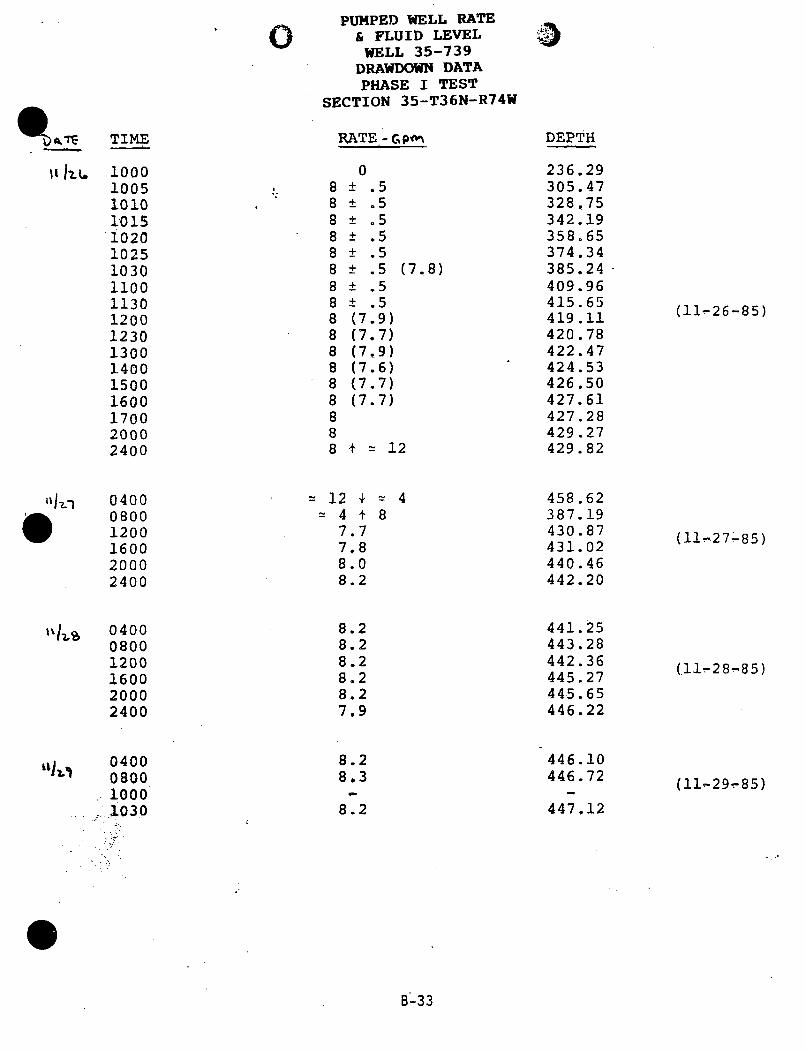
0PUMPED WELL RATE
& FLUID LEVELWELL 35-739
DRAWDOWN DATAPHASE I TEST
SECTION 35-T36N-R74W
RATE, - Cp,ezý 0, 7'cTIME
itI-Lt. i00010051010101510201025103011001130120012301300140015001600170020002400
. 88888888888888888
0± .5- .5± .5±+ .5-± .5± .5 (7.8)± .5- .5(7.9)(7.7)(7,9)(7.6)(7.7)(7.7)
f = 12
DEPTH
236.29305.47328,75342.19358.65374.34385.24409.96415.65419.11420.78422.47424.53426.50427.61427.28429.27429.82
458.62387.19430.87431.02440.46442.20
441.25443.28442.36445.27445.65446.22
446.10446.72
447.12
(11-26-85)
1% Itl 040008001200160020002400
-- 12 4- 4
7.77.88.08.2
84
lIV.LS 040008001200160020002400
0400080010001030
8.28.28.28.28.27,9
8.2
8.3
8.2
(11i27.-85)
(.11-28-85)
(11-29-85)
B-33
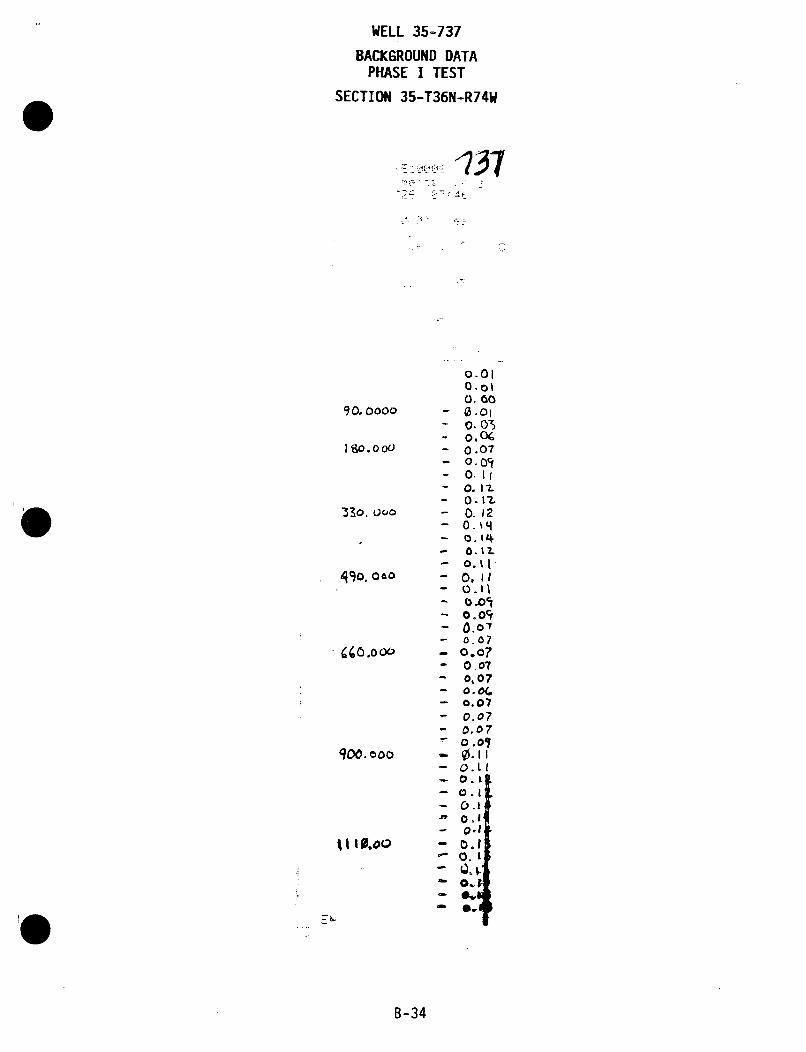
WELL 35-737
BACKGROUND DATAPHASE I TEST
SECTION 35-T36N-R74W
'137
90.0000
190,.000O
*330.060J
g4~o. oo
0.010.01
0.600. 0,00 . ol
0. OS0.07o.090. [10.17-20. M70. 120. vl0.14S~0. t Lo.t I0.11
0, Il0.070.09
0.07o .070.070.070,07
0.o7
0.07o .010. t0 t0.10.10.10.1
0It
0.i
q90.o0o
%1I 0.0o
B-34
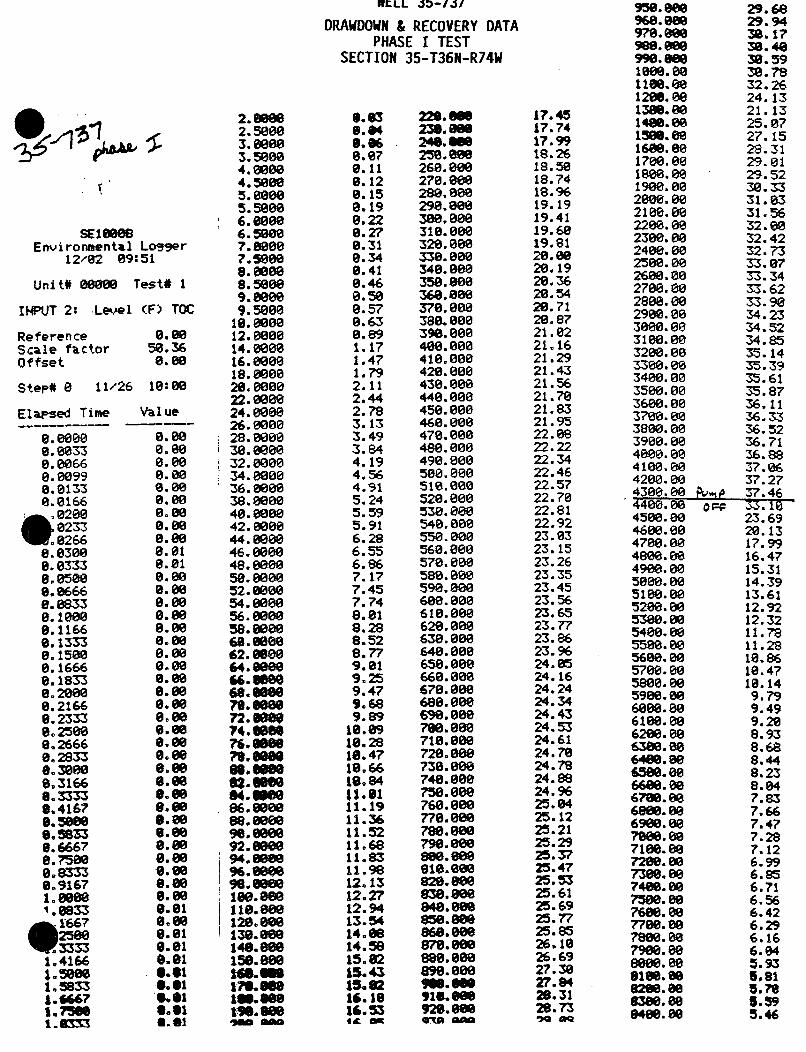
*ELL fl-/1l
DRAWDOWN & RECOVERY DATAPHASE I TEST
SECTION 35-T36N-R74W
@15
SE1 088Environmental Logger
12/02 09:51
Unit# 00888 Test# 1
INPUT 2: Level (F) TOC
Reference 8.80Scale factor 50.36Offset 0.00
Step# 0 11/26 10:08
Elapsed Time Value
0.0000 0.880.8033 0.880.0066 0.8808.099 0.000.0133 8.00e.0166 0.00
8200 0.08233 0.00
.0266 0.800.0300 0.018.0333 0.019.0500 8.8080,666 0.000.0033 8.000.1000 0.800.1166 8.000.1333 0.000.1580 0.000.1666 0.000.1833 0.000.2000 8.000.2166 0.008.2333 0.000.250, 0.000.2666 0.008.2833 0.008.3080 8.098.3166 6.088.3333 0.009.4167 0.088.5000 0.088.5833 8.080.6667 0.000.7500 0.008.8333 8.080.9167 8.001.89m 08001.0833 8.81
1667 6.082580 0.81I,33M3 9.01
1.4166 8.911.58m .. 011.5833 0.011.6"7 01lI.rm *.*I1.asm 8.81
2.08882.58883.00803.58804.88004.50885.808m5.58886. 0886.58087.88087.5m88.088008.588809.a8889.5000
10.008812.800814.000016.800018.0880020.000622.000024.000026.880028.800038.800032.800034.080036.080838.080040. 000042.0880044.080046.808048.8008058.00052.880054.800056.800858.008068.000062. WOO64.8080"a. am0
72. 8WN74.696076.66697-.0m". •m
84. am86.000e88.08m890.8m0092.888094.09M96.980"G. mmB180.888118.0888120. .8130.8m140. M150.908
imam
MASS1Imm0.•h
0.830.040.078.870.118.120.150.190.220.270.310.340.418.460.500.570.630.891.171.471.792.112.442.783.133.493.844.194.564.915.245.595.916.286.556.867.177.457.748.018.288.528.779.019.259.479.689.8918.0910.2810.4719.6610.8411.* 111.1911.3611.5211.6811.8311.9812.1312.2712.9413.5414.0814.5815.0215.4315.0216.1816.531 d c
220. MamD.230.68M258.888
268.00N27e. 08280. OM298.88838M.000318.088320.068330.800348.800358. MO836.8000378.088380.000398.00040e. 00e410.000
420.880430.800440.080450.000468.808470.000488.000490.008500.000510.000520.000530.000540.000550.000560.000570.800580.008598.000608.000610.0800620.008630.008640.000650.000660.000670.000688.00069%.000780.800718. 000728.088730.008740.000750.800760.88M770.000788.808790.8em
918.000829.800838.8M8840.000850.000
M7.90008680.00890.00"886.80".m91a.lt928.088
17.4517.7417.9918.2618.5018.7418.9619.1919.4119.6819.8120.0020.1920.3620.5420.7120.8721.0221.1621.2921.4321.5621.7021.8321.9522.0822.2222.3422.4622.5722.7022.8122.9223.0323.1523.2623.3523.4523.5623.6523.7723.8623.9624.8524.1624.2424.3424.4324.5324.6124.7824.7824.8824.9625.0425.1225.2125.2925.3725.4725.5325.6125.6925.7725.8526.1026.6927.3827.8428.3128.73" MG
950.0m0 29.68960.8am 29.94978.89M 30.179ne.0me 38.40990.8am 30.591008.00 30.781108.88 32.26120e. 08 24.1313"0.80 21.131408.00 25.0715•M.88 27.151609.00 28.311708.8e 29.011888.00 29.521900.00 30.332800.08 31.032188.00 31.562200.00 32.802300.00 32.422408.00 32.732580.080 33.072680.00 33.342788.08 33.622808.00 33.902900.08 34.233000.08 34.523100.00 34.853288.00 35.143300.00 35.393488.08 35.613500.00 35.873680.80 36. 113780.00 36.333808.00 36.523980.00 36.714000.00 36.884108.60 37.064200.00 37.274300.00 Pump 37.46446. 6 Opp 33.164588.08 23.694608.00 20.134788.00 17.994800.80 16.474988.88 15.315000.00 14.395188.00 13.615200.80 12.925380.80 12.325400.00 11.785560.08 11.285680080 10.865708.88 10.475800.08 10.145900.88 9.796808.80 9.496108.60 9.206280.80 8.93638M.00 8.686408.88 8.446508.00 8.23660M.00 8.04678. 88 7.836808.88 7.666988.08 7.4779900.0 7.287188.08 7.127200.80 6.997308.88 6.857400.00 6.7175w. 88 6.567600.80 6.427780.80 6.29788.800 6.167900.08 6.04a8m.800 5.930188.00 5.8162M88S. 5.786308.88 5.596400.88 5.46
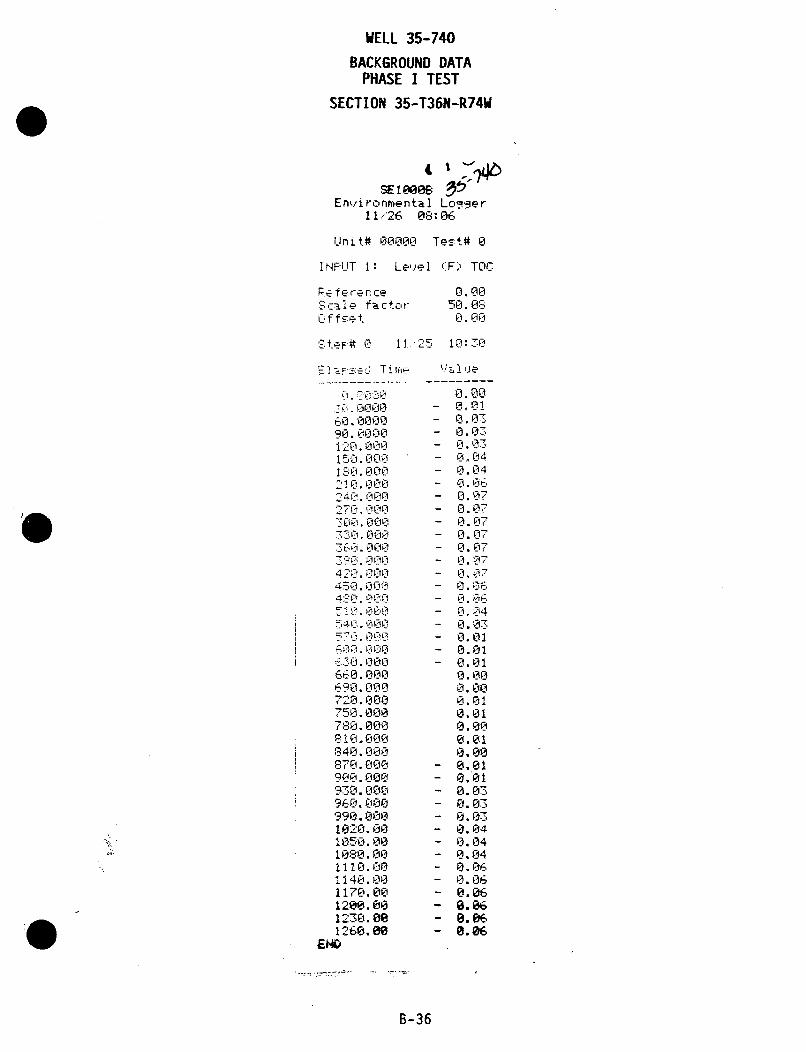
WELL 35-740
BACKGROUND DATAPHASE I TEST
SECTION 35-T36N-R74W
4SE18 1035
Environmental Loc-5er11/26 08:06
Unit# 00000 Test# 0
INPUT 1: Le,.,el (F) TOC
Re ferenceScale factorOffset
0.0050. 0G
L~ f.lc1
SteF# 0 11. 25 1E1" 3T?
E]&.:dTire
•0800060. 0000
15 - l0.0001SO 000
20. CCIl t i wOO 0241.awg
i.00
r4 L30,00•
690.•0002.000
7450. 000
4 : fl i'f'f'
e 80. 000S50.000340.000690.,000
7.000950.000790.0008010.000
10-0. 001080.000
1140. 001170. 0018200. 00
'+f14 viti
1230. a01 260. Oe
END'~
'.. u e
0. 00
-0.01iý
.l..- 0.04- 0.03- 0.03
- 0.04- 0.04-- f l "I
-0. 07- 0.07- 0.07- 0.07- 0.07- 0.07- a .s'
- 1,-14- 0.04- 0.03- 0.01- 0.01- 0.01
0.000.00.010.010. 000.010.00
- 0.01- 0.01- 0.03- 0.03- O, a3- 0.04- 0.04- 0.04- 0.06- 0.06- 0.06- 0.86- 0.06- 0.06
B-36
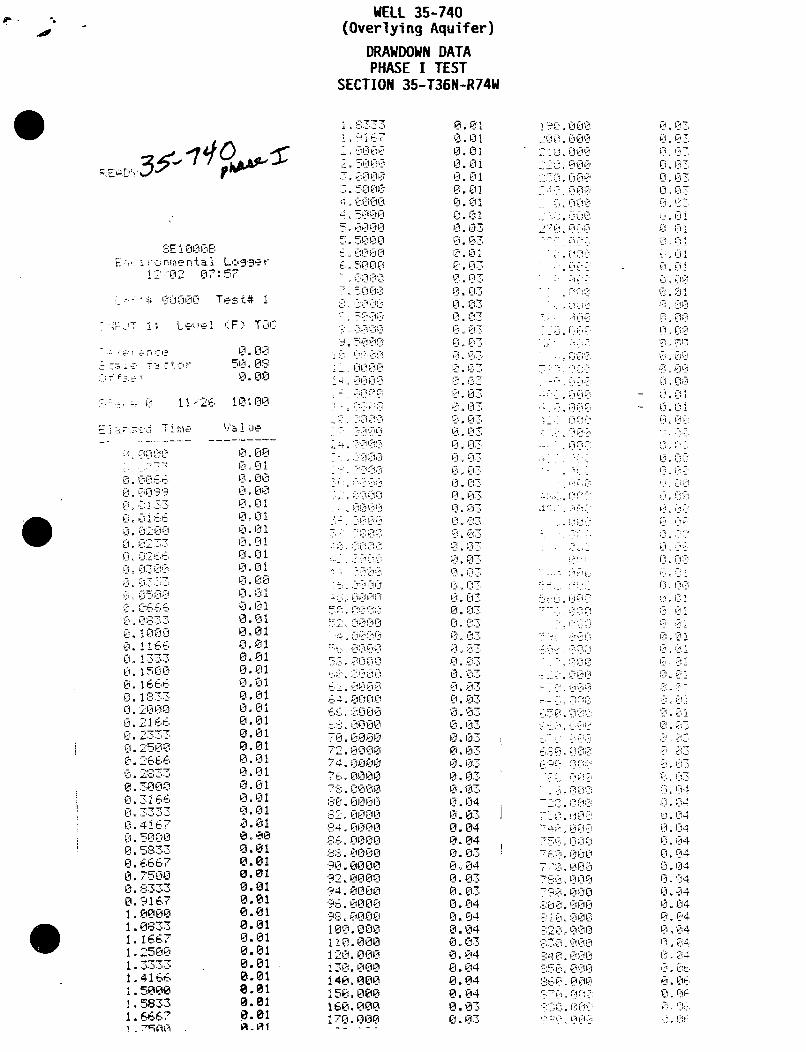
WELL 35-740(Overlying Aquifer)
DRAWDOWN DATAPHASE I TEST
SECTION 35-T36N-R74W
SE 1 0 CC5EE. 7ro.et~ j Lc._5er
2.02 0:57
l( .. . it • Te~st# 1
.- Le. ':5) TOC
rictcir0.00
50. 130.00
E" ~ ~ ~ ~ ~ a u ---.! T•m ,,]ue- - - --- - . ---
Ft. EOE,6 i 000~~ ~ .1 0+l '5J•l.
C.ci ct
ci. 'L2i 00 O
O. '7i:Z 64, i '-Ii
i7Li, fl1I
1 CIOI 0i17- 0.01
1. ,jh 0.01
. !16- 0.01
Li ~c .9J~ V I-+ 1333 0.01
5 0150 0.01.I3 L16i6 u. 01
L. 18u 0.010.01
210.01
it¶~ 0.01
4 G- 0.01:-. -!71JI0 0.800
0. 2500 0.01
.2667 0.01
.. .;, - -O 0 .0 1
0-±. 8-%:1 0.01.-
0. 9167 0.011.0000 0.01I.-08 3-3 0.01L.4iE? 0.011].25800 0.011.50333 0.811. 4166 0.01
. C000 0.01
I.50833 O,.01583 36', 0.01
1.667 0.01I. 5•00 A.I
r - 741171
- 7 I'7,l'-
17
1 1i j4
Vit'
Ail liu,
6 i. 0130-
;4 iv-D 0 G
-cl LBLI2i 0. 0
1 1-0 oi
3 icl i l14.000lhi
r1 50. 000160.J I-0
170.fluf
1-. elIC.I Illi
0i 0 1Li LI
0. 1.1-
F1. CA 7
t-i i-
C, FO
C, 07
C1+. 04: 30. 0•3
0. 043
0.' 04*-•o 031
0. 04
0.04
0. C10.040. 04
0. K0. 0Z3
0. -i ULiU•
i. Li30.i•
I.0
Li F3
0.03I.0
L'i 0I, 0
Ci 4ii.Li
Li -3
I.LiU ,.4P•0Li ii3
O. 04LI.PwLi.Li
j2:3 .17 .-j+ •
GAlL
:'a c. +.3 c 0F J-
- 7 .!' '•
-.- 1 !'"
l: .: ilt-.'
, -. Li ,j• .1 -, 1 +
I :I(;'L-,: 'i c ',
,ii:t/iL A.
F. F'
ii i
Si I
17'
0. -14
1. 04
- I.;i LI-
I-i+ Lit-i
L i
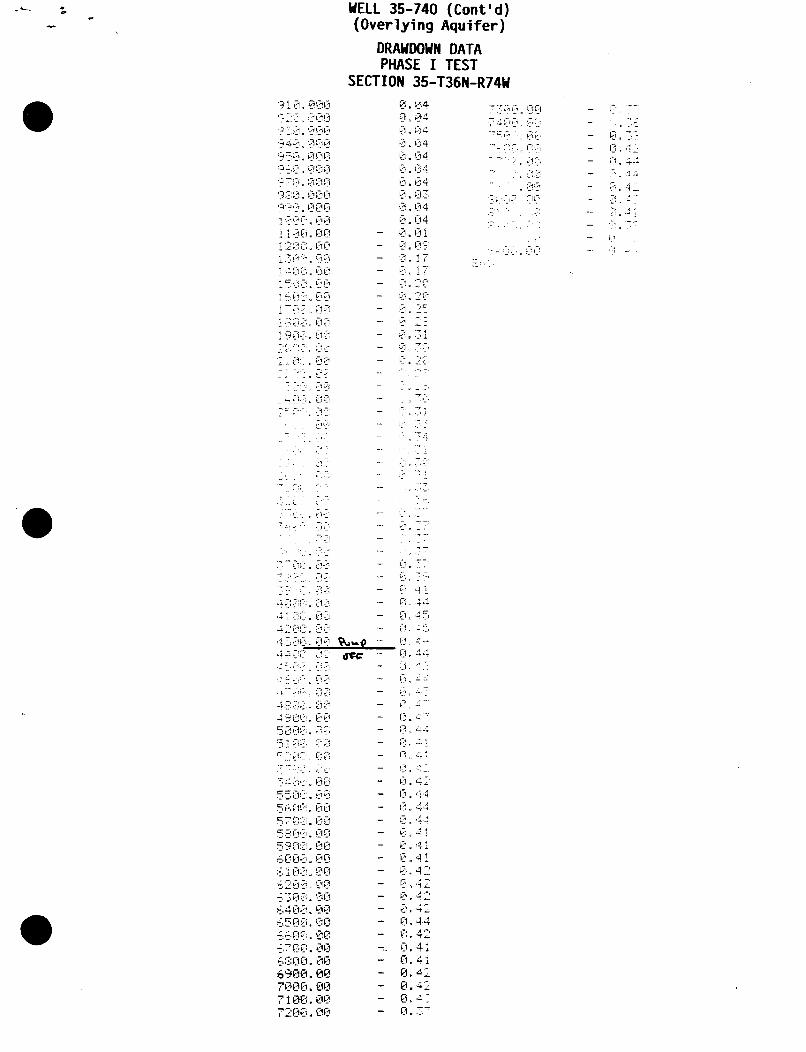
WELL 35-740 (Cont'd)(Overlying Aquifer)
DRAWDOWN DATAPHASE I TEST
SECTION 35-T36N-R74W
9:10. 00i'0 0.04 70.0- --T -
94&:• 0.00 0.£•04:'::.oT-- .,L
95V 000 0.04 -. 44
0L,004 0. 0-
.- - i. 1 1--
M o. - 0.04 0.7:
42~L Cu4F.
5,002-
-i ' r i..• : .. •.- .. -
- : F: • - .-. l. -:.-
:=•-ji%: ? - -
4" ý
600.
6 .10 ,7". . ... 0 2:
6 - 3 ci 4
I: . - -. -.I
64- .0. C-- - 4
. . 0 0l - 44
,- LL[: 1;• iZ :
-0.0• i--'1 •
r3 :r<'i IIA[ti( -- I '] 1 .
6-_5,0,:). i.: - g 4
56900-.00 - E.4
7000.00 - 0.42710 0.00 - i 4CCc 02. M. - 7,4
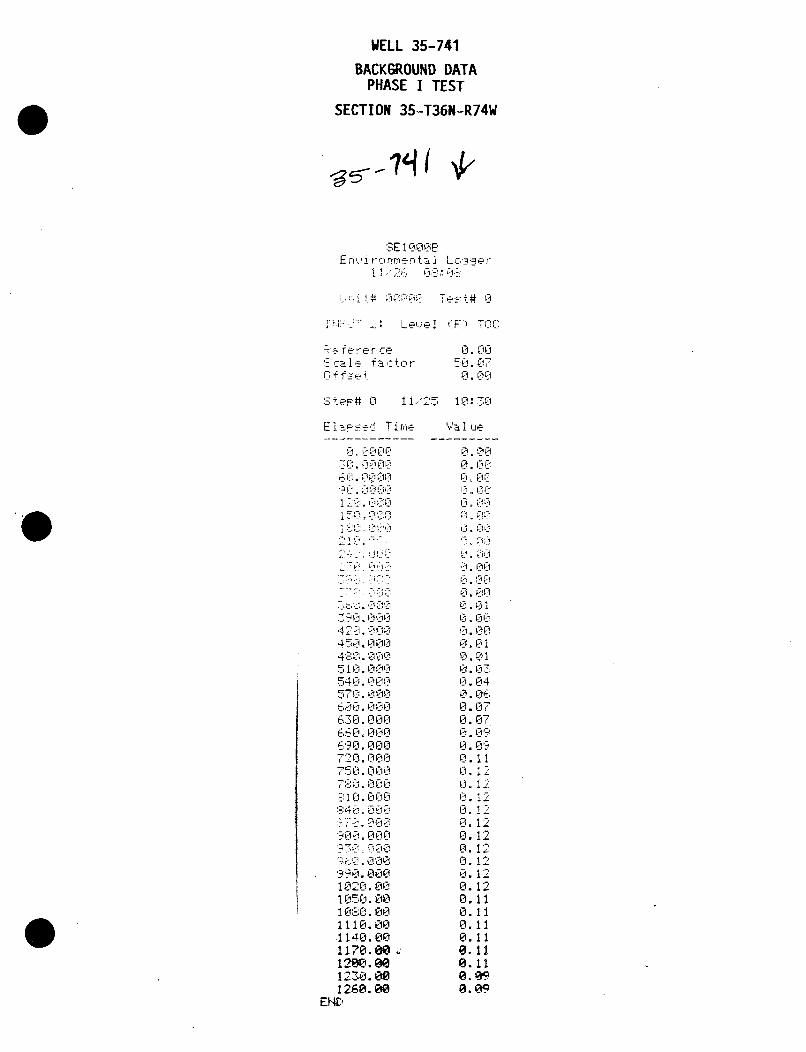
WELL 35-741
BACKGROUND DATAPHASE I TEST
SECTION 35-T36N-R74W
SE lI0l0EEr'...,I i- rime ra I I c -0er
t,:!. 88i084 Tes~t# El
][NP = -: Le,..el (F) TOO'
re enceScfale factorOf fs et
Li, LIU50.. 07
0. Oh
- 11525 11:30
EI----se Time
C3 . •-1-1 D @
5L _I
'P. e00n
023 0 17
418 0',D20j
4, 1Li I i 0l5 - . rip'..
*•,1 0)0i
4210. 000
6i9 l 0Li 054 2. cl 0
73:1 ] Li "71 iih7 1 . flII
ICi 0 0 C,
62o . c, S
6-tF A.t@
10*-1
1iK OkiLl
1140.008
1170.L 0 R-il
120C-. @981 30. Oe
1140.00END080
12.3k) ... @00
1260.080E 98ot
'I I ue
0.D 0
1i.17
Li I7-.t'
Ci t7I17I
C1 n714LI 0L
I-i u!lF. 1
@. i
0i 121
cEl. 12
0.110.11
-I. Li
0.11
0. 12
0.012
n .nLi. LI-
i. 12
0. 11
0.11i0.11.0.11.
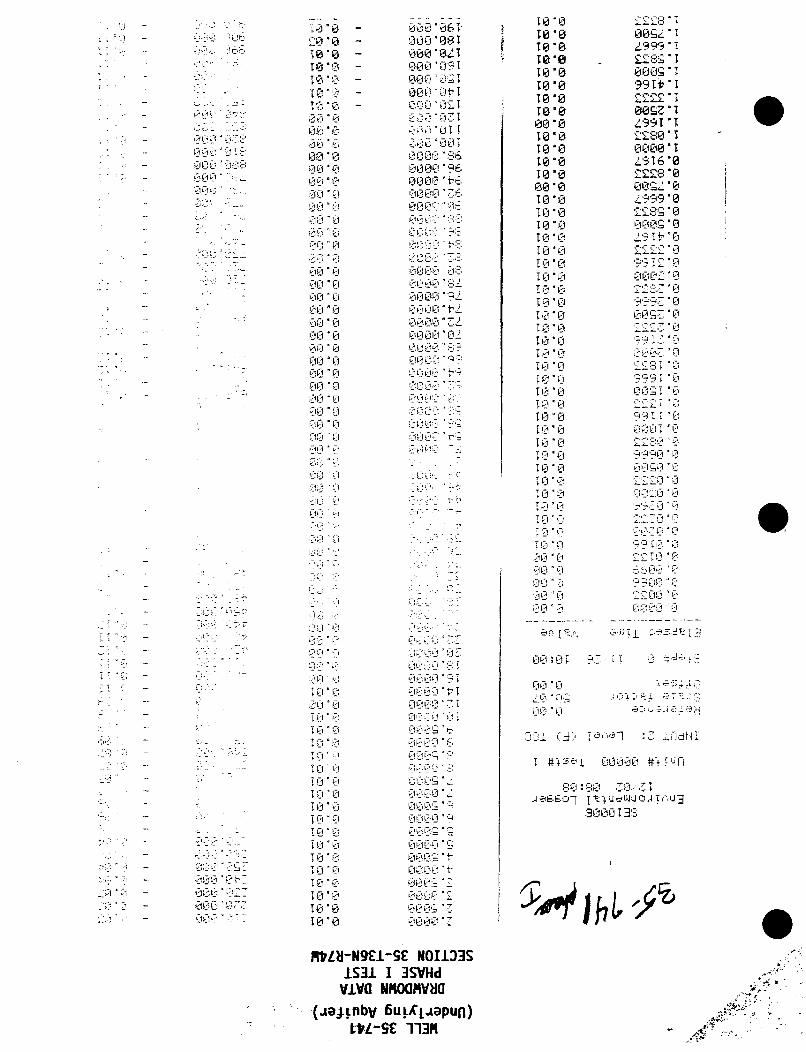
i~1.
Li ' -
- IlL. I t~ -
- .11111
'Li
I,
- riFit:i
- 11''
10 0
To~ I'DD0 "0
., "00 "ik00 '0
JL
IO 1
a
Z'ij LIz
tI•:l H
O 0
-I Li
TLI Li'I" Li
.JtI~l L:i
.1.,-- i.i
1.- '1 i
I I !
LI.' Li1w0 "Lto "a
[TO"S1Cl m
0. C-mi 'ibkT
l f•l 0 "fl1
00,0"-71Z0CWCi tII
LI, Ci C ,.
cl C •1;. f :-I ; -. :
L-t' ' 'l
Ui:.fltl0, '-6
L I t L .-
t i':] "t'
Lit '" diL: '< ;
• iLI L; :'I. .. -
"i.iL I ZI .
LiI I•. ," - .
LIL.LI.
ILL-.. .] :
IL' ,1~, •
10 0toeoTO "0TO "e
1010
toeo010'10'O1010TWOl
0•0100To "o
10 ".
Itcl flT0 0
I~lLT 0 "0
SIi LCi
Ti Li
TvsL
0 "
Icl Cl
Icl L!I
10 ",
I:l Li
I• "0 Lirt a0li- Li;a a0,Ii LI
I rI"
i• l LTI=;- •
I9 "
'.2 13-9,"
T• 991 t 'I
99 W"
0097-• TZ99 '1
ocl0" I21916"0'M£8 "0
E0S "0
,aag C.
9* 9 'IIqI~ C
*- IZ LI*Ci
-l LI, T
C_.- S, T >lI
7,Z .J :- ;7,"~
9'*11 'I ".;
•[ i ' •! :-J- ': Li "
.i'*i :L:Z
." III• 1 fl4 : • '"". ' - . .
a ,,;, , 'I •;.
T4,i A; U-,, lI l 4 4 C- fl
i3007 13-
>4't~bT 3-A''I
RtLN-N9EI-SS NOIJ33SIS31 I 3SVIid
VIVU NMOUMV'(i(nejtnbv 6ULKL.aPUO)
L-VL-SE; 113M
St
- *4.
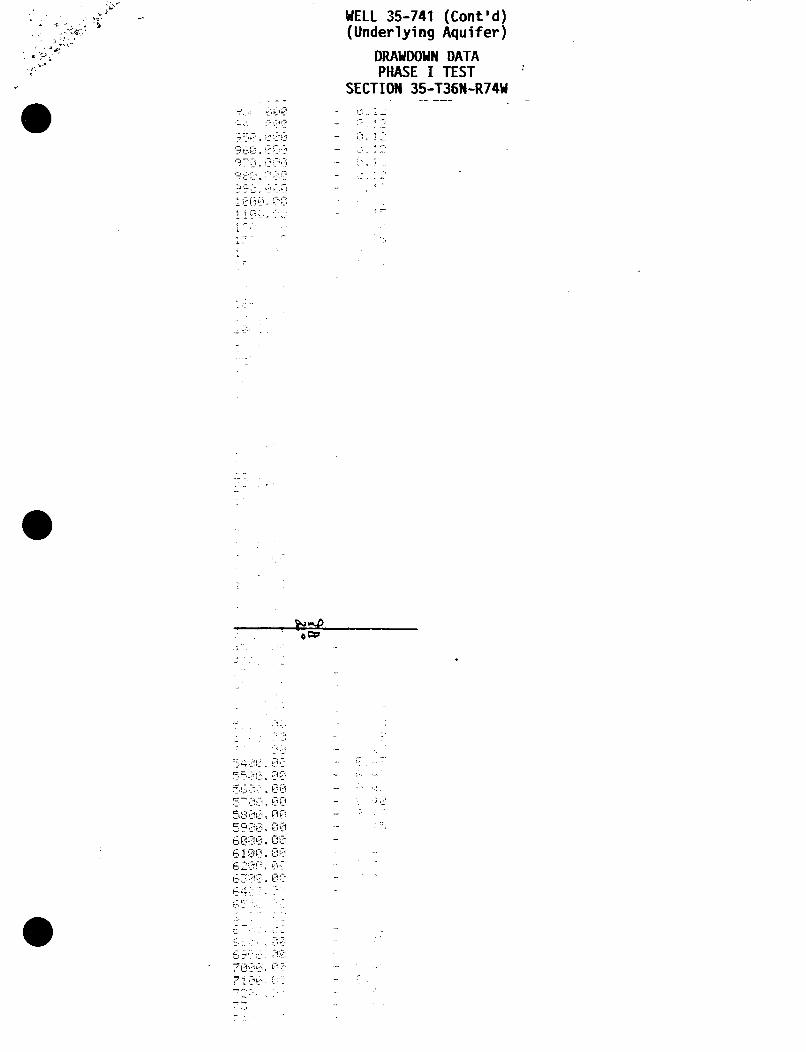
~1~ WELL 35-741 (Cont'd)(Underlying Aquifer)
DRAWDOWN DATAPHASE I TEST
SECTION 35-T36N-R74W
qkr1
iiv-T
j7-
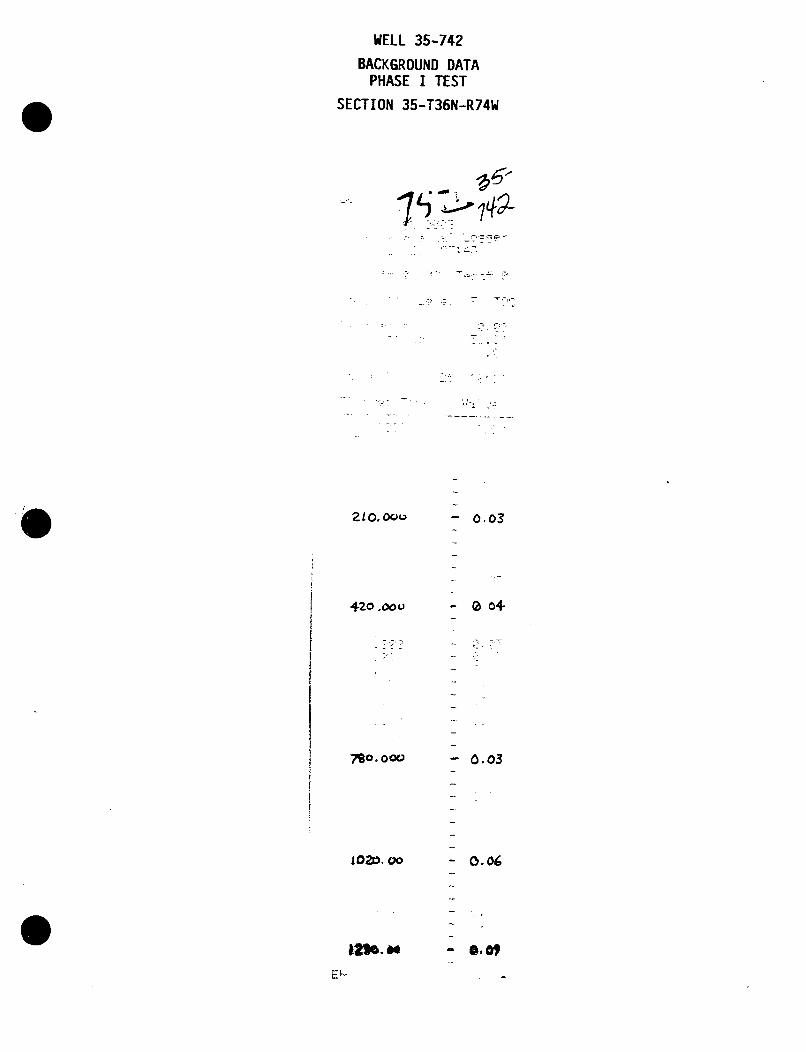
WELL 35-742
BACKGROUND DATAPHASE I TEST
SECTION 35-T36N-R74W
'2L0. 0OOQ
420 .oou
0.03
102-, 000
wz•o. QO
- 0.03
- 0.0,
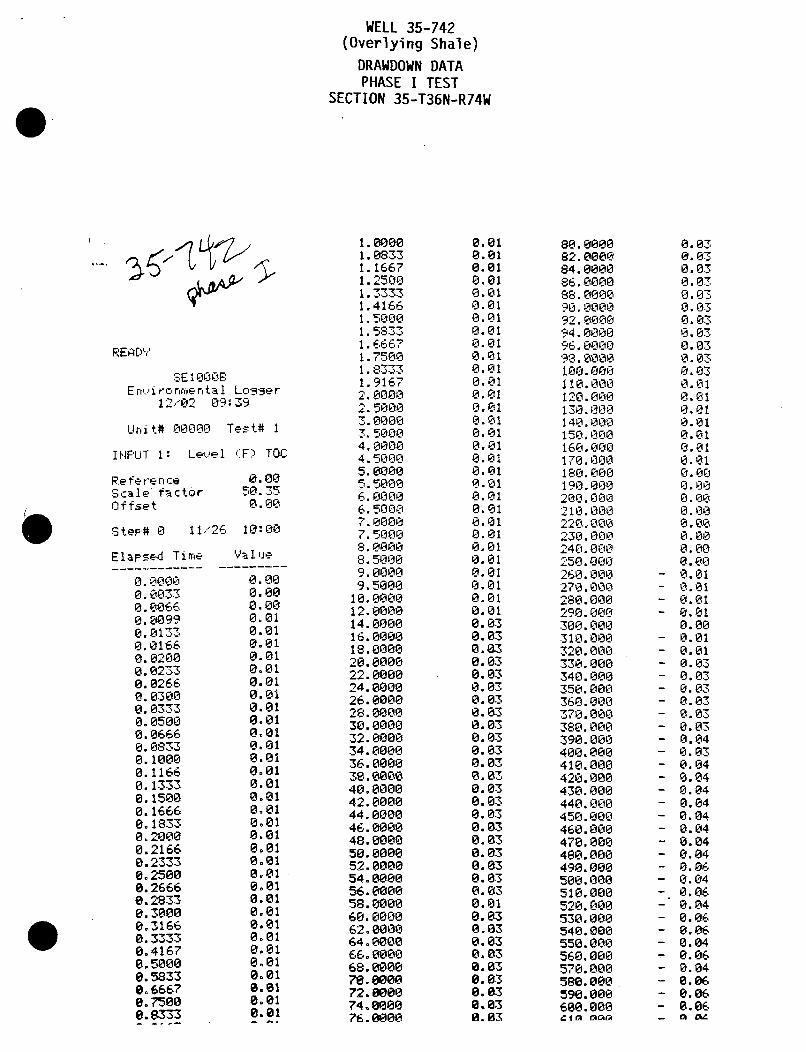
WELL 35-742(Overlying Shale)
DRAWDOWN DATAPHASE I TEST
SECTION 35-T36N-R74W
65-
READY
SE I 0008Environmental Lci-er
12,,02 09:39
Unit# 00000 Test# 1
INPUT 1 : Lev...el (F) TOC
ReferenceScale factorOffset
0.0050. 350.00
SteF# 0 11/26 10:00
Elapsed Time Value------- ---------
0.0000 0.000.0033 0.000.0066 0.000.0099 0.010. 0 133 0.010.0166 0.010.0200 0.010.0233 0.010.0266 0.010.0300 0.010.0333 0.010.0500 0.010.0666 0.010.0833 0.010.1000 0.010.1166 00010.1333 0.010.1500 0.010.1666 0.010.1833 0.010.2000 0.010.2166 0.010.2333 0.010.2500 0.010.2666 0.010.2833 0.010.3000 0.010.3166 0.010.3333 0.010.4167 0.010.5000 0.010.5833 0.010.6667 8.010.7500 0.01e.8333 0.01
1. 00001. 08331.16671.25001.33331.41661.50001.58331. E6671.1.75001.83331. 91672.00002. 50003.00003.50004.00004. 50005.00005.50006.00006.50007.00007.50008.00008.50009.00009.5000
10.000012.000014.000016.000018.000020.000022.000024.000026.000028.000030.000032.000034.000036.000039.000040.000042.000044.000046.000048.000050.000052.000054.000056.000058.000060.000062.000064.000066. 000068.000070.600072.600074.000076.0000
0.010.010.010.010.010.010.010.010.010.010.010.010.010.010.010.010.010.010.010.010.010.010.010.010.010.010.010.010.010.010.030.030.030.030.030.030.030.030.030.030.030. 030.030.030.030.030.030.030.030.030.030.030.010.030.030.030.030.030.030.030.03a. 03
80.000082.000084.000086. 000088.000090.000092.2000094. 000096.,0000
100.000110.000120.000130.000140.000150.000160.000170.000180.000190.000200.000210.000220.000230.000240.000250.000260.000270.000280.000290.000300.000310.000320.000330.000340.000350.000360.000370.000380.000390.000400.000410.000420.000430.000440.000450.000460.000470.000480.000490.000500.000510.000520.000530.000540.000550.000560.000570.000586.000590.000600.000eICkia aaa'
0.030.030.030.030.030.030.030.030.030.030.030.010.010.010.010.010.010.010. 000.00
0. 000.000.000.000.000.010.010.010.010.000.010.010.030.030. 030.030.030.030.040.030.040.040.040.040.040.040.040.040.060.040. 060.040.060.060.040.060.040.060.060.06a Viz
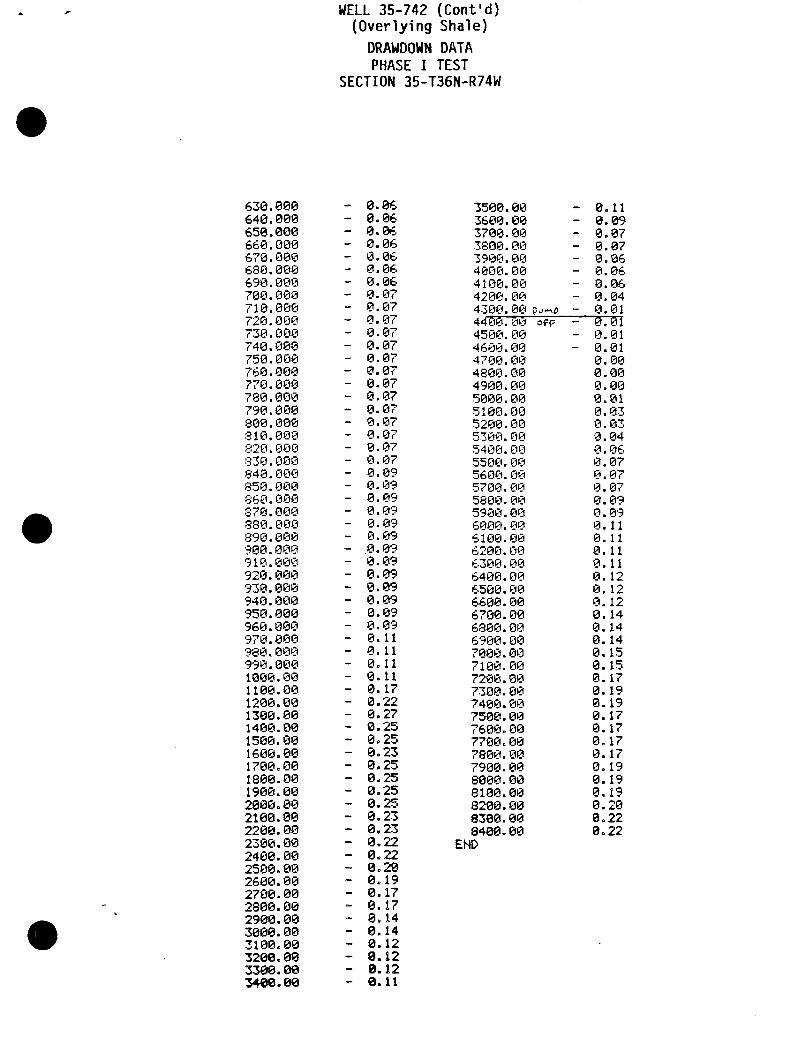
WELL 35-742 (Cont'd)(Overlying Shale)
DRAWDOWN DATAPHASE I TEST
SECTION 35-T36N-R74W
630.000 - 0.86 3500.00 - 0.11640.000 - 0.06 3600.00 - 0.09650.000 - 0.06 3700.00 - 0.07660.000 - 0.06 3900.00 - 0.07670.000 - 0.06 3900.00 - 0.06680.000 - 0.06 4000.00 - 0.06690.000 - 0.06 4100.00 - 0.06700.000 - 0.07 4200.00 - 0.04710.000 - 0.07 4300.00 po - 0.01720.000 - 0.07 4400.00ii ore - 0.01730.000 - 0.07 4500.00 - 0.01740.000 - 0.07 4600.00 - 0.01750.000 - 0.07 4700.00 0.00760.000 - 0.07 4800.00 0.00770.000 - 0.07 4900.00 0.00790.000 - 0.07 5000.00 0.01790.000 - 0.07 5100.00 0.03800.000 - 0.07 5200.00 0.03810.000 - 0.07 5300.00 0.04820.000 - 0.07 5400.00 0.06830.000 - 0.07 5500.00 0.07840.000 - 0.09 5600.00 0.07850.000 - 0.09 5700.00 0.07860.000 - 0.09 5800.00 0.09870.000 - 0.09 5900.00 0.09880.000 - 0.09 6000.00 0.11890.000 - 0.09 6100.00 0.11900.000 - 0.09 6200.00 0.11910.000 - 0.09 6300.00 0.11920.000 - 0.09 6400.00 0.12930.000 - 0.09 6500.00 0.12940.000 - 0.09 6600.00 0.12950.000 - 0.09 6700.00 0.14960.000 - 0.09 6800.00 0.14970.000 - 0.11 6900.00 0.14980.000 - 0.11 7000.00 0.15990.000 - 0.11 7100.00 0.151000.00 - 0.11 7200.00 0.171100.00 - 0.17 7300.00 0.191200.00 - 0.22 7400.00 0.191300.00 - 0.27 7500.00 0.171400.00 - 0.25 7600.00 0.171500.00 - 0.25 7700.00 0.171600.00 - 0.23 7800.00 0.171700.00 - 0.25 7900.00 0.191800.00 - 0.25 8000.00 0.191900.00 - 0.25 8100.00 0.192000.00 - 0.25 8200.00 0.202100.00 - 0.23 8300.00 0.222200.00 - 0.23 8400.00 0.222300.00 - 0.22 END2400.00 - 0.222500.00 - 0.202600.00 - 0.192700.00 - 0.172800.00 - 0.172900.00 - 0.143000.00 - 0.143100.00 - 0.123200.00 - 8.123300.00 - 0.123400.80 - 0.11
Section 35 Phase II Test
The Section 35 Phase II Test was conducted to provide data for
calculating hydrological properties in the production zone aquifer.
Transducers were placed in the pumped well, well 739, and- the three
production zone monitor wells, wells 736, 737 and 738. No background
data or recovery data was collected on well 738 because of equipment
problems. Drawdown data for well 738 was read and stored
automatically from the transducer, however the data had to be manually
accessed and recorded. Data collected for the above wells in this
test follow this page.
B-45
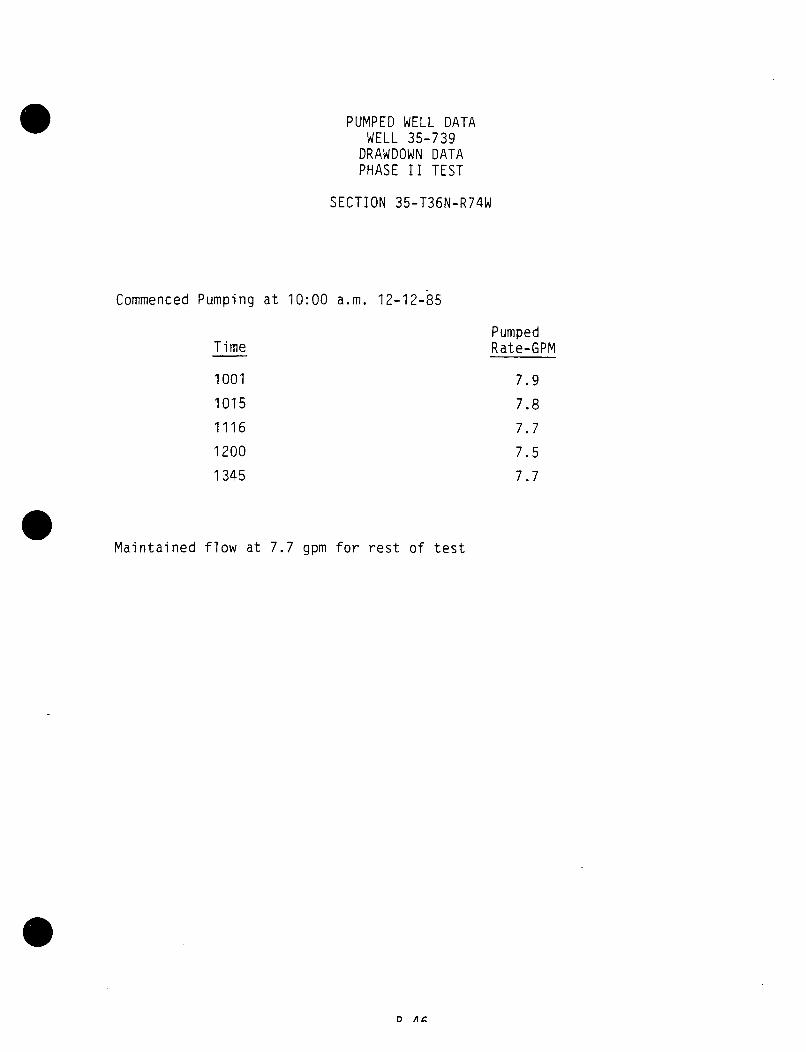
PUMPED WELL DATAWELL 35-739
DRAWDOWN DATAPHASE II TEST
SECTION 35-T36N-R74W
Commenced Pumping at 10:00 a.m. 12-12-85
Time
1001
1015
1116
1200
1345
PumpedRate-GPM
7.9
7.8
7.7
7.5
7.7
Maintained flow at 7.7 gpm for rest of test
D AC
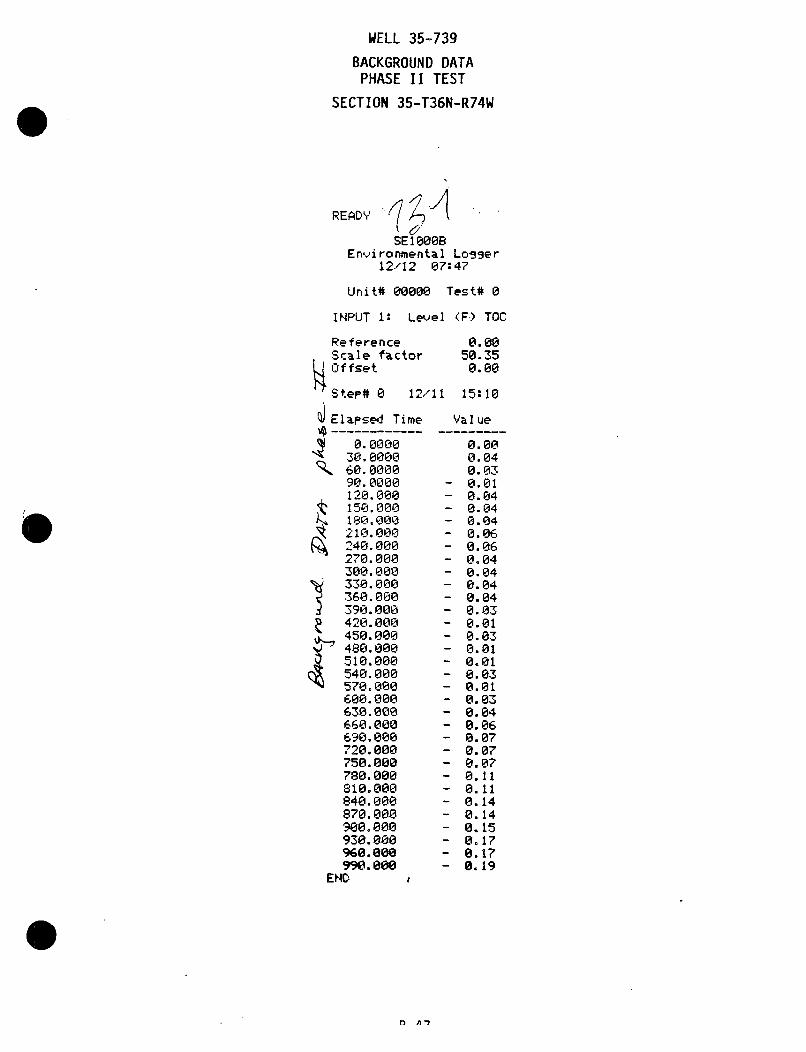
WELL 35-739
BACKGROUND DATAPHASE II TEST
SECTION 35-T36N-R74W
REAlDY
SE1000BEnvironmental Losser
12/12 07:47
Unit# @0000 Test# 0
INPUT 1: Level (F) TOC
Reference•r21o f~r4ar 0. 00
Offset 0.00
Step# 0 12/11 15:10
SElapsed Time Value
0.0000 0.0030.0000 0.0460.0000 0.0390.0000 - 0.01120.000 - 0.04150. 000 - 0.04140.000 - 0.04210.000 - 0.06340.000 - 0.06270.000 - 0.04300.000 - 0.04330.000 - 0.04360.000 - 0.04390.000 - 0.03420.000 - 0.01450.000 - 0.03480.000 - 0.01510.000 - 0.01540.000 - 0.03570.000 - 0.01600.000 - 0.03630.000 - 0.04660.000 - 0.06690.000 - 0.07720.000 - 0.07750.000 - 0.07780.000 - 0.11810.000 - 0.11840.000 - 0.14870.000 - 0.14900.000 - 0.15930.000 - 0.17960.000 - 0.17990.000 - 8.19
END
fl A'7
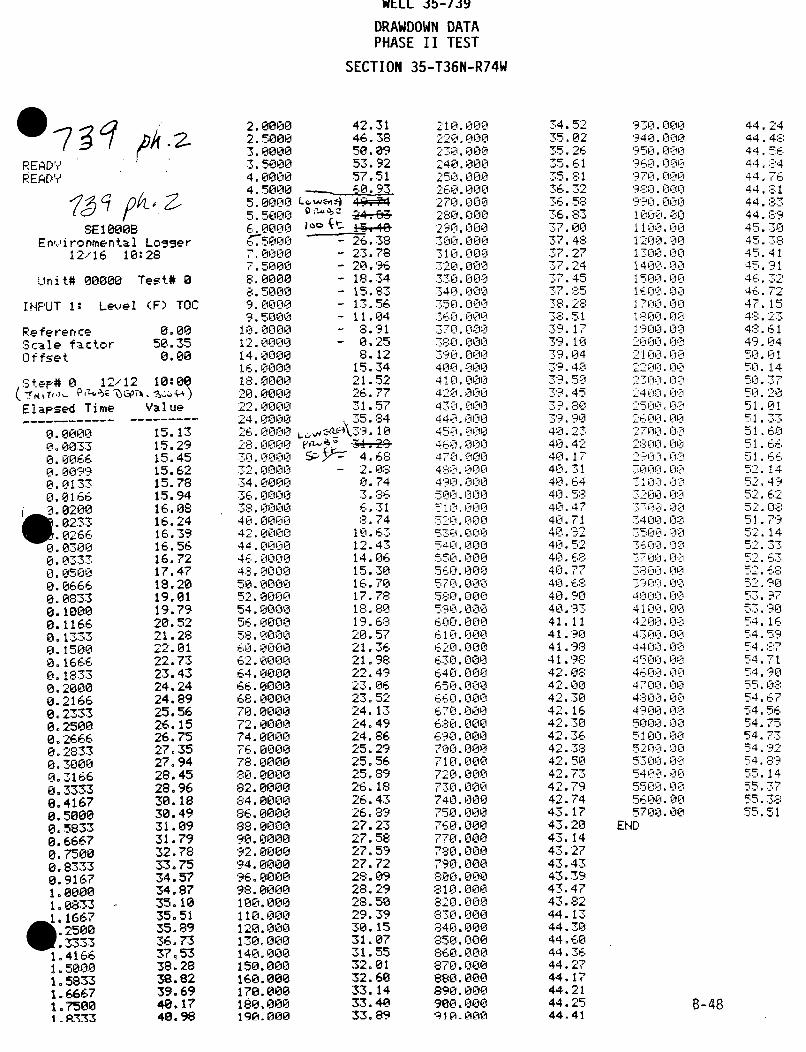
WtLL Jbo/JVDRAWDOWN DATA
PHASE II TEST
SECTION 35-T36N-R74W
@ 7 3 I
SE10008Env.-ironmental Losger
12/16 10:28
Unit# 00000 Test# 0
INPUT 1: Level (F) TOC
ReferenceScale factorOffset
0.0050.350.00
Step# 0 12/12 10:00
Elapsed Time
0.00000800330.00668.00990.01330. 016153.i•0200
0233
1W. 0333E8.06660.03700
0.03330.15000.06660.08330.1000
0.11660. 133Z0.15000. 1660. 183330.20000.21660. 231330. 250-00.°2666
0.28330.30000.31660.33330.41670.50000.58330.66670. 75000.83330.91671.00001.0833-'.1667
2500.3333
1.41661.50001.58331.66671.75001 .Rý333
Value
15.1315.2915.4515.6215.7815.9416.0816.2416.3916.5616.7217.4718.2019.0119.7920.5221.2822.0122.7323.4324.2424.8925.5626.1526.7527.3527.9428.4528.9630.1830.4931.0931.7932.7833.7534.5734.8735.1035.5135.8936.7337.5338.2838.8239.6940.1740.98
2.00002. 50003.0000
50200
4. 00004.50005.00005.,50006.00007 5 o Cor
>800007 5000
8. 00008.5008
900009. 5000C
10.0000
12. 000014. 000016E:.000018.0000
20.000022. 00002 ý4. 0000
26000028.0 00 0
34.,000038': 0000
44.0000
6. 00008. @000
50.0000
52. 000054.0800
56.0000
58.0000
50.000062. 00005ý_4. 000066. 0000
48.0000470. 000042, 0 0L-h1-T6. 000054.000080.0000
82.000084.0000
-. 000048.0000
bt. 00892.0000r94.80000
82.00008. 00001088.000
08.008
120.00092. 800894. 00096.000098.0008108.888
110.000120.000130.000140.,008158. 088168.000170.080188. 080190.080
42.3146.3850. 0953.9257.51
- L-2638
- 23.78- 28.96- 18.34- 15.83- 13.56- 11.04- 8.91- 8.25
8.1215.3421.5226. 7731.57:•5.84
LC4'. f -l1f9. 10FfaAJ *4 •-T4-8-
4.682.080.743.866.318( 74
10. 6312.4314.061503016.7017.7818.8019.6820.5721.3621.9822.4923.0623.5224. 1324.4924.8625.2925.5625.8926.1826.4326.8927.2327.5827.5927.7228.0928.2928.5029.3930.1531.0731.5532.0132.6033.1433.4033.89
210. 000
20. 000240.000290.000260.000
2.000
280T.O0002940.000I75 17.1.000
30.0 017J. 000
300.000
450.0003 1-I-.l000
440.000450. 000
:90.000400.000
410.000420.000
430.000440.000
54171. nOiIO560. 000
4 70.1000
580. 000
51;0 .0006 171 C .0 0*41 0 IO-620. 000
640.1000
650.00-560.000570.000580.000
690, 00010.00
20.000
10.000
77'0.04-JOC
740.0007650.000
,60.000
1170.000
,780, 000
190.0008 0.000D10.000720.000830. 000840.000
850.,000760.0008770. 000
8780.000
890.000900. 000
810, 000
34. 5235.02
36.-,236. 58
86.28
'IT7. 0057.4837. 27
3r7. 224--I c.4577. 85'=3:8. 28
39. 1039- 4.04
39,. 40379.50
945
37.80
79'.9040:. 2•40.4240. 1740. 3140. 64
40. 5,8,40. 4740.71
4• 9F
40.5240.,68
40. 040..41.1141i .9041.91411. '842.08
42.30r'412 16
42. 3642.-3842. 50
42.7342'. 7942.7443. 1743.2043.1443.2743.4343.3943.4743.8244.1344.3044.6044.3644.2744.1744.2144.2544.41
930. 000940. 0013
50.0 0
0 (L i 0-1.10-
2I171171F1i1100.000
1200.00
1400.00
15.b 1 -i 0l
16500.07160c. 00IDCl01.71
'00 00
20• 00
23000
1711712500. C0
1 71-1 1.117 00 00
LIL7 w -1 1.]
4.1Liin 0i0
2710I0 010
C-1 1 .1-
4 1 V- 1- 1.10
4 '00.- C, 0-
4 4n 0 010i
4t0,0-
4 70 0.0 04:3,00. CI
3160r0. O01
58000 00
5100. CO
04440O
4LlC,1 0.1C1.1
45000
*4700. CI
9E-NiD .
El-0.'
44. 2444,4844.544. :-;444. 7644. E144. 8-44.- A,'44 ... 345.30
45.4145.9146. 32
46.7247. 154':_-- . 2234 . 14'9.04
150 . 1I50. 14
51 01=1 3351 .6051 6651 66
5 '.1452 4952 .6 -252
!5 1 7914
52:' .33
=,-
='-' •3-
=4. 1 E45 90
5,4.1654.1554 -11
54.755 4 .7354. K254.69
154. 14
5 . 3
55.3755.3855.51
B-48
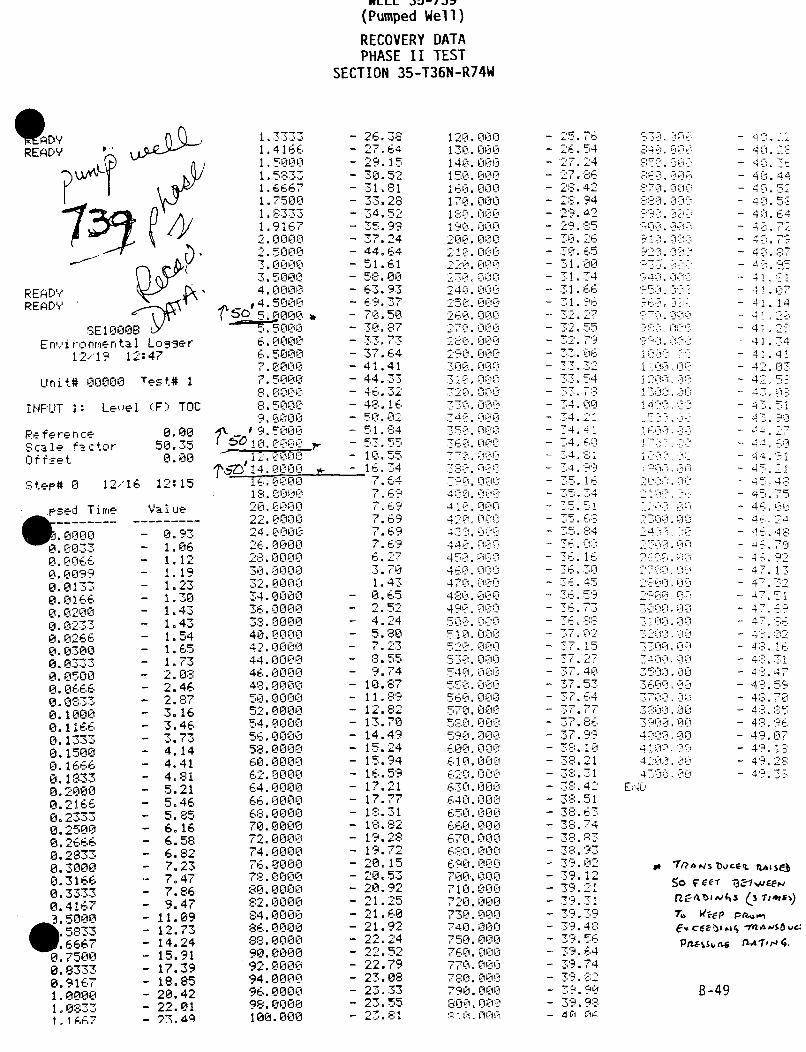
KLLL Jj-I0J3
(Pumped Well)
RECOVERY DATAPHASE II TEST
SECTION 35-T36N-R74W
W11101READY
READYREDY SE00
Envi ronrental Lo'5_er12/19 12:47
Unit# 00000 Test# 1
INPUT 1: Level (F) TOC
Reference 0.00Scale factor 50.35Offset 0.00
Step# 0 12/16 12:15
,, sed Time Value-----a--------.000 - 0.930.0033 - 1.060.006 - 1.120.0099 - 1.190.0133 - 1.230016 - 1.300.02r00 - 1.430.0233 -1.430.0266 1.540.0300 - 1.650.0333 1.73o.05o0 - 2.080.0666 - 2.460.0833 - 2.870.1000 - 3.160.1166 - 3.460.1333 - 3.730.1500 - 4.140.1666 - 4.410.1833 - 4.810.2000 - 5.210.2166 - 5.460.2333 - 5.850.2500 - 6.160.2666 - 6.580.2833 - 6.820.3000 - 7.230.3166 - 7.470.3333 - 7.860.4167 - 9.47.%5000 - 11.09
5833 - 12.73.6667 - 14.24
0.7500 - 15.910.8333 - 17.390.9167 - 18.851.0000 - 20.421.0833 - 22.011.1XA7 - 97.4%:
1.3333 -26.381.4166 27.641.5000 -29.151.5833 -30.521.6667 -31,811. 7500 -33.-2.8.1.8333 -34.521.9167 -35.9,9
1 , LI i -_ -_ 1 .
2. 0000 -30%24L2.5000 44.64
3.0000 - 51.613.5000 - 58.004 rn.0i - 63.93t 4. 5000i - 69.37
IS0 F - 70.50
6. 0000 -3-3,.736. 5000 -37.647.0000 -41.417. 5000C- 44. 338.0000 i46.328.5000 - 48.169.8r000- 50.02
t•o9. 5000 -51.8-'4o., 0000_ - 5.2-.55
77. 00015 10.55on J14.00 16.34
I '10. 0000 ;.6418. 0000 71. 69,'20. 0000 f%6922. 0000 7.6924. 0000 1. 6926. 0000 7.61928.0000lR~ 6.2730.0000 3.7032.-' 00r0 1.4334.0•000 - 0.6536. 10000l -- 2.52•38.00010 - 4.2440.08000 - 5.8042i.0 0 fl"1't-- 7.2344.000}0 - 8.5546. 0000 - 9..74489.0000•L - 10.87,50. 0000 - 11.89:'52,.0000 - 12.8•Z254. 0000 - 13.7056.000I0 - M4.4958.0000 - 15.2460,.0000 - 15.9462. 0000 - 16.59364. 0000i - 17.2166.0000O - 17.7768-'.0000 - 18.3170. 0000 - 1S.S272.0000 - 19.2874. 0000:•- - 19.72=76. 0000 - 20.1578_. 0000 - 20.5380. 0000 - 20.9282. 0000 - 21.25S4.00•00 - 21.6086. 000-0 - 21.9288. 0000 - 22.2490.0000 - 22.5292,.0000 - 22.79394. 0000 - 23.0896.0000e - 23.3398.0000 - 23.55100.000 _.,,- 2 . 81
120.000130. 000
140. 000150.000160. 000170. 0001 8i 0.000190.00-0-ii
200. r0002!0. 000220. 000
240. 000250. 000260. 000270. ;D0028--0. 000290. o0e300. 000
320. 000
72_.0. 000
,49. 000
73,5-:0.000:i362L-. 000#77?.Li L?0i0
4 ! . AM P
420. 000
4401 . 0-i
450.0r30
470.000-48,0.0009
510A. 000
J 'i - iW-
520.000O
540.000550. 000
560. 000
...LI. 0
-, ,
-._-,.' h i f 71 LI
590.000••600. -000610.00-0•,6*20-. 000630.000O64&.0006_50. AA0660. 000670.0',[0
68:0. 000690. 00070%. 0001710.0,-00720. O00730.000to40. 000,7._0. 00O760. CEO770.0003780. 000
790. 000SOO. 00e'I. LOnoL
25.7626.542.24-
27.86'€_28.:422.* 9429.42
29.8:-530.2630. 6531.0031.3431.66
31.96
.3.--,06
33. 5437":. 7"'23.4.0034.2174.4174.60
]A . S 1_4,9
35.164.,
J •-fl 1
35.6::-
3.4
76.0;-36.1i636...3036,4576,. 5'9
36, -
KI1
37.0237.15-.7.273 -,7.40
3,7.53.64
39.77
37. -66
37.99
3i.21
3S,--.42Mr: 51
3 1:=:. E, _3':;. 74
3'?. 0239.12
3'9.2139.3'139.47.
359.563'9.6439.74
39.90_-',39.98?4n. 04.,
87_.:-:_-,o000: - 4 0. 2:-ý'840' -,00.- - 40.0-t-60.00- - 40.44-7-Li -Of 0'- '--, -. 0- . -- 4 ;. ,F•
.-.-.......:Too. Rio - 40.0
'9 .i .-. - 40.'7910- ; :.25 - 3 7, ? •-
90 , 7 "-. ox 41 , ." 0
062,•. 2i::: -. 4 . Wi.1
901.--; ODD-. 4 i 2:.-ý
'1000• 02-f 41.41•
'I--.-
1i :.•00f X? 42.03
140'MA AD 42.71:
]'•,%,Y• .A- 4- .1:
!':-'""I l -i 47,5
.70..-.-- 4 1 9"
,,_,-',,.3,5 rim - 4 . 1
0-0:. 41 4 . M
-iv ý-. 44.4
. _',-'- .0i r- 4 '32100:ý. & 4 -•5, 73
I Li-- W 4 6. 2,4 O'Li_• S.t - 47.20-00.-, 0 - 44.92
2'-10- , - - 47.0-310"-0. 'i0 4 7, S.-.
3"100.,,,20,- 4S. M,.-i,
Z50-0.00 -Q :.,473600•,0'0; - 48?. 59
3700.So -- 43.07-1
39-0.0 WKp .4 &(,I00.- 49.0f 7410 so: 7,: 4 9. !;---4200k "••,0 . - 49. 2:-:47.,0•.003 49.0?
ENE.,
B-49
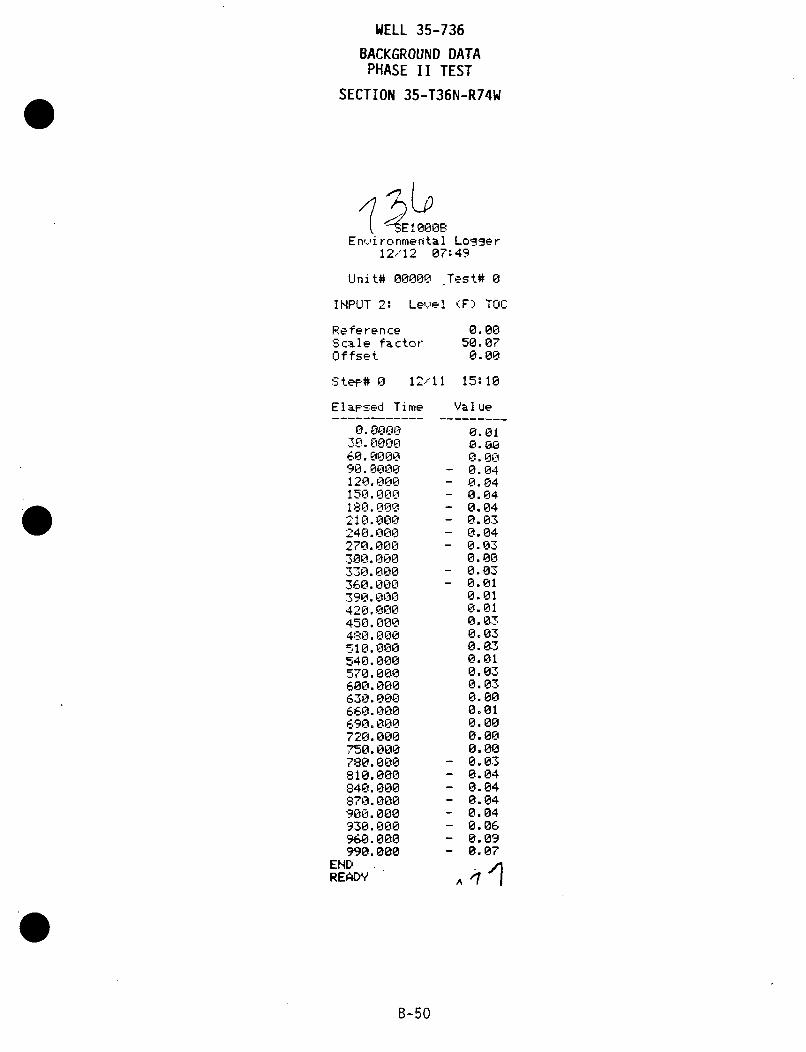
WELL 35-736
BACKGROUND DATAPHASE II TEST
SECTION 35-T36N-R74W
3LoOE1000B
Environmental Lo39er12/12 07:49
Unit# 00000 Test# 0
INPUT 2: Level (F) TOC
ReferenceScale factorOffset
0.0050.070.00
Step# 0 12/11 15:10
Elapsed Time
3.0000
60. (00090.0000120.000150.000180.000210.000240.000270.000300.000330.000360.000390.000420.000450.000480.000510.000540.000570.000600.000630.000660.000690.000720.000750.000780.000810.000840.000870.000900.000930.000960.000990.000
ENDREVDY
Val ue
0.01Ci.0
0.00- 0.04- 0.04- 0.04- 0.04- 0.03- 0.04- 0.03
0.00- 0.03- 0.01
0.010.010.030.030.030.010.030.030.000.010.000.000.00
- 0.03- 0.04- 0.04- 0.04- 0.04- 0.06- 0.09- 0.07
AllI
B-50
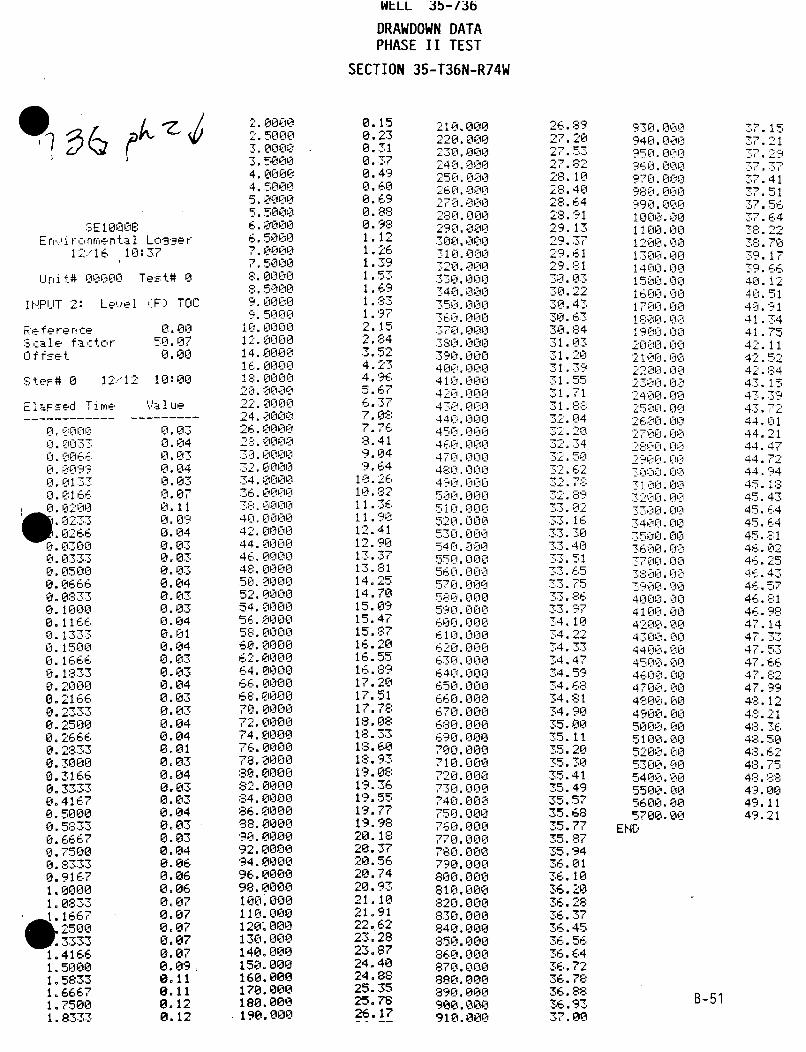
WLLL ib-/3b
DRAWDOWN DATA
PHASE II TEST
SECTION 35-T36N-R74W
SE I1OQOE
Enri ironrme ntal Log_:er12/16 10:37
Urit# 00000 Test# 0
I PFUT 2: Le 1e (F) TOC
ReferenceScale factorif fset
50.0?
0.00
SteF'# 0 12212 10:00
E l aFsed Time aI ue
0. 03-3 0.040. 006-. 0.03
0l,0099t~ 0.040. 01.- 0.030. 0 166. 0. 07
(0 . 0 21 023020 0..'0011
Af. 031200 0. 091W. 30.03
0. 0500 0.040. 01-16 0. 040. Pi87133 0.03
0.1000 0. 030. 11rm'6 0.040. 1373 0.01
0.1500 0.040. 16616 0. 03.
1:11. 1833 0.0C30. 000 0 .040.2166 0.030. 133 3 0.030.l2500 0.040. 2616 0.040. 28313 0.010.3000 0 030.3166 0.040. 33773 0.030. 41E7 0.030.5000 0.040. 5833 0.030. 6667 0.030.7500 0.040. 8333 0.060.9167 0.061.0000 0.061.0833 0.07
t.1667 0.07u.?5000 0.04
3.333 0.071.4166 0.061.5000 0.06;
1.5833 0.111.46667 0.11
1.7500 0.121.8333 0.12
2.00002.5000
3. 50004. 00004. 50005. 00005. 580CI6. Oc0006. 50CIO7. 0 000L-1'.50008. 0000R. 5000
9. 5000O
9 11711
0 0 01
12. 000014. 000016. 00001:-:. 0000.22. 00.022.0 0 -0
24. i_000026. 0000
O0.00-10
34 . 0000
34. 0000
40. 12000042'. C10 C0044. ON-0461. O000048. 000050. 000052. 000054. 0000O56. 0000O58. 0000GO. 0000
0000
64, 0000
68. 000070. WOO072. 000074. 000076. 000078. 0000:30. MOO0821. 0000834.1.J00086. 000088. 0000,90. 0000'92. 000094. 000096. 000098. 0000100. 000
110.0001110 000413. 000140. 000150.000160. 000170. 000180. 000190.0000
0.150.230.31
0.490.60
0.880.981.121.261.391.531 .691 . 831 .972.152.,843.52
4.234.965.676.377.087.768. 419.049. 6410r.4
12.41
1 7pr13.37S
14 .2514.7015. 0915. 415.8716.2016.5516. ,-3917.2017.5117.7818.0818.331:3.6018.9319.0819.3619.5519.7719.9820.1820.3720.5620.7420.9321. 1021.9122.6223.2823.8724.4024.8825.3525.7826.17
2,10.00022 0. 00020. 000
40. 000250. 000
-70. 000280. 000290 . c0:c
30.000
7310. 00020 . 00 0
3-40. 000351 i0.cl00
70. 000l73 10 0001
390.. 00174N1. 0nn41 10. 000
42l. 13111
4 40. 00
450. 0 0 F
47'"0. 0011 04180. 00
'91;1 131110117
i flu0 lic
52C'. 000
540. 000550. 000
57.000
F9. l -0 00600. 000610. 01111
411. o1-L l
6 0, . 01010
640.0006;50. 000
.16.0,000E;770. cl000A-80. 000690. 00070. CIO70. 000
730. 000l7140. 000.50. 000
4. OeiLli .1
760.0777.0.000780. 000
i 90.000800. 000
810.000820. 000:3717. 000840. 000850. 000:360. 000
870. 000880.000890. 000900. 000910. 000
26. 89S7.20
27.-53-
28. 1028.4048. 64
29.1329.37Li.6129. 'R-
-.0. 07
43
11 . 4".-0.6384
41.2051
31.5531.717-1.804
4204234
4Z. 59
47 65
32.61
5 0
2.7..2:-'.
".5 11
.>J. 5?
35.68
35.8?
35.9734. 313. 4935.5931. 6835. 78
35. 8735.94
36. 0813.109
36.30
36.45
36.64
36.01236.7836.28316.28777.370
9"30. 000940. 000
9570. 0
'7960. 0109 710. 00
9911 fil'r
1100. 001
1200. 00i30P :131
160l.0 005700. On
LIII F1 713-c
Iri::O li 11
210 00
23000.2'400.00l
E50. C O-100
171 j7. tu r!000.0
7 1001 C1L3
73 0 0. 001'_4017. :00
5100. nn
3 00.O37 70 0. zlo0
7i -:17 i . 111C
4000.0CI4 100. 00
4l 211 ,. 0110
4 -11711 1111
4600.00lc
114 - OC. lII0
4 1100. 010
4900l. 005000.0CI5 100. 00
5200. CI5.300. 0
5400. 005500.0CIl
5600. 005700. 00
END
3 7.21
741.7.5=1
-o.70
39ý_. 179. 66
40. 12'40. 5140.5141.7 441. 75
4 2.52
44.1543.31943. _72744.1 ---l44.2144.4744 7244.9445. 145. 445.4-445. 6445. 8146.0246. 254c 4746.5746.8146.9847.14
47.347.5'3
47.647. 8'247.9948.124c8. 21
48. 3648-..5048. 622
48.7548. 8':49.0049.1149.21
B-51
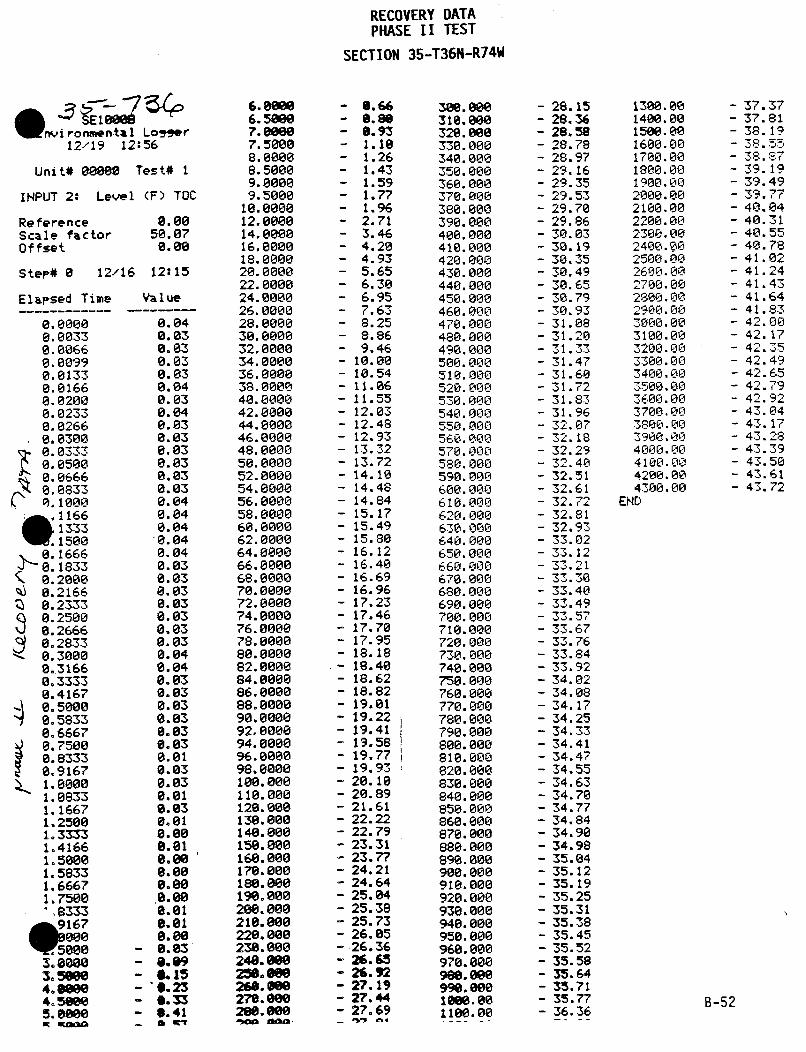
RECOVERY DATAPHASE II TEST
SECTION 35-T36N-R74W
s~-7 4oO nvi roninntal Logger
12/19 12:56
Unit# 00000 Tes t# 1
INPUT 2: Level (F) TOC
Reference 8.00Scale factor 50.07Offset 0.00
Step# 0 12/16 12:15
Elapsed Time Value
0.0000 0.040.0033 0.030.0066 8.030.0099 0.030.0133 0.030.0166 0.040.0200 0.030.0233 0.040.0266 0.030.0300 0.030.0333 0.030.8500 0.030.0666 0.030.0833 0.03
C•' .1000 0.041166 0.0413353 0.04
.1500 -0.040. 1666 0.040.1833 0.03
<1 0.2000 0.030.2166 0.030.2333 0.030.2500 0.030.2666 0.030.2833 0.030.3000 0.040..3166 0.040.3333 0.030.4167 0.030.5000 0.030.5833 0.030.6667 0.030.7500 0.030.8333 0.010.9167 0,03
1.0000 0.031.0833 0.011.1667 8.031.2500 0.011.3333 0.001.4166 0.011.5000 8.001.5833 0.801.6667 0.001.7500 0.00A,8333 0.01.9167 0.01l
)000 0.00
5000 - 8.833.0080 - 8.093.5m80 - .154o6680 -'6.23
4.5680 - 6.335.8880 - 0.41
IR .09o i amt
6.80OM6.58007. em87.50008.00008.50009.00009.5000
10.000012.000014.8000016.8000018.000020.000022.000024.000026.000028.000030.000032.000034.000036.000038.000040.000042.000044.000046.000048.8000050.8000052.8000054.000056.8000058.000060.000062.000064.8000066.000068.000070.000072.000074.000076.000078.8000080.000082.000084.000886.8000088.000090. 000092.000094.000096.000098.0000100.000110.000120. 00e138.000140.000150.000160.8000170.000180.000198.000200.000210.000220.000238.000240.8ON258. O2". SW0278.9W8280.8We
AOO Mad
6.660.800.931.181.261.431.591.771.962.713.464.204.935.656.306.957.638.258.869.46
10.0010.5411.0611.5512.0312.4812.9313.3213.7214.1014.4814.8415.1715.4915.8016.1216.4016.6916.9617.2317.4617.7017.9518.1818.4018.6218.8219.0119.2219.4119.5819.7719. 9320.1020.8921.6122.2222.7923.3123.7724.2124.6425.8425.3825.7326.0526.3626.6526.9227.1927.4427.69
a%3pt 4
3m0. 00318.00.320. 000330.000340.000350.000360.000370.000380.000390.000400.000410.000420.000430.000440.000450.000460.000470.000480.000490.000500.000510.000520.000530.000540.000550.000560.000570.000580.000590.000600.000610.000620.000630.000640.000650.000660. 000670.000680.000690.000700.000710.000720.000730.000740.000750.000760.000770.000780.000790.000800.000810.000820.000830.000840.000850.000860.000870.000880.000890.000900.000910.000920.000930.000940.000950.000960.000970.000900.w00990.000180.801180.00
28.1528.3628.5828.7828.9729.1629.3529.5329.7029.8630.0330.1930.3530.4930.6530.7930.9331.0831.2031.3331.4731.6031.7231.8331.9632.0732. 1832.29
2. 4032.5132.6132.7232.8132.9333.0233.1233. 2133.3033.4033.4933.5733.6733.7633.8433.9234.0234.0834.1734.2534.3334.4134.4734.5534.6334.7034.7734.8434.9034.9835.0435.1235.1935.2535.3135.3835.4535.5235.5835.6435.7135.7736.36
1300.001400.001580.001600.001700.001800.001900.002000.002100.002200.002300.002400.002500.002600.002700.002800.002900.003000.003100.003200.003300.003400.00,500.003600.003700.003800.003900.004000.004100.004200.004300,00
END
37.3737.8138.1938.5538.8739.1939.4939.7740.0440.3140.5540.7841.0241.2441.4341.6441.8342.0042.1742.3542.4942.6542.7942.9243.0443.1743.2843.3943.5043. 6143.72
B-52
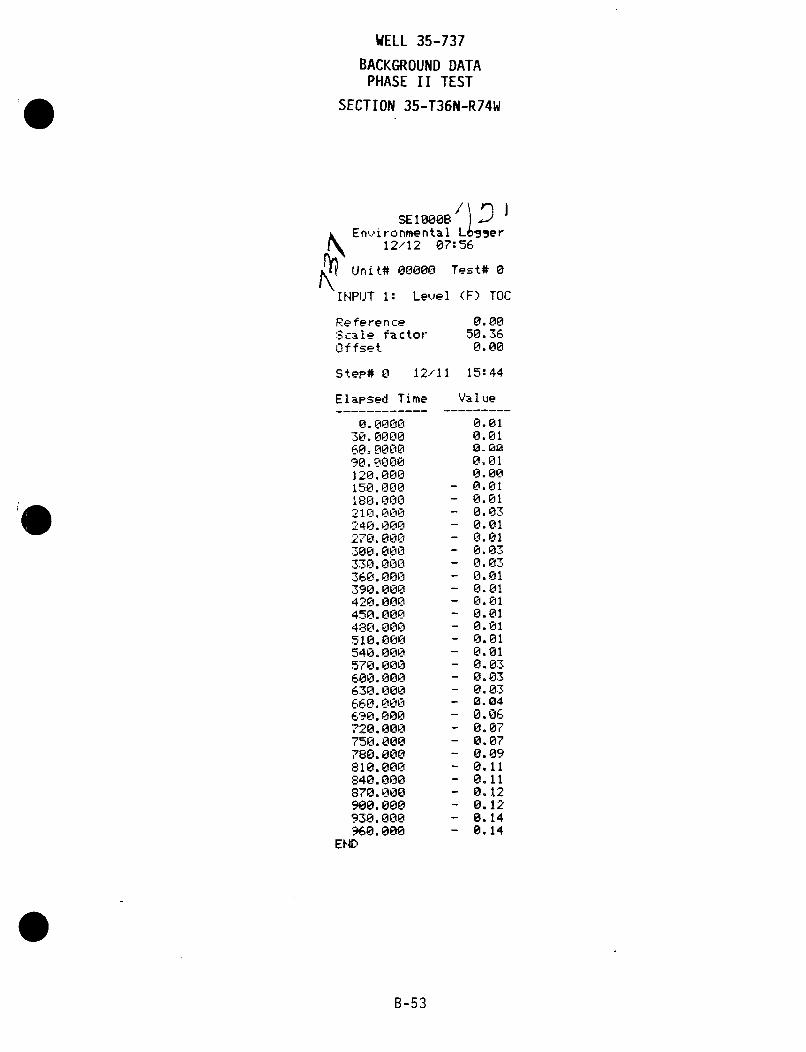
WELL 35-737
BACKGROUND DATAPHASE II TEST
SECTION 35-T36N-R74W
SE100080 DEnv,,ironmental Lbsser
12/12 07:56
Unit# 00000 Test# 0
INPUT 1: Level (F) TOC
ReferenceScale factorOffset
0.0050.360.00
Step# 0 12/11 15:44
Elapsed Time
0.000030.00006@-000090.0000120.000150.000180.000210.000240.000270.000380.00330.000360.000390.000420.000450.000480.000510.000540.000570.000600.000630.000660. 000690.000720.000750.000780.000810.000840.000870.000900.000930.000960.000
END
Va 1 ue
0.010.01
0.010.00
- 0.01- 0.01- 0.03- 0.01- 0.01- 0.03- 0.03- 0.01- 0.01- 0.01- 0.01- 0.01- 0.01- 0.01- 0.03- 0.03- 0.03- 2.04- 0.06- 0.07- 0.07- 0.09- 0.11- 0.11- 0.12- 0.12- 0.14- 0.14
B-53
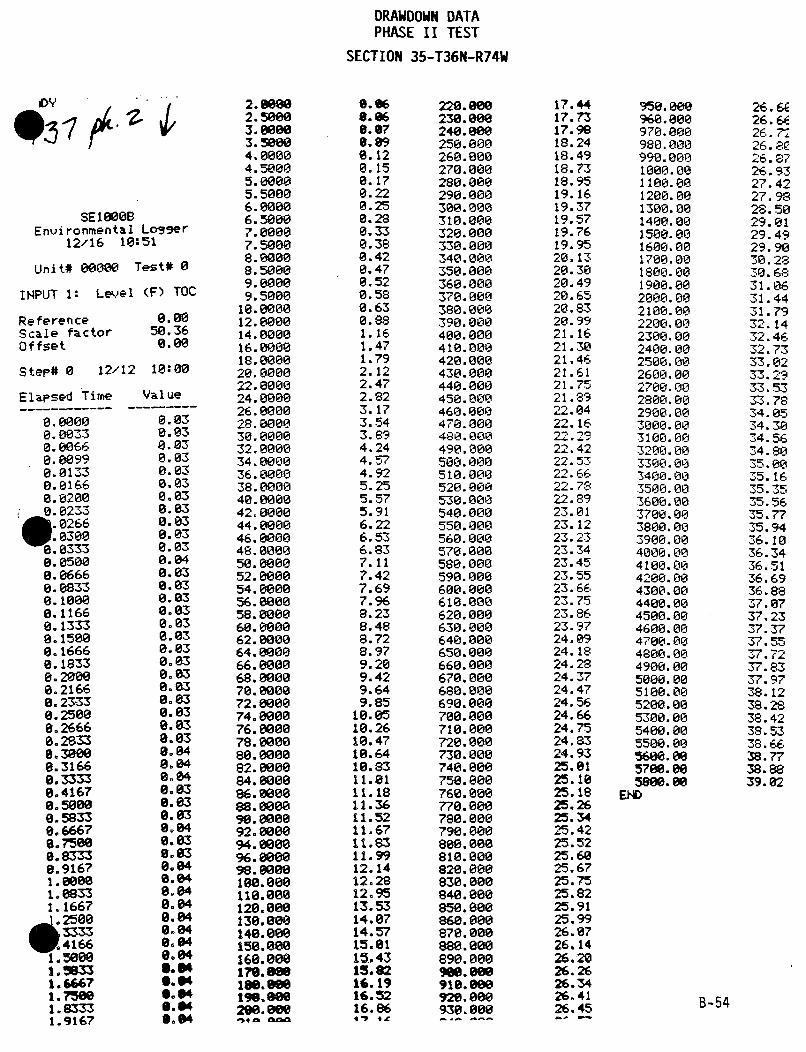
DRAWDOWN DATAPHASE II TEST
SECTION 35-T36N-R74W
DY
SE1800BEnvironmental Lo9ger
12/16 18:51
Unit# 00000 Test# 0
INPUT 1: Lev.el (F) TOC
Reference 0.00Scale factor 50.36Offset 0.00
Step# 0 12/12 18:00
Elapsed Time Value
0.0000 0.030.0033 0.030.0066 0.038.0099 0.030.0133 0.030.0166 0.030.0200 0.030.0233 0.83of.266 0.03q 03-00 0.03
8.0333 0.030. 0500 0.04
0.0666 0.030.8833 0.030.1000 0.030.1166 0.030.1333 0.038.1500 0.030.1666 0.030.1833 0.030.208 08.030.2166 0.030.23-33 8.038.2500 0.838.2666 0.038.2833 8.030.3080 0.840.3166 0.048.3333 8.048.4167 8.030.5000 0.030.5833 8.030.6667 .8048.7500 0.030.8333 08.30.9167 0.041.0000 0.041.0833 8.041.1667 0.04
2500 8.04
3333 0.044166 8.04
1,5000 0.04I. "M 9..94
1.6667 g.041. 758 6.041.8333 6.041.9167 so04
2.980W2.500W3.088003.50004.00004.50005.00005.50006.80806.50007. W007.50008. 80008.50009.00009.5000
10.000812.000014.000016.000018. 000020.000022.000024.000026.000028.8000030.000032.000034.000036.000038.000040.000042. 000044.000046.000048.000050.000052.000054.000856.800058.000060.8000062.000064.000066.000068.000070.000072.800074.000076.880878.000080.000082.000884.008086.008888.080090.000092.000094.000096.000098.0000100.000110.000120.0880130.000140.000150.000160.000176.9w6188.868
210.9W62&.000
9.960.069.07/9.99e.120.150.170.220.250.280.330.380.420.470.520.580.630.881.161.471.792.122.472.823.173.543.894.244.574.925.255.575.916.226.536.837.117.427.697.968.238.488.728.979.289.429.649.85
10.0510.2610.4718.6410.8311.0111.1811.3611.5211.6711.8311.9912.1412.2812.9513.5314.0714.5715.8115,4315.0216.1916.5216.86,.', ft
220.00W230.80M240.80M250.000260.000270.000280.000290.000300.080310.000320.000330.000340.000350.000360.000370.000380.000390.000400.000410.000420.000430.000440.000450. 0M-468.008470.000480.000490.000500.000510.000520.000530.000540.000550.000560.000570.000580.000590.000600.000610.000620.000630.000640.000650.000660.000670.000680.000690.000700.000710.000720.000730.000740.000750.000760.000770.000780.000790.000880.000810.000820.000830.000840.000858.080860.000870.000880.000890.000900.0ow910.000928.M80930.000
17.4417.7317.9818.2418.4918.7318.9519.1619.3719.5719.7619.9520.1320.3020.4920.6520.8320.9921.1621.3021.4621.6121.7521.8922.0422. 16
22. 2922 .4222.5722.6622.7822.8923.0123. 1223.2323.3423.4523.5523.6623.7523.8623.9724.0924.1824.2824.3724.4724.5624.6624.7524.8324.9325.0125.1025.1825.2625.3425.4225.5225.6025.6725.7525.8225.9125.9926.0726.1426.2026.2626.3426.4126.45
95.800096.8000970.000980.000990.0001000.001100.001200.001300.001400.001500.001600.001700.001800.001900.002000.082100.002200.082300. O02400.002500.002600.082700.002800.002900.003000.003108.083200.003300.003400.003500.003600.003700.003800.003900.004000.004100.004200.084300.004400.004500.004600.004700.004800.004900.005080.005100.005200.005300.005460.005500.0056M8.005700.005800.08
END
26. U26. 6626. 7226.8C2,j. aor26.9327.4227.9828.5029.0129.4929.9030.2830.6831.0631.4431.7932.1432.4632.7333.0233.2933.5333.7834.0534.3034.5634.8035.0035.1635.3535.5635.7735.9436.1036.3436.5136.6936.8837.0737.2337.3737.5537.7237.8337. 9738.1238.2838.4238.5338.6638.7738.8839.02
B-54
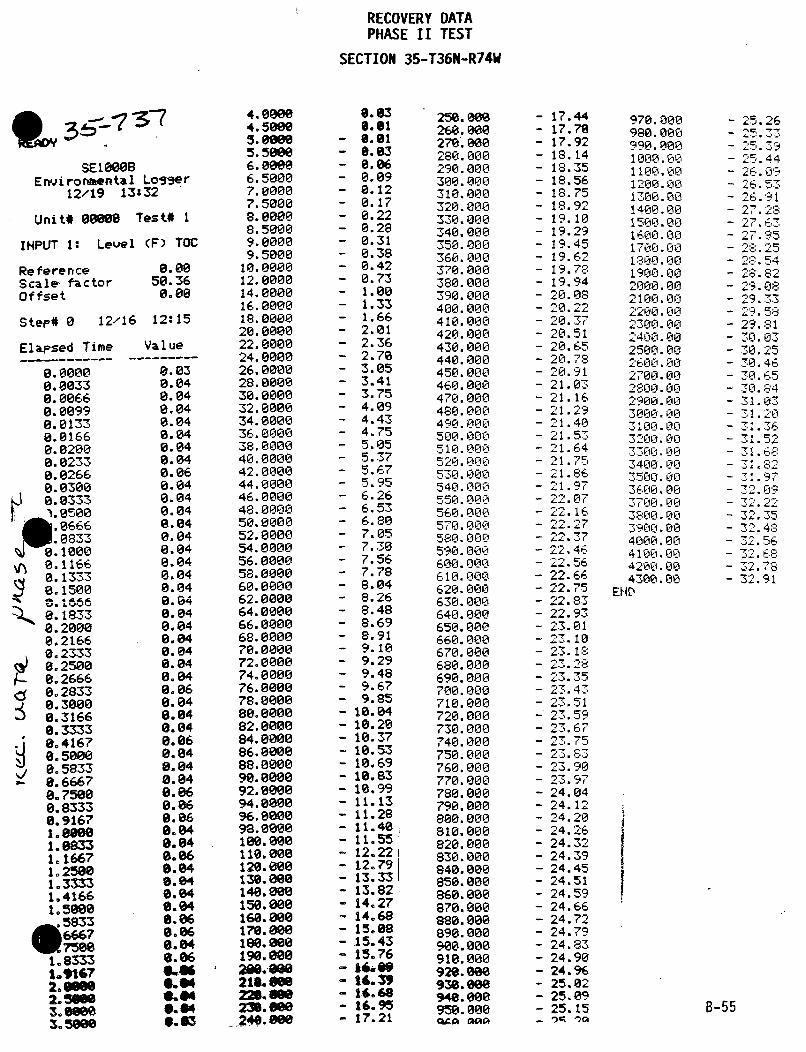
RECOVERY DATAPHASE II TEST
SECTION 35-T36N-R74W
SE•180BEnvironmental Logger
12/19 13:32
Unit# 0808M Test# I
INPUT 1: Level (F) TOC
ReferenceScale' factorOffset
0.0050.360.08
Step# 0 12/16 12:15
Elapsed Time
0.00000.00330.00660.80990.01338.81660.02000.82330.82660. 0300
0.6660833
0:1000
j' 0.11660.13330. 1500
0.20000.21660. 23330.25000. 26660.28330. 30008.3166
8.33330.4167S. 5000
0.58336.66678.75000.83338.91671.986801.83=31.16671.25801.33331.4166
5833
1.83331.9167
2.5M
3.5m8
Value
0.03.804.804
0.040.040.048.048.040.060.040.040.04e. 040.04
.804
.8040.048.040.840.84
.8040.040.048.848.840.06
.8048.04
.804
.806O. 048.040.048.060.068.060.048.048.068.048.040.046.049.060.060.046.066.66Os.*0.040.940.64
4.0OWO4.50005.6e885.56666.88Me6.50007.00007.50008.00008.50009.00009.5000
10.000012.000014.000016.000018.000020.000022.000024.000026.000028.000030.000032.000034.000036.000038.000040.000042.000044.000046.000048.000050.000052.000054.000056.000058.000060.000062.000064.000066.000068.000070.000072.000074.000076.000078.000080.000082.000084.000086.000088.000090.000092.000094.000096.000098.0000100.000110.000120.000130.000140.888150.000160.000170.000180.000190.888290658210. ON2a2Lm2ae. S12". OW
8.830.018.818.838.860.09
0.120.170.220.280.310.380.420.731.8001.331.662.012.362.703.053.413.754.094.434.755.055.375.675.956.266.536.807.057.307.567.788.048.268.488.698.919.109.299.489.679.8510.0410.20810.3710.5310.6910.8318.9911.1311.2811.4011.5512.2212.7913.3313.82.14.2714.6815.e815.4315.7616.39
16.6616.9517.21
250.088260.000278. 080280. 000290. 000300.000310.000320.000330.000340. 008350. 000360. 000370. 000380. 000390. 000400. 000410. 000420. 000430. 000440. 000450. 000460.000470. 000480. 000490. 000500. 000510. 000520. 000530. 000540. 000550. 000560.000570. 000580. 000590. 000600. 000610. 000620. 000630. 000640.000650.000660. 000670.000680. 000690. 000700.000710.000720.000730.000740.000750.000760.000770.000780.000790.000800.000810.000820.000830.000840.000850.000868. 000870.000880.000890.8000900.000910.000926.6We936.8we948.000950.000
17.4417.7e17.9218.1418.3518.5618.7518.9219.1019.2919.4519.6219.7819.9420.0820.2220.3720.5120.6520.7820.9121.00321.1621.22921.4021.5321. 6421.7521.8621 .9722.07
•..A'
. -'2 1'E"
2 2. 22 7x-2.7*
22. 462.7.5622.6622.7522.8322.9323.01
23.10.18
23.3523. 43
2'3. 5123.5923.67
2. 75
23.9023.9724.0424.1224.2024.2624.3224.3924.4524.5124.5924.6624.7224.7924.8324.9024.9625.0225.0925.155>W *'>g
970. 000980.000990.000100. 001100.001200.001300.001400.001500.001600.001700.001808.001900.002000. 002100. 002400.002300.00
74-00. 001700. 002000. 00
270002 8 -10Sr
100. 00
29 CIO.
-3 0 ,-1 0II0
3400.00
MOO.lV 003100.004200.00
4300.00
END~
-25.2625.
-25. .44,- 2.j09
5
-7 2-.9
95-28.25
.-. 54
-28.82
- 9.58-29.81
-0. 0'3-- 30.2530.463- 0.6E 5M- 384
- 31.3
-31 4-- j )h•
- 32. 48
32.91
I
8-55
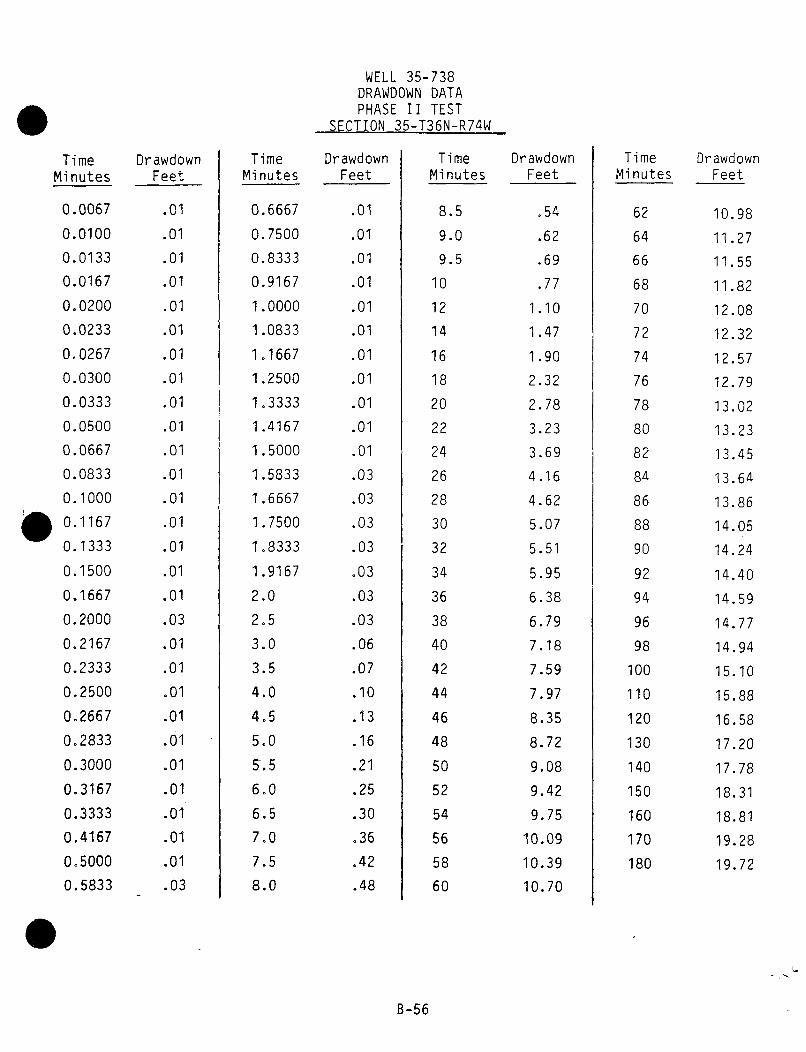
WELL 35-738DRAWDOWN DATAPHASE II TEST
SECTION 35-T36N-R74W
Time Drawdown Time Drawdown Time Drawdown Time DrawdownMinutes Feet Minutes Feet Minutes Feet Minutes Feet
0.0067 .01 0.6667 .01 8.5 .54 62 10.98
0.0100 .01 0.7500 .01 9.0 .62 64 11.27
0.0133 .01 0.8333 .01 9.5 .69 66 11.55
0.0167 .01 0.9167 .01 10 .77 68 11.82
0.0200 .01 1.0000 .01 12 1.10 70 12.08
0.0233 .01 1.0833 .01 14 1.47 72 12.32
0.0267 .01 1.1667 .01 16 1.90 74 12.57
0.0300 .01 1.2500 .01 18 2.32 76 12.79
0.0333 .01 1.3333 .01 20 2.78 78 13.02
0.0500 .01 1.4167 .01 22 3.23 80 13.23
0.0667 .01 1.5000 .01 24 3.69 82 13.45
0.0833 .01 1.5833 .03 26 4.16 84 13.64
0.1000 .01 1.6667 .03 28 4.62 86 13.86
0.1167 .01 1.7500 .03 30 5.07 88 14.05
0.1333 .01 1.8333 .03 32 5.51 90 14.24
0.1500 .01 1.9167 .03 34 5.95 92 14.40
0.1667 .01 2.0 .03 36 6.38 94 14.59
0.2000 .03 2.5 .03 38 6.79 96 14.77
0.2167 .01 3.0 .06 40 7.18 98 14.94
0.2333 .01 3.5 .07 42 7.59 100 15.10
0.2500 .01 4.0 .10 44 7.97 110 15.88
0.2667 .01 4.5 .13 46 8.35 120 16.58
0.2833 .01 5.0 .16 48 8.72 130 17.20
0.3000 .01 5.5 .21 50 9.08 140 17.78
0.3167 .01 6.0 .25 52 9.42 150 18.31
0.3333 .01 6.5 .30 54 9.75 160 18.81
0.4167 .01 7.0 .36 56 10.09 170 19.28
0.5000 .01 7.5 .42 58 10.39 180 19.72
0.5833 .03 8.0 .48 60 10.70
B-56
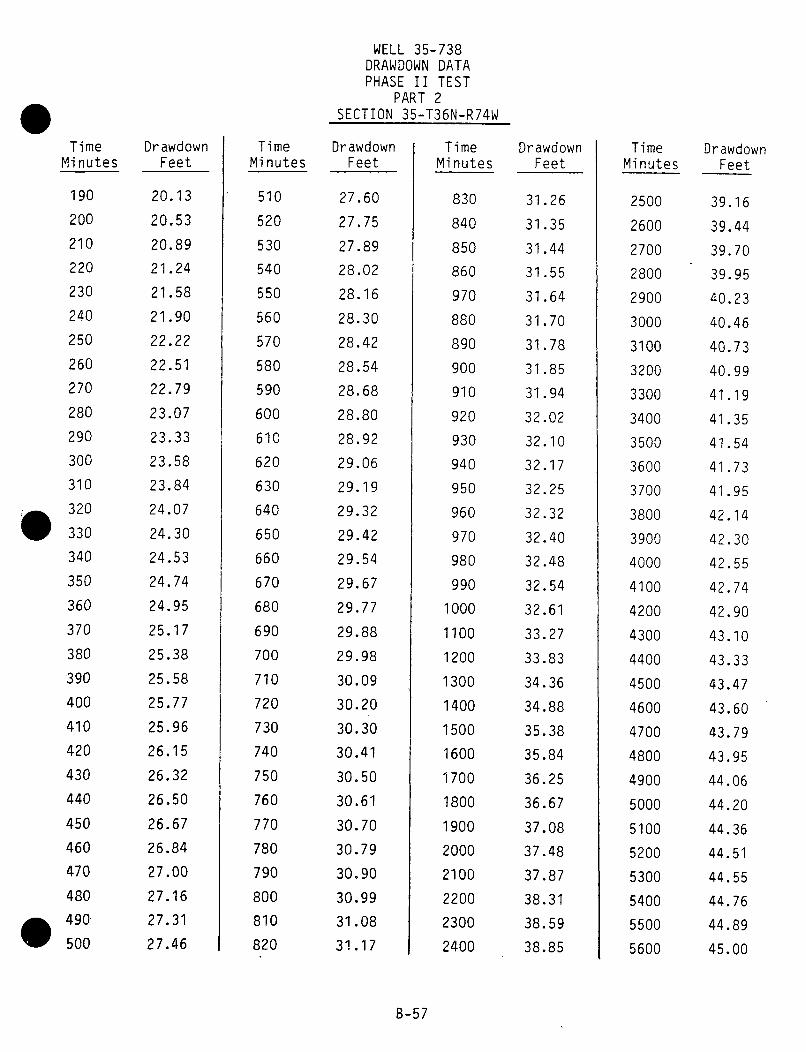
WELL 35-738DRAWDOWN DATAPHASE II TEST
PART 2SECTION 35-T36N-R74W
Time Drawdown Time Drawdown Time Drawdown Time DrawdownMinutes Feet Minutes Feet Minutes Feet Minutes Feet
190 20.13 510 27.60 830 31.26 2500 39.16200 20.53 520 27.75 840 31.35 2600 39.44210 20.89 530 27.89 850 31.44 2700 39.70220 21.24 540 28.02 860 31.55 2800 39.95230 21.58 550 28.16 970 31.64 2900 40.23240 21.90 560 28.30 880 31.70 3000 40.46250 22.22 570 28.42 890 31.78 3100 40.73260 22.51 580 28.54 900 31.85 3200 40.99270 22.79 590 28.68 910 31.94 3300 41.19280 23.07 600 28.80 920 32.02 3400 41.35290 23.33 610 28.92 930 32.10 3500 41.54300 23.58 620 29.06 940 32.17 3600 41.73310 23.84 630 29.19 950 32.25 3700 41.95320 24.07 640 29.32 960 32.32 3800 42.14330 24.30 650 29.42 970 32.40 3900 42.30340 24.53 660 29.54 980 32.48 4000 42.55350 24.74 670 29.67 990 32.54 4100 42.74360 24.95 680 29.77 1000 32.61 4200 42.90370 25.17 690 29.88 1100 33.27 4300 43.10380 25.38 700 29.98 1200 33.83 4400 43.33'390 25.58 710 30.09 1300 34.36 4500 43.47400 25.77 720 30.20 1400 34.88 4600 43.60410 25.96 730 30.30 1500 35.38 4700 43.79420 26.15 740 30.41 1600 35.84 4800 43.95430 26.32 750 30.50 1700 36.25 4900 44.06440 26.50 760 30.61 1800 36.67 5000 44.20450 26.67 770 30.70 1900 37.08 5100 44.36460 26.84 780 30.79 2000 37.48 5200 44.51470 27.00 790 30.90 2100 37.87 5300 44.55480 27.16 800 30.99 2200 38.31 5400 44.76490 27.31 810 31.08 2300 38.59 5500 44.89500 27.46 820 31.17 2400 38.85 5600 45.00
B-57
Section 35 Underlying Shale Test
As previously stated, attempts to repair the seal in the original
underlying shale well were unsuccessful and a new shale monitor well,
well 737-A, was completed. This test was conducted to evaluate the
underlying shale completion. Transducers were placed in shale well
737-A and in production zone monitor well 736. Fluid levels in pumped
well 739 were checked periodically with a wire line probe. Data
collected from the above wells during this test follow this page.
B-58
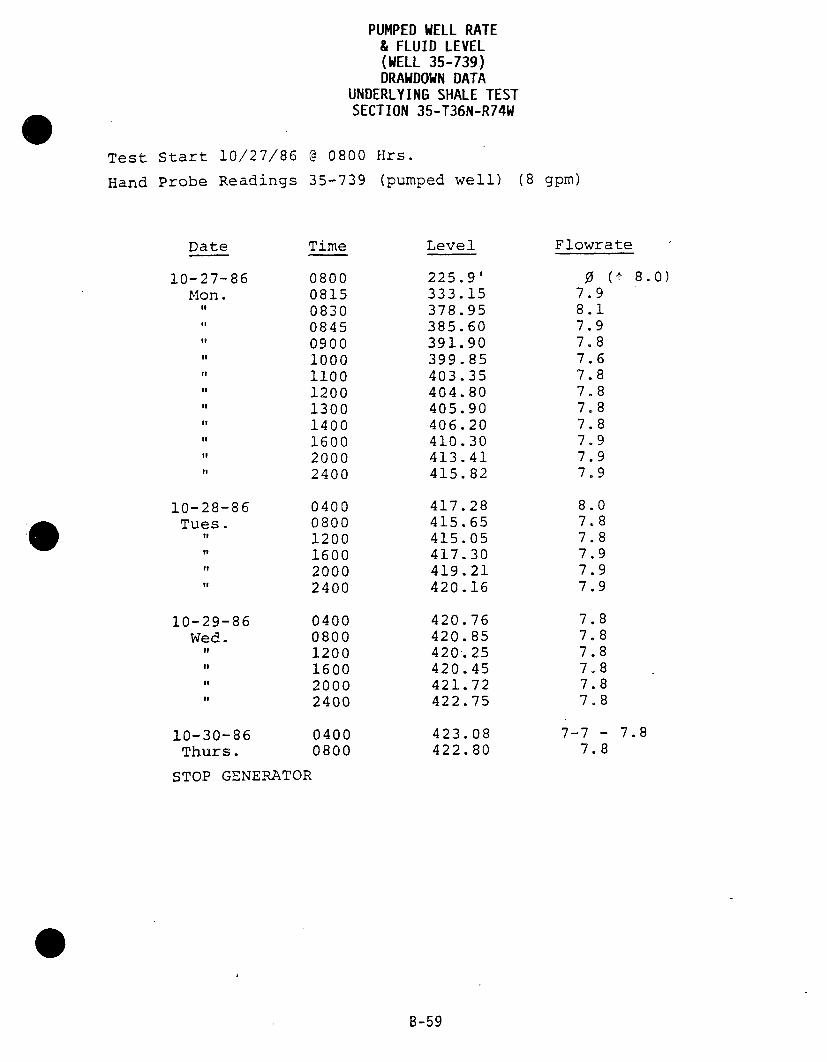
PUMPED WELL RATE& FLUID LEVEL(WELL 35-739)DRAWDOWN DATA
UNDERLYING SHALE TESTSECTION 35-T36N-R74W
Test Start 10/27/86 @ 0800 Hrs.
Hand Probe Readings 35-739 (pumped well)
Level
(8 gpm)
FlowrateDate
10-27-86Mon.
to
11
of
it
It
it
If
itII
It
'I
10-28-86Tues.
it
It
'I
10-29-86Wed.
If
It'I
10-30-86Thurs.
Time
0800081508300845090010001100120013001400160020002400
040008001200160020002400
040008001200160020002400
04000800
225.9'333.15378.95385.60391.90399.85403.35404.80405.90406.20410.30413.41415.82
417.28415.65415.05417.30419.21420.16
420.76420.85420-.25420.45421.72422.75
423.08422.80
0 (t 8. 0)7.98.17.97.87.67.87.87.87.87.97.97.9
8.07.87.87.97.97.9
7.87.87.87.87.87.8
7-7 - 7.87.8
STOP GENERATOR
B-59
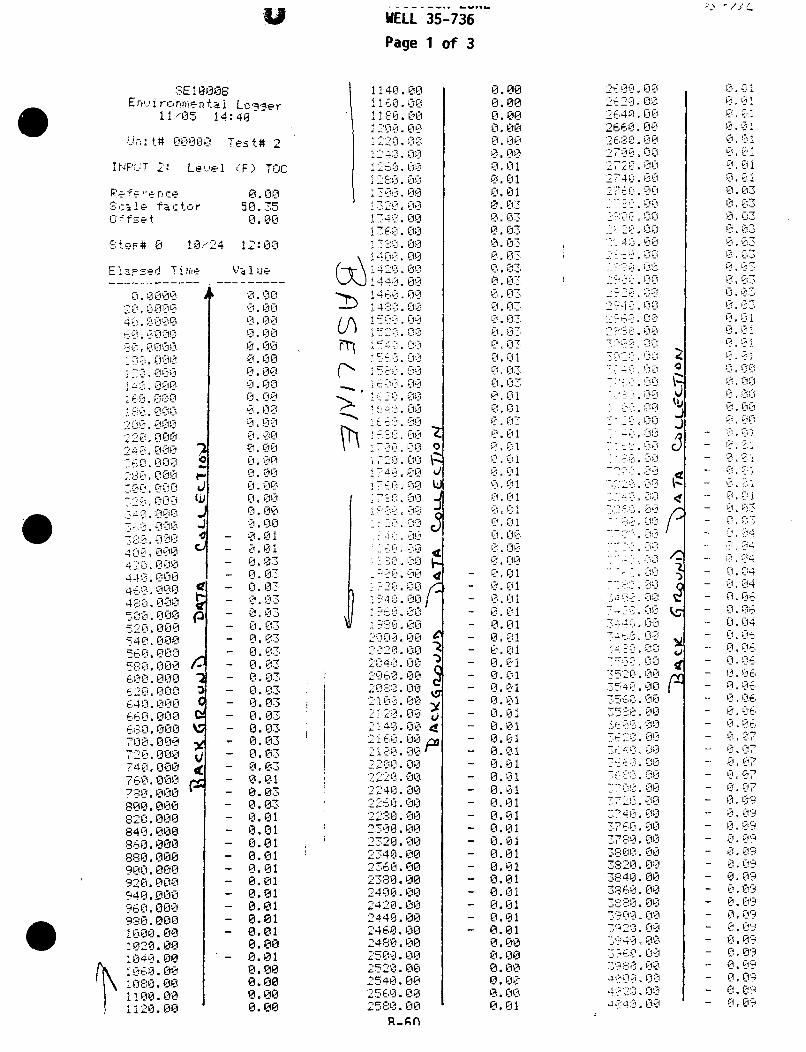
U WELL 35-736
Page 1 of 3
ý.ý -/Yl
SE 18008En,.'i ronri entia Lo._.3er
11/05 14: 40
Unit# 00000 Test# 2
INPUT 2: Le'.,1 (F) TOc
F'ýý -Fý reý r, -:e
S-ae ftactorOffset
0.0050.350.00
Step# 0 10/24 12:00
El ased Time VaI ue
0.00900 A 0o. 0020.0000 to. 00fi
4* ,''' Lil1 Li. 1-i1029...0-0On 0.00
84. 000i1 0.00
2:,00.00 0,0014. 000' 0.00
i 1-80;T.00,0 0.00n
,, L-. i. -,i@ P-t L-i1i
'200,.000 0100220.000 0.00:240.000 ,., 0. 00
-. -ý 'Q -00 C1.0
.*-20 n. Ii i0, 002V 000 I. Lii,4.i P1.1 - j C1. 0i
78&.el -OA 0.01400-006e,@• 0.01
4203.000 - 0.07,[email protected] 0,-07.
- 0.93
500o000o IM 0 - 0.7"520.000 - 0.07.540. 000 - 0.03,560.00 - 0,0758•,0.119 0 , 03600.000 " 0- .0362 0.0 - 0,.0364;!0.00. 0 0.03660.000 -0.03680.E•000 -0.03700.000 -0.0372V .0001 0.03740.,000 -0.03760. 000• 0.0178,-"0. 000 - 0.03800.000 -0.03820.000 -0.01840.000 -0.01860. 000 -0.01880.000 -0.01900. 000 -0.019720.0z00- 0,.01940.000 -0,.01960.000 -0.01980. 000 -0.011000.00 -0.01! 020.00 0.001040.00 0 . 01i1060.00 0.00i 080.00 0.00MONO8.0 0.00
1120.00 0.00
1240.00
12S0.001120.00
'1LO . L-0_-02L0. O0
!j:: 00
1 41. 0015 T.00
... . ii, •,
*•. i -: •] -iLIi
•."1120.'00
172"£0.001, 2-,J. 019'i 749.00@! 740.00
S720-:. 00
MY: @, 00
1:020. 00
19'60.00,1940.0020006. 00
2020.0020740.002060•.00
21 M.2i;i 00
2120.002140;.002160!.002 ,':80;.. 00'
2240.002220J. 00'224:0.00226C'0.00
2280.002340.00
2z,-ý. 00
.23,8.0.. 002400. E00--420. 0024413.00
248,0.00
2500 .002520.002540.00F2560.00-' 5'O'.00
Liif
0.000.00
0.000. 000. 000.000.010.010.010.03
0.030.03
0.03
U.0 7iL i
Li07t1
Li P
0.01S0,0
0.070.01
Pt ii
L i
0. Al0.01
0.01
*[email protected].ý01
Li. 100
0. 00K.010.01
0.010.01
01.0113.01
0.010.010.,01
0.010.010.010. 01
0.010.,010. 010.01
0. 01
0. 0010.01
0.01
Li C-11I0.01iPt.00
0. 01
2600.002620. 002640. 00266,0.00
2680.002700.002720.002740.- i2760. .00
293. ::] 00.ZY: 2'-:. 00
M- 40. 00_
-:-A. 00
n%&n. 0,02 0-I.00
"'0, 0.: 00
'7M£., A". iO
i '4 , -i-
•LI
T' -:222.
• -.i -' *
:2,0. 00
7- R. 0030G@. 00
-a'A". Oil
74A.@@ 00
T7520;. OAN
35M0. C10
1020.00@
-.744Q. 0-03800.00A820. O00
3740.00
3800!.00382:-0. 00
79N). 003920.00
sole. 4900
1'[email protected]. 004 ?:Q::. 0"040<40.00
'0
U'4)
j
3C
A-:3
'I
-0 01
0.01
0.07.
0,07
0, 07,
0i
0 -r
A 0
0'
0.i0.0.6
S0.0
0. 06
0. 060. 06
0. 06
L Li:
i. Ai
L 1
0i9i
LI L09
0 . 090 . Q40 . 09
- . 09-- . Q ,C
0 .04)
-- 0. 09
- 0.96~t
- 0. 090 . 03
- . 0?-0. Q6
Li @.
- i Li,
-. L,07
- , Li-
-i Li-'1-i 0, -I
- 0.0'-L- 0 Ii-?'
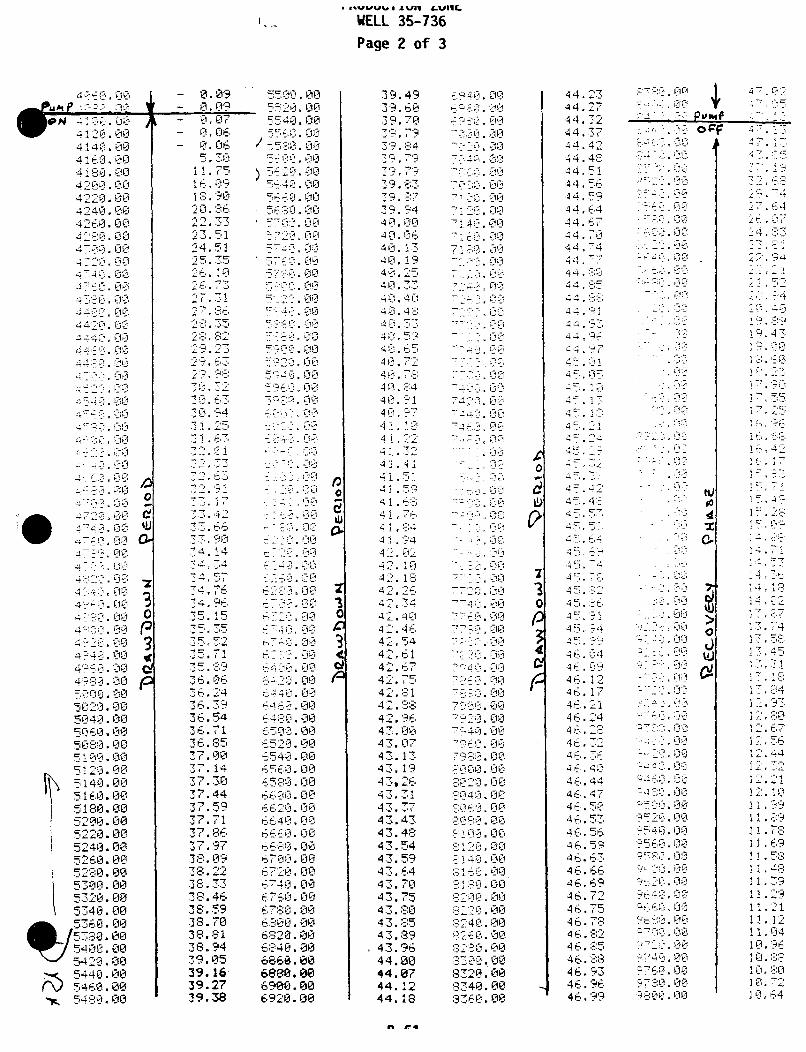
* .n..q, I A Ull WUIlL
WELL 35-736Page 2 of 3
MO - 0
aP&FwxPn nnA mWON 0
4140. CIO4160. 0ii4.'80. 00
4220.00@4240-00OE
42Mi-. t10l
4 T.a@ L1-i
472L".00¢
474Q. 008"760.00
~418f.fl
4420.000
44i20.00
-L4 .ML 00C4 ,-:-. AIi
47---4 . [1-a ý.: A". GDý'
a7-}20:- 00
47M-@ 00
45 h? 00
41- if l-
-4 p 0004-.0 6800
4160-.00
Ho:-- o 0050--20.00@
9120. 00
49i 4. 00i
510-00 •05E200.005220.00
5240M. 00
52360.00
5!280.001
5300.00
53220.005340.00
,5360. 05300.005420.00
35440. 005460.005480_.00
Ap
'I
dO,
- 0.09 5520.00
- 0.07 55-40. CI- n.-6 060581.00- nf. /6 TO. 0
11.75 5 'in0.01 ,.04 5-40.00
18. 0 5-.6 i.0i20.86 560-:.001
22-33 1 70..023.51 572". 00
24.51 5- nio25-...35 ' [email protected] 570-"[email protected] 5 ;:'0.00
27.31 ' -.. -27.86 740.402,- 35 40%. -218,2 ... o% M,@d.029.23.',' 59g'9.029, 6_- 109 ,00 O29. 98 UK=4.070o.32,:-•- 5060.0070. 63 T5'G8. 00
30.94 &. .00w .25 w-.- - -,01. 63 10i4_. 00
c- 4-•. ,@ .. -. ,-='. A
72.33 ý07.030
7 2.9! 1 ,1.0...00
-3.17 v. '1 l-dOP33'._.42 ': 7W. & @'
33.66 i -. O
33.9 4 200.M0
34.14 .72- .-74,34 0240. O@ý-4..57'•" 626 ,00. 70
,-4.76 KA Mm 074.96 6700.0035.15 6-: 1._.."'""00
35=..._ 52 6,T"_-0.00•
35.7'1 htL31.00f
-El.06i - . iiii76.24 6440- . 00i-36.39 6460.¢0036.54 6,4-80.00
36.71 6500. 0036.85 652.0-037.00 6540. 00
37.14 656. 0037.30 6580.0037.44 6600.00
37.59 6620.0037.71 6640. 037.86 6660.0037.97 6680.00
38.09 670,. 0038.22 6720.00.38.33 6740.•-0038.46 E760. 00
38.59 6780.0038.70 6800.0038.81 6820.00E38.94 6840. 0039.05 6660.00
39.16 6880.0e39.27 6MON.O039.38 6920.00
0
62
39.4939.6039. 70
39.7939.54M. 79...7-a 'f9
39.. .. 83
39.S7
40.00@40,0640,.1340•.194 0. 25_-'-40.3340.40l40.41 '40:.5340I.5940. 6540.72
44014
40.97741.i-10
41 •.2'24 1 4.
_ 4 1! ._ 4 1-
41 .4
AL1 1e
'11 .9442.02q2. :-
42.i8
42.26• 42. :3442.404246425442.67
42.75:42.88
42.9643,.00E43.0743.134 3.
43, 2643.1
43.3743.4343.4843.5443.59)43.6443.7134 3. 754 3. 804 3.854 3.,°894 43. 96
44.0744. 1244618
6940.006960.00
-'20. 010
-' .- @bt-7242.00
7GS5.,007120'.00ii
7120.00
7180.00
R4 -St. 00
724-.-
7%'--1 p•00" '. 00
44.- . i-SMc
- -'11.09
"740., 0
772:-. 00'020:.007420.00
7- TO, 0i
- AT'~nf
00
"1-'0. 00
--740, 0"0
7720. U@
T1 . LU-1
-l-S . 00
7?20. 00
8020.008040.00_•F
S120.008040.@00
8200.008',[email protected]:;;80.003200.00
K240. COO
8340.00E060. 00,•
0
p3:4
44.2344.2744.344.3744 42
44.46_-4451
44.56
44 6744 70
44-,7444.-714 .'
44 85
.4. 4,-S:-;
44 '4.!
4491
44 .9
45. &I4 5 051
45 18
45.145.1245.245,2
45.42
;.- 42--45.48
45.64
45.644-. -4
44. 7S
45. 2M5.8645.7145,.5445-. ?9-
W40
46.0946.1246. 1746.2146.244 6. 28-
46. 246.3646.40--46.44,46.4746.5046.5346.5646.5946.6346.66
46.6946.7246.75
46.7846.8246.8546.88
4 6. 934 6. 9646.99
145a. 0070%":. 00
' ...-' -- <V 9
4-., 0L i
•- - ,il- , L...'f
' .33
• .-00
,-00
S- 3.00
7922-. DJ
O- qA. 00?
"-" -.: , 0 "
:"5'40.00@
95d60.00O
9500. go
9" 80.00W620. 009648.009060.00
?"A@. 00
074.009P760. 00
97:-:0:J-. CIO
(~ifl 4>17:-- - i-J'1 V C-IT
o•'f
0
"h
C
I)
'44
47 -'
7 1132 "-- 5:..
20 . 072 4. 8-1"'o-
22.94
i 0:. 40
!9. S.?:
ii.{
19'. 471
i 7y, ='.= j-
17,5
i6,i
L5,i
1 k
Ii s4 i@
i4. 7:r
14,14 "10.2
15,27
13, 45
12.512. 80:12.6712, 5 6'i2.44.
12.21
0I,9
i1 ,69
11,48-
!1,.391!I.A1i.21!i,12
10., 9610. .-8S10, 1s'01 8,.7210,64
m ea
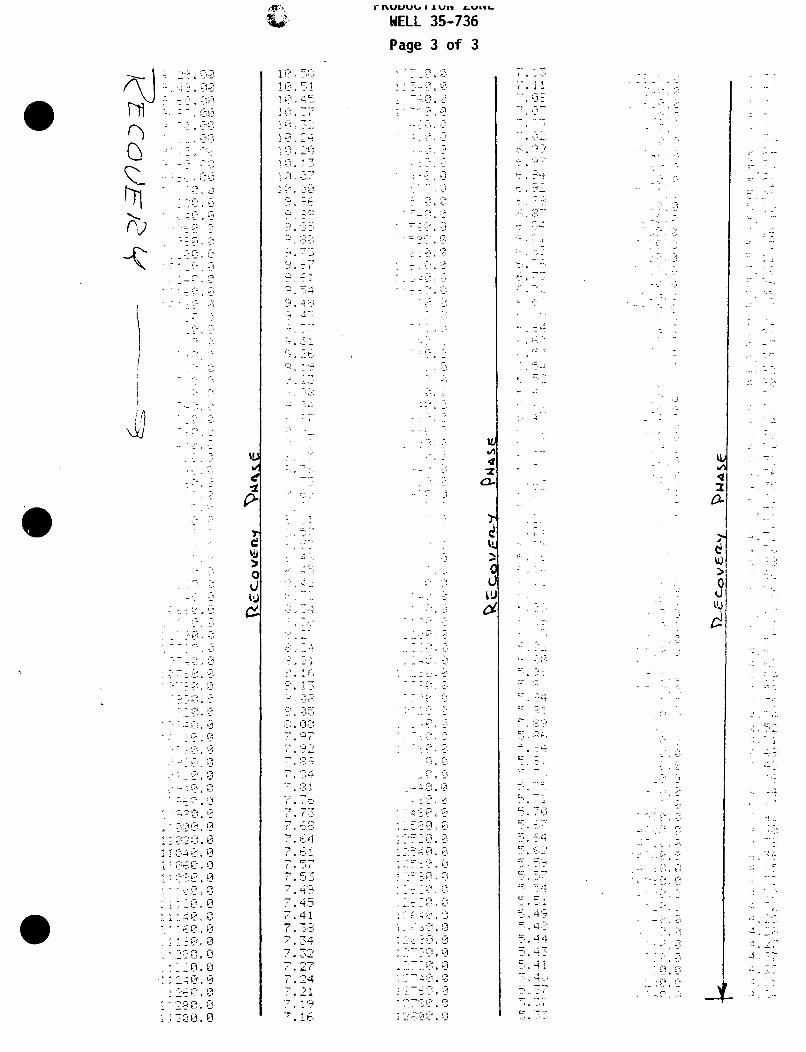
l rjuui.. I Av IA..
WELL 35-736
Page 3 of 3
C,
)-
O-D
2 4Q- cc
10, 0
10.5
7.177. 1". M-,7 071 , 7 -.-.7, j
j2*
)
coo ;Ji
1102'.
15 .
-7,7
7.7M6
7,641
74.
7.51
7.45,"-.417. 72E,7.34
".'2
7.247.21
7.197. A.
lop
79.
ý;7 -D
1 too 0
10. 0
ý2-20. 0
N
IL
4
* S
62
5. 515. 4?51 &-ý5. 44TOT,. 4
_77-
4
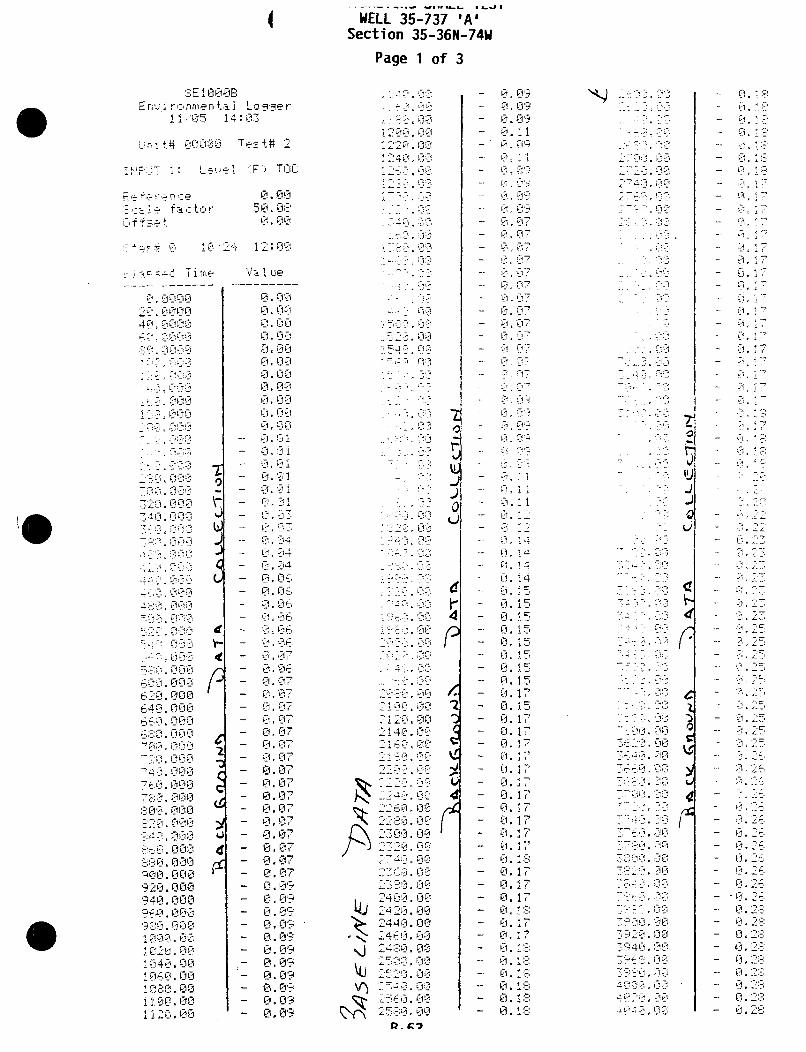
I WELL 35-737 'A'Section 35-36N-74W
Page 1 of 3
E 10AFiEý72
I 1 4. 5 s~ 14
ir*ctT 5'. 0C-0t 0 C
i--i 4
,-' J1Ti17-
4:, i-4O
C I CI 0i4 '.r$i
C - L -i. 0
(-V I 7IiI
ocil a0 -1 0L
LlLP.%< '
- i,.i 4'
L: i LJLJL• 'I'-
:-Jl-I: LILI l
-;,.
151•.1 Li-i
1 •" i L --I 7i i- I
71>. WA0
7i 1 (.-1
C, I,
0 CI
0l 0F_7
C1 I 7I
C4, C1 'LIý
- ii i
- Li lii
- I'. 11
- Fo
- ,'-, Li--•
- Li I--2•- .- .ii-
- LI Li4
- '. LI.- O.0
_- .- L .
- j.4 44
- I. LI- LI• I6- Li.LI- I-I (9
- -Li 7l- Li @'- L4
.Li
- u LI,
- C• Li
- Li L7
- 0. C97- L Li7- LI 4J- U• Li-'- LI LI- Li Li-- Li U7
- Li Li-- vO Fl9- LI LI9- Li LI-
- LI,4 L2 i:-'.L Li'_ I0
4i
f220. O@
4' 1 i D
2 47;-1.7" ,:3
Li- .--<
-4 LI'K
7 1,0 L-t
_.- -I Lii
--+.-'I !i'
.- I Li-i
'i--n i --.LI5].0l
.. c,2. ;
I
vi
p~
01 •. CI
L- i 11
Li 1
-- i
0- k. 1•~
- LI '<
- ,97
.1
C I 7
Li A
Li @
Li@,@• I 9 9- I0 i
- -_I )J¢
@.i- , 7
L7i I cLI = :,
Li @.¢:-- -?
LI@ ,:
-- 1. !- •1i
L .I
- L:1 15
- L0.15
N .%..]=:j-
07'L
J
Id
' 'I
LA,. -
.. . 1-7: i " -
Cir.:,? -
C
4
C
CIs
lx
C.--, 2.
V)
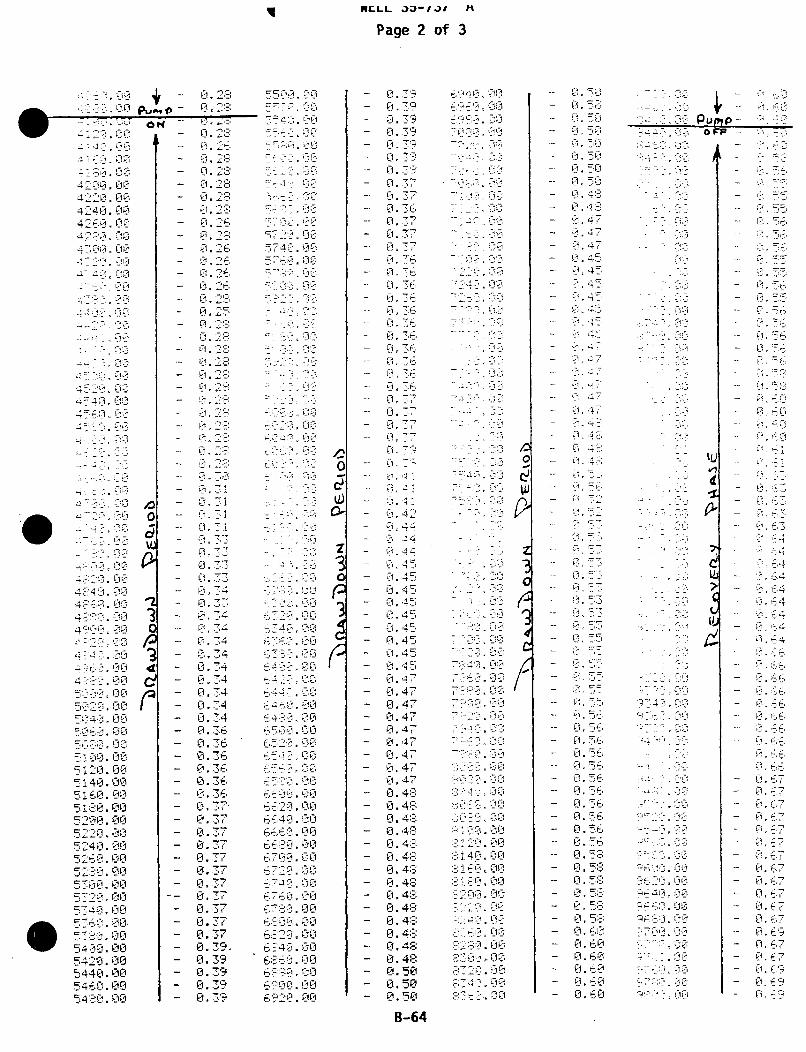
N.LL ,--J/I
Page 2 of 3
k
17~9Fi
SHAM4.
11540.Lj0
.7 2 0 .L&
TA.~ 00~
;SSA OT
4430.0
4,2-.02
20I
Lii
452.0
~.-So. ToI
41060661L
,; D' LiI ý
-4962.00
*¾3 '.00
WAY11 00L
1120g. 00
ON
I
0
.7
41
d
- 0.28
- 0.28
- I . 2.
0.28i
0.24
0.28 -
C,,2I E
2- i '
- 0.26
- 0.24
0 ' .25
WS t
0.L2 8
0.281~-
0.28I-
0.281
0.2i
0 .28
0.220.28
-0.39
-0.39
-0.39
p
55 ' L'.1
, 1.00
T* H. 1-1,
0--1
?.4. , ,LL-- 1.2i9
00-' 1
- '-20. I2
3F
F-
- L. -4
- LI. 39
- L. '4- L. '-4
- Li,.T-. 4,.3
- O. h,.-- L1 2I ,- EL. i- LTI T
- -*1 •
- 0.373
-- LI 7-- I I ;
0 36
- 36
- I -
-- .1",7- ;I.
--- LI -..,
- LI •
- LI3 -,4- II 4,-.
- "-I 4' :
- ,_. 4-- Li 4.
0- 4
- Li 4=_- Li 44
_. Li 4 .'- LI 4.- L2 47- L~i 47- Li 47- LI 47- LI 47- Li 4- Li47- Li 4:-
- 0.48- 0.4:
- 0.4-
- 0.47
- 0, 4:-
- 0.42-0.4
- n4 5
- TO,50 .450
B-645
6040.00VIT. 006991.207ete. 00-020. 33-000 317vn 0. 001060.027100, OC
ý0. 00
Ov. to
-,73.00
1 W. 09
-720,00
-220.307240.091260,097 n 0 1 ,
7 V ý ý .7:
77, so
33
00
D
7ý 10,"ton,
7 ýQj' ý-!O'
AS
700-: 007902 ý 00
K0. 00?w 0 . Go
7SM M7?S2, 32
W&G. 00
QN. 30
0000
A 0--S: 00S120 008141-D : 008160.002150.008200 01,.D.
00AM. 00VS?. 003280.00Rzonoo8220.008740,00
F760. 00
34
C
- I•. %-
• - -1 %
-. Li. 5'
-- _ LI Z
- .4
- 47
- I.q
0. ,450.9,45
- Li, +,
- I ,,.
- . 5- 4.- .7
-- H ,47
- 0 47
-- LI •"'
5s.4
N IS
5, 2
" Li7
,1 -_
-- 'I '?-i
- - 53
-- 0.55
- 0t.55-
0.9,560.},56
1-.- 1, 56- 0::.56
- 0.56- 0. 56
- 0. 58
CI . 5: ::- 0.58
-0.60•0 .60
- 0.60
- 0.,60- 0c.•60
30Pump - Qovp
1,7
,I.
141 Li -
Li
LI6
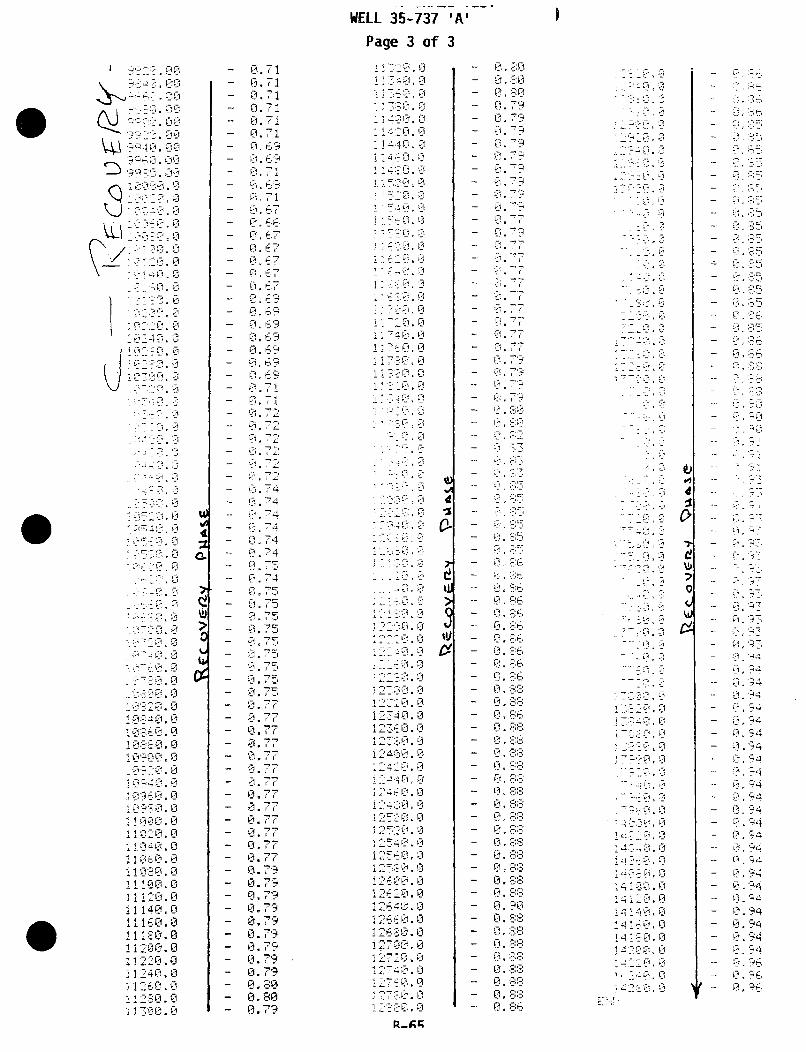
Q 3ZC : , Y
D,*~ i~
i2
05
1020-. 0i
EL-4 , . C
1010.
1 i..4.. . 0I
'v00-.I 1
1102'0.0L'140.0
i1'060.0110j -_, a
11100.
1100. 0.i~*
C6
%U
0.710. 710.71lI. 7Ti0. 710. 71
0.7!3
0, 7
E-7
0. 67
0.67
047
0. 670.,67
0,. 6'?0. 6-9
0
0,6
03.71(-i . ,"-.."0.72
ý'. 72:ei. 7 2
,7 20,., 74--{i,. 74
LI
0,74
0 74
0. 74
- 75
0. 75"
0 . 7509 75
C9 o 77
0.79 71•I
0.u77
0,77.0.779
Cl. 770.77
0.770.770. ,790.800, 79
0. 7
0.7
LI71
0.i7
0.I7
Li 7
0. S
0.1 0
0.79-
WELL 35-737 'A'
Page 3 of 3
4- CD>2 .9 . 7-"9
420..0 . - 0.0-C
* :-:0. - 0.79
1- 40. 0 .' : '- 0.75.
i1 4 - 1]0- ;. 7-
* : 0. l Cl. 7":Ii 4-4 1} @ i '
I14-0 •3 - 0.79 ..... ,. . ~ = 1 ., . .
L~ LI
• ! 7 L-•.9 - 0. 77
* ,0. 75
116 5, 20 .0- 0,77,.i ; 5e. 0 &;i 3- {.77
M G0•--. 3 - 0{.77
11700- . 0 0? • :. 77- • fc" 7-? 0-- ! ,3 77r
1 - C 0.. 77
-issT , -j.7
i • v E•. - 0.79
* ' -": ' I tt- i 7
'-19. L - - 7
L1 1 , •i
!•. ;•_ -- Q 97-•
*- ',¶'-r. I? - H
1 .115 .0 0.06
: :-: ::,. • - 0 . SE.:.
1 '220D:. 0• 0 :=
i~ ;2130.0 08:,-,!
.. . .. l L I Li - ! ::
122 - 7., K
1;M O.0•= '.-• - 0. 816-
1f--3SO 0010@ --;12400. .0• t '. 8;-:,
i2420.0 1. s:-_:R27 4: .0 0, 8:,-:;
124_0.0 0 . 8: -_.:
127410 O - 9 -:
12500.,7 013-.": -_L:
12520.0 - VAD::05L-40.0 0 1- . 8"-':12560.0 0. 8 -::-::1 24 0} . 0 - 0 ::;ý_812600.0••B 0.:: -!-
, >640.0 - 0 .90':-i2660.g.0 0. T,;:-
12720.0 0- O:12740•.0 - 0 '?i27SO.0 - 0 .8'.:::-3 ..2780;.0:• 0. 8-8'' ,,_i2700.0 0 .:.:-'
1272 r. ;•- A ,:-
nO 7.2 . 03
T Loc. ,7 ---D -, 0
;' 5 . -D
- 1 • L..
-_ _ 3.0
•i 7040. 0
,700.%*? 0
• 4 . 1; : •-
Aso G -
14"7"0.0
AM?. 0-
14. 0
1 4 1 i.
-42C. -0 %
:4-29,0.' L I?
LI-:2¢ o -
t)-9a
d
VLi
'Ii
A
-- :. 0 5q-:
Of.
-. 44.-,".
- . :-44-
- , 4H3
- L': . .--4
Li S5'
A 14
-- 0, :05
-.44
- :. 045
- 0. 94
,4 -4f
0.9 "-
-- 0:-. -9 ..
0_-. 96]
A
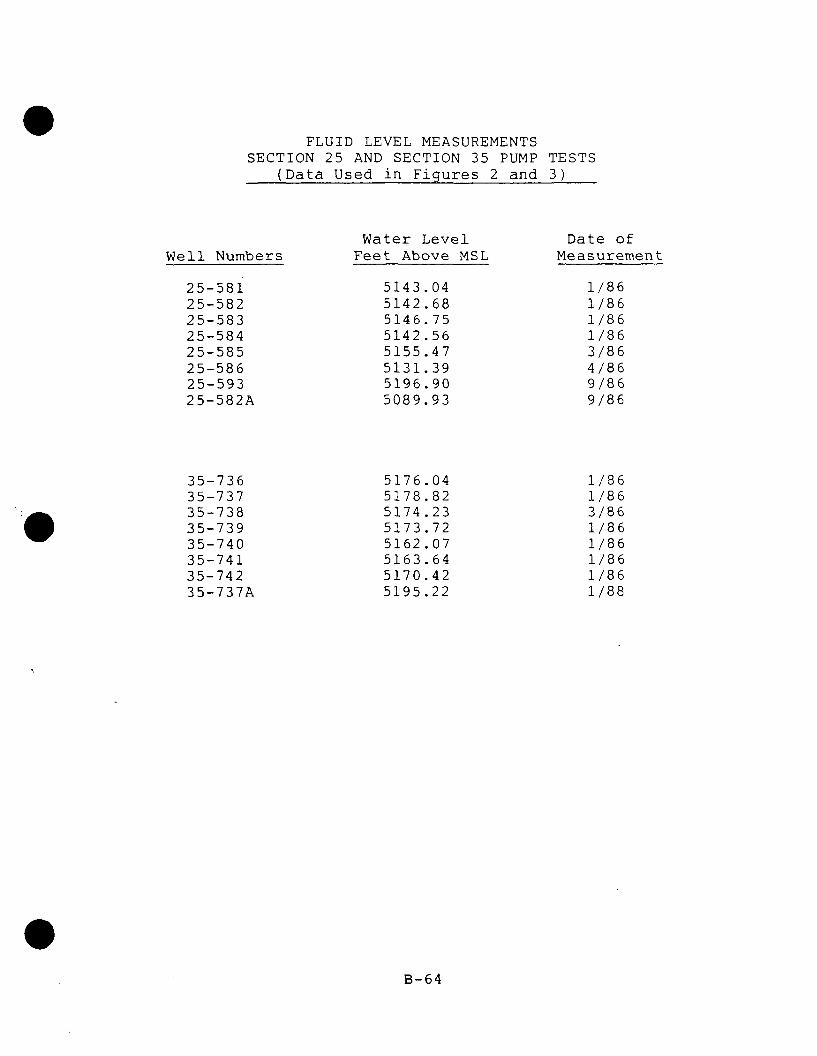
FLUID LEVEL MEASUREMENTSSECTION 25 AND SECTION 35 PUMP TESTS
(Data Used in Figures 2 and 3)
Well Numbers
25-58125-58225-58325-58425-58525-58625-59325-582A
Water LevelFeet Above MSL
5143.045142.685146.755142.565155.475131.395196.905089.93
Date ofMeasurement
1/861/861/861/863/864/869/869/86
35-73635-73735-73835-73935-74035-74135-74235-737A
5176.045178.825174.235173.725162.075163.645170.425195.22
1/861/863/861/861/861/861/861/88
B-64
APPENDIX C
Transmissivity and Storage Coefficient Calculations

THEIS LOG-LOG SOLUTION (EARLY TIME DATA)
T = 114.6Q W(u)s
= gpd/ftS = u 7t
Q = gpms = feetr = feett = days
1/u = 1SECTION 25
Well #25-581:
Q = 50 gpm W(u) = 1
s = 3.0t = 0.001r = 75
T = 114.6(50)3-.0T
(1) = 1910 gpd/ft
Well #25-582: s = 5.6t = 0.006r = 75
S = (1)(1910)(0.001) = 1.8 X 10
1.87(75)2
T = 114.6(50) (1) = 1025 gpd/ft(5.6)
S = (1)(1025)(0.006) = 6 X 10⁻⁴
1.87(75)2
Well #25-583: s = 5.6t = 0.006r = 68
T = 114.6(50)(5.4)
(1) = 1060 gpd/ft
S = (1)(1060)(0.006) = 6 X 10
1.87(68)2
SECTION 35 Q = 8.0 gpm W(u) = 1 1/u = 1
Well #35-736: s = 10t = 0.014r = 71
T = 114.6(8) (1) = 92 gpd/ft10
S = (1)(92)(0.014) = 1X 10
1.87(71)2
C-I
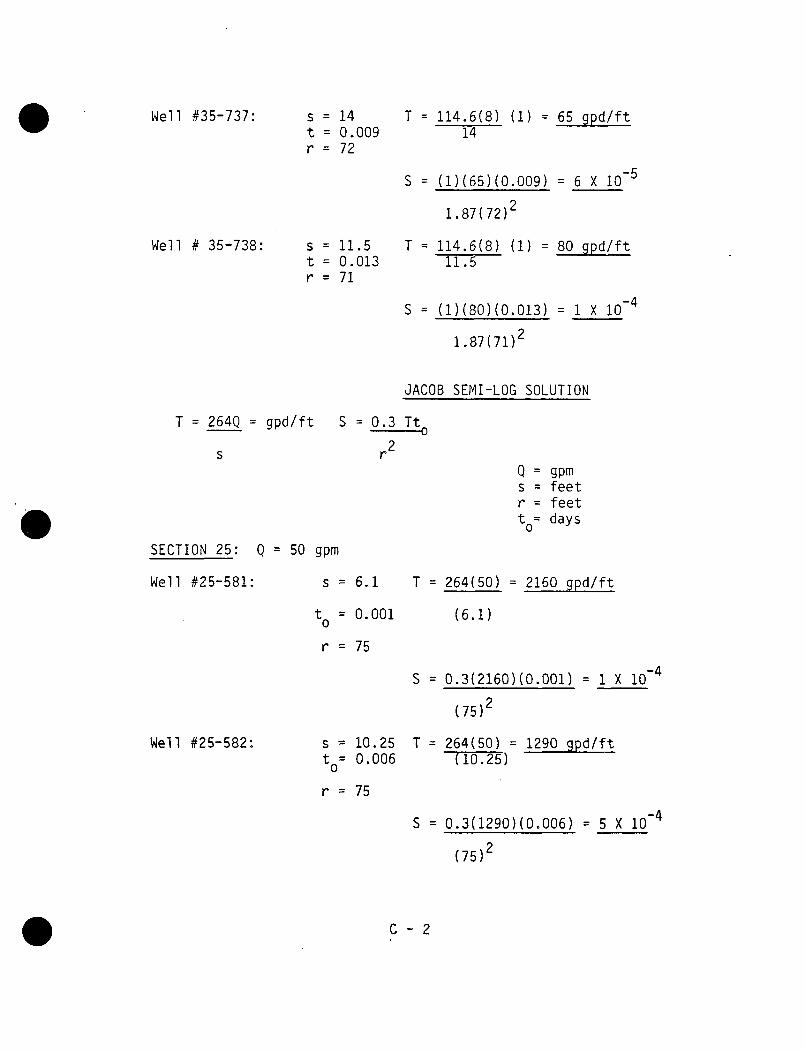
Well #35-737: s = 14t = 0.009r = 72
Well # 35-738: s = 11.5t = 0.013r = 71
T = 114.6(8) (1) = 65 gpd/ft14
S = (1)(65)(0.009) = 6 X 10⁻⁵
1.87(72)2
T = 114.6(8) (1) = 80 gpd/ft11.5
S = (1)(80)(0.013) = 1X 10⁻⁴
1.87(71)2
JACOB SEMI-LOG SOLUTION
T = 264Q = gpd/ft S = 0.3 Tt
s r 2
Q = gpms = feetr = feetto = days
SECTION 25: Q = 50 gpm
Well #25-581: s = 6.1 T = 264(50) = 2160 gpd/ft
t = 0.0010r = 75
(6.1)
Well #25-582: s = 10.25t = 0.006
0r = 75
S = 0.3(2160)(0o001) = 1 X 10⁻⁴
(75)2
T = 264(50) = 1290 gpd/ft(10.25)
S = 0.3(1290)(0.006) = 5 X 10⁻⁴
(75)2
C-2

Well #25-583: s = 10.25t = 0.006
0r = 68
T : 264(50)(10.25)
= 1290 gpd/ft
S = 0.3(1290)(0.006) = 5 X 10⁻⁴
(68)
SECTION 35:
Well #35-736:
Q = 8 gpm
s = 14.0to= 0.008
r = 71
T = 264(8) = 150 gpd/ft(14)
S = 0.3(150)(0.008) = 7 X 10⁻⁵
(71)2
Well #35-737: s = 15t =0.011
r = 72
T = 264(8) = 140 gpd/ft(15)-
Well #35-738: s = 21t = 0.013r = 71
S = 0.3(140)(0.011) = 9 X 10⁻⁵
(72)2
T = 264(8) = 100 gpd/ft(21)
S = 0.3(100)(0.013) = 8 X 10⁻⁵
(71)2
C-3
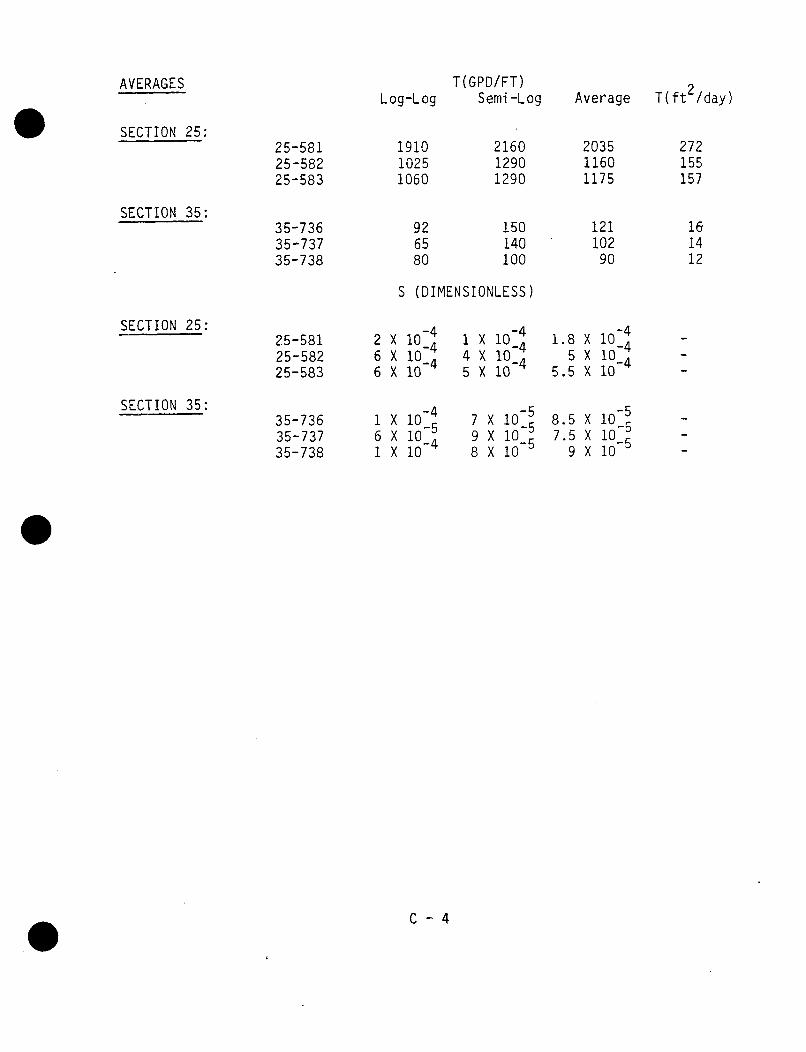
AVERAGESLog-Log
SECTION 25:
T(GPD/FT)Semi-Log
216012901290
Average T(ft 2 /day)
25-58125-58225-583
35-73635-73735-738
191010251060
203511601175
272155157
SECTION 35:926580
150140100
121102
90
16&1412
S (DIMENSIONLESS)
SECTION 25:
SECTION 35:
25-58125-58225-583
35-73635-73735-738
266
161
xxx
xxx
10-410
x 10-44 X 1045 x 10_4
1.8 X5. X
8.5 X7.5 X
9X
0- 410-4
10- 4
10- 510 -10- 57
98
x 10o5x 1x i0o 5
C-4
APPENDIX C
Transmissivity and Storage Coefficient Calculations
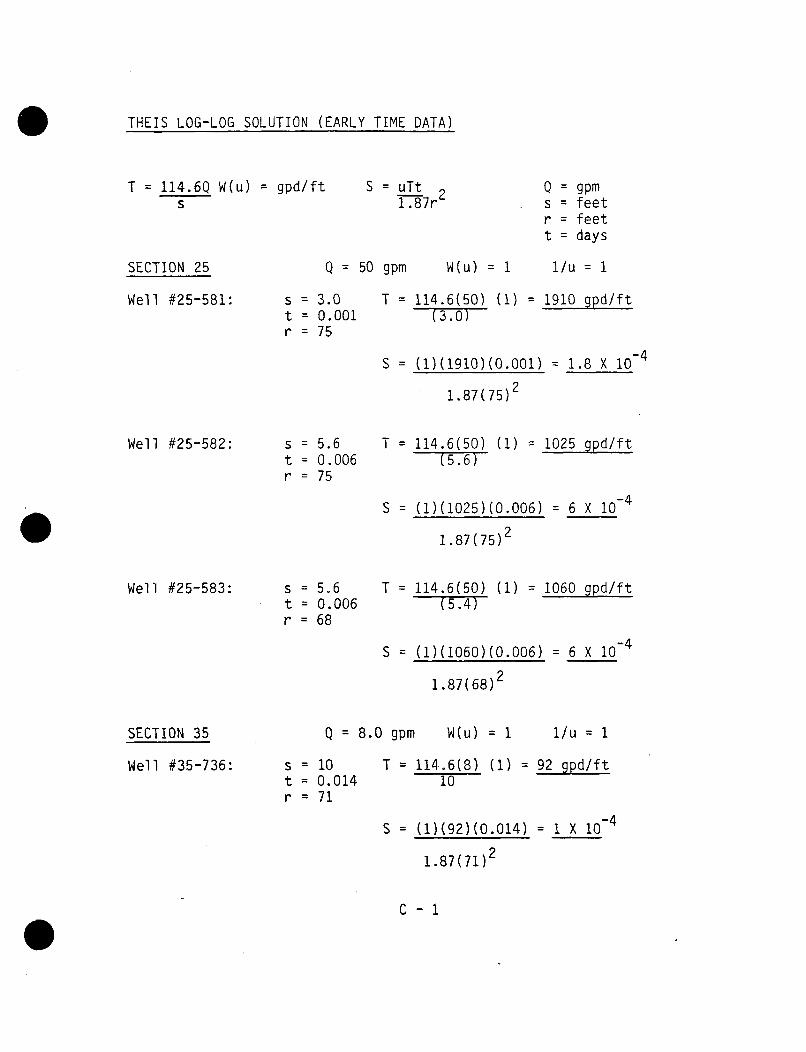
THEIS LOG-LOG SOLUTION (EARLY TIME DATA)
T = 114.6Q W(u)S
= gpd/ft S = uTt 21 .87r
Q = gpms = feetr = feett = days
1/u = 1SECTION 25
Well #25-581:
Q = 50 gpm W(u) = 1
s = 3.0t = 0.001r = 75
T = 114.6(50) (1)T(37.
= 1910 gpd/ft
Well #25-582: s = 5.6t = 0.006r = 75
S = (1)(1910)(0.001) = 1.8 X 10
1.87(75)2
T = 114.6(50) (1) = 1025 gpd/ft(5.6)
S = (1)(1025)(0.006) = 6 X 10⁻⁴
1.87(75)2
T = 114.6(50) (1) = 1060 gpd/ft(5.4)
S = (1)(1060)(0.006) = 6 X 10
1.87(68)2
Well #25-583: S = 5.6t = 0.006r = 68
SECTION 35
Well #35-736:
Q = 8.0 gpm w(u) = 1 1/u = 1
S = 10t = 0.014r = 71
T = 114.6(8) (1) = 92 gpd/ft10
S = (1)(92)(0.014) = 1 X 10
1.87(71)2
c-I
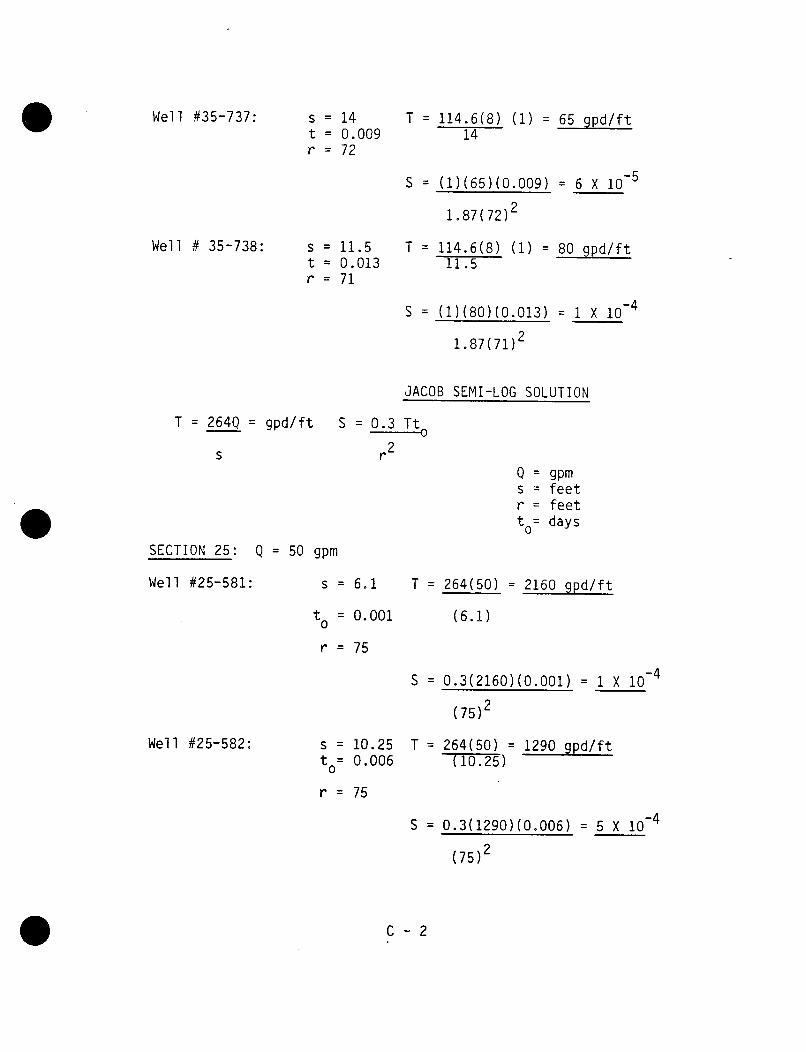
Well #35-737: s = 14t = 0.009r = 72
T = 114.6(8) (1) = 65 gpd/ft14
S = (1)(65)(0.009) = 6 X 10⁻⁵
1.87(72)2
Well # 35-738: s = 11.5t = 0.013r = 71
T = 114.6(8) (1) =11.5
80 gpd/ft
S = (1)(80)(0.013) = 1X 10.4
1.87(71)2
JACOB SEMI-LOG SOLUTION
T = 264Q = gpd/ft S = 0.3 Tt°
s r 2
Q = gpms = feetr = feetto= days
SECTION 25:
Well #25-581:
Q = 50 gpm
s = 6.1 T = 264(50) = 2160 gpd/ft
t = 0.001
r = 75
(6.1)
Well #25-582: s = 10.25t = 0.0060
S = 0.3(2160)(0.001) = 1 X 10⁻⁴
(75)2
T = 264(50) = 1290 gpd/ft(10.25)
S = 0.3(1290)(0.006) = 5 X 10⁻⁴
(75)2
r = 75
C-2
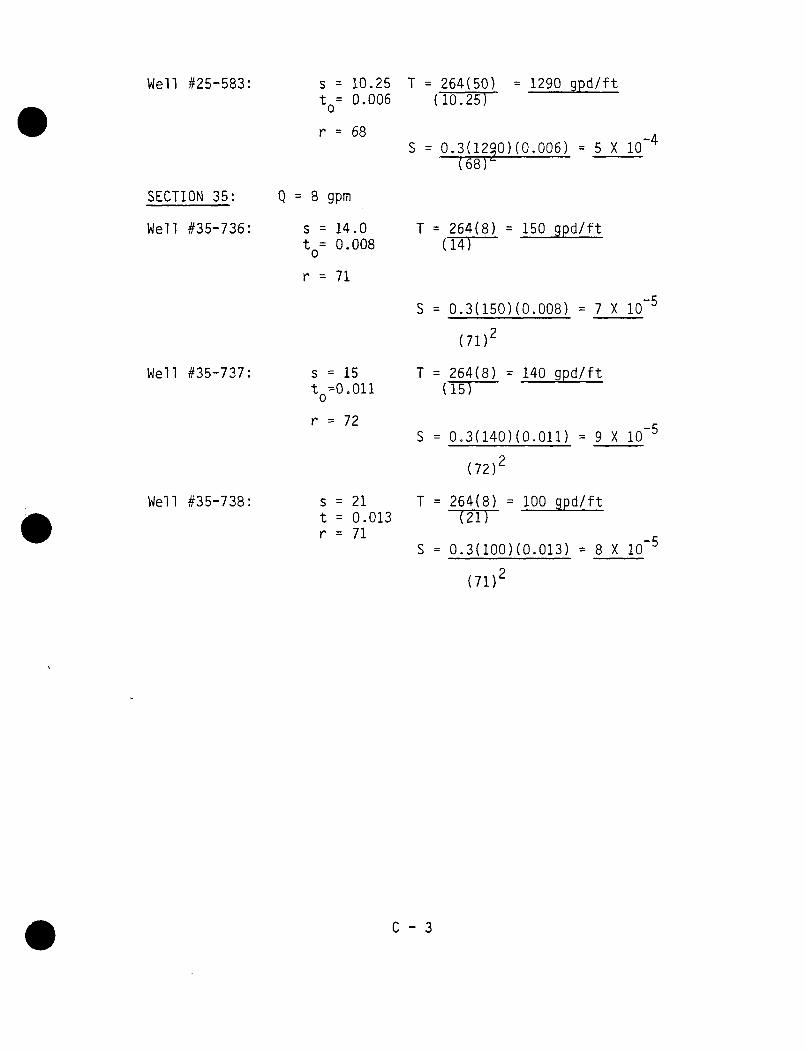
Well #25-583: s = 10.25to= 0.006
r = 68
T = 264(50)(10.25)
= 1290 gpd/ft
S = 0.3(1290)(0.006) = 5 X 10⁻⁴
(68)•
SECTION 35:
Well #35-736:
Q = 8 gpm
s = 14.0t = 0.008
0
r = 71
T = 264(8) = 150 gpd/ft(14)
S = 0.3(150)(0.008) = 7 X 10⁵
(71)2
Well #35-737: s = 15t =0.011
0
r = 72
T = 264(8) = 140 gpd/ft(15)
Well #35-738: s = 21t = 0.013r = 71
S = 0.3(140)(0.011) = 9 X 10⁻⁵
(72)2
T = 264(8) = 100 gpd/ft
S = 0.3(100)(0.013) = 8 X 10⁻⁵
(71)2
C-3
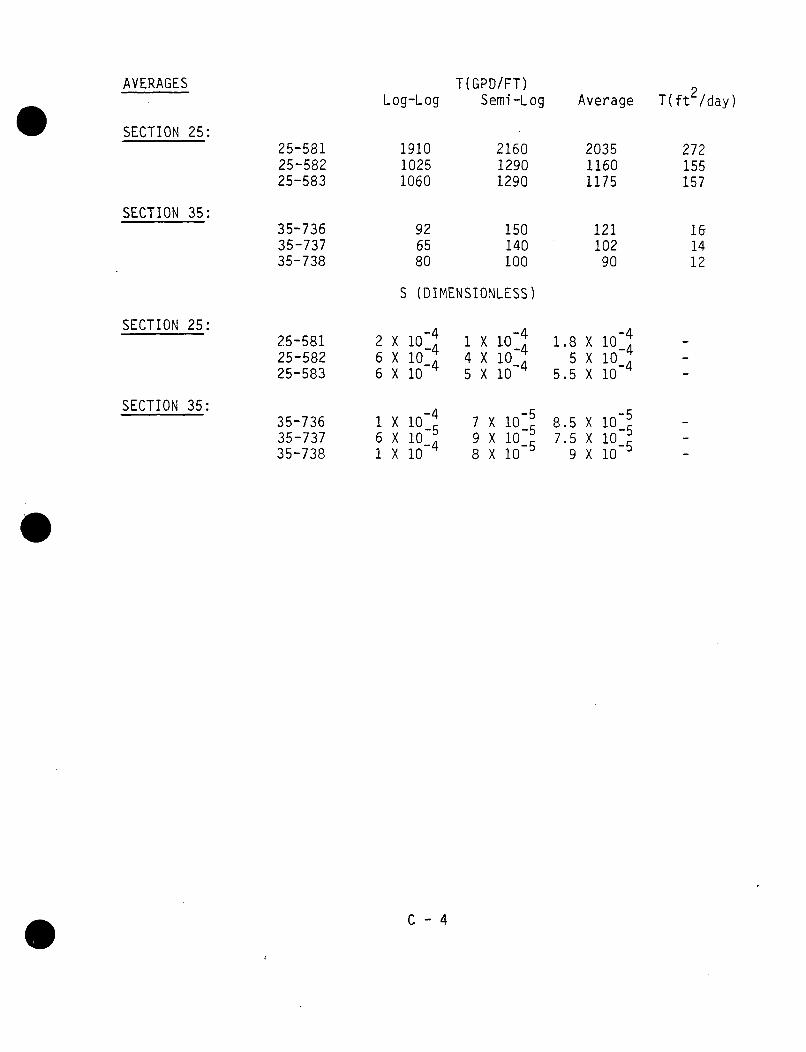
AVERAGESLog-Log
SECTION 25:
T(GPD/FT)Semi-Log
216012901290
Average T(ft 2 /day)
25-58125-58225-583
35-73635-73735-738
191010251060
203511601175
272155157
SECTION 35:926580
150140100
121102
90
16"1412
S (DIMENSIONLESS)
SECTION 25:
SECTION 35:
25-58125-58225-583
35-73635-73735-738
266
161
xxx
xxx
i0- 410-410 -4
10-510-4
I x 10-44 X 104 4
5 X 10⁴
7 X 10-59 x 10 58 X 10-5
1.8 X5X
5.5 X
8.5 X7.5 X
9X
10-4
10-410-4
10- 5
C-4
APPENDIX D
Application of Ratio Method to K' Calculations
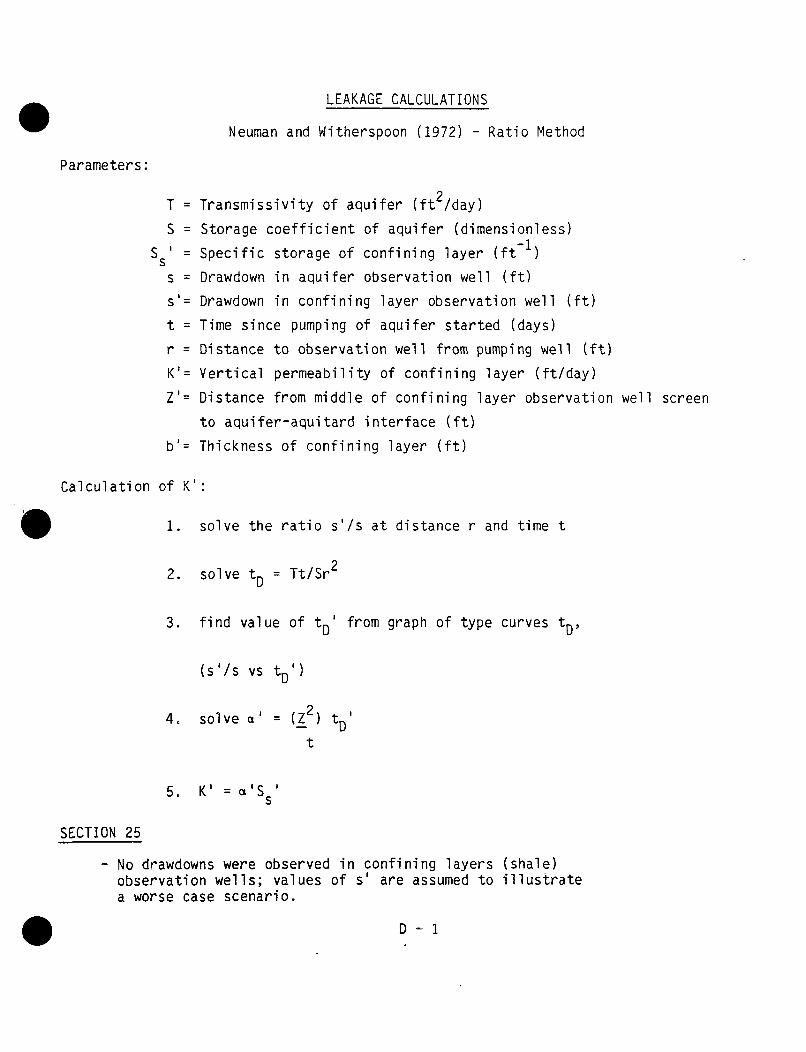
LEAKAGE CALCULATIONS
Neuman and Witherspoon (1972) - Ratio Method
Parameters:
T = Transmissivity of aquifer (ft 2 /day)
S = Storage coefficient of aquifer (dimensionless)s ' = Specific storage of confining layer (ft-1s= Specifc s ini layero (ft)
s = Drawdown in aquifer observation well (ft)s'= Drawdown in confining layer observation well (ft)
t = Time since pumping of aquifer started (days)
r = Distance to observation well from pumping well (ft)
K'= Vertical permeability of confining layer (ft/day)
Z'= Distance from middle of confining layer observation well screen
to aquifer-aquitard interface (ft)
b'= Thickness of confining layer (ft)
Calculation of K':
1. solve the ratio s'/s at distance r and time t
2. solve tD = Tt/Sr 2
3. find value of tDI from graph of type curves tD,
(s'/s vs tD )
4. solve al = (_ 2 ) tD,
t
5. K' = a'Ss
SECTION 25
- No drawdowns were observed in confining layers (shale)observation wells; values of s' are assumed to illustratea worse case scenario.
D- 1
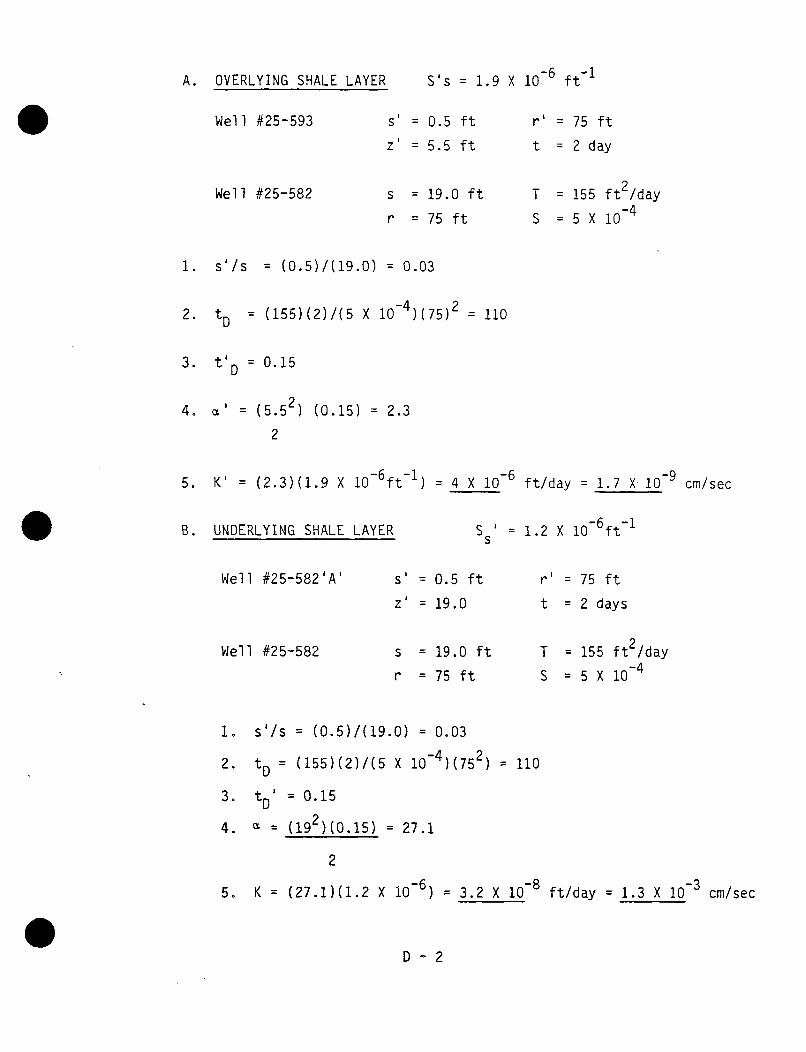
A. OVERLYING SHALE LAYER S'S = 1.9 X 10- 6 ft- 1
Well #25-593 S' = 0.5 ft
Z' = 5.5 ft
s = 19.0 ft
r = 75 ft
r' = 75 ft
t = 2 day
Well #25-582 T = 155 ft 2/day
S = 5 X 10⁻⁴
1. s'/s = (0.5)/(19.0) = 0.03
2. tD = (155)(2)/(5 X 10-4)(75)2 = 110
3. t' D 0.15
4. = (5.52) (0.15) = 2.3
2
5. K' =(2.3)(1.9 X 10⁻⁶ ft-1) 4 X 1-6ft/day = 1.7 X 10- cm/sec
B. UNDERLYING SHALE LAYER Ss
= 1.2 X 10⁻⁶ ft- 1
r' = 75 ftWell #25-582'A' S' = 0.5 ft
Z' = 19.0 t = 2 days
Well #25-582 s = 19.0 ft T = 155 ft 2 /day
r = 75 ft S = 5 X 10⁴
1. s'/s = (0.5)/(19.0) = 0.03
2. tD = (155)(2)/(5 X 10-4)(752) 110
3. tDI = 0.15
4. = (192 )(0.15) = 27.1
2
5. K = (27.1)(1.2 X 10⁻⁶) = 3.2 X 10⁻⁸ ft/day = 1.3 X 10⁻³ cm/sec
D-2
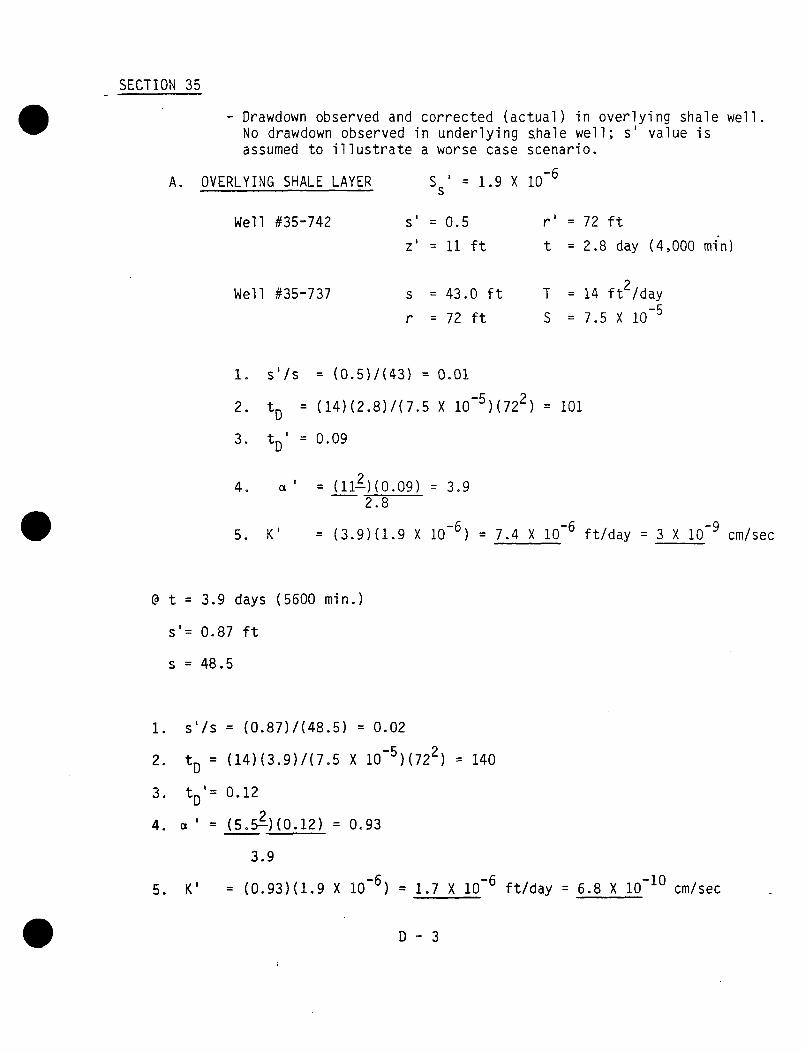
SECTION 35
- Drawdown observed and corrected (actual) in overlying shale well.No drawdown observed in underlying shale well; s' value isassumed to illustrate a worse case scenario.
A. OVERLYING SHALE LAYER S' =1.9 X10S
Well #35-742 s' = 0.5
z' = 11 ft
s = 43.0 ft
r = 72 ft
r' = 72 ft
t = 2.8 day (4,000 min)
Well #35-737 T = 14 ft 2/day
S = 7.5 X 10⁻⁵
1. s'/s = (0.5)/(43) = 0.01
2. tD = (14)(2.8)/(7.5 X 10-5)(722) = 101
3. tD = 0.09
4. = (112)(0.09) = 3.92.8
5. K' = (3.9)(1.9 X 10⁻⁶) = 7.4 X 10- 6 ft/day = 3 X 10⁻⁹ cm/sec
@ t = 3.9 days (5600 min.)
s'= 0.87 ft
s = 48.5
1. s'/s = (0.87)/(48.5) = 0.02
2. tD = (14)(3.9)/(7.5 X 10-5 )(722) 140
3. tDa 0.12
4. =' (5.-5.?)(O.12) = 0.93
3.9
5. KI = (0.93)(1.9 X 10⁻⁶) = 1.7 X 10⁻⁶ ft/day = 6.8 X 10⁻¹⁰ cm/sec
D-3
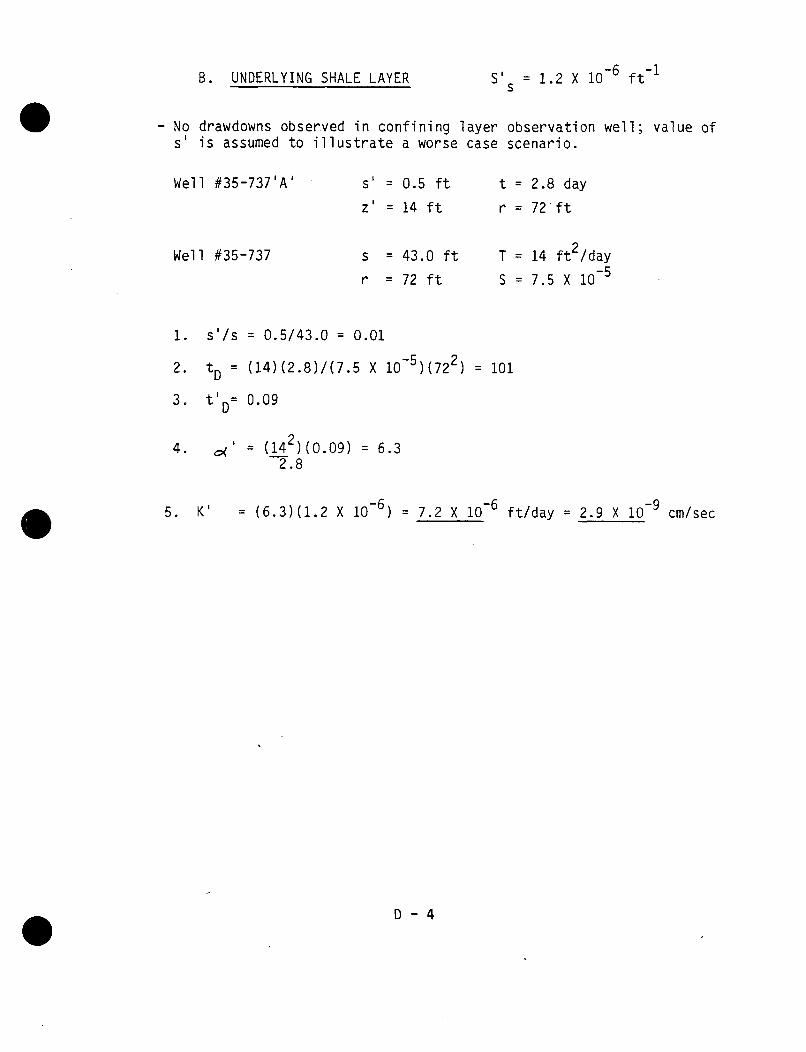
B. UNDERLYING SHALE LAYER S' = 1.2 X 10- 6 ft- 1
s
- No drawdowns observed in confining layer observation well; value ofs' is assumed to illustrate a worse case scenario.
Well #35-737'A' S, = 0.5 ft
z' = 14 ft
s = 43.0 ft
r = 72 ft
t = 2.8 day
r = 72 ft
Well #35-737 T = 14 ft 2 /day
S = 7.5 X 10⁵
1. s'/s = 0.5/43.0 = 0.01
2.tD = (14)(2.8)/(7.5 X 10-5)(722) 2 101
2.23. t' D= 0.09
4. ' (142 )(0.09) = 6.32.8
5. K' = (6.3)(1.2 X 10⁻⁶) = 7.2 X 10⁻⁶ ft/day = 2.9 X 10⁻⁹ cm/sec
D-4
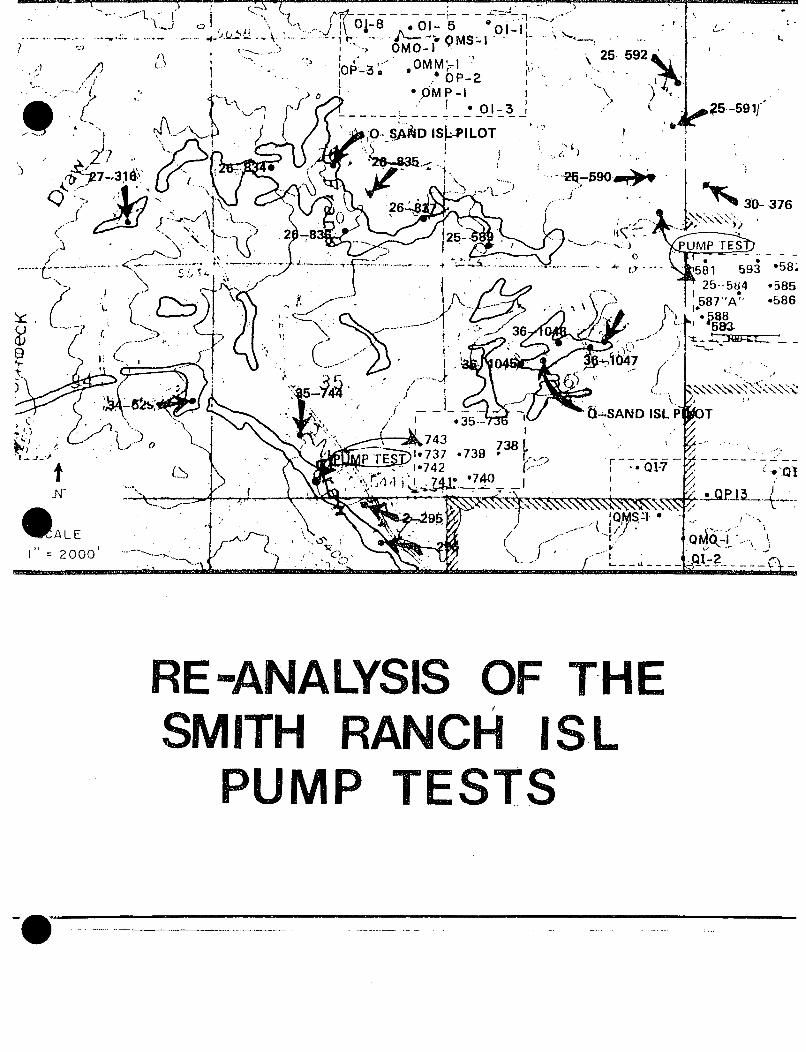
7 /.'A (A
* t4U -. .
-. ~0 1- 8 .01- 5 0 1 -'I~
~25-
p~ OMO-IrO~I 2
592
RE-ANALYSIS OF THESMITH RANCH ISL
PUMP TESTS
/RE-ANALYSIS OF THE
SMITH RANCH ISL
PUMP TESTS
FOR:
RIO ALGOM MINING
BY:
HYDRO-ENGINEERING
APRIL.. 1990
THOMAS QUINNHYDROLOGIST
TABLE OF CONTENTS
1.0
2.0
2.2
3.0
3.1
3.2
4.0
4.1
4.2
4.3
4.4
INTRODUCTION AND SUMMARY. ...... ........
O SAND TEST. ...................
PREVIOUS ANALYSIS ........ .............
HYDRO ANALYSIS ........... ..............
0 SAND TEST ............ ................
PREVIOUS ANALYSIS ........ .............
HYDRO ANALYSIS ......... ...............
SECTION 25 TEST .......... ..............
PREVIOUS ANALYSIS ........ .............
HYDRO PHASE II ANALYSIS ...... ..........
HYDRO PHASE II - RETEST ANALYSIS .......
HYDRO SHALE COMMUNICATION TEST ANALYSIS. .
PAGE NO.
.... 1-i
.... 2-1
.... 2-1
. . . . 2-2
3-1
3-1
.... 3-1
. . . . 4-1
. . . . 4-1
. . . . 4-2
. . . . 4-3
.... 54-3
.... 5-i5.0 SECTION 35 TEST ..........
5.1 PREVIOUS ANALYSIS .........
5.2 HYDRO PHASE I ANALYSIS . . .
5.3 HYDRO PHASE II TEST. ....
5.4 HYDRO UNDERLYING SHALE TEST.
6.0 REFERENCES ..... .........
APPENDIX A: AQUIFER-TEST THEORY.
. . . . . . . 5-i
. . . . . . . 5-2
5-;
. . . . . . . 6-1
TABLES:
1-1 REPRESENTATIVE AQUIFER PROPERTIES AT SMITH RANCH . .I-
1-2 SUMMARY OF AQUIFER PROPERTIES AT SMITH RANCH . . . . 1-4
1-3 SUMMARY OF AQUITARD PROPERTIES AT SMITH RANCH. . . . 1-7
TABLE OF CONTENTS (CONTINUED)
2-1 DRAWDOWN
2-2 DRAWDOWN
2-3 DRAWDOWN
2-4 DRAWDOWN
2-5 DRAWDOWN
2-6 DRAWDOWN
2-7 DRAWDOWN
2-8 RECOVERY
2-9 RECOVERY
2-10 RECOVERY
2-11 RECOVERY
3-1 DRAWDOWN
3-2 DRAWD0WN
3-5 DRAWDOWN
l-4 DRAWDOWN
3-5 DRAWDOWN
3-6 DRAWDOWN
3-7 DRAWDOWN
3-8 DRAWDOWN
3-9 DRAWDOWN
3-10 DRAWDOWN
3-11 DRAWDOWN
3-12 RECOVERY
3-13 RECOVERY
3-14 RECOVERY
IN PUMPING WELL QP-3 ...... ............ 2-4
IN OBSERVATION WELL QI-2. SEMI-LOG ..... .. 2-5
IN OBSERVATION WELL QI-2, LOG-LOG ..... 2-6
IN OBSERVATION WELL QI-7, SEMI-LOG ..... .. 2-7
IN OBSERVATION WELL 01-7, LOG-LOG ..... .. 2-8
IN OBSERVATION WELL QI-11, SEMI-LOG . ... 2-9
IN OBSERVATION WELL QI-1I, LOG-LOG ..... .. 2-10
IN PUMPING WELL QP-3, SEMI-LOG ......... .. 2-11
IN OBSERVATION WELL QI-2, SEMI-LOG ...... 2-12
IN OBSERVATION WELL QI-7, SEMI-LOG ..... .. 2-13
IN OBSERVATION WELL 01-ii, SEMI-LOG..... 2-14
DATA FOR PUMPING WELL OP-2 ............ 3-4
DATA FOR OBSERVATION WELL OP-3 .......... 3-5
DATA FOR OBSERVATION WELL OP-3, LOG-LOG 3-6
DATA FOR OBSERVATION WELL 01-i. .... ....... 3-7
DATA FOR OBSERVATON WELL 01-I. LOG-LOG 3-8
DATA FOR OBSERVATION WELL 01-3. ........... 3-9
DATA FOR OBSERVATION WELL 01-3. LOG-LOG 3-10
DATA FOR OBSERVATION WELL 01-5 ........... 5-
DATA FOR OBSERVATION WELL 01-5, LOG-LOG 3-12
DATA FOR OBSERVATION WELL 0i-8., ......... -13
DATA FOR OBSERVATION WELL 01-8. LOG-LOG 3-i4
IN PUMPING WELL OP-2 ....................... . -15
IN OBSERVAT1ON WELL OP-3. ....... .......... 3-16
IN OBSERVATION WELL 0I-i .... .......... 3-17
ii
TABLE OF CONTENTS (CONTINUED)
3-15 RECOVERY
3-16 RECOVERY
3-17 RECOVERY
4-1 DRAWDOWN
4-2 DRAWDOWN
4-3 DRAWDOWN
4-4 DRAWDOWN
4-5 DRAWDOWN
4-6 DRAWDOWN
4-7 DRAWDOWN
4-8 DRAWDOWNSEMI-LOG
4-9 DRAWDOWNSEMI-LOG
4-10 DRAWDOWNLOG-LOG.
4-11 RECOVERYSEMI-LOG
4-12 RECOVERYSEMI-LOG
4-13 RECOVERYSEMI-LOG
4-14 RECOVERYSEMI-LOG
4-15 DRAWDOWNTEST . .
FIGURES:
IN OBSERVATION WELL 01-3 ...... ..........
IN OBSERVATION WELL 01-51 ...... ..........
IN OBSERVATION WELL 01-8e ...... ..........
IN PUMPING WELL 584, PHASE II,
IN OBSERVATION WELL 581, PHASE
IN OBSERVATION WELL 581, PHASE
IN OBSERVATION WELL 582, PHASE
IN OBSERVATION WELL 582, PHASE
IN OBSERVATION WELL 583, PHASE
IN OBSERVATION WELL 5831 PHASE
IN PUMPING WELL 584. PHASE II,
IN OBSERVATION WELL 583. PHASE. . . . . . . . . . . . . . .
IN OBSERVATION WELL 583. PHASE
IN OBSERVATION WELL 582. PHASE
SEMI -LOG
I1, SEMI-LOG
11, LOG-LOG
II, SEMI-LOG
II, LOG-LOG
II., SEMI-LOG
11, LOG-LOG
RETEST,
II, RETEST,
I1. RETEST,
II, RETEST,
PAGE NO.
3-18
3-19
3-20
4-6
4-7
4-8
4-9
4-10
4-11
4-12
4-13
IN OBSERVATION WELL 581. PHASE Ii. RETEST,
IN OBSERVATION WELL 583, PHASE II. RETEST,
IN PUMPPING WELL 584. PHASE II. RETEST,
IN PUMPING WELL 586. SHALE COMMUNICATION
4-15
4-16
4-17
4-18
4-19
4-20
4-21
4-22
4-16 DRAWDOWN IN OBSERVATION WELL 581. SHALE COMMUNICATIONTEST. SEMI-LOG ............... ...................
4-17 DRAWDOWN IN OBSERVATION WELL 581, SHALE COMMUNICATIONTEST, LOG-LOG ................ ....................
I ý
-7ABLE OF CONTENTS (CONTINUED)
FIGURES:
5-1 DRAWDOWN IN PUMPING WELL 35-739. PHASE I, SEMI-LOG
PAGE NO.
5-4
5-2 DRAWDOWNSEMI-LOG
5-3 DRAWDOWNLOG-LOG.
5-4 RECOVERY
t-5 ORAWDuWNQb-t, ui-AwJUWi'
SEMI-LOG
5-7 DRAWDOWNLOG-LOG.
5-8 DRAWDOWNSEMI-LOG
5-9 DRAWDOWNLOG-LOG.
5-10 DRAWDOWNSEMI-LOG
5-11 DRAWDOWNLOG-LOG.
5-12 RECOVERY
5-13 RECOVERY
5-14 RECOVERY
IN OBSERVATION WELL 35-737, PHASE I.
I . . . .E .N W . . . . .- . E . .
IN OBSERVATION WELL 35-737, PHASE I.. . . . . . • . . . . . . • . . . . .
IN OBSERVATION WELL 35-737, PHASE II.
IN OBSERVLDTGo WLL 535 -737-, MHSE I".
IN ISERV i IUIN WELLL 13 5-738 Hf I-. . . . . . . . . . . . . . . . . . .
IN OBSERVATION WELL 35-736, PHASE II,N PU G L 5 -. . . . . .. . .
IN OBSERVATION WELL 35-737, PHASE II.I . . . . . . .W . .5 . . . . . . .
IN OBSERVATION WELL ->5-7317, PHASE iI,
IN OBSERVATION WELL 3_5-738 , PHASE 11,
IN OBSERVATION WELL 35-738, PHASE II,
IN PUMPING WELL 35-739, PHASE 11. . .
IN OBSERVATION WELL 3-5-73ý6. PHASE i 1.
IN OBSERVATION WELL _35-737. PHASE If.
. . . 5-5
. . . 5-6
. . . 5-7
-L7. 5-9
. . . 5-9
. . . 5-10
. . . 5-11
. . . 5-12
* . 5-14
* . 5-15
5-16
* . 5-17
5-15 DRAWDOWN IN PUMPING WELL 35-739., SEMI-LOG,UNDERLYING SHALE TEST ........ ..............
5-16 DRAWDOWN IN OBSERVATION WELL 35-736, SEMI-LOG,UNDERLYING SHALE TEST ........ ..............
5-17 DRAWDOWN IN OBSERVATION WELL 35-73,. LOG-LOG,
UNDERLYING SHALE TEST. ......... .............
5-18 RECOVERY IN OBSERVATION WELL 35-736. UNDERLYINGSHALE TEST ............... ...................
5-18
5-19
5-20
• . 5-21
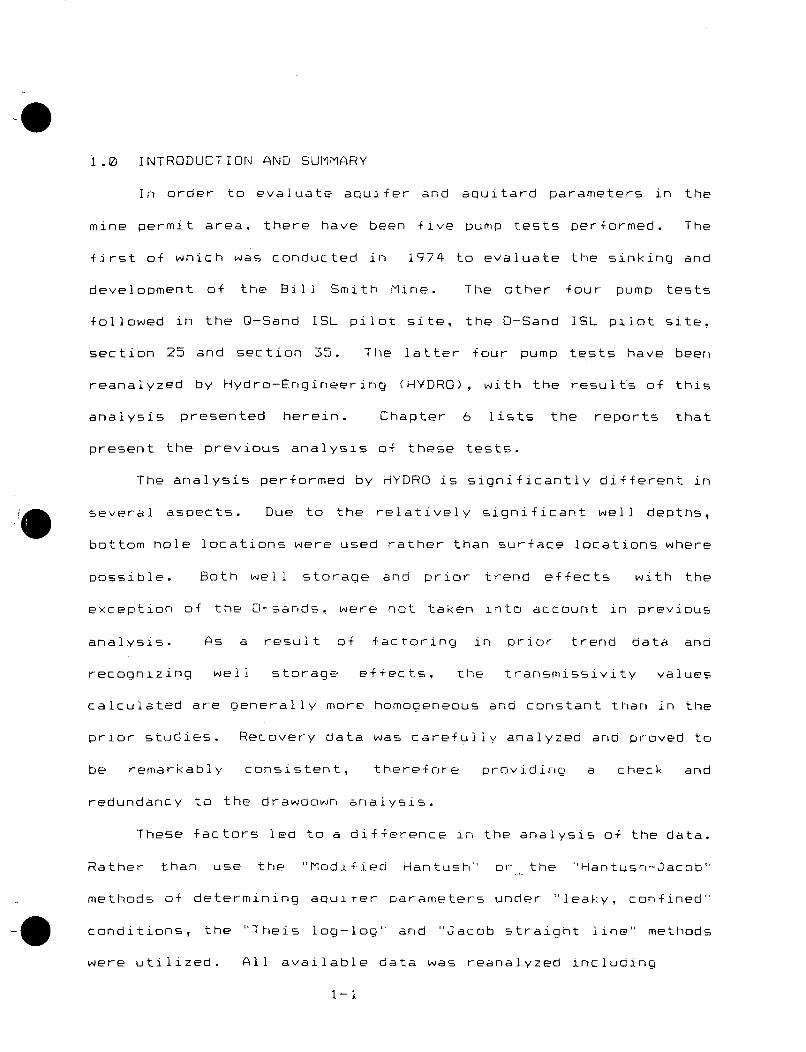
1.0 INTRODUCTION AND SUMMARY
In order to evaluate aquifer and aquitard parameters in the
mine permit area, there have been five pump tests performed. The
first of which was conducted in 1974 to evaluate the sinking and
development of the Bill Smith Mine. The other four pump tests
followed in the O-Sand ISL pilot site, the O-Sand ISL pilot site.
section 25 and section 35. The latter four pump tests have been
reanalyzed by Hydro-Engineering (HYDRO), with the results of this
analysis presented herein. Chapter 6 lists the reports that
present the previous analysis of these tests.
The analysis performed by HYDRO is significantly different in
several aspects. Due to the relatively significant well depths,
bottom hole locations were used rather than surface locations where
possible. Both well storage and prior trend effects with the
exception of the 0-sands, were not taken into account in previous
analysis. As a result of factoring in prior trend data and
recognizing well storage effects, -he transmissivity values
calculated are generally more homogeneous and constant than in the
prior studies. Recovery data was carefully analyzed and proved to
be remarkably consistent, therefore providino a check and
redundancy to the drawdown analysis.
These factors led to a difference in the analysis of the data.
Rather than use the "Modified Hantush" or the "Hantush-Jacob"
methods of determining aquifer parameters under "leaky, confined"
conditions, the "Theis log-log" and 'Jacob straight line" methods
were utilized. All available data was reanalyzed including
1-1
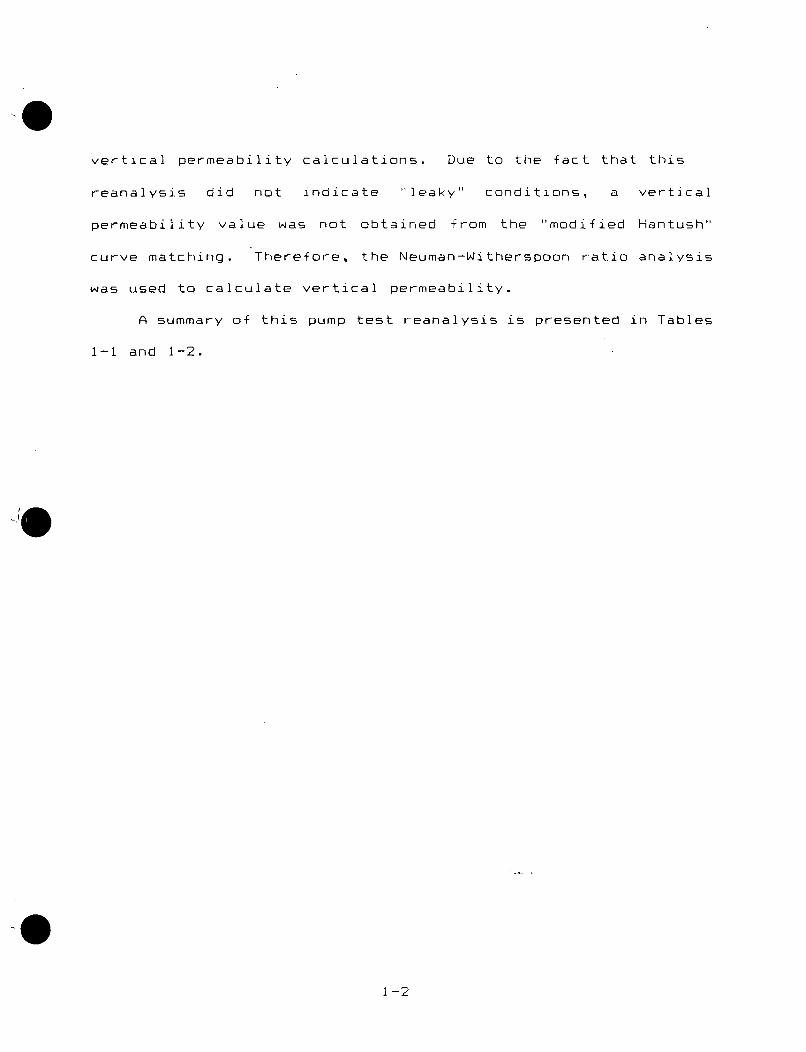
vertical permeability calculations. Due to the fact that this
reanalysis did not indicate 'leaky" conditions, a vertical
permeability value was not obtained from the "modified Hantush"
curve matching. Therefore, the Neuman-Witherspoon ratio analysis
was used to calculate vertical permeability.
A summary of this pump test reanalysis is presented in Tables
1-1 and 1-2.
1-2
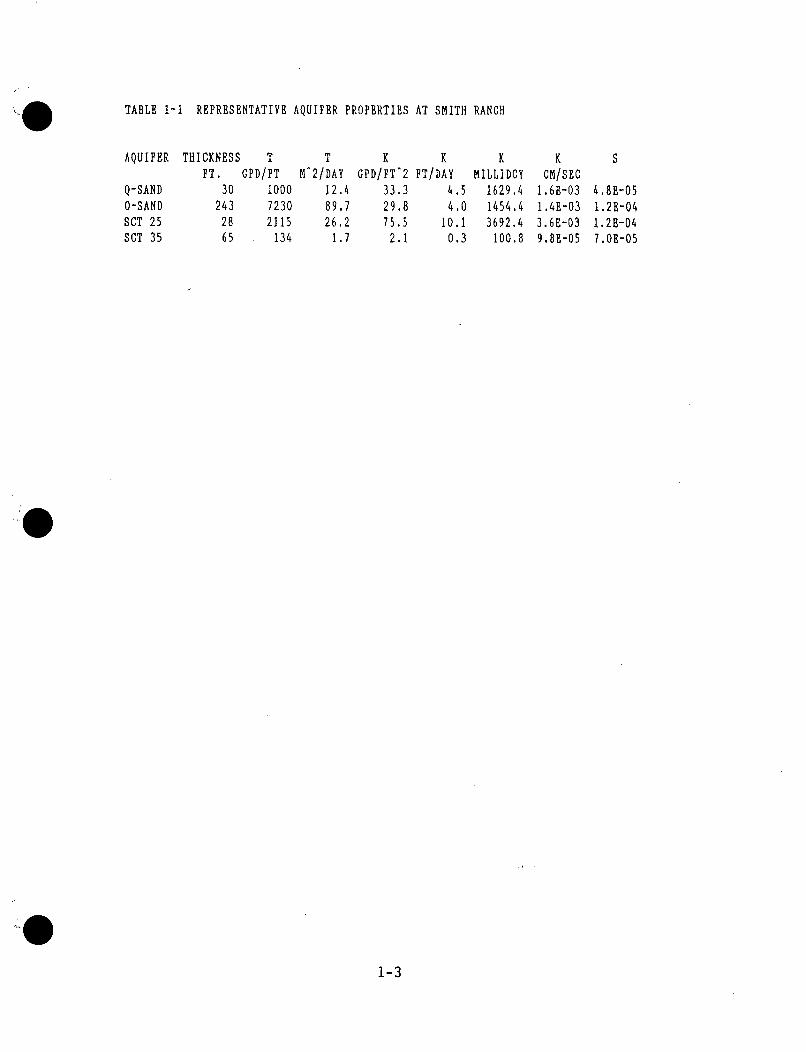
TABLE 1-1 REPRESENTATIVE AQUIFER PROPERTIES AT SMITH RANCH
AQUIFER THICKNESS T T K KFT. GPD/FT M^2/DAY GPD/FT^2 FT/DAY
Q-SAND 30 1000 12.4 33.3 4.O-SAND 243 7230 89.7 29.8 4
.5
.0
KMILLIDCY
1629.41454.43692.4
100.8
K SCM/SEC
1.6E-03 4.8E-051,4E-03 1.2E-043.6E-03 1.2E-049.8E-05 7.OE-05
SCT 25SCT 35
2865
2115134
26.21.7
75.5 10.12.1 0.3
1-3
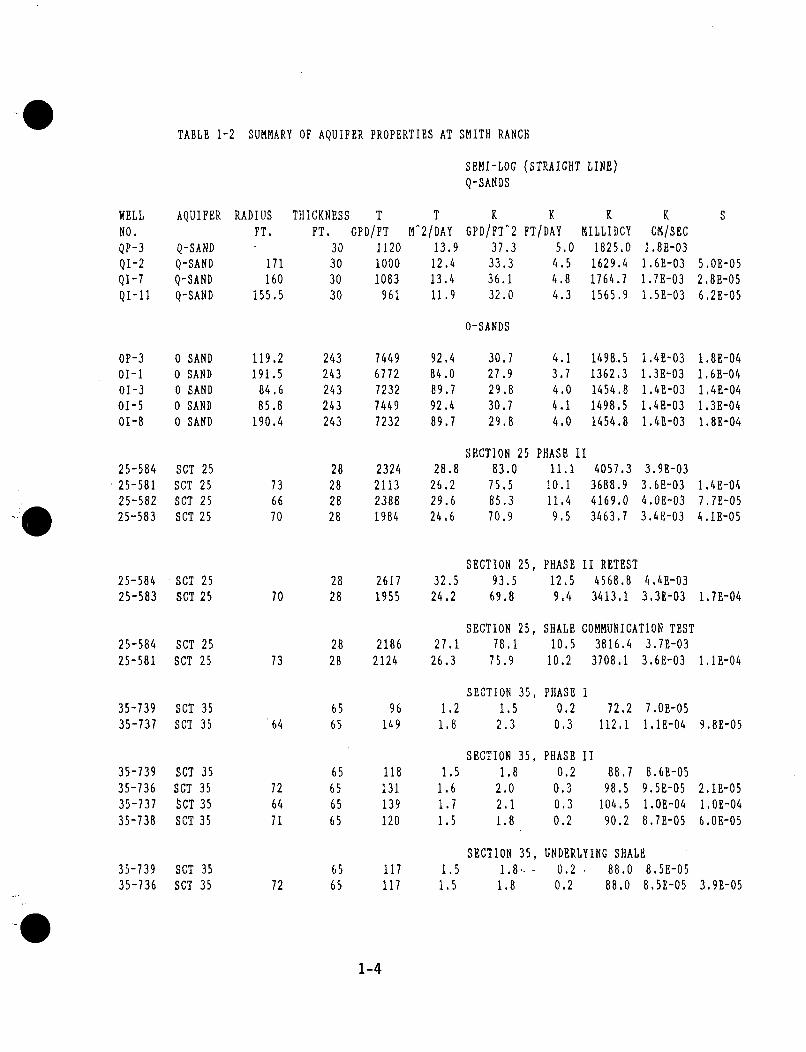
TABLE 1-2 SUMMARY OF AQUIFER PROPERTIES AT SMITH RANCH
SEMI-LOG (STRAIGHT LINE)Q-SANDS
WELLNO.QP-3QI-2QI-7QI-II
AQUIFER RADIUSFT.
q-a lvu
Q-SANDQ-SANDQ-SAND
THICKNES.'FT.
30303030
T T K K K KGPD/FT MA2/DAY GPD/FT-2 FT/DAY MILLIDCY CM/SEC
1120 13.9 37.3 5.0 1825.0 1.BE-031000 12.4 33.3 4.5 1629.4 1.6E-031083 13.4 36.1 4.8 1764.7 1.7E-03
961 11.9 32.0 4.3 1565,9 1.5E-03
S
5,0E-052.8E-056 2E-05
171160
155.5
O-SANDS
OP-301-101-301-501-8
25-58425-58125-58225-583
00000
SANDSANDSANDSANDSAND
119.2191.5
84.685.8
190.4
243243243243243
28282828
74496772723274497232
2324211323881984
92.484.089.792.489.7
28.826.229.624.6
30.727.929.830.729.8
4.13.74.04.14.0
1498.51362.31454.81498.51454.8
[I
4057.33688.94169.03463.7
1 .4E-031.3F,-03
1.4E-031.48-031.4E-03
3.9E-033.6E-034.0E-033.4 -03
1.8E-041.68-041.4E-041.3E-041.8E-04
1.4E-047.7E-054.1E-05
SCTSCTSCTSCT
25252525
736670
SECTION 25 PHASE I83.0 11.1
75.5 10.185.3 11.470.9 9.5
25-584 SCT 2525-583 SCT 25
25-584 SCT 2525-581 SCT 25
35-739 SCT 3535-737 SCT 35
2870 28
2873 28
6564 65
SECTION 25,2617 32.5 93.51955 24.2 69.8
SECTION 25,2186 27.1 78.12124 26.3 75.9
PHASE12.59.4
SHALE10.5
10.2
II RETEST4568.8 4.4E-033413.1 3.3E-03 1.7E-04
COMMUNICATION TEST3816.4 3.7E-03
3708.1 3.6E-03 1. I,-04
35-73935-73635-73735-738
SCTSCT8CTSCT
35353535
726471
65656565
96149
118131139120
117117
1.21.8
1.51.61.71.5
1.51.5
SECTION 35, PHASE I1.5 0.22.3 0.3
SECTION 35,1.8
2.02.11.8
SECTION 35,1.8- .1.8
PHASE II0.2
0.30.30.2
88.798.5
104.590.2
8.6E-059. 5E-051.OE-048.7E-05
72.2 7.O0-05112.1 1,iE-04 9.8E-05
2. 1E-051 OB-046.08-05
35-739 SCT 3535-736 SCT 35
6572 65
UNDERLYING SHALE0.2 88.0 8.5E-050.2 88.0 8.5E-05 3.9E-05
1-4
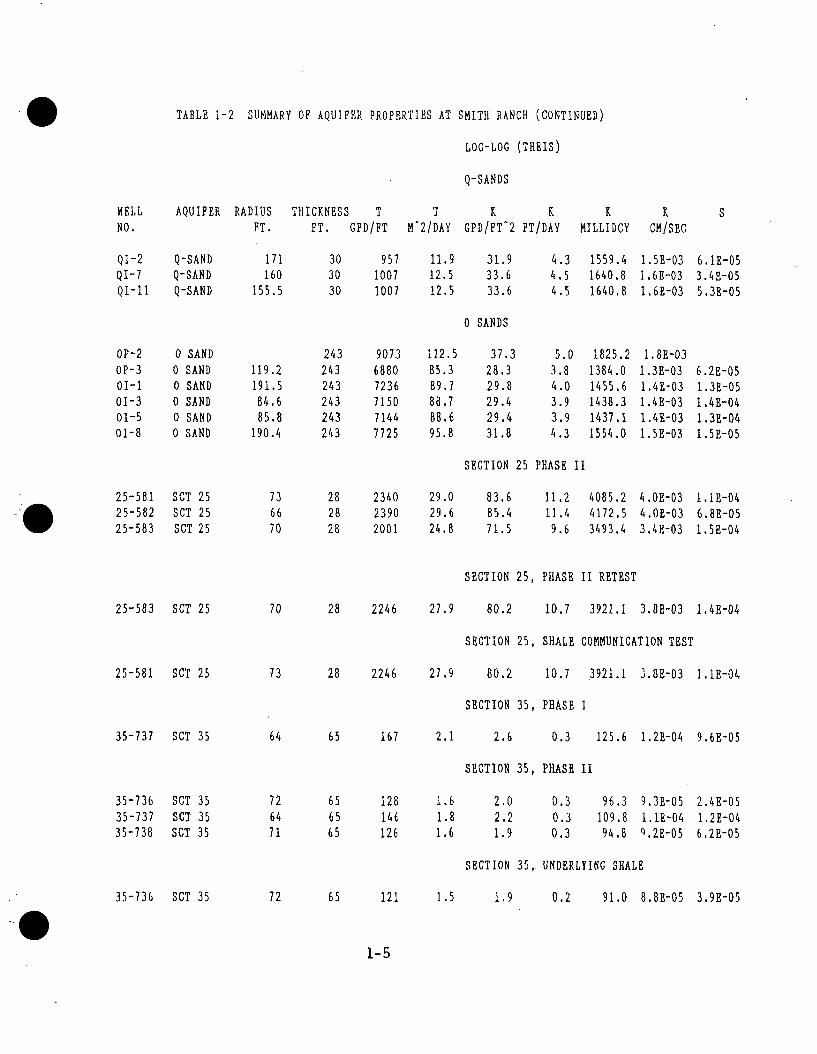
TABLE 1-2 SUMMARY OF AQUIFER PROPERTIES AT SMITH RANCH (CONTINUED)
LOG-LOG (THEIS)
Q-SANDS
WELLNO.
AQUIFER RADIUSFT.
THICKNESS T T K K K KFT. GPD/FT MW2/DAY GPD/FT'2 FT/DAY MILLIDCY CM/SEC
S
QI-2QI-7QI-II
Q-SANDQ-SANDQ-SAND
171160
155.5
303030
957 11.9 31.91007 12.5 33.61007 12.5 33.6
4.3 1559.44.5 1640.84.5 1640.8
1 .5E-031 .6E-031.6E-03
6.1E-053.4E-055 .3E-05
0 SANDS
OP-2OP-3OI-101-301-501-8
0 SAND0 SAND0 SAND0 SAND0 SAND0 SAND
119.2191.5
84.685.8
190.4
243243243243243243
907368807236715071447725
112.585.389.788.788.695.8
37.328.329.829.429.431.8
5.03.84.03.93.94.3
1825.21384.01455.61438.31437.11554.0
1.8E-031 .3E-031 .4E-031.4E-031 4E-031.5E-03
6.2E-051.3E-O51 .4B-041.3E-041.5E-05
SECTION 25 PHASE II
25-58125-58225-583
SCT 25SCT 25SCT 25
736670
282828
2340 29.0 83.6 11.2 4085.22390 29.6 85.4 11.4 4172.52001 24.8 71.5 9.6 3493.4
4 .0-034.0E-033.4E-03
I.1B-046.BE-051.5E-04
SECTION 25, PHASE II RETEST
25-583 SCT 25 70 28 2246 27.9 80.2 10.7 3921.1 3.8E-03 1.4E-04
SECTION 25, SHALE COMMUNICATION TEST
25-581 SCT 25 73 28 2246 27.9 80.2 10.7 13921.1 3.8E-03 1.1E-04
SECTION 35, PHASE I
35-737 SCT 35 64 65 167 2.1 2.6 0.3 125.6 1.2E-04 9.6E-05
35-73635-73735-738
SOT 35SOT 35SCT 35
726471
656565
128146126
1.61.81.6
SECTION 35, PHASE II
2.0 0.3 96.3 9.3E-05 2.4E-052.2 0.3 109.8 I.IE-04 1.2E-041.9 0.3 94.8 4.2E-0 5 6.2E-05
SECTION 35, UNDERLYING SHALE
35-736 SCT 35 72 65 121 1.5 1.9 0.2 91.0 8.8E-05 3.9E-05
1-5
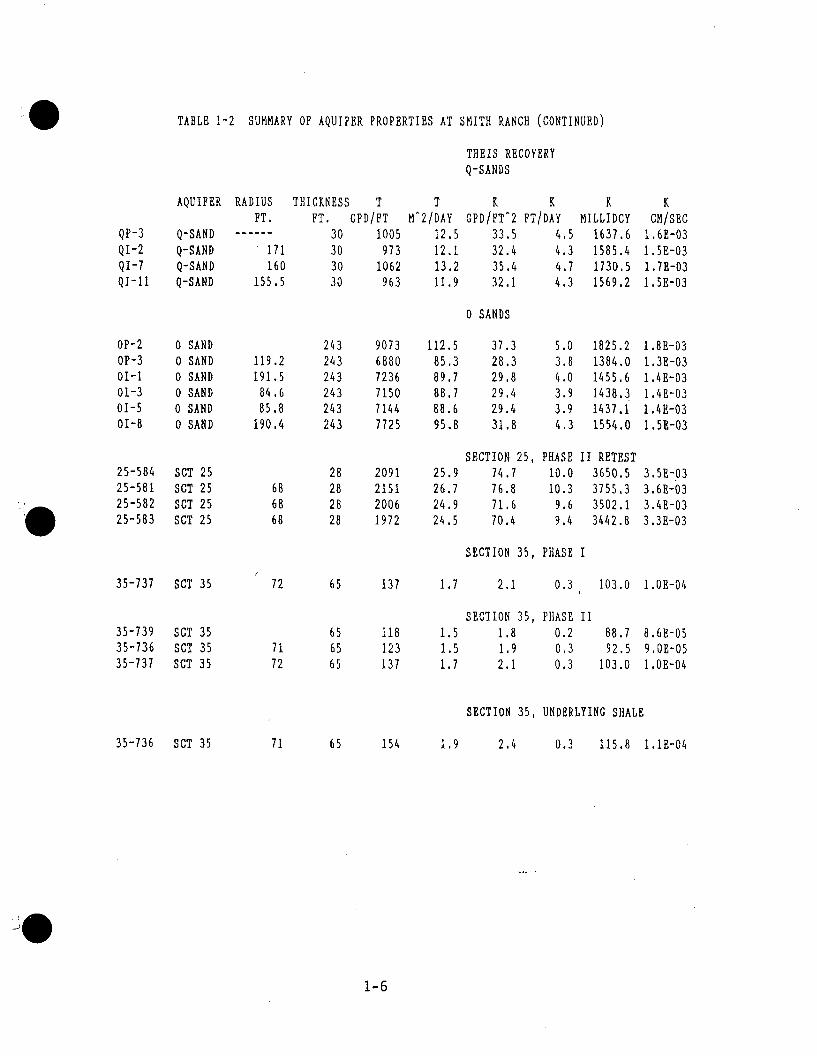
TABLE 1-2 SUMMARY OF AQUIFER PROPERTIES AT SMITH RANCH (CONTINUED)
THEIS RECOVERYQ-SANDS
QP-3QI-2QI-7QI-lI
AQUIFER RADIUSFT.
Q-SANDQ-SAND 171Q-SAND 160Q-SAND 155.5
THICKNESSFT.
30303030
GPD/FT1005
9731062963
M^2/DAY12.512.113.211.9
T T K K KGPD/FTf2 FT/DAY MILLIDCY
33.5 4.5 1637.632.4 4.3 1585.435.4 4.7 1730.532.1 4.3 1569.2
KCM/SEC
1.6E-031.5E-031.7E-031.5E-03
0 SANDS
OP-2OP-301-101-301-501-8
000000
SANDSANDSANDSANDSANDSAND
119.2191.584.685.8
190.4
243243243243243243
28282828
907368807236715071447725
2091215120061972
112.585.389.788.788.695.8
25.926.724.924.5
37.328.329.829.429.431.8
SECTION 25,74.776.871.670.4
5.03.84.03.93.94.3
PHASE10.010.39.69.4
1825.21384.01455.61438.31437.11554.0
11 RETEST3650.53755.33502.13442.8
1 .8E-031.3E-031.4 B-031.4E-031 .4E-031.5R-03
3.5E-033.6E-033.4E-033.3E-03
25-58425-58125-58225-583
SCTSCTSCTSCT
25252525
686868
SECTION 35, PHASE I
35-737 SCT 35 72 65 137 1.7 2.1 0.3 103.0 1.0E-04
35-73935-73635-737
SOT 35SGT 35SCT 35
7172
656565
118123137
1.51.51.7
SECTION 35, PHASE II1.8 0.21.9 0.32.1 0.3
88.792.5
103.0
8.6E-059 OE-051 .0-04
SECTION 35, UNDERLYING SHALE
35-736 SCT 35 71 65 154 1.9 2.4 0.3 115.8 1.IE-04
1-6
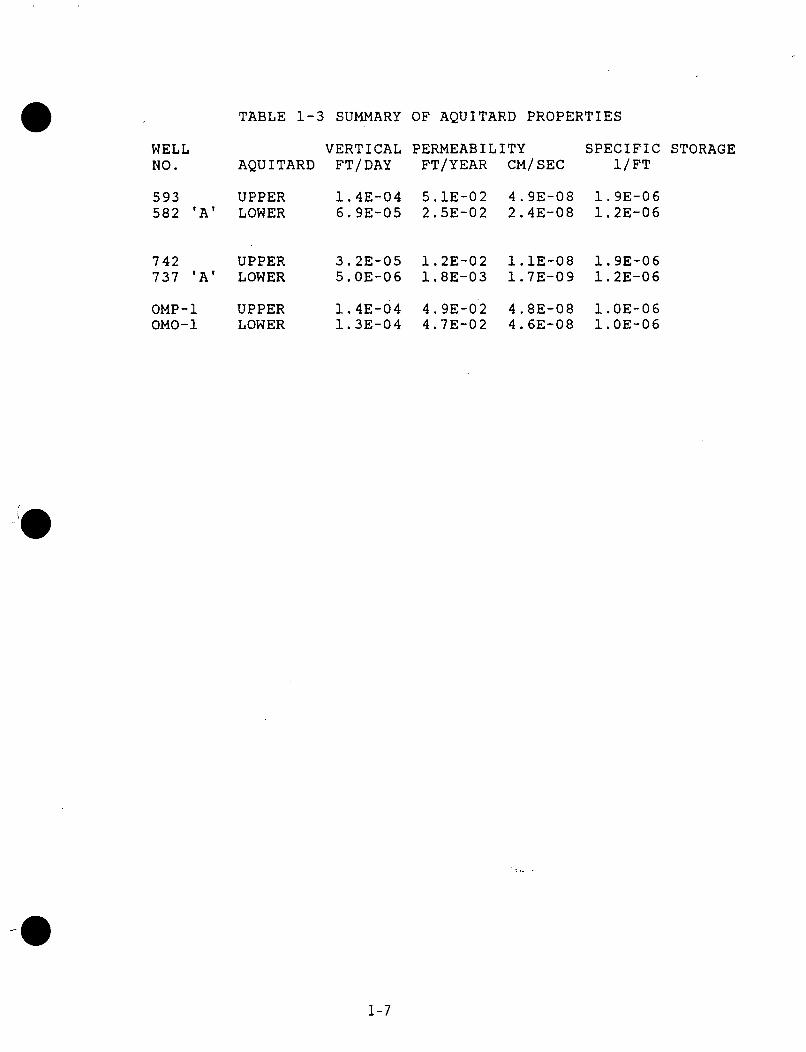
TABLE 1-3 SUMMARY OF AQUITARD PROPERTIES
WELLNO.
VERTICAL PERMEABILITYAQUITARD FT/DAY FT/YEAR CM/SEC
SPECIFIC STORAGE1/FT
593 UPPER582 'A' LOWER
742 UPPER737 'A' LOWER
1.4E-04 5.1E-02 4.9E-08 1.9E-066.9E-05 2.5E-02 2.4E-08 1.2E-06
3.2E-05 1.2E-02 1.1E-08 1.9E-065.OE-06 1.8E-03 1.7E-09 1.2E-06
1.4E-04 4.9E-02 4.8E-08 1.OE-061.3E-04 4.7E-02 4.6E-08 1.OE-06
OMP-1OMO -1
UPPERLOWER
1-7
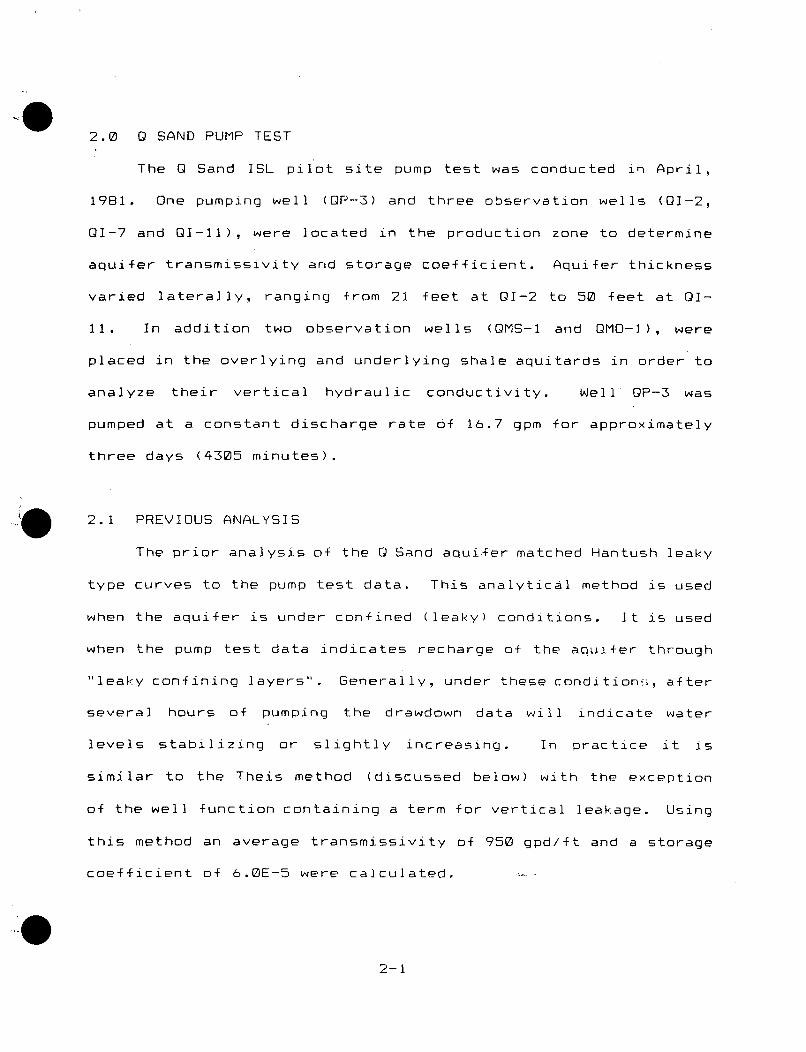
2.0 Q SAND PUMP TEST
The Q Sand ISL pilot site pump test was conducted in April,
1981. One pumping well (QP-3) and three observation wells (01-2,
QI-7 and QI-II), were located in the production zone to determine
aquifer transmissivity and storage coefficient. Aquifer thickness
varied laterally, ranging from 21 feet at QI-2 to 50 feet at 01-
11. In addition two observation wells (QMS-1 and QMO-1), were
placed in the overlying and underlying shale aquitards in order to
analyze their vertical hydraulic conductivity. Well QP-3 was
pumped at a constant discharge rate of 16.7 gpm for approximately
three days (4305 minutes).
2.1 PREVIOUS ANALYSIS
The prior analysis of the Q Sand aquifer matched Hantush leaky
type curves to the pump test data. This analytical method is used
when the aquifer is under confined (leaky) conditions. It is used
when the pump test data indicates recharge of the aquifer through
"leaky confining layers". Generally, under these conditionsi, after
several hours of pumping the drawdown data will indicate water
levels stabilizing or slightly increasing. In practice it is
similar to the Theis method (discussed below) with the exception
of the well function containing a term for vertical leakage. Using
this method an average transmissivity of 950 gpd/ft and a storage
coefficient of 6.0E-5 were calculated.
2-1
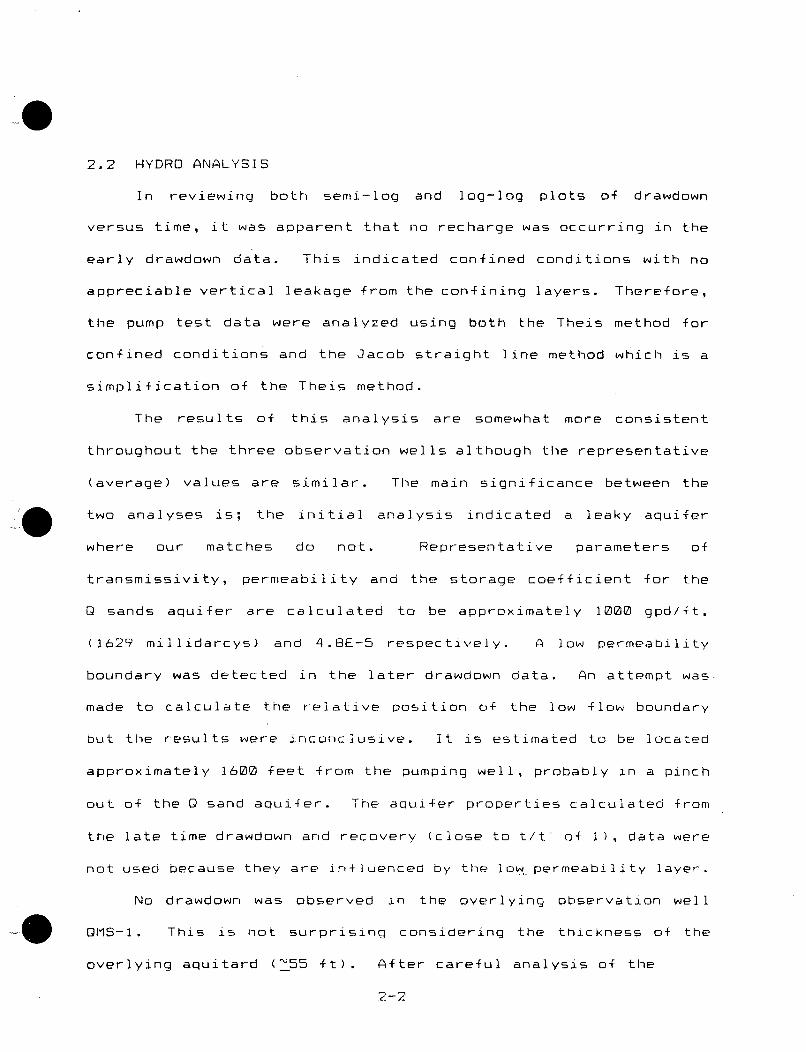
2.2 HYDRO ANALYSIS
In reviewing both semi-log and log-log plots of drawdown
versus time, it was apparent that no recharge was occurring in the
early drawdown data. This indicated confined conditions with no
appreciable vertical leakage from the confining layers. Therefore,
the pump test data were analyzed using both the Theis method for
confined conditions and the Jacob straight line method which is a
simplification of the Theis method.
The results of this analysis are somewhat more consistent
throughout the three observation wells although the representative
(average) values are similar. The main significance between the
two analyses is; the initial analysis indicated a leaky aquifer
where our matches do not. Representative parameters of
transmissivity, permeability and the storage coefficient for the
Q sands aquifer are calculated to be approximately 1000 gpdift.
(1629 millidarcys) and 4.8E-5 respectively. A low permeability
boundary was detected in the later drawdown data. An attempt was.
made to calculate the relative position of the low flow boundary
but the results were inconclusive. It is estimated to be located
approximately 1600 feet from the pumping well, probably in a pinch
out of the Q sand aquifer. The aquifer properties calculated from
the late time drawdown and recovery (close to t/t' of 1), data were
not used because they are influenced by the low permeability layer.
No drawdown was observed in the overlying observation well
0iMS-I. This is not surprising considering the thickness of the
overlying aquitard ('_55 ft). After careful analysis of the
2-
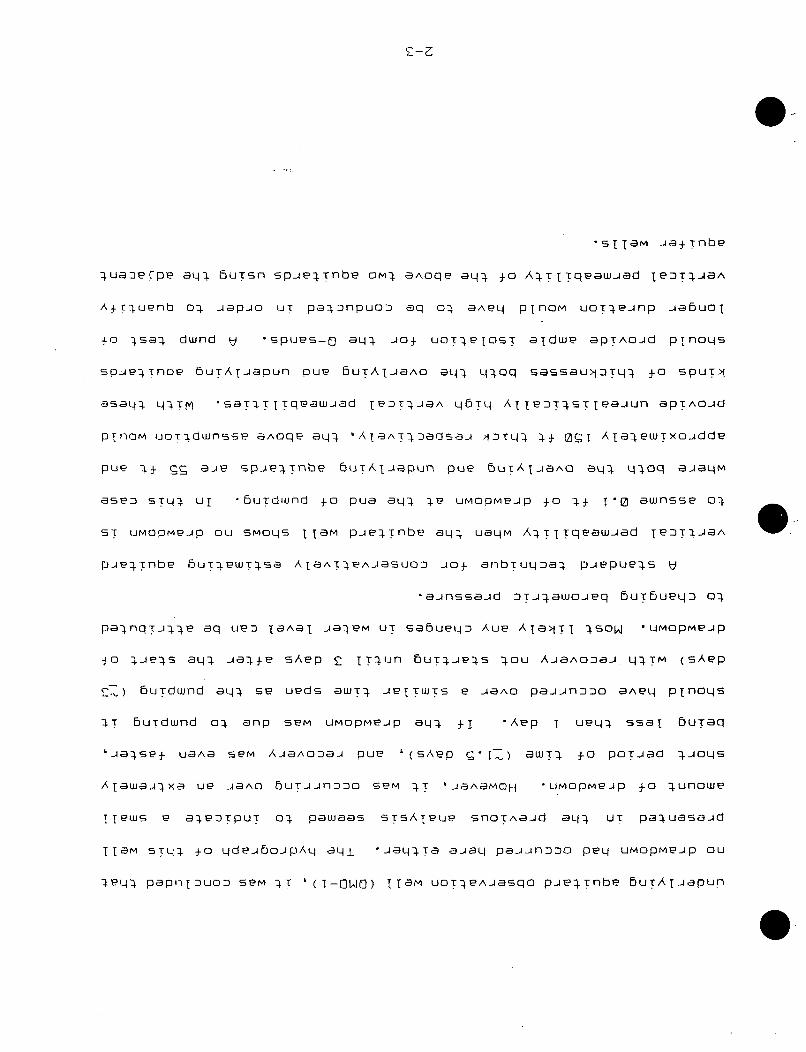
• sI~aM Ja+Tnbe
quGaeJpe aM} 5ursn spje4Tnbe oMq aAoqe aq4 fo A4TTTqeawJad leDT4jaA
AýTjuenb oq japio uT paqDnpuoD eq o- aAeL4 pfnolM uoTle4np -aeuoQ
q o 3s-4 dwnd j "pU'eS-0 aq4 L40 UOTqelOST aldwe apTAOJd plnoqs
spie4Tnue buTAIeapun pue 5UTAI-JaAO aq4 qqoq SaSSaujNTqL4 +0 SpUT
asaq4 qqTM "saT4T[Tqeawjad eDTq-JaA qbT4 AteT2jTsTjeejun apTAoJd
pTfnoM UOT4dWnssp aAoqe a- 'ACAT43DdaS.j fDTL44 4+ g Ata4ewTxo-dde
pue 4+ gg aje spilTribe buTAIjapun pue 6UTAI-JA0 a^ 4 q4oq a4eLaM
aseD sTq4 UI UT udwnd +o pue aLj -1 umooMe-p +o 4+ W0 awnsse o0
sT utmopmep ou sMoq4s Itm pAe4Tnbe at4- Ua6LM A4TiTqeawJed TeDT4.JaA
pJejTnbe buT~eWT4Sa AjaATqe^JASUoD Jo0 anbTU4D84 pJepue4s $
• inssaid oTjqawojeq buibueqo o0
paqnqTjqqe aq uPD la^i JaqM UT sabue•t4 Aue AIeNTI 4sow umopMeip
+o 4jeqs aqq jaqie sAep £ lTq~jn buT4-4s 4ou AJaAODaJ 4jTM (SAep
j b 5urdwnd aq; se ueds aWTj -JeiwTs e -Aao pJýnDDo aeq PqflnOqs
4T burdwnd o0 anp suM UMOpMeip aJ4 +I "Aep T ue244 ssal buTaq
'JalSe4 UaAa SeM AJaAODaJ pue &(sAep [) aWT4 40 p0Tjad 4Joqs
Ajawa•Ia ue aAO buTinoDDo sum qT '1 JaAamOH "umopmejp 0o junowe
rruws e a;e'JrTPUT 04 pawaas STSAteue snoTAa-d aq; uT pa-4uasaejd
IjaM sTqq +o qdeAbojpAq ql -"J,44Ta aJaq pajjnD~o peq umopMeip ou
4e44 papniluon SeM 4T '(1-OWW) tIat UOTqeA-jsqo P-4efTnbe bUTATJaPUfn
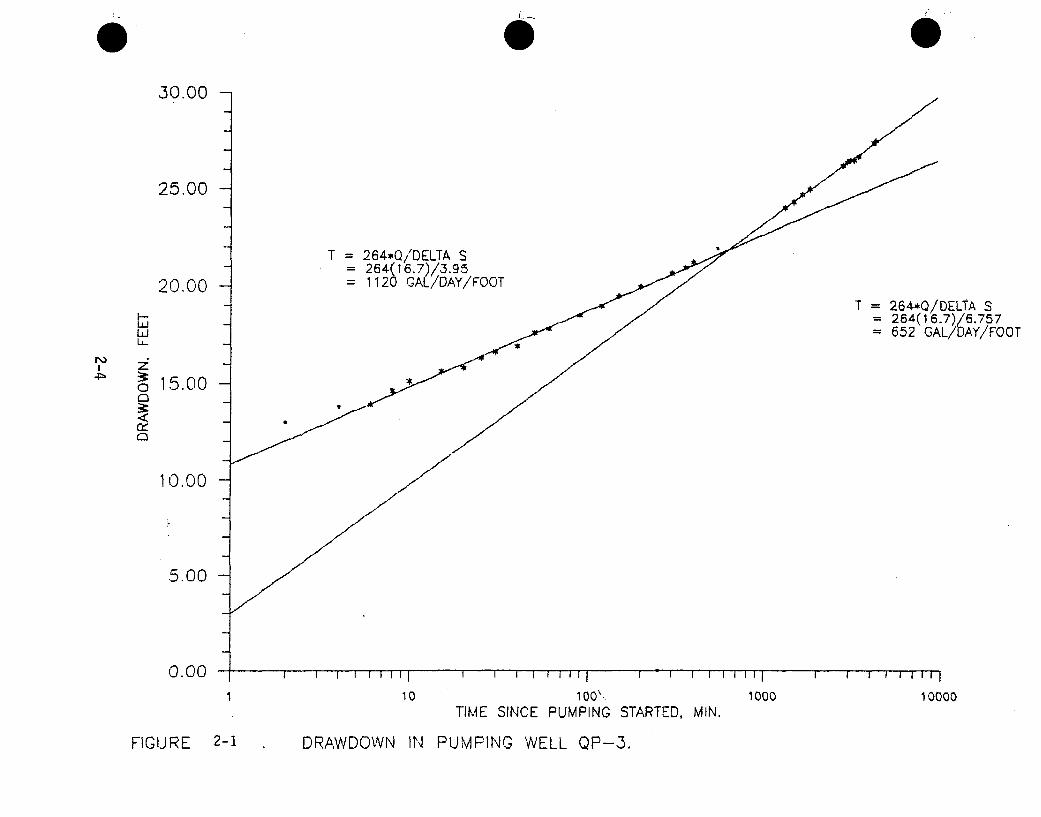
4I 0
I4•
30.00
25.00
20,00
LU-
g 15.00
10.00
5.00
0.00
T = 264*Q/DELTA S264(16.7)/6.757652 GAL/DAY/FOOT
T = 264*Q/2DELTA S= 264(1 6.7)/3.95= 1120 GAL/DAY/FOOT
1 10 100"TIME SINCE PUMPING STARTED, MIN.
1000 10000
FIGURE 2-1 DRAWDOWN VI PUMPING WELL QP-3.
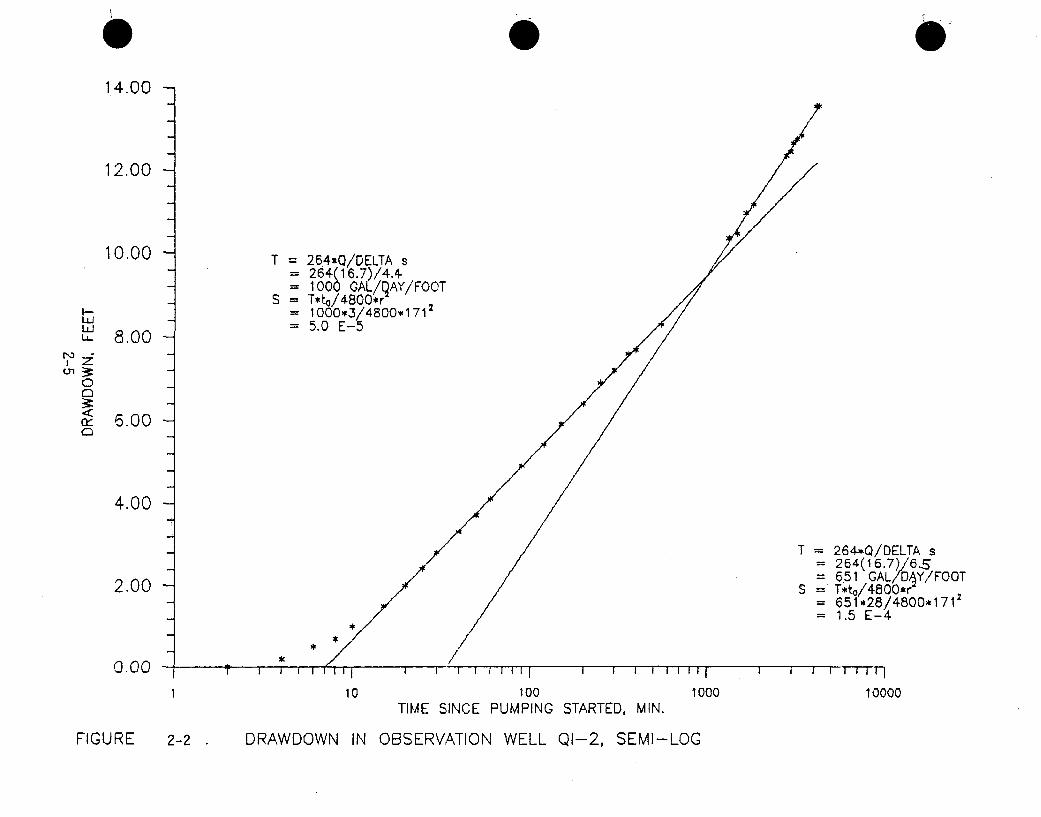
14.00- 7
12,00
10.00 T = 264*Q/DELTA s= 264(16.7)/4.4-= 1000 GAL/QAY/FOOT_S =T*to/4800*r'= 1000*3/4800*1712
,,, = 5.0 E-5" 8.00
c- 6.00
4.00
T = 264*Q/DELTA s2 264(16.7)/ 6.S
2.00 -6.51 GAL/D0Y/FOOT2S T*to/4800*r
- 651*28/4800*171.1.5 E-4
0.00- /1 10 100 1000 10000
TIME SINCE PUMPING STARTED, MIN.
DRAWDOWN IN OBSERVATION WELL QI-2, SEMI-LOGFIGURE 2-2
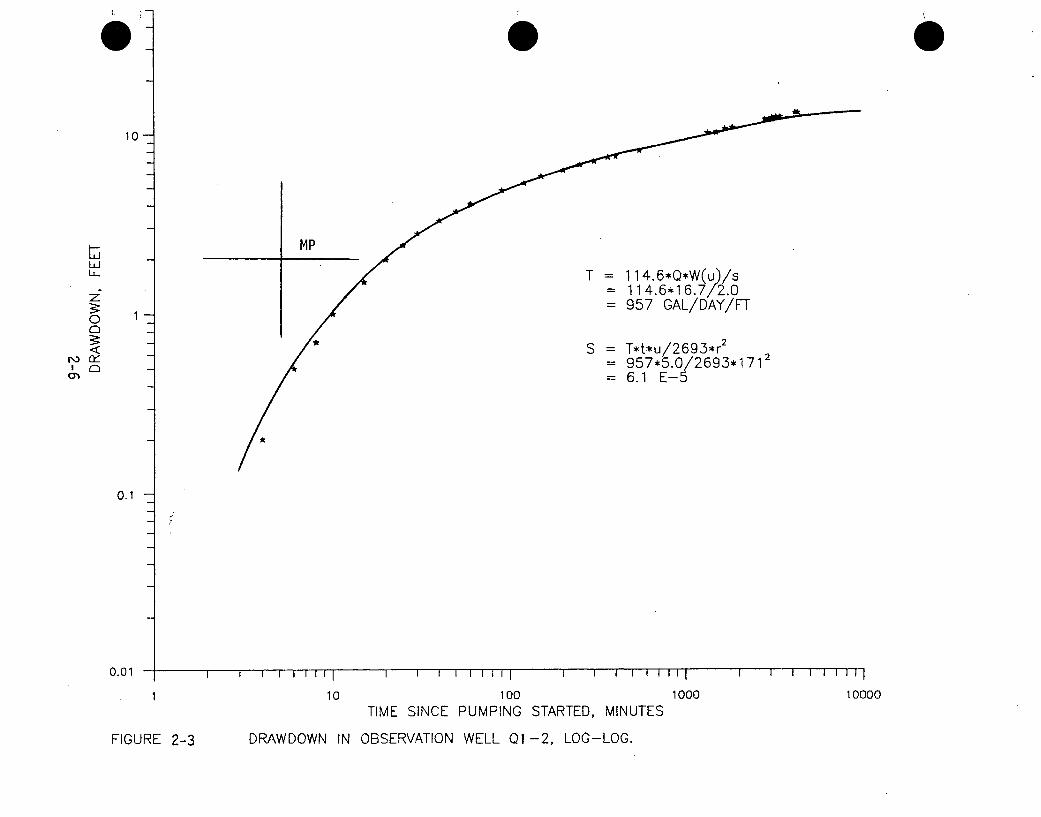
0
10-
Ld
0
MP
1--
T 114.6*Q*W(u)/s= 114.6*16.7/2.0= 957 GAL/DAY/FT
S = T*t*u/2693*r 2
= 957*5.0/269.3*1712=6.1 E-5
rQ
*
0.1 -
0.01 I I I liii I I I hf
S I I I I i I101
I I I I I I I
100TIME SINCE PUMPING
1000
STARTED, MINUTES10000
FIGURE 2-3 DRAWDOWN IN OBSERVATION WELL QI -2, LOG-LOG.
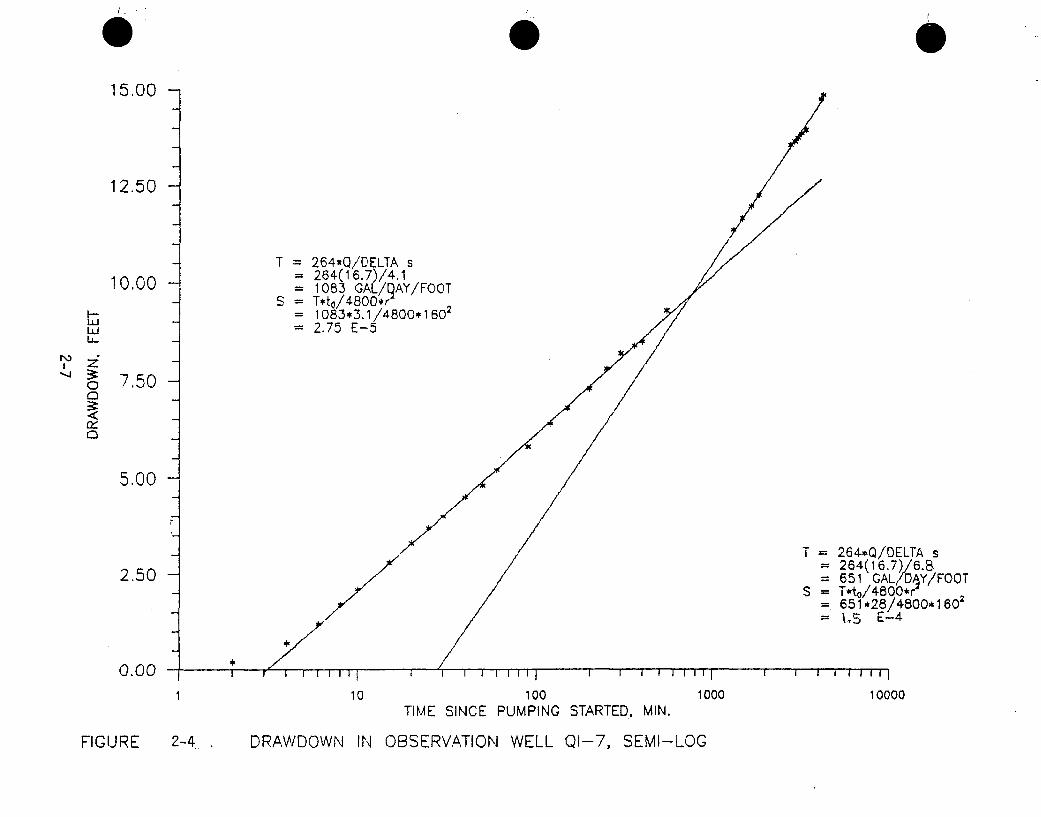
15.00
12.50
T = 264*Q/DELTA s= 264(16.7)/4.1
10.00 = 1083 GAL/QAY/FOOTS = T*to/4800*r"
= 1083,3.1/4800, 1602= 2.7.5 E-5
• 7.50
5.00
T = 2640Q/DELTA s20264(16.7)/6.82.5 0 651 . AL DrjY/FOOT
S T T*to/4800*r 2- 651*28/4800*1602- 'L3 E-4
4.
0.00-0. 0rI " i 1I I / I1 I I IIIIj I I '1 II1 I I I 1 1 11I
1 10 100 1000 10000TIME SINCE PUMPING STARTED. MIN.
FIGURE 2-4. . DRAWDOWN IN OBSERVATION WELL QI-7, SEMI-LOG
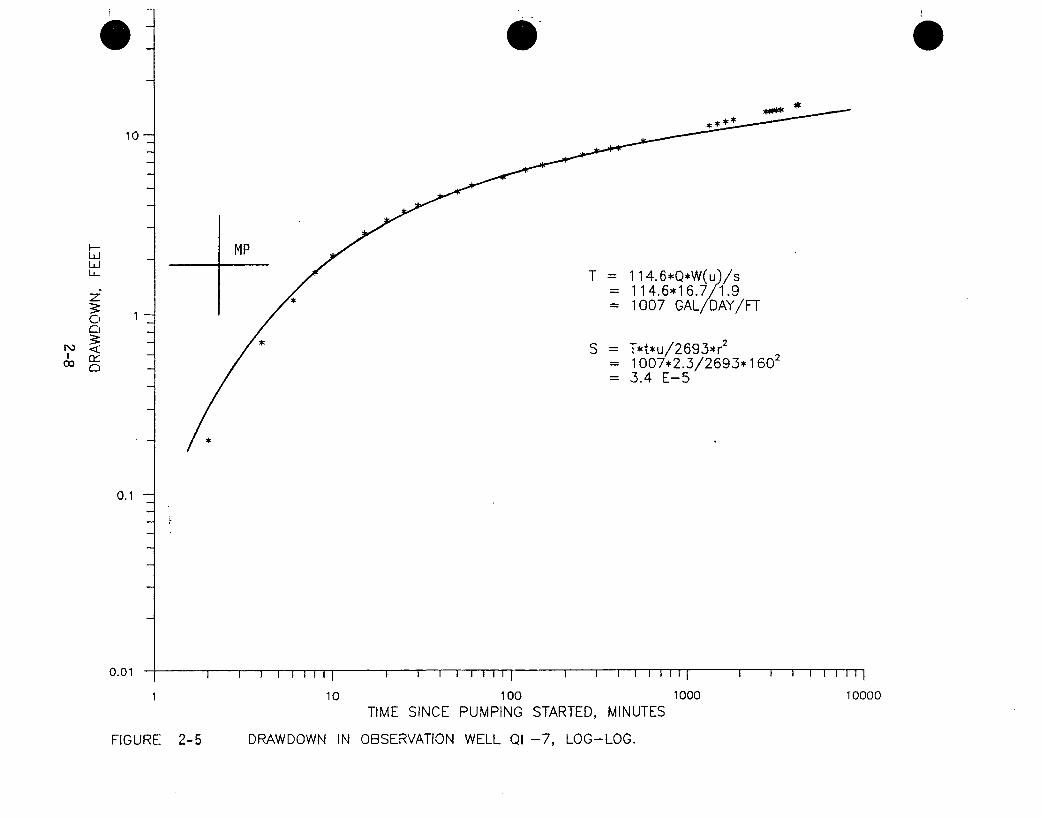
0
10
I--uLJLJ-LL_
z0
n
MP
80
!1-
'K
T 114.6*Q*W(u)/s= 114.6*16.7 1.9= 1007 GAL DAY/FT
S = T*t*u/2693*r2 2= 1007*2.3/2693*160= 3.4 E-5
*
0.1
0.01 I I liii
10
I I I .I I I I I) 1
1
TIME SINCE100
PUMPING
I I I I I I I I
1000
STARTED, MINUTES10000
FIGURE 2-5 DRAWDOWN IN OBSERVATION WELL QI -7, LOG-LOG.
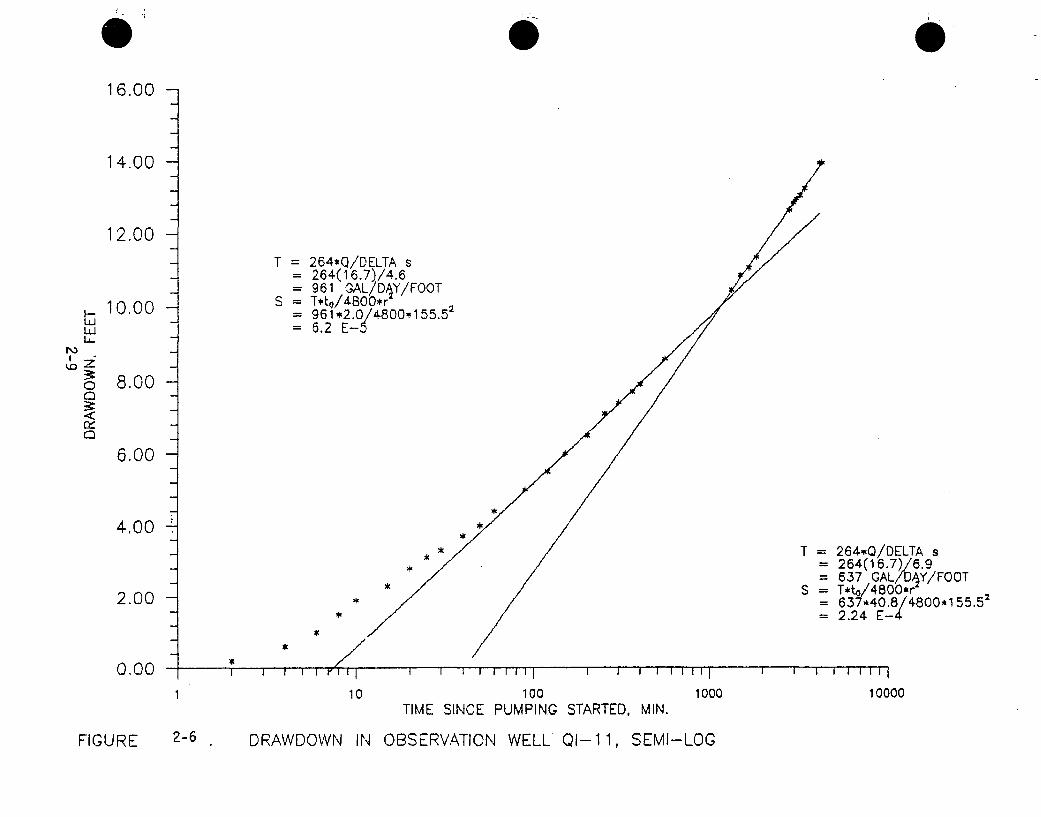
0
LU_N,
0I
Q:
0D
16.00 -
14.00 -
12.00 -
10.00 -
8.00 -
6.00 -
4,00 -
2.00 -
264*Q/DELTA s264(1 6.7)/4.6961 GAL/DAY/FOOTT*tQ/48005*r' 2961*2.0/4800,155.526.2 E-5
T = 264-,Q/DELTA s264(16.7)/6.9637 GAL/DJY/FOOT
S T*to/4800*r637*40.8/4 800*,155.522.24 EN4
*
*
*
0.00 -4 I I I ny I
I I I I r iI 110
i i 1 i 1 i1 1 I I I I 11111 0I I I I
100001 100
TIME SINCE PUMPING STARTED, MIN.1000
FIGURE: 2-6 , DRAWDOWN IN OBSERVATION WELL QI-1 1, SEMI-LOG
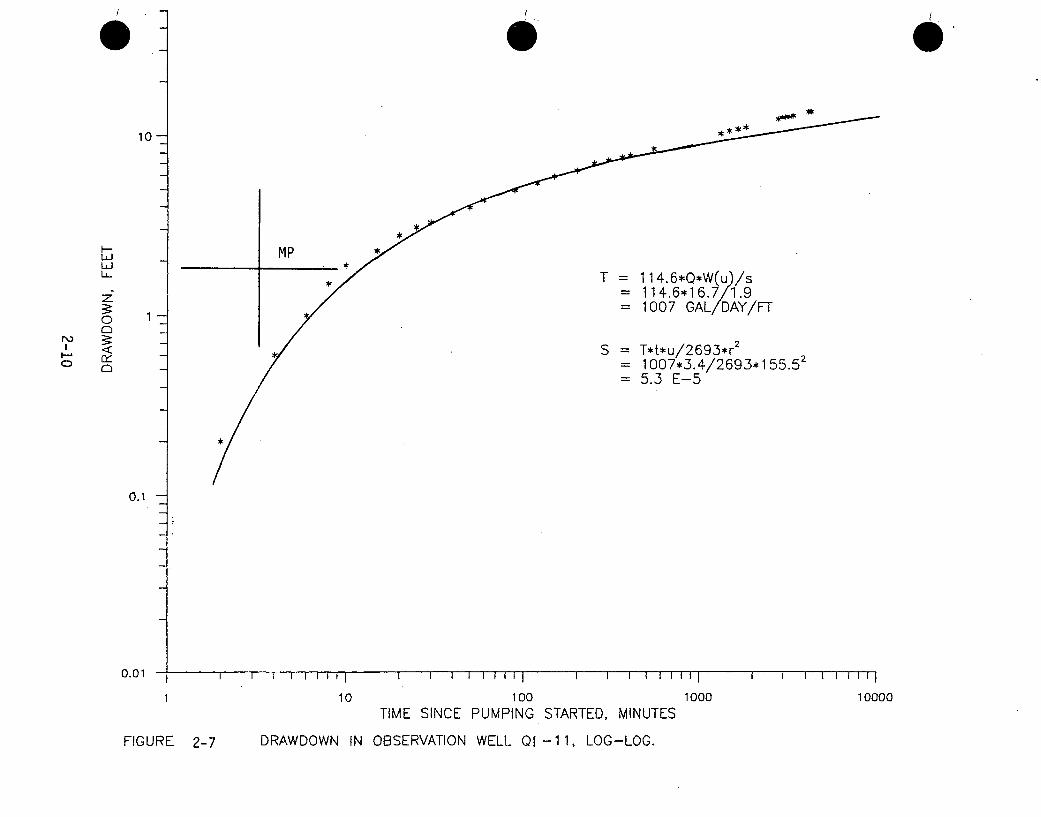
*
* * *10-
H-LUL_
z0
r-•0nC
mP*
4'
N)
C)0
1-*-
T = 114.6*Q*W(u)/s= 114.6*16.7/1.9= 1007 GAL DAY/FT
S = T*t*u/2693*r2
= 1007*3.4/2693*155.52= 5.3 E-5
*
0.1
0.01 I I I I I I1101
I I I I I i II I
100
TIME SINCE PUMPING
OBSERVATION WELL QI
I I J i i i J
1000STARTED, MINUTES
-11, LOG-LOG.
I i I I I fl ii100000
FIGURE 2-7 DRAWDOWN IN
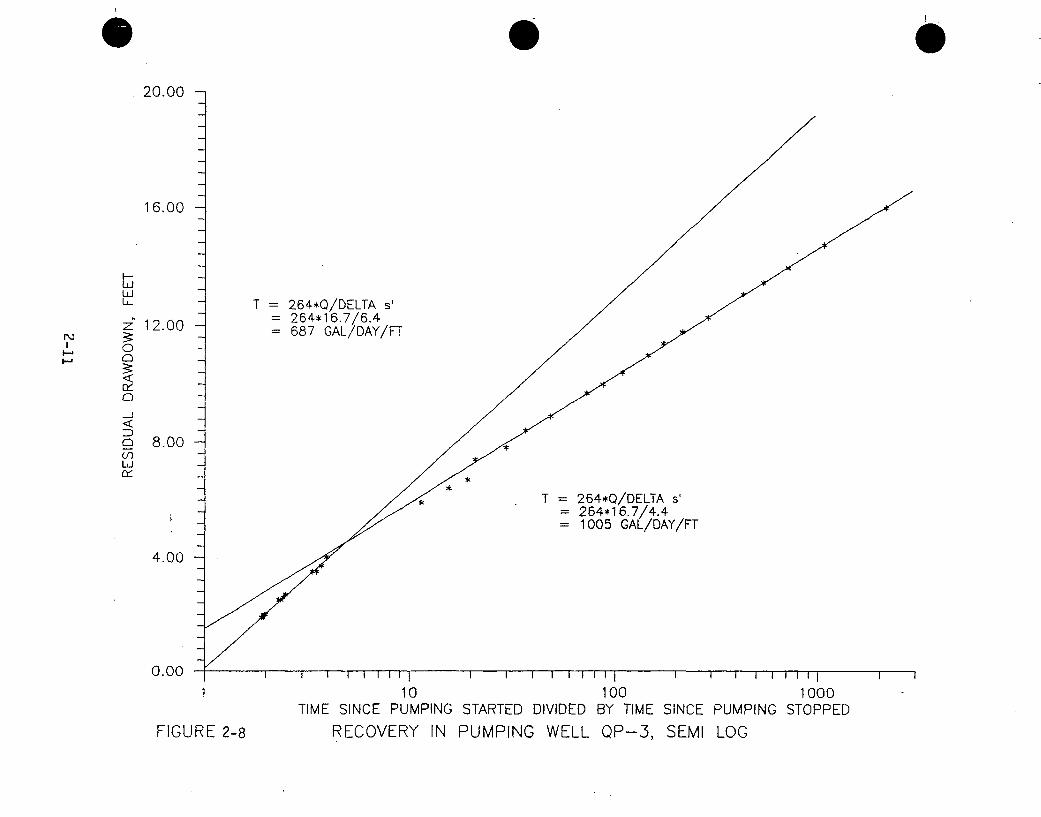
* 020.00
16.00
U- - T = 264*Q/DELTA s'264*16.7/6.4z" 12.00 - 687 GAL/DAY/FT
I0-
-.-
--J_
CD
co 8.00(/)Ld
- T =264*Q/DELTA s'- = ~264,16.7/4-.4 .
- 1005 GAL/DAY/FT
4.00
0.0I I 0 I I I I I iI
10 100 1000TIME SINCE PUMPING STARTED DIVIDED BY TIME SINCE PUMPING STOPPED
FIGURE 2-8 RECOVERY IN PUMPING WELL QP-3, SEMI LOG
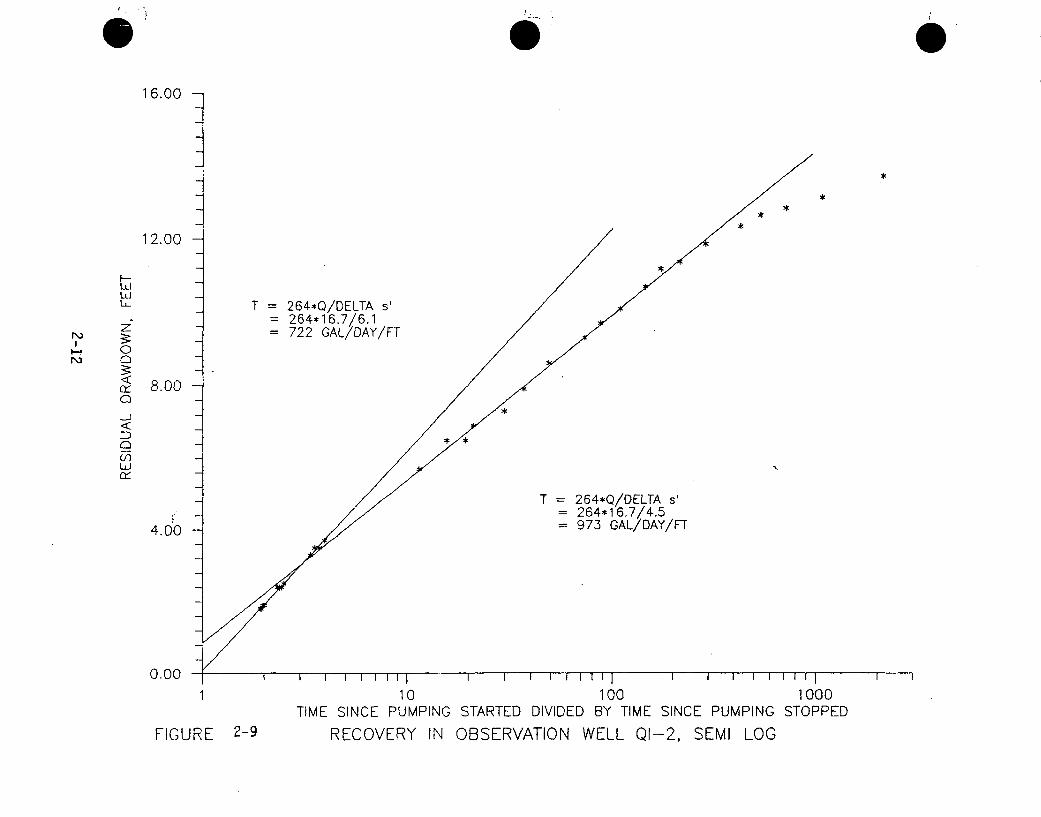
016.00
i*
i*
- , *
12.00
I--LULULi. • T = 264*0/DELTA s'
z = 264*16.7/6.1P1 = 722 GAL/DAY/FT
- 8.00C-_J
T =264*0/DELTA s'_ 264*16.7/4.5
4.0 0 -973 GAL/DAY/FT
0.00
0 .00 -I I I I I E Ji I i I I "' 1 I I II i i i I l Ii
1 10 100 1000TIME SINCE PUMPING STARTED DIVIDED BY TIME SINCE PUMPING STOPPED
FIGURE 2-9 RECOVERY IN OBSERVATION WELL QI-2, SEMI LOG
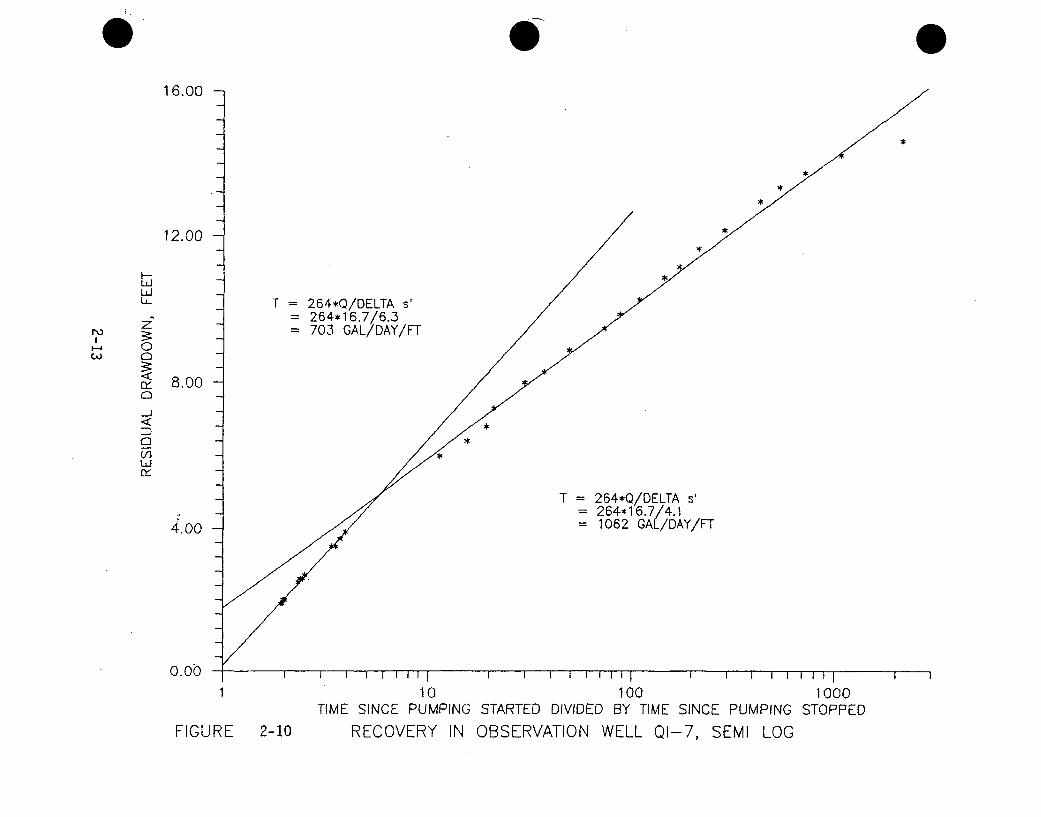
1 6.00
12.00 -
L_ - T = 264*Q/DELTA s'=264*16.7/6.3
0 703 GAL/DAY/FT0
-J
T = 264*Q/DELTA s= 264*16.7/4.1
4.00 = 1062 GAL/DAY/FT0.0
1 10 100 1000TIME SINCE PUMPING STARTED DIVIDED BY TIME SINCE PUMPING STOPPED
*
FIGURE 2-10 RECOVERY IN OBSERVATION WELL QI-7, SEMI LOG
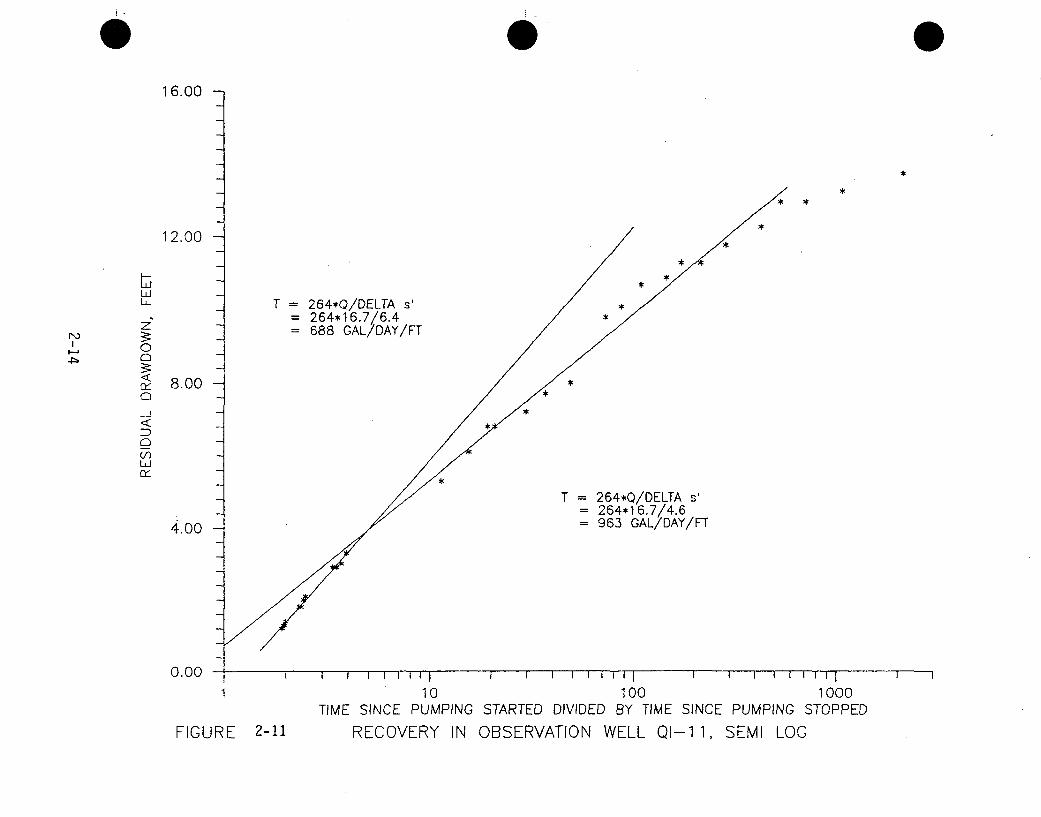
16.00
i*
12.00_*
U, T =264*Q/DELTAs' *
= 264*16.7/6.4= 688 GAL/DAY/FT
--
, 8.00 - /C
<*
- ~T =264*Q/DELTA s_ = 264*16.7/4.6
4.00 -- =963 GAL/DAY/FF
0.00
110 10O0 1 000TIME SINCE PUMPING STARTED DIVIDED BY TIME SINCE PUMPING STOPPED
FIGURE 2-11 RECOVERY IN OBSERVATION WELL QI-1 1, SEMI LOG
*
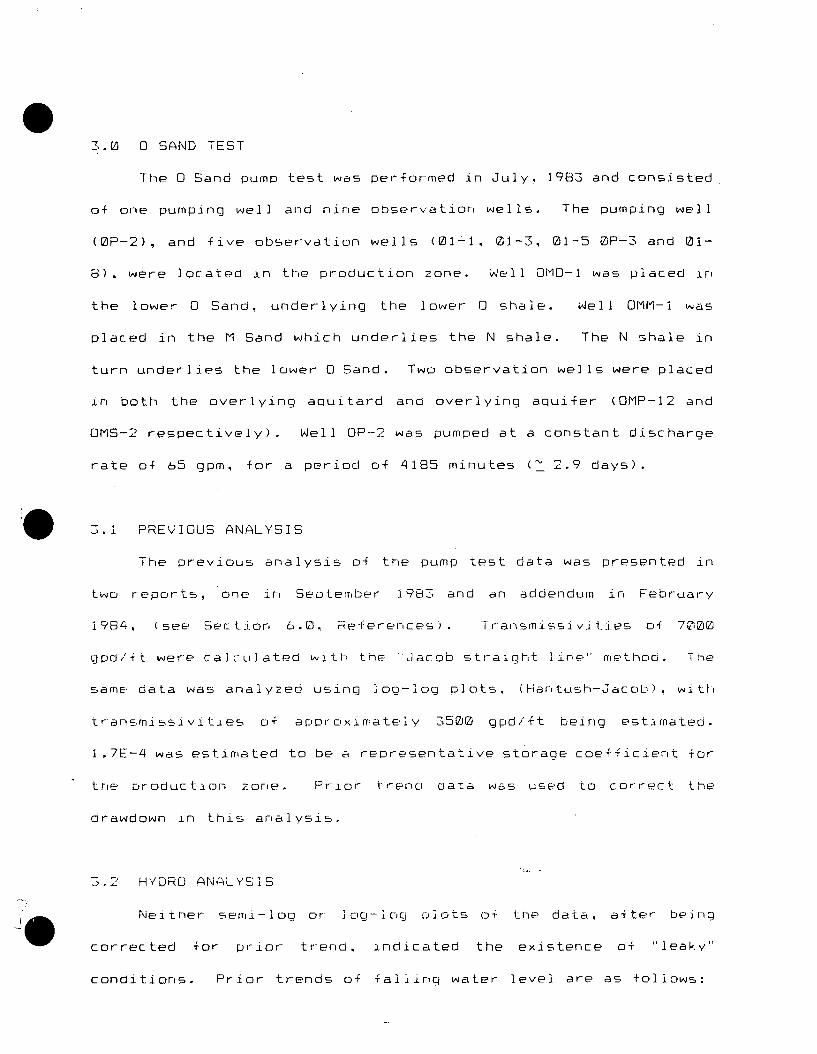
37.0 0 SAND TEST
The 0 Sand pump test was performed in July, 1983 and consisted
of one pumping well and nine observation wells. The pumping well
(OP-2), and five observation wells (01`-, 01-3, 01-5 OP-3 and 01-
8). were located in the production zone. Well 0M0-i was placed iri
the lower 0 Sand, underlying the lower 0 shale. Well OMM-i was
placed in the M Sand which underlies the N shale. The N shale in
turn underlies the lower 0 Sand. Two observation wells were placed
in both the overlying aquitard and overlying aquifer (OMP-12 and
OMS-2 respectively). Well OP-2 was pumped at a constant discharge
rate of 65 gpm, for a period of 4185 minutes (- 2.9 days).
3.1 PREVIOUS ANALYSIS
The previous analysis of the pump test data was presented in
two reports, one in September 1983 and an addendum in February
1984, (see Section 6.0, References). Transmissivities of 70,00
gpd/•t were calculated with the 'Jacob straight line" method. The
same data was analyzed using log-log plots, (Hantush-Jacob), with
transmissivities o+ approximatelv 3500 gpd/ft being estimated.
1.7E-4 was estimated to be a representative storage coe-f-ficient for
trie oroduction zone. Prior trend data was used to correct the
Orawdown in this analvsis.
.'.2 HYDRO ANALYSIS
Neither semi-log or iog-log plots o{ the data. after being
corrected for prior trend, indicated the existence of "leaky'
conditions. Prior trends of falling water level are as follows:
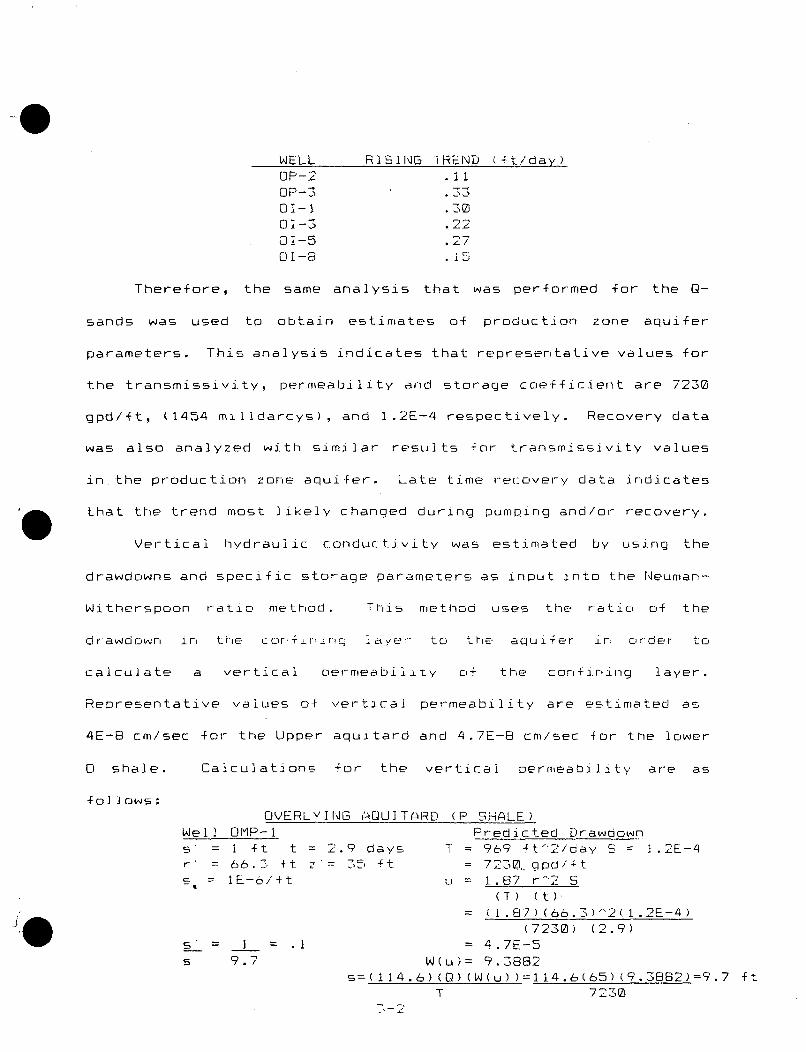
WELL RISING TREND (ft/day)OP-2 .11OP-S .33
OI- .37001-3 .2201-5 .2701-3 .15
Therefore, the same analysis that was performed for the Q-
sands was used to obtain estimates of production zone aquifer
parameters. This analysis indicates that representative values for
the transmissivity, permeability and storage coefficient are 7230
gpd/ft, (1454 milldarcys), and 1.2E-4 respectively. Recovery data
was also analyzed with similar results for transmissivity values
inthe production ZOFne aquifer. Late time recovery data indicates
that the trend most likely changed during pumping and/or recovery.
Vertical hydraulic conductivity was estimated by using the
drawdowns and specific storage parameters as input into the Neuman-
Witherspoon ratio method. This method uses the ratic, of the
drawdown, in the CO e L ayes- to the aquifer in, order to
calculate a vertical oermeabiiity of the confin ing layer.
Representative values of vertical permeability are estimated as
4E-B cm/sec for the Upper aquitard and 4.7E-8 cm/sec for the lower
0 shale. Calculations for the vertical permeability are as
fol lows:OVERLYING AQU1T(ARD (P SHALE)
Well OMP-l Predicted Drawoown1= ft t = 2.9 days 1 = 969 ft"2/oay S l J.2E-4
= 663, ft z 35 ft 7230, gpdCq ts lE-6/ft u 1.87 r 2 S
(T) (t)= 1 .87) (86. 3)"2(1 .2E-4)
(7230) (2.9)1= .=. =4.7E-5
s 9.7 W(u)= 9.3882s=(114.6)(Q )(W(u))=114.6(65)(9.3882)=9.7 ft
T 7230
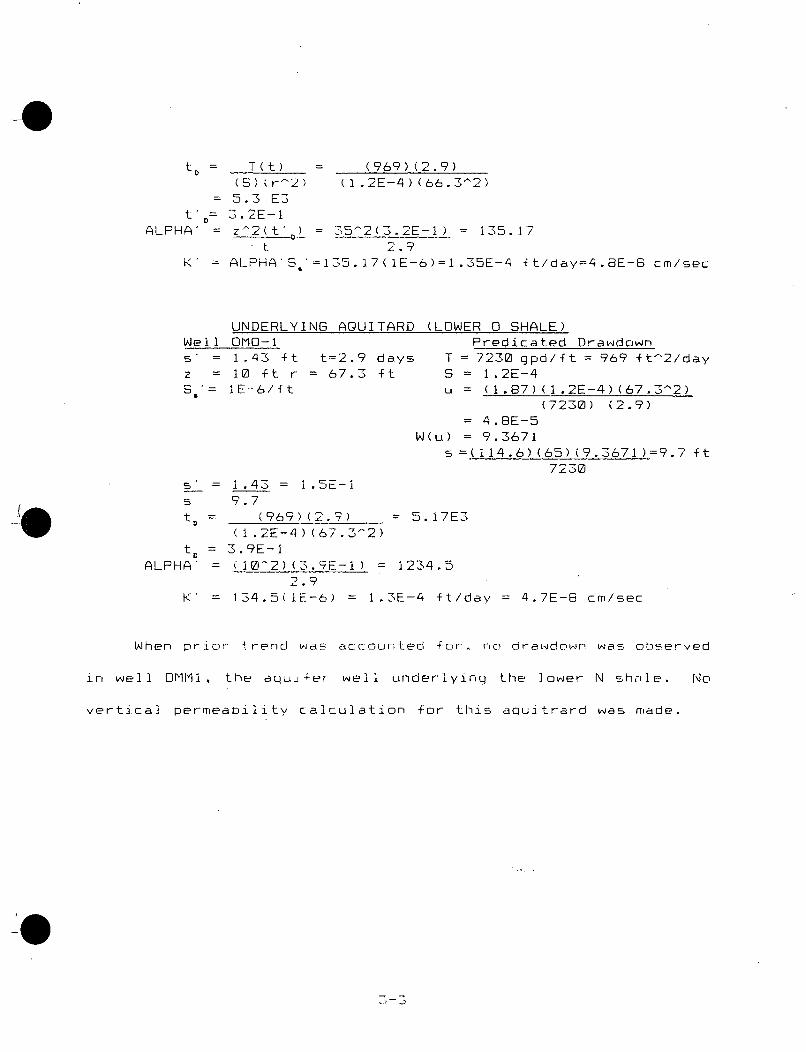
= T(t) = (969) (2.9)(5) (r-2) (1.2E-4)(66.3^2)
= 5.3 E3t 5.2E-1
ALPHA' = z-2(t" = 35-2(3.2E-1) = 135.17t. 2.9
K' = ALPHA'S '=135.17(IE-6)=1.35E-4 ft/day=4.8E-8 cm/sec
UNDERLYING AQU1TARD (LOWER 0 SHALE)Well OMO-1 Predicated Drawdowns' = 1.43 ft t=2.9 days T 7230 gpd/-ft = 969 ft-2/dayz = 10 ft r = 67.3 ft S 1.2E-4S'= IE-6/ft u = (1.87)(1.2E-4)(67.3^2)
(7230) (2.9)= 4.BE-5
W(u) = 9.3671
s = 114.6) (65) (9.3671)=9.7 ft7230
s'= 1.43 = 1.5E-is 9.7t = (969)(2.9) 5.17E3
(1.2E-4)(67.3-2)t = 3.9E-1
ALPHA' = (10-2)(3.9E-1) = 1234.52.9
K' 134.5(IE-6) = 1.3E-4 ft/day = 4.7E-6 cm/sec
When prior trend was accounted for, no draNdown was observed
in well OMMi, the aquiver well underlying the lower N shole. No
vertical permeability calculation for this aQuitrard was made.
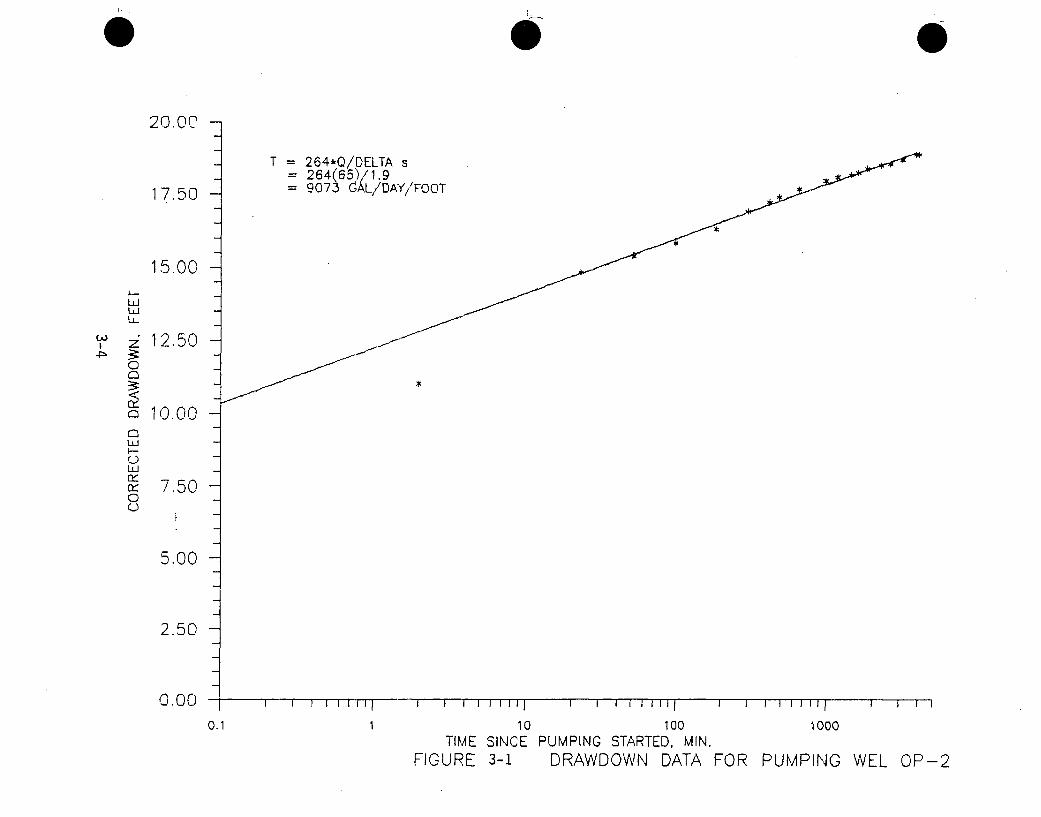
0
20.00
17.50
15.00
T = 264,Q/DELTA s= 264(65)/0.9= 9073 YAL/DAY/!FOOT
IU
H--Ld
CD
u
C~LU
0LU
0<
0
12.50
10.00
7.50
5.00
2.50
0.000.1 1 10 100 1000
TIME SINCEFIGURE 3-1
PUMPING STARTED, MIN.DRAWDOWN DATA FOR PUMPING WEL OP-2
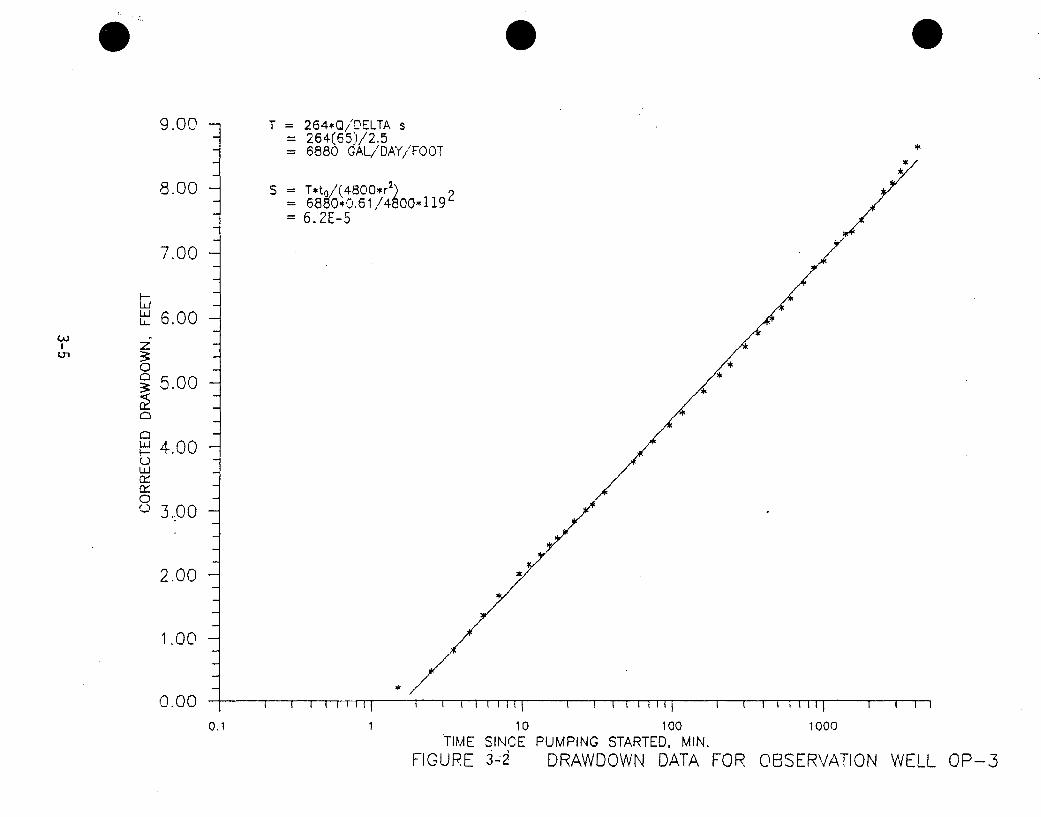
9.00
z
264*0it'DELTAs264(65)/2.56880 GAL/DAY/FOOT
T*-to/'(4800*r 2) 2685040.61//4800*1196. 2E-5
**
!,
ui
LUiwUOf
z
8.00 -
--1
7.00 -
6.00 -
5.00 -
4.00 -
3.00
2.00
1.00
S=
*
0.00 iI I I
10 100
I I I 0 0
1000
I I I I
0.1TIME SINCE PUMPING STARTED, MIN.
FIGURE ,-2 DRAWDOWN DATA FOR OBSERVATION WELL OP-3
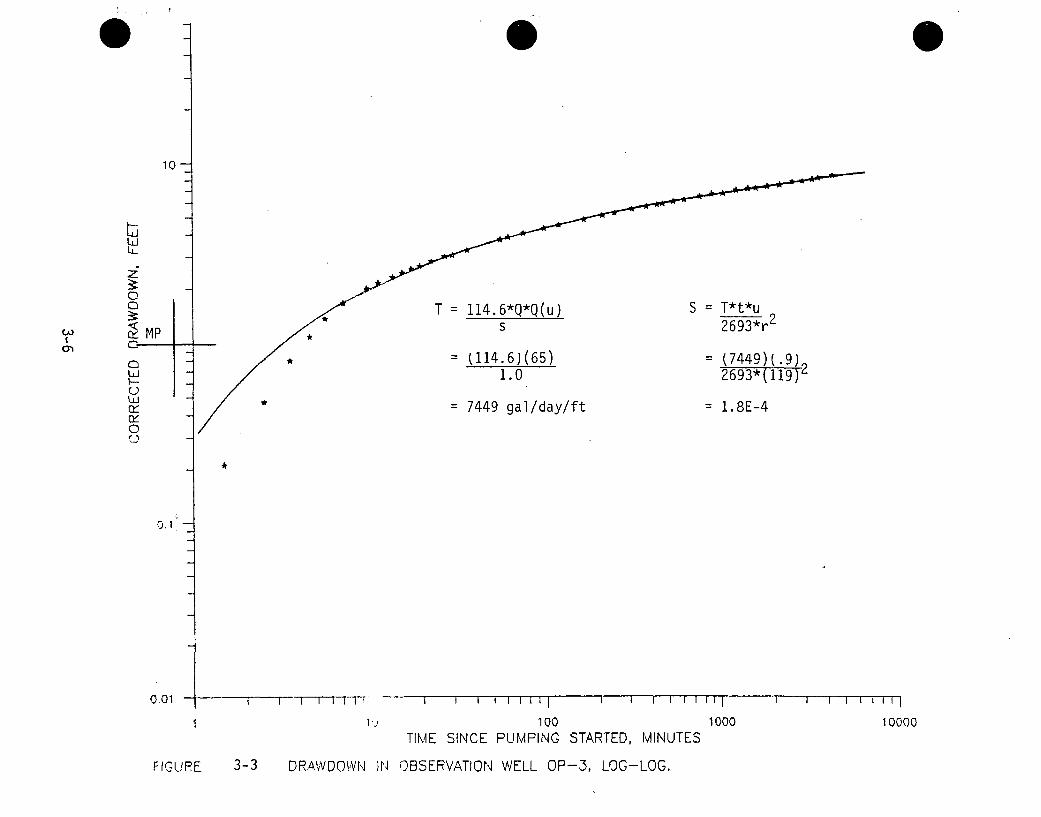
0
10
LiiLL
0C
I *
0
*
T = 114.6*Q*Q(u) S = T*t*u 2s T6 2693*r
= (114.6)(65) = (7449)(1.0- 2693*"1
= 7449 gal/day/ft = 1.8E-4
•.9)219)
*
*
0. 1
0.01 I I I I I I I I i I I i I I I I i I I I I I I I
1 100PUMPING
1000 10000TIME SINCE STARTED, MINUTES
FIGURE 3-3 DRAWDOWN IN OBSERVATION WELL OP-3, LOG-LOG.

8.00 T = 264*Q/DELTA s- 264(65)/2.4
7236 GAL/DAY/FOOT
0 -T*to/(4800*r )7.00 7236*.031/480 1922
= 1.3E-5
6.00
L!JLU
, z" 5.00-4-
c•4.00-
3 00
2fo .00 -_/1
1.00
0.o0 -
- *
0.1 110 100 1000
TIME SINCE PUMPING STARTED, MIN.FIGURE 3-4 DRAWDOWN DATA FOR OBSERVA
**
TION WELL 01-1
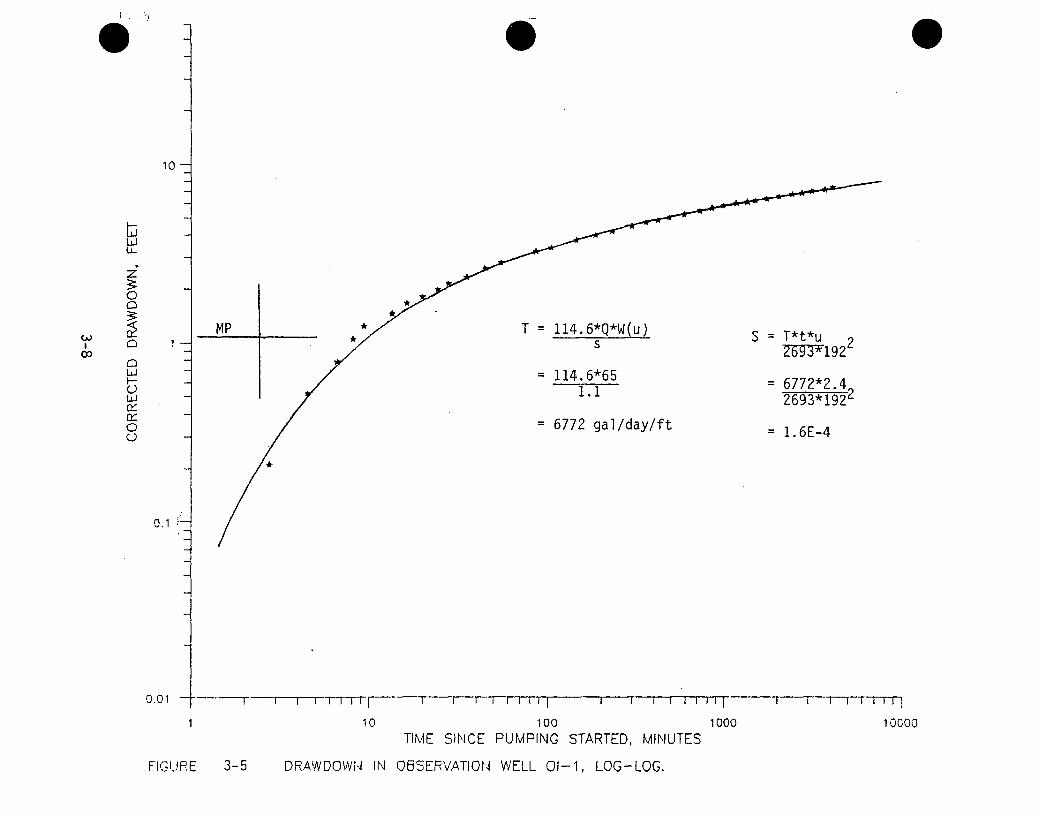
10-
C)
LUJ
LUJ
MP *
co1- *
T = 114.6*Q*W(u) S = T*t*u 9
S =192
= 114.6*65 = 6772*2.41.1 2693*1922
= 6772 gal/day/ft = 1.6E-4
*
0.1
0.01 I I I 1 11111 1 1 1 1 11 11 1
1 100PUMPING
I I I I 1 111
1000STARTED, MINUTES
10000TIME SINCE
FIGURE 3-5 DRAWDOWN IN OBSERVATION WELL 01-1, LOG-LOG.
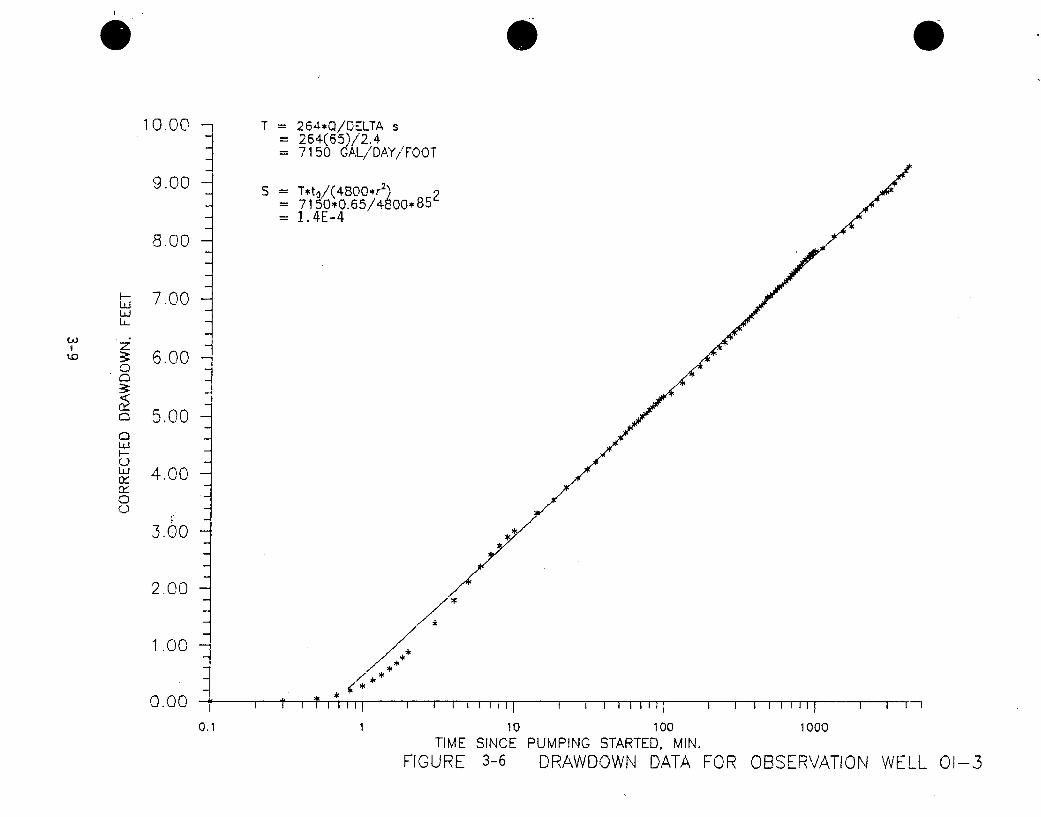
¶ rm• r't-I
(J
bLL,LLJ
z
r
Lor)Ld
0C-JrYry
9.00 -
8.00 -
7.00
6.00
5.00
4. 00
3.00
2.00
1.00
S =
T = 264*Q/DELTA s= 264(65)/'2.4= 7150 dAL//DAY/FO0T
T*to/(48OO*r2 827150i0.65/4 00*851. 4E-4
".. ,M
0.00III' I I I I 1 Il I I I I I I I I I I I I I I I I I I I I
0.1 10 100 1000TIME SINCE PUMPING STARTED, MIN.
FIGURE 3-6 DRAWDOWN DATA FOR OBSERVATION WELL 01-3
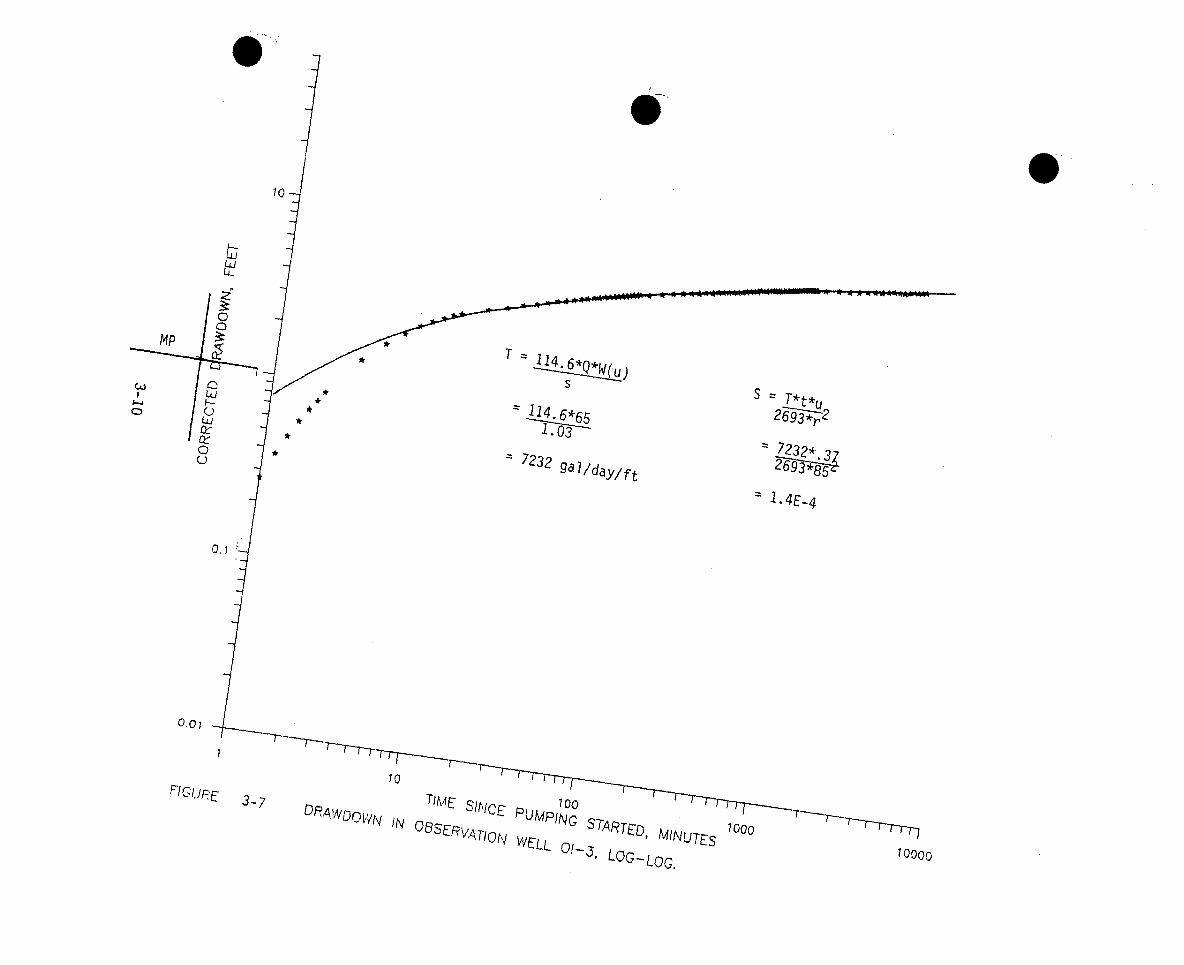
10
l-i
*
*
0
k*
21 4. 6*Q*W(u
S = T*t*u
11. 6*5203-
-r
-7232 9al/day/f
* 5
-1.4E-4
*1
*
0.7
0.07
I lo
3-7
0DRAWDol~tq
Tiih4C SlIHCE
IN 0B6SFvA
TIoQ
"EL NGSTARTED,
MINUTE-S
VLL01-.3, Loc-LOG,
1000 10000
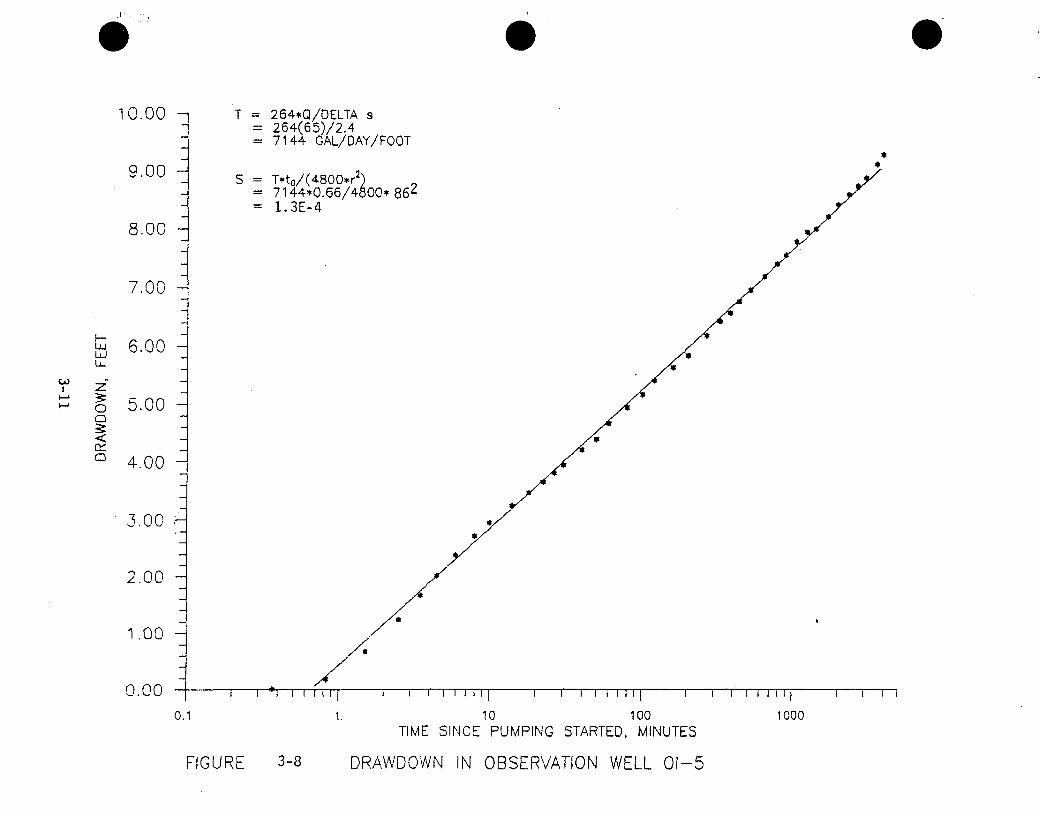
.~ ,-~ r~r~I
IA
u-j
0L
CD
.UU
9.00-
8.00
7.00 -
6.00 -
5.00 -
4.00 -
-3.00
2.00
1.00
S = Thto/(48OO*r 2 )= 7144*O.66/48OO* 862
=1.3E-4
264,Q/DELTA s264(65)/2.47144 GAL/DAY/FOOT
*!
*
a
0.00 ~I I I I III
V
I I I I I I I I I I i l l I I I I I I Il I I I I
0.1 10 100
TIME SINCE PUMPING STARTED, MINUTES
DRAWDOWN IN OBSERVATION WELL 01-5
1000
FIGURE 3-8
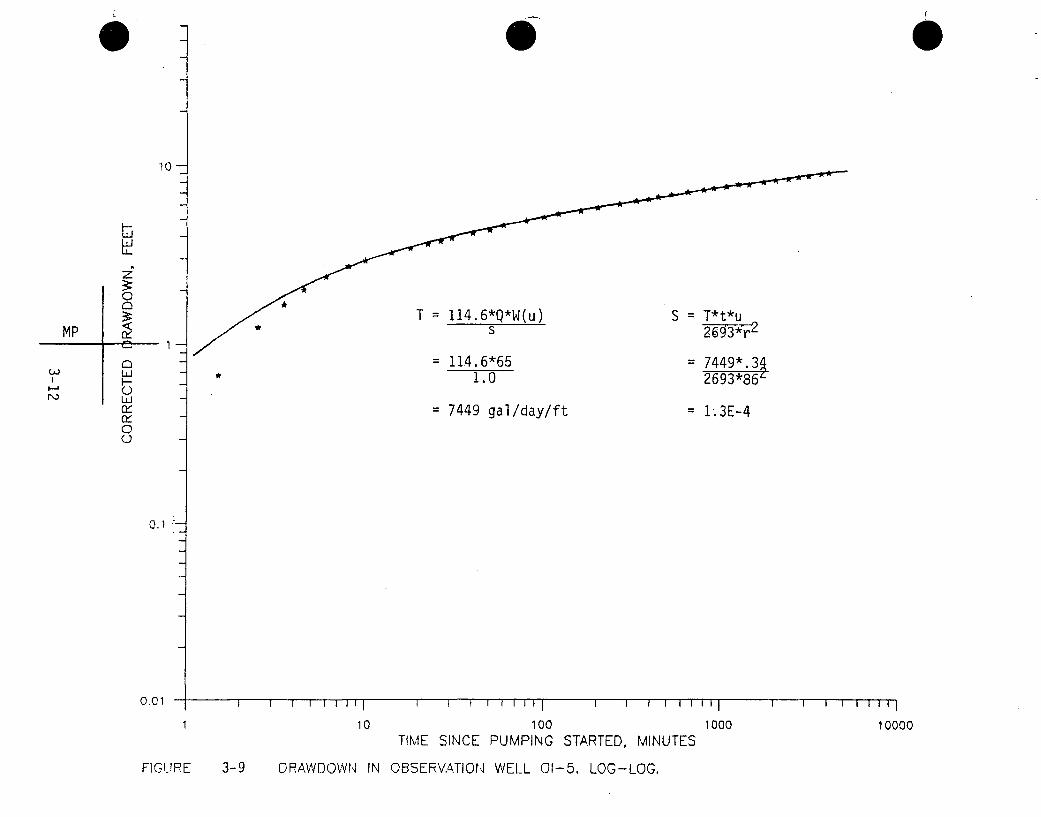
0 0
10-
MP
L
CK
0C-,
T = 114.6*Q*W(u)* S
S = tu2693*rL
*
1-
= 114.6*65* 1.0
= 7449*.342693*86•
= 13E-4= 7449 gal/day/ft
0.1
0.01 I I I I
10I I I I I I I I I I I I I I I I I I I I 000
100001 100
TIME SINCE PUMPING STARTED, MINUTES1000
FIGURE 3-9 DRAWDOWN IN OBSERVATION WELL 01-5, LOG-LOG.
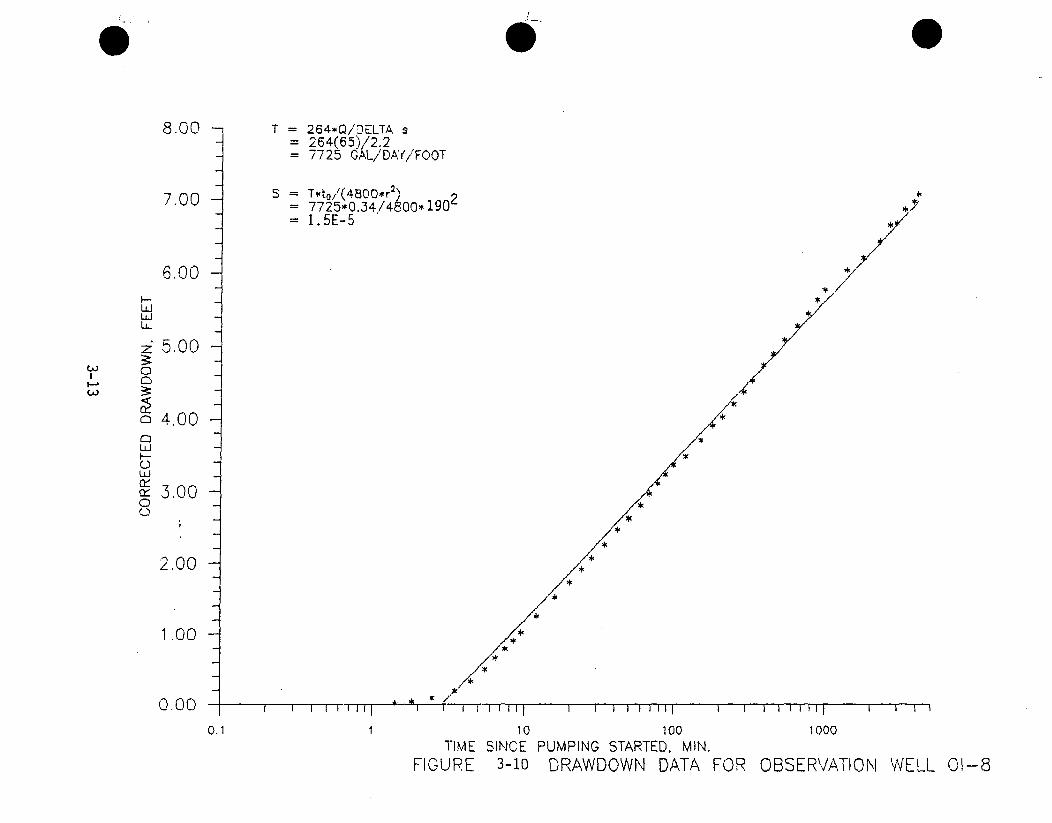
8.00 264*Q/DELTA s264(65)/2.27725 GAL/DAY/FOOT
I-
LiiLuJ
C-)z•
0
C)1)
0~
7.00 "
6.00
5.00
4,00
3,00
2.00
1.00
S = T*tO/'(4800*r 2) 27725,10,34-/4800* 1901. 5E-5
*
0.00 I I 11111
10
I I I I I I III
100
I I I I
0.1 1000
TIME SINCE PUMPING STARTED, MIN.FIGURE 3-10 DRAWDOWN DATA FOR OBSERVATION WELL 01-8
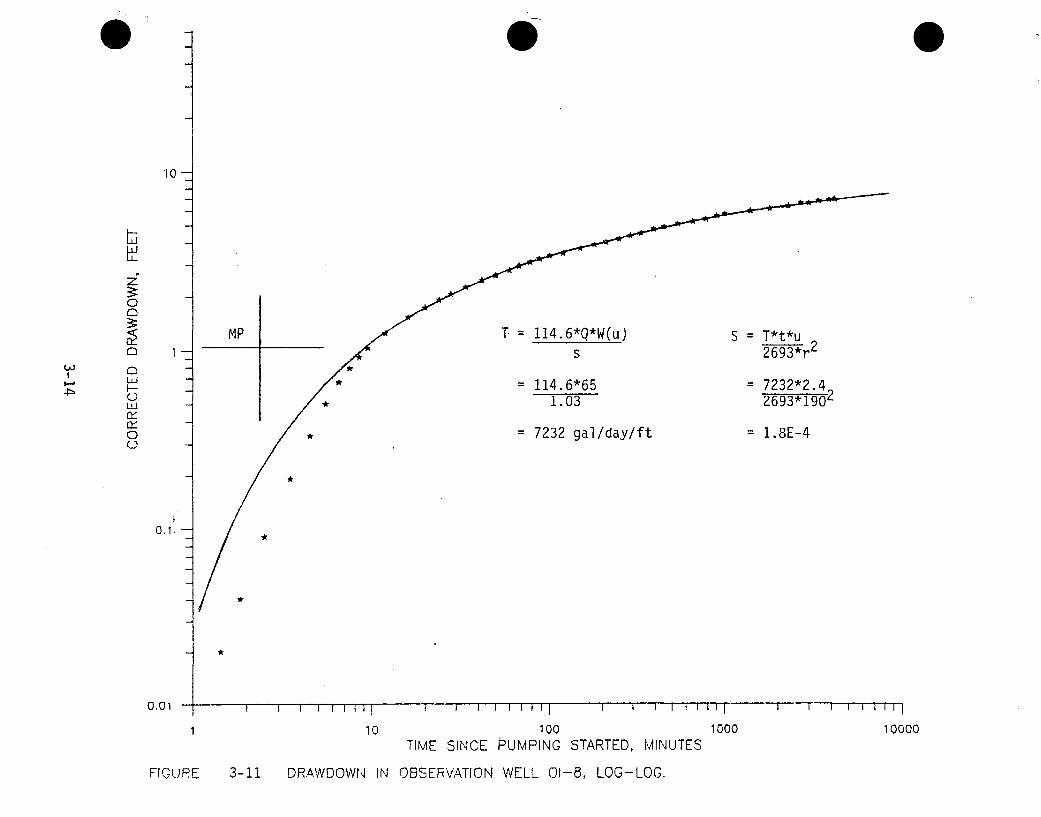
0 S
10-
L-i
r,,0
C)C3ILUI-
LU
0•0-
MP
I-
1--T = 114.6*Q*W(u) S = T*t*u 2
= 114.6*65 = 7232*2.4
1.03 Z693*1902
= 7232 gal/day/ft = 1.8E-4
t
*
*
0.1.
0.01
*
*
*
10
i I I I I lI I 1
1 100PUMPING
I II I I I I
1000
STARTED, MINUTES
I I I I I III0
10000
TIME SINCE
FIGURE 3-11 DRAWDOWN IN OBSERVATION WELL 01-8, LOG-LOG,
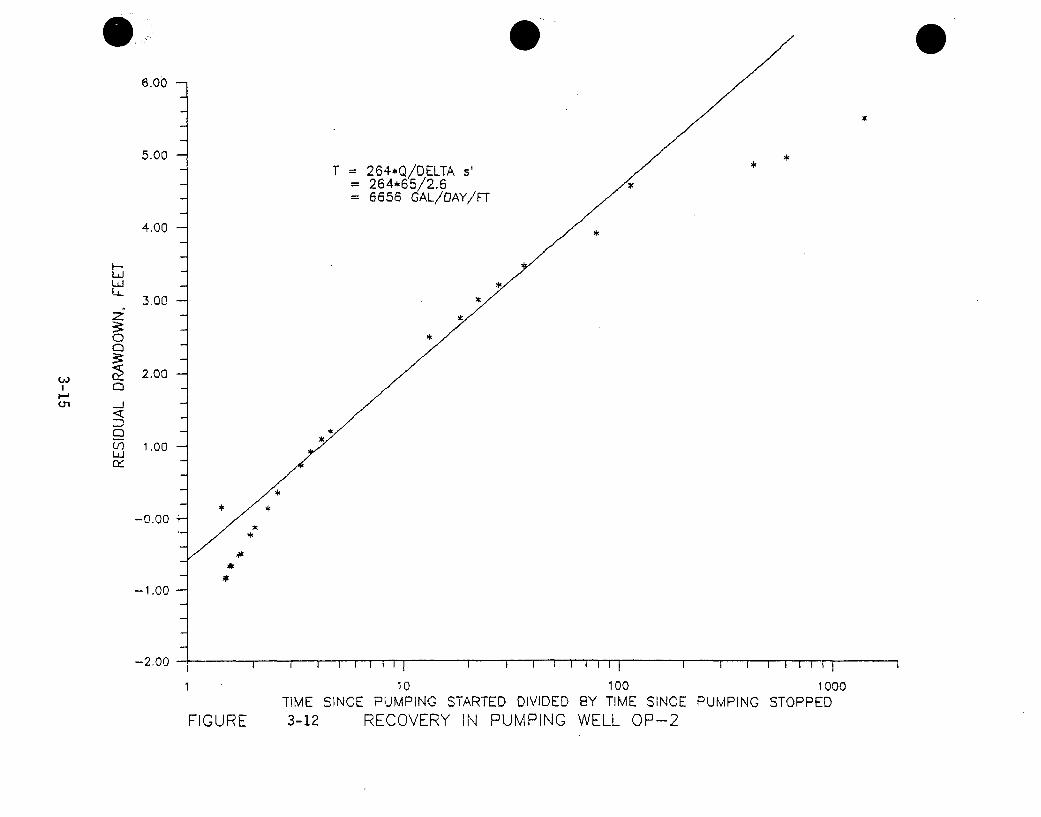
6.00
5.00 -- *
T = 264*Q/DELTA s'= 264*65/2.6
6656 GAL/DAY/FT
4.00 -
ILU
LL13.00
Z
o: *
-2.00
iU,
00 100 1000
TIME SINCE PUMPING STARTED DIVIDED BY TIME SINCE PUMPING STOPPED
FIGURE 3-12 RECOVERY IN PUMPING WELL OP-2
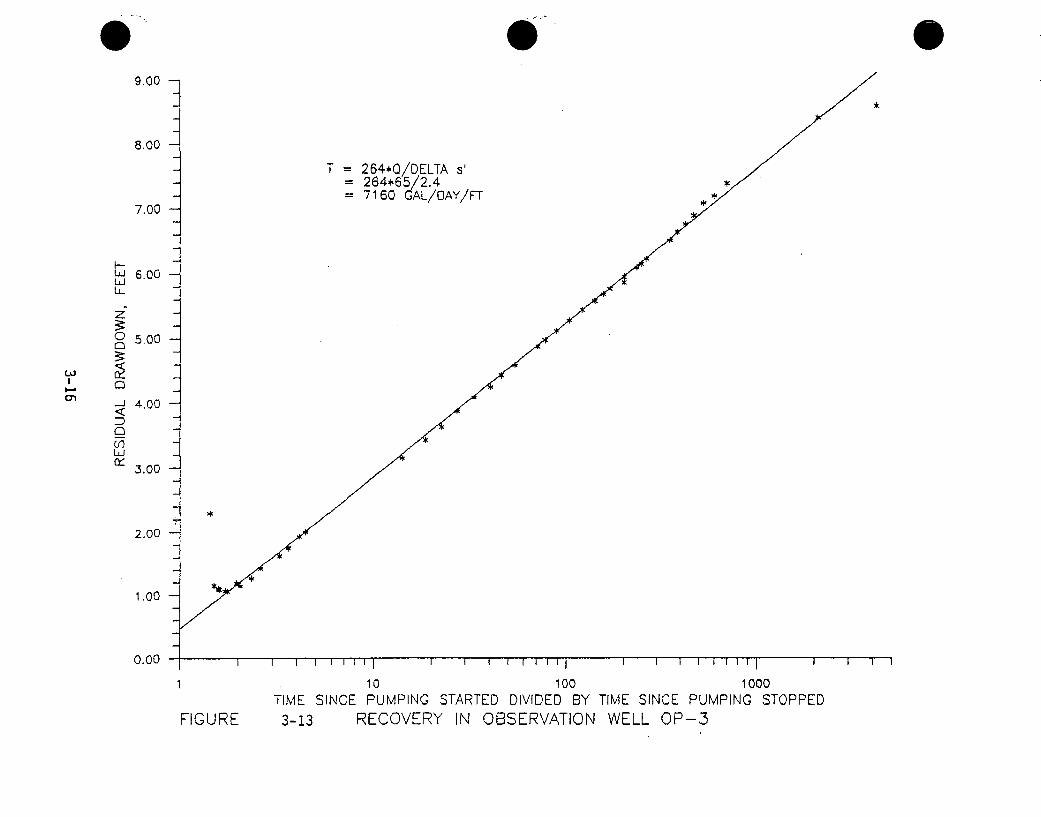
9.00
8.00
T = 264*0/DELTA s'= 264*65/2.4 *
7.00 ~= 7160 GAL/OAY/FT**7.00
6.00
o 5.00
-J• 4.00
n"3.00
2.00
1.00
0.00
110 10O0 1000
TIME SINCE PUMPING STARTED DIVIDED BY TIMvE SINCE PUMPING STOPPEDFIGURE 3-13 RECOVERY IN OBSERVATION WELL OP-3
*
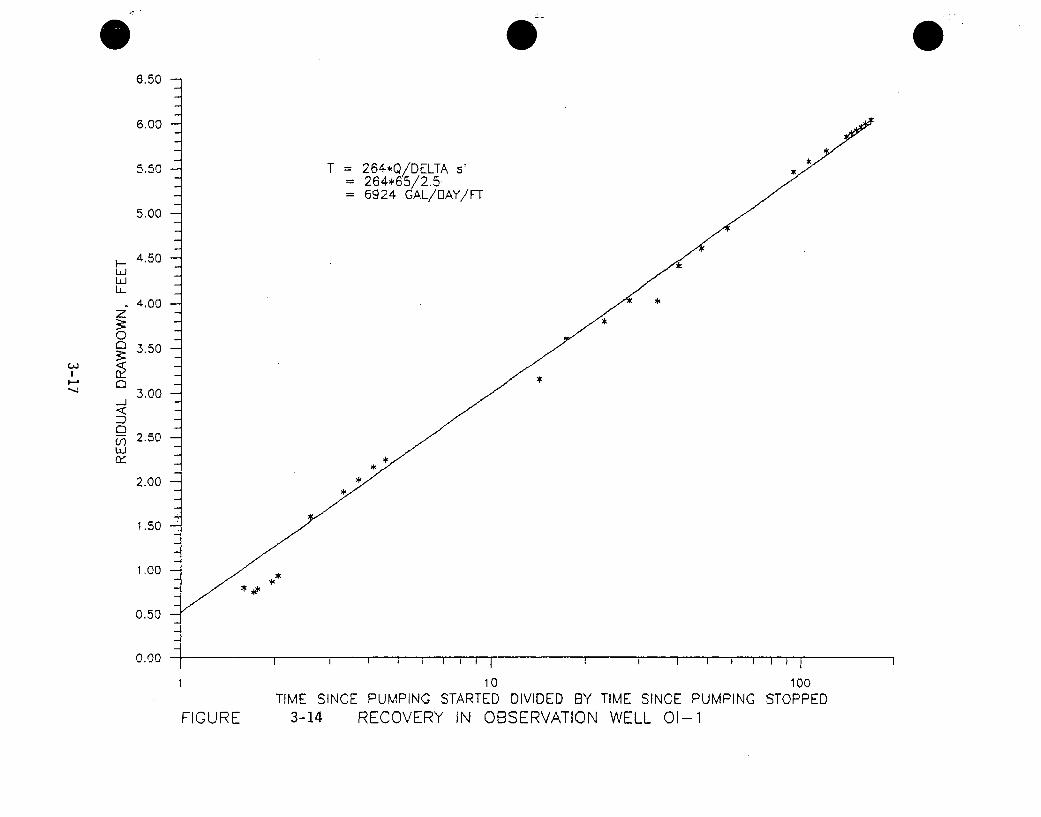
6.50
6.00
5.50 T = 264-*Q/DELTA s *264*65/2.5
= 6924 GAL/DAY/FT
5.00
4.50
.. 4,00 *
C' 3.50
• 3.00
2.50Lu
IL
2.00
1.5o -
1.00
0.50
3 .00 Ii • i i i i i Iii I i i i I I
1 10 100TIME SINCE PUMPING STARTED DIVIDED BY TIME SINCE PUMPING STOPPED
FIGURE 3-14 RECOVERY IN OBSERVATION WELL 01-1
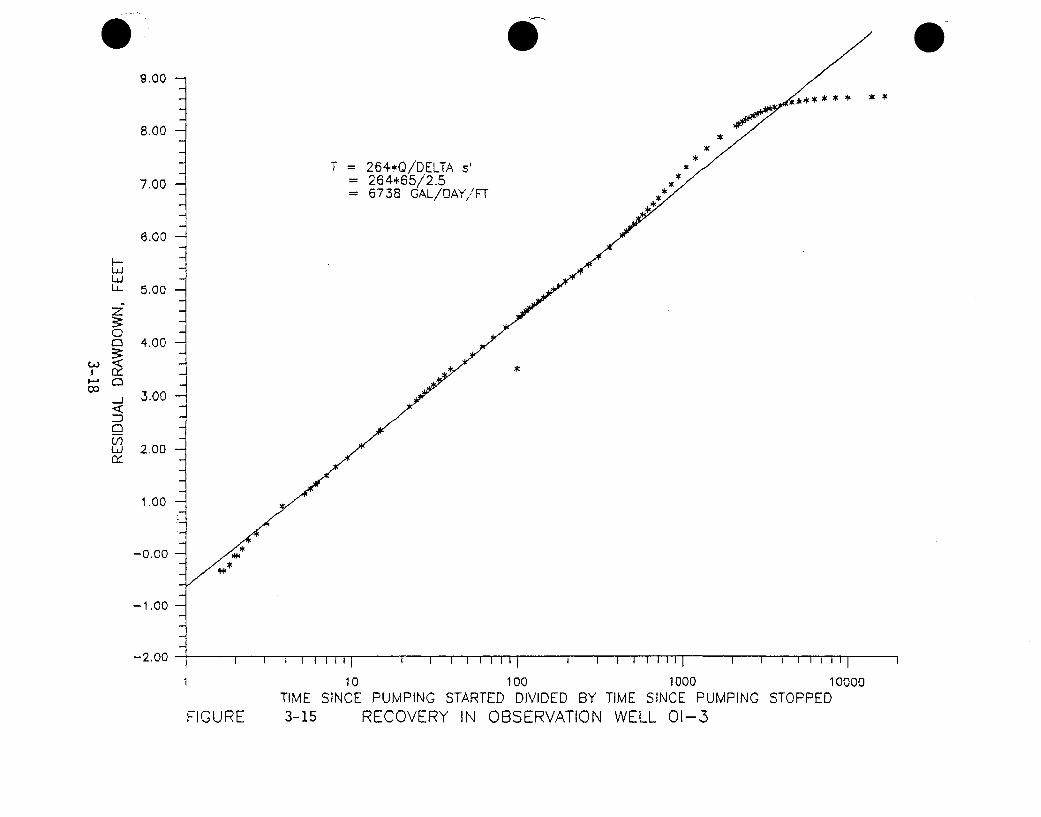
9.00
8.00
T = 264*Q/DELTA 3' **
7.00 = 264*65/2.5 **= 6738 GAL/OAY,/FT ,,
6.00
I-.LJL,.. 5.00
C34.00
03
O 3.00 <*
Z)
LUJ 2.00
1.00
-0.00
-1.00
- 2.00 , • I i l ' l t ' l ' " I
1 10 100 1000 10000TIME SINCE PUMPING STARTED DIVIDED BY TIME SINCE PUMPING STOPPED
FIGURE 3-15 RECOVERY IN OBSERVATION WELL 01-3
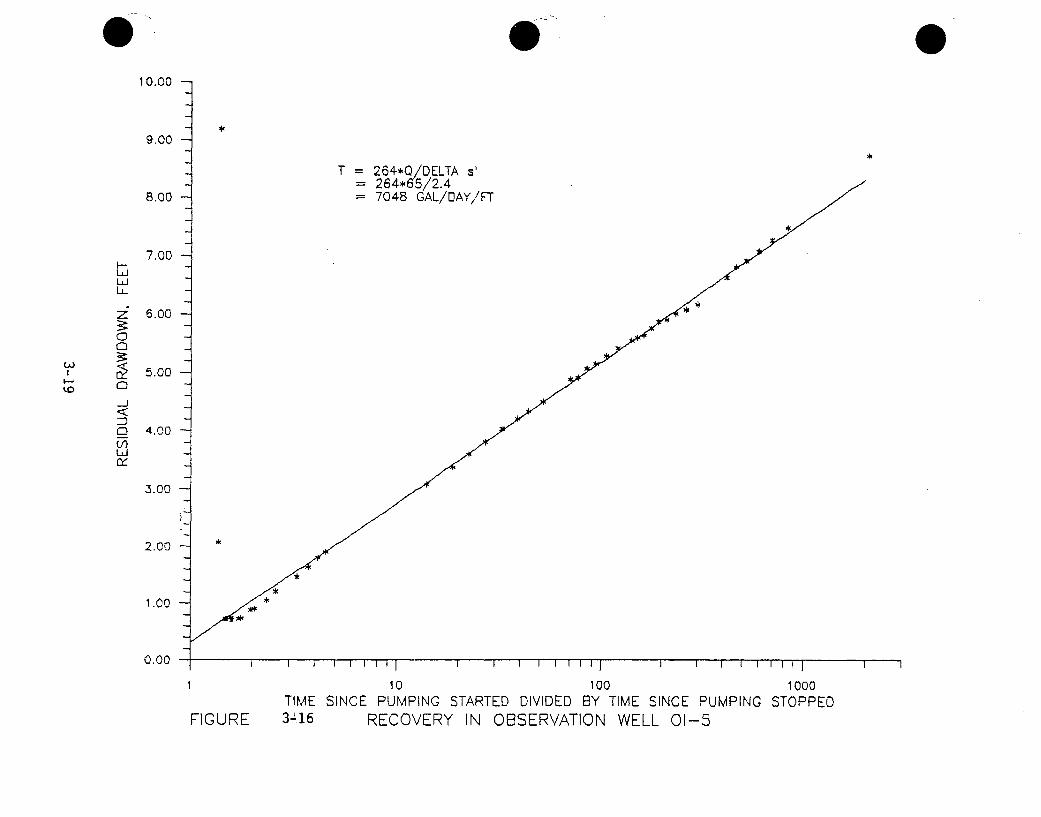
a 0. 010.00
i
9.00
T = 264*Q/DELTA '= 264*65/2.4
8.00 = 7048 GAL/DAY/FT
7.00
Li
6.00
Cl
3 5.00
o) 4.00LUJ
3.00
2.00
1.00
1 10 100 1000TIME SINCE PUMPING STARTED DIVIDED BY TIME SINCE PUMPING STOPPED
FIGURE 31-416 RECOVERY IN OBSERVATION WELL 01-5
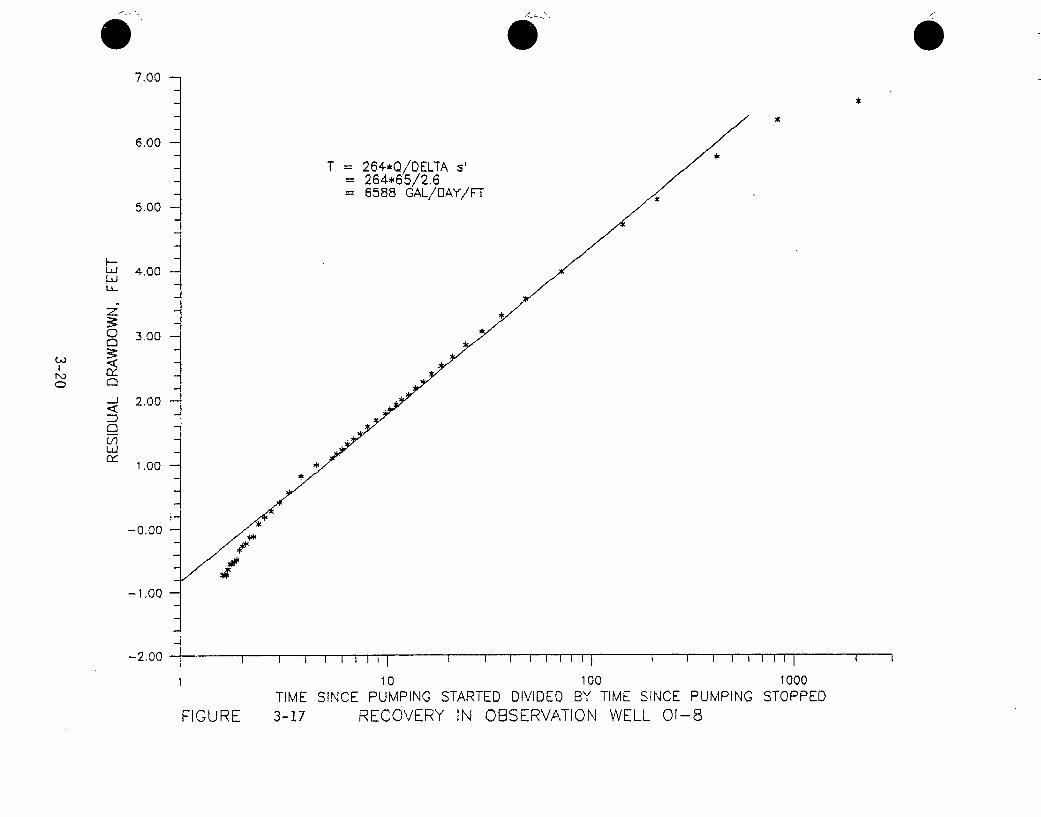
7.00
6.00
T = 264-*Q/DELTA. s'= 264*65/2.6= 6588 GAL/DAY/FT
5.00
I.-S4.00
LdLL.
o 3.00
N)
- 2.00
Ll)
1.00
-0,00
/-1.00
-2.00 I I , III I I I I I 11111
1 10 100 1000TIME SINCE PUMPING STARTED DIVIDED BY TIME SINCE PUMPING STOPPED
FIGURE 3-17 RECOVERY IN OBSERVATION WELL 01-8
*
4.0 SECTION 25 TEST
Section 25 data analysis consisted of four discrete phases,
as described in the March 25, 1988 report prepared by Kerr-McGee.
However, data from Phase I was not analyzed due to a malfunction
of the pump after 17 hours. Phase II drawdown data was analyzed
but the recovery data was not collected due to a breakdown of the
generator. Both drawdown (only collected for wells 584 and 583)
and recovery data were analyzed for the Phase 11 retest. The
drawdowns in the production zone, (only wells 584 and 581),
recorded during the shale communication test phase have also been
analyzed. Table 1-I presents a tabulation of the Section 25 pump
test results along with the other aquifer tests.
For the ore production zone, representative values of T=2i15
gal/day/ft, K=3700 millidarcy and 5=1.2E-4 have beern calculated.
Vertical hydraulic conductivity of the overlying shale is in the
neighborhood of 1.4E-4 ft/day (4.9E-B cm/sec). The uncerlyIng
shale has a vertical hydraulic conductivity of approximately o.9E-
5 ft/day (2.4E-8 cm/sec).
4.1 PREVIOUS ANALYSIS
Prior analysis of the pump test data for section 25 consisted
of log-log (Theis) and semi-log (Jacob) curve matching and
analysis. The Neuman-Witherspoon ratio method. was used to estimate
the vertical permeability of the upper and lower confining layers.
Recovery data was not analyzed. Estimated production zone aquifer
parameters were 1160 gpd/ft for transmissivity and 5E-4 for the
4-1
storage coefficient. Vertical permeability (K') was estimated to
be 1.7E-9 for the overlying shale layer and 1.3E-8 for the
underlying shale layer. K' values were also calculated by using
a relationship between observed drawdown in overlying and
underlying aquifer wells and the vertical permeability of the
aquitards. These K' values did not necessarily agree with the
Neuman-Witherspoon calculations.
4.2 HYDRO PHASE II ANALYSIS
Phase II began on January 7, 1986 and continued for
approximately 2.8 days (4000 minutes). Well 25-584 was the pumping
well for all phases. Wells 25-581, 582 and 583 are the observation
wells in the production zone. Well 584 was pumped at 4? gpm.
Phase II drawdown data was analyzed using both the Theis log-
log and the Jacob semi-log methods. Results were consistent from
well to well indicating a relatively homogeneous horizontal
hydraulic conductivity. This differs from the previous analysis
perfnrmed in the aforementioned Kerr-McGee report it, which
transmissivities around well 25-581 were approximately twice the
transmissivities around wells 25-583 and 25-582. These differences
are thought to be due to the well storage effects noted on the
semi-log plot, which the Kerr-McGee report did not take into
accotint. On average transmissivity value for this phase of testing
is 2200 gal/day/ft, with the storage' . coef4icient being
approximately 9.8E-5. The drawdown data was corrected for prior
rising trends of 0.43, 0.53, 0.32 and 0.44 ft/day for wells 584,
4-2
581, 582 and 583 respectively. The corrected drawdown does not
indicate leakage as the previous analysis did.
4.3 HYDRO PHASE II RETEST ANALYSIS
Drawdown data was analyzed in a similar fashion for wells 584
and 583 in this phase of the test. The Phase II retest began on
January 14, 1986 and lasted for a period of 4200 minutes (- 2.9
days), with well 584 pumping at 49 gpm. No drawdown or recovery
data for this phase of testing was analyzed in the Kerr-McGee
report, although its sole purpose was to collect recovery data.
Recovery data was collected for wells 581, 582 583 and the pumping
well 584. Trends equal to the ones used for these wells for the
Phase iI test were used to correct the drawdown and recovery data
for the Phase II retest. The recovery data proved to be very
consistent with earlier results. Calculated transmissivities o+
the aquifer ranged +rom 1955 to 2246 gal/day/ft from which a
representative value of 2050 gal/day/ft was estimated.
4.4 HYDRO SHALE COMMUNICATION TEST ANALYSIS
The shale communication test began on September 18, 1986 and
lasted a total of 31 days (4300 minutes. with the same pumping rate
as before (49 gpm).
Vertical hydraulic conductivity (K). calculations. were redone
using the new values for T and S and data 4rom we!l 58i rather than
582, due to the fact that well 581 was the monitor well during this
phase of testing. These changes did not appreciably effect the
/4-3
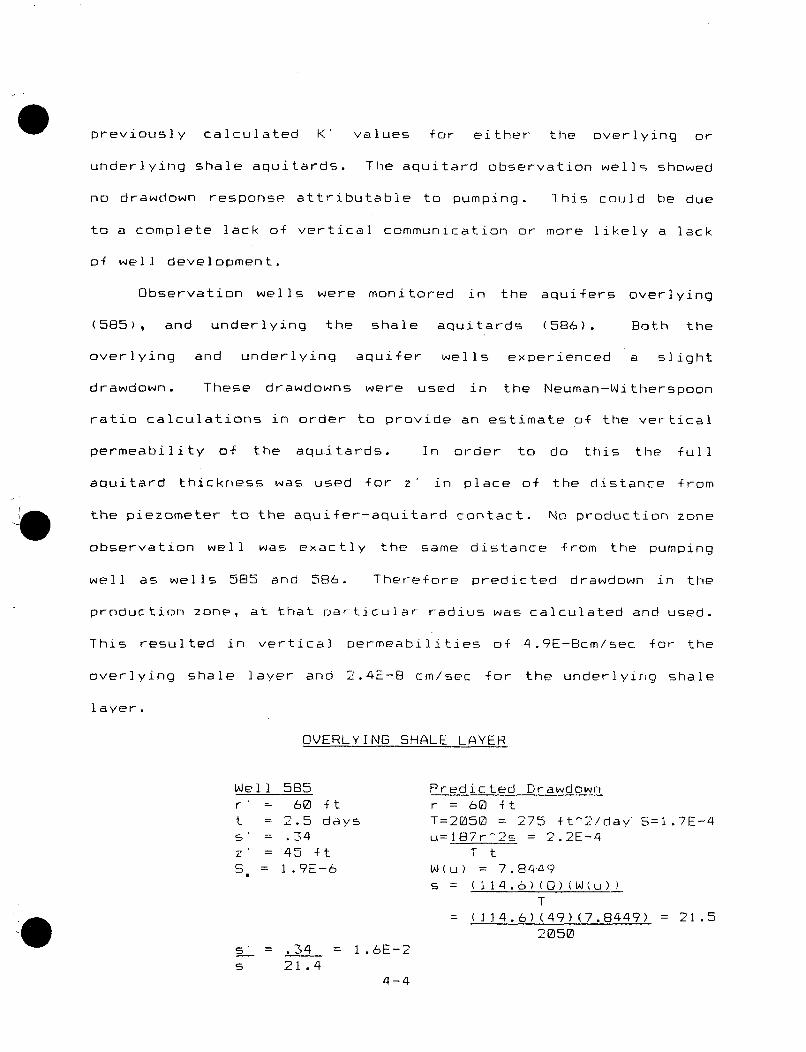
previously calculated K' values for either the overlying or
underlying shale aquitards. The aquitard observation wells showed
no drawdown response attributable to pumping. This could be due
to a complete lack of vertical communication or more likely a lack
of well development.
Observation wells were monitored in the aquifers overlying
(585), and underlying the shale aquitards (586). Both the
overlying and underlying aquifer wells experienced a slight
drawdown. These drawdowns were used in the Neuman-Witherspoon
ratio calculations in order to provide an estimate of the vertical
permeability of the aquitards. In order to do this the full
aquitard thickness was used for z' in place of the distance from
the piezometer to the aquifer-aquitard contact. No production zone
observation well was exactly the same distance from the pumping
well as wells 585 and 586. Therefore predicted drawdown in the
production zone, at that Particular radius was calculated and used.
This resulted in vertical permeabilities of 4.9E-8cm/sec. for the
overlying shale layer and 2.4E-8 cm/sec for the underlying shale
layer.
OVERLYING SHALE LAYER
Well 585 Predicted Drawdownr = 60 ft r = 60 ftt = 2.5 days T=2050 = 275 ft^2/day S=1.7E-4s = .34 u=187r-'2s = 2.2E-4z = 45 ft T tS = 1.9E-6 W(u) = 7.84-49
s =(II,4.6)(0)(W(u))
T= (114.6)(49)(7.8449) = 21.5
2050s' = .34 = 1.6E-2s 21.4
4-4
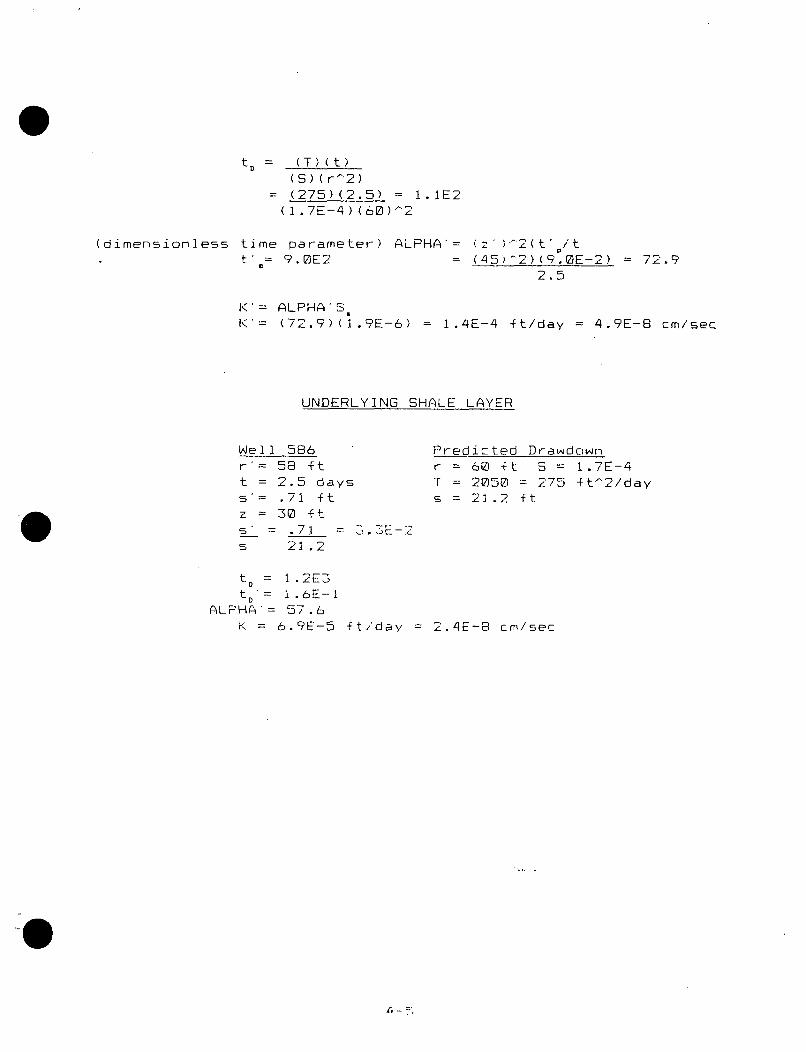
tD = (T)(t)(5) (r'2)
= (275)(2.5) = 1.1E2
(1.7E-4)(60)-2
(dimensionless time parameter) ALPHA'= (z2(t'tt 9.0E2 = (45)-2)(9.OE-2) = 72.9
2.5
K'= ALPHA'SK'= (72.9)(1.9E-6) = 1.4E-4 ft/day = 4.9E-8 cm/sec
UNDERLYING SHALE LAYER
Well 586r 58 ftt = 2.5 dayss'= .71 ftz = 30 fts = .71 = E-2s 21.2
Predicted Drawdownr = 60 ft S = 1.7E-4T = 2050 = 275 ft^2/day
s = 21.2 ft
t = 1 . 2E3tD 1 .6E-1
ALPHA'= 57.6K = 6.9E-5 ft/day 2.4E-8 cm/sec
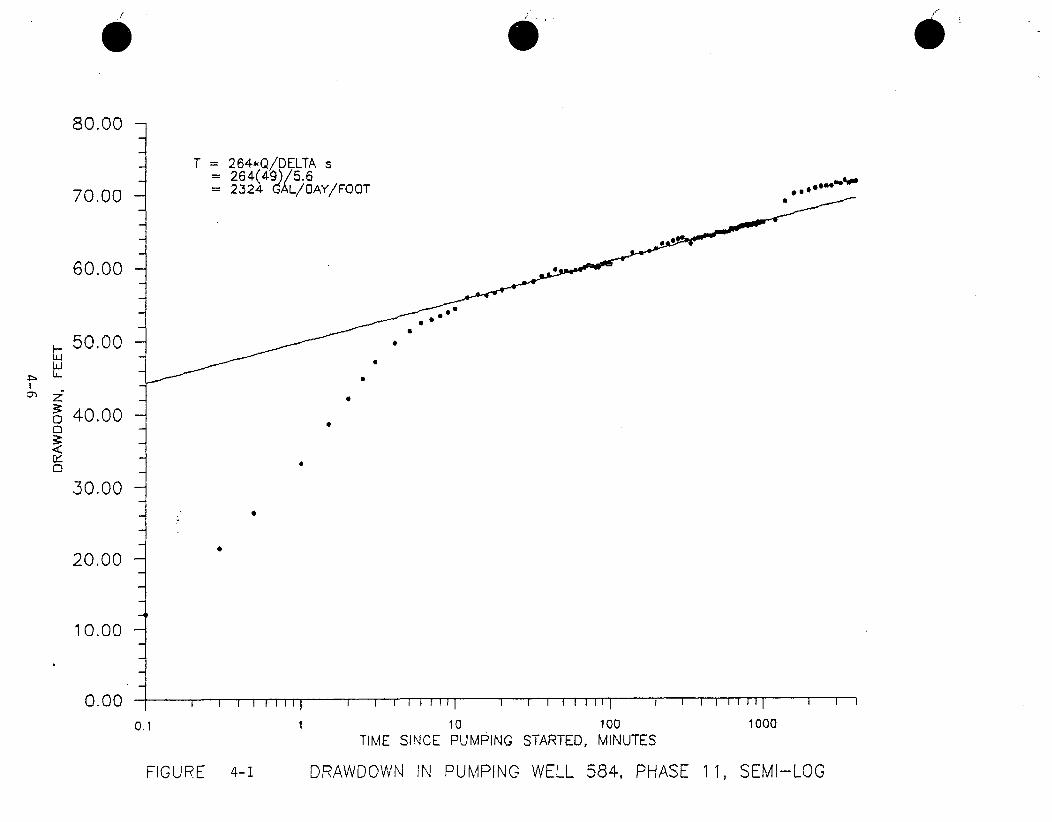
80.00 -
70.00
60.0.0 -
50.00 -LU
o 40.00
0
.30.00-
T = 264*0Q/DELTA= 264(49)/5.6
2324 GAL/QAY/FOOT
/ • .0/ 0
/S/0
/ •
20.00 -
10.00
0.00 i1
I I I -I" I I I
10.1
I I I I I I I11
10TIME SINCE PUMPING
i I I i I I I I I I I1 1 I1i i I * i I I ; I I i , , I I i I
100STARTED, MINUTES
1000
FIGURE 4-1 DRAWDOWN IN PUMPING WELL 584, PHASE 11, SEMI-LOG
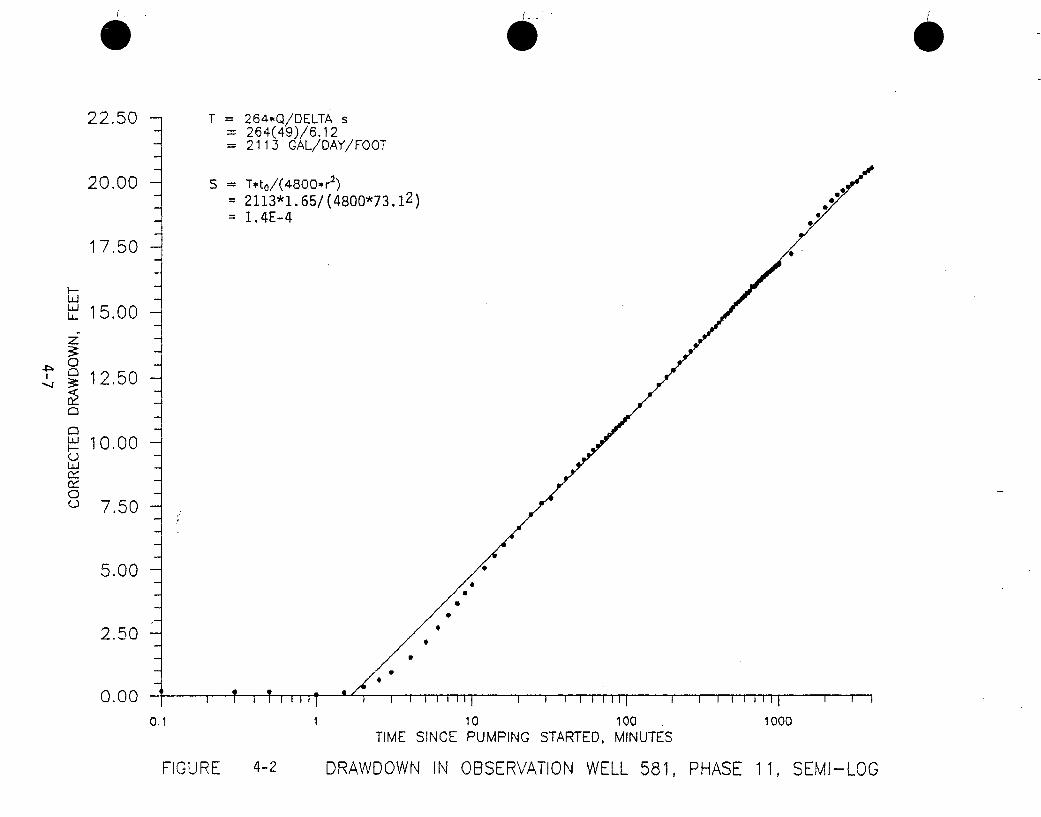
22.50 T = 264,Q/DELTA s1 264(49)/6.12
- 2113 GAL/DAY/FOOT
20.00 S Tt 0/(4800*r 2)- 2113*1.65/(4800*73.12) eg
1.4E-4
17.50
I--
uw, 15.00
0S•12.50
"u 10.00C- •
0O 7.50
5.00 -
2.50
0.00 C 7 7,tI
0.1 1 10 100 1000
TIME SINCE PUMPING STARTED, MINUTES
FIGURE 4-2 DRAWDOWN IN OBSERVATION WELL 581, PHASE 11, SEMI-LOG
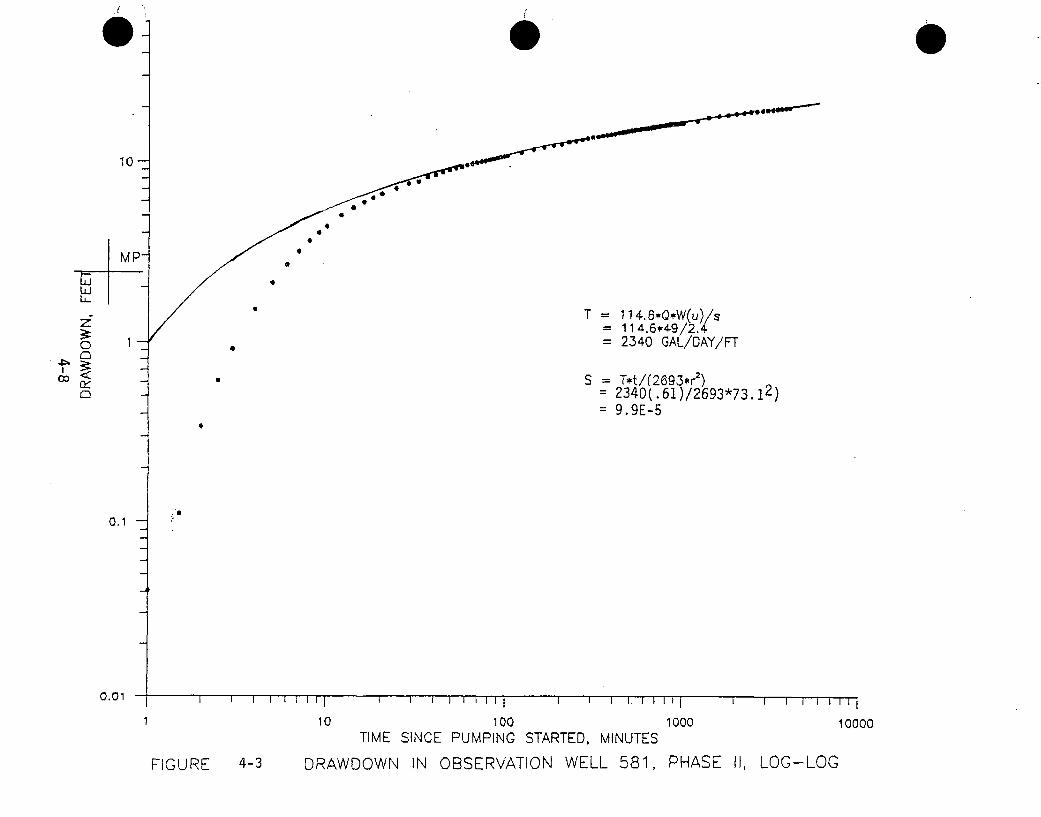
4t
04-,---_
4
a
z"0
T = 114..6*0.W(u)/s= 11 4.6*49/2.4= 2340 GAL/DAY/FT1
0, a S = T*t/(2693*r2)2340(.61)/2693*73.12)
= 9.9E-50
0.1
0.01
I 10 100TIME SINCE PUMPING STARTED, MINUTES
1000 10000
FIGURE 4-3 DRAWDOWN IN OBSERVATION WELL 581, PHASE II, LOG-LOG
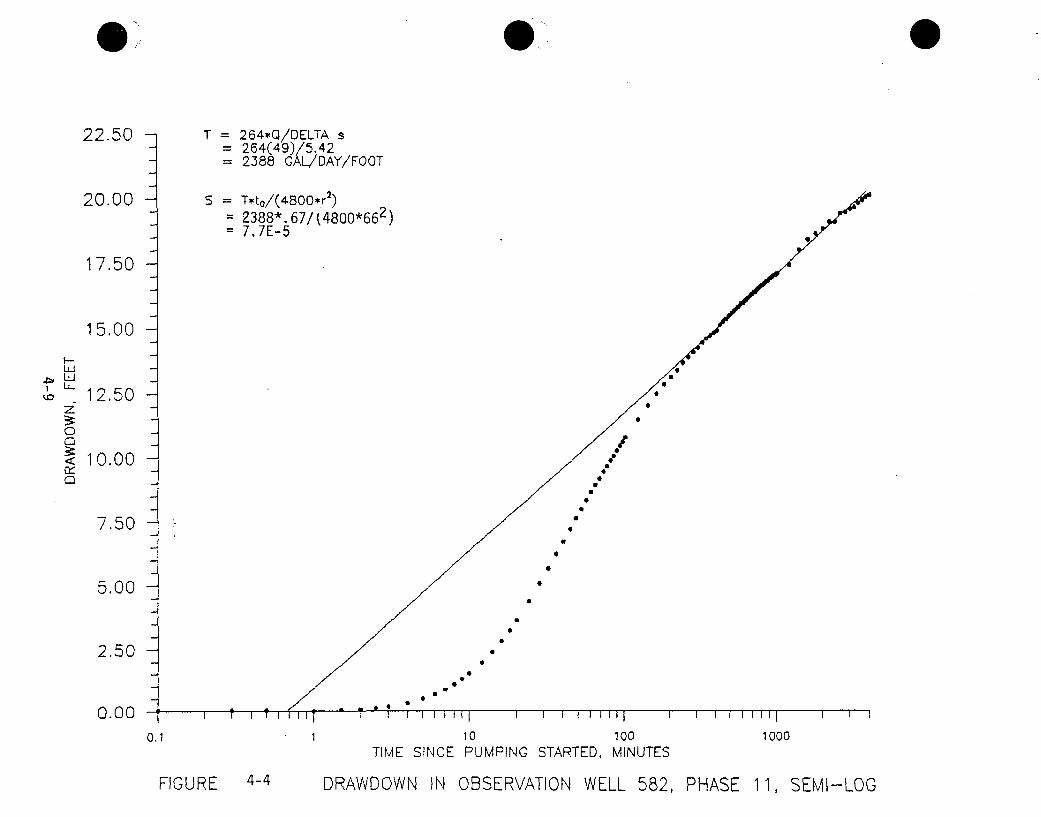
22.50 T = 264*Q/DELTA s= 264(49)/5.42= 2388 CAL/DAY/FOOT
20.00 s T*to/(4800*r 2)
- 2388*. 67/(4800*662)7= .7E-5
17.50
15.00
iLd
Lz.12.50 -
0
< 10.00 •"
7.50-
5.00
2.50
0 .0 0 1 1 1 I T I I I 0II,
0.1 10 100 1000TIME SINCE PUMPING STARTED, MINUTES
FIGURE 4-4 DRAWDOWN IN OBSERVATION WELL 582, PHASE 11, SEMI-LOG
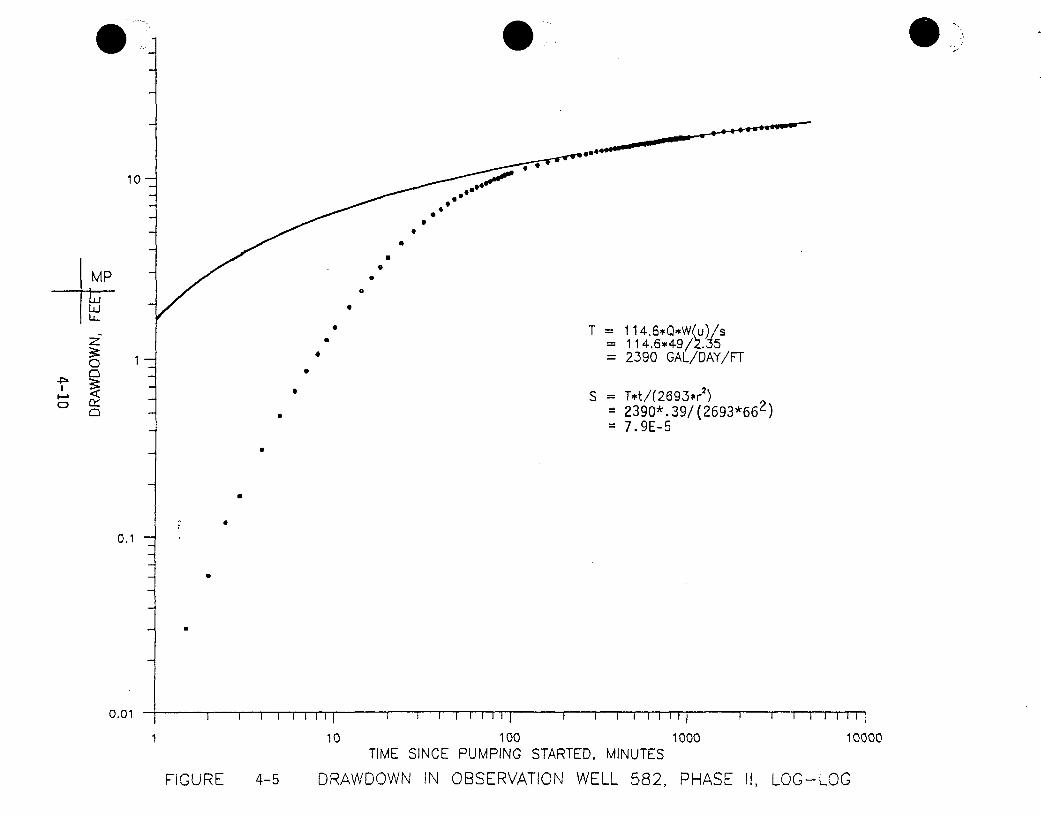
10-
LUJ" T = 114.6*0*Wýýu)s
Z = 114.6*49/ .. 5o 1- = 2390 GAL/DAY/FT
C3
S = T*t/(2693*r2)jCo , 2390*.39/(2693"66 )
= 7.9E-5
0.1 -
0.01i
1 10 100 1000 10000
TIME SINCE PUMPING STARTED, MINUTES
FIGURE 4-5 DRAWDOWN IN OBSERVATION WELL 582, PHASE I1, LOG-LOG
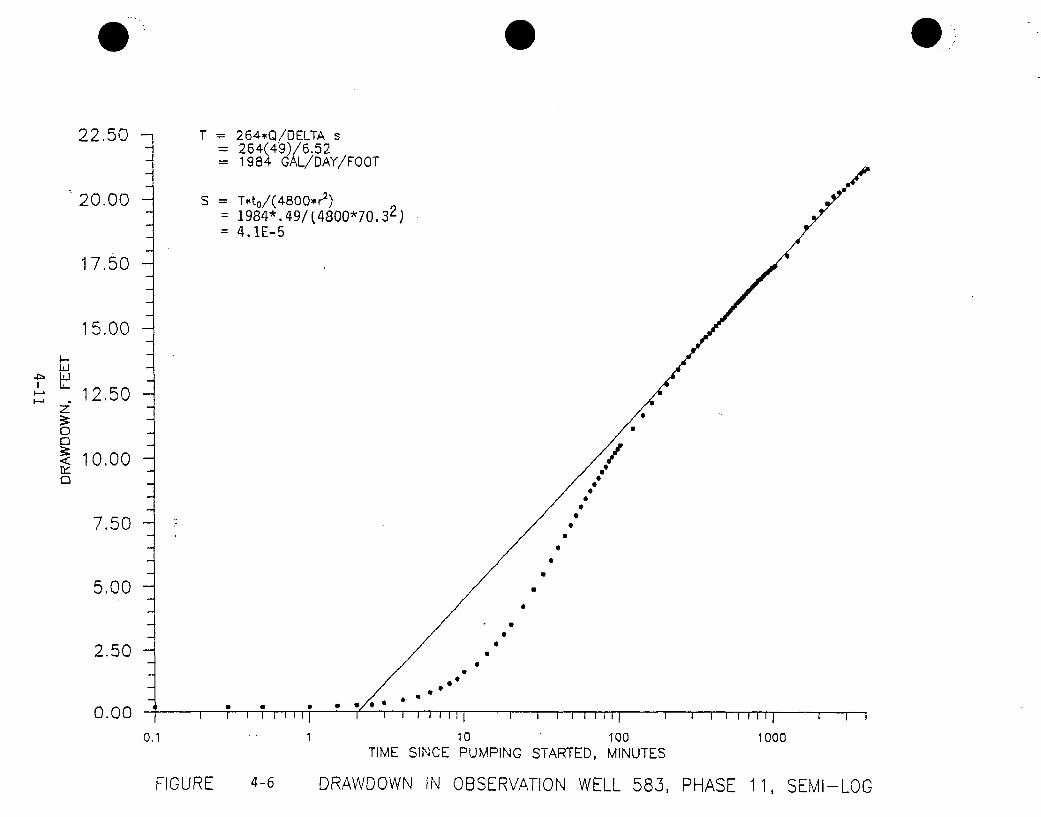
22.50 T = 2640Q/DELTA s= 264(49)/6.52= 1984 (AL/DAY/FOOT
20.00 S = Tdto/(4800*r2)= 1984*.49/(4800*10.32)= 4.1E-5
17.50
15.00
7-.
- ,"
12.50
< 10.00
5 0 .1 10
TIME -E7.50 -
5 .0 0 U I ' ' ' i i i i i Ii I i i i I l Ii i i , I I i i
0.1 110 100 1000TIME SINCE PUMPING STARTED, MINUTES
FIGURE 4-6 DRAWDOWN IN OBSERVATION WELL 58.3, PHASE 11, SEMI-LOG
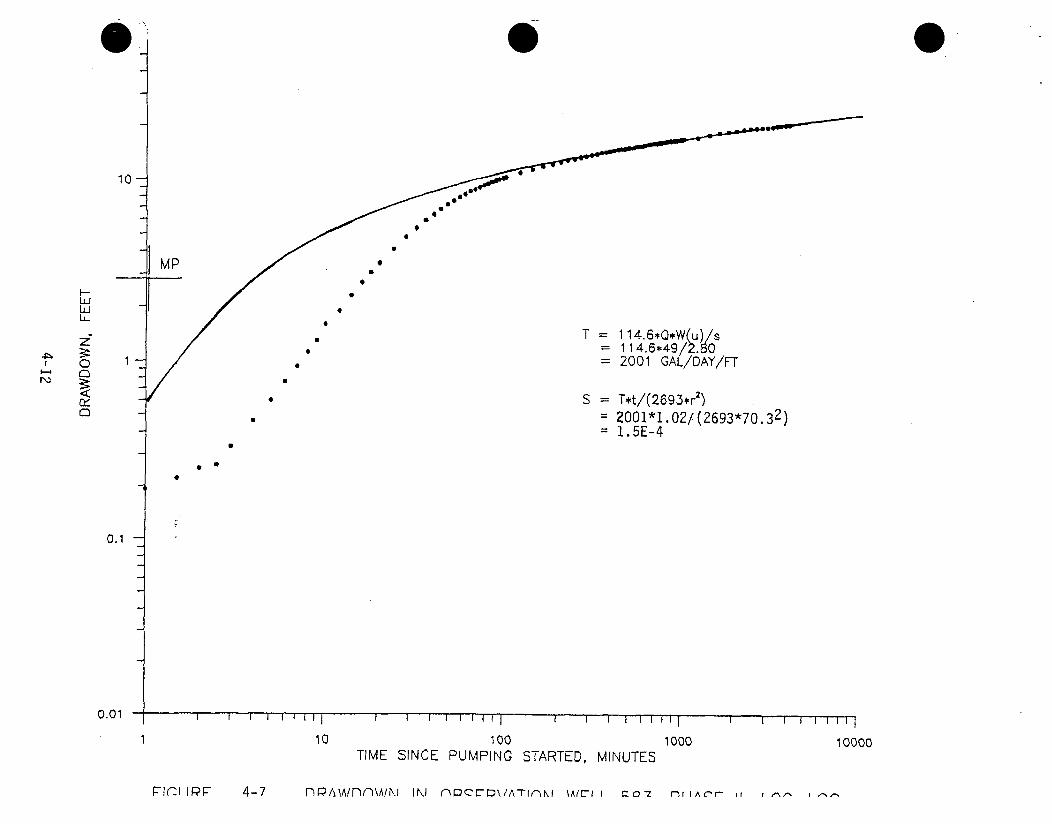
10
a
a
MP 0a
4 1ýt
I-Ld
0
Cy
r-
1
In
0
a
T 114.6*0,W.(u)s= 114.6,49/21.0= 2001 GAL/DAY/FT
S = T*t/(2693*r2 )= 2001*1.02/(2693*70.32)= 1.5E-4
0
Ia
0.1
0.01
1 10 100TIME SINCE PUMPING STARTED, MINUTES
1000 10000
Fl(-,l )PF 4-7 nPmIR 4- lRAA/flf\A/NlI NI - Q C-D\/1A Tl KI MA(-1 I r- 07 rl II A Cr- I ^^ I ý-
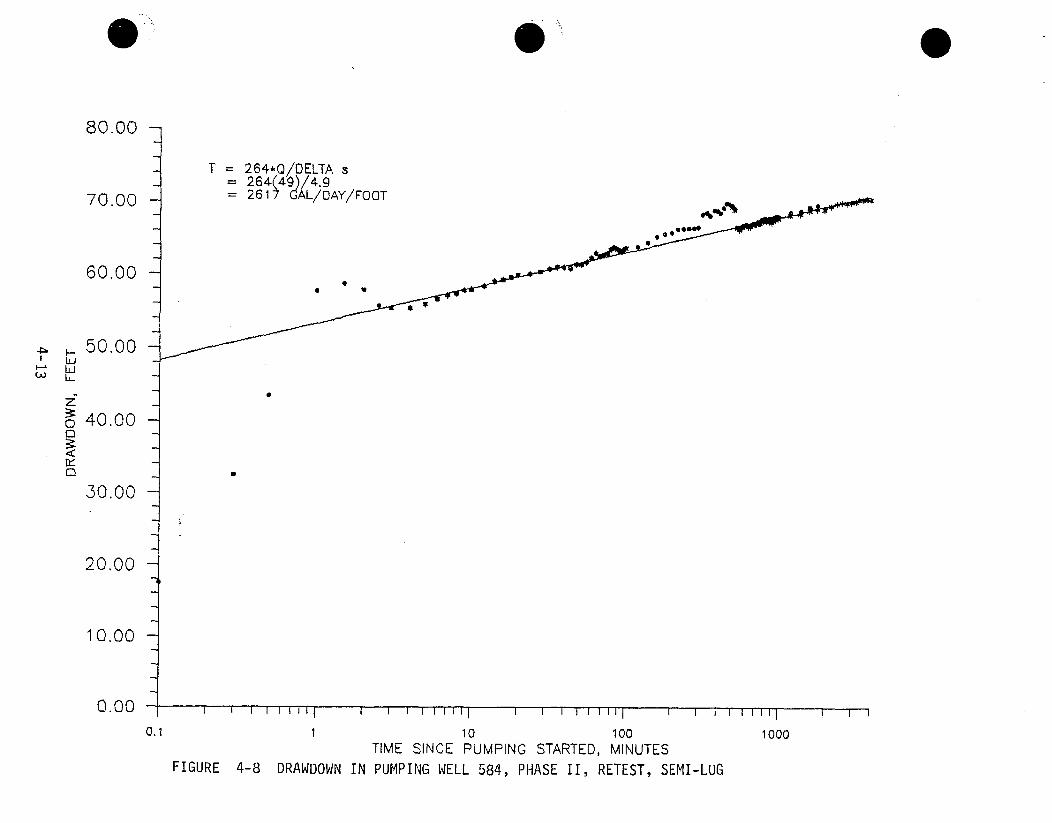
!-Ld
80.00 -
70.00 -
60.00
50.00 -
40.00 -
30.00 -
20.00
10.00
T = 264,Q/DELTA s264(49)/4.9
= 2617 GAL/DAY/FOOT %%P' k
0 U. .•-• R
0
a
0.00 I I I I 11111 I I I I III I I I I I I I I I i 1 1 1 1 I I I
0,1 10 100TIME SINCE PUMPING STARTED, MINUTES
PUMPING WELL 584, PHASE II, RETEST, SEMI-LUG
1000
FIGURE 4-8 DRAWDOWN IN
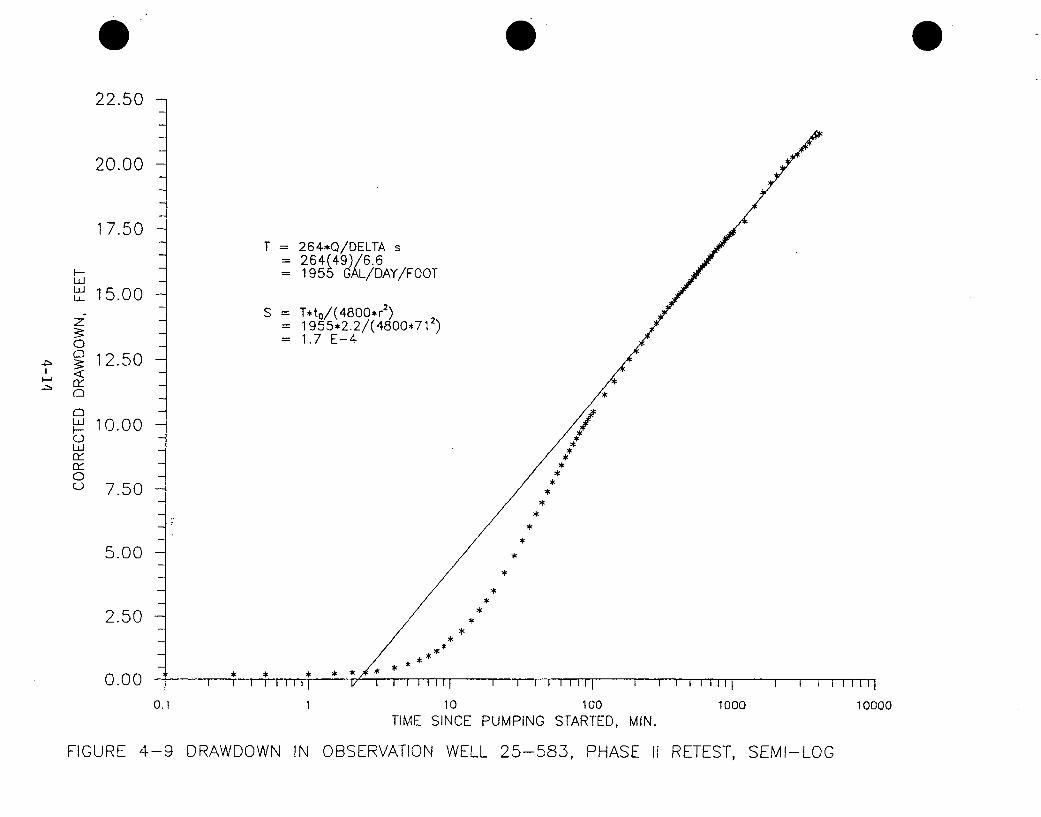
22.50
20.00
17.50T = 264*Q/DELTA s
264V49)/6.6," 150 -1955 GAL/DAY/FOOT
S15.00Tto/(480r2)
S -S 1955*2.2/(4800*712)o-= 1.7 E-4
• 12.50rY
10.00 -0 -
o -00 7.50 -
5.00 0
2.50 *-*
u~~uu ~ i I I 111 i1I ,i1 l I I l i iiI l
0.1 1 10 100 1000 10000TIME SINCE PUMPING STARTED, MIN.
FIGURE 4-9 DRAWDOWN IN OBSERVATION WELL 25-583, PHASE II RETEST, SEMI-LOG
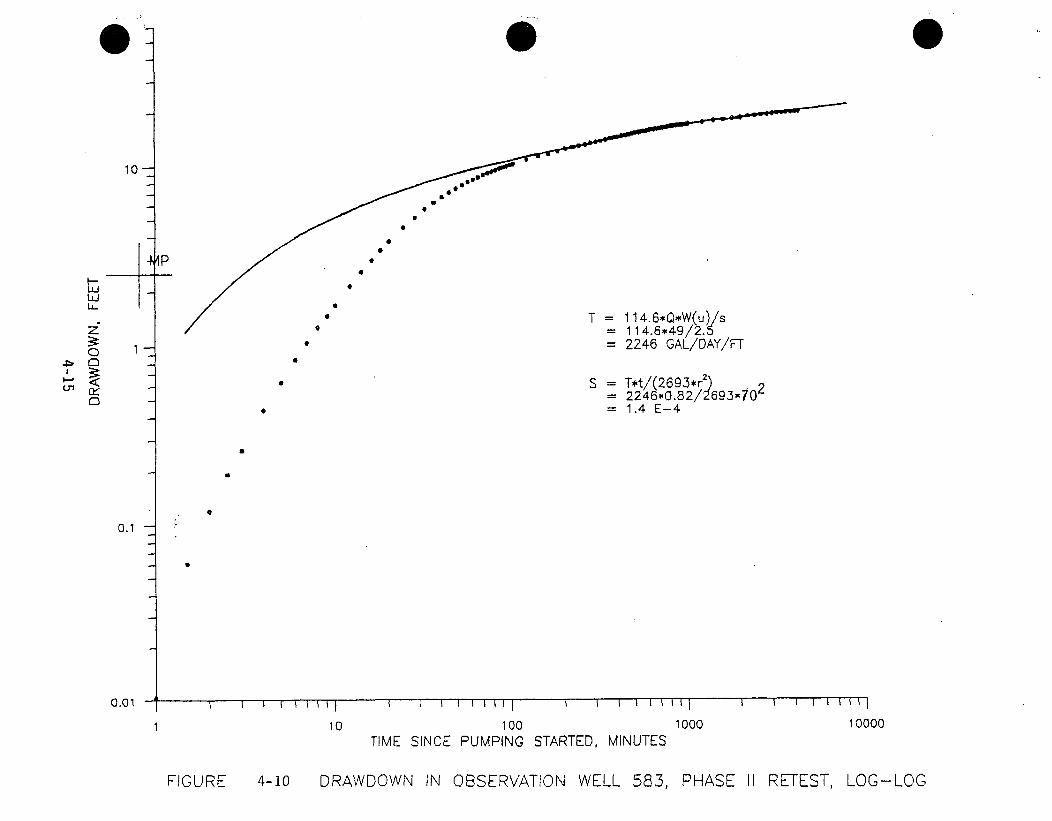
10
a
2
0
4
LULd
0
w
T - 114.6*Q•,W(u)/s114.6*49/2.52246 GAL/DAY/FTI
U-?
a
S = T*t/(2693*r2 ) 22246*0.82/2 6934,02
= 1.4 E-4
a
0.1
0.01
1 10 100TIME SINCE PUMPING STARTED, MINUTES
1000 10000
FIGURE 4-10 DRAWDOWN IN OBSERVATION WELL 583, PHASE II RETEST, LOG-LOG
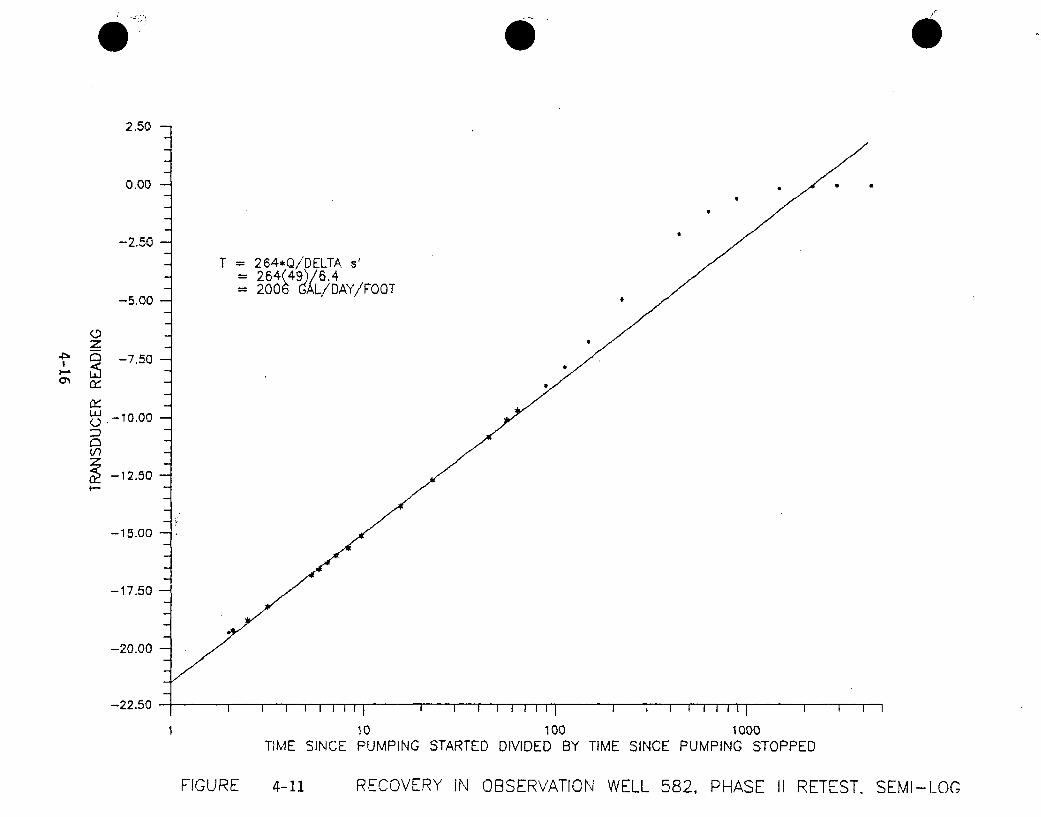
2.50
0.00
-2.50T = 264,Q/DELTA S
- 264-49&)/6.4
-5.00 20A L/DAY/FOOT
zQ-7.50
ui-10.00
-12.50
-15.00
-17.50
-20.00
-22.50- I
9
v
10 100 1000TIME SINCE PUMPING STARTED DIVIDED BY TIME SINCE PUMPING STOPPED
F IG, U RE 4-11 RECOVERY IN OBSERVATION WELL 582, PHASE II RETEST. SEMI-LOG
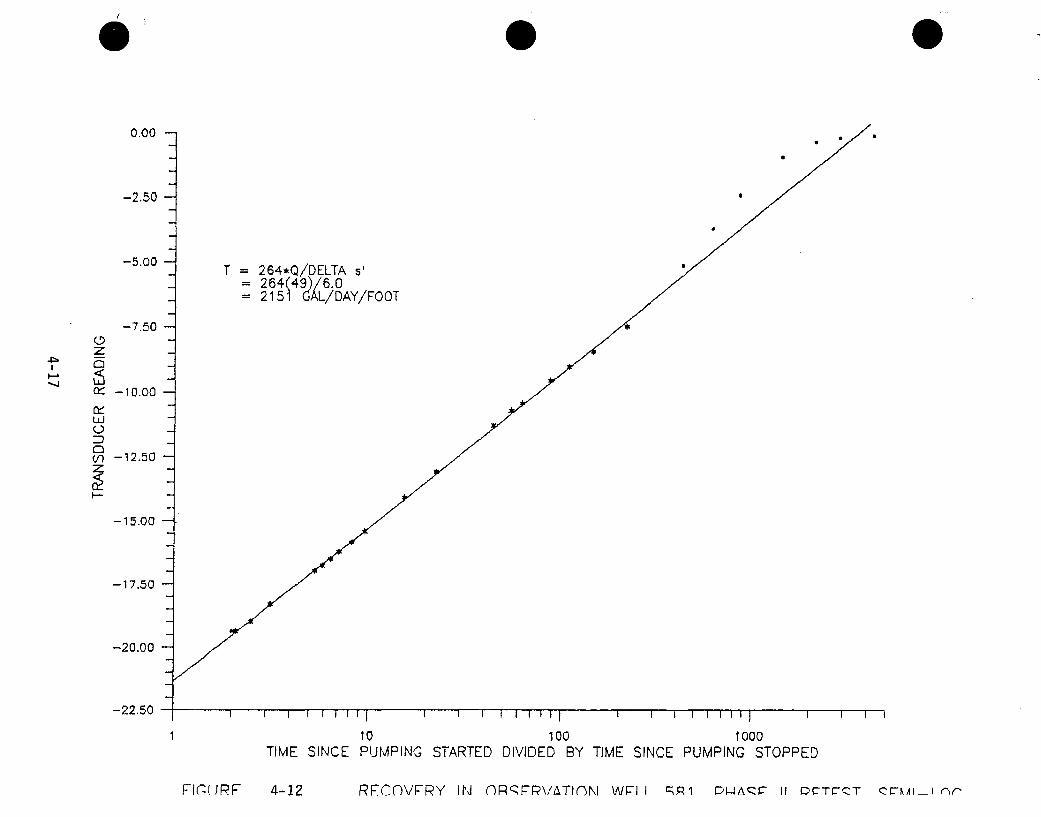
0.00
I.
-4M
0z
ULJ
V)
-2.50
-5.00
-7.50
-10.00
-12.50
-15.00
-17.50
-20.00
-22.50
T = 264*Q/DELTA s'= 264 (49)/6.0= 2151 GAL/DAY/FOOT
1 10 100 1000TIME SINCE PUMPING STARTED DIVIDED BY TIME SINCE PUMPING STOPPED
FI(7,ý)RF 4-12 RriR 4-2 RFCC)VFPY iIN flR1ý1P\/iTICnM WPI I c;Rq1 ý-4AR I:Z71 QC:TCQT Ck[(w
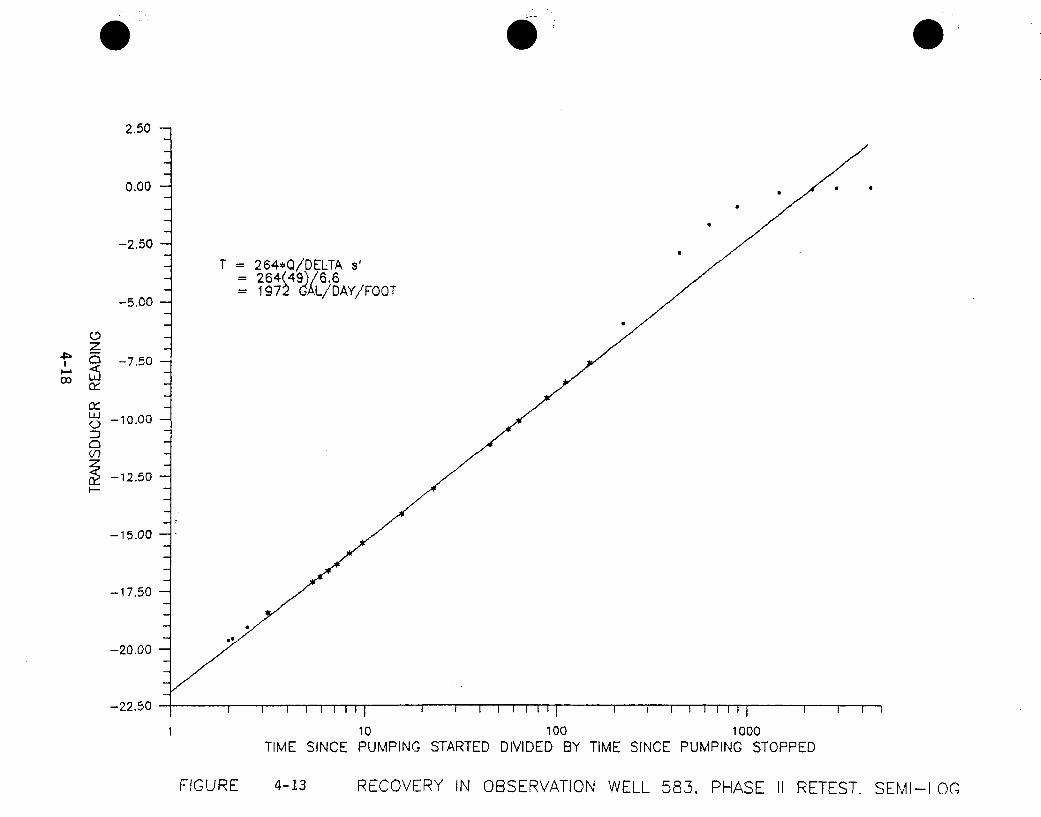
0
2.50
0.00
-2.50
-5.00
0 0
T =264*Q/DELTA s
19 IAXL/DAY/FOOT
00.
0z
-7.50
i'Y
-10.00
-12.50
-15.00
-17.50
-20.00
-22.50
1 10 100 1000TIME SINCE PUMPING STARTED DIVIDED BY TIME SINCE PUMPING STOPPED
FIGURE 4-13 RECOVERY IN OBSERVATION WELL 583. PHASE II RETEST. SEMI-I OC
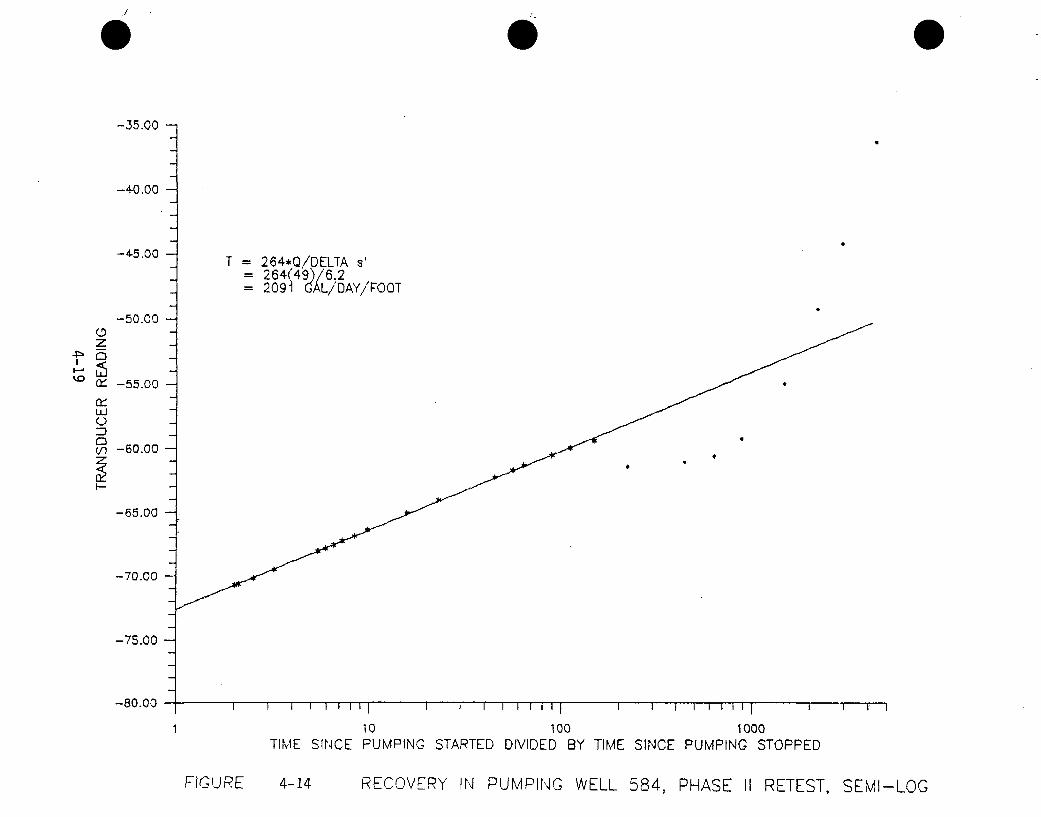
-35.00
-4-0.00
-4-5.00
-50.00
zn
n," -55.00
L•-
:D
n -60.00
T = 264*Q/DELTA=264(49)'6.2
4 1 0
0
0
-65.00
-70.00
-75.00
-80.00
1 10 100 1000TIME SINCE PUMPING STARTED DIVIDED BY TIME SINCE PUMPING STOPPED
FICUPE 4-14 RECOVERY IN PUMPING WELL 584, PHASE II RETEST, SEMI-LOG
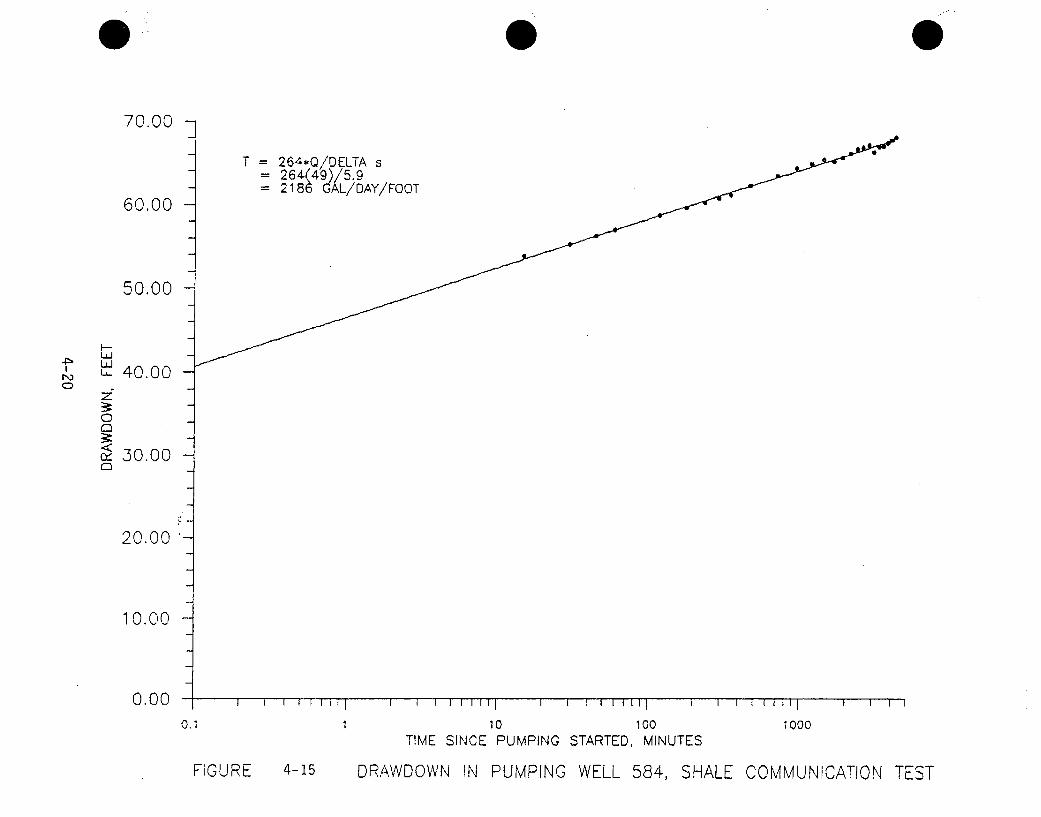
70.00 1
T = 264*Q/DELTA s= 264(49)/5.9= 2186 GAL/DAY/FOOT
60.00
50-00
LUl
u- 40.000
z"
CD
,30.00
20,00
10.00
0.1 1 10 100 1000TIME SINCE PUMPING STARTED, MINUTES
FIGURE 4-15 DRAWDOWN IN PUMPING WELL 584, SHALE COMMUNICATION TEST
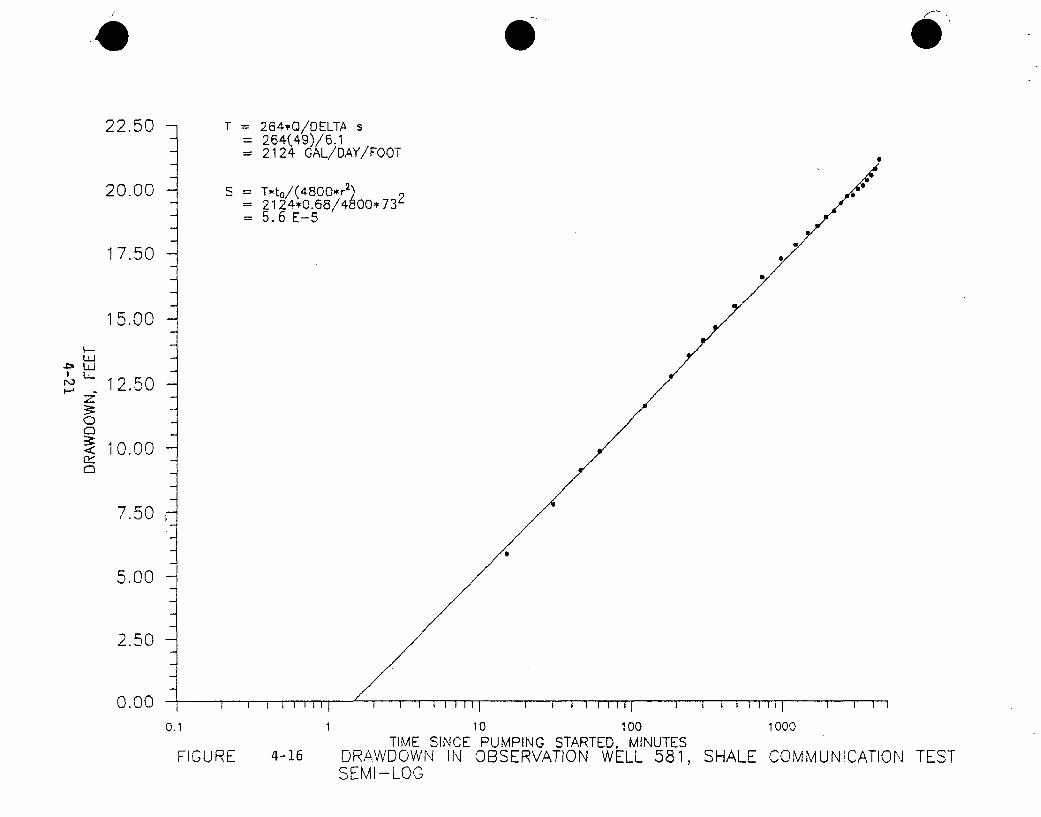
22.50 T = 264*Q/OELTA s- 264(49)/6.1- 2124 GAL/DAY/FOOT
20.00 S = T*to/(480O*r' 2= 2124"0.68/4800* 73"- 5. 6 E-5
17.50
15.00
ILi
~ 12.50
0
< 10.00rn'C3
7.50
5.00
2.50
0.00 - I III I I II
0.1 110 100 1000TIME SINCE PUMPING STARTED, MINUTES
FIGURE 4-16 DRAWDOWN IN OBSERVATION WELL 581, SHALE COMMUNICATION TESTSEMI-LOG
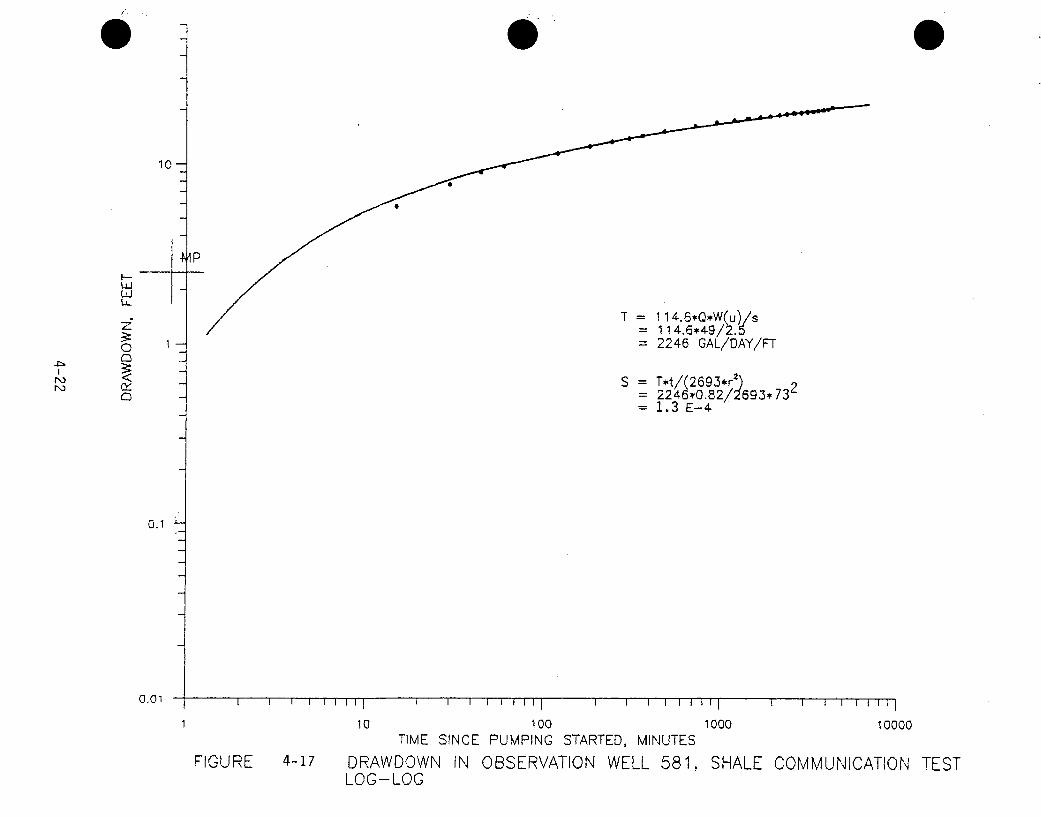
10
I-LuJ
CC
T = 1 4.6*Q*W(u)/s= 114.6*,49/2.5=2246 GAL/DAY/F-r1
S = T*t/(2693*r 2= 2246,0 '82/2'691ý732= 1.3 E-4
0.1
0.01
1 10 100 1000 10000TIME SINCE PUMPING STARTED, MINUTES
FIGURE 4-17 DRAWDOWN IN OBSERVATION WELL 581, SHALE COMMUNICATION TESTLOG-LOG
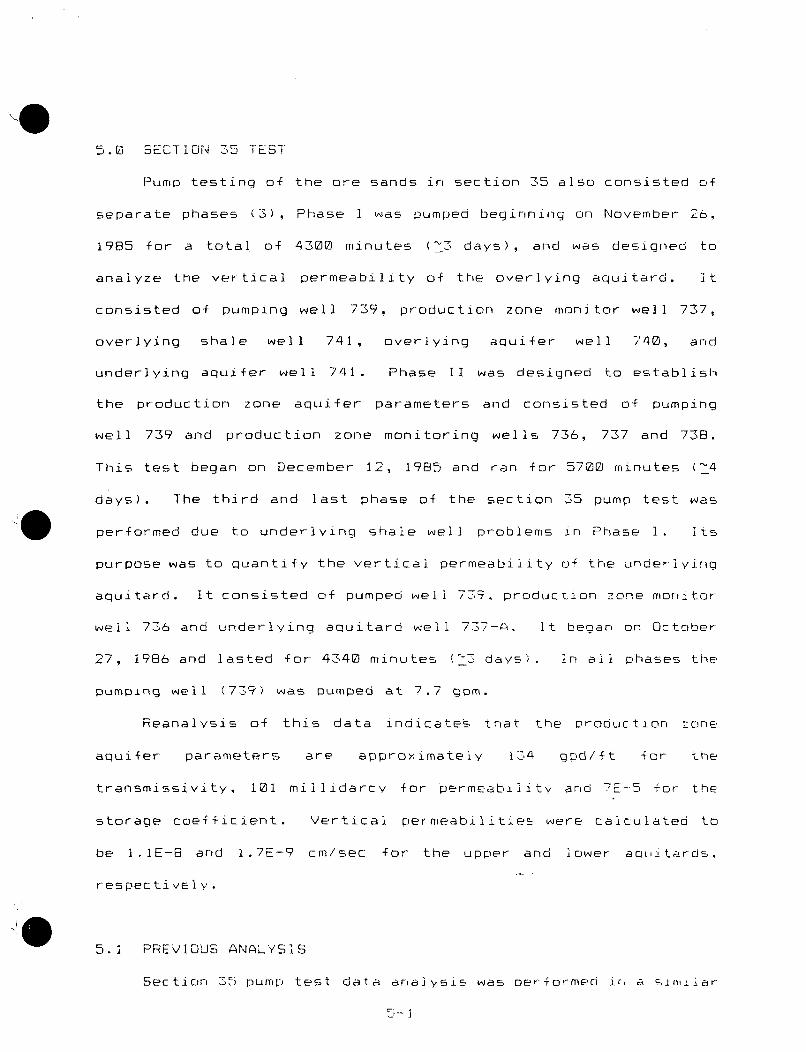
5.0 SECTION 35 TEST
Pump testing of the ore sands in section 35 also consisted of
separate phases (3), Phase I was pumped beginning on November 26.
1985 for a total of 43100 minutes (-3 days), and was designed to
analyze the vertical permeability of the overlying aquitard. it
consisted of pumping well 739, production zone monitor well 737,
overlying shale well 741, overlying aquifer well Y40, and
underlying aquifer well 741. Phase II was designed to establish
the production zone aquifer parameters and consisted of pumping
well 739 and production zone monitoring wells 736, 737 and 738.
This test began on December 12, 1985 and ran for 5700 minutes (-4
days). The third and last phase of the section 55 pump test was
performed due to underlying shale well problems in Phase I. its
purpose was to quantify the vertical permeability of the underlying
aquitard. It consisted of pumped well 739, production zone monitor
well 736 and underlying aquitard well 737-9. It beoan on October
27, 1986 and lasted for 4340 minutes ('5 days). In all phases the
pumping well (739) was Dumped at 7.7 gpm.
Reanalysis of this data indicates tnat the croduction zone
aquifer parameters are approximately 134 gpd/ft for the
transmissivity, 101 millidarcy for permeability and 7E-5 for the
storage coefficient. Vertical permeabilities were calculated to
be l.IE-8 and 1.7E-9 cm/sec for the upper and lower a0tjitards,
respec tive I y.
5.1 PREVIOUS ANALYSIS
Section 35 pump test data a, aIysis was Der+ormed irý a sim, iar
5-
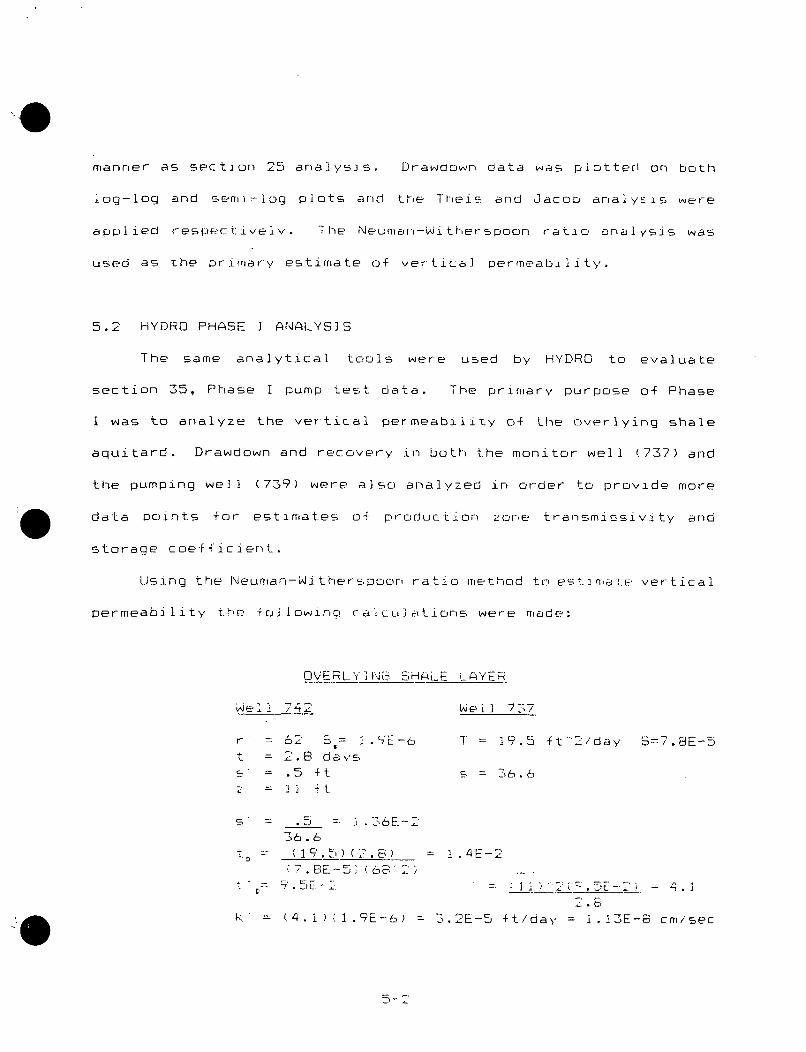
manner as section 25 analysis. Drawdown data was plotted on both
log-log and semi-log plots and the Theis and Jacob analysis were
applied respectively. The Neumarn-Witherspoon ratio analysis was
used as the primary estimate of vertical permeability.
5.2 HYDRO PHASE I ANALYSIS
The same analytical tools were used by HYDRO to evaluate
section 35, Phase I pump test data. The primary purpose of Phase
I was to analyze the vertical permeability of the overlying shale
aquitard. Drawdown and recovery in both the monitor well (737) and
the pumping well (739) were also analyzed in order to provide more
data points for estimates of production none transmissivity and
storage coefficient.
Using the Neuman-Witherspoor ratio method to t~mate vertical
permeability the +ollowing calculations were made:
DVERLYING SHALE LAYER
Well 742 Wel l 757
r 62 5 =.9E-o = 19.5 +t"2/day S=7.8E-5
t = 2.8 dayss' = .5 ft s 36.6Z' = A] +t
s = .36E-236.6_95)(2.8 = .4E-2."7.BE-5 (68 '")...
" (4.. ...9.•.E-1.=. tda =, i.5E-8 cm/se
K': (4.1)11.9E-6) =3.2E-5 It/day =1.13E-8 cmisec
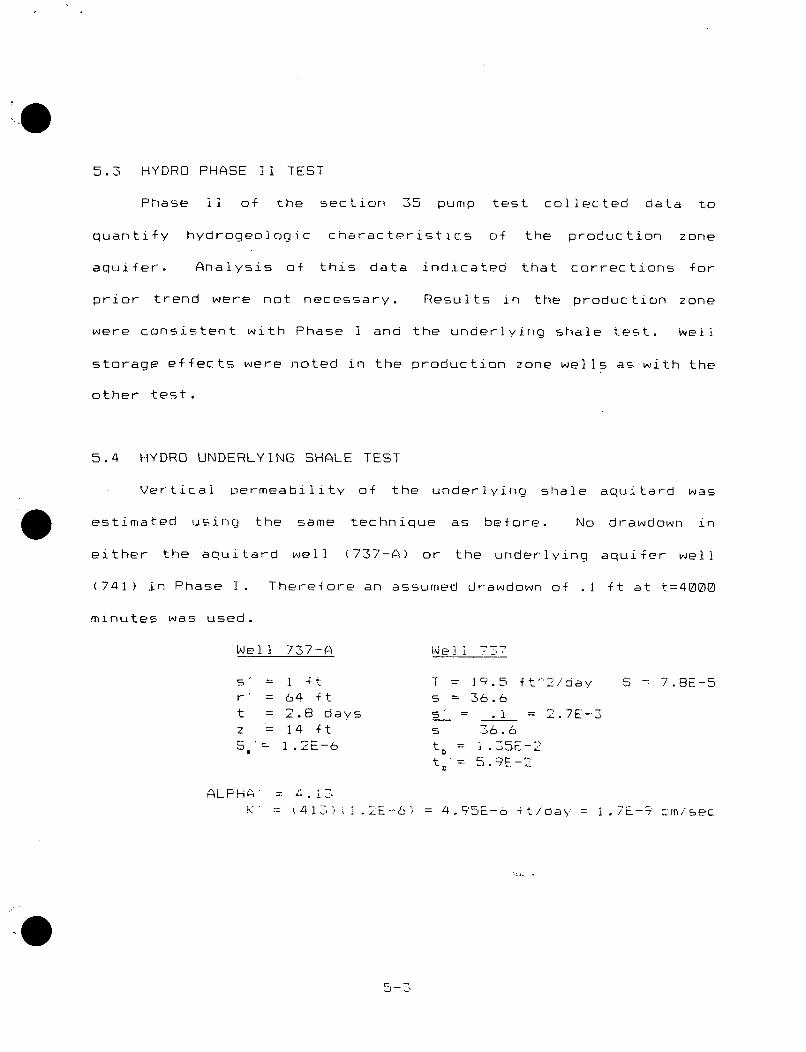
5.3 HYDRO PHASE II TEST
Phase i1 of the section 35 pump test collected data to
quantify hydrogeologic characteristics of the production zone
aquifer. Analysis of this data indicated that corrections for
prior trend were not necessary. Results in the production zone
were consistent with Phase I and the underlying shale test. Well
storage effects were noted in the production zone wells as with the
other test.
5.4 HYDRO UNDERLYING SHALE TEST
Vertical permeability of the underlying shale aquitard was
estimated using the same technique as before. No drawdown in
either the aquitard well (737-A) or the underlying aquifer well
(741) in Phase 1. Therefore an assumed drawdown of .1 ft at t=4000
minutes was used.
Well 737-A WelI 7C-
s = I 4t T = 19.5 ft'2ioay S 7.8E-5r = 64 ft s = 36.6t = 2.8 days s = .i = 2.7E-3
z = 14 ft s 36.6S'= 1.2E-6 t D = i.35E-2
t' 5.9E-2
ALPHA =
K 1 .1) 2.LE-6) = 4,9ý5E-6 -fti/ay ,f-5cm/sec
5-')
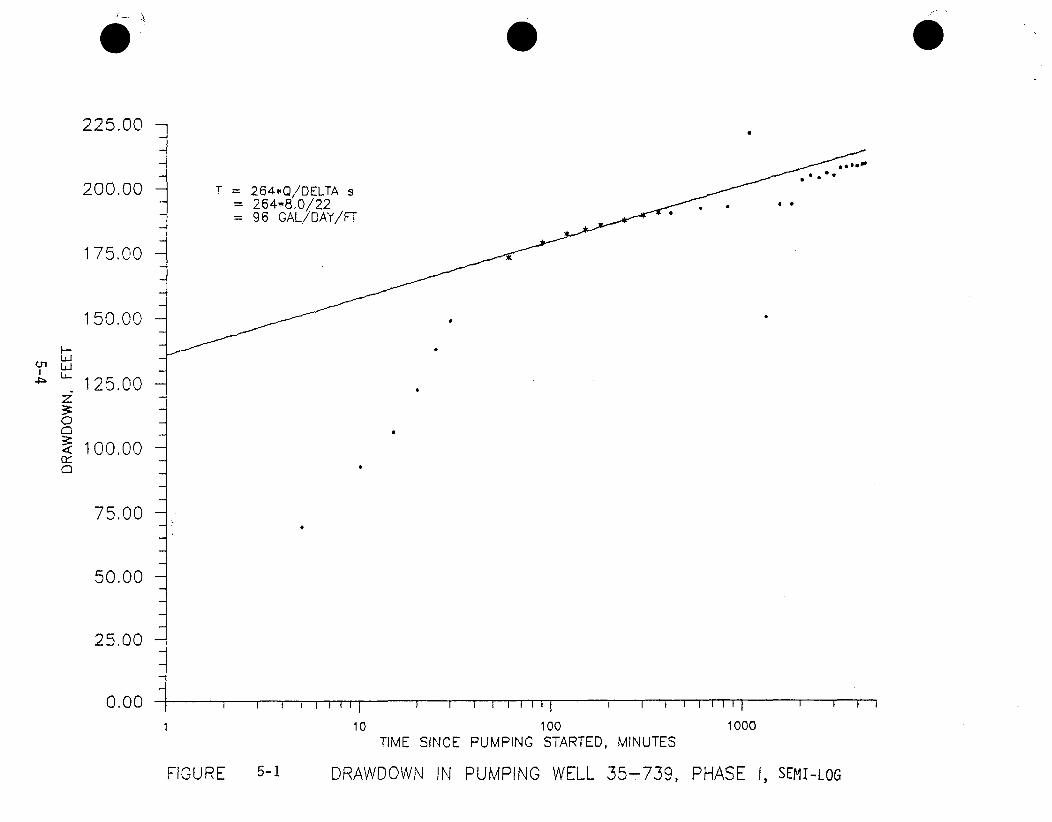
225.00
200.00 T = 264,Q,/DELTA s-= 264-8.0/22- 96 GAL/DAY/FT
175.00
1 50.00----
125.00
0
<100.00
(Y
C]
75.00-
50.00
25.00
0 .0 0 , , , ,,, , I
1 l0 100 1000
TIME SINCE PUMPING STARTED, MINUTES
FPl r PF 5-1 F)PA\A/I")f"nWNI Il PH INAPlti- \A/P'I I 'G-7-TQ P!MAqA
* ***
U Q O ID B
0 .
I SFMT_1 nrYL.I %~ IYiLJ~.i 7711 III I ~dIYII Hl'.d VYL....L..L... ~J'..d - .. Jd, I III I%.JL.... I, .. ,I, LUU
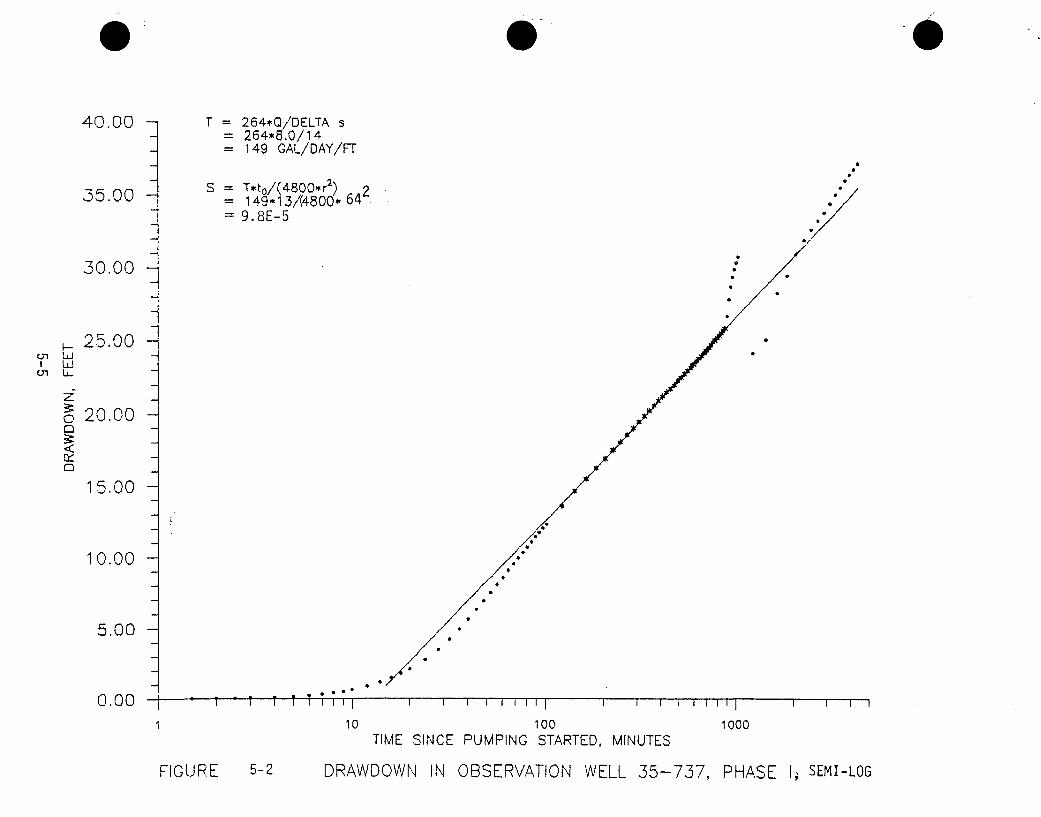
40.00 -
35.00 -
30.00 -
264vQ/DELTA s264*8.0/14149 GAL/DAY/FT
T•tto/(4800' r2)149*13/(4800 64
9.8E-5
o@
0, LUI LU
U, L~
2
C
C
C
25.00
20.00 -
15,00
10.00
5.00 -
0.00*
- 1 ¶ TS I I I I1 1 0
10Si I II I I1 1 I I I I I I I I I I I I I
1
TIME SINCE PUMPING100STARTED, MINUTES
1000
FIGURE 5-2 DRAWDOWN IN OBSERVATION WELL 35-737, PHASE I; SEMI-LOG
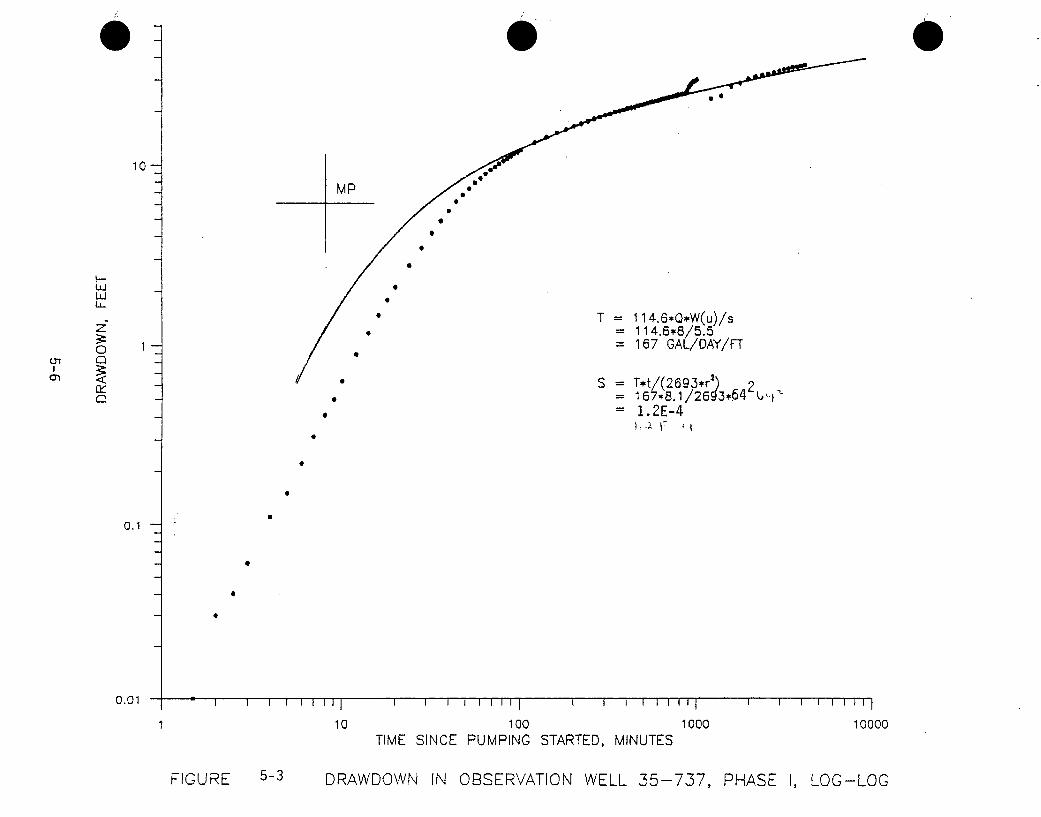
, 0
10-
MP
0
a
LuLUJLU_
C
Cy
T = 114.6*Q*W(u)/s= 114.6*8/5.5= 167 GAL/DAY/FT
4
aI
1--0
T*t/(2693*r 2 21. 2E-4
j 'I_ (
0
0
a
0.1
0
9
0.01 -I. I I I I I III
10 100TIME SINCE PUMPING
I I I I I II I
1000STARTED, MINUTES
I I I I I I I I i
10000
FIGURE 5-3 DRAWDOWN IN OBSERVATION WELL 35-737, PHASE I, LOG-LOG
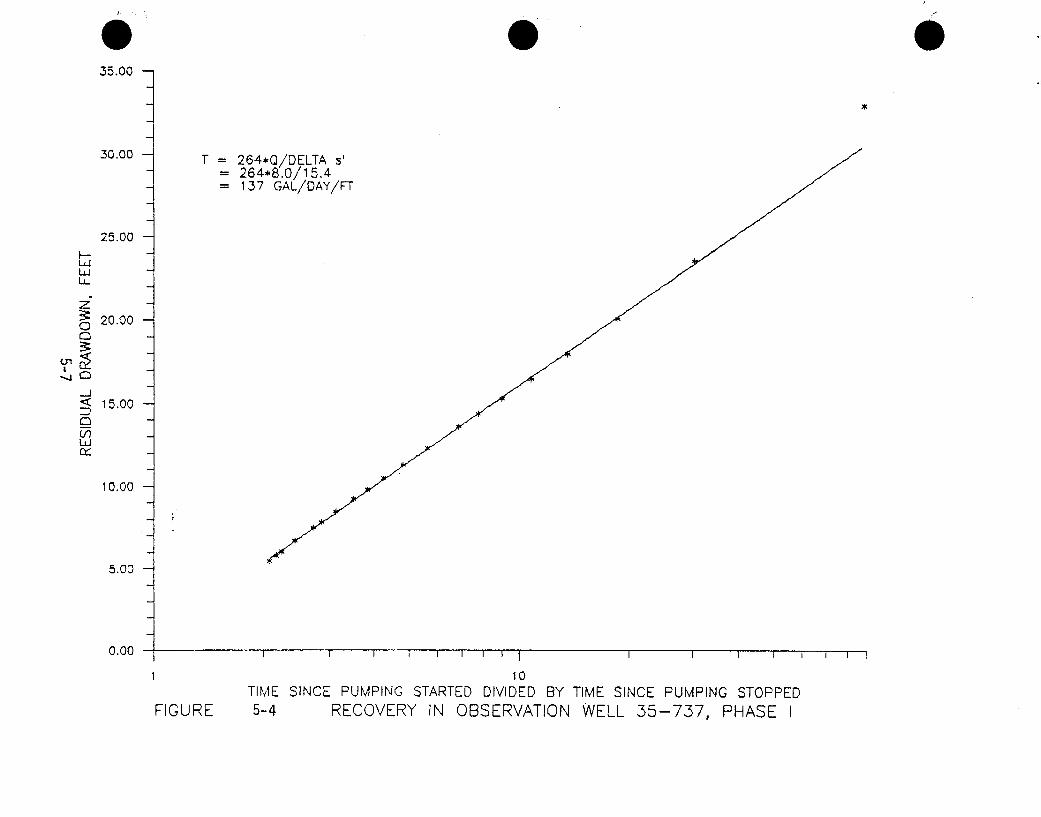
35.00
30.00 T = 264*0/DELTA ' s'= 264*8.0/115.4
= 137 GAL/DAY/FT
25.00
LJ,LL
20.00
-J
< 15.00
LUJ
10.0o0-
5.00
0.00 - I ,
1 10TIME SINCE PUMPING STARTED DIVIDED BY TIME SINCE PUMPING STOPPED
FIGURE 5-4 RECOVERY IN OBSERVATION WELL 35-737, PHASE I
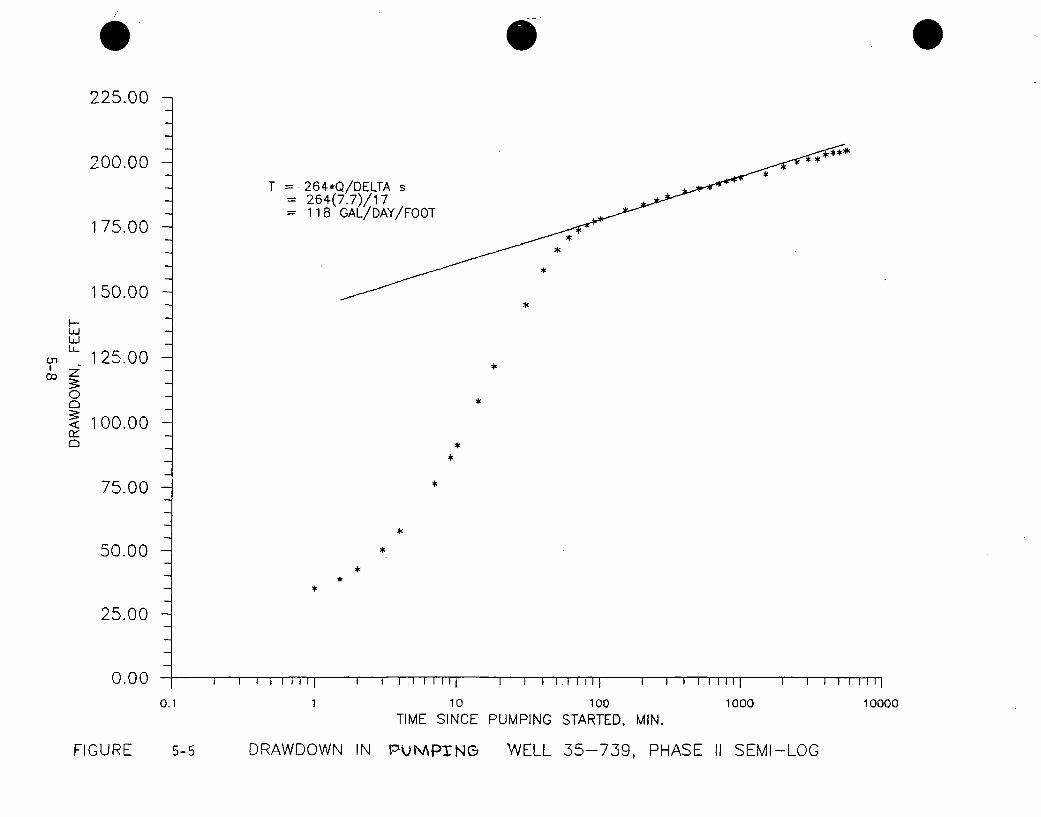
U,
Liji.LiLL_
0C
rC
225.00 -
200.00 -
175.00 -
150.00 -
125.00
100.00 -
75.00 -
50.00 -
25.00 -
0.00
*
*
*
T 264*Q/DELTA s264(7.7)/17118 GAL/DAY/FOOT
*
*
*
**
*
*
*
**
*
I I I I J l I I I I I II I I I I I I . l II I I I I I I l III I I F I TVF I
100000.1 10 100
TIME SINCE PUMPING STARTED, MIN.1000
FIGURE 5-5 DRAWDOWN IN PkiNAPIN& WELL 35-739, PHASE II SEMI-LOG
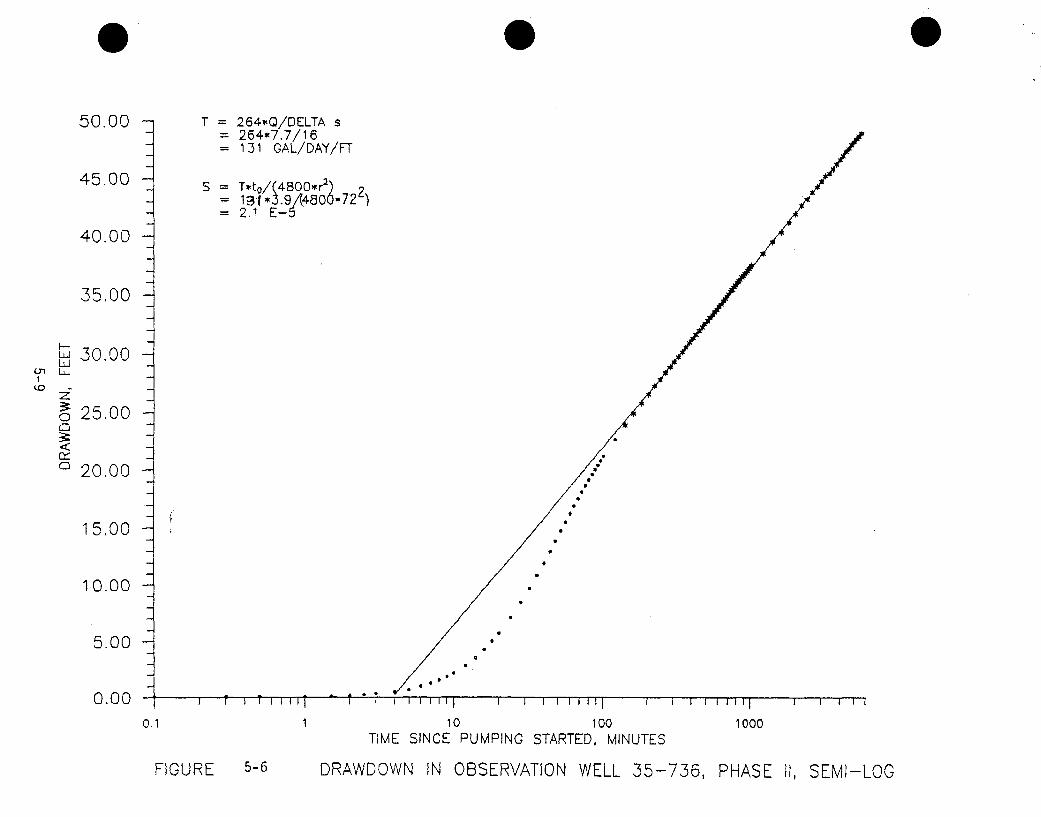
50.00
45.00
40.00
35.00
264,,Q!DELTA s254--7.7/16
131 GAL/DAY/'FT
S = Ttto/(4800* r2 )*22= 13-1 *3.9/(480072= 2.1 E-5
10I
w.30.00LU
o 25.00
20.00
15.00
10.00
5.00
0.00
/0
0.1 1 10 100TIME SINCE PUMPING STARTED, MINUTES
1000
FIGURE 5-6 DRAWDOWN IN OBSERVATION WELL 35-736, PHASE 11, SEMI-LOG
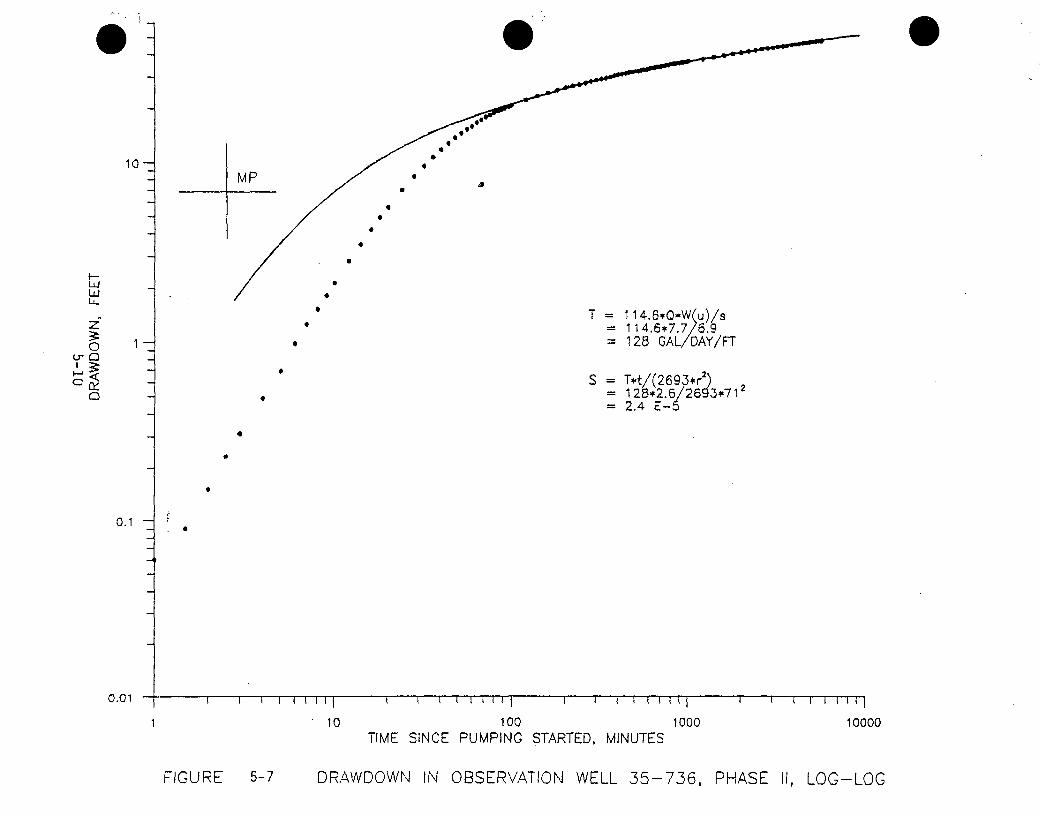
0
10
MPa
a
a
LUj
LL
1 - 0
T = 114.6,0*,W(u)/s114.6 *7.7/ 6.9
- 128 GAL/DAY/FT
S = T*t/(2693*r 2)12B,2.6/2693,7-122.4 E-5
0
0
9
0.1 -.0
0,01
101 100TIME SINCE PUMPING
I I I 1 1 11
1000STARTED, MINUTES
S 1 { 10000
10000
FIGURE 5-7 DRAWDOWN IN OBSERVATION WELL 35-736, PHASE II, LOG-LOG
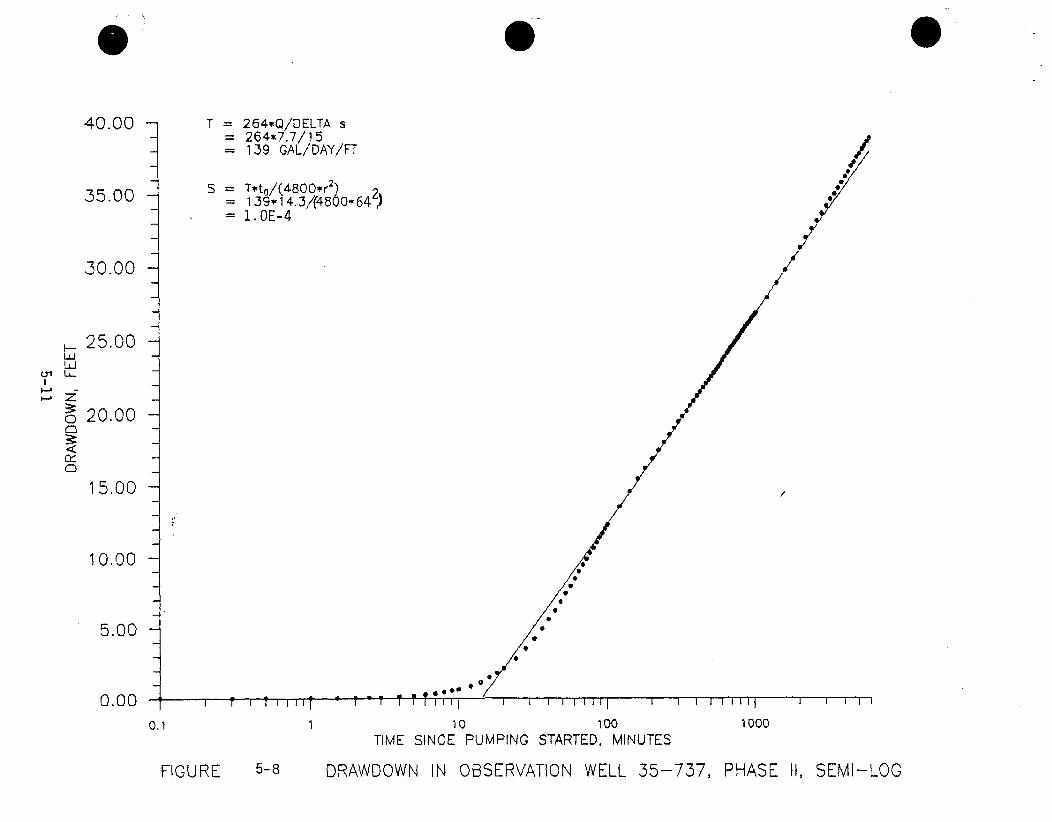
• • 0
40.00 T 264,Q/DELTA s-= 264*7,7/15= 139 GAL/DAY/FT
,2'55.00 - S = T~to/(48OO'rj 2= 139* 14.3/(4500 641)= 1. OE-4
30.00
25.00
S20.00
15-:.0 0
10.00
5.00
0.00
0"1 b_
0 z.00- I ,
0.1 110 100 1000TIME SINCE PUMPING STARTED, MINUTES
FIGURE 5-8 DRAWDOWN IN OBSERVATION WELL 35-737, PHASE II, SEMI-LOG
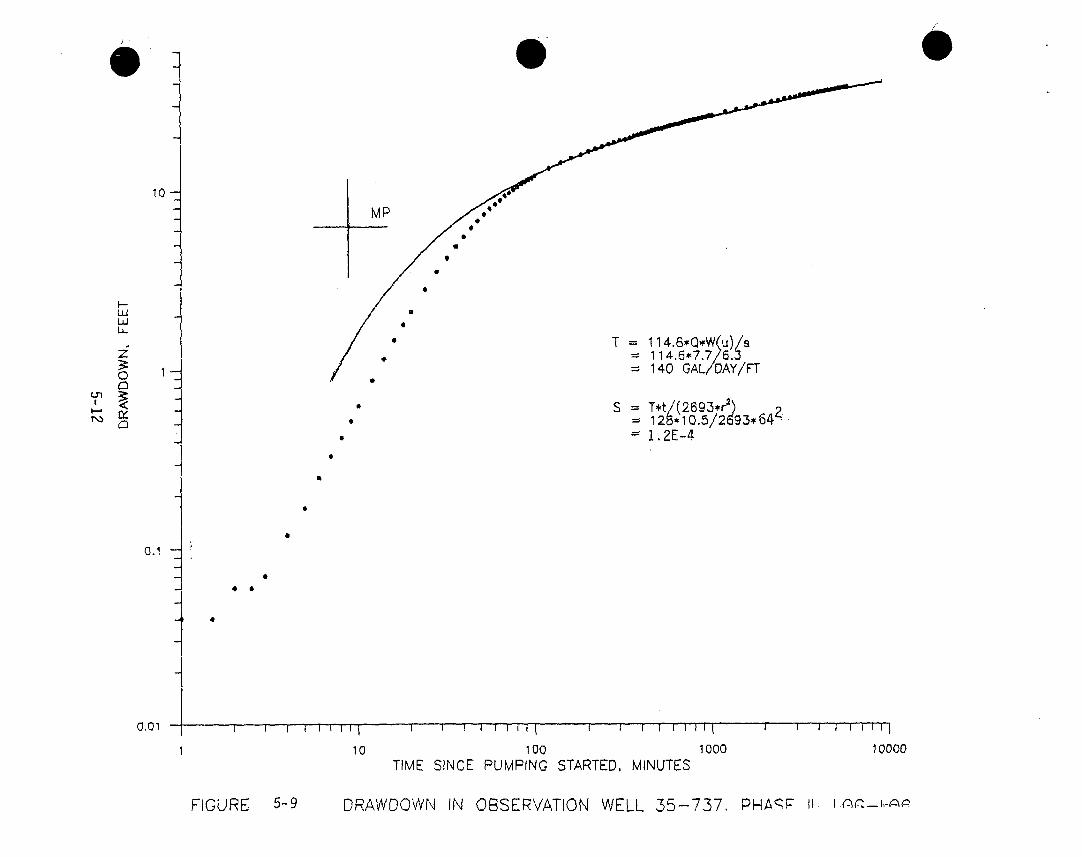
10--
MP
a0
LULU
LL.2C
Cy
0 T - 114.6*•QwWu)/s- 114,5*7,7/6.3- 140 GAL/DAY/FT
4
I
,1a
125*10.5/2293*6 41. 2E-4
a
0.1 -
0 0
q1'-4
0.01 -tI I I l
101
T I I I ING
1O00TIME SINCE PUMPING
SI I I I I
1000STARTED, MINUTES
l I I I I I
10000
FIGURE 5-9 DRAWDOWN IN OBSERVATION WELL 35-737. PHARF II 1
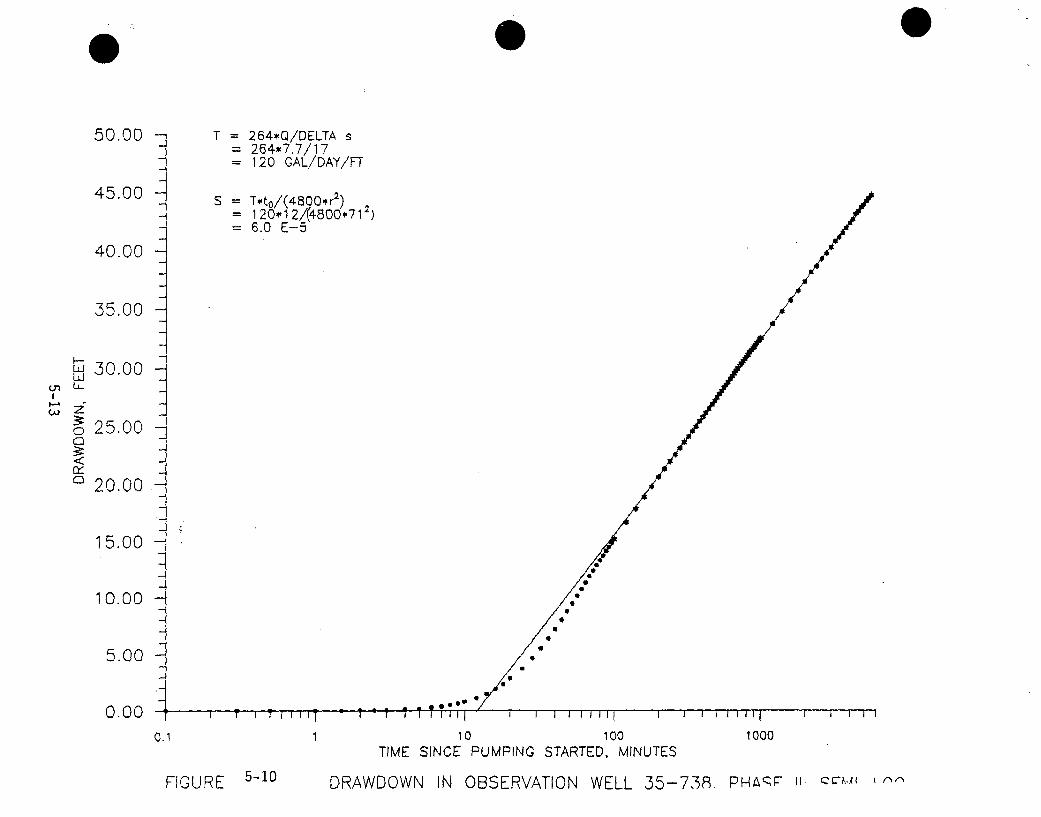
50.00 T = 264+Q/DELTA s= 264*7.7/17
120 GAL/DAY/FT
45.00 = T~to/(4800*r 2 ) 2
= 120-12/(4800,171= 6.0 E-5
40.00
35.00
I-I
"' 30.00U,
o 25.00
rY20.00
15.00
10.00 . .
5.00
0 .00 - I T• I I- -I I
0.1 1 10 100 1000TIME SINCE PUMPING STARTED, MINUTES
FI GIJ R E '-10 DRAWDOWN IN OBSERVATION WELL 35-7,38- P-HAR It c..& , I nn
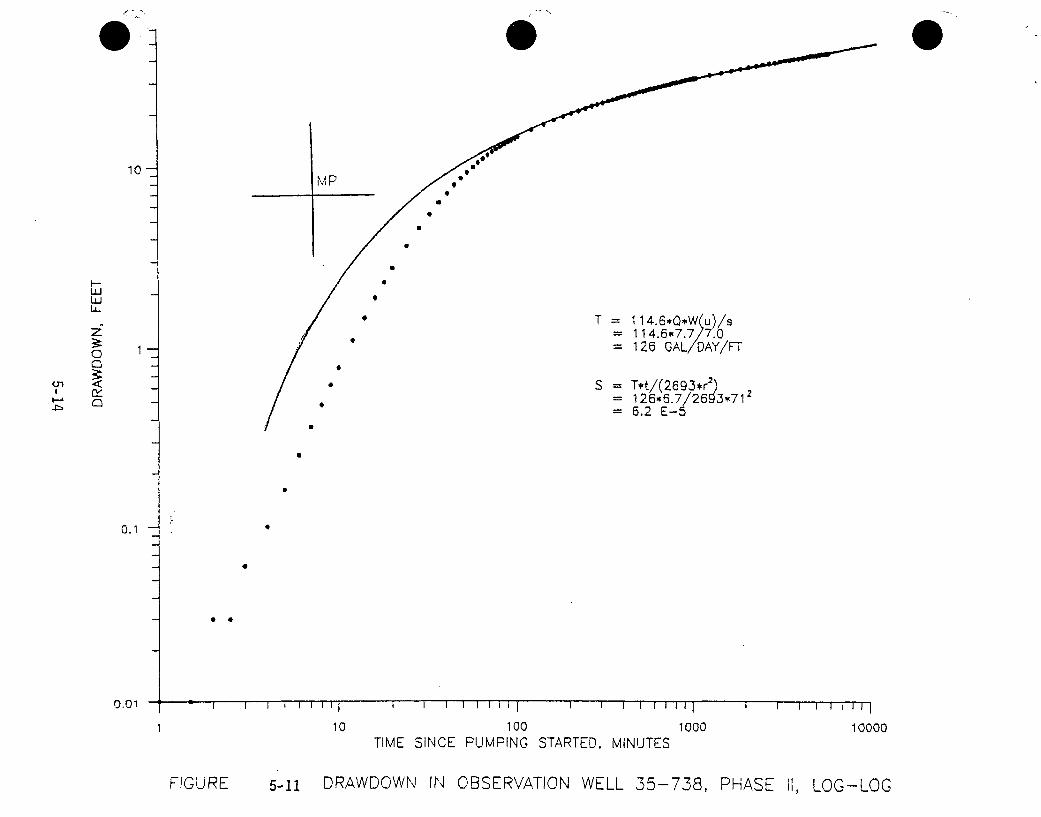
2
10--MIP
0
a
Li
31-I
0
(Y
r)
0
4
U,
I-.
T = 114.6*Q0W u)/s= 11 4.57.7 7.0= 126 GAL/DAY/FT
S T*t/(2693*r2)
= 126*6.7/26 3*712= 5.2 E-5
4
a
a
0.1
0.01 -
0
0 *
*
10
i i 1 i I i i 1
1 100PUMPING
i i I 11I 1II
1000STARTED, MINUTES
i I I I1 000010000
TIME SINCE
FIGURE 5-11 DRAWDOWN 11"I OBSERVATION WELL 35-738, PHASE II, LOG-LOG
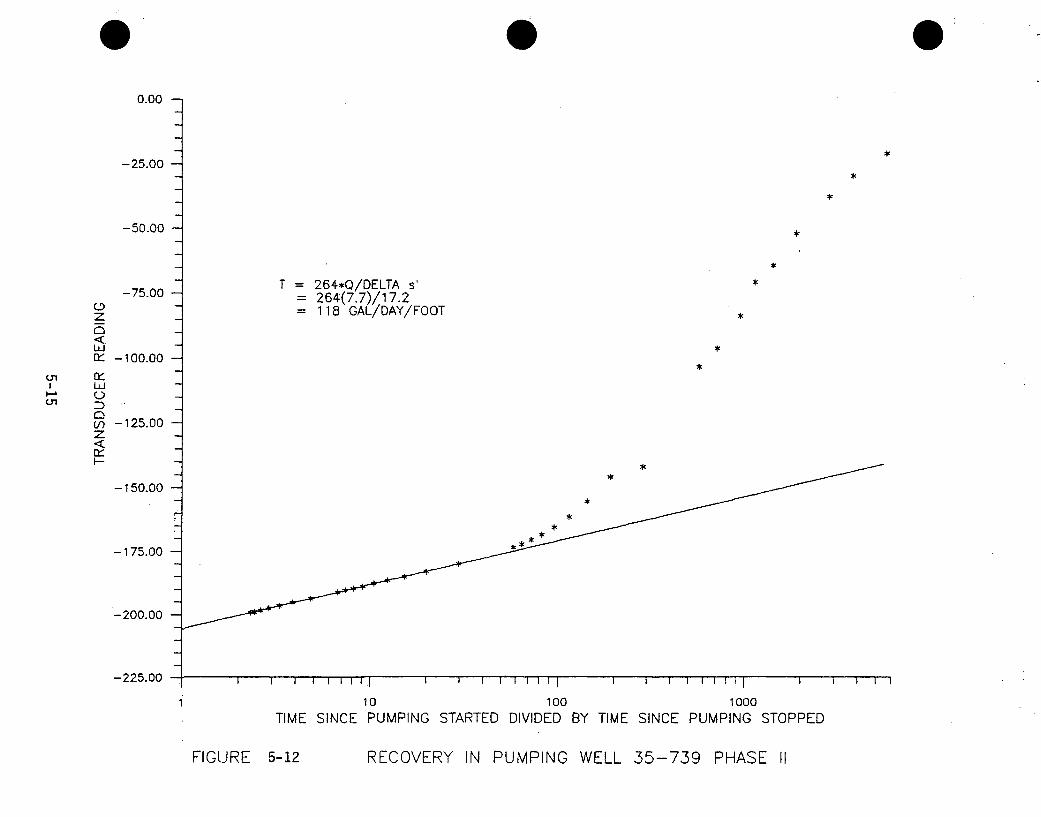
0.00 -
-25.00
-50.00 -
T = 264*Q/DELTA s' *-75.00 264(7.7)/17.2o = 118 GAL/DAY/FOOTzui5
x -100.00
v) -125.00z
-150.00
-175.00
-200.00
o-2125.00 -
1 10 100 1000TIME SINCE PUMPING STARTED DIVIDED BY TIME SINCE PUMPING STOPPED
FIGURE 5-12 RECOVERY IN PUMPING WELL 35-739 PHASE 11
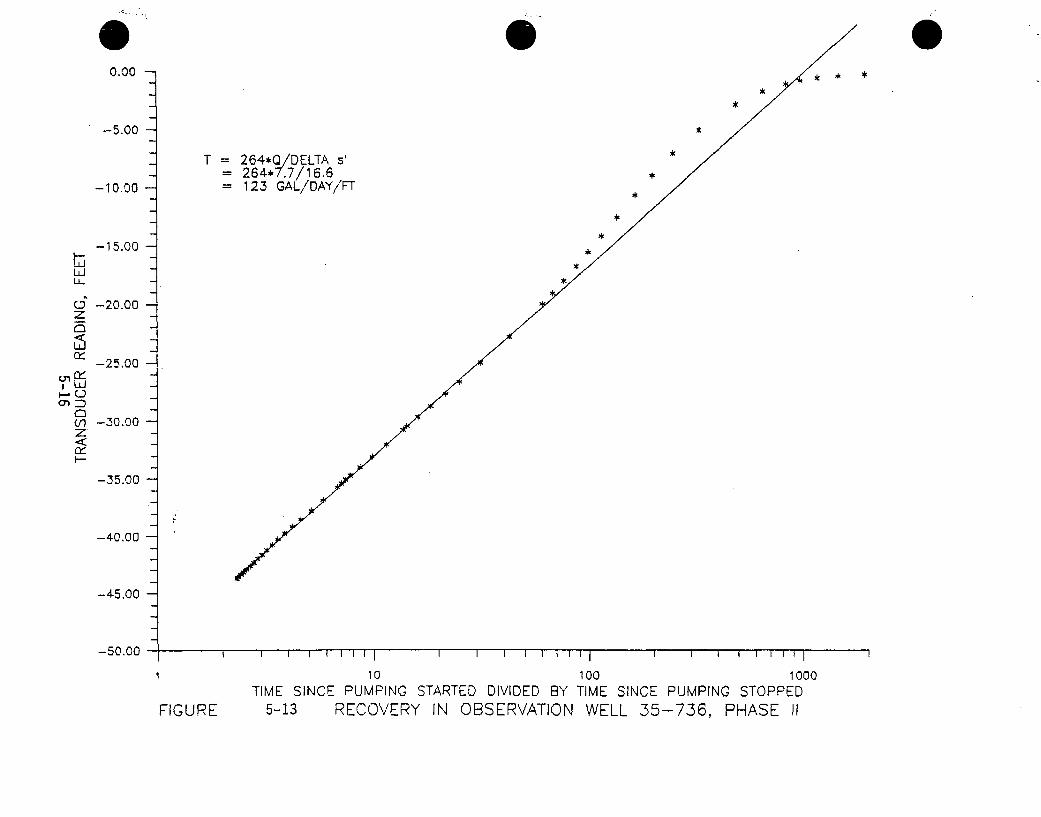
0.00 - *
-5.00 -
T = 264*•QDELTA s'= 264*7.7/16.6 ,
-10.00 123 GAL/DAY/FT
-15.00 -
0 -20.00z01
-25.00ry,
,Lu
(n -30.00z(y-
-35.00
-40.00
-45.00
-50.00 - I I I I I I I
1 10 100 1000TIME SINCE PUMPING STARTED DIVIDED BY TIME SINCE PUMPING STOPPED
FIGURE 5-13 RECOVERY IN OBSERVATION WELL 35-736, PHASE II
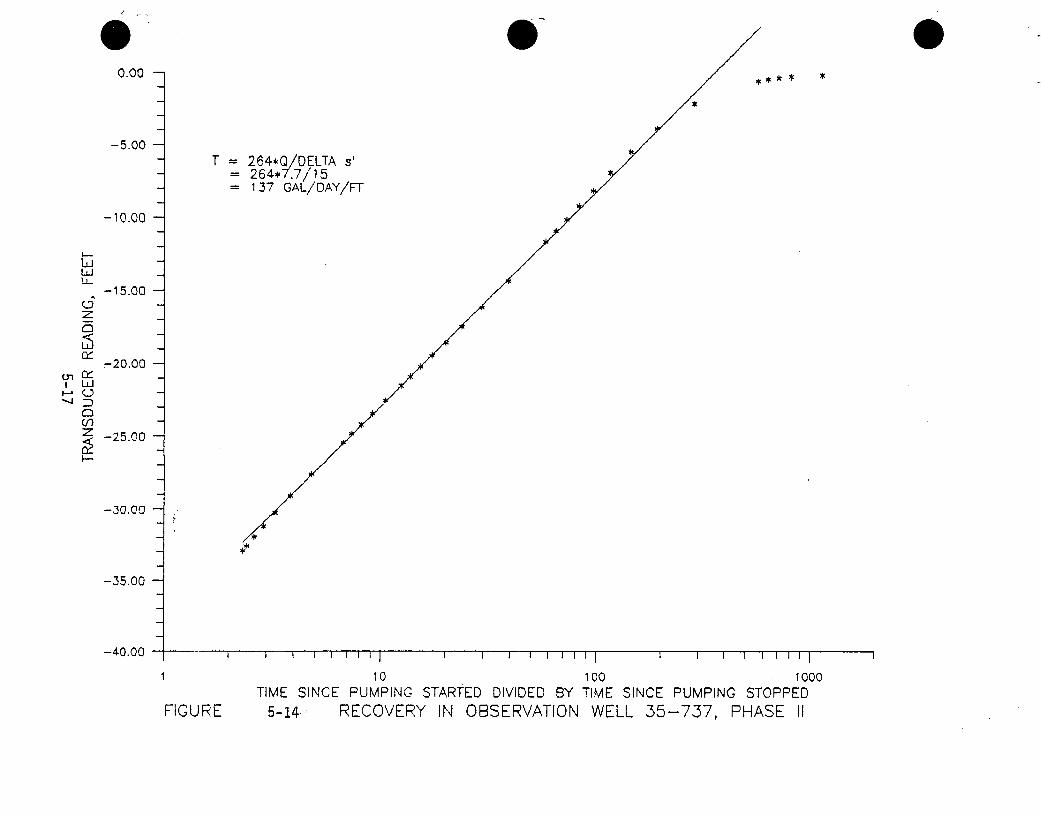
0.00
-5.00T = 264*Q/DELTA s'
= 264*7.7/15= 137 GAL/DAY/FT
-10.00
--Li_
- 15.00
z
-20.00
0 - 25.0 _
-30.00
-35.00
- 4.0.00 i , i i , I 1 I, J l i ' • JI I 1 I1 o Il I O0I ooo
110 100 1000TIME SINCE PUMPING STARTED DIVIDED BY TIME SINCE PUMPING STOPPED
FIGURE 5-14-: RECOVERY IN OBSERVATION WELL 35-737, PHASE I1
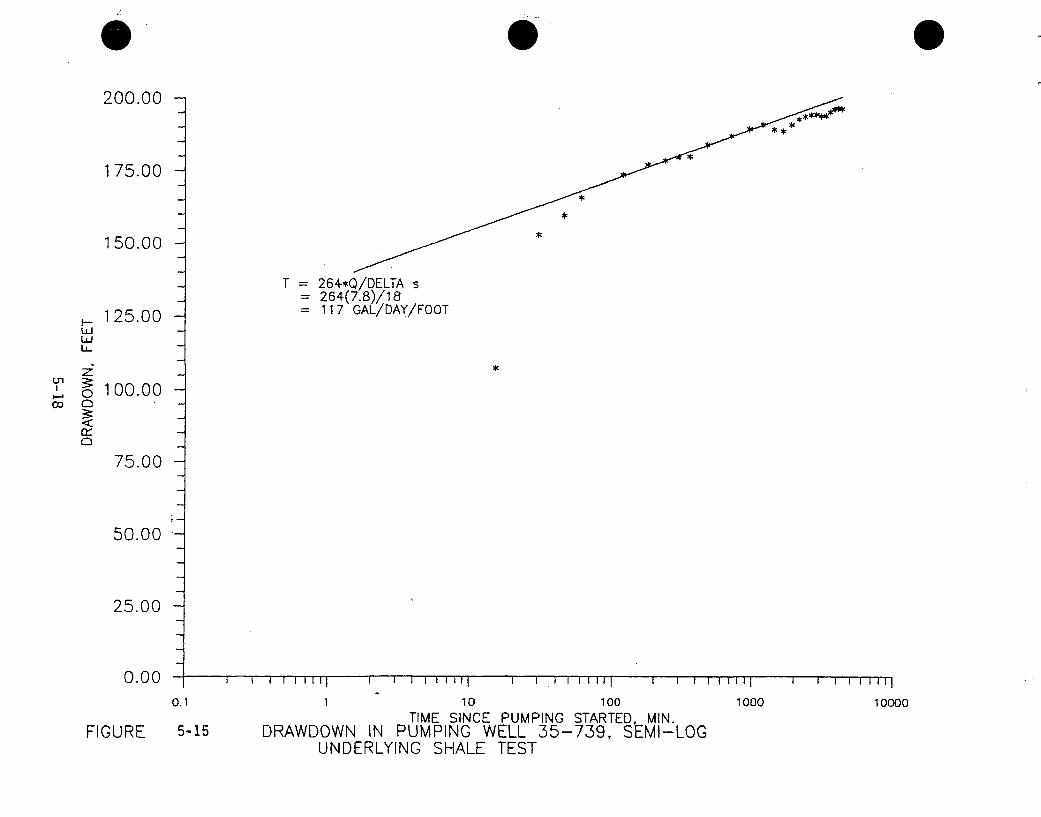
200.00 -
**
c,I-.
LuLi
0
175.00 -
150.00 -
125.00 -
100.00 -
75.00 -
50.00
25.00
T 264*Q/DELTA s264(7.8)/18117 GAL/DAY/FOOT
*
*
*
0.000.1
FIGURE 5-15
I 11111i1l I I I I i tIII i I 1 i 1 tlI1 I I I
1 10 100TIME SINCE PUMPING STARTED, MIN.
DRAWDOWN IN PUMPING WELL 35-739, SEMI-LOGUNDERLYING SHALE TEST
I III
1000
I I I I 11 1 0
10000
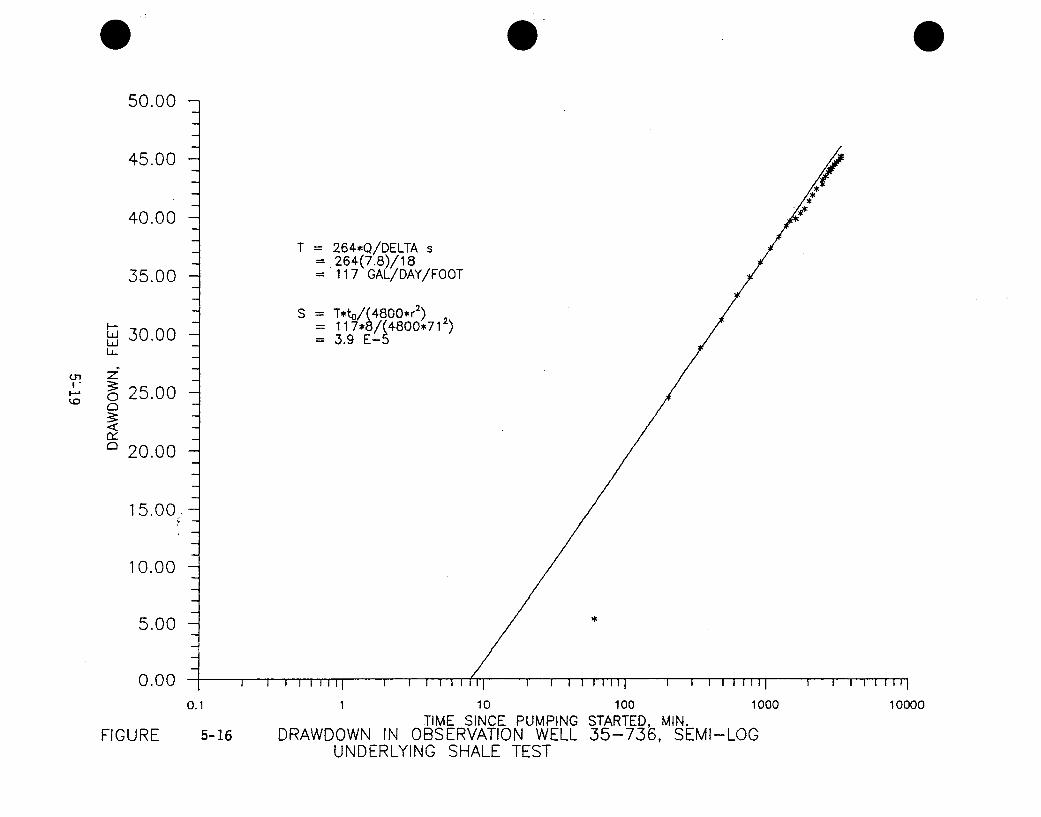
50.00
45.00
40.00
35.00
T = 264*Q/DELTA s= 264(7.8)/18117 GAL/DAY/FOOT
S = T*to/( 4800*r2) 2-117*8/4800*71)
3.9 E-5
I-.
t-o
LU 30.00
z"
0 25.00
0 20.00
15.00
10.00
5.00
0.00
*
0.1 1 10 100 1000 10000
FIGURE 5-16TIME SINCE PUMPING STARTED, MIN.
DRAWDOWN IN OBSERVATION WELL 35-736, SEMI-LOGUNDERLYING SHALE TEST
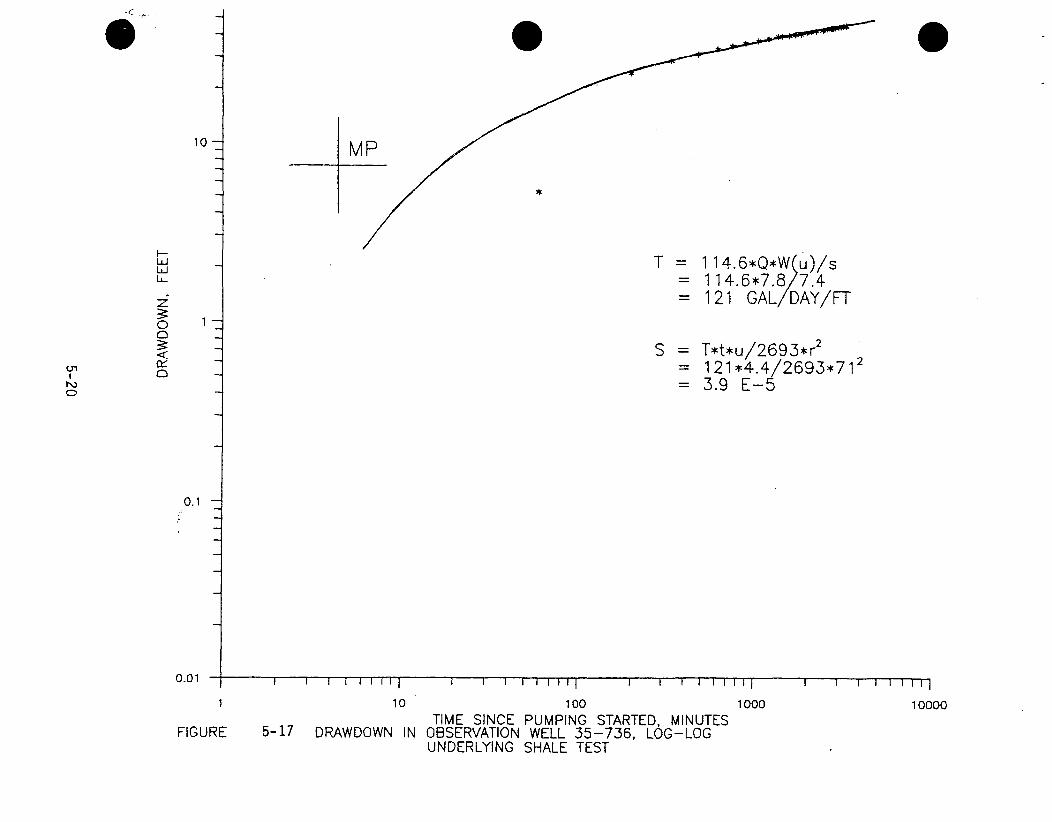
C
10 MP
*
LiLUJ
zL
0rC
4C.
1-*-
7-n
T = 1 14.6*Q*W(u)/s= 114-.6*7.8/7.4= 121 GAL/DAY/FT
S =T*t*u/2695*r 2= 121*4.4-/2693*71 2
3 3.9 E-50
0.1
0.01 I I I I I I I I I I II I I I 1 111 I I I I I I 1 1 I 2 I IlI--]
100001 10 100
TIME SINCE PUMPING STARTED, MINUTESFIGURE 5-17 DRAWDOWN IN OBSERVATION WELL 35-736, LOG-LOG
UNDERLYING SHALE TEST
1000
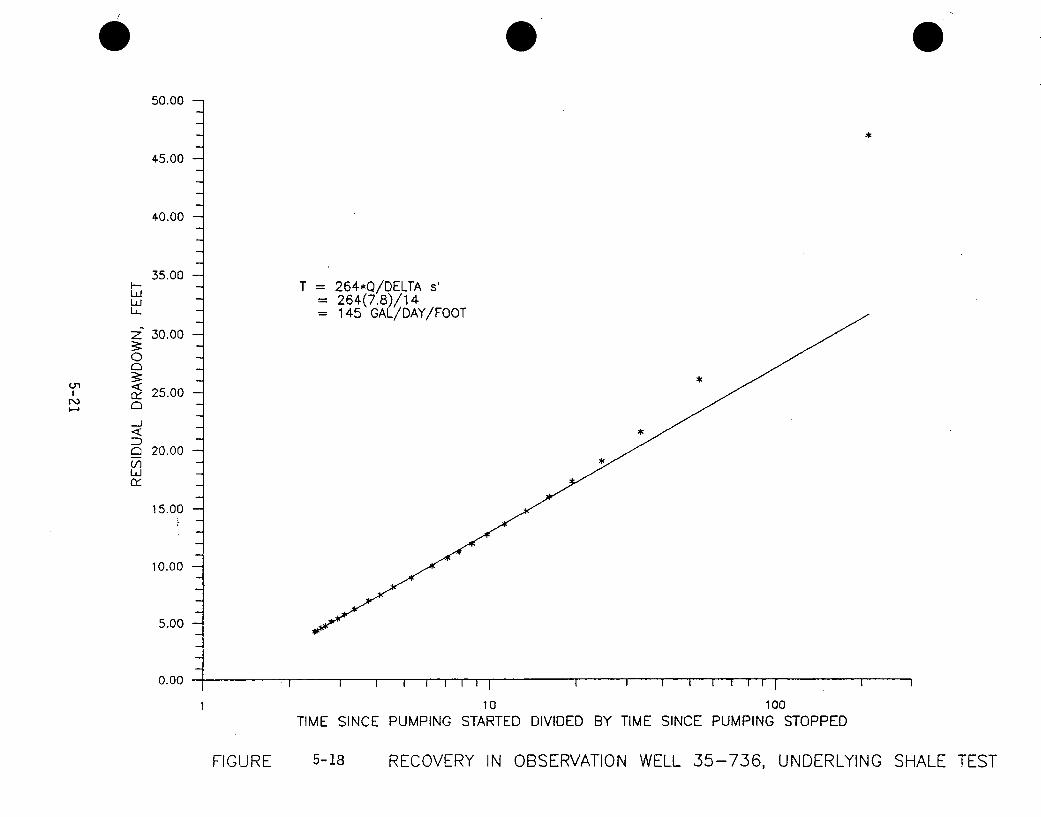
50.00 -
*
u,!3
45.00 -
40.00 -
35.00 -H -LdLl
z" 30.00
0
25.00
Q• 20.00-._J
15.00-
10.00-
5.00 -
*
T 264*Q/DELTA s'264(7.8)/14145 GAL/DAY/FOOT
*
0.00 I I I I I I I I I I I I I I I I I I
1 10PUMPING STARTED DIVIDED
100BY TIME SINCE PUMPING STOPPEDTIME SINCE
FIGURE 5-18 RECOVERY IN OBSERVATION WELL 35-736, UNDERLYING SHALE TEST
6.0 REFERENCES
USNRC, June 1987, Environmental Impact Appraisal inConsideration of the Issuance of Source Material License No. SUA-1;87 for the KERR-MCGEE Nuclear Corporation South Fowder RiverBasin "Q" Sand Solution Mining Project.
USNRC, June 1981. Environmental impact Appraisal inConsideration of the issuance of an Amendment to Source MaterialLicense No. SUA-1387 +or the Sequoyah Fuels Corporation SouthPowder River Basin "0" Sand Research and Development In Situ LeachProject.
KERR-MCGEE Nuclear Corporation, February 1984, Addendum toAquifer Pump Test "" Sand In Situ Leach Project South Powder RiverBasin, Converse County, Wyoming.
Sequoyah Fuels Corporation March 1988, Aquifer Test Analysis,In Situ Leach Project, South Powder River Basin, Converse County,Wyoming. Analysis of Sections 25 and 35.
6-1
PiC!UIFEE-TEcSTI THE'ORY
1 X ('i-- F (:~oTENT-
PAG3E IAIvIBLER,
*1 I NTRf-Or(..JCT I C'4...............N . ...
Ari 2 THEI'3 E~uvI(:)I' ..................................
A. 2. 1 G9TR(-iI GHT L.. ,INE ECIUJ iI ON . ......................... A- ,
A~?. THEIS RECOYE:E-lY EQOUATION .............. A3
* EivNWITi1R3COiMETHOD ............ A~-4
Pif"PEND IX (-*- F'EF"ERENCES .. . . . . . . . . . . . . . . . . A-
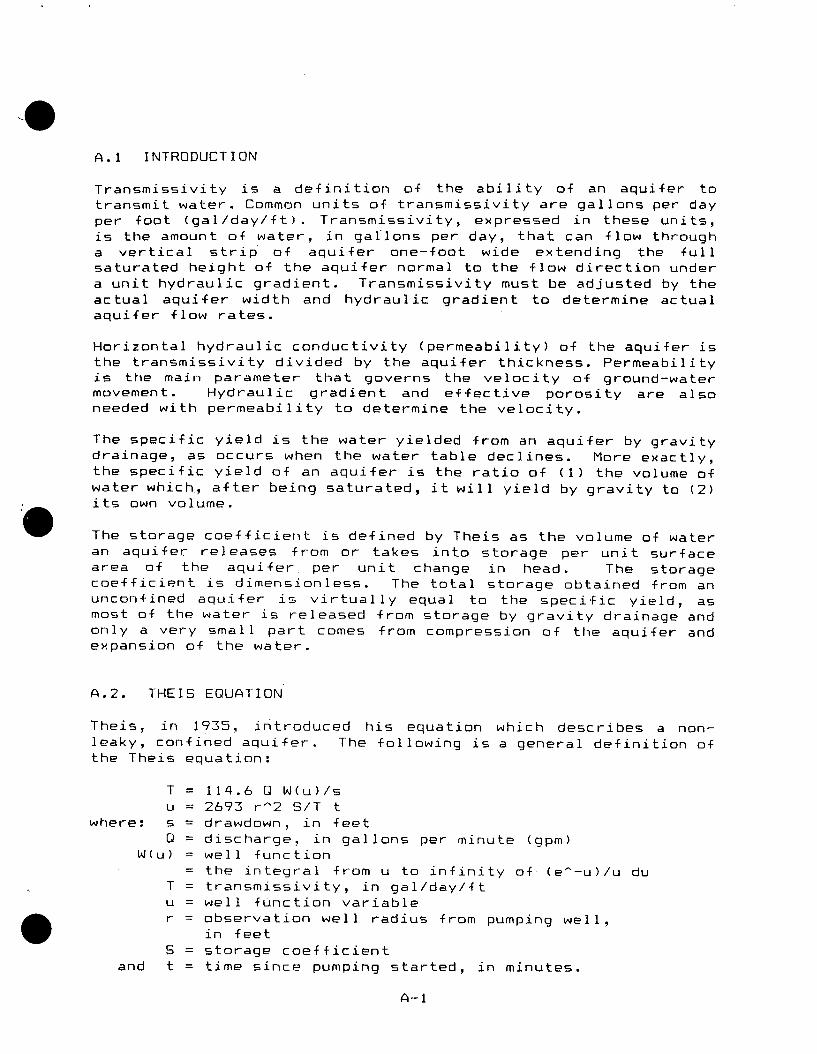
A.1 INTRODUCTION
Transmissivity is a definition of the ability of an aquifer to
transmit water. Common units of transmissivity are gallons per day
per foot (gal/day/ft). Transmissivity, expressed in these units,
is the amount of water, in gallons per day, that can flow through
a vertical strip of aquifer one-foot wide extending the fullsaturated height of the aquifer normal to the flow direction under
a unit hydraulic gradient. Transmissivity must be adjusted by theactual aquifer width and hydraulic gradient to determine actual
aquifer flow rates.
Horizontal hydraulic conductivity (permeability) of the aquifer isthe transmissivity divided by the aquifer thickness. Permeabilityis the main parameter that governs the velocity of ground-watermovement. Hydraulic gradient and effective porosity are also
needed with permeability to determine the velocity.
The specific yield is the water yielded from an aquifer by gravity
drainage, as occurs when the water table declines. More exactly,
the specific yield of an aquifer is the ratio of (1) the volume of
water which,, after being saturated, it will yield by gravity to (2)
its own volume.
The storage coefficient is defined by Theis as the volume of water
an aquifer releases from or takes into storage per unit surface
area of the aquifer per unit change in head. The storage
coefficient is dimensionless. The total storage obtained from an
unconfined aquifer is virtually equal to the specific yield, asmost of the water is released from storage by gravity drainage and
only a very small part comes from compression of the aquifer and
expansion of the water.
A.2. THEIS EQUATION
Theis, in 1935, introduced his equation which describes a non-leaky, confined aquifer. The following is a general definition of
the Theis equation:
T = 114.6 0 W(u)/s
u = 2693 r-2 S/T twhere: s = drawdown, in feet
0 = discharge, in gallons per minute (gpm)W(u) = well function
= the integral from u to infinity of- (e^-u)/u duT = transmissivity, in gal/day/ftu = well function variabler = observation well radius from pumping well,
in feetS = storage coefficient
and t = time since pumping started, in minutes.
A-1
NOTE: '". denotes exponentiation.
Pump test data are analyzed by matching the log-log plot ofdrawdown versus time to Theis' type curve [W(u) vs. 1/u] andapplying the above equations to the match. Pages 92-98 of Ferrisand others (1962) present a more thorough discussion of the Theisequation.
The value of the integral expression for W(u) is given by thefollowing series:
W(u) = -0.577216- In u + u - u^2/2.2! +u^3/3.3! ...
where all terms are as previously defined.
A.2.1 STRAIGHT LINE EQUATION
Jacob developed a simplified form of Theis' drawdown equation bytruncating the well function series after the first two terms.Assuming the truncation, the following equations were developed toanalyze drawdown versus time data on semi-log plots and is calledthe straight-line or Jacob equation:
T = 264 Q [log (t2/tl)]/(s2 - sl)T = 264 Q/DELTA sS = T to/4800 r-2
si = drawdown, in feet, at time sincet1, in minutes
s2 = drawdown, in feet, at time sincet2, in minutes
t2 > tlA s = change in drawdown over one log
a semi-log plot, in feetS = storage coefficient
to = straight-line intercept of zeror = radius of well, in feet.
andDELT
pumping started,
pumping started,
cycle of time on
drawdown, in min.
A straight line is fitted to the semi-log plot of drawdown versustime (log scale) to obtain transmissivity. Jacob suggested thatu values less than 0.01 are needed before his straight-line methodis useful. However, a plot of W(u) versus 1/u on semi-log paperindicates that this method should be applicable for values of u aslarge as 0.1. Pages 98-100 of Ferris and others (1962) should'beconsulted for additional information on Jacob's method.-
A.2.2 THEIS RECOVERY EQUATION
Theis equation can be modified to handle recharge of a well ormultiple pumping periods by summation of the well functions. Thefollowing equation is the solution of Theis' equation for one
pumping and recharge cycle (Recovery equation) using a log-log
match format:
T = 114.6 Q Ew(u) - W (u')]/s'
u' = 2693 r^2 S/Tt'
T = 114.6 Q [W(u) - W(u) + W(u')] sr= 114.6 Q W(u°)/sr
sr = S - s'
where: sr = recovery, in feets' = residual drawdown (static water level -
water level @ t'), in feetW(u') = recovery well function
u' = recovery well function variablet' = time since pumping stopped, min.
The recovery data are analyzed by matching the log-log plot of therecovery versus time since pumping stopped to Theis' type curve.The type curve variables are W(u' ) and 1/u' for the recovery match.The recovery is computed by estimating the drawdown which wouldhave occurred if pumping had continued, and subtracting thispredicted drawdown from the residual drawdown. For example, therecovery at 100 minutes after pumping has stopped is computed byestimating the drawdown at that time if the pumping has continueduninterrupted, and subtracting this drawdown from the residualdrawdown. The straight-line fit of the drawdown is normallyextended to obtain these estimates of drawdown.
The well functions of the residual-drawdown form of Theis' equationwere approximated by using only the first two terms in the wellfunction series. The following equations present the semi-log formof the Theis recovery equation:
T = 264 0 [log (t/t')]/s'or T = 264 Q/DELTA s'
where: t = time since pumping started, in min.t' = time since pumping stopped, in min.s' = residual drawdown, in feet
andDELTA s' = change in residual drawdown over one log
cycle of t/t' on a semi-log plot, in feet
Therefore, when residual drawdown is plotted on an arithmetic scaleversus t/t' on a logarithmic scale, the above,-equation can be usedfor the straight line fit. Pages 100-102 of Ferris and others(1962) should be consulted for a discussion of Theis' recoverymethod. Theis' recovery equation is for a non-leaky confinedaquifer also.
AQUIFER THINNING
A-3
Theis' equation with Jacob's (1944) correction for aquiferthinning has been used extensively to analyze unconfined aquifertests. The correction for aquifer thinning for both drawdown andresidual drawdown equations can be expressed as follows:
ST = S - SCSC = S^2/2M
where:
ST = drawdown (or residual drawdown), in feet, corrected foraquifer thinning,
S = observed drawdown (or observed residual drawdown),in feet,
SC = drawdown correction (or residual drawdown correction),in feet,
M = saturated aquifer thickness, in feet,^ = denotes exponentiation.
A.3 HANTUSH'S MODIFIED METHOD
Hantush (1960) presented a modification of the theory of leakyconfined aquifers which had previously been described by Hantushand Jacob (1955). The modification took into account storage ofwater in the semipervious confining bed. Equations developed areas follows:
T = [114.6 (Q) / s] H (u, BETA)where:H(u, BETA) = the integral from u to infinity of (e^-y)/y
[complementary error function of(BETfA/Square Root u) / Square Root (y(y-u))]dy
u = [(2693) r-2 (S)] / Ttand BETA = r / 4b Square Root (K' Ss' / K ss)
The main parameters are as follows:
T = transmissivity, gal/day/ft,Q = discharge, gpms = drawdown, ft,y = variable of integrationr = radius, ft,S = storage coefficient,t = time, min,b = aquifer thickness, ft,K = aquifer permeability, ft/day,
K' = confining layer permeability, ft/day,
Ss = aquifer specific storage, l/ft,and Ss' = confining layer specific storage, 1/ft.
Hantush (1961) presented tabulations of H(u, BETA) for varying
values of u and BETA, and subsequently, a family of type curvesshowing H(u, BETA) vs. 1/u has been developed. Main aquiferproperties can be determined by matching plots of observed drawdownversus time data to one of Hantush's type curves and using theequations presented above. Semi-pervious confining layer verticalpermeability can then be calculated by noting the value of BETA forthe curve which best fits observed data and applying the equationfor BETA presented above.
A.3 NEUMAN EQUATION
Theis' equation with Jacob's (1944) correction for aquifer thinninghas been used extensively to analyze unconfined aquifer tests.However, this equation does not take into account the free surfaceboundary of the water table. Theories of unconfined aquifers aremore complicated than Theis' equation with the moving boundary atthe phreatic surface. Boulton (1954) presented an unconfined flowequation for drawdown at the free surface. This equation has notbeen used very extensively, because drawdowns at the phreatic
surface and from a well which penetrates the aquifer areconsiderably different. Stallman (1963, 1965) developed some typecurves for an unconfined aquifer from an electric analog, but thesecurves have not been used extensively because they are for limitedwell conditions. Dagan (1967) and Neuman (1972, 1976) havedeveloped computer programs which compute type curve values forunconfined aquifer conditions. Neuman showed that unconfinedaquifers have some storage from compression of the aquiferstructure and the expansion of the fluid. His equation, therefore,has both a storage coefficient and a specific yield term. Dagan'sequation considers only the specific yield for storage. All ofthese unconfined aquifer equations produce equal type curves forthe same conditions except Neuman's curves, which depart from theother curves at early pumping times. Unconfined aquifers whichdemonstrate the confining effect normally have a flat drawdowncurve after the confined portion of the curve. Finally, thedrawdown curve returns to a Theis type drawdown curve. Neuman(1974) and Dagan (1967) have demonstrated that the flat portion ofthe drawdown curve is due to the vertical flow effects. This flatportion of the drawdown curve will be more obvious as theanisotropic ratio (vertical permeability divided by ,horizontalpermeability) decreases.
Development of Neuman (1974) type curves requires execution of acomputer program for each individual pump test. Streltsova (1972,1973) developed an approximation of the vertical flow equation andhas shown this approximation is the same as Boulton's (1963) flowequation. Streltsova's approximation allows Boulton's type curves
A-5
to be used to analyze an unconfined aquifer with consideration of
vertical flow, if all wells are fully penetrating. Whenpenetration (the length of the well bore where water enters) of the
pumping and observation wells is significant. the Streltsova methodcannot be used. Under these conditions, the Neuman method was
used.
Neuman (1974) presents the theory of his unconfined flow equationwhich is used in the development of Neuman type curves from a
computer program. The following is a form of Neuman's unconfinedaquifer equation.
T = 114.6(0) (sD/s)Sy = Tt/10,770 (r^2)(ty)
BETA = r^2/D^2 (Kv/Kh)ALPHA S/Sy
where: All terms are the same as previously defined, plus
sD = dimensionless drawdown (same as well function in Theis'equation, except it accounts for penetration and twostorage terms)
ty = dimensionless time (same as 1/u in Theis' equation)D = aquifer thickness, in feet
Sy = specific yieldKv = vertical permeability, in ft/dayKh = horizontal permeability, in ft/day
This basic form of the Neuman equation is used with the geometric
setting of the pumping and observation wells and penetrationinformation in the computer program to produce dimensionlessdrawdown (sD) versus dimensionless time (ty) data points fordifferent BETA and ALPHA conditions. Figure A-1 presents thevariables used to define well penetrations. The pumping wellpenetrations are defined by two variables and the observationwell's penetration can be defined by two variables which define the
top and bottom of. the observation well perforation. It can be
shown that most observation wells can be represented by apiezometer at the center of the perforated interval withoutintroducing significant errors. The radius of the observation wellfrom the pumping well and the aquifer thickness are included in theBETA term. This term is typically varied for different anisotropicratios (Kv/Kh). Neuman (1975) recommends the use of a small ALPHA(S/Sy) value for the computer development of the type curves and
then adjusting the ALPHA as outlined by Neuman (1975) to obtain theALPHA value that best fits the observed data.
Neuman's or Dagan's equations do not account for aquifer thinning.Therefore, Jacob's (1944) correction for aquifer thinning isrecommended for pump test analyses with these theories also. Pumptest data are analyzed by matching the log- log plot of drawdownversus time to Neuman's type curve (sD vs. ty) and applying theabove equation to the match.
Jacob's straight-line method can be used to analyze drawdown inunconfined aquifers, but the u value is not the only criterion to
determine if this method is applicable. A semi-log plot of
Neuman's type curves are presented in Figure 2 of Neuman (1975) todemonstrate the applicability of using the straight-line plot todetermine transmissivity for unconfined aquifers. Early- andlate-time portions of the Theis equation, which form a straightline, are shown as a solid line on this plot. The straight-linemethod should yield an accurate transmissivity when the Neuman typecurves converge with the solid lines. The specific yield valuecould be in error, however, because partial penetration can causethe late straight line to be shifted away from the Theis straightline. Partial penetration can cause straight line slopes that arenot equal to the Theis slope. An adjustment in straight linecoefficient (264) needs to be made to adjust for the change instraight line slope.
Five Neuman type curves are shown on Figure 2 of Neuman (1975) todemonstrate when the straight-line method should be appropriate forcertain portions of the aquifer. The curves for the very low BETAvalues (less than 0.01) fit some of the early-time Theis curves.The BETA curve of 0.001 is representative of a pumping well fortypical aquifer properties. This curve indicates that early datafrom a pumping well could be accurately analyzed by thestraight-line method. Early (first few minutes) drawdown data inpumping wells is often influenced by well storage effects whichcauses a deviation from the Theis straight line. Therefore, wellstorage effects would have to be small to make use of thestraight-line method for early drawdown in a pumping well. TheNeuman type curves do not fit the Theis type curve for moderatetime values (normally a few tens of minutes to possibly days). Theuse of the straight-line method for analysis during this time wouldyield high transmissivity values. The BETA type curve of 0.001eventually converges with the late-time Theis straight line and theslope is equal to-the early-time slope after this convergence.This convergence generally occurs from a few hundred minutes toseveral days.
The BETA curve of 0.03 is typical of an observation well inside oneaquifer thickness radius from the pumping well. The early drawdowndata for an observation well with a BETA of 0.03 do not reach theslope of the Theis straight line. Transmissivities determined froma straight-line plot of early drawdown data for an observation wellwi~th a BETA of 0.03 would be too high. The BETA type curveconverges with the late-time Theis curve at a ty va 1 ue of 20. Thetime for the drawdown data of a close observation well to convergeto the late-time Theis curve could be from a few minutes to a fewdays depending on the aquifer properties.
The BETA curve of 0.4 is more typical of distant observation wells(radius of several aquifer thicknesses). This plot indicates that
A-7
the straight-line method should not be used for a distantobservation well until the drawdown data converges on the late-timeTheis curve. The pumping time required to reach the late-time
straight line could be from a few tens of minutes to tens of days.General knowledge of aquifer properties is needed to determineroughly when the straight-line method is appropriate for analyzingunconfined aquifer tests.
The same straight-line equations which are presented for the Theisequation are applicable for determining the aquifer properties.The specific yield should replace the storage coefficient foranalyzing late-time straight line.
A.4 NEUMAN-WITHERSPOON METHOD
AZ method for determining aquitard vertical permeability has beendescribed by Neuman and Witherspoon (1971) and Neuman andWitherspoon (1972). In this technique, referred to as the RatioMethod, the ratio of drawdown in the aquitard to the drawdown inthe pumped aquifer at the same time distance is related to adimensionless time parameter, t'D:
t'D = K't / Ss z-2where: K' = aquitard vertical permeability
t = time for which drawdown ratio was determinedSs' = specific storage of the aquitard
= K'/ALPHA'
ALPHA' = aquitard diffusivity,and z = vertical distance from the center of the screened
section of the well completed in the aquitard to
the aquifer.
t'D is determined graphically. Therefore, aquitard diffusivity(ALPHA') can be calculated from ALPHA' = K' / Ss' T'D Z'2 / t.
In order to determine aquitard vertical permeability, K', aquitardspecific storage, Ss , must be ascertained.
Ss' = avWw / (1 + e)where: av = coefficient of compressibility
Ww = weight of water,and e = void ratio
The values of av and e must be determined on samples of theaquitard in the laboratory or Ss'may be estimated based onpublished reports on similar sediments.
A.5 DIRECTIONAL TRANSMISSIVITY
To determine the directional anisotropy of the aquifer, a method
described by Papadopulos (1965) is used. Papadopulos derived an
equation for the drawdown distribution around a well discharging
at a constant rate from an infinite horizontal anisotropic aquifer.
Aquifer-test data from a minimum of three observation wells are
analyzed to obtain principal transmissivities and the orientationof the principal axes.
The equations derived by Papadopulos for use in a type-curvematching technique are as follows:
114.6 Q W(Uxy)S -------------------
[(Txx)(Tyy)-Txy^2]^1/2, and
(1.87S) [(Txx)(y^2)+(Tyy)(x^2)-(2 Txy)(x)(y)]Uxy =--------------------------------------------
(t) [(Txx)(Tyy)-Txy^2]
where: s = drawdown, in feet,Q = discharge, in gpm,
W(Uxy) = well function,Txx, Tyy & Txy = transmissivity components, in gal/day/ft,
Uxy = well function variable,S = storage coefficient,t = elapsed time, in days,x = distance from pumping well of observation well
along arbitrarily selected x-axis, in feet,and y = distance from pumping well of observation well
alongarbitrarily selected y-axis (orthogonIto x-axis), in feet.
For each of the three wells being analyzed, observed drawdown dataare matched against type curves to determine values of s, t,W(Uxy), and Uxy. Three equations with three unknowns are thensolved simultaneously to determine the transmissivity componentsTxx, Tyy and Txy. Then principal transmissivities, Tee and Tnn,are calculated from the equations:
Tee = 1/2[(Txx + Tyy) + (Txx - Tyy)^2J+ 4 Tyy^2] and
Tnn = 1/2[(Txx + Tyy) - (Txx - Tyy)^2 + 4 Txy^2]
where: Tee = maximum transmissivity, andTnn = minimum transmissivity
A-9
The angle between the arbitrarily selected x-axis and the axis of
maximum transmissivity (0 ) is then determined by the following
equation:
9 = arctan (Tee-Txx)/Txy
APPENDIX A REFERENCES
Ferris, J.G., D.B. Knowles, R.H. Brown, and R.W. Stallman,
1962, Theory of aquifer tests, U.S. Geol. Survey, Water-SupplyPaper 1536-E.
Hantush, M.S., and C.E. Jacob, 1955, Nonsteady radial flow inan infinite leaky aquifer: Am. Geophys. Union Trans., V. 36, No.1, p. 95-100.
Hantush, M.S., 1960, Modification of the theory of leakyaquifers: Jour. Geophys. Research, V. 65, No. 11, p. 3713-3725.
Hantush, M.S., 1961, Tables of the Function H (u, BETA): NewMexico Inst. Mining and Technology, Prof. Paper 103, 14p.
Jacob, C.E., 1944, Notes on determining permeability ofpumping tests under water-table conditions, U.S. Geol. Survey,open-file report.
Neuman, S.P., and P.A. Witherspoon, 1971, Flow in multiple
aquifer systems, Chap. IV, in Sea-Water Intrusion: Aquitards in theGround Water Basin of Oxnard Plain, Ventura County, Bulletin No.63-4, State of California Dept. of Water Resources and Univ. ofCalifornia, Dept. of Civil Engineering, Geotechnical Engineering,Berkeley, California.
Neuman, S.P., and P.A. Witherspoon, 1972, Field determinationof the hydraulic properties of leaky multiple aquifer systems:Water Res. Research, Vol. B, No. 5, p. 1284- 1296.
Papadopulos, I.S., 1965, Nonsteady flow to a well it) an
infinite anisotropic aquifer, International Association ofScierntific Hydrology, Symposium of Dubrovnik.
()-I I
SPACING OF ORE SAND MONITORING
WELLS ADJACENT TO THE SMITH RANCH PROJECT
INSITU WELL FIELD
"0 SANDS"
FOR:
RIO ALGOM, I NC.
BY:HYDRO-ENGINEERING
APRIL, 1990
THOMAS QUINNHYDROLOGIST
&YROWG E L "'--40 F F M A N, P.EHYDROLOG ~T
TABLE OF CONTENTS
PAGE NO.
1.0
2.0
2.1
2.1.1
2.1.2
2.1.3
2.2
2.2.1
2.2.2
3.0
4.0
5.0
INTRODUCTION ........... ..............
ZONE OF CONTROL FOR THE 0 AND Q SANDS. .
DRAWDOWN ESTIMATES ....... ...........
O SAND WELL FIELD SIMULATION ... ......
O SAND AQUIFER PROPERTIES ... .......
O SAND GRADIENT REVERSAL .......
Q SAND WELL FIELD SIMULATION ... ......
Q SAND AQUIFER PROPERTIES ... .......
Q SAND GRADIENT REVERSAL .......
RECOMMENDED SPACING FOR THE 0 AND Q SANDWELL FIELDS .......... ...............
EXCURSION RETRIEVAL ...... ...........
REFERENCES ........... ...............
. . . . 1- 1
. . . . 2-1
2-2
. . . . 2-3
2-4
2-4
2-5
2-6
2-6
3-1
4-1
5-1
*1
F I GURES:
2-1
2-2
2-3
2-4
3-1
3-2
TABLES:
2-1
2-2
2-3
2-4
LOCATION OF WELL FIELD AND SIMULATED DRAWDOWNGRID (0 SANDS) ............. ................
DRAWDOWN CHANGES ADJACENT TO THE 0 SANDMINING UNIT .............. ..................
LOCATION OF WELL FIELD AND SIMULATED DRAWDOWNGRID (Q SANDS) ............. ................
DRAWDOWN CHANGES ADJACENT TO THE Q SANDMINING UNIT .............. ..................
RECOMMENDED SPACING BETWEEN MONITORING WELLSFOR THE 0 SAND MINING UNIT ..... ..........
RECOMMENDED SPACING BETWEEN MONITORING WELLSFOR THE Q SAND MINING UNIT ..... ..........
2-8
* 2-9
* 2-10
* 2-11
* 3-2
* 3-3
2-12
* 2-16
* 2-18
* 2-37
INPUT PARAMETERSUNIT SIMULATION
DRAWDOWN CHANGESMINING UNIT
INPUT PARAMETERSUNIT SIMULATION
DRAWDOWN CHANGESMINING UNIT
FOR THE 0 SAND MINING
ADJACENT TO THE 0 SAND
FOR THE Q SAND MINING
ADJACENT TO THE Q SAND. . . . . . . . . . . .
ii
1.0 INTRODUCTION
This report presents the recommended ore sand monitor well
spacing for the Smith Ranch Project insitu well field (0 and Q
sands). It is recommended that horizontal excursion monitoring
wells be located within the well field zone of control. The well
field zone of control is the zone in the aquifer where the well
field controls the ground-water movement. The zone of control or
gradient reversal is created by the bleed rate from the well field.
The procedure presented in Hydro-Engineering (1989) that predicts
the drawdowns from the bleed rate was used, with an adjustment for
the natural ground-water gradient to determine the area where the
well field controls the flow which exists within the zone of
ground-water reversal. Recommendations on the selection of
monitoring well spacing concludes this report.
1-1
2.0 ZONE OF CONTROL FOR THE 0 AND Q SANDS
The placement of monitoring wells in the ore sand aquifer
needs to be within the zone where the ground-water flow is
controlled by the operation of the mining unit. The bleed from the
mining unit creates a zone around the mine where the head is lower
than outside of this zone. This reversal zone causes ground water
in this area to flow towards the mining unit and for purposes of
this report is called the zone of control. The zone of control
includes the area of ground-water reversal in the two downgradient
sides of the well field and also the two upgradient sides. At
present the Bill Smith mine shaft is being pumped at approximately
200 gpm, thus creating a depression in the 0 sand aquifer in its
general area. The present gradient in the 0 sand is .0025 ft/ft
at south 140' east. This pumping is going to be stopped at the
time of mine construction which will allow the groundwater to
recover to its natural gradient and flow direction. For
calculation purposes this flow has been conservatively estimated
with a gradient of 0.001 ft/ft at north 45° east. If it is found to
be significantly different at the time of production begins these
calculation may need revised. Q sand groundwater flow has been
calculated to be north 410 east with a gradient of 0.0015 ft/ft.
Therefore these sites have two upgradient and two downgradient
sides. Flow from the upgradient sides of the well field enters the
well field area prior to the operation with the bleed rate only
increasing the gradient in these sides. The well field is
effectively controlling flow on these two sides as well. Figure
2-I of Hydro-Engineering (1989), presents a cross section of the
hydraulic gradient adjacent to a well field. The zone of reversal
is shown downgradient of the well field where the ground water is
flowing back to the well- field. Beyond the zone of reversal the
ground-water flow continues downgradient. The zone of control
includes the two reversal (downgradient) sides and the two
upgradient sides.
The following presents our evaluation of the zone of control
around the proposed mining areas of the 0 and 0 sand units. Only
portions of the areas were initially simulated because they are
proposed as the initial start-up regions. Drawdowns at distances
from the mining units are first estimated by summing the individual
drawdowns. The drawdowns are adjusted for the natural ground-water
gradient to estimate the changes in the piezometric surface with
distance from the mining unit.
2.1 DRAWDOWN ESTIMATES
The appropriate ground-water flow model for the 0 and Q sand
minin(I units is the Theis confined non-leaky model. The use of
a partially penetrating well model is not necessary due to the
length of time and distances where the drawdowns are needed. The
following procedures are the same as those outlined in Hydro-
Engineering (1989).
A version of the WELFLO program presented in Walton (1989) has
been modified by HYDRO in order to compute drawdowns from the Theis
equation. This program has the advantage in that it computes
drawdowns along grid lines and therefore several lines of drawdowns
2-2
are developed with one execution.
2.1.1 0 SAND WELL FIELD SIMULATION
The total production from the recovery wells is slightly
higher than the total injection rate. This difference is called
the bleed rate. It was simulated at 0.5%, 1%, and 1.5% in order
to quantify drawdowns in the mining area. At bleed rates less than
1.5%. the zone of control is relatively close (approximately 400
feet at 1%) to the mining area and at bleeds greater than 1.5% the
zone of control is extremely far away (> 2000 feet). A bleed rate
of 1.57. is therefore the recommended percentage rate of the total
recovery for the 0 sand site. The bleed rate, not the recovery and
injection rates, becomes the important rate with time. The zone
of reversal was simulated with only the bleed rate for t h e
proposed initial 0 sand mining area. Figure 2-1 shows the outer
limits (dashed line) of the 0 sand mining unit. This area is being
simulated by 29 bleed sites that are spaced 100 feet apart. The
modelled area is shown on Figure 2-1 as a solid line. Average
total bleed rate of 1.5% for the 29 well nodes is 1.55 gpm per node
for a total recovery rate for this mining unit of 3000 gpm. The
total bleed rate of 45 gpm for this simulation is applied uniformly
over the well field area but could be applied unevenly if the well
field was planned to be operated with a non-uniform bleed.
The drawdown calculations consist of 29 pumping (bleed) sites
with drawdowns simulated over a 30 by 30 grid. Table 2-1 presents
the list of input parameters that are listed with the output from
2-3
the WELFLO program. The output listing does not list the first
three inputs: enter 1 for printer, enter 1 for non leaky condition
and enter I for fully penetrating wells. Table 2-1 presents the
remainder of the input data. Table 2-2 presents the listing of the
simulated drawdowns from the program output. Figure 2-1 shows
the grid used to calculate the drawdown adjacent to the 0 sand
mining unit.
2.1.2 0 SAND AQUIFER PROPERTIES
Averaqe aquifer properties (transmissivity and storage
coefficient) from the HYDRO re-analysis (Hydro-Enqineering, 1990)
of pump test data were calculated to be 7230 gpd/ft and .00012.
These parameters are very consistent throughout the 0 sand area and
are thought to be the best representative along the line of
drawdowns used for the reversal determination.
2.1.3 0 SAND GRADIENT REVERSAL
The pre-mine hydraulic gradient in the ore sand aquifer is
integrated with the drawdown calculations to determine the zone
that the bleed has caused reversal in the gradient (towards the
well field). This is the down gradient portion of the zone of
control of the well field. Monitoring in the ore sand aquifer is
recommended within the zone of control where the bleed controls the
flow in the aquifer.
A pre-mine gradient of 0.001 ft/ft means that there needs to
be more than 0.1 -feet of drawdown between nodes along the line of
drawdowns (100 foot spacing) for reversal to exist along the
drawdown lines that are downgradient to the ground-water flow
direction. The ground-water flow direction at the 0 sand is
estimated to be north 45 degrees east. An adjustment needs to be
made to the gradient due to the fact that it is intercepting the
simulated mining area at an oblique angle. Therefore, the drawdown
difference required for lines of drawdown to the north and east of
the well field is 0.07 feet (0.1 x cosine 45 degrees). Figure
2-2 presents the drawdown changes along four lines extending from
this well field. The change in drawdown in the drawdown lines
between 100 foot node points needs to be 0.07 feet for the gradient
to be reversed. Therefore, the reversal in this area extends
greater than 1000 feet from the northern and southern edges of the
well field.
The western half of the mining unit was not simulated but the
zone of reversal will be very similar to the eastern half reversal
because the area of withdrawal is very similar and the bleed rate
will be the same. Therefore, a zone of reversal of greater than
1000 feet should exist as well field development progresses from
the eastern to the western half of the 0 sand mining unit.
2.2 0 SAND WELL FIELD SIMULATION
The bleed rate for the Q sands was also simulated at 0.5%, 1%,
and 1.5% with .5% found to be adequate. Bleed rates greater than
.57 extend the zone of control to over 2000 feet. Figure 2-3 shows
the outer limits (dashed line) of the Q sand mining unit. This
area is being simulated by 120 nodes that are 100 feet on each
side. The modelled area is shown on Figure 2-3 as a solid line.
Average total bleed rate of .5 percent for the 120 nodes is .125
gpm per node for a total recovery rate for this mining unit of 3000
gpm. The total bleed rate of 15 gpm for this simulation is applied
uniformly over the well field area.
The drawdown calculations for the example consists of 120
pumping (bleed) sites with drawdowns simulated over a 36 by 31
grid. Table 2-3 presents the list of input parameters that are
listed with the output from the WELFLO program. Table 2-4 presents
the listing of the simulated drawdowns from the program output,
Figure 2-3 shows the grid used to calculate the drawdown adjacent
to the 0 sand mining unit.
2.2.1 Q SAND AQUIFER PROPERTIES
Average aguifer properties (transmissivity and storage
coefficient) from the HYDRO re-analysis (Hydro-Engineering, 1990)
of pump test data were calculated to be 1000 gpd/ft and .000048.
These parameters are very consistent throughout the Q sand area and
are thought to be the best representative along the line of
drawdowns used for the reversal determination.
2.2.2 Q SAND GRADIENT REVERSAL
A pre-mine gradient of 0.0015 ft/ft means that there needs to
be more than 0.15 feet of drawdown between nodes along the line of
drawdowns (100 foot spacing) for reversal to exist along the
drawdown lines that are downgradient to the ground-water flow
direction. The ground-water flow direction at the 0 sand is
estimated to be north 41 degrees east, An adjustment needs to be
made to the gradient due to the fact that it is intercepting the
simulated mining area at an oblique angle. Therefore, the drawdown
difference required for lines of drawdown to the north of the well
field is 0.11 feet (0.15 x cosine 41 degrees). On the east the
drawdown difference is .098 feet (0.15 x cosine 49 degrees).
Figure 2-4 presents the drawdown changes along two lines extending
from this well field. The change in drawdown in the drawdown lines
between 100 foot node points needs to be 0.11 feet and .098 feet
in the north and east respectively for the gradient to be reversed.
Therefore, the reversal in this area extends greater than 1800 feet
from the north and over 1200 feet from the eastern edges of the
well1 field.
Ihe southern half of the mining unit was not simulated but the
7one of reversal will be very similar to the northern half reversal
because the area of withdrawal is very similar and the bleed rate
will be the same. Therefore, a zone of reversal of greater than
1800 feet in the north and 1200 feet in the east should exist as
well field development progresses from the northern to the southern
half of the 0 sand mining unit.
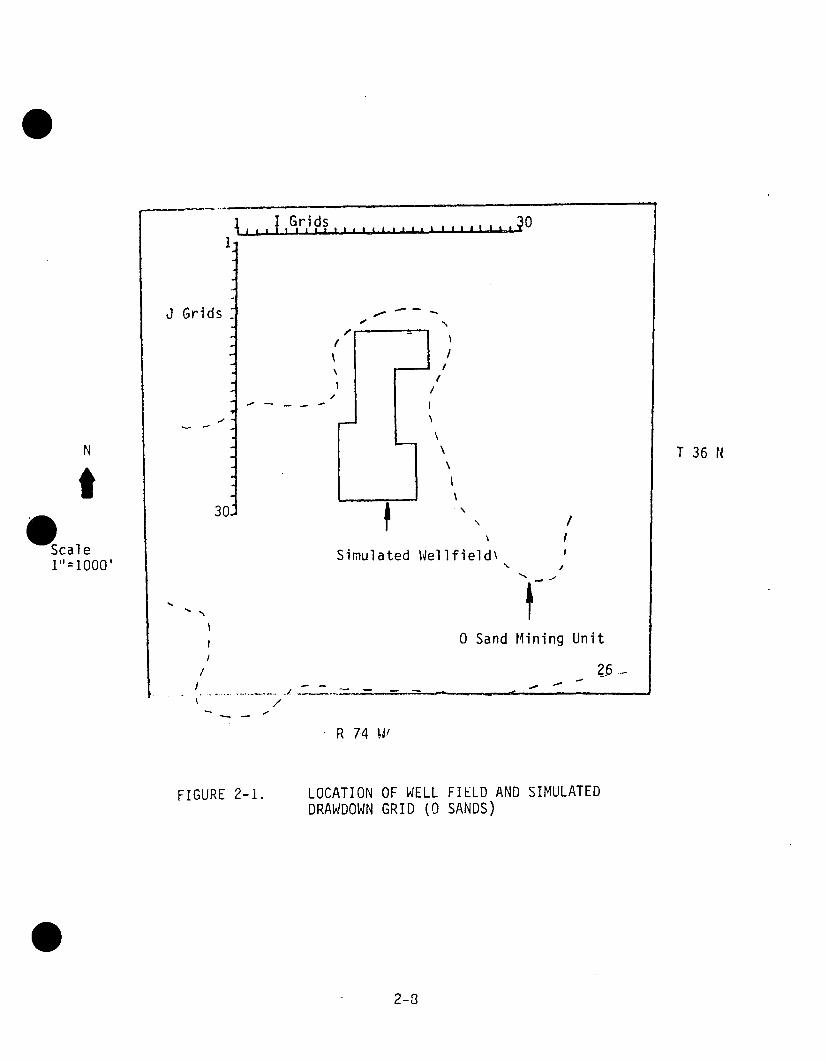
I , I IIIGri Os1-
J Grids
30
N
/
///
N
fScaleI"=1000'
T 36 N
Simulated Wellfield\
/
0 Sand Mining UnitI
/\ /
-
R 74 tl/
FIGURE 2-1. LOCATION OF WELL FIELD AND SIMULATEDDRAWDOWN GRID (0 SANDS)
2-3
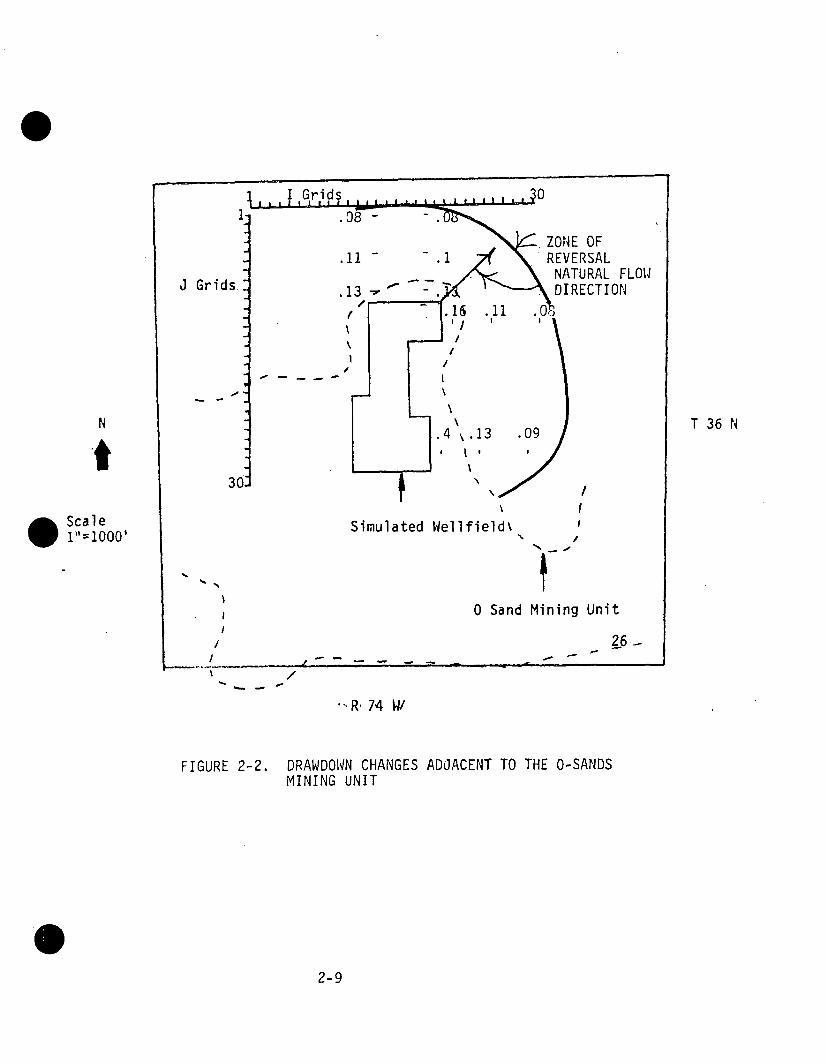
J Grids:
30:
REVERSALNATURAL FLOW
GdDIRECTION
N
. Scale1iI000,
T 36 N
Simlt /
Simulated Wellfield\
-
IJ
0 Sand Mining Unit
26/
\ /
-R, 74 WI
FIGURE 2-2. DRAWDOWN CHANGES ADOACENT TO THE O-SANDSMINING UNIT
02-9
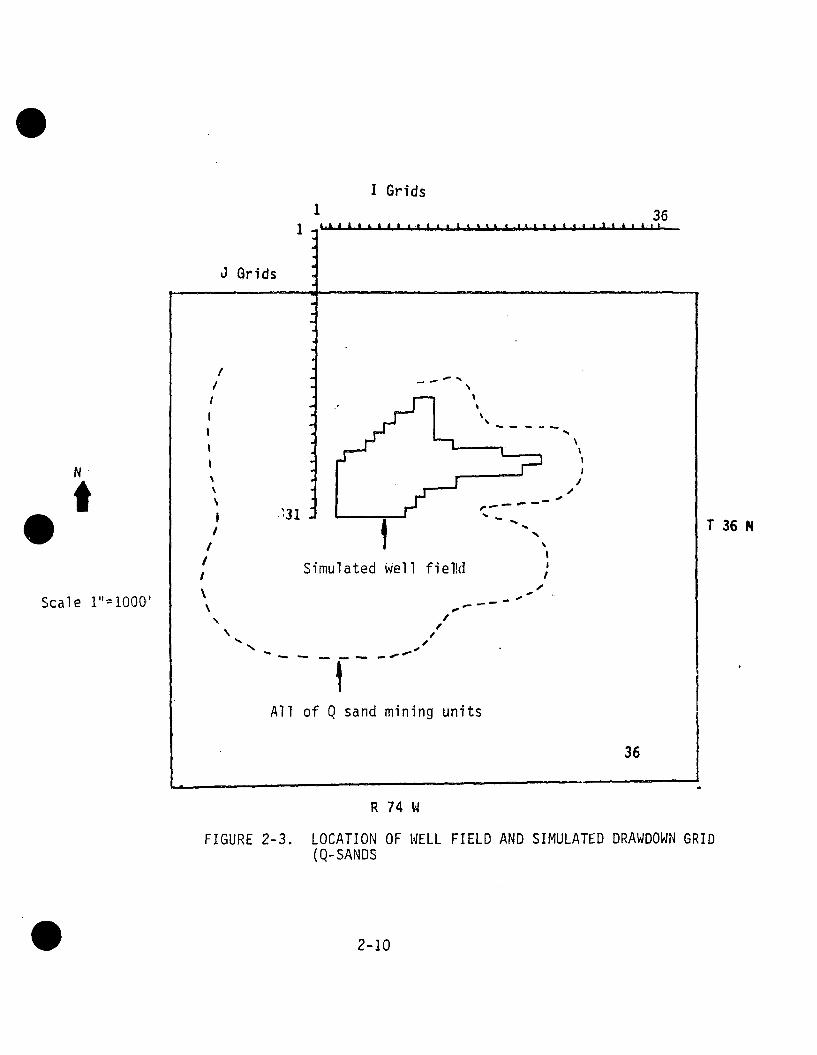
I Grids1 36
T 36 N
Scale I"=1000'
R 74 W
FIGURE 2-3. LOCATION OF WELL FIELD AND SIMULATED DRAWDOWN GRID(Q-SANDS
2-10
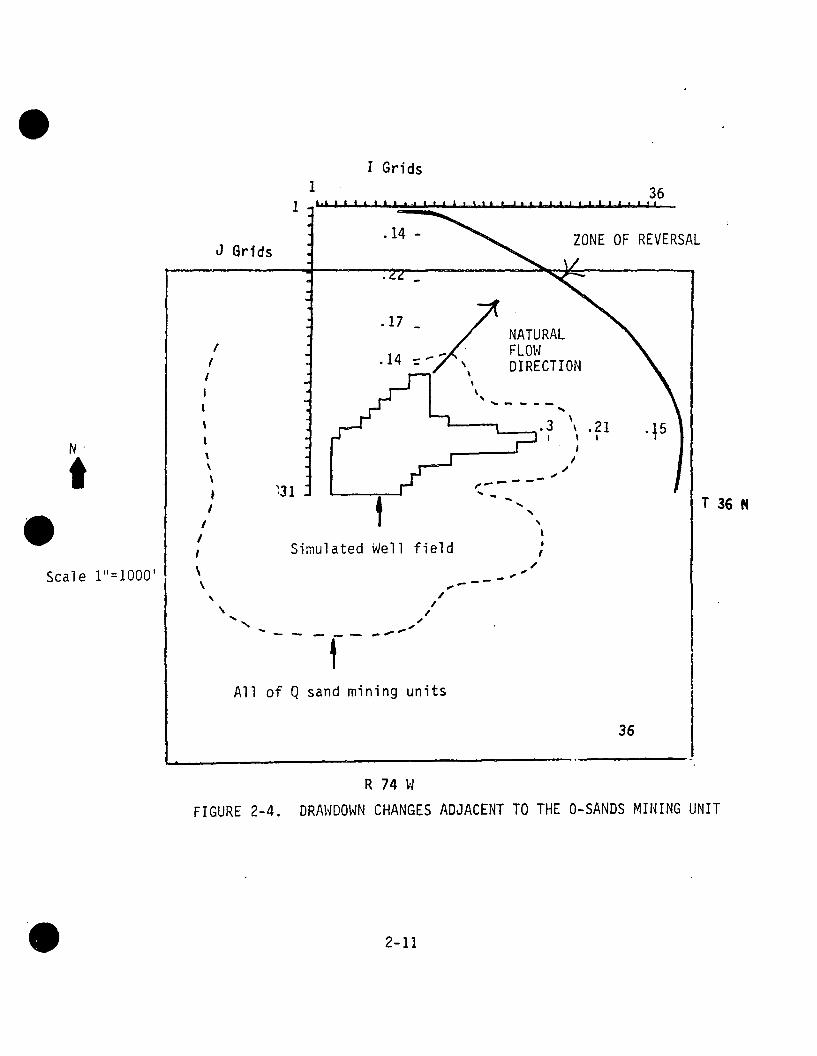
I Grids136
ZONE OF REVERSALJ Grids
.17-NATURALFLOW
/ .14 DIRECTIONI
3T 36 N
Simulated Well field
Scale I"=1000'
All of Q sand mining units
36
R 74 W
FIGURE 2-4. DRAWDOWN CHANGES ADJACENT TO THE O-SANDS MINING UNIT
2-11
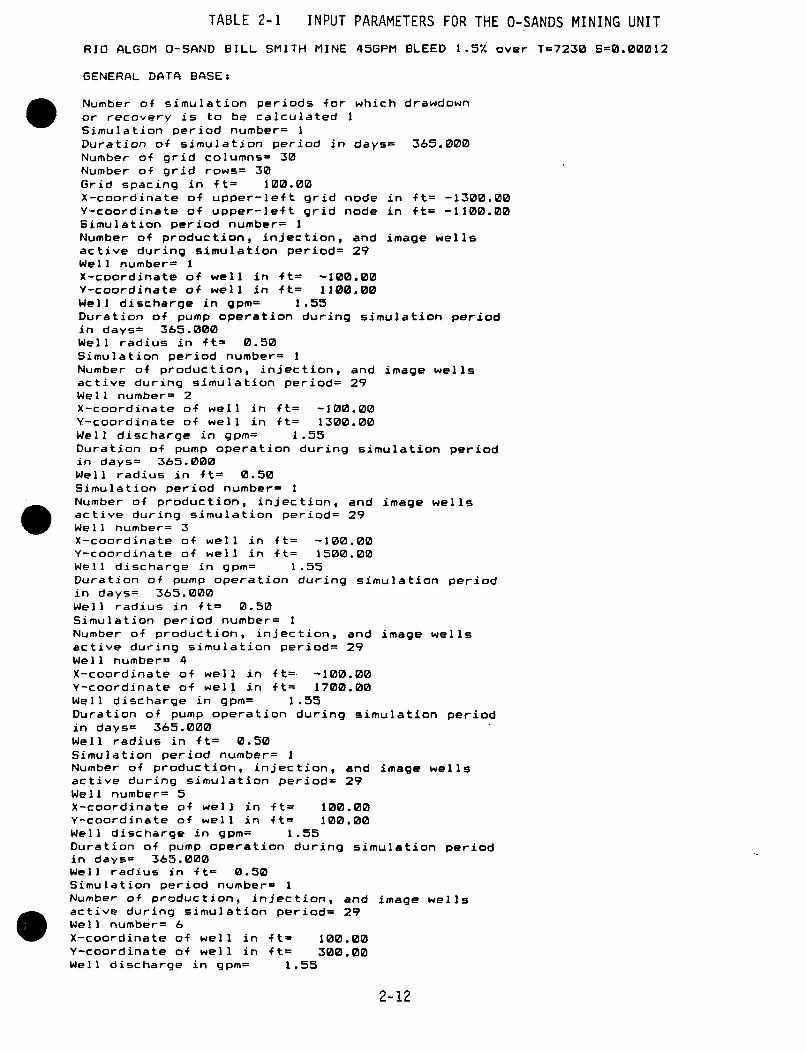
TABLE 2-1 INPUT PARAMETERS FOR THE O-SANDS MINING UNIT
RIO ALGOM O-SAND BILL SMITH MINE 45GPM BLEED 1.57 over T=7230 S=0.00012
GENERAL DATA BASE:
Number of simulation periods for which drawdownor recovery is to be calculated ISimulation period number= IDuration of simulation period in days= 365.000Number of grid columns= 30Number of grid rows= 30Grid spacing in ft= 100.00X-coordinate of upper-left grid node in ft= -1300.00Y-coordinate of upper-left grid node in ft= -1100.00Simulation period number= INumber of production, injection, and image wellsactive during simulation period= 29Well number= 1X-coordinate of well in ft= -100.00Y-coordinate of well in ft= 1100.00Well discharge in gpm= 1.55Duration of pump operation during simulation periodin days= 365.000Well radius in ft= 0.50Simulation period number= INumber of production, injection, and image wellsactive during simulation period= 29Well number= 2X-coordinate of well in ft= -100.00Y-coordinate of well in ft= 1300.00Well discharge in gpm= 1.55Duration of pump operation during simulation periodin days= 365.000Well radius in ft= 0.50Simulation period number= INumber of production, injection, and image wellsactive during simulation period= 29Well number= 3X-coordinate of well in ft= -100.00Y-coordinate of well in ft= 1500.00Well discharge in gpm= 1.55Duration of pump operation during simulation periodin days= 365.000Well radius in ft= 0.50Simulation period number= INumber of production, injection, and image wellsactive during simulation period= 29Well number= 4X-coordinate of well in ft= -100.00Y-coordinate of well in ft= 1700.00Well discharge in gpm= 1.55Duration of pump operation during simulation periodin days= 365.000Well radius in ft= 0.50Simulation period number= INumber of production, injection, and image wellsactive during simulation period= 29Well number= 5X-coordinate of well in ft= 100.00Y-coordinate of well in ft= 100.00Well discharge in gpm= 1.55Duration of pump operation during simulation periodin days= 365.000Well radius in ft- 0.50Simulation period number= 1Number of production, injection, and image wellsactive during simulation period= 29Well number= 6X-coordinate of well in it= 100.00Y-coordinate of well in ft= 300.00Well discharge in gpm= 1.55
2-12
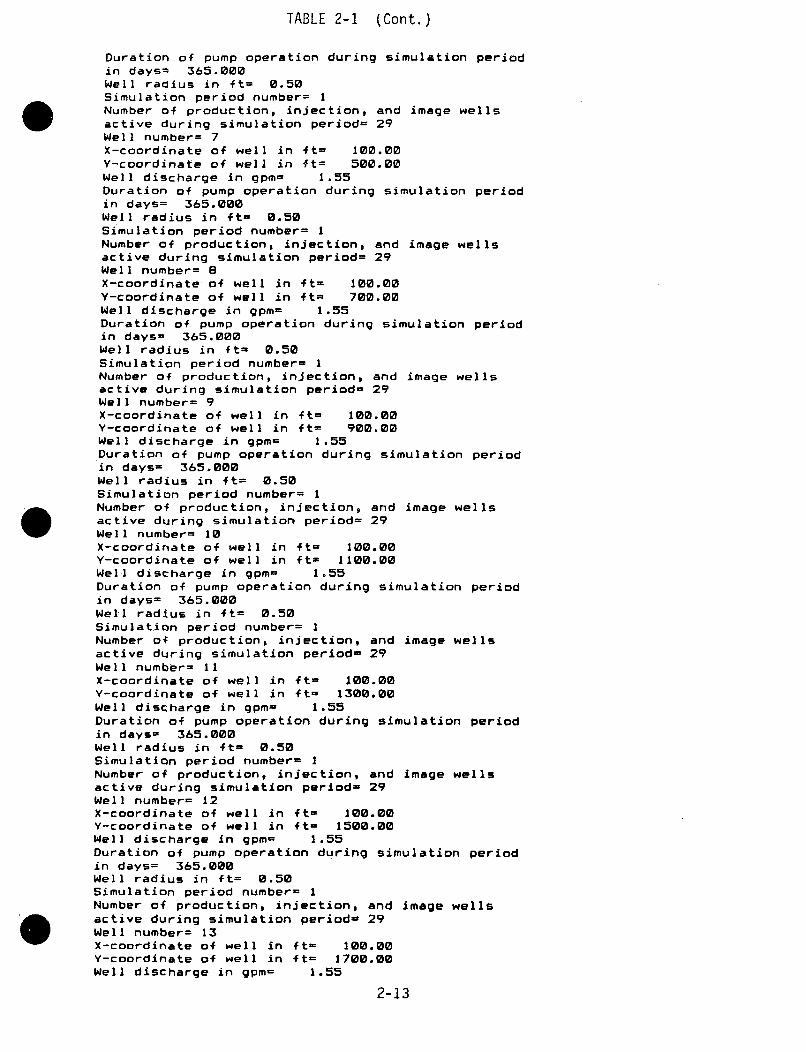
TABLE 2-1 (Cont.)
Duration of pump operation during simulation periodin days= 365.000Well radius in ft= 0.50Simulation period number= 1Number of production, injection, and image wellsactive during simulation period= 29Well number= 7X-coordinate of well in ft= 100.00Y-coordinate of well in ft= 500.00Well discharge in gpm= 1.55Duration of pump operation during simulation periodin days= 365.000Well radius in ft- 0.50Simulation period number= 1Number of production, injection, and image wellsactive during simulation period= 29Well number= 8X-coordinate of well in ft= 100.00Y-coordinate of well in ft- 700.00Well discharge in gpm= 1.55Duration of pump operation during simulation periodin days= 365.000Well radius in ft- 0.50Simulation period number- 1Number of production, injection, and image wellsactive during simulation period= 29Well number= 9X-coordinate of well in ft= 100.00Y-coordinate of well in ft= 900.00Well discharge in gpm= 1.55*Duration of pump operation during simulation periodin days= 365.000Well radius in ft= 0.50Simulation period number= 1Number of production, injection, and image wellsactive during simulation period= 29Well number= 10X-coordinate of well in ft- 100.00Y-coordinate of well in ft= 1100.00Well discharge in gpm= 1.55Duration of pump operation during simulation periodin days= 365.000Well radius in ft= 0.50Simulation period number= 1Number of production, injection, and image wellsactive during simulation period= 29Well number= 11X-coordinate of well in ft- 100.00Y-coordinate of well in ft- 1300.00Well discharge in gpm= 1.55Duration of pump operation during simulation periodin days= 365.000Well radius in ft= 0.50Simulation period number= INumber of production, injection, and image wellsactive during simulation period= 29Well number= 12X-coordinate of well in ft- 100.00Y-coordinate of well in ft- 1500.00Well discharge in gpm= 1.55Duration of pump operation during simulation periodin days= 365.000Well radius in ft= 0.50Simulation period number= 1Number of production, injection, and image wellsactive during simulation period- 29Well number= 13X-coordinate of well in ft- 100.00Y-coordinate of well in ft= 1700.00Well discharge in gpm= 1.55
2-13
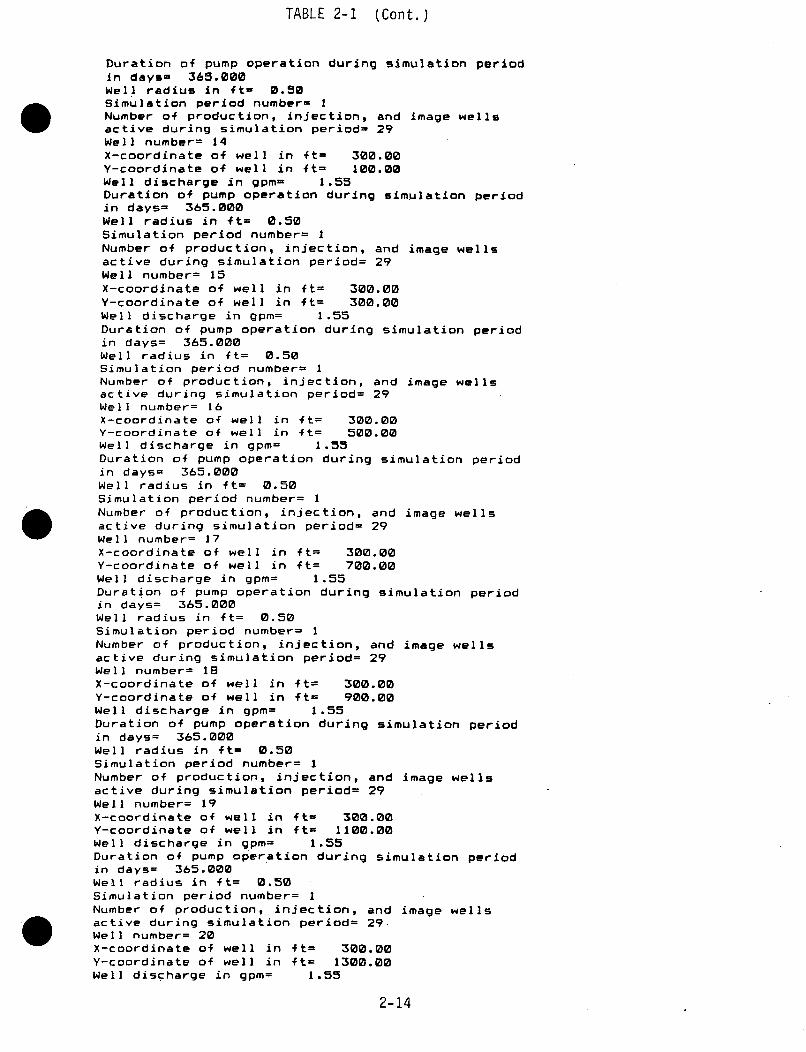
TABLE 2-1 (Cont.)
Duration of pump operation during simulation periodIn days= 365.000Well radius in ft- 0.50Simulation period number= INumber of production, injection, and image wellsactive during simulation period- 29Well number= 14X-coordinate of well in ft= 300.00Y-coordinate of well in ft= 100.00Well discharge in gpm= 1.55Duration of pump operation during simulation periodin days= 365.000Well radius in ft= 0.50Simulation period number= INumber of production, injection, and image wellsactive during simulation period= 29Well number= 15X-coordinate of well in ft= 300.00Y-coordinate of well in ft= 300.00Well discharge in gpm= 1.55Duration of pump operation during simulation periodin days= 365.000Well radius in ft= 0.50Simulation period number- 1Number of production, injection, and image wellsactive during simulation period= 29Well number= 16X-coordinate of well in ft= 300.00Y-coordinate of well in ft= 500.00Well discharge in gpm= 1.55Duration of pump operation during simulation periodin days= 365.000Well radius in ft= 0.50Simulation period number= 1Number of production, injection, and image wellsactive during simulation period= 29Well number= 17X-coordinate of well in ft= 300.00Y-coordinate of well in ft= 700.00Well discharge in gpm= 1.55Duration of pump operation during simulation periodin days= 365.000Well radius in ft= 0.50Simulation period number= 1Number of production, injection, and image wellsactive during simulation period= 29Well number= 18X-coordinate of well in ft= 300.00Y-coordinate of well in ft- 900.00Well discharge in gpm= 1.55Duration of pump operation during simulation periodin days= 365.000Well radius in ft= 0.50Simulation period number= 1Number of production, injection, and image wellsactive during simulation period= 29Well number= 19X-coordinate of well in ft= 300.00Y-coordinate of well in ft= 1100.00Well discharge in gpm= 1.55Duration of pump operation during simulation periodin days= 365.000Well radius in ft= 0.50Simulation period number= INumber of production, injection, and image wellsactive during simulation period= 29.Well number= 20X-coordinate of well in ft= 300.00Y-coordinate of well in ft= 1300.00Well discharge in gpm= 1.55
2-14
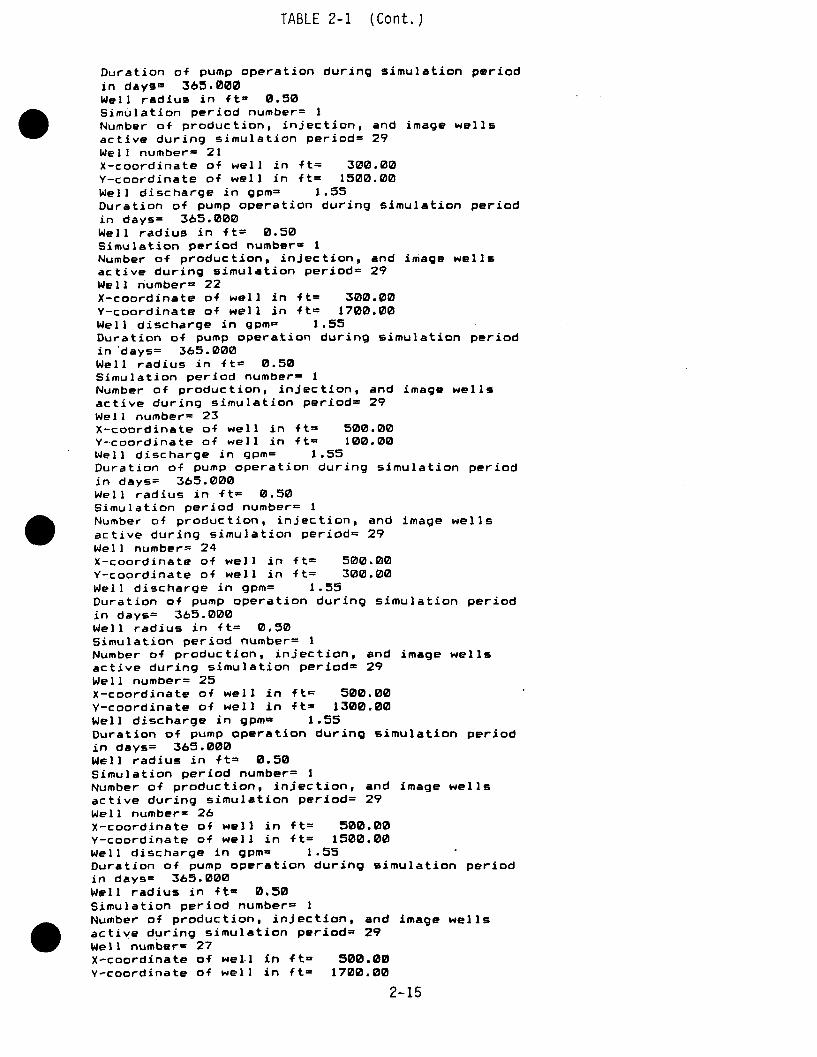
TABLE 2-1 (Cont.)
Duration of pump operation during simulation periodin days- 365.000Well radius in ft- 0.50Simulation period number= 1Number of production, injection, and image wellsactive during simulation period= 29Well number= 21X-coordinate of well in ft= 300.00Y-coordinate of well in ft= 1500.00Well discharge in gpm= 1.55Duration of pump operation during simulation periodin days= 365.000Well radius in ft= 0.50Simulation period number- INumber of production, injection, and image wellsactive during simulation period= 29Well number- 22X-coordinate of well in ft= 300.00Y-coordinate of well in ft= 1700.00Well discharge in gpm- 1.55Duration of pump operation during simulation periodin days= 365.000Well radius in ft- 0.50Simulation period number= INumber of production, injection, and image wellsactive during simulation period= 29Well number= 23X-coordinate of well in ft= 500.00Y-coordinate of well in ft= 100.00Well discharge in gpm= 1.55Duration of pump operation during simulation periodin days= 365.000Well radius in ft- 0.50Simulation period number= 1Number of production, injection, and image wellsactive during simulation period= 29Well number= 24X-coordinate of well in ft= 500.00Y-coordinate of well in 4t= 300.00Well discharge in gpm= 1.55Duration of pump operation during simulation periodin days= 365.000Well radius in ft= 0.50Simulation period number= 1Number of production, injection, and image wellsactive during simulation period= 29Well number= 25X-coordinate of well in ft= 500.00Y-coordinate of well in ft= 1300.00Well discharge in gpm= 1.55Duration of pump operation during simulation periodin days= 365.000Well radius in ft= 0.50Simulation period number= INumber of production, injection, and image wellsactive during simulation period= 29Well number= 26X-coordinate of well in ft= 500.00Y-coordinate of well in ft= 1500.00Well discharge in gpm= 1.55Duration of pump operation during simulation periodin days= 365.000Well radius in ft- 0.50Simulation period number= INumber of production, injection, and image wellsactive during simulation period= 29Well number- 27X-coordinate of wel-l in ft- 500.00y-coordinate of well in ft= 1700.00
2-15
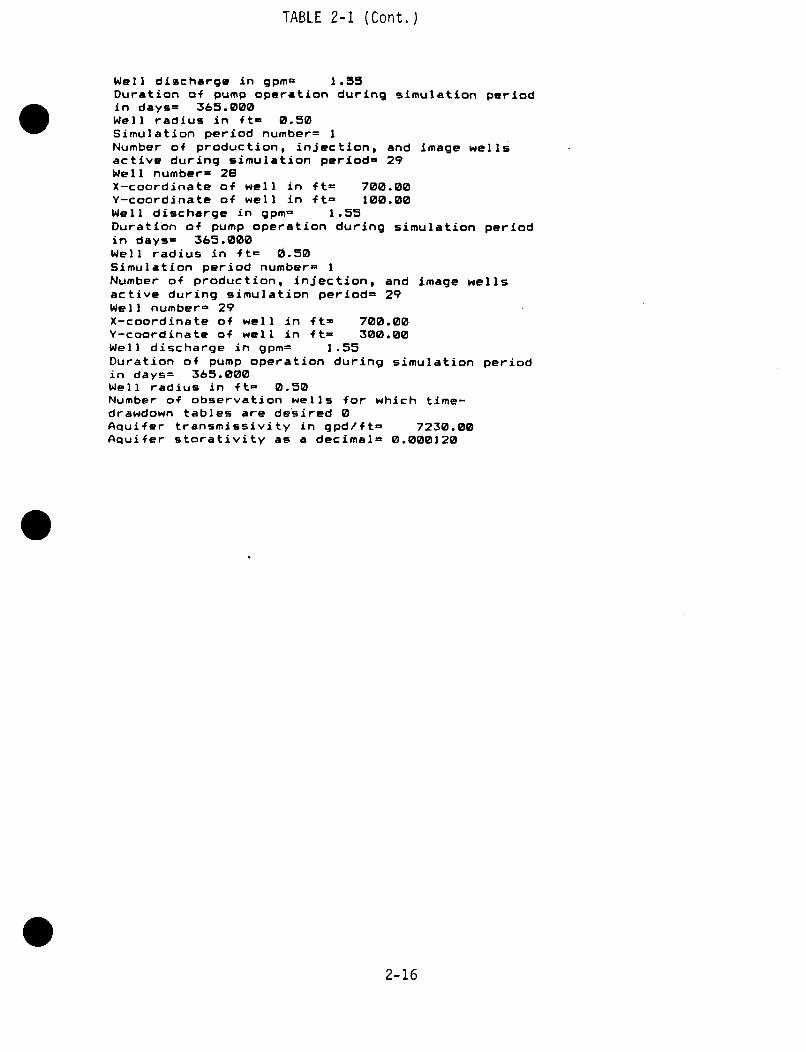
TABLE 2-1 (Cont.)
Well discharge in gpm- 1.55Duration of pump operation during simulation periodin days- 365.000Well radius in ft- 0.50Simulation period number= 1Number of production, injection, and image wellsactive during simulation period- 29Well number= 28X-coordinate of well in ft= 700.00Y-coordinate of well in ft= 100.00Well discharge in gpm= 1.55Duration of pump operation during simulation periodin days- 365.000Well radius in 4t= 0.50Simulation period number= 1Number of production, injection, and image wellsactive during simulation period- 29Well number= 29X-coordinate of well in ft= 700.00Y-coordinate of well in ft- 300.00Well discharge in gpm= 1.55Duration of pump operation during simulation periodin days= 365.000Well radius in ft= 0.50Number of observation wells for which time-drawdown tables are desired 0Aquifer transmissivity in gpd/ft- 7230.00Aquifer storativity as a decimal= 0.000120
2-16
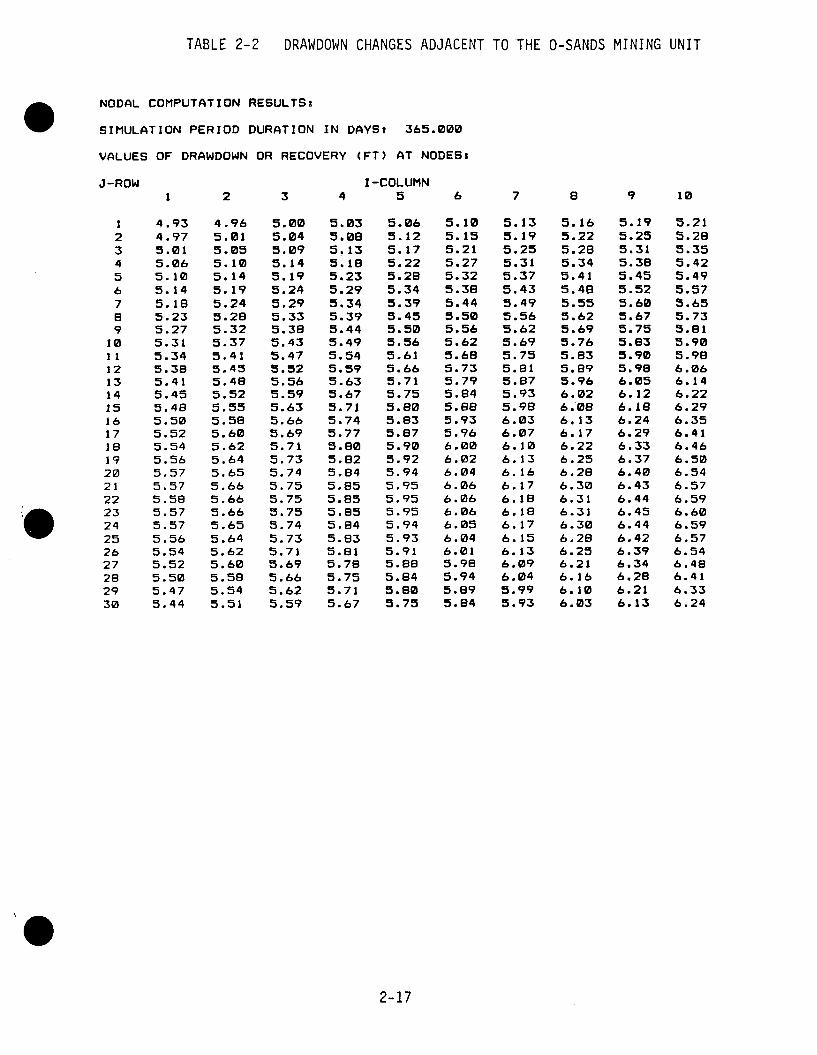
TABLE 2-2 DRAWDOWN CHANGES ADJACENT TO THE O-SANDS MINING UNIT
NODAL COMPUTATION RESULTS:
SIMULATION PERIOD DURATION IN DAYS: 365.000
VALUES OF DRAWDOWN OR RECOVERY (FT) AT NODES:
J-ROW I-COLUMN
I23456789
101112131415161718192021222324252627282930
1 2 3 4 5 6 7 8 9 10
4.934.975.015.065.105.145.185.235.275.315.345.385.415.455.485.505 . 525.545.565.575.575.585.575.575.565.545.525.505 .475.44
4.965.015.055.105.145.195.245.285.325.375.415.455.485.525.555 • 585.605.625.645.655.665.665.665.655.645.625 . 605.585.545.51
5.005.045.095.145.195.245.295.335.385.435.475.525.565.595.635.665.695.715.735.745.755.755.755.745.735.715.695.665.625.59
5.035.085.135.185.235.295.345.395.445.495.545.595.635.675.715.745.775.805.825.845.855.855. 855.845.835.815.785.755.715.67
5.065.125.175.225.285.345.395.455.505.565.615.665.715.755.805.835.875.905.925.945.955.955.955.945.935.915.885.845.805.75
5.105.155.215.275.325.385.445.505.565.625.685.735.795.845.885.935.966.006.026.046.066.066 . 066.056.046.015.985.945 . 895.84
5.135.195.255.315.375.435.495.565.625.695.755.815.875.935.986.036.076.106.136.166.176.186.186.176.156.136.096.045.995.93
5.165.225.285.345.415.485.555.625.695.765.835.895.966.026 • 086.136.176.226.256.286.306.316.316.306,286.256.216.166.106.03
5.195.255.315.385.455.525.605.675.755. 835.905.986.056.126.186.246.296 . 336.376.406.436.446.456.446.426.396.346.286.216.13
5.215.285.355.425.495.575.655.735.815.905.986.066.146.226.296.356.416.466.506.546.576.596.606.596.576.546.486.416.336.24
2-17
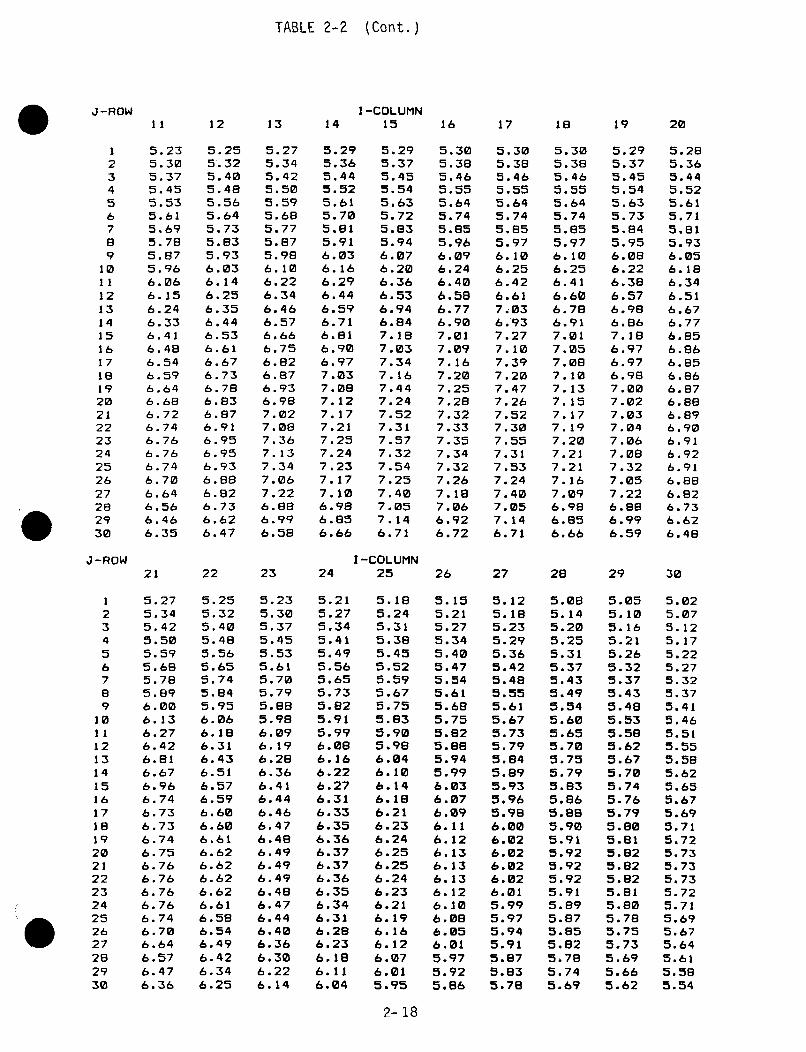
TABLE 2-2 (Cont.)
I -COLUMN11 12 13 14 15 16 17 18 19 20
J -ROW
12345
7
9101 112131415161716192021222324252627282930
J -ROW
23456789101 112131415161716192021222324252627282930
5.235.305.375.455.535.615.695.*785.675.966.066.156.*246.336.416.486.546.596.646. 6B6. 726. 746. 766.766.746. 706.646.566.466. 35
5.255.325.*405.485.565.645.*735.835.936.036.146.256.356.*446.536.616.676.736. 786.836.876.916.956.956.936.6886.626.736.626.*47
5.275.345.425.*505.595.685.775.875.986.106.226.*346.*466.576.*666.*756.826.878.936.967.027.*087.*367.137 .347.067.226.S868.996.58
5.29 5.295.36 5.375.44 5.455.52 5.545.61 5.635.70 5.725.61 5.8e35.91 5.946.03 6.076.16 6.206.29 6.366.44 6.536.59 6.946.71 8.846.81 7.186.90 7.036.97 7.347.03 7.167.08 7.447.12 7.247.17 7.527.21 7.317.25 7.577.24 7.327.23 7.547.17 7.257.10 7.406.98 7.056.85 7.146.66 6.71
I-COLUMN
5.*305.*385.*465.555.645.745.855.*966.096.246.*406.586.776.907.017.097.167.207.257.*287.327.337.357.*347.*327.*267.187.066.926.72
5.305.*385.*465.555.645.*745.855.976.106.256.426.617.036.*937.*277.107.*397.*207.*477.267.527.*307.557.317.537.*247.407.*057.148.71
5.305.*365.465.555.645.745.855.978.106.256.416.606.786.917.017.057.*067.*107.137.157.177.197.*207.*217.217.167.096.986.856.66
5.295.375.455.545.635.735.845.956.088.226.386.576.986. B 67.186.976.976.987.007.027.*037.047.067.087.327.057.226.88E6.998.59
5.285.385.445.525.615.715.815.936.056.186.346.5186.676.776.856.868.856.866.676.886.896.906.916.926.916.*886.826.736.826.*48
21 22 23 24 25 26 27 28 29 30
5.275.345.425.505.595.6885.785.6E96.008.136.276.426.818.878.9686.748.738.736.748.758. 768.786.788.788.748.7086.646.576.478.36
5.255.325.405.485.585.655.745.845.*956.066.186.318.436.516.576.596.*608.806.818.828.826.626.626.818.588.5486.496.426.346.25
5.235.305.375.455.535.615.705.795.885.986.096.196.286.368.416.446.*466.476.4886.496.496.496.488.476.4486.406.*366.*306.226.14
5.215.275.345.415.495.565.855.735.8e25.915.996.98e6.166.226.278.318.336.356.386.378.376.366.356.346.316.286.*236.18e6.116.04
5.185.245.315.385.455.525.595.*675.755.835.905.98e6.046.108.146.186.218.238.246.256.256.246.*238.216.196.166.126.*076.015.95
2-18
5.155.215.275.345.*405.475.*545.615.685.755.8e25.88e5.945.996.036.076.096.116.126.136.136.136.126.106.08e6.056.*015.975.92
5.125.185.235.295.365.425.485.555.615.675.735.795.845.895.935.965.986.006.026.026.026.026.015.995.975.945.915.875.83
5.085.145.205.255.315.375.*435.495.545.605.655.705.755.795.835.865.88B5.905.915.925.925.925.915.895.8e75.855.825.785.74
5.055.105.185.215.265.325.375.435.485.535.585.625.675.705.745.765.795.80e5.815.825.825.825.815.805.*785.755.735.695.66
5.025.075.125.175.225.275.325.375.415.*465.515.555.585.625.655.675.695.715.725.735.735.735.725.715.695.875.645.615.56
5.B 6 5.78 5.69 5.62 5.54
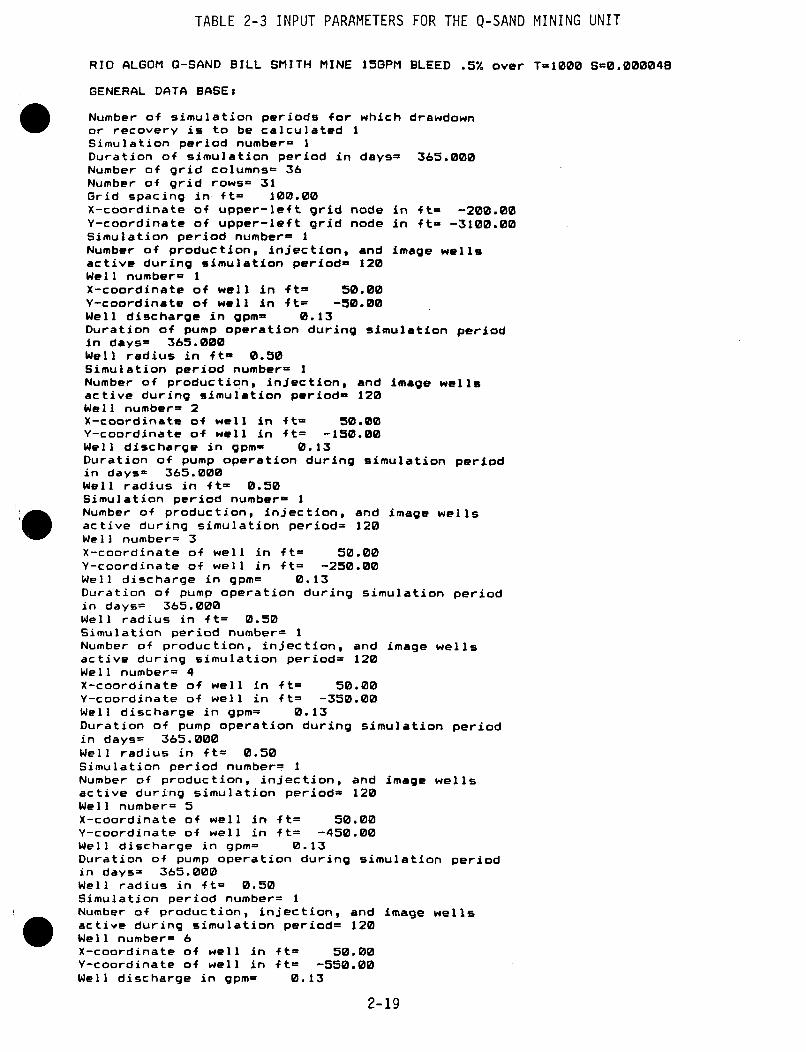
TABLE 2-3 INPUT PARAMETERS FOR THE Q-SAND MINING UNIT
RID ALGOM 0-SAND BILL SMITH MINE 15GPM BLEED .5% over T=1000 S=0.000048
GENERAL DATA BASE;
Number of simulation periods for which drawdownor recovery is to be calculated ISimulation period number= 1Duration of simulation period in days= 365.000Number of grid columns= 36Number of grid rows= 31Grid spacing in ft= 100.00X-coordinate of upper-left grid node in ft= -200.00Y-coordinate of upper-left grid node in ft- -3100.00Simulation period number= INumber of production, injection, and image wellsactive during simulation period- 120Well number= 1X-coordinate of well in 4t= 50.00Y-coordinate of well in ft= -50.00Well discharge in gpm- 0.13Duration of pump operation during simulation periodin days= 365.000Well radius in ft- 0.50Simulation period number= INumber of production, injection, and image wellsactive during simulation period- 120Well number= 2X-coordinate of well in ft- 50.00Y-coordinate of well in ft= -150.00Well discharge in gpm- 0.13Duration of pump operation during simulation periodin days= 365.000Well radius in ft= 0.50Simulation period number- INumber of production, injection, and image wellsactive during simulation period= 120Well number= 3X-coordinate of well in ft= 50.00Y-coordinate of well in ft= -250.00Well discharge in gpm= 0.13Duration of pump operation during simulation periodin days= 365.000Well radius in ft- 0.50Simulation period number= INumber of production, injection, and image wellsactive during simulation period= 120Well number= 4X-coordinate of well in ft= 50.00Y-coordinate of well in ft= -350.00Well discharge in gpm= 0.13Duration of pump operation during simulation periodin days= 365.000Well radius in ft= 0.50Simulation period number= 1Number of production, injection, and image wellsactive during simulation period= 120Well number= 5X-coordinate of well in ft= 50.00Y-coordinate of well in ft= -450.00Well discharge in gpm= 0.13Duration of pump operation during simulation periodin days= 365.000Well radius in ft= 0.50Simulation period number= 1Number of production, injection, and image wellsactive during simulation period= 120Well number= 6X-coordinate of well in ft= 50.00Y-coordinate of well in 4t= -550.00Well discharge in gpm= 0.13
2-19
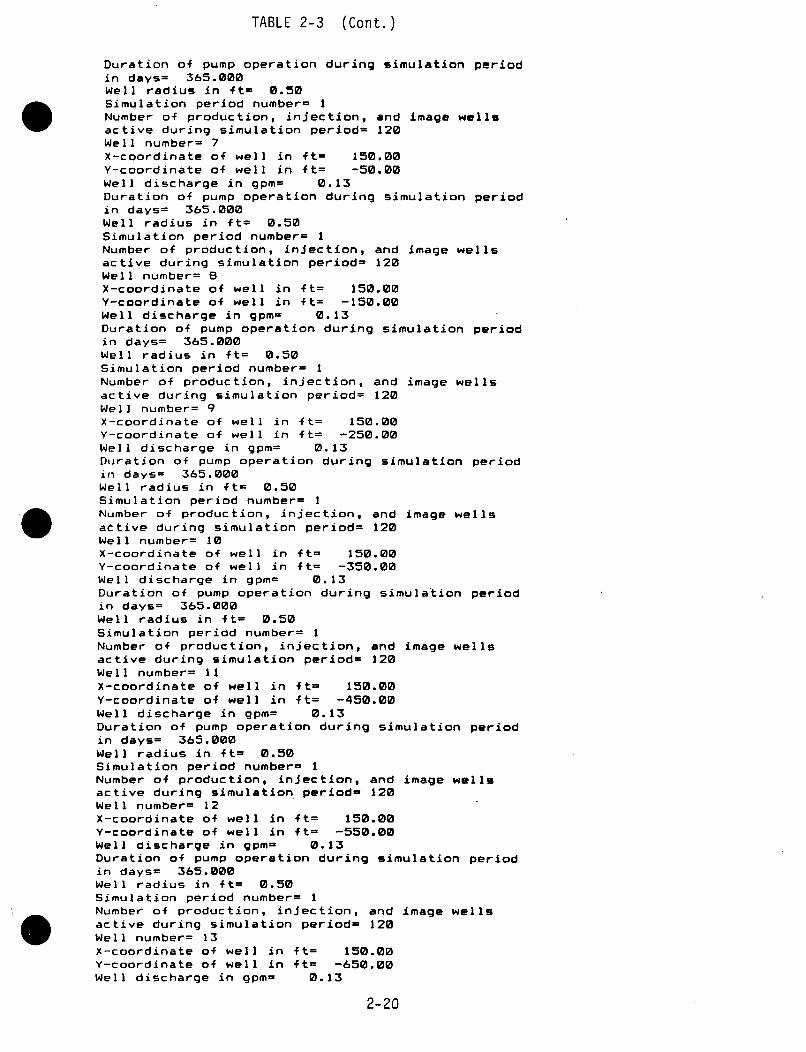
TABLE 2-3 (Cont.)
Duration of pump operation during simulation periodin days= 365.000Well radius in ft= 0.50Simulation period number= INumber of production, injection, and image wellsactive during simulation period= 120Well number= 7X-coordinate of well in ft= 150.00Y-coordinate of well in ft= -50.00Well discharge in gpm= 0.13Duration of pump operation during simulation periodin days= 365.000Well radius in ft= 0.50Simulation period number= INumber of production, injection, and image wellsactive during simulation period= 120Well number= 8X-coordinate of well in ft= 150.00Y-coordinate of well in ft= -150.00Well discharge in gpm= 0.13Duration of pump operation during simulation periodin days= 365.000Well radius in ft= 0.50Simulation period number= 1Number of production, injection, and image wellsactive during simulation period= 120Well number= 9X-coordinate of well in ft= 150.00Y-coordinate of well in ft= -250.00Well discharge in gpm= 0.13Duration of pump operation during simulation periodin days= 365.000Well radius in ft= 0.50Simulation period number= INumber of production, injection, and image wellsactive during simulation period= 120Well number= 10X-coordinate of well in ft- 150.00Y-coordinate of well in ft= -350.00Well discharge in gpm= 0.13Duration of pump operation during simulation periodin days= 365.000Well radius in ft= 0.50Simulation period number= INumber of production, injection, and image wellsactive during simulation period= 120Well number= 11X-coordinate of well in ft= 150.00Y-coordinate of well in ft= -450.00Well discharge in gpm= 0.13Duration of pump operation during simulation periodin days= 365.000Well radius in ft= 0.50Simulation period number- INumber of production, injection, and image wellsactive during simulation period- 120Well number= 12X-coordinate of well in ft= 150.00Y-coordinate of well in ft= -550.00Well discharge in gpm= 0.13Duration of pump operation during simulation periodin days= 365.000Well radius in ft= 0.50Simulation period number= INumber of production, injection, and image wellsactive during simulation period= 120Well number= 13X-coordinate of well in ft= 150.00Y-coordinate of well in ft= -650.00Well discharge in gpm= 0.13
2-20
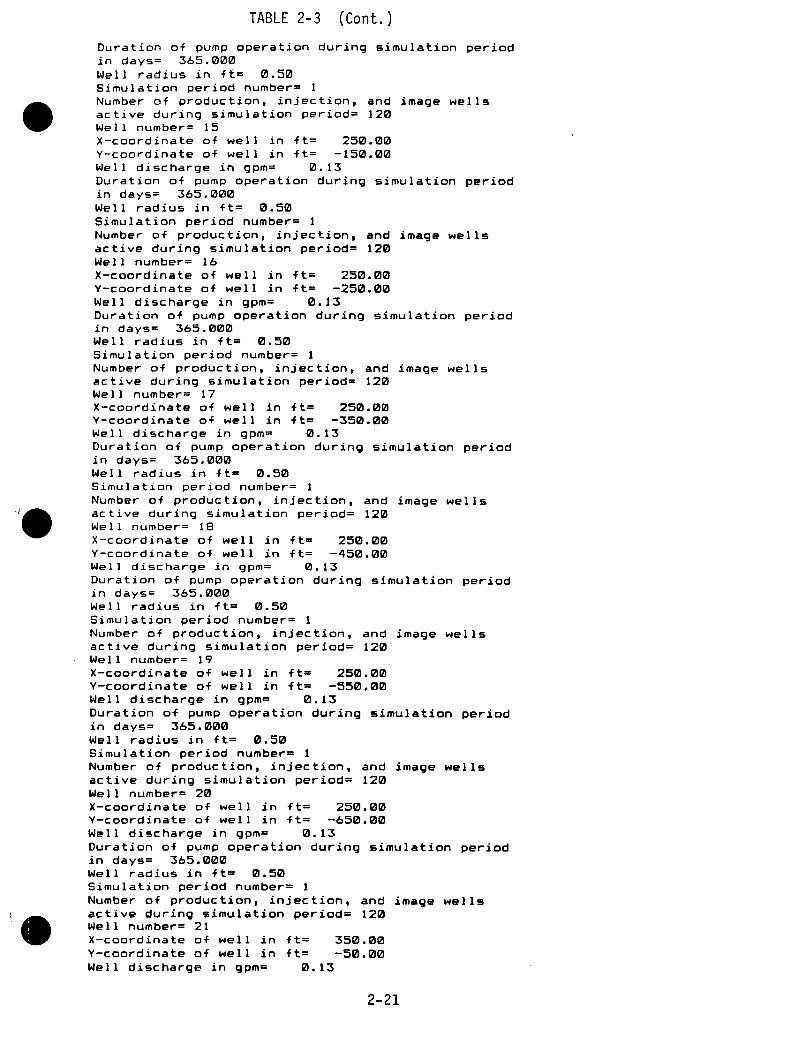
TABLE 2-3 (Cont.)
Duration of pump operation during simulation periodin days= 365.000Well radius in ft= 0.50Simulation period number= INumber of production, injection, and image wellsactive during simulation period= 120Well number= 15X-coordinate of well in ft= 250.00Y-coordinate of well in ft= -150.00Well discharge in gpm= 0.13Duration of pump operation during simulation periodin days= 365.000Well radius in ft= 0.50Simulation period number= INumber of production, injection, and image wellsactive during simulation period= 120Well number= 16X-coordinate of well in ft= 250.00Y-coordinate of well in ft= -250.00Well discharge in gpm= 0.13Duration of pump operation during simulation periodin days= 365.000Well radius in ft= 0.50Simulation period number= 1Number of production, injection, and image wellsactive during simulation period= 120Well number= 17X-coordinate of well in ft= 250.00Y-coordinate of well in ft= -350.00Well discharge in gpm= 0.13Duration of pump operation during simulation periodin days= 365.000Well radius in ft= 0.50Simulation period number= 1Number of production, injection, and image wellsactive during simulation period= 120Well number= 18X-coordinate of well in ft= 250.00Y-coordinate of well in ft= -450.00Well discharge in gpm= 0.13Duration of pump operation during simulation periodin days= 365.000Well radius in ft= 0.50Simulation period number= 1Number of production, injection, and image wellsactive during simulation period= 120Well number= 19X-coordinate of well in ft= 250.00Y-coordinate of well in ft= -550.00Well discharge in gpm= 0.13Duration of pump operation during simulation periodin days= 365.000Well radius in ft= 0.50Simulation period number= 1Number of production, injection, and image wellsactive during simulation period= 120Well number= 20X-coordinate of well in ft= 250.00Y-coordinate of well in ft= -650.00Well discharge in gpm= 0.13Duration of pump operation during simulation periodin days= 365.000Well radius in ft= 0.50Simulation period number= 1Number of production, injection, and image wellsactive during simulation period= 120Well number= 21X-coordinate of well in ft= 350.00Y-coordinate of well in ft= -50.00Well discharge in gpm= 0.13
2-21
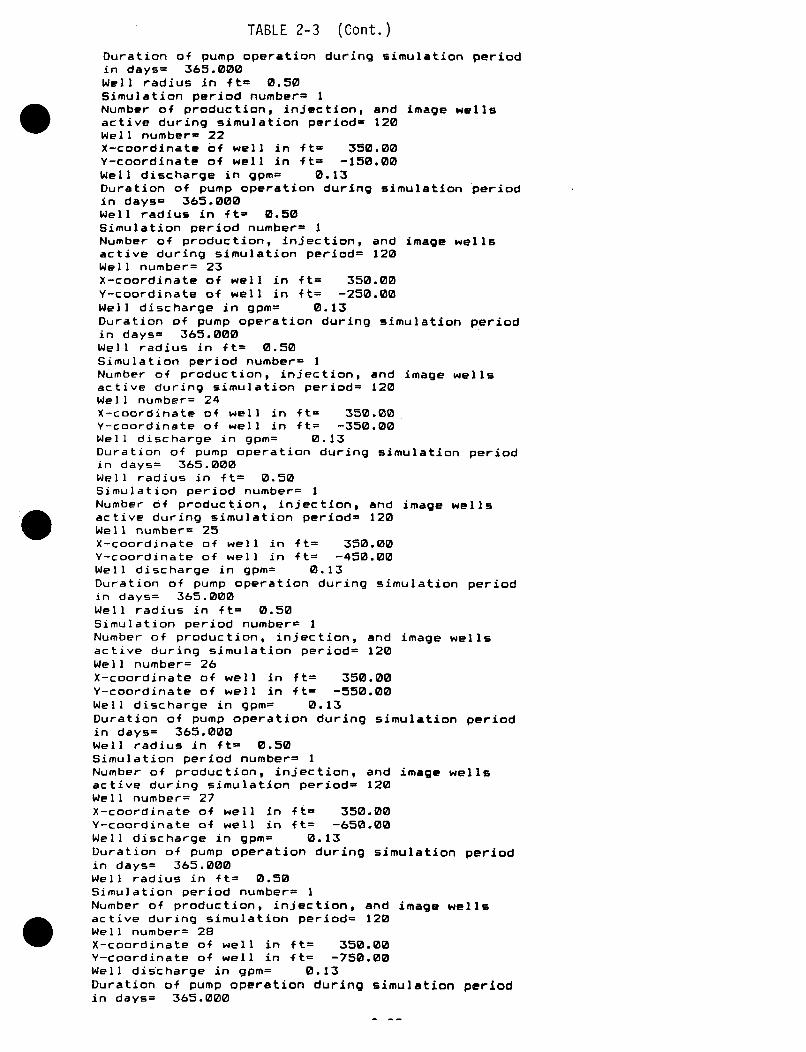
TABLE 2-3 (Cont.)
Duration of pump operation during simulation periodin days= 365.000Well radius in ft= 0.50Simulation period number- INumber of production, injection, and image wellsactive during simulation period- 120Well number= 22X-coordinate of well in ft= 350.00Y-coordinate of well in it= -150.00Well discharge in gpm= 0.13Duration of pump operation during simulation periodin days= 365.000Well radius in ft- 0.50Simulation period number= 1Number of production, injection, and image wellsactive during simulation period= 120Well number= 23X-coordinate of well in ft= 350.00Y-coordinate of well in it= -250.00Well discharge in gpm= 0.13Duration of pump operation during simulation periodin days= 365.000Well radius in ft= 0.50Simulation period number= 1Number of production, injection, and image wellsactive during simulation period= 120Well number= 24X-coordinate of well in ft= 350.00Y-coordinate of well in ft= -350.00Well discharge in gpm= 0.13Duration of pump operation during simulation periodin days= 365.000Well radius in ft= 0.50Simulation period number= INumber of production, injection, and image wellsactive during simulation period= 120Well number= 25X-coordinate of well in ft= 350.00Y-coordinate of well in ft= -450.00Well discharge in gpm= 0.13Duration of pump operation during simulation periodin days= 365.000Well radius in ft= 0.50Simulation period number.- 1Number of production, injection, and image wellsactive during simulation period= 120Well number= 26X-coordinate of well in ft= 350.00Y-coordinate of well in ft= -550.00Well discharge in gpm= 0.13Duration of pump operation during simulation periodin days= 365.000Well radius in ft- 0.50Simulation period number- 1Number of production, injection, and image wellsactive during simulation period- 120Well number= 27X-coordinate of well in ft= 350.00Y-coordinate of well in ft= -650.00Well discharge in gpm= 0.13Duration of pump operation during simulation periodin days= 365.000Well radius in ft= 0.50Simulation period number= 1Number of production, injection, and image wellsactive during simulation period= 120Well number= 28X-coordinate of well in ft= 350.00Y-coordinate of well in ft= -750.00Well discharge in gpm= 0.13Duration of pump operation during simulation periodin days= 365.000
TABLE 2-3 (Cont.)
Well radius in ft= 0.50Simulation period number= INumber of production , injection, and image wells.active during simulation period= 120Well number= 29X-coordinate of well in ft= 450.00Y-coordinate of well in ft= -50.00Well discharge in gpm= 0.13Duration of pump operation during simulation periodin days= 365.000Well radius in ft= 0.50Simulation period number= INumber of production, injection, and image wellsactive during simulation period= 120Well number= 30X-coordinate of well in ft= 450.00Y-coordinate of well in ft= -150.00Well discharge in gpm= 0.13Duration of pump operation during simulation periodin days= 365.000Well radius in it= 0.50Simulation period number= INumber of production, injection, and image wellsactive during simulation period= 120Well number= 31X-coordinate of well in ft= 450.00Y-coordinate of well in ft= -250.00Well discharge in gpm= 0.13Duration of pump operation during simulation periodin days= 365.000Well radius in ft= 0.50Simulation period number= INumber of production, injection, and image wellsactive during simulation period= 120Well number= 32X-coordinate of well in ft= 450.00Y-coordinate of well in ft= -350.00Well discharge in gpm= 0.13Duration of pump operation during simulation periodin days= 365.000Well radius in ft= 0.50Simulation period number= INumber of production, injection, and image wellsactive during simulation period= 120Well number= 33X-coordinate of well in ft= 450.00Y-coordinate of well in ft= -450.00Well discharge in gpm= 0.13Duration of pump operation during simulation periodin days= 365.000Well radius in ft= 0.50Simulation period number= 1Number of production, injection, and image wellsactive during simulation period= 120Well number= 34X-coordinate of well in ft= 450.00Y-coordinate of well in ft= -550.00Well discharge in gpm= 0.13Duration of pump operation during simulation periodin days= 365.000Well radius in ft= 0.50Simulation period number= INumber of production, injection, and image wellsactive during simulation period= 120Well number= 35X-coordinate of well in ft= 450.00Y-coordinate of well in ft= -650.00Well discharge in gpm= 0.13Duration of pump operation during simulation periodin days= 365.000Well radius in ft= 0.50
2-23
TABLE 2-3 (Cont.)
Simulation period number- 1Number of production, injection, and image wellsactive during simulation period- 120Well number- 36X-coordinate of well in 4t- 450.00Y-coordinate of well in ft- -758.00Well discharge in gpm= 8.13Duration of pump operation during simulation periodin days- 365.000Well radius in ft- 0.50Simulation period number- INumber of production, injection, and image wellsactive during simulation period- 120Well number= 37X-coordinate of well in ft- 450.00Y-coordinate of well in ft= -850.00Well discharge in gpm= 0.13Duration of pump operation during simulation periodin days- 365.000Well radius in ft- 0.50Simulation period number- INumber of production, injection, and image wellsactive during simulation period- 120Well number- 38X-coordinate of well in ft= 550.00Y-coordinate of well in ft- -50.00Well discharge in gpm= 0.13Duration of pump operation during simulation periodin days= 365.000Well radius in ft- 0.50Simulation period number- 1Number of production, injection, and image wellsactive during simulation period- 120Well number= 39X-coordinate of well in ft- 550.00Y-coordinate of well in ft- -150.00Well discharge in gpm- 0.13Duration of pump operation during simulation periodin days- 365.000Well radius in ft- 0.50Simulation period number- INumber of production, injection, and image wellsactive during simulation period- 120Well number- 40X-cobrdinate of well in ft- 550.00Y-coordinate of well in ft. -250.00Well discharge in gpm= 0.13Duration of pump operation during simulation periodin days- 365.000Well radius in ft- 0.50Simulation period number- INumber of production, injection, and image wellsactive during simulation period- 120Well number- 41X-coordinate of well in ft= 550.00Y-coordinate of well in ft= -350.00Well discharge in gpm= 0.13Duration of pump operation during simulation periodin days- 365.000Well radius in ft- 0.50Simulation period number- 1Number of production, injection, and image wellsactive during simulation period- 120Well number- 42X-coordinate of well in ft- 550.00Y-coordinate of well in ft= -450.00Well discharge in gpm= 0.13Duration of pump operation during simulation periodin days= 365.000Well radius in ft- 0.50Simulation period number- 1Number of production, injection, and image wellsactive during simulation period= 120 2-24
TABLE 2-3 (Cont.)
Well numbors 43x-coordinate of well In ft= 550.00Y-coordinate of well in ft- -550.00Well discharge in gpm= 0.13Duration o+ pump operation during simulation periodin days= 365.000Well radius in ft= 0.50Simulation period number= 1Number of production, injection, and image wellsactive during simulation period= 120Well number= 44X-coordinate of well in ft= 550.00y-coordinate of well in ft= -650.00Well discharge in gpm= 0.13Duration of pump operation during simulation periodin days= 365.000Well radius in ft= 0.50Simulation period number= INumber of production, injection, and image wellsactive during simulation period= 120Well number= 45X-coordinate of well in ft= 550.00Y-coordinate of well in ft= -750.00Well discharge in gpm= 0.13Duration of pump operation during simulation periodin days= 365.000Well radius in ft= 0.50Simulation period number= INumber of production, injection, and image wellsactive during simulation period= 120Well number= 46X-coordinate of well in ft= 550.00Y-coardinate of well in ft= -850.00Well discharge in gpm= 0.13Duration of pump operation during simulation periodin days= 365.000Well radius in ft= 0.50Simulation period number= INumber of production, injection, and image wellsactive during simulation period= 120Well number= 47X-coordinate of well in ft= 550.00Y-coordinate of well in ft= -950.00Well discharge in gpm- 0.13Duration of pump operation during simulation periodin days= 365.000Well radius in ft= 0.50Simulation period number= 1Number of production, injection, and image wellsactive during simulation period= 120Well number= 48X-coordinate of well in ft= 650.00Y-coordinate of well in ft= -50.00Well discharge in gpm= 0.13Duration of pump operation during simulation periodin days= 365.000Well radius in ft= 0.50Simulation period number= INumber of production, injection, and image wellsactive during simulation period= 120Well number= 49X-coordinate of well in ft= 650.00Y-coordinate of well in ft= -150.00Well discharge in gpm= 0.13Duration of pump operation during simulation periodin days= 365.000Well radius in ft= 0.50Simulation period number= INumber of production, injection, and image wellsactive during simulation period= 120
2-25
TABLE 2-3 (Cont.)
Well number= 50X-coordinate of well in ft= 650.00Y-coordinate of well in ft= -250.00Well discharge in gpm= 0.13Duration of pump operation during simulation periodin days= 365.000Well radius in ft= 0.50Simulation period number= INumber of production, injection, and image wellsactive during simulation period= 120Well number= 51X-coordinate of well in ft= 650.00Y-coordinate of well in ft= -350.00Well discharge in gpm= 0.13Duration of pump operation during simulation periodin days= 365.000Well radius in ft= 0.50Simulation period number= INumber of production, injection, and image wellsactive during simulation period= 120Well number= 52X-coordinate of well in ft= 650.00Y-coordinate of well in ft= -450.00Well discharge in gpm- 0.13Duration of pump operation during simulation periodin days= 365.000Well radius in ft= 0.50Simulation period number= INumber of production, injection, and image wellsactive during simulation period= 120Well number= 53X-coordinate of well in ft= 650.00Y-coordinate of well in ft= -550.00Well discharge in gpm= 0.13Duration of pump operation during simulation periodin days= 365.000Well radius in ft= 0.50Simulation period number= 1Number of production, injection, and image wellsactive during simulation period= 120Well number= 54X-coordinate of well in ft= 650.00Y-coordinate of well in ft= -650.00Well discharge in gpm= 0.13Duration of pump operation during simulation periodin days= 365.000Well radius in ft= 0.50Simulation period number= INumber of production, injection, and image wellsactive during simulation period= 120Well number= 55X-coordinate of well in ft= 650.00Y-coordinate of well in ft- -750.00Well discharge in gpm= 0.13Duration of pump operation during simulation periodin days= 365.000Well radius in ft- 0.50Simulation period number= INumber of production, injection, and image wellsactive during simulation period= 120Well number= 56X-coordinate of well in ft- 650.00Y-coordinate of well in ft- -850.00Well discharge in gpm= 0.13Duration of pump operation during simulation periodin days= 365.000Well radius in ft- 0.50Simulation period number= 1Number of production, injection, and image wellsactive during simulation period= 120
2-26
TABLE 2-3 (Cont.)
Well number= 57X-coordinate of well in ft- 650.00Y-coordinate of well in ft- -950.00Well discharge in gpm= 0.13Duration of pump operation during simulation periodin days= 365.000Well radius in ft= 0.50Simulation period number= 1Number of production, injection, and image wellsactive during simulation period= 120Well number= 58X-coordinate of well in ft= 650.00Y-coordinate of well in ft= -1050.00Well discharge in gpm= 0.13Duration of pump operation during simulation periodin days= 365.000Well radius in ft- 0.50Simulation period number= INumber of production, injection, and image wellsactive during simulation period= 120Well number= 59X-coordinate of well in ft- 750.00Y-coordinate of well in ft= -150.00Well discharge in gpm= 0.13Duration of pump operation during simulation periodin days= 365.000Well radius in ft= 0.50Simulation period number= INumber of production, injection, and image wellsactive during simulation period- 120Well number= 80X-coordinate of well in ft= 750.00Y-coordinate of well in ft= -250.00Well discharge in gpm= 0.13Duration of pump operation during simulation periodin days= 365.000Well radius in ft= 0.50Simulation period number= INumber of production, injection, and image wellsactive during simulation period- 120Well number= 61X-coordinate of well in ft- 750.00Y-coordinate of well in ft- -350.00Well discharge in gpm- 0.13Duration of pump operation during simulation periodin days= 365.000Well radius in ft- 0.50Simulation period number= INumber of production, injection, and image wellsactive during simulation period- 120Well number- 62X-coordinate of well in ft= 750.00Y-coordinate of well in ft- -450.00Well discharge in gpm= 0.13Duration of pump operation during simulation periodin days= 365.000Well radius in It= 0.50Simulation period number= INumber of production, injection, and image wellsactive during simulation period= 120Well number= 63X-coordinate of well in ft= 750.00Y-coordinate of well in ft= -550.00Well discharge in gpm= 0.13Duration of pump operation during simulation periodin days= 365.000Well radius in ft= 0.50Simulation period number= 1Number of production, injection, and image wellsactive during simulation period= 120
2-27
TABLE 2-3 (Cont.)
Well number= 64X-coordinate of well in ft- 750.00Y-coordinate of well in ft= -650.00Well discharge in gpm= 0.13Duration of pump operation during simulation periodin days= 365.000Well radius in ft= 0.50Simulation period number= 1Number of production, injection, and image wellsactive during simulation period= 120Well number= 65X-coordinate of well in ft= 750.00Y-coordinate of well in ft= -750.00Well discharge in gpm= 0.13Duration of pump operation during simulation periodin days= 365.000Well radius in ft= 0.50Simulation period number- INumber of production, injection, and image wellsactive during simulation period- 120Well number= 66X-coordinate of well in ft= 750.00Y-coordinate of well in ft= -850.00Well discharge in gpm= 0.13Duration of pump operation during simulation periodin days= 365.000Well radius in ft= 0.50Simulation period number= 1Number of production, injection, and image wellsactive during simulation period= 120Well number= 67X-coordinate of well in ft= 750.00Y-coordinate of well in ft= -950.00Well discharge in gpm= 0.13Duration of pump operation during simulation periodin days= 365.000Well radius in ft= 0.50Simulation period number= INumber of production, injection, and image wellsactive during simulation period= 120Well number= 68X-coordinate of well in ft= 750.00Y-coordinate of well in ft= -1050.00Well discharge in gpm= 0.13Duration of pump operation during simulation periodin days= 365.000Well radius in ft= 0.50Simulation period number= INumber of production, injection, and image wellsactive during simulation period= 120Well number= 69X-coordinate of well in ft= 850.00Y-coordinate of well in ft= -250.00Well discharge in gpm= 0.13Duration of pump operation during simulation periodin days= 365.000Well radius in ft= 0.50Simulation period number= INumber of production, injection, and image wellsactive during simulation period= 120Well number= 70X-coordinate of well in ft= 850.00Y-coordinate of well in ft= -350.00Well discharge in gpm= 0.13Duration of pump operation during simulation periodin days= 365.000Well radius in ft= 0.50Simulation period number= 1Number of production, injection, and image wellsactive during simulation period= 120
2-28
I' .TABLE 2-3 (Cont.)
Well number= 71X-coordinate of well in ft- 850.00Y-coordinate of well in ft -450.00Well discharge in gpm= 0.13Duration of pump operation during simulation periodin days= 365.000Well radius in ft= 0.50Simulation period number= INumber of production, injection, and image wellsactive during simulation period= 120Well number= 72X-coordinate of well in ft= 850.00Y-coordinate of well in ft= -550.00Well discharge in gpm= 0.13Duration of pump operation during simulation periodin days= 365.000Well radius in ft- 0.50Simulation period number- INumber of production, injection, and image wellsactive during simulation period- 120Well number= 73X-coordinate of well in ft= 850.00Y-coordinate of well in ft= -650.00Well discharge in gpm= 0.13Duration of pump operation during simulation periodin days= 365.000Well radius in ft= 0.50Simulation period number= INumber of production, injection, and image wellsactive during simulation period= 120Well number= 74X-coordinate of well in ft= 850.00Y-coordinate of well in ft= -750.00Well discharge in gpm= 0.134 Duration of pump operation during simulation periodin days= 365.000Well radius in ft= 0.50Simulation period number= INumber of production, injection, and image wellsactive during simulation period= 120Well number= 75X-coordinate of well in ft= 850.00Y-coordinate of well in ft= -850.00Well discharge in gpm= 0.13Duration of pump operation during simulation periodin days= 365.000Well radius in ft= 0.50Simulation period number= INumber of production, injection, and image wellsactive during simulation period= 120Well number= 76X-coordinate of well in ft= 850.00Y-coordinate of well in ft= -950.00Well discharge in gpm= 0.13Duration of pump operation during simulation periodin days= 365.000Well radius in ft= 0.50Simulation period number= 1Number of production, injection, and image wellsactive during simulation period= 120Well number= 77X-coordinate of well in ft= 850.00Y-coordinate of well in ft= -1050.00Well discharge in gpm= 0.13. Duration of pump operation during simulation periodin days= 365.000Well radius in ft= 0.50Simulation period number= 1Number of production, injection, and image wellsactive during simulation period= 120 2-29
TABLE 2-3 (Cont.)
Well number- 78X-coordinate of well in ft= 850.00.Y-coordinate of well in ft- -1150.00Well discharge in gpm= 0.13Duration of pump operation during simulation periodin days= 365.000Well radius in ft= 0.50Simulation period number- INumber of production, injection, and image wellsactive during simulation period= 120Well number- 79X-coordinate of well in ft= 850.00Y-coordinate of well in ft= -1250.00Well discharge in gpm= 0.13Duration of pump operation during simulation periodIn days= 365.000Well radius in ft= 0.50Simulation period number= INumber of production, injection, and image wellsactive during simulation period= 120Well number= 80X-coordinate of well in ft= 950.00Y-coordinate of well in ft- -350.00Well discharge in gpm= 0.13Duration of pump operation during simulation periodin days= 365.000Well radius in ft= 0.50Simulation period number= INumber of production, injection, and image wellsactive during simulation period- 120Well number= 81X-coordinate of well in ft- 950.00Y-coordinate of well in ft= -450.00Well discharge in gpm= 0.13Duration of pump operation during simulation periodin days= 365.000Well radius in ft= 0.50Simulation period number= 1Number of production, injection, and image wellsactive during simulation period= 120Well number= 82X-coordinate of well in ft= 950.00Y-coordinate of well in ft= -550.00Well discharge in gpm= 0.13Duration of pump operation during simulation periodin days= 365.000Well radius in ft= 0.50Simulation period number= INumber of production, injection, and image wellsactive during simulation period= 120Well number= 83X-coordinate of well in ft= 950.00Y-coordinate of well in ft= -650.00Well discharge in gpm= 0.13Duration of pump operation during simulation periodin days= 365.000Well radius in ft= 0.50Simulation period number= 1Number of production, injection, and image wellsactive during simulation period= 120Well number= 84X-coordinate of well in ft= 950.00Y-coordinate of well in ft= -750.00Well discharge in gpm= 0.13. Duration of pump operation during simulation periodin days= 365.000Well radius in ft= 0.50Simulation period number= 1Number of production, injection, and image wellsactive during simulation period= 120
2-30
TABLE 2-3 (Cont.)
Well number= 85X-coordinate of well in ft= 950.00Y-coordinate of well in ft= -850.00Well discharge in gpm= 0.13Duration of pump operation during simulation periodin days= 365.000Well radius in ft= 0.50Simulation period number= INumber of production, injection, and image wellsactive during simulation period= 120Well number= 86X-coordinate of well in ft= 950.00Y-coordinate of well in ft= -950.00Well discharge in gpm= 0.13Duration of pump operation during simulation periodin days= 365.000Well radius in ft= 0.50Simulation period number= INumber of production, injection, and image wellsactive during simulation period= 120Well number= 87X-coordinate of well in ft= 950.00Y-coordinate of well in ft= -1050.00Well discharge in gpm= 0.13Duration of pump operation during simulation periodin days= 365.000Well radius in ft= 0.50Simulation period number= INumber of production, injection, and image wellsactive during simulation period= 120Well number= 88X-coordinate of well in ft= 950.00Y-coordinate of well in ft= -1150.00Well discharge in gpm= 0.13Duration of pump operation during simulation periodin days= 365.000Well radius in ft= 0.50Simulation period number= INumber of production, injection, and image wellsactive during simulation period= 120Well number= 89X-coordinate of well in ft= 950.00Y-coordinate of well in ft- -1250.00Well discharge in gpm= 0.13Duration of pump operation during simulation periodin days= 365.000Well radius in ft= 0.50Simulation period number= INumber of production, injection, and image wellsactive during simulation period= 120Well number= 90X-coordinate of well in ft= 1050.00Y-coordinate of well in ft= -350.00Well discharge in gpm= 0.13Duration of pump operation during simulation periodin days= 365.000Well radius in ft= 0.50Simulation period number= INumber of production, injection, and image wellsactive during simulation period= 120Well number= 91X-coordinate of well in ft= 1050.00Y-coordinate of well in ft= -450.00Well discharge in gpm= 0.13Duration of pump operation during simulation periodin days= 365.000Well radius in ft= 0.50Simulation period number= INumber of production, injection, and image wellsactive during simulation period= 120
2-31
TABLE 2-3 (Cont.)
Well number= 92X-coordinate of well in 4t- 1050.00Y-coordinate of well in ft= -550.00Well discharge in gpm= 0.13Duration of pump operation during simulation periodin days= 365.000Well radius in ft= 0.50Simulation period number= 1Number of production, injection, and image wellsactive during simulation period- 120Well number= 93X-coordinate of well in ft= 1050.00Y-coordinate of well in 4t= -650.00Well discharge in gpmi 0.13Duration of pump operation during simulation periodin dayg= 365.000Well radius in ft= 0.50Simulation period number= 1Number of production, injection, and image wellsactive during simulation period- 120Well number- 94X-coordinate of well in ft- 1050.00Y-coordinate of well in ft= -750.00Well discharge in gpm= 0.13Duration of pump operation during simulation periodin days= 365.000Well radius in ft= 0.50Simulation period number= 1Number of production, injection, and image wellsactive during simulation period= 120Well number= 95X-coordinate of well in ft= 1150.00Y-coordinate of well in ft= -350.00Well discharge in gpm= 0.13Duration of pump operation during simulation periodin days= 365.000Well radius in ft= 0.50Simulation period number- INumber of production, injection, and image wellsactive during simulation period- 120Well number- 96X-coordinate of well in ft= 1150.00Y-coordinate of well in ft= -450.00Well discharge in gpm= 0.13Duration of pump operation during simulation periodin days= 365.000Well radius in ft= 0.50Simulation period number= 1Number of production, injection, and image wellsactive during simulation period= 120Well number= 97X-coordinate of well in ft= 1150.00Y-coordinate of well in ft= -550.00Well discharge in gpm= 0.13Duration of pump operation during simulation periodin days= 365.000Well radius in ft= 0.50Simulation period number= INumber of production, injection, and image wellsactive during simulation period= 120Well number= 98X-coordinate of well in ft= 1150.00Y-coordinate of well in ft= -650.00Well discharge in gpm= 0.13Duration of pump operation during simulation periodin days= 365.000Well radius in ft= 0.50Simulation period number= INumber of production, injection, and image wellsactive during simulation period- 120
2-32
TABLE 2-3 (Cont.)
Well numberz 99X-coordinate of well in ft= 1150.00Y-coordinate of well in ft= -750.00Well discharge in gpm- 0.13Duration of pump operation during simulation periodin days= 365.000Well radius in ft- 0.50Simulation period number= 1Number of production, injection, and image wellsactive during simulation period= 120Well number= 100X-coordinate of well in ft= 1250.00Y-coordinate of well in ft- -450.00Well discharge in gpm= 0.13Duration of pump operation during simulation periodin days= 365.000Well radius in ft- 0.50Simulation period number= INumber of production, injection, and image wellsactive during simulation period= 120Well number= 101X-coordinate of well in ft= 1250.00Y-coordinate of well in ft- -550.00Well discharge in gpm= 0.13Duration of pump operation during simulation periodin days= 365.000Well radius in ft- 0.50Simulation period number= INumber of production, injection, and image wellsactive during simulation period= 120Well number= 102X-coordinate of well in ft= 1250.00Y-coordinate of well in ft= -650.00Well discharge in gpm- 0.13Duration of pump operation during simulation periodin days- 365.000Well radius in ft= 0.50Simulation period number= INumber of production, injection, and image wellsactive during simulation period= 120Well number= 103X-coordinate of well in ft= 1350.00Y-coordinate of well in it= -450.00Well discharge in gpm= 0.13Duration of pump operation during simulation periodin days= 365.000Well radius in ft= 0.50Simulation period number= INumber of production, injection, and image wellsactive during simulation period- 120Well number= 104X-coordinate of well in 4t= 1350.00Y-coordinate of well in It= -550.00Well discharge in gpm= 0.13Duration of pump operation during simulation periodin days= 365.000Well radius in ft= 0.50Simulation period number= INumber of production, injection, and image wellsactive during simulation period= 120Well number= 105X-coordinate of well in it= 1350.00Y-coordinate of well in it= -650.00Well discharge in gpm= 0.13Duration of pump operation during simulation periodin days= 365.000Well radius in ft- 0.50Simulation period number= INumber of production, injection, and image wellsactive during simulation period= 120 2-33
TABLE 2-3 (Cont.)
Well number= 106X-coordinate of well in ft= 1450.00Y-coordinate of well in ft= -450.00Well discharge in gpm= 0.13Duration of pump operation during simulation periodin days= 365.000Well radius in ft= 0.50Simulation period number= INumber of production, injection, and image wellsactive during simulation period= 120Well number= 107X-coordinate of well in ft= 1450.00Y-coordinate of well in ft= -550.00Well discharge in gpm= 0.13Duration of pump operation during simulation periodin days= 365.000Well radius in ft= 0.50Simulation period number= INumber of production, injection, and image wellsactive during simulation period= 120Well number= 108X-coordinate of well in ft= 1450.00Y-coordinate of well in ft= -650.00Well discharge in gpm= 0.13Duration of pump operation during simulation periodin days= 365.000Well radius in ft= 0.50Simulation period number= 1Number of production, injection, and image wellsactive during simulation period= 120Well number= 109X-coordinate of well in ft= 1550.00Y-coordinate of well in ft= -450.00Well discharge in gpm= 0.13Duration of pump operation during simulation periodin days= 365.000Well radius in ft= 0.50Simulation period number= INumber of production, injection, and image wellsactive during simulation period= 120Well number= 110X-coordinate of well in ft= 1550.00Y-coordinate of well in ft= -550.00Well discharge in gpm= 0.13Duration of pump operation during simulation periodin days= 365.000Well radius in ft= 0.50Simulation period number= 1Number of production, injection, and image wellsactive during simulation period= 120Well number= 111X-coordinate of well in ft= 1550.00V-coordinate of well in ft= -650.00Well discharge in gpm= 0.13Duration of pump operation during simulation periodin days= 365.000Well radius in ft= 0.50Simulation period number= INumber of production, injection, and image wellsac.tive during simulation period= 120Well number= 112X-coordinate of well in ft= 1650.00Y-coordinate of well in ft= -450.00Well discharge in gpm- 0.13Duration of pump operation during simulation periodin days= 365.000Well radius in ft= 0.50Simulation period number= INumber of production, injection, and image wellsactive during simulation period- 120
2-34
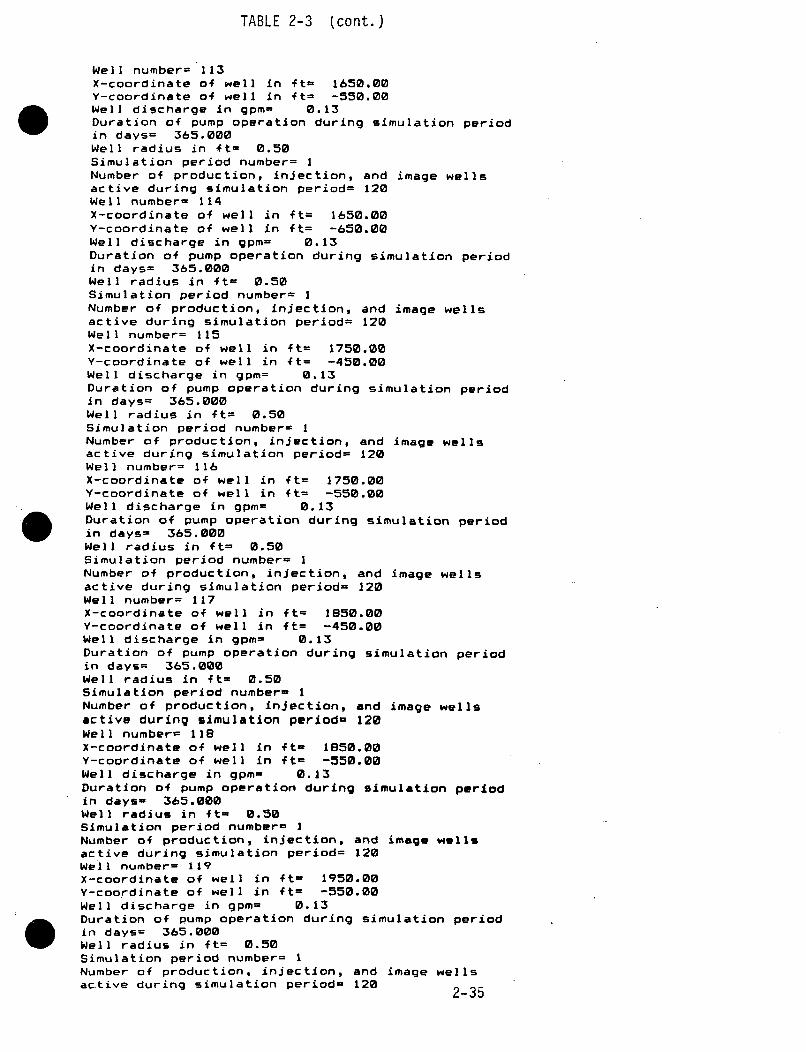
TABLE 2-3 (cont.)
Well number= 113X-coordinate of well in ft- 1650.00Y-coordinate of well in 4t= -550.00Well discharge in gpm= 0.13Duration of pump operation during simulation periodin days= 365.000Well radius in ft= 0.50Simulation period number= 1Number of production, injection, and image wellsactive during simulation period= 120Well number= 114X-coordinate of well in ft= 1650.00Y-coordinate of well in ft= -650.00Well discharge in gpm= 0.13Duration of pump operation during simulation periodin days= 365.000Well radius in ft= 0.50Simulation period number- 1Number of production, injectiong and image wellsactive during simulation period= 120Well number= 115X-coordinate of well in ft= 1750.00Y-coordinate of well in ft= -450.00Well discharge in gpm= 0.13Duration of pump operation during simulation periodin days= 365.000Well radius in ft= 0.50Simulation period number= 1Number of production, injection, and image wellsactive during simulation period- 120Well number= 116X-coordinate of well in ft= 1750.00Y-coordinate of well in ft= -550.00Well discharge in gpm= 0.13Duration of pump operation during simulation periodin days= 365.000Well radius in ft- 0.50Simulation period number- 1Number of production, injection, and image wellsactive during simulation period= 120Well number= 117X-coordinate of well in ft= 1850.00Y-coordinate of well in ft= -450.00Well discharge in gpm= 0.13Duration of pump operation during simulation periodin days= 365.000Well radius in ft- 0.50Simulation period number= 1Number of production, injection, and image wellsactive during simulation period- 120Well number= 118X-coordinate of well in ft- 1850.00Y-coordinate of well in ft= -550.00Well discharge in gpm= 0.13Duration of pump operation during simulation periodin days- 365.000Well radius in ft- 0.50Simulation period number- 1Number of production, injection, and image wellsactive during simulation period= 120Well number= 119X-coordinate of well in ft= 1950.00Y-coordinate of well in ft= -550.00Well discharge in gpm= 0.13Duration of pump operation during simulation periodin days= 365.000Well radius in ft= 0.50Simulation period number= INumber of production, injection, and image wellsactive during simulation period= 120 2-35
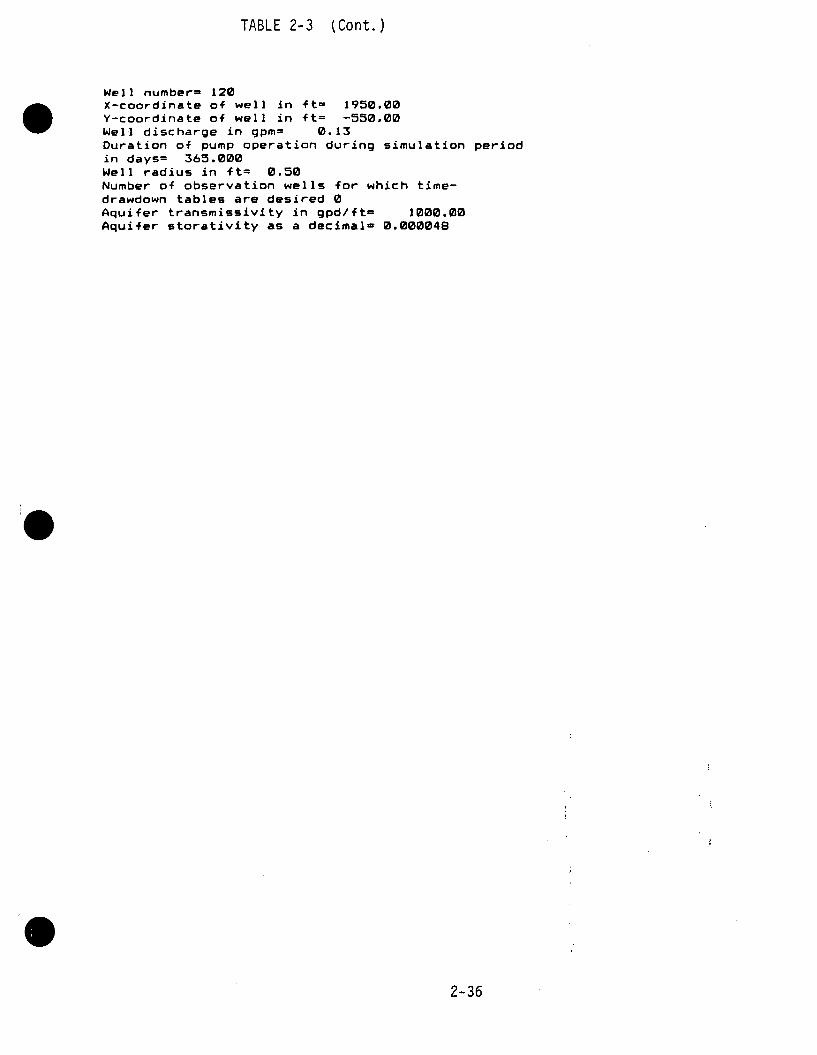
TABLE 2-3 (Cont.)
Well number= 120X-coordinate of well In ft= 1950.00Y-coordinate of well in ft= -550.00Well discharge in gpm= 0.13Duration of pump operation during simulation periodin days= 365.000Well radius in ft= 0.50Number of observation wells for which time-drawdown tables are desired 0Aquifer transmissivity in gpd/ft= 1000.00Aquifer storativity as a decimal- 0.000048
2-36
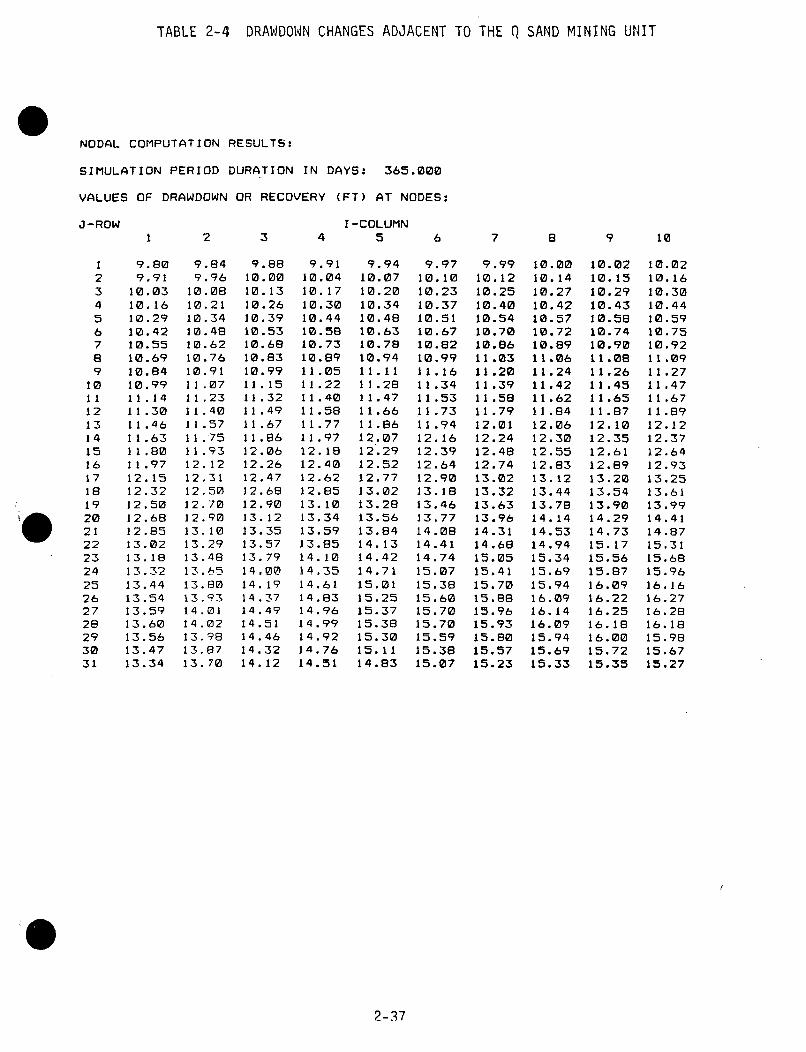
TABLE 2-4 DRAWDOWN CHANGES ADJACENT TO THE Q SAND MINING UNIT
NODAL COMPUTATION RESULTS:
SIMULATION PERIOD DURATION IN DAYS: 365.000
VALUES OF DRAWDOWN OR RECOVERY (FT) AT NODES:
J-ROW
I23456789
10111213141516171819202122232425262728293031
I-COLUMN1 2 3 4 5 6 7 8 9 10
9.809.91
10.0310.1610.2910.4210.5510.6910.8410.9911.1411 .3011 .4611 .6311.8011 .9712.1512.3212.5012.6812.8513.0213.1813.3213.4413.5413.5913.6013.5613.4713.34
9.849.96
10.0810.2110.3410.4810.6210.7610.9111.0711.2311.4011.5711.7511.9312.1212.3112.5012.7012.9013.1013.2913.4813 . 6513.8013.9314.0114.0213.9813.8713.70
9.8810.0010.1310.2610.3910.5310.6810.8310.9911.1511.3211.4911.6711.8612.0612.2612.4712.6812.9013.1213.3513.5713.7914.0014.1914.3714.4914.5114.4614.3214.12
9.9110.0410.1710.3010.4410.5810.7310.8911.0511.2211.4011.5811.771*1.9712.1812.4012.6212.8513.1013.3413.5913.8514.1014.3514.6114.8314.9614.9914.9214.7614.51
9.9410.0710.2010.3410.4810.6310.7810.9411.1111.2811.4711.6611.8612.0712.2912.5212.7713.0213.2813.5613.8414.1314.4214.7115.0115.2515.3715.3815.3015.1114.83
9.9710.1010.2310.3710.5110.6710.8210.9911.1611.3411.53!11.73
11.9412.1612.3912.6412.9013.1813.4613.7714.0814.4114.7415.0715.3815.6015.7015.7015.5915.3815.07
9.9910.1210.2510.4010.5410.7010.8611.0311.2011.3911.5811.7912.0112.2412.4812.7413.0213.3213.6313.9614.3114.6815.0515.4115.7015.8815.9615.9315.8015.5715.23
10.0010.1410.2710.4210.5710.7210.8911.0611.2411.4211.6211.8412.0612.3012.5512.8313.1213.4413.7814.1414.5314.9415.3415.6915.9416.0916.1416.0915.9415.6915.33
10.0210.1510.2910.4310.5810.7410.9011.0811.2611 .45
11.6511.8712.1012.3512.6112.8913.2013.5413.9014.2914.7315.1715.5615.8716.0916.2216.2516.1816.0015.7215.35
10.0210.1610.3010.4410.5910.7510.9211.0911.2711.4711.6711.8912.1212.3712.6412.9313.2513.6113.9914.4114.8715.3115.6815.9616.1616.2716.2816.1815.9815.6715.27
2-37
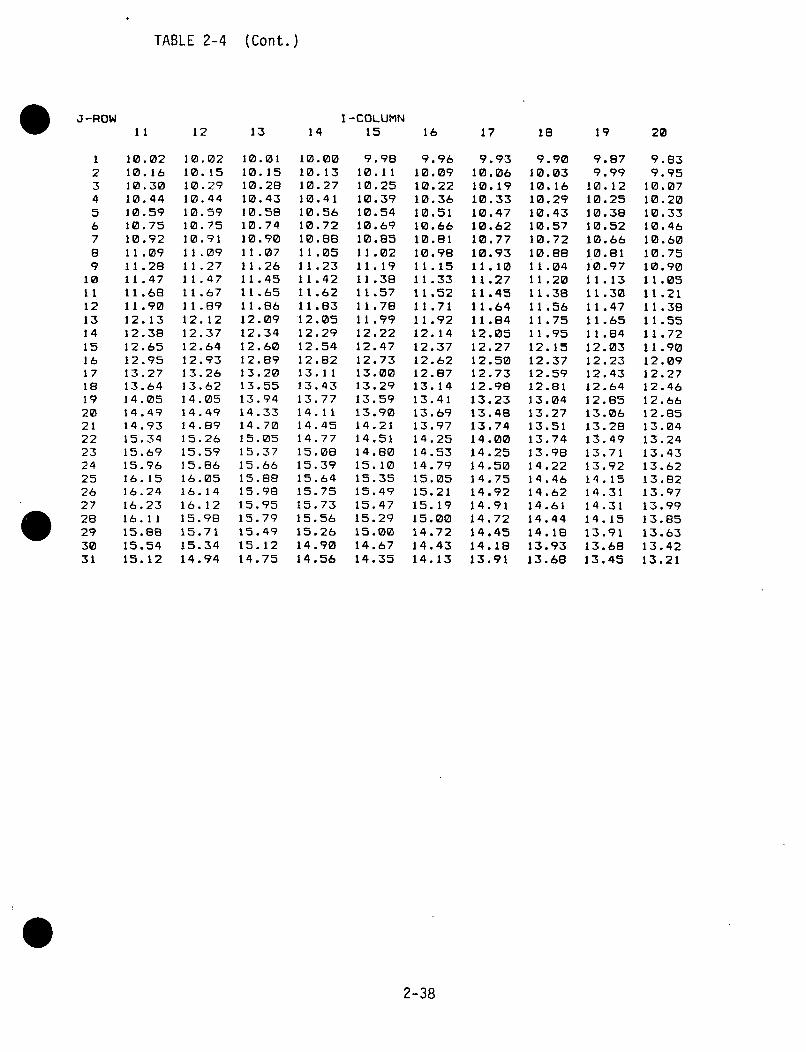
TABLE 2-4 (Cont.)
J-ROW I-COLUMN11 12 13 14 15 16 17 18 19 20
1 10.02 10.02 10.01 10.00 9.98 9.96 9.93 9.90 9.87 9.832 10.16 10.15 10.15 10.13 10.11 10.09 10.06 10.03 9.99 9.953 10.30 10.29 10.28 10.27 10.25 10.22 10.19 10.16 10.12 10.074 10.44 10.44 10.43 10.41 10.39 10.36 10.33 10.29 10.25 10.205 10.59 10.59 10.58 10.56 10.54 10.51 10.47 10.43 10.38 10.336 10.75 10.75 10.74 10.72 10.69 10.66 10.62 10.57 10.52 10.467 10.92 10.91 10.90 10.88 10.85 10.81 10.77 10.72 10.66 10.608 11.09 11.09 11.07 11.05 11.02 10.98 10.93 10.88 10.81 10.759 11.28 11.27 11.26 11.23 11.19 11.15 11.10 11.04 10.97 10.90
10 11.47 11.47 11.45 11.42 11.38 11.33 11.27 11.20 11.13 11.0511 11.68 11.67 11.65 11.62 11.57 11.52 11.45 11.38 11.30 11.2112 11.90 11.89 11.86 11.83 11.78 11.71 11.64 11.56 11.47 11.3813 12.13 12.12 12.09 12.05 11.99 11.92 11.84 11.75 11.65 11.5514 12.38 12.37 12.34 12.29 12.22 12.14 12.05 11.95 11.84 11.7215 12.65 12.64 12.60 12.54 12.47 12.37 12.27 12.15 12.03 11.9016 12.95 12.93 12.89 12.82 12.73 12.62 12.50 12.37 12.23 12.0917 13.27 13.26 13.20 13.11 13.00 12.87 12.73 12.59 12.43 12.2718 13.64 13.62 13.55 13.43 13.29 13.14 12.98 12.81 12.64 12.4619 14.05 14.05 13.94 13.77 13.59 13.41 13.23 13.04 12.85 12.6620 14.49 14.49 14.33 14.11 13.90 13.69 13.4S 13.27 13.06 12.8521 14.93 14.89 14.70 14.45 14.21 13.97 13.74 13.51 13.28 13.0422 15.34 15.26 15.05 14.77 14.51 14.25 14.00 13.74 13.49 13.2423 15.69 15.59 15.37 15.08 14.80 14.53 14.25 13.98 13.71 13.4324 15.96 15.86 15.66 15.39 15.10 14.79 14.50 14.22 13.92 13.6225 16.15 16.05 15.88 15.64 15.35 15.05 14.75 14.46 14.15 13.8226 16.24 16.14 15.98 15.75 15.49 15.21 14.92 14.62 14.31 13.9727 16.23 16.12 15.95 15.73 15.47 15.19 14.91 14.61 14.31 13.9928 16.11 15.98 15.79 15.56 15.29 15.00 14.72 14.44 14.15 13.8529 15.88 15.71 15.49 15.26 15.00 14.72 14.45 14.18 13.91 13.6330 15.54 15.34 15.12 14.90 14.67 14.43 14.18 13.93 13.68 13.4231 15.12 14.94 14.75 14.56 14.35 14.13 13.91 13.68 13.45 13.21
2-38
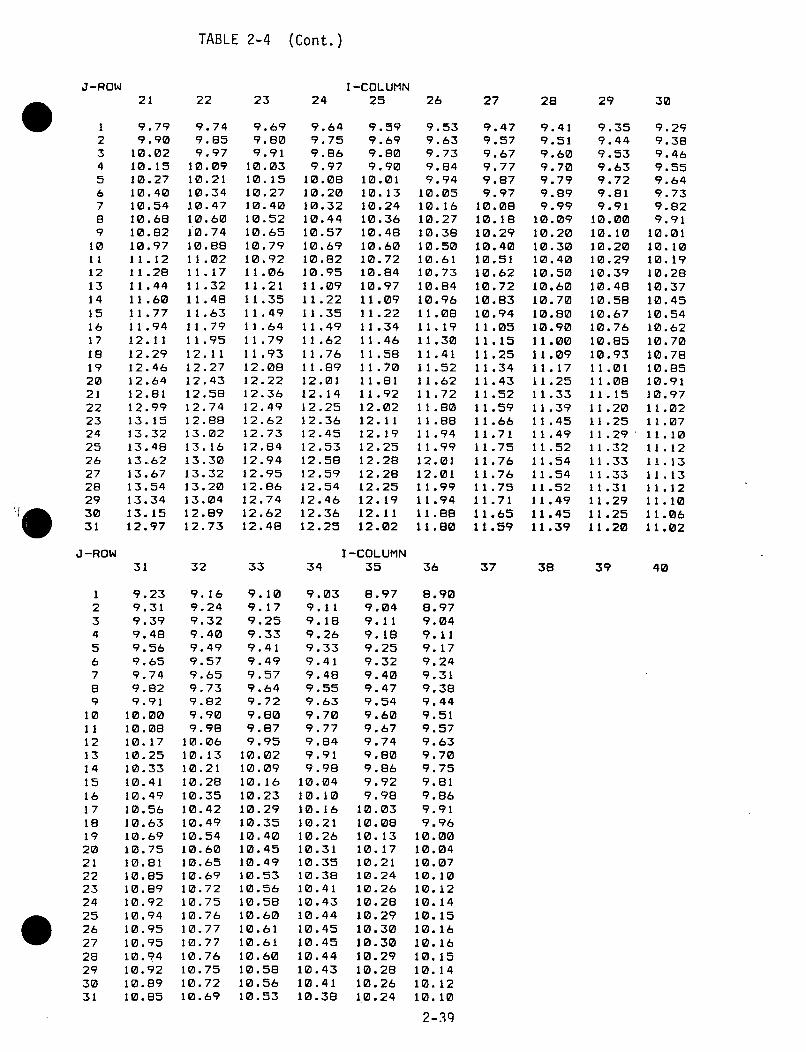
TABLE 2-4 (Cont.)
J-ROW
123456789
1011
1213141516171819202122232425262728293031
I-COLUMN21 22 23 24 25 26 27 28 29 30
9.799.90
10.0210.1510.2710.4010.5410.6810.8210.9711.1211.2811.4411.6011.7711.9412.1112.2912.4612.6412.8112.9913.1513.3213.4813.6213.6713.5413.3413.1512.97
9.749?. 859.97
10.0910.2110.3410.4710.6010.7410.8811.0211.1711.3211.4811.6311.7911.9512.1112.2712.4312.5812.7412.8813.0213.1613.3013.3213.2013.0412.8912.73
9.699.809.91
10.0310.1510.2710.4010.5210.6510.7910.9211.0611.2111.3511.4911.6411.7911.9312.0812.2212.3612.4912.6212.7312.8412.9412.9512.8612.7412.6212.48
9.649.759.869.97
10.0810.2010.3210.4410.5710.6910.8210.9511.0911.2211.3511.4911.6211.7611.8912.0112.1412.2512.3612.4512.5312.5812.5912.5412.4612.3612.25
9.599.699.809.90
10.0110.1310.2410.3610.4810.6010.7210.8410.9711.0911.2211.3411.4611.5811.7011.8111.9212.0212.1112.1912.2512.2812.2812.2512.1912.1112.02
9.539.639.739.849.94
10.0510.1610.2710.3810.5010.6110.7310.8410.9611.0811.1911.3011.4111.5211.6211.7211.8011.8811.9411.9912.0112.0111.9911.9411.8811.80
9.479.579.679.779.879.97
10.0810.1810.2910.4010.5110.6210.7210.8310.9411.0511.1511.2511.3411.4311.5211.5911.6611.7111.7511.7611.7611.7511.7111.6511.59
9.419.519.609.709.799.899.99
10.0910.2010.3010.4010.5010.6010.7010.8010.9011.0011.0911.1711.2511.3311.3911.4511.4911.5211 . 5411.5411.5211.4911.4511.39
9.359.449.539.639.729.819.91
10.0010.1010.2010.2910.3910.4810.5810.6710.7610.8510.9311.0111.0811.1511.2011.2511.2911.3211.3311.3311.3111 .291 .2511 20
9.299.389.469.559.649.739.829.91
10.0110.1010.1910.2810.3710.4510.5410.6210.7010.7810.8510.9110.9711.0211.0711.1011.1211.1311.1311.1211.1011.0611.02
J-ROW
123456789
10111213141516171819202122232425262728293031
I-COLUMN31 32 33 34 35
9.239.319.399.489.569.659.749.829.91
10.0010.0810.1710.2510.3310.4110.4910.5610.6310.6910.7510.8110.8510.8910.9210.9410.9510.9510.9410.9210.8910.85
9.169.249.329.409.499.579.659.739.829.909.98
10.0610.1310.2110.2810.3510.4210.4910.5410.6010.6510.6910.7210.7510.7610.7710.7710.7610.7510.7210.69
9.109.179.259.339.419.499.579.649.729.809.879.95
10.0210.0910.1610.2310.2910.3510.4010.4510.4910.5310.5610.5810.6010.6110.6110.6010.5810.5610.53
9.039.119.189.269.339.419.489.559.639.709.779.849.919.98
10.0410.1010.1610.2110.2610.3110.3510.3810.4110.4310.4410.4510.4510.4410.4310.4110.38
8.979.049.119.189.259.329.409.479.549.609.679.749.809.869.929.98
10.0310.0810.1310.1710.2110.2410.2610.2810.2910.3010.3010.2910.2810.2610.24
36 37 38 39 40
8.908.979.049.119.179.249.319.389.449.519.579.639.709.759.819.869.919.96
10.0010.0410.0710.1010.1210.1410.1510.1610.1610.1510.1410.1210.10
2-39
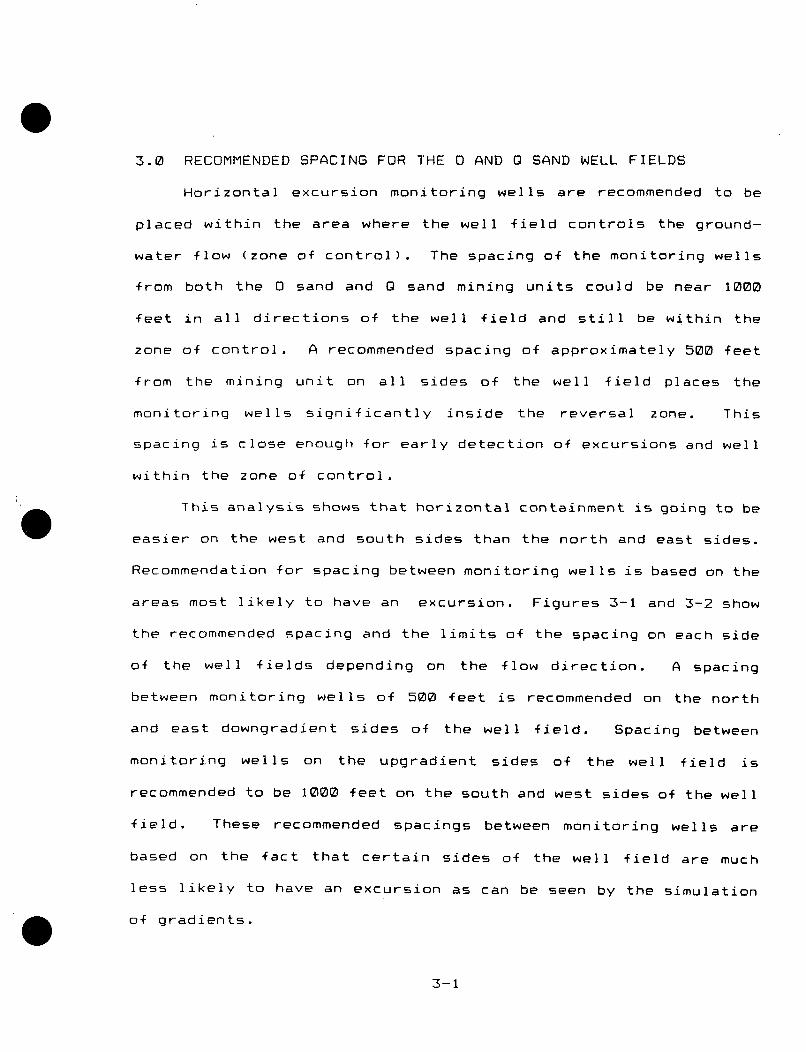
3.0 RECOMMENDED SPACING FOR THE 0 AND Q SAND WELL FIELDS
Horizontal excursion monitoring wells are recommended to be
placed within the area where the well field controls the ground-
water flow (zone of control). The spacing of the monitoring wells
from both the 0 sand and Q sand mining units could be near 1000
feet in all directions of the well field and still be within the
zone of control. A recommended spacing of approximately 500 feet
from the mining unit on all sides of the well field places the
monitoring wells significantly inside the reversal zone. This
spacing is close enough for early detection of excursions and well
within the zone of control.
This analysis shows that horizontal containment is going to be
easier on the west and south sides than the north and east sides.
Recommendation for spacing between monitoring wells is based on the
areas most likely to have an excursion. Figures 3-1 and 3-2 show
the recommended spacing and the limits of the spacing on each side
of the well fields depending on the flow direction. A spacing
between monitoring wells of 500 feet is recommended on the north
and east downgradient sides of the well field. Spacing between
monitoring wells on the upgradient sides of the well field is
recommended to be 1000 feet on the south and west sides of the well
field. These recommended spacings between monitoring wells are
based on the fact that certain sides of the well field are much
less likely to have an excursion as can be seen by the simulation
of gradients.
3-1
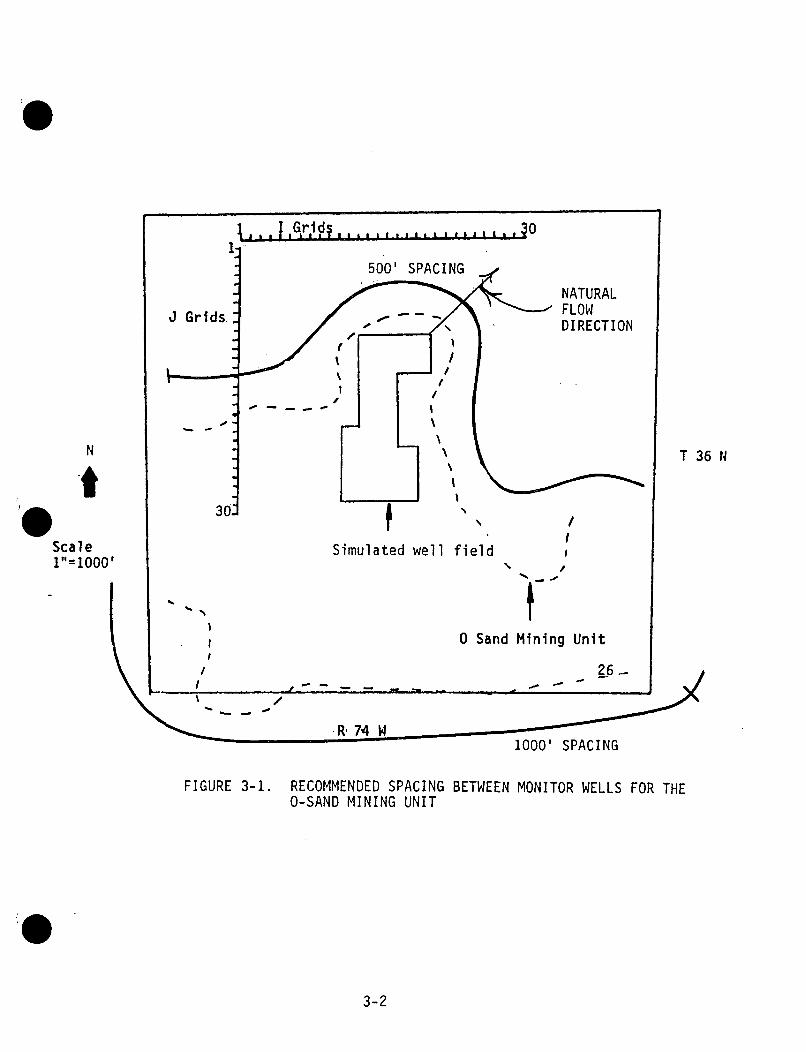
I I GqrJA. .. , - - - - - - -I a, , V
1-500' SPACING
NATURALFLOWDIRECTION
J Grids.
- - -
N
i
ScaleI"=10001
T 36 N
u tSimulated well field
/- -
//I
0 Sand Mining Unit
/
1000' SPACING
FIGURE 3-1. RECOMMENDED SPACING BETWEEN MONITOR WELLS FOR THEO-SAND MINING UNIT
3-2
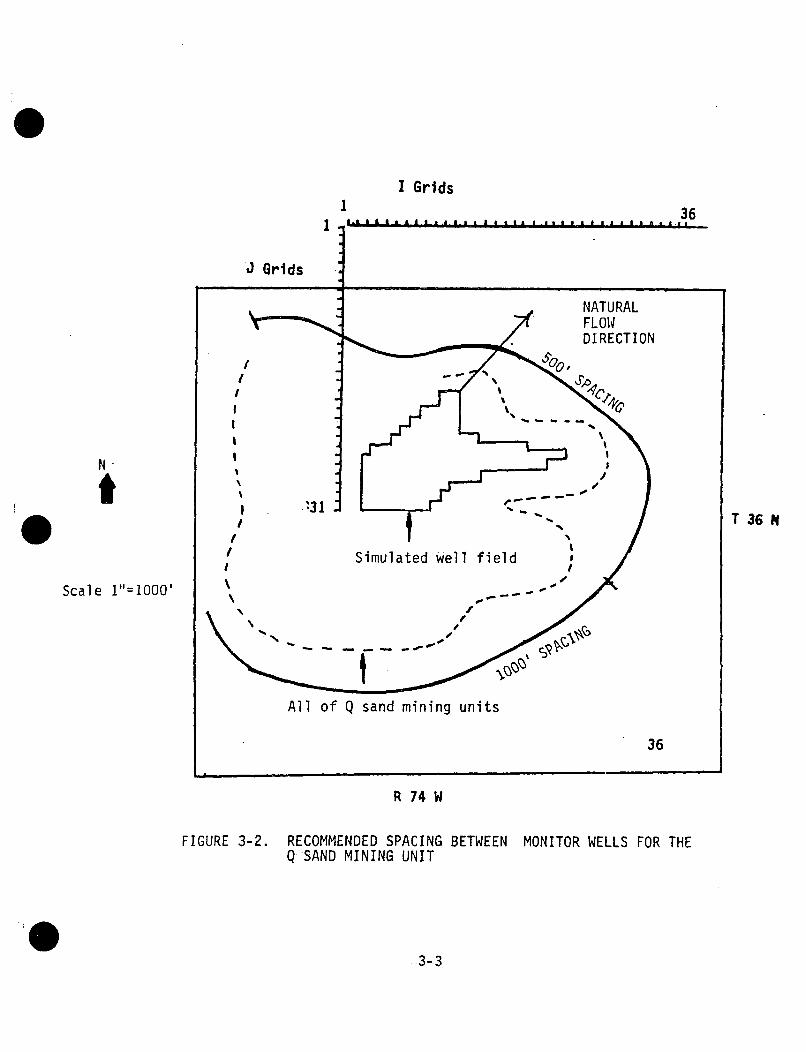
I GridsI 36
T 36 N
Scale 1"=1000'
R 74 W
FIGURE 3-2. RECOMMENDED SPACING BETWEEN MONITOR WELLS FOR THEQ"SAND MINING UNIT
3-3
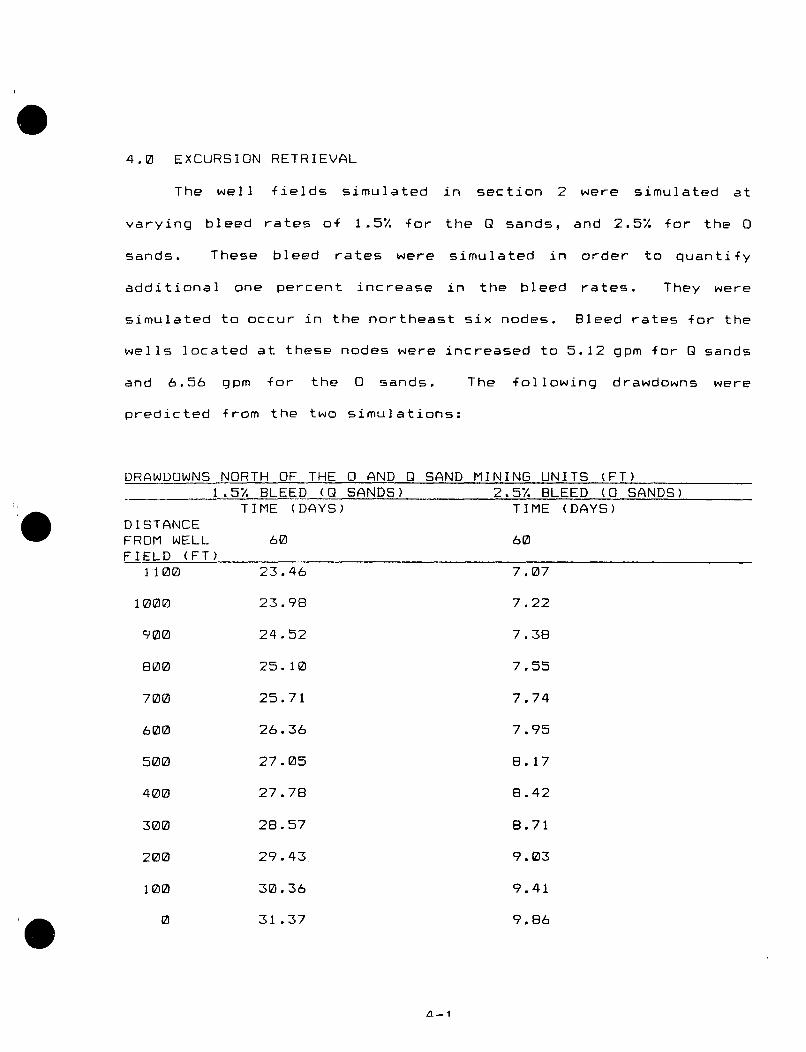
4.0 EXCURSION RETRIEVAL
The well fields simulated in section 2 were simulated at
varying bleed rates of 1.5% for the Q sands, and 2.5% for the 0
sands. These bleed rates were simulated in order to quantify
additional one percent increase in the bleed rates. They were
simulated to occur in the northeast six nodes. Bleed rates for the
wells located at these nodes were increased to 5.12 gpm for 0 sands
and 6.56 gpm for the 0 sands. The following drawdowns were
predicted from the two simulations:
DRAWDOWNS NORTH OF THE 0 AND 0 SAND MINING UNITS (FT)1.5% BLEED (Q SANDS) 2.5% BLEED (0 SANDS)
TIME (DAYS) TIME (DAYS)
DISTANCEFROM WELL 60 60FIELD (FT)
1100 23.46 7.07
1000 23.98 7.22
900 24.52 7.38
800 25.10 7.55
700 25.71 7.74
600 26.36 7.95
500 27.05 8.17
400 27.78 8.42
300 28.57 8.71
200 29.43 9.03
100 30.36 9.41
0 31.37 9.86
AI-1
A correction of 0.07 ft. per 100 feet for the 0 sand gradient
is needed to obtain the change in head between two 100 foot nodes.
For the Q sand the correction is .11 ft per 100 feet. Therefore
the predicted gradients toward the well field at the proposed
monitoring well location (500 feet) after 60 days of increased rate
are .0018 and .0062 ft/ft for the 0 and Q sands respectively. The
average ground-water movement rates back to the well field are
estimated to be .072 ft/day and .28 ft/day for the 0 and 0 sands
respectively with the increased bleed rates (based on
permeabilities of 4.5 ft/day for the Q sands and 4.0 ft/day for the
o sand, and effective porosities of 0.1). These movement rates
will require travel times of 139 and 36 days, respectively for the
water to move ten feet back to the well field. The excursion is
"controlled" at the beginning of the period because contaminated
water is moving back toward the well field. The wells on excursion
status will most likely be off excursion prior to the end of the
above stated periods due to the hydro-chemical nature of an
excursion.
4-2
5.0 REFERENCES
Hydro-Engineering, 1989, Guideline for Spacing Ore SandMonitoring Wells Adjacent to an Insitu Well Field.
Hydro-Engineering, 1990, Re-analysis of the Smith RanchProject Pump Test Data.
Theis, C.V., 1935, The Relation Between the Lowering of thePiezometric Surface and the Rate and Duration of Discharge of aWell Using Ground-Water Storage: Transactions of the AmericanGeophysical Union, V. 16, Part 2.
Walton, W.C., 1989, Analytical Ground-Water Modeling, Flow andContaminant Migration: Lewis Publishers Inc.
9-1
H;>-DRODecember 21, 1990
Rio Algom401 E ECasper, WY 82601
ATTN: Donna Wichers
Dear Donna:
Enclosed are the responses to questions 18, 19 and 20. If you
have any questions please give me a call.
Sincerely,
eorgeL. Hoffman, P.E.Hydrologist
M ,DQ ALVV D>ViS iO NDECFE 9 ,1991
.. I Q ER;•]"1---' '-r ¶-"(
633
HYDRO-ENGINEERING770 East Magnolia Casper, Wyoming 82604 (307) 266-6597
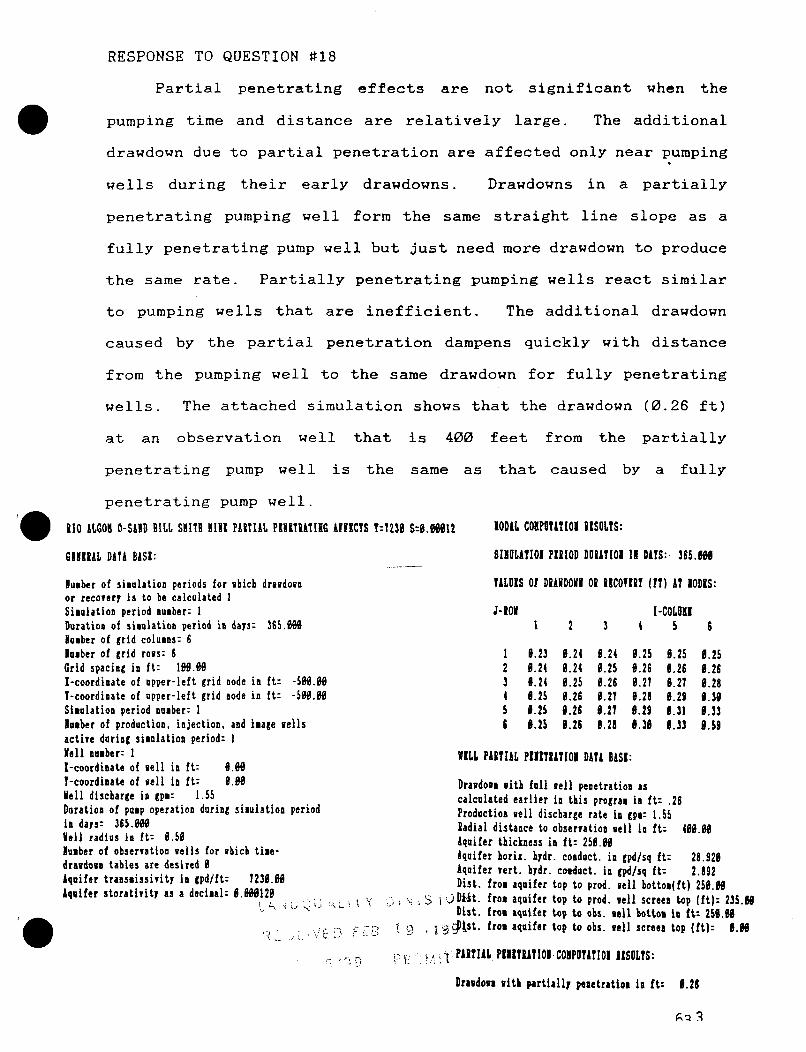
RESPONSE TO QUESTION #18
Partial penetrating effects are not significant when the
pumping time and distance are relatively large. The additional
drawdown due to partial penetration are affected only near pumping
wells during their early drawdowns. Drawdowns in a partially
penetrating pumping well form the same straight line slope as a
fully penetrating pump well but just need more drawdown to produce
the same rate. Partially penetrating pumping wells react similar
to pumping wells that are inefficient. The additional drawdown
caused by the partial penetration dampens quickly with distance
from the pumping well to the same drawdown for fully penetrating
wells. The attached simulation shows that the drawdown (0.26 ft)
at an observation well that is 400 feet from the partially
penetrating pump well is the same as that caused by a fully
penetrating pump well.
10 i&LGO! O-SHID BILL SlIT! 1111 PARTIAL PENETIATIIG AFfICTS T:1236 S:O.6 I2 IODAL COIPUTITIO RISULTS:
GENERAL DATA BASE: SINULATIOI PERIOD DURITIOi I! DAYS: 365.6
lumber of simulation periods for which drawdown VALUIS Of DANDOMI OR RICOVERY (IT) AT IODIS:or recovery is to be calculated ISimulation period number: I J-RON I-COLUIDuration of simulation period in days: 365.M 1 2 3 4 5 6Number of grid columns: 6lumber of grid rows: 6 1 0.23 0.24 0.24 0.25 6.25 0.25Grid spacing in it: 160.60 2 6.24 0.24 6.25 6.26 6.26 6.26I-coordinate of upper-left grid node in ft: -5H.66 3 6.24 6.25 0.26 6.27 0.27 6.28Y-coordinate of upper-left grid node in ft: -500.H 4 0.25 6.26 0.27 6.28 6.29 0.36Simulation period number: 1 5 6.25 6.26 0.27 6.29 1.31 6.33Number of production, injection, and image wells 6 6.25 6.26 3.28 6.30 1.33 6.59active during simulation period: IWell number: 1 WILL PARTIAL PEINTRATI01 DATA BASI:I-coordinate of well in it: 6.H1-coordinate of well in it: 6.00 Drawdown with full well penetration asWell discharge in gpm: 1.55 calculated earlier in this program in it: .26Duration of pump operation during simulation period Production well discharge rate in gpm: 1.55in days: 365.0f0 Radial distance to observation well in ft: 460.66Well radius in it: 6.56 Aquifer thickness in At= 250.0lumber of observation wells for which time- Aquifer horit , hydr. coiducts in gpd/sq 2t: 28.925draudown tables are desired 0 Aquifer vert. hydr. comduct. in gpd/sq it: 2.392
quifer transmissivity in gpd/ft: 7230.00 Dist. from aquifer top to prod. well botton(ft) 250.6Aquifer storativitY as a decimal: 6.60120 j •f iU t. from aquifer top to prod. well screen top (ft): 235.66Dist. from aquifer top to obs. well bottom in ft: 256.6
'o , Iz Jst. from aquifer top to obs. well screen top (it): 6.6
. PARTIAL PIIITRUTIOI.CONPUTATIOl IISOLTS:
Drawdowm witk partially pmmetratiom in it: 0.28
RESPONSE TO QUESTION #19
The attached simulation shows that a bleed rate of 4.5% will
retrieve the excursion 10 feet in 54 days. Therefore this is the
proposed increased bleed rate to retrieve the excursion in a
reasonable time.
,~ ~ ~ ~ 0 Y i,•••i•
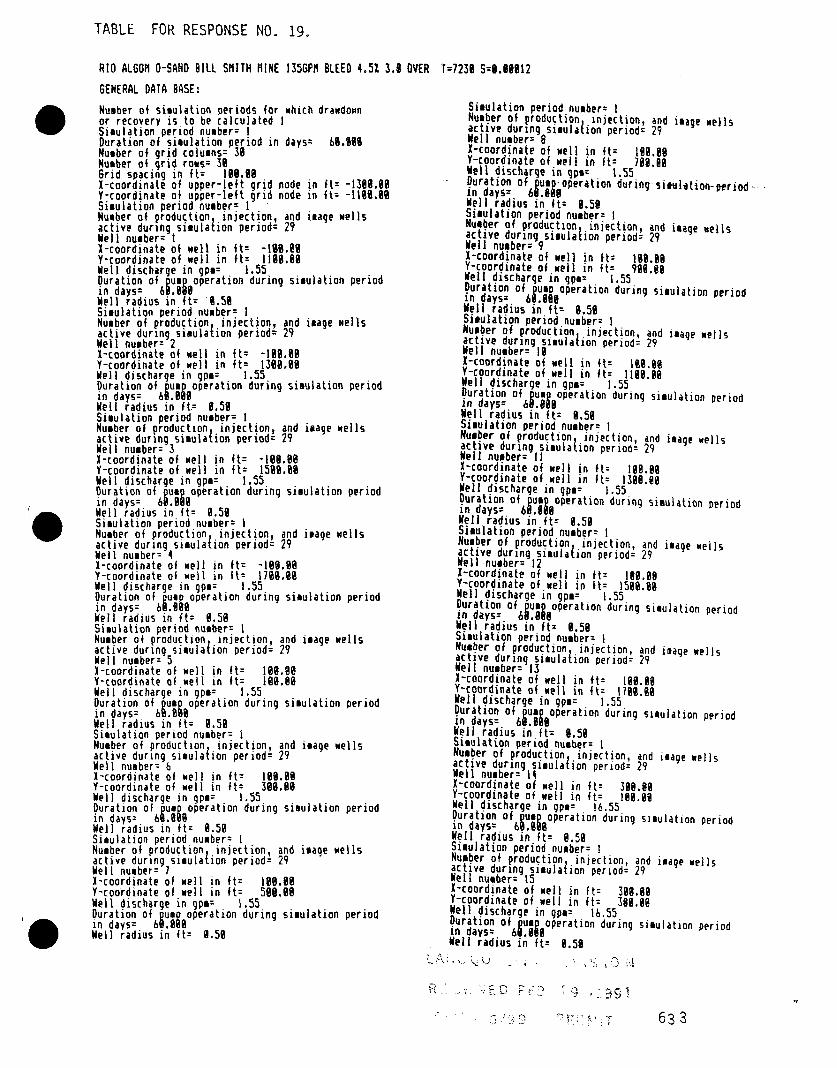
TABLE FOR RESPONSE NO. 19.
RIO ALGOM O-SAND BILL SMITH MINE 135GPM BLEED 4.51 3.8 OVER T=7239 S=6.68812
GENERAL DATA BASE:
Number of simulation periods for which drawdown Simulation period number: Ior recovery is to be calculated I Number of production injection, and image wellsSioulation period numbert I active during simulation period: 29
Duration of simulation period in days: 6=.999 Well number= 8Number of grid columns= 36 X-coordinate of well in ft: 119.88
Number of grid rows: 39 Y-coordinate of well in it: 798.98
Grid spacing in it: 189.88 Well discharge in gpm: 1.55
i-coordinate of upper-left grid node in it: -1388.90 Duration of pump-operation duringsimulatiton-periodY-coordinate of upper-left grid node in it: -1111.18 in days: 61.998
Simulation period number: I Well radius in it 8.58Number of production injection, and image wells Simulation period number: Iactive during simulation Period= 29 Number of production, injection, and image wellsaell numrer a I active during simulation period: 29
1-coordinate of well in it: -109.99 Well number: 9
Y-coordinate of well in it: 1199l.@ X-coordinate of well in it: 198.99
Well discharge in 9pm: 1.55 Y-coordinate of well in it: 989.99Duration opupoperation during simulation period Well discharge in 9pm: 1.55in dayso 6pump Duration of pump operation during simulation period
Well radius in it= 1.50 in days= 6.0.59
Simulation period number: I Well radius in it: 8.58
Number of production injection, and image wells Simulation period number: I
active during simulation period: 29 Number of production injection, and image wells
Well number: 2 active during simulation period: 29
X-coordinate of well in it: -189.88 Well number: 19
Y-coordinate of well in it: 1309.99 1-coordinate of well in ft: 199.99
Well discharge in . pm: 1.55 Y-coordinate of well in it: 1180.55Duration of pump operation during simulation period Well discharge in gpmn 1.55in days: 6. Duration of pumpoperation during simulation periodWell radius in it: 9.58 in days= 6 .Simulation period number= I Well radius in it: 8.59Nulber of productio ne o, and image wells Simulation period number: Iactive durong simulaton i eriond 29 Number of production injection, and image wells
Well numberi u active during simulation period= 29
X-coordinate of well in it: -198.09 Well number: I1
Y-coordinate of well in it: 1588.08 X-coordinate of well in it: 199.99
Well discharge in gpm: 1.55 Y-coordinate of well in it: 1398.98
Duration of % peration during simulation period Well discharge in gpm: 1.55in days= 6 Duration o pump operation during simulation period
Well radius in it: 8.59 in days= 6 .t0 .
Simulation period number: Well radius in it: 0.58
Number of production injection, and image wells Simulation period number: I
active during simulation period: 29 Number of production injection, and image wells
Well number: 4 active during simulation period: 29
I-coordinate of well in it: -109.88 Well number: 12Y-coordinate of well in it: 170%.08 X-coordinate of well in it: 190.98Well discharge in gpm= 1.55 Y-coordinate of well in it= 1598.88
ju e a i n Well discharge in 9pm: 1.5Duration of pump operation during simulation period Well discharge in 9pm: 1.55in days: 6,.9 a Duration of pump operation during simulation period
Well radius in it: 0.50 in days= 6i.8n
Simulation period number: I Well radius in it= 8.58
Number of production injection, and image wells Simulation period number: Iactive during simulation period= 29 Number of production, injection, and image wellsWell numberi 5 active during simulation period: 29
X-coordinate of well in it: 199.9@ Well number: 13Y-coordinate of well in It: 108.90 I-coordinate of well in it= 108.99Well discharge in gpm: 1.55 Y-coordinate of well in It: 1799.99
Duello di jschrei p: 15 Well discharge in 9p: 1.55Duration of pump operation during simulation period Drto oa onpm= ins i
in days: 6 Duration of p! operation during simulation Period
Well radius in it: 9.59 in days: 60.908
Simulation period number: I Well radius in it: 9.59
Number of production injection, and image wells Simulation period number: Iactive during simulation period= 29 Number of production injection, and image wellsWell numbern 6 active during simulation period: 29
X-coordinate of well in ft: 189.98 Well number: 14Y-coordinate of well in it: 389.89 I-coordinate of well in it: 380.88
Well discharge in 9pm: 1.55 Y-coordinate of well in it=
Duration of ump operation during simulation period Well discharge in gpm: 16.55in days= 6,. Duration of pump operation during simulation period
Well radius in it: 8.59 in days= 6 .t: 5
Simulation period number: I Well radius in It= 0.58Number of production injection, and image wells Simulation period number: Iactive during simulation period= 29 Number of production injection, and image wells
Well number: 7 active during simulation period: 29
I-coordinate of well in it: 189.88 Well number: 15
Y-coordinate of well in it: 598.98 X-coordinate of well in it: 398.99
Well discharge in 9pm: 1.55 Y-coordinate of well in it: 389.89
Duration of pump operation during simulation period Well discharge in gpm: 16.55in days: 6 .9 9 Duration of pump operation during simulation period
Well radius in it: 0.58 in days: 68.898Well radius in it: 9.59•..- . .. • -- • . , S ,.• i,
.. . .. . . .. . .. . .... •. ,-E C <-.- • .q 3c•
633
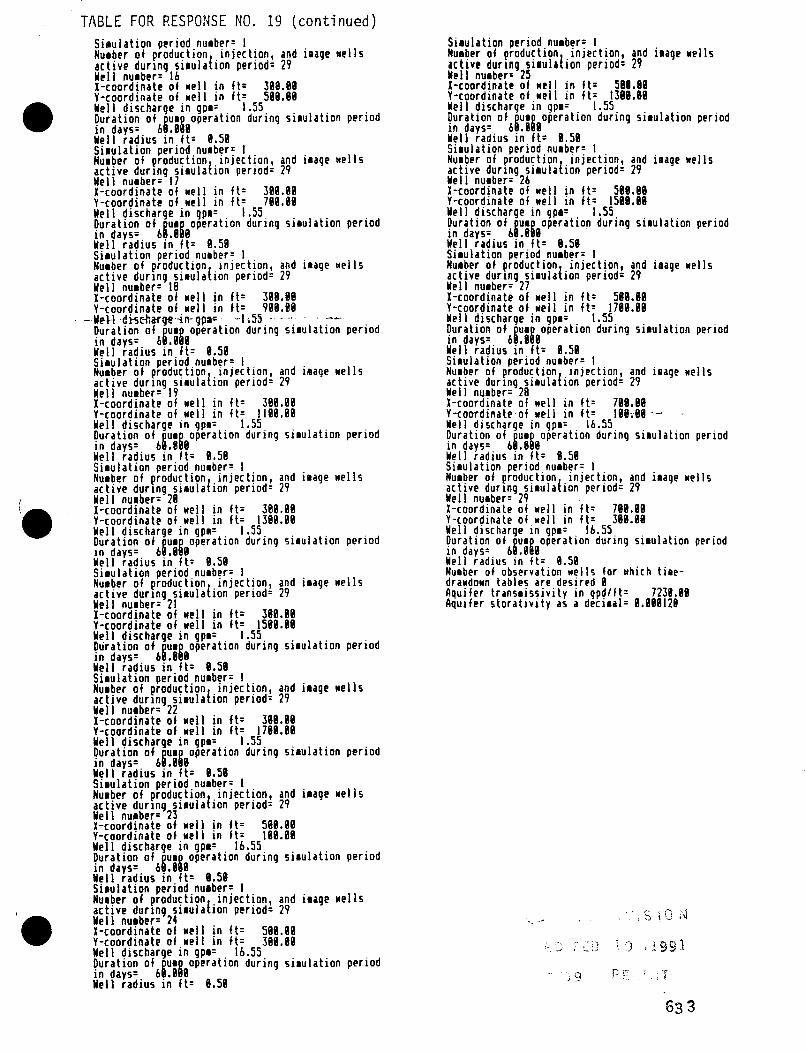
TABLE FOR RESPONSE NO. 19 (continued)
Simulation period number: INumber of production, injection, and image wellsactive during simulation period: 29Well number= 16X-coordinate of well in fte 388.03Y-coordinate of well in it= 598.89Well discharge in gpm: 1.55Duration of pump operation during simulation periodin days: 69.999
Well radius in ft= 9.59Simulation period number= INumber of production, injection, and image wellsactive during simulation period= 29Well number= 17X-coordinate of well in it= 399.69Y-coordinate of well in it= 769.98Well discharge in gpm= 1.55Duration of .um aoperation during simulation periodin days= 6 e.eeWell radius in ft: 98.5Simulation period number= INumber of production injection, and image wellsactive during simulation period= 29Well number= 18I-coordinate of well in it= 389.99Y-coordinate of well in it: 990.88
-ll-e-disc-harrge.4-n-g- -1. 55 --..--..... ..Duration of pump operation during simulation periodin days= 61.96Well radius in it= 8.58Simulation period number= INumber of production injection, and image wellsactive during simulation period= 29Well number: 19X-coordinate of well in it: 369.99Y-coordinate of well in it= 11199.8Well discharge in gpm: 1.55Duration of pump operation during simulation periodin days= 6.e,99Well radius in it: 9.58Simulation period number= INumber of production injection, and image wellsactive during simulation period= 29Well number: 28X-coordinate of well in it= 309.09Y-coordinate of well in it= 1399.99Well discharge in gpm=: 1.55Duration of pump operation during simulation periodin days: 69.6999Well radius in it: 9.58Simulation period number: INumber of production injection, and image wellsactive during simulation period= 29Well number= 21X-coordinate of well in it= 399.89Y-coordinate of well in ft= 1599.99Well discharge in gpm= 1.55Duration of pump operation during simulation periodin days= 6 .9 9Well radius in it: 8.59Simulation period number= INumber of production, injection, and image wellsactive during simulation period= 29Well number: 22I-coordinate of well in it: 396.98Y-coordinate of well in it: 1799.99Well discharge in gpm= 1.55Duration of pump operation during simulation periodin days= 69.989Well radius in it= 9.58Simulation period number= INumber of production, injection, and image wellsactive during simulation period= 29Well number= 23X-coordinate of well in ft= 599.99Y-coordinate of well in it: 199.09Well discharge in gpm: 16.55Duration ofMpump operation during simulation periodin days: oe.nU9Well radius in it: 9.58Simulation period number= INumber of production, injection, and image wellsactive during simulation period= 29Well number= 24X-coordinate of well in it= 598.99Y-coordinate of well in it= 399.89Well discharge in gpm= 16.55Duration of puml operation during simulation periodin days= 69.999Well radius in ft= 9.59
Simulation period number= INumber of production injection, and image wellsactive during simulation period: 29Well number= 25I-coordinate of well in it: 580.98Y-coordinate of well in it: 1399.99Well discharge in gpm= 1.55Duration of pump operation during simulation periodin days= 69. 99Well radius in it= 8.59Simulation period number= INumber of production, injection, and image wellsactive during simulation period= 29Well number= 26I-coordinate of well in it: 599.98Y-coordinate of well in it: 1598.89Well discharge in gpm= 1.55Duration of p up operation during simulation periodin days= 69. 99Well radius in it: 9.59Simulation period number= INumber of production injection, and image wellsactive during simulation period= 29Well number: 27I-coordinate of well in it= 599.89Y-coordinate of well in it: 1788.99Well discharge in gpm= 1.55Duration of pump operation during simulation periodin days= 69.999Well radius in ft: 0.59Simulation period number= INumber of production injection, and image wellsactive during simulation period= 29Well number= 28X-coordinate of well in it= 799.99Y-coordinate-of well in ft= 116~99-MWell discharge in gpm= 16.55Duration of pump operation during simulation periodin days: 6!. 99Well radius in it: 9.59Simulation period number= INumber of production, injection, and image wellsactive during simulation period= 29Well number: 29X-coordinate of well in it: 799.99Y-coordinate of well in it: 399.69Well discharge in gpm= 16.55Duration of pump operation during simulation periodin days: 69.999Well radius in it= 0.59Number of observation wells for which time-drawdown tables are desired 9Aquifer transmissivity in gpd/ft: 7239.99Aquifer storativity as a decimal= 9.199128
-' ;7) • P
633
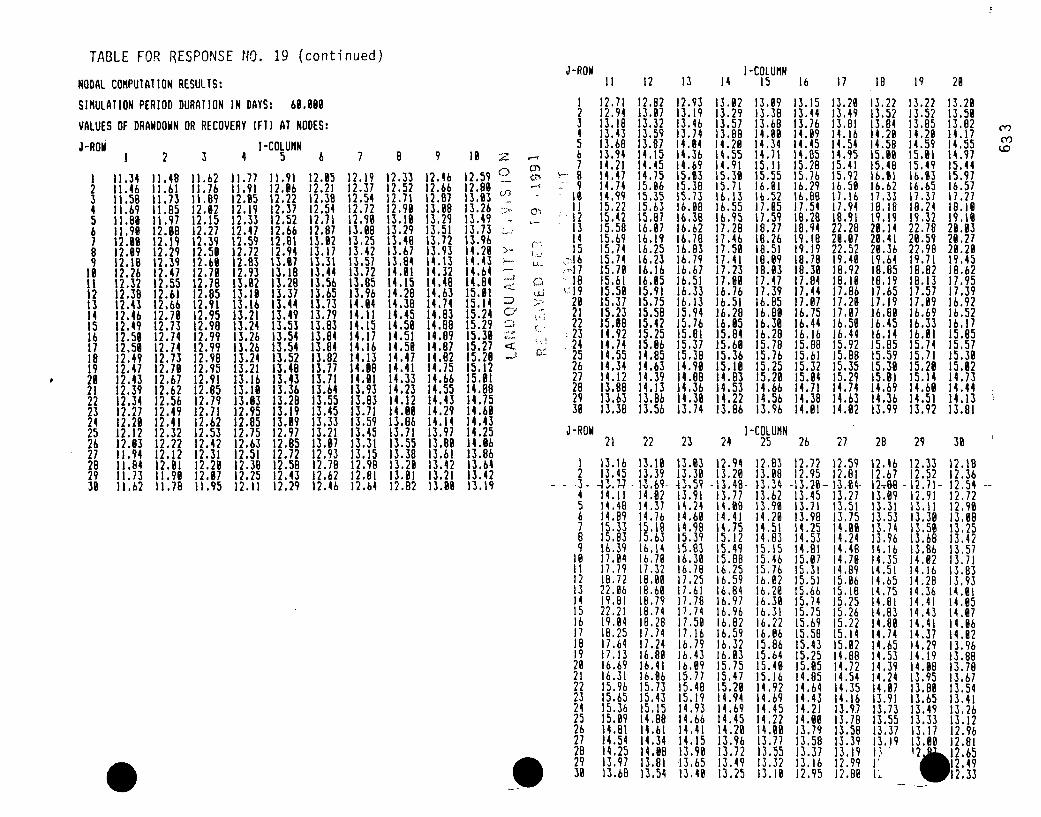
TABLE FOR RESPONSE NO. 19 (continued)
NODAL COMPUTATION RESULTS:
SIMULATION PERIOD DURATION IN DAYS: 69.989
VALUES OF DRAWDOWN OR RECOVERY (FT) AT NODES:
J-ROW I-COLUMNII 12 13 14 15 16 17 (8 19 20
J-ROW
123456789(9
12131415161718192921222324252627282939
!
11.3411.4611.5811.69
11.9112.89
12.1812.2612.3212.3812.4312.4612.4912.5112.5912.4912.4712.4312.3912.3412.2712.2912.1212.9311.9411.8411.7311.62
2
11.4811.6111.7311.8511.9712.9812.1912.2912.3912.4712.5512.6112.6612.7912.7312.7412.7412.7312.7612.6712.6212.5612.4912.4112.3212.2212.1212.9111.9911.78
3
11.6211.7611.8912.6212.1512.2712.3912.5112.6912.7912.7812.8512.9112.9512.9812.9912.9912.9812.9512.9112.8512.7912.7112.6212.5312.4212.3112.2112.9711.95
I-COLUMN4 5
11.77 11.9111.91 12.8612.95 12.2212.19 12.3712.33 12.5212.47 12.6612.59 12.8112.72 12.9412.83 13.0712.93 13.1813.%2 13.2813.19 13.3713.16 13.4413.21 13.4913.24 13.5313.26 13.5413.26 13.5413.24 13.5213.21 13.4813.16 13.4313.19 13.3613.83 13.2812.95 13.1912.85 13.8912.75 12.9712.63 12.8512.51 12.7212.38 12.5812.25 12.4312.11 12.29
6
12.9512.2112.3812.5412.7112.8713.9213.1713.3113.4413.5613.6513.7313.7913.8313.8413.8413.8213.7713.7113.6413.5513.4513.3313.2113.9712.9312.7812.6212.46
7
12.1912.3712.5412.7212.9913.9813.2513.4213.5713.7213.8513.9614.9414.1114.1514.1714.1614.1314.9814.9113.9313.8313.7113.5913.4513.3113.1512.9812.8112.64
8
12.3312.5212.7112.9913.1913.2913.4613.6713.8414.8114.1514.2814.3814.4514.5914.5114.5814.4714.4114.3314.2314.1214.8913.8613.7113.5513.3813.2913.9112.92
9
12.4612.6612.8713.9813.2913.5113.7213.9314.1314.3214.4814.6314.7414.8314.8814.8914.8714.8214.7514.6614.5514.4314.2914.1413.9713.8913.6113.4213.2113.99
I19 z
12.59012.91 +
13:9313.2613.49 -13.7313.9614.29 >-14.43 :-.-14.64 -
14.8415.6115.14 D15.24 C'15.29 "15.3915.27 <15.20 -J
15.1215.9114.8814.7514.6914.4314.2514.9613.8613.6413.4213.19
1234567
.9
121314" 15
;-170 2 18
". 21- .22
2324
c" 252627282939
J-ROW
12
456789
I@I11213141516171819202122232425262728i 2931
12.7112.9413.1813.4313.6813.9414.2114.4714.7414.9915.2215.4215.5815.6915.7415.7415.7915.6115.5815.3715.2315.9814.9214.7414.5514.3414.1213.8813.6313.38
12.8213.9713.3213.5913.8714.1514.4514.7515.9615.3515.6315.8716.9716.1916.2516.2316.1616.8515.9115.7515.5815.4215.2515.8614.8514.6314.3914.1313.8613.56
12.9313.1913.4613.7414.9414.3614.6915.9315.3815.7316.9816.3816.6216.7816.8316.7916.6716.5116.3316.1315.9415.7615.8115.3715.3814.9914.8B14.3614.3913.74
13.9213.2913.5713.8814.2914.5514.9115.3915.7116.1316.5516.9517.2817.4617.5917.4117.2317.9616.7616.5116.2816.8515.8415.6915.3615.1614.8314.5314.2213.86
13.8913.3813.6814.9914.3414.7115.1115.5516.9116.5217.9517,5918.2718.2618.5118.09(8.9317.4717.3916.8516.8916.3916.2815.7815.7615.2515.2914.6614.5613.96.
13.1513.4413.7614.8914.4514.8515.2815.7616.2916.6817.5418.2818.9419.1819.1918.7818.3917.8417.4417.716.7516.4416.1615.8815.6115.3215.94(4.7114.3814.91
13.2913,4913.81(4.1b14.5414.9515.4115.92(6.5917.1617.9418.9122.2829.9722.5219.4918.9218.1917.8617.2917.9716.5916.4415.9215.8815.3515.2914.7414.6314.92
13.2213.5213.8414.2614.5815.9815.48(6.9116.6217.331(.1819.1929.1429.4129.3619.6418.8518.1917.6517.1916.8916.4516.1415.8515.5915.3915.9114.6914.3613.99
13.2213.5213.8514.2914.5915.9115.49lb.9316.6517.3718.2419.3222.7829.5922,9819.7116.821(.1317.5717.8916.6916.3316.9115.7415.7115.2915.1414.6914.5113.92
13.2913.5913.8214.1714.5514.9715.4415.9716.5717.2718.1919.1926.9329.2729.2919.4518.6217.9517.3916.9216.5216.1715.8515.5715.3915.9214.73(4.4414.1313.81
I-COLUMN21 22 23 24 25 26 27 28 29 39
13.1613.45
4 3. 7-14.1114.4814.8915.3315,8316.3917.9417.7918.7222.9619.8122.2119.e418.2517.6417.1316.6916.3115.9615.6515.3615.0914.8114.5414.2513.9713.68
13.1013.39IZ.69-14.8214.3714.7615.1815.6316.1416.7017.3218.9918.6918.7918.7418.2817.7417.24(6.8916.4116.8615.7315.4315.1514.8814.6114.3414.9813.8113.54
13.9313.3913,5913.9114.2414.6914.9815.3915.8316.3016.7617.2517.61(7.7817.7417.5917,1616.7916.4316.9915.7715.4815.1914.9314.6614.4114.1513.9913.6513.40
12.9413.29
-13,48-13.7714.0814.4114.7515.1215.4915,8816.2516,5916,8416,9716.9616.8216.5916.3216.6315.7515.4715.2914.9414.6914.4514.2913.9613.7213.4913.25
12.8313.813,3413.6213.9914.2914.5114.8315.1515.4615.7616.9216.2916.3916.3116.2216.9615.8615,6415.4915.1614.9214.6914.4514.2214.9813.7713.5513.3213.10
12.7212.95
-13.2%-13.4513.7113.9814.2514.5314.8115.0715.3115.5115.6615.7415.7515.6915.5815.4315.2515.9514.8514.6414.4314.2114.6913.7913.5813.3713.1612.95
12.5912.81
13.2713.5113,7514.9914.2414,4814.79(4.8915.9615.1815.2515.2615.2215.1415.9214.8814.7214.5414.3514.1613.9.713.7813.5813.3913.1912.9912.89
12.4612.67
13.8913.3113.5313.7413.9614.1614.3514.5114.6514,7514,8114,8314.8914.74(4.6514.5314.39(4.24(4.9713.9113.7313.5513,3713.191'
12.33 12.1812.52 12.36
-12.71- 12.54 --12.91 12.7213.11 12,9013.39 13.8813.5% 13.2513.68 13.4213.86 13.5714.92 13.7114.16 13.8314.28 13.9314.36 14.9114.41 (4.9514.43 14,. 714.41 14.96(4.37 14.8214.29 13.9614.19 13.8814.08 13.7813.95 13.6713.88 13.5413.65 13.4113.49 13.2613.33 13.1213.17 12.9613.89 12.8112.6 71.65
•12.49S12.33
RESPONSE TO QUESTION #20
Adequate drawdowns need to be established to reverse the
gradient in the area of the monitoring well to establish control.
In a confined aquifer the drawdowns to reverse the gradient at a
monitoring well should be developed within one day after the
increased bleed rate is established. The over injection would
develop a mound in the area which may extend a large distance
beyond the monitoring well and the reversal needs to be developed
only in the area near the monitoring well.
L A~ C, > U , N.t J .
_ -- .
63 3
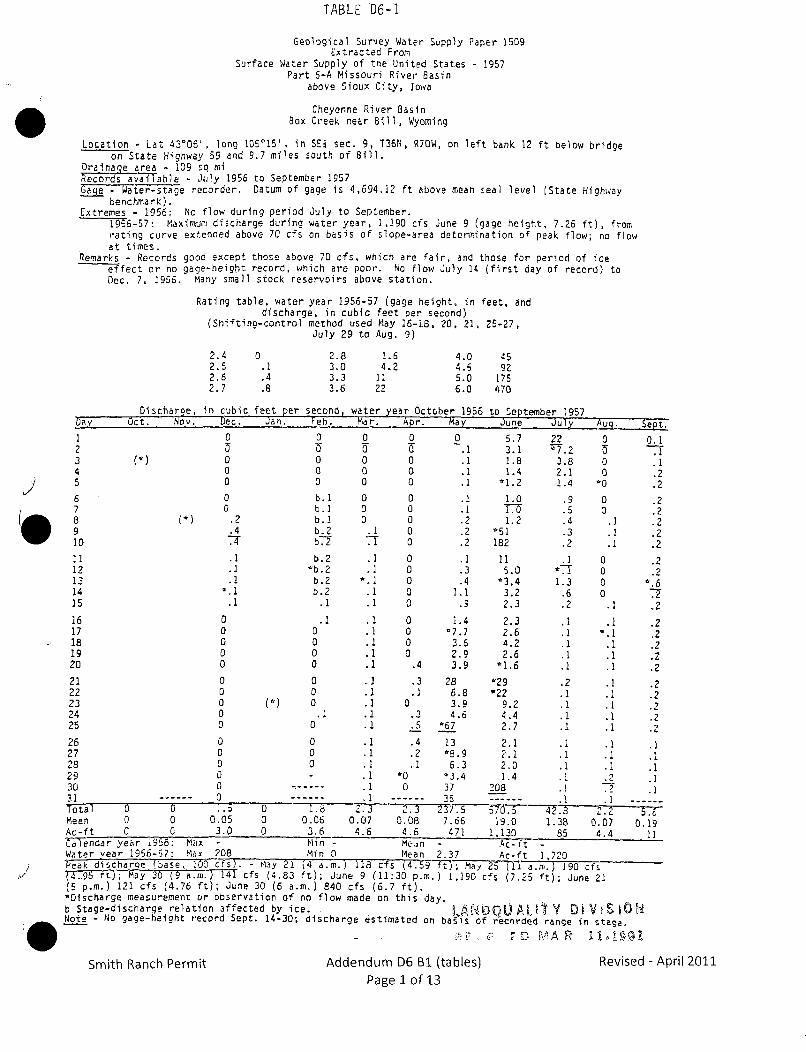
TABLE D6-1
Geological Survey Water Supply Paper 1509Extracted From
Surface Water Supply of the United States - 1957Part 6-A Missouri River Basin
above Sioux City, Iowa
Cheyenne River BasinBox Creek near Bill, Wyoming
Location - Lat 43'06', long 105'15', in SEI sec. 9, T36N, R7OW, on left bank 12 ft below bridgeon State Highway 59 and 9.7 miles south of Bill.
Drainaqe area - 109 sq miTe.cords ½ý.ilable - July 1956 to September 1957Gage - Water-stage recorder. Datum of gage Is 4,694.12 ft above mean seal level (State Highway
benchmark).Extremes - 1956: No flow during period July to September.
19S6-57: Maximum discharge during water year, 1,190 cfs June 9 (gage height, 7.26 ft), fromrating curve extended above 70 cfs on basis of slope-area determination of peak flow; no flowat times.
Remarks - Records good except those above 70 cfs, which are fair, and those for period of iceeffect or no gage-height record, which are poor. No flow July 14 (first day of record) toDec. 7, 1956. Many small stock reservoirs above station.
Rating table, water year 1956-57 (gage height, in feet, anddischarge, in cubic feet per second)
(Shifting-control method used May 16-18, 20. 21, 25-27,July 29 to Aug. 9)
2.42.5
0.1
2.83.03.33.6
1.64.2
1122
4.04.55.06.0
4592
175470
2.6 .42.7 .8
Discharge, In cubic feet per s;econd, water year October 1956 to September 1957Day Oct. Nov. Dec. Jan. Feb. Mar. Apr. May June July Aug. Sept.
1 0 0 0 0 0 5.7 22 0 0.12 U0 0 -6 .1 3.1 -".2 U .13 (*) 0 0 0 0 .1 1.8 3.8 0 .14 0 0 0 0 .1 1.4 2.1 0 .25 S 0 0 0 0 .1 *1.2 1.4 *0 .2
6 0 b.1 0 0 .1 1.0 .9 0 .27 0 b.1 0 0 .1 T-6 .5 0 .2
(8) .2 b.1 0 0 .2 1.2 .4 .1 .29 .4 b.2 .1 0 .2 051 .3 .1 .210 b.-T .T 0 .2 182 .2 .1 .211 .i b.2 .1 0 .1 11 .1 0 .212 . *b.2 .1 0 .3 5.0 .T 0 .213 .1 b.2 *.1 0 .4 *3.4 1.3 0 *.614 •.1 b.2 .1 0 1.1 3.2 .6 0 7715 .1 .1 .1 0 .9 2.3 .2 .1 .2
16 0 .1 .1 0 1.4 2.3 .1 .1 .217 0 0 .1 0 17.7 2.6 .1 .1 .218 0 0 .1 0 3.6 4.2 .1 .1 .219 0 0 .1 0 2.9 2.6 .1 .1 .220 0 0 .1 .4 3.9 *1.6 .1 .1 .221 0 0 .1 .3 28 *29 .2 .1 .222 0 0 .1 .1 6.8 *22 .1 .1 .223 0 (*) 0 .1 0 3.9 9.2 .1 .1 .224 0 .1 .1 .3 4.6 4.4 .1 .1 .225 0 0 .1 .5 *67 2.7 .1 .1
26 0 0 .1 .4 13 2.1 .1 .1 .127 0 0 .1 .2 *8.9 2.1 .1 .1 .128 0 0 .1 .1 5.3 2.0 .1 .1 ,129 0 .1 *0 *3.4 1.4 .1 .2 .130 0 -.---- .1 0 37 208 .1 CT .131 ------ 0 ---. ..... 35 .- .-Total 0 0 1.5 0 . 2.3 23 7. 5"6C. 42f9 8 2.2 5. --Mean 0 0 0.05 0 0.06 0.07 0.08 7.66 19.0 1.38 0.07 0.19Ac-ft 0 0 3.0 0 3.6 4.6 4.6 471 1,130 85 4.4 11C-alendar year 1956: Max - Min - Mej n - Ac-7t -Water year 1956-57: Max 208 Mi n 0 Mean 2.37 Ac-ft 1,720,' Peak. discharoe 'base, 100 cfs). - May 21 j4 a.m.) 118 cfs .4.59-•- May 25 (11 a.m.) 190 cfs(4_ r•-• JOT-T30 (9 a.m.) 141 cfs (4.83 ft); June 9 (11:30 p.m.) 1,190 cfs (7.25 ft); June 21(5 p.m.) 121 cfs (4.76 ft); June 30 (6 a.m.) 840 cfs (6.7 ft).*Discharge measurement or observation of no flow made on this day.b Stage-discharge relation affected by ice. LA U'.;0rU A L •V D'- V , •S i (D4Note - No gage-height record Sept. 14-30; discharge estimated on ba is of recorded range in stage.
-i of r . VA~ . L e .'; rang £ g e
Smith Ranch Permit Addendum D6 B1 (tables)Page 1 of 13
Revised - April 2011
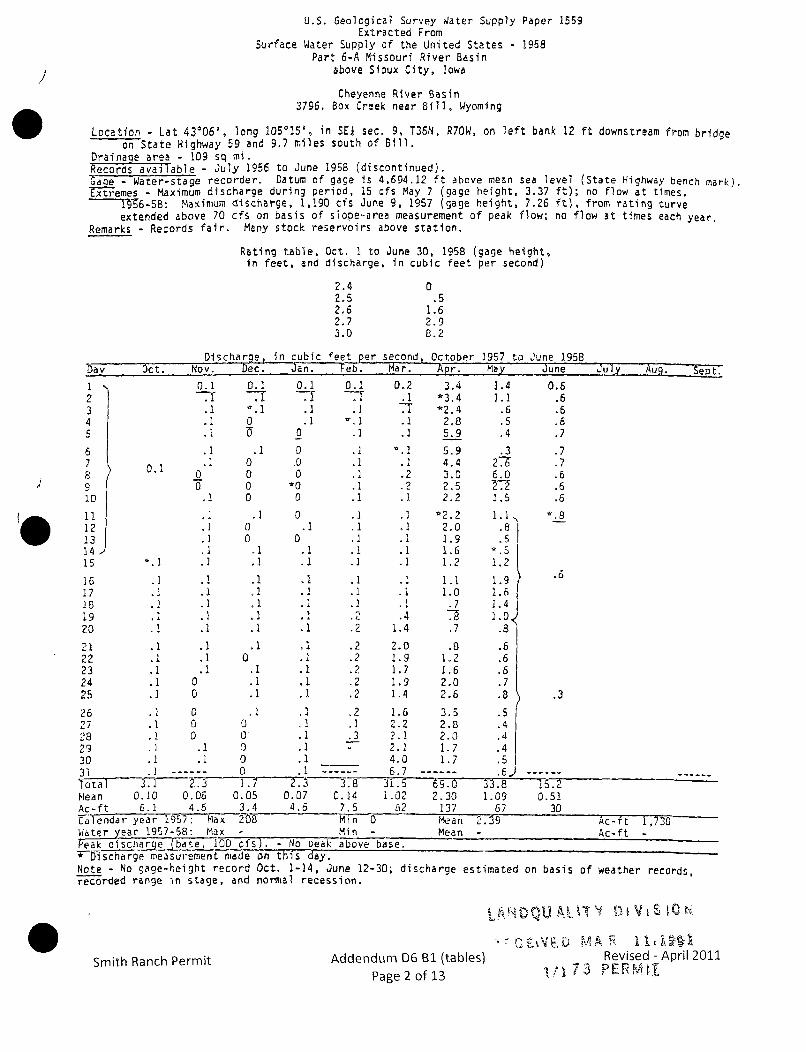
I
U.S. Geological Survey Water Supply Paper 1559Extracted From
Surface Water Supply of the United States - 1958Part 6-A Missouri River Basin
above Sioux City, Iowa
Cheyenne River Basin3796. Box Creek near Bill, Wyoming
Location - Lat 43006', long 105015', in SEi sec. 9, T36N, R70W, on left bank 12 ft downstream from bridgeon State Highway 59 and 9.7 miles south of Bill.
Drainage area - 109 sq mi.Records available - July 1956 to June 1958 (discontinued).Gaoe - Water-stage recorder. Datum of gage is 4,694.12 ft above mean sea level (State Highway bench mark).'Ntemes - Maximum discharge during period, 15 cfs May 7 (gage height, 3.37 ft); no flow at times.
T-•6-5B: Maximum discharge, 1,190 cfs June 9, 1957 (gage height, 7.26 ft), from rating curveextended above 70 cfs on basis of slope-area measurement of peak flow; no flow at times each year,
Remarks - Records fair. Many stock reservoirs above station.
Rating table, Oct. I to June 30, 195B (gage height,in feet, and discharge, in cubic feet per second)
2.42.52.62.73.0
0.5
1.62.9B.2
Discharge, in cubic feet per second, October 1957 to June 1958Day Oct. Nov. Dec. Jan. Fe-. Mar. Apr. May June July AU Sept
I2345
678
910
(0 111213
1415
1617181920
2122232425
0.1
.i
.0
.1
.I
.i0.1I .
.50.1
.1
.1
.1
.1
0.1
0
0.1
.1
0000
0
.I 0.00
*00
.1 00 .10 0.1 .1,I .1
.i
.1
.1
.1
.1
.1
.1
.1
.2
.1
.1
.1
.1
.i.2.1.2.i
.1.1.1.1oi
.1
.1
.1
.1
.1
0.1
.2
.1
.2
.2
.2
.2
.2
.1.3.1.i.1.1
,i.1.1
.2
.2
.2
.2
.2
.2
.2
.1.3
0.2.1
.2
.4
2.1.1.2.2
.1
.4
.1
.2
.1
.1
.1
.1
.1.4
1.4
2.01.91.71.91.4
1.62.22.12.14.0
3.4*3.4*2.4
2.85.95.94.43.02.52.2
*2.22.01.91.61.2
1.11.0
.7
.7
.81.21.62.02.6
3.52.82.01.71.7
1.41.1
.6
.5.4
.3276.0
1.5
1.18
1.2
1.91.61.4
.8
.6
.6
.6
.7
.8
.5
.4
.4
.4
.5
0.6.6.6.6.7
.7.7.6.6,6
.0
.3
.1 .1
.1 0
0 .10 .1
26 .1 027 .1 028 .1 0
29 .i .130 .1 .1
0
0A
.1S.1
.1
.1
- -U .----- U- .. . Qw -, -......
"Total 3 -" 3 1.7 2 - -- -- .-8 31.25 6C.06" 33.8 1. S2Mean 0.10 0.06 0.05 0.07 0.14 1.02 2.30 1.09 0.51Ac-ft 6.1 4.6 3.4 4.6 7.5 62 137 67 30fTendar year 1957: Max 2-8 Min 0 Mean 2.39 Ac-ft 1,730 -Water year 1957-58: Max - Min - Mean - Ac-ft -Peak discljarqe Tbase, 100 cfs). - No Deal, above base.
Dis charget meiasurtiteme L ma~ue on Lill~
Note - No gage-height record Oct. 1-)4, June 12-30; discharge estimatedre--rded range in stage, and normal recession.
on basis of weather records,
Smith Ranch Permit Addendum D6 B1 (tables)Page 2 of 13
5"~i M A I . ý4Revised - April 2011
7i. 73 P:'E F`. 14
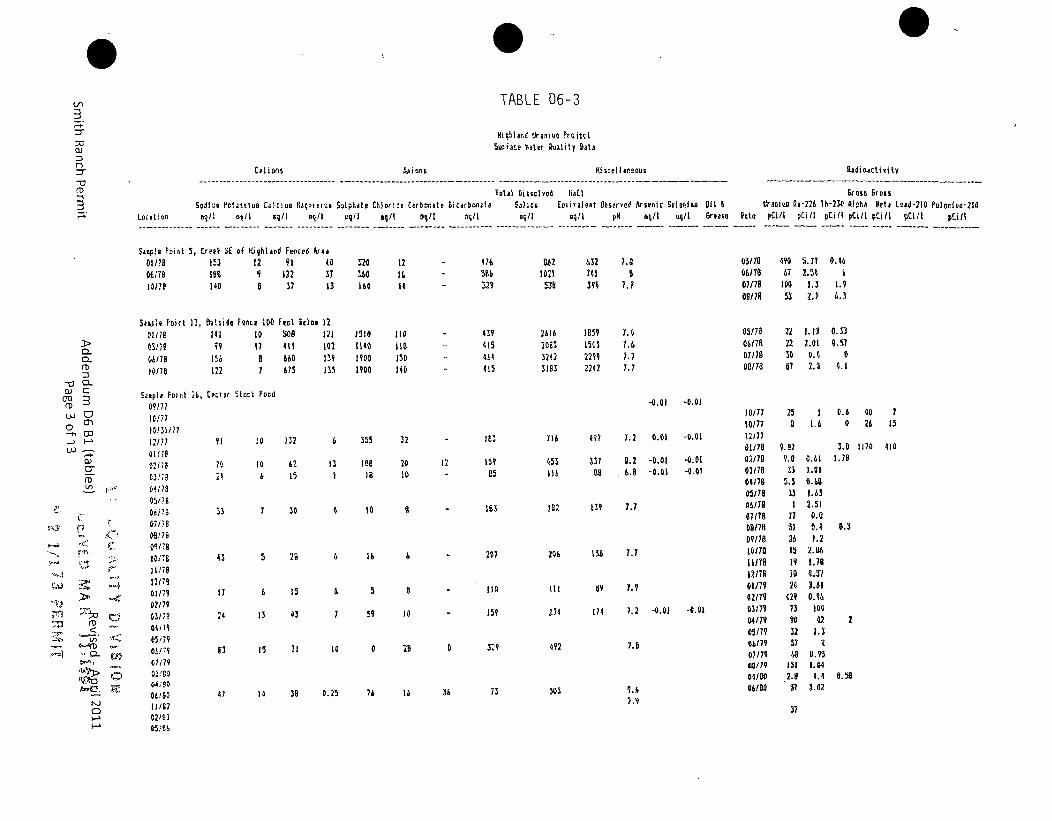
0--
a,
C-,
TABLE D6-3
lfifi.lardA Uraniuu PruiettSpliar'e later Ouelity Datae
Cation Anions H iscel appul Raedioactivity
Sodkm.* Potaoaius a lcitic hapmu Sulphtol Ulviev Carbmate Bicarbonzte M~idrn EýLivalent Observ'ed Arsenic Sgludnl Oil ItrDauj Ra-U6 Th-23( At -,N IBet) Lead-7I0 Petenua-210Locot:on bq/1 q."I gg/I vq/I e/il asq/ 4 /1 mqI mg/I eq/1 PH aq/I 4q11 farme Date pCill. Pci/I pli/il Pcil. Pci/I PCIII OEM/
Se&F4!e Feint 5, Creek SE of Hiiqlalad Fmenre Area81/?2 1 33 12 91 4.0061:7a 19% 9 122 3710008 140 8 37 I3
Sasple Foirt 11, Outuido Fence 10 Feet Belo 12
320360164
12I'14
476
U63 29
8,21021
531I
2616
M3324271163
432 7.0741 9394 7.7
IB59 7.01503 1.6225Q 7.72242 7.7
03/10 4M 5.39 0.4606170 67 LIM 107/70 IO 2.3 1.908/70 53 2.7 0.3
CL
CD
0)
01172
0617a01/70
141
122
1o 50017 411
7 675
172102139135
1510 1101140 110IV"0 IS01900 140
429415464415
".3
Salple Point 46, Cortovr Slczk Poul0,9177
W0311771/,77 91 :0 IN2
102787~ 10 112
05/15
06553 7 3007/18
09110tI ns!1 43 5 2011,178112 7901179 II 6 150217903/7? N4 13 45
6 335 32 183 W1 437 7.2 0.01 -0.01
13 lea 20 1t 15q 435 137 8.2 -0.01 -0.01I )a 10 - 05 I16 00 6.0 -0.01 -0.19
q 10 6
-0.01 -0.01
US3 122 139 7,7
0'
03/78 22 1.13 0.1306/78 22 2.01 0.5107178 30 0.0 800178 67 2.5 4.1
10/71 25 I 0.6 40 718/77 0 1.6 0 26 131227701/78 9.R2 3.0 1170 41002/17 9.0 0.61 1.70
03/79 15 1.01001178 .3 0.6005,78 33 2.0306/70 I 2.3107179 TI 080
09178 5) 8.4 8.309/78 26 2.210/70 I 2.1611170 19 1.7812/7 0 ID 0.3701/79 24 3.6182(7? (29 0.960317V 73 104
04(79 U0 4 20517V 32 2.3
U6/19 57 a07/79 Qa 0.95miloT 151 1.0404/80 2.9 M. 0.5606(90 57 3.02
37
IS 16 &o - 207 2N6 156 1.7
6 Ito ill 89 7.9
ISO 234 174 7.2 -0.01 -. 017 !9 18040175i/79W1907/7902"Go0 , :80046/011/6702/6 2051!to
61 15 31 10 0 20 8 R2, 492
47 14 30 0.25 76 1b 36 73 W03 9.07,9
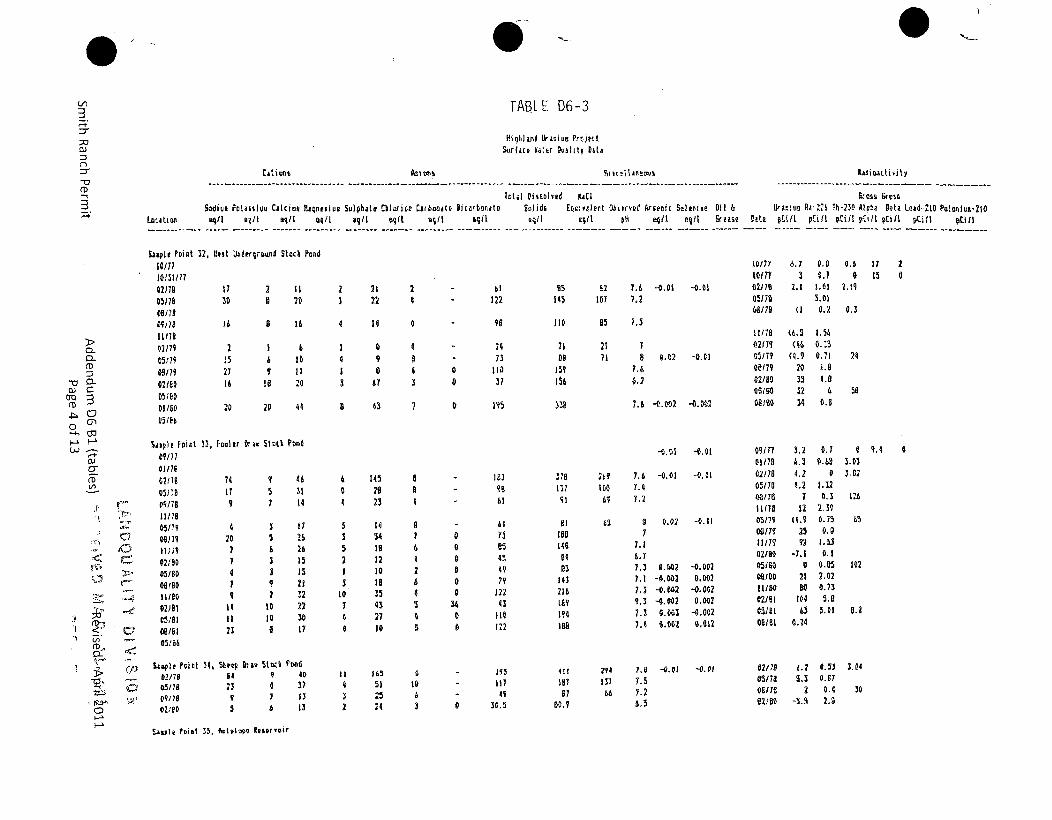
0-0 1--
(A3
(D
CD
TABLE D6-3
Highling Uraniua Prrcje~tSurface Vale 0jiitr ViaI
Cations %melztIwts
TOWa Dhisolved NACI L-OS2 GiressSadiun Fo'.ass8ou Calcine Raipnniue Sulhato Wboride Carbronate 111corbaonio Entidi A E~uivalrnt 0Doryo/ Aeic Selepite 0il & t(ii9u Rd-226- Th-230 Alv~a Ooa Lead-2.10 Po~uu-2s0
Lmahmi 041I 03/1 s/1l mqti aq/1 eq(0 li/1 os/i ol QqI it P4 0*11 0I Grelse loto fc/il Plitt Pci/I F~ill pCits PtU/8 OEM/
Salpit I'Dit 32, litst Iiderground Stock Pond
02170 17 2 11 2 21 205/78 30 a 20 1 22 0
0917a 86 a 16 4 14 4
> 11171a.. 01711 2 a 6
(D=30/179 27 112 0 4C-02/00 16 Is 20 3 67 3
D~3 051,55DOM0 210 20 44 a 03 7
0 0)30/h
$agp) F 1`010 33, FDOnlr 9-ir SInLI Pond
01/71
(D 021,76 74 q 46 6 145 a
05118 17 5 38 4 26 0
M9/18 9 7 14 4 23 4
04jOV11 20 5 26 3 5.4 1
tC ii~ a 26 5 Is0/07 3 15 2 12 0
Is/0 4 3 5 0 2
WOO0 9 2! 3 Is 6
1 81e0 7 :2 10 .15 4.< 02)01 14 to 22 7 43 5
05/6 II 1 20 30 4 27 4
0e'0/ 5 23 a 17 4 20 5Ll 05!8&
i t-o*Qlr NeIt 34, I~ 90tau Simb 1`O009'M>02/79 64 9 40 22 265 6
Q 05/7 23 4 21 4 51 to0/69 7 13 3 25 6
0 2,10 5 1 3 2 24 3
122
- 9
00
2473
11037
05 u2 7.6 -0.01 -0.01145 107 7.2
110 65 7.3
20 21 706 71 8 0.02 -D.C1
129 7,6156 6.2
LID 7.6 ". M2 -0. 2
-e. 0 -6.01
I370 269 7.6 -0.01 -6.08I1I too 7.4
i2 fil 7.2
92 65 0 0.02 -4.0l106 7
146 7.1
64 L.713 7.3 9.002 -0.002
143 7.2 -0.002 0.002216 7.5 -0.002 -0.602100? 9.3 -0.002 0.002191 7.3 0.003 -0.002
800 7.4 6.002 0.012
11 21?4 7.0 -0.02 -0.01807 837 7.507 6 7.2
00.9 6.5
10/77 6.7 0.7 06 17
0 2/170 2 . 1 I 'm 2 . ! g
05M7 3.01/178 (U 0.2 0.2
11/76 (6.5 1.56t2l79 (46 0. 505/7? (4.9 0.71 24
06/79 20 2.602/60 33 0.9
05193 12 & Ao"I/0S 34 0.0
09/17 3,2 0.7 0 9.4 001/78 6.3 4.60 3.0302/178 4.2 0 3.0265/70 4.2 1.32
oat's 1 0.3 826IS170 12 2.3945/79 (4.9 0.75 6506/79 25 6.611/179 92 i.51020O0 -7.1 0.105/I0 0 0.85 80208100 21 2.0211/00 00 0.73072192 t4 5.605/hL 63 5.02 0.606181 0.24
021,10 I.Z 6.51 J.0465/76 5.3 6.67WIG7 2 0.4 30
02100 -3.5 2.5
006
0
0p
&I73
4,4979
122
43Ito18.2
117
0936.3
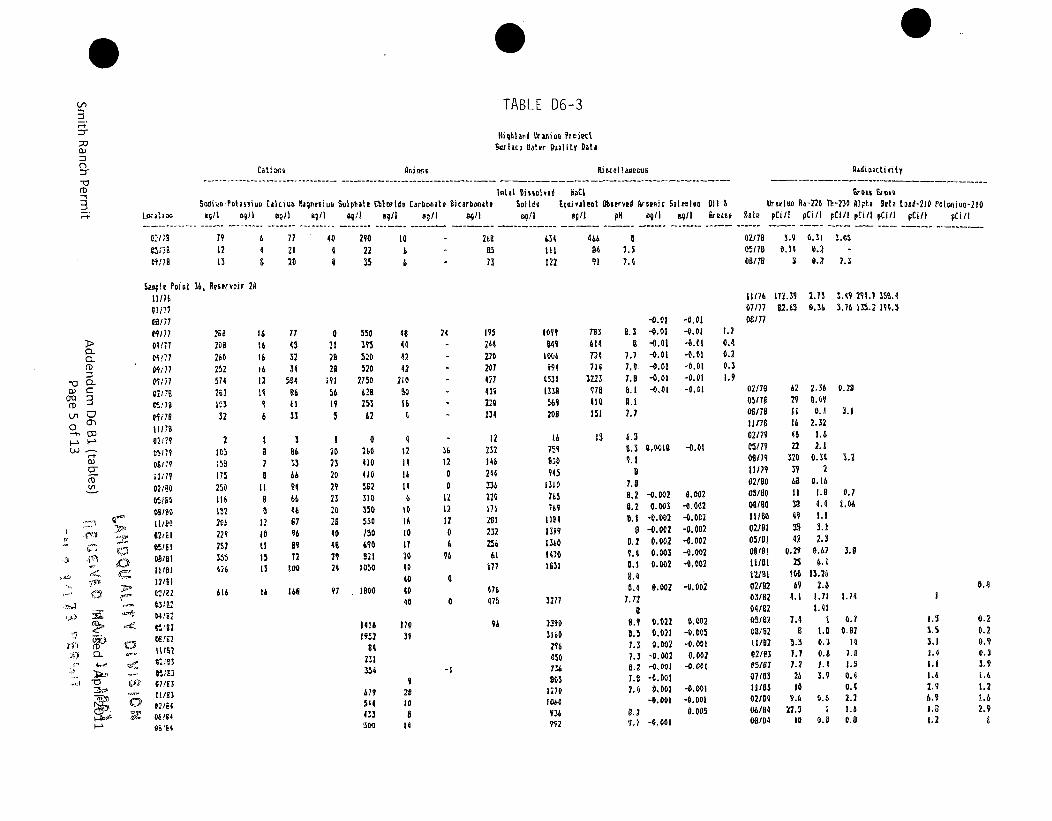
V)
(D
TABLE 06-3
11iqhlanr tkaziuI projectSgflaca dater Duality Data
Anivo5 .i Mel I gOU R~adioactivity
Sodi'eP0450up CaliOut %aptsiuo Sulphate O WIort Carbonaite Bicarbon~ate Slihds Eqivalent 0observed WOrsic So1rclue 01) trarlul Ra-226 Th-230 Alph.a Bata Laae-2l4 Polofliuc-210Uxallon R911 8911 DQ/1 mt/I 4,1 @111 8;/i 94/1 &9/1 89/1 PH 091 mgII l.rease Myt Pci/I pCi/l PC1/I pEM/ pCi/I pCi/l pCifa
0C2/h7
os/7O791213
4772120
4044
2902235
1066•
2688572
122
122
4W4491
47.37.4
02W7I 3.9 6.31 !.0505178 0.14 0.2 -
0/170 3 0.2 7.3
a)C
3~0
Sao,!t Point U6, Resprncir 2A
11176
Ol/77
M/760B 16
01:77 260 lb09077 252 16401117 574 12
oV~h 202 19
p1/76 32 6
i U 7902,10t'.165D4/94
01/I
1211I
-4. Dvs02
Of k 495
2 1105 0
175 a250 i7115 S
116 4452 4
204 12229 10252 t1M3 15426 13
616 16
774332
34
B661:3
4632Ob661466466796I972
100
166
0212,20
i9)
56
550395520520
275062O253V2
I 02D 26023 U10
20 41429 58223 31S20 35026 53040 15044 69029 92124 1050
U7 .18"
48444242
210
m416
412
14
1614
16
to17
20QD404040
36120
0121212
06
96
4
0
11176 172.39 2.13 3.09 294.7 354.407177 U2.3 0.36 3.76 135.2 IV4.50W/77
19574422020742743i1201324
12233140244326226171241232251
177
476475
1099049
1006094
45311334569208
1675`1430
9451310
765
769
12913401470
3277
74361472§714
322397041q151
-0.0) -0.014.3 -0.01 -C.o0
7.V.1 -0.01 0.017.0. -0.01 -0.017.6 -0.01 -0.4)
.1l -0.01 -0.014.47.7
15 4.34.3 0,0430 -4.419,'
7.40.2 -4.002 0.0024.2 0.003 -0.0029.1 -0.002 -0.002
0 -0.002 -0.0024.2 0.002 -. 0029.4 0.003 -4.0025.1 0.002 4.0024.44.4 0.002 -0.002
7.72a
4.9 0.022 0.0044.5 0.021 -0.0057.3 0.D02 -0.0017.3 -0.002 0.0024.2 ,-0.0O -0.0017.4 -4.0,12.4 0.001 -0.00)
-0.001 -0o. 00.2 0.0059.7 -4. 00)
02170 62 2.36 0.2005(70 29 @.4909(79 1) 0.) 2.411176 16 2.3202179 44 1.605179 22 2.104479 320 0.34 3.211179 3 202/00 60 9.1605/90 1 4.4 0.704/44 34 4.0 L.0A41144 49 1.102J01 25 3.051/4 42 2.306!01 0.29 0967 3.011181 25 6.942/0 106 13.2402/92 b9 2.6031(2 4.1 1.71 1.7404102 I.4105192 7.4 1 0.701162 6 1.4 0.6211/02 5.5 0.3 1402/M3 7.7 0.6 1.805/63 7.2 1.1 1.507/83 26 3.9 0.411Wes 90 0.402/64 9.0 4.6 2.206/04 22.3 I 1.L04/44 10 9.0 0.8
1.70.40.20.31.9
14161952
8423)
254
679544033
500
17029
- I
96 239M31602964507:4N3
12701060936"2
1.53.S3.11.0LI.
1.2
0.4
0.20.20.90.33291.61.22.62.9
920100
14
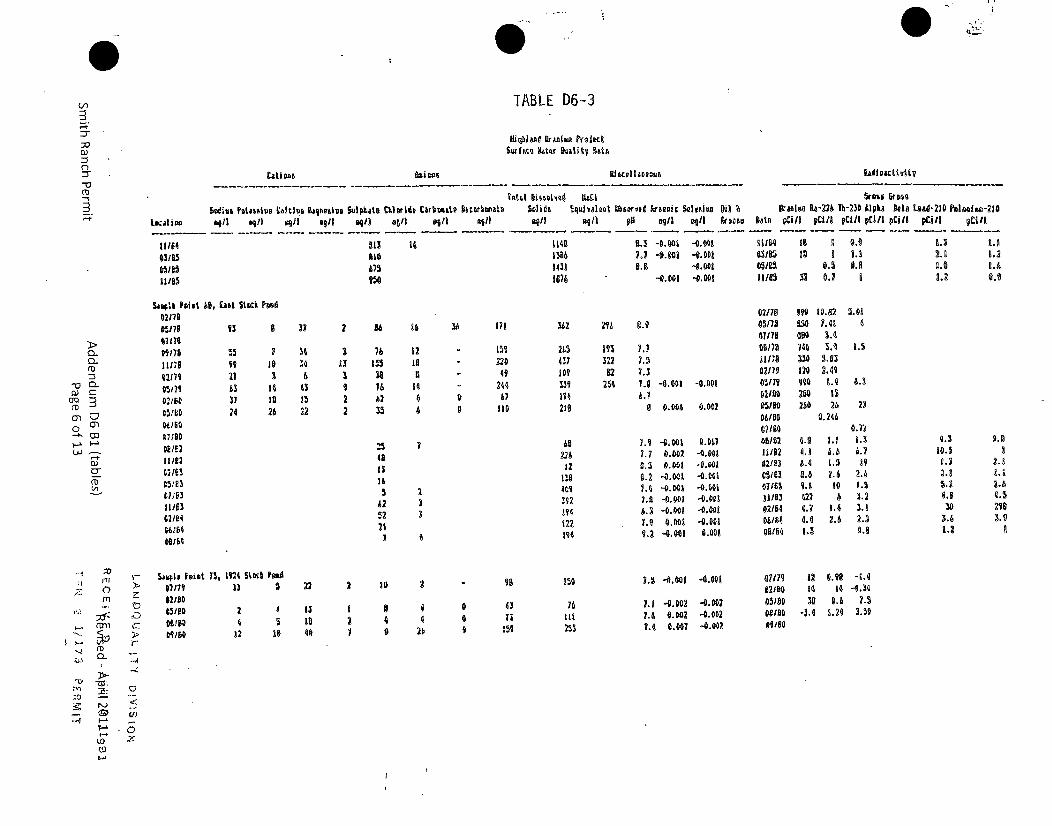
(In
3v
TABLE D6-3
Sufac. W~ar waliv 114hOI
cations al a Uri 40gaus OAAIDOEL1$4V
sw4%& hWassitle 0.aldo rol0~1iv Su9$ptat 061m16o Carboiktt piarkmato Sol ids i ql~valent m~grvti repic WedgeI~ oil b Prialoo R4-224 10-230 61lika 614 Lmad-2iO F~oloolu-23Location fig1 A4/1 sq/9 bell 60/1 soil &III "I/t soil &oil 019 aooI 4111 W o Dato 91I/I pCi/l pCi/I PCI/I pCi/I pCi/I pCi/I
11/14 513 to 1146 0.3 -0.001 -01.01 911/64 16 1 0.9 1. .063165 BIG 9309 1.1 -0.001 -0-041 63165 is6 ~1 .3. 2.9 B.205/10 A75 1431 0.0 -0.002 05105 0.5 0.6 9.00.11/85 M5 1676 -.0.001 -0.001 11/935 3 0.1 0 9.2 0.0
rD
-0W-MC 3DC))
Sampa0 pa1o4 69, Enot Stott had02178
06478 135111186 00 1001/17 21 305171 0 1401160 31 96Wee1 24 26
71/00
C5,13ME3:01/E342M1
37 2 66 14 36 111 342 29 .
3434
72
3133
S2
76
3836i)
35
2548ti
6252
12IIa
0
156220
49
24467110
24,407lot339194
210
22612
1.6
4•'192194t2z194
163322
•2254
7.)7.1
1.6 -0.009 -0.0014.1
6 0.006 0.002
7.9 4-.001 0.0611.7 0.002 -0.0010.5 P.009 -6.0016.2 -1001 -0.0097.A -0.00 -0.0011.6 -0.01 -0.0016.3 -0.001 -0.0017.9 0.001 -0.0119.2 -4.0,81 0.01
1.5 -.0.001 -4.00t
1.1 -6.002 -0.0021.6 0.001 -0.0021.4 6.007 -0.042
02/17 W 10.62 5.690376 150 1.49 a07170 no 3.4
06178 146 3.9 1.511/16 w 3.6302f7if 120 :2.49C'/17V "10 4.4 6.302160 250 1I
05/80O 260 26 2301t0 0.246
06/82 4.6 1.9 1.311/02 4.0 1.0 4.10vel 4.4 1.5 19M/l83 6.0 2.6 2.607161 9.9 t0 I.%81/03 421 b 3.202/64 4.1 8.4 3.1
06/m 4.4 2.6 2.306/04 1.3 0.6
01179 12 @.98 -1.462/00 9Q 94 -0.3405/60 36 0.6 1.3og/00 -3.4 9.26 3.5961/s0
4.300.57.3
30
0.0
2.40.32.04.52603.6
4
23,3
X - Sja1+1 I'DiAt7, 16S.1tiITT > 17 I 5 2
M7I".)0/9
Q11 2 4 0
1 00 2
30 4
20
000
4313
761it
253
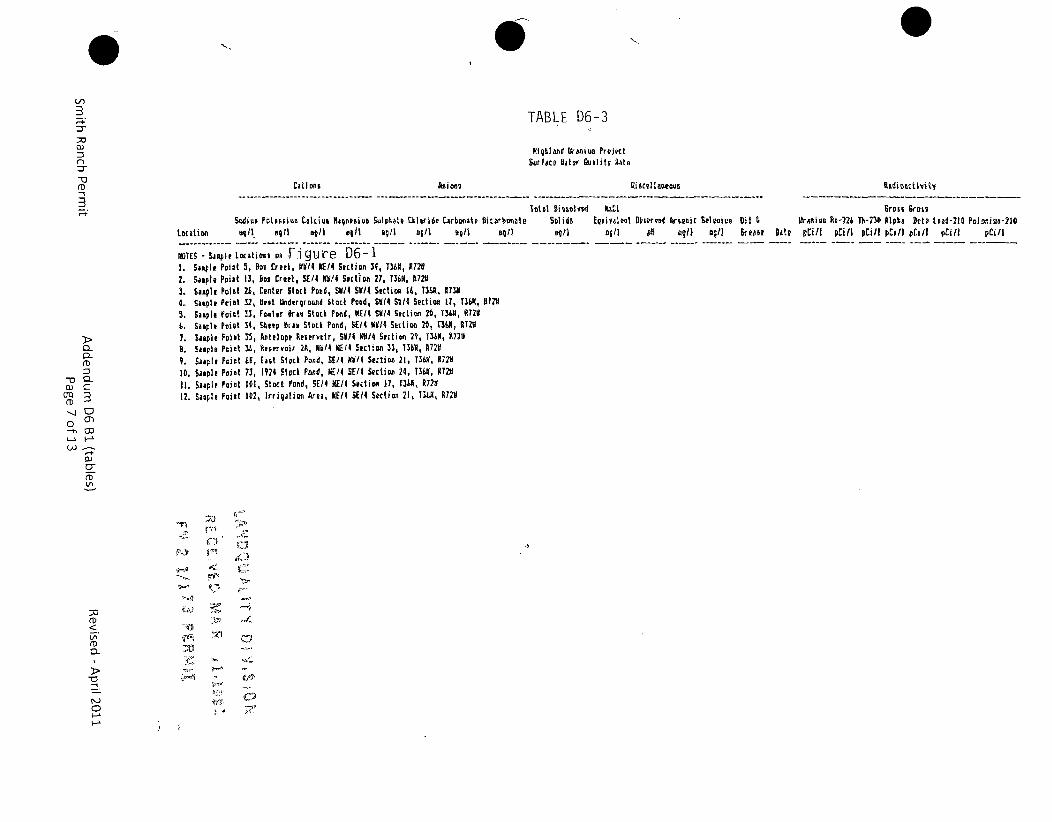
rD
3o
TABLE D6-3
Righl~ntd Uramima ProjectSurfance gate, Dualit Data
Cations Wasje ViSettn
Toatl bitsolysm KAZ1Sodius Potassmn Caldvao Aqnetju% Ioptat, Uklurde Carbovite litnrbrhate Sol i d Eqviilpalt Observet Areic Senlmiu Oil a
Loetiton &/Il ol!! eag/I evil ag/l tog/I 09/1 Sol) nl 05/I PHt Q71) egfl 6fna e d G ate
NOOTES - Staple Location$ PAn FJ gure D6-11. Stapl~e PoalM 5, Bat Creek, 140/4 NE/4 Section 34, TUN9, 172V2. Saiple Poitt 13, Box Creek, SE/4 90/14 Section 27, T3611, 97243. Siapla Poiat 26, Center ftbCi Pond, SU/4 S1114 SIMtta 16, TVA1, 97394. Staple Poiat 12, Vest Unoderground Stott ftad, S4/4 Skill Settion 17, T36N, R7245. Siaple Poict !3, Foulter Oraw Stott Pond, KE/4 9414 Section 20, T3.44, R1246. Staple Poibt 3.4, Steep B'rie Stott Pond, SE/4 KW14 Setionm 20, ISM1, 91247. SaRPle Poile 35, Wteiser Reservoir, SVII 910/4 Sectton 2?, 13.41, 972V1. Sipple Poict 3., Ocoorrvair 2A, Mill CC/4 Section 33, 136N, 47209. SnmeIe Pait LF, East Stock Pond, SL/4 90/4 Serticm 21, TIM0, 672V10. Simple Poist 73, 11124 Stock Pond, hj/4 SUE/ Seftion 24, 036X, 972911. Sim;pI Poilt 101, S'.onr Fend, SUE 95/4 Secien ;7, 13M0, 972112. Saiple Paiet 102, Irrigation Area, REM4 55/4 Section 21, 11611, R724
Grnea GrossUrativa Ra-22b IN-230 Alpha Beta Lead-210 Pola~niao-210p~ilI PCi/I pCilI PEW/ PCi/I pCi/I pCi/i
CL
uQ 3
(D
0 M
00
10j
:Z
CD
0-
C).
0,.,~,b
~~4~'
0$-;,
j I
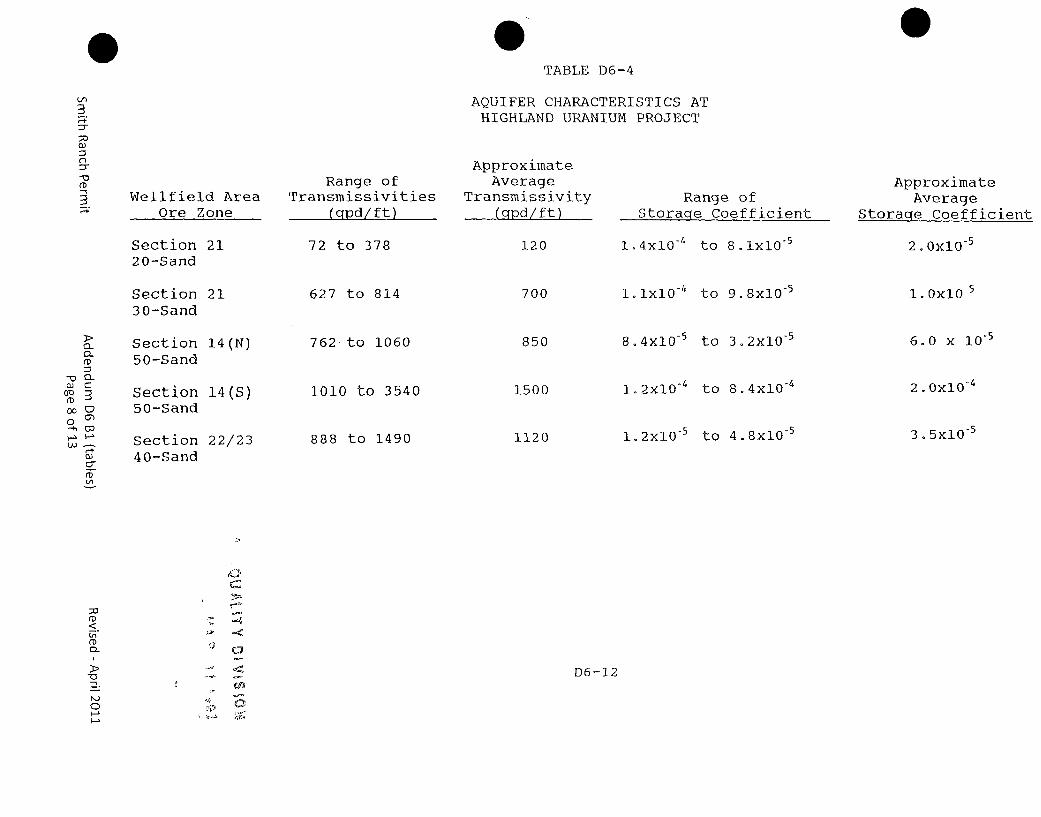
0TABLE D6-4
V)
(D
AQUIFER CHARACTERISTICS ATHIGHLAND URANIUM PROJECT
Wellfield AreaOre Zone
Range ofTransmissivities
(qpd/ft)
ApproximateAverage
Transmissivity(qpd/ft)
Range ofStoraae Coefficient
ApproximateAverage
Storage Coefficient
Section 2120-Sand
Section 2130-Sand
CL
(Dn
-0
0~co
(D
CD0-
Section 14(N)50-Sand
Section 14(S)50-Sand
Section 22/2340-Sand
72 to 378
627 to 814
762 to 1060
1010 to 3540
888 to 1490
120
700
850
1500
1120
14x10-4 to 8.oX110 5
.llxl0- 4 to 9.8x10⁻⁵
8.4xI0 5 to 3.2XI0-5
1.2x10 4 to 8.4X,0- 4
l12x10-5 to 4.8xi0O5
2 . 0xI10 5
1. 0X10- 5
6.0 x 10⁻⁵
2. OxlO-4
3. 5xi05
D6-12
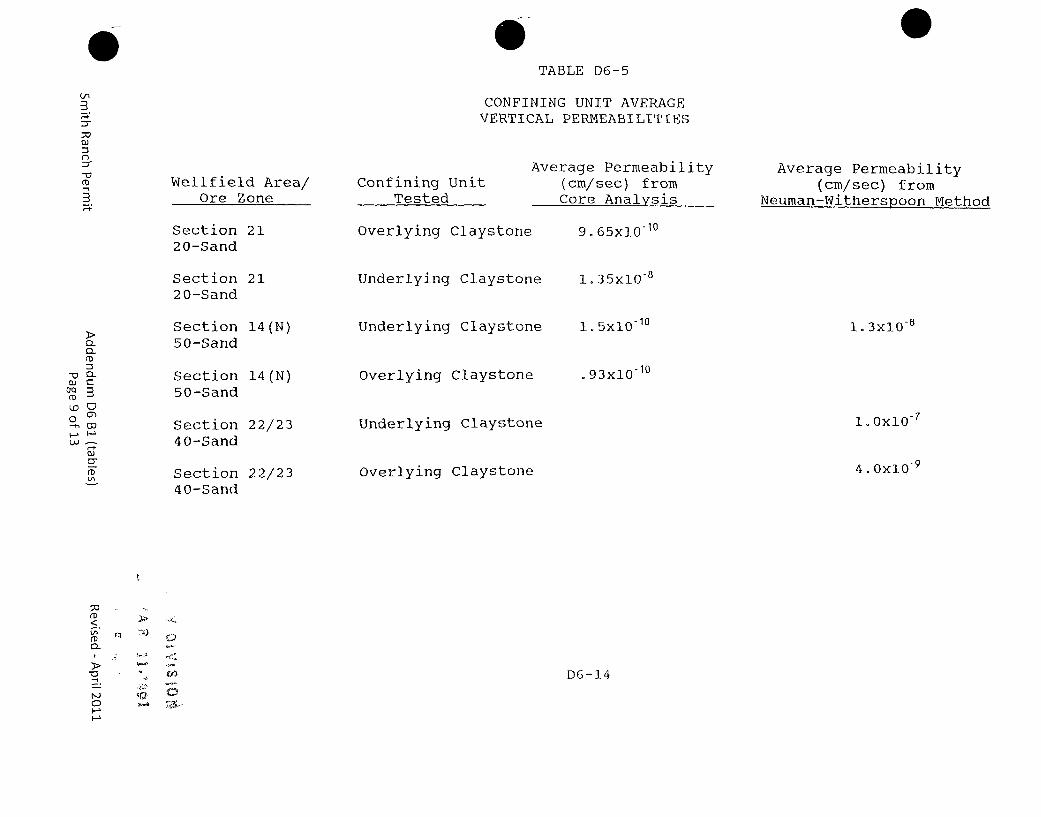
TABLE D6-5
CONFINING UNIT AVERAGEVERTICAL PERMEABILITIES
0~0~CDn
OT~
CD
0
I-~ I-~~
0~CD
Wellfield Area/Ore Zone
Section 2120-Sand
Section 2120-Sand
Section 14(N)50-Sand
Section 14(N)50-Sand
Section 22/2340-Sand
Section 22/2340-Sand
Confining UnitTested
Average Permeability(cm/sec) fromCore Analysis
Overlying Claystone
Underlying Claystone
Underlying Claystone
Overlying Claystone
Underlying Claystone
Overlying Claystone
9. 65xl10-0
1. 35X10-'
1. 5xl10 10
.93x10-10
1 3x10⁻⁸
Average Permeability(cm/sec) from
Neuman-Witherspoon Method
1. 0x10 7
4 .0x10-9
(D
(DCL
C,
D6-14
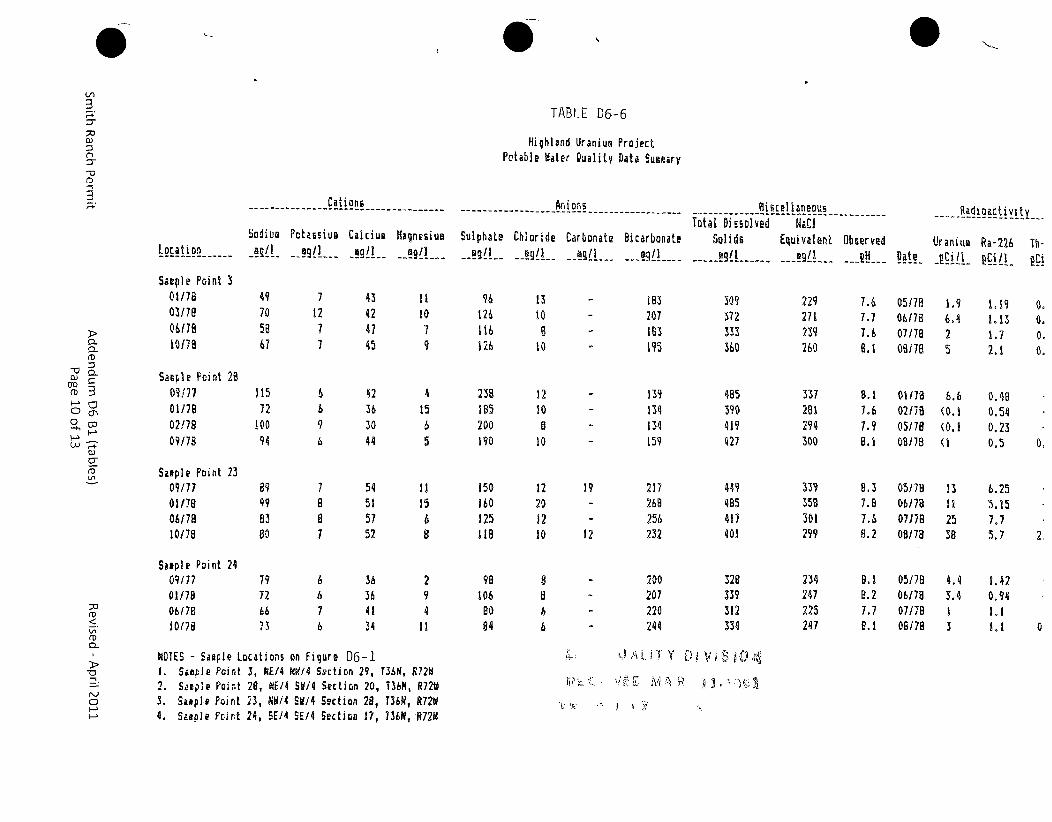
0
TABLU D6-6
M.
3o
Ca, ion&
Sodius Potaisiub Calciun Miagnesium
Highland Uraniua ProjectPotable Water Quality Data Sugeary
Ani ons
Sulphate Chloride Carbonate Bicarbonate
MiscellaneousTotal Dissolved HNCI
Solids Equivalent Observed----- W !L ...... .. --- W ! .. --- -- ___-
---Radioactivity
Liraniua Ra-226 1h-
M
CD3
CD)
0 00
LU
L .catio .
Satple Point 301/7803/780607810178
Sanrle Point 280317701/7802!7809/78
Satple Point 2309/7701/7806/7810178
Sample Point 240917701/780617801/78
497058
67
11572
10094
8999
8380
79726673
71277
7
76
9
88
66
76
43424745
42363044
54515752
36364134
1110
79
4
1565
1115
68
29411
96126116126
238185200190
150160125118
981068084
13
10810
12
20
10
12201210
8I8
- 1B3207
- 1G3S195
139
134134159
217268256232
309372333360
085390
419427
449485417401
328339312
334
229271
239260
3372B8294300
33935B301299
234247225247
7.67.7
7.68.1
8.17.6
7.?8.1
8.37.87.68.2
B.1B.27.78.1
05/7806/780717808/T8
01/17802/7805/7808978
0517806/7807/7808/78
05/790617807/7806/78
1.963425
6.6
(0.1
112538
4.43.4
3
1,19
1.131.7
2.1
0. q90.540.230.5
6.255.157.75.7
1.420.941.11.1
19
12
200207
- 220244
(0
(D
0~
0
NOTES - Saiple Locations on Figure D6-1I. Saeple Point 3, NE/4 k14 Section 29, T36N, R72N2. Saiple Point 28, NE/4 SY/4 Section 20, 136N, R72W3. Sample Point 23, NNi4 SV/4 Section 28, T36N, R72V4. Saiple Point 24, SE/4 SEA4 Section 17, 136N, R72N
'~ 2.r~t1
Ii" 2 ~2$
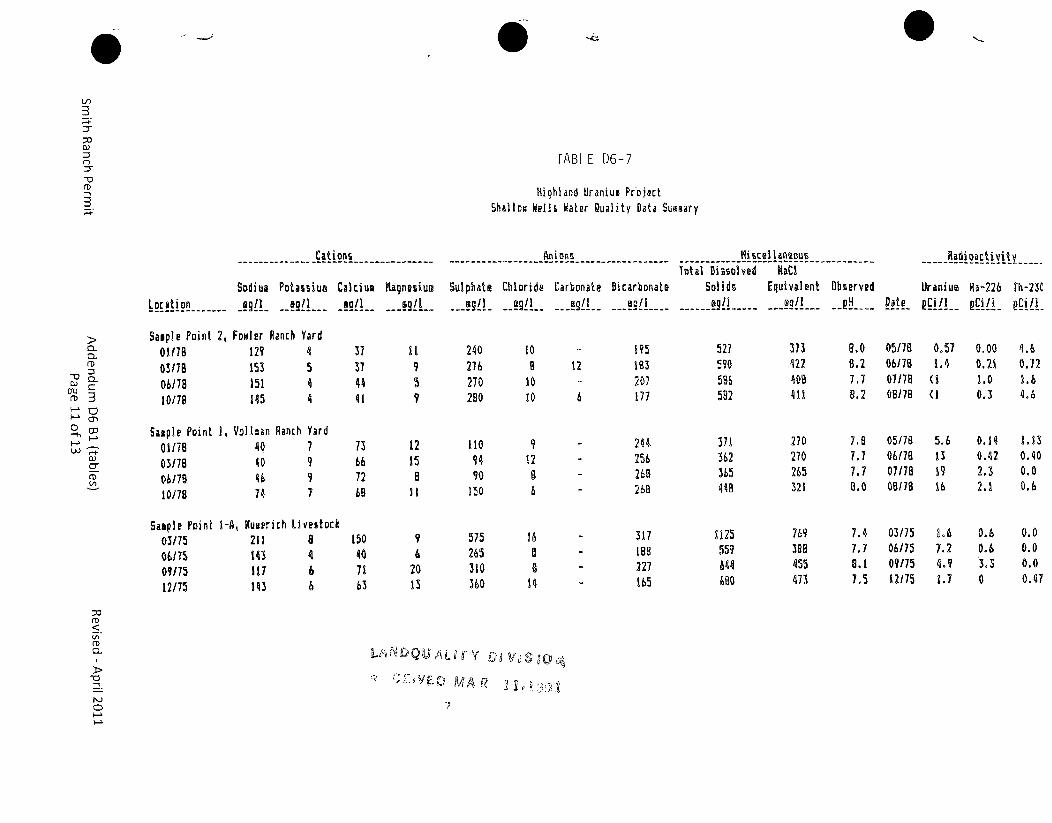
0
L/)
3v
70 TABLE D6-7
Highland Uraniu@ ProjectShallow We~ll Nater Quality Data Sugaary
Cations
Sodium Potassium Calcium Mlagnesium
Anioni
Sulphate Chloride Carbonate Bicarbonate._•! __s!L. .. gL ! -... !!..
4i scel laneousTotal Dissolved KaC!
Solids Equivalent Observed......-- • W /I ------ _ ý ---- P2V _
Uranium Ra-226 Th-23C
pgi!LL P~ffl_ PVJ.Locati on
rD
0h
(D
3
Sample Point01/780311/710ob17810/78
Sagple Point01/7803178O617810178
Sample Point03/75Wg750917512/75
Fowler Ranch Yard129 4153 5151 4145 4
l, Vollaan Ranch Yard40 740 946 974 7
I-A, Nuaerich Liveetock211 8143 4111 6143 6
37374441
73667269
150407163
129
59
12158
9
2013
240276270280
Ito9490
150
575265310360
10
912
a6
814
12195183207177
244.2562682b8
3171882271b5
527590586582
371362
565448
1125559644680
373422408411
270270265321
769388455473
8.08.2
7.7B.2
7.87,77.78.0
7.47.78.17.5
05/7806178071780137B
05/7806/7807/780B/78
03/7506/17509/7512/75
0.57
(1
5.6131916
8.67.2
4.91.7
0.000.211.00.3
0.140.422.32.1
0.60.6
3.30
4.60.721.b4.6
1.130.400.00.6
0.00.00.00.47
70(D
a
r..
HH
L ~tN'~ D 1i Q U Y SýQ
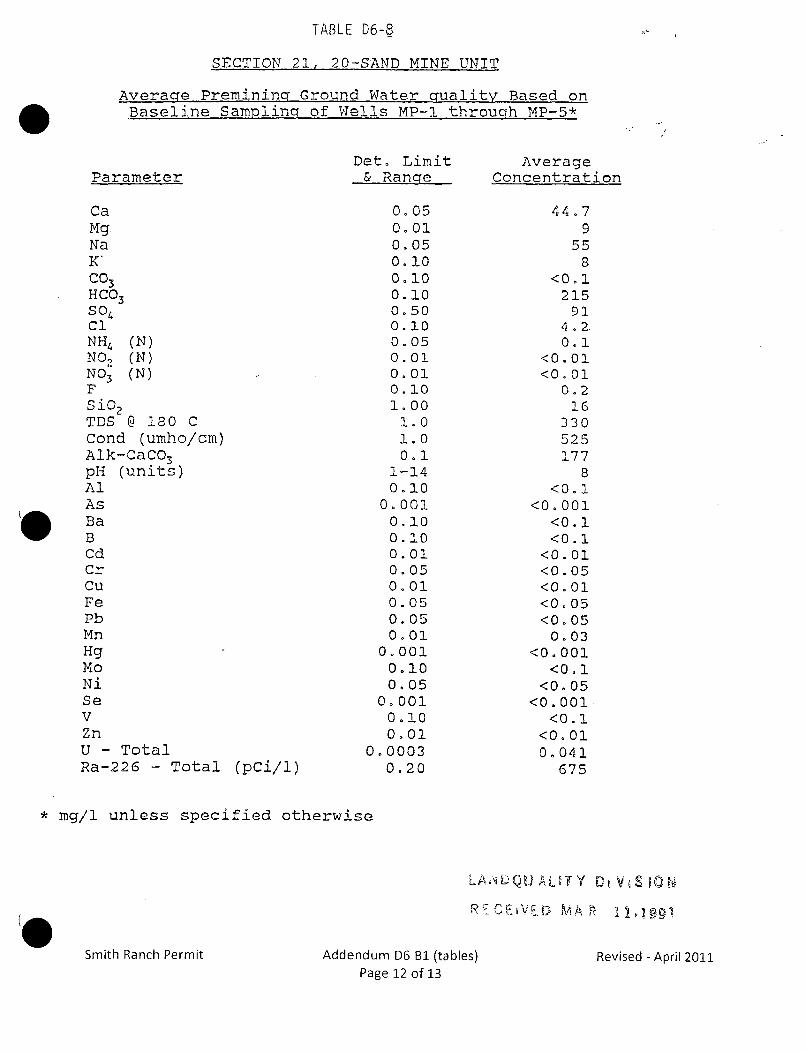
TABLE D6-8
SECTION 21, 20-SAND MINE UNIT
Average Premining Ground Water qcuality Based onBaseline Samolinq of Wells MP-I throuch MP-5*
Det° LimitParameter & Range
AverageConcentration
CaMgNaK,c03HCO3
S04ClNH4 (N)N02 (N)N03 (N)FSi0 2TDS @ 180 CCond (umho/cm)Alk-CaCO3pH (units)AlAsBaBCdCrCuFePbMnHgMoNi
0.050.010.050.100.100.100.50.0.100.050.010.010.101.00
1.01.00.1
1-140.10
0.0010.100.100.010.050.010.050.050.01
0.0010.100.05
44.79
558
<00 1215
914.20.1
<0.01<0.01
0.216
330525177
8<0.1
<0.001<0. 1<0. 1
<0.01<0. 05<0.01<0. 05<0. 050.03
<0.001<0. 1
<0. 05<0. 001
<0.1<0.010.041
675
SeVZnU - Total 0Ra-226 - Total (pCi/i)
* mg/i unless specified otherwise
0.0010.100.01
.00030.20
ILAoi LQU r',Lf TY 0 t V tS ý [ý
Smith Ranch Permit Addendum D6 B1 (tables)Page 12 of 13
Revised - April 2011
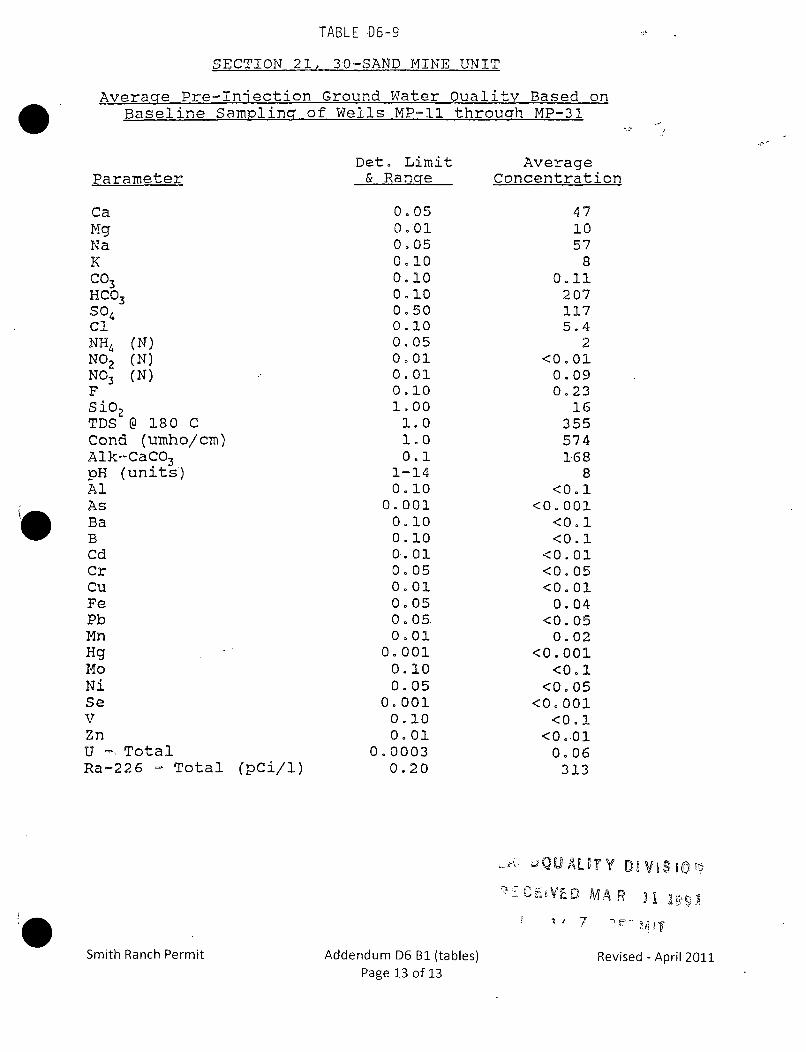
TABLE D6-9
SECTION 21, 30-SAND MINE UNIT
Average Pre-Injection Ground Water Quality Based onBaseline Sampling of Wells MP-II through MP-31
Det. LimitParameter & Range
AverageConcentration
CaMgNaKCO3HCO3SO4ClNH4 (N)NO2 (N)NO 3 (N)FS 102TDS @ 180 CCond (umho/cm)Alk-CaCO3pH (units)AlAsBaBCdCrCuFePbMnHgMoNiSeVZnU -, TotalRa-226 - Total (pCi/I)
0.050.010.050.100.100.100.500.100.050.010.010.101.00
1.01.00.1
1-140.10
0.0010.100.100.010.050.010.050.050.01
0.0010.100.05
0.0010.100.01
0.00030.20
471057
80.11
2071175.4
2<0.01
0.090.23
16355574168
8<0.1
<0.001<0. 1<0.1
<0. 01<0. 05<0.01
0.04<0. 05
0.02<0.001
<0. I<0. 05
<0. 001<0. I
<0..010.06
313
QC U~ MA L
1. e 7 7, iff ~f'1
Smith Ranch Permit Addendum D6 BI (tables)Page 13 of 13
Revised - April 2011
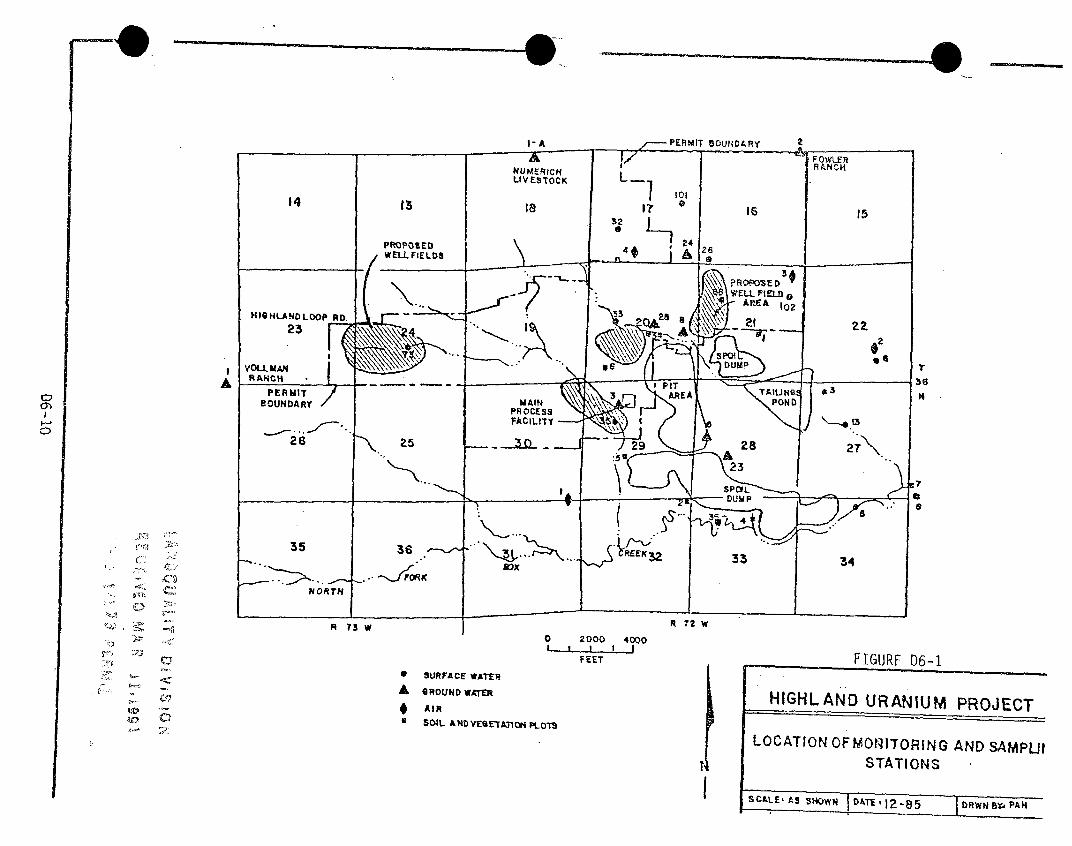
0
0
A
1"
36
I'
C
~(. ~'!)
L
C)
0 2000 4000
FEET
0 SURFACE WATER
A GOULND WA~TE
* AIR
*SOIL ANDVrBE-TA~oNj PLOjM
FIGURE D6-1
HIGHLAND URANIUM PROJECT
LOCATION OF MONITORING AND SAMPLASTATIONS
SCkLE'AS SHOWN 0DATE',j-8 5 DRWNB PAN
The following 5 Drawingsspecifically referencedAppendix D6 Table ofContents have beenprocessed into ADAMS.
These drawings can beaccessed within the ADAMSpackage or by performing asearch on theDocument/Report Number.
D-148 to D-152
APPENDIX D-6
HYDROLOGY
REYNOLDS RANCH AMENDMENT AREACONVERSE COUNTY, WYOMING
I GROUNDWATER
Descriptions of the geologic formations of the Powder River Basin and their hydrologicproperties have been discussed in numerous publications (Hodson et al., 1973;Hodson, 1971, Whitcomb et al., 1958; Huntoon, 1976; Davis, 1976) and weresummarized in Appendix D-5 (Geology). The hydrologic units beneath the permit areaand the general vicinity include the following: Holocence-age alluvial deposits, theEocene-age Wasatch Formation, the Paleocene-age Fort Union Formation, and theCretaceous-age Lance and Fox Hills Formations (Table D-6.1). Individual sandstoneswithin these units may be classified as aquifers depending on their hydrologiccharacteristics and potential yield to wells and/or springs.
1.1 GROUNDWATER RIGHTS
Listings of all known water wells and springs in the permit area or within three miles ofthe permit boundary are provided on Table D-6.2. The general locations of stock wellsand springs within the nearest ¼ ¼ Section are indicated on Figure D-6.1. The welllisting is by the Wyoming permit number and well name as listed in the Wyoming StateEngineers Office (WSEO) Water Rights Database. Table D-6.2 reflects listings in theWSEO Water Rights Database as of August 2004. Monitor wells associated with in situmining or development are not included in Table D-6.2.
1.2 GROUNDWATER QUALITY
Extensive groundwater quality data was previously collected by Solution MiningCorporation from the planned Production Zones and also other zones that arerepresentative of potential potable or existing stock water sources (not planned miningzones). Baseline water quality data for the Production Zones and potable/stock watersources are summarized in Attachment D6-2. See Figure D6-1 for the locations ofthese wells.
Baseline data will be extensively developed for the designated wells in each mining unitprior to start-up to determine baseline conditions, Upper Control Limits, and RestorationTarget Values. This data will be submitted to WDEQ-WQD prior to placing a mining unitinto production.
Smith Ranch Permit Addendum D5 C April- 20 11Page 1
1.3 HYDROGEOLOGIC UNITS
Alluvium. The alluvium in the permit area consists of thin, unconsolidated, poorlystratified clays, silts, sands, and gravels. The total thickness of these deposits isestimated to range from less than 1 foot to 30 feet. Small amounts of precipitationinfiltrate the alluvium during part of the year and intermittent flows across the alluviummay provide some recharge. The water table however is typically more than 100 feetbelow the land surface throughout most of the permit area.
The potential for future development of alluvial groundwater supplies in the permit areais considered very poor.
Wasatch Formation. The Wasatch Formation typically is lenticular fine- to coarse-grained sandstones with interbedded claystones and siltstones. The WasatchFormation contains some of the more important shallow aquifers in the Powder RiverBasin.
Properly constructed wells penetrating the Wasatch aquifer in the vicinity of theproposed project site generally yield from 5 to 15 gallons per minute (gpm).
For the most part, groundwater in the Wasatch aquifer occurs under water table(unconfined) conditions and its primary use in the permit area is low-yielding wells usedfor watering livestock. Artesian (confined) zones near the base of the formation areseparated from near-surface deposits and from each other by impermeable shalelayers.
Fort Union Formation. The Fort Union Formation underlies the Wasatch Formation inthe permit area. Typically, the Fort Union is comprised of lenticular fine- to coarse-grained sandstones with interbedded claystones, siltstones, and coal. The formation isas much as 3000 feet thick beneath the permit area.
The Fort Union Formation contains important aquifers in the Powder River Basin, andcontains the principle production zones for the Reynolds Ranch Project. While most ofthe solution mining wells are designated for limited yields (5 to 30 gpm of water), wellscompleted in the Fort Union formation can produce substantial volumes of groundwaterover extended periods as demonstrated by the various past mining operations in theSouthern Powder River Basin.
Lance and Fox Hills Formations. The Lance and Fox Hills Formations underlie the FortUnion Formation at depths of approximately 3500 feet and 5500 feet, respectivelybeneath the proposed permit area. The formations are comprised of fine to mediumgrained sandstones, interbedded sandy shales and claystones. Well yields from theseformations are not expected to exceed 100 gpm, and the groundwater reserves may belimited. Little is known of the hydrologic characteristics of the Lance and Fox HillsFormations as no water wells tap these aquifers in the vicinity of the permit area.Because of the depths of these formation and the availability of water from other
Smith Ranch Permit Addendum D5 C April- 2011Page 2
shallow aquifers, it appears unlikely that these formations will be tapped for waterS supplies in the future in the permit area.
1.4 LOCAL HYDROGEOLOGIC SETTING
The hydrostratigraphic units of primary concern in analyzing the possible impacts ofuranium in-situ mining operations in the 0-sand and U/S-Sand aquifers of the FortUnion Formation are:
o Wasatch Formation sandstones (overlying aquifers G and E-Sands)o W-sand aquifer (upper production zone- undeveloped)* Fort Union Formation V Shale (upper confining stratum)* U/S-sand aquifer (middle production zone)* Intermediate P Shale (U/S-sand lower confining stratum and 0-sand upper
confining stratum)* O-sand aquifer (lower production zone)" Basal Shale (lower confining stratum)
Detailed descriptions of each of these stratigraphic units is presented in Appendix D-5.
1.5 AQUIFER PUMP TESTS AND ANALYSIS
Pump tests have been conducted in the permit area to evaluate the hydrologiccharacteristics of the mineralized zones. The pump tests were performed by In-Situ,Inc. for Solution Mining Company and are presented in Attachment D6-1. The In-SituInc. pump tests were performed in January 1989 in areas of each production zonewhere future production is likely to occur. The pump tests conducted demonstrated thatthe mineralized formations have acceptable permeability and transmissivitycharacteristics for solution mining and all confining shale members tested have provento be effective aquitards for controlling the vertical movement of leach solutions.
It is important to note that terminology for the stratigraphic formations described in thepump test and analysis by In-Situ Inc. and Solution Mining Company (SMC) is differentthan the terminology used by Power Resources, Inc for the same formations. The listbelow provides a cross-reference for the different terminologies used.
" The SMC E-sand is equivalent to the PRI 0-sand.* The SMC H-sand is equivalent to the PRI U/S-sand." The SMC I-shale is equivalent to the PRI V-shale.
1.5.1 U/S Sand Pump Test Results
* The U/S-sand production zone aquifer is separated into upper (U) and lower (S) zonesby a discontinuous shale horizon. Transmissivities of the U/S-sand were found to range
Smith Ranch Permit Addendum D5 C April - 201 1Page 3
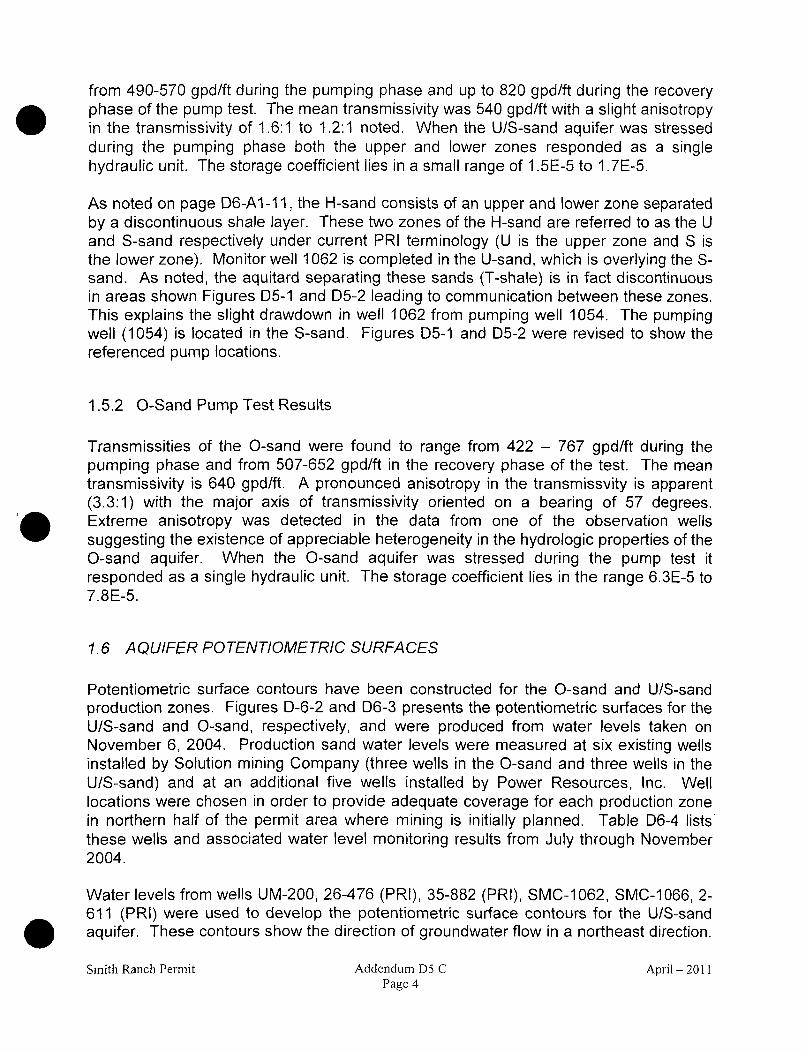
from 490-570 gpd/ft during the pumping phase and up to 820 gpd/ft during the recoveryphase of the pump test. The mean transmissivity was 540 gpd/ft with a slight anisotropyin the transmissivity of 1.6:1 to 1.2:1 noted. When the U/S-sand aquifer was stressedduring the pumping phase both the upper and lower zones responded as a singlehydraulic unit. The storage coefficient lies in a small range of 1.5E-5 to 1.7E-5.
As noted on page D6-A1-11, the H-sand consists of an upper and lower zone separatedby a discontinuous shale layer. These two zones of the H-sand are referred to as the Uand S-sand respectively under current PRI terminology (U is the upper zone and S isthe lower zone). Monitor well 1062 is completed in the U-sand, which is overlying the S-sand. As noted, the aquitard separating these sands (T-shale) is in fact discontinuousin areas shown Figures D5-1 and D5-2 leading to communication between these zones.This explains the slight drawdown in well 1062 from pumping well 1054. The pumpingwell (1054) is located in the S-sand. Figures D5-1 and D5-2 were revised to show thereferenced pump locations.
1.5.2 O-Sand Pump Test Results
Transmissities of the O-sand were found to range from 422 - 767 gpd/ft during thepumping phase and from 507-652 gpd/ft in the recovery phase of the test. The meantransmissivity is 640 gpd/ft. A pronounced anisotropy in the transmissvity is apparent(3.3:1) with the major axis of transmissivity oriented on a bearing of 57 degrees.Extreme anisotropy was detected in the data from one of the observation wellssuggesting the existence of appreciable heterogeneity in the hydrologic properties of theO-sand aquifer. When the 0-sand aquifer was stressed during the pump test itresponded as a single hydraulic unit. The storage coefficient lies in the range 6.3E-5 to7.8E-5.
1.6 AQUIFER POTENTIOMETRIC SURFACES
Potentiometric surface contours have been constructed for the O-sand and U/S-sandproduction zones. Figures D-6-2 and D6-3 presents the potentiometric surfaces for theU/S-sand and O-sand, respectively, and were produced from water levels taken onNovember 6, 2004. Production sand water levels were measured at six existing wellsinstalled by Solution mining Company (three wells in the O-sand and three wells in theU/S-sand) and at an additional five wells installed by Power Resources, Inc. Welllocations were chosen in order to provide adequate coverage for each production zonein northern half of the permit area where mining is initially planned. Table D6-4 liststhese wells and associated water level monitoring results from July through November2004.
Water levels from wells UM-200, 26-476 (PRI), 35-882 (PRI), SMC-1062, SMC-1 066, 2-611 (PRI) were used to develop the potentiometric surface contours for the U/S-sandaquifer. These contours show the direction of groundwater flow in a northeast direction.
Smith Ranch Permit Addendum D5 C April- 2011Page 4
The average groundwater velocity is estimated to be 8 ft/yr based on a hydraulicconductivity of 22 gpd/ft2 (2.89 ft/day), a matrix porosity of 0.27, and average gradient of0.002 ft/ft. These estimates also correlate closely with estimates determined by theprevious hydrologic testing from Solution Mining Company.
Water levels from wells SMC-1055, SMC-1058, SMC-1067, 26-477 (PRI), and 35-883(PRI) were used to develop the potentiometric surface contours for the O-sand aquifer.These contours show the direction of groundwater flow in a northwesterly direction. Theaverage velocity is estimated to be 1.9 ft/year based on a hydraulic conductivity of 21gal/day/ft2 (2.81 ft/day), a matrix porosity of 0.27, and an average gradient of 0.0005ft/ft. These estimates show that the 0-sand potentiometric surface is extremely flat,which correlates with the findings from Solution Mining Company hydrologic testsconducted previously.
2 SURFACE WATER
Surface flow in the permit area is intermittent, the result of both the relatively lowaverage annual precipitation in the region and the fact that most stream channels in thearea are underlain by quaternary deposits of high transmissivity.
Most of the high flow rates in the streams of the permit area result from high-intensityconvective storms that enter the region from the east (Lowers, 1960). These storms aremost likely to occur during May and June.
The permit area is located in the Duck Creek, Willow Creek, and Brown Springs Creekdrainages all attendant to the Dry Fork drainage of Little Cheyenne River. The LittleCheyenne River is part of the Cheyenne River drainage system in the southern part ofthe Powder River Basin. The only natural surface water in the permit area is ephemeralrunoff in response to intermittent precipitation and seepage into small basins at lowpoints in the Duck Creek, Willow Creek, and Brown Springs Creek drainages. Surfacerunoff is very limited, surrounding stock ponds collect some runoff for livestock andwildlife consumption, but are dry most of the year. Some stock ponds on the permitarea are fed by a pumped well and will contain water for longer durations.
The average annual runoff from this part of Wyoming is approximately 0.3 to 0.5 inches,or between approximately 0.022 and 0.037 cubic feet per second per square mile (U.S.Soil Conservation Service, 1975; Hodson et al., 1973).
2.1 SURFACE WATER QUALITY
Surface water inside the Permit Area is limited to snow melt and rain runoff. Surfacewater is present for only short periods of time. A working stock pond, which is suppliedprimarily by a shallow well, is located within the Permit Area. Solution Mining Companyconducted surface water analysis of the stock pond and other surface water sites
Smith Ranch Permit Addendum D5 C April- 2011Page 5
including the Silver Spoon Reservoir and Brown Springs Creek for radiologicalconstituents. The results of these analyses are presented in Attachment D6-2.
2.2 SURFACE WATER RIGHTS
A listing of all the adjudicated and non-adjudicated surface water rights is provided inTable D-6-3. Only two surface water rights (the Silver Spoon Reservoir) exist in thePermit Area or with one-half mile of the Permit Area as determined from the WSEOWater Rights Database in August of 2004. The general location of these surface waterrights are indicated on Figure D-6.1.
Smith Ranch Permit Addendum D5 CPage 6
April - 2011
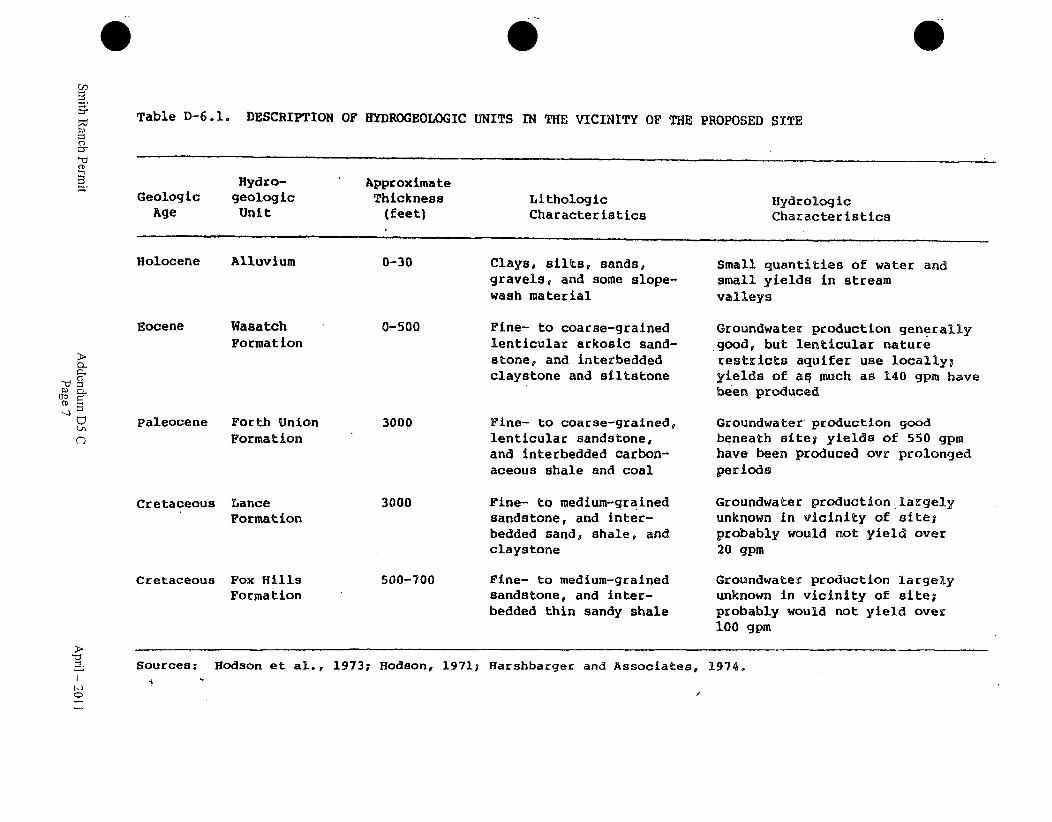
CDCDC)
CD
Table D-6.1. DESCRIPTION OF HYDROGEOLOGIC UNITS IN THE VICINITY OF THE PROPOSED SITE
CD-
QA
nD
Hydro- ApproximateGeologic geologic Thickness Lithologic Hydrologic
Age Unit (feet) Characteristics Characteristics
Holocene Alluvium 0-30 Clays, silts, sands, Small quantities of water andgravels1 and some slope- small yields in streamwash material valleys
Eocene Wasatch 0-500 Fine- to coarse-grained Groundwater production generallyFormation lenticular arkosic sand- good, but lenticular nature
stone, and interbedded restricts aquifer use locally;claystone and siltatone yields of aq much as 140 gpm have
been produced
Paleocene Forth Union 3000 Fine- to coarse-grained, Groundwater production good
Formation lenticular sandstone, beneath site; yields of 550 gpm
and interbedded carbon- have been produced ovr prolongedaceous shale and coal periods
Cretaceous Lance 3000 Fine- to medium-grained Groundwater production largely
Formation sandstone, and inter- unknown in vicinity of site;bedded sand, shale, and probably would not yield overclaystone 20 gpm
Cretaceous Fox Hills 500-700 Fine- to medium-grained Groundwater production largelyFormation sandstone, and inter- unknown in vicinity of site;
bedded thin sandy shale probably would not yield over100 gpm
Sources: Hodson et al., 1973; Hodson, 1971; Harshbarger and Associates, 1974.0
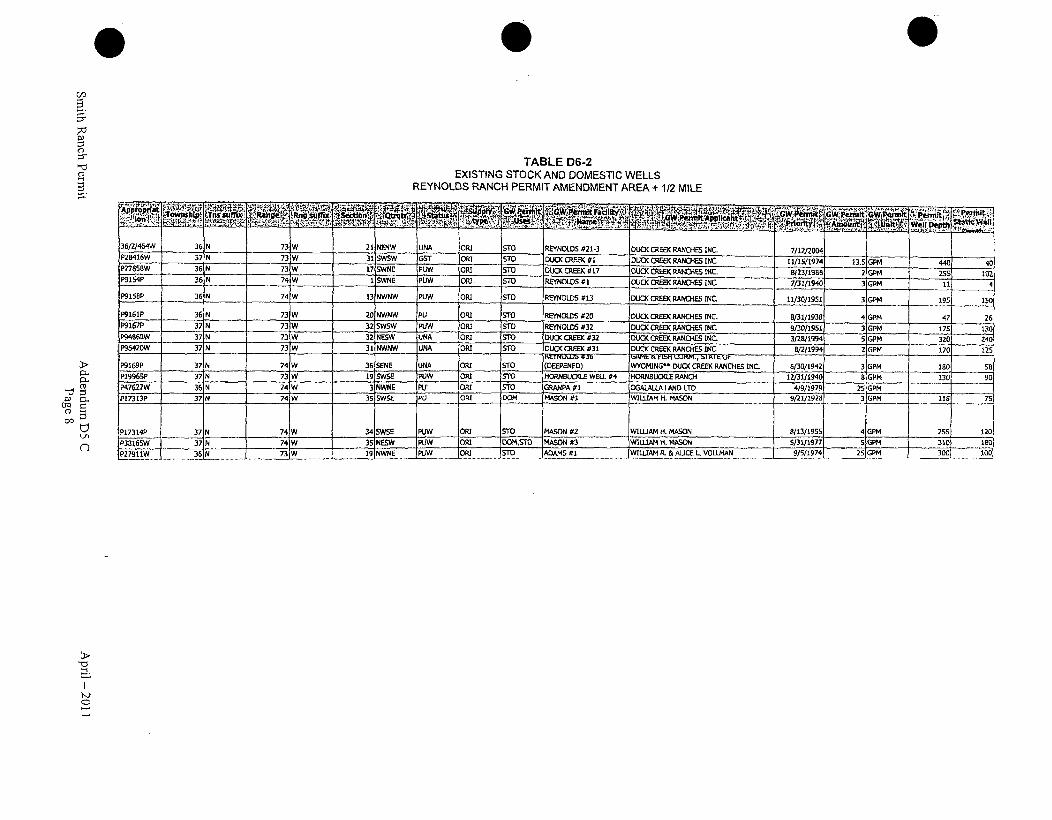
TABLE D6-2EXISTING STOCK AND DOMESTIC WELLS
REYNOLDS RANCH PERMIT AMENDMENT AREA + 112 MILE
I I36/7/464W 36 N 73 W 2_ 1 NENW UNA OR1 STO R&YNOLS #21-3 DUCK CREEK RANCHES INC. 7/12/2004
P28416W 37 N 73 W 31 SWSW GST OR] 510 DUCK CREEK #1 DUCK CREEK RANCHES INC. 11/15/1974 13.S GPM 440 40
P77858W 36 N 73 W 17 SWNE PUW OR1 STO DUOC CREEK #'17 DUCK CREEK RANCHES [EtC. Sf23/1686 2 G-M 25S 102
P154P 36iN 74 W WNE PUW OR]. _ 7 .T REYNOLDS #1 DUCK CREEK RANCHES INC. 7/31/1940 3 GPM 14
Pg1siP 36 N 74 W 13 NWNW PUW OR STO REYNOLDS #13 ODUC CREEK RANCHES INC. 11/30/1951 3 GPM 195 10
P9161P 36 N 73W 20 'NWNW PU OR1 51"O REYNO.DS #20 DUCK CREEK RANCHES INC. 8/31/1938 4 GPM 47 26P9167P 37 N 73 W 32SWSW PUW 01 m0 REYNOLDS #32 DUCKCREEK RANCHES IN . 9/0/1951 3 G" 175 130
P94860W 37 N 73 W 32 NESW UNA ORI 5TO DUCK'CREEK #32 DUCK CREEK RANCHES INC. 3/28/1994 5 GPM 320 240
P96420W 37 N 73 W 31 NWNW UNA ORI STO DUCK CREEK #31 DUCK CREEK RANCHES INC. 8/2/1994 2 GPM 170 125
P9169P 37 N 74 W 36 SENE UNA OR STO (DEEPENED) WYOMING** DUCK CREEK RANCHES INC. 6/30/1942 3 GPM 180 58P19965P 37 N 73 W 19 SWSE P11W OP6 STO HORNBUCKLE WELL #4 HORN8UCK.E RANCH 12/31/1940 8 GPM 130 90
P476Z7W 36 N 74 W 3 NWNE PU OR 51O GRANPA #1 DGALAUA LAND LTD 4/1/1979 25 GPMP17313P 37 N 74 W 35 SWSE PU ORI DOM MASON #1 WILLIAM H. MASON 9/21/19268 3 GPM 118 75,
P17314P 37 N 74 W 34 SWSE PuW ORI 510 MASON #2 WILLIAM H. MASON 8/13/1955 4 GPM 255 120
P38t65W - 37 N - 74W 3SNESW PUW 6OR DOSTO MASON 03 WILUAM H. MASON - S/31/1977 SC 310 160
79 ADAMS #I WILlJAM R. & ALICE L VOLMAN 9/9/1974 25 GM.....
CD
00
>0
NI
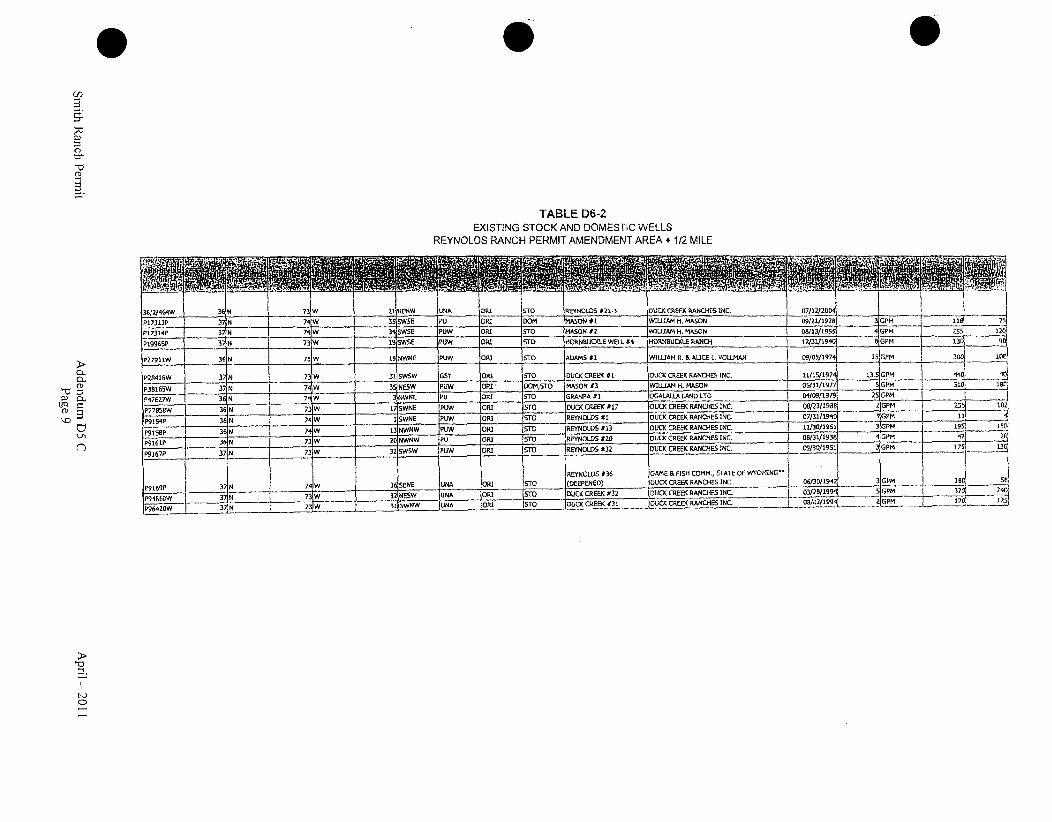
Cr'
(D
TABLE D6-2EXISTING STOCK AND DOMESTIC WELLS
REYNOLDS RANCH PERMIT AMENDMENT AREA + 1/2 MILE
161f146AW .31W I 01 rN8W 1UNA ORI 510 IREYNOI.DS $21-3 0711 2/20S4iN DUCK CREEK RANCHES INC.
CD
CD ~
A17313A 37 N_____ 35 SW5E PU DPRI 0DM IMASON #1 IWILLIAM Ii. MASON (92198 Y lP17314P 37 N___ 4W 3 T SVWSE P2W p CR1 520 MASON $2 IWIUIAM4 H, MASON I 08/13/955 4 GPM 2551. 1209199659 37 N I 7NW 19 SWSE IPUPA 0181 STO HORNBUCKIS WEII. #4 HDAR~UCKLF RANCH 833.~o GPDM 1300 9I
P27911W I 3C N 3P 19INWNE 1PUPA DPJ $T0 ADAMS 01 IWILlAM R. & ALICE L. VOUMAN 091/05/1974 25 GPM 300, 10111
73158 36 31_ ____ ___ WILLIA ___ G44'
P28416W 3; N 7W31 SWWS32 08 1 DUCK CREEK #I DC CEKRACE INC. 1/115/197 3 A
P38165W 37 N___ 74R E-sP JP1W OR CR 3MSOMSN#3 - H AO 52317 IGPM 30 1
A9154At 36N 73W 36NI SPNE PUPA OR! 1 ENLS0 DC RE ACE INC. 07/31/1940i 3 GPM _1215P _____P - ~ 71 PA SWNEAP P1W DI £D RYOD 3 UKCEKRNS INC. 13/NS lA 9A9194P I 368 ___1_ f____ 511/9 Ia.______________________
AS~l _ _ 38 J 731 0NNW A R 00 RYOD 2 UKREENIE N.08/31/1938,1 GPM 4
IP9167P 37 N___ 73W 32 SWSW PUW OR! ISrI REYNOLDS 8132 01C RE ACES INC. j 0/311/l9Sl0 ___ _ GPM 175 13d
P169P 378 73 SENE UNA
NFS`W I IN
ORI i51O
ORI 157O
. II
W"
REYNOLDS #36 GAME & FISH COMM., STATE O WYOMING-(DEEPEND DUCK CREEK RANCHES INC. _______I 06/301194 3GYMDUCK CREEK #32 DUCK CREEK RANCHES INC. .. 03/28/1994'1 ADUCK CREEK 431 DUCK CREEK RANCHES INC. 002/1991
laoot s'oA .97
NWW UNA 003 121
'51
K)
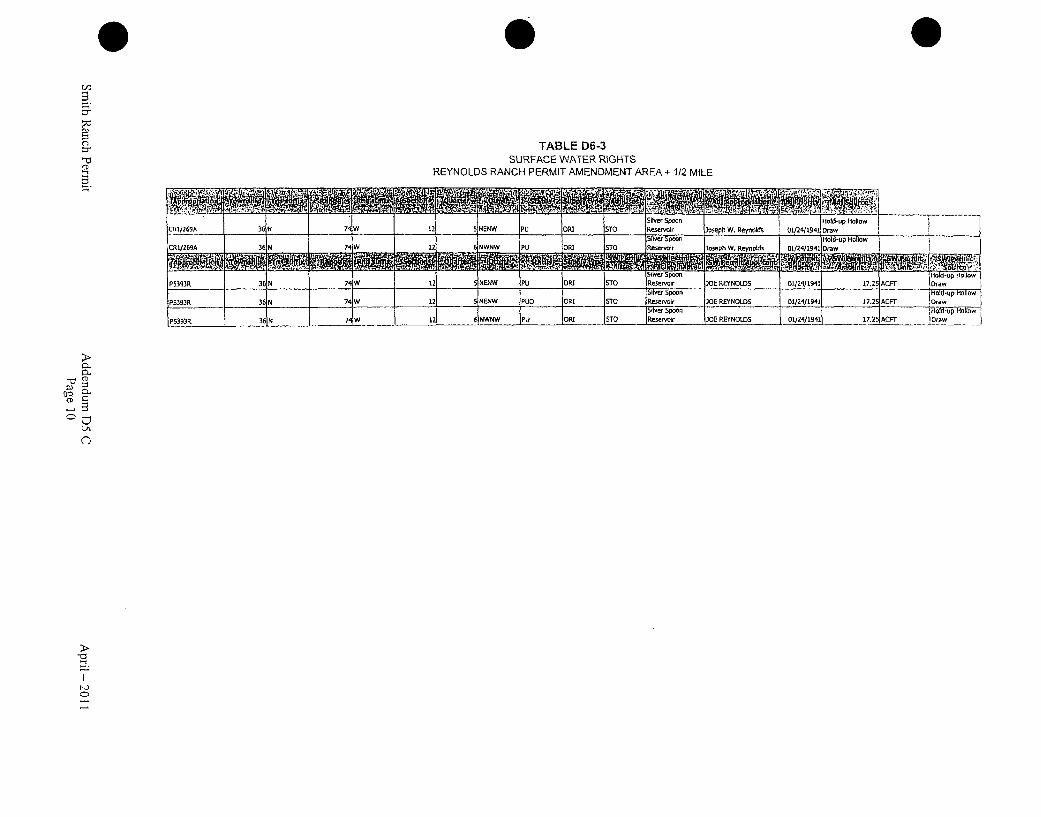
C,)9
(0~0'
C
Cl
9
TABLE D6-3SURFACE WATER RIGHTS
REYNOLDS RANCH PERMIT AMENDMENT AREA + 1/2 MILE
Cr1/Z69A0 30 N________ 7W 12 5 NENW PU Op! STO Reservoir Joseph W. Reynolds 01/24/1941D raw.... I Hl sP- pHollow
,C241269A 36 N 74 W 12 fNWNW Pu OR! STO Reservoir loseph W. Reynoldso Olr4/1941 Drawu
P5393R 36 N 741W 1" 2 5 NENW PU ORI STO Resevoir MOE REYNOLDS 01/24/1941 17.2u ACFT Dr w
I y•iv~ 1poon -Hold-up"Hollow
P5393R 36 N 7' W 12; NENW PUD O R!FL 570 Reervooo JOR R-ITNOLDS 01/24/1,041 17.25 ACOT •Oraw
P53'5 36N 74, __________ _____ R __,_____ ___oon_____ .... 141HoId'up I1flP5393R _36 N 7W 12 6 NWNW PUo OR i STO Reservoir 201 REYNOEDS ''1 17.2 ACOT IDrow
CL
(D
Uq
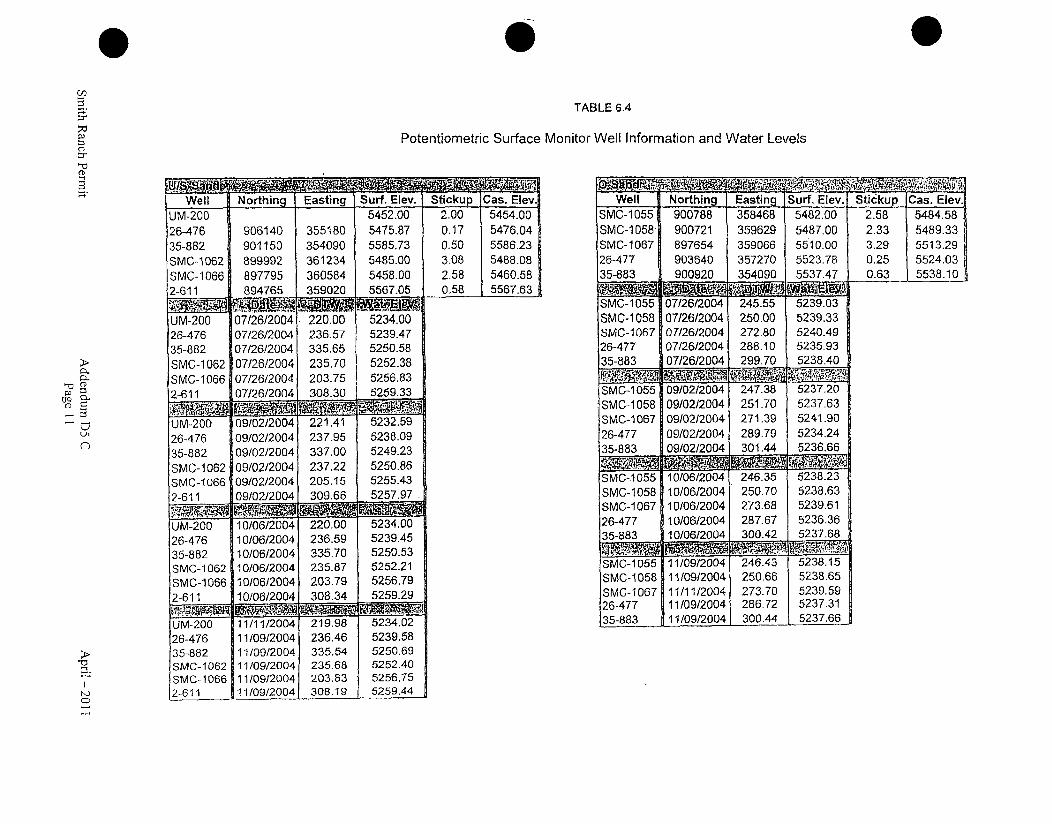
TABLE 6.4
C0
-e
Potentiometric Surface Monitor Well Information and Water Levels
Well Northing Easting Surf. Elev. Stickup Cas. ElevUM-200 5452.00 2.00 5454.0026-476 906140 355180 5475.87 0.17 5476.0435-882 901150 354090 5585.73 0.50 5586.23SMC-1062 899992 361234 5485.00 3.08 5488.08SMC-1066 897795 360584 5458.00 2.58 5460.582-611 894765 359020 5567.05 0.58 5567.63
Well Northing Easting Surf. Elev. Stickup Cas. Elev.SMC-1055 900788 358468 5482.00 2.58 5484.58SMC-1058 900721 359629 5487.00 2.33 5489.33SMC-1067 897654 359066 5510.00 3.29 5513.29
26-477 903640 357270 5523.78 0.25 5524.0335-88 900920 1354090 15537.47 0.63 5538.10
UM-20026-47635-882SMC-1062SMC-106612-11I
07/26/200407/26/200407/26/200407/26/200407/26/200407/26/2004
220.00236.57335.65235.70203.75308.30
5234.005239.475250.585252.385256.835259.33
CDUM-200 09/02/2004 221.41 5232.5926-476 09/02/2004 237.95 5238.0935-882 09/02/2004 337.00 5249.23SMC-1062 09/02/2004 237.22 5250.86SMC-1066 09/02/2004 205.15 5255.432-611 09/02/2004 309.66 5257.97
UM-200 10/06/2004 220.00 5234.0026-476 10/06/2004 236.59 5239.4535-882 10/06/2004 335.70 5250.53SMC-1062 10/06/2004 235.87 5252.21SMC-1066 10/06/2004 203.79 5256.792-611 10/06/2004 308.34 5259.29
SMC-1055 07/26/2004 245.55 5239.03SMC-1058 07/26/2004 250.00 5239.33
SMC-1067 07/26/2004 272.80 5240.4926-477 07/26/2004 288.10 5235.9335-883 07/26/2004 299.70 5238.40
SMC-1055 09/02/2004 247.38 5237.20SMC-1 058 09/02/2004 251.70 5237.63SMC-1067 09/02/2004 271.39 5241.9026-477 09/02/2004 289.79 5234.2435-883 09/02/2004 301.44 5236.66
SMC-1055 10/06/2004 246.35 5238.23SMC-1058 10/06/2004 250.70 5238.63SMC-1067 10/06/2004 273.68 5239.6126-477 10/06/2004 287.67 5236.3635-883 10/06/2004 300.42 5237.68
SMC-1055 11/09/2004 246.43 5238.15SMC-1058 11/09/2004 250.68 5238.65SMC-1067 11/11/2004 273.70 5239.5926-477 11/09/2004 286.72 5237.3135-883 11/09/2004 300.44 5237.66UM-200
26-47635-882SMC-1062SMC-10662-611
11/11/2004 219.9811/09/2004 236.4611/09/2004 335.5411/09/2004 235.6811/09/2004 203.8311/09/2004 308.19
5234.025239.585250.695252.405256.755259.44

The following 3 Drawingsspecifically referencedAppendix D6 Table ofContents have beenprocessed into ADAMS.
These drawings can beaccessed within the ADAMSpackage or by performing asearch on theDocument/Report Number.
D-153 to D-155
ATTACHMENT D6-1
O-SAND AND U/S-SAND PUMPING TESTS
Prepared By In-Situ IncorporatedDecember 1989
Note: The terminology for the stratigraphic formations described in the pump test andanalysis by In-Situ Inc. and Solution Mining Company (SMC) is different than theterminology used by Power Resources, Inc for the same formations. The list belowprovides a cross-reference for the different terminologies used.
* The SMC E-sand is equivalent to the PRI O-sand.* The SMC H-sand is equivalent to the PRI U/S-sand.* The SMC I-shale is equivalent to the PRI V-shale.
Page D6-A 1 -i
APPENDIX D6=AI
H- AND E-SAND CONSTANT RATEPUMPING TESTS
Prepared By:
R. KoenigIn-Situ Incorporated
210 South Third StreetLaramie, Wyoming 82070-0920
December 1989
Page D6-A1-ii
APPENDIX D6=A1H- AND E-SAND CONSTANT RATE PUMPING TESTS
TABLE OF CONTENTS
D)6. Al. I
D6. Al.2
D 6.Al. 3
D 6 Al 04
D6. Al 0 5
DG.0 Al.0 6
INTRODUCTION AND SUMMARY
PUMPING TEST PROCEDURE
DATA ANALYSIS METHODS
PUMPING TEST 1 (H-SAND) RESULTS
PUMPING TEST 2 (E=SAND) RESULTS
REFERENCES
Page
D6-Al1-
D 6 -A -3
D6-A1-5
DG-Ai-8
D6-Al-12
D6-Al-15
Page D6-AI--iii
LIST OF TABLES
TABLES FOLLOW THE TEXT
TitleTableNumber Page
D6-Al-l
D6-Al-2
D6_Al-3
D6-Al-4
D6-AI-5
D6-Al-6
D6-Al-7
D6-Al-8
D6-Al-9
D6-Al-10
D6-Al-II
D6-Al-12
D6-Al-13
D6-AI-14
Well Construction and Completion Data forConstant-Rate Pumping TestsCoordinates and Collar Elevations of WellsUsed in Pumping TestTransmissivities and Storage Coefficient ValuesFor H-Sand Pumping Test Computed According ToDifferent Analytical MethodsDetermination of Horizontal DirectionalTransmissivities By Means of Papadopulos Methodwith Theis Input Data: H-Sand Pumping TestDetermination of Horizontal DirectionalTransmissivities By Means of Papadopulos Methodwith Cooper-Jacob Input Data: H-Sand Pumping TestTransmissivities and Storage Coefficient ValuesFor E-Sand Pumping Test Computed According ToDifferent Analytical MethodsDetermination of Horizontal DirectionalTransmissivities By Means of Papadopolus Methodwith Cooper-Jacob Input Data: E-Sand Pumping TestDetermination of Transmissivity, Storage Coefficientand Horizontal Directional Transmissivities By Meansof Theis Curve Matching: E-Sand Pumping TestH-Sand Pumping Test: Water Levels in Pumping andMonitor Wells Prior to Commencement of Pumping TestH-Sand Pumping Test: Hourly Discharge Rates DuringPumping PhaseH-Sand Pumping Test: Well Drawdown Versus Time forPumping and Recovery PhasesE-Sand Pumping Test: Water Levels in Pumping andMonitor Wells Prior to Commencement of Pumping TestE-Sand Pumping Test: Hourly Discharge Rates DuringPumping PhaseE-Sand Pumping Test: Well Drawdown Versus Time forPumping and Recovery Phases
D)6-Al-TI
D6 -Al-T2
D6-Al-T3
D6-Al-T4
D6-Al-T5
D6-Al--T6
D6-Al-T-
D6-Al-T(
D6-Al-Tlp
D6-A1--T13
D6-AI-T15
D6-Al-T16
D6-Al-T17
D6-Al-T19
Page D6-Al-iv
LIST OF FIGURES
FigureNumber
FIGURES FOLLOW THE TEXT
Title Page
D6-A1-1D6-AI-2D6-Al-3
D6-Al-4D6-AI-5D6-Ai-6D6-AI-7
D6-AI-8D6-AI-9D6-Al-10
D6-AI-1lD6-Al-12D6-AI-13
D6-A1-14
D6-Al-15
D6-Al-16. D6-AI-17D6-AI-18D6-AI-19
D6-AI-20D6-AI-21D6-Al-22
D6-AI-23D6-AI-24D6-AI-25
D6-Al-26D6-AI-27D6-A1-28
D6-Al-29D6-AI-3 0D6-AI-31
D6-Al-32
D6-AI-33
H-Sand Pumping TestSMC Pumping Test 1,SMC Pumping Test 1,Recovery Phase)SMC Pumping Test 1,SMC Pumping Test 1,SMC Pumping Test 1,SMC Pumping Test 1,
I Well ConfigurationWell 1056 (Log-Log, Pumping Phase)Well 1056 (Semi-Log,
Recovery Phase)SMC Pumping TestSMC Pumping TestSMC Pumping TestRecovery Phase)SMC Pumping TestSMC Pumping TestSMC Pumping TestRecovery Phase)
1,1,1,
1,1,1,
WellWellWellWell
WellWellWell
WellWellWell
1062106310631063
106410641064
106510651065
(Log-Log, Pumping Phase)(Log-Log, Pumping Phase)(Semi-Log, Pumping Phase)(Semi-Log,
(Log-Log, Pumping Phase)(Semi-Log, Pumping Phase)(Semi-Log,
(Log-Log, Pumping Phase)(Semi-Log, Pumping Phase)(Semi-Log,
Determination of H-Sand Aquifer Direction andGradient of Ground Water Flow: 10 January 1989Determination of H-Sand Aquifer Direction andGradient of Ground Water Flow: 6-7 JulyE-Sand Pumping TestSMC Pumping Test 2,SMC Pumping Test 2,SMC Pumping Test 2,Recovery Phase)SMC Pumping Test 2,SMC Pumping Test 2,SMC Pumping Test 2,Recovery Phase)SMC Pumping Test 2,SMC Pumping Test 2,SMC Pumping Test 2,Recovery Phase),SMC Pumping Test. 2,SMC Pumping Test 2,SMC Pumping Test 2,Recovery Phase)SMC Pumping Test 2,SMC Pumping Test 2,SMC Pumping Test 2,Recovery Phase)SMC Pumping Test 2,
2 Well ConfigurationWellWellWell
WellWellWell
WellWellWell
WellWellWell
WellWellWell
105510551055
105410541054
105810581058
106010601060
106110611061
(Log-Log, Pumping Phase)(Semi-Log, Pumping Phase)(Semi-Log,
(Log-Log, Pumping Phase)(Semi-Log, Pumping Phase)(Semi-Log,
(Log-Log, Pumping Phase)(Semi-Log, Pumping Phage)(Semi-Log,
(Log-Log, Pumping Phase)(Semi-Log, Pumping Phase)(Semi-Log,
(Log-Log, Pumping Phase)(Semi-Log, Pumping Phase)(Semi-Log,
D6.-AI-F1D6-Al-F2
D6-Al-F3D6-Al-F4D6-A-Fp5D6-Al-F6
D6-AI-F7D6-AI-F8D6-AI-F9
D6-AI-FI0D6-Ai-F1ID6-A1-F12
D6-AI-Fl3
D6-Al-F14
D6-AI-FI5D6-AI-F16D6-AI-F17D6-AI-FI8
D6-AI-F19D6-Al-F20D6-Al-F21
D6-A1-F22D6-AI-F23D6-Al-F24
D6-Al-F25D6-Al-F26D6-AI-F27
D6-Al-F28D6-Al-F29D6-AI-F30
D6-Al-F31
D6-Al-F32
D6-AI-F33
Theis Curve Automated Matching,Well 1054 (Pumping Phase)SMC Pumping Test 2, Theis Curve Automated Matching,Well 1060 (Pumping Phase)
Page D6-A1-v
D6-AI-34
D6-AI-35
D6-AI-3 6
SMC Pumping Test 2, Theis Curve Automated Matching,Well 1061 (Pumping Phase)SMC Pumping Test 2, Theis Curve Automated Matching,Well 1058 (Pumping Phase)Determination of E-Sand Aquifer Direction andGradient of Ground Water Flow: 26 January 1989,Pumping Test 2
D6-A-
D6-Al-Fj 6
Page D6-A I-vi
Appendix D6-AlPump Tests
D6°.Al1 INTRODUCTION AND SUMMARY
Two multiple well, constant-rate pumping tests were
conducted to investigate the ground water hydrology of two
uranium-bearing horizons (H-sand and E-sand) at Solution
Mining Corporation's Blizzard Heights project site in
Converse County, Wyoming. Each test encompassed both a 72
hour pumping phase (pumping at approximately 20 gpm) and a
215-271 hour recovery phase after cessation of pumping.
Six methods were used to analyze the constant-rate and
recovery data to determine:
* transmissivity
* storage coefficient
* directional transmissivity
* leakage
Water levels measured in July 1989 in the pumping and
monitor wells after the aquifers had been undisturbed for
several months were approximately 5243 ft msl for wells
completely penetrating the H-sand horizon and approximately
5229 ft msl for the E-sand horizon. Ground water flows
naturally at a bearing of 325 degrees with a gradient of
- 0.002 ft/ft and a velocity of about 11 ft/yr in the H-sand
horizon. The potentiometric surface of the E-sand aquifer
is very flat and the ground water practically does not flow.
Page D6-Al-l
Appendix D6-AlPump Tests
In the H-sand aquifer the mean transmissivity is 540 gpd/ft
and the storage coefficient between 1.5xlO- and 1.o7x0 5o
Slight directional transmissivity with a ratio of not more
than 1.6:1 was seen and may be considered of minor concern.
Drawdown of more than 2 ft in a well completed in what was
initially believed to be the first aquifer overlying the H-
sand production zone was noted; geologic analysis of the H-
sand in the vicinity of the pumping test site subsequently
revealed that the interlying shale aquitard is, in fact, a
discontinuous shale parting. The drawdown response in the
observation wells is not consistent with leakage through a
competent aquitard.
In the E-sand aquifer the mean transmissivity is 590 to 640
gpd/ft and the storage coefficient between 6.3xi0- 5 and
7.8x0-5. Significant directional transmissivity with a
ratio of at least 3.4:1 was seen. The bearing of the
anisotropy generally is 0-60 degrees depending, on whether
monitor well 1058 is included in the analysis. Heterogeneity
is likely in the E-sand aquifer.
Page D6-Al-2
Appendix D6-A1Pump Tests
D6.A1o2 PUMPING TEST PROCEDURE
Two 72-hour constant-rate pumping tests were conducted at
Solution Mining Corporation's (SMC) Blizzard Heights Project
site in Converse County, Wyoming (Section 36, T37N, R74W).
Pumping Test 1 (11-25 January 1989) investigated the ground
water hydrology of the H-sand production horizon and Pumping
Test 2 (27 January - 8 February 1989) the E-sand horizon.
A 15 HP Lowara electric submersible pump with a gate valve
at the head of the discharge line was used to control the
discharge rate at about 20 gpm. A Badger meter was
installed downstream of the control valve to measure the
volume of water for calculating the discharge rate. (The
Badger meter failed at the beginning of Pumping Test 1, and
hourly measurements of the time needed to fill a 21-gallon
container were used to compute the discharge rate.)
Pressure sensors to monitor and record the water level were
installed in the pumping well and the four observation wells
in each pumping test. An In-Situ Inc. HERMIT 2000
programmable data logger was used to automatically record
time versus water level on a logarithmic schedule during
three days of pumping and several days of recovery.
Water level measurements in each of the test wells prior to
the start of pumping were used to determine the ground water
Page D6-Al-3
Appendix D6-AlPump Tests
gradient and flow direction for the H-sand and E-sand
horizons. 4
Table D6-Al-l summarizes the well construction and
completion information for the ten wells used in the two
pumping tests and Table D6-AI-2 the coordinates and collar
elevations of the pumping and monitor wells.
Page D6-AI-4
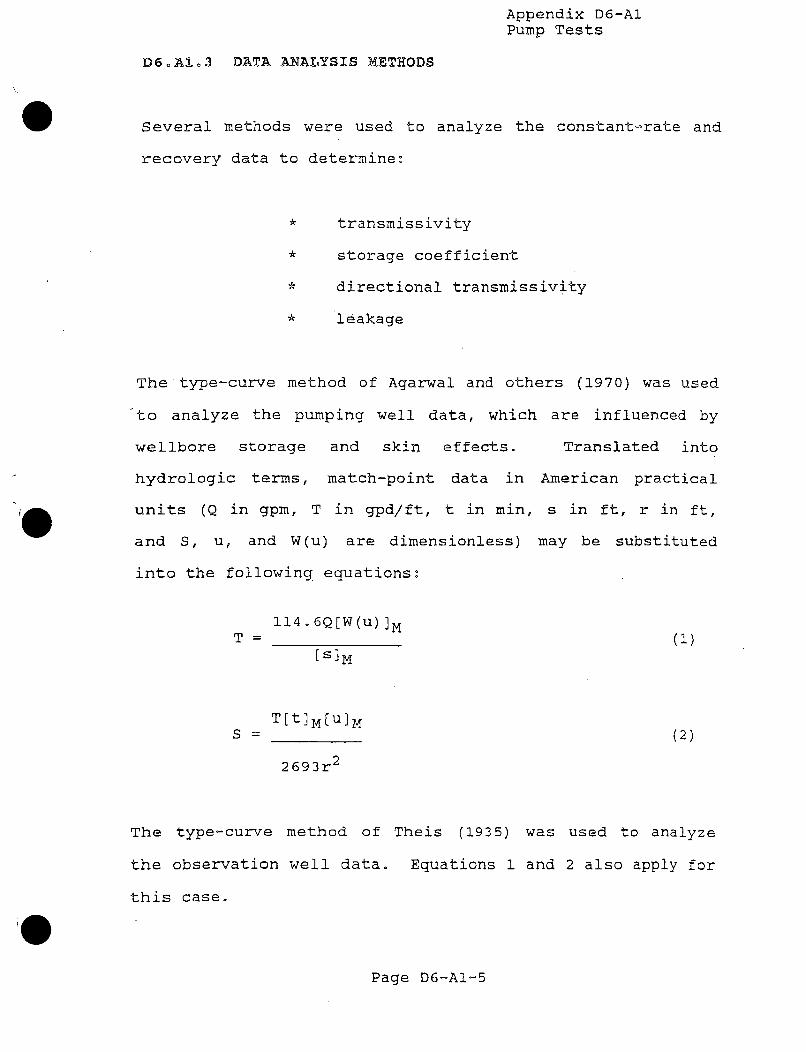
Appendix D6-AlPump Tests
D6oA1o3 DATA ANALYSIS METHODS
Several methods were used to analyze the constant-rate and
recovery data to determine:
* transmissivity
* storage coefficient
* directional transmissivity
* leakage
The type-curve method of Agarwal and others (1970) was used
to analyze the pumping well data, which are influenced by
wellbore storage and skin effects. Translated into
hydrologic terms, match-point data in American practical
units (Q in gpm, T in gpd/ft, t in min, s in ft, r in ft,
and S, u, and W(u) are dimensionless) may be substituted
into the following equations:
114.o6Q[W(u) IMT = (1)
T[t]M[u]Ms = (2)
2693r2
The type-curve method of Theis (1935) was used to analyze
the observation well data. Equations 1 and 2 also apply for
this case.
Page D6-Al-5
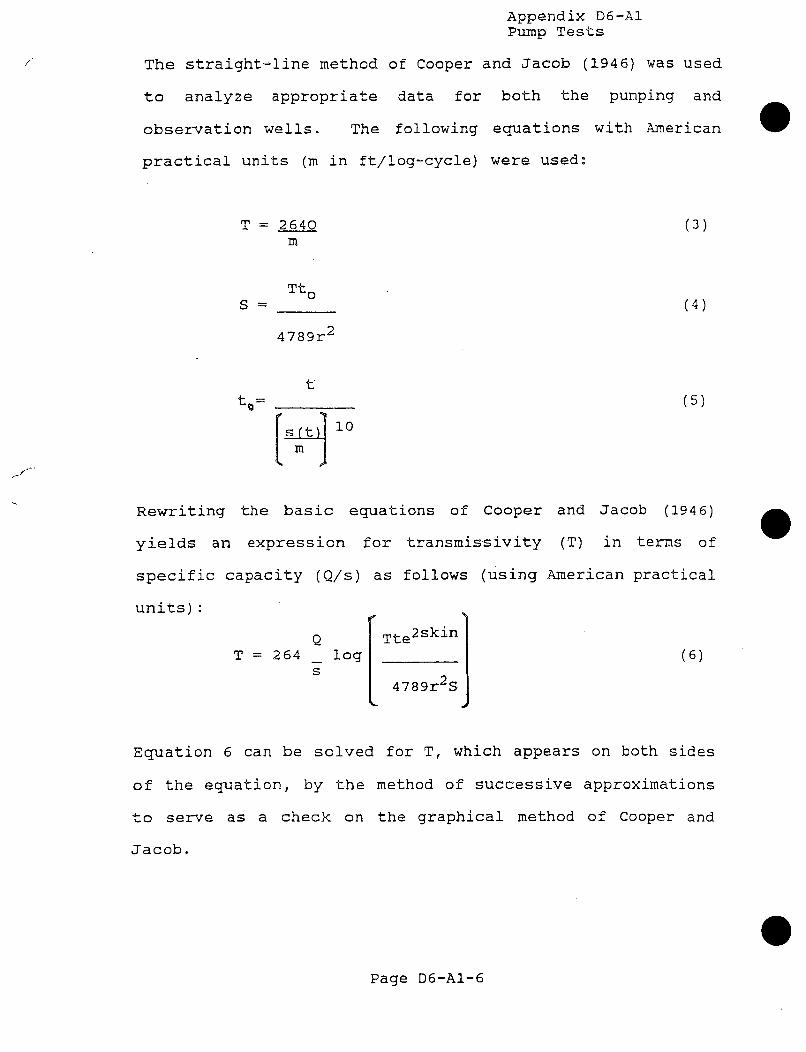
Appendix D6-AIPump Tests
The straight-line method of Cooper and Jacob (1946) was used
to analyze appropriate data for both the pumping and
observation wells. The following equations with American
practical units (m in ft/log-cycle) were used:
T = 264Q (3)m
Ttos (4)
4789r2
tto= (5)
1 S 10
Rewriting the basic equations of Cooper and Jacob (1946)
yields an expression for transmissivity (T) in terms of
specific capacity (Q/s) as follows (using American practical
units):
ni)Q Tte2skinT = 264 log (6)
s
4789r2SJ
Equation 6 can be solved for T, which appears on both sides
of the equation, by the method of successive approximations
to serve as a check on the graphical method of Cooper and
Jacob.
Page D6-Al-6
Appendix D6-AlPump Tests
The recovery data after pumping stopped were also analyzed
for transmissivity according to the principles set forth by
Theis (1935) Residual drawdown versus the logarithm of
(tp+ At)/At, where tp is time of pumping and At is time
since pumping stopped, may be plotted and the slope (m) of
the straight-line portion of the data determined.
Substitution into equation 3 yields the transmissivity.
Computer software marketed by In-Situ Inc. (TS-MATCH and
PAPADOP) was also used to determine directional
transmissivity. TS-MATCH automatically matches test data to
Theis type-curves and uses the method of Papadopulos (1965)
to determine directional transmissivity. PAPADOP uses the
method of Papadopulos (1965) to determine directional
transmissivity using aquifer parameters determined by other
methods.
Page D6-Al-7
Appendix D6-AlPump Tests
D6oA.o4 PUMPING TEST I (H=SAND) RESULTS
A pumping well (1056) and three observation wells (1063,
1064, and 1065) fully penetrating the H-sand aquifer were
used for Pumping Test 1. An additional well (1062) was
completed in what was initially believed to be the first
aquifer above the H-sand aquifer to detect possible
communication with other units when the H-sand aquifer is
stressed. Subsequent geologic analysis revealed that in the
area in which well 1062 was completed the H-sand production
zone aquifer is simply separated into upper and lower zones
by a relatively discontinuous shale horizon (see Section
D6.2 . l6. of Appendix D-6 text).
Figure D6-AI-1 illustrates the well pattern for Pumping Test
1. Drift surveys of the wells (Table D6-Al-I) showed that
the bottoms of all the wells were within one or two percent
of directly below their tops, so the surface locations of
the wells were used in all of the subsequent calculations.
Water level elevations in the pumping and monitor wells
prior to the start of the test at 0900 hours on 11 January
1989 are presented in Table D6-A1-9, hourly discharge rate
data during the pumping phase in Table D6-Al-10 and drawdown
versus time data for both the pumping and recovery phases in
Table D6-Al-II.
Figures D6-Al-2 through D6-Al-13 show manual analyses by the
various methods. Controlling the discharge rate at a
Page D6-AI-8
Appendix D6-AlPump Tests
constant rate was difficult because of freezing temperatures
and a tendency for restriction of flow at exposed portions
of the discharge line. The flow meter failed at the
beginning of the test. Different discharge rates were used
for different analysis methods. A rate of 18 gpm was used
for methods using early data, 23 gpm for late data, and 20
gpm for an average rate.
The results of the various methods are summarized in Table
D6-Al-3. With the exception of the transmissivity value
from the recovery method for well 1064, the results are
reasonably consistent.
Relying primarily on the earlier data from about one to two
hours while the discharge rate was relatively constant, the
parameters from the Theis type-curve matching and the Cooper
and Jacob straight-line methods were input into PAPADOP to
determine directional transmissivity. Table D6-Al-4 shows
the results for the Theis method and Table D6-Al-5 for the
Cooper and Jacob method. The mean values of transmissivity
are both close to 540 gpd/ft with indications of slight
anisotropy in the range of 1.6:1 to 1.2:1. The storage
coefficient lies in a small range of l.5x10-5 to 1.7x10⁻⁵.
Only the orientation of the major axis of transmissivity is
significantly different between the two sets of input data.
Since the directional transmissivity is small, the
orientation is a minor consideration. Assuming a mean
Page D6-Al-9
Appendix D6-AIPump Tests
transmissivity of 540 gpd/ft and mean H-sand thickness of 25
ft the permeability of this production zone aquifer is 1,052
millidarcies.
Water levels were measured in the wells of the test pattern
on January 9 and again on January 10 prior to the start of
the pumping test. Based on the calculated water level
elevations on January. 10 (see Table D6-AI-9) in wells 1063
(5243.16 ft msl), 1064 (5243.21), and 1065 (5243.60), the
direction and gradient of the natural ground water flow were
determined. Figure D6-AI-14 shows the resulting direction
bearing 325 degrees with a gradient of -0.002 ft/ft. Based
on a matrix porosity of 0.2 and hydraulic conductivity of 22
gpd/ft 2 , the natural ground water flow rate is approximately
11 ft/yr.
As a check on the natural ground water flow characteristics,
water level elevations measured on July 6 and 7 in H-sand
wells 1057 (5240.2)m 1065 (5343.8) , and 1066 (5246.6) were
used to determine a direction of 3250, a gradient of -0.002
ft/ft, and a velocity of 11 ft/yr as shown in Figure D6-AI-
15.
Slightly more than 2 ft of drawdown was seen in well 1062,
completed in the sandstone aquifer above the H-sand aquifer.
This compares to more than 40 ft of drawdown seen in well
1064, completed in the H-sand aquifer, which is the same
Page D6-Al-I0
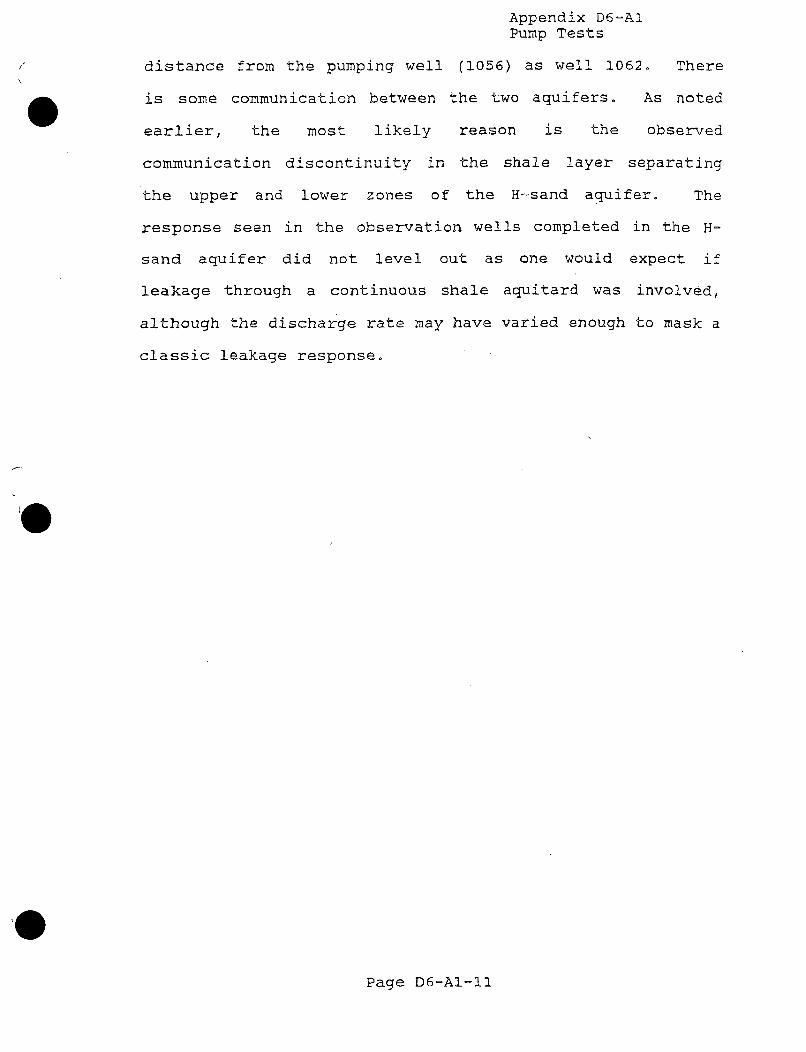
Appendix D6-AIPump Tests
distance from the pumping well (1056) as well 1062. There
is some communication between the two aquifers. As noted
earlier, the most likely reason is the observed
communication discontinuity in the shale layer separating
the upper and lower zones of the H-sand aquifer. The
response seen in the observation wells completed in the H-
sand aquifer did not level out as one would expect if
leakage through a continuous shale aquitard was involved,
although the discharge rate may have varied enough to mask a
classic leakage response.
Page D6-Al-II
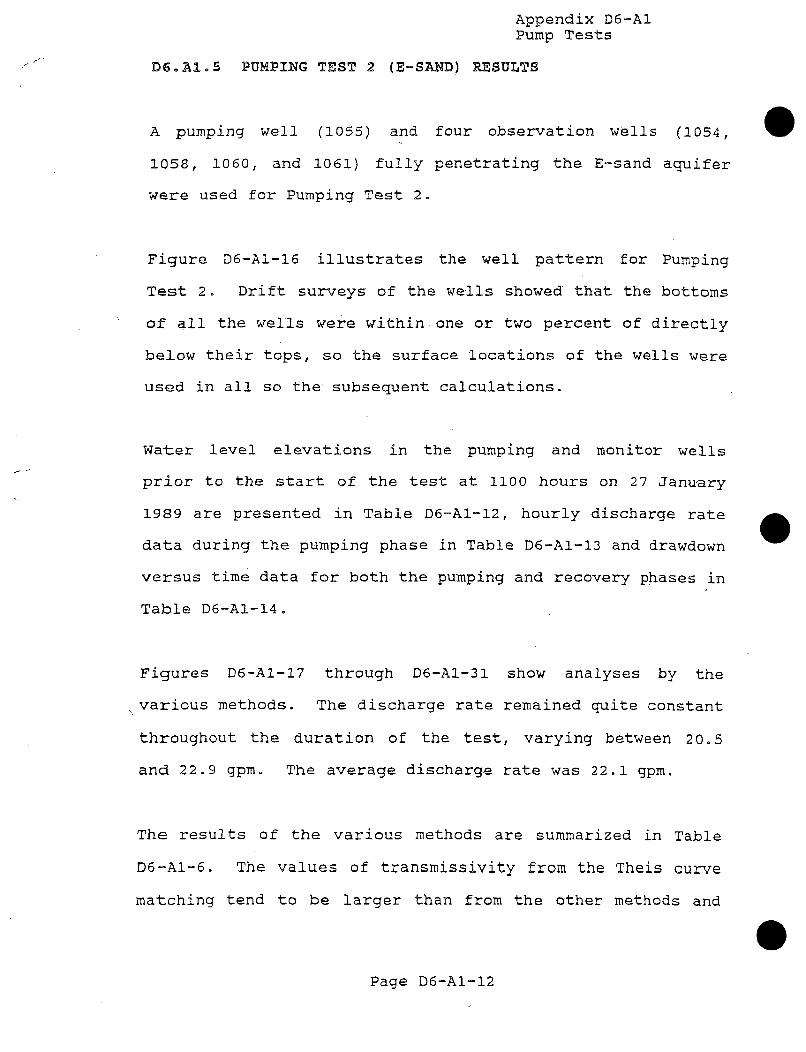
Appendix D6-AlPump Tests
D6oAIo5 PUMPING TEST 2 (E=SAND) RESULTS
A pumping well (1055) and four observation wells (1054, 01058, 1060, and 1061) fully penetrating the E-sand aquifer
were used for Pumping Test 2.
Figure D6-AI-16 illustrates the well pattern for Pumping
Test 2. Drift surveys of the wells showed that the bottoms
of all the wells were within one or two percent of directly
below their tops, so the surface locations of the wells were
used in all so the subsequent calculations.
Water level elevations in the pumping and monitor wells
prior to the start of the test at 1100 hours on 27 January
1989 are presented in Table D6-AI-12, hourly discharge rate
data during the pumping phase in Table D6-Al-13 and drawdown
versus time data for both the pumping and recovery phases in
Table D6-Al-14.
Figures D6-AI-17 through D6-AI-31 show analyses by the
various methods. The discharge rate remained quite constant
throughout the duration of the test, varying between 20.5
and 22.9 gpm. The average discharge rate was 22.1 gpm.
The results of the various methods are summarized in Table
D6-Al-6. The values of transmissivity from the Theis curve
matching tend to be larger than from the other methods and
Page D6-Al-12
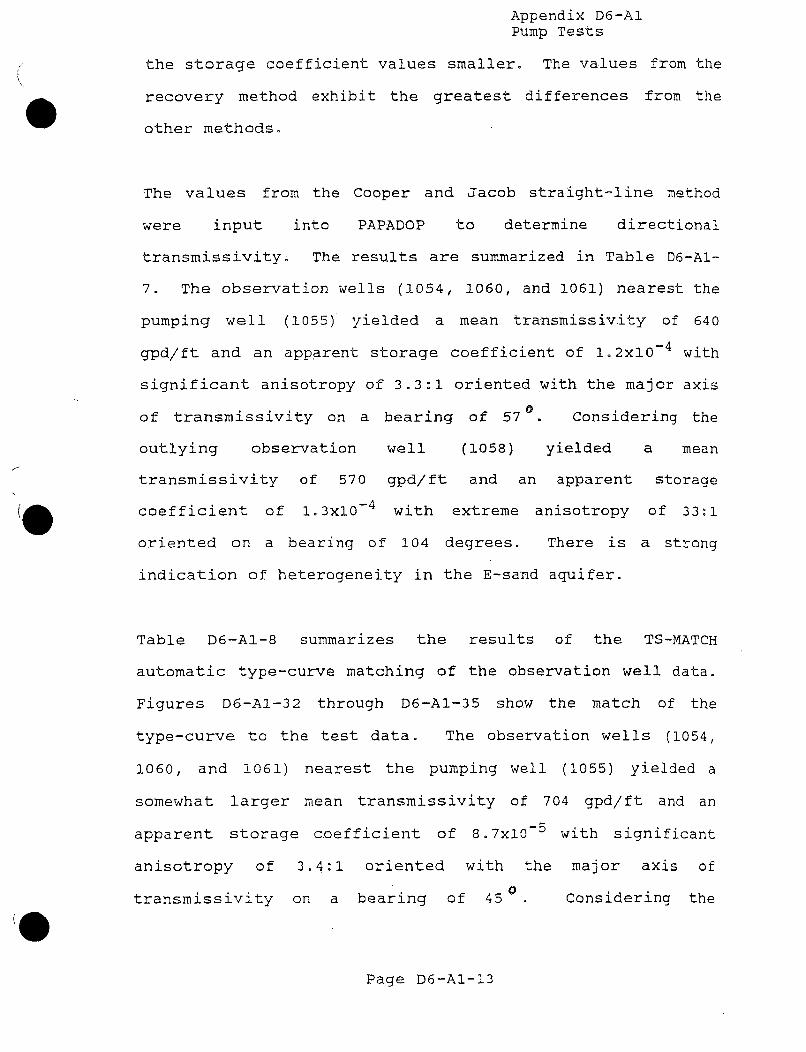
Appendix D6-AlPump Tests
the storage coefficient values smaller. The values from the
recovery method exhibit the greatest differences from the
other methods.
The values from the Cooper and Jacob straight-line method
were input into PAPADOP to determine directional
transmissivity. The results are summarized in Table D6-Al-
7. The observation wells (1054, 1060, and 1061) nearest the
pumping well (1055) yielded a mean transmissivity of 640
gpd/ft and an apparent storage coefficient of l.2x10-4 with
significant anisotropy of 3.3:1 oriented with the major axis
of transmissivity on a bearing of 570. Considering the
outlying observation well (1058) yielded a mean
transmissivity of 570 gpd/ft and an apparent storage
coefficient of lo3x10- 4 with extreme anisotropy of 33:1
oriented on a bearing of 104 degrees. There is a strong
indication of heterogeneity in the E-sand aquifer.
Table D6-Al-8 summarizes the results of the TS-MATCH
automatic type-curve matching of the observation well data.
Figures D6-AI-32 through D6-AI-35 show the match of the
type-curve to the test data. The observation wells (1054,
1060, and 1061) nearest the pumping well (1055) yielded a
somewhat larger mean transmissivity of 704 gpd/ft and an
apparent storage coefficient of 8.7x10- 5 with significant
anisotropy of 3.4:1 oriented with the major axis of
transmissivity on a bearing of 45 . Considering the
Page D6-Al-13
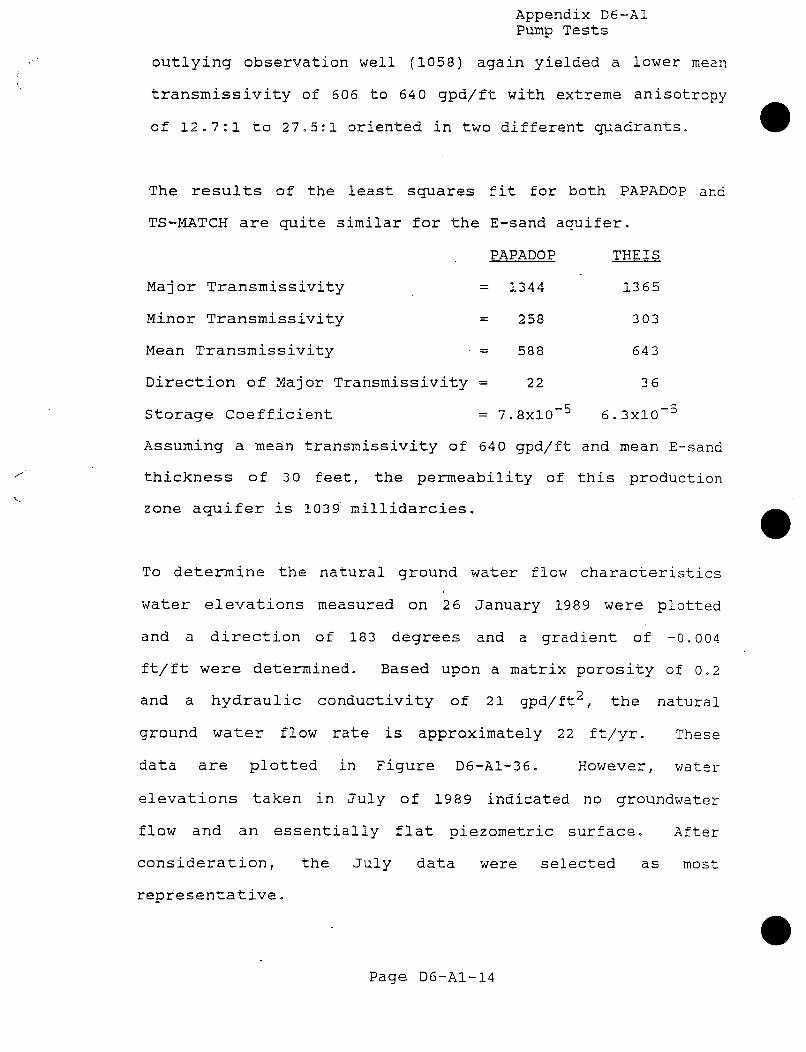
Appendix D6-AIPump Tests
outlying observation well (1058) again yielded a lower mean
transmissivity of 606 to 640 gpd/ft with extreme anisotropy
of 12o7:1 to 27.5:1 oriented in two different quadrants.
The results of the least squares fit for both PAPADOP and
TS-MATCH are quite similar for the E-sand aquifer.
PAPADOP THEIS
Major Transmissivity = 1344 1365
Minor Transmissivity = 258 303
Mean Transmissivity = 588 643
Direction of Major Transmissivity = 22 36
Storage Coefficient = 7.8xi0- 5 6.3xi0- 5
Assuming a mean transmissivity of 640 gpd/ft and mean E-sand
thickness of 30 feet, the permeability of this production
zone aquifer is 1039 millidarcies.
To determine the natural ground water flow characteristics
water elevations measured on 26 January 1989 were plotted
and a direction of 183 degrees and a gradient of -0.004
ft/ft were determined. Based upon a matrix porosity of 0.2
and a hydraulic conductivity of 21 gpd/ft 2 , the natural
ground water flow rate is approximately 22 ft/yr. These
data are plotted in Figure D6-Al-36. However, water
elevations taken in July of 1989 indicated no groundwater
flow and an essentially flat piezometric surface. After
consideration, the July data were selected as most
representative.
Page D6-Al-14
Appendix D6-AlPump Tests
D6.AI.6 REFERENCES
Agarwal, R. G., R. Al-Hussainy, and H. J. Ramey, Jr., 1970.An investigation of wellbore storage and skin effect inunsteady liquid flow, I: Analytical treatment. Soc.Petr. Eng. J., Sept., pp 291-297.
Cooper, H. H.., Jr., and C. E. Jacob, 1946. A generalizedgraphical method for evaluating formation constants andsummarizing well-field history. Trans. Amer.Geophysical Union, v. 27, pp. 526-534.
Papadopulos, I. S., 1965. Nonsteady flow to a well in aninfinite anisotropic aquifer. Int. Assoc. Sci.Hydrol., Symposium of Dubrovnik, pp. 21-31.
Theis, C. V., 1935. The relation between the lowering ofthe piezometric surface and the rate and duration ofdischarge of a well using ground-water storage. Trans.Amer. Geophysical Union, v. 16, pp. 519-524.
Page D6-Al-15
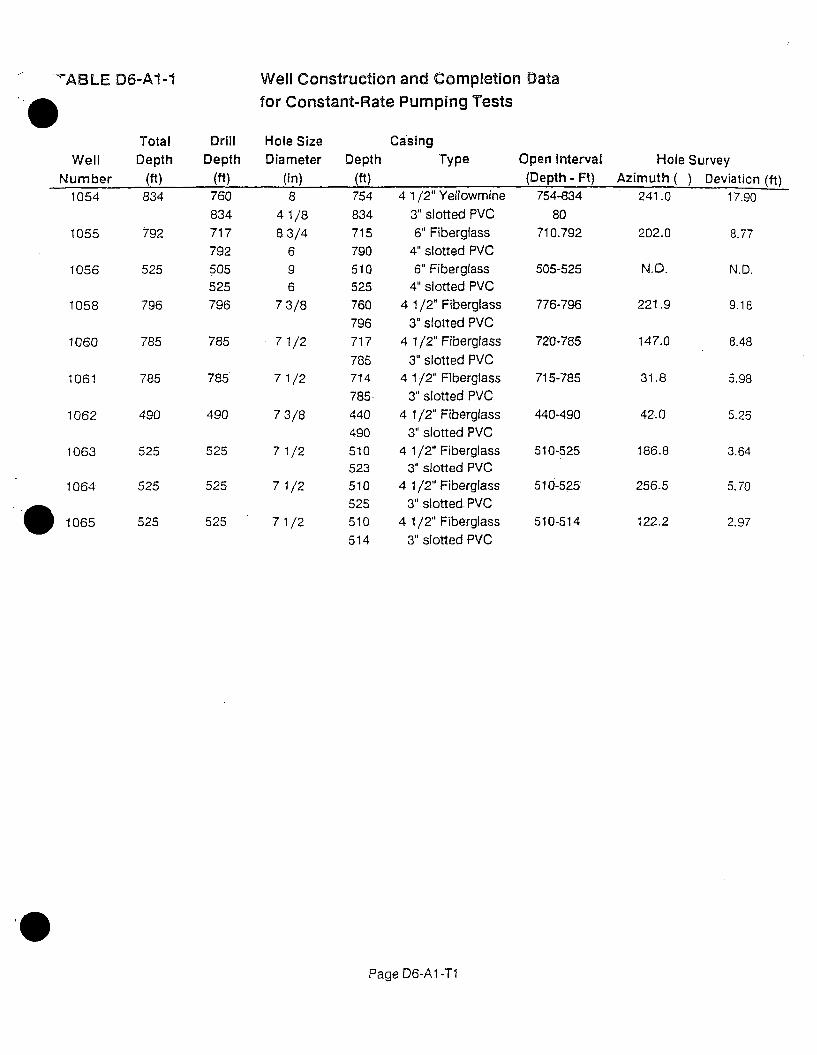
'ABLE D6-Al1= Well Construction and Completion Datafor Constant-Rate Pumping Tests
WellNumber
1054
1055
1056
1058
1060
1061
1062
1063
1064
.0 1065
TotalDepth
(ft)
834
792
525
796
785
785
490
525
525
525
DrillDepth
(ft)760
834717792505525796
785
785
490
525
525
525
Hole SizeDiameter
(in)8
41/883/4
696
7 3/8
71/2
7 1/2
7 3/8
71/2
71/2
7 1/2
Depth
(ft)754834715790510525760796717
785714785-440490510523510525510514
CasingType
4 1/2" Yellowmine3" slotted PVC
6" Fiberglass4" slotted PVC6" Fiberglass
4" slotted PVC4 1/2" Fiberglass
3" slotted PVC4 1/2" Fiberglass
3" slotted PVC4 1/2" Fiberglass
3" slotted PVC
4 1/2" Fiberglass3" slotted PVC
4 1/2" Fiberglass3" slotted PVC
4 1/2" Fiberglass3" slotted PVC
4 1/2" Fiberglass
3" slotted PVC
Open Interval(Depth - Ft)
754-834
80710.792
505-525
776-796
720-785
715-785
440-490
510-525
510-525
510-514
Hole SurveyAzimuth ( ) Deviation (ft)
241.0 17.90
202.0
N.D.
221.9
147.0
31.8
42.0
186.8
256.5
122.2
8.77
N.D.
9.18
8.48
5.98
5.26
3.64
5.70
2.97
Page D6-A1-T1
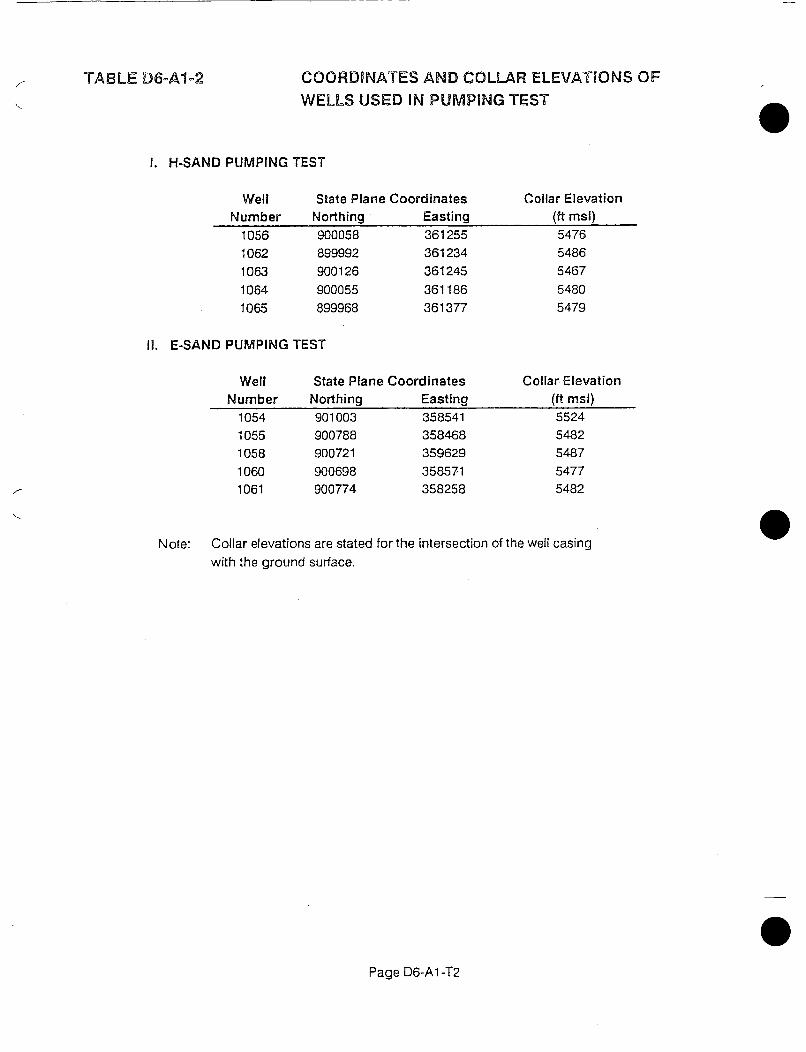
TABLE D6°A12 COORDINATES AND COLLAR ELEVATIONS OF
WELLS USED IN PUMPING TEST
I. H-SAND PUMPING TEST
WellNumber
10561062106310641065
State Plane CoordinatesNorthing Easting
900058 361255899992 361234900126 361245
900055 361186
899968 361377
Collar Elevation(ft msl)5476
5486
5467
5480
5479
II. E-SAND PUMPING TEST
WellNumber
10541055105810601061
State PlaneNorthing901003900788900721900698900774
CoordinatesEasting358541358468359629
358571358258
Collar Elevation(ft msl)5524
5482
5487
5477
5482
Note: Collar elevations are stated for the intersection of the well casingwith the ground surface.
Page D6-A1-T2
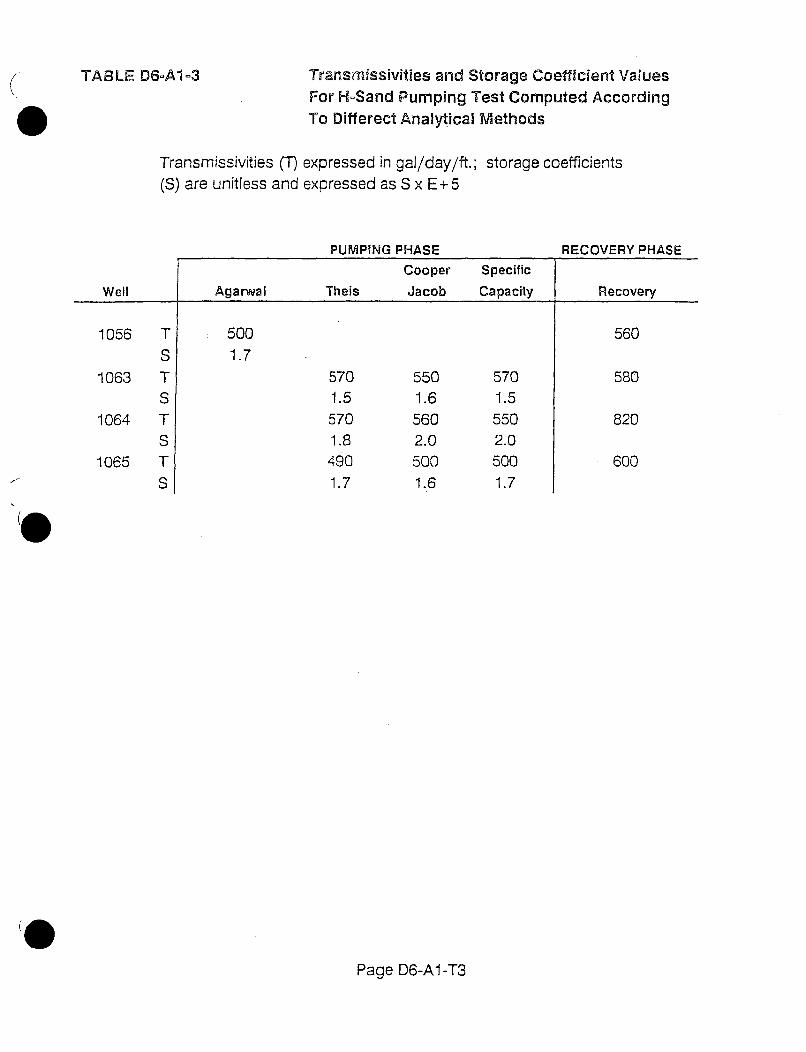
TABLE D6-A1=3 Transmissivities and Storage Coefficient ValuesFor H-Sand Pumping Test Computed AccordingTo Diff erect Analytical Methods
Transmissivities (T) expressed in gal/day/ft.; storage coefficients(S) are unitless and expressed as S x E+5
PUMPING PHASE RECOVERY PHASE
Cooper
Jacob
Specific
CapacityWell Agarwal Theis Recovery
1056 TS
1063 TS
1064 TS
1065 TS
5001.7
5701.5
570
1.8
490
1.7
5501.65602.05001.6
5701.55502.05001.7
560
580
820
600
Page D6-A1-T3
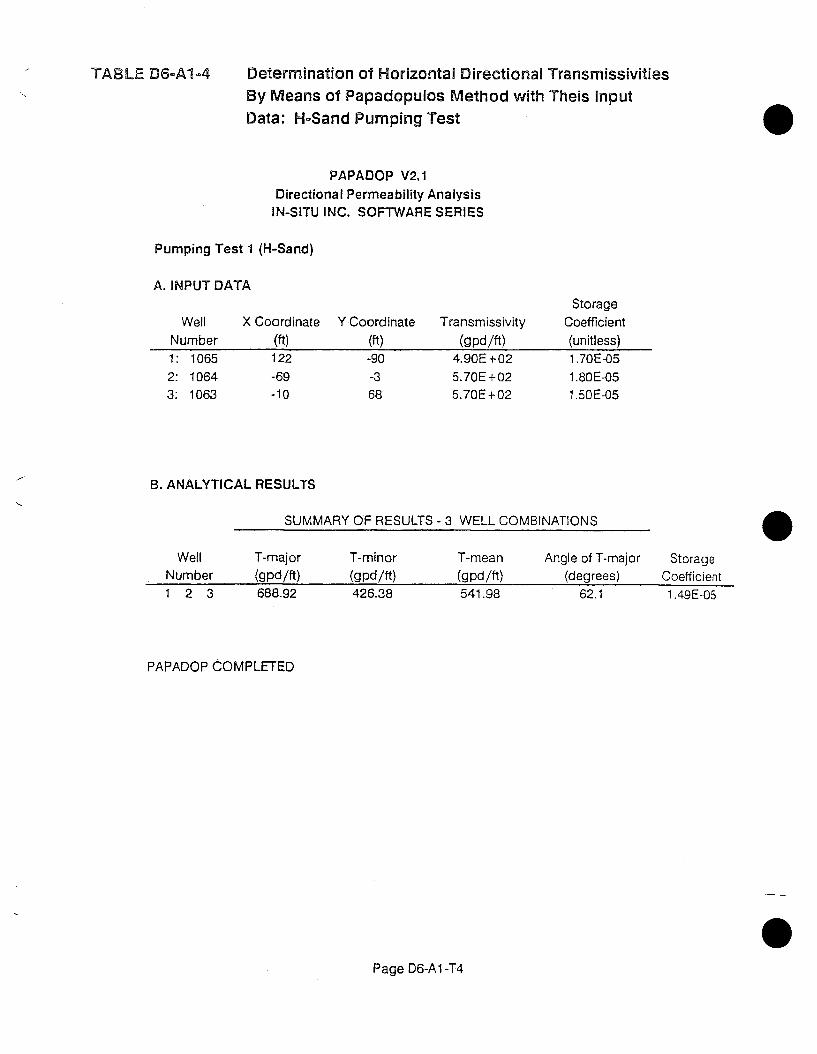
TABLE D6-Al4 Determination of Horizontal Directional TransmissivitiesBy Means of Papadopulos Method with Theis Input
Data: H-Sand Pumping Test
PAPADOP V2.1
Directional Permeability Analysis
IN-SITU INC. SOFTWARE SERIES
Pumping Test 1 (H-Sand)
A. INPUT DATA
WellNumber1: 10652: 10643: 1063
X Coordinate Y Coordinate Transmissivity
(ft) (ft) (gpd/ft)122 -90 4.90E+02
-69 -3 5.70E + 02-10 68 5.70E+02
Storage
Coefficient(unitless)1.70E-051.80E-051.50E-05
B. ANALYTICAL RESULTS
SUMMARY OF RESULTS - 3 WELL COMBINATIONS
WellNumber
T-major(gpd/ft)
T-minor(gpd/ft)
T-mean(gpd/ft)
Angle of T-major(degrees)
62.1
StorageCoefficient
1.49E-051 2 3 688.92 426.38 541.98
PAPADOP COMPLETED
Page D6-A1-T4
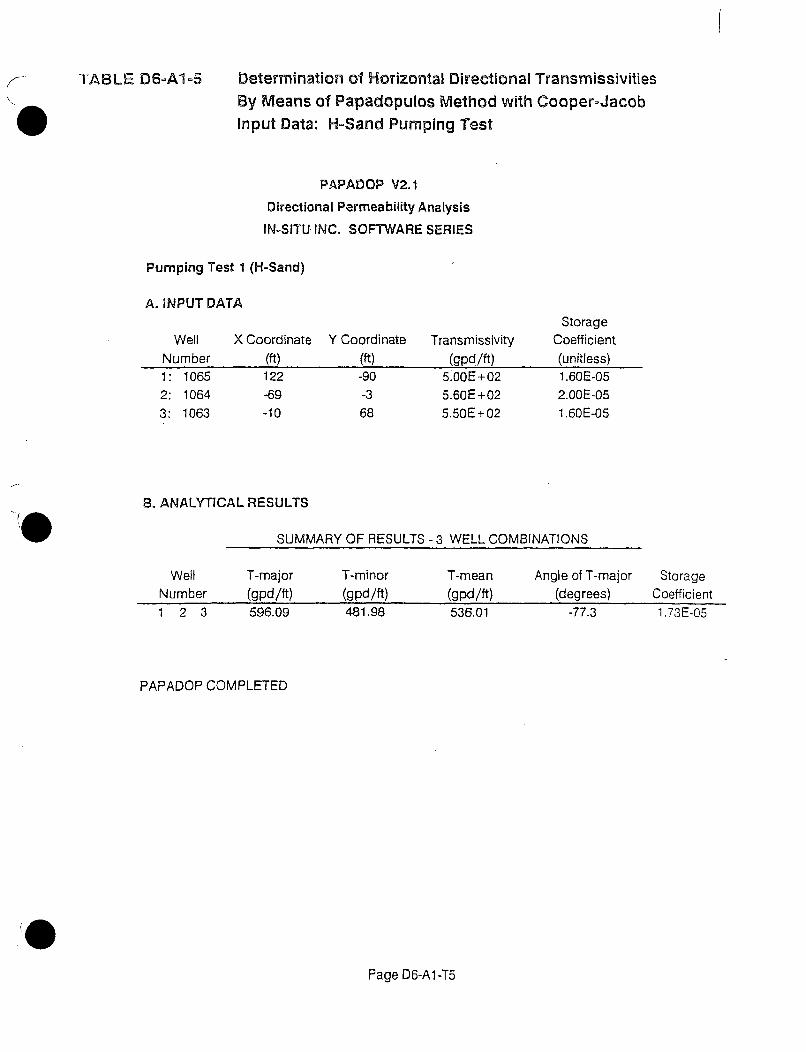
f
TABLE D6oA1-5 Determination of Horizontal Directional TransmissivitiesBy Means of Papadopulos Method with Cooper-Jacob
Input Data: H-Sand Pumping Test
PAPADOP V2.1
Directional Permeability Analysis
IN-SITU INC. SOFTWARE SERIES
Pumping Test 1 (H-Sand)
A. INPUT DATA
WellNumber1: 10652: 10643: 1063
X Coordinate Y Coordinate
(ft) (ft)122 -90
-69 -3-10 68
Transmissivity(gpd/ft)
5.OOE+025.60E+025.50E + 02
StorageCoefficient(unitless)1.60E-052.OOE-051.60E-05
S. ANALYTICAL RESULTS
SUMMARY OF RESULTS - 3 WELL COMBINATIONS
WellNumber1 2 3
T-major(gpd/ft)596.09
T-minor(gpd/ft)481.98
T-mean(gpd/ft)536.01
Angle of T-major(degrees)
-77.3
StorageCoefficient1.73E-05
PAPADOP COMPLETED
Page D6-A -T5
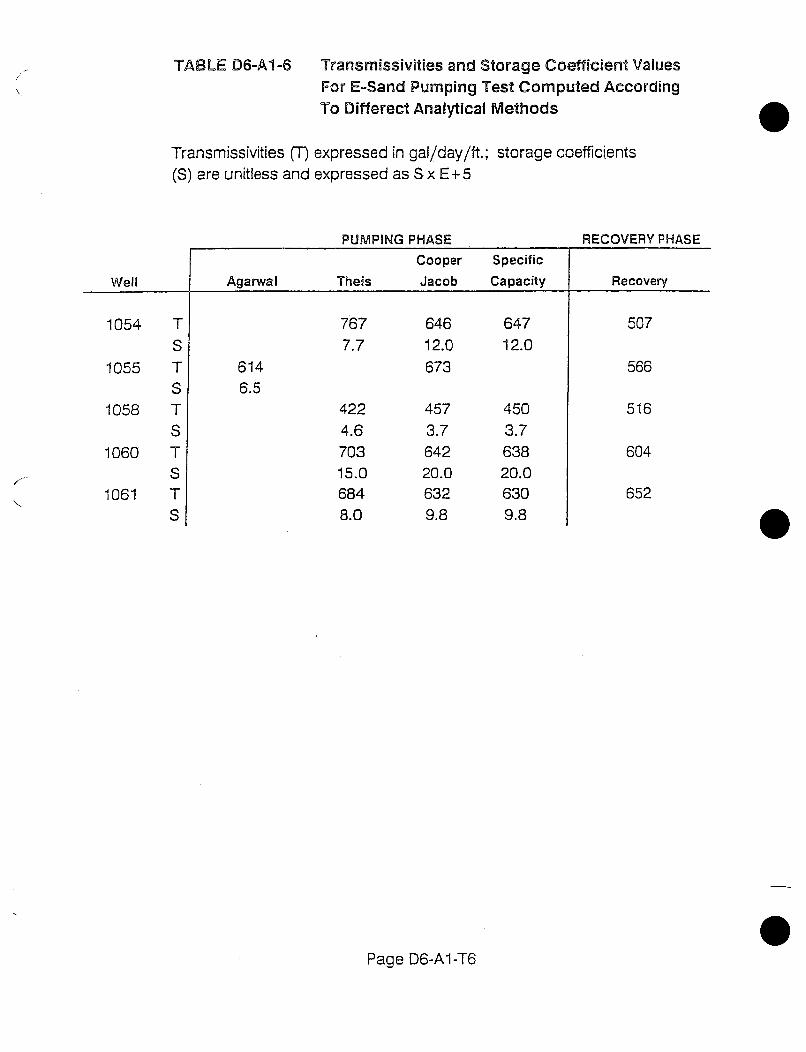
TABLE D6=A1 6
Transmissivities (T)(S) are unitless and
Transmissivities and Storage Coefficient ValuesFor E=Sand Pumping Test Computed AccordingTo Differect Analytical Methods
expressed in gal/day/ft.; storage coefficientsexpressed as S x E+5
PUMPING PHASE RECOVERYPHASE
Cooper
Jacob
Specific
CapacityWell Agarwal Theis Recovery
1054 TS
1055 TS
1058 TS
1060 TS
1061 TS
7677.7
6146.5
4224.670315.06848.0
64612.0673
4573.764220.06329.8
64712.0
4503.763820.0
6309.8
507
566
516
604
652
Page D6-A1-T6
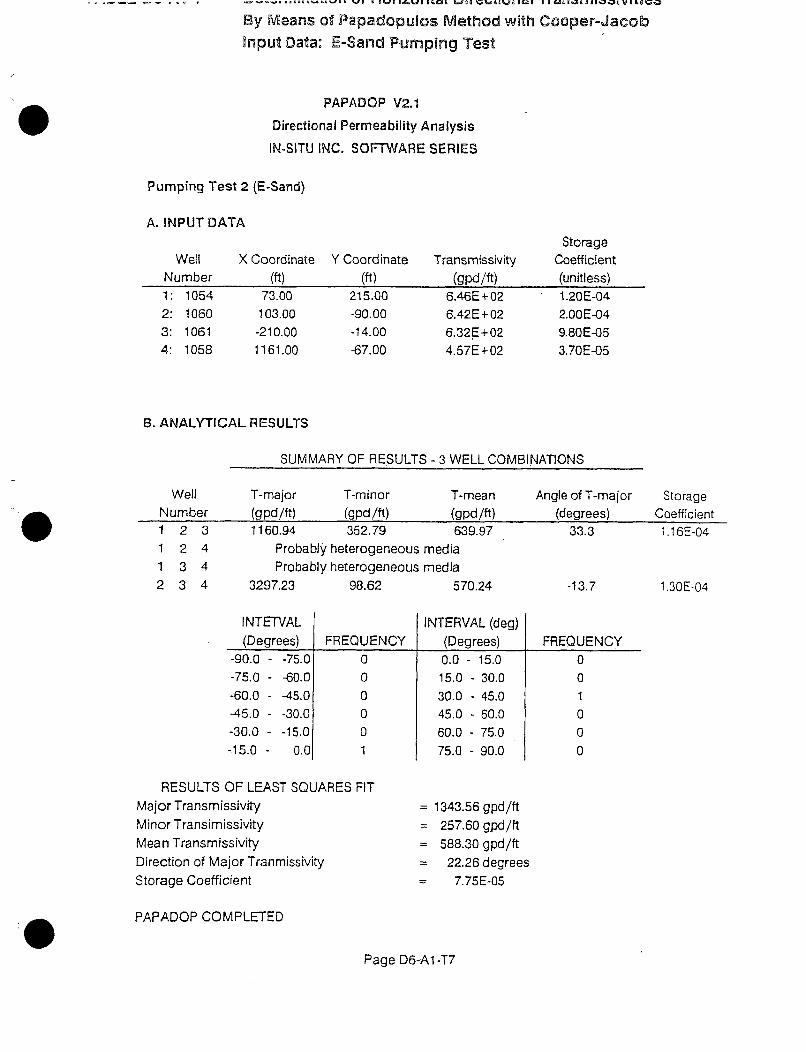
3%J 01ct~ID~Di~a 1g3 Leg UUw 12 a ~I &H .1 a vI~ l V U .5
By Means of Papadopulos Method with Cooper-JacobInput Data: E°Sand Pumping Test
PAPADOP V2.1
Directional Permeability Analysis
IN-SITU INC. SOFTWARE SERIES
Pumping Test 2 (E-Sand)
A. INPUT DATA
WellNumber
X Coordinate
(ft)
Y Coordinate(ft)
Transmissivity(gpd/ft)
StorageCoefficient(unitless)
1: 10542: 10603: 10614: 1058
73.00103.00
-210.001161.00
215.00-90.00-14.00-67.00
6.46E+026.42E+026:32E+024.57E + 02
1.20E-042.OOE-049.80E-053.70E-05
B. ANALYTICAL RESULTS
SUMMARY OF RESULTS - 3 WELL COMBINATIONS
WellNumber
T-major(gpd/ft)
T-minor(gpd/ft)
T-mean(aldlft)
Angle of T-major(degrees)
StorageCoefficient
1 2 31 2 41 3 42 3 4
1160.94 352.79 639.97Probably heterogeneous media
Probably heterogeneous media
33.3
-13.7
1.16E-04
1.30E-043297.23 98.62 570.24
I NTETVAL(Degrees)
INTERVAL (deg)(Degrees) FREQUENCYFREQUENCY
-90.0 - -75.0
-75.0 - -60.0
-60.0 - -45.0
-45.0 - -30.0
-30.0 - -15.0
-15.0 - 0.0
000001
0.0 - 15.0
15.0 - 30.0
30.0 - 45.0
45.0 - 60.0
60.0 - 75.0
75.0 - 90.0
001000
RESULTS OF LEAST SQUARES FITMajor TransmissivityMinor Transimissivity
Mean TransmissivityDirection of Major Tranmissivity
Storage Coefficient
1343.56 gpd/ft
257.60 gpd/ft588.30 gpd/ft
22.26 degrees7.75E-05
PAPADOP COMPLETED
Page D6-A1-T7
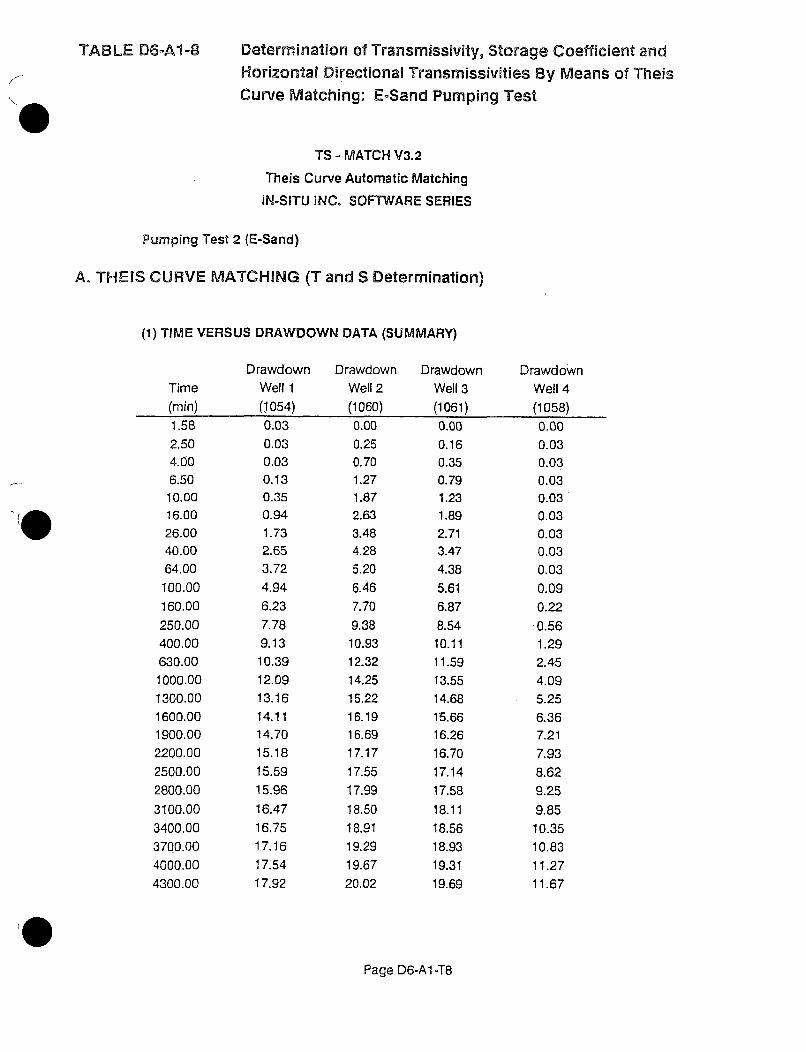
TABLE D6°Al=8 Determination of Transmissivity, Storage Coefficient andHorizontal Directional Transmissivities By Means of TheisCurve Matching: EoSand Pumping Test
TS - MATCH V3.2
Theis Curve Automatic Matching
IN-SITU INC. SOFTWARE SERIES
Pumping Test 2 (E-Sand)
A. THEIS CURVE MATCHING (T and S Determination)
(1) TIME VERSUS DRAWDOWN DATA (SUMMARY)
Drawdown Drawdown Drawdown DrawdownTime Well 1 Well 2 Well 3 Well 4(min) (1054) (1060) (1061) (1058)1.58 0.03 0.00 0.00 0.002.50 0.03 0.25 0.16 0.034.00 0.03 0.70 0.35 0.036.50 0.13 1.27 0.79 0.0310.00 0.35 1.87 1.23 0.0316.00 0.94 2.63 1.89 0.0326.00 1.73 3.48 2.71 0.0340.00 2.65 4.28 3.47 0.0364.00 3.72 5.20 4.38 0.03100.00 4.94 6.46 5.61 0.09160.00 6.23 7.70 6.87 0.22250.00 7.78 9.38 8.54 0.56400.00 9.13 10.93 10.11 1.29630.00 10.39 12.32 11.59 2.451000.00 12.09 14.25 13.55 4.091300.00 13.16 15.22 14.68 5.251600.00 14.11 16.19 15.66 6.361900.00 14.70 16.69 16.26 7.212200.00 15.18 17.17 16.70 7.932500.00 15.59 17.55 17.14 8.622800.00 15.96 17.99 17.58 9.253100.00 16.47 18.50 18.11 9.853400.00 16.75 18.91 18.56 10.353700.00 17.16 19.29 18.93 10.834000.00 17.54 19.67 19.31 11.274300.00 17.92 20.02 19.69 11.67
Page D6-A1 -T8
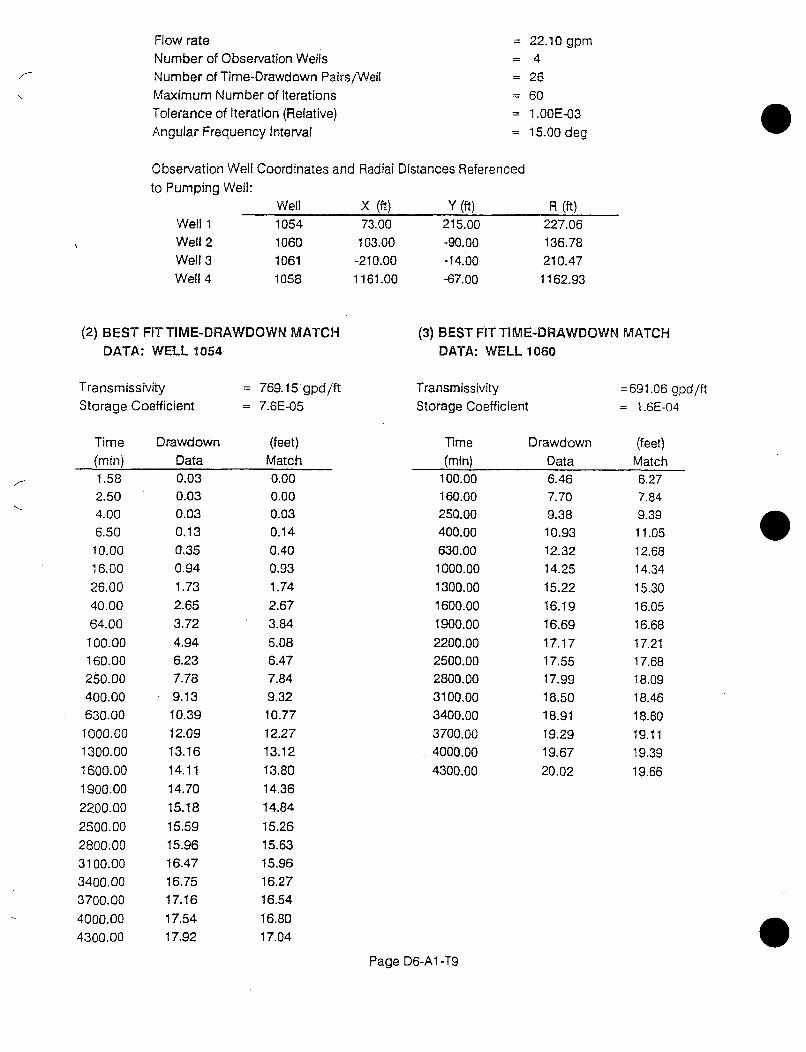
Flow rateNumber of Observation WellsNumber of Time-Drawdown Pairs/WellMaximum Number of IterationsTolerance of Iteration (Relative)Angular Frequency Interval
Observation Well Coordinates and Radial Distances Referenced
to Pumping Well:
22.10 gpm4
26601.OOE-0315.00 deg
R (ft)227.06136.78210.471162.93
0
Well 1Well 2Well 3Well 4
Well1054106010611058
X (ft)73.00103.00
-210.001161.00
Y (ft)215.00-90.00-14.00-67.00
(2) BEST FIT TIME-DRAWDOWN MATCHDATA: WELL 1054
(3) BEST FIT TIME-DRAWDOWN MATCHDATA: WELL 1060
TransmissivityStorage Coefficient
Time Drawdown
= 769.15 gpd/ft= 7.6E-05
TransmissivityStorage Coefficient
= 691.06 gpd/ft
= 1.6E-04
(min)1.582.504.006.5010.0016.00
26.00
40.0064.00
100.00160.00
250.00400.00630.00
1000.001300.00
1600.00.1900.00
2200.00
2500.002800.003100.00
3400.003700.004000.00
4300.00
Data0.030.030.030.130,350.941.732.65
3.72
4.946.237.789.1310.3912.0913,1614,1114.70
15.18
15.5915.9616.47
16.7517.16
17.5417.92
(feet)Match0.000.000.030.14
0.400.931.74
2.673.84
5.086.477.849.3210.77
12.2713.1213.80
14.36
lime(min)
100.00160.00250.00400.00630.001000.00
1300.001600.001900.00
2200.002500.002800.003100.003400.003700.004000.00
4300.00
Drawdown
Data6.467.709.3810.9312.3214.25
15.2216.19
16.69
17.1717.5517.9918.5018.9119.2919.67
20.02
(feet)Match6.277.849.3911.0512.6814.34
15.3016.0516.68
17.2117.6818.0918.4618.8019.1119.39
19.66
14.84
15.2615.6315.96
16.2716.54
16.8017.04 0
Page D6-A1-T9
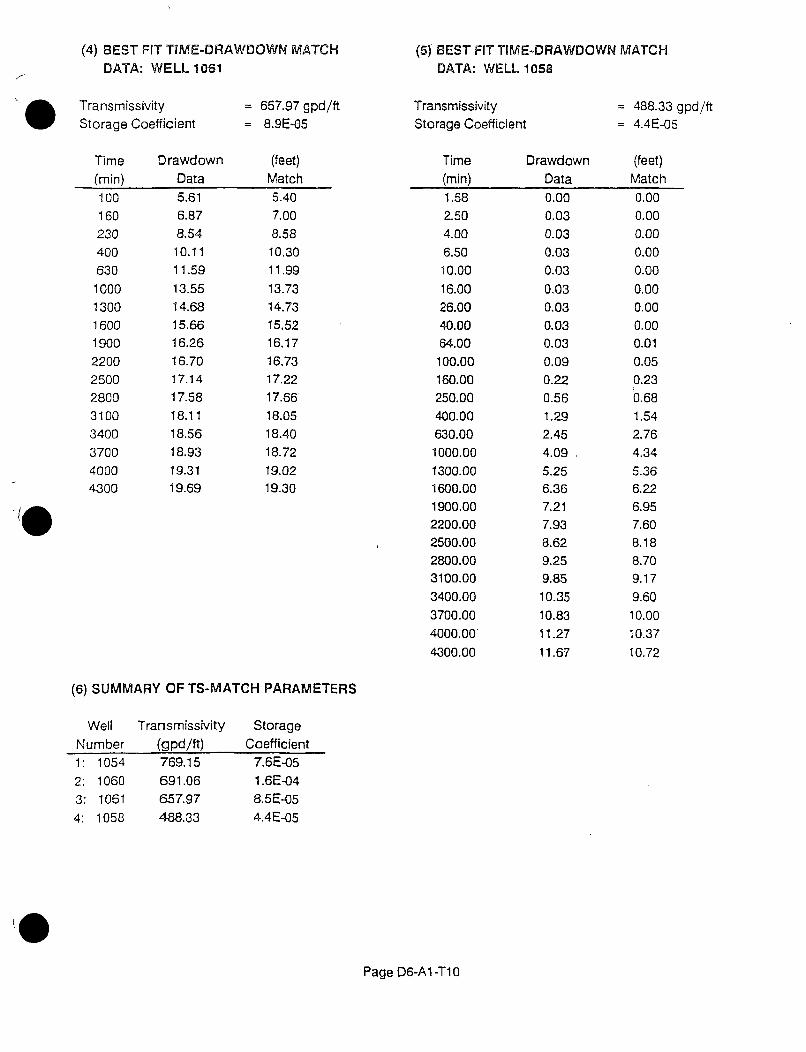
(4) BEST FIT TIME-DRAWDOWN MATCH
DATA: WELL 1061(5) BEST FIT TIME-DRAWDOWN MATCH
DATA: WELL 1058
. TransmissivityStorage Coefficient
Time.(min)100160230400630100013001600190022002500280031003400370040004300
DrawdownData
5.616.878.5410.1111.59
13.5514.6815.6616.26
16.7017.1417.5818.1118.5618.9319.3119.69
= 657.97 gpd/ft
= 8.9E-05
(feet)Match5.40
7.008.58
10.3011.99
13.7314.7315.5216.1716.7317,2217.66
18.0518.4018.7219.0219.30
TransmissivityStorage Coefficient
Time(min)1.582.504.006.5010.00
16.0026.0040.0064.00100.00160.00250.00400.00630.001000.001300.001600.001900.002200.002500.002800.003100.003400.00
3700.004000.00
4300.00
DrawdownData0.000.030.030.030.03
0.030.030.030.030.090.220.561.292.454.09
5.256.367.21
7.938.629.259.8510.35
10.8311.27
11.67
= 488.33 gpd/ft= 4.4E-05
(feet)Match
0.000.00
0.000.000.000.000.000.000.010.050.230.681.542.764.345.366.226.957.608.188.709.179.6010.0010.37
10,72
(6) SUMMARY OF TS-MATCH PARAMETERS
Well Transmissivity Storage
Number (gpd/ft) Coefficient
1: 1054 769.15 7.6E-05
2: 1060 691.06 1.6E-043: 1061 657.97 8.5E-05
4: 1058 488.33 4.4E-05
Page D6-A1-T10
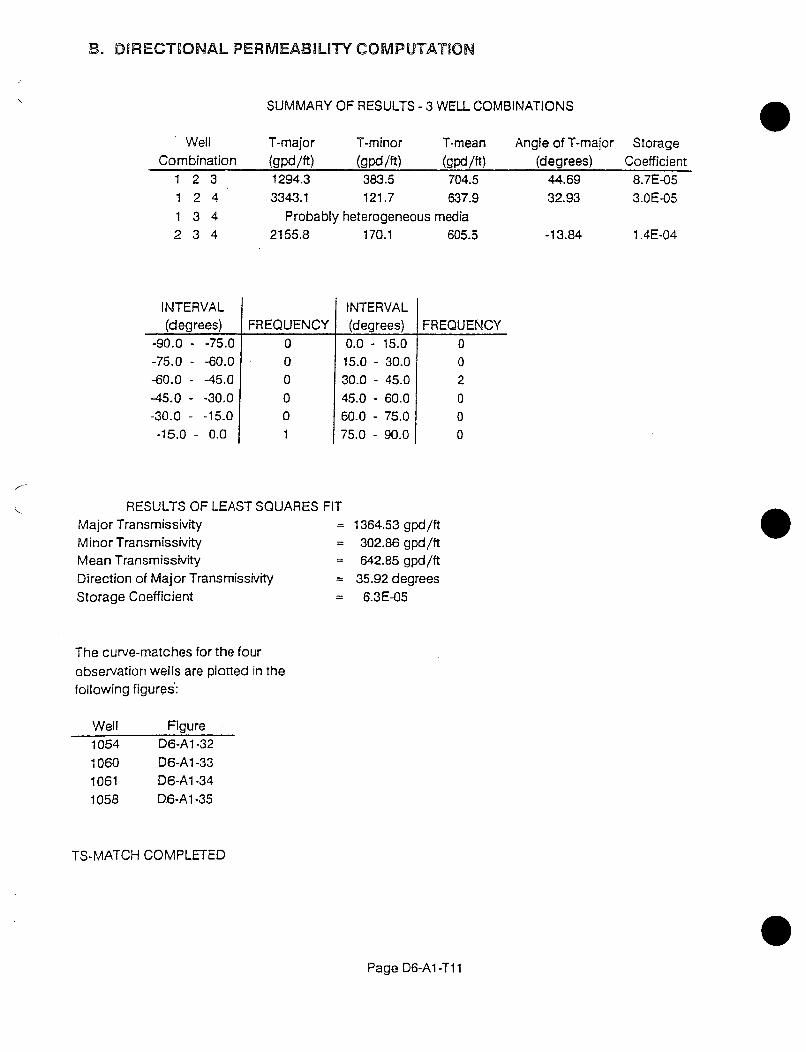
B. DIRECTIONAL PERMEABILITY COMPUTATION
SUMMARY OF RESULTS - 3 WELL COMBINATIONS
WellCombination
T-major
(gpd/ft)
T-minor
(gpd/ft)
T-mean(gpd/ft)
Angle of T-major(degrees)
StorageCoefficient
1 21 2
1 32 3
34
44
1294.3 383.5 704.5
3343.1 121.7 637.9
Probably heterogeneous media
2155.8 170.1 605.5
44.69
32.93
-13.84
8.7E-053.OE-05
1.4E-04
INTERVAL(degrees)
INTERVAL(degrees)FREQUENCY FREQUENCY
-90.0 - -75.0-75.0 - -60.0
-60.0 - -45.0
-45.0 - -30.0-30.0 - -15.0-15.0- 0.0
000001
0.0 "
15.0 -
30.0 -
45.0 -
60.0 -
75.0 -
15.0
30.045.060.075.090.0
002000
RESULTS OF LEAST SQUARES FITMajor TransmissivityMinor Transmissivity=Mean Transmissivity
Direction of Major Transmissivity
Storage Coefficient
The curve-matches for the four
observation wells are plotted in thefollowing figures:
1364.53 gpd/ft302.86 gpd/ft642.85 gpd/ft
35.92 degrees6.3E-05
Well Figure1054106010611058
D6-A1-32D6-A1 -33D6-A1 -34D6-A1-35
TS-MATCH COMPLETED
Page D6-A1 -T11
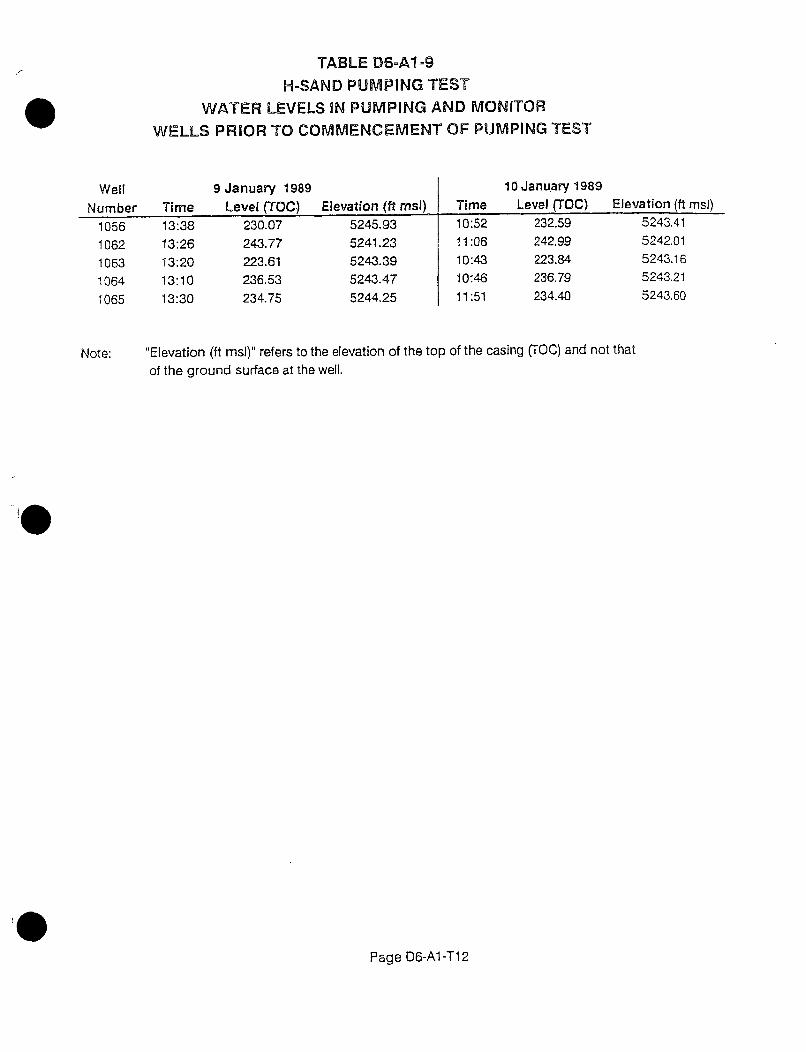
TABLE D6=A1=9
H=SAND PUMPING TEST
WATER LEVELS IN PUMPING AND MONITOR
WELLS PRIOR TO COMMENCEMENT OF PUMPING TEST
Well
Number
9 January 1989
Time Level (TOC) Elevation (ft msl)
10 January 1989
Time Level (TOC) Elevation (ft msl)
10561062106310641065
13:3813:2613:2013:1013:30
230.07243.77223.61236.53234.75
5245.93
5241.235243-395243.475244.25
10:5211:0610:4310:4611:51
232.59242.99223.84236.79234.40
5243.41
5242.01
5243.16
5243.21
5243.60
Note: "Elevation (ft msl)" refers to the elevation of the top of the casing (TOC) and not that
of the ground surface at the well.
Page D6-A1 -T12
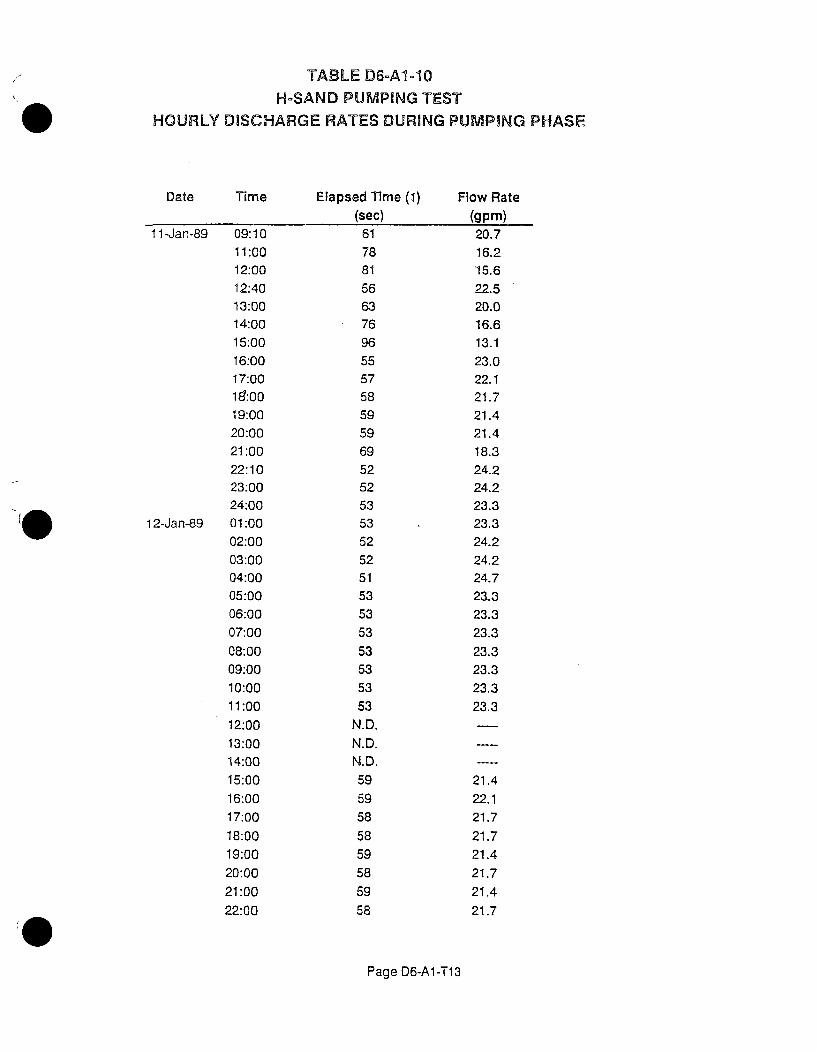
TABLE D6-Al-10
H-SAND PUMPING TESTHOURLY DISCHARGE RATES DURING PUMPING PHASE
Date Time
11 -Jan-89 09:1011:0012:0012:4013:0014:0015:0016:0017:0019:0019:0020:0021:0022:1023:0024:00
12-Jan-89 01:0002:0003:0004:00
05:0006:00
07:0008:0009:0010:0011:0012:0013:0014:0015:00
16:0017:00
18:0019:00
20:0021:00
22:00
Elapsed Time (1)(sec)
61788156637696
555758
59596952525353525251535353
53535353
N.D.
N.D.N.D.
59
5958
585958
59
58
Flow Rate
(gpm)20.716.215.622.5
20.016.613.123.022.121.7
21.421.418.324.224.223.323.324.224.224.723.323.323.3
23.323.323.3
23.3
21.422.121.7
21.721.421.7
21.4
21.7
Page D6-A1-T13
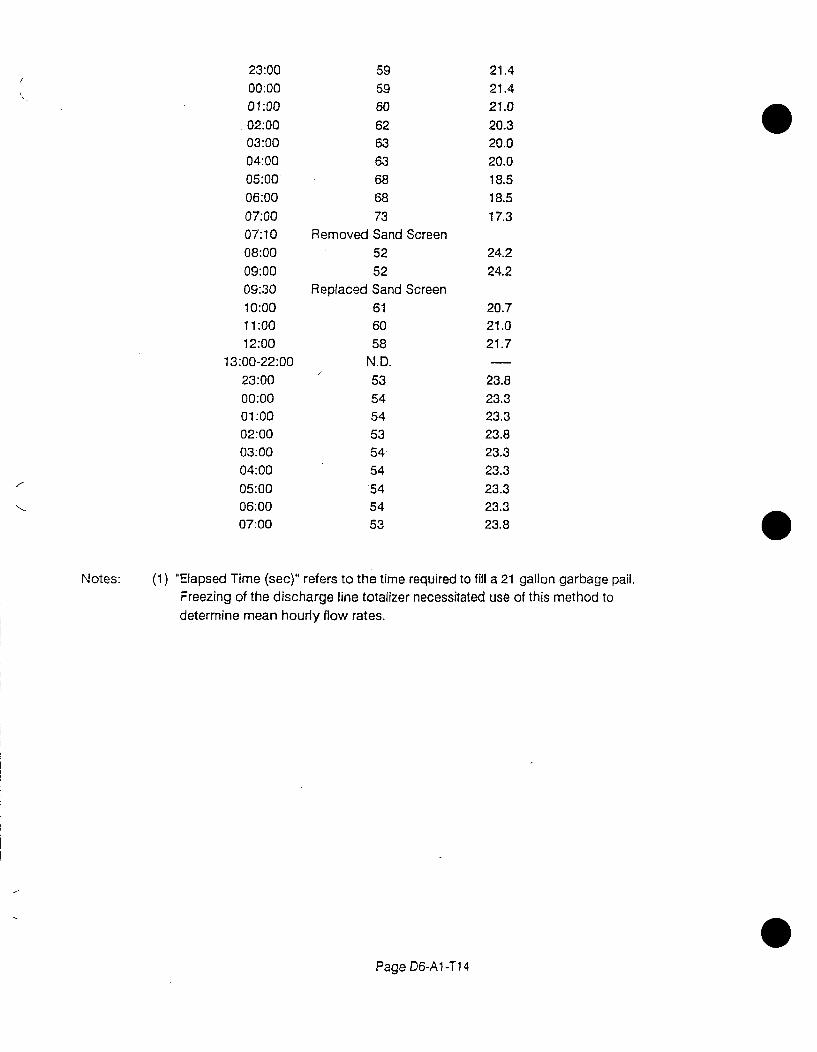
23:00
00:0001:00
02:0003:0004:0005:0006:00
07:0007:1008:0009:0009:3010:0011:0012:00
13:00-22:0023:0000:0001:0002:0003:0004:0005:0006:0007:00
595960626363686873
Removed Sand Screen
5252
Replaced Sand Screen
616058
N.D.535454535454
545453
21.421.421.0
20.320.020.018.518.5
17.3
24.2
24.2
20.721.021.7
23.823.323.323.823.323.323.323.323.8 0
Notes: (1) "Elapsed Time (sec)" refers to the time required to fill a 21 gallon garbage pail.Freezing of the discharge line totalizer necessitated use of this method to
determine mean hourly flow rates.
Page D6-Al -T14
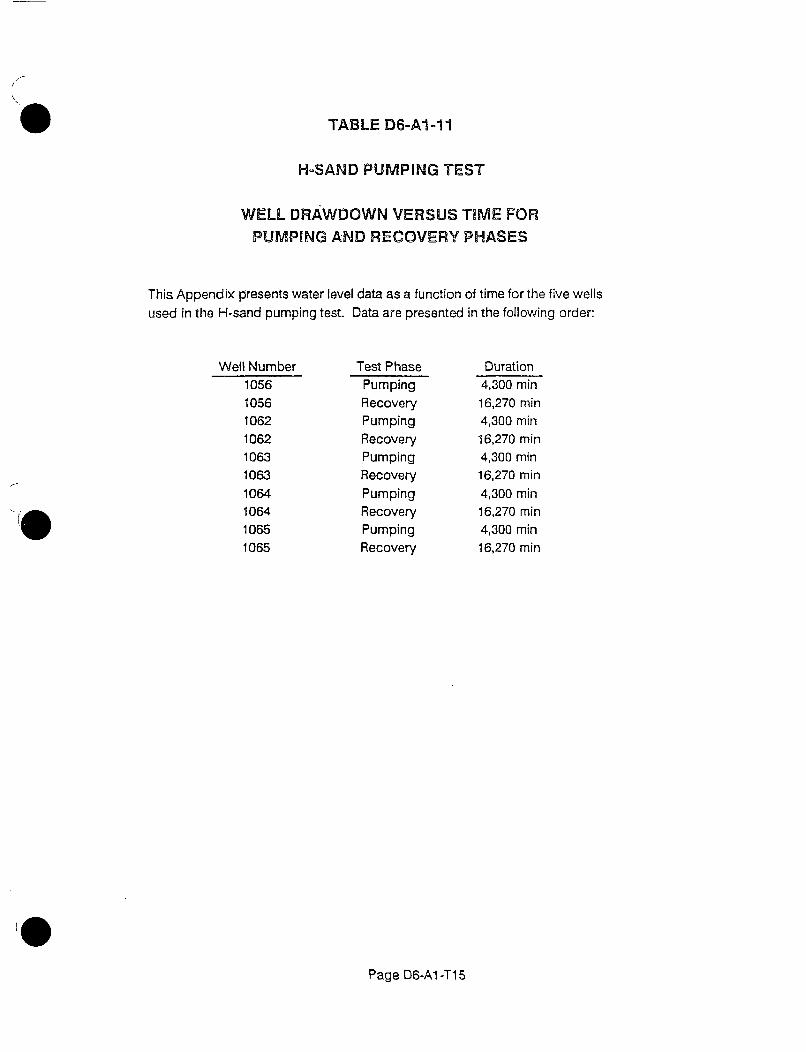
TABLE D6-A1 -11
HoSAND PUMPING TEST
WELL DRAWDOWN VERSUS TIME FORPUMPING AND RECOVERY PHASES
This Appendix presents water level data as a function of time for the five wells
used in the H-sand pumping test. Data are presented in the following order:
Well Number1056105610621062106310631064106410651065
Test PhasePumpingRecoveryPumpingRecoveryPumpingRecoveryPumpingRecoveryPumpingRecovery
Duration4,300 min16,270 min4,300 min16,270 mm4,300 min16,270 mm4,300 min16,270 mm4,300 min16,270 min
Page D6-A1 -T1 5
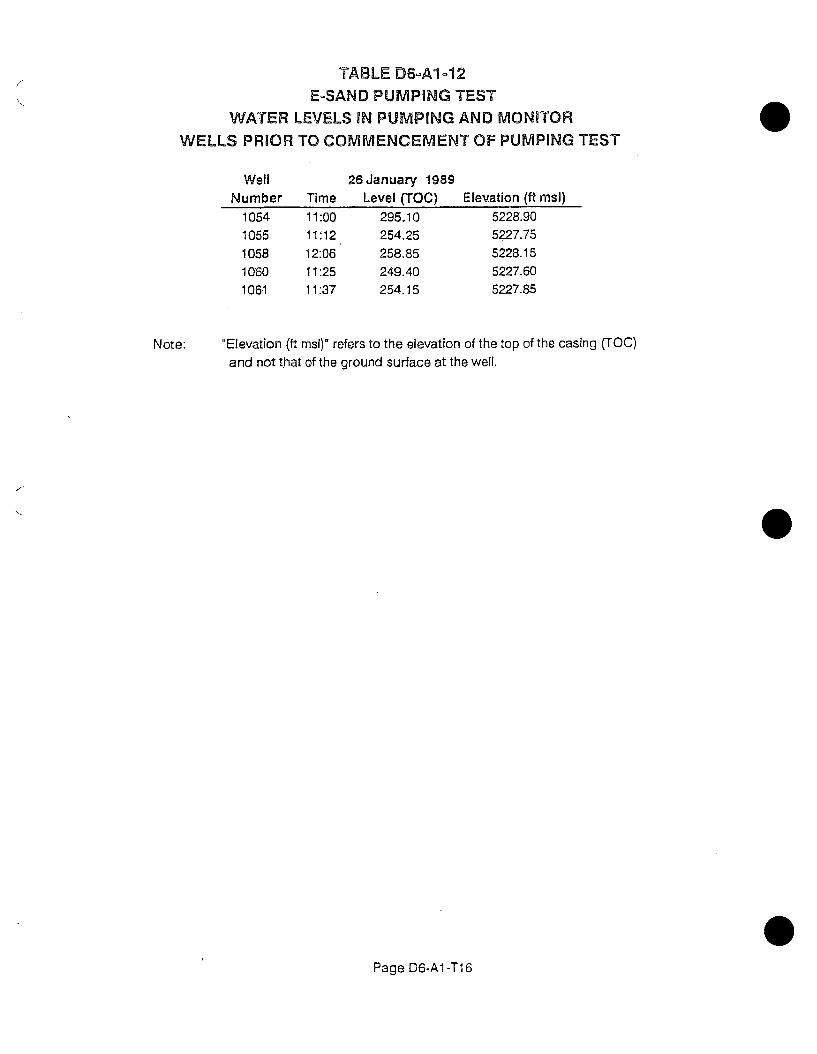
TABLE D6=A1.=12
E-SAND PUMPING TESTWATER LEVELS IN PUMPING AND MONITOR
WELLS PRIOR TO COMMENCEMENT OF PUMPING TEST
WellNumber
10541055105810601061
Time11:0011:1212:0611:2511:37
26 January 1989Level (TOC)
295.10254.25258.85249.40254.15
Elevation (ft msl)
5228.905227.755228.155227.605227.85
Note: "Elevation (ft msl)" refers to the elevation of the top of the casing (TOC)and not that of the ground surface at the well.
Page D6-Al -T1 6
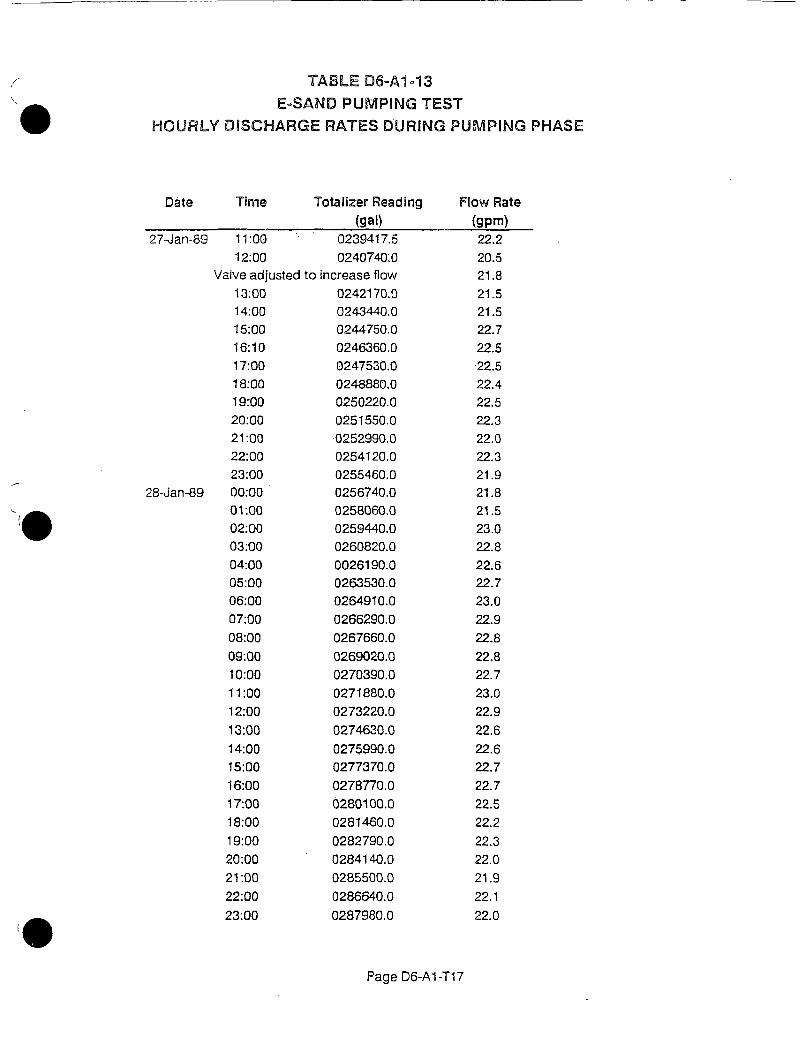
TABLE D6-Al13E-SAND PUMPING TEST
HOURLY DISCHARGE RATES DURING PUMPING PHASE
Date Time Totalizer Reading Flow Rate(gal) (gpm)
27-Jan-89 11:00 0239417.5 22.212:00 0240740.0 20.5
Valve adjusted to increase flow 21.813:00 0242170.0 21.514:00 0243440.0 21.515:00 0244750.0 22.716:10 0246360.0 22.517:00 0247530.0 22.518:00 0248880.0 22.419:00 0250220.0 22.520:00 0251550.0 22.321:00 0252990.0 22.022:00 0254120.0 22.323:00 0255460.0 21.9
28-Jan-89 00:00 0256740.0 21.801:00 0258060.0 21.502:00 0259440.0 23.003:00 0260820.0 22.804:00 0026190.0 22.605:00 0263530.0 22.706:00 0264910.0 23.007:00 0266290.0 22.9
08:00 0267660.0 22.809:00 0269020.0 22.810:00 0270390.0 22.711:00 0271880.0 23.012:00 0273220.0 22.913:00 0274630.0 22.614:00 0275990.0 22.615:00 0277370.0 22.716:00 0278770.0 22.717:00 0280100.0 22.518:00 0281460.0 22.219:00 0282790.0 22.320:00 0284140.0 22.021:00 0285500.0 21.922:00 0286640.0 22.1
23:00 0287980.0 22.0
Page D6-Al -T17
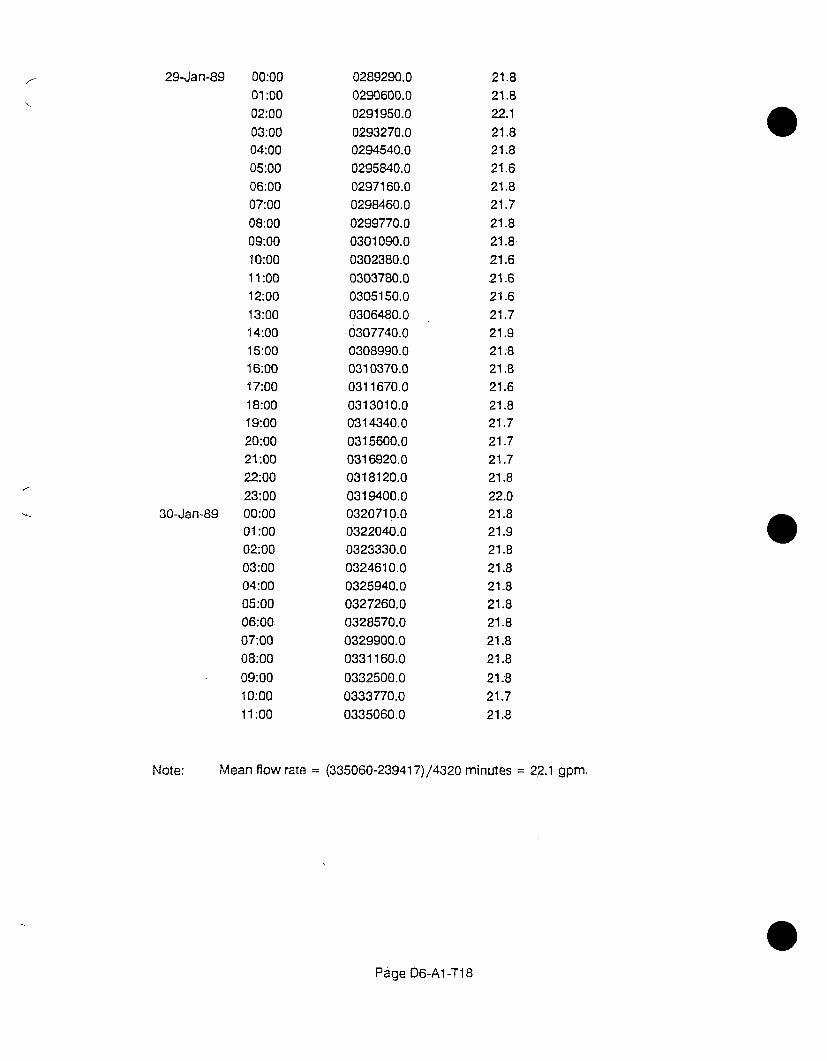
29-Jan-89 00:0001:00
02:0003:0004:0005:0006:0007:0008:0009:0010:00
11:0012:00
13:0014:0015:0016:0017:0018:0019:0020:0021:0022:00
23:00
30-Jan-89 00:0001:0002:0003:0004:0005:0006:00
07:0008:00
09:0010:0011:00
0289290.00290600.00291950.00293270.00294540.0
0295840.00297160.00298460.00299770.00301090.00302380.00303780.00305150.00306480.00307740.00308990.00310370.00311670.0
0313010.00314340.0
0315600.00316920.00318120.00319400.00320710.00322040.00323330.00324610.00325940.00327260.00328570.00329900.0
0331160.00332500.00333770.0
0335060.0
21.821.822.121.821.821.621.821.721.821.821.621.621.621.721.921.821.8
21.621.821.721.721.721.822.021.821.921.821.821.821.821.8
21.821.8
21.821.721.8
Note: Mean flow rate = (335060-239417)/4320 minutes = 22.1 gpm.
Page D6-Al -T18
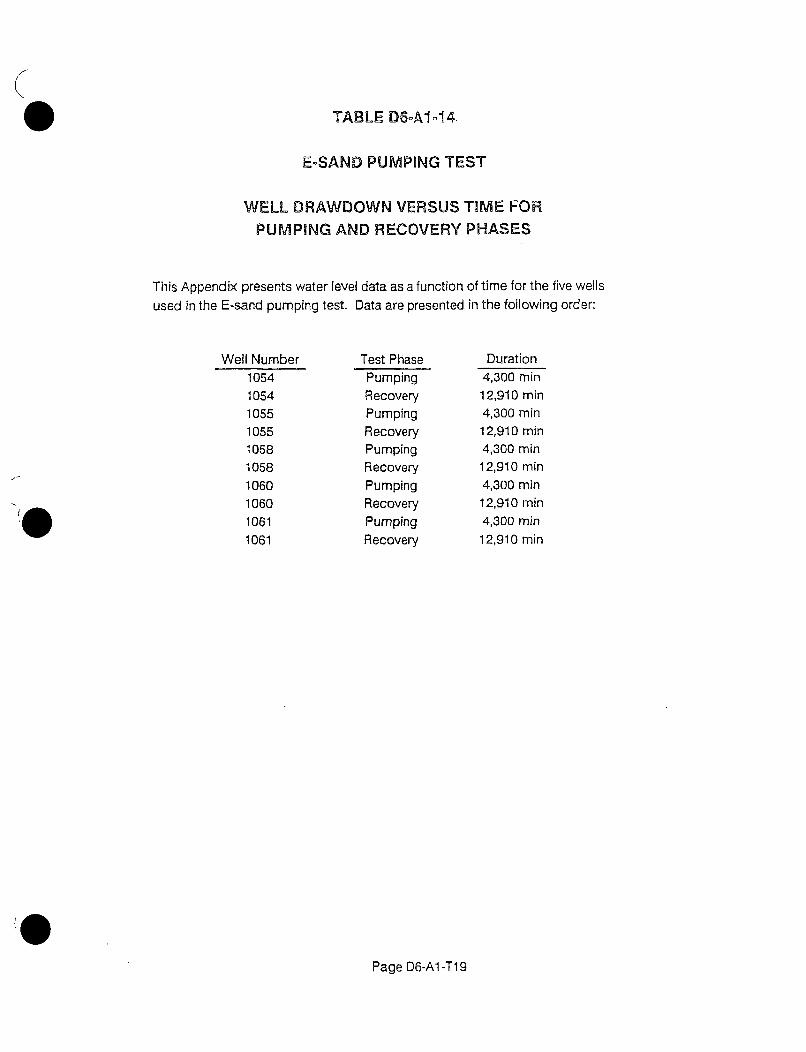
TABLE D6oA1o14
E-SAND PUMPING TEST
WELL DRAWDOWN VERSUS TIME FOR
PUMPING AND RECOVERY PHASES
This Appendix presents water level data as a function of time for the five wellsused in the E-sand pumping test. Data are presented in the following order:
Well Number1054105410551055105810581060106010611061
Test PhasePumpingRecoveryPumpingRecoveryPumpingRecoveryPumpingRecoveryPumpingRecovery
Duration4,300 min12,910 min4,300 min12,910 min.4,300 min12,910 min4,300 min12,910 min4,300 min12,910 min
Page D6-A1-T19
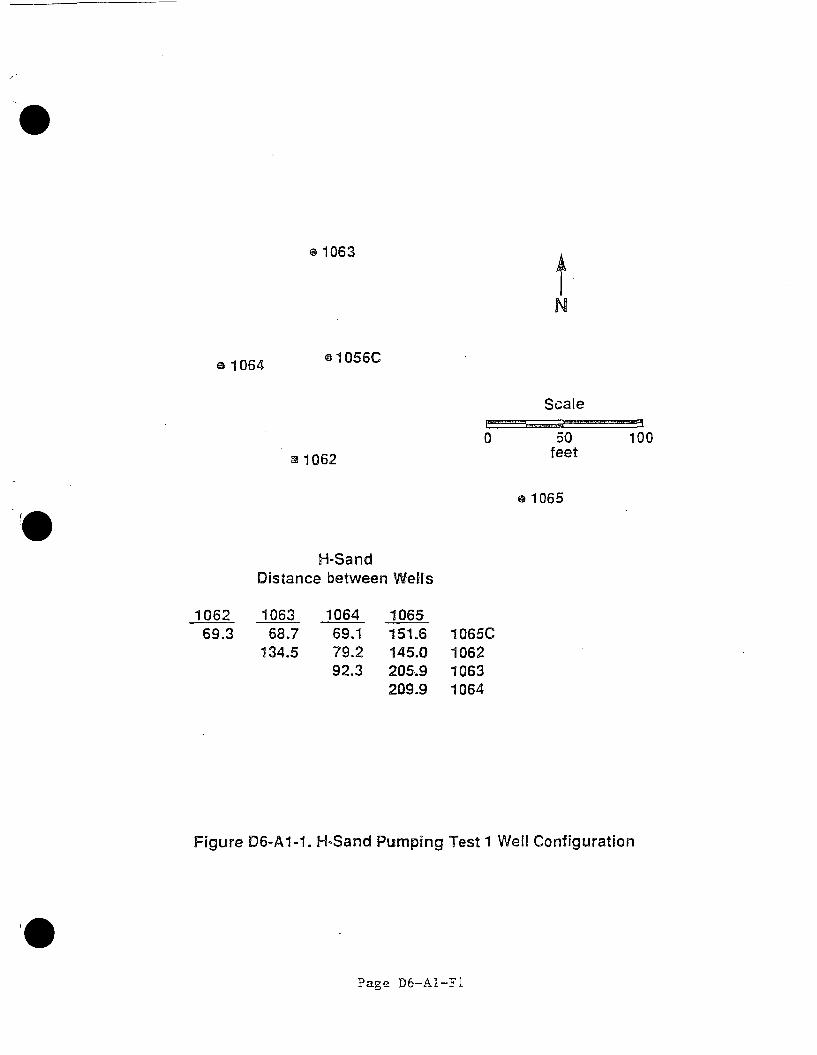
a1063
fN
@1056Ce1064
Scale
0 50feet
1001062
@1065
H-SandDistance between WelIs
1062 106369.3 68.7
134.5
106469.179.292.3
1065151.6145.0205.9209.9
1065C106210631064
Figure 06-Al-1. H-Sand Pumping Test 1 Well Configuration
Page D6-AI-F1
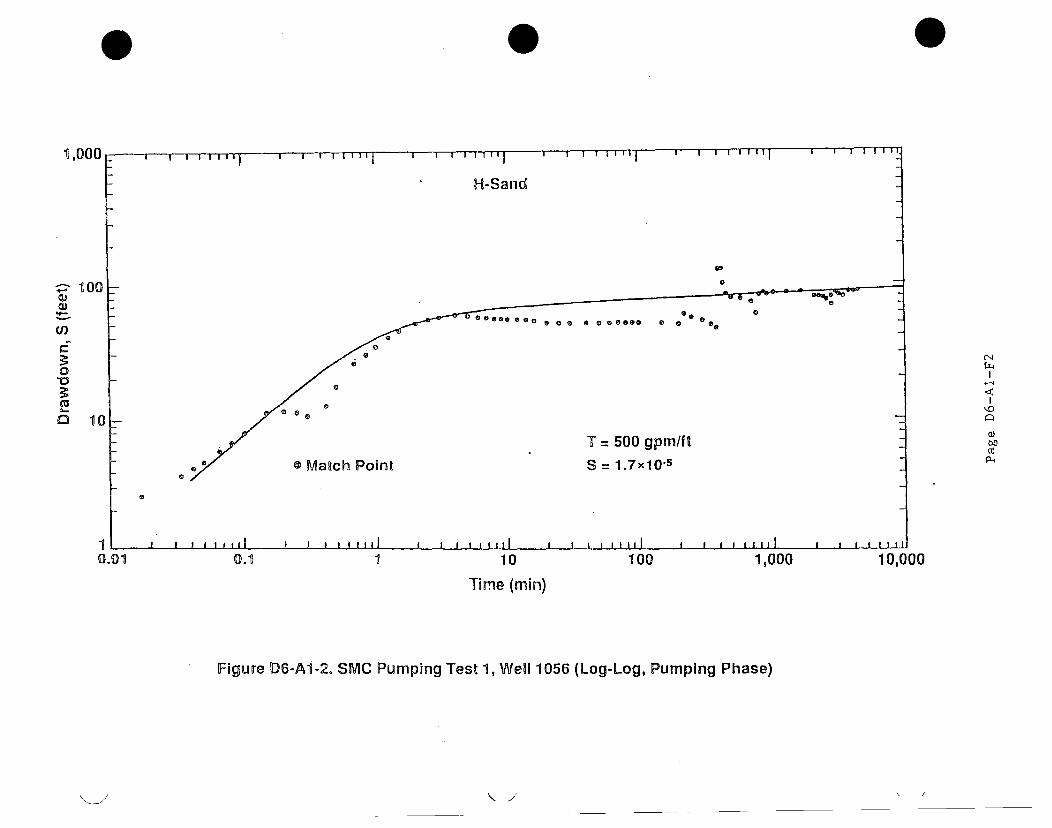
* 0
1,000 , I i i II
H-Sand
- 100
U)
0
O 10
T = 500 gpm/f tMaRch Point S = 1.7x10"
a
0.01 0.1 1 10 100 1,000 10,000Time (min)
Figure D6-A1-2. SMC Pumping Test 1, Well 1056 (Log-Log, Pumping Phase)
\/ J
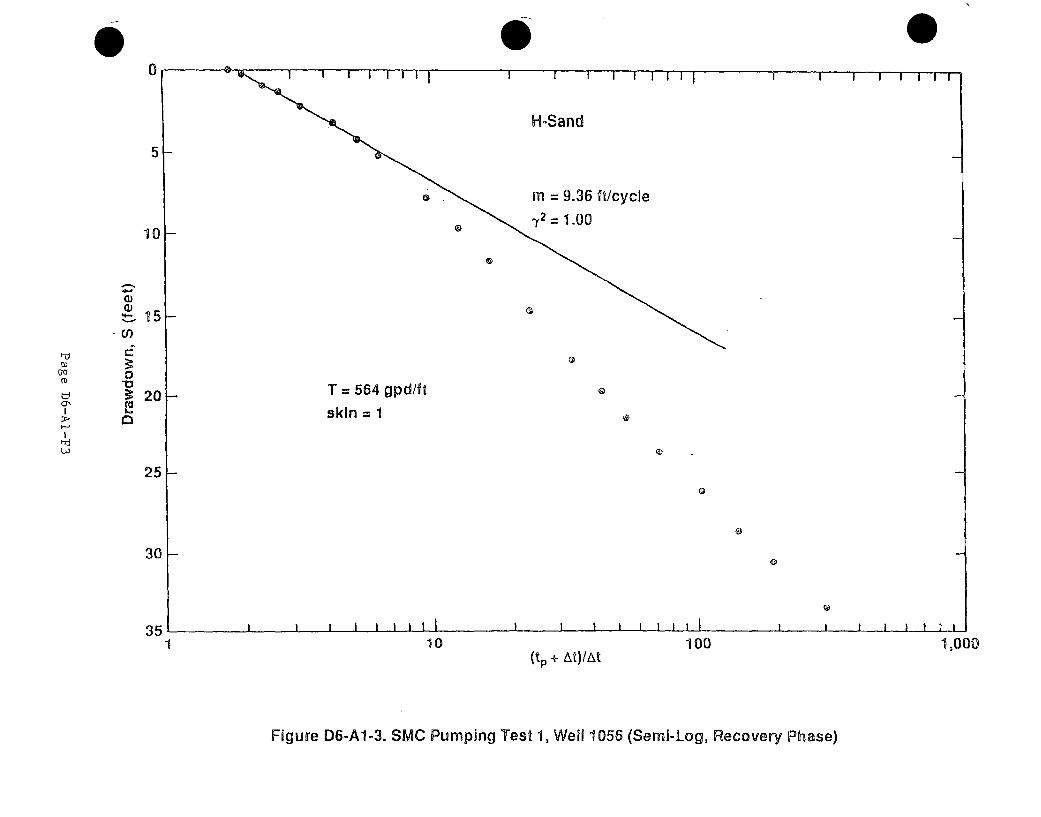
00
5
10
hi
OQ
(-~I
4-1d)t-15
Cn
0
S20
25
30
351 10 100
(tp + At)/At1,000
Figure D6-A1-3. SMC Pumping Test 1, Well 1056 (Semi-Log, Recovery Phase)
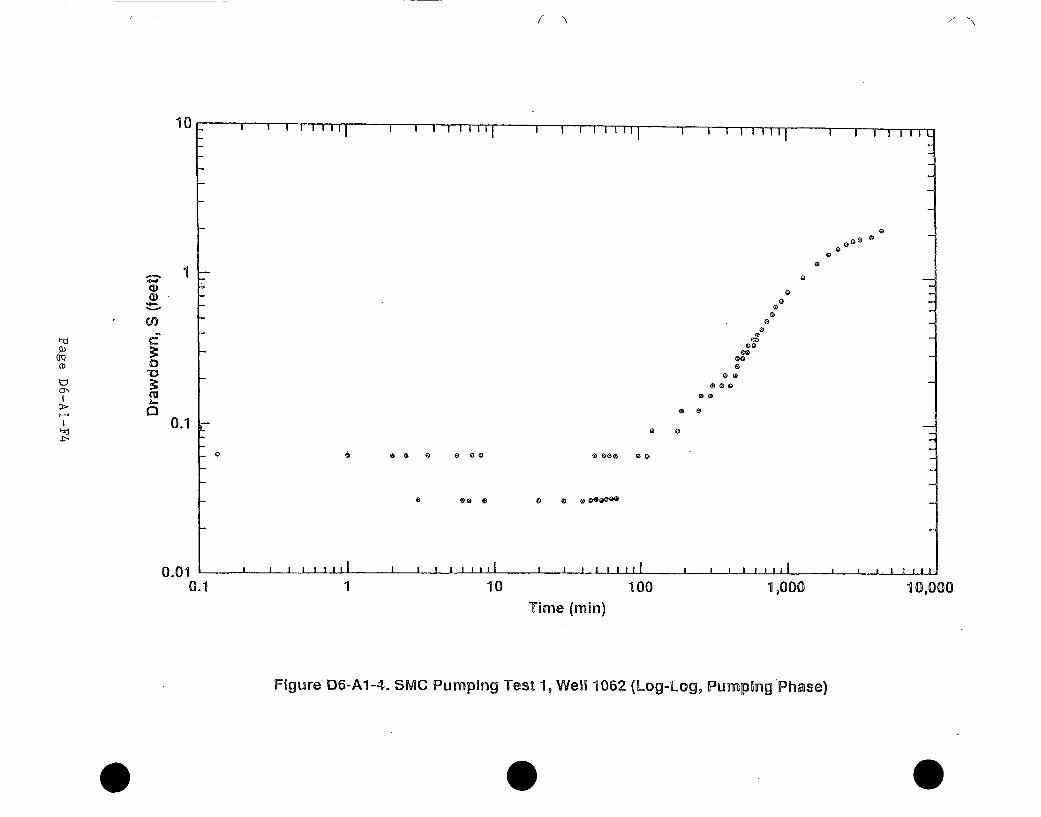
10
O9
d)41
U)
1
0.1
I I 111111 I I I IIIIIj IW1lj I I I IIIIIj I I I IllI~
00000 -
00
0
0
000
0
00
0009
000
00
00009
0 0
0 9
0 00 0 900 0000 00
0 Ge 0 0 0
1111111 I I 111111 IIIIiII I I 13111 ii liii0.010.1 1 10 100 1,000 10,000
Time (min)
Figure D6-A1-4. SMC Pumping Test 1, Well 1062 (Log-Log, Pumping Phase)
0
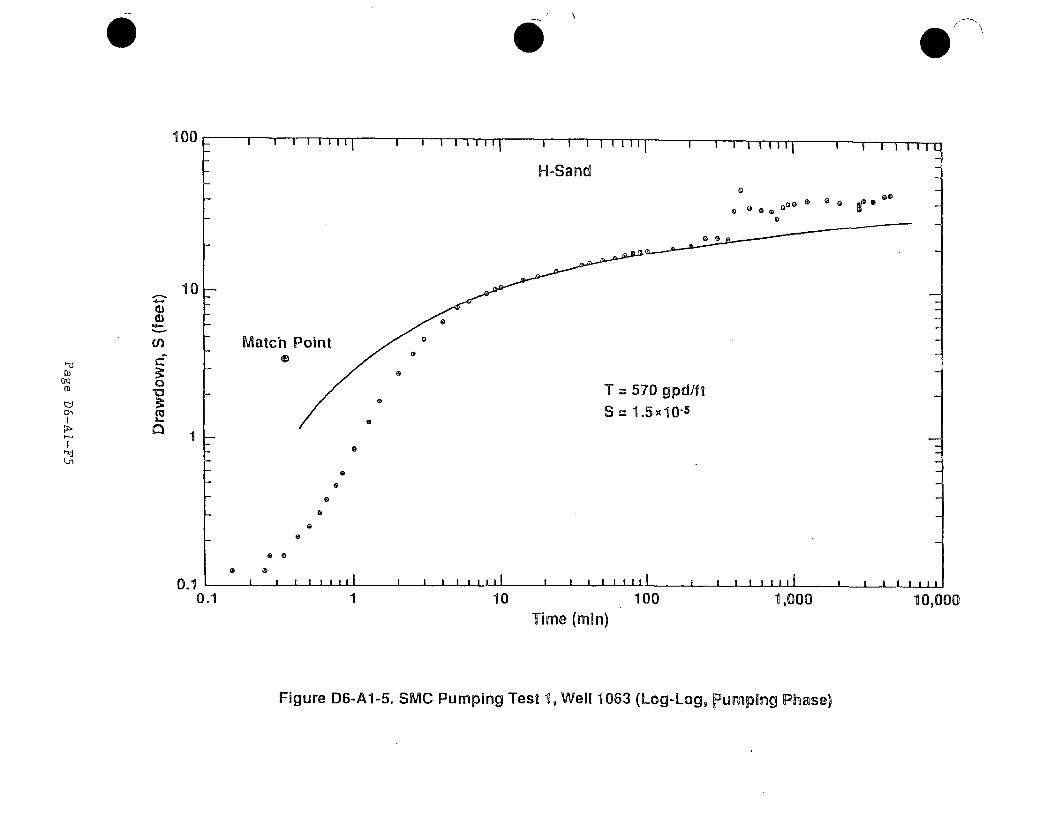
100----
H-SandQ
0 0
*0o
10
U) Match Point
T = 570 gpd/ft
C-- S = 1.5x10"5
I0. 1
00
0" 0
01I I I i I IIII IIIIII I p
0.1 1 10 100 1,000 10,000
Time (min)
Figure D6-Al-5. SMC Pumping Test 1, Well 1063 (Log-Log, pumping Phase)
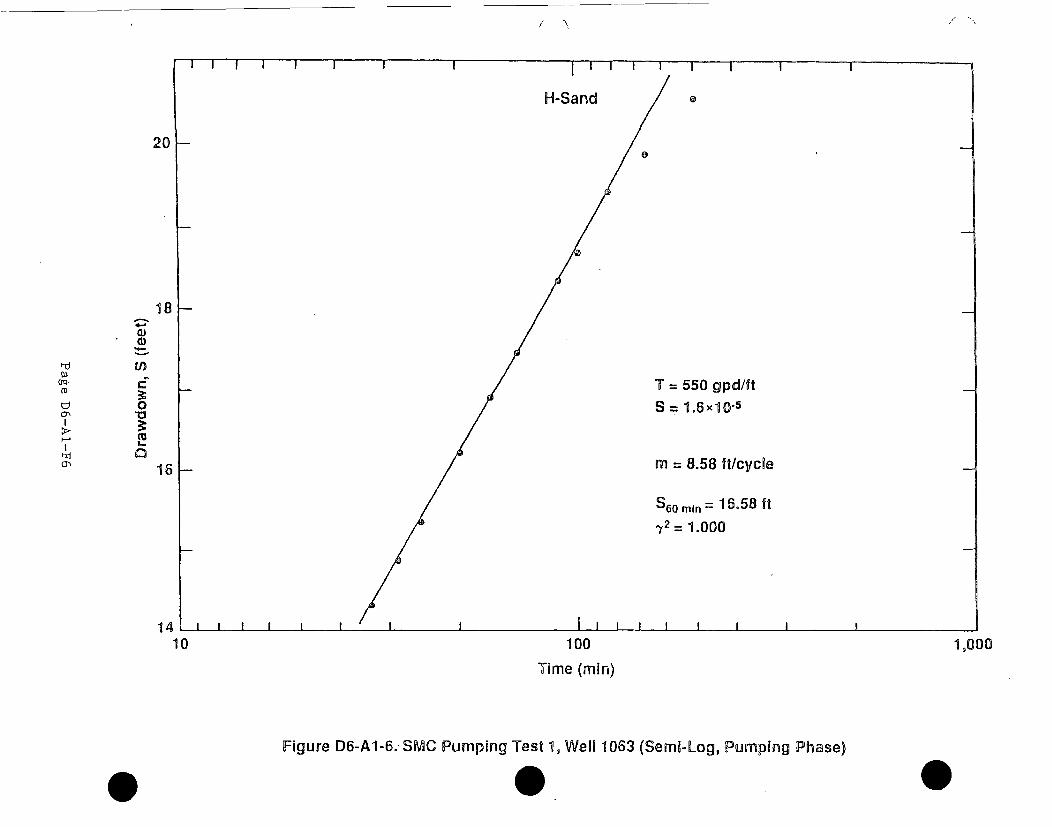
I I I I I I I I II I f I I I I I I I I I I I II I
H-Sand
20k-0
181-
T = 550 gpd/ftS = 1.6x10⁻⁵
m 8.58 ft/cycle
S 60 min = 16.58 it72 = 1.000
(D
U 0
(U
16--
1411
I I I I I I I f I I I I I Ic-I0
100
Time (min)
Figure D6-A1-6., SMC Pumping Test 1, Well 1063 (Semi-Log, Pumping Phase)0
1,000
0
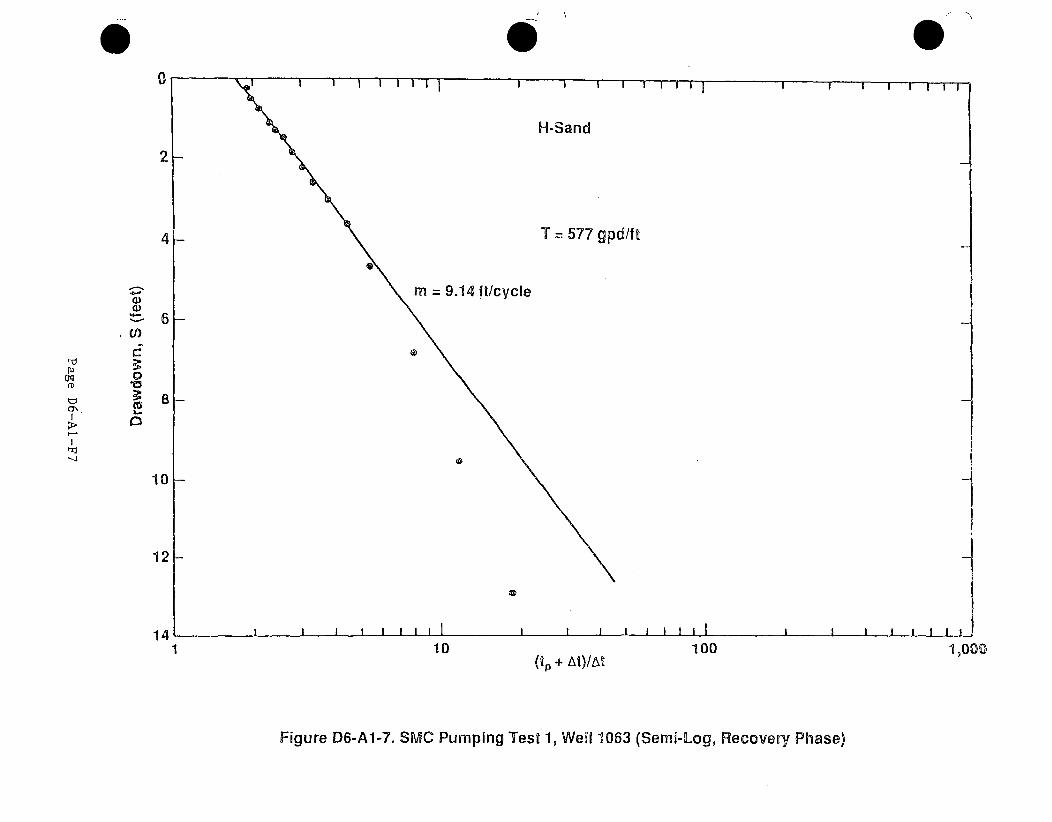
00
2
0303
C',60
0
10
12
141 10 100
(tp + At)/At1 9000
Figure D6-A1-7. SIVMC Pumping Test 1, Well 1063 (Semi-Log, Recovery Phase)
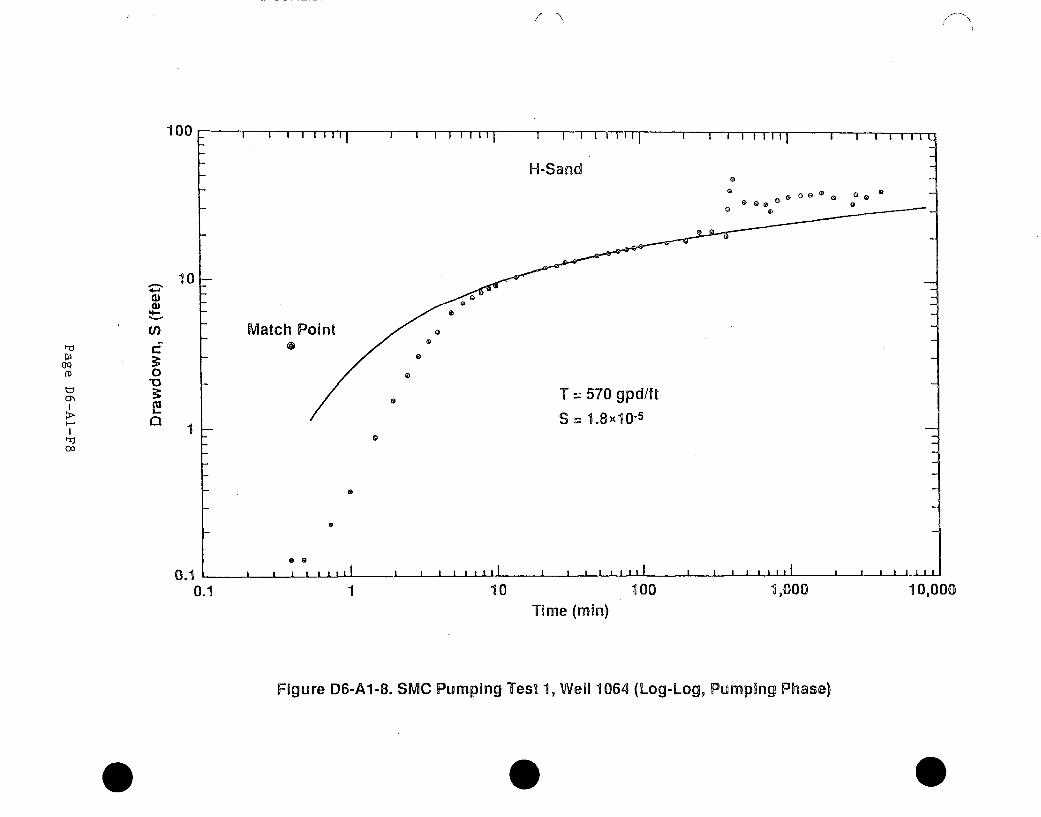
7~ N
100 I I 1 1'1 I I I 111111 I I I 1 1 , I I I iI
H-Sand
10 -4-01)
U) Match Point'
( 0
\ =570 gpd/t
1 S = 1.8X10.5
00 'i i p
0.1 1 10 100 1,000 10,000
Time (min)
Figure D6-A1-8. SMC Pumping Test 1, Well 1064 (Log-Log, Pumping Phase)
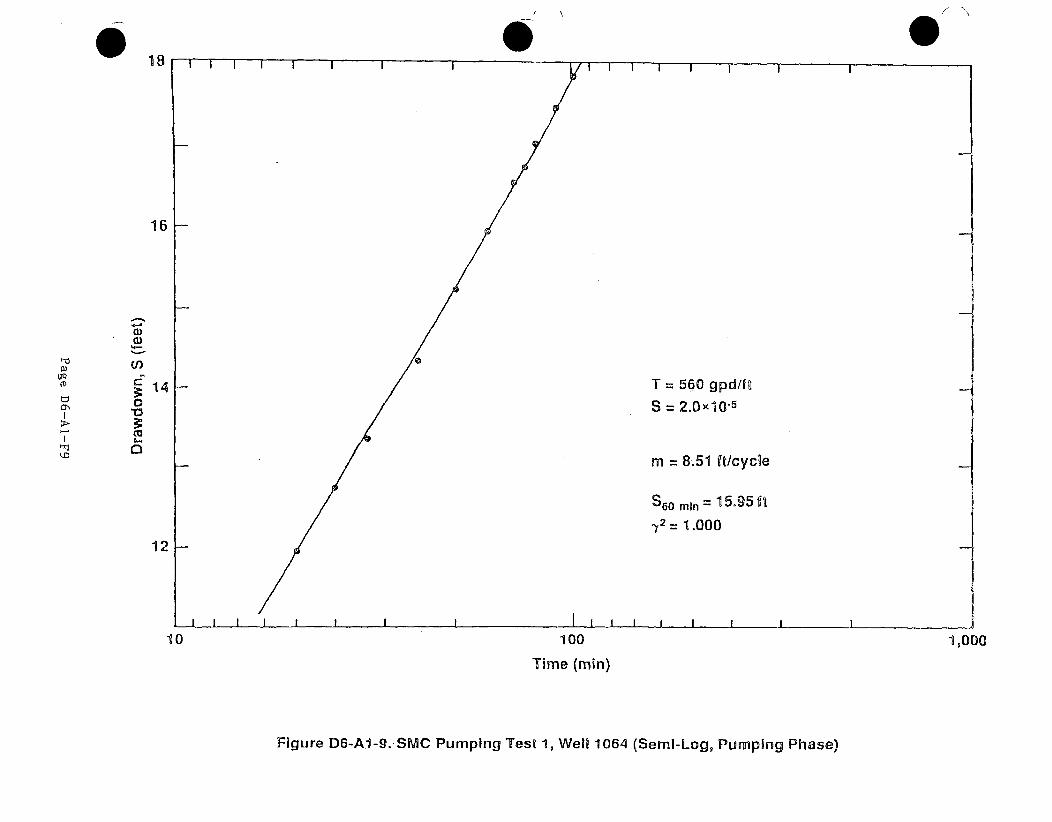
. 18I I II W I
16
CD
(n14
0'U
I-
T
S
m
S
I I I I
(D~
= 560 gpd/ft
= 2.0x10-5
= 8.51 ft/cycle
60 min = 15.95 i
S= 1.000
121-
I I I I I I I I I I I I I I
10 100
Time (min)
1,000
Figure D6-A1-9. SMC Pumping Test 1, Well 1064 (Semi-Log, Pumping Phase)
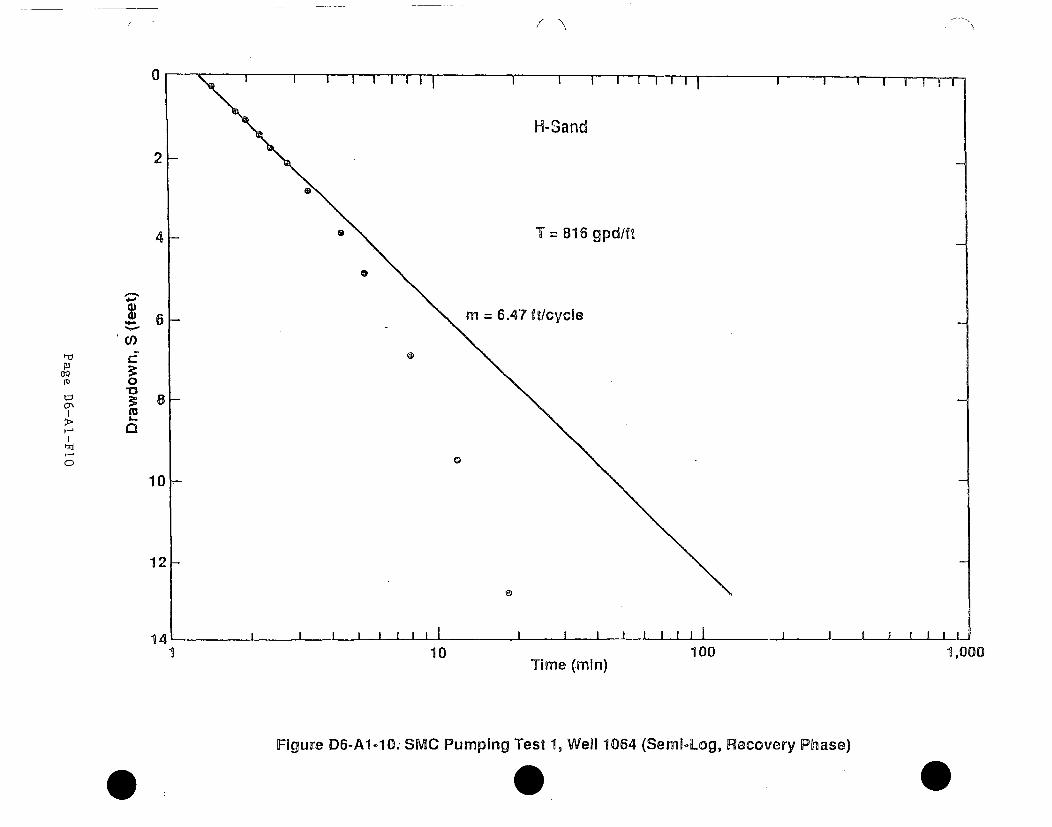
N"'x
0 I I I I 1 1 1 1 1 1 1 11 I I I I I I II
H-Sand
2
4 - T = 816 gpd/ft
6~ rn 6.47 f t/cycleE)
D3
10
12-
14 I t I I I i I~l I t I I I I iii I I lii
1 10 100 1,000Time (mai)
Figure D6-Al-10. SMC Pumping Test 1, Well 1064 (Semi-Log, Recovery Phase)
a 0 0
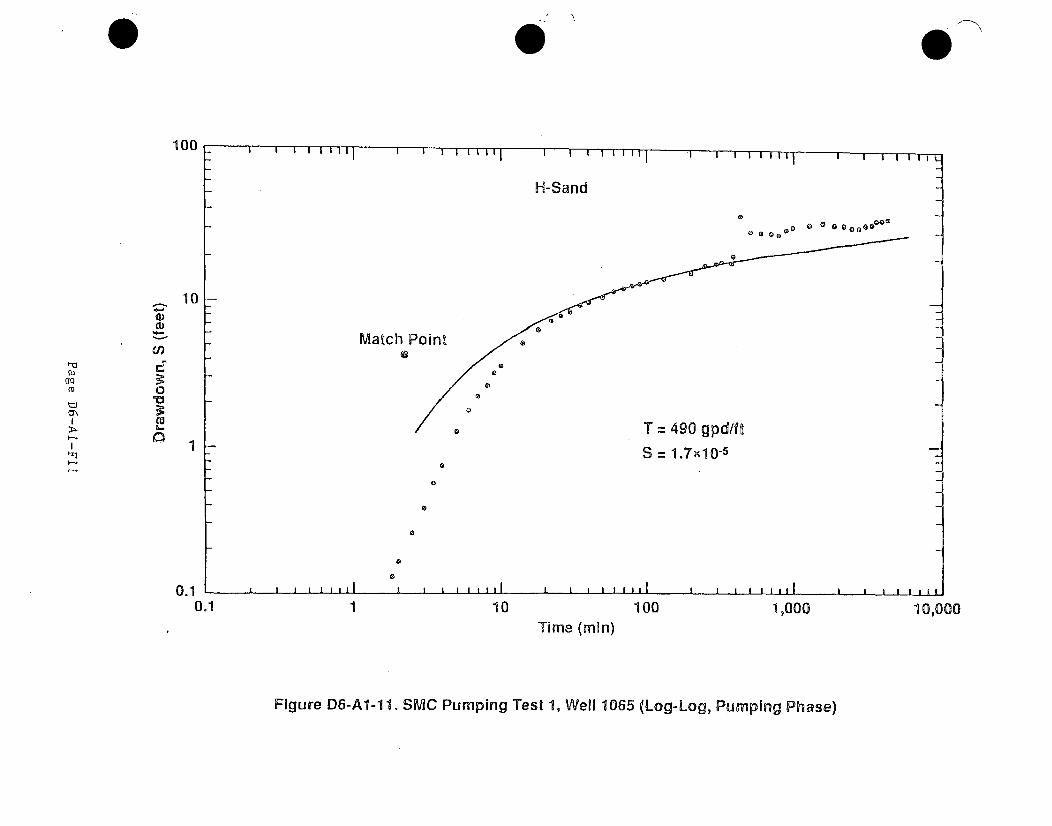
0
100
10
I-,
c0-
0)
1
0.1 10.1 1 10 100 1,000
Time (min)10,000
Figure D6-A1-11. SMC Pumping Test 1, Well 1065 (Log-Log, Pumping Phase)
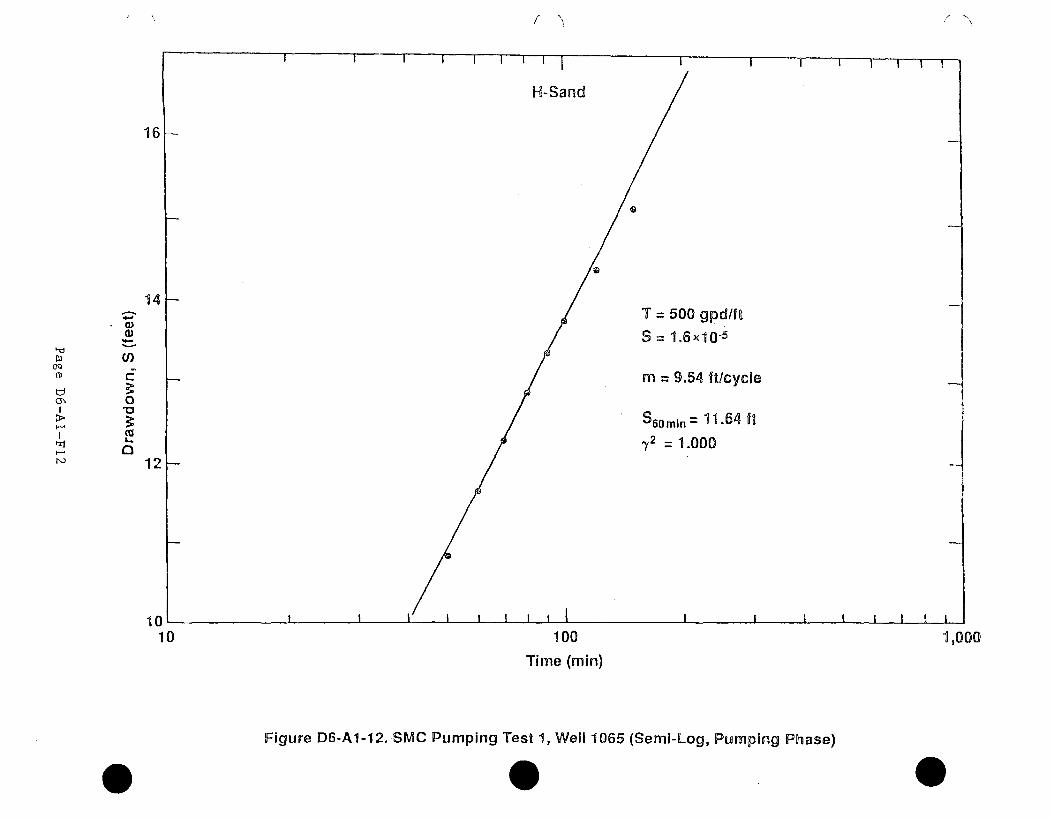
(" \
16-
0
14T = 500 gpd/ft
ciiS = 1.6x10⁻⁵
U)m = 9.54 I/cycle
0S6omin = 11.64 I
.- ~1 =1.000
12
10-
10 100 1,000
Time (min)
Figure D6-A1-12. SMC Pumping Test 1, Well 1065 (Semi-Log, Pumping Phase)
0
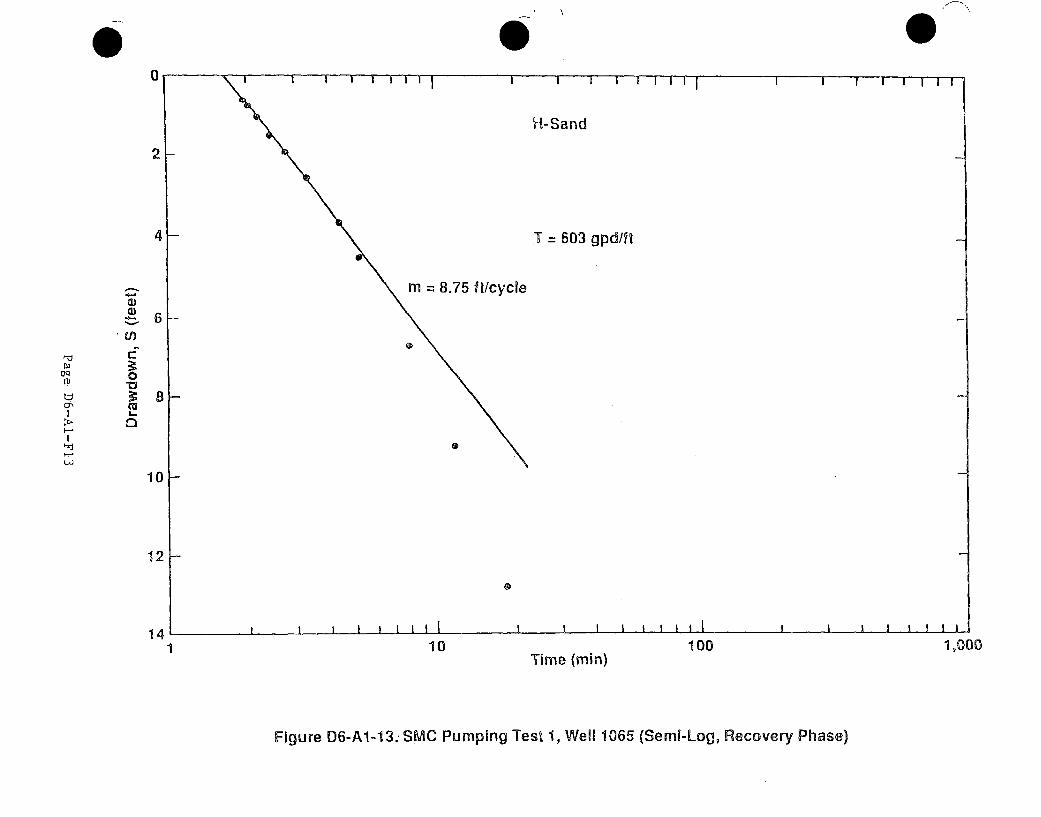
001
2_
4_
m =8.75 ft/cycle
H-Sand
T = 603 gpd/ft
i I I I I IIjI I I I I I I I I
411
wJ
a)U)~t-6
C')
c0
L.0
10[-
12-
a
I I I Ii a a I I a a Iii I I I I I I I I14
1 10 100 1,000Time (min)
Figure D6-Al-133. StMC Pumping Test 1, Well 1065 (Semi-Log, Recovery Phase)
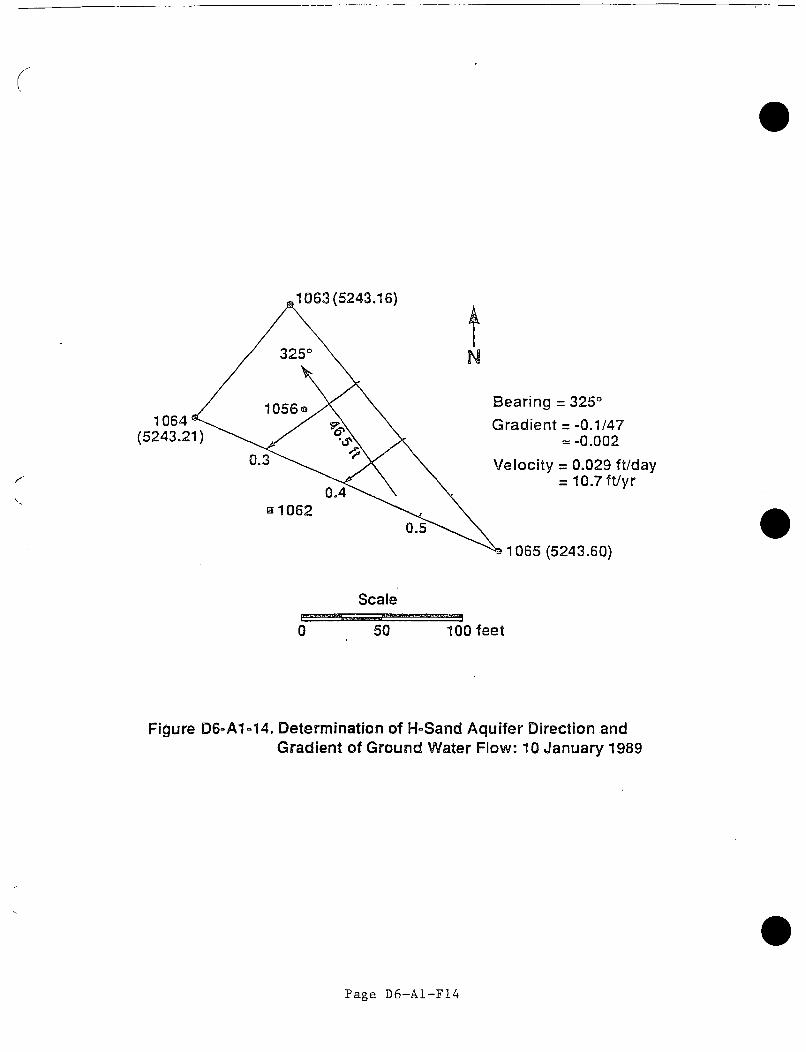
0
1063 (5243.16)
N
1064 -(5243.21)
0.3
a 1062
Bearing = 3250
Gradient = -0.1/47= -0.002
Velocity = 0.029 ft/day= 10.7 ft/yr
1065 (5243.60)
0.
Scale
0 50 100 feet
Figure D6-A1-14. Determination of H-Sand Aquifer Direction andGradient of Ground Water Flow: 10 January 1989
Page D6-AI-F14
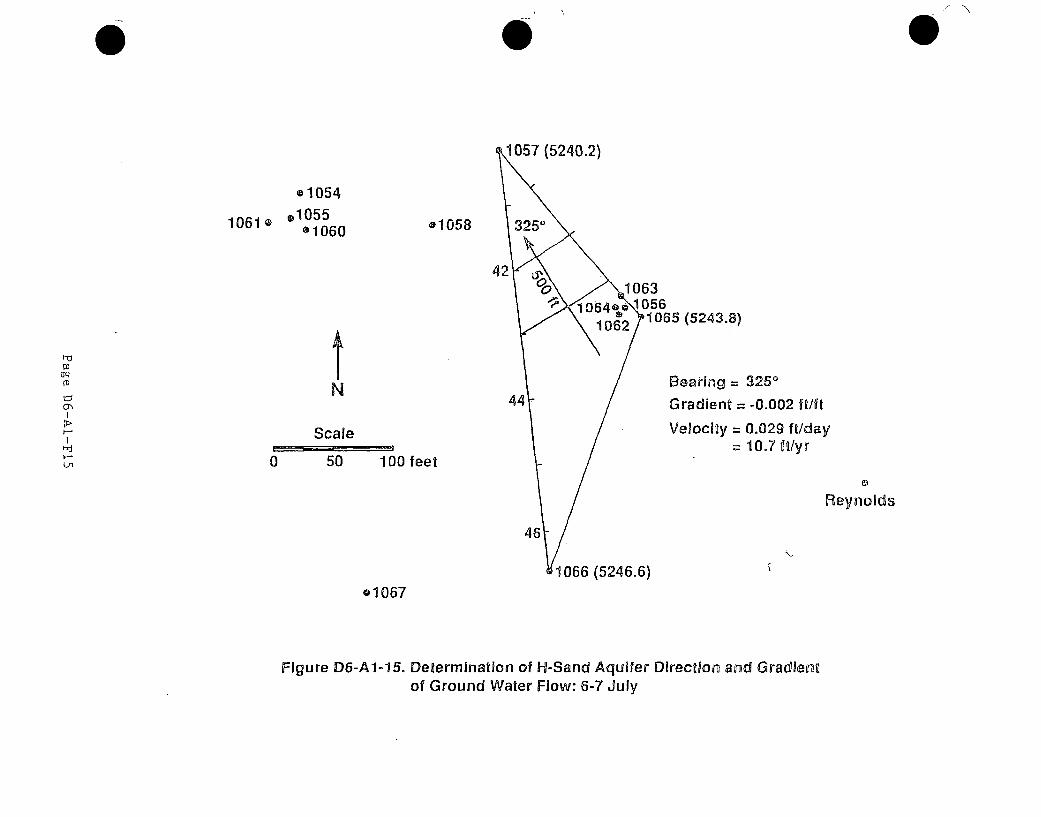
0
(5240.2)
e1054
10610 105501060 e1058
42063
I-ti
(El
0"
E~Jl
tN
Scale
0 50 100 feet
35(5243.8)
Bearing = 3250
Gradient = -0.002 ft/ft
Velocity = 0.029 ft/day10.7 it/yr
Reynolds
U1066 (5246.6)
e-1067
Figure D6-Al-15. Determination of H-Sand Aquifer Direction and Gradientof Ground Water Flow: 6-7 July
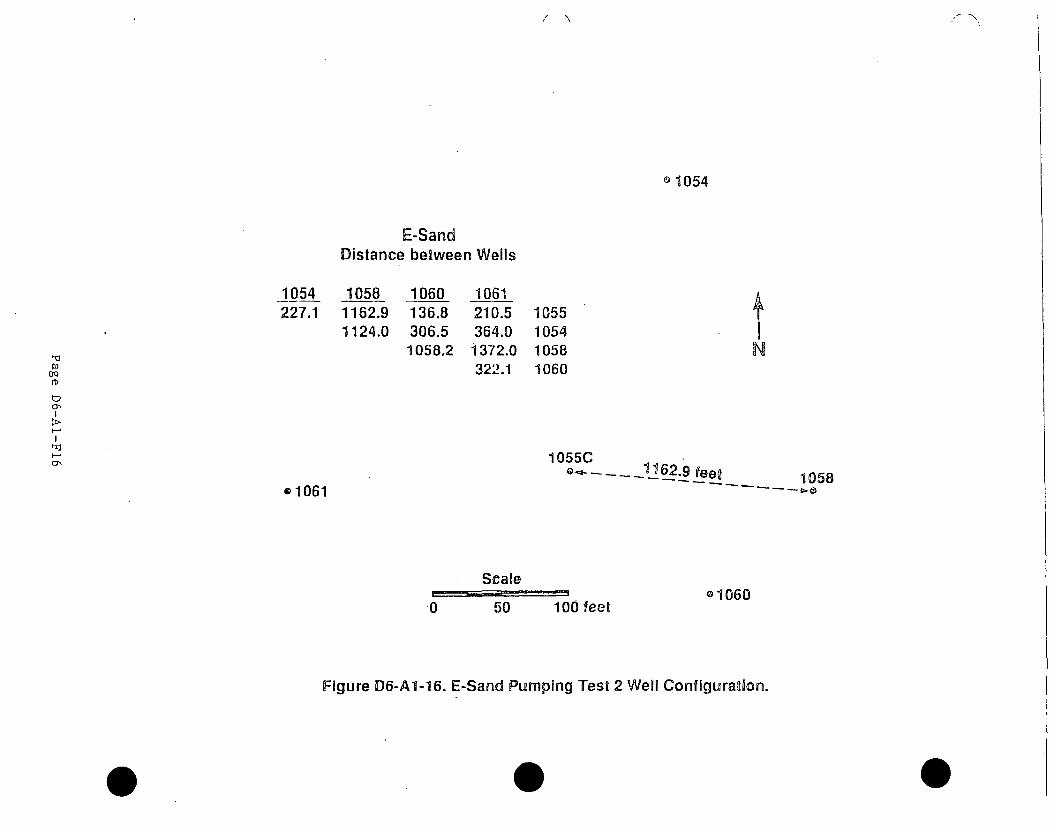
011054
E-SandDistance between Wells
1054227.1
10581162.91124.0
1060136.8
306.51058.2
1061210.5364.01372.0322.1
1055105410581060
t'-ti
a-'
1055C•_• 1162.9 feet 15a1061
Scale0 50 100 feet
o1060
Figure D6-Al-16. E-Sand Pumping Test 2 Well Configuration.
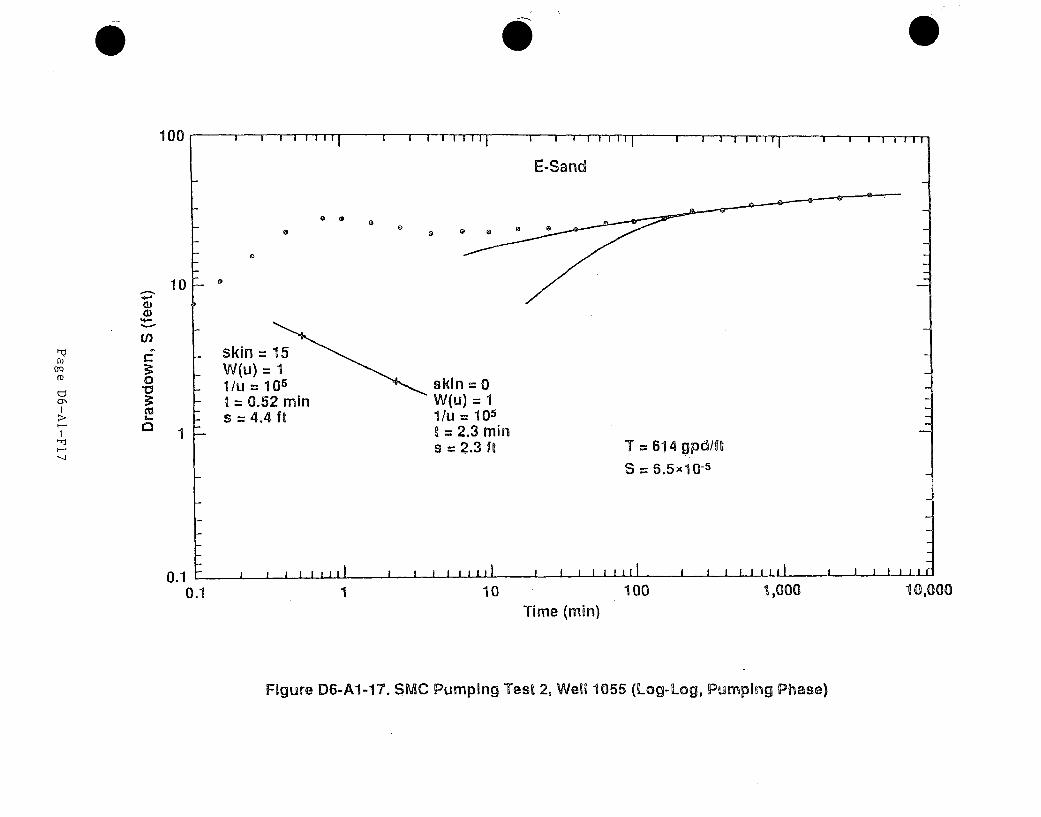
100 , U I I U UUU*1 U I*1I1' I • ' ' ' ' ' I
C-Sand
' I ' I S If I I I a I I
o * e0 0 0 0 0 -
0
d)
fD 0
0j v
10
1
0
skin =15W(u) = 11/u = 10 5 skin =01 0.52 min W(u) = 1s =4.4 ft 1/u = 105
t = 2.3 minS = 2.3 ft T = 614 gpd/ft
S = 6.5x10⁻⁵
., I S , , , , ,I I I I I , I I I I I I I I I I I I I I I I III~-
0.10.
I I I I 11111 III,,.,.
1 1 10 100 3,000 10,000Time (min)
Figure D6-Al-17. SMC Pumping Test 2, Well 1055 (Log-Log, Pumping Phase)
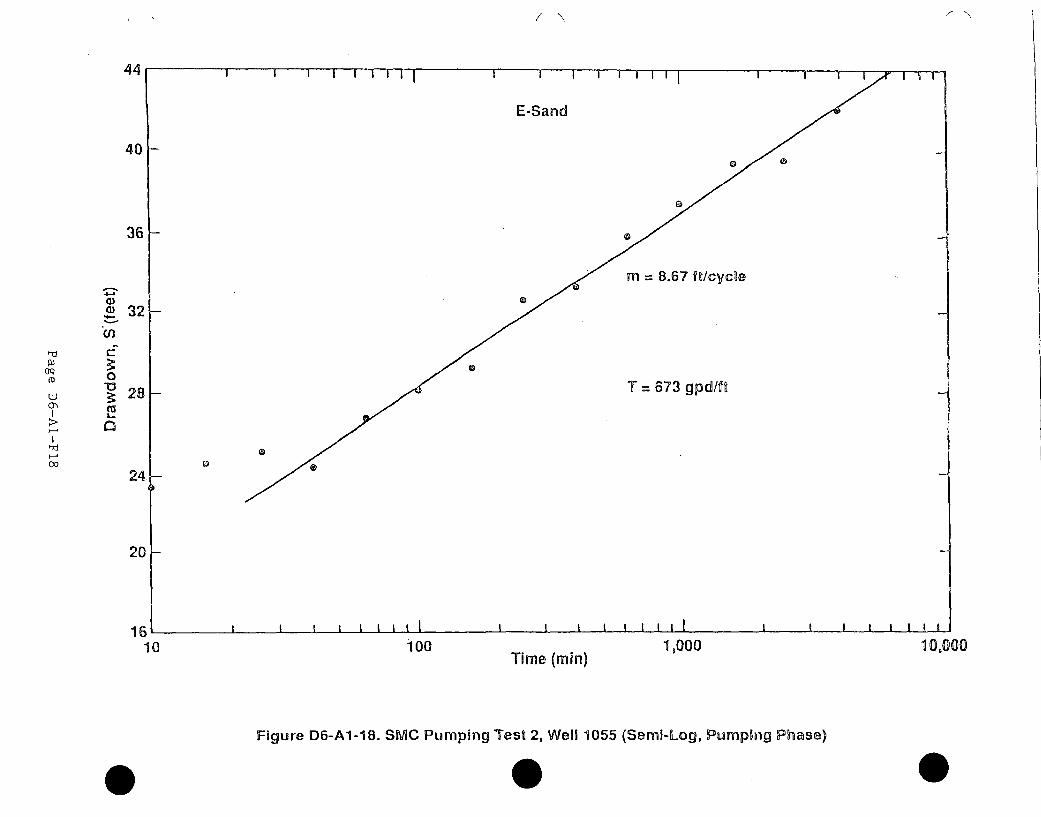
,/ N
44 1 1 1 I i i 1 1 1 I i- I
E-Sand
40 -
36
3m 8.67 ft/cycle
. 32-"Cl)
0" 28 T= 673 gpd/ft
24-
20-
16 I I I I iii l I I i i ! I i ii I i I i i !I
10 100 Time1,000 10000
Figure D6-Al-18. SMC Pumping Test 2, Well 1055 (Semi-Log, Pumping Phase)
a= 0 0
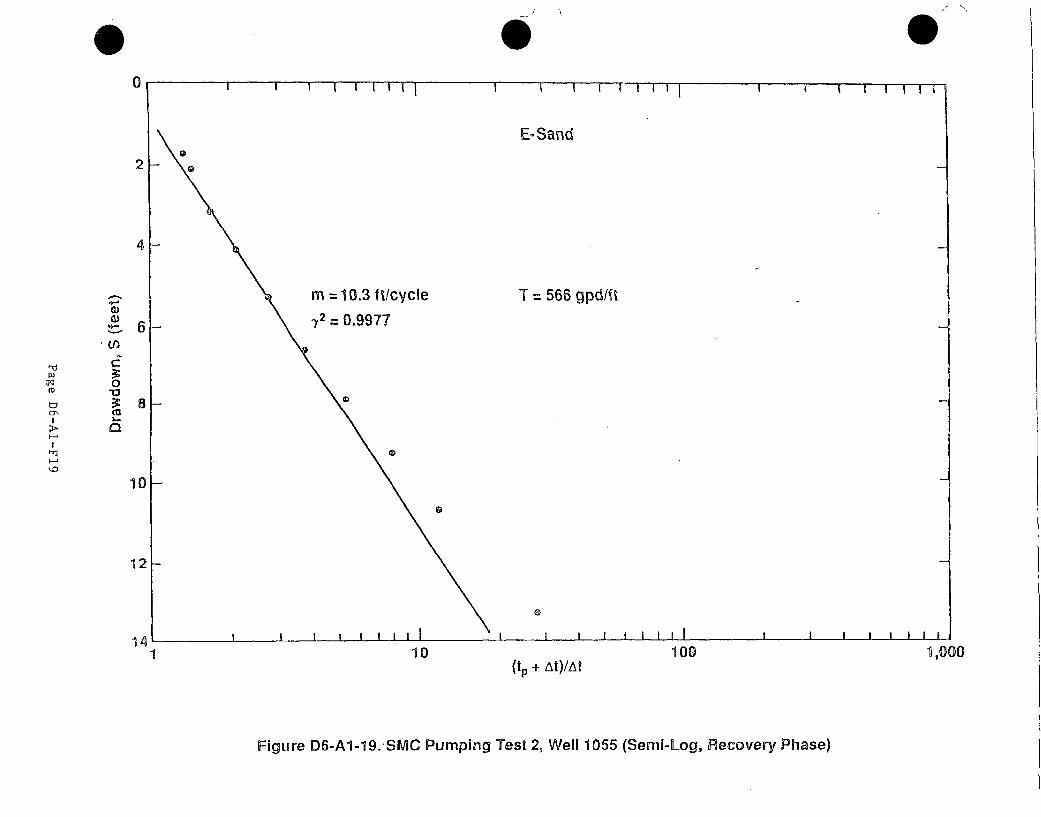
00
I I I I ~ I III I I I I i I iI I I I I I I I II
21
4
*1-'
cii
cnj0-a'U1-.
0
6
m = 10.3 it/cycle-2 = 0.9977
0o
t I t I i Ii
T = 566 gpd/ft
E=Sand
8a
101
12
I - I I I~ I LI I I I I I I I I I I141 10 100 1,000
(p+ 6)A
Figure D6-A1-19.'SMC Pumping Test 2, Well 1055 (Semi-Log, Recovery Phase)
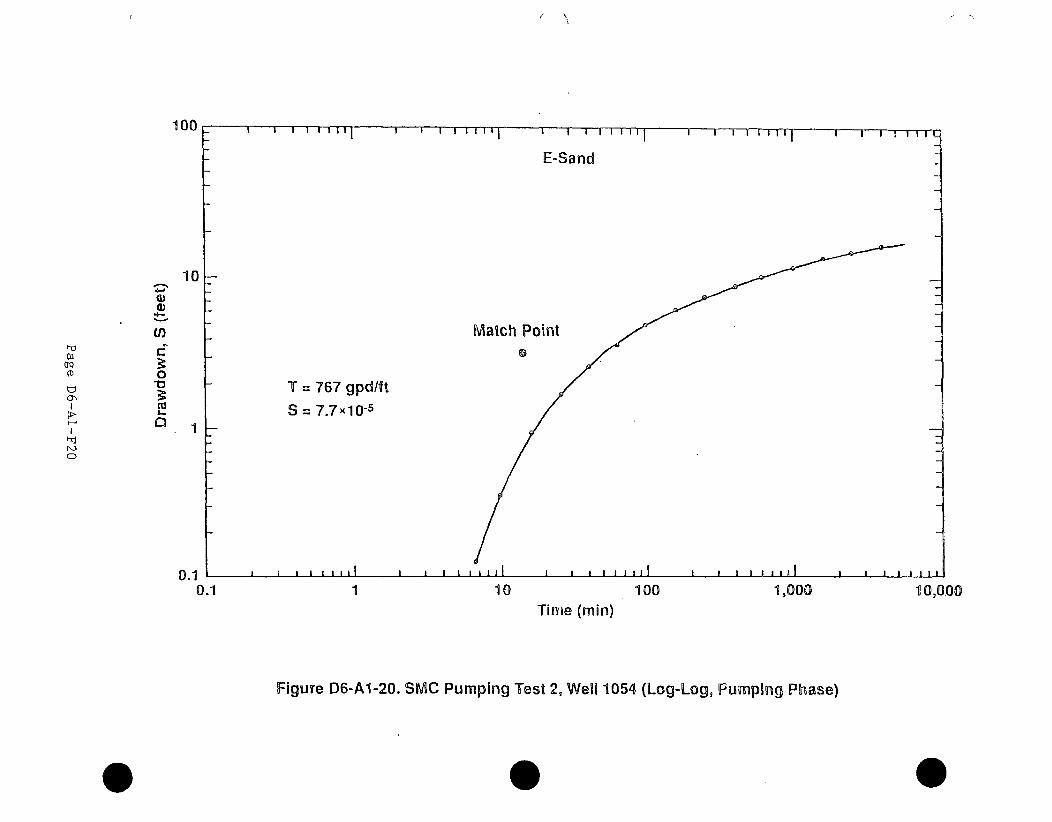
100 - I I 1111111 I I I I 11111 I I 0,10
. . . . . . . I
E-Sand
I I ' ' ' ' 1 v I I I l~ L
C)
0
CDU
10
1
Match Point
T = 767 gpd/ft
S = 7.7x10⁵-
I I I I I I I I I I I I I I I I I I I I I # I Ii I I I a I I oaI0.1
i n i I I nIll
0.1 1 10 100 1,000 10,000Time (min)
Figure D6-A1-20. SMC Pumping Test 2, Well 1054 (Log-Log, Pumping Phase)
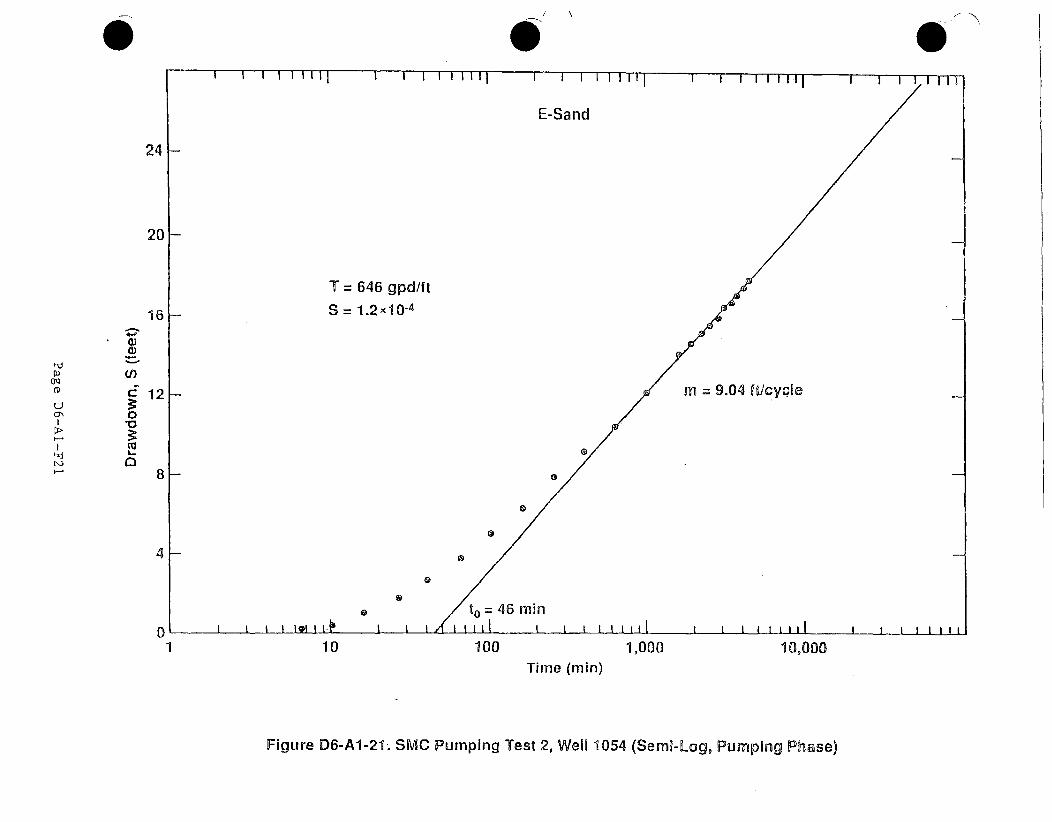
6P
241-
S = 1.
20k
16~
U
a'
I-.
d)
0
Cl
I -I I I IIII I I I tI l1 J i 1I I 11 .11 I 11I1 I II
E-Sand
16 gpd/ft
2x1Q-4
m = 9.04 ff/cycpIe
@0
to= 46 minI t I i I IIL[ I I I I t li I III 1 11
12
8
4ký
0
I I I II@III~01 10 100 1,000 10,000
Time (min)
Figure D6-A1-21,. SMC Pumping Test 2, Well 1054 (Semi-Log, Pumping Phase)
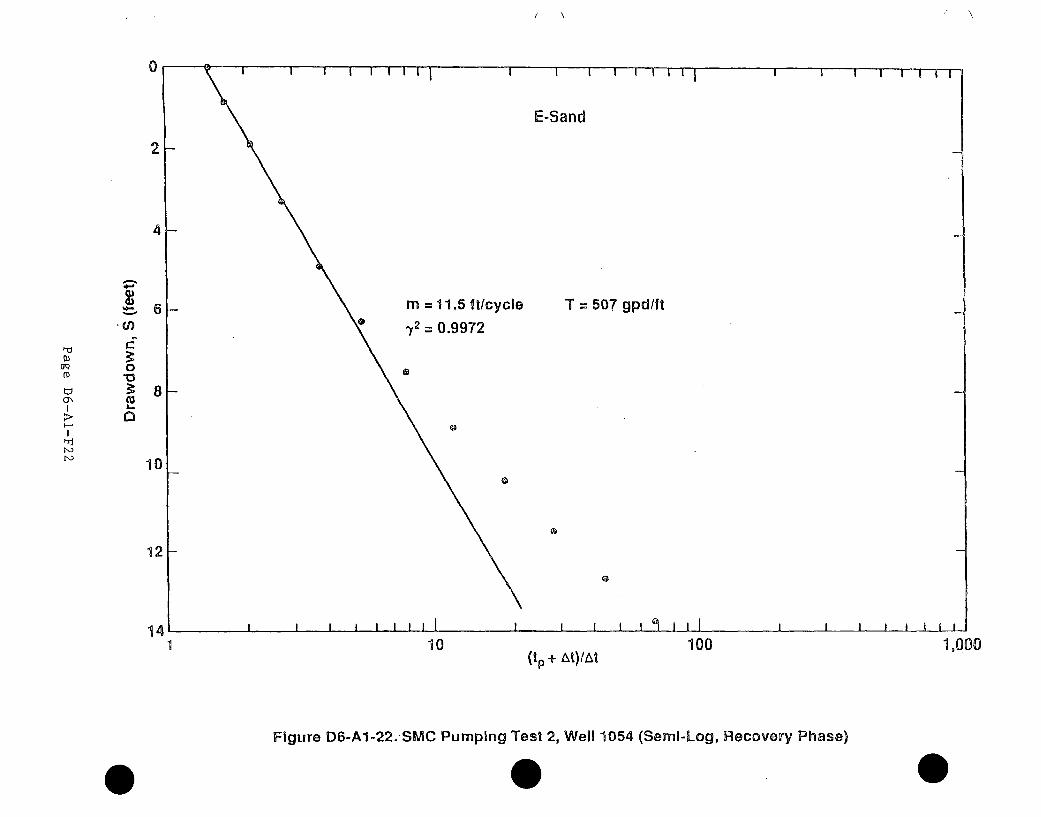
I \
0
2
4
C-.
0
6 m = 11.5 ft/cycle
'1 2 = 0.9972
I I 1 1 1 1 1 1
E-Sand
T = 507 gpd/ft
I I I I liii
8
10
0
12
I I 1 I1 9 1 114 I I I I I I I I
1 10 100 1,000(I P + At)/At
Figure D6-A1-22.SMC Pumping Test 2, Well 1054 (Semi-Log, Recovery Phase)
0
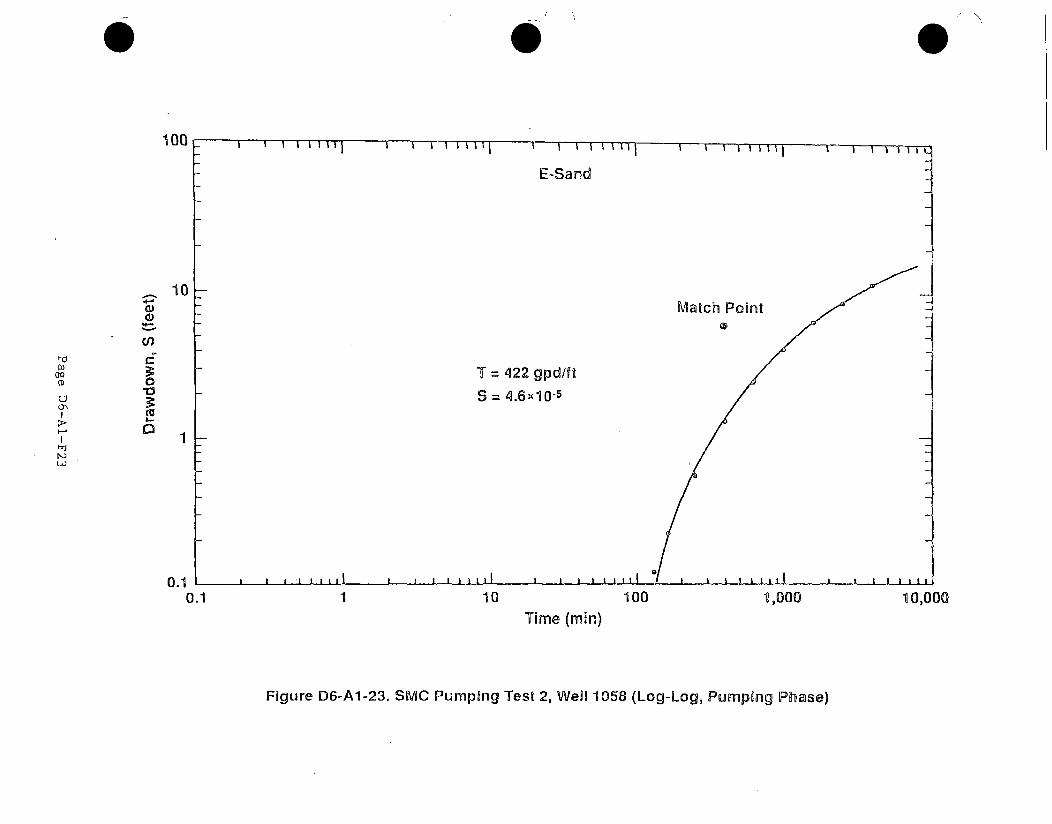
* 0
E-Sand
_ 10-Match Point
d ()
T = 422 gpd/ft
S = 4.610.5
0"
0.
i ~1-
0.1 1 10 100 1,000 10,000
Time (min)
Figure D6-A1-23. SMC Pumping Test 2, Well 1058 (Log-Log, Pumping Phase)
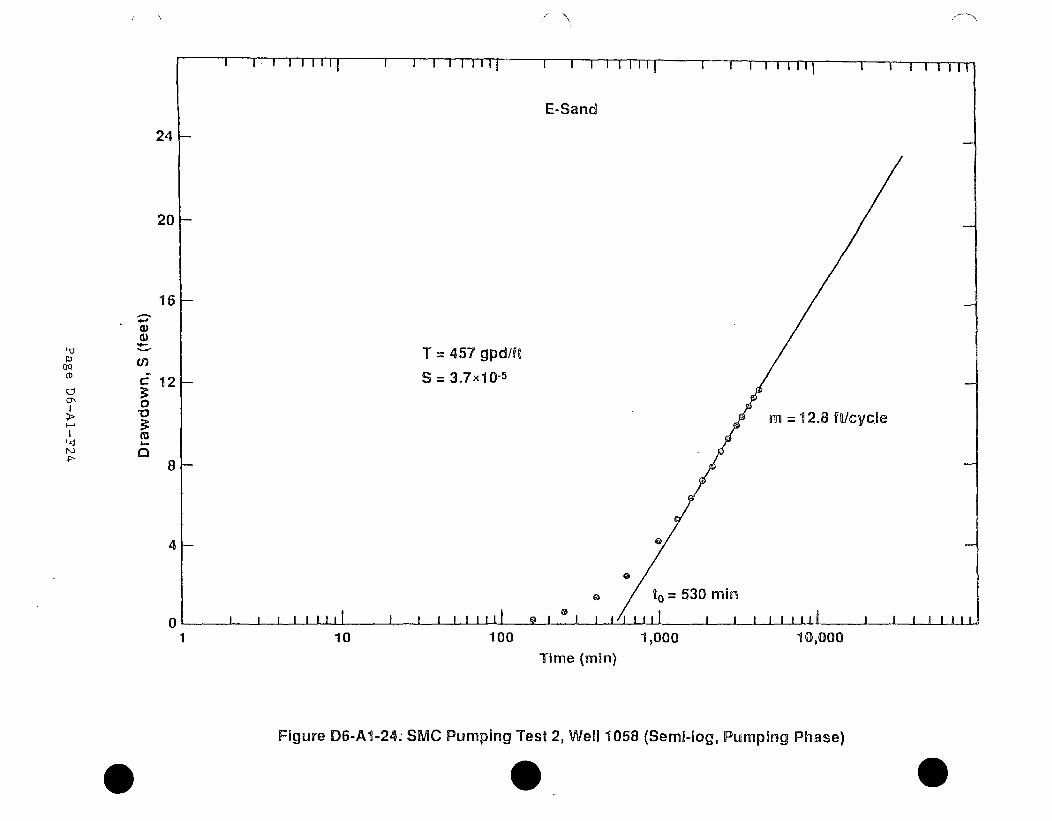
-- N
24
20
16-
01)
T = 457 gpd/ft
D CF 12 - S = 3.7x10.5
cy" 0 I,•• nm 1 2 .8 it)
4 -
t= 530 min
0 I ! I I l llI I 1 1 1 111
1 10 100 1,000 10,000Time (min)
Figure D6-A1-24: SMC Pumping Test 2, Well 1058 (Semi-log, Pumping Phase)
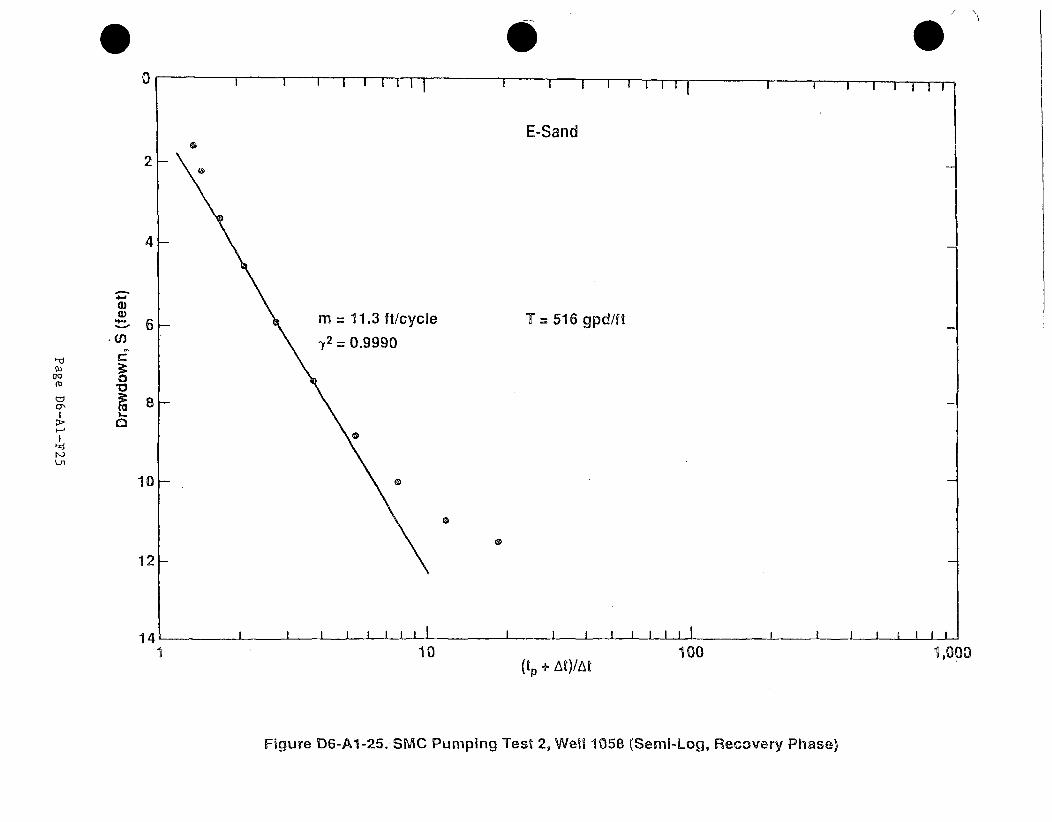
I I I I 1 1 1 I I I I III I I I I I I I I I ~ VW~VT7
E-Sand
2_-
4_-
0-t
I-'
a)M) 6_- m = 11.3 ft/cycle
'T2 = 0.9990
T = 516 gpd/ft
k_
10-
12
I I I I I I I I I I I i I I I II I14
I a I I A I I a
1 10 100 1,000(tp + At)/At
Figure D6-Al-25. SMC Pumping Test 2, Well 1058 (Semi-Log, Recovery Phase)
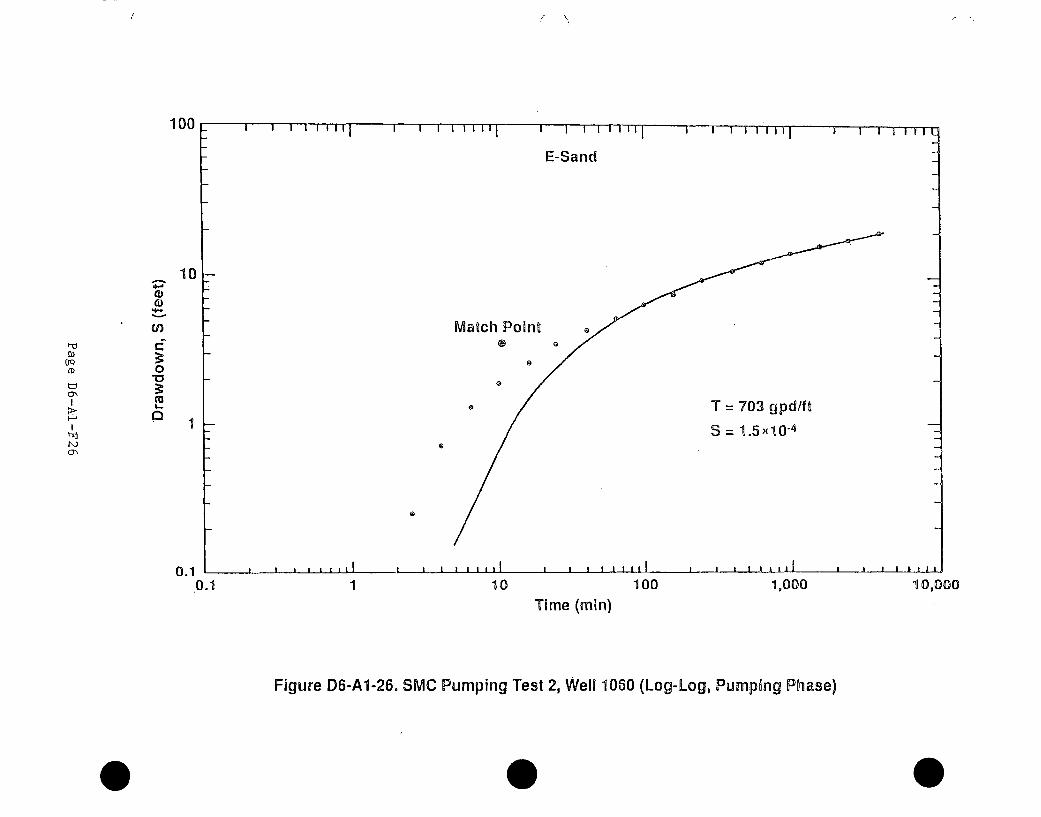
100
(D
d).4-
U)
0
10
1
E-Sand
Match Point
T = 703 gpd/ft
S = 1.5 X10⁴
0.1.0.1 1 10 100 1,000 10,000
Time (min)
Figure D6-A1-26. SMC Pumping Test 2, Well 1060 (Log-Log, Pumping Phase)
0
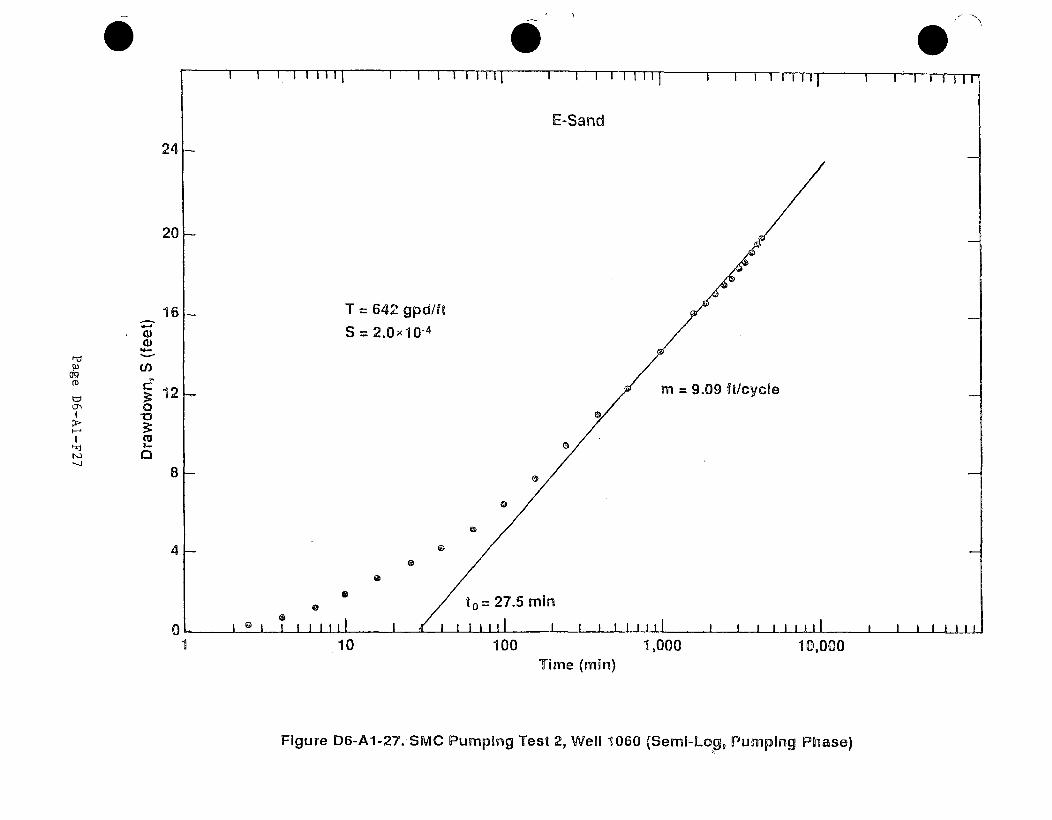
0I I I liii! I I I I 111,1 I *IIIIK,,
, I I , i I S i i I I I I I I I I I I I I I I I I I I I I I I I III
E-Sand
24 I-
20[-
16K-
U)U)
(I)
c0V
Cu2~0
121-
T =64
S 2.1
0b
0t
2 gpd/ft
DX10-4
m 9.09 it/cycle
to= 27.5m
@0
, J , i , l, i I , , , , , , , , ,
81-
4
0
00
I~I I III SII I I I I I I I I
1 10 100 1,000 10,000Time (min)
Figure D6-A1-27..SMC Pumping Test 2, Well 1060 (Semi-Log, Pumping Phase)
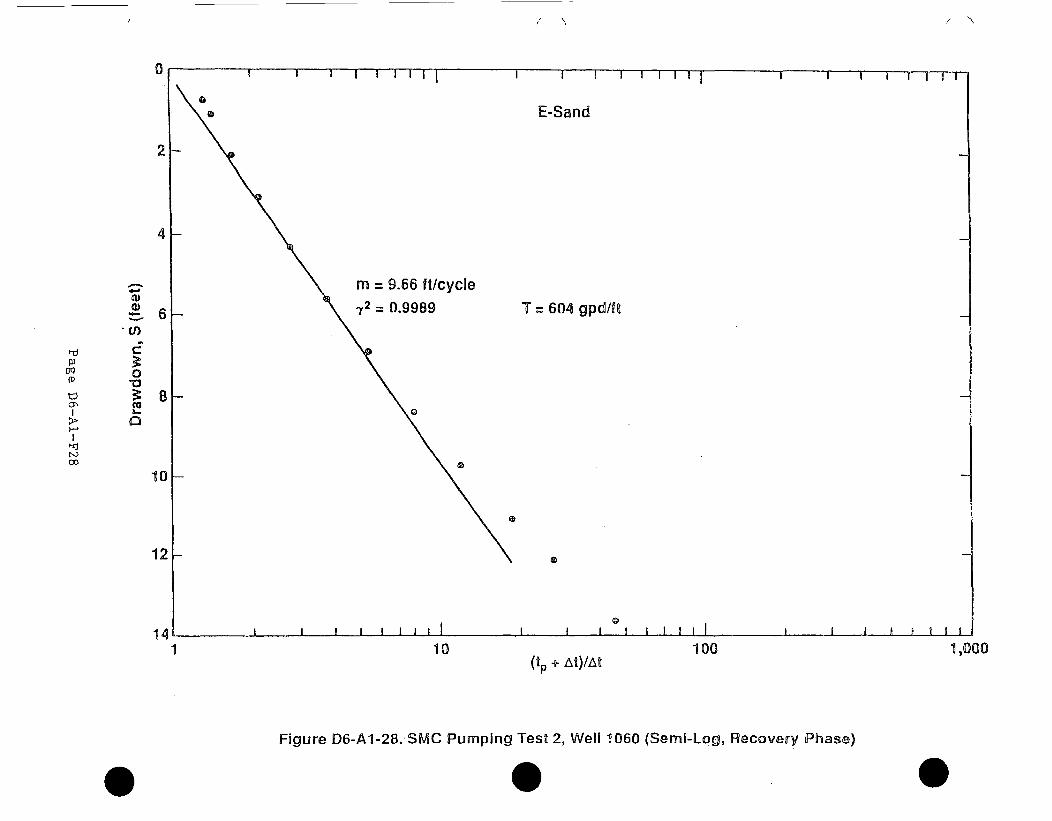
0
2
4
I-d
w'
4-
0)
'Cl)
C
0
VL.
61
8
10
12
141 10 100(+ ÷ •t)/At 1,000
Figure D6-A1-28. SMC Pumping Test 2, Well 1060 (Semi-Log, Recovery Phase)
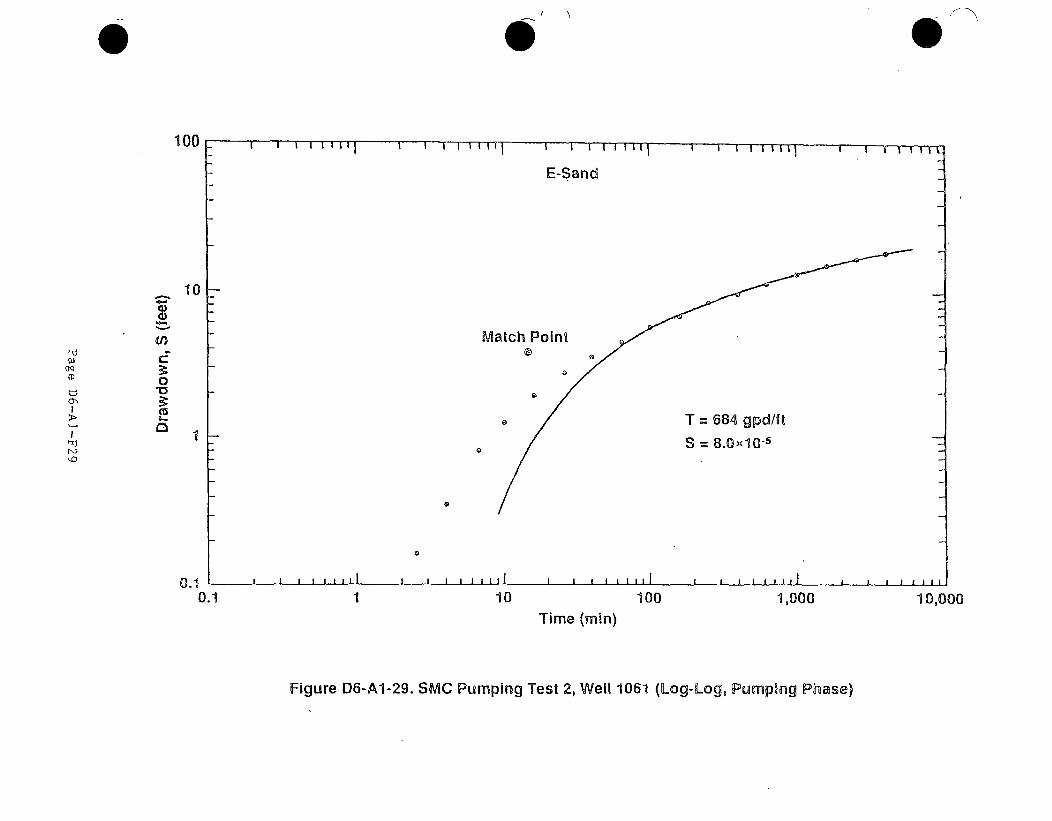
100 1 t I I I I I 11 1 I I C
E-Sand
10
4.-
un Match Point
VV
T " 684 gpd/if
S 8.0-10"5
0.1 1 10 100 1,000 10,000
Time (min)
Figure D6-A1-29. SMC Pumping Test 2, Well 1061 (Log-Log, Pumping Phase)
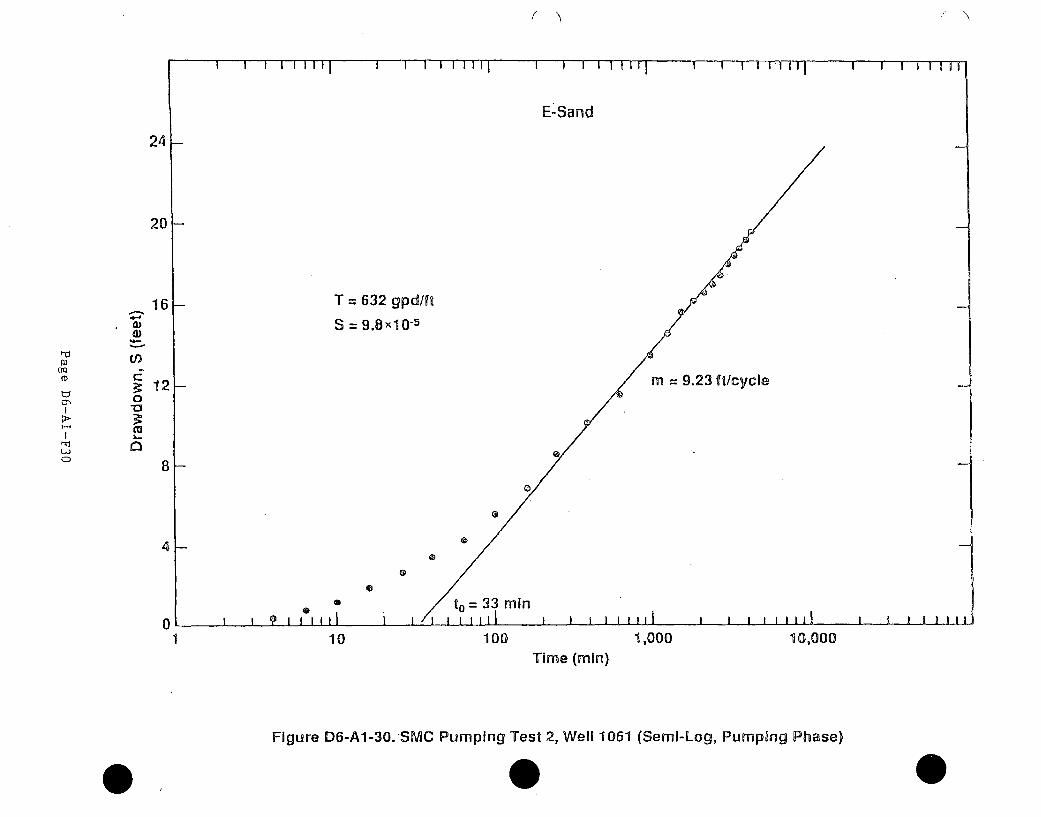
E- Sand
24
20
16 T = 632 gpd/ft
aS= 9.8x10⁻⁵d1)
100
wVtv 12-
L.=M 0
o ~8-
4--
_ to =33 rmnin0 • ~iIII~ i I/I 111111 i I•
1 10 100Time (min)
m = 9.23 ft/cycle
1,000 10,000
Figure D6-Al-30.-SMC Pumping Test 2, Well 1061 (Semi-Log, Pumping Phase)
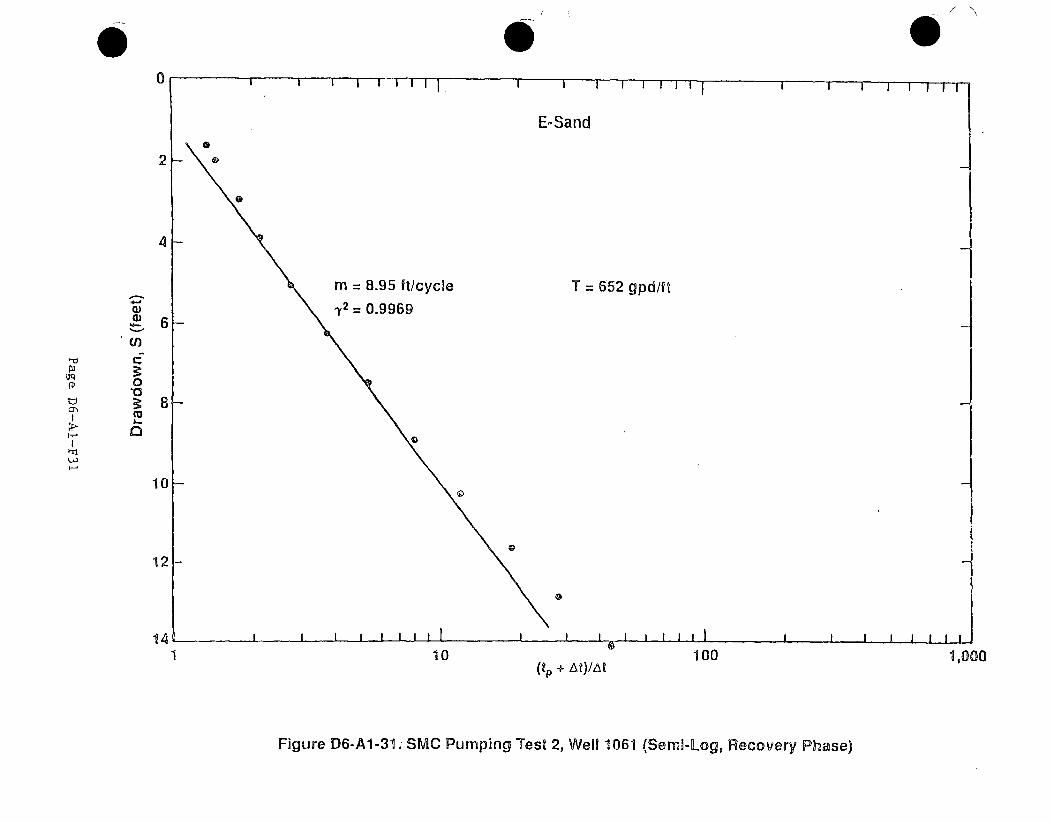
0
4-
0)~1)
(I)
C
w 00
L..
Q~rj
1 10 100 1,000(tp + At)/At
Figure D6-A1-31. SIVMC Pumping Test 2, Well 1061 (Semi-Log, Recovery Phase)
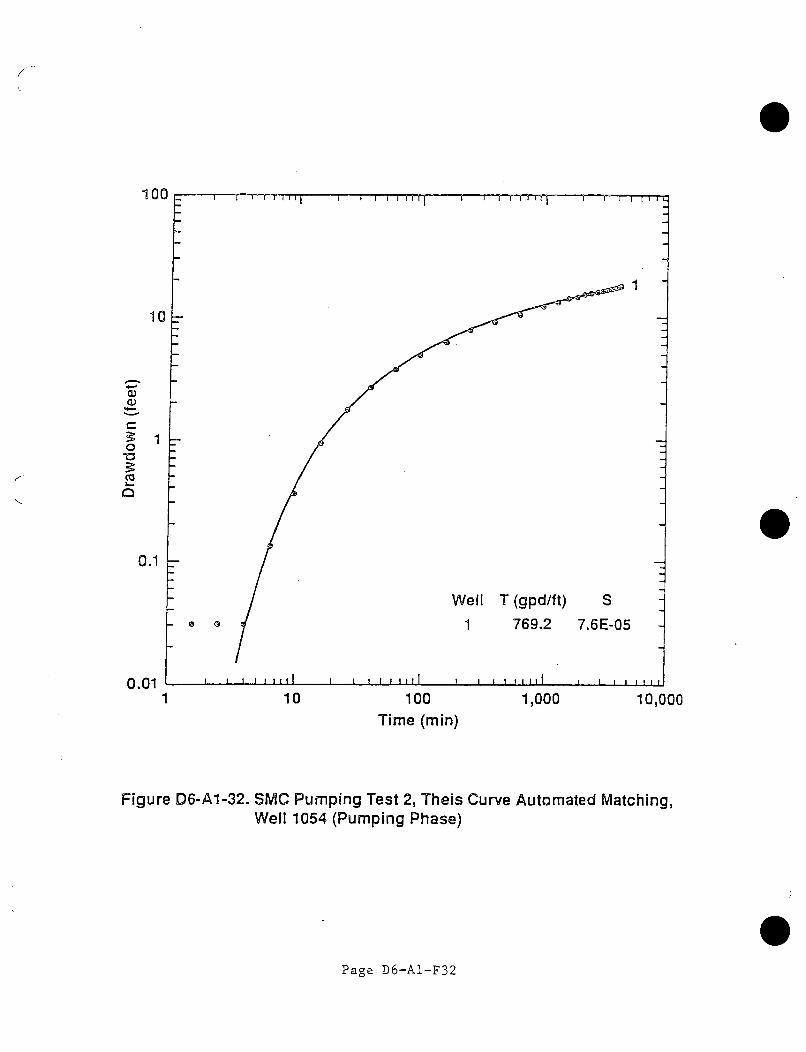
100
10
Cz1
0.1
0.011 10 100 1,000 10,000
Time (min)
Figure D6-A1-32. SIVIC Pumping Test 2, Theis Curve Automated Matching,Well 1054 (Pumping Phase)
Page D6-A1-F32
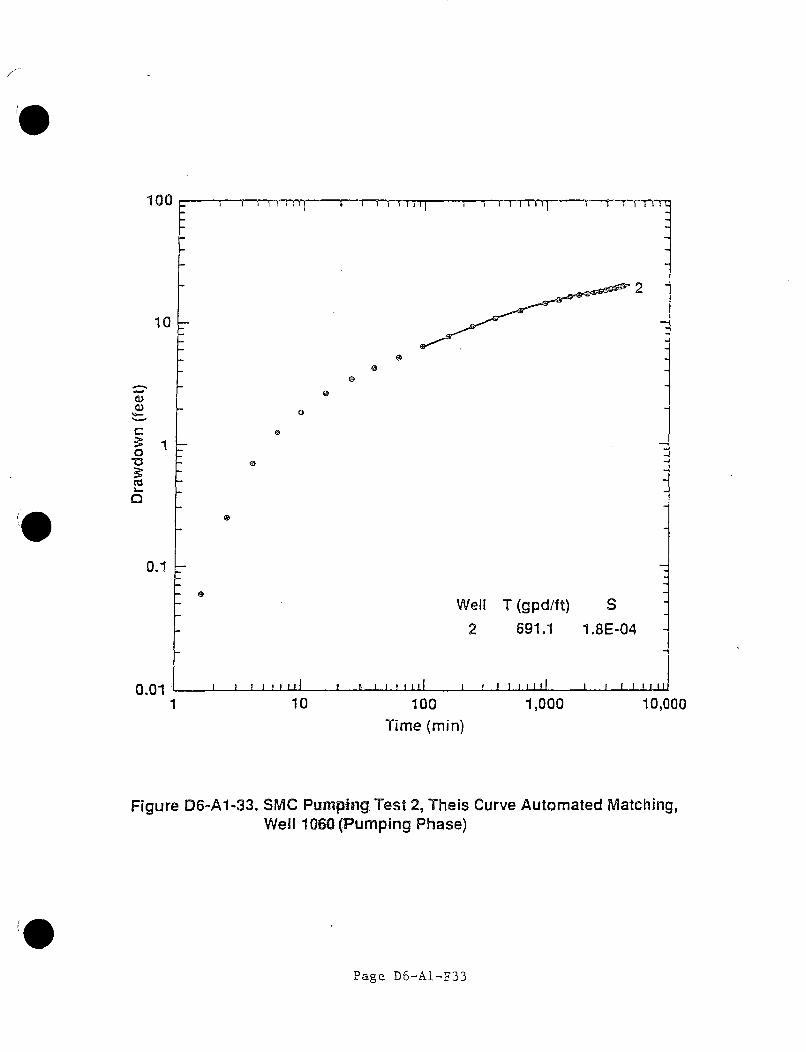
100
10
0)
0)
C
0
Cu
1
Well T (gpd/ft) S
2 691.1 1.8 E-04
I I tl I I I f ill I I I I I t' l I I I I i ll
0.1
0.011 10 100
Time (min)1,000 10,000
Figure D6-A1-33. SMC Pumping, Test 2, Theis Curve Automated Matching,Well 1060(Pumping Phase)
Page D6-A1-F33
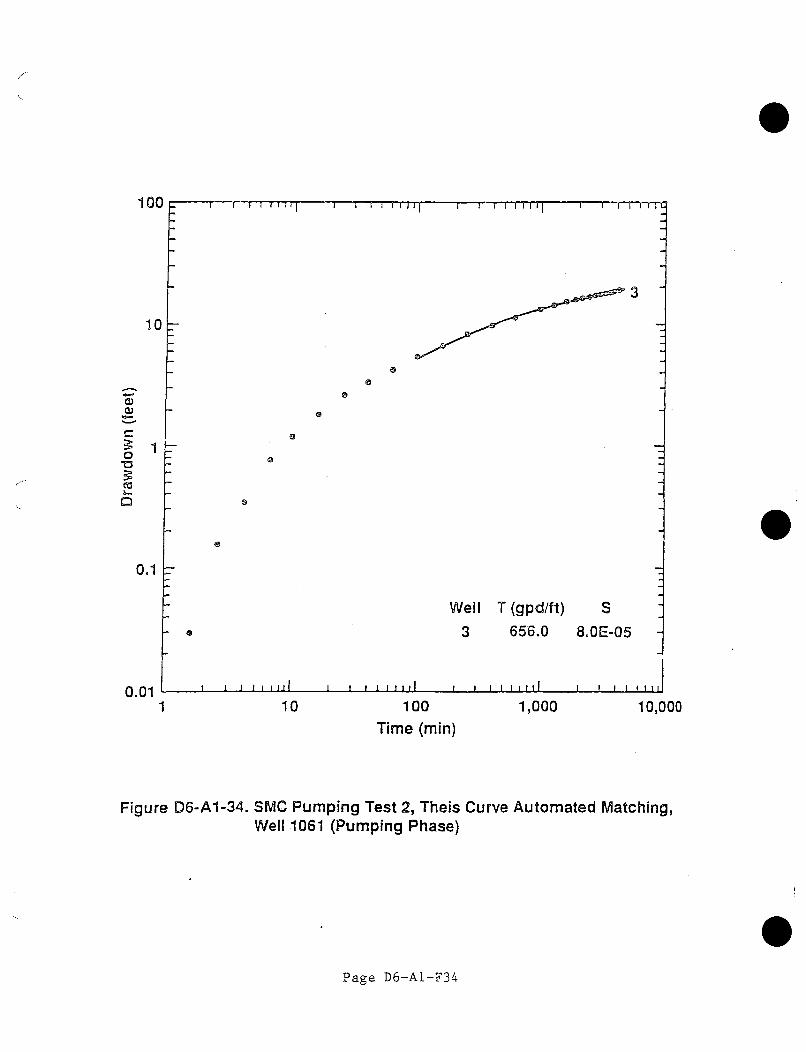
100
10
Si 1 1 . III I A I I I I I II I I I I I I I II SII I IlL
3
a
aa,
a)
C
0 1
0
0a
0.1
0.01
Well
3
T (gpd/ft)
656.00
S
8.OE-05
I I I I I I I I I I II I I I I I I I I I
1 10 100Time (min)
1,000 10,000
Figure D6-A1-34. SMC Pumping Test 2, TheisWell 1061 (Pumping Phase)
Curve Automated Matching,
Page D6-A1-F34
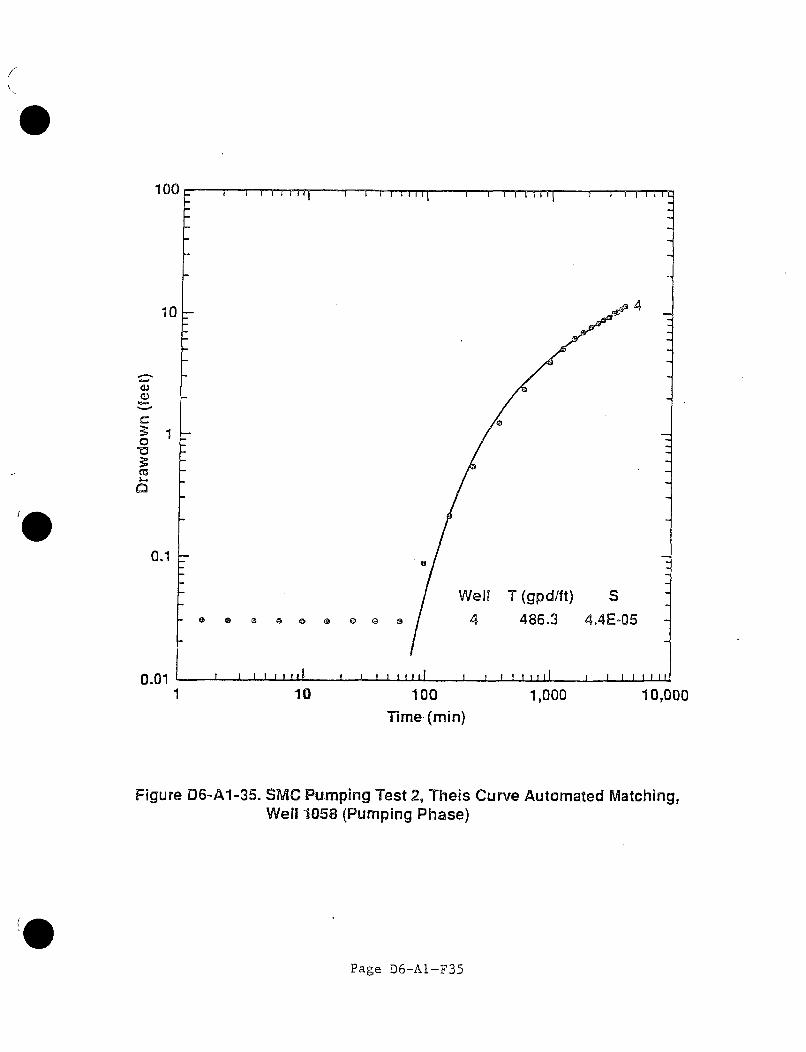
100 I ] i h I T i • • L i i I I i i I u • • I n r • T m i
10
C
01
,I I• I i I I i I I I i 1
4
Well T (gpd/ft) S0 Q • O 4 486.3 4.4E-05
!~ t V I I I ii i i , I • i t , , i i I i I I I
0.1
0.011 10 100 1,000 10,000
Time (min)
Figure D6-A1-35. SMC Pumping Test 2, Theis Curve Automated Matching,Well 1058 (Pumping Phase)
Page D6-A1-F35
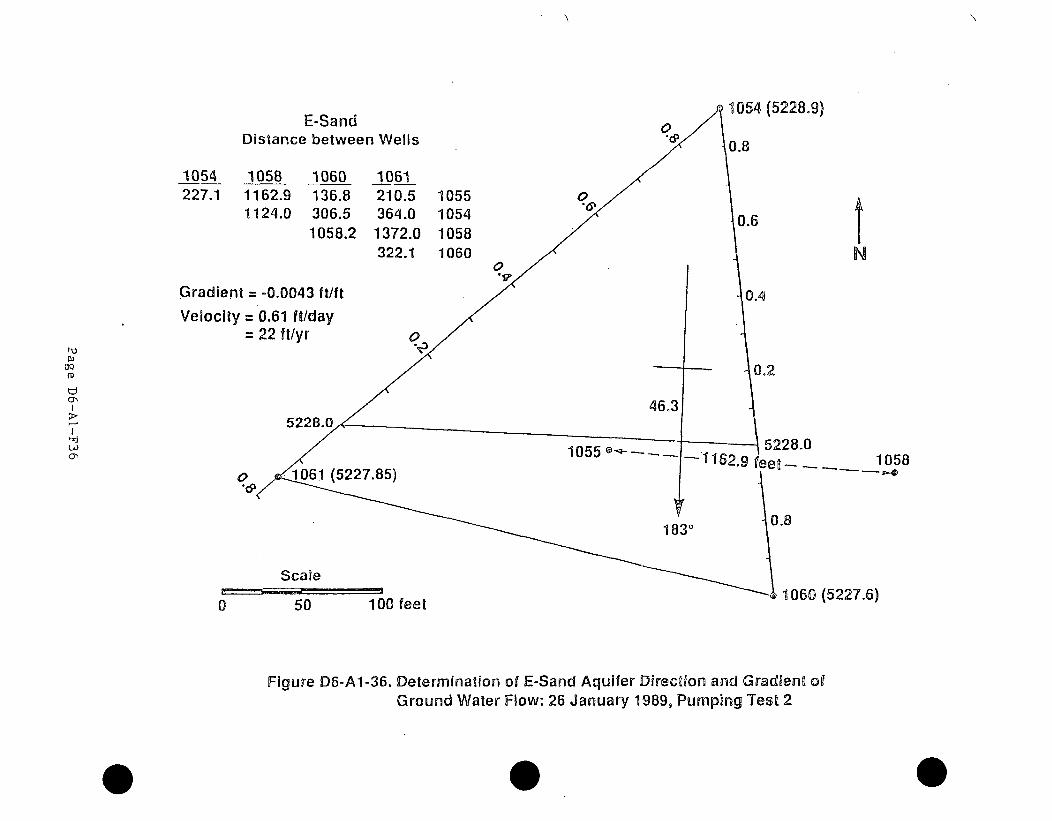
1054 (5228.9)E-Sand
Distance between Wells
1054 1058 1060 1061227.1 1162.9 136.8 210.5 1055
1124.0 306.5 364.0 10541058.2 1372.0 1058
322.1 10600
*1
Gradient = -0.0043 ft/ft
Velocity = 0.61 ft/day=22 ft/yr o
0.6
0.4
09
U,
all
0.2
IN
28.01058
.8
1060 (5227.6)
52
Scale
0 50 100 feet
Figure D6-A1-36. Determination of E-Sand Aquifer Direction and Gradient ofGround Water Flow: 26 January 1989, Pumping Test 2
ATTACHMENT D6-2
BASELINE GROUNDWATER AND SURFACE WATER DATA
Reynold's Ranch Application/Attachment D6-2 December 2004Attachment D6-2-i
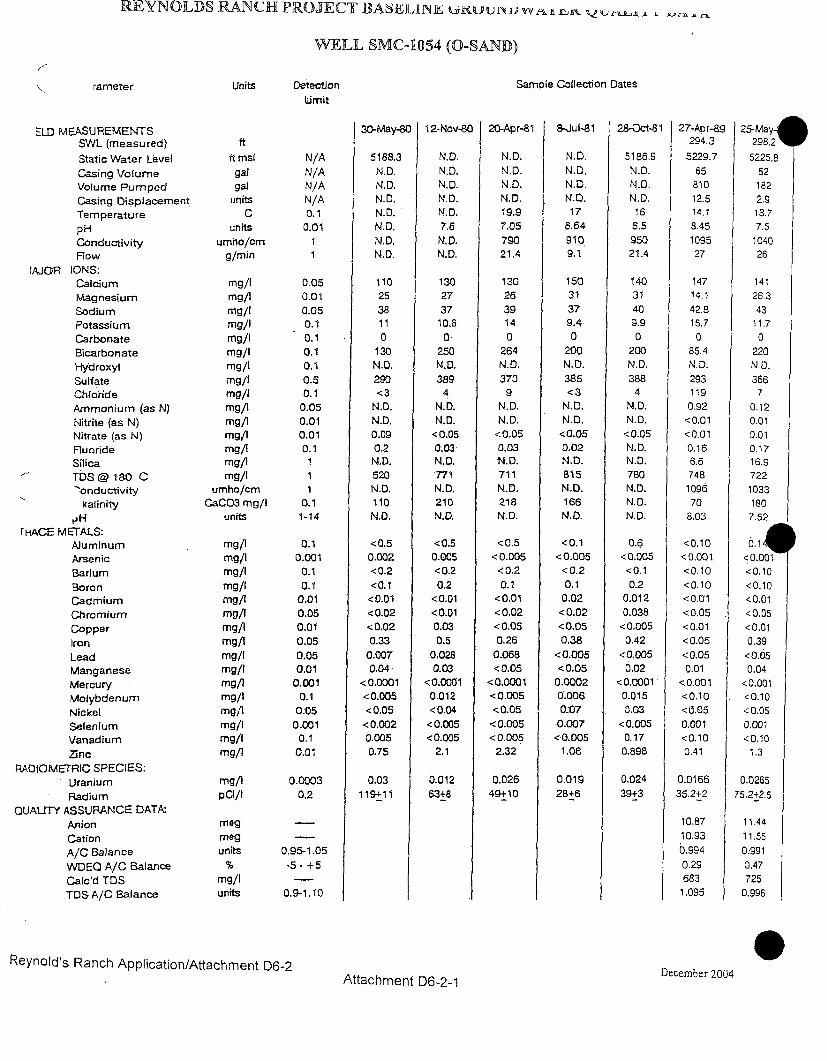
REYNOLDS RANCH PROJECT BASELINEh vujvv -
WELL SMC-1054 (0-SAND)
7
rameter Units DetectionLimit
Sample Collection Dates
ELD MEASUREMENTSSWL (measured)
Static Water Level
Casing VolumeVolume PumpedCasing DisplacementTemperaturepHConductivityFlow
IAJOR IONS:CalciumMagnesiumSodiumPotassiumCarbonateBicarbonateHydroxylSulfateChlorideAmmonium (as N)Nitrite (as N)Nitrate (as N)FluorideSilica
- TDs@ 180 c"onductivity
kalinity
f HACE METALS:AluminumArsenicBariumBoronCadmiumChromiumCopperIronLeadManganeseMercuryMolybdenumNickelSeleniumVanadium
ZincPADIOMETRIC SPECIES:
UraniumRadium
QUALITY ASSURANCE DATA:
AnionCationA/C BalanceWDEQ A/C Balance
Calc'd TDSTOS A/C Balance
ftft msl
galgal
unitsC
unitsumho/cm
g/min
mg/Img/lmg/lmg/Imgj/mg/lmg/Img/lmg/Img/1mg/1mg/lmg/Img/Img/I
umho/cmCaCO3 mg/I
units
mg/Img/Img/Img/Img/Img/Img/Img/Img/Img/Img/Img/Img/Img/Img/Img/I
mg/I
megmegunits
mg/Iunits
N/AN/AN/AN/A0.1
0.01
0.050.010.050.10.10.10.10.50.10.050.010.010.1
0.11-14
0.10.0010.10.1
0.010.050.010.050.050.01
0.0010.1
0.t050.001
0.10.01
0.00030.2
0.95-1.05.5. +5
0.9-1.10
30-May-80
5188.3N.D.N.D.N.D.N.D.N.D.N.D.N.D.
1102538110
130N.D.290<3
N.D.N.D.0.090.2
N.D.520N.D.110
N.D.
<0.50.002<0.2<0.1<0.01<0.02< 0.020.33
0.0070.04
< 0.005<0.05
12-Nov-80 20-Apr-81
N.D. N.D.N.D. N.D.N .D N.D.
N.D.N.D.7.6
N.D,N.D,
8-Jul-81
N.D.19.97.0579021.4
N.D,N.D.N.D.N.D.17
6.64
9109.1
1302737
10.60
250N.D.389
4N.D.N.D.
<0.050.03N.D.771N.D.210N.D.
<0.50.005<0.20.2
<0.01<0.010.030.5
0.0280.03
<0.00010.012<0.04
<0.005<0.005
2.1
1302639140
264N.D.370
9N.D.N.D.<0.050.03N.D.711N.D.218N.D.
<0.5<0.005<0.20.1
<0.01<0.02< 0.050.260.068<0.05
<0.0001< 0.005<0.05
<0.005<0.0052.32
0.02649+10
15031379.40
200N.D.385<3
N.D.N.D.
<0.050.02N.D.815N.D.166
N. D.
<0.1<0:005
<0.20.10.02
<0.02<0.050.38
<0.005<0.050.00020.008
28-Oct-81
5186.9N.D.N.D.N.D.166.595021.4
14031409.90
200N.D.3884
N.D.N.D.<0.05N.D.N.D.780N.D.N.D.N.D.
0.6< 0.005
<0.10,2
0.0120.038
<0.0050.42
<0,0050.02
<0.00010.015
27-Apr--89294.3
5229.765
81012.514.1
8.451095
27
14714.142.815.70
85.4N. D.293119
0.92<0.01<0.010.166.6748
109670
8,03
<0.10<0.001<0.10<0.10<0.01<0.05<0.01<0.05<0.050.01
<0.001<0.10<0.050.001<0.100.41
0.016635.2+2
10.8710.930.9940.29683
1.095
25-May11
298.25225.8
621822.9
13.77,5
104026
14126.343
11,70
220N.D.3667
0.120.010.010.1716.97221033180
7.52
0.1e<0.001,<0.10<0.10<0.01<0.05<0.010,39<0.050.04
<0.001<0:10<0.050.001<0.101.3
0.0265
75.2+2.5
11,4411.550:9910.47725
0.996
I
007 1 003
<0.0020.0050.75
0.007<.0.005
1.08
0.01928+6
<0.0050,170.898
0,02439+30.03 j 0.012
119+11 63+8
Reynold's Ranch Application/Attachment D6-2
Attachment D6-2-1December 2004
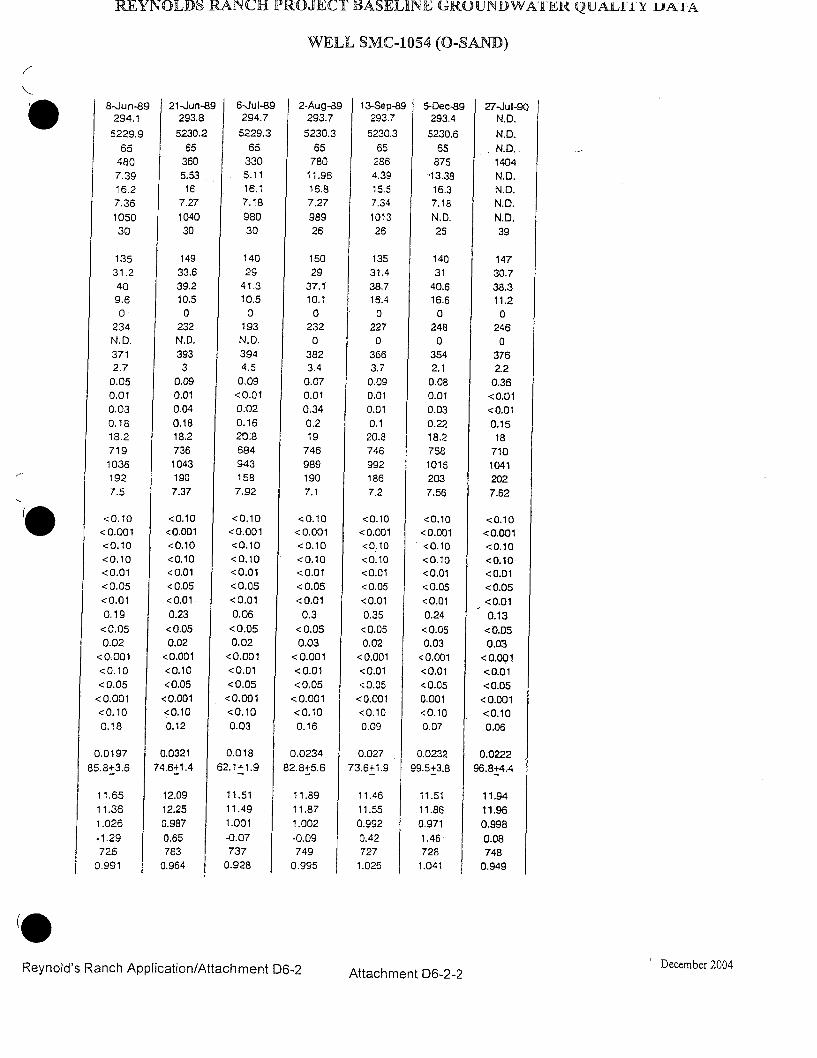
REYNOLDS RANCH PROJECT BASELINE UROUNDWAITH QUALIIl Y UlAIA
WELL SMC-1054 (O-SAND)
8-Jun-89 21-Jun-89 6-Jul-89 2-Aug-89 13-Sep-89 5-Dec-89 27-Jul-90
294.1 293.8 294.7 293.7 293.7 293:4 N.D.
5229.9 5230.2 5229.3 5230.3 5230.3 5230.6 N.D.
65 65 65 65 65 65 N.D.
480 360 330 780 286 875 14047.39 5.53 5.11 11.96 4.39 '13.38 N.D.
16.2 16 16.1 16.8 15.5 16.3 N.D.
7.36 7.27 7.18 7.27 7.34 7.18 N.D.
1050 1040 980 989 1013 N.D. N.D.
30 30 30 26 26 25 39
135 149 140 150 135 140 147
31.2 33.6 29 29 31.4 31 30.7
40 39.2 41.3 37.1 38.7 40,6 38.3
9.6 10.5 10.5 10.1 16.4 16.6 11.2
a 0 0 0 0 0 0
234 232. 193 232 227 248 246
N.D. N.D. N.D. 0 0 0 0
371 393 394 382 366 354 376
2.7 3 4.5 3.4 3.7 2.1 2.2
0.05 0.09 0.09 0.07 0.09 0.08 0.36
0.01 0.01 <0.01 0.01 0.01 0.01 <0.01
0.03 0.04 0,02 0.34 0.01 0.03 <0.01
0.18 0.18 0.16 0.2 0.1 0.22 0.15
18.2 18.2 20:8 19 20.8 18.2 18
719 736 684 746 746 758 710
1036 1043 943 989 992 1015 1041
192 190 158 190 186 203 202
7.5 7.37 7.92 7.1 7.2 7.56 7.62
<0.10 <0.10 <0.10 <0.10 <0.10 <0.10 <0.10
<0.001 <0.001 <0.001 <0.001 <0.001 <0.001 <0.001
<0.10 <0.10 <0.10 <0.10 <0.10 <0.10 <0.10
<0.10 <0.10 <0.10 <0.10 <0.10 <0.10 <0.10
<0.01 <0.01 <0.01 <0.01 <0.01 <0.01 <0.01
<0.05 < 0.05 <0.05 < 0.05 <0.05 <0.05 < 0.05
<0.01 <0.01 <0.01 <0.01 <0.01 <0.01 <0.01
0,19 0.23 0.06 0.3 0.35 0.24 0.13
<0.05 <0.05 < 0.05 < 0.05 <0.05 < 0.05 < 0.05
0.02 0.02 0.02 0.03 0.02 0.03 0.03
<0,001 <0.001 <0.001 <0.001 <0.001 <0.001 <0.001
<0.10 <0.10 <0.01 <0.01 <0.01 <0.01 <0.01
<0.05 <0.05 <0.05 < 0.05 <0.05 <0.05 <0.05
<0.001 <0.001 <0.001 <0.001 <0.001 0.001 <0.001
<0.10 <0.10 <0.10 <0.10 <0.10 <0.10 <0.10
0.18 0.12 0.03 0.16 0.09 0.07 0.06
0.0197 0.0321 0.018 0.0234 0.027 0.0232 0.0222
85.8+3.6 74.6+1.4 62.1+1.9 82.8+5.6 73.6+1.9 99.5+3.8 96.8+4.4
11.65 12.09 11.51 11.89 11.46 11.51 11.94
11.36 12.25 11.49 11.87 11.55 11.86 11.96
1.026 0.987 1.001 1.002 0.992 0.971 0.998
-1.29 0.65 -0.07 -0.09 0.42 1.46 0.08
726 763 737 749 727 728 748
0.991 0.964 0.928 0.995 1.026 1.041 0.949
nrh Anlir,.finn/Affh n + " .... ..... 'December 2004R¢,\lnmld'eReynold' Attachment D6-2-2
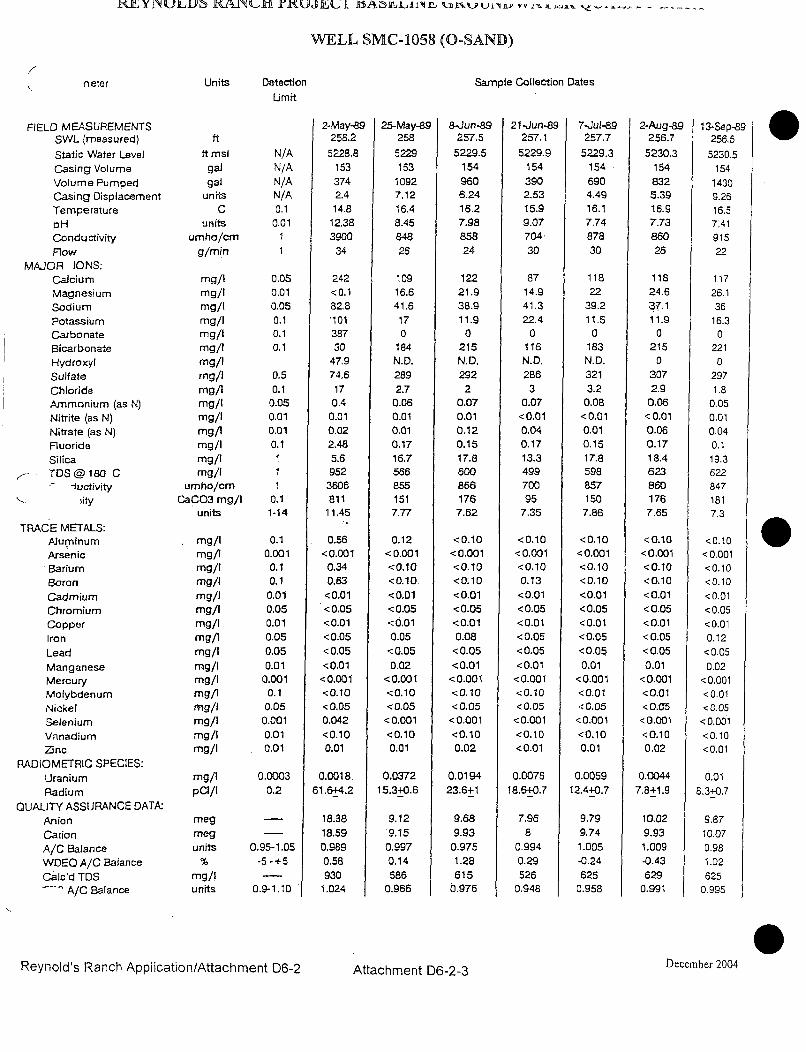
WELL SMC-1058 (0-SAND)
neter Units Detection
Umit
Sample Collection Dates
FIELD MEASUREMENTSSWL (measured)
Static Water LevelCasing VolumeVolume PumpedCasing DisplacementTemperaturepHConductivityFlow
MAJOR IONS:CalciumMagnesiumSodiumPotassiumCarbonateBicarbonateHydroxylSulfateChlorideAmmonium (as N)Nitrite (as N)Nitrate (as N)FluorideSilicaTOTDS@180 C
-luctivity-ity
TRACE METALS:AluminumArsenicBariumBoronCadmiumChromiumCopperIronLeadManganeseMercuryMolybdenumNickelSeleniumVanadiumZinc
RADIOMETRIC SPECIES:
UraniumRadium
QUAUTY ASSURANCE DATA:AnionCationA/C BalanceWDEO A/C Balance
Calc'd TDS--.. A/C Balance
ft
ft mslgalgal
unitsC
unitsumho/cm
g/m~n
mg/Img/Img/lmg/Img/Img/Img/Img/Img/Img/Img/Img/Img/Img/Img/I
umho/cmCaCO3 mg/I
units
mg/Img/Img/lmg/Img/Img/Img/Img/Img/Img/Img/Img/Img/I
mg/Img/Img/I
mg/I
pCI/I
megmegunits
mg/Iunits
N/AN/AN/AN/A0.1
0.01II
0.050.010.050.10.10.1
0.50.10.050.010.010.1
1
1-1
010.1
1-14
0.10.001
0.10.10.01
0.050.010.050.050.01
0.0010.10.050.0010.010.01
0.0003
0.2
0.95-1.05
-5 -+5
0.9-1.10
2-May-89258.2
5228.81533742.414.8
12.383900
34
242<0.182.8*1 01
38730
47.974,6170.4
0.010.022.485.69523606811
11.45
0.56<0.0010.340.63<0.01<0.05<0.01< 0.05<0.05<0.01<0.001<0.10< 0.050.042<0.100.01
0.0018.61.6+4.2
18.3818.590.9890.58930
1.024
25-May-89258
5229153
10927.1216.48.4584826
10916.641.6170
184N.D.2892.7
0.060.010.010.1716.75668551517.77
0.12<0.001<0.10<0.10<0.01<0.05<0.010.05
<0.050.02
<0.001<0.10<0.05
<0.001<0.100.01
0.037215.3+0.6
9.129.150.9970.14586
0.966
8-Jun-89257.5
5229.51549606.2416.27.9885824
12221.938.911.9
0215N.D.292
20.070.010.120.1517.86008661767.62
<0.10<0.001<0.10<0.10<0.01< 0.05<0.010.08
<0.05<0.01<0.001<0.10<0.05
<0.001<0.100.02
0.019423.6+1
9.689.930.9751.28615
0.976
21-Jun-89257.1
5229.91543902.5315.99.07704.30
8714.941.322.4
0116
N.D.2863
0.07<0.010.040.1713.349970095
7.35
<0.10<0.001<0.100.13<0.01<0.05<0.01<0.05<0.05<0.01
<0.001<0.10<0.05
<0.001<0.10<0.01
0.007618.6+0.7
7.968
0.9940.29526
0.948
7-Jul-.89257.7
5229.31546904.4916.17.7487830
11822
39.211.50
183N. D.3213.2
0.08<0.010.010.1517.85988571507.86
<0.10<0.001<0.10<0.10<0.01<0.05<0.01<0.05<0.050.01
<0.001<0.01<0.05<0.001
2-Aug-89256.7
5230.31548325.3916.97.7386026
11824.6
11.90
2150
3072.9
0.06<0.010.060.1718.46238601767.65
<0.10<0.001<0.10<0.10<0,01< 0.05<0.01< 0.05<0.050.01
<0.001<0.01<0.05<0.001
13-Sep-89256.5
5230.5154
14309.2616.5
7.4191522
11726.136
16.30
2210
2971.8
0.050.010.040.119.36228471817.3
<0.10< 0.001<0.10<0.10<0.01<0.05<0.010.12
<0.050.02
<0.001<0.01<0.05<0.001
<0.10 <0.10 <0.100.01 i 0.02 <0.01
0.005912.4+0.7
9.799.741.005-0.24625
0.958
0.00447.8+1.9
0.018.3+0.7
10.02 9.879.93 10.071,009 0.98-0.43 1.02629 625
0.991 0.995
Reynold's Ranch Application/Attachment D6-2 Attachment D6-2-3December 2004

REYNOLDS RANCH PROJECT BASELINE GROUNDWATER Q U ALj[ i x i i A
WELL SMC-1058 (0-SAND)
5-Dec-89 27-Jul-90256.7 255
5230.3 5232
154 155
700 528
4.54 3.4
15.6 N.D.
7.75 N.D.
NO. N.D,
25 24
103 48.4
25.9 10.7
38.3 38.3
18.4 10.4
0 0
201 83
0 0
283 190
1.9 <0.1
< 0.05 0.44
0.01 <0.01
0.55 0.03
0.19 0.16
17.5 15.5
594 357
825 530
164 68.4
7.92 8.05
<0.10 <0.10
<0.001 <0.001
<0.10 <0.10
<0.10 0.35
<0.01 <0.01
<0.05 <0.05
<0.01 <0.01
< 0.05 < 0.05
< 0,05 <0.05
0.01 <0.01
<0.001 <0.001
<0.01 <0,01
<0o05 <0.05
0.002 < 0.001
<0.10 <0.10
<0.01 0.01
0.0049 0.0021
8.9+0.6 5.3+0.6
9.29 5.33
9.51 5.43
0.978 0.983
1.13 0.88
592 357
1.004 1
Reynold's Ranch Application/Attachment D6-2
December 2004
Attachment D6-2-4
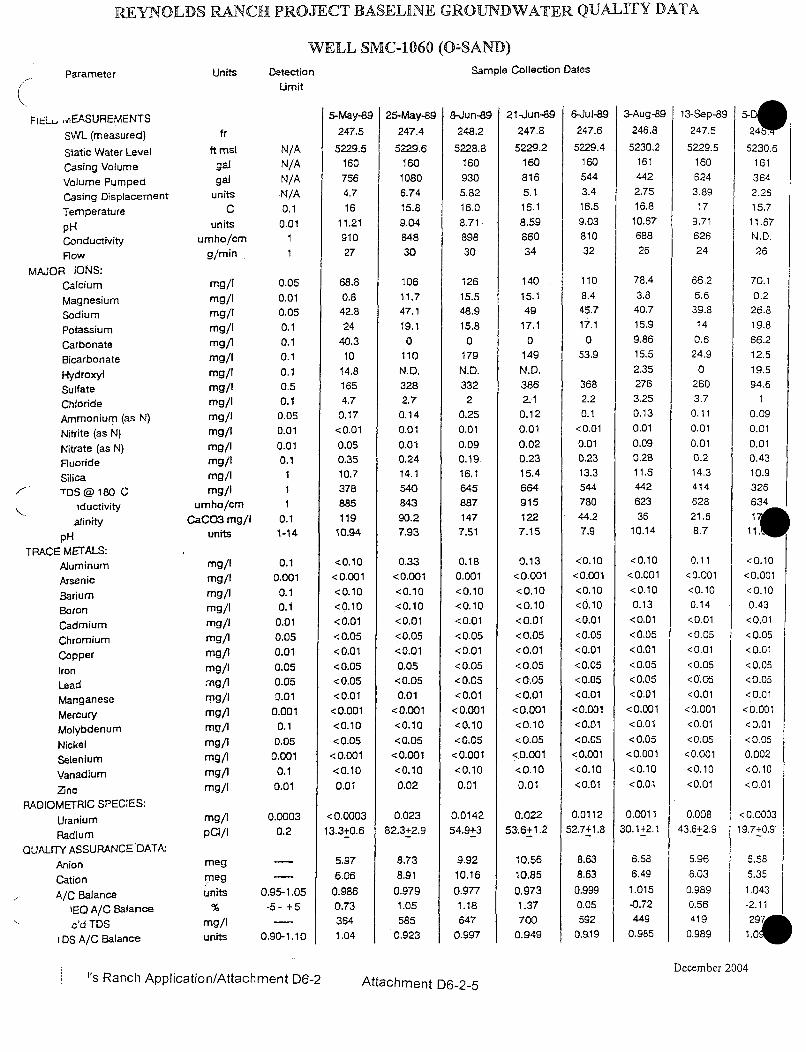
REYNOLDS RANCH PROJECT BASELINE GROUNDWATER QUALITY DATA
WELL SMC-1060 (O-SAND)
Parameter Units DetectionLimit
Sample Collection Dates
FIEL., iEASUREMENTS
SWL (measured)
Static Water Level
Casing Volume
Volume PumpedCasing Displacement
Temperature
pHConductivity
Flow
MAJOR IONS:Calcium
MagnesiumSodium
Potassium
Carbonate
Bicarbonate
Hydroxyl
SulfateChlorideAmmonium (as N)
Nitrite (as N)
Nitrate (as N)FluorideSilica
S TDS @ 180 C
iductivity,aminity
pHTRACE METALS:
Aluminum
Arsenic
BariumBoron
Cadmium
ChromiumCopper
IronLead
Manganese
MercuryMolybdenum
NickelSelenium
Vanadium
ZincRADIOMETRIC SPECIES:
UraniumRadium
QUALITY ASSURANCE DATA-
Anion
Cation
A/C Balance1EQ A/C Balance
c'd TDS
0 DS A/C Balance
5-May-89 25-May-89 I 8-Jun-89 21-Jun-89 6-Jul-89 3-Aug-89 13-Sep-89
fr
ft mslgal
gal
unitsC
unitsumho/cm
g/min
mg/I
mg/Img/I
mg/Img/img/I
mg/Img/Img/Img/I
mg/I
mg/Img/Img/Img/I
umho/cm
CaCO3 mg/Iunits
mg/Img/I
mg/lmg/I
mg/I
mg/img/Img/Img/i
mg/I
mg/img/Img/Img/img/Img/I
mg/i
pCi/l
megmeg
units
mg/Iunits
N/AN/AN/AN/A
0.1
0.01
0.050.010.05
0.10.10.1
0.10.50.10.050.010.010.1
0.11-14
0.10.001
0.10.1
0.010.05
0.010.050.05
0.01
0.0010.1
0.050.001
0.1
0.01
247.5
5229.5160
7564.716
11.21910
27
68.8
0.842.8
24.40.310
14.81654.7
0.17
<0.01
0.050.3510.7378885119
10.94
<0.10<0.001
<0.10<0.10
<0.01
< 0.05
<0.01
<0.05<0.05<0.01
<0.001<0.10
< 0.05<0.001
<0.10
0.01
247.4
5229.6160
1080
6.7415.89.04848
30
106
11.747.1
19.1
0i10
N.D.3282.7
0.14
0.01
0.010.2414.154084390.27.93
0.33<0.001
<0.10<0.10
<0.01
<0.05
<0.01
0.05<0.050.01
<0.001
<0.10<0.05
248.2
5228.8160
930
5.8216.0
8.7189830
126
15.548.9
15.8
0179
N.D.3322
0.25
0.01
0.090.19.16.16458871477.51
0.18
0.001<0.10<0.10<0.01
<0.05<0.01
<0.05<0.05
<0.01<0.001<0.10
<0.05
<0.001
<0.10
0.01
247.8
5229.2160
8165.116.1
8.5986034
247.6
5229.4160
5443.416.5
9.03810
140
15.149
17.1
0149
N.D.3862.1
0.12
0.01
0.020.2315.4
664915
122I.4
32
110
8.445.717.1
053.9
3682.20.1
<0.010.010.2313.354478044.27.9
<0.10<0.001
<0.10<0.10
<0.01<0.05
<0.01
<0.05
<0.05<0.01
<0.001<0.01
<0.05<0.001
<0.10
<0.01
246.8
5230.2161
4422.7516.8
10.6768826
78.4
3.840.7
15.99.8615.5
2.35276
3.250.13
0.01
0.090.2811.644262336
10.14
<0.10<0.001
<0.100.13<0.01
<0.05<0.01
<0.05< 0.05<0.01
<0.001<0.01
<0.05<0.001
<0.10
<0.0.1
247.5
5229.51605243.8917
9.71626
24
66.2
5.6
39.8
14
0.6
24.9
0
260
3.7
0.11
0.01
0.01
0.2
14.3
414
628
21.6
8.7
0.11
<0.001
<0.10
0.14
<0.01
<0.05
<0.01
<0.05
< 0.C-5
<0.01
<0.001
<0.01
<0.05
<0.001
<0.10
<0.01
5230.6161
364
2.2615.7
11.67N.O.26
70.10.226.819.8
66.212.5
19.594.6
1
0.090.01
0.010.4310.9326634
17
<0.10<0.001
<0.100.43
<0.01< 0.05<0.01
<0.05<0.05
<0.01<0.001<0.01
<0.05
0.13<0.001
<0.10<0.10
<0.01
< 0.05<0.01
<0.05<0.05<0.01
<0.001<0.10
< 0.05<0.001
<0.10
0.01
<0.001<0.10
0.02
0.002
<0.10
<0.01
0.0003 <0.00030.2 13.3+0.6
0.023 0.0142 0.022 0.0112 0.0011 0,00882.3+2.9 54.9+3 53.6+1.2 52.7+1.8 30.1+2.1 43.6+2.9
0.95-1.05-5- +5
0.90-1.10
5.97
6.06
0.9860.733641.04
8.73
8.91
0.9791.05
585
0.923
9.9210.16
0.9771.18647
0.997
10.5610.85
0.9731.37700
0.949
8.63
8.63
0.9990.05592
0.919
6.586.49
1.015-0.72449
0.985
5.966.03
0.9890.56419
0.989
<0.000319.7+0.9
5,58
5.35
1.043-2.1129Td
1.0je
December 2004I s Ranch Application/Attachment D6-2 Attachment D6-2-5
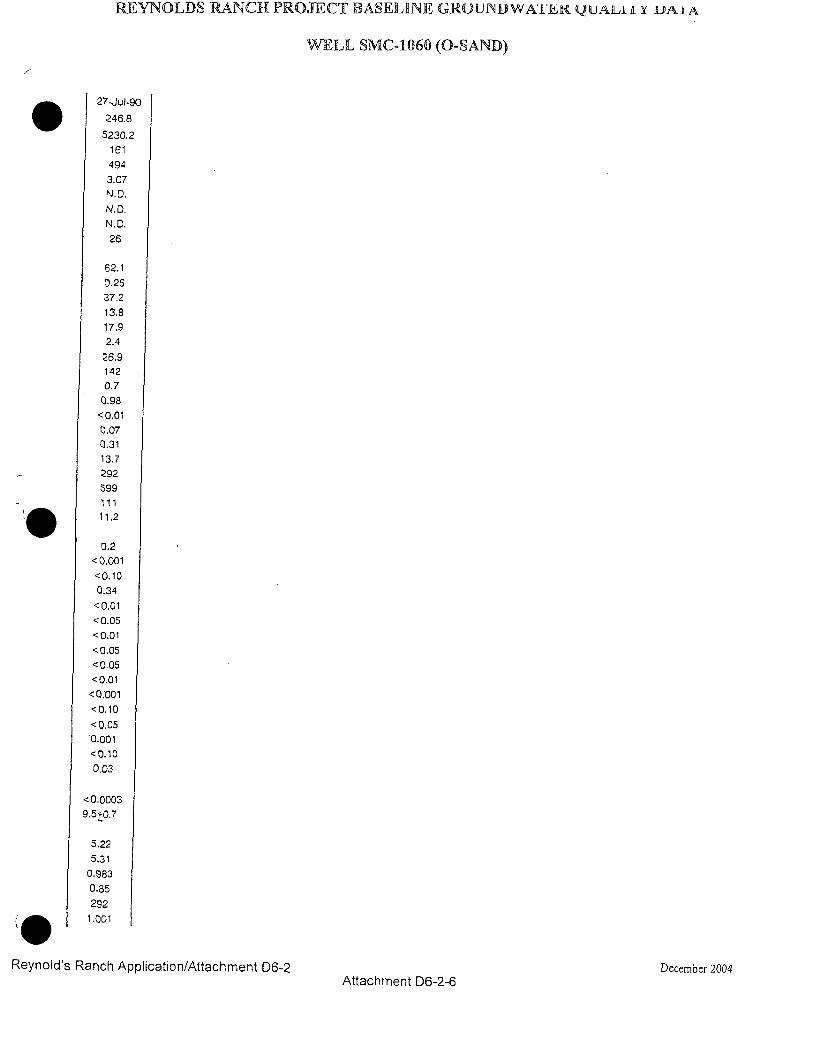
REYNOLDS RANCH PROJECT BASELINE GR(JUINDWATIE ,UALM Y XAIA
WELL SMC-1060 (0-SAND)
27-Ju!-90
.246.85230.2
161
494
3.07N. D.N. D.N. D.26
62.1
0.25
37.213.817.92.4
26.91420.70.98<0.010.070.3113.7292
399-111
11.2
0.2<0.001
<0.100.34
<0.01<0.05
<0.01<0.05<0.05<0.01< Q.001
<0.10
<0.050.001<0.100.03
<0.00039.5+0.7
5,225.31
0.-830.85
292
1.001
Reynold's Ranch Application/Attachment D6-2 December 2004
Attachment D6-2-6
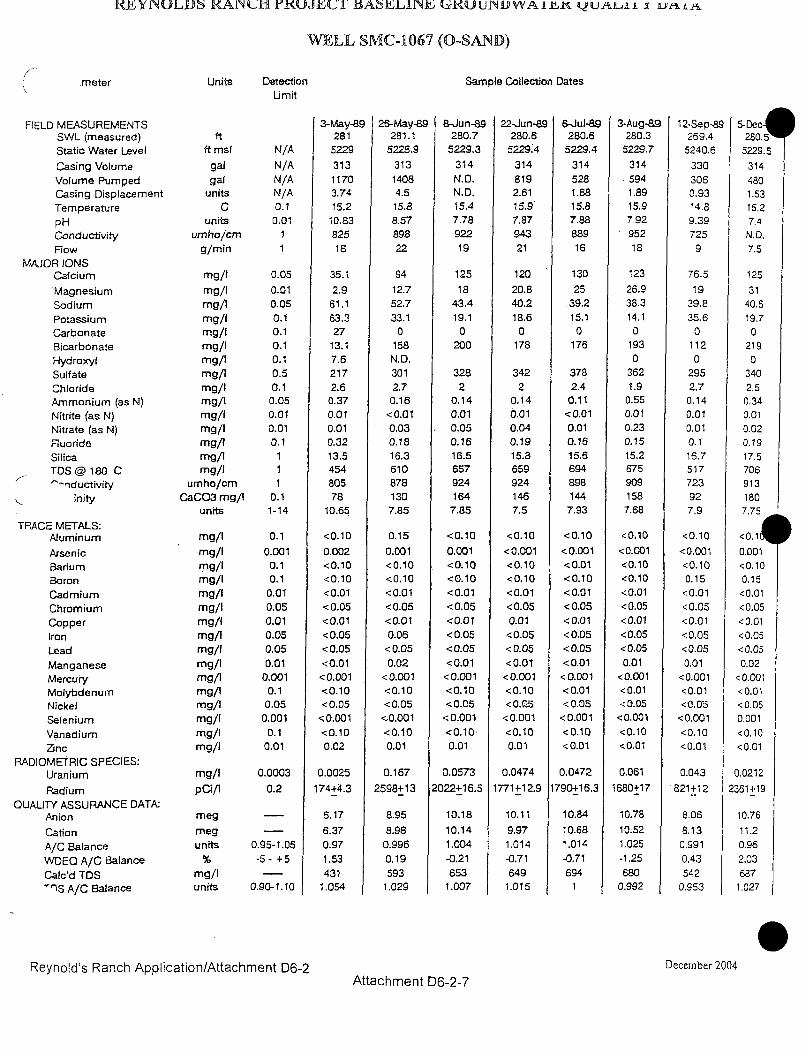
REYfNULJJS R{AINCH irRUJJMJT1W&~L11Nk k.i{UIUNDWA111ýI t..A~LJAJ. I Aipk-,,A
WELL SMC-1067 (0-SAND)
.meter Units DetectionUmit
Sample Collection Dates
FIELD MEASUREMENTSSWL (measured)Static Water Level
Casing VolumeVolume PumpedCasing DisplacementTemperaturepHConductivityFlow
MAJOR IONSCalcium
MagnesiumSodiumPotassiumCarbonateBicarbonateHydroxylSulfateChlorideAmmonium (as N)Nitrite (as N)Nitrate (as N)FluorideSilicaTDS @ 180 C"-nductivity
inity
TRACE METALS:Aluminum
ArsenicBariumBoronCadmiumChromiumCopperIronLeadManganeseMercuryMolybdenumNickelSeleniumVanadiumZinc
RADIOMETRIC SPECIES:Uranium
RadiumQUALITY ASSURANCE DATA-
Anion
CationA/C BalanceWDEQ A/C BalanceCalc'd TDS""3S A/C Balance
ftft msl
galgal
unitsC
unitsumho/cm
g/min
mg/Img/Img/Img/Img/Img/Img/Img/Img/Img/img/Img/Img/lmg/img/I
umho/cmCaCO3 mg/I
units
mg/Img/Img/Img/Img/Img/Img/Img/Img/img/Img/Img/Img/Img/Img/Img/I
mg/IpCO/I
megmegunits
mg/Iunits
N/AN/AN/AN/A0.10.01
1
0.050.010.050.10.10.10.10.50.10.050.010.010.111
0.11-14
0.1
0.0010.10.10.01
0.050.010.050.050.01
0.0010.1
0., 050.0010.10.01
0.0003
0.2
0.95-1.05-5- +5
0.90-1.10
3-May-892815229313
11703.7415.2
10.8382518
35.1
2.961.163.327
13.17.62172.60.370.010.010.3213.545480578
10.65
<0.10
0.002<0.10<0.10<0.01<0.05<0.01<0.05<0.05<0.01
< 0.001<0.10<0.05<0.001<0.100.02
0.0025
174+4.3
6.17
6.370.971.53431
1.054
26-May.89 8-Jun-89281.1
5228.9
31314084.5
15.88.5789822
94
12.752.733.1
0158
N.D.3012.7
0.16<0.010.030.1816.36108781307.85
0.15
0.001<0.10<0.10<0.01<0.05<0.010.06
<0.050.02
280.75229.3
314N.D.N.D.15.47.7892219
125
1843.419.1
0200
3282
0.140.010.050.1616.56579241647.85
<0.10
0.001<0.10<0.10<0.01<0.05<0.01<0.05<0;05<0.01<0.001<0.10<0.05
<0.001<0.100.01
280.65229.4
3148192.6115.97.8794321
22-Jun-89 I 6-Jul-89280.65229.4
3145281.6815.87.8888916
120
20.840.218.6
0178
3422
0.140.010.040.1915.86599241467.5
<0.10
<0.001<0.10<0.10<0.01<0.050.01<0.05<0.05<0.01
<0.001<0.10<0.CZ
130
25.39.215.10
176
3782.4
0.11<0.010.010.1615.6694898144
7.93
<0.10
<0.001<0.01<0.10<0.01< 0.05<0.01< 0.05<0.05<0.01
<0.001<0.01< 0.05
< 0.001<0.10<0.01
3-Aug-89280.3
5229.7314
.5941.8915.97.9295218
123
26.938.314.10
1930
3621.9
0.550.010.230.1515.2675909158
7.68
<0.10
<0.001<0.10<0.10<0.01<0.05<0.01<0.05<0.05
0.01<0.001<0.01<.0.05<0,001<0.10<0.01
12-Sep-89 5-Dec269.4 280.55240.6 5229.5
330 314
306 4800.93 1.5314.8 15.29.39 7.4725 N. D
9 7.5
76.5
1939.835.6
01120
2952.7
0.140.010.010.116.7517723927.9
<0.10
<0.001<0.100.15
<0.01<0.05<0.01<0.05<0.050.01
<0.001<0.01<0.05<0.001<0.10<0.01
0.043
821+12
8.06
8.130.9910.43542
0.953
12531
40.619.70
2190
3402.5
0.340.010.020.1917.5706913180
7.75
<0.1
0.001<0.100.15
<0.01<0.05<0.01.<0.05<0.050.02
<0.001<0.01<0.05
I
<0.001<0.10<0.05<0.001<0.100.01
<0.001<0.100.01
0.001<0.10<0.01
0.167 0.0573 0.0474 1 0.0472 1 0.061
2598+13
8.95
8.980.9960.19593
1.029
2022+16.5
10.18
10.141.004-0.21653
1.007
1771+12.9
10.11
9.971.014-0.71649
1.015
1790+16.3 1680+17
10.84 10.78
10.68 10.521.014 1.025-0.71 -1.25694 680
1 0.992
0.02122361+19
10.7611.20.962.03687
1.027
Reynold's Ranch Application/Attachment D6-2 December 2004
Attachment D6-2-7

REYNOLDS RANCH PROJECT BASELINE GRO UNUWATE XQU ALiI xr 1ji•
WELL SMC-1067 (0-SAND)
27-Ju -90275.55234.5
32166
0.21N.D.N,D.N.D.
2
132
0.0136.9
2846.21.9
89.2103
5.90.29
<0.01<0.010.2616.63691575341
11.72
1.12
<0.0010.210.68<0.01< 0.05
<0.01<0.05<0.05<0.01
< 0.001<0.10<0.050.002<0.100.01
0.0011
27+7.8
9.15
9.280.9850.74372
0.991
Reynold's Ranch Application/Attachment D6-2 December 2004
Attachment D6-2-8
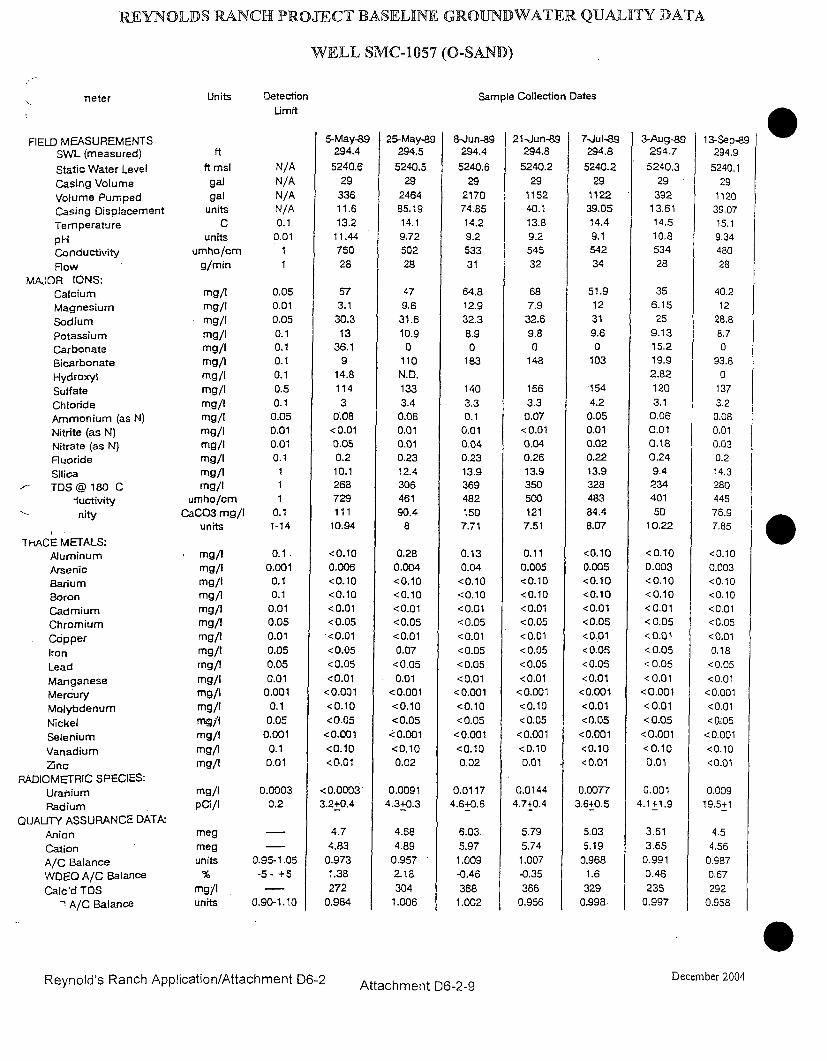
REYNOLDS RANCH PROJECT BASELINE GROUNDWATER QUALITY DATA
WELL SMC-1057 (O-SAND)
neter
FIELD MFEASUREMENTSSWL (measured)
Static Water LevelCasing VolumeVolume PumpedCasing Displacement
TemperaturepHConductivity
FlowMAJOR IONS:
CalciumMagnesiumSodiumPotassiumCarbonateBicarbonateHydroxylSulfateChlorideAmmonium (as N)Nitrite (as N)
Nitrate (as N)FluorideSilicaTDS @ 180 C
"iuctivitynity
THACE METALS:AluminumArsenicBariumBoronCadmiumChromiumCopperIronLeadManganeseMercuryMolybdenumNickelSeleniumVanadiumZnc
RADIOMETRIC SPECIES:UraniumRadium
QUAUTY ASSURANCE DATA:AnionCationA/C BalanceWDEQ A/C Balance
Calc'd TDSA/C Balance
Units DetectionUmit
Sample Collection Dates
ft
ft mslgalgal
unitsC
unitsumho/cm
g/min
mg/Img/Img/Img/Img/Img/Img/Img/Img/Img/Img/img/Img/Img/1mg/I
umho/cmCaCO3 mg/I
units
mg/Img/Img/Img/Img/Img/Img/Img/Img/Img/Img/Img/Img/Img/Img/1mg/I
mg/I
megmegunits
mg/Iunits
N/AN/AN/AN/A0.10.01
1
1
0.050.010.050.10.10.10.10.50.10.050.010.010.1
11
0.11-14
0.10.001
0.10.1
0.010.050.010.050.050.010.0010.10.05
0.0010.10.01
0.0003
5-May-89294.4
5240,62933611.613.211.4475028
573.130.313
36.19
14.81143
0.08<0.01
0.050.210.1268729111
10.94
<0.100.006<0.10<0.10<0.01< 0.05<0.01< 0.05<0.05<0.01<0.001<0.10<0.05<0.001<0.10<0.01
<0.0003
294.5
5240.5
29246485.1914.19.7250228
479.6
31.610.90
110N.D.1333.40.060.010.010.2312.430646190.4
8
0.280.004<0.10<0.10<0.01<0.05<0.010.07
<0.050.01
<0.001<0.10<0.05<0.001
25-May-89 8-Jun-&9294.4
5240.629
217074.8514.29.253331
64.812.932.38.90
183
1403.30.10.010.040.2313.93694821507.71
0.130.04<0.10<0.10<0.01<0.05<0.01<0.05<0.05<0.01
<0.001<0.10<0.05
<0.001
21-Jun-89294.8
5240.229
115240.113.89.254532
687.932.69.80
148
1563.30.07<0.010.040.2613.93505001217.51
0.110.005<0.10<0.10<0.01<0.05<0.01< 0.05<0.05<0.01
7-Jul-89294.8
5240.229
112239.0514.49.154234
51.912319.60
103
1544.20.050.010.020.2213.932848384.48.07
<0.100.005<0.10<0.10<0.01<0.05<0.01< 0.05<0.05<0.01<0.001<0.01<0.05<0.001
3-Aug-89294.7
5240,329392
13.6114.510.853428
356.1525
9.1315.219.92.821203.1
0.060.010.180.249.423440150
10.22
<0.100.003<0.10<0.10<0.01<0.05<0.01<0.05<0.05<0.01<0.001<0.01< 0.0.5
<0.001<0.100.01
0.0014.1+1.9
3.613.650.9910.46235
0.997
13-Se8p-9294.9
5240.129
112039.0715.19.3448028
40.212
28.88.70
93.80
1373.2
0.080.010.030.214,328044576.97.85
<0.100.003<0.10<0.10<0.01<0.05<0.010.18
<0.05<0.01<0.001<0.01< 0(.05<0.001<0.10<0.01
0.00919.5+1
4.54.56
0.9870.67292
0.958
<0.001<0.10<0.05<0.00 1
0.2 3.2+0.4
- 4.7- 4.83
0.95-1.05 0.973-5 - +5 1.38
- 272
0.90-1.10 0.984
<0.10 <0.100.02 0.02
0.0091 0.01174.3+0.3 4.64-0.6
4.68 6.034.89 5.97
0.957 1.009
2.18 -0.46
304 3681.006 1.002
<0.10 <0.100.01 . <0.01
0.0144 0.00774,7+0.4 3.6+0.5
5.795.74
1.007-0.35366
0.956
5.035.19
0.9681.6329
0.998
Reynold's Ranch Application/Attachment D6-2 Attachment D6-2-9 December 2004
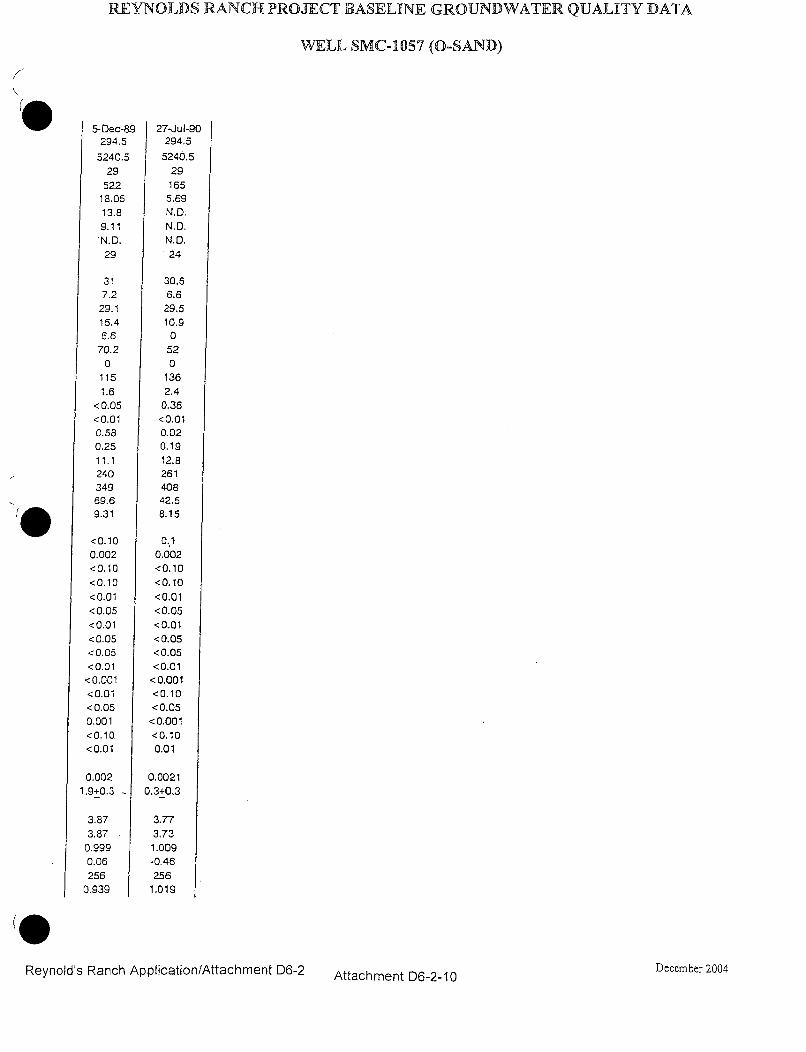
REYNOLDS RANCH PROJECT BASELINE GROUNDWATER QUALITY DATA
WELL SMC-1057 (O-SAND)
O 5-Dec-89 27,Ju1-20
294.5 294.5
5240.5 5240.5
29 29
522 165
18.05 5.69
13.8 N.D,
9.11 N.D.
N.D. N.D.
29 24
317.229.115.46.6
70.20
1151.6
< 0.05<0.010.580.2511.124034969.69.31
<0.100.002<0.10<0.10<0.01<0.05<0.01<0.05<0.05<0.01<0.001<0.01<0.050.001<0.10.<0.01
0.0021,9+0.3 -
3.873.870.9990.06256
0,939
30.66.6
29.510.90
520
1362.4
0.36<0.010,02
0.1912.826140842.58.15
0.01
<0.10<0.10<0.01<0.05<0.01<0.05<0.05<0.01
<0.001<0.10< 0.05<0.001<ý0.10
0.01
0.00210.3+0,3
3.773.731.009-0.46256
1.019
Reynold's Ranch Application/Attachment D6-2 December 2004Attachment D6-2-10
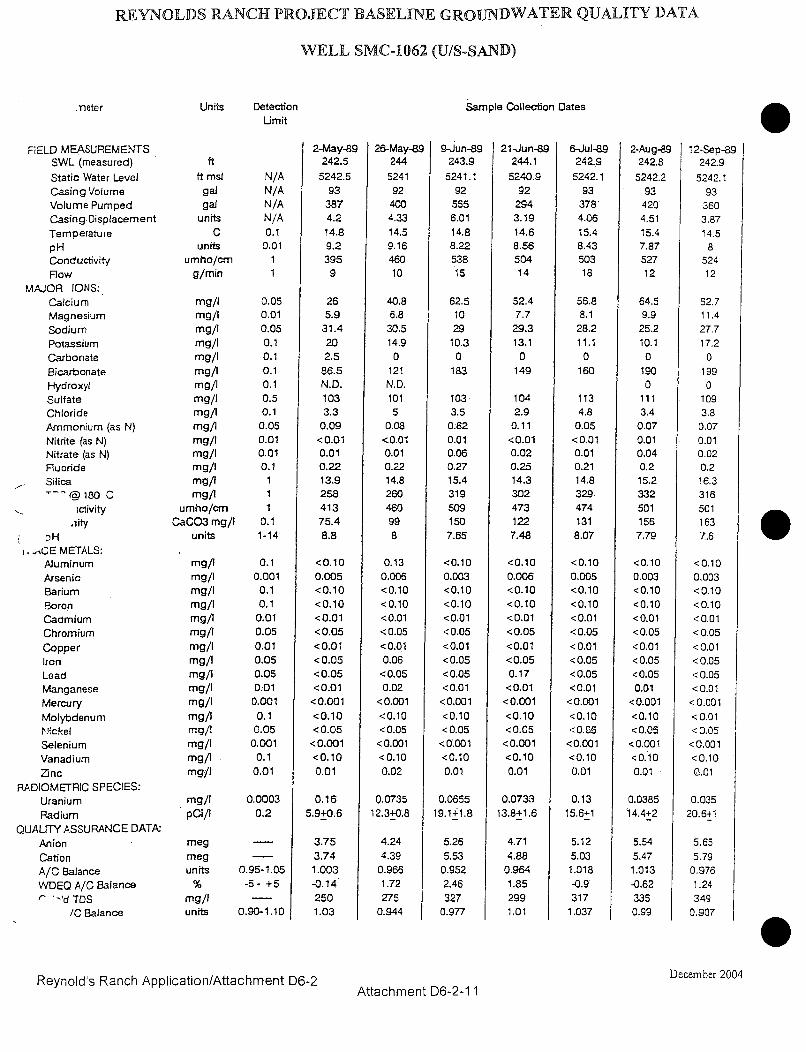
REYNOLDS RANCH PROJECT BASELINE GROUNDWATER QUALITY DATA
WELL SMC-1062 (U/S-SAND)
,neter Units Detection Sample Collection DatesLimit
FIELD MEASUREMENTS 2-May-89 26-May-89 9-Jun-89 21-Jun-89 6-Jul-89 2-Aug-89 12-Sep-8,9SWL (measured) ft 242.5 244 243.9 244.1 242.9 242.8 242.9
Static Water Level ft msl N/A 5242.5 5241 5241.1 5240.9 5242.1 5242.2 5242.1Casing Volume gal N/A 93 92 92 92 93 93 93
Volume Pumped gai N/A 387 400 555 294 378' 420 360Casing.Displacement units N/A 4.2 4.33 6.01 3.19 4.06 4.51 3.87
Temperature C 0.1 14.8 14.5 14.8 14.6 15.4 15.4 14.5pH units 0.01 9.2 9.16 8.22 8.56 8.43 7.87 8Conductivity umho/cm 1 395 460 538 504 503 527 524
Flow g/min 1 9 10 15 14 18 12 12
MAJOR IONS:Calcium mg/I 0.05 26 40.8 62.5 52.4 56.8 64.5 62.7Magnesium mg/I 0.01 5.9 6.8 10 7.7 8.1 9.9 11.4
Sodium mg/I 0.05 31.4 30.5 29 29.3 28.2 25.2 27.7Potassium mg/I 0.1 20 14.9 10.3 13.1 11.1 10.1 17.2
Carbonate mg/I 0.1 2.5 0 0 0 0 0 0
Bicarbonate mg/1 0.1 86.5 121 183 149 160 190 199
Hydroxyl mg/I 0.1 N.D. N.D. 0 0
Sulfate mg/I 0.5 103 101 103 104 113 111 109
Chloride mg/I 0.1 3.3 5 3.5 2.9 4.8 3.4 3.8Ammonium (as N) mg/i 0.05 0.09 0.08 0.62 0.11 0.05 0.07 0.07
Nitrite (as N) mg/I 0.01 <0.01 <0.01 0.01 <0.01 <0.01 0.01 0.01Nitrate (as N) mg/I 0.01 0.01 0.01 0.06 0.02 0.01 0.04 0.02Fluoride mg/I 0.1 0.22 0.22 0.27 0.25 0.21 0.2 0.2Silica mg/I 1 13.9 14.8 15.4 14.3 14.8 15.2 16.3,--- @ 180 C mg/I 1 258 260 319 302 329 332 316
,ctivity umho/cm 1 413 460 509 473 474 501 501,aity CaCO3 mg/I 0.1 75.4 99 150 122 131 156 163
:31-1units 1-14' 8.8 8 7.65 7.48 8.07 7.79 7.6. I-CE METALS:
Aluminum mg/I 0.1 <0.10 0.13 <0.10 <0.10 <0.10 <0.10 <0.10
Arsenic mg/I 0.001 0.005 0.006 0,003 0.006 0.005 0.003 0.003Barium mg/I 0.1 <0.10 <0.10 <0.10 <0.10 <0.10 <0.10 <0.10
Boron mg/I 0.1 <0.10 <0.10 <0.10 <0.10 <0.10 <0.10 <0.10
Cadmium mg/I 0.01 <0.01 <0.01 <0.01 <0.01 <0.01 <0.01 <0.01
Chromium mg/I 0.05 <0.05 <0.05 <0.05 <0.05 <0.05 <0.05 <0.05
Copper mg/I 0.01 <0.01 <0.0.1 <0.01 <0.01 <0.01 <0.01 <0.01Iron mg/I 0.05 <0.05 0.06 <0.05 <0.05 < 0.05 <0.05 < 0.05
Lead mg/I 0.05 < 0.05 <0.05 <0.05 0.17 < 0.05 <0.05 <0.05Manganese mg/I 0;01 <0.01 0.02 <0.01 <0.01 <0.01 0.01 <0.01
Mercury mg/I 0.001 <0.001 <0.001 <0.001 <0.001 <0.001 <0.001 <0.001
Molybdenum mg/I 0.1 <0.10 <0.10 <0.10 <0.10 <0.10 <0.10 <0.01N•ckel mg/I 0.05 <0.05 <0.05 <0.05 <0.05 <0.65 <0.05 <0.05
Selenium mg/I 0.001 <0.001 <0.001 <0.0001 <0.001 <0.001 <0.001 <0.001
Vanadium mg/i 0.1 <0.10 <0.10 <0.10 <0.10 <0.10 <0.10 <0.10
Zinc mgyl: 0.01 0.01 0.02 0.01 0.01 0.01 0.01 0.01RADIOMETRIC SPECIES:
Uranium mg/I 0.0003 0.16 0.0735 0.0655 0.0733 0.13 0.0385 0.035
Radium paCi 0.2 5.9+0.6 12.3+0.8 19.1_1.8 13.8+1.6 15.6+1 14.4+2 20.6+1
QUALITY ASSURANCE DATA-Anion meg - 3.75 4.24 5.26 4.71 5.12 5.54 5.65
Cation meg - 3.74 4.39 5.53 4.88 5.03 5.47 5.79A/C Balance units 0.95-1.05 1.003 0.966 0.952 0.964 1.018 1.013 0.976
WDEQ A/C Balance % -5- +5 -0.14 1.72 2.46 1.85 -0.9 -0.62 1.24
- '-'d TDS mg/I - 250 275 327 299 317 335 349/C Balance units 0.90-1.10 1.03 0.944 0.977 1.01 1.037 0.99 0.907
j .December 2004
eynoyi Si Kanch tI AppiJJIaLiUni% I CIPLd. II ii L LU0-ZAttachment D6-2-1 1

REYNOLDS RANCH PROJECT BASELINE GROUNDWATER QUALITY DATA
WELL SMC-1062 (U/S-SAND)
5-Dec-89243.3
5241.793
1351.4613.48.36N.D.15
48.17.529130
1460
1013.3
0.080.010.060.2714.8292449120
8.12
<0.100.004<0.10<0.10<0,01<0.05<0.01<0.05<0.05<0.01
<0.001<0.01<0.050.003<0.100.01
0.10617.4+0.8
4.614.69
0.9830.87291
1.003
27-Jul-90243.4
5241.693
3303.56N.D.N.D.N.D.15
49.79.7
30.613.11.9
1790
98.50.4
0.37<0.01<0.010.1916
299481150
8.35
<0;10<0.001<0.10<0.10<0.01<0.05<0.01<0.05<0.05<0.01<0.001<0.10<0.05<0.001<0.100.01
0.046412.8+0.9
5.075.051.004-0.22311
0.962
Reynold's Ranch Application/Attachment D6-2 December 2004
Attachment D6-2-12
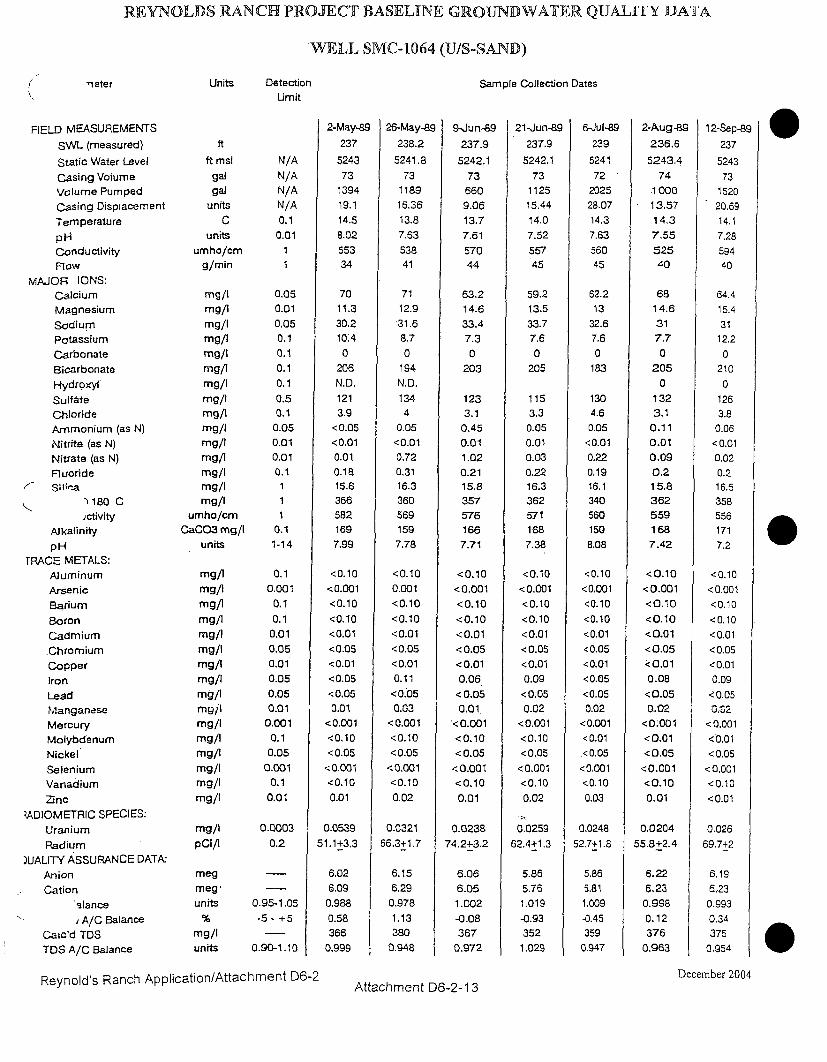
REYNOLDS RANCH PROJECT BASELINE GROUNDWATER QUALITY DATA
WELL SMC-1064 (U/S-SAND)
'neter Units DetectionUmit
Sample Collection Dates
FIELD MEASUREMENTS
SWL (measured)
Static Water Level
C,asing Volume
Volume Pumped
Cýasing Displacement
Temperature
pHConductivityFlow
MAJOR IONS:Calcium
MagnesiumSodiumPotassium
Cýarbonate
BicarbonateHydroxyl
SulfateChlorideAmmonium (as N)
Nitrite (as N)
Nitrate (as N)
FluorideK- Sil"a
•180 Cjctivity
Alkalinity
pHTRACE METALS:
AluminumArsenic
Barium
Boron
CadmiumChromium
CopperIron
LeadManganeseMercury
MolybdenumNickel
SeleniumVanadium
Zinc
3ADIOMETRIC SPECIES:
UraniumRadium
)UALITY ASSURANCE DATA-
Anion
Cationalance
) A/C Balance
Caic'd TDS
TDS A/C Balance
2-May-89 26-May-89
ft
ft mslgalgal
units
C
units
umho/cmg/min
mg/Img/I
mg/Img/Img/I
mg/I
mg/I
mg/Img/Img/Img/Img/Img/Img/Img/I
umho/cm
CaCO3 mg/Iunits
mg/Img/I
mg/I
mg/I
mg/Img/Img/1mg/I
mg/I
mg/l
mg/Img/Img/Img/l
mg/I
mg/I
pCi/l
megmegunits
mg/I
units
N/A
N/AN/AN/A
0.10.01
11
0.050.01
0.050.10.10.1
0.1
0,50.10.050.010.010.1111
0.1
1-14
0.10.001
0.1
0.10,01
0.050.010.05
0.050.010.001
0.10.05
0.0010.1
0.01
0.0003
0.2
0.95-1.05-5- +5
0.90-1.10
237
5243
731394
19.114.5
8.0255334
238.2
5241.8
731189
16.3613.8
7.63
53841
7011.3
30.2104
0
206N.D.
1213.9
<0.05
<0.010.010.1815.63665821697.99
<0.10
<0.001<0.10
<0.10<0.01
<0.05<0.01<0.05
<0.050.01
<0.001<0.10
<0.05<0.001<0.10
0.01
0.0539
51.1+3.3
6.026.090.988
0.58366
0.999
7112.9
31.68.70
194N.D.1344
0.05
<0.010.720.3116.3
360569159
7.78
<0.100.001
<0.10
<0.10<0.01
<0.05<0.010.11
< om0.03
<0.001
<0.10<0.05
<0.001<0.10
0.02
0.0321
66.3+1.7
6.15
6.29
0,9781.13380
0.948
9-Jun-89
237.9
5242.1
736609.0613.7
7.61
57044
63.214.633.4
7.30
203
1233.1
0.450.011.020.2115,8357576166
7.71
<0.10<0.001
<0.10
<0.10
<0.01< 0.05<0.01
0.06
< 0.050.01
<0.001
<0.10< 0.05
<0.001<0.10
0.01
0.0238
74.2+3.2
6.066.051.002
-0.08367
0.972
21-Jun-89 I 6-Jul-89
237.9
5242.1
731125
15.4414.0
7.52
55745
59.213.533.7
7.6
0205
1153.30.05
0.010.030.2216.3362571
168
7.38
<0.10
<0.001<0.10
<0.10
<0.01<0.05<0.01
0.09
<0.050.02
<0.001<0.10< 0.05
<0.001<0.10
0.02
0.0259
62.4+1.3
5.86
5.761.019
-0.93352
1.029
239
5241
72
2025
28.0714.3
7.6356045
621213
32.67.60
183
1304.6
0.05<0.010.220.1916.1340560150
8.08
<0.10
<0.001
<0.10
<0.10<0.01<0.05<0.01
<0.05
<0.050.02
<0.001<0-01<0.05
<0.001<0.10
0.03
0.024852.7+1.8
5.865.811.009
-0.45
3590.947
2-Aug-89 12-Sep-89
236.6 237
5243.4 5243
74 731000 152013.57 20.69
14.3 14.1
7.55 7.28
525 594
40 40
6814.6
317.7
0205
0
1323.10.11
0.010.090.215.83625591687.42
<0.10<0.001<0.10
<0.10<0.01<0.05<0.010.08
<0.050.02
<0.001<0.01<0.05
<0.001<0.100.01
0.020455.8+2.4
5.22
6.230.998
0.12376
0.963
64.415.4
3112.2
0
210
0
126
3.80.06
<0.010.02
0.216.5
358556171
7.2
<0.10<0.001
<0.10
<0.10
<0.01
<0.05<0.010.09
<-0.05
<0.001
<0.01
<0.05< 0.001
<0.10
<0.01
0.026
69,7+2
6.196.230.993
0.34375
0.954
Reynold's Ranch Application/Attachment D6-2December 2004
Attachment D6-2-13
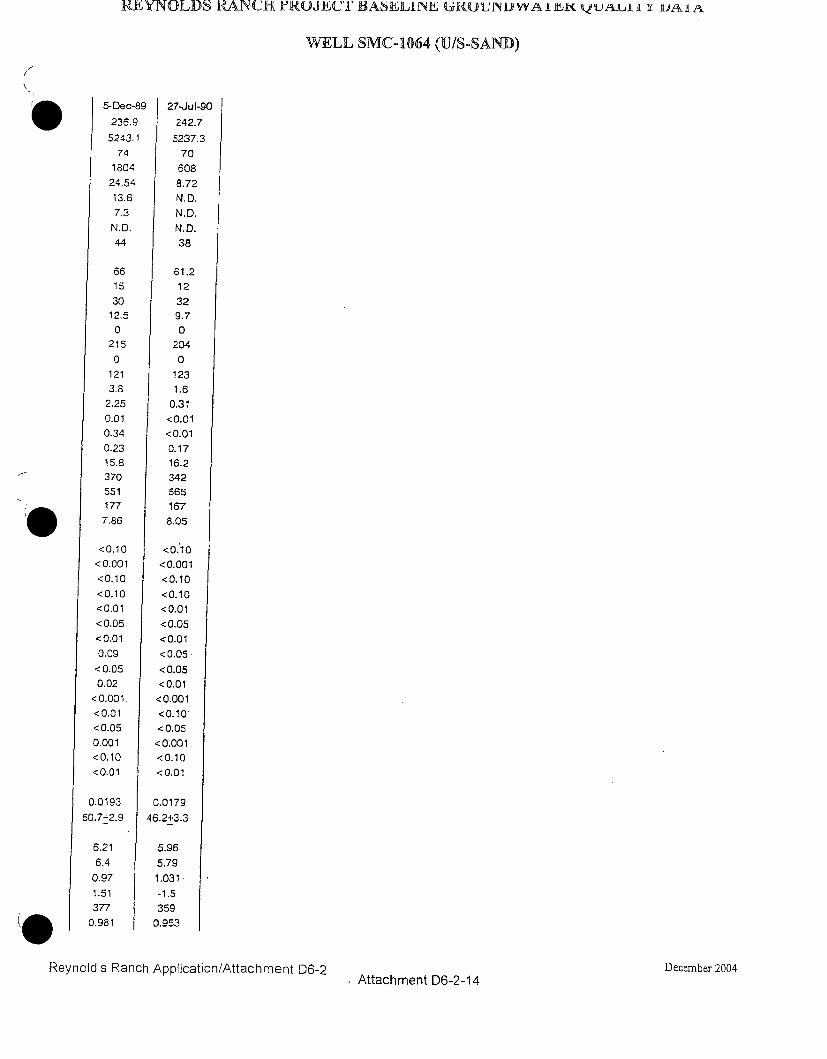
REYNOLDS RA-INC FROJI~J EITASI•LIfN• E U U N 0W A I EK V AU.& I x uJA IA
WELL SMC-1064 (U/S-SAND)
5-Dec-89 27-Jul-90236.9 242.7
5243.1 5237.3
74 701804 608
24.54 8.72
13.6 N.D.
7.3 N.D.
N.D. N.D.
44 38
66 61.215 12
30 3212.5 9.7
0 0216 204
0 0121 123
3.8 1.6
2.25 0.31
0.01 <0.01
0.34 <0.01
0.23 0.1715.8 16.2
370 342551 565
177 167
7.86 8.05
<0.10 <0.10
<0.001 <0.001
<0.10 <0.10
<0.10 <0.10<0.01 <0.01
<0,05 <0.05
<0.01 <0.01
0.09 <0.05
<0.05 < 0.05
0.02 <0.01
<0.001. <0.001
<0.01 <0.10<0.05 <0.05
0.001 <0;001<0.10 <0.10
<0.01 <0.01
0.0193 0.0179
60.7+2.9 46.2+3.3
6.21 5.96
6.4 5.79
0.97 1.031.
1.51 -1.5
377 3590.981 0.953
Reynold's Ranch Application/Attachment D6-2 December 2004I Attachment D6-2-14
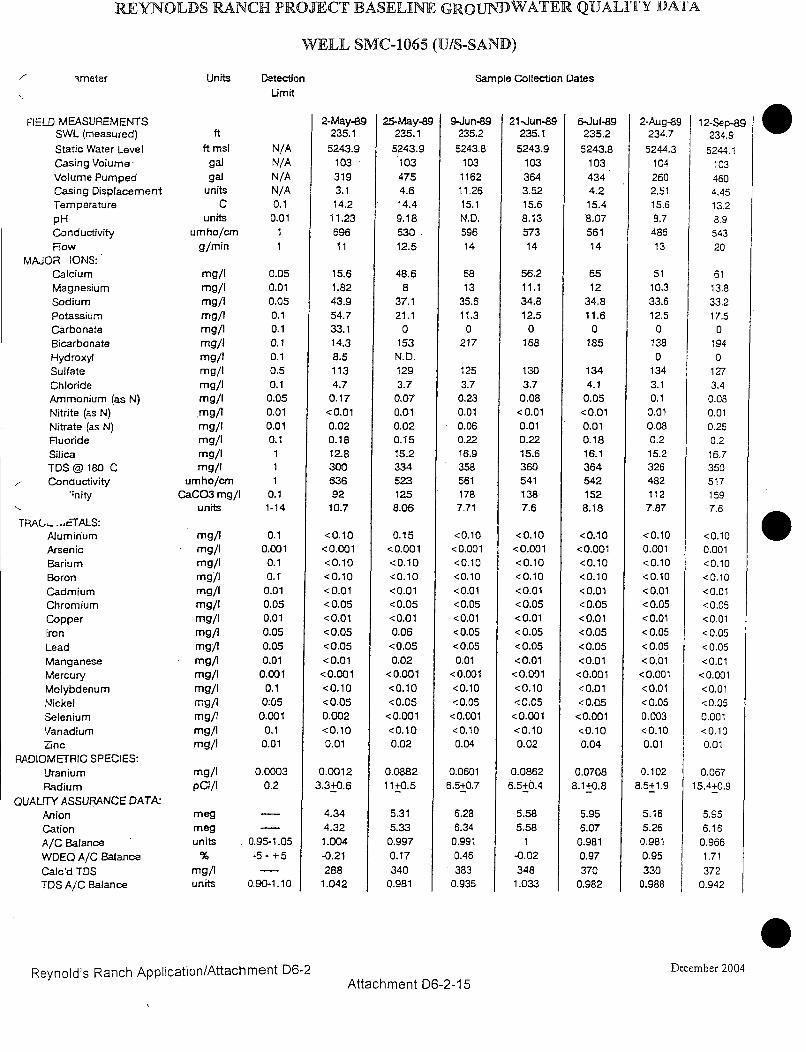
REYNOLDS RANCH PROJECT BASELINE GROuNDWATER QUALITY DATIA
WELL SMC-1065 (U/S-SAND)
/ -meter Units Detection
UmitSample Collection Dates
FIELD MEASUREMENTSSWL (measured)
Static Water LevelCasing Volume'Volume PumpedCasing DisplacementTemperaturepHConductivityFlow
MAJOR IONS:CalciumMagnesiumSodiumPotassiumCarbonateBicarbonateHydroxylSulfateChlorideAmmonium (as N)Nitrite (as N)Nitrate (as N)FluorideSilicaTDS @ 180 CConductivity
I;nity
TRAG- .T..,--ALS:AluminumArsenicBariumBoronCadmiumChromiumCopperIronLeadManganeseMercuryMolybdenumNickelSeleniumVanadiumZinc
RADIOMETRIC SPECIES:UraniumRadium
QUALITY' ASSURANCE DATA:AnionCationA/C BalanceWDEQ A/C BalanceCalc'd TDSTDS A/C Balance
ft
ft mslgalgal
unitsC
unitsumho/cm
g/min
mg/Img/Img/lmg/Img/Img/Img/Img/I
mg/Img/Img/Img/lmg/lmg/1mg/I
umho/crnCaCO3 mg/I
units
mg/Img/Img/lmg/Img/Img/Img/Img/Img/Img/lmg/Img/lmg/lmg/Img/Img/I
mg/Ipa/I
megmegunits
mg/Iunits
N/AN/AN/AN/A0.10.01
11
0.050.010.050.10,10.10.10.50.10.050.010.010.1
111
0.11-14
0.10.0010.10.1•
0.010.050.010.050.05
0.010.001
0.1
0:050.0010.10.01
0.00030.2
0.95-1.05-5- +5
0.90-1.10
2-May-89235.1
5243.91033193.114.2
11.2369611
15.61t8243.954.733.114.38.51134.7
0.17<0.010.020.1812.830063692
10.7
<0.10<0.001<0.10<0.10<0.01< 0.05<0.01<0.05<0.05<0.01<0.001<0.10<0.050.002<0.100.01
0.00123.3+0.6
4.344.321.004-0.212881.042
25-May-&9235.1
5243.91034754.6
14.49.1853012.5
48.68
37.121.1
0153
N.D.1293.70.070.010.020.1515.23345231258.06
0.15<0.001<0.10<0;10<0.01< 0.05<0.010.06<0.050.02
<0.001<0.10<0.05<0.001<0.100.02
0.088211+0.5
5.315.33
0.9970.17340
0.981
235.2
5243.8103
116211.2615.1N.D.59614
6813
35.611.3
0217
1253.7
0.230.010.060.2216.9358561178
7.71
<0.10<0.001<0.10<0,10<0.01< 0.05<0.01<0.05<0.050.01
<0.001<0.10<0.05
<0.001<0.100.04
0.06016.5+0.7
6.286.34
0.9910.46383
0.935
235.1
5243.91033643.5215.6
8.1357314
56.211.134.812.5
0168
1303.70.08<0.010.010.2215.63605411387.6
<0.10<0.001<0.10<0.10<0.01< 0.05<0.01< 0.05<0.05<0.01<0.001<0.10<0.05<0.001
9-Jun-89 21-Jun-89 6-Jul-89235.2
5243.81034344.2
15.48.0756114
6512
34.811.60
185
1344.10.05<0.010.010.1816.1364542152
8.18
<0.10<0.001<0.10<0.10<0.01< 0.05<0.01<0.05< 0.05<0.01<0.001<0.01< 0.05<0.001
2-Aug-89234.7
5244.3104260
2.5115.68.748513
5110.333.612.50
1380
1343.10.10.010.080.2
15.23264821127.87
<0.100.001<0.10<0.10<0.01<0.05<0.01< 0.05<0.05<0.01<0.001<0.01< 0.050.003<0.100.01
12-Sep-89234.9
5244.11034604.4513.28.9
54320
6113.833.217.5
01940
1273.4
0.080.010.250.216.73505171597.6
<0.100.001<0.10<0.10<0.01<0,05<0.01<0.05<0.05<0.01
<0.001<0.01< 0.050.001<0.100.01
<0.10 <0.100.02 0.04
0.08626.5+0.4
5.585.58
1
-0.02348
1.033
0.07088.1+0.8
5.956.070.9810.97
3700.982
0.102 0.0678.5+1.9 15.4+0.9
5.165.260.9810.95330
0.988
5.956.16
0.9661.71372
0.942
SReynold's Ranch Application/Attachment D6-2 December 2004
Attachment D6-2-1 5
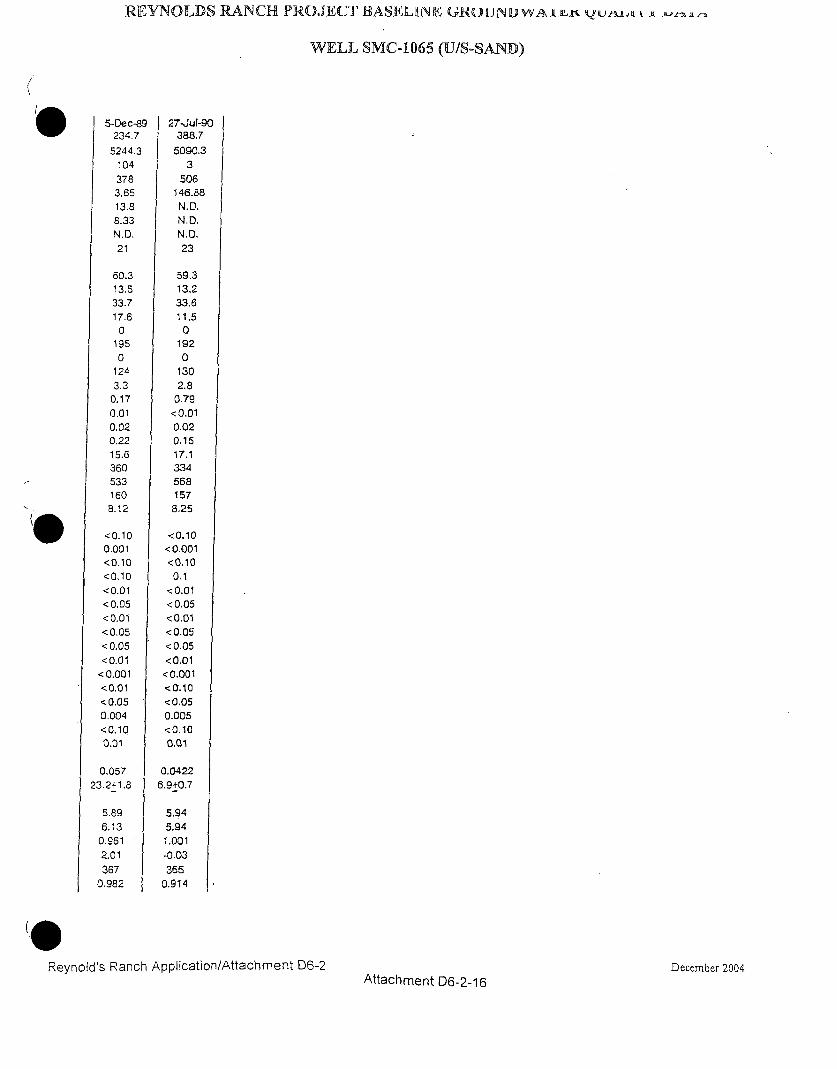
REYNOLDS RANCH PROJECT BASELINE GR(UND WAi I UI F.Z z-2ý
WELL SMC-1065 (U/S-SAND)
. 5-Dec-89 27-Jul-90234.7 388.7
5244.3 5090.3104 3
378 506
3.65 146.88
13.8 N.D.
8.33 N.D.
N.O. N.D.
21 23
60.3 59.313.5 13.2
33.7 33.6
17.60
1950
1243.3
0.170.010.020.2215.6360533160
8.12
11,50
1920
1302.80.79<0.010.020.1517.13345681578.25
<0.100.001<0.10<0.10<0.01<0.05<0.01<0.05<0.05<0.01
<0.001<0.01< 0.050.004<0.100.01
0,05723.2+1.8
5.896.130.9612.01
3670,982
<0.10<0.001<0.100.1
<0.01<0.05<0.01<0,05< 0.05<0.01< 0.001<0.10<0.050.005<0.100.01
0.04226.9+0.7
5.94
5.941.001-0.03365
0.914
R0Reynold's Ranch Application/Attachment D6-2 December 2004
Attachment D6-2-16
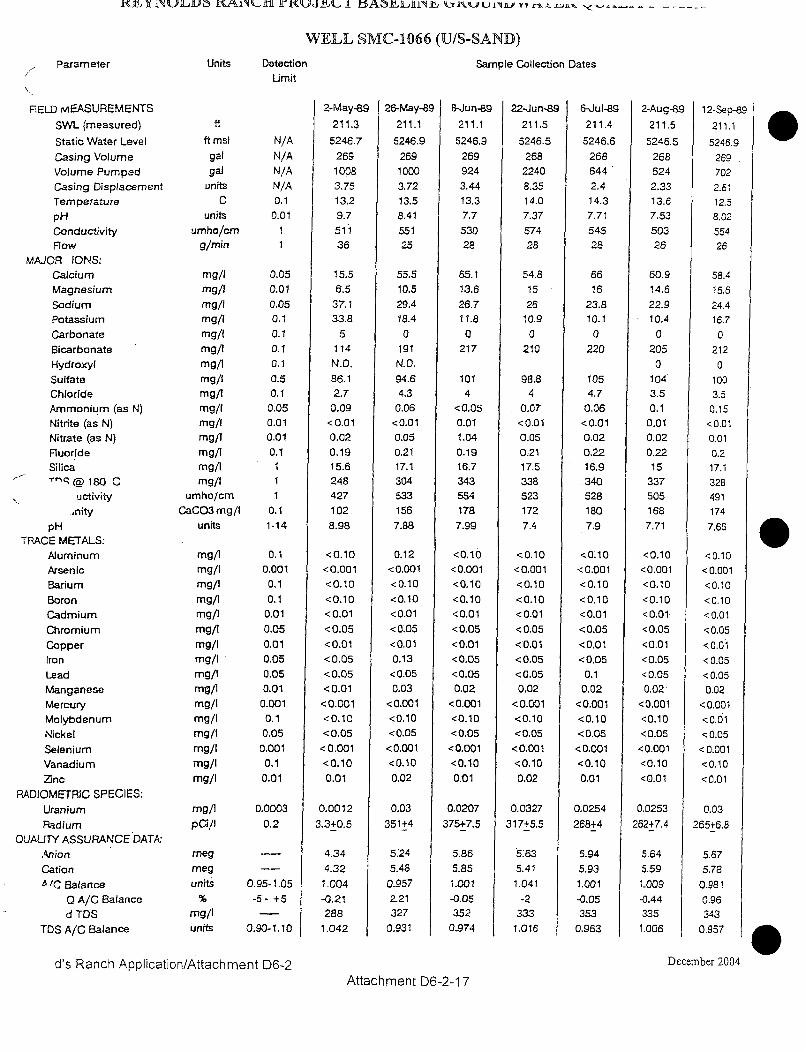
11~I~J1UJL~ 1A~1 LV1JJ~X..I ~A1~L11~I1~ uiv~ -
WELL SMC-1066 (U/S-SAND)
Parameter Units Detection
LimitSample Collection Dates
FELD MEASUREMENTS
SWL (measured)
Static Water Level
Casing VolumeVolume Pumped
Casing Displacement
TemperaturepH
ConductivityFlow
MAJOR IONS:CalciumMagnesium
SodiumPotassium
Carbonate
BicarbonateHydroxyl
SulfateChlorideAmmonium (as N)Nitrite (as N)Nitrate (as N)
RuorideSilica-"@180 C
uctivity
,nitypH
TRACE METALS:
AluminumArsenic
Barium
Boron
Cadmium
Chromium
CopperIron
Lead
ManganeseMercuryMolybdenum
Nickel
SeleniumVanadium
ZncRADIOMETRIC SPECIES:
Uranium
RadiumQUALITY ASSURANCE DATA-
Anion
CationA'C Balance
0 A/C Balanced TDS
TDS A/C Balance
ft
ft rnslgalgal
unitsC
unitsumho/cm
g/rnin
mg/Img/Img/lrmg/mg/I
mg/lmg/i
mg/Img/Img/Img/Img/Img/Img/I
umho/cmCaCe3 mg/I
units
mg/Img/Img/Img/img/Img/Img/Img/Img/Img/Img/Img/Img/Img/Img/Img/I
mg/IPCI/I
megmegunits
mg/I
units
N/A
N/A
N/AN/A
0.10.01
I1
0.050.01
0.050.1
0.10.1
0.10.50.1
0.050.010.01
0.1
0.11-14
0.10.001
0.1
0.10.01
0,050.010.05
0.050.01
0.0010.10.05
0.0010.10.01
0.0003
0.2
2-May-89 26-May-89
211.3 211.1
5246.7 5246.9
269 269
1008 1000
3.75 3.7213.2 13.5
9.7 8.41
511 55136 25
211.1 211.5
8-Jun-89 I 22-Jun-89
15.5
6.5
37.133.8
5114
N.D,
86.12.70.09
<0.010.02
0.1915.6
248427
1028.98
<0.10<0.001
<0.10
<0.10<0.01
<0.05
<0.01<0.05<0.05<0.01
<0.001<0.10< 0.05
<0.001<0.100.01
0.0012
3.3+0.6
55.510.5
29.418.4
0191
N.D.94.64.3
0.06<0.010.05
0.2117.1304533
7.88
0.12<0.001
<0.10
<0.10<0.01
<0.05
<0.01
0.13
<0.050.03
<0.001<0.10
<0.05
<0.001<0.10
0.02
0.03
351+4
5246.9
269924
3.4413.37.7
53028
65.113.6
26.711.8
0217
1014
<0.050.011.04
0.1916.7
343554178
7.99
<0.10<0.001
<0.10<0.10<0.01
<0.05
<0.01< 0.05<0.050.02
<0.001
<0.10<0.05
<0.001<0.100.01
0.0207
375+7.5
5.86
5.85
1.001
-0.05352
0-974
5246.5
2682240
8.3514.07.37
57428
54.815
2610.9
0
210
98.84
0.07<0.01
0.05
0;2117.5338523172
7.4
<0.10<0.001<0.10
<0.10<0.01
<0.05
<0.01
< 0.05<0.050.02
<0.001<0.10
6-Jul-89
211.4
5246.6
268644
2.414.37.71
54528
6616
23.810.1
0220
1054.7
0.06<0.010.020.2216.9340
5281807.9
<0,10<0.001
<0.10<0.10<0.01
< 0.05<0.01
<0.050.1
0.02
<0.001
2-Aug-89
211.5
5246.5268
624
2.3313.67,5350326
60.9
14.6
22.910.4
0205
0104
3.50.1
0.01
0.020.2215
337505168
7.71
<0.10
<0.001<0.10
<0.10<0.01
<0.05
<0.01
<0.05<0.050.02
<0.001
12-Sep-89
211.1
5246.9
269702
2.6112.58.02
55426
58.4
15.6
24.416.7
0212
01003.5
0.15<0.01
0.010.217.1328491174
7.66
<0.10
<0.001
<0.10
<0.10<0.01
< 0.05
<0.01<0.05
< 0.050.02
<0.001<0.10 <0.10 <0.01
<0.05 <0.05
<0.001 <0.001
< 0.05 < 0.05
<0.001 <0.001
4,34 5.24
- 4.32 5.48
0.95-1.05 1.004 0.957-5- +5 -0.21 2.21
- 288 3270.90-1.10 1.042 0.931
<0.100.02
0.0327
317+5.5
5:63
5.41
1.041
-2333
1.016
<0.100.01
0.0254
268+4
5.94
5.93
1.001-0.05353
0.963
<0.10
<0.01
0,0253
262+7.4
<0.10
<0.01
0.03
265+6.8
5.64 5.67
5.59 5.781.009 0.981
-0.44 0.96
335 3431.006 0.957
d's Ranch Application/Attachment D6-2 December 2004
Attachment D6-2-1 7
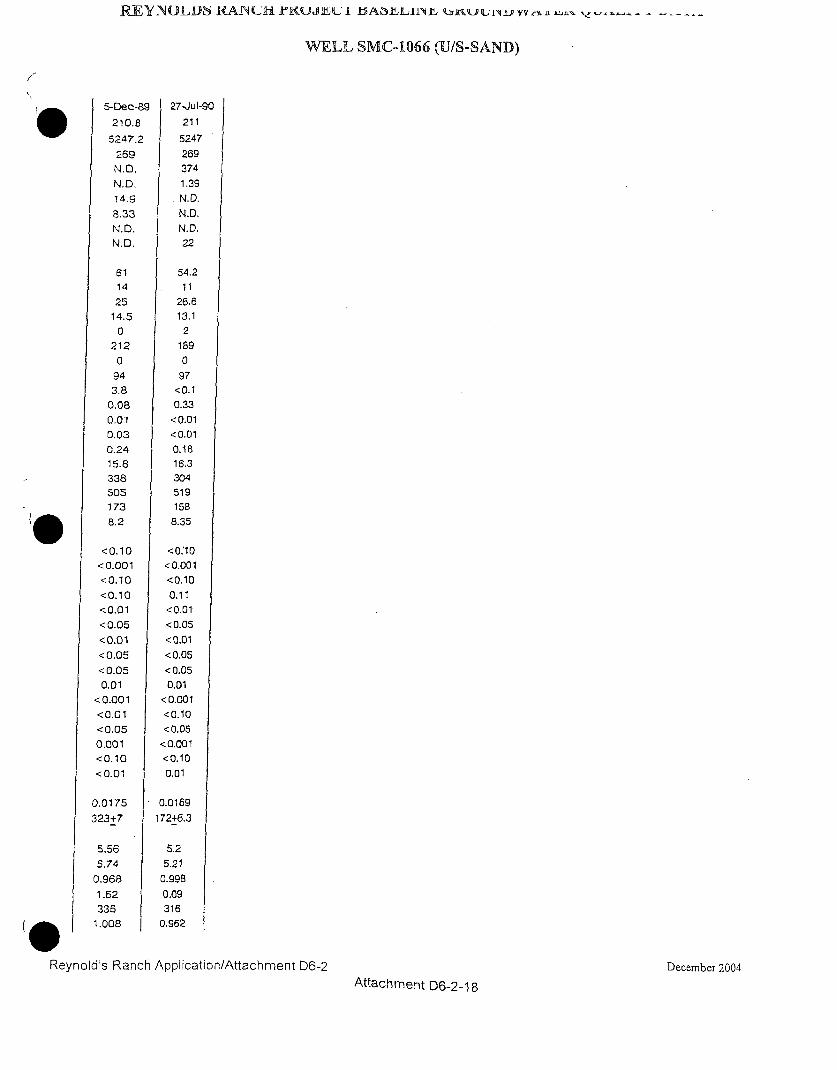
R-EYNOLA)SHAA4-fIrKUjkk- I JJA6hiirNr, - ----
WELL SMC-1066 (U/S-SAND)
5-Dec-89 27-Jul-90
210.8 211
5247.2 5247
269 269
N.D. 374
N.D. 1.39
14.9 N.D.
8.33 N.D.
N.D. N.D.
N.D. 22
61 54.2
14 11
25 26.6
14.5 13.1
0 2
212 189
0 0
94 97
3.8 <0.1
0.08 0.33
0.01 <0.01
0.03 <0.01
0.24 0.18
15.8 16.3
338 304
505 519
173 158
8.2 8.35
<0.10 <0.'10
<0.001 <0.001
<0.10 <0.10
<0.10 0.11
<0.01 <0.01
<0.05 <0.05
<0.01 <0.01
<0.05 <0.05
<0.05 <0.05
0.01 0.01
<0.001 <0.001
<0.01 <0.10
<0.05 <0.05
0.001 <0,001
<0.10 <0.10
<0.01 0.01
0.0175 0.0169
323+7 172+6.3
5.56 5.2
5.74 5.21
0.968 0.998
1.62 0.09
335 316
1.008 0.962
Reynold's Ranch Application/Attachment D6-2December 2004
Attachment D6-2-18
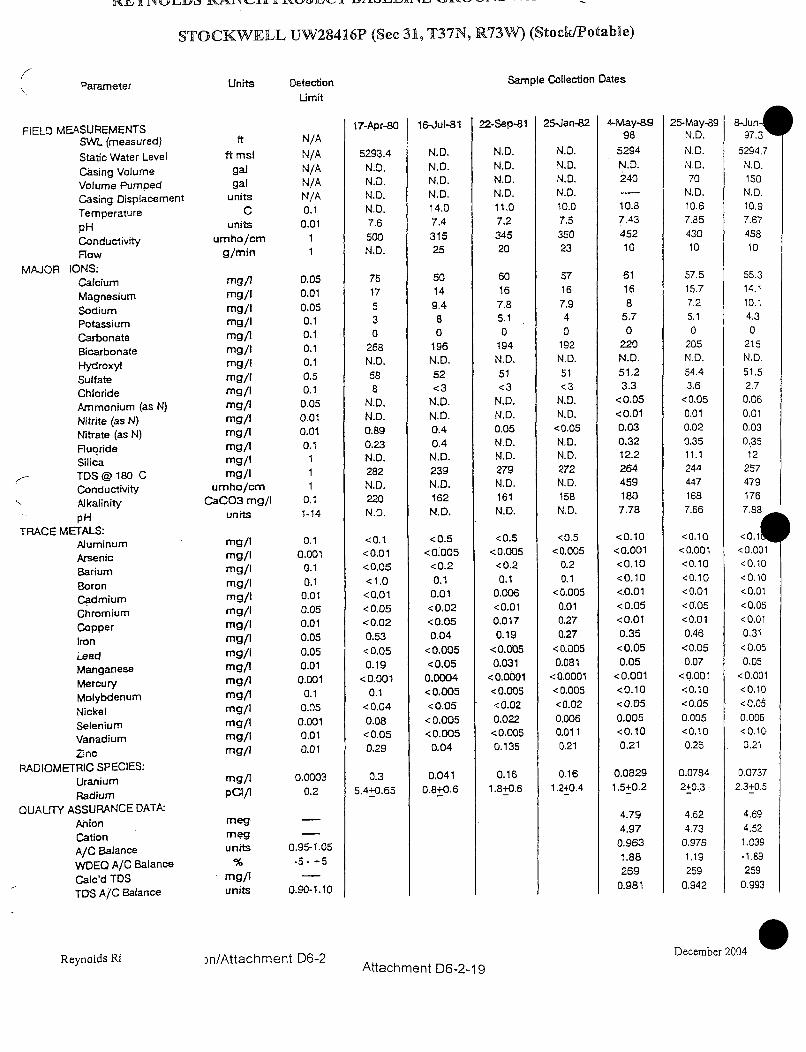
$TJ'W, I ('V'keci 3LJA, - - 73W) -- - tb -
STOCKWELL UW28416P (See 31, T37N, R73W) (Stock/Potable)
Parameter Units DetectionLimit
Sample Collection Dates
FIELD MEASUREMENTSSWL (measured)
Static Water Level
Casing VolumeVolume .PumpedCasing DisplacementTemperaturepHConductivityFlow
MAJOR IONS:CalciumMagnesiumSodiumPotassiumCarbonateBicarbonateHydroxylSulfateChlorideAmmonium (as N)Nitrite (as N)Nitrate (as N)FluorideSilicaTDS @ 180 CConductivityAlkalinitypH
TRACE METALS:AluminumArsenicBariumBoronCadmiumChromiumCopperIronLeadManganeseMercuryMolybdenumNickelSeleniumVanadiumZnc
RADIOMETRIC SPECIES:
UraniumRadium
QUALITY ASSURANCE DATA-
AnionCationA/C BalanceWDEQ A/C Balance
Calo'd TDSTDS AIC Balance
ftft msl
galgal
unitsC
unitsumho/cm
g/min
mg/Img/Img/Img/Img/Img/Img/Img/Img/lmg/Img/Img/Img/Img/Img/I
umho/cmCaCO3 mg/I
units
mg/Img/Img/Img/Img/Img/Img/Img/Img/Img/Img/1mg/Img/Img/Img/Img/I
mg/I
megmegunits
mg/Iunits
N/AN/AN/AN/AN/A0.10.01
11
0.050.010.050.10.10.10.10.50.10.050.010.010.1
111
0.11-14
0.10.001
0.10.1
0,01
0.050.010.050.05
0.010.001
0.10.050.0010.010.01
0.0003
0.2
0.95-1.05-5- +5
0.90-1.10
17-Apr-80
5293.4N.D.N.D.N.D.N.D.7.6500N.D.
7617530
268N.D.588
N.D.N.D.0.890.23N.D.282N.D.220N.D.
<0.1<0.01<0.05<1,0<0.01<0.05<0.020.53
< 0.050.19
<0.0010.1
<0.040.08
< 0.050.29
0.3
5.4+0.65
16-Jul-81
N.D.N.D.N.D.N.D.14.07.4
31525
50149.480
196N.D.52<3
N.D.N.D.0.40.4
N.D.239N.D.162N.D.
<0.5<0.005
<0.20.10.01<0.02< 0.050.04
<0.005<0.05
0.0004<0.005<0.05<0.005<0.0050.04
0,0410.8+0.6
22-Sep-81
N. D.N.D.N.D.N.D.11.07.2
34520
60167.85.10
194N.D.51<3
N.D.N.D.0.05N.D.N.D.279N.D.161N.D.
<0.5<0.005
<0.20.1
0.006<0.010.0170.19
<0.0050.031
<0.0001<0.005<0.020.022
<0.0050.135
0.161.8+0.6
25-Jan-82
N.D.N. D.N.D.N.D.10.07.535023
57167.940
192N.D.51<3
N.D.N.D.<0.05N.D.N. D.272N. D.158N.D.
<0.5
< 0.0050.20.1
<0.0050,010.270.27
<0.0050;081
<0.0001<0.005<0.020.0060.0110.21
0.161.2+0.4
4-May-8a98
5294N.D.240
10.87.4345210
61168
5.70
220N.D.51.23.3
<0.05<0.010.030.3212.22644591807.78
<0.10<0.001<0.10<0.10<.0.01<0.05<0.010.35<0.050.05
<0.001<0.10<0.050.005<0.100.21
0.08291.5+0.2
4.794.970.9631.88269
0.981
25-May-89N. D.N. D.
N, D.70
N.D.10.67.8543010
57.515.77.25.10
205N.D.54.43.6
< 0.050.010.020.3511.12444471687.66
<0.10<0.001<0.10<0.10<0.01<0.05<0.010.46<0.050.07
<0.001<0.10<0.050.005<0,100.26
0.07842+0.3
4.624.73
0.9761.19259
0.942
5294.7N.D.150N. D.10.97.6745810
55.314.110.14.30
215N.D.51.52.7
0.060.010.030.3512
2574791767.88
<0.14<0.001<0.10<0.10<0.01<0.05<0.010.31
< 0.050.05
<0.001<0.10<0.050.006<0.100.21
0.07372.3+0.5
4.694.521.039-1.89259
0.993
December 2004Reynolds R;1 )n/Attachment D6-2 Attachment D6-219
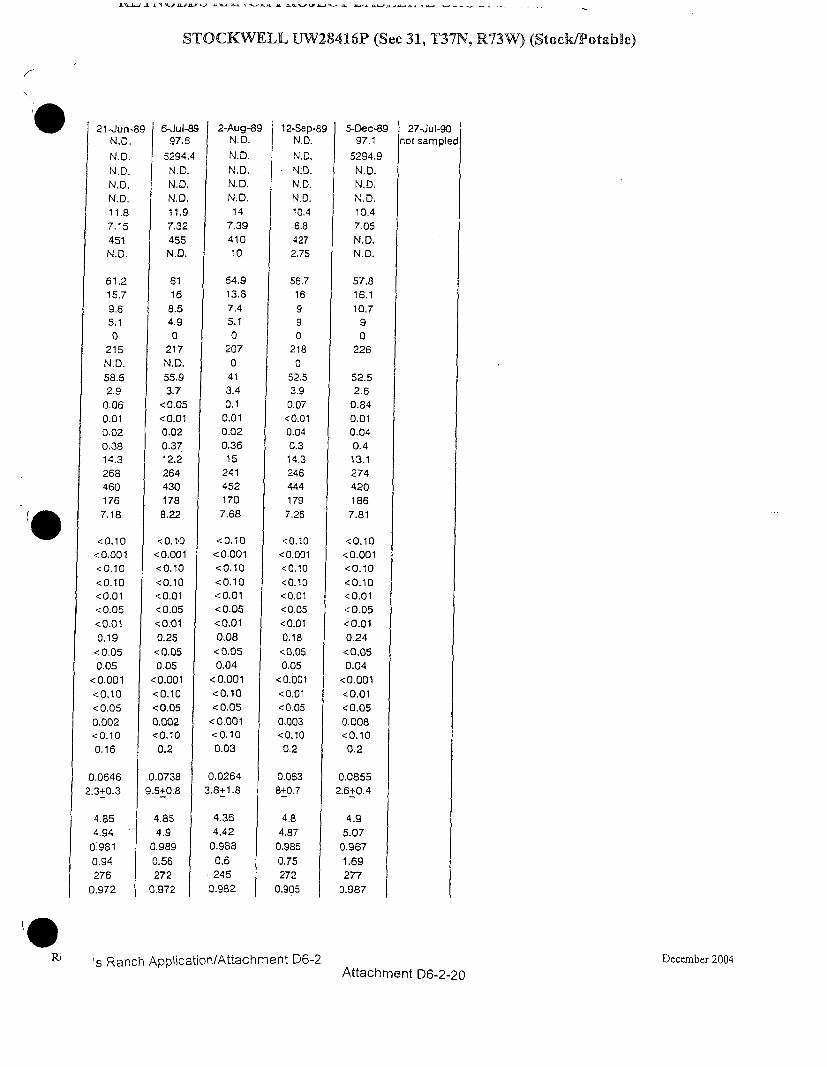
fl.J14d.flJ.N'&A'4tJzJ.L.~ Sk~~±~' J.fl ~ ~ --
STOCKWELL UW28416P (Sec 31, T37N, R73W) (Stock/Potable)
K
21-Jun-89 6-Jul-89 2-Aug-89 12-Sep-89 5-Dec-89 27-Jul-90
N.D. 97.6 N.D. N.D. 97.1 not sampled
N.D. 5294.4 N.D. N.D. 5294.9
N.D. ND. N.D. N.D. N.D.
N.D. N.D. N.D, N.D. N.D.
N.D. N.D. N.D. N.D. N.D.
11,8 11.9 14 10.4 10.4
7.15 7.32 7.39 6.8 7.05
451 455 410 427 N.D.
N.D. N.D. 10 2.75 N.D.
61.2 61 54.9 56.7 57.8
15.7 16 13.8 16 16.1
9.6 8.5 7.4 9 10.7
5.1 4.9 5.1 9 9
0 0 '0 0 0
215 217 207 218 226
NMD. N.D. 0 0
58.5 55.9 41 52.5 52.5
2.9 3.7 3.4 3.9 2.6
0.06 <0.05 0.1 0.07 0.84
0.01 <0.01 0.01 <0.01 0.01
0.02 0.02 0.02 0.04 0.04
0.38 0.37 0.36 0.3 0.4
14.3 12.2 15 14.3 13.1
268 264 241 246 274
460 430 452 444 420
176 178 170 179 186
7.18 8.22 7,68 7.26 7.81
<0.10 < 0.1,0 <0.10 <0.10 <0.10
<0.001 <0.001 <0.001 <0.001 <0.001
<0.10 <0.10 <0.10 <0.10 <0.10
<0.10 <0.10 <0.10 <0.10 <0.10
<0.01 <0.01 <0.01 <0.01 <0.01
<0.05 <0.05 <0.05 <0.05 <0.05
<0.01 <0.01 <0.01 <0.01 <0.01
0.19 0.25 0.08 0.18 0.24
<0.05 <0.05 <0.05 <0.05 <0.05
0.05 0.05 0.04 0.05 0.04
<0.001 <0.001 <0.001 <0,001 <0.001
<0.10 <0.10 <0.10 <0.01 <0.01
<0.05 <0.05 <0.05 <0.05 <0.05
0.002 0.002 <0.001 0.003 0.008
<0.10 <0.10 <0.10 <0.10 <0.10
0.16 0.2 0.03 0.2 0.2
0.0646 .0.0738 0.0264 0.063 0.0855
2.3+0.3 9.5+0.8 3.8+1.8 8+0.7 2.6+0.4
4.85 4.85 4.36 4.8 4.9
4.94 4.9 4,42 4.87 5.07
0.981 0.989 0.988 0.985 0.967
0.94 0.56 0.6 0.75 1.69
276 272 245 272 277
0.972 0.972 0.982 0.905 0.987
Ri < Ranch ADblication/Attachment D6-2 December 2004
Attachment D6-2-20
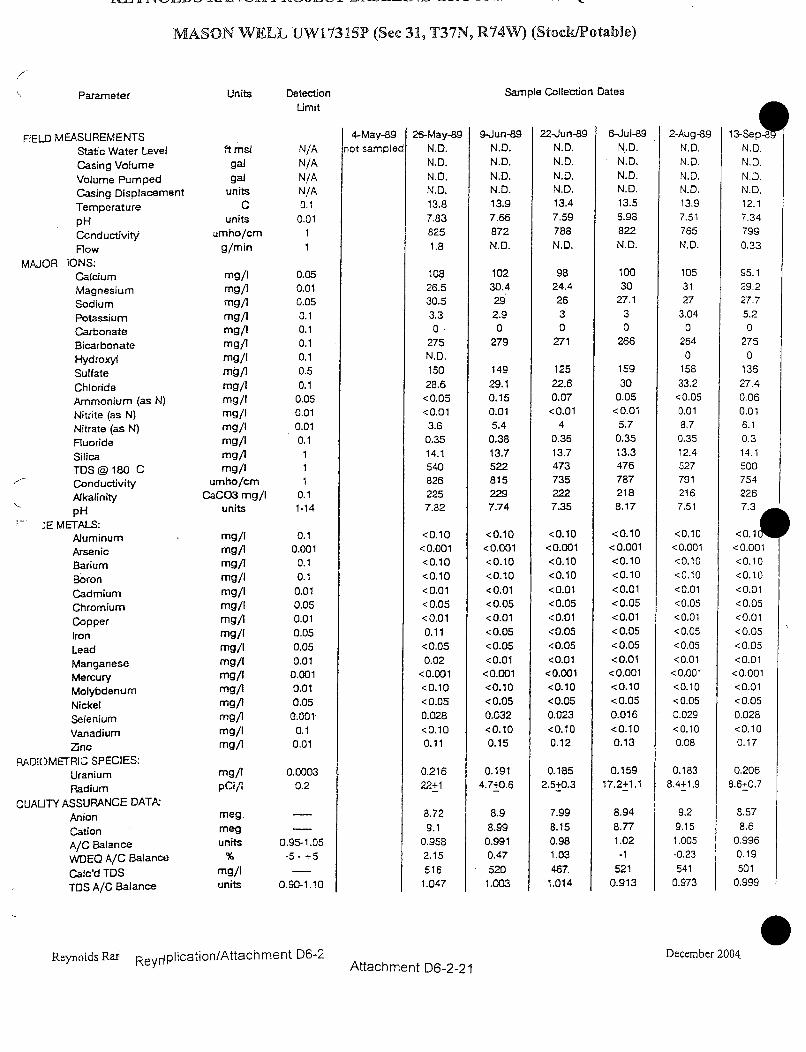
MASON WELL UW17315P (Sec 31, T37N, R74W) (Stock/Potable)
Parameter Units Detection Sample Collection Dates
FIELD MEASUREMENTS Limit 4-May-89 26-May-89 9-Jun-89 22-Jun-89 6-Jul-89 2-Aug-89 13-Sep!
Static Water Level ft ms! N/A not sampled N.D. N.D. N.D. N.D. N.D. N.D.
Casing Volume gal N/A N.D. N.D. N.D. N.D. N.D. N.D.
Volume Pumped gal N/A N.D. N.D. N.D. N.D. N.D. N.D.
Casing Displacement units N/A N.D. N.D. N.D. N.D. N.D. N.D.
Temperature C 0.1 13.8 13.9 13.4 13.5 13.9 12.1
p H units 0.01 7.83 7.66 7.59 6.98 7.51 7.34
Conductivity umho/cm 1 825 872 788 822 765 799
Flow g/min 1 1.8 N.D. N.D. N.D. N.D. 0.33
MAJOR IONS:Calcium mg/1 0.05 108 102 98 100 105 95.1
Magnesium mg/I 0.01 26.5 30.4 24.4 30 31 29.2
Sodium mg/1 0.05 30.5 29 26 27.1 27 27.7
Potassium mg/1 0.1 3.3 2.9 3 3 3.04 5.2
Carbonate mg/I 0.1 0 0 0 0 0 0
Bicarbonate mg/1 0.1 275 279 271 266 264 275
Hydroxyl mg/I 0.1 N.D. 0 0
Sulfate mg/I 0.5 150 149 125 159 158 136
Chloride mg/l 0.1 28.6 29.1 22.6 30 33.2 27.4
Ammonium (as N) mg/I 0.05 <0.05 0.15 0.07 0.05 <0.05 0.06
Nitrite (as N) mg/I 0.01 <0.01 0.01 <0.01 <0.01 0.01 0.01
Nitrate (as N) mg/I 0.01 3.6 5.4 4 5.7 8.7 6.1
Fluoride mg/I 0.1 0.35 0.38 0.36 0.35 0.35 0.3
Silica mg/1 1 14.1 13.7 13.7 13.3 12.4 14.1
TDS @ 180 C mg/I 1 540 522 473 476 527 500
Conductivity umho/cm 1 826 815 735 787 791 754
Alkalinity CaCO3 mg/I 0.1 225 229 222 218 216 226
pH units 1-14 7.82 7.74 7.35 8.17 7.51 7.3
;E METALS:Aluminum mg/I 0.1 <0.10 <0.10 <0.10 <0.10 <0.10 <0.1
Arsenic mg/I 0.001 <0.001 <0.001 <0.001 <0.001 <0.001 <0.001
Barium mg/I 0.1 <0.10 <0.10 <0.10 <0.10 <0.10 <0.10
Boron mg/I 0.1 <0.10 <0.10 <0.10 <0.10 <0.10 <0.10
Cadmium mg/I 0.01 <0.01 <0.01 <0.01 <0.01 <0.01 <0.01
Chromium mg/I 0.05 <0.05 <0.05 <0.05 <0.05 <0.05 <0.05
Copper mg/I 0.01 <0.01 <0.01 <0.01 <0.01 <0.01 <0.01
Iron mg/I 0.05 0.11 < 0.05 <0.05 <0.05 <0.05 <0.05
Lead mg/I 0.05 <0.05 <0.05 <0.05 <0.05 <0.05 <0.05
Manganese mg/I 0.01 0.02 <0.01 <0.01 <0.01 <0.01 <0.01
Mercury mg/I 0.001 <0.001 <0.001 <0.001 <0.001 <0..001 <0.001
Molybdenum mg/i 0.01 <0.10 <0.10 <0.10 <0.10 <0.10 <0.01
Nickel mg/I 0.05 < 0.05 < 0.05 <0.05 < 0.05 < 0.05 <0.05
Selenium mg/I 0.001 0.028 0.032 0.023 0-016 0.029 0.028
Vanadium mg/I 0.1 <0.10 <0.10 <0.10 <0.10 <0.10 <0.10
Znc mg/1 0.01 0.11 0.15 0.12 0.13 0.08 0.17
RADIOMETRIC SPECIES:Uranium mg/I 0.0003 0.216 0.191 0.185 0.159 0.183 0.206
Radium pCi/I 0.2 22+1 4.7+0.6 2.5+0.3 17.2+1.1 8.4+1.9 8.6+0.7
QUALITY ASSURANCE DATA:Anion meg. - 8.72 8.9 7.99 8.94 9.2 8.57
Cation meg - 9.1 8.99 8.15 8.77 9.15 8.6
A/C Balance units 0.95-1.05 0.958 0.991 0.98 1.02 1.005 0.996
WDEQ A/C Balance % -5- +5 2.15 0.47 1.03 -1 -0.23 0.19
Calc'd TDS mg/l - 516 520 467. 521 541 501
TDS A/C Balance units 0.90-1.10 1.047 1.003 1.014 0.913 0.973 0.999
Rennlds R yar nlication/Attachment D6-2 December 2004Rep r Attachment D6-2-21
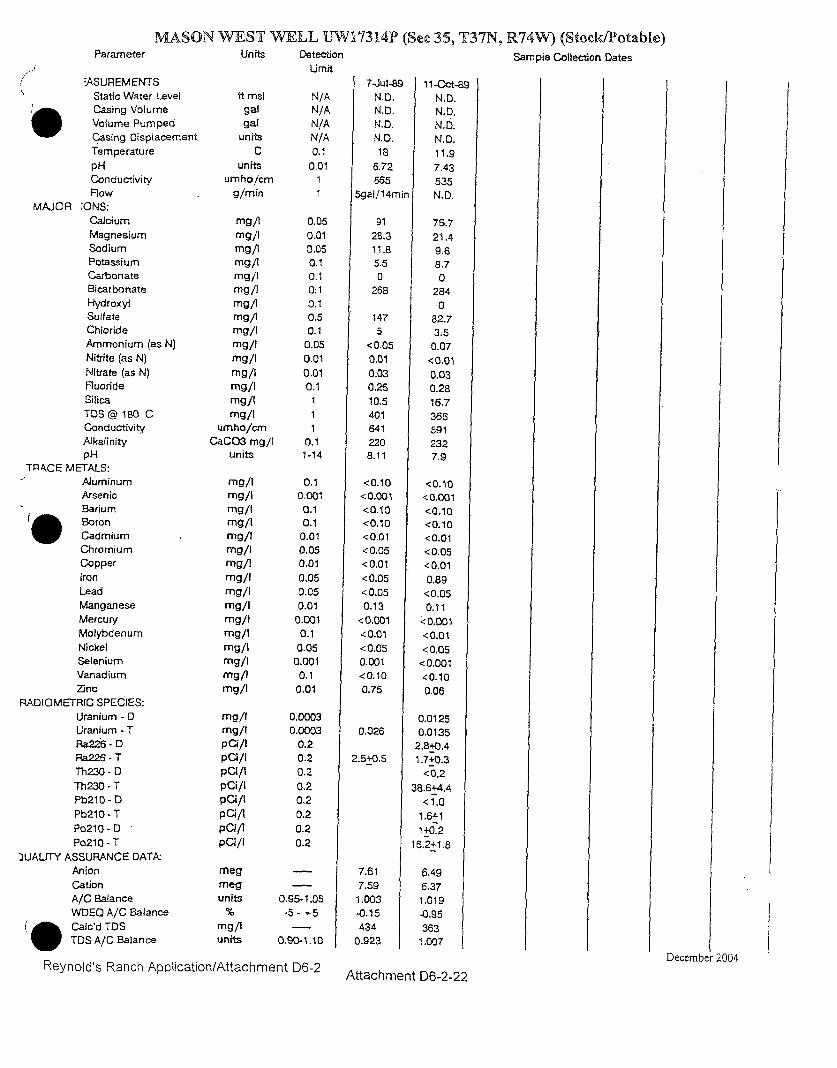
MASON WEST WELL UW17314P (See 35, T37N, R74W) (Stock/Potable)
Parameter Units Detection Sample Collection Dates
LUmit
-ASUREMENTS 7-Jul-89 11-Oct-8.,
Static Water Level ft msl N/A N.D. ND.
Casing Volume gal N/A N.D. N.DZ
Volume Pumped gal N/A N.D. N.D.
Casing Displacement units N/A N.D. N.D.
Temperature C 0.1 18 11.9
pH units 0.01 6.72 7.43
Conductivity umho/cm 1 665 535
Flow g/min 1 5gal/l14min N.D.
MAJOR IONS:Calcium mg/I 0.05 91 76,7
Magnesium mg/I 0.01 28,3 21.4
Sodium mg/I 0.05 11.8 9.6
Potassium mg/I 0.1 5.5 8.7
Carbonate mg/i 0.1 0 0
Bicarbonate mg/I 0:1 268 284
Hydroxyl mg/l 0.1 0
Sulfate mg/I 0.5 147 82.7
Chloride mg/I 0.1 5 15
Ammonium (as N) mg/I 0.05 <0.05 0.07
Nitrite (as N) mg/I 0.01 0.01 <0.01
Nitrate (as N) mg/I 0.01 0.03 0.03
Fluoride mg/I 0.1 0.26 0.28
Silica mg/I 1 10.5 15.7
TDS @ 180 C mg/I 1 401 366
Conductivity umho/cm 1 641 591
Alkalinity CaCO3 mg/I 0.1 220 232
pH units 1-14 8.11 7.9
TRACE METALS:Aluminum mg/I 0.1 <0.10 <0.10
Arsenic mg/I 0.001 <0.001 <0.001
Barium mg/I 0.1 <0.10 <0.10
Boron rngI 0.1 <0.10 <0.10
Cadmium mg/I 0.01 <0.01 <0.01
Chromium mg/I 0.05 <0.05 <0.05
Copper mg/A 0.01 < 0.01 <0.01
Iron mg/I 0.05 <0.05 0.89
Lead mg/I 0.05 < 0.05 <0.05
Manganese mg/I 0.01 0.13 0.11
Mercury mg/I 0.001 <0.001 <0.001
Molybdenum mg/I 0.1 < 0.01 <0.01
Nickel mg/I 0.05 < 0.05 <0.05
Selenium mg/I 0.001 0.001 <0.001
Vanadium mg/I 0.1 <0.10 <0.10
Zinc mg/I 0.01 0.75 0.06
RADIOMETRIC SPECIES:Uranium - D mg/I 0.0003 0.0125
Uranium - T mg/I 0.0003 0.026 0.0135
Ra226 - D pai/I 0.2 2.8+0.4
Ra226 - T pCi/I 0.2 2.5+0.5 1.7+0.3
Th230 - D pCi/I 0.2 <0.2
Th230 - T pCi/I 0.2 38.6+4.4
Pb210 - D pCi/I 0.2 < 1.0
Pb210 - T pCi/i 0.2 1.6+1
Po210- D pCi/I 0.2 1+0.2
Po210 - T pCi/I 0.2 16.2+1.8
)UALITY ASSURANCE DATA.Anion meg - 7.61 6.49
Cation meg - 7.59 6.37
A/C Balance units 0.95-1.05 1.003 1.019
WDEQ A/C Balance % -5- +5 -0.15 -0.95
* Calc'd TDS mg/l - 434 363
TDS A/C Balance units 0.90-1.10 0.923 1.007
. .. .. December 2004
R~eynoldI's Rnh(3ll Applicationl/Attachlment D6-2 Attachment D6-2-22
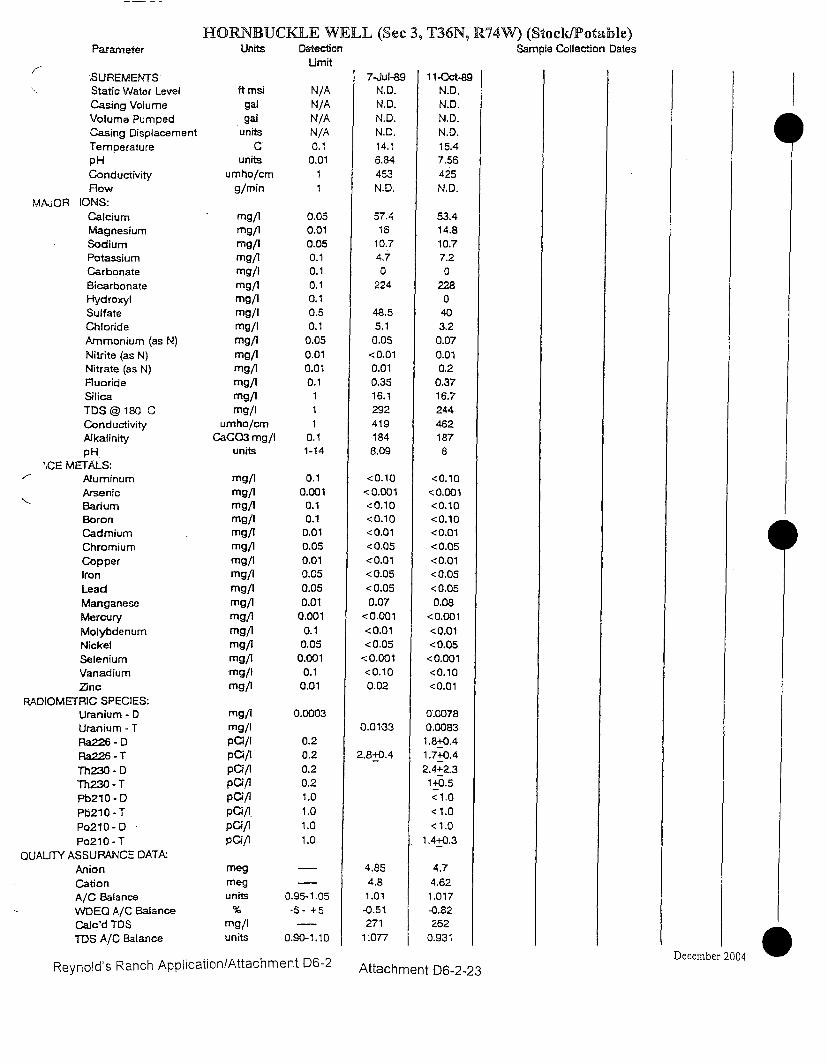
Parameter
-SUREMENTSStatic Water Level
Casing VolumeVolume PumpedCasing DisplacementTemperaturepHConductivityFlow
MAJOR IONS:CalciumMagnesiumSodiumPotassiumCarbonateBicarbonateHydroxylSulfateChlorideAmmonium (as N)
Nitrite (as N)Nitrate (as N)
FluorideSilicaTDS @ 180 C
ConductivityAlkalinitypH
"•CE METALS:AluminumArsenicBariumBoronCadmiumChromiumCopperIronLead
ManganeseMercuryMolybdenumNickelSeleniumVanadiumZnc
RADIOMETRIC SPECIES:Uranium - DUranium - TRa226 - DRa226 - T
Th230 - DTh230 - TPb210 - D
Pb210 - T
Po210- DPo210 - T
QUALITY ASSURANCE DATA-
AnionCationA/C BalanceWDEQ A/C Balance
Calc'd TDSTOS A/C Balance
HORNBUCKLE WELL (Sec 3, T36N, R74W) (Stock/Potable)Units Detection Sample Collection Dates
Umit
ft msjgal
galunits
Cunits
umho/cmg/min
mg/Img/1mg/img/img/Img/Img/Img/Img/Img/img/Img/Img/img/img/I
umho/cmCaCO3 mg/I
units
mg/img/Img/Img/1mg/Img/Img/img/Img/Img/Img/Img/Img/img/Img/I
mg/Img/IpCI/IpappappCap
pappCi/IpCi/I
•megmegunits
mg/Iunits
N/AN/AN/AN/A0.10.01
0.050.010.050.10.10.10.10.50.1
0.05
0.010.010.1
0.11-14
0.10.0010.10.10.01
0.050.010.050.050.01
0.001
0.10.050.0010..10.01
0.0003
0.2
0.2
0.20.21.0
1.0
1.01.0
0.95-1.05-5- +5
0.90-1.10
7-Jul-89N.D.N.D.N.D.N.D.14.16.84453N.D.
57.416
10.74.70
224
48.55.10.05<0.010.010.3516.12924191848.09
<0.10<0.001<0.10<0.10<0.01<0.05<0.01< 0.05<0.050.07
<0.001<0.01<0.05
<0.001<0.100.02
0.01-33
2.8+0.4
4.854.81.01-0.512711.077
11-Oct-89N.D.N.D.N.D.N.D.15.47.56425N.D.
53.414.810.77.20
2280
403.20.070.010.20.3716.72444621878
<0.10<0.001<0.10<0.10<0.01<0.05<0.01<0.05<0.050.08
<0.001<0.01<0.05<0.001<0.10<0.01
0.00780.00831.8+0.41.7+0.42.4+2.3
1+0.5< 1.0<1.0< 1.0
1.4+0.3
4.74.62
1.017-0.82262
0.931 10ADecember
Reynold's Ranch Application/AttachmentAttachment D6-2•VU•
Attachment D6-2-23
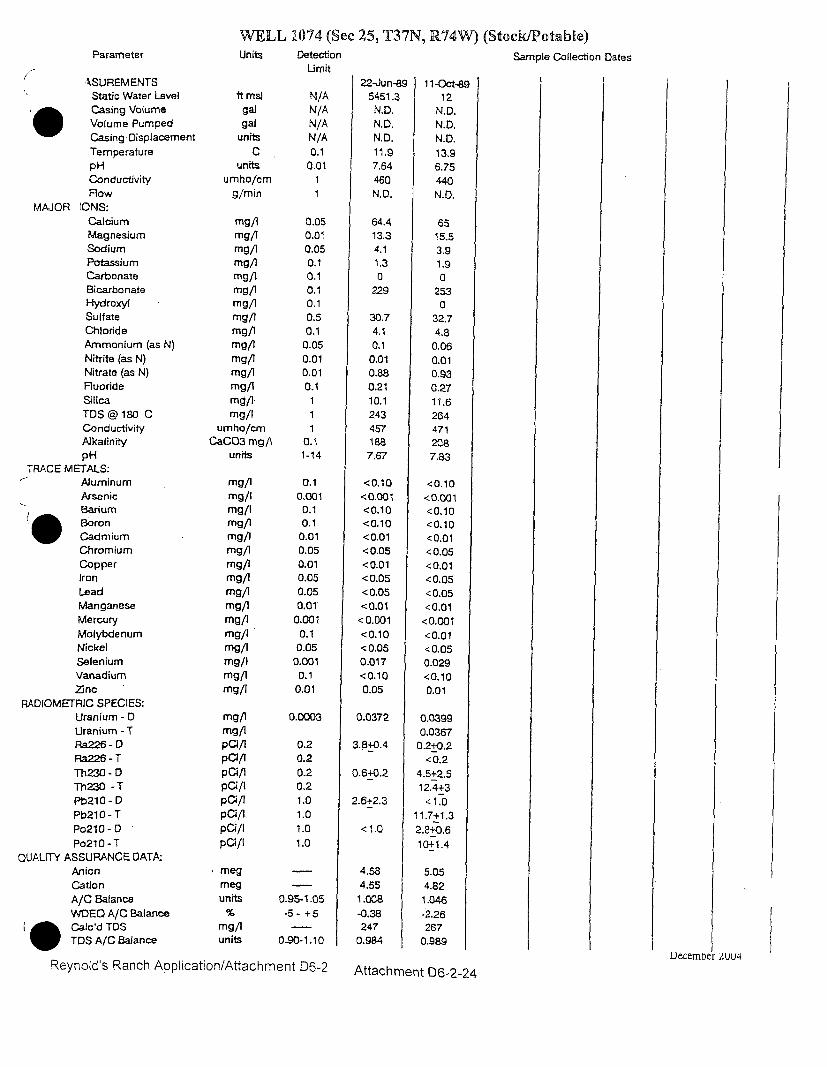
WELL 1074 (See 25, T37N, R74W) (Stock/Potable)
Parameter
ASUREMENTSStatic Water Level
Casing Volume
Volume Pumped
Casing DisplacementTemperature
pHConductivityFlow
MAJOR IONS:CalciumMagnesiumSodiumPotassiumCarbonateBicarbonateHydroxylSulfateChlorideAmmonium (as N)
Nitrite (as N)
Nitrate (as N)
FluorideSilicaTOS @ 180 C
ConductivityAlkalinitypH
TRACE METALS:AluminumArsenicBariumBoronCadmiumChromiumCopperIronLeadManganeseMercuryMolybdenumNickelSeleniumVanadiumZinc
RADIOMETRIC SPECIES:Uranium - D
Uranium - T
Ra226 - D
Ra226 -TTh230 - D
Th230 -T
Pb210 - D
Pb210 - T
Po210- D
Po210 - T
QUALITY ASSURANCE DATA-
AnionCation
A/C Balance
WOEC A/C Balance
( • Calc'd TDS
TDS A/C Balance
Units DetectionLimit
ft ms)galgal
unitsC
unitsumho/cm
g/min
mg/1mg/lmg/1mg/Img/Img/1mg/Img/Irmg/mg/Img/Img/Img/lmg/Img/I
umho/cmCaCO3 mg/I
units
mg/Img/Img/Img/Img/Img/Img/Img/Img/Img/Img/Img/img/Img/Img/Amg/I
mg/img/IpCi/IpCI/pCI/IpCI/lpCI/IpCi/I.pci/IpCi/I
megmegunits
mg/Iunits
N/AN/AN/AN/A0.10.01
11
0.050.010.050.10.10.10.10.50.1
0.050.010.010.1
111
0.11-14
0.10.001
0.10.10.010.050.010.050.050.01
0.001
0.10.05
0.0010.1
0.01
0.0003
0.20.20.20.2
1.01.01.01.0
0.95-1.05
-5- +5
0.90-1.10
22-Jun-895451.3
N.D.N.D.N.D.11.97.64460N.D.
64.413.34.11.30
229
30.74.10.10.010.880.2110.12434571887.67
<0.10<0.001<0.10<0.10<0.01<0.05<0.01<0.05< 0.05
<0.01<0.001<0.10< 0.050.017<0.100.05
0.0372
3.8+0.4
0.64-0.2
2.6+2.3
< 1.0
4.584.551.008-0.38247
0.984
11-Oct-8912
N.D.N.D.N.D.13.96.75440N.D.
6515.53.91.90
2530
32.74.80.060.010.930.2711.62644712087.83
<0.10<0.001<0.10<0.10<0.01< 0.05<0.01<0.05< 0,05<0.01<0.001<0,01<0.050.029<0.100.01
0.03990.03670.2+0.2
<0.24.5+2.512.4+3
<1,011.7+1.32.8+0.610+1.4
5.054.821.046-2.26267
0.989
Sample Collection Dates
Reynold's Ranch Application/Attachment D6-2 Attachment D6-2-24
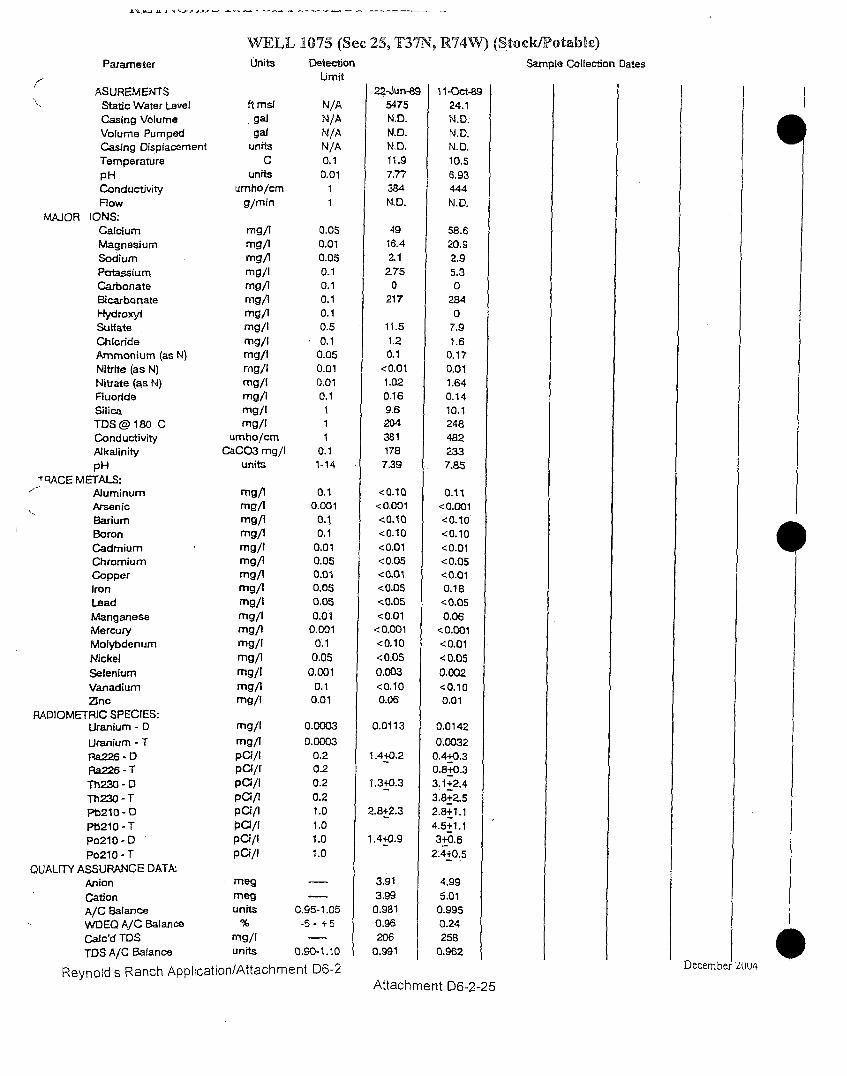
WELL 1075 (Sec 25, T37N, R74W) (Stock/Potable)
Parameter Units Detection Sample Collection Dates
LUmit
ASUREMENTS 22-Jun-89 11-Oct-89
Static Water Level ft ms! N/A 5475 24.1
Casing Volume gal N/A N.D. N.D.
Volume Pumped gal N/A NZD. N.D.
Casing Displacement units N/A N.D. N.D.
Temperature C 0.1 11.9 10.5
pH units 0.01 7.77 6.93
Conductivity umho/cm 1 384 444
Flow g/min 1 ND. N.D.
MAJOR IONS:Calcium mg/i 0.0S 49 58.6
Magnesium mg/1 0.01 16.4 20.9
Sodium mg/1 0.05 2.1 2.9
Potassium mg/I 0.1 275 5.3
Carbonate mg/1 0.1 0 0
Bicarbonate mg/i 0.1 217 284
Hydroxyl mg/i 0.1 0
Suffate mg/I 0.5 11.5 7.9
Chloride mg/I 0.1 1.2 1.6
Ammonium (as N) mg/I 0.05 0.1 0.17
Nitrite (as N) mg/I 0.01 <0.01 0.01
Nitrate (as N) mg/I 0.01 1.02 1.64
Fluoride mg/i 0.1 0.16 0.14
Silica mg/I 1 9.6 10.1
TDS @ 180 C mg/I 1 204 248
Conductivity umho/cm 1 381 482
Alkalinity CaCO3 mg/I 0.1 178 233
pH units 1-14 7.39 7.85
T RACE METALS:Aluminum mg/i 0.1 <0.10 0.11
Arsenic mg/i 0.001 <0.001 <0.001
Barium mg/I 0.4 <0.10 <0.10
Boron mg/i 0.1 <0.10 <0.10
Cadmium mg/I 0.01 <0.01 <0.01
Chromium mg/1 0.05 <0.05 <0.05
Copper mg/i 0.01 <0.01 <0.01
Iron mg/i 0.05 <0.05 0.18
Lead mg/I 0.05 <0.05 <0.05
Manganese mg/I 0.01 <0.01 0.06
Mercury mg/i 0.001 <0.001 <0.001
Molybdenum mg/I 0.1 <0.10 <0.01
Nickel mg/I 0.05 < 0.05 < 0.05
Selenium mg/I 0.001 0.003 0.002
Vanadium mg/i 0.1 <0.10 <0.10
Znc mg/i 0.01 0.06 0.01
RADIOMETRIC SPECIES:Uranium - D mg/I 0.0003 0.0113 0.0142
Uranium - T mg/i 0.0003 0.0032
Ra226 - D pCi/I 0.2 1.4+0.2 0.4+0.3
Ra226 - T PCO/i 0.2 0.8+0.3
Th230-D pCi/I 0.2 1.3+0.3 3.1+2.4
Th230 - T pCA/i 0.2 3.8+2.5
Pb210 - D PCI/i 1.0 2.8+2.3 2.8+1.1
Pb210 - T pCa/I .0 4.5+1.1
Po210 - D pCa/I 1.0 1.4+0.9 3+0.6
Po210 - T pCi/I 1.0 2.4+0.5
QUAL"TY ASSURANCE DATXAnion meg - 3.91 4.99
Cation meg - 3,99 5.01
A/C Balance units 0.95-1.05 0.981 0.995
" WDEQ A/C Balance % -5- +5 0.96 0.24
Calc'd TOS mg/I - 206 258
TDS A/C Balance units 0.90-1.10 0.991 0.962... k., •,.I- A-,r.li,...•i,,-n/Affac"hmenf D6l-2 December 2UU4
Meynold s Ranc HH '-ýAttachment D6-2-25
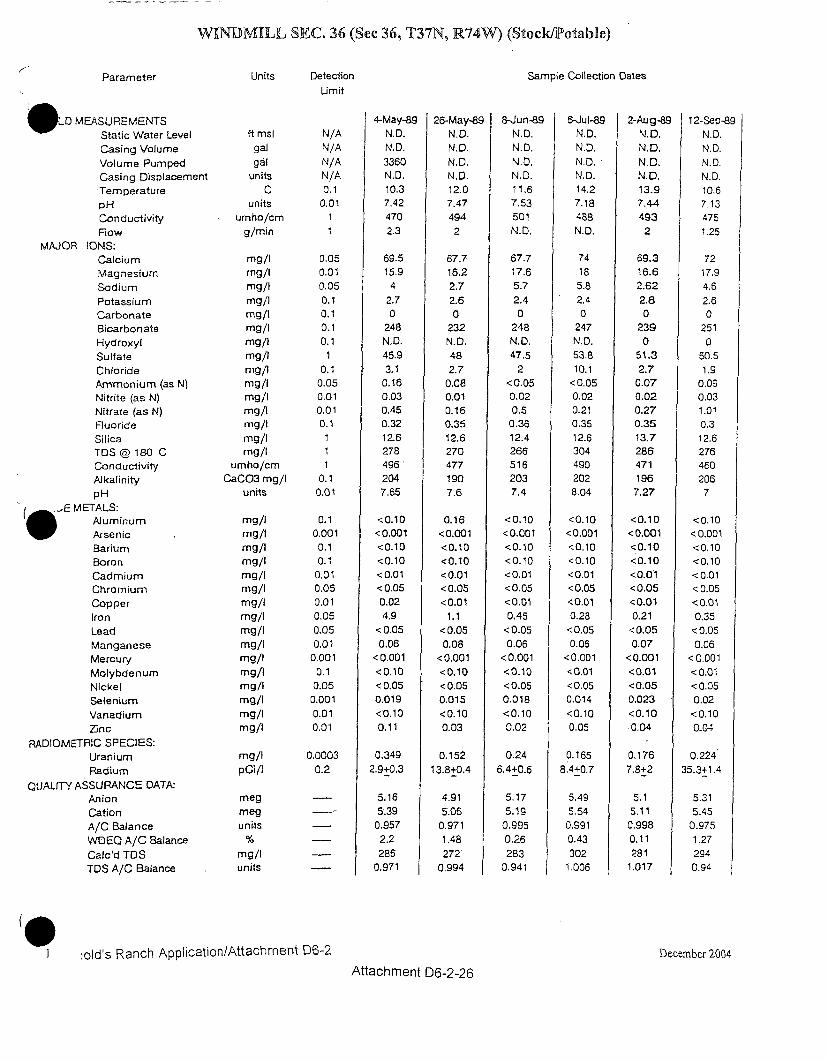
WINDMILL SEC. 36 (See 36, T37N, R74W) (Stock/Potable)
Parameter Units DetectionLimit
Sample Collection Dates
. LO MEASUREMENTSStatic Water Level
Casing VolumeVolume PumpedCasing DisplacementTemperaturepHConductivityFlow
MAJOR IONS:CalciumMagnesiumSodiumPotassiumCarbonateBicarbonateHydroxylSulfateChlorideAmmonium (as N)Nitrite (as N)Nitrate (as N)FluorideSilicaTDS @ 180 CConductivityAlkalinitypH
-E METALS:AluminumArsenicBariumBoronCadmiumChromiumCopperIronLeadManganeseMercuryMolybdenumNickelSeleniumVanadiumZ~nc
RADIOMETRIC SPECIES:UraniumRadium
QUALITY ASSURANCE DATA.AnionCationA/C BalanceWOEQ A/C Balance
Calc'd TDSTDS A/C Balance
ft mslgal
galunits
Cunits
umho/cmg/min
mg/Img/Img/Img/Img/Img/Img/lmg/Img/Img/Img/Img/Img/Img/Img/I
umho/cmCaC03 mg/I
units
mg/Img/Img/Img/Img/Img/Img/Img/Img/Img/Img/Img/Img/Img/lmg/Img/I
mg/IpOi/I
N/AN/AN/AN/A0.10.01
11
0.050.010.050.10.10.10.1
I
0.10.050.010.010.1
111
0.10.01
0.10.001
0.10.10.010.050.01
0.05O0,5
0.010.001
0.1• 0.050.0010,010.01
0.00030.2
4-May-89 26-May-89 8-Jun-89 6-Jul-89
N.D. N.D. N.D. N.D.
N.D. N.D. N.D. ND.
3360 N.D. N.D. N.D.
N.D. N.D. N.D. N.D.
10.3 12.0 11.6 14.2
7.42 7.47 7.53 7.18
470 494 501 488
2.3 2 N.D. N.D.
69.515.94
2.70
248N.D.45.93.1
0.160.030.450.3212.6278496'2047.65
<0.10<0.001<0.10<0.10<0.01< 0.050.024.9
<0.050.06
<0.001<0.10< 0,050.019<0.100.11
0.3492.9+0.3
5.165.390.957
2.2286
0.971
67.716.22.72.60
232N.D.482.70.080.010.160.3512.62704771907.6
0.16<0.001<0.10<0.10<0.01<0.05<0.01
1.1< 0.050.08
<0.001<0.10<0.050.015<0.100.03
0.15213.8+0.4
4.915.*060.9711.48272
0.994
67.717.65.72.40
248N.D.47.5
2<0.050.020.50.3612.42665162037.4
<0.10<0.001<0.10<0.10<0.01<0.05<0.010.45
<0.050.06
< 0.001<0.10<0.050.018<0.100.02
0.24
6.4+0.6
5.175.190.9950.26283
0.941
7418
5.82.40
247N.D.53.810.1
<0.050.020.210.3512.63044902028.04
<0.10<0.001<0.10<0.10<0.01<0.05<0.010.28
< 0.050.06
<0.001<0.01<0.050.014<0.100.05
0.1658.4+0.7
5.495.54
0,9910.43302
1.006
2-Aug-89N. D.N.D.N.D.N.D.13.97.444932
69.316.62.622.80
2390
51.32.7
0.070.020.270.3513.72864711967.27
<0.10<0.001<0.10<0.10<0.01<0.05<0.010.21<0.050.07
<0.001<0.01<0.050.023<0.10.0.04
0.1767.8+2
5.15.110.9980.11281
1.017
12-Sep-89N.D.N.D.N. D.N.D.10.67.134751.25
7217.94.62.60
2510
50.51.9
0.090.031.010.3
12.62764602067
<0,10< 0.001<0.10<0.10< 0.0.1< 0.05<0.010.35<0.050.06
<0.001<0.01<0.050.02<0.100.04
0.22435.3+1.4
5.315.45
0.9751.272940.94
megmegunits
mg/Iunits
jold's Ranch Application/Attachment D6-2 December 2004
Attachment D6-2-26
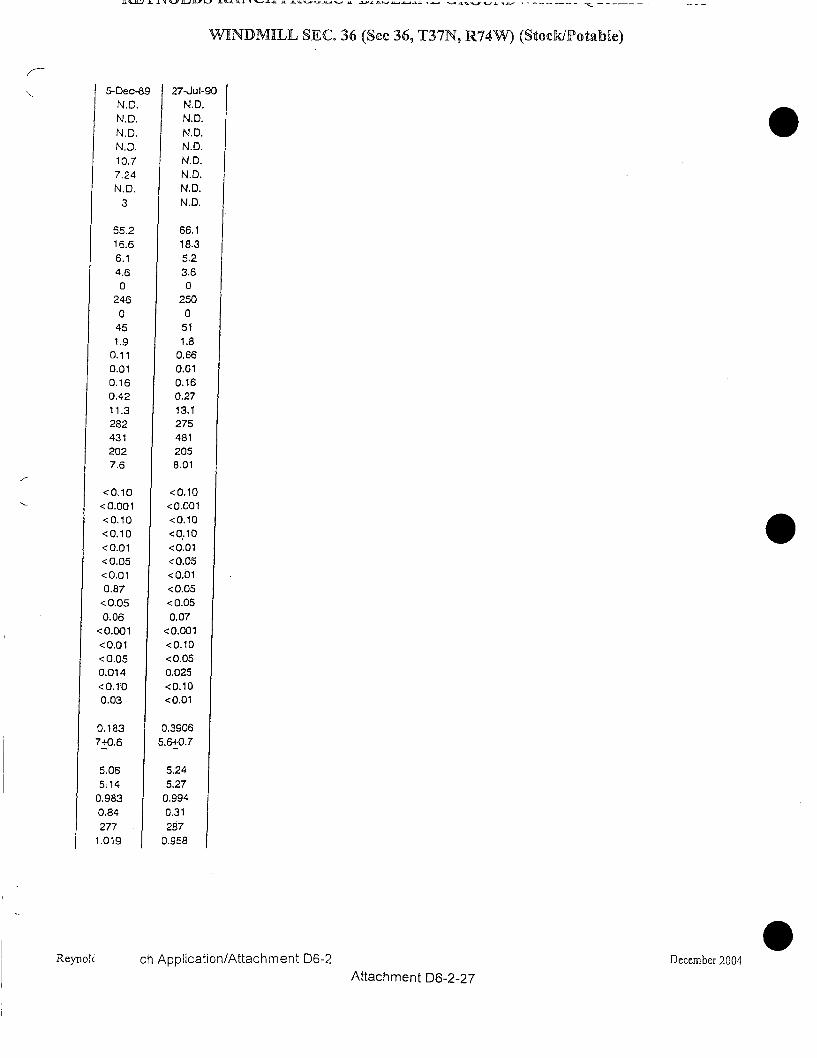
WINDMILL SEC. 36 (See 36, T37N, R74W) (Stock/Potable)
5-Dec-89 27-Jul-90
N.D. N.D.N.D. N.D.
N.D. N.D.N.D. N.D.
10.7 N.D.7.24 N.D.N.D. N.D.
3 N.D.
65.2 66.116.6 18.3
6.1 5.24.6 3.60 0
246 250
0 045 51
1.9 1.80.11 0.660.01 0.010.16 0.160.42 0.2711.3 13.1282 275431 481202 2057.6 8.01
<0.10<0.001<0.10<0.10<0.01<0.05<0.010.87
< 0.050.06
<0.001<0.01<0.050.014<0.1:00.03
<0.10<0.001<0.10<0.10<0.01< 0.05<0.01<0.05<0.050.07
<0.001<0.10<0.050.025<0.10<0.01
0.1837+0.6
5.065;140.9830.84277
1.019
0.39065.6+0.7
5.245.270.9940.31287
0.958
Reynol( ch Application/Attachment D6-2 December 2004
Attachment D6-2-27
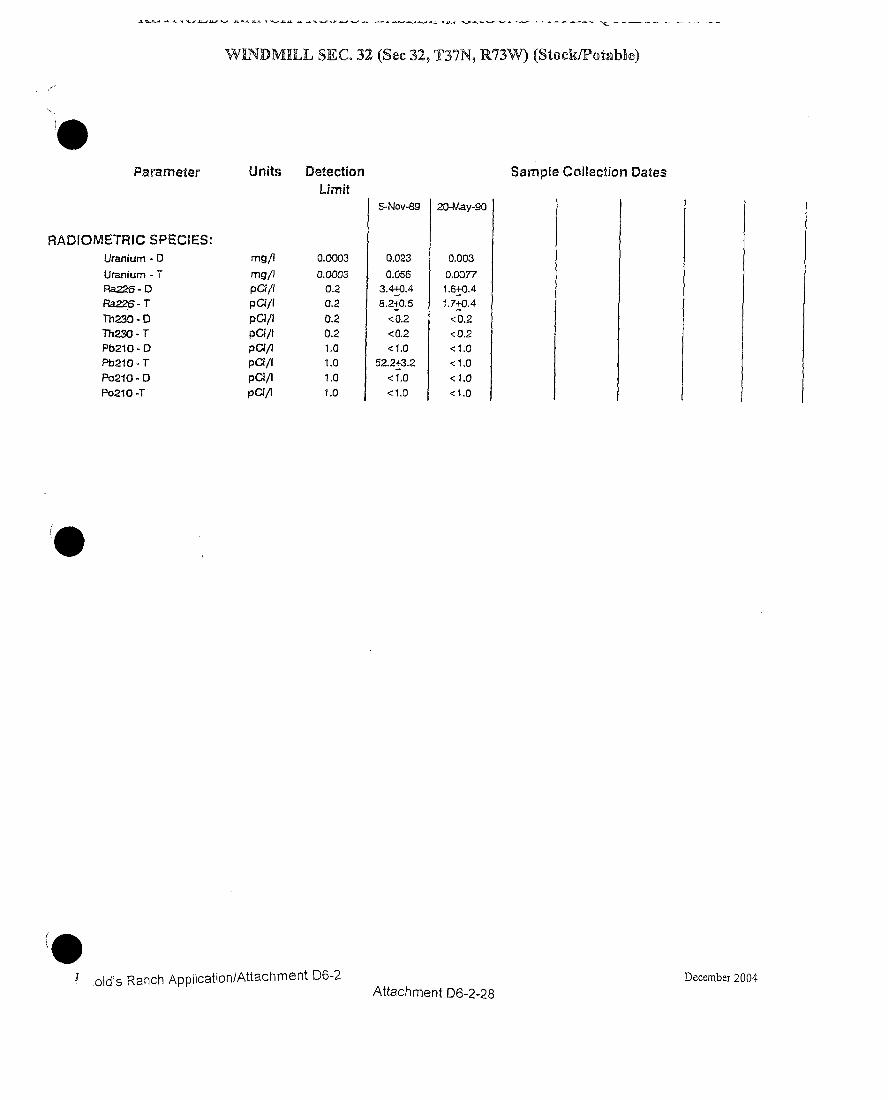
WINDMILL SEC. 32 (Sec 32, T37N, R73W) (StockfPotable)
Parameter Units DetectionLimit
Sample Collection Dates
5-Nov-89
RADIOMETRIC SPECIES:Uranium - D
Uranium - TRa226- DRa226 - T
Th230 - D
Th230 - TPb21O - DPb21O - T
Po210 - 0Po210 -T
20-May-90
0.003
0.00771.6+0.44. Ai.
mg/1mg/I
pCl/l
PCI/IpCVI/PallPc./1
PCO
0.0003
0.00030.20.2
0.20.21.01.0
1.01.0
0.023
0.0563.4+0.4
8.2+0.5
<0.2
<0.2<1.0
52.2+3.2
<1,0<1.0
<0.2<0.2<1.0<1.0< 1.0
<1.0
old's Ranch Application/Attachment D6-2 December 2004
Attachment D6-2-28
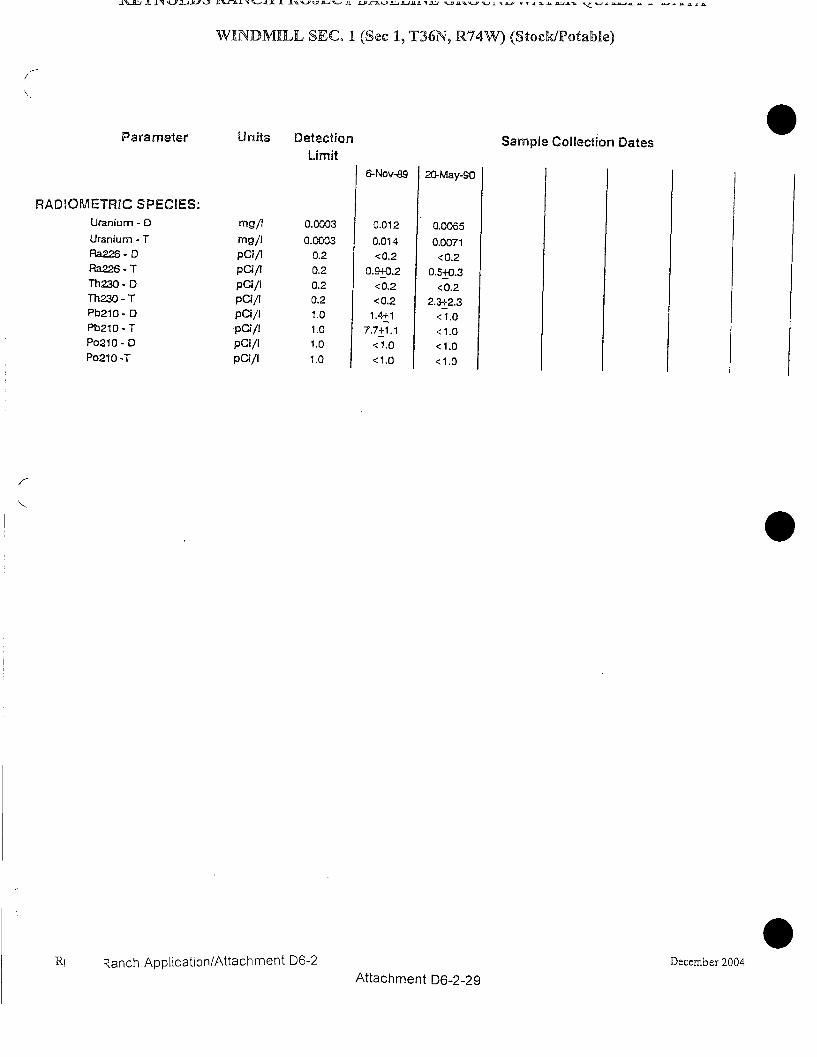
KtLh,.2iNJP iLiýY tl JM 1 4.-..L-K.1 A 0- ý A- IfkB2.J. -P2 '-Si , -f'i -J - -P -V 1 1 - --~k' ~ 1kk1.III
WINDMILL SEC. 1 (Sec 1, T36N, R74W) (Stock/Potable)
Parameter Units DetectionLimit
Sample Collection Dates
RADIOMETRIC SPECIES:Uranium - D
Uranium - T
Ra226 - D
Ra226 - T
Th230 - D
Th230 - TPb210- DPb210 - T
Po210 - D
P0210 -T
mg/i
mg/i
PC;/]PC•p
PCI/!pCi/iPCI/IPCi/IpCi/I
pCI/I
0.0003
0.00030.2
0.2
0.20.21.01.01.0
1.0
6-Nov-89 20-May-90
0.012 0.0065
0.014 0.0071<0.2 <0.2
0.9+0.2 0.5+0.3
<0.21.4+1
7.7+1.1<1.0<1,0
<U.2-
2.3+2.3< 1.0
< 1.0<1.0
<1.0
Ri Rýanch Application/Attachment D6-2 December 2004
Attachment D6-2-29
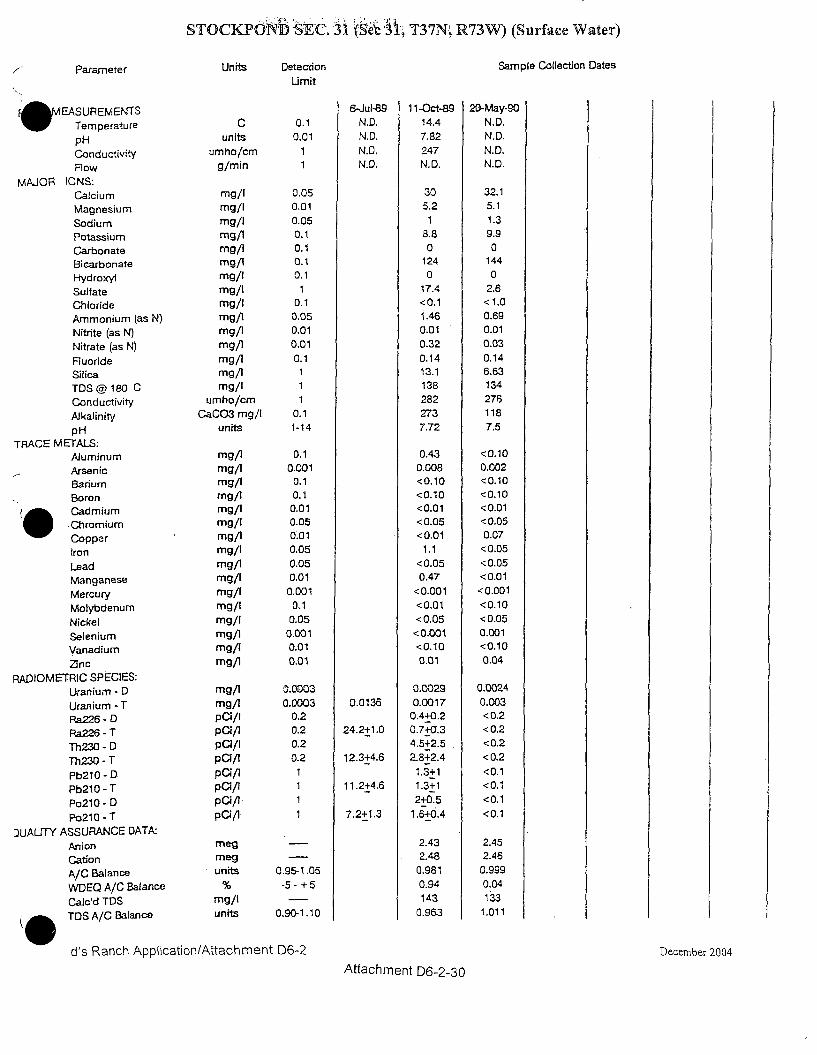
STOCKPONO -SEC 31 (SeA -n T37N; R73W) (Surface Water)
K Parameter Units Detection Sample Collection Dates
Limit
MEASUREMENTS 6-Jul-89 1 1-Oct-89 20-May-90
Temperature C 0.1 N.D. 14.4 N.D.
pH units 0.01 N.D. 7.82 N.D.
Conductivity umho/cm 1 N.D. 247 N.D.
Flow g/min 1 N.D. N.D. N.D.
MAJOR IONS:Calcium mg/I 0.05 30 32.1
Magnesium mg/I 0.01 5.2 5.1
Sodium mg/I 0.05 1 1.3
Potassium mg/il 0.1 8.8 9.9
Carbonate mg/l 0.1 0 0
Bicarbonate mg/1 0.1 124 144
Hydroxyl mg/i 0.1 0 0
Sulfate mg/I 1 17.4 2.6
Chloride mg/I 0.1 <0.1 < 1.0
Ammonium (as N) mg/i 0.05 1.46 0.69
Nitrite (as N) mg/i 0.01 0.01 0.01
Nitrate (as N) mg/1 0.01 0.32 0.03
Fluoride mg/i 0.1 0.14 0.14
Silica mg/i 1 13.1 6.63
TDS @ 180 C mg/I 1 138 134
Conductivity umho/cm 1 282 276
Alkalinity CaCO3 mg/I 0.1 273 118
pH units 1-14 7.72 7.5
TRACE METALS:Aluminum mg/i 0.1 0.43 <0.10
Arsenic mg/i 0.001 0.008 0.002
Barium mg/I 0.1 <0.10 <0.10
Boron mg/1 0.1 <0.10 <0.10
Cadmium mg/i 0.01 <0.01 <0.01
• Chromium mg/i 0.05 < 0.05 < 0.05
Copper mg/I 0.01 <0.01 0.07
Iron mg/I 0.05 1.1 <0.05
Lead mg/i 0.05 <0.05 <0.05
Manganese mg/l 0.01 0.47 <0.01
Mercury mg/I 0.001 <0.001 <0.001
Molybdenum mg/I 0.1 <0.01 <0.10
Nickel mg/i 0.05 < 0.05 < 0.05
Selenium mg/i 0.001 <0.001 0.001
Vanadium mg/i 0.01 <0.10 <0.10
Zinc mg/i 0.01 0.01 0.04
RADIOMETRIC SPECIES:Lranium -:D mg/i 0.O03 0.0029 0.0024
Uranium - T mg/i 0.0003 0.0136 0.0017 0.003
Ra226 - D pCi/i 0.2 0.440.2 <0.2
Ra226 - T pCi/i 0.2 24.2+1.0 0.7_+0.3 < 0.2
Th230 - D pCi/I 0.2 4.5+2.5 <0.2
Th230 - T pCi/ 0.2 12.3+4.6 2.8+2.4 <0.2
Pb210 - D paAi 1 1.3+1 <0.1
Pb210 - T pCI/I 1 11.2+4.6 1.3+1 <0.1
Po210 - D p/Ci/ 1 2+0.5 <0.1
Po210 - T pCi/1 1 7.2+1.3 1.6+-0.4 <0.1
DUALUTY ASSURANCE DATA:Anion meg - 2.43 2.45
Cation meg - 2.48 2.46
A/C Balance units 0.95-1.05 0,981 0.999
WDEQ A/C Balance % -5- + 5 0.94 0.04
Cajc'd TOS mg/I - 143 133
TOS A/C Balance units 0.90-1.10 0.963 1.011
d's Ranch Application/Attachment D6-2 December 2004
Attachment D6-2-30
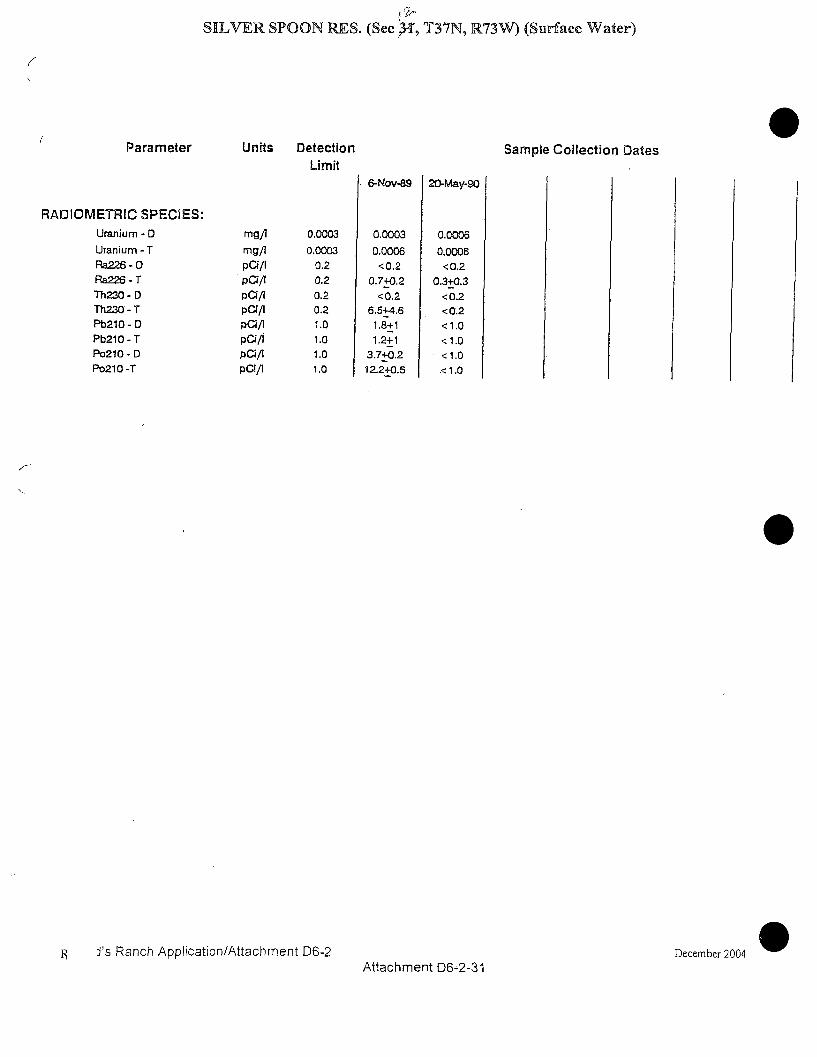
SILVER SPOON RES. (See ý4, T37N, R73W) (Surface Water)
0Parameter
RADIOMETRIC SPECIES:
Uranium - 0
Uranium - TRa226 - DRa226 - T
Th230 - DTh230 - T
Pb210 - DPb210 - TPo210- DPo210 -T
Units DetectionLimit
Sample Collection Dates
mg/1mg/1pciflPC/I
pCI/IpC/IpclflpCi/IpCi/IpCI/I
0.0003
0.00030.2
0.2
0.20.21.0
1.01.01.0
6-Nov-89
0.0003
0.0006<0.2
0.7+0.2
<0.26.5+4.6
1.8+1
1.2+ 1
3.7+0.212.2+0.5
20-May-90
0,0006
0,0006
<0.20.3+0.3
<0.2<0.2< 1.0
< 1.0< 1.0.< 1.0
December 2004 0. J's Ranch Application/Attachment D6-2Attachment D6-2-31
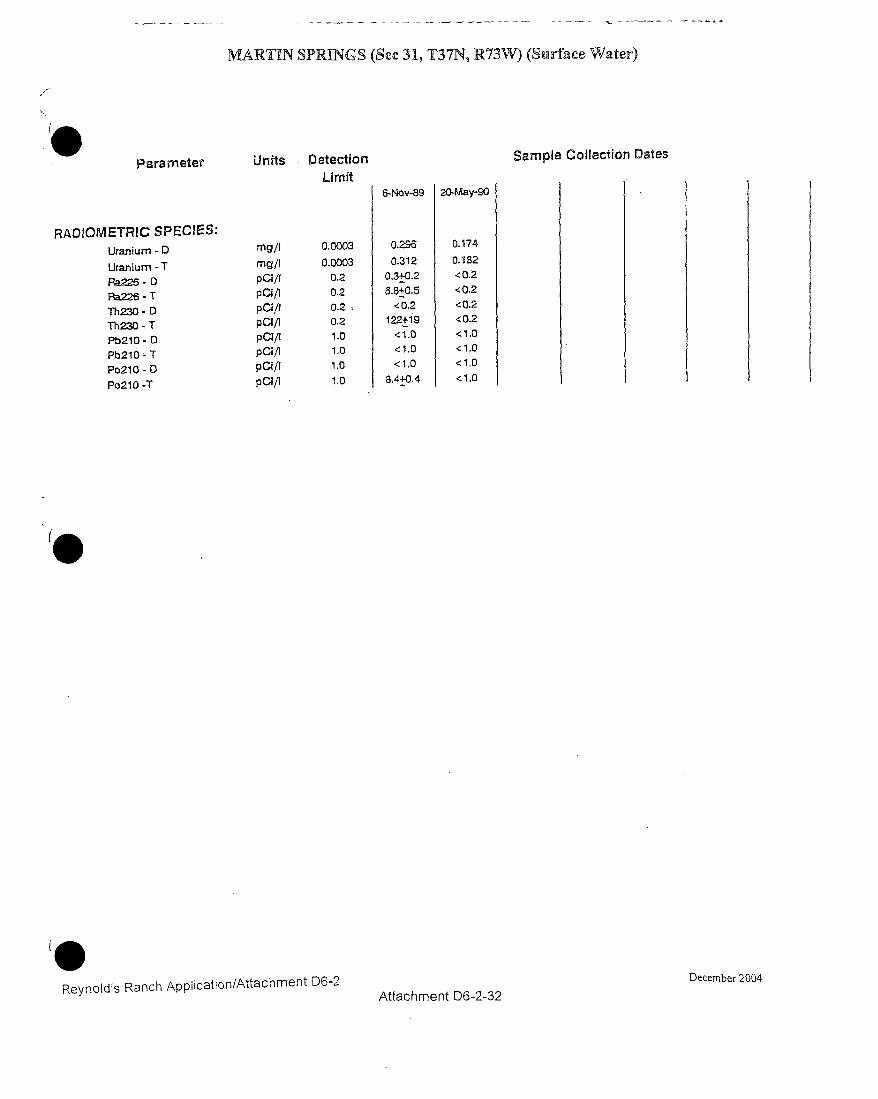
MARTIN SPRINGS (Sec 31, T37N, R73W) (Surface Water)
Parameter
RADIOMETRIC SPECIES:
Uranium - D
Uranium - TRa226 - DRa226 - T
Th230 - DTh230 - TPb210 - DPb210 - T
Po2lo.- D
Pa210 -T
Units DetectionLimit
Sample Collection Dates
mg/Img/I
pCi/fpCi/I
pclp•pcippC~i/
pCi/Ipappcip
0.0003
0.00030.20.20.20.2
1.01.0
1.0
1.0
6-Nov-89
0.296
0.3120.3+0.26.8+0.5
<0.2122+19
<1.0
<1.0
< 1.0
8.4+0.4
20-May-90
0.174
0.182
<0.2
<0.2<0.2<0.2< 1.0<1.0
<1.0<1.0
(0
Reynold's Ranch Application/Attachment D6-2 December 2004Attachment D6-2-32
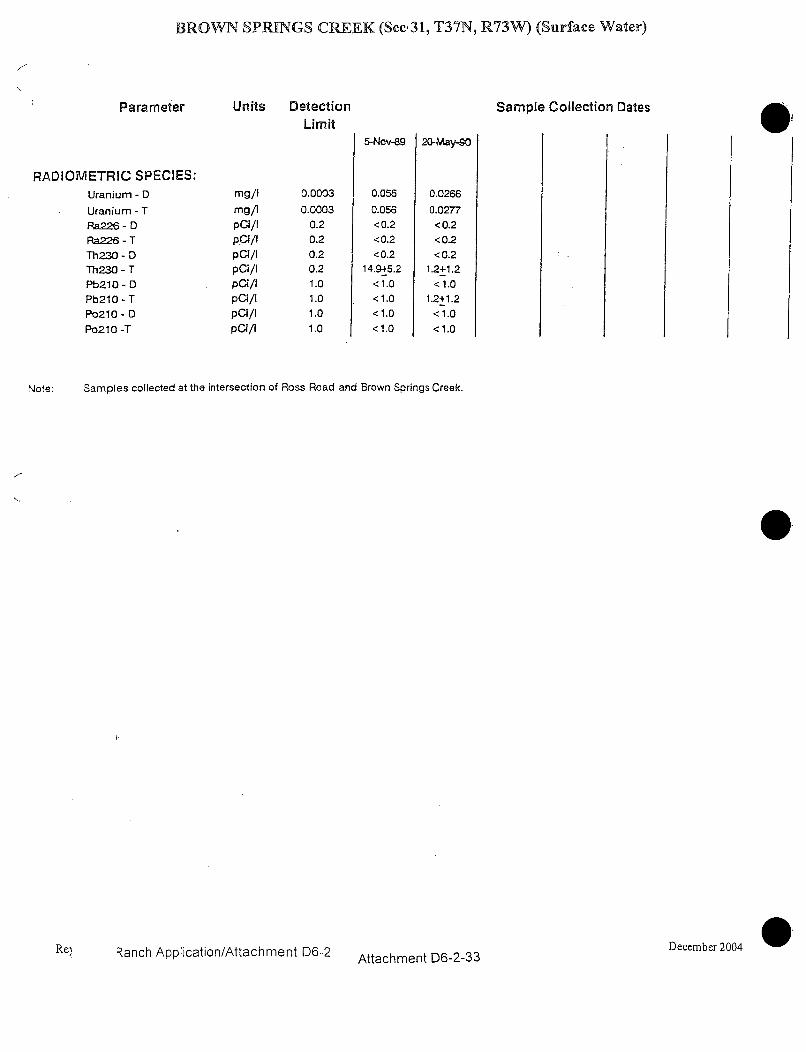
BROWN SPRINGS CREEK (Sec,31, T37N, R73W) (Surface Water)
Parameter
RADIOMETRIC SPECIES:Uranium - D
Uranium - TRa226 - DRa226 - T
Th230 - DTh230 - TPb210 - DPb210 - T
Po210 - D
Po2i0 -T
Units DetectionLimit
Sample Collection Dates
mg/I
mg/1
pCI/IpCI/IpCO/
pC4/IpCi/1
pCi/Ipoi,
0.0003
0.00030.20.20.2
0.21.01.0
1.0
1.0
5-Nov-89
0.056
0.056<0.2<0.2
<0.214.9+5.2
<1.0
<1.0<1.0
<1.0
20-May-90
0.0266
0.0277
<0.2<0.2
<0.21.2+1.2
< 1.01.2+1.2
< 1.0
<1.0
.
Note: Samples collected at the intersection of Ross Road and Brown Springs Creek.
December 2004 0Re. Ranch Application/Attachment D6-2Attachment D6-2-33