high-resolution two-dimensional electrophoresis separation of proteins from metal-stressed rice...
TRANSCRIPT

Electrophoresis 2014, 00, 1–10 1
Florian Weiland1
Carla M. Zammit2
Frank Reith3
Peter Hoffmann1
1Adelaide Proteomics Centre,University of Adelaide,Adelaide, Australia
2Earth Sciences, Universityof Queensland, Brisbane,Australia
3School of Earth andEnvironmental Sciences,University of Adelaide,Adelaide, Australia
Received February 4, 2014Revised February 27, 2014Accepted March 7, 2014
Research Article
High resolution two-dimensionalelectrophoresis of native proteins
Blue native PAGE (BN-PAGE) is a powerful method to separate protein complexes whilepreserving their native state. However, the resolution of the method is limited as complexeswith similar molecular masses cannot be resolved. Here we describe native 2DE usingimmobilized pH-gradients in combination with BN-PAGE to resolve protein complexes bytheir pI and molecular mass. This method enables electrophoretic separation of proteinsbetween pI 3 and 10 and can resolve molecular masses up to 1.2 MDa. Visualized gel spotsat large molecular weight were identified using MS to confirm potential protein complexes.Several protein complexes could be identified, most prominent GroEL in complex withGroES, parts of the ribosomal machinery and membrane transport system. In summary,this method enables easy high-resolution electrophoretic separation of protein complexes.
Keywords:
BN-PAGE / 2DE / IPGs / Native DOI 10.1002/elps.201400060
1 Introduction
The detection and identification of protein complexes in theirnative state is one of the major challenges in Proteomics [1,2].The most widely used method for the analysis of oligomericprotein states is blue-native PAGE (BN-PAGE) (reviewedin [1, 3]). However, a major drawback of BN-PAGE is thelimitation of the molecular mass being the only dimension ofseparation. This results in difficulties to quantify changes inthese complexes due to the colocalization of similar masses.2DE allows the simultaneous resolution of thousands of pro-teins on one gel which overcomes these quantification dif-ficulties [4]. The application of native 2D approaches usingIEF as a first and BN-PAGE as a second dimension havebeen described previously. However, these approaches werelimited to the usage of carrier ampholytes to establish thepH-gradient [5] which results in pH-gradient instability overtime or could only resolve a limited number of proteins [6].Here we describe an improved method for native IEF in IPGsin combination with BN-PAGE. Applying this method, wewere able to achieve highly resolved native 2D gels whereprotein complexes and their charge isoforms between a pI of3 and 10 and with a molecular mass of up to 1.2 MDa can bevisualized.
Correspondence: Dr. Peter Hoffmann, Adelaide Proteomics Cen-tre, The University of Adelaide, Adelaide, South Australia 5005,AustraliaE-mail: [email protected]: +61-8-8313-4362
Abbreviations: BN-PAGE, blue native PAGE; emPAI, ex-ponentially modified protein abundance index; FDC-P1,factor-dependent continuous cell line, Paterson Laborato-ries 1; PPI, protein–protein interactions; TRAP, tripartite ATP-independent periplasmic
2 Materials and methods
2.1 Reagents and samples
IPG strips 3–10 NL (11 cm) and acrylamide were purchasedfrom Bio-rad (Hercules, CA, USA). EZQ protein quantifi-cation kit, Novex Sharp prestained and NativeMark un-stained were purchased from Life Technologies (Carlsbad,CA, USA). Protease inhibitor cocktail (P8340), tricine, im-idazole, sodium thiosulphate, formaldehyde, Tris-bufferedmineral salts medium, sodium gluconate, and Coomassiebrilliant blue G-250 were obtained from Sigma-Aldrich (St.Louis, MO, USA). Urea, sodium chloride, hydrochloric acid,ethanol, methanol, silver nitrate, sodium carbonate, andacetic acid were obtained from Merck (Darmstadt, Germany).CHAPS and PSC Protector reagent were purchased fromRoche (Basel, Switzerland). Pharmalyte 3–10, ammoniumpersulfate, thiourea, coverfluid, glycerol, and TEMED wereobtained from GE Healthcare LS (Uppsala, Sweden). Lowmelt agarose was from Probiogen (Berlin, Germany). Glycinewas purchased from AMRESCO (Solon, OH, USA). 2,2-Dithiodiethanol and 2-butanol were purchased from Fluka(St. Louis, MO, USA). PBS was obtained from SA Pathology(Adelaide, SA, Australia). Rapid Fixer was purchased fromAgfa (Mortsel, Belgium).
Cupriavidus metallidurans CH34 was obtained fromDeutsche Sammlung von Mikroorganismen und Zellkul-turen and grown in Tris-buffered mineral salts medium [7]containing 2 g/L sodium gluconate at 30°C with shaking at120 rpm. C. metallidurans CH34 was initially grown on solidmedia and a single colony was picked and grown in liquid me-dia, until the completion of the exponential phase of growth.In 150 mL Erlenmeyer flasks, 10 �L of culture was addedto 40 mL of fresh media and grown to the beginning of theexponential phase. Cultures were left to grow until the end
C© 2014 WILEY-VCH Verlag GmbH & Co. KGaA, Weinheim www.electrophoresis-journal.com

2 F. Weiland et al. Electrophoresis 2014, 00, 1–10
of the exponential phase and the cells were harvested by cen-trifugation at 10 000 rpm for 10 min at 4°C. Cells were thenwashed three times with PBS (137 mM NaCl, 2.7 mM KCl,10 mM Na2HPO4, 2 mM KH2PO4) and stored at −80°C.
Factor-dependent continuous cell line, Paterson Labora-tories 1 (FDC-P1) [8] was grown from a 1 × 10⁵ cell per micro-liter starting culture in 10% fetal calf serum supplementedwith mouse interleukin-3, 5% CO2 atmosphere at 37°C for2 days, the cell count was maintained between 1 × 10⁵ and1 × 106 cells per microliter. Cells were harvested by centrifu-gation with 400 × g for 5 min at room-temperature (RT). Thecell pellet was washed twice with ice-cold PBS and stored at−80°C until further use.
2.2 Protein extraction
Cell pellets were resuspended in 200 �L extraction buffer(96.9% H2O, 1.1% PSC protector reagent, 1% CHAPS, 1%protease inhibitor cocktail) and cell lysis was carried out usinga Bioruptor UDC-200 using the following settings: Output:high, Sonication: 30 s, Pause: 60 s for 7.5 min with a subse-quent exchange of the ice-cold water in the ultrasonic bathand a second cycle of 7.5 min. Cell debris was centrifugeddown at 20 000 × g for 30 min at 4°C. The supernatant wasaliquoted and the protein concentration was determined byan EZQ protein quantification kit according to the manufac-turer’s recommendations. The remaining protein extract wasstored at −80°C until further use.
2.3 Native IEF
IPG strips 3–10 NL (11 cm) were rehydrated overnight in200 �L native rehydration solution (97.5% H2O, 1% pro-tease inhibitor cocktail, 1% CHAPS, 0.5% Pharmalyte 3–10)at room-temperature. Three-hundred micrograms protein ofC. metallidurans CH34 and 500 �g protein of FDC-P1 werefilled up to a volume of 98 �L with extraction buffer and2 �L Pharmalyte 3–10 were added. Samples were appliedby anodal cup-loading. IEF was performed at 15°C using anIPGphor II (GE Healthcare) with following parameters: 90 Vfor 2 h, 180 V for 2 h, 360 V for 2.5 h, ramp-up to 8000 V for1.5 h, 8000 V for 27 000 Vh. After the last step, the voltagewas set to 180 V until the strips were taken off. The currentwas limited to 50 �A per strip.
2.4. Denaturing IEF
The same methodology as under Section 2.3 was applied, de-viating in the use of 200 �L denaturing rehydration solution(6 M urea, 2 M thiourea, 1% CHAPS, 0.5% Pharmalyte 3–10, and 200 mM 2,2-dithiodiethanol) as rehydration buffer.Samples were mixed with denaturing sample buffer (7 Murea, 2 M thiourea, 4% CHAPS) to a total volume of 98 �L todenature the proteins, before IEF 2 �L Pharmalyte 3–10 were
added. IEF was performed at 20°C. All other conditions werethe same as in Section 2.3.
2.5 Equilibration after native and denaturing IEF
IPG strips were incubated in 4 mL equilibration solution(50 mM NaCl, 50 mM imidazole, 10 mM CHAPS, 30% glyc-erol, 0.125% Coomassie brilliant blue G-250, pH 7.0) for30 min on an orbital shaker at 40 rpm. BN-PAGE was con-ducted immediately afterwards.
2.6 BN-PAGE gel casting
15 × 16 × 1 mm3 polyacrylamide gradient gels (T = 4–16%)incorporating a 15 mM imidazole, pH 7.0 buffer system [9]under omission of 6-aminohexanoic acid were cast. Imme-diately afterwards, the gels were overlayed with 1 mL of a2 + 3 mixture of gel buffer and 2-butanol and polymerizedovernight at RT.
2.7 BN-PAGE
Gel buffer and 2-butanol mixture was removed from theheadspace of the cassette and the gel edge was washed withH2O. IPG strips were applied onto the upper edge of thegel. Five microliters NativeMark or Novex sharp prestainedmaker, respectively, was mixed with 1 �L 95% H2O, 5% w/vCoomassie brilliant blue G-250 and 4 �L cathode buffer B/10(50 mM tricine, 7.5 mM imidazole, 0.002% Coomassie bril-liant blue G-250, pH 7.0) [9] and applied using a filter paperplaced on the cathodal side of the IPG strip. For 1D BN-PAGEof the two samples, 2 �L of total lysate of the respective cellline was mixed with 2 �L cathode buffer B/10 and 2 �L 95%H2O, 5% w/v Coomassie brilliant blue G-250 solution andapplied on a filter paper. The strip and filter paper(s) wereoverlayed with 1% agarose in cathode buffer B/10 which wascooled down to RT beforehand. Electrophoresis was carriedout using a SE 600 Ruby System (Hoefer) employing an-ode buffer (25 mM imidazole, pH adjusted to 7.0 with HCl)and cathode buffer B/10 [9]. Following settings were applied:100 V for 30 min, 500 V for 4 h, the current was limited to15 mA per gel; the temperature was set to 4°C.
2.8 Protein visualization
After BN-PAGE, the proteins were fixed into the gels using40% ethanol, 10% acetic acid and placed on an orbital shakerat RT overnight. The next day the proteins were visualizedusing the silver stain protocol according to Blum et al. [10].
2.9 Protein identification
Proteins were cut out manually, washed in 400 �L 50 mMammonium bicarbonate and destained using Rapid Fixer
C© 2014 WILEY-VCH Verlag GmbH & Co. KGaA, Weinheim www.electrophoresis-journal.com
Electrophoresis 2014, 00, 1–10 Proteomics and 2DE 3
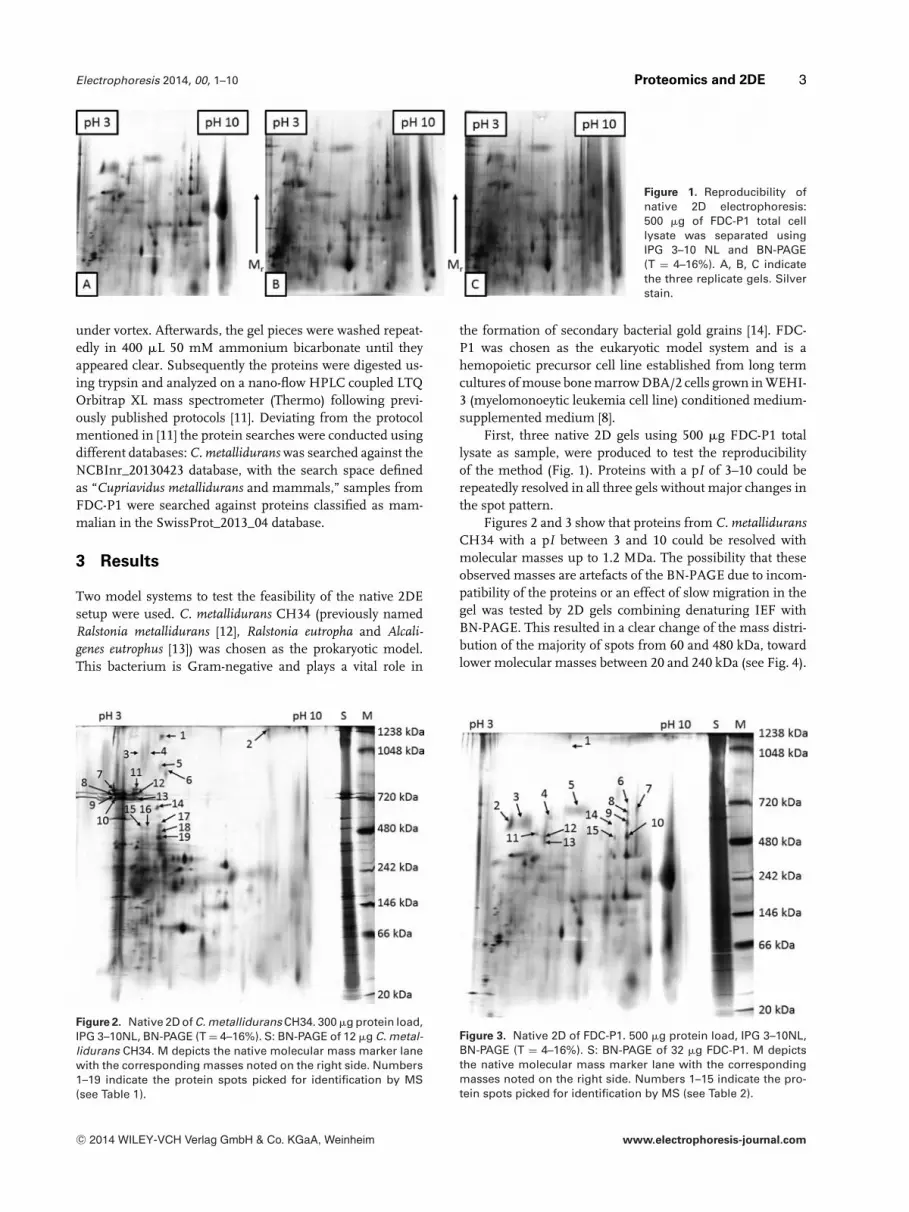
Figure 1. Reproducibility ofnative 2D electrophoresis:500 �g of FDC-P1 total celllysate was separated usingIPG 3–10 NL and BN-PAGE(T = 4–16%). A, B, C indicatethe three replicate gels. Silverstain.
under vortex. Afterwards, the gel pieces were washed repeat-edly in 400 �L 50 mM ammonium bicarbonate until theyappeared clear. Subsequently the proteins were digested us-ing trypsin and analyzed on a nano-flow HPLC coupled LTQOrbitrap XL mass spectrometer (Thermo) following previ-ously published protocols [11]. Deviating from the protocolmentioned in [11] the protein searches were conducted usingdifferent databases: C. metallidurans was searched against theNCBInr_20130423 database, with the search space definedas “Cupriavidus metallidurans and mammals,” samples fromFDC-P1 were searched against proteins classified as mam-malian in the SwissProt_2013_04 database.
3 Results
Two model systems to test the feasibility of the native 2DEsetup were used. C. metallidurans CH34 (previously namedRalstonia metallidurans [12], Ralstonia eutropha and Alcali-genes eutrophus [13]) was chosen as the prokaryotic model.This bacterium is Gram-negative and plays a vital role in
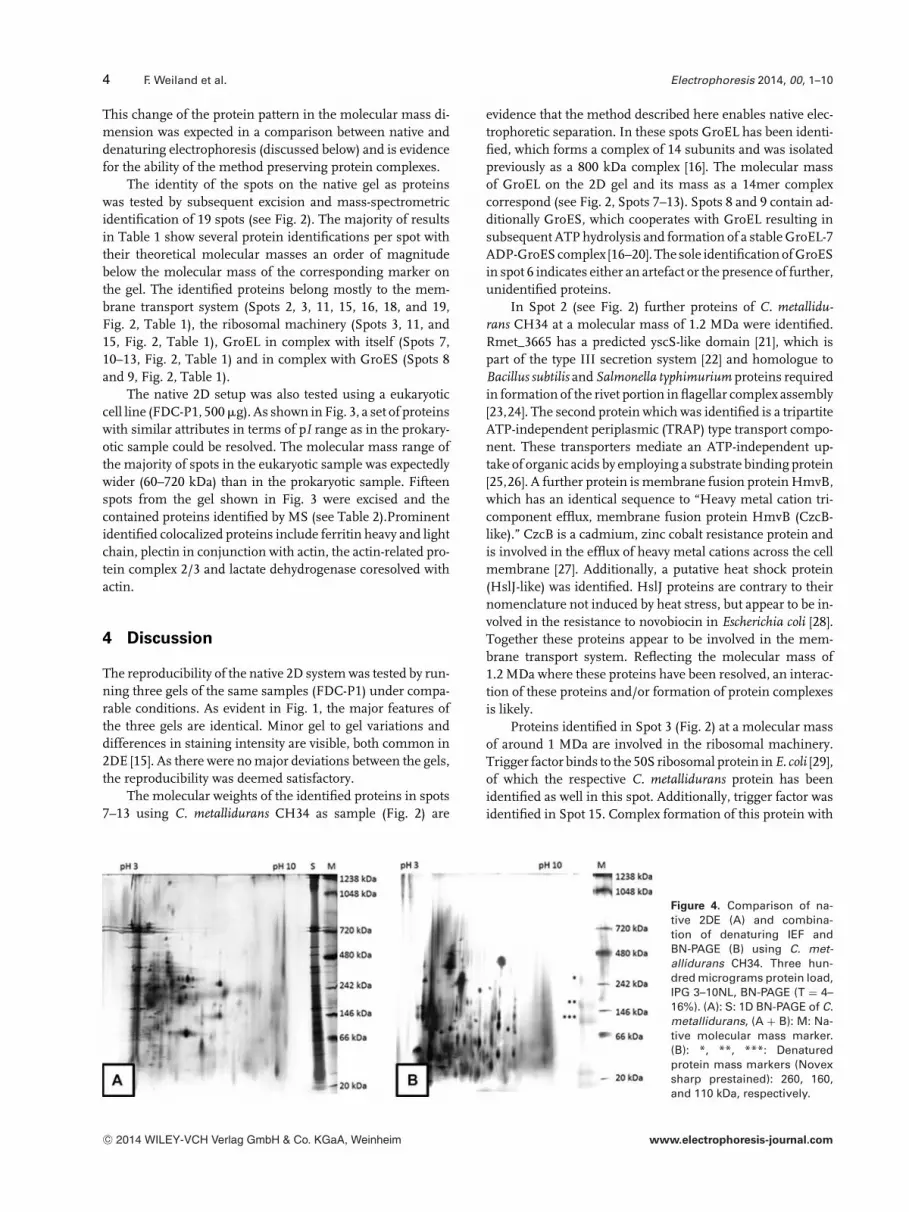
Figure 2. Native 2D of C. metallidurans CH34. 300 �g protein load,IPG 3–10NL, BN-PAGE (T = 4–16%). S: BN-PAGE of 12 �g C. metal-lidurans CH34. M depicts the native molecular mass marker lanewith the corresponding masses noted on the right side. Numbers1–19 indicate the protein spots picked for identification by MS(see Table 1).
the formation of secondary bacterial gold grains [14]. FDC-P1 was chosen as the eukaryotic model system and is ahemopoietic precursor cell line established from long termcultures of mouse bone marrow DBA/2 cells grown in WEHI-3 (myelomonoeytic leukemia cell line) conditioned medium-supplemented medium [8].
First, three native 2D gels using 500 �g FDC-P1 totallysate as sample, were produced to test the reproducibilityof the method (Fig. 1). Proteins with a pI of 3–10 could berepeatedly resolved in all three gels without major changes inthe spot pattern.
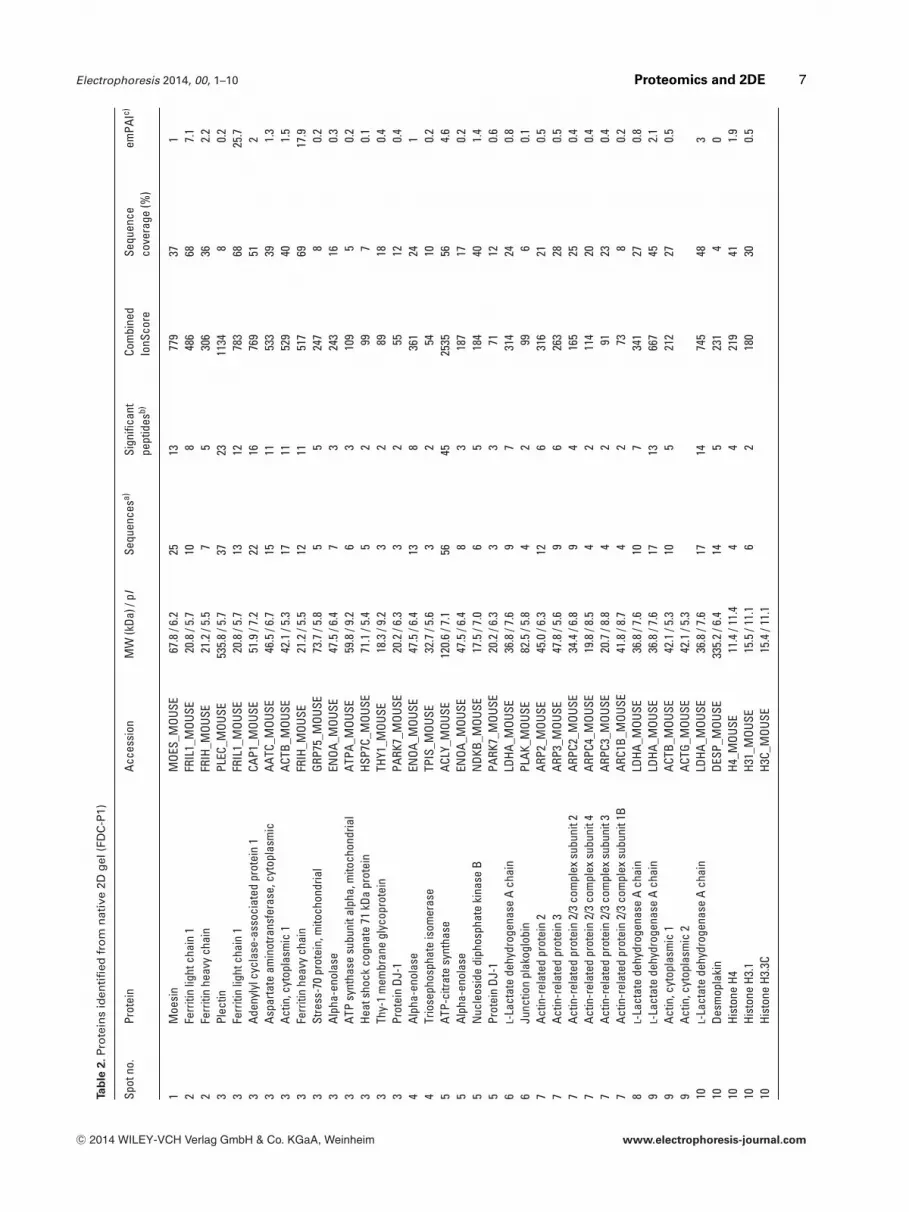
Figures 2 and 3 show that proteins from C. metalliduransCH34 with a pI between 3 and 10 could be resolved withmolecular masses up to 1.2 MDa. The possibility that theseobserved masses are artefacts of the BN-PAGE due to incom-patibility of the proteins or an effect of slow migration in thegel was tested by 2D gels combining denaturing IEF withBN-PAGE. This resulted in a clear change of the mass distri-bution of the majority of spots from 60 and 480 kDa, towardlower molecular masses between 20 and 240 kDa (see Fig. 4).
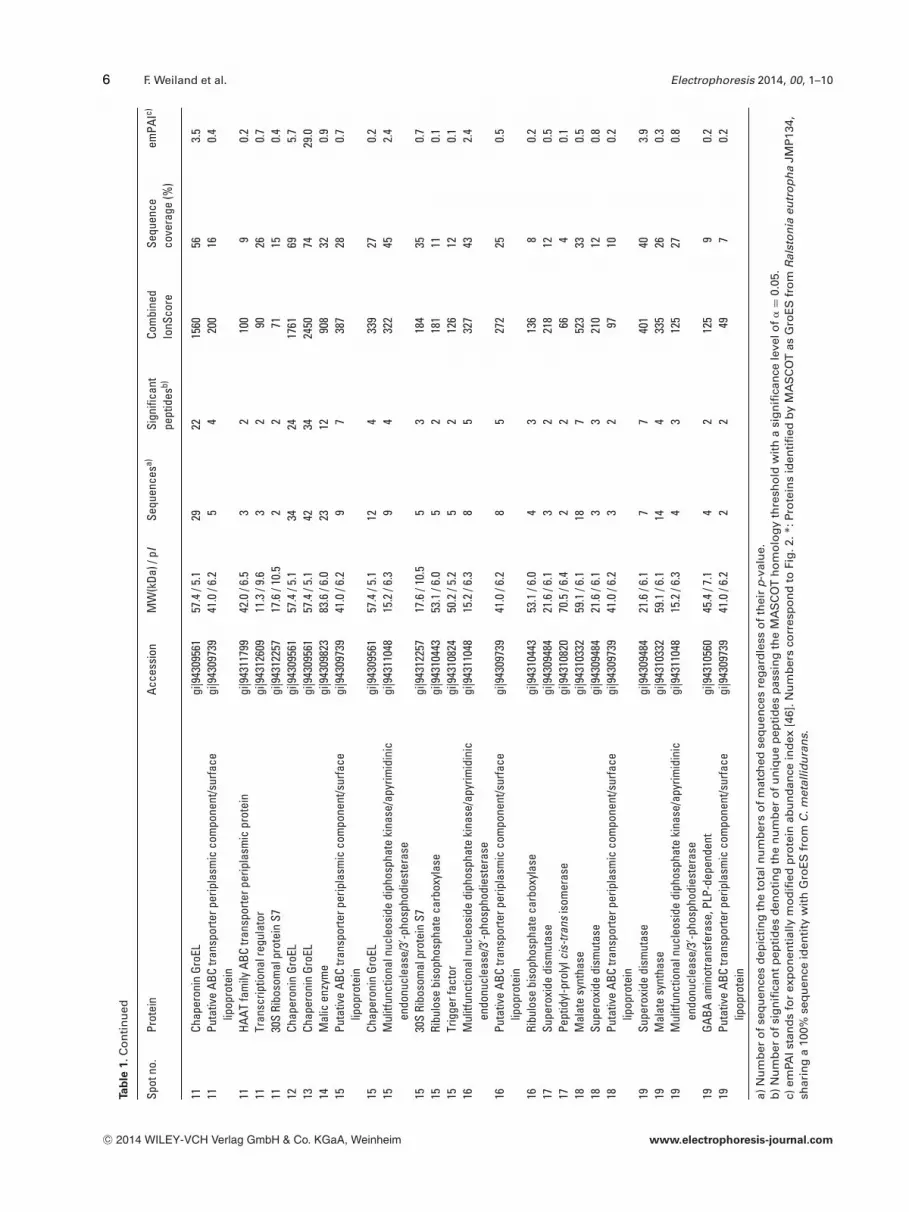
Figure 3. Native 2D of FDC-P1. 500 �g protein load, IPG 3–10NL,BN-PAGE (T = 4–16%). S: BN-PAGE of 32 �g FDC-P1. M depictsthe native molecular mass marker lane with the correspondingmasses noted on the right side. Numbers 1–15 indicate the pro-tein spots picked for identification by MS (see Table 2).
C© 2014 WILEY-VCH Verlag GmbH & Co. KGaA, Weinheim www.electrophoresis-journal.com
4 F. Weiland et al. Electrophoresis 2014, 00, 1–10
This change of the protein pattern in the molecular mass di-mension was expected in a comparison between native anddenaturing electrophoresis (discussed below) and is evidencefor the ability of the method preserving protein complexes.
The identity of the spots on the native gel as proteinswas tested by subsequent excision and mass-spectrometricidentification of 19 spots (see Fig. 2). The majority of resultsin Table 1 show several protein identifications per spot withtheir theoretical molecular masses an order of magnitudebelow the molecular mass of the corresponding marker onthe gel. The identified proteins belong mostly to the mem-brane transport system (Spots 2, 3, 11, 15, 16, 18, and 19,Fig. 2, Table 1), the ribosomal machinery (Spots 3, 11, and15, Fig. 2, Table 1), GroEL in complex with itself (Spots 7,10–13, Fig. 2, Table 1) and in complex with GroES (Spots 8and 9, Fig. 2, Table 1).
The native 2D setup was also tested using a eukaryoticcell line (FDC-P1, 500 �g). As shown in Fig. 3, a set of proteinswith similar attributes in terms of pI range as in the prokary-otic sample could be resolved. The molecular mass range ofthe majority of spots in the eukaryotic sample was expectedlywider (60–720 kDa) than in the prokaryotic sample. Fifteenspots from the gel shown in Fig. 3 were excised and thecontained proteins identified by MS (see Table 2).Prominentidentified colocalized proteins include ferritin heavy and lightchain, plectin in conjunction with actin, the actin-related pro-tein complex 2/3 and lactate dehydrogenase coresolved withactin.
4 Discussion
The reproducibility of the native 2D system was tested by run-ning three gels of the same samples (FDC-P1) under compa-rable conditions. As evident in Fig. 1, the major features ofthe three gels are identical. Minor gel to gel variations anddifferences in staining intensity are visible, both common in2DE [15]. As there were no major deviations between the gels,the reproducibility was deemed satisfactory.
The molecular weights of the identified proteins in spots7–13 using C. metallidurans CH34 as sample (Fig. 2) are
evidence that the method described here enables native elec-trophoretic separation. In these spots GroEL has been identi-fied, which forms a complex of 14 subunits and was isolatedpreviously as a 800 kDa complex [16]. The molecular massof GroEL on the 2D gel and its mass as a 14mer complexcorrespond (see Fig. 2, Spots 7–13). Spots 8 and 9 contain ad-ditionally GroES, which cooperates with GroEL resulting insubsequent ATP hydrolysis and formation of a stable GroEL-7ADP-GroES complex [16–20]. The sole identification of GroESin spot 6 indicates either an artefact or the presence of further,unidentified proteins.
In Spot 2 (see Fig. 2) further proteins of C. metallidu-rans CH34 at a molecular mass of 1.2 MDa were identified.Rmet_3665 has a predicted yscS-like domain [21], which ispart of the type III secretion system [22] and homologue toBacillus subtilis and Salmonella typhimurium proteins requiredin formation of the rivet portion in flagellar complex assembly[23,24]. The second protein which was identified is a tripartiteATP-independent periplasmic (TRAP) type transport compo-nent. These transporters mediate an ATP-independent up-take of organic acids by employing a substrate binding protein[25,26]. A further protein is membrane fusion protein HmvB,which has an identical sequence to “Heavy metal cation tri-component efflux, membrane fusion protein HmvB (CzcB-like).” CzcB is a cadmium, zinc cobalt resistance protein andis involved in the efflux of heavy metal cations across the cellmembrane [27]. Additionally, a putative heat shock protein(HslJ-like) was identified. HslJ proteins are contrary to theirnomenclature not induced by heat stress, but appear to be in-volved in the resistance to novobiocin in Escherichia coli [28].Together these proteins appear to be involved in the mem-brane transport system. Reflecting the molecular mass of1.2 MDa where these proteins have been resolved, an interac-tion of these proteins and/or formation of protein complexesis likely.
Proteins identified in Spot 3 (Fig. 2) at a molecular massof around 1 MDa are involved in the ribosomal machinery.Trigger factor binds to the 50S ribosomal protein in E. coli [29],of which the respective C. metallidurans protein has beenidentified as well in this spot. Additionally, trigger factor wasidentified in Spot 15. Complex formation of this protein with
Figure 4. Comparison of na-tive 2DE (A) and combina-tion of denaturing IEF andBN-PAGE (B) using C. met-allidurans CH34. Three hun-dred micrograms protein load,IPG 3–10NL, BN-PAGE (T = 4–16%). (A): S: 1D BN-PAGE of C.metallidurans, (A + B): M: Na-tive molecular mass marker.(B): *, **, ***: Denaturedprotein mass markers (Novexsharp prestained): 260, 160,and 110 kDa, respectively.
C© 2014 WILEY-VCH Verlag GmbH & Co. KGaA, Weinheim www.electrophoresis-journal.com

Electrophoresis 2014, 00, 1–10 Proteomics and 2DE 5Ta
ble
1.Pr
ote
ins
iden
tifi
edfr
om
nat
ive
2Dg
el(C
.met
allid
ura
ns
CH
34)
Spot
no.
Prot
ein
Acce
ssio
nM
W(k
Da)/
pISe
quen
cesa)
Sign
ifica
ntCo
mbi
ned
Sequ
ence
emPA
Ic)
pept
ides
b)Io
nSco
reco
vera
ge(%
)
1–
––
––
––
–2
Hypo
thet
ical
prot
ein
Rmet
_366
5gi
|943
1259
752
.5/7
.726
1810
0465
3.3
2TR
AP-ty
pem
anni
tol/c
hlor
oaro
mat
icco
mpo
und
trans
port
syst
em,p
erip
lasm
icco
mpo
nent
gi|9
4312
474
41.9
/8.5
209
763
591.
7
2He
avy
met
alca
tion
trico
mpo
nent
efflu
x,m
embr
ane
fusi
onpr
otei
nHm
vBgi
|943
1276
743
.4/8
.918
1165
247
2.0
2Le
mA
like
prot
ein
gi|9
4309
610
22.2
/9.0
118
503
622.
12
Nitr
itere
duct
ase
gi|9
4312
103
60.8
/8.8
125
298
220.
32
Puta
tive
lipop
rote
ingi
|943
1001
445
.2/9
.08
529
130
0.4
2Pu
tativ
ehe
atsh
ock
prot
ein
(Hsl
J-lik
e)gi
|943
1164
529
.7/8
.69
427
034
0.7
2Pu
tativ
eex
porte
dlip
opro
tein
gi|9
4309
366
20.0
/9.5
54
256
340.
92
Puta
tive
lipop
rote
ingi
|943
1201
424
.0/9
.43
214
615
0.3
3M
ulitf
unct
iona
lnuc
leos
ide
diph
osph
ate
kina
se/a
pyrim
idin
icen
donu
clea
se/3
′ -pho
spho
dies
tera
segi
|943
1104
815
.2/6
.310
539
262
3.1
350
Srib
osom
alpr
otei
nL1
0gi
|943
1226
717
.9/9
.28
425
656
1.0
3Pu
tativ
eAB
Ctra
nspo
rterp
erip
lasm
icco
mpo
nent
/sur
face
lipop
rote
ingi
|943
0973
941
.0/6
.26
424
819
0.4
3Tr
igge
rfac
tor
gi|9
4310
824
50.2
/5.2
73
209
180.
23
Type
IVpi
lus
stru
ctur
alsu
buni
tPilA
gi|9
4309
642
15.9
/9.2
22
110
160.
53
Glyc
eral
dehy
de-3
-pho
spha
tede
hydr
ogen
ase
Agi
|943
1191
136
.0/6
.52
210
49
0.2
3Ou
term
embr
ane
prot
ein
(por
in)
gi|9
4312
165
41.9
/9.0
22
101
90.
23
Cyto
chro
me
cfa
mily
prot
ein
gi|9
4312
404
29.5
/6.4
32
9314
0.2
4M
ulitf
unct
iona
lnuc
leos
ide
diph
osph
ate
kina
se/a
pyrim
idin
icen
donu
clea
se/3
′ -pho
spho
dies
tera
segi
|943
1104
815
.2/6
.37
424
536
1.2
4Pu
tativ
eAB
Ctra
nspo
rterp
erip
lasm
icco
mpo
nent
/sur
face
lipop
rote
ingi
|943
0973
941
.0/6
.25
423
817
0.4
4Hy
poth
etic
alpr
otei
nRm
et_3
566
gi|9
4312
497
38.0
/5.4
43
170
170.
35
Supe
roxi
dedi
smut
ase
gi|9
4309
484
21.6
/6.1
32
113
120.
35
Puta
tive
ABC
trans
porte
rper
ipla
smic
com
pone
nt/s
urfa
celip
opro
tein
gi|9
4309
739
41.0
/6.2
32
105
100.
2
6Co
-cha
pero
nin
GroE
S*gi
|735
4234
210
.4/5
.85
420
362
4.6
7Ch
aper
onin
GroE
Lgi
|943
0956
157
.4/5
.124
1611
1148
2.0
7Ty
peIV
pilu
sst
ruct
ural
subu
nitP
ilAgi
|943
0964
215
.9/9
.22
270
160.
58
Chap
eron
inGr
oEL
gi|9
4309
561
57.4
/5.1
4836
2664
8040
.98
Co-c
hape
roni
nGr
oES*
gi|7
3542
342
10.4
/5.8
54
250
623.
29
Chap
eron
inGr
oEL
gi|9
4309
561
57.4
/5.1
4032
2224
6516
.29
Co-c
hape
roni
nGr
oES*
gi|7
3542
342
10.4
/5.8
43
142
331.
410
Chap
eron
inGr
oEL
gi|9
4309
561
57.4
/5.1
5442
3172
8111
9.9
C© 2014 WILEY-VCH Verlag GmbH & Co. KGaA, Weinheim www.electrophoresis-journal.com
6 F. Weiland et al. Electrophoresis 2014, 00, 1–10
Ta
ble
1.C
on
tin
ued
Spot
no.
Prot
ein
Acce
ssio
nM
W(k
Da)/
pISe
quen
cesa)
Sign
ifica
ntCo
mbi
ned
Sequ
ence
emPA
Ic)
pept
ides
b)Io
nSco
reco
vera
ge(%
)
11Ch
aper
onin
GroE
Lgi
|943
0956
157
.4/5
.129
2215
6056
3.5
11Pu
tativ
eAB
Ctra
nspo
rterp
erip
lasm
icco
mpo
nent
/sur
face
lipop
rote
ingi
|943
0973
941
.0/6
.25
420
016
0.4
11HA
ATfa
mily
ABC
trans
porte
rper
ipla
smic
prot
ein
gi|9
4311
799
42.0
/6.5
32
100
90.
211
Tran
scrip
tiona
lreg
ulat
orgi
|943
1260
911
.3/9
.63
290
260.
711
30S
Ribo
som
alpr
otei
nS7
gi|9
4312
257
17.6
/10.
52
271
150.
412
Chap
eron
inGr
oEL
gi|9
4309
561
57.4
/5.1
3424
1761
695.
713
Chap
eron
inGr
oEL
gi|9
4309
561
57.4
/5.1
4234
2450
7429
.014
Mal
icen
zym
egi
|943
0982
383
.6/6
.023
1290
832
0.9
15Pu
tativ
eAB
Ctra
nspo
rterp
erip
lasm
icco
mpo
nent
/sur
face
lipop
rote
ingi
|943
0973
941
.0/6
.29
738
728
0.7
15Ch
aper
onin
GroE
Lgi
|943
0956
157
.4/5
.112
433
927
0.2
15M
ulitf
unct
iona
lnuc
leos
ide
diph
osph
ate
kina
se/a
pyrim
idin
icen
donu
clea
se/3
′ -pho
spho
dies
tera
segi
|943
1104
815
.2/6
.39
432
245
2.4
1530
SRi
boso
mal
prot
ein
S7gi
|943
1225
717
.6/1
0.5
53
184
350.
715
Ribu
lose
biso
phos
phat
eca
rbox
ylas
egi
|943
1044
353
.1/6
.05
218
111
0.1
15Tr
igge
rfac
tor
gi|9
4310
824
50.2
/5.2
52
126
120.
116
Mul
itfun
ctio
naln
ucle
osid
edi
phos
phat
eki
nase
/apy
rimid
inic
endo
nucl
ease
/3′ -p
hosp
hodi
este
rase
gi|9
4311
048
15.2
/6.3
85
327
432.
4
16Pu
tativ
eAB
Ctra
nspo
rterp
erip
lasm
icco
mpo
nent
/sur
face
lipop
rote
ingi
|943
0973
941
.0/6
.28
527
225
0.5
16Ri
bulo
sebi
soph
osph
ate
carb
oxyl
ase
gi|9
4310
443
53.1
/6.0
43
136
80.
217
Supe
roxi
dedi
smut
ase
gi|9
4309
484
21.6
/6.1
32
218
120.
517
Pept
idyl
-pro
lylc
is-tr
ans
isom
eras
egi
|943
1082
070
.5/6
.42
266
40.
118
Mal
ate
synt
hase
gi|9
4310
332
59.1
/6.1
187
523
330.
518
Supe
roxi
dedi
smut
ase
gi|9
4309
484
21.6
/6.1
33
210
120.
818
Puta
tive
ABC
trans
porte
rper
ipla
smic
com
pone
nt/s
urfa
celip
opro
tein
gi|9
4309
739
41.0
/6.2
32
9710
0.2
19Su
pero
xide
dism
utas
egi
|943
0948
421
.6/6
.17
740
140
3.9
19M
alat
esy
ntha
segi
|943
1033
259
.1/6
.114
433
526
0.3
19M
ulitf
unct
iona
lnuc
leos
ide
diph
osph
ate
kina
se/a
pyrim
idin
icen
donu
clea
se/3
′ -pho
spho
dies
tera
segi
|943
1104
815
.2/6
.34
312
527
0.8
19GA
BAam
inot
rans
fera
se,P
LP-d
epen
dent
gi|9
4310
560
45.4
/7.1
42
125
90.
219
Puta
tive
ABC
trans
porte
rper
ipla
smic
com
pone
nt/s
urfa
celip
opro
tein
gi|9
4309
739
41.0
/6.2
22
497
0.2
a)N
um
ber
of
seq
uen
ces
dep
icti
ng
the
tota
lnu
mb
ers
of
mat
ched
seq
uen
ces
rega
rdle
sso
fth
eir
p-v
alu
e.b
)N
um
ber
of
sig
nifi
can
tp
epti
des
den
oti
ng
the
nu
mb
ero
fu
niq
ue
pep
tid
esp
assi
ng
the
MA
SC
OT
ho
mo
log
yth
resh
old
wit
ha
sig
nifi
can
cele
velo
f�
=0.
05.
c)em
PAIs
tan
ds
for
exp
on
enti
ally
mo
difi
edp
rote
inab
un
dan
cein
dex
[46]
.Nu
mb
ers
corr
esp
on
dto
Fig
.2.*
:Pro
tein
sid
enti
fied
by
MA
SC
OT
asG
roE
Sfr
om
Ral
sto
nia
eutr
op
ha
JMP
134,
shar
ing
a10
0%se
qu
ence
iden
tity
wit
hG
roE
Sfr
om
C.m
etal
lidu
ran
s.
C© 2014 WILEY-VCH Verlag GmbH & Co. KGaA, Weinheim www.electrophoresis-journal.com
Electrophoresis 2014, 00, 1–10 Proteomics and 2DE 7Ta
ble
2.Pr
ote
ins
iden
tifi
edfr
om
nat
ive
2Dg
el(F
DC
-P1)
Spot
no.
Prot
ein
Acce
ssio
nM
W(k
Da)/
pISe
quen
cesa)
Sign
ifica
ntCo
mbi
ned
Sequ
ence
emPA
Ic)
pept
ides
b)Io
nSco
reco
vera
ge(%
)
1M
oesi
nM
OES_
MOU
SE67
.8/6
.225
1377
937
12
Ferr
itin
light
chai
n1
FRIL
1_M
OUSE
20.8
/5.7
108
486
687.
12
Ferr
itin
heav
ych
ain
FRIH
_MOU
SE21
.2/5
.57
530
636
2.2
3Pl
ectin
PLEC
_MOU
SE53
5.8
/5.7
3723
1134
80.
23
Ferr
itin
light
chai
n1
FRIL
1_M
OUSE
20.8
/5.7
1312
783
6825
.73
Aden
ylyl
cycl
ase-
asso
ciat
edpr
otei
n1
CAP1
_MOU
SE51
.9/7
.222
1676
951
23
Aspa
rtate
amin
otra
nsfe
rase
,cyt
opla
smic
AATC
_MOU
SE46
.5/6
.715
1153
339
1.3
3Ac
tin,c
ytop
lasm
ic1
ACTB
_MOU
SE42
.1/5
.317
1152
940
1.5
3Fe
rriti
nhe
avy
chai
nFR
IH_M
OUSE
21.2
/5.5
1211
517
6917
.93
Stre
ss-7
0pr
otei
n,m
itoch
ondr
ial
GRP7
5_M
OUSE
73.7
/5.8
55
247
80.
23
Alph
a-en
olas
eEN
OA_M
OUSE
47.5
/6.4
73
243
160.
33
ATP
synt
hase
subu
nita
lpha
,mito
chon
dria
lAT
PA_M
OUSE
59.8
/9.2
63
109
50.
23
Heat
shoc
kco
gnat
e71
kDa
prot
ein
HSP7
C_M
OUSE
71.1
/5.4
52
997
0.1
3Th
y-1
mem
bran
egl
ycop
rote
inTH
Y1_M
OUSE
18.3
/9.2
32
8918
0.4
3Pr
otei
nDJ
-1PA
RK7_
MOU
SE20
.2/6
.33
255
120.
44
Alph
a-en
olas
eEN
OA_M
OUSE
47.5
/6.4
138
361
241
4Tr
iose
phos
phat
eis
omer
ase
TPIS
_MOU
SE32
.7/5
.63
254
100.
25
ATP-
citra
tesy
ntha
seAC
LY_M
OUSE
120.
6/7
.156
4525
3556
4.6
5Al
pha-
enol
ase
ENOA
_MOU
SE47
.5/6
.48
318
717
0.2
5N
ucle
osid
edi
phos
phat
eki
nase
BN
DKB_
MOU
SE17
.5/7
.06
518
440
1.4
5Pr
otei
nDJ
-1PA
RK7_
MOU
SE20
.2/6
.33
371
120.
66
L-La
ctat
ede
hydr
ogen
ase
Ach
ain
LDHA
_MOU
SE36
.8/7
.69
731
424
0.8
6Ju
nctio
npl
akog
lobi
nPL
AK_M
OUSE
82.5
/5.8
42
996
0.1
7Ac
tin-r
elat
edpr
otei
n2
ARP2
_MOU
SE45
.0/6
.312
631
621
0.5
7Ac
tin-r
elat
edpr
otei
n3
ARP3
_MOU
SE47
.8/5
.69
626
328
0.5
7Ac
tin-r
elat
edpr
otei
n2/
3co
mpl
exsu
buni
t2AR
PC2_
MOU
SE34
.4/6
.89
416
525
0.4
7Ac
tin-r
elat
edpr
otei
n2/
3co
mpl
exsu
buni
t4AR
PC4_
MOU
SE19
.8/8
.54
211
420
0.4
7Ac
tin-r
elat
edpr
otei
n2/
3co
mpl
exsu
buni
t3AR
PC3_
MOU
SE20
.7/8
.84
291
230.
47
Actin
-rel
ated
prot
ein
2/3
com
plex
subu
nit1
BAR
C1B_
MOU
SE41
.8/8
.74
273
80.
28
L-La
ctat
ede
hydr
ogen
ase
Ach
ain
LDHA
_MOU
SE36
.8/7
.610
734
127
0.8
9L-
Lact
ate
dehy
drog
enas
eA
chai
nLD
HA_M
OUSE
36.8
/7.6
1713
667
452.
19
Actin
,cyt
opla
smic
1AC
TB_M
OUSE
42.1
/5.3
105
212
270.
59
Actin
,cyt
opla
smic
2AC
TG_M
OUSE
42.1
/5.3
10L-
Lact
ate
dehy
drog
enas
eA
chai
nLD
HA_M
OUSE
36.8
/7.6
1714
745
483
10De
smop
laki
nDE
SP_M
OUSE
335.
2/6
.414
523
14
010
Hist
one
H4H4
_MOU
SE11
.4/1
1.4
44
219
411.
910
Hist
one
H3.1
H31_
MOU
SE15
.5/1
1.1
62
180
300.
510
Hist
one
H3.3
CH3
C_M
OUSE
15.4
/11.
1
C© 2014 WILEY-VCH Verlag GmbH & Co. KGaA, Weinheim www.electrophoresis-journal.com

8 F. Weiland et al. Electrophoresis 2014, 00, 1–10
Ta
ble
2.C
on
tin
ued
Spot
no.
Prot
ein
Acce
ssio
nM
W(k
Da)/
pISe
quen
cesa)
Sign
ifica
ntCo
mbi
ned
Sequ
ence
emPA
Ic)
pept
ides
b)Io
nSco
reco
vera
ge(%
)
10Hi
ston
eH3
.2H3
2_M
OUSE
15.4
/11.
310
Hist
one
H3.3
H33_
MOU
SE15
.4/1
1.3
10El
onga
tion
fact
or1-
alph
a1
EF1A
1_M
OUSE
50.4
/9.1
54
156
130.
310
Tubu
linbe
ta-2
Ach
ain
TBB2
A_M
OUSE
50.3
/4.8
52
105
130.
110
40S
ribos
omal
prot
ein
SARS
SA_M
OUSE
32.9
/4.8
22
988
0.2
10Tu
bulin
alph
a-1A
chai
nTB
A1A_
MOU
SE50
.8/4
.93
395
90.
210
Actin
,aor
ticsm
ooth
mus
cle
ACTA
_MOU
SE42
.4/5
.25
295
80.
210
Beta
-act
in-li
kepr
otei
n2
ACTB
L_M
OUSE
42.3
/5.3
10Ac
tin,c
ytop
lasm
ic1
ACTB
_MOU
SE42
.1/5
.310
Actin
,alp
haca
rdia
cm
uscl
e1
ACTC
_MOU
SE42
.3/5
.210
Actin
,cyt
opla
smic
2AC
TG_M
OUSE
42.1
/5.3
10Ac
tin,g
amm
a-en
teric
smoo
thm
uscl
eAC
TH_M
OUSE
42.2
/5.3
10Ac
tin,a
lpha
skel
etal
mus
cle
ACTS
_MOU
SE42
.4/5
.210
14-3
-3pr
otei
nsi
gma
1433
S_M
OUSE
27.8
/4.7
32
8310
0.2
11Ci
trate
synt
hase
,mito
chon
dria
lCI
SY_M
OUSE
52.0
/8.7
139
460
280.
711
Diab
loho
mol
og,m
itoch
ondr
ial
DBLO
H_M
OUSE
27.0
/6.0
63
248
200.
611
Cyto
sola
min
opep
tidas
eAM
PL_M
OUSE
56.5
/7.6
65
205
130.
312
Talin
-1TL
N1_
MOU
SE27
1.8
/5.8
4833
1572
190.
512
Alph
a-en
olas
eEN
OA_M
OUSE
47.5
/6.4
1611
438
351.
213
Talin
-1TL
N1_
MOU
SE27
1.8
/5.8
5439
1868
240.
613
Alph
a-en
olas
eEN
OA_M
OUSE
47.5
/6.4
1812
590
361.
613
Cyto
sola
min
opep
tidas
eAM
PL_M
OUSE
56.5
/7.6
109
380
240.
713
Nuc
leos
ide
diph
osph
ate
kina
seA
NDK
A_M
OUSE
17.3
/6.8
32
6824
0.4
14L-
Lact
ate
dehy
drog
enas
eA
chai
nLD
HA_M
OUSE
36.8
/7.6
96
295
240.
714
Trio
seph
osph
ate
isom
eras
eTP
IS_M
OUSE
32.7
/5.6
42
103
120.
215
L-La
ctat
ede
hydr
ogen
ase
Ach
ain
LDHA
_MOU
SE36
.8/7
.615
1057
743
1.4
15Ca
tala
seCA
TA_M
OUSE
60.0
/7.7
94
261
180.
215
Mul
tifun
ctio
nalp
rote
inAD
E2PU
R6_M
OUSE
47.7
/6.9
52
108
110.
1
a)N
um
ber
of
seq
uen
ces
dep
icti
ng
the
tota
lnu
mb
ers
of
mat
ched
seq
uen
ces
rega
rdle
sso
fth
eir
p-v
alu
e.b
)N
um
ber
of
sig
nifi
can
tp
epti
des
den
oti
ng
the
nu
mb
ero
fu
niq
ue
pep
tid
esp
assi
ng
the
MA
SC
OT
ho
mo
log
yth
resh
old
wit
ha
sig
nifi
can
cele
velo
f�
=0.
05.
c)em
PAIs
tan
ds
for
exp
on
enti
ally
mo
difi
edp
rote
inab
un
dan
cein
dex
.Nu
mb
ers
corr
esp
on
dto
Fig
.3.P
rote
inen
trie
sin
Sp
ot
10,s
har
ing
thei
rst
atis
tics
,can
no
tb
ed
isti
ng
uis
hed
by
the
der
ived
MS
dat
aset
.
C© 2014 WILEY-VCH Verlag GmbH & Co. KGaA, Weinheim www.electrophoresis-journal.com

Electrophoresis 2014, 00, 1–10 Proteomics and 2DE 9
30S ribosomal protein S7, which is colocalized in this spot,has been shown previously and the usage of trigger factor asmeans to aid assembly of protein complexes has been sug-gested [30]. Together with the identification of the nucleosidediphosphate kinase in this spot, which provides GTP for pro-tein synthesis [31], this indicates the identification of a partof the ribosomal machinery.
Malic enzyme was identified in Spot 14 (Fig. 2). This pro-tein forms under native conditions a homotetramer [32, 33]which sums up to a molecular mass of 340 kDa; howeverthe observed molecular weight on the gel is around double(slightly below the 720 kDa marker). This indicates a homooc-tamer formation of this protein. If this is a native conditionspecific for this bacterium, an increase in mass caused byfurther unidentified proteins within this spot or an artefactdue to dye-binding to the complex and subsequent bias theelectrophoretic behavior of the protein [34–36] cannot be de-termined based on the conducted analysis and would needto be further investigated using, for example, density gradi-ent centrifugation. However, the accuracy of the molecularmass estimation of protein complexes using BN-PAGE wasconfirmed previously [35] and therefore the resolved mass islikely to be correct.
The native 2D setup was further tested using the eu-karyotic model system. In the native 2D gel using FDC-P1as sample (see Fig. 3), the following proteins were identi-fied: Spot 2 in Fig. 3 contains ferritin light and heavy chain.Ferritin is a complex consisting of 24 subunits of light andheavy chain proteins [37] and is an iron-storage protein. Themass of the bound iron can reach up to 60% of the ferritinmass [37], which may explain the variable molecular mass ofthe protein complex as seen on the 2D gel. However, the low-est molecular mass of around 500 kDa of the protein complexcorresponds to the mass of 420 ± 40 kDa described in theliterature [37, 38].
An isoform of the putative ferritin complex was iden-tified in Spot 3 which is located between the 480 and720 kDa marker. Additionally, plectin and actin were iden-tified in this spot, which have been shown to noncovalentlylink with each other and are involved in the cross-linkingof the intermediate filaments of the cytoskeleton [39, 40].This, too, gives evidence for the native environment of thehere described electrophoresis system. If this colocalizationof all twelve identified proteins in Spot 3 is due to ac-tual interaction with each other or to insufficient resolu-tion of the wide pH-gradient would have to be investigatedfurther.
Spot 7 contains proteins of the actin related protein 2/3complex. This complex is responsible for the growth of actinfilaments, consists of seven proteins and is not stable underdenaturing conditions [41]. The here derived molecular massof approximately 700 kDa is nearly three times the experi-mentally established mass of 220 kDa [42]. However, as seenin Fig. 3, the protein spot exhibits a vertical streaking with astarting point at approximately 300 to 400 kDa which is closeto the established mass. As mentioned above, the reasons forthis variable mass would need further investigation.
The proteins identified in Spot 9, lactate dehydrogenase,and actin, have been reported previously to interact with eachother in rabbit muscle, leading to conformational changes inF-actin [43].
Apart from colocalization of proteins known to inter-act, further evidence for a separation system keeping proteincomplexes intact would be the yield of a 2D protein spotpattern with an increased spot number in the high molecularweight range as in comparison with a denaturing system. Thiswould be due to the preservation of protein–protein interac-tions (PPI) and protein complexes and the resulting changein molecular mass in the native system. As seen in Fig. 4,the combination of a denaturing IEF and BN-PAGE led to analtered distribution of the proteins with the majority of pro-tein spots shifted toward the lower molecular mass region ofthe gel. Prominent high molecular mass protein complexessuch as GroEL are missing and no protein spot has a molec-ular mass of over 720 kDa. A denatured protein marker withknown molecular masses was used in comparison to nativemarkers to investigate possible changes in migration behaviorof denatured proteins in BN-PAGE. As seen from Fig. 4B, themolecular masses between the denatured and native markercorrespond, indicating no changes in protein migration be-havior. Additionally, Fig. 2 shows a 1D BN-PAGE band of thesame C. metallidurans CH34 sample as used for the 2D gel.The molecular mass of major protein bands correspond be-tween the 1D BN-PAGE and prominent protein spots in thecombination of native IEF and BN-PAGE. This is evidence forthe preservation of native conditions while IEF and equilibra-tion using the here described setup. In Fig. 3 a 1D BN-PAGElane was also applied, but due to the too high amount of pro-tein loaded (32 �g) for silver stain, no distinct features can beobserved.
In summary, the obtained results demonstrate that thepresented method for native 2DE is suitable to separate pro-teins while preserving PPI and protein complexes. Further-more, the methodology is easy to use and the cost is in thesame range as traditional, denaturing 2DE with no need toinvest into additional equipment. Drawbacks of the methodare the required optimization of detergent and Coomassiebrilliant blue concentrations to preserve the PPI and proteincomplexes, which is depending on the entities to study, butthis problem is inherent to BN-PAGE as well. The influenceof the pH and the high electrical fields used for IEF onto thestability of protein complexes and PPI would need furtherinvestigation as disruptive qualities cannot be excluded. Ad-ditionally, protein complexes up to 10 MDa, as in BN-PAGEusing gradient gels with a starting T-value of 3%, cannotbe resolved in the here described native 2DE setup, as IPGstrips classically have a T-Value of 4.5 and 5% [44, 45]. De-spite these drawbacks, the ability to additionally resolve pro-tein complexes by their charge offers the possibility to studycomplexes in which exchanges/modifications of their con-stituents do not significantly alter the molecular weight ofthe complex but their pI. This gain in resolution allows theseparation of singular protein complexes and therefore easyquantification of changes in the complexosome.
C© 2014 WILEY-VCH Verlag GmbH & Co. KGaA, Weinheim www.electrophoresis-journal.com
10 F. Weiland et al. Electrophoresis 2014, 00, 1–10
The authors would like to thank the support of theAustralian Research Council; The Commonwealth Scientific andIndustrial Research Organization; The University of Adelaide;Manuela Klingler-Hoffmann for providing the FDC-P1 cell lineand Michelle Hooi for the help in conducting the mass spectro-metric analysis.
The authors have declared no conflict of interest.
5 References
[1] Krause, F., Electrophoresis 2006, 27, 2759–2781.
[2] Pellegrini, M., Haynor, D., Johnson, J. M., Expert Rev.Proteomics 2004, 1, 239–249.
[3] Wittig, I., Schagger, H., Proteomics 2008, 8, 3974–3990.
[4] Gorg, A., Obermaier, C., Boguth, G., Harder, A., Scheibe,B., Wildgruber, R., Weiss, W., Electrophoresis 2000, 21,1037–1053.
[5] Altenhofer, P., Schierhorn, A., Fricke, B., Electrophoresis2006, 27, 4096–4111.
[6] Becker, J. S., Lobinski, R., Becker, J. S., Metallomics2009, 1, 312–316.
[7] Mergeay, M., Nies, D., Schlegel, H. G., Gerits, J., Charles,P., Van Gijsegem, F., J. Bacteriol. 1985, 162, 328–334.
[8] Dexter, T. M., Garland, J., Scott, D., Scolnick, E., Metcalf,D., J. Exp. Med. 1980, 152, 1036–1047.
[9] Wittig, I., Braun, H. P., Schagger, H., Nat. Protoc. 2006, 1,418–428.
[10] Blum, H., Beier, H., Gross, H., Electrophoresis 1987, 8,93–99.
[11] Weiland, F., Fritz, K., Oehler, M. K., Hoffmann, P., Int. J.Mol. Sci. 2012, 13, 9942–9958.
[12] Vandamme, P., Coenye, T., Int. J. Syst. Evol. Microbiol.2004, 54, 2285–2289.
[13] Goris, J., De Vos, P., Coenye, T., Hoste, B., Janssens, D.,Brim, H., Diels, L., Mergeay, M., Kersters, K., Vandamme,P., Int. J. Syst. Evol. Microbiol. 2001, 51, 1773–1782.
[14] Reith, F., Rogers, S. L., McPhail, D. C., Webb, D., Science2006, 313, 233–236.
[15] Voss, T., Haberl, P., Electrophoresis 2000, 21, 3345–3350.
[16] Mayhew, M., da Silva, A. C., Martin, J., Erdjument-Bromage, H., Tempst, P., Hartl, F. U., Nature 1996, 379,420–426.
[17] Hayer-Hartl, M. K., Martin, J., Hartl, F. U., Science 1995,269, 836–841.
[18] Martin, J., Mayhew, M., Langer, T., Hartl, F. U., Nature1993, 366, 228–233.
[19] Todd, M. J., Viitanen, P. V., Lorimer, G. H., Science 1994,265, 659–666.
[20] Burston, S. G., Ranson, N. A., Clarke, A. R., J. Mol. Biol.1995, 249, 138–152.
[21] Janssen, P. J., Van Houdt, R., Moors, H., Monsieurs, P.,Morin, N., Michaux, A., Benotmane, M. A., Leys, N., Val-laeys, T., Lapidus, A., Monchy, S., Medigue, C., Taghavi,
S., McCorkle, S., Dunn, J., van der Lelie, D., Mergeay,M., PLoS One 2010, 5, e10433.
[22] Cornelis, G. R., Wolf-Watz, H., Mol. Microbiol. 1997, 23,861–867.
[23] Fields, K. A., Plano, G. V., Straley, S. C., J. Bacteriol. 1994,176, 569–579.
[24] Jones, C. J., Macnab, R. M., J. Bacteriol. 1990, 172,1327–1339.
[25] Forward, J. A., Behrendt, M. C., Wyborn, N. R., Cross, R.,Kelly, D. J., J. Bacteriol. 1997, 179, 5482–5493.
[26] Mulligan, C., Fischer, M., Thomas, G. H., FEMS Micro-biol. Rev. 2011, 35, 68–86.
[27] Diels, L., Dong, Q., van der Lelie, D., Baeyens, W.,Mergeay, M., J. Ind. Microbiol. 1995, 14, 142–153.
[28] Lilic, M., Jovanovic, M., Jovanovic, G., Savic, D. J., FEMSMicrobiol. Lett. 2003, 224, 239–246.
[29] Blaha, G., Wilson, D. N., Stoller, G., Fischer, G.,Willumeit, R., Nierhaus, K. H., J. Mol. Biol. 2003, 326,887–897.
[30] Martinez-Hackert, E., Hendrickson, W. A., Cell 2009, 138,923–934.
[31] Sonnemann, J., Mutzel, R., Biochem. Biophys. Res. Com-mun. 1995, 209, 490–496.
[32] Kam, P. L., Lin, C. C., Chang, G. G., Int. J. Pept. ProteinRes. 1987, 30, 217–221.
[33] Chen, F., Okabe, Y., Osano, K., Tajima, S., Appl. Environ.Microbiol. 1998, 64, 4073–4075.
[34] Schagger, H., von Jagow, G., Anal. Biochem. 1991, 199,223–231.
[35] Schagger, H., Cramer, W. A., von Jagow, G., Anal.Biochem. 1994, 217, 220–230.
[36] Heuberger, E. H., Veenhoff, L. M., Duurkens, R. H.,Friesen, R. H., Poolman, B., J. Mol. Biol. 2002, 317,591–600.
[37] Ford, G. C., Harrison, P. M., Rice, D. W., Smith, J. M.,Treffry, A., White, J. L., Yariv, J., Philos. Trans. R. Soc.Lond. B Biol. Sci. 1984, 304, 551–565.
[38] Theil, E. C., Annu. Rev. Biochem. 1987, 56, 289–315.
[39] Svitkina, T. M., Verkhovsky, A. B., Borisy, G. G., J. CellBiol. 1996, 135, 991–1007.
[40] Sevcik, J., Urbanikova, L., Kost’an, J., Janda, L., Wiche,G., Eur. J. Biochem. 2004, 271, 1873–1884.
[41] Mullins, R. D., Stafford, W. F., Pollard, T. D., J. Cell. Biol.1997, 136, 331–343.
[42] Machesky, L. M., Atkinson, S. J., Ampe, C., Vandekerck-hove, J., Pollard, T. D., J. Cell Biol. 1994, 127, 107–115.
[43] Kirillina, V. P., Stabrovskaya, V. I., Borovikov Yu, S., Gen.Physiol. Biophys. 1989, 8, 435–446.
[44] Gorg, A., Obermaier, C., Boguth, G., Weiss, W., Elec-trophoresis 1999, 20, 712–717.
[45] Dossi, G., Celentano, F., Gianazza, E., Righetti, P. G., J.Biochem. Biophys. Methods 1983, 7, 123–142.
[46] Ishihama, Y., Oda, Y., Tabata, T., Sato, T., Nagasu, T.,Rappsilber, J., Mann, M., Mol. Cell Proteomics 2005, 4,1265–1272.
C© 2014 WILEY-VCH Verlag GmbH & Co. KGaA, Weinheim www.electrophoresis-journal.com