high resolution phe imaging of rat glioma using ph-dependent relaxivity
TRANSCRIPT
High Resolution pHe Imaging of Rat Glioma UsingpH-Dependent Relaxivity
Maria L. Garcia-Martin,1 Gary V. Martinez,1 Natarajan Raghunand,1 A. Dean Sherry,3
Shanrong Zhang,3 and Robert J. Gillies1*
Previous studies using MR spectroscopy have shown that theextracellular pH (pHe) of tumors is acidic compared to normaltissues. This has a number of important sequelae that favor theemergence of more aggressive and therapy-resistant tumors.New MRI methods based on pH-sensitive T1 relaxivity are anattractive alternative to previous spectroscopic methods, asthey allow improvements in spatial and temporal resolution.Recently, pH-dependent GdDOTA-4AmP5- and a pH-indepen-dent analog, GdDOTP5-, were used to image renal pH in mice.The current study has used a similar approach to image pHe inrat gliomas. Significant differences were observed compared tothe renal study. First, the relaxivity of GdDOTP5- was found tobe affected by the higher extracellular protein content of tu-mors. Second, the pixel-by-pixel analysis of the GdDOTP5- andGdDOTA-4AmP5- pharmacokinetics showed significant disper-sion, likely due to the temporal fluctuations in tumor perfusion.However, there was a robust correlation between the maximalenhancements produced by the two boluses. Therefore, to ac-count for the local time-courses differences, pHe maps werecalculated at the time of maximal enhancement in each pixel.Finally, the comparison of the pHe and the time to maximalintensity maps revealed an inverse relationship between pHe
and tumor perfusion. Magn Reson Med 55:309–315, 2006.© 2006 Wiley-Liss, Inc.
Key words: acid-base; MRI; relaxivity; gadolinium; tumor, pH
Over the past decades, non-invasive imaging techniqueshave been developed to characterize the metabolic and phys-iologic environments of living tissues. An important appli-cation to emerge in this area has been the measurement oftumor pH using magnetic resonance. This application beganearly on with the acquisition of 31P MR spectra, which pro-vided information not only on the in vivo nucleoside triphos-phate (NTP) levels, but also inorganic phosphate, Pi, whosechemical shift is pH dependent (1,2). A neutral-to-alkalinetumor pH calculated from the chemical shift of Pi has beenreported in numerous 31P MRS studies of human and animal
tumors (i.e., 7.0–7.4). This was discrepant with previousmicroelectrode reports of an acid pH in tumors, and was notresolved until it was shown that Pi reported primarily theintracellular pH (3). The extracellular pH (pHe) can be inter-rogated using an exogenous 31P NMR reporter, 3-amino pro-pylphosphonate, 3-APP (4). Studies with 3-APP have con-firmed that the average pHe of tumors is acidic, with valuesreaching as low as 6.0 (5).
However, 31P investigations are limited in both spatialand temporal resolution. Even at high field, voxel size islimited to ca. 4 � 4 � 4 mm3, with a temporal resolutionon the order of 5 min. An improvement in spatial resolu-tion has been achieved using 1H NMR and 2-imidazol-1-yl-3-ethoxycarbonyl-propionate, IEPA, which has a hydro-gen attached to C-2 of the imidazole ring whose chemicalshift is pH-sensitive (6). This compound is non-toxic andis membrane impermeant, and thus restricted to the extra-cellular compartment. Using magnetic resonance spectro-scopic imaging (MRSI), IEPA has been used to measurepHe in breast cancer tumors (7,8) and gliomas (9) withspatial resolution up to 1 � 1 � 1 mm3. These studiesshowed, for the first time, that the pHe in tumors washeterogeneous, with differences in pHe of as much as0.5 pH unit across 8 mm in distance. The relationshipbetween the low pHe and perfusion has been inferred (seerefs. (5,8), yet cannot be directly tested by this method dueto differences in the spatial resolution between dynamiccontrast MR images and MRSI. Although the use of IEPAhas led to an increase in the understanding of tumor pHe
regulation, it still suffers from relatively poor spatial andtemporal resolution.
In recent years, methods have been developed that allowpH to be rapidly determined at spatial resolutions compa-rable to standard MRI. These methods fall into two broadcategories: magnetization transfer and relaxation en-hanced contrast (10). Magnetization transfer can beachieved with either endogenous (11) or exogenous (12–14) hydrogen donors, and has great potential, as the con-trast can be turned on or off through on- and off-resonanceirradiation. Relaxation enhanced pH measurements in-volve the use of gadolinium-based contrast reagents (Gd-CR) whose relaxivity is pH dependent. A number of suchcompounds have been developed (15,16) where the relax-ation enhancement is primarily achieved through in-creased hydrogen exchange rates at the lanthanide center.This approach was first used by Brindle’s group (17), whorealized that the ability to quantitatively determine pHe
with relaxivity required accurate knowledge of the Gd-CRconcentration in each voxel. More recently, this approachhas been used to measure the pHe in kidneys using Gd-DOTA-4AmP5- (18,19). In that study, the concentration ofGdDOTA-4AmP5- at a given time post-injection was as-
1Department of Biochemistry and Molecular Biophysics, Arizona Cancer Cen-ter, The University of Arizona, Tucson, AZ, USA.2Department of Chemistry, The University of Texas at Dallas, Richardson, TX,USA.3The Rogers Magnetic Resonance Center, Department of Radiology, Univer-sity of Texas Southwestern Medical Center, Dallas, TX, USA.Grant Sponsor: NCI; Grant Numbers: R01 Ca 077575 and R24 088578 toRJG. Grant Sponsor: Robert A. Welch Foundation; Grant Number: AT-584.Grant Sponsor: National Institutes of Health; Grant Number: CA-84697. GrantSponsor: Division of Research Resources and the National Institutes ofHealth; Grant Number: RR-02584 to ADS.*Correspondence to: Robert J. Gillies, Department of Biochemistry and Mo-lecular Biophysics, Arizona Cancer Center; 1515 N. Campbell Ave., Tucson,AZ, USA 85724-5024. E-mail: [email protected] 11 July 2005; revised 3 October 2005; accepted 14 October 2005.DOI 10.1002/mrm.20773Published online 9 January 2006 in Wiley InterScience (www.interscience.wiley.com).
Magnetic Resonance in Medicine 55:309–315 (2006)
© 2006 Wiley-Liss, Inc. 309
sumed equal to the concentration of pH-independent Gd-DOTP5- at the same time following a prior injection in thesame animal. The renal pharmacokinetics of GdDOTP5-
and the structurally dissimilar Gd-DTPA2- were shown tobe identical in mice. Since GdDOTP5- and GdDOTA4AmP5-
are more closely related in charge and structure, it wasassumed that they would also display identical renal phar-macokinetics.
The current study describes the continued use of thisapproach, mutatis mutandis, to measure pHe in tumors.Using this strategy in tumors is significantly more difficultthan in kidneys, owing to the notoriously heterogeneousdistribution of patent blood vessels, slower wash-in andwash-out of i.v. delivered agents, and higher protein con-tent of extracellular fluid. Despite these difficulties, accu-rate pHe maps were generated and validated by compari-son to IEPA results from the same model, as well as arigorous analysis of the times to maximal intensity (TMI)of the two paramagnetic contrast reagents. This analysisallowed local time-dependent alterations in tumor perfu-sion to be identified and corrected before calculating thepHe maps. The comparison of pHe and TMI, which is ameasure of tumor perfusion, revealed an inverse relation-ship between these two parameters.
METHODS
Cell Lines and Tumors
Rat C6 glioma cells (ATCC, CCL-107) were grown in Dulbec-co’s modified Eagle’s medium (DMEM, Sigma, St. Louis, MO,USA) supplemented with 10% fetal bovine serum (FBS,Omega Scientific Inc., Tarzana, CA, USA). Gliomas wereproduced in female Wistar rats (200–250 g in body weight)by stereotaxic injection of 105 C6 cells in the right caudatenucleus (20). The rats were anesthetized with ketamine/xy-lazine (80/10 mg kg�1, respectively, I.P.) and placed in astereotaxic apparatus. After exposing the skull by a midlinescalp incision, a 1 mm hole was drilled at 3.5 mm right frombregma and the cells were injected at a depth of 5.5 mm. Tofinish, the craniotomy was sealed with dental cement and thescalp sutured. Tumors developed for 2 to 3 weeks, occupyingthen up to 50% of the right hemisphere. All animal protocolswere approved by the University of Arizona InstitutionalAnimal Care and Use Committee.
In Vitro MRI Experiments
Solutions of GdDOTP5- and GdDOTA-4AmP5- were pre-pared in both phosphate buffered saline (PBS) and fetal
bovine serum (FBS) at concentrations ranging from 0 to5 mM and pH from 5 to 8.5. All the NMR measurementswere carried out at 37°C and 4.7 T using the same exper-imental setting as for the in vivo experiments. T1 wasdetermined using an inversion-recovery sequence, withrecovery delays from 20 to 12,000 ms. The T1 relaxivitieswere then determined by fitting the experimental data tothe following equation:
1T1
�1
T10� r1�Gd� [1]
where T1 and T10 are the longitudinal relaxation times ofwater in the presence and absence of CR, respectively; and[Gd] is the concentration of the CR.
In Vivo MRI Experiments
Experiments were performed on a Bruker BiospecAvance® 4.7 T instrument equipped with 200mT/m ac-tively shielded gradients. An 18 mm diameter surface coilpositioned above the head of the rat was used for signalreception, and a 73 mm inner diameter volume resonatorwas used for excitation.
Animals were anesthetized with 1.5% (v/v) isoflurane inO2 at 1L/min and then placed in a homemade holderequipped with ear bars to immobilize the head. Both rectaltemperature and respiration rate were monitored allthrough the experiment. Temperature was maintained at37–37.5°C by recirculating warm water. Two CRs, the pH-insensitive GdDOTP5- (Macrocyclics, Dallas, TX, USA,Fig. 1a) and the pH-sensitive GdDOTA-4AmP5- (Macrocy-clics, Fig. 1b), were injected through the tail vein at aninfusion rate of 0.24 mmol�Kg�1�min�1 over a total injec-tion time of 25 s. Prior to injection of any CR, protondensity and T1 weighted spin echo images were acquiredusing the following parameters: TR � 5 s (proton density)or 80 ms (T1 weighted), TE � 6 ms, FOV � 4 mm, slicethickness � 1 mm, matrix size � 128 � 128. Following theinjection of each CR, a dynamic series of 120 T1 weightedimages was acquired over 1 h.
pHe was calculated for each pixel as previously de-scribed (19). Briefly, the concentration of GdDOTP5- wasdetermined as follows:
�GdDOTP� �1
TRr1,GdDOTPLn
1 � �IB,GdDOTP/I0�
1 � �IA,GdDOTP/I0��5� [2]
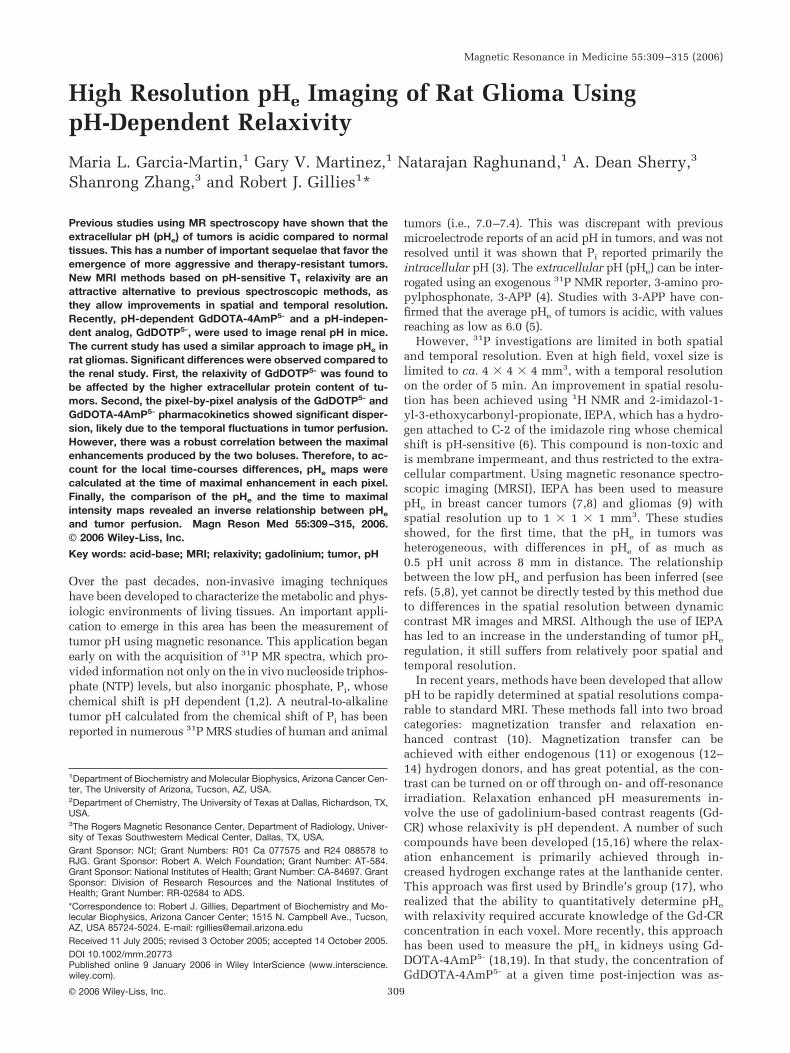
FIG. 1. Gadolinium chelates used for pHe imaging:(a) pH-insensitive GdDOTP5-, (b) pH-sensitive Gd-DOTA-4AmP5-.
310 Garcia-Martin et al.
where TR is the repetition time for the T1 weighted image,r1 is T1 relaxivity of GdDOTP5- determined in vitro, IB,Gd-
DOTP and IA,GdDOTP are the signal intensities on the T1
weighted images before and after the injection of Gd-DOTP5-, and IO is the signal intensity on the proton densityimage. IA corresponds to the maximal intensity in eachpixel. The r1 for GdDOTA-4AmP5- was determined froman analogous equation assuming the same concentration asGdDOTP5-. The pHe was then calculated according to thein vitro titration curve of pHe versus r1.
Data Analysis
The image processing software was developed in-houseusing Iterative Data Language (IDL; Research Systems,Boulder, CO, USA).
Statistical analysis of the relationship between pHe andTMI was done by segmentation, using the CHAID (Chi-squared Automatic Interaction Detection) algorithm devel-oped by Kass (21) as implemented in the SPSS Answer-Tree Program (SPSS Inc. Headquarters, Chicago, IL, USA).CHAID allows the identification of cut-points for the inde-pendent (predictor) variables that lead to a statisticallysignificant discrimination in the dependent measurement.This way a classification tree is generated where the treetrunk is all of the initial data and the branches are thesubgroups delimited by the cut-points. ANOVA and nonparametric analysis were done to ensure that extreme val-ues did not affect the results.
RESULTS
In Vitro Calibration
The T1 relaxivities (r1) of GdDOTP5- and GdDOTA-4AmP5-
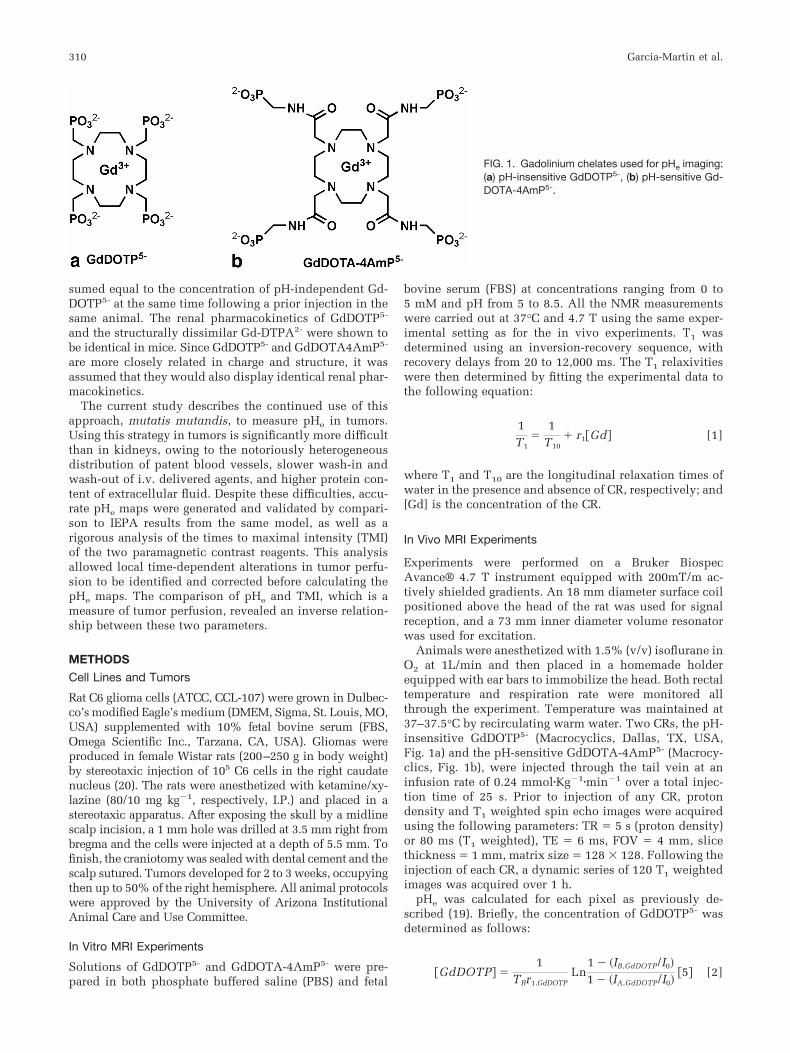
were determined in PBS at different pH values at 37°C and4.7 T. The T1 relaxivity value obtained for GdDOTP5- inPBS was 3.2 � 0.04 mM�1 s�1, which is in good agreementwith previously published values (22). The T1 relaxivity ofGdDOTP5- was pH-independent whereas the GdDOTA-4AmP5- relaxivity was, as expected, strongly dependent onpH (Fig. 2). The experimental data were fit to a Hill-modified Henderson Hasselbach equation:
pH � 6.87 �
�6.91 � r1,GdDOTA�4AmP
r1,GdDOTA�4AmP � 3.45�1.28
�7� [3]
Although the relaxivities measured in buffered aqueoussolutions like PBS are frequently assumed to be a goodapproximation to the in vivo situation, recent studies haveshown that macromolecular content can have a significanteffect on the relaxivities of Gd chelates commonly used inclinical MRI (23). Therefore, the effect of macromoleculesbinding on the relaxivities of both GdDOTP5- and Gd-DOTA-4AmP5- was investigated by using fetal bovine se-rum, FBS, instead of PBS as solution media. The T1 relax-ivity of GdDOTP5- in 100% FBS was 5.7 � 0.1 mM�1 s�1,higher than in PBS (3.2 � 0.04 mM�1 s�1). However, the r1
relaxivities of GdDOTA-4AmP5- were not statistically dif-ferent in the two solutions. The r1 of GdDOTP5- deter-mined in FBS was used for the in vivo data analysis.
Reproducibility of Pharmacokinetics
The R1 relaxation enhancement produced by GdDOTA-4AmP5- in vivo depends on both contrast reagent concen-tration and extracellular pH. Therefore, in order to calcu-late the extracellular pH, an independent measurement ofthe CR concentration is needed. The current experimentalprotocol addressed this matter by using the pH-insensitivecontrast reagent GdDOTP5-, which was injected prior tothe pH-sensitive GdDOTA-4AmP5-, assuming that bothCRs have identical pharmacokinetics. This approach hasbeen successfully applied to mouse kidney studies (19).However, tumors are much more heterogeneously per-fused as compared to kidneys, which may lead to spatiallyand temporally heterogeneous pharmacokinetics.
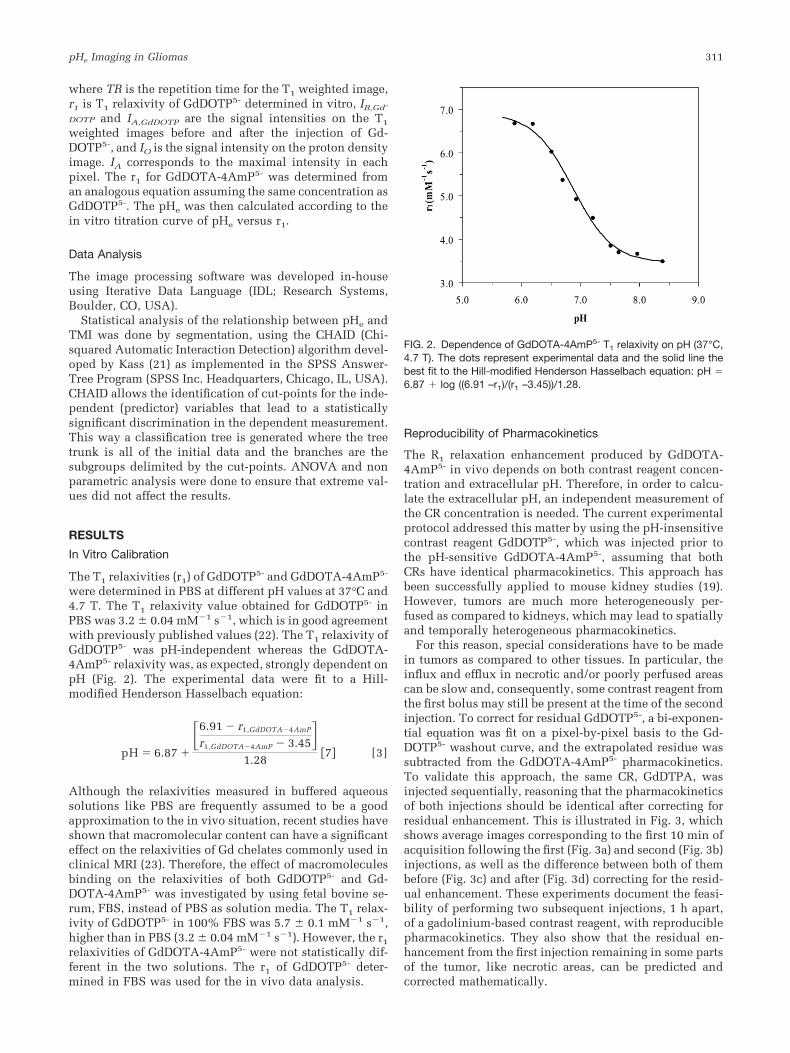
For this reason, special considerations have to be madein tumors as compared to other tissues. In particular, theinflux and efflux in necrotic and/or poorly perfused areascan be slow and, consequently, some contrast reagent fromthe first bolus may still be present at the time of the secondinjection. To correct for residual GdDOTP5-, a bi-exponen-tial equation was fit on a pixel-by-pixel basis to the Gd-DOTP5- washout curve, and the extrapolated residue wassubtracted from the GdDOTA-4AmP5- pharmacokinetics.To validate this approach, the same CR, GdDTPA, wasinjected sequentially, reasoning that the pharmacokineticsof both injections should be identical after correcting forresidual enhancement. This is illustrated in Fig. 3, whichshows average images corresponding to the first 10 min ofacquisition following the first (Fig. 3a) and second (Fig. 3b)injections, as well as the difference between both of thembefore (Fig. 3c) and after (Fig. 3d) correcting for the resid-ual enhancement. These experiments document the feasi-bility of performing two subsequent injections, 1 h apart,of a gadolinium-based contrast reagent, with reproduciblepharmacokinetics. They also show that the residual en-hancement from the first injection remaining in some partsof the tumor, like necrotic areas, can be predicted andcorrected mathematically.
FIG. 2. Dependence of GdDOTA-4AmP5- T1 relaxivity on pH (37°C,4.7 T). The dots represent experimental data and the solid line thebest fit to the Hill-modified Henderson Hasselbach equation: pH �6.87 log ((6.91 –r1)/(r1 –3.45))/1.28.
pHe Imaging in Gliomas 311
The pharmacokinetics of GdDOTP5- and GdDOTA-4AmP5- administered 1 h apart were compared by examiningthe time to maximal intensity (TMI) maps for both CRs. TheTMI depends on the perfusion properties of the tumor, suchas flow, vascular volume, volume of the extracellular/extravascular space, the extraction fraction, and the vas-cular permeability, as well as the CR pharmacokineticsand rate of renal clearance. Despite these complexities,TMI maps of CRs with similar pharmacokinetics wereexpected to be comparable for a given tumor.
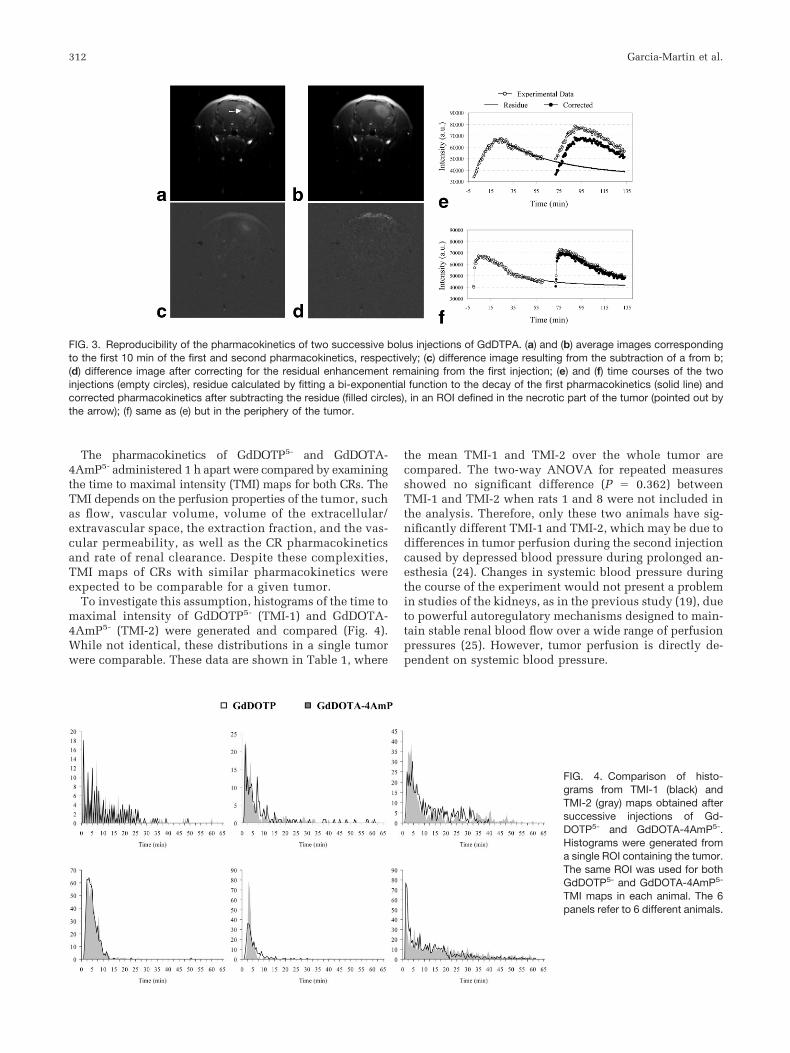
To investigate this assumption, histograms of the time tomaximal intensity of GdDOTP5- (TMI-1) and GdDOTA-4AmP5- (TMI-2) were generated and compared (Fig. 4).While not identical, these distributions in a single tumorwere comparable. These data are shown in Table 1, where
the mean TMI-1 and TMI-2 over the whole tumor arecompared. The two-way ANOVA for repeated measuresshowed no significant difference (P � 0.362) betweenTMI-1 and TMI-2 when rats 1 and 8 were not included inthe analysis. Therefore, only these two animals have sig-nificantly different TMI-1 and TMI-2, which may be due todifferences in tumor perfusion during the second injectioncaused by depressed blood pressure during prolonged an-esthesia (24). Changes in systemic blood pressure duringthe course of the experiment would not present a problemin studies of the kidneys, as in the previous study (19), dueto powerful autoregulatory mechanisms designed to main-tain stable renal blood flow over a wide range of perfusionpressures (25). However, tumor perfusion is directly de-pendent on systemic blood pressure.
FIG. 3. Reproducibility of the pharmacokinetics of two successive bolus injections of GdDTPA. (a) and (b) average images correspondingto the first 10 min of the first and second pharmacokinetics, respectively; (c) difference image resulting from the subtraction of a from b;(d) difference image after correcting for the residual enhancement remaining from the first injection; (e) and (f) time courses of the twoinjections (empty circles), residue calculated by fitting a bi-exponential function to the decay of the first pharmacokinetics (solid line) andcorrected pharmacokinetics after subtracting the residue (filled circles), in an ROI defined in the necrotic part of the tumor (pointed out bythe arrow); (f) same as (e) but in the periphery of the tumor.
FIG. 4. Comparison of histo-grams from TMI-1 (black) andTMI-2 (gray) maps obtained aftersuccessive injections of Gd-DOTP5- and GdDOTA-4AmP5-.Histograms were generated froma single ROI containing the tumor.The same ROI was used for bothGdDOTP5- and GdDOTA-4AmP5-
TMI maps in each animal. The 6panels refer to 6 different animals.
312 Garcia-Martin et al.
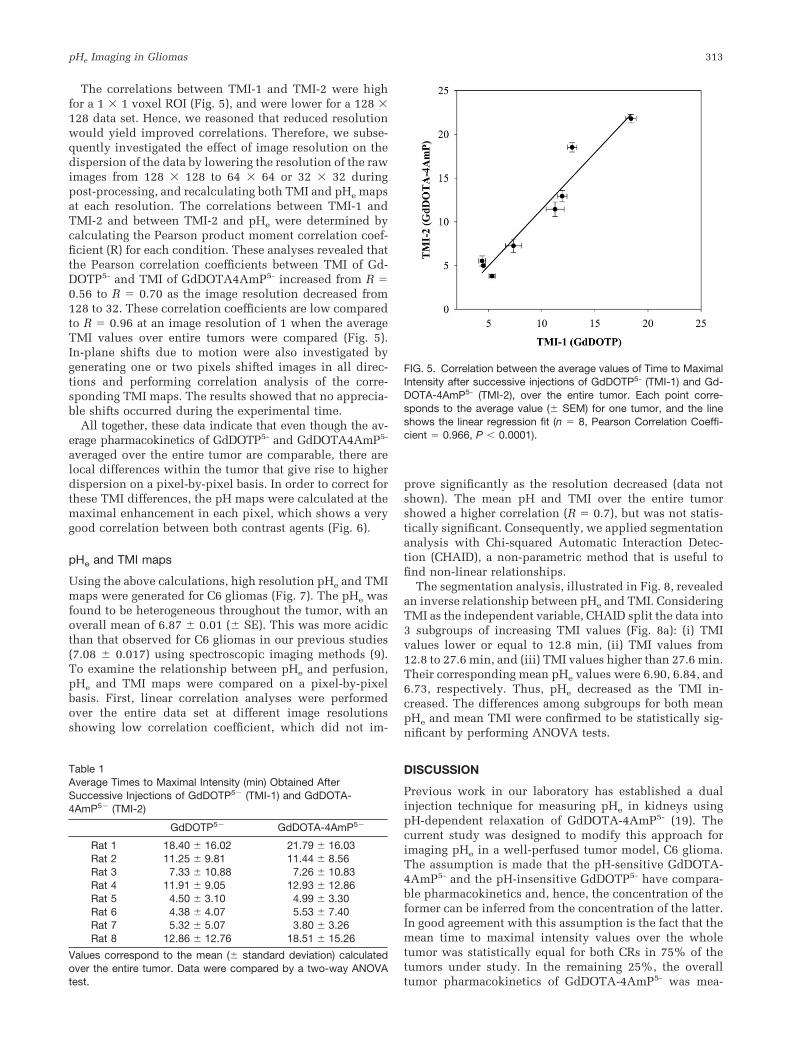
The correlations between TMI-1 and TMI-2 were highfor a 1 � 1 voxel ROI (Fig. 5), and were lower for a 128 �128 data set. Hence, we reasoned that reduced resolutionwould yield improved correlations. Therefore, we subse-quently investigated the effect of image resolution on thedispersion of the data by lowering the resolution of the rawimages from 128 � 128 to 64 � 64 or 32 � 32 duringpost-processing, and recalculating both TMI and pHe mapsat each resolution. The correlations between TMI-1 andTMI-2 and between TMI-2 and pHe were determined bycalculating the Pearson product moment correlation coef-ficient (R) for each condition. These analyses revealed thatthe Pearson correlation coefficients between TMI of Gd-DOTP5- and TMI of GdDOTA4AmP5- increased from R �0.56 to R � 0.70 as the image resolution decreased from128 to 32. These correlation coefficients are low comparedto R � 0.96 at an image resolution of 1 when the averageTMI values over entire tumors were compared (Fig. 5).In-plane shifts due to motion were also investigated bygenerating one or two pixels shifted images in all direc-tions and performing correlation analysis of the corre-sponding TMI maps. The results showed that no apprecia-ble shifts occurred during the experimental time.
All together, these data indicate that even though the av-erage pharmacokinetics of GdDOTP5- and GdDOTA4AmP5-
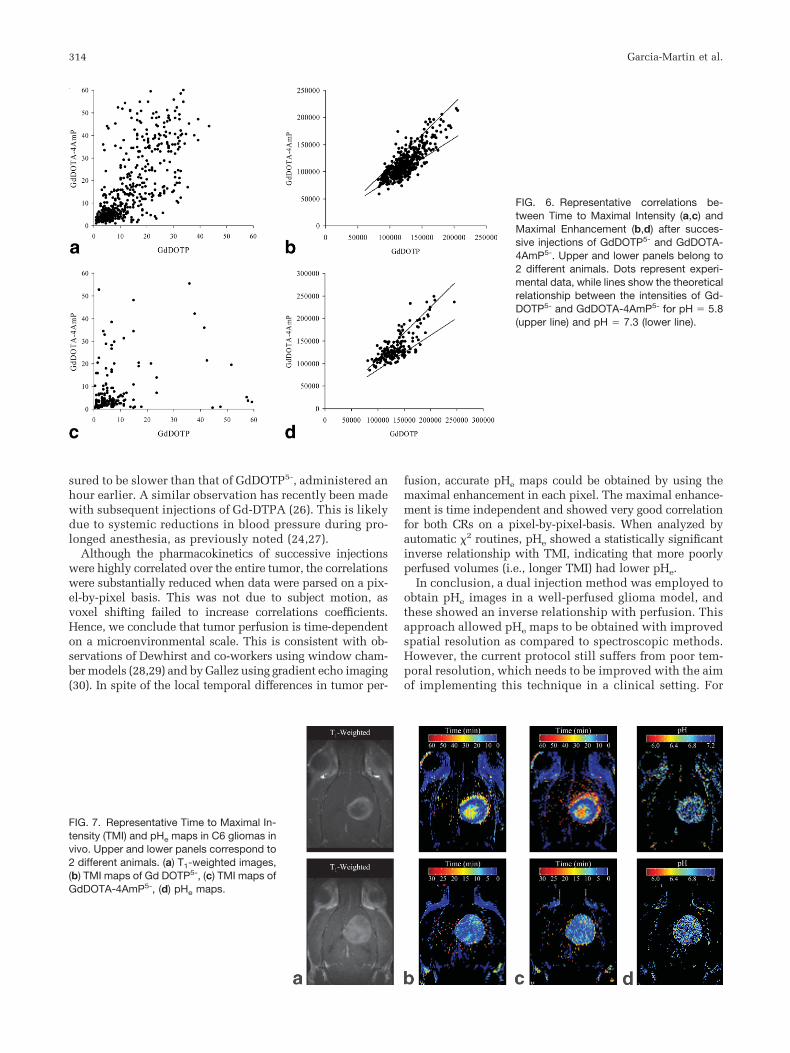
averaged over the entire tumor are comparable, there arelocal differences within the tumor that give rise to higherdispersion on a pixel-by-pixel basis. In order to correct forthese TMI differences, the pH maps were calculated at themaximal enhancement in each pixel, which shows a verygood correlation between both contrast agents (Fig. 6).
pHe and TMI maps
Using the above calculations, high resolution pHe and TMImaps were generated for C6 gliomas (Fig. 7). The pHe wasfound to be heterogeneous throughout the tumor, with anoverall mean of 6.87 � 0.01 (� SE). This was more acidicthan that observed for C6 gliomas in our previous studies(7.08 � 0.017) using spectroscopic imaging methods (9).To examine the relationship between pHe and perfusion,pHe and TMI maps were compared on a pixel-by-pixelbasis. First, linear correlation analyses were performedover the entire data set at different image resolutionsshowing low correlation coefficient, which did not im-
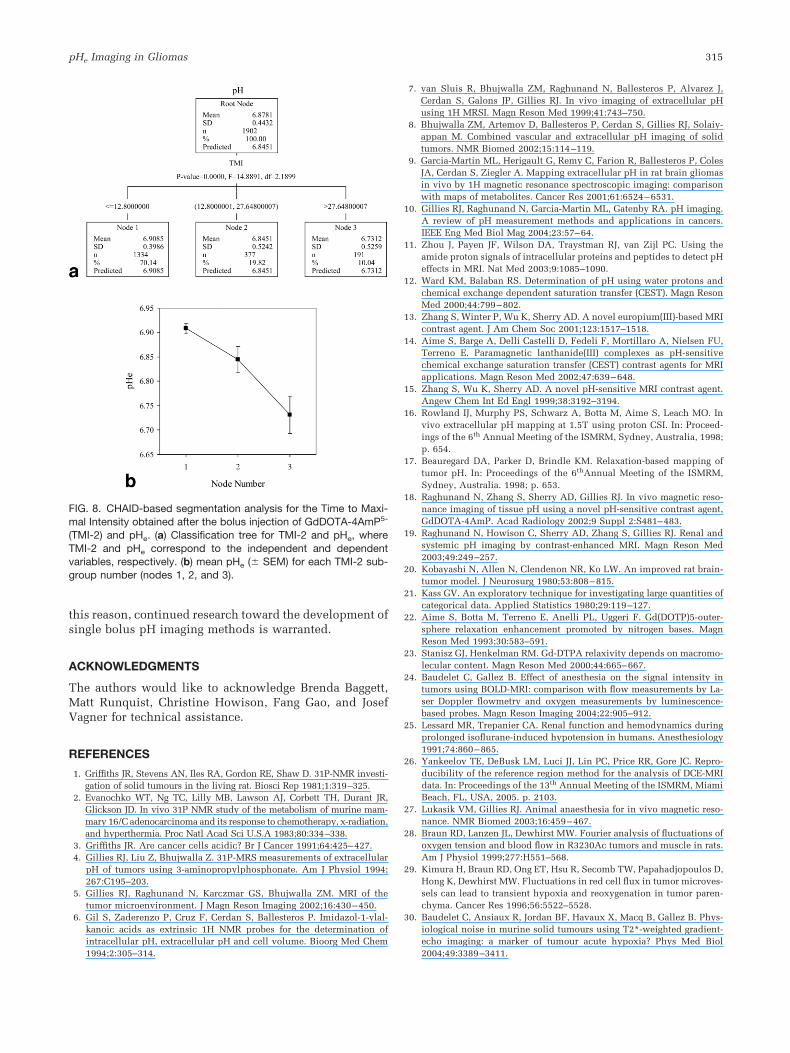
prove significantly as the resolution decreased (data notshown). The mean pH and TMI over the entire tumorshowed a higher correlation (R � 0.7), but was not statis-tically significant. Consequently, we applied segmentationanalysis with Chi-squared Automatic Interaction Detec-tion (CHAID), a non-parametric method that is useful tofind non-linear relationships.
The segmentation analysis, illustrated in Fig. 8, revealedan inverse relationship between pHe and TMI. ConsideringTMI as the independent variable, CHAID split the data into3 subgroups of increasing TMI values (Fig. 8a): (i) TMIvalues lower or equal to 12.8 min, (ii) TMI values from12.8 to 27.6 min, and (iii) TMI values higher than 27.6 min.Their corresponding mean pHe values were 6.90, 6.84, and6.73, respectively. Thus, pHe decreased as the TMI in-creased. The differences among subgroups for both meanpHe and mean TMI were confirmed to be statistically sig-nificant by performing ANOVA tests.
DISCUSSION
Previous work in our laboratory has established a dualinjection technique for measuring pHe in kidneys usingpH-dependent relaxation of GdDOTA-4AmP5- (19). Thecurrent study was designed to modify this approach forimaging pHe in a well-perfused tumor model, C6 glioma.The assumption is made that the pH-sensitive GdDOTA-4AmP5- and the pH-insensitive GdDOTP5- have compara-ble pharmacokinetics and, hence, the concentration of theformer can be inferred from the concentration of the latter.In good agreement with this assumption is the fact that themean time to maximal intensity values over the wholetumor was statistically equal for both CRs in 75% of thetumors under study. In the remaining 25%, the overalltumor pharmacokinetics of GdDOTA-4AmP5- was mea-
Table 1Average Times to Maximal Intensity (min) Obtained AfterSuccessive Injections of GdDOTP5� (TMI-1) and GdDOTA-4AmP5� (TMI-2)
GdDOTP5� GdDOTA-4AmP5�
Rat 1 18.40 � 16.02 21.79 � 16.03Rat 2 11.25 � 9.81 11.44 � 8.56Rat 3 7.33 � 10.88 7.26 � 10.83Rat 4 11.91 � 9.05 12.93 � 12.86Rat 5 4.50 � 3.10 4.99 � 3.30Rat 6 4.38 � 4.07 5.53 � 7.40Rat 7 5.32 � 5.07 3.80 � 3.26Rat 8 12.86 � 12.76 18.51 � 15.26
Values correspond to the mean (� standard deviation) calculatedover the entire tumor. Data were compared by a two-way ANOVAtest.
FIG. 5. Correlation between the average values of Time to MaximalIntensity after successive injections of GdDOTP5- (TMI-1) and Gd-DOTA-4AmP5- (TMI-2), over the entire tumor. Each point corre-sponds to the average value (� SEM) for one tumor, and the lineshows the linear regression fit (n � 8, Pearson Correlation Coeffi-cient � 0.966, P 0.0001).
pHe Imaging in Gliomas 313
sured to be slower than that of GdDOTP5-, administered anhour earlier. A similar observation has recently been madewith subsequent injections of Gd-DTPA (26). This is likelydue to systemic reductions in blood pressure during pro-longed anesthesia, as previously noted (24,27).
Although the pharmacokinetics of successive injectionswere highly correlated over the entire tumor, the correlationswere substantially reduced when data were parsed on a pix-el-by-pixel basis. This was not due to subject motion, asvoxel shifting failed to increase correlations coefficients.Hence, we conclude that tumor perfusion is time-dependenton a microenvironmental scale. This is consistent with ob-servations of Dewhirst and co-workers using window cham-ber models (28,29) and by Gallez using gradient echo imaging(30). In spite of the local temporal differences in tumor per-
fusion, accurate pHe maps could be obtained by using themaximal enhancement in each pixel. The maximal enhance-ment is time independent and showed very good correlationfor both CRs on a pixel-by-pixel-basis. When analyzed byautomatic �2 routines, pHe showed a statistically significantinverse relationship with TMI, indicating that more poorlyperfused volumes (i.e., longer TMI) had lower pHe.
In conclusion, a dual injection method was employed toobtain pHe images in a well-perfused glioma model, andthese showed an inverse relationship with perfusion. Thisapproach allowed pHe maps to be obtained with improvedspatial resolution as compared to spectroscopic methods.However, the current protocol still suffers from poor tem-poral resolution, which needs to be improved with the aimof implementing this technique in a clinical setting. For
FIG. 6. Representative correlations be-tween Time to Maximal Intensity (a,c) andMaximal Enhancement (b,d) after succes-sive injections of GdDOTP5- and GdDOTA-4AmP5-. Upper and lower panels belong to2 different animals. Dots represent experi-mental data, while lines show the theoreticalrelationship between the intensities of Gd-DOTP5- and GdDOTA-4AmP5- for pH � 5.8(upper line) and pH � 7.3 (lower line).
FIG. 7. Representative Time to Maximal In-tensity (TMI) and pHe maps in C6 gliomas invivo. Upper and lower panels correspond to2 different animals. (a) T1-weighted images,(b) TMI maps of Gd DOTP5-, (c) TMI maps ofGdDOTA-4AmP5-, (d) pHe maps.
314 Garcia-Martin et al.
this reason, continued research toward the development ofsingle bolus pH imaging methods is warranted.
ACKNOWLEDGMENTS
The authors would like to acknowledge Brenda Baggett,Matt Runquist, Christine Howison, Fang Gao, and JosefVagner for technical assistance.
REFERENCES
1. Griffiths JR, Stevens AN, Iles RA, Gordon RE, Shaw D. 31P-NMR investi-gation of solid tumours in the living rat. Biosci Rep 1981;1:319–325.
2. Evanochko WT, Ng TC, Lilly MB, Lawson AJ, Corbett TH, Durant JR,Glickson JD. In vivo 31P NMR study of the metabolism of murine mam-mary 16/C adenocarcinoma and its response to chemotherapy, x-radiation,and hyperthermia. Proc Natl Acad Sci U.S.A 1983;80:334–338.
3. Griffiths JR. Are cancer cells acidic? Br J Cancer 1991;64:425–427.4. Gillies RJ, Liu Z, Bhujwalla Z. 31P-MRS measurements of extracellular
pH of tumors using 3-aminopropylphosphonate. Am J Physiol 1994;267:C195–203.
5. Gillies RJ, Raghunand N, Karczmar GS, Bhujwalla ZM. MRI of thetumor microenvironment. J Magn Reson Imaging 2002;16:430–450.
6. Gil S, Zaderenzo P, Cruz F, Cerdan S, Ballesteros P. Imidazol-1-ylal-kanoic acids as extrinsic 1H NMR probes for the determination ofintracellular pH, extracellular pH and cell volume. Bioorg Med Chem1994;2:305–314.
7. van Sluis R, Bhujwalla ZM, Raghunand N, Ballesteros P, Alvarez J,Cerdan S, Galons JP, Gillies RJ. In vivo imaging of extracellular pHusing 1H MRSI. Magn Reson Med 1999;41:743–750.
8. Bhujwalla ZM, Artemov D, Ballesteros P, Cerdan S, Gillies RJ, Solaiy-appan M. Combined vascular and extracellular pH imaging of solidtumors. NMR Biomed 2002;15:114–119.
9. Garcia-Martin ML, Herigault G, Remy C, Farion R, Ballesteros P, ColesJA, Cerdan S, Ziegler A. Mapping extracellular pH in rat brain gliomasin vivo by 1H magnetic resonance spectroscopic imaging: comparisonwith maps of metabolites. Cancer Res 2001;61:6524–6531.
10. Gillies RJ, Raghunand N, Garcia-Martin ML, Gatenby RA. pH imaging.A review of pH measurement methods and applications in cancers.IEEE Eng Med Biol Mag 2004;23:57–64.
11. Zhou J, Payen JF, Wilson DA, Traystman RJ, van Zijl PC. Using theamide proton signals of intracellular proteins and peptides to detect pHeffects in MRI. Nat Med 2003;9:1085–1090.
12. Ward KM, Balaban RS. Determination of pH using water protons andchemical exchange dependent saturation transfer (CEST). Magn ResonMed 2000;44:799–802.
13. Zhang S, Winter P, Wu K, Sherry AD. A novel europium(III)-based MRIcontrast agent. J Am Chem Soc 2001;123:1517–1518.
14. Aime S, Barge A, Delli Castelli D, Fedeli F, Mortillaro A, Nielsen FU,Terreno E. Paramagnetic lanthanide(III) complexes as pH-sensitivechemical exchange saturation transfer (CEST) contrast agents for MRIapplications. Magn Reson Med 2002;47:639–648.
15. Zhang S, Wu K, Sherry AD. A novel pH-sensitive MRI contrast agent.Angew Chem Int Ed Engl 1999;38:3192–3194.
16. Rowland IJ, Murphy PS, Schwarz A, Botta M, Aime S, Leach MO. Invivo extracellular pH mapping at 1.5T using proton CSI. In: Proceed-ings of the 6th Annual Meeting of the ISMRM, Sydney, Australia, 1998;p. 654.
17. Beauregard DA, Parker D, Brindle KM. Relaxation-based mapping oftumor pH. In: Proceedings of the 6thAnnual Meeting of the ISMRM,Sydney, Australia. 1998; p. 653.
18. Raghunand N, Zhang S, Sherry AD, Gillies RJ. In vivo magnetic reso-nance imaging of tissue pH using a novel pH-sensitive contrast agent,GdDOTA-4AmP. Acad Radiology 2002;9 Suppl 2:S481–483.
19. Raghunand N, Howison C, Sherry AD, Zhang S, Gillies RJ. Renal andsystemic pH imaging by contrast-enhanced MRI. Magn Reson Med2003;49:249–257.
20. Kobayashi N, Allen N, Clendenon NR, Ko LW. An improved rat brain-tumor model. J Neurosurg 1980;53:808–815.
21. Kass GV. An exploratory technique for investigating large quantities ofcategorical data. Applied Statistics 1980;29:119–127.
22. Aime S, Botta M, Terreno E, Anelli PL, Uggeri F. Gd(DOTP)5-outer-sphere relaxation enhancement promoted by nitrogen bases. MagnReson Med 1993;30:583–591.
23. Stanisz GJ, Henkelman RM. Gd-DTPA relaxivity depends on macromo-lecular content. Magn Reson Med 2000;44:665–667.
24. Baudelet C, Gallez B. Effect of anesthesia on the signal intensity intumors using BOLD-MRI: comparison with flow measurements by La-ser Doppler flowmetry and oxygen measurements by luminescence-based probes. Magn Reson Imaging 2004;22:905–912.
25. Lessard MR, Trepanier CA. Renal function and hemodynamics duringprolonged isoflurane-induced hypotension in humans. Anesthesiology1991;74:860–865.
26. Yankeelov TE, DeBusk LM, Luci JJ, Lin PC, Price RR, Gore JC. Repro-ducibility of the reference region method for the analysis of DCE-MRIdata. In: Proceedings of the 13th Annual Meeting of the ISMRM, MiamiBeach, FL, USA, 2005. p. 2103.
27. Lukasik VM, Gillies RJ. Animal anaesthesia for in vivo magnetic reso-nance. NMR Biomed 2003;16:459–467.
28. Braun RD, Lanzen JL, Dewhirst MW. Fourier analysis of fluctuations ofoxygen tension and blood flow in R3230Ac tumors and muscle in rats.Am J Physiol 1999;277:H551–568.
29. Kimura H, Braun RD, Ong ET, Hsu R, Secomb TW, Papahadjopoulos D,Hong K, Dewhirst MW. Fluctuations in red cell flux in tumor microves-sels can lead to transient hypoxia and reoxygenation in tumor paren-chyma. Cancer Res 1996;56:5522–5528.
30. Baudelet C, Ansiaux R, Jordan BF, Havaux X, Macq B, Gallez B. Phys-iological noise in murine solid tumours using T2*-weighted gradient-echo imaging: a marker of tumour acute hypoxia? Phys Med Biol2004;49:3389–3411.
FIG. 8. CHAID-based segmentation analysis for the Time to Maxi-mal Intensity obtained after the bolus injection of GdDOTA-4AmP5-
(TMI-2) and pHe. (a) Classification tree for TMI-2 and pHe, whereTMI-2 and pHe correspond to the independent and dependentvariables, respectively. (b) mean pHe (� SEM) for each TMI-2 sub-group number (nodes 1, 2, and 3).
pHe Imaging in Gliomas 315