high powered rocketry flight safety design course
TRANSCRIPT

High Powered Rocketry
Flight Safety Design Course
Actioni contrariam semper et aequalem esse reactionem.For every action there is an equal an opposite reaction.
- Isaac Newton
Pat Lampton
Spring 2016
1

Small Rocket Atmospheric Flight
• Course Objective: Describe how to perform atmospheric flight simulations and performance predictions for small suborbital launch vehicles using example vehicle.
Day 1
• Flight Performance
– Stability and Control / Center of Pressure / Drag Prediction
– Flight Simulation / In – Plane (2 DOF) / Ascent only
• Flight Safety
– Rail Exit Velocity
– Supersonic/Transonic Aerodynamics effect on Xcp
– Flutter
– Ballistic Coefficient and Terminal Velocity
Day 2
• Rocket Motor Design, Operation & Performance
2

Very Basic Flight Mechanics
• During the ascent trajectory, multiple forces act
on the launch vehicle. Summing these forces
and integrating will yield the velocity and
position of the vehicle over time.
Local Horizontal
WeightF = Thrust
Lift
Velocity
centerline
Drag• These forces act in different
directions and at different locations.
Both the forces and resulting
moments must be carefully balanced
to maintain the proper flight
orientation.
• We can compute the trajectory of a vehicle with varying degrees of accuracy and fidelity. Trajectory simulations that compute the position of the vehicle in the three axes (x, y, z) are commonly called 3 degree of freedom models(3 DOF).
• Higher fidelity simulations also compute the rotation of the vehicle around its center of mass. (Since the lift and drag of the vehicle both depend on its orientation relative to its velocity vector, for the highest accuracy we must compute the orientation throughout the trajectory.) Simulations that compute the vehicle orientation (roll, pitch and yaw) as well as its position are commonly called 6 degree of freedom models (6 DOF).
3
Center of gravity location
Center of pressure location

Trajectory Calculation Example
• We will discuss small rocket atmospheric flight and develop prediction and analysis tools. We will use these to perform mission analysis for their small rockets.
t ax vx x az vz z F W phi alpha CD CL A g q density
0.00 12.749 0.000 0.000 2.942 0.000 0.000 1300 1000 0 0 0.1 0.1 0.5 9.807 0.000 1
0.10 12.877 1.275 0.127 3.071 0.294 0.029 1300 990 0 0 0.1 0.1 0.5 9.807 0.856 1
0.20 13.008 2.563 0.384 3.204 0.601 0.090 1300 980 0 0 0.1 0.1 0.5 9.807 3.464 1
0.30 13.139 3.863 0.770 3.340 0.922 0.182 1300 970 0 0 0.1 0.1 0.5 9.807 7.888 1
0.40 13.273 5.177 1.288 3.481 1.256 0.307 1300 960 0 0 0.1 0.1 0.5 9.807 14.191 1
0.50 13.409 6.505 1.938 3.625 1.604 0.468 1300 950 0 0 0.1 0.1 0.5 9.807 22.441 1
0.60 13.546 7.846 2.723 3.773 1.966 0.664 1300 940 0 0 0.1 0.1 0.5 9.807 32.709 1
0.70 13.685 9.200 3.643 3.925 2.344 0.899 1300 930 0 0 0.1 0.1 0.5 9.807 45.067 1
0.80 13.826 10.569 4.700 4.082 2.736 1.172 1300 920 0 0 0.1 0.1 0.5 9.807 59.591 1
0.90 13.969 11.951 5.895 4.244 3.144 1.487 1300 910 0 0 0.1 0.1 0.5 9.807 76.359 1
1.00 14.114 13.348 7.230 4.411 3.569 1.844 1300 900 0 0 0.1 0.1 0.5 9.807 95.454 1
1.10 14.260 14.759 8.706 4.582 4.010 2.245 1300 890 0 0 0.1 0.1 0.5 9.807 116.960 1
1.20 14.409 16.185 10.324 4.759 4.468 2.691 1300 880 0 0 0.1 0.1 0.5 9.807 140.967 1
1.30 14.560 17.626 12.087 4.942 4.944 3.186 1300 870 0 0 0.1 0.1 0.5 9.807 167.566 1
1.40 14.712 19.082 13.995 5.130 5.438 3.730 1300 860 0 0 0.1 0.1 0.5 9.807 196.855 1
1.50 14.867 20.554 16.050 5.324 5.951 4.325 1300 850 0 0 0.1 0.1 0.5 9.807 228.933 1
1.60 15.023 22.040 18.254 5.525 6.484 4.973 1300 840 0 0 0.1 0.1 0.5 9.807 263.905 1
1.70 15.182 23.543 20.609 5.732 7.036 5.677 1300 830 0 0 0.1 0.1 0.5 9.807 301.880 1
4
gM
ACVF
avehicle
D
z
)sin(2
1 2
vehicle
D
xM
ACVF
a
)cos(2
1 2
0VatVz 0ZtvZ z

Propulsion
• Commercially available
• Short duration
• Low Thrust ~ relative
• Limited data
• Uncertainty
5
Cesaroni K1200 Brochure Calculated Official
Diameter (mm): 54.0 54.0
Length (cm): 48.8 40.4
Prop. Weight (g): 981.4 960.0
Total Weight (g): 1,631.9 —
Avg. Thrust (N): 1,183.2 1,191.2 —
Max. Thrust (N): 1,369.5 1,369.5 —
Tot. Impulse (Ns): 2,011.4 2,011.4 1,364.0
Burn Time (s): 1.7 1.7 —

Typical Launch Vehicle Aerodynamics
• Aerodynamic forces and moments
– Normal force coefficients
– Axial force coefficients
– Rolling Moment
– Pitching moment coefficient
– Location of center of pressure (static stability)
– GN&C and Autopilot
• Aerodynamic load distributions (bending moments …)
• Protuberance air loads
• Ground wind loads and wind induced oscillations
• Plume effects
• Aeroelasticity
• Aeroacoustics
• Unsteady aerodynamics – Buffet, Flutter, etc
• Vehicle venting 6

Static Stability & Drag
• We will ignore almost all aero analysis except static stability and drag.
7

Static Stability of a System
• Equilibrium, for an aircraft in steady uniform flight, is defined as the condition where all aerodynamic moments around the aircraft Xcg sum to zero. This is also called the trim condition.
• If the moments of the aircraft around the Xcg are non zero, the aircraft is subject to rotational or translational forces (and hence accelerations).
• Stability is the initial tendency for an air vehicle to return its equilibrium position after a disturbance
• Aerodynamic stability is generally divided into static and dynamic stability (not covered).
8

Static Stability of a Vehicle
9
• Stable - If a gust disturbs the vehicle to a positive pitch angle, would develop a negative (nose down) pitching moment which would tend to rotate the vehicle toward its (trim) equilibrium position.
• Unstable - If a gust disturbs the vehicle to a higher pitch angle an unstable vehicle would develop a positive (nose up) pitching moment which would tend to rotate the vehicle away from its equilibrium (trim) position.
(+) Nose up
(+) Nose up
(-) Nose down
(-) Nose down

Dynamic Stability
10
• Dynamic stability is determined by the aircraft ability to dampen or excite (negative damping) a disturbance

Center of Pressure definition
• The center of pressure of an aerodynamic body is the location where of the aerodynamic pressure field may be represented by a single force vector with no moment.
• At low angles of attack, the contributions to the center of pressure are dominated by the nose, and fins not by a cylindrical body.
• Rockets are typically designed to be aerodynamically axi-symmetric. Therefore equilibrium (or trim) position is typically zero angle of attack (AoA)
• James S. Barrowman’s paper entitled 'The Practical Calculation of the Aerodynamic Characteristics of Slender Finned Vehicles‘, primarily for NASA sounding rockets
• The Barrowman document provides a series of simple algebraic methods for determining the location of the center of pressure of a slender rockets flying at subsonic velocities and small angles of attack
11

Analytical Estimation of Axi-Symmetric Vehicle Xcp
12
NoseBody Motor
Fins
dNoseXcp
dFins
vehicle
finsfinsnosenose
cpCn
CndCndX
**
cpNose cpFins

Center of Pressure for Nose Cone
Lxcp3
2
13
Ogive
Conical K is a caliber term =
nose L/D
Slender,
body of
revolution,
inviscid
flow

Center of Pressure (Slender Body Limitation)
• The center of pressure for the nose is calculated using slender body theory.
• Cross flow theory is more complex (producing variable Xcp during flight) but predicts high angle of xcp very close to experimental results
• The result is a rearward shift of Xcp at low velocity and reduction or loss of vehicle stability
14

Two important Xcp effects of Rocket Angle of Attack α
• Slender body theory (Barrowman) breaks down above α>2 deg due to cross flow aerodynamic separation
• Fin stall at α>10 deg reduces effectiveness of aero fins
15

Impact of Crosswind on Slender Body Theory / Stability
• Minimum Allowed Stability Margin = 2.0
• Maximum Allowable crosswind = 20 mph or 29.3 fps
• Minimum Allowable Rail Exit is > 55 fps
16
• At an AOA Xcp shifts forward due to aerodynamic lift contribution of rocket body and fin stall
55 fps
20 MPH = 29.3 fps
AOA = atan (V cross wind / V rail exit)
At 20 mph limit AOA = 28 deg
Location of Center of Gravity
Location of Center of Pressure

Flutter
17
• Wing bending-torsion flutter
• Fin stiffness/damping
modulus
• Thickness to Chord ratio
• Span to chord ratio
• Typically occurs above
~750 fps
Poor Span to chord ratioGood Thickness to chord ratio
NACA 4197 simplified in Apogee Newsletter
Issue 291 JULY 19, 2011

Xcp Contribution from Trapezoidal Fin
• Barrowman used CN, or Normal Force coefficients of each aero surface multiplied by the location of the aero surfaces’ centers of pressure to calculate total Xcp for the vehicle.
• This technique is very good for stability analysis and static margin assessments at subsonic speeds and low angles of attack
18
Example of Barrowman’s Equation for XCP
determination for a swept, tapered, trapezoidal fin

Analytical Estimation of Axi-Symmetric Vehicle Xcg
19
NoseBody Motor
Fins
dNose dBody Xcg
dMotor
dFins
total
finsfinsmotormotorbodybodynosenose
cgW
WdWdWdWdX
****
cgNose cgBody cgMotor cgFins

Drag
• Drag is the component of the resultant aerodynamic force that is parallel to the velocity vector.
• The aerodynamic drag is produced by the pressure forces and by skin friction forces that act on the surface. We will represent all drag by a single number generated at low AoA.
• Prediction
– Local atmospheric density (at altitude)
– Velocity
– Drag Coefficient (0.75 for most kits, 0.40-0.60 for high performance)
– Projected Area
20
AreaCVF Ddrag **2
1 2

Small Rocket Example Project
• Analyze small performance
• Develop spreadsheet tools to estimate Xcg, Xcp, CD
• Develop a flight trajectory prediction for your small rocket
• Single Stage
21
t ax vx x az vz z F W phi alpha CD CL A g q density
0.00 12.749 0.000 0.000 2.942 0.000 0.000 1300 1000 0 0 0.1 0.1 0.5 9.807 0.000 1
0.10 12.877 1.275 0.127 3.071 0.294 0.029 1300 990 0 0 0.1 0.1 0.5 9.807 0.856 1
0.20 13.008 2.563 0.384 3.204 0.601 0.090 1300 980 0 0 0.1 0.1 0.5 9.807 3.464 1
0.30 13.139 3.863 0.770 3.340 0.922 0.182 1300 970 0 0 0.1 0.1 0.5 9.807 7.888 1
0.40 13.273 5.177 1.288 3.481 1.256 0.307 1300 960 0 0 0.1 0.1 0.5 9.807 14.191 1
0.50 13.409 6.505 1.938 3.625 1.604 0.468 1300 950 0 0 0.1 0.1 0.5 9.807 22.441 1
0.60 13.546 7.846 2.723 3.773 1.966 0.664 1300 940 0 0 0.1 0.1 0.5 9.807 32.709 1
0.70 13.685 9.200 3.643 3.925 2.344 0.899 1300 930 0 0 0.1 0.1 0.5 9.807 45.067 1
0.80 13.826 10.569 4.700 4.082 2.736 1.172 1300 920 0 0 0.1 0.1 0.5 9.807 59.591 1
0.90 13.969 11.951 5.895 4.244 3.144 1.487 1300 910 0 0 0.1 0.1 0.5 9.807 76.359 1
1.00 14.114 13.348 7.230 4.411 3.569 1.844 1300 900 0 0 0.1 0.1 0.5 9.807 95.454 1
1.10 14.260 14.759 8.706 4.582 4.010 2.245 1300 890 0 0 0.1 0.1 0.5 9.807 116.960 1
1.20 14.409 16.185 10.324 4.759 4.468 2.691 1300 880 0 0 0.1 0.1 0.5 9.807 140.967 1
1.30 14.560 17.626 12.087 4.942 4.944 3.186 1300 870 0 0 0.1 0.1 0.5 9.807 167.566 1
1.40 14.712 19.082 13.995 5.130 5.438 3.730 1300 860 0 0 0.1 0.1 0.5 9.807 196.855 1
1.50 14.867 20.554 16.050 5.324 5.951 4.325 1300 850 0 0 0.1 0.1 0.5 9.807 228.933 1
1.60 15.023 22.040 18.254 5.525 6.484 4.973 1300 840 0 0 0.1 0.1 0.5 9.807 263.905 1
1.70 15.182 23.543 20.609 5.732 7.036 5.677 1300 830 0 0 0.1 0.1 0.5 9.807 301.880 1

Trajectory Calculation Example
22

Density Calculation as a Function of altitude
• During the development of the flight simulation a density vs. altitude was performed using:
• The above equation is valid only for the isothermal portion of the atmosphere only.
• The density/altitude realtion ship for the linearly thermal varying portion of the atmosphere:
• This has been corrected in the spreadsheet provided with the course materials.
23

Transonic Flight
24

Symmetric Airfoil at Small AoA in Transonic Flow
25
• Local high pressure (low velocity)
regions exist downstream of the shock.
• Aero stability is affected by the pressure
differential. Very difficult to predict
High pressure,
low velocity
region
Unaffected
pressure/
velocity region

26

Shock wave visualization over an F-20 at low
supersonic velocity and low AoA
27

Cambered Airfoil in Transonic Flow
28
Transonic Wave Drag
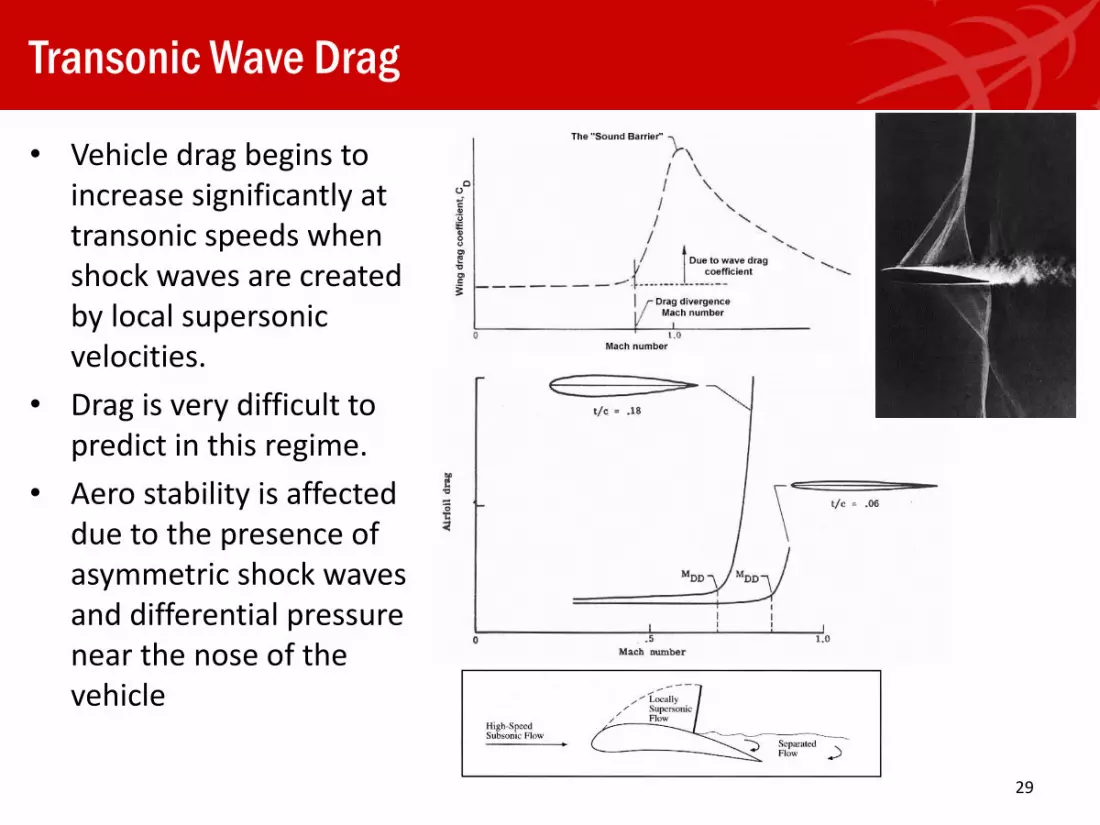
• Vehicle drag begins to increase significantly at transonic speeds when shock waves are created by local supersonic velocities.
• Drag is very difficult to predict in this regime.
• Aero stability is affected due to the presence of asymmetric shock waves and differential pressure near the nose of the vehicle
29
Day 2
Rocket Motor Design, Operation & Performance
30

Advanced Rocket Design Workshop
Rocket Fundamentals
31

Rocket Fundamentals
• Thrust Equation
• Total Impulse
• Specific Impulse
• Thrusting Acceleration Level
• Mass Parameters
• Ideal Rocket Equation
• Sizing Analysis
• Multi-stage Optimization
32

Thrust Equation – Momentum Derivation
• The major source of thrust for a rocket is the exchange of momentum between the exhaust gases and the vehicle
mvPmom )/( smkgmomentumPmom
)(kgmassm
)/( smvelocityv
eemom mdvdmvdP
emom v
dt
dm
dt
dP
eemom
m vmvdt
dm
dt
dPF
F = momentum thrust magnitude (N)
= mdot = m/t (t0) mass flow rate of propellant (kg/s)
ve = exit or exhaust velocity magnitude of the propellant (m/s)
Expelled
propellant mass
Exhaust
velocity
Rocket velocity
0
m
33

Thrust Equation - Pressure
• It can be seen that, at the nozzle exit plane, there is a pressure imbalance between the exit pressure and the ambient pressure. We add an additional term to the thrust equation to account for this pressure differential.
e
surface
aep AppF Fp = pressure thrust magnitude (N)
pe = nozzle exit pressure (Pa)
pa = ambient pressure (Pa)
Ae = nozzle exit cross-sectional area (m2)
34

Thrust Equation
• Combining the momentum and pressure thrust equations provides:
F = thrust magnitude (N)
mdot = mass flow rate of propellant (kg/s)
ve = exit or exhaust velocity magnitude of the
propellant (m/s)
pe = nozzle exit pressure (Pa)
pa = ambient pressure (Pa)
Ae = nozzle exit cross-sectional area (m2)
If we can calculate these parameters, we can estimate the rocket’s performance.
eaee AppvmF
35

Total Impulse
• The total impulse of a rocket is defined as the area under the thrust-time curve. Total impulse is a measure the change in velocity (v capability) that a given rocket motor design will provide.
bt
FdtI0
bFtI
Where
I = Total Impulse (N-s)
F = Instantaneous Thrust Magnitude (N)
tb = thrust duration or burn time (s)
“Total Impulse is the Area Under the Thrust Curve”
For a system with a constant thrust magnitude,
36

Specific Impulse (Isp)
• Isp, the ratio of thrust to mass flow rate of the propellant, is a typical performance parameter.
• Isp as the amount of thrust (momentum change) you can get from a unit mass of propellant.
• Isp is measured in seconds.
0gm
FI sp
F = thrust magnitude (N)
mdot = mass flow rate of propellant (kg/s)
g0 = 9.807 (m/s2)
Propulsion Isp (s)
Cold Gas 60-250
Liquid Rocket
Monopropellant
Bipropellant
140-235
320-460
Solid Rocket 260-300
Hybrid Rocket 290-350
Typical Isp values for various propulsion systems
b
b
t
t
sp
dtmg
FdtI
00
0
For constant mass flow and constant thrust, the Isp equation reduces to this simplified form.
37

Thrusting Acceleration Level
• The imposed thrusting-acceleration load must be designed to be less than the structural capability of payload.
• This is load typically expressed in “g’s”.
0
Loadon Acceleratimg
F
Where
F = Instantaneous Thrust Magnitude (N)
m = mass (kg)
go=9.807
38

Advanced Rocket Design Workshop
Survey of Solid Rockets
39

Space Shuttle Solid Rocket Boosters
Space Shuttle
The Space Shuttle Solid Rocket Booster is the largest solid rocket ever flown and the first designed for reuse.
Units ISP f inertAverage
Thrust
Average
Pc
Burn
Time
Total
Mass
Propellant
Mass
Nozzle
Mass
Case
Mass
Insulation
Mass
Igniter
Mass
SI 268 s 0.117 11,600 kN 4.58 MPa 124 s 568,000 kg 500,000 kg 10,860 kg 44,800 kg 11,200 kg 230 kg
English - - 2,600,000 lbf 664 psi - 1,250,000 lb 1,100,000 lb 24,000 lb 98,800 lb 24,700 lb 510 lb
40

In-Space Motors
• Space motors provide additional impulse for orbital transfers from LEO to higher Earth orbit or to interplanetary orbit.
• Solids are very attractive for in-space applications due to their inherently high density impulse (product of the specific impulse and propellant density).
Units ISP f inertAverage
Thrust
Average
Pc
Burn
Time
Total
Mass
Propellant
Mass
Nozzle
Mass
Case
Mass
Insulation
Mass
Igniter
Mass
SI 292.6 s 0.085 38.4 kN 3.63 MPa 66 s 956 kg 884 kg 31.7 kg 26.3 kg 12.7 kgIncl in
Nozzle
English - - 8,630 lbf 527 psi - 2,108 lb 1,950 lb 69.9 lb 58 lb 28 lb -
Star 37 Nominal Characteristics
41

Amateur Class Rockets
• Amateur class rockets are significantly smaller than vehicles carrying interplanetary or LEO payloads but they are very instructive for larger vehicles.
• This class of solid rocket motor performance is dissimilar to large motors since the small size short burn times of the small rocket motors are within the timeframe of unsteady, transient portion of most large motors.
Units ISPAverage
Thrust
Max
Thrust
Burn
Time
Loaded
Mass
Propellant
Mass
B/O
Mass
SI 193.8 s 335 N 410.6 N 1.93 s 627 g 341.5 g 261 g
English - 75.41 lb 92.3 lb - 22.12 oz 12.05 oz 9.21 oz
Cesaroni Technology J335 First Stage Motor Nominal Characteristics
42

How Does a Solid Rocket Motor Work?
43

Solid Rocket Motor Major Components
• Propellant
• Case
• Nozzle
• Insulation
• Igniter
44

Solid Rocket Components – PropellantFunction – The propellant grains combusts to convert stored chemical energy into high pressure/high temperatures to provide thrust
Constituents/Formulations
• Granular fuel & oxidizer in a ‘rubber’ matrix binder
• Typical fuels are metal powders such as AL
• Typical oxidizers are ammonium perchlorate
• Typical binder is polybutadiene
• Minor ingredients include cure catalysts, plasticizers, darkening agents, bonding agents, burn rate enhancers
45
The internal molded shape or geometry of the grain can be highly tailored to provided a pressure, thrust or acceleration profile as required

Solid Rocket Components – Case
Function – The rocket motor cast contains combustion pressure and transmits thrust forces to vehicle
Materials – High strength metal (steel, aluminum, titanium) or wound composite
The density and strength of the case materials are of primary importance to the designer.
46

Solid Rocket Components – Insulation
Function – The solid rocket motor insulation protects the motor case from high temperature propellant combustion gases
Materials - Low thermal conductivity
Typically rubber materials with fibrous fillers to improve structural integrity. ethylene propylene diene monomer (EPDM) or nitrile butadiene rubber (NBR) filled with silica, or Kevlar pulp.
Performance – Density, Thermal conductivity, char and erosion properties
47

Load Response
• Propellant, Liner and Insulation are “viscoelastic” materials. Their mechanical response reflects the magnitude, rate, duration and history of the applied load
Propellant
Liner
Insulation
Case
48

Solid Rocket Components – Nozzle
Function - Controls expansion of chamber pressures, may include thrust vector control for vehicle guidance and control
Materials – High temperature materials – typically ablatively cooled, carbon-phenolic, silica-phenolic, or carbon/carbon
Performance Parameters – expansion ratio, cone angle, throat area, exit area, char/erosion properties
49

Solid Rocket Components – Igniters
Function - Provides high pressure, high temperature gases to initiate the main propellant grain
Designs - Forward end or Aft end mounted
Pyrotechnic – Utilizes an electrical signal to initiate a solid explosive or propellant-like formulation. (Initiators)
Pyrogenic – A small rocket motor designed specifically to ignite a large rocket motor
Materials – Solid explosive materials including boron-potassium nitride, boron-potassium perchlorate as initiators or solid rocket propellant formulations as igniters.
Performance Parameters – charge weight vs main motor free volume
50

Propellant Ballistics & Basic Performance
51

Propellant Ballistics and Basic Performance Prediction
• Propellant Burn Rate Equation / Pressure Relationship
• Basic Ballistics Calculations
• Lumped Parameter Method
– Example Spreadsheet
52

Propellant Burn Rate Equation
• Propellant burn rate is defined as the rate at which the exposed propellant surface is consumed.
• The typical prediction uses an empirical model, based on test results.
• The propellant burn rate is a strong function of the motor chamber pressure.
n
cb apr
• “a” is the burn rate coefficient.
• “n” is the burn rate exponent.
• Burn rates are also a function of the propellant bulk temperature.
53ln r = ln a + n ln p
ln r ≅ ln a + n ln p

Small Particle Classification
54

Propellant Ingredients by Weight
55
18% Al71 % AP
<<1 %
Curative,
Plasticizer,
Burn Rate Enhancer,
Etc.
11 % HTPB

Propellant Formulation
• Select propellant parameters, based on historical formulation data.
• The burn rate coefficient is typically given in non-standard units
– SI: cm/s and MPa.
– English: mils/sec and psi
Formulationp
kg/m3
c*
m/s
Tc
Ka n
Star 63D TP-H-1202
21% Al, 57% AP, 12% HMX, 10% HTPB1840 1541 3636 0.415 0.31
Star 48 Star 37 TP-H-3340
18% Al, 71% AP, 11% HTPB1800 1527 3396 0.399 0.30
Orbus 21, Orbus (IUS SRM-1, SRM-2)
18% Al, 68% AP, 14% HTPB 1744 1585 3347 0.355 0.35
Many other propellant formulations are also available.
56

Characteristic Exhaust Velocity, c*
• The characteristic exhaust velocity, c*, is a function of the propellant characteristics and the combustion chamber design efficiency measure of the propellant combustion process.
• Actual c* is less than the ideal value by a significant amount. Fluid flow (e.g., vorticity and viscous losses), heat losses, and combustion inefficiencies contribute to reductions in the available flow energy. A c* efficiency factor will be used to account for these losses. The losses defined in this efficiency factor all occur upstream of the nozzle throat.
m
pATRc ctgas
11
1/2
*
57
Ideal Empirical

Basic Ballistic Calculation Techniques
• Lumped Parameter Method:
– For motors that have low chamber flow velocities, the pressure variations through the chamber will be small.
– The lumped parameter method assumes a constant pressure in the entire chamber zone of the motor.
• Ballistic Element Method:
– For motors that are long, the flow will accelerate down the bore and static pressure will drop.
– Pressure variations through the chamber cannot be neglected.
– This technique involves using a series of control volumes where the pressure is assumed constant.
Constant Pressure
Constant Pressure
Constant Pressure
Constant Pressure
Constant Pressure
M<<1 M1M<<1
Lumped Parameter Ballistic Element
58

Mass of Propellant “Combusted”
• The mass of propellant that is injected into the combustion chamber (bore) is equal to the mass of the propellant that is combusted.
• The rate of propellant mass injected is equal to the rate at which the propellant is combusted.
59
bpropellantbpropellantbin rAtxAm /
Δx
xAm propellantbin

Steady State - Lumped Parameter Method
At
Ab
Conservation of Mass
outin mm
bpropellantbin rAm
0*
c
pArAmm ctbpropellantboutin
n
t
bpropellant
cA
cAap
1
1
*
n
cb apr substituting
From the definition of c*
We assume that the mass input from the burning propellant surface equals the mass
exiting the nozzle. (This assumption is valid for certain conditions discussed on the
next chart)
Where:
Ab = exposed surface area of propellant
propellant = propellant density
rb = propellant burn rate
a = burn rate coefficient “Beware of Units”
n = burn rate exponent
At = nozzle throat area
c* = characteristic velocity
pc = chamber pressure
*c
pAm ct
out
60

Conditions for Steady State (Mass Flow Equilibrium) Operation
• The ballistics calculation is based on an assumption that the mass flux created by the propellant combustion is equal to the mass flux that discharges through the nozzle.
• This assumption is appropriate if the propellant burn rate exponent “n” is less than one. See the charts to the right.
• However, larger values of the pressure exponent “n” have equilibrium pressures that are quite large.
0
20
40
60
80
100
0.0 2.0 4.0 6.0
Pc (MPa)
m d
ot
(kg
/s)
m input
m discharge
0
20
40
60
80
100
120
140
160
0.0 5.0 10.0 15.0
Pc (MPa)
m d
ot
(kg
/s)
m input
m discharge
n = 0.35
n = 0.40
61

Propellant Grain Design
• Propellant Formulation must be selected to estimate:
– Burn Rate Parameters
– Density
– Flame Temperature
– Characteristic Velocity
• Grain Design– Burn Surface Area as
a function of time
– Exposure Time for insulation design
– Case maximum pressure
– Required propellant mass
– Case length/diameter constraints
Many grain designs include combinations of these cross section designs.
62

Advanced Rocket Design Workshop
Thermo-chemistry
63

Thermochemistry
• Objectives
• Solid Propellant Ingredients
• Propellant Formulation
• Thermochemical Equilibrium Assumptions
• Thermochemical Properties
• ISP Program
64

Objective
• The objective of Thermochemical Analysis, for the purposes of our preliminary design project, is to evaluate key thermochemical properties of the flow in order to calculate flow performance parameters.
• These parameters will be used to predict the conditions at the nozzle exit plane and, using these conditions, the motor thrust.
Inlet
ExitConditions in combustion chamber are known.
M = 1
M > 1
Throat Conditions vary throughout the nozzle. We need to know exit velocity and pressure to calculate thrust.
eaee AppvmF
65

NASA’s Typical Propellant Ingredients
• Composite propellants consist of a mixture of oxidizer crystals and a powdered fuel held together in a matrix of rubber/plastic binder.
• Fuels – The most common fuel used is aluminum.
• Oxidizers - Ammonium perchlorate (AP) is the most common oxidizer used.
• Binders – The binder holds the fuel and oxidizer together and must be able to withstand the environments of processing storage, transportation and flight.
• Minor Ingredients – Minor ingredients are added to the formulation to improve the performance. These typically include a cure catalyst, plasticizer, darkening agent and a burn rate catalyst.
66

Formulation
• The propellant formulation is the percent by (weight) of the various chemical ingredients.
• A typical propellant has between 5 and 15 different ingredients.
• Formulation , ingredients and effect on performance will be covered in more detail in the Propellant section
Formulation
Star 63D TP-H-1202
21% Al, 57% AP, 12% HMX, 10% HTPB
Star 48 Star 37 TP-H-3340
18% Al, 71% AP, 11% HTPB
Orbus 21, Orbus (IUS SRM-1, SRM-2)
18% Al, 68% AP, 14% PBHT
67

Thermochemical Property Determination Equilibrium Assumptions
• Frozen Flow
– Assumes the composition of the combustion gas does not change from the combustion chamber to the nozzle exit plane.
– No chemical reactions or phase changes.
– This technique typically underestimates performance by 1 - 4%.
• Shifted Equilibrium Flow (at the nozzle exit plane)
– Chemical reactions proceed at an infinite rate.
– As the pressure and temperature change through the nozzle, the reactions equilibrate instantaneously. Equilibrium is maintained at all locations within the nozzle.
– This typically overstates performance by 1 - 4%.
• Finite Rate Chemistry
– Chemical reactions occur at a finite, temperature dependent rate.
– Estimate the reaction rates and calculate non-equilibrium properties throughout the flow.
68

Flame Temperature
• Composite propellant decomposes as it heats. Oxidizer rich gases and fuel rich gases mix above the burning surface. Solid particulates of aluminum, AP and binder break loose and into the gas flow. The gas reaches an characteristic equilibrium temperature shortly above the propellant surface.
• Flame temperature is weakly dependent on the chamber pressure. For the first iteration, assume no dependence. Use your calculated average pressure for subsequent analysis.
• The flame temperature is the Total Temperature of the flow.
69

Ratio of Specific Heats,
• The ratio of specific heats is a thermodynamic parameter defined as the specific heat at constant pressure divided by the specific heat at constant volume. This parameter appears in many of the isentropic flow equations.
• The value of is 1.4 for diatomic gases (oxygen and nitrogen) and between 1.1 and 1.3 for more complex molecules.
• The ISP thermochemical analysis program can be used to estimate at various locations in the nozzle, using a shifted equilibrium approximation.
• Variations in significantly affect the flow parameters through the nozzle.
70

Molecular Weight
• Combustion of solid rocket fuel is highly complex forming dozens of reaction products and, in many cases, multi-phase flows.
• The chemical reactions occur inside the grain port very close to the propellant surface. However, the flow field conditions, pressure and temperature, change as the combustion gases flow through the nozzle and the reaction products change.
• The reaction products are mainly gaseous form but liquid and solid phases also exist within the flow. For example, in the high temperature combustion chamber liquid aluminum oxide is present in the flow. When the liquid droplets enter the lower temperature nozzle flow, they condense and form small particulates.
• For simplicity we will use an single molecular weight value that is the average molecular weight of the combustion products. We will ignore multi-phase flow effects and correct for this omission later on.
71

Characteristic Exhaust Velocity, c*
• The characteristic exhaust velocity, c*, is a function of the propellant combustion process. c* is proportional to the square root of (Tc/MW). These thermochemical parameters are dependent on the motor chamber pressure, therefore c* also is dependent on pc.
• Actual c* is less than the theoretical value by a significant amount. Fluid flow (e.g., vorticity and viscous losses), heat losses, and combustion inefficiencies contribute to reductions in the available flow energy. A c* efficiency factor will be used to account for these losses. The losses defined in this efficiency factor all occur upstream of the nozzle throat.
72

The Gas Constant and Molecular Weight
• A perfect or ideal gas follows the Ideal gas Law:
• R is the gas constant for a particular gas and is related to the Universal Gas Constant R and the molecular mass M by:
RTPv
RU = 8314.41 J / kmol-K
M – Molecular mass of the gas in kg / kmol
M
RR U
73

Advanced Rocket Design Workshop
Compressible Flow in a Nozzle
Isentropic Flow
74

Thermodynamics Topics
• Perfect Gas Laws
• Joule’s Law
• Conservation Laws (Mass, Momentum, Energy)
• Isentropic Flow in a Nozzle
• Thrust Equations
75

Nozzle Flow Theory - Assumptions
• Isentropic flow
– No heat exchange with surroundings (Adiabatic)
– No losses (Reversible, Frictionless)
• Products of Combustion are a perfect gas.
• Assume no work interaction
• No force field effects (gravity, electromagnetic)
76

Flow Properties - Static and Stagnation Conditions
• Static conditions – the properties that an observer moving with the fluid would measure. Including pressure, temperature and density.
• Stagnation (Total) conditions – the properties that would result if the flow were decelerated to zero velocity in a steady adiabatic process. Designated by the subscript zero.
2
02
1Vpp
FactorilityCompressibV
pp_
2
2
0
Illustration of Static and Stagnation pressures using a Pitot-Static Tube. Low speed, incompressible flow (M << 1.0)
At higher velocities, the flow becomes compressible and changes in static density must be accounted for.
Pressure Example
77

Isentropic Flow in a Variable Area Duct
• Why do rocket nozzles have a converging area inlet and diverging area exit?
Recall the thrust equation:
• High thrust (high Isp) requires high exit velocity. Therefore we wish to accelerate the flow throughout the nozzle.
• Subsonic flow accelerates in a converging area duct and supersonic flows accelerates in a diverging area duct
InletExit
M < 1
M = 1M > 1
Throat
eaee AppvmF
78

Nozzle Flow Theory
• Stagnation properties are constant through the nozzle, if we assume that the flow can be isentropically stagnated.
• Using the stagnation properties, we can calculate the flow static properties anywhere in the nozzle.
12
0
2
11
M
pp
2
0
2
11 M
TT
InletExit
M < 1
M = 1M > 1
Throat
79

Nozzle Flow Theory – Exit Mach Number
• We can calculate the Mach number at the nozzle exit if we know the ratio of the throat area to the exit area and the isentropic ratio .
• Note: The Me relationship is an intrinsic function and must be computed iteratively.
1
1
2
2
11
1
2
e
e
te M
A
AM
Inlet Exit
M < 1
M = 1 M > 1
Throat
80

Variation Along the Nozzle
0
0.5
1
1.5
2
2.5
3
3.5
4
4.5
0 10 20 30 40 50 60 70
Expansion Ratio
Ma
ch #
Inlet Exit
M < 1
M = 1 M > 1
Throat 0.00
0.50
1.00
1.50
2.00
2.50
3.00
3.50
4.00
0 10 20 30 40 50 60 70
Expansion Ratio
To
tal
Pre
ssu
re (
Mp
a)
0
0.5
1
1.5
2
2.5
0 10 20 30 40 50 60 70
Expansion Ratio
Sta
tic P
ressu
re (
Mp
a)
0
500
1000
1500
2000
2500
3000
3500
4000
0 10 20 30 40 50 60 70
Expansion Ratio
To
tal
Tem
pera
ture
(K
)
0
500
1000
1500
2000
2500
3000
3500
0 10 20 30 40 50 60 70
Expansion Ratio
Sta
tic T
emp
era
ture
(K
)
81

Rocket Design Workshop Example Design Spreadsheet
t Pc
SA
Total SA Side Port R Port L r B Throat A Throat R
0.00 3.08E+06 4.25 4.25369 0.470 1.440 0.00526 0.0201 0.0800
0.16 3.08E+06 4.26 4.25803 0.471 1.439 0.00526 0.0201 0.0800
0.32 3.08E+06 4.26 4.26234 0.472 1.438 0.00526 0.0201 0.0800
0.48 3.09E+06 4.27 4.26664 0.473 1.437 0.00527 0.0201 0.0800
0.64 3.09E+06 4.27 4.27092 0.473 1.436 0.00527 0.0201 0.0801
0.80 3.10E+06 4.28 4.27519 0.474 1.435 0.00527 0.0201 0.0801
0.95 3.10E+06 4.28 4.27943 0.475 1.434 0.00527 0.0202 0.0801
1.11 3.11E+06 4.28 4.28366 0.476 1.433 0.00528 0.0202 0.0801
1.27 3.11E+06 4.29 4.28787 0.477 1.432 0.00528 0.0202 0.0801
MEOP
Max Pressure
Average Pressure
Burn Time
Insulation Exposure Time
Pc
0.00E+00
5.00E+05
1.00E+06
1.50E+06
2.00E+06
2.50E+06
3.00E+06
3.50E+06
4.00E+06
0.00 20.00 40.00 60.00 80.00 100.00
Time
PC
(P
a)
82