high inclusion of partially deshelled and whole krill meals in diets for atlantic salmon ( salmo...
TRANSCRIPT
Aquaculture 310 (2010) 164–172
Contents lists available at ScienceDirect
Aquaculture
j ourna l homepage: www.e lsev ie r.com/ locate /aqua-on l ine
High inclusion of partially deshelled and whole krill meals in diets for Atlanticsalmon (Salmo salar)
Jon Øvrum Hansen a, Michael Penn b, Margareth Øverland a, Karl D. Shearer a, Åshild Krogdahl b,Liv Torunn Mydland a, Trond Storebakken a,⁎a Aquaculture Protein Centre, CoE, Department of Animal and Aquaculture Sciences, Norwegian University of Life Sciences, P.O. Box 5003, NO-1432 Ås, Norwayb Aquaculture Protein CoE, Department of Basic Sciences and Aquatic Medicine, Norwegian School of Veterinary Science, P.O. Box 8146 Dep, NO-0033 Oslo, Norway
⁎ Corresponding author. Tel.: +47 64965263; fax: +E-mail address: [email protected] (T. Stor
0044-8486/$ – see front matter © 2010 Elsevier B.V. Adoi:10.1016/j.aquaculture.2010.10.003
a b s t r a c t
a r t i c l e i n f oArticle history:Received 9 July 2010Received in revised form 4 October 2010Accepted 5 October 2010
Keywords:Atlantic salmonKrillDigestibilityFluoride
The aim of this study was to investigate how diets containing partially deshelled or whole krill meals affectedgrowth, digestibility of main nutrients, faecal excretion of minerals, fluoride accumulation, and organ indicesand health parameters in Atlantic salmon (Salmo salar). Three extruded diets were fed for 100 days to salmonwith an average weight of 550 g, distributed into 9 tanks equipped with flow through sea water. The dietarytreatments comprised a control diet based on high-quality fish meal (FM) and two experimental diets wherethe FM was substituted with either partially deshelled krill meal (PDKM) or whole krill meal (WKM). Shellremoval reduced the chitin content from 28 to 8 g kg−1 dry matter (DM), while fluoride was only reducedfrom 940 to 631 mg kg−1 DM.Growth rate for fish fedWKMwas significantly lower than for salmon fed control diet whereas the PDKM dietdid not appear to alter growth during the first feeding period. Digestibility of lipid tended to be higher forPDKM and lower for WKM compared to the FM control. No significant difference was seen for digestibility ofnitrogen, but fish fed the FM diet had higher digestibility of threonine, serine, glutamine, histidine and lysinecompared to fish fed the WKM diet. No major differences in plasma were seen for triacylglycerols, free fattyacids, glucose, total protein, albumin, globulin, urea, and total bilirubin. Trypsin activities in the pyloric andmid intestine were lower in fish fed the WKM diet compared to FM. Bile acid concentration in the pyloricintestine were significantly lower in fish fed the WKM diet compared to FM and PDKM. Fish fed both dietscontaining krill meal had signs of mild to moderate nephrosis. To conclude, PDKM could successfully replaceFM as a sole protein source for Atlantic salmon, whereas the WKM slightly reduced growth rate compared tothe FM and the PDKM diet.
47 64965101.ebakken).
ll rights reserved.
© 2010 Elsevier B.V. All rights reserved.
1. Introduction
Farming of marine carnivorous fishes is increasing; implying acomparable increase in the demand for high-quality protein feedingredients. Antarctic krill (Euphausia superba) is receiving increasedattention as a marine protein source. Knox (2007) describes thedifficulty of obtaining a reliable estimate of the Antarctic krill biomassbut suggests that this biomass is between 108 and 109tons. Krill wasexamined as a source for fish feeds in the late 70's and early 80's(Storebakken, 1988), but it's commercial use did not increase due tothe economics of the krill fisheries, problemswith krill processing andincreased supplies of fish meal (FM) (Ichii, 2000).
A limiting factor for use of krill in European fish feeds has been EU'srestriction on fluoride level in feed of 150 mg kg−1 (Commission dir.2002/32/EC). A recent EU directive increased the allowable fluoride
level in complete feed for fish to 350 mg kg−1 (Commission dir. 2008/76/EC). Fluoride is mainly located in the exoskeleton of the krill andthe fluoride level in whole Antarctic krill has been shown to bebetween 1000 mg kg−1 (Boone and Manthey, 1983; Zhang et al.,1993) and 2400 mg kg−1 (dry wt.) (Soevik and Braekkan, 1979). Areduction of fluoride concentration in krill meal can be obtained byseparating the exoskeleton from the muscle fraction prior to mealproduction. The fluoride, however, is able to leach from theexoskeleton to the muscle fraction during cold storage in atemperature dependent manner (Christians and Leinemann, 1983;Adelung et al., 1987). A partial deshelling of the krill meal will alsoreduce the level of chitin, a long-chain polymer of N-acetyl-glucosamine that is known to reduce growth rate similarly to thatof dietary fiber (Tharanathan and Kittur, 2003). Another limitingfactor for use of krill is the natural high level of copper in krill; EU'sallows a maximum of 25 mg kg−1 in complete feedstuff (Commissiondir. 2003/100/EC).
Feeding rainbow trout (Salmo gairdneri) with krill resulted inreduced growth rate and feed efficiency when average quality FMwas
Table 1Chemical composition of fishmeal (FM), partly deshelled krill meal (PDKM), and wholekrill meal (WKM) used in the experimental diets.
FM PDKM WKM
Composition, g kg−1
Dry matter 969 964 925Crude proteinb 708 610 594Crude lipid 88 187 151Ash 139 118 134Chitin 0.2 8 28Ammonium nitrogen 26 8 9Total volatile nitrogen 0.1 b.1 b.1Volatile fatty acids, % of total 18:1 nd. a 29 31Peroxide value nd. 0.7 4.1
Amino acidsc, g kg−1
Total AAd 519.6 390.6 381.5Cysteine 5.7 5.2 4.8Methionine 16.1 11.7 11.0Aspargine 54.7 43.8 43.4Threonine 25.4 19.7 19.2Serine 25.3 17.8 17.1Glutamine 83.9 58.1 57.9Proline 23.1 22.1 23.0Glycine 30.8 20.2 21.1Alanine 32.6 22.0 22.3Valine 26.4 20.5 20.2Isoleucine 23.7 20.6 19.7Leucine 42.0 31.8 30.7Tyrosine 15.2 14.0 13.1Phenylalanine 22.0 18.4 17.9Histidine 11.8 8.3 8.6Lysine 45.5 31.4 30.0Arginine 35.3 24.9 21.5
Minerals, mg kg−1
Fluoride 176 631 940Copper 5.2 78 81Zinc 63 58 55
Biogenic amines, mg kg−1
Tyramine 215 92.6 529Putrescine 122 12.4 21.1Cadaverine 496 b1 b1Histamine 7.0 b1 b1
a nd. = not determined.b Adjusted for chitin nitrogen.c Presented in dehydrated form.d Total sum of amino acids without tryptophan.
165J.Ø. Hansen et al. / Aquaculture 310 (2010) 164–172
completely replaced with krill meal (Beck et al., 1977; Koops et al.,1979). Feeding Atlantic salmon (Salmo salar) with Antarctic krill, acomplete replacement of high-quality FM also gave significantlylower final weights compared to fish fed a diet with 200 gkg−1 krillmeal replacement (Rungruangsak-Torrissen, 2007). These experi-ments suggest that krill meal might contain components that reducegrowth rate at high dietary inclusions. In contrast, Yoshitomi et al.(2007) reported no negative effect on growth in small rainbow troutreared in fresh water and fed graded levels, up to completereplacement of a brown FM with a low fluoride krill meal, producedby deshelling the meal after it was dried.
The aims of this study were to examine nutritional, physiologicaland histo-pathological responses to diets where krill meals, with andpartly without shell, fully replaced FM as the source of protein.
2. Materials and methods
2.1. Krill meal and diet production
The experimental krill meals were produced at the NorwegianUniversity of Life Sciences (UMB) (Ås, Norway) by a technologyproprietary to Krillsea Group AS, using frozen Antarctic krill,Euphausia superba (United Ocean Co., Ltd, South Korea). Two typesof krill meal were produced. One was a partially deshelled krill meal(PDKM), where parts of the shells had been mechanically removedprior to heating. The other was a WKM, with shells (Table 1). Bothmeals contained krill water solubles (“stickwater”), which is shown tobe responsible for some of the palatability properties in krill meal(Tibbetts et al., 2010). The shell removal process reduced the chitinlevel from 28 to 8 gkg−1 drymatter (DM), while the fluoride level wasonly reduced from 940 to 631 mg kg−1 DM. The experimental krillmeals were lower in ammonium and volatile nitrogen compared tothe FM (Table 1). The levels of biogenic amines in all threemeals werewithin the quality specifications for Norse Eco LT FM from NorsildmelA/L, Fyllingsdalen, Norway. The WKM contained higher level of thebiogenic amine tyramine compared to the FM, but putrescine,cadaverine, and histamine levels were higher in the FM comparedto the krill meals.
Three extruded diets were produced at the Centre for FeedTechnology at UMB (Table 2). Yttrium oxide (Y2O3) was used as aninert marker for determination of digestibility (Austreng et al., 2000).The diets were mixed, ground, conditioned, extruded, dried andvacuum coated by the same equipment and procedures as used byAslaksen et al. (2007).
After cooling, the coated pellets were packed in plastic bags andstored at 5 °C. The diets were formulated to be isonitrogenous andisolipidic (Table 3). Because FM and krill meals differed in lipidcontent, different levels of oil were added during vacuum coating toobtain similar dietary lipid levels.
2.2. Biological experiment and facilities
A total of 225 Atlantic salmon, weighing 550 g on average, wererandomly distributed to nine fibreglass tanks of 1.5 m3 each and keptin 34 g l−1 sea water supplied at 22 lmin−1. The mean watertemperature was 8.1 °C for days 1–56 and 7.0 °C for days 57–100.The tanks were under constant light 24 hd−1. Each diet was fed totriplicate groups of fish. Feed was supplied in excess of appetite inorder to ensure maximum voluntary feed intake.
2.3. Sampling procedure
All fish were weighed at the start of the experiment and at days 56and 100. At the end of the experiment, the fish were anaesthetizedwith metacaine (MS-222™; 50 mg l−1 water). Weight was recordedfor all fish. Randomly selected fish from each tank were sampled for
analyses. All fish in each tank, except those sampled for histology andgut enzymes, were stripped for faeces. Three fish per tank werehomogenized and pooled prior to analyzing for whole bodycomposition. Another five fish per tank were sampled for weight ofthe gastrointestinal tract (GIT), liver and carcass. Blood was drawnfrom six fish by caudal venipuncture using vacutainers containinglithium heparin. The gastrointestinal tracts were removed andcarefully cleaned of adherent adipose. The intestine was then dividedinto four regions: stomach (ST), pyloric caeca (pyloric intestine, PI),mid intestine (MI) and distal intestine (DI). Digesta was collectedfrom the PI (distal half), MI and DI (proximal half) for analysis of bileacid concentration and lipase and trypsin activities. The tissue of eachregion was individually weighed and samples taken for histology(fixed in neutral buffered formalin) and the remainder frozen in liquidN2 for brush border enzyme activity analyses. Additional samples forhistology were taken from the liver (LI) and trunk (filtrative) kidney(KI). The Norwegian quality cut, NQC (NS, 1994) was sampled fromthree fish per tank. A standard piece, approximately 10 g of the whitedorsal muscle from the NQC was sampled with a cork punch. Theremainderwasmicrowaved in sealed plastic bags until the bone easilyseparated from the muscle. The bone and muscle were freeze driedand pooled within tank, ground with a pestle and mortal prior tofluoride analysis. Three whole fish from each tank were frozen andlater thawed for radiography.
Table 3Chemical composition of the diets.
FM PDKMa WKMb
Dry matter (DM), g kg−1 959.8 955.9 951.1In DM, kg−1
Crude protein, g 484.4 494.0 464.9Total proteinc, g 484.4 490.4 455.9Lipid, g 323.0 284.6 310.2Starch, g 72.9 67.0 66.2Ash, g 103.7 108.4 112.1Chitin, g 0.1 8.5 20.9Gross energy, MJ 23.6 22.6 22.9
Amino acidsd, g kg−1
Total AAe 336.0 315.8 296.9Cysteine 3.7 4.3 3.8Methionine 10.1 9.2 8.4Aspargine 35.2 35.3 33.4Threonine 16.2 15.9 14.9Serine 16.6 14.8 13.6Glutamine 56.5 48.4 46.6Proline 16.1 18.5 18.1Glycine 20.2 16.0 16.3Alanine 20.8 17.6 17.3Valine 16.7 16.1 15.5Isoleucine 14.8 16.0 14.8Leucine 26.8 25.5 23.6Tyrosine 9.8 11.4 10.1Phenylalanine 14.4 14.9 14.0Histidine 7.5 6.7 6.3Lysine 27.9 24.8 23.1Arginine 22.7 20.4 16.9
Minerals, kg−1
Phosphorus, g 14.5 14.5 12.3Copper, mg 10.0 72.0 64.0Iron, mg 13.0 22.0 14.0Zinc, g 0.19 0.20 0.19Fluoride, mg 110 470 640Yttrium, mg 82.0 87.0 84.0
a PDKM; partly deshelled krill meal.b WKM; whole krill meal.c Adjusted for chitin nitrogen.d Presented in dehydrated form.e Total sum of amino acids without tryptophan.
Table 2Diet formulation.
Diet FM a PDKM b WKM c
Formulation, g kg−1
Partly deshelled krill meal 0 752 0Whole krill meal 0 0 689Fish meala 641 0 0Wheat flourd 108 105 107Vitamin and mineral premixe 5.0 5.0 5.0Vitamin Cf 0.60 0.60 0.60MCPg 0 18.0 18.3Yttrium oxideh 0.1 0.1 0.1Fish oili 245 119 180
a Norse Eco LT, Norsildmel, Egersund, Norway.b PDKM; partly deshelled krill meal.c WKM; whole krill meal.d Felleskjøpet, Kambo, Norway.e Farmix, Trouw Nutrition, LA Putten, The Netherlands. Per kg feed. Retinol 2500.0 IU,
Cholecalciferol 32400.0 IU, α-tocopherol SD 0.2 IU, Menadione 40.000 mg, Thiamin15.0 mg, Riboflavin 25.0 mg, d-Ca-Pantothenate 40.003 mg,Niacin 150.003 mg, Biotin3000.0 mg, Cyanocobalamin20.0 mg, Folic acid 5.0 mg, Pyridoxine15.0 mg, Ascorbatepolyphosphate 0.098 g, Cu: CuSulfate 5H2O 11.998 mg, Zn: ZnSulfate 89.992 mg, Mn:Mn(II)Sulfate 34.993 mg, I: K-Iodide 1.999 mg, Se: Na-Selenite 0.200 mg, Cd Max.0.003 mg, Pb Max. 0.028 mg, Ca 0.915 g, K 1.380 g, Na 0.001 g, Cl 1.252 g.
f Stay-C® 35. DSM Nutritional Products, Basel, Switzerland.g Bolifor® MCP-F. KPP Oy, Animal Nutrition, Helsingborg, Sweden.h Y2O3. Metal Rare Earth Limited, Shenzhen, China.i NorSalmOil, Norsildmel, Egersund, Norway.
166 J.Ø. Hansen et al. / Aquaculture 310 (2010) 164–172
2.4. Chemical and physical analyses
Diets and freeze-dried faeces were ground with a pestle andmortar prior to analysis. Diets and faeces were analyzed for drymatter by drying to constant weight at 104 °C (Commission dir. 71/393/EEC), protein using Kjeldahl nitrogen (Commission dir. 93/28/EEC)×6.25, lipid by HCl hydrolysis followed by diethyl etherextraction (Commission dir. 98/64/EC), starch (AOAC enzymaticmethod 996.11), ash (Commission dir. 71/250/EEC), minerals (ICP-AES/ICP-MS) (Nordic Committee on Food Analysis (NMKL) method161), and yttrium oxide (ICP-AES) (NS-EN ISO 11885). Starchgelatinization was analyzed by the BioLab Analyse (Nofima Ingre-dients, Bergen) using a modification of Chiang and Johnson (1977)glucoamylasemethodology. Biogenic amines were analyzed by usingHPLC according to Smělá et al. (2003). Amino acids were analyzedaccording to Commission dir. 98/64/EC on a Biochrom 30 amino acidanalyzer (Biochrom Ltd., Cambridge, UK). Chitin in diets wasdetermined as glucosamine-residues after post-column derivatiza-tionwith ninhydrin on the same Biochrom 30 analyzer as used for theamino acid analyses. In brief, the 100 mg chitin samples werehydrolyzed at 110 °C for 4 h in Duran-Schott GL-18 screw cappedtubes in a Labtherm® heating block (Liebisch Labortechnik GmbH,Bielefeld, Germany) using 10 ml of 6 M HCl. After cooling to roomtemperature, 8 ml of 7.5 M NaOH was gently added and thehydrolysates were diluted to 100 ml using 0.2 M sodium citrateloading buffer, pH 2.2 (Biochrom Ltd., Cambridge, UK). An aliquot(1 ml) of the hydrolysates was micro-filtrated (0.45 μm Spartanmembrane filter, Schleicher & Schuell, Dassel, Germany) prior toinjection (40 μl). All data were analyzed against external standards ofglucosamine-HCl (Sigma Chemical, St. Louis, Mo., U.S.A.) using theChromeleon® Chromatography Management Software (DionexCorporation, Sunnyvale, CA). Fluoride concentrationwas determinedusing a fluoride ion selective combination electrode (VWR sympho-ny, model 14002-788) using the procedure given by Malde et al.(2001).
Physical pellet quality was tested for durability, hardness andexpansion 14 days after production. Pellet durability was tested witha DORIS pellet tester (AKVAsmart, Bryne, Norway) using 100 g of pre-sieved pellets. After the pellets passed through the machine the pelletcollector was emptied on a 4 mm screen with a collector and sieved
for 60 s at 0.5 amplitude with a Retsch AS 200 Control (Haan,Germany). Thematerial remaining on the 4.0-mm screen after sievingwas weighed. The durability was defined as the percentage of pelletsremaining on the screen. The testing was conducted in triplicate foreach diet. Hardness was determined with a Texture Analyzer TA-XT2(SMS Ltd, Surrey, UK), equipped with a 5 kg load cell as described byØverland et al. (2009). The length of each pellet tested was recordedwith an electrical caliper and the pellet width was recorded by thetexture analyzer. Expansion was calculated as: ((pellet width−diediameter)×die diameter−1)×100.
2.5. Plasma clinical chemistry
The Central Laboratory at The Norwegian School of VeterinaryScience performed plasma analyses according to standard methods.These methods are based on Mulder et al. (1983) for free fatty acidsand Trinder (1969) and Allain et al. (1974) for cholesterol. Theanalyses for alanine aminotransferase (ALT), aspartate aminotrans-ferase (AST), alkaline phosphatase (AP), total protein, albumin,globulin, urea, creatinine, glucose, triglycerides, free fatty acids, bileacids, total bilirubin, inorganic phosphorus, Ca, Na, K, and Cl, are basedon Tietz (1995). Bile acid in plasma was determined using theEnzabile® test kit (Cat. No. 550101, Bio-Stat Diagnostic Systems,Cheshire, UK). The concentrations of 3α-hydroxy bile acids werecalculated from a standard curve generated using bovine serum basedstandards containing glycohenodeoxycholic acid.
Table 5Growth for Atlantic salmon fed diets with fish meal (FM), partially deshelled krill meal(PDKM) or whole krill meal (WKM).
FM PDKM WKM s.e.m.1 P-value
Start weight, g 544 554 553 3.38 0.17Mid weight 56 d, g 758ab 809a 711b 12.2 0.004End weight, 100 d, g 1060ab 1100a 956b 32.0 0.045SGR, 1–56 d 0.76a 0.86a 0.57b 0.035 0.003SGR 1–100 d 0.66 0.69 0.55 0.033 0.055
1 Pooled standard error of mean. Different letters denote significant (Pb0.05)difference among diets. n=3 replicates per treatments.
167J.Ø. Hansen et al. / Aquaculture 310 (2010) 164–172
2.6. Histological evaluation
Samples were fixed in neutral buffered formalin (40 g formalde-hyde l−1; pH 7.4) for 24 h and subsequently transferred to 70%ethanol until processing. Initially three fish sampled from each tankwere processed for tissue histology (n=nine per treatment). Tissueswere processed at the Pathology Laboratory, NVH using standardhistological methods. Sections for routine histological analysis werestained with haematoxylin and eosin (H&E). When initial screeningindicated differences among groups (i.e. in kidney samples) addi-tional samples were examined (n=18 total per treatment).
2.7. Brush border enzyme activities
Brush border membrane bound alkaline phosphatase (ALP),leucine aminopeptidase (LAP) andmaltase activities were determinedin homogenates of intestinal tissue. The tissues were thawed, weighedand homogenized (1:20) in ice-cold 2 mM Tris/50 mM mannitol, pH7.1, containing the serine protease inhibitor phenyl-methyl-sulphonylfluoride (Sigma no. P-7626; Sigma Chemical Co., St. Louis, MO, USA).Aliquots of homogenates were frozen in liquid nitrogen and stored at−80 °C until analysis. Enzyme activities were determined colorimet-rically as previously described by Krogdahl et al. (2003). Incubationswere performed at 37 °C. Enzyme activities are expressed as molsubstrate hydrolyzed min−1 and related to kg fish (specific activity).
2.8. Trypsin and lipase activities and bile acid content of digesta
Trypsin and lipase activities and bile acid concentration weredetermined on pooled, freeze dried digesta from the distal PI, MI andproximal DI. Trypsin activity was determined colorimetrically(Kakade et al., 1973) using the substrate benzoyl-arginine-p-nitroa-nilide (BAPNA) (Sigma no. B-4875) and a curve derived from astandardized bovine trypsin solution.
Lipase activity was analyzed in freeze dried digesta (1.25 mg ml−1
sonicated suspension in 25 mM Tris-buffer, pH 8.0) spectrophoto-metrically by hydrolysis of 4-nitrophenol-myristate (4-NPM) asdescribed by Gjellesvik et al. (1992). The reaction rate was measuredat 37 °C and pH 8.0. Bile acid concentration was determined using thesame method described for plasma chemistry.
2.9. Calculation and statistical analysis
Specific mechanical energy (SME) during extrusion was calculat-ed as: (2×π×60−1)×(Srpm×TkNm×Tt/h
−1), where Srpm is screw speed,
Table 4Processing parameters and physical pellet quality and starch gelatinization in dietsbased on fish meal (FM), partially deshelled krill meal (PDKM) and whole krill meal(WKM).
FM PDKM WKM s.e.m1 P-value
Feed mashLipid content 2, g kg−1 77.9 162 130Moisture content 3, g kg−1 268 162 185
ExtrusionSection 3, °C 118 129 124SME 4, Wh kg−1 37.0 45.0 35.0
Physical pellet qualityHardness, N 16.7b 29.9a 31.4a 0.23 0.0002Durability, % 64.4c 83.8b 92.2a 0.77 b.0001Expansion, % 23.6a 15.0b 8.6c 1.12 b.0001
Starch gelatinization 5 91.3 73.4 84.1
1 Pooled standard error of mean. Different letters denote significant (Pb0.05)difference among diets. n=3 replicates per treatments. Tukey multiple range test isused. 2 Lipid content in feed mash prior to processing. No lipid was added beforevacuum coating. 3 Total moisture content, calculated based on analyzed moisture inraw materials and added amounts of steam and water in the conditioner. 4 Specificmechanical energy, W h kg−1. 5 Percent of total starch content in finished feed.
TkNm is torque and Tt/h is throughput. Specific growth rate (SGR) wascalculated as: SGR=100×(ln(endwt)− ln(start wt)/Δt), where endwt= endweight of fish, start wt = start weight of fish, Δt=numberof experimental days. Apparent digestibility coefficients (%) ofindividual nutrients were calculated as follows: ADC=100×(1−(Di×Fi
−1×Fn×Dn−1)), where; Di and Fi represent the concentrations
of inert marker in the diet and faeces, and Dn and Fn represent theconcentrations of nutrients in the diet and faeces, respectively. Faecalexcretion for minerals was calculated as follows: (−100×(1−(Di×Fi
−1)×(Fn×Dn−1)))+100.
The results were statistically analyzed by one-way analysis ofvariance to differentiate between the diets (SAS, 1990). Results arepresented as means and pooled standard errors of means (s.e.m.).Significant (Pb0.05) differences among means were ranked byTukey's multiple range test and are indicated in the tables by differentsuperscripts a,b,c. Tendency is indicated for 0.10NP≥0.05.
3. Results
3.1. Feed production and pellet quality
Different amounts of water and steam were added into theextruder to obtain equal conditions between the dietary productions,because the amount of lipid in mash prior to extrusion differed amongthe diets (Table 4). The SME varied from 35 to 45 for the experimentaldiets (Table 4). The krill meal based diets had increased pellethardness and durability compared to the FM diet, while expansionwas lower in the krill diets. The degree of starch gelatinizing was 91.3,73.4, and 84.1% of total starch for the FM, PDKM, WKM diets,respectively (Table 4).
3.2. Growth performance
No fish died during the experimental period and there were nodifferences among treatments for initial weights. The fish grew froman average of 550 g to between 956 and 1100 g during 100 days offeeding (Table 5). During the first 56 days of feeding, growth rateswere significantly higher for the fish fed PDKM and FM than fish fedWKM. For the entire 100 days of feeding, there was a strong tendencyfor reduced growth rate for theWKM diet compared to the PDKM andFM diets.
3.3. Nutrient digestibility and mineral faecal excretion
There was a clear tendency for reduced lipid digestibility (Table 6),whereas the fish fed the WKM were ranked below the PDKM and FMtreatments. Replacement of FM with WKM did not appear to affectstarch digestibility, whereas PDKM reduced starch digestibility.Nitrogen digestibility did not significantly differ from the two dietarykrill diets compared to the FM control. However, digestibility ofseveral amino acids was affected. Cysteine digestibility ranged from80.2 to 83% and tended to be higher for the PDKM fed fish compared tothe FM fed fish. Fish fed the WKM diet had significantly lower
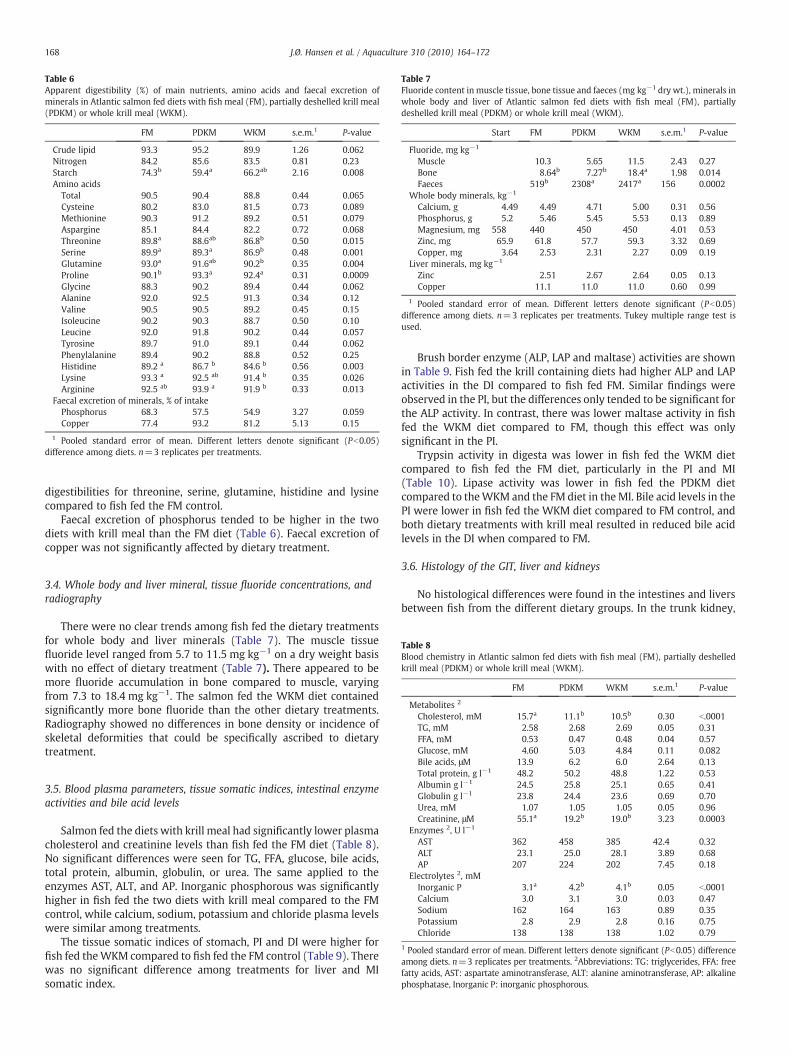
Table 6Apparent digestibility (%) of main nutrients, amino acids and faecal excretion ofminerals in Atlantic salmon fed diets with fish meal (FM), partially deshelled krill meal(PDKM) or whole krill meal (WKM).
FM PDKM WKM s.e.m.1 P-value
Crude lipid 93.3 95.2 89.9 1.26 0.062Nitrogen 84.2 85.6 83.5 0.81 0.23Starch 74.3b 59.4a 66.2ab 2.16 0.008Amino acids
Total 90.5 90.4 88.8 0.44 0.065Cysteine 80.2 83.0 81.5 0.73 0.089Methionine 90.3 91.2 89.2 0.51 0.079Aspargine 85.1 84.4 82.2 0.72 0.068Threonine 89.8a 88.6ab 86.8b 0.50 0.015Serine 89.9a 89.3a 86.9b 0.48 0.001Glutamine 93.0a 91.6ab 90.2b 0.35 0.004Proline 90.1b 93.3a 92.4a 0.31 0.0009Glycine 88.3 90.2 89.4 0.44 0.062Alanine 92.0 92.5 91.3 0.34 0.12Valine 90.5 90.5 89.2 0.45 0.15Isoleucine 90.2 90.3 88.7 0.50 0.10Leucine 92.0 91.8 90.2 0.44 0.057Tyrosine 89.7 91.0 89.1 0.44 0.062Phenylalanine 89.4 90.2 88.8 0.52 0.25Histidine 89.2 a 86.7 b 84.6 b 0.56 0.003Lysine 93.3 a 92.5 ab 91.4 b 0.35 0.026Arginine 92.5 ab 93.9 a 91.9 b 0.33 0.013
Faecal excretion of minerals, % of intakePhosphorus 68.3 57.5 54.9 3.27 0.059Copper 77.4 93.2 81.2 5.13 0.15
1 Pooled standard error of mean. Different letters denote significant (Pb0.05)difference among diets. n=3 replicates per treatments.
Table 7Fluoride content in muscle tissue, bone tissue and faeces (mg kg−1 dry wt.), minerals inwhole body and liver of Atlantic salmon fed diets with fish meal (FM), partiallydeshelled krill meal (PDKM) or whole krill meal (WKM).
Start FM PDKM WKM s.e.m.1 P-value
Fluoride, mg kg−1
Muscle 10.3 5.65 11.5 2.43 0.27Bone 8.64b 7.27b 18.4a 1.98 0.014Faeces 519b 2308a 2417a 156 0.0002
Whole body minerals, kg−1
Calcium, g 4.49 4.49 4.71 5.00 0.31 0.56Phosphorus, g 5.2 5.46 5.45 5.53 0.13 0.89Magnesium, mg 558 440 450 450 4.01 0.53Zinc, mg 65.9 61.8 57.7 59.3 3.32 0.69Copper, mg 3.64 2.53 2.31 2.27 0.09 0.19
Liver minerals, mg kg−1
Zinc 2.51 2.67 2.64 0.05 0.13Copper 11.1 11.0 11.0 0.60 0.99
1 Pooled standard error of mean. Different letters denote significant (Pb0.05)difference among diets. n=3 replicates per treatments. Tukey multiple range test isused.
168 J.Ø. Hansen et al. / Aquaculture 310 (2010) 164–172
digestibilities for threonine, serine, glutamine, histidine and lysinecompared to fish fed the FM control.
Faecal excretion of phosphorus tended to be higher in the twodiets with krill meal than the FM diet (Table 6). Faecal excretion ofcopper was not significantly affected by dietary treatment.
Table 8Blood chemistry in Atlantic salmon fed diets with fish meal (FM), partially deshelledkrill meal (PDKM) or whole krill meal (WKM).
FM PDKM WKM s.e.m.1 P-value
Metabolites 2
Cholesterol, mM 15.7a 11.1b 10.5b 0.30 b.0001TG, mM 2.58 2.68 2.69 0.05 0.31FFA, mM 0.53 0.47 0.48 0.04 0.57Glucose, mM 4.60 5.03 4.84 0.11 0.082
3.4. Whole body and liver mineral, tissue fluoride concentrations, andradiography
There were no clear trends among fish fed the dietary treatmentsfor whole body and liver minerals (Table 7). The muscle tissuefluoride level ranged from 5.7 to 11.5 mg kg−1 on a dry weight basiswith no effect of dietary treatment (Table 7). There appeared to bemore fluoride accumulation in bone compared to muscle, varyingfrom 7.3 to 18.4 mg kg−1. The salmon fed the WKM diet containedsignificantly more bone fluoride than the other dietary treatments.Radiography showed no differences in bone density or incidence ofskeletal deformities that could be specifically ascribed to dietarytreatment.
Bile acids, μM 13.9 6.2 6.0 2.64 0.13Total protein, g l−1 48.2 50.2 48.8 1.22 0.53Albumin g l−1 24.5 25.8 25.1 0.65 0.41Globulin g l−1 23.8 24.4 23.6 0.69 0.70Urea, mM 1.07 1.05 1.05 0.05 0.96Creatinine, μM 55.1a 19.2b 19.0b 3.23 0.0003
Enzymes 2, U l−1
AST 362 458 385 42.4 0.32ALT 23.1 25.0 28.1 3.89 0.68AP 207 224 202 7.45 0.18
Electrolytes 2, mMInorganic P 3.1a 4.2b 4.1b 0.05 b.0001Calcium 3.0 3.1 3.0 0.03 0.47Sodium 162 164 163 0.89 0.35Potassium 2.8 2.9 2.8 0.16 0.75Chloride 138 138 138 1.02 0.79
1 Pooled standard error of mean. Different letters denote significant (Pb0.05) differenceamong diets. n=3 replicates per treatments. 2Abbreviations: TG: triglycerides, FFA: freefatty acids, AST: aspartate aminotransferase, ALT: alanine aminotransferase, AP: alkalinephosphatase, Inorganic P: inorganic phosphorous.
3.5. Blood plasma parameters, tissue somatic indices, intestinal enzymeactivities and bile acid levels
Salmon fed the diets with krill meal had significantly lower plasmacholesterol and creatinine levels than fish fed the FM diet (Table 8).No significant differences were seen for TG, FFA, glucose, bile acids,total protein, albumin, globulin, or urea. The same applied to theenzymes AST, ALT, and AP. Inorganic phosphorous was significantlyhigher in fish fed the two diets with krill meal compared to the FMcontrol, while calcium, sodium, potassium and chloride plasma levelswere similar among treatments.
The tissue somatic indices of stomach, PI and DI were higher forfish fed theWKM compared to fish fed the FM control (Table 9). Therewas no significant difference among treatments for liver and MIsomatic index.
Brush border enzyme (ALP, LAP and maltase) activities are shownin Table 9. Fish fed the krill containing diets had higher ALP and LAPactivities in the DI compared to fish fed FM. Similar findings wereobserved in the PI, but the differences only tended to be significant forthe ALP activity. In contrast, there was lower maltase activity in fishfed the WKM diet compared to FM, though this effect was onlysignificant in the PI.
Trypsin activity in digesta was lower in fish fed the WKM dietcompared to fish fed the FM diet, particularly in the PI and MI(Table 10). Lipase activity was lower in fish fed the PDKM dietcompared to theWKM and the FM diet in theMI. Bile acid levels in thePI were lower in fish fed the WKM diet compared to FM control, andboth dietary treatments with krill meal resulted in reduced bile acidlevels in the DI when compared to FM.
3.6. Histology of the GIT, liver and kidneys
No histological differences were found in the intestines and liversbetween fish from the different dietary groups. In the trunk kidney,
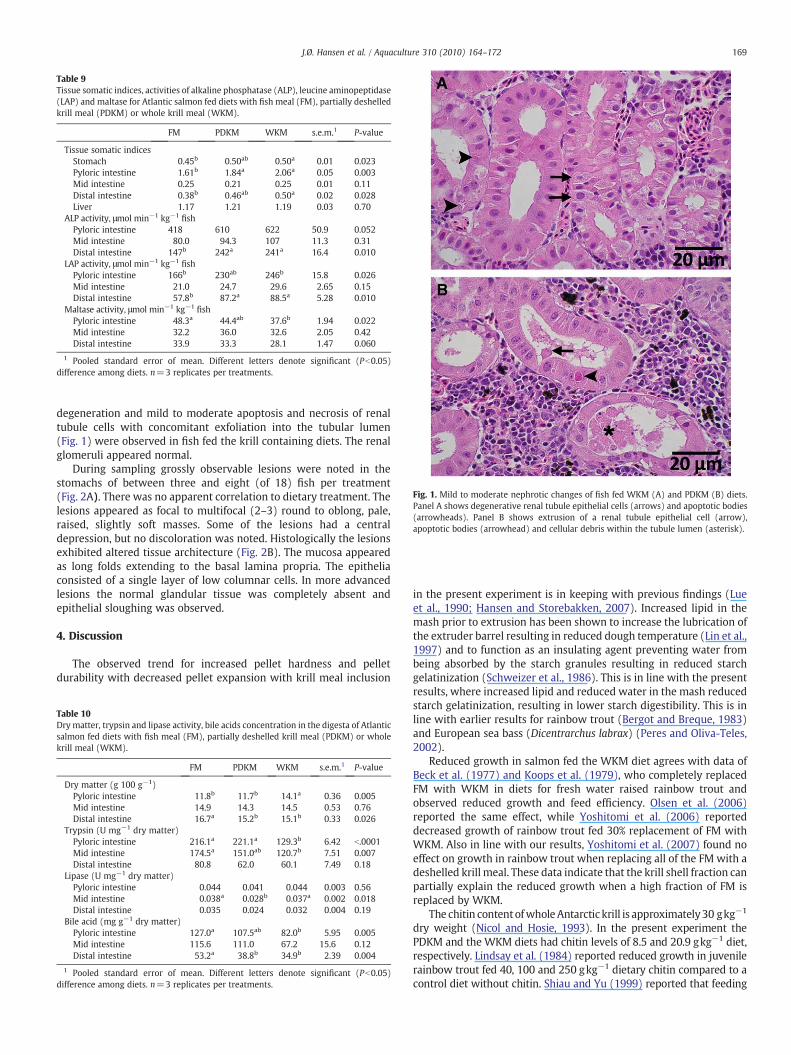
Table 9Tissue somatic indices, activities of alkaline phosphatase (ALP), leucine aminopeptidase(LAP) and maltase for Atlantic salmon fed diets with fish meal (FM), partially deshelledkrill meal (PDKM) or whole krill meal (WKM).
FM PDKM WKM s.e.m.1 P-value
Tissue somatic indicesStomach 0.45b 0.50ab 0.50a 0.01 0.023Pyloric intestine 1.61b 1.84a 2.06a 0.05 0.003Mid intestine 0.25 0.21 0.25 0.01 0.11Distal intestine 0.38b 0.46ab 0.50a 0.02 0.028Liver 1.17 1.21 1.19 0.03 0.70
ALP activity, μmol min−1 kg−1fish
Pyloric intestine 418 610 622 50.9 0.052Mid intestine 80.0 94.3 107 11.3 0.31Distal intestine 147b 242a 241a 16.4 0.010
LAP activity, μmol min−1 kg−1fish
Pyloric intestine 166b 230ab 246b 15.8 0.026Mid intestine 21.0 24.7 29.6 2.65 0.15Distal intestine 57.8b 87.2a 88.5a 5.28 0.010
Maltase activity, μmol min−1 kg−1fish
Pyloric intestine 48.3a 44.4ab 37.6b 1.94 0.022Mid intestine 32.2 36.0 32.6 2.05 0.42Distal intestine 33.9 33.3 28.1 1.47 0.060
1 Pooled standard error of mean. Different letters denote significant (Pb0.05)difference among diets. n=3 replicates per treatments.
Fig. 1. Mild to moderate nephrotic changes of fish fed WKM (A) and PDKM (B) diets.Panel A shows degenerative renal tubule epithelial cells (arrows) and apoptotic bodies(arrowheads). Panel B shows extrusion of a renal tubule epithelial cell (arrow),apoptotic bodies (arrowhead) and cellular debris within the tubule lumen (asterisk).
169J.Ø. Hansen et al. / Aquaculture 310 (2010) 164–172
degeneration and mild to moderate apoptosis and necrosis of renaltubule cells with concomitant exfoliation into the tubular lumen(Fig. 1) were observed in fish fed the krill containing diets. The renalglomeruli appeared normal.
During sampling grossly observable lesions were noted in thestomachs of between three and eight (of 18) fish per treatment(Fig. 2A). There was no apparent correlation to dietary treatment. Thelesions appeared as focal to multifocal (2–3) round to oblong, pale,raised, slightly soft masses. Some of the lesions had a centraldepression, but no discoloration was noted. Histologically the lesionsexhibited altered tissue architecture (Fig. 2B). The mucosa appearedas long folds extending to the basal lamina propria. The epitheliaconsisted of a single layer of low columnar cells. In more advancedlesions the normal glandular tissue was completely absent andepithelial sloughing was observed.
4. Discussion
The observed trend for increased pellet hardness and pelletdurability with decreased pellet expansion with krill meal inclusion
Table 10Dry matter, trypsin and lipase activity, bile acids concentration in the digesta of Atlanticsalmon fed diets with fish meal (FM), partially deshelled krill meal (PDKM) or wholekrill meal (WKM).
FM PDKM WKM s.e.m.1 P-value
Dry matter (g 100 g−1)Pyloric intestine 11.8b 11.7b 14.1a 0.36 0.005Mid intestine 14.9 14.3 14.5 0.53 0.76Distal intestine 16.7a 15.2b 15.1b 0.33 0.026
Trypsin (U mg−1 dry matter)Pyloric intestine 216.1a 221.1a 129.3b 6.42 b.0001Mid intestine 174.5a 151.0ab 120.7b 7.51 0.007Distal intestine 80.8 62.0 60.1 7.49 0.18
Lipase (U mg−1 dry matter)Pyloric intestine 0.044 0.041 0.044 0.003 0.56Mid intestine 0.038a 0.028b 0.037a 0.002 0.018Distal intestine 0.035 0.024 0.032 0.004 0.19
Bile acid (mg g−1 dry matter)Pyloric intestine 127.0a 107.5ab 82.0b 5.95 0.005Mid intestine 115.6 111.0 67.2 15.6 0.12Distal intestine 53.2a 38.8b 34.9b 2.39 0.004
1 Pooled standard error of mean. Different letters denote significant (Pb0.05)difference among diets. n=3 replicates per treatments.
in the present experiment is in keeping with previous findings (Lueet al., 1990; Hansen and Storebakken, 2007). Increased lipid in themash prior to extrusion has been shown to increase the lubrication ofthe extruder barrel resulting in reduced dough temperature (Lin et al.,1997) and to function as an insulating agent preventing water frombeing absorbed by the starch granules resulting in reduced starchgelatinization (Schweizer et al., 1986). This is in line with the presentresults, where increased lipid and reduced water in the mash reducedstarch gelatinization, resulting in lower starch digestibility. This is inline with earlier results for rainbow trout (Bergot and Breque, 1983)and European sea bass (Dicentrarchus labrax) (Peres and Oliva-Teles,2002).
Reduced growth in salmon fed the WKM diet agrees with data ofBeck et al. (1977) and Koops et al. (1979), who completely replacedFM with WKM in diets for fresh water raised rainbow trout andobserved reduced growth and feed efficiency. Olsen et al. (2006)reported the same effect, while Yoshitomi et al. (2006) reporteddecreased growth of rainbow trout fed 30% replacement of FM withWKM. Also in line with our results, Yoshitomi et al. (2007) found noeffect on growth in rainbow trout when replacing all of the FM with adeshelled krill meal. These data indicate that the krill shell fraction canpartially explain the reduced growth when a high fraction of FM isreplaced by WKM.
The chitin contentofwholeAntarctic krill is approximately30 gkg−1
dry weight (Nicol and Hosie, 1993). In the present experiment thePDKM and the WKM diets had chitin levels of 8.5 and 20.9 gkg−1 diet,respectively. Lindsay et al. (1984) reported reduced growth in juvenilerainbow trout fed 40, 100 and 250 gkg−1 dietary chitin compared to acontrol diet without chitin. Shiau and Yu (1999) reported that feeding
Fig. 2. Gross (A) and microscopic (B) appearances of stomach lesions. Histologically thelesions exhibited altered tissue architecture. The mucosa appeared as long folds(arrow) extending to the basal lamina propria. The epithelia consisted of a single layerof columnar cells. There is an area of widened lamina propria and leukocyte infiltration(arrowhead) accompanied by epithelial necrosis and sloughing (asterisk). The normalglandular tissue is completely absent. This condition appeared both for the FM and krillmeal dietary treatments.
170 J.Ø. Hansen et al. / Aquaculture 310 (2010) 164–172
juvenile tilapia (Oreochromis niloticus×O. aureus) diets with 0, 20, 50and 100 gkg−1 chitin resulted in a linear decrease in weight gain.Moreover, adding 10 gkg−1 chitin to diets depressed growth in juvenilecarp compared to a control diet (Gopalakannan and Arul, 2006). Thus, itappears that even small amounts of dietary chitin can depress growth infish.
The tendency of reduced lipid digestibility in fish fed theWKMdietin the present experiment indicates a negative effect of the krill shellfraction on lipid digestibility. Similarly, Olsen et al. (2006) found atendency toward reduced lipid digestibility when all of the FM wasreplaced byWKM and suggested that the chitin produced a diarrhoea-like effect in the gastrointestinal tract. However, no such diarrhoea-like effect was observed in the present study, although a smalldifference in faecal dry matter content was noted among fish fed withFM and those fed diets with krill meal. Furthermore, Shiau and Yu(1999) reported decreased lipid digestibility (from 96.1 to 89.5%) intilapia fed diets with increasing levels of dietary chitin (varying from 0to 100 gkg−1). Chitin is a natural biopolymer found in exoskeletons ofcrustaceans and has characteristics in common with insoluble plantfibre. However, the chemical properties of chitin differ mainly in itsability to form strong hydrogen bonds between the amino acetyl andhydroxyl groups (Minke and Blackwell, 1978). These chemicalproperties make chitin able to reduce activity of digestive enzymesas demonstrated for porcine pancreatic lipase (Kilinç et al., 2006).Furthermore, Zacour et al. (1992) reported that rats fed 5% chitinshowed higher levels of triglycerides in faeces, suggesting that chitinmay interfere with lipid absorption in the intestine. Our results didnot reveal reduced lipase activity at high dietary chitin level, and thus,we cannot explain the reduction in lipid digestibility for fish fed the
WKM diet by chitin's lipase inhibitory effects. The explanation for thelack of effect of WKM on lipase activity may be the fact that fish lipaseare of the bile salt dependent type and as such different from the co-lipase dependent porcine pancreatic lipase (Gjellesvik et al., 1992).Rather, the decreased bile acid level in the pyloric intestine for fish fedthe WKM diet might contribute to the reduced lipid digestibilitybecause the pyloric region is the main area for lipid digestion and bileacids are essential for lipase activation as well as for efficient fatty acidabsorption.
The reduction in digestibility of threonine, serine, glutamine,histidine, and lysine in fish fed the WKM compared to the FM fed fishmay be related to the low trypsin activity seen in the fish fed theWKMdiets compared to the control fed fish. A study by Rungruangsak-Torrissen (2007) supports our results by showing a significantreduction of in vitro amino acid digestibility with increased dietaryWKM. One possible reason for this could be that chitin from a partiallydigested krill shell fraction is able to immobilize proteolytic enzymesas shown in previous experiments (Muzzarelli, 1980; Spagna et al.,1998).
In contrast to fish, that use hemoglobin for oxygen transport,crustacean blood utilizes respiratory proteins, with copper as theoxygen binding atom. This, results in high copper content in krillmeals. Information on copper concentration in whole Antarctic krill,from several publications has been summarized by Locarnini andPresley (1995). The review shows variation from 12 to 82 mg copperkg−1 krill. The results of the present study are in line with previousstudies showing 81 mg copper kg−1 of WKM. The high copper levelwas, however, not considered to be a factor in the observed growthreduction as Berntssen et al. (1999) found no effects on growth injuvenile Atlantic salmon fed up to 500 mg copper kg−1 diet.
In the present study, dietary krill inclusion did not affect musclefluoride content, which is in line with previous experiments withAtlantic salmon, rainbow trout, Atlantic halibut (Hippoglossus hippo-glossus) and Atlantic cod (Gadus morhua) (Julshamn et al., 2004;Moren et al., 2007). In contrast, there was an increase in bone fluoridelevel in the fish fed the WKM diet with a dietary fluoride level of640 mg kg−1 in the present study. This increase in bone fluoride wasnot seen in rainbow trout, Atlantic halibut, Atlantic cod or Atlanticsalmon reared in sea water and fed krill diets containing up to1080 mg fluoride kg−1 (Moren et al., 2007). The reason for increasedbone fluoride in fish fed the WKM diet in the present study remainsunclear. However, the amount of fluoride accumulated in the salmonbones in the present study was small (18.4 mg kg−1 dry bone)compared to fluoride accumulation found in rainbow trout fed krill infresh water (2400 mg kg−1 dry bone) (Yoshitomi et al., 2006). Thepossible negative effect of a high content of fluoride in diets for fishhas not been well examined. Yoshitomi, et al. (2006) found asignificant reduction in growth for fresh water raised rainbow troutfed diets with 30% replacement of FM with WKM containing 444 mgfluoride kg−1 diet compared to a FM control group. In contrast, up to acomplete replacement of FM with a deshelled krill meal (222 mgfluoride kg−1 diet) did not depress growth in rainbow trout reared infresh water (Yoshitomi et al., 2007). Yoshitomi et al. (2007) suggestedincreased fluoride deposition in bone could depress fish growth.However, Landy (1988) showed reduction in feed intake and growthin fresh water raised rainbow trout fed 4450 mg fluoride kg−1 dietduring the first four weeks of feeding, but obtained similar feed intakeand growth as the control group after six weeks of the total 30 weeksfeeding period. Growth was similar in fish fed b30, 450 and 2250 mgfluoride kg−1 diet during the total feeding period.
The blood parameters for Atlantic salmon fed the three experi-mental diets are within normal levels (Sandnes et al., 1988; Stoskopf,1993). The reason for the decrease in blood cholesterol seen in krillfed fish is uncertain. It has been shown that chitin can prevent uptakeof TG and reduce liver cholesterol for rats (Zacour et al., 1992).However, this seems not to be a pure effect of chitin, because the
171J.Ø. Hansen et al. / Aquaculture 310 (2010) 164–172
PDKM and WKM diet contained 8.45 and 20.9 g chitin kg−1 diet andgave the same plasma cholesterol level. In contrast, Olsen et al. (2006)did not see any differences in plasma cholesterol level of Atlanticsalmon when WKM totally replaced FM. However, blood lipidparameters are highly dependent on sampling and feeding time,thus, it is difficult to draw any firm conclusions. The plasma enzymesAST, ALT, AP can serve as indicators of liver and kidney functions infish (Sandnes et al., 1988). The present results for these enzymesindicate that replacing all the FM with a PDKM or WKM for Atlanticsalmon did not affect liver or kidney functions.
Increased concentrations of creatinine and urea in plasma mayreflect renal structural damage or kidney dysfunction (Bernet et al.,2001). The reason for the elevated creatinine plasma levels of the FMcompared to the krill fed fish is uncertain, however, all values wereclose to normal levels (Sandnes et al., 1988). The levels of inorganicphosphorous in plasma of fish fed the krill diets reflect the reducedfaecal excretion values of phosphorous in these diets. The decreasedfaecal excretion of phosphorous in the krill diets, which weresupplemented with mono calcium phosphate, indicates that phos-phorous from FM is less available than phosphorous from thisphosphorus source. This is in line with previous results (Nordrumet al., 1997).
Intestinal brush border enzyme activities can be sensitiveindicators of enterocyte alterations. Marked reductions in intestinalbrush border enzyme activities are observed in the DI of salmon fedsoy-based diets (Krogdahl et al., 2003; Kraugerud et al., 2007;Øverland et al., 2009) indicating enterocyte dysfunction or lack ofmaturation. Differences in brush border enzyme activities of alkalinephosphatase (ALP) and leucine aminopeptidase (LAP) were foundbetween dietary treatments in the current work in the PI and DI.However, activities were higher in krill fed fish compared to FM fedfish. While the exact cause of the increased activities is not clear, itmay be related to increased tissue mass as indicated by higherorganosomatic indices for PI and DI in krill fed fish compared to FMfed fish.
The lesions observed in the stomach are consistent with intestinalmetaplasia, based on hematoxylin and eosin staining. In humans,intestinal metaplasia of the stomach is most often associated withchronic gastritis, and is generally considered to be a pre-neoplasticchange. No signs of chronic gastritis, however, were observed in thepresent experiment. Whether or not these lesions are pre-neoplasticin Atlantic salmon is unknown. To our knowledge there are no reportsdescribing this type of lesion in salmon. Spontaneously occurring aswell as chemically induced gastro-intestinal neoplasms have beenreported in fish (Bunton, 1996; Spitsbergen and Kent, 2003; Daleet al., 2009) though very little is known regarding their behavior. Thelesions observed in the present experiment did not appear to becorrelated with inclusion of krill meal in the diets. If any correlationwith diet exists, then it is more likely to be associated with a commoncomponent(s) or characteristic all diets.
The histological findings in the kidney are consistent with mild tomoderate nephrosis. Nephrosis has been associated with nephrotoxictherapeutants (antibiotics, anti-inflammatory agents), heavy metals(mercury, uranium, arsenic, nickel and cadmium) and xenobioticpollutants (Reimschuessel and Ferguson, 2006). The fish in thecurrent study have no history of treatment with potential nephrotoxictherapeutants. No analysis for xenobiotic pollutants was performed.Based on the reported levels of heavy metals in krill (Gasparics et al.,2000; Moren et al., 2006), levels in the diets were expected to be lessthan current EU limits (Commission dir. 2002/32/EC, 1334/2003,2005/87/EC), except for copper. Copper levels exceeded EU limits inboth the krill diets. However, neither whole body nor liver coppertissue levels were higher in fish fed diets containing krill mealcompared to fish fed the FM control, nor were any significanthistological changes observed in the liver. Excessive dietary fluoridehas been shown to produce morphological changes in the rat kidney
(Ogilvie, 1953), and renal tissue apoptosis and necrosis in both rabbits(Shashi et al., 2002) and pigs (Zhan et al., 2006). The fresh waterteleost Labeo rohita exhibited renal damage after 30, 60, 90, and120 days of exposure to water-borne fluoride at a level of 6.8 mg l−1
(Bhatnagar et al., 2007). However, in all of these studies the authorsnote changes in both renal glomeruli and tubules, whereas in thecurrent study only tubular changes were observed. Even if there wasno, or a low level, of fluoride accumulation in bone in fish fed krill, thedietary fluoride may explain the changes in kidney histology of fishfed the two krill diets. Additional studies are necessary to clarify thecause(s) of the observed kidney changes.
To conclude, replacing fish meal with a whole krill meal to Atlanticsalmon reared in sea water gave reduced growth rate and reduceddigestibility of several amino acids compared to a fish meal control.Replacing fish meal with a partially deshelled krill meal, on the otherhand, generally resulted in similar or better growth performance andsimilar nutrient digestibilities than fish fed the fish meal control. Bothkrill containing diets gave signs of mild to moderate nephrosis.
Acknowledgements
The research was supported by the Krillsea Group AS, Ålesund,Norway. We are grateful to Dr. Johan Høgset Jansen for verification ofthe histology findings. Jon Øvrum Hansen was supported by a PhDgrant from The Norwegian University of Life Sciences.
References
Adelung, D., Buchholz, F., Culik, B., Keck, A., 1987. Fluoride in tissues of krill Euphausiasuperba Dana and Meganyctiphanes norvegica M. Sars in relation to the molt cycle.Polar Biol. 7, 43–50.
Allain, C.C., Poon, L.S., Chan, C.S.G., Richmond, W., Fu, P.C., 1974. Enzymaticdetermination of total serum cholesterol. Clin. Chem. 20, 470–475.
Aslaksen, M.A., Kraugerud, O.F., Penn, M., Svihus, B., Denstadli, V., Jørgensen, H.Y.,Hillestad, M., Krogdahl, Å., Storebakken, T., 2007. Screening of nutrient digest-ibilities and intestinal pathologies in Atlantic salmon, Salmo salar, fed diets withlegumes, oilseeds, or cereals. Aquaculture 272, 541–555.
Austreng, E., Storebakken, T., Thomassen, M.S., Refstie, S., Thomassen, Y., 2000.Evaluation of selected trivalent metal oxides as inert markers used to estimateapparent digestibility in salmonids. Aquaculture 188, 65–78.
Beck, H., Koops, H., Tiews, K., Gropp, J., 1977. Further possibilities to replace fish meal inrainbow trout feeds; replacement of fish meal by alkane yeast and krillmeal. Arch.Fish Wiss. 28, 1–17.
Bergot, F., Breque, J., 1983. Digestibility of starch by rainbow trout: effects of thephysical state of starch and of the intake level. Aquaculture 34, 203–212.
Bernet, D., Schmidt, H., Wahli, T., Burkhardt-Holm, P., 2001. Effluent from a sewagetreatment works causes changes in serum chemistry of brown trout (Salmo truttaL.). Ecotoxicol. Environ. Saf. 48, 140–147.
Berntssen, M.H.G., Lundebye, A.-K., Maage, A., 1999. Effects of elevated dietary copperconcentrations on growth, feed utilisation and nutritional status of Atlantic salmon(Salmo salar L.) fry. Aquaculture 174, 167–181.
Bhatnagar, C., Bhatnagar, M., Regar, B.C., 2007. Fluoride-induced histopathologicalchanges in gill, kidney, and intestine of fresh water teleost, Labeo rohita. Fluoride40, 55–61.
Boone, R.J., Manthey, M., 1983. The anatomical distribution of fluoride within variousbody segments and organs of Antarctic krill (Euphausia superba Dana). Arch. FishWiss. 34, 81–85.
Bunton, T.E., 1996. Experimental chemical carcinogenesis in fish. Toxicol. Pathol. 24,603–618.
Chiang, B.-Y., Johnson, J.A., 1977. Measurement of total and gelatinized starch byglucoamylase and o-Toluidine reagent. Cereal Chem. 54, 429–435.
Christians, O., Leinemann, M., 1983. Investigations on themigration of fluoride from theshell into the muscle flesh of Antarctic krill (Euphausia superba Dana) independence of storage temperature and storage time. Arch. Fish Wiss. 34, 87–95.
Dale, O.B., Tørud, B., Kvellestad, A., Koppang, H.S., Koppang, E.O., 2009. From chronicfeed-induced intestinal inflammation to adenocarcinoma with metastases insalmonid fish. Cancer Res. 69, 4355–4362.
Gasparics, T., Martínez, R.M.G., Caroli, S., Záray, G., 2000. Determination of traceelements in Antarctic krill samples by inductively coupled atomic emission andgraphite furnace atomic absorption spectrometry. Microchem. J. 67, 279–284.
Gjellesvik, D.R., Lombardo, D., Walther, B.T., 1992. Pancreatic bile salt dependent lipasefrom cod (Gadus morhua): purification and properties. Biochem. Biophys. Acta1124, 123–134.
Gopalakannan, A., Arul, V., 2006. Immunomodulatory effects of dietary intake of chitin,chitosan and levamisole on the immune system of Cyprinus carpio and control ofAeromonas hydrophila infection in ponds. Aquaculture 255, 179–187.
172 J.Ø. Hansen et al. / Aquaculture 310 (2010) 164–172
Hansen, J.Ø., Storebakken, T., 2007. Effects of dietary cellulose level on pellet quality andnutrient digestibilities in rainbow trout (Oncorhynchus mykiss). Aquaculture 272,458–465.
Ichii, T., 2000. Krill harvesting. In: Everson, I. (Ed.), Krill biology, ecology and fisheries.Blackwell Science, Oxford, pp. 228–261.
Julshamn, K., Malde, M.K., Bjorvatn, K., Krogedal, P., 2004. Fluoride retention of Atlanticsalmon (Salmo salar) fed krill meal. Aquacult. Nutr. 10, 9–13.
Kakade, M.L., Hoffa, D.E., Liener, I.E., 1973. Contriburion of trypsin inhibitors todeleterious effects of unheated soybeans fed to rats. J. Nutr. 103, 1772–1778.
Kilinç, A., Teke, M., Onal, S., Telefoncu, A., 2006. Immobilization of pancreatic lipase onchitin and chitosan. Prep. Biochem. Biotechnol. 36, 153–163.
Knox, G.A., 2007. Biology of the southern ocean. CRC Press, Boca Raton. 621 pp.Koops, H., Tiews, K., Gropp, J., Beck, H., 1979. Krill in trout diets. Proc.World Symp.
Finfish nutrition and fishfeed technology. Hamburg, 20–23 June 1978. Vol. II.Heenemann, pp. 281–293.
Kraugerud, O.F., Penn, M., Storebakken, T., Refstie, S., Krogdahl, Å., Svihus, B., 2007.Nutrient digestibilities and gut function in Atlantic salmon (Salmo salar) fed dietswith cellulose or non-starch polysaccharides from soy. Aquaculture 273, 96–107.
Krogdahl, Å., Bakke-McKellep, A.M., Baeverfjord, G., 2003. Effects of graded levels ofstandard soybean meal on intestinal structure, mucosal enzyme activities, andpancreatic response in Atlantic salmon (Salmo salar L.). Aquacult. Nutr. 9, 361–371.
Landy, R.B., 1988. The effect of selected cation supplementation on fluoride toxicity inrainbow trout, Salmo gairdneri. PhD Thesis., Departments of avian and aquaticanimal medicine and pathology. Cornell University, pp. 141.
Lin, S., Hsieh, F., Huff, H.E., 1997. Effects of lipids and processing conditions on degree ofstarch gelatinization of extruded dry pet food. Lebensm. Wiss. Technol. 30,754–761.
Lindsay, G.J.H., Walton, M.J., Adron, J.W., Fletcher, T.C., Cho, C.Y., Cowey, C.B., 1984. Thegrowth of rainbow trout (Salmo gairdneri) given diets containing chitin and itsrelationship to chitinolytic enzymes and chitin digestibility. Aquaculture 37,315–334.
Locarnini, S.J.P., Presley, B.J., 1995. Trace element concentrations in Antarctic krill,Euphausia superba. Polar Biol. 15, 283–288.
Lue, S., Hsieh, F., Peng, I.C., Huff, H.E., 1990. Expansion of corn extrudates containingdietary fiber: a microstructure study. Lebensm. Wiss. Technol. 23, 165–173.
Malde, M.K., Bjorvatn, K., Julshamn, K., 2001. Determination of fluoride in food by theuse of alkali fusion and fluoride ion-selective electrode. Food Chem. 73, 373–379.
Minke, R., Blackwell, J., 1978. The structure of alpha-chitin. J. Mol. Biol. 120, 167–181.Moren, M., Suontama, J., Hemre, G.-I., Karlsen, Ø., Olsen, R.E., Mundheim, H., Julshamn,
K., 2006. Element concentrations in meals from krill and amphipods, – possiblealternative protein sources in complete diets for farmed fish. Aquaculture 261,174–181.
Moren, M., Malde, M.K., Olsen, R.E., Hemre, G.-I., Dahl, L., Karlsen, Ø., Julshamn, K., 2007.Fluorine accumulation in Atlantic salmon (Salmo salar), Atlantic cod (Gadusmorhua), rainbow trout (Onchorhyncus mykiss) and Atlantic halibut (Hippoglossushippoglossus) fed diets with krill or amphipod meals and fish meal based diets withsodium fluoride (NaF) inclusion. Aquaculture 269, 525–531.
Mulder, C., Schouten, J.A., Popp-Snijders, C., 1983. Determination of free fatty acids: acomparative study of the enzymatic versus the gas chromatographic and thecolorimetric method. J. Clin. Chem. Clin. Biochem. 21, 823–827.
Muzzarelli, R.A.A., 1980. Immobilization of enzymes on chitin and chitosan. EnzymeMicrob. Technol. 2, 177–184.
Nicol, S., Hosie, G.W., 1993. Chitin production by krill. Biochem. Syst. Ecol. 21, 181–184.Nordrum, S., Åsgård, T., Shearer, K.D., Arnessen, P., 1997. Availability of phosphorus in
fish bone meal and inorganic salts to Atlantic salmon (Salmo solar) as determinedby retention. Aquaculture 157, 51–61.
NS, 1994. NS 9401, Atlantic salmon. Reference sampling for quality measurments.Norwegian Standard Association, Oslo.
Ogilvie, A.L., 1953. Histologic findings in the kidney, liver, pancreas, adrenal, andthyriod glands of the rat following sodium fluoride administration. J. Dent. Res. 32,386–397.
Olsen, R.E., Suontama, J., Langmyhr, E., Mundheim, H., Ringø, E., Melle, W., Malde, M.K.,Hemre, G.-I., 2006. The replacement of fish meal with Antarctic krill, Euphausiasuperba in diets for Atlantic salmon, Salmo salar. Aquacult. Nutr. 12, 280–290.
Øverland, M., Sørensen, M., Storebakken, T., Penn, M., Krogdahl, Å., Skrede, A., 2009. Peaprotein concentrate substituting fish meal or soybean meal in diets for Atlanticsalmon (Salmo salar)–Effect on growth performance, nutrient digestibility, carcasscomposition, gut health, and physical feed quality. Aquaculture 288, 305–311.
Peres, H., Oliva-Teles, A., 2002. Utilization of raw and gelatinized starch by European seabass (Dicentrarchus labrax) juveniles. Aquaculture 205, 287–299.
Reimschuessel, R., Ferguson, H.W., 2006. Kidney. In: Ferguson, H.W. (Ed.), SystemicPathology of Fish. Scotian Press, London, pp. 91–118.
Rungruangsak-Torrissen, K., 2007. Digestive efficiency, growth and qualities of muscleand oocyte in Atlantic salmon (Salmo salar L.) fed on diets with krill meal as analternative protein source. J. Food Biochem. 31, 509–540.
Sandnes, K., Lie, Ø., Waagbø, R., 1988. Normal ranges of some blood chemistryparameters in adult farmed Atlantic salmon, Salmo salar. J. Fish Biol. 32, 129–136.
SAS, 1990. Statistical Analysis System, User's guide. Version 6 4th ed. SAS institute, Cary,NC, USA. 956 pp.
Schweizer, T.F., Reimann, S., Solms, J., Eliasson, A.-C., Asp, N.-G., 1986. Influence of drumdrying and twin screw extrusion-cooking on wheat carbohydrates, II, Effects oflipids on physical properties, degradation and complex formation of starch inwheat flour. J. Cereal Sci. 4, 249–260.
Shashi, A., Singh, J.P., Thapar, S.P., 2002. Toxic effects of fluoride on rabbit kidney.Fluoride 35, 38–50.
Shiau, S.-Y., Yu, Y.-P., 1999. Dietary supplementation of chitin and chitosan depressesgrowth in tilapia, Oreochromis niloticus×O. aureus. Aquaculture 179, 439–446.
Smělá, D., Pechová, P., Komprda, T., Klejdus, B., Kubáň, V., 2003. Liquid chromotographicdetermination of biogenic amines in a meat product during fermentation and long-term storage. Czech. J. Food Sci. 21, 167–175.
Soevik, T., Braekkan, O.R., 1979. Fluoride in Antarctic krill (Euphausia superba) andAtlantic krill (Meganyctiphanes norvegica). J. Fish. Res. Board Can. 36, 1414–1416.
Spagna, G., Andreani, F., Salatelli, E., Romagnoli, D., Pifferi, P.G., 1998. Immobilization ofalpha-L-arabinofuranosidase on chitin and chitosan. Process Biochem. 33, 57–62.
Spitsbergen, J.M., Kent, M.L., 2003. The state of the art of the zebrafish model fortoxicology and toxicologic pathology research–Advantages and current limitations.Toxicol. Pathol. 31, 62–87.
Storebakken, T., 1988. Krill as a potential feed source for salmonids. Aquaculture 70,193–205.
Stoskopf, M.K., 1993. Fish Medicine. W.B. Saunders Company, Philadelphia. 1216 pp.Tharanathan, R.N., Kittur, F.S., 2003. Chitin – the undisputed biomolecule of great
potential. Crit. Rev. Food Sci. Nutr. 43, 61–87.Tibbetts, S.M., Olsen, R.E., Lall, S.P., 2010. Effects of partial or total replacement of fishmeal
with freeze-dried krill (Euphausia superba) on growth and nutrient utilization ofjuvenile Atlantic cod (Gadusmorhua) and Atlantic halibut (Hippoglossus hippoglossus)fed the same practical diets. Aquacult. Nutr. doi:10.1111/j.1365-2095.2010.00753.x.
Tietz, N.W., 1995. Clinical Guide to Laboratory Tests, 3rd ed. WB Saunders, Philadelphia.997 pp.
Trinder, P., 1969. Determination of glucose in blood using glucose oxidase with analternative oxygen acceptor. Ann. Clin. Biochem. 6, 24–27.
Yoshitomi, B., Aoki, M., Oshima, S.-i., Hata, K., 2006. Evaluation of krill (Euphausiasuperba) meal as a partial replacement for fish meal in rainbow trout(Oncorhynchus mykiss) diets. Aquaculture 261, 440–446.
Yoshitomi, B., Aoki, M., Oshima, S.-i., 2007. Effect of total replacement of dietary fishmeal by low fluoride krill (Euphausia superba) meal on growth performance ofrainbow trout (Oncorhynchus mykiss) in fresh water. Aquaculture 266, 219–225.
Zacour, A.C., Silva, M.E., Cecon, P.R., Bambirra, E.A., Vieira, E.C., 1992. Effect of dietary chitinon cholestrol absorption and metabolism in rats. J. Nutr. Sci. Vitaminol. 38, 609–613.
Zhan, X.-A., Wang, M., Xu, Z.-R., Li, J.-X., 2006. Toxic effects of fluoride on kidneyfunction and histological structure in young pigs. Fluoride 39, 22–26.
Zhang,H., Xianhao, C., Jianming, P.,Weiping, X., 1993. Biogeochemistry researchoffluoridein Antarctic Ocean. I. The study of fluoride anomaly in krill. Antarct. Sci. 4, 36–41.