high-frequency quasi-periodic oscillations in black hole binaries
TRANSCRIPT

Mon. Not. R. Astron. Soc. 000, 1–?? (2012) Printed 11 July 2012 (MN LATEX style file v2.2)
High-Frequency Quasi-Periodic Oscillations in black-holebinaries
T.M. Belloni
1?, A. Sanna
2, M. Mendez
21INAF - Osservatorio Astronomico di Brera, Via E. Bianchi 46, I-23807, Merate, Italy2Kapteyn Astronomical Institute, University of Groningen, P.O. Box 800, 9700 AV Groningen, The Netherlands
Accepted 2012 Month day. Received 2012 Month day; in original form 2012 Month day
ABSTRACTWe present the results of the analysis of a large database of X-ray observations of 22galactic black-hole transients with the Rossi X-Ray timing explorer throughout its op-erative life for a total exposure time of⇠12 Ms. We excluded persistent systems and thepeculiar source GRS 1915+105, as well as the most recently discovered sources. Thesemi-automatic homogeneous analysis was aimed at the detection of high-frequency(100-1000 Hz) quasi-periodic oscillations (QPO), of which several cases were previ-ously reported in the literature. After taking into account the number of independenttrials, we obtained 11 detections from two sources only: XTE J1550-564 and GROJ1655-40. For the former, the detected frequencies are clustered around 180 Hz and280 Hz, as previously found. For the latter, the previously-reported dichotomy 300-450Hz is found to be less sharp. We discuss our results in comparison with kHz QPO inneutron-star X-ray binaries and the prospects for future timing X-ray missions.
Key words: accretion, accretion discs – black hole physics – relativistic processes –X-rays: binaries
1 INTRODUCTION
The Rossi X-Ray Timing Explorer (RXTE) mission hasprovided thousands of high-quality observations of black-hole transients (BHTs), which have profoundly changed ourknowledge of the properties of accretion onto stellar-massblack holes (see e.g. Belloni 2010; Fender 2010; Belloni et al.2012). An important aspect has been the detection of Quasi-Periodic Oscillations (QPO) at frequencies higher than ⇠40Hz, which opened a new window onto fast phenomena inthe frequency range expected from signals associated to Ke-plerian motion in the innermost regions of an accretion diskaround a black hole. A small number of detections is avail-able in the literature from a a small number of sources: GRS1915+105 (Morgan et al. 1997; Strohmayer 2001a; Belloniet al. 2001; Remillard et al. 2002b; Belloni et al. 2006), GROJ1655-40 (Remillard et al. 1999; Strohmayer 2001b), XTEJ1550-564 (Homan et al. 2001; Miller et al. 2001; Remillardet al. 2002a), H1743-322 (Homan et al. 2005; Remillard etal. 2006), XTE J1650-500 (Homan et al. 2003), 4U 1630-47(Klein-Wolt, Homan & van der Klis 2004), XTE J1859+226(Cui et al. 2000) and IGR J17091-3624 (Altamirano & Bel-loni 2012). The signals are very weak and some detectionsappear to have marginal statistical significance. Althoughthese High-Frequency QPOs (hereafter HFQPOs) are very
? E-mail: [email protected]
important as they constitute a promising way to detectinge↵ects of General Relativity in the strong field regime, nosystematic work on the existing bulk of RXTE data is avail-able. In particular, it is important to compare quantitativelythe existing results with those from kilohertz QPOs fromneutron star X-ray binaries, where signals are stronger andthe known phenomenology much better covered (see e.g. vander Klis 2006 for a review). The similarities between the tim-ing features of these two classes of sources are strong (seeWijnands et al. 1999; Psaltis et al. 1999; Belloni et al. 2002;van der Klis 2006), but it is not clear how HFQPOs fit in thiscomparison. In this paper, we present a systematic analysisof a large sample of RXTE observations of BHTs, concen-trating on the detection of HFQPOs. All major sources arepresent, with the exception of GRS 1915+105, which will bethe subject of a separate paper due to the large number ofavailable observations and its peculiarities) and IGR J17091-3624, which was observed by RXTE after the analysis part ofthis work was completed. An a posteriori bulk analysis of thedata su↵ers from problems related to number of trials, whichmeans that the sensitivity to detections will be reduced. Inaddition, our procedure was aimed only at detecting onepeak in each Power Density Spectrum (PDS), which meansthat double detections do not appear. Finally, di↵erent ob-servations were analyzed separately without any merging,although merging was the way some of these oscillationswere found. However, such a (semi-automatic) procedure is
c� 2012 RAS
arX
iv:1
207.
2311
v1 [
astro
-ph.
HE]
10
Jul 2
012
2 T. M. Belloni, A. Sanna and M. Mendez
useful to assess what is available from RXTE data and toplan future observations with upcoming facilities like AS-TROSAT and LOFT. The comparison with previous worksis in many cases di�cult as the starting conditions for theanalysis are markedly di↵erent. Motivated selection of ob-servations and/or merging, as well as the relaxation of theconstraints imposed in our search (total number of availableobservations, frequency range considered, energy range forthe accumulation, limits on the quality factor of the signal)can lead to more sensitive results.
2 DATA AND ANALYSIS
We selected all RXTE observations of known transientblack-hole binaries available in the archive from the startof the mission until MJD 55601 (2011 February 9), con-centrating on the data from the Proportional Counter Ar-ray (PCA) instrument. We analyzed 22 sources, for a totalof 7108 observations (see Tab. 1). The bright source GRS1915+105 was not included for two reasons: its peculiarityand the fact that e↵ectively during the RXTE lifetime it be-haved as a persistent source. The analysis of data from GRS1915+105 will be reported in a forthcoming paper. For theproject presented here, it is important to establish a detailedanalysis procedure in advance, in order to control and min-imize the probability of spurious detections. The followingmulti-step procedure was applied.
(i) Two energy bands were considered for analysis: ab-solute channels 0-79 and 14-79 (corresponding to energies1.51-21.30 keV and 4.07-21.30 keV at the beginning of themission and to energies 2.06-33.43 keV and 6.12-33.43 keV athe end of the mission, due to gain changes in the detectors).We will refer to these as the total and hard band respectively.For some observations, these exact bands were not availabledue to the data modes, in which case we chose the closestapproximation to those boundaries. In a few cases, the datamodes were such that we used the full channel range and/orthe total and hard band resulted to be identical. The choiceof the hard band was made in order not to deplete too muchthe number of counts and allow the examination of moreobservations (see next bullet).
(ii) When analyzing a large number of observations, theissue of number of trials must be considered carefully. Ofall observations in our sample, a sizable number were of asource at the very start or at the end of an outburst, wherecount rate is low and the sensitivity to detect quasi-periodicfeatures is very low. We decided not to analyze observationswhere the data are not expected to yield a positive detec-tion for HFQPO. Rather than selecting a simple thresholdin count rate to exclude the observations, we used the ex-pression to estimate the significance (in number of sigmas,n�
) of a broad feature in frequency domain
n�
=12r2s
S2
(S +B)
rTexp
�⌫
(see van der Klis 1998) where rs
is the fractional rmsvariability of the feature, S is the source net count rate,B is the corresponding background count rate, T
exp
is theexposure time and �⌫ is the FWHM of the feature. We
assumed a QPO with 6% fractional rms and 10 Hz FWHMand used the observed count rates and exposure time toestimate the expected sensitivity. We then excluded all hardor total observations which yielded n
�
< 3.With this procedure we retained 4205 total observations
and 3106 hard observations, for a cumulative exposure timeof 12.2 Ms and 10.0 Ms respectively (see Tab. 1). We considera separate observation (or dataset) the data correspondingto a RXTE observation ID.
(iii) The large number of observations made it necessaryto perform an automatic search in order to select candidatesfor HFQPOs. For each observation, the adopted procedure,applied both to the total and hard energy band, was thefollowing:
• We produced a PDS by dividing the dataset in in-tervals of 16s duration and averaging the correspondingPDS. The time resolution for all spectra was 4096 pointsper second, corresponding to a Nyquist frequency of ⇠2kHz. The PDS were normalized according to Leahy et al.(1983). The powers were rebinned logarithmically in sucha way that each frequency bin was larger than the previ-ous one by ⇠2%. Uncertainties in the power values wereestimated following van der Klis (1988).
• Since the PDS of BHTs are rather complex and wewere interested only in the high-frequency region, we con-sidered only the frequency range 100-1000 Hz. This meansthat our implicit definition of HFQPO is limited to cen-troid frequencies larger than 100 Hz.
• We fitted the PDS with an automatic procedure witha model consisting of a power law (to account for the Pois-sonian noise component) and a Lorentzian. The slope ofthe power law was not fixed to 0 (constant component) inorder to fit any possible remaining tail of low-frequencyfeatures. We did the fit by first fixing the Lorentzian cen-troid frequency to all values between 100 and 1000 Hz insteps by 1 Hz. The FWHM of the Lorentzian was boundbetween 0.5 Hz and 1000 Hz. A fit with a free centroidwas then made around the frequency corresponding tothe minimum chi square. This resulted in a single best fitfor each observation. Notice that this procedure is aimedat detecting a single HFQPO in each PDS and would notbe able to detect multiple peaks.
• From each fit, we estimated the significance of thedetection by dividing the normalization (integral) of theLorentzian by its 1� error on the negative side. Onlyfeatures with this figure of merit larger than 3 were con-sidered. The surviving number of observations can be seenin the 3� columns of Tab. 1.
• Examining the best fit parameters, we were able toeliminate obvious meaningless fits. Those included fitswhere the FWHM had reached one of the two imposedlimits (see above), making the feature impossibly narrowor broad, and those where the centroid frequency was closeto the search limits. In addition, we discarded all featureswith a quality factor Q = ⌫0/FWHM significantly lessthan 2, as we are interested only in peaked signals. Wechecked all these cases visually in order not to miss pecu-liar features. None were found. In this way, the numbersof HFQPO candidates dropped to those in the “good”columns in Tab. 1.
• For all remaining PDS, we made a manual fit with
c� 2012 RAS, MNRAS 000, 1–??
HFQPO in black-hole binaries 3
Table 1. Statistics of available data and obtained detections. Columns are: source name, total number of observations, numberof observations analyzed in each band, total exposure considered in each band, number of observations with single try probability>3� in each band, number of detections after manual analysis in each band and final number of detections.
Source name N. obs. Valid T. Valid H. Exp. T (ks) Exp. H (ks) > 3� T > 3� H Good T Good H Final
GX 339-4 1353 893 517 2190 1657 31 34 4 11 44U 1630-47 1002 846 701 1934 1672 31 27 11 7 4GRO J1655-40 596 516 491 2295 2214 18 24 7 8 11H 1743-322 504 386 300 1153 941 19 20 6 8 4XTE J1550-564 409 319 280 860 790 46 31 15 14 16Swift J1753.5-0127 278 240 172 671 527 14 8 3 3 0XTE J1752-223 208 138 79 343 250 6 6 0 4 2XTE J1650-500 182 101 69 219 155 17 5 4 2 0Swift J1539.2-6227 156 61 42 153 122 1 3 1 1 0XTE J1817-330 155 112 79 372 256 3 2 1 1 0XTE J1859+226 131 115 102 314 281 6 4 2 2 14U 1543-47 104 53 38 161 125 6 3 0 1 0XTE J1720-318 100 75 19 233 101 1 1 0 1 04U 1957+115 100 97 46 529 334 1 0 0 0 0XTE J1118+480 94 62 50 174 154 0 3 0 1 0MAXI J1659-152 66 63 54 148 135 1 1 0 1 0SLX J1746-331 65 47 23 125 72 2 2 0 0 0XTE J1652-453 57 30 1 67 2 1 0 0 0 0XTE J1748-288 24 23 21 103 99 0 1 0 0 0SAX J1711.6-3808 17 17 12 43 30 0 0 0 0 0GS 1354-644 8 7 7 52 52 0 1 0 0 0GRS 1737-31 5 4 3 40 28 0 0 0 0 0
Total 7108 4205 3106 12177 9996 204 176 54 65 42
the same model described above and we re-established thesignificance of the fit in the same way. In case we found apeak at a consistent frequency, both in the hard and totalPDS, we retained the one with the highest significance.The final numbers of detections from this procedure areshown in the last column of Tab. 1. The total number was42. For all fits, the reduced chi square was close to unity.
(iv) The resulting HFQPOs have a significance (esti-mated in the way described above) larger than 3� for a singletrial. We searched them in a number of PDS for each sourceand we considered a broad range of frequencies. Both theseprocedures translate in a number of trials. For each source,we considered how many PDS were searched (for the to-tal plus hard band) and how many independent frequencieswere considered: for each detection we divided the 900 Hzinterval used for the search by the FWHM of the detectedQPO. Keeping these two e↵ects in mind of course lowers thesignificance.
We did this under the assumption that any frequencywithin the considered range would be accepted. If one wantsto limit to certain frequencies, for instance considering onlypeaks around 180 Hz and 280 Hz for XTE J1550-564 aspreviously detected (Homan et al. 2001; Miller et al. 2001;Remillard et al. 2002a), the number of trials will changeand so will the significance of the detections. For this rea-son, in Tab. 2 we show all 42 detections. In the following, wewill restrict the discussion only to those with a high signifi-cance.We marked in boldface in the table the HFQPOs witha final chance probability less than 10�2. Notice that a num-ber of detections have a (rounded) final chance probabilityof 1, making them unlikely to be real. One has a rounded
probability of 0, as it was so low that the spreadsheet weused could not approximate it.
(v) Notice that our procedure can only detect one peakper PDS. In principle, two di↵erent features can be detectedin the total and hard PDS, but this did not happen. No clearadditional peaks were seen visually in the PDS containing adetection.
In addition, we produced a Hardness-Intensity Diagram(HID) for each source, one point per observation, by accu-mulating net energy spectra from PCU2 (the best calibratedof the five units of the PCA) using standard procedures 1.The count rates were corrected for gain changes by divid-ing the spectra by a Crab spectrum (power law with photonindex 2 and normalization 10 ph/cm�2s�1keV�1 at 1 keV)simulated with the detector response at the day of the ob-servation. Intensity is accumulated over PCA channels 8-49,corresponding to 3.2-19 keV at the end of the mission. Hard-ness is defined asH/S where S andH are the corrected ratesin the channel bands 8-14 (3.2-6 keV) and 15-24 (6-10 keV)respectively.
3 RESULTS
In this section we examine the results for each source forwhich HFQPOs have been detected. We study in detail onlydetections at more than 3� significance after keeping numberof trials into account.
1 http://heasarc.nasa.gov/docs/xte/data analysis.html
c� 2012 RAS, MNRAS 000, 1–??

4 T. M. Belloni, A. Sanna and M. Mendez
Table 2. List of detected HFQPOs. Columns are: observation date (MJD), exposure time, band in whichthe QPO was detected (Total/Hard), centroid frequency, FWHM and fractional rms of the QPO, single trialand final chance probabilities, source observed count rate (in PCU2) and X-ray hardness.
MJD Exp. (s) B ⌫0 (Hz) FWHM (Hz) %rms P0 PF
Rate HR
XTE J1550-564
51076.000 2960 T 180.76 +3.92�4.37 95.12 +16.12
�22.00 1.15 +0.14�0.12 2.87E-07 1.62E-03 15700 0.68
51101.607 1584 T 140.70 +1.71�1.92 16.51 +19.85
�4.84 1.12 +0.59�0.17 6.64E-04 1.00E+00 3135 0.57
51108.076 9872 T 182.27 +3.25�3.20 77.88 +11.65
�9.77 1.74 +0.20�0.16 1.90E-08 1.31E-04 3636 0.53
51115.281 2048 H 272.43 +3.42�4.09 30.59 +16.30
�8.95 4.02 +0.78�0.47 7.80E-06 1.28E-01 1785 0.41
51241.802 3104 H 284.07 +1.35�1.36 26.86 +3.88
�3.12 3.66 +0.21�0.17 8.77E-29 0.00E+00 4258 0.42
51242.507 1504 H 280.00 +2.87�2.49 30.00 +9.80
�6.85 3.78 +0.46�0.32 2.05E-09 3.69E-05 4107 0.43
51245.354 2752 T 180.75 +2.02�2.54 16.76 +8.71
�6.21 1.08 +0.25�0.13 8.54E-06 2.40E-01 4718 0.54
51247.979 2816 T 185.20 +6.73�4.93 46.04 +15.69
�12.13 1.32 +0.30�0.17 3.30E-05 3.21E-01 4509 0.54
51255.158 4080 H 280.84 +2.00�1.92 24.37 +8.53
�6.28 4.35 +0.50�0.41 7.20E-08 1.59E-03 2329 0.38
51258.497 1104 H 276.02 +6.64�6.20 36.77 +23.00
�12.36 5.22 +0.01�0.76 2.91E-04 9.86E-01 1816 0.35
51259.253 880 H 274.87 +4.30�3.61 26.00 +14.57
�8.68 5.09 +1.00�0.67 7.53E-05 7.90E-01 1710 0.39
51291.184 1536 T 134.75 +1.76�1.45 7.81 +5.16
�3.25 6.84 +1.28�1.09 8.45E-04 1.00E+00 88 0.42
51664.409 2240 H 274.40 +3.43�3.47 41.96 +19.88
�10.66 6.66 +1.23�0.64 1.11E-07 1.42E-03 1347 0.29
51664.637 2864 H 274.97 +2.90�3.21 33.51 +13.97
�8.16 5.42 +0.87�0.51 4.65E-08 7.47E-04 1419 0.31
51665.406 2144 H 264.66 +7.09�3.19 42.87 +22.01
�15.43 6.50 +1.35�1.02 6.87E-04 1.00E+00 1105 0.28
51668.829 2976 H 263.29 +9.41�9.96 53.90 +30.55
�17.58 5.50 +1.56�0.75 1.36E-04 7.44E-01 856 0.26
GRO J1655-40
50296.311 9056 T 273.72 +3.97�3.96 70.33 +19.40
�10.92 1.15 +0.15�0.08 1.15E-13 1.483E-9 7443 0.67
50301.665 6464 T 307.16 +8.17�6.77 68.46 +0.00
�38.07 0.88 +0.21�0.11 3.91E-05 4.04E-01 6414 0.61
50311.391 1856 T 285.56 +8.91�11.19 63.78 +42.48
�17.38 1.14 +0.36�0.16 1.93E-04 9.35E-01 5450 0.54
50317.441 6176 H 443.16 +4.12�3.79 41.44 +20.27
�13.66 5.39 +0.81�0.64 1.28E-05 2.44E-01 5210 0.51
50324.380 4896 T 289.67 +6.26�6.03 98.78 +40.67
�17.67 1.41 +0.30�0.11 1.59E-10 1.46E-06 7267 0.65
50330.254 6144 H 453.72 +6.29�5.32 37.69 +16.46
�12.16 5.69 +0.89�0.71 2.91E-05 5.03E-01 4964 0.49
50335.913 8160 H 446.35 +4.10�4.15 38.74 +9.80
�8.00 6.03 +0.59�0.54 9.01E-09 2.11E-04 4983 0.50
50383.565 6192 H 442.34 +4.71�4.28 31.50 +15.62
�10.61 4.55 +0.70�0.62 1.31E-04 9.77E-01 6092 0.54
50394.884 5792 T 313.45 +9.38�9.81 98.11 +38.42
�19.10 1.17 +0.25�0.11 3.72E-08 3.44E-04 5497 0.59
53498.415 13968 T 125.81 +1.10�1.20 7.49 +3.86
�2.91 0.65 +0.11�0.09 2.16E-04 1.00E+00 3190 0.29
53508.507 7504 T 266.63 +7.96�7.80 61.76 +30.61
�13.60 0.76 +0.19�0.09 2.67E-05 3.24E-01 10164 0.57
XTE J1859+226
51485.875 6064 H 269.44 +5.03�6.28 38.55 +33.43
�13.53 4.91 +1.57�0.71 2.70E-04 7.46E-01 824 0.21
H 1743-322
52803.517 6416 H 240.39 +3.99�4.26 33.11 +14.35
�10.41 3.01 +0.59�0.36 1.66E-05 2.66E-01 1366 0.34
52805.425 5232 H 232.38 +1.41�1.38 7.65 +6.43
�3.20 2.09 +0.49�0.31 3.13E-04 1.00E+00 1314 0.35
53207.602 2608 H 178.57 +1.23�0.93 6.01 +4.09
�3.80 6.84 +1.26�1.10 9.04E-04 1.00E+00 316 0.14
55422.024 1440 T 208.36 +1.50�1.78 8.04 +4.68
�3.38 5.39 +0.51�0.75 1.72E-04 1.00E+00 238 0.81
GX 339-4
52387.556 11200 H 127.70 +4.16�5.57 44.21 +26.18
�10.53 3.19 +1.05�0.35 2.95E-06 8.12E-02 977 0.82
52490.229 816 H 278.67 +3.47�3.09 15.48 +10.47
�6.55 6.32 +1.45�1.01 8.74E-04 1.00E+00 1186 0.16
52690.841 3408 T 105.35 +1.77�1.50 8.87 +4.46
�3.78 6.32 +1.12�1.01 8.45E-04 1.00E+00 74 0.09
54291.443 1264 T 208.44 +2.81�2.68 14.68 +8.67
�5.19 12.53 +2.43�1.93 5.98E-04 1.00E+00 41 0.87
XTE J1752-223
55135.406 2896 H 442.91 +3.42�3.90 20.23 +16.19
�8.27 7.06 +1.51�1.06 4.50E-04 9.87E-01 391 0.94
55140.573 3424 H 114.87 +0.76�0.58 4.50 +3.42
�2.39 2.22 +0.49�0.35 8.16E-04 1.00E+00 393 0.93
4U 1630-47
50893.719 9936 T 287.73 +3.18�3.95 20.17 +17.73
�8.60 2.85 +0.78�0.46 9.04E-04 1.00E+00 250 0.69
50972.126 880 T 267.55 +5.32�6.59 32.97 +14.55
�12.50 15.30 +2.64�2.46 9.35E-04 1.00E+00 41 1.60
52929.482 1712 H 446.72 +2.39�2.95 14.22 +8.77
�7.29 3.65 +0.59�0.57 6.41E-04 1.00E+00 1438 0.60
53215.429 1488 T 150.46 +0.88�1.14 4.91 +3.36
�3.09 1.96 +0.43�0.30 4.83E-04 1.00E+00 799 0.48
c� 2012 RAS, MNRAS 000, 1–??
HFQPO in black-hole binaries 5
3.1 XTE J1550-564
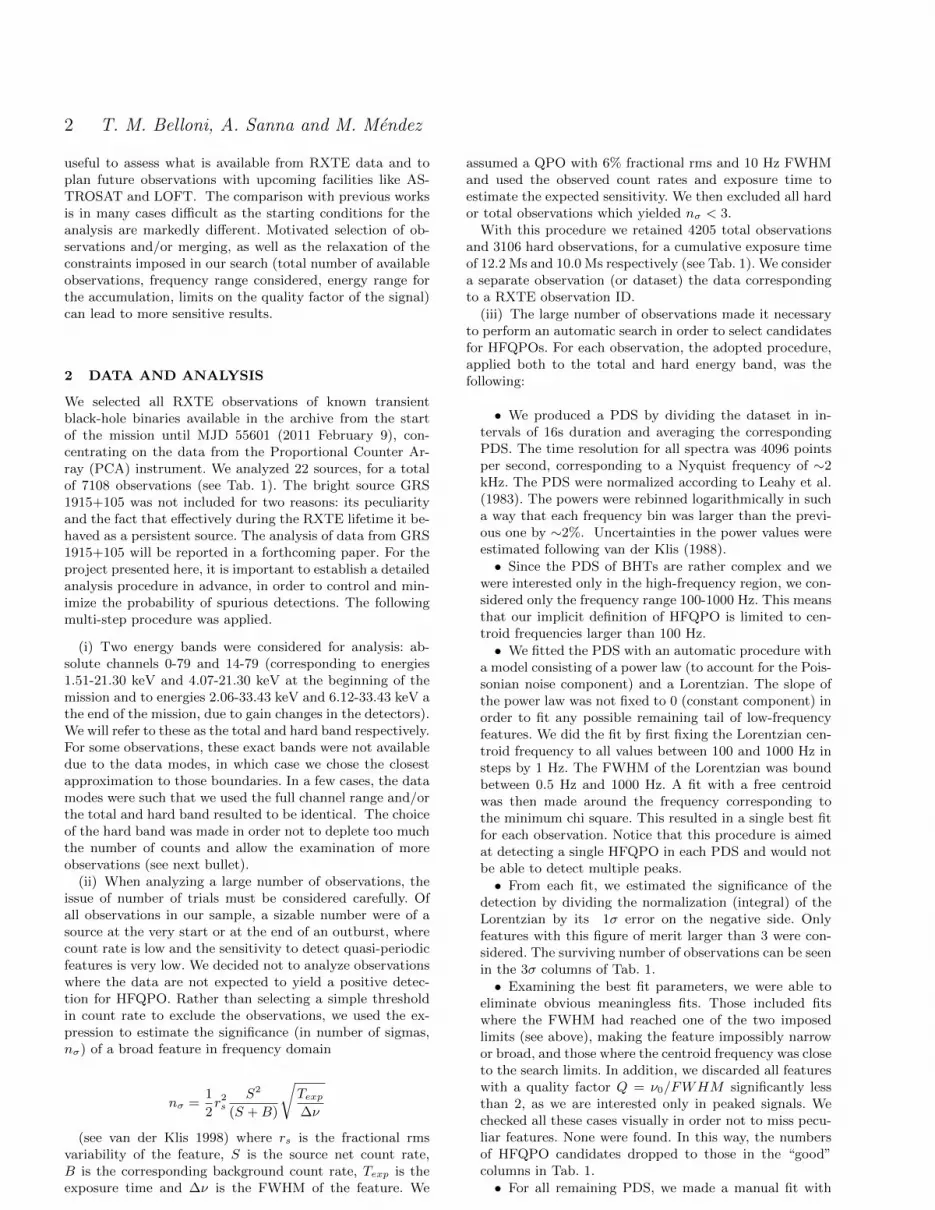
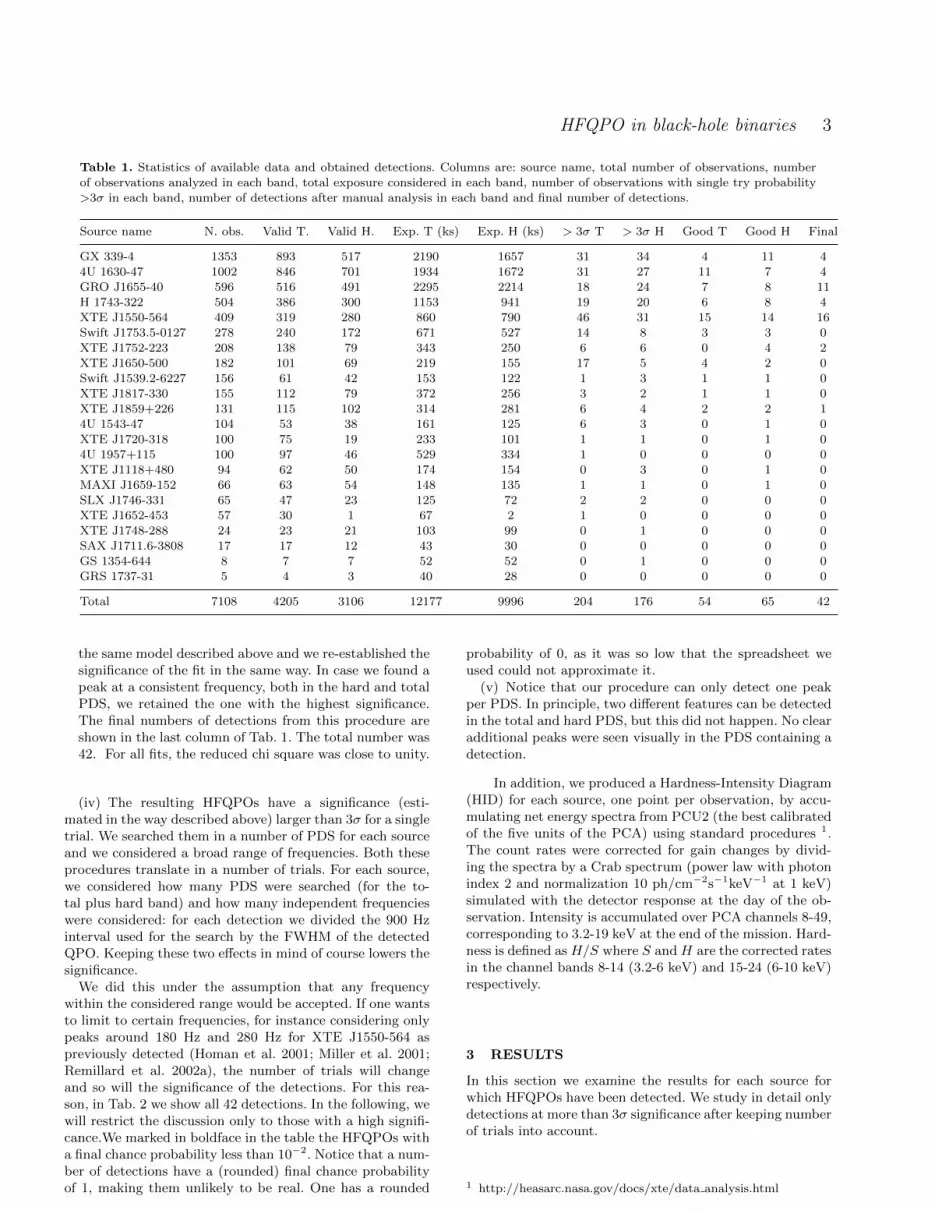
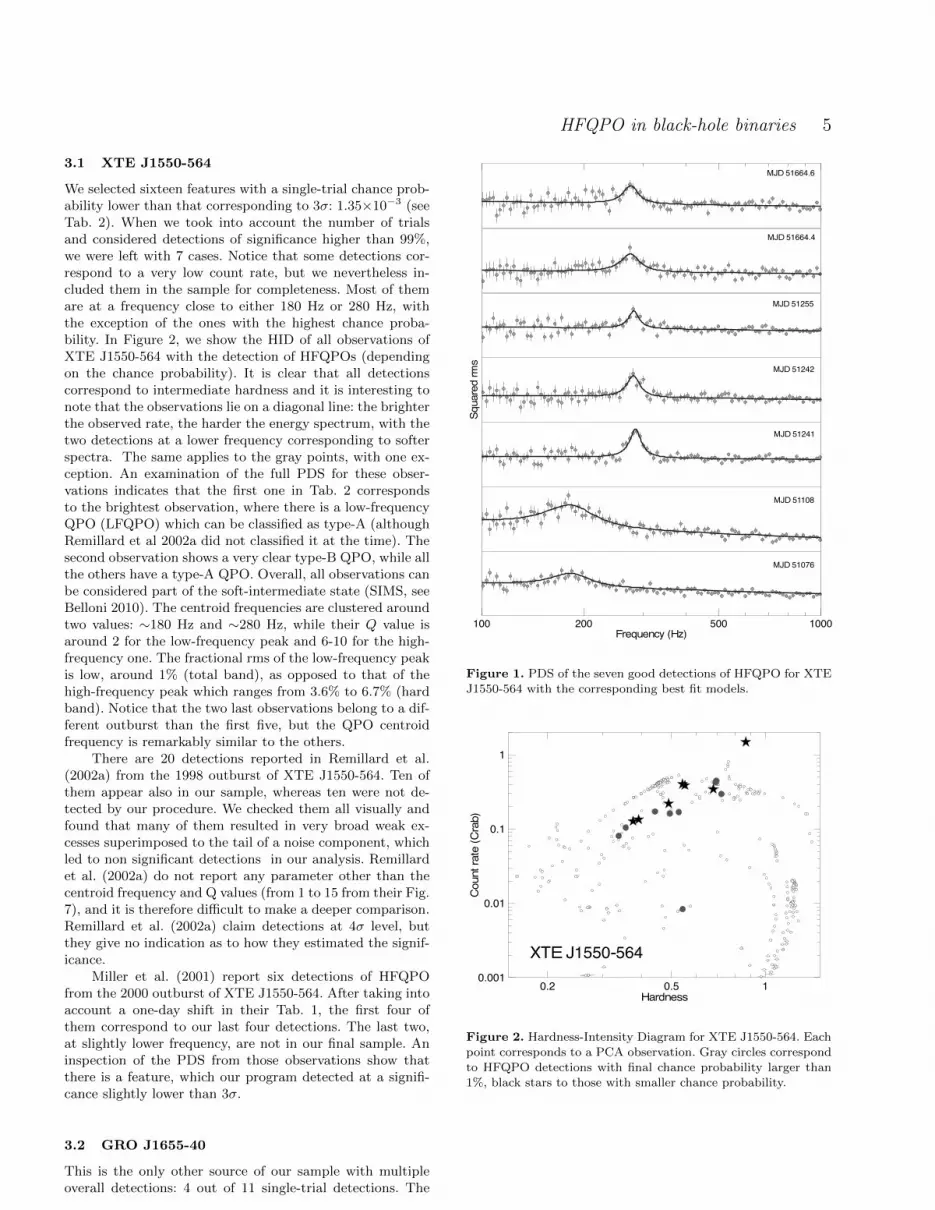
We selected sixteen features with a single-trial chance prob-ability lower than that corresponding to 3�: 1.35⇥10�3 (seeTab. 2). When we took into account the number of trialsand considered detections of significance higher than 99%,we were left with 7 cases. Notice that some detections cor-respond to a very low count rate, but we nevertheless in-cluded them in the sample for completeness. Most of themare at a frequency close to either 180 Hz or 280 Hz, withthe exception of the ones with the highest chance proba-bility. In Figure 2, we show the HID of all observations ofXTE J1550-564 with the detection of HFQPOs (dependingon the chance probability). It is clear that all detectionscorrespond to intermediate hardness and it is interesting tonote that the observations lie on a diagonal line: the brighterthe observed rate, the harder the energy spectrum, with thetwo detections at a lower frequency corresponding to softerspectra. The same applies to the gray points, with one ex-ception. An examination of the full PDS for these obser-vations indicates that the first one in Tab. 2 correspondsto the brightest observation, where there is a low-frequencyQPO (LFQPO) which can be classified as type-A (althoughRemillard et al 2002a did not classified it at the time). Thesecond observation shows a very clear type-B QPO, while allthe others have a type-A QPO. Overall, all observations canbe considered part of the soft-intermediate state (SIMS, seeBelloni 2010). The centroid frequencies are clustered aroundtwo values: ⇠180 Hz and ⇠280 Hz, while their Q value isaround 2 for the low-frequency peak and 6-10 for the high-frequency one. The fractional rms of the low-frequency peakis low, around 1% (total band), as opposed to that of thehigh-frequency peak which ranges from 3.6% to 6.7% (hardband). Notice that the two last observations belong to a dif-ferent outburst than the first five, but the QPO centroidfrequency is remarkably similar to the others.
There are 20 detections reported in Remillard et al.(2002a) from the 1998 outburst of XTE J1550-564. Ten ofthem appear also in our sample, whereas ten were not de-tected by our procedure. We checked them all visually andfound that many of them resulted in very broad weak ex-cesses superimposed to the tail of a noise component, whichled to non significant detections in our analysis. Remillardet al. (2002a) do not report any parameter other than thecentroid frequency and Q values (from 1 to 15 from their Fig.7), and it is therefore di�cult to make a deeper comparison.Remillard et al. (2002a) claim detections at 4� level, butthey give no indication as to how they estimated the signif-icance.
Miller et al. (2001) report six detections of HFQPOfrom the 2000 outburst of XTE J1550-564. After taking intoaccount a one-day shift in their Tab. 1, the first four ofthem correspond to our last four detections. The last two,at slightly lower frequency, are not in our final sample. Aninspection of the PDS from those observations show thatthere is a feature, which our program detected at a signifi-cance slightly lower than 3�.
3.2 GRO J1655-40
This is the only other source of our sample with multipleoverall detections: 4 out of 11 single-trial detections. The
MJD 51076
MJD 51108
MJD 51241
MJD 51242
MJD 51255
MJD 51664.4
MJD 51664.6
Squa
red
rms
Frequency (Hz)100 200 500 1000
Figure 1. PDS of the seven good detections of HFQPO for XTEJ1550-564 with the corresponding best fit models.
XTE J1550-564
Cou
nt ra
te (C
rab)
0.001
0.01
0.1
1
Hardness0.2 0.5 1
Figure 2. Hardness-Intensity Diagram for XTE J1550-564. Eachpoint corresponds to a PCA observation. Gray circles correspondto HFQPO detections with final chance probability larger than1%, black stars to those with smaller chance probability.
c� 2012 RAS, MNRAS 000, 1–??

6 T. M. Belloni, A. Sanna and M. Mendez
MJD 50296
MJD 50324
MJD 50335
MJD 50394
Squ
ared
rms
Frequency (Hz)100 200 500 1000
Figure 3. PDS of the four good detections of HFQPO for GROJ1655-40 with the corresponding best fit models.
frequency of the QPO is also bimodal: between 273 Hz and313 Hz for the low-frequency peak (Q between 3 and 4, rmsslightly above 1%) and 446 Hz for the high-frequency peak(Q=12 and 6% rms). From Fig. 4 it is evident that all de-tections correspond to the “anomalous state” at very highfluxes (see Belloni 2010). The PDS is also typical of thatstate. As in the case of XTE J1550-564, the HID points aredistributed along a diagonal line. Overall, the four detec-tions with high significance after correction for number oftrials show quite a range of frequencies: 274, 290, 313 and446 Hz.
Detections of HFQPO in the 1996 outburst of GROJ1655-40 were reported by Remillard et al. (1999). Theydetect six features in single observations, in addition to theanalysis of sets of combined observations, obviously not com-parable with our results. Four of their detections correspondto entries in our Tab. 2, one corresponds to our 443 Hz ob-servation at MJD 50317, but at a di↵erent frequency (294Hz); our detection is from the hard band, while theirs isfrom the total band. In the total band we do detect theirsignal, but just below 3� single trial. The same is for the ob-servation at MJD 50383. As in the case of XTE J1550-564,Remillard et al. (1999) give no details on the detections, noron the procedure followed. Two of our detections do not ap-pear in their sample. The observation from MJD 50394 doesnot appear in their list, while that from MJD 50335 is avery significant peak at 446 Hz in our data, but in the hardband. Nothing can be seen in the total band, so our result isconsistent with theirs. This last one is the observation wherethe ⇠450 Hz QPO was discovered (Strohmayer 2001b). All
GRO J1655-40
Cou
nt ra
te (C
rab)
0.001
0.01
0.1
1
Hardness0.2 0.5 1
Figure 4. Hardness-Intensity Diagram for GRO J1655-40 (seeFig. 2).
other observations from Strohmayer (2001b) appear in oursample, although for MJD 50311 the high-frequency peakfound by Strohmayer appears slightly below our 3� level.
3.3 XTE J1859+226
Only one feature appears in our sample, at a single trialprobability of 2.7⇥10�4, which translates in a very high fi-nal chance probability. This feature is very unlikely to bereal. The source appears at intermediate hardness in theHID (see Fig. 5); the presence of a type-B QPO indicatesthat the source was in the SIMS. Cui et al. (2000) reportthree detections of HFQPOs. None of these QPO appearsin our sample. Two of them appear to be below our > 3�single-trial threshold in their table (the significance is com-puted as the ratio between normalization and its lower-sideerror, while using fractional rms as done by Cui et al. (2000)increases the value by a factor of two because of the errorpropagation), while the third one is a very broad featurewhich is automatically discarded by our procedure.
3.4 H 1743-322
We detect four QPOs, with high final chance probability.From Fig. 5 we can see that in one case the source wasin a very soft HSS, in one case the source was rather hard(the full PDS shows a type-C QPO, from which we concludethe source was in the HIMS), and in two cases the sourceshowed intermediate hardness, and was in a similar locationin the HID as the ones discussed for GRO J1655-40 andXTE J1550-564. In these last two cases the full PDS showsa strong type-B QPO, and therefore the source was in theSIMS. HFQPOs were reported from H 1743-322 by Homanet al. (2005) at 163 and 240 Hz from the observations of MJD52787. They do not appear in our sample, but accumulationof more than one observation is needed to obtain a detection,so our results are not inconsistent with theirs. The sameapplies to the detection of Remillard et al. (2006).
c� 2012 RAS, MNRAS 000, 1–??

HFQPO in black-hole binaries 7
XTE J1859+226
Cou
nt ra
te (C
rab)
0.001
0.01
0.1
Hardness0.1 0.2 0.5 1
H 1743-322
Cou
nt ra
te (C
rab)
0.001
0.01
0.1
Hardness0.2 0.5 1
GX 339-4
Cou
nt ra
te (C
rab)
0.001
0.01
0.1
Hardness0.001 0.01 0.1 1
XTE J1752-223
Cou
nt ra
te (C
rab)
0.001
0.01
0.1
Hardness0.1 1
4U 1630-47
Cou
nt ra
te (C
rab)
0.001
0.01
0.1
Hardness0.5 1.0 1.5 2.0
Figure 5. Hardness-Intensity Diagram for the remaining sources for which no HFQPO with chance probability < 1% was found afteraccounting for the number of trials. Observations with HFQPOs with chance probability > 1% are marked with thick circles and crosses.
3.5 GX 339-4 and XTE J1752-223
For GX 339-4, the fur detections form a square in the HID(see Fig. 5). The two hard ones are obviously LHS. The twosoft ones are HSS. For XTE J1752-223 the two detectionsare at the same high value of hardness, in the LHS. Inthese two case the chance probability was, respectively, 0.23and 0.035. These are most likely statistical fluctuations andtherefore we do not discuss them further.
3.6 4U 1630-47
None of the four peaks in Tab. 2 appear to be statisticallysignificant after the (large) number of trials is taken intoaccount. Two peaks are detected when the source flux waslow: in one case the source was in the LHS, while in theother case the full PDS shows very little noise, making itdi�cult to classify the state. The remaining two observa-tions lie along a diagonal branch in the HID and also showlow noise level. High-frequency features in this source werereported by Klein-Wolt et al. (2004). Those are very broadfeatures which depend crucially on the subtraction of Pois-sonian noise. However, all of them were obtained after aver-aging observations corresponding to di↵erent intervals in the1998 outburst and therefore cannot appear in our sample.
3.7 XTE J1650-500
We did not obtain detections for this source. Homan et al.(2003) report high-frequency features, some of which verybroad like in the case of 4U 1630-47. Once again, consid-erable averaging of more observations has been performed,which explains the absence of detections in our sample.
4 DISCUSSION
We analyzed 7108 RXTE/PCA observations of 22 black-holetransients searching for HFQPO. From the whole sample, af-ter taking into account the number of trials due to the manyobservations for each source and the number of independentfrequencies sampled, we obtain only 11 detections with achance probability less than 1%. These detections belongto two sources : XTE J1550-564 (7) and GRO J1655-40 (4).The small number of detections (including single-trial detec-tions at significance higher than 3� there are only 42), con-firms that these are very elusive signals, as already indicatedby the small number of detections reported in the literature.A few additional detections were obtained by other authorsby averaging observations according to hardness, but thosecases will not be discussed here. From our detections, a num-ber of aspects can be discussed.
All detections correspond to PDS from very specificstates. Six out of seven detections for XTE J1550-564 arefrom the SIMS, while the last one corresponds to the high-soft state (HSS). One observation has a clear type-B QPO,three have a type-A QPO and one corresponds to the brightflare in 1998, where a LFQPO can be tentatively identifiedwith type-A (see Remillard et al. 2002a). No type-C QPOis detected simultaneous to one of the HFQPO. The firstfive HFQPO are from the 1998 outburst, the last two fromthe 2000 outburst (see Rodrıguez et al. 2004). The four de-tections from GRO J1655-40 correspond to the “anomalousstate” described in Belloni (2010). Again, no type-C QPOcan be identified in those four PDS. These detections comeall from the 1996 outburst (Remillard et al. 1999). From theHIDs in Figs. 2 and 4, we see that the points correspondingto the HFQPO detections in both sources are distributeddiagonally. However, it is di�cult to relate this to precisespectral characteristics.
c� 2012 RAS, MNRAS 000, 1–??

8 T. M. Belloni, A. Sanna and M. Mendez
For XTE J1550-564, the centroid frequencies of the de-tected QPOs appear to cluster around two values: ⇠ 180Hz and ⇠280 Hz. Interestingly, the low-frequency detectionscome from the total energy band, while the high-frequencydetections come from the hard band, indicating that thehigh-frequency oscillation has a harder spectrum. Moreover,inspection of Fig. 3 shows that the low-frequency peaks areclearly broader than the high-frequency ones.
For GRO J1655-401, the dichotomy 300-450 Hz seemsto be less sharp. Strohmayer (2001) detected the ⇠450 Hzfeature simultaneous with the 300 Hz one when averagingobservations, showing that the two peaks correspond to dif-ferent time scales. We see also frequencies (⇠270 and ⇠290Hz) significantly lower than 300 Hz. Also in this source thehigh-frequency detection is significantly narrower than thoseat lower frequencies.
The fact that the few available detections appear atmore or less the same frequencies for XTE J1550-565, evenfor di↵erent outbursts, and that the upper peak is nar-rower than the lower make a comparison with kHz QPO inneutron-star binaries di�cult. There, the centroid frequen-cies are observed to vary in a way consistent with a randomwalk (see Belloni et al. 2005, 2007) and the upper peak isbroader than the lower one (see e.g. Barret et al. 2005).
Two sources which are known to show HFQPOs wereexcluded from the analysis. GRS 1915+105 is a very pe-culiar system with many observations and many HFQPOdetections. We will present our results on this source in aforthcoming paper. IGR J17091-3624 is a new “twin” of GRS1915+105, in the sense that it is the only other known sourceto display its unusual variability. Results were already pub-lished in Altamirano et al. (2012).
It is interesting to compare our results with those of kHzQPOs in neutron-star LMXBs (see van der Klis 2006 for areview). The neutron-star system 4U 1636-53 was observedregularly during the last few years of the RXTE lifetime,yielding a solid database from which to extract statisticalinformation. In this source, ⇠40% of the observations ledto the detection of at least one high-frequency feature (seeSanna et al. 2012) as opposed to 0.15% here.
Revnivtsev & Sunyaev (2000) showed that there is asystematic di↵erence in power level between black-hole andneutron-star sources in the hard state, attributing it tothe presence of a radiation-dominated spreading layer inthe latter, the so-called boundary layer. As already sug-gested by these authors, the presence/absence of stronghigh-frequency QPOs can be part of the same picture. Fol-lowing this line, Gilfanov et al. (2003) and Gilfanov &Revnivtsev (2005) analysed low-frequency and kHz QPOs inneutron-star binaries and concluded that the oscillations arecaused by variations in the luminosity of the boundary layer.In this framework, it is the diminishing relative importanceof the boundary-layer emission which weakens kHz QPO asthey move to very high frequencies (see Mendez 2006 foradditional discussion). Moreover, our HFQPOs are detectedin intermediate states. Belloni et al. (2007) and Sanna etal. (2012) showed that in the neutron-star LMXB 4U 1636-53 kHz QPOs are not found in the observations when thesource is the hardest, at intermediate hardness mostly theupper kHz QPO is detected and in the softest observationsmostly the lower kHz QPO is present. It is di�cult to make acomparison with our case: that no kHz QPOs are detected in
Rms > 10%
Rms > 15%4U 1636-53Upper kHz QPO
4U 1636-53Lower kHz QPO
All
All
Num
ber o
f det
ectio
ns
0
10
20
0
5
10
15
QPO Frequency (Hz)400 600 800 1000 1200
Figure 6. Frequency distributions for all detections of upper (toppanel) and lower (bottom panel) kHz QPOs in the NS LMXB 4U1636-53 (Sanna et al. 2012) (gray histograms). The black his-tograms include only detections with rms >15% for the upperand >10% for the lower.
the hard state is consistent with the black-hole case, while adetailed comparison between soft states remains to be done.
The detection of only a few specific frequencies in thecase of black-hole HFQPOs is something that does not ap-ply to kHz QPOs in neutron-star binaries. The frequenciesof kHz QPO are distributed along a very broad range (seevan der Klis 2006, Mendez 2006, Belloni et al. 2007, Barretet al. 2005, 2007). KHz QPOs in neutron stars are usu-ally strong, more easily detected than HFQPO, which thenleads to a much larger number of detections. Moreover, atmost frequencies the lower kHz peak is narrower and moresignificant than the upper one. The question is whether thefrequencies of the oscillations can be understood in terms ofthe same physical mechanisms in the two classes of sources.In order to check what frequencies would be observed if thiswas the case, in Fig. 6 we plot the distribution of upper andlower kHz QPOs in the full RXTE database of 4U 1636-53(data from Sanna et al. 2012). In both panels, the black his-togram contains only the strongest detected peaks (we chosean rms threshold of 15% and 10% for the upper and lowerpeaks respectively in order to select only a handful of detec-tions). A comparison with the HFQPOs of XTE J1550-564is interesting. There, the lower-frequency HFQPO is weakerand broader than the higher-frequency one. Unfortunately,the only reported case of a double-detection in XTE J1550-564, obtained through averaging of many observations, doesnot allow a good determination of the quality factor of thetwo peaks (Miller et al. 2005). The black histograms showthat on average the strongest upper kHz QPOs in 4U 1636-53 appear at a lower frequency than the strongest lower kHzQPOs. This is consistent with the spread of the frequencieswe find in XTE J1550-564. Clearly, the limited number ofdetections of XTE J1550-564 does not allow a more precisecomparison.
The width of the QPO peaks is another interestingquantity of a comparison with neutron-star binaries. In our
c� 2012 RAS, MNRAS 000, 1–??

HFQPO in black-hole binaries 9
detections, the Q factor of the upper-frequency peak ishigher than that of the lower-frequency one. In neutron-star binaries it is generally the opposite (see e.g. Barret etal. 2007). This is a clear di↵erence between the neutron-starand black-hole cases. If the process originating the oscilla-tions is the same of the two classes of courses, the presenceof the boundary layer is likely to be the reason for this dif-ference, yielding another observational constraint for theo-retical modeling (see Mendez 2006).
Overall, we detected eleven significant features after an-alyzing around 7000 observations, resulting in a detectione�ciency of ⇠ 10�3. Of course, since the HFQPOs are de-tected only in intermediate states and these states are theshort-lived ones, observing with new instruments and con-centrating on the most likely periods during outbursts canincrease the probability of detection. In other words, to de-tect HFQPOs one does not need a good coverage of a fulloutburst, but only of the intermediate states. The LAXPCinstrument on board the upcoming ASTROSAT mission(Agrawal 1996) will increase the e↵ective area of the PCAabove 10 keV, where the HFQPOs are stronger (see Morganet al. 2001), but in order to be e↵ective ASTROSAT willhave to concentrate observations during bright intermediatestates. The LOFT mission (Feroci et al. 2010), under evalu-ation by ESA at the time of writing, is planned with a verylarge e↵ective area (around 12 m2) and will allow samplingof these weak signals in all states.
ACKNOWLEDGEMENTS
The research leading to these results has received fundingfrom the European Communitys Seventh Framework Pro-gramme (FP7/2007-2013) under grant agreement numberITN 215212 Black Hole Universe. This paper was writ-ten during an extended stay of TMB at The University ofSouthampton, funded by a Leverhulme Trust Visiting Pro-fessorship. TMB thanks S. Motta for her help with sourcestates.
REFERENCES
Agrawal, P.C., 2006, Adv. Sp. Res, 38, 2989Altamirano, D., Belloni, T, 2012, ApJ, 747, L4Altamirano, D., Belloni, T, Linares, M. et al., 2012, ApJ,742, L17
Barret, D., Olive, J.-F., Miller, M.C., 2005, MNRAS, 361,855
Barret, D., Olive, J.-F., Miller, M.C., 2007, MNRAS, 376,1139
Belloni, T.M., Mendez, M., Sanchez-Fernandex, 2001,A&A, 372, 551
Belloni, T., Psaltis, D., van der Klis, M., ApJ, 572, 392Belloni, T.M., Mendez, M., Homan, J., 2005, A&A, 437,209
Belloni, T.M., Soleri, P., Casella, P., 2006, MNRAS, 369,305
Belloni, T.M., Homan, J., Motta, S. et al., 2007, MNRAS,379, 247
Belloni, T.M., 2010, in “The Jet Paradigm: from Micro-quasars to Quasars,” Ed. T.M. Belloni, Springer, LNP794, p53.
Belloni, T.M., Motta, S., Munoz-Darias, T., 2012, Bull. ofthe Astr.Soci. of India, 39, 409
Cui, W., Shrader, C.R., Haswell, C.A. et al., 2000, ApJ,535, L123
Fender, R.P., 2010, in “The Jet Paradigm: from Micro-quasars to Quasars,” Ed. T.M. Belloni, Springer, LNP794, p115.
Gilfanov, M., Revnivtsev, M., Molkov, 2003, A&A, 410,217
Gilfanov, M., Revnivtsev, 2003, AN, 326, 812Feroci, M., Stella, L., Vecchi, A. et al., 2010, SPIE, 7732,57
Homan, J., Wijnands, van der Klis, M. et al., 2001, ApJS,132, 377
Homan, J., Klein-Wolt, M., Rossi, S. et al., 2003, ApJ, 586,1262
Homan, J., Miller, J.M., Wijnands et al., 2005, ApJ, 623,383
Klein-Wolt, M., Homan, J., van der Klis, M., 2004,Nucl.Phys. B Proc. Suppl., 132, 381
Leahy, D.A., Darbro, W., Elsner, R.F. et al., 1983, ApJ,266, 160
Miller, J.M., Wijnands, R., Homan, J. et al., 2001, ApJ,563, 928
Mendez, M., 2006, MNRAS, 371, 1925Morgan, E.H., Remillard, R.A., Greiner, J., 2001, ApJ, 482,993
Psaltis, D., Belloni, T., van der Klis, M., ApJ, 520, 262Remillard, R.A., Morgan E.H., McClintock, J.E et al.,1999, ApJ, 522, 397
Remillard, R.A., Sobczak, G.J., Muno, M.P. et al., 2002a,ApJ, 564, 962
Remillard, R.A., Muno, M.P., McClintock, J.E. et al.,2002b, in Durouchoux Ph., Fuchs Y., Rodriguez J., eds,New Views on Microquasars. Center for Space Physics,Kolkata, India, p. 49
Remillard, R.A., McClintock, J.E., Orosz, J.A. et al., 2006,ApJ, 637, 1002
Rodrıguez, J., Corbel, S., Kalemci, E. et al., 2004, ApJ,612,1018
Sanna, A., Mendez, M., Belloni, T. et al., 2012, MNRAS,in press (arXiv:1206.0182)
Strohmayer, T., 2001a, ApJ, 554, L169Strohmayer, T., 2001b, ApJ, 552, L49Sunyaev, R., Revnivtsev, M., 2000, A&A, 358, 617van der Klis M., 1998, in “The Many Faces of NeutronStars,” NATO ASI Series 515, p. 337
van der Klis M., 2006, in “Compact Stellar X-ray Sources,”Eds. Lewin, W.H.G & van der Klis, M.,Cambridge Univ.Press, p39.
Wijnands, R., van der Klis M., 1999, ApJ, 514, 939
c� 2012 RAS, MNRAS 000, 1–??