hedging currency risk in emerging market equity portfolios 1-20-14 (newer format)
TRANSCRIPT
Hedging Currency Risk in Emerging Market Equity PortfoliosThe Rock Creek GroupJanuary 20, 2014
ABSTRACTThe Rock Creek team members have been investing globally in hedge funds since theearly 1990s including in emerging and small managers. Our investment process forselecting the best emerging/small managers and constructing portfolios has beenextremely successful. We have observed that many of these emerging managers are infact diversity owned firms. This paper seeks to analyze whether having a large numberof diversity firms has been an important factor in overall portfolios’ performance.While our analysis focuses specifically on the implications of investing with womenand minority owned hedge fund firms (“WMOHF”) on an institution’s hedge fundportfolio, the analysis can easily be expanded to other asset classes in theirportfolio.
We find that WMOHF have strong performance and risk-reward characteristics which havebeen important factors in the strong performance of Rock Creek’s portfolio.Consequently, it seems reasonable that institutional investors should considerexplicit allocations to diversity managers. We believe, a well-executed emergingmanager hedge fund program that includes high-quality woman- and minority-ownedinvestment managers results in a better diversified portfolio (across both type ofinvestments as well as portfolio manager perspective) that not only helps aninstitutional investor meet its fiduciary obligations, but has the ancillary benefitof supporting the broader social goals of an endowment, foundation or legislature’smandate.
Introduction:One of the landmark developments in finance was the introduction of modern portfoliotheory (“MPT”) which demonstrated how investors could ‘reap the benefits ofdiversification’ and achieve higher expected risk-return outcomes in their portfoliosby investing in uncorrelated asset classes. Over the past few years, investors haveexpanded this concept of diversification beyond financial assets to includeperspectives. In other words, investing with different teams in the same asset class,who have different backgrounds and approaches to constructing portfolios, can alsobring about diversification benefits. It is this argument that has sparked aninterest in investing with women and minority business enterprises (“WMBE”), with thebelief that these groups will bring a different perspective to investing and willtherefore provide additional correlation benefits to portfolios.
More recently, the numerous public plans have enacted programs (“Emerging ManagerPrograms”) targeting investment with newer independent asset managers. Many of theseprograms specifically incorporate a preference for WMBE enterprises. The obviousquestion that arises from this increased interest of investing with WMBE managers iswhether such allocations have any material impact, either positive or negative on thepension plan’s fiduciary obligation of investing with the best interest of the planparticipants in mind. In this paper, we seek to understand why institutions have beenincreasing their allocation to diversity firms, and whether their inclusion has hadany impact on the overall performance of their portfolio.
Interest in Diversity Owned Firms:It is a common perception that the motivation of public figures to increaseinvestments with diversity firms does not arise from any theoretical underpinnings,but rather from social pressures exerted by their constituent base to have a higher
1
representation of diversity firms among their external service providers, includinginvestment managers.
The United States is becoming a more diverse country as new immigrants and theirchildren will account for over 80% of the growth in the working age population between2000 and 2050. In fact, by 2050, census data projects that no single racial orethnic group will command a majority in the U.S. This shift in the U.S. demographicsis in part driving the greater pressure by public pension plan constituents forincreasing the diversity in the management of their plan assets. Till recently,pension plans have mainly focused on increasing diversity in their internal hiringdecisions, but more recently this has shifted to increasing the diversity among theirexternal service providers.
With a proliferation in diversity focused mandates, the key question is whether havingsuch targeted investment programs within a portfolio can be justified on an economicbasis thereby eliminating any potential conflict with the pension plan’s fiduciaryduty to always act in the best interest of its plan participants by generating thebest returns possible for a given level of risk.
Researchers have found that “teams of strong, but diverse individuals outperform teamsof the best individuals with similar perspectives and ways of approaching a problem”(“Thinking about Diversity of Thought” – S. Woods). If, as the research implies,diversity can enhance value to decision making, the obvious question is whether thisproposition holds for investment decision-making. Here again, research seems tosuggest that diversity does help enhance the returns from investment decision making.
One clear measure of performance is that of stock performance of companies with highor low ratings in diversity. According to a recent study by Thomson Reuters, “Miningthe Metrics of Board Diversity”, they observed that indices of companies with mixedboards tend to on aggregate have marginally better or very similar performance to areference benchmark whereas those companies with no diversity on their boards displayslightly more volatility and underperform on average, relative to companies withdiverse boards. While they do not conclude this outperformance is purely the resultof the composition of the boards, their data has shown higher or similar returns incompanies with mixed boards since 2007. However, a recent study by the Credit SuisseInstitute performed in 2012 has shown that the relationship between greater diversityand improved profitability and stock price performance is more one of correlation thanof causation. To summarize, they conclude that a company’s desire to have a mixedboard may be acting as a positive signal to investors because it shows that thecompany has a greater focus on corporate governance and is already performing well.In addition, there is other evidence that supports the idea that greater diversity canlead to better average performance. Professor Katherine Phillips (Paul CalelloProfessor of Leadership and Ethics at Columbia University) and her colleagues havestudied the impact of greater diversity in team exercises and found that (a)individuals are, on average, likely to do more preparation for any exercise that theyknow is going to involve working with a diverse rather than a homogenous group; (b)that a wider range of available data inputs are likely to be Rationalizing the linkbetween performance and gender diversity debated in a diverse rather than a homogenoussetting; and (c) that the diverse group, in the end, is more likely to generate thecorrect answer to a particular problem than is the case for the homogenous group. Inconclusion, it is not necessarily the performance of the diversity individuals thathave enhanced the result. Rather, it is the fact that the majority group improves itsown performance in response to minority involvement. Simply put, nobody wants to lookbad in front of a stranger. Hence, the greater the effort and attention to detail, thebetter average outcome in a more diverse environment.
2
Another academic study, ‘Competitiveness through Management of Diversity: Effects onStock Price Valuation” found that firms that received Department of Labor awards fortheir success in implementing voluntary affirmative action policies are rewarded fortheir success with a boost in their share price while those firms that were foundguilty of discrimination saw a decline in their share price within ten days of theannouncement The authors conclude that their results indicate that announcements ofquality affirmative action programs are associated with “significant and positiveexcess returns that represent the capitalization of positive information concerningimproved business prospects” while the announcement of “discrimination settlementsrepresent the capitalization of negative economic implications associated withdiscriminatory corporate practices”. Anecdotally, Rock Creek has found its owndiversity to be a strong competitive edge. Over the past ten years, operating as adiverse and woman owned firm has provided Rock Creek with a unique perspective whichappears to have contributed greatly to our ability to generate strong risk-adjustedreturns, with many of our portfolios and strategies outperforming our peers.
Pension funds have a fiduciary duty to act in the best interest of plan participants.Empirical research, although based on limited data, provides a justification forconsidering allocations based on a manager’s background. As a result, many pensionfunds make explicit allocations to WMBE, even while ensuring that these managers meetall other selection criteria such as high-performance track record, stable portfoliomanagement team, understandable investment process and high peer group rankings.
Some public pension funds have targeted WMBE managers by setting up ‘emerging manager’programs that seek to invest in small and less established managers. This approachhas been successful in increasing allocations to WMBE managers since the majority ofthese managers tend to be smaller in both number and size. Moreover, like early-stagefunds in general, WMBE funds might have the potential to outperform established fundsbecause of their ability to stay nimble, access less crowded trades, focus onperformance, and provide enhanced transparency and potentially reduced fees. A numberof research studies performed by Goldman Sachs, Barclays Capital among others haveshown that smaller and younger funds have historically outperformed more establishedmanagers.
Women & Minority owned Hedge Fund Universe:While we have so far addressed the rationale as to why some organizations are seekingto increase exposure to diversity firms within their investment portfolios, it isequally important to understand whether such targeting has any adverse impact on theoverall performance of the overall portfolio. We will focus specifically, in thispaper, on the implications of investing with women and minority owned hedge fund firms(“WMOHF”) on an institution’s overall hedge fund portfolio1. The hedge fund asset class is relatively small and dynamic when compared to otherasset classes in the investment management industry. Consequently, it is much easierfor entrepreneurially oriented individuals to start a new hedge fund than it is forthem to start an equity or fixed income firm. This is reflected in the large number ofhedge fund startups every year. It is therefore not surprising that we observe thelargest number of new woman and minority owned firms in the hedge fund industry. This
1 The Rock Creek team has been a pioneer investing in emerging and small hedge fund managers, includingminority- and woman-owned managers, with a strong performance record while at the World Bank since the 1990sand at Rock Creek. Rock Creek itself encourage diversity in its own team hiring process. Team members speakmore than 10 languages and have lived in many countries including in the US, Europe, Asia, and emergingcountries. We believe that our diverse team has provided us with a truly global perspective in our macro-economic outlook.
3
availability of data, in turn, makes analyzing WMOHF much easier than it is analyzingthese firms in other asset classes.
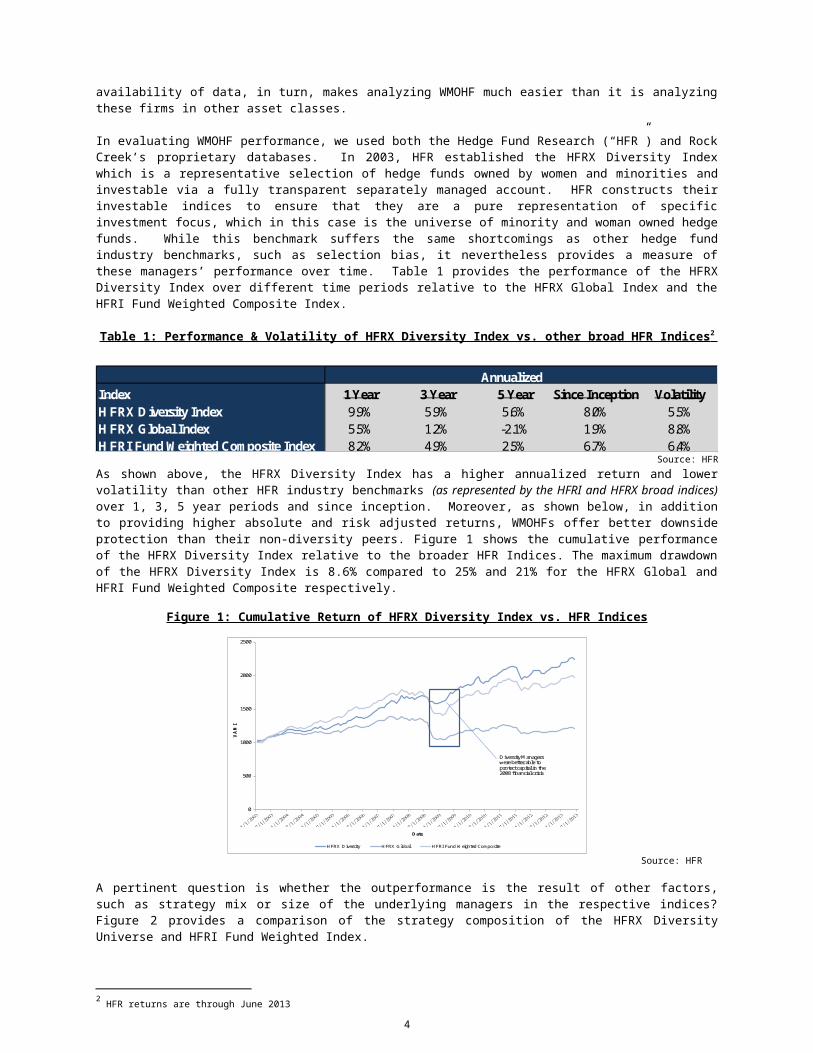
In evaluating WMOHF performance, we used both the Hedge Fund Research (“HFR”) and RockCreek’s proprietary databases. In 2003, HFR established the HFRX Diversity Indexwhich is a representative selection of hedge funds owned by women and minorities andinvestable via a fully transparent separately managed account. HFR constructs theirinvestable indices to ensure that they are a pure representation of specificinvestment focus, which in this case is the universe of minority and woman owned hedgefunds. While this benchmark suffers the same shortcomings as other hedge fundindustry benchmarks, such as selection bias, it nevertheless provides a measure ofthese managers’ performance over time. Table 1 provides the performance of the HFRXDiversity Index over different time periods relative to the HFRX Global Index and theHFRI Fund Weighted Composite Index.
Table 1: Performance & Volatility of HFRX Diversity Index vs. other broad HFR Indices 2
AnnualizedIndex 1 Year 3 Year 5 Year Since Inception VolatilityH FRX D iversity Index 9.9% 5.9% 5.6% 8.0% 5.5%H FRX Global Index 5.5% 1.2% -2.1% 1.9% 8.8%H FRI Fund W eighted Com posite Index 8.2% 4.9% 2.5% 6.7% 6.4%
Source: HFRAs shown above, the HFRX Diversity Index has a higher annualized return and lowervolatility than other HFR industry benchmarks (as represented by the HFRI and HFRX broad indices)over 1, 3, 5 year periods and since inception. Moreover, as shown below, in additionto providing higher absolute and risk adjusted returns, WMOHFs offer better downsideprotection than their non-diversity peers. Figure 1 shows the cumulative performanceof the HFRX Diversity Index relative to the broader HFR Indices. The maximum drawdownof the HFRX Diversity Index is 8.6% compared to 25% and 21% for the HFRX Global andHFRI Fund Weighted Composite respectively.
Figure 1: Cumulative Return of HFRX Diversity Index vs. HFR Indices
0
500
1000
1500
2000
2500
VAMI
Date
HFRX Diversity HFRX Global HFRI Fund W eighted Composite
D iversity M anagers were better able to protect capital in the 2008 financial crisis
Source: HFR
A pertinent question is whether the outperformance is the result of other factors,such as strategy mix or size of the underlying managers in the respective indices?Figure 2 provides a comparison of the strategy composition of the HFRX DiversityUniverse and HFRI Fund Weighted Index.
2 HFR returns are through June 2013
4
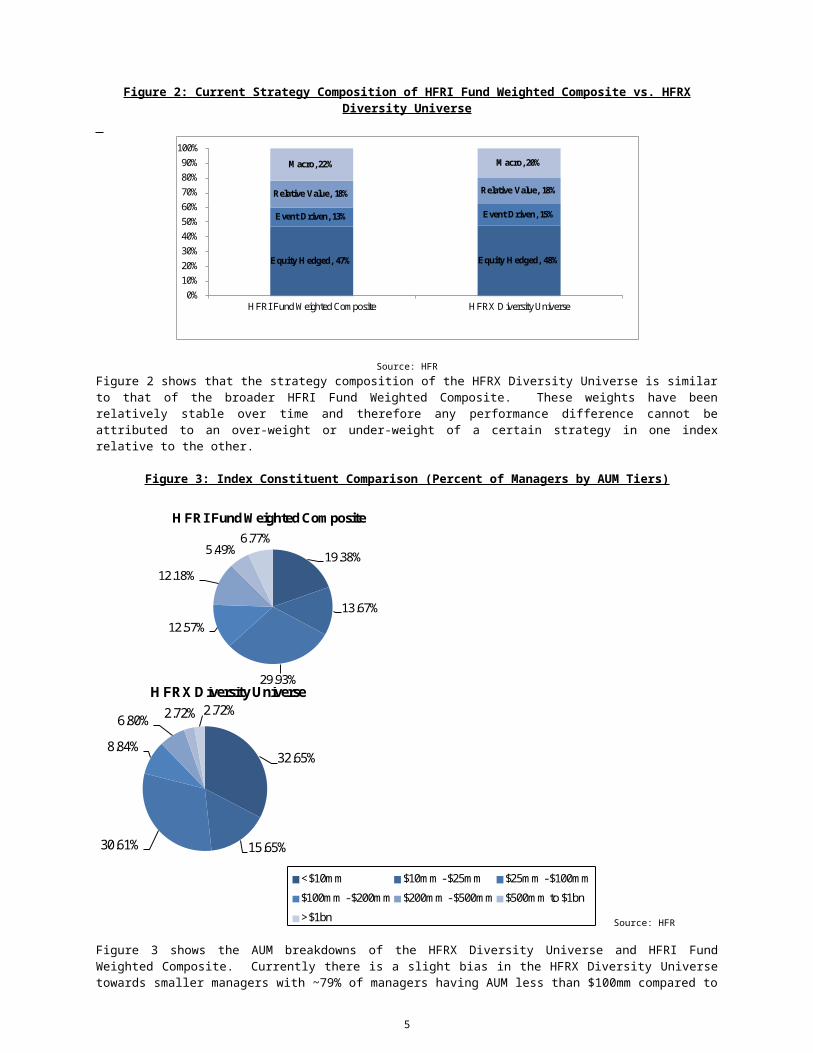
Figure 2: Current Strategy Composition of HFRI Fund Weighted Composite vs. HFRXDiversity Universe
Equity H edged, 47% Equity H edged, 48%
Event Driven, 13% Event Driven, 15%
Relative Value, 18% Relative Value, 18%
M acro, 22% M acro, 20%
0%10%20%30%40%50%60%70%80%90%100%
H FRI Fund W eighted Com posite H FRX D iversity Universe
Source: HFRFigure 2 shows that the strategy composition of the HFRX Diversity Universe is similarto that of the broader HFRI Fund Weighted Composite. These weights have beenrelatively stable over time and therefore any performance difference cannot beattributed to an over-weight or under-weight of a certain strategy in one indexrelative to the other.
Figure 3: Index Constituent Comparison (Percent of Managers by AUM Tiers)
19.38%
13.67%
29.93%
12.57%
12.18%
5.49%6.77%
H FRI Fund W eighted Com posite
<$10m m $10m m -$25m m $25m m -$100mm$100mm -$200mm $200m m -$500m m $500m m to $1bn>$1bn
32.65%
15.65%30.61%
8.84%6.80% 2.72% 2.72%
H FR D iversity Universe
<$10m m $10m m -$25m m $25m m -$100m m$100m m -$200mm $200mm -$500mm $500mm to $1bn>$1bn
32.65%
15.65%30.61%
8.84%6.80% 2.72% 2.72%
H FRX D iversity Universe
<$10m m $10m m -$25m m $25m m -$100m m$100m m -$200m m $200m m -$500m m $500m m to $1bn>$1bn
32.65%
15.65%30.61%
8.84%6.80% 2.72% 2.72%
H FR D iversity Universe
<$10m m $10m m -$25m m $25m m -$100m m$100m m -$200m m $200m m -$500m m $500m m to $1bn>$1bn Source: HFR
Figure 3 shows the AUM breakdowns of the HFRX Diversity Universe and HFRI FundWeighted Composite. Currently there is a slight bias in the HFRX Diversity Universetowards smaller managers with ~79% of managers having AUM less than $100mm compared to
5
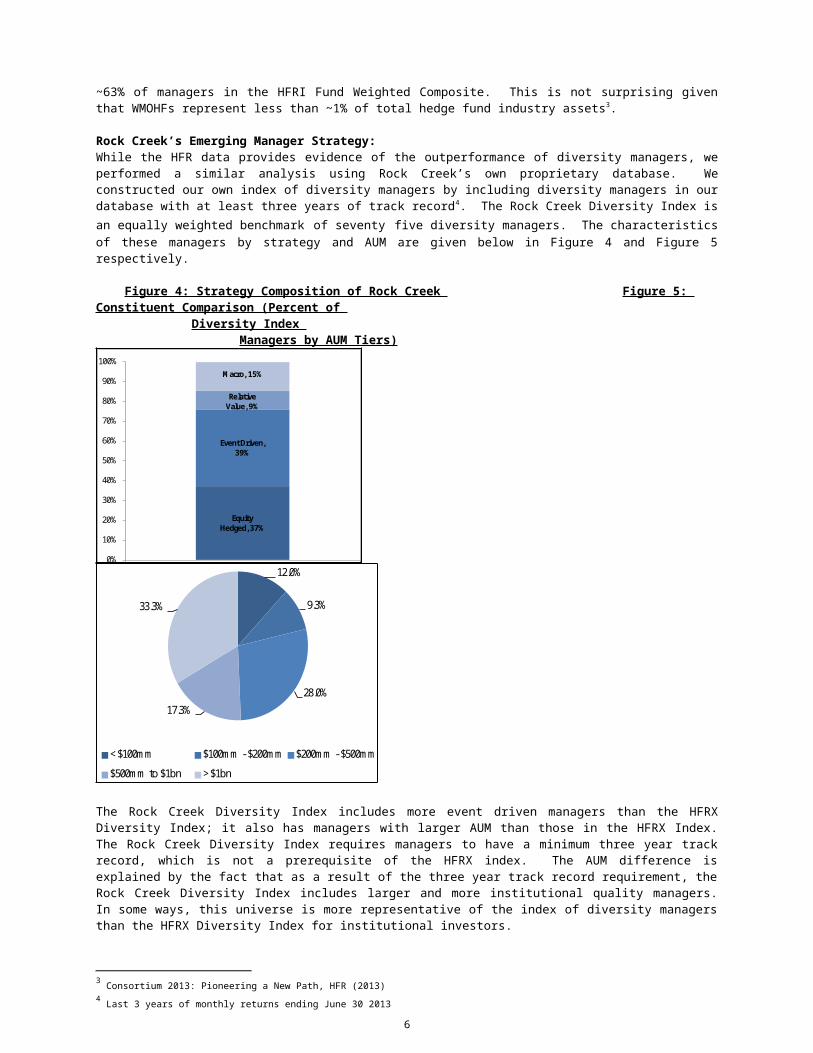
~63% of managers in the HFRI Fund Weighted Composite. This is not surprising giventhat WMOHFs represent less than ~1% of total hedge fund industry assets3.
Rock Creek’s Emerging Manager Strategy:While the HFR data provides evidence of the outperformance of diversity managers, weperformed a similar analysis using Rock Creek’s own proprietary database. Weconstructed our own index of diversity managers by including diversity managers in ourdatabase with at least three years of track record4. The Rock Creek Diversity Index isan equally weighted benchmark of seventy five diversity managers. The characteristicsof these managers by strategy and AUM are given below in Figure 4 and Figure 5respectively.
Figure 4: Strategy Composition of Rock Creek Figure 5: Constituent Comparison (Percent of
Diversity Index Managers by AUM Tiers)
Equity Hedged, 37%
Event Driven, 39%
Relative Value, 9%
M acro, 15%
0%
10%
20%
30%
40%
50%
60%
70%
80%
90%
100%
Rock Creek D iversity Index12.0%
9.3%
28.0%17.3%
33.3%
<$100mm $100mm -$200mm $200mm -$500mm$500mm to $1bn >$1bn
The Rock Creek Diversity Index includes more event driven managers than the HFRXDiversity Index; it also has managers with larger AUM than those in the HFRX Index.The Rock Creek Diversity Index requires managers to have a minimum three year trackrecord, which is not a prerequisite of the HFRX index. The AUM difference isexplained by the fact that as a result of the three year track record requirement, theRock Creek Diversity Index includes larger and more institutional quality managers.In some ways, this universe is more representative of the index of diversity managersthan the HFRX Diversity Index for institutional investors.
3 Consortium 2013: Pioneering a New Path, HFR (2013)4 Last 3 years of monthly returns ending June 30 2013
6
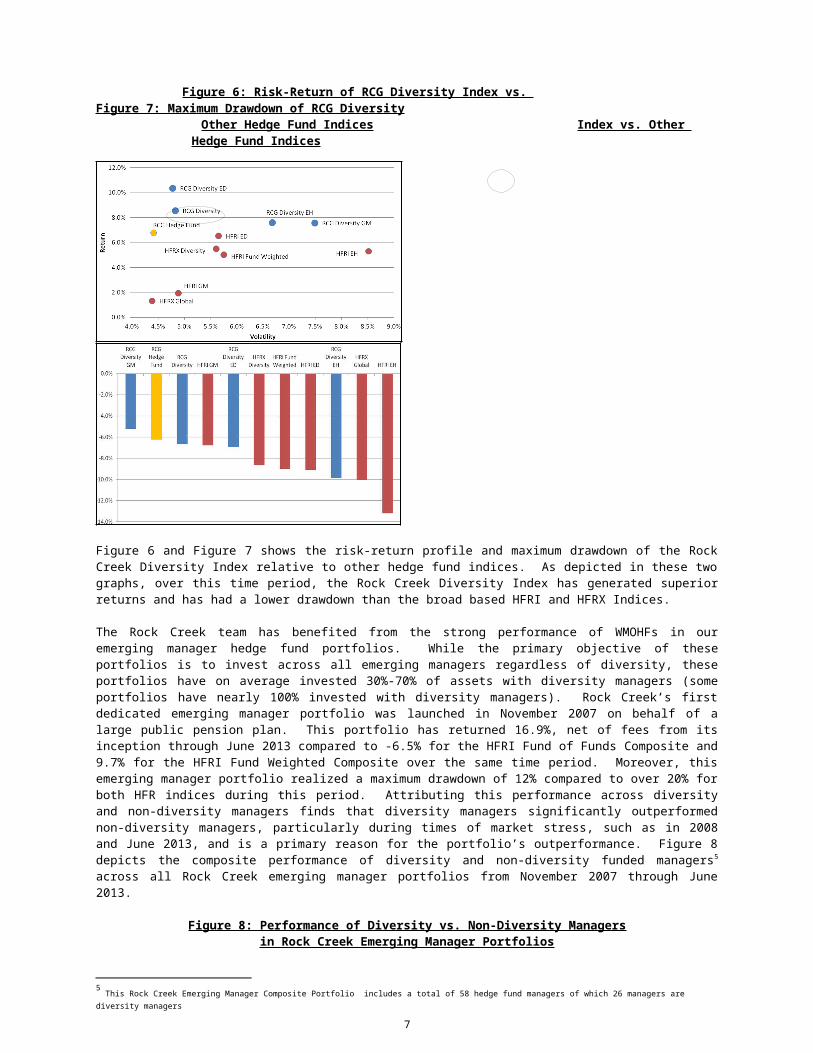
Figure 6: Risk-Return of RCG Diversity Index vs. Figure 7: Maximum Drawdown of RCG Diversity
Other Hedge Fund Indices Index vs. Other Hedge Fund Indices
Figure 6 and Figure 7 shows the risk-return profile and maximum drawdown of the RockCreek Diversity Index relative to other hedge fund indices. As depicted in these twographs, over this time period, the Rock Creek Diversity Index has generated superiorreturns and has had a lower drawdown than the broad based HFRI and HFRX Indices.
The Rock Creek team has benefited from the strong performance of WMOHFs in ouremerging manager hedge fund portfolios. While the primary objective of theseportfolios is to invest across all emerging managers regardless of diversity, theseportfolios have on average invested 30%-70% of assets with diversity managers (someportfolios have nearly 100% invested with diversity managers). Rock Creek’s firstdedicated emerging manager portfolio was launched in November 2007 on behalf of alarge public pension plan. This portfolio has returned 16.9%, net of fees from itsinception through June 2013 compared to -6.5% for the HFRI Fund of Funds Composite and9.7% for the HFRI Fund Weighted Composite over the same time period. Moreover, thisemerging manager portfolio realized a maximum drawdown of 12% compared to over 20% forboth HFR indices during this period. Attributing this performance across diversityand non-diversity managers finds that diversity managers significantly outperformednon-diversity managers, particularly during times of market stress, such as in 2008and June 2013, and is a primary reason for the portfolio’s outperformance. Figure 8depicts the composite performance of diversity and non-diversity funded managers5
across all Rock Creek emerging manager portfolios from November 2007 through June2013.
Figure 8: Performance of Diversity vs. Non-Diversity Managersin Rock Creek Emerging Manager Portfolios
5 This Rock Creek Emerging Manager Composite Portfolio includes a total of 58 hedge fund managers of which 26 managers are diversity managers
7
-4.00%
-2.00%
0.00%
2.00%
4.00%
6.00%
8.00%
10.00%
12.00%
14.00%
0.70
0.80
0.90
1.00
1.10
1.20
1.30
Nov-0
7Jan
-08Mar-08
May-08
Jul-08
Sep-08
Nov-0
8Jan
-09Mar-09
May-09
Jul-09
Sep-09
Nov-0
9Jan
-10Mar-10
May-10
Jul-10
Sep-10
Nov-1
0Jan
-11Mar-11
May-11
Jul-11
Sep-11
Nov-1
1Jan
-12Mar-12
May-12
Jul-12
Sep-12
Nov-1
2Jan
-13Mar-13
May-13
Jul-13
Outperform
ance
Cummula
tive Return
M onthly Outperformance of Diversity M anagers Diversity M grs (LHS) Non-Diversity M grs (LHS)
D iversity m anagers have consistently protectedtheir portfolio during difficult
periods in the m arket
Source: Rock Creek Group
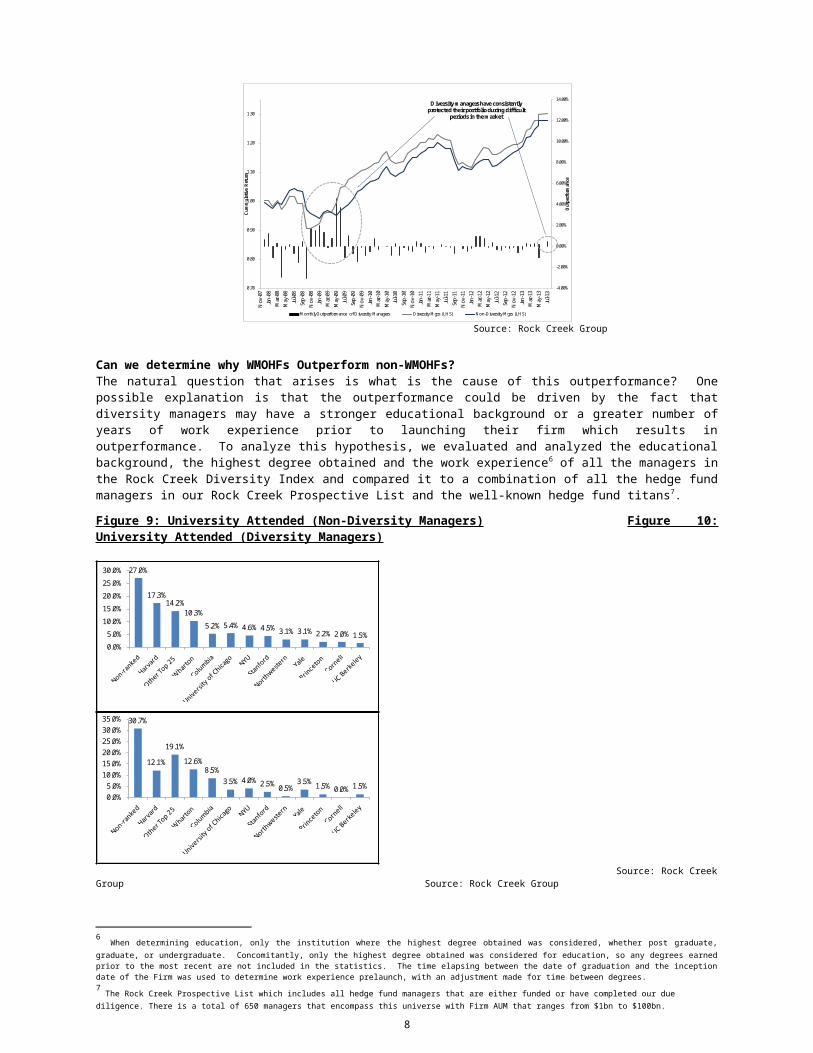
Can we determine why WMOHFs Outperform non-WMOHFs? The natural question that arises is what is the cause of this outperformance? Onepossible explanation is that the outperformance could be driven by the fact thatdiversity managers may have a stronger educational background or a greater number ofyears of work experience prior to launching their firm which results inoutperformance. To analyze this hypothesis, we evaluated and analyzed the educationalbackground, the highest degree obtained and the work experience6 of all the managers inthe Rock Creek Diversity Index and compared it to a combination of all the hedge fundmanagers in our Rock Creek Prospective List and the well-known hedge fund titans7.
Figure 9: University Attended (Non-Diversity Managers) Figure 10:University Attended (Diversity Managers)
27.0%
17.3%14.2%
10.3%5.2% 5.4% 4.6% 4.5% 3.1% 3.1% 2.2% 2.0% 1.5%
0.0%5.0%10.0%15.0%20.0%25.0%30.0%
University where highest degree obtained
30.7%
12.1%
19.1%12.6%
8.5%3.5% 4.0% 2.5% 0.5%
3.5% 1.5% 0.0% 1.5%0.0%5.0%10.0%15.0%20.0%25.0%30.0%35.0%
University where highest degree obtained
Source: Rock CreekGroup Source: Rock Creek Group
6 When determining education, only the institution where the highest degree obtained was considered, whether post graduate,graduate, or undergraduate. Concomitantly, only the highest degree obtained was considered for education, so any degrees earnedprior to the most recent are not included in the statistics. The time elapsing between the date of graduation and the inceptiondate of the Firm was used to determine work experience prelaunch, with an adjustment made for time between degrees. 7 The Rock Creek Prospective List which includes all hedge fund managers that are either funded or have completed our due diligence. There is a total of 650 managers that encompass this universe with Firm AUM that ranges from $1bn to $100bn.
8
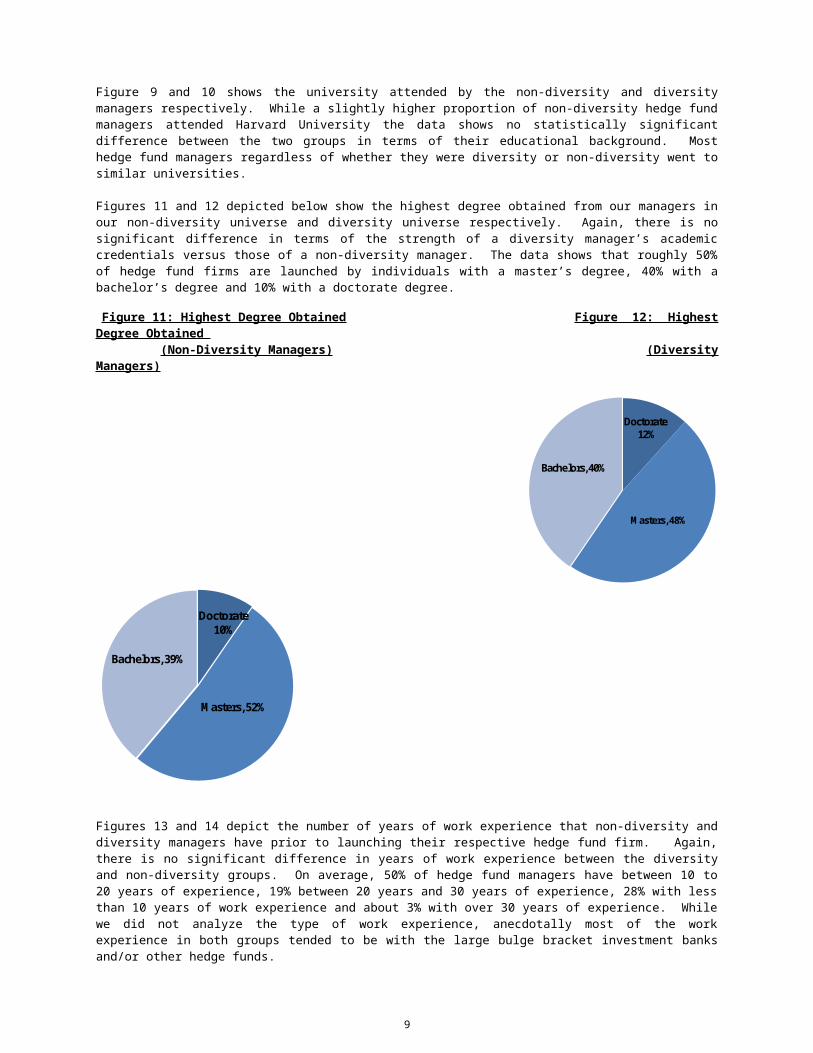
Figure 9 and 10 shows the university attended by the non-diversity and diversitymanagers respectively. While a slightly higher proportion of non-diversity hedge fundmanagers attended Harvard University the data shows no statistically significantdifference between the two groups in terms of their educational background. Mosthedge fund managers regardless of whether they were diversity or non-diversity went tosimilar universities.
Figures 11 and 12 depicted below show the highest degree obtained from our managers inour non-diversity universe and diversity universe respectively. Again, there is nosignificant difference in terms of the strength of a diversity manager’s academiccredentials versus those of a non-diversity manager. The data shows that roughly 50%of hedge fund firms are launched by individuals with a master’s degree, 40% with abachelor’s degree and 10% with a doctorate degree.
Figure 11: Highest Degree Obtained Figure 12: HighestDegree Obtained (Non-Diversity Managers) (DiversityManagers)
M asters, 48%
Doctorate12%
Bachelors, 40%
Doctorate 10%
M asters, 52%
Bachelors, 39%
Figures 13 and 14 depict the number of years of work experience that non-diversity anddiversity managers have prior to launching their respective hedge fund firm. Again,there is no significant difference in years of work experience between the diversityand non-diversity groups. On average, 50% of hedge fund managers have between 10 to20 years of experience, 19% between 20 years and 30 years of experience, 28% with lessthan 10 years of work experience and about 3% with over 30 years of experience. Whilewe did not analyze the type of work experience, anecdotally most of the workexperience in both groups tended to be with the large bulge bracket investment banksand/or other hedge funds.
9
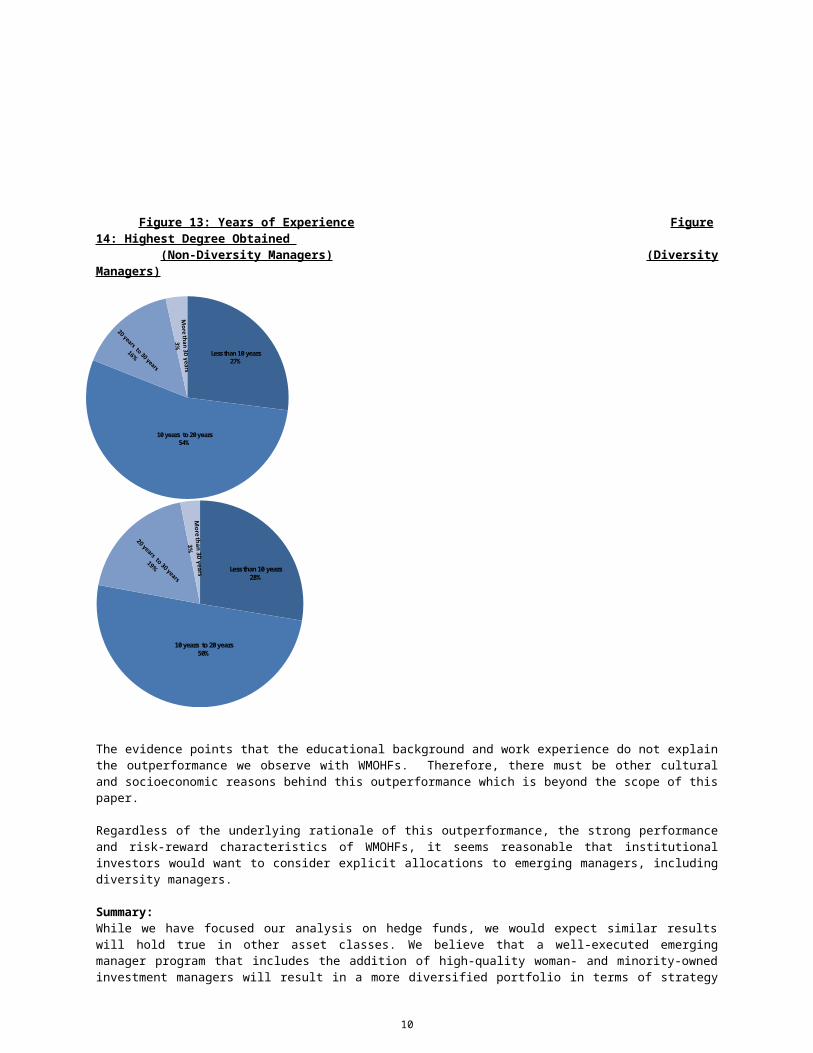
Figure 13: Years of Experience Figure14: Highest Degree Obtained (Non-Diversity Managers) (DiversityManagers)
10 years to 20 years 54%
Less than 10 years27%
Less than 10 years28%
10 years to 20 years 50%
The evidence points that the educational background and work experience do not explainthe outperformance we observe with WMOHFs. Therefore, there must be other culturaland socioeconomic reasons behind this outperformance which is beyond the scope of thispaper.
Regardless of the underlying rationale of this outperformance, the strong performanceand risk-reward characteristics of WMOHFs, it seems reasonable that institutionalinvestors would want to consider explicit allocations to emerging managers, includingdiversity managers.
Summary:While we have focused our analysis on hedge funds, we would expect similar resultswill hold true in other asset classes. We believe that a well-executed emergingmanager program that includes the addition of high-quality woman- and minority-ownedinvestment managers will result in a more diversified portfolio in terms of strategy
10

and perspectives that will not only meet an institutional investor’s fiduciaryobligations, but have the ancillary benefits of supporting broader social goals.
11