heat treatment abstract
TRANSCRIPT
47International Journal of Metalcasting/Fall 2011
An EvAluAtion of QuAlity PArAmEtErs for HigH PrEssurE DiEcAstings PArt ii: HEAt trEAtmEnt
R. Lumley and N. Deeva CSIRO Future Manufacturing Flagship, Victoria, Australia
Copyright © 2011 American Foundry Society
Abstract
In our earlier paper, comparative quality of as-cast high pressure diecastings (HPDC’s) was evaluated using Weibull statistics combined with flow curve and defect equivalence derivations based on the Ludwik-Holloman equation.1 Here, we extend this work to examine the effect of heat treatment on one A380 composition. Samples were examined in as-solution treated (solution treated, quenched, then immediately tested), T4 (solution treated, quenched then naturally aged) and T6 (solution treated, quenched and artificially aged) tempers, with comparisons made against the as-cast condition. Solution treatment appeared to remediate, or otherwise render innocuous, a
portion of the complex defect arrangement present in the die-casting through microstructural changes, resulting in an improvement in casting quality. Similar to the as-cast condition, the lower limits of quality for solution treated and T4 treated alloy were related to oxide films or flakes present on the fracture surfaces. The T6 treated material did not noticeably exhibit these films or flakes, and the equivalent fraction of defects present on the fracture surface was reduced.
Keywords: high pressure diecasting, quality index, A380 aluminium, heat treatment
Heat treatment of High Pressure Diecastings
Successful heat treatment of conventionally produced high pressure diecastings (HPDC’s) has been shown to be possi-ble by the use of severely truncated solution treatment times at lower than normal temperatures (e.g. 15 minutes at 430-490C [806-914F]).2-8 This procedure avoids the well-known problems associated with formation of surface blisters and dimensional instability, both of which occur during the con-ventional heat treatment of HPDC’s.
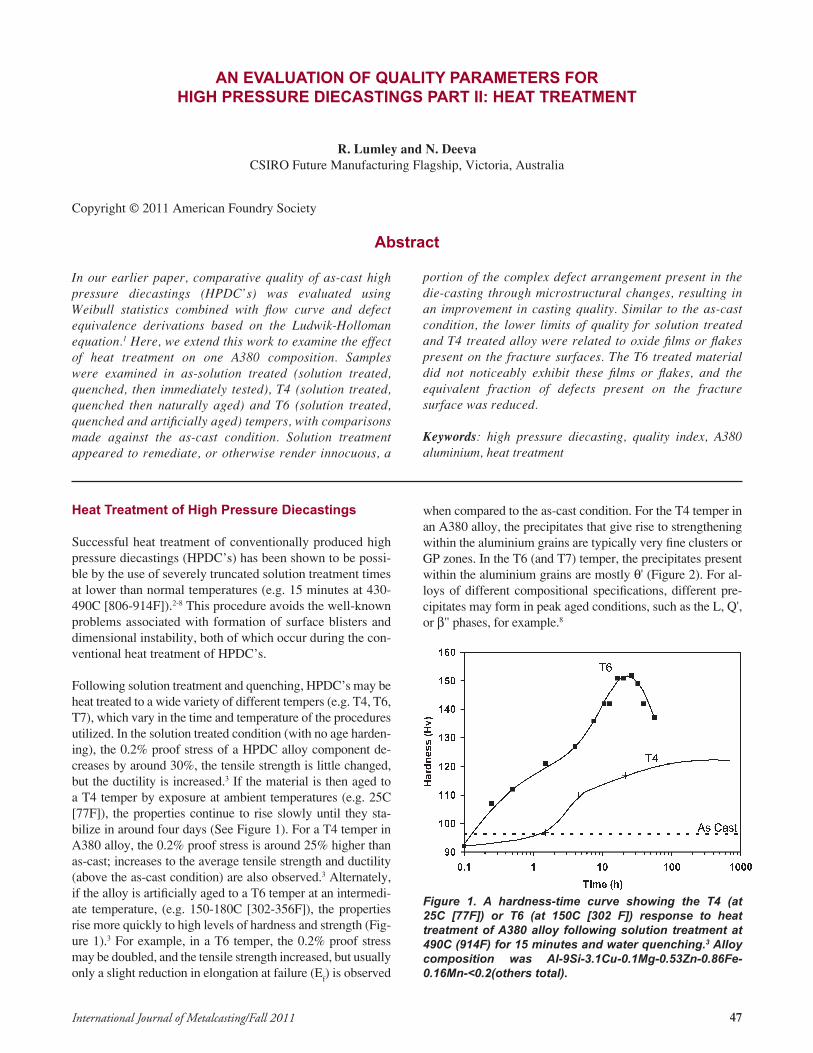
Following solution treatment and quenching, HPDC’s may be heat treated to a wide variety of different tempers (e.g. T4, T6, T7), which vary in the time and temperature of the procedures utilized. In the solution treated condition (with no age harden-ing), the 0.2% proof stress of a HPDC alloy component de-creases by around 30%, the tensile strength is little changed, but the ductility is increased.3 If the material is then aged to a T4 temper by exposure at ambient temperatures (e.g. 25C [77F]), the properties continue to rise slowly until they sta-bilize in around four days (See Figure 1). For a T4 temper in A380 alloy, the 0.2% proof stress is around 25% higher than as-cast; increases to the average tensile strength and ductility (above the as-cast condition) are also observed.3 Alternately, if the alloy is artificially aged to a T6 temper at an intermedi-ate temperature, (e.g. 150-180C [302-356F]), the properties rise more quickly to high levels of hardness and strength (Fig-ure 1).3 For example, in a T6 temper, the 0.2% proof stress may be doubled, and the tensile strength increased, but usually only a slight reduction in elongation at failure (E
f) is observed
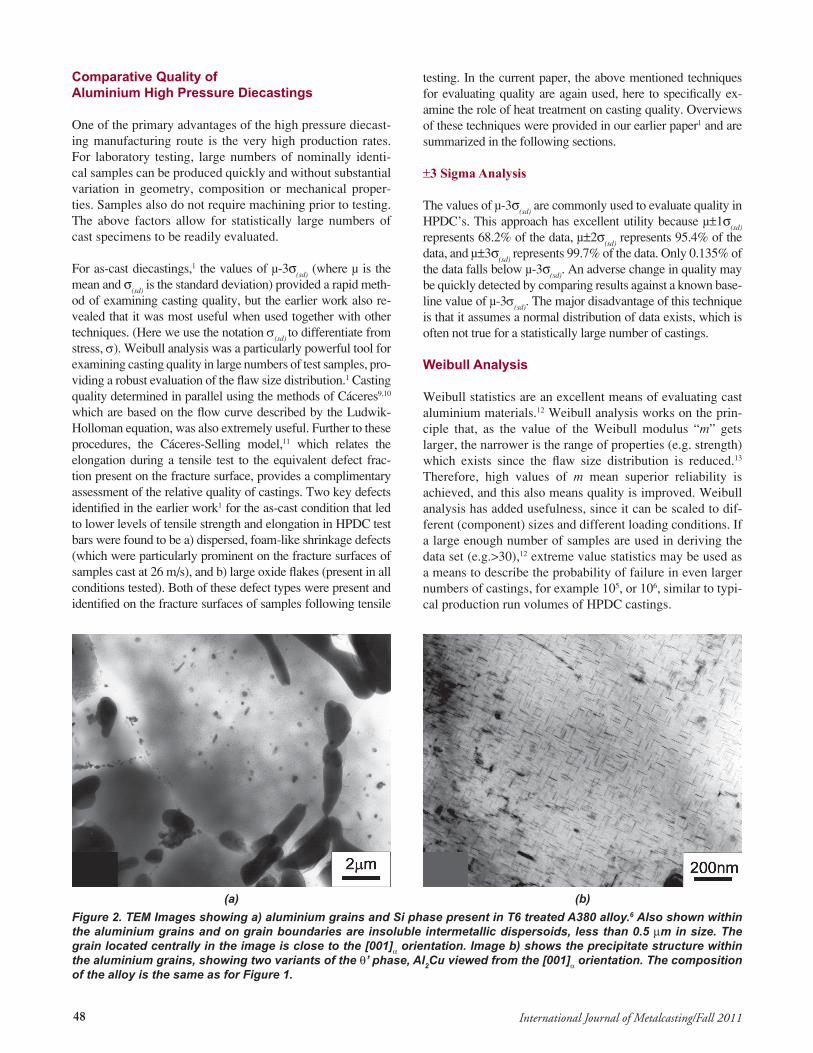
when compared to the as-cast condition. For the T4 temper in an A380 alloy, the precipitates that give rise to strengthening within the aluminium grains are typically very fine clusters or GP zones. In the T6 (and T7) temper, the precipitates present within the aluminium grains are mostly q' (Figure 2). For al-loys of different compositional specifications, different pre-cipitates may form in peak aged conditions, such as the L, Q', or b" phases, for example.8
Figure 1. A hardness-time curve showing the T4 (at 25C [77F]) or T6 (at 150C [302 F]) response to heat treatment of A380 alloy following solution treatment at 490C (914F) for 15 minutes and water quenching.3 Alloy composition was Al-9Si-3.1Cu-0.1Mg-0.53Zn-0.86Fe-0.16Mn-<0.2(others total).
48 International Journal of Metalcasting/Fall 2011
comparative Quality of Aluminium High Pressure Diecastings
One of the primary advantages of the high pressure diecast-ing manufacturing route is the very high production rates. For laboratory testing, large numbers of nominally identi-cal samples can be produced quickly and without substantial variation in geometry, composition or mechanical proper-ties. Samples also do not require machining prior to testing. The above factors allow for statistically large numbers of cast specimens to be readily evaluated.
For as-cast diecastings,1 the values of μ-3σ(sd) (where μ is the mean and σ(sd) is the standard deviation) provided a rapid meth-od of examining casting quality, but the earlier work also re-vealed that it was most useful when used together with other techniques. (Here we use the notation σ(sd) to differentiate from stress, σ). Weibull analysis was a particularly powerful tool for examining casting quality in large numbers of test samples, pro-viding a robust evaluation of the flaw size distribution.1 Casting quality determined in parallel using the methods of Cáceres9,10 which are based on the flow curve described by the Ludwik-Holloman equation, was also extremely useful. Further to these procedures, the Cáceres-Selling model,11 which relates the elongation during a tensile test to the equivalent defect frac-tion present on the fracture surface, provides a complimentary assessment of the relative quality of castings. Two key defects identified in the earlier work1 for the as-cast condition that led to lower levels of tensile strength and elongation in HPDC test bars were found to be a) dispersed, foam-like shrinkage defects (which were particularly prominent on the fracture surfaces of samples cast at 26 m/s), and b) large oxide flakes (present in all conditions tested). Both of these defect types were present and identified on the fracture surfaces of samples following tensile
testing. In the current paper, the above mentioned techniques for evaluating quality are again used, here to specifically ex-amine the role of heat treatment on casting quality. Overviews of these techniques were provided in our earlier paper1 and are summarized in the following sections.
±3 Sigma Analysis
The values of μ-3σ(sd) are commonly used to evaluate quality in HPDC’s. This approach has excellent utility because μ±1σ(sd) represents 68.2% of the data, μ±2σ(sd) represents 95.4% of the data, and μ±3σ(sd) represents 99.7% of the data. Only 0.135% of the data falls below μ-3σ(sd). An adverse change in quality may be quickly detected by comparing results against a known base-line value of μ-3σ(sd). The major disadvantage of this technique is that it assumes a normal distribution of data exists, which is often not true for a statistically large number of castings.
Weibull Analysis
Weibull statistics are an excellent means of evaluating cast aluminium materials.12 Weibull analysis works on the prin-ciple that, as the value of the Weibull modulus “m” gets larger, the narrower is the range of properties (e.g. strength) which exists since the flaw size distribution is reduced.13 Therefore, high values of m mean superior reliability is achieved, and this also means quality is improved. Weibull analysis has added usefulness, since it can be scaled to dif-ferent (component) sizes and different loading conditions. If a large enough number of samples are used in deriving the data set (e.g.>30),12 extreme value statistics may be used as a means to describe the probability of failure in even larger numbers of castings, for example 105, or 106, similar to typi-cal production run volumes of HPDC castings.
Figure 2. TEM Images showing a) aluminium grains and Si phase present in T6 treated A380 alloy.6 Also shown within the aluminium grains and on grain boundaries are insoluble intermetallic dispersoids, less than 0.5 mm in size. The grain located centrally in the image is close to the [001]a orientation. Image b) shows the precipitate structure within the aluminium grains, showing two variants of the q’ phase, Al2Cu viewed from the [001]a orientation. The composition of the alloy is the same as for Figure 1.
(a) (b)
49International Journal of Metalcasting/Fall 2011
The Weibull analysis provides a probability of failure at a given stress, and is often expressed by the empirical relationship:
Equation 1
Where P is the probability of failure at a stress, σ, m is the Weibull modulus, σ
u is the stress at which P=0 (and is nor-
mally taken to equal zero), X is the strength limiting dimen-sion of the material, and σ
o is a normalizing factor, referred
to as the position parameter (where σo = (1-1/e), the value
where 37% of samples survive).14 Since the elongation at failure is more sensitive to microstructural changes than the tensile strength, Weibull modulus is optimally evaluated for this quantity as well.
Therefore, for specimens of constant geometry,
Equation 2
The simplest method of obtaining σo and m from a series of
data is to rank the stress (σ) data from smallest to largest and assign P values so that:
Equation 3
Where “i” is the rank and N the total number of specimens. Eqn 2 can then be expressed as:
y=A+Bx Equation 4
where:
The best estimates of σo and m can then be obtained using
the linear least squares method,13 but in practice, m is the slope of Eqn 4, and is determined quickly.
A physical background to the Weibull distribution has been es-tablished,15 which relates to the probability density f(a), of flaw sizes within the material, with f(a) being approximated by:
Equation 5
Where n in Eqn 5 is the rate at which f(a) tends to zero for a>>c/n, and c is a scaling parameter. Assuming there are a large number of randomly oriented flaws, m and n are related through m=2n-2. (Note that “n” used in equation 5 is the same notation as the original reference 15 and is not the same as the strain hardening exponent, n, used later in equations 7 and 8). Therefore, the scatter in data and hence the value of the Weibull modulus, is directly related to the flaw size distribution and casting quality.
the cáceres-selling model; influence of Defects on mechanical Properties of Aluminium castings
Cáceres and Selling11 expanded the earlier model pro-posed by Surappa et al.,16 and thereby related the decrease in elongation to fracture E
f, in a tensile test, to the pres-
ence of any types of defects present on the fracture surface of a test specimen. The Cáceres-Selling model11 proposes a relationship between a cross sectional area not contain-ing a defect, A
o, and the cross sectional area containing a
defect, Ai, such that A
i=A
o(1-f), where f is the area frac-
tion covered by the defect. In this case, load equilibrium is maintained if:
σi(1-f)A
oe-ei =σ
hA
oe-eh Equation 6
Where σi and e
i are the true stress and strain respectively,
inside the defect, and σh and e
h are the true stress and strain
respectively, outside the defect.
If during stressing, the material follows the Ludwik-Hollo-man equation:
σ=Ken Equation 7where σ is true stress, e is true plastic strain, K is a constant, known as the strength coefficient, and n is the strain harden-ing exponent;
then combining Eqns 6 and 7 leads to
(1-f)e-ei ein = e-eh e
hn Equation 8
This equation relates the strain inside the defect contain-ing region to the strain outside the defect containing region. When solving Eqn 8, as the defect area present on the frac-ture surface f, increases, for a fixed value of strain outside the defect (e
h), the strain inside the defect containing region
(ei ) increases more rapidly.
Quality index for Aluminium castings
Cáceres9,10 showed that for any aluminium alloy, deriva-tion of the model flow curve of Eqn 7 from experimen-tal data could also provide the basis for the assignment of iso-quality (q) indices based on proportions of what would constitute a defect-free casting; that is, where the true strain e=n. This follows since n can be shown ex-perimentally to be equivalent to the uniform elongation, or the true strain at the onset of necking. This means that a defect-free casting will continue to elongate until the maximum stress is achieved and necking begins, leading to failure. The presence of defects in the material means that the metal fails at a lower level of strength and ductil-ity where e<n, the level being proportionate to the frac-tion of defects present in the material.
50 International Journal of Metalcasting/Fall 2011
Experimental methods
The alloy used for all experiments was Al-9Si-3.1Cu-0.1Mg-0.53Zn-0.86Fe-0.16Mn-<0.2(others total).HPDC alloy specimens for tensile testing were produced using a Toshiba cold chamber die-casting machine with a 250 ton locking force, a shot sleeve with an internal diameter of 50 mm (~2 in.) and a stroke of 280 mm (~11 in.). The calculated metal velocity at the gate was 82 m/s (3228 in./s) for all tensile test samples. The die provided two cylindrical tensile specimens and one flat tensile speci-men from each shot, conforming to specification AS1391. The flat tensile specimen produced was not used. The cy-lindrical tensile test bars had a total length of 100 mm (~4 in.), with a central parallel gauge section 33 mm (1.3 in.) long and a diameter of 5.55±0.1 mm (0.218±0.004 in.). Gage length was 25mm (1 in.). Tensile testing was conducted following standard procedures, at a crosshead speed of 5 mm/min (0.2in./min). Samples for each batch were selected randomly from a larger set of cast samples. As-cast data was reported previously.1 For heat treatment, the alloys were solution treated for 15 minutes immersion at 490C (914F), water-quenched and either naturally aged 14 days at ~25C (77F) to achieve the T4 temper or aged to peak strength and hardness at 150C (302F) to achieve the T6 temper. For each of the heat treated conditions at least 40 samples were used, and, for the T4 temper, 100 sam-ples were used. For determination of the tensile properties in the solution treated condition, batches of ten samples at a time were solution treated, quenched, and then immedi-ately tested. The time between solution treatment and ten-sile testing was under 1 hour for these samples. Scanning electron microscopy was conducted using a Leica S440 SEM microscope. Quantitative analysis was conducted on optical microstructures using Image Pro-Plus software across a total area of ~122063 μm2.
results and Discussion
mechanical Properties
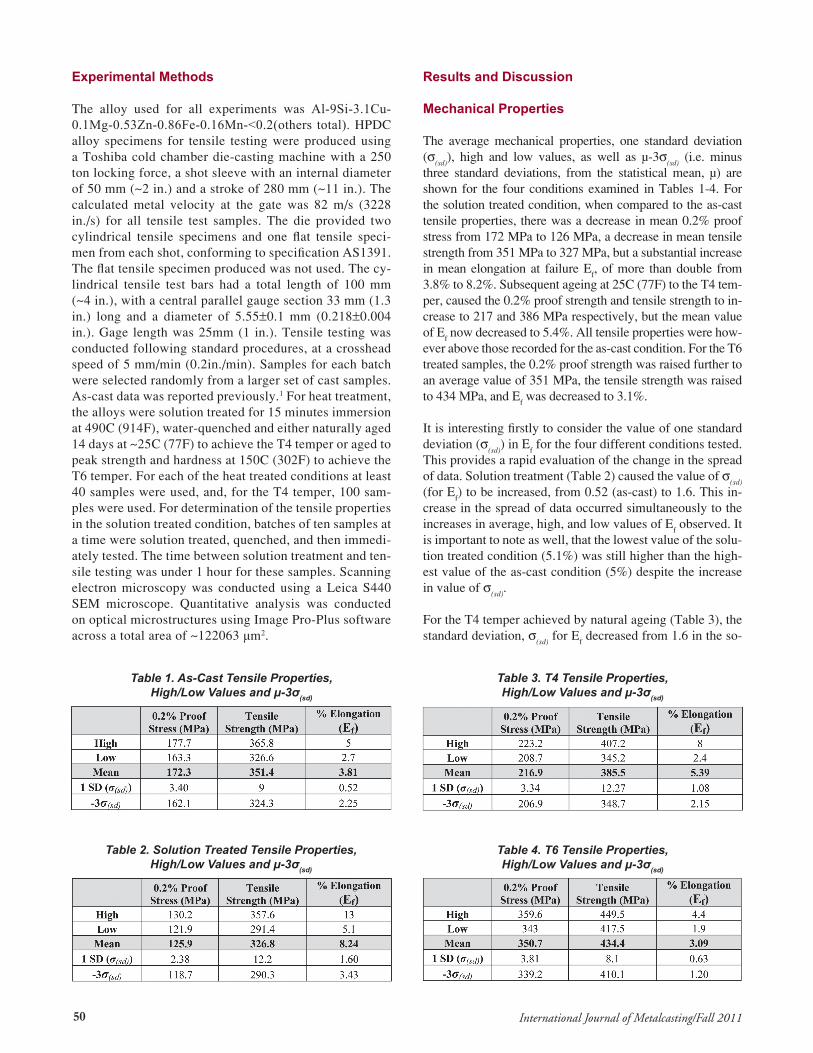
The average mechanical properties, one standard deviation (σ(sd)), high and low values, as well as μ-3σ(sd) (i.e. minus three standard deviations, from the statistical mean, μ) are shown for the four conditions examined in Tables 1-4. For the solution treated condition, when compared to the as-cast tensile properties, there was a decrease in mean 0.2% proof stress from 172 MPa to 126 MPa, a decrease in mean tensile strength from 351 MPa to 327 MPa, but a substantial increase in mean elongation at failure E
f, of more than double from
3.8% to 8.2%. Subsequent ageing at 25C (77F) to the T4 tem-per, caused the 0.2% proof strength and tensile strength to in-crease to 217 and 386 MPa respectively, but the mean value of E
f now decreased to 5.4%. All tensile properties were how-
ever above those recorded for the as-cast condition. For the T6 treated samples, the 0.2% proof strength was raised further to an average value of 351 MPa, the tensile strength was raised to 434 MPa, and E
f was decreased to 3.1%.
It is interesting firstly to consider the value of one standard deviation (σ(sd)) in E
f for the four different conditions tested.
This provides a rapid evaluation of the change in the spread of data. Solution treatment (Table 2) caused the value of σ(sd) (for E
f) to be increased, from 0.52 (as-cast) to 1.6. This in-
crease in the spread of data occurred simultaneously to the increases in average, high, and low values of E
f observed. It
is important to note as well, that the lowest value of the solu-tion treated condition (5.1%) was still higher than the high-est value of the as-cast condition (5%) despite the increase in value of σ(sd).
For the T4 temper achieved by natural ageing (Table 3), the standard deviation, σ(sd) for E
f decreased from 1.6 in the so-
Table 1. As-Cast Tensile Properties, High/Low Values and μ-3σ(sd)
Table 2. Solution Treated Tensile Properties, High/Low Values and μ-3σ(sd)
Table 3. T4 Tensile Properties, High/Low Values and μ-3σ(sd)
Table 4. T6 Tensile Properties, High/Low Values and μ-3σ(sd)
51International Journal of Metalcasting/Fall 2011
lution treated condition, to 1.1 in the T4 temper. This cor-responded to a decrease in the mean, high and low values of E
f, for the T4 treated alloy. This trend continued in the
T6 temper (Table 4), where the value of σ(sd) for Ef now de-
creased to 0.6, simultaneously to increases in the mean, high and low values recorded.
The trends observed for the differences in σ(sd) for Ef were
somewhat different for those observed for the differences in σ(sd) for tensile strength. Here, the T6 temper displayed the lowest spread in the data for tensile strength (σ(sd) = 8.1, Table 4), the T4 and solution treated conditions show simi-lar, higher values (σ(sd) ~12.2, Table 2 and 3), and the as-cast condition had a value of σ(sd) = 9 (Table 1). Although the values of σ(sd) do show a small variability for 0.2% proof stress, the differences were not significant.
Weibull Analysis
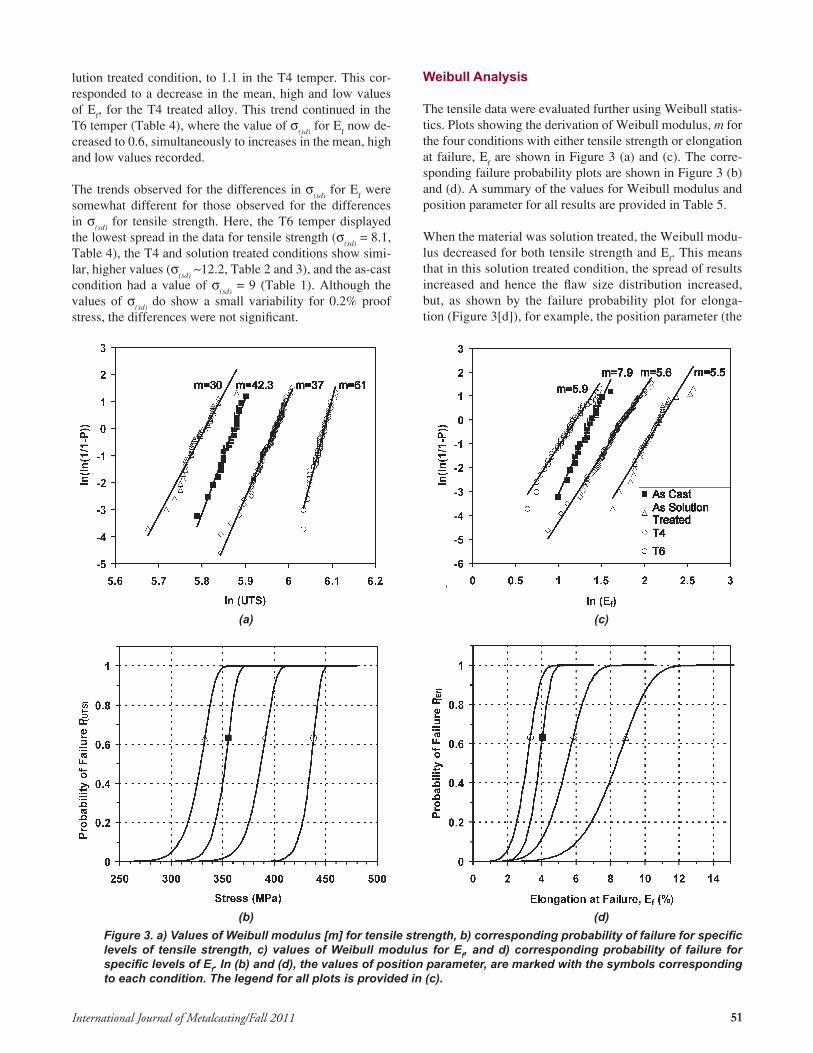
The tensile data were evaluated further using Weibull statis-tics. Plots showing the derivation of Weibull modulus, m for the four conditions with either tensile strength or elongation at failure, E
f are shown in Figure 3 (a) and (c). The corre-
sponding failure probability plots are shown in Figure 3 (b) and (d). A summary of the values for Weibull modulus and position parameter for all results are provided in Table 5.
When the material was solution treated, the Weibull modu-lus decreased for both tensile strength and E
f. This means
that in this solution treated condition, the spread of results increased and hence the flaw size distribution increased, but, as shown by the failure probability plot for elonga-tion (Figure 3[d]), for example, the position parameter (the
Figure 3. a) Values of Weibull modulus [m] for tensile strength, b) corresponding probability of failure for specific levels of tensile strength, c) values of Weibull modulus for Ef, and d) corresponding probability of failure for specific levels of Ef. In (b) and (d), the values of position parameter, are marked with the symbols corresponding to each condition. The legend for all plots is provided in (c).
(a) (c)
(b) (d)
52 International Journal of Metalcasting/Fall 2011
single marker on the line) was much greater. This means that, although all elongation results were improved, the best quality samples would appear to be improved propor-tionately more. For example, examining only the highest and lowest values, Tables 1 and 2 show that the lowest value of E
f for the as-cast condition was raised from 2.7%
to 5.1% (1.9×) by solution treating, whereas the highest value was raised from 5% as-cast to 13% in the solution treated condition (2.6×).
For the T4 and T6 tempers, the values of Weibull modulus for both tensile strength and E
f were improved following
ageing from the solution treated condition meaning the flaw size distribution decreased. For the fully hardened T6 temper tensile strengths, for example, m was equal to 61 and the position parameter, σ
o was 438 MPa. This repre-
sents an improvement to Weibull modulus, (m) above the as-cast (42.3), solution treated (30), and T4 (37) condi-tions, and hence a substantial improvement in qual-ity. For E
f, the values of Weibull modulus and posi-
tion parameters were decreased only slightly from solution treated, to T4, to T6 conditions, depicted by the failure probability plots shown in Figure 3 (d) and summarised in Table 5.
Quality charts and Equivalent Defect fractions Derived from the ludwik-Holloman Equation
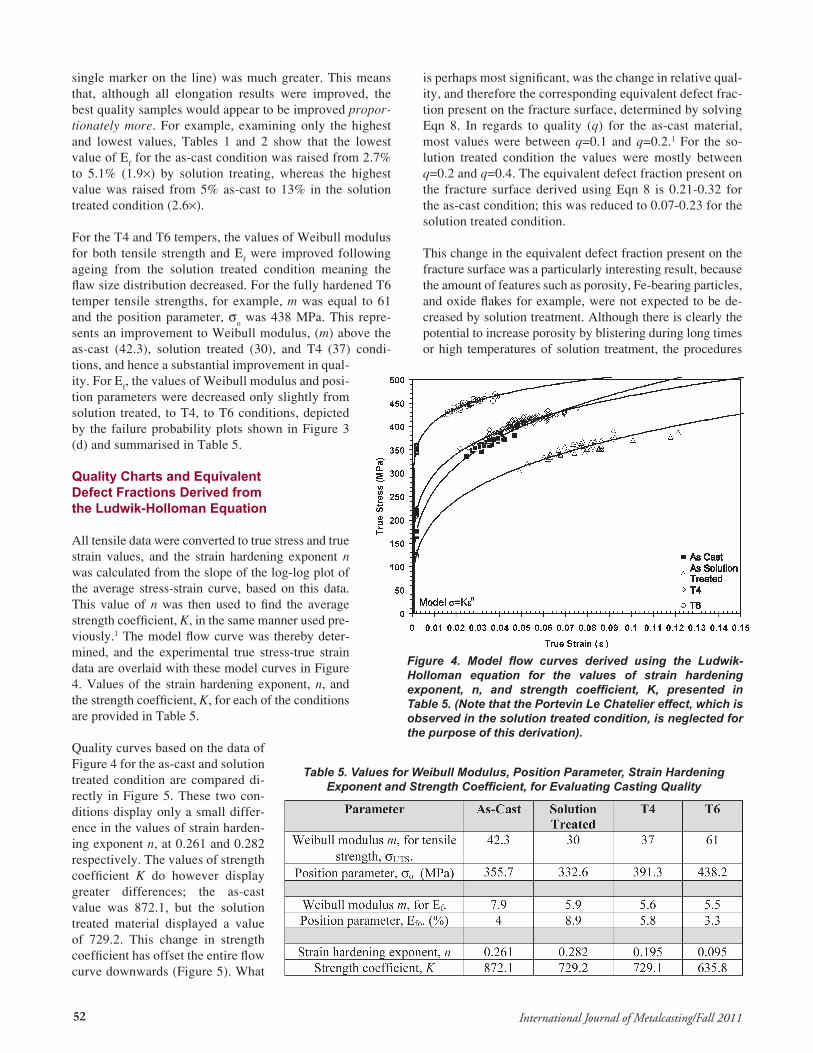
All tensile data were converted to true stress and true strain values, and the strain hardening exponent n was calculated from the slope of the log-log plot of the average stress-strain curve, based on this data. This value of n was then used to find the average strength coefficient, K, in the same manner used pre-viously.1 The model flow curve was thereby deter-mined, and the experimental true stress-true strain data are overlaid with these model curves in Figure 4. Values of the strain hardening exponent, n, and the strength coefficient, K, for each of the conditions are provided in Table 5.
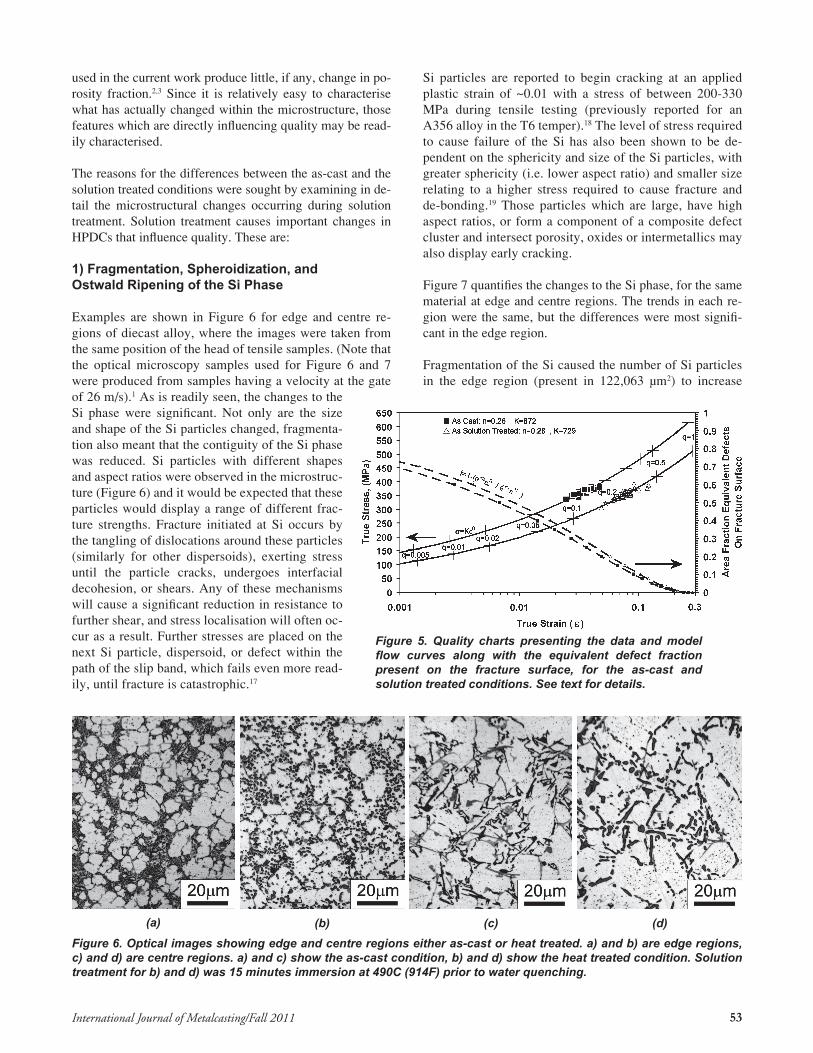
Quality curves based on the data of Figure 4 for the as-cast and solution treated condition are compared di-rectly in Figure 5. These two con-ditions display only a small differ-ence in the values of strain harden-ing exponent n, at 0.261 and 0.282 respectively. The values of strength coefficient K do however display greater differences; the as-cast value was 872.1, but the solution treated material displayed a value of 729.2. This change in strength coefficient has offset the entire flow curve downwards (Figure 5). What
is perhaps most significant, was the change in relative qual-ity, and therefore the corresponding equivalent defect frac-tion present on the fracture surface, determined by solving Eqn 8. In regards to quality (q) for the as-cast material, most values were between q=0.1 and q=0.2.1 For the so-lution treated condition the values were mostly between q=0.2 and q=0.4. The equivalent defect fraction present on the fracture surface derived using Eqn 8 is 0.21-0.32 for the as-cast condition; this was reduced to 0.07-0.23 for the solution treated condition.
This change in the equivalent defect fraction present on the fracture surface was a particularly interesting result, because the amount of features such as porosity, Fe-bearing particles, and oxide flakes for example, were not expected to be de-creased by solution treatment. Although there is clearly the potential to increase porosity by blistering during long times or high temperatures of solution treatment, the procedures
Figure 4. Model flow curves derived using the Ludwik-Holloman equation for the values of strain hardening exponent, n, and strength coefficient, K, presented in Table 5. (Note that the Portevin Le Chatelier effect, which is observed in the solution treated condition, is neglected for the purpose of this derivation).
Table 5. Values for Weibull Modulus, Position Parameter, Strain Hardening Exponent and Strength Coefficient, for Evaluating Casting Quality
53International Journal of Metalcasting/Fall 2011
used in the current work produce little, if any, change in po-rosity fraction.2,3 Since it is relatively easy to characterise what has actually changed within the microstructure, those features which are directly influencing quality may be read-ily characterised.
The reasons for the differences between the as-cast and the solution treated conditions were sought by examining in de-tail the microstructural changes occurring during solution treatment. Solution treatment causes important changes in HPDCs that influence quality. These are:
1) fragmentation, spheroidization, and ostwald ripening of the si Phase
Examples are shown in Figure 6 for edge and centre re-gions of diecast alloy, where the images were taken from the same position of the head of tensile samples. (Note that the optical microscopy samples used for Figure 6 and 7 were produced from samples having a velocity at the gate of 26 m/s).1 As is readily seen, the changes to the Si phase were significant. Not only are the size and shape of the Si particles changed, fragmenta-tion also meant that the contiguity of the Si phase was reduced. Si particles with different shapes and aspect ratios were observed in the microstruc-ture (Figure 6) and it would be expected that these particles would display a range of different frac-ture strengths. Fracture initiated at Si occurs by the tangling of dislocations around these particles (similarly for other dispersoids), exerting stress until the particle cracks, undergoes interfacial decohesion, or shears. Any of these mechanisms will cause a significant reduction in resistance to further shear, and stress localisation will often oc-cur as a result. Further stresses are placed on the next Si particle, dispersoid, or defect within the path of the slip band, which fails even more read-ily, until fracture is catastrophic.17
Si particles are reported to begin cracking at an applied plastic strain of ~0.01 with a stress of between 200-330 MPa during tensile testing (previously reported for an A356 alloy in the T6 temper).18 The level of stress required to cause failure of the Si has also been shown to be de-pendent on the sphericity and size of the Si particles, with greater sphericity (i.e. lower aspect ratio) and smaller size relating to a higher stress required to cause fracture and de-bonding.19 Those particles which are large, have high aspect ratios, or form a component of a composite defect cluster and intersect porosity, oxides or intermetallics may also display early cracking.
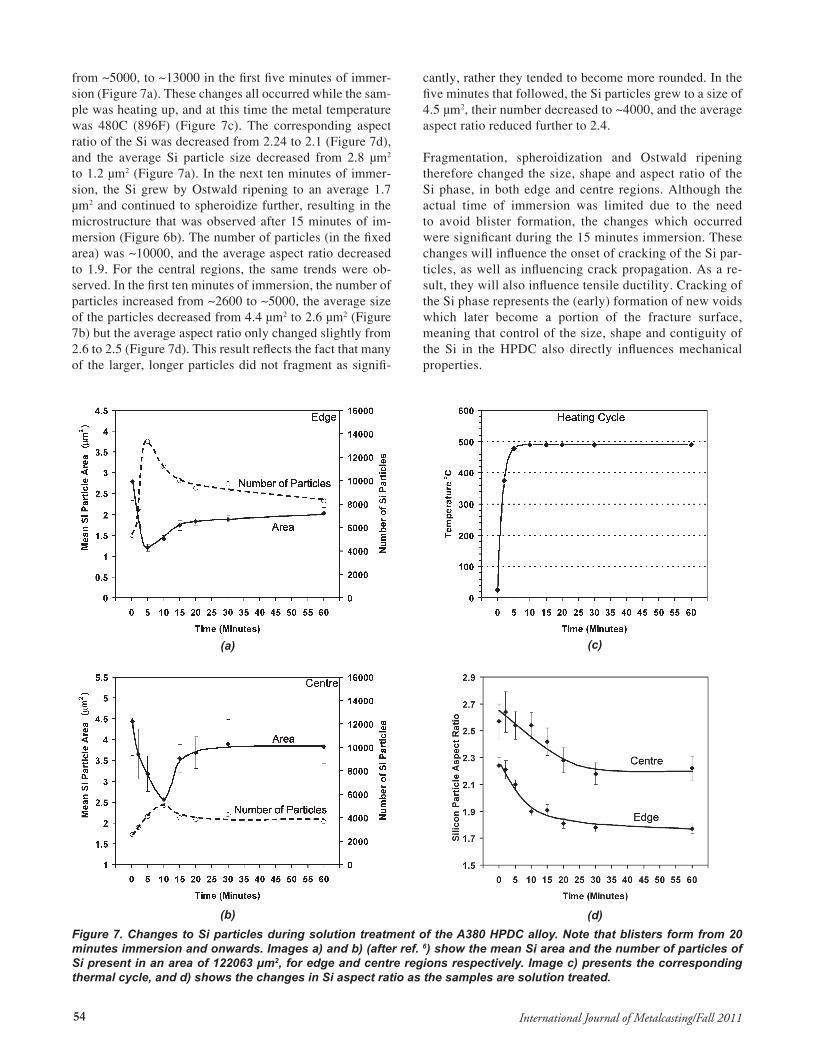
Figure 7 quantifies the changes to the Si phase, for the same material at edge and centre regions. The trends in each re-gion were the same, but the differences were most signifi-cant in the edge region.
Fragmentation of the Si caused the number of Si particles in the edge region (present in 122,063 μm2) to increase
Figure 6. Optical images showing edge and centre regions either as-cast or heat treated. a) and b) are edge regions, c) and d) are centre regions. a) and c) show the as-cast condition, b) and d) show the heat treated condition. Solution treatment for b) and d) was 15 minutes immersion at 490C (914F) prior to water quenching.
(a) (c)(b) (d)
Figure 5. Quality charts presenting the data and model flow curves along with the equivalent defect fraction present on the fracture surface, for the as-cast and solution treated conditions. See text for details.
54 International Journal of Metalcasting/Fall 2011
from ~5000, to ~13000 in the first five minutes of immer-sion (Figure 7a). These changes all occurred while the sam-ple was heating up, and at this time the metal temperature was 480C (896F) (Figure 7c). The corresponding aspect ratio of the Si was decreased from 2.24 to 2.1 (Figure 7d), and the average Si particle size decreased from 2.8 μm2 to 1.2 μm2 (Figure 7a). In the next ten minutes of immer-sion, the Si grew by Ostwald ripening to an average 1.7 μm2 and continued to spheroidize further, resulting in the microstructure that was observed after 15 minutes of im-mersion (Figure 6b). The number of particles (in the fixed area) was ~10000, and the average aspect ratio decreased to 1.9. For the central regions, the same trends were ob-served. In the first ten minutes of immersion, the number of particles increased from ~2600 to ~5000, the average size of the particles decreased from 4.4 μm2 to 2.6 μm2 (Figure 7b) but the average aspect ratio only changed slightly from 2.6 to 2.5 (Figure 7d). This result reflects the fact that many of the larger, longer particles did not fragment as signifi-
cantly, rather they tended to become more rounded. In the five minutes that followed, the Si particles grew to a size of 4.5 μm2, their number decreased to ~4000, and the average aspect ratio reduced further to 2.4.
Fragmentation, spheroidization and Ostwald ripening therefore changed the size, shape and aspect ratio of the Si phase, in both edge and centre regions. Although the actual time of immersion was limited due to the need to avoid blister formation, the changes which occurred were significant during the 15 minutes immersion. These changes will influence the onset of cracking of the Si par-ticles, as well as influencing crack propagation. As a re-sult, they will also influence tensile ductility. Cracking of the Si phase represents the (early) formation of new voids which later become a portion of the fracture surface, meaning that control of the size, shape and contiguity of the Si in the HPDC also directly influences mechanical properties.
Figure 7. Changes to Si particles during solution treatment of the A380 HPDC alloy. Note that blisters form from 20 minutes immersion and onwards. Images a) and b) (after ref. 6) show the mean Si area and the number of particles of Si present in an area of 122063 μm2, for edge and centre regions respectively. Image c) presents the corresponding thermal cycle, and d) shows the changes in Si aspect ratio as the samples are solution treated.
(a) (c)
(b) (d)
55International Journal of Metalcasting/Fall 2011
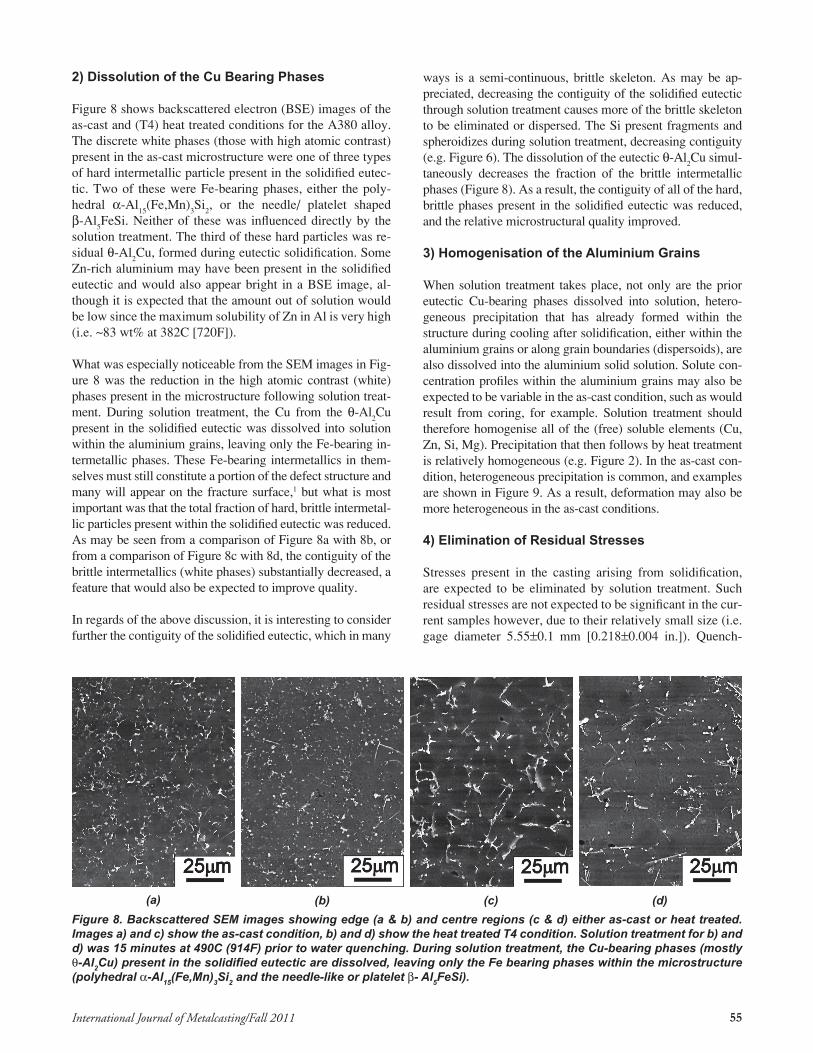
2) Dissolution of the cu Bearing Phases
Figure 8 shows backscattered electron (BSE) images of the as-cast and (T4) heat treated conditions for the A380 alloy. The discrete white phases (those with high atomic contrast) present in the as-cast microstructure were one of three types of hard intermetallic particle present in the solidified eutec-tic. Two of these were Fe-bearing phases, either the poly-hedral a-Al
15(Fe,Mn)
3Si
2, or the needle/ platelet shaped
b-Al5FeSi. Neither of these was influenced directly by the
solution treatment. The third of these hard particles was re-sidual q-Al
2Cu, formed during eutectic solidification. Some
Zn-rich aluminium may have been present in the solidified eutectic and would also appear bright in a BSE image, al-though it is expected that the amount out of solution would be low since the maximum solubility of Zn in Al is very high (i.e. ~83 wt% at 382C [720F]).
What was especially noticeable from the SEM images in Fig-ure 8 was the reduction in the high atomic contrast (white) phases present in the microstructure following solution treat-ment. During solution treatment, the Cu from the q-Al
2Cu
present in the solidified eutectic was dissolved into solution within the aluminium grains, leaving only the Fe-bearing in-termetallic phases. These Fe-bearing intermetallics in them-selves must still constitute a portion of the defect structure and many will appear on the fracture surface,1 but what is most important was that the total fraction of hard, brittle intermetal-lic particles present within the solidified eutectic was reduced. As may be seen from a comparison of Figure 8a with 8b, or from a comparison of Figure 8c with 8d, the contiguity of the brittle intermetallics (white phases) substantially decreased, a feature that would also be expected to improve quality.
In regards of the above discussion, it is interesting to consider further the contiguity of the solidified eutectic, which in many
ways is a semi-continuous, brittle skeleton. As may be ap-preciated, decreasing the contiguity of the solidified eutectic through solution treatment causes more of the brittle skeleton to be eliminated or dispersed. The Si present fragments and spheroidizes during solution treatment, decreasing contiguity (e.g. Figure 6). The dissolution of the eutectic q-Al
2Cu simul-
taneously decreases the fraction of the brittle intermetallic phases (Figure 8). As a result, the contiguity of all of the hard, brittle phases present in the solidified eutectic was reduced, and the relative microstructural quality improved.
3) Homogenisation of the Aluminium grains
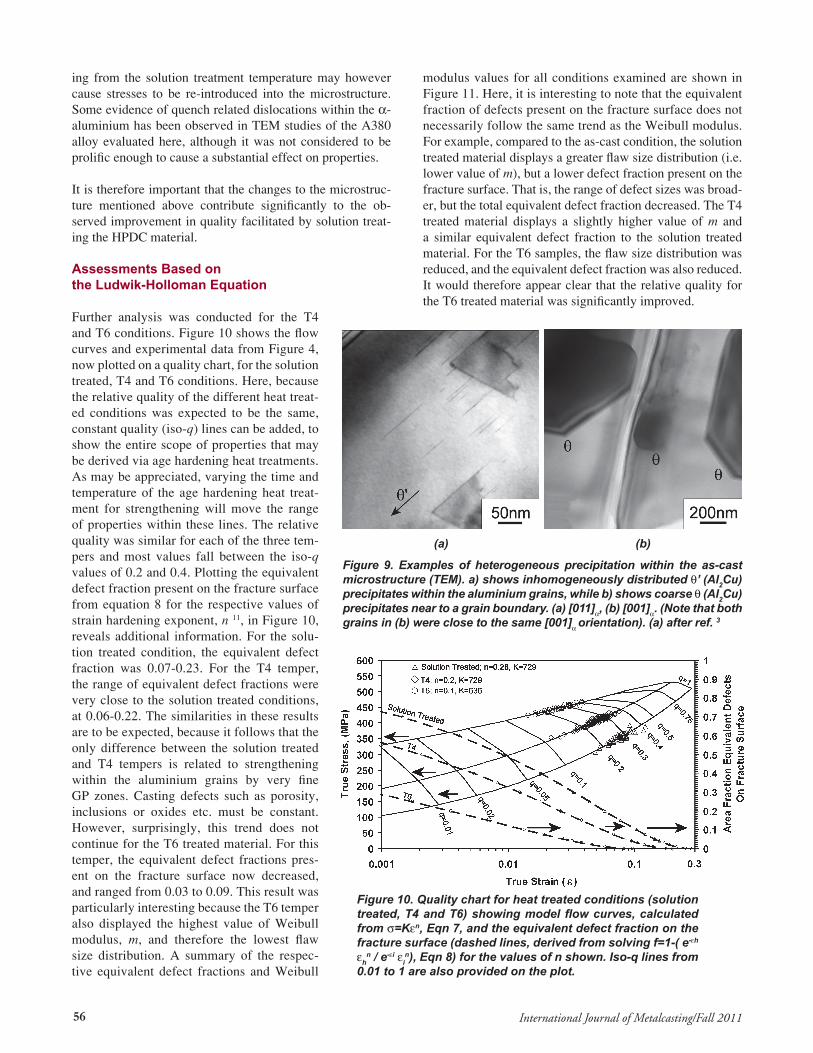
When solution treatment takes place, not only are the prior eutectic Cu-bearing phases dissolved into solution, hetero-geneous precipitation that has already formed within the structure during cooling after solidification, either within the aluminium grains or along grain boundaries (dispersoids), are also dissolved into the aluminium solid solution. Solute con-centration profiles within the aluminium grains may also be expected to be variable in the as-cast condition, such as would result from coring, for example. Solution treatment should therefore homogenise all of the (free) soluble elements (Cu, Zn, Si, Mg). Precipitation that then follows by heat treatment is relatively homogeneous (e.g. Figure 2). In the as-cast con-dition, heterogeneous precipitation is common, and examples are shown in Figure 9. As a result, deformation may also be more heterogeneous in the as-cast conditions.
4) Elimination of residual stresses
Stresses present in the casting arising from solidification, are expected to be eliminated by solution treatment. Such residual stresses are not expected to be significant in the cur-rent samples however, due to their relatively small size (i.e. gage diameter 5.55±0.1 mm [0.218±0.004 in.]). Quench-
Figure 8. Backscattered SEM images showing edge (a & b) and centre regions (c & d) either as-cast or heat treated. Images a) and c) show the as-cast condition, b) and d) show the heat treated T4 condition. Solution treatment for b) and d) was 15 minutes at 490C (914F) prior to water quenching. During solution treatment, the Cu-bearing phases (mostly q-Al2Cu) present in the solidified eutectic are dissolved, leaving only the Fe bearing phases within the microstructure (polyhedral a-Al15(Fe,Mn)3Si2 and the needle-like or platelet b- Al5FeSi).
(a) (c)(b) (d)
56 International Journal of Metalcasting/Fall 2011
ing from the solution treatment temperature may however cause stresses to be re-introduced into the microstructure. Some evidence of quench related dislocations within the a-aluminium has been observed in TEM studies of the A380 alloy evaluated here, although it was not considered to be prolific enough to cause a substantial effect on properties.
It is therefore important that the changes to the microstruc-ture mentioned above contribute significantly to the ob-served improvement in quality facilitated by solution treat-ing the HPDC material.
Assessments Based on the ludwik-Holloman Equation
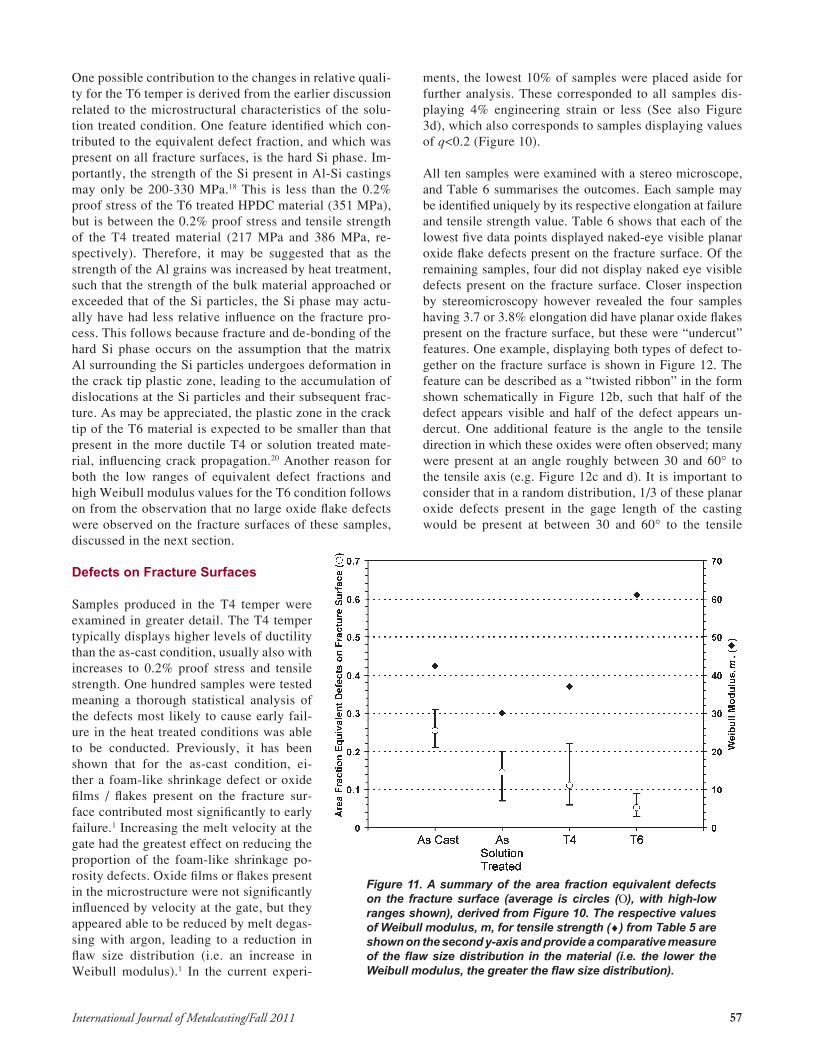
Further analysis was conducted for the T4 and T6 conditions. Figure 10 shows the flow curves and experimental data from Figure 4, now plotted on a quality chart, for the solution treated, T4 and T6 conditions. Here, because the relative quality of the different heat treat-ed conditions was expected to be the same, constant quality (iso-q) lines can be added, to show the entire scope of properties that may be derived via age hardening heat treatments. As may be appreciated, varying the time and temperature of the age hardening heat treat-ment for strengthening will move the range of properties within these lines. The relative quality was similar for each of the three tem-pers and most values fall between the iso-q values of 0.2 and 0.4. Plotting the equivalent defect fraction present on the fracture surface from equation 8 for the respective values of strain hardening exponent, n 11, in Figure 10, reveals additional information. For the solu-tion treated condition, the equivalent defect fraction was 0.07-0.23. For the T4 temper, the range of equivalent defect fractions were very close to the solution treated conditions, at 0.06-0.22. The similarities in these results are to be expected, because it follows that the only difference between the solution treated and T4 tempers is related to strengthening within the aluminium grains by very fine GP zones. Casting defects such as porosity, inclusions or oxides etc. must be constant. However, surprisingly, this trend does not continue for the T6 treated material. For this temper, the equivalent defect fractions pres-ent on the fracture surface now decreased, and ranged from 0.03 to 0.09. This result was particularly interesting because the T6 temper also displayed the highest value of Weibull modulus, m, and therefore the lowest flaw size distribution. A summary of the respec-tive equivalent defect fractions and Weibull
modulus values for all conditions examined are shown in Figure 11. Here, it is interesting to note that the equivalent fraction of defects present on the fracture surface does not necessarily follow the same trend as the Weibull modulus. For example, compared to the as-cast condition, the solution treated material displays a greater flaw size distribution (i.e. lower value of m), but a lower defect fraction present on the fracture surface. That is, the range of defect sizes was broad-er, but the total equivalent defect fraction decreased. The T4 treated material displays a slightly higher value of m and a similar equivalent defect fraction to the solution treated material. For the T6 samples, the flaw size distribution was reduced, and the equivalent defect fraction was also reduced. It would therefore appear clear that the relative quality for the T6 treated material was significantly improved.
Figure 9. Examples of heterogeneous precipitation within the as-cast microstructure (TEM). a) shows inhomogeneously distributed q’ (Al2Cu) precipitates within the aluminium grains, while b) shows coarse q (Al2Cu) precipitates near to a grain boundary. (a) [011]a, (b) [001]a. (Note that both grains in (b) were close to the same [001]a orientation). (a) after ref. 3
Figure 10. Quality chart for heat treated conditions (solution treated, T4 and T6) showing model flow curves, calculated from σ=Ken, Eqn 7, and the equivalent defect fraction on the fracture surface (dashed lines, derived from solving f=1-( e-eh eh
n / e-ei ein), Eqn 8) for the values of n shown. Iso-q lines from
0.01 to 1 are also provided on the plot.
(a) (b)
57International Journal of Metalcasting/Fall 2011
One possible contribution to the changes in relative quali-ty for the T6 temper is derived from the earlier discussion related to the microstructural characteristics of the solu-tion treated condition. One feature identified which con-tributed to the equivalent defect fraction, and which was present on all fracture surfaces, is the hard Si phase. Im-portantly, the strength of the Si present in Al-Si castings may only be 200-330 MPa.18 This is less than the 0.2% proof stress of the T6 treated HPDC material (351 MPa), but is between the 0.2% proof stress and tensile strength of the T4 treated material (217 MPa and 386 MPa, re-spectively). Therefore, it may be suggested that as the strength of the Al grains was increased by heat treatment, such that the strength of the bulk material approached or exceeded that of the Si particles, the Si phase may actu-ally have had less relative influence on the fracture pro-cess. This follows because fracture and de-bonding of the hard Si phase occurs on the assumption that the matrix Al surrounding the Si particles undergoes deformation in the crack tip plastic zone, leading to the accumulation of dislocations at the Si particles and their subsequent frac-ture. As may be appreciated, the plastic zone in the crack tip of the T6 material is expected to be smaller than that present in the more ductile T4 or solution treated mate-rial, influencing crack propagation.20 Another reason for both the low ranges of equivalent defect fractions and high Weibull modulus values for the T6 condition follows on from the observation that no large oxide flake defects were observed on the fracture surfaces of these samples, discussed in the next section.
Defects on fracture surfaces
Samples produced in the T4 temper were examined in greater detail. The T4 temper typically displays higher levels of ductility than the as-cast condition, usually also with increases to 0.2% proof stress and tensile strength. One hundred samples were tested meaning a thorough statistical analysis of the defects most likely to cause early fail-ure in the heat treated conditions was able to be conducted. Previously, it has been shown that for the as-cast condition, ei-ther a foam-like shrinkage defect or oxide films / flakes present on the fracture sur-face contributed most significantly to early failure.1 Increasing the melt velocity at the gate had the greatest effect on reducing the proportion of the foam-like shrinkage po-rosity defects. Oxide films or flakes present in the microstructure were not significantly influenced by velocity at the gate, but they appeared able to be reduced by melt degas-sing with argon, leading to a reduction in flaw size distribution (i.e. an increase in Weibull modulus).1 In the current experi-
ments, the lowest 10% of samples were placed aside for further analysis. These corresponded to all samples dis-playing 4% engineering strain or less (See also Figure 3d), which also corresponds to samples displaying values of q<0.2 (Figure 10).
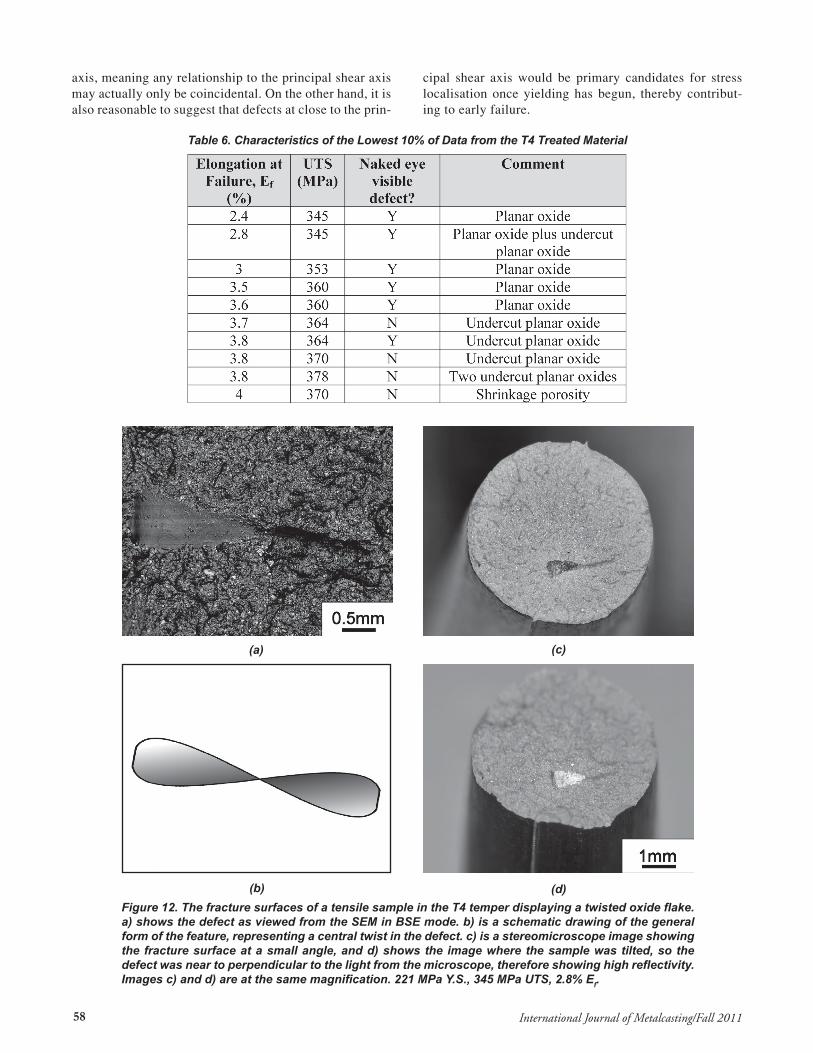
All ten samples were examined with a stereo microscope, and Table 6 summarises the outcomes. Each sample may be identified uniquely by its respective elongation at failure and tensile strength value. Table 6 shows that each of the lowest five data points displayed naked-eye visible planar oxide flake defects present on the fracture surface. Of the remaining samples, four did not display naked eye visible defects present on the fracture surface. Closer inspection by stereomicroscopy however revealed the four samples having 3.7 or 3.8% elongation did have planar oxide flakes present on the fracture surface, but these were “undercut” features. One example, displaying both types of defect to-gether on the fracture surface is shown in Figure 12. The feature can be described as a “twisted ribbon” in the form shown schematically in Figure 12b, such that half of the defect appears visible and half of the defect appears un-dercut. One additional feature is the angle to the tensile direction in which these oxides were often observed; many were present at an angle roughly between 30 and 60° to the tensile axis (e.g. Figure 12c and d). It is important to consider that in a random distribution, 1/3 of these planar oxide defects present in the gage length of the casting would be present at between 30 and 60° to the tensile
Figure 11. A summary of the area fraction equivalent defects on the fracture surface (average is circles (O), with high-low ranges shown), derived from Figure 10. The respective values of Weibull modulus, m, for tensile strength (♦) from Table 5 are shown on the second y-axis and provide a comparative measure of the flaw size distribution in the material (i.e. the lower the Weibull modulus, the greater the flaw size distribution).
58 International Journal of Metalcasting/Fall 2011
axis, meaning any relationship to the principal shear axis may actually only be coincidental. On the other hand, it is also reasonable to suggest that defects at close to the prin-
cipal shear axis would be primary candidates for stress localisation once yielding has begun, thereby contribut-ing to early failure.
Figure 12. The fracture surfaces of a tensile sample in the T4 temper displaying a twisted oxide flake. a) shows the defect as viewed from the SEM in BSE mode. b) is a schematic drawing of the general form of the feature, representing a central twist in the defect. c) is a stereomicroscope image showing the fracture surface at a small angle, and d) shows the image where the sample was tilted, so the defect was near to perpendicular to the light from the microscope, therefore showing high reflectivity. Images c) and d) are at the same magnification. 221 MPa Y.S., 345 MPa UTS, 2.8% Ef.
Table 6. Characteristics of the Lowest 10% of Data from the T4 Treated Material
(a) (c)
(b) (d)
59International Journal of Metalcasting/Fall 2011
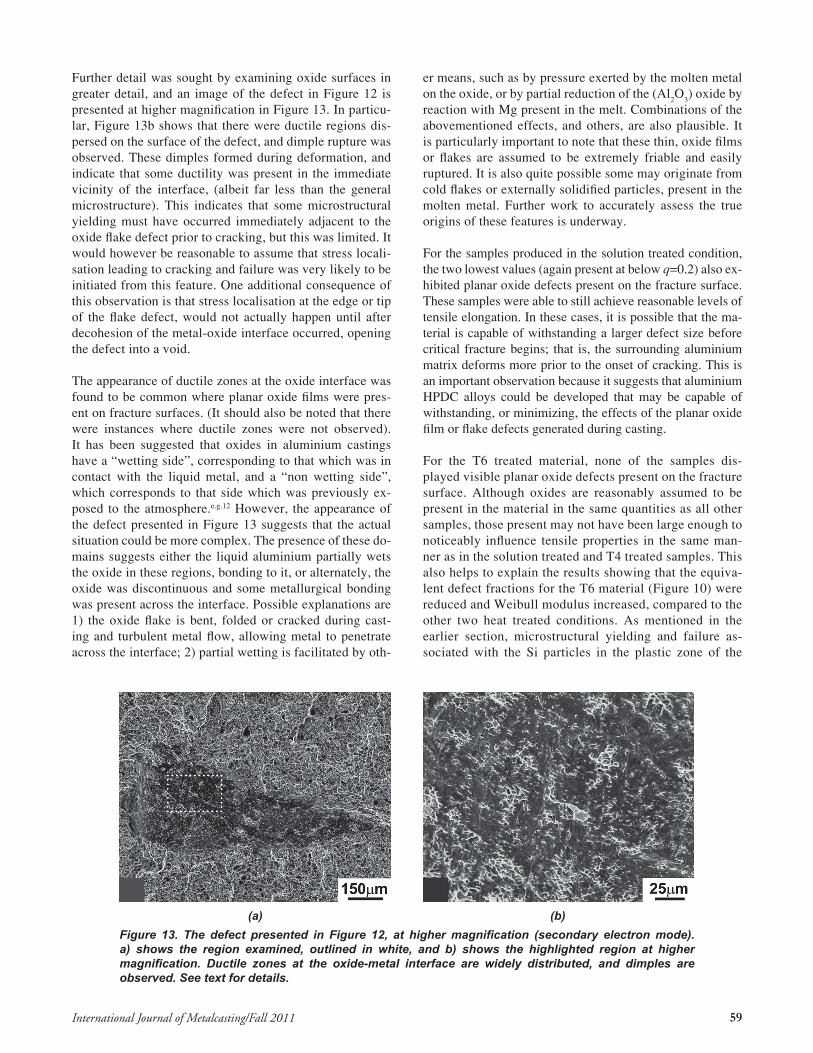
Further detail was sought by examining oxide surfaces in greater detail, and an image of the defect in Figure 12 is presented at higher magnification in Figure 13. In particu-lar, Figure 13b shows that there were ductile regions dis-persed on the surface of the defect, and dimple rupture was observed. These dimples formed during deformation, and indicate that some ductility was present in the immediate vicinity of the interface, (albeit far less than the general microstructure). This indicates that some microstructural yielding must have occurred immediately adjacent to the oxide flake defect prior to cracking, but this was limited. It would however be reasonable to assume that stress locali-sation leading to cracking and failure was very likely to be initiated from this feature. One additional consequence of this observation is that stress localisation at the edge or tip of the flake defect, would not actually happen until after decohesion of the metal-oxide interface occurred, opening the defect into a void.
The appearance of ductile zones at the oxide interface was found to be common where planar oxide films were pres-ent on fracture surfaces. (It should also be noted that there were instances where ductile zones were not observed). It has been suggested that oxides in aluminium castings have a “wetting side”, corresponding to that which was in contact with the liquid metal, and a “non wetting side”, which corresponds to that side which was previously ex-posed to the atmosphere.e.g.12 However, the appearance of the defect presented in Figure 13 suggests that the actual situation could be more complex. The presence of these do-mains suggests either the liquid aluminium partially wets the oxide in these regions, bonding to it, or alternately, the oxide was discontinuous and some metallurgical bonding was present across the interface. Possible explanations are 1) the oxide flake is bent, folded or cracked during cast-ing and turbulent metal flow, allowing metal to penetrate across the interface; 2) partial wetting is facilitated by oth-
er means, such as by pressure exerted by the molten metal on the oxide, or by partial reduction of the (Al
2O
3) oxide by
reaction with Mg present in the melt. Combinations of the abovementioned effects, and others, are also plausible. It is particularly important to note that these thin, oxide films or flakes are assumed to be extremely friable and easily ruptured. It is also quite possible some may originate from cold flakes or externally solidified particles, present in the molten metal. Further work to accurately assess the true origins of these features is underway.
For the samples produced in the solution treated condition, the two lowest values (again present at below q=0.2) also ex-hibited planar oxide defects present on the fracture surface. These samples were able to still achieve reasonable levels of tensile elongation. In these cases, it is possible that the ma-terial is capable of withstanding a larger defect size before critical fracture begins; that is, the surrounding aluminium matrix deforms more prior to the onset of cracking. This is an important observation because it suggests that aluminium HPDC alloys could be developed that may be capable of withstanding, or minimizing, the effects of the planar oxide film or flake defects generated during casting.
For the T6 treated material, none of the samples dis-played visible planar oxide defects present on the fracture surface. Although oxides are reasonably assumed to be present in the material in the same quantities as all other samples, those present may not have been large enough to noticeably influence tensile properties in the same man-ner as in the solution treated and T4 treated samples. This also helps to explain the results showing that the equiva-lent defect fractions for the T6 material (Figure 10) were reduced and Weibull modulus increased, compared to the other two heat treated conditions. As mentioned in the earlier section, microstructural yielding and failure as-sociated with the Si particles in the plastic zone of the
Figure 13. The defect presented in Figure 12, at higher magnification (secondary electron mode). a) shows the region examined, outlined in white, and b) shows the highlighted region at higher magnification. Ductile zones at the oxide-metal interface are widely distributed, and dimples are observed. See text for details.
(a) (b)
60 International Journal of Metalcasting/Fall 2011
propagating crack is expected to be important. What is of course particularly noticeable from fracture studies e.g.4 was that the crack path was always very straight and rela-tively planar in T6 treated material, but was microstruc-turally convoluted and often branched in T4 treated mate-rial. As a result, the T4 material will most likely interact with more of the microstructural flaws within the alloy on convoluted fracture surfaces, whereas the T6 material tends to interact with only those defects and other features which are directly in the fracture path, or very near to it. It then is reasonable to suggest that for the T6 material, planar defects and oxides would actually need to be large enough to initiate cracking to be observed on the fracture surfaces, and in such cases the material would most likely fail with little or no ductility.
summary and conclusions
Earlier work examining casting quality for HPDC’s has been extended to heat treated conditions in one A380 alloy. It has been found that:
1. Solution treatment has a particularly positive in-fluence on microstructural quality of HPDC’s. This improvement arises because of changes oc-curring within the microstructure, namely, a) the fragmentation and spheroidization of the Si phase; b) the dissolution of hard Cu-bearing phases, c) homogenisation of the solute elements within the aluminium grains, and d) the assumed relaxation of residual stresses. In the current samples, d) was considered to have minimal effect. Factors a), b) and c) together, decrease the contiguity of the re-sidual hard phases present in the solidified eutectic. It can be concluded that each of these features must contribute to the equivalent defect fraction on the fracture surface in the as-cast condition. In the as-cast condition, the equivalent defect fraction on the fracture surface was 0.21-0.32, and following solu-tion treatment, after the abovementioned changes had occurred, the range was reduced to 0.07-0.23.
2. Material heat treated to a T4 or T6 temper retains the same relative quality ranges as the solution treated condition, when following the method of Cáceres.9,10 In the solution treated and T4 tempers, nearly the same equivalent defect fractions were present on the fracture surface (e.g. 0.06-0.22 for the T4 temper). For a T6 temper, the equivalent fraction of defects present on the fracture surface was reduced to 0.03-0.09. In the T6 temper, the Weibull modulus was also substantially increased, meaning the flaw size distribution was reduced. In the solution treated and T4 tempers, naked eye vis-ible film or flake defects were observed on the frac-ture surfaces of the samples with the lowest 5% of elongation values recorded. No such defects were
observed on the T6 fracture surfaces. It is proposed that in addition to the absence of the planar oxide film or flake defects on the fracture surfaces in the T6 temper, the reduced influence of hard Si par-ticles where yielding occurs above the Si fracture stress is important in improving the relative quality of the T6 treated material.
3. Ductile domains were observed at the oxide-metal
interface of the planar defects in T4 treated mate-rial. This suggests that the microstructure immedi-ately adjacent to the defect yielded, before becom-ing a site for stress localisation at its edges, initiat-ing failure.
4. In statistical testing of T4 treated material, the lowest 9% of the results were found to display planar defects present on the fracture surfaces, which adversely influenced properties. Two types of planar oxide film or flake defects were observed; one was easily seen by the naked-eye on the fracture surface, and the second was found to be an undercut, observable by tilting in stereo-microscopy. Both contributed to the lower values of elongation observed.
Acknowledgements
The authors would like to thank Andy Yob, Dayalan Gunas-egaram and Maya Gershenzon for assistance with casting of samples.
rEfErEncEs
1. Lumley, R.N., Deeva, N, Gershenzon, M., “An Evaluation of Quality Parameters for High Pressure Diecastings”, Int. J. Metalcasting, vol.5, issue 3, pg. 37-56 (2011).
2. Lumley, R.N., O’Donnell, R.G., Gunasegaram, D.R., Givord, M, International Patent Application, WO2006/066314.
3. Lumley, R.N., O’Donnell, R.G., Gunasegaram, D.R., Givord, M., “Heat Treatment of High Pressure Diecastings” Metall. and Mater. Trans A, vol. 38A, p.2564-2574 (2007).
4. Lumley, R.N., “A Preliminary Evaluation On The Fracture Toughness Of Heat Treated Aluminium High Pressure Diecastings”, Adv. Mater. Res., vols. 41-42, pp.99-104 (2008).
5. Lumley, R.N. “Technical Data Sheets for Heat-Treated Aluminium High-Pressure Die Castings”, Die Cast. Eng., vol. 52, no.5, p.32-36 (2008).
6. Lumley, R.N., Gershenzon, M., and Gunasegaram, D.R., “Alloy Design for Heat Treatment of High Pressure Diecastings”, Mat. Sci. Forum, vol. 618-619, p.331-339 (2009).
7. Lumley, R.N., Polmear, I.J., Curtis, P.R., “Rapid Heat
61International Journal of Metalcasting/Fall 2011
Treatment of Aluminum High Pressure Diecastings”. Metall. and Mater. Trans. A, vol.40, no.7, p.1716-1726 (2009).
8. Lumley, R.N., The Potential for Cost and Weight Reduction in Transport Applications Through the use of Heat Treated Aluminium High Pressure Diecastings, Nova Science Publishers Inc. New York (2010).
9. Cáceres, C.H., “A Rationale for the Quality Index of Al-Si-Mg Casting Alloys”, Int. J. Cast Met. Res., vol. 10, pp.293-299 (1998).
10. Cáceres, C.H., “A Phenomenological Approach to the Quality Index”, Int. J. Cast Met. Res., vol. 12, pp.367-375 (2000).
11.Cáceres C.H., and Selling, B.I., “Casting Defects and the Tensile Properties of an Al-Si-Mg Alloy”, Mat. Sci. Eng. A, A220, pp.109-116 (1996)
12. Campbell, J. Castings: The New Metallurgy of Cast Metals, 2nd ed. Elsevier, Oxford, UK (2004).
13.Davies, I.J., “Best Estimate of Weibull Modulus Obtained Using Linear Least Squares Analysis: An Improved Empirical Correction Factor”, J. Mat. Sci., 39(4) pp. 1441-1444 (2004).
14.Sigworth, G.K., “Quality Issues in Aluminium Castings”, in “Fundamentals of Aluminium Metallurgy”, , Chapter 7, R.N. Lumley, ed., Woodhead Publishing, Cambridge, UK., pp.155-184 (2010)
15.Jayatilaka, A. De S. and Trustrum, K., Statistical Approach to Brittle Fracture, J. Mat. Sci. 12, pp.1426-1430 (1977).
16.Surappa, M.K., Blank, E.W. and Jaquet, J.C., “Effect of Macro Porosity on the Strength and Ductility of Cast Al-7Si-0.3Mg Alloy.”, Scripta Metall, 20, pp.1281-1286 (1986).
17.Knott,J.F.“FractureResistanceinAluminium”,in“Fundamentals of Aluminium Metallurgy”,Chapter18,R.N.Lumley,ed.,WoodheadPublishing,Cambridge,UK.,pp.539-574(2010).
18. Finlayson, T.R., Griffiths, J.R., Viano, D., Fitzpatrick, M.E., Oliver, E.C., and Wang, Q.G., “Stresses In The Eutectic Silicon Particles Of Strontium-Modified A356 Castings Loaded In Tension”, Shape Casting: 2nd International Symposium Edited by Paul N. Crepeau, Murat Tiryakioğlu and John Campbell, TMS (The Minerals, Metals & Materials Society), p.127-134 (2007).
19. Su, J.F., Nie, X., Stoilov, V., Characterization of Fracture and Debonding of Si Particles in Al-Si Alloys, Mat. Sci. & Eng. A, vol.527, Iss.27-28, pp. 7168-7175 (2010).
20. Lados, D.A., Apelian, D, Major, J.F., Fatigue Crack Growth mechanisms at the Microstructure Scale in Al-Si-Mg Cast Alloys: Mechanisms in Regions II and III, Metall. and Mater. Trans. A, vol.37A, no.8, pp. 2405-2418 (2006).
technical review & Discussion
An Evaluation of Quality Parameters for High Pressure Diecastings Part 2: Heat treatment R. Lumley, N. Deeva, CSIRO Future Manufacturing Flagship, Victoria, Australia
Authors: In response to reviewers’ notes in relation to the chemistry and precipitation sequence in Al-Cu alloy. The precipitation sequence in (binary) aluminium-copper alloys is currently believed to be:1
· Supersaturated solid solution (SSSS)GP zonesq"q'q, where the q phase is the equilibrium precipitate and the others are transitional phases formed during the decomposition of the solid solution.
· The form of GP zones is coherent, and usually forms as single layers (disks) of Cu atoms on substitutional sites of {100}a. (i.e. a single layer of Cu atoms between adjoining layers of Al atoms, [Al-Cu-Al])
· The form of q” is a coherent precipitate, reported to have two layers of Cu atoms separated by three layers of aluminium atoms (, i.e. [Cu-Al-Al-Al]n, like 3-D stacked GP zones) and formal stoichiometry of Al3Cu.2
· The form of q’ is a semicoherent tetragonal precipitate with chemistry Al2Cu that forms on {100}a. When cold work is applied to the aluminium following solution treatment, q’ forms directly on dislocations without forming GP zones or q”.
· The (equilibrium) form of q is an incoherent body centred tetragonal phase with chemistry of Al2Cu.
1. Polmear, I.J., “Light Alloys: From Traditional Alloys to Nanocrystals”, 4th ed. Butterworth-Heinemann publishers, 2005, p.57.
2. Bastow, T.J., Celotto, S., “Structure Evolution in Dilute Al(Cu) Alloys Observed by 63Cu NMR” Acta Materialia 51 (2003) pp.4621–4630.

62 International Journal of Metalcasting/Fall 2011