health services and territorial hierarchies in brazil
TRANSCRIPT
41ST CONGRESS OF THE EUROPEAN REGIONAL SCIENCE ASSOCIATION
HEALTH SERVICES AND TERRITORIAL HIERARCHIES IN BRAZIL
Evangelina OliveiraInstituto Brasileiro de Geografia e Estatística, [email protected]
This paper deals with the different territorial hierarchies established by the
consumption of health services in Brazil. Flows are classified in two groups,
one for general services (general hospitals, laboratory analysis and dental
services), another for specialised, higher level attention (specialist
consultations and exams, major surgery, organ transplants). Urban centers
are classified in terms of the level of equipment they are endowed with.
The traditional approach to analysis of polarisation in terms of dominant
flows between centers has been extended by Rabino to deal with other
types of flows, such as counter-hierarchical and transversal flows (see
Rabino and Occelli, 1997, and Berroir et al., 2001). The research reported
here shows that in Rio Grande do Sul, a southern State selected for a
preliminary analysis, the two networks identified illustrate different types of
organisation. Both the higher level and the general services network are
strongly hierarchical, with well defined, nested levels. The general services
network, however, is far less dependent on the hierarchy of the centres,
exhibiting a larger proportion of both transversal and shorter distance flows.

Introduction
The Brazilian Constitution (1988) established the Unified Health Care System (SUS),
based on universal access to health care services, and from 1990, when the system was
implemented, several policies were designed to promote the “hierarchical
regionalization” of services. Geographical equity is a necessary – though not a sufficient
– condition for achieving social equity in health services utilisation, equity being
understood to mean equal access opportunities for equal needs (Travassos et al., 2000).
Per capita measures of availability of health care resources should be based on areas
which reflect travel patterns for health care, not on arbitrary geographic units (Makuc,
1991). Delineating functional regions – which also provide a way to compare the
average distances that patients have to travel – is thus the first requirement. This paper
is part of a larger ongoing research project, and its major thrust is the test of a
methodology to establish the initial benchmark, in the early 90's, against which to
compare developments to date, in order to evaluate how far the stated equity aims have
been reached as regards the reduction of geographical inequalities. The dominant-flow
approach to the identification of nodal regions extracts the tree of the graph associated
with the matrix of flows between places to define the organisation of networks of cities
and the position of each city within the network (Nystuen and Dacey,1961). In this
paper two networks were identified for Rio Grande do Sul, a Brazilian state, for
specialised, and general, health care services. Within the two nodal regions defined by
these networks, the flows between centers have been analysed following Rabino’s
classification, which considers, besides hierarchical, counter-hierarchical and
transversal flows (see Rabino and Occelli, 1997, and Berroir et al., 2001), to investigate
whether the global trend towards increasing interdependence and complementarity
between medium-sized urban centers (Castells, 1996) could be discerned in this area of
Brazil.
The Region
One reason for selecting Rio Grande do Sul for the preliminary analysis of the different
territorial hierarchies established by the consumption of health services in Brazil was its
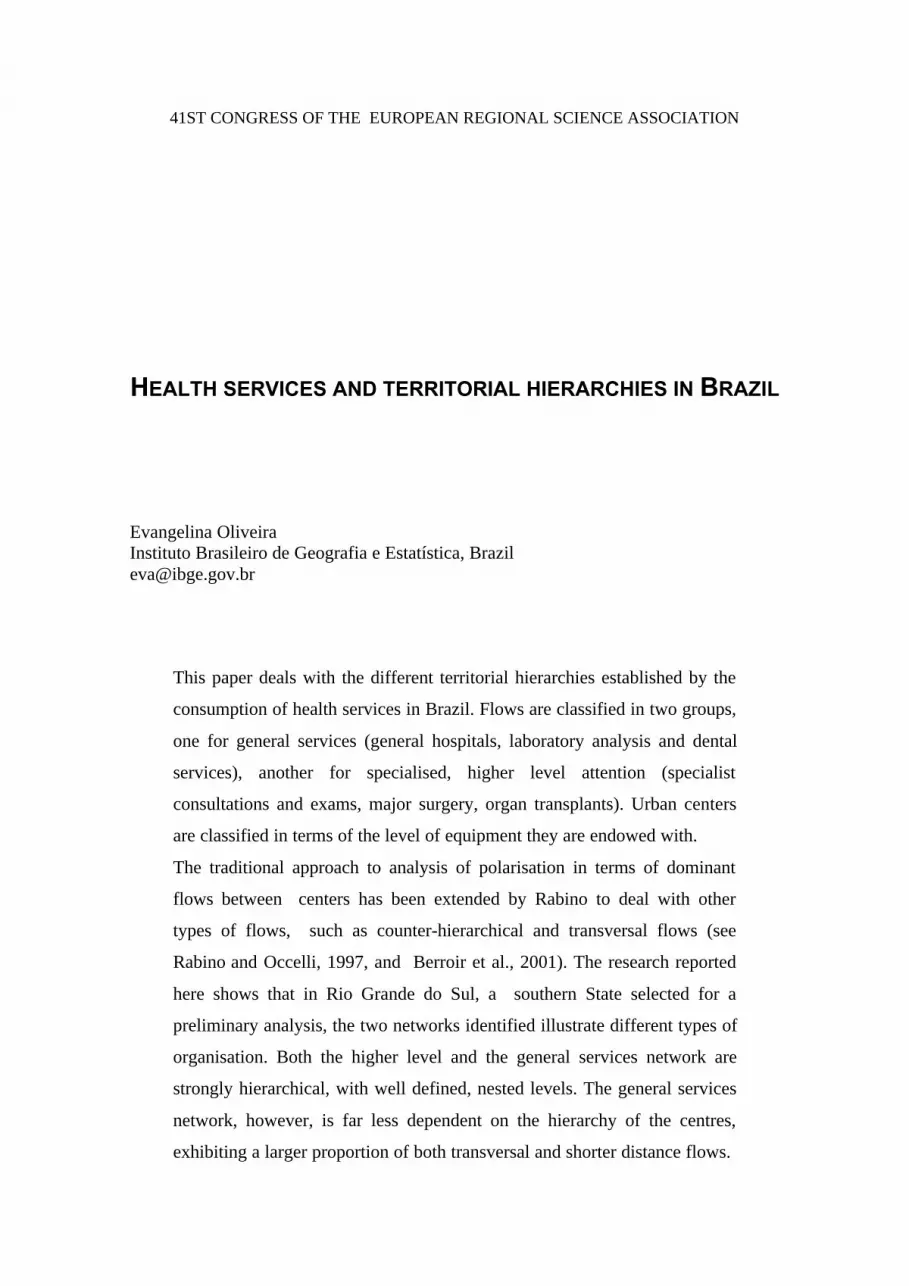
peripheral location in the extreme south of Brazil (Figure 1). The definition of an
arbitrary cut-off for flows – both incoming and outgoing – at the state’s limits is thus
less of a problem than would be the case with otherwise centrally located states.
2
Population densities are low in most of the area, with a marked north-south divide in
settlement patterns. The sparsely populated lowlands to the South are traditional cattle-
raising and rice growing areas, the North-western area is a major grain producer (soy,
corn and wheat), and in the Northeast the metropolitan area of Porto Alegre, the state
capital, is the hub of a nationally significant industrial region. The three largest regional
centers are Passo Fundo in the North, Santa Maria in the Central region, and Pelotas in
the Southeast.
Method and data
A method for the identification of nodal regions was developed by Nystuen and Dacey
(1961) “on the basis of the single strongest flow emanating from or moving to each of
Brazi l
Rio G ra nd e do Sul
"A"A
"A$B"A"A
"A
$B "A"A "A
"A%C"A"A"A
"A "A"A$B "A
"A"A
"A%C $B "A"A
"A"A$B
"A"A
$B
"A
"A
%C
"A
"A %C"A "A
%C%C%C$B "A
"A
"A
$B
"A
$B
%C"A
"A
%C "A"A
"A
$B"A
"A"A "A
%C
"A
"A
%C$B
"A"A
$B"A"A
"A
"A %C$B"A"A
$B
$B $B$B"A
$B%C"A "A
"A
%C
"A $B%C%C
"A
%C$B
"A$B $B"A
$B%C$B"A
"A "A%C$B $B$B
$B$B %C
"A
"A
%C $B%C"A $B"A
%C$B%C
%C%C%C%C
$B%C
"A
$BE$B %C%C$B
$B$B
%C
$B
"A
$B
"A
%C"A
"A
"A
%C$B
%C $B"A
"A
$B"A
%C$B"A %C
"A
"A
$B
$B
"A$B
$B$B $B$B $B%C $B$B $B
"A%C$B "A"A
$B "A $B%C "A"A $B$B %C $B $B$B $B$B$B
"A$B
$B
"A
"A
$B
$B"A $B
$B $B
%C é%C$B "A"A
"A
$B
$B
$B$B
$B"A
%C $B "A$B$B
$B $B$B "A
%C
$B
$Bé
$B
$B"A
$B$B"A
"A
$B %C$B$B$B
$B
$B $B"A$B $B
%C$B"A
"A
%C
$B $B$B
%C$B
%C$B
$B$B $B$B $Bé"A$B
"A"A$B$B $B
$B$B
$B$B
"A
%C$B%C
$B $B"A $B$B$B
%C$B%C"A
$B%C
"A
"A %C$B $B%C $B
$B$B
$B
$B
"A
"A
"A
%C$B
"A
"A
$B$B
%C $B$B$B
$B"A
é$B"A é
$B
"A
$B
$B
$B$B$B
$B$B
$B $B$B $B$B
$B
$B$B %C$B
$B$B
$B
$B $B
$B
$B
%C$B $B $B$B
$B
$B
$B$B
$B$B
$B$B%C $B$B $B$B
$B$B
$B$B$B
$B(F$B
$B$B
$B $B$B
$B $B
%C$B
$B
POR TO ALEG RE
PASSO FU NDO
SANTA MARIA
PELOT AS
People per Square Kilometer
2 - 5050 - 100100 - 250250 - 2560.1
Populationmunicipalities over 20,000
E 1280114
%C 150000 - 303000
%C 50000 - 150000"A 20000 - 50000
Complexity of care
$B Medium low
%C Medium
%C Medium high
(F Maximal
Porto Alegre
"A 11 - 50$B 51 - 191
%C 201 - 539
é 701 - 1628
%C 8994
Hospita l beds
Figure 1. Rio Grande do Sul, Brazil, population and services, 1992-1993.
3
the unit areas in the vicinity of a central place”. Their method entails a prior ranking of
the cities, as “a city is ‘independent’ if its largest flow is to a smaller city” (idem). On
the other hand, if the dominant flow goes to a larger city, the smaller city is subordinate
to the larger. Once the hierarchy of centers has been established, and the network
structure has been identified, Rabino extended this approach in order to deal with the
diversity of flows through which the internal and external relations of a region are
structured. The classification of flows requires a definition of “significant areas”, the
set of nodes of a given hierarchical level which are over a threshold, both in terms of
size and of number of subordinate units. The graph is thus partitioned at a specified “cut
level”, and the resulting upper level identifies “that part of the hierarchical structure
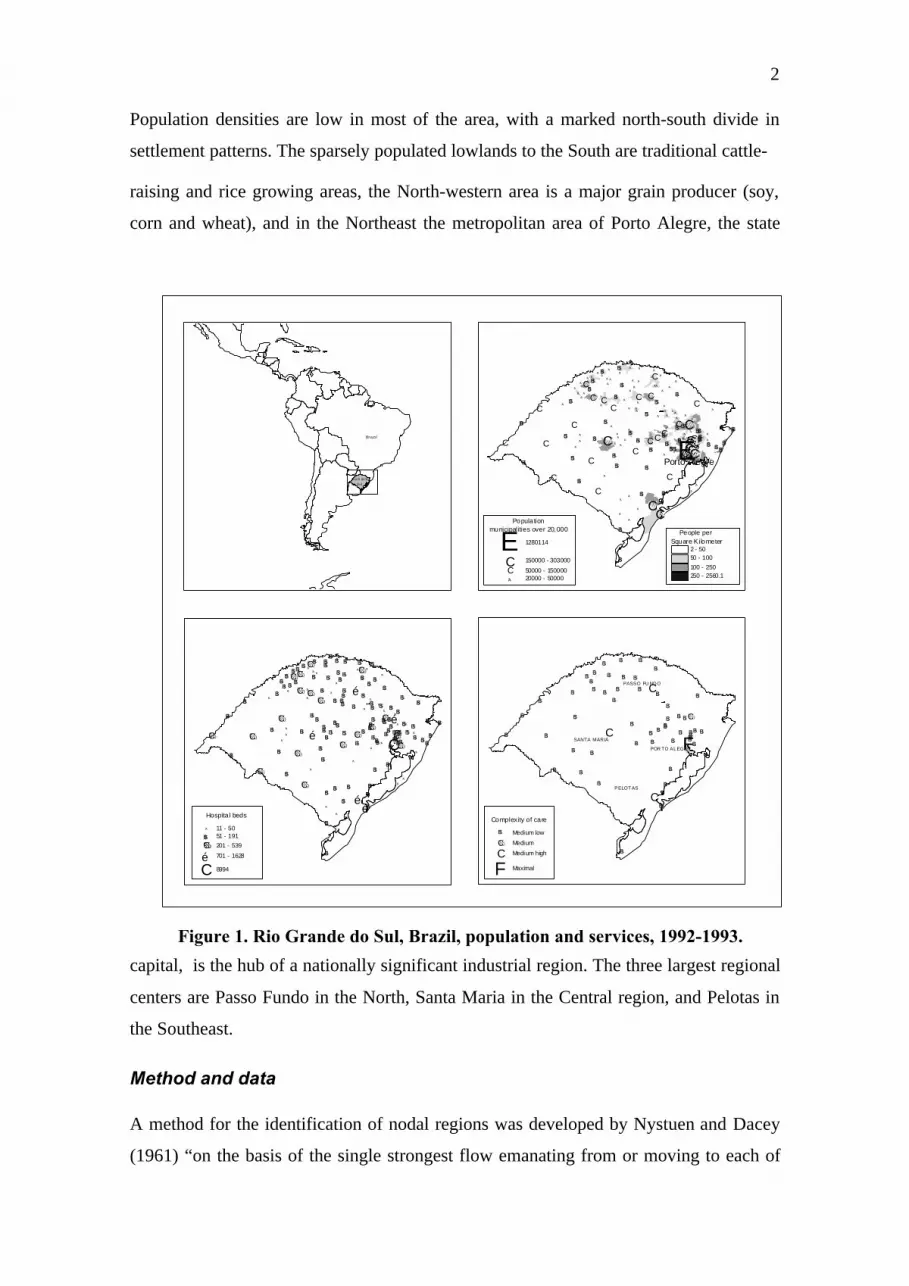
which falls outside the areas themselves.” (Rabino and Occelli, 1997). The typology of
flows comprises hierarchical ascending, counter hierarchical descending, and
transversal, and is presented in Figure 2, adapted from Rabino and Occelli (1997) and
Berroir et al. (2001). The classification of flows used the software developed by L.
Mabini and G. Rabino.
For the identification of nodal regions, then, two elements are required: a measure of
size for the centers, and of the linkages between them. Here, municipalities are ranked
by a composite measure, combining number of hospital beds (IBGE, 1992) and an index
of complexity of hospital care available (Oliveira, 2001). This index is based on a
TYPES OF FLOWS§ Hierarchical ascending
1a direct1b “short circuited”1c eso-hierarchical
§ Counter hierarchicaldescending2a direct2b “short circuited”
§ Transversal (same tree)3a ascending3b horizontal3c descending
§ Transversal (differenttrees)4a ascending4b horizontal4c descending
Cut level
1a
1b
2a2b
1c
4a
4b
4c3a
3b
3c
Figure 2. Types of flows

4
classification of medical (clinical and surgical) procedures appearing on 1993 microdata
files from the in-patient information system – SIH-SUS – with information on hospital
costs charged to the Unified Health System (DATASUS, 1993). For the linkages, a
national study delineating nodal regions – Regiões de Influência das Cidades, 1993 –
collected information for all cities with population over 20,000 on preferred locations
for provision of various kinds of goods and services (IBGE, 2000). For higher level
services the original questionnaire listed the cities providing those services, for general
services the question was where people came from to get the services provided. This
second item was not investigated for nine of the major cities in the country, Porto
Alegre, the state capital, among them.
A subset of the original database, comprising flows relating to health services was
selected for this study. The flows for general services refer to general hospitals,
laboratory analysis and dental services, those for specialised attention comprise
specialist consultations and exams, major surgery, and organ transplants.
Results
Two networks were derived, one for specialised services, the other for general services.
For the former, Porto Alegre, with size more than 9 times that of the second largest
Figure 3. Health care services networks in Rio Grande do Sul – 1993 -
ô"$B
$B$B ô"%C$B
%C ô"$B ô"
ö'W$B$B ô"$B$B ô"
$B$B %C$B $B$B %C $B ô"
ô"
$B$B$B
$B$B
%C$B
%C
$B
ô" $B$B ô"
$B%C$B
ô" $Bô"
$B
$B
$B
$B
$B
$Bô"
%C $B $B$B
$B$B
%C$B
$B
$B
%C
%C$B
$B$B
$B$B$B
$B
$B %C $B$B%C
$B
$B%C
$B%C
%C$B $B
$B
%C
%C
$B%C
%C
%C
$B$B$B %C
$B$B%C
%C%C$B %C%C%C %C
%C%C
%C$B
$B%C
%C$B%C
%C %C$B%C$B
%C
%C
%C%C%C
$B
$B
%C
%Cö'W
%C %C%C
%C
$B$B
%C
$B
%C
%C
%C
%C
%C$B
%C
%C$B
%C $B$B$B
$B%C
%C
$B$B %C
$B
$B
$B
$B
'E
%C
%C
%C
%C
%C
PASS O FU N DO
SAN T A M AR IA
PEL OT AS
POR T O ALEGR E
CA XIA S D O S UL
SAN T A R OS A
%C 2$B 3ô" 4
'E%C
1 (Porto Alegre)2 (significant)
Hierarchical levels
Higher level services
Hierachical levels
ö'W 1%C 2$B 3"A 4"A 5
'E 1 (significant)
0 50 100 150 200 250 Kilometers
General services
"A$B
"A"A
%C$B
$Bö'W
"A
ö'W%C$B ö'W$B $B"A $B$B "A
"A%C"A
%C $B$B"A
"A
$B%C$B "A
"A "A
"A
%C"A $B
"A %C"A $B
$B%C
"A
%C$B
"A$B"A $B"A
$B$B
"A$B $B %C"A
$B"A
"A "A
$B ö'W%C
"A "A%C$B
ö'W"A%C"A"A"A "A
%C $B$B%C
$B $Bö'W
ö'W"A
$B
$B
$B$B $B%C
"A$B"A
"A
$B%C$B
"A
%C
$B$B$B
$B
%C
%C"A "A %C"A
"A$B
"A
$B$B"A
$B
%C
$B $B"A%C
%C
"A"A %C
%C$B $B$B $B"A $B
%C
ö'W
"A$B $B
ö'Wö'W%C
$B$B
%C$B
$B
%C $B
%C
$B$B"A
"A$B
%C
%C %C%C $B
$B
ö'W
$Bö'W
"A"A %C
$B
%Cö'W
$B
"A
%C
"A"A$B $B "A
"A$B
"A"A
$B"A$B
$B
$B$B
$Bö'W "A
%C$B %C$B
$B$B "A
"A "A$B$B$B $B
ö'W
%C"A
ö'W
%C
"A
ö'W
ö'W%C
%C%C
ö'W
"A"A"A
%C$B %C%C $Bö'W
%C $B"A
"A$B %C%C
$B
%C
%C$B
%C"A
%C$B
$B$B$B$B$B
$B$B $B%C %C
$B$B"A
%C$B
$B$B$B%C ö'W$Bö'W %C
$B ö'Wö'W%C
"A
%C"A$B
%C
%C"A$B
"A
"A
%C%C
%C
$B
%C$B
"A"A%C
ö'W
%C$B $B%C"A"A
ö'W
$B"A "A ö'W%C%C
%C"A
%C"A
"A$B
%C%C"A%C
ö'W"A$B "A
$B$B%C $Bö'W
"A"A %C$B$B $B
%C%C%C
%C $B$B
"A "A$B%C
%C %C%C"A
"A
%C
$B%C
%C
"A
"A
ö'W"A
$B ö'W"A $B$B %C
ö'W %C%C
$B
ö'W%Cö'W
$B %C "A
%C
%C
%C
%C ö'W$B
ö'W%C
%Cö'W
%C%C
%C$B
%C
ö'W$B
%C
$B%C
$B
%C
%C
ö'W
%C
$B
$B
$B
$B%C
$B
$B
ö'W%C
$B %C
ö'W
$B
%C$B
%C
%C"A
%C
%C
ö'W
%C
$B
$B
%C
ö'W%C
$B
%C
%C
'E
'E'E'E
'E
'E
'E
'E
'E
IJU I
LAJ E AD O
PELO TAS
SAN T A R OS A
PASS O F U N DO
SAN T A M AR IA
CA XIA S D O S UL
CA CH OE IR A D O S UL

5
center (Pelotas), and receiving 31.3% of the flows (9.7% for the second placed in terms
of incoming flows, Santa Maria), is the head of the network. There is another city
classified as first level, because its dominant flow is directed to a smaller city, but it is
quite small, and does not have any subordinate cities of its own. In the same way, only
14 of the 62 second level centers have tributaries, as do four of the 86 third level. There
are also 13 cities on the fourth and last rung of the hierarchy. The first map in Figure 3
shows the spatial distribution of the network. The dominance of Porto Alegre ranges
over the whole state, with second level centers clustered around its immediate vicinity,
spaced along the international frontier and, in the more densely peopled areas, providing
foci for their own tributary networks. For the classification of flows, significant areas
were defined as those of second level centers with size over 1,000,000 and more than
five subordinate cities. The reason for focusing on the second level was to simplify
comparison with the other network, in which Porto Alegre does not figure. Five out of
the 14 second level regions met the stated criteria, Santa Maria, Passo Fundo, Pelotas,
Caxias do Sul and Santa Rosa. The first three, as already mentioned, are the largest
regional centers in the state. Passo Fundo, with 30 centers in its region, and Santa
Maria, with 32, are the largest regions, standing, as they do, in densely occupied areas.
On the other hand, having far fewer neighbours, Pelotas is a pole for 10 municipalities.
With only nine centers, Caxias do Sul is very close to Porto Alegre, and the outlying
Santa Rosa commands six municipalities.
The general services network (Figure 3) is made up of several unconnected trees: there
are 43 first level centers, 30 of which subordinate other cities. This contrasting pattern is
basically due to not having Porto Alegre investigated, as already mentioned. Of the 124
second level centers, 52 have tributaries, as do 33 of the 148 third level, and five of the
96 on the fourth level. In the fifth and last level in the hierarchy, there are seven cities.
In the South and South-western sparsely peopled areas, the main centers have few
levels, and the increased density and local articulation of the network in the rest of the
state is striking. The definition of significant areas used the same criteria as before:
centers with size over 1,000,000 and more than five subordinate cities. Nine out of the
30 first level regions met these criteria: the five previously identified for the higher
level, i.e. Santa Maria, Passo Fundo, Pelotas, Caxias do Sul and Santa Rosa, plus Ijuí,
Santo Angelo, Lajeado and Cachoeira do Sul.
6
The arrangement of this network leads to a reduction of the region of Santa Maria, both
in number of cities, now only 12, and in range. The other regions have increased their
number of cities, in line with the larger number of centers investigated in this level:
Passo Fundo with 86 cities, Caxias do Sul with 52, Santa Rosa with 18. Only Pelotas,
constrained by its position, is stable, now with 11 cities.
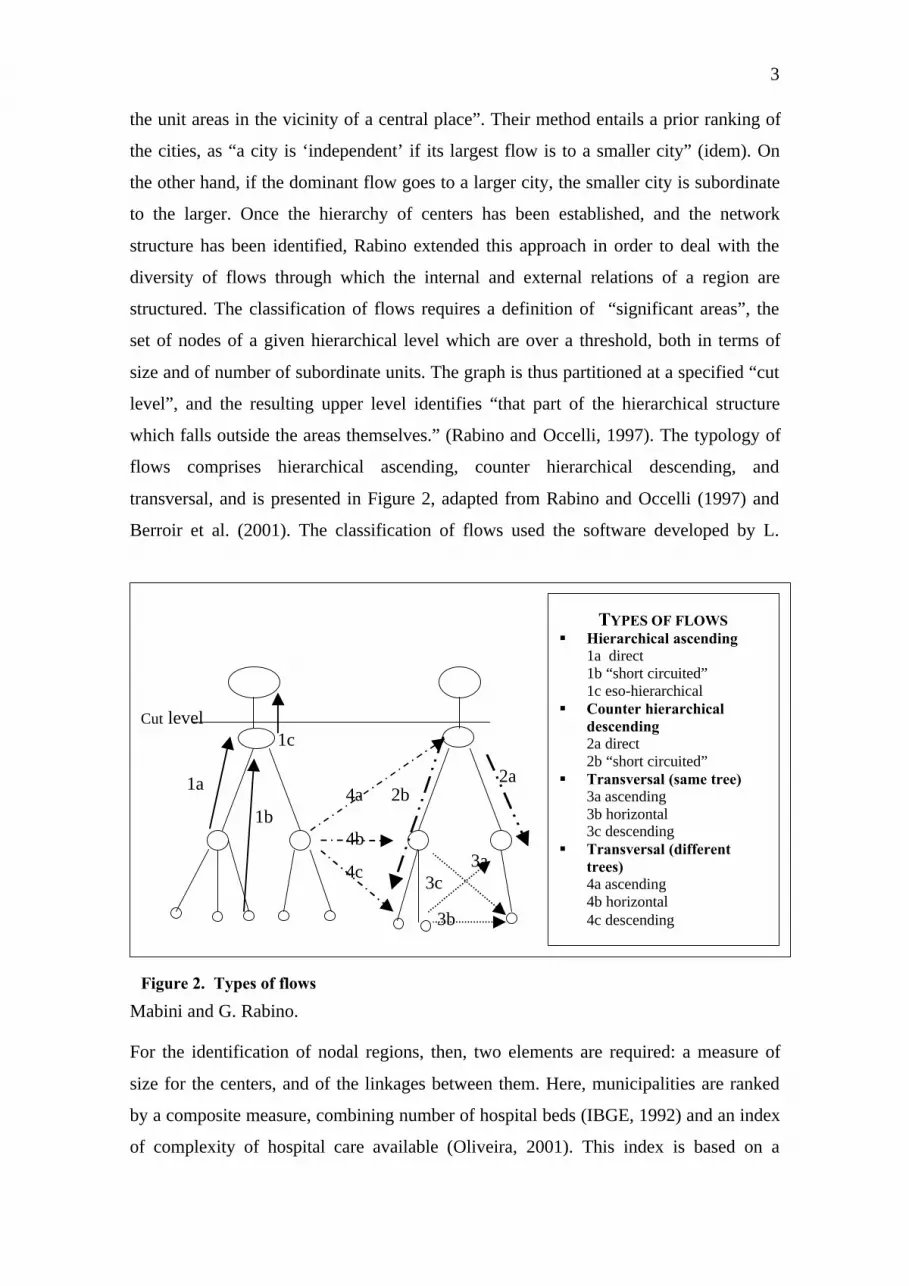
Besides size and concentration, the two networks also differ in the way their flows are
structured. Although both are strongly hierarchical (Table 1), the flows demanding
specialised services are more dependent on larger central places, witness the
convergence of flows to Porto Alegre coming from all over the state (Figure 4). The
pattern of transversal flows between different trees also suggests that city size is more of
ô"$B$B$B ô"%C $B
%C ô"$B ô"
ö'W$B$B ô"$B$B ô" $B$B %C$B $B$B%C $B ô"
ô"
$B$B$B$B $B
%C$B
%C
$Bô" $B
$B ô"
$B%C$B
ô" $Bô"
$B$B
$B$B
$B$Bô"
%C $B $B$B$B $B %C$B
$B
$B
%C
%C$B$B$B
$B$B$B$B
$B %C$B$B%C$B
$B %C%C$B %C%C$B $B$B
%C
%C$B
%C
%C
%C$B
$B$B %C$B $B%C%C%C
$B %C%C%C %C%C
%C%C
$B$B
%C
%C$B%C
%C %C$B %C$B%C
%C%C%C%C
$B$B
%C%C ö'W%C %C%C
%C
$B$B
%C
$B%C
%C%C
%C%C
$B
%C
%C$B
%C $B$B$B
$B %C
%C$B$B %C
$B
$B
$B
$B
ö'W
%C
%C
%C
%C
%C
P ASS O FU N D O
SA NTA M AR IA
P ELO TAS
POR T O A L EG R E
CAX IAS D O S U L
S ANT A R OS A
0 50 100 150 200 Kilometers
ô"$B$B$B ô"%C $B
%C ô"$B ô"
ö'W$B$B ô"$B$B ô" $B$B %C$B $B$B%C $B ô"
ô"
$B$B$B$B $B
%C$B
%C
$Bô" $B
$B ô"
$B%C$B
ô" $Bô"
$B$B
$B$B
$B$Bô"
%C $B $B$B$B $B %C$B
$B
$B
%C
%C$B$B$B
$B$B$B$B
$B %C$B$B%C$B
$B %C%C$B %C%C$B $B$B
%C
%C$B
%C
%C
%C$B
$B$B %C$B $B%C%C%C
$B %C%C%C %C%C
%C%C
$B$B
%C
%C$B%C
%C %C$B %C$B%C
%C%C%C%C
$B$B
%C%C ö'W%C %C%C
%C
$B$B
%C
$B%C
%C%C
%C%C
$B
%C
%C$B
%C $B$B$B
$B %C
%C$B$B %C
$B
$B
$B
$B
ö'W
%C
%C
%C
%C
%C
P ASS O FU ND O
S ANT A M AR IA
P ELO TA S
POR TO A L EG R E
CA XIA S D O SU L
S AN TA R O SA
ô"$B$B$B ô"%C $B
%C ô"$B ô"
ö'W$B$B ô"$B$B ô"
$B$B %C$B $B$B%C $B ô"ô"
$B$B$B$B $B
%C$B
%C
$Bô" $B
$B ô"
$B%C$B
ô" $Bô"
$B$B
$B$B
$B$Bô"
%C $B $B$B$B
$B %C$B
$B
$B
%C
%C$B
$B$B$B
$B$B $B$B %C$B$B
%C$B
$B %C%C$B %C%C$B
$B$B
%C
%C$B
%C
%C
%C$B
$B$B %C$B$B%C
%C%C$B %C%C%C %C%C
%C%C
$B$B
%C
%C$B%C
%C %C$B %C$B%C
%C%C%C%C
$B$B
%C%C ö'W%C %C%C %C
$B$B
%C
$B%C
%C%C
%C%C
$B
%C%C
$B
%C $B$B$B
$B %C
%C$B$B %C
$B
$B
$B
$B
ö'W
%C
%C
%C
%C
%C
P ASS O FU N D O
SA NTA M AR IA
P ELO TAS
POR T O A L EG R E
CAX IAS D O S U L
S ANT A R OS A
ô"$B$B$B ô"%C $B
%C ô"$B ô"
ö'W$B$B ô"$B$B ô"
$B$B %C$B $B$B%C $B ô"ô"
$B$B$B$B $B
%C$B
%C
$Bô" $B
$B ô"
$B%C$B
ô" $Bô"
$B$B
$B$B
$B$Bô"
%C $B $B$B$B
$B %C$B
$B
$B
%C
%C$B
$B$B$B
$B$B $B$B %C$B$B
%C$B
$B %C%C$B %C%C$B
$B$B
%C
%C$B
%C
%C
%C$B
$B$B %C$B$B%C
%C%C$B %C%C%C %C%C
%C%C
$B$B
%C
%C$B%C
%C %C$B %C$B%C
%C%C%C%C
$B$B
%C%C ö'W%C %C%C %C
$B$B
%C
$B%C
%C%C
%C%C
$B
%C%C
$B
%C $B$B$B
$B %C
%C$B$B %C
$B
$B
$B
$B
ö'W
%C
%C
%C
%C
%C
P ASS O FU ND O
S ANT A M AR IA
P ELO TA S
POR TO A L EG R E
CA XIA S D O SU L
S AN TA R O SA
Hierarchical ascending
Transversal flows same tree
Transversal flowsdifferent trees
Hierarchical ascending
direct"short circuited" eso-hierarchical
Figure 4. Types of flows for the specialised services network.

7
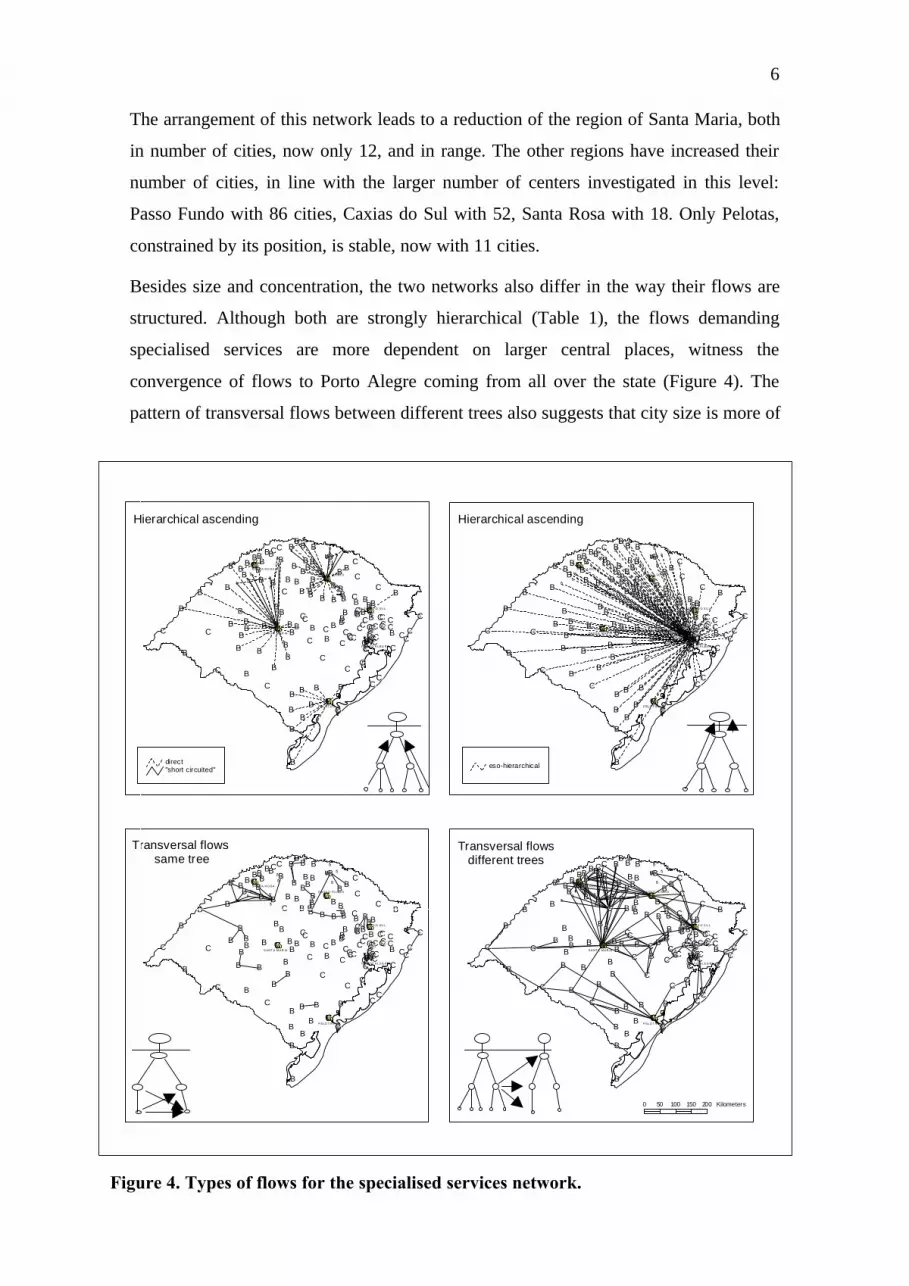
a determinant for complex services than for less complex needs. The maps in Figures 4
and 5 suggest that transversal flows between trees are more likely to be directed to cities
at the top of the hierarchy in the specialised services network. The pattern for general
services evidences a more general dependency on the internal hierarchy, with a larger
share of hierarchical ascending flows, even though there are some instances of short
distance descending flows.
The evidence of the maps is that distances travelled for less complex services are
smaller, and distance effects are also related to flow type: both descending and
Transversal flowsdifferent trees
Transversal flows same tree
Counter hierarchical descending
gg
gg
gg
g'Eg
'Egg 'Eggg g g g
ggg
g ggg
gg
gg gg g
g
gg g
g gg g
gg
gg
gggg gg
gg
gg ggg gg
g g
g 'Egg g gg
'Eggggg g
g ggg
g g'E
'Egg
g
gg gg
ggg
ggg
gg
g
ggg
g
g
gg g gg
g gg
ggg
g
g
g gg g
g
gg g
gg g
g gg gg
'E
g g g'E'E
g
gg
gg
g
gg
g
ggg g gg
gg
gg
g
'E
g'E
gg g
g
g
'Eg
g
g
ggg g g
gg gg
g ggg
gg
g'E g
gg g
g
gg g
g gggg
g
'E
g g'E
g
g'E
'Eg
gg
'E
ggg
g
g gg g'E g gg
g g ggg
g
gg
gg
gg gg
ggg
gg
gg gggg
gg
gggg'E
g'E g
g'E
'Eg g
ggg
g
gg
g g
g
gg
g
g
g
g ggg
'E
gg gg
gg
'E
gg g 'Egg
gg
gg
gg
gggg
'Egg g
gg
g g'Egg gg
g gg
ggg g
gg ggg
g ggg
gg
gg
gg
g
'Eg
g 'Eg gg g
'E gg
g
'E
g'E
gg g
g
g
g
g'E
g
'Eg
g'E
gg
gg
g
'Eg
g
gg
g
g
g
'E
g
g
g
g
gg
g
g
'Eg
g g
'E
g
gg
g
gg
g
g
'E
g
g
g
g
'Eg
g
g
g
'E
'E'E'E
'E
'E'E
'E
'E
gg
gg
gg
g'Eg
'Egg 'Eg gg gg g
ggg
g ggg
gg
gg gg g
g
gg g
g gg g
g gg
gg
ggg ggg
ggg g
ggg
gg g
g 'Egg g gg
'Eggggg g
ggg
gg g
'E'Eg
g
g
gg gg
ggg
ggg
gg
g
gg
gg
g
gg g gg
ggg
ggg
g
g
gg
g g
g
gg g
gg g
g gg gg
'E
g g g'E'E
g
gg
gg
g
gg
g
ggg gg
g
gg
g gg
'E
g'E
gg g
g
g
'Eg
g
ggg
g g gg
g ggg ggg
gg
g'E g
g
g gg
gg g
g gggg
g
'E
g g'E
g
g'E
'Eg
gg
'E
ggg
gg gg g'E
g gg
g g ggg
g
gg
gg
gg
gg
ggg
gg
gg g
ggg
gg
gggg 'Eg'E g
g'E
'Eg g
ggg
g
gg
g g
g
gg
g
g
gg
ggg
'E
gg gggg
'E
gg g 'Egg
gg
gg
gg
ggg
g
'Egg g
gg
g g'Egg gg
g gg
ggg g
gg ggg
g ggg
gg
gg
gg
g
'Eg
g 'Eg gg g
'E gg
g
'E
g'E
g g g
g
g
g
g'E
g
'Eg
g'E
gg
gg
g
'Eg
g
gg
g
g
g
'E
g
g
g
g
gg
g
g
'Eg
g g
'E
g
gg
g
gg
g
g
'E
g
g
g
g
'Eg
g
g
g
'E
'E'E'E
'E
'E'E
'E
'E
gg
gg
gg
g'E
g'Egg 'Eg gg g g ggg
gg gg
g
gg
gg gg g
g
gg g
g gg gg
gg
gggg
g ggg
ggg g
ggg
gg g
g 'Egg g
gg'E
ggggg gg gg
gg g
'E'Eg
g
g
gg g
ggg
gg
ggg
gg
gg
gg
g
gg g gg
ggg
ggg
g
g
gg
g g
g
gg g
gg g
g gg gg
'E
g g g'E'E
g
gg
gg
g
g g
g
ggg gg
g
gg
g gg
'E
g'E
gg g
g
g'E
g
gg
ggg g g
gg gg g gg
ggg
g'E g
gg gg
gg g
g ggg
gg
'E
g g'E
g
g'E
'Eg
gg
'E
ggg
g
g gg g'E g gg
g g ggg
g
gg
gg
gg
gg
ggg
gg
gg g
ggg
gg
gggg'E
g'E g
g'E
'Eg g
gg
g
g
gg
g g
g
gg
g
g
gg
ggg
'E
gg gggg
'E
gg g 'Egg
gg
gg
gg
gggg
'Egg g
gg
g g'Egg gg
g gg
ggg g
gg g
gg
g ggg
gg
g
g
gg
g
'Eg
g 'Eg gg g
'Eg
g
g
'E
g'Eg
g g
g
g
g
g'E
g
'Eg
g'E
gg
gg
g
'Eg
g
gg
g
g
g
'E
g
g
g
g
gg
g
g
'Eg
g g
'E
g
gg
g
gg
g
g
'E
g
g
g
g
'Eg
g
g
g
'E
'E'E'E
'E
'E'E
'E
'E
gg
gg
gg
g'E
g'Egg 'Eg gg g
g ggg
gg gg
g
gg
gg gg g
g
gg g
g gg g
gg
gg
ggg
g ggg
ggg
ggg
ggg g
g 'Egg g
gg'E
ggggg gg
ggg
g g'E
'Eg
g
g
gg g
ggg
gg
ggg
gg
ggg
g
g
gg g gg
g gg
ggg
g
g
g gg g
g
gg g
gg g
g gg gg
'Eg g g
'E'Eg
gg
gg
g
gg
g
ggg g gg
g gg g
g
'E
g'E
gg g
g
g'E
g
g
ggg
g g gg
g ggg gg
g
gg
g'E g
g
g gg
gg g
g gggg
g
'E
g g'E
g
g'E
'Eg
gg
'E
ggg
g
g gg g'Eg g
gg g gg
g
g
ggg
gg
gggggg
gg gg g
ggg
gg
gggg 'Eg'E g
g'E
'Egg
ggg
g
gg
g g
g
gg
g
g
gg
ggg
'E
gg gggg
'E
gg g 'Egg
gg
gg
gggg
gg
'Egg g
gg
g g'Egg gg
g gg
ggg g
gg g
gg
g ggg
gg
g
g
gg
g
'Eg
g 'Eg gg g
'Eg
g
g
'Eg'E
gg g
g
g
g
g'E
g
'Eg
g'E
gg
gg
g
'Eg
g
gg
g
g
g
'E
g
g
g
g
gg
g
g
'Eg
g g
'E
g
gg
g
gg
g
g
'E
g
g
g
g
'Eg
g
g
g
'E
'E'E'E
'E
'E'E
'E
'E
direct"short c ircuited"
'E 1g 2 - 5
'E 1 (significant)Hierarchical levels
Flows
0 50 100 150 200 Kilometers
Hierarchical ascending
Figure 5. Types of flows for the general services network.

8
transversal flows in the same tree are consistently shorter than either ascending, or
transversal flows between different trees (Table 2).
Table 1. Types of flows in the two networks between origins and destinations in the stateof Rio Grande do Sul (Brazil), 1993
TYPES SPECIALISED SERVICES GENERAL SERVICES
OF FLOWS Number % Number %Hierarchical ascending 254 49.0 360 44.5
direct 82 15.8 272 33.6"short circuited" 12 2.3 88 10.9eso-hierarchical 160 30.9 - -
Counter hierarchical descending 2 0.4 31 3.9direct 2 0.4 28 3.5"short circuited" - - 3 0.4
Transversal (same tree) 43 8.3 107 13.2Transversal (different trees) 219 42.3 310 38.4Total 518 100.0 808 100.0
Table 2. Straight line distances (km) between origins and destinations in the state of RioGrande do Sul (Brazil), by type of flow, 1993.
TYPES OF FLOWS Mean Minimum Percentile
25
Median Percentile
75
Maximum
SPECIALISED NETWORK
Hierarchical ascending
direct 82.2 12.7 39.2 67.8 110.3 296.3"short circuited" 123.7 27.4 82.3 130.6 178.6 193.3eso-hierarchical 227.1 11.7 95.3 227.4 349.6 618.4
Counter hierarchical descendingdirect 26.9 19.0 19.0 26.9 34.7"short circuited"
Transversal (same tree) 51.3 8.7 30.1 40.2 60.0 138.4Transversal (different trees) 76.2 1.5 30.0 56.0 99.9 346.4
GENERAL SERVICES NETWORK
Hierarchical ascendingdirect 27.6 3.3 15.0 22.0 35.2 142.2"short circuited" 40.4 9.1 25.2 34.9 46.8 114.0eso-hierarchical
Counter hierarchical descending
direct 25.2 4.2 15.0 22.8 33.6 58.3"short circuited" 27.6 26.3 23.6 24.6 34.5
Transversal (same tree) 24.5 5.3 14.2 21.2 32.9 74.0Transversal (different trees) 39.1 1.5 16.1 29.9 51.5 207.0
Comparing the five major regions across the two networks one finds some differences
in their patterns. In the region of Passo Fundo a proportion of hierarchical ascending
flows of 58% in the specialised network, and 70% in the general, point to a tighter

9
control of its area, especially for the less complex levels of care. External transversal
flows are proportionally less than the state average: 20% for the specialised and 7.9%
for the general services networks. Even so, for the specialised services, Passo Fundo
makes large inroads to the west, attracting centers directly linked to Porto Alegre such
as Três Passos and Tenente Portela and cutting into the area of Santa Rosa. Being the
smallest, Santa Rosa is the only region to have a share of external transversal flows
(50%) larger than that of ascending flows (42.3%) for the more complex network; for
the general health care services, however, its closure is quite high: 70% of the flows
ascending, and only 10% external transversal. Pelotas exhibits traits of a closed, isolated
region: 79% and 70% for ascending flows in each network, but external transversal
flows extend its linkages to the neighbouring areas of Rio Grande and, to the west,
Bagé. The regions of Santa Maria and Caxias do Sul, exhibit patterns closer to the state
average. Even so, their “control” seems to be tighter: 56% and 52.4% (for specialised
and general health care services, respectively) of ascending flows in the Santa Maria
area, 51.5% and 54.2% in the second. This last – Caxias do Sul – is similar to Pelotas as
regards the significance of external transversal flows (33.3%) in the specialised network
flows.
Discussion
The application of the methodology to Rio Grande do Sul provide a first picture of the
different types of organisation established by the consumption of health services. Two
networks were derived, according to level of services, and both of them exhibit
markedly nested hierarchies. The fact that the range of the services is smaller for those
of lesser complexity, and larger for the higher level group is something that, as Hagget
(1965) says, has been well established in central place literature for decades, and in
everyday experience since time was. The interesting question, as usual, is the way in
which these networks deviate from the norm. For the specialised network, interregional
flows tend to be directed to larger centers, and the primacy of Porto Alegre is the
dominant key, though there are also cases of links between centers on the same level,
and flows to smaller neighbouring centers. In this instance, the weakening of the
hierarchical principle is primarily due to centers "leapfrogging" the hierarchical level,
going straight to the top. For the general services, the instances of descending flows,
together with a large proportion of transversal flows in the same tree possibly reflect the
policy of municipal consortiums, whereby neighbouring municipalities pool their
10
resources and divide medical facilities between members, for shared use. The Santa
Maria University, with its leading teaching hospital may cause the link between Caxias
do Sul and Santa Maria, and the interconnections established in the general services
network, reflect more traditional elements of accessibility and neighbourhood. There is
no real evidence, in either case, of the process of increasing interdependence and
complementarity between medium-sized urban centers posited by Castells (1996). This
may be merely an expression of the inadequacy of the regional scale (limited to the state
of Rio Grande do Sul), and this question will be considered again at the national level.
As regards the test of the methodology for establishing functional regions for evaluating
per capita measures of availability of health care resources, this paper has established
the method's capacity for defining the "skeleton" of the regions. The major contribution
of the analysis of flows within and between regions in this context has been to establish
the relative "closure" of the regions, validating their use as basic units of analysis. The
next step will be to aggregate the areas, probably nesting the general services regions as
a second level, and to extend the analysis to the whole country.
A final comment refers to the importance of using purpose built regions for specific
analysis, whenever possible, as already suggested in the national definition of nodal
regions (IBGE, 2000). This study was based on the complete questionnaire, which
includes a diversity of other service and commercial central functions, and it also ranks
Pelotas, Passo Fundo and Santa Maria, on the second level. As for the other centers here
identified, Caxias do Sul is on the third level, directly linked to Porto Alegre, and Santa
Rosa is a fourth level center in the Santa Maria region. Ijuí is also assigned to Santa
Maria, as a third level center subordinating – among others – Santa Rosa and Santo
Angelo. Lajeado and Cachoeira do Sul are both directly linked to Porto Alegre, as
fourth and fifth level centers, respectively. These results illustrate that similarities in the
general delineation of regions do not mean identity of flows for different purposes.
Acknowledgements
I thank G. Rabino for making available the software, as well as for his advice on how to
make it run; Paulo Malta, for much needed help with the Italian instructions; Rogerio B.
Mattos, for access to the original flow database; and Wolney C. Menezes and Claudia
Travassos, for helpful comments and challenging criticism to a previous version.

11
References
BERROIR S. et al. 2001, Modeles regionaux et reorganisation des hierarchiesterritoriales. Revue d'Économie Régionale et Urbaine RERU.
CASTELLS M., 1996, The rise of the network society. Oxford: Blackwell Publishers.
DATASUS, 1993, Movimento de Autorização de Internação Hospitalar (ArquivosReduzidos) 1993. CD-ROM.
HAGGET P. 1965, Locational analysis in human geography, London: Edward Arnold.
IBGE, 1992, Assistência médico-sanitária 1992. Rio de Janeiro: IBGE.
IBGE, 2000, Regiões de influência das cidades 1993. Rio de Janeiro: IBGE.(Departamento de Geografia).
MAKUC D. et al. 1991, The use of health service areas for measuring provideravailability. The Journal of Rural Health.7(4)suppl.: 347-356.
NYSTUEN J.D., DACEY M.F., 1961, A graph theory interpretation of nodal regions.Papers and Proceedings of the Regional Science Association. 7:29-42.
OLIVEIRA E., 2001, Hierarquia dos municípios brasileiros segundo complexidade dosprocedimentos médicos disponíveis. (Unpublished paper).
RABINO G.A., OCCELLI S., 1997, Understanding spatial structure from network data:theoretical considerations and applications. Cybergeo. No. 29.
TRAVASSOS C. et al. 2000, Desigualdades geográficas e sociais na utilização deserviços de saúde no Brasil. Ciência & Saúde Coletiva. 5(1): 133-149.