headspace solid-phase microextraction of pesticide residues in \u003ci\u003ecannabis\u003c/i\u003e...
TRANSCRIPT

Article
Reference
Headspace solid-phase microextraction of pesticide residues in
Cannabis samples
ILIAS Yara et al
Abstract
A headspace solid-phase microextraction method combined with gas chromatographyndashmass
spectrometry was evaluated for the extraction and analysis of selected pesticides namely
alachlor β-hexachlorocyclohexane bromopropylate carbaryl diazinon linuron
polychlorobiphenyl 209 permethrine and simazine in cannabis samples Using a 100 μm
PDMS fibre compounds were directly extracted in the headspace mode at 150 degC for 5 min
and desorption was performed in the GC injector in the splitless mode at 280 degC for 3 min
Pesticide analysis was achieved and method repeatability given as the coefficient of
variation ranged between 24 for bromopropylate and 126 for linuron T he limits of
detection obtained using single ion monitoring (SIM) were between 0014 and 083 mgkg
depending on the pesticide
ILIAS Yara et al Headspace solid-phase microextraction of pesticide residues in Cannabis
samples Chimia 2006 vol 60 no 12 p 846-851
DOI 102533chimia2006846
Available at
httparchive-ouverteunigechunige6725
Disclaimer layout of this document may differ from the published version
[ Downloaded 21082012 at 211157 ]
1 1
Note 846CHIMIA200660No12
Chimia 60 (2006) 846ndash851 copy Schweizerische Chemische Gesellschaft
ISSN 0009ndash4293
Headspace Solid-Phase Microextraction of Pesticide Residues in Cannabis Samples
YaraIliasSergeRudazPhilippeChristenandJean-LucVeuthey
AbstractAheadspacesolid-phasemicroextractionmethodcombinedwithgaschromatographyndashmassspectro-metrywasevaluatedfortheextractionandanalysisofselectedpesticidesnamelyalachlorβ-hexachlorocyclohex-anebromopropylatecarbaryldiazinonlinuronpolychlorobiphenyl209permethrineandsimazineincannabissamplesUsinga100micromPDMSfibrecompoundsweredirectlyextractedintheheadspacemodeat150degCfor5minanddesorptionwasperformedintheGCinjectorinthesplitlessmodeat280degCfor3minPesticideanalysiswasachievedandmethodrepeatabilitygivenasthecoefficientofvariationrangedbetween24forbromopro-pylateand126forlinuronthelimitsofdetectionobtainedusingsingleionmonitoring(SIM)werebetween0014and083mgkgdependingonthepesticide
KeywordsCannabis middotHeadspacesolid-phasemicroextraction middotPesticides
large amount of solvent Thus the sample preparation often constitutes the limiting step of the analytical procedure and alterna-tive methods have been developed to over-come these disadvantages In particular recent techniques have been evaluated for the extraction of pesticides such as micro-wave-assisted extraction (MAE) [2][3] and supercritical fluid extraction (SFE) [4][5] After extracting drugs from plants differ-ent conventional techniques are available for sample purification and concentration such as liquidndashliquid extraction (LLE) and solid-phase extraction (SPE) [6ndash8]
New sample preparation strategies prior to GC analysis have appeared in the litera-ture in order to reduce the above-mentioned disadvantages Solid-phase microextraction (SPME) a solvent-free technique was in-troduced in 1990 by Arthur and Pawliszyn [9] and has gained a large interest due to its simplicity sensitivity ease of automation and relatively low cost This technique is performed in two steps with a modified sy-ringe containing the extraction fibre as pre-viously described in the literature [10] In the first step analytes are extracted from the matrix and retained on the stationary phase impregnated on the fibre In the second step compounds are desorbed in the GC injec-tor According to both the physico-chemical properties of the compounds of interest and to the matrix complexity there are mainly two modes of extraction direct SPME (DI-SPME) in which the fibre is dipped into a liquid sample and headspace-SPME (HS-SPME) with extraction of the compounds from the samplersquos headspace The number of applications of SPME is increasing and
includes environmental [11][12] biomedi-cal [13ndash15] food [16][17] and pharmaceu-tical [15][18] fields A number of reviews have been published that describe the use of this technique for pesticide monitoring [11][19ndash21]
In Switzerland for several years there have been numerous discussions on the legalization of the culture and consump-tion of cannabis and derivatives in which case a strict quality control would become mandatory for cannabis material For this purpose a method was developed in our laboratory to perform the cannabis profil-ing by a simple HS-SPME combined with GC-MS [22] The aim of the present study was to evaluate this HS-SPME method also for the extraction of pesticides from canna-bis with the ultimate objective of perform-ing simultaneous analyses of cannabinoids and pesticide residues in plant material It should be noted that since cannabis is considered as a drug of abuse in almost all countries there are few publications in the scientific literature concerning pesticide residues in cannabis [23][24] But accord-ing to its popularity cannabis cultivation is largely documented Information collected from the internet as well as from authorities (eg Service de Protection de la Consom-mation Geneva) showed that the following pesticides have been frequently observed and thus selected for this study alachlor (herbicide) β-hexachlorocyclohexane (β-HCH) (insecticide) bromopropylate (aca-ricide) carbaryl (insecticide) diazinon (insecticide) linuron (herbicide) poly-chlorobiphenyl 209 (PCB) (environmental contaminant) permethrine (insecticide)
CorrespondenceProfJ-LVeutheyLaboratoryofPharmaceuticalAnalyticalChemistryUniversityofGenevaUniversityofLausanne20bddrsquoYvoyCH-1211Geneva4tel+41223796336Fax+41223796808e-Mailjean-lucveutheypharmunigech
1 Introduction
Even if pesticides are widely used they are associated with important health and envi-ronmental risks Because of the persistence and potential toxicity of some compounds pesticide residue analysis has received increasing attention in the last few years Thus environmental food and biological samples are analysed regularly to obtain qualitative and quantitative information on their pesticide content Due to the extensive number of pesticides and significant matrix diversity chromatographic separations us-ing either gas chromatography (GC) or high-performance liquid chromatography (HPLC) coupled with different detec-tors are generally used However prior to these analyses a sample preparation step including extraction clean-up and pre-con-centration is often mandatory For plant material extraction is often performed by Soxhlet solvent maceration or percolation [1] These procedures offer good perform-ance but can be tedious and consume a
doi102533chimia2006846
Note 847CHIMIA200660No12
simazine (herbicide) The chemical struc-tures of these compounds are presented in Fig 1 Numerous SPME methods have al-ready been reported in the literature for the analysis of these substances They included extractions from different matrices such as water [25ndash27] soils [28][29] foodstuff [30-32] biological fluids [19][33][34] and plants [35ndash38] using both types of SPME modes and several fibres
2 Experimental
21 Chemicals and StandardsAnalytical grade solvents were pur-
chased from Panreac Quimica SA (Bar-celona Spain) Standard pesticides were from Riedel-de-Haeumln (Seelze Germany) It should be noted that permethrine contained both cis and trans isomers Depending on each compoundrsquos solubility standard stock solutions were prepared in methanol at dif-ferent concentrations (Table 1) Stock so-lutions were used to prepare a methanolic mixture containing all compounds except the internal standard (IS) fenthion (see con-centrations in Table 1)
22 Plant MaterialIn this study two different plant materi-
als were used The first was employed for the method development and the second consisted of home-cultivated plants sub-jected to pesticide treatment (see conditions below) for real case analyses
It should be noted that a special authori-zation (Decision AB-85-BetmG-222) from the federal authorities (Bundesamt fuumlr Ge-sundheit Switzerland) was attributed to our laboratory for projects on cannabis Thus the laboratory can acquire keep in stock use and produce cannabis
221Method DevelopmentAs previously reported [22] Swiss
marijuana samples from the Geneva area and without pesticides were used for the method development Method suitability and evaluation of quantitative performance were carried out by spiking the samples with the pesticide mixture
222Cannabis Cultivation Twenty-one-month old plantlets (two
per pesticide and two untreated samples) of certified origin were purchased in Geneva They were transferred into 13 cm id pots filled with commercial potting mixes (pH = 7) Before repotting the plantlets herbi-cides ie alachlor linuron and simazine as well as the environmental contaminant PCB 209 were added in methanolic solutions at 1 to the soils The remaining pesticides were applied twice (one month apart) by spraying 10 ml of a 1 methanolic solutions on plants This concentration corresponded
to the average concentration recommended for pesticide applications on cannabis
Plants were grown from June until the end of September in a room equipped with large windows without artificial light The ambient temperature varied between 20 and 25 degC during the day and 12 and 15 degC dur-ing the night The room was aerated twice daily for 15 min Watering was done once a week Flowering took place at the end of September and flowering tops were distrib-uted all along the plant Plants were cut at 2 cm above soil level hung upside-down in the same room and allowed to dry for two weeks Finally each dried plant was cut into three parts and flowering tops were separated from leaves
23 SPME Procedure A 100 microm polydimethylsiloxane (PDMS)
fibre purchased from Supelco (Bellefonte PA USA) was used and conditioned accord-ing to the instructions given by the supplier
231Standard Solution AnalysisStandard methanolic solutions contain-
ing the pesticide mixture were introduced into 2 ml glass vials and solvent evapo-rated to dryness at ambient temperature under a gentle stream of nitrogen (Techne Concentrator Witeg AG Littau-Luzern Switzerland) for 2 min As reported else-where [22] vials sealed with siliconePTFE septa were placed in a thermostated bath at 150 degC Solid-phase microextractions were
N
NCH3
CH3
CH3
OP
S
OH3CO
H3C
ClCl
ClCl
Cl
Cl
O
O
NH
CH3
N
H3C OCH3
CH3
O
Cl
NH
C lC l
N
CH3
MeO
O
N N
NHN CH3
HNH3C
Cl
Cl Cl
Cl
ClClClCl
Cl
Cl Cl
O
C H3H3C
O
O
C l
C l
OPr-i
BrBr
C
C
OH
O
1 2 3
45 6
78 9
N
NCH3
CH3
CH3
OP
S
OH3CO
H3C
ClCl
ClCl
Cl
Cl
O
O
NH
CH3
N
H3C OCH3
CH3
O
Cl
NH
C lC l
N
CH3
MeO
O
N N
NHN CH3
HNH3C
Cl
Cl Cl
Cl
ClClClCl
Cl
Cl Cl
O
C H3H3C
O
O
C l
C l
OPr-i
BrBr
C
C
OH
O
OPr-i
BrBr
C
C
OH
O
OPr-i
BrBr
C
C
OH
O
1 2 3
45 6
78 9
Figure 1
Fig1Chemicalstructuresoftheselectedpesticides1alachlor2β-HCH3bromopropylate4carbaryl5diazinon6linuron7PCB2098permethrine9simazine
table1Concentrationsofpesticides[ppm]instandardstocksolutionsandinthemixture
Compound Stock solution Mixture
Diazinon 1500 150
Alachlor 1000 100
Bromopropylate 1000 100
Carbaryl 1000 100
β-HCH 1000 100
Linuron 1000 100
Permethrine 1000 100
Fenthion (IS) 1000 ndash
Simazine 100 10
PCB 209 50 15
Note 848CHIMIA200660No12
performed without agitation in the head-space mode for 5 min After extraction the fibre was removed and directly inserted into the injection port of the GC and analytes were desorbed at 280 degC for 3 min
232Spiked Plant AnalysisMarijuana samples were powdered with
a ball-mill (MM Retsch Switzerland) and sieved to an average particle size between 100 and 150 microm Powdered marijuana (60 mg per analysis) was placed in 2 ml glass vials and pesticides in solution were added on the plant material After 5 min the sol-vent was evaporated under a nitrogen steam and HS-SPME was performed as described above Before introducing the pesticide so-lutions a blank analysis was performed on the plant material to determine the cannabi-noid profile and to confirm the absence of pesticides All analyses were carried out in triplicate
233Cultivated Plant AnalysisDried cultivated marijuana samples
were powdered and analysed in triplicate by HS-SPME in the same conditions described above
24 Focused Microwave-assisted Extraction of Cultivated Plants
Focused microwave-assisted extrac-tions (FMAE) were performed to extract all putative pesticides and compare the results with those obtained by HS-SPME Samples containing 60 mg of dried and powdered marijuana were immersed in 5 ml methanol and exposed for 30 s to mi-crowave irradiation (125 W) [39] Extrac-tions were performed at atmospheric pres-sure at a standard frequency of 2450 MHz using a 36 FMAE apparatus (Prolabo France) Methanolic extracts were filtered over a 045 microm PTFE filter and aliquots of 1 microl were directly analysed by GCMS
25 GCMS Conditions GCMS analyses were performed on an
HP 5890 series II gas chromatograph (Agi-lent Technologies Waldbronn Germany) coupled with an HP 5972 mass spectrom-eter A HP-5MS capillary column (30 m times 025 mm id 025 microm phase thickness) was used The injection was performed in the splitless mode (3 min) at 280 degC The oven temperature was 50 degC for 1 min to 190 degC at 10 degCmin to 200 degC at 1 degCmin to 290 degC at 45 degCmin held for 3 min Helium was used as carrier gas at constant flow rate (1 ml min) The transfer line temperature was set at 280 degC For qualitative analysis the mass spectrometer was operated using electron impact (EI) ionisation at 70 eV in the scan range mz 30ndash400 For quantification of the different pesticides single ion monitoring (SIM) was employed (see Table 2 for the monitored ions for each compound)
3 Results and Discussion
31 Qualitative AnalysisIn a previous study [22] a straightfor-
ward SPMEGC-MS method was devel-oped for profiling cannabinoids from plant material Compounds were directly ex-tracted from the plantrsquos headspace for 5 min with a 100 microm PDMS fibre The extraction temperature was 150 degC and desorption was directly performed in the GC injection port at 280 degC for 3 min in the splitless mode
In order to evaluate the applicability of this method to the extraction of the se-lected pesticides first experiments were performed on standard pesticide solutions dried under nitrogen and extracted by HS-
SPME Fig 2 presents a typical chromato-gram obtained for the mixture of the nine selected pesticides
From a qualitative point of view all pesticides were extracted and detected In addition MS detection allowed the identi-fication of three supplementary peaks cor-responding to degradation products of car-baryl (peak 3) and linuron (peaks 1 and 2) Muumlller and Stan [38] reported the degrada-tion of carbamates (carbaryl) into the cor-responding phenols and methyl-isocyanate (Fig 3) This degradation was dependent on the GC injection mode In the case of on-column injection no degradation was observed by the authors On the other hand a total degradation was obtained when a
table2Monitoredionsforthequantificationoftheselectedpesticides
CompoundRetention time
[min]Quantification ion
[Th]Confirmation ion
[Th]
Aromatic isocyanate 1040 124 187
Dichloroaniline 1204 161 163
Naphthalenol 1323 115 144
Simazine 1581 201 68
β-HCH 1596 181 183
Diazinon 1666 137 304
Alachlor 1829 160 188
Linuron 1914 61 160
Fenthion 1980 278 125
Bromopropylate 2750 341 183
Cis-permethrine 2866 183 163
Trans-permethrine 2876 183 163
PCB 209 2990 497 428
Fig 2 GC-MS chromatogram of the pesticide mixture extracted by HS-SPMe Compounds 1aromatic isocyanate 2 dichloroaniline 3 naphthalenol 4 simazine 5 β-HCH 6 diazinon 7alachlor8linuron9bromopropylate10cis-permethrine11trans-permethrine12PCB209
Note 849CHIMIA200660No12
splitless injection was performed at 220 degC whereas only partial decomposition was noted in the case of a programmable temperature vaporization (PTV) injection In our method since desorption was ac-complished in the splitless mode at 280 degC carbaryl was entirely degraded and only naphthalenol was detected
Concerning linuron the degradation scheme is more complex (Fig 4) Indeed not only the temperature but also the injec-tion solvent can influence the degradation process as discussed by Carabias-Martinez et al [40] In our case only aromatic iso-cyanate and dichloroaniline were observed in addition to the original compound peak since methanol was completely evaporated prior to SPME For the following inves-tigations peak area of naphthalenol was monitored for carbaryl whereas the sum of isocyanate dichloroaniline and linuron was reported for linuron
In addition an analysis on blank plant material was performed and the chromato-gram showing the cannabinoid profile is presented in Fig 5 The window between 10 and 16 min contains volatile compounds of cannabis [22] whereas cannabinoids elute between 26 and 285 min
Moreover by spiking plant material with the solution containing all pesticides simultaneous analysis of the cannabinoids and the selected pesticides was achieved with the same procedure The chromato-graphic profile is presented in Fig 6 Com-pounds with retention times below 16 min ie aromatic isocyanate (1) dichloroaniline (2) and naphthalenol (3) cannot be deter-mined on the chromatogram since they appeared in the cannabis volatiles window (see Fig 5)
32 Quantitative AspectsIn order to evaluate the quantification
of pesticides using the HS-SPMEGC-MS method preliminary experiments were per-formed
Calibration curves were established by spiking cannabis samples with standard so-lutions at increasing concentrations (with fenthion as internal standard at 20 ppm) Five concentrations were used with three independent analyses at each calibration level After evaporating the solvent analy-ses were performed to establish calibration
OH
C N CH3O
O NH
O
CH3
carbaryl naphtalenol
+methyl-isocyanate
ΔOH
C N CH3O
O NH
O
CH3
carbaryl naphtalenol
+methyl-isocyanate
Δ
Figure 3
Fig3Degradationschemeofcarbaryl[38]
NH
ClCl
N
CH3
MeO
O
ClCl
NC
O
ClCl
NHOMe
O
ClCl
NH2
linuron aromatic isocyanate
carbamic ester(swep)
dichloroaniline
MeOH
waterΔ
ΔNH
ClCl
N
CH3
MeO
O
ClCl
NC
O
ClCl
NHOMe
O
ClCl
NH2
linuron aromatic isocyanate
carbamic ester(swep)
carbamic ester(swep)
dichloroaniline
MeOH
waterΔ
Δ
Figure 4
Fig4Degradationschemeoflinuron
Fig5GC-MSchromatogramofaplantwithoutpesticidesextractedbyHS-SPMeCannabinoids[22]Acannabinoid1BtetrahydrocannabivarineCcannabinoid2DcannabicyclolEcannabivarineFcannabidiolGcannabichromeneH∆9-tetrahydrocannabinolJcannabigerolKcannabinol
Fig6GC-MSchromatogramofaspikedplantextractedbyHS-SPMePesticidescompounds1to3arenotshownonthischromatogram(seeexplanationsinthetext)4simazine5β-HCH6diazinon7alachlor8linuron9bromopropylate10cis-permethrine11trans-permethrine12PCB209Cannabinoids[22]Acannabinoid1Btetrahydrocannabivarine Ccannabinoid2DcannabicyclolEcannabivarineFcannabidiolGcannabichromeneH∆9-tetrahydrocannabinolJcannabigerolKcannabinol
Note 850CHIMIA200660No12
parameters based on conventional least-squared regression (Table 3) The deter-mination of the limits of detection (LOD) was carried out by spiking the plants with decreasing concentrations of the standard solutions In order to evaluate the method sensitivity when available reference val-ues indicated for tobacco [41] were taken as targets and listed in Table 3
As reported in Table 3 satisfactory re-sults were achieved with the applied HS-SPMEGC-MS method The simplest linear model exhibited coefficients of determina-tion (R2) between 096 and 099 LODs obtained in the SIM acquisition mode dem-onstrated that the method was sensitive enough to allow quantification of pesticide residues in plant material
Furthermore results concerning repeat-ability and method trueness were studied by performing six analyses on plant material spiked with the pesticide mixture solution at a concentration level situated in the cen-tre of the investigation range As listed in Table 4 coefficients of variation (CVs) of the peak area ratios (compoundIS) ranged from 24 for bromopropylate to 126 for linuron Finally the method trueness expressed as recoveries (measured amountapplied amount) ranged from 961 to 1048 (Table 4)
33 Application on Cultivated Cannabis
The HS-SPMEGC-MS method pro-vided suitable qualitative and quantitative performance for the analysis of cannabis previously spiked with pesticides Final investigations were conducted to test the analysis of pesticides in real cases ie in cultivated samples treated with such com-pounds Therefore cannabis plants were cultivated at the University of Geneva in-cluding regular treatments with the differ-ent pesticides
HS-SPME and GC-MS analyses were performed on flowering tops as well as on leaves in triplicate in both acquisition modes (scan and SIM) For all plants can-nabinoids were detected but none of the screened pesticides were found
Different explanations for these results can be proposed Firstly residues could be at lower concentrations than determined LODs Secondly a loss of pesticides could occur either by natural removal (eg wash-ing evaporation and photolysis) or by me-tabolization in the plant The latter also described as the detoxification process is the major route of elimination of pes-ticides by plants and is mainly based on enzymatic transformations [42] involving cytochromes P450 peroxidases and other oxidoreductases hydrolytic enzymes etc These various and complex metabolic pathways are generally classified in a three-phase process as described by Roberts [43]
and Hoagland et al [44] The final hypoth-esis to explain the absence of pesticides on the chromatograms could be their strong matrix linkage hindering their extraction by HS-SPME
Therefore plants were submitted to more drastic extraction conditions using microwave irradiation In this case the pen-etration of solvent molecules into the matrix is enhanced by two phenomena disruption of hydrogen bonds together with migra-tion of dissolved ions [45] As a result a better solvation of the components can be obtained particularly in the case of solid matrices Thus a FMAE method previously developed for cocaine extraction [39] was applied to the spiked cannabis samples Under these conditions all pesticides were extracted (data not shown) FMAE extracts of cultivated plants were finally analysed by GC-MS No pesticides were found on the chromatograms This confirmed the
absence of pesticide residues in cultivated plant material and supported the results ob-tained by the HS-SPME procedure
4 Conclusion
Headspace solid-phase microextraction combined with GC-MS can be used for the determination of pesticide residues in plant material The highly efficient PDMS fibre allowed several compounds of different chemical structures and physicochemical properties to be simultaneously extracted Indeed the same method was performed for the extraction of cannabinoids and pesticide residues from cannabis Moreover satisfac-tory quantitative performance was obtained with LODs lower than targeted concentra-tions and repeatability ranging from 24 to 126 Thus the HS-SPMEGC-MS method provides the possibility of a simple
table3QuantitativeevaluationoftheHS-SPMeGC-MSmethod
Compound
Calibration range [mgkg]
Coefficient of determination
(R2)
LODa
[mgkg] Recommended
maximum amounts [mgkg]
Naphthalenol 083ndash165 09754 017 3
Simazine 086ndash165 09694 017 nib
β-HCH 085ndash165 09632 017 1
Diazinon 013ndash165 09776 0025 1
Alachlor 087ndash165 09701 0017 01
Linuron 365ndash165 09630 083 5
Bromopropylate 008ndash165 09725 0017 ni
Cis-permethrine 006ndash1207 09604 0014 ni
Trans-permethrine 008ndash165 09625 0014 ni
PCB 209 037ndash50 09884 0083 ni
aDeterminedatasignal-to-noiseratioof3bnotindicatedForthesecompoundsalimitof1mgkgwasfixedasareferencevalue
table4estimationofthemethodrepeatabilityandtrueness(n=6)
Compound CV [] Trueness []
Naphtalenol 54 972
Simazine 49 988
β-HCH 32 966
Diazinon 63 977
Alachlor 72 1015
Linuron 126 964
Bromopropylate 24 1019
Cis-permethrine 103 961
Trans-permethrine 82 986
PCB 209 49 1048
Note 851CHIMIA200660No12
and rapid quality control of plant material based on cannabinoid profiling (qualitative analysis scan mode) and pesticide residue determination (quantitative analysis SIM mode)
Finally the developed method was ap-plied to the analysis of plants treated with the selected pesticides at usual concentra-tions No pesticide residues were observed even when samples were submitted to mi-crowave extraction
AcknowledgementsThe authors are indebted to Dr Patrick Edder
and Dr Didier Ortelli (Service de Protection de la Consommation Geneva) for their fruitful discussions on the pesticide selection and the recommended maximum amounts We are also grateful to Ms Annick Dupont for her technical assistance
Received November 2 2006
[1] ES Ong J Chromatogr B 2004 812 23[2] M Barriada-Pereira E Concha-Grana
MJ Gonzalez-Castro S Muniategui-Lo-renzo P Lopez-Mahia D Prada-Rodri-guez E Fernandez-Fernandez J Chro-matogr A 2003 1008 115
[3] M Ramil Criado I Rodriguez Peirero R Cela Torrijos J Chromatogr A 2003 985 137
[4] HB Wan MK Wong J Chromatogr A 1996 754 43
[5] VG Zuin JH Yariwake C Bicchi J Chromatogr A 2003 985 159
[6] MM Bashir J Borossay K Torkos Microchem J 1998 58 31
[7] H Sabik R Jeannot B Rondeau J Chro-matogr A 2000 885 217
[8] Y Pico JC Molto J Manes G Font J Microcol Sep 1994 6 331
[9] CL Arthur J Pawliszyn Anal Chem 1990 62 2145
[10] H Lord J Pawliszyn J Chromatogr A 2000 885 153
[11] M Alpendurada J Chromatogr A 2000 889 3
[12] CG Zambonin Anal Bioanal Chem 2003 375 73
[13] S Ulrich J Chromatogr A 2000 902 167
[14] NH Snow J Chromatogr A 2000 885 445
[15] H Kataoka Trends Anal Chem 2003 22 232
[16] H Kataoka H Lord J Pawliszyn J Chromatogr A 2000 880 35
[17] W Wardencki M Michulec J Curylo Int J Food Sci Tech 2004 39 703
[18] T Kumazawa XP Lee K Sato O Suzu-ki Anal Chim Acta 2003 492 49
[19] J Beltran F Lopez F Hernandez J Chromatogr A 2000 885 389
[20] JS Aulakh AK Malik V Kaur P Schmitt-Kopplin Crit Rev Anal Chem 2005 35 71
[21] LJ Krutz SA Senseman AS Sciumba-to J Chromatogr A 2003 999 103
[22] Y Ilias S Rudaz P Mathieu P Christen JL Veuthey J Sep Sci 2005 28 2293
[23] JM Mc Partland PL Pruitt Altem Ther Health M 1997 3 39
[24] JM Mc Partland lsquoContaminants and Adulterants in Herbal Cannabisrsquo in lsquoCan-nabis and Cannabinoids Pharmacology Toxicology and Therapeutic Potentialrsquo Haworth Press ed New York London Oxford 337ndash343 (2002)
[25] C Gonccedilalves M Alpendurada J Chro-matogr A 2002 968 177
[26] DA Lambropoulou TA Albanis J Chromatogr A 2001 922 243
[27] HP Li GC Li JF Jen J Chromatogr A 2003 1012 129
[28] WF Ng MJK Teo HA Lasko Frese-niusrsquo J Anal Chem 1999 363 673
[29] G Shen HK Lee J Chromatogr A 2003 985 167
[30] J Beltran A Peruga E Pitarch FJ Lo-pez F Hernandez Anal Bioanal Chem 2003 376 502
[31] M Volante M Pontello L Valoti M Cattaneo M Bianchi L Colzani Pest Manag Sci 2000 56 618
[32] DA Lambropoulou TA Albanis J Ag-ric Food Chem 2002 50 3359
[33] H Tsoukali G Theodoris N Raikos I Grigoratou J Chromatogr B 2005 822 194
[34] FJ Lopez E Pitarch S Egea J Beltran F Hernandez Anal Chim Acta 2001 433 217
[35] MVN Rodrigues FGR Reyes VLG Rehder S Rath Chromatographia 2005 61 291
[36] WH Ho SJ Hsieh Anal Chim Acta 2001 428 111
[37] BH Hwang MR Lee J Chromatogr A 2000 898 245
[38] HM Muumlller HJ Stan High Resol Chro-matogr 1990 13 759
[39] A Brachet P Christen JL Veuthey Phy-tochem Anal 2002 13 162
[40] R Carabias-Martinez C Garcia-Hermida E Rodriguez-Gonzalo FE Soriano-Bra-vo J Hernagravendez-Meacutendez J Chromatogr A 2003 1002 1
[41] W Wittekindt Beitr Tabakforsch 1986 13 271
[42] LL Van Eerd RE Hoagland JC Hall Weed Sci 2003 51 472
[43] TR Roberts Pestic Outlook 1998 9 17 [44] RE Hoagland RM Zablotowicz JC
Hall ACS Symposium Series 2001 777 2
[45] K Ganzler I Szinai A Salgo J Chroma-togr 1990 520 257
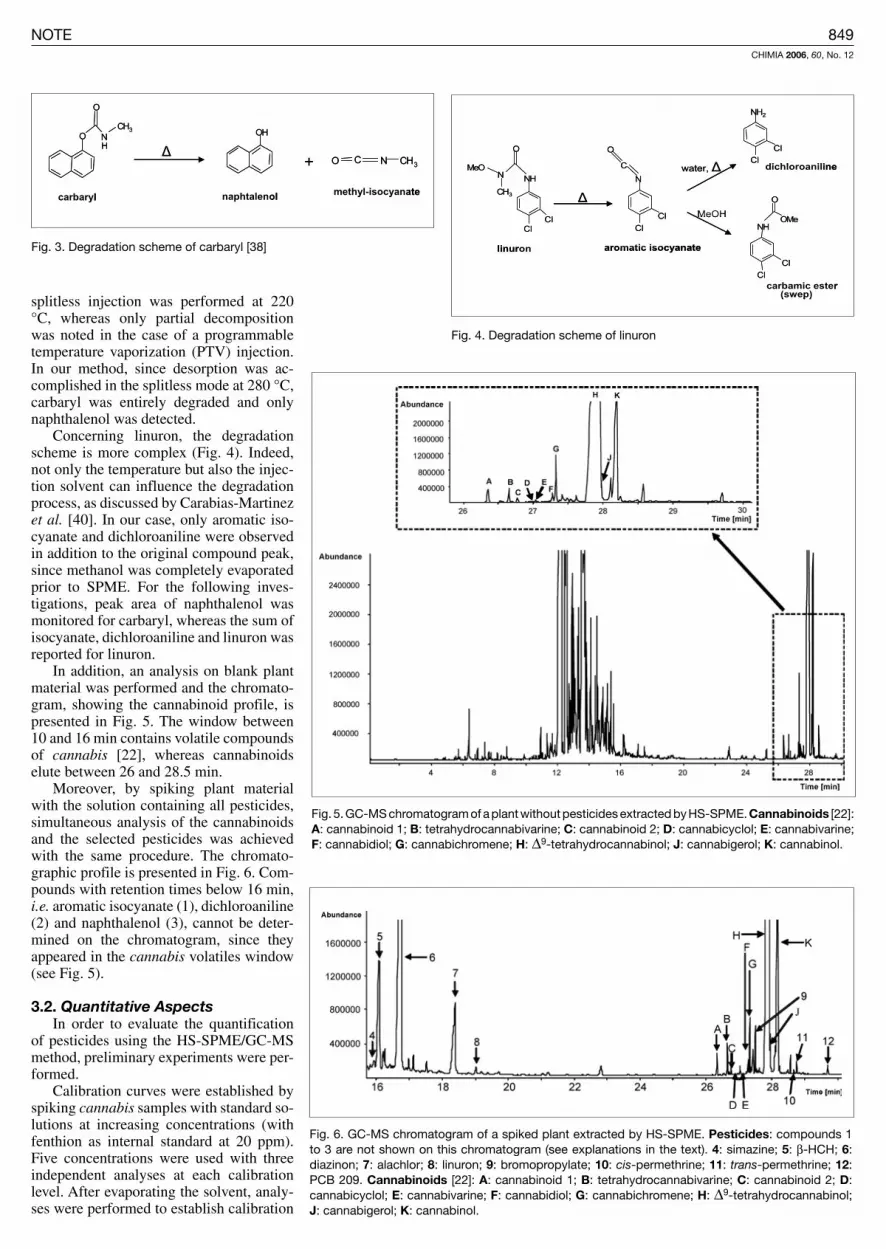