hart km, sartain ar, hillis-starr z-m, mayor pa, allen jb, pemberton r, phillips b, lundgren i....
TRANSCRIPT
ORIGINAL PAPER
Ecology of juvenile hawksbills (Eretmochelys imbricata) at BuckIsland Reef National Monument, US Virgin Islands
Kristen M. Hart • Autumn R. Sartain • Zandy-Marie Hillis-Starr •
Brendalee Phillips • Philippe A. Mayor • Kimberly Roberson • Roy A. Pemberton Jr. •
Jason B. Allen • Ian Lundgren • Susanna Musick
Received: 11 October 2012 /Accepted: 9 April 2013
� Springer-Verlag Berlin Heidelberg (outside the USA) 2013
Abstract Surveys of juvenile hawksbills around Buck
Island Reef National Monument, US Virgin Islands from
1994 to 1999 revealed distributional patterns and resulted
in a total of 75 individual hawksbill captures from all years;
turtles ranged from 23.2 to 77.7 cm curved carapace length
(CCL; mean 42.1 ± 12.3 cm SD). Juveniles concentrated
where Zoanthid cover was highest. Length of time between
recaptures, or presumed minimum site residency, ranged
from 59 to 1,396 days (mean 620.8 ± 402.4 days SD).
Growth rates for 23 juveniles ranged from 0.0 to
9.5 cm year-1 (mean 4.1 ± 2.4 cm year-1SD). Annual
mean growth rates were non-monotonic, with the largest
mean growth rate occurring in the 30–39 cm CCL size
class. Gastric lavages indicated that Zoanthids were the
primary food source for hawksbills. These results contrib-
ute to our understanding of juvenile hawksbill ecology and
serve as a baseline for future studies or inventories of
hawksbills in the Caribbean.
Introduction
Understanding the ecology of juvenile marine turtles in
developmental habitats is vital for designing strategies to
ensure persistence of the species, especially when the
habitat and species may be at risk (Meylan et al. 2011). As
juveniles, Chelonidae species spend the greatest period of
their lives within developmental habitats, and their asso-
ciation with particular sites may last for decades. When
they reach sexual maturity (20–30 years), adults leave
foraging grounds to make temporary reproductive migra-
tions (Limpus 1994). Juvenile hawksbill sea turtles (Er-
etmochelys imbricata) in particular have been observed
spending many years in developmental habitat (Witzell
1983; Van Dam and Diez 1997, 1998), and previous studies
have shown they have small home ranges in these areas
(*1 km2 or less; Van Dam and Diez 1997, 1998; Berube
CNTS is contracted to U.S. Geological Survey, Southeast Ecological
Science Center, Davie, FL, USA.
Communicated by R. Lewison.
K. M. Hart (&)
U.S. Geological Survey, Southeast Ecological Science Center,
Davie, FL, USA
e-mail: [email protected]
A. R. Sartain
CNTS, Davie, USA
Z.-M. Hillis-Starr � P. A. Mayor � I. Lundgren � S. Musick
National Park Service, Buck Island Reef National Monument,
Christiansted, USVI, USA
B. Phillips
U.S. Fish and Wildlife Service, John Heinz National Wildlife
Refuge, Philadelphia, PA, USA
K. Roberson
NOAA, Center for Coastal Monitoring and Assessment, Silver
Springs, MD, USA
R. A. Pemberton Jr.
Division of Fish and Wildlife, DPNR, Government of U.S.
Virgin Islands, St. Thomas, USVI, USA
J. B. Allen
Mote Marine Laboratory, Sarasota, FL, USA
123
Mar Biol
DOI 10.1007/s00227-013-2249-x
2012; Scales et al. 2011; also see Cuevas et al. 2007).
Additionally, these developmental habitats can be home to
juveniles from many different nesting aggregations, each
often consisting of genetically distinct subpopulations
(Bass et al. 1996; Velez-Zuazo et al. 2008).
Hawksbills primarily occupy coral reef habitats
throughout most of their Caribbean range (Carr et al. 1966;
Mortimer and Donnelly 2008). In parts of the eastern
Pacific, they also inhabit mangrove estuaries (Gaos et al.
2012). Although hawksbills are circumtropically distrib-
uted, they are considered endangered in all parts of their
range (National Marine Fisheries Service [NMFS] and
United States Fish and Wildlife Service [USFWS] 1993;
NMFS and USFWS 1998). The hawksbill was listed as
critically endangered on the International Union for Con-
servation of Nature (IUCN) Red List of Threatened Species
in 1996, based on overall decline in the species of over
80 %, and extensive subpopulation declines in all ocean
basins (Mortimer and Donnelly 2008). There are few pla-
ces in the Caribbean where aggregations of hawksbill tur-
tles, adults or juveniles, remain today (NMFS and USFWS
1993). Previous studies on juvenile hawksbill populations
in the Caribbean have been conducted in Puerto Rico (Van
Dam and Diez 1997, 1998), the Cayman Islands (Blu-
menthal et al. 2009a, b), Honduras (Dunbar et al. 2008;
Berube 2012), and the Dominican Republic (Leon and Diez
1999). Limited hawksbill population surveys have also
been conducted in near-shore waters of the Virgin Islands
(Boulon 1994, see Pemberton 2001). Still, the ecology of
this species during the juvenile life stage is not well
understood.
Buck Island Reef National Monument (BIRNM), US
Virgin Islands (USVI) is the only fully protected site in the
Caribbean where hawksbills both forage and nest (USFWS
and NMFS 1993). The Hawksbill Recovery Plan identifies
the need to determine (for all life stages) distribution,
abundance, seasonal movements, foraging areas (Sec-
tion 121 and 2,211), growth rates, and survivorship (Sect.
2,213; USFWS and NMFS 1993); these data are key for
making inferences about hawksbill population demo-
graphics. In particular, juvenile growth rates can eventually
affect the rate and potential of nesting stock growth and
recovery (see Kubis et al. 2009).
This study was designed to conduct baseline surveys for
abundance and distribution of juvenile hawksbills, identify
benthic composition in foraging areas, determine diet
through lavages, and gather data on growth rates and
minimum residency from recaptured turtles. Our specific
objectives involved using three approaches from 1994 to
1999, including (1) in-water distribution surveys to deter-
mine occurrence of hawksbills and relative abundance in
relation to specific habitat features; (2) in-water capture
efforts to tag and recapture individuals, collect biometric
data, and assess habitat use; and (3) gastric lavages to
determine the diet of juvenile hawksbills captured in
shallow areas of BIRNM.
Materials and methods
Study site
BIRNM includes a 0.71-km2 uninhabited island (Buck
Island) located on the shallow St. Croix shelf (approx.
15–20 m depth range), 2.4 km northeast of the island of St.
Croix in the USVI at N17� 47.40, W64� 37.20 (Fig. 1). Thecoral sand beaches on the island dominate the southwest
side and serve as nesting habitat for hawksbill, loggerhead
(Caretta caretta), green (Chelonia mydas), and leatherback
(Dermochelys coriacea) sea turtles. An emergent bank-
barrier reef girdles the island from the southeast to the
northwest, enclosing a lagoon 50–150 m wide (Fig. 1).
This reef is primarily made up of dead elkhorn coral (Ac-
ropora palmatta), the dominant reef-building coral in the
Caribbean; this reef experienced extensive damage from
white-band disease in the 1970s and 1980s and from
Hurricane Hugo in 1989 (Gladfelter 1982; Bythell et al.
1993). In the forereef (seaward of the barrier reef), these A.
palmata corals create ‘‘haystacks’’ that rise to the surface
from a depth of 9 m, with the east forereef representing one
of the densest stands around St. Croix. Other dominant
coral species of the bank-barrier reef and the patch reefs
include Montastria annularis, Porities astreoides, Diploria
sp., Porites porites, and Acropora cervicornis. Other
dominant organisms include various algae, Zoanthus sp.,
Briarium, Millepora sp., and seagrasses. The waters of
BIRNM provide foraging habitat for all four species of sea
turtle that nest on Buck Island.
The current boundary of BIRNM was expanded in 2001
from the original 1961 designation, adding 73.4 km2 of
submerged lands. Our study took place from 1994 to 1999,
while the original boundary was in place and all activities
occurred within that area. This included 0.71 km2 of land
and 2.9 km2 of water and coral reef system. For all surveys,
we entered the lagoon via motor boat, and either moored
the boat near dive locations (i.e., Underwater Trail or
SCUBA Cut) or anchored it in sand at other locations,
depending on weather, sea conditions, or location of in-
water surveys (see Fig. 1).
Turtle distribution surveys
We conducted daily turtle distribution surveys, weather
permitting, from May to August 1998 (summer) and from
December 1998 through March 1999 (winter). To define
Mar Biol
123
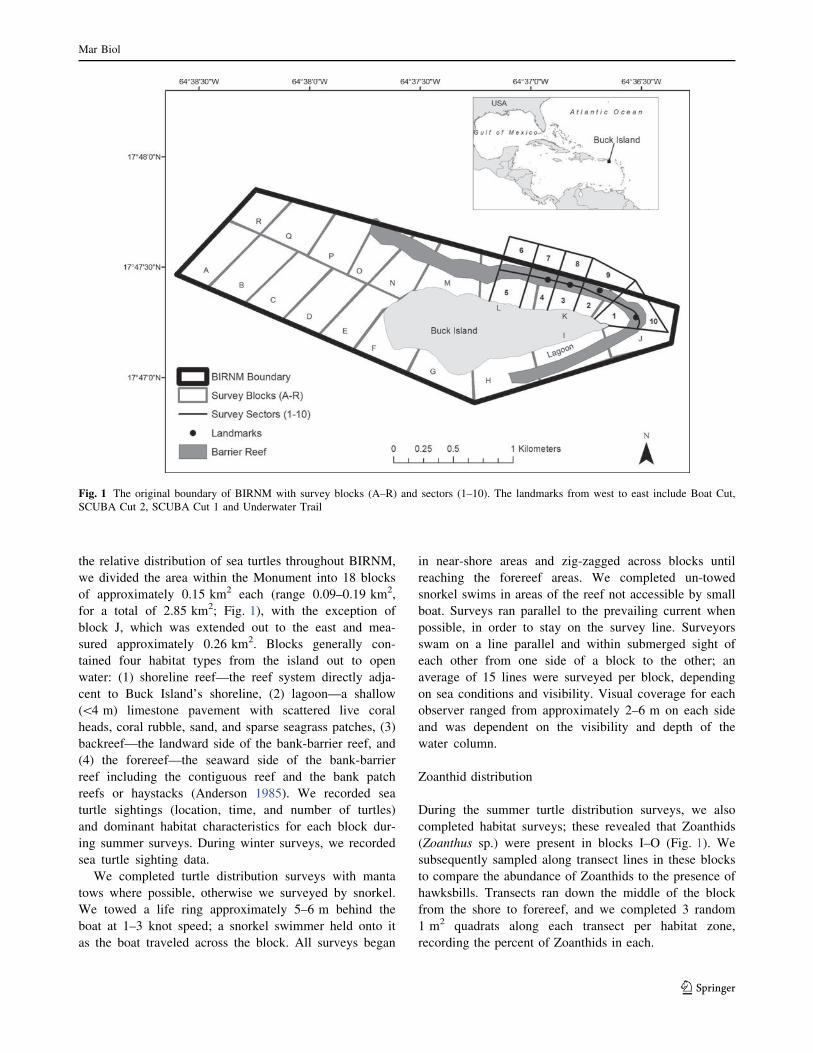
the relative distribution of sea turtles throughout BIRNM,
we divided the area within the Monument into 18 blocks
of approximately 0.15 km2 each (range 0.09–0.19 km2,
for a total of 2.85 km2; Fig. 1), with the exception of
block J, which was extended out to the east and mea-
sured approximately 0.26 km2. Blocks generally con-
tained four habitat types from the island out to open
water: (1) shoreline reef—the reef system directly adja-
cent to Buck Island’s shoreline, (2) lagoon—a shallow
(\4 m) limestone pavement with scattered live coral
heads, coral rubble, sand, and sparse seagrass patches, (3)
backreef—the landward side of the bank-barrier reef, and
(4) the forereef—the seaward side of the bank-barrier
reef including the contiguous reef and the bank patch
reefs or haystacks (Anderson 1985). We recorded sea
turtle sightings (location, time, and number of turtles)
and dominant habitat characteristics for each block dur-
ing summer surveys. During winter surveys, we recorded
sea turtle sighting data.
We completed turtle distribution surveys with manta
tows where possible, otherwise we surveyed by snorkel.
We towed a life ring approximately 5–6 m behind the
boat at 1–3 knot speed; a snorkel swimmer held onto it
as the boat traveled across the block. All surveys began
in near-shore areas and zig-zagged across blocks until
reaching the forereef areas. We completed un-towed
snorkel swims in areas of the reef not accessible by small
boat. Surveys ran parallel to the prevailing current when
possible, in order to stay on the survey line. Surveyors
swam on a line parallel and within submerged sight of
each other from one side of a block to the other; an
average of 15 lines were surveyed per block, depending
on sea conditions and visibility. Visual coverage for each
observer ranged from approximately 2–6 m on each side
and was dependent on the visibility and depth of the
water column.
Zoanthid distribution
During the summer turtle distribution surveys, we also
completed habitat surveys; these revealed that Zoanthids
(Zoanthus sp.) were present in blocks I–O (Fig. 1). We
subsequently sampled along transect lines in these blocks
to compare the abundance of Zoanthids to the presence of
hawksbills. Transects ran down the middle of the block
from the shore to forereef, and we completed 3 random
1 m2 quadrats along each transect per habitat zone,
recording the percent of Zoanthids in each.
Fig. 1 The original boundary of BIRNM with survey blocks (A–R) and sectors (1–10). The landmarks from west to east include Boat Cut,
SCUBA Cut 2, SCUBA Cut 1 and Underwater Trail
Mar Biol
123
Capture surveys
We concentrated capture activities near the east-south-
eastern tip of Buck Island, to the north-western end of the
patch reef system. We divided the eastern section into 10
sectors ranging in size from approximately 0.05–0.08 km2
(1–10; Fig. 1) to identify capture locations on a finer scale.
We conducted captures from May to December 1994,
January–November 1995, May–September 1996, January–
December 1997, and January–October 1998. For each
capture, we recorded the sector in which each turtle was
originally sighted. For each hawksbill sighting and capture
event, we recorded location, water depth, turtle depth, time,
sea conditions, and visibility. Whenever possible, we
captured turtles for individual work-up and standard data
collection. However, a non-captured turtle (and the
accompanying data, e.g., water depth) was considered
‘‘recaptured’’ for data summary purposes if the flipper tags
were successfully read while under water.
Turtle capture
We free-dove and hand-captured hawksbill juveniles in
BIRNM. After anchoring the boat, snorkelers would swim
alongside each other, spreading out to maximize the area
surveyed while also maintaining visual contact (approxi-
mately 4.5 m apart). Once a snorkeler sighted a turtle, they
would secure the attention of at least one other snorkeler to
assist with capture. Captures were made by grabbing the
carapace, with one hand placed at the nuchal scute and the
other on the post-marginal region. Turtles were then
pointed head up and carefully brought to the surface. Once
captured, turtles were brought on board the boat for
workup.
Standard turtle workup
Upon reaching the boat, we carefully lifted each turtle by
taking hold under the front flippers to bring it onto the boat.
While on the boat, we covered the head and body of the
turtles with a wet towel to keep them moist and cool.
Workup consisted of collecting biological samples (i.e.,
blood, tissue), taking standard straight carapace length
(SCL), curved carapace length (CCL), straight plastron
length (SPL), curved plastron length (CPL), as well as tail
measurements, and identification photos. Measurements of
minimum CCL (to the notch) were used for all analyses.
Each turtle was weighed on an Ohaus electronic scale
(model I5S; Forestry Suppliers, Jackson, Mississippi) sus-
pended from a pole and was measured to the nearest
0.1 kg.
Each turtle over 20 cm CCL was tagged with two
National Marine Fisheries Service Inconel tags (National
Band & Tag Co., Newport, Kentucky) and one AVID
Passive Integrated Transponder (PIT) tag/chip (Norco,
California). One Inconel tag was placed on the scale closest
to the body on the left front flipper and another on either
the scale tab or tissue of a hind flipper. These tags were
placed with certain considerations in mind: to avoid the tag
catching on marginal scutes by placing the tag closer to the
body than the hind flipper scale, to leave space for growth,
and to avoid interference with future nest digging. PIT tags
were placed in the right shoulder. All turtles were released
within an hour near the site of capture; we carefully
released them over the side of the boat into the water,
observing each turtle until it swam away.
Gastric lavages
We performed gastric lavages on juvenile hawksbills cap-
tured in 1996 (July, August, and September) and 1998
(January). We captured turtles on the northeast section of
the island and referenced captures to the same block
numbers as in the distribution surveys. If gastric lavage was
performed, turtle workup took up to an hour and a half. The
flushing during the lavage procedure took 3 min or less.
Gastric lavage techniques generally followed Mendonca
(1983) and were performed by a trained veterinary tech-
nician (B. Phillips). We placed the turtles with their cara-
pace down and posterior end slightly elevated. We opened
the jaws by hand and placed a bite block with protective
padding inside the mouth to prevent closure. We used a
single lavage tube ranging from 12.7/9.5 to 9.0/7.0 mm
(outer/inner tube dimensions) based on the turtle’s size. All
tubes had rounded tips to prevent damage to the esophagus
upon insertion. Once the single tube was inserted approx-
imately 5 cm into the esophagus, we started the flow of salt
water and collected water and food particles expelled from
the mouth. We stored lavage samples in vials containing
formalin (Fisher Scientific Formalde-Fresh solution diluted
with filtered sea water to 4 %) to later identify food par-
ticles to genus, or species when possible.
In 1996, we combined specimens from all the samples to
collect a total wet weight value, weighed with an Acculab
Pocket-Pro scale Model PP-250-B (250 g 9 0.1 g capac-
ity/readability; Forestry Suppliers, Jackson, Mississippi). In
1998, we identified species consumed per turtle. For both
sampling periods, we divided the samples into four groups
based on CCL ranges (30–39, 40–49, 50–59, 60–69 cm)
and compared dominant food types across groups. We
assessed diversity within samples in two ways: (1) distinct
food items: the number of species (or genera if species was
unavailable) in each sample per turtle, and (2) the preva-
lence of an individual food item across all samples, pro-
vided as a range from a species occurring in one sample
within the group to all samples. We also classified food
Mar Biol
123
items into separate groups based on taxonomy (i.e., red
algae, green algae, brown algae, Cnidaria, Zonathus, Le-
brunia danae, and non-food). We summed these groups
across all samples by size class for both years.
Hawksbill high-use areas
We compared juvenile hawksbill sightings to the percent
abundance of Zoanthids for each block using linear
regression analysis; samples from each block were
assumed to be independent, and the variances were found
to be homogenous using Levene’s Test. We also used an
analysis of variance (ANOVA) to compare the sightings of
juvenile hawksbills to the concentrations of Zoanthids. The
Zoanthid concentrations (‘‘Zoanthid Cover’’) were classi-
fied as either Low (0–0.3 %) or High (10–34.8 %), and the
corresponding number of juvenile hawksbills served as the
response (dependent) variable. We used the statistical
program SAS (1997) v. 6 for all analyses, with an
alpha\0.05 to signify statistical significance.
To determine habitat characteristics of hawksbill high-
use areas, we compared areas with high numbers of turtle
sightings to both a 3 m LIDAR bathymetry layer collected
by the National Oceanic and Atmospheric Administration
(NOAA) in 2011 (http://ccma.nos.noaa.gov/products/
biogrography/usvi_nps/data/; accessed 11 May 2012) and
a hardbottom habitat layer published in 2012 by NOAA
(http://ccma.nos.noaa.gov/ecosystems/coralreef/stcroix_data.
aspx; accessed April 10, 2012). Using these layers in ArcGIS
9.3 (ESRI 2007), we extracted the range of depths and domi-
nant habitat types per high-use blocks. Finally, we determined
length of time between recapture events for individual turtles,
or minimum presumed site residency, by calculating the dif-
ference in days between first and last in-water capture events at
BIRNM.
Growth rates
We summed all captures and recaptures by sector and size
class. For recaptured turtles, we calculated the days
between first and last capture event and the yearly growth
rates for both length (CCL) and mass if the turtles had more
than one measurement. We calculated change in CCL
following Bjorndal et al. (2000) and included zero growth
rates. We did not, however, constrain the data to only
recaptures with[11-month intervals. For growth rates by
size class, we included measurements from within a given
size class; if an individual turtle had more than one growth
rate estimation, it had multiple measurements over the
years and changed size classes.
An earlier radioimmunoassay study was conducted on
juveniles caught at Buck Island for an independent analysis
from 1995 to 1999 (Geis et al. 2003); we incorporated these
sex results for applicable turtles in this study for use in
comparing growth rates of the different sexes.
Results
Turtle distribution surveys and high-use areas
We sighted a total of 85 turtles including 66 hawksbills and
19 green turtles (data not shown) during the distribution
surveys. Turtles from 30 to 39 and 40 to 49 cm CCL were
the most frequently observed size classes. Hawksbill turtles
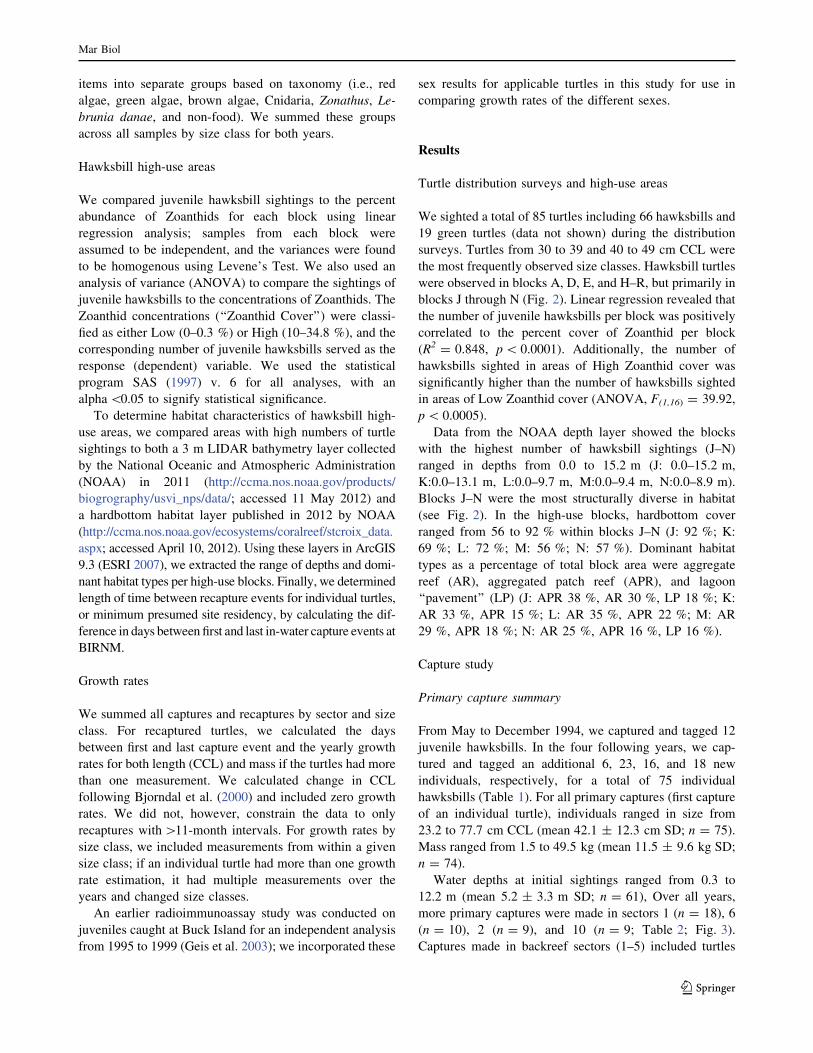
were observed in blocks A, D, E, and H–R, but primarily in
blocks J through N (Fig. 2). Linear regression revealed that
the number of juvenile hawksbills per block was positively
correlated to the percent cover of Zoanthid per block
(R2 = 0.848, p\ 0.0001). Additionally, the number of
hawksbills sighted in areas of High Zoanthid cover was
significantly higher than the number of hawksbills sighted
in areas of Low Zoanthid cover (ANOVA, F(1,16) = 39.92,
p\ 0.0005).
Data from the NOAA depth layer showed the blocks
with the highest number of hawksbill sightings (J–N)
ranged in depths from 0.0 to 15.2 m (J: 0.0–15.2 m,
K:0.0–13.1 m, L:0.0–9.7 m, M:0.0–9.4 m, N:0.0–8.9 m).
Blocks J–N were the most structurally diverse in habitat
(see Fig. 2). In the high-use blocks, hardbottom cover
ranged from 56 to 92 % within blocks J–N (J: 92 %; K:
69 %; L: 72 %; M: 56 %; N: 57 %). Dominant habitat
types as a percentage of total block area were aggregate
reef (AR), aggregated patch reef (APR), and lagoon
‘‘pavement’’ (LP) (J: APR 38 %, AR 30 %, LP 18 %; K:
AR 33 %, APR 15 %; L: AR 35 %, APR 22 %; M: AR
29 %, APR 18 %; N: AR 25 %, APR 16 %, LP 16 %).
Capture study
Primary capture summary
From May to December 1994, we captured and tagged 12
juvenile hawksbills. In the four following years, we cap-
tured and tagged an additional 6, 23, 16, and 18 new
individuals, respectively, for a total of 75 individual
hawksbills (Table 1). For all primary captures (first capture
of an individual turtle), individuals ranged in size from
23.2 to 77.7 cm CCL (mean 42.1 ± 12.3 cm SD; n = 75).
Mass ranged from 1.5 to 49.5 kg (mean 11.5 ± 9.6 kg SD;
n = 74).
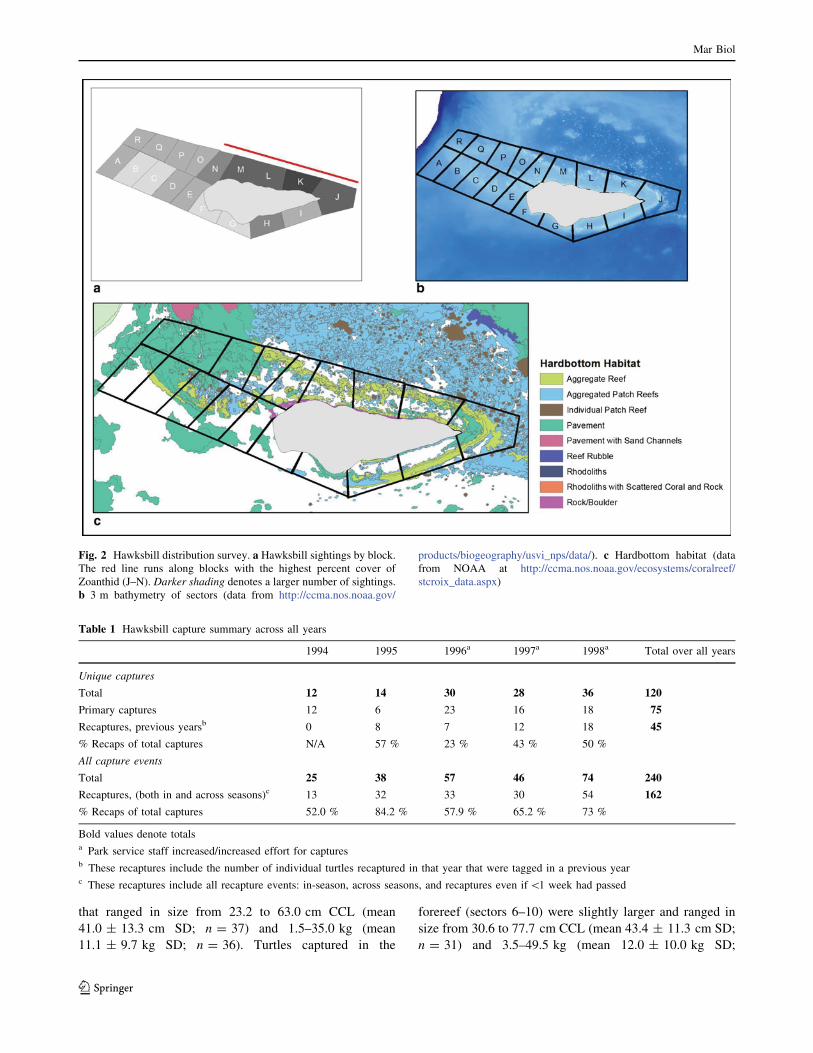
Water depths at initial sightings ranged from 0.3 to
12.2 m (mean 5.2 ± 3.3 m SD; n = 61), Over all years,
more primary captures were made in sectors 1 (n = 18), 6
(n = 10), 2 (n = 9), and 10 (n = 9; Table 2; Fig. 3).
Captures made in backreef sectors (1–5) included turtles
Mar Biol
123
that ranged in size from 23.2 to 63.0 cm CCL (mean
41.0 ± 13.3 cm SD; n = 37) and 1.5–35.0 kg (mean
11.1 ± 9.7 kg SD; n = 36). Turtles captured in the
forereef (sectors 6–10) were slightly larger and ranged in
size from 30.6 to 77.7 cm CCL (mean 43.4 ± 11.3 cm SD;
n = 31) and 3.5–49.5 kg (mean 12.0 ± 10.0 kg SD;
Fig. 2 Hawksbill distribution survey. a Hawksbill sightings by block.The red line runs along blocks with the highest percent cover of
Zoanthid (J–N). Darker shading denotes a larger number of sightings.
b 3 m bathymetry of sectors (data from http://ccma.nos.noaa.gov/
products/biogeography/usvi_nps/data/). c Hardbottom habitat (data
from NOAA at http://ccma.nos.noaa.gov/ecosystems/coralreef/
stcroix_data.aspx)
Table 1 Hawksbill capture summary across all years
1994 1995 1996a 1997a 1998a Total over all years
Unique captures
Total 12 14 30 28 36 120
Primary captures 12 6 23 16 18 75
Recaptures, previous yearsb 0 8 7 12 18 45
% Recaps of total captures N/A 57 % 23 % 43 % 50 %
All capture events
Total 25 38 57 46 74 240
Recaptures, (both in and across seasons)c 13 32 33 30 54 162
% Recaps of total captures 52.0 % 84.2 % 57.9 % 65.2 % 73 %
Bold values denote totalsa Park service staff increased/increased effort for capturesb These recaptures include the number of individual turtles recaptured in that year that were tagged in a previous yearc These recaptures include all recapture events: in-season, across seasons, and recaptures even if\1 week had passed
Mar Biol
123
n = 31). One turtle (49.3 cm CCL at initial capture) was
caught and recaptured outside sectors 1–10, in blocks D,
M, N, and O (see Fig. 2a) between June 12, 1998, and
August 10, 1998.
Recapture summary
We recaptured 33 of the 75 turtles (44 %) throughout the
study period. However, three turtles were recaptured within
Table 2 Number of hawksbill captures (of 68 total) by sector with mean, min, and max curved carapace length (CCL) and mass. n/a not
applicable
Sector Blocka #Captures Mean CCL (cm) Min CCL (cm) Max CCL (cm) Mean mass (kg) Min mass (kg) Max mass (kg)
1 J 18 41.6 23.2 63.0 11.7 1.5 35
2 K 9 38.7 25.3 62.4 9.9b 2b 26.5b
3 K 4 43.6 24.5 56.1 10.8 1.5 24
4 K 1 29.2c n/a n/a 3c n/a n/a
5 L 5 43.8 37 50.2 10.8 6 15.5
6 L 10 48.6 37.6 67 14.9 6 34.5
7 K 3 54.5 32.8 77.7 24.3 4.5 49.5
8 K 3 37.4 35.5 39.5 7.0 8 6.5
9 K 6 38.5 32.1 51.1 8.25 4 17.0
10 J 9 39.4 30.6 62 8.7 3.5 27.5
a Blocks and sectors do not line up exactly. The block number here is given for reference only and is the block with the most area within a sector
(see Fig. 1)b N = 8 for these values, although there were 9 captures in sector 2c The measurements of the single capture are given here
Fig. 3 Hawksbill captures by sector; primary captures shown (n = 68; sector information unavailable for n = 7 primary captures). Darkershading denotes a larger number of captures. Sampling effort was biased to areas of high hawksbill concentration
Mar Biol
123
1 week of primary capture and were excluded from analysis.
For the 30 remaining recaptured individuals, we had 162
recapture events from June 27, 1994, to October 9, 1998.
Turtles were recaptured both within the same year and across
years (Table 1). The length of time between recaptures, or
presumedminimum residency, for these 30 turtles ranged from
59 to 1,396 days (mean 620.8 ± 402.4 days SD; n = 30);
none of the turtles had tracking devices affixed to them so even
though we presume site residency based on their juvenile life
stage, turtles may not have remained in the area between
capture events. Of these 30 recaptured turtles, 25 were mea-
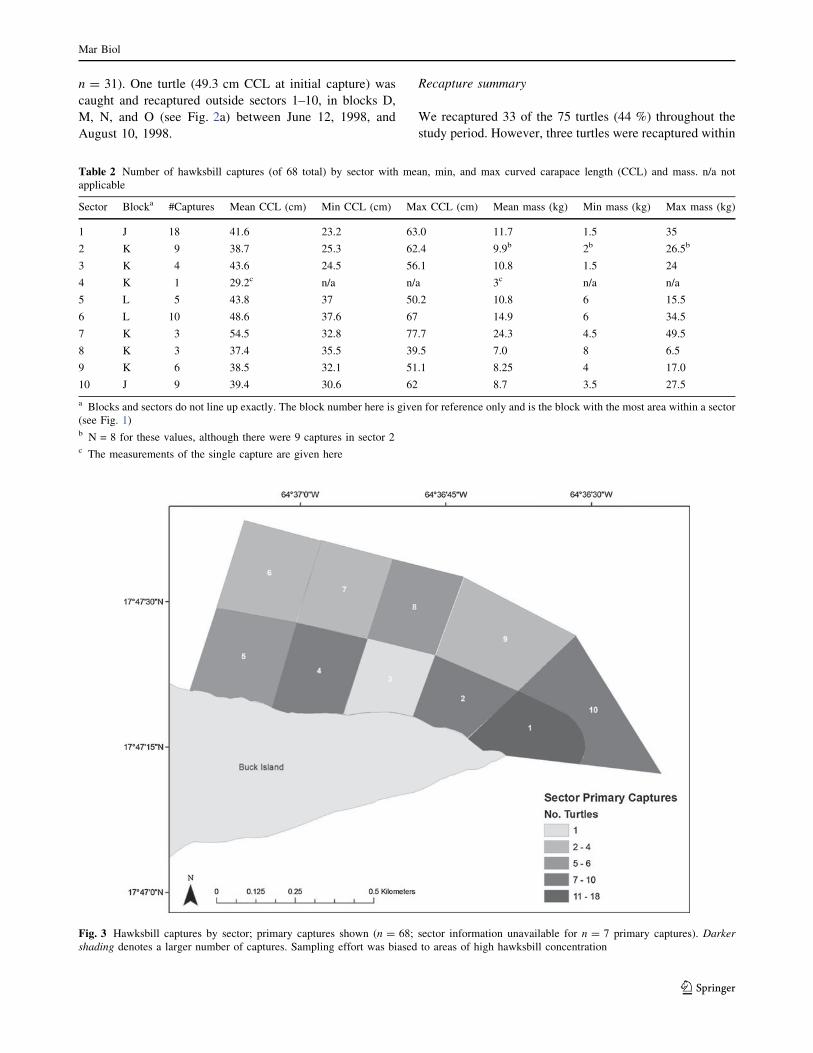
sured for primary capture CCL. Size class comparisons (based
on the primary CCL) showed similar ranges for minimum
residency times: 20–29 cm CCL was 225–1,276 days,
30–39 cm CCL was 237–1,396 days, 40–49 cm CCL was
143–1,359 days, 50–59 cm CCL was 101–1,177 days, and
60–69 cm CCL was 280–1,233 days (Fig. 4).
Recapture location (sector) was predominantly in the
same sector as original capture location; 18 of 29 turtles
(62 %) were recaptured in their primary capture sector or
in sectors immediately adjacent to their primary capture
sector. Of the remaining turtles, the number of sectors in
which they were captured ranged from 1 to 6 (mean
2.6 ± 1.3 sectors SD; n = 29).
Growth rates
A total of 23 turtles had measurements taken after an in-
water recapture. Recapture events ranged 101–1,276 days
from initial capture events (mean 646.0 ± 337.7 days;
n = 23). The measured change in CCL ranged from 0.0 to
24.1 cm CCL (mean 7.5 ± 5.9 cm SD; n = 23). The
measured change in mass ranged from 0.0 to 21.0 kg
(mean 5.1 ± 5.2 kg; n = 23). Thus, growth rates for these
turtles ranged from 0.0 to 9.5 cm year-1 CCL (mean
4.1 ± 2.4 cm SD; n = 23) and 0.0–6.9 kg year-1 (mean
2.4 ± 1.7 kg SD; n = 23; Table 3).
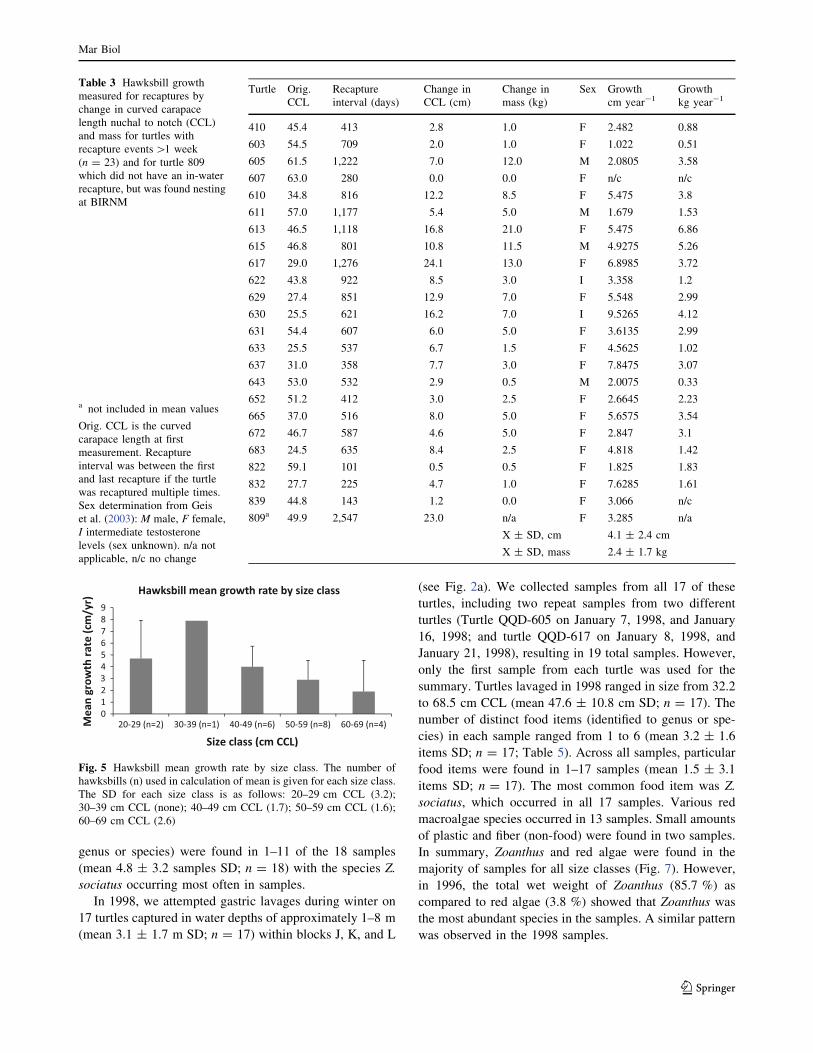
Annual mean growth rates differed by size class, with the
largestmean growth rate occurring in the 30–39 cmCCL size
class and otherwise decreasing with increasing turtle size
(Fig. 5): 4.7 cm year-1 CCL for 20–29 cm CCL (n = 2),
7.9 cm year-1 for 30–39 cm CCL (n = 1), 4.0 cm year-1
CCL for 40–49 cm CCL (n = 6), 2.9 cm year-1 CCL for
50–59 cm CCL (n = 8) and 1.9 cm year-1 CCL for
60–69 cm CCL (n = 4).
One hawksbill was not recaptured in-water but instead
7 years later while nesting at BIRNM. Upon primary
capture in-water, this female was 49.9 cm CCL and 16 kg
(July 28, 1997) and 2,547 days later (*7 years) when this
turtle nested on Buck Island she was 72.9 cm CCL (Z.
Hillis-Starr, pers. observ.; mass not recorded, July 18,
2004; Table 3). Over this period, she showed a 23.0 cm
increase in CCL.
We calculated growth rates for 18 females and four males
(sex determination fromGeis et al. 2003), including 21 of the
23 in-water recaptures (that had measurements and deter-
mined sex). Growth rates for females (24.5–63.0 cm CCL
first capture size) ranged from 0.0 to 7.8 cm year-1 (mean
4.2 ± 2.2 cm SD year-1; n = 18). For males (46.8–61.5 cm
CCL first capture size), growth rates ranged from 1.7 to
4.9 cm year-1 (mean 2.7 ± 1.5 cm SD; n = 4). As a com-
parison to themale growth rates,whichwere only available in
the 40–49, 50–59, and60–69 size classes, female growth rates
for the same classes ranged from 0.0 to 5.5 cm year-1 (mean
2.6 ± 1.5 cm year-1 SD; n = 10).
Gastric lavages
In 1996, we attempted gastric lavages on 25 turtles cap-
tured during summer months, yielding 18 samples (72 %).
Successfully lavaged turtles ranged in size from 31.0 to
67.0 cm CCL (mean 49.5 ± 10.7 cm SD, n = 18) and
were captured in blocks J, K, and L (see Fig. 2a) at water
depths of approximately 2–12 m (mean 6.3 ± 3.3 m SD;
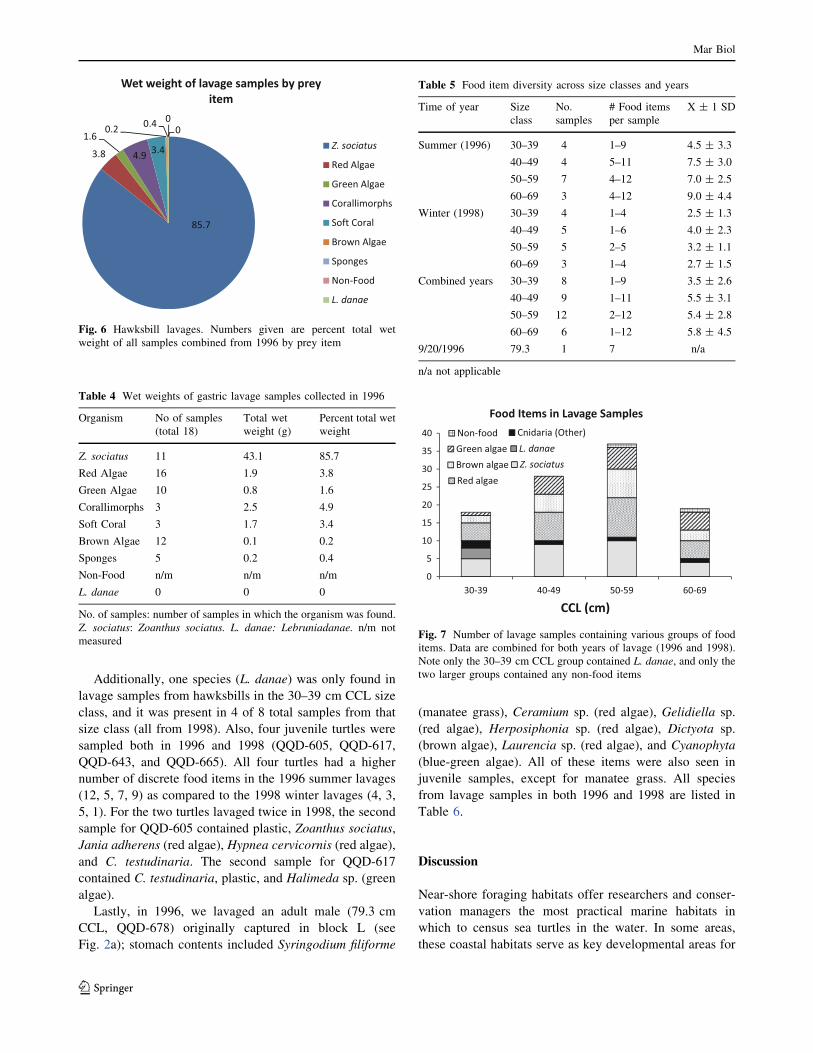
n = 16). Stomach contents included primarily Zoanthids
(Zoanthus sociatus), which constituted 85.7 % of the total
wet weight of all samples (present in 11 samples; Fig. 6).
We found various algae (e.g., red, brown, and green spe-
cies) in 17 samples; however, they comprised only 5.6 %
of the total wet weight of all samples (Fig. 6; Table 4).
Various red macroalgae, not identified to species or genus,
occurred in 16 of the 18 samples. Further, each individual
sample contained 1–12 distinct food items (identified to
genus or species; mean 6.9 ± 3.2 items SD; n = 18).
Across all samples, particular food items (identified to
Fig. 4 Numbers of days between first and last recapture events (if
greater than 1 week) for all in-water recaptured turtles by size class.
Size class (cm CCL) 20–29 ranged 225–1,276 days, 30–39 ranged
237–1,396 days, 40–49 ranged 143–1,359 days, 50–59 ranged
101–1,177 days, and 60–69 ranged 280–1,233 days
Mar Biol
123
genus or species) were found in 1–11 of the 18 samples
(mean 4.8 ± 3.2 samples SD; n = 18) with the species Z.
sociatus occurring most often in samples.
In 1998, we attempted gastric lavages during winter on
17 turtles captured in water depths of approximately 1–8 m
(mean 3.1 ± 1.7 m SD; n = 17) within blocks J, K, and L
(see Fig. 2a). We collected samples from all 17 of these
turtles, including two repeat samples from two different
turtles (Turtle QQD-605 on January 7, 1998, and January
16, 1998; and turtle QQD-617 on January 8, 1998, and
January 21, 1998), resulting in 19 total samples. However,
only the first sample from each turtle was used for the
summary. Turtles lavaged in 1998 ranged in size from 32.2
to 68.5 cm CCL (mean 47.6 ± 10.8 cm SD; n = 17). The
number of distinct food items (identified to genus or spe-
cies) in each sample ranged from 1 to 6 (mean 3.2 ± 1.6
items SD; n = 17; Table 5). Across all samples, particular
food items were found in 1–17 samples (mean 1.5 ± 3.1
items SD; n = 17). The most common food item was Z.
sociatus, which occurred in all 17 samples. Various red
macroalgae species occurred in 13 samples. Small amounts
of plastic and fiber (non-food) were found in two samples.
In summary, Zoanthus and red algae were found in the
majority of samples for all size classes (Fig. 7). However,
in 1996, the total wet weight of Zoanthus (85.7 %) as
compared to red algae (3.8 %) showed that Zoanthus was
the most abundant species in the samples. A similar pattern
was observed in the 1998 samples.
Table 3 Hawksbill growth
measured for recaptures by
change in curved carapace
length nuchal to notch (CCL)
and mass for turtles with
recapture events[1 week
(n = 23) and for turtle 809
which did not have an in-water
recapture, but was found nesting
at BIRNM
a not included in mean values
Orig. CCL is the curved
carapace length at first
measurement. Recapture
interval was between the first
and last recapture if the turtle
was recaptured multiple times.
Sex determination from Geis
et al. (2003): M male, F female,
I intermediate testosterone
levels (sex unknown). n/a not
applicable, n/c no change
Turtle Orig.
CCL
Recapture
interval (days)
Change in
CCL (cm)
Change in
mass (kg)
Sex Growth
cm year-1Growth
kg year-1
410 45.4 413 2.8 1.0 F 2.482 0.88
603 54.5 709 2.0 1.0 F 1.022 0.51
605 61.5 1,222 7.0 12.0 M 2.0805 3.58
607 63.0 280 0.0 0.0 F n/c n/c
610 34.8 816 12.2 8.5 F 5.475 3.8
611 57.0 1,177 5.4 5.0 M 1.679 1.53
613 46.5 1,118 16.8 21.0 F 5.475 6.86
615 46.8 801 10.8 11.5 M 4.9275 5.26
617 29.0 1,276 24.1 13.0 F 6.8985 3.72
622 43.8 922 8.5 3.0 I 3.358 1.2
629 27.4 851 12.9 7.0 F 5.548 2.99
630 25.5 621 16.2 7.0 I 9.5265 4.12
631 54.4 607 6.0 5.0 F 3.6135 2.99
633 25.5 537 6.7 1.5 F 4.5625 1.02
637 31.0 358 7.7 3.0 F 7.8475 3.07
643 53.0 532 2.9 0.5 M 2.0075 0.33
652 51.2 412 3.0 2.5 F 2.6645 2.23
665 37.0 516 8.0 5.0 F 5.6575 3.54
672 46.7 587 4.6 5.0 F 2.847 3.1
683 24.5 635 8.4 2.5 F 4.818 1.42
822 59.1 101 0.5 0.5 F 1.825 1.83
832 27.7 225 4.7 1.0 F 7.6285 1.61
839 44.8 143 1.2 0.0 F 3.066 n/c
809a 49.9 2,547 23.0 n/a F 3.285 n/a
X ± SD, cm 4.1 ± 2.4 cm
X ± SD, mass 2.4 ± 1.7 kg
Fig. 5 Hawksbill mean growth rate by size class. The number of
hawksbills (n) used in calculation of mean is given for each size class.
The SD for each size class is as follows: 20–29 cm CCL (3.2);
30–39 cm CCL (none); 40–49 cm CCL (1.7); 50–59 cm CCL (1.6);
60–69 cm CCL (2.6)
Mar Biol
123
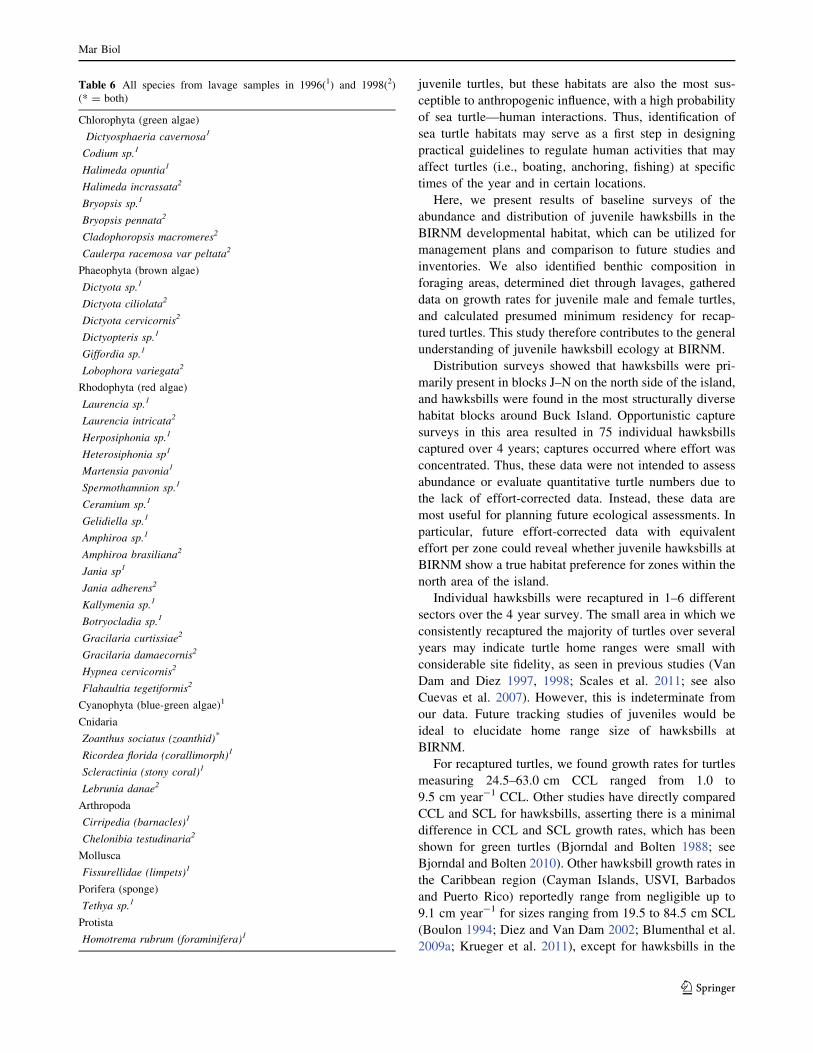
Additionally, one species (L. danae) was only found in
lavage samples from hawksbills in the 30–39 cm CCL size
class, and it was present in 4 of 8 total samples from that
size class (all from 1998). Also, four juvenile turtles were
sampled both in 1996 and 1998 (QQD-605, QQD-617,
QQD-643, and QQD-665). All four turtles had a higher
number of discrete food items in the 1996 summer lavages
(12, 5, 7, 9) as compared to the 1998 winter lavages (4, 3,
5, 1). For the two turtles lavaged twice in 1998, the second
sample for QQD-605 contained plastic, Zoanthus sociatus,
Jania adherens (red algae), Hypnea cervicornis (red algae),
and C. testudinaria. The second sample for QQD-617
contained C. testudinaria, plastic, and Halimeda sp. (green
algae).
Lastly, in 1996, we lavaged an adult male (79.3 cm
CCL, QQD-678) originally captured in block L (see
Fig. 2a); stomach contents included Syringodium filiforme
(manatee grass), Ceramium sp. (red algae), Gelidiella sp.
(red algae), Herposiphonia sp. (red algae), Dictyota sp.
(brown algae), Laurencia sp. (red algae), and Cyanophyta
(blue-green algae). All of these items were also seen in
juvenile samples, except for manatee grass. All species
from lavage samples in both 1996 and 1998 are listed in
Table 6.
Discussion
Near-shore foraging habitats offer researchers and conser-
vation managers the most practical marine habitats in
which to census sea turtles in the water. In some areas,
these coastal habitats serve as key developmental areas for
Fig. 6 Hawksbill lavages. Numbers given are percent total wet
weight of all samples combined from 1996 by prey item
Table 4 Wet weights of gastric lavage samples collected in 1996
Organism No of samples
(total 18)
Total wet
weight (g)
Percent total wet
weight
Z. sociatus 11 43.1 85.7
Red Algae 16 1.9 3.8
Green Algae 10 0.8 1.6
Corallimorphs 3 2.5 4.9
Soft Coral 3 1.7 3.4
Brown Algae 12 0.1 0.2
Sponges 5 0.2 0.4
Non-Food n/m n/m n/m
L. danae 0 0 0
No. of samples: number of samples in which the organism was found.
Z. sociatus: Zoanthus sociatus. L. danae: Lebruniadanae. n/m not
measured
Table 5 Food item diversity across size classes and years
Time of year Size
class
No.
samples
# Food items
per sample
X ± 1 SD
Summer (1996) 30–39 4 1–9 4.5 ± 3.3
40–49 4 5–11 7.5 ± 3.0
50–59 7 4–12 7.0 ± 2.5
60–69 3 4–12 9.0 ± 4.4
Winter (1998) 30–39 4 1–4 2.5 ± 1.3
40–49 5 1–6 4.0 ± 2.3
50–59 5 2–5 3.2 ± 1.1
60–69 3 1–4 2.7 ± 1.5
Combined years 30–39 8 1–9 3.5 ± 2.6
40–49 9 1–11 5.5 ± 3.1
50–59 12 2–12 5.4 ± 2.8
60–69 6 1–12 5.8 ± 4.5
9/20/1996 79.3 1 7 n/a
n/a not applicable
Fig. 7 Number of lavage samples containing various groups of food
items. Data are combined for both years of lavage (1996 and 1998).
Note only the 30–39 cm CCL group contained L. danae, and only the
two larger groups contained any non-food items
Mar Biol
123
juvenile turtles, but these habitats are also the most sus-
ceptible to anthropogenic influence, with a high probability
of sea turtle—human interactions. Thus, identification of
sea turtle habitats may serve as a first step in designing
practical guidelines to regulate human activities that may
affect turtles (i.e., boating, anchoring, fishing) at specific
times of the year and in certain locations.
Here, we present results of baseline surveys of the
abundance and distribution of juvenile hawksbills in the
BIRNM developmental habitat, which can be utilized for
management plans and comparison to future studies and
inventories. We also identified benthic composition in
foraging areas, determined diet through lavages, gathered
data on growth rates for juvenile male and female turtles,
and calculated presumed minimum residency for recap-
tured turtles. This study therefore contributes to the general
understanding of juvenile hawksbill ecology at BIRNM.
Distribution surveys showed that hawksbills were pri-
marily present in blocks J–N on the north side of the island,
and hawksbills were found in the most structurally diverse
habitat blocks around Buck Island. Opportunistic capture
surveys in this area resulted in 75 individual hawksbills
captured over 4 years; captures occurred where effort was
concentrated. Thus, these data were not intended to assess
abundance or evaluate quantitative turtle numbers due to
the lack of effort-corrected data. Instead, these data are
most useful for planning future ecological assessments. In
particular, future effort-corrected data with equivalent
effort per zone could reveal whether juvenile hawksbills at
BIRNM show a true habitat preference for zones within the
north area of the island.
Individual hawksbills were recaptured in 1–6 different
sectors over the 4 year survey. The small area in which we
consistently recaptured the majority of turtles over several
years may indicate turtle home ranges were small with
considerable site fidelity, as seen in previous studies (Van
Dam and Diez 1997, 1998; Scales et al. 2011; see also
Cuevas et al. 2007). However, this is indeterminate from
our data. Future tracking studies of juveniles would be
ideal to elucidate home range size of hawksbills at
BIRNM.
For recaptured turtles, we found growth rates for turtles
measuring 24.5–63.0 cm CCL ranged from 1.0 to
9.5 cm year-1 CCL. Other studies have directly compared
CCL and SCL for hawksbills, asserting there is a minimal
difference in CCL and SCL growth rates, which has been
shown for green turtles (Bjorndal and Bolten 1988; see
Bjorndal and Bolten 2010). Other hawksbill growth rates in
the Caribbean region (Cayman Islands, USVI, Barbados
and Puerto Rico) reportedly range from negligible up to
9.1 cm year-1 for sizes ranging from 19.5 to 84.5 cm SCL
(Boulon 1994; Diez and Van Dam 2002; Blumenthal et al.
2009a; Krueger et al. 2011), except for hawksbills in the
Table 6 All species from lavage samples in 1996(1) and 1998(2)
(* = both)
Chlorophyta (green algae)
Dictyosphaeria cavernosa1
Codium sp.1
Halimeda opuntia1
Halimeda incrassata2
Bryopsis sp.1
Bryopsis pennata2
Cladophoropsis macromeres2
Caulerpa racemosa var peltata2
Phaeophyta (brown algae)
Dictyota sp.1
Dictyota ciliolata2
Dictyota cervicornis2
Dictyopteris sp.1
Giffordia sp.1
Lobophora variegata2
Rhodophyta (red algae)
Laurencia sp.1
Laurencia intricata2
Herposiphonia sp.1
Heterosiphonia sp1
Martensia pavonia1
Spermothamnion sp.1
Ceramium sp.1
Gelidiella sp.1
Amphiroa sp.1
Amphiroa brasiliana2
Jania sp1
Jania adherens2
Kallymenia sp.1
Botryocladia sp.1
Gracilaria curtissiae2
Gracilaria damaecornis2
Hypnea cervicornis2
Flahaultia tegetiformis2
Cyanophyta (blue-green algae)1
Cnidaria
Zoanthus sociatus (zoanthid)*
Ricordea florida (corallimorph)1
Scleractinia (stony coral)1
Lebrunia danae2
Arthropoda
Cirripedia (barnacles)1
Chelonibia testudinaria2
Mollusca
Fissurellidae (limpets)1
Porifera (sponge)
Tethya sp.1
Protista
Homotrema rubrum (foraminifera)1
Mar Biol
123
Bahamas, for which growth rates of up to 15.7 cm year-1
SCL have been measured (Bjorndal and Bolten 1988,
2010). Our growth rate estimates for juvenile hawksbills
fall within previous estimates, with a slightly higher growth
rate as compared to juveniles from non-Bahamian Carib-
bean sites.
We found that the growth rates of these turtles generally
decreased with turtle size, but peaked at the 30–39 cm
CCL size class. These results should be considered with
caution, as our peak growth rate came from a size class
with only one measurable growth rate; however, previous
studies on growth rates of hawksbills have found both
monotonic and non-monotonic growth rates. Monotonic
growth rates, showing a decrease in growth rates with
increasing turtle size, from the Bahamas, St Thomas USVI,
and Cayman Islands were found for turtles measuring
20.5–71.3 SCL (Bjorndal and Bolten 1988; Boulon 1994;
Blumenthal et al. 2009a; Bjorndal and Bolten 2010). Non-
monotonic growth rates from various locations showed
peaks within two different brackets of size classes,
including the 30–35 or 50–60 cm SCL size class (Puerto
Rico: 34–35 cm SCL, Diez and Van Dam 2002; Souther
Great Barrier Reef: 60 cm CCL, Chaloupka and Limpus
1997; Barbados: 30–35 cm SCL, Krueger et al. 2011; Al-
dabra: 50–60 cm CCL, Mortimer et al. 2003). A slower
growth rate for smaller hawksbills may reflect a period of
adjustment to new habitat for newly recruited juveniles
(Bjorndal and Bolten 2010) and increased growth rates that
follow (for non-monotonic growth rates) may represent a
compensatory phase (see Krueger et al. 2011). The lack of
smaller size classes in growth rate studies may contribute
to an inability to detect a non-monotonic growth rate (see
Krueger et al. 2011). Variable growth rates across the
Caribbean indicate either density-dependent or habitat
quality factors may affect growth rates (Diez and Van Dam
2002; Krueger et al. 2011, and see Kubis et al. 2009 [green
turtles]). Reported growth rates for hawksbills in the
Caribbean are higher than those reported from Australia or
Aldabra, further suggesting that growth rates may be
affected by local conditions.
There have been three previous studies that evaluated
differences in growth rates of hawksbills based on sex;
only one occurred in the Caribbean region. Chaloupka and
Limpus (1997) found females from the Southern Great
Barrier Reef had a faster growth rate than males (turtles
from 39.0 to 85.0 cm CCL), but Bell and Pike (2012) found
no difference in growth rates by sex for turtles
61.3–91.4 cm CCL at a site in the Northern Great Barrier
Reef. Similarly, Krueger et al. (2011) found no difference
in growth rates by sex for turtles 23.7–80.0 cm CCL in
Barbados. Due to small sample size, we were unable to
statistically compare the male and female growth rates in
our study; however, mean growth rates across size classes
from 40–69 cm CCL appear similar at BIRNM (females:
0.0–5.5 cm year-1, males: 1.7–4.9 cm year-1).
Habitat use studies rarely characterize the forage
resources simultaneously with captures, and there are few
hawksbill lavage studies in the literature for comparison.
Generally considered spongivores (Meylan 1988), hawks-
bills consume other species such as corallimorphs, hy-
droids, sea urchins, and jellyfish (Carr et al. 1966; Leon and
Bjorndal 2002; Blumenthal et al. 2009a; Rincon-Diaz et al.
2011). Cnidarians have therefore been reported in hawks-
bill diets (corallimorphs, hydroids and jellyfish), as well as
the consumption of another Zoanthid species, Palythoa
caribaeorum (Stampar et al. 2007), but the genus Zoanthus
has not previously been documented as a high proportion
of the hawksbill diet. Thus, our lavage results shed new
light on hawksbill prey items in the Caribbean. Further,
only the two largest size classes (50–59 and 60–69 cm
CCL) had non-food items in their lavage samples (e.g.,
plastic and fibers). We speculate that these larger individ-
uals may consume food items near where human activities
occur at BIRNM (i.e., at recreational use areas near
beaches).
Rincon-Diaz et al. (2011) were first to report the pres-
ence of L. danae in the diet of a juvenile hawksbill. This
species contains highly venomous nematocysts with a
potent neurotoxin (Sanchez-Rodriguez and Cruz-Vazquez
2006). We also found this species in our samples (n = 3),
but only in the smallest size class (30–39 cm CCL). It is
possible these specific toxins do not harm the turtles.
However, toxicity analyses of some sponges commonly
consumed by hawksbills have shown low or variable
chemical defenses (Pawlik et al. 1995; Swearington and
Pawlik 1998) suggesting the species may avoid highly
toxic prey. The absence of this item from the diets of older
turtles and other lavage studies suggests learning or com-
petition with larger hawksbills for particular food items
may be involved.
Recent studies suggest that hawksbill prey selection
results from the interaction between preference and local
abundance, with positive selectivity sometimes occurring
for rare items and low preferences sometimes occurring for
items abundant in lavages (Leon and Bjorndal 2002; Rin-
con-Diaz et al. 2011). Habitat surveys of BIRNM in the
late 1980s and early 1990s revealed very little sponge at the
site, whereas Zoanthus occurred in dense mats (Gladfelter
et al. 1977; Bythell 1992). Additionally, the number of
prey items per lavage sample at BIRNM ranged from 1 to
12. Previous lavage studies in other Caribbean locations
have only reported up to three or four prey items per
sample (Leon and Bjorndal 2002; Rincon-Diaz et al. 2011).
The higher amount of prey items per sample observed at
BIRNM, and the high percent of Zoanthids, may be due in
part to the lack of sponges at the site, perhaps signifying
Mar Biol
123
compensatory behavior as they attempt to obtain necessary
nutrients without sponges in their diet. Future studies at
BIRNM investigating the abundance of other prey species
in benthic surveys, in conjunction with lavages, could
elucidate prey selectivity.
Studies at other foraging grounds have shown juvenile
hawksbill residency for at least several years in small home
ranges (Mona and Monito Islands, Puerto Rico; Van Dam
and Diez 1998). Thus, we presumed continued residency of
immature hawksbills between capture–recapture events.
Our results showed presumed minimum residency up to
almost 4 years, with similar residency periods for all size
classes. However, we are uncertain that turtles remained
within the BIRNM boundaries between captures; future
tracking studies should aim to confirm site residency for
juveniles at this site.
The time required to grow to given sizes is key infor-
mation for stage-based population models (Kendall and
Bjorkland 2001; Heppell et al. 2003). The growth rates
presented here will contribute toward creating and
improving hawksbill population models and our general
understanding of variation in these rates from one site to
another. Moreover, the basic biological data presented here
can be used to determine size structure and growth rates;
these data will ultimately help determine which conserva-
tion methods will be most effective (i.e., through elasticity
analyses, see de Kroon et al. 1986). In the short term,
georeferenced sighting and capture rate information can be
used by managers to identify locations where human–turtle
interactions may be possible, as well as where resources
used by turtles may warrant additional protection. As well,
additional studies on turtle use of deeper regions of BIR-
NM are warranted. The condition of the foraging resources
at BIRNM will be important for sustaining juvenile
hawksbills in this developmental habitat over many years.
Our results support the growing body of evidence that
hawksbill diet may be much more plastic than previously
believed.
Acknowledgments Fieldwork was permitted by NPS under the
DPNR territorial permit (years 1994–1999) and only within Federal
waters. National Park accession numbers from 1998 to 2000: BUIS-
00037 to BUIS-00058; catalog number BUIS 3415. Funding for this
work was provided by the National Park Service, and the USGS
Priority Ecosystem Science Program. Any use of trade, product, or
firm names is for descriptive purposes only and does not imply
endorsement by the US Government.
References
Anderson MH, Lund D, Gladfelter E, Davis M (1985) Ecological
community type maps and biological community descriptions for
Buck Island Reef National Monument and proposed marine sites
in the British Virgin Islands. In: Virgin Islands Resource
management cooperative biosphere reserve research report 4.
National park service technical report: 214–229
Bass AL, Good DA, Bjorndal KA, Richardson JI, Hillis Z-M,
Horrocks JA, Bowen BW (1996) Testing models of female
reproductive migratory behaviour and population structure in the
Caribbean hawksbill turtle, Eretmochelys imbricata, with
mtDNA sequences. Mol Ecol 5:321–328
Bell I, Pike DA (2012) Somatic growth rates of hawkbsill turtles
Eretmochelys imbricata in a northern great barrier reef foraging
area. Mar Ecol Prog Ser 446:275–283
Berube MD, Dunbar SG, Rutzler K, Hayes WK (2012) Homes range
and foraging ecology of juvenile hawksbill sea turtles (Eretm-ochelys imbricata) on inshore reefs of Honduras. Chelonian
Conserv Biol 11(1):33–43
Bjorndal KA, Bolten AB (1988) Growth rates of immature green
turtles, Chelonia mydas, on feeding grounds in the southern
Bahamas. Copeia 3:555–564
Bjorndal KA, Bolten AB (2010) Hawksbill sea turtles in seagrass
pastures: success in a peripheral habitat. Mar Biol 157:135–145
Bjorndal KA, Bolten AB, Chaloupka MY (2000) Green turtle somatic
growth model: evidence for density dependence. Ecol Appl
10(1):269–282
Blumenthal JM, Austin TJ, Bell CDL, Bothwell JB, Broderick AC,
Ebanks-Petrie G, Gibb JA, Luke KE, Olynik JR, Orr MF,
Solomon JL, Godley BJ (2009a) Ecology of hawksbill turtles,
Eretmochelys imbricata, on a western Caribbean foraging
ground. Chelonian Conserv Biol 8(1):1–10
Blumenthal JM, Austin TJ, Bothwell JB, Broderick AC, Ebanks-
Petrie G, Olynik JR, Orr MF, Solomon JL, Witt MJ, Godley BJ
(2009b) Diving behavior and movements of juvenile hawksbill
turtles Eretmochelys imbricata on a Caribbean coral reef. Coral
Reefs 28:55–65
Boulon RH (1994) Growth rates of wild juvenile hawksbill turtles,
Eretmochelys imbricata, in St. Thomas. United States Virgin
Islands. Copeia 3:811–814
Bythell JC, Gladfelter EH, Bythell M (1992) Ecological studies of
Buck Island Reef National Monument. A quantitative assess-
ment of selected components of the coral reef ecosystem and
establishment of long-term monitoring sites. Part II. US National
Park Service, Cruz Bay, St. John, US Virgin Islands, St. Croix,
p 72
Bythell JC, Bythell M, Gladfelter EH (1993) Initial results of a long-
term coral-reef monitoring program—impact of hurricane Hugo
at Buck Island Reef National Monument, St Croix, U.S. Virgin
Islands. J Exp Mar Biol Ecol 172:17–18
Carr A, Hirth H, Ogren L (1966) The ecology and migrations of sea
turtles, 6. The hawskbill turtle in the Caribbean Sea. Am Mus
Novit 2248:1–29
Chaloupka MY, Limpus CJ (1997) Robust statistical modeling of
hawksbill sea turtle growth rates (southern Great Barrier Reef).
Mar Ecol Prog Ser 146:1–8
Cuevas E, Liceaga-Correa MA, Garduno-Andrade M (2007) Spatial
characterization of a foraging area for immature hawksbill turtles
(Eretmochelys imbricata) in Yucatan, Mexico. Amphibia-Rep-
tilia 28:337–346
de Kroon, Hans, Anton Plaisier, Jan van Groenendael, and Hal
Caswell. 1986. Elasticity: the relative contribution of demo-
graphic parameters to population growth rate. Ecology
67:1427–1431. http://dx.doi.org/10.2307/1938700
Diez CE, Van Dam RP (2002) Habitat effect on hawksbill turtle
growth rates on feeding grounds at Mona and Monito Islands,
Puerto Rico. Mar Ecol Prog Ser 234:301–309
Dunbar SG, Salinas L, Stevenson L (2008) In-water observations of
recently released juvenile hawksbills Eretmochelys imbricata.Mar Turt Newsl 121:5–9
ESRI (2007) ArcGIS 9.3 GIS, Redlands, CA
Mar Biol
123
Gaos AR, Lewison RL, Yanez IL, Wallace BP, Liles MJ, Nichols WJ,
Baquero A, Hasbun CR, Vasquez M, Urteaga J, Seminoff JA
(2012) Shifting the life-history paradigm: discovery of novel
habitat use by hawksbill turtles. Biol Lett 8(1):54–56
Geis A, Wibbels T, Phillips B, Hillis-Starr Z, Meylan A, Meylan P,
Diez C, Van Dam R (2003) Predicted sex ratio of juvenile
hawksbill sea turtles inhabiting Buck Island Reef National
Monument, US Virgin Islands. J Herpetol 37:400–404
Gladfelter WB (1982) White-band disease in Acropora palmata:implications for the structure and growth of shallow reefs. Bull
Mar Sci 32(2):639–643
Gladfelter WB, Gladfelter EH, Monahan RK, Ogden JC, Dill RF
(1977) Environmental studies of Buck Island Reef National
Monument, St. Croix, VI. West Indies Laboratory, St. Croix,
USVI. 136 pp
Heppell SS, Crowder LB, Crouse DT, Epperly SP, Frazer NB (2003)
Population models for Atlantic loggerheads: past, present, and
future. In: Bolten AB, Witherington BE (eds) Loggerhead sea
turtles. Smithsonian Institution Press, Washington, pp 255–273
Kendall WL, Bjorkland R (2001) Using open robust design models to
estimate temporary emigration from capture—recapture data.
Biometrics 57:1113–1122
Krueger BH, Chaloupka MY, Leighton PA, Dunn JA, Horrocks JA
(2011) Somatic growth rates for a hawksbill turtle population in
coral reef habitat around Barbados. Mar Ecol Prog Ser
432:269–276
Kubis S, Chaloupka M, Ehrhart L, Bresete M (2009) Growth rates of
juvenile green turtles Chelonia mydas from three ecologically
distinct foraging habitats along the east central coast of Florida,
USA. Mar Ecol Prog Ser 389:257–269. doi:10.3354/meps08206
Leon YM, Bjorndal KA (2002) Selective feeding in the hawksbill
turtle, an important predator in coral reef ecosystems. Mar Ecol
Prog Ser 245:249–258
Leon YM, Diez CE (1999) Population structure of hawksbill turtles
on a foraging ground in the Dominican Republic. Chelonian
Conserv Biol 3(2):230–236
Limpus CJ (1994) The hawksbill turtle, Eretmochelys imbricate, in
Queensland: population structure within a southern Great Barrier
Reef feeding ground. Wildl Res 19(4):489–505
Mendonca MT (1983) Movements and feeding ecology of immature
green turtles (Chelonia mydas) in a Florida lagoon. Copeia
1983(4):1013–1023
Meylan A (1988) Spongivory in hawksbill turtles: a diet of glass.
Science 239:393–395
Meylan PA, Meylan AB, Gray JA (2011) The ecology and migrations
of sea turtles. 8. Tests of the developmental habitat hypothesis.
B Am Mus Nat Hist. Number 357. 70
Mortimer JA, Donnelly M (IUCN SSC Marine Turtle Specialist
Group) (2008) Eretmochelys imbricata. In: IUCN 2012. IUCN
Red List of Threatened Species. Version 2012.1.
www.iucnredlist.org. Downloaded on 30 July 2012
Mortimer JA, Collie J, Jupiter T, Chapman R, Liljevik A, Betsy B
(2003) Growth rates of immature hawksbills (Eretmochelys
imbricata) at Aldabra Atoll, Seychelles (Western Indian Ocean).
In: Seminoff JA (ed) Proceedings of the 22nd annual symposium
on sea turtle biology and conservation. NOAA Technical
Memorandum NMFS-SEFSC-503. US Department of Com-
merce, Miami, FL, pp 247–248
National Marine Fisheries Service (NMFS) and United States fish and
wildlife service (USFWS) (1993) Recovery plan for hawksbill
turtles in the U.S. Caribbean Sea, Atlantic Ocean, and Gulf of
Mexico. St. Petersburg, FL
NMFS & USFWS (1998) Recovery plan for U.S. Pacific populations
of the hawksbill turtle (Eretmochelys imbricata). NMFS Silver
Spring, MD
Pawlik JR, Chanas B, Toonen RJ, Fenical W (1995) Defenses of
Caribbean sponges against predatory reef fish. I. Chemical
deterrency. Mar Ecol Prog Ser 127:183–194
Pemberton RA Jr (2001) The Habitat Utilization of Hawksbill Sea
Turtles Eretmochelys imbricata at Buck Island Reef National
Monument St. Croix U.S. Virgin Islands, MS Thesis, Virginia
Institute of Marine Science, Gloucester Point, VA 111 pp
Rincon-Diaz MP, Diez CE, Van Dam RP, Sabat AM (2011) Foraging
selectivity of the hawksbill sea turtle (Eretmochelys imbricata)in the Culebra Archipelago, Puerto Rico. J Herpetol 45:277–282
Sanchez-Rodrıguez J, Cruz-Vazquez K (2006) Isolation and biolog-
ical characterization of neurotoxic compounds from the sea
anemone Lebrunia danae (Duchassaing and Michelotti 1860).
Arch Toxicol 80:436–441
SAS (1997) SAS version 6. SAS Institute Inc, Cary
Scales KL, Lewis JA, Lewis JP, Castellanos D, Godley BJ, Graham
RT (2011) Insights into habitat utilisation of the hawksbill turtle,
Eretmochelys imbricata (Linnaeus 1766), using acoustic telem-
etry. J Exp Mar Biol Ecol 407:122–129
Stampar SN, da Silva PF, Luiz OJ Jr (2007) Predation on the Zoanthid
Palythoa caribaerum (Anthozoa, Cnidaria) by a hawksbill turtle
(Eretmochelys imbricata) in southeastern Brazil. Mar Turtle
Newsl 117:3–5
Swearington DC, Pawlik JR (1998) Variability in the chemical
defense of the sponge Chondrilla nucula against predatory reef
fishes. Mar Biol 131:619–627
Van Dam RP, Diez CE (1997) Diving behavior of immature
hawksbill turtles (Eretmochelys imbricata) in a Caribbean reef
habitat. Coral Reefs 16:133–138
Van Dam RP, Diez CE (1998) Home range of immature hawksbill
turtles (Eretmochelys imbricata (Linnaeus)) at two Caribbean
islands. J Exp Mar Biol Ecol 220:15–24
Velez-Zuazo X, Ramos WD, Van Dam RP, Diez CE, Abreu-Groboiss
A, McMillan WO (2008) Dispersal, recruitment and migratory
behaviour in a hawksbill sea turtle aggregation. Mol Ecol
17:839–853
Witzell WN (1983) Synopsis of biological data on the hawksbill turtle
Eretmochelys imbricata Linnaeus, 1766). FAO Fisheries Syn-
opsis 137:1–78
Mar Biol
123