growth area element - city of phoenix
TRANSCRIPT

Executive Summary
The Growth Area element is based on the Growth Strategy adopted by the City Council in 1998.
The city should maintain a high quality of life and an economically healthy
community.
The strategy is based on an understanding of how growth in the Phoenix metropolitan area affects
the ability of Phoenix to maintain quality neighborhoods, a viable economic base and adequate
revenue to support city services. Key concepts include:
ncourage new employment growth in northern and west
Valley targeted growth areas to provide jobs close to new regional residential growth.
encourage new housing growth in southern and southwestern
targeted growth areas to support job growth in the west Valley and within existing central Phoenix
employment centers.
explore new infrastructure financing programs and
guide growth to areas in which infrastructure can be most economically provided.
promote a desert lifestyle by strategically protecting and
utilizing existing desert and open space areas to define the character, location and form of new
development.
promote infill housing to support central area employment centers and maintain
healthy central area communities.
plan balanced employment, residential and commercial
development to ensure Phoenix receives its fair share of regional sales tax.
integrate land use and transportation planning to minimize
trip numbers and lengths and tus improve air quality.
give priority to six growth areas when planning future public facilities and
expanding city services.
Growth Goal:
Location of employment growth: e
Location of residential growth:
Financial management of infrastructure:
Open space and desert preservation:
Infill housing:
Capture of public revenues:
Transit and transportation planning:
Targeted growth areas:
Growth Area ElementGrowth Area ElementGrowth Area Element
17
A STRATEGIC VIEW OF GROWTH
INTRODUCTION
Since 1970, Arizona and Maricopa County have been
among the fastest growing areas in the United
States. A major factor has been Arizona's quality of
life, including its climate, recreational opportunities
and positive business climate. Even during times of
national recession, Arizona and Maricopa County still
experienced modest levels of growth. Although
Phoenix's growth rate has been slower than that of
the county, our city also has experienced rapid
growth rates. During the last 30 years, Phoenix
doubled its population to over a million people, an
effective annual growth rate of 2.5 percent. As a
result, Phoenix now encompasses over 600 square
miles within its planning area, nearly one-half of
which is agricultural or desert.
Long-term national forecasts of the United States
economy indicate that the factors that fueled growth
in Arizona over the last 30 years will continue to be
factors in the future. Thus the region will grow, with
Arizona, Maricopa County and Phoenix continuing to
attract new employment and residents in the
foreseeable future. It is estimated that Maricopa
County will double its population to 5 million by
2025.
While most of the factors driving growth in Arizona
are regional rather than local, our state does not have
a regional planning authority. Instead, many
autonomous local governments each have
jurisdiction over their own specific areas and
functions. For many of the regional factors driving
growth, such as climate and wages, there is little that
individual local governments can do to alter the
impact these factors have on growth in their
community. Local attempts to stop or slow growth
would be like squeezing on a water balloon
constraint on one side would causes a bulge
elsewhere. However, this does not mean that
growth will be equally distributed among these
jurisdictions, or that the benefits and negative
impacts of growth will be equally distributed. This
also does not mean that each community does not
have the ability or responsibility to manage its own
growth. How each jurisdiction manages its
community to respond to regional growth will
determine whether the results are positive or
negative. In turn, one city's decisions or lack of
decisions on how to manage growth can impact
other cities. Thus communities have a regional as
well as a local responsibility when responding to
growth issues.
The city of Phoenix recognizes that growth is a
regional phenomenon for which it has a
responsibility to think regionally and act locally, and
hopes that other communities will do the same. This
Growth Area element reflects this philosophy, based
on the city's Strategic View of Growth developed in
1994 and adopted in 1998. The Strategic View of
Growth includes a basic goal and six strategic growth
concepts, focusing on: managing long-term
employment and residential growth, encouraging
infill of inner city areas, protecting Phoenix's unique
desert resources, and linking economic development
efforts more closely with community needs and
growth goals. These concepts are intended to
provide a basis for more detailed discussion of
specific community programs, and how they should
be managed to reflect regional growth as well as the
goals of the city of Phoenix.
Maintain a high quality of life and
economically healthy community.
Future employment growth within any part
of the region will be closely linked to the
characteristics and growth of the
surrounding residential areas located within
a 30 to 45-minute commute.
Future sales tax generation will be more
t ight ly l inked to provid ing reta i l
opportunities close to residential areas and
employment areas.
The abi l i ty to f inancia l ly provide
infrastructure will be the major constraint for
residential growth located at the outer edge
of the region's urban areas.
The commute shed (area of the region where
most of the people who work in an
employment center live) for some existing
employment centers eventually will not
include residential growth areas at the urban
fringe, so urban infill becomes key to
employment growth of such centers.
Strategic View of Growth
Goal 1: Growth:
Key concepts directing growth in all General Plan
elements:
18

New residential growth areas are moving
further from existing employment centers,
resulting in longer commute times and
vehicle miles traveled. Addressing traffic
and air quality concerns will require
providing new employment opportunities in
fringe residential growth areas.
The legacy of Phoenix's mountain preserves
has been a major part of our city's quality of
life. However, growth now has extended
well beyond the existing preserve system.
Preserving desert resources and character in
growth areas will be critical to the quality of
life in these new developing areas.
To assist in implementing these strategic growth
concepts, the Strategic View of Growth identifies six
major target growth areas (see Figure 1).
The growth areas:
are used as a basis by city departments to
develop programs and set priorities for
developing infrastructure and expanding
services, such as police and fire.
have become a key component of the
Phoenix Economic Development Plan, used
in the city's Community and Economic
Development Department in its business
expansion strategies and programs.
are the basis for the Planning Department's
area planning work program.
The following sections provide a more detailed
discussion of the analysis and trends behind the
strategic growth concepts, targeted growth areas,
and the concepts' implementation.
As the central city of the region, Phoenix has the
burden of bearing a larger than proportional share of
regional growth impacts. Central Phoenix has a high
number of regional services such as Sky Harbor
Airport and the State Capitol. Being the center of the
region places Phoenix at the center of regional traffic
congestion, and so the city has had to bear a high
level of responsibility for major regional streets.
Targeted Growth Areas
Background
Central Phoenix also has the highest concentration of
lower-income families in the region, as well as many
of the facilities that provide related services. The
effects of these impacts will increase as the region
grows.
Phoenix also has had its share of new growth, and
the needs created by it. Understanding the
relationship between regional growth, new growth
and infill development in Phoenix, as well as the
positive and negative impacts of each, is important
to understanding how Phoenix should respond to
future regional growth.
Resulting from this examination of growth issues
was a set of strategic growth management concepts
developed and presented to City Council in the
summer of 1995 (see six concepts under Strategic
View of Growth above). Over the next three years,
these concepts provided the basis for a series of area
plans and general plan amendments in various parts
of the city. In each area plan, the general growth
concepts were applied to that area's unique growth
issues. The Strategic View of Growth, adopted by
the City Council in 1998 as the city's official growth
policy, is the basis for this Growth Area element.
19
Historical Growth Trends
Historically, Phoenix's role in the region has shifted
from being the dominate city within the region, with
almost all regional growth located within its city
limits, to being the largest city in an even larger
rapidly growing region. Phoenix's share of the
region's population has slowly declined, and now
more people live in the communities that surround
Phoenix than live in it. However, unlike other central
cities in rapidly growing regions, Phoenix is not
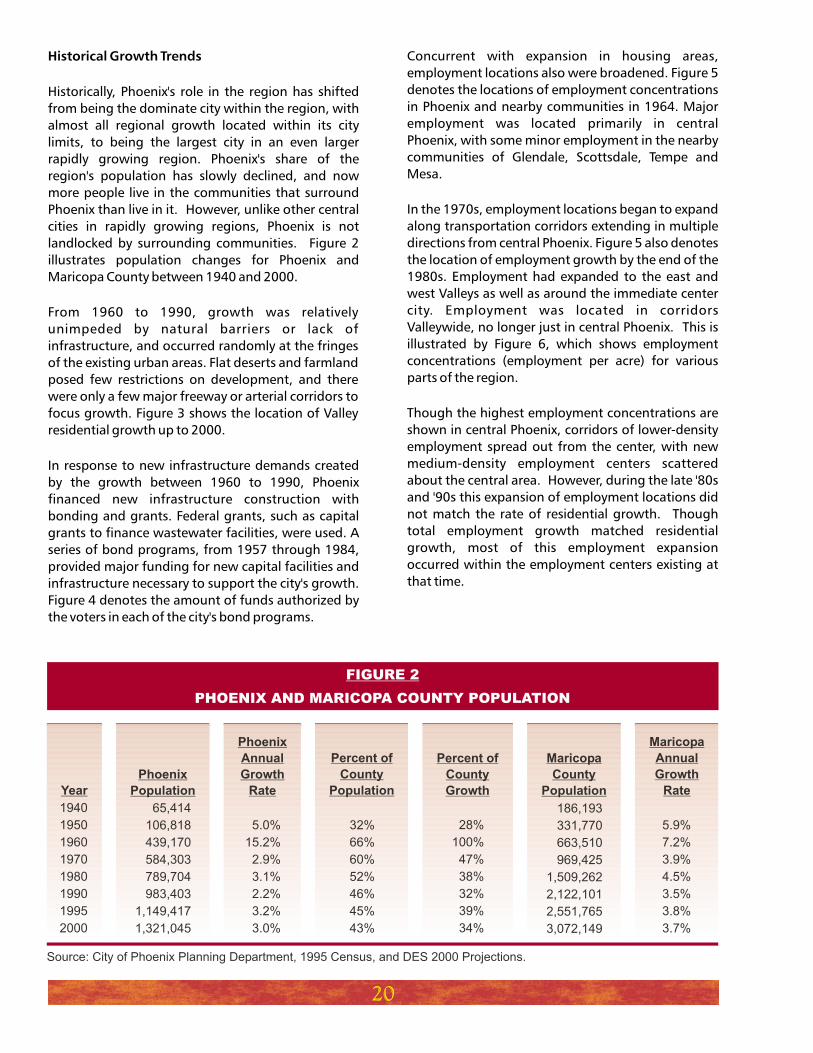
landlocked by surrounding communities. Figure 2
illustrates population changes for Phoenix and
Maricopa County between 1940 and 2000.
From 1960 to 1990, growth was relatively
unimpeded by natural barriers or lack of
infrastructure, and occurred randomly at the fringes
of the existing urban areas. Flat deserts and farmland
posed few restrictions on development, and there
were only a few major freeway or arterial corridors to
focus growth. Figure 3 shows the location of Valley
residential growth up to 2000.
In response to new infrastructure demands created
by the growth between 1960 to 1990, Phoenix
financed new infrastructure construction with
bonding and grants. Federal grants, such as capital
grants to finance wastewater facilities, were used. A
series of bond programs, from 1957 through 1984,
provided major funding for new capital facilities and
infrastructure necessary to support the city's growth.
Figure 4 denotes the amount of funds authorized by
the voters in each of the city's bond programs.
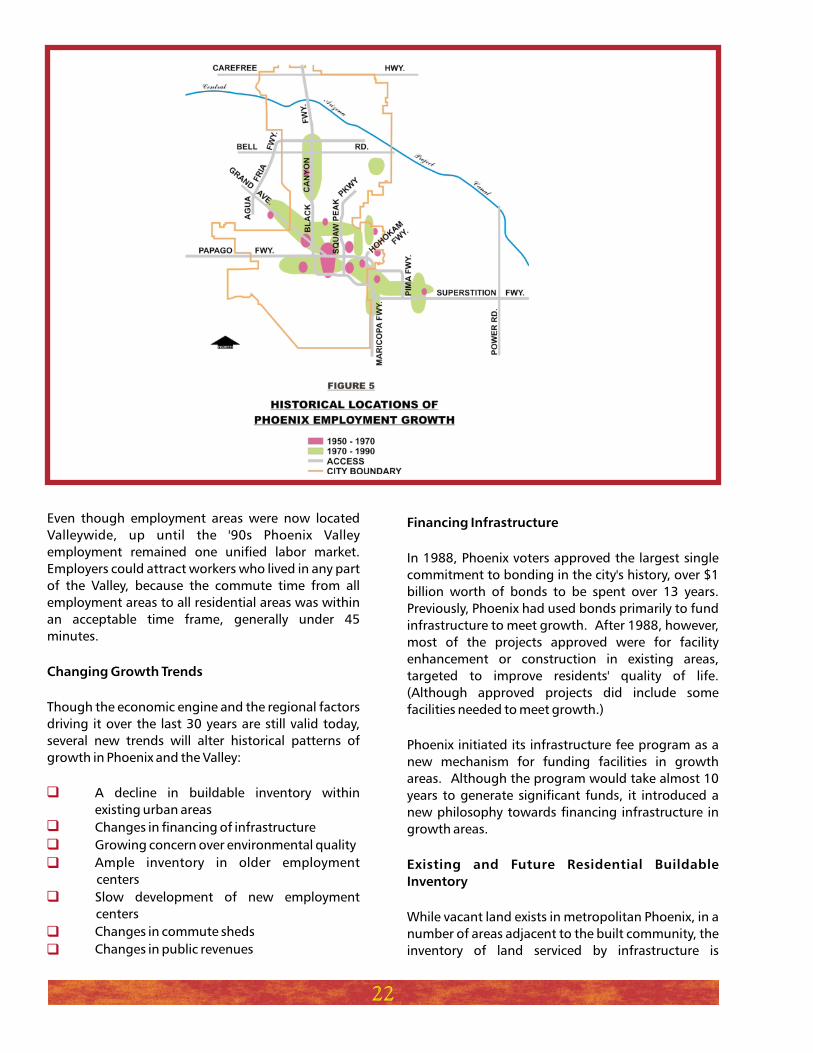
Concurrent with expansion in housing areas,
employment locations also were broadened. Figure 5
denotes the locations of employment concentrations
in Phoenix and nearby communities in 1964. Major
employment was located primarily in central
Phoenix, with some minor employment in the nearby
communities of Glendale, Scottsdale, Tempe and
Mesa.
In the 1970s, employment locations began to expand
along transportation corridors extending in multiple
directions from central Phoenix. Figure 5 also denotes
the location of employment growth by the end of the
1980s. Employment had expanded to the east and
west Valleys as well as around the immediate center
city. Employment was located in corridors
Valleywide, no longer just in central Phoenix. This is
illustrated by Figure 6, which shows employment
concentrations (employment per acre) for various
parts of the region.
Though the highest employment concentrations are
shown in central Phoenix, corridors of lower-density
employment spread out from the center, with new
medium-density employment centers scattered
about the central area. However, during the late '80s
and '90s this expansion of employment locations did
not match the rate of residential growth. Though
total employment growth matched residential
growth, most of this employment expansion
occurred within the employment centers existing at
that time.
20
1940
1950
1960
1970
1980
1990
1995
2000
65,414
106,818
439,170
584,303
789,704
983,403
1,149,417
1,321,045
186,193
331,770
663,510
969,425
1,509,262
2,122,101
2,551,765
3,072,149
5.9%
7.2%
3.9%
4.5%
3.5%
3.8%
3.7%
5.0%
15.2%
2.9%
3.1%
2.2%
3.2%
3.0%
32%
66%
60%
52%
46%
45%
43%
28%
100%
47%
38%
32%
39%
34%
Source: City of Phoenix Planning Department, 1995 Census, and DES 2000 Projections.
PHOENIX AND MARICOPA COUNTY POPULATION
FIGURE 2
Year
Phoenix
Population
Phoenix
Annual
Growth
Rate
Percent of
County
Population
Percent of
County
Growth
Maricopa
County
Population
Maricopa
Annual
Growth
Rate

21
1961
1970
1973
1975
1979-83
1984
1988
1989
2001
103,000,000
177,400,000
56,500,000
207,300,000
398,590,000
265,000,000
528,600,000
15,000,000
750,000,000
PHOENIX NON-ENTERPRISE
BOND PROGRAMS
FIGURE 4
Year Amount of Authorization
22
Even though employment areas were now located
Valleywide, up until the '90s Phoenix Valley
employment remained one unified labor market.
Employers could attract workers who lived in any part
of the Valley, because the commute time from all
employment areas to all residential areas was within
an acceptable time frame, generally under 45
minutes.
Though the economic engine and the regional factors
driving it over the last 30 years are still valid today,
several new trends will alter historical patterns of
growth in Phoenix and the Valley:
A decline in buildable inventory within
existing urban areas
Changes in financing of infrastructure
Growing concern over environmental quality
Ample inventory in older employment
centers
Slow development of new employment
centers
Changes in commute sheds
Changes in public revenues
Changing Growth Trends
Financing Infrastructure
Existing and Future Residential Buildable
Inventory
In 1988, Phoenix voters approved the largest single
commitment to bonding in the city's history, over $1
billion worth of bonds to be spent over 13 years.
Previously, Phoenix had used bonds primarily to fund
infrastructure to meet growth. After 1988, however,
most of the projects approved were for facility
enhancement or construction in existing areas,
targeted to improve residents' quality of life.
(Although approved projects did include some
facilities needed to meet growth.)
Phoenix initiated its infrastructure fee program as a
new mechanism for funding facilities in growth
areas. Although the program would take almost 10
years to generate significant funds, it introduced a
new philosophy towards financing infrastructure in
growth areas.
While vacant land exists in metropolitan Phoenix, in a
number of areas adjacent to the built community, the
inventory of land serviced by infrastructure is

beginning to decline. Figure 7 shows the locations of
new residential growth within the Valley between
1990 and 1999.
Although these will require some infrastructure
construction and service development, within these
areas the majority of basic water, streets and
wastewater service is already in place. Though
infrastructure costs will be higher in these areas than
in the past, the majority of infrastructure expense has
already been committed by the public sector through
its traditional capital improvement programs. While
the amount of land available for new residential
development varies for different parts of the Valley,
this inventory represents less than a five-year supply
of land.
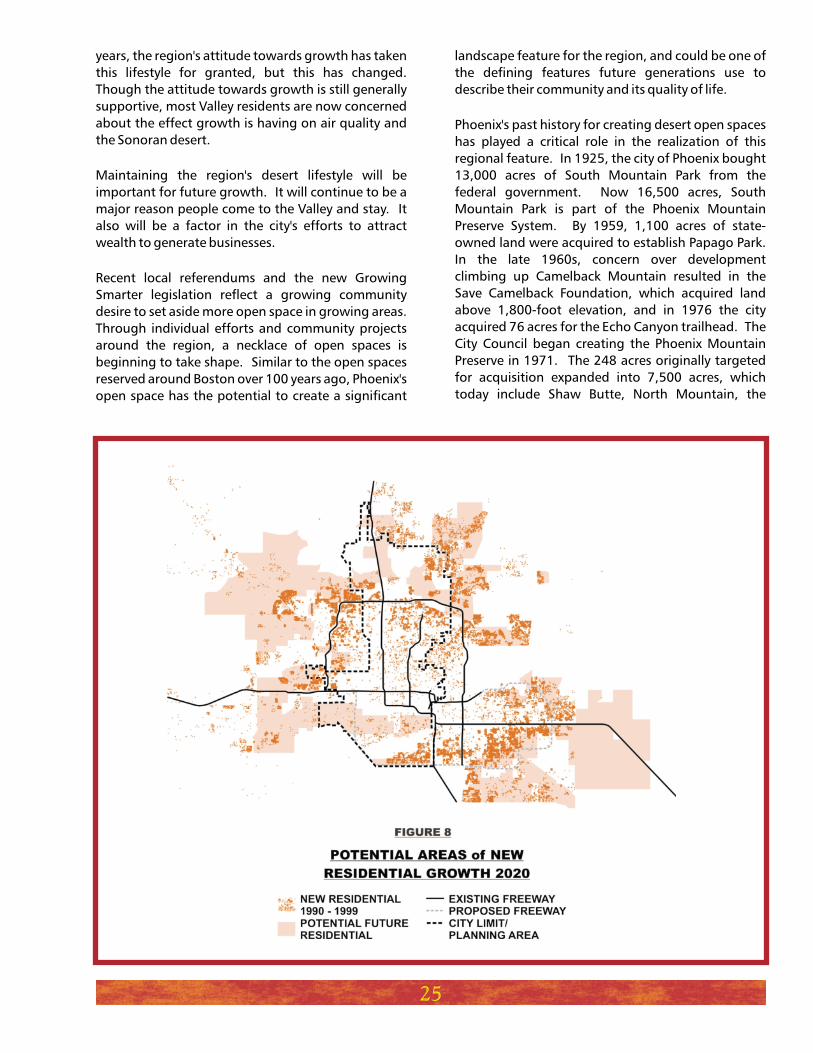
Figure 8 shows the four major parts of the Valley
where there is a significant future potential supply of
residential land: the northeast (Phoenix and
Scottsdale); the north-northwest (Phoenix, Peoria
and Surprise); the southwest (Phoenix, Avondale,
Buckeye and Goodyear); and the southeast (Chandler
and Gilbert). However, developing these areas will
create a new set of growth challenges different from
those that Valley communities have faced in the past.
As shown above, the environment for financing
infrastructure in metro Phoenix has undergone some
radical changes in the last 10 years. In addition to a
decline in federal dollars, Valley communities are
now experiencing constraints on traditional means of
infrastructure financing. For example, Gilbert has
recently called for a moratorium on growth in an
effort to get a handle on infrastructure costs. In 2001,
the city of Phoenix adopted a new bond package
($753.9 million), which likely will not result in project
funding until 2002. This five-year program proposes
only limited funds for infrastructure in growth areas.
This, combined with the increasing need for capital
replacement funds, will limit Phoenix's ability to
NEW CHALLENGES
Financing Infrastructure
23
Figure 6: 2000 Estimated Employment Density (employees/acre)
24
finance growth-related infrastructure as it has in the
past. In preparing the 2001 bond proposal,
estimates of Phoenix's needs for the next five years
were three times greater than estimated bond
capacity.
Anticipating the critical need for additional
infrastructure funding, in 1987 Phoenix became one
of the first cities in the country to implement an
impact fee program requiring developers to pay for a
portion of the facilities necessary to service the new
homes and businesses. Although the impact fees
were initially charged in peripheral areas, the
program is gradually being expanded so that
eventually all of the city's growth areas will be
included. In some parts of the city, such as in Desert
View Village, impact fees and associated repayment
agreements have played a critical role in facilitating
the construction of needed street, water and sewer
infrastructure. Many other Arizona cities and towns
have recognized the necessity of making new
development "pay its way," and have begun charging
impact fees, while others are currently preparing
impact fee ordinances or investigating their use.
Even with impact fees, financing new infrastructure
in the city of Phoenix and other Arizona communities
can be a difficult task, because of the rapid growth
rate and significant demand for new streets, water
and sewer facilities, fire and police stations, and
parks. A large portion of the impact fees collected in
any given area usually are collected as the area
matures and retail and commercial uses are added to
service the existing residential and industrial uses.
This often results in a lag of many years between the
time the major infrastructure must be put in place,
and the time when a large portion of impact fees are
collected. Often the city and major developers seek
creative financing techniques to bridge the gap. (See
Cost of Development element for a more detailed
discussion of Phoenix impact fees.)
One of the factors that has attracted people to the
Phoenix region is the desert lifestyle, including clear
vistas of surrounding deserts and mountains, and
easy access to desert open spaces, highlighted by
rivers and washes crossing the Valley. For many
Growth, Open Space and Desert Preservation
years, the region's attitude towards growth has taken
this lifestyle for granted, but this has changed.
Though the attitude towards growth is still generally
supportive, most Valley residents are now concerned
about the effect growth is having on air quality and
the Sonoran desert.
Maintaining the region's desert lifestyle will be
important for future growth. It will continue to be a
major reason people come to the Valley and stay. It
also will be a factor in the city's efforts to attract
wealth to generate businesses.
Recent local referendums and the new Growing
Smarter legislation reflect a growing community
desire to set aside more open space in growing areas.
Through individual efforts and community projects
around the region, a necklace of open spaces is
beginning to take shape. Similar to the open spaces
reserved around Boston over 100 years ago, Phoenix's
open space has the potential to create a significant
landscape feature for the region, and could be one of
the defining features future generations use to
describe their community and its quality of life.
Phoenix's past history for creating desert open spaces
has played a critical role in the realization of this
regional feature. In 1925, the city of Phoenix bought
13,000 acres of South Mountain Park from the
federal government. Now 16,500 acres, South
Mountain Park is part of the Phoenix Mountain
Preserve System. By 1959, 1,100 acres of state-
owned land were acquired to establish Papago Park.
In the late 1960s, concern over development
climbing up Camelback Mountain resulted in the
Save Camelback Foundation, which acquired land
above 1,800-foot elevation, and in 1976 the city
acquired 76 acres for the Echo Canyon trailhead. The
City Council began creating the Phoenix Mountain
Preserve in 1971. The 248 acres originally targeted
for acquisition expanded into 7,500 acres, which
today include Shaw Butte, North Mountain, the
25

26
Dreamy Draw Recreation Area and Squaw Peak
Summit Trail.
However, in the last 10 years, the growth of Phoenix's
preserves has not matched the growth of the city.
The city now has 27,000 acres of mountain preserves
and desert parks, with less than 2,000 of this added
since the acquisitions cited above. While the amount
of open space has continually increased in acreage,
the amount per capita has decreased. Phoenix needs
to acquire more open space to maintain the current
level per capita. These new areas will be important as
the city's growth approaches more mountainous
areas with more dense vegetation and wildlife.
In February of 1998, the City Council approved the
Sonoran Desert Master Plan, calling for up to 25,000
acres of state-owned and private desert lands to be
preserved in northern Phoenix. A city study
completed in 1998 estimated that acquisition of
these lands could take up to 40 years and would
require a wide range of acquisition techniques. In
1999, city of Phoenix voters approved a one-tenth of
a cent sales tax for 10 years, for developing new parks
and acquiring desert preserves. Forty percent of this
fund is dedicated to acquiring lands for the Sonoran
Preserve. However, even this funding source will not
be enough to acquire all lands identified as part of
the preserve.
The city is also involved in other regional open space
projects, including the Rio Salado Restoration
Program and the Aqua Fria River restoration. Such a
regional system will be important in connecting trails
and in maintaining and expanding the desert life style
of Phoenix and surrounding cities.
Though employment in Phoenix and the Valley
continues to grow at healthy rates, the existing
employment centers developed during the '80s and
'90s will not grow in land area in the near future,
because substantial zoned vacant land remains
available within them for future employment
opportunities.
Figure 9 provides an inventory of vacant land within
the employment centers in the city of Phoenix. Most
of these have sufficient inventory to accommodate
employment growth for a number of years.
Employment Growth and Location
Ahwatukee
E. I-10 / Broadway
Camelback Core
North Central Corridor
Desert-View
Gateway Area
North Black-Canyon
Deer Valley Core
South Central Corridor
Kierland
Sky-Harbor
West I-10
Total
164
256
9
38
756
184
1,975
220
40
31
1,155
727
5,555
1,784,871
2,786,751
1,220,551
6,690,816
8,229,137
8,030,722
21,506,225
2,394,167
7,028,842
338,135
12,579,475
7,911,803
80,501,494
Source: 1999 Phoenix Planning Department, estimates of potential development and
zoning entitlements of land zoned for commercial, industrial, and office uses based on
review of vacant land.
VACANT ACREAGE AVAILABLE FOR
ADDITIONAL BASIC EMPLOYMENT IN CITY OF PHOENIX
FIGURE 9
Employment Center
Acres Vacant And
Zoned Industrial
Potential Square Feet of
Built Space
Stronger Linkage Between Home and Work
Future employment growth will be linked more
directly to residential growth. As the Valley has
grown, the time it takes to travel from one part of it
to another has increased. This is due to both an
increase in the physical distance and increased
congestion of freeways and arterials at peak hour.
Several trends indicate that increased travel time is
beginning to fragment what has historically been a
unified labor market.
The first trend is that people are choosing to remain
close to their workplace. Even though the Valley has
grown larger, the average travel time to work in the
Phoenix area, 21.6 minutes, is only slightly higher
than in 1980, and remains under the United States
national average in 1990 of 22.4 minutes. Also, an
analysis of 1990 census data of work and residence
locations for specific employment centers in Phoenix,
shows that workers have begun to locate their homes
closer to work.
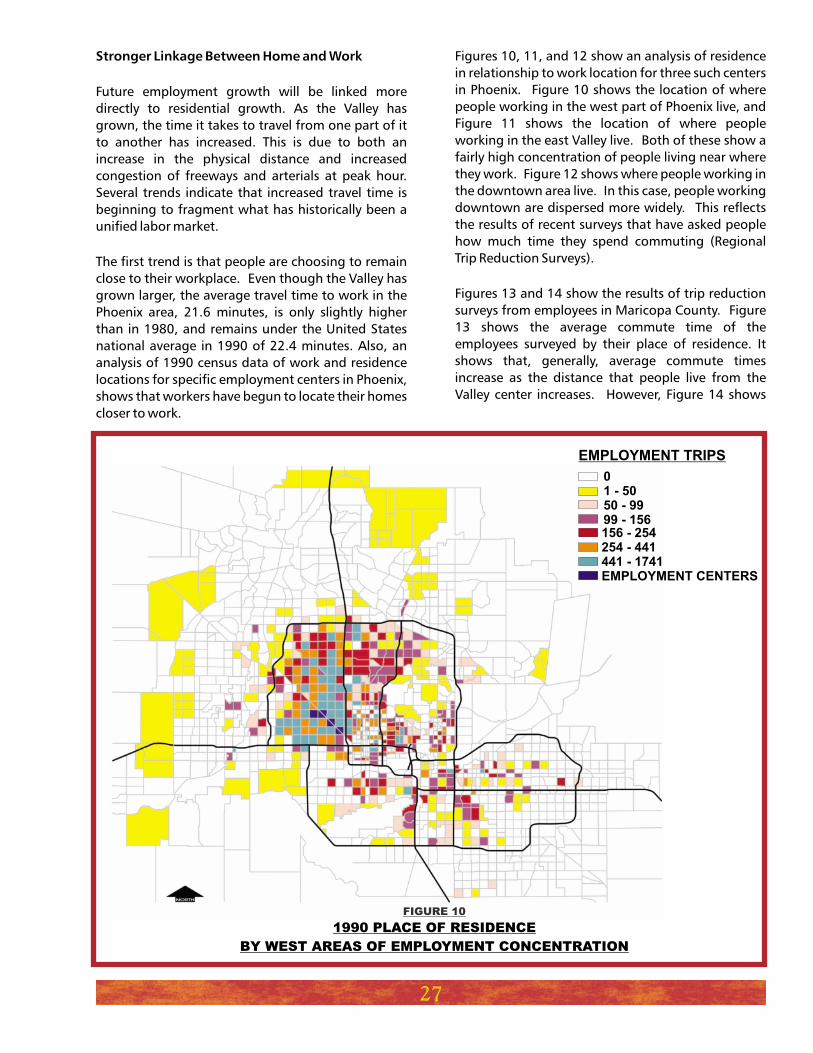
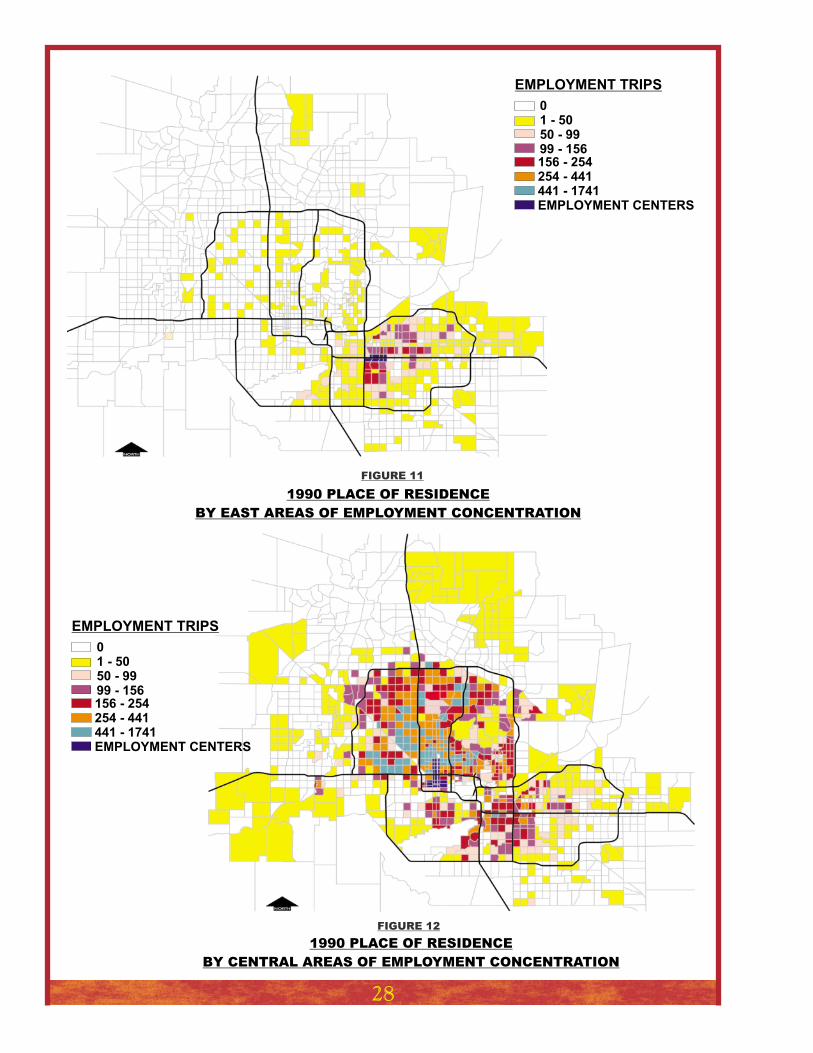
Figures 10, 11, and 12 show an analysis of residence
in relationship to work location for three such centers
in Phoenix. Figure 10 shows the location of where
people working in the west part of Phoenix live, and
Figure 11 shows the location of where people
working in the east Valley live. Both of these show a
fairly high concentration of people living near where
they work. Figure 12 shows where people working in
the downtown area live. In this case, people working
downtown are dispersed more widely. This reflects
the results of recent surveys that have asked people
how much time they spend commuting (Regional
Trip Reduction Surveys).
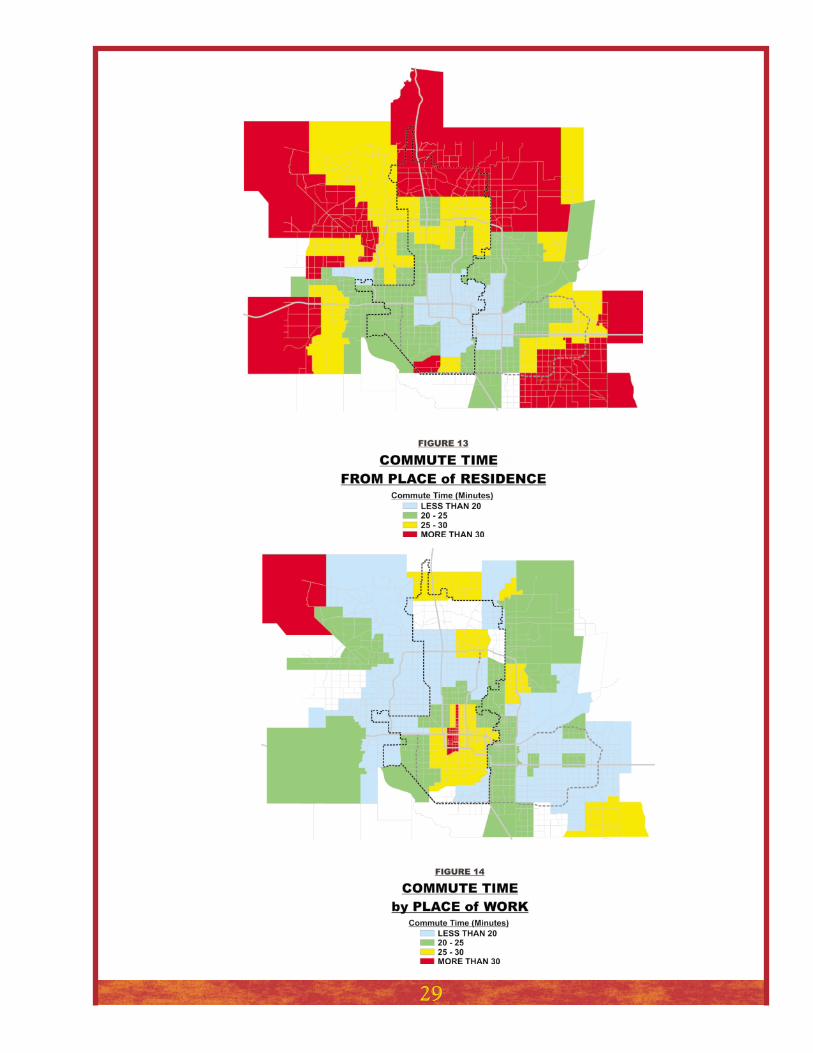
Figures 13 and 14 show the results of trip reduction
surveys from employees in Maricopa County. Figure
13 shows the average commute time of the
employees surveyed by their place of residence. It
shows that, generally, average commute times
increase as the distance that people live from the
Valley center increases. However, Figure 14 shows
27
01 - 5050 - 9999 - 156156 - 254254 - 441441 - 1741EMPLOYMENT CENTERS
EMPLOYMENT TRIPS
1990 PLACE OF RESIDENCE
BY WEST AREAS OF EMPLOYMENT CONCENTRATION
FIGURE 10
28
1990 PLACE OF RESIDENCE
BY EAST AREAS OF EMPLOYMENT CONCENTRATION
FIGURE 11
01 - 5050 - 9999 - 156156 - 254254 - 441441 - 1741EMPLOYMENT CENTERS
EMPLOYMENT TRIPS
01 - 5050 - 9999 - 156156 - 254254 - 441441 - 1741EMPLOYMENT CENTERS
EMPLOYMENT TRIPS
1990 PLACE OF RESIDENCE
BY CENTRAL AREAS OF EMPLOYMENT CONCENTRATION
FIGURE 12
29
30
the average commute time by place of work rather
than where they live. Those working in the central
city have an average commute time of more than 30
minutes; yet those working in areas farther from the
central city have a lower average commute time.
These maps show two important concepts. 1) The
central city still is drawing employees from a large
part of the Valley, and these workers have accepted
longer commute times. This means that the
commute shed for the central city will be slightly
larger than that for other employment areas. 2)
Workers at businesses developing at the edges of the
Valley have shorter average commute times, and thus
live closer to their jobs.
The second trend is that businesses can no longer rely
on the entire Valley as a source for employees. An
analysis of commute times around the Valley's areas
of employment concentration also shows that each
employment center begins to include residential
areas that are exclusively within their 30-minute
commute shed. Figure 15 shows how the areas of
major employment concentration in the Valley can be
aggregated into six major zones of employment
based on the size and location of their commute

31
2020 METROPLEX-EMPLOYMENT ZONES COMMUTE
SHEDS-BASED ON 2020 AM PEAK HOUR TRAVEL TIME
FIGURE 16
NORTHWESTNORTHEASTCENTRALSOUTHEAST
RESIDENTIAL GROWTHPLANNING AREA
2020 CENTRAL CITY
COMMUTE SHED TRAVEL TIMES
FIGURE 17
1 - 1920 - 4445 - 5960 - 90
EMPLOYMENT CENTERSPOTENTIAL NEW RESIDENTIALPLANNING AREA
MorningPeak HourMinutes

32
2020 NORTHEAST
COMMUTE SHED TRAVEL TIMES
FIGURE 19
1 - 1920 - 4445 - 5960 - 90
EMPLOYMENT CENTERSPOTENTIAL NEW RESIDENTIALPLANNING AREA
Morning Peak HourMinutes
2020 NORTH VALLEY
COMMUTE SHED TRAVEL TIMES
FIGURE 18
1 - 1920 - 4445 - 5960 - 90
EMPLOYMENT CENTERSPOTENTIAL NEW RESIDENTIALPLANNING AREA
Morning Peak HourMinutes
33
2020 EAST VALLEY
COMMUTE SHED TRAVEL TIMES
FIGURE 21
1 - 1920 - 4445 - 5960 - 90
EMPLOYMENT CENTERSPOTENTIAL NEW RESIDENTIALPLANNING AREA
Morning Peak HourMinutes
2020 WEST VALLEY
COMMUTE SHED TRAVEL TIMES
FIGURE 20
1 - 1920 - 4445 - 5960 - 90
EMPLOYMENT CENTERSPOTENTIAL NEW RESIDENTIALPLANNING AREA
MorningPeak HourMinutes

34
shed. Figure 16 shows for new residential
development which zone generally will be closest to
it in terms of commute time. Finally, Figures 17
through 22 show the actual commute shed for each
zone. Though there is some overlap between
adjacent zones, the commute sheds for the east and
southeast Valley overlap very little with commute
sheds for the west, north and northeast. Also, the
commute sheds for the northeast Valley overlap very
little with the west. To some extent, all but the
southeast commute sheds overlap with the central
city commute shed.
Most significant, however, is the relationship of
potential new residential growth to each commute
shed. The shaded areas on each map show that
future potential residential areas are located at the
fringe of the urban areas. Each commute shed is
located distinctly near its own area of new residential
growth. All new potential residential areas are
outside of the central city commute shed, except for
those in the southwest Valley. The central zone
shares these southwest residential areas with the
west employment zone. Similarly, the commute
sheds for three east Valley employment zones are
outside all new residential areas except those within
the southeast, which they share. The north and
northeast zones share new residential areas to the
north and northeast. Finally, the west and north
zones share the new residential areas in the west and
northwest.
Analysis of the labor force in each of the current
commute sheds also shows some small distinctions in
workers categorized by profession and industry. The
work force in the east Valley commute shed has a
larger percent (18 percent) of its labor force
identified as professional specialist; a larger
percentage employed in manufacturing (17 percent),
and a larger percent with Bachelor and Graduate
Professional degrees (22 percent) than the other
commute sheds. Conversely, the labor force in the
West I-10 commute shed has the highest percent of
work force categorized as machine operators (8
percent), and the lowest percent with Bachelor and
Graduate Professional degrees (17 percent). Along
with the Grand Avenue commute shed work force,
they share the lowest percent of the work force
designating Professional Specialist as their
occupation (15 percent).
2020 SOUTHEAST VALLEY
COMMUTE SHED TRAVEL TIMES
FIGURE 22
1 - 1920 - 4445 - 5960 - 90
EMPLOYMENT CENTERSPOTENTIAL NEW RESIDENTIALPLANNING AREA
Morning Peak HourMinutes

All of these issues indicate that the relationships
between jobs and housing within the Valley are
changing. Over the past 20 years, most people lived
within 30 to 45 minutes of most of the Valley's
employment areas. Thus one could live and work
almost anywhere in the Valley and still have a
reasonable commute to work. However, this is
changing.
As new residential construction is built further
towards the periphery of the Valley, two trends likely
will emerge. First, commute times (and thus vehicle
miles traveled) will increase as people moving into
new residential areas travel longer distances to older
employment centers. Then, as travel times reach
"undesirable levels" due to increased distance and
traffic, typically more than 45 minutes, commute
sheds likely will intensify around major employment
locations. This is already beginning to occur in
Phoenix, as it has in other Southern and Southwest
growth cities, such as Dallas, Denver, Houston, and
Los Angeles.
As commute times begin to increase and people
travel longer distances to existing and new jobs in
older employment centers, several responses likely
will occur. First, existing businesses will reduce the
size of the area that they consider to be their labor
pool, to match more acceptable commute times.
Second, some employers will seek locations at the
fringe of the urban area as they try to locate their
businesses within acceptable commute times of new
employees. Third, new Valley businesses will examine
the structure of the labor force within a reasonable
commute distance of the various employment
centers, and choose the centers with labor force
structures best matching their labor needs. These
trends will result in the metropolitan labor market
fracturing into specific labor markets within a
comfortable travel time to each employment area.
This will have a profound effect on the dynamics of
growth in the region.
As the commute shed phenomena solidifies, there
will be implications for each distinct employment
market. The markets with commute sheds having
room to add new residences will be able to attract
new employment. Markets with limited ability to
expand their housing base may not have the
opportunity to grow, since they may lack the ability to
attract additional workers to their respective
employment zones.
Also, there is the potential for new employment
centers to develop within future residential growth
areas. New and existing freeways located in the
west, north and east Valley have the potential to
serve new employment centers. Figure 24 shows
existing and some potential areas of employment
concentration within the Valley. Figure 23 shows
existing and future employment centers in Phoenix.
All of these areas will be closely linked to freeway
locations and, in the future, more closely linked to
the character of new residential growth within their
commute sheds.
The quantity, character, and mix of housing within
each employment center's commute shed will have a
greater impact on the growth of the employment
center. Residential value and quality will need to
match the economic and cultural profile of the new
workers. Lack of housing for future workers could
hamper the growth of an employment center. The
opposite is true as well. The value and type of some
of the jobs being attracted will need to match the
economic and skills profile of existing residents.
Otherwise, existing residents will have to make long
commutes or move closer to available jobs.
35
EXISTING AND POTENTIAL EMPLOYMENT CENTERS
FIGURE 23
DEER VALLEYNORTH I-17DESERT RIDGE / KIERLANDCAMELBACK CORRIDORNORTH CENTRAL AVENUEDOWNTOWN
GATEWAYAIRPORTSOUTH MOUNTAINAHWATUKEE / FOOTHILLSSOUTHWEST PHOENIXFUTURE EMPLOYMENT CENTERS
A - G -
B - H -
C - I
D - J -
E - K -
F -
-

36
EX
IS
TIN
G2000
AN
DP
OT
EN
TIA
LFU
TU
RE
2020
PLA
CE
SO
FE
MP
LO
YM
EN
TC
ON
CE
NT
RA
TIO
N
FIG
UR
E24
1-
2-
3-
4-
5-
6-
7-
8-
9-
10
-
11
-
12
-
13
-
14
-
15
-
16
-
17
-
18
-
19
-
20
-
21
-
22
-
23
-
24
-
DE
ER
VA
LL
EY
NO
RT
HB
LA
CK
CA
NY
ON
NO
RT
HI-
17
DE
SE
RT
RID
GE
/KIE
RL
AN
D
CA
ME
LB
AC
KC
OR
RID
OR
GA
TE
WA
Y
DO
WN
TO
WN
PH
OE
NIX
NO
RT
HC
EN
TR
AL
AV
EN
UE
SK
YH
AR
BO
RA
IRP
OR
T
PH
OE
NIX
BR
OA
DW
AY
CU
RV
E
SO
UT
HW
ES
TP
HO
EN
IX
SO
UT
HC
EN
TR
AL
IND
US
TR
IAL
PH
OE
NIX
GR
AN
DA
VE
NU
E
PA
RA
DIS
EV
AL
LE
YM
AL
LA
RE
A
SO
UT
HM
OU
NTA
INF
OO
TH
ILL
S
FU
TU
RE
SO
UT
HM
OU
NTA
INL
OO
P
PH
OE
NIX
LO
OP
10
1
CA
ME
LB
AC
K/1
9T
HA
VE
NU
E
BU
CK
EY
E/1
07
TH
AV
EN
UE
WIL
LIA
MS
AIR
PA
RK
CH
AN
DL
ER
AIR
PA
RK
FA
LC
ON
FIE
LD
LU
KE
AIR
BA
SE
AR
RO
WH
EA
DC
EN
TE
R

37
Public Service Revenues
The last area of change impacts public revenues from
collecting local community sales tax. Phoenix's
financial ability to provide services to its residents
rests on three factors: First, basic industry, which pays
city taxes on business-to-business sales. Second, the
employees to whom these businesses pay salaries,
part of which are spent on taxable goods. And third,
where these retail sales occur employees tend to
purchase taxable goods in the vicinities of where they
live, work and commute.
In the past, as long as retails sales occurred in
Phoenix, it did not matter in which local community
employers were located or where their employees
lived in relation to work. Most opportunities for
retail sales were in Phoenix, within a reasonable travel
time from suburban communities, and it was still
attractive and easy to make these purchases in
Phoenix.
As Phoenix retained a majority of the Valley's
employment, the city benefited from business retail
sales taxes, as well as from employees making
personal retail purchases while working in Phoenix or
"passing through" during their commute. As a result,
even though a substantial amount of residential and
employment growth was located outside of Phoenix,
the city's per capital retail sales were higher than the
amount of local spendable dollars available from
Phoenix residents. As such, Phoenix's strategy was
based on a model of a central business district with
people living around it and commuting into the
central area to work.
However, this has changed. Phoenix's share of per
capita sales has been steadily declining, even taking
into account differences in household incomes. As
residential areas move farther away from central
Phoenix, its central shopping opportunities become
less attractive. As employment opportunities in
other communities increase, and people choose to
live near their work place, these people living outside
Phoenix will commute to work and purchase taxable
goods closer to where they live. As a result,
Phoenix's share of this sales tax will also likely decline.
It is important to view the three-pronged process of
local sales tax collection industries; their employees;
and the location where retail sales occur as a three-
legged stool. In the future all three legs will be
located primarily within the commute shed of Valley
employment centers, instead of within a central area.
Since these employment centers do not match city
boundaries, the new model will be one of several
stools, each with some legs in one community and
some legs in other communities. How well
communities plan for such a balance in their
community, will determine how successful they will
be in collecting sales tax proceeds from the activity in
their communities.
Such trends could also be compounded by Internet
sales. Though to date, Internet sales have had only a
minor impact on city sales tax revenues, the fate of
such sales is still unresolved. One area of rapid
growth has been business-to-business Internet sales.
Currently these sales are taxable, but if in the future
they are exempted from sales tax or rendered difficult
to collect, this could have an impact on Phoenix's
sales tax revenues as well.
Based on these anticipated changes in growth
trends, Phoenix's past strategies to facilitate
employment and residential growth and finance
public infrastructure and services will no longer be
adequate. The communities that can respond best to
these changes will fare the best financially, as well as
in the ability to maintain or enhance their residents'
quality of life.
Phoenix has responded by creating new economic
development and planning strategies, which center
around six key concepts as explained in the beginning
of this element.
Using these concepts as a guide, individual city
departments developed specific policies. The
following discusses these growth concepts and new
specific policies and how they can be used to take
advantage of the positive and avoid the negative
impacts of growth.
The city of Phoenix has been working to increase its
employment base since the mid-1980s. For example,
the Community and Economic Development
Department (CEDD) assists wealth-generating
companies which export products or services
outside of metropolitan Phoenix to locate and
expand within the city. The reasoning behind this
strategy is that the money generated by these
companies is returned to Phoenix and circulated
throughout the local economy. This inflow and
Strategic Adaptation to Growth
Strategic Employment Growth
38
The city's diverse and distinct employment centers
play a prominent role in CEDD wealth-generation
efforts. Based on proactive planning efforts and
market conditions, the city has identified 11
employment centers (shown in Figure 23) and
focuses much of its efforts within them. By
attracting new business and promoting business
expansion within employment centers, the city is able
to reduce commute times and reduce air pollution.
Such reductions are key factors in the city's General
Plan objectives to balance housing and jobs in the
community's villages. Figure 24 shows 24
employment centers in the Valley, including the 11
Phoenix employment centers.
Marketing materials, or profiles, are used to market
each of the city's employment centers, highlighting
the advantages for a company that expands or
relocates to one of the areas. Each profile includes
information about historical population growth,
educat iona l ins t i tut ions , t ranspor tat ion
infrastructure, telecommunications services, major
employers, workforce education levels, available real
estate, quality of life, and workforce availability.
Figures 23 and 24 also illustrate two emerging
employment centers in Phoenix and the Valley. The
North Black Canyon Corridor and West Valley
Employment Center are locations for future office
development.
As noted earlier in this report, residential growth will
likely continue to expand farther out from current
employment centers. The new residential areas will
provide an expanding residential base for the west,
north and east Valley commute sheds. However, until
recently the central Valley had no significant new
residential construction within its future commute
shed. To begin promoting residential growth in these
areas, the city initiated four area plans for Baseline
Road, Laveen, Estrella, and Rio Montaña.
It is likely that the central Valley employment center
will be outside of the commute shed of most new
residential housing areas by the year 2020. Only
south and southwest Phoenix have significant vacant
land for new residential development within the
central Valley commute shed. Historically, the south
and southwest parts of Phoenix have not been active
housing areas for new residential construction.
These areas suffered primarily due to poor access,
Strategic Residential Growth
circulation of otherwise unavailable money increases
the overall wealth of Phoenix residents.
As residential growth continues to occur throughout
the Valley, areas of new residential development will
become increasingly farther from existing central
employment centers. This could mean longer
commute times and increased vehicle miles traveled,
resulting in increased congestion and air pollution.
This will be particularly true for Phoenix's northern
areas. To help avert this trend, the city has promoted
development of new employment centers in
northern Phoenix so that commute trips from new
residential areas can be shorter.
CEDD promotes employment growth through
business retention and workforce development.
Furthermore, the department teams with various
economic development partners to increase the
scope of services available to Phoenix businesses.
CEDD staff can provide businesses with information
about taxes, available real estate, business assistance
programs, demographics, city operations, workforce
recruitment and retention, and obtaining city
permits. Most CEDD activities related to employment
growth are focused upon wealth-generating
companies.
City of Phoenix employment growth efforts are
directed by the Phoenix Economic Development Plan,
approved by the Phoenix City Council in 2000. This
three-year plan resulted from a collaborative effort
between the city of Phoenix, the Greater Phoenix
Chamber of Commerce, the Downtown Phoenix
Partnership, the Greater Phoenix Convention and
Visitors Bureau, the Greater Phoenix Economic
Council, and the Phoenix Community Alliance. It
focuses upon four main goals:
Growth in jobs, wages and number of
businesses in targeted business clusters
Growth in Phoenix residents' income
Improvement in Phoenix quality of life
Growth in sales tax revenues
The Economic Development Plan identifies four
targeted industry clusters, or industry types, for
business attraction and retention:
Software Development and Information
Technology
Aerospace and Advanced Composites
High Technology Electronics
High-End Business Services
39
lack of water and drainage infrastructure, financially
struggling school districts, and a generally poor
public perception of the area.
Through its area planning efforts, the city began to
bring southwest Phoenix landowners, residents and
school officials together with developers to identify
the barriers to single family development. Based on
this dialogue, they have formed partnerships and
plans that will overcome access, water, and drainage
issues, provide the school district with new financing
options for new facilities, and improve the market
appeal of the area. For example, there are plans for
extending infrastructure and approving thousands of
residential units in new subdivisions and planned
communities. The city has partnered with the
Maricopa County Flood Control District to develop an
area-wide drainage system, and new freeways and
river crossings also are being planned for the area.
Another option for providing new residential
housing within the central Valley is infill
development. With the lack of substantial new
residential subdivisions within a comfortable travel
time to the central Valley, infill housing will be
increasingly important to address the housing need
for an expanding labor force. In an effort to
understand the barriers to infill development, in
1995 the Planning Department conducted an
analysis and identified the opportunities and barriers
to infill housing. Some of the barriers include the
financial difficulties in developing small scattered
sites surrounded by existing neighborhoods, and the
poor perception of some neighborhoods by the
community, financial institutions and many potential
buyers.
In an effort to overcome these barriers, the city
identified areas in which to promote new or
redevelopment. Efforts in Neighborhood Initiative
and Redevelopment areas have successfully attracted
new apartment complexes and single-family
development. In the last five years, apartment
development in north central and east Phoenix has
occurred without city assistance. Within the
downtown core area, the city successfully attracted
several multifamily projects since 1996. The city also
has initiated an infill housing program that provides
incentives (fee waivers and expedited project
reviews) to developers building new single-family
homes within a larger area. In 1995 and 1996, the
city focused on enhanced enforcement and financial
Infill Housing
assistance, along with rezoning and free site
planning work, as part of a state auction of 200
homes and 100 acres of land along Paradise Freeway.
All of the homes were auctioned for home
ownership, and several new single-family infill
projects were started. In January of 2000, the Arizona
legislature adopted provisions governing the
designation of infill incentive districts. If a city
decides to establish an infill incentive district, it must
also adopt an infill incentive plan to encourage
redevelopment in the district. The plan may include:
Expedited zoning or rezoning procedures
Expedited processing of plans and proposals
Waivers of municipal fees for development
activities, as long as the waivers are not
funded by other development fees
Relief from development standards
State law requires that an infill incentive area meet at
least three of the following requirements:
There is a large number of vacant older or
dilapidated buildings or structures.
There is a large number of vacant or
underused parcels of property, obsolete or
inappropriate lot or parcel sizes, or
environmentally contaminated sites.
There is a large number of buildings or other
places where nuisances exist or occur.
There is an absence of development and
investment activity compared to other areas
in the city.
There is a high occurrence of crime.
There is a continuing decline in population.
The opportunity to provide incentives will be
important to overcoming some of the financial
barriers for those trying to develop infill projects in
the central city. The Land Use element, Goal 3, has
policies and recommendations about adopting such
infill development incentive areas in Phoenix.
Encouraging the expansion of infill opportunities will
require more than just incentives. The promotion of
viable infill development will involve improving and
maintaining the qual i ty of centra l c i ty
neighborhoods, educating central city residents
about the need for infill development, and making
sure new infill is compatible with existing
neighborhoods. The Neighborhood element, Goal 2,
discusses ensuring compatible infill development
and involving neighborhood residents in infill

planning. The Conservation, Rehabilitation, and
Redevelopment element, Goals 2, 3 and 5, has goals
and policies related to improving the quality of
existing neighborhoods.
The key to future residential development within
Phoenix's growth corridors will be the availability of
infrastructure. Phoenix has a head start on other
Valley cities because of the city's well-established
infrastructure fee program. This program already has
generated funds being used for growth-related roads
and parks. But this program alone will not be
enough. Phoenix is also beginning to look at
managing growth in a fashion that maximizes the
efficiency of infrastructure development.
Phoenix coordinates land use decisions with
infrastructure management. Historically,
infrastructure planning responded primarily to
growth trends and planned development. Now
Phoenix is guiding growth in areas where it can
maximize the cost effectiveness of infrastructure. In
some areas, concentrating growth into defined
corridors will be necessary to ensure efficient
recovery of capital costs through user and
development fees.
Although Phoenix has a well established
infrastructure fee program, these development-
based funds will not be sufficient to meet all
infrastructure needs within critical time frames. The
city collects development and user fees as or after
development occurs. However, some infrastructure
and funding for it is needed in advance, in order to
meet local land use and economic goals. In the past,
the city has often worked successfully with the
private sector to finance such facilities. However,
costs for certain facilities exceeded the private
sector's ability to finance. In order to ensure efficient
and timely construction of such facilities, the city will
need to carefully use traditional funding sources to
provide critical infrastructure early in the
development of new growth areas. Such funds will
be reimbursed by future infrastructure fees paid over
a longer term as development occurs.
Annexing new areas into the city of Phoenix can also
impact the f inanc ing of infrastructure.
Understanding these financial implications should
important in annexation decisions. In some cases,
annexation requests may have a negative impact
Financial Management of Infrastructure
while, in other cases, more proactive annexation
policies may be appropriate. Annexing county islands
to which municipal services can be readily provided,
may be important. This would allow the collection of
impact fees otherwise not available. Annexations
outside of targeted growth areas may increase
demand for infrastructure, which could negatively
impact infrastructure financing within growth areas.
(See the Cost of Development element, Goals 1 and 2
for more discussion on infrastructure financing.)
Preservation of Phoenix's north Sonoran desert has
become a high priority to the community and will be
important in maintaining a high quality of life.
Unfortunately, these desert resources exist in areas
highly desirable for development. Resolving this
conflict between development pressures and
preservation desires is critical to both the financial
health and quality of life for northern and southern
parts of Phoenix. This is not a new effort Phoenix has
progressively implemented a series of policies
specifically addressing this issue.
Preserved natural areas provide visual and emotional
relief from day to day stresses of life in the urban
setting, recreation for people, and habitat for native
flora and fauna. Additionally, it has been
demonstrated that natural open space positively
affects residential and commercial property values.
These areas are defined, to some extent, by terrain
features such as mountains and washes. To preserve
them, policies must be established prior to
development in such areas.
Recognizing this dilemma, in 1987 Phoenix adopted
a plan, called the Area C & D Plan, for the northern
part of the city. It called for a change in quality and
design of traditional development, to preserve
desirable Sonoran desert hills and flat lands, as well
as the western rural character of the area.
In 1995, Phoenix adopted a Desert Preserve Concept
plan, calling for the acquisition and preservation of
12,000 to 16,000 acres of Sonoran desert mountains,
flat lands, and washes in north Phoenix. To
implement this, Phoenix is developing an acquisition
strategy in cooperation with the Arizona State Land
Department.
In 1996 and 1999, Phoenix adopted a series of
General Plan policies that not only further preserve
Desert Preservation
40
41
Also, the city better understands the relationship
between employment location, residential growth
and retail sales. The need for transportation and
housing to support employment centers has shaped
planning of the North Black Canyon Corridor and
Desert View Village.
Transportation and land use planning are the keys to
improving our air quality. Phoenix and other Valley
cities are actively pursuing both alternative modes of
transportation and integrated land use in their
transportation planning efforts. One example is
Valley Connections, a cooperative effort among
residents, the Maricopa Association of Governments,
the Regional Public Transportation Authority, the
Federal Transit and Highway Administrations, and
the cities of Phoenix, Tempe and Mesa. The purpose
of the effort is to identify feasible transit solutions to
meet the Valley's future high-capacity transportation
needs. One study, the Central Phoenix/East Valley
Major Investment Study, analyzed possible solutions
to our traffic problems and recommended a regional
light rail transit system that would link central
Phoenix, Tempe and Mesa. In 1999, Phoenix and
Tempe voters approved a 20-year sales tax to help
fund expanded transit service in Phoenix, including a
light rail system. Both expanded transit service and a
light rail system are being implemented. Current
schedules for the light rail project call for
construction beginning in 2003 and operation in
2006.Modes of travel other than cars and transit will
also play a role in improving air quality. Community
design to enhance pedestrian and bicycle trips that
would traditionally be made by automobile, will be
important. Such design will be particularly important
when planning trails and more urban mixed-use
areas.
The strategic growth concepts are intended to guide
the development of other General Plan elements,
various city programs, and more detailed planning
efforts. Several General Plan elements directly
incorporate these concepts. The Land Use element
includes goals, policies and recommendations to
further location of housing and jobs in support of
present and future employment centers and
commute sheds and the urban village model. The
inclusion of the infill program in this element also
Transit and Transportation Planning Protecting
Air Quality
Implementation of Strategic View of Growth
Concepts
desert areas, but also encourage the integration of
the desert into the developed portions of the
community. The goal is to both preserve desert and
create a unique desert character for the area. These
policies shift densities from sensitive Sonoran desert
areas into areas where more concentrated
development is more appropriate. They created
character areas to define and preserve the rural and
desert character of lower-density areas. These
character areas also define the more suburban and
urban areas, and how the desert can be used to
enhance their form and landscape. Wash locations,
vegetation quality and flooding characteristics were
used to determine appropriate densities and
clustering. The policies also recognize the importance
of key major wash corridors in maintaining a stable
regional environment. How development occurs at
the edges the preserves is also addressed.
Such efforts will not be limited just to the northern
growing areas. The Rio Salado Restoration Project
and the Aqua Fria projects also will play an important
role in maintaining the desert lifestyle of central and
west Phoenix. (See the Open Space element, Goal 1
for a further discussion of desert preservation.)
Recognizing the role that retail and sales tax play in
Phoenix's ability to deliver public services, the city has
focused on the role that retail uses and retail sales
serve in community development. Areas that have
been identified as being under-served by retail
development have received close scrutiny. In these
areas efforts have been initiated to facilitate new
retail development, either through rezoning or
development incentives. The city also has explored
the possibilities of sales tax-sharing with adjacent
communities. This would help to eliminate the
aggressive competition that exists between cities as
they try to attract retail development to their borders.
In its long-range planning efforts, Phoenix has begun
to quantify and allocate sufficient commercial sites to
serve future growth. In some areas, the residential
market is so lucrative that landowners would rather
sell now for residential use than wait for a future
commercial buyer. Phoenix should work harder to
ensure that designated commercial sites remain
viable for future commercial use, to prevent sites
from becoming too small or being shifted to less
desirable locations.
Capturing Public Revenues From a Growth
Economy
supports the continued vitality of central city
employment centers. The Cost of Development
element includes policy to ensure that where
necessary, new development should pay the full cost
of additional public facility needs. Water Resources
includes policies to ensure that new development
does not place an unreasonable burden on ground
and surface water supplies. The elements for
Env i ronmenta l P l ann ing ; Conse r va t i on ,
Rehabilitation and Redevelopment; Open Space; and
Housing include policies that provide for affordable
housing, and protect general environmental quality,
air and water quality, neighborhoods, scenic vistas,
natural open space, mountain and other public
preserves, historic areas and archaeological sites. The
Circulation element includes policies and
requirements to promote multi-modal forms of
transportation.
Since 1995, the city has adopted six area plans that
apply the Strategic View of Growth concepts to five
of the six targeted growth areas referenced in this
Growth Area element. The Laveen area has two area
plans: Laveen covering the portion west of 27
Avenue and Rio Montaña, from Central Avenue to
27 Avenue, the river to the mountains. Each of the
six area plans applies the growth concepts to the
issues that are unique to each area. The following
summarizes these area plans and the major Growth
Strategies of each plan.
Covering the northeast part of Phoenix, this series of
General Plan Amendments focused on three growth
concepts: expanding employment opportunities,
financing public infrastructure, and preserving desert
open spaces. Issues unique to this area included:
Expanding the Desert Ridge Core into a major
regional employment center covering over
1,800 acres
Shifting residential densities from north to
south, to provide more efficient design and
financing of public infrastructure
Developing character districts to ensure that
future residential development is compatible
with future desert preserves, rural lifestyle
and suburban desert character of the area
th
th
Desert Ridge, Paradise Ridge and North Land Use
Plan General Plan Amendments 1995/1996
Baseline Area Master Plan 1996
Laveen Plan 1998
This plan focuses on the growth concept of
encouraging the development of new residential
neighborhoods. Issues unique to this area included:
Creating land use and design concepts that
promote the histor ica l mixed-use
agricultural character of the area
Improving the image of public and private
spaces, particularly at the gateways and
access points to the area
Creating an overlay district to implement the
Baseline Scenic Corridor and other plan goals
This plan focuses on two key growth concepts for this
part of Phoenix encouraging the development of
new residential neighborhoods, and the financing of
public infrastructure needed to support it. Issues
unique to this area included:
Identifying a Rural Development Transition
Area south of Baseline Road and east of the
Loop 202 (South Mountain Freeway), and
preparing Rural Development Area
Guidelines for determining residential
densities
Developing land use policies and design
guidelines that will encourage new
residential growth to be compatible with the
agricultural character and natural resources
of the area
Developing financing for the water and
sewer infrastructure needed to support new
residential growth
Forming partnerships to resolve the
significant drainage issues in the area
Providing arterial and freeway access to the
area
42

43
Rio Montaña 2000 (Western portion of South
Mountain Village)
Estrella Plan 1999
The Rio Montaña Plan was prepared for the western
portion of South Mountain Village. It focuses on
encouraging the development of new residential
neighborhoods, rehabilitating and/or redeveloping
existing deteriorated neighborhoods, and
transitioning existing uses to different uses in the
future. Issues unique to this area included:
Developing land use policies and design
guidelines to encourage new residential
growth to be compatible with the
agricultural character and natural resources
of the area
Adopting strategies to finance the water and
sewer infrastructure needed to support new
residential growth
Strengthening Central Avenue commercial
areas and the coreUsing parks, open space
and trails to link neighborhoods and provide
a village identity
E n c o u r a g i n g d e v e l o p m e n t a n d
redevelopment along the Rio Salado that will
be compatible with the Rio Salado Habitat
Restoration Project
This plan focuses on two key growth concepts for this
part of Phoenix, encouraging the development of
new residential neighborhoods and the financing of
public infrastructure needed to support this growth.
Issues unique to this area included:
Using parks, open space and trails to link
neighborhoods and provide a village identity
Encouraging development along the Rio
Salado that will be compatible with the new
residential character village
Financing streets, water, sewer and drainage
facilities needed to ensure timely new
residential growth
Refining the core and streetscape plans for
the village
North Black Canyon Corridor Plan 1999
Covering the north and northwest parts of Phoenix,
this plan focuses on three growth concepts:
expanding employment opportunities, financing
public infrastructure, and preserving desert open
spaces. Issues unique to this area included:
Designating a new 800 acre employment
center
Linking residential growth and employment
growth
Designating an infrastructure limit line to
ensure efficient financing of public water
and wastewater infrastructure, through
p u b l i c / p r i v a t e p a r t n e r s h i p s a n d
development fees
D e s i g n i n g a n o n - s t r u c t u r a l a n d
environmental approach to water course
management
Integrating desert preserves and urban-
suburban development