growth and instability in agricultural production in haryana: a district level analysis
TRANSCRIPT
International Journal of Scientific and Research Publications, Volume 4, Issue 7, July 2014 1 ISSN 2250-3153
www.ijsrp.org
Growth and Instability in Agricultural Production in
Haryana: A District level Analysis
Rakesh Sihmar
Research Scholar Centre for the Study of Regional Development (C.S.R.D) JNU New Delhi
Abstract- Indian agriculture history is witness of the new
agriculture arrangement which took place in India has changed
the overall traditional cropping pattern in India as well as in
Haryana. There are many agriculture reforms such as land
reforms, green revolution, minimum support price, and new
economic reforms have adopted in Indian agriculture. All these
reforms have directly affected the agriculture sector in overall
India. Even these reforms are favourable in terms of productivity
and production of all the crops but they have inadequately
affected in terms of crop stability. Only a few crops such as rice
and wheat are going to more stable but the coarse cereals and
pulses are going to highest instable in area and production in
Haryana.
Index Terms- Growth, Instability Area, Production, Agriculture
I. INTRODUCTION
aryana is the state which has large amount of fertile land, in
India. It is doing well in industrial as well as agricultural
sectors. About 70% of the population is engaged in agriculture,
directly or indirectly. Haryana has achieved a remarkable growth
in its agricultural sector, which not only has made it self-
sufficient in foodgrains production but also has elevated it to the
second largest contributor to India's central pool of food grains1.
On the question the relationship between growth and instability,
in the cases of some crops; the modern technology reduced
variation while other believe that it is bound to increase. The
modern technology do help to reduce variability in yields and
production only a few crops (Mehra Shakuntala 1981). There are
many studies on instability conducted during 1980s concluded
that agriculture production had become more unstable after the
introduction of new agricultural technology (Mehra 1981; Hazell
1982; Dev 1987; and Ray et al 1988). Sharma et al 2006
estimated crop wise and state wise variability in production and
yield for two time periods, namely 1981/82 - 1990/91 and
1991/92 – 2000/01, and the study find out that production of
food grains became more stable during 1990s compared with
1980s at all India levels and in most of the states.
Instability, in agricultural sector, which measures the range
of variation in different dimensions; it may be in area of
cultivation, yield or production. Here it has been shown, the
range of instability in production among different crops in
Haryana. In other word, this study intends to measure the extent
of instability in the production of major crops in this state. The
1 Economics survey of Haryana, 2007-08
paper is divided in two sections. It begins with an examination of
growth in area of cultivation and production of major crops in
Haryana. And, secondly it measures the instability in crop
production. There are many studies such as Rao (1975), Dharm
Narain (1976), Mehra (1981), Hazell (1982), Rao et al (1988),
etc, have pointed out that the new strategy of agri-cultural
production based on high-yield varieties (HYV) seed-fertiliser
technology has contributed to the growth in production and
productivity. At the same time they have also pointed out
that this growth has been accompanied with the increase in
the output/yield variability (B P Vani and Vinod Vyasulu 1996).
There are many reasons which create new agriculture
arrangement in India. Among these the green revaluation is
favourable only a few crops; it enhance the productivity, but only
for a few crops, Minimum Support Price (MSP) and government
policy are favourable only for a few specific crops. These entire
factors collectively change the traditional cropping pattern in
Haryana as well as in India. Thus the change in the variability
and instability with the adoption of green revolution becomes
an important issue (B P Vani et al 1996). It highly reduces the
instability in a few crops, while it increases high instability in
coarse cereals and diversifies the resource in mono-crop culture
in Haryana. Instability declined progressively in some states
(Punjab, Haryana, Assam, Himachal Pradesh, MP, Rajasthan
and UP) whereas in some other states (Orissa, West Bengal,
Thmil Nadu) it became progressively un-stable (S
Mahendradev 1987).
The agricultural instability can be measured by different
methods, such as the coefficient of variation (CV), dispersion,
Cuddy Della Valle Index (CDI), etc. The present study applies
the Cuddy Della Valle Index for measuring the instability. This
Index first de-trends the given series and gives a clear direction
about the instability. The use of coefficient of variation as a
measure to show the instability in any time series data has some
limitation. If the time series data exhibit any trend the variation
measured by CV can be over-estimated, i.e. the region which has
growing production are at constant rate will score high in
instability of production if CV is applied for measuring
instability. As against that Cuddy-Della Valle index attempts de-
trend the CV by using coefficient of determination (R2). Thus it
is a better measure to capture instability in agricultural
production. A low value of this index indicates the low instability
in farm production and vice-versa. To calculate instability of
crop production Cuddy-Della Valle index has been used in the
present study.
H
International Journal of Scientific and Research Publications, Volume 4, Issue 7, July 2014 2
ISSN 2250-3153
www.ijsrp.org
Cuddy-Della valle index2 = C.V.*(1 –R
2)
0.5
Where C.V. = Coefficient of Variation
R2 = ESS/TSS i.e. ratio of explained variation to total variation.
ESS = Variation explained by explanatory variable.
TSS = Total Variation.
Variation can be measured by C.V. But due to presences of
trend with variation in production with passes of time. Here C.V.
adjusts with R2 to de-trend the production series, because it is
statistically sound. The present study divides the CDI value into
three categories, which represent the different range of
instability.
The ranges of instability are as follows:
Low instability = between 0 to 15
Median instability = greater than 15 and lower than 30
High instability = greater than 30
Data Sources The study is based on secondary data, the
data sources are Statistical Abstract of Haryana (Different
Issues), Economics Survey of Haryana and India (Different
Issues)
Districts Covered - This Study is based on the analysis of
district-wise data pertaining of the 12 major district namely
Ambala, Kurukshetra , Karnal Sonipat, Rohtak Faridabad,
Gurgaon, Mahendergarh, Bhiwani, Jind Hisar and Sirsa. There
were 12 districts in 1980-81 in Haryana and this study is begun
from 1980-81 so that to analysis easily those districts are
separated from the particularly districts are combing them. The
districts are Yamunanagar and Panchkula are clubbed in Ambala,
Kaithal is added in Kurukshetra, Panipat is added in Karnal,
Jhajjar is added in Rohtak, Rewari is added in Mahendergarh,
Fathehabad is clubbed in Hisar, and Mewat in Gurgaon district
II. AGRICULTURE GROWTH IN HARYANA
The agricultural production increased in almost the al kind of
crops during the 1980s except maize, barley and massar. Gram
which registered 3.1 percent of total growth from 1980-81 to
1990-91 thereafter, it registered a sharp declining trend during
nineties and during 2000-01 to 2006-07 by (-82.9%) and (-
12.5%) percent, respectively.
2 The cuddy- Della Valle index takes in to account the time trend
in a variable, which is not captured in the coefficient of
variation the index is applied when a variable shows some
trend which may be linear or non linear and such case Cuddy-
Della Valle index is used as an appropriate measure of
variability.
International Journal of Scientific and Research Publications, Volume 4, Issue 7, July 2014 3
ISSN 2250-3153
www.ijsrp.org
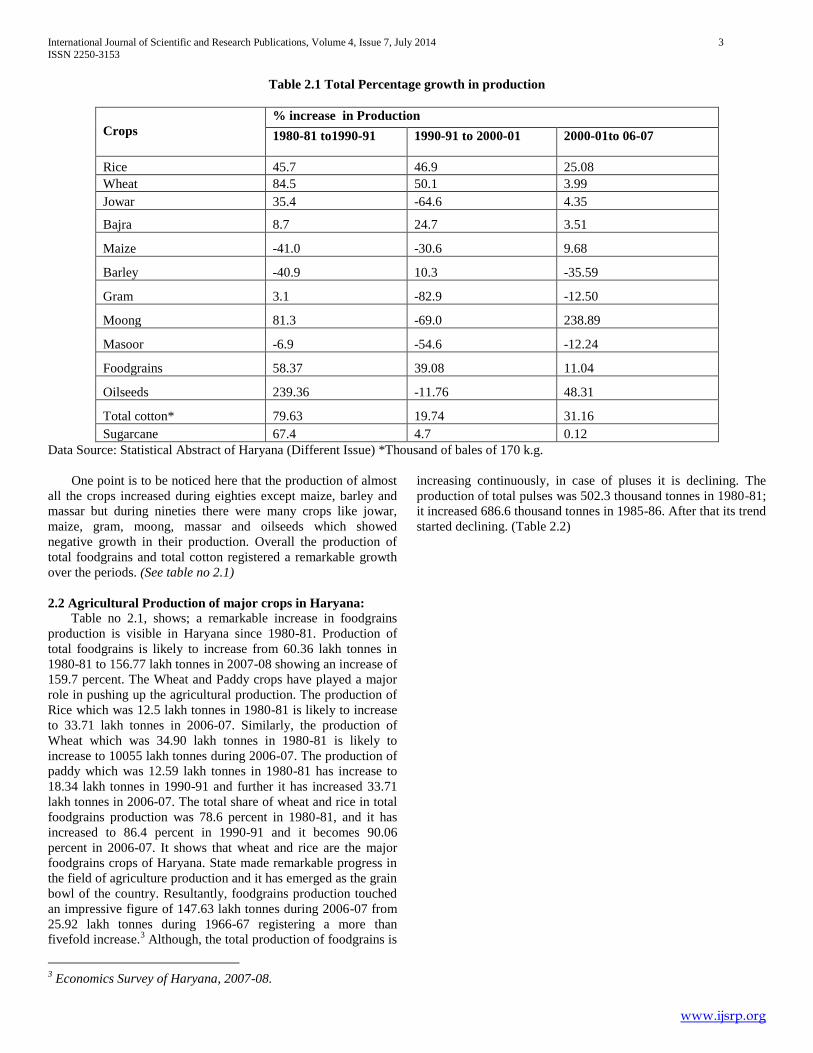
Table 2.1 Total Percentage growth in production
Crops
% increase in Production
1980-81 to1990-91 1990-91 to 2000-01 2000-01to 06-07
Rice 45.7 46.9 25.08
Wheat 84.5 50.1 3.99
Jowar 35.4 -64.6 4.35
Bajra 8.7 24.7 3.51
Maize -41.0 -30.6 9.68
Barley -40.9 10.3 -35.59
Gram 3.1 -82.9 -12.50
Moong 81.3 -69.0 238.89
Masoor -6.9 -54.6 -12.24
Foodgrains 58.37 39.08 11.04
Oilseeds 239.36 -11.76 48.31
Total cotton* 79.63 19.74 31.16
Sugarcane 67.4 4.7 0.12
Data Source: Statistical Abstract of Haryana (Different Issue) *Thousand of bales of 170 k.g.
One point is to be noticed here that the production of almost
all the crops increased during eighties except maize, barley and
massar but during nineties there were many crops like jowar,
maize, gram, moong, massar and oilseeds which showed
negative growth in their production. Overall the production of
total foodgrains and total cotton registered a remarkable growth
over the periods. (See table no 2.1)
2.2 Agricultural Production of major crops in Haryana:
Table no 2.1, shows; a remarkable increase in foodgrains
production is visible in Haryana since 1980-81. Production of
total foodgrains is likely to increase from 60.36 lakh tonnes in
1980-81 to 156.77 lakh tonnes in 2007-08 showing an increase of
159.7 percent. The Wheat and Paddy crops have played a major
role in pushing up the agricultural production. The production of
Rice which was 12.5 lakh tonnes in 1980-81 is likely to increase
to 33.71 lakh tonnes in 2006-07. Similarly, the production of
Wheat which was 34.90 lakh tonnes in 1980-81 is likely to
increase to 10055 lakh tonnes during 2006-07. The production of
paddy which was 12.59 lakh tonnes in 1980-81 has increase to
18.34 lakh tonnes in 1990-91 and further it has increased 33.71
lakh tonnes in 2006-07. The total share of wheat and rice in total
foodgrains production was 78.6 percent in 1980-81, and it has
increased to 86.4 percent in 1990-91 and it becomes 90.06
percent in 2006-07. It shows that wheat and rice are the major
foodgrains crops of Haryana. State made remarkable progress in
the field of agriculture production and it has emerged as the grain
bowl of the country. Resultantly, foodgrains production touched
an impressive figure of 147.63 lakh tonnes during 2006-07 from
25.92 lakh tonnes during 1966-67 registering a more than
fivefold increase.3 Although, the total production of foodgrains is
3 Economics Survey of Haryana, 2007-08.
increasing continuously, in case of pluses it is declining. The
production of total pulses was 502.3 thousand tonnes in 1980-81;
it increased 686.6 thousand tonnes in 1985-86. After that its trend
started declining. (Table 2.2)
International Journal of Scientific and Research Publications, Volume 4, Issue 7, July 2014 4
ISSN 2250-3153
www.ijsrp.org
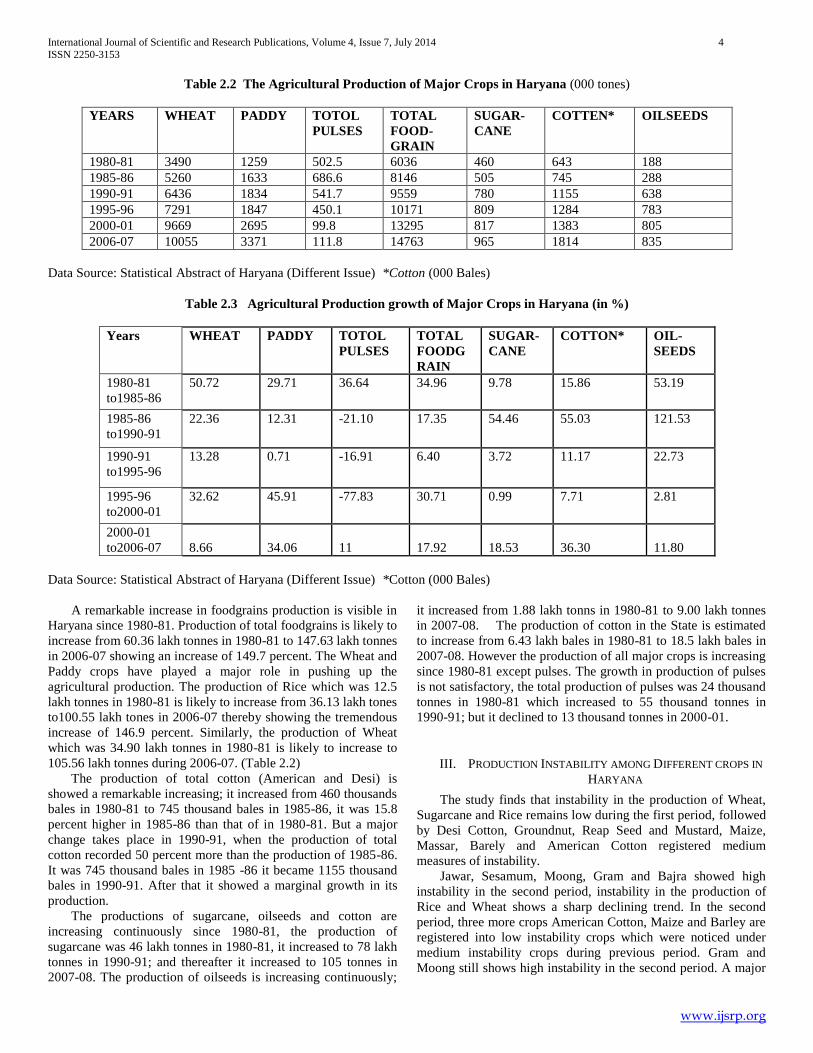
Table 2.2 The Agricultural Production of Major Crops in Haryana (000 tones)
YEARS WHEAT PADDY TOTOL
PULSES
TOTAL
FOOD-
GRAIN
SUGAR-
CANE
COTTEN* OILSEEDS
1980-81 3490 1259 502.5 6036 460 643 188
1985-86 5260 1633 686.6 8146 505 745 288
1990-91 6436 1834 541.7 9559 780 1155 638
1995-96 7291 1847 450.1 10171 809 1284 783
2000-01 9669 2695 99.8 13295 817 1383 805
2006-07 10055 3371 111.8 14763 965 1814 835
Data Source: Statistical Abstract of Haryana (Different Issue) *Cotton (000 Bales)
Table 2.3 Agricultural Production growth of Major Crops in Haryana (in %)
Years WHEAT PADDY TOTOL
PULSES
TOTAL
FOODG
RAIN
SUGAR-
CANE
COTTON* OIL-
SEEDS
1980-81
to1985-86
50.72 29.71 36.64 34.96 9.78 15.86 53.19
1985-86
to1990-91
22.36 12.31 -21.10 17.35 54.46 55.03 121.53
1990-91
to1995-96
13.28 0.71 -16.91 6.40 3.72 11.17 22.73
1995-96
to2000-01
32.62 45.91 -77.83 30.71 0.99 7.71 2.81
2000-01
to2006-07 8.66 34.06 11 17.92 18.53 36.30 11.80
Data Source: Statistical Abstract of Haryana (Different Issue) *Cotton (000 Bales)
A remarkable increase in foodgrains production is visible in
Haryana since 1980-81. Production of total foodgrains is likely to
increase from 60.36 lakh tonnes in 1980-81 to 147.63 lakh tonnes
in 2006-07 showing an increase of 149.7 percent. The Wheat and
Paddy crops have played a major role in pushing up the
agricultural production. The production of Rice which was 12.5
lakh tonnes in 1980-81 is likely to increase from 36.13 lakh tones
to100.55 lakh tones in 2006-07 thereby showing the tremendous
increase of 146.9 percent. Similarly, the production of Wheat
which was 34.90 lakh tonnes in 1980-81 is likely to increase to
105.56 lakh tonnes during 2006-07. (Table 2.2)
The production of total cotton (American and Desi) is
showed a remarkable increasing; it increased from 460 thousands
bales in 1980-81 to 745 thousand bales in 1985-86, it was 15.8
percent higher in 1985-86 than that of in 1980-81. But a major
change takes place in 1990-91, when the production of total
cotton recorded 50 percent more than the production of 1985-86.
It was 745 thousand bales in 1985 -86 it became 1155 thousand
bales in 1990-91. After that it showed a marginal growth in its
production.
The productions of sugarcane, oilseeds and cotton are
increasing continuously since 1980-81, the production of
sugarcane was 46 lakh tonnes in 1980-81, it increased to 78 lakh
tonnes in 1990-91; and thereafter it increased to 105 tonnes in
2007-08. The production of oilseeds is increasing continuously;
it increased from 1.88 lakh tonns in 1980-81 to 9.00 lakh tonnes
in 2007-08. The production of cotton in the State is estimated
to increase from 6.43 lakh bales in 1980-81 to 18.5 lakh bales in
2007-08. However the production of all major crops is increasing
since 1980-81 except pulses. The growth in production of pulses
is not satisfactory, the total production of pulses was 24 thousand
tonnes in 1980-81 which increased to 55 thousand tonnes in
1990-91; but it declined to 13 thousand tonnes in 2000-01.
III. PRODUCTION INSTABILITY AMONG DIFFERENT CROPS IN
HARYANA
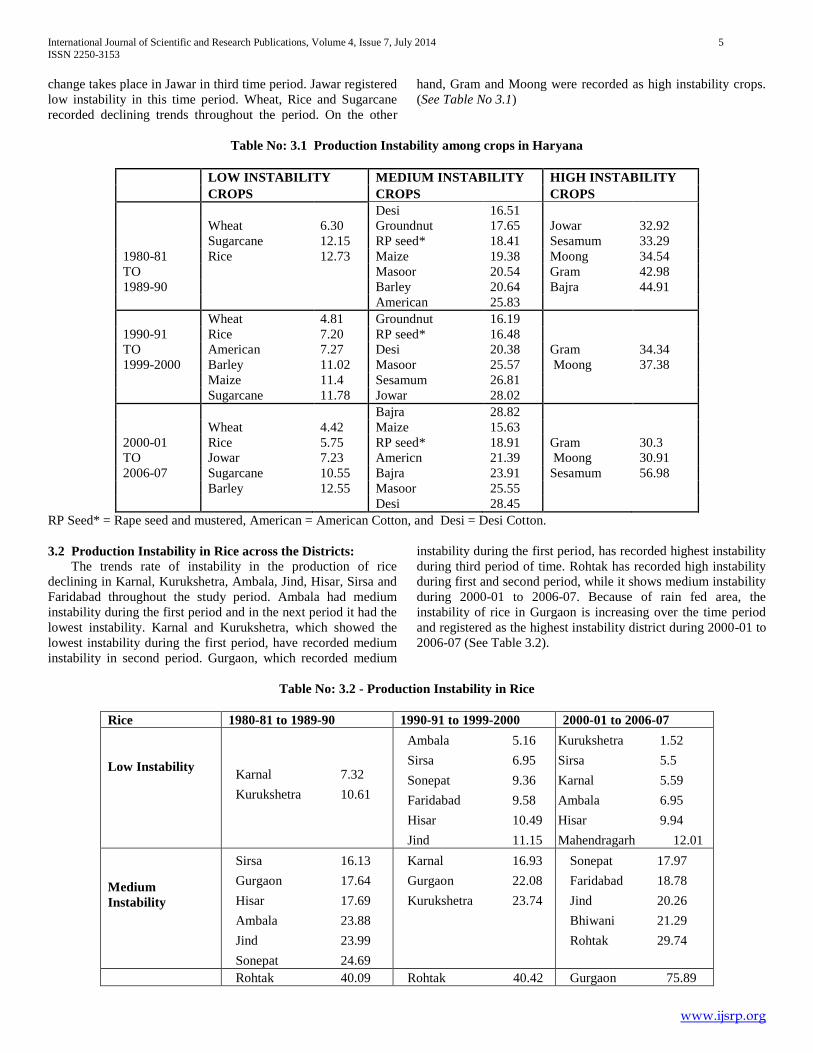
The study finds that instability in the production of Wheat,
Sugarcane and Rice remains low during the first period, followed
by Desi Cotton, Groundnut, Reap Seed and Mustard, Maize,
Massar, Barely and American Cotton registered medium
measures of instability.
Jawar, Sesamum, Moong, Gram and Bajra showed high
instability in the second period, instability in the production of
Rice and Wheat shows a sharp declining trend. In the second
period, three more crops American Cotton, Maize and Barley are
registered into low instability crops which were noticed under
medium instability crops during previous period. Gram and
Moong still shows high instability in the second period. A major
International Journal of Scientific and Research Publications, Volume 4, Issue 7, July 2014 5
ISSN 2250-3153
www.ijsrp.org
change takes place in Jawar in third time period. Jawar registered
low instability in this time period. Wheat, Rice and Sugarcane
recorded declining trends throughout the period. On the other
hand, Gram and Moong were recorded as high instability crops.
(See Table No 3.1)
Table No: 3.1 Production Instability among crops in Haryana
LOW INSTABILITY MEDIUM INSTABILITY HIGH INSTABILITY
CROPS CROPS CROPS
Desi 16.51
Wheat 6.30 Groundnut 17.65 Jowar 32.92
Sugarcane 12.15 RP seed* 18.41 Sesamum 33.29
1980-81 Rice 12.73 Maize 19.38 Moong 34.54
TO Masoor 20.54 Gram 42.98
1989-90 Barley 20.64 Bajra 44.91
American 25.83
Wheat 4.81 Groundnut 16.19
1990-91 Rice 7.20 RP seed* 16.48
TO American 7.27 Desi 20.38 Gram 34.34
1999-2000 Barley 11.02 Masoor 25.57 Moong 37.38
Maize 11.4 Sesamum 26.81
Sugarcane 11.78 Jowar 28.02
Bajra 28.82
Wheat 4.42 Maize 15.63
2000-01 Rice 5.75 RP seed* 18.91 Gram 30.3
TO Jowar 7.23 Americn 21.39 Moong 30.91
2006-07 Sugarcane 10.55 Bajra 23.91 Sesamum 56.98
Barley 12.55 Masoor 25.55
Desi 28.45
RP Seed* = Rape seed and mustered, American = American Cotton, and Desi = Desi Cotton.
3.2 Production Instability in Rice across the Districts:
The trends rate of instability in the production of rice
declining in Karnal, Kurukshetra, Ambala, Jind, Hisar, Sirsa and
Faridabad throughout the study period. Ambala had medium
instability during the first period and in the next period it had the
lowest instability. Karnal and Kurukshetra, which showed the
lowest instability during the first period, have recorded medium
instability in second period. Gurgaon, which recorded medium
instability during the first period, has recorded highest instability
during third period of time. Rohtak has recorded high instability
during first and second period, while it shows medium instability
during 2000-01 to 2006-07. Because of rain fed area, the
instability of rice in Gurgaon is increasing over the time period
and registered as the highest instability district during 2000-01 to
2006-07 (See Table 3.2).
Table No: 3.2 - Production Instability in Rice
Rice 1980-81 to 1989-90 1990-91 to 1999-2000 2000-01 to 2006-07
Low Instability
Karnal 7.32
Kurukshetra 10.61
Ambala 5.16
Sirsa 6.95
Sonepat 9.36
Faridabad 9.58
Hisar 10.49
Jind 11.15
Kurukshetra 1.52
Sirsa 5.5
Karnal 5.59
Ambala 6.95
Hisar 9.94
Mahendragarh 12.01
Medium
Instability
Sirsa 16.13
Gurgaon 17.64
Hisar 17.69
Ambala 23.88
Jind 23.99
Sonepat 24.69
Karnal 16.93
Gurgaon 22.08
Kurukshetra 23.74
Sonepat 17.97
Faridabad 18.78
Jind 20.26
Bhiwani 21.29
Rohtak 29.74
Rohtak 40.09 Rohtak 40.42 Gurgaon 75.89
International Journal of Scientific and Research Publications, Volume 4, Issue 7, July 2014 6
ISSN 2250-3153
www.ijsrp.org
High Instability Faridabad 71.09
Mahendragarh -
Bhiwani -
Mahendragarh -
Bhiwani -
Haryana Rice 12.73
Rice 7.20
Rice 5.75
Data Source: Statistical Abstract of Haryana (Different Issue)
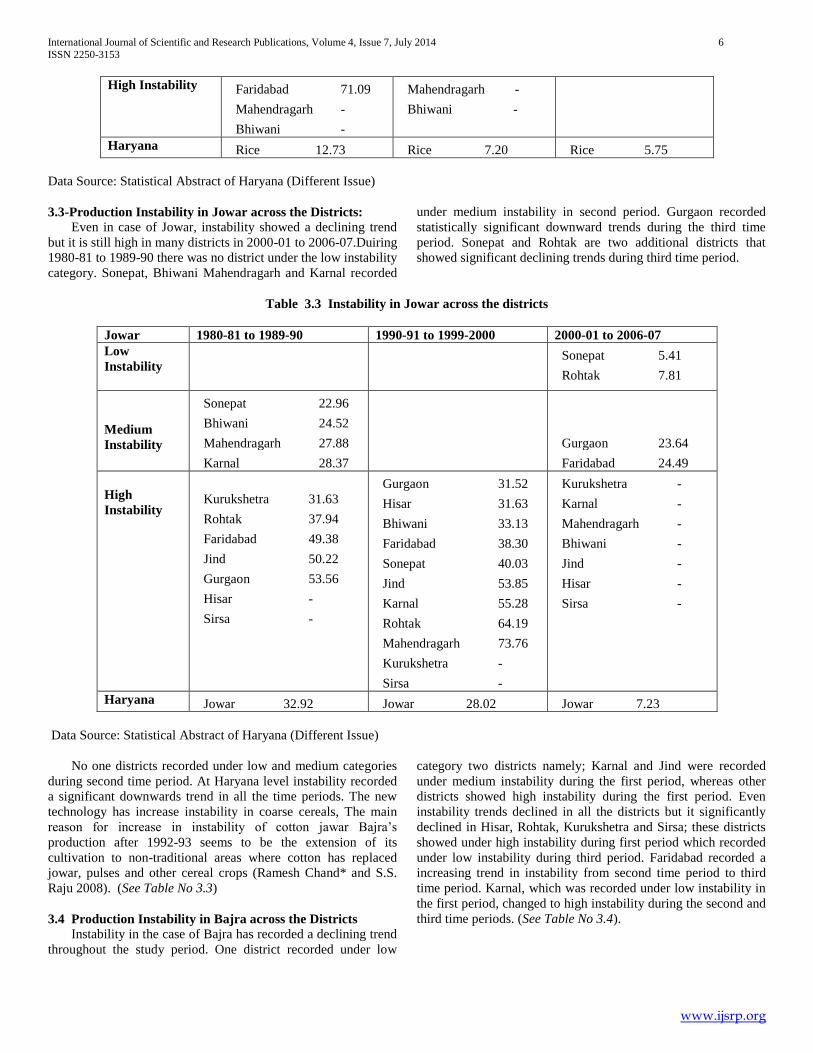
3.3-Production Instability in Jowar across the Districts:
Even in case of Jowar, instability showed a declining trend
but it is still high in many districts in 2000-01 to 2006-07.Duiring
1980-81 to 1989-90 there was no district under the low instability
category. Sonepat, Bhiwani Mahendragarh and Karnal recorded
under medium instability in second period. Gurgaon recorded
statistically significant downward trends during the third time
period. Sonepat and Rohtak are two additional districts that
showed significant declining trends during third time period.
Table 3.3 Instability in Jowar across the districts
Jowar 1980-81 to 1989-90 1990-91 to 1999-2000 2000-01 to 2006-07
Low
Instability
Sonepat 5.41
Rohtak 7.81
Medium
Instability
Sonepat 22.96
Bhiwani 24.52
Mahendragarh 27.88
Karnal 28.37
Gurgaon 23.64
Faridabad 24.49
High
Instability
Kurukshetra 31.63
Rohtak 37.94
Faridabad 49.38
Jind 50.22
Gurgaon 53.56
Hisar -
Sirsa -
Gurgaon 31.52
Hisar 31.63
Bhiwani 33.13
Faridabad 38.30
Sonepat 40.03
Jind 53.85
Karnal 55.28
Rohtak 64.19
Mahendragarh 73.76
Kurukshetra -
Sirsa -
Kurukshetra -
Karnal -
Mahendragarh -
Bhiwani -
Jind -
Hisar -
Sirsa -
Haryana Jowar 32.92
Jowar 28.02
Jowar 7.23
Data Source: Statistical Abstract of Haryana (Different Issue)
No one districts recorded under low and medium categories
during second time period. At Haryana level instability recorded
a significant downwards trend in all the time periods. The new
technology has increase instability in coarse cereals, The main
reason for increase in instability of cotton jawar Bajra’s
production after 1992-93 seems to be the extension of its
cultivation to non-traditional areas where cotton has replaced
jowar, pulses and other cereal crops (Ramesh Chand* and S.S.
Raju 2008). (See Table No 3.3)
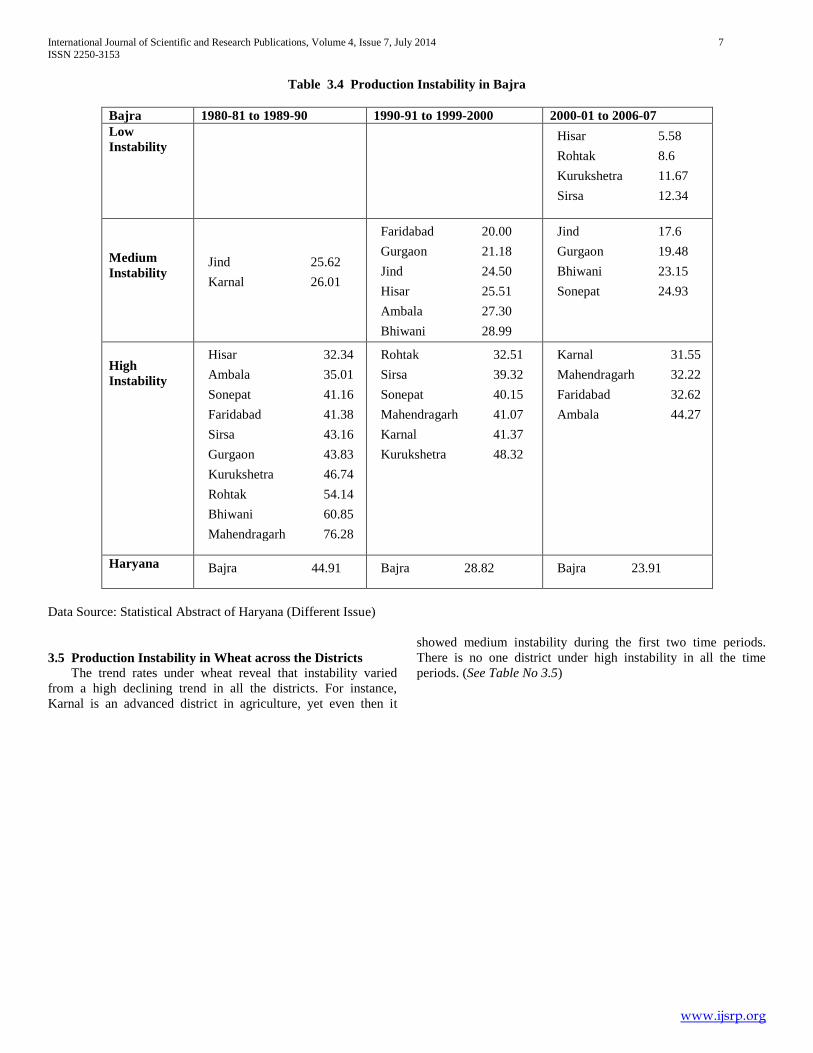
3.4 Production Instability in Bajra across the Districts Instability in the case of Bajra has recorded a declining trend
throughout the study period. One district recorded under low
category two districts namely; Karnal and Jind were recorded
under medium instability during the first period, whereas other
districts showed high instability during the first period. Even
instability trends declined in all the districts but it significantly
declined in Hisar, Rohtak, Kurukshetra and Sirsa; these districts
showed under high instability during first period which recorded
under low instability during third period. Faridabad recorded a
increasing trend in instability from second time period to third
time period. Karnal, which was recorded under low instability in
the first period, changed to high instability during the second and
third time periods. (See Table No 3.4).
International Journal of Scientific and Research Publications, Volume 4, Issue 7, July 2014 7
ISSN 2250-3153
www.ijsrp.org
Table 3.4 Production Instability in Bajra
Bajra 1980-81 to 1989-90 1990-91 to 1999-2000 2000-01 to 2006-07
Low
Instability
Hisar 5.58
Rohtak 8.6
Kurukshetra 11.67
Sirsa 12.34
Medium
Instability
Jind 25.62
Karnal 26.01
Faridabad 20.00
Gurgaon 21.18
Jind 24.50
Hisar 25.51
Ambala 27.30
Bhiwani 28.99
Jind 17.6
Gurgaon 19.48
Bhiwani 23.15
Sonepat 24.93
High
Instability
Hisar 32.34
Ambala 35.01
Sonepat 41.16
Faridabad 41.38
Sirsa 43.16
Gurgaon 43.83
Kurukshetra 46.74
Rohtak 54.14
Bhiwani 60.85
Mahendragarh 76.28
Rohtak 32.51
Sirsa 39.32
Sonepat 40.15
Mahendragarh 41.07
Karnal 41.37
Kurukshetra 48.32
Karnal 31.55
Mahendragarh 32.22
Faridabad 32.62
Ambala 44.27
Haryana Bajra 44.91
Bajra 28.82
Bajra 23.91
Data Source: Statistical Abstract of Haryana (Different Issue)
3.5 Production Instability in Wheat across the Districts The trend rates under wheat reveal that instability varied
from a high declining trend in all the districts. For instance,
Karnal is an advanced district in agriculture, yet even then it
showed medium instability during the first two time periods.
There is no one district under high instability in all the time
periods. (See Table No 3.5)
International Journal of Scientific and Research Publications, Volume 4, Issue 7, July 2014 8
ISSN 2250-3153
www.ijsrp.org
Table 3.5 Production Instability in Wheat
Wheat 1980-81 to 1989-90 1990-91 to 1999-2000 2000-01 to 2006-07
Low
Instability
Kurukshetra 6.63
Rohtak 9.86
Faridabad 9.89
Bhiwani 9.95
Hisar 10.4
Jind 10.72
Gurgaon 10.85
Sirsa 11.26
Sonepat 11.8
Ambala 12.05
Mahendragarh 14.84
Hisar 3.26
Bhiwani 3.93
Faridabad 4.85
Jind 5.59
Gurgoan 6.50
Ambala 7.21
Sirsa 8.17
Rohtak 9.96
Sonepat 13.40
Jind 1.3
Kurukshetra 2.32
Karnal 2.49
Rohtak 2.58
Hisar 2.7
Sonepat 3.05
Mahendragarh 3.05
Ambala 3.88
Sirsa 3.94
Bhiwani 4.27
Gurgaon 5.47
Faridabad 8.33
Medium
Instability
Karnal 34.91
Karnal 17.61
Mahendragarh 22.98
Kurukshetra 26.61
High
Instability
Haryana Wheat 6.30
Wheat 4.81
Wheat 4.42
Data Source: Statistical Abstract of Haryana (Different Issue)
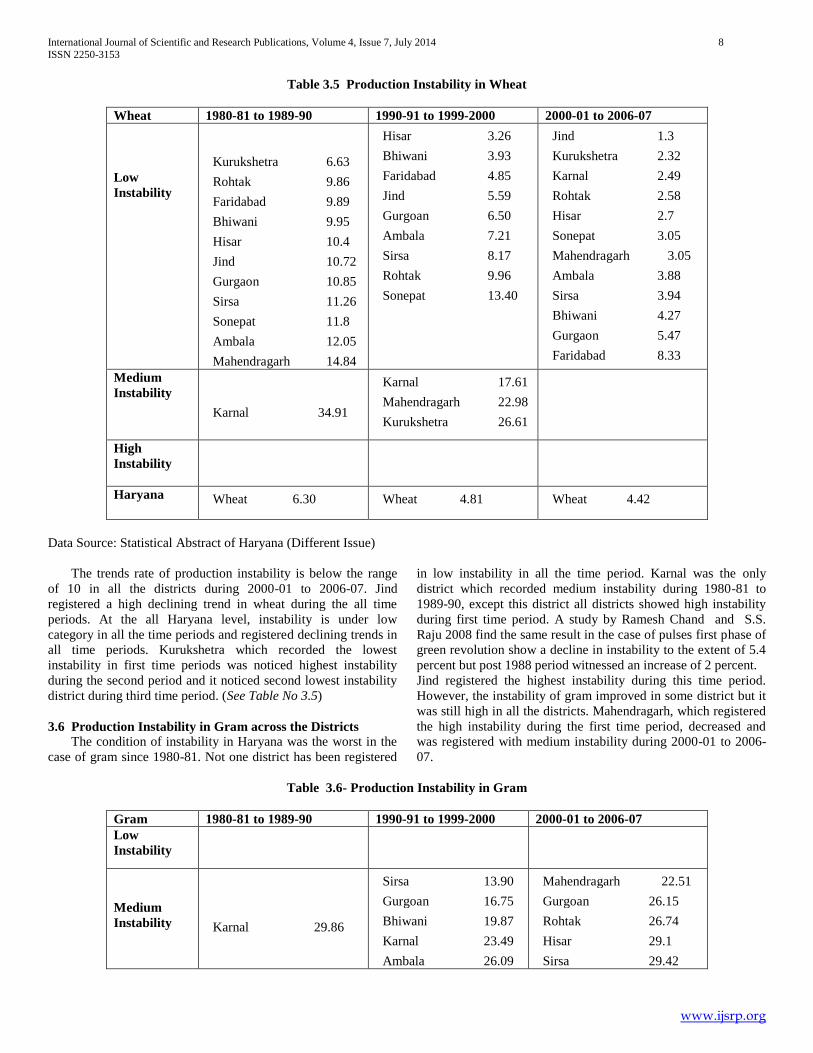
The trends rate of production instability is below the range
of 10 in all the districts during 2000-01 to 2006-07. Jind
registered a high declining trend in wheat during the all time
periods. At the all Haryana level, instability is under low
category in all the time periods and registered declining trends in
all time periods. Kurukshetra which recorded the lowest
instability in first time periods was noticed highest instability
during the second period and it noticed second lowest instability
district during third time period. (See Table No 3.5)
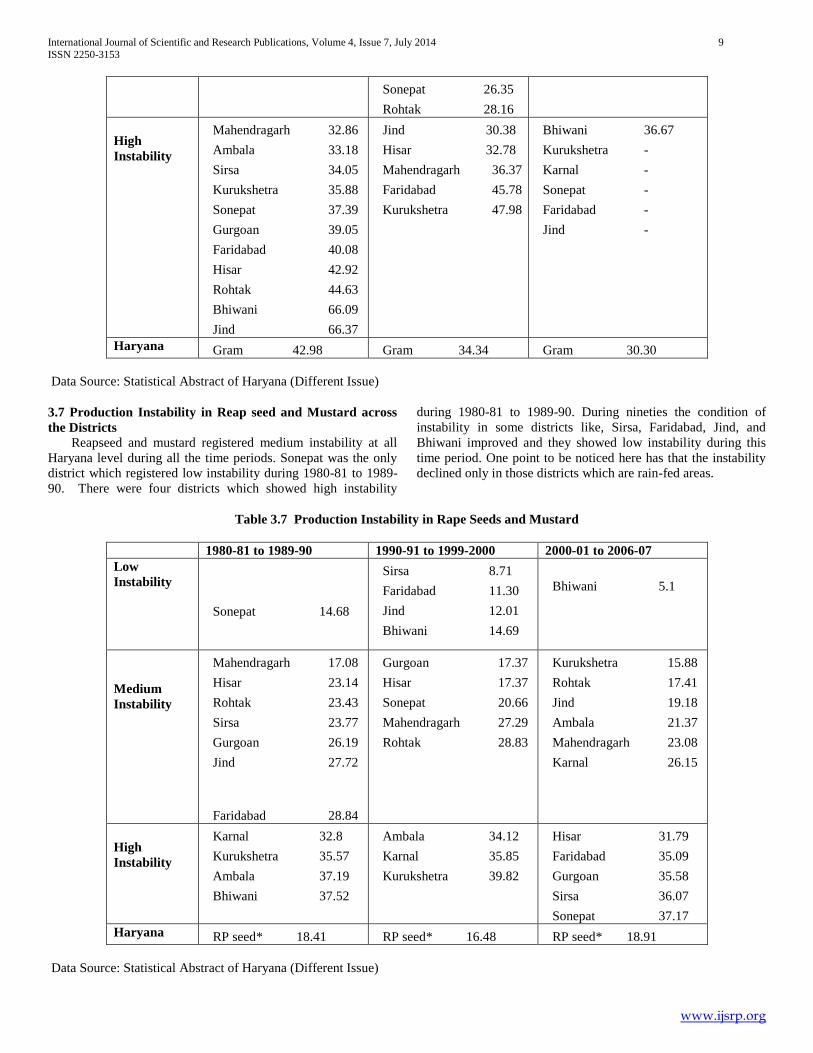
3.6 Production Instability in Gram across the Districts
The condition of instability in Haryana was the worst in the
case of gram since 1980-81. Not one district has been registered
in low instability in all the time period. Karnal was the only
district which recorded medium instability during 1980-81 to
1989-90, except this district all districts showed high instability
during first time period. A study by Ramesh Chand and S.S.
Raju 2008 find the same result in the case of pulses first phase of
green revolution show a decline in instability to the extent of 5.4
percent but post 1988 period witnessed an increase of 2 percent.
Jind registered the highest instability during this time period.
However, the instability of gram improved in some district but it
was still high in all the districts. Mahendragarh, which registered
the high instability during the first time period, decreased and
was registered with medium instability during 2000-01 to 2006-
07.
Table 3.6- Production Instability in Gram
Gram 1980-81 to 1989-90 1990-91 to 1999-2000 2000-01 to 2006-07
Low
Instability
Medium
Instability
Karnal 29.86
Sirsa 13.90
Gurgoan 16.75
Bhiwani 19.87
Karnal 23.49
Ambala 26.09
Mahendragarh 22.51
Gurgoan 26.15
Rohtak 26.74
Hisar 29.1
Sirsa 29.42
International Journal of Scientific and Research Publications, Volume 4, Issue 7, July 2014 9
ISSN 2250-3153
www.ijsrp.org
Sonepat 26.35
Rohtak 28.16
High
Instability
Mahendragarh 32.86
Ambala 33.18
Sirsa 34.05
Kurukshetra 35.88
Sonepat 37.39
Gurgoan 39.05
Faridabad 40.08
Hisar 42.92
Rohtak 44.63
Bhiwani 66.09
Jind 66.37
Jind 30.38
Hisar 32.78
Mahendragarh 36.37
Faridabad 45.78
Kurukshetra 47.98
Bhiwani 36.67
Kurukshetra -
Karnal -
Sonepat -
Faridabad -
Jind -
Haryana Gram 42.98
Gram 34.34
Gram 30.30
Data Source: Statistical Abstract of Haryana (Different Issue)
3.7 Production Instability in Reap seed and Mustard across
the Districts Reapseed and mustard registered medium instability at all
Haryana level during all the time periods. Sonepat was the only
district which registered low instability during 1980-81 to 1989-
90. There were four districts which showed high instability
during 1980-81 to 1989-90. During nineties the condition of
instability in some districts like, Sirsa, Faridabad, Jind, and
Bhiwani improved and they showed low instability during this
time period. One point to be noticed here has that the instability
declined only in those districts which are rain-fed areas.
Table 3.7 Production Instability in Rape Seeds and Mustard
1980-81 to 1989-90 1990-91 to 1999-2000 2000-01 to 2006-07
Low
Instability
Sonepat
14.68
Sirsa 8.71
Faridabad 11.30
Jind 12.01
Bhiwani 14.69
Bhiwani 5.1
Medium
Instability
Mahendragarh 17.08
Hisar 23.14
Rohtak 23.43
Sirsa 23.77
Gurgoan 26.19
Jind 27.72
Faridabad 28.84
Gurgoan 17.37
Hisar 17.37
Sonepat 20.66
Mahendragarh 27.29
Rohtak 28.83
Kurukshetra 15.88
Rohtak 17.41
Jind 19.18
Ambala 21.37
Mahendragarh 23.08
Karnal 26.15
High
Instability
Karnal 32.8
Kurukshetra 35.57
Ambala 37.19
Bhiwani 37.52
Ambala 34.12
Karnal 35.85
Kurukshetra 39.82
Hisar 31.79
Faridabad 35.09
Gurgoan 35.58
Sirsa 36.07
Sonepat 37.17
Haryana RP seed* 18.41
RP seed* 16.48
RP seed* 18.91
Data Source: Statistical Abstract of Haryana (Different Issue)
International Journal of Scientific and Research Publications, Volume 4, Issue 7, July 2014 10
ISSN 2250-3153
www.ijsrp.org
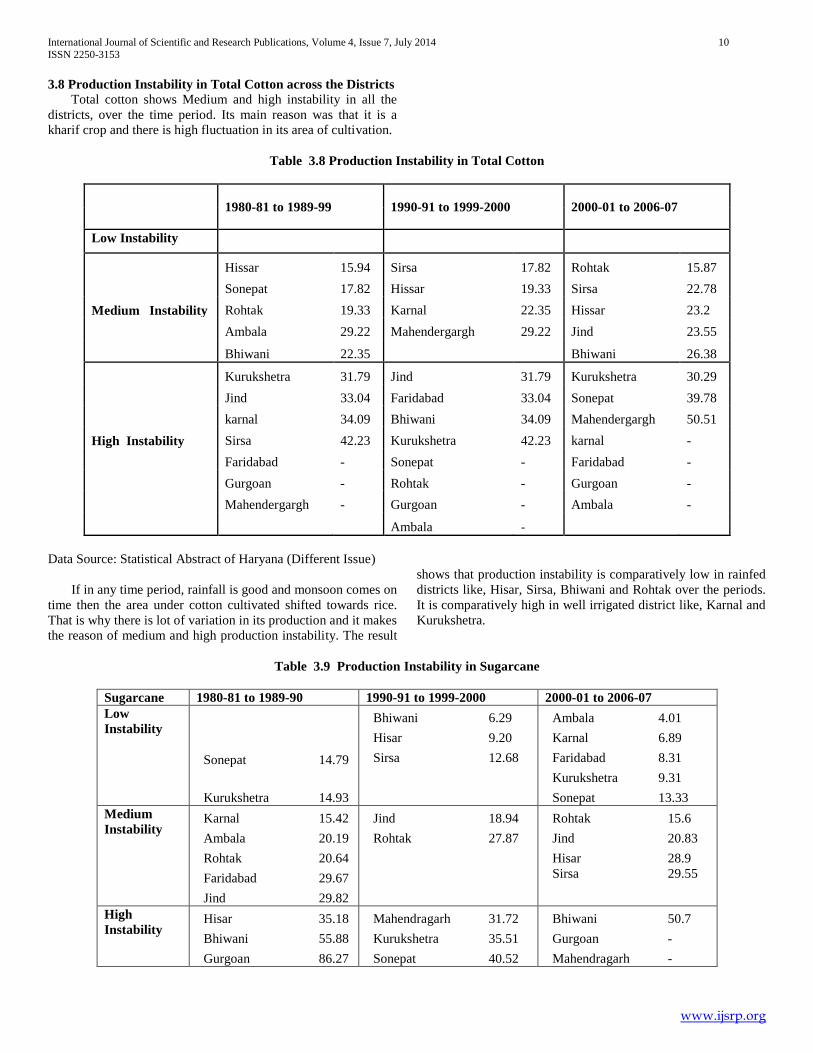
3.8 Production Instability in Total Cotton across the Districts
Total cotton shows Medium and high instability in all the
districts, over the time period. Its main reason was that it is a
kharif crop and there is high fluctuation in its area of cultivation.
Table 3.8 Production Instability in Total Cotton
1980-81 to 1989-99 1990-91 to 1999-2000 2000-01 to 2006-07
Low Instability
Hissar 15.94 Sirsa 17.82 Rohtak 15.87
Sonepat 17.82 Hissar 19.33 Sirsa 22.78
Medium Instability Rohtak 19.33 Karnal 22.35 Hissar 23.2
Ambala 29.22 Mahendergargh 29.22 Jind 23.55
Bhiwani 22.35
Bhiwani 26.38
Kurukshetra 31.79 Jind 31.79 Kurukshetra 30.29
Jind 33.04 Faridabad 33.04 Sonepat 39.78
karnal 34.09 Bhiwani 34.09 Mahendergargh 50.51
High Instability Sirsa 42.23 Kurukshetra 42.23 karnal -
Faridabad - Sonepat - Faridabad -
Gurgoan - Rohtak - Gurgoan -
Mahendergargh - Gurgoan - Ambala -
Ambala -
Data Source: Statistical Abstract of Haryana (Different Issue)
If in any time period, rainfall is good and monsoon comes on
time then the area under cotton cultivated shifted towards rice.
That is why there is lot of variation in its production and it makes
the reason of medium and high production instability. The result
shows that production instability is comparatively low in rainfed
districts like, Hisar, Sirsa, Bhiwani and Rohtak over the periods.
It is comparatively high in well irrigated district like, Karnal and
Kurukshetra.
Table 3.9 Production Instability in Sugarcane
Sugarcane 1980-81 to 1989-90 1990-91 to 1999-2000 2000-01 to 2006-07
Low
Instability
Sonepat 14.79
Kurukshetra 14.93
Bhiwani 6.29
Hisar 9.20
Sirsa 12.68
Ambala 4.01
Karnal 6.89
Faridabad 8.31
Kurukshetra 9.31
Sonepat 13.33
Medium
Instability Karnal 15.42
Ambala 20.19
Rohtak 20.64
Faridabad 29.67
Jind 29.82
Jind 18.94
Rohtak 27.87
Rohtak 15.6
Jind 20.83
Hisar 28.9
Sirsa 29.55
High
Instability
Hisar 35.18
Bhiwani 55.88
Gurgoan 86.27
Mahendragarh 31.72
Kurukshetra 35.51
Sonepat 40.52
Bhiwani 50.7
Gurgoan -
Mahendragarh -
International Journal of Scientific and Research Publications, Volume 4, Issue 7, July 2014 11
ISSN 2250-3153
www.ijsrp.org
Mahendragarh -
Sirsa -
Ambala -
Karnal -
Faridabad -
Gurgoan -
Haryana Sugarcane 12.15 Sugarcane 11.78 Sugarcane 10.55
Data Source: Statistical Abstract of Haryana (Different Issue)
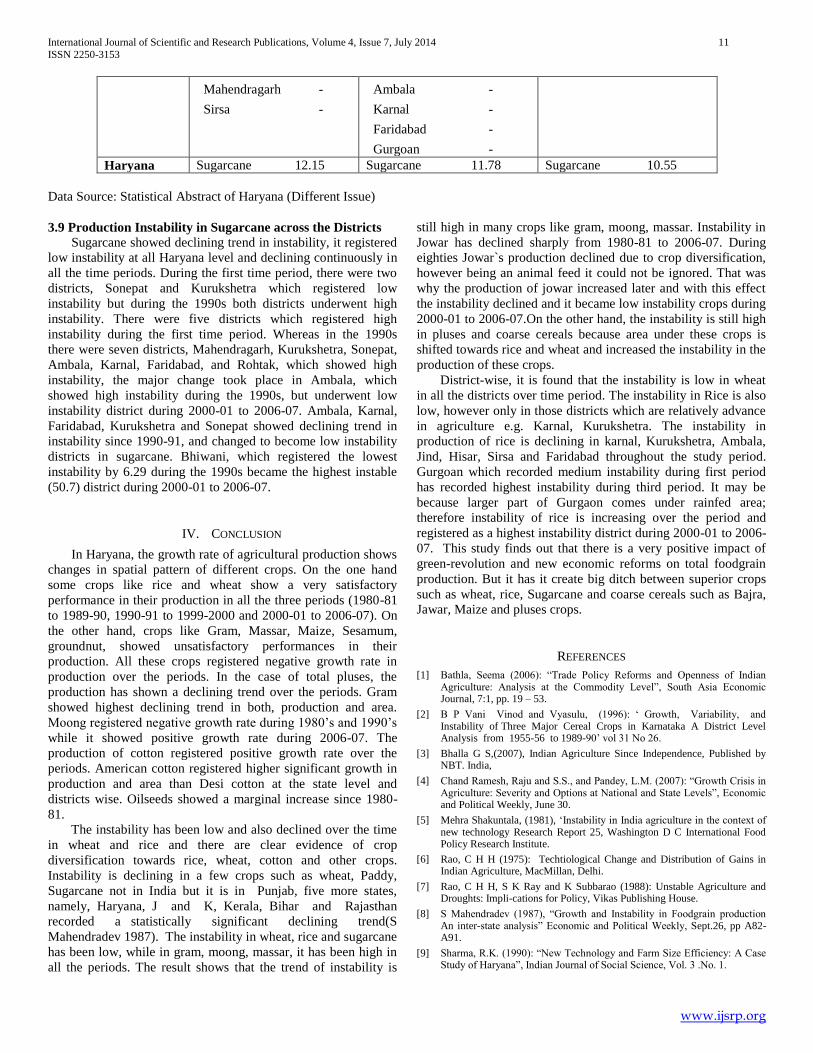
3.9 Production Instability in Sugarcane across the Districts
Sugarcane showed declining trend in instability, it registered
low instability at all Haryana level and declining continuously in
all the time periods. During the first time period, there were two
districts, Sonepat and Kurukshetra which registered low
instability but during the 1990s both districts underwent high
instability. There were five districts which registered high
instability during the first time period. Whereas in the 1990s
there were seven districts, Mahendragarh, Kurukshetra, Sonepat,
Ambala, Karnal, Faridabad, and Rohtak, which showed high
instability, the major change took place in Ambala, which
showed high instability during the 1990s, but underwent low
instability district during 2000-01 to 2006-07. Ambala, Karnal,
Faridabad, Kurukshetra and Sonepat showed declining trend in
instability since 1990-91, and changed to become low instability
districts in sugarcane. Bhiwani, which registered the lowest
instability by 6.29 during the 1990s became the highest instable
(50.7) district during 2000-01 to 2006-07.
IV. CONCLUSION
In Haryana, the growth rate of agricultural production shows
changes in spatial pattern of different crops. On the one hand
some crops like rice and wheat show a very satisfactory
performance in their production in all the three periods (1980-81
to 1989-90, 1990-91 to 1999-2000 and 2000-01 to 2006-07). On
the other hand, crops like Gram, Massar, Maize, Sesamum,
groundnut, showed unsatisfactory performances in their
production. All these crops registered negative growth rate in
production over the periods. In the case of total pluses, the
production has shown a declining trend over the periods. Gram
showed highest declining trend in both, production and area.
Moong registered negative growth rate during 1980’s and 1990’s
while it showed positive growth rate during 2006-07. The
production of cotton registered positive growth rate over the
periods. American cotton registered higher significant growth in
production and area than Desi cotton at the state level and
districts wise. Oilseeds showed a marginal increase since 1980-
81.
The instability has been low and also declined over the time
in wheat and rice and there are clear evidence of crop
diversification towards rice, wheat, cotton and other crops.
Instability is declining in a few crops such as wheat, Paddy,
Sugarcane not in India but it is in Punjab, five more states,
namely, Haryana, J and K, Kerala, Bihar and Rajasthan
recorded a statistically significant declining trend(S
Mahendradev 1987). The instability in wheat, rice and sugarcane
has been low, while in gram, moong, massar, it has been high in
all the periods. The result shows that the trend of instability is
still high in many crops like gram, moong, massar. Instability in
Jowar has declined sharply from 1980-81 to 2006-07. During
eighties Jowar`s production declined due to crop diversification,
however being an animal feed it could not be ignored. That was
why the production of jowar increased later and with this effect
the instability declined and it became low instability crops during
2000-01 to 2006-07.On the other hand, the instability is still high
in pluses and coarse cereals because area under these crops is
shifted towards rice and wheat and increased the instability in the
production of these crops.
District-wise, it is found that the instability is low in wheat
in all the districts over time period. The instability in Rice is also
low, however only in those districts which are relatively advance
in agriculture e.g. Karnal, Kurukshetra. The instability in
production of rice is declining in karnal, Kurukshetra, Ambala,
Jind, Hisar, Sirsa and Faridabad throughout the study period.
Gurgoan which recorded medium instability during first period
has recorded highest instability during third period. It may be
because larger part of Gurgaon comes under rainfed area;
therefore instability of rice is increasing over the period and
registered as a highest instability district during 2000-01 to 2006-
07. This study finds out that there is a very positive impact of
green-revolution and new economic reforms on total foodgrain
production. But it has it create big ditch between superior crops
such as wheat, rice, Sugarcane and coarse cereals such as Bajra,
Jawar, Maize and pluses crops.
REFERENCES
[1] Bathla, Seema (2006): “Trade Policy Reforms and Openness of Indian Agriculture: Analysis at the Commodity Level”, South Asia Economic Journal, 7:1, pp. 19 – 53.
[2] B P Vani Vinod and Vyasulu, (1996): ‘ Growth, Variability, and Instability of Three Major Cereal Crops in Karnataka A District Level Analysis from 1955-56 to 1989-90’ vol 31 No 26.
[3] Bhalla G S,(2007), Indian Agriculture Since Independence, Published by NBT. India,
[4] Chand Ramesh, Raju and S.S., and Pandey, L.M. (2007): “Growth Crisis in Agriculture: Severity and Options at National and State Levels”, Economic and Political Weekly, June 30.
[5] Mehra Shakuntala, (1981), ‘Instability in India agriculture in the context of new technology Research Report 25, Washington D C International Food Policy Research Institute.
[6] Rao, C H H (1975): Techtiological Change and Distribution of Gains in Indian Agriculture, MacMillan, Delhi.
[7] Rao, C H H, S K Ray and K Subbarao (1988): Unstable Agriculture and Droughts: Impli-cations for Policy, Vikas Publishing House.
[8] S Mahendradev (1987), “Growth and Instability in Foodgrain production An inter-state analysis” Economic and Political Weekly, Sept.26, pp A82- A91.
[9] Sharma, R.K. (1990): “New Technology and Farm Size Efficiency: A Case Study of Haryana”, Indian Journal of Social Science, Vol. 3 .No. 1.
International Journal of Scientific and Research Publications, Volume 4, Issue 7, July 2014 12
ISSN 2250-3153
www.ijsrp.org
AUTHORS First Author – Rakesh Sihmar, Research Scholar Centre for the
Study of Regional Development (C.S.R.D) JNU New Delhi