green revolution research saved an estimated 18 to 27 million hectares from being brought into...
TRANSCRIPT

Green Revolution research saved an estimated 18 to 27million hectares from being brought intoagricultural productionJames R. Stevensona,1, Nelson Villoriab, Derek Byerleec, Timothy Kelleya, and Mywish Marediad
aCGIAR Independent Science and Partnership Council Secretariat, Food and Agriculture Organization, Rome 00185, Italy; bDepartment of AgriculturalEconomics, Purdue University, West Lafayette, IN 47907; cCGIAR Standing Panel on Impact Assessment, Washington, DC 20007; and dDepartment ofAgricultural, Food, and Resource Economics, Michigan State University, East Lansing, MI 48824
Edited by Kenneth G. Cassman, University of Nebraska, Lincoln, NE, and accepted by the Editorial Board December 16, 2012 (received for reviewJune 15, 2012)
New estimates of the impacts of germplasm improvement in themajor staple crops between 1965 and 2004 on global land-coverchange are presented, based on simulations carried out usinga global economic model (Global Trade Analysis Project Agro-Ecological Zone), a multicommodity, multiregional computablegeneral equilibrium model linked to a global spatially explicitdatabase on land use. We estimate the impact of removing thegains in cereal productivity attributed to the widespread adoptionof improved varieties in developing countries. Here, several differ-ent effects—higher yields, lower prices, higher land rents, andtrade effects—have been incorporated in a single model of theimpact of Green Revolution research (and subsequent advancesin yields from crop germplasm improvement) on land-coverchange. Our results generally support the Borlaug hypothesis thatincreases in cereal yields as a result of widespread adoption ofimproved crop germplasm have saved natural ecosystems frombeing converted to agriculture. However, this relationship is com-plex, and the net effect is of a much smaller magnitude than Bor-laug proposed. We estimate that the total crop area in 2004 wouldhave been between 17.9 and 26.7 million hectares larger in a worldthat had not benefited from crop germplasm improvement since1965. Of these hectares, 12.0–17.7 million would have been in de-veloping countries, displacing pastures and resulting in an esti-mated 2 million hectares of additional deforestation. However,the negative impacts of higher food prices on poverty and hungerunder this scenario would likely have dwarfed the welfare effectsof agricultural expansion.
agricultural productivity | land-use change
The competition for global agricultural land and forest re-sources is high on the development agenda as a result of
climate change, rising commodity prices, and rising land prices.Land cover change is the third most important human-inducedcause of carbon emissions globally and the second most impor-tant in developing countries (1). In turn, agricultural expansion,especially commercial agriculture (2), is the single most impor-tant determinant of tropical deforestation. Between 1980 and2000, 83% of all new agricultural land in the tropics came fromeither intact forests (55%) or disturbed forests (28%) (3).Many have argued that agricultural research to increase yields
is critical to saving the world’s remaining forests and in doing so,limiting losses of biodiversity (4, 5) and greenhouse gas (GHG)emissions (6, 7). The theory is that technological change improvesproductivity on existing agricultural land and saves natural eco-systems (including forests) from being converted to agriculture.This is commonly known as the Borlaug hypothesis after NormanBorlaug, the “father of the Green Revolution,” who claimed thatthe intensification of agriculture between 1950 and 2000, partly asa result of the technological change made possible by the GreenRevolution, had saved hundreds of millions of hectares* frombeing brought into agricultural production (8).
However, the relationship between adoption of new technol-ogies and land-use and land-cover change is complex. Increasesin productivity from new agricultural technologies may increasethe profitability of agriculture in comparison with alternativeland uses (such as forest and pasture), thereby encouraging ex-pansion of the agricultural land frontier. This is particularly thecase for crops with an elastic demand (9). Where this kind oftechnological change takes place in forest-rich regions, there isthe potential for it to contribute to deforestation, and severalcase studies in Angelsen and Kaimowitz (10) are examples of thiskind of outcome.CGIAR, a global agricultural research partnership, is a major
source of improved technologies for food crops, including thecrop germplasm technologies that spurred the Green Revolu-tion. The impacts of CGIAR technologies on global agriculturalproductivity have been well documented (11). Conversely, im-pacts of the CGIAR system on the environment have receivedlittle attention. The land-use effects of technological change mayrepresent the single most important source of environmentalimpacts of the work of CGIAR globally (12). Earlier studies haveargued that CGIAR-led agricultural technologies have signifi-cantly reduced agricultural expansion (relative to the counter-factual in which the observed productivity gains had not takenplace) and in doing so potentially saved forests (13, 14).It is not possible to assess these relationships directly in em-
pirical studies, because the counterfactual cannot be observed.Moreover, the pathways through which technological change hasimpacts on land-use change are manifested through markets foragricultural outputs and the factors of production. For thesereasons, the impacts of technological change in agriculture canonly be estimated through modeling.
Previous StudiesA simple identity, the global food equation (9), links globalpopulation (N), food consumption and production (q), land area(L), and agricultural yield (q/L), with demand on the left-handside and supply on the right-hand side:
Author contributions: J.R.S., D.B., T.K., and M.M. designed research; N.V. performed re-search; J.R.S., N.V., D.B., T.K., and M.M. analyzed data; and J.R.S., N.V., D.B., T.K., andM.M. wrote the paper.
The authors declare no conflict of interest.
This article is a PNAS Direct Submission. K.G.C. is a guest editor invited by the EditorialBoard.1To whom correspondence should be addressed. E-mail: [email protected].
This article contains supporting information online at www.pnas.org/lookup/suppl/doi:10.1073/pnas.1208065110/-/DCSupplemental.
*The quote from Borlaug is: “If the global cereal yields of 1950 still prevailed in 2000, wewould have needed nearly 1.2 billion more hectares of the same quality, instead of the660 million hectares used, to achieve 2000’s global harvest.” (ref. 8, p. 359). We actuallythink that the “more” in this sentence is a typographical error. Borlaug’s argument fitsbetter with a total area of cereals in 2000 of 1.2 billion in absence of observed yieldincreases. This suggests a land-saving effect of 560million hectares (1,220 million ha − 660million ha), rather than 1.2 billion additional hectares.
www.pnas.org/cgi/doi/10.1073/pnas.1208065110 PNAS | May 21, 2013 | vol. 110 | no. 21 | 8363–8368
SUST
AINABILITY
SCIENCE
ECONOMIC
SCIENCE
SSP
ECIALFEATU
RE
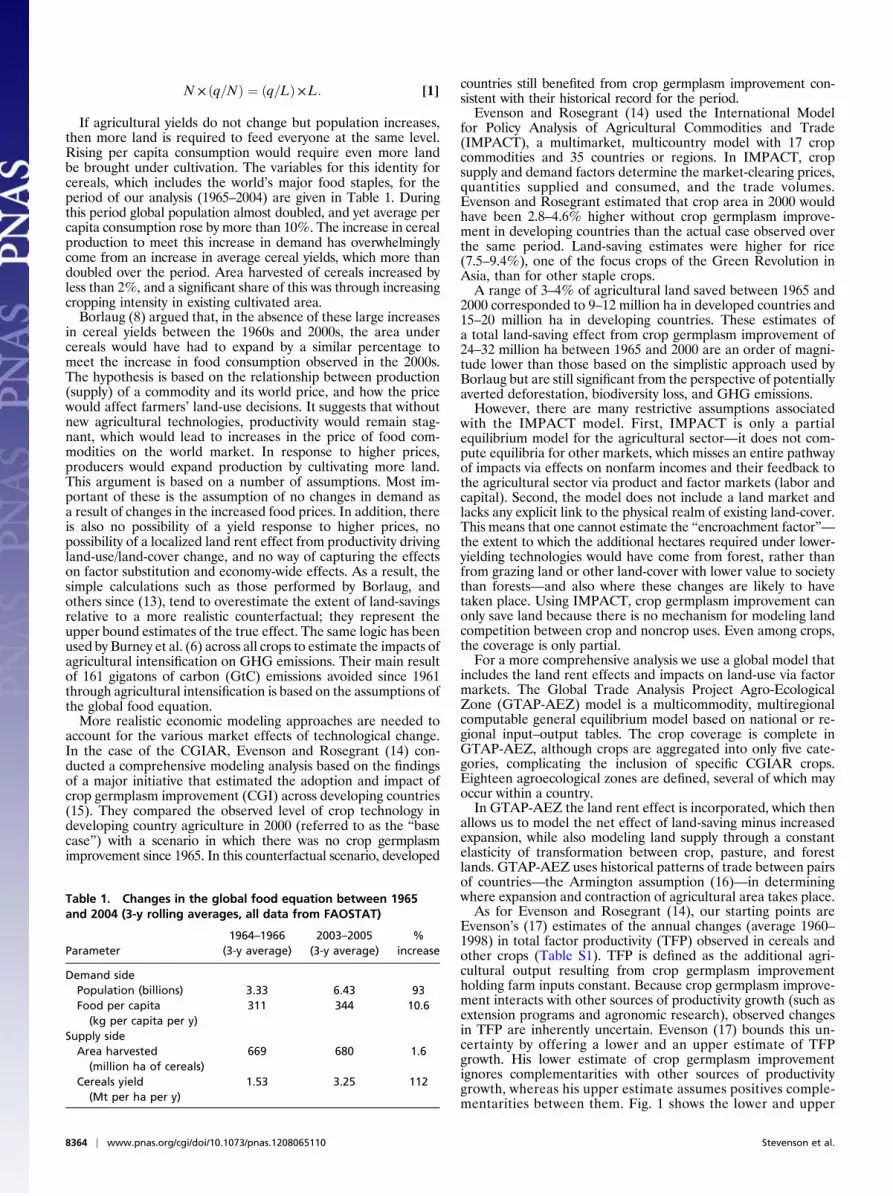
N × ðq=NÞ ¼ ðq=LÞ×L: [1]
If agricultural yields do not change but population increases,then more land is required to feed everyone at the same level.Rising per capita consumption would require even more landbe brought under cultivation. The variables for this identity forcereals, which includes the world’s major food staples, for theperiod of our analysis (1965–2004) are given in Table 1. Duringthis period global population almost doubled, and yet average percapita consumption rose by more than 10%. The increase in cerealproduction to meet this increase in demand has overwhelminglycome from an increase in average cereal yields, which more thandoubled over the period. Area harvested of cereals increased byless than 2%, and a significant share of this was through increasingcropping intensity in existing cultivated area.Borlaug (8) argued that, in the absence of these large increases
in cereal yields between the 1960s and 2000s, the area undercereals would have had to expand by a similar percentage tomeet the increase in food consumption observed in the 2000s.The hypothesis is based on the relationship between production(supply) of a commodity and its world price, and how the pricewould affect farmers’ land-use decisions. It suggests that withoutnew agricultural technologies, productivity would remain stag-nant, which would lead to increases in the price of food com-modities on the world market. In response to higher prices,producers would expand production by cultivating more land.This argument is based on a number of assumptions. Most im-portant of these is the assumption of no changes in demand asa result of changes in the increased food prices. In addition, thereis also no possibility of a yield response to higher prices, nopossibility of a localized land rent effect from productivity drivingland-use/land-cover change, and no way of capturing the effectson factor substitution and economy-wide effects. As a result, thesimple calculations such as those performed by Borlaug, andothers since (13), tend to overestimate the extent of land-savingsrelative to a more realistic counterfactual; they represent theupper bound estimates of the true effect. The same logic has beenused by Burney et al. (6) across all crops to estimate the impacts ofagricultural intensification on GHG emissions. Their main resultof 161 gigatons of carbon (GtC) emissions avoided since 1961through agricultural intensification is based on the assumptions ofthe global food equation.More realistic economic modeling approaches are needed to
account for the various market effects of technological change.In the case of the CGIAR, Evenson and Rosegrant (14) con-ducted a comprehensive modeling analysis based on the findingsof a major initiative that estimated the adoption and impact ofcrop germplasm improvement (CGI) across developing countries(15). They compared the observed level of crop technology indeveloping country agriculture in 2000 (referred to as the “basecase”) with a scenario in which there was no crop germplasmimprovement since 1965. In this counterfactual scenario, developed
countries still benefited from crop germplasm improvement con-sistent with their historical record for the period.Evenson and Rosegrant (14) used the International Model
for Policy Analysis of Agricultural Commodities and Trade(IMPACT), a multimarket, multicountry model with 17 cropcommodities and 35 countries or regions. In IMPACT, cropsupply and demand factors determine the market-clearing prices,quantities supplied and consumed, and the trade volumes.Evenson and Rosegrant estimated that crop area in 2000 wouldhave been 2.8–4.6% higher without crop germplasm improve-ment in developing countries than the actual case observed overthe same period. Land-saving estimates were higher for rice(7.5–9.4%), one of the focus crops of the Green Revolution inAsia, than for other staple crops.A range of 3–4% of agricultural land saved between 1965 and
2000 corresponded to 9–12 million ha in developed countries and15–20 million ha in developing countries. These estimates ofa total land-saving effect from crop germplasm improvement of24–32 million ha between 1965 and 2000 are an order of magni-tude lower than those based on the simplistic approach used byBorlaug but are still significant from the perspective of potentiallyaverted deforestation, biodiversity loss, and GHG emissions.However, there are many restrictive assumptions associated
with the IMPACT model. First, IMPACT is only a partialequilibrium model for the agricultural sector—it does not com-pute equilibria for other markets, which misses an entire pathwayof impacts via effects on nonfarm incomes and their feedback tothe agricultural sector via product and factor markets (labor andcapital). Second, the model does not include a land market andlacks any explicit link to the physical realm of existing land-cover.This means that one cannot estimate the “encroachment factor”—the extent to which the additional hectares required under lower-yielding technologies would have come from forest, rather thanfrom grazing land or other land-cover with lower value to societythan forests—and also where these changes are likely to havetaken place. Using IMPACT, crop germplasm improvement canonly save land because there is no mechanism for modeling landcompetition between crop and noncrop uses. Even among crops,the coverage is only partial.For a more comprehensive analysis we use a global model that
includes the land rent effects and impacts on land-use via factormarkets. The Global Trade Analysis Project Agro-EcologicalZone (GTAP-AEZ) model is a multicommodity, multiregionalcomputable general equilibrium model based on national or re-gional input–output tables. The crop coverage is complete inGTAP-AEZ, although crops are aggregated into only five cate-gories, complicating the inclusion of specific CGIAR crops.Eighteen agroecological zones are defined, several of which mayoccur within a country.In GTAP-AEZ the land rent effect is incorporated, which then
allows us to model the net effect of land-saving minus increasedexpansion, while also modeling land supply through a constantelasticity of transformation between crop, pasture, and forestlands. GTAP-AEZ uses historical patterns of trade between pairsof countries—the Armington assumption (16)—in determiningwhere expansion and contraction of agricultural area takes place.As for Evenson and Rosegrant (14), our starting points are
Evenson’s (17) estimates of the annual changes (average 1960–1998) in total factor productivity (TFP) observed in cereals andother crops (Table S1). TFP is defined as the additional agri-cultural output resulting from crop germplasm improvementholding farm inputs constant. Because crop germplasm improve-ment interacts with other sources of productivity growth (such asextension programs and agronomic research), observed changesin TFP are inherently uncertain. Evenson (17) bounds this un-certainty by offering a lower and an upper estimate of TFPgrowth. His lower estimate of crop germplasm improvementignores complementarities with other sources of productivitygrowth, whereas his upper estimate assumes positives comple-mentarities between them. Fig. 1 shows the lower and upper
Table 1. Changes in the global food equation between 1965and 2004 (3-y rolling averages, all data from FAOSTAT)
Parameter1964–1966
(3-y average)2003–2005
(3-y average)%
increase
Demand sidePopulation (billions) 3.33 6.43 93Food per capita
(kg per capita per y)311 344 10.6
Supply sideArea harvested
(million ha of cereals)669 680 1.6
Cereals yield(Mt per ha per y)
1.53 3.25 112
8364 | www.pnas.org/cgi/doi/10.1073/pnas.1208065110 Stevenson et al.

TFP shocks compounded during the period 1961–2004 expe-rienced by the cereals (wheat, rice, and coarse grains) andother crops (cassava, lentils, beans, and potatoes) in the de-veloping world that benefited from CGI [SI Materials andMethods and Table S2 provide detailed mapping from originalcrops in Evenson and Rosegrant (14) to GTAP]. The morenegative the productivity shock is, the greater the observedcontribution from crop germplasm improvement is estimated tohave been in this period. These negative TFP shocks to cropagriculture allow us to track the main price, production, land-use, trade, and emission effects in a counterfactual world that didnot benefit from the observed productivity gains in agricultureattributable to crop germplasm improvement.
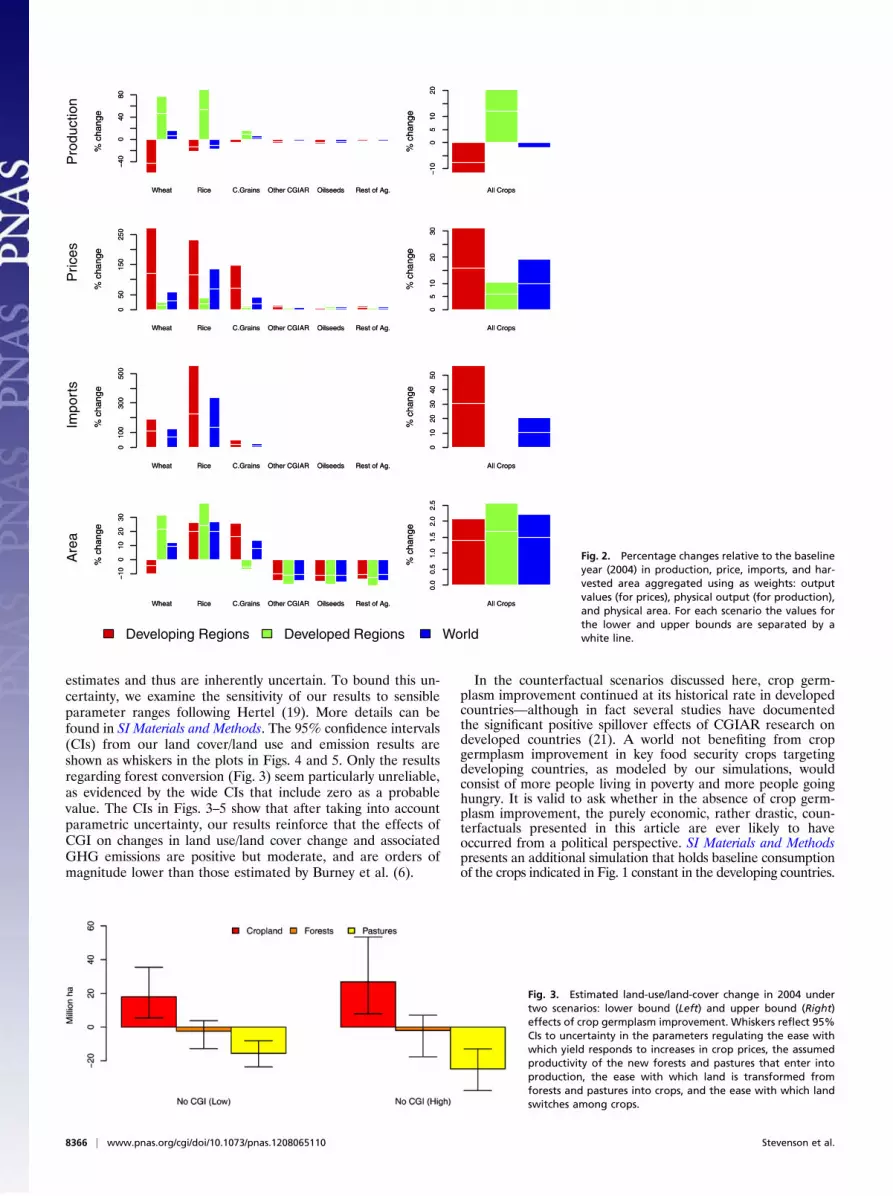
ResultsSimulated changes (lower and upper estimates relative to the2004 baseline) in production, prices, imports, and harvested areaare shown in Fig. 2 for developed and developing regions aswell as for the world (Table S3). Focusing first on the developingregions, in the absence of CGI, wheat production in 2004 wouldhave been 43–60% lower than observed. Rice, coarse grains, andthe other CGIAR crops affected by the productivity shocks alsoshow reduced outputs. Oilseeds and the rest of the agriculturalproducts, although not directly affected by the shocks, also showdeclines in production as a result of the reallocation of pro-duction factors (such as land) to those crops for which priceswould have increased.Fig. 2 (Upper Middle) shows that the output reductions in the
developing world are ultimately reflected in increased regionaland world prices. For instance, in the developing world, wheatprices would have more than doubled in the absence of CGI(121–272%). Fig. 2 (Lower Middle) shows that the reductions inwheat output in developing countries would have partially beenoffset by increases in imports, which also more than doubled inboth scenarios. Such a surge in import demand drives wheatprices up in the developed world. Thus, using export values asweights, global weighted average wheat prices would have been29–59% higher than they actually were in 2004. Similarly, globalrice prices would have been 68–134% higher, reflecting the factthat rice is mostly produced in developing countries where weare applying the shocks. The coarse grains also show significantworld price increases (20–41%), whereas changes in the worldprices in the other CGIAR crops are more moderate (6–10%),reflecting both lower CGI gains in cassava and the fact that po-tatoes and cassava represent relatively low shares of the pro-duction value of the world agricultural sector. The price increasesobtained by Evenson and Rosegrant (14) are remarkably similarto those reported here (Table S4). For the 1965 CGI counter-factual, Evenson and Rosegrant found that wheat prices increasedby 29–61%, rice by 80–124%, maize by 23–45%, and other grainsby 21–50%.
Fig. 2 shows that price effects are the consequence of reducedproductivity, but at the same time higher prices make productionmore profitable, thus attracting production factors (land, labor,capital) that are withdrawn from other activities. Fig. 2 (Bottom)shows how the harvested area of rice and coarse grains increasesconsiderably under the 1965 CGI counterfactual in both de-veloping and developed regions. Table S5 has a further level ofdisaggregation of these results. The expansion of lands in thesesectors is partly sustained by reductions of land in wheat in de-veloping countries, and oilseeds and the rest of the agriculturalsector in both developing and developed countries. The reductionin output is accompanied by displacement of production from thedeveloping to the developed countries—the production of wheatand rice in developed countries expands significantly, driven entirelyby area expansion of these crops. The overall result is a moderatereduction of total output ranging from 1.9% to 2.3% (last plot inFig. 2, Top, shows changes for the agricultural sector as a whole)and an increase in harvested area ranging from 1.5% to 2.2%. Thistranslates to an expansion in cropland of between 17.9 and 26.8million ha (Fig. 3), which is comparable to the results of Evensonand Rosegrant (14), who estimated 24–32 million ha globally.Additional crop land in GTAP-AEZ is obtained through
conversion of pastures or forests. Fig. 3 shows that additionalagricultural land would come mainly from pastures (15.6–24.8Mha) and some from forests (approximately 2 Mha). In Figs. 4and 5 we also show estimates of the GHG emissions implied byour counterfactuals. We include emissions from changes in fer-tilizer production (18), land cover change (19), agricultural soils(20), and rice cultivation (20), which range from 5.2 to 7.4 GtCequivalent (shown in Fig. 4). Fig. 5 shows negligible increases inemissions from changes in fertilizer production (consistent withthe moderate output reductions discussed above), as well as verymoderate increases in the emissions from agricultural soils andrice cultivation (consistent with a moderate expansion of thecropland). Therefore, almost all of the total increase in GHGemissions in the absence of crop germplasm improvement wouldcome from changes in land cover.These simulation results from GTAP-AEZ demonstrate that
for the main staple food crops, there is a net land-saving asa result of global crop germplasm improvement in developingcountries and associated increases in yields observed since 1965.These estimates are orders of magnitude lower than predicted bythe simple global food equation that does not take account offeedback loops through prices of products, consumption de-mand, and land-use decisions. For example, Burney et al. (6)found that expansion of cropland would have been 864–1,514Mha greater without agricultural intensification (lower bound:yields and fertilizers at 1961 levels and no increase in consump-tion; upper bound: yields and fertilizers at 1961 levels with real-world observed evolution in consumption), corresponding to 86.5–161 GtC higher emissions than observed. We should note thatBurney et al. (6) subtract total yield growth globally to obtaintheir estimates, whereas the results reported here subtract onlyTFP growth in a limited number of crops in the developingcountries, meaning that the results are not directly comparable.The lower net land-saving effects reported here still represent
a significant positive impact of agricultural research on the envi-ronment. However, the overall effects on land-saving are dwarfedby the effects of crop germplasm improvement on food prices(Table S4). Our estimates support the findings of Evenson andRosegrant (14), who argue that in the absence of crop germplasmimprovement in developing countries, higher food prices wouldhave had serious negative implications on poverty andmalnutrition.The results of the GTAP model depend on a few key
parameters regulating (i) the ease with which yields respond toincreases in crop prices; (ii) the assumed productivity of the newforest and pasture lands that enter into crop production; (iii) theease with which land is transformed from forests and pasturesinto crops; and (iv) the ease with which land switches amongcrops. These parameters are based on the available econometric
−60
−40
−20
0
−60
−40
−20
0
−60
−40
−20
0
−60
−40
−20
0
Developing Asia Latin America M. East & N. Africa Sub−Saharan Africa
Wheat Rice Coarse Grains Other CGIAR
% C
hang
e in
TF
P G
row
th
Fig. 1. Negative shocks to TFP growth in developing country agricultureduring the period 1965–2004 equivalent to removing the observed pro-ductivity gains from crop germplasm improvement [estimated by Evenson(17), pp. 466–467]. The lower-bound TFP shocks are given by the segmentbetween the origin and the white line. The additional segment representsthe upper-bound TFP shocks.
Stevenson et al. PNAS | May 21, 2013 | vol. 110 | no. 21 | 8365
SUST
AINABILITY
SCIENCE
ECONOMIC
SCIENCE
SSP
ECIALFEATU
RE
estimates and thus are inherently uncertain. To bound this un-certainty, we examine the sensitivity of our results to sensibleparameter ranges following Hertel (19). More details can befound in SI Materials and Methods. The 95% confidence intervals(CIs) from our land cover/land use and emission results areshown as whiskers in the plots in Figs. 4 and 5. Only the resultsregarding forest conversion (Fig. 3) seem particularly unreliable,as evidenced by the wide CIs that include zero as a probablevalue. The CIs in Figs. 3–5 show that after taking into accountparametric uncertainty, our results reinforce that the effects ofCGI on changes in land use/land cover change and associatedGHG emissions are positive but moderate, and are orders ofmagnitude lower than those estimated by Burney et al. (6).
In the counterfactual scenarios discussed here, crop germ-plasm improvement continued at its historical rate in developedcountries—although in fact several studies have documentedthe significant positive spillover effects of CGIAR research ondeveloped countries (21). A world not benefiting from cropgermplasm improvement in key food security crops targetingdeveloping countries, as modeled by our simulations, wouldconsist of more people living in poverty and more people goinghungry. It is valid to ask whether in the absence of crop germ-plasm improvement, the purely economic, rather drastic, coun-terfactuals presented in this article are ever likely to haveoccurred from a political perspective. SI Materials and Methodspresents an additional simulation that holds baseline consumptionof the crops indicated in Fig. 1 constant in the developing countries.
Wheat Rice C.Grains Other CGIAR Oilseeds Rest of Ag.
% c
hang
e
−40
040
80
Wheat Rice C.Grains Other CGIAR Oilseeds Rest of Ag.
% c
hang
e
−40
040
80
All Crops
% c
hang
e
−10
05
1020
All Crops
% c
hang
e
−10
05
1020
Wheat Rice C.Grains Other CGIAR Oilseeds Rest of Ag.
% c
hang
e
050
150
250
Wheat Rice C.Grains Other CGIAR Oilseeds Rest of Ag.
% c
hang
e
050
150
250
All Crops
% c
hang
e
05
1020
30
All Crops
% c
hang
e
05
1020
30
Wheat Rice C.Grains Other CGIAR Oilseeds Rest of Ag.
% c
hang
e
010
030
050
0
Wheat Rice C.Grains Other CGIAR Oilseeds Rest of Ag.
% c
hang
e
010
030
050
0
All Crops
% c
hang
e
010
2030
4050
All Crops
% c
hang
e
010
2030
4050
Wheat Rice C.Grains Other CGIAR Oilseeds Rest of Ag.
% c
hang
e
−10
010
2030
Wheat Rice C.Grains Other CGIAR Oilseeds Rest of Ag.
% c
hang
e
−10
010
2030
All Crops
% c
hang
e
0.0
0.5
1.0
1.5
2.0
2.5
All Crops
% c
hang
e
0.0
0.5
1.0
1.5
2.0
2.5
Developing Regions Developed Regions World
Pro
duct
ion
Pric
esIm
port
sA
rea
Fig. 2. Percentage changes relative to the baselineyear (2004) in production, price, imports, and har-vested area aggregated using as weights: outputvalues (for prices), physical output (for production),and physical area. For each scenario the values forthe lower and upper bounds are separated by awhite line.
Fig. 3. Estimated land-use/land-cover change in 2004 undertwo scenarios: lower bound (Left) and upper bound (Right)effects of crop germplasm improvement. Whiskers reflect 95%CIs to uncertainty in the parameters regulating the ease withwhich yield responds to increases in crop prices, the assumedproductivity of the new forests and pastures that enter intoproduction, the ease with which land is transformed fromforests and pastures into crops, and the ease with which landswitches among crops.
8366 | www.pnas.org/cgi/doi/10.1073/pnas.1208065110 Stevenson et al.

To explore the effects on land-saving estimates of keeping de-veloping country consumption levels constant, we ran alternativecounterfactuals using the same productivity shocks but keepingconsumption in the developing world constant in the baselineyear (2004) (Table S6). These simulations give a range of 22–43million ha (Table S7) land savings from crop germplasm im-provement, suggesting that our main findings may represent lowerbound estimates of the impact of crop germplasm improvement onland saving. However, this only serves to reinforce the point thateven the estimates simulating a policy-mediated response are stillwell below projections using the global food equation, furtherunderscoring the importance of considering market responsesin assessing the effects of technological progress.
DiscussionGTAP-AEZ is one of a number of global economic models ofland-use change (22), but most others, such as IMPACT (23),World Agricultural Trade Simulation Model (WATSIM) (24),Agriculture and Land Use Model (AgLU) (25), and the Forestand Agriculture Sector Optimization Model (FASOM) (26,27), are partial equilibrium models that do not consider impactsthrough economy-wide effects or, most importantly for thisstudy, through land market effects. Nonetheless, the introductionof land heterogeneity (AEZs), pasture and forest land-use, and landmarkets into CGE models is a relatively new enterprise. Althoughwe have examined the sensitivity of our results to key parameters,the GTAP-AEZ model does not estimate the land conversionprocess (pastures or forests to cropland) directly for specific sites—only in the abstract at the level of the AEZ. Thus, to the extentthat specific pastures or forests have heterogeneous emissionfactors access costs, the GTAP model could be over- or under-estimating forest and pasture conversions and their associatedemissions. Another limitation is that the model only considersconversions from pastures and forest to cropland, thus the roleof transitions (forests to pastures to cropland) is overlooked.It is important that claims of the land-saving effects of new
technologies be carefully scrutinized, especially because many
scientists continue to argue that they are saving forests throughintensification on the forest margin (7, 28), and improved agri-cultural technologies are one of the most common mechanismsproposed for how to make reducing emissions from de-forestation and forest degradation (REDD and REDD+) work(along with protected areas and community/local forest man-agement). In particular, three critical factors influence whethernew agricultural technologies reduce or increase pressure onforests: the location of productivity shifts (biased to forest marginor biased to established areas); the characteristics of the tech-nological change (in particular, whether it is labor saving); andthe demand elasticity for the agricultural product in question.Technologies that are predominantly adopted at or close to theforest margin and that produce a good with elastic demand onexport markets will likely add to the pressure on the forest. Underthese criteria, technological change in oil palm looks likely toinduce further deforestation, in the absence of better regulation—oilpalm production is located near forest margins, and there is po-tentially almost unlimited demand (29). Technologies for cropsthat have inelastic demand and that are predominantly adop-ted in existing cultivated areas will likely save land. Many of theCGIAR’s mandate crops (e.g., rice, maize, wheat) fit this de-scription. Finally, labor-intensive technologies adopted in tradi-tionally cultivated areas may draw people away from the forest,further reducing pressure to clear forests (30).We should also recognize that the impact of technological
change on land-saving is likely to be a weak effect compared withthe range of other exogenous factors driving land-use change anddeforestation. Even for rapidly expanding commodities on theforest margin, such as pastures, soybeans, and oil palm, theeffects of technological change on land expansion throughreturns to land are likely to be much smaller than effects of poorgovernance of land and forest resources. That is, expansion atthe intensive margin through new technologies is unlikely tosucceed if it is cheaper to expand at the extensive margin whereforest land is readily available and poorly governed. Expansion atthe extensive margin usually does not consider the real socialvalue of forest resources foregone. Recent experience with bettergovernance and monitoring of the Brazilian Amazon has showna dramatic drop in rates of deforestation, even as commodityprices have risen sharply in the past 5 y (31–33). As this exampledemonstrates, for agricultural technologies to make a differenceto slowing deforestation, their adoption by farmers has to beaccompanied by a significant scaling up of enforcement of forestprotection policies. This is consistent with one of the mainfindings of the long-run Alternatives to Slash and Burn programof the CGIAR: that raising agricultural productivity is a neces-sary but not sufficient condition for saving forests (34).Land-cover change remains a dynamic process, with consid-
erable potential for further deforestation to take place to meetthe projected demands of a growing population, rising incomes,structural changes in diets, and particularly from new demandsfrom biofuels. Conversion of natural grasslands and woodlands islikely to have lower costs in terms of ecosystem services foregonethan conversion of tropical forests with high conservation values,carbon storage, and other services. Agro-ecological modeling ofland suitability by the International Institute for Advanced Sys-tems Analysis has identified 1,210 Mha of land that is still po-tentially suitable for conversion to rain-fed agriculture, even ifthe uncultivated land is likely more marginal than currentlyfarmed land (perhaps with a replacement value of approximately0.7). Well over half of this is forested, with two thirds in tropicalareas. However, approximately 450 Mha is savannah or wood-lands suited to crop agriculture, with two thirds of this located insub-Saharan Africa and Latin America (35). Some continuedexpansion of agricultural land seems inevitable over the comingdecades. The technological and governance challenge for humanityis how best to guide this expansion so that it takes place in areaswhere the environmental and social costs will be lowest.
Fig. 4. Estimated increase in total GHG emissions (in Gt of CO2) for the period1965–2004 from land-cover change. Two scenarios and CIs as per Fig. 3.
Fig. 5. Estimated agricultural emissions from changes in input use, agriculturalsoils, and rice cultivation associatedwith a counterfactual of no crop germplasmimprovement over the period 1965–2004. Two scenarios and CIs as per Fig. 3.
Stevenson et al. PNAS | May 21, 2013 | vol. 110 | no. 21 | 8367
SUST
AINABILITY
SCIENCE
ECONOMIC
SCIENCE
SSP
ECIALFEATU
RE

As a framework for achieving this governance challenge, Rudelet al. (36) argue for more place-based agricultural policies inpreventing deforestation. In general, the principle is that policiesshould strengthen agriculture near major centers of population toencourage intensification rather than extensification of agricul-ture at a distance, in response to rising demand from income andpopulation growth. However, this vision will bump up against twomajor economic realities that will limit their political attractive-ness to policy makers. First, policies that concentrate on “re-warding” landholders in favorable areas may be accused of beingregressive and further marginalizing rural poor people. Second,with growing cities, the economic opportunity costs of farmlandnear cities increase as agricultural land is subject to competitionfrom nonagricultural uses, making the implementation of thesepolicies more expensive. To complement this place-based policyagenda, continued investment in agricultural productivity in thetraditional areas for crop production, away from the forest fron-tier, should remain an important part of the global efforts incontaining agricultural expansion. Nonetheless, we hope that thisarticle serves to put expectations for “land-saving” benefits fromthese efforts in their proper context.
Materials and MethodsWe use the GTAP-AEZ model, a modified version of the standard GTAPmodel that incorporates different types of land (Fig. S1). The GTAP-AEZmodel is a multicommodity, multiregional computable general equilibrium,comparative static model that exhaustively tracks bilateral trade flows between
all countries in the world and explicitly models the consumption and pro-duction for all commodities of each national economy (37). GTAP-AEZ hasrecently been validated with respect to its performance in predicting theprice impacts of exogenous supply side shocks, such as those that mightresult from sudden technological change (38). The model used in this articleincorporates different types of land. The foundations of these data are theglobal datasets for agricultural productivity (39) and forests (40). Lee et al.(41) used these data to develop a land-use and land-cover database thatoffers a consistent global characterization of land in crops, livestock, andforestry, taking into account biophysical growing conditions. We use themost recent version of this database, which defines 18 global AEZs andidentifies crop and forest extent and production for each region by AEZ forspecific crop and forest types in year 2004. The GTAP-AEZ framework usedfor this work introduces land competition directly into land supply (Fig. S2)via a two-tiered structure, such as that used by Keeney and Hertel (42). In theupper tier, crops compete with each other for land within a given AEZ. In thelower tier, crops as a whole compete with grazing and forestry for land withina given AEZ. In addition, different AEZs can be substituted in the productionof any single agricultural or forest product. As explained in SI Materials andMethods, the shocks summarized in Fig. 1 are annualized over the period1965–2004 and used to move the world economy from an initial equilibrium(characterized in the baseline year of 2004) to a counterfactual equilibriumabsent of crop germplasm improvement in developing countries.
ACKNOWLEDGMENTS. We thank Arild Angelsen, Thomas Tomich, KenCassman, Mark Rosegrant, and Bhavani Shankar for suggestions on earlierdrafts of this paper. We also thank two anonymous reviewers for extensivecomments that have improved the paper. This work was funded by theCGIAR Independent Science and Partnership Council.
1. World Bank (2010) World Development Report 2010: Development and ClimateChange (World Bank, Washington, DC).
2. Lambin EF, Meyfroidt P (2011) Global land use change, economic globalization, andthe looming land scarcity. Proc Natl Acad Sci USA 108(9):3465–3472.
3. Gibbs HK, et al. (2010) Tropical forests were the primary sources of new agriculturalland in the 1980s and 1990s. Proc Natl Acad Sci USA 107(38):16732–16737.
4. Green RE, Cornell SJ, Scharlemann JPW, Balmford A (2005) Farming and the fate ofwild nature. Science 307(5709):550–555.
5. Phalan B, Balmford A, Green RE, Scharlemann JPW (2011) Minimising the harm tobiodiversity of producing more food globally. Food Policy 36:S62–S71.
6. Burney JA, Davis SJ, Lobell DB (2010) Greenhouse gas mitigation by agricultural in-tensification. Proc Natl Acad Sci USA 107(26):12052–12057.
7. West PC, et al. (2010) Trading carbon for food: Global comparison of carbon stocks vs.crop yields on agricultural land. Proc Natl Acad Sci USA 107(46):19645–19648.
8. Borlaug N (2007) Feeding a hungry world. Science 318(5849):359.9. Angelsen A (2010) Policies for reduced deforestation and their impact on agricultural
production. Proc Natl Acad Sci USA 107(46):19639–19644.10. Angelsen A, Kaimowitz D, eds (2001) Agricultural Technologies and Tropical Deforestation
(CABI, Wallingford, UK).11. Renkow M, Byerlee D (2010) The impacts of the CGIAR: A review of recent evidence.
Food Policy 35:391–402.12. Renkow M (2011) Assessing the Environmental Impacts of the CGIAR Research: Toward
an Analytical Framework. Working Paper for the CGIAR Standing Panel on Impact As-sessment (CGIAR Independent Science and Partnership Council Secretariat, Rome).
13. Nelson M, Maredia M (2001) Environmental Impacts of the CGIAR: An Assessment.TAC Secretariat Report No. SDR/TAC:IAR/01/11. (CGIAR Secretariat, Washington, DC).
14. Evenson RE, Rosegrant M (2003) in Crop Variety Improvement and its Effect on Pro-ductivity, eds Evenson RE, Gollin D (CABI, Wallingford, UK), pp 473–497.
15. Evenson RE, Gollin D, eds (2003) Crop Variety Improvement and its Effect on Pro-ductivity (CABI, Wallingford, UK).
16. Armington P (1969) A theory of demand for products distinguished by place ofproduction. Int Monetary Fund Staff Papers XVI:159–178.
17. Evenson RE (2003) in Crop Variety Improvement and its Effect on Productivity, edsEvenson RE, Gollin D (CABI, Wallingford, UK), pp 447–471.
18. Lee H-L (2008) An emissions data base for integrated assessment of climate changepolicy using GTAP (Center for Global Trade Analysis). Available at: http://www.gtap.agecon.purdue.edu/resources/res_display.asp?RecordID=1143. Accessed September 1,2011.
19. Hertel TW, et al. (2010) Effects of US maize ethanol on global land use and green-house gas emissions: Estimating market-mediated responses. Bioscience 60:223–231.
20. Rose SK, Lee HL (2009) Economic Analysis of Land Use in Global Climate ChangePolicy, eds Hertel TW, Rose S, Tol R (Routledge, Abingdon, UK), pp 89–121.
21. Pardey PG, Alston JM, Christian JE, Fan S (1996) Hidden Harvest: U.S Benefits fromInternational Research Aid (International Food Policy Research Institute, Washington, DC).
22. Hertel TW, Rose S, Tol R (2009) Economic Analysis of Land-use in Global ClimateChange Policy, eds Hertel TW, Rose S, Tol R (Routledge, Abingdon, UK), pp 3–30.
23. Rosegrant MS, Meijer S, Cline S (2002) International Model for Policy Analysis ofAgricultural Commodities and Trade (IMPACT): Model Description (InternationalFood Policy Research Institute, Washington, DC).
24. Kuhn A (2003) From World Market to Trade Flow Modelling—The Re-designedWATSIM Model (Institute of Agricultural Policy, Market Research and EconomicSociology, University of Bonn, Bonn, Germany).
25. Sands RD, Leimbach M (2003) Modeling agriculture and land-use in an integratedassessment framework. Clim Change 56:185–210.
26. Adams DM, Alig RJ, Callaway JM, McCarl BA, Winnett SM (1996) The Forest andAgriculture Sector Optimization Model (FASOM): Model Structure and Policy Applications.Research Paper PNW-RP-495. (US Department of Agriculture Forest Service, Portland, OR).
27. US Environmental Protection Agency (2005) Greenhouse Gas Mitigation Potential inUS Forestry and Agriculture. Report No. EPA-R-05-006. (US Environmental ProtectionAgency, Washington, DC).
28. Gockowski J, Sonwa D (2011) Cocoa intensification scenarios and their predictedimpact on CO2 emissions, biodiversity conservation, and rural livelihoods in theGuinea rain forest of West Africa. Environ Manage 48(2):307–321.
29. Stevenson J, Byerlee D, Villoria N, Kelley T, Maredia M (2011) Agricultural technology,global land-use and deforestation: A review and new estimates of the impact of cropresearch. Measuring the Environmental Impacts of Agricultural Research: Theory andApplications to CGIAR Research (Independent Science and Partnership Council Sec-retariat of the CGIAR, Rome), Chap 3, pp 49–87.
30. Shively GE (2001) Agricultural change, rural labor markets, and forest clearing: anillustrative case from the Philippines. Land Econ 77:268–284.
31. Nepstad D, et al. (2009) Environment. The end of deforestation in the BrazilianAmazon. Science 326(5958):1350–1351.
32. Macedo MN, et al. (2012) Decoupling of deforestation and soy production in thesouthern Amazon during the late 2000s. Proc Natl Acad Sci USA 109(4):1341–1346.
33. Assunção J, Gandour CC, Rocha R (2012) Deforestation Slowdown in the LegalAmazon: Prices or Policies? Working Paper (Climate Policy Initiative, Rio de Janeiro).
34. Tomich TP, van Noordwijk M, Vosti S, Witcover J (1998) Agricultural developmentwith rainforest conservation: Methods for seeking best bet alternatives to slash-and-burn, with applications to Brazil and Indonesia. Agric Econ 19:159–174.
35. Deininger K, Byerlee D (2011) The Rise of Large Farms in Land Abundant Countries:Do They Have a Future? (World Bank, Washington, DC).
36. Rudel TK, Defries R, Asner GP, Laurance WF (2009) Changing drivers of deforestationand new opportunities for conservation. Conserv Biol 23(6):1396–1405.
37. Hertel TW, ed (1997) Global Trade Analysis: Models and Applications (CambridgeUniv Press, Cambridge, UK).
38. Valenzuela E, Hertel TW, Keeney R, Reimer JJ (2007) Assessing global computablegeneral equilibrium model validity using agricultural price volatility. Am J Agric Econ89:383–397.
39. Monfreda C, Ramankutty N, Hertel T (2009) Economic Analysis of Land-use in GlobalClimate Change Policy, eds Hertel TW, Rose S, Tol R (Routledge, Abingdon, UK), pp 33–49.
40. Sohngen B, Tennity C, Hnytka M, Meeusen K (2009) Economic Analysis of Land-use inGlobal Climate Change Policy, eds Hertel TW, Rose S, Tol R (Routledge, Abingdon,UK), pp 49–72.
41. Lee H, Hertel T, Sohngen B, Ramankutty N (2005) Towards an Integrated Land-UseDatabase for Assessing the Potential for Greenhouse GasMitigation. GTAP Technical Paper26. Available at: http://docs.lib.purdue.edu/gtaptp/26. Accessed September 1, 2011.
42. Keeney R, Hertel TW (2009) The indirect land-use impacts of United States biofuelpolicies: The importance of acreage, yield, and bilateral trade responses. Am JAgric Econ 91:895–909.
8368 | www.pnas.org/cgi/doi/10.1073/pnas.1208065110 Stevenson et al.