green, greener or brown: choosing the right color of the product
TRANSCRIPT

1 23
Annals of Operations Research ISSN 0254-5330 Ann Oper ResDOI 10.1007/s10479-014-1781-5
Green, greener or brown: choosing the rightcolor of the product
Arda Yenipazarli & Asoo J. Vakharia

1 23
Your article is protected by copyright and all
rights are held exclusively by Springer Science
+Business Media New York. This e-offprint is
for personal use only and shall not be self-
archived in electronic repositories. If you wish
to self-archive your article, please use the
accepted manuscript version for posting on
your own website. You may further deposit
the accepted manuscript version in any
repository, provided it is only made publicly
available 12 months after official publication
or later and provided acknowledgement is
given to the original source of publication
and a link is inserted to the published article
on Springer's website. The link must be
accompanied by the following text: "The final
publication is available at link.springer.com”.
Ann Oper ResDOI 10.1007/s10479-014-1781-5
Green, greener or brown: choosing the right colorof the product
Arda Yenipazarli · Asoo J. Vakharia
© Springer Science+Business Media New York 2015
Abstract There does not exist a one-size-fits-all green product strategy in green market,and formulating a strategy that aligns a company’s economic and environmental goals isno small feat. In this paper we provide insights into a firm’s green product strategy choicewith a focus on two alternative strategies: Greening-Up and Greening-Out. In doing so, weincorporate two important characteristics of the customer market where there are substantialnumbers of customers who are potentially receptive to a green appeal: (1) Customer marketis divided into three distinct and mutually exclusive segments based on large-scale surveysand interviews conducted to measure both customers’ willingness-to-pay for products withenvironmental attribute(s) and their propensity to buy these products; and (2) We factorin the findings of the most recent market behavior studies that even the customers thatdemonstrate the least environmental responsibility of all the segments can buy green productsfor non-environmental reasons. The contributions and findings of our work are as follows.First, we characterize the market- and product-related factors a firm should act on for asuccessful execution of green product strategies. Second, on the basis of customer choicedata available, we assess the strategic fit of distinct pricing options under each strategychoice with the objective(s) of a firm. Third, we explore the extent to which a green productstrategy creates higher environmental benefits while providing economic payoffs to a firm.In contrast to prevailing view, we show that greening up an existing brown product is notnecessarily better at reducing the environmental impact of a firm than designing a new greenproduct. We observe that responsiveness of the least environmentally conscious customersto environmental attributes added into a brown product sets one of the two major constraintson the environmental performance of Greening-Up strategy. We also observe that there does
A. YenipazarliDepartment of Logistics and Supply Chain Management, Georgia Southern University,Statesboro, GA 30460, USAe-mail: [email protected]
A. J. Vakharia (B)Department of Information Systems and Operations Management, University of Florida,Gainesville, FL 32611, USAe-mail: [email protected]
123
Author's personal copy
Ann Oper Res
not exist a strict dichotomy between having a better economic performance and achieving ahigher environmental performance, and a firm can achieve both goals simultaneously, evenif it means leaving out serving some of the customers targeted by the firm’s existing brownproduct.
Keywords Environmental sustainability · Product positioning · Portfolio design ·Market segmentation
1 Introduction
Not too long ago, green shoppers in the marketplace were only a minority with inadequatebuying power to draw attention to green products. At that time, green shopping was viewedas part of a fringe lifestyle and green products could not find their ways into the shoppinglists. Green products did not even appear in firms’ To-Do lists because environment was notthe focus of public attention, and most firms tended to follow the old phrase “If it ain’t broke,don’t fix it.” The widespread thinking was “this is a bad thing for our bottom line.” Productsthat claim to be “green” were mostly from tiny mom-and-pop firms and they had all gathereddust on the bottom shelves of the stores, if not forgotten at all in back rooms or basements,because they used to carry a negative baggage. They did not perform as well as their “brown”counterparts and were not a good value.
That is all water under the bridge. Today, there are substantial numbers of consumerswho are espousing environmental values and changing their shopping lists. The waves ofconsumer desires for green products have finally started to earn mainstream understandingto drive action. For instance, more than one-third of the U.S. consumers are purchasingnatural cleaning/personal care products, organically produced foods, compact-fluorescentlamps, and rechargeable batteries. Thanks in part to advances in technology and governmentmandates, a growing selection of today’s green products are alluring, highly accessible, anddesigned to deliver convenience, lower costs and perform better than their brown counterparts.For example, energy efficient, front-loading washers clean better and are gentler on clothescompared to conventional top-loading washers. This helps to broaden the appeal of greenproducts to a wider customer audience. Energy-efficient electronics and appliances, cold-water and ultra-concentrated detergents, and air- and water-filtration devices are now on thetop of consumers’ shopping lists. The U.S. green marketplace was reported to be almost $300billion in 2010, representing investments in organic foods, Energy Star appliances, hybridsand electric vehicles, green home furnishings and apparel, and renewable power.1
Interest in green shopping is not just here to stay; it is also growing rapidly. The NaturalMarketing Institute (NMI) predicted the green marketplace to reach $420 billion by 2010, and$845 billion by 2015. Even the ongoing economic woes have not deterred green sentiments inpurchasing behavior, nor consumers’ expectations that companies will develop high-qualitygreen products. Information Resources, Inc. found that consumers are actually maintainingor increasing their spending on green products in spite of the recently down economy.2 Forinstance, Seventh Generation’s sales grew by 20 % in 2007 and 50 % in 2008, while CloroxGreen Works became the best-selling cleaning brand during its market debut year 2008.3 This
1 http://blog.lohas.com/blog/jacquelyn-ottmans-blog, accessed on May 16, 2014.2 http://www.iriworldwide.com/NewsEvents/PressReleases/ItemID/749/View/Details.aspx, accessed onMay 16, 2014.3 http://www.supermarketbattles.com/images/articles-pdf/042009.pdf, accessed on December 6, 2010.
123
Author's personal copy
Ann Oper Res
has led to green products being increasingly available on the shelves, and increasing numbersof shoppers are now putting green products into their shopping carts. Apparently, this shift ingreen behavior has been gaining forefront attention of companies, since they have been rollingout more and more green products—to seize the inherent opportunities available in greenmarket. Toyota’s fuel-efficient Prius, Procter & Gamble’s Duracell rechargeable batteries,energy-saving Tide Coldwater laundry detergents and PUR water filtration products, Philips’Marathon CFL bulbs, and Whirlpool’s Duet front-loading washers and dryers are just someof the notable examples of this trend.
It used to be that consumers simply expected the products they would buy to perform well,be affordably priced, and be sold under familiar brand names. Apparently, that seemingly shortand simple checklist now includes a highly varied record of environmental considerations.This presents to companies looking to address the sustainability-related product concernsof customers the need to improve the environmental performance of their products andprocesses, and restructure their agenda on the basis of environmental considerations. Klenier(1991) brings into focus three important questions that any company’s green agenda shouldinclude: (1) What type of a green product should a company bring to the market, and whatmaterials should the firm include in it? (2) How should a company align his environmentalactions with environmental attitudes and behaviors of consumers? and (3) How can a companyaddress environmental issues in product design? Hopkins (2010) points out that a companyrecognized for his brown offerings can mould the perceptions of environmentally sensitivecustomers about his product(s) either by adding green features into the existing product or bycoming up with a radically different design that is unabashedly better for the environment.
These observations motivate the focus of this paper. In this paper we evaluate alternativegreen product strategies a firm can choose and implement for integrating environmentalbenefits into his product design. The specific research questions we address in this paper areas follows. First, in today’s green marketplace which is segmented by customers’ varyingdegrees of environmental concern and purchasing behavior, what are the key parametersthat drive a firm to choose a specific strategy? Essentially, we are interested in identifyingthe key drivers which motivate the firm to introduce either a product which is completelyenvironmentally friendly or a product which offers both traditional and environmentallyfriendly attributes. A second question relates to which strategy choice would be preferredfrom an environmental perspective and whether a profit-maximizing strategy choice mightalways be the one that results in greater environmental benefits. Finally, we also address theissue of market coverage in that whether a profit maximizing strategy choice does result inincomplete or complete market coverage.
The remainder of this paper is organized as follows. Section 2 reviews relevant literaturewith a focus on product design and variety in vertically differentiated consumer markets.Section 3 describes our modeling framework, followed by a structural characterization ofeach strategy choice in Sect. 4. In Sect. 5, we discuss the economic and environmentalconsequences of each strategy choice, and drivers for and obstacles to implementing eachstrategy. Section 6 contains concluding remarks and directions for future research.
2 Literature review
Our paper contributes to the growing literature on product-line design and sustainability. Themanagement of product design and development has been extensively studied in marketingand operations management. Product-line design typically involves decisions of what prod-uct(s) to offer, how to position them in a heterogeneous consumer market and what pricing
123
Author's personal copy
Ann Oper Res
regime to apply. In this context, effective product design and associated pricing decisions arecrucial to extract value from a heterogeneous population of customers. Product designs aredefined by multiple attributes that can be grouped into two main categories: vertical and hori-zontal differentiation. Vertical differentiation captures the product performance or quality asa well-established driver of consumers’ willingness-to-pay, whereas horizontal differentia-tion represents the feature choices of product design. Our paper is centered around prior workon vertical differentiation and the reader is referred to Lancaster (1990) for a comprehensivereview of earlier studies that deal with horizontally differentiated markets.
Mussa and Rosen (1978), O’Keeffe (1980) and Katz (1984) are the first among relatedresearch papers that restrict market behavior into vertical differentiation via product qualityand analyze price-quality decisions of a firm. In their seminal work, Mussa and Rosen (1978)derive a firm’s optimal price-quality schedule offered to a heterogeneous customer marketwith a continuous preference parameter along the quality dimension over a bounded range.Moorthy (1984) substantiates the benefits of serving multiple consumer segments throughproduct design and different pricing schedules when consumers have discrete types. In thispaper, the firm offers a menu of vertically differentiated products such that higher qualityproducts are priced higher. As an alternative approach, Dobson and Kalish (1988) proposea model that determines how a firm should position/reposition and price a line of substituteproducts. Kim and Chhajed (2000) analyze the effects of commonality on customers’ valu-ation of products when it is used to design products in different classes. Common featuresincrease similarity between products and influence customers’ choice of products, and theystudy the trade-off between cost-savings and revenue losses due to reduced product differen-tiation. Desai et al. (2001) use a model with two distinct customer segments and rule out suchdirect valuation changes and analyze alternative product design configurations with commoncomponents by introducing a model that investigates the trade-off between revenue lossesresulting from reduced product differentiation and cost savings induced through design effort.
By generalizing the models in Mussa and Rosen (1978) and Moorthy (1984), Kim andChhajed (2002) study a firm’s product design problem with multiple quality-type attributes ina customer market partitioned into two distinctive segments. They derive a measure of multi-dimensional customer preference and show that a single product offering is never optimal fortheir two-segment setting. Choudhary et al. (2005) study the effect of personalized pricingon a firm’s quality choices. Based on complete knowledge of customers’ willingness-to-pay, the firm charges different prices to different consumers based on their willingness-to-pay. Heese and Swaminathan (2006) focus on a firm that designs a product line with twoproducts, consisting of components that can be common for or unique to both products.The firm determines the component quality levels, and whether to use common or differentcomponents for the two products. For each component, the firm can reduce the cost ofproduction by exerting a certain amount of effort. Instead of beginning with the premise thatoffering a product line is optimal and then just tackling the question of pricing, Andersonand Dana (2009) attempt to answer the question of whether price discrimination is alwaysprofitable and characterize the necessary conditions. Wu (2010) studies a firm that designs asingle product with two quality dimensions, namely design quality and conformance quality,to serve consumers with diverse willingness-to-pay and maximize his profits. By integratingthese two quality dimensions, the interrelationships between design quality, conformancequality, price and market demand are analyzed.
Our paper also adds to the growing body of literature on green product design. In astudy closely related to this paper, Chen (2001) proposes a utility model where a product ischaracterized by two quality-type attributes, namely traditional and environmental attributes,and analyzes a firm’s strategic decisions and policy issues regarding the design of a product
123
Author's personal copy
Ann Oper Res
line. By jointly considering the interactions among the preferences of customers, productstrategies, and environmental standards imposed by governments, it is shown that greenproduct development and stricter environmental standards might not necessarily benefit theenvironment. Recently, using a model similar in most respects to Chen (2001), Krishnan andLecourbe (2010) focus on a firm that faces a trade-off between traditional and environmentalattributes of his product(s) as well as the differential willingness-to-pay of customer market forthese distinct quality dimensions. In this context, they study policies that promote sustainableinnovation, under which it is possible for the firm to both maximize his profits and improve theaggregate environmental quality of his product line. More recently, Yenipazarli and Vakharia(2015) provide strategic insights into expanding a brown product line with a new greenproduct. In their analysis, they explicitly incorporate a segmented consumer market whereindividual consumers may value the same product differently, the economies of scale and thelearning effects associated with new green products, and capacity constraints for the currentproduction system.
In the context of green product design, there are also papers of peripheral relevance inremanufacturing literature, since remanufactured products are associated with lower environ-mental impact. Some of the key papers in this stream of literature are those of Ferrer (1996),Debo et al. (2005), Atasu et al. (2008), Ferrer and Swaminathan (2010), and Subramanianand Subramanyam (2012). Rather than reviewing this strand of literature, we refer the readerto Souza (2013) who offers an excellent review of extant contributions in this field.
The key distinguishing features of our paper are as follows. First, customers are segmentedinto three distinct and mutually exclusive groups, characterized by their commitment to green,and involvement in green values and purchasing. The importance of this unique market struc-ture is that it makes targeted marketing of consumers with different environmental attitudespossible. This segmentation model is drawn directly upon the recent Green Gauge reportsprepared by the GfK Roper Consulting, which examines how U.S. adult consumers’ environ-mental knowledge affects their purchasing behaviors. In contrast to a simplistic segmentationapproach (with two segments) adopted by Chen (2001) and Krishnan and Lecourbe (2010),our approach is a better reflection of the current marketplace and can lead to a firm pricing hisproducts such that complete market coverage is not always optimal. Second, within each mar-ket segment, we explicitly consider differences in consumer valuations for both “brown” and“environmental” qualities built into the product offering. Coupled with the market segmentsincorporated in our paper, this allows us to more clearly specify differences in the willingness-to-pay for each consumer in each segment. In essence, our framework allows us to incorporatethe fact that traditional consumers value brown attributes more than environmental attributes;green consumers value environmental attributes more than brown attributes; all the while theconsumers in the middle of these two extremes value both attributes equally. Finally, withineach strategy choice, we allow for supply side differences in marginal production and fixedcosts. This enables strategy choices to be moderated not only by market prices and marketcoverage but also differences in strategy-specific costs for each product offering.
3 Model preliminaries
Our focus here is on a profit-maximizing firm that operates in a consumer market dividedinto three segments based on customers’ environmental attitudes and shopping behaviors.From a product perspective, consumers have higher expectations for the products they buyand environmental attributes emerge as a new dimension of product quality. Therefore, weposit that a product’s design attributes can be classified into two distinct aggregate dimen-
123
Author's personal copy
Ann Oper Res
sions: environmental and brown attributes—so that designing a product involves setting eachattribute level. An environmental attribute may represent a set of product characteristics thatare more environmentally sustainable such as recycled content, energy- and fuel-efficiency,and non-toxicity, while a brown attribute can be considered as a composite measure of safety,availability and style. Both brown and environmental attributes are characterized by qualitylevels built into the product, and hence consumers always prefer more of attributes than less.From now on, these brown and environmental qualities will be referred to as qb and qe,respectively, leading to the following specific assumption in our paper.
Assumption 1 A product is characterized by two quality levels qb and qe, with higher valuesrepresenting better quality.
3.1 Market structure
Customers increasingly incorporate green sentiments into their buying decisions. However,not every customer responds to green products in the same way. To zero in on these customersand so extract the most value out of their products, firms divide their customer market intodistinct segments based on customers’ shopping behavior and commitment to green. GfKRoper Public Affairs and Media consistently surveys customers to identify segments basedon their environmental attitudes. The results of their recent surveys—conducted in 2002,2007 and 2008—lead us to define three distinct market segments which are of relevance inexamining our product offering strategies:4
(a) Traditionals segment (T): This segment includes customers who are characterized by:(1) being “unconcerned about the environment”; (2) “not caring about the environmentalissues and being convinced that buying green products cannot make a difference inhelping to protect and improve the environment”; and (3) being “more likely to think thatthe environmental movement is a front for political interest groups.” The percentage ofconsumers in this group has steadily declined over time from 37 % in 2002 to 18 % in2007 to 12 % in 2008.
(b) Fence-Sitters segment (F): This segment includes customers characterized by: (1) show-ing “middling levels of concern about environmental problems” and the fact that “eventhough they are inclined to adjust their shopping behaviors, they are not utterly resoluteabout which side of the environmental fence they are on, and so capable of going eitherway”; (2) having “strong attitudes which have yet to turn to action except for easierbehaviors such as recycling”; and (3) having “a lesser concern for the environment thanthose of the entire population.” The percentage of consumers in this segment has beenfairly steady at 46 % in 2002, 41 % in 2007, and 42 % in 2008.
(c) Greens segment (G): This segment includes customers who are characterized by: (1) thosewho are “environmental activists”; (2) those who would always choose green productsif they had enough information; and (3) those that are not politically active at this timebut as committed to green buying as the activists. The percentage of consumers in thissegment has steadily increased over time from 15 % in 2002 to 40 % in 2007 to 46 % in2008.
Based on this segmentation scheme, we define rT , rF , and rG as the proportion ofconsumers in the Traditionals, Fence-Sitters, and Greens segments, respectively, with
4 The detailed results of the 2002 survey are available in Russo (2008); the detailed results of the 2007 surveyare available at http://ecomerge.blogspot.com/2008/06/gfk-ropers-green-gauge.html (accessed on May 16,2014); and the detailed results of the 2008 survey are available at http://www.reuters.com/article/2009/03/10/idUS146105+10-Mar-2009+PRN20090310 (accessed on May 16, 2014).
123
Author's personal copy
Ann Oper Res
rT + rF + rG = 1. A final key issue relating to market segments is that our approach toanalytically characterize the product design and pricing decisions under each strategy choiceis based on a two-period analysis. The two aspects which drive our choice of a two-periodanalysis are: (1) industry data indicate that proportion of customers in each market segmentchange over time; and (2) it is likely that overall market size would also vary over time. Inorder to incorporate both of these features, we define M1 and M2 as the total market size forperiod 1 and period 2, respectively. If rT is the proportion of customers in the Traditionalsmarket segment in period 1, then we assume that rT − δ (0 ≤ δ ≤ rT ) is the proportion ofcustomers in the same segment in period 2. Similarly, if rG is the proportion of customersin the Greens market segment in period 1, then this would translate into rG + δ in period 2,representing the proportion of customers in the same segment in period 2. It is important tonote that to be consistent with the changes in distinct market segment sizes observed in theGfK Roper surveys, the proportion of customers in the Fence-Sitters segment is assumed tobe unchanged over the two periods. Based on this discussion, the specific market structureassumption is as follows.
Assumption 2 rT , rF and rG represent the proportion of consumers in each market segment(0 ≤ rT , rF , rG ≤ 1 such that rT + rF + rG = 1) in period 1, with the total number ofconsumers in period 1 being M1. In period 2, the total number of consumers is M2, withrT − δ, rF and rG + δ representing the proportion of consumers in each market segment(δ ≥ 0 such that 0 ≤ rT − δ, rF , rG + δ ≤ 1).
3.2 Consumer characteristics
It is assumed that customers in each market segment are homogeneous in terms of theirwillingness-to-pay for a product offering. On the other hand, customers across different mar-ket segments differ on the ranking of product quality and in their willingness-to-pay. Basedon the literature on product differentiation, we use the notion of consumers’ willingness-to-pay to describe the utility derived by a consumer from a product purchase, and assume thatcustomers’ willingness-to-pay for a product is a linear function of its quality levels (see, forexample, Chen 2001 and Krishnan and Lecourbe 2010, among others).
Define vb (ve) as the marginal willingness-to-pay for brown (environmental) quality; pas the price of the product, and 1 − θ (θ ) as the responsiveness of Traditionals (Greens)to environmental (brown) attributes integrated into the product design, where θ ∈ (0, 1).Therefore, the net utility derived by a customer in market segment i (i = T, F, G) from thepurchase of a product (qb, qe) offered at price p is:
Ui =⎧⎨
⎩
vbqb + (1 − θ)veqe − p, if the customer is in Traditionals segment,vbqb + veqe − p, if the customer is in Fence-Sitters segment,θvbqb + veqe − p, if the customer is in Greens segment.
(1)
As is obvious, the parameter θ represents the orthogonal adjustments to the marginalvaluation of brown and environmental qualities for consumers in Traditionals and Greenssegments, respectively. The rationale for this adjustment stems from the following observa-tions. For customers in Greens market segment, the utility function is indicative of their focuson a product’s non-environmental attributes. It can be argued that there does not exist a trulygreen product as every product uses resources and creates waste. For instance, even thoughCFLs are energy-efficient, all compact fluorescents contain a tiny yet highly toxic amount ofmercury. Conventional alkaline batteries may contain no added mercury, but they are highlytoxic nevertheless, because of the other materials they contain. In other times, what may
123
Author's personal copy
Ann Oper Res
appear to be an environmental benefit may actually lead to non-green product attributes thatmay at least partially offset benefits/savings to the environment. Hybrid cars, for instance,are fuel-efficient and save energy but the electric batteries they contain represent a potentiallysignificant source of hazardous waste. In these circumstances, Greens segment customers,seeking out products that synchronize with their discerning environmental standards, favorthe product based on its green benefits, but may point out the shortcomings of the product’snon-environmental attributes and this can be expressed with a lower value of θ .
Conversely, for customers in Traditionals market segment, the adjustment in marginalvaluation towards environmental attributes is represented by (1−θ). Environmental benefits,such as energy-efficiency and water-efficiency, help cost-conscious Traditionals segmentcustomers save money on energy and water bills over the long term, and so can be a powerfulmotivator. For example, Energy Star rated washers use at least 50 % less energy and 30 %less water than do traditional washers, while Energy Star refrigerators use at least 15 % lessenergy than do standard models. Such green products as energy-efficient appliances thusappeal to Traditionals segment consumers’ self-interest while at the same time promotingenvironmental benefits—a dual feature which would be reflected in a lower θ value.
The enforced orthogonality in the value of θ across Traditionals and Greens segments isbased on the following rationale. Given that θ represents the focus of a consumer in Greenssegment on non-environmental attributes, the GfK Roper surveys note that these two marketsegments are fairly orthogonal in their thoughts (e.g., Traditionals are “unconcerned about theenvironment” while Greens are “environmental activists”). Therefore, it seems reasonable toassume that both segment valuations for the attribute not of primary importance would bevalued in an orthogonal manner.5
A final point is regarding the utility function of customers in the Fence-Sitters segment.Recall that these customers have environmental attitudes that can cut both ways and so theyare capable of going either way—in contrast to customers in the Traditionals and Greenssegments who are more fixed in their preferences. Given the Fence-Sitters’ ambivalent atti-tudes towards buying green products, and the fact that they “can be persuaded to buy greenif appealed appropriately” (see Ginsberg and Bloom 2004), the utility function of these cus-tomers proposes that shoppers positioned on the “fence” use both brown and environmentalattributes as part of their personal valuation of the product offering, and hence fully integratetwo distinct qualities into their actual buying decisions. Based on this discussion, our specificassumption on the consumer choice is as follows.
Assumption 3 Consumers within each market segment are homogeneous, whereas acrossmarket segments, they are heterogeneous in their willingness-to-pay for a product offering. Inline with prior research on vertical differentiation models, the net utility a consumer derivesfrom a product purchase is linearly increasing in the quality levels and decreasing in price.
3.3 Strategy alternatives
Given the market structure and customer choice characterization, in this paper we examinethree mutually exclusive single-product strategies:
5 It could be contended that if we assume symmetric adjustments in the consumer valuations (i.e., if we let θ
represent both Traditionals’ and Greens’ adjustment to the marginal valuations on environmental and brownquality levels, respectively), then our results would be completely different. In an earlier version of this paper,we carried out such an analysis and found that (as would be expected) the exact expressions for Greening-Outand Greening-Up strategies change especially when the firm chooses to price to cover Greens market segment.However, the qualitative insights into strategy choice do not change substantively, and hence we do not presentthe detailed results for a symmetric adjustment to consumer valuations in this paper.
123
Author's personal copy
Ann Oper Res
1. Greening-Off : This strategy is characterized by the firm offering a product defined by asingle “brown” attribute defined in terms of the quality qb1;
2. Greening-Out: Under this strategy, the firm offers a new product that incorporates onlyenvironmentally–friendly features, and so the product offering is defined in terms of asingle quality-type attribute environmental qe2; and
3. Greening-Up: Under this strategy, the firm redesigns his current “brown” product offeringto incorporate environmentally–friendly features so that the product offering is definedin terms of two quality-type attributes (qb3, qe3).
In essence, if we view these strategies on a continuum, we have the Greening-Off strategy atone end; the Greening-Out strategy at the other end; and the Greening-Up strategy somewherein the middle.
Before discussing the resulting market coverage for each strategy choice, we make anexplicit assumption on product pricing that a product is offered at the same price to allconsumers in the market. Hence, we do not consider price discrimination across marketsegments. Our assumption on a common price for each product is of course in line with thatof prior work on product design in a vertical differentiation and market coverage framework.However, more importantly it seems to reflect current practice where firms offering green(or partially green) products offer them at the same price to all consumers regardless of theconsumer orientation. This leads to the following specific assumption on product pricingassociated with each strategy choice.
Assumption 4 Under each strategy choice, the firm offers a single product at a commonprice to all consumers in the market.
Given this assumption, the firm has several options to determine the market segments to becovered and this is governed by his product pricing decision. That is, a specific product pricecould lead to either all consumers in a specific segment deriving a non-negative net utilityand so choosing to purchase the product; or all consumers in the same segment deriving anegative net utility so that none of them would purchase the product. Examining the utilityfunctions under each strategy alternative, the following pricing options are available to thefirm:
1. Greening-Off : Given that the firm offers a single “brown” product (qb1, p) under thisstrategy, the net utility of all customers in each market segment are:
UT = vbqb1 − p
UF = vbqb1 − p
UG = θvbqb1 − p (2)
Since θ ∈ (0, 1), the firm has two distinct pricing options:
i. Setting p = vbqb1, and hence covering market segments T and F completely; andii. Setting p = θvbqb1, and covering all market segments (i.e., T , F and G) completely.
2. Greening-Out: Given that the firm offers a single “green” product (qe2, p) under thisstrategy, the net utility of all customers in each market segment are:
UT = (1 − θ) veqe2 − p
UF = veqe2 − p
UG = veqe2 − p (3)
Since θ ∈ (0, 1), the two distinct pricing options are:
123
Author's personal copy
Ann Oper Res
i. Setting p = veqe2, and hence covering market segments F and G completely; andii. Setting p = (1 − θ) veqe2, and covering all market segments (i.e., T , F and G)
completely.
3. Greening-Up: Because the firm offers a single “greened-up” product (qb3, qe3, p) underthis strategy, the net utility of all customers in each market segment are:
UT = vbqb3 + (1 − θ) veqe3 − p
UF = vbqb3 + veqe3 − p
UG = θvbqb3 + veqe3 − p (4)
Given θ ∈ (0, 1), there are three distinct pricing options available under this strategychoice:
i. Setting p = vbqb3 + veqe3, and hence covering market segment F completely;ii. Setting p = θvbqb3 + veqe3, and completely covering all market segments (i.e.,
T , F and G) if vbqb3/ (vbqb3 + veqe3) ≥ θ , and only segments F and G ifvbqb3/ (vbqb3 + veqe3) < θ ; and
iii. Setting p = vbqb3 + (1 − θ) veqe3, and completely covering all market segments(i.e., T , F and G) if vbqb3/ (vbqb3 + veqe3) ≤ θ , and only segments T and F ifvbqb3/ (vbqb3 + veqe3) > θ .
Although it might be argued that only those pricing options which result in complete coverageof all segments should be the dominant choices, this is not always the case because the supplyparameters would also be relevant in making the optimal pricing decision. These supplyparameters for each strategy choice are described in the following section.
3.4 Supply parameters
On the supply side, the firm attempts to serve all the customers in targeted market segment(s)with either a single-attribute product (i.e., a brown product represented solely by brown qual-ity qb1 or a green product represented solely by environmental quality qe2) or a two-attributeproduct (i.e., a greened-up product composed of both qualities qb3 and qe3). Based on theargument put forward by Moorthy (1984), we also assume that unit production cost increasesat a faster rate than consumers’ willingness-to-pay, and the cost of supplying a product—regardless of whether it is a brown, green or greened-up product—increases quadraticallywith its quality level(s). More specifically, we assume that the unit cost of supplying a brownproduct (qb1) and a green product (qe2) is given by cbq2
b1 and ceq2e2, respectively, where
cb and ce are positive cost coefficients, and the unit cost of production for the greened-upproduct (qb3, qe3) is given by cu(qb3 + qe3)
2 with cu > 0. The cost coefficients cb, ce andcu reflect the differences in costs of producing a product across different quality types. Inaddition, although there could be learning effects from the supply side, we adopt a worst-casescenario and assume that per-unit variable production costs are time-invariant.
In addition to the per-unit variable production costs, the total cost of developing a greenproduct and a greened-up product comprises another strategy specific components. In imple-menting the Greening-Out strategy, the firm incurs up-front costs from introducing a newgreen product into the market for process R&D, market research and other relevant expenses.Drawing upon the literature on new product development (see, for example, Chen 2001), thepresumed sunk costs of developing and launching the green product is represented by a con-stant N > 0. Under the strategy of Greening-Up, the firm improves the environmental qualityof his existing brown product by designing bad materials out of the product or replacing its
123
Author's personal copy
Ann Oper Res
bad materials with better ones. Such R&D related efforts of the firm directly translate into afixed cost of product redesign (e.g., cost of developing renewable packaging material), whichis assumed to be convex and strictly increasing in the environmental quality qe3 designedinto the existing brown product, and given by Fq2
e3 with F > 0.6
4 Model analysis
In a two-period setting, the firm’s key decision is to specify the quality level(s) to be suppliedunder a strategy choice at time 0. Before structurally analyzing each strategy choice, we makeone additional assumption. Note that our market structure characterization in Sect. 3.1 allowsfor the proportional change in consumers between segments between two time periods. Ouranalysis is, however, restricted to the firm considering a single strategy choice over the twoperiods. The basis for this assumption is threefold. First, it allows us to identify dominantsingle-strategy choices when the firm has a priori information on evolving market structureswhich is the focus of our paper. This in turn enables us to explore the trade-offs betweenpartial versus complete market coverage in making the pricing decisions under each strategychoice. Second, it is in line with the focus of our work since it provides guidelines for firmsinterested in introducing a single product rather than a product combination to the market.Third, it provides a foundation for exploring issues related to introducing combinations ofproducts rather than a single product which in itself is an important first step in analyzing greenproduct introduction decisions. The explicit assumption stemming from these arguments isas follows.
Assumption 5 In the analysis that follows, we evaluate three mutually exclusive choices forthe firm: Greening-Off; Greening-Out; and Greening-Up.
To appropriately account for the realized firm-level profits under each strategy choice, wedefine e1 and e2 as the continuous discount factors for periods 1 and 2, respectively. Thecomplete notation for our paper is defined in Table 1.
4.1 Greening-Off strategy
Under this strategy, the firm offers a single brown product with quality level qb1 without anyconcern for environmental considerations. The firm’s potential shopper base is made up ofTraditionals, Fence-Sitters and Greens segments, and depending upon his pricing decision,the brown product can potentially be attractive to consumers in each segment. Recall thata brown product of quality qb1 delivers a value of vbqb1 to consumers in Traditionals andFence-Sitters segments, while Greens value the same product differently at θvbqb1 with0 < θ < 1. Therefore, there are two potential targeting strategies available to the firm:
i. The firm can target his existing brown product specifically at only Traditionals and Fence-Sitters consumers by setting a selling price equivalent to these two segments’ willingness-to-pay for a unit of traditional quality (i.e., p = vbqb1)—a move that enables the firm toextract all consumer surplus from Traditionals and Fence-Sitters segments. Nonetheless,asking Greens to accept a product without any environmental benefits at fairly high pricesis likely to keep these customers away from purchasing the product because the valuation
6 The quadratic structure of product redesign cost is an approximation of a general convex cost functionwidely observed in practice, and it has been commonly employed in the literature (see, for example, Lacourbeet al. 2009, among others).
123
Author's personal copy

Ann Oper Res
Table 1 Notation
Decision variables
qb Traditional (brown) quality of a product
qe Environmental (green) quality of a product
p Price of a product
Market structure
rT , rF , rG Proportion of consumers in Traditionals, Fence-Sitters and Greens segments
M1, M2 Total market size for periods 1 and 2
δ Decrease (increase) in proportion of consumers in Traditionals (Greens) segment
Consumer characteristics
vb Marginal willingness-to-pay on brown quality
ve Marginal willingness-to-pay on environmental quality
Θ Responsiveness of Greens to brown quality
Costs
cb, ce, cu Variable cost coefficients of brown, green and greened-up products
F Product redesign cost of a greened-up product
N Fixed costs of developing and introducing a green product
they place on the brown product would fall below its selling price (i.e., θvbqb1 < p).Hence, if this pricing option is adopted, the firm’s profit maximization problem gets thefollowing form:
maxqb1≥0
Π i1 = (e1 M1 (rT + rF ) + e2 M2 (rT + rF − δ))
(vbqb1 − cbq2
b1
)(5)
Clearly, this profit function is strictly concave in qb1, and by setting the first order condi-tion equal to 0, the optimal brown quality level and associated firm profits are obtainedas follows:
q∗b1 = vb
2cb(6)
Π i1∗ = ((rT + rF ) (e1 M1 + e2 M2) − e2 M2δ) v2
b
4cb(7)
ii. The firm can attempt to cover his entire customer base by jointly addressing customersin all market segments—a strategy that works only if the firm sets a selling price for hisbrown product low enough such that it matches the moderately low willingness-to-payof Greens segment customers for brown product attributes (i.e., p = θvbqb). This allowsthe firm to extract the entire consumer surplus from Greens segment, while creating apositive surplus for Traditionals and Fence-Sitters customers. In this setting, the firm’sprofit maximization problem is:
maxqb1≥0
Π i i1 = (e1 M1 + e2 M2)
(θvbqb1 − cbq2
b1
)(8)
It is apparent that this profit function is strictly concave in qb1, and by setting the firstorder condition equal to 0, the optimal brown quality level and corresponding firm profitsare derived as follows:
123
Author's personal copy
Ann Oper Res
q∗b1 = θvb
2cb(9)
Π i i1
∗ = (e1 M1 + e2 M2) θ2v2b
4cb(10)
Based on this analysis, it is possible to structurally characterize conditions under whichthe firm should choose between these two distinct pricing options and the proposition belowprovides this condition.
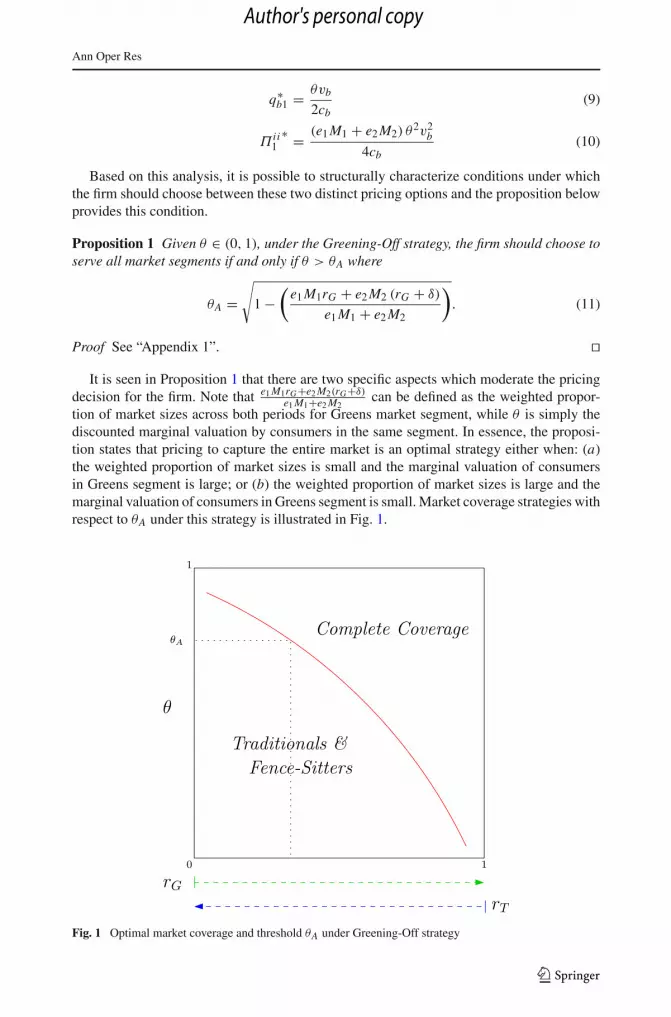
Proposition 1 Given θ ∈ (0, 1), under the Greening-Off strategy, the firm should choose toserve all market segments if and only if θ > θA where
θA =√
1 −(
e1 M1rG + e2 M2 (rG + δ)
e1 M1 + e2 M2
)
. (11)
Proof See “Appendix 1”. ��It is seen in Proposition 1 that there are two specific aspects which moderate the pricing
decision for the firm. Note that e1 M1rG+e2 M2(rG+δ)e1 M1+e2 M2
can be defined as the weighted propor-tion of market sizes across both periods for Greens market segment, while θ is simply thediscounted marginal valuation by consumers in the same segment. In essence, the proposi-tion states that pricing to capture the entire market is an optimal strategy either when: (a)the weighted proportion of market sizes is small and the marginal valuation of consumersin Greens segment is large; or (b) the weighted proportion of market sizes is large and themarginal valuation of consumers in Greens segment is small. Market coverage strategies withrespect to θA under this strategy is illustrated in Fig. 1.
θ
1
0 1
θA
Traditionals &Fence-Sitters
Complete Coverage
rG
rT
Fig. 1 Optimal market coverage and threshold θA under Greening-Off strategy
123
Author's personal copy

Ann Oper Res
4.2 Greening-Out strategy
Under this strategy, driven by the underlying fact that the burgeoning and highly desirableGreens segment shoppers have unmet needs and wants that are attributed to their environmen-tal concerns and that await a solution, the brown firm discontinues selling his brown productand embarks upon an entirely new or different product concept: a new green product builtfrom scratch with quality level qe2, representing minimal (if not zero) environmental impact.The primary end goal of this radical change is to get an environmentally preferable substi-tute for the traditional brown product into the hands of Greens and Fence-Sitters consumerswho place a high priority on environmental quality. Nevertheless, the firm can also improveconsumer appeal for his environmentally-sensitive product by positioning its environmentalfeatures into advantages that resonate with Traditionals segment consumer values. Whenvalue added benefits of an environmentally–friendly product (e.g., cost-savings) appeal toTraditionals segment consumers, they are more amenable to buying it. The two distinct pric-ing strategies that enable the firm to capture the full possible value of his new green offeringby strongly influencing consumer purchase decisions can be described as follows:
i. The firm can vary his green product’s price according to Greens and Fence-Sitters segmentcustomers’ latitude of price acceptance, which is a range of possible prices within whichprice changes have little or no impact on these customers’ purchase decisions, expressedby veqe2. By pricing in this manner, the firm may very well raise his profit marginsper product to (veqe2 − ceq2
e2) but suffer from a guaranteed decrease in its sales due toexclusion of Traditionals from the consumption activity. In this case, the firm’s profitmaximization problem would be
maxqe2≥0
Π i2 = (e1 M1 (rG + rF ) + e2 M2 (rG + rF + δ))
(veqe2 − ceq2
e2
) − N . (12)
This profit function is apparently strictly concave in qe2, and by setting the first ordercondition equal to 0, the optimal environmental quality level and associated firm profitsare obtained as follows:
q∗e2 = ve
2ce(13)
Π i2∗ = ((e1 M1 + e2 M2) (rG + rF ) + e2 M2δ) v2
e
4ce− N (14)
ii. In a continuing effort to increase the collective market share of his new green productthrough additionally capturing Traditionals segment customers, the firm can push thesales of his green product by adjusting its prices according to Traditionals’ willingness-to-pay for the environmental benefits it offers (i.e., p = (1 − θ) veqe2). Pricing basedon Traditionals’ valuation on green product not only entices these customers to purchasethe green product they otherwise would not have considered, but also creates a positivesurplus for Greens and Fence-Sitters who are willing to pay higher prices and so who willbenefit from lower prices. This increases the number of customers that could be servedunder the previous pricing option. Based on that, the firm’s profit maximization problemwould be
maxqe2≥0
Π i i2 = (e1 M1 + e2 M2)
((1 − θ) veqe2 − ceq2
e2
) − N . (15)
Clearly, this profit function is strictly concave in qe2, and on the basis of the first ordercondition, the optimal green quality level and corresponding firm profits are derived asfollows:
123
Author's personal copy
Ann Oper Res
q∗e2 = (1 − θ) ve
2ce(16)
Π i i2
∗ = (e1 M1 + e2 M2) (1 − θ)2 v2e
4ce− N (17)
Now we can compare these two distinct pricing options the firm can employ under theGreening-Out strategy to transform his new green product into a profitable offering, andidentify what factors are driving the firm’s choice of each.
Proposition 2 Given θ ∈ (0, 1), under the Greening-Out strategy, the firm would be betteroff serving all market segments if and only if θ < θB where
θB = 1 −√
1 −(
e1 M1rT + e2 M2 (rT − δ)
e1 M1 + e2 M2
)
. (18)
Proof See “Appendix 2”. ��Mirroring the findings presented in Proposition 1, Proposition 2 also shows that there
are two specific aspects which moderate the pricing decision of the firm. Note thate1 M1rT +e2 M2(rT −δ)
e1 M1+e2 M2can be defined as the weighted proportion of market sizes across both
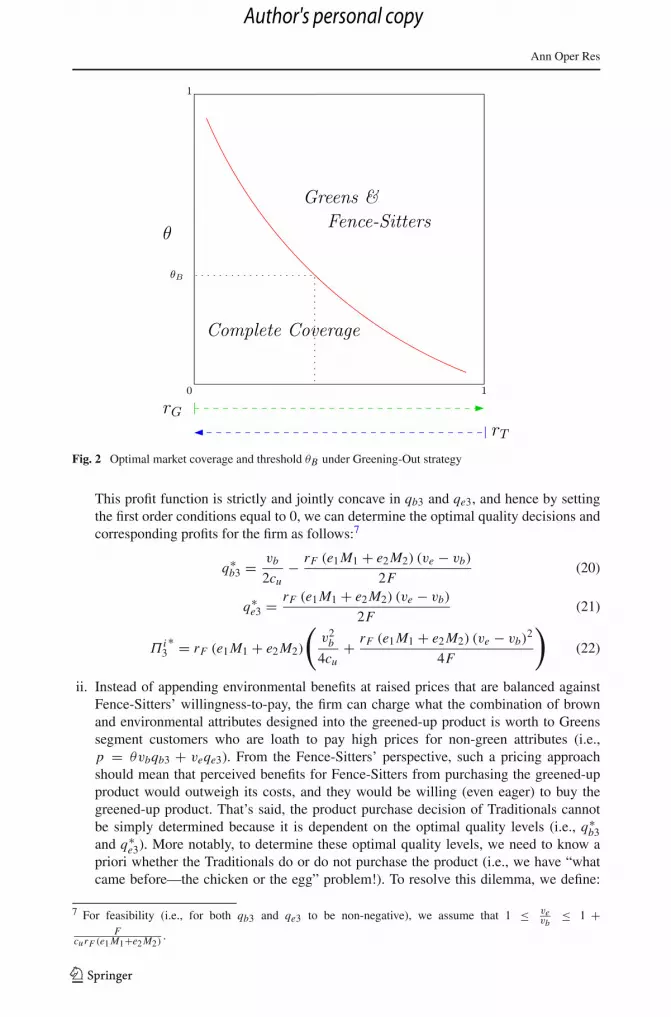
periods for Traditionals market segment, while θ is simply the discounted marginal valuationby consumers in the same segment. Hence, pricing to capture the entire market is an optimalstrategy either when: (a) the weighted proportion of market sizes is small and the marginalvaluation of consumers in Traditionals segment is large; or (b) the weighted proportion ofmarket sizes is large and the marginal valuation of consumers in Traditionals segment is small.Market coverage strategies with respect to θB under this strategy is illustrated in Fig. 2.
4.3 Greening-Up strategy
Under this strategy, the firm’s existing brown product is streamlined to reduce waste, cutenergy and water use, lower carbon-emissions, minimize use of materials, and so forth. Inother words, the firm now offers a product with both brown and environmental qualities,represented by (qb3, qe3). Note that the additional environmental benefit(s), properly con-nected with tastes and buying behavior of shoppers with differing environmental attitudes,help these customers to better appreciate the prevailing product. This in turn merits the firm’sasking for higher prices for additional environmental features to cover the added costs overhis existing brown product. In doing so, the firm can extract additional economic value byredesigning his existing brown product. Because overall customer market is comprised ofTraditionals, Fence-Sitters and Greens segments, the firm can choose among three differentpricing options to better leverage the heterogeneity in valuation of customers in differentsegments. These pricing options are as follows:
i. The firm can equate the price of his greened-up product (qb3, qe3) with Fence-Sitterssegment customers’ willingness-to-pay (i.e., p = vbqb3 + veqe3). However, offering thesame brown product with additional environmental benefits at such a price would leadto loss of customers served in Traditionals and Greens segments, since these customers’willingness-to-pay would be lower than the price. In fact, these customers would resistthe “overpriced” product. Therefore, under this pricing option, the profit maximizationproblem for the firm becomes
maxqb3;qe3≥0
Π i3 = rF (e1 M1 + e2 M2)
(vbqb3 + veqe3 − cu(qb3 + qe3)
2) − Fq2e3. (19)
123
Author's personal copy
Ann Oper Res
Greens &
1
0 1
rG
rT
θ
θB
Complete Coverage
Fence-Sitters
Fig. 2 Optimal market coverage and threshold θB under Greening-Out strategy
This profit function is strictly and jointly concave in qb3 and qe3, and hence by settingthe first order conditions equal to 0, we can determine the optimal quality decisions andcorresponding profits for the firm as follows:7
q∗b3 = vb
2cu− rF (e1 M1 + e2 M2) (ve − vb)
2F(20)
q∗e3 = rF (e1 M1 + e2 M2) (ve − vb)
2F(21)
Π i3∗ = rF (e1 M1 + e2 M2)
(v2
b
4cu+ rF (e1 M1 + e2 M2) (ve − vb)
2
4F
)
(22)
ii. Instead of appending environmental benefits at raised prices that are balanced againstFence-Sitters’ willingness-to-pay, the firm can charge what the combination of brownand environmental attributes designed into the greened-up product is worth to Greenssegment customers who are loath to pay high prices for non-green attributes (i.e.,p = θvbqb3 + veqe3). From the Fence-Sitters’ perspective, such a pricing approachshould mean that perceived benefits for Fence-Sitters from purchasing the greened-upproduct would outweigh its costs, and they would be willing (even eager) to buy thegreened-up product. That’s said, the product purchase decision of Traditionals cannotbe simply determined because it is dependent on the optimal quality levels (i.e., q∗
b3and q∗
e3). More notably, to determine these optimal quality levels, we need to know apriori whether the Traditionals do or do not purchase the product (i.e., we have “whatcame before—the chicken or the egg” problem!). To resolve this dilemma, we define:
7 For feasibility (i.e., for both qb3 and qe3 to be non-negative), we assume that 1 ≤ vevb
≤ 1 +F
curF (e1 M1+e2 M2).
123
Author's personal copy
Ann Oper Res
(a) x1 = e1 M1 + e2 M2, if Traditional segment customers buy the product; and (b)x2 = (rG + rF ) (e1 M1 + e2 M2) + e2 M2δ, if they choose not to do so. Thus, the profitmaximization problem for the firm under this pricing option becomes
maxqb3;qe3≥0
Π i i3 = x
(θvbqb3 + veqe3 − cu(qb3 + qe3)
2) − Fq2e3, (23)
where x can be set equal to either x1 or x2 as defined earlier. Regardless of the value ofx , this profit function is strictly and jointly concave in qb3 and qe3, and so the optimalquality levels and corresponding profits for the firm can be determined by means of thefirst order conditions as follows:8
q∗b3 = θvb
2cu− x (ve − θvb)
2F(24)
q∗e3 = x (ve − θvb)
2F(25)
Π i i3
∗ = x
(θ2v2
b
4cu+ x(ve − θvb)
2
4F
)
(26)
Examining the solution to this problem, the optimal market coverage for this pricing optionunder Greening-Up strategy is given in the following proposition.
Proposition 3 Given θ ∈ (0, 1) and cu > 0, when greened-up product is priced based onTraditionals segment customers’ willingness-to-pay, the optimal market coverage is:
a. If 1 ≤ veθvb
≤ 1 + Fcu x1
, then all market segments are covered; and
b. If 1 + Fcu x1
< veθvb
≤ 1 + Fcu x2
, then only Fence-Sitters and Greens market segments arecovered,
where x1 = e1 M1 + e2 M2 and x2 = (rG + rF ) (e1 M1 + e2 M2) + e2 M2δ.
Proof See “Appendix 3”. ��
iii. In contrast to basing the price on Greens’ willingness-to-pay, the price tag of the firm’sgreened-up product can reflect Traditionals segment customers’ valuation for the brownand environmental benefits the “refreshed” brown product offers (i.e., p = vbqb3 +(1 − θ) veqe3). In this setting, it is the coverage of Greens segment which is uncertainand based on a reasoning similar to that detailed in the preceding case, the firm’s profitmaximization problem is
maxqb3;qe3≥0
Π i i i3 = y
(vbqb3 + (1 − θ) veqe3 − cu(qb3 + qe3)
2) − Fq2e3, (27)
where y is set equal to either x1 (as defined earlier) or x3 = (rT + rF )(e1 M1 + e2 M2) −e2 M2δ. It is relatively easy to show that this profit function is strictly and jointly concavein qb3 and qe3, and so the optimal quality decisions and corresponding profits for the firmcan be derived by setting the first order conditions equal to 0 as follows:9
8 For feasibility (i.e., for both qb3 and qe3 to be non-negative), we assume that 1 ≤ veθvb
≤ 1 + Fcu x2
.9 For feasibility (i.e., for both qb3 and qe3 to be non-negative), we assume that 1 ≤ (1−θ)ve
vb≤ 1 + F
cu x3.
123
Author's personal copy
Ann Oper Res
q∗b3 = vb
2cu− y ((1 − θ) ve − vb)
2F(28)
q∗e3 = y ((1 − θ) ve − vb)
2F(29)
Π iii3
∗ = y
(v2
b
4cu+ y((1 − θ) ve − vb)
2
4F
)
(30)
Examining the solution to this problem, the optimal market coverage for this pricing optionunder Greening-Up strategy is given in the following proposition.
Proposition 4 Given θ ∈ (0, 1) and cu > 0, when greened-up product is priced based onGreens segment customers’ willingness-to-pay, the optimal market coverage is:
a. If 1 ≤ (1−θ)vevb
≤ 1 + Fcu x1
, then all market segments are covered; and
b. If 1 + Fcu x1
<(1−θ)ve
vb≤ 1 + F
cu x3, then only Traditionals and Fence-Sitters market
segments are covered,
where x1 = e1 M1 + e2 M2 and x3 = (rT + rF )(e1 M1 + e2 M2) − e2 M2δ.
Proof See “Appendix 4”. ��Based on the arguments and findings provided above, the following proposition outlines
the optimal pricing decisions of the firm under Greening-Up strategy.
Proposition 5 Given θ ∈ (0, 1) and cu > 0, the firm’s optimal pricing decision underGreening-Up strategy choice is as follows:
a. When θ ≤ ve/vb < 1, it is optimal to set p = θvbqb3 + veqe3 (i.e., case ii);b. When 1 ≤ ve/vb < 1/ (1 − θ), it is optimal to set p = vbqb3 + veqe3 (i.e., case i)
if cu (e1 M1 + e2 M2)((ve − θvb)
2 − r2F (ve − vb)
2) − Fv2b
(rF − θ2
)< 0, and p =
θvbqb3 + veqe3 (i.e., case ii), otherwise; andc. When ve/vb ≥ 1/ (1 − θ), it is optimal to set p = θvbqb3 + veqe3 (i.e., case ii) if
cu (e1 M1 + e2 M2)((ve − θvb)
2 − ((1 − θ) ve − vb)2) − Fv2
b
(1 − θ2
)> 0, and p =
vbqb3 + (1 − θ) veqe3 (i.e., case iii), otherwise.
Proof See “Appendix 5”. ��The insights stemming from these results are that in all cases pricing to capture Greens
segment customers is always a choice. It is only in certain extreme situations that either oneof the other two pricing options emerges as a dominant choice. Note also that the feasibilityof each pricing option under Greening-Up strategy depends upon the relative values of ve/vb
and θ . For example, when ve/vb is greater than or equal to θ but strictly less than 1, theonly feasible option (and so the optimal pricing strategy) is to set the price of the greened-upproduct equal to Greens segment customers’ willingness-to-pay. On the other hand, whenve/vb ≥ 1/(1 − θ), the firm has to make a choice between pricing on the basis of Greensand Traditionals customers’ product valuation. In this case, additional product- and market-related factors (i.e., cu , F , e1 M1 and e2 M2) enter into the equation to determine the optimalpricing regime under Greening-Up strategy.
Our focus now shifts to evaluating and comparing three strategy choices with differentpricing options.
123
Author's personal copy
Ann Oper Res
5 Strategy comparisons and insights
In this section, we focus on economic and environmental issues germane to greener products,and examine how the characteristics of green market environment (i.e., relative sizes of greenconsumer segments and consumers’ product valuations) create incentives for a firm to adopt aspecific green product strategy. In doing so, we encounter a major hurdle in that an analyticalcomparison of strategies seems to be very difficult due to multiple strategy- and product-specific parameters, and alternative pricing options under each strategy choice. That is said,it is important to note that existent consumer choice data provide valuable insights into thevalues of relevant market parameters used in our analysis.
To start with, we set the relative size of each market segment in period 1 equal to therespective ratios specified in 2008 GfK Roper market survey: rT = 0.12, rF = 0.42 andrG = 0.46. For period 2, the reduction δ (increase) in proportion of customers in Traditionalssegment (Greens segment) is set equal to 0.04. This value is derived by averaging out thedecline in that proportion from 2002 to 2008 as indicated by the GfK Roper surveys. Wenormalize the discounted market size in the first period to 1 (i.e., e1 M1 = 1). For the secondperiod, we set e2 M2 = 1.07 to capture the findings of 2008 GfK Roper survey reports thatthere is a 7 % increase in the number of customers who think more about “green” from 2007to 2008.
On the supply side, from a product-attribute perspective, previous literature on productdesign and green product development (see, for example, Chen 2001 and Liu et al. 2012,among others) attribute: (a) the lowest coefficient of unit production cost to products withonly brown attributes; (b) the highest coefficient of unit production cost to products with onlyenvironmental attributes; and (c) the moderate coefficient of unit production cost to productsdefined by a combination of both brown and environmental attributes. We draw upon thesestudies and set the per product unit cost coefficients cb, ce and cu at $1.0, $2.0 and $1.5,respectively.
On the basis of these market and supply parameters, we start by considering two extremecases by considering θ = 0 and θ = 1. When θ equals 0, it means that Greens segmentcustomers do not derive any additional value from the non-environmental attributes of aproduct. On the other hand, because 1 − θ gets equal to 1 when θ = 0, it also impliesthat environmental attributes of the product completely resonate with Traditionals segmentcustomer values. In other words, the environmental attributes of the product offer “non-green”consumer value (or mainstream appeal) such as cost savings, convenience and health. As acase in point, the appeal of CFL bulbs can be attributed to their energy savings and longlife-qualities that make them convenient and economical over time. As shown by marketevidence, when these customers are convinced of such desirable “non-green” benefits ofenvironmental products, they are more inclined to adopt them. When θ = 0, Traditionalssegment customers no longer recognize the environmental product as green because they buyit for non-green reasons.
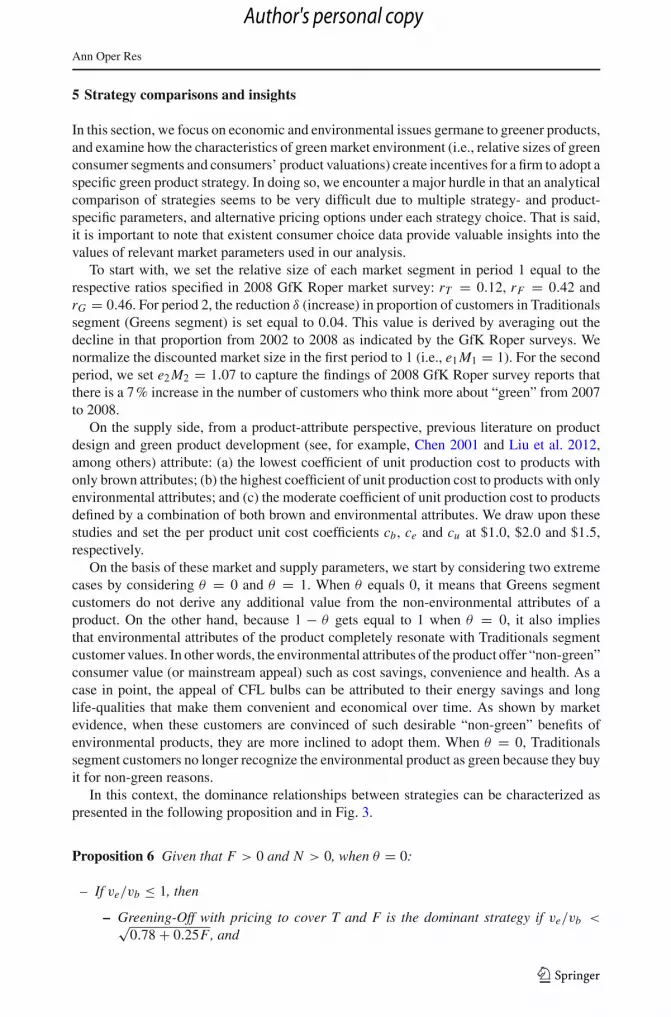
In this context, the dominance relationships between strategies can be characterized aspresented in the following proposition and in Fig. 3.
Proposition 6 Given that F > 0 and N > 0, when θ = 0:
– If ve/vb ≤ 1, then
– Greening-Off with pricing to cover T and F is the dominant strategy if ve/vb <√0.78 + 0.25F, and
123
Author's personal copy
Ann Oper Res
Fig. 3 Strategy choices and market coverage when θ = 0
– Greening-Up with pricing to cover either market segments F and G or all marketsegments is the dominant strategy if ve/vb ≥ √
0.78 + 0.25F;
– If ve/vb > 1 and N is prohibitively high, then
– Greening-Off with pricing to cover market segments T and F is the dominant strategyif ve/vb ≤ √
0.75 + 0.24F, and– Greening-Up with pricing to cover either market segments F and G or all market
segments is the dominant strategy if ve/vb >√
0.75 + 0.24F.
Proof See “Appendix 6”. ��When θ equals 1, because 1 − θ gets equal to 0, environmental benefits of a product
appeal to only Greens and Fence-Sitters customers. These attributes do not fulfill the needsand interests of Traditionals segment customers beyond what is good for the environment.Traditionals segment customers are outside the green niche and they are not attracted intopurchasing the greener product unless the product does offer such a desirable benefit as costeffectiveness, health and safety. Take inkjet cartridges, for example. They can be made withpost-consumer plastics by using a process that combines various kinds of recycled plastics,from used inkjet cartridges to common water bottles, with a variety of chemical additives.This can save the energy needed to ship and produce new materials, preventing in turn theair pollution associated with the generation of new energy. Even though its recycled contentmakes the product better for the environment and so makes it appealing to Greens segmentcustomers, this product is quite unlikely to appeal to Traditionals segment customers’ self-interest or needs. In such cases, θ = 1 indicates that Traditionals are indifferent to the valueoffered by the environmental benefits of a greener product and so they do not derive additionalvalue from it, whereas Greens completely approve the non-environmental attributes of theproduct.
In this context, the dominance relationships between strategies can be characterized aspresented in the following proposition and in Fig. 4.
123
Author's personal copy

Ann Oper Res
1 + 0.49√
F
10 ve/vb
Greening-Off
FT & F & G
Greening-Off Greening-Up
T & F
Fig. 4 Strategy choices and market coverage when θ = 1
Proposition 7 Given that F > 0 and N > 0, when θ = 1:
– If ve/vb ≤ 1, then
– Greening-Off with pricing to cover all market segments is always the dominant strat-egy;
– If ve/vb > 1 and N is prohibitively high, then
– Greening-Off with pricing to cover market segments T and F is the dominant strategyif ve/vb ≤ 1 + 0.49
√F, and
– Greening-Up with pricing to cover market segment F is the dominant strategy ifve/vb > 1 + 0.49
√F.
Proof See “Appendix 7”. ��We now turn our attention to the more general case where θ ∈ (0, 1). Based on the
settings for market-side and supply-side parameters, we show the optimal quality level(s)and firm-level profits for each market coverage option (as determined by the chosen pricingregime) under each strategy choice in Table 2. Notice that the strategy choice of a firm thatwould maximize his profits is determined by the relative values of parameters ve and vb,and the value of parameter θ , along with the strategy specific cost parameters F and N .Recall from Sect. 3.2 that depending on certain product-related and market-related factors,Greens customers’ sensitivity to non-environmental attributes of a product θ can take anyvalue between 0 and 1.
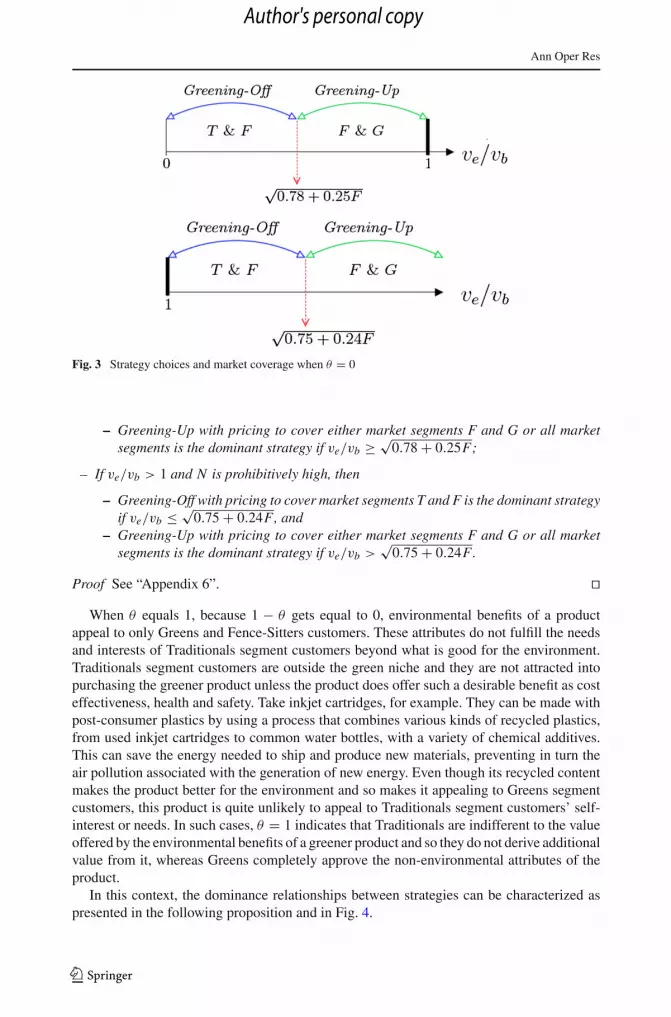
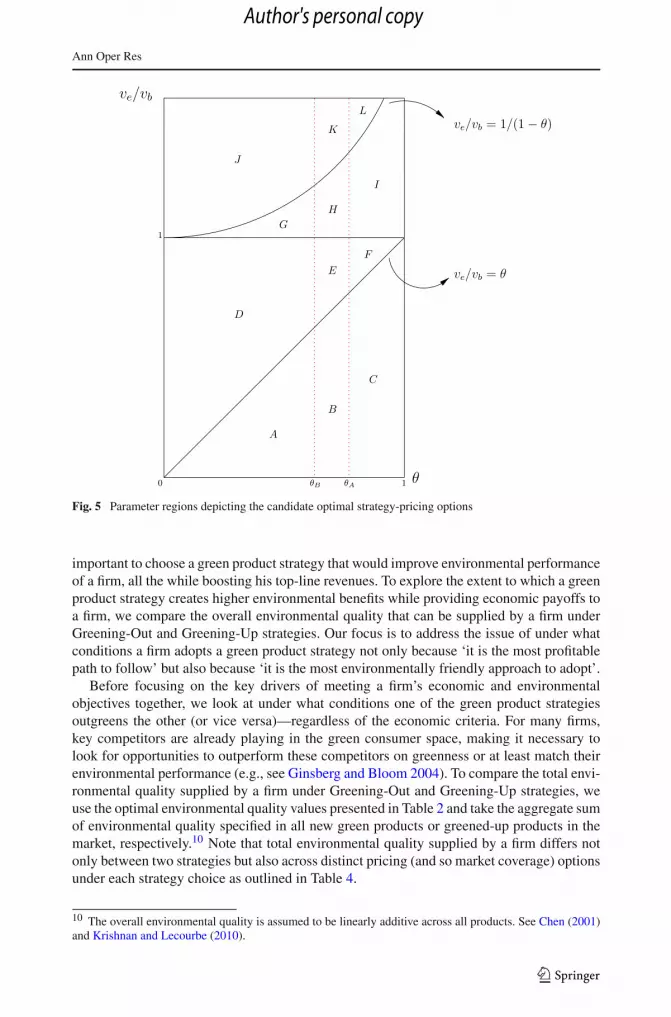
When we merge the feasibility and optimality conditions of distinct pricing regimes underGreening-Up strategy (presented in Proposition 5) with those of Greening-Off and Greening-Out strategies (presented in Propositions 1 and 2, respectively), we are able to obtain Fig. 5with thresholds θA and θB (defined in Propositions 1 and 2, respectively). Note that eachdesignated region in Fig. 5 defines a set of candidate optimal strategies based on the relativevalues of ve/vb and θ , and the value of θ relative to thresholds θA and θB . For example, regionD points to the set of strategy-pricing options when ve/vb ∈ [θ, 1] and θ ∈ [0, θB ]. In eachof these regions, the optimal strategy choice and subsequent pricing regime of the firm aredependent upon the cost parameters F and N , specific to Greening-Up and Greening-Outstrategies, respectively. The candidate dominant strategies in each region depicted in Fig. 5,along with customer segments to be covered by each strategy, are provided in detail in Table 3.
The economic implications of green product strategies reflect that a firm can derive eco-nomic benefits from “design for environment” under different market conditions. However,green product strategy choice of a firm cannot be determined by economic criteria alone.Creating bottom-line benefits can be only one part of choosing a green product strategybecause firms are under ever-increasing pressure from governments (in addition to customermarket and supply chain partners) to reduce their environmental impact. In other words, it is
123
Author's personal copy

Ann Oper Res
Tabl
e2
Opt
imal
qual
ityle
vels
and
profi
tsfo
rst
rate
gych
oice
s
Stra
tegy
Mar
kets
egm
ents
Qua
lity
leve
lsPr
ofit
Bro
wn
Env
iron
men
tal
Gre
enin
g-O
ff(i
)T,
F(0
.50)
vb
NA
(0.2
7)v
2 b
Gre
enin
g-O
ff(i
i)T,
F,G
(0.5
0)θv
bN
A(0
.52)
θ2v
2 b
Gre
enin
g-O
ut(i
)F,
GN
A(0
.25)
ve
(0.2
3)v
2 e−
N
Gre
enin
g-O
ut(i
i)T,
F,G
NA
(0.2
5)(1
−θ)v
e(0
.26)
(1−
θ)2
v2 e
−N
Gre
enin
g-U
p(i
)F
(0.3
3)v
b−
(0.4
3)(v
e−
vb)/
F(0
.43)
(ve
−v
b)/
F(0
.14)
v2 b
+(0
.19)
(ve
−v
b)2
/F
Gre
enin
g-U
p(i
i)T,
F,G
(0.3
3)θv
b−
(1.0
4)(v
e−
θv
b)/
F(1
.04)
(ve
−θv
b)/
F(0
.35)
θ2v
2 b+
(1.0
7)(v
e−
θv
b)2
/F
Gre
enin
g-U
p(i
ii)T,
F,G
(0.3
3)v
b−
(1.0
4)((
1−
θ)v
e−
vb)/
F(1
.04)
((1
−θ)v
e−
vb)/
F(0
.35)
v2 b
+(1
.07)
((1
−θ)θv
e−
vb)2
/F
For
Gre
enin
g-U
pst
rate
gych
oice
,the
last
two
pric
ing
optio
nsal
way
sle
adto
com
plet
em
arke
tcov
erag
e(s
eePr
opos
ition
s3
and
4)
123
Author's personal copy
Ann Oper Res
1
ve/vb
1
0
ve/vb = θ
θ
ve/vb = 1/(1 − θ)
A
D
C
θB θA
J
F
I
K
H
B
E
G
L
Fig. 5 Parameter regions depicting the candidate optimal strategy-pricing options
important to choose a green product strategy that would improve environmental performanceof a firm, all the while boosting his top-line revenues. To explore the extent to which a greenproduct strategy creates higher environmental benefits while providing economic payoffs toa firm, we compare the overall environmental quality that can be supplied by a firm underGreening-Out and Greening-Up strategies. Our focus is to address the issue of under whatconditions a firm adopts a green product strategy not only because ‘it is the most profitablepath to follow’ but also because ‘it is the most environmentally friendly approach to adopt’.
Before focusing on the key drivers of meeting a firm’s economic and environmentalobjectives together, we look at under what conditions one of the green product strategiesoutgreens the other (or vice versa)—regardless of the economic criteria. For many firms,key competitors are already playing in the green consumer space, making it necessary tolook for opportunities to outperform these competitors on greenness or at least match theirenvironmental performance (e.g., see Ginsberg and Bloom 2004). To compare the total envi-ronmental quality supplied by a firm under Greening-Out and Greening-Up strategies, weuse the optimal environmental quality values presented in Table 2 and take the aggregate sumof environmental quality specified in all new green products or greened-up products in themarket, respectively.10 Note that total environmental quality supplied by a firm differs notonly between two strategies but also across distinct pricing (and so market coverage) optionsunder each strategy choice as outlined in Table 4.
10 The overall environmental quality is assumed to be linearly additive across all products. See Chen (2001)and Krishnan and Lecourbe (2010).
123
Author's personal copy
Ann Oper Res
Table 3 Regions, candidate optimal strategy choices and market coverage
Region Range for θ Range for ve/vb Strategies Market segments
A (0, θB ] (0, θ ] Greening-Off (i) T, F
B [θB , θA] (0, θ ] Greening-Off (i) T, F
C [θA, 1) (0, θ ] Greening-Off (i i) T, F, G
D (0, θB ] [θ, 1] Greening-Off (i) T, F
Greening-Up (i i) T, F, G
E [θB , θA] [θ, 1] Greening-Off (i) T, F
Greening-Up (i i) T, F, G
F [θA, 1) [θ, 1] Greening-Off (i i) T, F, G
Greening-Up (i i) T, F, G
G (0, θB ][1, 1
(1−θ)
]Greening-Off (i) T, F
Greening-Up (i) F
Greening-Up (i i) T, F, G
H [θB , θA][1, 1
(1−θ)
]Greening-Off (i) T, F
Greening-Out (i) F, G
Greening-Up (i) F
Greening-Up (i i) T, F, G
I [θA, 1)[1, 1
(1−θ)
]Greening-Off (i i) T, F, G
Greening-Out (i) F, G
Greening-Up (i i) T, F, G
J (0, θB ] [1/(1 − θ),−) Greening-Off (i) T, F
Greening-Up (i i) T, F, G
K [θB , θA] [1/(1 − θ),−) Greening-Off (i) T, F
Greening-Out (i) F, G
Greening-Up (i i) T, F, G
Greening-Up (i i i) T, F, G
L [θA, 1) [1/(1 − θ),−) Greening-Off (i i) T, F, G
Greening-Out (i) F, G
Greening-Up (i i) T, F, G
Greening-Up (i i i) T, F, G
θB = 0.05 and θA = 0.72 based on available consumer choice data and expressions provided in Propositions 1and 2
Table 4 Total environmental quality under Greening-Out and Greening-Up strategies
Strategy Market coverage Total environmentalquality (TEQ)
Greening-Out F, G (0.47)ve
T, F, G (0.52) (1 − θ) ve
Greening-Up F (0.37) (ve − vb) /F
T, F, G (2.15) (ve − θvb) /F
T, F, G (2.15) ((1 − θ)ve − vb) /F
123
Author's personal copy
Ann Oper Res
Greening-Out
0 1 θ
ve/vbθ = 0.10
ve/vb = θ
1
ve/vb = 4.57θ4.57−F
ve/vb = 4.13θ4.13−F (1−θ)
Greening-Up
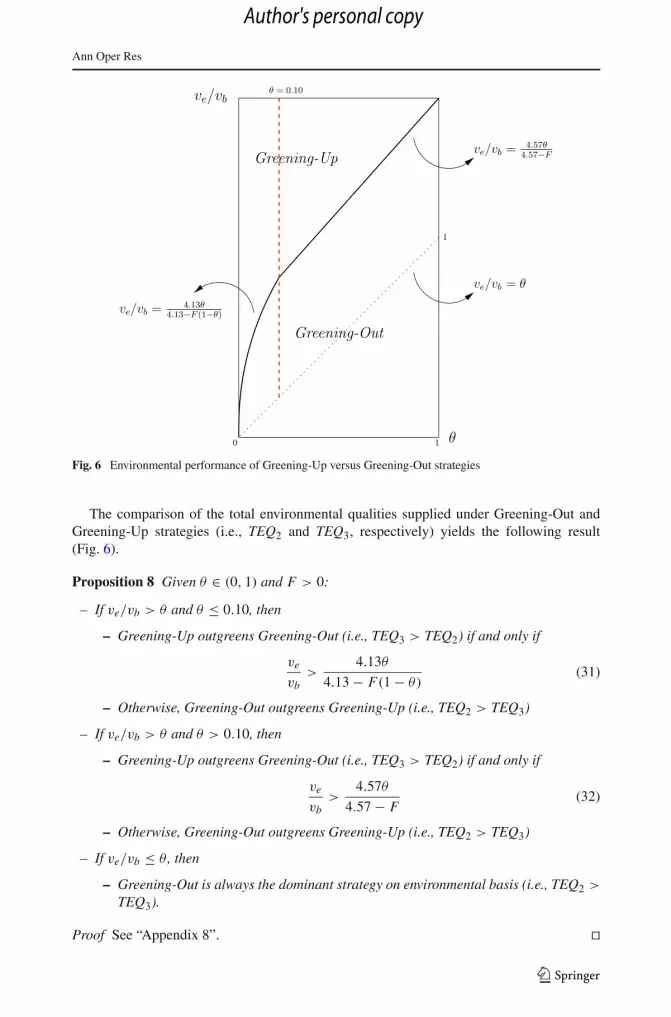
Fig. 6 Environmental performance of Greening-Up versus Greening-Out strategies
The comparison of the total environmental qualities supplied under Greening-Out andGreening-Up strategies (i.e., TEQ2 and TEQ3, respectively) yields the following result(Fig. 6).
Proposition 8 Given θ ∈ (0, 1) and F > 0:
– If ve/vb > θ and θ ≤ 0.10, then
– Greening-Up outgreens Greening-Out (i.e., TEQ3 > TEQ2) if and only if
ve
vb>
4.13θ
4.13 − F(1 − θ)(31)
– Otherwise, Greening-Out outgreens Greening-Up (i.e., TEQ2 > TEQ3)
– If ve/vb > θ and θ > 0.10, then
– Greening-Up outgreens Greening-Out (i.e., TEQ3 > TEQ2) if and only if
ve
vb>
4.57θ
4.57 − F(32)
– Otherwise, Greening-Out outgreens Greening-Up (i.e., TEQ2 > TEQ3)
– If ve/vb ≤ θ , then
– Greening-Out is always the dominant strategy on environmental basis (i.e., TEQ2 >
TEQ3).
Proof See “Appendix 8”. ��
123
Author's personal copy
Ann Oper Res
The prevailing view on the link between design for environment and environmental impactstates that even though developing a green product from scratch enables firms to address envi-ronmental concerns in detail in their products/operations, it is the incremental changes madeon an existing non-green product that would significantly improve the environmental perfor-mance of firms (see Hopkins 2010, for example). On the other hand, Proposition 8 showsthat this view is not necessarily true and greening up an existing brown product can be betterat reducing the overall environmental impact than designing a new green product if certainproduct- and market-related conditions hold. In essence, we observe two major constraintson the environmental performance of Greening-Up strategy: (i) product redesign cost F ; and(ii) responsiveness of Traditionals segment customers to the environmental attributes of aproduct (1 − θ ). Apparently, the former adversely affects the environmental performanceof Greening-Up strategy because higher costs deter firms from making incremental changesthat would carry product design toward no-impact outcomes. The latter shows that if incre-mental changes force Traditionals segment customers to compromise on traditional productattributes (e.g., convenience, price and performance), then Greening-Up strategy is unlikelyto outperform Greening-Out strategy on environmental sustainability basis—even though asignificant portion of customers in the market fall within Fence-Sitters and Greens segments(i.e., rF + rG = 0.88). Interestingly, this outcome can be observed even when customers’marginal valuations on environmental attributes are less than those on brown attributes (i.e.,ve/vb < 1).
Ultimately, we look at whether there is a strict dichotomy between having a better eco-nomic performance and achieving a higher environmental performance. First, it is observedfrom Table 3, Table 4 and Proposition 8 that when ve/vb ≤ θ , the firm is never better offcreating both bottom-line and environmental benefits. That is, as shown in Proposition 8, inregions A, B and C , Greening-Out strategy always outgreens the Greening-Up strategy, butthese two green product strategies are always outperformed economically by Greening-Offstrategy. This holds true regardless of how environmental and brown attributes of a prod-uct are perceived by Traditionals and Greens segment customers, respectively. However,this does not mean that it is supposed to be an either-or proposition. Notice that as long asve/vb > θ , the firm can achieve both goals simultaneously, even if it means leaving outserving Traditionals segment customers. For example, in region I where θ ∈ [θA, 1) andve/vb ∈ [1, 1/(1 − θ)], even though all three strategies are candidates for better economicperformance, a new green product targeted at only Fence-Sitters and Greens segment cus-tomers can allow the firm to capitalize on becoming greener. At this point, it is important forthe firm to gain an understanding of how responsive the customers are to the environmentaland brown attributes in a product and the value equation of products in the mind of customers.In other words, rather than focusing myopically on the strategy specific cost parameters F andN , understanding where a firm really stands on the two dimensions of ve/vb and θ is criticalto devise profitable products that are better for the environment. The bad implementations ofgreen product strategies (e.g., replacing the existing brown product with a new green productwhen ve/vb < θ ) can adversely affect the bottom-line.
6 Concluding remarks
Consumers are choosing to buy green products and supporting companies perceived to begreen. In response, many consumer goods companies, eyeing these green consumers, aremoving beyond environment, filling up the pipeline of greener products targeting the greenmarketplace. These firms are looking for new ways to leverage green thinking into their
123
Author's personal copy
Ann Oper Res
product designs. At Clorox, for example, CEO Don Knauss has identified sustainability asone of three core consumer trends with which he wants to align Clorox products. The factis, most companies encounter a fork in this road to sustainability. Should they offer greenerproducts that represent small enhancements or “tweaks” to their existing brown productsby replacing virgin materials with recycled content, designing packaging to be refilled, andso forth? Or should they offer a new green product that is built from scratch and that isunabashedly green? It is not easy to answer.
Many green products on the market nowadays represent small tweaks to their existingbrown counterparts. For example, washing machines save water and energy by tumblingclothes on a horizontal axis as opposed to a vertical axis. Although these are needed techni-cal achievements as well, our findings underline that the reductions in environmental impactgreened-up products represent may not be enough to address consumers’ environmental con-cerns and so greening up an existing brown product may not be a good option for companieslooking to cash in on the potential for green-oriented sales. Rather, it might be innovativegreen products with radical new designs that would offer companies double bottom-linebenefits—one bottom line for profits, the other one reflecting their contribution to environ-mental cleanup. With this regard, it is important to note that creating bottom-line benefitsand reducing environmental footprint is not necessarily an either-or proposition. Both goalscan be accomplished simultaneously, but it is important for a firm to gain an understandingof how responsive the customers are to the environmental and brown attributes in a productand the value equation of products in the mind of customers. Another key takeaway is thatgreen consumer segments are complex and selecting the right consumer to target is criticalto the success of each green product strategy. Knowing that there are many different types ofgreen consumers, it is essential for company managers to keep in mind that there are manydifferent kinds of environmental issues of concern ranging from hazardous waste to energyefficiency—that concern even the non-environmentalist consumers.
There are also opportunities to extend our research in several directions. To start with,we assume no repeat purchases. However, Deloitte recently examined 6,498 shopper experi-ences in 11 major U.S. retailers and found that green shoppers are a valuable consumer targetbecause they represent a consumer segment who buy more products on each store visit, whovisit the store more regularly, and who demonstrate more brand and retailer loyalty in theirpurchasing behavior.11 They are active consumers who buy more and shop more often asopposed to the average shopper, and they are generally not bargain hunters. More importantly,once a green product has captured these shoppers’ attention, it tends to create brand stick-iness by retaining their loyalty through repurchase. That’s why addressing repeat purchasebehavior of green consumers would be an interesting extension. Second, we characterize theenvironmental profile of a product by a single environmental attribute. However, a singlegreen metric might not be amenable to evaluate trade-offs within multiple dimensions of“green” (e.g., energy efficiency, toxicity and recyclability). For instance, CPC—the makersof Mueller’s pasta—found that converting to recycled carton material would actually addabout 20 % to the width of their package material and this would partially offset savingsto the environment, considering the extra energy needed to ship new boxes. Using a singlegreen attribute can also overlook the fact that consumers’ might have distinct valuations forenvironmental attributes. Hence, an analysis of a product design decision where a productcan be characterized on multiple “green” dimensions would be another potential extensionof our study.
11 https://www.deloitte.com/assets/Dcom-Lebanon/Local%20Assets/Documents/Consumer%20Business/DeloitteGreenShopperStudy_2009.pdf, accessed on March 17, 2013.
123
Author's personal copy

Ann Oper Res
Another important assumption in our model is that the firm commits in advance to theproduct and pricing strategy. This implies that before any sales take place, the firm decideson (and commits to) the qualities, the selling price and the type of product he would offer.Moreover, customers believe in these commitments and act accordingly. The firm thus solvesthe two-period maximization problem only once-at the start of the first period. Here it shouldbe noted that we adopt a two-period setting in our model to factor in changing market segmentcompositions and market sizes rather than a product and/or pricing strategy. In addition tocommitment assumption, we also assume that the firm does not price discriminate betweenmarket segments to be in line with prior literature on vertical differentiation. Based on this,one potential extension might be to allow for third-degree price discrimination. Second,firms in some industries (e.g., industries characterized by large production uncertainties)may not be able to credibly commit in advance to a product and pricing strategy, meaningthat they can only position and price their products one period at a time (as and when they areoffered). Then, it might be interesting to extend our model by considering a firm incapableof commitment, meaning that the firm should choose different green product strategies (andso offer different products) in different periods. Note that in this case the firm must takecustomer behavior into account when choosing his strategy in each period, because potentialcustomers would rationally look ahead to what the firm might do in period 2 before decidingwhen to buy.
Appendices
Appendix 1: Proof of Proposition 1
Under the Greening-Off strategy, the firm is indifferent between the two pricing options ifand only if Π i
1∗
given in (7) is equal to Π ii1
∗given in (10). Solving Π i
1∗ = Π ii
1∗
for θ shows
that this equality holds as long as θ is equal to
√
1 −(
e1 M1rG+e2 M2(rG+δ)e1 M1+e2 M2
), denoted by θA.
The proof follows. ��Appendix 2: Proof of Proposition 2
Under the Greening-Out strategy, the firm is indifferent between the two pricing options ifand only if Π i
2∗
given in (14) is equal to Π ii2
∗given in (17). Solving Π i
2∗ = Π ii
2∗
for θ shows
that this equality holds as long as θ is equal to 1 −√
1 −(
e1 M1rT +e2 M2(rT −δ)e1 M1+e2 M2
), denoted by
θB . The proof follows. ��Appendix 3: Proof of Proposition 3
Note that the solution to the problem stated above is feasible (i.e., both qb3 and qe3 are non-negative), if and only if 1 ≤ ve
θvb≤ 1 + F
cu x . Since x1 > x2, we know that: (a) Π ii3
∗(x =
x1) > Π ii3
∗(x = x2); and (b) F
cu x1< F
cu x2. Therefore, when 1 ≤ ve
θvb≤ 1 + F
cu x1, it is
optimal to cover all market segments, while the only possibility for the firm is to cover theFence-Sitters and Greens market segments when 1 + F
cu x1< ve
θvb≤ 1 + F
cu x2. ��
123
Author's personal copy
Ann Oper Res
Appendix 4: Proof of Proposition 4
Note that the solution to the problem stated above is feasible (i.e., both qb3 and qe3 are non-negative), if and only if 1 ≤ ve
θvb≤ 1 + F
cu y . Since x1 > x3, we know that: (a) Π iii3
∗(x =
x1) > Π iii3
∗(x = x3); and (b) F
cu x1< F
cu x3. Therefore, when 1 ≤ ve
θvb≤ 1 + F
cu x1, it is
optimal to cover all market segments, while the only possibility for the firm is to cover theTraditionals and Fence-Sitters market segments when 1 + F
cu x1< ve
θvb≤ 1 + F
cu x3. ��
Appendix 5: Proof of Proposition 5
When θ ≤ ve/vb < 1, the second pricing strategy is the only feasible (i.e., both qb3 and qe3 arenon-negative) and so the optimal option. When 1 ≤ ve/vb < 1/ (1 − θ), the first and secondpricing strategies become feasible. In this case, the first pricing option dominates the secondone only if Π i
3∗
> Π i i3
∗. On the basis of Proposition 3, comparison of the expressions
provided in Eqs. (22) and (26) yields the necessary condition for the above inequality tohold. Finally, when ve/vb ≥ 1/ (1 − θ), all three pricing options are feasible. In this case,comparing Π i
3∗
separately with Π i i3
∗and Π i i i
3∗
shows that it is always dominated by thesetwo pricing options. Then, in order to determine under what conditions Π i i
3∗
is greater thanΠ i i i
3∗, we compare the respective expressions provided in Eqs. (26) and (30), and on the
basis of Proposition 4, we obtain the necessary condition provided. ��Appendix 6: Proof of Proposition 6
When θ = 0, the total number of pricing options under three strategies reduces to fourpossibilities. Under the Greening-Off strategy, the only option is to set p = vbqb in which caseonly Traditionals and Fence-Sitters customers are completely served. Under the Greening-Out strategy, the only pricing option is to set p = veqe, allowing the firm to cover all segmentscompletely. Under the Greening-Up strategy, there are two options available: p = vbqb+veqe
and p = veqe. In the former case, only Traditionals and Fence-Sitters customers are servedentirely, whereas all segments are completely covered in the latter case. Based on theseoptions, we re-solve the firm’s maximization problem, and obtain the optimal profits for eachoption by using the parameter settings given in Sect. 5.
π i1 = (0.27)v2
b (33)
π i i2 = (0.26)v2
e − N (34)
π i3 = (0.18)v2
b + (0.29) (ve − vb)2
F(35)
π i i3 = (4.28)v2
e
12.42 + 4F(36)
Mutual comparison of these expressions leads to the respective dominance relationshipsprovided in Proposition 6. ��Appendix 7: Proof of Proposition 7
When θ = 1, the total number of pricing options under three strategies reduces to fourpossibilities. Under the Greening-Off strategy, the only option is to set p = vbqb and com-pletely cover all segments. Under the Greening-Out strategy, the only pricing option is to setp = veqe, allowing the firm to serve only Fence-Sitters and Greens customers completely.
123
Author's personal copy
Ann Oper Res
Under the Greening-Up strategy, there are two options available: p = vbqb + veqe andp = vbqb. In the former case, only Fence-Sitters and Greens customers are served entirely,whereas all segments are completely covered in the latter case. Based on these options, were-solve the firm’s maximization problem, and obtain the optimal profits for each option byusing the parameter settings given in Sect. 5.
π i i1 = (0.52)v2
b (37)
π i2 = (0.23)v2
e − N (38)
π i3 = (0.31)v2
b + (0.87) (ve − vb)2
F(39)
π i i i3 = (0.35)v2
b (40)
Mutual comparison of these expressions leads to the respective dominance relationshipsprovided in Proposition 7. ��Appendix 8: Proof of Proposition 8
Based on the environmental qualities provided in Table 4, the aggregate environmental qual-ities supplied under two pricing options of the Greening-Out strategy are equal if and only ifθ = 0.10. Then, when θ ≤ 0.10, it is better for the environment to target the green product atall market segments. Otherwise, targeting the product at Fence-Sitters and Greens segmentcustomers yields higher overall environmental quality. To sum up,
TEQ2 ={
(0.52)(1 − θ)ve, if θ ≤ 0.10,
(0.47)ve, else.(41)
Regarding the Greening-Up strategy, as long as ve/vb > θ , setting the price of the greened-up product according to Greens segment customers’ product valuation (and targeting allmarket segments) always results in more aggregate environmental quality than other twopricing options, in which case
TEQ3 = (2.15) (ve − θvb) /F. (42)
Combining the conditions and expressions given above yields the proposition and the prooffollows. ��
References
Anderson, E. T., & Dana, J. D. (2009). When is price discrimination profitable? Management Science, 55,980–989.
Atasu, A., Sarvary, M., & Wassenhove, L. N. V. (2008). Remanufacturing as a marketing strategy. ManagementScience, 54, 1731–1746.
Chen, C. (2001). Design for the environment: A quality-based model for green product development. Man-agement Science, 47, 250–263.
Choudhary, V., Ghose, A., Mukhopadhyay, T., & Uday, R. (2005). Personalized pricing and quality differen-tiation. Management Science, 51, 1120–1130.
Debo, L. G., Toktay, L. B., & Wassenhove, L. N. V. (2005). Market segmentation and product technologyselection for remanufacturable products. Management Science, 51, 1193–1205.
Desai, P., Kekre, S., Radhakrishnan, S., & Srinivasan, K. (2001). Product differentiation and commonality indesign: Balancing revenue and cost drivers. Management Science, 47, 37–51.
Dobson, G., & Kalish, S. (1988). Positioning and pricing a product line. Marketing Science, 7, 107–125.Ferrer, G. (1996). Market segmentation and product line design in remanufacturing. Working Paper 96/66/TM,
INSEAD, Fontainebleau, France.
123
Author's personal copy
Ann Oper Res
Ferrer, G., & Swaminathan, J. M. (2010). Managing new and remanufactured products. European Journal ofOperational Research, 203, 370–379.
Ginsberg, J. M., & Bloom, P. N. (2004). Choosing the right green marketing strategy. MIT Sloan ManagementReview, 46, 79–84.
Heese, H. S., & Swaminathan, J. M. (2006). Product line design with component commonality and cost-reduction effort. Manufacturing & Service Operations Management, 8(2), 206–219.
Hopkins, M. S. (2010). How sustainability fuels design innovation. MIT Sloan Management Review, 52, 75–81.Katz, M. L. (1984). Firm-specific differentiation and competition among multiproduct firms. The Journal of
Business, 57, 149–166.Kim, K., & Chhajed, D. (2000). Commonality in product design: Cost saving, valuation change and cannibal-
ization. European Journal of Operational Research, 125, 602–621.Kim, K., & Chhajed, D. (2002). Product design with multiple quality-type attributes. Management Science,
48, 1502–1511.Klenier, A. (1991). What does it mean to be green? Harvard Business Review, 69, 38–47.Krishnan, V. V., & Lecourbe, P. (2010). Designing product lines with higher aggregate environmental quality.
Working Paper.Lacourbe, P., Loch, C. H., & Kavadias, S. (2009). Product positioning in a two-dimensional market space.
Production and Operations Management, 18, 315–332.Lancaster, K. (1990). The economics of product variety: A survey. Marketing Science, 9, 189–210.Liu, Z., Anderson, T. D., & Cruz, J. M. (2012). Consumer environmental awareness and competition in
two-stage supply chains. European Journal of Operational Research, 218, 602–613.Moorthy, K. S. (1984). Market segmentation, self-selection, and product line design. Marketing Science, 3,
288–307.Mussa, M., & Rosen, S. (1978). Monopoly and product quality. Journal of Economic Theory, 18, 301–317.O’Keeffe, M. (1980). Quality and price discrimination. Ph.D. Thesis, Harvard University.Russo, M. V. (2008). Environmental management: Readings and cases. London: Sage.Souza, G. C. (2013). Closed-loop supply chains: A critical review, and future research. Decision Sciences, 44,
7–38.Subramanian, R., & Subramanyam, R. (2012). Key factors in the market for remanufactured products. Man-
ufacturing & Service Operations Management, 14, 315–326.Wu, L. (2010). Managing design quality and conformance quality: Models and insights. Total Quality Man-
agement, 21, 383–389.Yenipazarli, A., & Vakharia, A. (2015). Pricing, market coverage and capacity: Can green and brown products
co-exist? European Journal of Operational Research, 242(1), 304–315.
123
Author's personal copy