gray-brown mouse lemurs (microcebus griseorufus) as an example of distributional constraints through...
TRANSCRIPT

Gray-brown Mouse Lemurs (Microcebusgriseorufus) as an Example of DistributionalConstraints through Increasing Desertification
Yvonne Eva-Maria Barbara Bohr & Peggy Giertz &
Yedidya Rakotomalala Ratovonamana &
Jörg Ulrich Ganzhorn
Received: 28 August 2010 /Accepted: 2 December 2010 /Published online: 2 April 2011# Springer Science+Business Media, LLC 2011
Abstract Climate change will impose new constraints on the distribution of speciesthrough desertification. Small-scale endemists common in biodiversity hotspots suchas Madagascar are especially threatened. Among them are the gray-brown mouselemurs (Microcebus griseorufus), which occupy the driest habitats in Madagascar ofall Microcebus spp. We studied impacts of aridity on this species to identify criticalfactors for distributional limits. Accordingly, we compared populations of 2 adjacenthabitats that differ in their humidity levels. We found that the more humid habitatprovided more high-quality food and maintained a higher population density ofMicrocebus griseorufus, with individuals in better condition compared to the drierhabitat. At the end of the wet, but not in the dry season, Microcebus griseorufusadjusted its home range size to local food plant density, which indicates thatindividuals optimize food intake in the wet season to prepare for the dry season. Wefound a negative exponential relationship between food plant density and homerange size, which suggests an upper limit for the size of home ranges. According tothis relationship, individuals from the drier habitat could not compensate for reducedfood availability by enlarging their home range beyond this threshold. Thus, in caseof declining food availability during the wet season due to a generally drier climate,individuals will not be able to extend their home ranges to include more foodresources, and hence to accumulate enough fat reserves for the dry season. Inconsequence, they will have to migrate toward more mesic refugia. Migration,however, requires habitat connectivity, which is scarce in Madagascar’s largely
Int J Primatol (2011) 32:901–913DOI 10.1007/s10764-011-9509-8
Y. E.-M. B. Bohr (*) : P. Giertz : J. U. GanzhornDepartment of Animal Ecology and Conservation, University of Hamburg, Biozentrum Grindel,20146 Hamburg, Germanye-mail: [email protected]
Y. R. RatovonamanaDépartement de Biologie et Ecologie Végétale, Faculté des Sciences, Université d’Antananarivo,Antananarivo 101, Madagascar

anthropogenic and heavily fragmented landscape. Our data suggest that upper limits inhome range sizes can limit a species’ ability to adapt to increasing aridity.
Keywords Aridity . Climate change . Habitat quality . Madagascar . Microendemism
Introduction
Madagascar has been identified as one of the world’s biodiversity hotspots thatcontinues to be under severe anthropogenic pressure (Ganzhorn et al. 2001; Harperet al. 2007; Ingram and Dawson 2005; Mittermeier et al. 2008; Myers et al. 2000).As degradation continues, natural vegetation becomes severely fragmented andconnectivity between suitable habitats decreases (Irwin et al. 2010). Increasingaridity due to climate change is an additional factor threatening species—particularlythose with restricted ranges—not only in Madagascar, but also in other parts of theworld (Hannah et al. 2008; Hewitson and Crane 2006; Kremen et al. 2008; Malcolmet al. 2006; Tadross et al. 2008). It is assumed that natural climatic fluctuations havecontributed to the evolution of Madagascar’s unique biodiversity with its manymicroendemic species by isolating and reconnecting habitats (Wilmé et al. 2006).Today, however, and in view of an anthropogenic climate change, migration towardmore humid areas is hampered by fragmentation and thus might lead to theextinction of species that cannot tolerate increasing seasonality and aridity.
Primates respond in different ways to increased seasonality and food shortage.Apart from switching diets, New World monkeys tend to increase their home or dayranges during times of reduced food availability whereas Old World primates fromAfrica and Asia do not. Both, lemurs from Madagascar and African galagos tend toreduce their day range and their activity during the lean season (Hemingway andBynum 2005). This response to food shortage is linked to their capacity to reducetheir metabolic rate during this time of the year, either while still being active or byadopting various forms of energy-saving strategies, such as torpor or hibernation(Dausmann 2010; Ganzhorn et al. 2003; Kobbe et al. 2010; Nowack et al. 2010;Pereira et al. 1999).
Large-bodied species accumulate nutrients in times when they are available andreproduce and subsist on these storages. This “capital breeding” seems to be favoredwhen maternal investment is low in relation to large body size and extends over alonger period of time, possibly including lean seasons (Ganzhorn et al. 2009; Jansonand Verdolin 2005). For most small primate species, however, reproductive successis linked primarily to short-term food availability during the lush wet season whenfemales give birth and lactate and infants are weaned (“income breeders”; Ganzhorn2002; 2009; Richard et al. 2000; Wright et al. 2005). Therefore, and because of theirstrategy to enter an energy-saving mode during dry seasons, the energy reservesaccumulated during the wet season seem to be crucial for lemurs to survive thefollowing dry season. With increasing aridity, wet seasons may be shortened or mayproduce lower quality food, and thus may not provide sufficient resources forindividuals to endure the lean seasons. Retreat toward more mesic refugia will thenbe required, but the current and ongoing fragmentation of habitats will make a rangeshift impossible in many cases.
902 Y.E.-M.B. Bohr et al.

Gray-brown mouse lemurs (Microcebus griseorufus) are part of a speciose lemurgenus that experienced an enormous radiation and that occupies all vegetationformations on Madagascar, from spiny bush to evergreen humid forest (Mittermeieret al. 2008; Weisrock et al. 2010). They are the only mouse lemurs that occur in thedriest of these habitats, i.e., in the spiny bush, and thus represent the arid end of thegenus’ ecological niche. We therefore used Microcebus griseorufus to study thedistributional limits of animals faced with increasing aridity. We investigated factorslimiting the distribution of gray-brown mouse lemurs under these dry conditions,how these factors will be affected by increasing aridity, and whether Microcebusgriseorufus can compensate for such a change in habitat conditions. For thispurpose, we analyzed the food situation in 2 habitats that differ in terms of humidity.To find out whether, and in what way, gray-brown mouse lemurs compensate forpossible disadvantages resulting from aridity, e.g., by switching diet or by enlargingtheir home ranges to include more food resources, we studied their feeding andranging behavior under these differing conditions.
Methods
Microcebus griseorufus occurs in southwestern Madagascar. In the more mesic partsof its range, it lives sympatrically with Microcebus murinus, with the potential forhybridization between both species (Gligor et al. 2009). In the driest habitats,however, it is the only mouse lemur species (Génin 2008; Yoder et al. 2002).According to several years of trapping, this is the case at our study site in the ParcNational de Tsimanampetsotsa (Giertz unpubl. data; Rakotondranary et al. 2011).
The Parc National de Tsimanampetsotsa (24°03′–24°12′S, 43°46′–43°50′E;Fig. 1) is located ca. 85 km south of Toliara. It stretches along the MahafalyPlateau, a limestone karst formation whose western escarpment slopes down to the
Fig. 1 Map of the study site showing the different vegetation types and the location of both study plots.
Distributional Limits of Gray-brown Mouse Lemurs 903

halomorphic plain of a large saline lake. In this region, rainfall is highly seasonal andrarely exceeds 400 mm/yr, traditionally most of it falling during December andFebruary (Donque 1975). During the past few years, however, maximum rainfallshifted toward March and April (Ratovonamana et al. submitted). The vegetation hasa pronounced xerophytic character and is classified among Madagascar’s spinyforest formations (Moat and Smith 2007). It has the highest levels of plant endemismon the island, with 48% of the genera and 95% of the species being endemic. Itsdifferent vegetation formations vary according to the underlying soil and its water-holding capacity. Two main formations can be distinguished at our study site (Fig.1): 1) a dry forest on unconsolidated sands (DFS) on the foot of the MahafalyPlateau, which is characterized by Didierea madagascariensis (Didieraceae) andCedrelopsis grevei (Rutaceae) and that reaches a mean height of 6 m; and 2) axerophytic, spiny bush formation on calcareous soil (XBC), characterized byAlluaudia commosa (Didieraceae), Cassia meridionalis (Fabaceae), and Cedrelopsisgracilis (Rutaceae) that grows on the exposed Mahafaly Plateau and reaches amaximum height of 4 m (Ratovonamana et al. submitted).
The study period extended from April until July 2008. Based on weather andvegetation phenology, we defined April and May as the late wet season and June andJuly as the early dry season.
Capture and Marking
We established one study plot of 6 ha (150×400 m) in each vegetation formation(Fig. 1). We placed 96 Sherman Livetraps (H.B. Sherman Traps, Tallahassee; 7.5×7.5×30.5 cm) at 25-m intervals on each plot, leading to a grid of traps covering atrapping area of 6 ha in each habitat. We placed traps 0.5–2.0 m high in thevegetation and baited them with banana. We conducted 1 trapping session in eachhabitat and in each season (April and July). Each session lasted for 4 consecutivenights, resulting in a total of 384 trap nights per habitat and per season.
We anesthetized captured mouse lemurs with 0.02 ml of Ketasol-100 (Dr. E.Gräub, Bern). On their first capture, we marked subjects individually with asubcutaneous microchip (Trovan unique ID 100 Implantable Transponder, Trovan,UK). We weighed individuals that were caught for the first time in a trapping sessionto the nearest 0.5 g and measured their tail circumference at the tail base. In additionto body mass, tail circumference served as an indicator of body condition, as thegray-brown mouse lemurs store fat in their tail before the lean season (Génin 2008).
Radiotelemetry
To assess feeding and ranging patterns, we equipped 22 individuals (DFS: 6 females,5 males; XBC: 5 females, 6 males) with radio collars. We studied feeding behaviorvia focal observations of 2 radio-collared individuals (1 female, 1 male) perhabitat and per season (8 individuals in total). We followed each individual for 2half-nights (18:00–24:00 h and 00:00– 06:00 h), and recorded the type of foodingested (fruits, gum, flowers, or arthropods) and the lemur’s position each timeit moved >5 m. For analyses, we used the frequency of feeding on certain foodcategories instead of the time spent feeding on the items, as fruits, gum, and
904 Y.E.-M.B. Bohr et al.

arthropods are of very different compositions and require different handling andprocessing times (Koenig et al. 1997).
We tracked all 22 mouse lemurs sequentially by triangulation to assess theirspatial and temporal distribution over a total of 8 half-nights (18:00–24:00 h),taking 1 fix/h for each individual. We aimed for an optimal angle betweenbearings of 90°. Data from the sequential triangulation nights as well assightings by chance and data from the focal observations provided the basisfor home range estimations. We took only waypoints spaced at intervals ≥1 hinto account. We estimated home range sizes with Animal Movement (Hoogeand Eichenlaub 2000) and the minimum-convex-polygon method. To comparehome ranges, we calculated their size based on 19 fixes, which was the minimumnumber of fixes obtained per subject. These estimates do not represent absolutehome range size, but allow standardized comparisons between habitats andseasons. To test for seasonal variations in home range size, we compared the homeranges of 7 individuals (DFS = 2, XBC = 5) between the wet and the dry seasons.To test for habitat effects, we analyzed the home range data of 15 individuals(DFS = 8, XBC = 7).
Food Abundance
We mapped all individuals of known food plants on our study plots and usedArcView 3.2a (ESRI 1992–2000) to geoprocess them with the home range polygonsto assess food availability within individual home ranges.
In each vegetation formation we monitored plants in two phenology plots of0.1 ha (5×200 m). On these plots, we marked all food plants of a height >1 m (forshrubs) or a diameter at breast height >10 cm (for trees), and checked for flowersand fruits twice a month. We assigned each plant individual a 1 if it was bearing fruitand 0 if it was not, with the same for flowers and used these scores to calculate abiweekly mean index for fruit and flower availability.
Statistics
We performed statistical analyses with JMP 7.0 (SAS Institute 1989–2007).Although morphometric data did not deviate from normality, we used nonparametrictests throughout for consistency, except for the regression curve estimation, as inother cases measurements differed from normality or sample size was small. We setα=0.05 and detail the tests applied with the analyses.
Results
We captured a total of 95 different individuals (57 females, 38 males) of Microcebusgriseorufus, 77 in April and 41 in July. The cumulative number of capturesapproached a plateau after the second trapping session, indicating that we hadcaptured most individuals within the trapping area. According to the number ofindividuals caught per grid (DFS: 71, XBC: 24), the population density in the dryforest (11.8 individuals/ha) was 3 times higher than in the spiny bush (4.0
Distributional Limits of Gray-brown Mouse Lemurs 905

individuals/ha). Recapture rates did not differ significantly (DFS: 29.6%, XBC:8.3%; χ2 = 2.76, df = 1, p=0.1).
At the end of the wet season, mouse lemurs had higher body masses and largertail circumferences, i.e., fat storage, than at the beginning of the dry season.Individuals from the dry forest were in better condition than those from the spinybush (Table I).
Home ranges were significantly larger at the end of the wet season than during thedry months (Table II). Their sizes did not differ between vegetation formations(Table II). Home range size correlates positively with the tail circumference(Spearman rank correlation: rS = 0.73, n=11, p=0.01), but not with the body mass(rS = 0.39, n=17, p=0.12) of its inhabitant.
Diet and Food Abundance
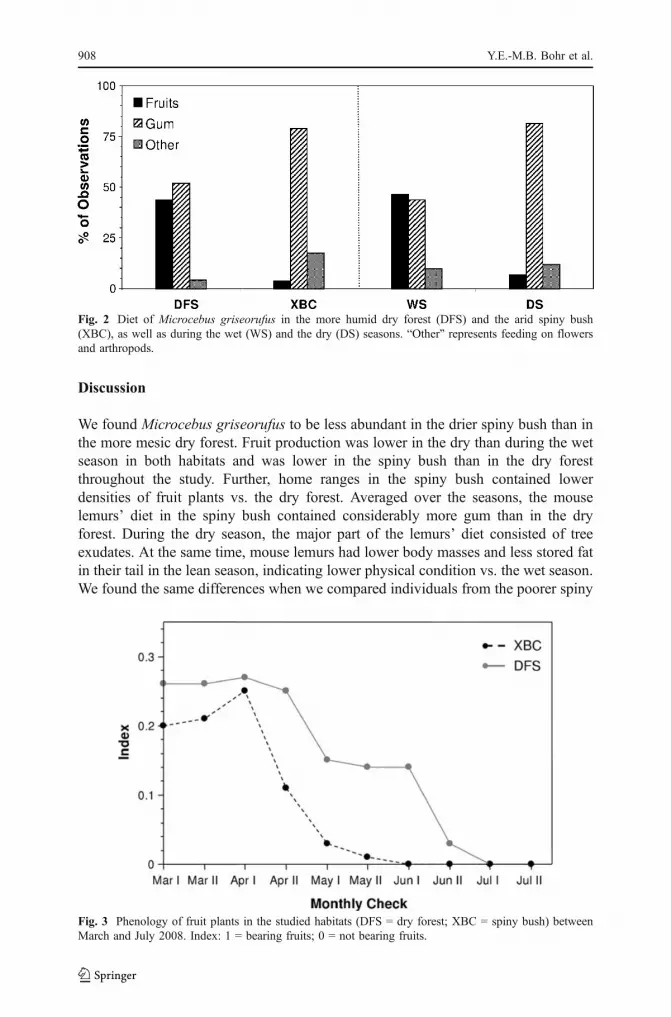
During 96 h of focal observation, we were in visual contact with the radio-collaredmouse lemurs for 36.1 h, during which time the subjects were feeding for 6.6 h,mostly on fruits and gum (Table III), but also on arthropods and flowers. In total, weobserved 48 feeding events in the dry forest and 52 events in the spiny bush. At theend of the rainy season (41 feeding events), the focal individuals fed equally onfruits and gum, whereas at the beginning of the dry season (59 feeding events), theamount of ingested gum dominated over that of fruits (Fig. 2). In the dry forest, gumand fruits accounted for similar proportions of the diet, whereas in the spiny bushgum prevailed and fruits made up only a small part of the observed food intake(Fig. 2). We saw a focal individual feeding on flowers only once. Arthropods(mostly insects) were eaten more frequently in the spiny bush than in the dry forest(Fig. 2).
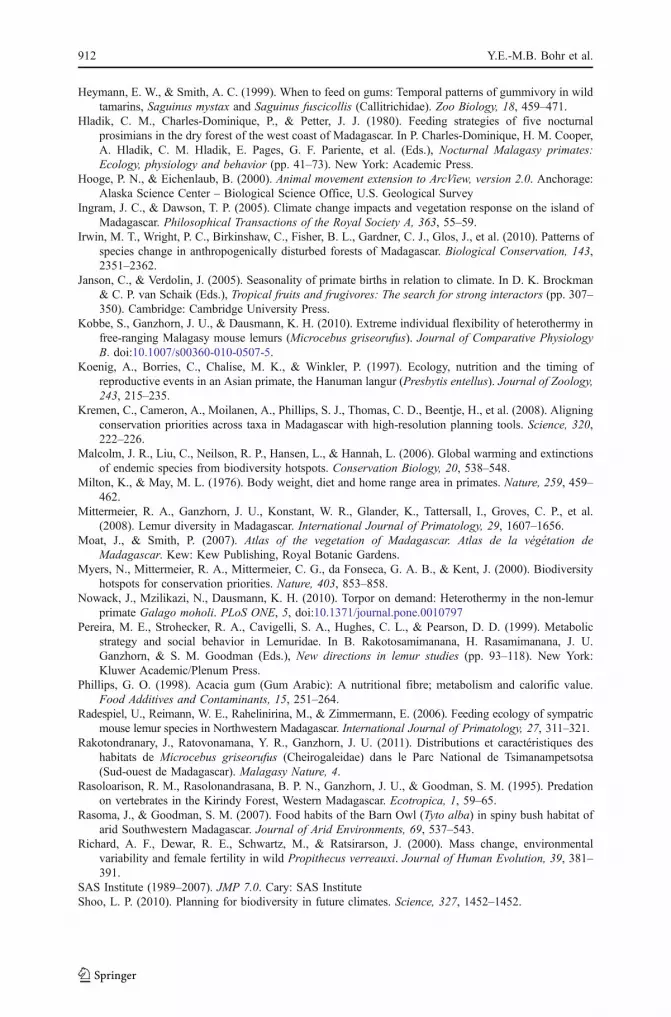
In all months, the number of fruit bearing plants on the phenology plot was lowerand declined faster in the arid spiny bush vs. the more mesic dry forest (Fig. 3). InMarch, food abundance was still high and then declined continuously toward Juneand July. The first month without any fruits on the phenology plot was June in thespiny bush and July in the dry forest. We found no flowering plants on thephenology plots during our study period.
Table I Comparison of body mass and tail circumference of Microcebus griseorufus between the seasonsand both habitats
Body mass (g) Tail circumference (cm)
Q25 / med. / Q75a n z p Q25 / med. / Q75
a n z p
WS 41.99 / 49.50 / 60.50 43 3.61 <0.001 2.00 / 2.45 / 2.60 44 5.08 <0.001
DS 37.25 / 42.00 / 44.75 40 1.70 / 1.90 / 2.05 41
DFS 41.00 / 44.00 / 55.25 65 2.70 0.007 1.90 / 2.10 / 2.50 64 4.08 <0.001
XBC 34.00 / 39.75 / 46.00 18 1.55 / 1.80 / 2.00 21
a Values are medians (med.) and quartiles (Q25, Q75); statistics are results of the Mann-Whitney U-test
WS = west season; DS = dry season; DFS = dry forest; XBC = spiny bush
906 Y.E.-M.B. Bohr et al.

We found a higher total number of fruit-producing vs. gum-producing plantindividuals in the home ranges of the dry forest (Sign test: p=0.03, n=5). Thistendency was reversed in the spiny bush (p=0.06, n=7). Home ranges in the spinybush had a significantly lower density of fruit-producing plants (median: 329; range:132–447 individuals/ha, n=7) than those in the more humid dry forest (median: 509,range: 429–639 individuals/ha, n=5; U-test: z=2.60, p=0.009). The density of gum-producing plants did not differ (XBC: median: 43, range: 210–772 individuals/ha;DFS: 395, range: 253–495 individuals/ha; z=0.32, p=0.75).
Home range size and food plant density correlated negatively at the end of the wetseason (Spearman rank correlation: rS = −0.75, n=10, p=0.013) but not during thedry season (rS = 0.40, n=8, p=0.249). The situation during the wet season is betterdescribed via an exponential regression (home range size = 2.337 * e –0.0016*number
food plants per ha, R² = 0.43, p=0.039) than via a linear relationship, indicating thathome range size would need to increase exponentially if food abundance was todecrease further (Fig. 4). No such relationship was apparent during the dry season.
Table III Fruit- and gum-producing plant species that the observed individuals of Microcebusgriseorufus fed on most frequently
Habitat Season Fruit Gum
DFS WS Bakarella sp. (Loranthaceae) Terminalia ulexoïdes (Combretaceae)
Grewia humblotii (Malvaceae) Delonix adansonoïdes (Fabaceae)
DS Bakarella sp. (Loranthaceae) Acacia bellula (Fabaceae)
— Terminalia disjucanta (Combretaceae)
XBC WS Grewia sp. (Malvaceae) Terminalia ulexoïdes (Combretaceae)
Ehretia ambovombensis (Boraginaceae) Commiphora monstruosa (Burseraceae)
DS — Terminalia disjucanta (Combretaceae)
— Delonix adansonoïdes (Fabaceae)
WS = west season; DS = dry season; DFS = dry forest; XBC = spiny bush
Table II Home range sizes of Microcebus griseorufus compared between the seasons and both habitats
Home range size (ha)
Q25 / med. / Q75a n p
WS 0.40 / 0.55 / 0.86 7 W = 1.00 0.03
DS 0.14 / 0.33 / 0.58
DFS 0.17 / 0.50 / 0.61 8 z = 0.12 0.908
XBC 0.29 / 0.42 / 0.58 7
a Values are medians (med.) and quartiles (Q25, Q75); statistics are results of the Wilcoxon test for pairedsamples (for seasons) and the Mann-Whitney U-test (for habitats)
WS = west season; DS = dry season; DFS = dry forest; XBC = spiny bush
Distributional Limits of Gray-brown Mouse Lemurs 907
Discussion
We found Microcebus griseorufus to be less abundant in the drier spiny bush than inthe more mesic dry forest. Fruit production was lower in the dry than during the wetseason in both habitats and was lower in the spiny bush than in the dry forestthroughout the study. Further, home ranges in the spiny bush contained lowerdensities of fruit plants vs. the dry forest. Averaged over the seasons, the mouselemurs’ diet in the spiny bush contained considerably more gum than in the dryforest. During the dry season, the major part of the lemurs’ diet consisted of treeexudates. At the same time, mouse lemurs had lower body masses and less stored fatin their tail in the lean season, indicating lower physical condition vs. the wet season.We found the same differences when we compared individuals from the poorer spiny
Fig. 3 Phenology of fruit plants in the studied habitats (DFS = dry forest; XBC = spiny bush) betweenMarch and July 2008. Index: 1 = bearing fruits; 0 = not bearing fruits.
Fig. 2 Diet of Microcebus griseorufus in the more humid dry forest (DFS) and the arid spiny bush(XBC), as well as during the wet (WS) and the dry (DS) seasons. “Other” represents feeding on flowersand arthropods.
908 Y.E.-M.B. Bohr et al.

bush with those from the richer dry forest. These results indicate substantialdifferences in habitat quality and identify the dry forest as the more favorable habitatfor Microcebus griseorufus.
Our data suggest that the mouse lemurs’ distribution was linked to foodabundance at the end of the wet season but not during the dry season. This findingmatches reports on other lemur species that depend more on the food situationduring the wet season instead of food abundance during the dry season (Ganzhorn2002; Wright et al. 2005). Toward the end of the lush season, infants becomeindependent (Janson and Verdolin 2005; Wright 1999) and lemurs need to preparefor the less favorable dry season. Microcebus species, and other lemurs, then reducetheir metabolic rates and lower their energy expenses instead of trying to increasetheir energy intake (Dausmann 2010; Hemingway and Bynum 2005; Kobbe et al.2010; Pereira et al. 1999). This, in addition to the fact that neither avian normammalian predators catch many individuals of Microcebus in this area (Andriatsi-mietry et al. 2009; Rasoma and Goodman 2007) in comparison to other sites (e.g.,Dollar et al. 2007; Rasoloarison et al. 1995), suggests that Microcebus griseorufus ismore limited by bottom-up factors than by top-down effects.
Fig. 4 Relationship betweenfood plant density and homerange size.
Distributional Limits of Gray-brown Mouse Lemurs 909

The higher population density in the dry forest, with its higher density of fruitplants, also indicates a bottom-up regulation of populations through food resources.Microcebus griseorufus preferred fruits over gum whereas arthropods were huntedopportunistically, matching the results described by Génin (2008). In contrast toarthropods, which present rich sources of high-quality protein, fruits and gum areeasier to locate and can be defended (Génin 2008; Génin et al. 2010). However,contrary to conventional wisdom and results from other parts of the world (Fleming1988; Phillips 1998), at least some exudates in Madagascar contain very highconcentrations of protein or carbohydrates that can exceed the concentrations infruits, which are protein poor in Madagascar (Ganzhorn et al. 2009; Génin et al.2010; Hladik et al. 1980). This, however, does not take into account the digestiveproperties of the components; secondary compounds, for instance, may not berelevant in ripe fruits but can occur in very high concentrations in gum and mightinhibit digestion.
Despite the nutritional quality of some exudates and their importance as a fallbackor staple food source throughout the year (Dammhahn and Kappeler 2008; Génin2008; Heymann and Smith 1999; Radespiel et al. 2006), the spiny bush ofTsimanampetsotsa obviously represents a less favorable habitat than the dry forest,which is indicated by the lower density and poorer body condition of Microcebusgriseorufus. Thus, the higher proportion of gum-producing plants in the spiny forestcannot compensate for the reduced density of fruit plants in this habitat. Desiccationin the wake of climate change will shift food availability further toward gum at theexpense of fleshy fruits. According to the exponential increase in home range sizewith declining food plant density, Microcebus griseorufus does not seem to be ableto extend its home range much beyond its present size; otherwise we would haveexpected larger home ranges in the spiny bush. Nevertheless, using tail circumfer-ence as a proxy for adipose tissue, animals with larger home ranges seem to be ableto accumulate more fat in preparation for hibernation. According to optimal foragingtheory, however, animals will reach a point wherein home range extension as acompensation for declining food abundance becomes unprofitable (Davies andHouston 1984; Milton and May 1976), which seems to be the situation in the spinybush.
In conclusion, Microcebus griseorufus lives at the dry limit of its ecological nichein the xerophytic spiny bush in southwestern Madagascar, with little remainingphysiological scope. Many other spatially restricted species living in regions that arethreatened by a drier climate may be in a similar situation. Under the scenario ofcontinuing climate change, we must therefore maintain or establish connectivitybetween habitats that are drying and more mesic regions, as proposed, e.g., byHannah et al. (2008). Given that this connectivity is no longer available in terms ofnatural habitats, we urgently need a much better understanding of components thatneed to be considered in habitat restoration and in the identification of suitablerefugia (Shoo 2010; Shoo et al. 2010).
Acknowledgments We conducted this study within the Accord de Collaboration between MadagascarNational Parks (MNP, formerly ANGAP), the University of Antananarivo, and the University of Hamburg. Wethank MNP, Mme Ch. Andrianarivo, Dr. J. Rakotomala, D. Rakotomalala, D. Rakotondravony, and the late O.Ramilijaona for their collaboration and support.We acknowledge the authorization and support of this study by the
910 Y.E.-M.B. Bohr et al.

Ministère de l’Environement, des Eaux et Forêts et du Tourisme, MNP, and the University of Antananarivo. InAntananarivo, J. Rakotondranary and T. Andrianasolo managed bureaucratic affairs. S. Kobbe, G. A. RakotoRamambason, Edson, Fisy, and Antsara provided important assistance in the field. We thank the editor-in-chief,Dr. J. Setchell, and 2 anonymous reviewers for their comments that greatly improved the manuscript. We alsothank Ms. Terry Kornak for copyediting and proofreading our manuscript. The study received financial supportfrom DAAD, DFG (Ga 342/15), VW Foundation, and WWF Germany.
References
Andriatsimietry, R., Goodman, S. M., Razafimahatratra, E., Jeglinski, J. W. E., Marquard, M., &Ganzhorn, J. U. (2009). Seasonal variation in the diet of Galidictis grandidieri Wozencraft, 1986(Carnivora: Eupleridae) in a sub-arid zone of extreme Southwestern Madagascar. Journal of Zoology,279, 410–415.
Dammhahn, M., & Kappeler, P. M. (2008). Comparative feeding ecology of sympatric Microcebusberthae and Microcebus murinus. International Journal of Primatology, 29, 1567–1589.
Dausmann, K. (2010). An (opposable) thumbs-up for hibernation – hypometabolism in primates. In J.Masters, M. Gamba, & F. Génin (Eds.), Leaping ahead: Advances in prosimian biology. New York:Springer. In press.
Davies, N. B., & Houston, A. I. (1984). Territory economics. In J. R. Krebs & N. B. Davies (Eds.),Behavioural ecology (pp. 148–169). Oxford: Blackwell Scientific Publications.
Dollar, L., Ganzhorn, J. U., & Goodman, S. M. (2007). Primates and other prey in the seasonally variablediet of Cryptoprocta ferox in the dry deciduous forest of Western Madagascar. In S. Gursky & K. A.Nekaris (Eds.), Primate anti-predator strategies (pp. 63–76). New York: Springer.
Donque, G. (1975). Contribution géographique à l'étude du climat de Madagascar. Antananarivo:Nouvelle Imprimerie des Arts Graphiques.
ESRI (1992–2000). ArcView 3.2a. Redlands: ESRI (Environmental Systems Research Institute)Fleming, T. H. (1988). The short-tailed fruit bat – a study in plant-animal interactions. Chicago: The
University of Chicago Press.Ganzhorn, J. U. (2002). Distribution of a folivorous lemur in relation to seasonally varying food resources:
Integrating quantitative and qualitative aspects of food characteristics. Oecologia, 131, 427–435.Ganzhorn, J. U., Arrigo-Nelson, S., Boinski, S., Bollen, A., Carrai, V., Derby, A., et al. (2009). Possible
fruit protein effects on primate communities in Madagascar and the neotropics. PLoS ONE, 4,doi:10.1371/journal.pone.0008253
Ganzhorn, J. U., Klaus, S., Ortmann, S., & Schmid, J. (2003). Adaptations to seasonality: Some primateand non-primate examples. In P. M. Kappeler & M. E. Pereira (Eds.), Primate life histories andsocioecology (pp. 132–148). Chicago: University of Chicago Press.
Ganzhorn, J. U., Lowry, P. P., II, Schatz, G. E., & Sommer, S. (2001). The biodiversity of Madagascar:One of the world's hottest hotspots on its way out. Oryx, 35, 346–348.
Génin, F. (2008). Life in unpredictable environments: First investigation of the natural history ofMicrocebus griseorufus. International Journal of Primatology, 29, 303–321.
Génin, F. G. S., Masters, J. C., & Ganzhorn, J. U. (2010). Gummivory in cheirogaleids: Primitive retentionor adaptation to hypervariable environments? In A. M. Burrows & L. T. Nash (Eds.), The evolution ofexudativory in primates (pp. 123–140). New York: Springer.
Gligor, M., Ganzhorn, J. U., Rakotondravony, D., Ramilijaona, O. R., Razafimahatratra, E., Zischler, H.,et al. (2009). Hybridization between mouse lemurs in an ecological transition zone in SouthernMadagascar. Molecular Ecology, 18, 520–533.
Hannah, L., Dave, R., Lowry, P. P., Andelman, S., Andrianarisata, M., Andriamaro, L., et al. (2008).Climate change adaptation in Madagascar. Biological Letters, 4, 590–594. doi:10.1098/rsbl.2008.0270.
Harper, G., Steininger, M., Tucker, C., Juhn, D., & Hawkins, F. (2007). Fifty years of deforestation andforest fragmentation in Madagascar. Environmental Conservation, 34, 325–333.
Hemingway, C. A., & Bynum, N. (2005). The influence of seasonality on primate diet and ranging. In D.K. Brockman & C. P. van Schaik (Eds.), Seasonality in primates: Studies of living and extinct humanand non-human primates (pp. 57–104). Cambridge: Cambridge University Press.
Hewitson, B. C., & Crane, R. G. (2006). Consensus between GCM climate change projections withempirical downscaling: Precipitation downscaling over South Africa. International Journal ofClimatology, 26, 1315–1337.
Distributional Limits of Gray-brown Mouse Lemurs 911
Heymann, E. W., & Smith, A. C. (1999). When to feed on gums: Temporal patterns of gummivory in wildtamarins, Saguinus mystax and Saguinus fuscicollis (Callitrichidae). Zoo Biology, 18, 459–471.
Hladik, C. M., Charles-Dominique, P., & Petter, J. J. (1980). Feeding strategies of five nocturnalprosimians in the dry forest of the west coast of Madagascar. In P. Charles-Dominique, H. M. Cooper,A. Hladik, C. M. Hladik, E. Pages, G. F. Pariente, et al. (Eds.), Nocturnal Malagasy primates:Ecology, physiology and behavior (pp. 41–73). New York: Academic Press.
Hooge, P. N., & Eichenlaub, B. (2000). Animal movement extension to ArcView, version 2.0. Anchorage:Alaska Science Center – Biological Science Office, U.S. Geological Survey
Ingram, J. C., & Dawson, T. P. (2005). Climate change impacts and vegetation response on the island ofMadagascar. Philosophical Transactions of the Royal Society A, 363, 55–59.
Irwin, M. T., Wright, P. C., Birkinshaw, C., Fisher, B. L., Gardner, C. J., Glos, J., et al. (2010). Patterns ofspecies change in anthropogenically disturbed forests of Madagascar. Biological Conservation, 143,2351–2362.
Janson, C., & Verdolin, J. (2005). Seasonality of primate births in relation to climate. In D. K. Brockman& C. P. van Schaik (Eds.), Tropical fruits and frugivores: The search for strong interactors (pp. 307–350). Cambridge: Cambridge University Press.
Kobbe, S., Ganzhorn, J. U., & Dausmann, K. H. (2010). Extreme individual flexibility of heterothermy infree-ranging Malagasy mouse lemurs (Microcebus griseorufus). Journal of Comparative PhysiologyB. doi:10.1007/s00360-010-0507-5.
Koenig, A., Borries, C., Chalise, M. K., & Winkler, P. (1997). Ecology, nutrition and the timing ofreproductive events in an Asian primate, the Hanuman langur (Presbytis entellus). Journal of Zoology,243, 215–235.
Kremen, C., Cameron, A., Moilanen, A., Phillips, S. J., Thomas, C. D., Beentje, H., et al. (2008). Aligningconservation priorities across taxa in Madagascar with high-resolution planning tools. Science, 320,222–226.
Malcolm, J. R., Liu, C., Neilson, R. P., Hansen, L., & Hannah, L. (2006). Global warming and extinctionsof endemic species from biodiversity hotspots. Conservation Biology, 20, 538–548.
Milton, K., & May, M. L. (1976). Body weight, diet and home range area in primates. Nature, 259, 459–462.
Mittermeier, R. A., Ganzhorn, J. U., Konstant, W. R., Glander, K., Tattersall, I., Groves, C. P., et al.(2008). Lemur diversity in Madagascar. International Journal of Primatology, 29, 1607–1656.
Moat, J., & Smith, P. (2007). Atlas of the vegetation of Madagascar. Atlas de la végétation deMadagascar. Kew: Kew Publishing, Royal Botanic Gardens.
Myers, N., Mittermeier, R. A., Mittermeier, C. G., da Fonseca, G. A. B., & Kent, J. (2000). Biodiversityhotspots for conservation priorities. Nature, 403, 853–858.
Nowack, J., Mzilikazi, N., Dausmann, K. H. (2010). Torpor on demand: Heterothermy in the non-lemurprimate Galago moholi. PLoS ONE, 5, doi:10.1371/journal.pone.0010797
Pereira, M. E., Strohecker, R. A., Cavigelli, S. A., Hughes, C. L., & Pearson, D. D. (1999). Metabolicstrategy and social behavior in Lemuridae. In B. Rakotosamimanana, H. Rasamimanana, J. U.Ganzhorn, & S. M. Goodman (Eds.), New directions in lemur studies (pp. 93–118). New York:Kluwer Academic/Plenum Press.
Phillips, G. O. (1998). Acacia gum (Gum Arabic): A nutritional fibre; metabolism and calorific value.Food Additives and Contaminants, 15, 251–264.
Radespiel, U., Reimann, W. E., Rahelinirina, M., & Zimmermann, E. (2006). Feeding ecology of sympatricmouse lemur species in Northwestern Madagascar. International Journal of Primatology, 27, 311–321.
Rakotondranary, J., Ratovonamana, Y. R., Ganzhorn, J. U. (2011). Distributions et caractéristiques deshabitats de Microcebus griseorufus (Cheirogaleidae) dans le Parc National de Tsimanampetsotsa(Sud-ouest de Madagascar). Malagasy Nature, 4.
Rasoloarison, R. M., Rasolonandrasana, B. P. N., Ganzhorn, J. U., & Goodman, S. M. (1995). Predationon vertebrates in the Kirindy Forest, Western Madagascar. Ecotropica, 1, 59–65.
Rasoma, J., & Goodman, S. M. (2007). Food habits of the Barn Owl (Tyto alba) in spiny bush habitat ofarid Southwestern Madagascar. Journal of Arid Environments, 69, 537–543.
Richard, A. F., Dewar, R. E., Schwartz, M., & Ratsirarson, J. (2000). Mass change, environmentalvariability and female fertility in wild Propithecus verreauxi. Journal of Human Evolution, 39, 381–391.
SAS Institute (1989–2007). JMP 7.0. Cary: SAS InstituteShoo, L. P. (2010). Planning for biodiversity in future climates. Science, 327, 1452–1452.
912 Y.E.-M.B. Bohr et al.

Shoo, L. P., Storlie, C., Vanderwal, J., Little, J., & Williams, S. E. (2010). Targeted protection andrestoration to conserve tropical biodiversity in a warming world. Global Change Biology. doi:10.1111/j.1365-2486.2010.02218.x.
Tadross, M., Randriamarolaza, L., Rabefitia, Z., & Zheng, K. Y. (2008). Climate change in Madagascar;recent past and future. Washington: World Bank. www.csag.uct.ac.za/~mtadross/Madagascar%20Climate%20Report.pdf.
Weisrock, D. W., Rasoloarison, R. M., Fiorentino, I., Ralison, J. M., Goodman, S. M., Kappeler, P. M., etal. (2010). Delimiting species without nuclear monophyly in Madagascar’s mouse lemurs. PLoSONE, 5, doi:10.1371/journal.pone.0009883
Wilmé, L., Goodman, S. M., & Ganzhorn, J. U. (2006). Biogeographic evolution of Madagascar'smicroendemic biota. Science, 312, 1063–1065.
Wright, P. C. (1999). Lemur traits and Madagascar ecology: Coping with an island environment. Yearbookof Physical Anthropology, 42, 31–72.
Wright, P. C., Razafindratsita, V. R., Pochron, S. T., & Jernvall, J. (2005). The key to Madagascarfrugivores: The search for strong indicators. In J. L. Dew & J. P. Boubli (Eds.), Tropical fruits andfrugivores (pp. 121–138). Dordrecht: Springer.
Yoder, A. D., Burns, M. M., & Génin, F. (2002). Molecular evidence of reproductive isolation insympatric sibling species of mouse lemurs. International Journal of Primatology, 23, 1335–1343.
Distributional Limits of Gray-brown Mouse Lemurs 913