grasim-annual-report-2020-21.pdf - aditya birla chemicals
TRANSCRIPT


Shri Aditya Vikram Birla
We live by his values.Integrity, Commitment, Passion, Seamlessness and Speed.
Chairman’s Letter to Shareholders
Dear Shareholders,The COVID-19 pandemic has touched every aspect of our lives across the world. It has altered mindsets, perceptions, and strategies for businesses and beyond. If there is one abiding lesson, it is that sustainable growth and development involves holistic nurturing of human, natural, and financial capital. 2020 is a year that will only gain in significance when viewed through the perspective lens of time.
The Global EconomyThe world has been fighting the Covid-19 pandemic for more than a year now, and the struggle has had deleterious economic effects. In 2020, the global economy contracted by 3.3%, the largest contraction on record, at least since World War II. Much of it was concentrated in the first half of our fiscal year FY21, as several countries enforced strict lockdowns. Economies bounced back – albeit at differentiated speeds – in subsequent quarters, on the back of large fiscal stimulus packages, especially in the developed countries, restocking demand after dilution of lockdowns, and improved confidence levels following the start of vaccination programmes. As per the recent forecasts from International Monetary Fund (IMF), the US and China are expected to record a strong recovery in 2021, resulting in a net positive expansion of their economies over the 2019 levels. These two engines of growth are expected to boost demand for exports from other countries. Even the other two large economies, the EU and Japan, are expected to expand.
In response to the pandemic, central banks resorted to strongly supportive monetary policies in most developed economies, causing interest rates to go down to record lows. At the same time, another consequence of this policy has been a surfeit of liquidity. That has led to
a strong rally in prices of many industrial commodities, which has also been supported by the evolving economic recovery, stimulus-related demand expectations and certain supply-side disruptions. This has caused inflationary pressures on the cost dynamic of several manufacturing industries.
The latest IMF forecast suggests a strong 6% growth in global GDP in 2021. But the occurrence of second and third waves of Covid in different parts of the world and reports of virus mutations have created downside risks to the outlook of a strong growth rebound. Recovery remains uneven and uncertain, with the extent of fiscal support and level of vaccination being key differentiators of the short-term economic outlook across countries.
Indian Economy Indian economy, which was firmly on the path of recovery in the second half of FY21, was hit by a rather unexpectedly virulent second wave of Covid-19. That caused a severe strain on healthcare facilities in many parts of the country, leading to localised lockdowns and a fall in mobility to levels seen a year ago. This may lead to some reassessment of growth estimates for FY22.
As a silver lining, disruptions to production and supply chains have been far less severe during the second wave than during the first wave. Vaccinations are picking up pace, which would support faster normalisation of mobility levels and of related economic activities. Continued accommodative monetary policy of the RBI and the expected increase in capex from the Government are factors that will support growth recovery. In addition, global growth prospects provide us with exports as an additional strong driver of growth.
The longer-term prospects for the Indian economy continue to be robust. Various initiatives, including privatisation of public sector enterprises, monetisation of assets, implementation of National Infrastructure Pipeline, targeted investment incentives through the Production-Linked Incentives Scheme and the new Labour Code, are likely to spur a virtuous cycle of investments and growth in the medium-term.
ABG in PerspectiveLike for many other organisations, the Covid crisis brought out challenges of many forms. Economic impact and business disruptions apart, many members of our extended family – our employees and their near ones, our value chain partners, our neighbourhoods – faced health emergencies. The pandemic also caused deep psychological scars as people had to adjust to new ways of living and working. Notwithstanding these challenges, our employees have displayed the highest possible resilience in coping with personal concerns and yet staying focused on the customers and the business. Our business results convey only a small part of the story of our employee courage, compassion, community spirit and cultural strength.
As the lockdowns took a firm grip on people’s lives and constraints mounted in the early part of the financial year, our leadership teams rose to the occasion with robust planning and continuous communication with people at all levels through the organisation. Personally, it was energising for me to engage at scale with employees globally through a series of digital townhalls that instilled confidence in employees and reinforced the power of ‘One ABG’. The ‘Respond, Recover and Re-imagine’ framework underpinned several new initiatives. These included close coordination among HR teams across the Group units to respond to local-level challenges by leveraging the organisational resources and a thrust on disseminating relevant information through all digital channels about the resources lined up to help the extended ABG family deal with the emergencies.
Covid warriors were trained, and voluntary networks were formed to assist our employees and their families in need. Preferential tie-ups with local hospitals and a central coordination centre with an external party were set up to provide special assistance to our employees through Doctors’ network, telemedicine and other COVID related health assistance. Workplace health, hygiene and Covid-appropriate behaviour remained the focus of our managers at all levels helping the organisation to stay ever vigilant. ‘Test, Treat and Trace’ was the mantra of protection and well-being followed scrupulously.
Apart from focusing on health emergencies, initiatives for mental agility and continuous learning were taken to maintain organisational morale. A learning programme christened as ‘Chairman’s Invitation Series’ was curated to bring the best insights on a changing world from the world’s leading thought leaders. There was an increased thrust on online education, recognition, and knowledge sharing sessions.
These well-rounded initiatives on the people front also helped our business performance to bounce back strongly. The focus on customers and costs remained undiminished though the year. Critical business processes such as new line commissioning, new product launches, new system and technology implementation- all happened seamlessly and presented a unique human story of innovation and fortitude bringing alive the values of commitment and passion. People learnt new skills and new behaviour at work while not being at office or at the workplace as one knows. People engagement, team trust and Group values proved to be the energy and the glue for our performance.
In the spirit of not letting a crisis go to waste, our HR Teams globally collaborated to create a long-term HR Strategy for the Group and individual businesses. This was achieved even while working remotely; 150 of the HR leaders came together digitally over a four-month period to craft a coherent HR strategy to reflect both Group aspirations and the business needs. Premised on creating an Avant Garde HR strategy, the work focused on employee experience and business productivity in a balanced mix with growth, technology, and talent as other critical pillars. This HR strategy is under dissemination to various stakeholders and an annual action agenda is being rolled out at all levels. This has
2 Grasim Industries Limited
been a signature example of collaboration, thought leadership and determined action – ingredients that usually make up most successful organisations.
Your Company’s Performance The pandemic induced shutdowns at the start of the fiscal year created an unprecedented business environment. Your Company gave primacy to the safety and well-being of its employees and local communities, along with a clear focus on maintaining business continuity.
Grasim’s inherent dynamism and resilience, cushioned by its strong balance sheet, enabled the Company to navigate this disruption and accelerate the journey from revival to renewal. The sharp recovery in the operational performance was on account of your Company’s steadfast commitment to its long-term strategies of customer orientation, sustainability, cost optimisation and R&D led product development.
Keeping in mind the long-term strategic intent of creating value for all shareholders, your Company has identified paints as a new engine of growth. Decorative paints as an industry witnessed double-digit growth rate for the last many years, and it has achieved significant scale. In FY21, as part of the long-term strategic portfolio choice, your Company also decided to monetise the fertilizer business.
On a Consolidated basis, Grasim’s Revenue for FY2020-21 stood at `76,398 Crore and EBITDA at `15,766 Crore.
ViscoseThe VSF business realigned its operations to the changing market dynamics in FY21. Demand for textile products was severely impacted in Q1FY21 as most global markets were ravaged by COVID-induced shutdowns. The market situation started improving from Q2FY21 with the gradual reopening of various economies and with demand recovery picking pace. The business witnessed unprecedented volatility during FY21, as the capacity utilisation rates dipped to low single-digit in Q1FY21 and scaled back to full utilisation level by Q4FY21. The relentless focus on Innovation, Sustainability and Cost optimisation enabled the business to weather the unprecedented disruption caused by the pandemic and emerge stronger.
The Company has identified the potential of “Green Fibre”, which is a solution to a sustainable future. Green Fibre credentials are based on the three key tenets of “Green Product” produced through “Green Technology”, ensuring a “Green Ecosystem”. The business has made significant progress with the launch of a circular product – Liva Reviva, which is made using industrial cotton waste. The launch of Anti-microbial fibre and non-woven products under the brand name Birla Purocel-EcoFlush exemplifies solution-oriented innovations and the Company’s commitment to sustainability.
Sustainability is now at the core of every decision of the business. The concerted action on this front is now getting due external recognition. In 2020, Grasim attained a prominent rank in the S&P Dow Jones Sustainability Indices (DJSI) among participating
Statutory ReportsFinancial statem
entsIntegrated Report
Integrated Annual Report 2020-21 3
companies in its sector. The VSF business has been ranked #1 Globally with ‘Dark Green Shirt’ in Canopy’s Hot Button Report 2020 and was also the recipient of the ‘Golden Peacock Global Award for Sustainability’ for the year 2020.
The VSF business has been working on achieving the EU-BAT norms in all its plants by 2022. It is also in the process of setting up the first Zero Liquid Discharge plant for the viscose fibre industry at its Nagda unit by 2021.
The pandemic presented an opportunity to relook at cost structures to drive efficiency. The business team has been able to significantly reduce the fixed cost and variable cost during the year.
The VSF business reported production and sales volume of 452 KT and 463 KT respectively, in FY21. The Revenue from VSF sales stood at `6,965 Crore and EBITDA at `1,187 Crore. Better product mix, cost optimisation and recovery in the prices during H2FY21 partially cushioned the dent caused by the weak operational performance on account of the lockdowns during Q1FY21.
ChemicalsThe operational performance of the Chemicals business was above par despite COVID-induced lockdowns, which impacted plant operations briefly. The global demand for caustic soda was impacted due to weakness in the demand from end-user industries like paper and textile. Global caustic soda prices remained subdued during the year, while chlorine prices stayed strong. Domestic caustic soda prices maintained a weak trend influenced by weak global prices, substantial capacity additions and continuous imports. Despite a delay owing to COVID-induced lockdowns, the business is on the path to complete its capacity expansion program for Caustic soda and Chlorine VAPs in FY22. The business endeavours to improve the percentage of Chlorine integration by increasing the VAP portfolio, which fits into the long-term strategy of improving the rate of chlorine integration to 40% by FY25 from 28% in FY21.
The performance of the Advanced Materials (Epoxy) business was robust, driven by strong demand from the end-user segment (Auto and Wind Power) and substantial improvement in realisation. Witnessing a strong demand in the Advanced Materials business, your Company has decided to double its capacity.
Improving the share of renewable energy in the overall power mix, which achieves the twin objective of cutting power costs and reducing emissions, and setting up Zero Liquid Discharge plants are core to the Sustainability strategy.
The Net Revenue for FY21 stood at `4,581 Crore and EBITDA at `590 Crore.
Other BusinessesThe Urea business reported an EBITDA of `222 Crore in FY21, a significant improvement from the previous year driven by better Purak sales and fixed cost optimisation. The Fertiliser Business divestment process is on course and expected to be completed in FY22 after receipt of NCLT approvals for the Scheme of Arrangement amongst other pending approvals.
The performance of the Textiles business, consisting of linen, wool, and premium cotton fabric, was severely impacted by the lockdown with a weak demand environment. There was an overall improvement in operational and financial performance from Q4FY21.
The performance of the Insulators business for FY21 improved, driven by demand from overseas markets, while the domestic demand remained subdued.
The importance of pulp JVs came to the fore this fiscal, especially during periods of supply tightness coupled with runaway prices. These units cater to a significant portion of our pulp requirement and ensure consistency in the supply of prime quality pulp. The financial performance of JVs improved during FY21, with the improvement in pulp prices during Q4FY21.
CapexYour Company has been in the process of executing a capex plan for raising capacities in both the VSF and Chemical businesses and towards modernisation capex at various plants. Towards this capex plan, the Company spent `1,508 Crore in FY21 and is expected to further spend `2,604 Crore in FY22 (standalone basis). This capex plan does not include the outlay for the Paints business. The Board of your Company has approved an initial capex of `5,000 Crore for the Paints business. This amount will be invested over the next three years.
UltraTech Cement Ltd. (a subsidiary of the Company) The Indian Cement demand contracted by 10%-12% in FY21, given the economic standstill in H1FY21. However, H2FY21 witnessed a steady demand recovery.
The uptick in demand for cement was driven by affordable housing projects and Government infrastructure projects like roads, metro, irrigation projects and others.
The cement demand growth in FY22 is expected to remain strong considering the Government’s thrust on infrastructure and roads development, housing, and rural infrastructure.
UltraTech reported net revenues of `44,239 Crore and EBITDA of `12,302 Crore during FY21.
4 Grasim Industries Limited
UltraTech has approved a fresh capex of `5,477 Crore towards increasing capacity by 12.8 MTPA with a mix of brownfield and greenfield expansion, in addition to a 6.7 MTPA capacity expansion currently underway. Upon completion of the latest round of expansion, UltraTech’s capacity will grow to 136.25 MTPA, reinforcing its position as the third-largest cement company in the world, outside of China.
Aditya Birla Capital Ltd. (a subsidiary of the Company)Aditya Birla Capital’s consolidated revenue grew by 15% YoY to `19,248 Crore, and net profit after minority interest grew by 22% YoY to `1,127 Crore for FY21. The active customer base across the businesses increased to 24 million with a clear focus on retail growth across all the businesses. The diversified portfolio of products and services offered by Aditya Birla Capital allows it to leverage broader opportunities in India’s financial services sector.
The Overall lending book (NBFC and Housing Finance) stood at `60,558 Crore. For the NBFC business, asset quality, technological innovation and cost optimisation remain the key focus areas for achieving growth.
The Life Insurance business reported a single-digit year on year growth in total gross premium to `9,775 Crore in FY21. The embedded value of the business increased to `6,441 Crore in FY21.
The Asset Management business reported domestic closing Assets Under Management (AAUM) of `2,81,035,433 Crore, up 7% YoY.
The Gross written premium in the Health insurance business grew 49% YoY to `1,301 Crore.
Aditya Birla RenewablesThe cumulative installed capacity of Aditya Birla Renewables stood at 502MW in FY21, which has increased by 3x in the last two years. The share of group captive capacity stood at 160 MW in FY21, which is likely to go up given our continuous focus on increasing the share of renewable mix in each of our Group businesses. This cumulative installed capacity is expected to rise to 845MW by FY23.
Conclusion The year-long response to the pandemic, across the globe, exhibited all that is noble and uplifting in the human spirit. A spirit that was also in display in your Company’s actions and performance during the year.
Through this pandemic, your Company’s people and systems have been battle tested and even better prepared to face any competitive challenge or serious external disruption. It has strengthened the bonds within, opened better vistas of co-operation and convinced our stakeholders that our people deliver – no matter what! That is our best assurance of sustainability and continued collective prosperity.
Yours sincerely,
Kumar Mangalam BirlaChairman
Statutory ReportsFinancial statem
entsIntegrated Report
Integrated Annual Report 2020-21 5
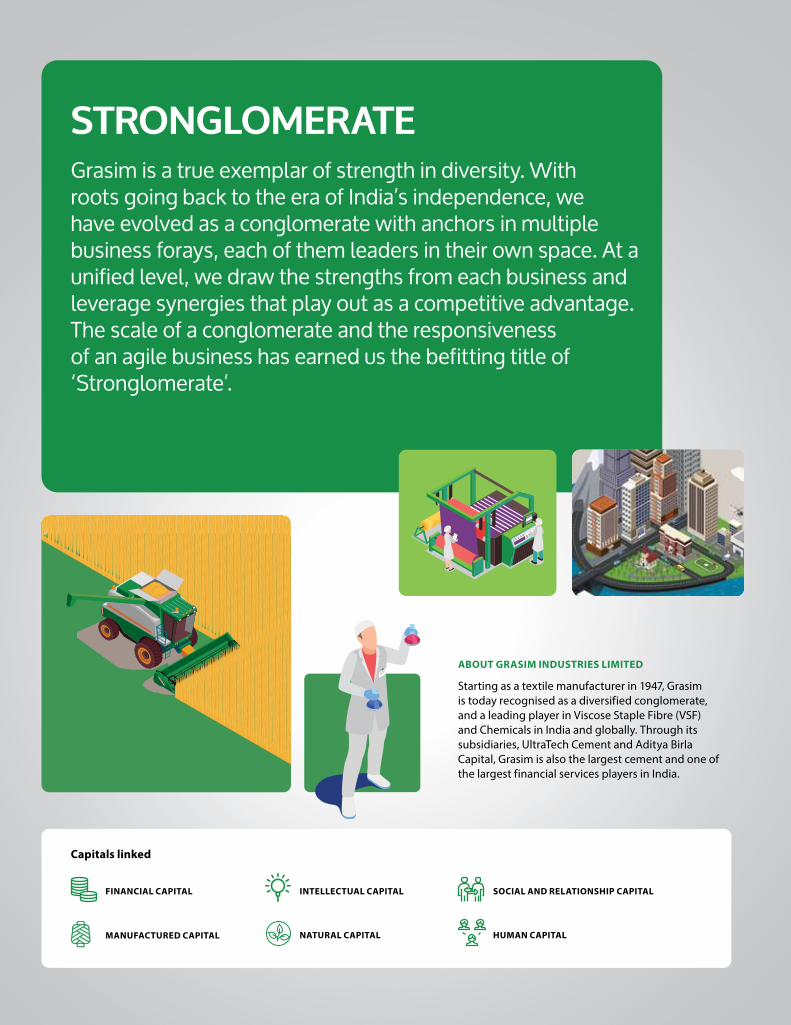
ABOUT GRASIM INDUSTRIES LIMITED
Starting as a textile manufacturer in 1947, Grasim is today recognised as a diversified conglomerate, and a leading player in Viscose Staple Fibre (VSF) and Chemicals in India and globally. Through its subsidiaries, UltraTech Cement and Aditya Birla Capital, Grasim is also the largest cement and one of the largest financial services players in India.
Grasim is a true exemplar of strength in diversity. With roots going back to the era of India’s independence, we have evolved as a conglomerate with anchors in multiple business forays, each of them leaders in their own space. At a unified level, we draw the strengths from each business and leverage synergies that play out as a competitive advantage. The scale of a conglomerate and the responsiveness of an agile business has earned us the befitting title of ‘Stronglomerate’.
STRONGLOMERATE
Capitals linked
MANUFACTURED CAPITAL NATURAL CAPITAL
SOCIAL AND RELATIONSHIP CAPITAL
HUMAN CAPITAL
FINANCIAL CAPITAL INTELLECTUAL CAPITAL
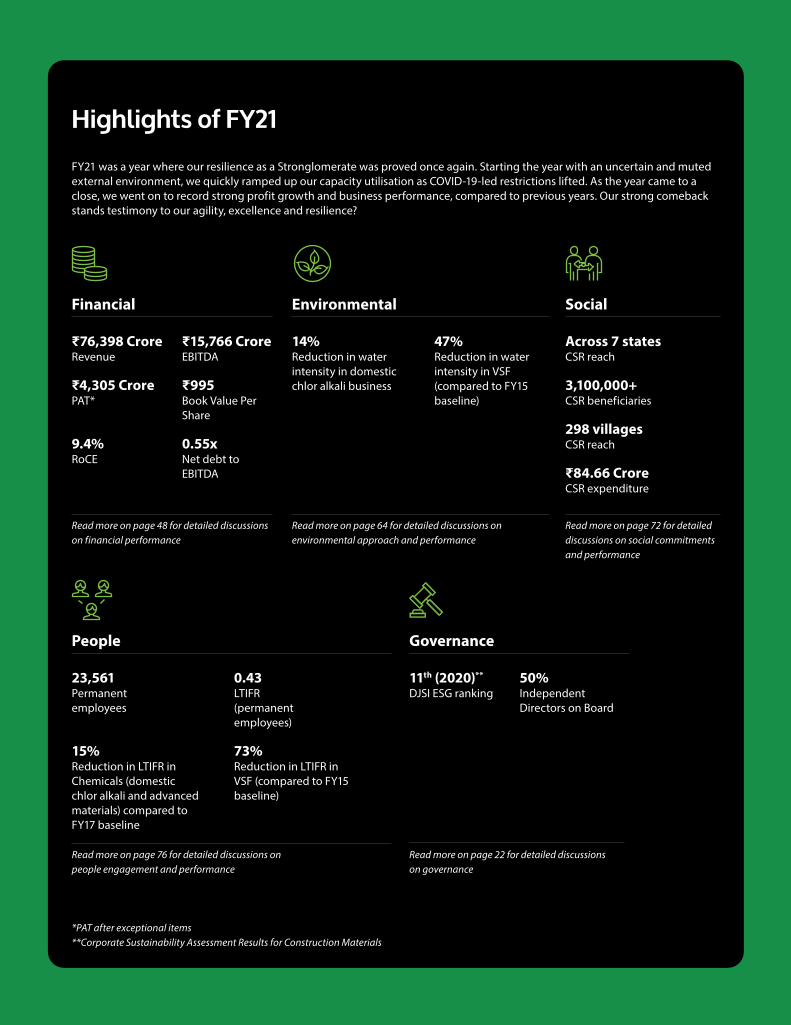
Highlights of FY21
FY21 was a year where our resilience as a Stronglomerate was proved once again. Starting the year with an uncertain and muted external environment, we quickly ramped up our capacity utilisation as COVID-19-led restrictions lifted. As the year came to a close, we went on to record strong profit growth and business performance, compared to previous years. Our strong comeback stands testimony to our agility, excellence and resilience?
Financial SocialEnvironmental
People
₹76,398 CroreRevenue
₹4,305 CrorePAT*
9.4%RoCE
Across 7 statesCSR reach
3,100,000+CSR beneficiaries
298 villagesCSR reach
₹84.66 CroreCSR expenditure
₹15,766 CroreEBITDA
₹995Book Value Per Share
0.55xNet debt to EBITDA
Read more on page 48 for detailed discussions on financial performance
Read more on page 72 for detailed discussions on social commitments and performance
Read more on page 64 for detailed discussions on environmental approach and performance
*PAT after exceptional items**Corporate Sustainability Assessment Results for Construction Materials
23,561Permanent employees
0.43LTIFR (permanent employees)
Governance
11th (2020)**
DJSI ESG ranking50%Independent Directors on Board
14%Reduction in water intensity in domestic chlor alkali business
15%Reduction in LTIFR in Chemicals (domestic chlor alkali and advanced materials) compared to FY17 baseline
47% Reduction in water intensity in VSF (compared to FY15 baseline)
73%Reduction in LTIFR in VSF (compared to FY15 baseline)
Read more on page 76 for detailed discussions on people engagement and performance
Read more on page 22 for detailed discussions on governance
Strategic interventions for enhanced customer connect
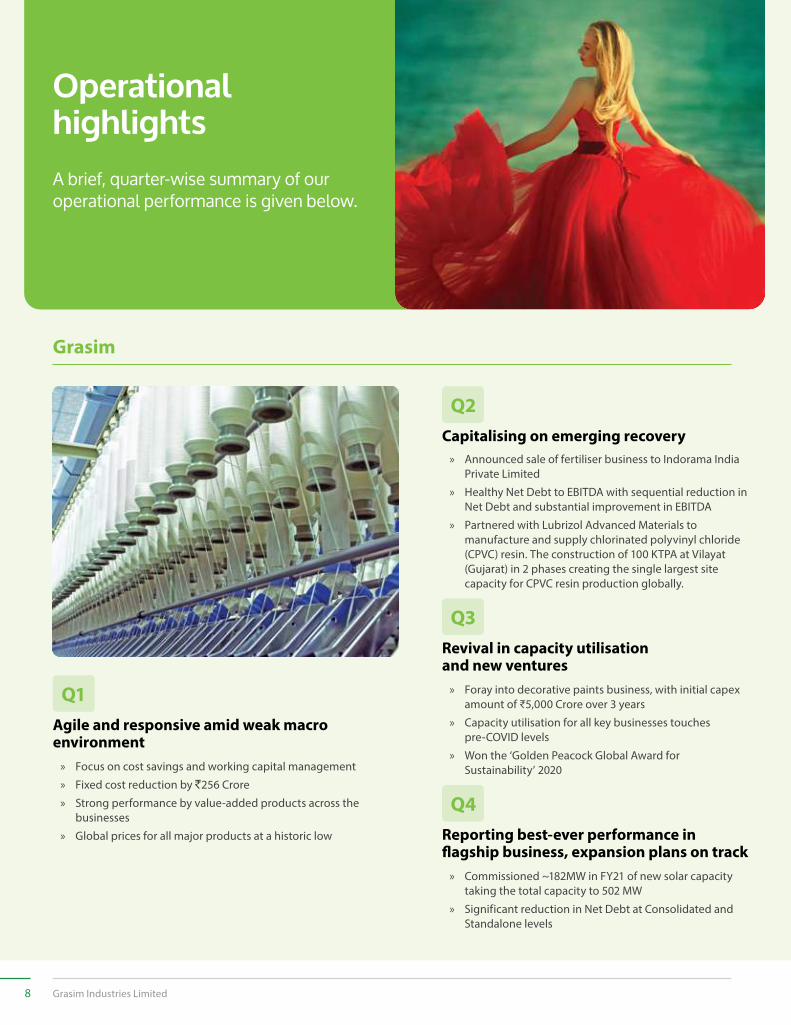
A brief, quarter-wise summary of our operational performance is given below.
Operational highlights
Grasim
Q1Agile and responsive amid weak macro environment
» Focus on cost savings and working capital management
» Fixed cost reduction by `256 Crore
» Strong performance by value-added products across the businesses
» Global prices for all major products at a historic low
Q2Capitalising on emerging recovery
» Announced sale of fertiliser business to Indorama India Private Limited
» Healthy Net Debt to EBITDA with sequential reduction in Net Debt and substantial improvement in EBITDA
» Partnered with Lubrizol Advanced Materials to manufacture and supply chlorinated polyvinyl chloride (CPVC) resin. The construction of 100 KTPA at Vilayat (Gujarat) in 2 phases creating the single largest site capacity for CPVC resin production globally.
Q3Revival in capacity utilisation and new ventures
» Foray into decorative paints business, with initial capex amount of ₹5,000 Crore over 3 years
» Capacity utilisation for all key businesses touches pre-COVID levels
» Won the ‘Golden Peacock Global Award for Sustainability’ 2020
Q4Reporting best-ever performance in flagship business, expansion plans on track
» Commissioned ~182MW in FY21 of new solar capacity taking the total capacity to 502 MW
» Significant reduction in Net Debt at Consolidated and Standalone levels
8 Grasim Industries Limited
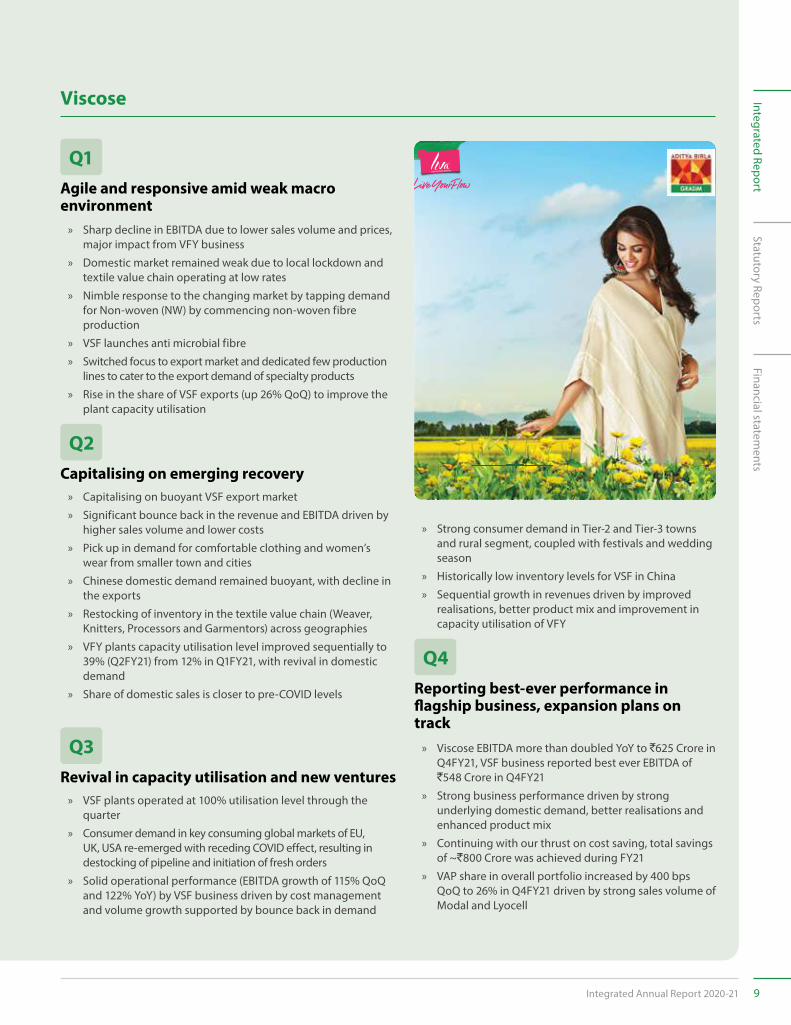
Viscose
Q1Agile and responsive amid weak macro environment
» Sharp decline in EBITDA due to lower sales volume and prices, major impact from VFY business
» Domestic market remained weak due to local lockdown and textile value chain operating at low rates
» Nimble response to the changing market by tapping demand for Non-woven (NW) by commencing non-woven fibre production
» VSF launches anti microbial fibre
» Switched focus to export market and dedicated few production lines to cater to the export demand of specialty products
» Rise in the share of VSF exports (up 26% QoQ) to improve the plant capacity utilisation
Q2Capitalising on emerging recovery
» Capitalising on buoyant VSF export market
» Significant bounce back in the revenue and EBITDA driven by higher sales volume and lower costs
» Pick up in demand for comfortable clothing and women’s wear from smaller town and cities
» Chinese domestic demand remained buoyant, with decline in the exports
» Restocking of inventory in the textile value chain (Weaver, Knitters, Processors and Garmentors) across geographies
» VFY plants capacity utilisation level improved sequentially to 39% (Q2FY21) from 12% in Q1FY21, with revival in domestic demand
» Share of domestic sales is closer to pre-COVID levels
»Q3Revival in capacity utilisation and new ventures
» VSF plants operated at 100% utilisation level through the quarter
» Consumer demand in key consuming global markets of EU, UK, USA re-emerged with receding COVID effect, resulting in destocking of pipeline and initiation of fresh orders
» Solid operational performance (EBITDA growth of 115% QoQ and 122% YoY) by VSF business driven by cost management and volume growth supported by bounce back in demand
» Strong consumer demand in Tier-2 and Tier-3 towns and rural segment, coupled with festivals and wedding season
» Historically low inventory levels for VSF in China
» Sequential growth in revenues driven by improved realisations, better product mix and improvement in capacity utilisation of VFY
Q4Reporting best-ever performance in flagship business, expansion plans on track
» Viscose EBITDA more than doubled YoY to `625 Crore in Q4FY21, VSF business reported best ever EBITDA of `548 Crore in Q4FY21
» Strong business performance driven by strong underlying domestic demand, better realisations and enhanced product mix
» Continuing with our thrust on cost saving, total savings of ~`800 Crore was achieved during FY21
» VAP share in overall portfolio increased by 400 bps QoQ to 26% in Q4FY21 driven by strong sales volume of Modal and Lyocell
Statutory ReportsFinancial statem
entsIntegrated Report
Integrated Annual Report 2020-21 9
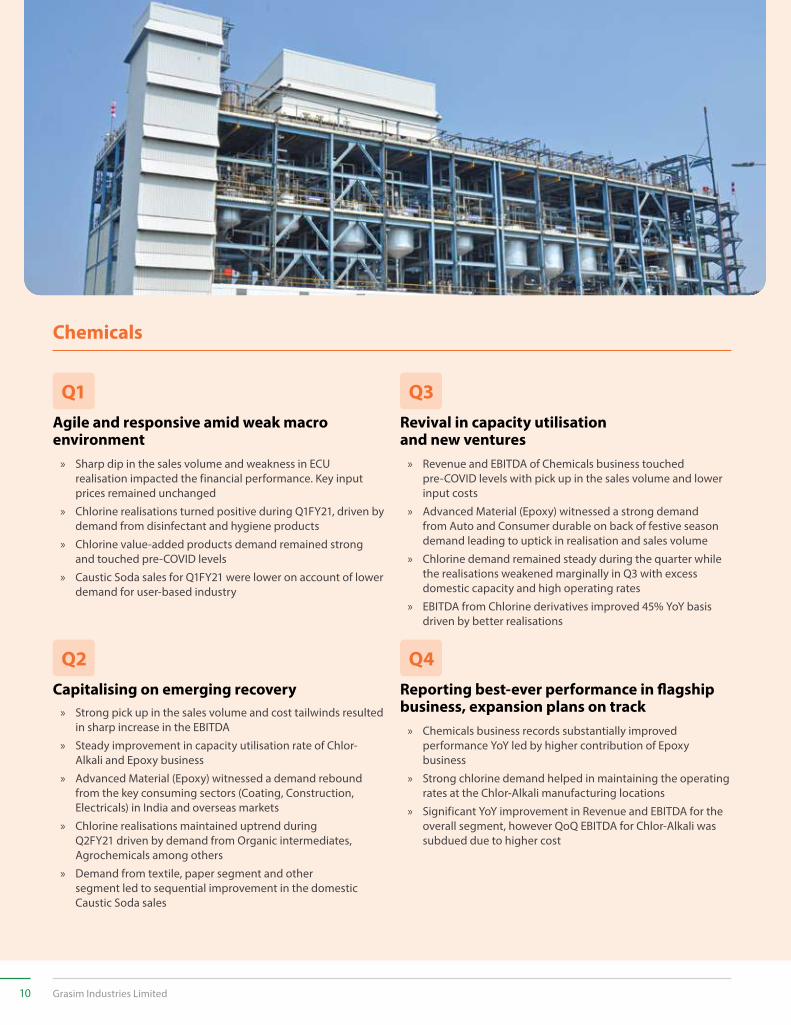
Chemicals
Q1Agile and responsive amid weak macro environment
» Sharp dip in the sales volume and weakness in ECU realisation impacted the financial performance. Key input prices remained unchanged
» Chlorine realisations turned positive during Q1FY21, driven by demand from disinfectant and hygiene products
» Chlorine value-added products demand remained strong and touched pre-COVID levels
» Caustic Soda sales for Q1FY21 were lower on account of lower demand for user-based industry
» Q2Capitalising on emerging recovery
» Strong pick up in the sales volume and cost tailwinds resulted in sharp increase in the EBITDA
» Steady improvement in capacity utilisation rate of Chlor-Alkali and Epoxy business
» Advanced Material (Epoxy) witnessed a demand rebound from the key consuming sectors (Coating, Construction, Electricals) in India and overseas markets
» Chlorine realisations maintained uptrend during Q2FY21 driven by demand from Organic intermediates, Agrochemicals among others
» Demand from textile, paper segment and other segment led to sequential improvement in the domestic Caustic Soda sales
»Q3Revival in capacity utilisation and new ventures
» Revenue and EBITDA of Chemicals business touched pre-COVID levels with pick up in the sales volume and lower input costs
» Advanced Material (Epoxy) witnessed a strong demand from Auto and Consumer durable on back of festive season demand leading to uptick in realisation and sales volume
» Chlorine demand remained steady during the quarter while the realisations weakened marginally in Q3 with excess domestic capacity and high operating rates
» EBITDA from Chlorine derivatives improved 45% YoY basis driven by better realisations
» YQ4Reporting best-ever performance in flagship business, expansion plans on track
» Chemicals business records substantially improved performance YoY led by higher contribution of Epoxy business
» Strong chlorine demand helped in maintaining the operating rates at the Chlor-Alkali manufacturing locations
» Significant YoY improvement in Revenue and EBITDA for the overall segment, however QoQ EBITDA for Chlor-Alkali was subdued due to higher cost
10 Grasim Industries Limited
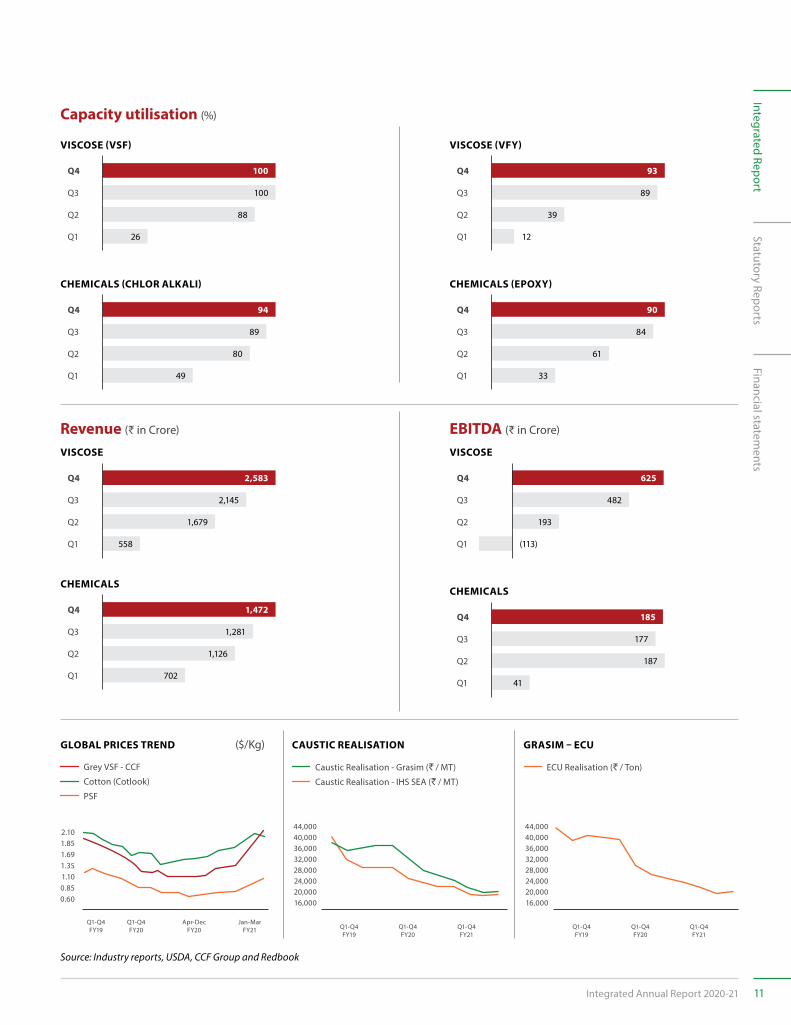
Capacity utilisation (%)
VISCOSE (VSF)
100
100
88
Q4
Q3
Q2
Q1 26
CHEMICALS (CHLOR ALKALI)
94
89
80
Q4
Q3
Q2
Q1 49
VISCOSE (VFY)
93
89
39
Q4
Q3
Q2
Q1 12
CHEMICALS (EPOXY)
90
84
61
Q4
Q3
Q2
Q1 33
Revenue (₹ in Crore)
VISCOSE
2,583
2,145
1,679
Q4
Q3
Q2
Q1 558
CHEMICALS
1,472
1,281
1,126
Q4
Q3
Q2
Q1 702
EBITDA (₹ in Crore)
CHEMICALS
185
177
187
Q4
Q3
Q2
Q1 41
VISCOSE
Q4
Q3
Q2
625
482
193
(113)Q1
GLOBAL PRICES TREND ($/Kg) CAUSTIC REALISATION GRASIM – ECU
44,000
36,00040,000
32,00028,00024,00020,00016,000
Q1-Q4FY19
Q1-Q4FY20
44,000
36,00040,000
32,00028,00024,00020,00016,000
Q1-Q4FY19
Q1-Q4FY20
Q1-Q4FY21
Q1-Q4FY21
2.101.851.691.351.100.850.60
Q1-Q4FY19
Q1-Q4FY20
Apr-DecFY20
Jan-MarFY21
Caustic Realisation - Grasim (` / MT) Caustic Realisation - IHS SEA (` / MT)
ECU Realisation (` / Ton) Grey VSF - CCF Cotton (Cotlook) PSF
Source: Industry reports, USDA, CCF Group and Redbook
Statutory ReportsFinancial statem
entsIntegrated Report
Integrated Annual Report 2020-21 11
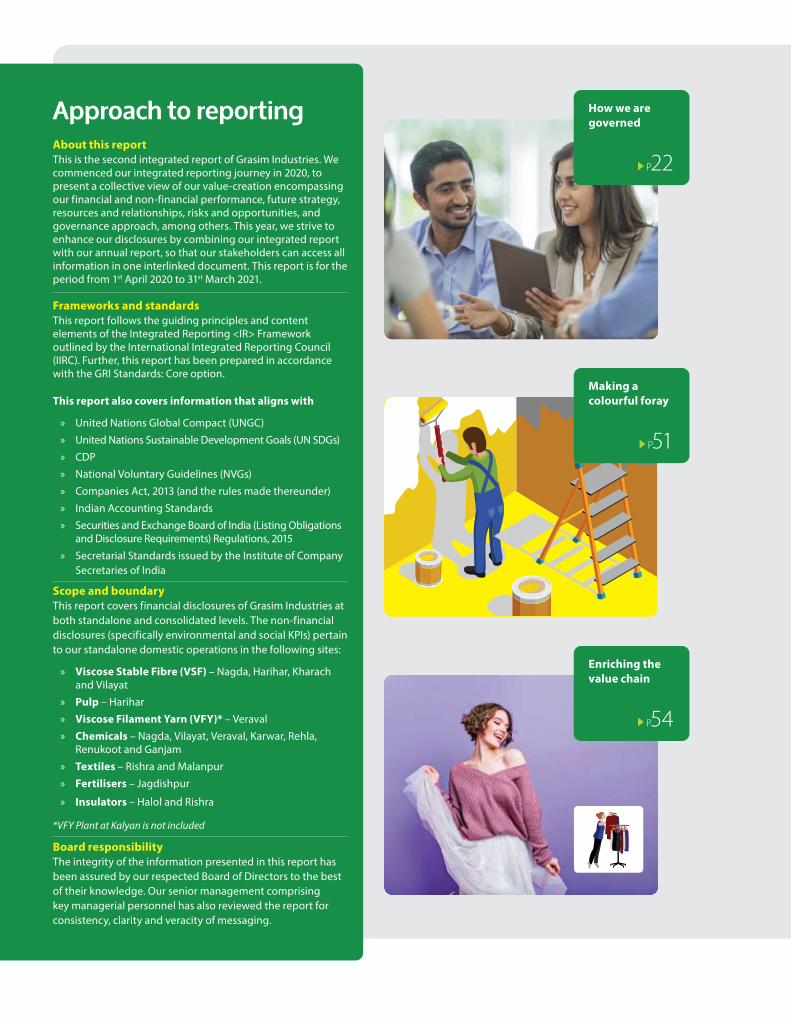
Approach to reportingAbout this reportThis is the second integrated report of Grasim Industries. We commenced our integrated reporting journey in 2020, to present a collective view of our value-creation encompassing our financial and non-financial performance, future strategy, resources and relationships, risks and opportunities, and governance approach, among others. This year, we strive to enhance our disclosures by combining our integrated report with our annual report, so that our stakeholders can access all information in one interlinked document. This report is for the period from 1st April 2020 to 31st March 2021.
Frameworks and standardsThis report follows the guiding principles and content elements of the Integrated Reporting <IR> Framework outlined by the International Integrated Reporting Council (IIRC). Further, this report has been prepared in accordance with the GRI Standards: Core option.
This report also covers information that aligns with
» United Nations Global Compact (UNGC)
» United Nations Sustainable Development Goals (UN SDGs)
» CDP
» National Voluntary Guidelines (NVGs)
» Companies Act, 2013 (and the rules made thereunder)
» Indian Accounting Standards
» Securities and Exchange Board of India (Listing Obligations and Disclosure Requirements) Regulations, 2015
» Secretarial Standards issued by the Institute of Company Secretaries of India
Scope and boundaryThis report covers financial disclosures of Grasim Industries at both standalone and consolidated levels. The non-financial disclosures (specifically environmental and social KPIs) pertain to our standalone domestic operations in the following sites:
» Viscose Stable Fibre (VSF) – Nagda, Harihar, Kharach and Vilayat
» Pulp – Harihar
» Viscose Filament Yarn (VFY)* – Veraval
» Chemicals – Nagda, Vilayat, Veraval, Karwar, Rehla, Renukoot and Ganjam
» Textiles – Rishra and Malanpur
» Fertilisers – Jagdishpur
» Insulators – Halol and Rishra
*VFY Plant at Kalyan is not included
Board responsibilityThe integrity of the information presented in this report has been assured by our respected Board of Directors to the best of their knowledge. Our senior management comprising key managerial personnel has also reviewed the report for consistency, clarity and veracity of messaging.
How we are governed
P22
Making a colourful foray
P51
Enriching the value chain
P54
ContentsAbout the Company 14
What we do 16
Where we are present 20
How we are governed 22
Message from the Managing Director 28
COVID-19 response 30
Value-creation model 32
Stakeholder engagement 34
Focusing on issues material to us 36
Strategy and resource allocation 38
Risk management 40
Achieving superior financial performance 48
Consistent operational performance 52
Innovating for lasting impact 58
Stewards of a sustainable tomorrow 62
Environment 64
Social 72
People 76
GRI index 82
Independent Assurance Statement 85
Financial highlights 88
Corporate information 92
Board’s Report 94
Management Discussion and Analysis 141
Report on Corporate Governance 148
Shareholder Information 173
Business Responsibility Report 184
Social Report 195
Standalone Financial Statements 199
Consolidated Financial Statements 298
Notice 475
Further information can be found online at grasim.com
Stakeholder engagement
P34
Remaining committed to our social goals
P72
Preserving the environment
P62
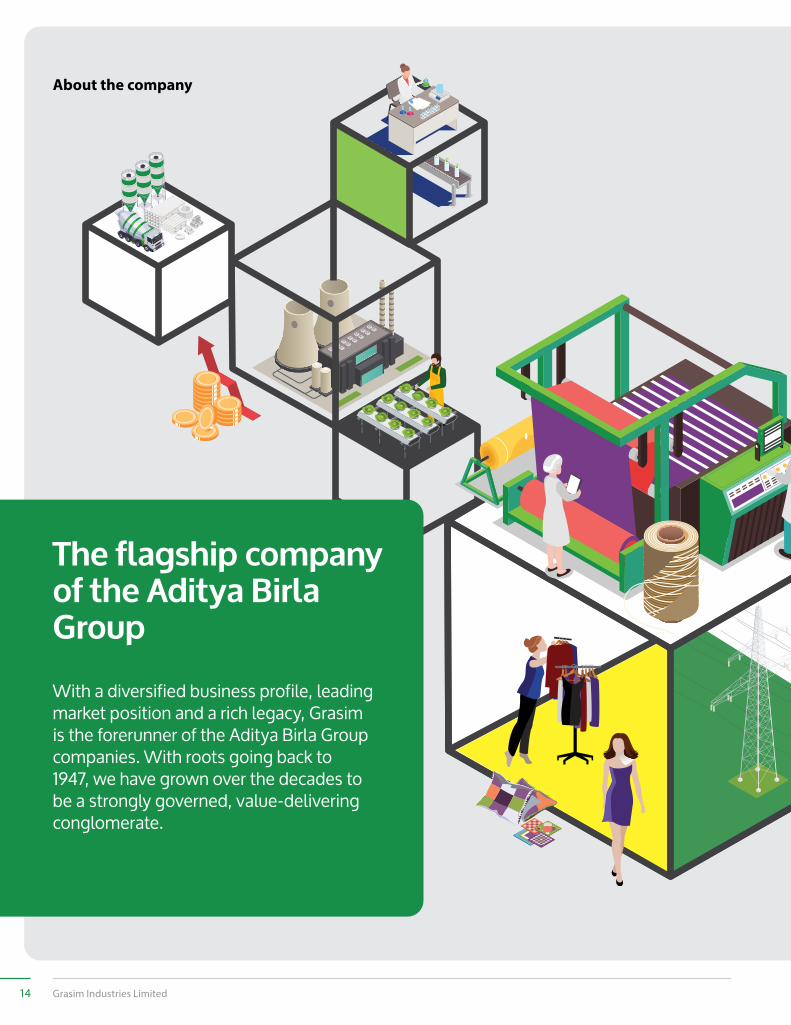
With a diversified business profile, leading market position and a rich legacy, Grasim is the forerunner of the Aditya Birla Group companies. With roots going back to 1947, we have grown over the decades to be a strongly governed, value-delivering conglomerate.
The flagship company of the Aditya Birla Group
About the company
14 Grasim Industries Limited
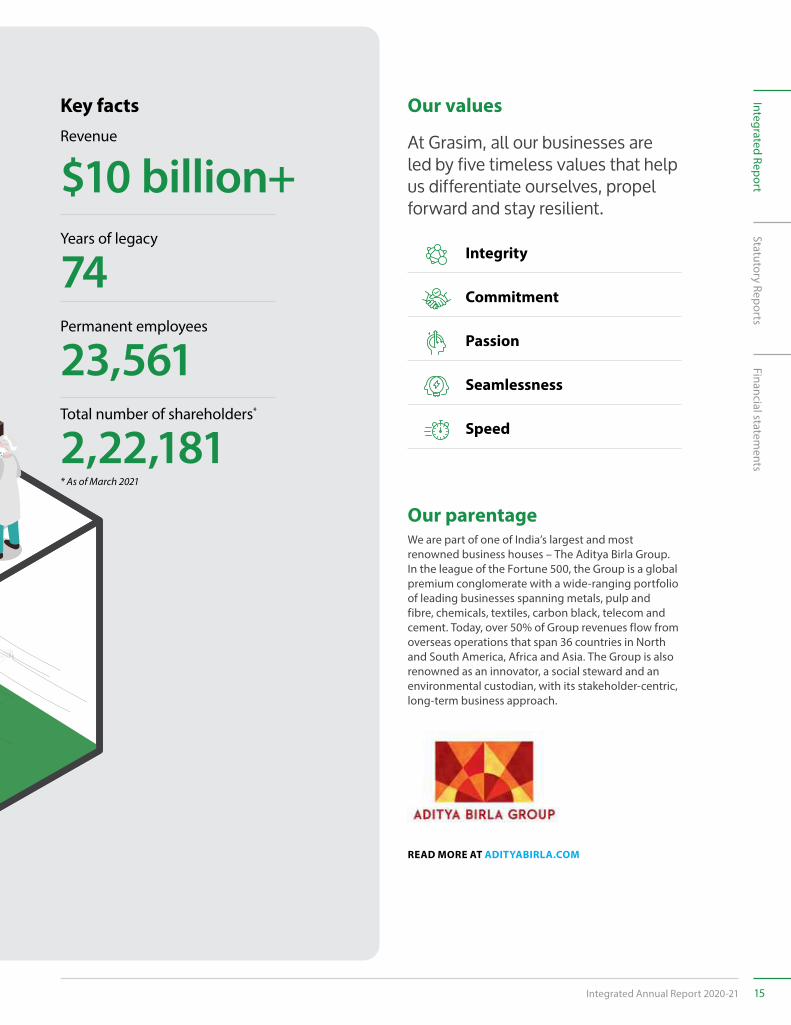
Key facts
$10 billion+
2,22,181
74
23,561
Revenue
Total number of shareholders*
Years of legacy
Permanent employees
Our values
Integrity
Commitment
Passion
Speed
Seamlessness
At Grasim, all our businesses are led by five timeless values that help us differentiate ourselves, propel forward and stay resilient.
Our parentageWe are part of one of India’s largest and most renowned business houses – The Aditya Birla Group. In the league of the Fortune 500, the Group is a global premium conglomerate with a wide-ranging portfolio of leading businesses spanning metals, pulp and fibre, chemicals, textiles, carbon black, telecom and cement. Today, over 50% of Group revenues flow from overseas operations that span 36 countries in North and South America, Africa and Asia. The Group is also renowned as an innovator, a social steward and an environmental custodian, with its stakeholder-centric, long-term business approach.
ADITYA BIRLA GROUP - BRAND GUIDELINES
Use the 2D textured colour Logo for print ads. In exceptional circumstances where the print is restricted to one colour, the black and white textured Logo can be used.
2D Colour Textured logosUsage on : Print media
2D LOGO WITH TEXTURE
READ MORE AT ADITYABIRLA.COM
* As of March 2021
Statutory ReportsFinancial statem
entsIntegrated Report
Integrated Annual Report 2020-21 15
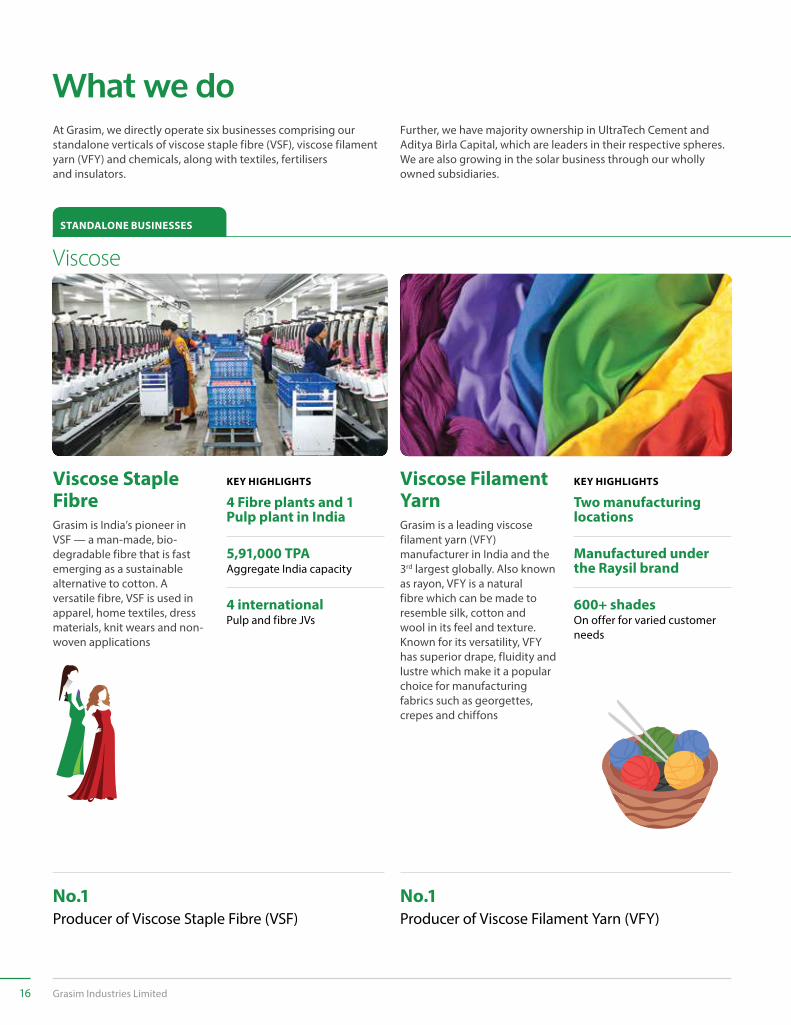
STANDALONE BUSINESSES
At Grasim, we directly operate six businesses comprising our standalone verticals of viscose staple fibre (VSF), viscose filament yarn (VFY) and chemicals, along with textiles, fertilisers and insulators.
What we doFurther, we have majority ownership in UltraTech Cement and Aditya Birla Capital, which are leaders in their respective spheres. We are also growing in the solar business through our wholly owned subsidiaries.
Grasim is India’s pioneer in VSF — a man-made, bio-degradable fibre that is fast emerging as a sustainable alternative to cotton. A versatile fibre, VSF is used in apparel, home textiles, dress materials, knit wears and non-woven applications
Grasim is a leading viscose filament yarn (VFY) manufacturer in India and the 3rd largest globally. Also known as rayon, VFY is a natural fibre which can be made to resemble silk, cotton and wool in its feel and texture. Known for its versatility, VFY has superior drape, fluidity and lustre which make it a popular choice for manufacturing fabrics such as georgettes, crepes and chiffons
Viscose Staple Fibre
Viscose
Viscose Filament Yarn
KEY HIGHLIGHTS KEY HIGHLIGHTS
4 Fibre plants and 1 Pulp plant in India
5,91,000 TPAAggregate India capacity
4 internationalPulp and fibre JVs
Two manufacturing locations
Manufactured under the Raysil brand
600+ shadesOn offer for varied customer needs
No.1Producer of Viscose Staple Fibre (VSF)
No.1Producer of Viscose Filament Yarn (VFY)
16 Grasim Industries Limited
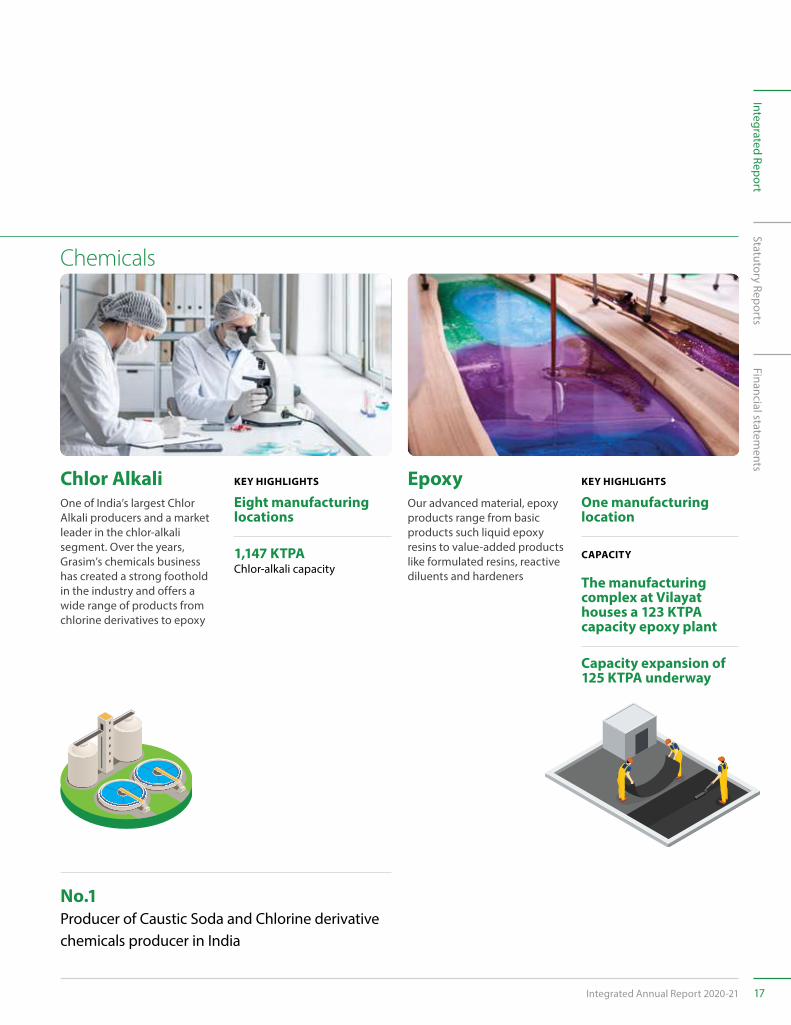
One of India’s largest Chlor Alkali producers and a market leader in the chlor-alkali segment. Over the years, Grasim’s chemicals business has created a strong foothold in the industry and offers a wide range of products from chlorine derivatives to epoxy
Chlor Alkali KEY HIGHLIGHTS
Our advanced material, epoxy products range from basic products such liquid epoxy resins to value-added products like formulated resins, reactive diluents and hardeners
EpoxyOne manufacturing location
KEY HIGHLIGHTS
Chemicals
CAPACITY
The manufacturing complex at Vilayat houses a 123 KTPA capacity epoxy plant
Capacity expansion of 125 KTPA underway
Eight manufacturing locations
1,147 KTPAChlor-alkali capacity
No.1Producer of Caustic Soda and Chlorine derivative chemicals producer in India
Statutory ReportsFinancial statem
entsIntegrated Report
Integrated Annual Report 2020-21 17
What we do
STANDALONE BUSINESSES
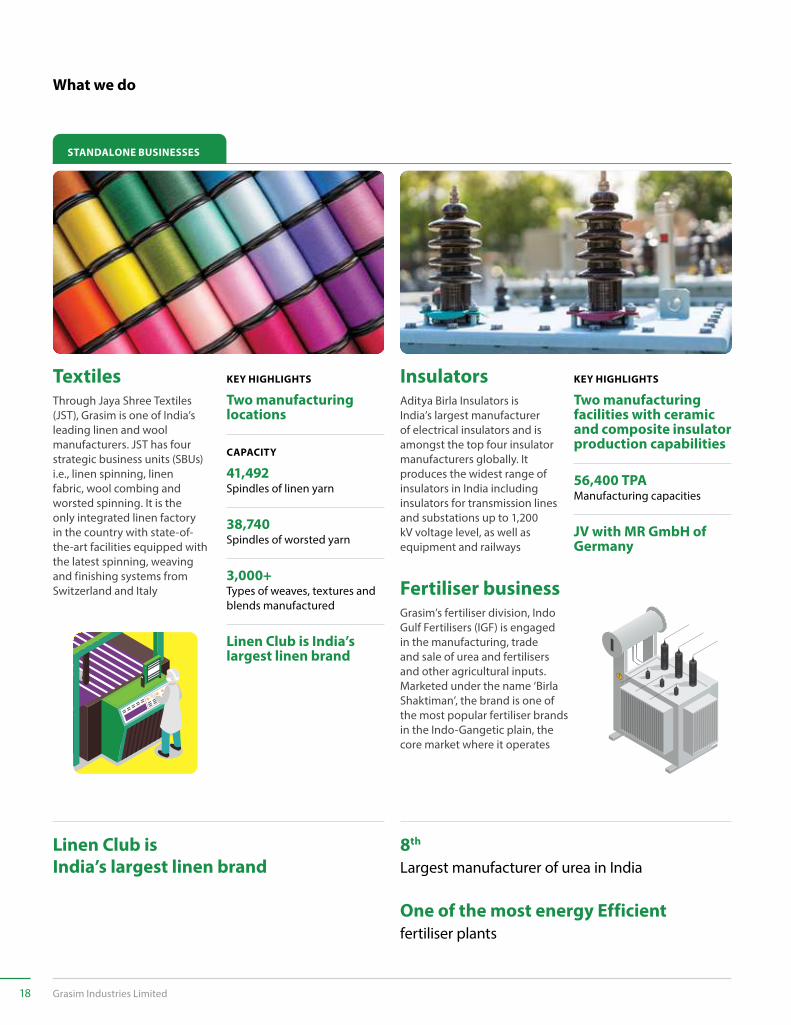
Through Jaya Shree Textiles (JST), Grasim is one of India’s leading linen and wool manufacturers. JST has four strategic business units (SBUs) i.e., linen spinning, linen fabric, wool combing and worsted spinning. It is the only integrated linen factory in the country with state-of-the-art facilities equipped with the latest spinning, weaving and finishing systems from Switzerland and Italy
Aditya Birla Insulators is India’s largest manufacturer of electrical insulators and is amongst the top four insulator manufacturers globally. It produces the widest range of insulators in India including insulators for transmission lines and substations up to 1,200 kV voltage level, as well as equipment and railways
Textiles Insulators
Fertiliser businessGrasim’s fertiliser division, Indo Gulf Fertilisers (IGF) is engaged in the manufacturing, trade and sale of urea and fertilisers and other agricultural inputs. Marketed under the name ‘Birla Shaktiman’, the brand is one of the most popular fertiliser brands in the Indo-Gangetic plain, the core market where it operates
KEY HIGHLIGHTS KEY HIGHLIGHTS
CAPACITY
Two manufacturing facilities with ceramic and composite insulator production capabilities
56,400 TPAManufacturing capacities
JV with MR GmbH of Germany
Linen Club is India’s largest linen brand
8th
Largest manufacturer of urea in India
One of the most energy Efficientfertiliser plants
41,492Spindles of linen yarn
38,740 Spindles of worsted yarn
3,000+Types of weaves, textures and blends manufactured
Linen Club is India’s largest linen brand
Two manufacturing locations
18 Grasim Industries Limited

Catering to the emerging and urgent need for non-conventional, greener sources of energy, the Aditya Birla Group forayed into the Renewables space, focusing on highly reliable and durable solar plants with high uptime, state-of-the-art technology, and a customer-centric approach
Aditya Birla Renewables
502 MW operational capacityKEY HIGHLIGHTS
SUBSIDIARIES WITH MAJORITY-STAKE OWNERSHIP
UltraTech Cement
KEY HIGHLIGHTS
A $5.8 billion building solutions powerhouse, UltraTech is the largest manufacturer of grey cement, ready mix concrete (RMC) and white cement in India
No.1 Cement producer in India
Among Top 5 Asset Management Companies in India
Aditya Birla Capital Limited (ABCL) is the holding company for the financial services businesses of the Aditya Birla Group. ABCL’s subsidiaries have a strong presence across Protecting, Investing and Financing solutions. ABCL is a universal financial solutions group catering to diverse needs of its customers across their life stages
Aditya Birla Capital
KEY HIGHLIGHTS
Third-largest cement producer in the world excluding China
Only cement company globally to have 100+ MTPA of cement manufacturing capacity in a single country*
116.8 MTPA consolidated grey cement capacity with 22 integrated manufacturing units, 27 grinding units, one clinkerisation unit and 7 bulk packaging
`3,200 billion AUM*
Consolidated lending book of `575 billion
Active customer base of 21 million
850+ branches
22,000 employees and 2,00,000+ agents
* Assets Under Management
Statutory ReportsFinancial statem
entsIntegrated Report
Integrated Annual Report 2020-21 19
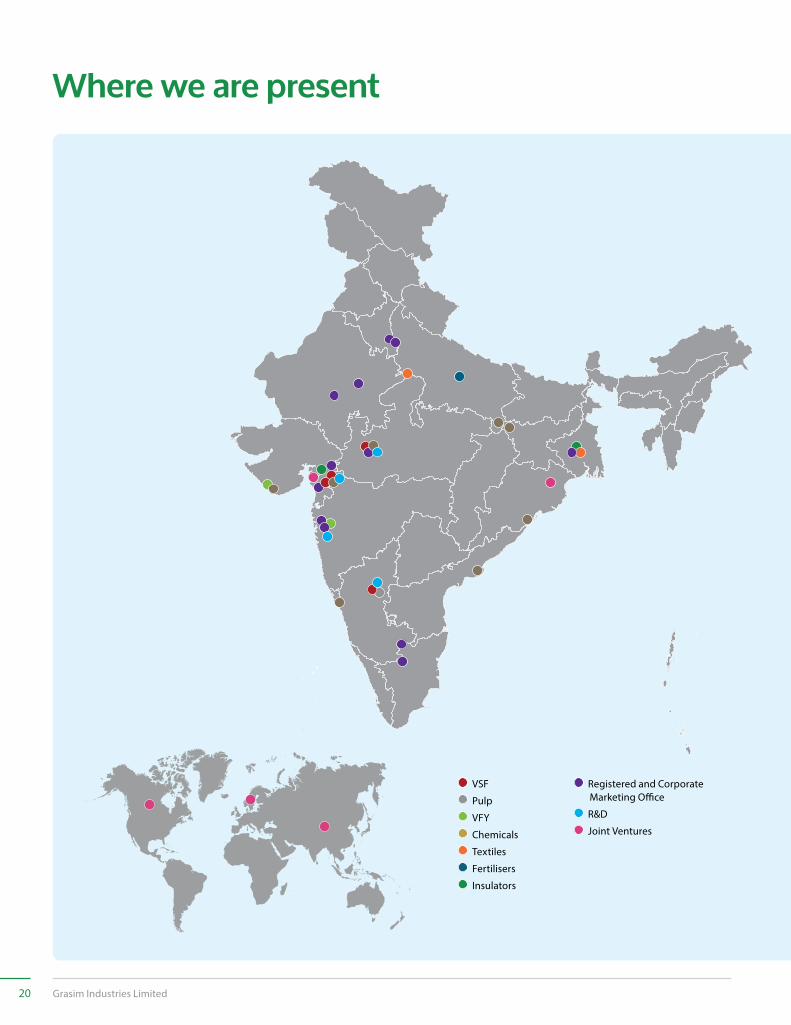
Where we are present
VSF
Pulp
VFY
Chemicals
Textiles
Fertilisers
Insulators
Registered and Corporate Marketing Office
R&D
Joint Ventures
20 Grasim Industries Limited
Manufacturing Sites
Registered and Corporate Marketing Office
R&D
Joint Ventures
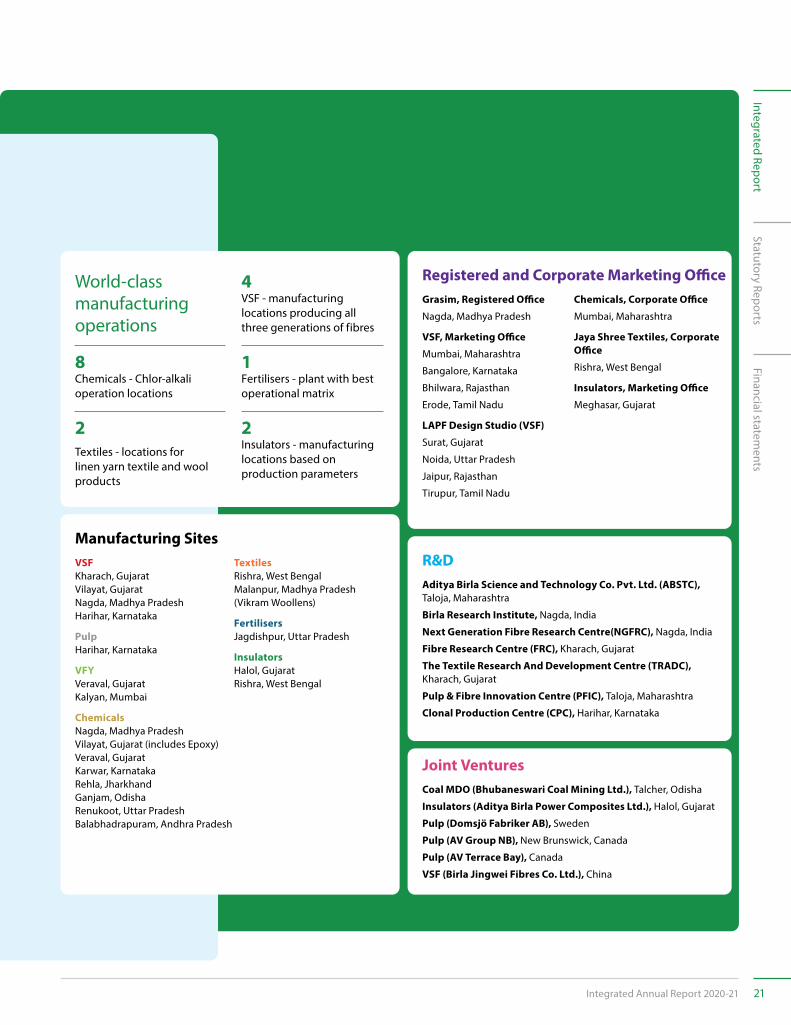
VSFKharach, GujaratVilayat, Gujarat Nagda, Madhya Pradesh Harihar, Karnataka
PulpHarihar, Karnataka
VFYVeraval, Gujarat Kalyan, Mumbai
ChemicalsNagda, Madhya Pradesh Vilayat, Gujarat (includes Epoxy) Veraval, GujaratKarwar, KarnatakaRehla, JharkhandGanjam, OdishaRenukoot, Uttar PradeshBalabhadrapuram, Andhra Pradesh
Aditya Birla Science and Technology Co. Pvt. Ltd. (ABSTC), Taloja, Maharashtra
Birla Research Institute, Nagda, India
Next Generation Fibre Research Centre(NGFRC), Nagda, India
Fibre Research Centre (FRC), Kharach, Gujarat
The Textile Research And Development Centre (TRADC), Kharach, Gujarat
Pulp & Fibre Innovation Centre (PFIC), Taloja, Maharashtra
Clonal Production Centre (CPC), Harihar, Karnataka
Coal MDO (Bhubaneswari Coal Mining Ltd.), Talcher, Odisha
Insulators (Aditya Birla Power Composites Ltd.), Halol, Gujarat
Pulp (Domsjö Fabriker AB), Sweden
Pulp (AV Group NB), New Brunswick, Canada
Pulp (AV Terrace Bay), Canada
VSF (Birla Jingwei Fibres Co. Ltd.), China
Grasim, Registered Office
Nagda, Madhya Pradesh
VSF, Marketing Office
Mumbai, Maharashtra
Bangalore, Karnataka
Bhilwara, Rajasthan
Erode, Tamil Nadu
LAPF Design Studio (VSF)
Surat, Gujarat
Noida, Uttar Pradesh
Jaipur, Rajasthan
Tirupur, Tamil Nadu
TextilesRishra, West BengalMalanpur, Madhya Pradesh (Vikram Woollens)
FertilisersJagdishpur, Uttar Pradesh
InsulatorsHalol, GujaratRishra, West Bengal
Chemicals, Corporate Office
Mumbai, Maharashtra
Jaya Shree Textiles, Corporate Office
Rishra, West Bengal
Insulators, Marketing Office
Meghasar, Gujarat
World-class manufacturing operations
4VSF - manufacturing locations producing all three generations of fibres
8Chemicals - Chlor-alkali operation locations
1Fertilisers - plant with best operational matrix
2Textiles - locations for linen yarn textile and wool products
2 Insulators - manufacturing locations based on production parameters
Statutory ReportsFinancial statem
entsIntegrated Report
Integrated Annual Report 2020-21 21

How we are governed
Good governance and responsible leadership are part of the strength we carry with pride at Grasim. Our operations that span multiple businesses, subsidiaries and investments, are guided by a singular set of codes, policies and standards that enable seamless integration between our various arms.Our Board of Directors, the highest decision-making body, guides our governance practices. This also extends to our sustainability governance, which is informed by the ABG Sustainable Business Framework.
Tenets of governance
Accountability towards all key stakeholders
Protection of minority interests and rights
Capital budgeting and allocation
Transparency and timely disclosure
Strategic guidance and effective monitoring
Compliance and governance of the highest standards
22 Grasim Industries Limited
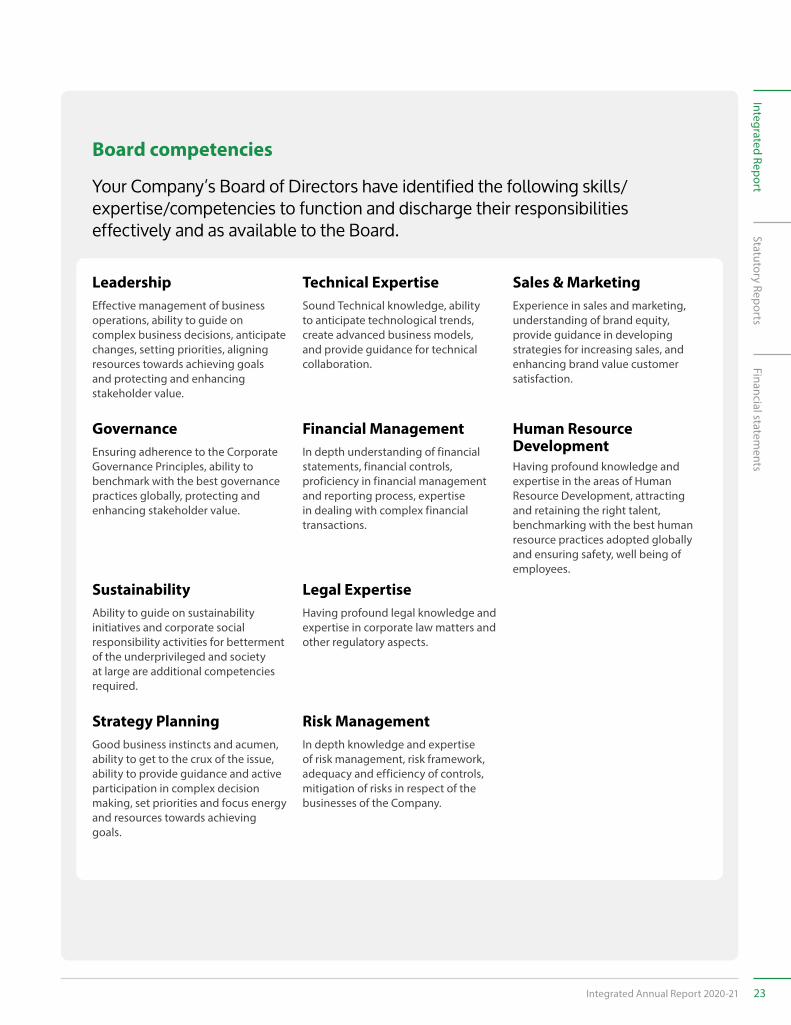
Board competencies
Your Company’s Board of Directors have identified the following skills/expertise/competencies to function and discharge their responsibilities effectively and as available to the Board.
Technical ExpertiseSound Technical knowledge, ability to anticipate technological trends, create advanced business models, and provide guidance for technical collaboration.
Financial ManagementIn depth understanding of financial statements, financial controls, proficiency in financial management and reporting process, expertise in dealing with complex financial transactions.
Legal Expertise Having profound legal knowledge and expertise in corporate law matters and other regulatory aspects.
Risk ManagementIn depth knowledge and expertise of risk management, risk framework, adequacy and efficiency of controls, mitigation of risks in respect of the businesses of the Company.
Sales & MarketingExperience in sales and marketing, understanding of brand equity, provide guidance in developing strategies for increasing sales, and enhancing brand value customer satisfaction.
Human Resource DevelopmentHaving profound knowledge and expertise in the areas of Human Resource Development, attracting and retaining the right talent, benchmarking with the best human resource practices adopted globally and ensuring safety, well being of employees.
LeadershipEffective management of business operations, ability to guide on complex business decisions, anticipate changes, setting priorities, aligning resources towards achieving goals and protecting and enhancing stakeholder value.
GovernanceEnsuring adherence to the Corporate Governance Principles, ability to benchmark with the best governance practices globally, protecting and enhancing stakeholder value.
Sustainability Ability to guide on sustainability initiatives and corporate social responsibility activities for betterment of the underprivileged and society at large are additional competencies required.
Strategy PlanningGood business instincts and acumen, ability to get to the crux of the issue, ability to provide guidance and active participation in complex decision making, set priorities and focus energy and resources towards achieving goals.
Statutory ReportsFinancial statem
entsIntegrated Report
Integrated Annual Report 2020-21 23
How we are governed
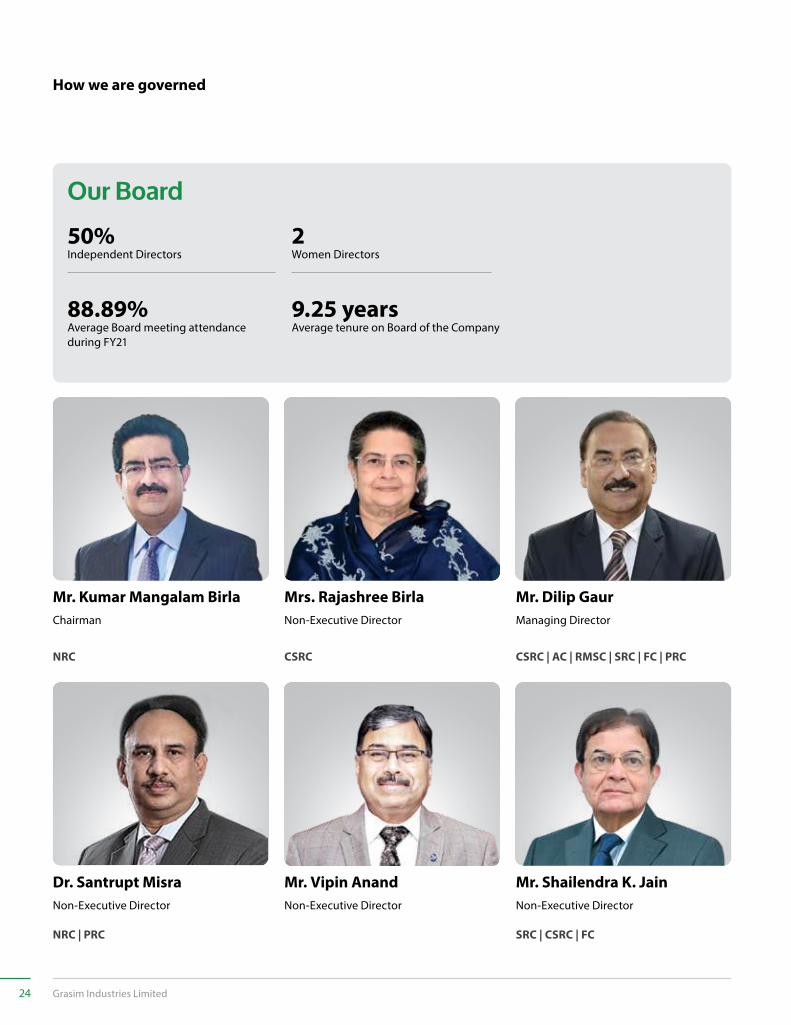
Our Board
50% 2
9.25 years88.89%
Independent Directors Women Directors
Average tenure on Board of the CompanyAverage Board meeting attendance during FY21
Dr. Santrupt Misra Mr. Vipin Anand Mr. Shailendra K. JainNon-Executive Director Non-Executive Director Non-Executive Director
NRC
NRC | PRC
CSRC CSRC | AC | RMSC | SRC | FC | PRC
SRC | CSRC | FC
Mr. Kumar Mangalam Birla Mrs. Rajashree Birla Mr. Dilip GaurChairman Non-Executive Director Managing Director
24 Grasim Industries Limited
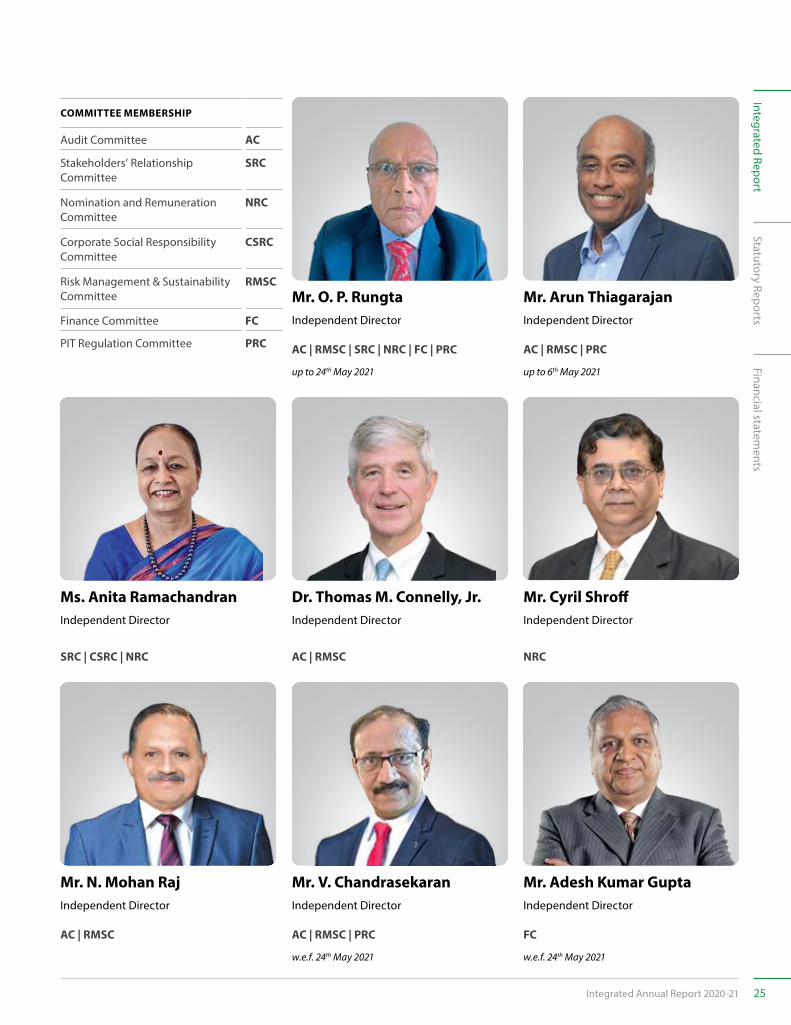
Mr. N. Mohan Raj Mr. V. Chandrasekaran Mr. Adesh Kumar GuptaIndependent Director Independent Director Independent Director
SRC | CSRC | NRC
AC | RMSC AC | RMSC | PRC FC
AC | RMSC NRC
Mr. O. P. Rungta Mr. Arun Thiagarajan Independent Director Independent Director
AC | RMSC | SRC | NRC | FC | PRC AC | RMSC | PRC
COMMITTEE MEMBERSHIP
Audit Committee AC
Stakeholders’ Relationship Committee
SRC
Nomination and Remuneration Committee
NRC
Corporate Social Responsibility Committee
CSRC
Risk Management & Sustainability Committee
RMSC
Finance Committee FC
PIT Regulation Committee PRC
Ms. Anita RamachandranIndependent Director
Dr. Thomas M. Connelly, Jr. Mr. Cyril ShroffIndependent Director Independent Director
w.e.f. 24th May 2021 w.e.f. 24th May 2021
up to 24th May 2021 up to 6th May 2021
Statutory ReportsFinancial statem
entsIntegrated Report
Integrated Annual Report 2020-21 25
At Grasim, we have a dedicated Code of Conduct that guides our corporate behaviour. Further, we have dedicated policies across key governance themes such as corporate tax, prohibition of insider trading, human rights, related party transactions, and diversity in Board members.
We accord due importance to cyber security and information security across our operations.
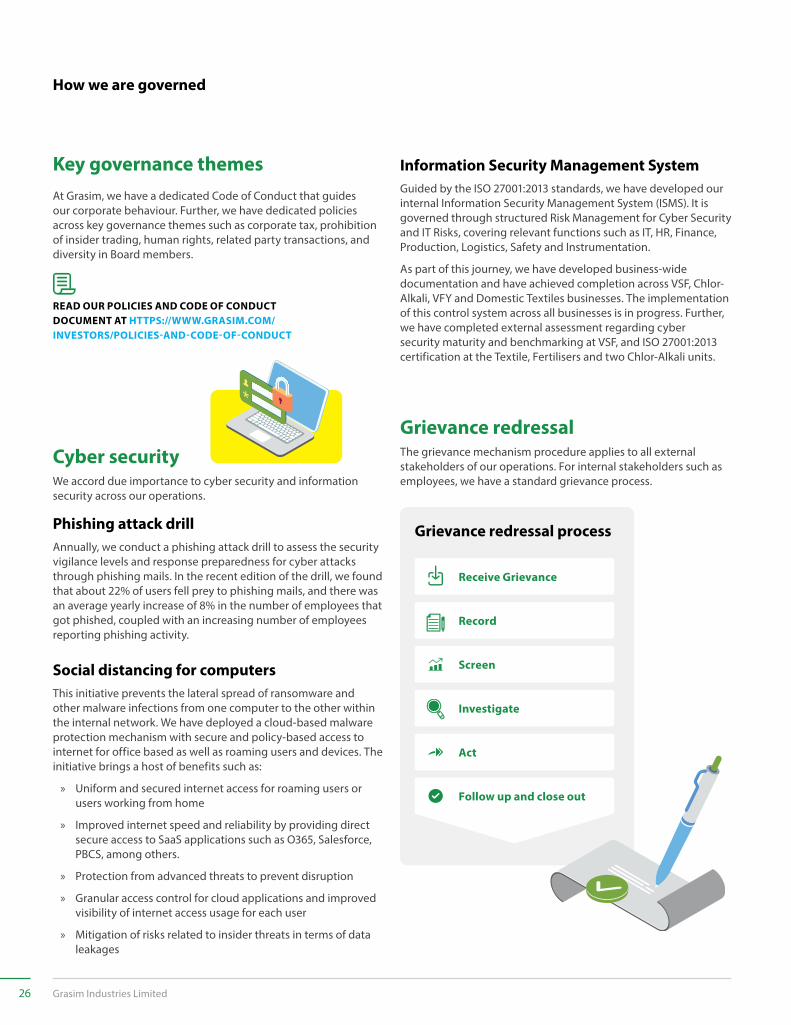
The grievance mechanism procedure applies to all external stakeholders of our operations. For internal stakeholders such as employees, we have a standard grievance process.
Annually, we conduct a phishing attack drill to assess the security vigilance levels and response preparedness for cyber attacks through phishing mails. In the recent edition of the drill, we found that about 22% of users fell prey to phishing mails, and there was an average yearly increase of 8% in the number of employees that got phished, coupled with an increasing number of employees reporting phishing activity.
Guided by the ISO 27001:2013 standards, we have developed our internal Information Security Management System (ISMS). It is governed through structured Risk Management for Cyber Security and IT Risks, covering relevant functions such as IT, HR, Finance, Production, Logistics, Safety and Instrumentation.
As part of this journey, we have developed business-wide documentation and have achieved completion across VSF, Chlor-Alkali, VFY and Domestic Textiles businesses. The implementation of this control system across all businesses is in progress. Further, we have completed external assessment regarding cyber security maturity and benchmarking at VSF, and ISO 27001:2013 certification at the Textile, Fertilisers and two Chlor-Alkali units.
This initiative prevents the lateral spread of ransomware and other malware infections from one computer to the other within the internal network. We have deployed a cloud-based malware protection mechanism with secure and policy-based access to internet for office based as well as roaming users and devices. The initiative brings a host of benefits such as:
» Uniform and secured internet access for roaming users or users working from home
» Improved internet speed and reliability by providing direct secure access to SaaS applications such as O365, Salesforce, PBCS, among others.
» Protection from advanced threats to prevent disruption
» Granular access control for cloud applications and improved visibility of internet access usage for each user
» Mitigation of risks related to insider threats in terms of data leakages
Key governance themes
Cyber securityGrievance redressal
Phishing attack drill
Information Security Management System
Social distancing for computers
How we are governed
Receive Grievance
Record
Screen
Investigate
Act
Follow up and close out
Grievance redressal process
READ OUR POLICIES AND CODE OF CONDUCT DOCUMENT AT HTTPS://WWW.GRASIM.COM/INVESTORS/POLICIES-AND-CODE-OF-CONDUCT
26 Grasim Industries Limited
We regularly communicate the redressal procedure to our external stakeholders to raise awareness. There are various channels available to external stakeholders for them to vocalise their grievances formally. These include an official telephone number and an e-mail ID (both directed to the Admin and Liaison Officer), among others.
Grievance reporting channels
Roles and responsibilities
Role/Position Title Responsibility
Grievance Committee (Comprises function heads of HRM, F&C and Environment)
Stakeholder Contact Officer(Admin and Liaison officer)
Employees(Officers of CSR, IR, Admin and Environment)
» Investigating the grievance and liaising with the external stakeholder/s
» Developing resolutions and actions to rectify any issue
» Follow up and track progress of grievance
» Receive grievances and forward to Grievance Committee
» Ensure that the grievance mechanism procedure is being adhered to and followed correctly
» Maintain grievance register and monitor any correspondence
» Monitor grievances/trends over time and report findings to the Committee
» Document any interactions with external stakeholders
» Receive grievances in person
» Report grievance to the Stakeholder Contact Officer by submitting the Grievance Lodgment Form
» May provide information and assistance in developing a response and closure of a grievance
Statutory ReportsFinancial statem
entsIntegrated Report
Integrated Annual Report 2020-21 27
Dear Stakeholders,
FY21 was a year of unprecedented challenges for India and the world. For Grasim, it was also year of reaffirmation of our abilities to withstand odds and move forward with precision and clarity. As the COVID-19 pandemic disrupted the way of life, we decided to leverage our strengths to drive breakthrough improvements, while staying nimble to navigate the uncertainty around. We rationalised our costs, continued innovating for customers, pursued our expansion projects, sharpened focus on our ESG goals and delivered our best-ever results in the latter part of the year overcoming such strong headwinds. We also announced our foray into the Paints segment, envisaging a key position in the market. Staying true to our 74-year legacy while being agile like a new-age enterprise, we retained our leadership across businesses, reinforcing the resilience and reflecting the true character of a Stronglomerate.
Message from the Managing Director
Staying true to our 74-year legacy while being agile like a new-age enterprise, we retained our leadership across businesses, reinforcing the resilience and reflecting the true character of a Stronglomerate.
A temporary pause and a sharp rebound What started as a health crisis snowballed into an economic one by the start of FY21, thus impacting both lives and livelihood. With global prices of our key products already at historical lows, and a slowdown in global demand, our sales volumes and operating profits were significantly impacted. The nationwide lockdowns in India and consequent disruptions in the textile value chain further dampened the sentiment.
We had to temporarily shut down our plants, with capacity utilisation dipping to 6% for Viscose and 23% for Caustic Soda in April 2020. However, as the phased unlocking began, we quickly ramped up production and by July, our utilisation levels had touched ~80% for both businesses to reach near pre-COVID levels gradually over the next two quarters.
To offset the lack of demand in the domestic market, we quickly switched focus to exports for VSF, even dedicating a few production lines to cater to that market. Some of the existing textile lines were swiftly converted to produce non-woven fibre, demand for which boomed in hygiene applications during the pandemic. This, in turn, improved our capacity utilisation and share of exports in the sales mix. We also introduced a new anti-microbial range of products, keeping in mind our customers’ nascent needs in the wake of the pandemic and have received encouraging response.
28 Grasim Industries Limited
As the year progressed, demand picked up for textiles, aided inventory restocking and led to a huge uptick in sales. EBITDA improved significantly, largely driven by lower costs on the back of robust fixed cost control initiatives.
For Chemicals, realisations were very weak in the first quarter while input costs remained unchanged, weighing heavily on the margins. This was partially offset by higher demand arising from disinfectant and hygiene products and other chlorine based value-added products. A more conducive demand scenario down the year led to higher capacity utilisation in both the Chlor Alkali and Epoxy businesses, backed by positive cost tailwind.
Growth plans and key projects on track Even as we took on the operational and business challenges with rigour, we maintained our focus on future growth plans. Line 1 and Line 2 of our Vilayat expansion are expected to be commissioned in Q2 and Q3 of FY22, respectively. Once complete, this would take our overall VSF capacity to 810 KTPA. Similarly, our expansions and maintenance projects in Balabhadrapuram, Vilayat and Rehla will provide us 1,457 KTPA caustic soda capacity by FY22. In addition, we increased our overall capex outlay for FY21 to `1,852 Crore.
The year also saw us enter an exclusive partnership with Lubrizol Advanced Materials (a Berkshire Hathaway company) to set up the world’s largest single-site resin capacity at Vilayat. The agreement would give exclusive CPVC manufacturing rights to Grasim.
With an objective to contribute to India’s decarbonisation drive and help fight climate change, we also augmented our solar portfolio, as part of Aditya Birla Renewables. The total capacity of our solar business now stands at 502 MW.
ESG focus – a key differentiator At Grasim, we operate a sustainable value chain led by one of the most biodegradable products with negligible end-of-life footprint, technological innovations focused on circularity and green chemistry, sustainable sourcing and environment-friendly processes that are aligned with best-in-class global standards and responsible manufacturing norms. We received the prestigious ‘Golden Peacock Global Award for Sustainability’, and were ranked 11 on the S&P DJSI sectoral indices in 2020. Our sustainability initiatives have been covered by the renowned Ivy Publisher and is now a Harvard Business School case study. We continue to lead the global industry in sustainable pulp sourcing, ranking #1 in Canopy’s Hot Button report and have been accorded the ‘dark green shirt’.
The pandemic strengthened our symbiotic relationship with customers and communities, as we ensured business continuity for our customers in uncertain times and passionately supported our communities in fighting the pandemic. For our employees, we ensured that their health and wellbeing remained our topmost priority, and constantly engaged with them, albeit virtually, to keep the teams motivated and help them overcome anxiety/mental stress. This year our community commitments were strengthened further in the wake of the pandemic, with our overall CSR expenditure touching all time high way ahead of the mandated norms and creating large-scale impact across our core intervention areas.
We also made significant strides towards our environmental goals. We were able to implement the EU BAT technology for VSF manufacturing in Vilayat, and reduced air emissions and water intensity compared to the FY17 baseline. We introduced products such as Cavallo by Linen Club, which utilises flax waste to create fashionable textiles.
Living the legacy As we enter into a new financial year with renewed hope and optimism, I can say with utmost confidence that we have emerged stronger and wiser from this crisis, which will set us for future growth. A key marker of our success is definitely the way you have always reposed faith in Grasim, for almost seven-and-a-half decades. Your confidence, aspirations and expectations provide us the strength to move forward and set new benchmarks in financial and ESG performance.
Best regards,
Dilip GaurManaging Director
The pandemic strengthened our symbiotic relationship with customers, as we worked on challenges and delivered results, together. For our employees, we ensured that their health and well-being remained our topmost priority, and constantly engaged with them, albeit virtually, to keep the teams motivated.
Statutory ReportsFinancial statem
entsIntegrated Report
Integrated Annual Report 2020-21 29
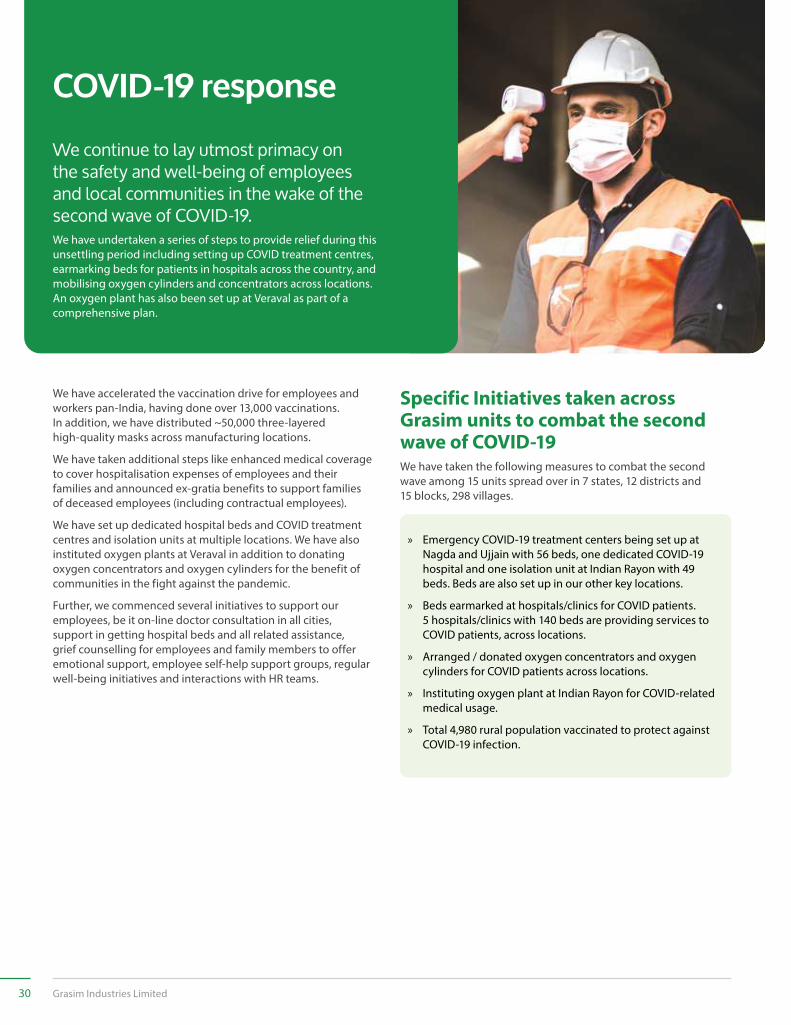
COVID-19 response
We continue to lay utmost primacy on the safety and well-being of employees and local communities in the wake of the second wave of COVID-19. We have undertaken a series of steps to provide relief during this unsettling period including setting up COVID treatment centres, earmarking beds for patients in hospitals across the country, and mobilising oxygen cylinders and concentrators across locations. An oxygen plant has also been set up at Veraval as part of a comprehensive plan.
We have accelerated the vaccination drive for employees and workers pan-India, having done over 13,000 vaccinations. In addition, we have distributed ~50,000 three-layered high-quality masks across manufacturing locations.
We have taken additional steps like enhanced medical coverage to cover hospitalisation expenses of employees and their families and announced ex-gratia benefits to support families of deceased employees (including contractual employees).
We have set up dedicated hospital beds and COVID treatment centres and isolation units at multiple locations. We have also instituted oxygen plants at Veraval in addition to donating oxygen concentrators and oxygen cylinders for the benefit of communities in the fight against the pandemic.
Further, we commenced several initiatives to support our employees, be it on-line doctor consultation in all cities, support in getting hospital beds and all related assistance, grief counselling for employees and family members to offer emotional support, employee self-help support groups, regular well-being initiatives and interactions with HR teams.
Specific Initiatives taken across Grasim units to combat the second wave of COVID-19We have taken the following measures to combat the second wave among 15 units spread over in 7 states, 12 districts and 15 blocks, 298 villages.
» Emergency COVID-19 treatment centers being set up at Nagda and Ujjain with 56 beds, one dedicated COVID-19 hospital and one isolation unit at Indian Rayon with 49 beds. Beds are also set up in our other key locations.
» Beds earmarked at hospitals/clinics for COVID patients. 5 hospitals/clinics with 140 beds are providing services to COVID patients, across locations.
» Arranged / donated oxygen concentrators and oxygen cylinders for COVID patients across locations.
» Instituting oxygen plant at Indian Rayon for COVID-related medical usage.
» Total 4,980 rural population vaccinated to protect against COVID-19 infection.
30 Grasim Industries Limited
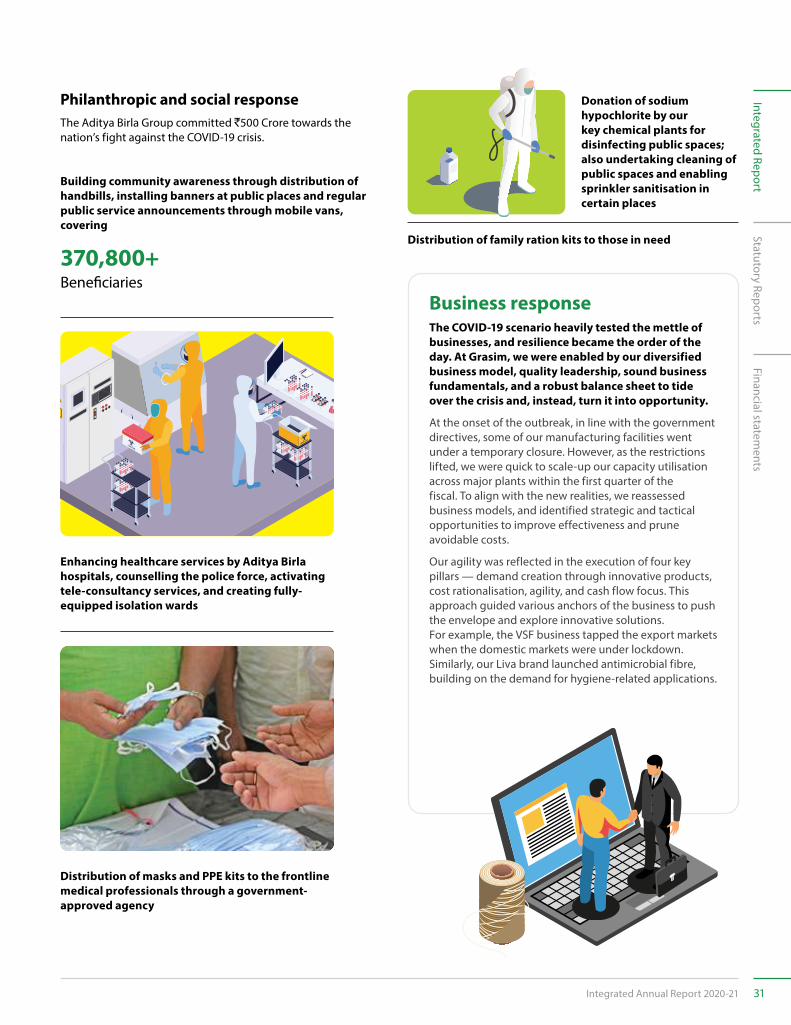
The Aditya Birla Group committed `500 Crore towards the nation’s fight against the COVID-19 crisis.
Business responseThe COVID-19 scenario heavily tested the mettle of businesses, and resilience became the order of the day. At Grasim, we were enabled by our diversified business model, quality leadership, sound business fundamentals, and a robust balance sheet to tide over the crisis and, instead, turn it into opportunity.
At the onset of the outbreak, in line with the government directives, some of our manufacturing facilities went under a temporary closure. However, as the restrictions lifted, we were quick to scale-up our capacity utilisation across major plants within the first quarter of the fiscal. To align with the new realities, we reassessed business models, and identified strategic and tactical opportunities to improve effectiveness and prune avoidable costs.
Our agility was reflected in the execution of four key pillars — demand creation through innovative products, cost rationalisation, agility, and cash flow focus. This approach guided various anchors of the business to push the envelope and explore innovative solutions. For example, the VSF business tapped the export markets when the domestic markets were under lockdown. Similarly, our Liva brand launched antimicrobial fibre, building on the demand for hygiene-related applications.
Donation of sodium hypochlorite by our key chemical plants for disinfecting public spaces; also undertaking cleaning of public spaces and enabling sprinkler sanitisation in certain places
Enhancing healthcare services by Aditya Birla hospitals, counselling the police force, activating tele-consultancy services, and creating fully-equipped isolation wards
Distribution of family ration kits to those in need
Building community awareness through distribution of handbills, installing banners at public places and regular public service announcements through mobile vans, covering
370,800+Beneficiaries
Philanthropic and social response
Distribution of masks and PPE kits to the frontline medical professionals through a government-approved agency
Statutory ReportsFinancial statem
entsIntegrated Report
Integrated Annual Report 2020-21 31
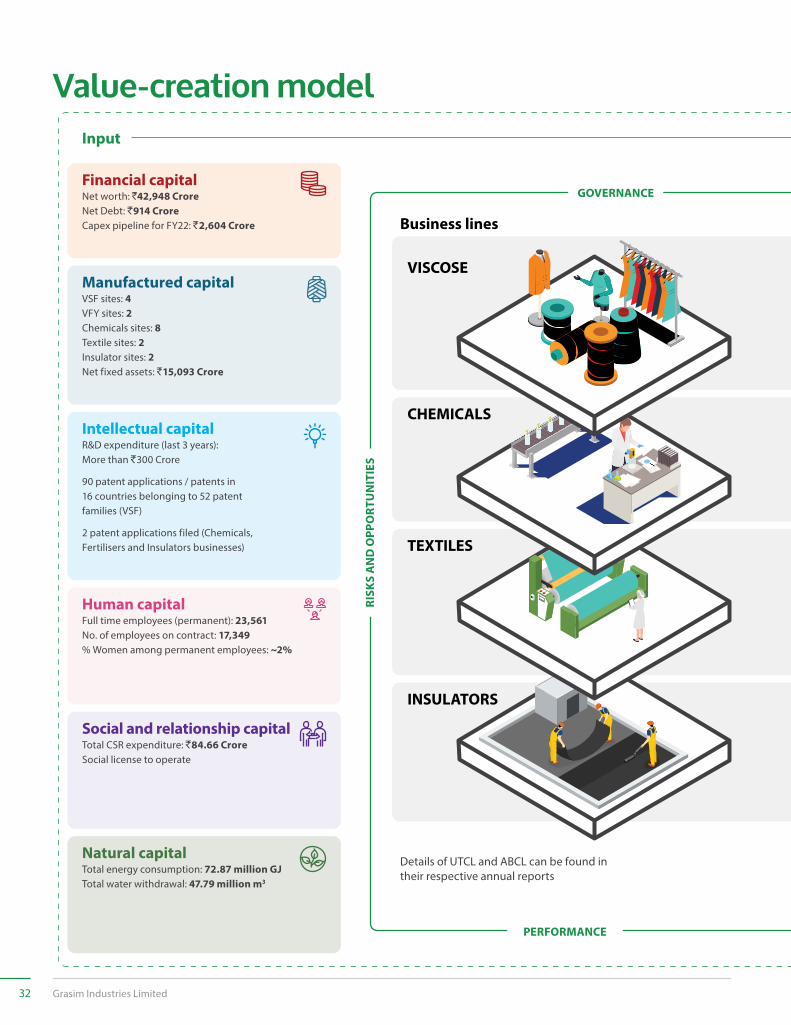
Value-creation model
Financial capitalNet worth: `42,948 CroreNet Debt: `914 CroreCapex pipeline for FY22: `2,604 Crore
Manufactured capitalVSF sites: 4VFY sites: 2Chemicals sites: 8Textile sites: 2Insulator sites: 2Net fixed assets: `15,093 Crore
Business lines
Intellectual capitalR&D expenditure (last 3 years):More than `300 Crore
90 patent applications / patents in16 countries belonging to 52 patentfamilies (VSF)
2 patent applications filed (Chemicals,Fertilisers and Insulators businesses)
Human capitalFull time employees (permanent): 23,561No. of employees on contract: 17,349% Women among permanent employees: ~2%
Social and relationship capitalTotal CSR expenditure: `84.66 CroreSocial license to operate
Natural capitalTotal energy consumption: 72.87 million GJTotal water withdrawal: 47.79 million m3
RISK
S A
ND
OPP
ORT
UN
ITIE
S
GOVERNANCE
PERFORMANCE
VISCOSE
CHEMICALS
TEXTILES
INSULATORS
Input
Details of UTCL and ABCL can be found in their respective annual reports
32 Grasim Industries Limited
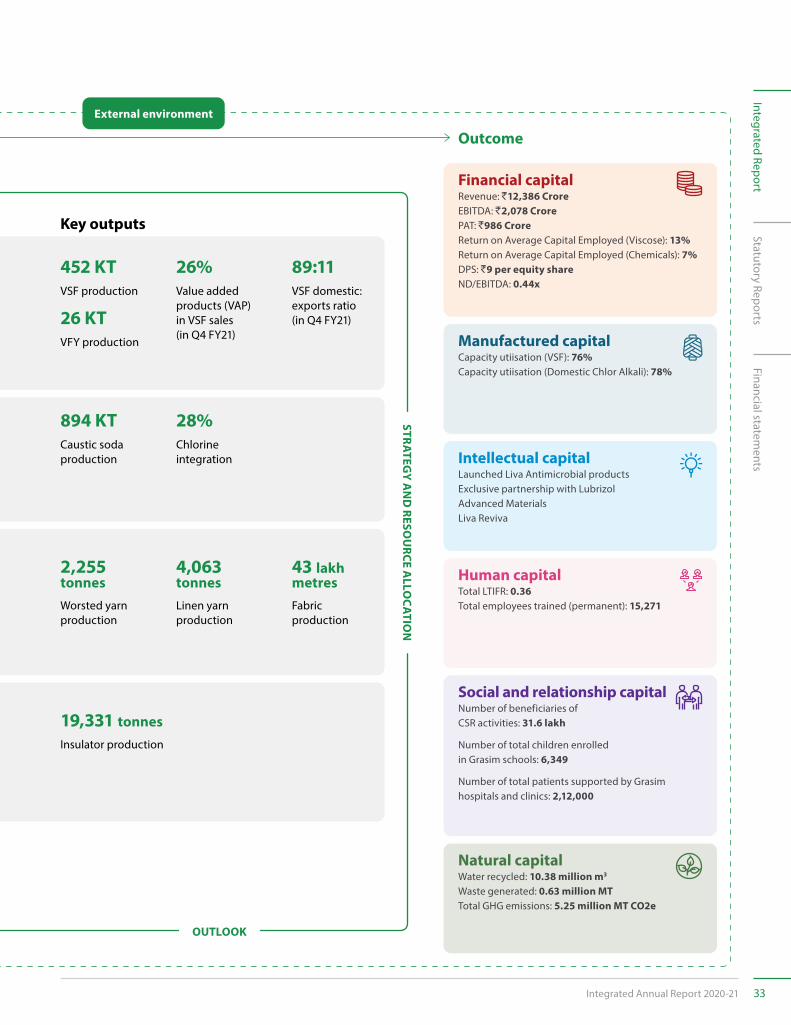
Financial capitalRevenue: `12,386 CroreEBITDA: `2,078 CrorePAT: `986 CroreReturn on Average Capital Employed (Viscose): 13%Return on Average Capital Employed (Chemicals): 7%DPS: `9 per equity shareND/EBITDA: 0.44x
Key outputs
Manufactured capitalCapacity utiisation (VSF): 76%Capacity utiisation (Domestic Chlor Alkali): 78%
Intellectual capitalLaunched Liva Antimicrobial productsExclusive partnership with Lubrizol Advanced MaterialsLiva Reviva
Human capitalTotal LTIFR: 0.36Total employees trained (permanent): 15,271
Social and relationship capitalNumber of beneficiaries of CSR activities: 31.6 lakh
Number of total children enrolled in Grasim schools: 6,349
Number of total patients supported by Grasim hospitals and clinics: 2,12,000
Natural capitalWater recycled: 10.38 million m3
Waste generated: 0.63 million MTTotal GHG emissions: 5.25 million MT CO2e
452 KT VSF production
26 KTVFY production
External environment
OUTLOOK
STRATEG
Y AN
D RESO
URCE A
LLOCATIO
N
Outcome
2,255 tonnesWorsted yarn production
43 lakh metresFabric production
4,063 tonnesLinen yarn production
89:11VSF domestic: exports ratio (in Q4 FY21)
26% Value added products (VAP) in VSF sales (in Q4 FY21)
19,331 tonnesInsulator production
894 KTCaustic soda production
28%Chlorine integration
Statutory ReportsFinancial statem
entsIntegrated Report
Integrated Annual Report 2020-21 33
At Grasim, we explore stakeholder relationships as a means to understand varied perspectives, pre-empt evolving needs and keep ourselves ahead of the trends.The engagement also provides us an opportunity to convey to them our approach and interventions, and how we can jointly create value. We extensively communicate our business purpose and objectives to our stakeholders and assess, evaluate and subsequently address our stakeholders’ concerns and then incorporate those in our decision-making process. Our stakeholder engagement strategy ensures advocacy and transparent communication on the challenges as well as the opportunities.
Stakeholder engagement
Our Stakeholder Engagement Policy covers the following aspects
Engagement processes specific to each stakeholder group, that is inclusive, material and responsive
Integrate stakeholder engagement
Inform, encourage, and build capacity
Review mechanism
Delineate scope and mode of engagement
Communicate to stakeholders
34 Grasim Industries Limited
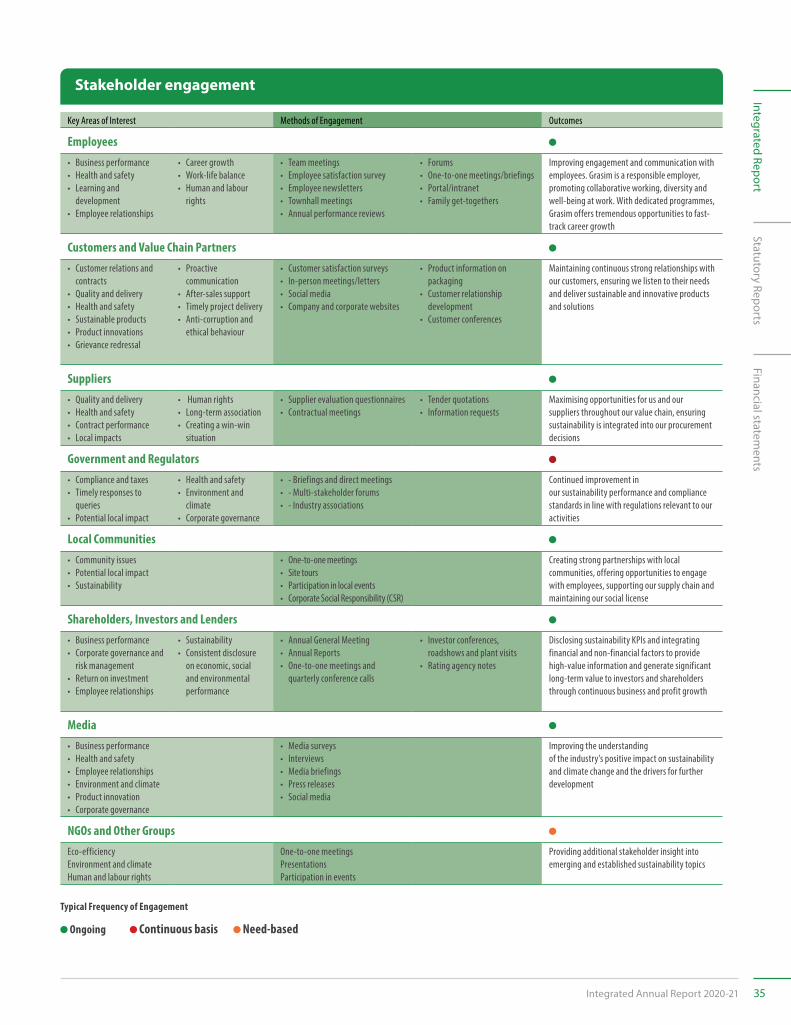
Key Areas of Interest Methods of Engagement Outcomes
Employees • Business performance • Health and safety • Learning and
development • Employee relationships
• Career growth • Work-life balance • Human and labour
rights
• Team meetings • Employee satisfaction survey • Employee newsletters • Townhall meetings • Annual performance reviews
• Forums • One-to-one meetings/briefings • Portal/intranet • Family get-togethers
Improving engagement and communication with employees. Grasim is a responsible employer, promoting collaborative working, diversity and well-being at work. With dedicated programmes, Grasim offers tremendous opportunities to fast-track career growth
Customers and Value Chain Partners • Customer relations and
contracts • Quality and delivery • Health and safety • Sustainable products • Product innovations • Grievance redressal
• Proactive communication
• After-sales support • Timely project delivery • Anti-corruption and
ethical behaviour
• Customer satisfaction surveys • In-person meetings/letters • Social media • Company and corporate websites
• Product information on packaging
• Customer relationship development
• Customer conferences
Maintaining continuous strong relationships with our customers, ensuring we listen to their needs and deliver sustainable and innovative products and solutions
Suppliers • Quality and delivery • Health and safety • Contract performance • Local impacts
• Human rights • Long-term association • Creating a win-win
situation
• Supplier evaluation questionnaires • Contractual meetings
• Tender quotations • Information requests
Maximising opportunities for us and our suppliers throughout our value chain, ensuring sustainability is integrated into our procurement decisions
Government and Regulators • Compliance and taxes • Timely responses to
queries • Potential local impact
• Health and safety • Environment and
climate • Corporate governance
• - Briefings and direct meetings • - Multi-stakeholder forums • - Industry associations
Continued improvement in our sustainability performance and compliance standards in line with regulations relevant to our activities
Local Communities • Community issues • Potential local impact • Sustainability
• One-to-one meetings • Site tours • Participation in local events • Corporate Social Responsibility (CSR)
Creating strong partnerships with local communities, offering opportunities to engage with employees, supporting our supply chain and maintaining our social license
Shareholders, Investors and Lenders • Business performance • Corporate governance and
risk management • Return on investment • Employee relationships
• Sustainability • Consistent disclosure
on economic, social and environmental performance
• Annual General Meeting • Annual Reports • One-to-one meetings and
quarterly conference calls
• Investor conferences, roadshows and plant visits
• Rating agency notes
Disclosing sustainability KPIs and integrating financial and non-financial factors to provide high-value information and generate significant long-term value to investors and shareholders through continuous business and profit growth
Media • Business performance • Health and safety • Employee relationships • Environment and climate • Product innovation • Corporate governance
• Media surveys • Interviews • Media briefings • Press releases • Social media
Improving the understanding of the industry’s positive impact on sustainability and climate change and the drivers for further development
NGOs and Other Groups Eco-efficiency Environment and climate Human and labour rights
One-to-one meetings Presentations Participation in events
Providing additional stakeholder insight into emerging and established sustainability topics
Stakeholder engagement
Typical Frequency of Engagement
Ongoing Continuous basis Need-based
Statutory ReportsFinancial statem
entsIntegrated Report
Integrated Annual Report 2020-21 35
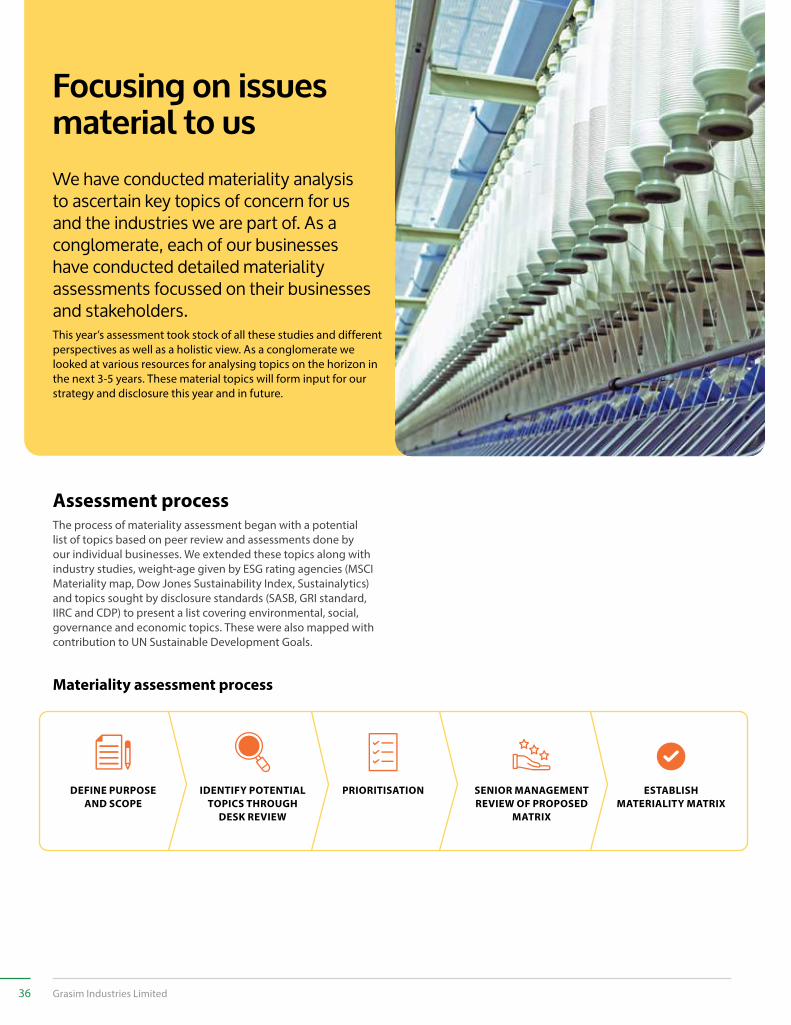
We have conducted materiality analysis to ascertain key topics of concern for us and the industries we are part of. As a conglomerate, each of our businesses have conducted detailed materiality assessments focussed on their businesses and stakeholders.This year’s assessment took stock of all these studies and different perspectives as well as a holistic view. As a conglomerate we looked at various resources for analysing topics on the horizon in the next 3-5 years. These material topics will form input for our strategy and disclosure this year and in future.
Focusing on issues material to us
Assessment processThe process of materiality assessment began with a potential list of topics based on peer review and assessments done by our individual businesses. We extended these topics along with industry studies, weight-age given by ESG rating agencies (MSCI Materiality map, Dow Jones Sustainability Index, Sustainalytics) and topics sought by disclosure standards (SASB, GRI standard, IIRC and CDP) to present a list covering environmental, social, governance and economic topics. These were also mapped with contribution to UN Sustainable Development Goals.
Materiality assessment process
DEFINE PURPOSE AND SCOPE
IDENTIFY POTENTIAL TOPICS THROUGH
DESK REVIEW
PRIORITISATION SENIOR MANAGEMENT REVIEW OF PROPOSED
MATRIX
ESTABLISH MATERIALITY MATRIX
36 Grasim Industries Limited
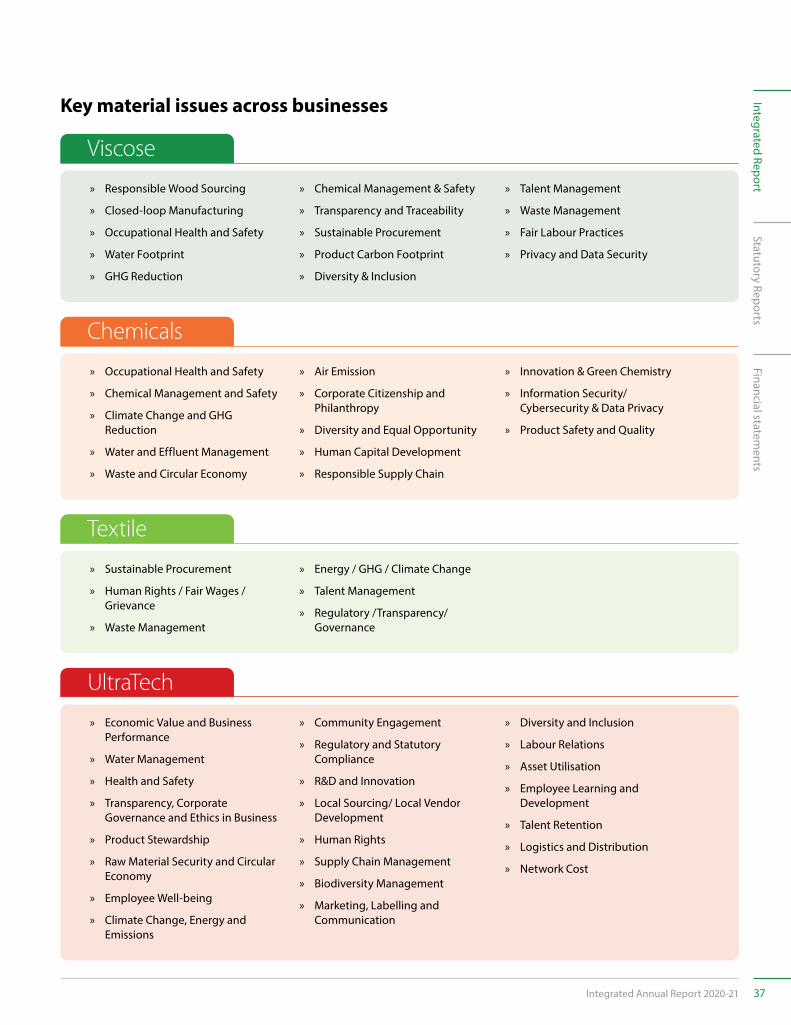
Key material issues across businesses
Viscose
Chemicals
Textile
UltraTech
» Responsible Wood Sourcing
» Closed-loop Manufacturing
» Occupational Health and Safety
» Water Footprint
» GHG Reduction
» Occupational Health and Safety
» Chemical Management and Safety
» Climate Change and GHG Reduction
» Water and Effluent Management
» Waste and Circular Economy
» Sustainable Procurement
» Human Rights / Fair Wages /Grievance
» Waste Management
» Chemical Management & Safety
» Transparency and Traceability
» Sustainable Procurement
» Product Carbon Footprint
» Diversity & Inclusion
» Air Emission
» Corporate Citizenship and Philanthropy
» Diversity and Equal Opportunity
» Human Capital Development
» Responsible Supply Chain
» Energy / GHG / Climate Change
» Talent Management
» Regulatory /Transparency/ Governance
» Talent Management
» Waste Management
» Fair Labour Practices
» Privacy and Data Security
» Innovation & Green Chemistry
» Information Security/Cybersecurity & Data Privacy
» Product Safety and Quality
» Economic Value and Business Performance
» Water Management
» Health and Safety
» Transparency, Corporate Governance and Ethics in Business
» Product Stewardship
» Raw Material Security and Circular Economy
» Employee Well-being
» Climate Change, Energy and Emissions
» Community Engagement
» Regulatory and Statutory Compliance
» R&D and Innovation
» Local Sourcing/ Local Vendor Development
» Human Rights
» Supply Chain Management
» Biodiversity Management
» Marketing, Labelling and Communication
» Diversity and Inclusion
» Labour Relations
» Asset Utilisation
» Employee Learning and Development
» Talent Retention
» Logistics and Distribution
» Network Cost
Statutory ReportsFinancial statem
entsIntegrated Report
Integrated Annual Report 2020-21 37
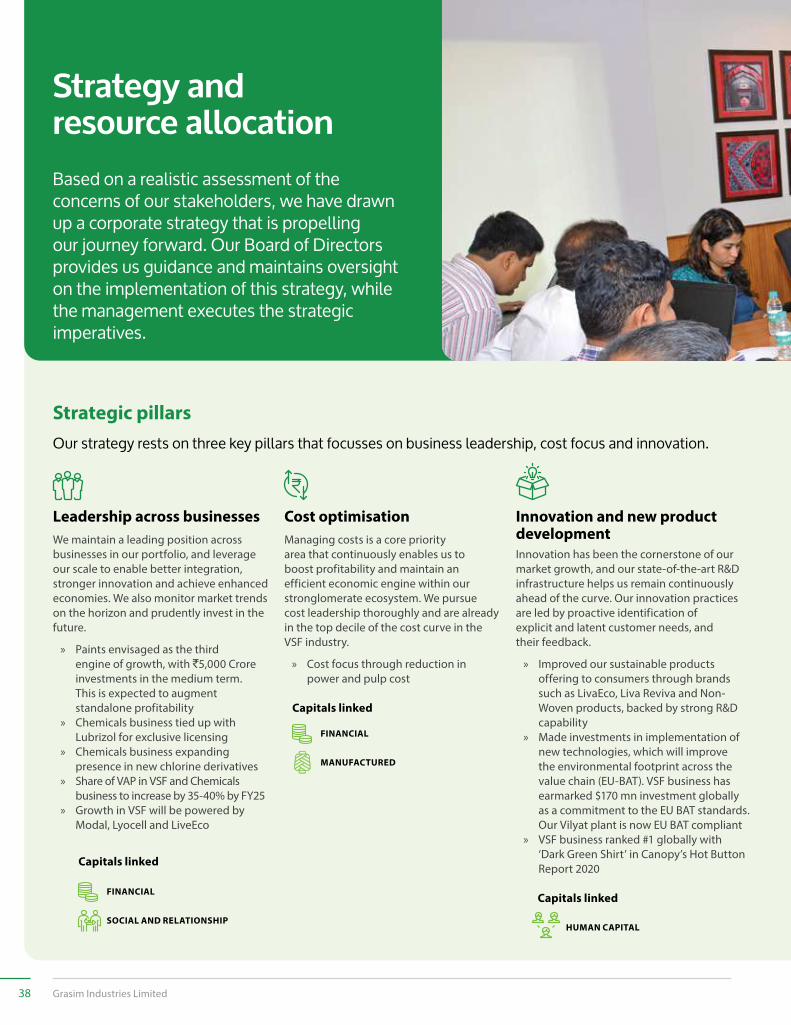
Leadership across businessesWe maintain a leading position across businesses in our portfolio, and leverage our scale to enable better integration, stronger innovation and achieve enhanced economies. We also monitor market trends on the horizon and prudently invest in the future.
» Paints envisaged as the third engine of growth, with `5,000 Crore investments in the medium term. This is expected to augment standalone profitability
» Chemicals business tied up with Lubrizol for exclusive licensing
» Chemicals business expanding presence in new chlorine derivatives
» Share of VAP in VSF and Chemicals business to increase by 35-40% by FY25
» Growth in VSF will be powered by Modal, Lyocell and LiveEco
Cost optimisationManaging costs is a core priority area that continuously enables us to boost profitability and maintain an efficient economic engine within our stronglomerate ecosystem. We pursue cost leadership thoroughly and are already in the top decile of the cost curve in the VSF industry.
» Cost focus through reduction in power and pulp cost
Strategic pillars
FINANCIAL
FINANCIAL
HUMAN CAPITAL
MANUFACTURED
Innovation and new product developmentInnovation has been the cornerstone of our market growth, and our state-of-the-art R&D infrastructure helps us remain continuously ahead of the curve. Our innovation practices are led by proactive identification of explicit and latent customer needs, and their feedback.
» Improved our sustainable products offering to consumers through brands such as LivaEco, Liva Reviva and Non-Woven products, backed by strong R&D capability
» Made investments in implementation of new technologies, which will improve the environmental footprint across the value chain (EU-BAT). VSF business has earmarked $170 mn investment globally as a commitment to the EU BAT standards. Our Vilyat plant is now EU BAT compliant
» VSF business ranked #1 globally with ‘Dark Green Shirt’ in Canopy’s Hot Button Report 2020
Strategy and resource allocationBased on a realistic assessment of the concerns of our stakeholders, we have drawn up a corporate strategy that is propelling our journey forward. Our Board of Directors provides us guidance and maintains oversight on the implementation of this strategy, while the management executes the strategic imperatives.
Our strategy rests on three key pillars that focusses on business leadership, cost focus and innovation.
Capitals linked
Capitals linked
Capitals linked
SOCIAL AND RELATIONSHIP
38 Grasim Industries Limited
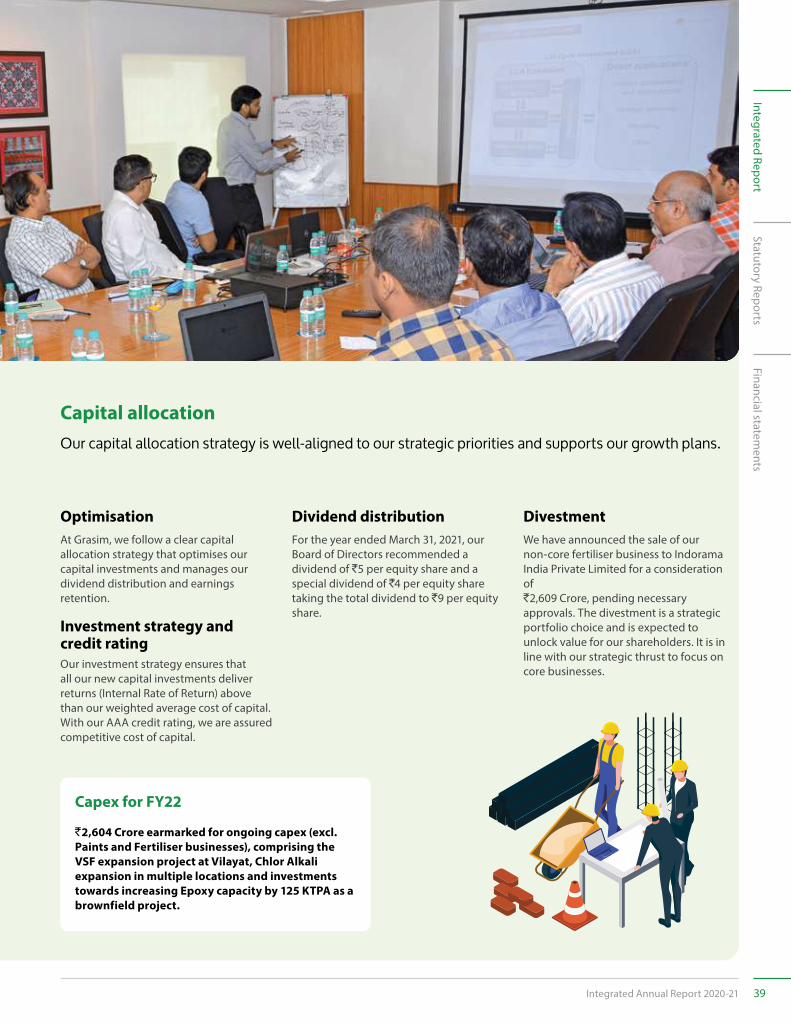
OptimisationAt Grasim, we follow a clear capital allocation strategy that optimises our capital investments and manages our dividend distribution and earnings retention.
Investment strategy and credit ratingOur investment strategy ensures that all our new capital investments deliver returns (Internal Rate of Return) above than our weighted average cost of capital. With our AAA credit rating, we are assured competitive cost of capital.
Dividend distributionFor the year ended March 31, 2021, our Board of Directors recommended a dividend of `5 per equity share and a special dividend of `4 per equity share taking the total dividend to `9 per equity share.
Capital allocationOur capital allocation strategy is well-aligned to our strategic priorities and supports our growth plans.
DivestmentWe have announced the sale of our non-core fertiliser business to Indorama India Private Limited for a consideration of `2,609 Crore, pending necessary approvals. The divestment is a strategic portfolio choice and is expected to unlock value for our shareholders. It is in line with our strategic thrust to focus on core businesses.
Capex for FY22
`2,604 Crore earmarked for ongoing capex (excl. Paints and Fertiliser businesses), comprising the VSF expansion project at Vilayat, Chlor Alkali expansion in multiple locations and investments towards increasing Epoxy capacity by 125 KTPA as a brownfield project.
Statutory ReportsFinancial statem
entsIntegrated Report
Integrated Annual Report 2020-21 39
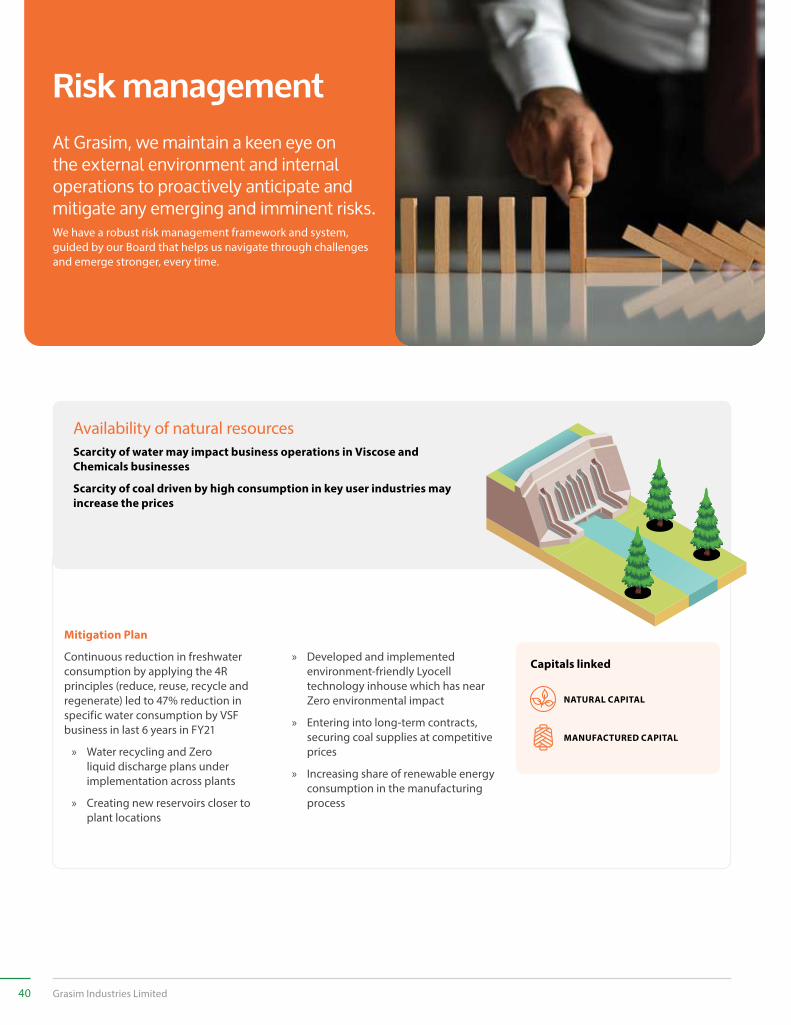
Availability of natural resources Scarcity of water may impact business operations in Viscose and Chemicals businesses
Scarcity of coal driven by high consumption in key user industries may increase the prices
Mitigation Plan
Continuous reduction in freshwater consumption by applying the 4R principles (reduce, reuse, recycle and regenerate) led to 47% reduction in specific water consumption by VSF business in last 6 years in FY21
» Water recycling and Zero liquid discharge plans under implementation across plants
» Creating new reservoirs closer to plant locations
» Developed and implemented environment-friendly Lyocell technology inhouse which has near Zero environmental impact
» Entering into long-term contracts, securing coal supplies at competitive prices
» Increasing share of renewable energy consumption in the manufacturing process
Capitals linked
MANUFACTURED CAPITAL
NATURAL CAPITAL
At Grasim, we maintain a keen eye on the external environment and internal operations to proactively anticipate and mitigate any emerging and imminent risks. We have a robust risk management framework and system, guided by our Board that helps us navigate through challenges and emerge stronger, every time.
Risk management
40 Grasim Industries Limited
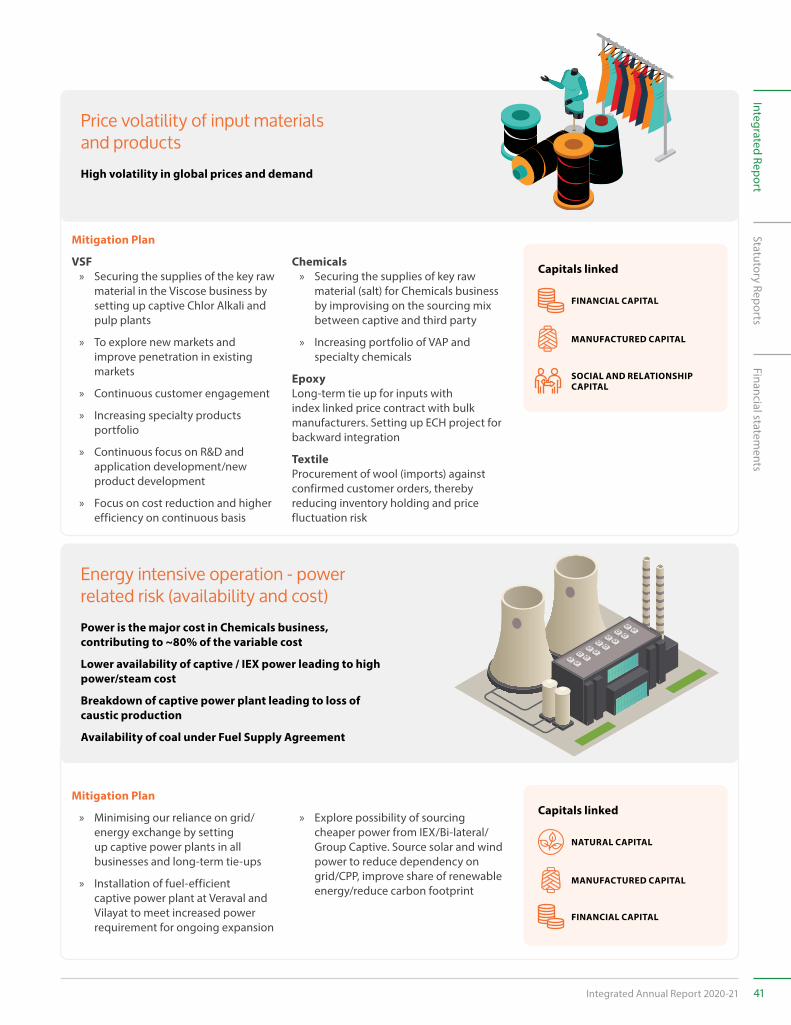
Price volatility of input materials and productsHigh volatility in global prices and demand
Mitigation Plan
VSF » Securing the supplies of the key raw
material in the Viscose business by setting up captive Chlor Alkali and pulp plants
» To explore new markets and improve penetration in existing markets
» Continuous customer engagement
» Increasing specialty products portfolio
» Continuous focus on R&D and application development/new product development
» Focus on cost reduction and higher efficiency on continuous basis
Chemicals » Securing the supplies of key raw
material (salt) for Chemicals business by improvising on the sourcing mix between captive and third party
» Increasing portfolio of VAP and specialty chemicals
EpoxyLong-term tie up for inputs with index linked price contract with bulk manufacturers. Setting up ECH project for backward integration
TextileProcurement of wool (imports) against confirmed customer orders, thereby reducing inventory holding and price fluctuation risk
Capitals linked
MANUFACTURED CAPITAL
SOCIAL AND RELATIONSHIP CAPITAL
FINANCIAL CAPITAL
Energy intensive operation - power related risk (availability and cost)Power is the major cost in Chemicals business, contributing to ~80% of the variable cost
Lower availability of captive / IEX power leading to high power/steam cost
Breakdown of captive power plant leading to loss of caustic production
Availability of coal under Fuel Supply Agreement
Mitigation Plan
» Minimising our reliance on grid/ energy exchange by setting up captive power plants in all businesses and long-term tie-ups
» Installation of fuel-efficient captive power plant at Veraval and Vilayat to meet increased power requirement for ongoing expansion
» Explore possibility of sourcing cheaper power from IEX/Bi-lateral/Group Captive. Source solar and wind power to reduce dependency on grid/CPP, improve share of renewable energy/reduce carbon footprint
Capitals linked
MANUFACTURED CAPITAL
NATURAL CAPITAL
FINANCIAL CAPITAL
Statutory ReportsFinancial statem
entsIntegrated Report
Integrated Annual Report 2020-21 41
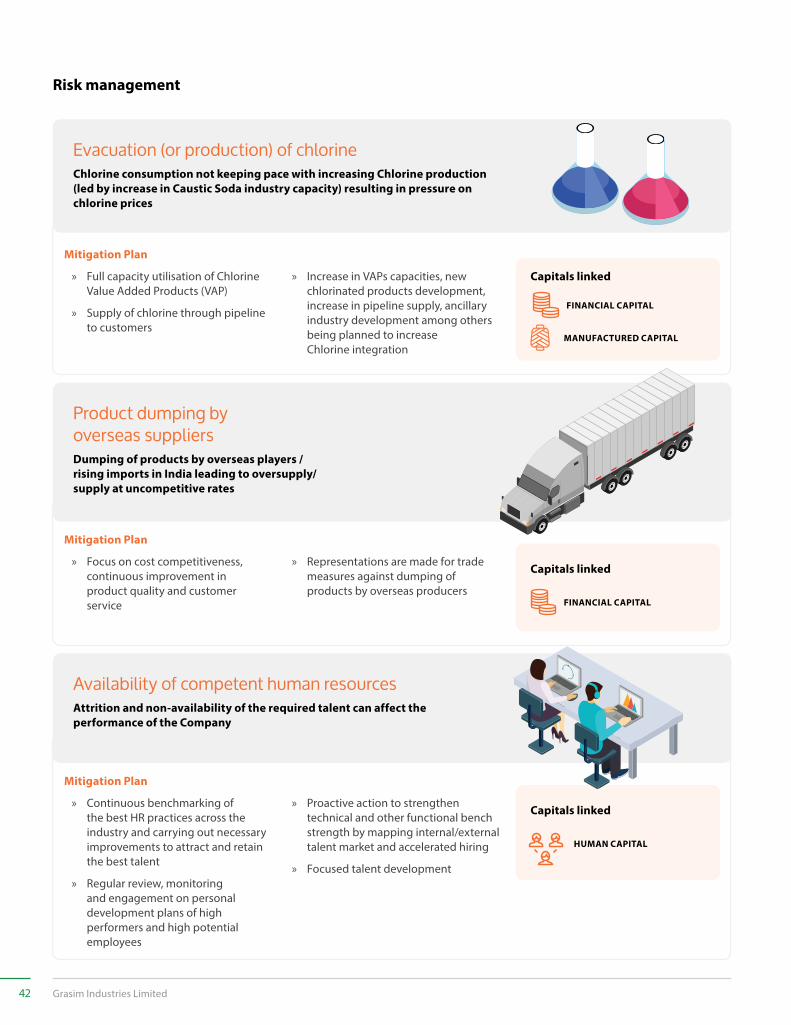
Risk management
Evacuation (or production) of chlorineChlorine consumption not keeping pace with increasing Chlorine production (led by increase in Caustic Soda industry capacity) resulting in pressure on chlorine prices
Mitigation Plan
Capitals linked » Full capacity utilisation of Chlorine Value Added Products (VAP)
» Supply of chlorine through pipeline to customers
» Increase in VAPs capacities, new chlorinated products development, increase in pipeline supply, ancillary industry development among others being planned to increase Chlorine integration
MANUFACTURED CAPITAL
Product dumping by overseas suppliersDumping of products by overseas players / rising imports in India leading to oversupply/ supply at uncompetitive rates
Mitigation Plan
Capitals linked » Focus on cost competitiveness, continuous improvement in product quality and customer service
» Representations are made for trade measures against dumping of products by overseas producers
FINANCIAL CAPITAL
Availability of competent human resources Attrition and non-availability of the required talent can affect the performance of the Company
Mitigation Plan
» Continuous benchmarking of the best HR practices across the industry and carrying out necessary improvements to attract and retain the best talent
» Regular review, monitoring and engagement on personal development plans of high performers and high potential employees
» Proactive action to strengthen technical and other functional bench strength by mapping internal/external talent market and accelerated hiring
» Focused talent development
Capitals linked
HUMAN CAPITAL
FINANCIAL CAPITAL
42 Grasim Industries Limited
Delay in project executionAny delay in execution of brownfield/ greenfield projects may lead to loss of contribution and cost overruns
Mitigation Plan
» Focused project implementation teams in place
» Regular follow ups to get environmental clearance and statutory approvals within stipulated timelines
» Strict monitoring of project execution by unit and senior management and timely actions to execute the project within the budgeted time and cost
Competition riskVSF and Chemicals are global commodities, therefore these are exposed to any change in the competition intensity in the global market space. Further, capacities have been added by competitors in Domestic markets in Chemical and Epoxy business
With expanding capacity of existing players and emergence of new entrants, competition is a sustained risk for cement business
Mitigation Plan
» Strategic initiatives and continuous investments to enhance the brand equity of the Company by focusing on R&D, quality, cost, timely delivery and customer service, increasing level of customer engagement
» Customer connect initiatives to reach out to end users (such as Liva brand for VSF)
» In Epoxy business, developing various customised products for customers. Long Term Volume Contract to secure sales volume
Capacity Expansion
» Vilayat VSF Expansion likely to complete as planned by Q2FY22
» Brownfield Vilayat expansion of 200 TPD chlor-alkali to match VSF increased capacity at marginal incremental capex
» Epoxy expansion by 125 KTPA to cater to increasing domestic market demand
» Addition of 16 CSY machines in VFY business increasing the capacity by 2 KTPA
» Continuous endeavours to enhance brand equity through innovative marketing activities, enhancement in the product portfolio and value-add services have been the thrust areas for your Company. The engineering expertise of your Company and its emphasis on quality also minimise its risk against market fluctuations considerably
Capitals linked
MANUFACTURED CAPITAL
NATURAL CAPITAL
FINANCIAL CAPITAL
Capitals linked
HUMAN CAPITAL
SOCIAL AND RELATIONSHIP CAPITAL
FINANCIAL CAPITAL
Statutory ReportsFinancial statem
entsIntegrated Report
Integrated Annual Report 2020-21 43
Risk management
Information technology / cyber security risk Risk of financial loss, disruption or damage to Company reputation resulting from failure of its Information Technology systems. There can be deliberate and unauthorised breaches of security to gain access to information systems
Mitigation Plan
» Implementation of Group level Information Security policy
» Grasim uses back-up procedures and stores information at two different locations. Systems are upgraded regularly with latest security standards. For critical applications, security policies and procedures are updated on a periodic basis and users educated on adherence to the policies so as to eliminate data leakages
» Ensuring End user awareness (E-Learning Module and Classroom Programme). Phishing campaigns are conducted twice a year to improve vigilance and user behaviour
» Brand Protection for Keyword “Grasim”
» Disaster Recovery System is in place
» Annual security assessments of IT networks
» Network Access control – Clear Pass On Guard installed on the endpoints which will check the Latest AV Signatures, Latest Patches installed and OS Compliance. User will get the network connectivity only after the Endpoint is compliant of the AV / Patch / OS / Domain
» EDR (Endpoint Detection and Response) for Advanced Threat Hunting, Threat and Vulnerability management, Attack Surface reduction and SOAR for Endpoints
» Smokescreen Deception to identify and exfiltration of data - Endpoint Decoys, Network Decoys, Email Decoys
» Secure Internet Access using ZSCALER - Zscaler Internet Access provides secure access to the open Internet and SaaS apps, no matter where users connect. Zscaler Private Access delivers a completely new way to provide access to internal applications, whether they reside in the data centre or cloud
» Office 365 to create, share, and collaborate from anywhere on any device with a cloud-based suite of productivity apps and services
Capitals linked
FINANCIAL CAPITAL
SOCIAL AND RELATIONSHIP CAPITAL
INTELLECTUAL CAPITAL
44 Grasim Industries Limited
Environmental and other regulatory risksAny default can attract penal provisions and may impact the Company reputation. Further Increased negative activism by society / NGOs could also impact reputation
Mitigation Plan
Capitals linked » Adherence to current norms is being ensured
» Technology/equipment upgradation is done on a continuous basis
» Continuous monitoring of regulatory changes to ensure compliance with all applicable statutes and regulations
» Implementation of various sustainability initiatives such as Zero Liquid Discharge at different plants
» Commitments to comply with the sustainability roadmap to meet international norms
» The community engagement programmes, the grievance management procedures, transparency in declaring our policy and performance and a series of corporate social responsibility programmes are put in place to improve our relations with community and for partnering with them for supply of materials and services
» Health management programmes and periodic monitoring are in place around the community. At the same time, the best available technologies are being installed at all the sites plants to minimise the impact of operations as a preventive measure
MANUFACTURED CAPITAL
NATURAL CAPITAL
SOCIAL AND RELATIONSHIP CAPITAL
SOCIAL AND RELATIONSHIP CAPITAL
Industrial safety, employee health and safety risk The manufacturing businesses are labour intensive and are exposed to health and injury risk due to machinery breakdown, human negligence among others. The Chemicals business has exposure to risks arising from the producing and handling of hazardous chemicals
Mitigation Plan
Capitals linked » Association with M/s DuPont Safety Resources to build a culture of safety and strengthen Company’s Safety Management System in Chemicals business
» Development and implementation of critical safety standards across the units and project sites, establishing processes for training need identification at each level of employee, introduction of ‘Life Saving Rules’
» Continuous focus on building of safety culture across units covering entire workforce
» Adequate insurance coverageHUMAN CAPITAL
Statutory ReportsFinancial statem
entsIntegrated Report
Integrated Annual Report 2020-21 45
Activism risk
Investments impairment risk
Pandemic related risks
Increased negative activism by society / NGOs could impact operations
Business performance of subsidiary companies and other investments could give rise to impairment charges in the future
Pandemics and reoccurrence thereof may impact business operations and employees safety
Mitigation Plan
Mitigation Plan
Mitigation Plan
Capitals linked
Capitals linked
Capitals linked
» The community engagement programmes, the grievance management procedures, transparency in declaring our policy and performance and a series of corporate social responsibility programmes are put in place to improve our relations with community and for partnering with them for supply of materials and services
» Investments are reviewed regularly and corrective actions are supported
» Crisis Management teams formed at all locations
» Adequate policies and procedures, infrastructure to enable “work from home” to ensure Business Continuity Plan
» Broad basing supply chains
» Adequate insurance coverage
» Health management programmes and periodic monitoring are in place around the community. At the same time, the best available technologies are being installed at all the plants to minimise the impact of operations as a preventive measure
» Commitments to comply with the sustainability roadmap to meet international norms
» Impairment testing being done periodically and wherever the impairment is noticed, it is being accounted for
» Maintaining adequate financial liquidity for sustained operations
» Learnings from first wave of Covid-19 pandemic were identified for action
» Relief measures being taken for impacted employees and their families
Risk management
SOCIAL AND RELATIONSHIP CAPITAL
FINANCIAL CAPITAL
HUMAN CAPITAL
MANUFACTURED CAPITAL
FINANCIAL CAPITAL
46 Grasim Industries Limited
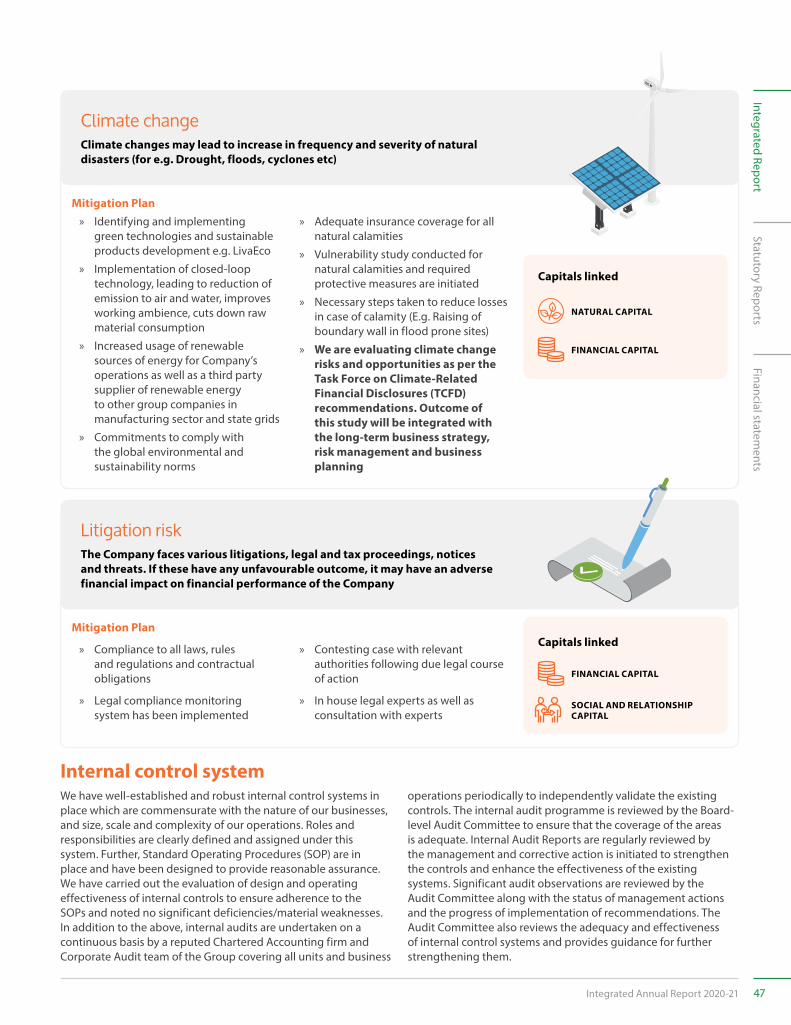
Climate change
Litigation risk
Climate changes may lead to increase in frequency and severity of natural disasters (for e.g. Drought, floods, cyclones etc)
The Company faces various litigations, legal and tax proceedings, notices and threats. If these have any unfavourable outcome, it may have an adverse financial impact on financial performance of the Company
Mitigation Plan
Mitigation Plan Capitals linked
» Identifying and implementing green technologies and sustainable products development e.g. LivaEco
» Implementation of closed-loop technology, leading to reduction of emission to air and water, improves working ambience, cuts down raw material consumption
» Increased usage of renewable sources of energy for Company’s operations as well as a third party supplier of renewable energy to other group companies in manufacturing sector and state grids
» Commitments to comply with the global environmental and sustainability norms
» Compliance to all laws, rules and regulations and contractual obligations
» Legal compliance monitoring system has been implemented
» Adequate insurance coverage for all natural calamities
» Vulnerability study conducted for natural calamities and required protective measures are initiated
» Necessary steps taken to reduce losses in case of calamity (E.g. Raising of boundary wall in flood prone sites)
» We are evaluating climate change risks and opportunities as per the Task Force on Climate-Related Financial Disclosures (TCFD) recommendations. Outcome of this study will be integrated with the long-term business strategy, risk management and business planning
» Contesting case with relevant authorities following due legal course of action
» In house legal experts as well as consultation with experts
Capitals linked
NATURAL CAPITAL
FINANCIAL CAPITAL
SOCIAL AND RELATIONSHIP CAPITAL
FINANCIAL CAPITAL
Internal control systemWe have well-established and robust internal control systems in place which are commensurate with the nature of our businesses, and size, scale and complexity of our operations. Roles and responsibilities are clearly defined and assigned under this system. Further, Standard Operating Procedures (SOP) are in place and have been designed to provide reasonable assurance. We have carried out the evaluation of design and operating effectiveness of internal controls to ensure adherence to the SOPs and noted no significant deficiencies/material weaknesses. In addition to the above, internal audits are undertaken on a continuous basis by a reputed Chartered Accounting firm and Corporate Audit team of the Group covering all units and business
operations periodically to independently validate the existing controls. The internal audit programme is reviewed by the Board-level Audit Committee to ensure that the coverage of the areas is adequate. Internal Audit Reports are regularly reviewed by the management and corrective action is initiated to strengthen the controls and enhance the effectiveness of the existing systems. Significant audit observations are reviewed by the Audit Committee along with the status of management actions and the progress of implementation of recommendations. The Audit Committee also reviews the adequacy and effectiveness of internal control systems and provides guidance for further strengthening them.
Statutory ReportsFinancial statem
entsIntegrated Report
Integrated Annual Report 2020-21 47
Our financial strengths
Optimal capital structureOur optimised debt-equity mix minimises our cost of capital while giving us significant headroom to pursue our growth ambitions. We take a conservative stand towards accumulating debt and finance a large share of our operational and growth objectives through internal accruals.
Prudent cash flow management We balance our inflows and outflows with prudence, narrowing our reliance on third party capital. We remain cash flow positive and maintain adequate liquidity for meeting cash flow requirements for both present and future needs.
Strong balance sheet with AAA ratingGrasim continues to enjoy highest credit rating and maintains a robust balance sheet with net worth of over `42,816 Crore and very low net debt to equity of .08 in FY21.
Achieving superior financial performance
At Grasim, our financial standing is backed by a strong balance sheet, prudent cost structure, superior capital management and steady cash flows. This allows us to take a long-term approach to business, and foray into markets and segments with changing consumer demand. With a calibrated approach to capital allocation, we set the ground for future growth, while ensuring consistent stakeholder returns.
FINANCIAL CAPITAL
Cost-focused approachWe have achieved our globally recognised cost leadership in VSF, through several cost optimisation measures, and our backward integration that drives our efficiencies. With continued technology deployment and integration, we achieve operational efficiencies leading to lower costs and benchmark quality.
Return-based approachOur competitive cost of production and value-added product mix drive our margin profile and return on capital employed (RoCE). Our capital and resource allocation policy is oriented towards generating consistent and superior returns for the business and providers of financial capital.
48 Grasim Industries Limited
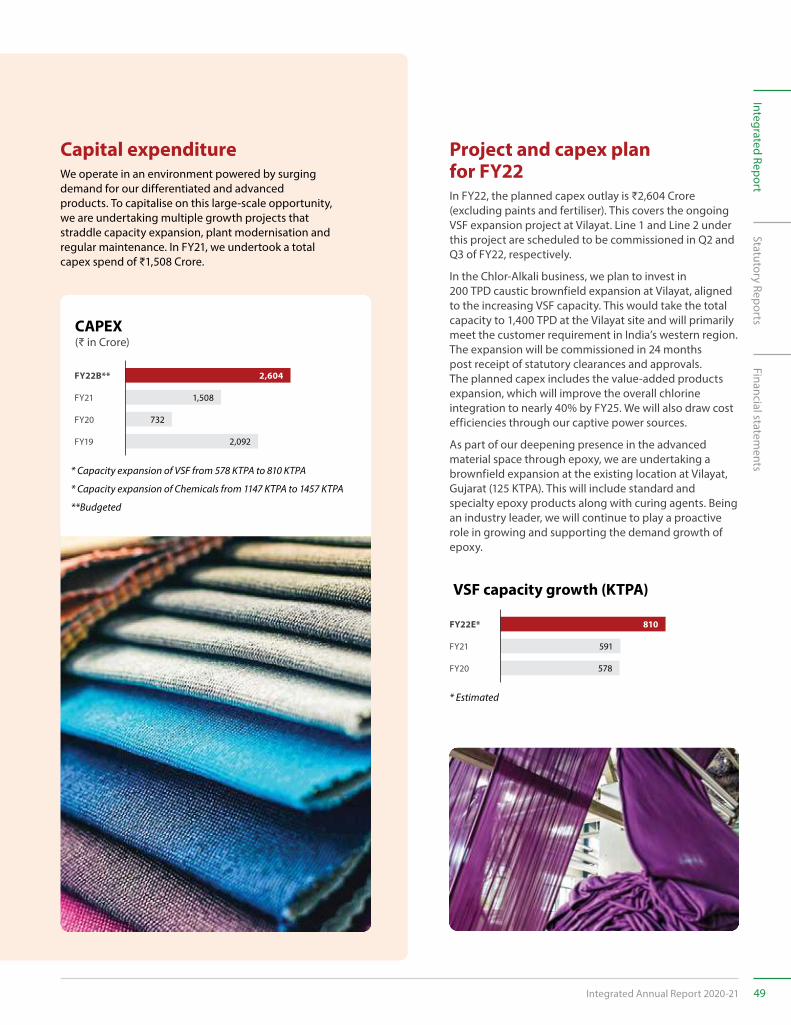
Capital expenditureWe operate in an environment powered by surging demand for our differentiated and advanced products. To capitalise on this large-scale opportunity, we are undertaking multiple growth projects that straddle capacity expansion, plant modernisation and regular maintenance. In FY21, we undertook a total capex spend of ₹1,508 Crore.
Project and capex plan for FY22In FY22, the planned capex outlay is ₹2,604 Crore (excluding paints and fertiliser). This covers the ongoing VSF expansion project at Vilayat. Line 1 and Line 2 under this project are scheduled to be commissioned in Q2 and Q3 of FY22, respectively.
In the Chlor-Alkali business, we plan to invest in 200 TPD caustic brownfield expansion at Vilayat, aligned to the increasing VSF capacity. This would take the total capacity to 1,400 TPD at the Vilayat site and will primarily meet the customer requirement in India’s western region. The expansion will be commissioned in 24 months post receipt of statutory clearances and approvals. The planned capex includes the value-added products expansion, which will improve the overall chlorine integration to nearly 40% by FY25. We will also draw cost efficiencies through our captive power sources.
As part of our deepening presence in the advanced material space through epoxy, we are undertaking a brownfield expansion at the existing location at Vilayat, Gujarat (125 KTPA). This will include standard and specialty epoxy products along with curing agents. Being an industry leader, we will continue to play a proactive role in growing and supporting the demand growth of epoxy.
VSF capacity growth (KTPA)
FY22E* 810
FY21 591
FY20 578
FY22B** 2,604
FY21 1,508
FY20
FY19
732
* Capacity expansion of VSF from 578 KTPA to 810 KTPA
* Capacity expansion of Chemicals from 1147 KTPA to 1457 KTPA
**Budgeted
* Estimated
CAPEX(₹ in Crore)
2,092
Statutory ReportsFinancial statem
entsIntegrated Report
Integrated Annual Report 2020-21 49
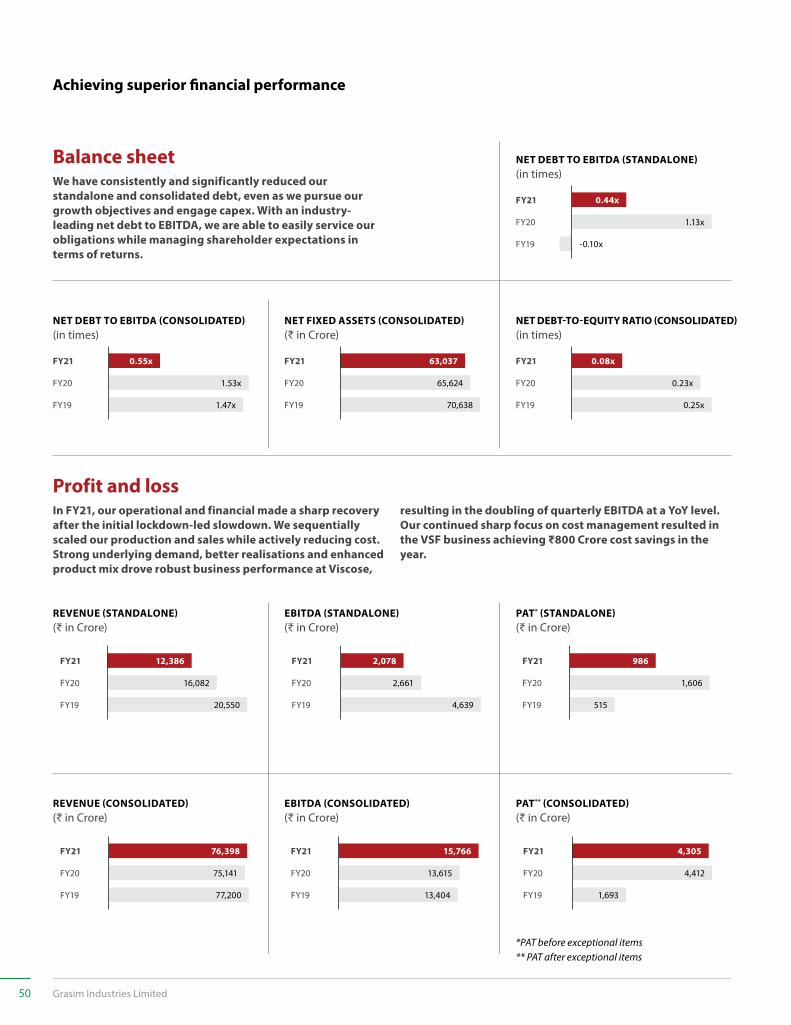
Profit and lossIn FY21, our operational and financial made a sharp recovery after the initial lockdown-led slowdown. We sequentially scaled our production and sales while actively reducing cost. Strong underlying demand, better realisations and enhanced product mix drove robust business performance at Viscose,
Balance sheetWe have consistently and significantly reduced our standalone and consolidated debt, even as we pursue our growth objectives and engage capex. With an industry-leading net debt to EBITDA, we are able to easily service our obligations while managing shareholder expectations in terms of returns.
Achieving superior financial performance
resulting in the doubling of quarterly EBITDA at a YoY level. Our continued sharp focus on cost management resulted in the VSF business achieving ₹800 Crore cost savings in the year.
NET DEBT TO EBITDA (CONSOLIDATED)(in times)
FY21
FY20
FY19
0.55x
1.53x
1.47x
NET DEBT-TO-EQUITY RATIO (CONSOLIDATED)(in times)
FY21
FY20
FY19
0.08x
0.23x
0.25x
NET FIXED ASSETS (CONSOLIDATED)(₹ in Crore)
FY21
FY20
FY19
63,037
65,624
70,638
FY21
FY20
FY19
76,398
75,141
77,200
REVENUE (CONSOLIDATED) (₹ in Crore)
FY21
FY20
FY19
986
1,606
515
PAT* (STANDALONE) (₹ in Crore)
NET DEBT TO EBITDA (STANDALONE)(in times)
FY21
FY20
FY19
0.44x
1.13x
-0.10x
*PAT before exceptional items** PAT after exceptional items
FY21
FY20
FY19
12,386
16,082
20,550
REVENUE (STANDALONE) (₹ in Crore)
FY21
FY20
FY19
2,078
2,661
4,639
EBITDA (STANDALONE) (₹ in Crore)
FY21
FY20
FY19
15,766
13,615
13,404
EBITDA (CONSOLIDATED) (₹ in Crore)
FY21
FY20
FY19
4,305
4,412
1,693
PAT** (CONSOLIDATED) (₹ in Crore)
50 Grasim Industries Limited
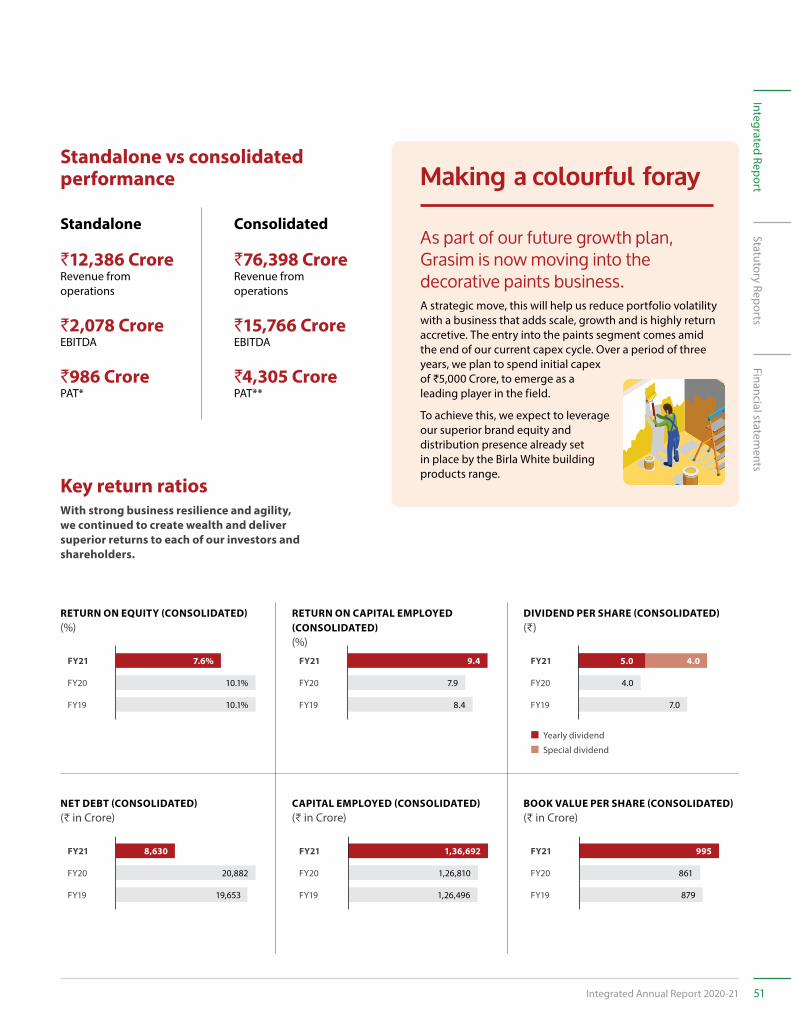
`12,386 CroreRevenue from operations
`2,078 CroreEBITDA
`986 CrorePAT*
`76,398 CroreRevenue from operations
`15,766 CroreEBITDA
`4,305 CrorePAT**
Standalone vs consolidated performance
As part of our future growth plan, Grasim is now moving into the decorative paints business. A strategic move, this will help us reduce portfolio volatility with a business that adds scale, growth and is highly return accretive. The entry into the paints segment comes amid the end of our current capex cycle. Over a period of three years, we plan to spend initial capex of ₹5,000 Crore, to emerge as a leading player in the field.
To achieve this, we expect to leverage our superior brand equity and distribution presence already set in place by the Birla White building products range.
Key return ratiosWith strong business resilience and agility, we continued to create wealth and deliver superior returns to each of our investors and shareholders.
Making a colourful foray
Standalone Consolidated
FY21
FY20
FY19
7.6%
10.1%
10.1%
RETURN ON EQUITY (CONSOLIDATED) (%)
FY21
FY20
FY19
9.4
7.9
8.4
RETURN ON CAPITAL EMPLOYED (CONSOLIDATED) (%)
FY21
FY20
FY19
4.0
4.0
7.0
5.0
Yearly dividend
Special dividend
DIVIDEND PER SHARE (CONSOLIDATED) (₹)
FY21
FY20
FY19
8,630
20,882
19,653
NET DEBT (CONSOLIDATED) (₹ in Crore)
FY21
FY20
FY19
1,36,692
1,26,810
1,26,496
CAPITAL EMPLOYED (CONSOLIDATED) (₹ in Crore)
FY21
FY20
FY19
995
861
879
BOOK VALUE PER SHARE (CONSOLIDATED) (₹ in Crore)
Statutory ReportsFinancial statem
entsIntegrated Report
Integrated Annual Report 2020-21 51
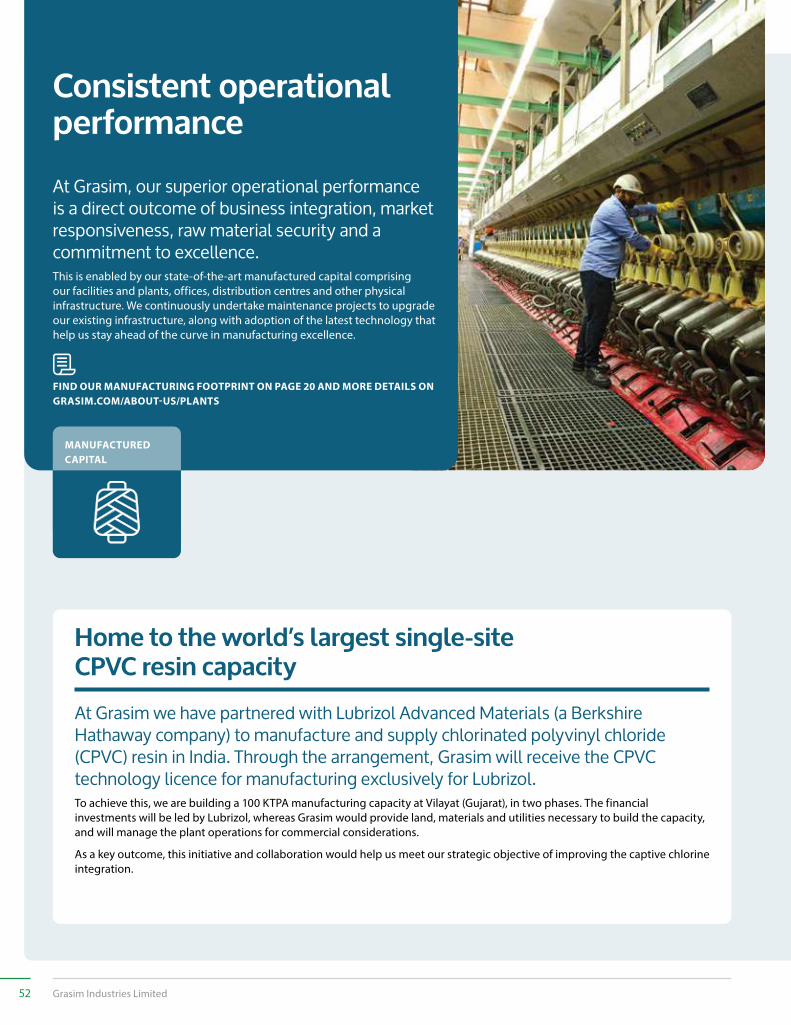
Consistent operational performance
At Grasim, our superior operational performance is a direct outcome of business integration, market responsiveness, raw material security and a commitment to excellence.This is enabled by our state-of-the-art manufactured capital comprising our facilities and plants, offices, distribution centres and other physical infrastructure. We continuously undertake maintenance projects to upgrade our existing infrastructure, along with adoption of the latest technology that help us stay ahead of the curve in manufacturing excellence.
MANUFACTURED CAPITAL
FIND OUR MANUFACTURING FOOTPRINT ON PAGE 20 AND MORE DETAILS ON GRASIM.COM/ABOUT-US/PLANTS
At Grasim we have partnered with Lubrizol Advanced Materials (a Berkshire Hathaway company) to manufacture and supply chlorinated polyvinyl chloride (CPVC) resin in India. Through the arrangement, Grasim will receive the CPVC technology licence for manufacturing exclusively for Lubrizol. To achieve this, we are building a 100 KTPA manufacturing capacity at Vilayat (Gujarat), in two phases. The financial investments will be led by Lubrizol, whereas Grasim would provide land, materials and utilities necessary to build the capacity, and will manage the plant operations for commercial considerations.
As a key outcome, this initiative and collaboration would help us meet our strategic objective of improving the captive chlorine integration.
Home to the world’s largest single-site CPVC resin capacity
52 Grasim Industries Limited
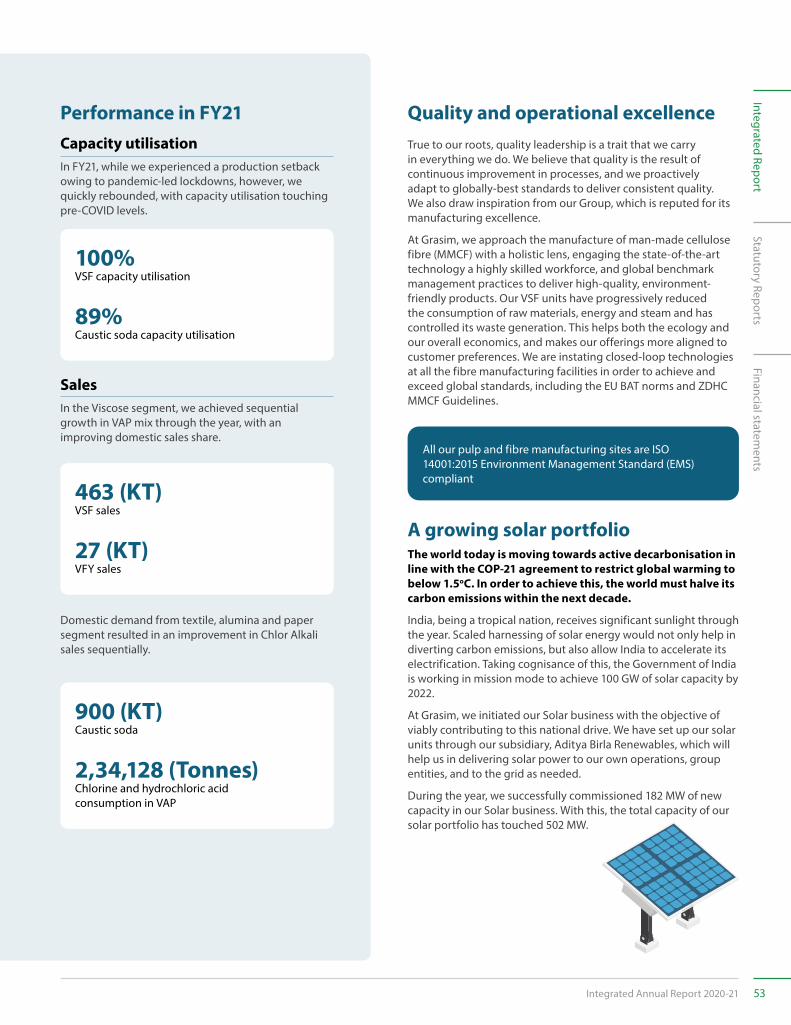
Performance in FY21Capacity utilisationIn FY21, while we experienced a production setback owing to pandemic-led lockdowns, however, we quickly rebounded, with capacity utilisation touching pre-COVID levels.
Domestic demand from textile, alumina and paper segment resulted in an improvement in Chlor Alkali sales sequentially.
100%VSF capacity utilisation
89%Caustic soda capacity utilisation
Quality and operational excellence
A growing solar portfolio
True to our roots, quality leadership is a trait that we carry in everything we do. We believe that quality is the result of continuous improvement in processes, and we proactively adapt to globally-best standards to deliver consistent quality. We also draw inspiration from our Group, which is reputed for its manufacturing excellence.
At Grasim, we approach the manufacture of man-made cellulose fibre (MMCF) with a holistic lens, engaging the state-of-the-art technology a highly skilled workforce, and global benchmark management practices to deliver high-quality, environment-friendly products. Our VSF units have progressively reduced the consumption of raw materials, energy and steam and has controlled its waste generation. This helps both the ecology and our overall economics, and makes our offerings more aligned to customer preferences. We are instating closed-loop technologies at all the fibre manufacturing facilities in order to achieve and exceed global standards, including the EU BAT norms and ZDHC MMCF Guidelines.
The world today is moving towards active decarbonisation in line with the COP-21 agreement to restrict global warming to below 1.5oC. In order to achieve this, the world must halve its carbon emissions within the next decade.
India, being a tropical nation, receives significant sunlight through the year. Scaled harnessing of solar energy would not only help in diverting carbon emissions, but also allow India to accelerate its electrification. Taking cognisance of this, the Government of India is working in mission mode to achieve 100 GW of solar capacity by 2022.
At Grasim, we initiated our Solar business with the objective of viably contributing to this national drive. We have set up our solar units through our subsidiary, Aditya Birla Renewables, which will help us in delivering solar power to our own operations, group entities, and to the grid as needed.
During the year, we successfully commissioned 182 MW of new capacity in our Solar business. With this, the total capacity of our solar portfolio has touched 502 MW.
All our pulp and fibre manufacturing sites are ISO 14001:2015 Environment Management Standard (EMS) compliant
SalesIn the Viscose segment, we achieved sequential growth in VAP mix through the year, with an improving domestic sales share.
463 (KT)VSF sales
27 (KT)VFY sales
900 (KT)Caustic soda
2,34,128 (Tonnes)Chlorine and hydrochloric acid consumption in VAP
Statutory ReportsFinancial statem
entsIntegrated Report
Integrated Annual Report 2020-21 53
Value chain The process includes:
» Starting SPE process and communicating with all internal stakeholders – periodic evaluation process starts uniformly across the organisation with all internal stakeholders receiving the process guide
» Evaluation of Suppliers to CP and PP teams – a team’s rating is only considered if they purchase relevant volumes from the related supplier on a regular basis
» Collation of results
» Distribution of overall ratings to the suppliers
» Identification of weaknesses for suppliers and communication of corrective actions required
» Documentation and monitoring of the corrective actions by the relevant CP / PP team
Suppliers are rated on their business relationship, price competitiveness, technical aspects (including technical and regulatory requirements and certifications), quality and delivery performance, order and supply management, and sustainability. Each supplier is assigned a score out of 100.
10% of this score is attributed to sustainability, which involves their compliance to the ABG Supplier Code of Conduct and Sustainability Policies; other Environment, Social, Governance objectives linked to supply chain management; formalised processes to identify potential sustainability risks; and EHS certifications (periodic safety audits, ISO 14000 compliance, OHSAS 18001 compliance, etc.)
Grasim also conducts risk assessments to identify any potential exposure to supply risks associated with supplier vulnerabilities in terms of business, finance, commercial, quality, and safety and sustainability risks. These are conducted when a new supplier is on-boarded, and annually for critical suppliers. Any supplier identified as presenting a high risk is required to create and implement actions to reduce that risk to continue their business operations with Grasim.
At Grasim, we continue to earn our competitive edge by delivering significant value additions at minimum cost, hence delivering superior value to our customers. We operate a consciously backward integrated viscose value-chain, with captive capabilities in dissolving grade wood pulp, Chlor Alkali, carbon-disulphide, power generation and steam. This has helped us achieve an edge in terms of raw material security, quality control, scale and efficiency.
To ensure the quality of our inputs, we have instituted a platform, LIVA Accredited Partner Forum (LAPF). It acts as the umbrella under our partner network operates and is a one-of-its kind consortium of over 450+ Value Chain Partners from India producing best in class Viscose, Modal and Lyocell based yarns and fabrics. LAPF is a group of value chain partners – starting from spinners to fabricators to processors, who produce fabrics that meet LIVA standards. The accredited forum has a certification mechanism in place and provides support on marketing, vendor management, design innovation, product perfection and sustainability.
Operating a conscious supply chainGlobally, there is an increasing concern across the apparel industry regarding tracking of materials used to make fabric and the conditions in which they are produced. At Grasim’s Birla Cellulose division, we have turned this concern into action by providing relevant information in a standardised format with various traceability and transparency initiatives. Key information on new products, new developments and new market opportunities are also discussed during our interactions with key stakeholders. We have partnered with leading global brands on initiatives to trace the source of the raw materials, and to help them trace their complicated supply chains. ‘Forest to Fashion’ is the first supply chain mapping project of its kind in the apparel industry.
Consistent operational performance
In FY21, CFI undertook a supply chain risk assessment at two levels:
Supplier performance evaluation
We executed the performance review with 140 suppliers (75 critical and 65 non-critical suppliers), with 404 evaluations.
Supplier risk assessment
We undertook 83 assessments, where 29 suppliers (35%) were identified as at high risk and 22 suppliers each were identified as at medium and low risk, respectively. We are in the process of developing and executing a mitigation strategy for the high-risk suppliers.
Evaluating supply chain risksWe conduct an annual assessment of our suppliers to ensure that they maintain a continuous improvement ideology across all Grasim plants. This includes an evaluation of the supplier’s performance, quality, and commercial ability to meet Grasim’s needs.
The responsibility for management of the Supplier Performance Evaluation (SPE) process lies with the Central Procurement (CP) and Plant Procurement (PP) teams. The CP/PP teams evaluate and manage improvement actions derived from those evaluations in order to constantly improve the performance of the suppliers.
54 Grasim Industries Limited
CustomersAt Grasim, we operate and build customer-centric brands which keep the interests and preferences of customers and consumers at the heart of every decision. Our sustainability decisions are also aligned with the goals of our customers and amplify their efforts in making the planet and society better. Ingrained into our ethos, it extends to our value chain partners as well, who make our products and provide services based on the environmental, societal and economic expectations of their customers and end consumers.
We consider our customers as our partners and continuously strive to improve their outcomes through reliability, quality and serviceability. We are guided by our strong belief of putting our ‘customer first’, which is now being formulated into a first-ever Global Customer Service Charter, which navigates our way forward to becoming a true B2B2C organisation. To deliver customer success across our global footprint with customers in more than 65 countries and a stronghold on every major global textile cluster, we have a comprehensive mechanism that leverages multiple aspects across the ecosystem.
To ensure compliance and due focus is maintained on same, we have and operate a customer centricity cell, which consistently listens to what our customers are saying, builds synergies around customer priorities and internalises their feedback into every business decision. We have a fully stacked call centre and an e-portal as our touchpoints, where customers can record their opinions, even anonymously. We are also actively investing to grow closer to them and empower them with more transparency and controls, by developing and introducing e-platforms where they can easily identify our product benefits and applicability, place orders and track serviceability.
In addition to continuous engagement with the Mission Happiness call centre and multiple researches every quarter, at each of our locations, we conduct a huddle with employees. This is done to listen to VOC (voice of customer), understand key concerns and bottlenecks and build actions to be taken to resolve them. At several of these huddles, we also invite and co-partner with customers to speak about how we can help solve any key challenges. To ensure and continuously build customer focus, the VOC is also circulated across entire workforce, in their regional languages, via technology, using the Mission Happiness portal and remote kiosks, installed at every unit.
Mission HappinessMission Happiness is an umbrella of various engagement activities with customers carried out on a real-time basis to continuously learn from customers and deliver a positive and uniform customer experience using VOC from our direct customers and value chain partners across nationalities. Employees are encouraged to be agile and proactive towards the customers’ requirements to achieve the objectives arrived at using VOC via Mission Happiness. It also provides employees a platform to voice their challenges and ideas to resolve business challenges, providing and making it a unique link between customers, employees and business objectives.
Product safety Our products are raw materials that constitute some of the most widely used end products in the apparel, home décor, personal care, hygiene and medical sectors. In this context, product safety continues to be our topmost priority and we ensure that every product out of our facilities are certified safe for use with tags such as Standard 100 by Oeko –Tex, USDA Bio Based Certification and OK Certification.
Contemporary fashion Through Raysil, we offer the latest in fabrics across georgettes, crepes, chiffons, to satins and velvets that are extensively utilised in women’s wear ranging from Indian ethnic wear to fusion wear across work, casual, occasion and bridal. Raysil also finds its applications in high end embroidery, knitted dresses and home textiles and men’s suiting.
FY21 interventionsDuring FY21 we recognised the stress points of our customer partners and initiated several measures that supported them in the face of the pandemic-induced slowdown, including relaxation in payment terms. Multiple engagements such as webinars, panel discussions and one-on-one conversations were initiated, focused on alleviating customer concerns and stress with regard to evolving market changes and future challenges. We engaged with 300+ partners in 12 webinars each, presided by industry stalwarts who gave a perspective on the current market and economic scenario and addressed concerns and queries of the participants. Further, recently we have arranged free unlimited medical e-consultation for all our domestic customers, through a popular and government certified e-medical platform. Through these initiatives that appealed to them from an economic and emotive standpoint, we were able to validate our continued commitment to customer centricity.
Statutory ReportsFinancial statem
entsIntegrated Report
Integrated Annual Report 2020-21 55
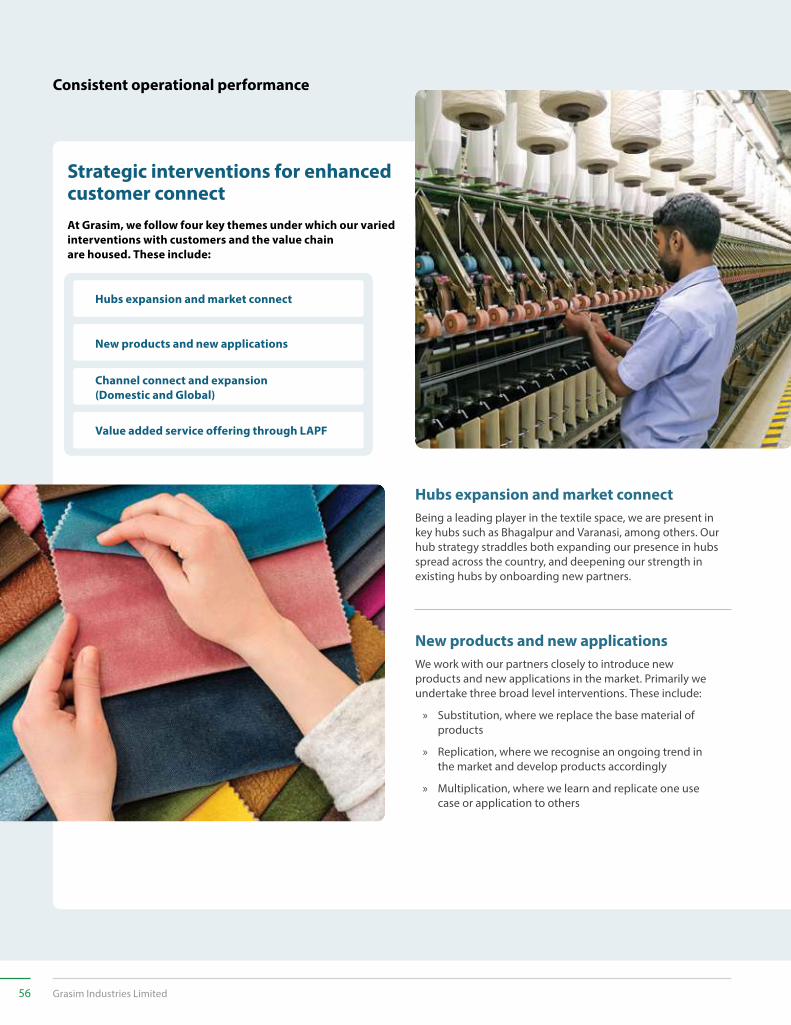
Consistent operational performance
Strategic interventions for enhanced customer connectAt Grasim, we follow four key themes under which our varied interventions with customers and the value chain are housed. These include:
Hubs expansion and market connect
New products and new applications
Channel connect and expansion (Domestic and Global)
Value added service offering through LAPF
Being a leading player in the textile space, we are present in key hubs such as Bhagalpur and Varanasi, among others. Our hub strategy straddles both expanding our presence in hubs spread across the country, and deepening our strength in existing hubs by onboarding new partners.
We work with our partners closely to introduce new products and new applications in the market. Primarily we undertake three broad level interventions. These include:
» Substitution, where we replace the base material of products
» Replication, where we recognise an ongoing trend in the market and develop products accordingly
» Multiplication, where we learn and replicate one use case or application to others
Hubs expansion and market connect
New products and new applications
56 Grasim Industries Limited
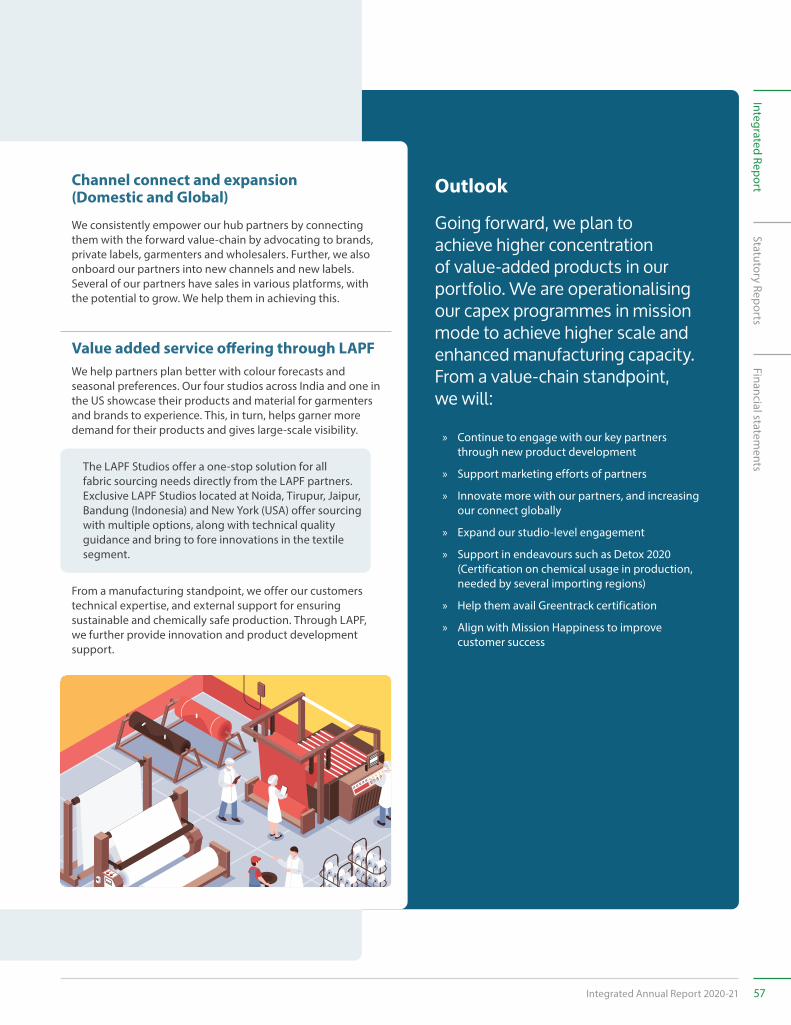
We consistently empower our hub partners by connecting them with the forward value-chain by advocating to brands, private labels, garmenters and wholesalers. Further, we also onboard our partners into new channels and new labels. Several of our partners have sales in various platforms, with the potential to grow. We help them in achieving this.
We help partners plan better with colour forecasts and seasonal preferences. Our four studios across India and one in the US showcase their products and material for garmenters and brands to experience. This, in turn, helps garner more demand for their products and gives large-scale visibility.
From a manufacturing standpoint, we offer our customers technical expertise, and external support for ensuring sustainable and chemically safe production. Through LAPF, we further provide innovation and product development support.
OutlookChannel connect and expansion (Domestic and Global)
Value added service offering through LAPF
The LAPF Studios offer a one-stop solution for all fabric sourcing needs directly from the LAPF partners. Exclusive LAPF Studios located at Noida, Tirupur, Jaipur, Bandung (Indonesia) and New York (USA) offer sourcing with multiple options, along with technical quality guidance and bring to fore innovations in the textile segment.
Going forward, we plan to achieve higher concentration of value-added products in our portfolio. We are operationalising our capex programmes in mission mode to achieve higher scale and enhanced manufacturing capacity. From a value-chain standpoint, we will:
» Continue to engage with our key partners through new product development
» Support marketing efforts of partners
» Innovate more with our partners, and increasing our connect globally
» Expand our studio-level engagement
» Support in endeavours such as Detox 2020 (Certification on chemical usage in production, needed by several importing regions)
» Help them avail Greentrack certification
» Align with Mission Happiness to improve customer success
Statutory ReportsFinancial statem
entsIntegrated Report
Integrated Annual Report 2020-21 57
Innovating for lasting impact
For us, innovation is not about a single ground-breaking discovery, but everyday efforts that act as enablers of our business success. We believe in regular and incremental innovations that constantly give us the edge, helping us stay agile and responsive.To achieve this, we have built cutting-edge R&D infrastructure that helps us identify areas of improvement, experiment with materials, offer more for less and leave a greener footprint behind. This forms the core of our intellectual capital, which has led us to gain patents and other IPRs, along with differentiated product brands.
INTELLECTUAL CAPITAL
Key R&D facilities include:1
5
4
Corporate R&D centre
Exclusive R&D centres for VSF
90 Patent applications / patents in 16 countries belonging to 52 patent families (VSF)
~300 CroreTotal R&D expenditure in last 3 years
Exclusive R&D centres for the Chlor-Alkali, Epoxy, Insulators and Fertilisers businesses
» Aditya Birla Water Application Development Centre (ABWADC)
» Aditya Birla Science and Technology Company (ABSTC), Taloja
» Clonal Production Centre (CPC), Harihar
» Fibre Research Centre (FRC), Kharach
» Pulp & Fibre Innovation Centre (PFIC), Taloja
» Next Generation Fibre Research Centre (NGFRC), Nagda
» Textile Research Application and Development Centre (TRADC), Kharach
» Materials Research Centre (Epoxy), Taloja
58 Grasim Industries Limited
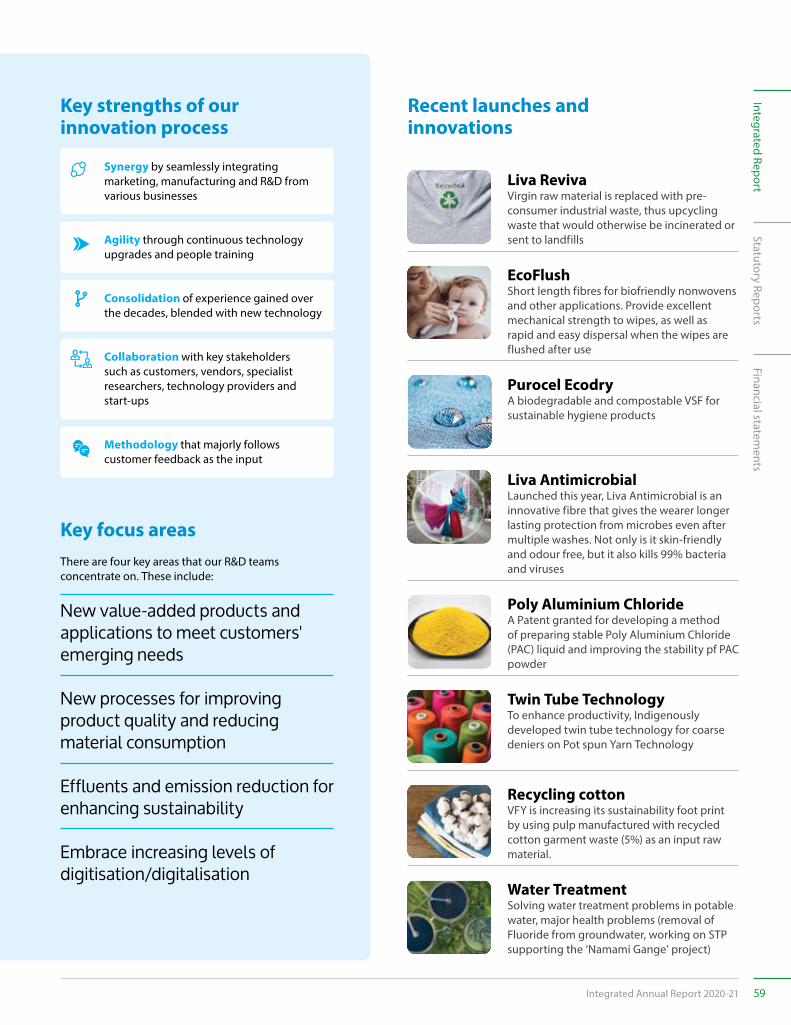
Key strengths of our innovation process
Key focus areas
Recent launches and innovations
There are four key areas that our R&D teams concentrate on. These include:
New value-added products and applications to meet customers' emerging needs
New processes for improving product quality and reducing material consumption
Effluents and emission reduction for enhancing sustainability
Embrace increasing levels of digitisation/digitalisation
Synergy by seamlessly integrating marketing, manufacturing and R&D from various businesses
Agility through continuous technology upgrades and people training
Consolidation of experience gained over the decades, blended with new technology
Collaboration with key stakeholders such as customers, vendors, specialist researchers, technology providers and start-ups
Methodology that majorly follows customer feedback as the input
Liva RevivaVirgin raw material is replaced with pre-consumer industrial waste, thus upcycling waste that would otherwise be incinerated or sent to landfills
EcoFlushShort length fibres for biofriendly nonwovens and other applications. Provide excellent mechanical strength to wipes, as well as rapid and easy dispersal when the wipes are flushed after use
Purocel EcodryA biodegradable and compostable VSF for sustainable hygiene products
Liva AntimicrobialLaunched this year, Liva Antimicrobial is an innovative fibre that gives the wearer longer lasting protection from microbes even after multiple washes. Not only is it skin-friendly and odour free, but it also kills 99% bacteria and viruses
Poly Aluminium ChlorideA Patent granted for developing a method of preparing stable Poly Aluminium Chloride (PAC) liquid and improving the stability pf PAC powder
Twin Tube TechnologyTo enhance productivity, Indigenously developed twin tube technology for coarse deniers on Pot spun Yarn Technology
Recycling cottonVFY is increasing its sustainability foot print by using pulp manufactured with recycled cotton garment waste (5%) as an input raw material.
Water TreatmentSolving water treatment problems in potable water, major health problems (removal of Fluoride from groundwater, working on STP supporting the ‘Namami Gange’ project)
Statutory ReportsFinancial statem
entsIntegrated Report
Integrated Annual Report 2020-21 59
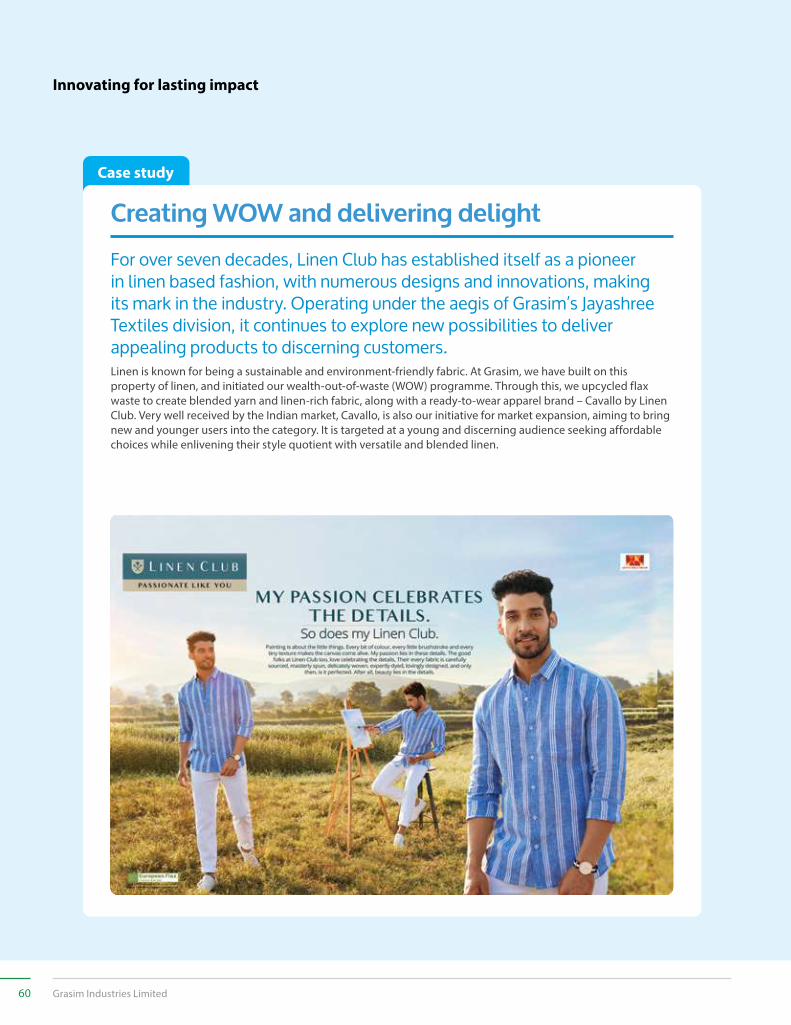
Case study
For over seven decades, Linen Club has established itself as a pioneer in linen based fashion, with numerous designs and innovations, making its mark in the industry. Operating under the aegis of Grasim’s Jayashree Textiles division, it continues to explore new possibilities to deliver appealing products to discerning customers. Linen is known for being a sustainable and environment-friendly fabric. At Grasim, we have built on this property of linen, and initiated our wealth-out-of-waste (WOW) programme. Through this, we upcycled flax waste to create blended yarn and linen-rich fabric, along with a ready-to-wear apparel brand – Cavallo by Linen Club. Very well received by the Indian market, Cavallo, is also our initiative for market expansion, aiming to bring new and younger users into the category. It is targeted at a young and discerning audience seeking affordable choices while enlivening their style quotient with versatile and blended linen.
Creating WOW and delivering delight
Innovating for lasting impact
60 Grasim Industries Limited
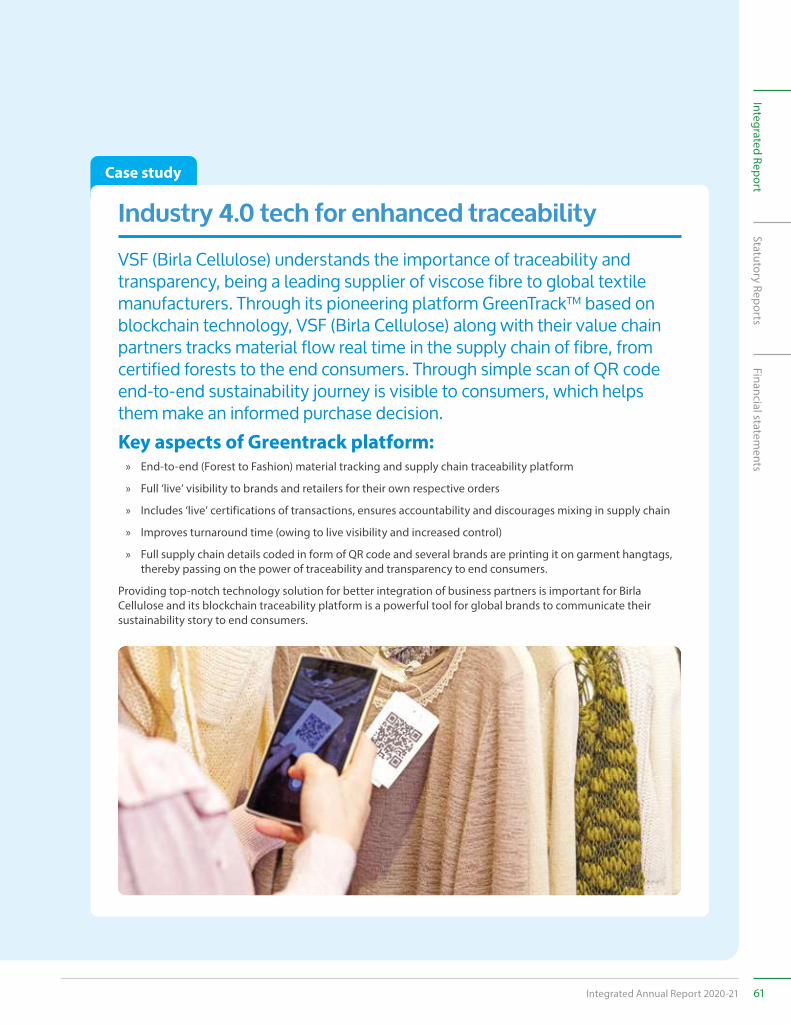
Case study
VSF (Birla Cellulose) understands the importance of traceability and transparency, being a leading supplier of viscose fibre to global textile manufacturers. Through its pioneering platform GreenTrack™ based on blockchain technology, VSF (Birla Cellulose) along with their value chain partners tracks material flow real time in the supply chain of fibre, from certified forests to the end consumers. Through simple scan of QR code end-to-end sustainability journey is visible to consumers, which helps them make an informed purchase decision.Key aspects of Greentrack platform:
» End-to-end (Forest to Fashion) material tracking and supply chain traceability platform
» Full ‘live’ visibility to brands and retailers for their own respective orders
» Includes ‘live’ certifications of transactions, ensures accountability and discourages mixing in supply chain
» Improves turnaround time (owing to live visibility and increased control)
» Full supply chain details coded in form of QR code and several brands are printing it on garment hangtags, thereby passing on the power of traceability and transparency to end consumers.
Providing top-notch technology solution for better integration of business partners is important for Birla Cellulose and its blockchain traceability platform is a powerful tool for global brands to communicate their sustainability story to end consumers.
Industry 4.0 tech for enhanced traceability
Statutory ReportsFinancial statem
entsIntegrated Report
Integrated Annual Report 2020-21 61
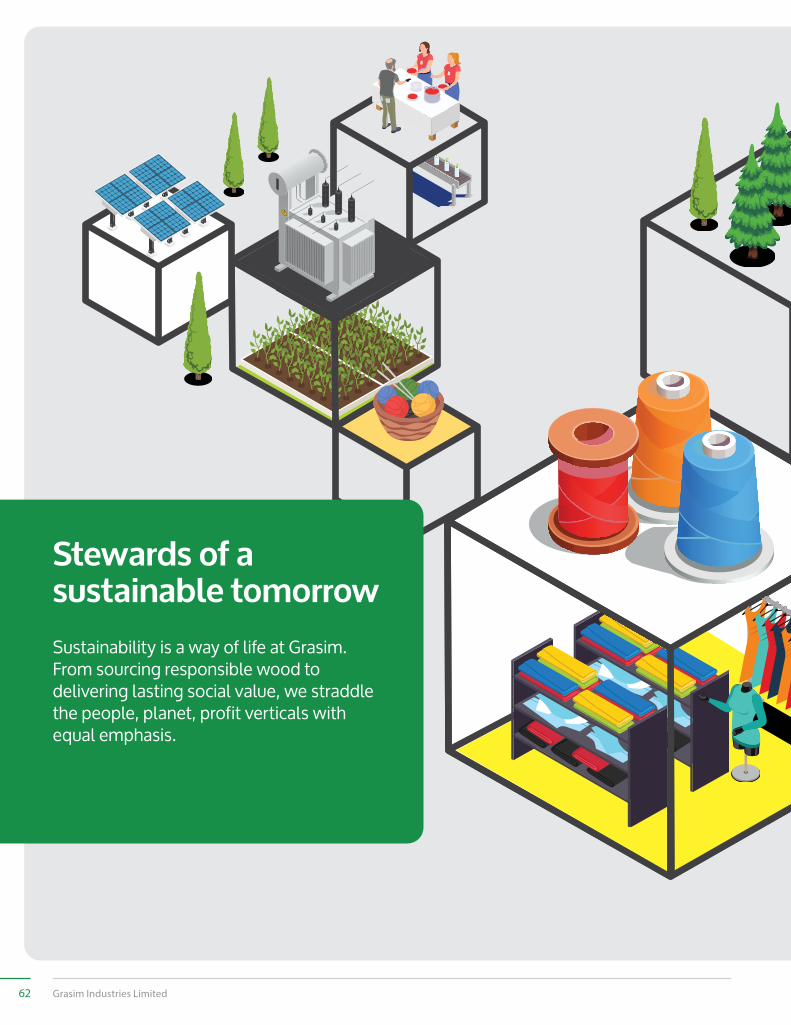
Sustainability is a way of life at Grasim. From sourcing responsible wood to delivering lasting social value, we straddle the people, planet, profit verticals with equal emphasis.
Stewards of a sustainable tomorrow
62 Grasim Industries Limited
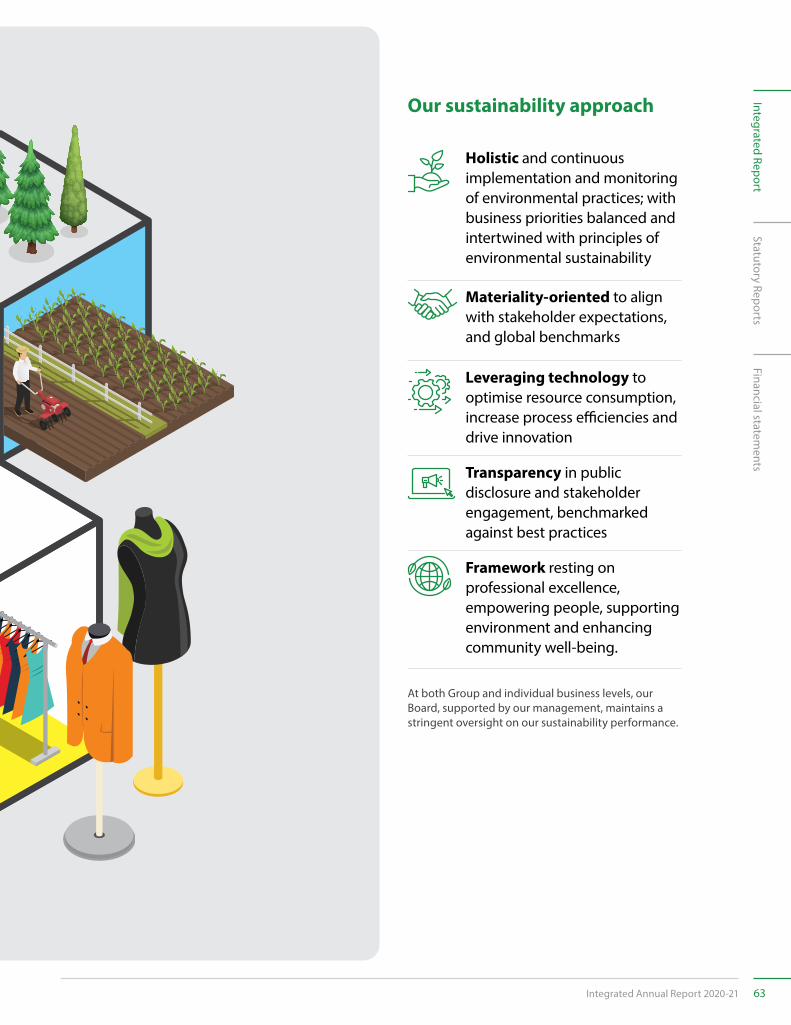
Our sustainability approach
Holistic and continuous implementation and monitoring of environmental practices; with business priorities balanced and intertwined with principles of environmental sustainability
Materiality-oriented to align with stakeholder expectations, and global benchmarks
Leveraging technology to optimise resource consumption, increase process efficiencies and drive innovation
Transparency in public disclosure and stakeholder engagement, benchmarked against best practices
Framework resting on professional excellence, empowering people, supporting environment and enhancing community well-being.
At both Group and individual business levels, our Board, supported by our management, maintains a stringent oversight on our sustainability performance.
Statutory ReportsFinancial statem
entsIntegrated Report
Integrated Annual Report 2020-21 63
As a manufacturing organisation, natural capital provides key inputs for our business. Across areas of intervention such as water, energy, forestry and waste management, we promote environmental conservation and preservation as our core goal.
Environment
Key highlights
VSF business received the No.1 rankingIn Canopy Hot Button Report 2020 and has been accorded ‘Dark Green Shirt’
Viscose business sustainability achievement has been showcased in a case study
“Birla Cellulose Spearheading Sustainable Fashion”Published by the world’s renowned Ivey Publisher and is now available on HBR website
VSF business achieved FEM 3.0 score of 92%Amongst the highest in MMCF industry globally, based on third-party verification
VSF business is amongst the lowest water consumption per tonneOf Viscose Staple Fibre (VSF) globally
VSF business won the Golden Peacock Global AwardFor Sustainability, 2020
NATURAL CAPITAL
64 Grasim Industries Limited
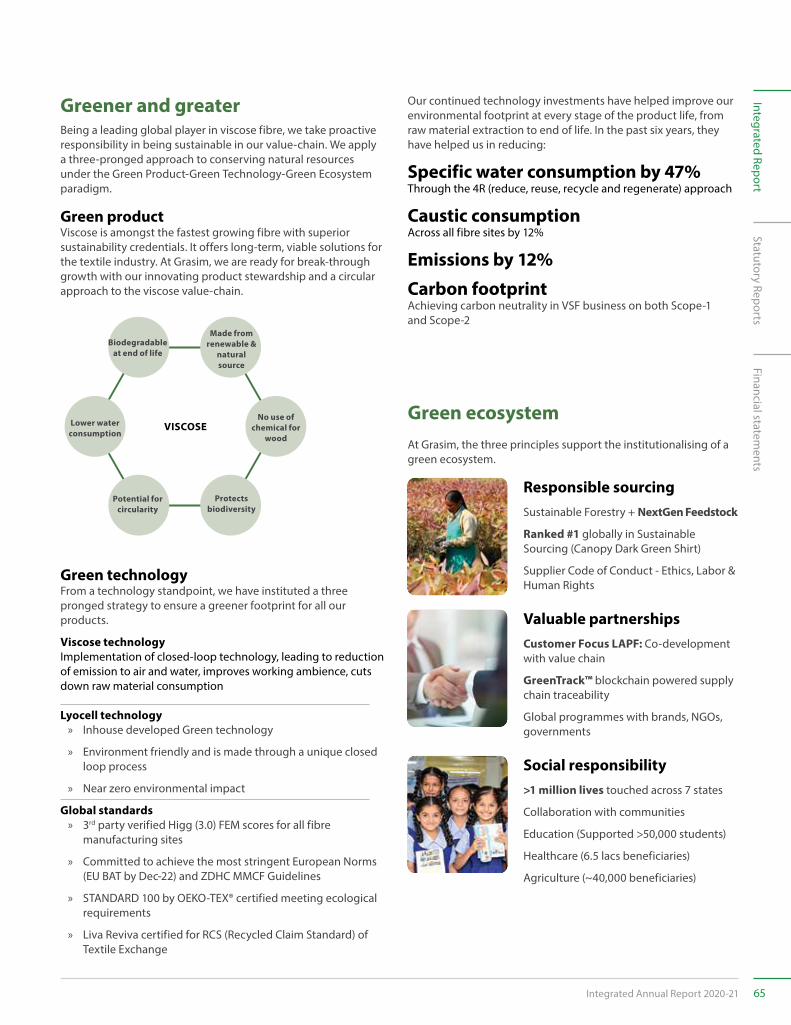
Greener and greater
Green ecosystem
Being a leading global player in viscose fibre, we take proactive responsibility in being sustainable in our value-chain. We apply a three-pronged approach to conserving natural resources under the Green Product-Green Technology-Green Ecosystem paradigm.
At Grasim, the three principles support the institutionalising of a green ecosystem.
Green product
Responsible sourcing
Valuable partnerships
Social responsibility
Green technology
Lyocell technology
Global standards
Viscose is amongst the fastest growing fibre with superior sustainability credentials. It offers long-term, viable solutions for the textile industry. At Grasim, we are ready for break-through growth with our innovating product stewardship and a circular approach to the viscose value-chain.
From a technology standpoint, we have instituted a three pronged strategy to ensure a greener footprint for all our products.
Viscose technologyImplementation of closed-loop technology, leading to reduction of emission to air and water, improves working ambience, cuts down raw material consumption
» Inhouse developed Green technology
» Environment friendly and is made through a unique closed loop process
» Near zero environmental impact
» 3rd party verified Higg (3.0) FEM scores for all fibre manufacturing sites
» Committed to achieve the most stringent European Norms (EU BAT by Dec-22) and ZDHC MMCF Guidelines
» STANDARD 100 by OEKO-TEX® certified meeting ecological requirements
» Liva Reviva certified for RCS (Recycled Claim Standard) of Textile Exchange
Our continued technology investments have helped improve our environmental footprint at every stage of the product life, from raw material extraction to end of life. In the past six years, they have helped us in reducing:
Specific water consumption by 47%Through the 4R (reduce, reuse, recycle and regenerate) approach
Caustic consumptionAcross all fibre sites by 12%
Emissions by 12%
Carbon footprintAchieving carbon neutrality in VSF business on both Scope-1 and Scope-2
Sustainable Forestry + NextGen Feedstock
Ranked #1 globally in Sustainable Sourcing (Canopy Dark Green Shirt)
Supplier Code of Conduct - Ethics, Labor & Human Rights
Customer Focus LAPF: Co-development with value chain
GreenTrack™ blockchain powered supply chain traceability
Global programmes with brands, NGOs, governments
>1 million lives touched across 7 states
Collaboration with communities
Education (Supported >50,000 students)
Healthcare (6.5 lacs beneficiaries)
Agriculture (~40,000 beneficiaries)
VISCOSE
Made from renewable &
natural source
No use of chemical for
wood
Protects biodiversity
Potential for circularity
Lower water consumption
Biodegradable at end of life
Statutory ReportsFinancial statem
entsIntegrated Report
Integrated Annual Report 2020-21 65
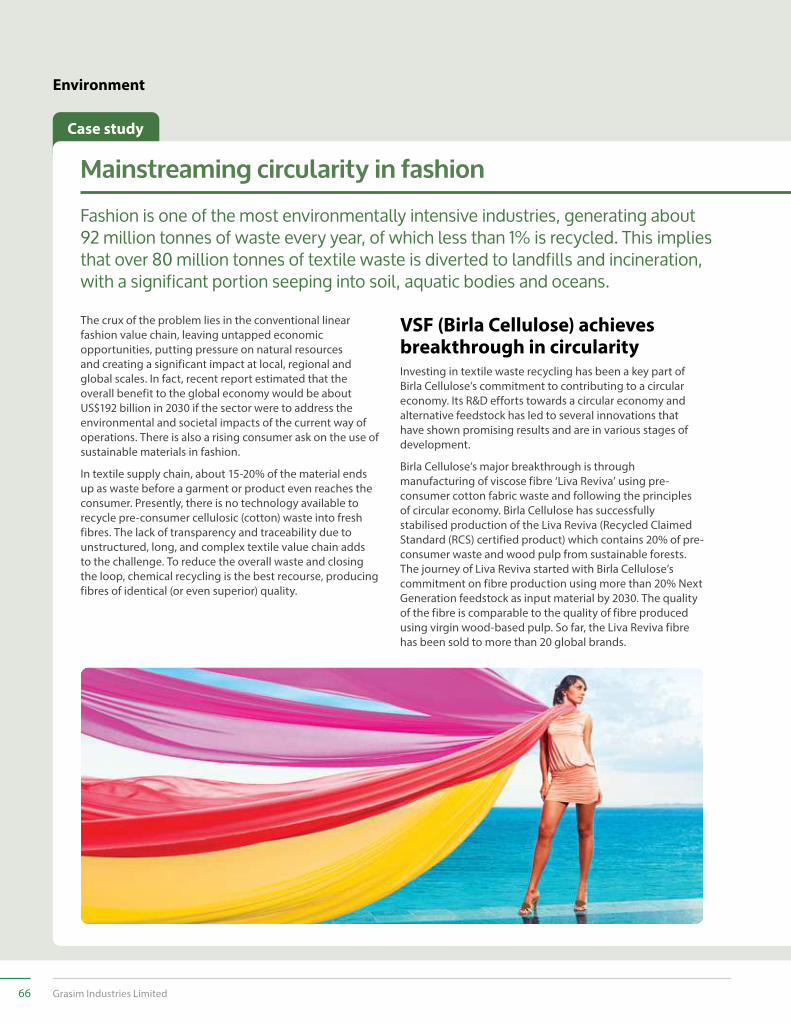
Case study
Fashion is one of the most environmentally intensive industries, generating about 92 million tonnes of waste every year, of which less than 1% is recycled. This implies that over 80 million tonnes of textile waste is diverted to landfills and incineration, with a significant portion seeping into soil, aquatic bodies and oceans.
Mainstreaming circularity in fashion
Environment
The crux of the problem lies in the conventional linear fashion value chain, leaving untapped economic opportunities, putting pressure on natural resources and creating a significant impact at local, regional and global scales. In fact, recent report estimated that the overall benefit to the global economy would be about US$192 billion in 2030 if the sector were to address the environmental and societal impacts of the current way of operations. There is also a rising consumer ask on the use of sustainable materials in fashion.
In textile supply chain, about 15-20% of the material ends up as waste before a garment or product even reaches the consumer. Presently, there is no technology available to recycle pre-consumer cellulosic (cotton) waste into fresh fibres. The lack of transparency and traceability due to unstructured, long, and complex textile value chain adds to the challenge. To reduce the overall waste and closing the loop, chemical recycling is the best recourse, producing fibres of identical (or even superior) quality.
VSF (Birla Cellulose) achieves breakthrough in circularityInvesting in textile waste recycling has been a key part of Birla Cellulose’s commitment to contributing to a circular economy. Its R&D efforts towards a circular economy and alternative feedstock has led to several innovations that have shown promising results and are in various stages of development.
Birla Cellulose’s major breakthrough is through manufacturing of viscose fibre ‘Liva Reviva’ using pre-consumer cotton fabric waste and following the principles of circular economy. Birla Cellulose has successfully stabilised production of the Liva Reviva (Recycled Claimed Standard (RCS) certified product) which contains 20% of pre-consumer waste and wood pulp from sustainable forests. The journey of Liva Reviva started with Birla Cellulose’s commitment on fibre production using more than 20% Next Generation feedstock as input material by 2030. The quality of the fibre is comparable to the quality of fibre produced using virgin wood-based pulp. So far, the Liva Reviva fibre has been sold to more than 20 global brands.
66 Grasim Industries Limited
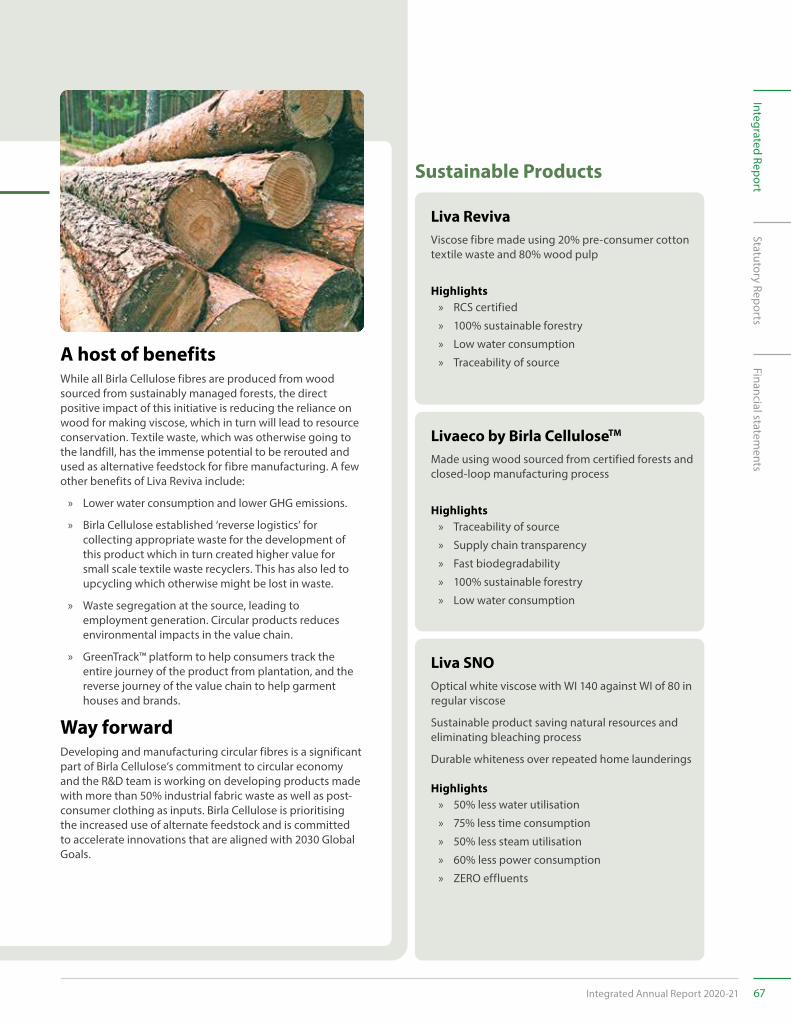
A host of benefitsWhile all Birla Cellulose fibres are produced from wood sourced from sustainably managed forests, the direct positive impact of this initiative is reducing the reliance on wood for making viscose, which in turn will lead to resource conservation. Textile waste, which was otherwise going to the landfill, has the immense potential to be rerouted and used as alternative feedstock for fibre manufacturing. A few other benefits of Liva Reviva include:
» Lower water consumption and lower GHG emissions.
» Birla Cellulose established ‘reverse logistics’ for collecting appropriate waste for the development of this product which in turn created higher value for small scale textile waste recyclers. This has also led to upcycling which otherwise might be lost in waste.
» Waste segregation at the source, leading to employment generation. Circular products reduces environmental impacts in the value chain.
» GreenTrack™ platform to help consumers track the entire journey of the product from plantation, and the reverse journey of the value chain to help garment houses and brands.
Way forwardDeveloping and manufacturing circular fibres is a significant part of Birla Cellulose’s commitment to circular economy and the R&D team is working on developing products made with more than 50% industrial fabric waste as well as post-consumer clothing as inputs. Birla Cellulose is prioritising the increased use of alternate feedstock and is committed to accelerate innovations that are aligned with 2030 Global Goals.
Sustainable Products
Liva Reviva
Livaeco by Birla CelluloseTM
Liva SNO
Highlights
Highlights
Highlights
Viscose fibre made using 20% pre-consumer cotton textile waste and 80% wood pulp
Made using wood sourced from certified forests and closed-loop manufacturing process
Optical white viscose with WI 140 against WI of 80 in regular viscose
Sustainable product saving natural resources and eliminating bleaching process
Durable whiteness over repeated home launderings
» RCS certified
» 100% sustainable forestry
» Low water consumption
» Traceability of source
» Traceability of source
» Supply chain transparency
» Fast biodegradability
» 100% sustainable forestry
» Low water consumption
» 50% less water utilisation
» 75% less time consumption
» 50% less steam utilisation
» 60% less power consumption
» ZERO effluents
Statutory ReportsFinancial statem
entsIntegrated Report
Integrated Annual Report 2020-21 67
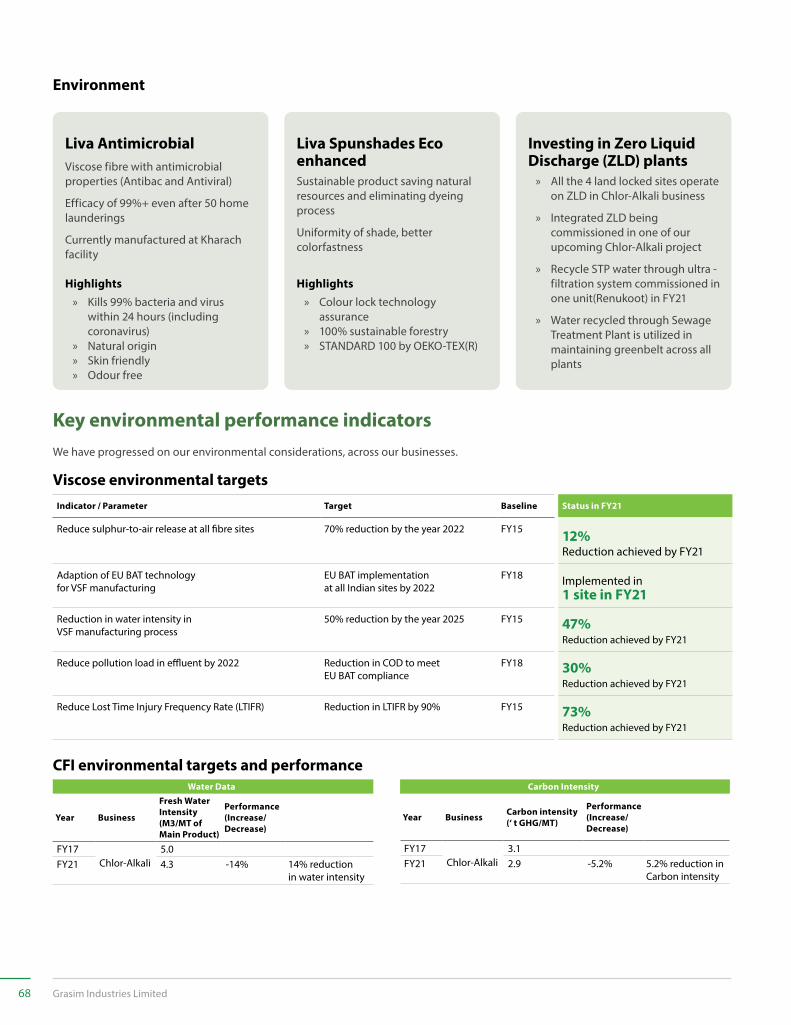
Environment
Highlights » Kills 99% bacteria and virus
within 24 hours (including coronavirus)
» Natural origin » Skin friendly » Odour free
Highlights » Colour lock technology
assurance » 100% sustainable forestry » STANDARD 100 by OEKO-TEX(R)
Key environmental performance indicators
Viscose environmental targetsIndicator / Parameter Target Baseline Status in FY21
Reduce sulphur-to-air release at all fibre sites 70% reduction by the year 2022 FY15 12%Reduction achieved by FY21
Adaption of EU BAT technology for VSF manufacturing
EU BAT implementation at all Indian sites by 2022
FY18 Implemented in 1 site in FY21
Reduction in water intensity in VSF manufacturing process
50% reduction by the year 2025 FY15 47%Reduction achieved by FY21
Reduce pollution load in effluent by 2022 Reduction in COD to meet EU BAT compliance
FY18 30%Reduction achieved by FY21
Reduce Lost Time Injury Frequency Rate (LTIFR) Reduction in LTIFR by 90% FY15 73%Reduction achieved by FY21
CFI environmental targets and performance Water Data
Year Business
Fresh Water Intensity (M3/MT of Main Product)
Performance (Increase/Decrease)
FY17Chlor-Alkali
5.0FY21 4.3 -14% 14% reduction
in water intensity
Carbon Intensity
Year Business Carbon intensity (‘ t GHG/MT)
Performance (Increase/Decrease)
FY17Chlor-Alkali
3.1FY21 2.9 -5.2% 5.2% reduction in
Carbon intensity
We have progressed on our environmental considerations, across our businesses.
Liva Spunshades Eco enhancedSustainable product saving natural resources and eliminating dyeing process
Uniformity of shade, better colorfastness
Liva AntimicrobialViscose fibre with antimicrobial properties (Antibac and Antiviral)
Efficacy of 99%+ even after 50 home launderings
Currently manufactured at Kharach facility
Investing in Zero Liquid Discharge (ZLD) plants
» All the 4 land locked sites operate on ZLD in Chlor-Alkali business
» Integrated ZLD being commissioned in one of our upcoming Chlor-Alkali project
» Recycle STP water through ultra - filtration system commissioned in one unit(Renukoot) in FY21
» Water recycled through Sewage Treatment Plant is utilized in maintaining greenbelt across all plants
68 Grasim Industries Limited
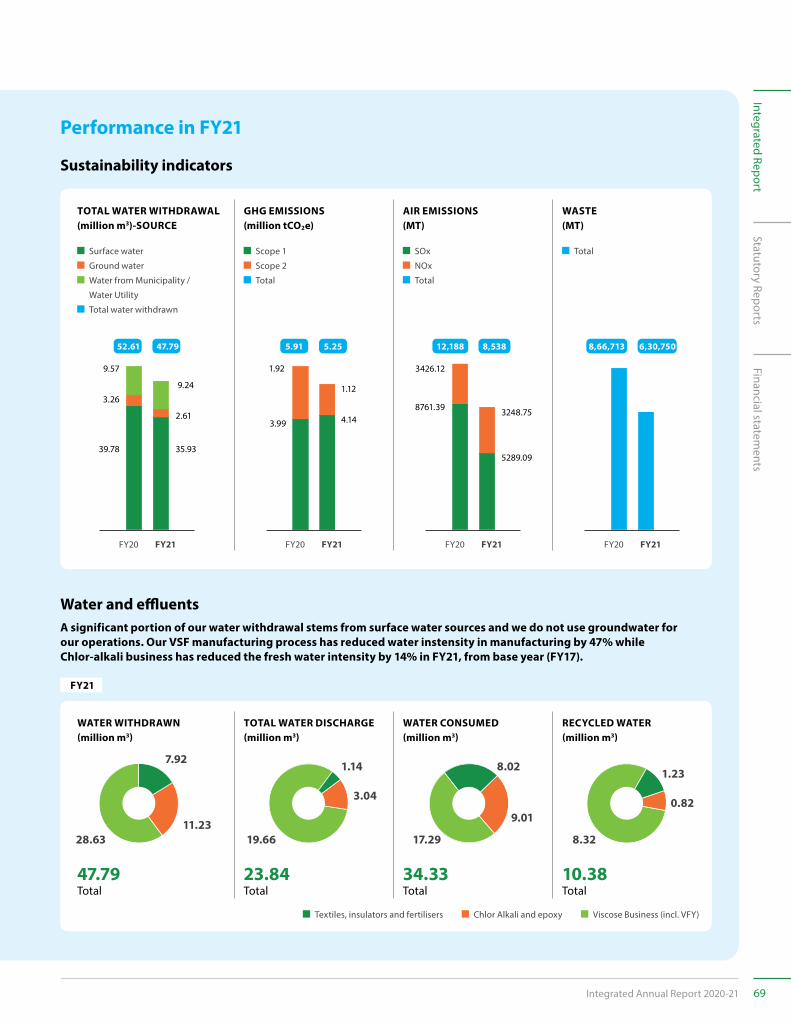
Performance in FY21
Sustainability indicators
Water and effluentsA significant portion of our water withdrawal stems from surface water sources and we do not use groundwater for our operations. Our VSF manufacturing process has reduced water instensity in manufacturing by 47% while Chlor-alkali business has reduced the fresh water intensity by 14% in FY21, from base year (FY17).
7.92
11.2328.63
1.14
3.04
19.66
1.23
0.82
8.32
8.02
9.01
17.29
Surface water
Ground water
Water from Municipality /
Water Utility
Total water withdrawn
TOTAL WATER WITHDRAWAL (million m3)-SOURCE
WATER WITHDRAWN (million m3)
Scope 1
Scope 2
Total
GHG EMISSIONS (million tCO2e)
TOTAL WATER DISCHARGE (million m3)
SOx
NOx
Total
Total
AIR EMISSIONS(MT)
WATER CONSUMED (million m3)
WASTE (MT)
RECYCLED WATER(million m3)
FY21FY20
100
9.24
2.61
35.93
9.57
3.26
39.78
52.61 47.79
FY21FY20
1.12
4.14
1.92
3.99
5.91 5.25
100
3248.75
5289.09
3426.12
8761.39
FY21FY20
12,188 8,538
100
FY21FY20
8,66,713 6,30,750
Textiles, insulators and fertilisers Chlor Alkali and epoxy Viscose Business (incl. VFY)
47.79Total
23.84Total
34.33Total
10.38Total
FY21
Statutory ReportsFinancial statem
entsIntegrated Report
Integrated Annual Report 2020-21 69
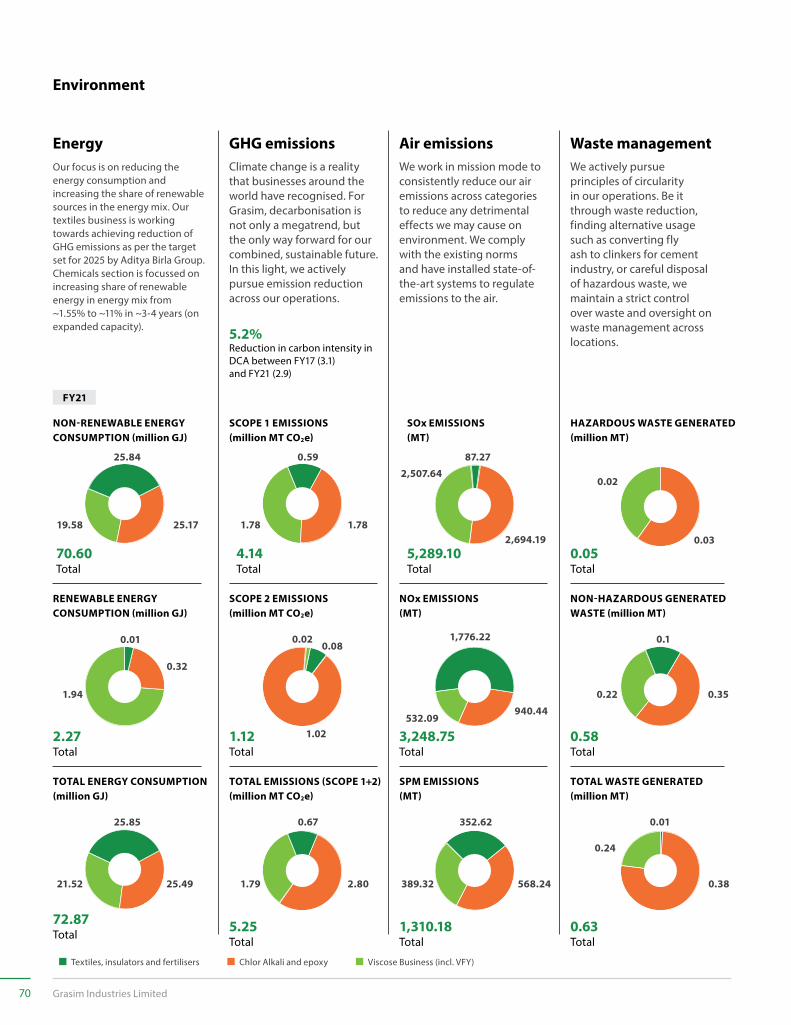
Environment
Textiles, insulators and fertilisers Chlor Alkali and epoxy Viscose Business (incl. VFY)
GHG emissionsClimate change is a reality that businesses around the world have recognised. For Grasim, decarbonisation is not only a megatrend, but the only way forward for our combined, sustainable future. In this light, we actively pursue emission reduction across our operations.
Air emissionsWe work in mission mode to consistently reduce our air emissions across categories to reduce any detrimental effects we may cause on environment. We comply with the existing norms and have installed state-of-the-art systems to regulate emissions to the air.
Waste management We actively pursue principles of circularity in our operations. Be it through waste reduction, finding alternative usage such as converting fly ash to clinkers for cement industry, or careful disposal of hazardous waste, we maintain a strict control over waste and oversight on waste management across locations.
NON-RENEWABLE ENERGY CONSUMPTION (million GJ)
RENEWABLE ENERGY CONSUMPTION (million GJ)
TOTAL ENERGY CONSUMPTION (million GJ)
SCOPE 1 EMISSIONS (million MT CO2e)
SCOPE 2 EMISSIONS (million MT CO2e)
TOTAL EMISSIONS (SCOPE 1+2) (million MT CO2e)
SOx EMISSIONS (MT)
NOx EMISSIONS (MT)
SPM EMISSIONS (MT)
HAZARDOUS WASTE GENERATED (million MT)
NON-HAZARDOUS GENERATED WASTE (million MT)
TOTAL WASTE GENERATED (million MT)
0.01
0.32
1.94
0.08
1.02
0.02 1,776.22
940.44532.09
5.2%Reduction in carbon intensity in DCA between FY17 (3.1) and FY21 (2.9)
25.84
25.1719.58
25.85
25.4921.52
0.59
1.781.78
0.67
2.801.79
87.27
2,694.19
2,507.64
352.62
568.24389.32
0.02
0.03
0.22
0.1
0.35
0.24
0.01
0.38
70.60Total
4.14Total
5,289.10Total
0.05Total
2.27Total
1.12Total
3,248.75Total
0.58Total
72.87Total
5.25Total
1,310.18Total
0.63Total
EnergyOur focus is on reducing the energy consumption and increasing the share of renewable sources in the energy mix. Our textiles business is working towards achieving reduction of GHG emissions as per the target set for 2025 by Aditya Birla Group. Chemicals section is focussed on increasing share of renewable energy in energy mix from ~1.55% to ~11% in ~3-4 years (on expanded capacity).
FY21
70 Grasim Industries Limited
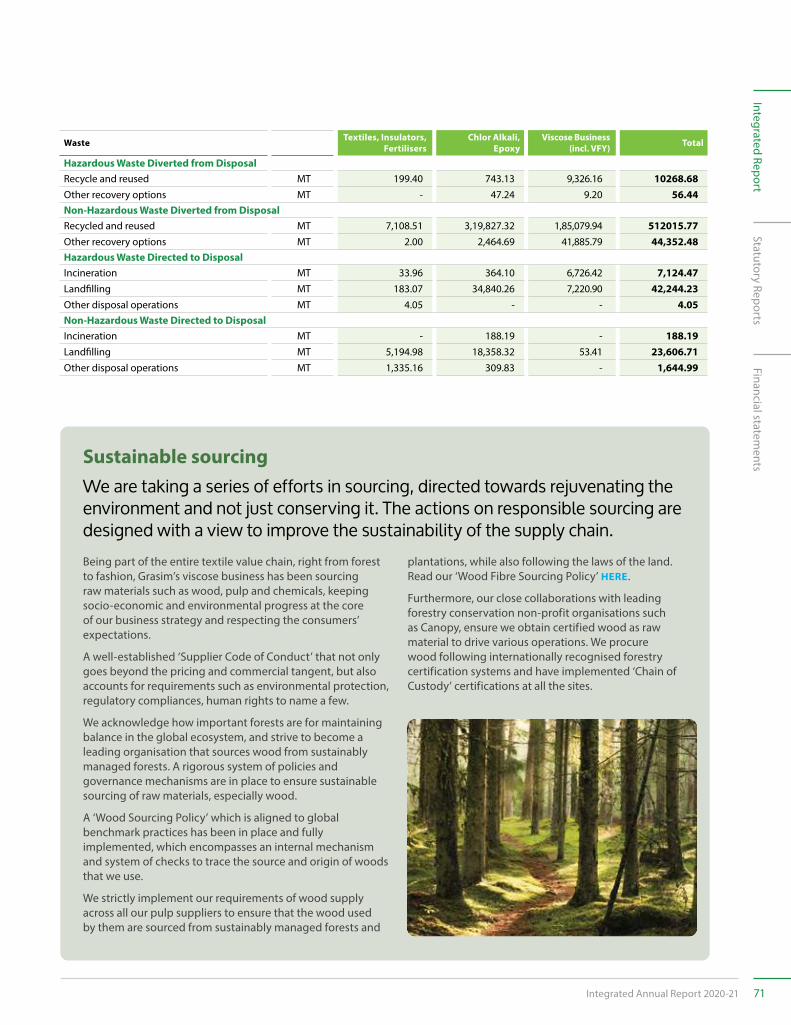
Sustainable sourcing We are taking a series of efforts in sourcing, directed towards rejuvenating the environment and not just conserving it. The actions on responsible sourcing are designed with a view to improve the sustainability of the supply chain.Being part of the entire textile value chain, right from forest to fashion, Grasim’s viscose business has been sourcing raw materials such as wood, pulp and chemicals, keeping socio-economic and environmental progress at the core of our business strategy and respecting the consumers’ expectations.
A well-established ‘Supplier Code of Conduct’ that not only goes beyond the pricing and commercial tangent, but also accounts for requirements such as environmental protection, regulatory compliances, human rights to name a few.
We acknowledge how important forests are for maintaining balance in the global ecosystem, and strive to become a leading organisation that sources wood from sustainably managed forests. A rigorous system of policies and governance mechanisms are in place to ensure sustainable sourcing of raw materials, especially wood.
A ‘Wood Sourcing Policy’ which is aligned to global benchmark practices has been in place and fully implemented, which encompasses an internal mechanism and system of checks to trace the source and origin of woods that we use.
We strictly implement our requirements of wood supply across all our pulp suppliers to ensure that the wood used by them are sourced from sustainably managed forests and
Waste Textiles, Insulators, Fertilisers
Chlor Alkali, Epoxy
Viscose Business (incl. VFY) Total
Hazardous Waste Diverted from DisposalRecycle and reused MT 199.40 743.13 9,326.16 10268.68Other recovery options MT - 47.24 9.20 56.44Non-Hazardous Waste Diverted from DisposalRecycled and reused MT 7,108.51 3,19,827.32 1,85,079.94 512015.77Other recovery options MT 2.00 2,464.69 41,885.79 44,352.48Hazardous Waste Directed to DisposalIncineration MT 33.96 364.10 6,726.42 7,124.47Landfilling MT 183.07 34,840.26 7,220.90 42,244.23Other disposal operations MT 4.05 - - 4.05Non-Hazardous Waste Directed to DisposalIncineration MT - 188.19 - 188.19Landfilling MT 5,194.98 18,358.32 53.41 23,606.71Other disposal operations MT 1,335.16 309.83 - 1,644.99
plantations, while also following the laws of the land. Read our ‘Wood Fibre Sourcing Policy’ HERE.
Furthermore, our close collaborations with leading forestry conservation non-profit organisations such as Canopy, ensure we obtain certified wood as raw material to drive various operations. We procure wood following internationally recognised forestry certification systems and have implemented ‘Chain of Custody’ certifications at all the sites.
Statutory ReportsFinancial statem
entsIntegrated Report
Integrated Annual Report 2020-21 71
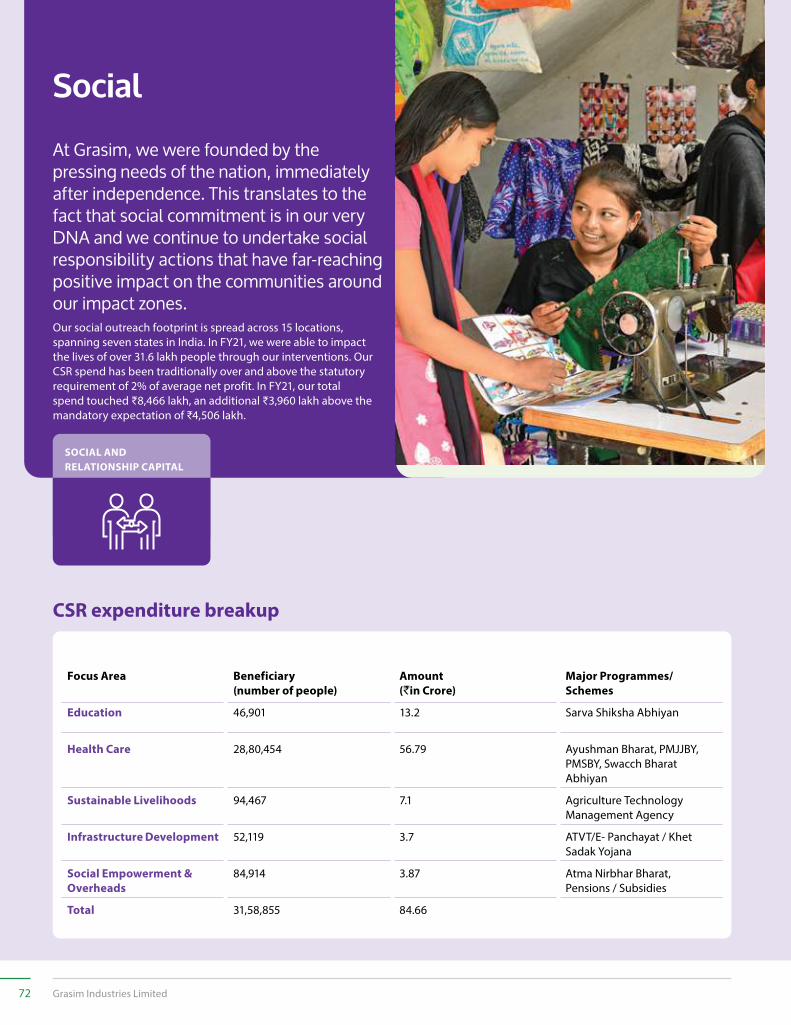
At Grasim, we were founded by the pressing needs of the nation, immediately after independence. This translates to the fact that social commitment is in our very DNA and we continue to undertake social responsibility actions that have far-reaching positive impact on the communities around our impact zones.Our social outreach footprint is spread across 15 locations, spanning seven states in India. In FY21, we were able to impact the lives of over 31.6 lakh people through our interventions. Our CSR spend has been traditionally over and above the statutory requirement of 2% of average net profit. In FY21, our total spend touched ₹8,466 lakh, an additional ₹3,960 lakh above the mandatory expectation of ₹4,506 lakh.
Social
CSR expenditure breakup
Focus Area Beneficiary (number of people)
Amount (`in Crore)
Major Programmes/ Schemes
Education 46,901 13.2 Sarva Shiksha Abhiyan
Health Care 28,80,454 56.79 Ayushman Bharat, PMJJBY, PMSBY, Swacch Bharat Abhiyan
Sustainable Livelihoods 94,467 7.1 Agriculture Technology Management Agency
Infrastructure Development 52,119 3.7 ATVT/E- Panchayat / Khet Sadak Yojana
Social Empowerment & Overheads
84,914 3.87 Atma Nirbhar Bharat, Pensions / Subsidies
Total 31,58,855 84.66
SOCIAL AND RELATIONSHIP CAPITAL
72 Grasim Industries Limited
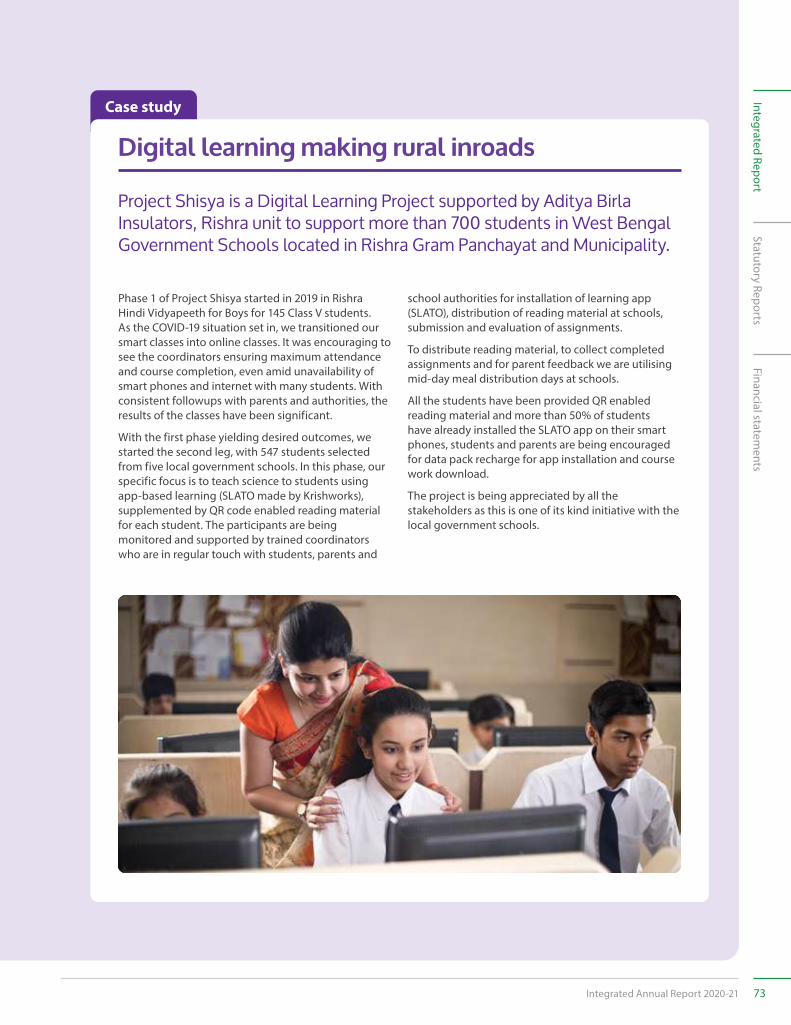
Case study
Project Shisya is a Digital Learning Project supported by Aditya Birla Insulators, Rishra unit to support more than 700 students in West Bengal Government Schools located in Rishra Gram Panchayat and Municipality.
Digital learning making rural inroads
Phase 1 of Project Shisya started in 2019 in Rishra Hindi Vidyapeeth for Boys for 145 Class V students. As the COVID-19 situation set in, we transitioned our smart classes into online classes. It was encouraging to see the coordinators ensuring maximum attendance and course completion, even amid unavailability of smart phones and internet with many students. With consistent followups with parents and authorities, the results of the classes have been significant.
With the first phase yielding desired outcomes, we started the second leg, with 547 students selected from five local government schools. In this phase, our specific focus is to teach science to students using app-based learning (SLATO made by Krishworks), supplemented by QR code enabled reading material for each student. The participants are being monitored and supported by trained coordinators who are in regular touch with students, parents and
school authorities for installation of learning app (SLATO), distribution of reading material at schools, submission and evaluation of assignments.
To distribute reading material, to collect completed assignments and for parent feedback we are utilising mid-day meal distribution days at schools.
All the students have been provided QR enabled reading material and more than 50% of students have already installed the SLATO app on their smart phones, students and parents are being encouraged for data pack recharge for app installation and course work download.
The project is being appreciated by all the stakeholders as this is one of its kind initiative with the local government schools.
Statutory ReportsFinancial statem
entsIntegrated Report
Integrated Annual Report 2020-21 73
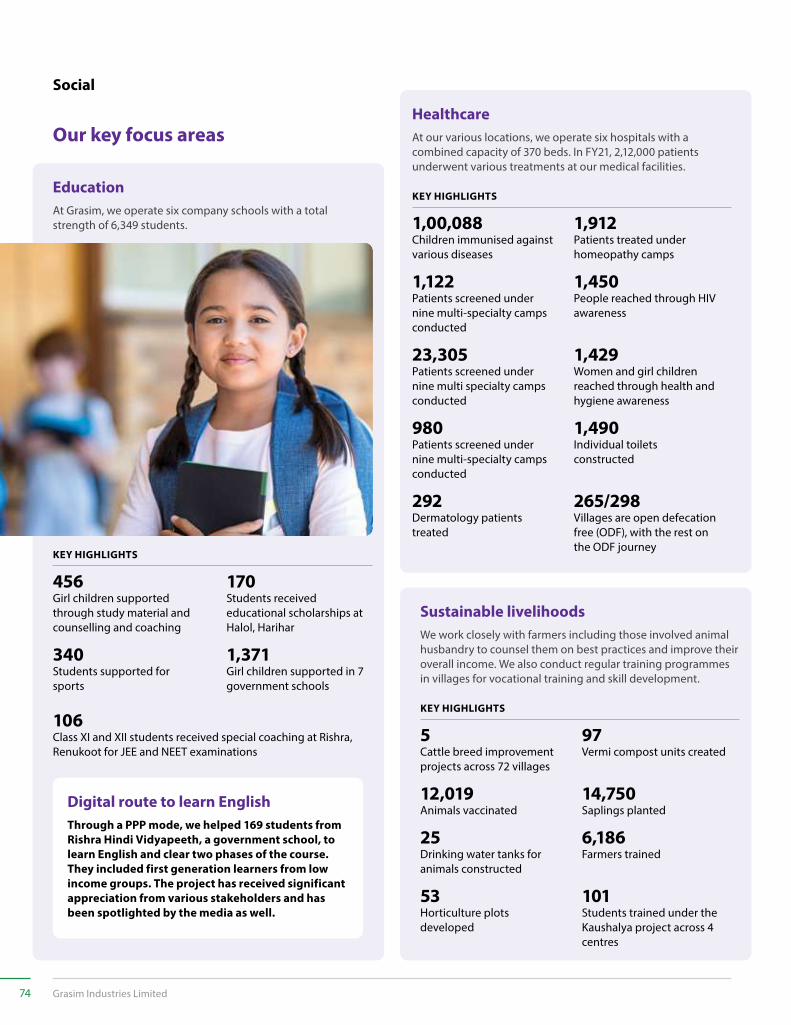
Social
Our key focus areas
Education
Healthcare
Sustainable livelihoods
At Grasim, we operate six company schools with a total strength of 6,349 students.
At our various locations, we operate six hospitals with a combined capacity of 370 beds. In FY21, 2,12,000 patients underwent various treatments at our medical facilities.
We work closely with farmers including those involved animal husbandry to counsel them on best practices and improve their overall income. We also conduct regular training programmes in villages for vocational training and skill development.
KEY HIGHLIGHTS
KEY HIGHLIGHTS
KEY HIGHLIGHTS
456Girl children supported through study material and counselling and coaching
1,00,088Children immunised against various diseases
5Cattle breed improvement projects across 72 villages
1,912Patients treated under homeopathy camps
97Vermi compost units created
1,371Girl children supported in 7 government schools
170Students received educational scholarships at Halol, Harihar
340Students supported for sports
1,122Patients screened under nine multi-specialty camps conducted
12,019Animals vaccinated
23,305Patients screened under nine multi specialty camps conducted
25Drinking water tanks for animals constructed
1,450People reached through HIV awareness
14,750 Saplings planted
106Class XI and XII students received special coaching at Rishra, Renukoot for JEE and NEET examinations
1,429Women and girl children reached through health and hygiene awareness
6,186 Farmers trained
980Patients screened under nine multi-specialty camps conducted
53Horticulture plots developed
292 Dermatology patients treated
1,490 Individual toilets constructed
101 Students trained under the Kaushalya project across 4 centres
265/298 Villages are open defecation free (ODF), with the rest on the ODF journey
Digital route to learn EnglishThrough a PPP mode, we helped 169 students from Rishra Hindi Vidyapeeth, a government school, to learn English and clear two phases of the course. They included first generation learners from low income groups. The project has received significant appreciation from various stakeholders and has been spotlighted by the media as well.
74 Grasim Industries Limited
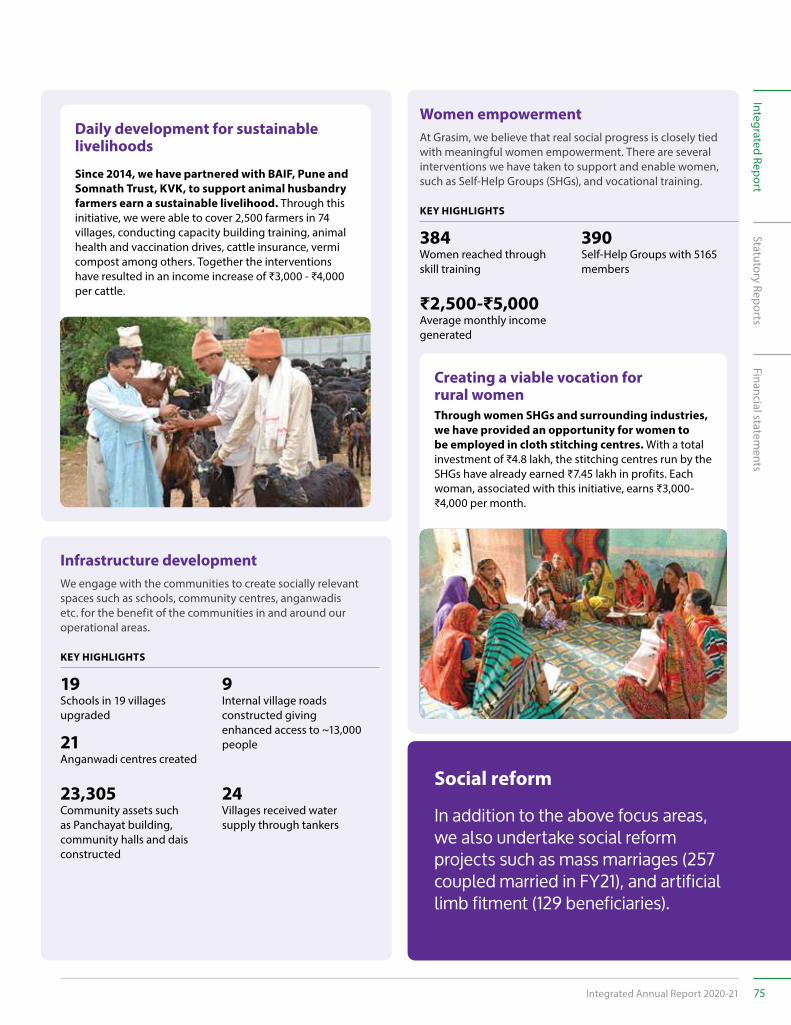
Social reform
Infrastructure development
Women empowerment
We engage with the communities to create socially relevant spaces such as schools, community centres, anganwadis etc. for the benefit of the communities in and around our operational areas.
At Grasim, we believe that real social progress is closely tied with meaningful women empowerment. There are several interventions we have taken to support and enable women, such as Self-Help Groups (SHGs), and vocational training.
KEY HIGHLIGHTS
KEY HIGHLIGHTS
19Schools in 19 villages upgraded
384Women reached through skill training
9Internal village roads constructed giving enhanced access to ~13,000 people
390Self-Help Groups with 5165 members
21Anganwadi centres created
₹2,500-₹5,000Average monthly income generated
23,305Community assets such as Panchayat building, community halls and dais constructed
24Villages received water supply through tankers
Daily development for sustainable livelihoods
Creating a viable vocation for rural women
Since 2014, we have partnered with BAIF, Pune and Somnath Trust, KVK, to support animal husbandry farmers earn a sustainable livelihood. Through this initiative, we were able to cover 2,500 farmers in 74 villages, conducting capacity building training, animal health and vaccination drives, cattle insurance, vermi compost among others. Together the interventions have resulted in an income increase of ₹3,000 - ₹4,000 per cattle.
Through women SHGs and surrounding industries, we have provided an opportunity for women to be employed in cloth stitching centres. With a total investment of ₹4.8 lakh, the stitching centres run by the SHGs have already earned ₹7.45 lakh in profits. Each woman, associated with this initiative, earns ₹3,000-₹4,000 per month.
In addition to the above focus areas, we also undertake social reform projects such as mass marriages (257 coupled married in FY21), and artificial limb fitment (129 beneficiaries).
Statutory ReportsFinancial statem
entsIntegrated Report
Integrated Annual Report 2020-21 75
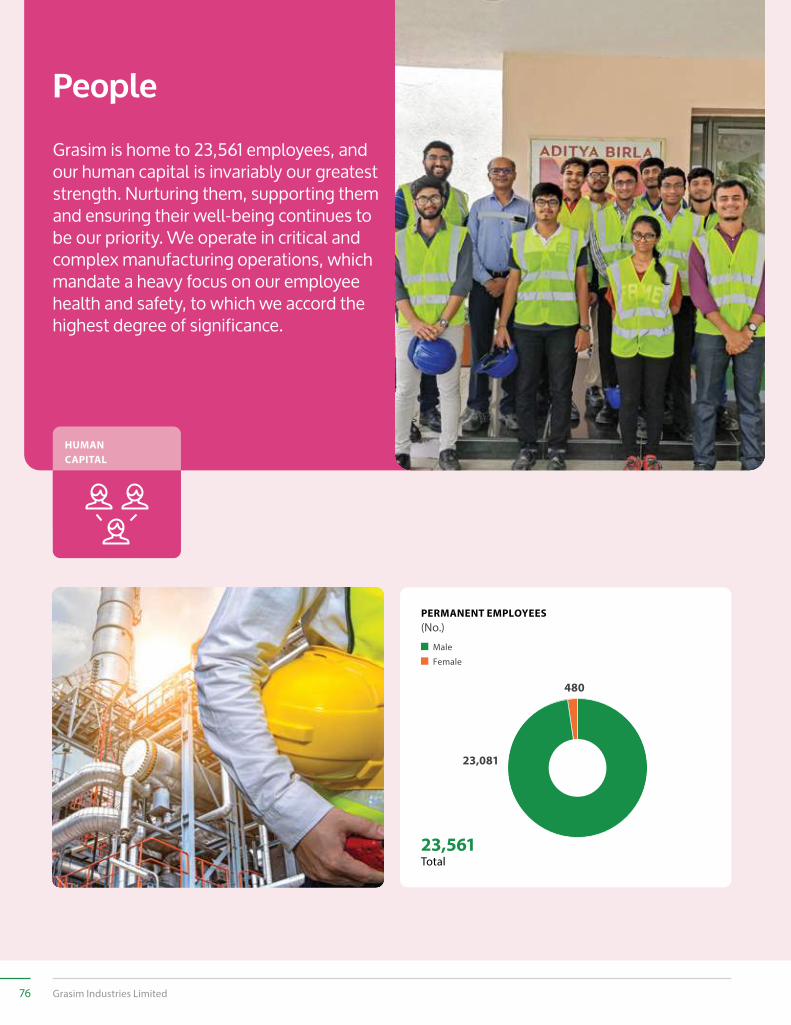
Grasim is home to 23,561 employees, and our human capital is invariably our greatest strength. Nurturing them, supporting them and ensuring their well-being continues to be our priority. We operate in critical and complex manufacturing operations, which mandate a heavy focus on our employee health and safety, to which we accord the highest degree of significance.
People
PERMANENT EMPLOYEES (No.)
Male
Female
23,081
480
23,561 Total
HUMAN CAPITAL
76 Grasim Industries Limited
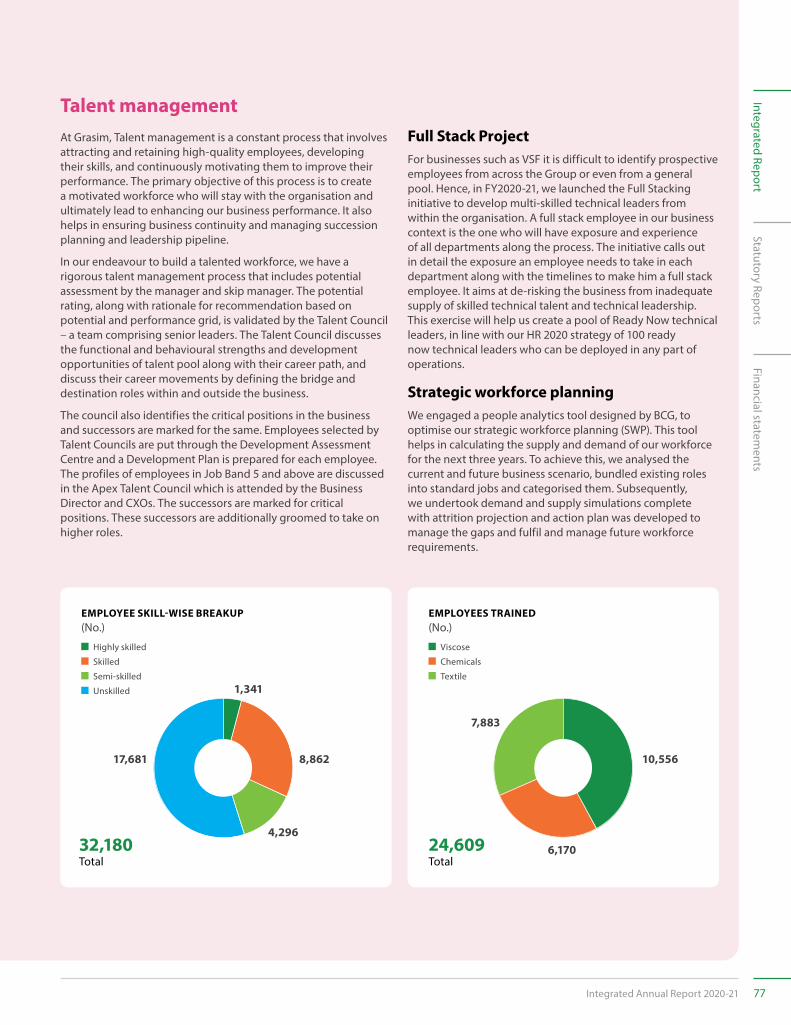
Talent managementFull Stack ProjectFor businesses such as VSF it is difficult to identify prospective employees from across the Group or even from a general pool. Hence, in FY2020-21, we launched the Full Stacking initiative to develop multi-skilled technical leaders from within the organisation. A full stack employee in our business context is the one who will have exposure and experience of all departments along the process. The initiative calls out in detail the exposure an employee needs to take in each department along with the timelines to make him a full stack employee. It aims at de-risking the business from inadequate supply of skilled technical talent and technical leadership. This exercise will help us create a pool of Ready Now technical leaders, in line with our HR 2020 strategy of 100 ready now technical leaders who can be deployed in any part of operations.
Strategic workforce planningWe engaged a people analytics tool designed by BCG, to optimise our strategic workforce planning (SWP). This tool helps in calculating the supply and demand of our workforce for the next three years. To achieve this, we analysed the current and future business scenario, bundled existing roles into standard jobs and categorised them. Subsequently, we undertook demand and supply simulations complete with attrition projection and action plan was developed to manage the gaps and fulfil and manage future workforce requirements.
At Grasim, Talent management is a constant process that involves attracting and retaining high-quality employees, developing their skills, and continuously motivating them to improve their performance. The primary objective of this process is to create a motivated workforce who will stay with the organisation and ultimately lead to enhancing our business performance. It also helps in ensuring business continuity and managing succession planning and leadership pipeline.
In our endeavour to build a talented workforce, we have a rigorous talent management process that includes potential assessment by the manager and skip manager. The potential rating, along with rationale for recommendation based on potential and performance grid, is validated by the Talent Council – a team comprising senior leaders. The Talent Council discusses the functional and behavioural strengths and development opportunities of talent pool along with their career path, and discuss their career movements by defining the bridge and destination roles within and outside the business.
The council also identifies the critical positions in the business and successors are marked for the same. Employees selected by Talent Councils are put through the Development Assessment Centre and a Development Plan is prepared for each employee. The profiles of employees in Job Band 5 and above are discussed in the Apex Talent Council which is attended by the Business Director and CXOs. The successors are marked for critical positions. These successors are additionally groomed to take on higher roles.
EMPLOYEE SKILL-WISE BREAKUP (No.)
Highly skilled
Skilled
Semi-skilled
Unskilled
8,862
4,296
17,681
1,341
EMPLOYEES TRAINED (No.)
Viscose
Chemicals
Textile
6,170
10,556
32,180Total
24,609Total
7,883
Statutory ReportsFinancial statem
entsIntegrated Report
Integrated Annual Report 2020-21 77
People
As part of the framework, we continuously track the safety performance against industry standard indicators. Safety initiatives and performance during FY21 are summarised below.
Key Initiatives
During the year, we conducted a safety culture (perception) survey across the Indian Fibre Units and a task force comprising the Fibre business leadership team brainstormed to develop an action plan to progress towards mainstreaming a proactive safety culture.
We established the Safety Training & Education Management System (STEMS) to design and coordinate training plans for all of our employees at site and business level. Our mission is to enhance individual competence and create business value through systematic learning and development focusing on three attributes: Knowledge, Skill and Attitude.
The Grasim Safety training and Competency programme has been developed based on the trade and individual’s role in the organisation. It encompasses induction and orientation, safety leadership, safety processes and internal trainer development.
Due to the challenging circumstances during COVID-19, we leveraged the group online training platform and developed e-learning portal for catering to business specific safety training requirements.
Building Safety Culture Safety Training and Competency Development
Key highlights of our safety culture in the Fibre business include:
» Strong demonstration by leadership to integrate safety in business
» Integrated safety management structure
» Well-defined standards for management and technical processes
» Safety is accepted to be a ‘line responsibility’
» Comprehensive training and competency programme in place
» Good management process for reporting and investigating incidents
» Risk assessment conducted as a part of management system
» Regular audit programme focusing on high risk areas
We have also linked safety performance of all management cadre employees to their performance appraisal system, making it part of their key result area. This has resulted in increased accountability for safety among all employees in the organisation, thereby enhancing the results of overall safety management.
Health and safetyWe, at Grasim, are committed to protecting human health and ensuring a safe working environment for all our employees and contractual workers. We have a three-pronged approach involving felt leadership for safety, embracing world-class processes and practices, and right governance structure for implementation. This has helped us embed a safety culture throughout the organisation with an objective of ‘Zero Harm’.
A robust health and safety framework encompassing all activities guides our culture across the organisation. The H&S management system is an integral part of the framework. We are proud that most of operational facilities are certified with OHSAS 18001 and other applicable international occupational health and safety management systems.
78 Grasim Industries Limited
We have maintained an integrated approach to Process Safety Management (PSM) directed at the elimination of incidents and the mitigation of risks. ABG’s PSM (in line with OSHA’s framework) is integrated in our HSE Management Framework.
In FY21, we remained diligent about safety management on a day-to-day basis and remained relentless in its implementation of the 10 Life Saving Rules. The 10 Life Saving Rules focus on the areas that have the greatest potential for serious injury.
They also set minimum benchmark standards across the P&F Business. A breach of the Life Saving Rules automatically triggers an investigation process and escalation for progressive consequence management.
We have adopted Group Occupational Health technical standards. The standards set expectations on occupational health risk assessments in terms of qualitative and quantitative exposure risk management incorporating a hierarchy of controls, health surveillance including return to work and specific management of areas such as ergonomics, ventilation, respiratory protection and stress is driven by Business level and Unit level Occupational Health Sub-committee involving the site-specific health and safety professionals and subject matter experts.
Qualitative Exposure Assessments (QLEA) have been completed at all Fibre Units. Based on input from QLEA, Quantitative Exposure Assessment (QNEA) have been initiated to measure occupational health hazards in the workplace through application of established sampling and monitoring protocols. Implementation of recommendations arising out of assessment are being monitored in Apex safety meetings for compliance.
Various initiatives in OHS were taken to ensure incident free and safe execution of the project activities namely
» Six-step contractor safety management programme
» Single window system for contractors (safety induction, medical examination and equipment/ tools inspection program prior to entry)
» Integrated Permit to work system for project
» Site Safety Inspection and audit by qualified Safety Supervisors
» Periodic Safety Performance review by Project Apex safety Committee and Project Safety Sub-Committee.
Above initiatives have helped us in achieving
» More than 35 million accident free man-hours
» Recognition by ABG Group Project Cell for the best ongoing project
Process Safety Management
Life Saving Rules Occupational Health
Project Safety
We have introduced the Process Safety Management Sub-committee in our safety governance structure at the onset of 2019. Sub-committee led by the leadership team has defined the charter and has identified seven key PSM elements for implementation across business
» Process Safety Information
» Process Hazard Analysis
» Operating Procedures
» Management of Change
» Pre- startup Safety Review
» Mechanical Integrity and Quality Assurance
» Emergency Response and Planning
Further, the requirement for building competence in Process Safety management and Process Hazard analysis (HAZOP, Consequence analysis, Bow-tie analysis) was addressed by involving external Subject matter experts- training and workshops for identified task force from various discipline across the business for employing structured approach in addressing the process safety risk.
Statutory ReportsFinancial statem
entsIntegrated Report
Integrated Annual Report 2020-21 79
People
To strengthen the performance and effectiveness of various safety process and to adapt to the new normal, use of digital platform was employed across the business.
While approaching the start of year 2020, the world was exposed to a challenging situation in the form of the COVID-19 global pandemic.
We, at Grasim, were not immune to its impact and consequences. The nature of our operations and application of our products provided us with the opportunity to serve the nation by supplying our products to key industry segments such as PPE, mask, non-woven fabrics across the healthcare industry.
These critical operations were running with minimum manpower, and our staff ensured adherence to required safety norms such as social distancing, temperature checks among others. All our plants, facilities, colonies and offices are being sanitised on a regular basis. Further, the option to work from home was provided to a majority of our employees, minimising exposure to the infection. All our employees, including contractual workers, and families living in the colonies had access to trainings and awareness sessions related to COVID-19.
Digitalisation in Safety COVID-19 Preparedness & Response
We have introduced ‘SHIELD- Safety & Health Information Exchange and Learning Directory’ – Safety Portal for the Pulp & Fibre business. Key features of the one-stop portal are:
» Various online safety processes viz. Safety Observations, Incident Investigation, and Permit to work audits, Safety Training & Competency development, E-learning, ASK to Learn, Management of Change & Task Management
» High-level dashboards to monitor the progress of above Safety processes
» Shared resources viz. Safety Standards, Policies, Procedures, latest updates, learning from incidents, good practices
Safety and wellbeing
Division LTIFR*(Permanent)
LTIFR*(Contractual)
LTIFR*(Total)
Textiles, insulators and fertilisers 0.44 0.30 0.39
Chlor Alkali and epoxy 0.34 0.38 0.37
Viscose domestic plants and VFY 0.44 0.12 0.33
Total LTIFR 0.43 0.29 0.36
*per million person hours
15%Reduction in LTIFR in DCA and Epoxy businesses between FY17 (0.46) and FY21 (0.39)
100%Reduction in LTIFR in VFY business (Veraval) between FY17 (0.12) and FY21 (0)
95%Reduction in LTIFR in insulators business between FY17 (9.91) and FY21 (0.5)
We have three levels across which accelerated leadership programmes are conducted for high potential employees:
Learning and DevelopmentIn the current unprecedented times of COVID-19, which has resulted in mass quarantines, lockdowns as well as social and physical distancing, the learning and development strategy of our business has been transformed to maximise the use of digital learning platforms. We also deploy technology to enable accessible learning and communication methods.
Learning interventions strongly aligned to business goalsThe Learning strategy for the Pulp & Fibre Business is closely aligned to the key business priorities. Various programmes have been rolled out to support the emerging business priorities and
to address the challenges faced by the business, in consultation with the Senior Management and Subject Matter Experts. It follows approach of high impact-low cost delivery model with digital and unconventional methods of learning.
Step up Program to develop Function Heads
Cutting edge Program to develop P&F leaders
Turning point Program to develop SBU Heads
80 Grasim Industries Limited
Key programmes
Focus 50The Focus 50 programme, a signature technical training programme, for select high potential employees, was developed to address the depleting technical talent at the leadership position; thereby supporting the business priority of sustaining VSF Leadership. Focus 50 program is tailored to develop VSF specific technical and behavioral competencies through high quality interventions which builds holistic cross functional knowledge and strengthens the core technical skills in the business.
TechXA Technical Academy offering 46 cutting-edge technical programmes, was launched to address the technical talent gap across all levels in the organisation. TechX focuses on building the core and fundamental technical skills under Process, Electrical and Instrumentation, Power Plant and Mechanical and Maintenance. We also launched TechX 2.0 which was a structured mentoring programme focusing on transfer of cross department technical knowledge and skills from retiring or retired managers to the young engineers.
FLEXFunctional programmes building technical and functional skills were initiated to build capabilities of the enabling units (support functions) who play a key role in supporting business priorities. FLEX for R&D department is crucial for building organisational capabilities in speciality products. FLEX R&D was launched to support the following focus areas to remain leader in speciality products –
» Building capability in R&D for Product, Process and Fabric Innovation and Development
» Rapid Scale Up & Commercialisation of new technology » Continuous quality improvement – System, Process and
Digitisation
SamarthyaAn academy to build functional skills of the sales and marketing team so that they are equipped to offer superior
customer service and thrive in the ever changing market scenario. The academy focuses on following skills:
» Execution excellence » Project management skills » Ability to understand and explain our VSF vis-à-vis
competing fibres to customers (features and benefits) » Commercial acumen & Pricing » Negotiation skills » Effective Key Account Management techniques » Strengthened focus on B2B sales » Category management » Presentation skills
Career stage programmesFirst time manager programmeThe First Time Manager program enables smooth transition from being a successful employee to a successful manager. This program sets new managers up for success by providing them with the training and skills needed to make a smooth transition. The program is backed by deeper research on offering meaningful perspective, experiences, and various skill sets required to be an effective first-time manager.
PROGRAMME COVERAGE
» To facilitate mind-set shift from being an individual contributor to a team manager
» To understand the role of a manager » Equip participants with the requisite skills – Managerial
Communication, Planning and Organising, Delegation, Influencing and Conflict resolution.
CORE MANAGERIAL SKILLS PROGRAMME FOR DHS
This program focuses on building and sharpening the key skills that make Department Head more effective and efficient. It has an intense curriculum to offer you a varied perspective from sharpening managerial effectiveness to strengthening cross-department technical skills, orienting towards sales and market scenario, appreciating business and commercial acumen, and understanding many other facets of DH’s role in depth.
Reverse mentoringTo leverage internal expertise, we launched a Reverse Mentoring programme for our Mid to Senior level managers. We have around 40 managers who are learning through the Reverse Mentoring process on cross-functional topics which will make them more effective. The learning topics are financial acumen, labour laws, technical process, IT skills and sustainability. Reverse Mentoring involves the pairing of a younger, junior employee as a mentor to share expertise with a senior colleague who will be the mentee. This programme aims to leverage internal expertise/knowledge and offer unconventional ways of learning from each other. It
encourages a culture where different generations collaborate better, leading to better teamwork and workplace relationships.
Nurturing young women leadersWe have designed an exclusive programme for women employees called WISE – Women Investing in Skills and Experiences. The programme aims to develop women employees at the junior level with a focus on building mindset, confidence to lead, and opportunity to come together and gain perspective that has direct relevance to their professional journey. This 9-month journey is designed carefully to offer experiences and exposure to tomorrow’s women leaders.
Statutory ReportsFinancial statem
entsIntegrated Report
Integrated Annual Report 2020-21 81
GRI indexThis report has been prepared in accordance with the GRI Standards core option.
GRI STANDARD DISCLOSURE DESCRIPTION PAGE NUMBER / REFERENCE LINK
GRI 102: GENERAL DISCLOSURES 2016
Organisational Profile
102-1 Name of the organisation 4
102-2 Activities, brands, products, and services 14-17
102-3 Location of headquarters 18-19, Back Cover
102-4 Location of operations 18-19
102-6 Markets served 14-17, 33
102-7 Scale of the organisation 4
102-8 Information on employees and other workers 5, 8, 30, 33, 76-77
102-9 Supply chain 33, 52-53, 69
102-13 Membership of associations 73
Ethics and Integrity 102-17 Mechanisms for advice and concerns about ethics 61
Governance 102-18 Governance structure 20-25
102-19 Delegating authority 20-23, 25
102-20 Executive-level responsibility for economic, environmental, and social topics
22-23
102-22 Composition of the highest governance body and its committees
22-23
102-23 Chair of the highest governance body 22
102-24 Nominating and selecting the highest governance body 22
102-25 Conflicts of interest 22-25
102-26 Role of highest governance body in setting purpose, values, and strategy
20-21
102-27 Collective knowledge of the highest governance body Grasim Industries Annual Report 2020-21
102-28 Evaluating the highest governance body’s performance Grasim Industries Annual Report 2020-21
102-29 Identifying and managing economic, environmental, and social impacts
Grasim Industries Annual Report 2020-21
102-30 Effectiveness of risk management processes 38-45
102-31 Review of economic, environmental, and social topics 20-21, 34-35
102-32 Highest governance body’s role in sustainability reporting 20-21
102-33 Communicating critical concerns 32-33
102-34 Nature and total number of critical concerns 32-33
102-35 Remuneration policies Grasim Industries Annual Report 2020-21
102-36 Process for determining remuneration Grasim Industries Annual Report 2020-21
102-37 Stakeholders’ involvement in remuneration Grasim Industries Annual Report 2020-21
102-38 Annual total compensation ratio Grasim Industries Annual Report 2020-21
102-39 Percentage increase in annual total compensation ratio Grasim Industries Annual Report 2020-21
82 Grasim Industries Limited
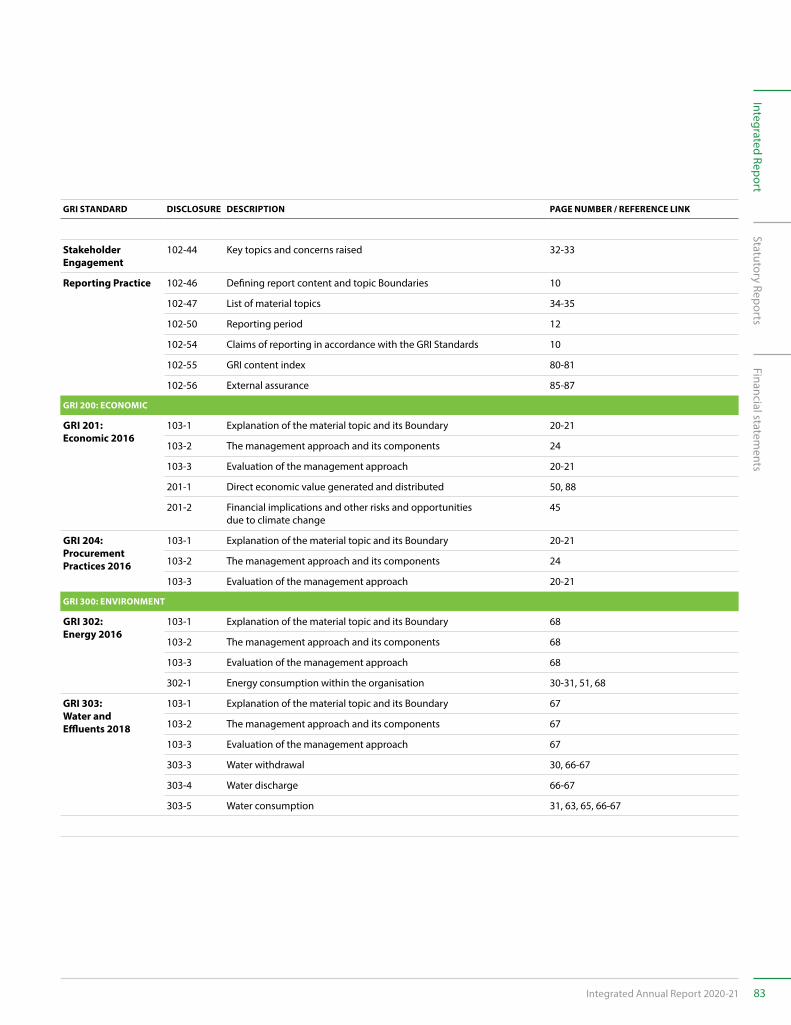
GRI STANDARD DISCLOSURE DESCRIPTION PAGE NUMBER / REFERENCE LINK
Stakeholder Engagement
102-44 Key topics and concerns raised 32-33
Reporting Practice 102-46 Defining report content and topic Boundaries 10
102-47 List of material topics 34-35
102-50 Reporting period 12
102-54 Claims of reporting in accordance with the GRI Standards 10
102-55 GRI content index 80-81
102-56 External assurance 85-87
GRI 200: ECONOMIC
GRI 201: Economic 2016
103-1 Explanation of the material topic and its Boundary 20-21
103-2 The management approach and its components 24
103-3 Evaluation of the management approach 20-21
201-1 Direct economic value generated and distributed 50, 88
201-2 Financial implications and other risks and opportunities due to climate change
45
GRI 204: Procurement Practices 2016
103-1 Explanation of the material topic and its Boundary 20-21
103-2 The management approach and its components 24
103-3 Evaluation of the management approach 20-21
GRI 300: ENVIRONMENT
GRI 302: Energy 2016
103-1 Explanation of the material topic and its Boundary 68
103-2 The management approach and its components 68
103-3 Evaluation of the management approach 68
302-1 Energy consumption within the organisation 30-31, 51, 68
GRI 303: Water and Effluents 2018
103-1 Explanation of the material topic and its Boundary 67
103-2 The management approach and its components 67
103-3 Evaluation of the management approach 67
303-3 Water withdrawal 30, 66-67
303-4 Water discharge 66-67
303-5 Water consumption 31, 63, 65, 66-67
Statutory ReportsFinancial statem
entsIntegrated Report
Integrated Annual Report 2020-21 83
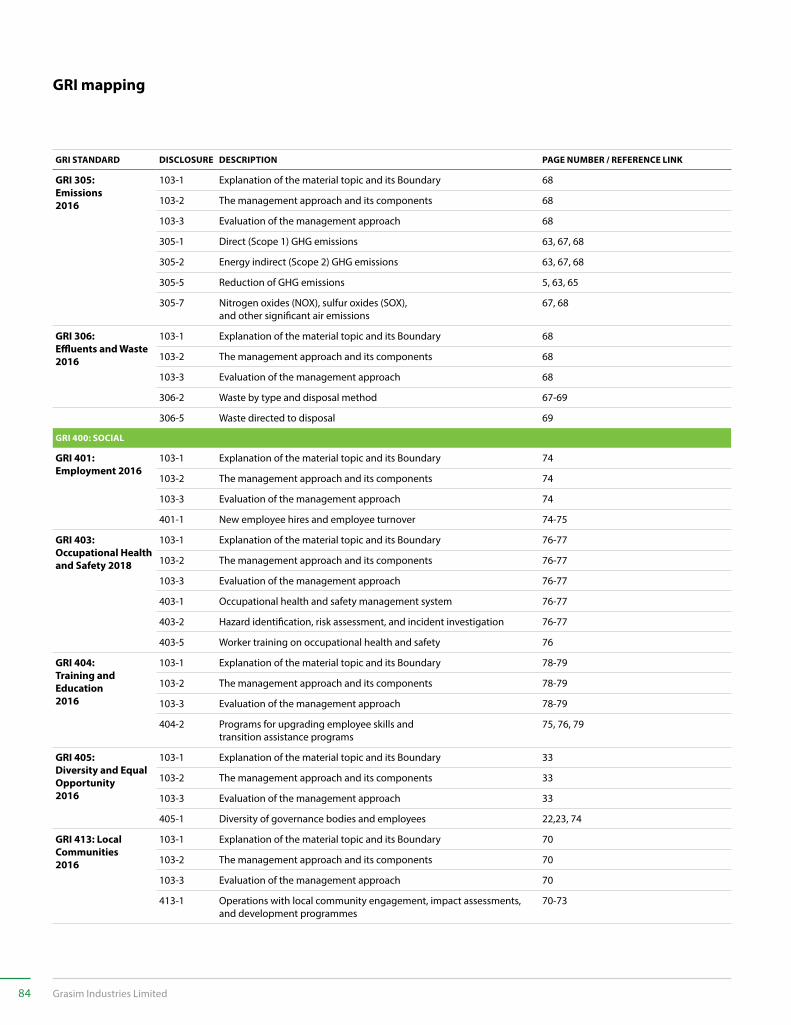
GRI STANDARD DISCLOSURE DESCRIPTION PAGE NUMBER / REFERENCE LINK
GRI 305: Emissions2016
103-1 Explanation of the material topic and its Boundary 68
103-2 The management approach and its components 68
103-3 Evaluation of the management approach 68
305-1 Direct (Scope 1) GHG emissions 63, 67, 68
305-2 Energy indirect (Scope 2) GHG emissions 63, 67, 68
305-5 Reduction of GHG emissions 5, 63, 65
305-7 Nitrogen oxides (NOX), sulfur oxides (SOX), and other significant air emissions
67, 68
GRI 306: Effluents and Waste2016
103-1 Explanation of the material topic and its Boundary 68
103-2 The management approach and its components 68
103-3 Evaluation of the management approach 68
306-2 Waste by type and disposal method 67-69
306-5 Waste directed to disposal 69
GRI 400: SOCIAL
GRI 401: Employment 2016
103-1 Explanation of the material topic and its Boundary 74
103-2 The management approach and its components 74
103-3 Evaluation of the management approach 74
401-1 New employee hires and employee turnover 74-75
GRI 403: Occupational Health and Safety 2018
103-1 Explanation of the material topic and its Boundary 76-77
103-2 The management approach and its components 76-77
103-3 Evaluation of the management approach 76-77
403-1 Occupational health and safety management system 76-77
403-2 Hazard identification, risk assessment, and incident investigation 76-77
403-5 Worker training on occupational health and safety 76
GRI 404: Training and Education2016
103-1 Explanation of the material topic and its Boundary 78-79
103-2 The management approach and its components 78-79
103-3 Evaluation of the management approach 78-79
404-2 Programs for upgrading employee skills and transition assistance programs
75, 76, 79
GRI 405: Diversity and Equal Opportunity2016
103-1 Explanation of the material topic and its Boundary 33
103-2 The management approach and its components 33
103-3 Evaluation of the management approach 33
405-1 Diversity of governance bodies and employees 22,23, 74
GRI 413: LocalCommunities 2016
103-1 Explanation of the material topic and its Boundary 70
103-2 The management approach and its components 70
103-3 Evaluation of the management approach 70
413-1 Operations with local community engagement, impact assessments, and development programmes
70-73
GRI mapping
84 Grasim Industries Limited
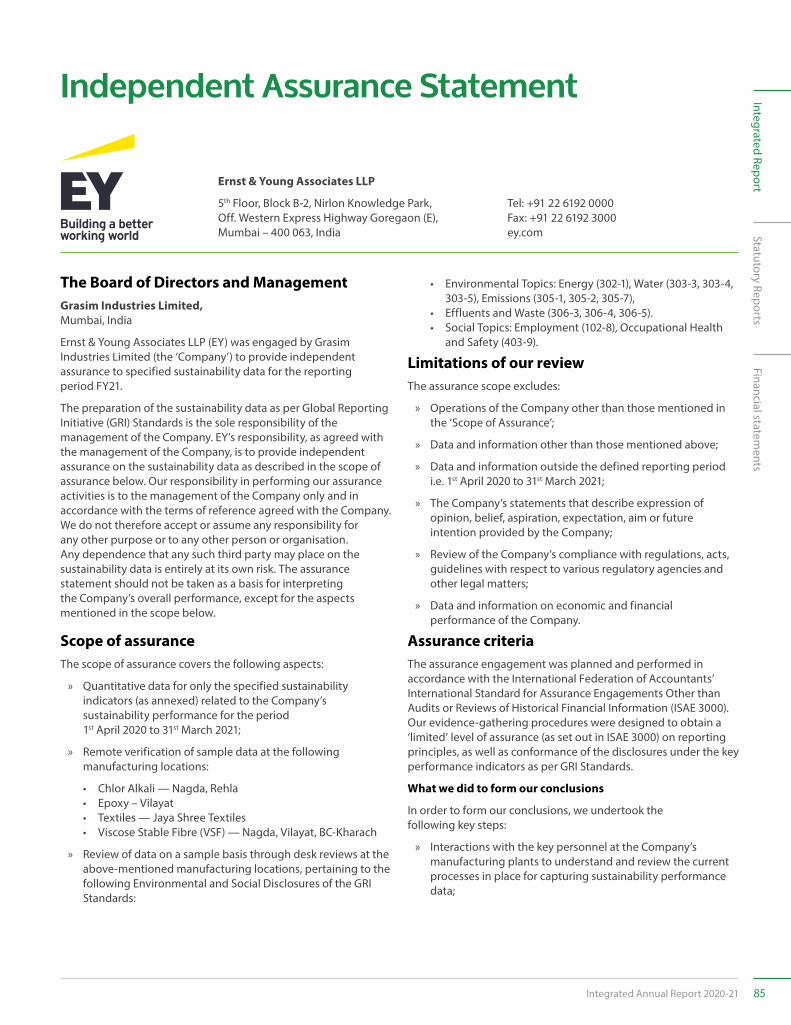
Ernst & Young Associates LLP
5th Floor, Block B-2, Nirlon Knowledge Park, Off. Western Express Highway Goregaon (E), Mumbai – 400 063, India
Tel: +91 22 6192 0000Fax: +91 22 6192 3000ey.com
The Board of Directors and ManagementGrasim Industries Limited, Mumbai, India
Ernst & Young Associates LLP (EY) was engaged by Grasim Industries Limited (the ‘Company’) to provide independent assurance to specified sustainability data for the reporting period FY21.
The preparation of the sustainability data as per Global Reporting Initiative (GRI) Standards is the sole responsibility of the management of the Company. EY’s responsibility, as agreed with the management of the Company, is to provide independent assurance on the sustainability data as described in the scope of assurance below. Our responsibility in performing our assurance activities is to the management of the Company only and in accordance with the terms of reference agreed with the Company. We do not therefore accept or assume any responsibility for any other purpose or to any other person or organisation. Any dependence that any such third party may place on the sustainability data is entirely at its own risk. The assurance statement should not be taken as a basis for interpreting the Company’s overall performance, except for the aspects mentioned in the scope below.
Scope of assuranceThe scope of assurance covers the following aspects:
» Quantitative data for only the specified sustainability indicators (as annexed) related to the Company’s sustainability performance for the period 1st April 2020 to 31st March 2021;
» Remote verification of sample data at the following manufacturing locations:
• Chlor Alkali — Nagda, Rehla • Epoxy – Vilayat• Textiles — Jaya Shree Textiles• Viscose Stable Fibre (VSF) — Nagda, Vilayat, BC-Kharach
» Review of data on a sample basis through desk reviews at the above-mentioned manufacturing locations, pertaining to the following Environmental and Social Disclosures of the GRI Standards:
• Environmental Topics: Energy (302-1), Water (303-3, 303-4, 303-5), Emissions (305-1, 305-2, 305-7),
• Effluents and Waste (306-3, 306-4, 306-5).• Social Topics: Employment (102-8), Occupational Health
and Safety (403-9).
Limitations of our reviewThe assurance scope excludes:
» Operations of the Company other than those mentioned in the ‘Scope of Assurance’;
» Data and information other than those mentioned above;
» Data and information outside the defined reporting period i.e. 1st April 2020 to 31st March 2021;
» The Company’s statements that describe expression of opinion, belief, aspiration, expectation, aim or future intention provided by the Company;
» Review of the Company’s compliance with regulations, acts, guidelines with respect to various regulatory agencies and other legal matters;
» Data and information on economic and financial performance of the Company.
Assurance criteriaThe assurance engagement was planned and performed in accordance with the International Federation of Accountants’ International Standard for Assurance Engagements Other than Audits or Reviews of Historical Financial Information (ISAE 3000). Our evidence-gathering procedures were designed to obtain a ‘limited’ level of assurance (as set out in ISAE 3000) on reporting principles, as well as conformance of the disclosures under the key performance indicators as per GRI Standards.
What we did to form our conclusions
In order to form our conclusions, we undertook the following key steps:
» Interactions with the key personnel at the Company’s manufacturing plants to understand and review the current processes in place for capturing sustainability performance data;
Independent Assurance Statement
Statutory ReportsFinancial statem
entsIntegrated Report
Integrated Annual Report 2020-21 85
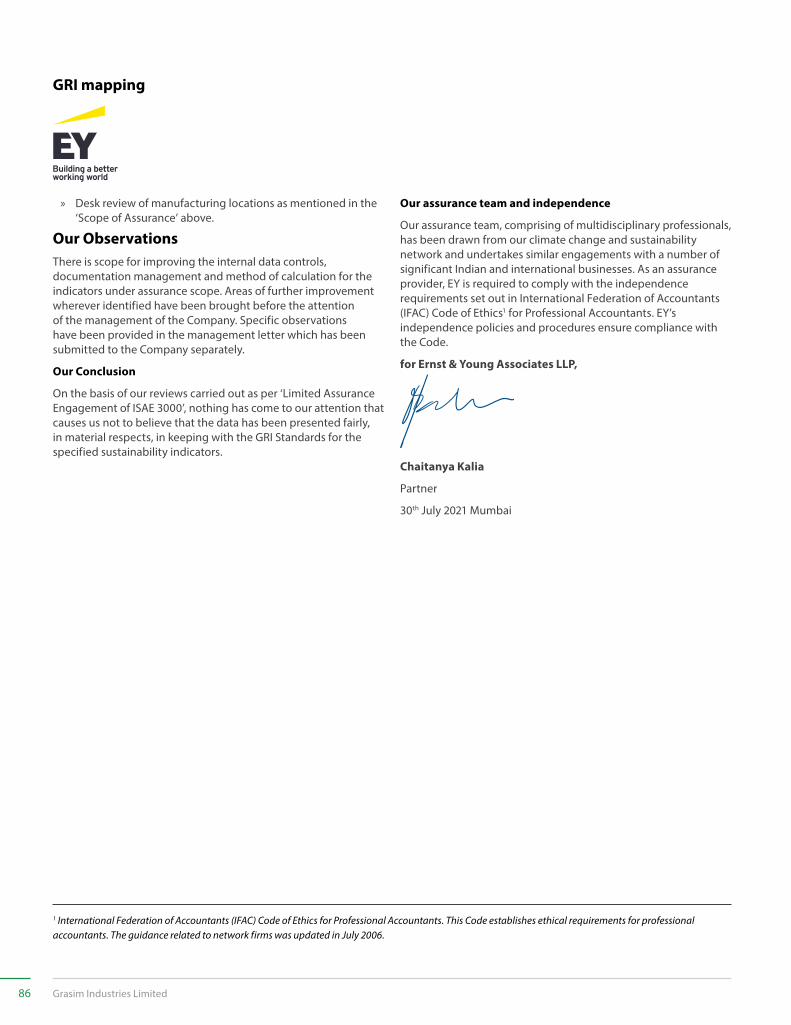
» Desk review of manufacturing locations as mentioned in the ‘Scope of Assurance’ above.
Our ObservationsThere is scope for improving the internal data controls, documentation management and method of calculation for the indicators under assurance scope. Areas of further improvement wherever identified have been brought before the attention of the management of the Company. Specific observations have been provided in the management letter which has been submitted to the Company separately.
Our Conclusion
On the basis of our reviews carried out as per ‘Limited Assurance Engagement of ISAE 3000’, nothing has come to our attention that causes us not to believe that the data has been presented fairly, in material respects, in keeping with the GRI Standards for the specified sustainability indicators.
1 International Federation of Accountants (IFAC) Code of Ethics for Professional Accountants. This Code establishes ethical requirements for professional accountants. The guidance related to network firms was updated in July 2006.
Our assurance team and independence
Our assurance team, comprising of multidisciplinary professionals, has been drawn from our climate change and sustainability network and undertakes similar engagements with a number of significant Indian and international businesses. As an assurance provider, EY is required to comply with the independence requirements set out in International Federation of Accountants (IFAC) Code of Ethics1 for Professional Accountants. EY’s independence policies and procedures ensure compliance with the Code.
for Ernst & Young Associates LLP,
Chaitanya Kalia
Partner
30th July 2021 Mumbai
GRI mapping
86 Grasim Industries Limited
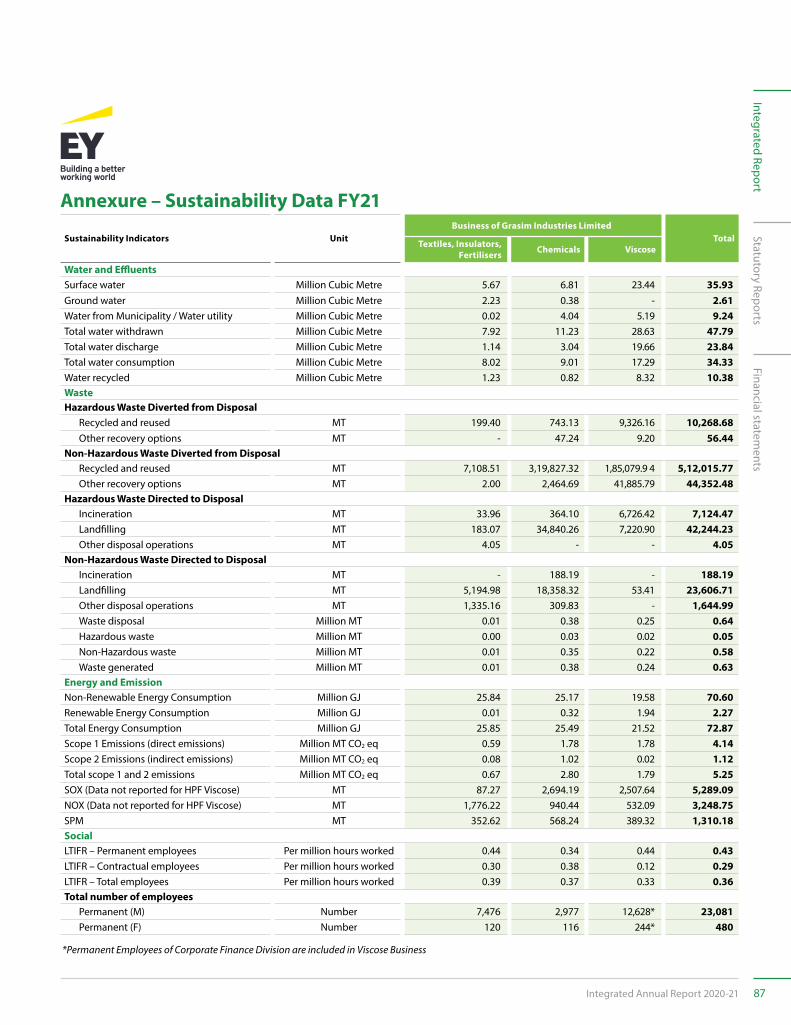
Annexure – Sustainability Data FY21
Sustainability Indicators UnitBusiness of Grasim Industries Limited
TotalTextiles, Insulators, Fertilisers Chemicals Viscose
Water and EffluentsSurface water Million Cubic Metre 5.67 6.81 23.44 35.93Ground water Million Cubic Metre 2.23 0.38 - 2.61Water from Municipality / Water utility Million Cubic Metre 0.02 4.04 5.19 9.24Total water withdrawn Million Cubic Metre 7.92 11.23 28.63 47.79Total water discharge Million Cubic Metre 1.14 3.04 19.66 23.84Total water consumption Million Cubic Metre 8.02 9.01 17.29 34.33Water recycled Million Cubic Metre 1.23 0.82 8.32 10.38WasteHazardous Waste Diverted from Disposal
Recycled and reused MT 199.40 743.13 9,326.16 10,268.68Other recovery options MT - 47.24 9.20 56.44
Non-Hazardous Waste Diverted from DisposalRecycled and reused MT 7,108.51 3,19,827.32 1,85,079.9 4 5,12,015.77Other recovery options MT 2.00 2,464.69 41,885.79 44,352.48
Hazardous Waste Directed to DisposalIncineration MT 33.96 364.10 6,726.42 7,124.47Landfilling MT 183.07 34,840.26 7,220.90 42,244.23Other disposal operations MT 4.05 - - 4.05
Non-Hazardous Waste Directed to DisposalIncineration MT - 188.19 - 188.19Landfilling MT 5,194.98 18,358.32 53.41 23,606.71Other disposal operations MT 1,335.16 309.83 - 1,644.99Waste disposal Million MT 0.01 0.38 0.25 0.64Hazardous waste Million MT 0.00 0.03 0.02 0.05Non-Hazardous waste Million MT 0.01 0.35 0.22 0.58Waste generated Million MT 0.01 0.38 0.24 0.63
Energy and EmissionNon-Renewable Energy Consumption Million GJ 25.84 25.17 19.58 70.60Renewable Energy Consumption Million GJ 0.01 0.32 1.94 2.27Total Energy Consumption Million GJ 25.85 25.49 21.52 72.87Scope 1 Emissions (direct emissions) Million MT CO2 eq 0.59 1.78 1.78 4.14Scope 2 Emissions (indirect emissions) Million MT CO2 eq 0.08 1.02 0.02 1.12Total scope 1 and 2 emissions Million MT CO2 eq 0.67 2.80 1.79 5.25SOX (Data not reported for HPF Viscose) MT 87.27 2,694.19 2,507.64 5,289.09NOX (Data not reported for HPF Viscose) MT 1,776.22 940.44 532.09 3,248.75SPM MT 352.62 568.24 389.32 1,310.18SocialLTIFR – Permanent employees Per million hours worked 0.44 0.34 0.44 0.43LTIFR – Contractual employees Per million hours worked 0.30 0.38 0.12 0.29LTIFR – Total employees Per million hours worked 0.39 0.37 0.33 0.36Total number of employees
Permanent (M) Number 7,476 2,977 12,628* 23,081Permanent (F) Number 120 116 244* 480
*Permanent Employees of Corporate Finance Division are included in Viscose Business
Statutory ReportsFinancial statem
entsIntegrated Report
Integrated Annual Report 2020-21 87
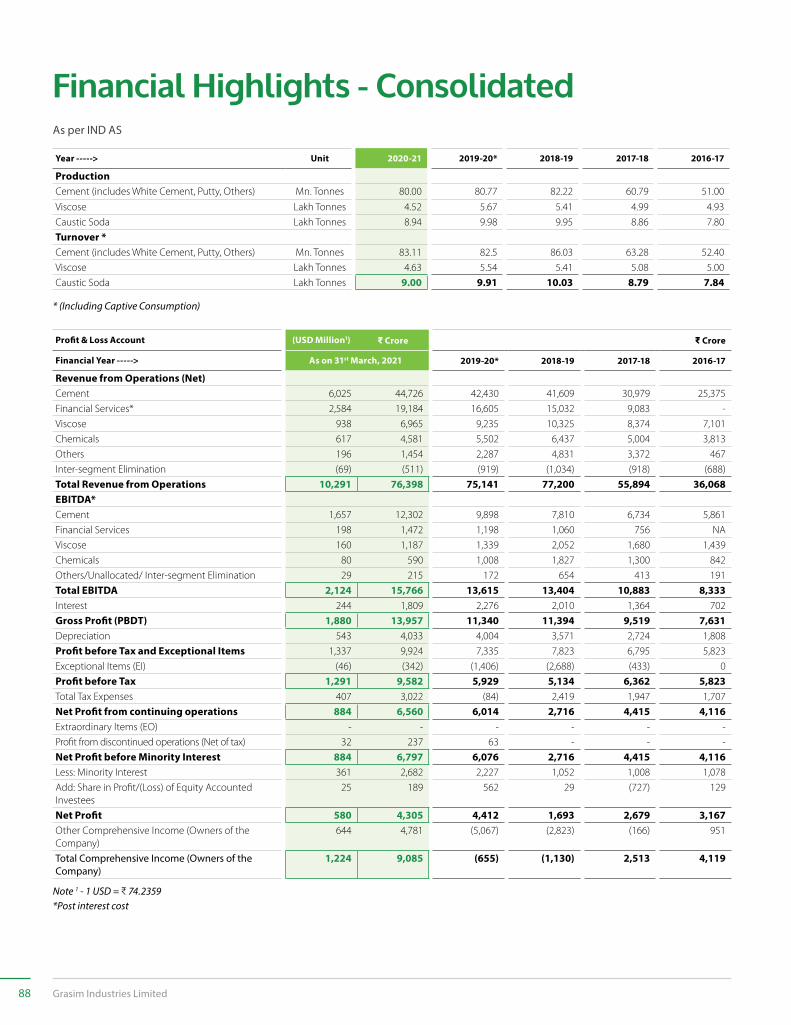
As per IND AS
Year -----> Unit 2020-21 2019-20* 2018-19 2017-18 2016-17
ProductionCement (includes White Cement, Putty, Others) Mn. Tonnes 80.00 80.77 82.22 60.79 51.00
Viscose Lakh Tonnes 4.52 5.67 5.41 4.99 4.93
Caustic Soda Lakh Tonnes 8.94 9.98 9.95 8.86 7.80
Turnover *Cement (includes White Cement, Putty, Others) Mn. Tonnes 83.11 82.5 86.03 63.28 52.40
Viscose Lakh Tonnes 4.63 5.54 5.41 5.08 5.00
Caustic Soda Lakh Tonnes 9.00 9.91 10.03 8.79 7.84
* (Including Captive Consumption)
Profit & Loss Account (USD Million1) G Crore G Crore
Financial Year -----> As on 31st March, 2021 2019-20* 2018-19 2017-18 2016-17
Revenue from Operations (Net)Cement 6,025 44,726 42,430 41,609 30,979 25,375
Financial Services* 2,584 19,184 16,605 15,032 9,083 -
Viscose 938 6,965 9,235 10,325 8,374 7,101
Chemicals 617 4,581 5,502 6,437 5,004 3,813
Others 196 1,454 2,287 4,831 3,372 467
Inter-segment Elimination (69) (511) (919) (1,034) (918) (688)
Total Revenue from Operations 10,291 76,398 75,141 77,200 55,894 36,068EBITDA*Cement 1,657 12,302 9,898 7,810 6,734 5,861
Financial Services 198 1,472 1,198 1,060 756 NA
Viscose 160 1,187 1,339 2,052 1,680 1,439
Chemicals 80 590 1,008 1,827 1,300 842
Others/Unallocated/ Inter-segment Elimination 29 215 172 654 413 191
Total EBITDA 2,124 15,766 13,615 13,404 10,883 8,333Interest 244 1,809 2,276 2,010 1,364 702
Gross Profit (PBDT) 1,880 13,957 11,340 11,394 9,519 7,631Depreciation 543 4,033 4,004 3,571 2,724 1,808
Profit before Tax and Exceptional Items 1,337 9,924 7,335 7,823 6,795 5,823
Exceptional Items (EI) (46) (342) (1,406) (2,688) (433) 0
Profit before Tax 1,291 9,582 5,929 5,134 6,362 5,823Total Tax Expenses 407 3,022 (84) 2,419 1,947 1,707
Net Profit from continuing operations 884 6,560 6,014 2,716 4,415 4,116Extraordinary Items (EO) - - - - - -
Profit from discontinued operations (Net of tax) 32 237 63 - - -
Net Profit before Minority Interest 884 6,797 6,076 2,716 4,415 4,116Less: Minority Interest 361 2,682 2,227 1,052 1,008 1,078
Add: Share in Profit/(Loss) of Equity Accounted Investees
25 189 562 29 (727) 129
Net Profit 580 4,305 4,412 1,693 2,679 3,167Other Comprehensive Income (Owners of the Company)
644 4,781 (5,067) (2,823) (166) 951
Total Comprehensive Income (Owners of the Company)
1,224 9,085 (655) (1,130) 2,513 4,119
Note 1 - 1 USD = C 74.2359*Post interest cost
Financial Highlights - Consolidated
88 Grasim Industries Limited
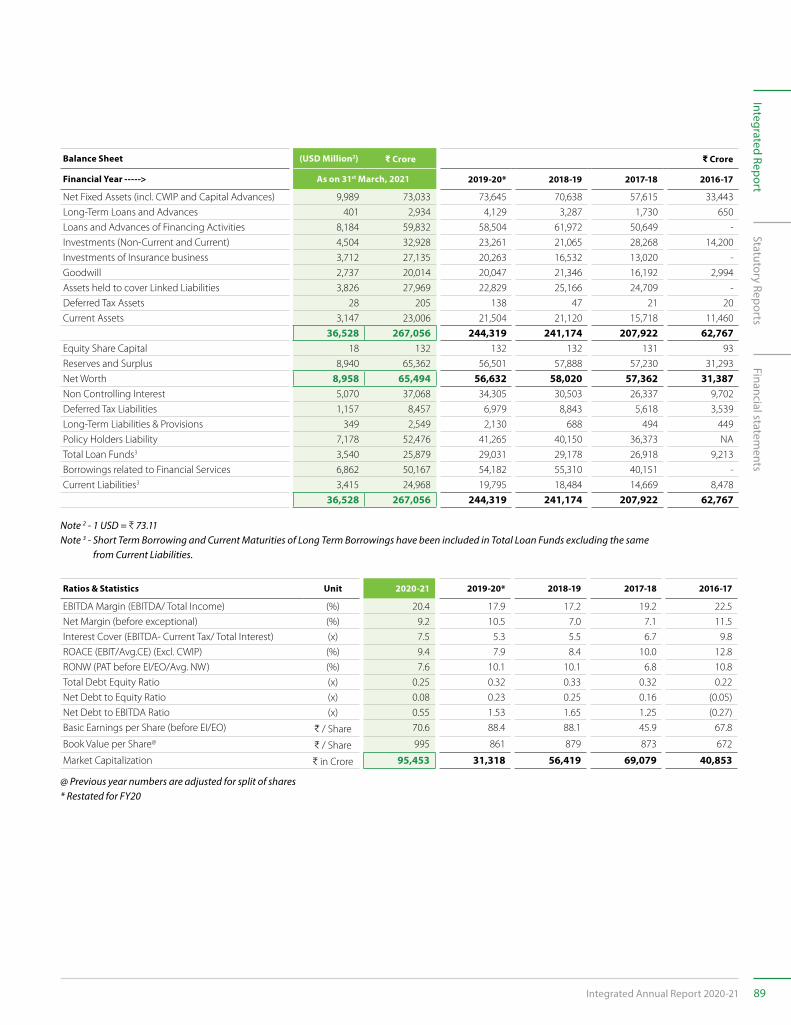
Balance Sheet (USD Million2) G Crore G Crore
Financial Year -----> As on 31st March, 2021 2019-20* 2018-19 2017-18 2016-17
Net Fixed Assets (incl. CWIP and Capital Advances) 9,989 73,033 73,645 70,638 57,615 33,443
Long-Term Loans and Advances 401 2,934 4,129 3,287 1,730 650
Loans and Advances of Financing Activities 8,184 59,832 58,504 61,972 50,649 -
Investments (Non-Current and Current) 4,504 32,928 23,261 21,065 28,268 14,200
Investments of Insurance business 3,712 27,135 20,263 16,532 13,020 -
Goodwill 2,737 20,014 20,047 21,346 16,192 2,994
Assets held to cover Linked Liabilities 3,826 27,969 22,829 25,166 24,709 -
Deferred Tax Assets 28 205 138 47 21 20
Current Assets 3,147 23,006 21,504 21,120 15,718 11,460
36,528 267,056 244,319 241,174 207,922 62,767Equity Share Capital 18 132 132 132 131 93
Reserves and Surplus 8,940 65,362 56,501 57,888 57,230 31,293
Net Worth 8,958 65,494 56,632 58,020 57,362 31,387Non Controlling Interest 5,070 37,068 34,305 30,503 26,337 9,702
Deferred Tax Liabilities 1,157 8,457 6,979 8,843 5,618 3,539
Long-Term Liabilities & Provisions 349 2,549 2,130 688 494 449
Policy Holders Liability 7,178 52,476 41,265 40,150 36,373 NA
Total Loan Funds3 3,540 25,879 29,031 29,178 26,918 9,213
Borrowings related to Financial Services 6,862 50,167 54,182 55,310 40,151 -
Current Liabilities3 3,415 24,968 19,795 18,484 14,669 8,478
36,528 267,056 244,319 241,174 207,922 62,767
Note 2 - 1 USD = C 73.11Note 3 - Short Term Borrowing and Current Maturities of Long Term Borrowings have been included in Total Loan Funds excluding the same
from Current Liabilities.
Ratios & Statistics Unit 2020-21 2019-20* 2018-19 2017-18 2016-17
EBITDA Margin (EBITDA/ Total Income) (%) 20.4 17.9 17.2 19.2 22.5
Net Margin (before exceptional) (%) 9.2 10.5 7.0 7.1 11.5
Interest Cover (EBITDA- Current Tax/ Total Interest) (x) 7.5 5.3 5.5 6.7 9.8
ROACE (EBIT/Avg.CE) (Excl. CWIP) (%) 9.4 7.9 8.4 10.0 12.8
RONW (PAT before EI/EO/Avg. NW) (%) 7.6 10.1 10.1 6.8 10.8
Total Debt Equity Ratio (x) 0.25 0.32 0.33 0.32 0.22
Net Debt to Equity Ratio (x) 0.08 0.23 0.25 0.16 (0.05)
Net Debt to EBITDA Ratio (x) 0.55 1.53 1.65 1.25 (0.27)
Basic Earnings per Share (before EI/EO) C / Share 70.6 88.4 88.1 45.9 67.8
Book Value per Share@C / Share 995 861 879 873 672
Market Capitalization C in Crore 95,453 31,318 56,419 69,079 40,853
@ Previous year numbers are adjusted for split of shares* Restated for FY20
Statutory ReportsFinancial statem
entsIntegrated Report
Integrated Annual Report 2020-21 89
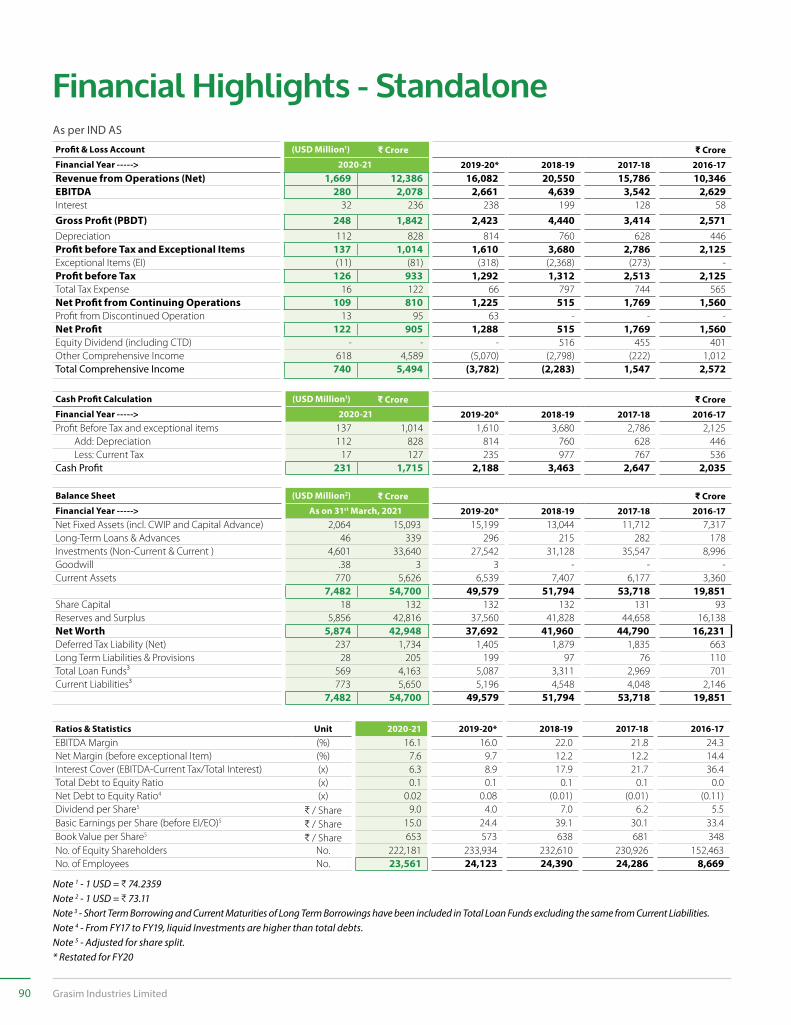
Profit & Loss Account (USD Million1) G Crore G Crore
Financial Year -----> 2020-21 2019-20* 2018-19 2017-18 2016-17Revenue from Operations (Net) 1,669 12,386 16,082 20,550 15,786 10,346EBITDA 280 2,078 2,661 4,639 3,542 2,629Interest 32 236 238 199 128 58
Gross Profit (PBDT) 248 1,842 2,423 4,440 3,414 2,571Depreciation 112 828 814 760 628 446Profit before Tax and Exceptional Items 137 1,014 1,610 3,680 2,786 2,125Exceptional Items (EI) (11) (81) (318) (2,368) (273) -Profit before Tax 126 933 1,292 1,312 2,513 2,125Total Tax Expense 16 122 66 797 744 565Net Profit from Continuing Operations 109 810 1,225 515 1,769 1,560Profit from Discontinued Operation 13 95 63 - - -Net Profit 122 905 1,288 515 1,769 1,560Equity Dividend (including CTD) - - - 516 455 401Other Comprehensive Income 618 4,589 (5,070) (2,798) (222) 1,012Total Comprehensive Income 740 5,494 (3,782) (2,283) 1,547 2,572
Cash Profit Calculation (USD Million1) G Crore G Crore
Financial Year -----> 2020-21 2019-20* 2018-19 2017-18 2016-17Profit Before Tax and exceptional items 137 1,014 1,610 3,680 2,786 2,125 Add: Depreciation 112 828 814 760 628 446 Less: Current Tax 17 127 235 977 767 536Cash Profit 231 1,715 2,188 3,463 2,647 2,035
Balance Sheet (USD Million2) G Crore G Crore
Financial Year -----> As on 31st March, 2021 2019-20* 2018-19 2017-18 2016-17Net Fixed Assets (incl. CWIP and Capital Advance) 2,064 15,093 15,199 13,044 11,712 7,317Long-Term Loans & Advances 46 339 296 215 282 178Investments (Non-Current & Current ) 4,601 33,640 27,542 31,128 35,547 8,996Goodwill .38 3 3 - - -Current Assets 770 5,626 6,539 7,407 6,177 3,360
7,482 54,700 49,579 51,794 53,718 19,851Share Capital 18 132 132 132 131 93Reserves and Surplus 5,856 42,816 37,560 41,828 44,658 16,138Net Worth 5,874 42,948 37,692 41,960 44,790 16,231Deferred Tax Liability (Net) 237 1,734 1,405 1,879 1,835 663Long Term Liabilities & Provisions 28 205 199 97 76 110Total Loan Funds³ 569 4,163 5,087 3,311 2,969 701Current Liabilities³ 773 5,650 5,196 4,548 4,048 2,146
7,482 54,700 49,579 51,794 53,718 19,851
Ratios & Statistics Unit 2020-21 2019-20* 2018-19 2017-18 2016-17EBITDA Margin (%) 16.1 16.0 22.0 21.8 24.3 Net Margin (before exceptional Item) (%) 7.6 9.7 12.2 12.2 14.4 Interest Cover (EBITDA-Current Tax/Total Interest) (x) 6.3 8.9 17.9 21.7 36.4 Total Debt to Equity Ratio (x) 0.1 0.1 0.1 0.1 0.0 Net Debt to Equity Ratio4 (x) 0.02 0.08 (0.01) (0.01) (0.11) Dividend per Share5
C / Share 9.0 4.0 7.0 6.2 5.5 Basic Earnings per Share (before EI/EO)5
C / Share 15.0 24.4 39.1 30.1 33.4 Book Value per Share5
C / Share 653 573 638 681 348 No. of Equity Shareholders No. 222,181 233,934 232,610 230,926 152,463 No. of Employees No. 23,561 24,123 24,390 24,286 8,669
Note 1 - 1 USD = C 74.2359Note 2 - 1 USD = C 73.11Note 3 - Short Term Borrowing and Current Maturities of Long Term Borrowings have been included in Total Loan Funds excluding the same from Current Liabilities.Note 4 - From FY17 to FY19, liquid Investments are higher than total debts.Note 5 - Adjusted for share split.* Restated for FY20
As per IND AS
Financial Highlights - Standalone
90 Grasim Industries Limited
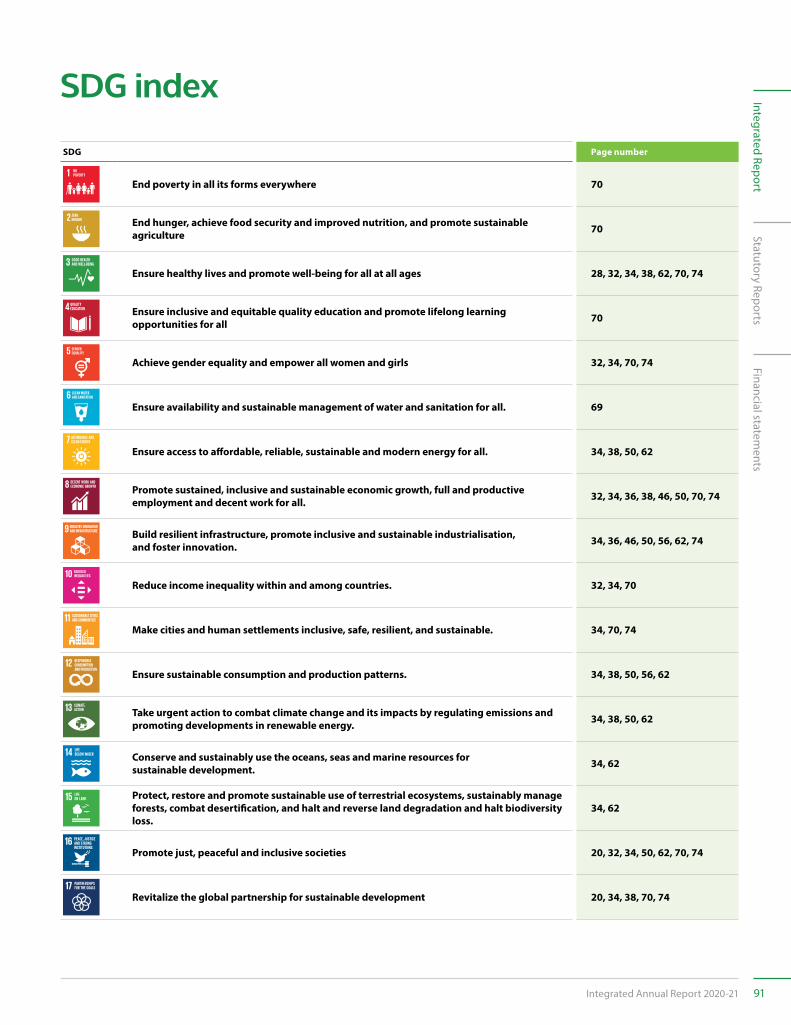
SDG index
SDG Page number
End poverty in all its forms everywhere 70
End hunger, achieve food security and improved nutrition, and promote sustainable agriculture 70
Ensure healthy lives and promote well-being for all at all ages 28, 32, 34, 38, 62, 70, 74
Ensure inclusive and equitable quality education and promote lifelong learning opportunities for all 70
Achieve gender equality and empower all women and girls 32, 34, 70, 74
Ensure availability and sustainable management of water and sanitation for all. 69
Ensure access to affordable, reliable, sustainable and modern energy for all. 34, 38, 50, 62
Promote sustained, inclusive and sustainable economic growth, full and productive employment and decent work for all. 32, 34, 36, 38, 46, 50, 70, 74
Build resilient infrastructure, promote inclusive and sustainable industrialisation, and foster innovation. 34, 36, 46, 50, 56, 62, 74
Reduce income inequality within and among countries. 32, 34, 70
Make cities and human settlements inclusive, safe, resilient, and sustainable. 34, 70, 74
Ensure sustainable consumption and production patterns. 34, 38, 50, 56, 62
Take urgent action to combat climate change and its impacts by regulating emissions and promoting developments in renewable energy. 34, 38, 50, 62
Conserve and sustainably use the oceans, seas and marine resources for sustainable development. 34, 62
Protect, restore and promote sustainable use of terrestrial ecosystems, sustainably manage forests, combat desertification, and halt and reverse land degradation and halt biodiversity loss.
34, 62
Promote just, peaceful and inclusive societies 20, 32, 34, 50, 62, 70, 74
Revitalize the global partnership for sustainable development 20, 34, 38, 70, 74
Statutory ReportsFinancial statem
entsIntegrated Report
Integrated Annual Report 2020-21 91
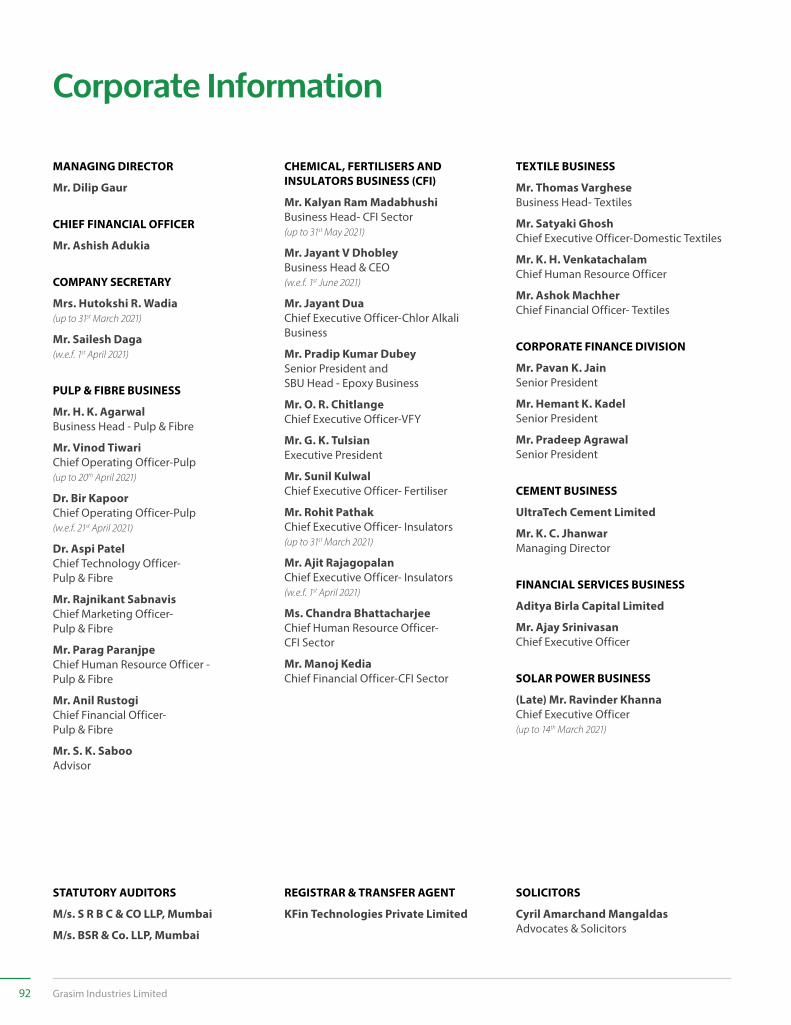
MANAGING DIRECTOR
Mr. Dilip Gaur
CHIEF FINANCIAL OFFICER
Mr. Ashish Adukia
COMPANY SECRETARY
Mrs. Hutokshi R. Wadia(up to 31st March 2021)
Mr. Sailesh Daga(w.e.f. 1st April 2021)
PULP & FIBRE BUSINESS
Mr. H. K. AgarwalBusiness Head - Pulp & Fibre
Mr. Vinod TiwariChief Operating Officer-Pulp(up to 20th April 2021)
Dr. Bir KapoorChief Operating Officer-Pulp(w.e.f. 21st April 2021)
Dr. Aspi PatelChief Technology Officer- Pulp & Fibre
Mr. Rajnikant SabnavisChief Marketing Officer- Pulp & Fibre
Mr. Parag ParanjpeChief Human Resource Officer - Pulp & Fibre
Mr. Anil RustogiChief Financial Officer- Pulp & Fibre
Mr. S. K. SabooAdvisor
CHEMICAL, FERTILISERS AND INSULATORS BUSINESS (CFI)
Mr. Kalyan Ram MadabhushiBusiness Head- CFI Sector(up to 31st May 2021)
Mr. Jayant V DhobleyBusiness Head & CEO(w.e.f. 1st June 2021)
Mr. Jayant DuaChief Executive Officer-Chlor Alkali Business
Mr. Pradip Kumar DubeySenior President andSBU Head - Epoxy Business
Mr. O. R. ChitlangeChief Executive Officer-VFY
Mr. G. K. TulsianExecutive President
Mr. Sunil KulwalChief Executive Officer- Fertiliser
Mr. Rohit PathakChief Executive Officer- Insulators(up to 31st March 2021)
Mr. Ajit RajagopalanChief Executive Officer- Insulators(w.e.f. 1st April 2021)
Ms. Chandra BhattacharjeeChief Human Resource Officer-CFI Sector
Mr. Manoj KediaChief Financial Officer-CFI Sector
TEXTILE BUSINESS
Mr. Thomas VargheseBusiness Head- Textiles
Mr. Satyaki GhoshChief Executive Officer-Domestic Textiles
Mr. K. H. VenkatachalamChief Human Resource Officer
Mr. Ashok MachherChief Financial Officer- Textiles
CORPORATE FINANCE DIVISION
Mr. Pavan K. JainSenior President
Mr. Hemant K. KadelSenior President
Mr. Pradeep AgrawalSenior President
CEMENT BUSINESS
UltraTech Cement Limited
Mr. K. C. JhanwarManaging Director
FINANCIAL SERVICES BUSINESS
Aditya Birla Capital Limited
Mr. Ajay SrinivasanChief Executive Officer
SOLAR POWER BUSINESS
(Late) Mr. Ravinder KhannaChief Executive Officer(up to 14th March 2021)
STATUTORY AUDITORS
M/s. S R B C & CO LLP, Mumbai
M/s. BSR & Co. LLP, Mumbai
REGISTRAR & TRANSFER AGENT
KFin Technologies Private Limited
SOLICITORS
Cyril Amarchand MangaldasAdvocates & Solicitors
Corporate Information
92 Grasim Industries Limited
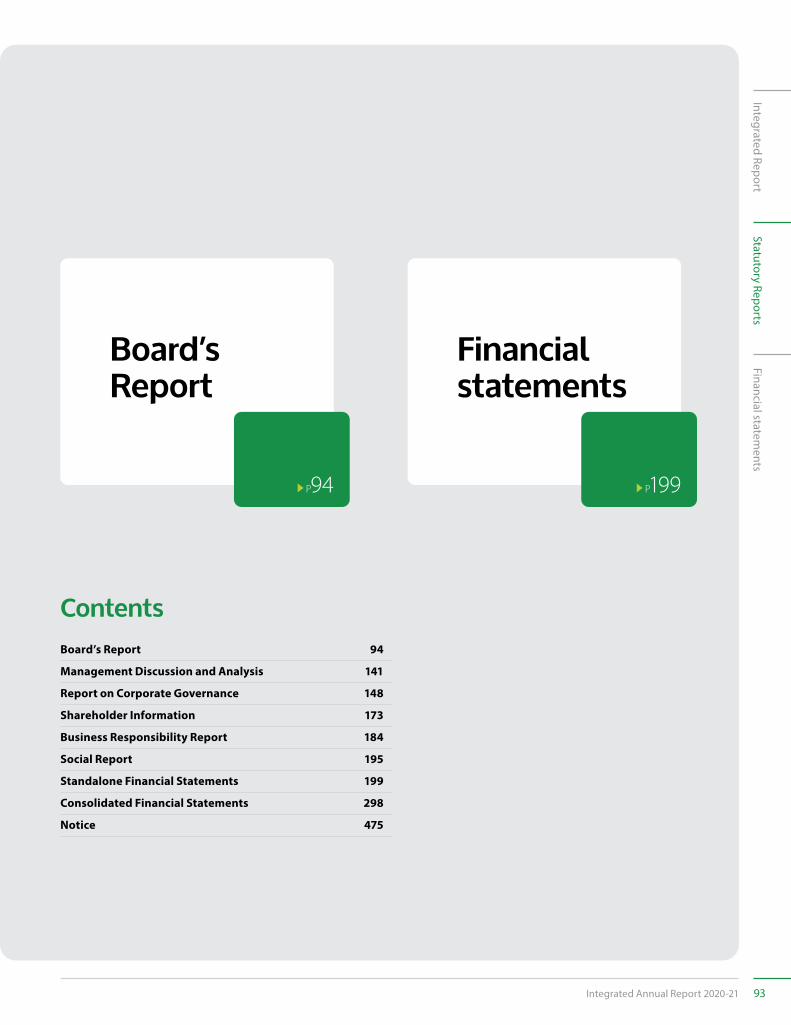
Contents
Board’s Report
Financial statements
P94 P199
Board’s Report 94
Management Discussion and Analysis 141
Report on Corporate Governance 148
Shareholder Information 173
Business Responsibility Report 184
Social Report 195
Standalone Financial Statements 199
Consolidated Financial Statements 298
Notice 475
Integrated ReportStatutory Reports
93Integrated Annual Report 2020-21
Financial statements
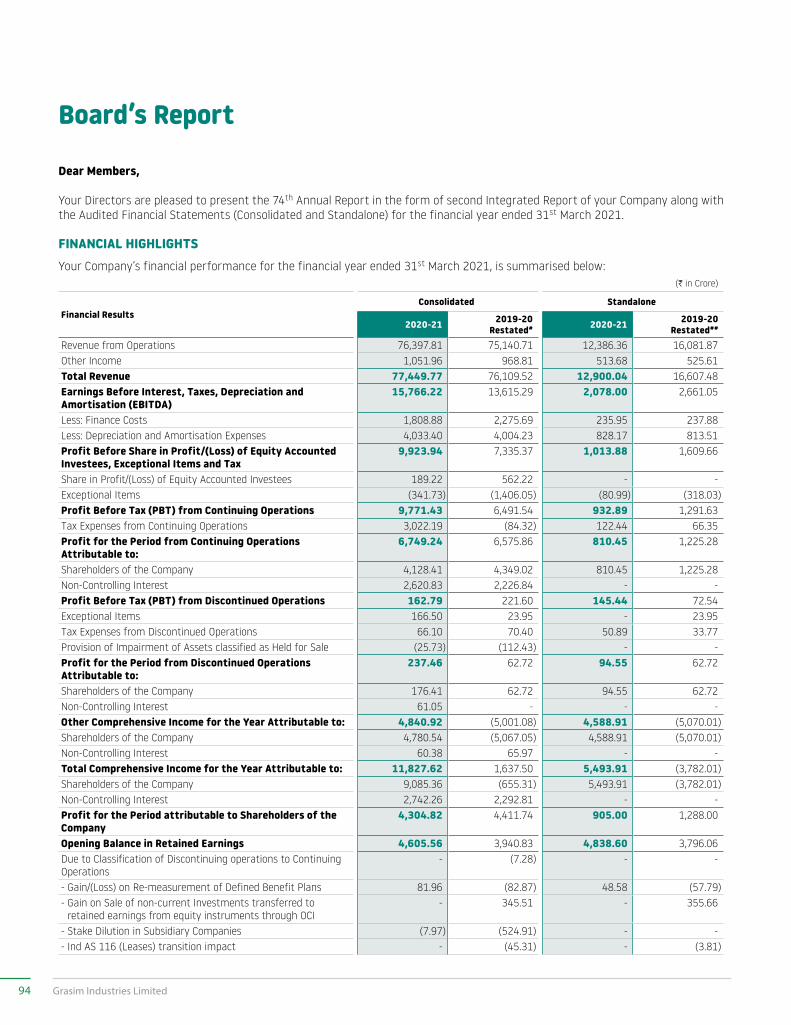
Dear Members,
Your Directors are pleased to present the 74th Annual Report in the form of second Integrated Report of your Company along with the Audited Financial Statements (Consolidated and Standalone) for the financial year ended 31st March 2021.
FINANCIAL HIGHLIGHTSYour Company’s financial performance for the financial year ended 31st March 2021, is summarised below:
(H in Crore)
Financial ResultsConsolidated Standalone
2020-21 2019-20Restated# 2020-21 2019-20
Restated##
Revenue from Operations 76,397.81 75,140.71 12,386.36 16,081.87Other Income 1,051.96 968.81 513.68 525.61Total Revenue 77,449.77 76,109.52 12,900.04 16,607.48Earnings Before Interest, Taxes, Depreciation and Amortisation (EBITDA)
15,766.22 13,615.29 2,078.00 2,661.05
Less: Finance Costs 1,808.88 2,275.69 235.95 237.88Less: Depreciation and Amortisation Expenses 4,033.40 4,004.23 828.17 813.51Profit Before Share in Profit/(Loss) of Equity Accounted Investees, Exceptional Items and Tax
9,923.94 7,335.37 1,013.88 1,609.66
Share in Profit/(Loss) of Equity Accounted Investees 189.22 562.22 - - Exceptional Items (341.73) (1,406.05) (80.99) (318.03)Profit Before Tax (PBT) from Continuing Operations 9,771.43 6,491.54 932.89 1,291.63Tax Expenses from Continuing Operations 3,022.19 (84.32) 122.44 66.35Profit for the Period from Continuing Operations Attributable to:
6,749.24 6,575.86 810.45 1,225.28
Shareholders of the Company 4,128.41 4,349.02 810.45 1,225.28Non-Controlling Interest 2,620.83 2,226.84 - - Profit Before Tax (PBT) from Discontinued Operations 162.79 221.60 145.44 72.54Exceptional Items 166.50 23.95 - 23.95Tax Expenses from Discontinued Operations 66.10 70.40 50.89 33.77Provision of Impairment of Assets classified as Held for Sale (25.73) (112.43) - - Profit for the Period from Discontinued Operations Attributable to:
237.46 62.72 94.55 62.72
Shareholders of the Company 176.41 62.72 94.55 62.72Non-Controlling Interest 61.05 - - - Other Comprehensive Income for the Year Attributable to: 4,840.92 (5,001.08) 4,588.91 (5,070.01)Shareholders of the Company 4,780.54 (5,067.05) 4,588.91 (5,070.01)Non-Controlling Interest 60.38 65.97 - - Total Comprehensive Income for the Year Attributable to: 11,827.62 1,637.50 5,493.91 (3,782.01)Shareholders of the Company 9,085.36 (655.31) 5,493.91 (3,782.01)Non-Controlling Interest 2,742.26 2,292.81 - - Profit for the Period attributable to Shareholders of the Company
4,304.82 4,411.74 905.00 1,288.00
Opening Balance in Retained Earnings 4,605.56 3,940.83 4,838.60 3,796.06Due to Classification of Discontinuing operations to Continuing Operations
- (7.28) - -
- Gain/(Loss) on Re-measurement of Defined Benefit Plans 81.96 (82.87) 48.58 (57.79)- Gain on Sale of non-current Investments transferred to
retained earnings from equity instruments through OCI - 345.51 - 355.66
- Stake Dilution in Subsidiary Companies (7.97) (524.91) - - - Ind AS 116 (Leases) transition impact - (45.31) - (3.81)
Board’s Report
94 Grasim Industries Limited
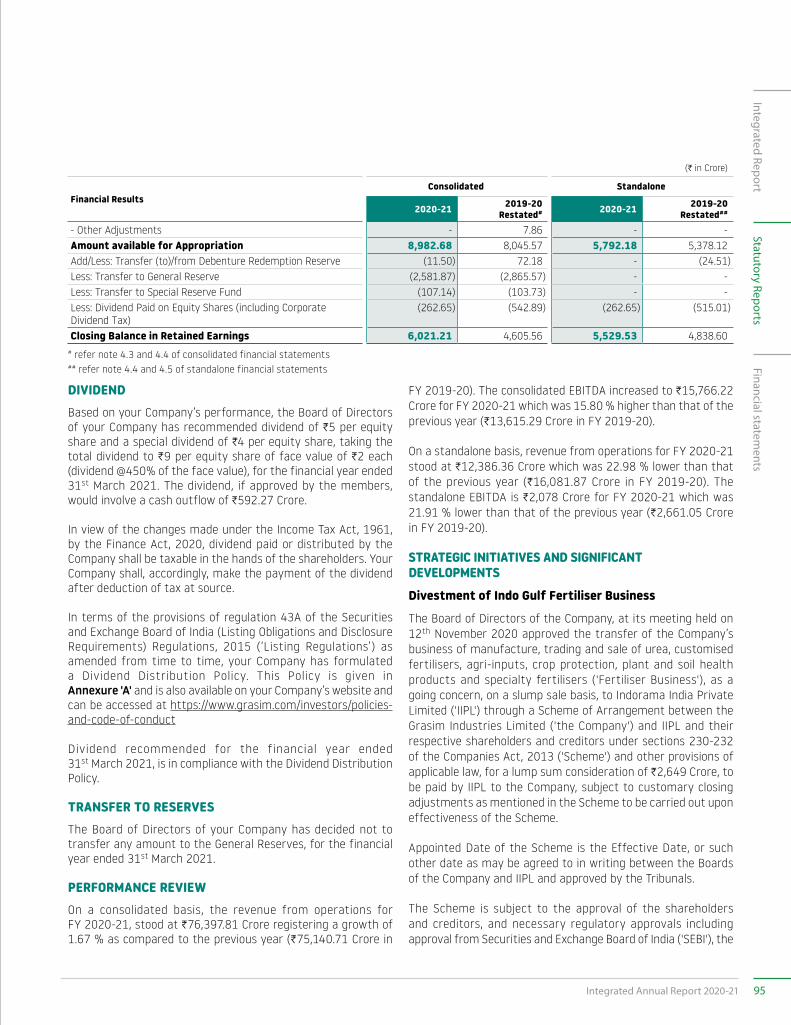
(H in Crore)
Financial ResultsConsolidated Standalone
2020-21 2019-20Restated# 2020-21 2019-20
Restated##
- Other Adjustments - 7.86 - -Amount available for Appropriation 8,982.68 8,045.57 5,792.18 5,378.12Add/Less: Transfer (to)/from Debenture Redemption Reserve (11.50) 72.18 - (24.51)Less: Transfer to General Reserve (2,581.87) (2,865.57) - -Less: Transfer to Special Reserve Fund (107.14) (103.73) - -Less: Dividend Paid on Equity Shares (including Corporate Dividend Tax)
(262.65) (542.89) (262.65) (515.01)
Closing Balance in Retained Earnings 6,021.21 4,605.56 5,529.53 4,838.60# refer note 4.3 and 4.4 of consolidated financial statements## refer note 4.4 and 4.5 of standalone financial statements
DIVIDENDBased on your Company’s performance, the Board of Directors of your Company has recommended dividend of H5 per equity share and a special dividend of H4 per equity share, taking the total dividend to H9 per equity share of face value of H2 each (dividend @450% of the face value), for the financial year ended 31st March 2021. The dividend, if approved by the members, would involve a cash outflow of H592.27 Crore.
In view of the changes made under the Income Tax Act, 1961, by the Finance Act, 2020, dividend paid or distributed by the Company shall be taxable in the hands of the shareholders. Your Company shall, accordingly, make the payment of the dividend after deduction of tax at source.
In terms of the provisions of regulation 43A of the Securities and Exchange Board of India (Listing Obligations and Disclosure Requirements) Regulations, 2015 (‘Listing Regulations’) as amended from time to time, your Company has formulated a Dividend Distribution Policy. This Policy is given in Annexure 'A' and is also available on your Company’s website and can be accessed at https://www.grasim.com/investors/policies-and-code-of-conduct
Dividend recommended for the f inancial year ended 31st March 2021, is in compliance with the Dividend Distribution Policy.
TRANSFER TO RESERVESThe Board of Directors of your Company has decided not to transfer any amount to the General Reserves, for the financial year ended 31st March 2021.
PERFORMANCE REVIEWOn a consolidated basis, the revenue from operations for FY 2020-21, stood at H76,397.81 Crore registering a growth of 1.67 % as compared to the previous year (H75,140.71 Crore in
FY 2019-20). The consolidated EBITDA increased to H15,766.22 Crore for FY 2020-21 which was 15.80 % higher than that of the previous year (H13,615.29 Crore in FY 2019-20).
On a standalone basis, revenue from operations for FY 2020-21 stood at H12,386.36 Crore which was 22.98 % lower than that of the previous year (H16,081.87 Crore in FY 2019-20). The standalone EBITDA is H2,078 Crore for FY 2020-21 which was 21.91 % lower than that of the previous year (H2,661.05 Crore in FY 2019-20).
STRATEGIC INITIATIVES AND SIGNIFICANT DEVELOPMENTSDivestment of Indo Gulf Fertiliser Business
The Board of Directors of the Company, at its meeting held on 12th November 2020 approved the transfer of the Company’s business of manufacture, trading and sale of urea, customised fertilisers, agri-inputs, crop protection, plant and soil health products and specialty fertilisers ('Fertiliser Business'), as a going concern, on a slump sale basis, to Indorama India Private Limited ('IIPL') through a Scheme of Arrangement between the Grasim Industries Limited ('the Company') and IIPL and their respective shareholders and creditors under sections 230-232 of the Companies Act, 2013 ('Scheme') and other provisions of applicable law, for a lump sum consideration of H2,649 Crore, to be paid by IIPL to the Company, subject to customary closing adjustments as mentioned in the Scheme to be carried out upon effectiveness of the Scheme.
Appointed Date of the Scheme is the Effective Date, or such other date as may be agreed to in writing between the Boards of the Company and IIPL and approved by the Tribunals.
The Scheme is subject to the approval of the shareholders and creditors, and necessary regulatory approvals including approval from Securities and Exchange Board of India ('SEBI'), the
95Integrated Annual Report 2020-21
Integrated ReportFinancial statem
entsStatutory Reports
jurisdictional Hon'ble National Company Law Tribunals ('NCLT') and the Competition Commission of India ('CCI').
The Scheme has been approved by CCI, Stock Exchanges and SEBI. The Scheme was approved by the shareholders and creditors of the Company at their respective meetings held on 16th April 2021. Hon'ble NCLT Kolkata Bench vide its order dated 26th March 2021 dispensed holding of meetings of shareholders and creditors of IIPL.
Petition for approval of the Scheme has been filed with jurisdictional NCLTs and hearing for the same is pending.
The Scheme, inter-alia, will be beneficial to the Company, as it will help the Company to pursue growth opportunities in its core businesses and unlock value with overall improvement in working capital cycle due to release of blocked funds from long receivable cycle involved in the said business. As the Scheme involves transfer of the fertiliser business through a slump sale, for a lump sum consideration, no shares will be allotted by IIPL to the shareholders of the Company. Therefore, the shareholding of the Company will not be affected by the Scheme.
Entering into Paints as new line of Business
The Board of Directors at it s meeting held on 22nd January 2021 approved entering into Paints as new line of business. The shareholders’ approval for alteration to the Object Clause thereby permitting the Company to foray into Paints business was obtained at the Extra Ordinary General Meeting held 22nd February 2021.
Historically, the Indian paints industry has been growing at a healthy rate. The organised segment constitutes approximately 70% by value of the total paints market and has historically grown faster than the unorganised segment and therefore gained market share from the unorganised segment.
The Company’s entry into this consumer-oriented business will further diversify its portfolio, provide scale and growth and will also offer a wide choice to Indian consumers as the Company plans to introduce the latest as well as a wide range of paint products.
The Company’s entry into this high growth sector is expected to help painters/applicators and all traditional and emerging channel partners across India to expand their existing business and grow. The Company’s Board of Directors has approved an initial capital expenditure of approximately H5,000 Crore over the next 3 years.
Entry in the paints sector will add size, scale and diversity to the existing business portfolio of the Company. The Company
believes that this sector is likely to be value accretive to its stakeholders.
Aditya Birla Power Composites Limited
Aditya Birla Power Composites Limited ('ABPCL'), is a joint venture between the Company and Maschinenfabrik Reinhausen Gmbh ('MR')wherein the Company holds 51% of share capital and the balance share capital (49%) is held by MR.
ABPCL is in the process of setting up a state-of-the-art Composite Hollow Core Insulators ('CHCI') manufacturing plant at Halol, Gujarat, India at a project cost of about H100 Crore for the manufacture and sale of CHCI to serve the power transmission & distribution industry globally. The work of setting up the Plant at Halol is in progress and will be commissioned in FY 2021-22.
Amalgamation of Grasim Premium Fabric Private Limited ('GPFPL') with your Company
The Scheme of Arrangement between GPFPL and Grasim Industries Limited ('Grasim') and their respective shareholders and all concerned ('Scheme') under sections 230 to 232 of the Companies Act, 2013 was approved by the Board of Directors of your Company and GPFPL and necessary application/petitions for approving merger were filed with jurisdictional NCLTs.
Hon'ble NCLT Indore Bench at Ahmedabad approved the Scheme vide its order dated 12th November 2020 as amended vide its order dated 28th January 2021. Your Company has filed the copy of the order with Registrar of Companies ('ROC'), Gwalior. Hon'ble NCLT Mumbai Bench approved the Scheme vide its order dated 23rd March 2021.
On receipt of the certified copy of the order from Hon'ble NCLT Mumbai, same will be filed with the ROC, Pune by GPFPL. The Scheme will be effective on the date of filing of the said order with appointed date being 1st April 2019.
Amalgamation of Sun God Trading and Investment Limited with ABNL Investment Limited
The Board of Directors of ABNL Investment Limited (wholly-owned subsidiary of your Company) and Sun God Trading and Investment Limited (wholly-owned subsidiary of ABNL Investment Limited) had approved the Scheme of Amalgamation between Sun God Trading and Investment Limited and ABNL Investment Limited and their respective shareholders and all concerned ('Scheme') under section 233 of the Companies Act, 2013.
ABNL Investment Limited has filed copy of the order of Regional Director (North-Western Region), Ahmedabad with Registrar of Companies, Ahmedabad. On receipt of the certified copy of the
Board’s Report (Contd.)
96 Grasim Industries Limited
order by Sun God Trading and Investment Limited, same will be filed with the Registrar of Companies, Gwalior.
Amalgamation of Aditya Birla Solar Limited ('ABSL') with Aditya Birla Renewables Limited ('ABReL')
ABSL and ABReL are wholly-owned subsidiaries of your Company, both engaged in the business of electric power generation using solar energy. The Board of Directors of both companies have approved the Scheme of Arrangement between ABSL and ABReL under sections 230 and 232 of the Companies Act, 2013. A joint application was filed by ABSL and ABReL with the Hon'ble NCLT, Mumbai Bench on 27th March 2020. Hon'ble NCLT Mumbai Bench vide its order dated 17th February 2021 dispensed with the requirement of convening meetings of shareholders and creditors of both ABSL and ABReL. ABSL and ABReL are in the process of filing petition seeking sanction of the merger and the dissolution of ABSL.
CONSOLIDATED FINANCIAL STATEMENTSIn accordance with the Companies Act, 2013, read with the Companies (Accounts) Rules, 2014, Listing Regulations and IND AS 110 - Consolidated Financial Statements (CFS)/and IND AS 28 - Investment in Associates/and Joint Ventures, the Audited Consolidated Financial Statements forms integral part of this Annual Report.
SUBSIDIARIES, ASSOCIATES AND JOINT VENTURE COMPANIESDuring the year under review, there were no changes in the direct subsidiaries, associates and joint venture companies of your Company.
In accordance with the provisions of section 129(3) of the Companies Act, 2013, read with rule 5 of the Companies (Accounts) Rules, 2014, a statement containing the salient features of financial statements of each of the subsidiaries/associates/joint venture companies of your Company, in the prescribed Form AOC-1, is given in Annexure 'B' to this Report.
The said Form also highlights the financial performance of each of the subsidiaries/associates/joint venture companies included in the CFS pursuant to rule 8(1) of the Companies (Accounts) Rules, 2014.
In accordance with the provisions of section 136(1) of the Companies Act, 2013, the Annual Report of your Company, containing, inter-alia, the audited standalone and consolidated financial statements, has been placed on the website of your Company and can be accessed at https://www.grasim.com/investors/results-reports-and-presentations.
Further, the audited financial statements along with related information and other reports of each of the subsidiary companies is also available on the website of your Company and can be accessed at https://www.grasim.com/investors/results-reports-and-presentations.
Your Company does not have any material unlisted subsidiary company. UltraTech Cement Limited and Aditya Birla Capital Limited are the material listed subsidiary companies of your Company. The Audit Committee and the Board reviews the financial statements, significant transactions and working of all the subsidiary companies, and the minutes of unlisted subsidiary companies are placed before the Board.
Your Company has in accordance with the Listing Regulations adopted the Policy for determining Material Subsidiaries. The said Policy is available on your Company’s website, www.grasim.com and can be accessed at https://www.grasim.com/investors/policies-and-code-of-conduct.
Convening Annual General Meeting through Audio-Visual meansConsider ing the present COVID-19 pandemic , the Ministry of Corporate Af fairs ( ‘MCA’ ) has vide its General Circular No. 20/2020 dated 5th May 2020 read with General Circular No. 14/2020 dated 8th April 2020; General Circular No.17/2020 dated 13th April 2020; and General Circular No. 02/2021 dated 13th January 2021 and Circular No. SEBI/HO/CFD/CMD1/CIR/P/2020/79 dated 12th May 2020 and Circular No. SEBI/HO/CFD/CMD2/CIR/P/2021/11 dated 15th January 2021 issued by the Securities and Exchange Board of India (‘SEBI’) (collectively referred to as ‘MCA and SEBI Circulars’) permitted convening the Annual General Meeting through Video Conference (VC)/Other Audio-Visual Means (OAVM), without the physical presence of the Members at a common venue. In compliance with the MCA & SEBI Circulars, applicable provisions of the Companies Act, 2013 and Listing Regulations, the 74th Annual General Meeting of your Company will be convened and conducted through VC/OAVM.
UltraTech Cement Limited (UltraTech)During the year, UltraTech Nathdwara Cement Limited (‘UNCL’) through its subsidiary, Krishna Holdings Pte. Ltd, (“Krishna”), a company incorporated in Singapore has completed the divestment of its entire equity shareholding of 92.5% in its cement subsidiary and has recorded net gain on divestment of C437.68 Crore.
In terms of the order of the National Company Law Appellate Tribunal (‘NCLAT’) dated 14th November, 2018, approving the Resolution Plan submitted by UTCL under the Insolvency and Bankruptcy Code, 2016 for acquisition of Binani Cement Limited, subsequently renamed UNCL, a loan of
97Integrated Annual Report 2020-21
Integrated ReportFinancial statem
entsStatutory Reports
US$ 230.4 million in 3B Binani Glassfibre SARL, (‘3B’) a company registered in Luxembourg, was assigned to UNCL from IDBI Bank Limited. Assignment of the loan was along with securities, which included pledge over all assets and shares of 3B in various forms in favour of UNCL. Since 3B was in continuous default in servicing the loan, UNCL enforced its pledge of 3B shares, consequent to which UNCL became owner of 100% equity of 3B w.e.f 12th March, 2021. 3B’s Board has also been re-constituted. UNCL has taken this step to safeguard and expedite the recovery of its loan from 3B. Till the time UNCL is able to recover its loan, the investment in 3B will be treated as investment held for sale.
Aditya Birla Capital Limited (ABCL)
Aditya Birla Sun Life AMC Limited (‘ABSLAMC’), a material subsidiary of ABCL, filed a draft red herring prospectus (‘DRHP’) dated 19th April 2021 with the Securities and Exchange Board of India for an initial public offering by way of an offer for sale (‘IPO’) of up to 3,88,80,000 equity shares of face value of C5 each constituting up to 13.50% of the paid-up share capital of ABSLAMC, subject to relevant approvals as required and other considerations. The above IPO comprises of an offer for sale of up to 28,50,880 equity shares of face value of C5 each held by ABCL in ABSLAMC.
SHARE CAPITALIssued, subscribed and paid-up capital of the Company stood at H1,31,60,89,688 as at 31st March 2021 comprising of 65,80,44,844 equity shares of H2 each fully paid up.
During the year under review, your Company issued and allotted 2,45,906 equity shares of H2 each pursuant to the exercise of Stock Options and Restricted Stock Units in terms of the Employees Stock Option Schemes of your Company.
PURCHASE OF TREASURY SHARESAs on 31st March 2021, Grasim Employees’ Welfare Trust ('Trust') constituted in terms of the Company’s Employee Stock Option Scheme 2018 (‘ESOS-2018’) holds 13,18,344 equity shares of your Company. During the financial year, the Trust did not acquire any equity shares of your Company from the secondary market. As per IND AS, purchase of own equity shares are treated as treasury shares.
DEPOSITSDuring the FY 2020-21, your Company has not accepted or renewed any deposits within the meaning of section 73 of the Companies Act, 2013, read with the Companies (Acceptance of Deposits) Rules, 2014, and, as such, no amount of principal or interest was outstanding, as on the date of the Balance Sheet.
ISSUE OF NON-CONVERTIBLE DEBENTURESDuring FY 2020-21, your Company has issued 5,000 fully paid-up, Unsecured, Redeemable Non-Convertible Debentures of face value of H10 Lakh each, at par, on private placement basis, as per the details set out hereunder:
Date of Issue
Number of Non-
Convertible Debentures
Issue Size (G in Crore) Tenure Rate of
InterestDate of
Maturity
17.06.2020 5,000 500 3 years 5.90% 16.06.2023
PARTICULARS OF LOANS, GUARANTEES AND INVESTMENTSPursuant to section 186 of the Companies Act, 2013 read with the Companies (Meetings of Board and its Powers) Rules, 2014, disclosures relating to loans, advances and investments as on 31st March 2021 are given in the Notes to the Financial Statements. There are no guarantees issued, or securities provided by your Company in terms of section 186 of the Companies Act, 2013, read with the rules issued thereunder.
MANAGEMENT DISCUSSION AND ANALYSISThe Management Discussion and Analysis for the year under review, as stipulated under regulation 34 of the Listing Regulations, is presented in a separate Section, and forms an integral part of this Report. It, inter-alia, provides details about the Indian economy, business performance review of the Company’s various businesses, risks and concerns and other material developments during FY 2020-21, including impact of COVID-19 on businesses of the Company.
CORPORATE GOVERNANCEYour Directors re-affirm their continued commitment to the best practices of Corporate Governance. Corporate Governance principles form an integral part of the core values of your Company. Your Company was compliant with the provisions relating to Corporate Governance.
The Corporate Governance Report for the year under review, as stipulated under regulation 34 of the Listing Regulations, is presented in a separate section, and forms an integral part of this Report. A certificate from the Auditors on its compliance is given in Annexure 'C' to this Report.
DIRECTORS AND KEY MANAGERIAL PERSONNELAppointment/Re-appointment of Directors• In accordance with the provisions of section 152 and other
applicable provisions, if any, of the Companies Act, 2013 read with Companies (Appointment & Qualification of Directors) Rules, 2014, and the Articles of Association of the Company, Mr. Kumar Mangalam Birla (DIN: 00012813) and
Board’s Report (Contd.)
98 Grasim Industries Limited
Dr. Santrupt Misra (DIN: 00013625), Directors of your Company, are liable to retire by rotation at the ensuing Annual General Meeting and, being eligible, have offered themselves for re-appointment . Br ief prof iles of Mr. Kumar Mangalam Birla and Dr. Santrupt Misra are provided in the Corporate Governance Report which forms an integral part of this Annual Report.
• Mr. Dilip Gaur was appointed as the Managing Director of the Company for a term of 5 years, with effect from 1st April 2016 to hold office up to 31st March 2021. Subject to the approval of the shareholders, and based on the recommendations of the Nomination and Remuneration Committee and taking into account his expertise, business acumen, outstanding leadership, his present performance and business needs, the Board at its meeting held on 12th February 2021 has re-appointed Mr. Dilip Gaur as the Managing Director of the Company for a further period of one year with effect from 1st April 2021.
Resolution seeking re-appointment of Mr. Dilip Gaur, Managing Director, along with his brief profile forms part of the Notice of the Annual General Meeting.
• Subject to the approval of the shareholders, and based on the recommendations of the Nomination and Remuneration Committee, the Board at its meeting held on 24th May 2021 appointed Mr. V. Chandrasekaran (DIN: 03126243) and Mr. Adesh Kumar Gupta (DIN: 00020403) as Additional Directors, qualifying as the Independent Directors of the Company, not liable to retire by rotation, for a period of five years commencing with effect from 24th May 2021. In terms of the provisions of the Companies Act, 2013, Mr. V. Chandrasekaran and Mr. Adesh Kumar Gupta will hold office up to the ensuing Annual General Meeting.
Resolutions seeking the appointment of Mr. V. Chandrasekaran and Mr. Adesh Kumar Gupta as Independent Directors along with their brief profile forms part of the Notice of the Annual General Meeting.
Your Directors commend the resolutions pertaining to appointment/re-appointment of aforesaid Directors for your approval.
Cessation of Directors
• Mr. Arun Thiagarajan retired as an Independent Director of the Company upon completion of his first term of 5 years on 6th May 2021.
• Mr. O.P. Rungta, Independent Director resigned from the Board of Directors of the Company with effect from close of business hours of 24th May 2021 due to health reasons on
account of his advanced age. There was no other material reason for his resignation except as stated.
The Board placed on record its sincere appreciation for the valuable contribution and services rendered by Mr. Arun Thiagarajan and Mr. O.P. Rungta during their tenure as the Independent Directors of the Company.
There is no pecuniary or business relationship between the Non-Executive Directors and the Company, except for the sitting fees and commission payable to the Non-Executive Directors, in accordance with the applicable laws and with the approval of the shareholders.
Key Managerial PersonnelPursuant to the provisions of sections 2(51) and 203 of the Companies Act, 2013, read with the Companies (Appointment and Remuneration of Managerial Personnel) Rules, 2014, Mr. Dilip Gaur, Managing Director, Mr. Ashish Adukia, Chief Financial Officer and Mrs. Hutokshi R. Wadia, President and Company Secretary are the Key Managerial Personnel of the Company as on 31st March 2021.
Mr. Sailesh Daga has been appointed as the Company Secretary and Compliance Officer of the Company in place of Mrs. Hutokshi R. Wadia with effect from 1st April 2021. Mrs. Hutokshi R. Wadia ceased to be the Company Secretary and Compliance Officer of the Company with effect from close of business hours on 31st March 2021.
The Board noted the same and placed on record its sincere appreciation for the valuable contribution made by Mrs. Hutokshi R. Wadia during her tenure as the Company Secretary and Compliance Officer of the Company.
MEETINGS OF THE BOARDThe Board of Directors of the Company met 7 (Seven) times during the year to deliberate on various matters. The meetings were held on 13th June 2020, 13th August 2020, 1st October 2020, 12th November 2020, 22nd January 2021, 12th February 2021 and 24th March 2021.
Further details are provided in the Corporate Governance Report, which forms an integral part of this Annual Report.
INDEPENDENT DIRECTORSDefinition of ‘Independence’ of Directors is derived from regulation 16(1)(b) of the Listing Regulations and section 149(6) of the Companies Act, 2013 and rules framed thereunder. Your Company has received declarations from all the Independent Directors of your Company confirming that they meet the criteria of independence as prescribed under section 149(6) of the Companies Act, 2013 and regulation 16(1)(b) of the
99Integrated Annual Report 2020-21
Integrated ReportFinancial statem
entsStatutory Reports
Listing Regulations. Your Company’s Board is of the opinion that the Independent Directors possess requisite qualifications, experience, and expertise in leadership, governance, sustainability, strategy planning, technical expertise, financial management, legal expertise, risk management, sales & marketing, human resource development and they hold highest standards of integrity.
FORMAL ANNUAL EVALUATIONPursuant to the provisions of the Companies Act, 2013 and the Listing Regulations, the Board of Directors has carried out an annual evaluation of its own performance, its Committees, Independent Directors, Non-Executive Directors, Executive Director and the Chairman of the Board.
The Nomination and Remuneration Committee of the Board has laid down the manner in which formal annual evaluation of the performance of the Board, its Committees and Individual Directors has to be made. It includes circulation of evaluation forms separately for evaluation of the Board and its Committees, Independent Directors/Non-Executive Directors/Executive Director and the Chairman of your Company.
The performance of Non-Independent Directors, the Board as a whole, and the Committees of the Board has been evaluated by Independent Directors in a separate meeting. At the same meeting, the Independent Directors also evaluated the performance of the Chairman of your Company, after taking into account the views of Executive Director and Non-Executive Directors. Evaluation as done by the Independent Directors was submitted to the Nomination and Remuneration Committee and subsequently to the Board.
The performance of the Board and its Committees was evaluated by the Nomination and Remuneration Committee after seeking inputs from all the Directors, on the basis of criteria such as the Board/Committee composition and structure, effectiveness of the Board/Committee process, information and functioning, etc.
The performance evaluation of all the Directors of your Company (including Independent Directors, Executive Director and Non-Executive Directors and Chairman), is done at the Nomination and Remuneration Committee meeting and the Board meeting by all the Board members, excluding the Director being evaluated on the basis of criteria, such as contribution at the meetings, strategic perspective or inputs regarding the growth and performance of your Company, among others. Following the meetings of Independent Directors and of Nomination and Remuneration Committee, the Board at its meeting discussed the performance of the Board, as a whole, its Committees and Individual Directors.
The Board expressed satisfaction on the overall functioning of the Board and its Committees. The Board was also satisfied with the contribution of directors, in their respective capacities, which reflected the overall engagement of the individual directors.
The new Director inducted on the Company’s Board attends an orientation programme. The details of the programme for familiarisation of Independent Directors are provided in the Corporate Governance Report, which forms part of this Annual Report and are also available on your Company’s website at https://www.grasim.com/investors/corporate-governance.
DIRECTORS’ RESPONSIBILITY STATEMENTThe audited accounts for the year under review are in conformity with the requirements of the Companies Act, 2013 and the Accounting Standards. The financial statements reflect fairly the form and substance of transactions carried out during the year under review and reasonably present your Company’s financial condition and results of operations.
Pursuant to section 134(5) of the Companies Act, 2013, the Board of Directors, to the best of its knowledge and ability, confirm that:
a) in the preparation of the Annual Accounts, the applicable accounting standards have been followed along with proper explanation relating to material departures, if any;
b) the accounting policies selected have been applied consistently, and judgements and estimates are made that are reasonable and prudent, so as to give a true and fair view of the state of affairs of your Company as at 31st March 2021 and of the profit of your Company for the year ended on that date;
c) proper and sufficient care has been taken for the maintenance of adequate accounting records, in accordance with the provisions of the Act for safeguarding the assets of your Company, and for preventing and detecting fraud and other irregularities;
d) annual accounts have been prepared on a ‘going concern’ basis;
e) the Directors have laid down proper internal financial controls, and that such internal financial controls are adequate and were operating effectively; and
f) the Directors have devised proper systems to ensure compliance with the provisions of all applicable laws, and that such systems were adequate and operating effectively.
Board’s Report (Contd.)
100 Grasim Industries Limited
ENERGY CONSERVATION, TECHNOLOGY ABSORPTION AND FOREIGN EXCHANGE EARNINGS AND OUTGOThe information on conservation of Energy, Technology Absorption and Foreign Exchange Earnings and Outgo stipulated under section 134(3)(m) of the Companies Act, 2013, read with the Companies (Accounts) Rules, 2014, is set out in Annexure 'D' to this Report.
INTEGRATED REPORTThe Company has voluntarily provided Integrated Report. This report is prepared in alignment with the Integrated Reporting Framework laid down by the International Integrated Reporting Council (IIRC) and aims at presenting the value creation approach for our stakeholders.
AUDITORS AND AUDIT REPORTSSTATUTORY AUDITORSPursuant to the provisions of section 139 of the Companies Act, 2013, read with the Companies (Audit and Auditors) Rules, 2014, as amended from time to time, M/s. B S R & Co. LLP Chartered Accountants (ICAI Firm Registration No. 101248W/W-100022) and M/s. S R B C & CO, LLP, Chartered Accountants (ICAI Firm Registration No. 324982E/E300003) have been appointed as Joint Statutory Auditors of the Company for a period of five consecutive years, to hold office till the conclusion of the 74th Annual General Meeting of the Company, to be held in the calender year 2021 and 75th Annual General Meeting of the Company to be held in the calender year 2022, respectively.
M/s. B S R & Co. LLP are due to retire at the ensuing 74th Annual General Meeting of the Company. M/s. B S R & Co. LLP has confirmed that they are eligible to be re-appointed in accordance with the provisions of the Act and Rules made thereunder. The Board of Directors, upon the recommendation of the Audit Committee, propose re-appointment of M/s. B S R & Co. LLP for a second term of 5 years, to the shareholders for their approval. Resolution seeking your approval forms part of the Notice convening the Annual General Meeting.
Pursuant to the provisions of section 139 of the Companies Act, 2013, as amended with effect from 7th May 2018, the requirement of ratification of the appointment of the statutory auditors, by the Members at every Annual General Meeting during the period of their appointment, has been withdrawn. In view of the above, no resolution is proposed for ratification of appointment of M/s. S R B C & Co. LLP, Chartered Accountants at the Annual General Meeting, and a note in respect of the same has been included in the Notice of the Annual General Meeting. However, they have confirmed that they are eligible to continue to act as Statutory Auditors of your Company.
The observations made by the Joint Statutory Auditors on the Financial Statements of the Company, in their Report for the financial year ended 31st March 2021, read with the Explanatory Notes therein, are self-explanatory and, therefore, do not call for any further explanation or comments from the Board under section 134(3)(f) of the Companies Act, 2013. The Auditors’ Report does not contain any qualification, reservation, disclaimer or adverse remark.
COST AUDITORSThe cost accounts and records as required under section 148(1) of the Companies Act, 2013 are duly prepared and maintained by your Company. Pursuant to the provisions of section 148 of the Companies Act, 2013 read with the Companies (Cost Records and Audit) Rules, 2014, as amended, notifications/circulars issued by the Ministry of Corporate Affairs from time to time, your Board has on the recommendation of the Audit Committee, appointed M/s. D. C. Dave & Co., Cost Accountants, Mumbai, M/s. M. R. Dudani & Co., Cost Accountants, Mumbai and M/s. K G Goyal and Associates, Cost Accountants, Jaipur as the Cost Auditors for FY 2021-22 to conduct cost audit for various divisions and units of the Company as detailed under:
Name of the Cost Auditor
Division of the Company Remuneration
M/s. D. C. Dave & Co., Cost Accountants, Mumbai (Registration No. 000611)
All Divisions of the Company, except Viscose Filament Yarn- Century Rayon Division and Indo Gulf Fertilisers Unit
Not exceeding H15.00 Lakh plus applicable taxes and reimbursement of out-of-pocket expenses
M/s. M. R. Dudani & Co., Cost Accountants, Mumbai (Registration No. FRN-104041)
Viscose Filament Yarn – Century Rayon Division
Not exceeding H2.20 Lakh plus applicable taxes and reimbursement of out-of-pocket expenses
M/s. K G Goyal and Associates, Cost Accountants, Jaipur (Registration No. FRN-000024)
Indo Gulf Fertilisers Unit (IGF Unit)
Not exceeding H2.00 Lakh plus applicable taxes and reimbursement of out-of-pocket expenses, to be paid on proportionate basis till divestment of IGF Unit
Your Company has received consent from M/s. D. C. Dave & Co., M/s. M. R. Dudani & Co. and M/s. K G Goyal and Associates, Cost Accountants, to act as the Cost Auditors of your Company for FY 2021-22, along with separate certificates confirming each of their eligibility.
As required under the Companies Act, 2013, a resolution seeking ratification of the remuneration payable to the cost auditors has been incorporated in the Notice of the Annual General Meeting for approval by the Members at the ensuing Annual General Meeting.
101Integrated Annual Report 2020-21
Integrated ReportFinancial statem
entsStatutory Reports
SECRETARIAL AUDITORS
Pursuant to the provisions of section 204 of the Companies Act, 2013 read with the Companies (Appointment and Remuneration of Managerial Personnel) Rules, 2014, the Board has appointed M/s. BNP & Associates, Company Secretaries, Mumbai, to conduct the secretarial audit for FY 2021-22. The Secretarial Audit Report, issued by M/s. BNP & Associates, Company Secretaries for the FY 2020-21, is set out in Annexure 'E' to this Report.
The Secretarial Audit Report does not contain any qualification, reservation, disclaimer or adverse remark.
The Secretarial Compliance Report for the financial year ended 31st March 2021, in relation to compliance of all applicable SEBI Regulations/circulars/guidelines issued thereunder, pursuant to requirement of regulation 24A of the Listing Regulations, is available on the website of the Company and can be accessed at https://www.grasim.com/investors/board-and-shareholder-meeting.
SECRETARIAL STANDARDSYour Company is in compliance with the Secretarial Standards specified by the Institute of Company Secretaries of India.
REPORTING OF FRAUDS BY AUDITORSDuring the year under review, neither the Statutory Auditors, Cost Auditors and the Secretarial Auditors have reported to the Audit Committee under section 143(12) of the Companies Act, 2013 any instances of fraud committed against your Company by its officers and employees, details of which would need to be mentioned in the Board’s Report.
DISCLOSURESCONTRACTS AND ARRANGEMENTS WITH RELATED PARTIES
During FY 2020-21, all contracts/arrangements/transactions entered into by your Company with Related Parties were on arm’s length basis and in the ordinary course of business. There are no material transactions with any Related Party as defined under section 188 of the Companies Act, 2013 read with the Companies (Meetings of Board and its Powers) Rules, 2014. All Related Party transactions have been approved by the Audit Committee of your Company and are reviewed by it on a quarterly basis. Your Company has implemented Related Party Transactions Policy and Standard Operating Procedures for the purpose of identification and monitoring of such transactions.
The details of contracts and arrangements with Related Parties of your Company for the financial year ended 31st March 2021,
are given in Notes to the Standalone Financial Statements, forming part of this Annual Report.
The Policy on Related Party Transactions, as approved by the Board, is available on your Company’s website and can be accessed at: https://www.grasim.com/investors/policies-and-code-of-conduct.
VIGIL MECHANISM/WHISTLE BLOWER POLICYYour Company has established a robust Vigil Mechanism for reporting of concerns through the Whistle Blower Policy of your Company, which is in compliance of the provisions of section 177 of the Companies Act, 2013, read with rule 7 of the Companies (Meetings of Board and its Powers) Rules, 2014, and the Listing Regulations. The Policy provides for framework and process whereby concerns can be raised by its employees against any kind of discrimination, harassment, victimisation or any other unfair practice being adopted against them. Adequate safeguards are provided against victimisation to those who avail of the mechanism, and access to the Chairman of the Audit Committee, in exceptional cases, is provided to them. The details of the Vigil Mechanism are also provided in the Corporate Governance Report, which forms part of this Annual Report and the Whistle Blower Policy has been uploaded on the website of your Company and can be accessed at https://www.grasim.com/investors/policies-and-code-of-conduct.
CORPORATE SOCIAL RESPONSIBILITYIn terms of the provisions of section 135 of the Companies Act, 2013, read with the Companies (Corporate Social Responsibility Policy) Rules, 2014, the Board of Directors of your Company has a Corporate Social Responsibility ('CSR') Committee, which is chaired by Mrs. Rajashree Birla. The other Members of the Committee are Ms. Anita Ramachandran, Independent Director, Mr. Shailendra K. Jain, Non-Executive Director and Mr. Dilip Gaur, Managing Director. Dr. Pragnya Ram, Group Executive President - CSR, Legacy Documentation & Archives, is a permanent invitee to the Committee. The Corporate Social Responsibility Policy ('CSR Policy'), indicating the activities undertaken by your Company, is available on your Company’s website and can be accessed at: https://www.grasim.com/investors/policies-and-code-of-conduct.
Your Company is a caring corporate citizen and lays significant emphasis on development of the host communities around which it operates. Your Company, with this intent, has identified several projects relating to Social Empowerment and Welfare, Rural Development, Sustainable Livelihood, Health Care and Education, during the year, and initiated various activities in neighboring villages around its plant locations. Your Company undertook several initiatives to help nation fight against COVID
Board’s Report (Contd.)
102 Grasim Industries Limited
crisis including supply of healthcare equipment’s, medical oxygen and oxygen concentrators, setting up hospital beds, distributing face masks, hand gloves, sanitiser bottles, creating COVID related awareness etc.
During the year, the Company spent H84.66 Crore of which H48.85 Crore was spent towards mandatory CSR obligations of the Company and additionally H35.81 Crore was spent towards voluntary CSR activities (totalling to around 3.76% of the average net profits of last three financial years) on CSR activities.
The initiatives undertaken by your Company on CSR activities, during the FY 2020-21, are set out in Annexure 'F' to this Report, in the format prescribed in the Companies (Corporate Social Responsibility Policy) Rules, 2014.
RISK MANAGEMENTPursuant to the requirement of Listing Regulations, your Company has constituted Risk Management Committee, which is inter-alia, mandated to review the risk management plan/process of your Company. Risk evaluation and management is an ongoing process within the organisation. The Committee periodically assesses risks in the internal and external environment, and incorporates risk mitigation plans in its strategy, business and operation plans. Your Company has comprehensive risk management framework, which is periodically reviewed by the Committee. The scope of the Committee has been enhanced to include activities pertaining to overseeing sustainability activities, advising Board on sustainability practices etc. and accordingly the Risk Management Committee was renamed as Risk Management and Sustainability Committee ('RMSC') effective from 24th May 2021.
There are no risks which in the opinion of the Board threaten the existence of the Company. However, some of the risks which may pose challenges are set out in the Management Discussion and Analysis which forms part of this Annual Report.
The Risk Management Policy is available on Company’s website and can be accessed at https://www.grasim.com/investors/policies-and-code-of-conduct.
BUSINESS RESPONSIBILITY REPORTAs per regulation 34(2)(f) of the Listing Regulations, a separate section on Business Responsibility Report, describing the initiatives taken by your Company from environmental, social and governance perspective, forms an integral part of this Annual Report.
ANNUAL RETURNIn terms of the provisions of Section 92 and Section 134 of the Act read with Rule 12 of the Companies (Management and Administration) Rules, 2014, the Annual Return of your Company as on 31st March 2021 is available on Company’s website and can be accessed at https://www.grasim.com/investors/board-and-shareholder-meeting.
INTERNAL CONTROLSYour Company has in place adequate internal control system (including internal financial control system) commensurate with the size of its operations. Internal control systems comprising of policies and procedures are designed to ensure sound management of your Company’s operations, safe keeping of its assets, optimal utilisation of resources, reliability of its financial information and compliance. Systems and procedures are periodically reviewed to keep pace with the growing size and complexity of your Company’s operations. During the year under review, no material or serious observation has been received from the Joint Statutory Auditors of your Company citing inefficiency or inadequacy of such controls.
REMUNERATION POLICYThe Company’s remuneration policy is directed towards rewarding performance based on review of achievements. The remuneration policy is in consonance with existing industry practice. There has been no change in the policy during the financial year under review.
The Remuneration Policy of your Company, as formulated by the Nomination and Remuneration Committee of the Board of Directors is given in Annexure 'G' to this Report and is also available on your Company’s website and can be accessed at https://www.grasim.com/investors/policies-and-code-of-conduct.
STATUTORY COMMITTEES OF THE BOARDAUDIT COMMITTEE
The Audit Committee (reconstituted on 24th May 2021) comprises of Mr. N. Mohan Raj (Chairman), Mr. V. Chandrasekaran, Dr. Thomas M. Connelly, Jr. and Mr. Dilip Gaur as its Members. Majority of the members of Audit Committee are Independent Directors with Chairman also being an Independent Director. The CFO of your Company is the permanent invitee at the Audit Committee Meetings.
Further details relating to the Audit Committee are provided in the Corporate Governance Report, which forms an integral part of this Annual Report.
103Integrated Annual Report 2020-21
Integrated ReportFinancial statem
entsStatutory Reports
All the recommendations made by the Audit Committee, during the year, were accepted by the Board of Directors of your Company.
NOMINATION AND REMUNERATION COMMITTEE
The Nomination and Remuneration Committee (reconstituted on 24th May 2021) comprises of Ms. Anita Ramachandran (Chairperson), Mr. Kumar Mangalam Birla, Dr. Santrupt Misra and Mr. Cyril Shroff as its members.
Further details relating to the Nomination and Remuneration Committee are provided in the Corporate Governance Report, which forms an integral part of this Annual Report.
CORPORATE SOCIAL RESPONSIBILITY COMMITTEE
The Corporate Social Responsibility Committee comprises of Mrs. Rajashree Birla (Chairperson), Ms. Anita Ramachandran, Mr. Shailendra K. Jain and Mr. Dilip Gaur as its members.
Further details relating to the Corporate Social Responsibility Committee are provided in the Corporate Governance Report, which forms an integral part of this Annual Report.
STAKEHOLDERS’ RELATIONSHIP COMMITTEE
Stakeholders’ Relationship Committee (reconstituted on 24th May 2021) comprises of Ms. Anita Ramachandran (Chairperson), Mr. Shailendra K. Jain and Mr. Dilip Gaur as its members. The Committee looks into matters relating to transfer/transmission of securities; non-receipt of dividend; non-receipt of annual report etc.
Further details pertaining to Stakeholders’ Relationship Committee are provided in the Corporate Governance Report, which forms an integral part of this Annual Report.
RESEARCH AND DEVELOPMENT (R&D)
The R&D projects portfolio is focused on improving the relative market position of your Company’s businesses in the face of increasingly volatile and competitive business environment. The focus is on developing and commercialising premium differentiated products, improving our competitive cost position, product quality and environmental sustainability. To support these goals, the businesses are managing a pipeline of projects that are addressing near and mid-term needs, as well as the exploration of future opportunities.
Pulp & Fibre Business
The Pulp Technology team is facilitating a comprehensive business quality improvement framework that seeks to enhance customer-centricity and the integration of pulp supply-chain and pulp quality. By employing a “product by process philosophy,”
significant improvement has been achieved in the consistency of pulp quality parameters. This has resulted in narrowing of the product specifications, and an enhanced ability to deliver higher quality pulp-grades more consistently. Furthermore, this has enabled the establishment of a more stringent A+ category of pulp quality, which caters to very demanding downstream pulp applications. The pulp team is now targeting to further improve its A+ product quality through process improvement. The Pulp team has also implemented digital transformation projects that seek to bring critical-to-customer information on the pulp supply in real-time to the downstream fiber units. Recently, agile processes and flexible working has enabled the pulp plants to quickly establish high levels of quality and uptime of process units amidst the disruptions caused by the Covid-19 pandemic.
Viscose Staple Fibre (VSF) production facilities have increasingly collaborated on reducing material consumption, increasing productivity, improving product quality, enhancing sustainability and developing specialty products. This is achieved through insightful developments in lab and pilot plant, and careful selection and implementation of the process technologies as well as process additives. One example in fiber making process is the increased efficiency of water utilisation to reduce effluent and improve recovery of chemicals from the effluent. Following demonstration in one line, plan is to implement on multiple lines and plants. Your Company is continuing to fulfill public commitments for reducing the environmental footprint by fully closed-loop recycling of water Nagda. Your Company has designed a zero liquid discharge (ZLD) system, and construction is nearing completion.
Aditya Birla Science and Technology Company Ltd. (ABSTC) has developed an understanding of the effluent streams characteristics as well as of the variations in the effluent treatments employed by different fibre units. This has resulted in the identification of cost saving potential through recovery of chemicals such as zinc, while also providing cleaner effluent. A pilot plant has been constructed at the Kharach plant where process data is being collected to aid the scale-up plan. Similarly, recent years’ understanding of the fundamentals of fiber dryer operation has been leveraged to increase productivity, reduce energy consumption and improve uniformity of fiber drying.
Our digitalisation program has aimed at assisting business decision making through data driven approaches for improvement in energy efficiency, asset uptime, quality, productivity and supply chain efficiency. Process optimisation has resulted in improved CS2 recovery. Pulp Logistics cost optimisation model is developed and is being piloted. As a start, your Company is developing digital-twin solutions at its Vilayat Unit for Chiller MSFE and Fibre Dryer processes, with an objective of improving energy economy, plant capacity and product quality.
Board’s Report (Contd.)
104 Grasim Industries Limited
At the Pulp and Fibre business R&D, an unwavering focus on enhancing customer experience has driven us towards the timely launch of several key Speciality products. Amidst heightened hygiene concerns owing to Covid-19, your Company quickly established the anti-viral performance of Liva Antimicrobial fibres and facilitated quick commercial manufacturing of these fibres at three fibre plants. Thanks to the nimbleness and commitment of a diverse workforce spanning multiple functions and geographies, the timely supply of Liva Antimicrobial fibres fulfilled a much-needed societal need. Working with external labs and customers, your Company has rapidly scaled-up the in-house developed Purocel EcoFlush nonwoven fibers, which is now accepted by multiple customers for making environmentally friendly, 100% flushable wipes. Through the launch of Liva Reviva, your Company now offer lyocell or viscose fibres made from raw materials partially containing cotton waste. By up-cycling cotton waste otherwise destined for low-end applications, incineration or use in land-fills, Liva Reviva serves the pressing global need of textile circularity and waste reduction. Liva Reviva thus enables its consumers to be stylish while simultaneously being environmentally conscious. Your Company has actively collaborated with multiple startups in this space, with aim of increasing access to reclaimed pulp from used cotton clothing. LivaEco fiber is our offering of a rich bouquet of sustainability features while retaining the fashion quotient of the Liva brand. Every Livaeco™ garment contains a unique molecular tracer which helps the end buyer to trace the origin and full journey of the garment he/she is buying.
Man-made cellulosic fibres are increasingly being seen as potential alternative to plastics, especially in light of regulations aiming to reduce use of plastics in packaging, and ABSTC is leading such development for its business, and is evaluating the potential of viscose-based solutions for retail and apparel bags.
In order to provide a new thrust towards improving fibre quality across all of its manufacturing units, the Fiber business has constituted a high level Quality Steering Committee comprising of senior leaders from fiber plants, marketing and R&D for seamless collaboration. Going forward, the focus will be to enhance the Customer Experience – by providing the right quality of fibers to each customer with superior technical support and 100% OTIF (On Time In Full) delivery. The aim is to take a quantum leap from ‘Customer Satisfaction’ to ‘Customer Delight’, by achieving next level of Quality and Consistency to meet changing customer requirement and to bring cultural transformation and outlook towards Quality.
Responding to high demand for NW fibre during the pandemic, technology for TiO2 incorporation for delustering of lyocell fibre (Excel) was quickly developed and commercial runs were conducted for customer evaluation. Your Company has also developed technology for introduction of physical tracer in its Excel fibre, the fibre thus being verifiable of its origin anywhere
in the subsequent value chain and customer’s hands. It has been successfully developed and scaled up to supply commercial volumes to key customers. Excel fibre using 20% cotton-recycle pulp from a USA based start-up was produced on the Company’s pilot line and is being evaluated for market promotion with international brands. Also, a process for making high tenacity lyocell fibres using bacterial-cellulose pulp by the Australian start-up 'Nanollose' was developed at lab scale and a joint patent application was filed.
Viscose Filament Yarn (VFY)
Your Company has been consistently developing new product variants according to consumer’s needs. During last year, your Company has successfully developed Antibacterial VFY, Monofilament, low and high denier/filament products etc. On new application side, your Company has created in-house facility to produce Air-textured Yarn from VFY, developed Lycra covered yarn (Spandex covered with PSY) which is stretchable, having usage in garment & Denim and developed Space dyed yarn for usage in fashion fabrics.
On the way to industry 4.0, exploring use of artificial intelligence based technology for defect identification before winding in order to supply defect free yarn to customer. To enhance productivity, Indigenously developed twin tube technology for coarse deniers on Pot spun Yarn Technology. Your Company is increasing its sustainability foot prints by using pulp manufactured with recycled cotton garment waste (5%) as an input raw material.
Chemical Business
Your Company’s R&D department is continuously evolving and taking a more outside-in approach to Innovation, process improvement for cost optimisation, product development, application development to bring in new products & solutions to customers in water management and Plastic derivatives industry segments as key focus. In addition, there are certain segments on horizon where your Company is constantly evaluating the potential growth opportunities like Food, Home care, Disinfection and Hygiene where there is expertise and good synergy with its business.
Your Company’s model of R&D also involves working on long term development with major customers and continuously looking at new technology that will help enhance performance of your Company’s offerings. Water Treatment Business being focus, we have leveraged our R&D Centre - Aditya Birla Water Application Development Centre (ABWADC) – for solving water treatment problems in Potable Water, some major health problems (removal of Fluoride from groundwater- Jointly with MNIT), working on STP supporting the ‘Namami Gange’ project, providing water and wastewater treatment solutions to Oil & Gas, Power, Pulp & Paper and Textile industry. ABWADC was awarded its 1st Patent this year in the area of Water treatment.
105Integrated Annual Report 2020-21
Integrated ReportFinancial statem
entsStatutory Reports
Your Company’s R&D Centre is approved by Dept. of Scientific and Industrial Research (DSIR) and is executing collaborative projects with many renowned institutes like MNIT-Jaipur, NCL etc. In addition, the centre also worked with Industry to develop range of plasticisers (phthalate free) for various applications where PVC, PU, metal working fluids and additives in Paints and Coatings are used. This will be a good focus area going forward both in India and International market. New product development effort in area of Disinfection & Hygiene has been initiated to address the current and future needs of the society.
Various enhancements in production process was undertaken by the team that helped improved production in CBGP plant, resolved issues in Super coagulant plant, modified recipes in PAC liquid production for better product and Conversion of spent Aluminium Chloride solution into value added product. This has helped to improve operational efficiencies and quality of product. Your Company is focused on process improvements for basic raw material blends to achieve process accelerations and engineering improvements.
Advanced Material – Epoxy Resins
Your Company’s R&D team is involved in synthesising mono, di, multifunctional epoxy building blocks, Reactive diluents of various viscosities, EEW, HyCl content, various hardeners or curing agents. You Company’s team is engaged in developing process for synthesising building blocks for multifunctional epoxies, application development in powder coating segment for coating electronics parts, Adhesive product development in construction segment, process development for synthesising acrylic based water soluble coating solution for can coating applications, developing products for floor coating and construction segments, epoxy system solutions for composite segment to make low & high pressure pipes, LPG gas storage tanks, and developing products such as Ignition coil, potting system, for electrical and electronic industries.
Agri-business
In line with Honorable PM’s Vision of doubling farmer income by 2022, your Company Agri-Business defined it purpose as ‘Farmers Prosperity through Innovative Solutions’. R&D approach is to innovate to deliver products that are customised, functional, with world-class quality and increase productivity. Your Company is continuously providing thrust on Purak segment (non-Urea business) which includes innovative and new variant of product Oorja. Several innovative products are at various stages of in-house development have performed better in research farm trials. NPK soil and crop specific (CFG) and Water-Soluble Fertiliser introduced are cost effective in production and superior in quality resulting in increase in yield for various crops. The analytical infrastructure built has helped in sourcing and ensuring specific
quality requirements for seeds, agrochemicals and related raw materials.
Insulators
Your Company’s Insulator Business has accelerated its R&D efforts with focus on process & working environment improvements. Your Company has worked towards indigenization and implemented following changes (a) Replacement of imported clay with indigenous clay to reduce import dependence and support domestic manufacturing with cost advantage, (b) In-house design optimisation of insulators for lower weight and better pollution performance. Your Company has also accelerated new product development to fulfill customer needs:
• New product development with specifications of narrow strength variations in product to meet export customers’ requirements.
• Use of latest 3D Simulation Software for Electric Field Magnitude Analysis of Composite Long Rod Insulators.
Textiles
Your Company is involved in driving innovation, servicing new customers with focus on sustainability and consumer’s emerging needs, and constantly improving its processes.
Your Company is the pioneer to launch a new linen range under the name ‘Linen Club – Uncrushable’, that offers a wrinkle-resist performance without compromising on natural linen properties.
Your Company has developed blends in both linen and wool with sustainable fibres such as Silk, Lyocell, Bamboo, etc. that offer Organic product certifications with complete traceability from farm to fashion.
As a response to the consumers’ demand, your Company has developed wool for athleisure/active wear using Super wash technology (1st in India) and yarn for protective wear applications using merino wool blended with Pyrotex®. Your Company has also developed a new effect called ‘Delave effect’ in linen yarn dyeing.
On process improvement front, your Company worked in collaboration with Aditya Birla Science & Technology Co Pvt Ltd. (ABSTC) to improve its by-product (grease) recovery percentage. Your Company has achieved sustainable improvement in recovery percentage with a gain of 0.48% against previous year by optimising our processes.
Your Company is also working in collaboration with Aditya Birla Science & Technology Co Pvt Ltd. (ABSTC) and other vendor for exploring feasibility of a developing hemp value chain in India. Your Company is also working with global partners e.g. CELC,
Board’s Report (Contd.)
106 Grasim Industries Limited
LP Studio, Wool Mark, etc. and other specialty fibre suppliers to explore and develop innovative yarns and fabric.
Thus, the wide span of the RD&T activities amply addresses the present and future needs of the Textile business.
MATERIAL CHANGES AND COMMITMENTS AFFECTING THE FINANCIAL POSITION OF YOUR COMPANY WHICH HAVE OCCURRED BETWEEN THE END OF THE FINANCIAL YEAR TO WHICH THE FINANCIAL STATEMENT RELATES AND THE DATE OF THE REPORTNo material changes and commitments, which could affect your Company’s financial position, have occurred between the end of the financial year and the date of this Report. There has been no change in the nature of business of your Company.
COVID-19The impact of the second COVID wave started showing up from end of March’ 21 and within few weeks most of the state government-imposed lockdown and various curbs to control the spread of virus.
In the time of crisis, your Company acted as a responsible citizen and caring employer giving utmost priority to the health and welfare of the employees. Your Company undertook several initiatives to provide financial, medical, psychological and emotional support to the employees and their family, battling COVID.
Some key initiatives undertaken by the Company included providing reimbursement of hospitalization expenses beyond insurance coverage, providing ex-gratia payment to the kin of deceased, providing housing and education assistance to the family of deceased employee, providing family medical insurance to the kin of deceased, providing COVID CARE giver’s leave to help employees take care of their family members, providing emotional and psychological support by way of counselling sessions, providing tele-counselling by doctors for COVID treatment, helping employees with hospital beds, providing oxygen cylinders, arranging vaccination camps for employees and their families etc.
As a responsible citizen, your Company undertook several COVID relief measures for society at large which inter-alia included setting up hospital beds, distributing oxygen cylinders, oxygen concentrators, oximeters, sanitisers, hand gloves, arranging vaccination camps etc.
Your Company’s plant operations across various states were impacted due to lockdown related restrictions imposed by government authorities. In Q1 FY 2021-22 the capacity utilisation of viscose, chemicals, insulators and textile plants
is likely to be lower than Q4 FY 2020-21, as the end markets were shut due to lockdown related restrictions imposed by state government. Your Company has taken necessary measures to maintain adequate financial liquidity and to ensure availability of raw materials and needed resources for sustained operations.
PARTICULARS OF EMPLOYEESDisclosures pertaining to remuneration and other details as required under section 197(12) of the Companies Act, 2013, read with rule 5(1) of the Companies (Appointment and Remuneration of Managerial Personnel) Rules, 2014 is annexed herewith as Annexure 'H' to this Report.
In accordance with the provisions of section 197(12) of the Companies Act, 2013 read with rules 5(2) and 5(3) of the Companies (Appointment and Remuneration of Managerial Personnel) Rules, 2014, the names and other particulars of employees drawing remuneration in excess of the limits, set out in the aforesaid rules, forms part of this Report. In line with the provisions of section 136(1) of the Companies Act, 2013, the Report and Accounts, as set out therein, are being sent to all the Members of your Company excluding the aforesaid information about the employees. Any Member, who is interested in obtaining these particulars about employees, may write to the Company Secretary at [email protected].
EMPLOYEE STOCK OPTION SCHEMES (ESOS)ESOS-2006
During the year under review, the Stakeholders’ Relationship Committee of the Board of Directors allotted 6,975 equity shares of H2 each of the Company to Option Grantees, pursuant to the exercise of the Stock Options under ESOS-2006.
ESOS-2013
During the year under review, 18,274 Stock Options, which were due for vesting in the eligible employees, had not vested and lapsed pursuant to the approval of the Nomination and Remuneration Committee and in accordance with the provisions of the ESOS-2013 due to vesting criteria not being met.
Further, the Stakeholders’ Relationship Committee issued and allotted 2,38,931 equity shares of H2 each of the Company to Stock Options and RSU Grantees, pursuant to the exercise of the Stock Options and RSUs, under ESOS-2013.
ESOS-2018
During the year under review, the Nomination and Remuneration Committee of the Board of Directors approved grant of 3,22,925 Stock Options and 13,172 Restricted Stock Units (RSUs) to the eligible employees, including Managing Director of the Company,
107Integrated Annual Report 2020-21
Integrated ReportFinancial statem
entsStatutory Reports
under ESOS-2018 and also approved vesting of 3,051 Stock Options to the eligible employees. Further, 2,51,787 Stock Options which were due for vesting to the eligible employees had not vested and lapsed pursuant to the approval of Nomination and Remuneration Committee and in accordance with the provisions of ESOS -2018 due to vesting criteria not being met.
39,031 equity shares were transferred from the ESOS Trust account to the employees account on account of exercise of Options by the grantees.
The details of Employee Stock Options granted pursuant to ESOS-2006 and the Employee Stock Options and RSUs granted pursuant to ESOS-2013 and ESOS-2018, and also the other disclosures in compliance with the provisions of the Securities and Exchange Board of India (Share Based Employee Benefits) Regulations, 2014, are available on your Company’s website and can be accessed at https://www.grasim.com/investors/board-and-shareholder-meeting.
A certificate from the Statutory Auditors, with respect to implementation of your Company’s Employees Stock Option Schemes will be available electronically for inspection without any fee by the members from the date of circulation of the Notice of the Annual General Meeting up to the date of Annual General Meeting. Members seeking to inspect such documents can send an email at [email protected].
POLICY ON PREVENTION OF SEXUAL HARASSMENT OF WOMEN AT WORKPLACEYour Company has zero tolerance for sexual harassment at workplace. The Company has adopted a Policy on Prevention, Prohibition and Redressal of Sexual Harassment at workplace in line with the provisions of the Sexual Harassment of Women at Workplace (Prevention, Prohibition and Redressal) Act, 2013 ('POSH Act') and the rules framed thereunder. All employees (permanent, contractual, temporary, trainees) are covered under this policy.
Your Company has constituted Internal Complaints Committee to redress and resolve any complaints arising under the POSH Act. No complaint was received under the POSH Act during the year under review. As on 31st March 2021, there were no outstanding complaints under the aforesaid Act. The Company is committed to providing a safe and conducive work environment to all its employees and associates.
HUMAN RESOURCESYour Company’s human resource is the strong foundation for creating many possibilities for its business. The efficient operations of manufacturing units, market development and expansion for various products was the highlight of our people effort.
Continuous people development for developing knowledge and skills coupled with the Talent Management practices will deliver the talent needs of the organisation. Your Company’s employee engagement score reflects high engagement and pride in being part of the organisation.
The Group’s Corporate Human Resources plays a critical role in your Company’s talent management process.
AWARDS AND ACCOLADESSome of the significant accolades earned by your Company during the year include:
• Your Company ranked 9th among the India’s Top Companies for Sustainability and CSR by The Economic times and Futurescape Responsible Business Rankings 2020.
• Birla Cellulose, Pulp & Fibre Business was accredited with the ‘Golden Peacock Global Award for Sustainability’ for the year 2020.
• Your Company won the Investor Relations Award 2020-ESG Disclosures by Investor Relations Society in collaboration with BSE Limited and KPMG India.
• Staple Fibre Divison of the Company at Nagda won the World CSR Leadership Award-2020 for best COVID-19 solutions for community care.
• Grasilene Division of the Company won the “Energy Efficient Unit Award” at 21st CII National Award for Excellence in Energy Management 2020.
• Domestic Chlor Alkali Business at Rehla, won 7th CSR INDIA 2020 Award for “Promotion of Health & Healthcare” by Greentech Foundation.
• Company’s Pulp and Fibre business won the ‘Special Award for Resiliency’ at IDC Digital Transformation Awards 2020- India.
• Insulator Unit at Rishra won Par Excellence Award at NCQC 2020 (National Convention on Quality Concept).
• Company’s Fashion Yarn won the Gold Award in India Green Manufacturing Challenge for Excellence in Sustainability by The International Research Institute for Manufacturing Industry, Mumbai.
• Company’s Harihar Complex won the “Commendation for Significant Achievement in Environment Management” by CII - ITC Sustainability award – 2020.
UPDATE ON MATERIAL ORDERS PASSED BY THE REGULATORS• Competition Commission of India ('CCI') had passed an
order under section 4 of the Competition Act, 2002 dated 16th March 2020, imposing a penalty of H301.61 Crore on your Company in respect of its domestic man-made fibre
Board’s Report (Contd.)
108 Grasim Industries Limited
turnover. Your Company had filed an appeal against the order before the Hon'ble National Company Law Appellate Tribunal ('NCLAT') and has obtained a stay by depositing H30 Crore with NCLAT on 11th November 2020. The matter is being heard by NCLAT.
• The Deputy Commissioner of Income Tax ('DCIT') has vide Order dated 14th March 2019 raised a demand of H5,872.13 Crore on account of dividend distribution tax (including interest) alleging that the demerger of financial services business is not a qualified demerger and holding that the value of shares allotted by Aditya Birla Capital Limited ('ABCL') to the shareholders of the Company in consideration of the transfer and vesting of the financial services business into ABCL pursuant to duly approved Scheme of Arrangement, amounted to distribution of dividend by the Company.
Your Company had challenged the said order by filing an appeal before the Commissioner of Income Tax (Appeal). The CIT (Appeal) upheld the order and reduced the quantum of demand from H5,872 Crore to H3,786 Crore. The Company has filed an appeal against the order of CIT (Appeal) before the Tribunal on 23rd November 2020 and has obtained stay on demand by furnishing the requisite security to Assessing Officer. The appeal is presently pending before the Tribunal.
Your Company, backed by independent expert’s opinion, believes that the said order is not tenable in law and accordingly no provision has been made in the books of account.
GENERALYour Directors state that no disclosure or reporting is required in respect of the following items as there were no transactions on these matters during the year under review:
1. Issue of equity shares with differential rights as to dividend, voting or otherwise;
2. Issue of shares (including sweat equity shares) to employees of your Company under any Scheme save and except ESOS Schemes referred to in this report;
3. The Managing Director of the Company does not receive any remuneration or commission from any of its subsidiaries;
4. There were no revisions in the financial statement;
5. There has been no change in the nature of business of your Company;
6. No significant or material orders were passed by the Regulators or Courts or Tribunals which impact the going concern status and your Company’s operations in the future. The update on the status of material orders passed by the Regulators or Court or Tribunals in the previous years is provided separately in this Report;
7. There were no proceeding initiated under the Insolvency and Bankruptcy Code, 2016;
8. There was no instance of one time settlement with any Bank or Financial Institution; and
9. There was no failure to implement any Corporate Action.
ACKNOWLEDGEMENTSYour Directors express their deep sense of gratitude to the banks, financial institutions, stakeholders, business associates, Central and State Governments for their co-operation and support and look forward to their continued support in future.
Your Directors very warmly thank all our employees for their contribution to your Company’s performance. We applaud them for their superior levels of competence, dedication and commitment to your Company. We have immense respect for every person who risked their lives and safety to fight this pandemic.
For and on behalf of the Board
Kumar Mangalam BirlaChairman
(DIN: 00012813)
Mumbai, 24th May 2021
109Integrated Annual Report 2020-21
Integrated ReportFinancial statem
entsStatutory Reports
Annexure 'A' to the Board’s Report
DIVIDEND DISTRIBUTION POLICYIntroductionAs per the SEBI (Listing Obligations and Disclosure Requirements) Regulations, 2015, as amended, the Company is required to formulate and disclose its Dividend Distribution Policy. Accordingly, the Board of Directors of the Company (‘the Board’) has approved this Dividend Distribution Policy of the Company at its meeting held on 28th October 2016.
The objective of this policy is to provide the dividend distribution framework to the stakeholders of the Company.
The Board of Directors shall recommend dividend in compliance with this policy, the provisions of the Companies Act, 2013, and Rules made thereunder, and other applicable legal provisions.
Target Dividend PayoutDividend will be declared out of the current year’s Profit after Tax of the Company.
Only in exceptional circumstances, including, but not limited to, loss after tax in any particular financial year, the Board may consider utilising retained earnings for declaration of dividends, subject to applicable legal provisions.
‘Other Comprehensive Income’ (as per applicable Accounting Standards), which mainly comprises of unrealized gains/losses, will not be considered for the purpose of declaration of dividend.
The Board will endeavour to achieve a dividend payout ratio (including dividend distribution tax) in the range of 25% to 45% of the Standalone Profit after Tax, net of dividend payout to preference shareholders, if any. Subject to the dividend payout range mentioned above, the Board will strive to pass on the dividend received from Material Subsidiaries, Joint Ventures and Associates (as defined in the Companies Act, 2013).
Factors to be Considered for Dividend PayoutThe Board will consider various internal and external factors, including, but not limited to, the following before making any recommendation for dividends:
• Stability of earnings
• Cash flow from operations
• Future capital expenditure, inorganic growth plans and reinvestment opportunities
• Industry outlook and stage of business cycle for underlying businesses
• Leverage profile and capital adequacy metrics
• Overall economic/regulatory environment
• Contingent liabilities
• Past dividend trends
• Buyback of shares or any such alternate profit distribution measure
• Any other contingency plans
GeneralRetained earnings will be used inter-alia for the Company’s growth plans, working capital requirements, debt repayments and other contingencies.
If the Board decides to deviate from this policy, the rationale for the same will be suitably disclosed. This policy would be subject to revision/amendment on a periodic basis, as may be necessary. This policy (as amended from time to time) will be available on the Company’s website and in the Annual Report.
110 Grasim Industries Limited
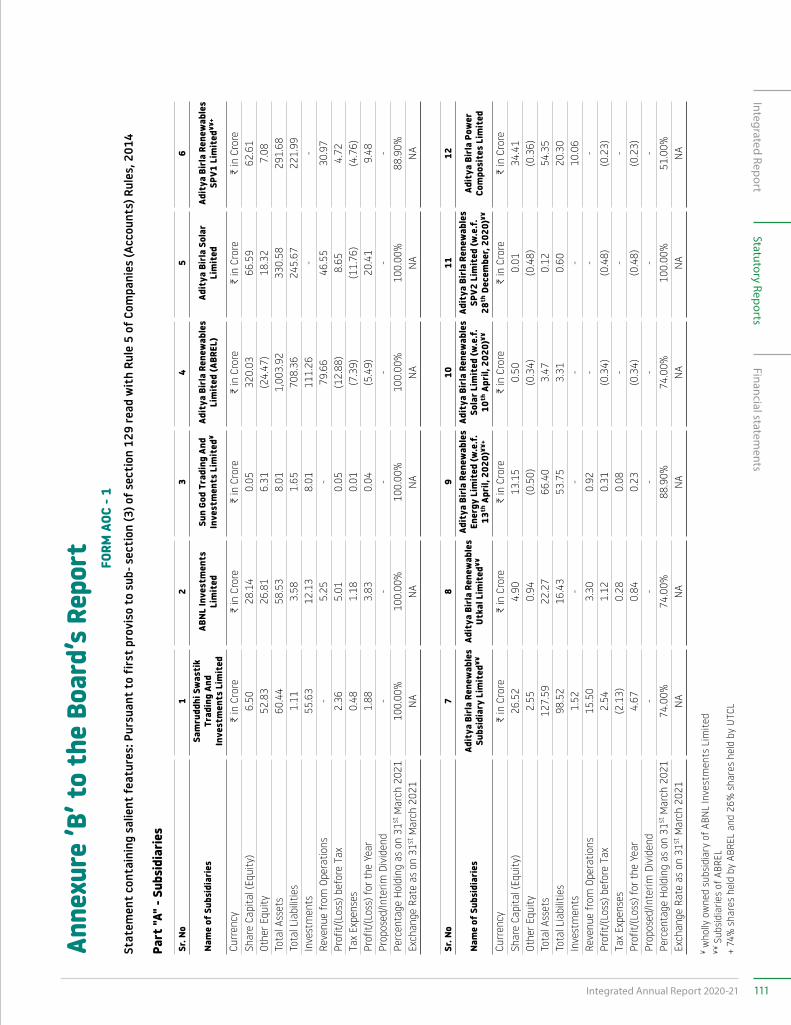
FORM
AOC
- 1
Stat
emen
t co
ntai
ning
sal
ient
feat
ures
: Pur
suan
t to
firs
t pr
ovis
o to
sub
- sec
tion
(3) o
f sec
tion
129
read
wit
h Ru
le 5
of C
ompa
nies
(Acc
ount
s) R
ules
, 201
4
Part
"A" -
Sub
sidi
arie
s
Sr. N
o1
23
45
6
Nam
e of
Sub
sidi
arie
sSa
mru
ddhi
Sw
asti
k Tr
adin
g An
d In
vest
men
ts L
imit
ed
ABNL
Inve
stm
ents
Li
mit
edSu
n Go
d Tr
adin
g An
d In
vest
men
ts L
imit
ed¥
Adit
ya B
irla
Ren
ewab
les
Lim
ited
(ABR
EL)
Adit
ya B
irla
Sol
ar
Lim
ited
Adit
ya B
irla
Ren
ewab
les
SPV1
Lim
ited
¥¥+
Curr
ency
C in
Cro
reC in
Cro
reC in
Cro
reC in
Cro
reC in
Cro
reC in
Cro
reSh
are
Capi
tal (
Equi
ty)
6.50
28.1
40.
0532
0.03
66.5
962
.61
Othe
r Equ
ity52
.83
26.8
16.
31(2
4.47
)18
.32
7.08
Tota
l Ass
ets
60.4
458
.53
8.01
1,00
3.92
330.
5829
1.68
Tota
l Lia
bilit
ies
1.11
3.58
1.65
708.
3624
5.67
221.
99In
vest
men
ts55
.63
12.1
38.
0111
1.26
--
Reve
nue
from
Ope
ratio
ns-
5.25
-79
.66
46.5
530
.97
Prof
it/(L
oss)
bef
ore
Tax
2.36
5.01
0.05
(12.
88)
8.65
4.72
Tax
Expe
nses
0.48
1.18
0.01
(7.3
9)(1
1.76
)(4
.76)
Prof
it/(L
oss)
for t
he Y
ear
1.88
3.83
0.04
(5.4
9)20
.41
9.48
Prop
osed
/Inte
rim D
ivid
end
--
--
--
Perc
enta
ge H
oldi
ng a
s on
31st
Mar
ch 2
021
100.
00%
100.
00%
100.
00%
100.
00%
100.
00%
88.9
0%Ex
chan
ge R
ate
as o
n 31
st M
arch
202
1N
AN
AN
AN
AN
AN
A
Sr. N
o7
89
1011
12
Nam
e of
Sub
sidi
arie
sAd
itya
Bir
la R
enew
able
s Su
bsid
iary
Lim
ited
¥¥Ad
itya
Bir
la R
enew
able
s Ut
kal L
imit
ed¥¥
Adit
ya B
irla
Ren
ewab
les
Ener
gy L
imit
ed (w
.e.f.
13
th A
pril,
202
0)¥¥
+
Adit
ya B
irla
Ren
ewab
les
Sola
r Lim
ited
(w.e
.f.
10th
Apr
il, 2
020)
¥¥
Adit
ya B
irla
Ren
ewab
les
SPV2
Lim
ited
(w.e
.f.
28th
Dec
embe
r, 20
20)¥¥
Adit
ya B
irla
Pow
er
Com
posi
tes
Lim
ited
Curr
ency
C in
Cro
reC in
Cro
reC in
Cro
reC in
Cro
reC in
Cro
reC in
Cro
reSh
are
Capi
tal (
Equi
ty)
26.5
24.
9013
.15
0.50
0.01
34.4
1Ot
her E
quity
2.55
0.94
(0.5
0)(0
.34)
(0.4
8)(0
.36)
Tota
l Ass
ets
127.
5922
.27
66.4
03.
470.
1254
.35
Tota
l Lia
bilit
ies
98.5
216
.43
53.7
53.
310.
6020
.30
Inve
stm
ents
1.52
--
--
10.0
6Re
venu
e fr
om O
pera
tions
15.5
03.
300.
92-
--
Prof
it/(L
oss)
bef
ore
Tax
2.54
1.12
0.31
(0.3
4)(0
.48)
(0.2
3)Ta
x Ex
pens
es(2
.13)
0.28
0.08
--
-Pr
ofit/
(Los
s) fo
r the
Yea
r4.
670.
840.
23(0
.34)
(0.4
8)(0
.23)
Prop
osed
/Inte
rim D
ivid
end
--
--
--
Perc
enta
ge H
oldi
ng a
s on
31st
Mar
ch 2
021
74.0
0%74
.00%
88.9
0%74
.00%
100.
00%
51.0
0%Ex
chan
ge R
ate
as o
n 31
st M
arch
202
1N
AN
AN
AN
AN
AN
A
¥ w
holly
ow
ned
subs
idia
ry o
f ABN
L In
vest
men
ts L
imit
ed¥¥
Sub
sidi
arie
s of
ABR
EL+
74%
sha
res
held
by
ABRE
L an
d 26
% s
hare
s he
ld b
y U
TCL
Anne
xure
’B’ t
o th
e Bo
ard’
s Re
port
111Integrated Annual Report 2020-21
Integrated ReportFinancial statem
entsStatutory Reports
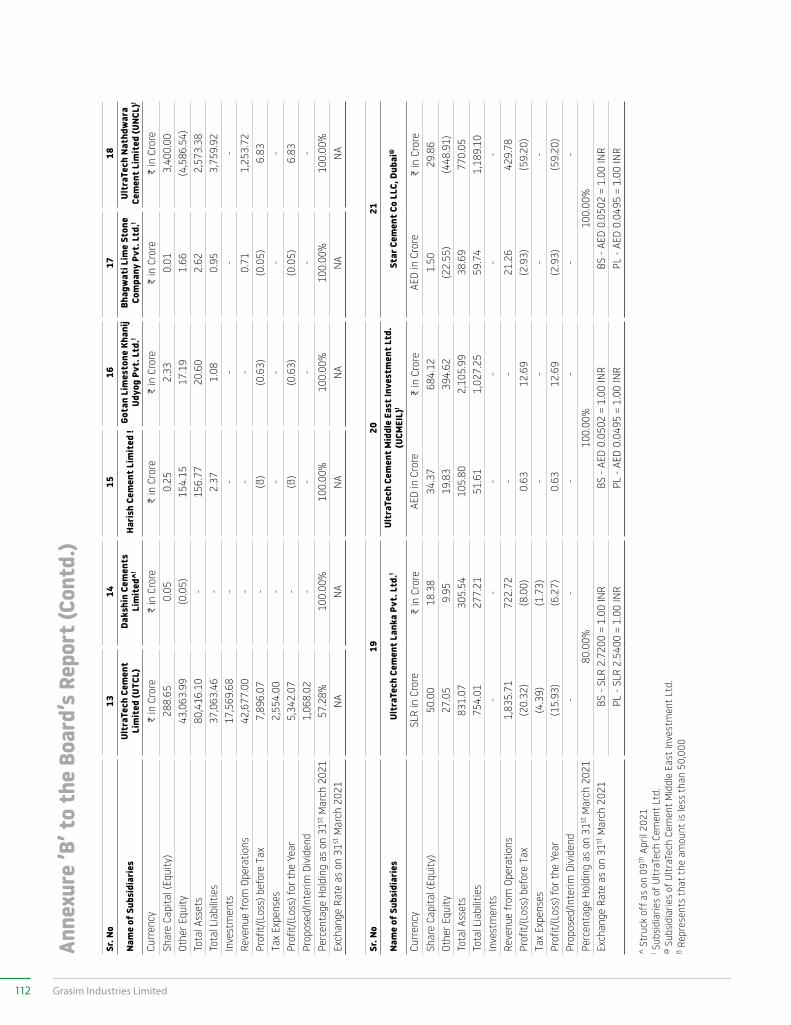
Sr. N
o13
1415
1617
18
Nam
e of
Sub
sidi
arie
sUl
traT
ech
Cem
ent
Lim
ited
(UTC
L)Da
kshi
n Ce
men
ts
Lim
ited
^!Ha
rish
Cem
ent L
imit
ed !
Gota
n Li
mes
tone
Kha
nij
Udyo
g Pv
t. L
td.!
Bhag
wat
i Lim
e St
one
Com
pany
Pvt
. Ltd
.!Ul
traT
ech
Nath
dwar
a Ce
men
t Lim
ited
(UNC
L)!
Curr
ency
C in
Cro
reC in
Cro
reC in
Cro
reC in
Cro
reC in
Cro
reC in
Cro
reSh
are
Capi
tal (
Equi
ty)
288.
650.
050.
252.
330.
013,
400.
00Ot
her E
quity
43,0
63.9
9(0
.05)
154.
1517
.19
1.66
(4,5
86.5
4)To
tal A
sset
s80
,416
.10
-15
6.77
20.6
02.
622,
573.
38To
tal L
iabi
litie
s37
,063
.46
-2.
371.
080.
953,
759.
92In
vest
men
ts17
,569
.68
--
--
-Re
venu
e fr
om O
pera
tions
42,6
77.0
0-
--
0.71
1,25
3.72
Prof
it/(L
oss)
bef
ore
Tax
7,89
6.07
-(ß
)(0
.63)
(0.0
5)6.
83Ta
x Ex
pens
es2,
554.
00-
--
--
Prof
it/(L
oss)
for t
he Y
ear
5,34
2.07
-(ß
)(0
.63)
(0.0
5)6.
83Pr
opos
ed/In
terim
Div
iden
d1,
068.
02-
--
--
Perc
enta
ge H
oldi
ng a
s on
31st
Mar
ch 2
021
57.2
8%10
0.00
%10
0.00
%10
0.00
%10
0.00
%10
0.00
%Ex
chan
ge R
ate
as o
n 31
st M
arch
202
1N
AN
AN
AN
AN
AN
A
Sr. N
o19
2021
Nam
e of
Sub
sidi
arie
sUl
traT
ech
Cem
ent L
anka
Pvt
. Ltd
.!Ul
traT
ech
Cem
ent M
iddl
e Ea
st In
vest
men
t Ltd
. (U
CMEI
L)!
Star
Cem
ent C
o LL
C, D
ubai
@
Curr
ency
SLR
in C
rore
C in
Cro
reAE
D in
Cro
reC in
Cro
reAE
D in
Cro
reC in
Cro
reSh
are
Capi
tal (
Equi
ty)
50.0
018
.38
34.3
768
4.12
1.50
29.8
6Ot
her E
quity
27.0
59.
9519
.83
394.
62(2
2.55
)(4
48.9
1)To
tal A
sset
s83
1.07
305.
5410
5.80
2,10
5.99
38.6
977
0.05
Tota
l Lia
bilit
ies
754.
0127
7.21
51.6
11,
027.
2559
.74
1,18
9.10
Inve
stm
ents
--
--
--
Reve
nue
from
Ope
ratio
ns1,
835.
7172
2.72
--
21.2
642
9.78
Prof
it/(L
oss)
bef
ore
Tax
(20.
32)
(8.0
0)0.
6312
.69
(2.9
3)(5
9.20
)Ta
x Ex
pens
es(4
.39)
(1.7
3)-
--
-Pr
ofit/
(Los
s) fo
r the
Yea
r(1
5.93
)(6
.27)
0.63
12.6
9(2
.93)
(59.
20)
Prop
osed
/Inte
rim D
ivid
end
--
--
--
Perc
enta
ge H
oldi
ng a
s on
31st
Mar
ch 2
021
80.0
0%10
0.00
%10
0.00
%Ex
chan
ge R
ate
as o
n 31
st M
arch
202
1BS
- SL
R 2.
7200
= 1
.00
INR
BS -
AED
0.05
02 =
1.0
0 IN
RBS
- AE
D 0.
0502
= 1
.00
INR
PL -
SLR
2.54
00 =
1.0
0 IN
RPL
- AE
D 0.
0495
= 1
.00
INR
PL -
AED
0.04
95 =
1.0
0 IN
R
^ St
ruck
off
as
on 0
9th A
pril
2021
! Sub
sidi
arie
s of
Ult
raTe
ch C
emen
t Lt
d.@ S
ubsi
diar
ies
of U
ltra
Tech
Cem
ent
Mid
dle
East
Inve
stm
ent
Ltd.
ß Re
pres
ents
tha
t th
e am
ount
is le
ss t
han
50,0
00
Anne
xure
’B’ t
o th
e Bo
ard’
s Re
port
(Con
td.)
112 Grasim Industries Limited
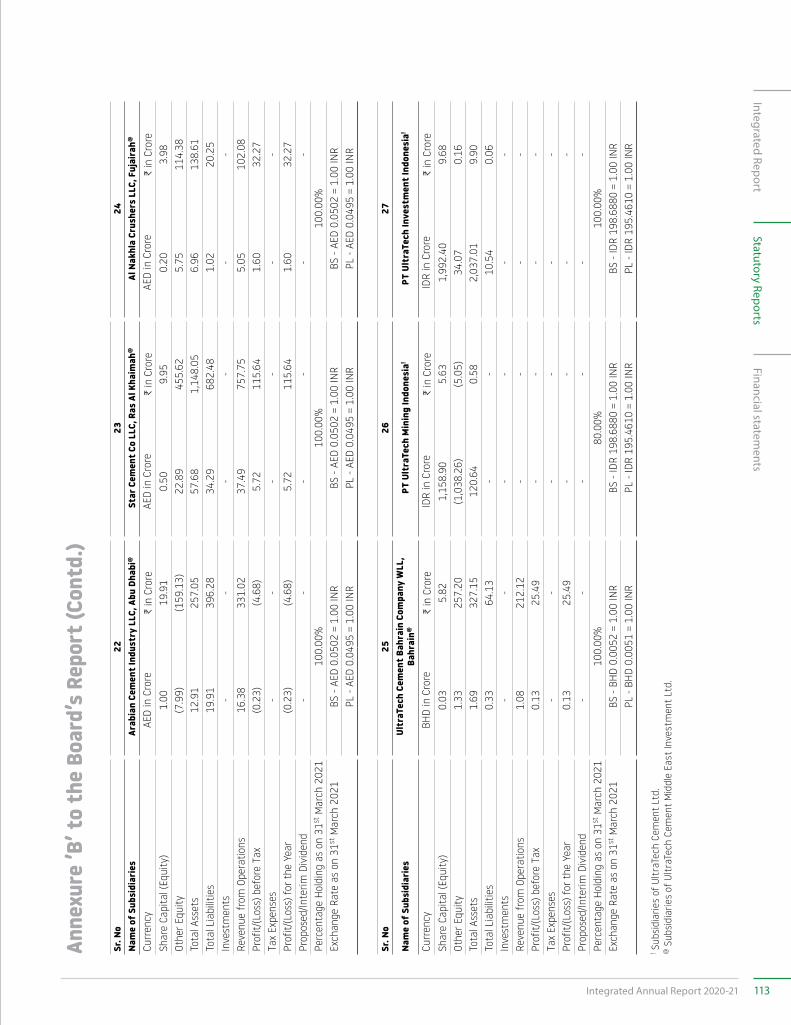
Sr. N
o22
2324
Nam
e of
Sub
sidi
arie
sAr
abia
n Ce
men
t Ind
ustr
y LL
C, A
bu D
habi
@St
ar C
emen
t Co
LLC,
Ras
Al K
haim
ah@
Al N
akhl
a Cr
ushe
rs L
LC, F
ujai
rah@
Curr
ency
AED
in C
rore
C in
Cro
reAE
D in
Cro
reC in
Cro
reAE
D in
Cro
reC in
Cro
reSh
are
Capi
tal (
Equi
ty)
1.00
19.9
10.
509.
950.
203.
98Ot
her E
quity
(7.9
9)(1
59.1
3)22
.89
455.
625.
7511
4.38
Tota
l Ass
ets
12.9
125
7.05
57.6
81,
148.
056.
9613
8.61
Tota
l Lia
bilit
ies
19.9
139
6.28
34.2
968
2.48
1.02
20.2
5In
vest
men
ts-
--
--
-Re
venu
e fr
om O
pera
tions
16.3
833
1.02
37.4
975
7.75
5.05
102.
08Pr
ofit/
(Los
s) b
efor
e Ta
x(0
.23)
(4.6
8)5.
7211
5.64
1.60
32.2
7Ta
x Ex
pens
es-
--
--
-Pr
ofit/
(Los
s) fo
r the
Yea
r(0
.23)
(4.6
8)5.
7211
5.64
1.60
32.2
7Pr
opos
ed/In
terim
Div
iden
d-
--
--
-Pe
rcen
tage
Hol
ding
as
on 3
1st M
arch
202
110
0.00
%10
0.00
%10
0.00
%Ex
chan
ge R
ate
as o
n 31
st M
arch
202
1BS
- AE
D 0.
0502
= 1
.00
INR
BS -
AED
0.05
02 =
1.0
0 IN
RBS
- AE
D 0.
0502
= 1
.00
INR
PL -
AED
0.04
95 =
1.0
0 IN
RPL
- AE
D 0.
0495
= 1
.00
INR
PL -
AED
0.04
95 =
1.0
0 IN
R
Sr. N
o25
2627
Nam
e of
Sub
sidi
arie
sUl
traT
ech
Cem
ent B
ahra
in C
ompa
ny W
LL,
Bahr
ain@
PT U
ltra
Tech
Min
ing
Indo
nesi
a!PT
Ult
raTe
ch In
vest
men
t Ind
ones
ia!
Curr
ency
BHD
in C
rore
C in
Cro
reID
R in
Cro
reC in
Cro
reID
R in
Cro
reC in
Cro
reSh
are
Capi
tal (
Equi
ty)
0.03
5.82
1,15
8.90
5.63
1,99
2.40
9.68
Othe
r Equ
ity1.
3325
7.20
(1,0
38.2
6)(5
.05)
34.0
70.
16To
tal A
sset
s1.
6932
7.15
120.
640.
582,
037.
019.
90To
tal L
iabi
litie
s0.
3364
.13
--
10.5
40.
06In
vest
men
ts-
--
--
-Re
venu
e fr
om O
pera
tions
1.08
212.
12-
--
-Pr
ofit/
(Los
s) b
efor
e Ta
x0.
1325
.49
--
--
Tax
Expe
nses
--
--
--
Prof
it/(L
oss)
for t
he Y
ear
0.13
25.4
9-
--
-Pr
opos
ed/In
terim
Div
iden
d-
--
--
-Pe
rcen
tage
Hol
ding
as
on 3
1st M
arch
202
110
0.00
%80
.00%
100.
00%
Exch
ange
Rat
e as
on
31st
Mar
ch 2
021
BS -
BHD
0.00
52 =
1.0
0 IN
RBS
- ID
R 19
8.68
80 =
1.0
0 IN
RBS
- ID
R 19
8.68
80 =
1.0
0 IN
RPL
- BH
D 0.
0051
= 1
.00
INR
PL -
IDR
195.
4610
= 1
.00
INR
PL -
IDR
195.
4610
= 1
.00
INR
! Sub
sidi
arie
s of
Ult
raTe
ch C
emen
t Lt
d.@ S
ubsi
diar
ies
of U
ltra
Tech
Cem
ent
Mid
dle
East
Inve
stm
ent
Ltd.
Anne
xure
’B’ t
o th
e Bo
ard’
s Re
port
(Con
td.)
113Integrated Annual Report 2020-21
Integrated ReportFinancial statem
entsStatutory Reports
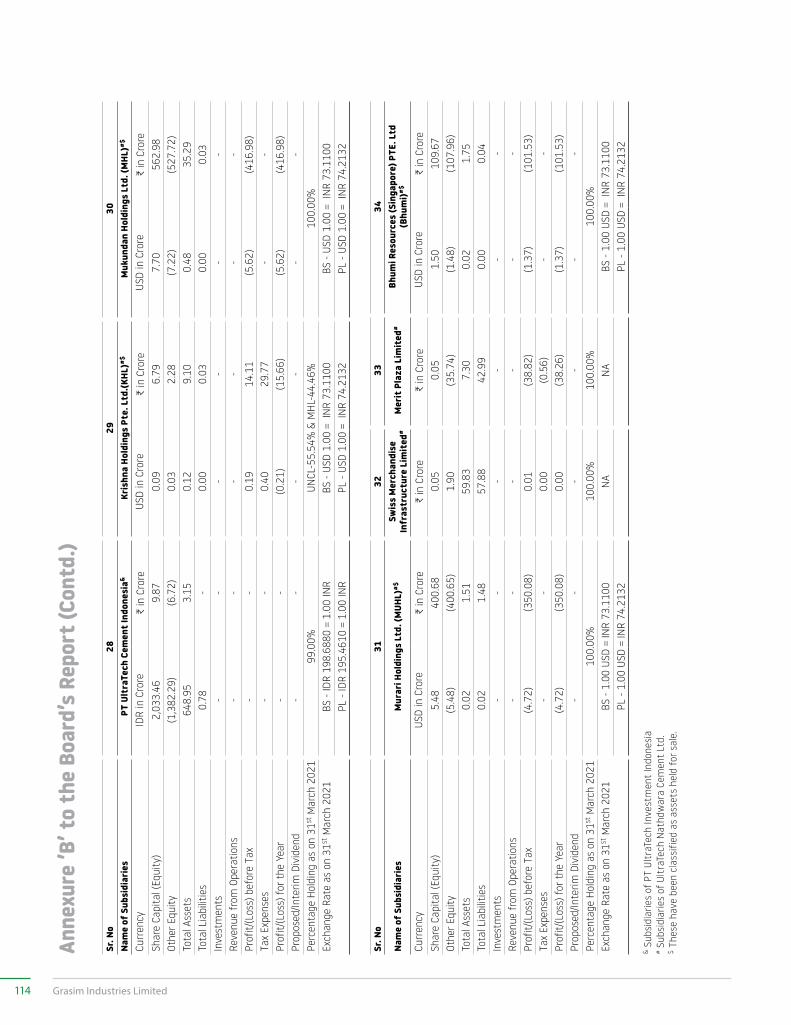
Sr. N
o28
2930
Nam
e of
Sub
sidi
arie
sPT
Ult
raTe
ch C
emen
t Ind
ones
ia&
Kris
hna
Hold
ings
Pte
. Ltd
.(KHL
)#$M
ukun
dan
Hold
ings
Ltd
. (M
HL)#$
Curr
ency
IDR
in C
rore
C in
Cro
reUS
D in
Cro
reC in
Cro
reUS
D in
Cro
reC in
Cro
reSh
are
Capi
tal (
Equi
ty)
2,03
3.46
9.87
0.09
6.79
7.70
562.
98Ot
her E
quity
(1,3
82.2
9)(6
.72)
0.03
2.28
(7.2
2)(5
27.7
2)To
tal A
sset
s64
8.95
3.15
0.12
9.10
0.48
35.2
9To
tal L
iabi
litie
s0.
78-
0.00
0.03
0.00
0.03
Inve
stm
ents
--
--
--
Reve
nue
from
Ope
ratio
ns-
--
--
-Pr
ofit/
(Los
s) b
efor
e Ta
x-
-0.
1914
.11
(5.6
2)(4
16.9
8)Ta
x Ex
pens
es-
-0.
4029
.77
--
Prof
it/(L
oss)
for t
he Y
ear
--
(0.2
1)(1
5.66
)(5
.62)
(416
.98)
Prop
osed
/Inte
rim D
ivid
end
--
--
--
Perc
enta
ge H
oldi
ng a
s on
31st
Mar
ch 2
021
99.0
0%UN
CL-5
5.54
% &
MH
L-44
.46%
100.
00%
Exch
ange
Rat
e as
on
31st
Mar
ch 2
021
BS -
IDR
198.
6880
= 1
.00
INR
BS -
USD
1.00
= I
NR
73.1
100
BS -
USD
1.00
= I
NR
73.1
100
PL -
IDR
195.
4610
= 1
.00
INR
PL -
USD
1.00
= I
NR
74.2
132
PL -
USD
1.00
= I
NR
74.2
132
Sr. N
o31
3233
34
Nam
e of
Sub
sidi
arie
sM
urar
i Hol
ding
s Lt
d. (M
UHL)
#$Sw
iss
Mer
chan
dise
In
fras
truc
ture
Lim
ited
#M
erit
Pla
za L
imit
ed#
Bhum
i Res
ourc
es (S
inga
pore
) PTE
. Ltd
(B
hum
i)#$
Curr
ency
USD
in C
rore
C in
Cro
reC in
Cro
reC in
Cro
reUS
D in
Cro
reC in
Cro
reSh
are
Capi
tal (
Equi
ty)
5.48
400.
680.
050.
051.
5010
9.67
Othe
r Equ
ity(5
.48)
(400
.65)
1.90
(35.
74)
(1.4
8)(1
07.9
6)To
tal A
sset
s0.
021.
5159
.83
7.30
0.02
1.75
Tota
l Lia
bilit
ies
0.02
1.48
57.8
842
.99
0.00
0.04
Inve
stm
ents
--
--
--
Reve
nue
from
Ope
ratio
ns-
--
--
-Pr
ofit/
(Los
s) b
efor
e Ta
x(4
.72)
(350
.08)
0.01
(38.
82)
(1.3
7)(1
01.5
3)Ta
x Ex
pens
es-
-0.
00(0
.56)
--
Prof
it/(L
oss)
for t
he Y
ear
(4.7
2)(3
50.0
8)0.
00(3
8.26
)(1
.37)
(101
.53)
Prop
osed
/Inte
rim D
ivid
end
--
--
--
Perc
enta
ge H
oldi
ng a
s on
31st
Mar
ch 2
021
100.
00%
100.
00%
100.
00%
100.
00%
Exch
ange
Rat
e as
on
31st
Mar
ch 2
021
BS -
1.00
USD
= IN
R 73
.110
0N
AN
ABS
- 1.
00 U
SD =
IN
R 73
.110
0PL
- 1.
00 U
SD =
INR
74.2
132
PL -
1.00
USD
= I
NR
74.2
132
& Su
bsid
iarie
s of
PT
Ultr
aTec
h In
vest
men
t In
done
sia
# Sub
sidi
arie
s of
Ult
raTe
ch N
athd
war
a Ce
men
t Lt
d.$
Thes
e ha
ve b
een
clas
sifie
d as
ass
ets
held
for
sal
e.
Anne
xure
’B’ t
o th
e Bo
ard’
s Re
port
(Con
td.)
114 Grasim Industries Limited
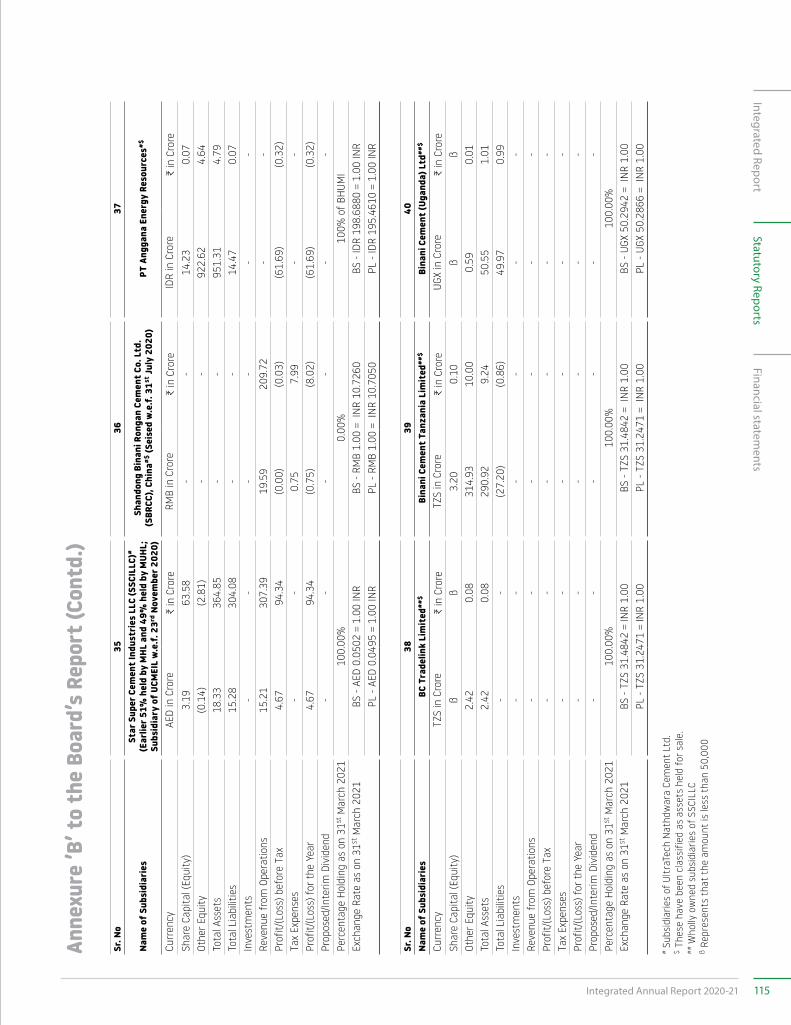
Sr. N
o35
3637
Nam
e of
Sub
sidi
arie
sSt
ar S
uper
Cem
ent I
ndus
trie
s LL
C (S
SCIL
LC)#
(Ear
lier 5
1% h
eld
by M
HL a
nd 4
9% h
eld
by M
UHL;
Su
bsid
iary
of U
CMEI
L w
.e.f.
23rd
Nov
embe
r 202
0)
Shan
dong
Bin
ani R
onga
n Ce
men
t Co.
Ltd
. (S
BRCC
), Ch
ina#$
(Sei
sed
w.e
.f. 3
1st Ju
ly 2
020)
PT A
ngga
na E
nerg
y Re
sour
ces#$
Curr
ency
AED
in C
rore
C in
Cro
reRM
B in
Cro
reC in
Cro
reID
R in
Cro
reC in
Cro
reSh
are
Capi
tal (
Equi
ty)
3.19
63.5
8-
-14
.23
0.07
Othe
r Equ
ity(0
.14)
(2.8
1)-
-92
2.62
4.64
Tota
l Ass
ets
18.3
336
4.85
--
951.
314.
79To
tal L
iabi
litie
s15
.28
304.
08-
-14
.47
0.07
Inve
stm
ents
--
--
--
Reve
nue
from
Ope
ratio
ns15
.21
307.
3919
.59
209.
72-
-Pr
ofit/
(Los
s) b
efor
e Ta
x4.
6794
.34
(0.0
0)(0
.03)
(61.
69)
(0.3
2)Ta
x Ex
pens
es-
-0.
757.
99-
-Pr
ofit/
(Los
s) fo
r the
Yea
r4.
6794
.34
(0.7
5)(8
.02)
(61.
69)
(0.3
2)Pr
opos
ed/In
terim
Div
iden
d-
--
--
-Pe
rcen
tage
Hol
ding
as
on 3
1st M
arch
202
110
0.00
%0.
00%
100%
of B
HUM
IEx
chan
ge R
ate
as o
n 31
st M
arch
202
1BS
- AE
D 0.
0502
= 1
.00
INR
BS -
RMB
1.00
= I
NR
10.7
260
BS -
IDR
198.
6880
= 1
.00
INR
PL -
AED
0.04
95 =
1.0
0 IN
RPL
- RM
B 1.
00 =
IN
R 10
.705
0PL
- ID
R 19
5.46
10 =
1.0
0 IN
R
Sr. N
o38
3940
Nam
e of
Sub
sidi
arie
sBC
Tra
delin
k Li
mit
ed##
$Bi
nani
Cem
ent T
anza
nia
Lim
ited
##$
Bina
ni C
emen
t (Ug
anda
) Ltd
##$
Curr
ency
TZS
in C
rore
C in
Cro
reTZ
S in
Cro
reC in
Cro
reUG
X in
Cro
reC in
Cro
reSh
are
Capi
tal (
Equi
ty)
ßß
3.20
0.10
ßß
Othe
r Equ
ity2.
420.
0831
4.93
10.0
00.
590.
01To
tal A
sset
s2.
420.
0829
0.92
9.24
50.5
51.
01To
tal L
iabi
litie
s-
-(2
7.20
)(0
.86)
49.9
70.
99In
vest
men
ts-
--
--
-Re
venu
e fr
om O
pera
tions
--
--
--
Prof
it/(L
oss)
bef
ore
Tax
--
--
--
Tax
Expe
nses
--
--
--
Prof
it/(L
oss)
for t
he Y
ear
--
--
--
Prop
osed
/Inte
rim D
ivid
end
--
--
--
Perc
enta
ge H
oldi
ng a
s on
31st
Mar
ch 2
021
100.
00%
100.
00%
100.
00%
Exch
ange
Rat
e as
on
31st
Mar
ch 2
021
BS -
TZS
31.4
842
= IN
R 1.
00BS
- TZ
S 31
.484
2 =
INR
1.00
BS -
UGX
50.2
942
= IN
R 1.
00PL
- TZ
S 31
.247
1 =
INR
1.00
PL -
TZS
31.2
471
= IN
R 1.
00PL
- UG
X 50
.286
6 =
INR
1.00
# Sub
sidi
arie
s of
Ult
raTe
ch N
athd
war
a Ce
men
t Lt
d.$
Thes
e ha
ve b
een
clas
sifie
d as
ass
ets
held
for
sal
e.##
Who
lly o
wne
d su
bsid
iarie
s of
SSC
ILLC
ß Re
pres
ents
tha
t th
e am
ount
is le
ss t
han
50,0
00
Anne
xure
’B’ t
o th
e Bo
ard’
s Re
port
(Con
td.)
115Integrated Annual Report 2020-21
Integrated ReportFinancial statem
entsStatutory Reports
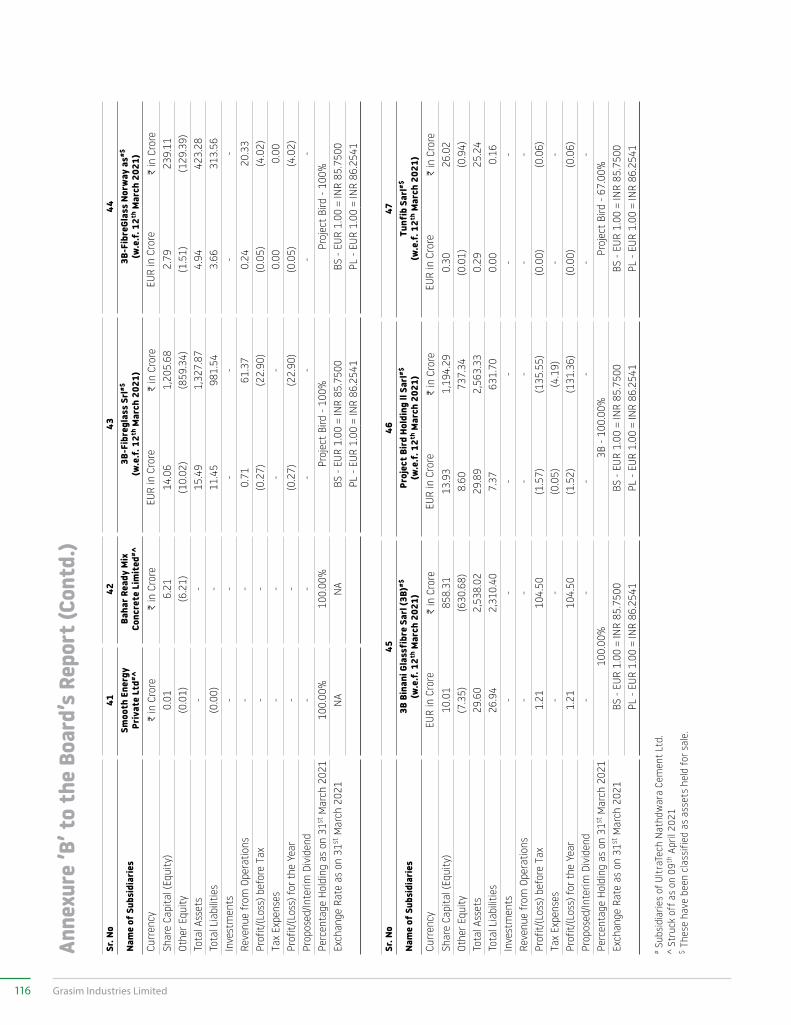
Sr. N
o41
4243
44
Nam
e of
Sub
sidi
arie
sSm
ooth
Ene
rgy
Pr
ivat
e Lt
d# ^Ba
har R
eady
Mix
Co
ncre
te L
imit
ed# ^
3B-F
ibre
glas
s Sr
l#$
(w.e
.f. 1
2th M
arch
202
1)3B
-Fib
reGl
ass
Norw
ay a
s#$
(w.e
.f. 1
2th M
arch
202
1)Cu
rren
cyC in
Cro
reC in
Cro
reEU
R in
Cro
reC in
Cro
reEU
R in
Cro
reC in
Cro
reSh
are
Capi
tal (
Equi
ty)
0.01
6.21
14.0
61,
205.
682.
7923
9.11
Othe
r Equ
ity(0
.01)
(6.2
1)(1
0.02
)(8
59.3
4)(1
.51)
(129
.39)
Tota
l Ass
ets
--
15.4
91,
327.
874.
9442
3.28
Tota
l Lia
bilit
ies
(0.0
0)-
11.4
598
1.54
3.66
313.
56In
vest
men
ts-
--
--
-Re
venu
e fr
om O
pera
tions
--
0.71
61.3
70.
2420
.33
Prof
it/(L
oss)
bef
ore
Tax
--
(0.2
7)(2
2.90
)(0
.05)
(4.0
2)Ta
x Ex
pens
es-
--
-0.
000.
00Pr
ofit/
(Los
s) fo
r the
Yea
r-
-(0
.27)
(22.
90)
(0.0
5)(4
.02)
Prop
osed
/Inte
rim D
ivid
end
--
--
--
Perc
enta
ge H
oldi
ng a
s on
31st
Mar
ch 2
021
100.
00%
100.
00%
Proj
ect
Bird
- 10
0%Pr
ojec
t Bi
rd -
100%
Exch
ange
Rat
e as
on
31st
Mar
ch 2
021
NA
NA
BS -
EUR
1.00
= IN
R 85
.750
0BS
- EU
R 1.
00 =
INR
85.7
500
PL -
EUR
1.00
= IN
R 86
.254
1PL
- EU
R 1.
00 =
INR
86.2
541
Sr. N
o45
4647
Nam
e of
Sub
sidi
arie
s3B
Bin
ani G
lass
fibr
e Sa
rl (3
B)#$
(w
.e.f.
12th
Mar
ch 2
021)
Proj
ect B
ird
Hold
ing
ll Sa
rl#$
(w
.e.f.
12th
Mar
ch 2
021)
Tunf
ib S
arl#$
(w
.e.f.
12th
Mar
ch 2
021)
Curr
ency
EUR
in C
rore
C in
Cro
reEU
R in
Cro
reC in
Cro
reEU
R in
Cro
reC in
Cro
reSh
are
Capi
tal (
Equi
ty)
10.0
185
8.31
13.9
31,
194.
290.
3026
.02
Othe
r Equ
ity(7
.35)
(630
.68)
8.60
737.
34(0
.01)
(0.9
4)To
tal A
sset
s29
.60
2,53
8.02
29.8
92,
563.
330.
2925
.24
Tota
l Lia
bilit
ies
26.9
42,
310.
407.
3763
1.70
0.00
0.16
Inve
stm
ents
--
--
--
Reve
nue
from
Ope
ratio
ns-
--
--
-Pr
ofit/
(Los
s) b
efor
e Ta
x1.
2110
4.50
(1.5
7)(1
35.5
5)(0
.00)
(0.0
6)Ta
x Ex
pens
es-
-(0
.05)
(4.1
9)-
-Pr
ofit/
(Los
s) fo
r the
Yea
r1.
2110
4.50
(1.5
2)(1
31.3
6)(0
.00)
(0.0
6)Pr
opos
ed/In
terim
Div
iden
d-
--
--
-Pe
rcen
tage
Hol
ding
as
on 3
1st M
arch
202
110
0.00
%3B
- 10
0.00
%Pr
ojec
t Bi
rd -
67.0
0%Ex
chan
ge R
ate
as o
n 31
st M
arch
202
1BS
- EU
R 1.
00 =
INR
85.7
500
BS -
EUR
1.00
= IN
R 85
.750
0BS
- EU
R 1.
00 =
INR
85.7
500
PL -
EUR
1.00
= IN
R 86
.254
1PL
- EU
R 1.
00 =
INR
86.2
541
PL -
EUR
1.00
= IN
R 86
.254
1
# Sub
sidi
arie
s of
Ult
raTe
ch N
athd
war
a Ce
men
t Lt
d.^
Stru
ck o
ff a
s on
09th
Apr
il 20
21$
Thes
e ha
ve b
een
clas
sifie
d as
ass
ets
held
for
sal
e.
Anne
xure
’B’ t
o th
e Bo
ard’
s Re
port
(Con
td.)
116 Grasim Industries Limited
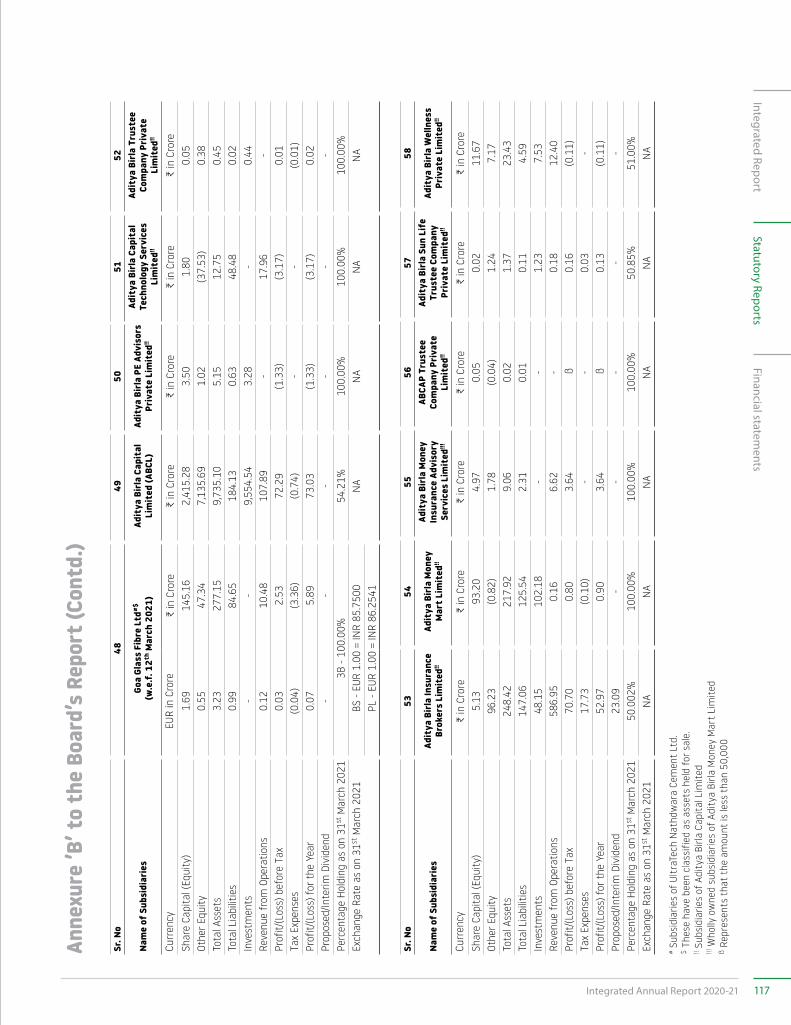
Sr. N
o48
4950
5152
Nam
e of
Sub
sidi
arie
sGo
a Gl
ass
Fibr
e Lt
d#$
(w.e
.f. 1
2th M
arch
202
1)Ad
itya
Bir
la C
apit
al
Lim
ited
(ABC
L)Ad
itya
Bir
la P
E Ad
viso
rs
Priv
ate
Lim
ited
!!
Adit
ya B
irla
Cap
ital
Te
chno
logy
Ser
vice
s Li
mit
ed!!
Adit
ya B
irla
Tru
stee
Co
mpa
ny P
riva
te
Lim
ited
!!
Curr
ency
EUR
in C
rore
C in
Cro
reC in
Cro
reC in
Cro
reC in
Cro
reC in
Cro
reSh
are
Capi
tal (
Equi
ty)
1.69
145.
162,
415.
283.
501.
800.
05Ot
her E
quity
0.55
47.3
47,
135.
691.
02(3
7.53
)0.
38To
tal A
sset
s3.
2327
7.15
9,73
5.10
5.15
12.7
50.
45To
tal L
iabi
litie
s0.
9984
.65
184.
130.
6348
.48
0.02
Inve
stm
ents
--
9,55
4.54
3.28
-0.
44Re
venu
e fr
om O
pera
tions
0.12
10.4
810
7.89
-17
.96
-Pr
ofit/
(Los
s) b
efor
e Ta
x0.
032.
5372
.29
(1.3
3)(3
.17)
0.01
Tax
Expe
nses
(0.0
4)(3
.36)
(0.7
4)-
-(0
.01)
Prof
it/(L
oss)
for t
he Y
ear
0.07
5.89
73.0
3(1
.33)
(3.1
7)0.
02Pr
opos
ed/In
terim
Div
iden
d-
--
--
-Pe
rcen
tage
Hol
ding
as
on 3
1st M
arch
202
13B
- 10
0.00
%54
.21%
100.
00%
100.
00%
100.
00%
Exch
ange
Rat
e as
on
31st
Mar
ch 2
021
BS -
EUR
1.00
= IN
R 85
.750
0N
AN
AN
AN
APL
- EU
R 1.
00 =
INR
86.2
541
Sr. N
o53
5455
5657
58
Nam
e of
Sub
sidi
arie
sAd
itya
Bir
la In
sura
nce
Brok
ers
Lim
ited
!!Ad
itya
Bir
la M
oney
M
art L
imit
ed!!
Adit
ya B
irla
Mon
ey
Insu
ranc
e Ad
viso
ry
Serv
ices
Lim
ited
!!!
ABCA
P Tr
uste
e Co
mpa
ny P
riva
te
Lim
ited
!!
Adit
ya B
irla
Sun
Lif
e Tr
uste
e Co
mpa
ny
Priv
ate
Lim
ited
!!
Adit
ya B
irla
Wel
lnes
s Pr
ivat
e Li
mit
ed!!
Curr
ency
C in
Cro
reC in
Cro
reC in
Cro
reC in
Cro
reC in
Cro
reC in
Cro
reSh
are
Capi
tal (
Equi
ty)
5.13
93.2
04.
970.
050.
0211
.67
Othe
r Equ
ity96
.23
(0.8
2)1.
78(0
.04)
1.24
7.17
Tota
l Ass
ets
248.
4221
7.92
9.06
0.02
1.37
23.4
3To
tal L
iabi
litie
s14
7.06
125.
542.
310.
010.
114.
59In
vest
men
ts48
.15
102.
18-
-1.
237.
53Re
venu
e fr
om O
pera
tions
586.
950.
166.
62-
0.18
12.4
0Pr
ofit/
(Los
s) b
efor
e Ta
x70
.70
0.80
3.64
ß
0.16
(0.1
1)Ta
x Ex
pens
es17
.73
(0.1
0)-
-0.
03-
Prof
it/(L
oss)
for t
he Y
ear
52.9
70.
903.
64 ß
0.
13(0
.11)
Prop
osed
/Inte
rim D
ivid
end
23.0
9-
--
--
Perc
enta
ge H
oldi
ng a
s on
31st
Mar
ch 2
021
50.0
02%
100.
00%
100.
00%
100.
00%
50.8
5%51
.00%
Exch
ange
Rat
e as
on
31st
Mar
ch 2
021
NA
NA
NA
NA
NA
NA
# Sub
sidi
arie
s of
Ult
raTe
ch N
athd
war
a Ce
men
t Lt
d.$
Thes
e ha
ve b
een
clas
sifie
d as
ass
ets
held
for
sal
e.!! S
ubsi
diar
ies
of A
dity
a Bi
rla C
apit
al L
imit
ed!!! W
holly
ow
ned
subs
idia
ries
of A
dity
a Bi
rla M
oney
Mar
t Li
mit
edß
Repr
esen
ts t
hat
the
amou
nt is
less
tha
n 50
,000
Anne
xure
’B’ t
o th
e Bo
ard’
s Re
port
(Con
td.)
117Integrated Annual Report 2020-21
Integrated ReportFinancial statem
entsStatutory Reports
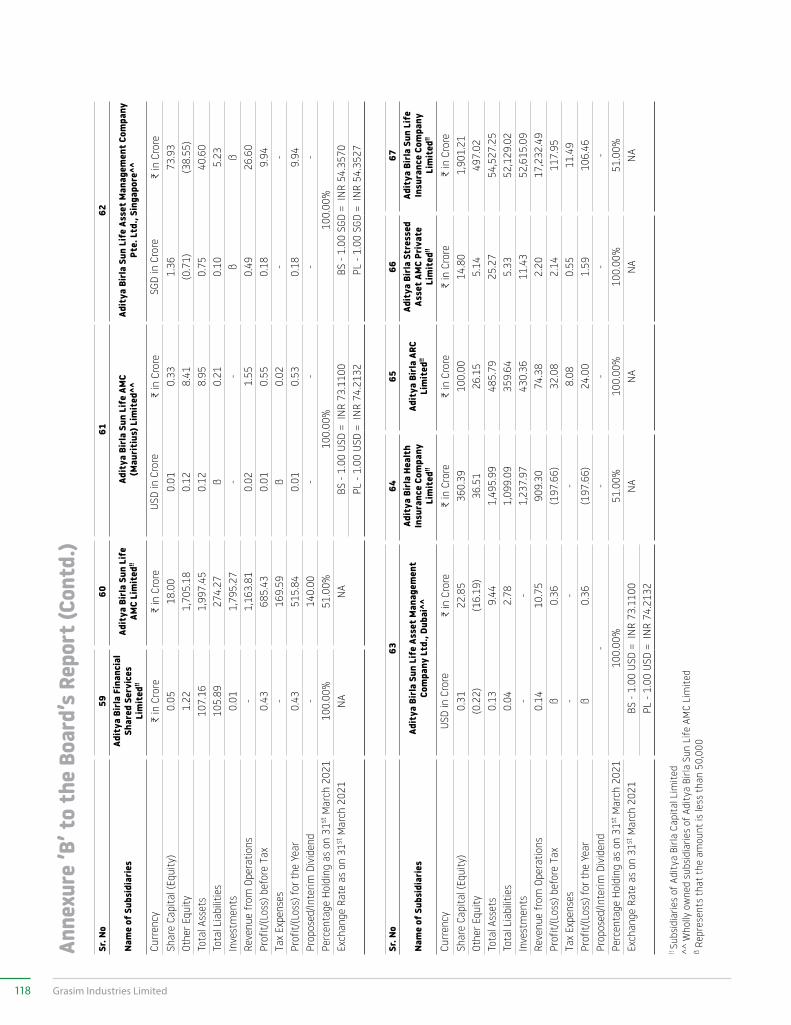
Sr. N
o59
6061
62
Nam
e of
Sub
sidi
arie
sAd
itya
Bir
la F
inan
cial
Sh
ared
Ser
vice
s Li
mit
ed!!
Adit
ya B
irla
Sun
Lif
e AM
C Li
mit
ed!!
Adit
ya B
irla
Sun
Lif
e AM
C
(Mau
riti
us) L
imit
ed^^
Adit
ya B
irla
Sun
Lif
e As
set M
anag
emen
t Com
pany
Pt
e. L
td.,
Sing
apor
e^^
Curr
ency
C in
Cro
reC in
Cro
reUS
D in
Cro
reC in
Cro
reSG
D in
Cro
reC in
Cro
reSh
are
Capi
tal (
Equi
ty)
0.05
18.0
00.
010.
331.
3673
.93
Othe
r Equ
ity1.
221,
705.
180.
128.
41(0
.71)
(38.
55)
Tota
l Ass
ets
107.
161,
997.
450.
128.
950.
7540
.60
Tota
l Lia
bilit
ies
105.
8927
4.27
ß0.
210.
105.
23In
vest
men
ts0.
011,
795.
27-
-ß
ßRe
venu
e fr
om O
pera
tions
-1,
163.
810.
021.
550.
4926
.60
Prof
it/(L
oss)
bef
ore
Tax
0.43
685.
430.
010.
550.
189.
94Ta
x Ex
pens
es-
169.
59ß
0.02
--
Prof
it/(L
oss)
for t
he Y
ear
0.43
515.
840.
010.
530.
189.
94Pr
opos
ed/In
terim
Div
iden
d-
140.
00-
--
-Pe
rcen
tage
Hol
ding
as
on 3
1st M
arch
202
110
0.00
%51
.00%
100.
00%
100.
00%
Exch
ange
Rat
e as
on
31st
Mar
ch 2
021
NA
NA
BS -
1.00
USD
= I
NR
73.1
100
BS -
1.00
SGD
= I
NR
54.3
570
PL -
1.00
USD
= I
NR
74.2
132
PL -
1.00
SGD
= I
NR
54.3
527
Sr. N
o63
6465
6667
Nam
e of
Sub
sidi
arie
sAd
itya
Bir
la S
un L
ife
Asse
t Man
agem
ent
Com
pany
Ltd
., Du
bai^
^
Adit
ya B
irla
Hea
lth
Insu
ranc
e Co
mpa
ny
Lim
ited
!!
Adit
ya B
irla
ARC
Li
mit
ed!!
Adit
ya B
irla
Str
esse
d As
set A
MC
Priv
ate
Lim
ited
!!
Adit
ya B
irla
Sun
Lif
e In
sura
nce
Com
pany
Li
mit
ed!!
Curr
ency
USD
in C
rore
C in
Cro
reC in
Cro
reC in
Cro
reC in
Cro
reC in
Cro
reSh
are
Capi
tal (
Equi
ty)
0.31
22.8
536
0.39
100.
0014
.80
1,90
1.21
Othe
r Equ
ity(0
.22)
(16.
19)
36.5
126
.15
5.14
497.
02To
tal A
sset
s0.
139.
441,
495.
9948
5.79
25.2
754
,527
.25
Tota
l Lia
bilit
ies
0.04
2.78
1,09
9.09
359.
645.
3352
,129
.02
Inve
stm
ents
--
1,23
7.97
430.
3611
.43
52,6
15.0
9Re
venu
e fr
om O
pera
tions
0.14
10.7
590
9.30
74.3
82.
2017
,232
.49
Prof
it/(L
oss)
bef
ore
Tax
ß0.
36(1
97.6
6)32
.08
2.14
117.
95Ta
x Ex
pens
es-
--
8.08
0.55
11.4
9Pr
ofit/
(Los
s) fo
r the
Yea
rß
0.36
(197
.66)
24.0
01.
5910
6.46
Prop
osed
/Inte
rim D
ivid
end
--
--
-Pe
rcen
tage
Hol
ding
as
on 3
1st M
arch
202
110
0.00
%51
.00%
100.
00%
100.
00%
51.0
0%Ex
chan
ge R
ate
as o
n 31
st M
arch
202
1BS
- 1.
00 U
SD =
IN
R 73
.110
0N
AN
AN
AN
APL
- 1.
00 U
SD =
IN
R 74
.213
2
!! Su
bsid
iarie
s of
Adi
tya
Birla
Cap
ital
Lim
ited
^^ W
holly
ow
ned
subs
idia
ries
of A
dity
a Bi
rla S
un L
ife A
MC
Lim
ited
ß Re
pres
ents
tha
t th
e am
ount
is le
ss t
han
50,0
00
Anne
xure
’B’ t
o th
e Bo
ard’
s Re
port
(Con
td.)
118 Grasim Industries Limited
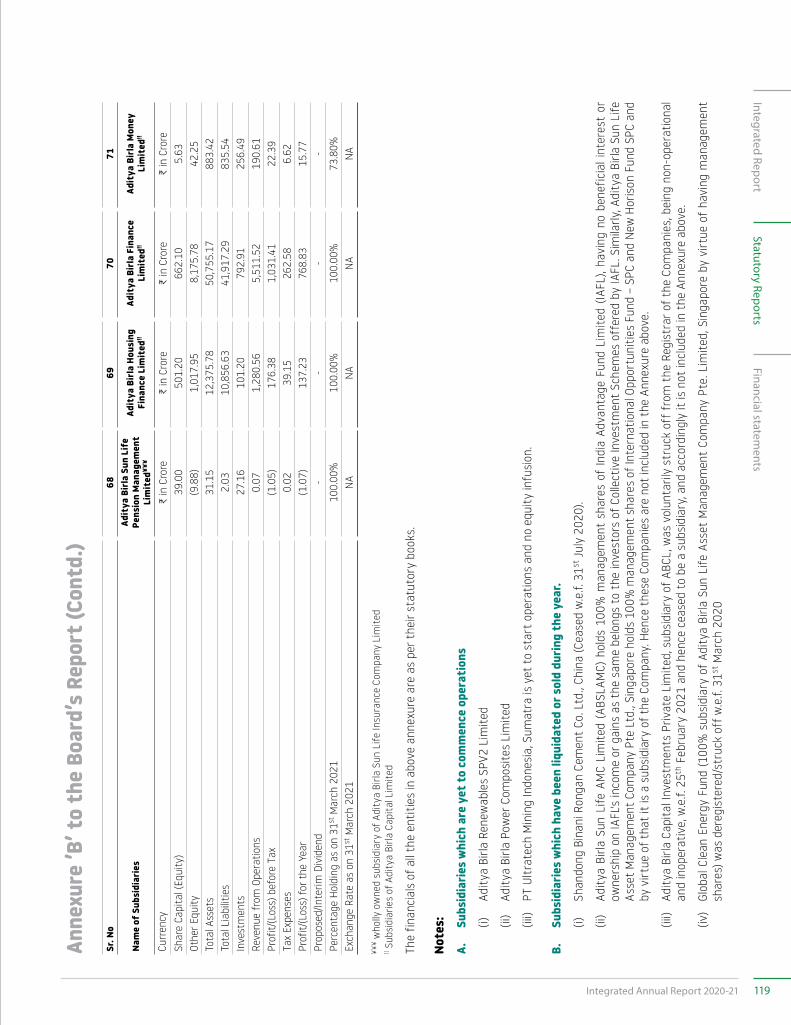
Sr. N
o68
6970
71
Nam
e of
Sub
sidi
arie
sAd
itya
Bir
la S
un L
ife
Pens
ion
Man
agem
ent
Lim
ited
¥¥¥
Adit
ya B
irla
Hou
sing
Fi
nanc
e Li
mit
ed!!
Adit
ya B
irla
Fin
ance
Li
mit
ed!!
Adit
ya B
irla
Mon
ey
Lim
ited
!!
Curr
ency
C in
Cro
reC in
Cro
reC in
Cro
reC in
Cro
reSh
are
Capi
tal (
Equi
ty)
39.0
050
1.20
662.
105.
63Ot
her E
quity
(9.8
8)1,
017.
958,
175.
7842
.25
Tota
l Ass
ets
31.1
512
,375
.78
50,7
55.1
788
3.42
Tota
l Lia
bilit
ies
2.03
10,8
56.6
341
,917
.29
835.
54In
vest
men
ts27
.16
101.
2079
2.91
256.
49Re
venu
e fr
om O
pera
tions
0.07
1,28
0.56
5,51
1.52
190.
61Pr
ofit/
(Los
s) b
efor
e Ta
x(1
.05)
176.
381,
031.
4122
.39
Tax
Expe
nses
0.02
39.1
526
2.58
6.62
Prof
it/(L
oss)
for t
he Y
ear
(1.0
7)13
7.23
768.
8315
.77
Prop
osed
/Inte
rim D
ivid
end
--
--
Perc
enta
ge H
oldi
ng a
s on
31st
Mar
ch 2
021
100.
00%
100.
00%
100.
00%
73.8
0%Ex
chan
ge R
ate
as o
n 31
st M
arch
202
1N
AN
AN
AN
A
¥¥¥
who
lly o
wne
d su
bsid
iary
of A
dity
a Bi
rla S
un L
ife In
sura
nce
Com
pany
Lim
ited
!! Sub
sidi
arie
s of
Adi
tya
Birla
Cap
ital
Lim
ited
The
finan
cial
s of
all
the
entit
ies
in a
bove
ann
exur
e ar
e as
per
the
ir st
atut
ory
book
s.
Note
s:A.
Su
bsid
iarie
s w
hich
are
yet
to
com
men
ce o
pera
tion
s
(i)
Ad
itya
Birl
a Re
new
able
s SP
V2 L
imite
d
(ii
) Ad
itya
Birl
a Po
wer
Com
posi
tes
Lim
ited
(ii
i) PT
Ultr
atec
h M
inin
g In
done
sia,
Sum
atra
is y
et t
o st
art
oper
atio
ns a
nd n
o eq
uity
infu
sion
.
B.
Subs
idia
ries
whi
ch h
ave
been
liqu
idat
ed o
r sol
d du
ring
the
year
.
(i)
Sh
ando
ng B
inan
i Ron
gan
Cem
ent
Co. L
td.,
Chin
a (C
ease
d w
.e.f.
31st
July
202
0).
(ii
) Ad
itya
Birl
a Su
n Li
fe A
MC
Lim
ited
(ABS
LAM
C) h
olds
100
% m
anag
emen
t sh
ares
of
Indi
a Ad
vant
age
Fund
Lim
ited
(IAFL
), ha
ving
no
bene
ficia
l int
eres
t or
ow
ners
hip
on IA
FL's
inco
me
or g
ains
as
the
sam
e be
long
s to
the
inve
stor
s of
Col
lect
ive
Inve
stm
ent
Sche
mes
off
ered
by
IAFL
. Sim
ilarly
, Adi
tya
Birla
Sun
Life
As
set
Man
agem
ent
Com
pany
Pte
Ltd
., Si
ngap
ore
hold
s 10
0% m
anag
emen
t sh
ares
of I
nter
natio
nal O
ppor
tuni
ties
Fund
– S
PC a
nd N
ew H
oris
on F
und
SPC
and
by v
irtue
of t
hat
it is
a s
ubsi
diar
y of
the
Com
pany
. Hen
ce t
hese
Com
pani
es a
re n
ot in
clud
ed in
the
Ann
exur
e ab
ove.
(ii
i) Ad
itya
Birl
a Ca
pita
l Inv
estm
ents
Priv
ate
Lim
ited,
sub
sidi
ary
of A
BCL,
was
vol
unta
rily
stru
ck o
ff f
rom
the
Reg
istr
ar o
f th
e Co
mpa
nies
, bei
ng n
on-o
pera
tiona
l an
d in
oper
ativ
e, w
.e.f.
25th
Feb
ruar
y 20
21 a
nd h
ence
cea
sed
to b
e a
subs
idia
ry, a
nd a
ccor
ding
ly it
is n
ot in
clud
ed in
the
Ann
exur
e ab
ove.
(iv
) Gl
obal
Cle
an E
nerg
y Fu
nd (1
00%
sub
sidi
ary
of A
dity
a Bi
rla S
un L
ife A
sset
Man
agem
ent
Com
pany
Pte
. Lim
ited,
Sin
gapo
re b
y vi
rtue
of
havi
ng m
anag
emen
t sh
ares
) was
der
egis
tere
d/st
ruck
off
w.e
.f. 3
1st M
arch
202
0
Anne
xure
’B’ t
o th
e Bo
ard’
s Re
port
(Con
td.)
119Integrated Annual Report 2020-21
Integrated ReportFinancial statem
entsStatutory Reports
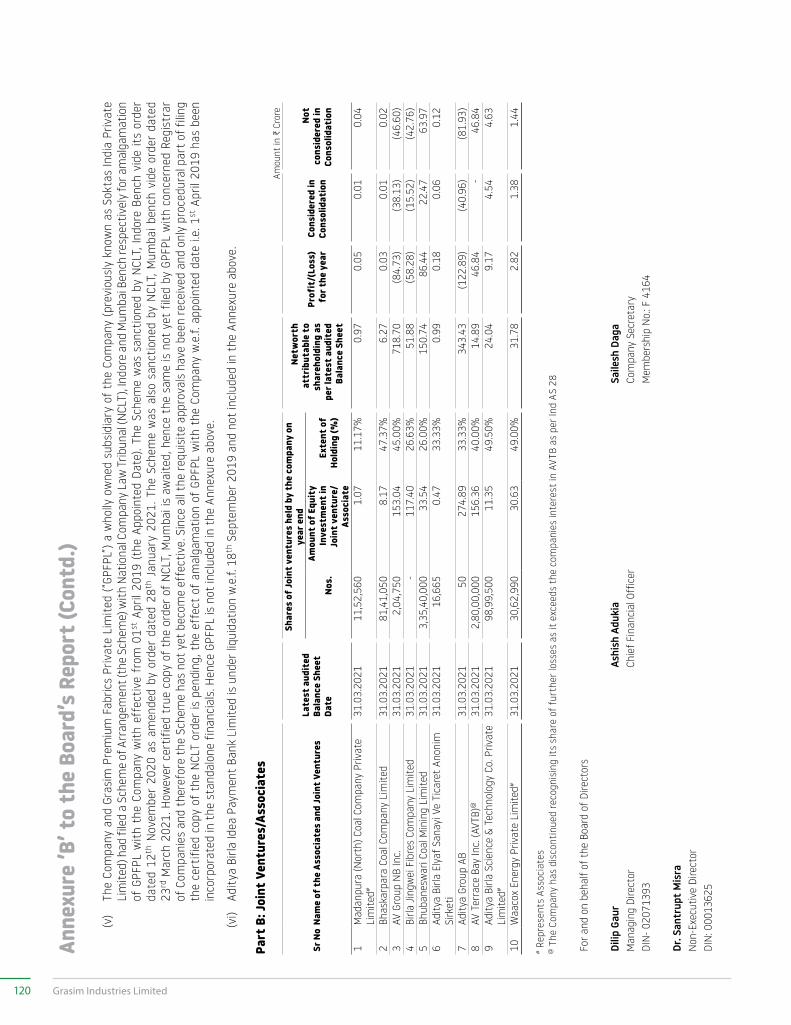
(v
) Th
e Co
mpa
ny a
nd G
rasi
m P
rem
ium
Fab
rics
Priv
ate
Lim
ited
(“GP
FPL”
) a w
holly
ow
ned
subs
idia
ry o
f th
e Co
mpa
ny (p
revi
ousl
y kn
own
as S
okta
s In
dia
Priv
ate
Lim
ited)
had
file
d a
Sche
me
of A
rran
gem
ent (
the
Sche
me)
with
Nat
iona
l Com
pany
Law
Trib
unal
(NCL
T), I
ndor
e an
d M
umba
i Ben
ch re
spec
tivel
y fo
r am
alga
mat
ion
of G
PFPL
with
the
Com
pany
with
eff
ectiv
e fr
om 0
1st A
pril
2019
(th
e Ap
poin
ted
Date
). Th
e Sc
hem
e w
as s
anct
ione
d by
NCL
T, In
dore
Ben
ch v
ide
its
orde
r da
ted
12th
Nov
embe
r 20
20 a
s am
ende
d by
ord
er d
ated
28th
Jan
uary
202
1. T
he S
chem
e w
as a
lso
sanc
tione
d by
NCL
T, M
umba
i ben
ch v
ide
orde
r da
ted
23rd
Mar
ch 2
021.
How
ever
cer
tifie
d tr
ue c
opy
of t
he o
rder
of
NCL
T, M
umba
i is
awai
ted,
hen
ce t
he s
ame
is n
ot y
et f
iled
by G
PFPL
with
con
cern
ed R
egis
trar
of
Com
pani
es a
nd t
here
fore
the
Sch
eme
has
not
yet
beco
me
effe
ctiv
e. S
ince
all
the
requ
isite
app
rova
ls h
ave
been
rec
eive
d an
d on
ly p
roce
dura
l par
t of
fili
ng
the
cert
ified
cop
y of
the
NCL
T or
der
is p
endi
ng, t
he e
ffec
t of
am
alga
mat
ion
of G
PFPL
with
the
Com
pany
w.e
.f. a
ppoi
nted
dat
e i.e
. 1st
Apr
il 20
19 h
as b
een
inco
rpor
ated
in t
he s
tand
alon
e fin
anci
als.
Hen
ce G
PFPL
is n
ot in
clud
ed in
the
Ann
exur
e ab
ove.
(v
i) Ad
itya
Birl
a Id
ea P
aym
ent
Bank
Lim
ited
is u
nder
liqu
idat
ion
w.e
.f. 1
8th S
epte
mbe
r 201
9 an
d no
t in
clud
ed in
the
Ann
exur
e ab
ove.
Part
B: J
oint
Ven
ture
s/As
soci
ates
Amou
nt in
C C
rore
Sr N
oNa
me
of t
he A
ssoc
iate
s an
d Jo
int V
entu
res
Late
st a
udit
ed
Bala
nce
Shee
t Da
te
Shar
es o
f Joi
nt v
entu
res
held
by
the
com
pany
on
year
end
Netw
orth
at
trib
utab
le t
o sh
areh
oldi
ng a
s pe
r lat
est a
udit
ed
Bala
nce
Shee
t
Prof
it/(
Loss
) fo
r the
yea
rCo
nsid
ered
in
Cons
olid
atio
n
Not
cons
ider
ed in
Co
nsol
idat
ion
Nos.
Amou
nt o
f Equ
ity
Inve
stm
ent i
n Jo
int v
entu
re/
Asso
ciat
e
Exte
nt o
f Ho
ldin
g (%
)
1M
adan
pura
(Nor
th) C
oal C
ompa
ny P
rivat
e Li
mite
d#31
.03.
2021
11,5
2,56
01.
0711
.17%
0.97
0.05
0.01
0.04
2Bh
aska
rpar
a Co
al C
ompa
ny L
imite
d31
.03.
2021
81,4
1,05
08.
1747
.37%
6.27
0.03
0.01
0.02
3AV
Gro
up N
B In
c.31
.03.
2021
2,04
,750
153.
0445
.00%
718.
70(8
4.73
)(3
8.13
)(4
6.60
)4
Birla
Jing
wei
Fib
res
Com
pany
Lim
ited
31.0
3.20
21-
117.
4026
.63%
51.8
8(5
8.28
)(1
5.52
)(4
2.76
)5
Bhub
anes
war
i Coa
l Min
ing
Lim
ited
31.0
3.20
213,
35,4
0,00
033
.54
26.0
0%15
0.74
86.4
422
.47
63.9
76
Adity
a Bi
rla E
lyaf
San
ayi V
e Ti
care
t An
onim
Si
rket
i31
.03.
2021
16,6
650.
4733
.33%
0.99
0.18
0.06
0.12
7Ad
itya
Grou
p AB
31.0
3.20
2150
274.
8933
.33%
343.
43(1
22.8
9)(4
0.96
)(8
1.93
)8
AV T
erra
ce B
ay In
c. (A
VTB)
@31
.03.
2021
2,80
,00,
000
156.
3640
.00%
14.8
946
.84
-46
.84
9Ad
itya
Birla
Sci
ence
& T
echn
olog
y Co
. Priv
ate
Lim
ited#
31.0
3.20
2198
,99,
500
11.3
549
.50%
24.0
49.
174.
544.
63
10W
aaco
x En
ergy
Priv
ate
Lim
ited#
31.0
3.20
2130
,62,
990
30.6
349
.00%
31.7
82.
821.
381.
44
# Rep
rese
nts
Asso
ciat
es@ T
he C
ompa
ny h
as d
isco
ntin
ued
reco
gnis
ing
its
shar
e of
fur
ther
loss
es a
s it
exce
eds
the
com
pani
es in
tere
st in
AVT
B as
per
Ind
AS 2
8
For a
nd o
n be
half
of th
e Bo
ard
of D
irect
ors
Dilip
Gau
rAs
hish
Adu
kia
Saile
sh D
aga
Man
agin
g Di
rect
orCh
ief F
inan
cial
Off
icer
Com
pany
Sec
reta
ryDI
N- 0
2071
393
Mem
bers
hip
No.
: F 4
164
Dr. S
antr
upt
Mis
raN
on-E
xecu
tive
Dire
ctor
DIN
: 000
1362
5
Anne
xure
’B’ t
o th
e Bo
ard’
s Re
port
(Con
td.)
120 Grasim Industries Limited
Independent Auditor’s Report on compliance with the conditions of Corporate Governance as per provisions of Chapter IV of Securities and Exchange Board of India (Listing Obligations and Disclosure Requirements) Regulations, 2015, as amended
The Members ofGrasim Industries LimitedBirlagram, Nagda - 456331,Ujjain, Madhya Pradesh
1. The Corporate Governance Report prepared by Grasim Industries Limited (hereinafter the “Company”), contains details as specified in regulations 17 to 27, clauses (b) to (i) of sub – regulation (2) of regulation 46 and para C, D, and E of Schedule V of the Securities and Exchange Board of India (Listing Obligations and Disclosure Requirements) Regulations, 2015, as amended (“the Listing Regulations”) (‘Applicable criteria’) for the year ended March 31, 2021 as required by the Company for annual submission to the Stock exchange.
Management’s Responsibility2. The preparation of the Corporate Governance Report is the
responsibility of the Management of the Company including the preparation and maintenance of all relevant supporting records and documents. This responsibility also includes the design, implementation and maintenance of internal control relevant to the preparation and presentation of the Corporate Governance Report.
3. The Management along with the Board of Directors are also responsible for ensuring that the Company complies with the conditions of Corporate Governance as stipulated in the Listing Regulations, issued by the Securities and Exchange Board of India.
Auditor’s Responsibility4. Pursuant to the requirements of the Listing Regulations,
our responsibility is to provide a reasonable assurance in the form of an opinion whether, the Company has complied with the conditions of Corporate Governance as specified in the Listing Regulations.
5. We conducted our examination of the Corporate Governance Report in accordance with the Guidance Note on Reports or Certificates for Special Purposes and the Guidance Note on Certification of Corporate Governance, both issued by the Institute of Chartered Accountants of India (“ICAI”). The Guidance Note on Reports or Certificates for Special Purposes requires that we comply with the ethical requirements of the Code of Ethics issued by the ICAI.
6. We have complied with the relevant applicable requirements of the Standard on Quality Control (SQC) 1, Quality Control for Firms that Perform Audits and Reviews of Historical Financial Information, and Other Assurance and Related Services Engagements.
7. The procedures selected depend on the auditor’s judgement, including the assessment of the risks associated in compliance of the Corporate Governance Report with the applicable criteria. Summary of procedures performed include:
i. Read and understood the information prepared by the Company and included in its Corporate Governance Report;
ii. Obtained and verified that the composition of the Board of Directors with respect to Executive and Non-Executive Directors has been met throughout the reporting period;
iii. Obtained and read the Register of Directors as on March 31, 2021 and verified that atleast one independent woman director was on the Board of Directors throughout the year;
iv. Obtained and read the minutes of the following committee meetings/other meetings held between April 1, 2020 to March 31, 2021:
(a) Board of Directors;
(b) Audit Committee;
(c) Annual General Meeting;
(d) Extra-ordinary General Meeting;
(e) Nomination and Remuneration Committee;
(f) Stakeholders' Relationship Committee;
(g) Risk Management Committee;
(h) Corporate Social Responsibility Committee;
(i) Finance Committee;
( j) Independent Directors’ Meeting;
(k) Independent Directors’ Committee;
(l) IGF Divestment Committee
Annexure ’C’ to the Board’s Report
121Integrated Annual Report 2020-21
Integrated ReportFinancial statem
entsStatutory Reports
v. Obtained necessary declarations from the directors of the Company;
vi. Obtained and read the policy adopted by the Company for related party transactions;
vii. Obtained the schedule of related party transactions during the year and balances at the year- end.
viii. Obtained and read the minutes of the audit committee meeting where in such related party transactions have been pre-approved by the audit committee; and
ix. Performed necessary inquiries with the management and also obtained necessary specific representations from management.
8. The above-mentioned procedures include examining evidence supporting the particulars in the Corporate Governance Report on a test basis. Further, our scope of work under this report did not involve us performing audit tests for the purposes of expressing an opinion on the fairness or accuracy of any of the financial information or the financial statements of the Company taken as a whole.
Opinion9. Based on the procedures performed by us, as referred in
paragraph 7 above, and according to the information and explanations given to us, we are of the opinion that the Company has complied with the conditions of Corporate Governance as specified in the Listing Regulations, as applicable for the year ended March 31, 2021, referred to in paragraph 1 above.
Other matters and Restriction on Use10. This report is neither an assurance as to the future viability
of the Company nor the efficiency or effectiveness with which the management has conducted the affairs of the Company.
11. This report is addressed to and provided to the members of the Company solely for the purpose of enabling it to comply with its obligations under the Listing Regulations with reference to compliance with the relevant regulations of Corporate Governance and should not be used by any other person or for any other purpose. Accordingly, we do not accept or assume any liability or any duty of care or for any other purpose or to any other party to whom it is shown or into whose hands it may come without our prior consent in writing. We have no responsibility to update this report for events and circumstances occurring after the date of this report.
For B S R & Co. LLP For S R B C & CO LLPChartered Accountants Chartered AccountantsFirm Registration No: 101248W/W-100022 Firm Registration No: 324982E/E300003
Vikas R Kasat Vijay ManiarPartner PartnerMembership No: 105317 Membership No: 36738UDIN: 21105317AAADR3304 UDIN: 21036738AAAADX6757
Mumbai MumbaiMay 24, 2021 May 24, 2021
Annexure ’C’ to the Board’s Report (Contd.)
122 Grasim Industries Limited
Annexure ’D’ to the Board’s ReportConservation of Energy, Technology Absorption and Foreign Exchange Earnings Outgo pursuant to provisions of Section 134 of the Companies Act, 2013 read with the Companies (Accounts) Rules, 2014
A. CONSERVATION OF ENERGY a) The steps taken and impact on conservation of
energy
The Company undertakes various initiatives for energy conservation through continuous improvements in operational efficiency, equipment upgradation, modernisation etc.
Following measures have been taken by different business units of the company:
i) Viscose Staple Fibre (VSF) and Pulp Units
• Improving utilisation of heat available in the system by heat integration of various processes to save steam and power through
− Improving utilisation of heat available in scrubber water by using it for dryer air preheating and Desulph bath heating
− Replacement of chilled water for press lye cooling by cooling tower water
− Utilisation of steam condensate of salt drum dryer for water evaporation in sodium salt Triple Effect Evaporator
− Reducing chilling load in steep lye cooling by installation of PHE for heat integration
− Resistance controller for charcoal based CS2 furnace leading to saving of power & improvement in productivity
− Refrigeration power saving by series operation and reducing load at low temperature.
− Air compressor pressure optimisation to save power.
− CPP Boiler Auto Blowdown: Optimised the DM water consumption & Heat for heating the same in boiler, implemented at one unit.
• Adoption of high efficiency equipment to reduce energy consumption:
− Installation of VFDs in critical and high power applications like dissolvers, MSFE circulation pumps, cutters and filter water pumps
− Replacement of old high power consuming Air conditioners with energy efficient ones and sodium/metal halide lamps with LEDs in phased manner
− FRP Pultruded cooling towers in place of old wooden cooling towers
− Replacing motors with high efficiency motors in cooling towers, WTP
− Steam ejector replacement with new design for salt crystallisation
− Adoption of high efficiency helical gear box in place of worm & worm wheel reduction gear box in viscose dissolvers
− Implementation of non-metallic wear rings in Boiler feed pump (high pressure-multi stage centrifugal pumps) of power plant for reduction of power consumption
• Process improvement to save energy
− Installation of additional Biogas reactor to utilise left over Pre Hydrolysis liquor to generate Biogas and save furnace oil
− Reducing salt mother liquor purging in crystalliser to reduce energy loss
− Optimising viscose ripening loop to minimise double pumping
− Balancing of exhaust air blowers to minimise power consumption in spinning section
− Optimisation of Pulping cycle time, mixing RPM & batch preparations logic to minimise power consumption
− Optimisation of viscose dissolving cycle time & process logic to minimise the power consumption
− Elimination of air conditioning requirement by insulating the equipment & piping in Viscose ripening area.
− Optimisation of residence time of Fiber in Dryers for effective use of steam
− Replacing high power consumption chillers with low power consumption Chillers & its economical utilisation
− Optimisation of pulping cycle time, mixing RPM & batch preparations logic to minimise power consumption
− Optimisation of Viscose dissolving cycle time & process logic to minimise power consumption
− Optimisation of steam in recovery trough to increase Fiber production
123Integrated Annual Report 2020-21
Integrated ReportFinancial statem
entsStatutory Reports
ii) Chemical Units
• Procured and installed IE-3 Grade Motors by replacing the Old – Non-IE and below IE-2– Standard with as available in the Market by best of manufactures.
• Adopted and replaced the existing conventional lighting fixtures only with LED technology for all kind of Lighting fixtures in plant.
• Migration to New Electrolysis Process with 6th Generation Zero Gap (Gap-less) to reduce the power consumption significantly to well below 2100kwh/ton.
• Reduction in power consumption for chlorine compressors by derating of existing compressors.
• Various initiatives have also taken in captive power plant like Successful Commissioning of New TG-3.
• Combine heat rate of TG’s, decreased by 300 Kcal/Kwh (w.e.f. 31/08/2020)
• Re-membraning of 6TH GEN electrolyser resulted in saving of cell power by 90 kwh/MT and 3172 kwh/per day at Renukoot and Rehla units respectively
iii) Textile Units
• Utilities:
− Variable Frequency Drive (VFD) installed in 17 Nos TFO machine at Worsted dept.
− Installed 1000 Nos of LED light at plant.
− Replacement of low efficiency motor with high efficiency IE-3 Motor.
• Thermal Energy:
− Replacement of electrical heating by steam heating in Autoclave Machine at worsted plant which result in saving of high electrical energy.
iv) VFY Units
• Installation of Energy Efficient Feed Water Heater for Boiler Feed Water Heating. (2080 kwh/Day (Extra PGS Power Generation)
• Installation of Mist Condenser for CSY Degasser to eliminate the Electric Driven Vacuum Pump.
• Automised closed loop control system for Turbine Back pressure control to improve operational efficiency of Turbine.
• Installation of VFD on Ageing Air washer fan no.1 to control air flow as per seasonal requirement.
• Spinning machine pot motors Frequency (HF) optimised by 1 Hz on 66 machines.
• Replacement of conventional Tube Lights with LED lights.
• Surplus Fan and tube light removed in plant premises.
v) Fertiliser Unit
• Replacement of conventional 80 W HPSV lights with LED lights in Plant area.
• Control System Performance improvement by control loops tuning to reduce Process fluctuations.
• Upgradation of Advance Control System in Ammonia and Urea plant is in progress.
• New design RG Boiler procured to improve operational efficiency and to be installed in FY 2021-22.
vi) Insulator Units
• Reduction of specific fuel consumption by adjusting the Kiln profile & effective utilisation of the excess fuel gases inside the kiln and optimisation of burner air fuel ratio
• Modification of kiln profile (hot air temperature increase in cooling zone) and effective utilisation of hot air temperature in channel dryer to reduce the burner running time
• Replacement of old type Hot air generator by new efficient technology HAG in channel dryer to reduce fuel consumption.
• Renovation of primary dryer P3 to prevent heat loss through walls
• Reduction in Thermopack burner cut of f temperature to reduce fuel consumption.
• Prevention of heat loss through Kiln walls by periodic thermography and corrective measures
• Installation of energy efficient motors on equipment
• Timers installed on Agitators of Slip house to run as per need.
vii) Epoxy Unit
• VFD installed in ETP cooling tower pumps and Fans.
• Segrigated Low and high air requirment and installed low air pressure system at ETP (Stopped high pressure consumptionat ETP)
Annexure ’D’ to the Board’s Report (Contd.)
124 Grasim Industries Limited
High speed Decantor machine replaced with Volute dewatering system in ETP - Reduce power load from 5 KW to 1 KW
b) The steps taken by the company for utilising alternate sources of energy
i) Viscose Staple Fibre (VSF) and Pulp Units
• The company has co-gen power plants using steam for manufacturing process as well as power generation.
• Kharach is planning to start using Agri waste in boilers in mixing with Coal
• By process optimisation and using 3 R (Reduce, Recycle and Reuse) fresh water reduced to ̃ 4% for fibre manufacturing in FY 2020-21 compared to FY 2018-19. However, consumption was on higher side last year on account of complete plant shutdowns and start up during Covid pandemic
ii) Chemical Units
Installation of Wind Power Plant under captive scheme by signing agreement with M/s CleanMax for 32.4 MVA, this scheme will provide total units of approx. 10,00,00,000 Units/year (11.415 MW), and generation started from March 2021, Installation of Solar Power Plant of 17 MW, PPA with M/s Aditya Birla Renewables Limited at Karwar unit. Letter of Intent is issued to ABREL to purchase 18 MW solar power. Used RE Solar Power of 4533800 Kwh units through IEX in Oct’20 and Nov’20 at Ganjam unit.
iii) Textile Units
3 MWp roof top solar power plant installed & commissioned at the various location of plant.
iv) Insulator Units
Business has entered into two PPA for 1.44 Mw each for Solar and wind power
c) The capital investment on energy conservation equipments
Total investment made C24.14 Cr.
B. TECHNOLOGY ABSORPTION a) The efforts made towards technology
absorption i) Viscose Staple Fibre (VSF) and Pulp Units
• Capability of commercialisation of in house developed new specialty products like Dye Catcher,
Shortcut fibre and Liva Eco were developed after successful trials at customer end
• Adopted latest equipment on two old lines at Nagda during major overhauling to improve fibre quality
• Planning to Implement Zero liquid discharge technology for the first time in the VSF industry by recycling of effluent through installation of Reverse Osmosis technology for the first time in VSF to reduce fresh water consumption
• Implemented environment friendly Oxygen Delignification process in place of chlorine bleaching for pulp plant resulting in reduction in water consumption and effluent by 25% and improving pulp quality
• In process to adopt waste gas recovery technology first Vilayat and then to Kharach, NGD to improve environment footprint
• Digitalisation:
Power plant optimiser: For savings on opportunity cost from the real time operational parameters, implemented at 2 units
Predictive Models for Quality Improvement
Multi Stage Flash Evaporator Optimisation model
Digital Twin – Chiller – Real Time Monitoring
ii) Chemical Units
• Installed 10 KVA Rooftop Solar Plant to boost the generation of Renewal Energy in the Plant and Colony premises, proposed to opt the Combo Technology of CCU & CSF in optimising and reducing the Steam consumption apparently from 560 Kg/ton to 420 Kg/ton by proper management of condensation and heat recovery in both systems at Nagda unit
iii) VFY Units
• Development of 50/6, 75/6 yarn of CSY for Organza segment.
• Trial module of 4 position electronic winders installed for superfine denier in CSY.
• Mist type humidification system installed in CSY Air Washers for improved humidity control (CSY new machines 51 to 66).
• Mist Cooling tower system installed for utilisation of ETP treated water in CSY degassers vacuum system.
125Integrated Annual Report 2020-21
Integrated ReportFinancial statem
entsStatutory Reports
• Capacitor back-up VFD panels installed for Tyrecord machines and Viscose spinning supply pumps to avoid interruption during power supply fluctuations.
iv) Epoxy Unit
• Agitator modification done to enhance mixing efficiency in RD reactor which reduces Caustic consumption from 465 kg/MT to 460 Kg/MT
• Agitator modification done to enhance mixing efficiency in solution cut system which has improved consistency in product quality
• Install Volute instead of high speed machine (Decantor) has reduce the moisture level has help to reduce non hazardous waste generation
v) Insulator Units
• Modification and upgradation of SCADA in Kiln K5 for Kiln pushing handling system to reduce the breakdown due to pushing related problems and ease of operation.
• Modification of ceramic coating application through equipment upgradation.
• Latest 3D Simulation Software for Electric Field Magnitude Analysis of Composite Long Rod Insulators.
b) The benefits derived like product improvement, cost reduction, product development or import substitution
i) Fertiliser Unit:
• The NPK soil and crop specific (CFG) and Water-Soluble Fertiliser introduced are cost effective in production and superior in quality resulting in average 8 to 15% increase in yield for various crops
• Organic Fertiliser (Oorja) specific grades for Tea and Apples is being evaluated for further expansion.
Comparative assessment with competitor samples shows better performance at competitive cost making it first choice of farmers
• Testing protocol for seed and agrochemical procurement has been introduced. The introduction has enabled Shakithman quality and standard to be delivered to farmer.
• Inhouse developed Zinca with 35.5% Zn and Cafura (organic liquid Fertiliser) have performed better in research farm trials compared to traded products.
ii) Insulator Units
• Replacement of imported clay with indigenous clay.
• Design optimisation of insulators.
• Quality improvement and achieving narrow range of failure strength for New Markets.
c) In case of imported technology (imported during the last three years reckoned from the beginning of the financial year):
NIL
d) The expenditure incurred on Research and Development:
Expenditure D in CroreFor Inhouse R&D a. Capital 13.71b. Revenue 58.89Contribution to Scientific Research Company
26.15
Total R&D Expenses 98.75
C. FOREIGN EXCHANGE EARNINGS AND OUTGO - Foreign Exchange used: C4,248.46 Crore - Foreign Exchange earned: C1,929.46 Crore
Annexure ’D’ to the Board’s Report (Contd.)
126 Grasim Industries Limited
Annexure ’E’ to the Board’s Report
FORM NO. MR-3SECRETARIAL AUDIT REPORT
FOR THE FINANCIAL YEAR ENDED 31ST MARCH 2021[Pursuant to section 204(1) of the Companies Act, 2013 and Rule 9 of the Companies
(Appointment and Remuneration of Managerial Personnel) Rules, 2014]
To, The Members of,Grasim Industries LimitedBirlagram, Nagda Ujjain, Madhya Pradesh– 456331
We have conducted the Secretarial Audit of the compliance of applicable statutory provisions and the adherence to good corporate practices by Grasim Industries Limited having CIN:-L17124MP1947PLC000410 (hereinafter called the ‘Company’) for the financial year ended on 31st March 2021 (the “Audit Period”).
We conducted the Secretarial Audit in a manner that provided us a reasonable basis for evaluating the Company’s corporate conducts/statutory compliances and expressing our opinion thereon.
We are issuing this report based on:
(i) Our verification of the Company’s books, papers, minutes books, forms and returns filed, records provided through data room and other records maintained by the Company;
(ii) Compliance certificates confirming compliance with Corporate laws applicable to the Company given by the Key Managerial Personnel/Senior Managerial Personnel of the Company and taken on record by the Audit Committee/Board of Directors; and
(iii) Representations made, documents produced and information provided by the Company, its officers, agents and authorised representatives during our conduct of Secretarial Audit
We hereby report that, in our opinion, during the Audit Period covering the financial year ended on 31st March 2021, the Company has:
(i) Complied with the statutory provisions listed hereunder; and
(ii) Board processes and compliance mechanisms are in place to the extent, in the manner and subject to the reporting made hereinafter.
The members are requested to read this report along with our letter of even date annexed to this report as Annexure-A.
1. COMPLIANCE WITH SPECIFIC STATUTORY PROVISIONS
We further report that:
1.1 We have examined the books, papers, minutes books, forms and returns filed and other records maintained by the Company during the year according to the applicable provisions/clauses of:
(i) The Companies Act, 2013 (the “Act”) and the Rules made thereunder;
(ii) The Securities Contracts (Regulation) Act, 1956 (‘SCRA’) and the Rules made thereunder;
(iii) The Depositories Act, 1996 and the Regulations and Bye-laws framed thereunder;
(iv) Foreign Exchange Management Act (FEMA), 1999 and the Rules and Regulations made thereunder to the extent of External Commercial Borrowings transferred from the erstwhile Aditya Birla Nuvo Limited pursuant to the Scheme of Arrangement and Overseas Direct Investment;
(v) The following Regulations and Guidelines prescribed under the Securities and Exchange Board of India Act, 1992 (‘SEBI Act’)
(a) The Securities and Exchange Board of India (Substantial Acquisition of Shares and Takeovers) Regulations, 2011;
(b) The Securities and Exchange Board of India (Prohibition of Insider Trading) Regulations, 2015;
(c) The Securities and Exchange Board of India (Share Based Employee Benefits) Regulations, 2014;
127Integrated Annual Report 2020-21
Integrated ReportFinancial statem
entsStatutory Reports
(d) Securities and Exchange Board of India (Listing Obligations and Disclosure Requirements) Regulations, 2015;
(e) Securities and Exchange Board of India (Depositories and Participants) Regulations, 2018;
(f) The Securities and Exchange Board of India (Registrars to an Issue and Share Transfer Agents) Regulations, 1993 regarding the Companies Act and dealing with client;
(g) The Securities and Exchange Board of India (Issue and Listing of Debt securities) Regulations, 2008;
(vi) Secretarial Standards relating to Board Meetings and General Meetings issued by The Institute of Company Secretaries of India (Secretarial Standards).
1.2 During the period under review:
(i) The Company has complied with the all the applicable provisions of all the aforesaid Acts, Rules, Regulations, Guidelines and Secretarial Standards as mentioned above.
(ii) Generally complied with the applicable provisions/clauses of:
(a) FEMA to the extent of External Commercial Borrowings and Overseas Direct Investment mentioned under paragraph 1.1 (iv) and
(b) The Secretarial Standards on meetings of Board of Directors (SS-1) and on General Meetings (SS-2) mentioned under paragraph 1.1 (vi) above, applicable to the meetings of the Board, Committees constituted by the Board held during the year, the 73rd Annual General Meeting (AGM) held on 14th September 2020. The compliance of the provisions of the Rules made under the Act with regard to participation of Directors through video conference for the Board/Committee meeting(s) held during the year, were verified based on the minutes of the meetings provided by the Company.
1.3 During the audit period under review, provisions of the following Act/Regulations were not applicable to the Company
(i) Foreign Exchange Management Act, 1999 and the rules and regulations made thereunder to the extent of Foreign Direct Investment;
(ii) The Securities and Exchange Board of India (Issue of Capital and Disclosure Requirements) Regulations, 2018;
(iii) The Securities and Exchange Board of India (Delisting of Equity Shares) Regulations, 2009; and
(iv) The Securities and Exchange Board of India (Buyback of Securities) Regulations, 2018
1.4 We have also examined, on test-check basis, the relevant documents and records maintained by the Company and provided to us with respect to the following laws which were applicable to the Company:-
a) The Environment Protection Act, 1986; and
b) The Sexual Harassment of Women at Workplace (Prevention, Prohibition and Redressal) Act, 2013
2. BOARD PROCESSES: We further report that:
2.1 The Board of Directors of the Company as on 31st March 2021 comprised of:
(v) One Executive Director;
(vi) Five Non-Executive Directors including a Women Director; and
(vii) Six Non-Executive Independent Directors, including a Woman Independent Director.
2.2 The processes relating to the following changes in the composition of the Board of Directors and Key Managerial Personnel during the year were carried out in compliance with the provisions of the Act and SEBI (Listing Obligations and Disclosure Requirements), Regulations 2015:
i. Ms. Usha Sangwan (DIN: 02609263), Non-Executive Director of the Company, resigned from the Board of Directors with effect from 16th May 2020.
ii. Dr. Santrupt Misra (DIN: 00013625) was appointed as the Non-Executive Director, on the Board of the Company with effect from 13th June 2020 and his appointment was regularised at the 73rd Annual
Annexure ’E’ to the Board’s Report (Contd.)
128 Grasim Industries Limited
General Meeting (AGM) of the Company held on 14th September 2020.
iii. Mr. Vipin Anand (DIN: 05190124) was appointed as the Non-Executive Director on the Board of the Company w.e.f. 13th August 2020 and his appointment was regularised at the 73rd AGM of the Company held on 14th September 2020.
iv. Re-appointment and continuation of Mrs. Rajashree Birla (DIN: 00022995) as a director liable to retire by rotation was approved by the members at the 73rd AGM held on 14th September 2020.
v. Re-appointment and continuation of Mr. Shailendra K. Jain (DIN: 00022454) as a Director of the Company, liable to retire by rotation was approved by the members at the 73rd AGM of the Company held on 14th September 2020.
vi. The Board of Directors of the Company at its meeting held on 12th February 2021 re-appointed Mr. Dilip Gaur (DIN: 02071393) as the Managing Director of the Company for a period of one year with effect from 1st April 2021, subject to the approval of the members to be obtained at the ensuing Annual General Meeting of the Company.
vii. Mr. Sailesh Daga was appointed as the Company Secretary and Compliance Officer of the Company with effect from 1st April 2021. Mrs. Hutokshi Wadia, ceased to be the Company Secretary and Compliance Officer of the Company with effect from close of business hours on 31st March 2021.
2.3 Adequate notices were given to all the directors to enable them to plan their schedules for the Board meeting(s), except for few meetings which were convened at a shorter notice to transact urgent business, which were compliant with the provisions of the Act as prescribed.
2.4 Notices for the Board meetings was sent to all the directors at least seven days in advance except for the few meetings convened at a shorter notice, at which more than one Independent Director was present as required under section 173 (3) of the Act and SS-1.
2.5 Agenda and detailed notes on agenda were generally sent to all the directors at least seven days before the Board meetings, except for few meetings which were convened at a shorter notice.
2.6 A system exists for directors to seek and obtain further information and clarifications on the agenda items before the meetings and for their meaningful participation at the meetings.
2.7 We note from the minutes examined that, at the Board meetings held during the year:
(i) Decisions were carried through the majority of the Board; and
(ii) No dissenting views were expressed by any Board member on any of the subject matters discussed, which were required to be captured and recorded as part of the minutes.
3. COMPLIANCE MECHANISM There are reasonably adequate systems and processes
prevalent in the Company, which are commensurate with its size and operations, to monitor and ensure compliance with all applicable laws, rules, regulations and guidelines.
4. SPECIFIC EVENTS/ACTIONS 4.1 During the year under review, the following specific events/
actions having a major bearing on the Company’s affairs took place:-
1. The Board of Directors of the Company, at its meeting held on 12th November 2020 approved the transfer of the Company’s business of manufacture, trading and sale of urea, customised fertilisers, agri-inputs, crop protection, plant and soil health products and specialty fertilisers (“Fertiliser Business”), as a going concern, on a slump sale basis, to Indorama India Pvt. Ltd. (“IIPL”) through a Scheme of Arrangement between the Company and IIPL and their respective shareholders and creditors (Scheme) under Sections 230-232 of the Companies Act, 2013 and other provisions of applicable law, for a lump sum consideration of C2,649 Crore, to be paid by IIPL to the Company, subject to necessary adjustments pertaining to working capital and capex as mentioned in the Scheme to be carried out upon the Scheme becoming effective.
The Scheme has been approved by CCI, Stock Exchanges and SEBI. The scheme was also approved by the shareholders and creditors of the Company at their meetings held on 16th April 2021. NCLT Kolkata Bench vide its order dated 26th March 2021 dispensed with the requirements of holding the meetings of shareholders and creditors of IIPL.
Petition for approval of the Scheme has been filed with jurisdictional NCLTs and hearing for the same is pending.
129Integrated Annual Report 2020-21
Integrated ReportFinancial statem
entsStatutory Reports
2. At the Extraordinary General Meeting held on 22nd February 2021 members of the Company approved alteration to the Object clause of the MOA so as to enable the Company to foray into paints business by approving addition of sub-clauses 3(m), 3(n), 3(o) and 3(p) to the existing Clause 3 of the MOA of the Company.
3. The Company executed a Limited Liability Partnership (LLP) agreement with Cleanmax Enviro Energy Solutions Pvt. Ltd. (Generator Partner) and Power Purchase Agreement with CleanMax Power 3 LLP (Power Producer) for the purpose of establishing, operating and maintaining the 32.4 MW wind power plant in the State of Karnataka wherein the power generated will be supplied exclusively to the Company’s unit in Karnataka under the Group Captive Scheme. The Company has invested C19.09 Crore for acquiring 26% stake in the LLP and the Generator Partner has invested C54.33 Crore for acquiring 74% stake in said LLP.
4. The Company issued and allotted 5,000 Unsecured, Redeemable Non-Convertible Debentures (NCDs) of C10,00,000 each on private placement basis aggregating to C500 Crore, listed on Wholesale Debt Market segment of BSE Ltd.
5. During the year under review the Company subscribed to 1,74,97,080 equity shares of Aditya Birla Power Composites Limited, a Joint Venture Company, of C10 each at par aggregating to C17. 49 Crore issued on ‘Rights’ basis.
6. The Company has subscribed to 1,02,13,318 equity shares of Aditya Birla Fashion and Retail Limited (ABFRL) at a price of C110 per share aggregating to C112.34 Crore pursuant to Rights Issue made by ABFRL.
7. The Company has subscribed to 4,33,47,500 equity shares of C10 each of Aditya Birla Renewables Limited at a price of C10 each, at par, on rights basis, aggregating to C43.34 Crore.
8. At the 73rd AGM of the Company held on 14th September 2020, members of the Company inter-alia, approved the following:
• alteration to the Object Clause of the Memorandum of Association (‘MOA’) of the Company by replacing the existing clause 4.L of the MOA with revised Clause 4.L.
• deletion of article 63A to 63D, appearing immediately after article 63 in the Articles of Association (‘AOA’) of the Company.
9. During the year under review, the Company issued and allotted 2,45,906 equity shares of C2 each, pursuant to exercise of stock options/RSUs in terms of the Employee Stock Option Scheme in various tranches.
10. During the year under review, no complaint was received under ‘The Sexual Harassment of Women at Workplace (Prevention, Prohibition and Redressal) Act, 2013’. However, one complaint which was outstanding at the beginning of the year was resolved during the year.
11. During the year under review, four complaints were received from the whistle blowers of which three complaints were closed during the year and one complaint was resolved subsequently.
12. The Competition Commission of India (CCI) had passed an order under section 4 of the Competition Act, 2002 dated 16th March 2020, imposing a penalty of C301.61 Crore on the Company in respect of its domestic Man-Made Fibre turnover. The Company had filed an appeal against the order before the National Company Law Appellate Tribunal (NCLAT) and has obtained a stay by depositing C30 Crore with NCLAT on 11th November 2020. The matter is being heard by NCLAT.
For BNP & AssociatesCompany Secretaries
[Firm Regn. No. P2014MH037400]
B. Narasimhan Partner
FCS No.: 1303COP No.: 10440
Place: Mumbai PR No.: 637/2019Date: 24th May 2021 UDIN: F001303C000362521
Annexure ’E’ to the Board’s Report (Contd.)
130 Grasim Industries Limited
Annexure A to the Secretarial Audit Report for the financial year ended 31st March 2021
To,The Members of,Grasim Industries Limited
Our Secretarial Audit Report of even date is to be read along with this letter.
1. The Company’s management is responsible for maintenance of secretarial records and compliance with the provisions of corporate and other applicable laws, rules, regulations and standards. Our responsibility is to express an opinion on the secretarial records produced for our audit.
2. We have followed such audit practices and processes as we considered appropriate to obtain reasonable assurance about the correctness of the contents of the secretarial records.
3. We have considered compliance related actions taken by the company based on independent legal/professional opinion obtained as being in compliance with law.
4. We have verified the secretarial records furnished to us on a test basis to see whether the correct facts are reflected therein. We have also examined the compliance procedures followed by the Company. We believe that the processes
and practices we followed, provide a reasonable basis for our opinion.
5. We have not verified the correctness and appropriateness of financial records and Books of Accounts of the Company.
6. We have obtained the management’s representation about the compliance of laws, rules and regulations and happening of events, wherever required.
7. Our Secretarial Audit Report is neither an assurance as to the future viability of the Company nor of the efficacy or effectiveness with which the management has conducted the affairs of the Company.
For BNP & AssociatesCompany Secretaries
[Firm Regn. No. P2014MH037400]
B. Narasimhan Partner
FCS No.: 1303COP No.: 10440
Place: Mumbai PR No.: 637/2019Date: 24th May 2021 UDIN: F001303C000362521
131Integrated Annual Report 2020-21
Integrated ReportFinancial statem
entsStatutory Reports
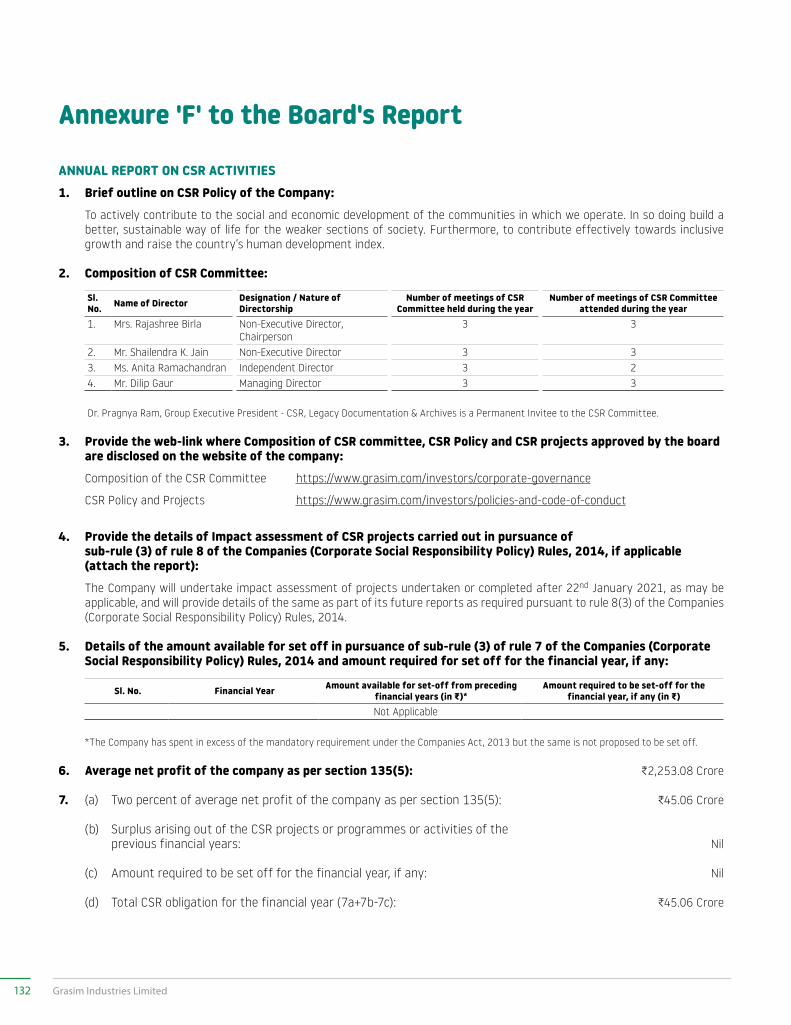
Annexure 'F' to the Board's Report
ANNUAL REPORT ON CSR ACTIVITIES1. Brief outline on CSR Policy of the Company: To actively contribute to the social and economic development of the communities in which we operate. In so doing build a
better, sustainable way of life for the weaker sections of society. Furthermore, to contribute effectively towards inclusive growth and raise the country’s human development index.
2. Composition of CSR Committee:
Sl. No. Name of Director Designation / Nature of
DirectorshipNumber of meetings of CSR
Committee held during the yearNumber of meetings of CSR Committee
attended during the year1. Mrs. Rajashree Birla Non-Executive Director,
Chairperson3 3
2. Mr. Shailendra K. Jain Non-Executive Director 3 33. Ms. Anita Ramachandran Independent Director 3 24. Mr. Dilip Gaur Managing Director 3 3
Dr. Pragnya Ram, Group Executive President - CSR, Legacy Documentation & Archives is a Permanent Invitee to the CSR Committee.
3. Provide the web-link where Composition of CSR committee, CSR Policy and CSR projects approved by the board are disclosed on the website of the company:
Composition of the CSR Committee https://www.grasim.com/investors/corporate-governance
CSR Policy and Projects https://www.grasim.com/investors/policies-and-code-of-conduct
4. Provide the details of Impact assessment of CSR projects carried out in pursuance of sub-rule (3) of rule 8 of the Companies (Corporate Social Responsibility Policy) Rules, 2014, if applicable (attach the report):
The Company will undertake impact assessment of projects undertaken or completed after 22nd January 2021, as may be applicable, and will provide details of the same as part of its future reports as required pursuant to rule 8(3) of the Companies (Corporate Social Responsibility Policy) Rules, 2014.
5. Details of the amount available for set off in pursuance of sub-rule (3) of rule 7 of the Companies (Corporate Social Responsibility Policy) Rules, 2014 and amount required for set off for the financial year, if any:
Sl. No. Financial Year Amount available for set-off from preceding financial years (in G)*
Amount required to be set-off for the financial year, if any (in G)
Not Applicable
*The Company has spent in excess of the mandatory requirement under the Companies Act, 2013 but the same is not proposed to be set off.
6. Average net profit of the company as per section 135(5): C2,253.08 Crore
7. (a) Two percent of average net profit of the company as per section 135(5): C45.06 Crore
(b) Surplus arising out of the CSR projects or programmes or activities of the previous financial years: Nil
(c) Amount required to be set off for the financial year, if any: Nil
(d) Total CSR obligation for the financial year (7a+7b-7c): C45.06 Crore
132 Grasim Industries Limited
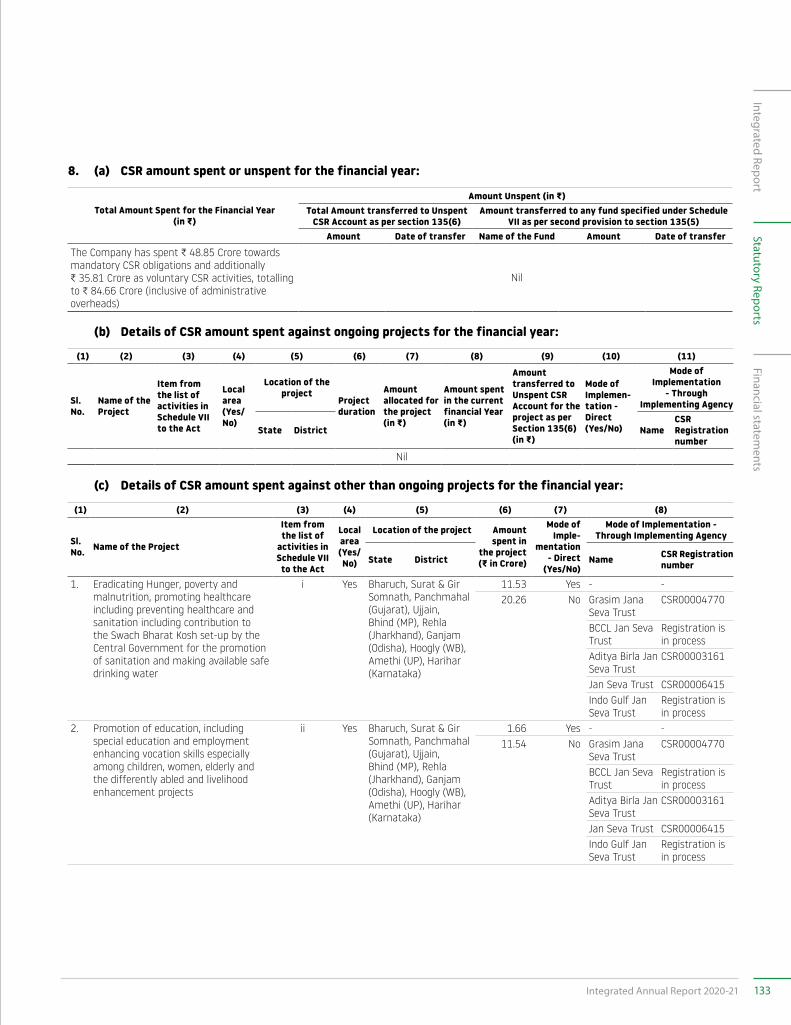
8. (a) CSR amount spent or unspent for the financial year:
Total Amount Spent for the Financial Year (in G)
Amount Unspent (in G)Total Amount transferred to Unspent
CSR Account as per section 135(6)Amount transferred to any fund specified under Schedule
VII as per second provision to section 135(5)Amount Date of transfer Name of the Fund Amount Date of transfer
The Company has spent C 48.85 Crore towards mandatory CSR obligations and additionally C 35.81 Crore as voluntary CSR activities, totalling to C 84.66 Crore (inclusive of administrative overheads)
Nil
(b) Details of CSR amount spent against ongoing projects for the financial year:
(1) (2) (3) (4) (5) (6) (7) (8) (9) (10) (11)
Sl. No.
Name of the Project
Item from the list of activities in Schedule VII to the Act
Local area (Yes/No)
Location of the project
Project duration
Amount allocated for the project (in G)
Amount spent in the current financial Year (in G)
Amount transferred to Unspent CSR Account for the project as per Section 135(6) (in G)
Mode of Implemen-tation - Direct (Yes/No)
Mode of Implementation
- Through Implementing Agency
State District NameCSR Registration number
Nil
(c) Details of CSR amount spent against other than ongoing projects for the financial year:
(1) (2) (3) (4) (5) (6) (7) (8)
Sl. No. Name of the Project
Item from the list of
activities in Schedule VII to the Act
Local area (Yes/No)
Location of the project Amount spent in
the project (G in Crore)
Mode of Imple-
mentation - Direct
(Yes/No)
Mode of Implementation - Through Implementing Agency
State District Name CSR Registration number
1. Eradicating Hunger, poverty and malnutrition, promoting healthcare including preventing healthcare and sanitation including contribution to the Swach Bharat Kosh set-up by the Central Government for the promotion of sanitation and making available safe drinking water
i Yes Bharuch, Surat & Gir Somnath, Panchmahal (Gujarat), Ujjain, Bhind (MP), Rehla (Jharkhand), Ganjam (Odisha), Hoogly (WB), Amethi (UP), Harihar (Karnataka)
11.53 Yes - -20.26 No Grasim Jana
Seva TrustCSR00004770
BCCL Jan Seva Trust
Registration is in process
Aditya Birla Jan Seva Trust
CSR00003161
Jan Seva Trust CSR00006415Indo Gulf Jan Seva Trust
Registration is in process
2. Promotion of education, including special education and employment enhancing vocation skills especially among children, women, elderly and the differently abled and livelihood enhancement projects
ii Yes Bharuch, Surat & Gir Somnath, Panchmahal (Gujarat), Ujjain, Bhind (MP), Rehla (Jharkhand), Ganjam (Odisha), Hoogly (WB), Amethi (UP), Harihar (Karnataka)
1.66 Yes - -11.54 No Grasim Jana
Seva TrustCSR00004770
BCCL Jan Seva Trust
Registration is in process
Aditya Birla Jan Seva Trust
CSR00003161
Jan Seva Trust CSR00006415Indo Gulf Jan Seva Trust
Registration is in process
133Integrated Annual Report 2020-21
Integrated ReportFinancial statem
entsStatutory Reports
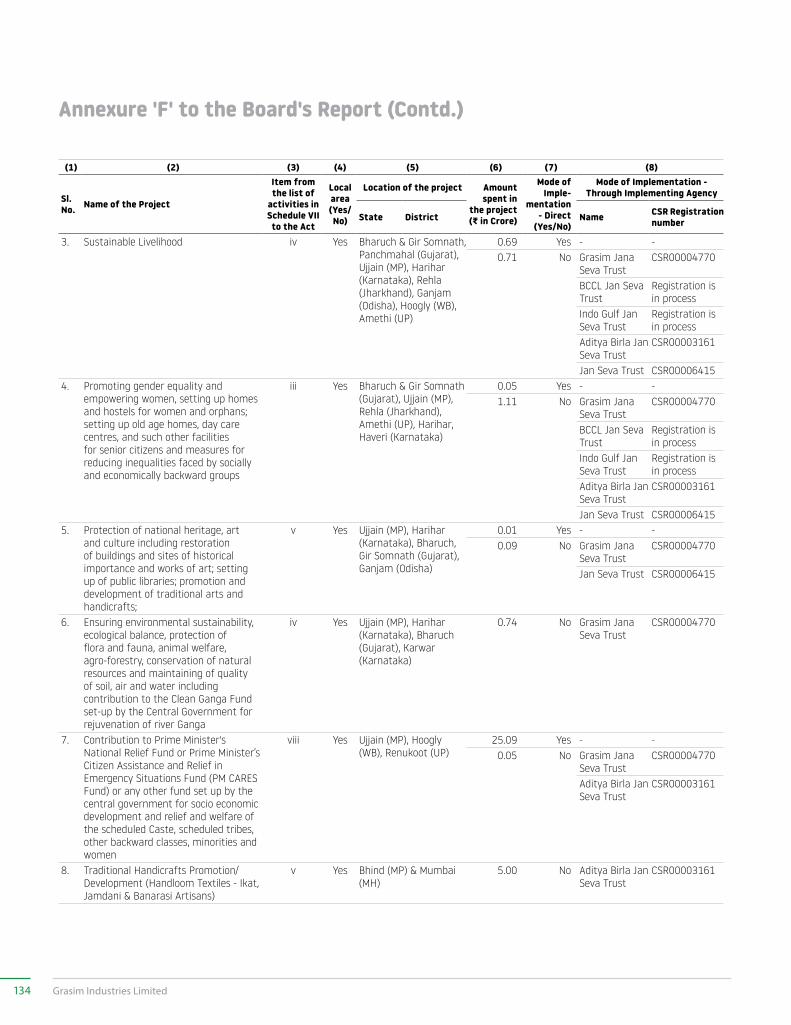
(1) (2) (3) (4) (5) (6) (7) (8)
Sl. No. Name of the Project
Item from the list of
activities in Schedule VII to the Act
Local area (Yes/No)
Location of the project Amount spent in
the project (G in Crore)
Mode of Imple-
mentation - Direct
(Yes/No)
Mode of Implementation - Through Implementing Agency
State District Name CSR Registration number
3. Sustainable Livelihood iv Yes Bharuch & Gir Somnath, Panchmahal (Gujarat), Ujjain (MP), Harihar (Karnataka), Rehla (Jharkhand), Ganjam (Odisha), Hoogly (WB), Amethi (UP)
0.69 Yes - -0.71 No Grasim Jana
Seva TrustCSR00004770
BCCL Jan Seva Trust
Registration is in process
Indo Gulf Jan Seva Trust
Registration is in process
Aditya Birla Jan Seva Trust
CSR00003161
Jan Seva Trust CSR000064154. Promoting gender equality and
empowering women, setting up homes and hostels for women and orphans; setting up old age homes, day care centres, and such other facilities for senior citizens and measures for reducing inequalities faced by socially and economically backward groups
iii Yes Bharuch & Gir Somnath (Gujarat), Ujjain (MP), Rehla (Jharkhand), Amethi (UP), Harihar, Haveri (Karnataka)
0.05 Yes - -1.11 No Grasim Jana
Seva TrustCSR00004770
BCCL Jan Seva Trust
Registration is in process
Indo Gulf Jan Seva Trust
Registration is in process
Aditya Birla Jan Seva Trust
CSR00003161
Jan Seva Trust CSR000064155. Protection of national heritage, art
and culture including restoration of buildings and sites of historical importance and works of art; setting up of public libraries; promotion and development of traditional arts and handicrafts;
v Yes Ujjain (MP), Harihar (Karnataka), Bharuch, Gir Somnath (Gujarat), Ganjam (Odisha)
0.01 Yes - -0.09 No Grasim Jana
Seva TrustCSR00004770
Jan Seva Trust CSR00006415
6. Ensuring environmental sustainability, ecological balance, protection of flora and fauna, animal welfare, agro-forestry, conservation of natural resources and maintaining of quality of soil, air and water including contribution to the Clean Ganga Fund set-up by the Central Government for rejuvenation of river Ganga
iv Yes Ujjain (MP), Harihar (Karnataka), Bharuch (Gujarat), Karwar (Karnataka)
0.74 No Grasim Jana Seva Trust
CSR00004770
7. Contribution to Prime Minister's National Relief Fund or Prime Minister’s Citizen Assistance and Relief in Emergency Situations Fund (PM CARES Fund) or any other fund set up by the central government for socio economic development and relief and welfare of the scheduled Caste, scheduled tribes, other backward classes, minorities and women
viii Yes Ujjain (MP), Hoogly (WB), Renukoot (UP)
25.09 Yes - -0.05 No Grasim Jana
Seva TrustCSR00004770
Aditya Birla Jan Seva Trust
CSR00003161
8. Traditional Handicrafts Promotion/ Development (Handloom Textiles - Ikat, Jamdani & Banarasi Artisans)
v Yes Bhind (MP) & Mumbai (MH)
5.00 No Aditya Birla Jan Seva Trust
CSR00003161
Annexure 'F' to the Board's Report (Contd.)
134 Grasim Industries Limited
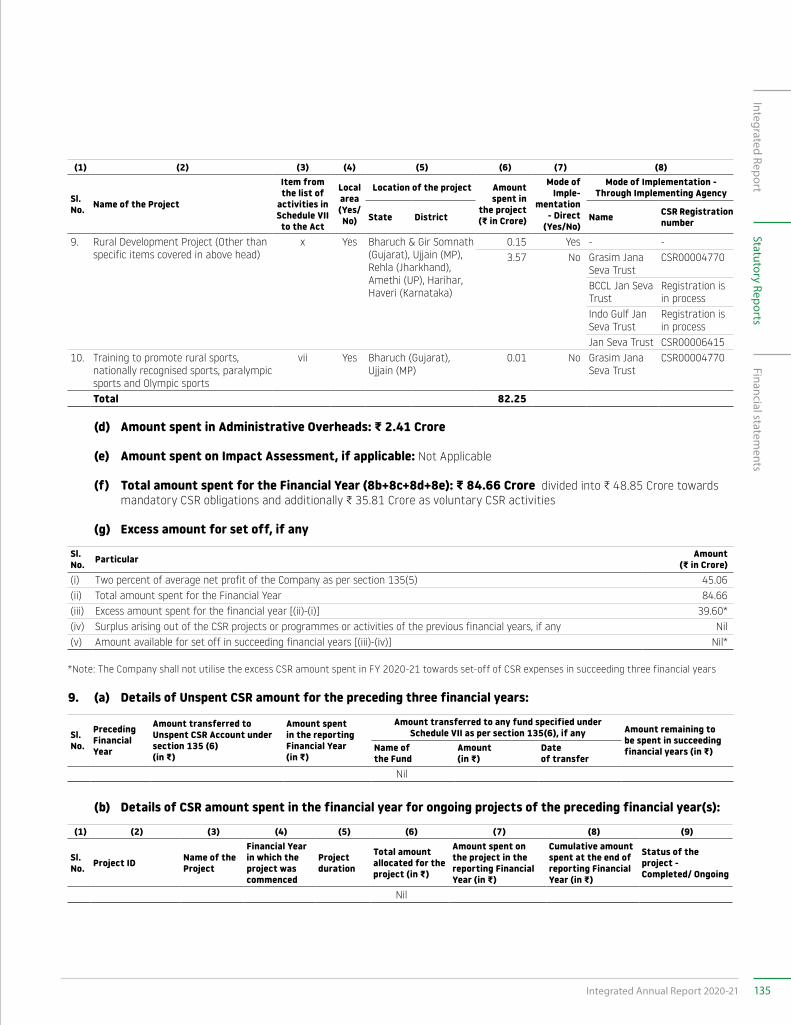
(1) (2) (3) (4) (5) (6) (7) (8)
Sl. No. Name of the Project
Item from the list of
activities in Schedule VII to the Act
Local area (Yes/No)
Location of the project Amount spent in
the project (G in Crore)
Mode of Imple-
mentation - Direct
(Yes/No)
Mode of Implementation - Through Implementing Agency
State District Name CSR Registration number
9. Rural Development Project (Other than specific items covered in above head)
x Yes Bharuch & Gir Somnath (Gujarat), Ujjain (MP), Rehla (Jharkhand), Amethi (UP), Harihar, Haveri (Karnataka)
0.15 Yes - -3.57 No Grasim Jana
Seva TrustCSR00004770
BCCL Jan Seva Trust
Registration is in process
Indo Gulf Jan Seva Trust
Registration is in process
Jan Seva Trust CSR0000641510. Training to promote rural sports,
nationally recognised sports, paralympic sports and Olympic sports
vii Yes Bharuch (Gujarat), Ujjain (MP)
0.01 No Grasim Jana Seva Trust
CSR00004770
Total 82.25
(d) Amount spent in Administrative Overheads: G 2.41 Crore
(e) Amount spent on Impact Assessment, if applicable: Not Applicable
(f) Total amount spent for the Financial Year (8b+8c+8d+8e): G 84.66 Crore divided into C 48.85 Crore towards mandatory CSR obligations and additionally C 35.81 Crore as voluntary CSR activities
(g) Excess amount for set off, if any
Sl. No. Particular Amount
(G in Crore)(i) Two percent of average net profit of the Company as per section 135(5) 45.06(ii) Total amount spent for the Financial Year 84.66(iii) Excess amount spent for the financial year [(ii)-(i)] 39.60*(iv) Surplus arising out of the CSR projects or programmes or activities of the previous financial years, if any Nil(v) Amount available for set off in succeeding financial years [(iii)-(iv)] Nil*
*Note: The Company shall not utilise the excess CSR amount spent in FY 2020-21 towards set-off of CSR expenses in succeeding three financial years
9. (a) Details of Unspent CSR amount for the preceding three financial years:
Sl. No.
Preceding Financial Year
Amount transferred to Unspent CSR Account under section 135 (6)(in G)
Amount spent in the reporting Financial Year (in G)
Amount transferred to any fund specified under Schedule VII as per section 135(6), if any Amount remaining to
be spent in succeeding financial years (in G)Name of
the FundAmount(in G)
Date of transfer
Nil
(b) Details of CSR amount spent in the financial year for ongoing projects of the preceding financial year(s):
(1) (2) (3) (4) (5) (6) (7) (8) (9)
Sl. No. Project ID Name of the
Project
Financial Year in which the project was commenced
Project duration
Total amount allocated for the project (in G)
Amount spent on the project in the reporting Financial Year (in G)
Cumulative amount spent at the end of reporting Financial Year (in G)
Status of the project - Completed/ Ongoing
Nil
135Integrated Annual Report 2020-21
Integrated ReportFinancial statem
entsStatutory Reports
10. In case of creation or acquisition of capital asset, furnish the details relating to the asset so created or acquired through CSR spent in the financial year (asset-wise details):
(a) Date of creation or acquisition of the capital asset(s): : None
(b) Amount of CSR spent for creation or acquisition of capital asset : Nil
(c) Details of the entity or public authority or beneficiary under whose name such capital asset is registered, their address etc.
: Not Applicable
(d) Provide details of the capital asset(s) created or acquired (including complete address and location of the capital asset).
: Not Applicable
11. Specify the reason(s), if the company has failed to spend two per cent of the average net profit as per section 135(5).
Not Applicable
Dilip Gaur Rajashree BirlaManaging Director Chairperson, CSR Committee
Mumbai, 24th May 2021 DIN: 02071393 DIN: 00022995
Annexure 'F' to the Board's Report (Contd.)
136 Grasim Industries Limited
Annexure 'G' to the Board's Report
Grasim Industries Limited, an Aditya Birla Group Company, has adopted the Executive Remuneration Philosophy/Policy as applicable across Group Companies. This Philosophy/Policy is detailed below:
ADITYA BIRLA GROUP: EXECUTIVE REMUNERATION PHILOSOPHY/POLICYAt the Aditya Birla Group, we expect our executive team to foster a culture of growth and entrepreneurial risk-taking. Our Executive Remuneration Philosophy/Policy supports the design of programmes that align executive rewards - including incentive programmes, retirement benefit programmes, promotion and advancement opportunities - with the long-term success of our stakeholders.
Our Business and Organisational ModelOur Group is a conglomerate and organised in a manner such that there is sharing of resources and infrastructure. This results in uniformity of business processes and systems thereby promoting synergies and exemplary customer experiences.
I. Objectives of the Executive Remuneration Programme
Our executive remuneration programme is designed to attract, retain, and reward talented executives, who will contribute to our long-term success, and thereby build value for our shareholders.
Our executive remuneration programme is intended to:
1. Provide for monetary and non-monetary remuneration elements to our executives on a holistic basis; and
2. Emphasise "Pay for Performance" by aligning incentives with business strategies to reward executives, who achieve or exceed Group business and individual goals.
II. Executives
Our Executive Remuneration Philosophy/Policy applies to the following:
1. Directors of the Company;
2. Key Managerial Personnel: Chief Executive Officer and equivalent e.g., Deputy Managing Director, Chief Financial Officer and Company Secretary; and
3. Senior Management.
III. Business and Talent Competitors
We benchmark our executive pay practices and levels against peer companies in similar industries, geographies and of similar size. In addition, we look at secondary reference (internal and external) benchmarks in order to ensure that the pay policies and levels across the Group are
broadly equitable and support the Group's global mobility objectives for executive talent. Secondary reference points bring to the table, the executive pay practices and pay levels in other markets and industries, to appreciate the differences in levels and medium of pay, and build in as appropriate for decision making.
IV. Executive Pay Positioning
We aim to provide competitive remuneration opportunities to our executives by positioning target total remuneration (including perks and benefits, annual incentive pay-outs, long-term incentive pay outs at target performance) and target the total cash compensation (including annual incentive pay-outs) at target performance directionally between median and top quartile of the primary talent market. We recognise the size and scope of the role and the market standing, skills and experience of incumbents while positioning our executives.
We use secondary market data only as a reference point for determining the types and amount of remuneration while principally believing that the target total remuneration packages should reflect the typical cost of comparable executive talent available in the sector.
V. Executive Pay-Mix
Our executive pay-mix aims to strike the appropriate balance between key components: (i) Fixed Cash Compensation (Basic Salary + Allowances); (ii) Annual Incentive Plan; (iii) Long-Term Incentives; and (iv) Perks and Benefits.
Annual Incentive Plan:
We tie annual incentive plan pay-outs of our executives to the relevant financial and operational metrics achievement and their individual performance. We annually align the financial and operational metrics with priorities/focus areas for the business.
Long-Term Incentives:
Our long-term incentive plans incentivise stretch performance, link executive remuneration to sustained long-term growth and act as a retention and reward tool.
We use stock options as the primary long-term incentive vehicles for our executives as we believe that they best align executive incentives with stockholder interests.
137Integrated Annual Report 2020-21
Integrated ReportFinancial statem
entsStatutory Reports
We grant restricted stock units as a secondary long-term incentive vehicle, to motivate and retain our executives.
VI. Performance Goal Setting
We aim to ensure that, for both annual incentive plans and long-term incentive plans, the target performance goals shall be achievable and realistic.
Threshold performance (the point at which incentive plans are paid out at their minimum, but non-zero, level) shall reflect a base-line level of performance, reflecting an estimated 90% probability of achievement.
Target performance is the expected level of performance at the beginning of the performance cycle, taking into account all known relevant facts likely to impact measured performance.
Maximum performance (the point at which the maximum plan pay-out is made) shall be based on an exceptional level of achievement, reflecting no more than an estimated 10% probability of achievement.
VII. Executive Benefits and Perquisites
Our executives are eligible to participate in our broad-based retirement, health and welfare, and other employee benefits plans. In addition to these broad-based plans, they are eligible for perquisites and benefits plans commensurate with their roles. These benefits are designed to encourage long-term careers with the Group.
Other Remuneration Elements:
Each of our executives is subject to an employment agreement. Each such agreement generally provides for
a total remuneration package for our executives, including continuity of service across the Group Companies.
We limit other remuneration elements, for example, Change in Control (CIC) agreements, severance agreements, to instances of compelling business need or competitive rationale, and generally do not provide for any tax gross-ups for our executives.
Risk and Compliance:
We aim to ensure that the Group's remuneration programmes do not encourage excessive risk taking. We review our remuneration programmes for factors, such as remuneration mix overly weighted towards annual incentives, uncapped pay-outs, unreasonable goals or thresholds, steep pay-out cliffs at certain performance levels that may encourage short-term decisions to meet pay-out thresholds.
Clawback Clause:
In an incident of restatement of financial statements, due to fraud or non-compliance with any requirement of the Companies Act, 2013, and the rules made thereafter, we shall recover from our executives, the remuneration received in excess, of what would be payable to him/her as per restatement of financial statements, pertaining to the relevant performance year.
Implementation:
The Group and Business Centre of Expertise teams will assist the Nomination and Remuneration Committee in adopting, interpreting and implementing the Executive Remuneration Philosophy/Policy. These services will be established through “arm’s-length”, agreements entered into as needs arise in the normal course of business.
Annexure 'G' to the Board's Report (Contd.)
138 Grasim Industries Limited
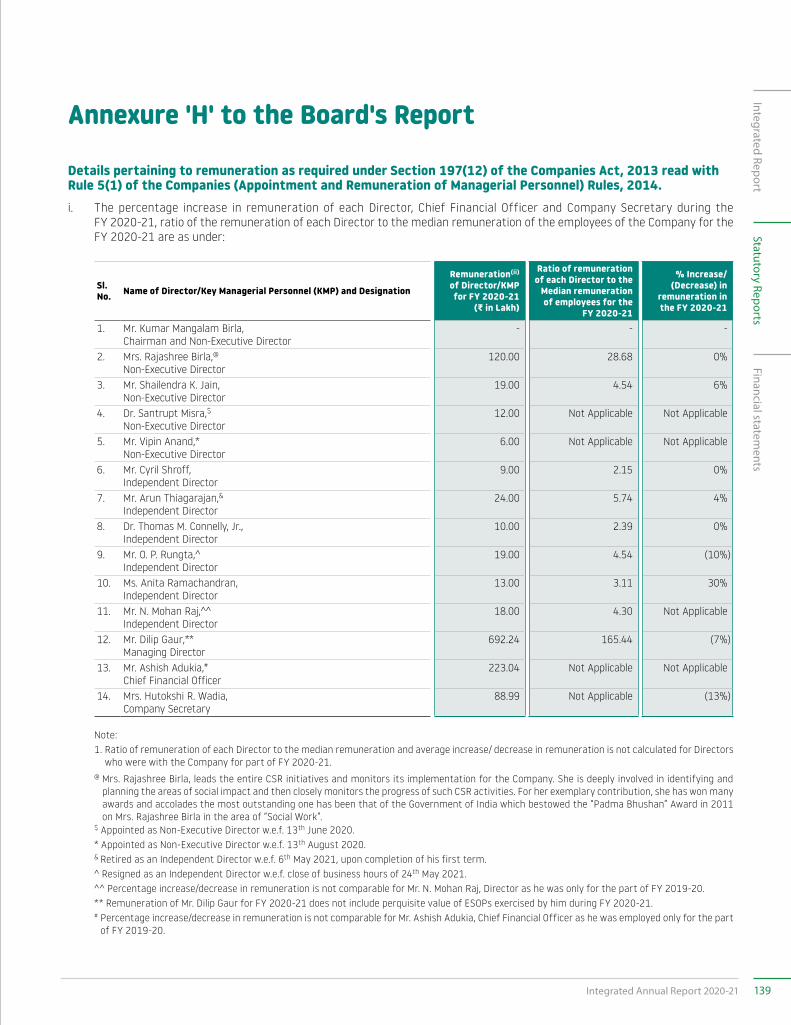
Details pertaining to remuneration as required under Section 197(12) of the Companies Act, 2013 read with Rule 5(1) of the Companies (Appointment and Remuneration of Managerial Personnel) Rules, 2014.i. The percentage increase in remuneration of each Director, Chief Financial Officer and Company Secretary during the
FY 2020-21, ratio of the remuneration of each Director to the median remuneration of the employees of the Company for the FY 2020-21 are as under:
Sl. No. Name of Director/Key Managerial Personnel (KMP) and Designation
Remuneration(ii)
of Director/KMP for FY 2020-21
(G in Lakh)
Ratio of remuneration of each Director to the
Median remuneration of employees for the
FY 2020-21
% Increase/ (Decrease) in
remuneration in the FY 2020-21
1. Mr. Kumar Mangalam Birla,Chairman and Non-Executive Director
- - -
2. Mrs. Rajashree Birla,@Non-Executive Director
120.00 28.68 0%
3. Mr. Shailendra K. Jain,Non-Executive Director
19.00 4.54 6%
4. Dr. Santrupt Misra,$ Non-Executive Director
12.00 Not Applicable Not Applicable
5. Mr. Vipin Anand,*Non-Executive Director
6.00 Not Applicable Not Applicable
6. Mr. Cyril Shroff,Independent Director
9.00 2.15 0%
7. Mr. Arun Thiagarajan,&Independent Director
24.00 5.74 4%
8. Dr. Thomas M. Connelly, Jr.,Independent Director
10.00 2.39 0%
9. Mr. O. P. Rungta,^Independent Director
19.00 4.54 (10%)
10. Ms. Anita Ramachandran,Independent Director
13.00 3.11 30%
11. Mr. N. Mohan Raj,^^Independent Director
18.00 4.30 Not Applicable
12. Mr. Dilip Gaur,**Managing Director
692.24 165.44 (7%)
13. Mr. Ashish Adukia,#Chief Financial Officer
223.04 Not Applicable Not Applicable
14. Mrs. Hutokshi R. Wadia,Company Secretary
88.99 Not Applicable (13%)
Note: 1. Ratio of remuneration of each Director to the median remuneration and average increase/ decrease in remuneration is not calculated for Directors
who were with the Company for part of FY 2020-21.
@ Mrs. Rajashree Birla, leads the entire CSR initiatives and monitors its implementation for the Company. She is deeply involved in identifying and planning the areas of social impact and then closely monitors the progress of such CSR activities. For her exemplary contribution, she has won many awards and accolades the most outstanding one has been that of the Government of India which bestowed the “Padma Bhushan” Award in 2011 on Mrs. Rajashree Birla in the area of “Social Work”.
$ Appointed as Non-Executive Director w.e.f. 13th June 2020. * Appointed as Non-Executive Director w.e.f. 13th August 2020. & Retired as an Independent Director w.e.f. 6th May 2021, upon completion of his first term. ^ Resigned as an Independent Director w.e.f. close of business hours of 24th May 2021. ^^ Percentage increase/decrease in remuneration is not comparable for Mr. N. Mohan Raj, Director as he was only for the part of FY 2019-20. ** Remuneration of Mr. Dilip Gaur for FY 2020-21 does not include perquisite value of ESOPs exercised by him during FY 2020-21. # Percentage increase/decrease in remuneration is not comparable for Mr. Ashish Adukia, Chief Financial Officer as he was employed only for the part
of FY 2019-20.
Annexure 'H' to the Board's Report
139Integrated Annual Report 2020-21
Integrated ReportFinancial statem
entsStatutory Reports
ii. Remuneration to Non-Executive and Independent Directors includes commission payable for the financial year ended 31st March 2021, which is subject to the approval of the members of the Company. Sitting fees paid to the Directors is excluded.
iii. On account of COVID-19 pandemic and as a part of productivity measurement, there was no increment and no payment of performance linked incentive of FY 2019-20 to the employees across key businesses. This has resulted in decrease in median remuneration and average remuneration paid to the employees during FY 2020-21.
iv. During the FY 2020-21, there was a decrease of 5.40% over the previous financial year, in the median remuneration of the employees.
v. The calculation of percentage increase/decrease in the median remuneration is based on the comparable employees.
vi. There were 23,561 permanent employees on the rolls of the Company as on 31st March 2021.
vii. Average percentage decrease in the salaries of employees, other than the managerial personnel in the FY 2020-21, was 3.53% over the previous financial year. However, the average salaries of the managerial personnel for the same financial year decreased by 10.23%.
viii. It is hereby affirmed that the remuneration paid is as per the Remuneration Philosophy/Policy of the Company.
Annexure 'H' to the Board's Report (Contd.)
140 Grasim Industries Limited
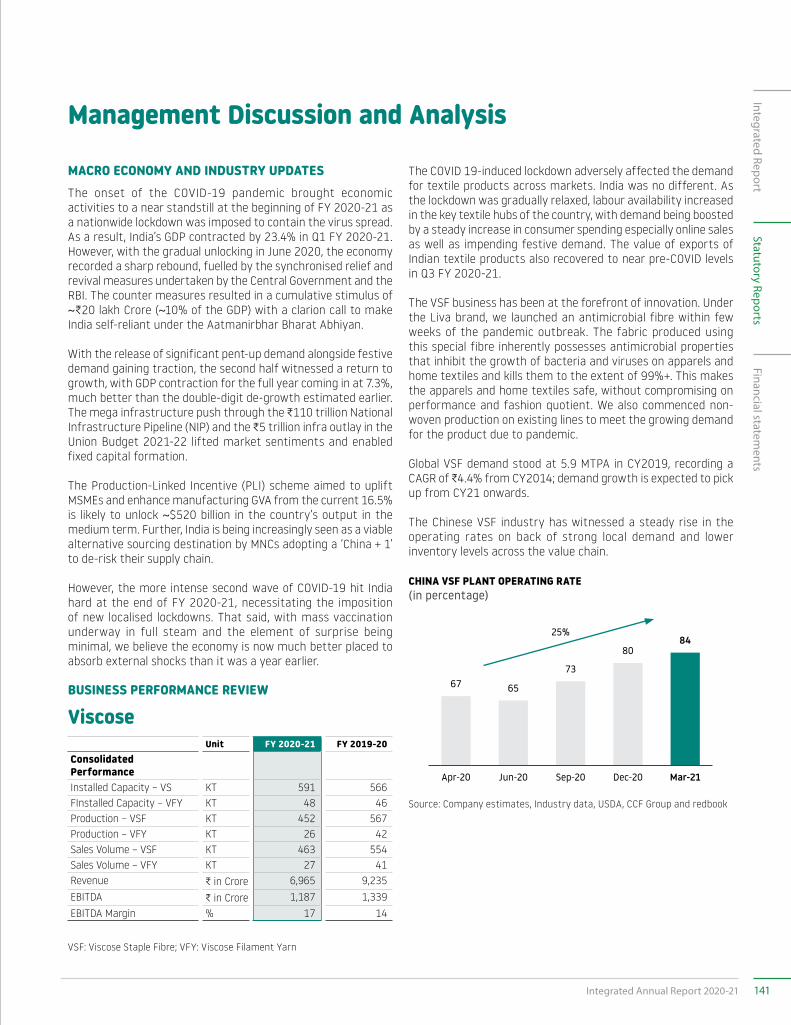
Management Discussion and Analysis
MACRO ECONOMY AND INDUSTRY UPDATESThe onset of the COVID-19 pandemic brought economic activities to a near standstill at the beginning of FY 2020-21 as a nationwide lockdown was imposed to contain the virus spread. As a result, India’s GDP contracted by 23.4% in Q1 FY 2020-21. However, with the gradual unlocking in June 2020, the economy recorded a sharp rebound, fuelled by the synchronised relief and revival measures undertaken by the Central Government and the RBI. The counter measures resulted in a cumulative stimulus of ~C20 lakh Crore (~10% of the GDP) with a clarion call to make India self-reliant under the Aatmanirbhar Bharat Abhiyan.
With the release of significant pent-up demand alongside festive demand gaining traction, the second half witnessed a return to growth, with GDP contraction for the full year coming in at 7.3%, much better than the double-digit de-growth estimated earlier. The mega infrastructure push through the C110 trillion National Infrastructure Pipeline (NIP) and the C5 trillion infra outlay in the Union Budget 2021-22 lifted market sentiments and enabled fixed capital formation.
The Production-Linked Incentive (PLI) scheme aimed to uplift MSMEs and enhance manufacturing GVA from the current 16.5% is likely to unlock ~$520 billion in the country’s output in the medium term. Further, India is being increasingly seen as a viable alternative sourcing destination by MNCs adopting a ‘China + 1’ to de-risk their supply chain.
However, the more intense second wave of COVID-19 hit India hard at the end of FY 2020-21, necessitating the imposition of new localised lockdowns. That said, with mass vaccination underway in full steam and the element of surprise being minimal, we believe the economy is now much better placed to absorb external shocks than it was a year earlier.
BUSINESS PERFORMANCE REVIEW
ViscoseUnit FY 2020-21 FY 2019-20
Consolidated PerformanceInstalled Capacity – VS KT 591 566FInstalled Capacity – VFY KT 48 46Production – VSF KT 452 567Production – VFY KT 26 42Sales Volume – VSF KT 463 554Sales Volume – VFY KT 27 41Revenue C in Crore 6,965 9,235EBITDA C in Crore 1,187 1,339EBITDA Margin % 17 14
VSF: Viscose Staple Fibre; VFY: Viscose Filament Yarn
The COVID 19-induced lockdown adversely affected the demand for textile products across markets. India was no different. As the lockdown was gradually relaxed, labour availability increased in the key textile hubs of the country, with demand being boosted by a steady increase in consumer spending especially online sales as well as impending festive demand. The value of exports of Indian textile products also recovered to near pre-COVID levels in Q3 FY 2020-21.
The VSF business has been at the forefront of innovation. Under the Liva brand, we launched an antimicrobial fibre within few weeks of the pandemic outbreak. The fabric produced using this special fibre inherently possesses antimicrobial properties that inhibit the growth of bacteria and viruses on apparels and home textiles and kills them to the extent of 99%+. This makes the apparels and home textiles safe, without compromising on performance and fashion quotient. We also commenced non-woven production on existing lines to meet the growing demand for the product due to pandemic.
Global VSF demand stood at 5.9 MTPA in CY2019, recording a CAGR of C4.4% from CY2014; demand growth is expected to pick up from CY21 onwards.
The Chinese VSF industry has witnessed a steady rise in the operating rates on back of strong local demand and lower inventory levels across the value chain.
CHINA VSF PLANT OPERATING RATE (in percentage)
Source: Company estimates, Industry data, USDA, CCF Group and redbook
Apr-20
67
Jun-20
65
Sep-20
73
25%
Dec-20
80
Mar-21
84
141Integrated Annual Report 2020-21
Integrated ReportFinancial statem
entsStatutory Reports
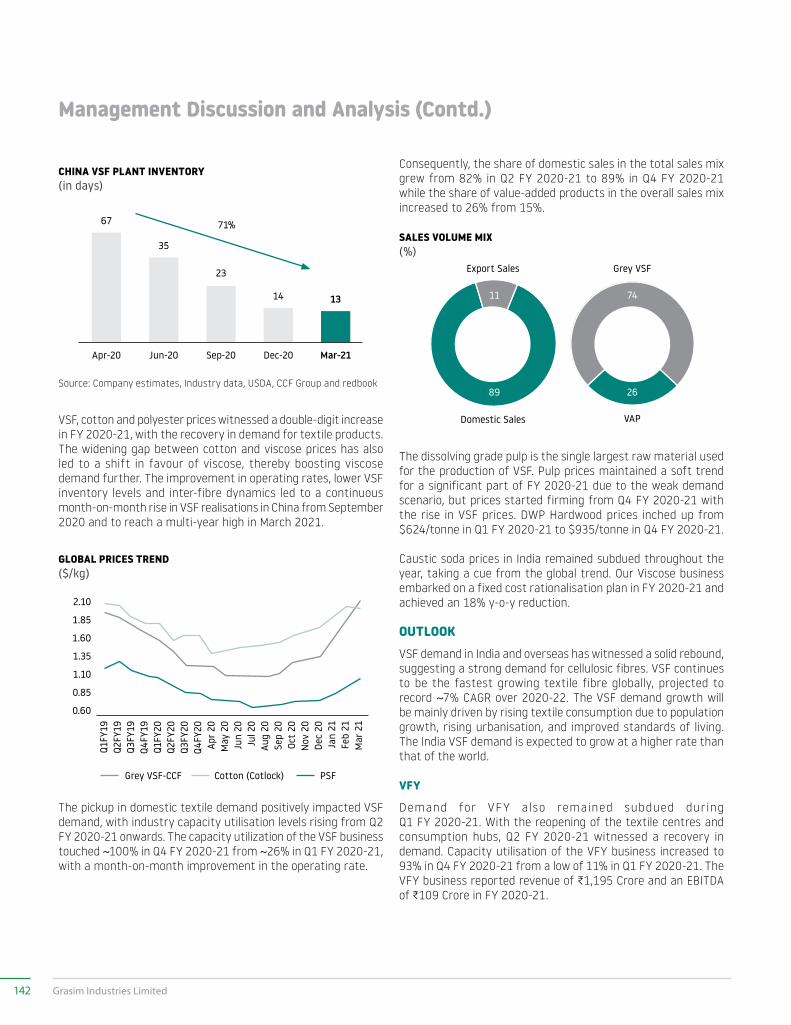
VSF, cotton and polyester prices witnessed a double-digit increase in FY 2020-21, with the recovery in demand for textile products. The widening gap between cotton and viscose prices has also led to a shift in favour of viscose, thereby boosting viscose demand further. The improvement in operating rates, lower VSF inventory levels and inter-fibre dynamics led to a continuous month-on-month rise in VSF realisations in China from September 2020 and to reach a multi-year high in March 2021.
The dissolving grade pulp is the single largest raw material used for the production of VSF. Pulp prices maintained a soft trend for a significant part of FY 2020-21 due to the weak demand scenario, but prices started firming from Q4 FY 2020-21 with the rise in VSF prices. DWP Hardwood prices inched up from $624/tonne in Q1 FY 2020-21 to $935/tonne in Q4 FY 2020-21.
Caustic soda prices in India remained subdued throughout the year, taking a cue from the global trend. Our Viscose business embarked on a fixed cost rationalisation plan in FY 2020-21 and achieved an 18% y-o-y reduction.
OUTLOOKVSF demand in India and overseas has witnessed a solid rebound, suggesting a strong demand for cellulosic fibres. VSF continues to be the fastest growing textile fibre globally, projected to record ~7% CAGR over 2020-22. The VSF demand growth will be mainly driven by rising textile consumption due to population growth, rising urbanisation, and improved standards of living. The India VSF demand is expected to grow at a higher rate than that of the world.
VFY
Demand for VFY also remained subdued dur ing Q1 FY 2020-21. With the reopening of the textile centres and consumption hubs, Q2 FY 2020-21 witnessed a recovery in demand. Capacity utilisation of the VFY business increased to 93% in Q4 FY 2020-21 from a low of 11% in Q1 FY 2020-21. The VFY business reported revenue of C1,195 Crore and an EBITDA of C109 Crore in FY 2020-21.
Consequently, the share of domestic sales in the total sales mix grew from 82% in Q2 FY 2020-21 to 89% in Q4 FY 2020-21 while the share of value-added products in the overall sales mix increased to 26% from 15%.
The pickup in domestic textile demand positively impacted VSF demand, with industry capacity utilisation levels rising from Q2 FY 2020-21 onwards. The capacity utilization of the VSF business touched ~100% in Q4 FY 2020-21 from ~26% in Q1 FY 2020-21, with a month-on-month improvement in the operating rate.
CHINA VSF PLANT INVENTORY (in days)
SALES VOLUME MIX (%)
Source: Company estimates, Industry data, USDA, CCF Group and redbook
GLOBAL PRICES TREND ($/kg)
Q1FY
19
2.10
1.85
1.60
1.35
1.10
0.85
0.60
Q2FY
19Q3
FY19
Q4FY
19Q1
FY20
Q2FY
20Q3
FY20
Q4FY
20Ap
r 20
May
20
Jun
20Ju
l 20
Aug
20Se
p 20
Oct
20N
ov 2
0De
c 20
Jan
21Fe
b 21
Mar
21
Apr-20
67
35
23
14 13
Jun-20 Sep-20
71%
Dec-20 Mar-21
Grey VSF-CCF Cotton (Cotlock) PSF
Domestic Sales
Export Sales Grey VSF
VAP
89
11
26
74
Management Discussion and Analysis (Contd.)
142 Grasim Industries Limited
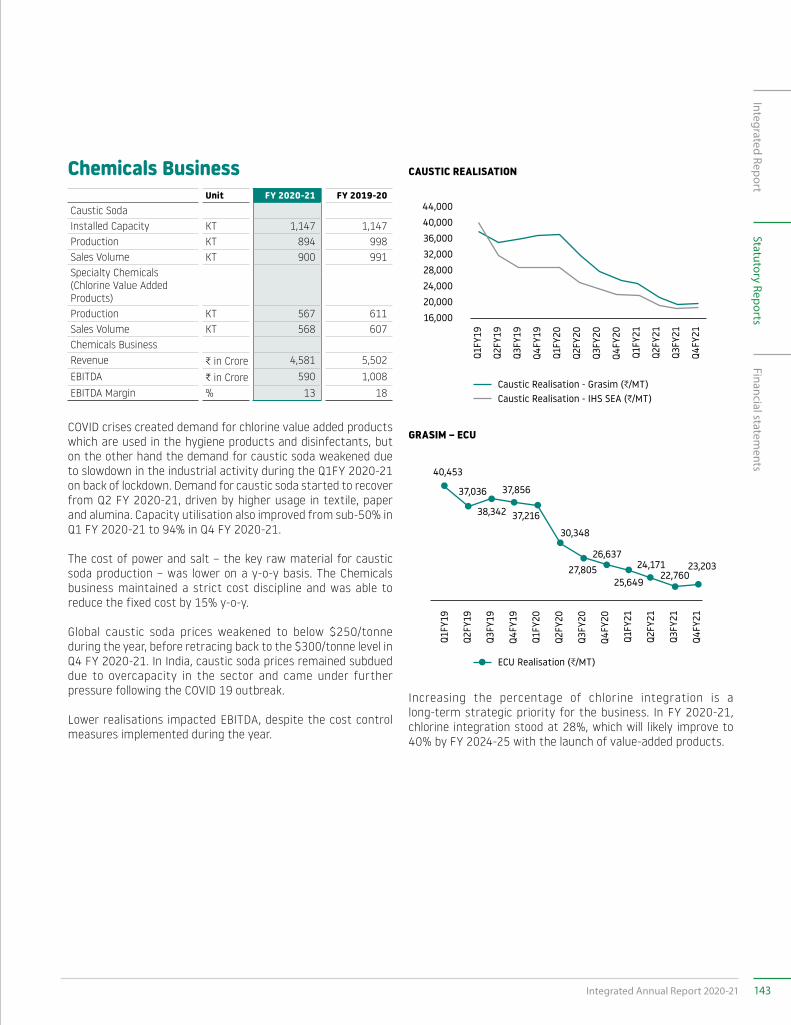
Chemicals BusinessUnit FY 2020-21 FY 2019-20
Caustic SodaInstalled Capacity KT 1,147 1,147Production KT 894 998Sales Volume KT 900 991Specialty Chemicals(Chlorine Value Added Products)Production KT 567 611Sales Volume KT 568 607Chemicals BusinessRevenue C in Crore 4,581 5,502EBITDA C in Crore 590 1,008EBITDA Margin % 13 18
COVID crises created demand for chlorine value added products which are used in the hygiene products and disinfectants, but on the other hand the demand for caustic soda weakened due to slowdown in the industrial activity during the Q1FY 2020-21 on back of lockdown. Demand for caustic soda started to recover from Q2 FY 2020-21, driven by higher usage in textile, paper and alumina. Capacity utilisation also improved from sub-50% in Q1 FY 2020-21 to 94% in Q4 FY 2020-21.
The cost of power and salt – the key raw material for caustic soda production – was lower on a y-o-y basis. The Chemicals business maintained a strict cost discipline and was able to reduce the fixed cost by 15% y-o-y.
Global caustic soda prices weakened to below $250/tonne during the year, before retracing back to the $300/tonne level in Q4 FY 2020-21. In India, caustic soda prices remained subdued due to overcapacity in the sector and came under further pressure following the COVID 19 outbreak.
Lower realisations impacted EBITDA, despite the cost control measures implemented during the year.
Increasing the percentage of chlorine integration is a long-term strategic priority for the business. In FY 2020-21, chlorine integration stood at 28%, which will likely improve to 40% by FY 2024-25 with the launch of value-added products.
CAUSTIC REALISATION
GRASIM – ECU
Q1FY
19
Q1FY
19
16,00020,00024,00028,00032,00036,00040,00044,000
Q2FY
19
Q2FY
19
Q3FY
19
Q3FY
19
Q4FY
19
Q4FY
19
Q1FY
20
Q1FY
20
Q2FY
20
Q2FY
20
Q3FY
20Q3
FY20
Q4FY
20Q4
FY20
Q1FY
21Q1
FY21
Q2FY
21Q2
FY21
Q3FY
21Q3
FY21
Q4FY
21Q4
FY21
Caustic Realisation - Grasim (C/MT)Caustic Realisation - IHS SEA (C/MT)
40,453
37,036
38,342
37,856
37,216
30,348
27,80526,637
25,649
24,17122,760
23,203
ECU Realisation (C/MT)
143Integrated Annual Report 2020-21
Integrated ReportFinancial statem
entsStatutory Reports
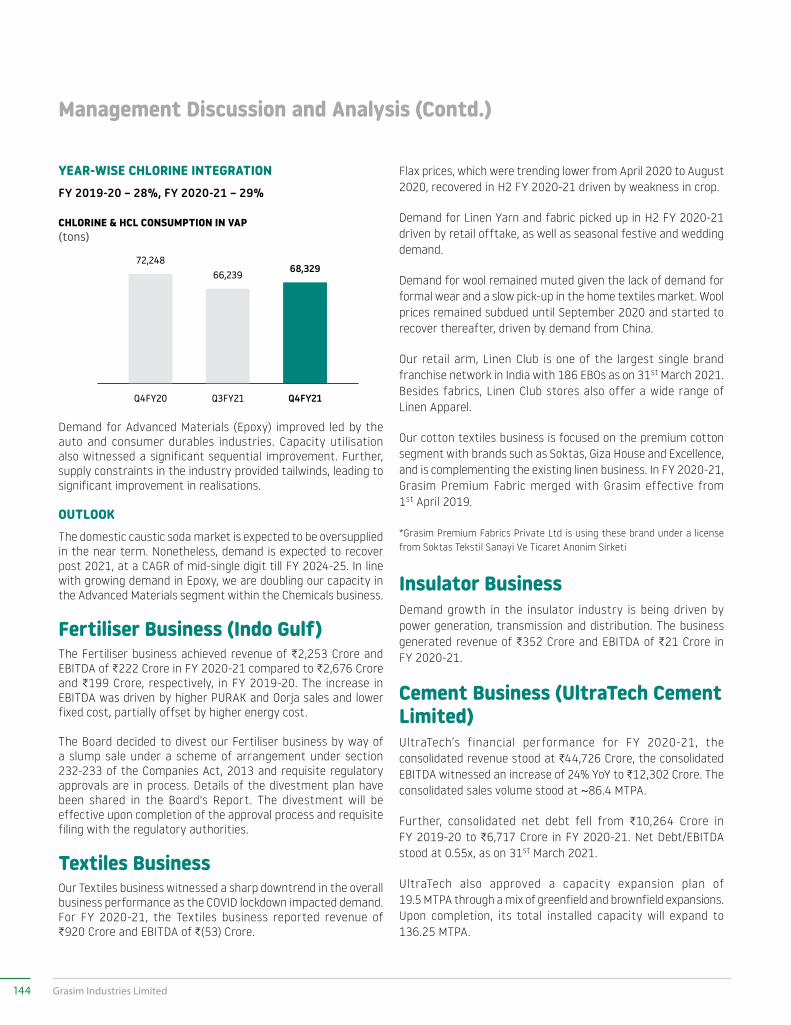
Demand for Advanced Materials (Epoxy) improved led by the auto and consumer durables industries. Capacity utilisation also witnessed a significant sequential improvement. Further, supply constraints in the industry provided tailwinds, leading to significant improvement in realisations.
OUTLOOKThe domestic caustic soda market is expected to be oversupplied in the near term. Nonetheless, demand is expected to recover post 2021, at a CAGR of mid-single digit till FY 2024-25. In line with growing demand in Epoxy, we are doubling our capacity in the Advanced Materials segment within the Chemicals business.
Fertiliser Business (Indo Gulf)The Fertiliser business achieved revenue of C2,253 Crore and EBITDA of C222 Crore in FY 2020-21 compared to C2,676 Crore and C199 Crore, respectively, in FY 2019-20. The increase in EBITDA was driven by higher PURAK and Oorja sales and lower fixed cost, partially offset by higher energy cost.
The Board decided to divest our Fertiliser business by way of a slump sale under a scheme of arrangement under section 232-233 of the Companies Act, 2013 and requisite regulatory approvals are in process. Details of the divestment plan have been shared in the Board's Report. The divestment will be effective upon completion of the approval process and requisite filing with the regulatory authorities.
Textiles BusinessOur Textiles business witnessed a sharp downtrend in the overall business performance as the COVID lockdown impacted demand. For FY 2020-21, the Textiles business reported revenue of C920 Crore and EBITDA of C(53) Crore.
Flax prices, which were trending lower from April 2020 to August 2020, recovered in H2 FY 2020-21 driven by weakness in crop.
Demand for Linen Yarn and fabric picked up in H2 FY 2020-21 driven by retail offtake, as well as seasonal festive and wedding demand.
Demand for wool remained muted given the lack of demand for formal wear and a slow pick-up in the home textiles market. Wool prices remained subdued until September 2020 and started to recover thereafter, driven by demand from China.
Our retail arm, Linen Club is one of the largest single brand franchise network in India with 186 EBOs as on 31st March 2021. Besides fabrics, Linen Club stores also offer a wide range of Linen Apparel.
Our cotton textiles business is focused on the premium cotton segment with brands such as Soktas, Giza House and Excellence, and is complementing the existing linen business. In FY 2020-21, Grasim Premium Fabric merged with Grasim effective from 1st April 2019.
*Grasim Premium Fabrics Private Ltd is using these brand under a license from Soktas Tekstil Sanayi Ve Ticaret Anonim Sirketi
Insulator BusinessDemand growth in the insulator industry is being driven by power generation, transmission and distribution. The business generated revenue of C352 Crore and EBITDA of C21 Crore in FY 2020-21.
Cement Business (UltraTech Cement Limited)UltraTech’s financial performance for FY 2020-21, the consolidated revenue stood at C44,726 Crore, the consolidated EBITDA witnessed an increase of 24% YoY to C12,302 Crore. The consolidated sales volume stood at ~86.4 MTPA.
Further, consolidated net debt fell from C10,264 Crore in FY 2019-20 to C6,717 Crore in FY 2020-21. Net Debt/EBITDA stood at 0.55x, as on 31st March 2021.
UltraTech also approved a capacity expansion plan of 19.5 MTPA through a mix of greenfield and brownfield expansions. Upon completion, its total installed capacity will expand to 136.25 MTPA.
CHLORINE & HCL CONSUMPTION IN VAP (tons)
Q4FY20
72,248
Q3FY21
66,239
Q4FY21
68,329
Management Discussion and Analysis (Contd.)
YEAR-WISE CHLORINE INTEGRATIONFY 2019-20 – 28%, FY 2020-21 – 29%
144 Grasim Industries Limited
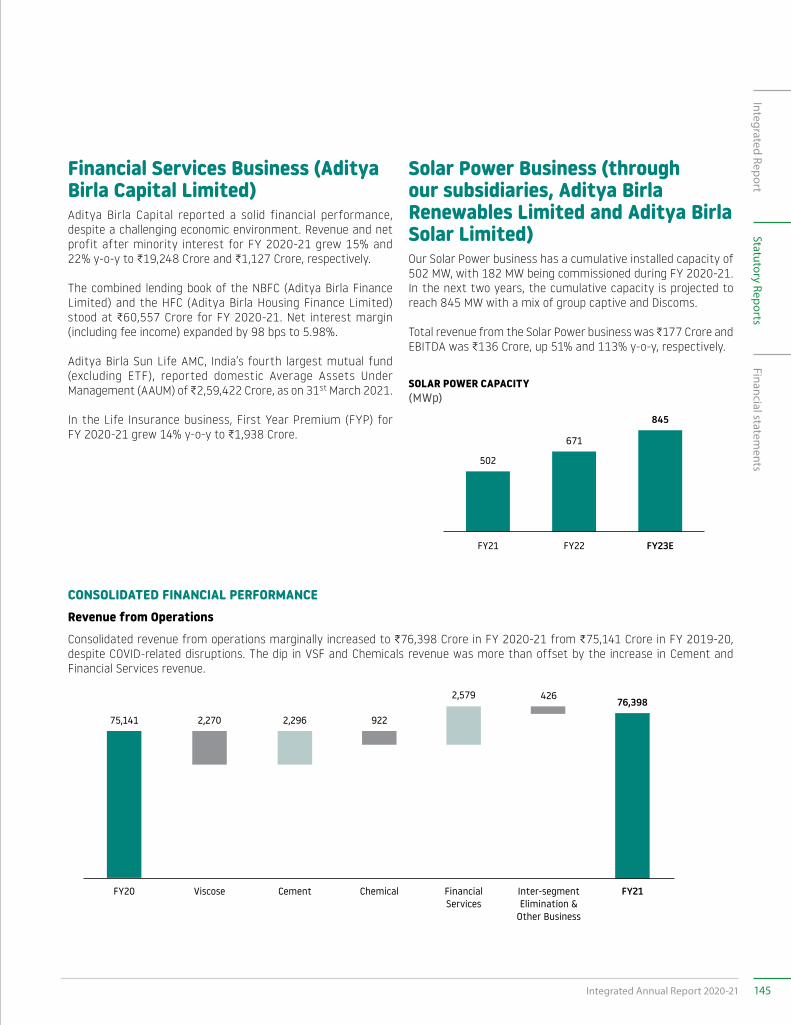
Financial Services Business (Aditya Birla Capital Limited)Aditya Birla Capital reported a solid financial performance, despite a challenging economic environment. Revenue and net profit after minority interest for FY 2020-21 grew 15% and 22% y-o-y to C19,248 Crore and C1,127 Crore, respectively.
The combined lending book of the NBFC (Aditya Birla Finance Limited) and the HFC (Aditya Birla Housing Finance Limited) stood at C60,557 Crore for FY 2020-21. Net interest margin (including fee income) expanded by 98 bps to 5.98%.
Aditya Birla Sun Life AMC, India’s fourth largest mutual fund (excluding ETF), reported domestic Average Assets Under Management (AAUM) of C2,59,422 Crore, as on 31st March 2021.
In the Life Insurance business, First Year Premium (FYP) for FY 2020-21 grew 14% y-o-y to C1,938 Crore.
CONSOLIDATED FINANCIAL PERFORMANCERevenue from OperationsConsolidated revenue from operations marginally increased to C76,398 Crore in FY 2020-21 from C75,141 Crore in FY 2019-20, despite COVID-related disruptions. The dip in VSF and Chemicals revenue was more than offset by the increase in Cement and Financial Services revenue.
Solar Power Business (through our subsidiaries, Aditya Birla Renewables Limited and Aditya Birla Solar Limited)Our Solar Power business has a cumulative installed capacity of 502 MW, with 182 MW being commissioned during FY 2020-21. In the next two years, the cumulative capacity is projected to reach 845 MW with a mix of group captive and Discoms.
Total revenue from the Solar Power business was C177 Crore and EBITDA was C136 Crore, up 51% and 113% y-o-y, respectively.
SOLAR POWER CAPACITY (MWp)
FY21
FY20 Viscose Cement Chemical FinancialServices
Inter-segmentElimination &
Other Business
4262,579
9222,2962,27075,141
FY21
76,398
502
FY22
671
FY23E
845
145Integrated Annual Report 2020-21
Integrated ReportFinancial statem
entsStatutory Reports
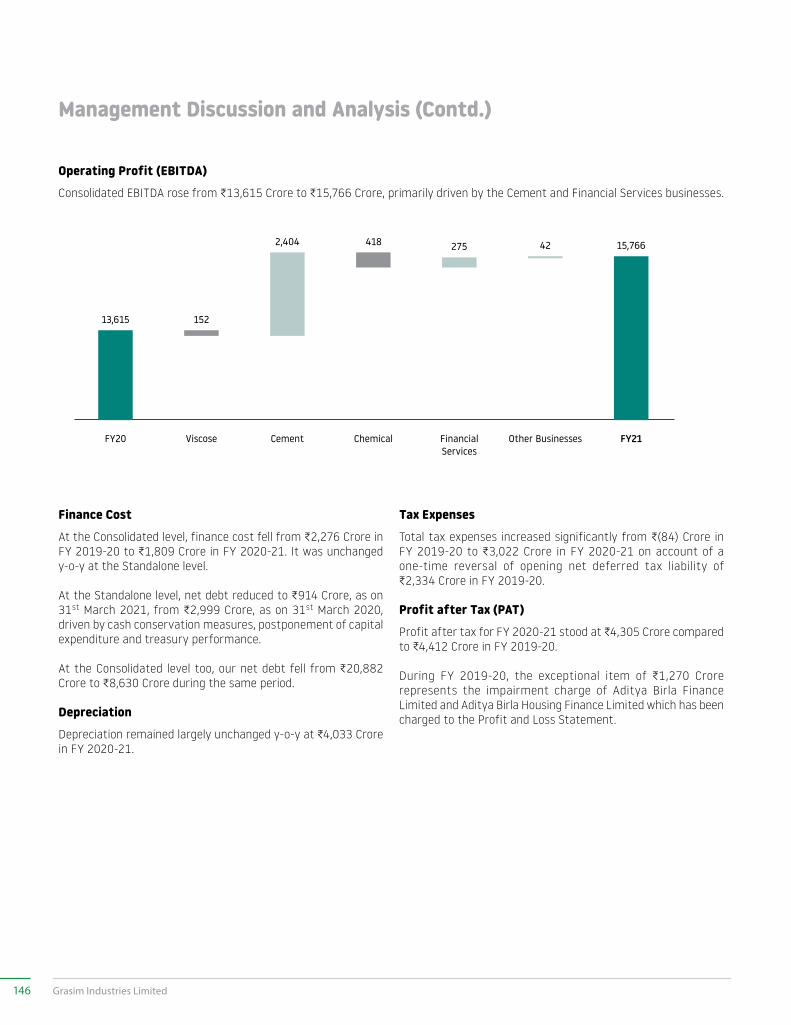
Finance CostAt the Consolidated level, finance cost fell from C2,276 Crore in FY 2019-20 to C1,809 Crore in FY 2020-21. It was unchanged y-o-y at the Standalone level.
At the Standalone level, net debt reduced to C914 Crore, as on 31st March 2021, from C2,999 Crore, as on 31st March 2020, driven by cash conservation measures, postponement of capital expenditure and treasury performance.
At the Consolidated level too, our net debt fell from C20,882 Crore to C8,630 Crore during the same period.
DepreciationDepreciation remained largely unchanged y-o-y at C4,033 Crore in FY 2020-21.
Operating Profit (EBITDA)Consolidated EBITDA rose from C13,615 Crore to C15,766 Crore, primarily driven by the Cement and Financial Services businesses.
Tax ExpensesTotal tax expenses increased significantly from C(84) Crore in FY 2019-20 to C3,022 Crore in FY 2020-21 on account of a one-time reversal of opening net deferred tax liability of C2,334 Crore in FY 2019-20.
Profit after Tax (PAT)Profit after tax for FY 2020-21 stood at C4,305 Crore compared to C4,412 Crore in FY 2019-20.
During FY 2019-20, the exceptional item of C1,270 Crore represents the impairment charge of Aditya Birla Finance Limited and Aditya Birla Housing Finance Limited which has been charged to the Profit and Loss Statement.
Other BusinessesFinancial Services
ChemicalCementViscoseFY20
13,615 152
2,404 418 275 42 15,766
FY21
Management Discussion and Analysis (Contd.)
146 Grasim Industries Limited
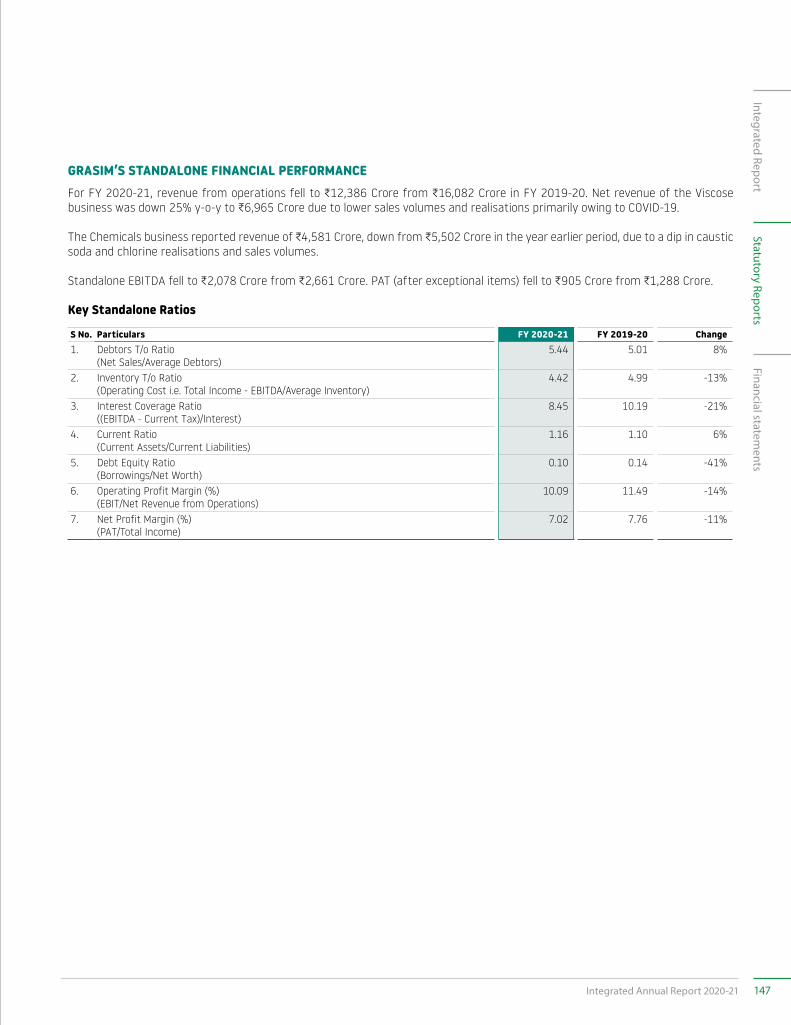
GRASIM’S STANDALONE FINANCIAL PERFORMANCEFor FY 2020-21, revenue from operations fell to C12,386 Crore from C16,082 Crore in FY 2019-20. Net revenue of the Viscose business was down 25% y-o-y to C6,965 Crore due to lower sales volumes and realisations primarily owing to COVID-19.
The Chemicals business reported revenue of C4,581 Crore, down from C5,502 Crore in the year earlier period, due to a dip in caustic soda and chlorine realisations and sales volumes.
Standalone EBITDA fell to C2,078 Crore from C2,661 Crore. PAT (after exceptional items) fell to C905 Crore from C1,288 Crore.
Key Standalone Ratios
S No. Particulars FY 2020-21 FY 2019-20 Change1. Debtors T/o Ratio
(Net Sales/Average Debtors)5.44 5.01 8%
2. Inventory T/o Ratio(Operating Cost i.e. Total Income - EBITDA/Average Inventory)
4.42 4.99 -13%
3. Interest Coverage Ratio((EBITDA - Current Tax)/Interest)
8.45 10.19 -21%
4. Current Ratio(Current Assets/Current Liabilities)
1.16 1.10 6%
5. Debt Equity Ratio(Borrowings/Net Worth)
0.10 0.14 -41%
6. Operating Profit Margin (%)(EBIT/Net Revenue from Operations)
10.09 11.49 -14%
7. Net Profit Margin (%)(PAT/Total Income)
7.02 7.76 -11%
147Integrated Annual Report 2020-21
Integrated ReportFinancial statem
entsStatutory Reports
I. COMPANY’S PHILOSOPHY ON CORPORATE GOVERNANCE
Corporate Governance refers to a set of laws, regulations and good practices that enables an organisation to perform its business efficiently and ethically to generate long-term wealth and create value for all its stakeholders. The essence of Corporate Governance lies in promoting and maintaining integrity, transparency and accountability across all business practices. Good Corporate Governance emerges from the application of the best and sound management practices and compliance with the laws coupled with adherence to the highest standards of transparency and business ethics.
Corporate Governance has always been intrinsic to the management of the business and affairs of our Company. In line with the above philosophy, your Company continuously strives for excellence and focuses on enhancement of long-term stakeholder value through adoption of best governance and disclosure practices. Your Company is committed to the adoption of best governance practices and its adherence in true spirit, at all times. Your Company aims at fostering and sustaining a culture that demonstrates highest standard of ethical and responsible business conduct.
Your Company’s governance practices are self-driven, reflecting the culture of the trusteeship that is deeply ingrained in its value system and reflected in its strategic growth process. Your Company’s governance philosophy rests on five basic tenets, viz.
• Board accountability to the Company and stakeholders
• Equitable treatment to all shareholders
• Strategic guidance and effective monitoring by the Board
• Protection of minority interests and rights
• Transparency and timely disclosure
Your Company confirms compliance with the Corporate Governance requirements stipulated in the Securities and Exchange Board of India (Listing Obligations and Disclosure Requirements) Regulations, 2015, as amended from time to time [hereinafter referred to as ‘Listing Regulations’], the details of which are as set out hereunder:
II. BOARD OF DIRECTORS Composition of Board of Directors (Board) Your Company has a balanced and diverse Board, which
includes independent professionals and confirms to the provisions of the Companies Act, 2013 (“the Act”) and the
Listing Regulations. Your Board represents a confluence of varied skills, experience and expertise from diverse background. The Directors possess requisite qualification, experience and expertise in their respective functional areas, which enable them to discharge their responsibilities and provide effective leadership to the management. In designing the Board composition, number of factors are considered, which include educational background; professional experience; gender; skills; knowledge; among others.
The Listing Regulations mandates that for a Company with a Non-Executive Chairman, who is a promoter, at least half of the Board should comprise of independent directors. As on the financial year end, the Company’s Board comprised of 12 Directors, of which 6 are Independent Directors, 5 are Non-Executive Directors and 1 is an Executive Director. The Listing Regulations also mandates that the Board of Directors of the top 1,000 listed entities shall have at least one independent woman director. Your Company’s Board comprises 2 women directors, of which 1 is an Independent Director. The position of Chairman and Managing Director are held by different individuals, where Chairman of the Board is a Non-Executive Chairman. The Board periodically evaluates the need for change in its size and composition in order to remain aligned with statutory and business requirements.
None of the Director is a director on the Board of more than 10 public limited companies or acts as an Independent Director in more than 7 listed companies. None of the Director holds directorship in more than 7 listed companies. Further, none of the Director is a Member of more than 10 committees or chairperson of more than 5 committees, across all public companies in which he/she is a Director. For the purpose of determination of limit of the Board Committees, chairpersonship and membership of the Audit Committee and Stakeholders’ Relationship Committee has been considered as per Regulation 26(1)(b) of the Listing Regulations. No Director is related to any other Director on the Board, except for Mr. Kumar Mangalam Birla and Mrs. Rajashree Birla, who are related to each other as son and mother respectively. The composition of the Board is in conformity with the requirements of the Act and the Listing Regulations.
All Independent Directors are free from any business or other relationship that could materially influence their judgment. The Company has issued the formal letter of appointment to all the Independent Directors as prescribed under Schedule IV of the Act and the Listing Regulations. The terms and conditions of their appointment are also available on the Company’s website, https://www.grasim.com/investors/corporate-governance. The Company has
Report on Corporate Governance
148 Grasim Industries Limited
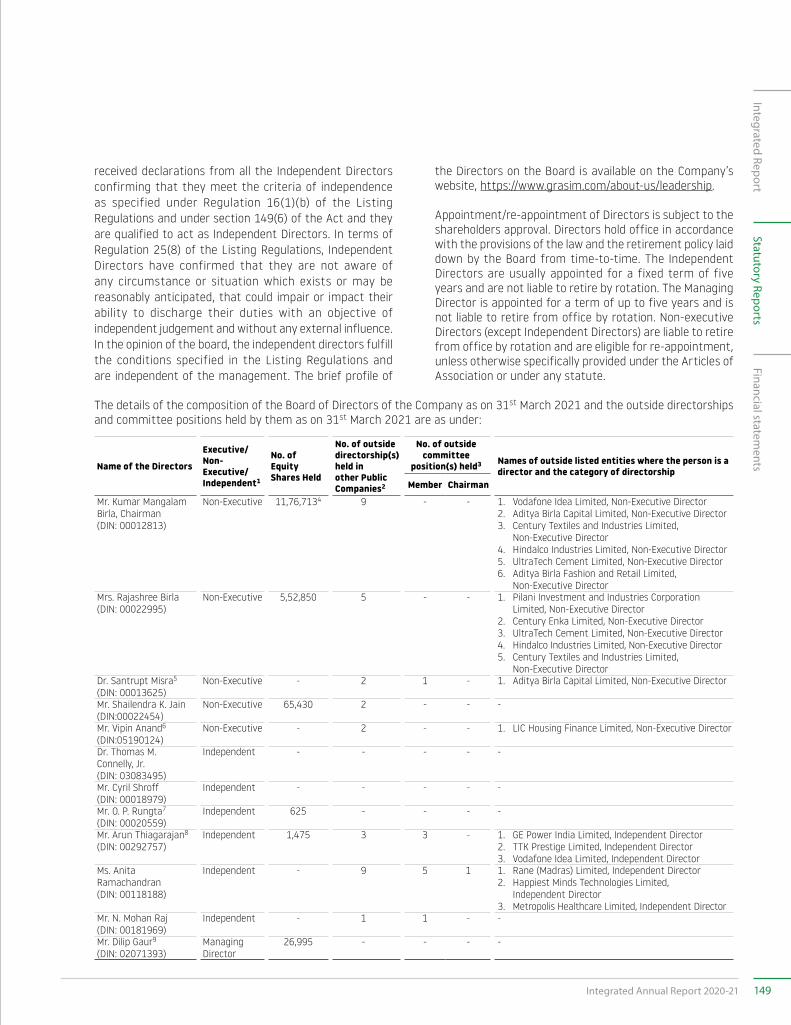
received declarations from all the Independent Directors confirming that they meet the criteria of independence as specified under Regulation 16(1)(b) of the Listing Regulations and under section 149(6) of the Act and they are qualified to act as Independent Directors. In terms of Regulation 25(8) of the Listing Regulations, Independent Directors have confirmed that they are not aware of any circumstance or situation which exists or may be reasonably anticipated, that could impair or impact their ability to discharge their duties with an objective of independent judgement and without any external influence. In the opinion of the board, the independent directors fulfill the conditions specified in the Listing Regulations and are independent of the management. The brief profile of
the Directors on the Board is available on the Company’s website, https://www.grasim.com/about-us/leadership.
Appointment/re-appointment of Directors is subject to the shareholders approval. Directors hold office in accordance with the provisions of the law and the retirement policy laid down by the Board from time-to-time. The Independent Directors are usually appointed for a fixed term of five years and are not liable to retire by rotation. The Managing Director is appointed for a term of up to five years and is not liable to retire from office by rotation. Non-executive Directors (except Independent Directors) are liable to retire from office by rotation and are eligible for re-appointment, unless otherwise specifically provided under the Articles of Association or under any statute.
The details of the composition of the Board of Directors of the Company as on 31st March 2021 and the outside directorships and committee positions held by them as on 31st March 2021 are as under:
Name of the Directors
Executive/Non-Executive/Independent1
No. of Equity Shares Held
No. of outside directorship(s) held in other Public Companies2
No. of outside committee
position(s) held3 Names of outside listed entities where the person is a director and the category of directorship
Member Chairman
Mr. Kumar Mangalam Birla, Chairman(DIN: 00012813)
Non-Executive 11,76,7134 9 - - 1. Vodafone Idea Limited, Non-Executive Director2. Aditya Birla Capital Limited, Non-Executive Director3. Century Textiles and Industries Limited,
Non-Executive Director4. Hindalco Industries Limited, Non-Executive Director5. UltraTech Cement Limited, Non-Executive Director6. Aditya Birla Fashion and Retail Limited,
Non-Executive DirectorMrs. Rajashree Birla(DIN: 00022995)
Non-Executive 5,52,850 5 - - 1. Pilani Investment and Industries Corporation Limited, Non-Executive Director
2. Century Enka Limited, Non-Executive Director3. UltraTech Cement Limited, Non-Executive Director4. Hindalco Industries Limited, Non-Executive Director5. Century Textiles and Industries Limited,
Non-Executive DirectorDr. Santrupt Misra5
(DIN: 00013625)Non-Executive - 2 1 - 1. Aditya Birla Capital Limited, Non-Executive Director
Mr. Shailendra K. Jain(DIN:00022454)
Non-Executive 65,430 2 - - -
Mr. Vipin Anand6
(DIN:05190124)Non-Executive - 2 - - 1. LIC Housing Finance Limited, Non-Executive Director
Dr. Thomas M. Connelly, Jr.(DIN: 03083495)
Independent - - - - -
Mr. Cyril Shroff(DIN: 00018979)
Independent - - - - -
Mr. O. P. Rungta7
(DIN: 00020559)Independent 625 - - - -
Mr. Arun Thiagarajan8
(DIN: 00292757)Independent 1,475 3 3 - 1. GE Power India Limited, Independent Director
2. TTK Prestige Limited, Independent Director3. Vodafone Idea Limited, Independent Director
Ms. Anita Ramachandran(DIN: 00118188)
Independent - 9 5 1 1. Rane (Madras) Limited, Independent Director2. Happiest Minds Technologies Limited,
Independent Director3. Metropolis Healthcare Limited, Independent Director
Mr. N. Mohan Raj(DIN: 00181969)
Independent - 1 1 - -
Mr. Dilip Gaur9
(DIN: 02071393)Managing Director
26,995 - - - -
149Integrated Annual Report 2020-21
Integrated ReportFinancial statem
entsStatutory Reports
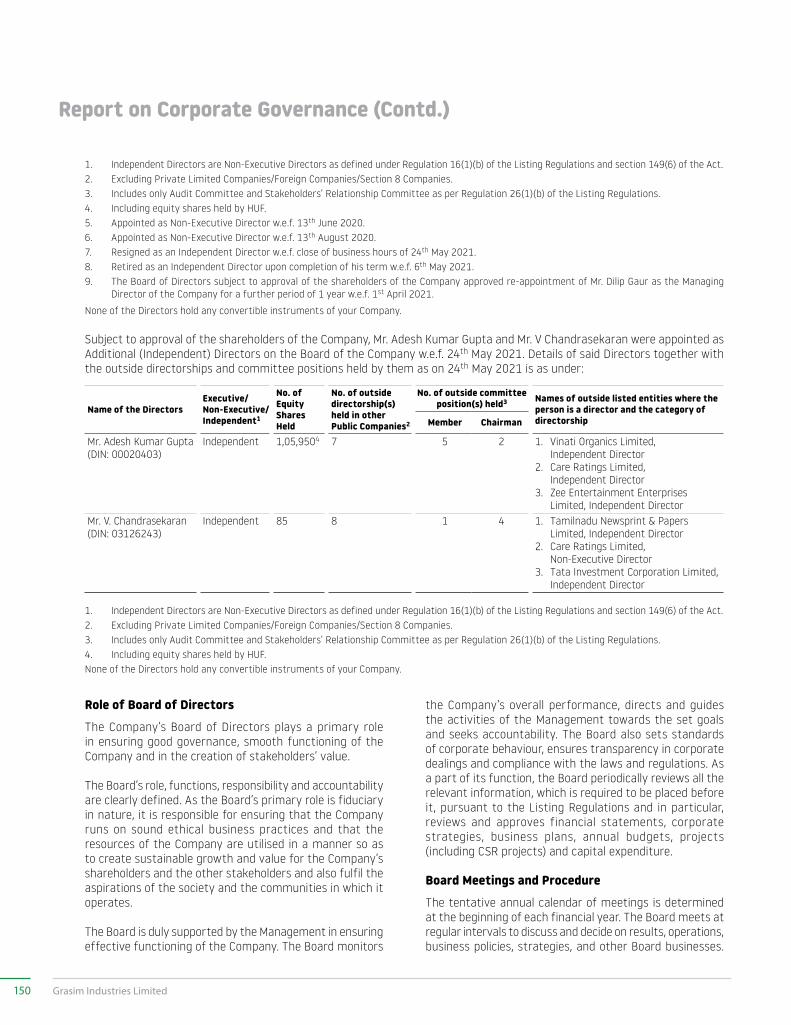
Role of Board of Directors The Company’s Board of Directors plays a primary role
in ensuring good governance, smooth functioning of the Company and in the creation of stakeholders’ value.
The Board’s role, functions, responsibility and accountability are clearly defined. As the Board’s primary role is fiduciary in nature, it is responsible for ensuring that the Company runs on sound ethical business practices and that the resources of the Company are utilised in a manner so as to create sustainable growth and value for the Company’s shareholders and the other stakeholders and also fulfil the aspirations of the society and the communities in which it operates.
The Board is duly supported by the Management in ensuring effective functioning of the Company. The Board monitors
the Company’s overall performance, directs and guides the activities of the Management towards the set goals and seeks accountability. The Board also sets standards of corporate behaviour, ensures transparency in corporate dealings and compliance with the laws and regulations. As a part of its function, the Board periodically reviews all the relevant information, which is required to be placed before it, pursuant to the Listing Regulations and in particular, reviews and approves financial statements, corporate strategies, business plans, annual budgets, projects (including CSR projects) and capital expenditure.
Board Meetings and Procedure The tentative annual calendar of meetings is determined
at the beginning of each financial year. The Board meets at regular intervals to discuss and decide on results, operations, business policies, strategies, and other Board businesses.
1. Independent Directors are Non-Executive Directors as defined under Regulation 16(1)(b) of the Listing Regulations and section 149(6) of the Act. 2. Excluding Private Limited Companies/Foreign Companies/Section 8 Companies. 3. Includes only Audit Committee and Stakeholders’ Relationship Committee as per Regulation 26(1)(b) of the Listing Regulations. 4. Including equity shares held by HUF. 5. Appointed as Non-Executive Director w.e.f. 13th June 2020. 6. Appointed as Non-Executive Director w.e.f. 13th August 2020. 7. Resigned as an Independent Director w.e.f. close of business hours of 24th May 2021. 8. Retired as an Independent Director upon completion of his term w.e.f. 6th May 2021. 9. The Board of Directors subject to approval of the shareholders of the Company approved re-appointment of Mr. Dilip Gaur as the Managing
Director of the Company for a further period of 1 year w.e.f. 1st April 2021.
None of the Directors hold any convertible instruments of your Company.
Subject to approval of the shareholders of the Company, Mr. Adesh Kumar Gupta and Mr. V Chandrasekaran were appointed as Additional (Independent) Directors on the Board of the Company w.e.f. 24th May 2021. Details of said Directors together with the outside directorships and committee positions held by them as on 24th May 2021 is as under:
Name of the DirectorsExecutive/Non-Executive/Independent1
No. of Equity Shares Held
No. of outside directorship(s) held in other Public Companies2
No. of outside committee position(s) held3 Names of outside listed entities where the
person is a director and the category of directorshipMember Chairman
Mr. Adesh Kumar Gupta(DIN: 00020403)
Independent 1,05,9504 7 5 2 1. Vinati Organics Limited, Independent Director
2. Care Ratings Limited, Independent Director
3. Zee Entertainment Enterprises Limited, Independent Director
Mr. V. Chandrasekaran(DIN: 03126243)
Independent 85 8 1 4 1. Tamilnadu Newsprint & Papers Limited, Independent Director
2. Care Ratings Limited, Non-Executive Director
3. Tata Investment Corporation Limited, Independent Director
1. Independent Directors are Non-Executive Directors as defined under Regulation 16(1)(b) of the Listing Regulations and section 149(6) of the Act. 2. Excluding Private Limited Companies/Foreign Companies/Section 8 Companies. 3. Includes only Audit Committee and Stakeholders’ Relationship Committee as per Regulation 26(1)(b) of the Listing Regulations. 4. Including equity shares held by HUF. None of the Directors hold any convertible instruments of your Company.
Report on Corporate Governance (Contd.)
150 Grasim Industries Limited
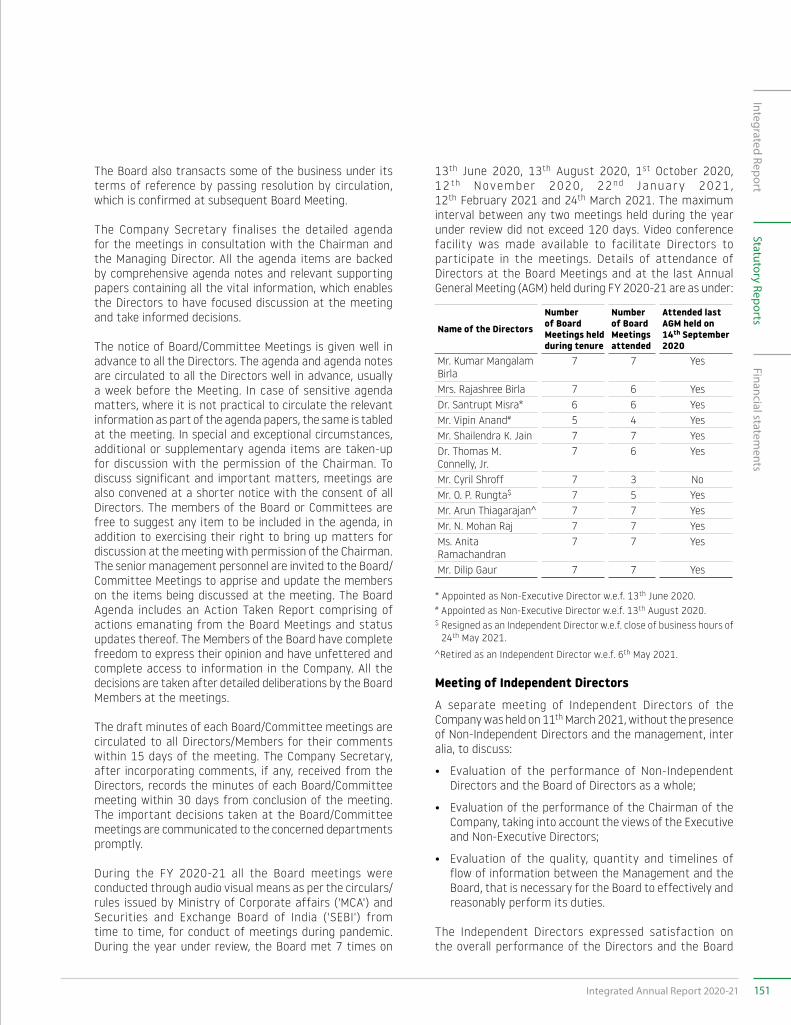
The Board also transacts some of the business under its terms of reference by passing resolution by circulation, which is confirmed at subsequent Board Meeting.
The Company Secretary finalises the detailed agenda for the meetings in consultation with the Chairman and the Managing Director. All the agenda items are backed by comprehensive agenda notes and relevant supporting papers containing all the vital information, which enables the Directors to have focused discussion at the meeting and take informed decisions.
The notice of Board/Committee Meetings is given well in advance to all the Directors. The agenda and agenda notes are circulated to all the Directors well in advance, usually a week before the Meeting. In case of sensitive agenda matters, where it is not practical to circulate the relevant information as part of the agenda papers, the same is tabled at the meeting. In special and exceptional circumstances, additional or supplementary agenda items are taken-up for discussion with the permission of the Chairman. To discuss significant and important matters, meetings are also convened at a shorter notice with the consent of all Directors. The members of the Board or Committees are free to suggest any item to be included in the agenda, in addition to exercising their right to bring up matters for discussion at the meeting with permission of the Chairman. The senior management personnel are invited to the Board/Committee Meetings to apprise and update the members on the items being discussed at the meeting. The Board Agenda includes an Action Taken Report comprising of actions emanating from the Board Meetings and status updates thereof. The Members of the Board have complete freedom to express their opinion and have unfettered and complete access to information in the Company. All the decisions are taken after detailed deliberations by the Board Members at the meetings.
The draft minutes of each Board/Committee meetings are circulated to all Directors/Members for their comments within 15 days of the meeting. The Company Secretary, after incorporating comments, if any, received from the Directors, records the minutes of each Board/Committee meeting within 30 days from conclusion of the meeting. The important decisions taken at the Board/Committee meetings are communicated to the concerned departments promptly.
During the FY 2020-21 all the Board meetings were conducted through audio visual means as per the circulars/rules issued by Ministry of Corporate affairs ('MCA') and Securities and Exchange Board of India ('SEBI') from time to time, for conduct of meetings during pandemic. During the year under review, the Board met 7 times on
13th June 2020, 13th August 2020, 1st October 2020, 12 th November 2020, 22nd Januar y 2021 , 12th February 2021 and 24th March 2021. The maximum interval between any two meetings held during the year under review did not exceed 120 days. Video conference facility was made available to facilitate Directors to participate in the meetings. Details of attendance of Directors at the Board Meetings and at the last Annual General Meeting (AGM) held during FY 2020-21 are as under:
Name of the Directors
Number of Board Meetings held during tenure
Number of Board Meetings attended
Attended last AGM held on 14th September 2020
Mr. Kumar Mangalam Birla
7 7 Yes
Mrs. Rajashree Birla 7 6 YesDr. Santrupt Misra* 6 6 YesMr. Vipin Anand# 5 4 YesMr. Shailendra K. Jain 7 7 YesDr. Thomas M. Connelly, Jr.
7 6 Yes
Mr. Cyril Shroff 7 3 NoMr. O. P. Rungta$ 7 5 YesMr. Arun Thiagarajan^ 7 7 YesMr. N. Mohan Raj 7 7 YesMs. Anita Ramachandran
7 7 Yes
Mr. Dilip Gaur 7 7 Yes
* Appointed as Non-Executive Director w.e.f. 13th June 2020.# Appointed as Non-Executive Director w.e.f. 13th August 2020.$ Resigned as an Independent Director w.e.f. close of business hours of
24th May 2021.
^Retired as an Independent Director w.e.f. 6th May 2021.
Meeting of Independent Directors A separate meeting of Independent Directors of the
Company was held on 11th March 2021, without the presence of Non-Independent Directors and the management, inter alia, to discuss:
• Evaluation of the performance of Non-Independent Directors and the Board of Directors as a whole;
• Evaluation of the performance of the Chairman of the Company, taking into account the views of the Executive and Non-Executive Directors;
• Evaluation of the quality, quantity and timelines of flow of information between the Management and the Board, that is necessary for the Board to effectively and reasonably perform its duties.
The Independent Directors expressed satisfaction on the overall performance of the Directors and the Board
151Integrated Annual Report 2020-21
Integrated ReportFinancial statem
entsStatutory Reports
as a whole. The Independent Directors also expressed satisfaction on the Board’s freedom to express views on matters transacted at meetings and the manner in which the management discusses various subject matters specified in the agenda of meetings. Suggestions made by the Independent Directors were discussed at the Board meeting and are being implemented.
Resignation of Independent Directors
During FY 2020-21, none of the Independent Directors of the Company resigned before the expiry of their respective tenure(s).
Mr. O.P. Rungta, Independent Director resigned from the Board of Directors of the Company effective from close of business hours of 24th May 2021 due to health reasons on account of advanced age and there is no other material reason for his resignation except as mentioned.
Code of Conduct
The Board of Directors has laid down a “Code of Conduct for the Board of Directors and Senior Management” of your Company, which is available on the Company’s website and can be accessed at https://www.grasim.com/investors/policies-and-code-of-conduct. All Board Members and Senior Management Personnel have confirmed compliance with the Code of Conduct for the Board of Directors and Senior Management. A declaration to that effect signed by the Managing Director is attached and forms part of this Report.
Training, Induction and Familiarisation Programme
Letters of appointment, stipulating the terms of appointment, role, rights and responsibilities, are issued to the Independent Directors at the time of their appointment. In terms of the Listing Regulations, the terms and conditions of appointment of Independent Directors are placed on the Company’s website and can be accessed at https://www.grasim.com/investors/corporate-governance. When a director joins the Board of the Company, your Company conducts introductory familiarisation programme, inter alia, covering the nature of the industry in which the Company operates, business model of the Company, organisational set-up, functioning of various departments internal control processes and relevant information pertaining to the Company. On an on-going basis, the Directors are familiarised with the Company’s business, its operations, strategy, functions, policies and procedures at the Board and Committee meetings. Changes in regulatory framework and its impact on the operations of the Company are also presented at the Board/Committee
meetings. The Directors are also apprised about risk assessment and minimisation procedures.
All the Directors (including Independent directors) have the freedom to interact with the Company’s Senior Management Personnel to discuss matters pertaining to the Company’s affairs.
The details of familiarisation programme, imparted to the Directors of the Company are available on the Company’s website and can be accessed at https://www.grasim.com/investors/corporate-governance.
Prevention of Insider Trading In compliance with the provisions of the Securities and
Exchange Board of India (Prohibition of Insider Trading) Regulations, 2015, as amended, the Company has formulated and adopted the “Code of Conduct to regulate, monitor and report trading by designated persons in Listed or Proposed to be Listed Securities” of the Company (“the Insider Trading Code”). The object of the Insider Trading Code is to set framework, rules and procedures which all concerned should follow, both in letter and spirit, while trading in listed or proposed to be listed securities of the Company. The Company has also adopted the Code of Practice and Procedures for Fair Disclosure of Unpublished Price Sensitive Information (“the Code”) in line with the SEBI (Prohibition of Insider Trading) Amendment Regulations, 2018 and formulated a Policy for determination of ‘legitimate purposes’ as a part of the Code. The Code also includes policy and procedures for inquiry in case of leakage of Unpublished Price Sensitive Information (UPSI) and aims at preventing misuse of UPSI. The Code is available on the Company’s website, https://www.grasim.com/investors/policies-and-code-of-conduct. The policy and the procedures are periodically revised from time to time and communicated to the Designated Persons. Trading window closure is intimated to all Designated Persons and to the Stock Exchanges in advance, whenever required. A structured digital database is being maintained by the Company, which contains the names and other prescribed particulars of the persons covered under the Insider Trading Code. This online tracking mechanism for monitoring trade in the Company’s securities by the 'Designated Persons' and their relatives helps in real time detection and taking appropriate action, in case of any violation/non-compliance of the Company’s Insider Trading Code. The Company Secretary has been appointed as the Compliance Officer and is responsible for adherence to the Code.
III. COMMITTEES OF THE BOARD The Board has constituted various Committees with
specific terms of reference in line with the provisions of the
Report on Corporate Governance (Contd.)
152 Grasim Industries Limited
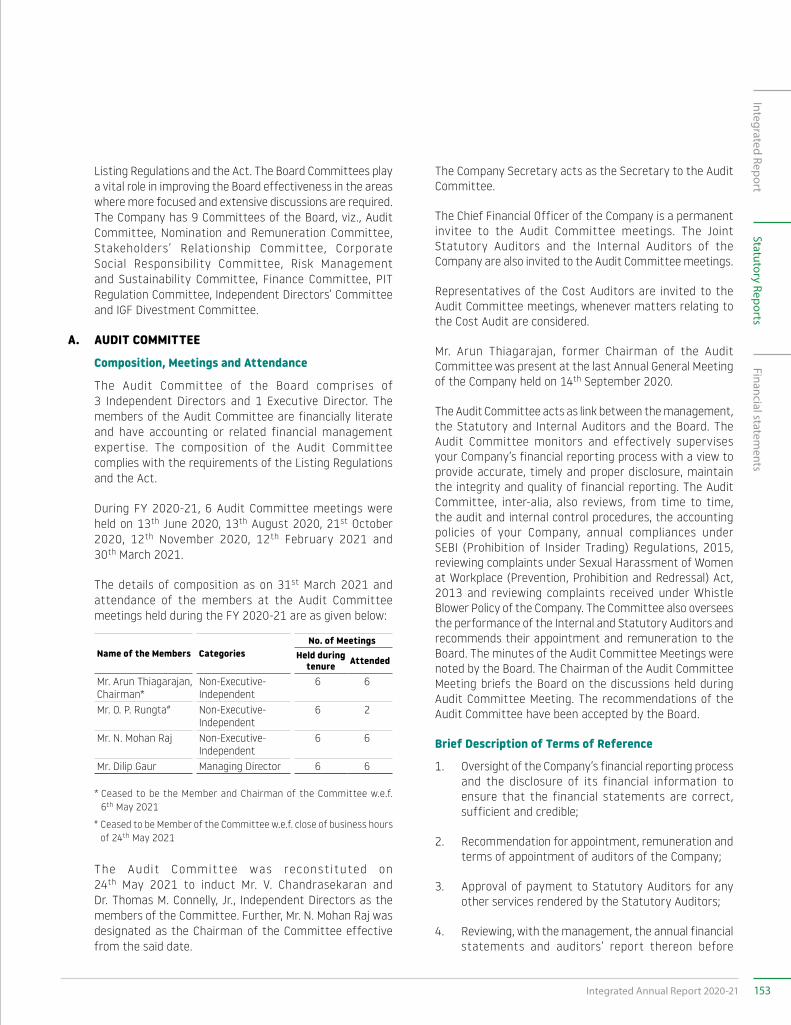
Listing Regulations and the Act. The Board Committees play a vital role in improving the Board effectiveness in the areas where more focused and extensive discussions are required. The Company has 9 Committees of the Board, viz., Audit Committee, Nomination and Remuneration Committee, Stakeholders’ Relationship Committee, Corporate Social Responsibility Committee, Risk Management and Sustainability Committee, Finance Committee, PIT Regulation Committee, Independent Directors’ Committee and IGF Divestment Committee.
A. AUDIT COMMITTEE
Composition, Meetings and Attendance
The Audit Committee of the Board comprises of 3 Independent Directors and 1 Executive Director. The members of the Audit Committee are financially literate and have accounting or related financial management expertise. The composition of the Audit Committee complies with the requirements of the Listing Regulations and the Act.
During FY 2020-21, 6 Audit Committee meetings were held on 13th June 2020, 13th August 2020, 21st October 2020, 12th November 2020, 12th February 2021 and 30th March 2021.
The details of composition as on 31st March 2021 and attendance of the members at the Audit Committee meetings held during the FY 2020-21 are as given below:
Name of the Members CategoriesNo. of Meetings
Held during tenure Attended
Mr. Arun Thiagarajan, Chairman*
Non-Executive-Independent
6 6
Mr. O. P. Rungta# Non-Executive-Independent
6 2
Mr. N. Mohan Raj Non-Executive-Independent
6 6
Mr. Dilip Gaur Managing Director 6 6
* Ceased to be the Member and Chairman of the Committee w.e.f. 6th May 2021
# Ceased to be Member of the Committee w.e.f. close of business hours of 24th May 2021
The Audit Commit tee was reconst i tuted on 24th May 2021 to induct Mr. V. Chandrasekaran and Dr. Thomas M. Connelly, Jr., Independent Directors as the members of the Committee. Further, Mr. N. Mohan Raj was designated as the Chairman of the Committee effective from the said date.
The Company Secretary acts as the Secretary to the Audit Committee.
The Chief Financial Officer of the Company is a permanent invitee to the Audit Committee meetings. The Joint Statutory Auditors and the Internal Auditors of the Company are also invited to the Audit Committee meetings.
Representatives of the Cost Auditors are invited to the Audit Committee meetings, whenever matters relating to the Cost Audit are considered.
Mr. Arun Thiagarajan, former Chairman of the Audit Committee was present at the last Annual General Meeting of the Company held on 14th September 2020.
The Audit Committee acts as link between the management, the Statutory and Internal Auditors and the Board. The Audit Committee monitors and effectively supervises your Company’s financial reporting process with a view to provide accurate, timely and proper disclosure, maintain the integrity and quality of financial reporting. The Audit Committee, inter-alia, also reviews, from time to time, the audit and internal control procedures, the accounting policies of your Company, annual compliances under SEBI (Prohibition of Insider Trading) Regulations, 2015, reviewing complaints under Sexual Harassment of Women at Workplace (Prevention, Prohibition and Redressal) Act, 2013 and reviewing complaints received under Whistle Blower Policy of the Company. The Committee also oversees the performance of the Internal and Statutory Auditors and recommends their appointment and remuneration to the Board. The minutes of the Audit Committee Meetings were noted by the Board. The Chairman of the Audit Committee Meeting briefs the Board on the discussions held during Audit Committee Meeting. The recommendations of the Audit Committee have been accepted by the Board.
Brief Description of Terms of Reference
1. Oversight of the Company’s financial reporting process and the disclosure of its financial information to ensure that the financial statements are correct, sufficient and credible;
2. Recommendation for appointment, remuneration and terms of appointment of auditors of the Company;
3. Approval of payment to Statutory Auditors for any other services rendered by the Statutory Auditors;
4. Reviewing, with the management, the annual financial statements and auditors’ report thereon before
153Integrated Annual Report 2020-21
Integrated ReportFinancial statem
entsStatutory Reports
submission to the Board for approval, with particular reference to:
(a) matters required to be included in the Directors’ Responsibility Statements to be included in the Board’s Report in terms of clause (c) of sub-section (3) of section 134 of the Act;
(b) changes, if any, in accounting policies and practices and reasons for the same;
(c) major accounting entries involving estimates based on the exercise of judgement by the management;
(d) significant adjustments made in the financial statements arising out of audit findings;
(e) compliance with listing and other legal requirements relating to the f inancial statements;
(f) disclosure of any related party transactions; and
(g) modified opinion(s) in the draft audit report.
5. Reviewing, with the management, the quarterly financial statements before submission to the Board for approval;
6. Reviewing, with the management, the statement of uses/application of funds raised through an issue (public issue, rights issue, preferential issue, etc.), the statement of funds utilised for the purposes other than those stated in the offer document/prospectus/notice and the report submitted by the monitoring agency monitoring the utilisation of proceeds of a public or rights issue, and making appropriate recommendations to the Board to take up steps in this matter;
7. Reviewing and monitoring the auditors’ independence and performance, and effectiveness of audit process;
8. Approval or any subsequent modification of transactions of the Company with related parties;
9. Scrutiny of inter-corporate loans and investments;
10. Reviewing the utilisation of loans and/or advances from/investment by the holding company in the subsidiary exceeding H 100 Crore or 10% of the asset size of the subsidiary, whichever is lower including
existing loans/advances/investments existing as on the date of coming into force of this provision;
11. Valuation of undertakings or assets of the Company, wherever it is necessary;
12. Evaluation of internal financial controls and risk management systems;
13. Monitoring the end use of funds raised through public offers and related matters;
14. Reviewing, with the management, performance of statutory and internal auditors, adequacy of the internal control systems;
15. Reviewing the adequacy of internal audit function, if any, including the structure of the internal audit department, staffing and seniority of the official heading the department, reporting structure coverage and frequency of internal audit;
16. Discussion with internal auditors of any significant findings and follow up thereon;
17. Reviewing the findings of any internal investigations by the internal auditors into matters where there is suspected fraud or irregularity or a failure of internal control systems of a material nature and reporting the matter to the Board;
18. Discussion with statutory auditors before the audit commences, about the nature and scope of audit as well as post-audit discussion to ascertain any area of concern;
19. To look into the reasons for substantial defaults in the payment to the depositors, debenture holders, shareholders (in case of non-payment of declared dividends) and creditors;
20. To review the functioning of the Whistle Blower Mechanism;
21. In consultation with the Internal Auditor, formulate the scope, functioning, periodicity and methodology for conducting the internal audit;
22. Approval of appointment of CFO after assessing the qualifications, experience and background, etc. of the candidate; and
23. Carrying out any other function as is mentioned in the terms of reference of the Audit Committee.
Report on Corporate Governance (Contd.)
154 Grasim Industries Limited
The Audit Committee mandatorily reviews the following information:
(1) Management Discussion and Analysis of financial condition and results of operations;
(2) Financial statements, in particular, the investments made by the unlisted subsidiary companies;
(3) Statement of significant related party transactions (as defined by the Audit Committee), submitted by the management;
(4) Management letters/letters of internal control weaknesses issued by the Statutory Auditors;
(5) Internal audit reports relating to internal control weaknesses;
(6) Appointment, removal and terms of remuneration of the Internal Auditor;
(7) Statement of deviations:
a. quarterly statement of deviation(s), including report of monitoring agency, if applicable, submitted to stock exchange(s) in terms of Listing Regulation;
b. annual statement of funds utilised for the purposes other than those stated in the offer document/prospectus/notice in terms of Listing Regulation.
(8) Any Show cause, demand, prosecution and penalty notices against the Company or its Directors which are materially important, including any correspondence with regulators or government agencies and any published reports which raise material issues regarding the Company’s financial statements or accounting policies;
(9) Any material default in financial obligations by the Company; and
(10) Any significant or important matters affecting the business of the Company.
Vigil Mechanism/Whistle Blower Policy
Your Company has adopted Whistle Blower Policy that provides a formal vigil mechanism for Directors and Employees to report genuine concerns about the unethical behaviour, actual or suspected frauds of violation of the Company’s Code of Conduct or Ethics Policy. The said
mechanism also provides for direct access to the Chairman of the Audit Committee in appropriate or exceptional cases. The policy provides for adequate safeguards against victimisation and all personnel have access to the Audit Committee. The Whistle Blower Policy has been uploaded on the Company’s website, https://www.grasim.com/upload/pdf/whistle_blower_policy.pdf. The Policy is in line with the Company’s Code of Conduct, Vision and Values and forms part of good Corporate Governance.
B. NOMINATION AND REMUNERATION COMMITTEE
Composition, Meetings and Attendance
The Nomination and Remuneration Committee (NRC) comprises of 4 Non-Executive Directors, of which 2 are Independent Directors. The composition of the NRC complies with the requirements of the Listing Regulations and the Act.
During FY 2020-21, 4 NRC meetings were held on 13th June 2020, 13th August 2020, 12th November 2020 and 12th February 2021. The recommendations of the NRC have been accepted by the Board.
The details of composition of NRC as on 31st March 2021 and attendance of the members at the NRC meetings held during FY 2020-21 are given below:
Name of the Members CategoriesNo. of Meetings
Held during tenure Attended
Mr. O. P. Rungta, Chairman#
Non-ExecutiveIndependent
4 3
Mr. Kumar Mangalam Birla
Non-Executive 4 4
Dr. Santrupt Misra* Non-Executive 3 3Mr. Cyril Shroff Non-Executive
Independent4 3
# Ceased to be Member and Chairman of the Committee w.e.f. close of business hours of 24th May 2021.
* Appointed as the Member of the Committee w.e.f. 13th June 2020.
The NRC was reconstituted on 24th May 2021 to induct Ms. Anita Ramachandran as the member (designated as the Chairperson) of the Committee effective from the said date.
The Company Secretary acts as the Secretary to the NRC.
Brief Description of Terms of Reference
(1) Formulate the criteria for determining qualifications, positive attributes and independence of a director and recommend to the Board of Directors a policy relating
155Integrated Annual Report 2020-21
Integrated ReportFinancial statem
entsStatutory Reports
to, the remuneration of the Directors, Key Managerial Personnel and other employees;
(2) Formulate the criteria for effective evaluation of performance of the Board, its Committees and individual Directors and review its implementation and compliance;
(3) Devise a policy on diversity of the Board of Directors;
(4) Identify persons who are qualified to become directors and who may be appointed in senior management in accordance with the criteria laid down, and recommend to the Board of Directors their appointment and removal;
(5) To consider whether to extend or continue the term of appointment of independent directors, on the basis of the report of performance evaluation of independent directors;
(6) Set the level and composition of remuneration which is reasonable and sufficient to attract, retain and motivate Directors and Senior Management of the quality required to run the Company successfully;
(7) Set the relationship of remuneration to performance;
(8) Check whether the remuneration provided to Directors, Key Managerial Personnel and Senior Management includes a balance between fixed and incentives pay reflecting short-term and long-term performance objectives appropriate to the working of the Company and its goals;
(9) Review and implement succession plans for Managing Director, Executive Directors and Senior Management;
(10) Review and make recommendations to the Board with respect to any incentive-based compensation and equity-based plans that are subject to Board or shareholder approval (including broad-based plans); and
(11) Recommend to the Board, all remuneration, in whatever form, payable to senior management.
Performance Evaluation
Pursuant to the provisions of the Act and the Listing Regulations, the Board of Directors has carried out an annual evaluation of its own performance, its Committees,
Independent Directors, Non-Executive Directors, Executive Director and the Chairman of the Board.
The Nomination and Remuneration Committee of the Board has laid down the manner in which formal annual evaluation of the performance of the Board, its Committees and Individual Directors has to be made. It includes circulation of evaluation forms separately for evaluation of the Board and its Committees, Independent Directors/Non-Executive Directors/Executive Directors and the Chairman of the Company. The Directors completed evaluation forms providing feedback on functioning of the Board, Committees and Chairman of the Board.
The performance of Non-Independent Directors, the Board as a whole, and the Committees of the Board has been evaluated by Independent Directors in a separate meeting. At the same meeting, the Independent Directors also evaluated the performance of the Chairman of your Company, after taking into account the views of Executive Director and Non-Executive Directors. Evaluation as done by the Independent Directors was submitted to the Nomination and Remuneration Committee and subsequently to the Board.
The performance of the Board and its Committees was evaluated by the Nomination and Remuneration Committee after seeking inputs from all the Directors, on the basis of criteria such as the Board/Committee composition and structure, effectiveness of the Board/Committee process, information and functioning, etc.
Following the meetings of Independent Directors and of Nomination and Remuneration Committee, the Board at its meeting discussed the performance of the Board, as a whole, its committees and individual Directors. The performance evaluation of all the Directors of your Company, (including Independent Directors, Executive and Non-Executive Directors and Chairman), is done at the Board meeting by all the Board members, excluding the Director being evaluated on the basis of criteria, such as contribution at the meetings, effective decision making, strategic perspective or inputs regarding the growth and performance of your Company, among others.
Core Skills/Expertise/Competencies available with the Board
Your Company’s Board of Directors have identified the following skills/expertise/competencies to function and discharge their responsibilities effectively and as available to the Board:
Report on Corporate Governance (Contd.)
156 Grasim Industries Limited
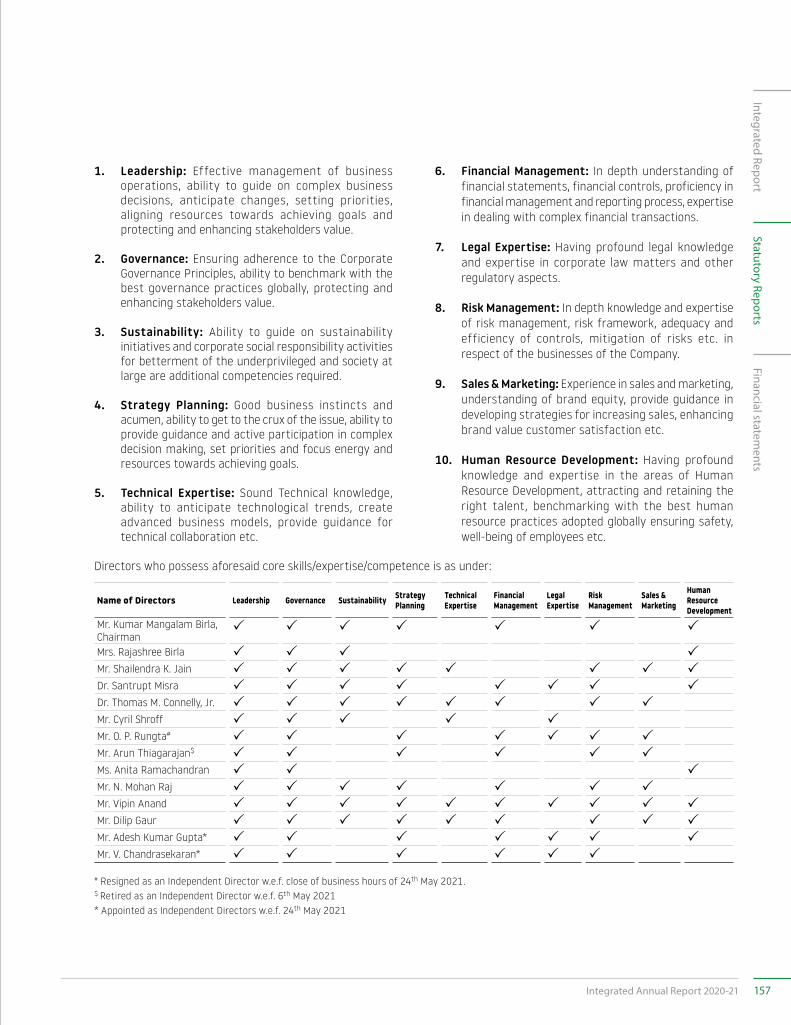
1. Leadership: Effective management of business operations, ability to guide on complex business decisions, anticipate changes, setting priorities, aligning resources towards achieving goals and protecting and enhancing stakeholders value.
2. Governance: Ensuring adherence to the Corporate Governance Principles, ability to benchmark with the best governance practices globally, protecting and enhancing stakeholders value.
3. Sustainability: Ability to guide on sustainability initiatives and corporate social responsibility activities for betterment of the underprivileged and society at large are additional competencies required.
4. Strategy Planning: Good business instincts and acumen, ability to get to the crux of the issue, ability to provide guidance and active participation in complex decision making, set priorities and focus energy and resources towards achieving goals.
5. Technical Expertise: Sound Technical knowledge, ability to anticipate technological trends, create advanced business models, provide guidance for technical collaboration etc.
6. Financial Management: In depth understanding of financial statements, financial controls, proficiency in financial management and reporting process, expertise in dealing with complex financial transactions.
7. Legal Expertise: Having profound legal knowledge and expertise in corporate law matters and other regulatory aspects.
8. Risk Management: In depth knowledge and expertise of risk management, risk framework, adequacy and efficiency of controls, mitigation of risks etc. in respect of the businesses of the Company.
9. Sales & Marketing: Experience in sales and marketing, understanding of brand equity, provide guidance in developing strategies for increasing sales, enhancing brand value customer satisfaction etc.
10. Human Resource Development: Having profound knowledge and expertise in the areas of Human Resource Development, attracting and retaining the right talent, benchmarking with the best human resource practices adopted globally ensuring safety, well-being of employees etc.
Directors who possess aforesaid core skills/expertise/competence is as under:
Name of Directors Leadership Governance Sustainability Strategy Planning
Technical Expertise
Financial Management
Legal Expertise
Risk Management
Sales & Marketing
Human Resource Development
Mr. Kumar Mangalam Birla, Chairman
Mrs. Rajashree Birla Mr. Shailendra K. Jain Dr. Santrupt Misra Dr. Thomas M. Connelly, Jr. Mr. Cyril Shroff Mr. O. P. Rungta# Mr. Arun Thiagarajan$ Ms. Anita Ramachandran Mr. N. Mohan Raj Mr. Vipin Anand Mr. Dilip Gaur Mr. Adesh Kumar Gupta* Mr. V. Chandrasekaran*
# Resigned as an Independent Director w.e.f. close of business hours of 24th May 2021. $ Retired as an Independent Director w.e.f. 6th May 2021 * Appointed as Independent Directors w.e.f. 24th May 2021
157Integrated Annual Report 2020-21
Integrated ReportFinancial statem
entsStatutory Reports
A BRIEF PROFILE OF THE BOARD OF DIRECTORS AS ON THE DATE OF THIS REPORT IS GIVEN BELOW:
Mr. Kumar Mangalam Birla is the Chairman of the Board of Directors of your Company and the Chairman of Aditya Birla Group (the “Aditya Birla Group”), which operates in 36 countries across six continents. He is a chartered accountant and holds an MBA degree from the London Business School.
Mr. Birla chairs the Boards of all major Group companies in India and globally. In the 25 years that he has been at the helm of the Group, he has accelerated growth, built meritocracy, and enhanced stakeholder value. In the process he has raised the Group’s turnover by over 20 times.
He has been the architect of over 40 acquisitions in India and globally, among the highest by any Indian multinational. Under his stewardship, the Aditya Birla Group enjoys a position of leadership in all the major sectors in which it operates, from cement to chemicals, metals to textiles, and apparels to financial services. Over the years, Mr. Birla has built a highly successful meritocratic organisation, anchored by an extraordinary force of 120,000 employees belonging to 42 different nationalities.
Outside the Group, Mr. Birla has held several key positions on various regulatory and professional Boards. He was a Director on the Central Board of Directors of the Reserve Bank of India. He was Chairman of the Advisory Committee constituted by the Ministry of Company Affairs and also served on the Prime Minister of India’s Advisory Council on Trade and Industry. As the Chairman of Securities and Exchange Board of India (SEBI) Committee on Corporate Governance, he framed the first-ever governance code for Corporate India.
He is also the first Indian Industrialist to be conferred an Honorary degree by the Institute of Company Secretaries of India (ICSI).
Mr. Birla is deeply engaged with Educational Institutions. He is the Chancellor of the Birla Institute of Technology & Science (BITS) with campuses in Pilani, Goa, Hyderabad and Dubai. He is also the Chairman of India’s premier management institute — Indian Institute of Management, Ahmedabad.
On the global arena, Mr. Birla serves on the London Business School’s Asia Pacific Advisory Board and is an Honorary Fellow of the London Business School. In 2019, Mr. Birla constituted a £15mn scholarship programme at the London Business School in memory of his grandfather, Mr. B.K. Birla,
marking the largest ever endowed scholarship gift to a European Business School.
A firm practitioner of the trusteeship concept, Mr. Birla has institutionalised the concept of caring and giving at the Aditya Birla Group. With his mandate, the Group is involved in meaningful welfare driven activities that distinctively impact the quality of life of weaker sections of society.
Mrs. Rajashree Birla is an exemplar in the area of community initiatives and rural development. Mrs. Birla spearheads the Aditya Birla Centre for Community Initiatives and Rural Development, the Aditya Birla Group’s (Group) apex body responsible for development projects.
She oversees the social and welfare driven work across all the Group’s major companies. The footprint of the Centre’s work straddles over 7,000 villages, reaching out to 9 million people. The Group runs 20 hospitals and 56 schools where quality education is imparted to over 46,500 children. Both its hospitals as well as schools are ‘Not For Profit’ institutions. Mrs. Birla is the Chairperson of the FICCI – Aditya Birla CSR Centre for Excellence, Habitat for Humanity (India) and is on the Board of the Asia Pacific Committee as well as Habitat’s Global Committee.
She is the Chairperson of FICCI’s first ever Expert Committee on CSR. She is on the Board of BAIF Development Research Foundation, Pune and also serves on the Board of directors of the CSR Committee of the State Bank of India. As a patron of arts and culture, she heads the “Sangit Kala Kendra”, a Centre for performing arts, as its President.
In recognition of the exemplary work done by Mrs. Rajashree Birla, leading national and international organisations have showered accolades upon her. Among these the most outstanding one has been that of the Government of India which bestowed the “Padma Bhushan” Award in 2011 on Mrs. Rajashree Birla in the area of “Social Work”.
In recognition of Mrs. Birla’s unrelenting endeavours towards polio eradication, she was honoured with the much coveted “Polio Eradication Champion” Award by the Government of India. Likewise, the ‘Global Golden Peacock Award for CSR’ was conferred upon her by Dr. Ola Ullsten, the Former Prime Minister of Sweden in Portugal. Among other distinctive awards received by Mrs. Birla, feature the Economic Times’ prestigious Award: Corporate Citizen of the Year, twice in a decade, first in 2003 and again in 2012; the All India Management Association’s ‘Corporate Citizen of the Year Award’, the IOD’s ‘Distinguished Fellowship Award’ and the ‘FICCI FLO Golden Laurel Award’.
Report on Corporate Governance (Contd.)
158 Grasim Industries Limited
Mr. Shailendra Kumar Jain is a Non-Executive Director of our Company since 2010. He holds a bachelor’s degree in Science from Vikram University, Ujjain and a bachelor’s degree in Engineering from University of Mumbai. He also holds a Master’s degree in Electrical Engineering from Massachusetts Institute of Technology, USA. He has over 55 years of experience with Aditya Birla Group out of which 45 years with the Company in all aspects of pulp and fibre business and 7 years as the Chairman of the Group’s Business Review Council for manufacturing businesses.
Immediately after completion of his graduate studies at MIT, Mr. Jain was directly inducted by the founder Chairman Mr. G.D. Birla at Grasim in 1965 to join its Staple Fibre Division, Nagda and he later became the President of the Company in December 1993. He was inducted on the Company’s Board as a Whole-time Director in 2001 and was also given the Directorship for Groups Global Pulp and Fibre Business. During the following decade he lead several merger and acquisitions in Pulp, Fibre and allied industries which led the Pulp and Fibre business of the group to become a Global Leader.
Besides being a director of the Company, he is also the Chairman of Aditya Birla Cellulosic (Egypt) Co. SAE and Domsjo Fabriker (Sweden). He is a Commissioner in PT Sunrise, Indonesia and a Director in Indo Phil Textile Mills Inc., Philippines. He is also on the Board of Director of Sun God Trading & Investment Limited and Samruddhi Swastik Trading & Investments Limited, wholly owned subsidiaries of the Company.
Dr. Santrupt Misra is a Non-Executive Director of the Company. Dr. Misra is currently the CEO, Birla Carbon; Director, Chemicals; and Director, Group Human Resources for the Aditya Birla Group, a USD 46 Billion Global Conglomerate.
A business leader and an HR Professional of standing, with over three decades of experience in global business leadership, corporate governance, organisational transformation, non-profit leadership, and professional development, Dr. Misra has worked at Board level for over two decades as Non-Executive Director and Executive Director in publicly listed companies, unlisted companies, and not for Profit Organisations both in India and overseas. He is a Director in several companies of the Aditya Birla Group including Aditya Birla Capital Ltd and Birla Carbon Thailand, which are listed companies. He was an Independent Director on the Board of the Oil and Natural Gas Corporation Ltd. (Revenue US 61 Billion), a leading Government of India enterprise, and the Chairperson of the Board of Governors of the National Institute of Technology, Rourkela.
Dr. Misra has been recently appointed as the Chairman of the Project Advisory Committee for the Ekamra Kshetra Scheme, an Odisha State Government project of immense significance for the heritage of Odisha and of cultural significance for the country.
He is also on Governing Bodies of professional organisations/associations such as the Association of Executive Search Consultants (AESC) U.S.A. He was also on the Board of the Xavier’s Institute of Management, Bhubaneswar and the Worldwide ERC, USA. He also served as a member of the SHRM Certification Commission, USA.
Dr. Misra holds two Post Graduate degrees in Political Science and in Personnel Management & Industrial Relations, from the Utkal University & the Tata Institute of Social Sciences, respectively. In addition, he also holds two PhDs, from India & UK, in Public Administration and Industrial Relations, respectively, and an honorary D.Sc. degree from Aston University, U.K. He is a Fellow of the National Academy of Human Resources (NAHR), USA; Hon. Fellow of the Coaching Federation of India; an Eisenhower Fellow, an Aston Business School Fellow, an AIMA Fellow and a Commonwealth Scholar.
Dr. Thomas M. Connelly, Jr. is an independent Director of the Company. He holds bachelor’s degrees in Chemical Engineering and Economics from Princeton University. He also holds a doctorate in Chemical Engineering from the University of Cambridge. He has over 35 years of experience in the chemical industry. He is the Executive Director and CEO of the American Chemical Society. Prior to joining ACS, he served as Chief Science and Technology Officer, and then as Chief Innovation Officer for the DuPont Company. At DuPont, Dr. Connelly led R&D organisation and businesses while based in the US, Europe and Asia. Dr. Connelly was elected to the National Academy of Engineering, and has chaired studies for the academies division of earth and Life Studies. He has also served in advisory roles to the U.S. Government and the Republic of Singapore.
Mr. Cyril Shroff is an Independent Director of the Company. He has over 39 years of experience in a wide range of areas, including corporate and securities law, disputes, banking, bankruptcy, infrastructure, private client, financial regulatory and others. He holds a bachelor’s degree in law from Government Law College, Mumbai. He is consistently ranked as “star practitioner” in India by Chambers Global and often regarded as the “M&A King of India”. He is Chairman of FICCI’s Corporate Laws Committee, member of CII National Council and Financial Markets Committee, National Committee on Financial Markets & others. He is also member of first apex advisory committee of the IMC International ADR Centre, Task force member of Society of
159Integrated Annual Report 2020-21
Integrated ReportFinancial statem
entsStatutory Reports
Insolvency Practitioners of India & Member of the Media Legal Defence Initiative International Advisory Board. He was a member of SEBI constituted Uday Kotak Committee on Corporate Governance and SEBI Committee on Insider Trading.
Chambers Asia Pacific 2021 recognised him as ‘Star Individual’ for Corporate/M&A and an ‘Eminent Practitioner’ for Private Equity, Restructuring & Insolvency and Banking & Finance in India, while Asian Legal Business awarded him with ‘Dealmaker of the Year 2020’.
Mr. O.P. Rungta is an independent Director of the Company. He joined the Board of Directors of our Company on 25th September 2014. He is a Chartered Accountant and holds a bachelor’s degree in law. He has vast experience in the manufacturing industry and is a finance and management consultant. Mr. O.P. Rungta resigned as an Independent Director of the Company with effect from close of business hours on 24th May 2021 due to health issues on account of advanced age.
Mr. Arun Thiagarajan is an independent Director of the Company. He joined the board of directors of our Company on 7th May 2016. He holds a bachelor’s degree in Business Administration and Information Systems from Uppsala University, Sweden and a master’s degree in Engineering (Electrical) from Royal Institute of Technology, Stockholm. He has also attended the Advanced Management Program of the Graduate School of Business, Harvard Business School. He has over 40 years of experience in CEO/Board positions of various industries. He has previously served as the managing director of Asea Brown Boveri Limited, as the vice chairman of Wipro Limited and as president of Hewlett-Packard India Private Limited. He is also on the board of directors of Vodafone India Limited, GE Power India Limited, TTK Prestige Limited and Fowler Westrup (India) Private Limited. Mr. Arun Thiagarajan retired as an Independent Director with effect from 6th May 2021, upon completion of his first term as an Independent Director.
Ms. Anita Ramachandran is an Independent Director of the Company. She holds a master’s degree in Management Studies from Jamnalal Bajaj Institute of Management. She is a renowned Human Resource professional with deep knowledge and experience for about 40 years as a management consultant. She is also one of the first generation of women professional to become an entrepreneur and run a highly successful HR consulting and services organisation.
Ms. Anita began her career with AF Ferguson & Co. (the KPMG network company in India then) in 1976 as the first woman consultant of the firm. In her 19 years stint
with AFF she worked across various parts of the country and wide range of areas from finance, industrial market research, strategy and human resource consulting. She was finally a Director of the firm.
Ms. Anita founded Cerebrus Consultants in 1995 to focus on HR advisory services, including organisation transformation. Her reputation and innovative work helped her build Cerebrus into a firm with national presence. Ms. Anita is known as an authority in reward management system in the country and her work in the compensation and rewards area is well recognised. In recent years she has been involved in several large organisation transformation assignments. Ms. Anita has been a regular facilitator for senior and top management workshops and an assessor for many senior positions. Her wide general management consulting experience and insights on HR has enabled her to be a strategic advisor to many family groups. She also works with several PE firms and start -ups to mentor them through their growth journey.
She is currently on the Board of Metropolis Healthcare Limited, Kotak Mahindra Life Insurance Company Limited, Happiest Minds Technologies Limited and several other companies.
Ms. Anita supports many organisations in the social sector through pro bono professional work and remains deeply committed to work with women. She has been in the past Chairperson of TIE Women.
Mr. N. Mohan Raj is an Independent Director of the Company. He holds a Master’s Degree in Arts (Economics). He was the former Executive Director of Life Insurance Corporation of India and has rich experience in the field of Adminstration, Marketing of Life Insurance, Mutual Fund, Finance and Investments. He serves as Director on the Board of LTIDPL Indvit Services Limited and Veritas Finance Private Limited.
Mr. Vipin Anand is a Non-Executive Director of the Company. He is the Managing Director of Life Insurance Corporation of India (LIC). He has been with LIC for more than 38 years. Mr. Anand has handled several important assignments in various capacities and departments, ranging from Information Technology, Marketing, and Personnel & Industrial Relations to Corporate Communications and International Operations, across different geographical locations of the country.
He was a member of the IRDAI committee for framing Regulations on Digital Marketing and was a member of the CII Committee on Insurance and Pensions. Mr. Anand was awarded ‘Top Rankers Excellence Award for Outstanding
Report on Corporate Governance (Contd.)
160 Grasim Industries Limited
Leadership’ in January 2020. He is currently Co-Chairman of ASSOCHAM National Council for Insurance.
Mr. Anand is a Science graduate and has received training from INSEAD Singapore, FALIA, Stephen Covey Institute, ISB Hyderabad, IIM Ahmedabad, IIM Lucknow, Institute of Public Administration - (RTI) Bangalore and National Insurance Academy.
He also serves as Non-Executive Chairman on the board of LIC Bangladesh Limited and as Non-Executive Director on the Boards of LIC Housing Finance Limited, LIC (International) B.S.C., Bahrain and LIC Cards Services Limited.
Mr. Dilip Gaur is the Managing Director of the Company & Business Director of the Aditya Birla Group’s, Global Pulp & Fibre Business. He is also Director of Aditya Birla Management Corporation Private Limited, the apex corporate body that provides strategic direction and vision to the Group Companies.
Mr. Gaur is the current Chairman of CII’s National Committee on Textiles & Apparel, a member of ASEAN- INDIA Economic Forum, Indonesia-India and Indo-Japan CEO’s forum.
Prior to his current assignment, he has done stints within Aditya Birla Group with UltraTech Cement Ltd. as Deputy Managing Director & Chief Manufacturing Officer, with Hindalco as Head of Global Copper Business, with Birla Carbon as Managing Director of the Egyptian business and as President & Country Head of Group’s Edible Oil & Oleo Chemicals business in Malaysia/Philippines.
Mr. Gaur joined Aditya Birla Group in 2004 after spending 24 years at Hindustan Unilever Ltd in Foods, HPC & Specialty Chemicals Business. He was a member of the Foods Management Committee.
Mr. Gaur is a Chemical Engineer by training and has undergone several National & International programmes in Management & Leadership Development including AMP at Harvard. He has spent best part of his professional career in managing transformational changes and turning around fledgling businesses across geographies. He enjoys working in a multi-cultural global business environment, is a firm believer in the Power of ‘Teams’ and extremely passionate about sustainability, climate control and circular economy agenda.
Mr. Adesh Kumar Gupta is an Independent Director of the Company. He is a qualified Chartered Accountant and a Company Secretary. Mr. Gupta is also an Insolvency Professional registered under Insolvency and Bankruptcy Code. He has over 36 years of vast experience in the
field on finance and general management. He has sound knowledge of finance and relevant industry. He serves as an Independent Director on the Board of various companies like Zee Entertainment Enterprises Limited, Vinati Organics Limited, CARE Ratings Limited etc. He was the former Whole Time Director & CFO of the Company till 30th June 2015. He was recognised as Best CFO by the Institute of Chartered Accountants of India, IMA, Business Today. He is Ex Member NACAS as representative of FICCI. NACAS was a statutory organisation constituted by Government of India for setting up Accounting Standards.
Mr. V. Chandrasekaran is an Independent Director of our Company. He is a qualified Chartered Accountant and retired Executive Director (Investment) of LIC of India. He has more than 3 decades of experience in Life Insurance Finance, Housing Finance and Mutual Fund Investment, with adequate exposure to a gamut of Investments. He is involved in Investment decision making processes, Investment Monitoring & Accounting and Investment Research and Risk Management. He serves as an Independent Director on the Board of various companies like Tamilnadu Newsprint & Papers Limited, Tata Investment Corporation Limited, etc.
Remuneration Policy
The Board has, on the recommendation of the Nomination and Remuneration Committee framed a policy on Remuneration of Directors and Senior Management Employees, which is available on the Company’s website, https://www.grasim.com/investors/policies-and-code-of-conduct. Performance Review System is primarily based on competencies and values. The Company closely monitors growth and development of top talent in the Company to align personal aspiration with the organisation’s goal.
Remuneration of Directors
All decisions relating to the remuneration of the Directors are taken by the Board of Directors of the Company in accordance with the Shareholders’ approval on recommendation of Nomination and Remuneration Committee.
Sitting fees is paid to the Non-Executive/Independent Directors for attending Board/Committee meetings, is as under:
Board/Committee Sitting Fee Per Meeting (J)
Board 50,000/-Audit Committee, ID Committee and IGF Divestment Committee
25,000/-
All other Committees 20,000/-
161Integrated Annual Report 2020-21
Integrated ReportFinancial statem
entsStatutory Reports
Details of remuneration paid/to be paid to the Executive Director for FY 2020-21 is as under:C in Lakh
Executive DirectorSalary, Benefits,
Bonus, Pension, etc., paid during the Year
Performance- linked Incentive paid
during the Year1
Service Contract, Notice Period and
Severance Fee
Stock Option Details, if any
Mr. Dilip Gaur (Managing Director) 687.10* 158.14 See Note 2 See Note 3
*Includes perquisite value of stock options/RSUs exercised during FY 2020-21.
1 The Board has approved payment of performance-linked variable pay for the FY 2019-20 as aforesaid to the Managing Director on achievement of the target.
2 The Managing Director’s appointment may be terminated by three months’ notice in writing on either side and no severance fees is payable to the Managing Director of the Company.
3 During the year, in terms of the Company’s Employee Stock Option Scheme 2013 (ESOS 2013), 7,610 Stock Options that were due for vesting in Mr. Dilip Gaur have lapsed and in terms of the Company’s Employee Stock Option Scheme 2018 (ESOS 2018) 29,762 Stock Options that were due for vesting in Mr. Dilip Gaur have lapsed. During the year, in terms of the Company’s ESOS 2018, 37,372 Stock Options have been granted to Mr. Dilip Gaur. During the year, in terms of the Company’s ESOS 2013, Mr. Dilip Gaur has exercised 22,830 Stock Options and 4,165 RSUs.
Based on recommendation of Nomination and Remuneration Committee, all decisions relating to remuneration of Directors are taken by the Board of your Company in accordance with the shareholder’s approval, wherever necessary. Shareholders have approved payment of commission to the Non-Executive Directors of an amount not exceeding 1% per annum of the net profit of your Company. The amount of the commission payable to the Non-Executive/Independent Directors is determined after assigning weightage to various factors, which, inter alia, include providing strategic perspective, Chairmanship and contributions made by the Directors, type of the meeting and responsibilities under various statutes, performance evaluation, etc. For FY 2020-21, the Board has approved payment of H250 Lakh as commission to the Non-Executive/Independent Directors.
Details of remuneration paid/to be paid to the Non-Executive/Independent Directors for FY 2020-21 is as under:
C in Lakh
Name of the Directors CommissionSitting Fees
(for Board and its Committees)
Mr. Kumar Mangalam Birla - 4.30Mrs. Rajashree Birla@ 120.00 3.60Dr. Santrupt Misra* 12.00 3.60Mr. Shailendra K. Jain 19.00 4.90Dr. Thomas M. Connelly, Jr. 10.00 3.25Mr. Cyril Shroff 9.00 2.10Mr. O. P. Rungta** 19.00 4.60Mr. Arun Thiagarajan** 24.00 5.70Ms. Anita Ramachandran 13.00 4.40
C in Lakh
Name of the Directors CommissionSitting Fees
(for Board and its Committees)
Mr. N. Mohan Raj 18.00 5.45Mr. Vipin Anand# 6.00 2.00Total 250.00 43.90
@ Mrs. Rajashree Birla, leads the entire CSR initiatives and monitors its implementation for the Company. She is deeply involved in identifying and planning the areas of social impact and then closely monitors the progress of such CSR activities. For her exemplary contribution, she has won many awards and accolades the most outstanding one has been that of the Government of India which bestowed the “Padma Bhushan” Award in 2011 on Mrs. Rajashree Birla in the area of “Social Work”. Profile of Mrs. Rajashree Birla, mentioned above highlights her socials work.
* Dr. Santrupt Misra was appointed as Non-Executive Director w.e.f. 13th June 2020.
** Mr. Arun Thiagarajan and Mr. O.P. Rungta ceased to be the Directors w.e.f. 6th May 2021 and close of business hours of 24th May 2021 respectively.
# Mr. Vipin Anand was appointed as Non-Executive Director w.e.f. 13th August 2020. Sitting fees for FY 2020-21 was paid to LIC and Commission for FY 2020-21 will be paid to LIC.
Notes: There were no pecuniary relationship or transaction
between your Company and its Non-Executive/Independent Directors for the FY 2020-21.
The remuneration package of the Managing Director is determined by the Nomination and Remuneration Committee, which is in accordance with the remuneration policy of the Company. A fair portion of the remuneration is linked to the Company’s performance, thereby creating a strong alignment of interest with shareholders.
Report on Corporate Governance (Contd.)
162 Grasim Industries Limited
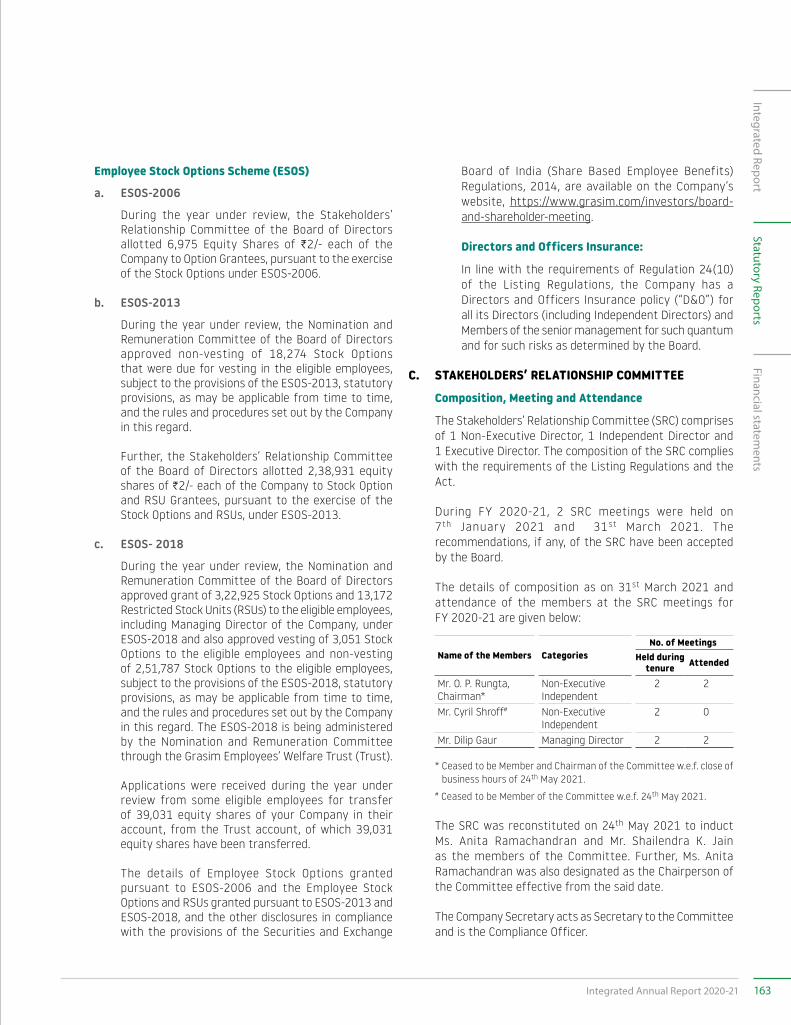
Employee Stock Options Scheme (ESOS)
a. ESOS-2006
During the year under review, the Stakeholders’ Relationship Committee of the Board of Directors allotted 6,975 Equity Shares of H2/- each of the Company to Option Grantees, pursuant to the exercise of the Stock Options under ESOS-2006.
b. ESOS-2013
During the year under review, the Nomination and Remuneration Committee of the Board of Directors approved non-vesting of 18,274 Stock Options that were due for vesting in the eligible employees, subject to the provisions of the ESOS-2013, statutory provisions, as may be applicable from time to time, and the rules and procedures set out by the Company in this regard.
Further, the Stakeholders’ Relationship Committee of the Board of Directors allotted 2,38,931 equity shares of H2/- each of the Company to Stock Option and RSU Grantees, pursuant to the exercise of the Stock Options and RSUs, under ESOS-2013.
c. ESOS- 2018
During the year under review, the Nomination and Remuneration Committee of the Board of Directors approved grant of 3,22,925 Stock Options and 13,172 Restricted Stock Units (RSUs) to the eligible employees, including Managing Director of the Company, under ESOS-2018 and also approved vesting of 3,051 Stock Options to the eligible employees and non-vesting of 2,51,787 Stock Options to the eligible employees, subject to the provisions of the ESOS-2018, statutory provisions, as may be applicable from time to time, and the rules and procedures set out by the Company in this regard. The ESOS-2018 is being administered by the Nomination and Remuneration Committee through the Grasim Employees’ Welfare Trust (Trust).
Applications were received during the year under review from some eligible employees for transfer of 39,031 equity shares of your Company in their account, from the Trust account, of which 39,031 equity shares have been transferred.
The details of Employee Stock Options granted pursuant to ESOS-2006 and the Employee Stock Options and RSUs granted pursuant to ESOS-2013 and ESOS-2018, and the other disclosures in compliance with the provisions of the Securities and Exchange
Board of India (Share Based Employee Benefits) Regulations, 2014, are available on the Company’s website, https://www.grasim.com/investors/board-and-shareholder-meeting.
Directors and Officers Insurance:
In line with the requirements of Regulation 24(10) of the Listing Regulations, the Company has a Directors and Officers Insurance policy (“D&O”) for all its Directors (including Independent Directors) and Members of the senior management for such quantum and for such risks as determined by the Board.
C. STAKEHOLDERS’ RELATIONSHIP COMMITTEE
Composition, Meeting and Attendance
The Stakeholders’ Relationship Committee (SRC) comprises of 1 Non-Executive Director, 1 Independent Director and 1 Executive Director. The composition of the SRC complies with the requirements of the Listing Regulations and the Act.
During FY 2020-21, 2 SRC meetings were held on 7th January 2021 and 31st March 2021. The recommendations, if any, of the SRC have been accepted by the Board.
The details of composition as on 31st March 2021 and attendance of the members at the SRC meetings for FY 2020-21 are given below:
Name of the Members CategoriesNo. of Meetings
Held during tenure Attended
Mr. O. P. Rungta, Chairman*
Non-Executive Independent
2 2
Mr. Cyril Shroff# Non-Executive Independent
2 0
Mr. Dilip Gaur Managing Director 2 2
* Ceased to be Member and Chairman of the Committee w.e.f. close of business hours of 24th May 2021.
# Ceased to be Member of the Committee w.e.f. 24th May 2021.
The SRC was reconstituted on 24th May 2021 to induct Ms. Anita Ramachandran and Mr. Shailendra K. Jain as the members of the Committee. Further, Ms. Anita Ramachandran was also designated as the Chairperson of the Committee effective from the said date.
The Company Secretary acts as Secretary to the Committee and is the Compliance Officer.
163Integrated Annual Report 2020-21
Integrated ReportFinancial statem
entsStatutory Reports
Mr. O.P. Rungta, former Chairman of the Stakeholders’ Relationship Committee attended the last Annual General Meeting (AGM) of the Company held on 14th September 2020.
Brief Description of Terms of Reference
1. To monitor complaints received by your Company from its Shareholders, Debenture holders, other security holders, Securities and Exchange Board of India (SEBI), Stock Exchanges, Ministry of Corporate Affairs, Registrar of Companies etc. and action taken by your Company for redressing the same;
2. To approve allotment of shares, debentures or any other securities as per the authority conferred/to be conferred to the Committee by the Board of Directors from time to time;
3. To approve requests for transposition, deletion, consolidation, sub-division, change of name, dematerialisation, rematerialisation etc. of shares, debentures and other securities;
4. To authorise Officers of your Company to approve requests for transposition, deletion, consolidation, sub-division, change of name, dematerialisation, rematerialisation etc. of shares, debentures and other securities;
5. To approve and ratify the action taken by the authorised officers of your Company in compliance of the requests received from the shareholders/investors for issue of duplicate/replacement/consolidation/sub-division, dematerialisation, rematerialisation and other purposes for the shares, debentures and other securities of your Company;
6. To monitor and expedite the status and process of dematerialisation and rematerialisation of shares, debentures and other securities of your Company;
7. To give directions for monitoring the stock of blank stationery and for printing of stationery required by the Secretarial Department of your Company from time to time for issuance of share certificates, debenture certificates, allotment letters, dividend warrants, pay orders, cheques and other related stationery;
8. To review the measures taken to reduce the quantum of unclaimed dividend/interest and ensuring timely receipt of dividend warrants/annual reports/statutory notices by the shareholders of your Company;
9. Resolving grievances of security holders including complaints related to transfers/transmission of shares, non-receipt of annual report, non-receipt of dividends, issue of new/duplicate certificates, general meetings etc.;
10. Review measures taken for effective exercise of voting rights by shareholders;
11. Review of adherence to the service standards adopted by the listed entity in respect of various services being rendered by the Registrar & Transfer Agent; and
12. To perform such other acts, deeds, and things as may be delegated to the Committee by the Board from time to time.
Shareholders’ complaints
The number of shareholders’ complaints received and resolved as on 31st March 2021 is given in the ‘Shareholder Information’ section, which forms an integral part of this Annual Report.
Compliance Officer
Mr. Sailesh Daga, Company Secretary acts as the Compliance Officer of the Company. The Compliance Officer briefs the Committee on the grievances/queries of the investors and the steps taken by the Company for redressing their grievances. The Compliance Officer can be contacted at: Grasim Industries Limited, Aditya Birla Centre, ‘A’ Wing, 2nd Floor, S.K. Ahire Marg, Worli, Mumbai-400030 Tel:91-22-6652 5000, 91-22-2499 5000, Email: [email protected]
D. CORPORATE SOCIAL RESPONSIBILITY COMMITTEE (CSR COMMITTEE)
Composition, Meeting and Attendance
The CSR Committee comprises of 2 Non-Executive Directors, 1 Independent Director and 1 Executive Director. The composition of the CSR complies with the provisions of the Act.
The CSR Committee recommends to the Board the CSR activities to be undertaken during the year and the amount to be spent on these activities and monitor its progress.
During the year under review, 3 CSR Committee meetings were held on 11th June 2020, 11th August 2020 and 31st March 2021. The recommendations of CSR Committee have been accepted by the Board.
Report on Corporate Governance (Contd.)
164 Grasim Industries Limited
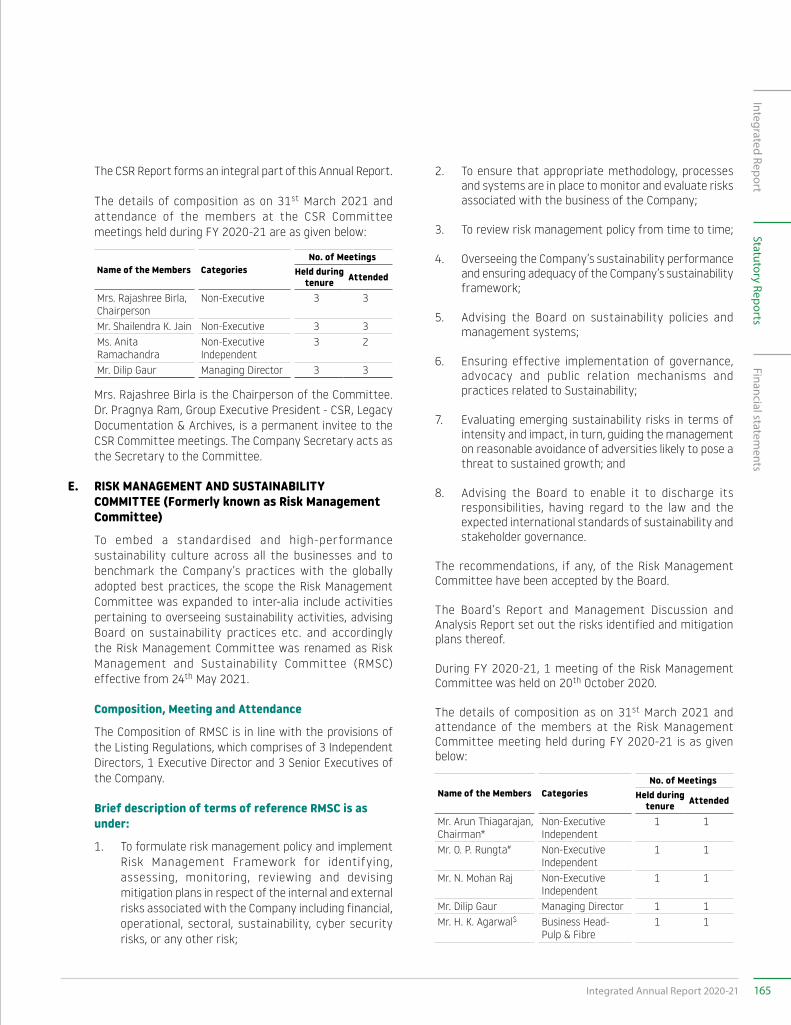
The CSR Report forms an integral part of this Annual Report.
The details of composition as on 31st March 2021 and attendance of the members at the CSR Committee meetings held during FY 2020-21 are as given below:
Name of the Members CategoriesNo. of Meetings
Held during tenure Attended
Mrs. Rajashree Birla, Chairperson
Non-Executive 3 3
Mr. Shailendra K. Jain Non-Executive 3 3Ms. Anita Ramachandra
Non-Executive Independent
3 2
Mr. Dilip Gaur Managing Director 3 3
Mrs. Rajashree Birla is the Chairperson of the Committee. Dr. Pragnya Ram, Group Executive President - CSR, Legacy Documentation & Archives, is a permanent invitee to the CSR Committee meetings. The Company Secretary acts as the Secretary to the Committee.
E. RISK MANAGEMENT AND SUSTAINABILITY COMMITTEE (Formerly known as Risk Management Committee)
To embed a standardised and high-performance sustainability culture across all the businesses and to benchmark the Company’s practices with the globally adopted best practices, the scope the Risk Management Committee was expanded to inter-alia include activities pertaining to overseeing sustainability activities, advising Board on sustainability practices etc. and accordingly the Risk Management Committee was renamed as Risk Management and Sustainability Committee (RMSC) effective from 24th May 2021.
Composition, Meeting and Attendance
The Composition of RMSC is in line with the provisions of the Listing Regulations, which comprises of 3 Independent Directors, 1 Executive Director and 3 Senior Executives of the Company.
Brief description of terms of reference RMSC is as under:
1. To formulate risk management policy and implement Risk Management Framework for identifying, assessing, monitoring, reviewing and devising mitigation plans in respect of the internal and external risks associated with the Company including financial, operational, sectoral, sustainability, cyber security risks, or any other risk;
2. To ensure that appropriate methodology, processes and systems are in place to monitor and evaluate risks associated with the business of the Company;
3. To review risk management policy from time to time;
4. Overseeing the Company’s sustainability performance and ensuring adequacy of the Company’s sustainability framework;
5. Advising the Board on sustainability policies and management systems;
6. Ensuring effective implementation of governance, advocacy and public relation mechanisms and practices related to Sustainability;
7. Evaluating emerging sustainability risks in terms of intensity and impact, in turn, guiding the management on reasonable avoidance of adversities likely to pose a threat to sustained growth; and
8. Advising the Board to enable it to discharge its responsibilities, having regard to the law and the expected international standards of sustainability and stakeholder governance.
The recommendations, if any, of the Risk Management Committee have been accepted by the Board.
The Board’s Report and Management Discussion and Analysis Report set out the risks identified and mitigation plans thereof.
During FY 2020-21, 1 meeting of the Risk Management Committee was held on 20th October 2020.
The details of composition as on 31st March 2021 and attendance of the members at the Risk Management Committee meeting held during FY 2020-21 is as given below:
Name of the Members CategoriesNo. of Meetings
Held during tenure Attended
Mr. Arun Thiagarajan, Chairman*
Non-Executive Independent
1 1
Mr. O. P. Rungta# Non-Executive Independent
1 1
Mr. N. Mohan Raj Non-Executive Independent
1 1
Mr. Dilip Gaur Managing Director 1 1Mr. H. K. Agarwal$ Business Head-
Pulp & Fibre1 1
165Integrated Annual Report 2020-21
Integrated ReportFinancial statem
entsStatutory Reports
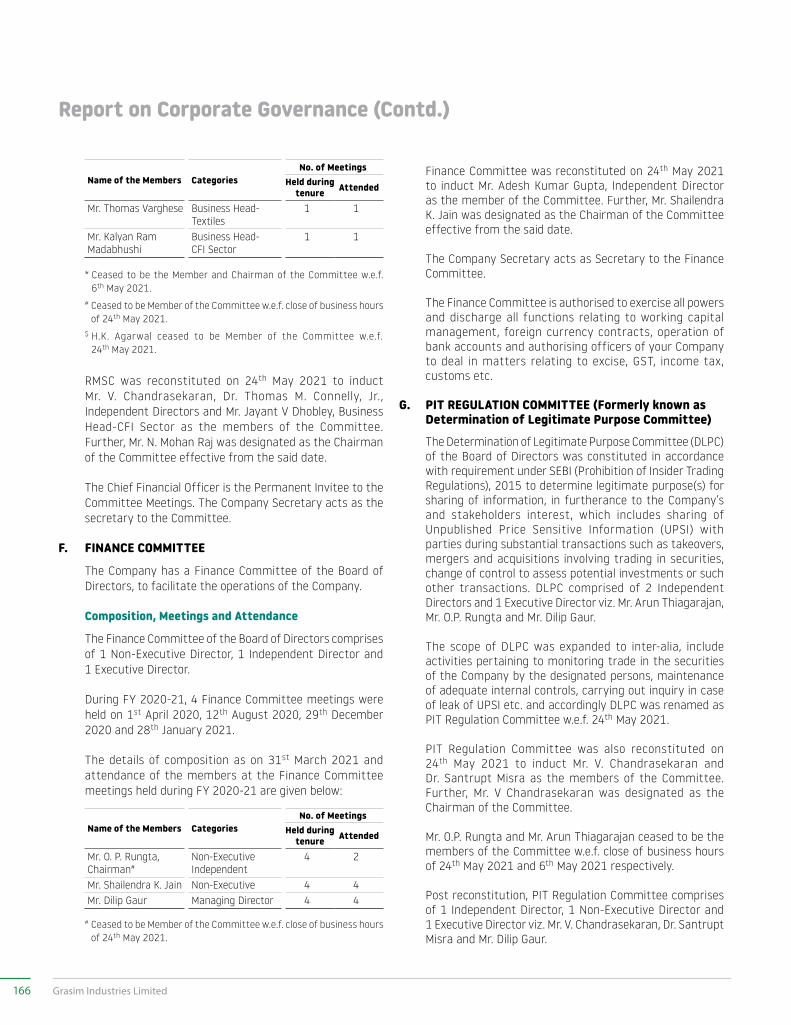
Name of the Members CategoriesNo. of Meetings
Held during tenure Attended
Mr. Thomas Varghese Business Head- Textiles
1 1
Mr. Kalyan Ram Madabhushi
Business Head- CFI Sector
1 1
* Ceased to be the Member and Chairman of the Committee w.e.f. 6th May 2021.
# Ceased to be Member of the Committee w.e.f. close of business hours of 24th May 2021.
$ H.K. Agarwal ceased to be Member of the Committee w.e.f. 24th May 2021.
RMSC was reconstituted on 24th May 2021 to induct Mr. V. Chandrasekaran, Dr. Thomas M. Connelly, Jr., Independent Directors and Mr. Jayant V Dhobley, Business Head-CFI Sector as the members of the Committee. Further, Mr. N. Mohan Raj was designated as the Chairman of the Committee effective from the said date.
The Chief Financial Officer is the Permanent Invitee to the Committee Meetings. The Company Secretary acts as the secretary to the Committee.
F. FINANCE COMMITTEE
The Company has a Finance Committee of the Board of Directors, to facilitate the operations of the Company.
Composition, Meetings and Attendance
The Finance Committee of the Board of Directors comprises of 1 Non-Executive Director, 1 Independent Director and 1 Executive Director.
During FY 2020-21, 4 Finance Committee meetings were held on 1st April 2020, 12th August 2020, 29th December 2020 and 28th January 2021.
The details of composition as on 31st March 2021 and attendance of the members at the Finance Committee meetings held during FY 2020-21 are given below:
Name of the Members CategoriesNo. of Meetings
Held during tenure Attended
Mr. O. P. Rungta, Chairman#
Non-Executive Independent
4 2
Mr. Shailendra K. Jain Non-Executive 4 4Mr. Dilip Gaur Managing Director 4 4
# Ceased to be Member of the Committee w.e.f. close of business hours of 24th May 2021.
Finance Committee was reconstituted on 24th May 2021 to induct Mr. Adesh Kumar Gupta, Independent Director as the member of the Committee. Further, Mr. Shailendra K. Jain was designated as the Chairman of the Committee effective from the said date.
The Company Secretary acts as Secretary to the Finance Committee.
The Finance Committee is authorised to exercise all powers and discharge all functions relating to working capital management, foreign currency contracts, operation of bank accounts and authorising officers of your Company to deal in matters relating to excise, GST, income tax, customs etc.
G. PIT REGULATION COMMITTEE (Formerly known as Determination of Legitimate Purpose Committee)
The Determination of Legitimate Purpose Committee (DLPC) of the Board of Directors was constituted in accordance with requirement under SEBI (Prohibition of Insider Trading Regulations), 2015 to determine legitimate purpose(s) for sharing of information, in furtherance to the Company’s and stakeholders interest, which includes sharing of Unpublished Price Sensitive Information (UPSI) with parties during substantial transactions such as takeovers, mergers and acquisitions involving trading in securities, change of control to assess potential investments or such other transactions. DLPC comprised of 2 Independent Directors and 1 Executive Director viz. Mr. Arun Thiagarajan, Mr. O.P. Rungta and Mr. Dilip Gaur.
The scope of DLPC was expanded to inter-alia, include activities pertaining to monitoring trade in the securities of the Company by the designated persons, maintenance of adequate internal controls, carrying out inquiry in case of leak of UPSI etc. and accordingly DLPC was renamed as PIT Regulation Committee w.e.f. 24th May 2021.
PIT Regulation Committee was also reconstituted on 24th May 2021 to induct Mr. V. Chandrasekaran and Dr. Santrupt Misra as the members of the Committee. Further, Mr. V Chandrasekaran was designated as the Chairman of the Committee.
Mr. O.P. Rungta and Mr. Arun Thiagarajan ceased to be the members of the Committee w.e.f. close of business hours of 24th May 2021 and 6th May 2021 respectively.
Post reconstitution, PIT Regulation Committee comprises of 1 Independent Director, 1 Non-Executive Director and 1 Executive Director viz. Mr. V. Chandrasekaran, Dr. Santrupt Misra and Mr. Dilip Gaur.
Report on Corporate Governance (Contd.)
166 Grasim Industries Limited
The Company Secretary acts as Secretary to the PIT Regulation Committee.
During FY 2020-21, no substantial transaction as mentioned above has taken place and therefore no meeting of the Committee was held.
H. IGF DIVESTMENT COMMITTEE IGF Divestment Committee of the Board of Directors of the
Company was constituted to handle matters pertaining to the Scheme of Arrangement between Grasim Industries Limited and Indorama India Private Limited and their respective shareholders and creditors.
As on 31st March 2021, Committee comprised of 2 Independent Directors, 1 Non-Executive Director and 1 Executive Director viz. Mr. Arun Thiagarajan, Ms. Anita Ramachandran, Mr. Shailendra K. Jain and Mr. Dilip Gaur. During FY 2020-21, one meeting of the Committee was held on 9th February 2021 and the same was attended by Mr. Arun Thiagarajan, Ms. Anita Ramachandran and Mr. Dilip Gaur.
Mr. Arun Thiagarajan ceased to be the member of the Committee w.e.f. 6th May 2021.
IGF Divestment Committee was reconstituted on 24th May 2021 to induct Mr. N. Mohan Raj as the member of the Committee. Post reconstitution IGF Divestment Committee comprises of 2 Independent Directors, 1 Non- Executive Director and 1 Executive Director viz. Mr. N. Mohan Raj, Ms. Anita Ramachandran, Mr. Shailendra K. Jain and Mr. Dilip Gaur.
Mr. Ashish Adukia, Chief Financial Officer and Mr. Pavan K. Jain are the permanent invitees to the Committee Meetings.
I. INDEPENDENT DIRECTORS COMMITTEE Independent Directors Committee, comprising of all the
Independent Directors of the Company, was constituted in terms of SEBI circular dated 10th March 2017 (as amended, including vide circular dated 3rd November 2020) wherein,
prior to filing the scheme of arrangement with the stock exchange(s), the scheme of arrangement was required to be recommended by a Committee of Independent Directors, vide a report, taking into consideration, inter-alia, that the scheme is not detrimental to the shareholders.
During FY 2020-21, one meeting of Independent Directors Committee was held on 12th November 2020 and the same was attended by Mr. Arun Thiagarajan, Ms. Anita Ramachandran, Dr. Thomas M. Connelly, Jr. and Mr. N. Mohan Raj.
Dissolution of Board Committees
Merger Committee
Merger Committee of the Board of Directors was constituted to facilitate the implementation of Scheme of Arrangement between Grasim Premium Fabric Private Limited and Grasim Industries Limited and their respective shareholders and all concerned. No meeting of the Committee was held during FY 2020-21. As the object for which the said Committee of the Board was constituted has been achieved the Merger Committee was dissolved w.e.f. 24th May 2021.
IV. SUBSIDIARY COMPANIES The Company does not have any material non- listed
Indian subsidiary company as defined under the Listing Regulations. UltraTech Cement Limited and Aditya Birla Capital Limited are the material listed subsidiaries of the Company. The Company has formulated a Policy for Determining Material Subsidiaries, which is available on the Company’s website and can be accessed at https://www.grasim.com/investors/policies-and-code-of-conduct.
The Audit Committee reviews the financial statements of the subsidiary Companies and, in particular, the investments made by the unlisted subsidiary companies. The minutes of the Board meetings as well as statements of all significant transactions of the Unlisted Subsidiary Companies are placed before the Board of Directors of the Company for its review.
167Integrated Annual Report 2020-21
Integrated ReportFinancial statem
entsStatutory Reports
V. GENERAL BODY MEETINGS Details of the General Meetings of the Company held during the last 3 years and up to 24th May 2021 are as follows:
Financial Year/Type of Meeting Date and Time Location Particulars of Special Resolution
2016-1770th AnnualGeneral Meeting
22nd September 2017,11.00 a.m.
Birlagram,Nagda-456331,Madhya Pradesh
• Issuance of Non-Convertible Debentures on private placement basis• Alteration of Articles of Association of the Company
2017-18 NCLTConvened Meeting
6th April 2017,11.00 a.m.
Birlagram, Nagda-456331, Madhya Pradesh
• Resolution passed for the Composite Scheme of Arrangement between Aditya Birla Nuvo Limited and Grasim Industries Limited and Aditya Birla Financial Services Limited (now known as Aditya Birla Capital Limited) and their respective shareholders and creditors.
2017-1871st Annual General Meeting
14th September 2018,11.00 a.m.
Birlagram, Nagda-456331, Madhya Pradesh
• Continuation of Directorships of Directors who have attained 75 years of age
• Adoption of Grasim Industries Limited Employee Stock Options Scheme-2018
• Extension of benefit of Grasim Industries Limited Employee Stock Option Scheme 2018 to permanent employees in the management cadre, including Managing and Whole-time Directors, of the Subsidiary Companies
• Approved the use of trust route for implementation of Grasim Industries Limited Employee Stock Options Scheme-2018 and secondary acquisition of the Equity Shares of the Company by the trust to be set up
2018-1972nd Annual General Meeting
23rd August 2019,11.00 a.m.
Birlagram, Nagda-456331, Madhya Pradesh
• Continuation of directorship of Mr. Arun Thiagarajan as an Independent Director
• Re-appointment of Mr. Cyril Shroff as an Independent Director• Re-appointment of Dr. Thomas M. Connelly, Jr. as an Independent
Director• Re-appointment of Mr. O. P. Rungta as an Independent Director
2019-2073rd Annual General Meeting
14th September 2020,3.00 p.m.
Through Video Conference/Other Audio- Visual Means
• Reappointment and Continuation of Mr. Shailendra K. Jain as a Non-Executive Director of the Company
• Alteration of the Object Clause of the Memorandum of Association of the Company
• Alteration to the Articles of Association of the Company• Continuation of Mrs. Rajashree Birla as a Non-Executive Director of
the Company2020-21Extra-OrdinaryGeneral Meeting
22nd February 2021,3.00 p.m.
Through Video Conference/Other Audio- Visual Means
• Alteration of the Object Clause of the Memorandum of Association of the Company
2021-22 NCLTConvened Meeting
16th April 2021,3.00 p.m. (Equity Shareholders)4.00 p.m. (Secured Creditors)5.00 p.m. [Unsecured Creditors (including unsecured debenture holders)]
Through Video Conference/Other Audio- Visual Means
• Approval of the Scheme of Arrangement between Grasim Industries Limited and Indorama India Private Limited and their respective shareholders and creditors
Report on Corporate Governance (Contd.)
168 Grasim Industries Limited
POSTAL BALLOT
During the FY 2020-21, no resolution was passed through Postal Ballot.
VI. MEANS OF COMMUNICATION• Copies of the press release, quarterly presentations on
the Company’s performance, official news release and presentation made to Institutional Investors/Analysts are hosted on the Company’s website, www.grasim.com, and the Group’s website, www.adityabirla.com.
• Quarterly Results:
Results are normally published in:
Newspaper Cities of PublicationBusiness Standard All EditionsNai Dunia Indore Edition
Results are displayed on the Company’s website, www.grasim.com and on www.adityabirla.com.
• After the end of each quarter, the Company organises earnings call with the analysts and investors and the transcripts of the same are thereafter uploaded on the website of the Company, www.grasim.com.
• Disclosures pursuant to various provisions of the Listing Regulations, as applicable, are promptly communicated to the stock exchanges where the shares of the Company are listed, and are also displayed on the Company’s website, www.grasim.com.
• Pursuant to the directions/order of the Hon'ble NCLT, the necessary advertisements pertaining to the Scheme of Arrangement between Grasim Industries Limited and Indorama India Private Limited and their respective shareholders and creditors, were published in Indian Express (All Editions) and Nai Dunia (Indore Edition).
• The Company has engaged KFin Technologies Private Limited to enable Members to attend the AGM through video conference (‘VC’)/other audio-visual means (‘OAVM’) or view the live webcast of the AGM at https://emeetings.kfintech.com.
VII. DISCLOSURES(i) Details of materially significant Related Party
Transactions that may have a potential conflict with the interest of the Company at large
During the year under review, no material transactions with any related party as defined under the Act and the Listing Regulations have been entered into, which have
a potential conflict with the interest of the Company at large. All contracts/arrangements/transactions entered into by your Company with its related parties were on an arm’s-length basis and in the ordinary course of business. All related party transactions have prior approval of the Audit Committee and are reviewed by the Audit Committee on a quarterly basis. Attention of the members is drawn to Note 4.7 of the Standalone Financial Statements, forming part of this Annual Report, which sets out the related party disclosures.
The Policy on Related Party Transactions, as approved by the Audit Committee and the Board is available on the Company’s website at https://www.grasim.com/investors/policies-and-code-of-conduct.
(ii) Details of non-compliance by the Company, penalties and strictures imposed on the Company by Stock Exchanges or SEBI or any Statutory Authority, on any matter related to capital markets, during the last three years
The Company has complied with all the provisions of Listing Regulations as well as regulations and guidelines of the Securities and Exchange Board of India (SEBI). There have been no instances of non-compliance by the Company on any matters related to capital markets during the last 3 years and, hence, no penalty or strictures are imposed by SEBI or the Stock Exchanges or any Statutory Authority.
(iii) Details of the Directors seeking appointment/re-appointment are provided in the Notice of the Annual General Meeting, which forms part of this Annual Report.
(iv) Confirmation of criteria of Independence
Your Company’s Board confirms that the Independent Directors fulfill the conditions specified in the Listing Regulations and are independent of the management.
(v) Proceeds from Public Issues, Rights Issues, Preferential Issues, etc.
During the year under review, the Company has not raised any proceeds by way of public issue, rights issue or preferential issue of equity shares.
(vi) Management Discussion and Analysis/Disclosure of Accounting Treatment
(a) Management Discussion and Analysis is given in a separate section forming an integral part of
169Integrated Annual Report 2020-21
Integrated ReportFinancial statem
entsStatutory Reports
this Annual Report and is in accordance with the requirements laid out in the Listing Regulations.
(b) The Company follows all relevant Accounting Standards while preparing the Financial Statements.
(vii) Certification by Practicing Company Secretary As per the Listing Regulations, the Company has obtained
a certificate from the Company Secretary in practice that none of the Directors on the Board of the Company have been debarred or disqualified, from being appointed or continuing as Directors, by Securities and Exchange Board of India/Ministry of Corporate Affairs or any such authority and the same is appended as an Annexure to this Report.
(viii) Total Fees paid to Statutory Auditors Total fees for all services paid by your Company and its
subsidiaries, on a consolidated basis, to the Statutory Auditors and all entities in the network firm/network entity of which the Statutory Auditors are a part is H15.26 Crore for FY 2020-21.
(ix) Disclosures in relation to the Sexual Harassment of Women at Workplace (Prevention, Prohibition and Redressal) Act, 2013:
a. number of complaints filed during the financial year: Nil
b. number of complaints disposed off during the financial year: 1*
c. number of complaints pending as on end of the financial year: Nil
* One complaint which was received during FY 2019-20 and was pending as on 31st March 2020, was resolved during FY 2020- 21.
(x) Managing Director and Chief Financial Officer Certification
In terms of provisions of regulation 17(8) of the Listing Regulations, certificate from Managing Director and Chief Financial Officer of the Company is appended as an Annexure to this Report.
(xi) Website Your Company’s website, www.grasim.com has a dedicated
section for investor relations containing the financial results, shareholding pattern, annual reports, quarterly reports, updates/intimations filed with Stock Exchange(s), various policies adopted by the Board. Other general information like history of the Company, business carried out by the Company, details of the Board of Directors, Key
Managerial Personnel and Business Heads of the Company, is also available on the Company’s website, www.grasim.com.
(xii) Status of Compliance of Non-Mandatory Requirement
a. Your Company maintains a separate office for the Non-Executive Chairman. All necessary infrastructure and assistance are made available to enable him to discharge his responsibilities.
b. There are no audit qualification on the Financial Statements of the Company for the financial year ended 31st March 2021.
c. The position of the Chairman of the Board of Directors and the Managing Director is separate.
d. The Internal Auditors have direct access to the Audit Committee and its representative participates in the Audit Committee meetings and present their observations to the Audit Committee when the audit matter is discussed.
VIII. REPORT ON CORPORATE GOVERNANCE This Corporate Governance Report forms an integral part
of the Annual Report. The Company is fully compliant with all the provisions of the Listing Regulations, as applicable to the Company.
IX. COMPLIANCES (i) Your Company confirms the compliances with
Corporate Governance requirements as specified in the Listing Regulations.
(ii) A Certificate from the Joint Statutory Auditors, confirming compliance with all the conditions of Corporate Governance as stipulated in Listing Regulations, is given as Annexure 'C' to the Board’s Report and forms part of this Annual Report.
(iii) There is a separate section for general Shareholder Information which forms an integral part of this Annual Report.
(iv) Name and Designation of Compliance Officer: Mr. Sailesh Daga, Company Secretary.
(v) During the year under review, all recommendations of the Committees of the Board which were mandatorily required have been accepted by the Board.
Report on Corporate Governance (Contd.)
170 Grasim Industries Limited
CODE OF CONDUCT
DECLARATION
CEO/CFO CERTIFICATION
As provided under Securities and Exchange Board of India (Listing Obligations and Disclosure Requirements) Regulations, 2015, the Board of Directors and the Senior Management Personnel have affirmed compliance with the Code of Conduct for Board Members and Senior Management for the year ended 31st March 2021.
Dilip GaurMumbai Managing DirectorDate: 24th May 2021 DIN: 02071393
The Board of DirectorsGrasim Industries Limited
We certify that:
A. We have reviewed the Financial Statements and the Cash Flow Statement of Grasim Industries Limited (‘the Company’) for the year ended 31st March 2021 and that to the best of our knowledge and belief:
(1) these statements do not contain any materially untrue statement or omit any material fact or contain statements that might be misleading; and
(2) these statements together present a true and fair view of the Company’s affairs and are in compliance with the existing accounting standards, applicable laws and regulations.
B. There are, to the best of our knowledge and belief, no transactions entered into by the Company during the year which are fraudulent, illegal or violative of the Company’s Code of Conduct.
C. We accept responsibility for establishing and maintaining internal controls for financial reporting and that we have evaluated the effectiveness of the internal control systems of the Company pertaining to financial reporting. We have disclosed to the Company’s Auditors and the Audit Committee of the Company’s Board of Directors, deficiencies in the design or operation of internal controls, if any, of which we are aware and the steps taken or proposed to be taken to rectify the deficiencies.
D. We have indicated to the Auditors and the Audit Committee:
(1) significant changes in the internal control, if any, over financial reporting during the year;
(2) significant changes in accounting policies during the year, if any, and that the same have been disclosed in the Notes to the Financial Statements; and
(3) instances of significant fraud of which we have become aware and the involvement therein, if any, of the Management or an employee having a significant role in the Company’s internal control system over financial reporting.
Dilip Gaur Ashish AdukiaPlace: Mumbai Managing Director Chief Financial OfficerDate: 24th May 2021 DIN: 02071393
171Integrated Annual Report 2020-21
Integrated ReportFinancial statem
entsStatutory Reports
CERTIFICATEPursuant to Regulation 34(3) and Schedule V Para C clause (10) (i) of the SEBI
(Listing Obligations and Disclosure Requirements) Regulations, 2015
To,The Members ofGrasim Industries LimitedBirlagram, Nagda – 456331Ujjain, Madhya Pradesh
We have examined the relevant books, papers, minutes books, forms and returns filed, notices received from the Directors for the FY 2020-21 as received in electronic form and other records maintained by the Company and also the information provided by the officers, agents and authorised representatives of Grasim Industries Limited having CIN: L17124MP1947PLC000410 (hereinafter referred to as the “the Company”) having its registered office at Birlagram, Nagda – 456331, District- Ujjain, Madhya Pradesh for the purpose of issue of Certificate, in accordance with Regulation 34 (3) read with Schedule V Para-C sub clause 10 (i) of the Securities and Exchange Board of India (Listing Obligations and Disclosure Requirements) Regulations, 2015 as amended vide notification no SEBI/LAD/NRO/GN/2018/10 dated 09th May 2018 issued by SEBI.
In our opinion and to the best of our information and according to the verifications [including Directors Identification Number (DIN) status at the portal of Ministry of Corporate Affairs (MCA) i.e. www.mca.gov.in] as considered necessary and explanations furnished to us by the Company & its Officers, we hereby certify that none of the Directors on the Board of the Company as stated below as on 31st March 2021, have been debarred or disqualified from being appointed or continuing to act as Directors of the Company by Securities and Exchange Board of India or the Ministry of Corporate Affairs, Government of India or any such other statutory authority.
Sr. No DIN Name of the Directors Designation Date of Appointment *1 00012813 Mr. Kumar Mangalam Birla Non-Executive Director (Chairman) 14/10/19922 00022995 Mrs. Rajashree Birla Non-Executive Director 14/03/19963 00013625 Dr. Santrupt Misra Non-Executive Director 13/06/20204 00022454 Mr. Shailendra K. Jain Non-Executive Director 20/08/20105 05190124 Mr. Vipin Anand Non-Executive Director 13/08/20206 00181969 Mr. N. Mohan Raj Independent Director 12/07/20197 00018979 Mr. Cyril Shroff Independent Director 25/07/20008 03083495 Dr. Thomas M. Connelly, Jr. Independent Director 20/08/20109 00020559 Mr. O. P. Rungta Independent Director 25/09/201410 00292757 Mr. Arun Thiagarajan# Independent Director 07/05/201611 00118188 Ms. Anita Ramachandran Independent Director 14/08/201812 02071393 Mr. Dilip Gaur$ Managing Director 01/04/2016
* Date of appointment of Directors are taken as appearing on MCA Portal.# Ceased to Director upon completion of term as an Independent Director with effect from 6th May 2021.$ The Board of Directors subject to approval of the members, re-appointed Mr. Dilip Gaur as the Managing Director for a period of 1 year with effect from
1st April 2021.
Ensuring the eligibility of every director for appointment/continuity of every Director on the Board is the responsibility of the Management of the Company. We further state that such compliance is neither an assurance as to the future viability of the Company nor of the efficiency or effectiveness with which the management has conducted the affairs of the Company.
For BNP & AssociatesCompany Secretaries
[Firm Regn. No. P2014MH037400]
B. Narasimhan Partner
FCS No.:-1303COP No.:-10440
Place: Mumbai PR No.:- 637/2019Date:- 24th May 2021 UDIN:- F001303C000362378
172 Grasim Industries Limited
Shareholder Information
1. ANNUAL GENERAL MEETING
- Date and Time Friday, 27th August 2021 at 3.00 p.m. (IST) - Venue Since the AGM will be held through Video Conference (VC)/Other Audio-
Visual Means (OAVM), the venue of the meeting will be deemed to be the registered office of the Company i.e. Grasim Staff Club, Birlagram, Nagda-456 331, Madhya Pradesh, India
- Participation through VC/OAVM for AGM/Webcast and transcripts
https://emeetings.kfintech.com
2. FINANCIAL CALENDAR FOR REPORTING
- Financial Year of the Company 1st April to 31st March- Financial reporting for the quarter ending 30th June 2021 On or before 14th August 2021 or such other date as may be applicable - Financial reporting for the quarter/half year ending
30th September 2021On or before 14th November 2021 or such other date as may be applicable
- Financial reporting for the quarter ending 31st December 2021
On or before 14th February 2022 or such other date as may be applicable
- Financial reporting for the quarter/year ending 31st March 2022
On or before 30th May 2022 or such other date as may be applicable
- 75th Annual General Meeting for the year ending 31st March 2022
On or before 31st August 2022 or such other date as may be applicable
3. DATES OF BOOK CLOSURE Saturday, 14th August 2021 to Friday, 27th August 2021 (both days inclusive)
4. DIVIDEND PAYMENT DATE On or after Monday, 30th August 2021
5. REGISTERED OFFICE Birlagram, Nagda- 456 331, Madhya Pradesh, India Tel: (07366) 246760/66 E-mail: [email protected]
6. WEBSITE www.grasim.com
7. CORPORATE IDENTIFICATION NUMBER (CIN) L17124MP1947PLC000410
8. LISTING DETAILS a. Listing on Stock Exchanges:
Equity Shares Non-Convertible Debentures and Commercial Papers Global Depository Receipts (GDRs)
BSE Limited (BSE)Phiroze Jeejeebhoy Towers, Dalal Street, Mumbai-400 001
BSE Limited (BSE)Phiroze Jeejeebhoy Towers,Dalal Street, Mumbai-400 001
Luxembourg Stock Exchange (LSE)Societe de la Bourse de Luxembourg P. O. Box 165, L-2011 Luxembourg, Grand Duchy of Luxembourg
National Stock Exchange of India Limited (NSE)Exchange Plaza, Plot No. C/1, G Block, Bandra-Kurla Complex, Bandra (East), Mumbai-400 051
National Stock Exchange of India Limited (NSE)Exchange Plaza, Plot No. C/1, G Block, Bandra-Kurla Complex,Bandra (East), Mumbai-400 051
Note: Annual Listing Fee has been paid to all Stock Exchanges and no amount is outstanding.
173Integrated Annual Report 2020-21
Integrated ReportFinancial statem
entsStatutory Reports
(b) Name and address of Trustees for the Debenture-holders
IDBI Trusteeship Services Limited, Asian Building, Ground floor 17, R. Kamani Marg, Ballard Estate,Mumbai-400001Tel: 91 022 40807000 Fax: 91 022 6631 1776 Email: [email protected]
(c) Overseas Depository for GDRs: Citibank N.A.Depository Receipt Services, 388, Greenwich Street, 6th Floor, New York, NY-10013Tel: +212-723-4483; Fax: +212-723-8023
(d) Domestic Custodian of GDRs: Citibank N.A.Custodial ServicesFIFC, 11th Floor, C 54 & 55, G Block, Bandra Kurla Complex, Bandra (East), Mumbai-400 098Tel.: 91-22-61757110; Fax: 91-22-26532205
9. STOCK CODE:
Stock Code Reuters BloombergBSE 500300 GRAS.BO GRASIM IBNSE GRASIM GRAS.NS GRASIM ISLSE - GRAS.LU GRAS LXISIN of Equity Shares INE047A01021 - -ISIN of GDRs US3887061030
CUSIP No. 388706103- -
10. MARKET PRICE DATA:
Month
BSE NSE LSE
High Low CloseNo. of
shares traded
High Low CloseNo. of
shares traded
High Low Close
(in G) (in Nos.) (in G) (in Nos.) (in US $)Apr-20 573.00 451.10 506.20 16,27,015 573.00 451.10 504.90 4,88,81,108 7.20 5.95 6.75May-20 601.95 469.30 589.55 19,77,046 602.00 469.20 589.20 5,56,54,048 7.75 6.20 7.75Jun-20 644.40 570.00 619.75 16,48,142 644.40 568.20 619.70 5,45,92,157 8.30 7.65 8.20Jul-20 653.00 565.10 633.30 21,64,915 653.40 565.00 633.05 5,97,16,871 8.70 7.60 8.45Aug-20 717.00 611.00 674.90 32,12,803 717.50 610.70 674.85 8,00,82,297 9.65 8.30 9.20Sep-20 750.40 651.50 743.95 31,84,076 750.40 651.05 744.20 8,13,41,081 10.10 9.10 10.10Oct-20 804.00 733.75 778.70 10,41,168 804.00 733.45 778.35 4,31,33,906 10.80 10.10 10.40Nov-20 885.40 775.35 876.25 20,49,876 885.85 775.35 875.75 5,13,81,044 11.90 9.80 11.30Dec-20 953.65 862.65 927.05 16,07,366 954.00 862.15 927.85 4,72,80,593 12.80 11.30 12.70Jan-21 1,122.65 920.65 1,055.45 21,08,466 1,122.65 920.25 1,055.65 6,07,81,826 14.90 13.00 14.50Feb-21 1,288.70 1,048.00 1,199.60 32,66,950 1,289.00 1,047.35 1,200.80 4,29,17,544 17.60 15.20 16.20Mar-21 1,456.40 1,203.30 1,452.10 30,04,864 1,456.40 1,202.20 1,450.55 4,14,44,951 19.90 17.20 19.90
Shareholder Information (Contd.)
174 Grasim Industries Limited
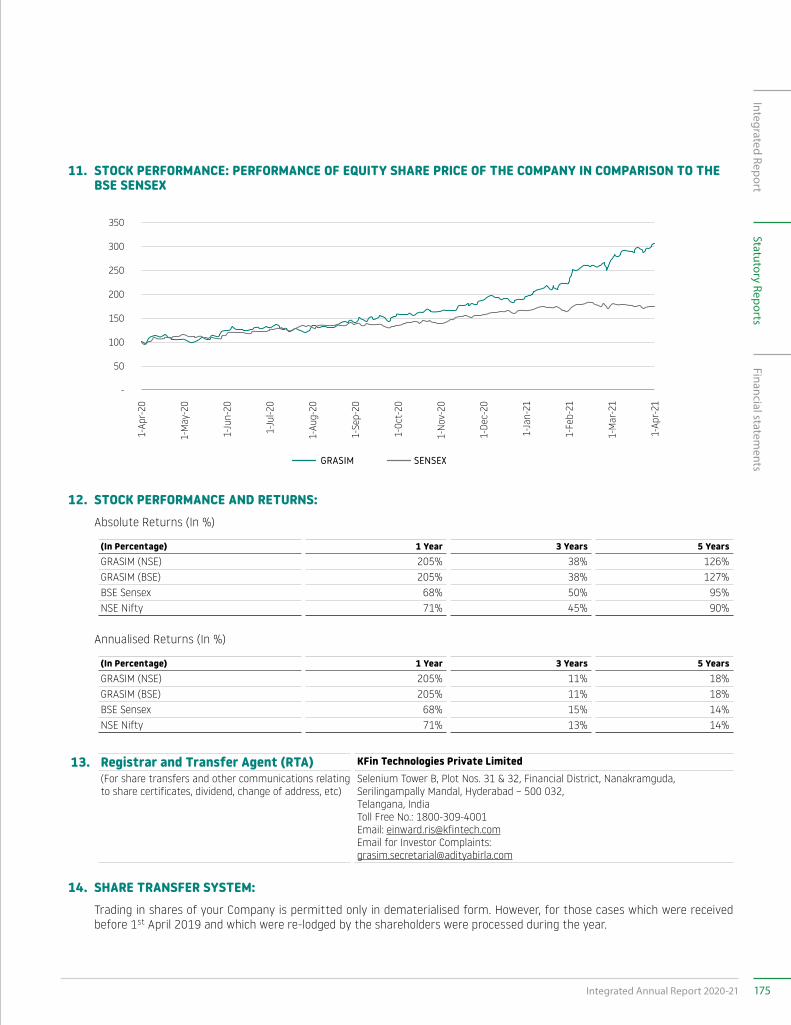
11. STOCK PERFORMANCE: PERFORMANCE OF EQUITY SHARE PRICE OF THE COMPANY IN COMPARISON TO THE BSE SENSEX
12. STOCK PERFORMANCE AND RETURNS: Absolute Returns (In %)
(In Percentage) 1 Year 3 Years 5 YearsGRASIM (NSE) 205% 38% 126%GRASIM (BSE) 205% 38% 127%BSE Sensex 68% 50% 95%NSE Nifty 71% 45% 90%
Annualised Returns (In %)
(In Percentage) 1 Year 3 Years 5 YearsGRASIM (NSE) 205% 11% 18%GRASIM (BSE) 205% 11% 18%BSE Sensex 68% 15% 14%NSE Nifty 71% 13% 14%
13. Registrar and Transfer Agent (RTA) KFin Technologies Private Limited (For share transfers and other communications relating to share certificates, dividend, change of address, etc)
Selenium Tower B, Plot Nos. 31 & 32, Financial District, Nanakramguda, Serilingampally Mandal, Hyderabad – 500 032,Telangana, IndiaToll Free No.: 1800-309-4001Email: [email protected] for Investor Complaints: [email protected]
14. SHARE TRANSFER SYSTEM: Trading in shares of your Company is permitted only in dematerialised form. However, for those cases which were received
before 1st April 2019 and which were re-lodged by the shareholders were processed during the year.
350
300
250
200
150
100
50
-
GRASIM SENSEX
1-Ap
r-20
1-M
ay-2
0
1-Ju
n-20
1-Ju
l-20
1-Au
g-20
1-Se
p-20
1-Oc
t-20
1-N
ov-2
0
1-De
c-20
1-Ja
n-21
1-Fe
b-21
1-M
ar-2
1
1-Ap
r-21
175Integrated Annual Report 2020-21
Integrated ReportFinancial statem
entsStatutory Reports
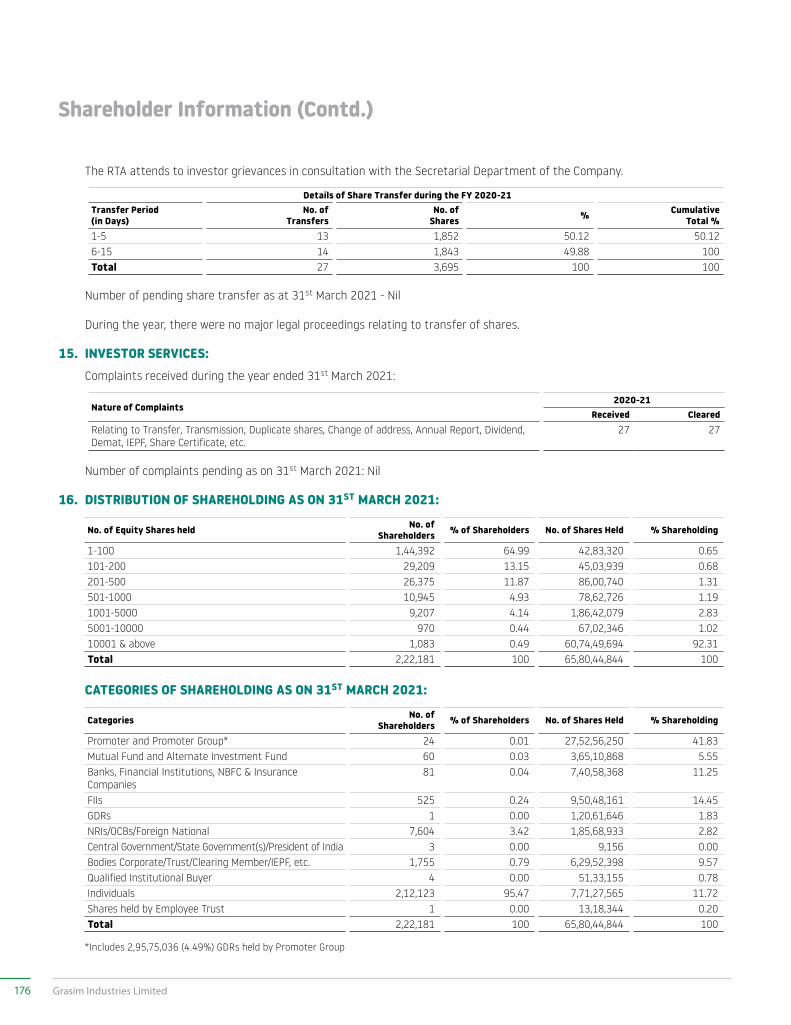
The RTA attends to investor grievances in consultation with the Secretarial Department of the Company.
Details of Share Transfer during the FY 2020-21Transfer Period(in Days)
No. ofTransfers
No. ofShares % Cumulative
Total %1-5 13 1,852 50.12 50.126-15 14 1,843 49.88 100Total 27 3,695 100 100
Number of pending share transfer as at 31st March 2021 - Nil
During the year, there were no major legal proceedings relating to transfer of shares.
15. INVESTOR SERVICES: Complaints received during the year ended 31st March 2021:
Nature of Complaints2020-21
Received ClearedRelating to Transfer, Transmission, Duplicate shares, Change of address, Annual Report, Dividend, Demat, IEPF, Share Certificate, etc.
27 27
Number of complaints pending as on 31st March 2021: Nil
16. DISTRIBUTION OF SHAREHOLDING AS ON 31ST MARCH 2021:
No. of Equity Shares held No. of Shareholders % of Shareholders No. of Shares Held % Shareholding
1-100 1,44,392 64.99 42,83,320 0.65101-200 29,209 13.15 45,03,939 0.68201-500 26,375 11.87 86,00,740 1.31501-1000 10,945 4.93 78,62,726 1.191001-5000 9,207 4.14 1,86,42,079 2.835001-10000 970 0.44 67,02,346 1.0210001 & above 1,083 0.49 60,74,49,694 92.31Total 2,22,181 100 65,80,44,844 100
CATEGORIES OF SHAREHOLDING AS ON 31ST MARCH 2021:
Categories No. of Shareholders % of Shareholders No. of Shares Held % Shareholding
Promoter and Promoter Group* 24 0.01 27,52,56,250 41.83Mutual Fund and Alternate Investment Fund 60 0.03 3,65,10,868 5.55Banks, Financial Institutions, NBFC & Insurance Companies
81 0.04 7,40,58,368 11.25
FIIs 525 0.24 9,50,48,161 14.45GDRs 1 0.00 1,20,61,646 1.83NRIs/OCBs/Foreign National 7,604 3.42 1,85,68,933 2.82Central Government/State Government(s)/President of India 3 0.00 9,156 0.00Bodies Corporate/Trust/Clearing Member/IEPF, etc. 1,755 0.79 6,29,52,398 9.57Qualified Institutional Buyer 4 0.00 51,33,155 0.78Individuals 2,12,123 95.47 7,71,27,565 11.72Shares held by Employee Trust 1 0.00 13,18,344 0.20Total 2,22,181 100 65,80,44,844 100
*Includes 2,95,75,036 (4.49%) GDRs held by Promoter Group
Shareholder Information (Contd.)
176 Grasim Industries Limited
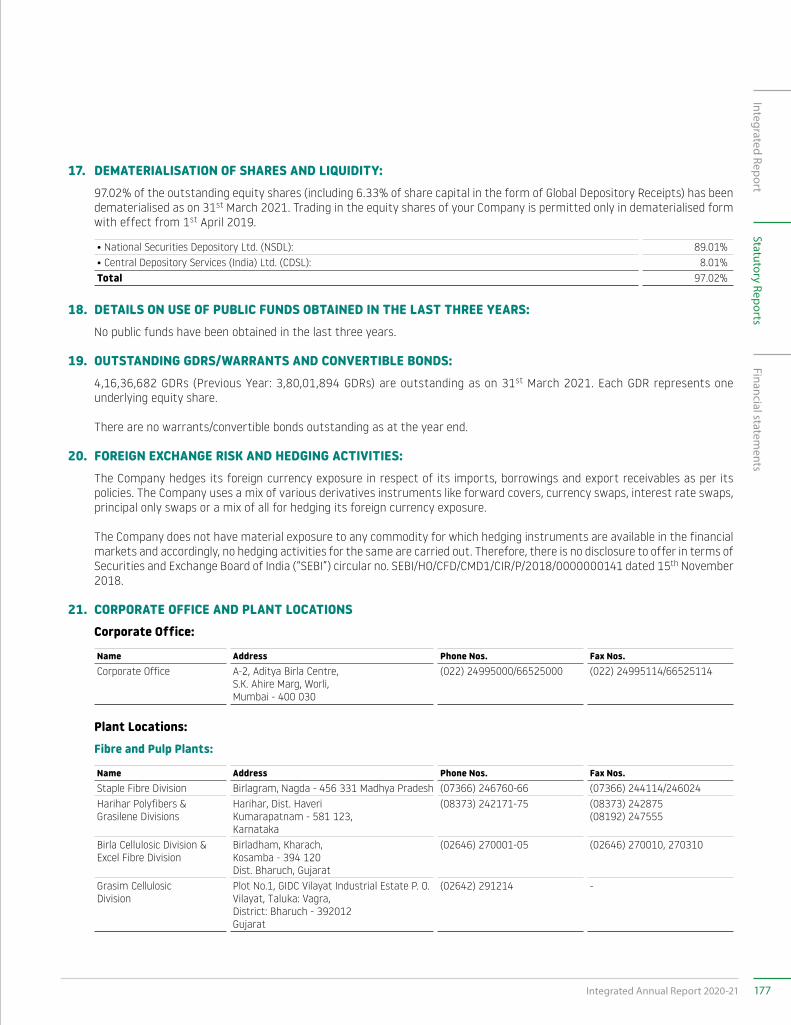
17. DEMATERIALISATION OF SHARES AND LIQUIDITY: 97.02% of the outstanding equity shares (including 6.33% of share capital in the form of Global Depository Receipts) has been
dematerialised as on 31st March 2021. Trading in the equity shares of your Company is permitted only in dematerialised form with effect from 1st April 2019.
• National Securities Depository Ltd. (NSDL): 89.01%• Central Depository Services (India) Ltd. (CDSL): 8.01%Total 97.02%
18. DETAILS ON USE OF PUBLIC FUNDS OBTAINED IN THE LAST THREE YEARS: No public funds have been obtained in the last three years.
19. OUTSTANDING GDRS/WARRANTS AND CONVERTIBLE BONDS: 4,16,36,682 GDRs (Previous Year: 3,80,01,894 GDRs) are outstanding as on 31st March 2021. Each GDR represents one
underlying equity share.
There are no warrants/convertible bonds outstanding as at the year end.
20. FOREIGN EXCHANGE RISK AND HEDGING ACTIVITIES: The Company hedges its foreign currency exposure in respect of its imports, borrowings and export receivables as per its
policies. The Company uses a mix of various derivatives instruments like forward covers, currency swaps, interest rate swaps, principal only swaps or a mix of all for hedging its foreign currency exposure.
The Company does not have material exposure to any commodity for which hedging instruments are available in the financial markets and accordingly, no hedging activities for the same are carried out. Therefore, there is no disclosure to offer in terms of Securities and Exchange Board of India (“SEBI”) circular no. SEBI/HO/CFD/CMD1/CIR/P/2018/0000000141 dated 15th November 2018.
21. CORPORATE OFFICE AND PLANT LOCATIONS Corporate Office:
Name Address Phone Nos. Fax Nos.Corporate Office A-2, Aditya Birla Centre,
S.K. Ahire Marg, Worli,Mumbai - 400 030
(022) 24995000/66525000 (022) 24995114/66525114
Plant Locations: Fibre and Pulp Plants:
Name Address Phone Nos. Fax Nos.Staple Fibre Division Birlagram, Nagda - 456 331 Madhya Pradesh (07366) 246760-66 (07366) 244114/246024Harihar Polyfibers &Grasilene Divisions
Harihar, Dist. HaveriKumarapatnam - 581 123,Karnataka
(08373) 242171-75 (08373) 242875(08192) 247555
Birla Cellulosic Division & Excel Fibre Division
Birladham, Kharach,Kosamba - 394 120Dist. Bharuch, Gujarat
(02646) 270001-05 (02646) 270010, 270310
Grasim CellulosicDivision
Plot No.1, GIDC Vilayat Industrial Estate P. O. Vilayat, Taluka: Vagra,District: Bharuch - 392012Gujarat
(02642) 291214 -
177Integrated Annual Report 2020-21
Integrated ReportFinancial statem
entsStatutory Reports
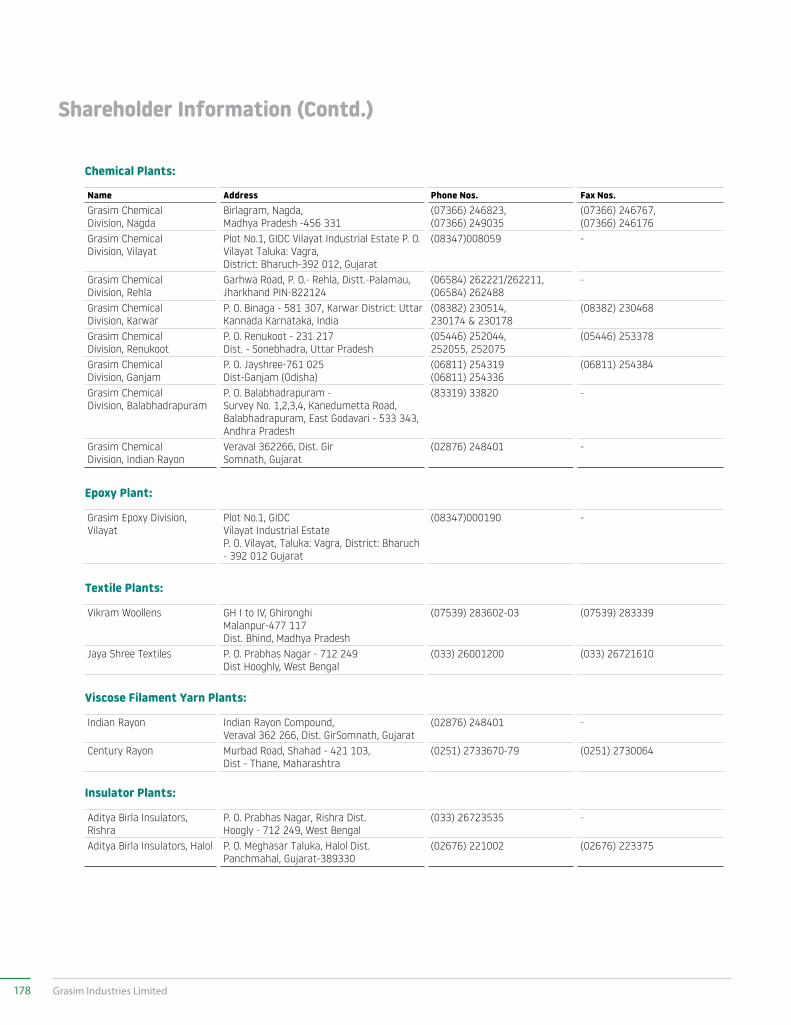
Chemical Plants:
Name Address Phone Nos. Fax Nos.Grasim ChemicalDivision, Nagda
Birlagram, Nagda,Madhya Pradesh -456 331
(07366) 246823,(07366) 249035
(07366) 246767,(07366) 246176
Grasim ChemicalDivision, Vilayat
Plot No.1, GIDC Vilayat Industrial Estate P. O. Vilayat Taluka: Vagra,District: Bharuch-392 012, Gujarat
(08347)008059 -
Grasim ChemicalDivision, Rehla
Garhwa Road, P. O.- Rehla, Distt.-Palamau, Jharkhand PIN-822124
(06584) 262221/262211,(06584) 262488
-
Grasim ChemicalDivision, Karwar
P. O. Binaga - 581 307, Karwar District: Uttar Kannada Karnataka, India
(08382) 230514,230174 & 230178
(08382) 230468
Grasim ChemicalDivision, Renukoot
P. O. Renukoot - 231 217Dist. - Sonebhadra, Uttar Pradesh
(05446) 252044,252055, 252075
(05446) 253378
Grasim ChemicalDivision, Ganjam
P. O. Jayshree-761 025Dist-Ganjam (Odisha)
(06811) 254319(06811) 254336
(06811) 254384
Grasim ChemicalDivision, Balabhadrapuram
P. O. Balabhadrapuram -Survey No. 1,2,3,4, Kanedumetta Road, Balabhadrapuram, East Godavari - 533 343,Andhra Pradesh
(83319) 33820 -
Grasim ChemicalDivision, Indian Rayon
Veraval 362266, Dist. GirSomnath, Gujarat
(02876) 248401 -
Epoxy Plant:
Grasim Epoxy Division,Vilayat
Plot No.1, GIDCVilayat Industrial EstateP. O. Vilayat, Taluka: Vagra, District: Bharuch - 392 012 Gujarat
(08347)000190 -
Textile Plants:
Vikram Woollens GH I to IV, GhironghiMalanpur-477 117Dist. Bhind, Madhya Pradesh
(07539) 283602-03 (07539) 283339
Jaya Shree Textiles P. O. Prabhas Nagar - 712 249 Dist Hooghly, West Bengal
(033) 26001200 (033) 26721610
Viscose Filament Yarn Plants:
Indian Rayon Indian Rayon Compound,Veraval 362 266, Dist. GirSomnath, Gujarat
(02876) 248401 -
Century Rayon Murbad Road, Shahad - 421 103, Dist - Thane, Maharashtra
(0251) 2733670-79 (0251) 2730064
Insulator Plants:
Aditya Birla Insulators,Rishra
P. O. Prabhas Nagar, Rishra Dist. Hoogly - 712 249, West Bengal
(033) 26723535 -
Aditya Birla Insulators, Halol P. O. Meghasar Taluka, Halol Dist. Panchmahal, Gujarat-389330
(02676) 221002 (02676) 223375
Shareholder Information (Contd.)
178 Grasim Industries Limited
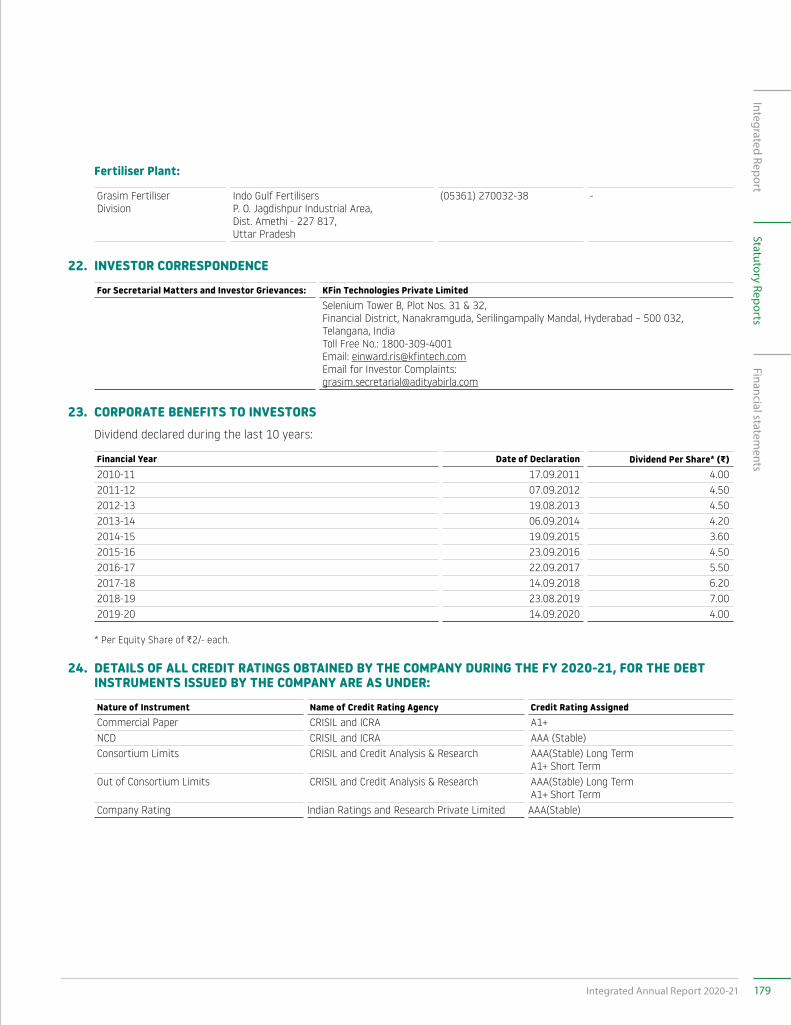
Fertiliser Plant:
Grasim FertiliserDivision
Indo Gulf FertilisersP. O. Jagdishpur Industrial Area,Dist. Amethi - 227 817,Uttar Pradesh
(05361) 270032-38 -
22. INVESTOR CORRESPONDENCE
For Secretarial Matters and Investor Grievances: KFin Technologies Private LimitedSelenium Tower B, Plot Nos. 31 & 32, Financial District, Nanakramguda, Serilingampally Mandal, Hyderabad – 500 032, Telangana, IndiaToll Free No.: 1800-309-4001Email: [email protected] for Investor Complaints:[email protected]
23. CORPORATE BENEFITS TO INVESTORS Dividend declared during the last 10 years:
Financial Year Date of Declaration Dividend Per Share* (G)2010-11 17.09.2011 4.002011-12 07.09.2012 4.502012-13 19.08.2013 4.502013-14 06.09.2014 4.202014-15 19.09.2015 3.602015-16 23.09.2016 4.502016-17 22.09.2017 5.502017-18 14.09.2018 6.202018-19 23.08.2019 7.002019-20 14.09.2020 4.00
* Per Equity Share of C2/- each.
24. DETAILS OF ALL CREDIT RATINGS OBTAINED BY THE COMPANY DURING THE FY 2020-21, FOR THE DEBT INSTRUMENTS ISSUED BY THE COMPANY ARE AS UNDER:
Nature of Instrument Name of Credit Rating Agency Credit Rating AssignedCommercial Paper CRISIL and ICRA A1+NCD CRISIL and ICRA AAA (Stable)Consortium Limits CRISIL and Credit Analysis & Research AAA(Stable) Long Term
A1+ Short TermOut of Consortium Limits CRISIL and Credit Analysis & Research AAA(Stable) Long Term
A1+ Short TermCompany Rating Indian Ratings and Research Private Limited AAA(Stable)
179Integrated Annual Report 2020-21
Integrated ReportFinancial statem
entsStatutory Reports
25. OTHER USEFUL INFORMATION FOR SHAREHOLDERS:
Dematerialisation
Dematerialisation requests, duly completed in all respects are normally processed within 21 days from the date of receipt by the RTA.
Shareholders are requested to note that if the physical documents, viz., Dematerialisation Request Form (DRF), Share Certificates, etc., are not received from their concerned Depositary Participants (DPs) by the Company within a period of 15 days from the date of generation of the Dematerialisation Request Number (DRN) for dematerialisation, the DRN will be treated as rejected/cancelled.
Permanent Account Number (PAN)
Members who hold shares in physical form are advised that SEBI has made it mandatory that a self attested copy of the PAN card of the transferee(s), surviving joint holders/legal heirs be furnished to the Company while making request for deletion of name of deceased joint holder, transposition of names and transmission of shares, as the case may be.
Nomination Facility for Shareholding
Section 72 of the Companies Act, 2013, extends nomination facility to individuals holding shares in physical form. Shareholders, in particular, those holding shares in single name, may avail the above facility by furnishing the particulars of their nominations in the prescribed Nomination Form, which can be downloaded from the website of the Company at https://www.grasim.com/investors/investors-forms or obtained from RTA by sending a written request through any mode including email at [email protected].
Change of Address and Furnishing of Bank Details
Shareholders holding shares in physical form should send their instructions regarding change of address, bank details, nomination, power of attorney, change in email address, etc., directly to the RTA under the signatures of sole/first joint holder.
Beneficial Owners of shares in demat form should send their instructions regarding change of address, bank details, nomination, power of attorney, change in email address, etc., directly to their DP as the said records are maintained by the DPs.
To prevent fraudulent encashment of dividend warrants, shareholders who hold shares in physical form should
provide their Bank Account details to the RTA, while those shareholders who hold shares in dematerialised form should provide their Bank Account details to their DP, for printing of the same on the dividend warrants.
Registering of email Address
Shareholders who have not yet registered their email address for availing the facility of e-communication, are requested to register the same with the RTA (in case the shares are held in physical form) by sending email at [email protected] or their DP (in case the shares are held in dematerialised form) so as to enable the Company to serve them fast.
Loss of Shares
In case of loss/misplacement of shares, investors should immediately lodge a FIR/Complaint with the police and inform to the RTA along with original or certified copy of FIR/Acknowledged copy of Police Complaint and a self-attested copy of their PAN card.
Correspondence with the Company
Shareholders/Beneficial Owners are requested to quote their Folio No./DP and Client ID Nos., in all correspondence with the Company.
All correspondence should be addressed to KFin Technologies Private Limited, RTA of the Company at Selenium Tower B, Plot Nos. 31 & 32, Financial District, Nanakramguda, Serilingampally Mandal, Hyderabad – 500 032, Telangana, India, Toll Free No. 1800-309-4001.
Shareholders may send correspondence through e-mail on [email protected] or [email protected]
Non-Resident Shareholders
Non-Resident Shareholders are requested to immediately notify the following to the RTA of the Company in respect of shares held in physical form and to their DPs in respect of shares held in dematerialized form:-
• Indian address for sending all communications, if not provided earlier;
• Change in their residential status on return to India for permanent settlement;
• Particulars of the Bank Account maintained with a bank in India, if not furnished earlier (Please send a photocopy of cancelled cheque);
Shareholder Information (Contd.)
180 Grasim Industries Limited
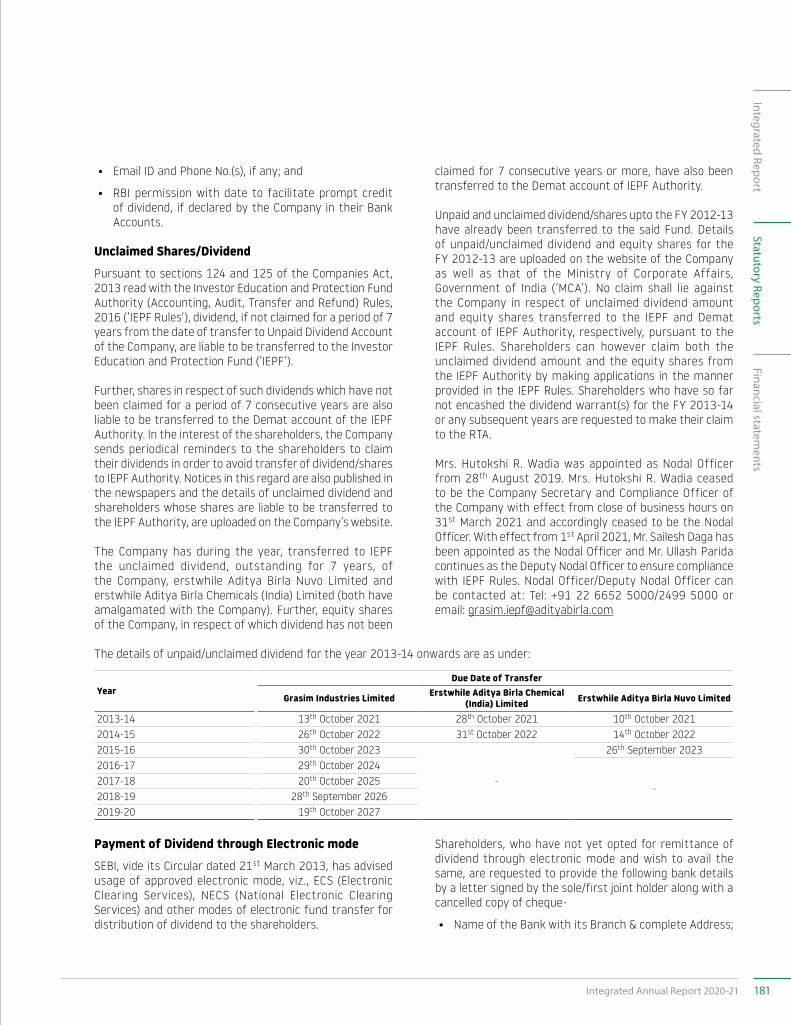
• Email ID and Phone No.(s), if any; and
• RBI permission with date to facilitate prompt credit of dividend, if declared by the Company in their Bank Accounts.
Unclaimed Shares/Dividend Pursuant to sections 124 and 125 of the Companies Act,
2013 read with the Investor Education and Protection Fund Authority (Accounting, Audit, Transfer and Refund) Rules, 2016 (’IEPF Rules‘), dividend, if not claimed for a period of 7 years from the date of transfer to Unpaid Dividend Account of the Company, are liable to be transferred to the Investor Education and Protection Fund (’IEPF‘).
Further, shares in respect of such dividends which have not been claimed for a period of 7 consecutive years are also liable to be transferred to the Demat account of the IEPF Authority. In the interest of the shareholders, the Company sends periodical reminders to the shareholders to claim their dividends in order to avoid transfer of dividend/shares to IEPF Authority. Notices in this regard are also published in the newspapers and the details of unclaimed dividend and shareholders whose shares are liable to be transferred to the IEPF Authority, are uploaded on the Company’s website.
The Company has during the year, transferred to IEPF the unclaimed dividend, outstanding for 7 years, of the Company, erstwhile Aditya Birla Nuvo Limited and erstwhile Aditya Birla Chemicals (India) Limited (both have amalgamated with the Company). Further, equity shares of the Company, in respect of which dividend has not been
claimed for 7 consecutive years or more, have also been transferred to the Demat account of IEPF Authority.
Unpaid and unclaimed dividend/shares upto the FY 2012-13 have already been transferred to the said Fund. Details of unpaid/unclaimed dividend and equity shares for the FY 2012-13 are uploaded on the website of the Company as well as that of the Ministry of Corporate Affairs, Government of India (‘MCA’). No claim shall lie against the Company in respect of unclaimed dividend amount and equity shares transferred to the IEPF and Demat account of IEPF Authority, respectively, pursuant to the IEPF Rules. Shareholders can however claim both the unclaimed dividend amount and the equity shares from the IEPF Authority by making applications in the manner provided in the IEPF Rules. Shareholders who have so far not encashed the dividend warrant(s) for the FY 2013-14 or any subsequent years are requested to make their claim to the RTA.
Mrs. Hutokshi R. Wadia was appointed as Nodal Officer from 28th August 2019. Mrs. Hutokshi R. Wadia ceased to be the Company Secretary and Compliance Officer of the Company with effect from close of business hours on 31st March 2021 and accordingly ceased to be the Nodal Officer. With effect from 1st April 2021, Mr. Sailesh Daga has been appointed as the Nodal Officer and Mr. Ullash Parida continues as the Deputy Nodal Officer to ensure compliance with IEPF Rules. Nodal Officer/Deputy Nodal Officer can be contacted at: Tel: +91 22 6652 5000/2499 5000 or email: [email protected]
The details of unpaid/unclaimed dividend for the year 2013-14 onwards are as under:
YearDue Date of Transfer
Grasim Industries Limited Erstwhile Aditya Birla Chemical (India) Limited Erstwhile Aditya Birla Nuvo Limited
2013-14 13th October 2021 28th October 2021 10th October 20212014-15 26th October 2022 31st October 2022 14th October 20222015-16 30th October 2023
-
26th September 20232016-17 29th October 2024
-2017-18 20th October 20252018-19 28th September 20262019-20 19th October 2027
Payment of Dividend through Electronic mode SEBI, vide its Circular dated 21st March 2013, has advised
usage of approved electronic mode, viz., ECS (Electronic Clearing Services), NECS (National Electronic Clearing Services) and other modes of electronic fund transfer for distribution of dividend to the shareholders.
Shareholders, who have not yet opted for remittance of dividend through electronic mode and wish to avail the same, are requested to provide the following bank details by a letter signed by the sole/first joint holder along with a cancelled copy of cheque-
• Name of the Bank with its Branch & complete Address;
181Integrated Annual Report 2020-21
Integrated ReportFinancial statem
entsStatutory Reports
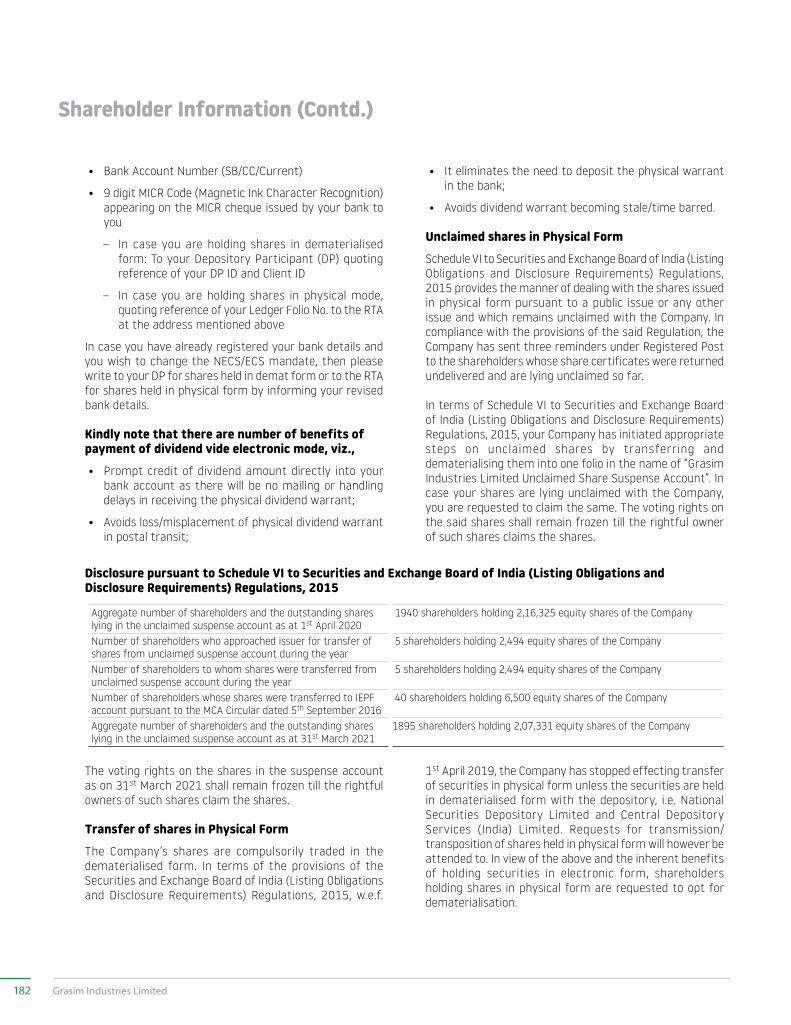
• Bank Account Number (SB/CC/Current)
• 9 digit MICR Code (Magnetic Ink Character Recognition) appearing on the MICR cheque issued by your bank to you
− In case you are holding shares in dematerialised form: To your Depository Participant (DP) quoting reference of your DP ID and Client ID
− In case you are holding shares in physical mode, quoting reference of your Ledger Folio No. to the RTA at the address mentioned above
In case you have already registered your bank details and you wish to change the NECS/ECS mandate, then please write to your DP for shares held in demat form or to the RTA for shares held in physical form by informing your revised bank details.
Kindly note that there are number of benefits of payment of dividend vide electronic mode, viz.,• Prompt credit of dividend amount directly into your
bank account as there will be no mailing or handling delays in receiving the physical dividend warrant;
• Avoids loss/misplacement of physical dividend warrant in postal transit;
• It eliminates the need to deposit the physical warrant in the bank;
• Avoids dividend warrant becoming stale/time barred.
Unclaimed shares in Physical Form Schedule VI to Securities and Exchange Board of India (Listing
Obligations and Disclosure Requirements) Regulations, 2015 provides the manner of dealing with the shares issued in physical form pursuant to a public issue or any other issue and which remains unclaimed with the Company. In compliance with the provisions of the said Regulation, the Company has sent three reminders under Registered Post to the shareholders whose share certificates were returned undelivered and are lying unclaimed so far.
In terms of Schedule VI to Securities and Exchange Board of India (Listing Obligations and Disclosure Requirements) Regulations, 2015, your Company has initiated appropriate steps on unclaimed shares by transferring and dematerialising them into one folio in the name of “Grasim Industries Limited Unclaimed Share Suspense Account”. In case your shares are lying unclaimed with the Company, you are requested to claim the same. The voting rights on the said shares shall remain frozen till the rightful owner of such shares claims the shares.
Disclosure pursuant to Schedule VI to Securities and Exchange Board of India (Listing Obligations and Disclosure Requirements) Regulations, 2015
Aggregate number of shareholders and the outstanding shares lying in the unclaimed suspense account as at 1st April 2020
1940 shareholders holding 2,16,325 equity shares of the Company
Number of shareholders who approached issuer for transfer of shares from unclaimed suspense account during the year
5 shareholders holding 2,494 equity shares of the Company
Number of shareholders to whom shares were transferred from unclaimed suspense account during the year
5 shareholders holding 2,494 equity shares of the Company
Number of shareholders whose shares were transferred to IEPF account pursuant to the MCA Circular dated 5th September 2016
40 shareholders holding 6,500 equity shares of the Company
Aggregate number of shareholders and the outstanding shares lying in the unclaimed suspense account as at 31st March 2021
1895 shareholders holding 2,07,331 equity shares of the Company
The voting rights on the shares in the suspense account as on 31st March 2021 shall remain frozen till the rightful owners of such shares claim the shares.
Transfer of shares in Physical Form The Company’s shares are compulsorily traded in the
dematerialised form. In terms of the provisions of the Securities and Exchange Board of India (Listing Obligations and Disclosure Requirements) Regulations, 2015, w.e.f.
1st April 2019, the Company has stopped effecting transfer of securities in physical form unless the securities are held in dematerialised form with the depository, i.e. National Securities Depository Limited and Central Depository Services (India) Limited. Requests for transmission/transposition of shares held in physical form will however be attended to. In view of the above and the inherent benefits of holding securities in electronic form, shareholders holding shares in physical form are requested to opt for dematerialisation.
Shareholder Information (Contd.)
182 Grasim Industries Limited
K-PRISM Shareholders are requested to note that, our RTA have
launched a mobile application - KPRISM and a website https://kprism.kfintech.com/ for our investors. Now you can download the mobile app and see your portfolios serviced by KFINTECH. Check Dividend status, request for annual reports, change of address, change/update Bank mandate and download standard forms. The android mobile application can be downloaded from Play Store by searching for “KPRISM”.
Company’s website Shareholders are requested to visit the Company’s website,
www.grasim.com -
• for information on investor services being offered by the Company; and
• for downloading of various forms/formats, viz., Nomination form, ECS Mandate form, Affidavits, Indemnity Bonds, etc.
Service of Documents in Electronic Form I. In compliance with MCA C ircular dated
13th January 2021, 5th May 2020, 8th April 2020 and 13th April 2020, and SEBI Circular dated 12th May 2020 and 15th January 2021, Notice of the AGM along with the Annual Report for FY 2020-21 is being sent only through electronic mode to those Members whose email ID are registered with the KFinTech/Depositories. Members may note that the Notice and Annual Report for FY 2020-21 will also be available on the Company’s website
www.grasim.com, websites of the Stock Exchanges i.e. BSE Limited and National Stock Exchange of India Limited at www.bseindia.com and www.nseindia.com respectively, and on the website of KFinTech at https://evoting.kfintech.com
II. Shareholders who have still not registered their email ID are requested to update at the earliest:
a) Shareholders holding shares in physical mode and who have not regis tered /updated their email ID with the Company are requested to register/update their email ID with KFinTech by sending requests at [email protected], with details of folio number and attaching a self-attested copy of PAN card or by logging onto https://ris.kfintech.com/clientservices/mobilereg/mobileemailreg.aspx.
b) Shareholders holding shares in dematerialised mode are requested to register/update their email addresses with the relevant Depository Participant
III. Link for availing the electronic communication (Green Initiative)- http: //grasim.com/green_initiative_corporate_governance.aspx
Feedback Shareholders are requested to give us their valuable
suggestions for improvement of our investor services.
183Integrated Annual Report 2020-21
Integrated ReportFinancial statem
entsStatutory Reports
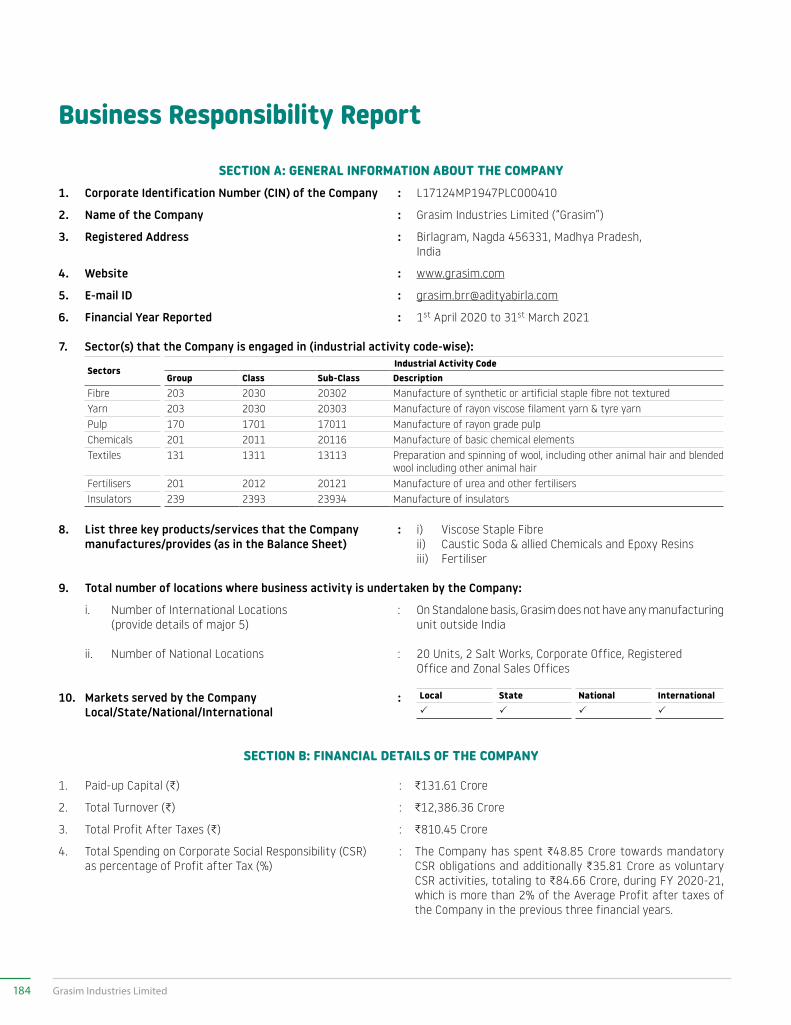
Business Responsibility Report
SECTION A: GENERAL INFORMATION ABOUT THE COMPANY1. Corporate Identification Number (CIN) of the Company : L17124MP1947PLC000410
2. Name of the Company : Grasim Industries Limited (“Grasim”)
3. Registered Address : Birlagram, Nagda 456331, Madhya Pradesh, India
4. Website : www.grasim.com
5. E-mail ID : [email protected]
6. Financial Year Reported : 1st April 2020 to 31st March 2021
7. Sector(s) that the Company is engaged in (industrial activity code-wise):
SectorsIndustrial Activity Code
Group Class Sub-Class DescriptionFibre 203 2030 20302 Manufacture of synthetic or artificial staple fibre not texturedYarn 203 2030 20303 Manufacture of rayon viscose filament yarn & tyre yarnPulp 170 1701 17011 Manufacture of rayon grade pulpChemicals 201 2011 20116 Manufacture of basic chemical elementsTextiles 131 1311 13113 Preparation and spinning of wool, including other animal hair and blended
wool including other animal hairFertilisers 201 2012 20121 Manufacture of urea and other fertilisersInsulators 239 2393 23934 Manufacture of insulators
8. List three key products/services that the Company : i) Viscose Staple Fibre manufactures/provides (as in the Balance Sheet) ii) Caustic Soda & allied Chemicals and Epoxy Resins iii) Fertiliser
9. Total number of locations where business activity is undertaken by the Company:
i. Number of International Locations : On Standalone basis, Grasim does not have any manufacturing (provide details of major 5) unit outside India
ii. Number of National Locations : 20 Units, 2 Salt Works, Corporate Office, Registered Office and Zonal Sales Offices
10. Markets served by the Company : Local/State/National/International
Local State National International
SECTION B: FINANCIAL DETAILS OF THE COMPANY
1. Paid-up Capital (C) : C131.61 Crore
2. Total Turnover (C) : C12,386.36 Crore
3. Total Profit After Taxes (C) : C810.45 Crore
4. Total Spending on Corporate Social Responsibility (CSR) as percentage of Profit after Tax (%)
: The Company has spent C48.85 Crore towards mandatory CSR obligations and additionally C35.81 Crore as voluntary CSR activities, totaling to C84.66 Crore, during FY 2020-21, which is more than 2% of the Average Profit after taxes of the Company in the previous three financial years.
184 Grasim Industries Limited
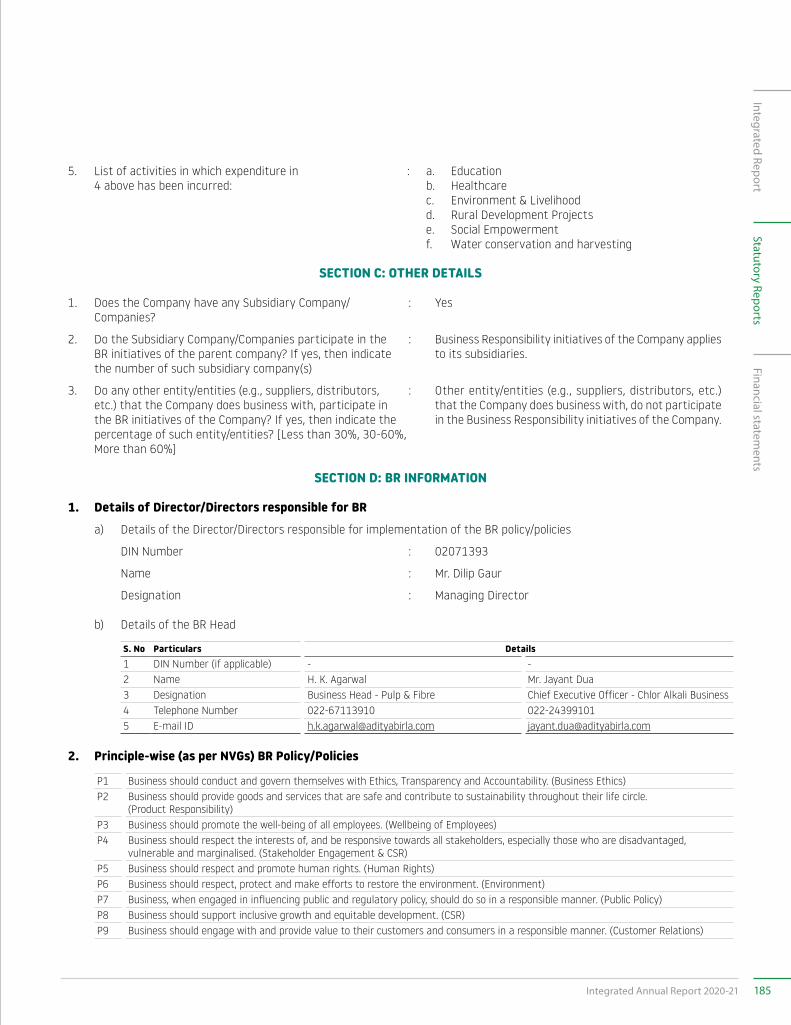
5. List of activities in which expenditure in : a. Education 4 above has been incurred: b. Healthcare c. Environment & Livelihood d. Rural Development Projects e. Social Empowerment f. Water conservation and harvesting
SECTION C: OTHER DETAILS
1. Does the Company have any Subsidiary Company/Companies?
: Yes
2. Do the Subsidiary Company/Companies participate in the BR initiatives of the parent company? If yes, then indicate the number of such subsidiary company(s)
: Business Responsibility initiatives of the Company applies to its subsidiaries.
3. Do any other entity/entities (e.g., suppliers, distributors, etc.) that the Company does business with, participate in the BR initiatives of the Company? If yes, then indicate the percentage of such entity/entities? [Less than 30%, 30-60%, More than 60%]
: Other entity/entities (e.g., suppliers, distributors, etc.) that the Company does business with, do not participate in the Business Responsibility initiatives of the Company.
SECTION D: BR INFORMATION
1. Details of Director/Directors responsible for BR a) Details of the Director/Directors responsible for implementation of the BR policy/policies
DIN Number : 02071393
Name : Mr. Dilip Gaur
Designation : Managing Director
b) Details of the BR Head
S. No Particulars Details1 DIN Number (if applicable) - -2 Name H. K. Agarwal Mr. Jayant Dua3 Designation Business Head - Pulp & Fibre Chief Executive Officer - Chlor Alkali Business4 Telephone Number 022-67113910 022-243991015 E-mail ID [email protected] [email protected]
2. Principle-wise (as per NVGs) BR Policy/Policies
P1 Business should conduct and govern themselves with Ethics, Transparency and Accountability. (Business Ethics)P2 Business should provide goods and services that are safe and contribute to sustainability throughout their life circle.
(Product Responsibility)P3 Business should promote the well-being of all employees. (Wellbeing of Employees)P4 Business should respect the interests of, and be responsive towards all stakeholders, especially those who are disadvantaged,
vulnerable and marginalised. (Stakeholder Engagement & CSR)P5 Business should respect and promote human rights. (Human Rights)P6 Business should respect, protect and make efforts to restore the environment. (Environment)P7 Business, when engaged in influencing public and regulatory policy, should do so in a responsible manner. (Public Policy)P8 Business should support inclusive growth and equitable development. (CSR)P9 Business should engage with and provide value to their customers and consumers in a responsible manner. (Customer Relations)
185Integrated Annual Report 2020-21
Integrated ReportFinancial statem
entsStatutory Reports
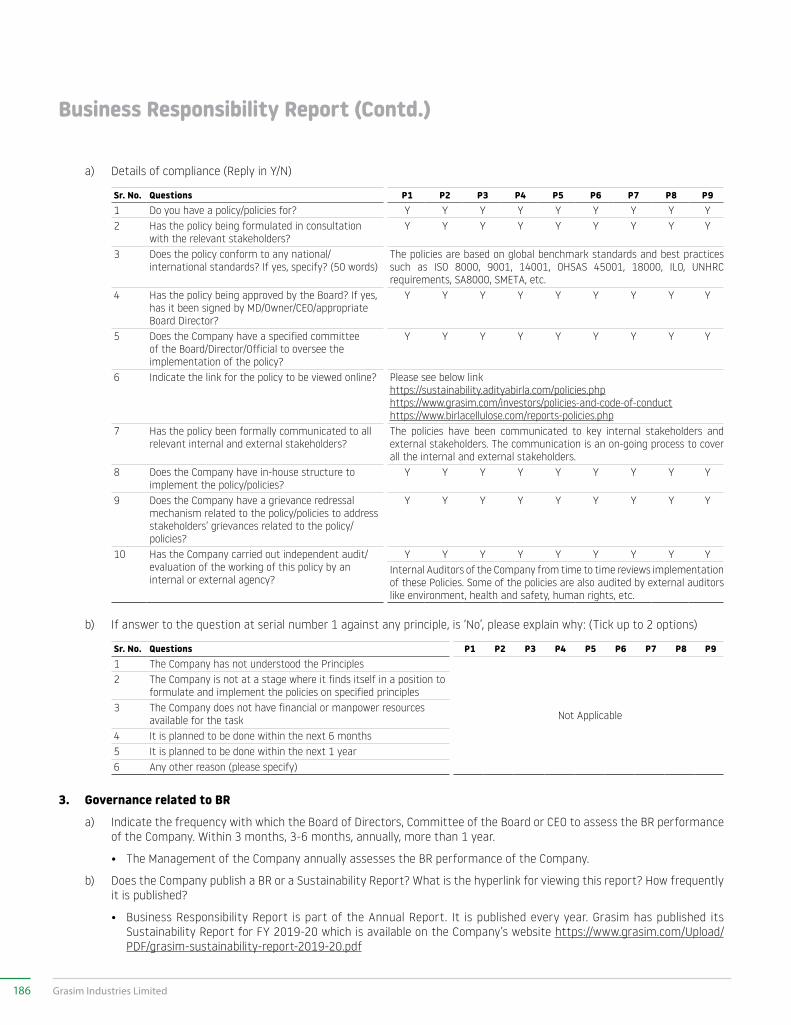
a) Details of compliance (Reply in Y/N)
Sr. No. Questions P1 P2 P3 P4 P5 P6 P7 P8 P91 Do you have a policy/policies for? Y Y Y Y Y Y Y Y Y2 Has the policy being formulated in consultation
with the relevant stakeholders?Y Y Y Y Y Y Y Y Y
3 Does the policy conform to any national/international standards? If yes, specify? (50 words)
The policies are based on global benchmark standards and best practices such as ISO 8000, 9001, 14001, OHSAS 45001, 18000, ILO, UNHRC requirements, SA8000, SMETA, etc.
4 Has the policy being approved by the Board? If yes, has it been signed by MD/Owner/CEO/appropriate Board Director?
Y Y Y Y Y Y Y Y Y
5 Does the Company have a specified committee of the Board/Director/Official to oversee the implementation of the policy?
Y Y Y Y Y Y Y Y Y
6 Indicate the link for the policy to be viewed online? Please see below linkhttps://sustainability.adityabirla.com/policies.phphttps://www.grasim.com/investors/policies-and-code-of-conducthttps://www.birlacellulose.com/reports-policies.php
7 Has the policy been formally communicated to all relevant internal and external stakeholders?
The policies have been communicated to key internal stakeholders and external stakeholders. The communication is an on-going process to cover all the internal and external stakeholders.
8 Does the Company have in-house structure to implement the policy/policies?
Y Y Y Y Y Y Y Y Y
9 Does the Company have a grievance redressal mechanism related to the policy/policies to address stakeholders’ grievances related to the policy/policies?
Y Y Y Y Y Y Y Y Y
10 Has the Company carried out independent audit/evaluation of the working of this policy by an internal or external agency?
Y Y Y Y Y Y Y Y YInternal Auditors of the Company from time to time reviews implementation of these Policies. Some of the policies are also audited by external auditors like environment, health and safety, human rights, etc.
b) If answer to the question at serial number 1 against any principle, is ‘No’, please explain why: (Tick up to 2 options)
Sr. No. Questions P1 P2 P3 P4 P5 P6 P7 P8 P91 The Company has not understood the Principles
Not Applicable
2 The Company is not at a stage where it finds itself in a position to formulate and implement the policies on specified principles
3 The Company does not have financial or manpower resources available for the task
4 It is planned to be done within the next 6 months5 It is planned to be done within the next 1 year6 Any other reason (please specify)
3. Governance related to BR a) Indicate the frequency with which the Board of Directors, Committee of the Board or CEO to assess the BR performance
of the Company. Within 3 months, 3-6 months, annually, more than 1 year.
• The Management of the Company annually assesses the BR performance of the Company.
b) Does the Company publish a BR or a Sustainability Report? What is the hyperlink for viewing this report? How frequently it is published?
• Business Responsibility Report is part of the Annual Report. It is published every year. Grasim has published its Sustainability Report for FY 2019-20 which is available on the Company’s website https://www.grasim.com/Upload/PDF/grasim-sustainability-report-2019-20.pdf
Business Responsibility Report (Contd.)
186 Grasim Industries Limited
SECTION E: PRINCIPLE-WISE PERFORMANCE
PRINCIPLE 1 - Businesses should conduct and govern themselves with Ethics, Transparency and Accountability1. Does the policy relating to ethics, bribery and
corruption cover only the Company? Yes/No. Does it extend to the Group/ Joint Ventures/ Suppliers/ Contractors/ NGOs/Others?
The Company’s governance structure guides the Company keeping in mind its core values of Integrity, Commitment, Passion, Seamlessness and Speed. The Corporate Principles and the Code of Conduct and Whistle Blower Policy cover the Company, all its Subsidiaries and Joint Ventures, and are applicable to all the employees of the Company and its Subsidiaries. A third-party external agency has been appointed to register complaints under the Company's Whistle Blower Policy.
2. How many stakeholder complaints have been received in the past financial year and what percentage was satisfactorily resolved by the Management? If so, provide details thereof, in about 50 words or so.
No stakeholder complaints were received during the year on the conduct of business involving ethics, transparency and accountability.
PRINCIPLE 2 - Businesses should provide goods and services that are safe and contribute to sustainability throughout their life cycle1. List up to 3 of your products or services whose design
has incorporated social or environmental concerns, risks and/or opportunities:
The Company is a responsible corporate citizen and is committed to sustainable development and looks at various ways to preserve the environment and manage resources responsibly. For its 3 major products i.e. Viscose Staple Fibre (VSF), and Caustic Soda & allied Chemicals (Chlorine, Hydro Chloric Acid and Sodium Hypo chloride) and Fertiliser, the Company understands its obligations relating to social and environmental concerns, risks and opportunities associated with their manufacturing. The Company has taken various initiatives for the overall sustainability, including social and environmental concerns. The Life Cycle Assessment (LCA) is used at the viscose staple fibre to understand the product footprint and to identify hotspots for improvement and these inputs are taken for the design of products. The business recently launched Livaeco range with enhanced sustainability aspects and it comes with low footprint on natural resources, water, emissions and using highly sustainable raw materials. These products support
complete traceability of the textile value chain from forest to fashion, with a capability of sharing the sustainability credentials in a transparent way up to the end consumer.
Our Chemical products (Caustic Soda, Chlorine, Hydrochloric Acid and Sodium Hypochlorite and Epoxy resin) find its application across industries vis. Pharmaceuticals, Hygiene & Sanitation, Plasticisers, Agriculture, Power Insulation, Textiles, Paper & Pulp, Construction, Metals, Wind Energy, Paints & Coatings, automotive, construction, transport, electronics, food and beverage packing etc., thereby touching lives of everyone. Caustic Soda and chlorine are the basic building blocks for many downstream industries.
2. For each such product, provide the following details in respect of resource use (energy, water, raw material, etc.) per unit of product (optional):
a) Reduction during sourcing/production/distribution achieved since the previous year throughout the value chain:
The Company has achieved reduction in consumption of key raw materials and major inputs like water, energy etc. and other resources through in-house innovations and replicated best practices across the units through continual and focused improvement projects. The resource consumptions are benchmarked for example in the VSF operations, with the European norms called EU Best Available Technology references that uses closed loop technologies to recycle and reuse the key raw materials in process. The EU BAT standards define the specific consumption norms of energy, water, raw materials for the finished product and all the sites meet 9 out of the 10 parameters and the remaining one parameters would be achieved by 2022 by all sites by implementation of closed loop technologies at all sites, which aims to recover and recycle the chemicals and resources and reduce emissions to environment. The company has been able to reduce its consumption ratio of all key raw materials by recycling and optimisation. The detailed data and trends are available in sustainability report. The VSF business sets the global benchmarks for the lowest specific water consumption at its Indian sites and has been able to reduce its water intensity by more than 35% in last 5 years. The VSF business is also ranked # 1 globally for its raw material (wood) sourcing practices by Canopy in their hot button report. The Company has a system to track key Environmental Performance Indicators to monitor its efforts towards sustainable use of resources in its operations. The Company has worked towards cost optimisation, optimisation of logistics, by adoption of new
187Integrated Annual Report 2020-21
Integrated ReportFinancial statem
entsStatutory Reports
techniques and alternate methods showing improved results every passing year.
The Company has achieved reduction in specific consumption of key raw materials and major inputs like water, energy etc. /other resources through operational efficiencies, in-house innovations and replicated best practices across the units through continual and focused improvement projects. The Company uses the latest 6th generation electrolysers, efficient equipments and increased share of renewable power/green energy footprint to reduce fossil fuels & carbon emissions.
b) Reduction during usage by consumers (energy, water) has been achieved since the previous year:
The Company has diverse consumers base; hence it is not feasible to measure the usage of water, and energy by consumers. However, we encourage our value chain partners to implement sustainable solutions in their processes. Our dope dyed product saves up to 90% water consumption in consumer processes compared to fabric dyeing process and the use of such products is encouraged in customer processes in fibre business.
3. Does the Company have procedures in place for sustainable sourcing (including transportation)? If Yes, what percentage of your inputs was sourced sustainably? Also, provide details thereof, in about 50 words or so.
The Company has integrated sustainability in the procurement process and our ‘Supplier Code of Conduct’ establishes the standards required from all suppliers who do business with us. The sourcing strategy is designed considering the management of risks pertaining to safety and environment, legal compliances, ethics, human rights and fair wages, among other aspects related to functionality of materials and services. The internal processes and procedures ensure adequate safety during transportation and optimisation of logistics, which, in turn, help to mitigate climate change.
Safe Transportation is a key requirement for both raw materials and products and TREM cards are used for transportation of hazardous materials and adequate training is provided to handle all the incidental situations.
The VSF business, is ranked no. 1 globally for its sustainable wood sourcing policies by the reputed NGO Canopy planet in their latest report called Hot Button Report 2019. The VSF business sets the standards of sustainable sourcing globally for the industry.
4. Has the Company taken any steps to procure goods and services from local and small producers, including communities surrounding their place of work?
If Yes, what steps have been taken to improve their capacity and capability of local and small vendors?
Yes, the Company fosters local and small suppliers for procurement of goods and services including communities in proximity to its plant locations. First preference is given to local vendors for input material locally available, has also encouraged setting up of many ancillary units around its plants. Training and technical support are being provided to them to improve and build their capability and to educate and raise their standards. The Company generates significant employment opportunities for the indirect employment around its sites. The local contractors are preferred for services required for the plant.
Business is also working towards indigenisation/replaced use of imported clay with indigenous clay to reduce import dependence and support domestic manufacturing with cost advantage.
In our integrated pulp & fibre site in Harihar, we have a clonal production centre where we develop eucalyptus clones. These clones are distributed to local farmers of Karnataka. We motivate the farming community to plant pulp wood species and making Agroforestry an attractive land use option. The sites have been a key source of employment for the local communities and in addition, a large number of contractors from surrounding communities are deployed at sites for various services.
Over a period of last few decades, the surrounding communities around our sides have progressed significantly and have exhibited higher socio economic development, due to various initiatives on income generation, education, capacity building, health and sanitation. With these efforts, we are ensuring to elevate income generation of the communities where we operate. Sustainable livelihood programs ensure socio-economic development of weaker section of society.
5. Does the Company have a mechanism to recycle products and waste? If Yes, what is the percentage of recycling of products and waste (separately as 10%). Also, provide details thereof, in about 50 words or so:
The Company focuses on resource optimisation and maximisation of 4 R’s Principles (Reduce, Recycle, Reuse and Regenerate). In line with this, the Company invests in latest technologies with high efficiency to reduce consumption levels, it also deploys closed loop technologies
Business Responsibility Report (Contd.)
188 Grasim Industries Limited
to recover and recycle natural resources such as water, energy, chemicals and waste.
The Company has started a new product by using pre-consumer garment waste and recycling it to make VSF and replacing the virgin raw material by 20%. The new product retains all the qualities of the product made from virgin raw material. The product has been received well by the value chain. The Company in future will increase the content of recycled material that will help in reducing the resource consumption and contribute to the overall sustainability of the business.
On the other hand, the waste generated in the manufacturing is recycled and reused. Fly Ash generated in our captive power plants is used by cement industry there by reducing the impact on environment that may arise due to the disposal of the waste. The gypsum produced in Effluent Treatment Plant (ETP) processes is used for cement manufacturing.
The Company recycles complete quantity of plastic packaging material used in all its products. Also it recycles the packaging material used by its raw material suppliers in a sustainable manner.
The Company has installed Sulphate removal system in one of its unit which will help in elimination/reduction of barium carbonate in brine system and sludge up to 30%. Wash water in the fiber washing is being recycled to a larger extent, thus also recycling the chemicals therein, as well as replacing use of fresh water to that extent.
PRINCIPLE 3 - Businesses should promote the well-being of all employees
1. Please indicate the total number of permanent employees
: 23,561
2. Please indicate the total number of employees hired on temporary/contractual/casual basis
: 17,349
3. Please indicate the number of permanent women employees
: 480
4. Please indicate the number of permanent employees with disabilities
: 90
5. Do you have an employee association that is recognised by management
: Yes
6. What percentage of your permanent employees is members of this recognised employee association?
: Almost, all the workers are members of the recognised employee associations (unions)
7. Please indicate the number of complaints relating to child labour, forced labour, involuntary labour, sexual harassment in the last financial year and pending, as on the end of the financial year
Sl. No. Category
No. of Complaints Filed during the Financial Year
No. of Complaints Pending as on end of the Financial Year
1 Child Labour/Forced Labour/Involuntary Labour
NIL NIL
2 Sexual Harassment NIL NIL3 Discriminatory Employment NIL NIL
The Company has Zero Tolerance policy towards Sexual Harassment. It has POSH committees at Unit level and Company level to investigate any reported cases. An organisation-wide drive is conducted to create more awareness for all employees.
8. What percentage of your under mentioned employees were given safety and skill up-gradation training in the last year?
(a) Permanent Employees It is an ongoing and continuous
process
(b) Permanent Women Employees(c) Casual/Temporary/Contractual Employees(d) Employees with Disabilities
Safety of our employees is a top-priority for us and is non-negotiable. All the employees upon their joining, irrespective of whether joining in management or staff or workmen cadre, mandatorily have to undergo a safety training as a part of their induction. The employees are also given refresher safety trainings through Virtual sessions, Classroom sessions, tool-box sessions and E-Learnings. The training content is structured and delivered in an interactive manner. The Company has a structured safety training agenda on an on-going basis to build a culture of safety across its workforce. The safety trainings are updated and delivered on a continuous basis with modifications as per new technology and trends.
As a part of skill upgradation and continuous learning, the Company uses different modes - virtual trainings, class room based trainings, E-Learnings, On-the-job projects and job rotation to ensure skill upgradation of its employees in a formalised manner both in technical and soft skill areas. The Company has institutionalised Long duration programs to develop leadership pipeline in middle and junior levels.
189Integrated Annual Report 2020-21
Integrated ReportFinancial statem
entsStatutory Reports
The Company has implemented Covid Safety Manual (guidelines/protocols) to proactively monitor and manage impact of Covid-19 across all its operations; imparted series of virtual on-line training/awareness sessions with employees/supply chain partners/vendors etc; leveraged digital initiatives using artificial intelligence to strengthen safety practices.
PRINCIPLE 4 - Businesses should respect the interests of, and be responsive towards all stakeholders, especially those who are disadvantaged, vulnerable and marginalised
1. Has the Company mapped its internal and external stakeholders? Yes/No:
Yes, the Company has mapped its internal as well as external stakeholders.
2. Out of the above, has the Company identified the disadvantaged, vulnerable and marginalised stakeholders:
Yes, the Company has identified disadvantaged, vulnerable and marginalised stakeholders through baseline surveys.
3. Are there any special initiatives taken by the Company to engage with the disadvantaged, vulnerable and marginalised stakeholders? If so, provide details thereof, in about 50 words or so:
The Company’s endeavour to bring in inclusive growth are channelised through the Aditya Birla Centre for Community Initiatives and Rural Development, of which, the Company’s Director, Mrs. Rajashree Birla is the Chairperson.
The Company believes in integrated development approach, with focus on disadvantaged, vulnerable and marginalised stakeholders. We believe on inclusive and collaborative growth, and initiatives aim to improve the quality of life, especially in areas near the Company's plants.
Service to society is at the very heart, of our value system. We do so with a sense of purpose. This is manifest in the various CSR projects that we run, providing the less fortunate strata of society with health care, education, infrastructure, watershed management, safe drinking water and sanitation, sustainable livelihood, self-help groups and income generation, etc.
PRINCIPLE 5 - Businesses should respect and promote Human Rights1. Does the policy of the Company on Human Rights
cover only the Company or extend to the Group/Joint Ventures/Suppliers/Contractors/NGOs/Others?
The Company has a Human Rights Policy which is also applicable to its subsidiaries, joint ventures, suppliers and contractors.
2. How many stakeholder complaints have been received in the past financial year and what percent was satisfactorily resolved by the management?
No complaints were received in the past financial year.
PRINCIPLE 6 - Business should respect, protect and make efforts to restore the environment1. Does the policy related to Principle 6 cover only the
Company or extends to the Group/Joint Ventures/Suppliers/Contractors/NGOs/Others:
Yes, the Company’s Policy on Safety, Health and Environment also extends to its JVs/subsidiaries and its upstream and downstream value chain. Common guidelines/framework for the Group is framed by Aditya Birla Corporate Sustainability Team, incorporating key points from global benchmark best practices. Sustainability policies such as climate change actions, conservation of natural resources including water, energy, environment, bio-diversity, occupational health, gender equality, safety, etc. are adopted by all the plants of the Company and are audited internally for compliances to these practices and performance is measured and benchmarked. The suppliers are required to follow the Supplier Code of Conduct which defines requirements for environment, health, safety, human rights, fair trade, legal compliances and fare wages. The downstream value chain is encouraged to use the sustainable practices through Liva Accredited Partnership program.
2. Does the Company have strategies/initiatives to address global environmental issues such as climate change, global warming, etc.? Y/N. If Yes, please give hyperlink for webpage, etc.:
Yes, the Company is committed to address issues of global warming and climate change. The Company has taken proactive steps in developing a framework for sustainability, based on the expectations of external and internal stakeholders as well as the United Nations Sustainable Development Goals (UN SDGs). The initiatives to reduce the GHG impacts include the use of best available highly efficient technologies, use of renewable energy,
Business Responsibility Report (Contd.)
190 Grasim Industries Limited
sourcing of raw material from sustainable sources, and net positive growth of forests from where the wood is sourced. Forests neutralise the GHG emissions by acting as carbon sink. The company is continually working on reducing its GHG emissions and adapt clean energy sources in all its operations.
More details on the initiatives can be found in the Company’s Sustainability Report which is available at h t t p s : / / w w w. g r a s im . c o m / U p l o a d / P D F / g r a s im -sustainability-report-2019-20.pdf.
3. Does the Company identify and assess potential environmental risks? Y/N:
Yes, the Company follows a structured risk management approach which encompasses identifying potential risks, assessing their potential impact mitigating them through taking timely action and continuous monitoring. The risks arising out of environment and sustainability aspects have been fully mapped by all the businesses and a risk management plan ensures that there is a proper action plan to manage the risks. The risks management committee oversees the risk management activities and reviews the progress periodically. The Climate Change Mitigation and Adaptation plan captures the control actions that are required to manage the risks arising out of Climate change.
The diversified nature of the businesses and wide coverage of operations necessitates a holistic approach towards risk management that focuses on critical areas such as energy mix and efficiency; water management; reuse, recycle and disposal of wastes; air emission; safety practices; supply chain initiatives; people processes; socio-economic development of the surrounding communities; etc. The Company has adopted an enterprise-wide approach to risk management.
More details on the risk management can be found in the Company’s Sustainability Report which is available at h t t p s : / / w w w. g r a s im . c o m / U p l o a d / P D F / g r a s im -sustainability-report-2019-20.pdf.
4. Does the Company have any project related to Clean Development Mechanism? If so, provide details thereof, in about 50 words or so. Also, if Yes, whether any environmental compliance report is filed?
The Company applies the principles of Clean Development Mechanism (CDM) at its manufacturing Units aiming to reduce its impact on the global warming.
Some examples are:
• Use of renewable energy
• More than 90% of the energy required at Harihar Polyfibres comes from renewable sources. It also treats Prehydrolysate (PH) Liquor generated there by reducing pollution and produce biogas
• Use of renewable green energy (Wind/Solar/hybrid) to reduce carbon footprints. Installed rooftop solar plant for generation of renewable energy at plant and colony.
• Use of energy efficient technologies at all our manufacturing processes.
• Use of clean fuel vis. natural gas in our Urea plant; natural gas/LPG in insulator business.
• Actively participate in Perform, Achieve and Trade (PAT) cycle as per Bureau of Energy Efficiency (BEE) which helps in conservation and efficient use of energy.
5. Has the Company undertaken any other initiatives on - clean technology, energy efficiency, renewable energy, etc.? Y/N. If Yes, please give hyperlink for web page etc.:
Yes, the Company has undertaken several initiatives on clean technology, energy efficiency, renewable energy, etc.
Energy Efficiency:
The Company regularly adopts new technologies and various initiatives to improve energy efficiency such as installation of VFDs, retrofitting, redesign processes, installation of energy efficient equipment’s etc. Please refer Annexure ‘D’ of the Board’s Report of the Annual Report for energy conservation initiatives. The same is available at https://www.grasim.com/investors/results-reports-and-presentations.
Renewable Energy:
The pulp plant at Harihar uses renewable energy in its process. Similarly, the solar and wind energy use is being increased in the plants of the Company. In Chemicals business 1.55% (previous year 1.27%) of total power consumption is sourced from renewable energy sources.
Renewable Raw Materials:
The complete raw material for VSF business comes from renewable natural sources and sustainably managed forests. Net positive growth of forest is ensured to also give benefit of carbon sequestration.
191Integrated Annual Report 2020-21
Integrated ReportFinancial statem
entsStatutory Reports
Circular Economy:
Launch of circular products like Liva Reviva, made using textile waste, commercial applications of waste generated in manufacturing process and reduce waste to landfill. 4R approach – Reduce, Reuse, Recycle and Re-generate the resources.
The Lyocell fibre production with closed-loop technology and recovery of more than 99.7% of the solvents used in the process. EU Best Available Technology standards are being adapted by all VSF sites, going beyond the regulatory norms, the technologies reduce the consumption level and reduces emissions to environment (air and water) and are considered to be globally the most stringing environment norms in the viscose industry.
6. Are the Emissions/Waste generated by the Company within the permissible limits given by CPCB/SPCB for the financial year being reported?
Yes, the Emissions/Waste generated by the Company are within the permissible limits given by Central Pollution Control Board (CPCB)/State Pollution Control Board (SPCB), and are reported on periodic basis.
The VSF business has gone beyond the regulatory limits to adapt the European norms EU BAT standard at all the fiber sites, which are considered to be the most stringent environmental norms globally in the VSF industry.
The sites monitor the performance on monthly basis and is also reviewed by the senior management and the Board on periodic basis. The Global Reporting Initiative (GRI) based reporting is available in the Grasim Sustainability Report 2020.
7. Number of show-cause/legal notices received from CPCB/SPCB which are pending (i.e. not resolved to satisfaction) as on the end of the Financial Year:
Three Show Cause Notices (SCN) were issued by the SPCB against Nagda, Vilayat and Karwar and all three were responded within the timeline. However, there are certain action plans and timelines that are provided for Karwar and Nagda, which needs to be followed up.
PRINCIPLE 7 - Businesses, when engaged in influencing Public and Regulatory Policy, should do so in a responsible manner
1. Is your Company a member of any trade and chamber or association? If Yes, name only those major ones that your business deals with:
The Company is a Member of Confederation of Indian Industry (CII); Confederation of Indian Textile Industry (CITI); The Synthetic & Rayon Textiles Export Promotion Council (SRTEPC). The other various trade and chambers and associations, include:
a) Federation of Indian Chambers of Commerce and Industry
b) Associated Chambers of Commerce and Industry of India
c) Association of Man-Made Fibre Industry of India
d) Indian Chemical Council
e) Indian Electrical and Electronics Manufacturers Association
f) Fertiliser Association of India
2. Have you advocated/lobbied through above associations for the advancement or improvement of public good? Yes/No; if Yes, specify the broad areas (Drop Box: Governance and Administration, Economic Reforms, Inclusive Development Policies, Energy Security, Water, Food Security, Sustainable Business Principles, Others).
Yes, the broad areas are Economic Reforms, Environment and Energy issues, and Water and Sustainable Business Principles.
PRINCIPLE 8 - Businesses should support Inclusive Growth and Equitable Development
1. Does the Company have specified programmes/initiatives/projects in pursuit of the policy related to Principle 8? If Yes, details thereof:
Yes, the Company has formulated a well-defined CSR policy, which focusses on the following major areas:
1. Education
2. Health Care
3. Environment and Livelihood
4. Rural Development
5. Social Empowerment
6. Water conservation and harvesting
Business Responsibility Report (Contd.)
192 Grasim Industries Limited
2. Are the programmes/ projects undertaken through in-house team/ own foundation/ external NGO/government structures/any other organisation?
The Company’s social projects are carried on under the aegis of the Aditya Birla Centre for Community Initiatives and Rural Development. Collaborative partnerships are formed with governments, district authorities, village panchayats, NGOs and like-minded stakeholders. It also collaborates with District Authorities, Village Panchayats, NGOs and like-minded stakeholders for its CSR initiatives. Most of the Company’s initiatives are carried out under private partnership model.
3. Have you done any impact assessment of your initiative?
Yes, the Company has conducted impact assessment of its CSR initiatives and has seen positive outcomes and benefits for the people in and around the Company’s plants.
4. What is your Company’s direct contribution to community development projects - Amount in INR and the details of the projects undertaken?
During the year under review, the Company has spent an amount of C84.66 Crore (mandatory C48.85 Crore and additional voluntary C35.81 Crore) on CSR activities, mainly on education, health care, environment and livelihood, rural development projects, social empowerment, etc., and to bring about social change by advocating and supporting various social campaigns and programmes.
5. Have you taken steps to ensure that this community development initiative is successfully adopted by the community? Please explain in 50 words, or so:
Yes, the Company has taken steps to ensure that the community initiatives benefit the community. Prior to the commencement of projects, a baseline study of the villages is carried out. Projects evolve out of the felt needs of the communities and they are engaged in the implementation of the welfare-driven initiatives planning, implementing, monitoring, as well. Project planning is done for a period of 1 to 3 years and are assessed/monitored on a monthly/quarterly basis. The Communities actively partner with the Company and take ownership of the projects, eventually as its positive outcome benefits them hugely. The projects have been designed on Sustainable, Scalable and Replicable model.
PRINCIPLE 9 - Businesses should engage with and provide value to their Customers and Consumers in a responsible manner1. What percentage of customer complaints/consumer
cases are pending as on the end of the financial year?
The Company has a well-defined system of addressing customer complaints. All complaints are appropriately addressed and resolved. Customer complaints remain a top priority for the business for amicable resolution within the defined timeframe. We have been able to resolve and close all the complaints within the year.
2. Does the Company display product information on the product label, over and above, what is mandated as per local laws? Yes/No/N.A./Remarks (additional information):
Yes, the Company displays product information on multiple levels from bale packaging to hang tags with clear product names and product attributes and benefits. The Company also has a website which provides information about its products and their usage. The Company has also introduced ‘molecular tracer’ in the fibre that gives full information on the source of the product and sustainable forestation practices certified by third-party agencies.
3. Is there any case filed by any stakeholder against the Company regarding unfair trade practices, irresponsible advertising and/or anti-competitive behaviour during the last five years and pending as on the end of the financial year? If so, provide details thereof, in about 50 words or so:
Three investigations were being conducted by the Competition Commission of India (CCI) for alleged abuse of dominance in the VSF business by the Company for the relevant periods 2008-09 to 2011-12, April 2012 - March 2017 and April 2016 - March 2018, respectively.
In respect of 2008-09 to 2011-12, CCI passed an order, directing the Director General (DG) to investigate into the allegations relating to cartel. DG concluded that there is no cartel agreement between the MMF manufacturers, including the Company but alleged that the Company has abused its dominance and violated section 4 of the Competition Act, 2002. Since the report of the DG was beyond the scope of its investigation, Company challenged it by way of a writ before the Delhi High Court, which decided in Company’s favour. CCI filed an appeal before the Division Bench of the Delhi High Court, which allowed CCI’s appeal against Grasim. The Company has appealed against High Court’s order before the Supreme Court of
193Integrated Annual Report 2020-21
Integrated ReportFinancial statem
entsStatutory Reports
India, and the Supreme Court directed that no coercive steps be taken against Company. The matter is pending before the Supreme Court for a final hearing. Meanwhile, Company received a notice from CCI directing to file response to DG’s allegations of abuse of dominance. The Company filed Response to DG Report under protest on 18th November 2020. Further, the CCI conducted the final hearing but agreed that CCI shall keep the final order in a sealed envelope till the outcome of the proceedings before the Hon’ble Supreme Court.
In respect of the matter of April 2012 - March 2017; CCI passed an order concluding that the Company has abused its dominant position in the relevant market of ‘the market for the supply of VSF to spinners in India’ by charging discriminatory prices to its customers and imposed a penalty of C301.61 Crore. The Company has filed an Appeal before the National Company Law Appellate Tribunal (NCLAT) wherein NCLAT has stayed the operation of the penalty amount against deposit of 10% of penalty amount.
The Company has deposited this amount. The stay is now extended till 27th May 2021.
Regarding the matter of 2016-18, CCI shared the investigation report of DG with the Company, and the Company has filed its response/objections to it. The hearing of the matter is concluded, and the Company is awaiting the final order of CCI.
Further, CCI has imposed a penalty on few Chlor-Alkali companies, including the Company, for alleged contravention of section 3(3)(d) of the Act regarding the supply of poly aluminum chloride. The Company has appealed before the NCLAT and has obtained a stay in the matter, pending for final hearing.
4. Did your Company carry out any consumer survey/consumer satisfaction trends?
Yes, Consumer Satisfaction Surveys are being conducted periodically through an independent agency to assess the consumer satisfaction levels.
Business Responsibility Report (Contd.)
194 Grasim Industries Limited
Social Report
CONTRIBUTION BY ADITYA BIRLA GROUPIndia’s COVID case load has been an area of grave concern. We are all collectively struggling, to stem this extremely challenging, and huge calamity. The Government, NGOs, corporates and other key stakeholders, have coalesced to bring COVID relief measures. Even at the cost of being repetitive, let us acknowledge the efforts by our nation’s doctors, medical and paramedical workers. They have and continue, to go beyond the line of duty, to bring succor to the COVID afflicted. Our population and the size of our country is beyond comparison. Enormous challenges confront us. We can overcome them with a strong sense of solidarity.
I would like to apprise you of the various initiatives we have taken through multiple channels at the Aditya Birla Group. I will focus on the relief measures executed by us at FICCI Aditya Birla CSR Centre for Excellence, we took cognizance, of the immediate needs that were COVID driven. First and foremost, was the need to address the problem of getting food for the marginalised. We worked with ISKON, and distributed cooked meals, for lunch and supper in Delhi, Mumbai, and Noida. We reached out to thousands of families. Likewise, we distributed ration kits, in partnership with Goonj, to thousands of families in 11 states. We arranged for 90,000 PPE kits, for frontline health workers in six states. COVID is also a livelihood disaster. More so for the informal sector workers, migrants, small land holding farmers, returnee migrants, villages youths and tribal women. So, with the Nudge Foundation, we launched a 3-year project, themed on “Creating Resilient Communities” in Odisha, West Bengal, Delhi NCR, Uttar Pradesh, Jharkhand, Karnataka and Maharashtra. We have impacted 4 lakh families.
If you recall, we had already shared with you the immediate COVID steps taken after the outbreak of the pandemic. Besides contributing over C500 Crore, we tried to address related issues at every level. Here is an update:
• Providing 5,000 jumbo cylinders pan India
• We have ordered 36 oxygen Pressure Swing Adsorption plants. Of these, six PSA plants have been delivered (Gujarat and eastern UP). These plants produce a litre of oxygen every 60 seconds and are integral to meet the oxygen shortage.
• Additionally, 2,000 oxygen concentrators, based on the Hub & Spoke model have been instituted in the major state’s capitals, which then pan out to the smaller towns.
• 1,000 oxygen concentrators supplied by Novelis, distributed to hospitals and communities.
• In addition, liquid oxygen plants are on stream across the nation at our plant sites. To give you a feel, the Birla Copper Plant in Dahej, has been supplying 25 tonnes of liquid oxygen day in and day out to bridge the gap. Up until now 1,600 tonnes of liquid oxygen has been supplied to the Gujarat Government.
• We are importing cryogenic tanks.
• Furthermore, specially designed 40 mobile cardiac ambulances are in service all over the country.
• More than 500 beds have been earmarked across locations.
• Proactive engagements with local communities, and other stakeholders, is an ongoing activity.
• More than a million triple layer surgical masks, have been distributed, along with tens of thousands of personal protective equipments.
• Hundreds of ventilators have also been given.
• To reinforce COVID prevention messages, such as using mask, social distancing, and sanitising, are unending.
Your Company has contributed significantly to this humongous effort supporting - oxygen concentrators, PSA plants, liquid oxygen and more. A gist of Grasim’s endeavours apart from the initiatives cited above:
• Organised over 2,100 awareness camps in 365 villages
• Donated 2,58,000 masks, 5,710 bottles of hand sanitisers, 6,000 hand Gloves, 60 Oximeters, 7,740 Vitamin C Tablets
• Distributed over 10,091 grocery kits
• Provided cooked meals for 38,125 migrants
• Sodium Hypochlorite sprayed in villages, covering a 15.23 lakhs populace
• Installed 2 disinfection tunnels at Nagda and Veraval
• Supplied 150 PPE kits to the hospitals in Bharuch
• Ayurvedic kadha/homeopathic tablets given to 6,454 families
• 168 oxygen cylinders towards patient care
• 7,883 COVID patients treated at our hospitals and health centers
• A dedicated medical team of 68 doctors and 215 paramedics in service
195Integrated Annual Report 2020-21
Integrated ReportFinancial statem
entsStatutory Reports
A summary of our work:
SDG-1: TO RID POVERTY ACROSS ALL NATIONS BY 2030This has been our unrelenting battle for decades. We are engaged in 7 states where our CSR work has made a difference. The percentage of BPL families has dropped significantly.
SDG-2: TO END ALL FORMS OF HUNGER AND MALNUTRITION BY 2030We have a holistic developmental model that addresses this issue. Sustainable agriculture, supporting particularly small-scale farmers with access to land, technology and markets are our major themes. We leverage Government Schemes and the services rendered by the District Authorities, including Collectors and Block Development Officers. We have made reasonable progress. Nevertheless, we have had to reset our target, extending it to 5% (3%) in the next 5 years.
Water positivityWater positivity is one of the most important tasks before us. Water conservation, and water harvesting structures are our mainstay. Water is the lifeline for agriculture. Farm-based interventions, farmer training programmes, farmer producer groups, improved agriculture techniques, and animal husbandry management, take us close to the goal of sustainable agriculture. Up until now we have constructed 5 check dams, 23 ponds conserving 50 MCFT of water. These measures along with lift and drip irrigation facilities, have impacted 14,546 farmers (Nagda, Harihar, Veraval and Rehla). A 53-acre horticulture plot has been
developed (Nagda, Harihar and Rehla). Towards better ecology, we have developed 97 vermicompost tanks to provide manure and encourage organic farming (Nagda and Veraval).
Our veterinary camps this year serviced a little over 6,480 cattle owners. As many as 16,200 cattle were immunised in veterinary camps. Of these 4,181 cattle were artificially inseminated. It has helped enhance the income of the farmers as the milk outcome notched up by 70%. Furthermore, our teams at Nagda, Vilayat and Veraval march on with their endeavours towards intensive farmer training and income enhancement. Its pursuit to raise the earnings of the farmers continues. Its benefits have a salutary effect on the lives of 200 farm families.
SDG-3: ENSURING, HEALTHY LIVES AND PROMOTING WELL-BEING FOR ALL, IN ALL AGE GROUPSMore than 3.53 lakh people across our units, have been the beneficiaries of our healthcare projects through more than 447 healthcare camps.
Our ambulance service facility with 5 ambulances is engaged, touching a 23,305 strong populace. Alongside we tend to patients at our company’s five hospitals and dispensaries.
Among other healthcare projects include eye camps, dental checkups and tuberculosis and general health counselling. Our touch points are in excess of 10,000 families.
We would like to add that in partnership with the District Health Department, our 47 Family Welfare Centers served 6,257 women
• 370 hospital beds equipped with ICUs, ventilators, bipaps and oxygen concentrators
• PSA oxygen plants in Veraval and Ahmedabad
• RT-PCR test done for 4,807 people
• CT-Scan facilities in Nagda, Veraval, Ujjain and Jagdishpur hospitals/COVID care centres, is on the anvil
Consequent to the extended lockdowns, our ground level activities in the 298 villages which service over a million people were constrained. Still good work is done. The spotlight continues to be on education, healthcare, sustainable livelihood, infrastructure development and social reform, in sync with the major UN SDG goals.
Mrs. Rajashree BirlaChairperson, Aditya Birla Centre for Community Initiatives and Rural Development
Chairperson, Grasim Industries Limited, CSR Committee of the Board
Social Report (Contd.)
196 Grasim Industries Limited
(antenatal, post-natal care, mass immunisation, nutrition and escort services for institutional delivery). Over 1,00,088 children were immunised against polio, BCG, DPT and Hepatitis-B across the Company’s Units.
Towards adolescent healthcare we covered, 1,429 girls at 38 camps organised at Government Girls High Schools.
SDG-4: EDUCATIONOur close involvement with the Kasturba Gandhi Balika Vidyalayas has motivated over a 1,371 girls to pursue formal education.
Our ‘meet the parent’ counselling programmes have not only helped dropouts come back to school but have significantly cut out the dropout rate to zero levels (15%).
Over 1,248 students from the villages attended the digital literacy programmes (Nagda, Harihar and Jagdishpur).
Nearly 1,513 children are enrolled at 21 Anganwadis that we support (Nagda, Vilayat, Jagdishpur, Rehla and Ganjam). Under the Integrated Child Development Scheme (ICDS) we reached out to 48 malnourished children and helped nurture them into healthy children.
At our 6 Aditya Birla Public Schools (Nagda, Kharach, Harihar, Jagdishpur), we have 6,349 students.
We have supported 106 students at Rishra and Halol through the ‘Gyanarjana’ project, which provides special coaching for Grade XI – XII students to enable them to appear for JEE and NEET competitive exams. At Harihar and Halol 170 students have been given a scholarship.
In project ‘Shishya’ 169 students attained proficiency in English.
We have upgraded 19 school buildings (Veraval, Vilayat, Jagdishpur and Malanpor). At several schools, sanitation/drinking water facilities have been set up.
SDG-5: WOMEN EMPOWERMENT AND GENDER EQUALITYOur 390 self-help groups comprising of 5,165 women enthusiasts have all been transformed into competent and confident women, engaged in meaningful work that earns them a livelihood.
A special mention must be made of the Self-Help Groups at Harihar. They have tailored 600 uniforms, along with 5,000 spinning candle bags and 50,000 face masks for us. Alongside
they made 3,000 garments/ornamental products. Our women self-help groups have made over 4 lakh face masks across our plants. Yet another group of our SHGs stitched 2 lakh jute bags for vendors.
The sixth, seventh and eighth SDGs, center on water and sanitation, reliable, sustainable, modern energy, decent work, and economic growth.
Towards providing accessibility to safe drinking water, up until now we have installed 25 Reverse Osmosis (RO) plants. Pipelines and borewells, water tanks, doorstep water facilities provide access to water, benefiting more than 97,050 villagers.
Additionally, 1,490 individual toilets and sanitation facilities were constructed at various locations. Consequently, 95% of the villages where we operate have been declared ODF.
Imparting vocational training, skills training, coupled with our farm/non-farm-based programmes and SHGs, meet with these SDG goals. Collectively we have touched the lives of nearly 8,664 people.
SDG-9: BUILD RESILIENT INFRASTRUCTUREOur infrastructure projects: connectivity, road repairs, community halls and assets, rest places, installation of solar lights, construction of water tanks and installation of piped water supply, have bettered the lives of 26,229 people.
Finally, on Model Villages. Of the 298 villages in our CSR projects, 50 villages have been earmarked for a transformative process. Up until now, 30 villages have made the cut. Impact assessment studies by external agencies have certified/commended the transformation of these villages.
Accolades/Awards received:
The output of our commitment to CSR is assuring. Evident from the several accolades conferred upon us. A gist:
SFD, Nagda
• World CSR Leadership Award 2020 for the best COVID19 solutions: community care
Indian Rayon, Veraval
• Best CSR Award by Quality Circle Forum of India: Vadodara Chapter
Chemical, Rehla
• 7th Greentech CSR Award for Rehla: for healthcare
197Integrated Annual Report 2020-21
Integrated ReportFinancial statem
entsStatutory Reports
Indo Gulf Fertiliser, Jagdishpur• Certificate of Merit by IMC Ramkrishna Bajaj National Quality
Award Trust: for excellence in crisis for initiative to stem the pandemic
• Good Corporate Citizen Award: PHD Chamber of Commerce: for Social Welfare
Harihar• Bangalore Chamber of Industries and Commerce CSR Impact
Award: for ‘Best Skill Development Initiatives’.
Our CSR spendsThis year we incurred C84.66 Crore divided into C48.85 Crore towards mandatory CSR obligations and additionally C35.81 Crore as voluntary CSR activities.
We have come this far because of the unflinching support of our Chairman, our Board of Directors, our Management, leadership teams, our CSR people and each and every colleague from Grasim. All of them are a source of constant stimulation to aim even higher.
Social Report (Contd.)
198 Grasim Industries Limited
Independent Auditor’s Report
To the Members of Grasim Industries Limited
REPORT ON THE AUDIT OF THE STANDALONE FINANCIAL STATEMENTS
OPINIONWe have audited the standalone financial statements of Grasim Industries Limited (“the Company”), which comprise the standalone balance sheet as at 31st March 2021, and the standalone statement of profit and loss (including other comprehensive income), standalone statement of changes in equity and standalone statement of cash flows for the year then ended, and notes to the standalone financial statements, including a summary of the significant accounting policies and other explanatory information (herein after referred to as “Standalone Financial Statements”).
In our opinion and to the best of our information and according to the explanations given to us, the aforesaid standalone financial statements give the information required by the Companies Act, 2013 (“Act”) in the manner so required and give a true and fair view in conformity with the accounting principles generally accepted in India, of the state of affairs of the Company as at 31st March 2021 and profit and other comprehensive income, changes in equity and its cash flows for the year ended on that date.
BASIS FOR OPINIONWe conducted our audit in accordance with the Standards on Auditing (SAs) specified under section 143(10) of the Act. Our responsibilities under those SAs are further described in the Auditor’s Responsibilities for the Audit of the Standalone Financial Statements section of our report. We are independent of the Company in accordance with the Code of Ethics issued by the Institute of Chartered Accountants of India together with the ethical requirements that are relevant to our audit of the standalone financial statements under the provisions of the Act and the Rules thereunder, and we have fulfilled our other ethical responsibilities in accordance with these requirements and the Code of Ethics. We believe that the audit evidence we have obtained is sufficient and appropriate to provide a basis for our opinion on the Standalone financial statements.
KEY AUDIT MATTERSKey audit matters are those matters that, in our professional judgment, were of most significance in our audit of the standalone financial statements of the current period. These matters were addressed in the context of our audit of the standalone financial statements as a whole, and in forming our opinion thereon, and we do not provide a separate opinion on these matters.
Key audit matters How our audit addressed the key audit matterAssessment of impairment of investments in subsidiaries, associates and joint venturesAs disclosed in note 2.4 of standalone financial statements, the Company has investments in subsidiaries, associates and joint venture companies of C 21,756.84 Crore (P.Y - C 21,695.99 Crore). The said investments are carried at cost less allowance for impairment.
The Company analyses regularly for indicators of impairment in the said investments by reference to the requirements under relevant Ind AS.
We identified the annual impairment assessment as a key audit matter because carrying value of these investments is significant, assessment process is complex, judgmental by nature, significant changes in business environment specifically due to outbreak of Covid-19 and further, is based on assumptions on:
• projected future cash inflows;
• expected growth rate; discount rate; terminal growth rate;
• comparison of price and market multiples
Refer note 1.32 – significant accounting policy for impairment of investments.
Our audit procedures included the following:
• Tested the design and the operating effectiveness of internal controls over the impairment assessment process including assessment of valuation models used in assessment of impairment in the value of investment in subsidiaries, associates and Joint venture
• Examined the Company’s assessment for indicators of impairment of such investments. In cases where such indicators existed, tested the estimates and assumption made by the Company of the recoverable amounts, and the allowance for impairment for these investments.
• Evaluated competence, capabilities and independence of the specialist engaged by the Company and analyzed the valuation reports issued by such specialist.
• Involved our valuation expert to assist in evaluating the key assumptions of the valuations.
• Tested the arithmetical accuracy of the computation of recoverable amounts of investments.
• Assessment of historical forecasting accuracy by comparing previously forecasted cash flows to actual.
• Assessed the disclosures in relation to its annual impairment test in note 1.32 to the financial statements.
199Integrated Annual Report 2020-21
Integrated ReportStatutory Reports
Financial statements
Key audit matters How our audit addressed the key audit matterRegulations – Litigation pertaining to matters related to direct tax and Competition Commission of India (CCI)As disclosed in note 4.1 of the standalone financial statements, the Company has pending litigations with regards to direct tax matter relating to demerger of financial services business amounting to C 7,340.16 Crore (including interest of C 1,468.03 Crore upto 31st March 2021) and order issued by the Competition Commission of India (“CCI”) on the Viscose Staple Fiber (“VSF”) business of the Company amounting to C 301.61 Crore detailed as under:
• The Company’s tax position has been challenged by the tax authorities and demanded dividend distribution tax alleging that the demerger of the Financial Services Business is not qualifying demerger as per Income Tax Act, 1961 and treating the value of shares allotted by the resulting Company to the shareholders of the Company in consideration of demerger as dividend distributed by the Company to its shareholde.
• CCI has issued an order against the Company alleging abuse of dominant position in VSF business and consequent violation of Competition Act, 2002.
We considered the above as key audit matter as the Company applies significant judgment in estimating the likelihood of the future outcome based on its own past assessments, judicial precedents and opinions of experts/legal counsels. when considering whether, and how much, to provide or in determining the required disclosure for the potential exposure of these matte. This is due to highly complex nature and magnitude of amounts involved along with the fact that resolution of income-tax and CCI proceedings may span over multiple years, may involve protracted litigation and these estimates could change substantially over time as based on regulatory positions as these matters progress.
Our audit procedures included the following:
• Tested the design and operating effectiveness of internal controls related to the assessment of the likely outcome of regulatory and tax matters, and provision made, if any.
• Obtained and read the details of legal and tax disputed matte. Further, read the latest correspondence between the Company and various regulatory authorities.
• Considered evaluation made by the management on direct tax and CCI matter and assessed management’s position through discussions on both the probability of success and the magnitude of any potential loss.
• Read external opinions obtained by the management for direct tax and CCI matter and other evidence to corroborate management’s assessment of the risk profile in respect of them.
• Involved tax expert in assessing the nature and amount of the tax exposure. Assessed management’s conclusions on whether exposures are probable, contingent or remote.
• Obtained direct legal confirmations for CCI matter from the law firm handling such matter to corroborate management’s conclusion.
• Assessed the disclosures in note 4.1 made in relation to these direct tax and CCI matter for compliance with disclosure requirements.
INFORMATION OTHER THAN THE STANDALONE FINANCIAL STATEMENTS AND AUDITORS’ REPORT THEREONThe Company’s management and Board of Directors are responsible for the other information. The other information comprises the information included in the Company’s annual report, but does not include the financial statements and our auditors’ report thereon.
Our opinion on the standalone financial statements does not cover the other information and we do not express any form of assurance conclusion thereon.
In connection with our audit of the standalone financial statements, our responsibility is to read the other information and, in doing so, consider whether the other information is materially inconsistent with the standalone financial statements or our knowledge obtained in the audit or otherwise appears to be materially misstated. If, based on the work we have performed, we conclude that there is a material misstatement of this other information, we are required to report that fact. We have nothing to report in this regard.
MANAGEMENT’S AND BOARD OF DIRECTORS’ RESPONSIBILITY FOR THE STANDALONE FINANCIAL STATEMENTS The Company’s Management and Board of Directors are responsible for the matters stated in section 134(5) of the Act
with respect to the preparation of these standalone financial statements that give a true and fair view of the state of affairs, profit and other comprehensive income, changes in equity and cash flows of the Company in accordance with the accounting principles generally accepted in India, including the Indian Accounting Standards (Ind AS) specified under section 133 of the Act. This responsibility also includes maintenance of adequate accounting records in accordance with the provisions of the Act for safeguarding of the assets of the Company and for preventing and detecting frauds and other irregularities; selection and application of appropriate accounting policies; making judgments and estimates that are reasonable and prudent; and design, implementation and maintenance of adequate internal financial controls that were operating effectively for ensuring accuracy and completeness of the accounting records, relevant to the preparation and presentation of the standalone financial statements that give a true and fair view and are free from material misstatement, whether due to fraud or error.
In preparing the standalone financial statements, the Management and Board of Directors are responsible for assessing the Company’s ability to continue as a going concern, disclosing, as applicable, matters related to going concern and using the going concern basis of accounting unless the Board of Directors either intends to liquidate the Company or to cease operations, or has no realistic alternative but to do so.
200 Grasim Industries Limited
The Board of Directors is also responsible for overseeing the Company’s financial reporting process.
AUDITOR’S RESPONSIBILITIES FOR THE AUDIT OF THE STANDALONE FINANCIAL STATEMENTSOur objectives are to obtain reasonable assurance about whether the standalone financial statements as a whole are free from material misstatement, whether due to fraud or error, and to issue an auditor’s report that includes our opinion. Reasonable assurance is a high level of assurance, but is not a guarantee that an audit conducted in accordance with SAs will always detect a material misstatement when it exists. Misstatements can arise from fraud or error and are considered material if, individually or in the aggregate, they could reasonably be expected to influence the economic decisions of users taken on the basis of these standalone financial statements.
As part of an audit in accordance with SAs, we exercise professional judgment and maintain professional skepticism throughout the audit. We also:
• Identify and assess the risks of material misstatement of the standalone financial statements, whether due to fraud or error, design and perform audit procedures responsive to those risks, and obtain audit evidence that is sufficient and appropriate to provide a basis for our opinion. The risk of not detecting a material misstatement resulting from fraud is higher than for one resulting from error, as fraud may involve collusion, forgery, intentional omissions, misrepresentations, or the override of internal control.
• Obtain an understanding of internal control relevant to the audit in order to design audit procedures that are appropriate in the circumstances. Under section 143(3)(i) of the Act, we are also responsible for expressing our opinion on whether the company has adequate internal financial controls with reference to financial statements in place and the operating effectiveness of such controls.
• Evaluate the appropriateness of accounting policies used and the reasonableness of accounting estimates and related disclosures in the standalone financial statements made by the Management and Board of directors.
• Conclude on the appropriateness of the Management and Board of Directors use of the going concern basis of accounting and, based on the audit evidence obtained, whether a material uncertainty exists related to events or conditions that may cast significant doubt on the Company’s ability to continue as a going concern. If we conclude that a material uncertainty exists, we are required to draw attention in our auditor’s report to the related disclosures in the standalone financial statements or, if such disclosures are inadequate, to modify our opinion. Our conclusions are based on the audit evidence obtained up to the date of our auditor’s report. However, future events or conditions may cause the Company to cease to continue as a going concern.
• Evaluate the overall presentation, structure and content of the standalone financial statements, including the disclosures, and whether the standalone financial statements represent the underlying transactions and events in a manner that achieves fair presentation.
We communicate with those charged with governance regarding, among other matters, the planned scope and timing of the audit and significant audit findings, including any significant deficiencies in internal control that we identify during our audit.
We also provide those charged with governance with a statement that we have complied with relevant ethical requirements regarding independence, and to communicate with them all relationships and other matters that may reasonably be thought to bear on our independence, and where applicable, related safeguards.
From the matters communicated with those charged with governance, we determine those matters that were of most significance in the audit of the standalone financial statements of the current period and are therefore the key audit matte. We describe these matters in our auditors’ report unless law or regulation precludes public disclosure about the matter or when, in extremely rare circumstances, we determine that a matter should not be communicated in our report because the adverse consequences of doing so would reasonably be expected to outweigh the public interest benefits of such communication.
REPORT ON OTHER LEGAL AND REGULATORY REQUIREMENTS1. As required by the Companies (Auditors’ Report) Order,
2016 (“the Order”) issued by the Central Government in terms of section 143 (11) of the Act, we give in the “Annexure A” a statement on the matters specified in paragraphs 3 and 4 of the Order, to the extent applicable.
2. (A) As required by Section 143(3) of the Act, we report that:
a) We have sought and obtained all the information and explanations which to the best of our knowledge and belief were necessary for the purposes of our audit.
b) In our opinion, proper books of account as required by law have been kept by the Company so far as it appears from our examination of those books.
c) The standalone balance sheet, the standalone statement of profit and loss (including other comprehensive income), the standalone statement of changes in equity and the standalone statement of cash flows dealt with by this Report are in agreement with the books of account.
201Integrated Annual Report 2020-21
Integrated ReportStatutory Reports
Financial statements
d) In our opinion, the aforesaid standalone financial statements comply with the Ind AS specified under section 133 of the Act.
e) On the basis of the written representations received from the directors as on 31st March 2021 taken on record by the Board of Directors, none of the directors is disqualified as on 31st March 2021 from being appointed as a director in terms of Section 164(2) of the Act.
f) With respect to the adequacy of the internal financial controls with reference to financial statements of the Company and the operating effectiveness of such controls, refer to our separate Report in “Annexure B”.
(B) With respect to the other matters to be included in the Auditors’ Report in accordance with Rule 11 of the Companies (Audit and Auditors) Rules, 2014, in our opinion and to the best of our information and according to the explanations given to us:
i. The Company has disclosed the impact of pending litigations as at 31st March 2021 on its financial position in its standalone financial statements - Refer Note 4.1 to the standalone financial statements;
ii. The Company has made provision, as required under the applicable law or accounting
standards, for material foreseeable losses, if any, on long-term contracts including derivative contracts- Refer Note 4.11 to the standalone financial statements;
iii. There has been no delay in transferring amounts, required to be transferred, to the Investor Education and Protection Fund by the Company.
iv. The disclosures in the standalone financial statements regarding holdings as well as dealings in specified bank notes during the period from 8th November 2016 to 30th December 2016 have not been made in these financial statements since they do not pertain to the financial year ended 31st March 2021
(C) With respect to the matter to be included in the Auditors’ Report under section 197(16):
In our opinion and according to the information and explanations given to us, the remuneration paid by the company to its directors during the current year is in accordance with the provisions of Section 197 of the Act. The remuneration paid to any director is not in excess of the limit laid down under Section 197 of the Act. The Ministry of Corporate Affairs has not prescribed other details under Section 197(16) which are required to be commented upon by us.
For B S R & Co. LLP For S R B C & CO LLPChartered Accountants Chartered AccountantsFirm’s Registration No: 101248W/W-100022 Firm’s Registration No: 324982E/E300003
Vikas R Kasat Vijay ManiarPartner PartnerMembership No: 105317 Membership No: 36738 UDIN : 2110531st7AAAADP9559 UDIN : 21036738AAAADV6736
Mumbai Mumbai24th May 2021 24th May 2021
202 Grasim Industries Limited
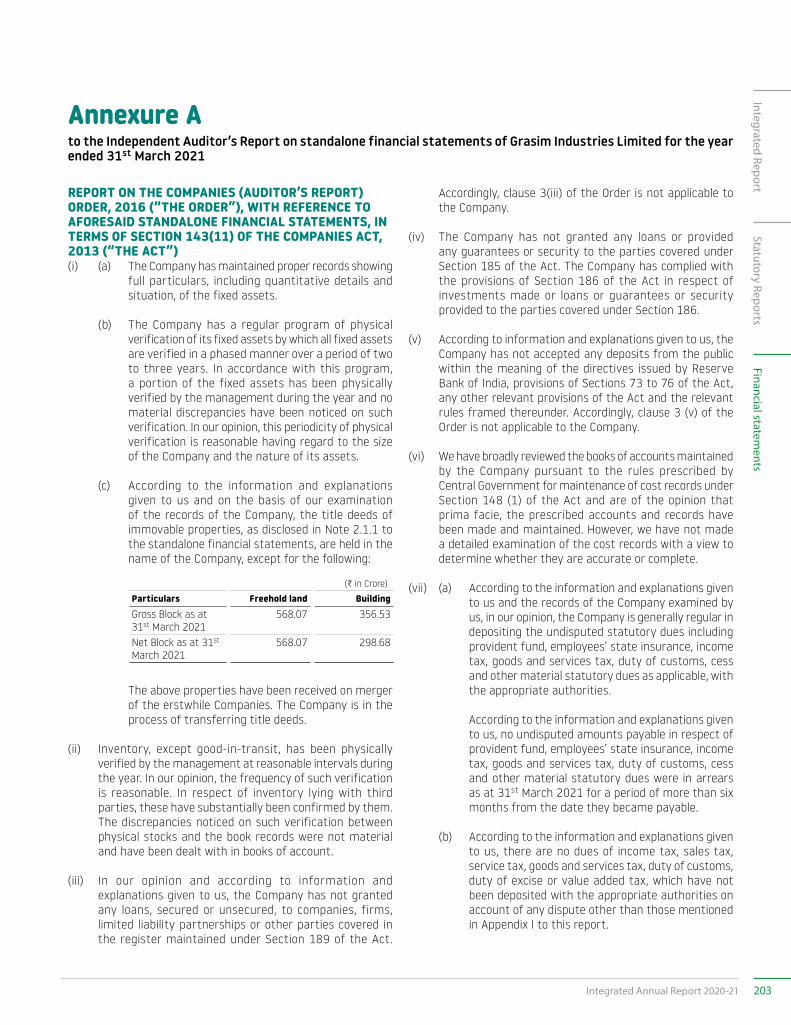
Annexure A to the Independent Auditor’s Report on standalone financial statements of Grasim Industries Limited for the year ended 31st March 2021
REPORT ON THE COMPANIES (AUDITOR’S REPORT) ORDER, 2016 (“THE ORDER”), WITH REFERENCE TO AFORESAID STANDALONE FINANCIAL STATEMENTS, IN TERMS OF SECTION 143(11) OF THE COMPANIES ACT, 2013 (“THE ACT”) (i) (a) The Company has maintained proper records showing
full particulars, including quantitative details and situation, of the fixed assets.
(b) The Company has a regular program of physical verification of its fixed assets by which all fixed assets are verified in a phased manner over a period of two to three years. In accordance with this program, a portion of the fixed assets has been physically verified by the management during the year and no material discrepancies have been noticed on such verification. In our opinion, this periodicity of physical verification is reasonable having regard to the size of the Company and the nature of its assets.
(c) According to the information and explanations given to us and on the basis of our examination of the records of the Company, the title deeds of immovable properties, as disclosed in Note 2.1.1 to the standalone financial statements, are held in the name of the Company, except for the following:
(C in Crore)
Particulars Freehold land BuildingGross Block as at 31st March 2021
568.07 356.53
Net Block as at 31st March 2021
568.07 298.68
The above properties have been received on merger of the erstwhile Companies. The Company is in the process of transferring title deeds.
(ii) Inventory, except good-in-transit, has been physically verified by the management at reasonable intervals during the year. In our opinion, the frequency of such verification is reasonable. In respect of inventory lying with third parties, these have substantially been confirmed by them. The discrepancies noticed on such verification between physical stocks and the book records were not material and have been dealt with in books of account.
(iii) In our opinion and according to information and explanations given to us, the Company has not granted any loans, secured or unsecured, to companies, firms, limited liability partnerships or other parties covered in the register maintained under Section 189 of the Act.
Accordingly, clause 3(iii) of the Order is not applicable to the Company.
(iv) The Company has not granted any loans or provided any guarantees or security to the parties covered under Section 185 of the Act. The Company has complied with the provisions of Section 186 of the Act in respect of investments made or loans or guarantees or security provided to the parties covered under Section 186.
(v) According to information and explanations given to us, the Company has not accepted any deposits from the public within the meaning of the directives issued by Reserve Bank of India, provisions of Sections 73 to 76 of the Act, any other relevant provisions of the Act and the relevant rules framed thereunder. Accordingly, clause 3 (v) of the Order is not applicable to the Company.
(vi) We have broadly reviewed the books of accounts maintained by the Company pursuant to the rules prescribed by Central Government for maintenance of cost records under Section 148 (1) of the Act and are of the opinion that prima facie, the prescribed accounts and records have been made and maintained. However, we have not made a detailed examination of the cost records with a view to determine whether they are accurate or complete.
(vii) (a) According to the information and explanations given to us and the records of the Company examined by us, in our opinion, the Company is generally regular in depositing the undisputed statutory dues including provident fund, employees’ state insurance, income tax, goods and services tax, duty of customs, cess and other material statutory dues as applicable, with the appropriate authorities.
According to the information and explanations given to us, no undisputed amounts payable in respect of provident fund, employees’ state insurance, income tax, goods and services tax, duty of customs, cess and other material statutory dues were in arrears as at 31st March 2021 for a period of more than six months from the date they became payable.
(b) According to the information and explanations given to us, there are no dues of income tax, sales tax, service tax, goods and services tax, duty of customs, duty of excise or value added tax, which have not been deposited with the appropriate authorities on account of any dispute other than those mentioned in Appendix I to this report.
203Integrated Annual Report 2020-21
Integrated ReportStatutory Reports
Financial statements
(viii) In our opinion and according to the information and explanations given to us, the Company has not defaulted in repayment of loans or borrowings to financial institutions, banks, government or due to debenture holde.
(ix) In our opinion and according to the information and explanations given to us, the Company has not raised any moneys by way of initial public offer or further public offer (including debt instruments) and term loans during the year. Accordingly, clause 3(ix) of the Order is not applicable to the Company.
(x) According to the information and explanations given to us, no material fraud by the Company or on the Company by its officers or employees has been noticed or reported during the year.
(xi) According to the information and explanations give to us and based on our examination of the records, the Company has paid or provided for managerial remuneration in accordance with the requisite approvals mandated by the provisions of Section 197 read with Schedule V to the Act.
(xii) In our opinion and according to the information and explanations given to us, the Company is not a Nidhi company and the Nidhi Rules, 2014 are not applicable to it. Accordingly, clause 3(xii) of the Order is not applicable to the Company.
(xiii) According to the information and explanations given to us and based on our examination of the records of the Company, transactions with the related parties are in compliance with Sections 177 and 188 of the Act, where applicable. The details of such related party transactions have been disclosed in the notes to the Standalone Financial Statements as required by applicable accounting standards as notified under the Companies (Indian Accounting Standards) (Amendment) Rules, 2016.
(xiv) According to the information and explanations give to us and based on our examination of the records of the Company, the Company has not made any preferential allotment or private placement of shares or fully or partly convertible debentures during the year. Accordingly, clause 3(xiv) of the Order is not applicable to the Company.
(xv) According to the information and explanations given to us and based on our examination of the records, the Company has not entered into non-cash transactions with directors or persons connected with them as referred to in section 192 of the Act. Accordingly, clause 3(xv) of the Order is not applicable to the Company.
(xvi) In our opinion and according to the information and explanations given to us, the Company is not required to be registered under section 45-IA of the Reserve Bank of India Act, 1934. Accordingly, clause 3 (xvi) of the Order is not applicable to the Company.
For B S R & Co. LLP For S R B C & CO LLPChartered Accountants Chartered AccountantsFirm’s Registration No: 101248W/W-100022 Firm’s Registration No: 324982E/E300003
Vikas R Kasat Vijay ManiarPartner PartnerMembership No: 105317 Membership No: 36738 UDIN : 2110531st7AAAADP9559 UDIN : 21036738AAAADV6736
Mumbai Mumbai24th May 2021 24th May 2021
204 Grasim Industries Limited
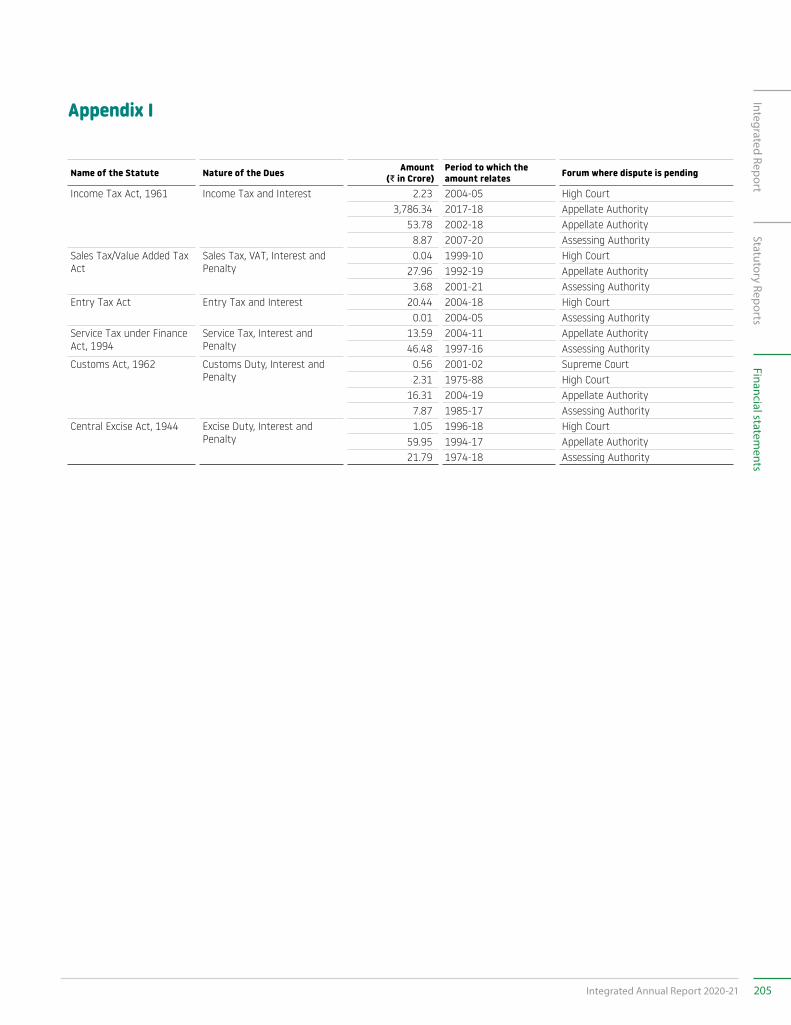
Appendix I
Name of the Statute Nature of the Dues Amount (D in Crore)
Period to which the amount relates Forum where dispute is pending
Income Tax Act, 1961 Income Tax and Interest 2.23 2004-05 High Court3,786.34 2017-18 Appellate Authority
53.78 2002-18 Appellate Authority8.87 2007-20 Assessing Authority
Sales Tax/Value Added Tax Act
Sales Tax, VAT, Interest and Penalty
0.04 1999-10 High Court 27.96 1992-19 Appellate Authority 3.68 2001-21 Assessing Authority
Entry Tax Act Entry Tax and Interest 20.44 2004-18 High Court 0.01 2004-05 Assessing Authority
Service Tax under Finance Act, 1994
Service Tax, Interest and Penalty
13.59 2004-11 Appellate Authority 46.48 1997-16 Assessing Authority
Customs Act, 1962 Customs Duty, Interest and Penalty
0.56 2001-02 Supreme Court 2.31 1975-88 High Court
16.31 2004-19 Appellate Authority 7.87 1985-17 Assessing Authority
Central Excise Act, 1944 Excise Duty, Interest and Penalty
1.05 1996-18 High Court 59.95 1994-17 Appellate Authority 21.79 1974-18 Assessing Authority
205Integrated Annual Report 2020-21
Integrated ReportStatutory Reports
Financial statements
Annexure B to the Independent Auditors’ report on the standalone financial statements of Grasim Industries Limited for the year ended 31st March 2021
Report on the internal financial controls with reference to the aforesaid standalone financial statements under Clause (i) of Sub-section 3 of Section 143 of the Companies Act, 2013
(Referred to in paragraph 2A(f) under ‘Report on Other Legal and Regulatory Requirements’ section of our report of even date)
OPINIONWe have audited the internal financial controls with reference to standalone financial statements of Grasim Industries Limited (“the Company”) as of 31st March 2021 in conjunction with our audit of the standalone financial statements of the Company for the year ended on that date.
In our opinion, the Company has, in all material respects, adequate internal financial controls with reference to standalone financial statements and such internal financial controls were operating effectively as at 31st March 2021, based on the internal financial controls with reference to standalone financial statements criteria established by the Company considering the essential components of internal control stated in the Guidance Note on Audit of Internal Financial Controls Over Financial Reporting issued by the Institute of Chartered Accountants of India (the “Guidance Note”).
MANAGEMENT’S RESPONSIBILITY FOR INTERNAL FINANCIAL CONTROLSThe Company’s management and the Board of Directors are responsible for establishing and maintaining internal financial controls based on the internal financial controls with reference to standalone financial statements criteria established by the Company considering the essential components of internal control stated in the Guidance Note. These responsibilities include the design, implementation and maintenance of adequate internal financial controls that were operating effectively for ensuring the orderly and efficient conduct of its business, including adherence to company’s policies, the safeguarding of its assets, the prevention and detection of frauds and errors, the accuracy and completeness of the accounting records, and the timely preparation of reliable financial information, as required under the Companies Act, 2013 (hereinafter referred to as “the Act”).
AUDITORS’ RESPONSIBILITYOur responsibility is to express an opinion on the Company’s internal financial controls with reference to standalone financial statements based on our audit. We conducted our audit in accordance with the Guidance Note and the Standards on Auditing, prescribed under section 143(10) of the Act, to the extent applicable to an audit of internal financial controls with reference to standalone financial statements. Those Standards and the Guidance Note require that we comply with ethical requirements and plan and perform the audit to obtain reasonable assurance about whether adequate internal financial controls with reference to standalone financial statements were established and maintained and whether such controls operated effectively in all material respects.
Our audit involves performing procedures to obtain audit evidence about the adequacy of the internal financial controls with reference to standalone financial statements and their operating effectiveness. Our audit of internal financial controls with reference to standalone financial statements included obtaining an understanding of such internal financial controls, assessing the risk that a material weakness exists, and testing and evaluating the design and operating effectiveness of internal control based on the assessed risk. The procedures selected depend on the auditor’s judgement, including the assessment of the risks of material misstatement of the standalone financial statements, whether due to fraud or error.
We believe that the audit evidence we have obtained is sufficient and appropriate to provide a basis for our audit opinion on the Company’s internal financial controls with reference to standalone financial statements.
MEANING OF INTERNAL FINANCIAL CONTROLS WITH REFERENCE TO STANDALONE FINANCIAL STATEMENTSA company’s internal financial controls with reference to standalone financial statements is a process designed to provide reasonable assurance regarding the reliability of financial reporting and the preparation of standalone financial statements for external purposes in accordance with generally accepted accounting principles. A company’s internal financial controls with reference to standalone financial statements
206 Grasim Industries Limited
include those policies and procedures that (1) pertain to the maintenance of records that, in reasonable detail, accurately and fairly reflect the transactions and dispositions of the assets of the company; (2) provide reasonable assurance that transactions are recorded as necessary to permit preparation of standalone financial statements in accordance with generally accepted accounting principles, and that receipts and expenditures of the company are being made only in accordance with authorisations of management and directors of the company; and (3) provide reasonable assurance regarding prevention or timely detection of unauthorised acquisition, use, or disposition of the company’s assets that could have a material effect on the standalone financial statements.
INHERENT LIMITATIONS OF INTERNAL FINANCIAL CONTROLS WITH REFERENCE TO STANDALONE FINANCIAL STATEMENTSBecause of the inherent limitations of internal financial controls with reference to standalone financial statements, including the possibility of collusion or improper management override of controls, material misstatements due to error or fraud may occur and not be detected. Also, projections of any evaluation of the internal financial controls with reference to standalone financial statements to future periods are subject to the risk that the internal financial controls with reference to standalone financial statements may become inadequate because of changes in conditions, or that the degree of compliance with the policies or procedures may deteriorate.
For B S R & Co. LLP For S R B C & CO LLPChartered Accountants Chartered AccountantsFirm’s Registration No: 101248W/W-100022 Firm’s Registration No: 324982E/E300003
Vikas R Kasat Vijay ManiarPartner PartnerMembership No: 105317 Membership No: 36738 UDIN : 2110531st7AAAADP9559 UDIN : 21036738AAAADV6736
Mumbai Mumbai24th May 2021 24th May 2021
207Integrated Annual Report 2020-21
Integrated ReportStatutory Reports
Financial statements
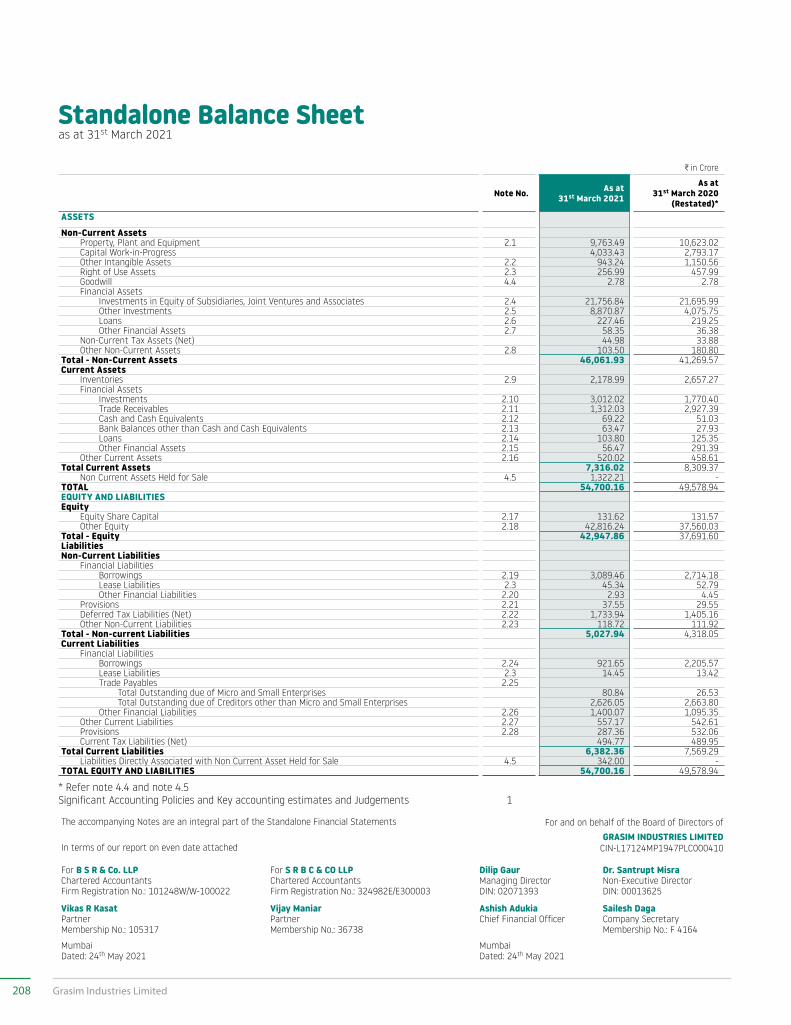
Standalone Balance Sheetas at 31st March 2021
C in Crore
Note No. As at 31st March 2021
As at 31st March 2020
(Restated)* ASSETSNon-Current Assets
Property, Plant and Equipment 2.1 9,763.49 10,623.02 Capital Work-in-Progress 4,033.43 2,793.17 Other Intangible Assets 2.2 943.24 1,150.56 Right of Use Assets 2.3 256.99 457.99 Goodwill 4.4 2.78 2.78 Financial Assets Investments in Equity of Subsidiaries, Joint Ventures and Associates 2.4 21,756.84 21,695.99 Other Investments 2.5 8,870.87 4,075.75 Loans 2.6 227.46 219.25 Other Financial Assets 2.7 58.35 36.38 Non-Current Tax Assets (Net) 44.98 33.88 Other Non-Current Assets 2.8 103.50 180.80
Total - Non-Current Assets 46,061.93 41,269.57 Current Assets
Inventories 2.9 2,178.99 2,657.27 Financial Assets Investments 2.10 3,012.02 1,770.40 Trade Receivables 2.11 1,312.03 2,927.39 Cash and Cash Equivalents 2.12 69.22 51.03 Bank Balances other than Cash and Cash Equivalents 2.13 63.47 27.93 Loans 2.14 103.80 125.35 Other Financial Assets 2.15 56.47 291.39 Other Current Assets 2.16 520.02 458.61
Total Current Assets 7,316.02 8,309.37 Non Current Assets Held for Sale 4.5 1,322.21 -
TOTAL 54,700.16 49,578.94 EQUITY AND LIABILITIESEquity
Equity Share Capital 2.17 131.62 131.57 Other Equity 2.18 42,816.24 37,560.03
Total - Equity 42,947.86 37,691.60 LiabilitiesNon-Current Liabilities
Financial Liabilities Borrowings 2.19 3,089.46 2,714.18 Lease Liabilities 2.3 45.34 52.79 Other Financial Liabilities 2.20 2.93 4.45 Provisions 2.21 37.55 29.55 Deferred Tax Liabilities (Net) 2.22 1,733.94 1,405.16 Other Non-Current Liabilities 2.23 118.72 111.92
Total - Non-current Liabilities 5,027.94 4,318.05 Current Liabilities
Financial Liabilities Borrowings 2.24 921.65 2,205.57 Lease Liabilities 2.3 14.45 13.42 Trade Payables 2.25 Total Outstanding due of Micro and Small Enterprises 80.84 26.53 Total Outstanding due of Creditors other than Micro and Small Enterprises 2,626.05 2,663.80 Other Financial Liabilities 2.26 1,400.07 1,095.35 Other Current Liabilities 2.27 557.17 542.61 Provisions 2.28 287.36 532.06 Current Tax Liabilities (Net) 494.77 489.95
Total Current Liabilities 6,382.36 7,569.29 Liabilities Directly Associated with Non Current Asset Held for Sale 4.5 342.00 -
TOTAL EQUITY AND LIABILITIES 54,700.16 49,578.94
* Refer note 4.4 and note 4.5 Significant Accounting Policies and Key accounting estimates and Judgements 1
The accompanying Notes are an integral part of the Standalone Financial Statements For and on behalf of the Board of Directors of GRASIM INDUSTRIES LIMITED
In terms of our report on even date attached CIN-L17124MP1947PLC000410
For B S R & Co. LLP For S R B C & CO LLP Dilip Gaur Dr. Santrupt MisraChartered Accountants Chartered Accountants Managing Director Non-Executive DirectorFirm Registration No.: 101248W/W-100022 Firm Registration No.: 324982E/E300003 DIN: 02071393 DIN: 00013625
Vikas R Kasat Vijay Maniar Ashish Adukia Sailesh DagaPartner Partner Chief Financial Officer Company SecretaryMembership No.: 105317 Membership No.: 36738 Membership No.: F 4164
Mumbai MumbaiDated: 24th May 2021 Dated: 24th May 2021
208 Grasim Industries Limited
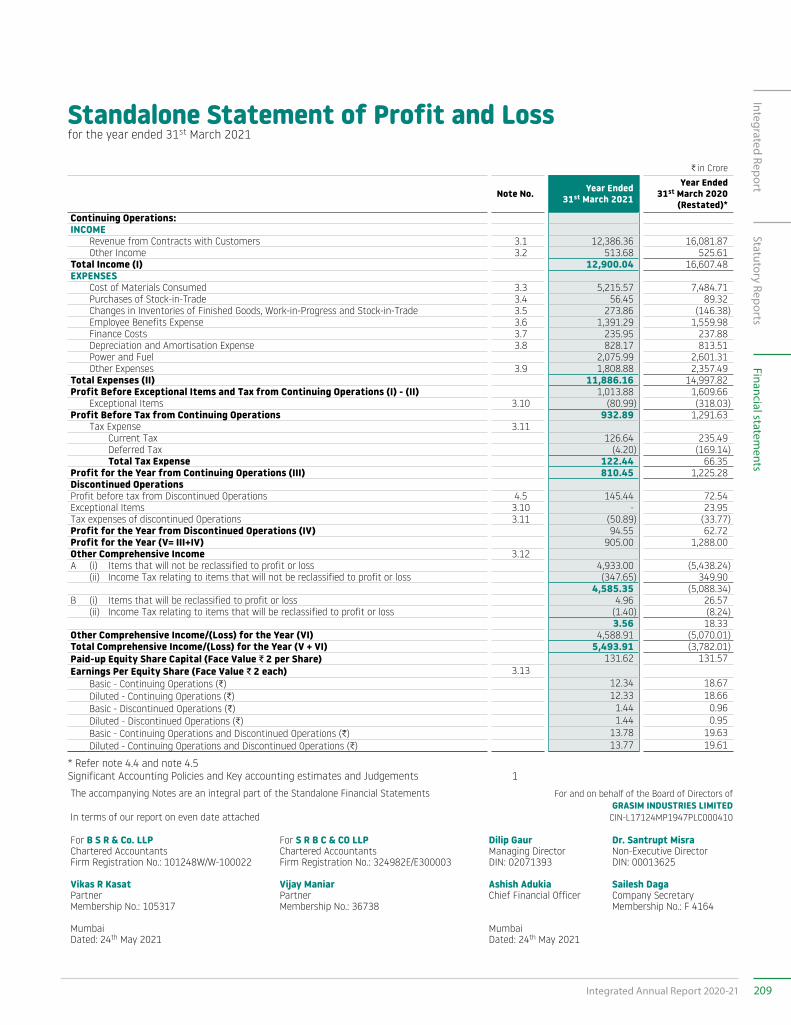
Standalone Statement of Profit and Lossfor the year ended 31st March 2021
C in Crore
Note No. Year Ended 31st March 2021
Year Ended 31st March 2020
(Restated)* Continuing Operations:INCOME
Revenue from Contracts with Customers 3.1 12,386.36 16,081.87 Other Income 3.2 513.68 525.61
Total Income (I) 12,900.04 16,607.48 EXPENSES
Cost of Materials Consumed 3.3 5,215.57 7,484.71 Purchases of Stock-in-Trade 3.4 56.45 89.32 Changes in Inventories of Finished Goods, Work-in-Progress and Stock-in-Trade 3.5 273.86 (146.38)Employee Benefits Expense 3.6 1,391.29 1,559.98 Finance Costs 3.7 235.95 237.88 Depreciation and Amortisation Expense 3.8 828.17 813.51 Power and Fuel 2,075.99 2,601.31 Other Expenses 3.9 1,808.88 2,357.49
Total Expenses (II) 11,886.16 14,997.82 Profit Before Exceptional Items and Tax from Continuing Operations (I) - (II) 1,013.88 1,609.66
Exceptional Items 3.10 (80.99) (318.03)Profit Before Tax from Continuing Operations 932.89 1,291.63
Tax Expense 3.11 Current Tax 126.64 235.49 Deferred Tax (4.20) (169.14)Total Tax Expense 122.44 66.35
Profit for the Year from Continuing Operations (III) 810.45 1,225.28 Discontinued OperationsProfit before tax from Discontinued Operations 4.5 145.44 72.54 Exceptional Items 3.10 - 23.95 Tax expenses of discontinued Operations 3.11 (50.89) (33.77)Profit for the Year from Discontinued Operations (IV) 94.55 62.72 Profit for the Year (V= III+IV) 905.00 1,288.00 Other Comprehensive Income 3.12 A (i) Items that will not be reclassified to profit or loss 4,933.00 (5,438.24)
(ii) Income Tax relating to items that will not be reclassified to profit or loss (347.65) 349.90 4,585.35 (5,088.34)
B (i) Items that will be reclassified to profit or loss 4.96 26.57 (ii) Income Tax relating to items that will be reclassified to profit or loss (1.40) (8.24)
3.56 18.33 Other Comprehensive Income/(Loss) for the Year (VI) 4,588.91 (5,070.01)Total Comprehensive Income/(Loss) for the Year (V + VI) 5,493.91 (3,782.01)Paid-up Equity Share Capital (Face Value D 2 per Share) 131.62 131.57 Earnings Per Equity Share (Face Value D 2 each) 3.13
Basic - Continuing Operations (C) 12.34 18.67 Diluted - Continuing Operations (C) 12.33 18.66 Basic - Discontinued Operations (C) 1.44 0.96 Diluted - Discontinued Operations (C) 1.44 0.95 Basic - Continuing Operations and Discontinued Operations (C) 13.78 19.63 Diluted - Continuing Operations and Discontinued Operations (C) 13.77 19.61
* Refer note 4.4 and note 4.5 Significant Accounting Policies and Key accounting estimates and Judgements 1
The accompanying Notes are an integral part of the Standalone Financial Statements For and on behalf of the Board of Directors of GRASIM INDUSTRIES LIMITED
In terms of our report on even date attached CIN-L17124MP1947PLC000410
For B S R & Co. LLP For S R B C & CO LLP Dilip Gaur Dr. Santrupt MisraChartered Accountants Chartered Accountants Managing Director Non-Executive DirectorFirm Registration No.: 101248W/W-100022 Firm Registration No.: 324982E/E300003 DIN: 02071393 DIN: 00013625
Vikas R Kasat Vijay Maniar Ashish Adukia Sailesh DagaPartner Partner Chief Financial Officer Company SecretaryMembership No.: 105317 Membership No.: 36738 Membership No.: F 4164
Mumbai MumbaiDated: 24th May 2021 Dated: 24th May 2021
209Integrated Annual Report 2020-21
Integrated ReportStatutory Reports
Financial statements
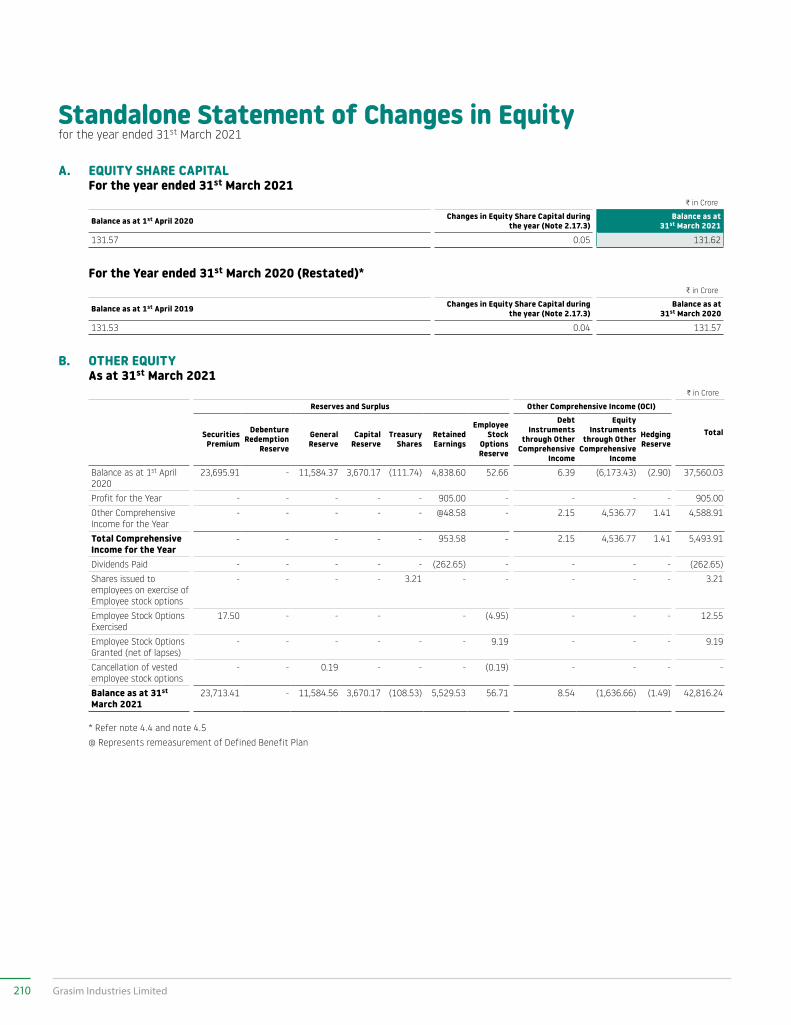
Standalone Statement of Changes in Equityfor the year ended 31st March 2021
A. EQUITY SHARE CAPITAL For the year ended 31st March 2021
C in Crore
Balance as at 1st April 2020 Changes in Equity Share Capital during the year (Note 2.17.3)
Balance as at 31st March 2021
131.57 0.05 131.62
For the Year ended 31st March 2020 (Restated)*C in Crore
Balance as at 1st April 2019 Changes in Equity Share Capital during the year (Note 2.17.3)
Balance as at 31st March 2020
131.53 0.04 131.57
B. OTHER EQUITY As at 31st March 2021
C in Crore
Reserves and Surplus Other Comprehensive Income (OCI)
TotalSecurities Premium
Debenture Redemption
Reserve
General Reserve
Capital Reserve
Treasury Shares
Retained Earnings
Employee Stock
Options Reserve
Debt Instruments
through Other Comprehensive
Income
Equity Instruments
through Other Comprehensive
Income
Hedging Reserve
Balance as at 1st April 2020
23,695.91 - 11,584.37 3,670.17 (111.74) 4,838.60 52.66 6.39 (6,173.43) (2.90) 37,560.03
Profit for the Year - - - - - 905.00 - - - - 905.00 Other Comprehensive Income for the Year
- - - - - @48.58 - 2.15 4,536.77 1.41 4,588.91
Total Comprehensive Income for the Year
- - - - - 953.58 - 2.15 4,536.77 1.41 5,493.91
Dividends Paid - - - - - (262.65) - - - - (262.65)Shares issued to employees on exercise of Employee stock options
- - - - 3.21 - - - - - 3.21
Employee Stock Options Exercised
17.50 - - - - (4.95) - - - 12.55
Employee Stock Options Granted (net of lapses)
- - - - - - 9.19 - - - 9.19
Cancellation of vested employee stock options
- - 0.19 - - - (0.19) - - - -
Balance as at 31st March 2021
23,713.41 - 11,584.56 3,670.17 (108.53) 5,529.53 56.71 8.54 (1,636.66) (1.49) 42,816.24
* Refer note 4.4 and note 4.5 @ Represents remeasurement of Defined Benefit Plan
210 Grasim Industries Limited
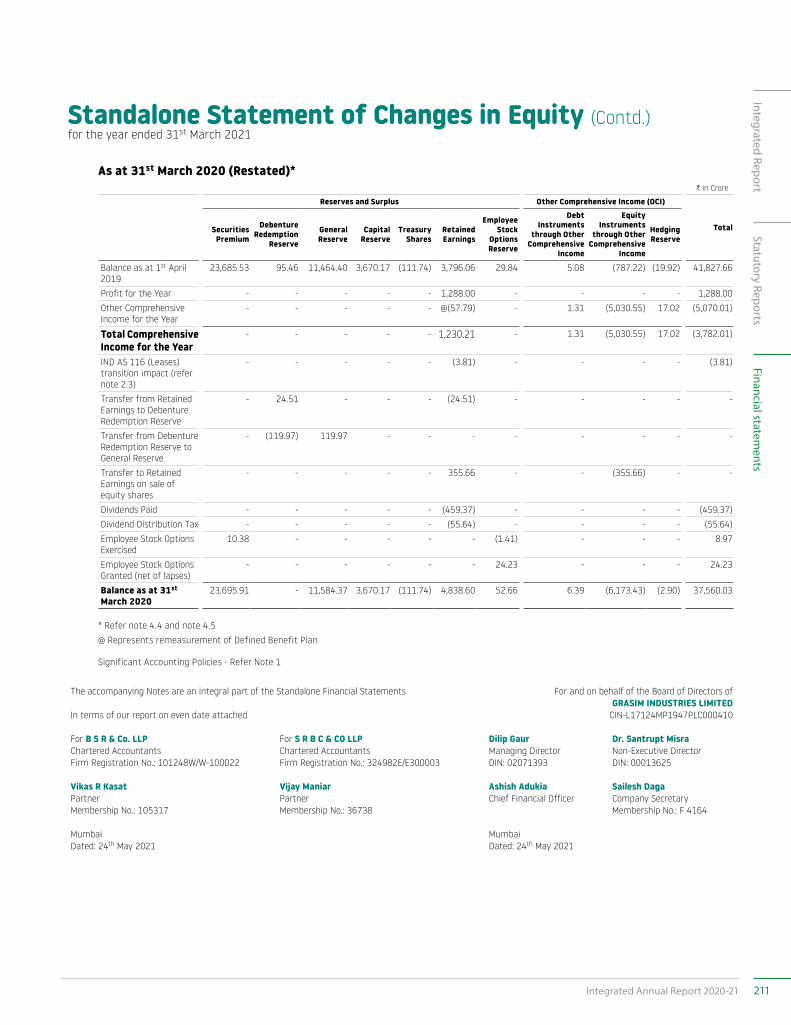
Standalone Statement of Changes in Equity (Contd.)for the year ended 31st March 2021
As at 31st March 2020 (Restated)*C in Crore
Reserves and Surplus Other Comprehensive Income (OCI)
TotalSecurities Premium
Debenture Redemption
Reserve
General Reserve
Capital Reserve
Treasury Shares
Retained Earnings
Employee Stock
Options Reserve
Debt Instruments
through Other Comprehensive
Income
Equity Instruments
through Other Comprehensive
Income
Hedging Reserve
Balance as at 1st April 2019
23,685.53 95.46 11,464.40 3,670.17 (111.74) 3,796.06 29.84 5.08 (787.22) (19.92) 41,827.66
Profit for the Year - - - - - 1,288.00 - - - - 1,288.00 Other Comprehensive Income for the Year
- - - - - @(57.79) - 1.31 (5,030.55) 17.02 (5,070.01)
Total Comprehensive Income for the Year
- - - - - 1,230.21 - 1.31 (5,030.55) 17.02 (3,782.01)
IND AS 116 (Leases) transition impact (refer note 2.3)
- - - - - (3.81) - - - - (3.81)
Transfer from Retained Earnings to Debenture Redemption Reserve
- 24.51 - - - (24.51) - - - - -
Transfer from Debenture Redemption Reserve to General Reserve
- (119.97) 119.97 - - - - - - - -
Transfer to Retained Earnings on sale of equity shares
- - - - - 355.66 - - (355.66) - -
Dividends Paid - - - - - (459.37) - - - - (459.37)Dividend Distribution Tax - - - - - (55.64) - - - - (55.64)Employee Stock Options Exercised
10.38 - - - - - (1.41) - - - 8.97
Employee Stock Options Granted (net of lapses)
- - - - - - 24.23 - - - 24.23
Balance as at 31st March 2020
23,695.91 - 11,584.37 3,670.17 (111.74) 4,838.60 52.66 6.39 (6,173.43) (2.90) 37,560.03
* Refer note 4.4 and note 4.5 @ Represents remeasurement of Defined Benefit Plan
Significant Accounting Policies - Refer Note 1
The accompanying Notes are an integral part of the Standalone Financial Statements For and on behalf of the Board of Directors of GRASIM INDUSTRIES LIMITED
In terms of our report on even date attached CIN-L17124MP1947PLC000410
For B S R & Co. LLP For S R B C & CO LLP Dilip Gaur Dr. Santrupt MisraChartered Accountants Chartered Accountants Managing Director Non-Executive DirectorFirm Registration No.: 101248W/W-100022 Firm Registration No.: 324982E/E300003 DIN: 02071393 DIN: 00013625
Vikas R Kasat Vijay Maniar Ashish Adukia Sailesh DagaPartner Partner Chief Financial Officer Company SecretaryMembership No.: 105317 Membership No.: 36738 Membership No.: F 4164
Mumbai MumbaiDated: 24th May 2021 Dated: 24th May 2021
211Integrated Annual Report 2020-21
Integrated ReportStatutory Reports
Financial statements
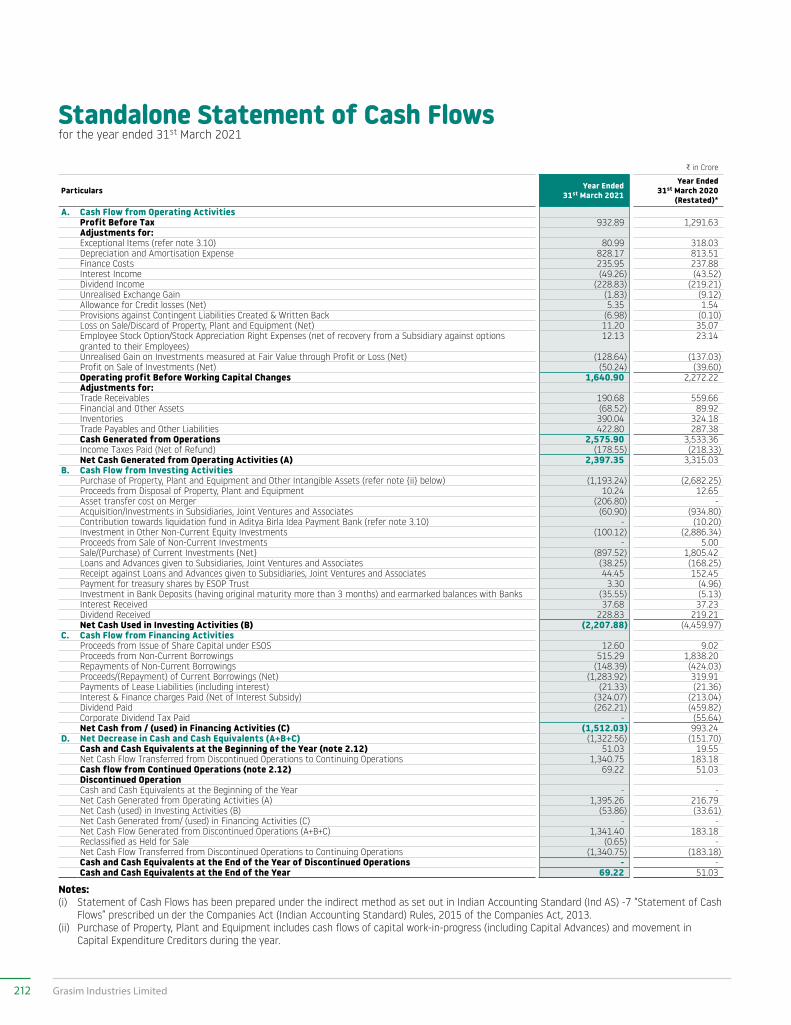
Standalone Statement of Cash Flowsfor the year ended 31st March 2021
C in Crore
Particulars Year Ended31st March 2021
Year Ended31st March 2020
(Restated)*A. Cash Flow from Operating Activities
Profit Before Tax 932.89 1,291.63 Adjustments for:Exceptional Items (refer note 3.10) 80.99 318.03 Depreciation and Amortisation Expense 828.17 813.51 Finance Costs 235.95 237.88 Interest Income (49.26) (43.52)Dividend Income (228.83) (219.21)Unrealised Exchange Gain (1.83) (9.12)Allowance for Credit losses (Net) 5.35 1.54 Provisions against Contingent Liabilities Created & Written Back (6.98) (0.10)Loss on Sale/Discard of Property, Plant and Equipment (Net) 11.20 35.07 Employee Stock Option/Stock Appreciation Right Expenses (net of recovery from a Subsidiary against options granted to their Employees)
12.13 23.14
Unrealised Gain on Investments measured at Fair Value through Profit or Loss (Net) (128.64) (137.03)Profit on Sale of Investments (Net) (50.24) (39.60)Operating profit Before Working Capital Changes 1,640.90 2,272.22 Adjustments for:Trade Receivables 190.68 559.66 Financial and Other Assets (68.52) 89.92 Inventories 390.04 324.18 Trade Payables and Other Liabilities 422.80 287.38 Cash Generated from Operations 2,575.90 3,533.36 Income Taxes Paid (Net of Refund) (178.55) (218.33)Net Cash Generated from Operating Activities (A) 2,397.35 3,315.03
B. Cash Flow from Investing ActivitiesPurchase of Property, Plant and Equipment and Other Intangible Assets (refer note {ii} below) (1,193.24) (2,682.25)Proceeds from Disposal of Property, Plant and Equipment 10.24 12.65 Asset transfer cost on Merger (206.80) - Acquisition/Investments in Subsidiaries, Joint Ventures and Associates (60.90) (934.80)Contribution towards liquidation fund in Aditya Birla Idea Payment Bank (refer note 3.10) - (10.20)Investment in Other Non-Current Equity Investments (100.12) (2,886.34)Proceeds from Sale of Non-Current Investments - 5.00 Sale/(Purchase) of Current Investments {Net} (897.52) 1,805.42 Loans and Advances given to Subsidiaries, Joint Ventures and Associates (38.25) (168.25)Receipt against Loans and Advances given to Subsidiaries, Joint Ventures and Associates 44.45 152.45 Payment for treasury shares by ESOP Trust 3.30 (4.96)Investment in Bank Deposits (having original maturity more than 3 months) and earmarked balances with Banks (35.55) (5.13)Interest Received 37.68 37.23 Dividend Received 228.83 219.21 Net Cash Used in Investing Activities (B) (2,207.88) (4,459.97)
C. Cash Flow from Financing ActivitiesProceeds from Issue of Share Capital under ESOS 12.60 9.02 Proceeds from Non-Current Borrowings 515.29 1,838.20 Repayments of Non-Current Borrowings (148.39) (424.03)Proceeds/(Repayment) of Current Borrowings (Net) (1,283.92) 319.91 Payments of Lease Liabilities (including interest) (21.33) (21.36)Interest & Finance charges Paid (Net of Interest Subsidy) (324.07) (213.04)Dividend Paid (262.21) (459.82)Corporate Dividend Tax Paid - (55.64)Net Cash from / (used) in Financing Activities (C) (1,512.03) 993.24
D. Net Decrease in Cash and Cash Equivalents (A+B+C) (1,322.56) (151.70)Cash and Cash Equivalents at the Beginning of the Year (note 2.12) 51.03 19.55 Net Cash Flow Transferred from Discontinued Operations to Continuing Operations 1,340.75 183.18 Cash flow from Continued Operations (note 2.12) 69.22 51.03 Discontinued OperationCash and Cash Equivalents at the Beginning of the Year - - Net Cash Generated from Operating Activities (A) 1,395.26 216.79 Net Cash (used) in Investing Activities (B) (53.86) (33.61)Net Cash Generated from/ (used) in Financing Activities (C) - - Net Cash Flow Generated from Discontinued Operations (A+B+C) 1,341.40 183.18 Reclassified as Held for Sale (0.65) - Net Cash Flow Transferred from Discontinued Operations to Continuing Operations (1,340.75) (183.18)Cash and Cash Equivalents at the End of the Year of Discontinued Operations - - Cash and Cash Equivalents at the End of the Year 69.22 51.03
Notes: (i) Statement of Cash Flows has been prepared under the indirect method as set out in Indian Accounting Standard (Ind AS) -7 “Statement of Cash
Flows” prescribed un der the Companies Act (Indian Accounting Standard) Rules, 2015 of the Companies Act, 2013.(ii) Purchase of Property, Plant and Equipment includes cash flows of capital work-in-progress (including Capital Advances) and movement in
Capital Expenditure Creditors during the year.
212 Grasim Industries Limited
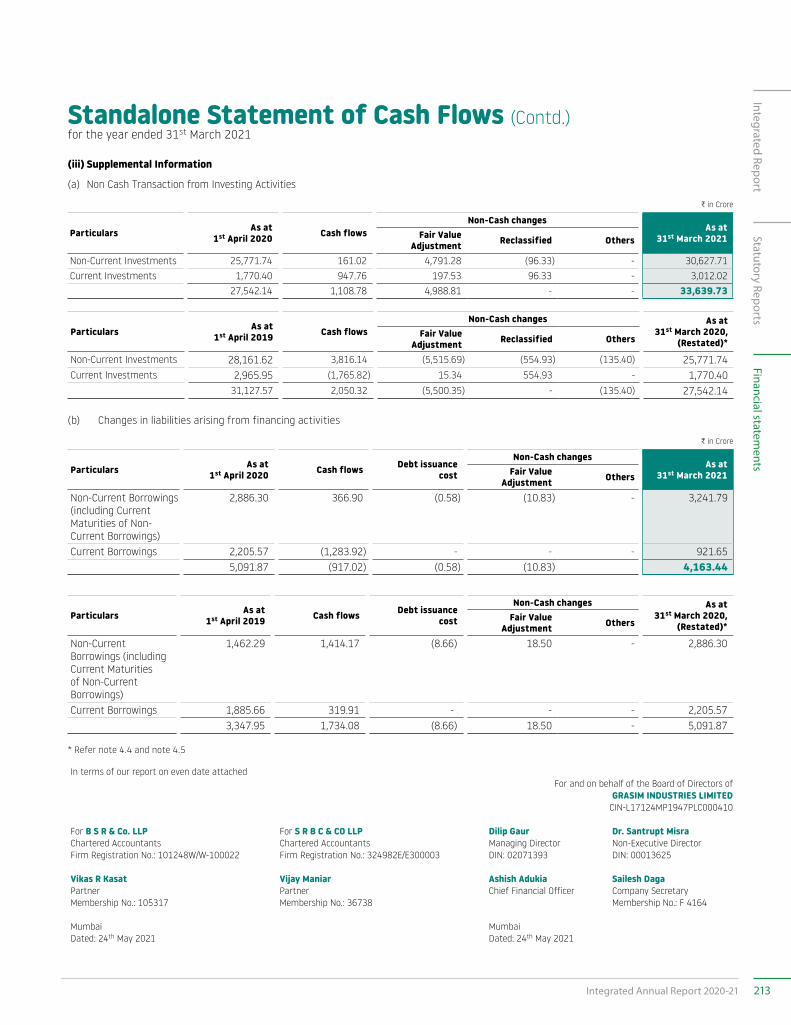
(iii) Supplemental Information
(a) Non Cash Transaction from Investing Activities
C in Crore
Particulars As at 1st April 2020 Cash flows
Non-Cash changes As at
31st March 2021 Fair Value Adjustment Reclassified Others
Non-Current Investments 25,771.74 161.02 4,791.28 (96.33) - 30,627.71 Current Investments 1,770.40 947.76 197.53 96.33 - 3,012.02
27,542.14 1,108.78 4,988.81 - - 33,639.73
Particulars As at 1st April 2019 Cash flows
Non-Cash changes As at 31st March 2020,
(Restated)* Fair Value
Adjustment Reclassified Others
Non-Current Investments 28,161.62 3,816.14 (5,515.69) (554.93) (135.40) 25,771.74 Current Investments 2,965.95 (1,765.82) 15.34 554.93 - 1,770.40
31,127.57 2,050.32 (5,500.35) - (135.40) 27,542.14
(b) Changes in liabilities arising from financing activities
C in Crore
Particulars As at 1st April 2020 Cash flows Debt issuance
cost
Non-Cash changes As at
31st March 2021 Fair Value Adjustment Others
Non-Current Borrowings (including Current Maturities of Non-Current Borrowings)
2,886.30 366.90 (0.58) (10.83) - 3,241.79
Current Borrowings 2,205.57 (1,283.92) - - - 921.65 5,091.87 (917.02) (0.58) (10.83) 4,163.44
Particulars As at 1st April 2019 Cash flows Debt issuance
cost
Non-Cash changes As at 31st March 2020,
(Restated)* Fair Value
Adjustment Others
Non-Current Borrowings (including Current Maturities of Non-Current Borrowings)
1,462.29 1,414.17 (8.66) 18.50 - 2,886.30
Current Borrowings 1,885.66 319.91 - - - 2,205.57 3,347.95 1,734.08 (8.66) 18.50 - 5,091.87
* Refer note 4.4 and note 4.5
In terms of our report on even date attachedFor and on behalf of the Board of Directors of
GRASIM INDUSTRIES LIMITED CIN-L17124MP1947PLC000410
For B S R & Co. LLP For S R B C & CO LLP Dilip Gaur Dr. Santrupt MisraChartered Accountants Chartered Accountants Managing Director Non-Executive DirectorFirm Registration No.: 101248W/W-100022 Firm Registration No.: 324982E/E300003 DIN: 02071393 DIN: 00013625
Vikas R Kasat Vijay Maniar Ashish Adukia Sailesh DagaPartner Partner Chief Financial Officer Company SecretaryMembership No.: 105317 Membership No.: 36738 Membership No.: F 4164
Mumbai MumbaiDated: 24th May 2021 Dated: 24th May 2021
Standalone Statement of Cash Flows (Contd.)for the year ended 31st March 2021
213Integrated Annual Report 2020-21
Integrated ReportStatutory Reports
Financial statements
Notesforming part of the Standalone Financial Statements for the year ended 31st March 2021
CORPORATE INFORMATIONGrasim Industries Limited (“the Company”) is a limited Company incorporated and domiciled in India. The registered office is at Birlagram, Nagda - 456 331, Dist. Ujjain (M.P.), India. The Company is a public limited Company and its shares are listed on the BSE Ltd., India, and the National Stock Exchange of India Ltd., India, and the Company’s Global Depository Receipts are listed on the Luxembourg Stock Exchange.
The Company is engaged primarily in Viscose (Pulp, Fibre and Yarn), Chemicals (Caustic Soda, Epoxy and allied Chemicals) and others (Insulators, Textiles, Fertilisers and Solar Power Designing, Engineering Procurement and Commissioning).
1. SIGNIFICANT ACCOUNTING POLICIES1.1 Statement of Compliance: These financial statements are prepared and presented
in accordance with the Indian Accounting Standards (Ind AS) notified under the Companies (Indian Accounting Standards) Rules, 2015, as amended from time to time as notified under section 133 of Companies Act, 2013, the relevant provisions of the Companies Act, 2013 (“the Act”) and the guidelines issued by the Securities and Exchange Board of India (SEBI), as applicable.
1.2 Basis of Preparation: The financial statements have been prepared and
presented on the going concern basis and at historical cost, except for the following assets and liabilities, which have been measured as indicated below:
• Derivative Financial Instruments at fair value (covered under para 1.20)
• Certain financial assets and liabilities at fair value [refer accounting policy regarding financial instruments (covered under para 1.22)]
• Assets held for disposal - measured at the lower of its carrying amount and fair value less cost to sell; and
• Employee’s Defined Benefit Plan measured as per actuarial valuation.
• Employee Stock Option Plans measured at fair value.
• Assets and Liabilities acquired under Business Combination measured at fair value.
1.3 Functional and Presentation Currency: The financial statements are presented in Indian Rupees,
which is the functional currency of the Company and the currency of the primary economic environment in which the Company operates, and all values are rounded to the nearest Crore, utpo 2 decimal places except as otherwise indicated.
1.4 Business Combination and Goodwill/Capital Reserve:
The Company uses the acquisition method of accounting to account for business combinations. The acquisition date is the date on which control is transferred to the acquirer. Judgement is applied in determining the acquisition date and determining whether control is transferred from one party to another. Control exists when the Company is exposed to or has rights to variable returns from its involvement with the entity and has the ability to affect those returns through power over the entity. In assessing control, potential voting rights are considered only if the rights are substantive.
Goodwill is initially measured at cost, being the excess of the aggregate of the consideration transferred and the amount recognised for non-controlling interests, and any previous interest held, over the net identifiable assets acquired and liabilities assumed. If the fair value of the net assets acquired is in excess of the aggregate consideration transferred, the Company re-assesses whether it has correctly identified all of the assets acquired and all of the liabilities assumed and reviews the procedures used to measure the amounts to be recognised at the acquisition date. If the re-assessment still results in an excess of the fair value of net assets acquired over the aggregate consideration transferred, then the gain is recognised in Other Comprehensive Income (OCI) and accumulated in other equity as capital reserve. However, if there is no clear evidence of bargain purchase, the entity recognises the gain directly in other equity as capital reserve, without routing the same through OCI.
Consideration transferred includes the fair values of the assets transferred, liabilities incurred by the Company to the previous owners of the acquiree, and equity interests issued by the Company. Consideration transferred also includes the fair value of any contingent consideration. Consideration transferred does not include amounts related to the settlement of pre-existing relationships. Any goodwill that arises on account of such business combination is tested annually for impairment.
Any contingent consideration is measured at fair value at the date of acquisition. If an obligation to pay contingent consideration that meets the definition of a financial instrument is classified as equity, then it is not re-measured and the settlement is accounted for within other equity. Otherwise, other contingent consideration is re-measured at fair value at each reporting date and subsequent changes in the fair value of the contingent consideration are recorded in the Statement of Profit and Loss.
214 Grasim Industries Limited
Notesforming part of the Standalone Financial Statements for the year ended 31st March 2021
A contingent liability of the acquiree is assumed in a business combination only if such a liability represents a present obligation and arises from a past event, and its fair value can be measured reliably. On an acquisition-by-acquisition basis, the Company recognises any non-controlling interest in the acquiree either at fair value or at the non-controlling interest’s proportionate share of the acquiree’s identifiable net assets. Transaction costs that the Company incurs in connection with a business combination, such as Stamp Duty for title transfer in the name of the Company, finder’s fees, legal fees, due diligence fees and other professional and consulting fees, are expensed as incurred.
1.5 Classification of Assets and Liabilities as Current and Non-Current:
All assets and liabilities are classified as current or non-current as per the Company’s normal operating cycle, and other criteria set out in Schedule III of the Companies Act, 2013. Based on the nature of products and the time lag between the acquisition of assets for processing and their realisation in cash and cash equivalents, 12 month period has been considered by the Company as its normal operating cycle.
1.6 Property, Plant and Equipment (PPE): On transition to Ind AS, the Company has elected to
continue with the carrying value of all its property plant and equipment recognised as at 1st April 2015 measured as per the previous GAAP and use that carrying value as the deemed cost of the property, plant and equipment.
Property, plant and equipment are stated at acquisition or construction cost less accumulated depreciation and impairment loss. Freehold land is stated at cost less impairment losses, if any. Cost comprises the purchase price and any attributable cost of bringing the asset to its location and working condition for its intended use, including relevant borrowings costs and any expected costs of de-commissioning.
If significant parts of an item of PPE have different useful lives, then they are accounted for as separate items (major components) of PPE.
The cost of an item of PPE is recognised as an asset if, and only if, it is probable that the economic benefits associated with the item will flow to the Company in future periods and the cost of the item can be measured reliably. Expenditure incurred after the PPE have been put into operations, such as repairs and maintenance expenses, are charged to the Standalone Statement of Profit and Loss during the year in which they are incurred.
Items such as spare parts, standby equipment and servicing equipment are recognised as PPE when these are held for use in the production or supply of goods or services, or for administrative purpose, and are expected to be used for more than one year. Otherwise, such items are classified as inventory.
An item of PPE is de-recognised upon disposal or when no future economic benefits are expected to arise from the continued use of the assets. Any gain or loss arising on the disposal or retirement of an item of PPE, is determined as the difference between the sales proceeds and the carrying amount of the asset and is recognised in Statement of Profit and Loss.
Capital work-in-progress includes cost of property, plant and equipment under installation/under development as at the reporting date.
1.7 Treatment of Expenditure during Construction Period:
Expenditure, net of income earned, during construction (including financing cost related to borrowed funds for construction or acquisition of qualifying PPE) period is included under capital work-in-progress, and the same is allocated to the respective PPE on the completion of construction. Advances given towards acquisition or construction of PPE outstanding at each reporting date are disclosed as Capital Advances under “Other Non-Current Assets”.
1.8 Depreciation: Depreciation is the systematic allocation of the depreciable
amount of an asset over its useful life and is provided on a straight-line basis, except for Viscose Staple Fibre Division (excluding Power Plants), Nagda, and Corporate Finance Division, Mumbai for which it is provided on written down value method, over the useful lives as prescribed in Schedule II of the Companies Act, 2013, or as per technical assessment.
Depreciable amount for PPE is the cost of PPE less its estimated residual value. The useful life of PPE is the period over which PPE is expected to be available for use by the Company, or the number of production or similar units expected to be obtained from the asset by the Company.
The Company has used the following useful lives of the property, plant and equipment to provide depreciation.
215Integrated Annual Report 2020-21
Integrated ReportStatutory Reports
Financial statements
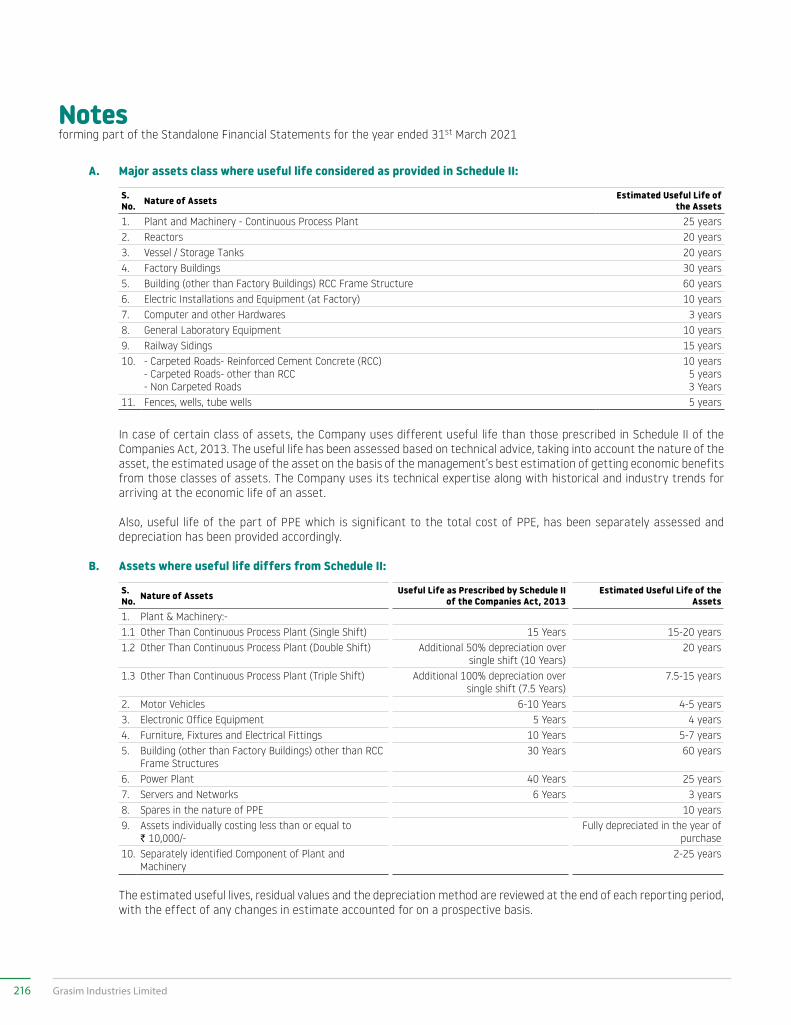
Notesforming part of the Standalone Financial Statements for the year ended 31st March 2021
A. Major assets class where useful life considered as provided in Schedule II:
S. No. Nature of Assets Estimated Useful Life of
the Assets1. Plant and Machinery - Continuous Process Plant 25 years2. Reactors 20 years3. Vessel / Storage Tanks 20 years4. Factory Buildings 30 years5. Building (other than Factory Buildings) RCC Frame Structure 60 years6. Electric Installations and Equipment (at Factory) 10 years7. Computer and other Hardwares 3 years8. General Laboratory Equipment 10 years9. Railway Sidings 15 years10. - Carpeted Roads- Reinforced Cement Concrete (RCC)
- Carpeted Roads- other than RCC- Non Carpeted Roads
10 years5 years3 Years
11. Fences, wells, tube wells 5 years
In case of certain class of assets, the Company uses different useful life than those prescribed in Schedule II of the Companies Act, 2013. The useful life has been assessed based on technical advice, taking into account the nature of the asset, the estimated usage of the asset on the basis of the management’s best estimation of getting economic benefits from those classes of assets. The Company uses its technical expertise along with historical and industry trends for arriving at the economic life of an asset.
Also, useful life of the part of PPE which is significant to the total cost of PPE, has been separately assessed and depreciation has been provided accordingly.
B. Assets where useful life differs from Schedule II:
S. No. Nature of Assets Useful Life as Prescribed by Schedule II
of the Companies Act, 2013Estimated Useful Life of the
Assets1. Plant & Machinery:- 1.1 Other Than Continuous Process Plant (Single Shift) 15 Years 15-20 years1.2 Other Than Continuous Process Plant (Double Shift) Additional 50% depreciation over
single shift (10 Years)20 years
1.3 Other Than Continuous Process Plant (Triple Shift) Additional 100% depreciation over single shift (7.5 Years)
7.5-15 years
2. Motor Vehicles 6-10 Years 4-5 years3. Electronic Office Equipment 5 Years 4 years4. Furniture, Fixtures and Electrical Fittings 10 Years 5-7 years5. Building (other than Factory Buildings) other than RCC
Frame Structures30 Years 60 years
6. Power Plant 40 Years 25 years7. Servers and Networks 6 Years 3 years8. Spares in the nature of PPE 10 years9. Assets individually costing less than or equal to
` 10,000/-Fully depreciated in the year of
purchase10. Separately identified Component of Plant and
Machinery2-25 years
The estimated useful lives, residual values and the depreciation method are reviewed at the end of each reporting period, with the effect of any changes in estimate accounted for on a prospective basis.
216 Grasim Industries Limited
Notesforming part of the Standalone Financial Statements for the year ended 31st March 2021
Continuous process plant, as defined in Schedule II of the Companies Act, 2013, have been classified on the basis of technical assessment and depreciation is provided accordingly.
Depreciation on additions is provided on a pro-rata basis from the month of installation or acquisition, and in case of a new Project, from the date of commencement of commercial production. Depreciation on deductions/disposals is provided on a pro-rata basis up to the month preceding the month of deduction/disposal.
1.9 Intangible Assets acquired separately and Amortisation:
On transition to Ind AS, the Company has elected to continue with the carrying value of all its Intangible Assets recognised as at 1st April 2015, measured as per the previous GAAP and use that carrying value as the deemed cost of the Intangible Assets.
Intangible assets, acquired separately, are measured on initial recognition at cost. The cost of intangible assets acquired in a business combination is their fair value at the date of acquisition. Following initial recognition, intangible assets are carried at cost less any accumulated amortisation and accumulated impairment losses, if any.
Intangible assets with finite lives are amortised over the useful economic life and assessed for impairment whenever there is an indication that the intangible asset may be impaired. The amortisation period and the amortisation method for an intangible asset with a finite useful life are reviewed at least at the end of each reporting period. Changes in the expected useful life or the expected pattern of consumption of future economic benefits embodied in the asset are considered to modify the amortisation period or method, as appropriate, and are treated as changes in accounting estimates. The amortisation expense on intangible assets with finite lives is recognised in the statement of profit and loss unless such expenditure forms part of carrying value of another asset. Intangible assets are amortised on a straight-line basis over their estimated useful lives.
Intangible assets with indefinite useful lives are not amortised, but are tested for impairment annually, either individually or at the cash-generating unit level. The assessment of indefinite life is reviewed annually to determine whether the indefinite life continues to be supportable. If not, the change in useful life from indefinite to finite is made on a prospective basis.
Gains or losses arising from de-recognition of an intangible asset are measured as the difference between the net disposal proceeds and the carrying amount of the asset and are recognised in the Statement of Profit and Loss when the asset is de-recognised.
Intangible Assets and their useful lives are as under:
S. No. Nature of Assets Estimated Useful
Life of the Assets1. Computer Software 3 years2. Trademarks, Technical Know-how 10 years3. Value of License/Right to use
infrastructure10 years
4. Customer Relationship 15-25 years5. Brands 10 years6. Production Formula 10 years7. Distribution Network 5-25 years8. Right to Manage and Operate
Manufacturing Facility15 years
9. Non-compete fees 3 years10. Order Backlog 3 months - 1 year
1.10 Internally Generated Intangible Assets - Research and Development Expenditure:
Revenue expenditure on research is expensed under the respective heads of the account in the period in which it is incurred. Development expenditure is capitalised as an asset, if the following conditions can be demonstrated:
a) The technical feasibility of completing the asset so that it can be made available for use or sell.
b) The Company has intention to complete the asset and use or sell it.
c) In case of intention to sell, the Company has the ability to sell the asset.
d) The future economic benefits are probable.
e) The Company has ability to measure the expenditure attributable to the asset during its development reliably.
Other development costs, which do not meet the above criteria, are expensed out during the period in which they are incurred.
PPE procured for research and development activities are capitalised.
217Integrated Annual Report 2020-21
Integrated ReportStatutory Reports
Financial statements
Notesforming part of the Standalone Financial Statements for the year ended 31st March 2021
1.11 Discontinued operations and non-current assets held for sale:
Discontinued operation is a component of the Company that has been disposed of or classified as held for sale and represents a major line of business.
Non-current assets and disposal groups are classified as held for sale if their carrying amount is intended to be recovered principally through a sale (rather than through continuing use) when the asset (or disposal group) is available for immediate sale in its present condition subject only to terms that are usual and customary for sale of such asset (or disposal group) and the sale is highly probable and is expected to qualify for recognition as a completed sale within one year from the date of classification.
Non-current assets and disposal groups classified as held for sale are measured at lower of their carrying amount and fair value less costs to sell.
1.12 Impairment of Non-Financial Assets: At the end of each reporting period, the Company reviews
the carrying amounts of non-financial assets to determine whether there is any indication that those assets have suffered an impairment loss. If any such indication exists, the recoverable amount of the asset is estimated in order to determine the extent of the impairment loss (if any). When it is not possible to estimate the recoverable amount of an individual asset, the Company estimates the recoverable amount of the cash-generating unit to which the asset belongs. When a reasonable and consistent basis of allocation can be identified, corporate assets are also allocated to individual cash-generating units, or otherwise they are allocated to the smallest group of cash-generating units, for which a reasonable and consistent allocation basis can be identified.
Intangible assets with indefinite useful lives and intangible assets not yet available for use are tested for impairment at least annually, and whenever there is an indication then the asset may be impaired.
Recoverable amount is the higher of fair value less costs of disposal and value in use. In assessing the value in use, the estimated future cash flows are discounted to their present value using a pre-tax discount rate that reflects current market assessments of the time value of money and the risks specific to the asset, for which the estimates of future cash flows have not been adjusted.
If the recoverable amount of an asset (or cash-generating unit) is estimated to be less than its carrying amount, the carrying amount of the asset (or cash-generating unit) is
reduced to its recoverable amount. An impairment loss is recognised immediately in the Statement of Profit and Loss, unless the relevant asset is carried at a revalued amount, in which case the impairment loss is treated as a revaluation decrease.
When an impairment loss subsequently reverses, the carrying amount of the asset (or a cash-generating unit) is increased to the revised estimate of its recoverable amount, but so that the increased carrying amount does not exceed the carrying amount that would have been determined had no impairment loss been recognised for the asset (or cash-generating unit) in prior years. A reversal of an impairment loss is recognised immediately in the Statement of Profit and Loss, unless the relevant asset is carried at a revalued amount, in which case the reversal of the impairment loss is treated as a revaluation increase.
1.13 Inventories: Inventories are valued at the lower of cost and net
realisable value.
Net realisable value is the estimated selling price in the ordinary course of business, less estimated costs of completion and the estimated costs necessary to make the sale.
Raw materials, stores and spare parts, and packing materials are considered to be realisable at cost, if the finished products, in which they will be used, are expected to be sold at or above cost. The cost is computed on weighted-average basis which includes expenditure incurred for acquiring inventories like purchase price, import duties, taxes (net of tax credit) and other costs incurred in bringing the inventories to their present location and condition.
Cost of finished goods and work-in-progress includes the cost of conversion based on normal capacity and other costs incurred in bringing the inventories to their present location and condition. The cost of finished goods and work-in-progress is computed on weighted-average basis.
In the absence of cost, waste/scrap is valued at estimated net realisable value.
Obsolete, defective, slow moving and unserviceable inventories, if any, are duly provided for.
Proceeds in respect of sale of raw materials/stores are credited to the respective heads.
218 Grasim Industries Limited
Notesforming part of the Standalone Financial Statements for the year ended 31st March 2021
1.14 Cash and Cash Equivalents Cash and Cash Equivalents comprise cash on hand and
cash at banks, including fixed deposit with original maturity period of three months or less and short-term highly liquid investments with an original maturity of three months or less.
1.15 Cash Flow Statement Cash flows are reported using the indirect method,
whereby the net profit before tax is adjusted for the effects of transactions of a non-cash nature, any deferrals or accruals of past or future operating cash receipts or payments and item of income or expenses associated with investing or financing cash flows. The cash flows from operating, investing and financing activities of the Company are segregated.
1.16 Employee Benefits: Short-Term Employee Benefits: Short-term employee benefits are recognised as an
expense on accrual basis.
Defined Contribution Plans: Contribution payable to the recognised provident fund and
approved superannuation scheme, which are substantially defined contribution plans, is recognised as expense in the Standalone Statement of Profit and Loss, when employees have rendered the service entitling them to the contribution.
The provident fund contribution as specified under the law is paid to the Regional Provident Fund Commissioner.
Defined Benefit Plans: The obligation in respect of defined benefit plans, which
covers Gratuity, Pension and other post-employment medical benefits, are provided for on the basis of an actuarial valuation at the end of each financial year using projected unit credit method. Gratuity is funded with an approved trust.
In respect of certain employees, Provident Fund contributions are made to a Trust, administered by the Company. The interest rate payable to the members of the Trust shall not be lower than the statutory rate of interest declared by the Central Government under the Employees’ Provident Funds and Miscellaneous Provisions Act, 1952, and shortfall, if any, shall be made good by the Company. The Company’s liability is actuarially determined (using the Projected Unit Credit Method) at the end of the year, and any shortfall in the Fund size maintained by the Trust set-up by the Company is additionally provided for.
Re-measurement, comprising actuarial gains and losses, the effect of the changes to the asset ceiling (if applicable) and the return on plan assets (excluding net interest), is reflected immediately in the Balance Sheet with a charge or credit recognised in Other Comprehensive Income in the period in which they occur.
Re-measurement recognised in Other Comprehensive Income is reflected immediately in retained earnings and will not be reclassified to profit or loss in the Statement of Profit and Loss. Defined benefit costs are categorised as follows:
• service cost (including current service cost, past service cost, as well as gains and losses on curtailments and settlements);
• net interest expense or income; and
• re-measurement.
The Company presents the first two components of defined benefit costs in Statement of Profit and Loss in the line item ‘Employee Benefits Expense’.
The present value of the Defined Benefit Plan liability is calculated using a discount rate, which is determined by reference to market yields at the end of the reporting period on government bonds.
The retirement benefit obligation, recognised in the Balance Sheet represents the actual deficit or surplus in the Company’s defined benefit plans. Any surplus resulting from this calculation is limited to the present value of any economic benefits available in the form of refunds from the plans or reductions in the future contribution to the plans.
Other Long-Term Benefits: Long-term compensated absences are provided for on
the basis of an actuarial valuation at the end of each financial year. Actuarial gains/losses, if any, are recognised immediately in the Standalone Statement of Profit and Loss.
1.17 Employee Share Based Payments: Equity-settled Transactions Equity-settled share-based payments to employees are
measured by reference to the fair value of the equity instruments at the grant date using Black-Scholes Model and Binomial Model.
219Integrated Annual Report 2020-21
Integrated ReportStatutory Reports
Financial statements
Notesforming part of the Standalone Financial Statements for the year ended 31st March 2021
The fair value, determined at the grant date of the equity-settled share-based payments, is charged to Standalone Statement of Profit and Loss on a systematic basis over the vesting period of the option, based on the Company’s estimate of equity instruments that will eventually vest, with a corresponding increase in other equity.
In case of forfeiture/lapse stock option, which is not vested, amortised portion is reversed by credit to employee compensation expense. In a situation where the stock option expires unexercised, the related balance standing to the credit of the Employee Stock Options Outstanding Account is transferred within other equity.
Cash-settled Transactions The cost of cash-settled transactions is measured initially
at fair value at the grant date using a Black-Scholes Merton Formula. This fair value is expensed over the period until the vesting date with recognition of a corresponding liability. The liability is re-measured to fair value at each reporting date up to, and including the settlement date, with changes in fair value recognised in employee benefits expense.
1.18 Treasury Shares: The Company has created an Employee Benefit Trust (EBT)
for providing share-based payment to its employees. The Company uses EBT as a vehicle for distributing shares to employees under the Employee Stock Option Scheme. The EBT purchase shares of the Company from the market, for giving shares to employees. The Company treats EBT as its extension and shares held by EBT are treated as treasury shares.
Own equity instruments that are re-acquired (treasury shares) are recognised at cost and deducted from other equity. No gain or loss is recognised in the Standalone statement of profit and loss on the purchase, sale, issue or cancellation of the Company’s own equity instruments. Share options whenever exercised, would be settled from such treasury shares.
1.19 Foreign Currency Transactions: In preparing the financial statements of the Company,
transactions in foreign currencies, other than the Company’s functional currency, are recognised at the rates of exchange prevailing at the dates of the transactions. At the end of each reporting period, monetary assets and liabilities denominated in foreign currencies are translated at the rate prevailing at that date. Non-monetary items that are measured in terms of historical cost in a foreign currency are not re-translated.
Exchange differences on monetary items are recognised in the Standalone Statement of Profit and Loss in the period in which these arise except for:
• exchange differences on foreign currency borrowings relating to assets under construction for future productive use, which are included in the cost of those assets when they are regarded as an adjustment to interest costs on those foreign currency borrowings; and
• exchange differences relating to qualifying effective cash flow hedges.
1.20 Derivative Financial Instruments and Hedge Accounting:
The Company enters into forward contracts to hedge the foreign currency risk of firm commitments and highly probable forecast transactions. Derivatives are initially recognised at fair value at the date the derivative contracts are entered into and are subsequently re-measured to their fair value at the end of each reporting period. The resulting gain or loss is recognised in the Standalone Statement of Profit and Loss immediately unless the derivative is designated and effective as a hedging instrument, in which event the timing of the recognition in the Standalone Statement of Profit and Loss depends on the nature of the hedging relationship and the nature of the hedged item.
The Company enters into derivative financial instruments viz. foreign exchange forward contracts, interest rate swaps and cross currency swaps to manage its exposure to interest rate, foreign exchange rate risks and commodity prices. The Company does not hold derivative financial instruments for speculative purposes.
Hedge Accounting: The Company designates certain hedging instruments
in respect of foreign currency risk, interest rate risk and commodity price risk as cash flow hedges. At the inception of a hedge relationship, the Company formally designates and documents the hedge relationship to which the Company wishes to apply hedge accounting and the risk management objective and strategy for undertaking the hedge. The documentation includes the Company’s risk management objective and strategy for undertaking hedge, the hedging/ economic relationship, the hedged item or transaction, the nature of the risk being hedged, hedge ratio and how the entity will assess the effectiveness of changes in the hedging instrument’s fair value in offsetting the exposure to changes in the hedged item’s fair value or cash flows attributable to the hedged risk. Such hedges are expected to be highly effective in achieving offsetting
220 Grasim Industries Limited
Notesforming part of the Standalone Financial Statements for the year ended 31st March 2021
changes in fair value or cash flows and are assessed on an ongoing basis to determine that they actually have been highly effective throughout the financial reporting periods for which they were designated.
The effective portion of changes in the fair value of the designated portion of derivatives that qualify as cash flow hedges is recognised in Other Comprehensive Income and accumulated under the heading of cash flow hedging reserve. The gain or loss relating to the ineffective portion is recognised immediately in the Standalone Statement of Profit and Loss.
Amounts previously recognised in Other Comprehensive Income and accumulated in other equity relating to (effective portion as described above) are re-classified to the Statement of Profit and Loss in the periods when the hedged item affects profit or loss. However, when the hedged forecast transaction results in the recognition of a non-financial asset or a non-financial liability, such gains and losses are transferred from equity and included in the initial measurement of the cost of the non-financial asset or non-financial liability.
Hedge accounting is discontinued when the hedging instrument expires or is sold, terminated, or exercised, without replacement or rollover (as part of the hedging strategy), or if its designation as a hedge is revoked, or when it no longer qualifies for hedge accounting. Any gain or loss recognised in Other Comprehensive Income and accumulated in other equity at that time remains in other equity and is recognised when the forecast transaction is ultimately recognised in Standalone Statement of Profit and Loss. When a forecast transaction is no longer expected to occur, the gain or loss accumulated in other equity is recognised immediately in Standalone Statement of Profit and Loss.
1.21 Fair Value Measurement: The Company measures financial instruments, such as
investments (other than equity investments in Subsidiaries, Joint Ventures and Associates) and derivatives at fair values at each Balance Sheet date.
Fair value is the price that would be received to sell an asset or paid to transfer a liability in an orderly transaction between market participants at the measurement date. The fair value measurement is based on the presumption that the transaction to sell the asset or transfer the liability takes place either:
In the principal market for the asset or liability, or
In the absence of a principal market, in the most advantageous market for the asset or liability.
The principal or the most advantageous market must be accessible by the Company.
The fair value of an asset or a liability is measured using the assumptions that market participants would use when pricing the asset or liability, assuming that market participants act in their economic best interest.
A fair value measurement of a non-financial asset takes into account a market participant’s ability to generate economic benefits by using the asset in its highest and best use, or by selling it to another market participant that would use the asset in its highest and best use.
The Company uses valuation techniques that are appropriate in the circumstances and for which sufficient data are available to measure fair value, maximising the use of relevant observable inputs and minimising the use of unobservable inputs.
All assets and liabilities (for which fair value is measured or disclosed in the financial statements) are categorised within the fair value hierarchy, described as follows, based on the lowest level input that is significant to the fair value measurement as a whole:
Level 1 — Quoted (unadjusted) market prices in active markets for identical assets or liabilities.
Level 2 — Valuation techniques for which the lowest level input that is significant to the fair value measurement is directly or indirectly observable other than quoted prices included in Level 1.
Level 3 — Valuation techniques for which the lowest level input that is significant to the fair value measurement is unobservable.
For assets and liabilities that are recognised in the financial statements on a recurring basis, the Company determines whether transfers have occurred between levels in the hierarchy by re-assessing categorisation (based on the lowest level input that is significant to the fair value
221Integrated Annual Report 2020-21
Integrated ReportStatutory Reports
Financial statements
Notesforming part of the Standalone Financial Statements for the year ended 31st March 2021
measurement as a whole) at the end of each reporting period.
Management determines the policies and procedures for both recurring fair value measurement, such as derivative instruments and unquoted financial assets measured at fair value, and for non-recurring measurement, such as assets held for disposal in discontinued operations.
At each reporting date, management analyses the movements in the values of assets and liabilities which are required to be re-measured or re-assessed as per the Company’s accounting policies. For this analysis, the management verifies the major inputs applied in the latest valuation by agreeing the information in the valuation computation to contracts and other relevant documents.
1.22 Financial Instruments: A financial instrument is any contract that gives rise to
a financial asset of one entity and a financial liability or equity instrument of another entity.
Financial Assets Initial Recognition and Measurement All financial assets are recognised initially at fair value.
However, in the case of financial assets not recorded at fair value through profit or loss, transaction costs that are attributable to the acquisition of the financial asset are added to the fair value. Purchases or sales of financial assets that require delivery of assets within a time frame established by regulation or convention in the market place (regular way trades) are recognised on the trade date, i.e., the date that the Company commits to purchase or sell the asset.
Subsequent Measurement For purposes of subsequent measurement, financial assets
are classified in four categories:
• Debt instruments at amortised cost
• Debt instruments at fair value through Other Comprehensive Income (FVTOCI)
• Debt instruments, derivatives and equity instruments, mutual funds at fair value
• through profit or loss (FVTPL)
• Equity instruments measured at fair value through other comprehensive income (FVTOCI)
Debt Instruments at Amortised Cost A ‘debt instrument’ is measured at the amortised cost if
both the following conditions are met:
a) The asset is held within a business model whose objective is to hold assets for collecting contractual cash flows, and
b) Contractual terms of the asset give rise on specified dates to cash flows that are solely payments of principal and interest (SPPI) on the principal amount outstanding.
After initial measurement, such financial assets are subsequently measured at amortised cost using the effective interest rate (EIR) method. Amortised cost is calculated by taking into account any discount or premium on acquisition and fees or costs that are an integral part of the EIR. The EIR amortisation is included in finance income in the profit or loss. The losses arising from impairment are recognised in the profit or loss. This category generally applies to trade and other receivables.
Debt Instrument at FVTOCI A ‘debt instrument’ is classified as at the FVTOCI if both of
the following criteria are met:
a) The objective of the business model is achieved both by collecting contractual cash flows and selling the financial assets, and
b) The asset’s contractual cash flows represent SPPI on the principal amount outstanding.
Debt instruments included within the FVTOCI category are measured initially as well as at each reporting date at fair value. Fair value movements are recognised in the other comprehensive income (OCI). However, the Company recognises interest income, impairment losses & reversals and foreign exchange gain or loss in the Statement of Profit and Loss. On de-recognition of the asset, cumulative gain or loss previously recognised in OCI is re-classified from the equity to Statement of Profit and Loss. Interest earned whilst holding FVTOCI debt instrument is reported as interest income using the EIR method.
Debt Instrument at FVTPL FVTPL is a residual category for debt instruments. Any
debt instrument, which does not meet the criteria for categorisation as at amortised cost or as FVTOCI, is classified as at FVTPL.
In addition, the Company may elect to designate a debt instrument, which otherwise meets amortised cost or FVTOCI criteria, as at FVTPL. However, such election is allowed only if doing so reduces or eliminates a measurement or recognition inconsistency (referred to as ‘Accounting Mismatch’).
222 Grasim Industries Limited
Notesforming part of the Standalone Financial Statements for the year ended 31st March 2021
Debt instruments included within the FVTPL category are measured at fair value with all changes recognised in the Standalone Statement of Profit and Loss.
Equity Instruments Investment in Subsidiaries, Associates and Joint ventures
are out of scope of Ind AS 109 and hence, the Company has accounted for its investment in Subsidiaries, Associates and Joint venture at cost.
All other equity investments are measured at fair value. Equity instruments which are held for trading are classified as at FVTPL. For equity instruments other than held for trading, the Company has irrevocable option to present in Other Comprehensive Income subsequent changes in the fair value. The Company makes such election on an instrument-by-instrument basis. The classification is made on initial recognition and is irrevocable.
Where the Company classifies equity instruments as at FVTOCI, then all fair value changes on the instrument, excluding dividends, are recognised in the OCI. There is no recycling of the amounts of profit or loss from OCI to Statement of Profit and Loss, even on sale of investment.
Equity instruments included within the FVTPL category are measured at fair value with all changes recognised in the Standalone Statement of Profit and Loss.
Impairment of Financial Assets: Financial assets, other than those at FVTPL, are assessed
for indicators of impairment at the end of each reporting period. In case of financial assets, the Company follows the simplified approach permitted by Ind AS 109 – Financial Instruments – for recognition of impairment loss allowance. The application of simplified approach does not require the Company to track changes in credit risk of trade receivable. The Company calculates the expected credit losses on trade receivables using a provision matrix on the basis of its historical credit loss experience.
De-recognition of Financial Assets: The Company de-recognises a financial asset when the
contractual rights to the cash flows from the asset expire, or when it transfers the financial asset and substantially all the risks and rewards of ownership of the asset to another party. If the Company neither transfers nor retains substantially all the risks and rewards of ownership and continues to control the transferred asset, the Company recognises its retained interest in the asset and an associated liability for amounts it may have to pay. If the Company retains substantially all the risks and rewards of ownership of a transferred financial asset, the
Company continues to recognise the financial asset and also recognises an associated liability.
On de-recognition of a financial asset, the difference between the asset’s carrying amount and the sum of the consideration received and receivable and the cumulative gain or loss that had been recognised in Other Comprehensive Income and accumulated in other equity is recognised in Standalone Statement of Profit and Loss.
Financial Liabilities and Equity Instruments: Classification as Debt or Equity: Debt and equity instruments, issued by the Company,
are classified as either financial liabilities or as equity in accordance with the substance of the contractual arrangements and the definitions of a financial liability and an equity instrument.
Equity Instruments: An equity instrument is any contract that evidences a
residual interest in the assets of the Company after deducting all of its liabilities. Equity instruments issued by the Company are recognised at the proceeds received, net of direct issue costs.
Financial Liabilities: Financial liabilities are classified, at initial recognition as
fair value through profit or loss:
• Loans and borrowings,
• Payables, or
• as derivatives designated as hedging instruments in an effective hedge, as appropriate.
All financial liabilities are recognised initially at fair value and in the case of loans and borrowings and payables, are recognised net of directly attributable transaction costs.
The Company’s financial liabilities include trade and other payables, loans and borrowings including bank overdrafts, financial guarantee contracts and derivative financial instruments.
Subsequent Measurement: The measurement of financial liabilities depends on their
classification, as described below:
Financial Liabilities at FVTPL: Financial liabilities at FVTPL include financial liabilities
held for trading and financial liabilities designated upon initial recognition as at FVTPL. Financial liabilities are classified as held for trading, if they are incurred for the
223Integrated Annual Report 2020-21
Integrated ReportStatutory Reports
Financial statements
Notesforming part of the Standalone Financial Statements for the year ended 31st March 2021
purpose of repurchasing in the near term. This category also includes derivative financial instruments entered into by the Company that are not designated as hedging instruments in hedge relationships as defined by Ind AS 109. Separated embedded derivatives are also classified as held for trading, unless they are designated as effective hedging instruments.
Gains or losses on liabilities held for trading are recognised in the Standalone Statement of Profit and Loss.
Financial liabilities, designated upon initial recognition at FVTPL, are designated as such at the initial date of recognition, and only if the criteria in Ind AS 109 are satisfied.
Loans and Borrowings: After initial recognition, interest-bearing loans and
borrowings are subsequently measured at amortised cost using the Effective Interest Rate (EIR) method. Gains and losses are recognised in the Statement of Profit and Loss when the liabilities are de-recognised as well as through the EIR amortisation process.
Amortised cost is calculated by taking into account any discount or premium on acquisition and fees or costs that are an integral part of the EIR. The EIR amortisation is included as finance costs in the Standalone Statement of Profit and Loss.
Financial Guarantee Contracts: Financial guarantee contracts issued by the Company
are those contracts that require a payment to be made to reimburse the holder for a loss it incurs, because the specified debtor fails to make a payment when due, in accordance with the terms of a debt instrument. Financial guarantee contracts are recognised initially as a liability at fair value, adjusted for transaction costs that are directly attributable to the issuance of the guarantee. Subsequently, the liability is measured at the higher of the amount of loss allowance determined as per impairment requirements of Ind AS 109, and the amount recognised less cumulative amortisation.
De-recognition of Financial Liabilities: The Company de-recognises financial liabilities when and
only when, the Company’s obligations are discharged, cancelled or have expired. The difference between the carrying amount of the financial liability de-recognised and the consideration paid and payable is recognised in Standalone Statement of Profit and Loss.
Embedded Derivatives: An embedded derivative is a component of a hybrid
(combined) instrument that also includes a non-derivative host contract – with the effect that some of the cash flows of the combined instrument vary in a way similar to a stand-alone derivative. An embedded derivative causes some or all of the cash flows that would otherwise be required by the contract to be modified according to a specified interest rate, financial instrument price, commodity price, foreign exchange rate, index of prices or rates, credit rating or credit index, or other variable, provided in the case of a non-financial variable, that the variable is not specific to a party to the contract. Re-assessment only occurs if there is either a change in the terms of the contract that significantly modifies the cash flows that would otherwise be required or a re-classification of a financial asset out of the fair value through profit or loss. If the hybrid contract contains a host that is a financial asset within the scope of Ind AS 109, the Company does not separate embedded derivatives. Rather, it applies the classification requirements contained in Ind AS 109, to the entire hybrid contract. Derivatives embedded in all other host contracts are accounted for as separate derivatives and recorded at fair value, if their economic characteristics and risks are not closely related to those of the host contracts, and the host contracts are not held for trading or designated at fair value though profit or loss. These embedded derivatives are measured at fair value with changes in fair value recognised in profit or loss, unless designated as effective hedging instruments.
Offsetting of Financial Instruments: Financial assets and financial liabilities are offset and the
net amount is reported in the Balance Sheet, if there is a currently enforceable legal right to offset the recognised amounts and there is an intention to settle on a net basis, to realise the assets and settle the liabilities simultaneously.
1.23 Revenue Recognition: (a) Revenue from contracts with customers;
• Revenue is recognised on the basis of approved contracts regarding the transfer of goods or services to a customer for an amount that reflects the consideration to which the entity expects to be entitled in exchange for those goods and services.
• Revenue is measured at the fair value of consideration received or receivable taking into account the amount of discounts, incentives, volume rebates, outgoing taxes on sales. Any
224 Grasim Industries Limited
Notesforming part of the Standalone Financial Statements for the year ended 31st March 2021
amounts receivable from the customer are recognised as revenue after the control over the goods sold are transferred to the customer which is generally on dispatch of goods.
• Variable consideration - This includes incentives, volume rebates, discounts etc. It is estimated at contract inception considering the terms of various schemes with customers and constrained until it is highly probable that a significant revenue reversal in the amount of cumulative revenue recognised will not occur when the associated uncertainty with the variable consideration is subsequently resolved. It is reassessed at end of each reporting period.
• Significant financing component - Generally, the Company receives short-term advances from its customers. Using the practical expedient in Ind AS 115, the Company does not adjust the promised amount of consideration for the effects of a significant financing component if it expects, at contract inception, that the period between the transfer of the promised good or service to the customer and when the customer pays for that good or service will be one year or less.
(b) Dividend income is accounted for when the right to receive the income is established.
(c) For all financial instruments measured at amortised cost or at fair value through Other Comprehensive Income, interest income is recorded using the effective interest rate (EIR), which is the rate that exactly discounts the estimated future cash payments or receipts through the expected life of the financial instrument to the gross carrying amount of the financial asset.
(d) Insurance, railway and other claims, where quantum of accruals cannot be ascertained with reasonable certainty, are accounted on acceptance basis.
1.24 Leases: The Company assesses whether a contract contains
a lease, at the inception of the contract. A contract is, or contains, a lease if the contract conveys the right to control the use of an identified asset for a period of time in exchange for consideration, To assess whether a contract conveys the right to control the use of an identified asset, the Company assesses whether -the contract involves the
use of identified asset; -the Company has substantially all of the economic benefits from the use of the asset through the period of lease and; -the Company has the right to direct the use of the asset.
As a lessee The Company recognises a right-of-use asset and a lease
liability at the lease commencement date. The right-of-use asset is initially measured at cost, which comprises the initial amount of the lease liability adjusted for any lease payments made at or before the commencement date, plus any initial direct costs incurred and an estimate of costs to dismantle and remove the underlying asset or to restore the underlying asset or the site on which it is located, less any lease incentives received.
The right-of-use asset is subsequently depreciated using the straight-line method from the commencement date to the earlier of the end of the useful life of the right-of-use asset or the end of the lease term. The estimated useful lives of right-of-use assets are determined on the same basis as those of property and equipment. In addition, the right-of-use asset is periodically reduced by impairment losses, if any, and adjusted for certain re-measurements of the lease liability.
The lease liability is initially measured at the present value of the lease payments that are not paid at the commencement date, discounted using the interest rate implicit in the lease or, if that rate cannot be readily determined, Company’s incremental borrowing rate. Generally, the Company uses its incremental borrowing rate as the discount rate.
• Lease payments included in the measurement of the lease liability comprise the following:
• Fixed payments, including in-substance fixed payments;
• Variable lease payments that depend on an index or a rate, initially measured using the index or rate as at the commencement date;
• Amounts expected to be payable under a residual value guarantee; and
• The exercise price under a purchase option that the Company is reasonably certain to exercise, lease payments in an optional renewal period if the Company is reasonably certain to exercise an extension option, and penalties for early termination of a lease unless the Company is reasonably certain not to terminate early
225Integrated Annual Report 2020-21
Integrated ReportStatutory Reports
Financial statements
Notesforming part of the Standalone Financial Statements for the year ended 31st March 2021
The lease liability is measured at amortised cost using the effective interest method. It is remeasured when there is a change in future lease payments arising from a change in an index or rate, if there is a change in the Company’s estimate of the amount expected to be payable under a residual value guarantee, or if Company changes its assessment of whether it will exercise a purchase, extension or termination option.
When the lease liability is remeasured in this way, a corresponding adjustment is made to the carrying amount of the right-of-use asset or is recorded in profit or loss if the carrying amount of the right-of-use asset has been reduced to zero.
Covid-19 related Rent Concessions The amendments provide relief to lessees from applying
Ind AS 116 guidance on lease modification accounting for rent concessions arising as a direct consequence of the Covid-19 pandemic. As a practical expedient, a lessee may elect not to assess whether a Covid-19 related rent concession from a lessor is a lease modification. A lessee that makes this election accounts for any change in lease payments resulting from the Covid-19 related rent concession the same way it would account for the change under Ind AS 116 if the change were not a lease modification. The amendments are applicable for annual reporting periods beginning on or after the 1st April 2020.
Short-term leases and leases of low-value assets The Company has elected not to recognise right-of-use
assets and lease liabilities for short-term leases that have a lease term of 12 months or lower and leases of low value assets. The Company recognises the lease payments associated with these leases as an expense on a straight-line basis over the lease term.
The Company as a lessor: The Company is not required to make any adjustments
on transition to Ind AS 116 for leases in which it acts as a lessor, except for a sub - lease. The Company accounted for its sub leases in accordance with Ind AS 116 from the date of initial application.
Leasehold Assets Depreciation: Leasehold Land and Building over the period of Lease
1.25 Borrowing Costs: Borrowing cost includes interest expense, amortisation
of discounts, hedge related cost incurred in connection with foreign currency borrowings, ancillary costs incurred
in connection with borrowing of funds and exchange difference, arising from foreign currency borrowings to the extent they are regarded as an adjustment to the interest cost.
Borrowing costs, that are attributable to the acquisition or construction or production of a qualifying asset, are capitalised as part of the cost of such asset till such time the asset is ready for its intended use. A qualifying asset is an asset that necessarily takes a substantial period of time to get ready for its intended use. All other borrowing costs are recognised as an expense in the period in which they are incurred.
Investment income earned on the temporary investment of specific borrowings pending their expenditure on qualifying assets is deducted from the borrowing costs eligible for capitalisation. All other borrowing cost are recognised in Statement of Profit and Loss in the period in which they are incurred.
1.26 Government Grants and Subsidies: Government Grants are recognised when there is a
reasonable assurance that the same will be received and all attached conditions will be complied with. When the grant relates to an expense item, it is recognised in the Statement of Profit and Loss by way of a deduction to the related expense on a systematic basis over the periods that the related costs, for which it is intended to compensate, are expensed. When the grant relates to an asset, it is recognised as income on a systematic basis over the expected useful life of the related asset.
Government grants, that are receivable towards capital investments under State Investment Promotion Scheme, are recognised in the Statement of Profit and Loss in the period in which they become receivable.
The benefit of a government loan at a below-market rate of interest is treated as a government grant, measured as the difference between proceeds received and the fair value of the loan based on prevailing market interest rates and is being recognised in the Statement of Profit and Loss.
When the Company receives grants of non-monetary assets, the asset and the grant are recorded at fair value amounts and released to profit or loss over the expected useful life in a pattern of consumption of the benefit of the underlying asset.
226 Grasim Industries Limited
Notesforming part of the Standalone Financial Statements for the year ended 31st March 2021
1.27 Exceptional Item: Exception items include income or expense that are
considered to be part of ordinary activities, however, are of such significance and nature that separate disclosure enables the user of Financial Statements to understand the impact in a more meaningful manner. Exceptional items are identified by virtue of either their sizeor nature so as to facilitate comparison with prior periods and to assess underlying trends in the financial performance of the Company.
1.28 Provision for Current and Deferred Tax: Current Income Tax: Current income tax assets and liabilities are measured
at the amount expected to be recovered from or paid to the taxation authorities. The tax rates and tax laws used to compute the amount are those that are enacted or substantively enacted, at the reporting date in the countries where the Company operates and generates taxable income.
Current income tax, relating to items recognised outside of the Statement of Profit and Loss, is recognised outside of the Statement of Profit and Loss (either in Other Comprehensive Income or in other equity). Current tax items are recognised in correlation to the underlying transaction either in OCI or directly in other equity. The management periodically evaluates positions taken in the tax returns with respect to situations in which applicable tax regulations are subject to interpretation and established provisions, where appropriate.
Deferred Tax: Deferred tax is provided using the liability method on
temporary differences between the tax bases of assets and liabilities, and their carrying amounts for financial reporting purposes at the reporting date.
Deferred tax liabilities are recognised for all taxable temporary differences, except:
When the deferred tax liability arises from the initial recognition of goodwill or an asset or liability in a transaction that is not a business combination and, at the time of the transaction, affects neither the accounting profit nor taxable profit or loss.
Deferred tax assets are recognised for all deductible temporary differences, the carry forward of unused tax credits and any unused tax losses. Deferred tax assets are recognised to the extent that it is probable that taxable
profit will be available, against which the deductible temporary differences, and the carry forward of unused tax credits and unused tax losses can be utilised, except:
When the deferred tax asset relating to the deductible temporary difference arises from the initial recognition of an asset or liability in a transaction that is not a business combination and, at the time of the transaction, affects neither the accounting profit nor taxable profit or loss.
The carrying amount of deferred tax assets is reviewed at each reporting date and reduced to the extent that it is no longer probable that sufficient taxable profit will be available to allow all or part of the deferred tax asset to be utilised. Unrecognised deferred tax assets are re-assessed at each reporting date and are recognised to the extent that it has become probable that future taxable profits will allow the deferred tax asset to be recovered.
Deferred tax assets and liabilities are measured at the tax rates that are expected to apply in the year when the asset is realised or the liability is settled, based on tax rates (and tax laws), that have been enacted or substantively enacted at the reporting date.
Deferred tax, relating to items recognised outside profit or loss, is recognised outside profit or loss (either in Other Comprehensive Income or in other equity). Deferred tax items are recognised in correlation to the underlying transaction either in OCI or directly in other equity. Deferred tax assets and deferred tax liabilities are offset, if a legally enforceable right exists to set off current tax assets against current tax liabilities, and the deferred taxes relate to the same taxable entity and the same taxation authority.
1.29 Minimum Alternate Tax (MAT) MAT is recognised as an asset only when and to the extent
there is convincing evidence that the Company will pay normal Income Tax during the specified period. In the year in which the MAT credit becomes eligible to be recognised, it is credited to the Statement of Profit and Loss and is considered as MAT Credit Entitlement. The Company reviews the same at each Balance Sheet date and writes down the carrying amount of MAT Credit Entitlement to the extent there is no longer convincing evidence to the effect that the Company will pay normal Income Tax during the specified period. Minimum Alternate Tax (MAT) Credit are in the form of unused tax credits that are carried forward by the Company for a specified period of time, hence, it is presented with Deferred Tax Asset.
227Integrated Annual Report 2020-21
Integrated ReportStatutory Reports
Financial statements
Notesforming part of the Standalone Financial Statements for the year ended 31st March 2021
1.30 Provisions and Contingent Liabilities: Provisions are recognised when the Company has a present
obligation (legal or constructive) as a result of a past event, it is probable that the Company will be required to settle the obligation, and a reliable estimate can be made of the amount of the obligation.
If the effect of the time value of money is material, provisions are determined by discounting the expected future cash flows to net present value using an appropriate pre-tax discount rate that reflects current market assessments of the time value of money and, where appropriate, the risks specific to the liability.
A present obligation that arises from past events, where it is either not probable that an outflow of resources will be required to settle or a reliable estimate of the amount cannot be made, is disclosed as a contingent liability. Contingent liabilities are also disclosed when there is a possible obligation arising from past events, the existence of which will be confirmed only by the occurrence or non-occurrence of one or more uncertain future events not wholly within the control of the Company.
Claims against the Company, where the possibility of any outflow of resources in settlement is remote, are not disclosed as contingent liabilities.
Contingent assets are not recognised in the financial statements since this may result in the recognition of income that may never be realised. However, when the realisation of income is virtually certain, then the related asset is not a contingent asset and is recognised.
Warranty Provisions Provisions for warranty-related costs are recognised as
an expense in the Standalone Statement of Profit and Loss when the product is sold or service provided to the customer. Initial recognition is based on historical experience. The initial estimate of warranty-related costs is revised annually.
1.31 Earnings Per Share (EPS): Basic earnings per share are calculated by dividing the net
profit for the year attributable to equity shareholders by the weighted-average number of equity shares outstanding during the period. The weighted-average number of equity shares outstanding during the period and for all periods presented is adjusted for events such as bonus issue; bonus element in a rights issue to existing shareholders; share split; and reverse share split (consolidation of shares) that
have changed the number of equity shares outstanding, without a corresponding change in resources.
For the purpose of calculating diluted earnings per share, the net profit or loss for the year attributable to equity shareholders and the weighted-average number of shares outstanding during the period are adjusted for the effects of all dilutive potential equity shares.
1.32 Significant Accounting Judgments, Estimates and Assumptions:
The preparation of financial statements, in conformity with the Ind AS requires judgments, estimates and assumptions to be made, that affect the reported amounts of assets and liabilities on the date of the financial statements, the reported amounts of revenues and expenses during the reporting period and the disclosures relating to contingent liabilities as of the date of the financial statements. Although these estimates are based on the management’s best knowledge of current events and actions, uncertainty about these assumptions and estimates could result in outcomes different from the estimates. Difference between actual results and estimates are recognised in the period in which the results are known or materialise. Estimates and underlying assumptions are reviewed on an ongoing basis. Any revision to accounting estimates is recognised prospectively in the current and future periods.
The key assumptions concerning the future and other key sources of estimation uncertainty at the reporting date, that have a significant risk of causing a material adjustment to the carrying amounts of asset and liabilities within the next financial year, are described below. The Company based its assumptions and estimates on parameters available when the financial statements were prepared. Existing circumstances and assumptions about future developments, however, may change due to market changes or circumstances arising that are beyond the control of the Company. Such changes are reflected in the assumptions when they occur.
• Estimation of uncertainties relating to global health pandemic from COVID-19:
The Company has considered the possible effects that may result from the pandemic relating to COVID-19 on the carrying amounts of receivables, intangibles, investments and other assets. In developing the assumptions relating to the possible future uncertainties in the economic conditions because of this pandemic, the Company has used internal and external sources of information. The Company has reviewed the assumptions used and based on current
228 Grasim Industries Limited
Notesforming part of the Standalone Financial Statements for the year ended 31st March 2021
estimates expects the carrying amount of these assets will be recovered. The impact of COVID-19 on the Company’s financial statements may differ from that estimated as at the date of approval of these financial statements and the Company will continue to closely monitor any material changes to future economic conditions.
• Classification of Lease Ind AS 116: Ind AS 116 Leases requires a lessee to determine the lease
term as the non-cancellable period of a lease adjusted with any option to extend or terminate the lease, if the use of such option is reasonably certain. The Company makes an assessment on the expected lease term on lease by lease basis and thereby assesses whether it is reasonably certain that any options to extend or terminate the contract will be exercised. In evaluating the lease term, the Company considers factors such as any significant leasehold improvements undertaken over the lease term, costs relating to the termination of lease and the importance of the underlying lease to the Company’s operations taking into account the location of the underlying asset and the availability of the suitable alternatives. The lease term in future periods is reassessed to ensure that the lease term reflects the current economic circumstances. The discount rate is generally based on the incremental borrowing rate specific to the lease being evaluated or for a portfolio of leases with similar characteristics.
• Litigation and contingencies: The Company has ongoing litigations with various regulatory
authorities. Where an outflow of funds is believed to be probable and a reliable estimate of the outcome of the dispute can be made based on management’s assessment of specific circumstances of each dispute and relevant external advice, management provides for its best estimate of the liability. Such accruals are by nature complex and can take number of years to resolve and can involve estimation uncertainty. Information about such litigations is provided in notes to the financial statements.
• Assessment of Impairment of investments in subsidiaries, associates and joint ventures:
The Company reviews its carrying value of investments in subsidiaries, associates and joint ventures annually, or more frequently when there is indication for impairment. If the recoverable amount is less than its carrying amount, the impairment loss is accounted for. Determining whether the investments is subsidiaries, associates and joint ventures is impaired requires an estimate in the value in use of investments. The Management carries out impairment
assessment for each investment by comparing the carrying value of each investment with the net worth of each company based on audited financials, comparable market price and comparing the performance of the investee companies with projections used for valuations, in particular those relating to the cash flows, sales growth rate, pre-tax discount rate and growth rates used and approved business plans.
• Useful Lives of Property, Plant and Equipment and Intangible Assets:
The Company uses its technical expertise along with historical and industry trends for determining the economic life of an asset/component of an asset. The useful lives are reviewed by the management periodically and revised, if appropriate. In case of a revision, the unamortised depreciable amount is charged over the remaining useful life of the assets.
• Measurement of Defined Benefit Obligation: The cost of the defined benefit gratuity plan and the
present value of the gratuity obligation are determined using actuarial valuations. An actuarial valuation involves making various assumptions that may differ from actual developments in the future. These include the determination of the discount rate, future salary increases and mortality rates. Due to the complexities involved in the valuation and its long-term nature, a defined benefit obligation is highly sensitive to changes in these assumptions. All assumptions are reviewed at each reporting date.
• Deferred Tax Assets / Deferred Tax liability: Pursuant to the announcement of the changes in the
corporate tax regime, the Companies have an option to either opt for the new tax regime or continue to pay taxes as per the old applicable tax structure together with the other benefits available to the companies including utilisation of the MAT credit available. This requires significant estimation in determining in which year the Company would migrate to the new tax regime basis future year’s taxable profits including the impact of ongoing expansion plans of the Company and consequential utilisation of available MAT credit. Accordingly, in accordance with IND AS 12 - Income Taxes, deferred tax assets and liabilities are required to be measured at the tax rates that are expected to apply to the year when the asset is realised or the liability is settled, based on tax rates (and tax laws) that have been enacted or substantively enacted at the reporting date.
229Integrated Annual Report 2020-21
Integrated ReportStatutory Reports
Financial statements
Notesforming part of the Standalone Financial Statements for the year ended 31st March 2021
• Recognition and Measurement of Provisions and Contingencies:
Key assumptions about the likelihood and magnitude of an outflow of resources.
• Fair Value Measurement of Financial Instruments: When the fair value of financial assets and financial
liabilities recorded in the Balance Sheet cannot be measured based on quoted prices in active markets, their fair values are measured using valuation techniques including the Discounted Cash Flow (DCF) model. The inputs to these models are taken from observable market where possible, but where this is not feasible, a degree of judgement is required in establishing fair values. Judgement include consideration of input such as liquidity risk, credit risk and volatility. Changes in assumptions about these factors could affect the reported fair value of financial instruments.
• Share-based Payments: The Company measures the cost of equity-settled
transactions with employees using Black-Scholes Model to determine the fair value of the liability incurred on
the grant date. Estimating fair value for share-based payment transactions requires determination of the most appropriate valuation model, which is dependent on the terms and conditions of the grant.
This estimate also requires determination of the most appropriate inputs to the valuation model including the expected life of the share option, volatility and dividend yield and making assumptions about them.
The assumptions and models used for estimating fair value for share-based payment transactions are disclosed in Note 4.10
1.33 Cash Dividend to Equity Holders of the Company: The Company recognises a liability to make cash
distributions to equity holders of the Company when the distribution is authorised and the distribution is no longer at the discretion of the Company. As per the corporate laws in India, a distribution is authorised when it is approved by the shareholders. A corresponding amount is recognised directly in other equity.
230 Grasim Industries Limited
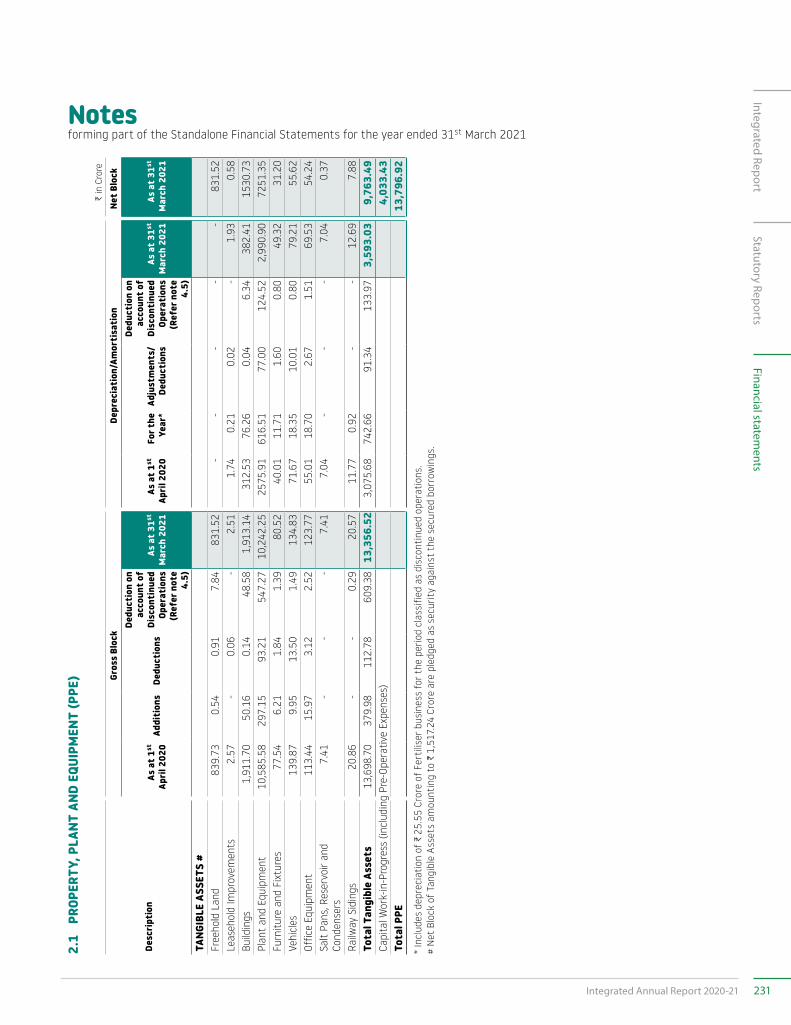
Notesforming part of the Standalone Financial Statements for the year ended 31st March 2021
2.1
PROP
ERTY
, PLA
NT A
ND E
QUIP
MEN
T (P
PE)
C in
Cro
re
Desc
ript
ion
Gros
s Bl
ock
Depr
ecia
tion
/Am
orti
sati
onNe
t Blo
ck
As a
t 1st
Ap
ril 2
020
Addi
tion
sDe
duct
ions
Dedu
ctio
n on
ac
coun
t of
Disc
onti
nued
Op
erat
ions
(R
efer
not
e 4.
5)
As a
t 31st
M
arch
202
1As
at 1
st
Apri
l 202
0Fo
r the
Ye
ar*
Adju
stm
ents
/De
duct
ions
Dedu
ctio
n on
ac
coun
t of
Disc
onti
nued
Op
erat
ions
(R
efer
not
e 4.
5)
As a
t 31st
M
arch
202
1As
at 3
1st
Mar
ch 2
021
TANG
IBLE
ASS
ETS
#Fr
eeho
ld L
and
839.
73
0.5
4 0
.91
7.8
4 8
31.5
2 -
- -
- -
831.
52
Leas
ehol
d Im
prov
emen
ts2.
57
- 0
.06
- 2
.51
1.74
0.
21
0.0
2 -
1.9
3 0.
58
Build
ings
1,91
1.70
5
0.16
0
.14
48.5
8 1
,913
.14
312.
53
76.2
6 0.
04
6.34
3
82.4
1 15
30.7
3 Pl
ant
and
Equi
pmen
t10
,585
.58
297
.15
93.2
1 54
7.27
1
0,24
2.25
25
75.9
1 61
6.51
77
.00
124.
52
2,9
90.9
0 72
51.3
5 Fu
rnitu
re a
nd F
ixtu
res
77.5
4 6
.21
1.84
1.
39
80.
52
40.0
1 11
.71
1.60
0.
80
49.
32
31.2
0 Ve
hicl
es13
9.87
9
.95
13.5
0 1.
49
134
.83
71.6
7 18
.35
10.0
1 0.
80
79.
21
55.6
2 Of
fice
Equi
pmen
t11
3.44
1
5.97
3.
12
2.52
1
23.7
7 55
.01
18.7
0 2.
67
1.51
6
9.53
54
.24
Salt
Pans
, Res
ervo
ir an
d Co
nden
sers
7.41
-
- -
7.4
1 7.
04
- -
- 7
.04
0.37
Railw
ay S
idin
gs20
.86
- -
0.2
9 2
0.57
11
.77
0.92
-
- 1
2.69
7.
88
Tota
l Tan
gibl
e As
sets
13,
698.
70
379
.98
112
.78
609
.38
13,
356.
52
3,0
75.6
8 7
42.6
6 9
1.34
1
33.9
7 3
,593
.03
9,7
63.4
9 Ca
pita
l Wor
k-in
-Pro
gres
s (in
clud
ing
Pre-
Oper
ativ
e Ex
pens
es)
4,0
33.4
3 To
tal P
PE 1
3,79
6.92
* In
clud
es d
epre
ciat
ion
of C
25.
55 C
rore
of F
ertil
iser
bus
ines
s fo
r the
per
iod
clas
sifie
d as
dis
cont
inue
d op
erat
ions
.#
Net
Blo
ck o
f Tan
gibl
e As
sets
am
ount
ing
to C
1,5
17.2
4 Cr
ore
are
pled
ged
as s
ecur
ity
agai
nst
the
secu
red
borr
owin
gs.
231Integrated Annual Report 2020-21
Integrated ReportStatutory Reports
Financial statements
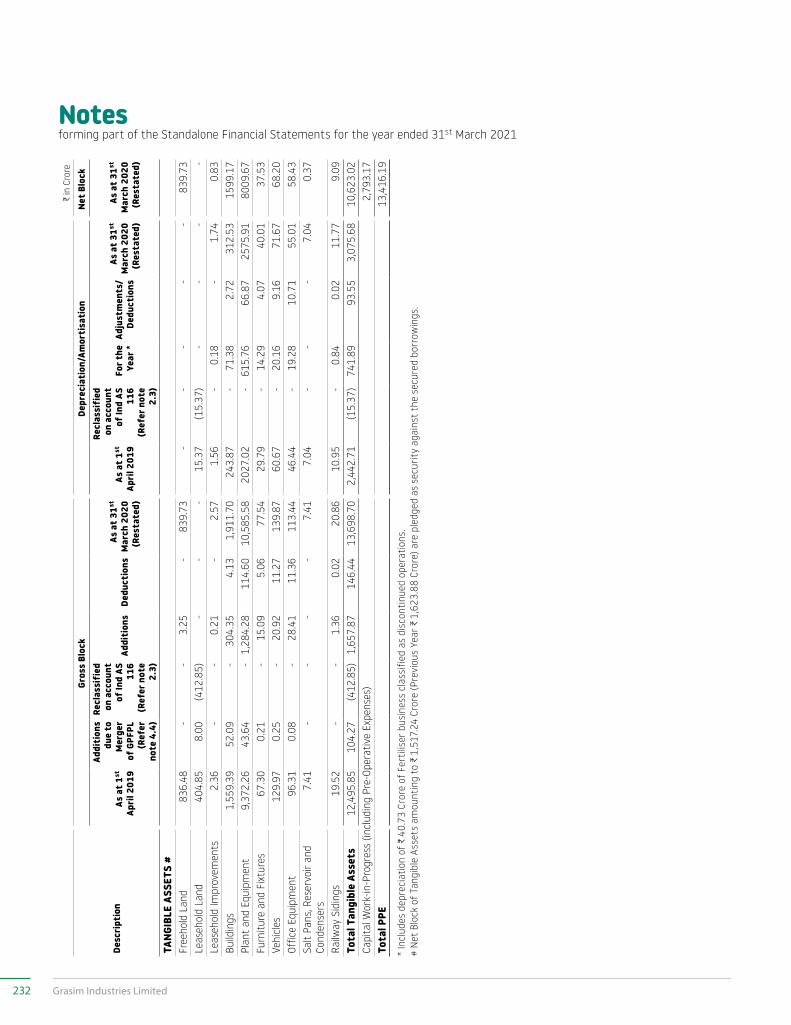
Notesforming part of the Standalone Financial Statements for the year ended 31st March 2021
C in
Cro
re
Desc
ript
ion
Gros
s Bl
ock
Depr
ecia
tion
/Am
orti
sati
onNe
t Blo
ck
As a
t 1st
Ap
ril 2
019
Addi
tion
s du
e to
M
erge
r of
GPF
PL
(Ref
er
note
4.4
)
Recl
assi
fied
on
acc
ount
of
Ind
AS
116
(Ref
er n
ote
2.3)
Addi
tion
sDe
duct
ions
As a
t 31st
M
arch
202
0(R
esta
ted)
As a
t 1st
Ap
ril 2
019
Recl
assi
fied
on
acc
ount
of
Ind
AS
116
(Ref
er n
ote
2.3)
For t
he
Year
*Ad
just
men
ts/
Dedu
ctio
ns
As a
t 31st
M
arch
202
0(R
esta
ted)
As a
t 31st
M
arch
202
0(R
esta
ted)
TANG
IBLE
ASS
ETS
#Fr
eeho
ld L
and
836.
48
- -
3.2
5 -
839
.73
- -
- -
- 83
9.73
Le
aseh
old
Land
404.
85
8.0
0 (4
12.8
5) -
- -
15.3
7 (1
5.37
) -
- -
- Le
aseh
old
Impr
ovem
ents
2.36
-
- 0
.21
- 2
.57
1.56
-
0.18
-
1.74
0.
83
Build
ings
1,55
9.39
5
2.09
-
304
.35
4.13
1
,911
.70
243.
87
- 71
.38
2.72
31
2.53
15
99.1
7 Pl
ant
and
Equi
pmen
t9,
372.
26
43.
64
- 1
,284
.28
114.
60
10,
585.
58
2027
.02
- 61
5.76
66
.87
2575
.91
8009
.67
Furn
iture
and
Fix
ture
s67
.30
0.2
1 -
15.
09
5.06
7
7.54
29
.79
- 14
.29
4.07
40
.01
37.5
3 Ve
hicl
es12
9.97
0
.25
- 2
0.92
11
.27
139
.87
60.6
7 -
20.1
6 9.
16
71.6
7 68
.20
Offic
e Eq
uipm
ent
96.3
1 0
.08
- 2
8.41
11
.36
113
.44
46.4
4 -
19.2
8 10
.71
55.0
1 58
.43
Salt
Pans
, Res
ervo
ir an
d Co
nden
sers
7.41
-
- -
- 7
.41
7.04
-
- -
7.04
0.
37
Railw
ay S
idin
gs19
.52
- -
1.3
6 0
.02
20.
86
10.9
5 -
0.84
0
.02
11.7
7 9.
09
Tota
l Tan
gibl
e As
sets
12,
495.
85
104
.27
(412
.85)
1,65
7.87
1
46.4
4 1
3,69
8.70
2
,442
.71
(15.
37)
741
.89
93.
55
3,0
75.6
8 1
0,62
3.02
Ca
pita
l Wor
k-in
-Pro
gres
s (in
clud
ing
Pre-
Oper
ativ
e Ex
pens
es)
2,7
93.1
7 To
tal P
PE 1
3,41
6.19
* In
clud
es d
epre
ciat
ion
of C
40.
73 C
rore
of F
ertil
iser
bus
ines
s cl
assi
fied
as d
isco
ntin
ued
oper
atio
ns.
# N
et B
lock
of T
angi
ble
Asse
ts a
mou
ntin
g to
C 1
,517
.24
Cror
e (P
revi
ous
Year
C 1
,623
.88
Cror
e) a
re p
ledg
ed a
s se
curi
ty a
gain
st t
he s
ecur
ed b
orro
win
gs.
232 Grasim Industries Limited
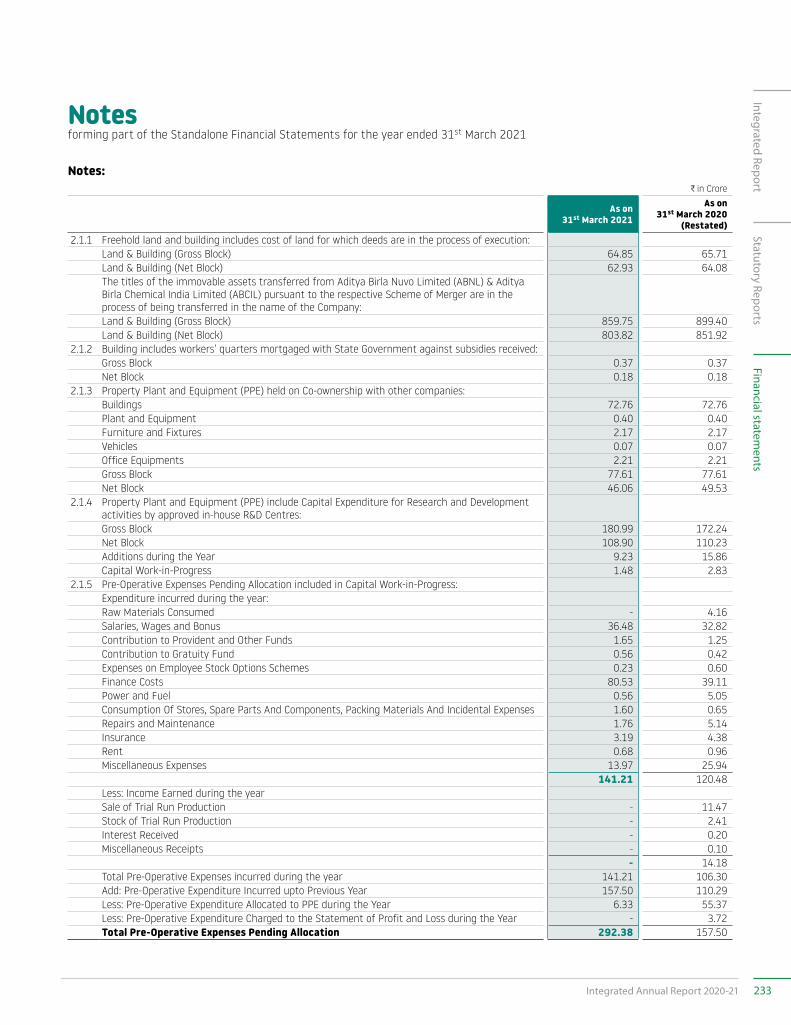
Notesforming part of the Standalone Financial Statements for the year ended 31st March 2021
Notes:C in Crore
As on 31st March 2021
As on 31st March 2020
(Restated)2.1.1 Freehold land and building includes cost of land for which deeds are in the process of execution:
Land & Building (Gross Block) 64.85 65.71 Land & Building (Net Block) 62.93 64.08 The titles of the immovable assets transferred from Aditya Birla Nuvo Limited (ABNL) & Aditya Birla Chemical India Limited (ABCIL) pursuant to the respective Scheme of Merger are in the process of being transferred in the name of the Company:Land & Building (Gross Block) 859.75 899.40 Land & Building (Net Block) 803.82 851.92
2.1.2 Building includes workers’ quarters mortgaged with State Government against subsidies received:Gross Block 0.37 0.37Net Block 0.18 0.18
2.1.3 Property Plant and Equipment (PPE) held on Co-ownership with other companies:Buildings 72.76 72.76Plant and Equipment 0.40 0.40Furniture and Fixtures 2.17 2.17Vehicles 0.07 0.07Office Equipments 2.21 2.21Gross Block 77.61 77.61Net Block 46.06 49.53
2.1.4 Property Plant and Equipment (PPE) include Capital Expenditure for Research and Development activities by approved in-house R&D Centres:Gross Block 180.99 172.24 Net Block 108.90 110.23 Additions during the Year 9.23 15.86 Capital Work-in-Progress 1.48 2.83
2.1.5 Pre-Operative Expenses Pending Allocation included in Capital Work-in-Progress:Expenditure incurred during the year:Raw Materials Consumed - 4.16 Salaries, Wages and Bonus 36.48 32.82 Contribution to Provident and Other Funds 1.65 1.25 Contribution to Gratuity Fund 0.56 0.42 Expenses on Employee Stock Options Schemes 0.23 0.60 Finance Costs 80.53 39.11 Power and Fuel 0.56 5.05 Consumption Of Stores, Spare Parts And Components, Packing Materials And Incidental Expenses 1.60 0.65 Repairs and Maintenance 1.76 5.14 Insurance 3.19 4.38 Rent 0.68 0.96 Miscellaneous Expenses 13.97 25.94
141.21 120.48 Less: Income Earned during the yearSale of Trial Run Production - 11.47 Stock of Trial Run Production - 2.41 Interest Received - 0.20 Miscellaneous Receipts - 0.10
- 14.18 Total Pre-Operative Expenses incurred during the year 141.21 106.30 Add: Pre-Operative Expenditure Incurred upto Previous Year 157.50 110.29 Less: Pre-Operative Expenditure Allocated to PPE during the Year 6.33 55.37 Less: Pre-Operative Expenditure Charged to the Statement of Profit and Loss during the Year - 3.72 Total Pre-Operative Expenses Pending Allocation 292.38 157.50
233Integrated Annual Report 2020-21
Integrated ReportStatutory Reports
Financial statements
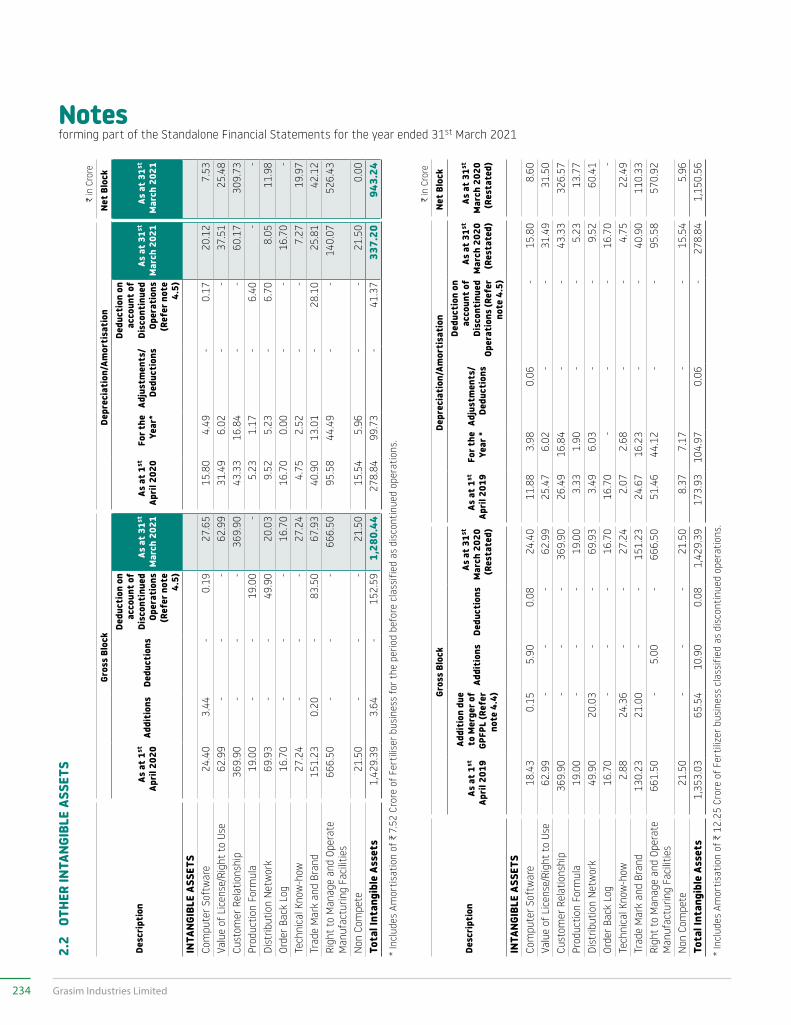
Notesforming part of the Standalone Financial Statements for the year ended 31st March 2021
2.2
OTHE
R IN
TANG
IBLE
ASS
ETS
C in
Cro
re
Desc
ript
ion
Gros
s Bl
ock
Depr
ecia
tion
/Am
orti
sati
onNe
t Blo
ck
As a
t 1st
Ap
ril 2
020
Addi
tion
sDe
duct
ions
Dedu
ctio
n on
ac
coun
t of
Disc
onti
nued
Op
erat
ions
(R
efer
not
e 4.
5)
As a
t 31st
M
arch
202
1As
at 1
st
Apri
l 202
0Fo
r the
Ye
ar*
Adju
stm
ents
/De
duct
ions
Dedu
ctio
n on
ac
coun
t of
Disc
onti
nued
Op
erat
ions
(R
efer
not
e 4.
5)
As a
t 31st
M
arch
202
1As
at 3
1st
Mar
ch 2
021
INTA
NGIB
LE A
SSET
S Co
mpu
ter S
oftw
are
24.4
0 3
.44
- 0
.19
27.
65
15.8
0 4.
49
- 0
.17
20.1
2 7.
53
Valu
e of
Lic
ense
/Rig
ht t
o Us
e62
.99
- -
- 6
2.99
31
.49
6.02
-
- 37
.51
25.4
8 Cu
stom
er R
elat
ions
hip
369.
90
- -
- 3
69.9
0 43
.33
16.8
4 -
- 60
.17
309.
73
Prod
uctio
n Fo
rmul
a19
.00
- -
19.
00
- 5.
23
1.17
-
6.4
0 -
- Di
strib
utio
n N
etw
ork
69.9
3 -
- 4
9.90
2
0.03
9.
52
5.23
-
6.7
0 8.
05
11.
98
Orde
r Bac
k Lo
g16
.70
- -
- 1
6.70
16
.70
0.00
-
- 16
.70
- Te
chni
cal K
now
-how
27.2
4 -
- -
27.
24
4.75
2.
52
- -
7.27
19
.97
Trad
e M
ark
and
Bran
d15
1.23
0
.20
- 8
3.50
6
7.93
40
.90
13.0
1 -
28.
10
25.8
1 42
.12
Righ
t to
Man
age
and
Oper
ate
Man
ufac
turin
g Fa
cilit
ies
666.
50
- -
- 6
66.5
0 95
.58
44.4
9 -
- 14
0.07
52
6.43
Non
Com
pete
21.5
0 -
- -
21.
50
15.5
4 5.
96
- -
21.5
0 0.
00
Tota
l Int
angi
ble
Asse
ts 1
,429
.39
3.6
4 -
152
.59
1,2
80.4
4 2
78.8
4 9
9.73
-
41.
37
337
.20
943
.24
* In
clud
es A
mor
tisa
tion
of C
7.5
2 Cr
ore
of F
ertil
iser
bus
ines
s fo
r the
per
iod
befo
re c
lass
ified
as
disc
ontin
ued
oper
atio
ns.
C in
Cro
re
Desc
ript
ion
Gros
s Bl
ock
Depr
ecia
tion
/Am
orti
sati
onNe
t Blo
ck
As a
t 1st
Ap
ril 2
019
Addi
tion
due
to
Mer
ger o
f GP
FPL
(Ref
er
note
4.4
)
Addi
tion
sDe
duct
ions
As a
t 31st
M
arch
202
0(R
esta
ted)
As a
t 1st
Ap
ril 2
019
For t
he
Year
*Ad
just
men
ts/
Dedu
ctio
ns
Dedu
ctio
n on
ac
coun
t of
Disc
onti
nued
Op
erat
ions
(Ref
er
note
4.5
)
As a
t 31st
M
arch
202
0(R
esta
ted)
As a
t 31st
M
arch
202
0(R
esta
ted)
INTA
NGIB
LE A
SSET
S Co
mpu
ter S
oftw
are
18.
43
0.1
5 5
.90
0.0
8 2
4.40
1
1.88
3
.98
0.0
6 -
15.
80
8.6
0 Va
lue
of L
icen
se/R
ight
to
Use
62.
99
- -
- 6
2.99
2
5.47
6
.02
- -
31.
49
31.
50
Cust
omer
Rel
atio
nshi
p 3
69.9
0 -
- -
369
.90
26.
49
16.
84
- -
43.
33
326
.57
Prod
uctio
n Fo
rmul
a 1
9.00
-
- -
19.
00
3.3
3 1
.90
- -
5.2
3 1
3.77
Di
strib
utio
n N
etw
ork
49.
90
20.
03
- -
69.
93
3.4
9 6
.03
- -
9.5
2 6
0.41
Or
der B
ack
Log
16.
70
- -
- 1
6.70
1
6.70
-
- -
16.
70
- Te
chni
cal K
now
-how
2.8
8 2
4.36
-
- 2
7.24
2
.07
2.6
8 -
- 4
.75
22.
49
Trad
e M
ark
and
Bran
d 1
30.2
3 2
1.00
-
- 1
51.2
3 2
4.67
1
6.23
-
- 4
0.90
1
10.3
3 Ri
ght
to M
anag
e an
d Op
erat
e M
anuf
actu
ring
Faci
litie
s 6
61.5
0 -
5.0
0 -
666
.50
51.
46
44.
12
- -
95.
58
570
.92
Non
Com
pete
21.
50
- -
- 2
1.50
8
.37
7.1
7 -
- 1
5.54
5
.96
Tota
l Int
angi
ble
Asse
ts 1
,353
.03
65.
54
10.
90
0.0
8 1
,429
.39
173
.93
104
.97
0.0
6 -
278
.84
1,1
50.5
6
* In
clud
es A
mor
tisa
tion
of C
12.
25 C
rore
of F
ertil
izer
bus
ines
s cl
assi
fied
as d
isco
ntin
ued
oper
atio
ns.
234 Grasim Industries Limited
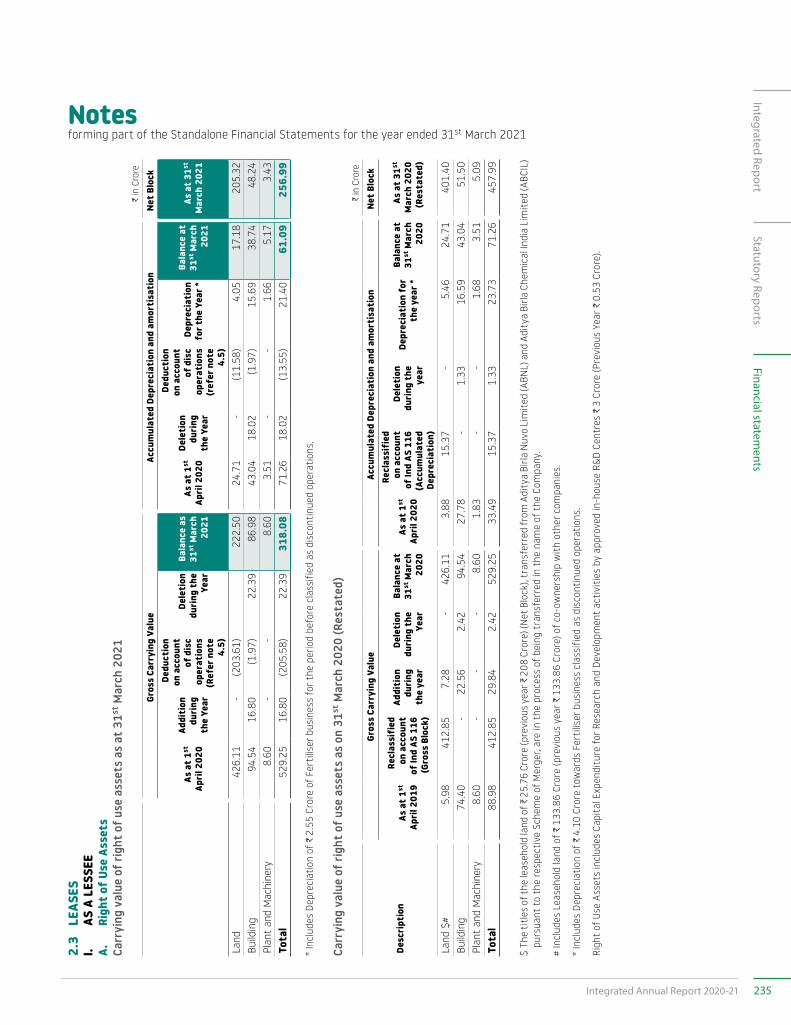
Notesforming part of the Standalone Financial Statements for the year ended 31st March 2021
2.3
LEA
SES
I. AS
A L
ESSE
EA.
Ri
ght o
f Use
Ass
ets
Carr
ying
val
ue o
f rig
ht o
f use
ass
ets
as a
t 31
st M
arch
202
1 C
in C
rore
Gros
s Ca
rryi
ng V
alue
Accu
mul
ated
Dep
reci
atio
n an
d am
orti
sati
onNe
t Blo
ck
As a
t 1st
Ap
ril 2
020
Addi
tion
du
ring
th
e Ye
ar
Dedu
ctio
n on
acc
ount
of
dis
c op
erat
ions
(R
efer
not
e 4.
5)
Dele
tion
du
ring
the
Ye
ar
Bala
nce
as
31st
Mar
ch
2021
As a
t 1st
Ap
ril 2
020
Dele
tion
du
ring
th
e Ye
ar
Dedu
ctio
n on
acc
ount
of
dis
c op
erat
ions
(r
efer
not
e 4.
5)
Depr
ecia
tion
fo
r the
Yea
r *
Bala
nce
at
31st
Mar
ch
2021
As a
t 31st
M
arch
202
1
Land
426
.11
- (2
03.6
1) 2
22.5
0 2
4.71
-
(11.
58)
4.0
5 1
7.18
2
05.3
2 Bu
ildin
g 9
4.54
1
6.80
(1
.97)
22.
39
86.
98
43.
04
18.
02
(1.9
7) 1
5.69
3
8.74
4
8.24
Pl
ant
and
Mac
hine
ry 8
.60
- -
8.6
0 3
.51
- -
1.6
6 5
.17
3.4
3 To
tal
529
.25
16.
80
(205
.58)
22.
39
318
.08
71.
26
18.
02
(13.
55)
21.
40
61.
09
256
.99
* In
clud
es D
epre
ciat
ion
of C
2.5
5 Cr
ore
of F
ertil
iser
bus
ines
s fo
r the
per
iod
befo
re c
lass
ified
as
disc
ontin
ued
oper
atio
ns.
Carr
ying
val
ue o
f rig
ht o
f use
ass
ets
as o
n 31
st M
arch
202
0 (R
esta
ted)
C in
Cro
re
Desc
ript
ion
Gros
s Ca
rryi
ng V
alue
Accu
mul
ated
Dep
reci
atio
n an
d am
orti
sati
onNe
t Blo
ck
As a
t 1st
Ap
ril 2
019
Recl
assi
fied
on
acc
ount
of
Ind
AS 1
16
(Gro
ss B
lock
)
Addi
tion
du
ring
th
e ye
ar
Dele
tion
du
ring
the
Ye
ar
Bala
nce
at
31st
Mar
ch
2020
As a
t 1st
Ap
ril 2
020
Recl
assi
fied
on
acc
ount
of
Ind
AS 1
16
(Acc
umul
ated
De
prec
iati
on)
Dele
tion
du
ring
the
ye
ar
Depr
ecia
tion
for
th
e ye
ar *
Bala
nce
at
31st
Mar
ch
2020
As a
t 31st
M
arch
202
0(R
esta
ted)
Land
$#
5.9
8 4
12.8
5 7
.28
- 4
26.1
1 3
.88
15.
37
- 5
.46
24.
71
401
.40
Build
ing
74.
40
- 2
2.56
2.
42
94.
54
27.
78
- 1
.33
16.
59
43.
04
51.
50
Plan
t an
d M
achi
nery
8.6
0 -
- -
8.6
0 1
.83
- -
1.6
8 3
.51
5.0
9 To
tal
88.
98
412
.85
29.
84
2.4
2 5
29.2
5 3
3.49
1
5.37
1
.33
23.
73
71.
26
457
.99
$ Th
e ti
tles
of th
e le
aseh
old
land
of C
25.
76 C
rore
(pre
viou
s ye
ar C
208
Cro
re) (
Net
Blo
ck),
tran
sfer
red
from
Adi
tya
Birla
Nuv
o Li
mit
ed (A
BNL)
and
Adi
tya
Birla
Che
mic
al In
dia
Lim
ited
(ABC
IL)
purs
uant
to
the
resp
ecti
ve S
chem
e of
Mer
ger,
are
in t
he p
roce
ss o
f bei
ng t
rans
ferr
ed in
the
nam
e of
the
Com
pany
.
# In
clud
es L
ease
hold
land
of C
133
.86
Cror
e (p
revi
ous
year
C 1
33.8
6 Cr
ore)
of c
o-ow
ners
hip
wit
h ot
her c
ompa
nies
.
* In
clud
es D
epre
ciat
ion
of C
4.1
0 Cr
ore
tow
ards
Fer
tilis
er b
usin
ess
clas
sifie
d as
dis
cont
inue
d op
erat
ions
.
Righ
t of
Use
Ass
ets
incl
udes
Cap
ital
Exp
endi
ture
for
Res
earc
h an
d D
evel
opm
ent
acti
vitie
s by
app
rove
d in
-hou
se R
&D C
entr
es C
3 C
rore
(Pre
viou
s Ye
ar C
0.5
3 Cr
ore)
.
235Integrated Annual Report 2020-21
Integrated ReportStatutory Reports
Financial statements
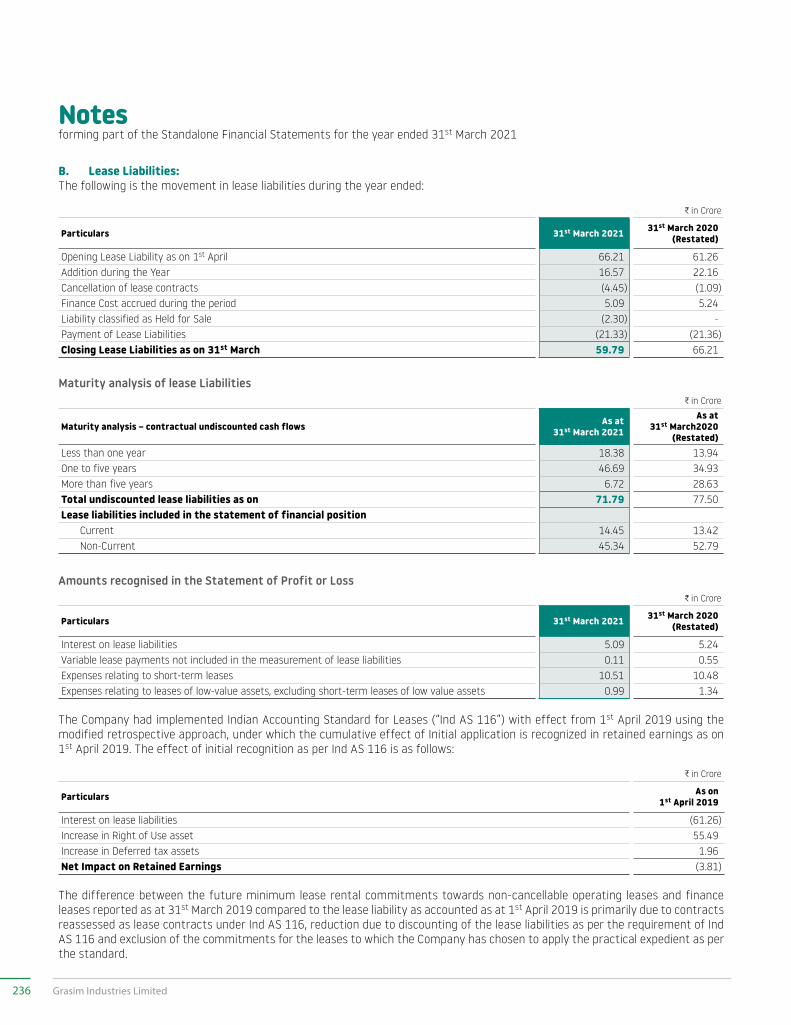
Notesforming part of the Standalone Financial Statements for the year ended 31st March 2021
B. Lease Liabilities:The following is the movement in lease liabilities during the year ended:
C in Crore
Particulars 31st March 2021 31st March 2020(Restated)
Opening Lease Liability as on 1st April 66.21 61.26 Addition during the Year 16.57 22.16 Cancellation of lease contracts (4.45) (1.09)Finance Cost accrued during the period 5.09 5.24 Liability classified as Held for Sale (2.30) - Payment of Lease Liabilities (21.33) (21.36)Closing Lease Liabilities as on 31st March 59.79 66.21
Maturity analysis of lease LiabilitiesC in Crore
Maturity analysis – contractual undiscounted cash flows As at 31st March 2021
As at 31st March2020
(Restated)Less than one year 18.38 13.94 One to five years 46.69 34.93 More than five years 6.72 28.63 Total undiscounted lease liabilities as on 71.79 77.50 Lease liabilities included in the statement of financial position Current 14.45 13.42 Non-Current 45.34 52.79
Amounts recognised in the Statement of Profit or LossC in Crore
Particulars 31st March 2021 31st March 2020(Restated)
Interest on lease liabilities 5.09 5.24 Variable lease payments not included in the measurement of lease liabilities 0.11 0.55 Expenses relating to short-term leases 10.51 10.48 Expenses relating to leases of low-value assets, excluding short-term leases of low value assets 0.99 1.34
The Company had implemented Indian Accounting Standard for Leases (“Ind AS 116”) with effect from 1st April 2019 using the modified retrospective approach, under which the cumulative effect of Initial application is recognized in retained earnings as on 1st April 2019. The effect of initial recognition as per Ind AS 116 is as follows:
C in Crore
Particulars As on 1st April 2019
Interest on lease liabilities (61.26)Increase in Right of Use asset 55.49Increase in Deferred tax assets 1.96Net Impact on Retained Earnings (3.81)
The difference between the future minimum lease rental commitments towards non-cancellable operating leases and finance leases reported as at 31st March 2019 compared to the lease liability as accounted as at 1st April 2019 is primarily due to contracts reassessed as lease contracts under Ind AS 116, reduction due to discounting of the lease liabilities as per the requirement of Ind AS 116 and exclusion of the commitments for the leases to which the Company has chosen to apply the practical expedient as per the standard.
236 Grasim Industries Limited
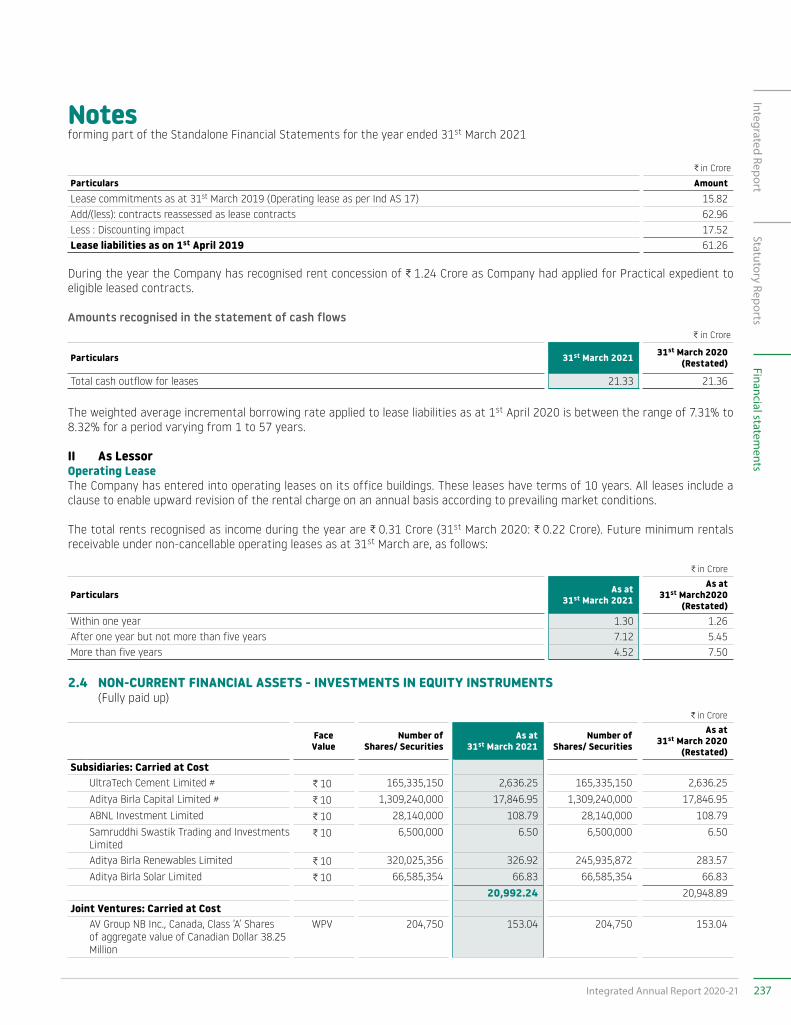
Notesforming part of the Standalone Financial Statements for the year ended 31st March 2021
C in Crore
Particulars AmountLease commitments as at 31st March 2019 (Operating lease as per Ind AS 17) 15.82Add/(less): contracts reassessed as lease contracts 62.96Less : Discounting impact 17.52Lease liabilities as on 1st April 2019 61.26
During the year the Company has recognised rent concession of C 1.24 Crore as Company had applied for Practical expedient to eligible leased contracts.
Amounts recognised in the statement of cash flowsC in Crore
Particulars 31st March 2021 31st March 2020(Restated)
Total cash outflow for leases 21.33 21.36
The weighted average incremental borrowing rate applied to lease liabilities as at 1st April 2020 is between the range of 7.31% to 8.32% for a period varying from 1 to 57 years.
II As LessorOperating Lease The Company has entered into operating leases on its office buildings. These leases have terms of 10 years. All leases include a clause to enable upward revision of the rental charge on an annual basis according to prevailing market conditions.
The total rents recognised as income during the year are C 0.31 Crore (31st March 2020: C 0.22 Crore). Future minimum rentals receivable under non-cancellable operating leases as at 31st March are, as follows:
C in Crore
Particulars As at 31st March 2021
As at 31st March2020
(Restated)Within one year 1.30 1.26 After one year but not more than five years 7.12 5.45 More than five years 4.52 7.50
2.4 NON-CURRENT FINANCIAL ASSETS - INVESTMENTS IN EQUITY INSTRUMENTS (Fully paid up)
C in Crore
Face Value
Number of Shares/ Securities
As at 31st March 2021
Number of Shares/ Securities
As at 31st March 2020
(Restated)Subsidiaries: Carried at Cost
UltraTech Cement Limited # C 10 165,335,150 2,636.25 165,335,150 2,636.25 Aditya Birla Capital Limited # C 10 1,309,240,000 17,846.95 1,309,240,000 17,846.95 ABNL Investment Limited C 10 28,140,000 108.79 28,140,000 108.79 Samruddhi Swastik Trading and Investments Limited
C 10 6,500,000 6.50 6,500,000 6.50
Aditya Birla Renewables Limited C 10 320,025,356 326.92 245,935,872 283.57 Aditya Birla Solar Limited C 10 66,585,354 66.83 66,585,354 66.83
20,992.24 20,948.89 Joint Ventures: Carried at Cost
AV Group NB Inc., Canada, Class ‘A’ Shares of aggregate value of Canadian Dollar 38.25 Million
WPV 204,750 153.04 204,750 153.04
237Integrated Annual Report 2020-21
Integrated ReportStatutory Reports
Financial statements
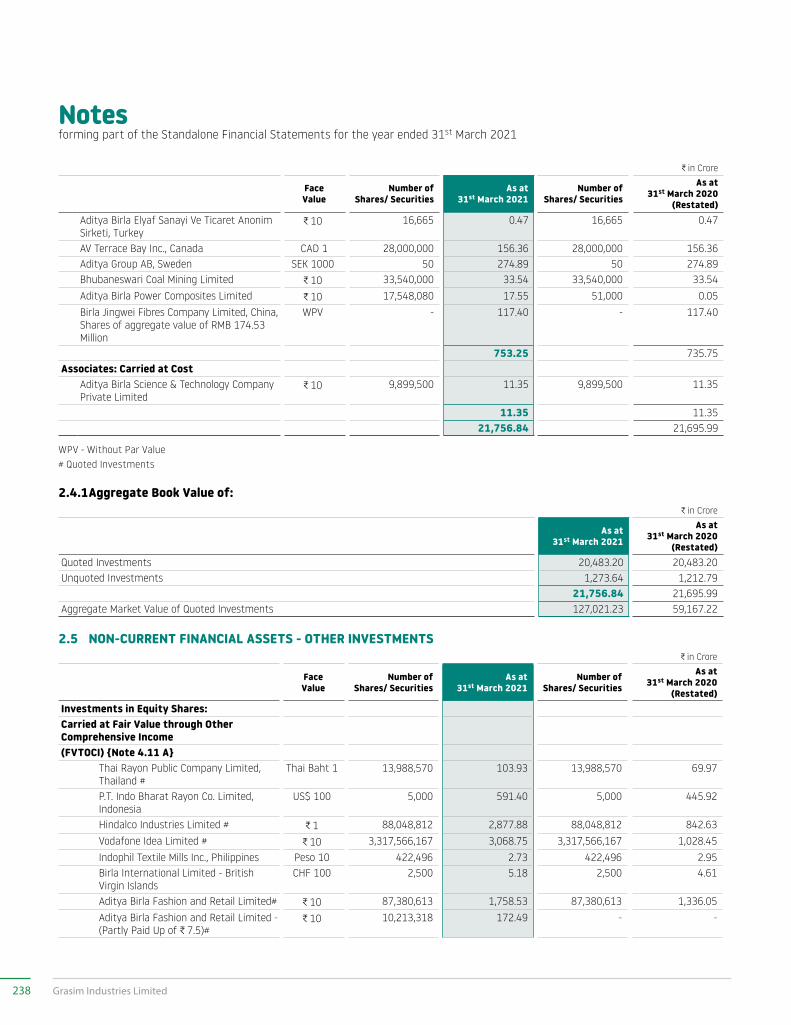
Notesforming part of the Standalone Financial Statements for the year ended 31st March 2021
C in Crore
Face Value
Number of Shares/ Securities
As at 31st March 2021
Number of Shares/ Securities
As at 31st March 2020
(Restated)Aditya Birla Elyaf Sanayi Ve Ticaret Anonim Sirketi, Turkey
C 10 16,665 0.47 16,665 0.47
AV Terrace Bay Inc., Canada CAD 1 28,000,000 156.36 28,000,000 156.36 Aditya Group AB, Sweden SEK 1000 50 274.89 50 274.89 Bhubaneswari Coal Mining Limited C 10 33,540,000 33.54 33,540,000 33.54 Aditya Birla Power Composites Limited C 10 17,548,080 17.55 51,000 0.05 Birla Jingwei Fibres Company Limited, China, Shares of aggregate value of RMB 174.53 Million
WPV - 117.40 - 117.40
753.25 735.75 Associates: Carried at Cost
Aditya Birla Science & Technology Company Private Limited
C 10 9,899,500 11.35 9,899,500 11.35
11.35 11.35 21,756.84 21,695.99
WPV - Without Par Value # Quoted Investments
2.4.1 Aggregate Book Value of: C in Crore
As at 31st March 2021
As at 31st March 2020
(Restated)Quoted Investments 20,483.20 20,483.20 Unquoted Investments 1,273.64 1,212.79
21,756.84 21,695.99 Aggregate Market Value of Quoted Investments 127,021.23 59,167.22
2.5 NON-CURRENT FINANCIAL ASSETS - OTHER INVESTMENTSC in Crore
Face Value
Number of Shares/ Securities
As at 31st March 2021
Number of Shares/ Securities
As at 31st March 2020
(Restated)Investments in Equity Shares: Carried at Fair Value through Other Comprehensive Income (FVTOCI) {Note 4.11 A}
Thai Rayon Public Company Limited, Thailand #
Thai Baht 1 13,988,570 103.93 13,988,570 69.97
P.T. Indo Bharat Rayon Co. Limited, Indonesia
US$ 100 5,000 591.40 5,000 445.92
Hindalco Industries Limited # C 1 88,048,812 2,877.88 88,048,812 842.63 Vodafone Idea Limited # C 10 3,317,566,167 3,068.75 3,317,566,167 1,028.45 Indophil Textile Mills Inc., Philippines Peso 10 422,496 2.73 422,496 2.95 Birla International Limited - British Virgin Islands
CHF 100 2,500 5.18 2,500 4.61
Aditya Birla Fashion and Retail Limited# C 10 87,380,613 1,758.53 87,380,613 1,336.05 Aditya Birla Fashion and Retail Limited - (Partly Paid Up of C 7.5)#
C 10 10,213,318 172.49 - -
238 Grasim Industries Limited
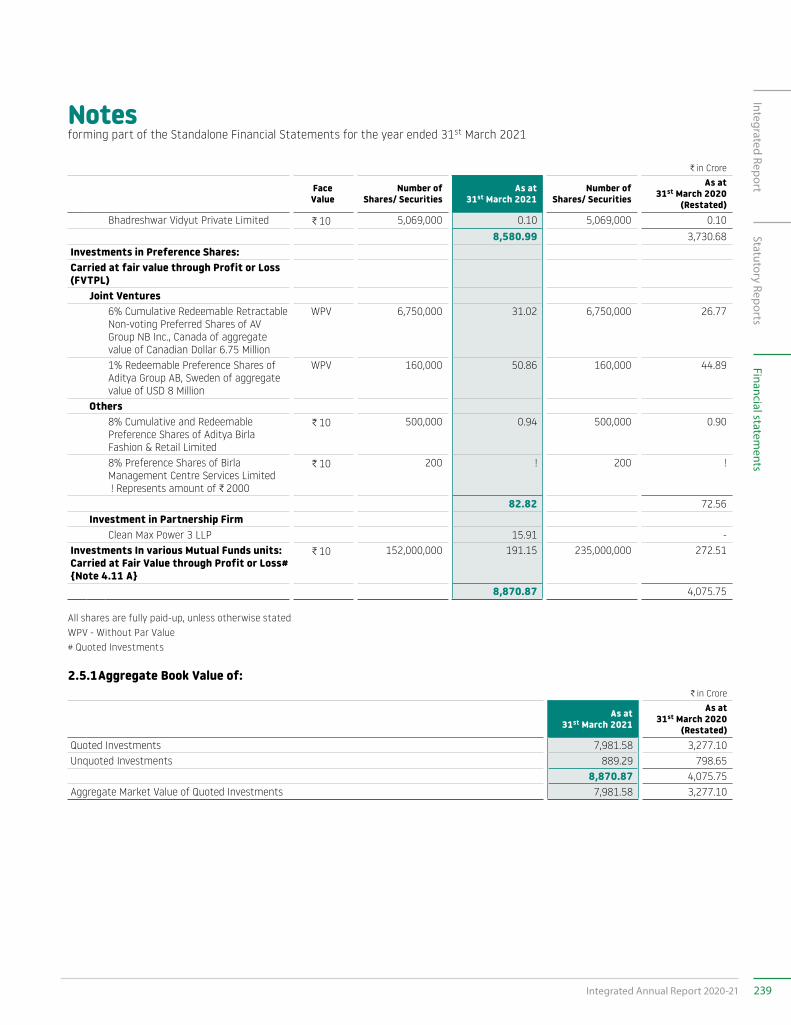
Notesforming part of the Standalone Financial Statements for the year ended 31st March 2021
C in Crore
Face Value
Number of Shares/ Securities
As at 31st March 2021
Number of Shares/ Securities
As at 31st March 2020
(Restated)Bhadreshwar Vidyut Private Limited C 10 5,069,000 0.10 5,069,000 0.10
8,580.99 3,730.68 Investments in Preference Shares: Carried at fair value through Profit or Loss (FVTPL)
Joint Ventures6% Cumulative Redeemable Retractable Non-voting Preferred Shares of AV Group NB Inc., Canada of aggregate value of Canadian Dollar 6.75 Million
WPV 6,750,000 31.02 6,750,000 26.77
1% Redeemable Preference Shares of Aditya Group AB, Sweden of aggregate value of USD 8 Million
WPV 160,000 50.86 160,000 44.89
Others8% Cumulative and Redeemable Preference Shares of Aditya Birla Fashion & Retail Limited
C 10 500,000 0.94 500,000 0.90
8% Preference Shares of Birla Management Centre Services Limited ! Represents amount of C 2000
C 10 200 ! 200 !
82.82 72.56 Investment in Partnership Firm
Clean Max Power 3 LLP 15.91 - Investments In various Mutual Funds units: Carried at Fair Value through Profit or Loss# {Note 4.11 A}
C 10 152,000,000 191.15 235,000,000 272.51
8,870.87 4,075.75
All shares are fully paid-up, unless otherwise stated WPV - Without Par Value # Quoted Investments
2.5.1 Aggregate Book Value of:C in Crore
As at 31st March 2021
As at 31st March 2020
(Restated)Quoted Investments 7,981.58 3,277.10Unquoted Investments 889.29 798.65
8,870.87 4,075.75 Aggregate Market Value of Quoted Investments 7,981.58 3,277.10
239Integrated Annual Report 2020-21
Integrated ReportStatutory Reports
Financial statements
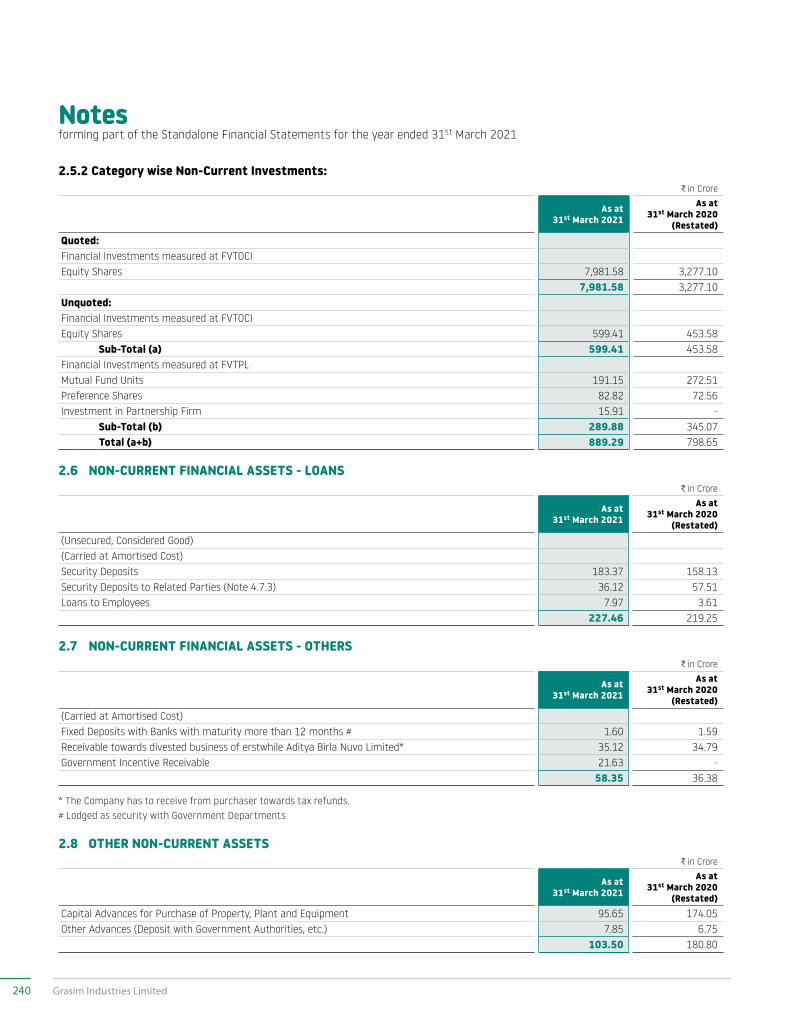
Notesforming part of the Standalone Financial Statements for the year ended 31st March 2021
2.5.2 Category wise Non-Current Investments:C in Crore
As at 31st March 2021
As at 31st March 2020
(Restated)Quoted:Financial Investments measured at FVTOCIEquity Shares 7,981.58 3,277.10
7,981.58 3,277.10 Unquoted:Financial Investments measured at FVTOCIEquity Shares 599.41 453.58
Sub-Total (a) 599.41 453.58 Financial Investments measured at FVTPLMutual Fund Units 191.15 272.51Preference Shares 82.82 72.56 Investment in Partnership Firm 15.91 -
Sub-Total (b) 289.88 345.07Total (a+b) 889.29 798.65
2.6 NON-CURRENT FINANCIAL ASSETS - LOANS C in Crore
As at 31st March 2021
As at 31st March 2020
(Restated)(Unsecured, Considered Good)(Carried at Amortised Cost)Security Deposits 183.37 158.13 Security Deposits to Related Parties (Note 4.7.3) 36.12 57.51 Loans to Employees 7.97 3.61
227.46 219.25
2.7 NON-CURRENT FINANCIAL ASSETS - OTHERSC in Crore
As at 31st March 2021
As at 31st March 2020
(Restated)(Carried at Amortised Cost)Fixed Deposits with Banks with maturity more than 12 months # 1.60 1.59 Receivable towards divested business of erstwhile Aditya Birla Nuvo Limited* 35.12 34.79 Government Incentive Receivable 21.63 -
58.35 36.38
* The Company has to receive from purchaser towards tax refunds. # Lodged as security with Government Departments
2.8 OTHER NON-CURRENT ASSETSC in Crore
As at 31st March 2021
As at 31st March 2020
(Restated)Capital Advances for Purchase of Property, Plant and Equipment 95.65 174.05 Other Advances (Deposit with Government Authorities, etc.) 7.85 6.75
103.50 180.80
240 Grasim Industries Limited
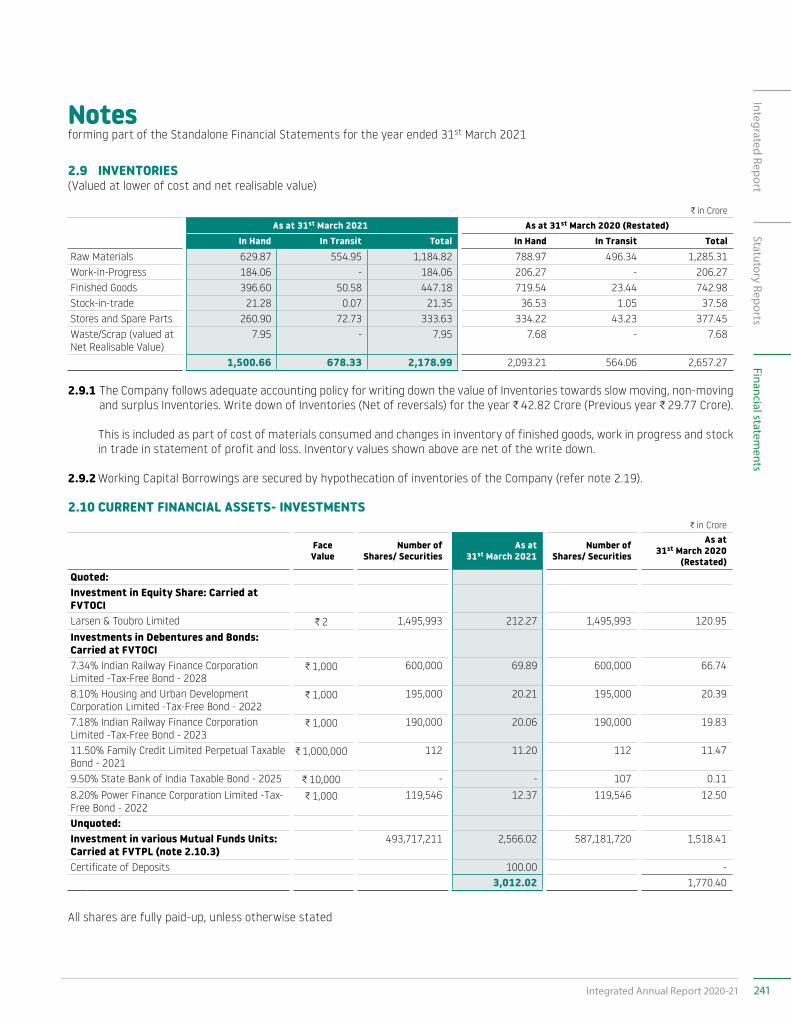
Notesforming part of the Standalone Financial Statements for the year ended 31st March 2021
2.9 INVENTORIES (Valued at lower of cost and net realisable value)
C in Crore
As at 31st March 2021 As at 31st March 2020 (Restated) In Hand In Transit Total In Hand In Transit Total
Raw Materials 629.87 554.95 1,184.82 788.97 496.34 1,285.31 Work-in-Progress 184.06 - 184.06 206.27 - 206.27 Finished Goods 396.60 50.58 447.18 719.54 23.44 742.98 Stock-in-trade 21.28 0.07 21.35 36.53 1.05 37.58 Stores and Spare Parts 260.90 72.73 333.63 334.22 43.23 377.45 Waste/Scrap (valued at Net Realisable Value)
7.95 - 7.95 7.68 - 7.68
1,500.66 678.33 2,178.99 2,093.21 564.06 2,657.27
2.9.1 The Company follows adequate accounting policy for writing down the value of Inventories towards slow moving, non-moving and surplus Inventories. Write down of Inventories (Net of reversals) for the year C 42.82 Crore (Previous year C 29.77 Crore).
This is included as part of cost of materials consumed and changes in inventory of finished goods, work in progress and stock in trade in statement of profit and loss. Inventory values shown above are net of the write down.
2.9.2 Working Capital Borrowings are secured by hypothecation of inventories of the Company (refer note 2.19).
2.10 CURRENT FINANCIAL ASSETS- INVESTMENTSC in Crore
Face Value
Number of Shares/ Securities
As at 31st March 2021
Number of Shares/ Securities
As at 31st March 2020
(Restated)Quoted:Investment in Equity Share: Carried at FVTOCILarsen & Toubro Limited C 2 1,495,993 212.27 1,495,993 120.95 Investments in Debentures and Bonds: Carried at FVTOCI7.34% Indian Railway Finance Corporation Limited -Tax-Free Bond - 2028
C 1,000 600,000 69.89 600,000 66.74
8.10% Housing and Urban Development Corporation Limited -Tax-Free Bond - 2022
C 1,000 195,000 20.21 195,000 20.39
7.18% Indian Railway Finance Corporation Limited -Tax-Free Bond - 2023
C 1,000 190,000 20.06 190,000 19.83
11.50% Family Credit Limited Perpetual Taxable Bond - 2021
C 1,000,000 112 11.20 112 11.47
9.50% State Bank of India Taxable Bond - 2025 C 10,000 - - 107 0.11 8.20% Power Finance Corporation Limited -Tax-Free Bond - 2022
C 1,000 119,546 12.37 119,546 12.50
Unquoted:Investment in various Mutual Funds Units: Carried at FVTPL (note 2.10.3)
493,717,211 2,566.02 587,181,720 1,518.41
Certificate of Deposits 100.00 - 3,012.02 1,770.40
All shares are fully paid-up, unless otherwise stated
241Integrated Annual Report 2020-21
Integrated ReportStatutory Reports
Financial statements
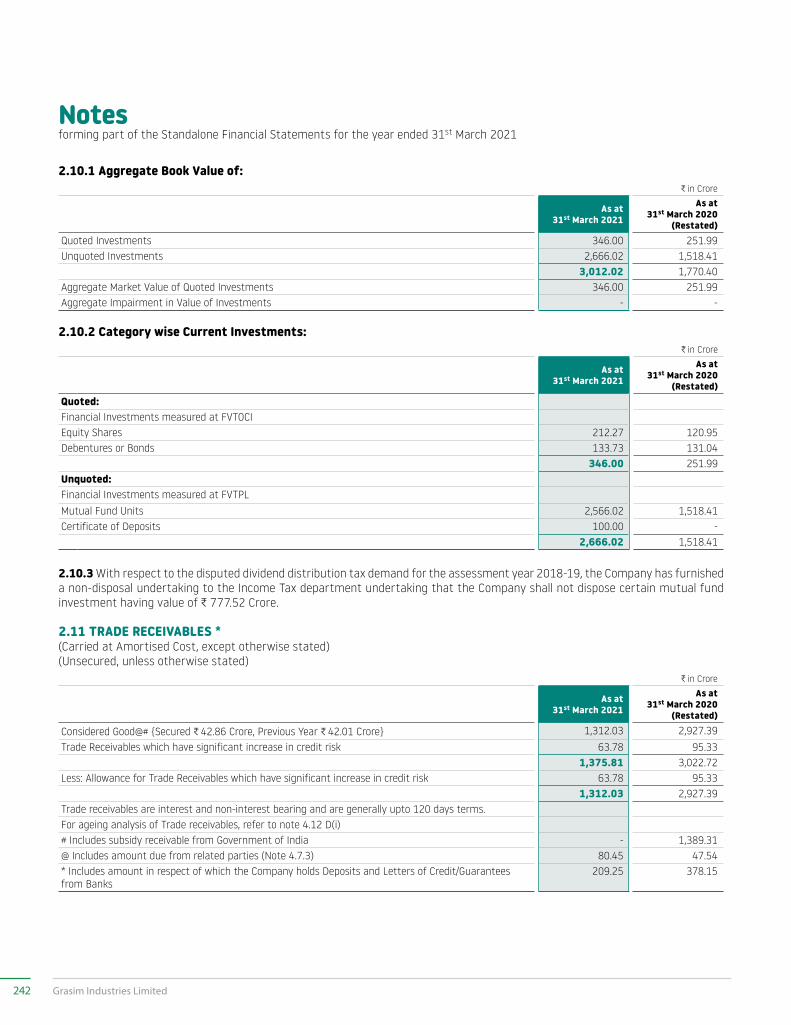
Notesforming part of the Standalone Financial Statements for the year ended 31st March 2021
2.10.1 Aggregate Book Value of:C in Crore
As at 31st March 2021
As at 31st March 2020
(Restated)Quoted Investments 346.00 251.99Unquoted Investments 2,666.02 1,518.41
3,012.02 1,770.40Aggregate Market Value of Quoted Investments 346.00 251.99Aggregate Impairment in Value of Investments - -
2.10.2 Category wise Current Investments: C in Crore
As at 31st March 2021
As at 31st March 2020
(Restated)Quoted:Financial Investments measured at FVTOCIEquity Shares 212.27 120.95 Debentures or Bonds 133.73 131.04
346.00 251.99 Unquoted:Financial Investments measured at FVTPLMutual Fund Units 2,566.02 1,518.41Certificate of Deposits 100.00 -
2,666.02 1,518.41
2.10.3 With respect to the disputed dividend distribution tax demand for the assessment year 2018-19, the Company has furnished a non-disposal undertaking to the Income Tax department undertaking that the Company shall not dispose certain mutual fund investment having value of C 777.52 Crore.
2.11 TRADE RECEIVABLES * (Carried at Amortised Cost, except otherwise stated)(Unsecured, unless otherwise stated)
C in Crore
As at 31st March 2021
As at 31st March 2020
(Restated)
Considered Good@# {Secured C 42.86 Crore, Previous Year C 42.01 Crore} 1,312.03 2,927.39 Trade Receivables which have significant increase in credit risk 63.78 95.33
1,375.81 3,022.72 Less: Allowance for Trade Receivables which have significant increase in credit risk 63.78 95.33
1,312.03 2,927.39 Trade receivables are interest and non-interest bearing and are generally upto 120 days terms.For ageing analysis of Trade receivables, refer to note 4.12 D(i)# Includes subsidy receivable from Government of India - 1,389.31 @ Includes amount due from related parties (Note 4.7.3) 80.45 47.54 * Includes amount in respect of which the Company holds Deposits and Letters of Credit/Guarantees from Banks
209.25 378.15
242 Grasim Industries Limited
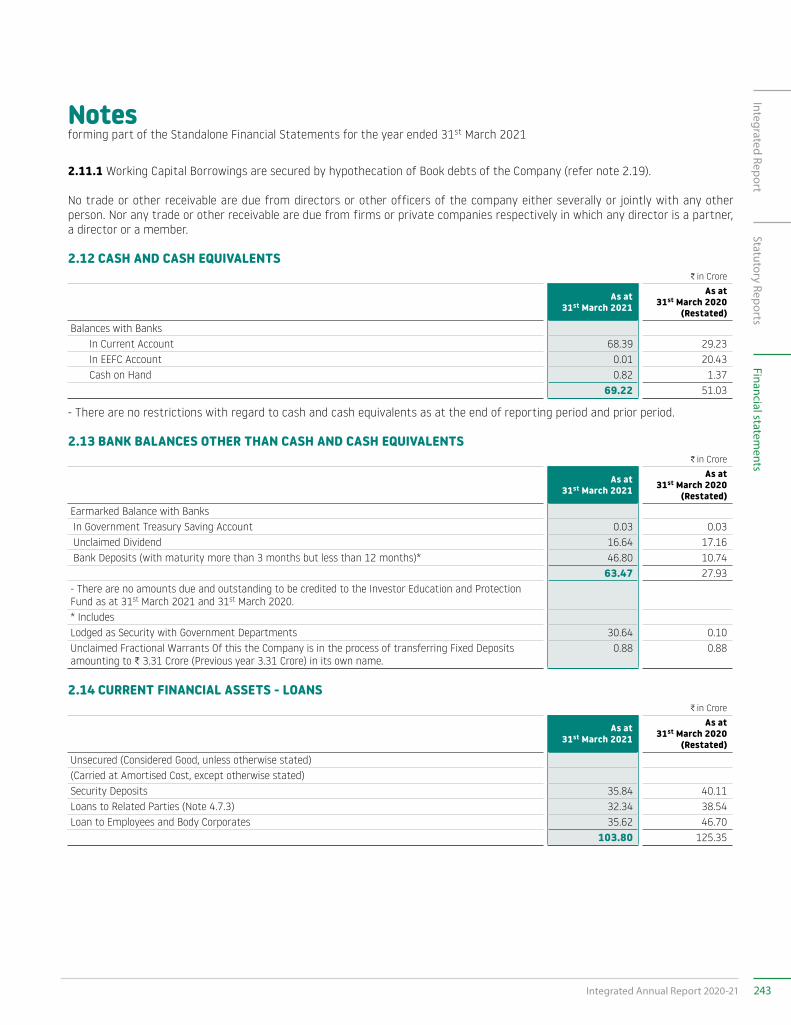
Notesforming part of the Standalone Financial Statements for the year ended 31st March 2021
2.11.1 Working Capital Borrowings are secured by hypothecation of Book debts of the Company (refer note 2.19).
No trade or other receivable are due from directors or other officers of the company either severally or jointly with any other person. Nor any trade or other receivable are due from firms or private companies respectively in which any director is a partner, a director or a member.
2.12 CASH AND CASH EQUIVALENTSC in Crore
As at 31st March 2021
As at 31st March 2020
(Restated)Balances with Banks In Current Account 68.39 29.23 In EEFC Account 0.01 20.43 Cash on Hand 0.82 1.37
69.22 51.03
- There are no restrictions with regard to cash and cash equivalents as at the end of reporting period and prior period.
2.13 BANK BALANCES OTHER THAN CASH AND CASH EQUIVALENTSC in Crore
As at 31st March 2021
As at 31st March 2020
(Restated)Earmarked Balance with Banks In Government Treasury Saving Account 0.03 0.03 Unclaimed Dividend 16.64 17.16 Bank Deposits (with maturity more than 3 months but less than 12 months)* 46.80 10.74
63.47 27.93 - There are no amounts due and outstanding to be credited to the Investor Education and Protection Fund as at 31st March 2021 and 31st March 2020.* IncludesLodged as Security with Government Departments 30.64 0.10 Unclaimed Fractional Warrants Of this the Company is in the process of transferring Fixed Deposits amounting to C 3.31 Crore (Previous year 3.31 Crore) in its own name.
0.88 0.88
2.14 CURRENT FINANCIAL ASSETS - LOANSC in Crore
As at 31st March 2021
As at 31st March 2020
(Restated)Unsecured (Considered Good, unless otherwise stated)(Carried at Amortised Cost, except otherwise stated)Security Deposits 35.84 40.11 Loans to Related Parties (Note 4.7.3) 32.34 38.54 Loan to Employees and Body Corporates 35.62 46.70
103.80 125.35
243Integrated Annual Report 2020-21
Integrated ReportStatutory Reports
Financial statements
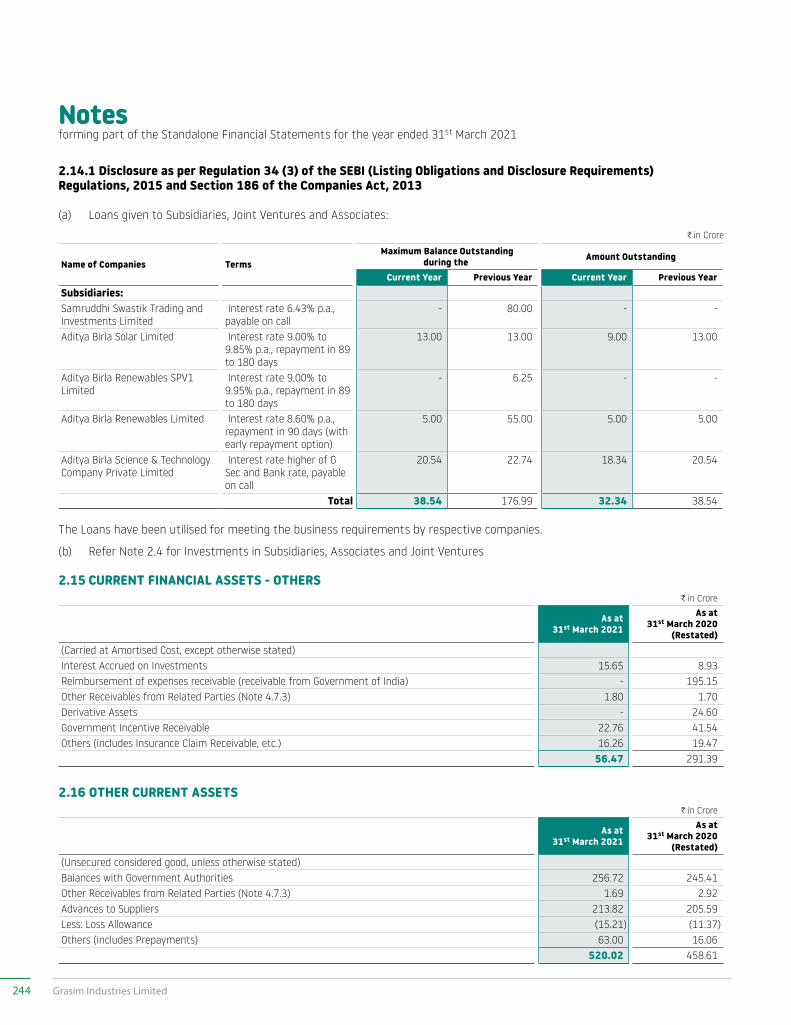
Notesforming part of the Standalone Financial Statements for the year ended 31st March 2021
2.14.1 Disclosure as per Regulation 34 (3) of the SEBI (Listing Obligations and Disclosure Requirements) Regulations, 2015 and Section 186 of the Companies Act, 2013 (a) Loans given to Subsidiaries, Joint Ventures and Associates:
C in Crore
Name of Companies Terms Maximum Balance Outstanding
during the Amount Outstanding
Current Year Previous Year Current Year Previous Year Subsidiaries:Samruddhi Swastik Trading and Investments Limited
Interest rate 6.43% p.a., payable on call
- 80.00 - -
Aditya Birla Solar Limited Interest rate 9.00% to 9.85% p.a., repayment in 89 to 180 days
13.00 13.00 9.00 13.00
Aditya Birla Renewables SPV1 Limited
Interest rate 9.00% to 9.95% p.a., repayment in 89 to 180 days
- 6.25 - -
Aditya Birla Renewables Limited Interest rate 8.60% p.a., repayment in 90 days (with early repayment option)
5.00 55.00 5.00 5.00
Aditya Birla Science & Technology Company Private Limited
Interest rate higher of G Sec and Bank rate, payable on call
20.54 22.74 18.34 20.54
Total 38.54 176.99 32.34 38.54
The Loans have been utilised for meeting the business requirements by respective companies.
(b) Refer Note 2.4 for Investments in Subsidiaries, Associates and Joint Ventures
2.15 CURRENT FINANCIAL ASSETS - OTHERSC in Crore
As at 31st March 2021
As at 31st March 2020
(Restated)(Carried at Amortised Cost, except otherwise stated)Interest Accrued on Investments 15.65 8.93 Reimbursement of expenses receivable (receivable from Government of India) - 195.15 Other Receivables from Related Parties (Note 4.7.3) 1.80 1.70 Derivative Assets - 24.60 Government Incentive Receivable 22.76 41.54 Others (includes Insurance Claim Receivable, etc.) 16.26 19.47
56.47 291.39
2.16 OTHER CURRENT ASSETS C in Crore
As at 31st March 2021
As at 31st March 2020
(Restated)(Unsecured considered good, unless otherwise stated)Balances with Government Authorities 256.72 245.41 Other Receivables from Related Parties (Note 4.7.3) 1.69 2.92 Advances to Suppliers 213.82 205.59 Less: Loss Allowance (15.21) (11.37)Others (includes Prepayments) 63.00 16.06
520.02 458.61
244 Grasim Industries Limited
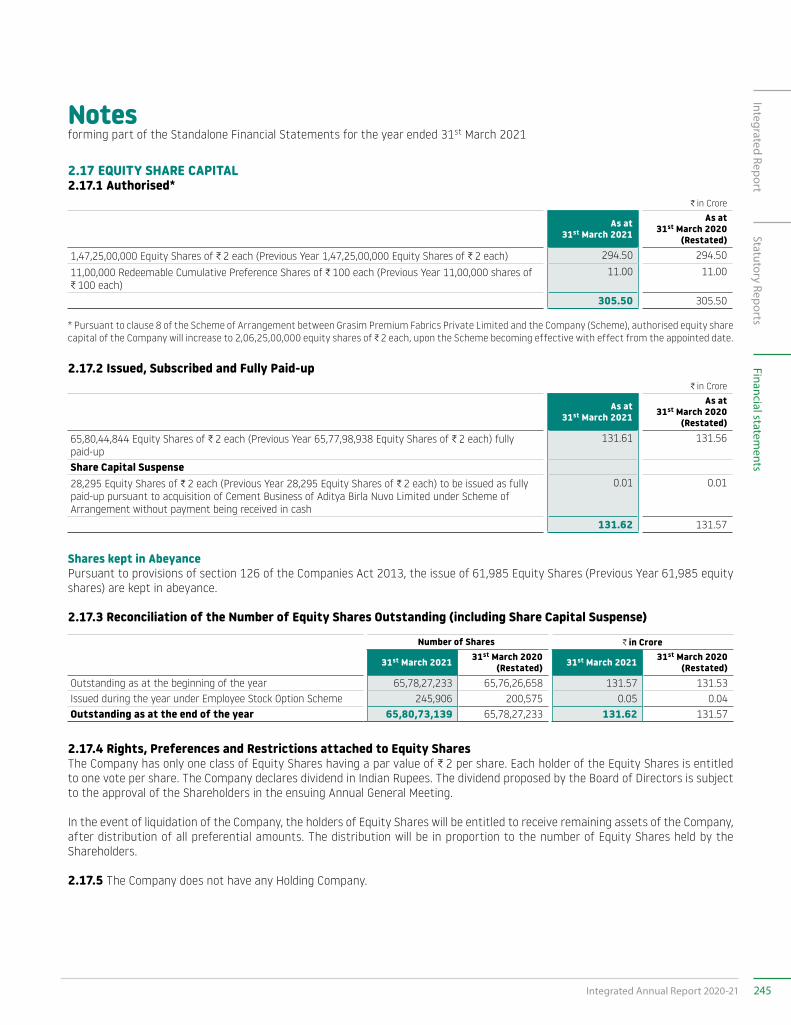
Notesforming part of the Standalone Financial Statements for the year ended 31st March 2021
2.17 EQUITY SHARE CAPITAL 2.17.1 Authorised*
C in Crore
As at 31st March 2021
As at 31st March 2020
(Restated)
1,47,25,00,000 Equity Shares of C 2 each (Previous Year 1,47,25,00,000 Equity Shares of C 2 each) 294.50 294.50
11,00,000 Redeemable Cumulative Preference Shares of C 100 each (Previous Year 11,00,000 shares of C 100 each)
11.00 11.00
305.50 305.50
* Pursuant to clause 8 of the Scheme of Arrangement between Grasim Premium Fabrics Private Limited and the Company (Scheme), authorised equity share capital of the Company will increase to 2,06,25,00,000 equity shares of C 2 each, upon the Scheme becoming effective with effect from the appointed date.
2.17.2 Issued, Subscribed and Fully Paid-upC in Crore
As at 31st March 2021
As at 31st March 2020
(Restated)
65,80,44,844 Equity Shares of C 2 each (Previous Year 65,77,98,938 Equity Shares of C 2 each) fully paid-up
131.61 131.56
Share Capital Suspense28,295 Equity Shares of C 2 each (Previous Year 28,295 Equity Shares of C 2 each) to be issued as fully paid-up pursuant to acquisition of Cement Business of Aditya Birla Nuvo Limited under Scheme of Arrangement without payment being received in cash
0.01 0.01
131.62 131.57
Shares kept in AbeyancePursuant to provisions of section 126 of the Companies Act 2013, the issue of 61,985 Equity Shares (Previous Year 61,985 equity shares) are kept in abeyance.
2.17.3 Reconciliation of the Number of Equity Shares Outstanding (including Share Capital Suspense)
Number of Shares C in Crore
31st March 2021 31st March 2020(Restated) 31st March 2021 31st March 2020
(Restated)Outstanding as at the beginning of the year 65,78,27,233 65,76,26,658 131.57 131.53 Issued during the year under Employee Stock Option Scheme 245,906 200,575 0.05 0.04 Outstanding as at the end of the year 65,80,73,139 65,78,27,233 131.62 131.57
2.17.4 Rights, Preferences and Restrictions attached to Equity SharesThe Company has only one class of Equity Shares having a par value of C 2 per share. Each holder of the Equity Shares is entitled to one vote per share. The Company declares dividend in Indian Rupees. The dividend proposed by the Board of Directors is subject to the approval of the Shareholders in the ensuing Annual General Meeting.
In the event of liquidation of the Company, the holders of Equity Shares will be entitled to receive remaining assets of the Company, after distribution of all preferential amounts. The distribution will be in proportion to the number of Equity Shares held by the Shareholders.
2.17.5 The Company does not have any Holding Company.
245Integrated Annual Report 2020-21
Integrated ReportStatutory Reports
Financial statements
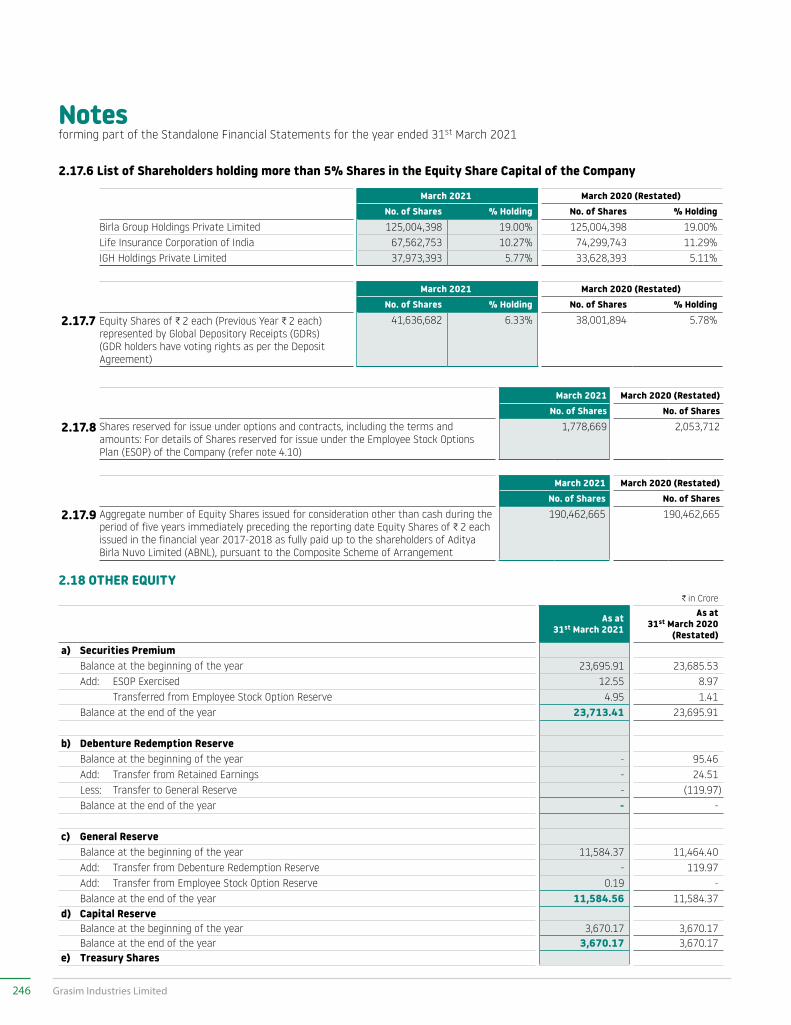
Notesforming part of the Standalone Financial Statements for the year ended 31st March 2021
2.17.6 List of Shareholders holding more than 5% Shares in the Equity Share Capital of the Company
March 2021 March 2020 (Restated)No. of Shares % Holding No. of Shares % Holding
Birla Group Holdings Private Limited 125,004,398 19.00% 125,004,398 19.00%Life Insurance Corporation of India 67,562,753 10.27% 74,299,743 11.29%IGH Holdings Private Limited 37,973,393 5.77% 33,628,393 5.11%
March 2021 March 2020 (Restated)No. of Shares % Holding No. of Shares % Holding
2.17.7 Equity Shares of C 2 each (Previous Year C 2 each) represented by Global Depository Receipts (GDRs) (GDR holders have voting rights as per the Deposit Agreement)
41,636,682 6.33% 38,001,894 5.78%
March 2021 March 2020 (Restated)No. of Shares No. of Shares
2.17.8 Shares reserved for issue under options and contracts, including the terms and amounts: For details of Shares reserved for issue under the Employee Stock Options Plan (ESOP) of the Company (refer note 4.10)
1,778,669 2,053,712
March 2021 March 2020 (Restated)No. of Shares No. of Shares
2.17.9 Aggregate number of Equity Shares issued for consideration other than cash during the period of five years immediately preceding the reporting date Equity Shares of C 2 each issued in the financial year 2017-2018 as fully paid up to the shareholders of Aditya Birla Nuvo Limited (ABNL), pursuant to the Composite Scheme of Arrangement
190,462,665 190,462,665
2.18 OTHER EQUITY C in Crore
As at 31st March 2021
As at 31st March 2020
(Restated)a) Securities Premium
Balance at the beginning of the year 23,695.91 23,685.53 Add: ESOP Exercised 12.55 8.97
Transferred from Employee Stock Option Reserve 4.95 1.41 Balance at the end of the year 23,713.41 23,695.91
b) Debenture Redemption ReserveBalance at the beginning of the year - 95.46 Add: Transfer from Retained Earnings - 24.51 Less: Transfer to General Reserve - (119.97)Balance at the end of the year - -
c) General ReserveBalance at the beginning of the year 11,584.37 11,464.40 Add: Transfer from Debenture Redemption Reserve - 119.97 Add: Transfer from Employee Stock Option Reserve 0.19 - Balance at the end of the year 11,584.56 11,584.37
d) Capital ReserveBalance at the beginning of the year 3,670.17 3,670.17 Balance at the end of the year 3,670.17 3,670.17
e) Treasury Shares
246 Grasim Industries Limited
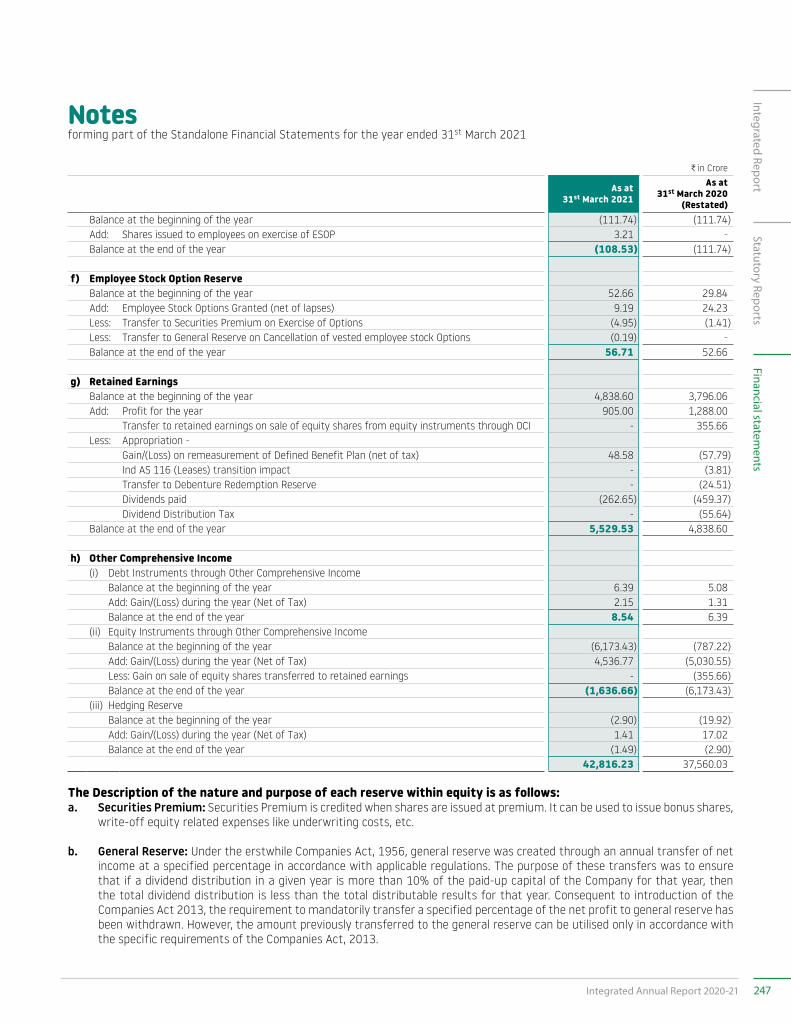
Notesforming part of the Standalone Financial Statements for the year ended 31st March 2021
C in Crore
As at 31st March 2021
As at 31st March 2020
(Restated)Balance at the beginning of the year (111.74) (111.74)Add: Shares issued to employees on exercise of ESOP 3.21 - Balance at the end of the year (108.53) (111.74)
f) Employee Stock Option ReserveBalance at the beginning of the year 52.66 29.84 Add: Employee Stock Options Granted (net of lapses) 9.19 24.23 Less: Transfer to Securities Premium on Exercise of Options (4.95) (1.41)Less: Transfer to General Reserve on Cancellation of vested employee stock Options (0.19) - Balance at the end of the year 56.71 52.66
g) Retained EarningsBalance at the beginning of the year 4,838.60 3,796.06 Add: Profit for the year 905.00 1,288.00
Transfer to retained earnings on sale of equity shares from equity instruments through OCI - 355.66 Less: Appropriation -
Gain/(Loss) on remeasurement of Defined Benefit Plan (net of tax) 48.58 (57.79)Ind AS 116 (Leases) transition impact - (3.81)Transfer to Debenture Redemption Reserve - (24.51)Dividends paid (262.65) (459.37)Dividend Distribution Tax - (55.64)
Balance at the end of the year 5,529.53 4,838.60
h) Other Comprehensive Income(i) Debt Instruments through Other Comprehensive Income Balance at the beginning of the year 6.39 5.08 Add: Gain/(Loss) during the year (Net of Tax) 2.15 1.31 Balance at the end of the year 8.54 6.39 (ii) Equity Instruments through Other Comprehensive Income Balance at the beginning of the year (6,173.43) (787.22) Add: Gain/(Loss) during the year (Net of Tax) 4,536.77 (5,030.55) Less: Gain on sale of equity shares transferred to retained earnings - (355.66) Balance at the end of the year (1,636.66) (6,173.43)(iii) Hedging Reserve Balance at the beginning of the year (2.90) (19.92) Add: Gain/(Loss) during the year (Net of Tax) 1.41 17.02 Balance at the end of the year (1.49) (2.90)
42,816.23 37,560.03
The Description of the nature and purpose of each reserve within equity is as follows:a. Securities Premium: Securities Premium is credited when shares are issued at premium. It can be used to issue bonus shares,
write-off equity related expenses like underwriting costs, etc.
b. General Reserve: Under the erstwhile Companies Act, 1956, general reserve was created through an annual transfer of net income at a specified percentage in accordance with applicable regulations. The purpose of these transfers was to ensure that if a dividend distribution in a given year is more than 10% of the paid-up capital of the Company for that year, then the total dividend distribution is less than the total distributable results for that year. Consequent to introduction of the Companies Act 2013, the requirement to mandatorily transfer a specified percentage of the net profit to general reserve has been withdrawn. However, the amount previously transferred to the general reserve can be utilised only in accordance with the specific requirements of the Companies Act, 2013.
247Integrated Annual Report 2020-21
Integrated ReportStatutory Reports
Financial statements
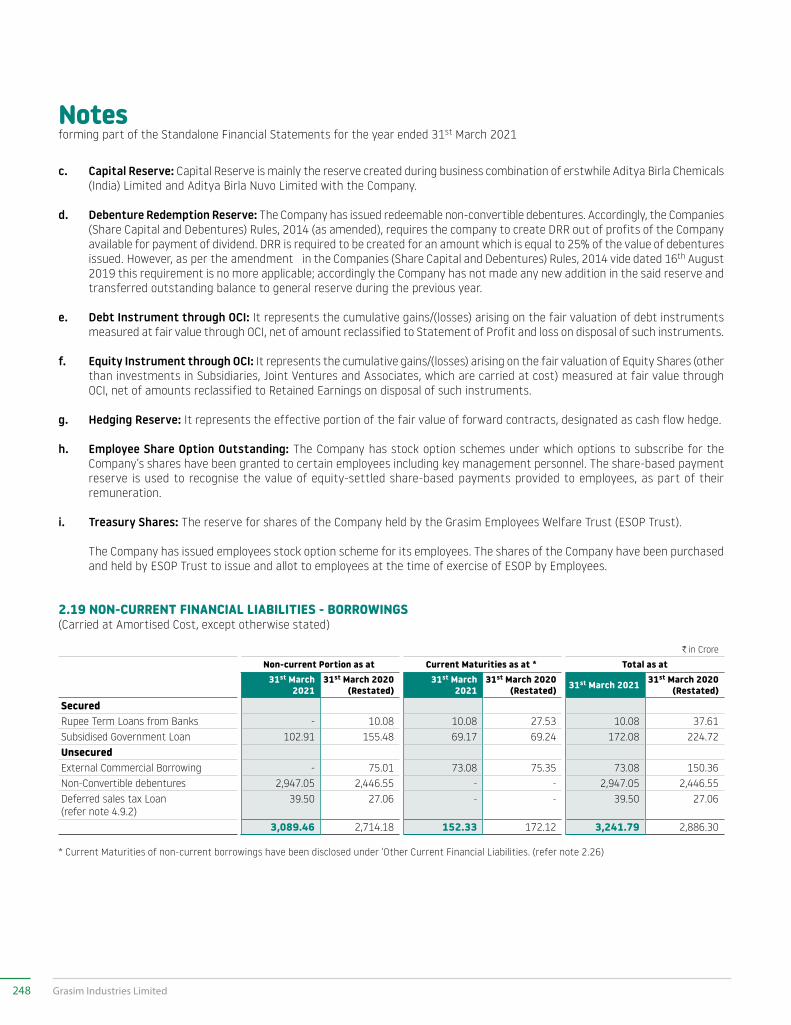
Notesforming part of the Standalone Financial Statements for the year ended 31st March 2021
c. Capital Reserve: Capital Reserve is mainly the reserve created during business combination of erstwhile Aditya Birla Chemicals (India) Limited and Aditya Birla Nuvo Limited with the Company.
d. Debenture Redemption Reserve: The Company has issued redeemable non-convertible debentures. Accordingly, the Companies (Share Capital and Debentures) Rules, 2014 (as amended), requires the company to create DRR out of profits of the Company available for payment of dividend. DRR is required to be created for an amount which is equal to 25% of the value of debentures issued. However, as per the amendment in the Companies (Share Capital and Debentures) Rules, 2014 vide dated 16th August 2019 this requirement is no more applicable; accordingly the Company has not made any new addition in the said reserve and transferred outstanding balance to general reserve during the previous year.
e. Debt Instrument through OCI: It represents the cumulative gains/(losses) arising on the fair valuation of debt instruments measured at fair value through OCI, net of amount reclassified to Statement of Profit and loss on disposal of such instruments.
f. Equity Instrument through OCI: It represents the cumulative gains/(losses) arising on the fair valuation of Equity Shares (other than investments in Subsidiaries, Joint Ventures and Associates, which are carried at cost) measured at fair value through OCI, net of amounts reclassified to Retained Earnings on disposal of such instruments.
g. Hedging Reserve: It represents the effective portion of the fair value of forward contracts, designated as cash flow hedge.
h. Employee Share Option Outstanding: The Company has stock option schemes under which options to subscribe for the Company’s shares have been granted to certain employees including key management personnel. The share-based payment reserve is used to recognise the value of equity-settled share-based payments provided to employees, as part of their remuneration.
i. Treasury Shares: The reserve for shares of the Company held by the Grasim Employees Welfare Trust (ESOP Trust).
The Company has issued employees stock option scheme for its employees. The shares of the Company have been purchased and held by ESOP Trust to issue and allot to employees at the time of exercise of ESOP by Employees.
2.19 NON-CURRENT FINANCIAL LIABILITIES - BORROWINGS (Carried at Amortised Cost, except otherwise stated)
C in Crore
Non-current Portion as at Current Maturities as at * Total as at 31st March
202131st March 2020
(Restated)31st March
202131st March 2020
(Restated) 31st March 2021 31st March 2020(Restated)
SecuredRupee Term Loans from Banks - 10.08 10.08 27.53 10.08 37.61 Subsidised Government Loan 102.91 155.48 69.17 69.24 172.08 224.72 UnsecuredExternal Commercial Borrowing - 75.01 73.08 75.35 73.08 150.36 Non-Convertible debentures 2,947.05 2,446.55 - - 2,947.05 2,446.55 Deferred sales tax Loan (refer note 4.9.2)
39.50 27.06 - - 39.50 27.06
3,089.46 2,714.18 152.33 172.12 3,241.79 2,886.30
* Current Maturities of non-current borrowings have been disclosed under ‘Other Current Financial Liabilities. (refer note 2.26)
248 Grasim Industries Limited
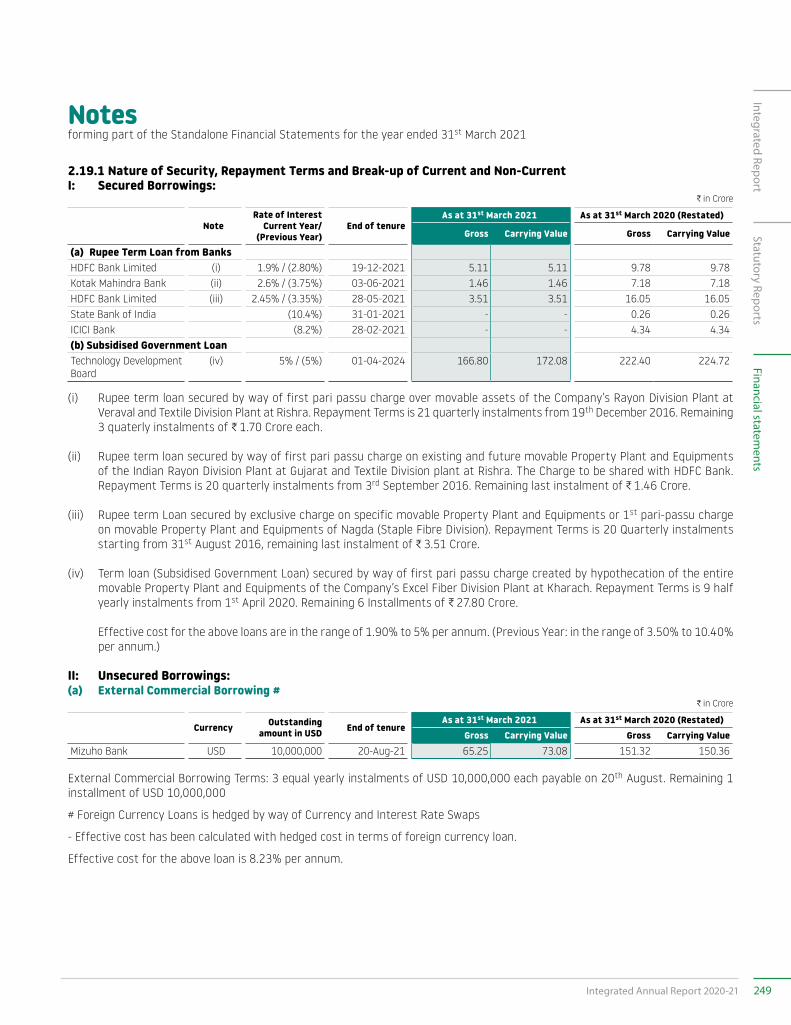
Notesforming part of the Standalone Financial Statements for the year ended 31st March 2021
2.19.1 Nature of Security, Repayment Terms and Break-up of Current and Non-CurrentI: Secured Borrowings:
C in Crore
NoteRate of Interest
Current Year/ (Previous Year)
End of tenure As at 31st March 2021 As at 31st March 2020 (Restated)
Gross Carrying Value Gross Carrying Value
(a) Rupee Term Loan from BanksHDFC Bank Limited (i) 1.9% / (2.80%) 19-12-2021 5.11 5.11 9.78 9.78 Kotak Mahindra Bank (ii) 2.6% / (3.75%) 03-06-2021 1.46 1.46 7.18 7.18 HDFC Bank Limited (iii) 2.45% / (3.35%) 28-05-2021 3.51 3.51 16.05 16.05 State Bank of India (10.4%) 31-01-2021 - - 0.26 0.26 ICICI Bank (8.2%) 28-02-2021 - - 4.34 4.34 (b) Subsidised Government LoanTechnology Development Board
(iv) 5% / (5%) 01-04-2024 166.80 172.08 222.40 224.72
(i) Rupee term loan secured by way of first pari passu charge over movable assets of the Company’s Rayon Division Plant at Veraval and Textile Division Plant at Rishra. Repayment Terms is 21 quarterly instalments from 19th December 2016. Remaining 3 quaterly instalments of C 1.70 Crore each.
(ii) Rupee term loan secured by way of first pari passu charge on existing and future movable Property Plant and Equipments of the Indian Rayon Division Plant at Gujarat and Textile Division plant at Rishra. The Charge to be shared with HDFC Bank. Repayment Terms is 20 quarterly instalments from 3rd September 2016. Remaining last instalment of C 1.46 Crore.
(iii) Rupee term Loan secured by exclusive charge on specific movable Property Plant and Equipments or 1st pari-passu charge on movable Property Plant and Equipments of Nagda (Staple Fibre Division). Repayment Terms is 20 Quarterly instalments starting from 31st August 2016, remaining last instalment of C 3.51 Crore.
(iv) Term loan (Subsidised Government Loan) secured by way of first pari passu charge created by hypothecation of the entire movable Property Plant and Equipments of the Company’s Excel Fiber Division Plant at Kharach. Repayment Terms is 9 half yearly instalments from 1st April 2020. Remaining 6 Installments of C 27.80 Crore.
Effective cost for the above loans are in the range of 1.90% to 5% per annum. (Previous Year: in the range of 3.50% to 10.40% per annum.)
II: Unsecured Borrowings:(a) External Commercial Borrowing #
C in Crore
Currency Outstanding amount in USD End of tenure
As at 31st March 2021 As at 31st March 2020 (Restated) Gross Carrying Value Gross Carrying Value
Mizuho Bank USD 10,000,000 20-Aug-21 65.25 73.08 151.32 150.36
External Commercial Borrowing Terms: 3 equal yearly instalments of USD 10,000,000 each payable on 20th August. Remaining 1 installment of USD 10,000,000
# Foreign Currency Loans is hedged by way of Currency and Interest Rate Swaps
- Effective cost has been calculated with hedged cost in terms of foreign currency loan.
Effective cost for the above loan is 8.23% per annum.
249Integrated Annual Report 2020-21
Integrated ReportStatutory Reports
Financial statements
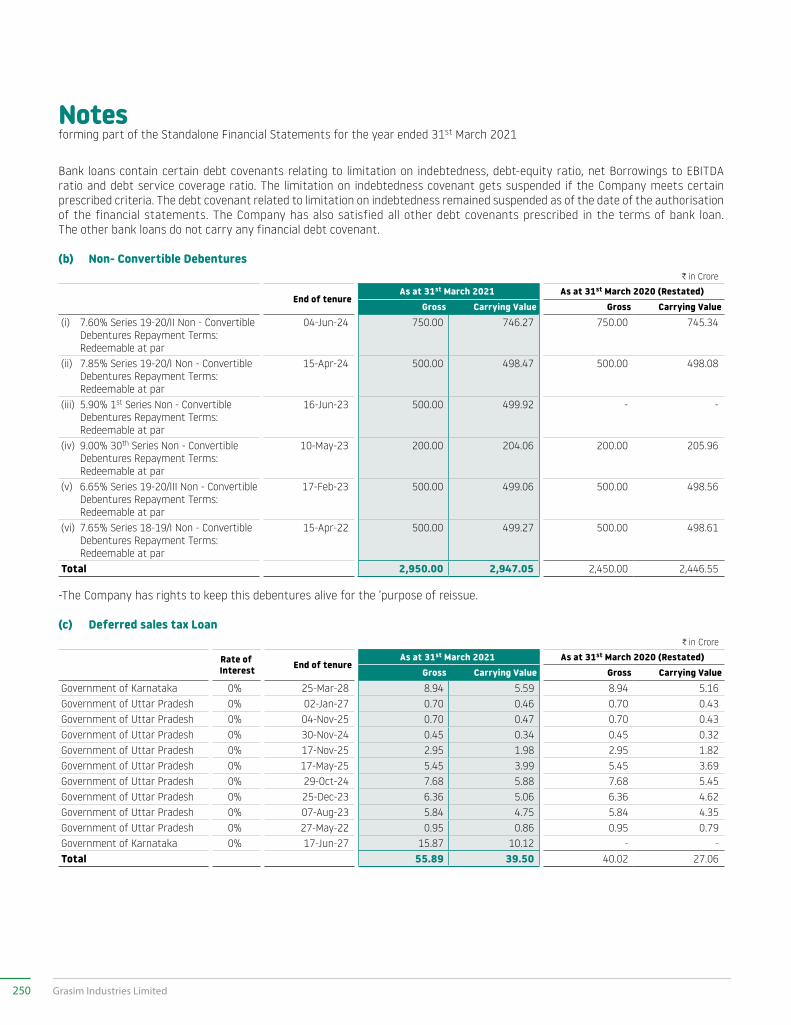
Notesforming part of the Standalone Financial Statements for the year ended 31st March 2021
Bank loans contain certain debt covenants relating to limitation on indebtedness, debt-equity ratio, net Borrowings to EBITDA ratio and debt service coverage ratio. The limitation on indebtedness covenant gets suspended if the Company meets certain prescribed criteria. The debt covenant related to limitation on indebtedness remained suspended as of the date of the authorisation of the financial statements. The Company has also satisfied all other debt covenants prescribed in the terms of bank loan. The other bank loans do not carry any financial debt covenant.
(b) Non- Convertible DebenturesC in Crore
End of tenure As at 31st March 2021 As at 31st March 2020 (Restated)
Gross Carrying Value Gross Carrying Value(i) 7.60% Series 19-20/II Non - Convertible
Debentures Repayment Terms: Redeemable at par
04-Jun-24 750.00 746.27 750.00 745.34
(ii) 7.85% Series 19-20/I Non - Convertible Debentures Repayment Terms: Redeemable at par
15-Apr-24 500.00 498.47 500.00 498.08
(iii) 5.90% 1st Series Non - Convertible Debentures Repayment Terms: Redeemable at par
16-Jun-23 500.00 499.92 - -
(iv) 9.00% 30th Series Non - Convertible Debentures Repayment Terms: Redeemable at par
10-May-23 200.00 204.06 200.00 205.96
(v) 6.65% Series 19-20/III Non - Convertible Debentures Repayment Terms: Redeemable at par
17-Feb-23 500.00 499.06 500.00 498.56
(vi) 7.65% Series 18-19/I Non - Convertible Debentures Repayment Terms: Redeemable at par
15-Apr-22 500.00 499.27 500.00 498.61
Total 2,950.00 2,947.05 2,450.00 2,446.55
-The Company has rights to keep this debentures alive for the ‘purpose of reissue.
(c) Deferred sales tax LoanC in Crore
Rate of Interest End of tenure
As at 31st March 2021 As at 31st March 2020 (Restated) Gross Carrying Value Gross Carrying Value
Government of Karnataka 0% 25-Mar-28 8.94 5.59 8.94 5.16 Government of Uttar Pradesh 0% 02-Jan-27 0.70 0.46 0.70 0.43 Government of Uttar Pradesh 0% 04-Nov-25 0.70 0.47 0.70 0.43 Government of Uttar Pradesh 0% 30-Nov-24 0.45 0.34 0.45 0.32 Government of Uttar Pradesh 0% 17-Nov-25 2.95 1.98 2.95 1.82 Government of Uttar Pradesh 0% 17-May-25 5.45 3.99 5.45 3.69 Government of Uttar Pradesh 0% 29-Oct-24 7.68 5.88 7.68 5.45 Government of Uttar Pradesh 0% 25-Dec-23 6.36 5.06 6.36 4.62 Government of Uttar Pradesh 0% 07-Aug-23 5.84 4.75 5.84 4.35 Government of Uttar Pradesh 0% 27-May-22 0.95 0.86 0.95 0.79 Government of Karnataka 0% 17-Jun-27 15.87 10.12 - - Total 55.89 39.50 40.02 27.06
250 Grasim Industries Limited
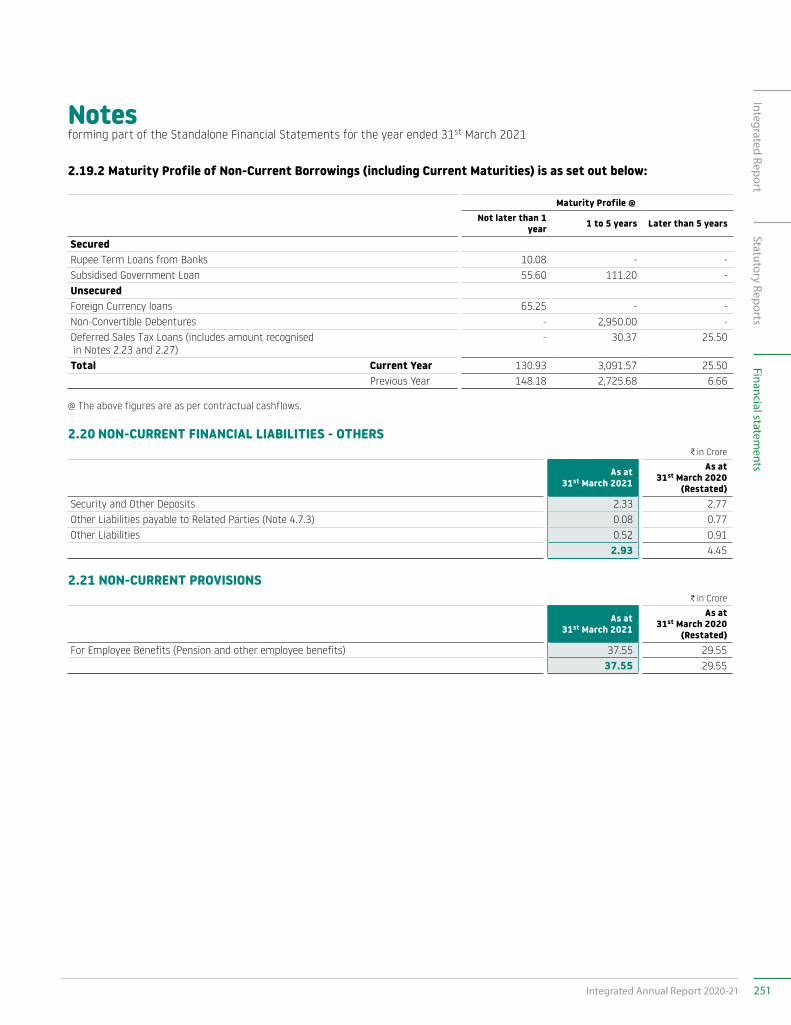
Notesforming part of the Standalone Financial Statements for the year ended 31st March 2021
2.19.2 Maturity Profile of Non-Current Borrowings (including Current Maturities) is as set out below:
Maturity Profile @ Not later than 1
year 1 to 5 years Later than 5 years
SecuredRupee Term Loans from Banks 10.08 - - Subsidised Government Loan 55.60 111.20 - UnsecuredForeign Currency loans 65.25 - - Non-Convertible Debentures - 2,950.00 - Deferred Sales Tax Loans (includes amount recognised in Notes 2.23 and 2.27)
- 30.37 25.50
Total Current Year 130.93 3,091.57 25.50 Previous Year 148.18 2,725.68 6.66
@ The above figures are as per contractual cashflows.
2.20 NON-CURRENT FINANCIAL LIABILITIES - OTHERSC in Crore
As at 31st March 2021
As at 31st March 2020
(Restated)Security and Other Deposits 2.33 2.77 Other Liabilities payable to Related Parties (Note 4.7.3) 0.08 0.77 Other Liabilities 0.52 0.91
2.93 4.45
2.21 NON-CURRENT PROVISIONSC in Crore
As at 31st March 2021
As at 31st March 2020
(Restated)For Employee Benefits (Pension and other employee benefits) 37.55 29.55
37.55 29.55
251Integrated Annual Report 2020-21
Integrated ReportStatutory Reports
Financial statements
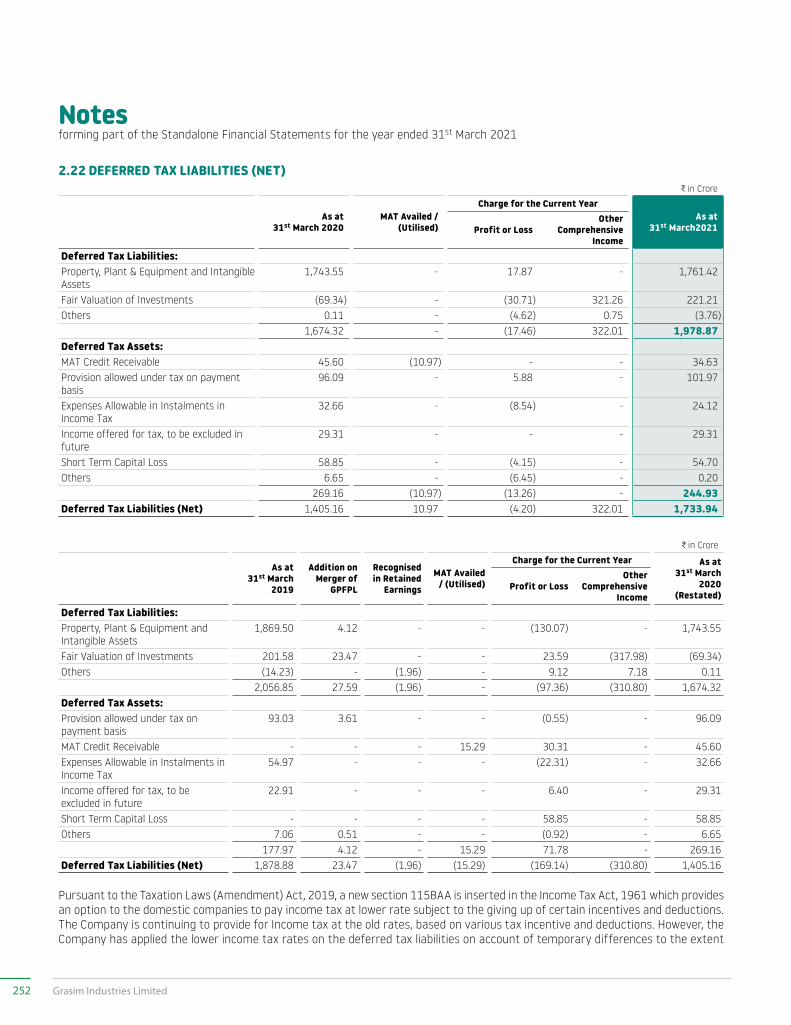
Notesforming part of the Standalone Financial Statements for the year ended 31st March 2021
2.22 DEFERRED TAX LIABILITIES (NET)C in Crore
As at 31st March 2020
MAT Availed / (Utilised)
Charge for the Current Year As at
31st March2021 Profit or LossOther
Comprehensive Income
Deferred Tax Liabilities:Property, Plant & Equipment and Intangible Assets
1,743.55 - 17.87 - 1,761.42
Fair Valuation of Investments (69.34) - (30.71) 321.26 221.21Others 0.11 - (4.62) 0.75 (3.76)
1,674.32 - (17.46) 322.01 1,978.87Deferred Tax Assets:MAT Credit Receivable 45.60 (10.97) - - 34.63Provision allowed under tax on payment basis
96.09 - 5.88 - 101.97
Expenses Allowable in Instalments in Income Tax
32.66 - (8.54) - 24.12
Income offered for tax, to be excluded in future
29.31 - - - 29.31
Short Term Capital Loss 58.85 - (4.15) - 54.70 Others 6.65 - (6.45) - 0.20
269.16 (10.97) (13.26) - 244.93Deferred Tax Liabilities (Net) 1,405.16 10.97 (4.20) 322.01 1,733.94
C in Crore
As at 31st March
2019
Addition on Merger of
GPFPL
Recognised in Retained
Earnings
MAT Availed / (Utilised)
Charge for the Current Year As at 31st March
2020 (Restated)
Profit or LossOther
Comprehensive Income
Deferred Tax Liabilities:Property, Plant & Equipment and Intangible Assets
1,869.50 4.12 - - (130.07) - 1,743.55
Fair Valuation of Investments 201.58 23.47 - - 23.59 (317.98) (69.34)Others (14.23) - (1.96) - 9.12 7.18 0.11
2,056.85 27.59 (1.96) - (97.36) (310.80) 1,674.32Deferred Tax Assets:Provision allowed under tax on payment basis
93.03 3.61 - - (0.55) - 96.09
MAT Credit Receivable - - - 15.29 30.31 - 45.60Expenses Allowable in Instalments in Income Tax
54.97 - - - (22.31) - 32.66
Income offered for tax, to be excluded in future
22.91 - - - 6.40 - 29.31
Short Term Capital Loss - - - - 58.85 - 58.85 Others 7.06 0.51 - - (0.92) - 6.65
177.97 4.12 - 15.29 71.78 - 269.16Deferred Tax Liabilities (Net) 1,878.88 23.47 (1.96) (15.29) (169.14) (310.80) 1,405.16
Pursuant to the Taxation Laws (Amendment) Act, 2019, a new section 115BAA is inserted in the Income Tax Act, 1961 which provides an option to the domestic companies to pay income tax at lower rate subject to the giving up of certain incentives and deductions. The Company is continuing to provide for Income tax at the old rates, based on various tax incentive and deductions. However, the Company has applied the lower income tax rates on the deferred tax liabilities on account of temporary differences to the extent
252 Grasim Industries Limited
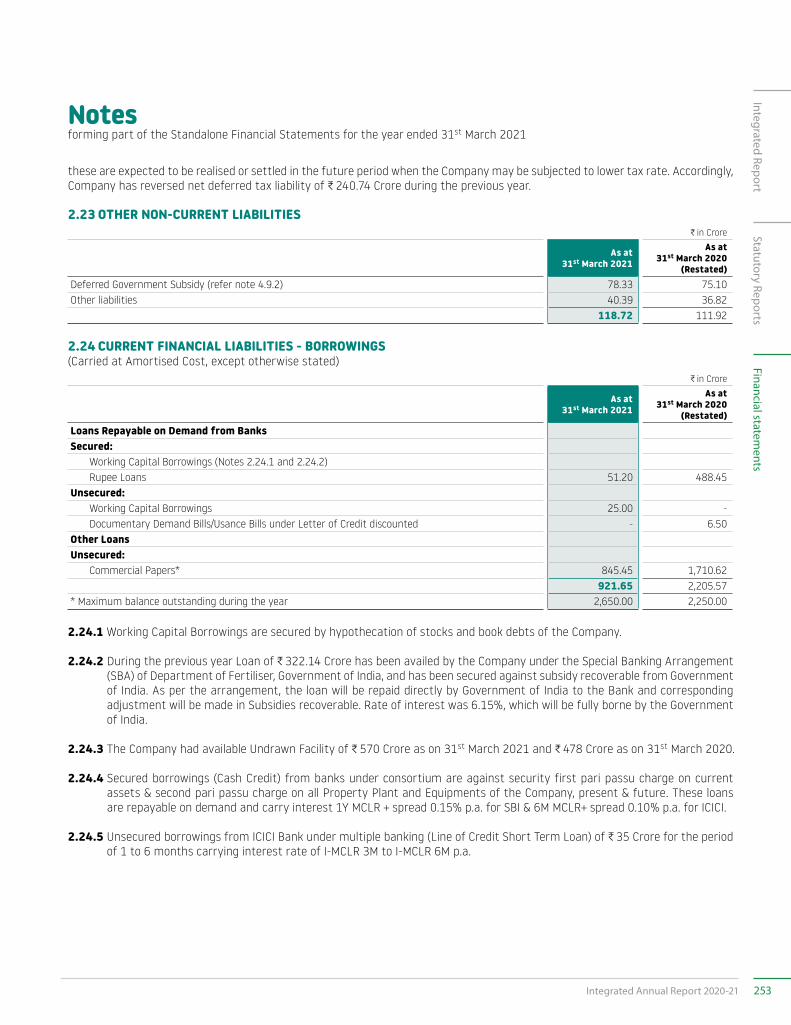
Notesforming part of the Standalone Financial Statements for the year ended 31st March 2021
these are expected to be realised or settled in the future period when the Company may be subjected to lower tax rate. Accordingly, Company has reversed net deferred tax liability of C 240.74 Crore during the previous year.
2.23 OTHER NON-CURRENT LIABILITIESC in Crore
As at 31st March 2021
As at 31st March 2020
(Restated)Deferred Government Subsidy (refer note 4.9.2) 78.33 75.10 Other liabilities 40.39 36.82
118.72 111.92
2.24 CURRENT FINANCIAL LIABILITIES - BORROWINGS(Carried at Amortised Cost, except otherwise stated)
C in Crore
As at 31st March 2021
As at 31st March 2020
(Restated)Loans Repayable on Demand from BanksSecured: Working Capital Borrowings (Notes 2.24.1 and 2.24.2) Rupee Loans 51.20 488.45 Unsecured: Working Capital Borrowings 25.00 - Documentary Demand Bills/Usance Bills under Letter of Credit discounted - 6.50 Other Loans Unsecured: Commercial Papers* 845.45 1,710.62
921.65 2,205.57 * Maximum balance outstanding during the year 2,650.00 2,250.00
2.24.1 Working Capital Borrowings are secured by hypothecation of stocks and book debts of the Company.
2.24.2 During the previous year Loan of C 322.14 Crore has been availed by the Company under the Special Banking Arrangement (SBA) of Department of Fertiliser, Government of India, and has been secured against subsidy recoverable from Government of India. As per the arrangement, the loan will be repaid directly by Government of India to the Bank and corresponding adjustment will be made in Subsidies recoverable. Rate of interest was 6.15%, which will be fully borne by the Government of India.
2.24.3 The Company had available Undrawn Facility of C 570 Crore as on 31st March 2021 and C 478 Crore as on 31st March 2020.
2.24.4 Secured borrowings (Cash Credit) from banks under consortium are against security first pari passu charge on current assets & second pari passu charge on all Property Plant and Equipments of the Company, present & future. These loans are repayable on demand and carry interest 1Y MCLR + spread 0.15% p.a. for SBI & 6M MCLR+ spread 0.10% p.a. for ICICI.
2.24.5 Unsecured borrowings from ICICI Bank under multiple banking (Line of Credit Short Term Loan) of C 35 Crore for the period of 1 to 6 months carrying interest rate of I-MCLR 3M to I-MCLR 6M p.a.
253Integrated Annual Report 2020-21
Integrated ReportStatutory Reports
Financial statements
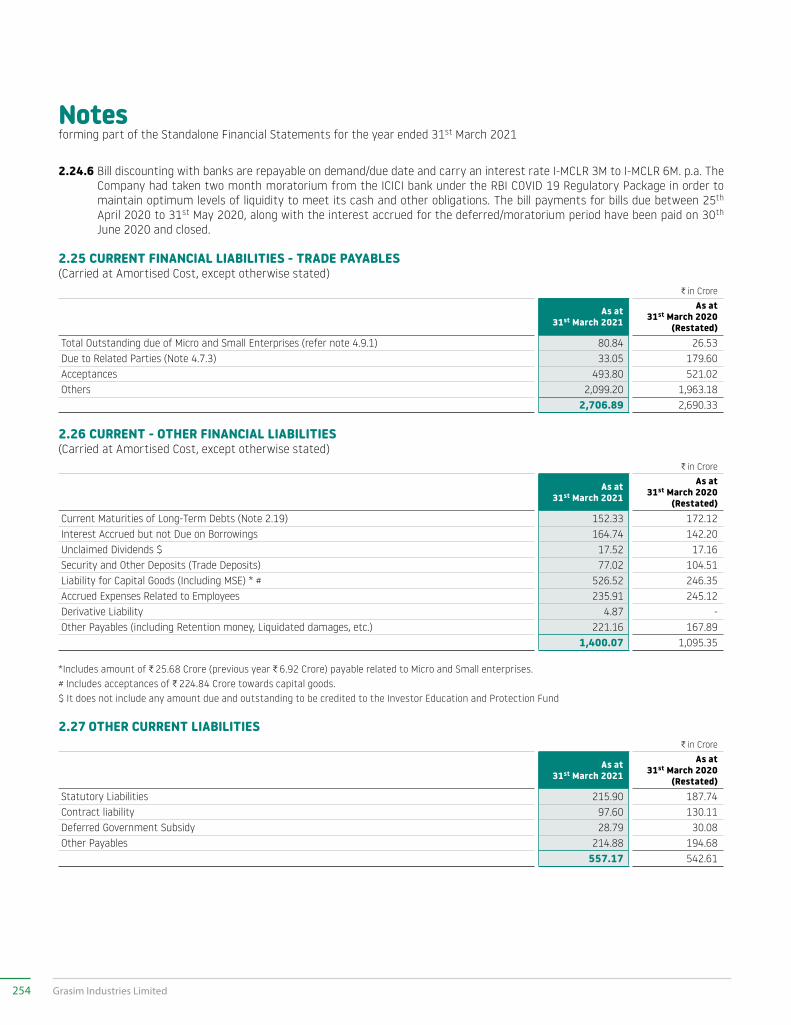
Notesforming part of the Standalone Financial Statements for the year ended 31st March 2021
2.24.6 Bill discounting with banks are repayable on demand/due date and carry an interest rate I-MCLR 3M to I-MCLR 6M. p.a. The Company had taken two month moratorium from the ICICI bank under the RBI COVID 19 Regulatory Package in order to maintain optimum levels of liquidity to meet its cash and other obligations. The bill payments for bills due between 25th April 2020 to 31st May 2020, along with the interest accrued for the deferred/moratorium period have been paid on 30th June 2020 and closed.
2.25 CURRENT FINANCIAL LIABILITIES - TRADE PAYABLES(Carried at Amortised Cost, except otherwise stated)
C in Crore
As at 31st March 2021
As at 31st March 2020
(Restated)Total Outstanding due of Micro and Small Enterprises (refer note 4.9.1) 80.84 26.53 Due to Related Parties (Note 4.7.3) 33.05 179.60 Acceptances 493.80 521.02 Others 2,099.20 1,963.18
2,706.89 2,690.33
2.26 CURRENT - OTHER FINANCIAL LIABILITIES(Carried at Amortised Cost, except otherwise stated)
C in Crore
As at 31st March 2021
As at 31st March 2020
(Restated)Current Maturities of Long-Term Debts (Note 2.19) 152.33 172.12 Interest Accrued but not Due on Borrowings 164.74 142.20 Unclaimed Dividends $ 17.52 17.16 Security and Other Deposits (Trade Deposits) 77.02 104.51 Liability for Capital Goods (Including MSE) * # 526.52 246.35 Accrued Expenses Related to Employees 235.91 245.12 Derivative Liability 4.87 - Other Payables (including Retention money, Liquidated damages, etc.) 221.16 167.89
1,400.07 1,095.35
*Includes amount of C 25.68 Crore (previous year C 6.92 Crore) payable related to Micro and Small enterprises. # Includes acceptances of C 224.84 Crore towards capital goods. $ It does not include any amount due and outstanding to be credited to the Investor Education and Protection Fund
2.27 OTHER CURRENT LIABILITIESC in Crore
As at 31st March 2021
As at 31st March 2020
(Restated)Statutory Liabilities 215.90 187.74 Contract liability 97.60 130.11 Deferred Government Subsidy 28.79 30.08 Other Payables 214.88 194.68
557.17 542.61
254 Grasim Industries Limited
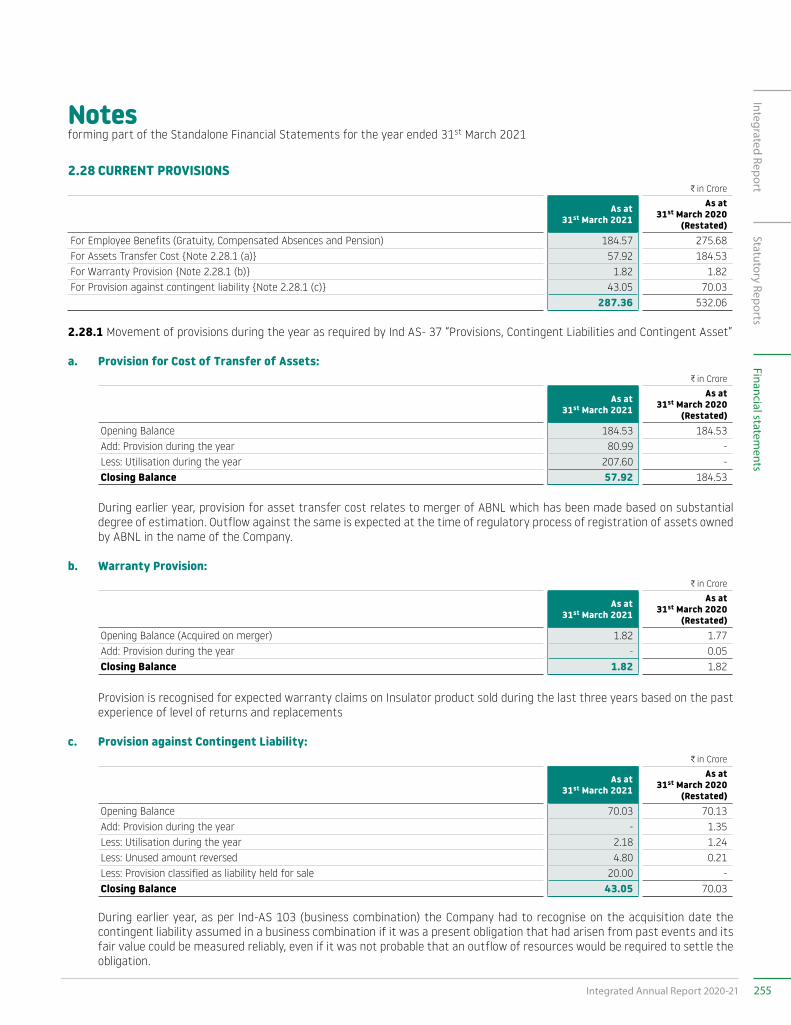
Notesforming part of the Standalone Financial Statements for the year ended 31st March 2021
2.28 CURRENT PROVISIONSC in Crore
As at 31st March 2021
As at 31st March 2020
(Restated)For Employee Benefits (Gratuity, Compensated Absences and Pension) 184.57 275.68 For Assets Transfer Cost {Note 2.28.1 (a)} 57.92 184.53 For Warranty Provision {Note 2.28.1 (b)} 1.82 1.82 For Provision against contingent liability {Note 2.28.1 (c)} 43.05 70.03
287.36 532.06
2.28.1 Movement of provisions during the year as required by Ind AS- 37 “Provisions, Contingent Liabilities and Contingent Asset”
a. Provision for Cost of Transfer of Assets:C in Crore
As at 31st March 2021
As at 31st March 2020
(Restated)Opening Balance 184.53 184.53 Add: Provision during the year 80.99 - Less: Utilisation during the year 207.60 - Closing Balance 57.92 184.53
During earlier year, provision for asset transfer cost relates to merger of ABNL which has been made based on substantial degree of estimation. Outflow against the same is expected at the time of regulatory process of registration of assets owned by ABNL in the name of the Company.
b. Warranty Provision:C in Crore
As at 31st March 2021
As at 31st March 2020
(Restated)Opening Balance (Acquired on merger) 1.82 1.77 Add: Provision during the year - 0.05 Closing Balance 1.82 1.82
Provision is recognised for expected warranty claims on Insulator product sold during the last three years based on the past experience of level of returns and replacements
c. Provision against Contingent Liability:C in Crore
As at 31st March 2021
As at 31st March 2020
(Restated)Opening Balance 70.03 70.13 Add: Provision during the year - 1.35 Less: Utilisation during the year 2.18 1.24 Less: Unused amount reversed 4.80 0.21 Less: Provision classified as liability held for sale 20.00 - Closing Balance 43.05 70.03
During earlier year, as per Ind-AS 103 (business combination) the Company had to recognise on the acquisition date the contingent liability assumed in a business combination if it was a present obligation that had arisen from past events and its fair value could be measured reliably, even if it was not probable that an outflow of resources would be required to settle the obligation.
255Integrated Annual Report 2020-21
Integrated ReportStatutory Reports
Financial statements
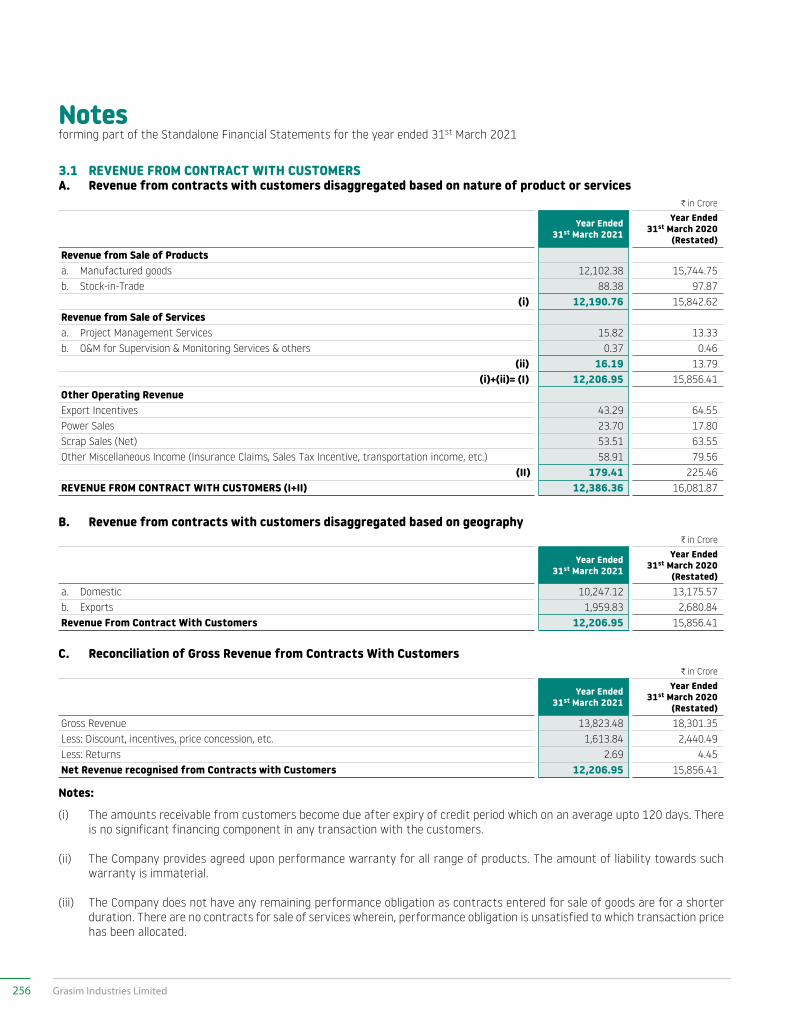
Notesforming part of the Standalone Financial Statements for the year ended 31st March 2021
3.1 REVENUE FROM CONTRACT WITH CUSTOMERSA. Revenue from contracts with customers disaggregated based on nature of product or services
C in Crore
Year Ended 31st March 2021
Year Ended 31st March 2020
(Restated)Revenue from Sale of Productsa. Manufactured goods 12,102.38 15,744.75 b. Stock-in-Trade 88.38 97.87
(i) 12,190.76 15,842.62 Revenue from Sale of Servicesa. Project Management Services 15.82 13.33 b. O&M for Supervision & Monitoring Services & others 0.37 0.46
(ii) 16.19 13.79 (i)+(ii)= (I) 12,206.95 15,856.41
Other Operating RevenueExport Incentives 43.29 64.55 Power Sales 23.70 17.80 Scrap Sales (Net) 53.51 63.55 Other Miscellaneous Income (Insurance Claims, Sales Tax Incentive, transportation income, etc.) 58.91 79.56
(II) 179.41 225.46 REVENUE FROM CONTRACT WITH CUSTOMERS (I+II) 12,386.36 16,081.87
B. Revenue from contracts with customers disaggregated based on geographyC in Crore
Year Ended 31st March 2021
Year Ended 31st March 2020
(Restated)a. Domestic 10,247.12 13,175.57 b. Exports 1,959.83 2,680.84 Revenue From Contract With Customers 12,206.95 15,856.41
C. Reconciliation of Gross Revenue from Contracts With CustomersC in Crore
Year Ended 31st March 2021
Year Ended 31st March 2020
(Restated)Gross Revenue 13,823.48 18,301.35 Less: Discount, incentives, price concession, etc. 1,613.84 2,440.49 Less: Returns 2.69 4.45 Net Revenue recognised from Contracts with Customers 12,206.95 15,856.41
Notes:
(i) The amounts receivable from customers become due after expiry of credit period which on an average upto 120 days. There is no significant financing component in any transaction with the customers.
(ii) The Company provides agreed upon performance warranty for all range of products. The amount of liability towards such warranty is immaterial.
(iii) The Company does not have any remaining performance obligation as contracts entered for sale of goods are for a shorter duration. There are no contracts for sale of services wherein, performance obligation is unsatisfied to which transaction price has been allocated.
256 Grasim Industries Limited
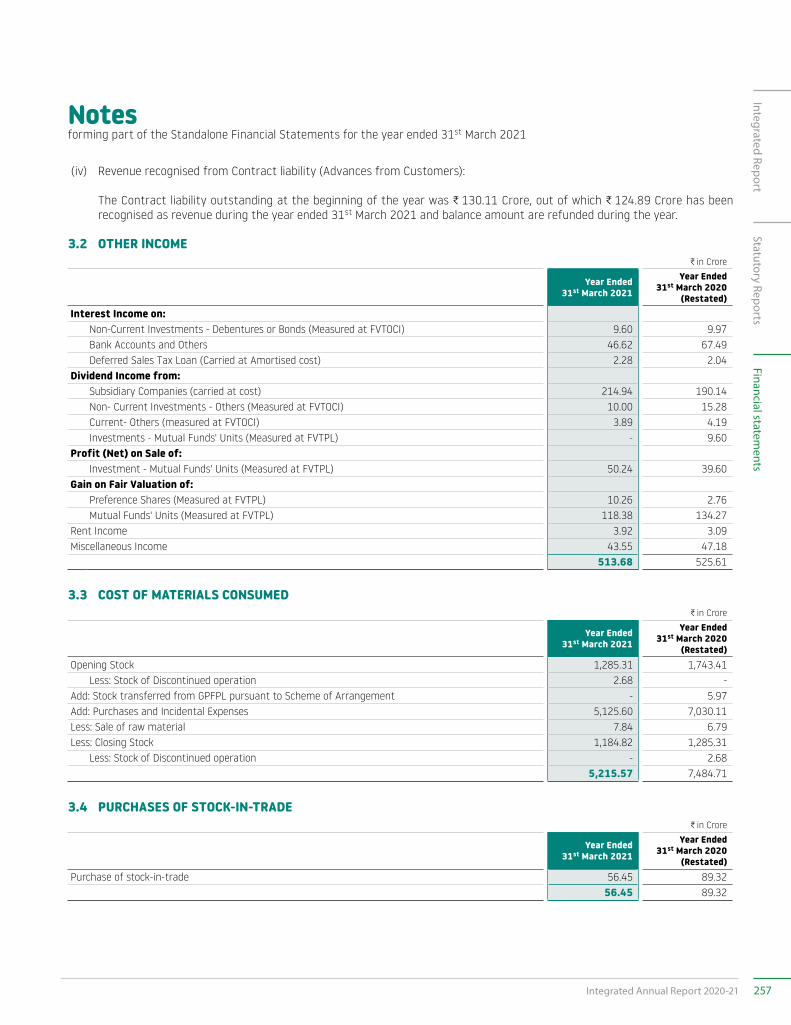
Notesforming part of the Standalone Financial Statements for the year ended 31st March 2021
(iv) Revenue recognised from Contract liability (Advances from Customers):
The Contract liability outstanding at the beginning of the year was C 130.11 Crore, out of which C 124.89 Crore has been recognised as revenue during the year ended 31st March 2021 and balance amount are refunded during the year.
3.2 OTHER INCOMEC in Crore
Year Ended 31st March 2021
Year Ended 31st March 2020
(Restated)Interest Income on:
Non-Current Investments - Debentures or Bonds (Measured at FVTOCI) 9.60 9.97 Bank Accounts and Others 46.62 67.49 Deferred Sales Tax Loan (Carried at Amortised cost) 2.28 2.04
Dividend Income from:Subsidiary Companies (carried at cost) 214.94 190.14 Non- Current Investments - Others (Measured at FVTOCI) 10.00 15.28 Current- Others (measured at FVTOCI) 3.89 4.19 Investments - Mutual Funds' Units (Measured at FVTPL) - 9.60
Profit (Net) on Sale of:Investment - Mutual Funds' Units (Measured at FVTPL) 50.24 39.60
Gain on Fair Valuation of:Preference Shares (Measured at FVTPL) 10.26 2.76 Mutual Funds' Units (Measured at FVTPL) 118.38 134.27
Rent Income 3.92 3.09 Miscellaneous Income 43.55 47.18
513.68 525.61
3.3 COST OF MATERIALS CONSUMEDC in Crore
Year Ended 31st March 2021
Year Ended 31st March 2020
(Restated)Opening Stock 1,285.31 1,743.41 Less: Stock of Discontinued operation 2.68 -Add: Stock transferred from GPFPL pursuant to Scheme of Arrangement - 5.97 Add: Purchases and Incidental Expenses 5,125.60 7,030.11 Less: Sale of raw material 7.84 6.79 Less: Closing Stock 1,184.82 1,285.31 Less: Stock of Discontinued operation - 2.68
5,215.57 7,484.71
3.4 PURCHASES OF STOCK-IN-TRADEC in Crore
Year Ended 31st March 2021
Year Ended 31st March 2020
(Restated)Purchase of stock-in-trade 56.45 89.32
56.45 89.32
257Integrated Annual Report 2020-21
Integrated ReportStatutory Reports
Financial statements
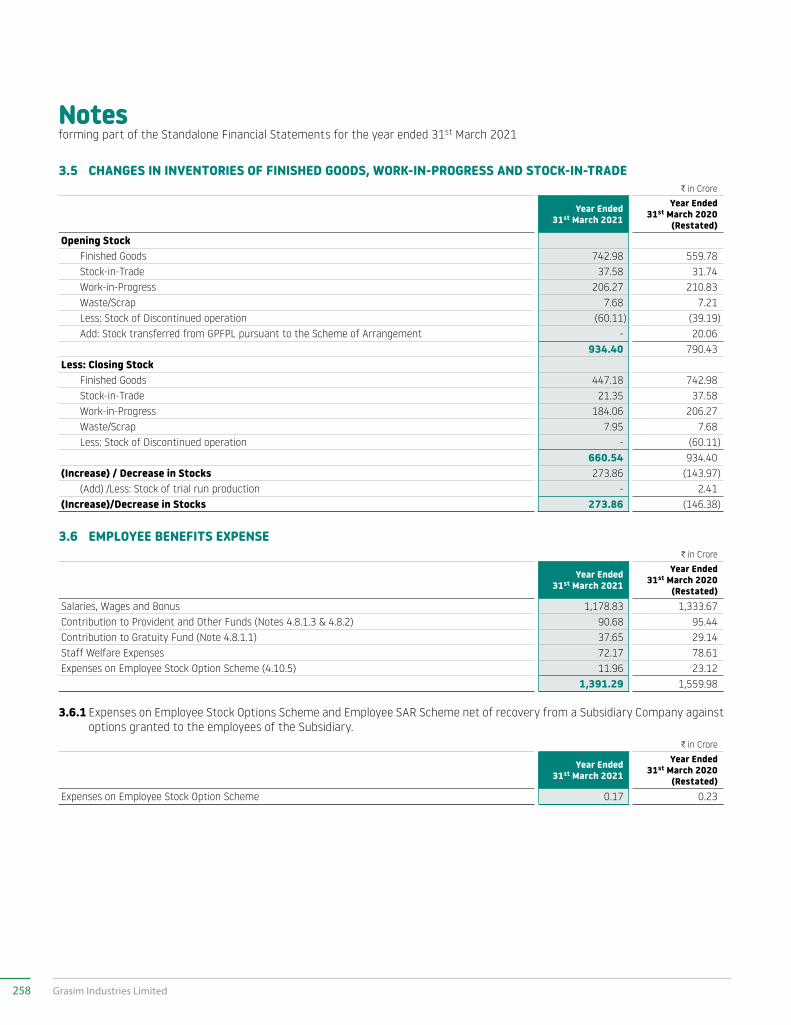
Notesforming part of the Standalone Financial Statements for the year ended 31st March 2021
3.5 CHANGES IN INVENTORIES OF FINISHED GOODS, WORK-IN-PROGRESS AND STOCK-IN-TRADEC in Crore
Year Ended 31st March 2021
Year Ended 31st March 2020
(Restated)Opening Stock
Finished Goods 742.98 559.78 Stock-in-Trade 37.58 31.74 Work-in-Progress 206.27 210.83 Waste/Scrap 7.68 7.21 Less: Stock of Discontinued operation (60.11) (39.19)Add: Stock transferred from GPFPL pursuant to the Scheme of Arrangement - 20.06
934.40 790.43 Less: Closing Stock
Finished Goods 447.18 742.98 Stock-in-Trade 21.35 37.58 Work-in-Progress 184.06 206.27 Waste/Scrap 7.95 7.68 Less: Stock of Discontinued operation - (60.11)
660.54 934.40 (Increase) / Decrease in Stocks 273.86 (143.97)
(Add) /Less: Stock of trial run production - 2.41 (Increase)/Decrease in Stocks 273.86 (146.38)
3.6 EMPLOYEE BENEFITS EXPENSEC in Crore
Year Ended 31st March 2021
Year Ended 31st March 2020
(Restated)Salaries, Wages and Bonus 1,178.83 1,333.67 Contribution to Provident and Other Funds (Notes 4.8.1.3 & 4.8.2) 90.68 95.44 Contribution to Gratuity Fund (Note 4.8.1.1) 37.65 29.14 Staff Welfare Expenses 72.17 78.61 Expenses on Employee Stock Option Scheme (4.10.5) 11.96 23.12
1,391.29 1,559.98
3.6.1 Expenses on Employee Stock Options Scheme and Employee SAR Scheme net of recovery from a Subsidiary Company against options granted to the employees of the Subsidiary.
C in Crore
Year Ended 31st March 2021
Year Ended 31st March 2020
(Restated)Expenses on Employee Stock Option Scheme 0.17 0.23
258 Grasim Industries Limited
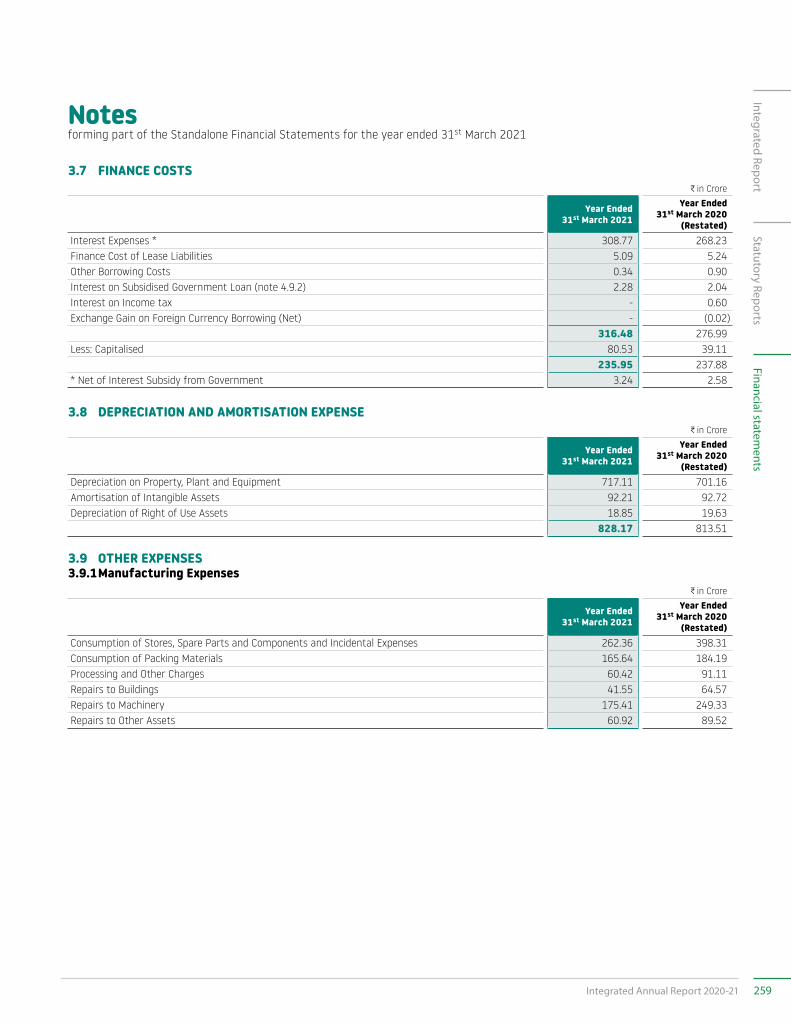
Notesforming part of the Standalone Financial Statements for the year ended 31st March 2021
3.7 FINANCE COSTSC in Crore
Year Ended 31st March 2021
Year Ended 31st March 2020
(Restated)Interest Expenses * 308.77 268.23 Finance Cost of Lease Liabilities 5.09 5.24 Other Borrowing Costs 0.34 0.90 Interest on Subsidised Government Loan (note 4.9.2) 2.28 2.04 Interest on Income tax - 0.60 Exchange Gain on Foreign Currency Borrowing (Net) - (0.02)
316.48 276.99 Less: Capitalised 80.53 39.11
235.95 237.88 * Net of Interest Subsidy from Government 3.24 2.58
3.8 DEPRECIATION AND AMORTISATION EXPENSEC in Crore
Year Ended 31st March 2021
Year Ended 31st March 2020
(Restated)Depreciation on Property, Plant and Equipment 717.11 701.16 Amortisation of Intangible Assets 92.21 92.72 Depreciation of Right of Use Assets 18.85 19.63
828.17 813.51
3.9 OTHER EXPENSES 3.9.1 Manufacturing Expenses
C in Crore
Year Ended 31st March 2021
Year Ended 31st March 2020
(Restated)Consumption of Stores, Spare Parts and Components and Incidental Expenses 262.36 398.31 Consumption of Packing Materials 165.64 184.19 Processing and Other Charges 60.42 91.11 Repairs to Buildings 41.55 64.57 Repairs to Machinery 175.41 249.33 Repairs to Other Assets 60.92 89.52
259Integrated Annual Report 2020-21
Integrated ReportStatutory Reports
Financial statements
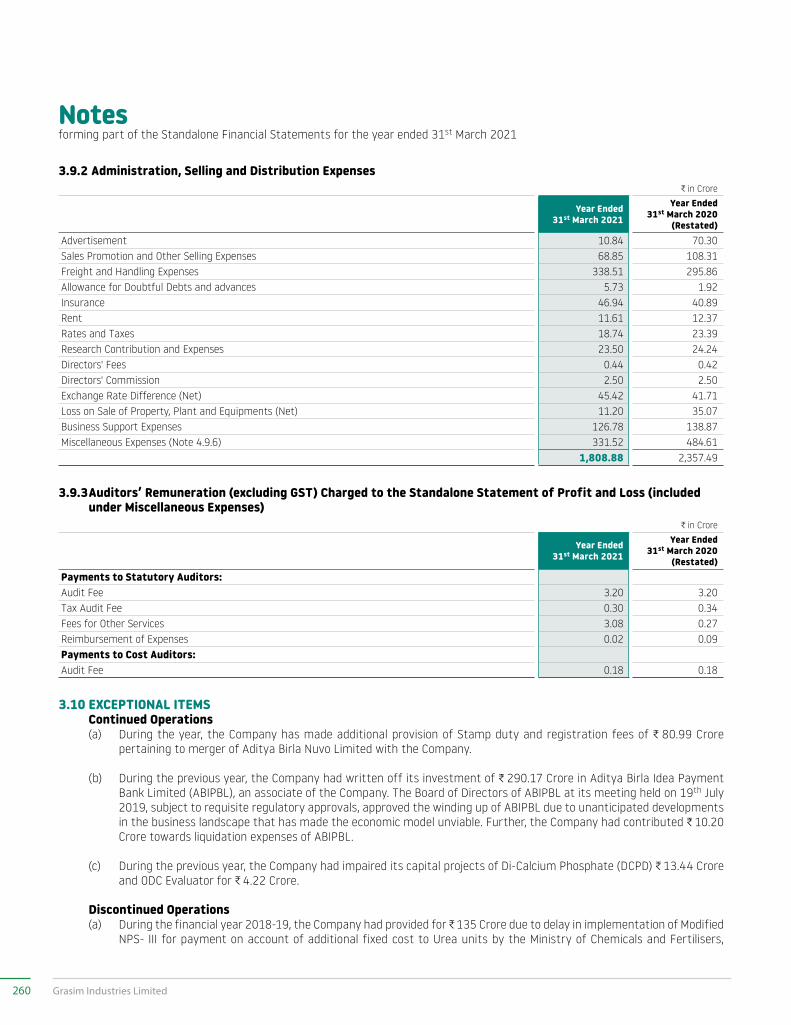
Notesforming part of the Standalone Financial Statements for the year ended 31st March 2021
3.9.2 Administration, Selling and Distribution ExpensesC in Crore
Year Ended 31st March 2021
Year Ended 31st March 2020
(Restated)Advertisement 10.84 70.30 Sales Promotion and Other Selling Expenses 68.85 108.31 Freight and Handling Expenses 338.51 295.86 Allowance for Doubtful Debts and advances 5.73 1.92 Insurance 46.94 40.89 Rent 11.61 12.37 Rates and Taxes 18.74 23.39 Research Contribution and Expenses 23.50 24.24 Directors' Fees 0.44 0.42 Directors' Commission 2.50 2.50 Exchange Rate Difference (Net) 45.42 41.71 Loss on Sale of Property, Plant and Equipments (Net) 11.20 35.07 Business Support Expenses 126.78 138.87 Miscellaneous Expenses (Note 4.9.6) 331.52 484.61
1,808.88 2,357.49
3.9.3 Auditors’ Remuneration (excluding GST) Charged to the Standalone Statement of Profit and Loss (included under Miscellaneous Expenses)
C in Crore
Year Ended 31st March 2021
Year Ended 31st March 2020
(Restated)Payments to Statutory Auditors:Audit Fee 3.20 3.20 Tax Audit Fee 0.30 0.34 Fees for Other Services 3.08 0.27 Reimbursement of Expenses 0.02 0.09 Payments to Cost Auditors:Audit Fee 0.18 0.18
3.10 EXCEPTIONAL ITEMS Continued Operations (a) During the year, the Company has made additional provision of Stamp duty and registration fees of C 80.99 Crore
pertaining to merger of Aditya Birla Nuvo Limited with the Company.
(b) During the previous year, the Company had written off its investment of C 290.17 Crore in Aditya Birla Idea Payment Bank Limited (ABIPBL), an associate of the Company. The Board of Directors of ABIPBL at its meeting held on 19th July 2019, subject to requisite regulatory approvals, approved the winding up of ABIPBL due to unanticipated developments in the business landscape that has made the economic model unviable. Further, the Company had contributed C 10.20 Crore towards liquidation expenses of ABIPBL.
(c) During the previous year, the Company had impaired its capital projects of Di-Calcium Phosphate (DCPD) C 13.44 Crore and ODC Evaluator for C 4.22 Crore.
Discontinued Operations (a) During the financial year 2018-19, the Company had provided for C 135 Crore due to delay in implementation of Modified
NPS- III for payment on account of additional fixed cost to Urea units by the Ministry of Chemicals and Fertilisers,
260 Grasim Industries Limited
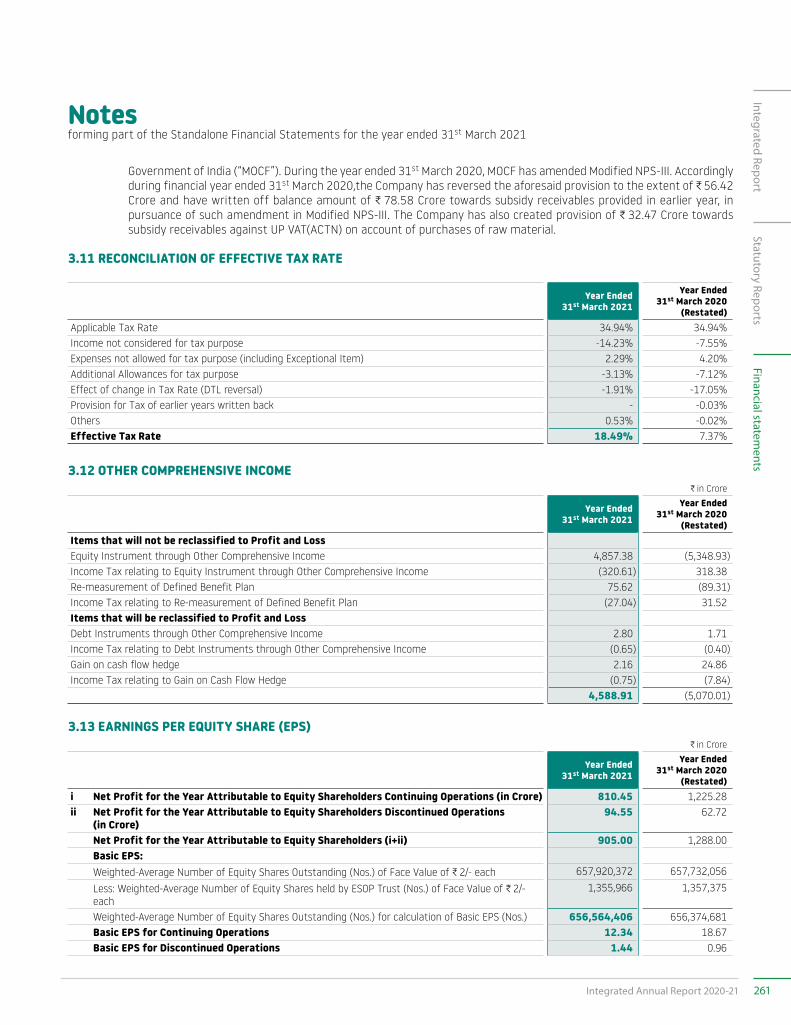
Notesforming part of the Standalone Financial Statements for the year ended 31st March 2021
Government of India (“MOCF”). During the year ended 31st March 2020, MOCF has amended Modified NPS-III. Accordingly during financial year ended 31st March 2020,the Company has reversed the aforesaid provision to the extent of C 56.42 Crore and have written off balance amount of C 78.58 Crore towards subsidy receivables provided in earlier year, in pursuance of such amendment in Modified NPS-III. The Company has also created provision of C 32.47 Crore towards subsidy receivables against UP VAT(ACTN) on account of purchases of raw material.
3.11 RECONCILIATION OF EFFECTIVE TAX RATE
Year Ended 31st March 2021
Year Ended 31st March 2020
(Restated)Applicable Tax Rate 34.94% 34.94%Income not considered for tax purpose -14.23% -7.55%Expenses not allowed for tax purpose (including Exceptional Item) 2.29% 4.20%Additional Allowances for tax purpose -3.13% -7.12%Effect of change in Tax Rate (DTL reversal) -1.91% -17.05%Provision for Tax of earlier years written back - -0.03%Others 0.53% -0.02%Effective Tax Rate 18.49% 7.37%
3.12 OTHER COMPREHENSIVE INCOMEC in Crore
Year Ended 31st March 2021
Year Ended 31st March 2020
(Restated)Items that will not be reclassified to Profit and LossEquity Instrument through Other Comprehensive Income 4,857.38 (5,348.93)Income Tax relating to Equity Instrument through Other Comprehensive Income (320.61) 318.38 Re-measurement of Defined Benefit Plan 75.62 (89.31)Income Tax relating to Re-measurement of Defined Benefit Plan (27.04) 31.52 Items that will be reclassified to Profit and LossDebt Instruments through Other Comprehensive Income 2.80 1.71 Income Tax relating to Debt Instruments through Other Comprehensive Income (0.65) (0.40)Gain on cash flow hedge 2.16 24.86 Income Tax relating to Gain on Cash Flow Hedge (0.75) (7.84)
4,588.91 (5,070.01)
3.13 EARNINGS PER EQUITY SHARE (EPS)C in Crore
Year Ended 31st March 2021
Year Ended 31st March 2020
(Restated)i Net Profit for the Year Attributable to Equity Shareholders Continuing Operations (in Crore) 810.45 1,225.28 ii Net Profit for the Year Attributable to Equity Shareholders Discontinued Operations
(in Crore) 94.55 62.72
Net Profit for the Year Attributable to Equity Shareholders (i+ii) 905.00 1,288.00 Basic EPS:Weighted-Average Number of Equity Shares Outstanding (Nos.) of Face Value of C 2/- each 657,920,372 657,732,056
Less: Weighted-Average Number of Equity Shares held by ESOP Trust (Nos.) of Face Value of C 2/- each
1,355,966 1,357,375
Weighted-Average Number of Equity Shares Outstanding (Nos.) for calculation of Basic EPS (Nos.) 656,564,406 656,374,681 Basic EPS for Continuing Operations 12.34 18.67 Basic EPS for Discontinued Operations 1.44 0.96
261Integrated Annual Report 2020-21
Integrated ReportStatutory Reports
Financial statements
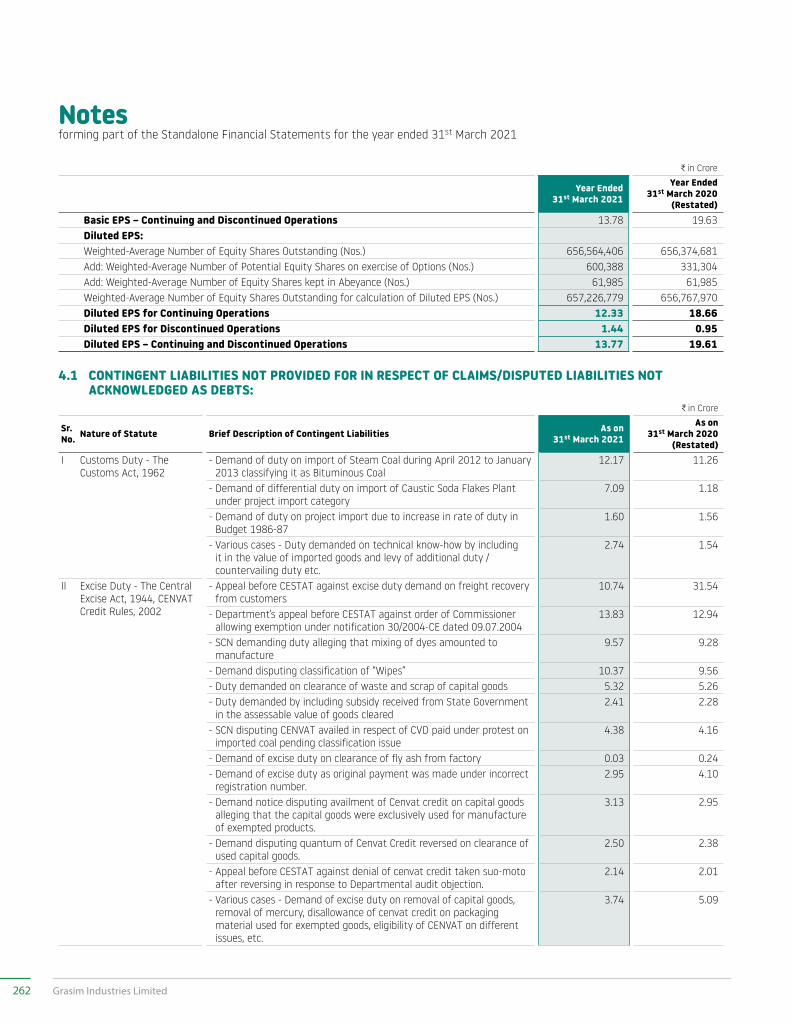
Notesforming part of the Standalone Financial Statements for the year ended 31st March 2021
C in Crore
Year Ended 31st March 2021
Year Ended 31st March 2020
(Restated)Basic EPS – Continuing and Discontinued Operations 13.78 19.63 Diluted EPS:Weighted-Average Number of Equity Shares Outstanding (Nos.) 656,564,406 656,374,681 Add: Weighted-Average Number of Potential Equity Shares on exercise of Options (Nos.) 600,388 331,304 Add: Weighted-Average Number of Equity Shares kept in Abeyance (Nos.) 61,985 61,985 Weighted-Average Number of Equity Shares Outstanding for calculation of Diluted EPS (Nos.) 657,226,779 656,767,970 Diluted EPS for Continuing Operations 12.33 18.66 Diluted EPS for Discontinued Operations 1.44 0.95 Diluted EPS – Continuing and Discontinued Operations 13.77 19.61
4.1 CONTINGENT LIABILITIES NOT PROVIDED FOR IN RESPECT OF CLAIMS/DISPUTED LIABILITIES NOT ACKNOWLEDGED AS DEBTS:
C in Crore
Sr. No. Nature of Statute Brief Description of Contingent Liabilities As on
31st March 2021
As on 31st March 2020
(Restated)I Customs Duty - The
Customs Act, 1962- Demand of duty on import of Steam Coal during April 2012 to January
2013 classifying it as Bituminous Coal12.17 11.26
- Demand of differential duty on import of Caustic Soda Flakes Plant under project import category
7.09 1.18
- Demand of duty on project import due to increase in rate of duty in Budget 1986-87
1.60 1.56
- Various cases - Duty demanded on technical know-how by including it in the value of imported goods and levy of additional duty / countervailing duty etc.
2.74 1.54
II Excise Duty - The Central Excise Act, 1944, CENVAT Credit Rules, 2002
- Appeal before CESTAT against excise duty demand on freight recovery from customers
10.74 31.54
- Department’s appeal before CESTAT against order of Commissioner allowing exemption under notification 30/2004-CE dated 09.07.2004
13.83 12.94
- SCN demanding duty alleging that mixing of dyes amounted to manufacture
9.57 9.28
- Demand disputing classification of “Wipes” 10.37 9.56- Duty demanded on clearance of waste and scrap of capital goods 5.32 5.26- Duty demanded by including subsidy received from State Government
in the assessable value of goods cleared2.41 2.28
- SCN disputing CENVAT availed in respect of CVD paid under protest on imported coal pending classification issue
4.38 4.16
- Demand of excise duty on clearance of fly ash from factory 0.03 0.24- Demand of excise duty as original payment was made under incorrect
registration number.2.95 4.10
- Demand notice disputing availment of Cenvat credit on capital goods alleging that the capital goods were exclusively used for manufacture of exempted products.
3.13 2.95
- Demand disputing quantum of Cenvat Credit reversed on clearance of used capital goods.
2.50 2.38
- Appeal before CESTAT against denial of cenvat credit taken suo-moto after reversing in response to Departmental audit objection.
2.14 2.01
- Various cases - Demand of excise duty on removal of capital goods, removal of mercury, disallowance of cenvat credit on packaging material used for exempted goods, eligibility of CENVAT on different issues, etc.
3.74 5.09
262 Grasim Industries Limited
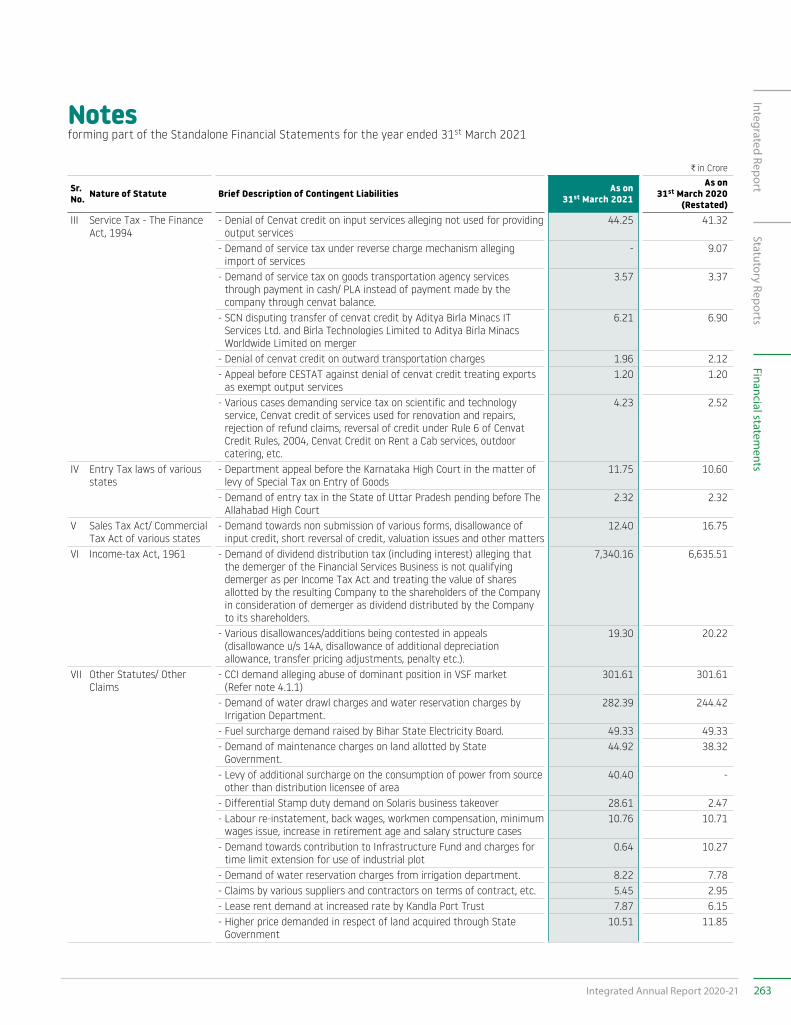
Notesforming part of the Standalone Financial Statements for the year ended 31st March 2021
C in Crore
Sr. No. Nature of Statute Brief Description of Contingent Liabilities As on
31st March 2021
As on 31st March 2020
(Restated)III Service Tax - The Finance
Act, 1994- Denial of Cenvat credit on input services alleging not used for providing
output services44.25 41.32
- Demand of service tax under reverse charge mechanism alleging import of services
- 9.07
- Demand of service tax on goods transportation agency services through payment in cash/ PLA instead of payment made by the company through cenvat balance.
3.57 3.37
- SCN disputing transfer of cenvat credit by Aditya Birla Minacs IT Services Ltd. and Birla Technologies Limited to Aditya Birla Minacs Worldwide Limited on merger
6.21 6.90
- Denial of cenvat credit on outward transportation charges 1.96 2.12- Appeal before CESTAT against denial of cenvat credit treating exports
as exempt output services1.20 1.20
- Various cases demanding service tax on scientific and technology service, Cenvat credit of services used for renovation and repairs, rejection of refund claims, reversal of credit under Rule 6 of Cenvat Credit Rules, 2004, Cenvat Credit on Rent a Cab services, outdoor catering, etc.
4.23 2.52
IV Entry Tax laws of various states
- Department appeal before the Karnataka High Court in the matter of levy of Special Tax on Entry of Goods
11.75 10.60
- Demand of entry tax in the State of Uttar Pradesh pending before The Allahabad High Court
2.32 2.32
V Sales Tax Act/ Commercial Tax Act of various states
- Demand towards non submission of various forms, disallowance of input credit, short reversal of credit, valuation issues and other matters
12.40 16.75
VI Income-tax Act, 1961 - Demand of dividend distribution tax (including interest) alleging that the demerger of the Financial Services Business is not qualifying demerger as per Income Tax Act and treating the value of shares allotted by the resulting Company to the shareholders of the Company in consideration of demerger as dividend distributed by the Company to its shareholders.
7,340.16 6,635.51
- Various disallowances/additions being contested in appeals (disallowance u/s 14A, disallowance of additional depreciation allowance, transfer pricing adjustments, penalty etc.).
19.30 20.22
VII Other Statutes/ Other Claims
- CCI demand alleging abuse of dominant position in VSF market (Refer note 4.1.1)
301.61 301.61
- Demand of water drawl charges and water reservation charges by Irrigation Department.
282.39 244.42
- Fuel surcharge demand raised by Bihar State Electricity Board. 49.33 49.33- Demand of maintenance charges on land allotted by State
Government.44.92 38.32
- Levy of additional surcharge on the consumption of power from source other than distribution licensee of area
40.40 -
- Differential Stamp duty demand on Solaris business takeover 28.61 2.47- Labour re-instatement, back wages, workmen compensation, minimum
wages issue, increase in retirement age and salary structure cases10.76 10.71
- Demand towards contribution to Infrastructure Fund and charges for time limit extension for use of industrial plot
0.64 10.27
- Demand of water reservation charges from irrigation department. 8.22 7.78- Claims by various suppliers and contractors on terms of contract, etc. 5.45 2.95- Lease rent demand at increased rate by Kandla Port Trust 7.87 6.15- Higher price demanded in respect of land acquired through State
Government10.51 11.85
263Integrated Annual Report 2020-21
Integrated ReportStatutory Reports
Financial statements
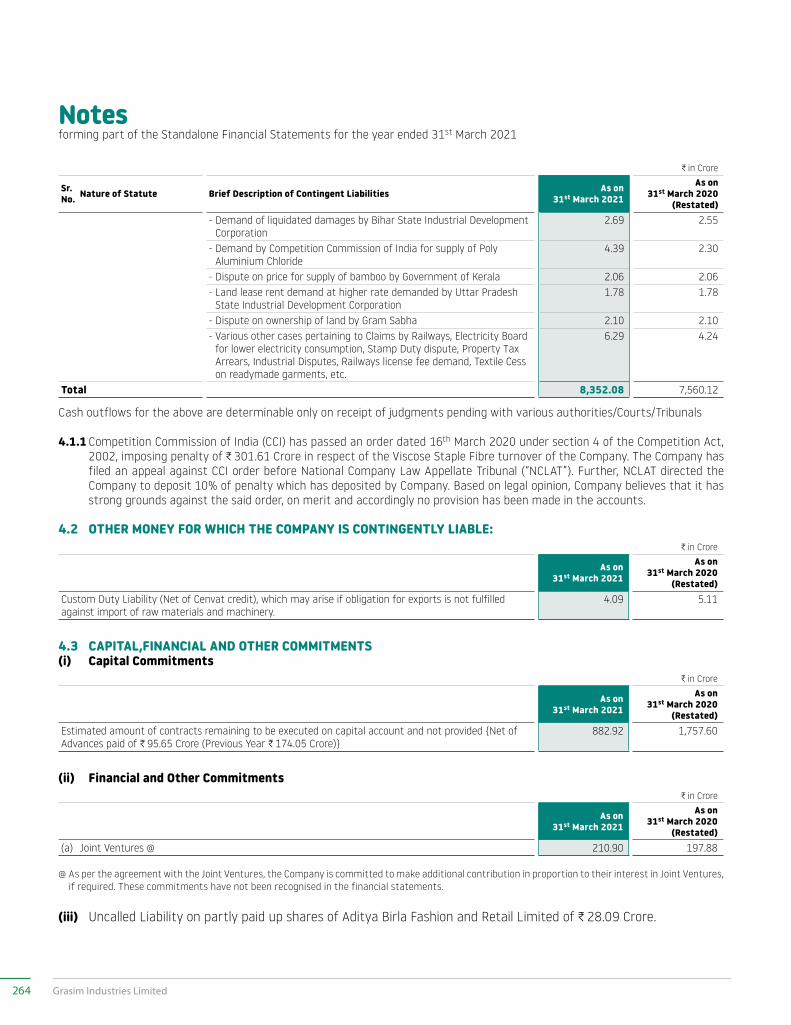
Notesforming part of the Standalone Financial Statements for the year ended 31st March 2021
C in Crore
Sr. No. Nature of Statute Brief Description of Contingent Liabilities As on
31st March 2021
As on 31st March 2020
(Restated)- Demand of liquidated damages by Bihar State Industrial Development
Corporation2.69 2.55
- Demand by Competition Commission of India for supply of Poly Aluminium Chloride
4.39 2.30
- Dispute on price for supply of bamboo by Government of Kerala 2.06 2.06- Land lease rent demand at higher rate demanded by Uttar Pradesh
State Industrial Development Corporation1.78 1.78
- Dispute on ownership of land by Gram Sabha 2.10 2.10- Various other cases pertaining to Claims by Railways, Electricity Board
for lower electricity consumption, Stamp Duty dispute, Property Tax Arrears, Industrial Disputes, Railways license fee demand, Textile Cess on readymade garments, etc.
6.29 4.24
Total 8,352.08 7,560.12
Cash outflows for the above are determinable only on receipt of judgments pending with various authorities/Courts/Tribunals
4.1.1 Competition Commission of India (CCI) has passed an order dated 16th March 2020 under section 4 of the Competition Act, 2002, imposing penalty of C 301.61 Crore in respect of the Viscose Staple Fibre turnover of the Company. The Company has filed an appeal against CCI order before National Company Law Appellate Tribunal (“NCLAT”). Further, NCLAT directed the Company to deposit 10% of penalty which has deposited by Company. Based on legal opinion, Company believes that it has strong grounds against the said order, on merit and accordingly no provision has been made in the accounts.
4.2 OTHER MONEY FOR WHICH THE COMPANY IS CONTINGENTLY LIABLE: C in Crore
As on 31st March 2021
As on 31st March 2020
(Restated)Custom Duty Liability (Net of Cenvat credit), which may arise if obligation for exports is not fulfilled against import of raw materials and machinery.
4.09 5.11
4.3 CAPITAL,FINANCIAL AND OTHER COMMITMENTS(i) Capital Commitments
C in Crore
As on 31st March 2021
As on 31st March 2020
(Restated)Estimated amount of contracts remaining to be executed on capital account and not provided {Net of Advances paid of C 95.65 Crore (Previous Year C 174.05 Crore)}
882.92 1,757.60
(ii) Financial and Other Commitments C in Crore
As on 31st March 2021
As on 31st March 2020
(Restated)(a) Joint Ventures @ 210.90 197.88
@ As per the agreement with the Joint Ventures, the Company is committed to make additional contribution in proportion to their interest in Joint Ventures, if required. These commitments have not been recognised in the financial statements.
(iii) Uncalled Liability on partly paid up shares of Aditya Birla Fashion and Retail Limited of C 28.09 Crore.
264 Grasim Industries Limited
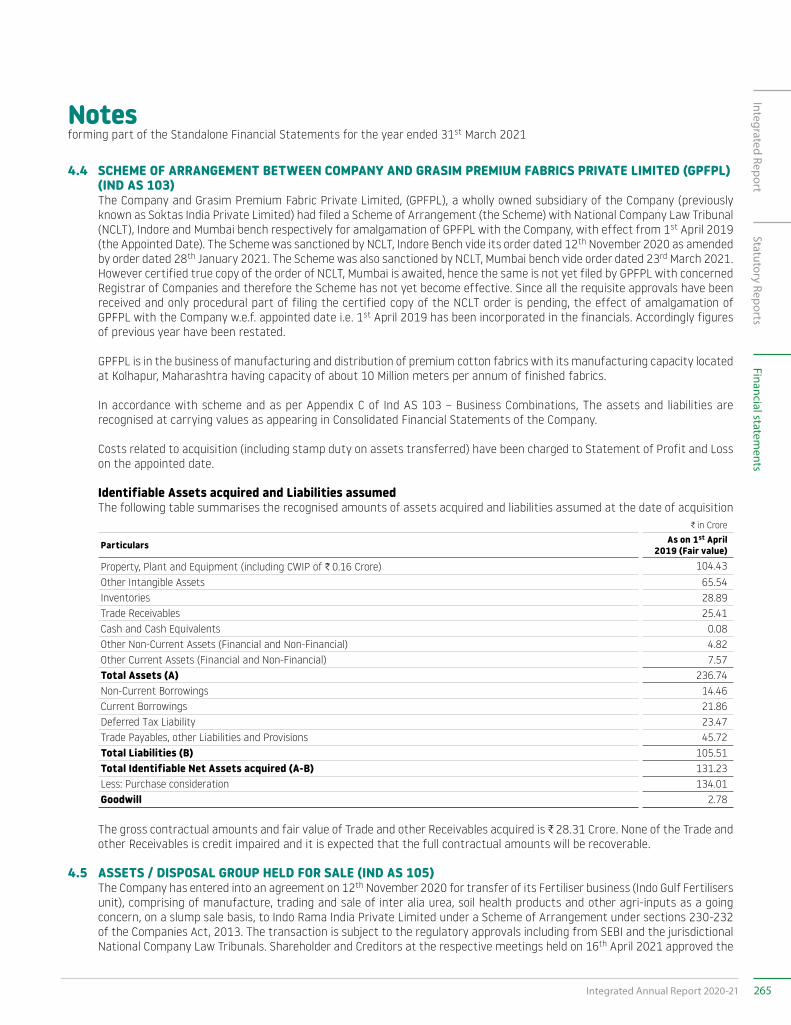
Notesforming part of the Standalone Financial Statements for the year ended 31st March 2021
4.4 SCHEME OF ARRANGEMENT BETWEEN COMPANY AND GRASIM PREMIUM FABRICS PRIVATE LIMITED (GPFPL) (IND AS 103)
The Company and Grasim Premium Fabric Private Limited, (GPFPL), a wholly owned subsidiary of the Company (previously known as Soktas India Private Limited) had filed a Scheme of Arrangement (the Scheme) with National Company Law Tribunal (NCLT), Indore and Mumbai bench respectively for amalgamation of GPFPL with the Company, with effect from 1st April 2019 (the Appointed Date). The Scheme was sanctioned by NCLT, Indore Bench vide its order dated 12th November 2020 as amended by order dated 28th January 2021. The Scheme was also sanctioned by NCLT, Mumbai bench vide order dated 23rd March 2021. However certified true copy of the order of NCLT, Mumbai is awaited, hence the same is not yet filed by GPFPL with concerned Registrar of Companies and therefore the Scheme has not yet become effective. Since all the requisite approvals have been received and only procedural part of filing the certified copy of the NCLT order is pending, the effect of amalgamation of GPFPL with the Company w.e.f. appointed date i.e. 1st April 2019 has been incorporated in the financials. Accordingly figures of previous year have been restated.
GPFPL is in the business of manufacturing and distribution of premium cotton fabrics with its manufacturing capacity located at Kolhapur, Maharashtra having capacity of about 10 Million meters per annum of finished fabrics.
In accordance with scheme and as per Appendix C of Ind AS 103 – Business Combinations, The assets and liabilities are recognised at carrying values as appearing in Consolidated Financial Statements of the Company.
Costs related to acquisition (including stamp duty on assets transferred) have been charged to Statement of Profit and Loss on the appointed date.
Identifiable Assets acquired and Liabilities assumed The following table summarises the recognised amounts of assets acquired and liabilities assumed at the date of acquisition
C in Crore
Particulars As on 1st April 2019 (Fair value)
Property, Plant and Equipment (including CWIP of C 0.16 Crore) 104.43 Other Intangible Assets 65.54 Inventories 28.89 Trade Receivables 25.41 Cash and Cash Equivalents 0.08 Other Non-Current Assets (Financial and Non-Financial) 4.82 Other Current Assets (Financial and Non-Financial) 7.57 Total Assets (A) 236.74 Non-Current Borrowings 14.46 Current Borrowings 21.86 Deferred Tax Liability 23.47 Trade Payables, other Liabilities and Provisions 45.72 Total Liabilities (B) 105.51 Total Identifiable Net Assets acquired (A-B) 131.23 Less: Purchase consideration 134.01 Goodwill 2.78
The gross contractual amounts and fair value of Trade and other Receivables acquired is C 28.31 Crore. None of the Trade and other Receivables is credit impaired and it is expected that the full contractual amounts will be recoverable.
4.5 ASSETS / DISPOSAL GROUP HELD FOR SALE (IND AS 105) The Company has entered into an agreement on 12th November 2020 for transfer of its Fertiliser business (Indo Gulf Fertilisers
unit), comprising of manufacture, trading and sale of inter alia urea, soil health products and other agri-inputs as a going concern, on a slump sale basis, to Indo Rama India Private Limited under a Scheme of Arrangement under sections 230-232 of the Companies Act, 2013. The transaction is subject to the regulatory approvals including from SEBI and the jurisdictional National Company Law Tribunals. Shareholder and Creditors at the respective meetings held on 16th April 2021 approved the
265Integrated Annual Report 2020-21
Integrated ReportStatutory Reports
Financial statements
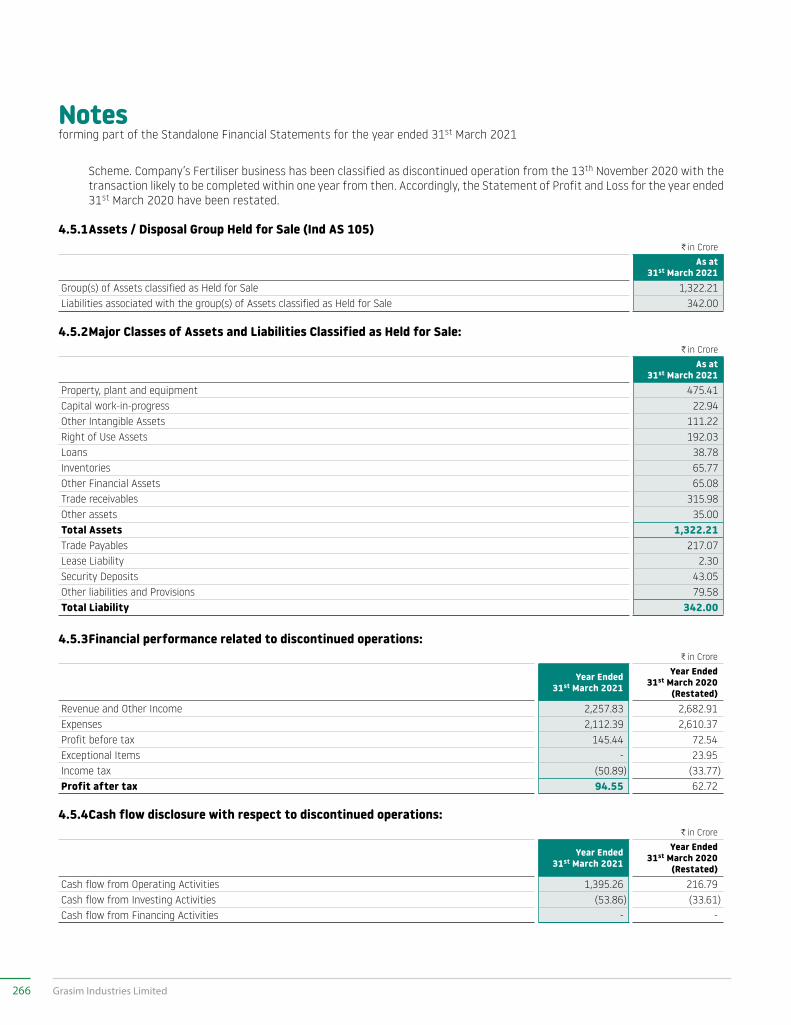
Notesforming part of the Standalone Financial Statements for the year ended 31st March 2021
Scheme. Company’s Fertiliser business has been classified as discontinued operation from the 13th November 2020 with the transaction likely to be completed within one year from then. Accordingly, the Statement of Profit and Loss for the year ended 31st March 2020 have been restated.
4.5.1 Assets / Disposal Group Held for Sale (Ind AS 105)C in Crore
As at 31st March 2021
Group(s) of Assets classified as Held for Sale 1,322.21 Liabilities associated with the group(s) of Assets classified as Held for Sale 342.00
4.5.2 Major Classes of Assets and Liabilities Classified as Held for Sale:C in Crore
As at 31st March 2021
Property, plant and equipment 475.41 Capital work-in-progress 22.94 Other Intangible Assets 111.22 Right of Use Assets 192.03 Loans 38.78 Inventories 65.77 Other Financial Assets 65.08 Trade receivables 315.98 Other assets 35.00 Total Assets 1,322.21 Trade Payables 217.07 Lease Liability 2.30 Security Deposits 43.05 Other liabilities and Provisions 79.58 Total Liability 342.00
4.5.3 Financial performance related to discontinued operations:C in Crore
Year Ended 31st March 2021
Year Ended 31st March 2020
(Restated)Revenue and Other Income 2,257.83 2,682.91 Expenses 2,112.39 2,610.37 Profit before tax 145.44 72.54 Exceptional Items - 23.95 Income tax (50.89) (33.77)Profit after tax 94.55 62.72
4.5.4 Cash flow disclosure with respect to discontinued operations:C in Crore
Year Ended 31st March 2021
Year Ended 31st March 2020
(Restated)Cash flow from Operating Activities 1,395.26 216.79 Cash flow from Investing Activities (53.86) (33.61)Cash flow from Financing Activities - -
266 Grasim Industries Limited
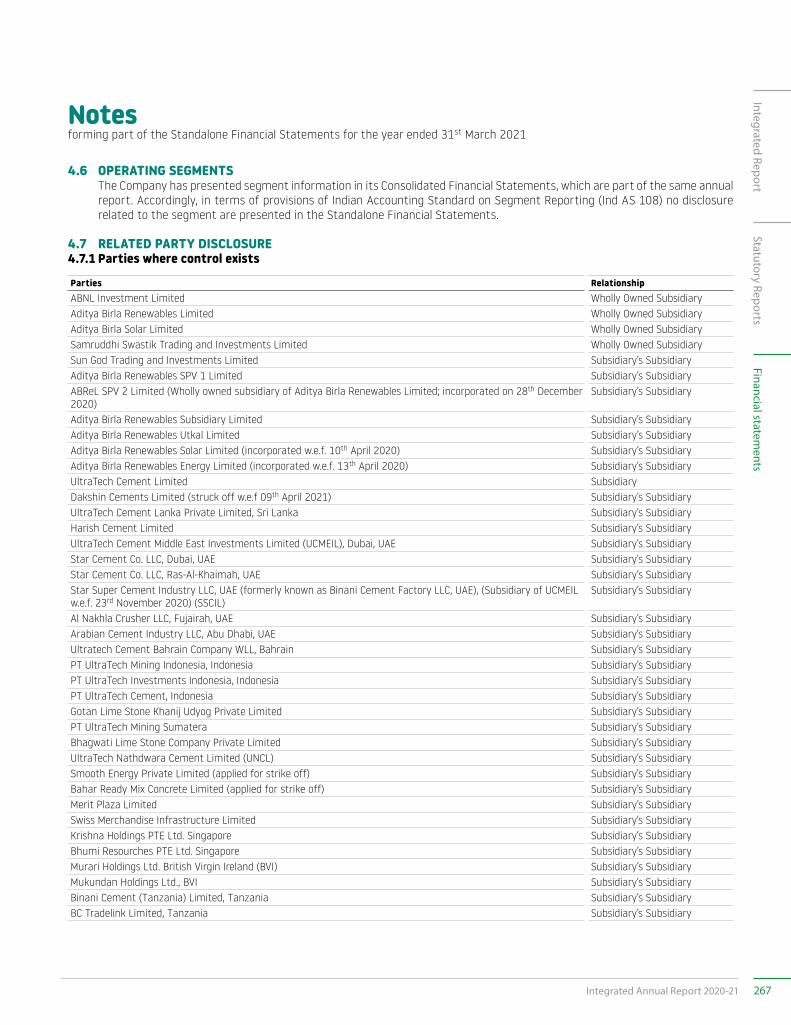
Notesforming part of the Standalone Financial Statements for the year ended 31st March 2021
4.6 OPERATING SEGMENTS The Company has presented segment information in its Consolidated Financial Statements, which are part of the same annual
report. Accordingly, in terms of provisions of Indian Accounting Standard on Segment Reporting (Ind AS 108) no disclosure related to the segment are presented in the Standalone Financial Statements.
4.7 RELATED PARTY DISCLOSURE 4.7.1 Parties where control exists
Parties RelationshipABNL Investment Limited Wholly Owned SubsidiaryAditya Birla Renewables Limited Wholly Owned SubsidiaryAditya Birla Solar Limited Wholly Owned SubsidiarySamruddhi Swastik Trading and Investments Limited Wholly Owned SubsidiarySun God Trading and Investments Limited Subsidiary’s SubsidiaryAditya Birla Renewables SPV 1 Limited Subsidiary’s SubsidiaryABReL SPV 2 Limited (Wholly owned subsidiary of Aditya Birla Renewables Limited; incorporated on 28th December 2020)
Subsidiary’s Subsidiary
Aditya Birla Renewables Subsidiary Limited Subsidiary’s SubsidiaryAditya Birla Renewables Utkal Limited Subsidiary’s SubsidiaryAditya Birla Renewables Solar Limited (incorporated w.e.f. 10th April 2020) Subsidiary’s SubsidiaryAditya Birla Renewables Energy Limited (incorporated w.e.f. 13th April 2020) Subsidiary’s SubsidiaryUltraTech Cement Limited SubsidiaryDakshin Cements Limited (struck off w.e.f 09th April 2021) Subsidiary’s SubsidiaryUltraTech Cement Lanka Private Limited, Sri Lanka Subsidiary’s SubsidiaryHarish Cement Limited Subsidiary’s SubsidiaryUltraTech Cement Middle East Investments Limited (UCMEIL), Dubai, UAE Subsidiary’s SubsidiaryStar Cement Co. LLC, Dubai, UAE Subsidiary’s SubsidiaryStar Cement Co. LLC, Ras-Al-Khaimah, UAE Subsidiary’s SubsidiaryStar Super Cement Industry LLC, UAE (formerly known as Binani Cement Factory LLC, UAE), (Subsidiary of UCMEIL w.e.f. 23rd November 2020) (SSCIL)
Subsidiary’s Subsidiary
Al Nakhla Crusher LLC, Fujairah, UAE Subsidiary’s Subsidiary Arabian Cement Industry LLC, Abu Dhabi, UAE Subsidiary’s SubsidiaryUltratech Cement Bahrain Company WLL, Bahrain Subsidiary’s SubsidiaryPT UltraTech Mining Indonesia, Indonesia Subsidiary’s SubsidiaryPT UltraTech Investments Indonesia, Indonesia Subsidiary’s SubsidiaryPT UltraTech Cement, Indonesia Subsidiary’s SubsidiaryGotan Lime Stone Khanij Udyog Private Limited Subsidiary’s SubsidiaryPT UltraTech Mining Sumatera Subsidiary’s SubsidiaryBhagwati Lime Stone Company Private Limited Subsidiary’s SubsidiaryUltraTech Nathdwara Cement Limited (UNCL) Subsidiary’s SubsidiarySmooth Energy Private Limited (applied for strike off) Subsidiary’s SubsidiaryBahar Ready Mix Concrete Limited (applied for strike off) Subsidiary’s SubsidiaryMerit Plaza Limited Subsidiary’s SubsidiarySwiss Merchandise Infrastructure Limited Subsidiary’s SubsidiaryKrishna Holdings PTE Ltd. Singapore Subsidiary’s SubsidiaryBhumi Resourches PTE Ltd. Singapore Subsidiary’s SubsidiaryMurari Holdings Ltd. British Virgin Ireland (BVI) Subsidiary’s SubsidiaryMukundan Holdings Ltd., BVI Subsidiary’s SubsidiaryBinani Cement (Tanzania) Limited, Tanzania Subsidiary’s SubsidiaryBC Tradelink Limited, Tanzania Subsidiary’s Subsidiary
267Integrated Annual Report 2020-21
Integrated ReportStatutory Reports
Financial statements
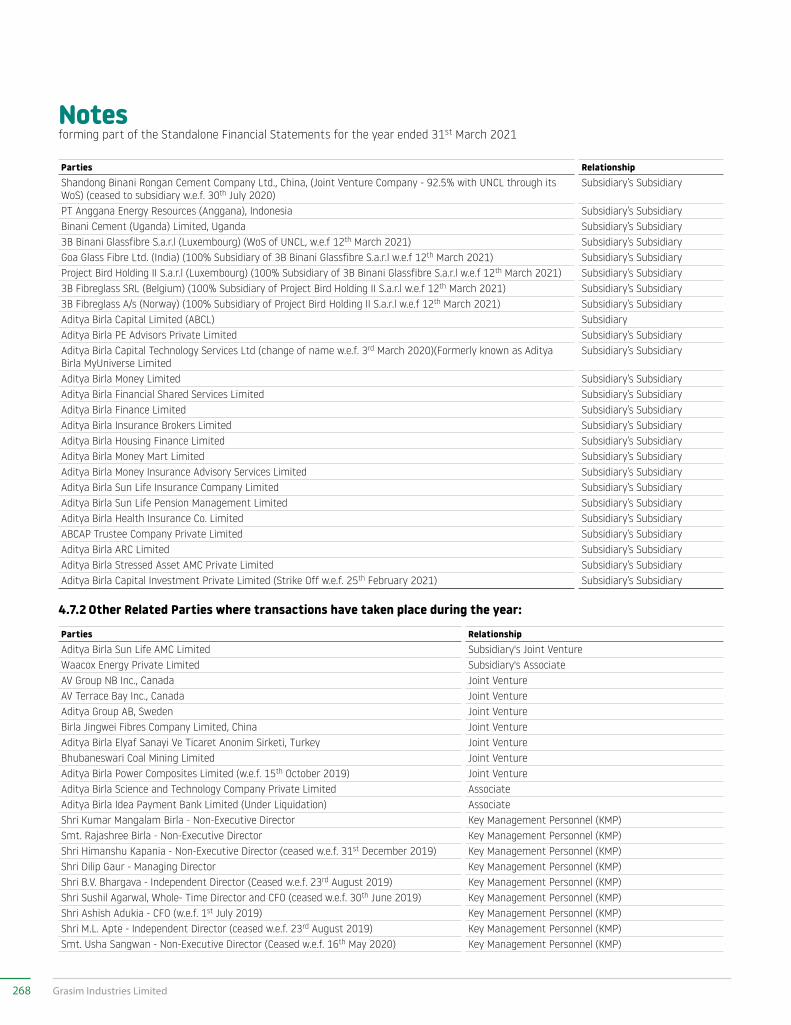
Notesforming part of the Standalone Financial Statements for the year ended 31st March 2021
Parties RelationshipShandong Binani Rongan Cement Company Ltd., China, (Joint Venture Company - 92.5% with UNCL through its WoS) (ceased to subsidiary w.e.f. 30th July 2020)
Subsidiary’s Subsidiary
PT Anggana Energy Resources (Anggana), Indonesia Subsidiary’s SubsidiaryBinani Cement (Uganda) Limited, Uganda Subsidiary’s Subsidiary3B Binani Glassfibre S.a.r.l (Luxembourg) (WoS of UNCL, w.e.f 12th March 2021) Subsidiary’s SubsidiaryGoa Glass Fibre Ltd. (India) (100% Subsidiary of 3B Binani Glassfibre S.a.r.l w.e.f 12th March 2021) Subsidiary’s SubsidiaryProject Bird Holding II S.a.r.l (Luxembourg) (100% Subsidiary of 3B Binani Glassfibre S.a.r.l w.e.f 12th March 2021) Subsidiary’s Subsidiary3B Fibreglass SRL (Belgium) (100% Subsidiary of Project Bird Holding II S.a.r.l w.e.f 12th March 2021) Subsidiary’s Subsidiary3B Fibreglass A/s (Norway) (100% Subsidiary of Project Bird Holding II S.a.r.l w.e.f 12th March 2021) Subsidiary’s SubsidiaryAditya Birla Capital Limited (ABCL) SubsidiaryAditya Birla PE Advisors Private Limited Subsidiary’s SubsidiaryAditya Birla Capital Technology Services Ltd (change of name w.e.f. 3rd March 2020)(Formerly known as Aditya Birla MyUniverse Limited
Subsidiary’s Subsidiary
Aditya Birla Money Limited Subsidiary’s SubsidiaryAditya Birla Financial Shared Services Limited Subsidiary’s SubsidiaryAditya Birla Finance Limited Subsidiary’s SubsidiaryAditya Birla Insurance Brokers Limited Subsidiary’s SubsidiaryAditya Birla Housing Finance Limited Subsidiary’s SubsidiaryAditya Birla Money Mart Limited Subsidiary’s SubsidiaryAditya Birla Money Insurance Advisory Services Limited Subsidiary’s SubsidiaryAditya Birla Sun Life Insurance Company Limited Subsidiary’s SubsidiaryAditya Birla Sun Life Pension Management Limited Subsidiary’s SubsidiaryAditya Birla Health Insurance Co. Limited Subsidiary’s SubsidiaryABCAP Trustee Company Private Limited Subsidiary’s SubsidiaryAditya Birla ARC Limited Subsidiary’s SubsidiaryAditya Birla Stressed Asset AMC Private Limited Subsidiary’s SubsidiaryAditya Birla Capital Investment Private Limited (Strike Off w.e.f. 25th February 2021) Subsidiary’s Subsidiary
4.7.2 Other Related Parties where transactions have taken place during the year:
Parties RelationshipAditya Birla Sun Life AMC Limited Subsidiary's Joint VentureWaacox Energy Private Limited Subsidiary's AssociateAV Group NB Inc., Canada Joint VentureAV Terrace Bay Inc., Canada Joint VentureAditya Group AB, Sweden Joint VentureBirla Jingwei Fibres Company Limited, China Joint VentureAditya Birla Elyaf Sanayi Ve Ticaret Anonim Sirketi, Turkey Joint VentureBhubaneswari Coal Mining Limited Joint VentureAditya Birla Power Composites Limited (w.e.f. 15th October 2019) Joint VentureAditya Birla Science and Technology Company Private Limited AssociateAditya Birla Idea Payment Bank Limited (Under Liquidation) AssociateShri Kumar Mangalam Birla - Non-Executive Director Key Management Personnel (KMP)Smt. Rajashree Birla - Non-Executive Director Key Management Personnel (KMP)Shri Himanshu Kapania - Non-Executive Director (ceased w.e.f. 31st December 2019) Key Management Personnel (KMP)Shri Dilip Gaur - Managing Director Key Management Personnel (KMP)Shri B.V. Bhargava - Independent Director (Ceased w.e.f. 23rd August 2019) Key Management Personnel (KMP)Shri Sushil Agarwal, Whole- Time Director and CFO (ceased w.e.f. 30th June 2019) Key Management Personnel (KMP)Shri Ashish Adukia - CFO (w.e.f. 1st July 2019) Key Management Personnel (KMP)Shri M.L. Apte - Independent Director (ceased w.e.f. 23rd August 2019) Key Management Personnel (KMP)Smt. Usha Sangwan - Non-Executive Director (Ceased w.e.f. 16th May 2020) Key Management Personnel (KMP)
268 Grasim Industries Limited
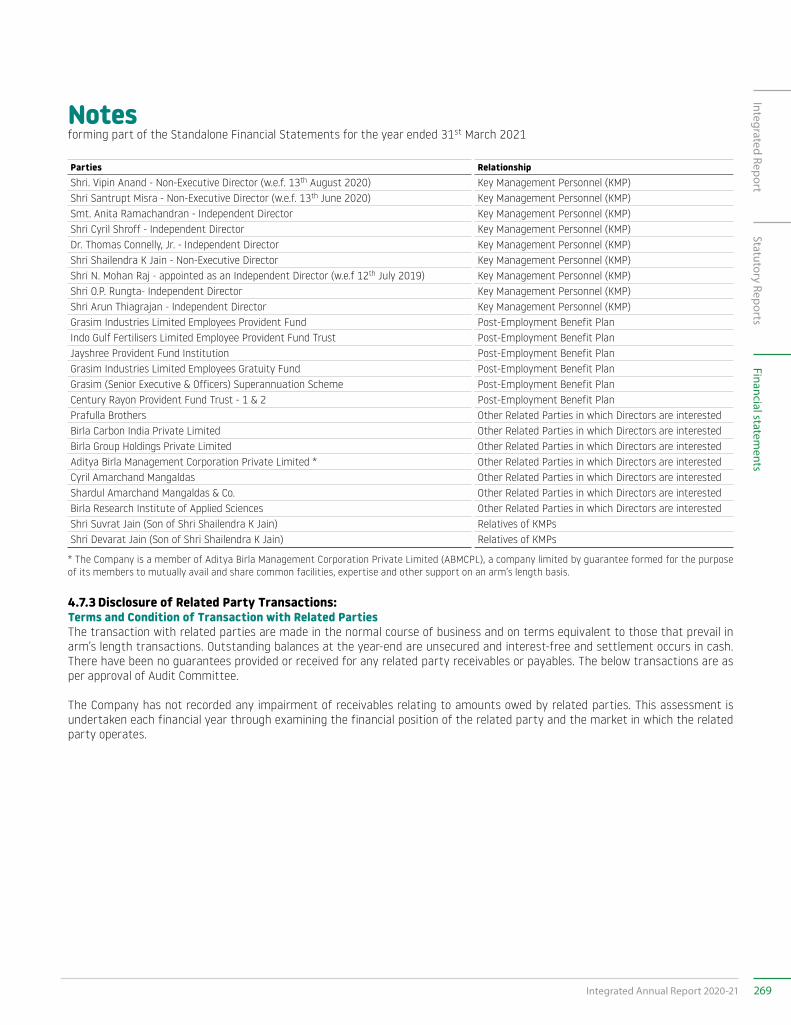
Notesforming part of the Standalone Financial Statements for the year ended 31st March 2021
Parties RelationshipShri. Vipin Anand - Non-Executive Director (w.e.f. 13th August 2020) Key Management Personnel (KMP)Shri Santrupt Misra - Non-Executive Director (w.e.f. 13th June 2020) Key Management Personnel (KMP)Smt. Anita Ramachandran - Independent Director Key Management Personnel (KMP)Shri Cyril Shroff - Independent Director Key Management Personnel (KMP)Dr. Thomas Connelly, Jr. - Independent Director Key Management Personnel (KMP)Shri Shailendra K Jain - Non-Executive Director Key Management Personnel (KMP)Shri N. Mohan Raj - appointed as an Independent Director (w.e.f 12th July 2019) Key Management Personnel (KMP)Shri O.P. Rungta- Independent Director Key Management Personnel (KMP)Shri Arun Thiagrajan - Independent Director Key Management Personnel (KMP)Grasim Industries Limited Employees Provident Fund Post-Employment Benefit PlanIndo Gulf Fertilisers Limited Employee Provident Fund Trust Post-Employment Benefit PlanJayshree Provident Fund Institution Post-Employment Benefit PlanGrasim Industries Limited Employees Gratuity Fund Post-Employment Benefit PlanGrasim (Senior Executive & Officers) Superannuation Scheme Post-Employment Benefit PlanCentury Rayon Provident Fund Trust - 1 & 2 Post-Employment Benefit PlanPrafulla Brothers Other Related Parties in which Directors are interestedBirla Carbon India Private Limited Other Related Parties in which Directors are interestedBirla Group Holdings Private Limited Other Related Parties in which Directors are interestedAditya Birla Management Corporation Private Limited * Other Related Parties in which Directors are interestedCyril Amarchand Mangaldas Other Related Parties in which Directors are interestedShardul Amarchand Mangaldas & Co. Other Related Parties in which Directors are interestedBirla Research Institute of Applied Sciences Other Related Parties in which Directors are interestedShri Suvrat Jain (Son of Shri Shailendra K Jain) Relatives of KMPsShri Devarat Jain (Son of Shri Shailendra K Jain) Relatives of KMPs
* The Company is a member of Aditya Birla Management Corporation Private Limited (ABMCPL), a company limited by guarantee formed for the purpose of its members to mutually avail and share common facilities, expertise and other support on an arm’s length basis.
4.7.3 Disclosure of Related Party Transactions:Terms and Condition of Transaction with Related Parties The transaction with related parties are made in the normal course of business and on terms equivalent to those that prevail in arm’s length transactions. Outstanding balances at the year-end are unsecured and interest-free and settlement occurs in cash. There have been no guarantees provided or received for any related party receivables or payables. The below transactions are as per approval of Audit Committee.
The Company has not recorded any impairment of receivables relating to amounts owed by related parties. This assessment is undertaken each financial year through examining the financial position of the related party and the market in which the related party operates.
269Integrated Annual Report 2020-21
Integrated ReportStatutory Reports
Financial statements
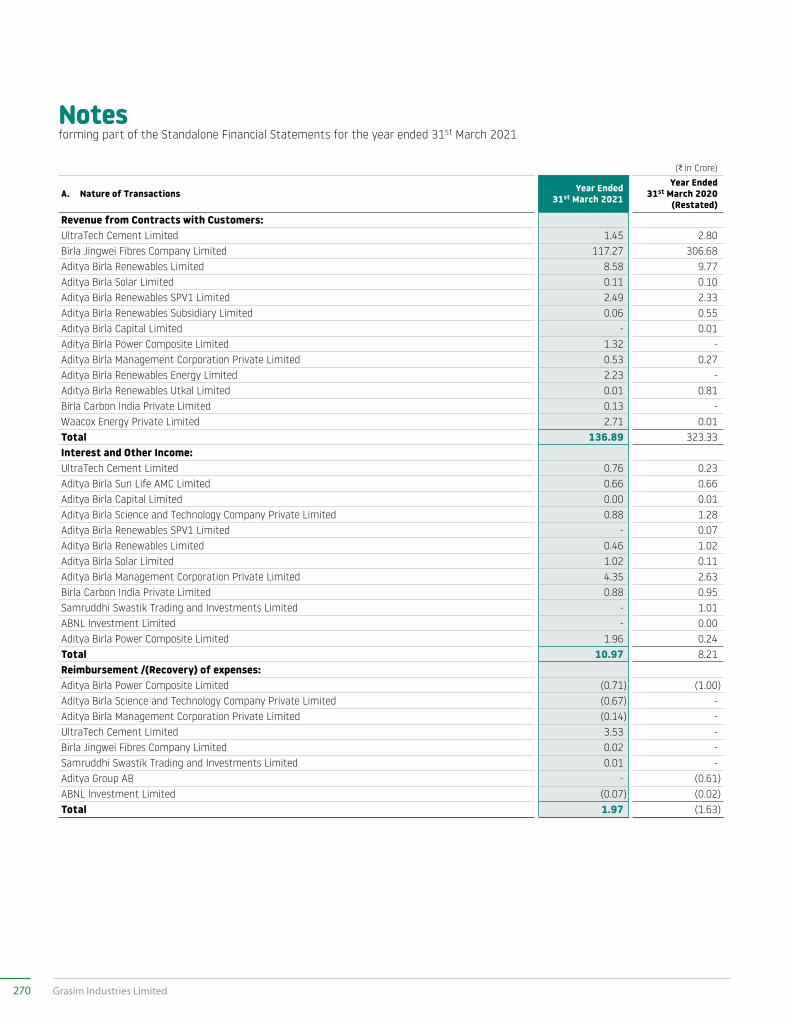
Notesforming part of the Standalone Financial Statements for the year ended 31st March 2021
(C in Crore)
A. Nature of Transactions Year Ended 31st March 2021
Year Ended 31st March 2020
(Restated)Revenue from Contracts with Customers:UltraTech Cement Limited 1.45 2.80 Birla Jingwei Fibres Company Limited 117.27 306.68 Aditya Birla Renewables Limited 8.58 9.77 Aditya Birla Solar Limited 0.11 0.10 Aditya Birla Renewables SPV1 Limited 2.49 2.33 Aditya Birla Renewables Subsidiary Limited 0.06 0.55 Aditya Birla Capital Limited - 0.01 Aditya Birla Power Composite Limited 1.32 - Aditya Birla Management Corporation Private Limited 0.53 0.27 Aditya Birla Renewables Energy Limited 2.23 - Aditya Birla Renewables Utkal Limited 0.01 0.81 Birla Carbon India Private Limited 0.13 - Waacox Energy Private Limited 2.71 0.01 Total 136.89 323.33 Interest and Other Income:UltraTech Cement Limited 0.76 0.23 Aditya Birla Sun Life AMC Limited 0.66 0.66 Aditya Birla Capital Limited 0.00 0.01 Aditya Birla Science and Technology Company Private Limited 0.88 1.28 Aditya Birla Renewables SPV1 Limited - 0.07 Aditya Birla Renewables Limited 0.46 1.02 Aditya Birla Solar Limited 1.02 0.11 Aditya Birla Management Corporation Private Limited 4.35 2.63 Birla Carbon India Private Limited 0.88 0.95 Samruddhi Swastik Trading and Investments Limited - 1.01 ABNL Investment Limited - 0.00 Aditya Birla Power Composite Limited 1.96 0.24 Total 10.97 8.21 Reimbursement /(Recovery) of expenses:Aditya Birla Power Composite Limited (0.71) (1.00)Aditya Birla Science and Technology Company Private Limited (0.67) -Aditya Birla Management Corporation Private Limited (0.14) -UltraTech Cement Limited 3.53 - Birla Jingwei Fibres Company Limited 0.02 - Samruddhi Swastik Trading and Investments Limited 0.01 -Aditya Group AB - (0.61)ABNL Investment Limited (0.07) (0.02)Total 1.97 (1.63)
270 Grasim Industries Limited
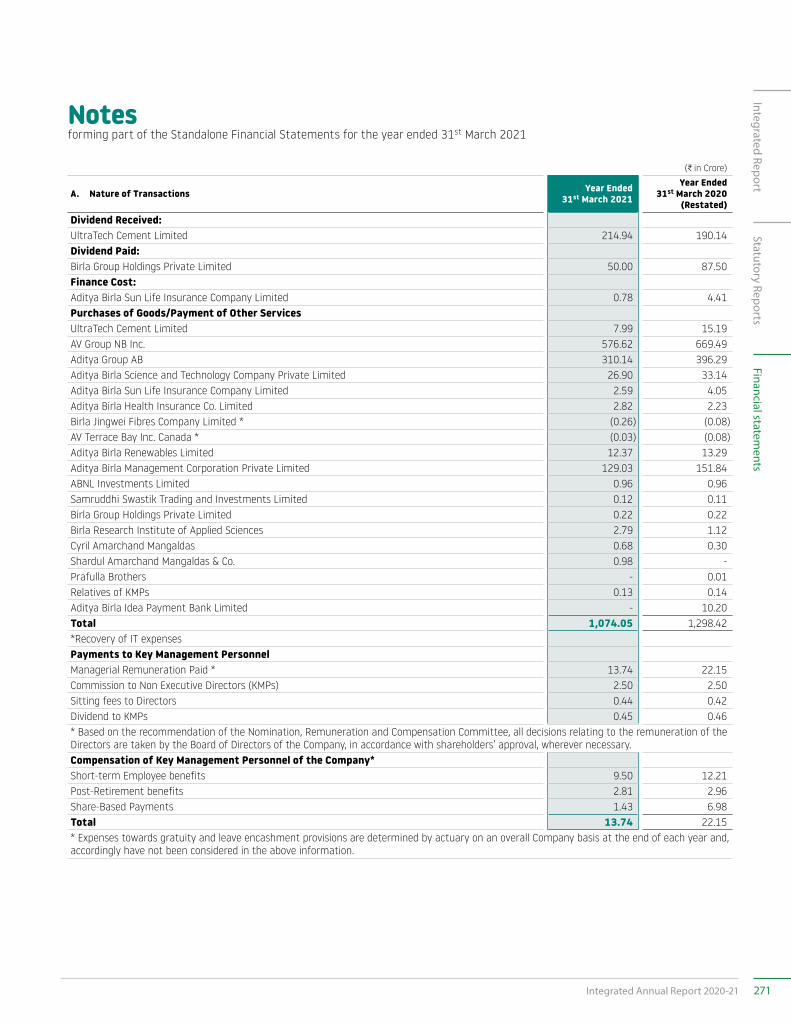
Notesforming part of the Standalone Financial Statements for the year ended 31st March 2021
(C in Crore)
A. Nature of Transactions Year Ended 31st March 2021
Year Ended 31st March 2020
(Restated)Dividend Received:UltraTech Cement Limited 214.94 190.14 Dividend Paid:Birla Group Holdings Private Limited 50.00 87.50 Finance Cost:Aditya Birla Sun Life Insurance Company Limited 0.78 4.41 Purchases of Goods/Payment of Other ServicesUltraTech Cement Limited 7.99 15.19 AV Group NB Inc. 576.62 669.49 Aditya Group AB 310.14 396.29 Aditya Birla Science and Technology Company Private Limited 26.90 33.14 Aditya Birla Sun Life Insurance Company Limited 2.59 4.05 Aditya Birla Health Insurance Co. Limited 2.82 2.23 Birla Jingwei Fibres Company Limited * (0.26) (0.08)AV Terrace Bay Inc. Canada * (0.03) (0.08)Aditya Birla Renewables Limited 12.37 13.29 Aditya Birla Management Corporation Private Limited 129.03 151.84 ABNL Investments Limited 0.96 0.96 Samruddhi Swastik Trading and Investments Limited 0.12 0.11 Birla Group Holdings Private Limited 0.22 0.22 Birla Research Institute of Applied Sciences 2.79 1.12 Cyril Amarchand Mangaldas 0.68 0.30 Shardul Amarchand Mangaldas & Co. 0.98 - Prafulla Brothers - 0.01 Relatives of KMPs 0.13 0.14 Aditya Birla Idea Payment Bank Limited - 10.20 Total 1,074.05 1,298.42 *Recovery of IT expensesPayments to Key Management PersonnelManagerial Remuneration Paid * 13.74 22.15 Commission to Non Executive Directors (KMPs) 2.50 2.50 Sitting fees to Directors 0.44 0.42 Dividend to KMPs 0.45 0.46 * Based on the recommendation of the Nomination, Remuneration and Compensation Committee, all decisions relating to the remuneration of the Directors are taken by the Board of Directors of the Company, in accordance with shareholders’ approval, wherever necessary. Compensation of Key Management Personnel of the Company*Short-term Employee benefits 9.50 12.21 Post-Retirement benefits 2.81 2.96 Share-Based Payments 1.43 6.98 Total 13.74 22.15 * Expenses towards gratuity and leave encashment provisions are determined by actuary on an overall Company basis at the end of each year and, accordingly have not been considered in the above information.
271Integrated Annual Report 2020-21
Integrated ReportStatutory Reports
Financial statements
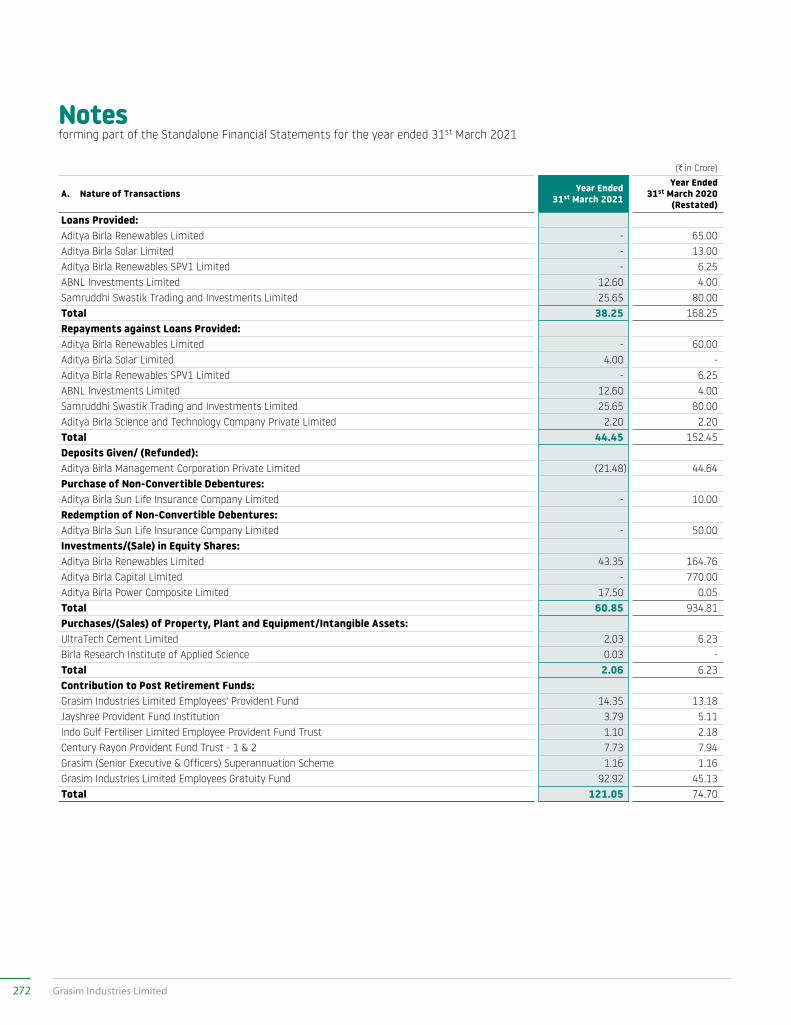
Notesforming part of the Standalone Financial Statements for the year ended 31st March 2021
(C in Crore)
A. Nature of Transactions Year Ended 31st March 2021
Year Ended 31st March 2020
(Restated)Loans Provided:Aditya Birla Renewables Limited - 65.00 Aditya Birla Solar Limited - 13.00 Aditya Birla Renewables SPV1 Limited - 6.25 ABNL Investments Limited 12.60 4.00 Samruddhi Swastik Trading and Investments Limited 25.65 80.00 Total 38.25 168.25 Repayments against Loans Provided:Aditya Birla Renewables Limited - 60.00 Aditya Birla Solar Limited 4.00 - Aditya Birla Renewables SPV1 Limited - 6.25 ABNL Investments Limited 12.60 4.00 Samruddhi Swastik Trading and Investments Limited 25.65 80.00 Aditya Birla Science and Technology Company Private Limited 2.20 2.20 Total 44.45 152.45 Deposits Given/ (Refunded):Aditya Birla Management Corporation Private Limited (21.48) 44.64 Purchase of Non-Convertible Debentures:Aditya Birla Sun Life Insurance Company Limited - 10.00 Redemption of Non-Convertible Debentures:Aditya Birla Sun Life Insurance Company Limited - 50.00 Investments/(Sale) in Equity Shares:Aditya Birla Renewables Limited 43.35 164.76 Aditya Birla Capital Limited - 770.00 Aditya Birla Power Composite Limited 17.50 0.05 Total 60.85 934.81 Purchases/(Sales) of Property, Plant and Equipment/Intangible Assets:UltraTech Cement Limited 2.03 6.23 Birla Research Institute of Applied Science 0.03 - Total 2.06 6.23 Contribution to Post Retirement Funds:Grasim Industries Limited Employees' Provident Fund 14.35 13.18 Jayshree Provident Fund Institution 3.79 5.11 Indo Gulf Fertiliser Limited Employee Provident Fund Trust 1.10 2.18 Century Rayon Provident Fund Trust - 1 & 2 7.73 7.94 Grasim (Senior Executive & Officers) Superannuation Scheme 1.16 1.16 Grasim Industries Limited Employees Gratuity Fund 92.92 45.13 Total 121.05 74.70
272 Grasim Industries Limited
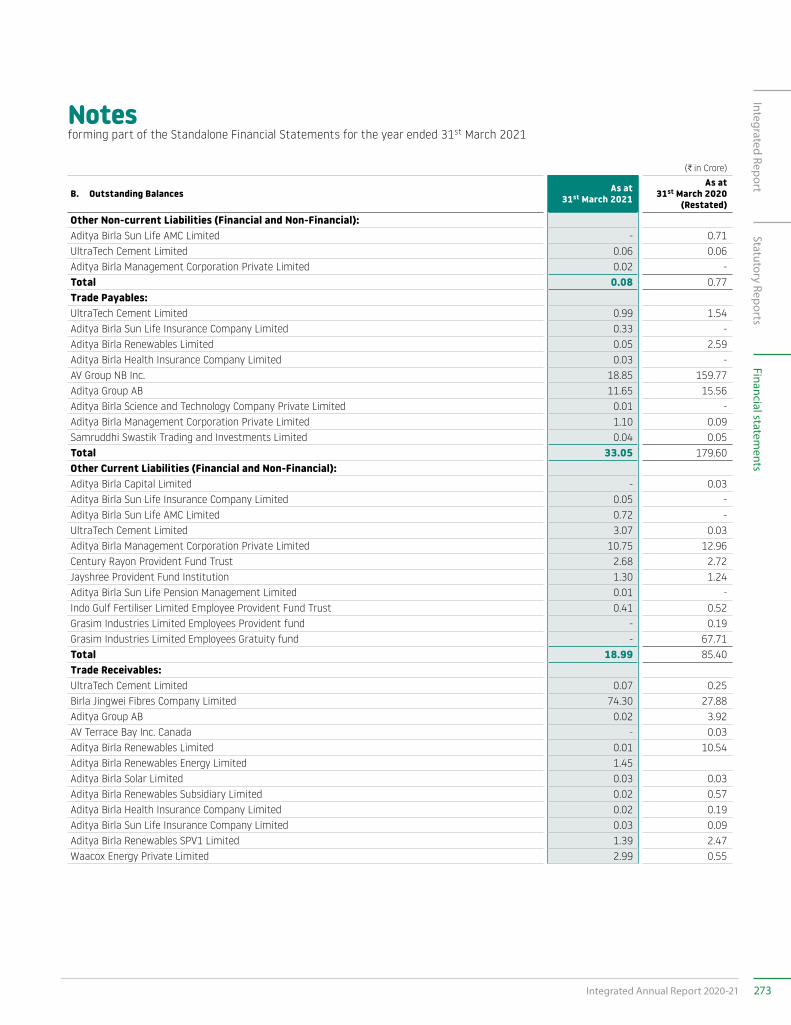
Notesforming part of the Standalone Financial Statements for the year ended 31st March 2021
(C in Crore)
B. Outstanding Balances As at 31st March 2021
As at 31st March 2020
(Restated)Other Non-current Liabilities (Financial and Non-Financial):Aditya Birla Sun Life AMC Limited - 0.71 UltraTech Cement Limited 0.06 0.06 Aditya Birla Management Corporation Private Limited 0.02 - Total 0.08 0.77 Trade Payables:UltraTech Cement Limited 0.99 1.54 Aditya Birla Sun Life Insurance Company Limited 0.33 - Aditya Birla Renewables Limited 0.05 2.59 Aditya Birla Health Insurance Company Limited 0.03 - AV Group NB Inc. 18.85 159.77 Aditya Group AB 11.65 15.56 Aditya Birla Science and Technology Company Private Limited 0.01 - Aditya Birla Management Corporation Private Limited 1.10 0.09 Samruddhi Swastik Trading and Investments Limited 0.04 0.05 Total 33.05 179.60 Other Current Liabilities (Financial and Non-Financial):Aditya Birla Capital Limited - 0.03 Aditya Birla Sun Life Insurance Company Limited 0.05 - Aditya Birla Sun Life AMC Limited 0.72 - UltraTech Cement Limited 3.07 0.03 Aditya Birla Management Corporation Private Limited 10.75 12.96 Century Rayon Provident Fund Trust 2.68 2.72 Jayshree Provident Fund Institution 1.30 1.24 Aditya Birla Sun Life Pension Management Limited 0.01 - Indo Gulf Fertiliser Limited Employee Provident Fund Trust 0.41 0.52 Grasim Industries Limited Employees Provident fund - 0.19 Grasim Industries Limited Employees Gratuity fund - 67.71 Total 18.99 85.40 Trade Receivables:UltraTech Cement Limited 0.07 0.25 Birla Jingwei Fibres Company Limited 74.30 27.88 Aditya Group AB 0.02 3.92 AV Terrace Bay Inc. Canada - 0.03 Aditya Birla Renewables Limited 0.01 10.54 Aditya Birla Renewables Energy Limited 1.45 Aditya Birla Solar Limited 0.03 0.03 Aditya Birla Renewables Subsidiary Limited 0.02 0.57 Aditya Birla Health Insurance Company Limited 0.02 0.19 Aditya Birla Sun Life Insurance Company Limited 0.03 0.09 Aditya Birla Renewables SPV1 Limited 1.39 2.47 Waacox Energy Private Limited 2.99 0.55
273Integrated Annual Report 2020-21
Integrated ReportStatutory Reports
Financial statements
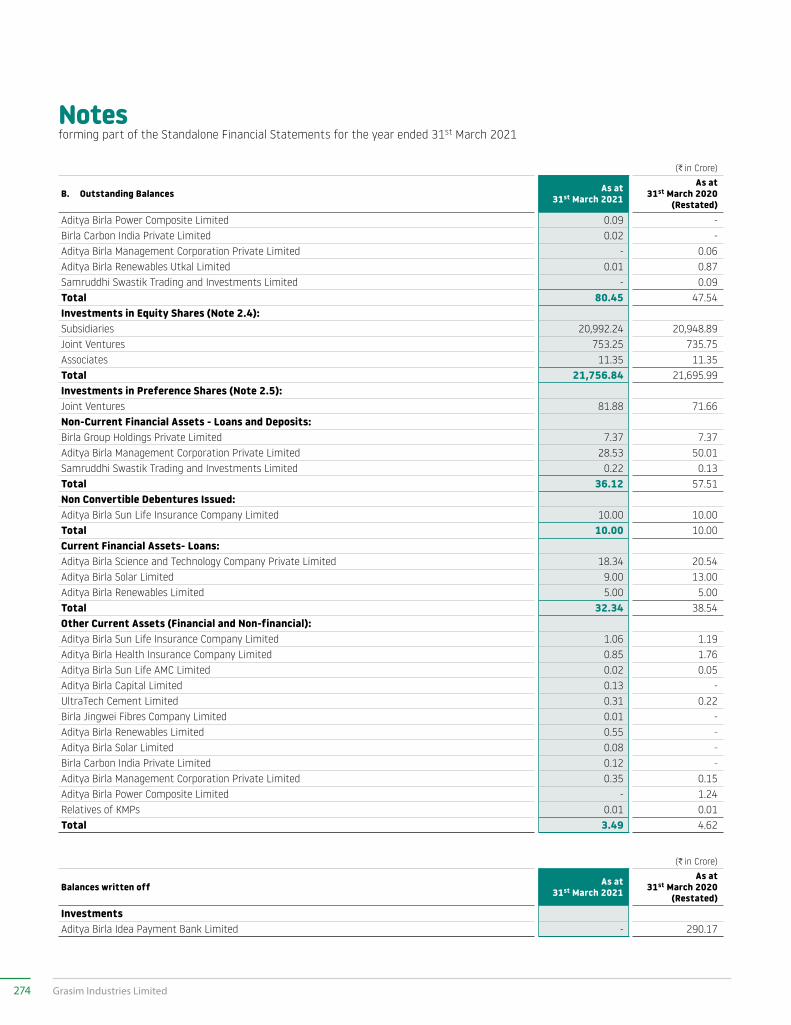
Notesforming part of the Standalone Financial Statements for the year ended 31st March 2021
(C in Crore)
B. Outstanding Balances As at 31st March 2021
As at 31st March 2020
(Restated)Aditya Birla Power Composite Limited 0.09 - Birla Carbon India Private Limited 0.02 - Aditya Birla Management Corporation Private Limited - 0.06 Aditya Birla Renewables Utkal Limited 0.01 0.87 Samruddhi Swastik Trading and Investments Limited - 0.09 Total 80.45 47.54 Investments in Equity Shares (Note 2.4):Subsidiaries 20,992.24 20,948.89 Joint Ventures 753.25 735.75 Associates 11.35 11.35 Total 21,756.84 21,695.99 Investments in Preference Shares (Note 2.5):Joint Ventures 81.88 71.66 Non-Current Financial Assets - Loans and Deposits:Birla Group Holdings Private Limited 7.37 7.37 Aditya Birla Management Corporation Private Limited 28.53 50.01 Samruddhi Swastik Trading and Investments Limited 0.22 0.13 Total 36.12 57.51 Non Convertible Debentures Issued:Aditya Birla Sun Life Insurance Company Limited 10.00 10.00 Total 10.00 10.00 Current Financial Assets- Loans:Aditya Birla Science and Technology Company Private Limited 18.34 20.54 Aditya Birla Solar Limited 9.00 13.00 Aditya Birla Renewables Limited 5.00 5.00 Total 32.34 38.54 Other Current Assets (Financial and Non-financial):Aditya Birla Sun Life Insurance Company Limited 1.06 1.19 Aditya Birla Health Insurance Company Limited 0.85 1.76 Aditya Birla Sun Life AMC Limited 0.02 0.05 Aditya Birla Capital Limited 0.13 - UltraTech Cement Limited 0.31 0.22 Birla Jingwei Fibres Company Limited 0.01 - Aditya Birla Renewables Limited 0.55 - Aditya Birla Solar Limited 0.08 - Birla Carbon India Private Limited 0.12 - Aditya Birla Management Corporation Private Limited 0.35 0.15 Aditya Birla Power Composite Limited - 1.24 Relatives of KMPs 0.01 0.01 Total 3.49 4.62
(C in Crore)
Balances written off As at 31st March 2021
As at 31st March 2020
(Restated)Investments Aditya Birla Idea Payment Bank Limited - 290.17
274 Grasim Industries Limited
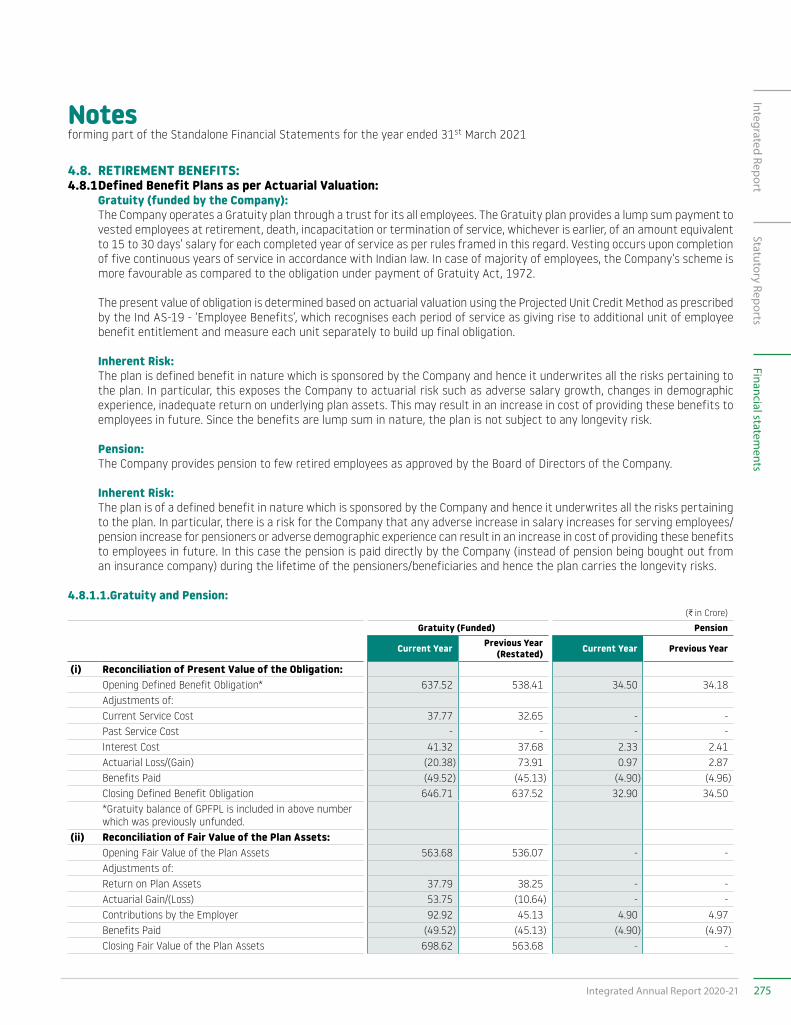
Notesforming part of the Standalone Financial Statements for the year ended 31st March 2021
4.8. RETIREMENT BENEFITS: 4.8.1 Defined Benefit Plans as per Actuarial Valuation: Gratuity (funded by the Company): The Company operates a Gratuity plan through a trust for its all employees. The Gratuity plan provides a lump sum payment to
vested employees at retirement, death, incapacitation or termination of service, whichever is earlier, of an amount equivalent to 15 to 30 days’ salary for each completed year of service as per rules framed in this regard. Vesting occurs upon completion of five continuous years of service in accordance with Indian law. In case of majority of employees, the Company’s scheme is more favourable as compared to the obligation under payment of Gratuity Act, 1972.
The present value of obligation is determined based on actuarial valuation using the Projected Unit Credit Method as prescribed by the Ind AS-19 - ‘Employee Benefits’, which recognises each period of service as giving rise to additional unit of employee benefit entitlement and measure each unit separately to build up final obligation.
Inherent Risk: The plan is defined benefit in nature which is sponsored by the Company and hence it underwrites all the risks pertaining to
the plan. In particular, this exposes the Company to actuarial risk such as adverse salary growth, changes in demographic experience, inadequate return on underlying plan assets. This may result in an increase in cost of providing these benefits to employees in future. Since the benefits are lump sum in nature, the plan is not subject to any longevity risk.
Pension: The Company provides pension to few retired employees as approved by the Board of Directors of the Company.
Inherent Risk: The plan is of a defined benefit in nature which is sponsored by the Company and hence it underwrites all the risks pertaining
to the plan. In particular, there is a risk for the Company that any adverse increase in salary increases for serving employees/pension increase for pensioners or adverse demographic experience can result in an increase in cost of providing these benefits to employees in future. In this case the pension is paid directly by the Company (instead of pension being bought out from an insurance company) during the lifetime of the pensioners/beneficiaries and hence the plan carries the longevity risks.
4.8.1.1.Gratuity and Pension: (C in Crore)
Gratuity (Funded) Pension
Current Year Previous Year (Restated) Current Year Previous Year
(i) Reconciliation of Present Value of the Obligation: Opening Defined Benefit Obligation* 637.52 538.41 34.50 34.18 Adjustments of:Current Service Cost 37.77 32.65 - - Past Service Cost - - - - Interest Cost 41.32 37.68 2.33 2.41 Actuarial Loss/(Gain) (20.38) 73.91 0.97 2.87 Benefits Paid (49.52) (45.13) (4.90) (4.96)Closing Defined Benefit Obligation 646.71 637.52 32.90 34.50 *Gratuity balance of GPFPL is included in above number which was previously unfunded.
(ii) Reconciliation of Fair Value of the Plan Assets:Opening Fair Value of the Plan Assets 563.68 536.07 - - Adjustments of:Return on Plan Assets 37.79 38.25 - - Actuarial Gain/(Loss) 53.75 (10.64) - - Contributions by the Employer 92.92 45.13 4.90 4.97 Benefits Paid (49.52) (45.13) (4.90) (4.97)Closing Fair Value of the Plan Assets 698.62 563.68 - -
275Integrated Annual Report 2020-21
Integrated ReportStatutory Reports
Financial statements
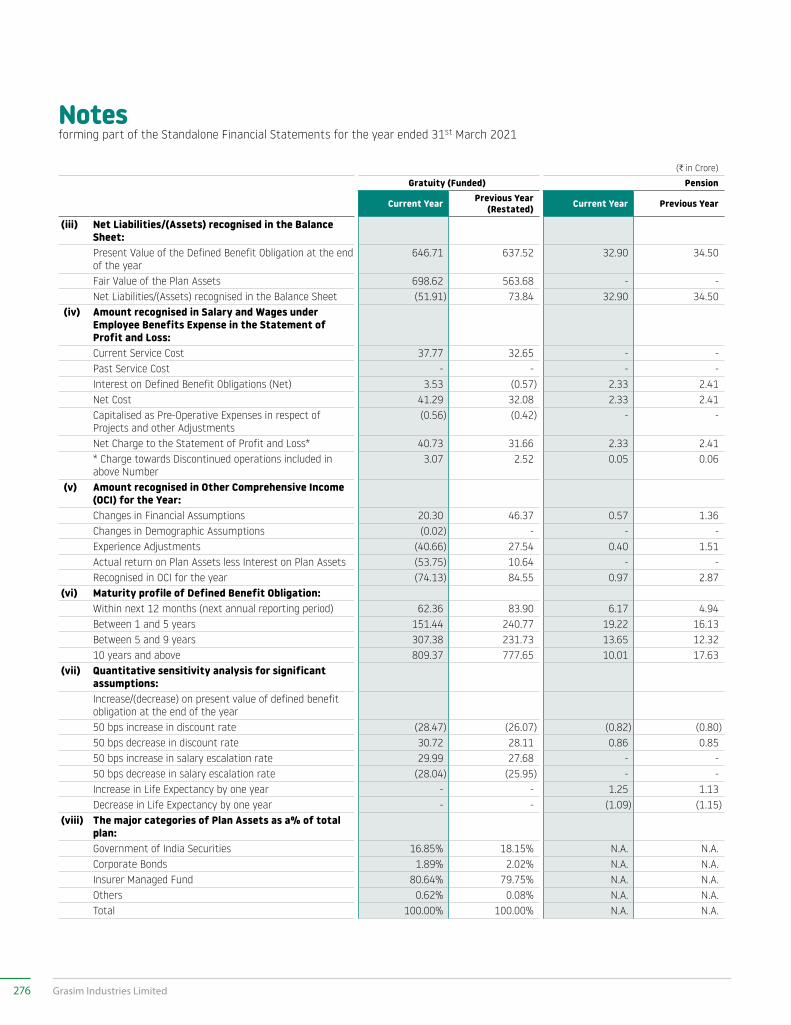
Notesforming part of the Standalone Financial Statements for the year ended 31st March 2021
(C in Crore)
Gratuity (Funded) Pension
Current Year Previous Year (Restated) Current Year Previous Year
(iii) Net Liabilities/(Assets) recognised in the Balance Sheet:Present Value of the Defined Benefit Obligation at the end of the year
646.71 637.52 32.90 34.50
Fair Value of the Plan Assets 698.62 563.68 - - Net Liabilities/(Assets) recognised in the Balance Sheet (51.91) 73.84 32.90 34.50
(iv) Amount recognised in Salary and Wages under Employee Benefits Expense in the Statement of Profit and Loss:Current Service Cost 37.77 32.65 - - Past Service Cost - - - - Interest on Defined Benefit Obligations (Net) 3.53 (0.57) 2.33 2.41 Net Cost 41.29 32.08 2.33 2.41 Capitalised as Pre-Operative Expenses in respect of Projects and other Adjustments
(0.56) (0.42) - -
Net Charge to the Statement of Profit and Loss* 40.73 31.66 2.33 2.41 * Charge towards Discontinued operations included in above Number
3.07 2.52 0.05 0.06
(v) Amount recognised in Other Comprehensive Income (OCI) for the Year:Changes in Financial Assumptions 20.30 46.37 0.57 1.36 Changes in Demographic Assumptions (0.02) - - - Experience Adjustments (40.66) 27.54 0.40 1.51 Actual return on Plan Assets less Interest on Plan Assets (53.75) 10.64 - - Recognised in OCI for the year (74.13) 84.55 0.97 2.87
(vi) Maturity profile of Defined Benefit Obligation:Within next 12 months (next annual reporting period) 62.36 83.90 6.17 4.94 Between 1 and 5 years 151.44 240.77 19.22 16.13 Between 5 and 9 years 307.38 231.73 13.65 12.32 10 years and above 809.37 777.65 10.01 17.63
(vii) Quantitative sensitivity analysis for significant assumptions:Increase/(decrease) on present value of defined benefit obligation at the end of the year50 bps increase in discount rate (28.47) (26.07) (0.82) (0.80)50 bps decrease in discount rate 30.72 28.11 0.86 0.85 50 bps increase in salary escalation rate 29.99 27.68 - - 50 bps decrease in salary escalation rate (28.04) (25.95) - - Increase in Life Expectancy by one year - - 1.25 1.13 Decrease in Life Expectancy by one year - - (1.09) (1.15)
(viii) The major categories of Plan Assets as a% of total plan:Government of India Securities 16.85% 18.15% N.A. N.A.Corporate Bonds 1.89% 2.02% N.A. N.A.Insurer Managed Fund 80.64% 79.75% N.A. N.A.Others 0.62% 0.08% N.A. N.A.Total 100.00% 100.00% N.A. N.A.
276 Grasim Industries Limited
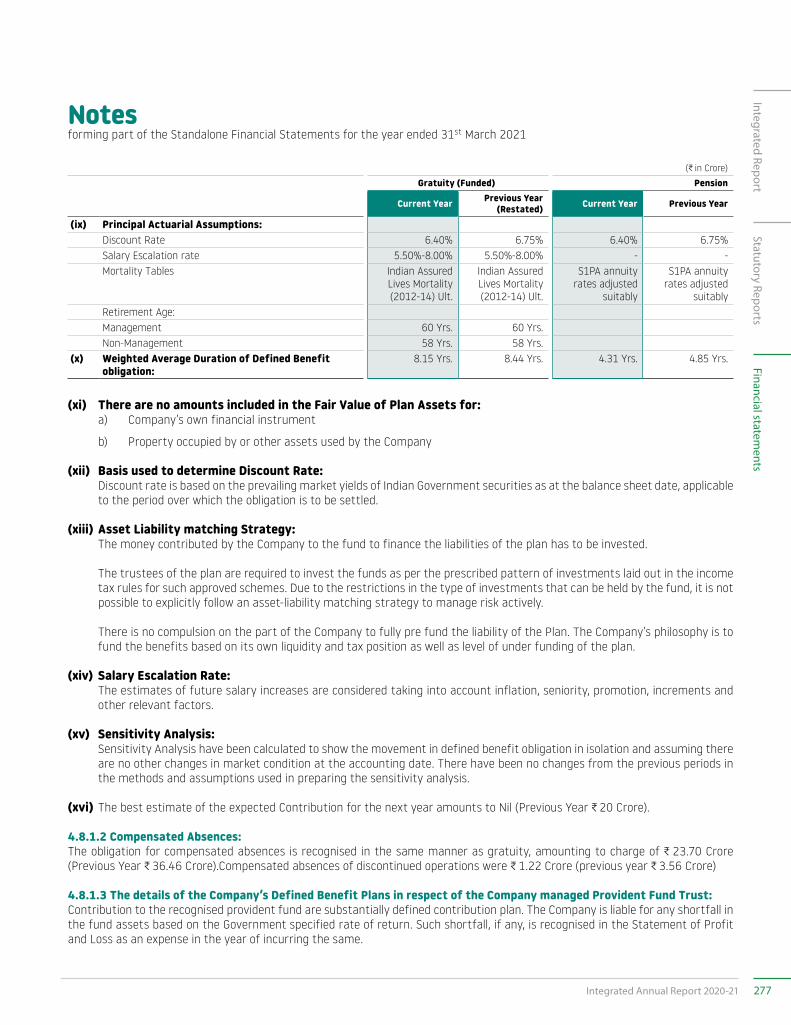
Notesforming part of the Standalone Financial Statements for the year ended 31st March 2021
(C in Crore)
Gratuity (Funded) Pension
Current Year Previous Year (Restated) Current Year Previous Year
(ix) Principal Actuarial Assumptions: Discount Rate 6.40% 6.75% 6.40% 6.75%Salary Escalation rate 5.50%-8.00% 5.50%-8.00% - -Mortality Tables Indian Assured
Lives Mortality (2012-14) Ult.
Indian Assured Lives Mortality (2012-14) Ult.
S1PA annuity rates adjusted
suitably
S1PA annuity rates adjusted
suitablyRetirement Age:Management 60 Yrs. 60 Yrs.Non-Management 58 Yrs. 58 Yrs.
(x) Weighted Average Duration of Defined Benefit obligation:
8.15 Yrs. 8.44 Yrs. 4.31 Yrs. 4.85 Yrs.
(xi) There are no amounts included in the Fair Value of Plan Assets for: a) Company’s own financial instrument
b) Property occupied by or other assets used by the Company
(xii) Basis used to determine Discount Rate: Discount rate is based on the prevailing market yields of Indian Government securities as at the balance sheet date, applicable
to the period over which the obligation is to be settled.
(xiii) Asset Liability matching Strategy: The money contributed by the Company to the fund to finance the liabilities of the plan has to be invested.
The trustees of the plan are required to invest the funds as per the prescribed pattern of investments laid out in the income tax rules for such approved schemes. Due to the restrictions in the type of investments that can be held by the fund, it is not possible to explicitly follow an asset-liability matching strategy to manage risk actively.
There is no compulsion on the part of the Company to fully pre fund the liability of the Plan. The Company’s philosophy is to fund the benefits based on its own liquidity and tax position as well as level of under funding of the plan.
(xiv) Salary Escalation Rate: The estimates of future salary increases are considered taking into account inflation, seniority, promotion, increments and
other relevant factors.
(xv) Sensitivity Analysis: Sensitivity Analysis have been calculated to show the movement in defined benefit obligation in isolation and assuming there
are no other changes in market condition at the accounting date. There have been no changes from the previous periods in the methods and assumptions used in preparing the sensitivity analysis.
(xvi) The best estimate of the expected Contribution for the next year amounts to Nil (Previous Year C 20 Crore).
4.8.1.2 Compensated Absences: The obligation for compensated absences is recognised in the same manner as gratuity, amounting to charge of C 23.70 Crore (Previous Year C 36.46 Crore).Compensated absences of discontinued operations were C 1.22 Crore (previous year C 3.56 Crore)
4.8.1.3 The details of the Company’s Defined Benefit Plans in respect of the Company managed Provident Fund Trust:Contribution to the recognised provident fund are substantially defined contribution plan. The Company is liable for any shortfall in the fund assets based on the Government specified rate of return. Such shortfall, if any, is recognised in the Statement of Profit and Loss as an expense in the year of incurring the same.
277Integrated Annual Report 2020-21
Integrated ReportStatutory Reports
Financial statements
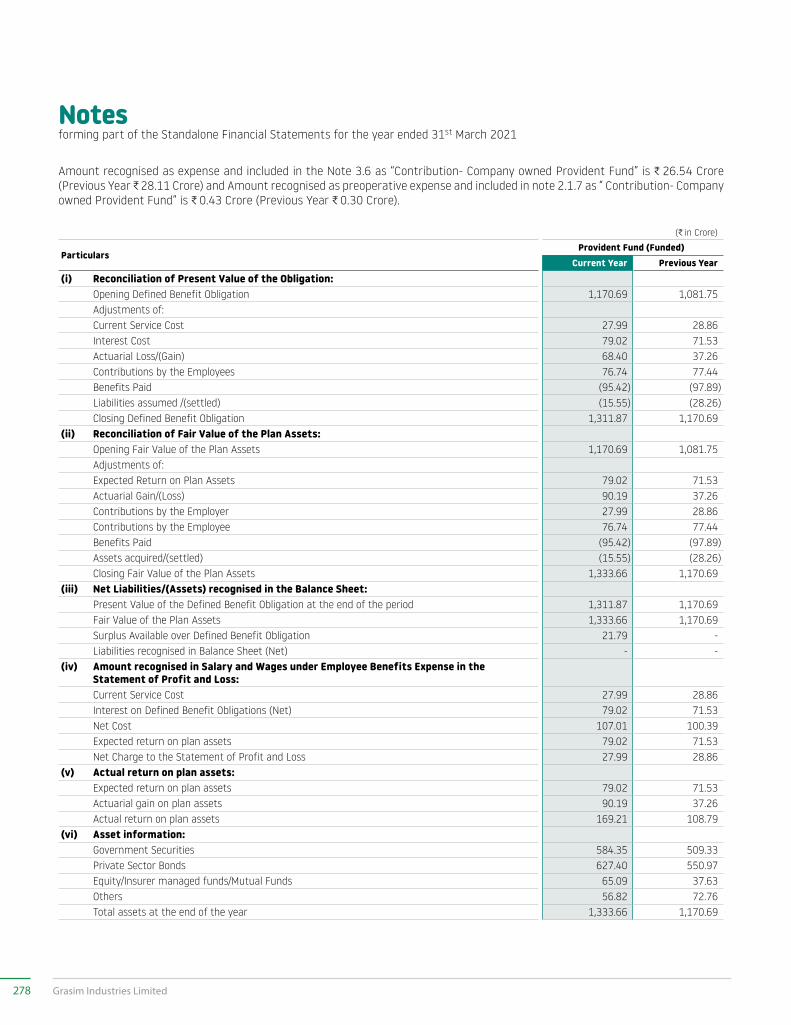
Notesforming part of the Standalone Financial Statements for the year ended 31st March 2021
Amount recognised as expense and included in the Note 3.6 as “Contribution- Company owned Provident Fund” is C 26.54 Crore (Previous Year C 28.11 Crore) and Amount recognised as preoperative expense and included in note 2.1.7 as “ Contribution- Company owned Provident Fund” is C 0.43 Crore (Previous Year C 0.30 Crore).
(C in Crore)
ParticularsProvident Fund (Funded)
Current Year Previous Year(i) Reconciliation of Present Value of the Obligation:
Opening Defined Benefit Obligation 1,170.69 1,081.75 Adjustments of:Current Service Cost 27.99 28.86 Interest Cost 79.02 71.53 Actuarial Loss/(Gain) 68.40 37.26 Contributions by the Employees 76.74 77.44 Benefits Paid (95.42) (97.89)Liabilities assumed /(settled) (15.55) (28.26)Closing Defined Benefit Obligation 1,311.87 1,170.69
(ii) Reconciliation of Fair Value of the Plan Assets:Opening Fair Value of the Plan Assets 1,170.69 1,081.75 Adjustments of:Expected Return on Plan Assets 79.02 71.53 Actuarial Gain/(Loss) 90.19 37.26 Contributions by the Employer 27.99 28.86 Contributions by the Employee 76.74 77.44 Benefits Paid (95.42) (97.89)Assets acquired/(settled) (15.55) (28.26)Closing Fair Value of the Plan Assets 1,333.66 1,170.69
(iii) Net Liabilities/(Assets) recognised in the Balance Sheet:Present Value of the Defined Benefit Obligation at the end of the period 1,311.87 1,170.69 Fair Value of the Plan Assets 1,333.66 1,170.69 Surplus Available over Defined Benefit Obligation 21.79 - Liabilities recognised in Balance Sheet (Net) - -
(iv) Amount recognised in Salary and Wages under Employee Benefits Expense in the Statement of Profit and Loss:Current Service Cost 27.99 28.86 Interest on Defined Benefit Obligations (Net) 79.02 71.53 Net Cost 107.01 100.39 Expected return on plan assets 79.02 71.53 Net Charge to the Statement of Profit and Loss 27.99 28.86
(v) Actual return on plan assets:Expected return on plan assets 79.02 71.53 Actuarial gain on plan assets 90.19 37.26 Actual return on plan assets 169.21 108.79
(vi) Asset information:Government Securities 584.35 509.33 Private Sector Bonds 627.40 550.97 Equity/Insurer managed funds/Mutual Funds 65.09 37.63 Others 56.82 72.76 Total assets at the end of the year 1,333.66 1,170.69
278 Grasim Industries Limited
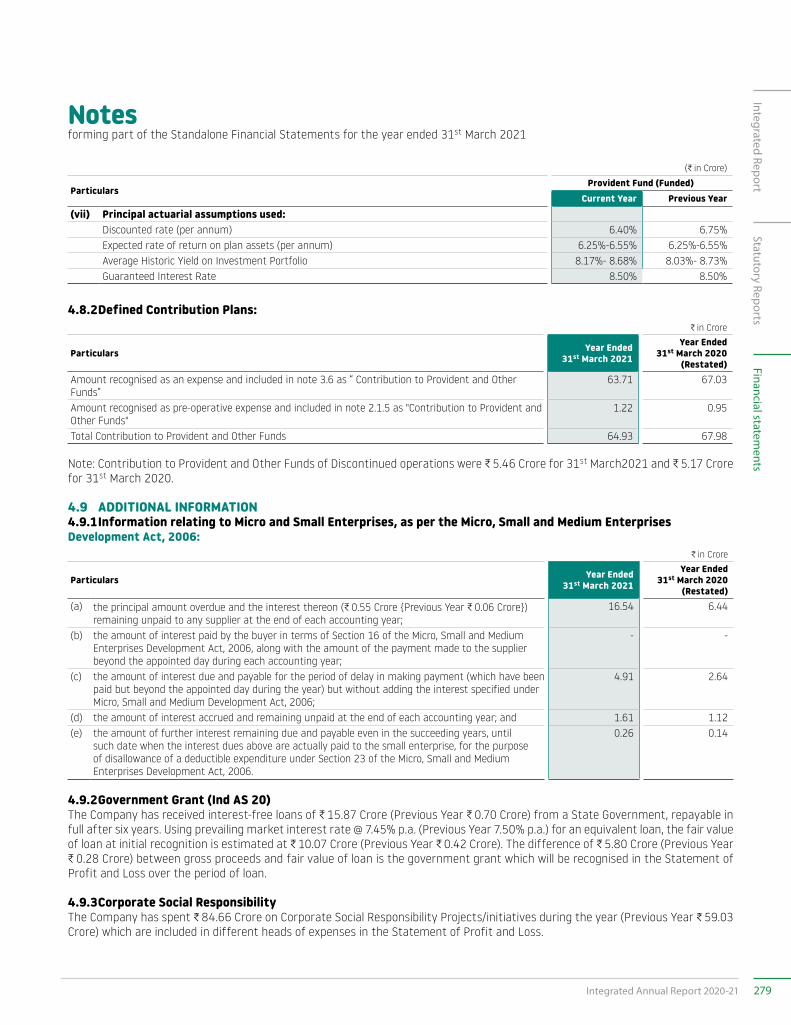
Notesforming part of the Standalone Financial Statements for the year ended 31st March 2021
(C in Crore)
ParticularsProvident Fund (Funded)
Current Year Previous Year(vii) Principal actuarial assumptions used:
Discounted rate (per annum) 6.40% 6.75%Expected rate of return on plan assets (per annum) 6.25%-6.55% 6.25%-6.55%Average Historic Yield on Investment Portfolio 8.17%- 8.68% 8.03%- 8.73%Guaranteed Interest Rate 8.50% 8.50%
4.8.2 Defined Contribution Plans:C in Crore
Particulars Year Ended 31st March 2021
Year Ended 31st March 2020
(Restated)Amount recognised as an expense and included in note 3.6 as “ Contribution to Provident and Other Funds”
63.71 67.03
Amount recognised as pre-operative expense and included in note 2.1.5 as "Contribution to Provident and Other Funds"
1.22 0.95
Total Contribution to Provident and Other Funds 64.93 67.98
Note: Contribution to Provident and Other Funds of Discontinued operations were C 5.46 Crore for 31st March2021 and C 5.17 Crore for 31st March 2020.
4.9 ADDITIONAL INFORMATION4.9.1 Information relating to Micro and Small Enterprises, as per the Micro, Small and Medium EnterprisesDevelopment Act, 2006:
C in Crore
Particulars Year Ended 31st March 2021
Year Ended 31st March 2020
(Restated)(a) the principal amount overdue and the interest thereon (C 0.55 Crore {Previous Year C 0.06 Crore})
remaining unpaid to any supplier at the end of each accounting year; 16.54 6.44
(b) the amount of interest paid by the buyer in terms of Section 16 of the Micro, Small and Medium Enterprises Development Act, 2006, along with the amount of the payment made to the supplier beyond the appointed day during each accounting year;
- -
(c) the amount of interest due and payable for the period of delay in making payment (which have been paid but beyond the appointed day during the year) but without adding the interest specified under Micro, Small and Medium Development Act, 2006;
4.91 2.64
(d) the amount of interest accrued and remaining unpaid at the end of each accounting year; and 1.61 1.12 (e) the amount of further interest remaining due and payable even in the succeeding years, until
such date when the interest dues above are actually paid to the small enterprise, for the purpose of disallowance of a deductible expenditure under Section 23 of the Micro, Small and Medium Enterprises Development Act, 2006.
0.26 0.14
4.9.2 Government Grant (Ind AS 20)The Company has received interest-free loans of C 15.87 Crore (Previous Year C 0.70 Crore) from a State Government, repayable in full after six years. Using prevailing market interest rate @ 7.45% p.a. (Previous Year 7.50% p.a.) for an equivalent loan, the fair value of loan at initial recognition is estimated at C 10.07 Crore (Previous Year C 0.42 Crore). The difference of C 5.80 Crore (Previous Year C 0.28 Crore) between gross proceeds and fair value of loan is the government grant which will be recognised in the Statement of Profit and Loss over the period of loan.
4.9.3 Corporate Social Responsibility The Company has spent C 84.66 Crore on Corporate Social Responsibility Projects/initiatives during the year (Previous Year C 59.03 Crore) which are included in different heads of expenses in the Statement of Profit and Loss.
279Integrated Annual Report 2020-21
Integrated ReportStatutory Reports
Financial statements
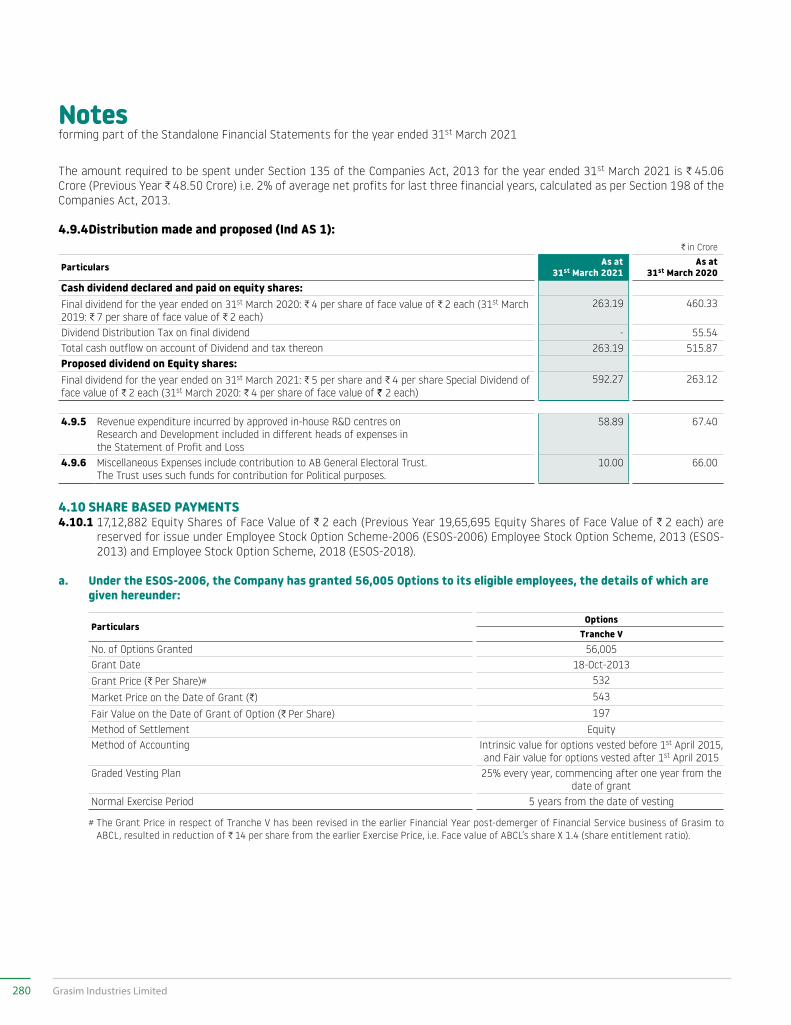
Notesforming part of the Standalone Financial Statements for the year ended 31st March 2021
The amount required to be spent under Section 135 of the Companies Act, 2013 for the year ended 31st March 2021 is C 45.06 Crore (Previous Year C 48.50 Crore) i.e. 2% of average net profits for last three financial years, calculated as per Section 198 of the Companies Act, 2013.
4.9.4 Distribution made and proposed (Ind AS 1):C in Crore
Particulars As at 31st March 2021
As at 31st March 2020
Cash dividend declared and paid on equity shares:Final dividend for the year ended on 31st March 2020: C 4 per share of face value of C 2 each (31st March 2019: C 7 per share of face value of C 2 each)
263.19 460.33
Dividend Distribution Tax on final dividend - 55.54 Total cash outflow on account of Dividend and tax thereon 263.19 515.87 Proposed dividend on Equity shares:Final dividend for the year ended on 31st March 2021: C 5 per share and C 4 per share Special Dividend of face value of C 2 each (31st March 2020: C 4 per share of face value of ` 2 each)
592.27 263.12
4.9.5 Revenue expenditure incurred by approved in-house R&D centres on Research and Development included in different heads of expenses in the Statement of Profit and Loss
58.89 67.40
4.9.6 Miscellaneous Expenses include contribution to AB General Electoral Trust. The Trust uses such funds for contribution for Political purposes.
10.00 66.00
4.10 SHARE BASED PAYMENTS4.10.1 17,12,882 Equity Shares of Face Value of C 2 each (Previous Year 19,65,695 Equity Shares of Face Value of C 2 each) are
reserved for issue under Employee Stock Option Scheme-2006 (ESOS-2006) Employee Stock Option Scheme, 2013 (ESOS-2013) and Employee Stock Option Scheme, 2018 (ESOS-2018).
a. Under the ESOS-2006, the Company has granted 56,005 Options to its eligible employees, the details of which are given hereunder:
ParticularsOptions
Tranche V No. of Options Granted 56,005Grant Date 18-Oct-2013Grant Price (C Per Share)# 532
Market Price on the Date of Grant (C) 543
Fair Value on the Date of Grant of Option (C Per Share) 197Method of Settlement Equity Method of Accounting Intrinsic value for options vested before 1st April 2015,
and Fair value for options vested after 1st April 2015Graded Vesting Plan 25% every year, commencing after one year from the
date of grantNormal Exercise Period 5 years from the date of vesting
# The Grant Price in respect of Tranche V has been revised in the earlier Financial Year post-demerger of Financial Service business of Grasim to ABCL, resulted in reduction of C 14 per share from the earlier Exercise Price, i.e. Face value of ABCL’s share X 1.4 (share entitlement ratio).
280 Grasim Industries Limited
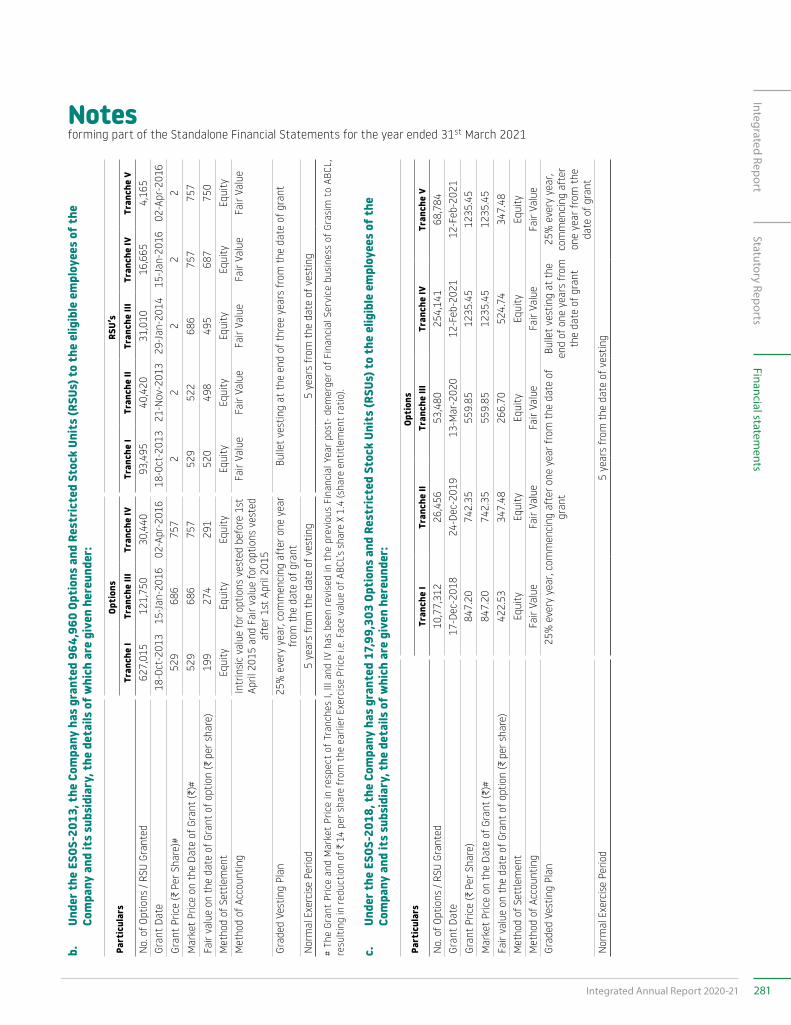
Notesforming part of the Standalone Financial Statements for the year ended 31st March 2021
b.
Unde
r the
ESO
S-20
13, t
he C
ompa
ny h
as g
rant
ed 9
64,9
60 O
ptio
ns a
nd R
estr
icte
d St
ock
Unit
s (R
SUs)
to
the
elig
ible
em
ploy
ees
of t
he
Com
pany
and
its
subs
idia
ry, t
he d
etai
ls o
f whi
ch a
re g
iven
her
eund
er:
Part
icul
ars
Opti
ons
RSU’
s T
ranc
he I
Tra
nche
III
Tra
nche
IV
Tra
nche
I T
ranc
he II
T
ranc
he II
I T
ranc
he IV
T
ranc
he V
N
o. o
f Opt
ions
/ RS
U Gr
ante
d62
7,01
512
1,75
030
,440
93,4
9540
,420
31,0
1016
,665
4,16
5Gr
ant
Date
18-O
ct-2
013
15-J
an-2
016
02-A
pr-2
016
18-O
ct-2
013
21-N
ov-2
013
29-J
an-2
014
15-J
an-2
016
02-A
pr-2
016
Gran
t Pr
ice
(C P
er S
hare
)#52
968
675
72
22
22
Mar
ket
Pric
e on
the
Date
of G
rant
(C)#
529
686
757
529
522
686
757
757
Fair
valu
e on
the
date
of G
rant
of o
ptio
n (C
per
sha
re)
199
274
291
520
498
495
687
750
Met
hod
of S
ettle
men
tEq
uity
Equi
tyEq
uity
Equi
tyEq
uity
Equi
tyEq
uity
Equi
tyM
etho
d of
Acc
ount
ing
Intr
insi
c va
lue
for o
ptio
ns v
este
d be
fore
1st
Ap
ril 2
015
and
Fair
valu
e fo
r opt
ions
ves
ted
afte
r 1st
Apr
il 20
15
Fair
Valu
eFa
ir Va
lue
Fair
Valu
eFa
ir Va
lue
Fair
Valu
e
Grad
ed V
estin
g Pl
an25
% e
very
yea
r, co
mm
enci
ng a
fter
one
yea
r fr
om th
e da
te o
f gra
ntBu
llet
vest
ing
at th
e en
d of
thre
e ye
ars
from
the
date
of g
rant
Nor
mal
Exe
rcis
e Pe
riod
5 ye
ars
from
the
date
of v
estin
g5
year
s fr
om th
e da
te o
f ves
ting
# Th
e Gr
ant
Pric
e an
d M
arke
t Pr
ice
in r
espe
ct o
f Tr
anch
es I,
III a
nd IV
has
bee
n re
vise
d in
the
pre
viou
s Fi
nanc
ial Y
ear
post
- de
mer
ger
of F
inan
cial
Ser
vice
bus
ines
s of
Gra
sim
to
ABCL
, re
sult
ing
in r
educ
tion
of C
14
per s
hare
fro
m t
he e
arlie
r Exe
rcis
e Pr
ice
i.e. F
ace
valu
e of
ABC
L’s s
hare
X 1
.4 (s
hare
ent
itle
men
t ra
tio).
c.
Unde
r the
ESO
S-20
18, t
he C
ompa
ny h
as g
rant
ed 1
7,99
,303
Opt
ions
and
Res
tric
ted
Stoc
k Un
its
(RSU
s) t
o th
e el
igib
le e
mpl
oyee
s of
the
Co
mpa
ny a
nd it
s su
bsid
iary
, the
det
ails
of w
hich
are
giv
en h
ereu
nder
:
Part
icul
ars
Opti
ons
Tra
nche
I T
ranc
he II
T
ranc
he II
I T
ranc
he IV
T
ranc
he V
N
o. o
f Opt
ions
/ RS
U Gr
ante
d10
,77,
312
26,4
5653
,480
254,
141
68,7
84Gr
ant
Date
17-D
ec-2
018
24-D
ec-2
019
13-M
ar-2
020
12-F
eb-2
021
12-F
eb-2
021
Gran
t Pr
ice
(C P
er S
hare
)84
7.20
742.
3555
9.85
1235
.45
1235
.45
Mar
ket
Pric
e on
the
Date
of G
rant
(C)#
847.
2074
2.35
559.
8512
35.4
512
35.4
5
Fair
valu
e on
the
date
of G
rant
of o
ptio
n (C
per
sha
re)
422.
5334
7.48
266.
7052
4.74
347.
48M
etho
d of
Set
tlem
ent
Equi
tyEq
uity
Equi
tyEq
uity
Equi
tyM
etho
d of
Acc
ount
ing
Fair
Valu
eFa
ir Va
lue
Fair
Valu
eFa
ir Va
lue
Fair
Valu
eGr
aded
Ves
ting
Plan
25%
eve
ry y
ear,
com
men
cing
aft
er o
ne y
ear f
rom
the
date
of
gran
tBu
llet
vest
ing
at th
e en
d of
one
yea
rs fr
om
the
date
of g
rant
25%
eve
ry y
ear,
com
men
cing
aft
er
one
year
from
the
date
of g
rant
Nor
mal
Exe
rcis
e Pe
riod
5 ye
ars
from
the
date
of v
estin
g
281Integrated Annual Report 2020-21
Integrated ReportStatutory Reports
Financial statements
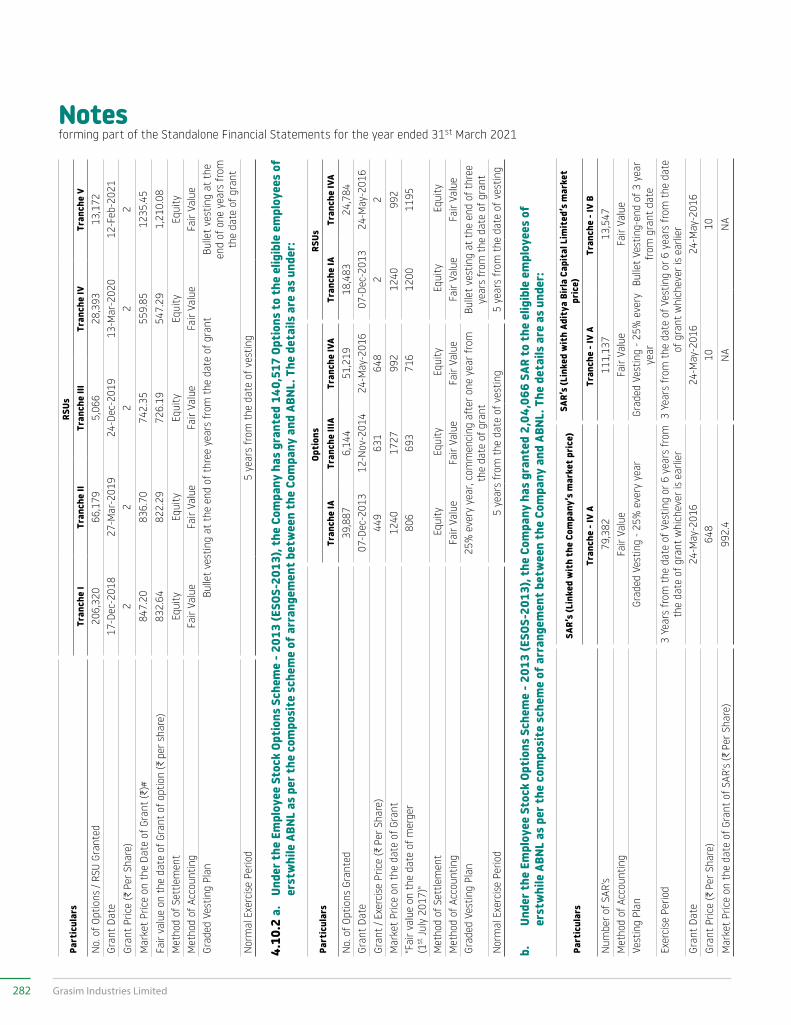
Notesforming part of the Standalone Financial Statements for the year ended 31st March 2021
Part
icul
ars
RSUs
Tra
nche
I T
ranc
he II
T
ranc
he II
I T
ranc
he IV
T
ranc
he V
N
o. o
f Opt
ions
/ RS
U Gr
ante
d20
6,32
066
,179
5,06
628
,393
13,1
72Gr
ant
Date
17-D
ec-2
018
27-M
ar-2
019
24-D
ec-2
019
13-M
ar-2
020
12-F
eb-2
021
Gran
t Pr
ice
(C P
er S
hare
)2
22
22
Mar
ket
Pric
e on
the
Date
of G
rant
(C)#
847.
2083
6.70
742.
3555
9.85
1235
.45
Fair
valu
e on
the
date
of G
rant
of o
ptio
n (C
per
sha
re)
832.
6482
2.29
726.
1954
7.29
1,21
0.08
Met
hod
of S
ettle
men
tEq
uity
Equi
tyEq
uity
Equi
tyEq
uity
Met
hod
of A
ccou
ntin
gFa
ir Va
lue
Fair
Valu
eFa
ir Va
lue
Fair
Valu
eFa
ir Va
lue
Grad
ed V
estin
g Pl
anBu
llet
vest
ing
at th
e en
d of
thre
e ye
ars
from
the
date
of g
rant
Bulle
t ve
stin
g at
the
end
of o
ne y
ears
from
th
e da
te o
f gra
ntN
orm
al E
xerc
ise
Perio
d5
year
s fr
om th
e da
te o
f ves
ting
4.10
.2 a
. Un
der t
he E
mpl
oyee
Sto
ck O
ptio
ns S
chem
e - 2
013
(ESO
S-20
13),
the
Com
pany
has
gra
nted
140
,517
Opt
ions
to
the
elig
ible
em
ploy
ees
of
erst
whi
le A
BNL
as p
er t
he c
ompo
site
sch
eme
of a
rran
gem
ent b
etw
een
the
Com
pany
and
ABN
L. T
he d
etai
ls a
re a
s un
der:
Part
icul
ars
Opti
ons
RSUs
Tra
nche
IA
Tra
nche
IIIA
T
ranc
he IV
A T
ranc
he IA
T
ranc
he IV
A N
o. o
f Opt
ions
Gra
nted
39,8
876,
144
51,2
1918
,483
24,7
84Gr
ant
Date
07-D
ec-2
013
12-N
ov-2
014
24-M
ay-2
016
07-D
ec-2
013
24-M
ay-2
016
Gran
t / E
xerc
ise
Pric
e (C
Per
Sha
re)
449
631
648
22
Mar
ket
Pric
e on
the
date
of G
rant
1240
1727
992
1240
992
"Fai
r val
ue o
n th
e da
te o
f mer
ger
(1st
July
201
7)"
806
693
716
1200
1195
Met
hod
of S
ettle
men
t E
quity
E
quity
E
quity
E
quity
E
quity
M
etho
d of
Acc
ount
ing
Fair
Valu
eFa
ir Va
lue
Fair
Valu
eFa
ir Va
lue
Fair
Valu
eGr
aded
Ves
ting
Plan
25%
eve
ry y
ear,
com
men
cing
aft
er o
ne y
ear f
rom
th
e da
te o
f gra
ntBu
llet
vest
ing
at th
e en
d of
thre
e ye
ars
from
the
date
of g
rant
Nor
mal
Exe
rcis
e Pe
riod
5 ye
ars
from
the
date
of v
estin
g5
year
s fr
om th
e da
te o
f ves
ting
b.
Unde
r the
Em
ploy
ee S
tock
Opt
ions
Sch
eme
- 201
3 (E
SOS-
2013
), th
e Co
mpa
ny h
as g
rant
ed 2
,04,
066
SAR
to t
he e
ligib
le e
mpl
oyee
s of
er
stw
hile
ABN
L as
per
the
com
posi
te s
chem
e of
arr
ange
men
t bet
wee
n th
e Co
mpa
ny a
nd A
BNL.
The
det
ails
are
as
unde
r:
Part
icul
ars
SAR’
s (L
inke
d w
ith
the
Com
pany
’s m
arke
t pri
ce)
SAR’
s (L
inke
d w
ith
Adit
ya B
irla
Cap
ital
Lim
ited
’s m
arke
t pr
ice)
Tran
che
- IV
ATr
anch
e - I
V A
Tran
che
- IV
BN
umbe
r of S
AR's
79,3
8211
1,13
713
,547
Met
hod
of A
ccou
ntin
gFa
ir Va
lue
Fair
Valu
eFa
ir Va
lue
Vest
ing
Plan
Grad
ed V
estin
g - 2
5% e
very
yea
rGr
aded
Ves
ting
- 25%
eve
ry
year
Bulle
t Ve
stin
g-en
d of
3 y
ear
from
gra
nt d
ate
Exer
cise
Per
iod
3 Ye
ars
from
the
date
of V
estin
g or
6 y
ears
from
th
e da
te o
f gra
nt w
hich
ever
is e
arlie
r3
Year
s fr
om th
e da
te o
f Ves
ting
or 6
yea
rs fr
om th
e da
te
of g
rant
whi
chev
er is
ear
lier
Gran
t Da
te24
-May
-201
624
-May
-201
624
-May
-201
6Gr
ant
Pric
e (C
Per
Sha
re)
648
1010
Mar
ket
Pric
e on
the
date
of G
rant
of S
AR's
(C P
er S
hare
)99
2.4
NA
NA
282 Grasim Industries Limited
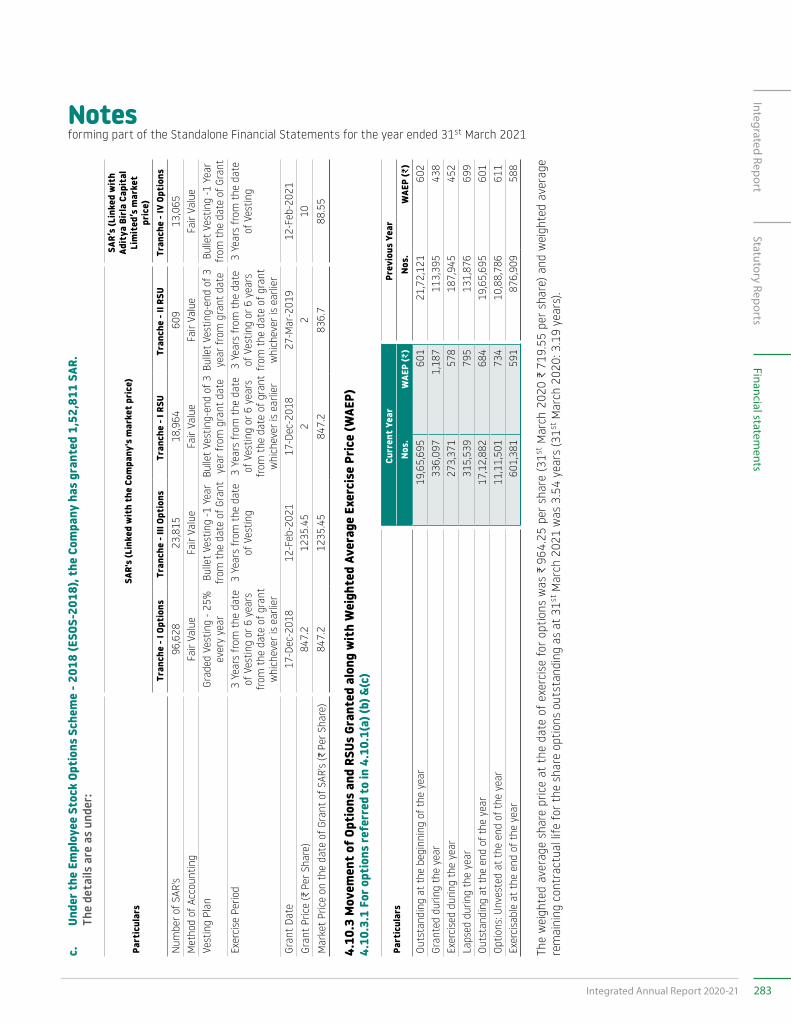
Notesforming part of the Standalone Financial Statements for the year ended 31st March 2021
c.
Unde
r the
Em
ploy
ee S
tock
Opt
ions
Sch
eme
- 201
8 (E
SOS-
2018
), th
e Co
mpa
ny h
as g
rant
ed 1
,52,
811
SAR.
Th
e de
tails
are
as
unde
r:
Part
icul
ars
SAR'
s (L
inke
d w
ith
the
Com
pany
's m
arke
t pri
ce)
SAR’
s (L
inke
d w
ith
Adit
ya B
irla
Cap
ital
Li
mit
ed’s
mar
ket
pric
e)Tr
anch
e - I
Opt
ions
Tran
che
- III
Opti
ons
Tran
che
- I R
SUTr
anch
e - I
I RSU
Tran
che
- IV
Opti
ons
Num
ber o
f SAR
's96
,628
23,8
1518
,964
609
13,0
65M
etho
d of
Acc
ount
ing
Fair
Valu
eFa
ir Va
lue
Fair
Valu
eFa
ir Va
lue
Fair
Valu
eVe
stin
g Pl
anGr
aded
Ves
ting
- 25%
ev
ery
year
Bulle
t Ve
stin
g -1
Yea
r fr
om th
e da
te o
f Gra
ntBu
llet
Vest
ing-
end
of 3
ye
ar fr
om g
rant
dat
eBu
llet
Vest
ing-
end
of 3
ye
ar fr
om g
rant
dat
eBu
llet
Vest
ing
-1 Y
ear
from
the
date
of G
rant
Exer
cise
Per
iod
3 Ye
ars
from
the
date
of
Ves
ting
or 6
yea
rs
from
the
date
of g
rant
w
hich
ever
is e
arlie
r
3 Ye
ars
from
the
date
of
Ves
ting
3 Ye
ars
from
the
date
of
Ves
ting
or 6
yea
rs
from
the
date
of g
rant
w
hich
ever
is e
arlie
r
3 Ye
ars
from
the
date
of
Ves
ting
or 6
yea
rs
from
the
date
of g
rant
w
hich
ever
is e
arlie
r
3 Ye
ars
from
the
date
of
Ves
ting
Gran
t Da
te17
-Dec
-201
812
-Feb
-202
117
-Dec
-201
827
-Mar
-201
912
-Feb
-202
1Gr
ant
Pric
e (C
Per
Sha
re)
847.
212
35.4
52
210
Mar
ket
Pric
e on
the
date
of G
rant
of S
AR's
(C P
er S
hare
)84
7.2
1235
.45
847.
283
6.7
88.5
5
4.10
.3 M
ovem
ent o
f Opt
ions
and
RSU
s Gr
ante
d al
ong
wit
h W
eigh
ted
Aver
age
Exer
cise
Pric
e (W
AEP)
4.
10.3
.1 F
or o
ptio
ns re
ferr
ed t
o in
4.1
0.1(
a) (b
) &(c
)
Part
icul
ars
Curr
ent Y
ear
Prev
ious
Yea
rNo
s.W
AEP
(D)
Nos.
WAE
P (D
)Ou
tsta
ndin
g at
the
begi
nnin
g of
the
year
19,
65,6
95
601
2
1,72
,121
6
02
Gran
ted
durin
g th
e ye
ar 3
36,0
97
1,1
87
113
,395
4
38
Exer
cise
d du
ring
the
year
273
,371
5
78
187
,945
4
52
Laps
ed d
urin
g th
e ye
ar 3
15,5
39
795
1
31,8
76
699
Ou
tsta
ndin
g at
the
end
of th
e ye
ar 1
7,12
,882
6
84
19,
65,6
95
601
Op
tions
: Unv
este
d at
the
end
of th
e ye
ar 1
1,11
,501
7
34
10,
88,7
86
611
Ex
erci
sabl
e at
the
end
of th
e ye
ar 6
01,3
81
591
8
76,9
09
588
The
wei
ghte
d av
erag
e sh
are
pric
e at
the
dat
e of
exe
rcis
e fo
r op
tions
was
C 9
64.2
5 pe
r sh
are
(31st
Mar
ch 2
020
C 7
19.5
5 pe
r sh
are)
and
wei
ghte
d av
erag
e re
mai
ning
con
trac
tual
life
for t
he s
hare
opt
ions
out
stan
ding
as
at 3
1st M
arch
202
1 w
as 3
.54
year
s (3
1st M
arch
202
0: 3
.19
year
s).
283Integrated Annual Report 2020-21
Integrated ReportStatutory Reports
Financial statements
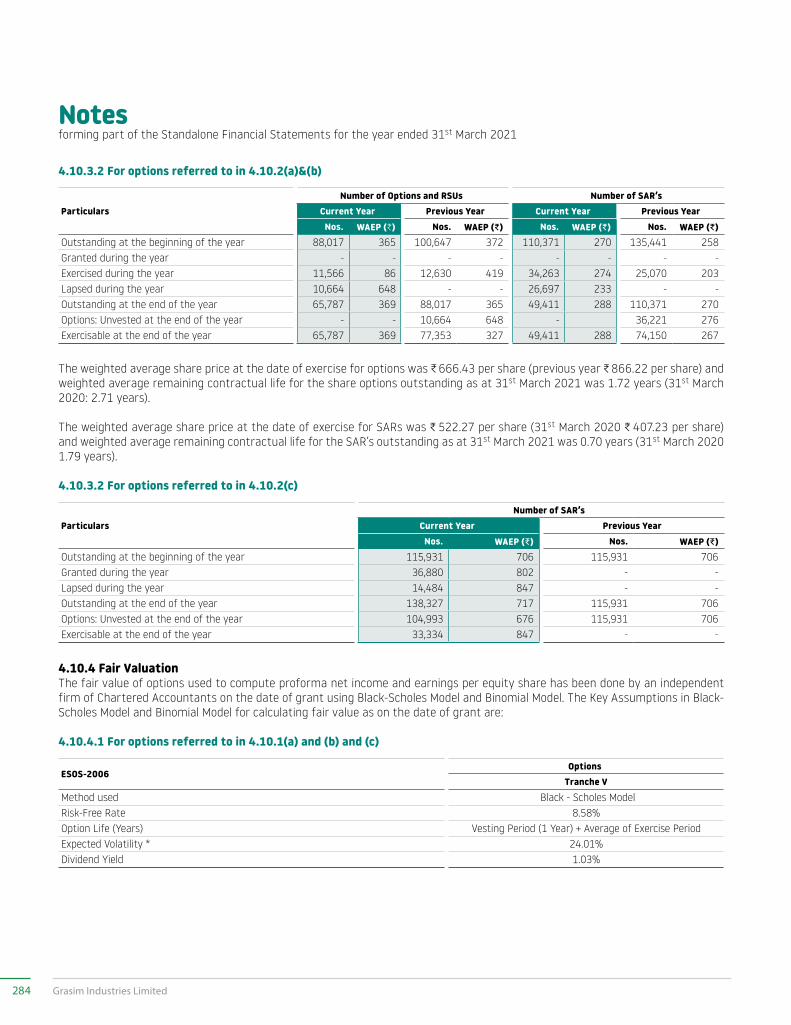
Notesforming part of the Standalone Financial Statements for the year ended 31st March 2021
4.10.3.2 For options referred to in 4.10.2(a)&(b)
ParticularsNumber of Options and RSUs Number of SAR’s
Current Year Previous Year Current Year Previous YearNos. WAEP (C) Nos. WAEP (D) Nos. WAEP (D) Nos. WAEP (D)
Outstanding at the beginning of the year 88,017 365 100,647 372 110,371 270 135,441 258 Granted during the year - - - - - - - - Exercised during the year 11,566 86 12,630 419 34,263 274 25,070 203 Lapsed during the year 10,664 648 - - 26,697 233 - - Outstanding at the end of the year 65,787 369 88,017 365 49,411 288 110,371 270 Options: Unvested at the end of the year - - 10,664 648 - 36,221 276 Exercisable at the end of the year 65,787 369 77,353 327 49,411 288 74,150 267
The weighted average share price at the date of exercise for options was C 666.43 per share (previous year C 866.22 per share) and weighted average remaining contractual life for the share options outstanding as at 31st March 2021 was 1.72 years (31st March 2020: 2.71 years).
The weighted average share price at the date of exercise for SARs was C 522.27 per share (31st March 2020 C 407.23 per share) and weighted average remaining contractual life for the SAR’s outstanding as at 31st March 2021 was 0.70 years (31st March 2020 1.79 years).
4.10.3.2 For options referred to in 4.10.2(c)
Particulars Number of SAR’s
Current Year Previous YearNos. WAEP (D) Nos. WAEP (D)
Outstanding at the beginning of the year 115,931 706 115,931 706 Granted during the year 36,880 802 - - Lapsed during the year 14,484 847 - - Outstanding at the end of the year 138,327 717 115,931 706 Options: Unvested at the end of the year 104,993 676 115,931 706 Exercisable at the end of the year 33,334 847 - -
4.10.4 Fair ValuationThe fair value of options used to compute proforma net income and earnings per equity share has been done by an independent firm of Chartered Accountants on the date of grant using Black-Scholes Model and Binomial Model. The Key Assumptions in Black-Scholes Model and Binomial Model for calculating fair value as on the date of grant are:
4.10.4.1 For options referred to in 4.10.1(a) and (b) and (c)
ESOS-2006Options
Tranche V Method used Black - Scholes Model Risk-Free Rate 8.58%Option Life (Years) Vesting Period (1 Year) + Average of Exercise PeriodExpected Volatility * 24.01%Dividend Yield 1.03%
284 Grasim Industries Limited
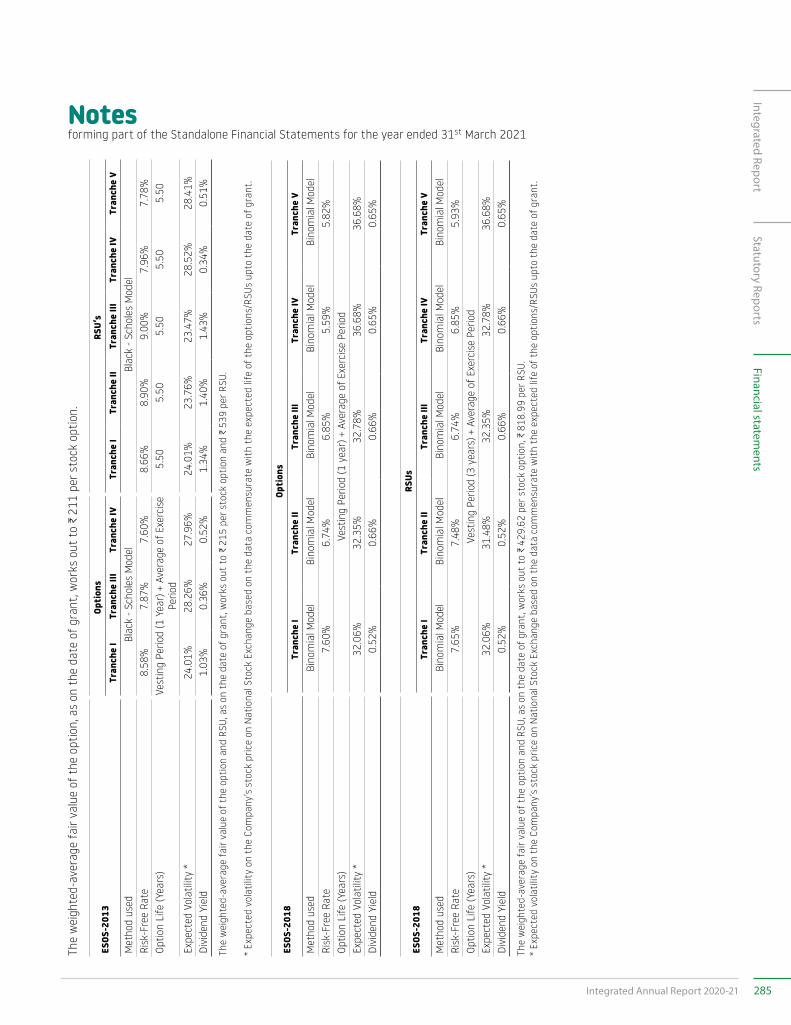
Notesforming part of the Standalone Financial Statements for the year ended 31st March 2021
The
wei
ghte
d-av
erag
e fa
ir va
lue
of t
he o
ptio
n, a
s on
the
dat
e of
gra
nt, w
orks
out
to
C 2
11 p
er s
tock
opt
ion.
ESOS
-201
3Op
tion
sRS
U’s
Tra
nche
I T
ranc
he II
I T
ranc
he IV
T
ranc
he I
Tra
nche
II
Tra
nche
III
Tra
nche
IV T
ranc
he V
Met
hod
used
Bla
ck -
Scho
les
Mod
el
Bla
ck -
Scho
les
Mod
el
Risk
-Fre
e Ra
te8.
58%
7.87
%7.
60%
8.66
%8.
90%
9.00
%7.
96%
7.78
%Op
tion
Life
(Yea
rs)
Vest
ing
Perio
d (1
Yea
r) +
Ave
rage
of E
xerc
ise
Perio
d5.
505.
505.
505.
505.
50
Expe
cted
Vol
atili
ty *
24.0
1%28
.26%
27.9
6%24
.01%
23.7
6%23
.47%
28.5
2%28
.41%
Divi
dend
Yie
ld
1.03
%0.
36%
0.52
%1.
34%
1.40
%1.
43%
0.34
%0.
51%
The
wei
ghte
d-av
erag
e fa
ir va
lue
of t
he o
ptio
n an
d RS
U, a
s on
the
dat
e of
gra
nt, w
orks
out
to
C 2
15 p
er s
tock
opt
ion
and
C 5
39 p
er R
SU.
*
Expe
cted
vol
atili
ty o
n th
e Co
mpa
ny’s
stoc
k pr
ice
on N
atio
nal S
tock
Exc
hang
e ba
sed
on t
he d
ata
com
men
sura
te w
ith
the
expe
cted
life
of t
he o
ptio
ns/R
SUs
upto
the
dat
e of
gra
nt.
ESOS
-201
8Op
tion
s T
ranc
he I
Tra
nche
II
Tra
nche
III
Tra
nche
IV
Tra
nche
V
Met
hod
used
Bin
omia
l Mod
el
Bin
omia
l Mod
el
Bin
omia
l Mod
el
Bin
omia
l Mod
el
Bin
omia
l Mod
el
Risk
-Fre
e Ra
te7.
60%
6.74
%6.
85%
5.59
%5.
82%
Optio
n Li
fe (Y
ears
)Ve
stin
g Pe
riod
(1 y
ear)
+ A
vera
ge o
f Exe
rcis
e Pe
riod
Expe
cted
Vol
atili
ty *
32.0
6%32
.35%
32.7
8%36
.68%
36.6
8%Di
vide
nd Y
ield
0.
52%
0.66
%0.
66%
0.65
%0.
65%
ESOS
-201
8RS
Us T
ranc
he I
Tra
nche
II
Tra
nche
III
Tra
nche
IV
Tra
nche
V
Met
hod
used
Bin
omia
l Mod
el
Bin
omia
l Mod
el
Bin
omia
l Mod
el
Bin
omia
l Mod
el
Bin
omia
l Mod
el
Risk
-Fre
e Ra
te7.
65%
7.48
%6.
74%
6.85
%5.
93%
Optio
n Li
fe (Y
ears
)Ve
stin
g Pe
riod
(3 y
ears
) + A
vera
ge o
f Exe
rcis
e Pe
riod
Expe
cted
Vol
atili
ty *
32.0
6%31
.48%
32.3
5%32
.78%
36.6
8%Di
vide
nd Y
ield
0.
52%
0.52
%0.
66%
0.66
%0.
65%
The
wei
ghte
d-av
erag
e fa
ir va
lue
of t
he o
ptio
n an
d RS
U, a
s on
the
dat
e of
gra
nt, w
orks
out
to
C 4
29.6
2 pe
r sto
ck o
ptio
n, C
818
.99
per R
SU.
* Ex
pect
ed v
olat
ility
on
the
Com
pany
’s st
ock
pric
e on
Nat
iona
l Sto
ck E
xcha
nge
base
d on
the
dat
a co
mm
ensu
rate
wit
h th
e ex
pect
ed li
fe o
f the
opt
ions
/RSU
s up
to t
he d
ate
of g
rant
.
285Integrated Annual Report 2020-21
Integrated ReportStatutory Reports
Financial statements
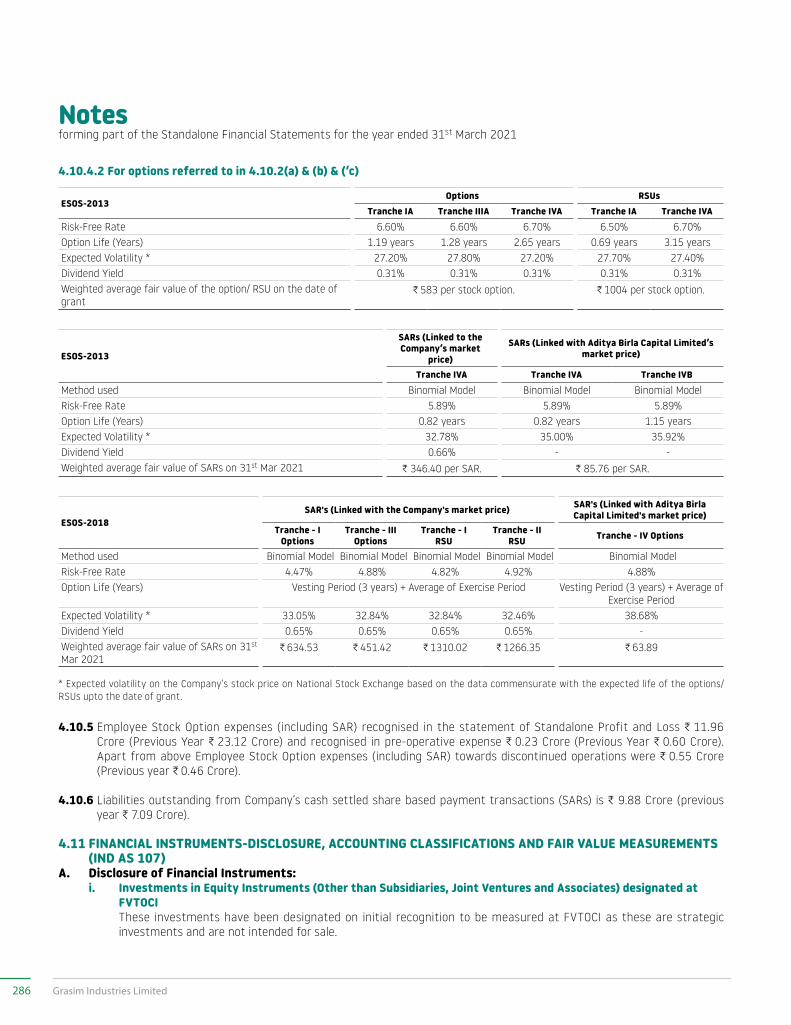
Notesforming part of the Standalone Financial Statements for the year ended 31st March 2021
4.10.4.2 For options referred to in 4.10.2(a) & (b) & (‘c)
ESOS-2013Options RSUs
Tranche IA Tranche IIIA Tranche IVA Tranche IA Tranche IVA Risk-Free Rate 6.60% 6.60% 6.70% 6.50% 6.70%Option Life (Years) 1.19 years 1.28 years 2.65 years 0.69 years 3.15 yearsExpected Volatility * 27.20% 27.80% 27.20% 27.70% 27.40%Dividend Yield 0.31% 0.31% 0.31% 0.31% 0.31%Weighted average fair value of the option/ RSU on the date of grant
C 583 per stock option. C 1004 per stock option.
ESOS-2013
SARs (Linked to the Company’s market
price)
SARs (Linked with Aditya Birla Capital Limited’s market price)
Tranche IVA Tranche IVA Tranche IVBMethod used Binomial Model Binomial Model Binomial ModelRisk-Free Rate 5.89% 5.89% 5.89%Option Life (Years) 0.82 years 0.82 years 1.15 yearsExpected Volatility * 32.78% 35.00% 35.92%Dividend Yield 0.66% - -Weighted average fair value of SARs on 31st Mar 2021 C 346.40 per SAR. C 85.76 per SAR.
ESOS-2018SAR's (Linked with the Company's market price) SAR's (Linked with Aditya Birla
Capital Limited's market price)Tranche - I
OptionsTranche - III
OptionsTranche - I
RSUTranche - II
RSU Tranche - IV Options
Method used Binomial Model Binomial Model Binomial Model Binomial Model Binomial ModelRisk-Free Rate 4.47% 4.88% 4.82% 4.92% 4.88%Option Life (Years) Vesting Period (3 years) + Average of Exercise Period Vesting Period (3 years) + Average of
Exercise PeriodExpected Volatility * 33.05% 32.84% 32.84% 32.46% 38.68%Dividend Yield 0.65% 0.65% 0.65% 0.65% -Weighted average fair value of SARs on 31st Mar 2021
C 634.53 C 451.42 C 1310.02 C 1266.35 C 63.89
* Expected volatility on the Company’s stock price on National Stock Exchange based on the data commensurate with the expected life of the options/RSUs upto the date of grant.
4.10.5 Employee Stock Option expenses (including SAR) recognised in the statement of Standalone Profit and Loss C 11.96 Crore (Previous Year C 23.12 Crore) and recognised in pre-operative expense C 0.23 Crore (Previous Year C 0.60 Crore). Apart from above Employee Stock Option expenses (including SAR) towards discontinued operations were C 0.55 Crore (Previous year C 0.46 Crore).
4.10.6 Liabilities outstanding from Company’s cash settled share based payment transactions (SARs) is C 9.88 Crore (previous year C 7.09 Crore).
4.11 FINANCIAL INSTRUMENTS-DISCLOSURE, ACCOUNTING CLASSIFICATIONS AND FAIR VALUE MEASUREMENTS (IND AS 107)
A. Disclosure of Financial Instruments: i. Investments in Equity Instruments (Other than Subsidiaries, Joint Ventures and Associates) designated at
FVTOCI These investments have been designated on initial recognition to be measured at FVTOCI as these are strategic
investments and are not intended for sale.
286 Grasim Industries Limited
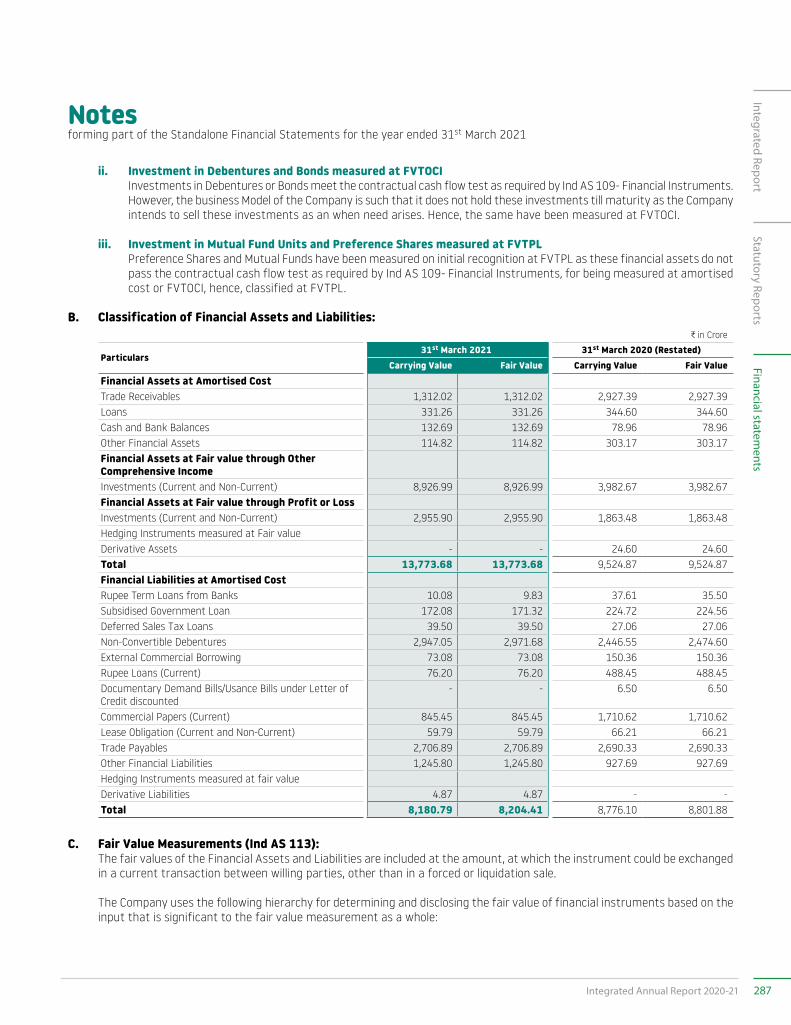
Notesforming part of the Standalone Financial Statements for the year ended 31st March 2021
ii. Investment in Debentures and Bonds measured at FVTOCI Investments in Debentures or Bonds meet the contractual cash flow test as required by Ind AS 109- Financial Instruments.
However, the business Model of the Company is such that it does not hold these investments till maturity as the Company intends to sell these investments as an when need arises. Hence, the same have been measured at FVTOCI.
iii. Investment in Mutual Fund Units and Preference Shares measured at FVTPL Preference Shares and Mutual Funds have been measured on initial recognition at FVTPL as these financial assets do not
pass the contractual cash flow test as required by Ind AS 109- Financial Instruments, for being measured at amortised cost or FVTOCI, hence, classified at FVTPL.
B. Classification of Financial Assets and Liabilities:C in Crore
Particulars31st March 2021 31st March 2020 (Restated)
Carrying Value Fair Value Carrying Value Fair ValueFinancial Assets at Amortised CostTrade Receivables 1,312.02 1,312.02 2,927.39 2,927.39 Loans 331.26 331.26 344.60 344.60 Cash and Bank Balances 132.69 132.69 78.96 78.96 Other Financial Assets 114.82 114.82 303.17 303.17 Financial Assets at Fair value through Other Comprehensive IncomeInvestments (Current and Non-Current) 8,926.99 8,926.99 3,982.67 3,982.67 Financial Assets at Fair value through Profit or LossInvestments (Current and Non-Current) 2,955.90 2,955.90 1,863.48 1,863.48 Hedging Instruments measured at Fair valueDerivative Assets - - 24.60 24.60 Total 13,773.68 13,773.68 9,524.87 9,524.87 Financial Liabilities at Amortised CostRupee Term Loans from Banks 10.08 9.83 37.61 35.50 Subsidised Government Loan 172.08 171.32 224.72 224.56 Deferred Sales Tax Loans 39.50 39.50 27.06 27.06 Non-Convertible Debentures 2,947.05 2,971.68 2,446.55 2,474.60 External Commercial Borrowing 73.08 73.08 150.36 150.36 Rupee Loans (Current) 76.20 76.20 488.45 488.45 Documentary Demand Bills/Usance Bills under Letter of Credit discounted
- - 6.50 6.50
Commercial Papers (Current) 845.45 845.45 1,710.62 1,710.62 Lease Obligation (Current and Non-Current) 59.79 59.79 66.21 66.21 Trade Payables 2,706.89 2,706.89 2,690.33 2,690.33 Other Financial Liabilities 1,245.80 1,245.80 927.69 927.69 Hedging Instruments measured at fair valueDerivative Liabilities 4.87 4.87 - - Total 8,180.79 8,204.41 8,776.10 8,801.88
C. Fair Value Measurements (Ind AS 113): The fair values of the Financial Assets and Liabilities are included at the amount, at which the instrument could be exchanged
in a current transaction between willing parties, other than in a forced or liquidation sale.
The Company uses the following hierarchy for determining and disclosing the fair value of financial instruments based on the input that is significant to the fair value measurement as a whole:
287Integrated Annual Report 2020-21
Integrated ReportStatutory Reports
Financial statements
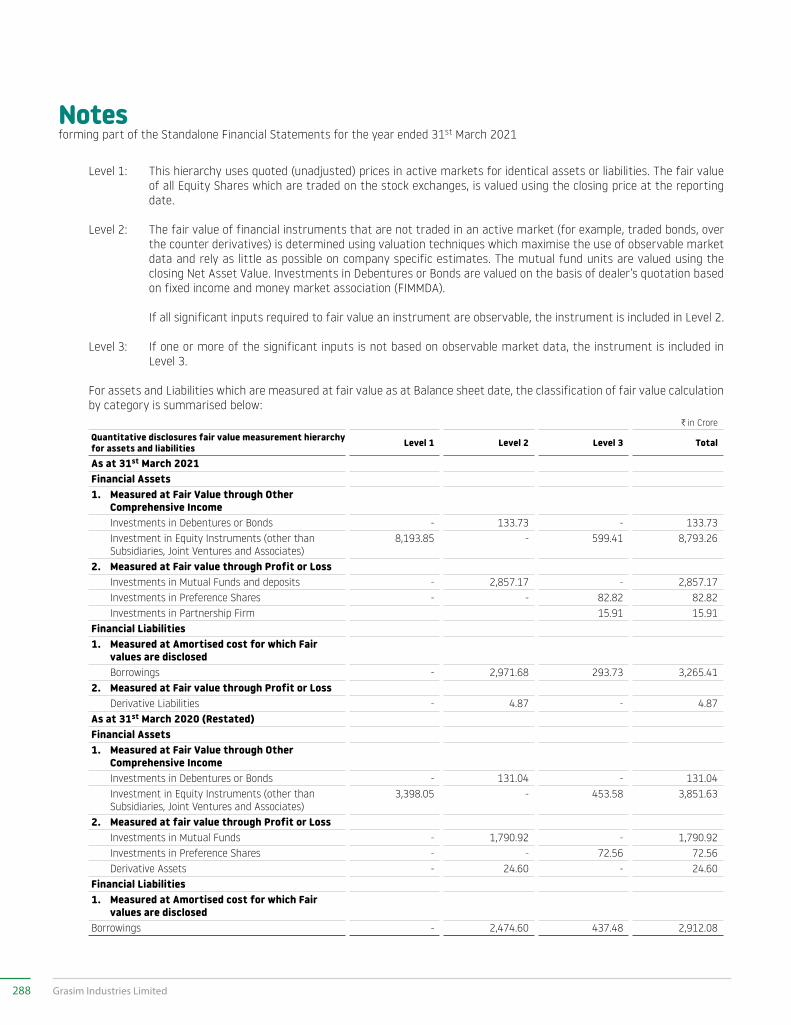
Notesforming part of the Standalone Financial Statements for the year ended 31st March 2021
Level 1: This hierarchy uses quoted (unadjusted) prices in active markets for identical assets or liabilities. The fair value of all Equity Shares which are traded on the stock exchanges, is valued using the closing price at the reporting date.
Level 2: The fair value of financial instruments that are not traded in an active market (for example, traded bonds, over the counter derivatives) is determined using valuation techniques which maximise the use of observable market data and rely as little as possible on company specific estimates. The mutual fund units are valued using the closing Net Asset Value. Investments in Debentures or Bonds are valued on the basis of dealer’s quotation based on fixed income and money market association (FIMMDA).
If all significant inputs required to fair value an instrument are observable, the instrument is included in Level 2.
Level 3: If one or more of the significant inputs is not based on observable market data, the instrument is included in Level 3.
For assets and Liabilities which are measured at fair value as at Balance sheet date, the classification of fair value calculation by category is summarised below:
C in CroreQuantitative disclosures fair value measurement hierarchy for assets and liabilities Level 1 Level 2 Level 3 Total
As at 31st March 2021Financial Assets1. Measured at Fair Value through Other
Comprehensive Income Investments in Debentures or Bonds - 133.73 - 133.73 Investment in Equity Instruments (other than
Subsidiaries, Joint Ventures and Associates) 8,193.85 - 599.41 8,793.26
2. Measured at Fair value through Profit or Loss Investments in Mutual Funds and deposits - 2,857.17 - 2,857.17 Investments in Preference Shares - - 82.82 82.82 Investments in Partnership Firm 15.91 15.91 Financial Liabilities1. Measured at Amortised cost for which Fair
values are disclosed Borrowings - 2,971.68 293.73 3,265.41 2. Measured at Fair value through Profit or Loss Derivative Liabilities - 4.87 - 4.87 As at 31st March 2020 (Restated)Financial Assets1. Measured at Fair Value through Other
Comprehensive Income Investments in Debentures or Bonds - 131.04 - 131.04 Investment in Equity Instruments (other than
Subsidiaries, Joint Ventures and Associates) 3,398.05 - 453.58 3,851.63
2. Measured at fair value through Profit or Loss Investments in Mutual Funds - 1,790.92 - 1,790.92 Investments in Preference Shares - - 72.56 72.56 Derivative Assets - 24.60 - 24.60 Financial Liabilities1. Measured at Amortised cost for which Fair
values are disclosedBorrowings - 2,474.60 437.48 2,912.08
288 Grasim Industries Limited
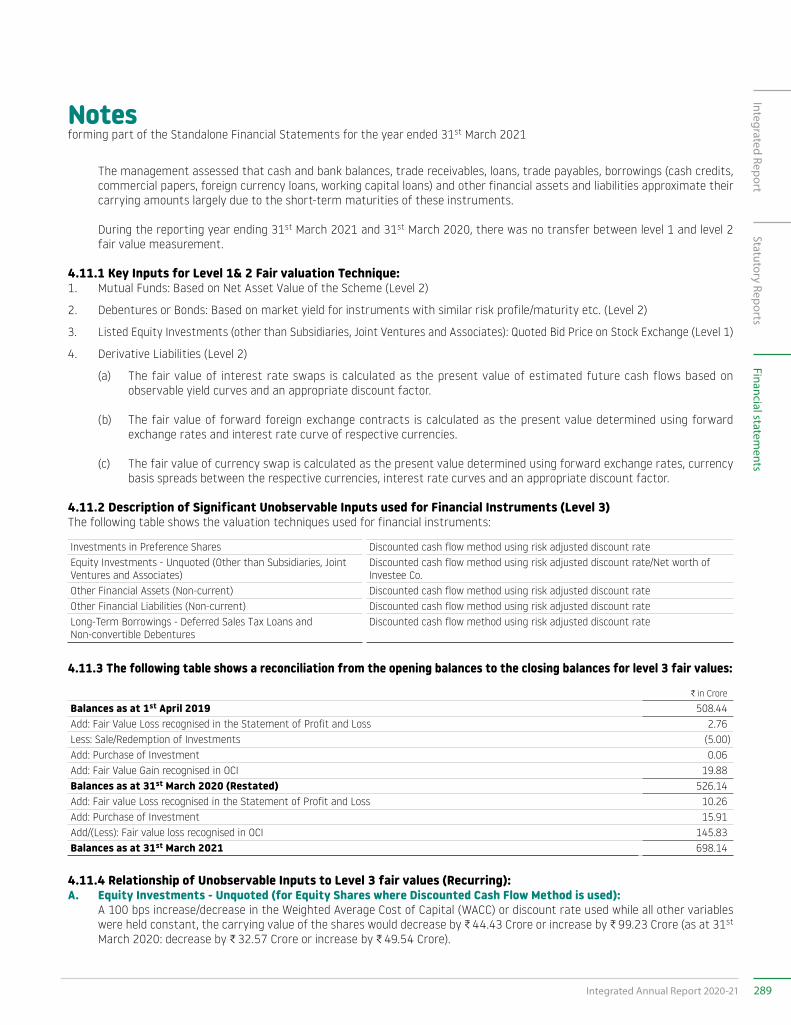
Notesforming part of the Standalone Financial Statements for the year ended 31st March 2021
The management assessed that cash and bank balances, trade receivables, loans, trade payables, borrowings (cash credits, commercial papers, foreign currency loans, working capital loans) and other financial assets and liabilities approximate their carrying amounts largely due to the short-term maturities of these instruments.
During the reporting year ending 31st March 2021 and 31st March 2020, there was no transfer between level 1 and level 2 fair value measurement.
4.11.1 Key Inputs for Level 1& 2 Fair valuation Technique:1. Mutual Funds: Based on Net Asset Value of the Scheme (Level 2)
2. Debentures or Bonds: Based on market yield for instruments with similar risk profile/maturity etc. (Level 2)
3. Listed Equity Investments (other than Subsidiaries, Joint Ventures and Associates): Quoted Bid Price on Stock Exchange (Level 1)
4. Derivative Liabilities (Level 2)
(a) The fair value of interest rate swaps is calculated as the present value of estimated future cash flows based on observable yield curves and an appropriate discount factor.
(b) The fair value of forward foreign exchange contracts is calculated as the present value determined using forward exchange rates and interest rate curve of respective currencies.
(c) The fair value of currency swap is calculated as the present value determined using forward exchange rates, currency basis spreads between the respective currencies, interest rate curves and an appropriate discount factor.
4.11.2 Description of Significant Unobservable Inputs used for Financial Instruments (Level 3)The following table shows the valuation techniques used for financial instruments:
Investments in Preference Shares Discounted cash flow method using risk adjusted discount rateEquity Investments - Unquoted (Other than Subsidiaries, Joint Ventures and Associates)
Discounted cash flow method using risk adjusted discount rate/Net worth of Investee Co.
Other Financial Assets (Non-current) Discounted cash flow method using risk adjusted discount rateOther Financial Liabilities (Non-current) Discounted cash flow method using risk adjusted discount rateLong-Term Borrowings - Deferred Sales Tax Loans and Non-convertible Debentures
Discounted cash flow method using risk adjusted discount rate
4.11.3 The following table shows a reconciliation from the opening balances to the closing balances for level 3 fair values:
C in Crore
Balances as at 1st April 2019 508.44 Add: Fair Value Loss recognised in the Statement of Profit and Loss 2.76 Less: Sale/Redemption of Investments (5.00)Add: Purchase of Investment 0.06 Add: Fair Value Gain recognised in OCI 19.88 Balances as at 31st March 2020 (Restated) 526.14 Add: Fair value Loss recognised in the Statement of Profit and Loss 10.26 Add: Purchase of Investment 15.91 Add/(Less): Fair value loss recognised in OCI 145.83 Balances as at 31st March 2021 698.14
4.11.4 Relationship of Unobservable Inputs to Level 3 fair values (Recurring): A. Equity Investments - Unquoted (for Equity Shares where Discounted Cash Flow Method is used): A 100 bps increase/decrease in the Weighted Average Cost of Capital (WACC) or discount rate used while all other variables
were held constant, the carrying value of the shares would decrease by C 44.43 Crore or increase by C 99.23 Crore (as at 31st March 2020: decrease by C 32.57 Crore or increase by C 49.54 Crore).
289Integrated Annual Report 2020-21
Integrated ReportStatutory Reports
Financial statements
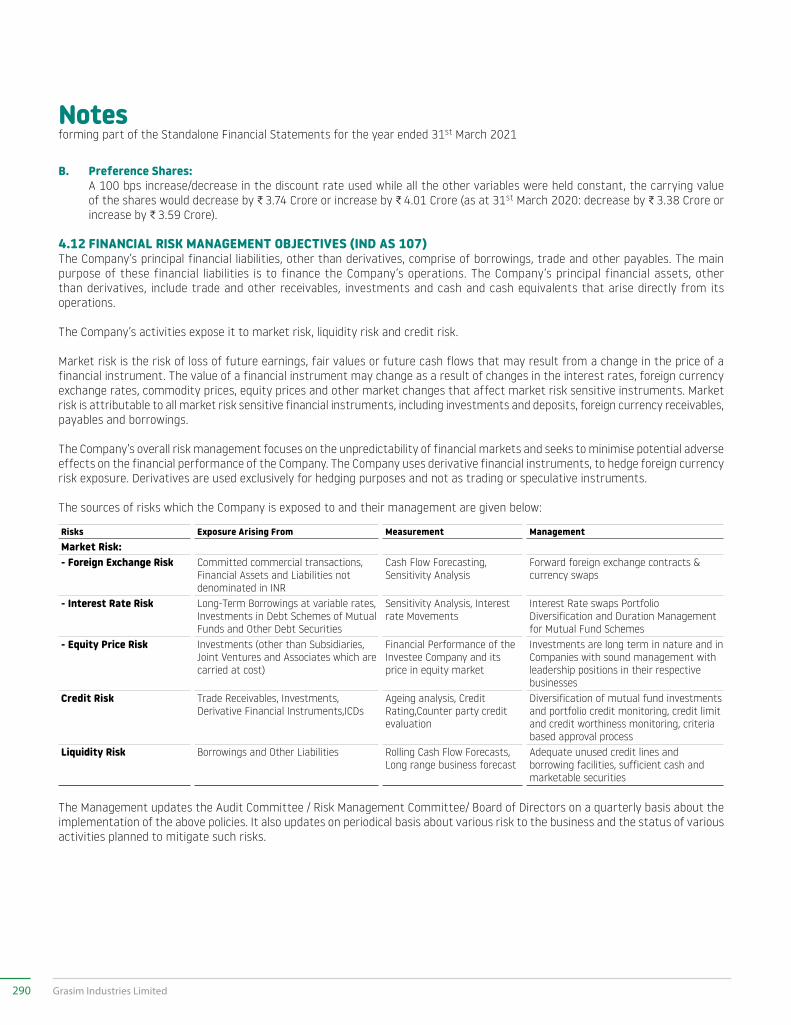
Notesforming part of the Standalone Financial Statements for the year ended 31st March 2021
B. Preference Shares: A 100 bps increase/decrease in the discount rate used while all the other variables were held constant, the carrying value
of the shares would decrease by C 3.74 Crore or increase by C 4.01 Crore (as at 31st March 2020: decrease by C 3.38 Crore or increase by C 3.59 Crore).
4.12 FINANCIAL RISK MANAGEMENT OBJECTIVES (IND AS 107)The Company’s principal financial liabilities, other than derivatives, comprise of borrowings, trade and other payables. The main purpose of these financial liabilities is to finance the Company’s operations. The Company’s principal financial assets, other than derivatives, include trade and other receivables, investments and cash and cash equivalents that arise directly from its operations.
The Company’s activities expose it to market risk, liquidity risk and credit risk.
Market risk is the risk of loss of future earnings, fair values or future cash flows that may result from a change in the price of a financial instrument. The value of a financial instrument may change as a result of changes in the interest rates, foreign currency exchange rates, commodity prices, equity prices and other market changes that affect market risk sensitive instruments. Market risk is attributable to all market risk sensitive financial instruments, including investments and deposits, foreign currency receivables, payables and borrowings.
The Company’s overall risk management focuses on the unpredictability of financial markets and seeks to minimise potential adverse effects on the financial performance of the Company. The Company uses derivative financial instruments, to hedge foreign currency risk exposure. Derivatives are used exclusively for hedging purposes and not as trading or speculative instruments.
The sources of risks which the Company is exposed to and their management are given below:
Risks Exposure Arising From Measurement ManagementMarket Risk:- Foreign Exchange Risk Committed commercial transactions,
Financial Assets and Liabilities not denominated in INR
Cash Flow Forecasting, Sensitivity Analysis
Forward foreign exchange contracts & currency swaps
- Interest Rate Risk Long-Term Borrowings at variable rates, Investments in Debt Schemes of Mutual Funds and Other Debt Securities
Sensitivity Analysis, Interest rate Movements
Interest Rate swaps Portfolio Diversification and Duration Management for Mutual Fund Schemes
- Equity Price Risk Investments (other than Subsidiaries, Joint Ventures and Associates which are carried at cost)
Financial Performance of the Investee Company and its price in equity market
Investments are long term in nature and in Companies with sound management with leadership positions in their respective businesses
Credit Risk Trade Receivables, Investments, Derivative Financial Instruments,ICDs
Ageing analysis, Credit Rating,Counter party credit evaluation
Diversification of mutual fund investments and portfolio credit monitoring, credit limit and credit worthiness monitoring, criteria based approval process
Liquidity Risk Borrowings and Other Liabilities Rolling Cash Flow Forecasts, Long range business forecast
Adequate unused credit lines and borrowing facilities, sufficient cash and marketable securities
The Management updates the Audit Committee / Risk Management Committee/ Board of Directors on a quarterly basis about the implementation of the above policies. It also updates on periodical basis about various risk to the business and the status of various activities planned to mitigate such risks.
290 Grasim Industries Limited
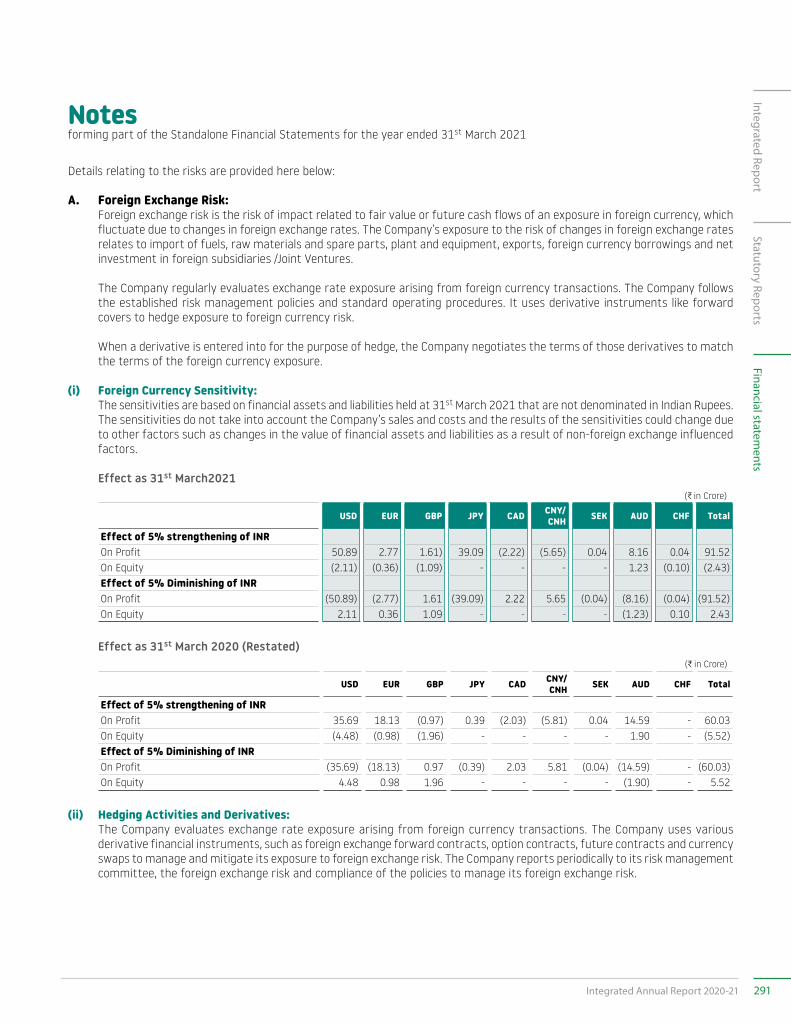
Notesforming part of the Standalone Financial Statements for the year ended 31st March 2021
Details relating to the risks are provided here below:
A. Foreign Exchange Risk: Foreign exchange risk is the risk of impact related to fair value or future cash flows of an exposure in foreign currency, which
fluctuate due to changes in foreign exchange rates. The Company’s exposure to the risk of changes in foreign exchange rates relates to import of fuels, raw materials and spare parts, plant and equipment, exports, foreign currency borrowings and net investment in foreign subsidiaries /Joint Ventures.
The Company regularly evaluates exchange rate exposure arising from foreign currency transactions. The Company follows the established risk management policies and standard operating procedures. It uses derivative instruments like forward covers to hedge exposure to foreign currency risk.
When a derivative is entered into for the purpose of hedge, the Company negotiates the terms of those derivatives to match the terms of the foreign currency exposure.
(i) Foreign Currency Sensitivity: The sensitivities are based on financial assets and liabilities held at 31st March 2021 that are not denominated in Indian Rupees.
The sensitivities do not take into account the Company’s sales and costs and the results of the sensitivities could change due to other factors such as changes in the value of financial assets and liabilities as a result of non-foreign exchange influenced factors.
Effect as 31st March2021(C in Crore)
USD EUR GBP JPY CAD CNY/CNH SEK AUD CHF Total
Effect of 5% strengthening of INROn Profit 50.89 2.77 1.61) 39.09 (2.22) (5.65) 0.04 8.16 0.04 91.52On Equity (2.11) (0.36) (1.09) - - - - 1.23 (0.10) (2.43)Effect of 5% Diminishing of INROn Profit (50.89) (2.77) 1.61 (39.09) 2.22 5.65 (0.04) (8.16) (0.04) (91.52)On Equity 2.11 0.36 1.09 - - - - (1.23) 0.10 2.43
Effect as 31st March 2020 (Restated)(C in Crore)
USD EUR GBP JPY CAD CNY/CNH SEK AUD CHF Total
Effect of 5% strengthening of INROn Profit 35.69 18.13 (0.97) 0.39 (2.03) (5.81) 0.04 14.59 - 60.03On Equity (4.48) (0.98) (1.96) - - - - 1.90 - (5.52)Effect of 5% Diminishing of INROn Profit (35.69) (18.13) 0.97 (0.39) 2.03 5.81 (0.04) (14.59) - (60.03)On Equity 4.48 0.98 1.96 - - - - (1.90) - 5.52
(ii) Hedging Activities and Derivatives: The Company evaluates exchange rate exposure arising from foreign currency transactions. The Company uses various
derivative financial instruments, such as foreign exchange forward contracts, option contracts, future contracts and currency swaps to manage and mitigate its exposure to foreign exchange risk. The Company reports periodically to its risk management committee, the foreign exchange risk and compliance of the policies to manage its foreign exchange risk.
291Integrated Annual Report 2020-21
Integrated ReportStatutory Reports
Financial statements
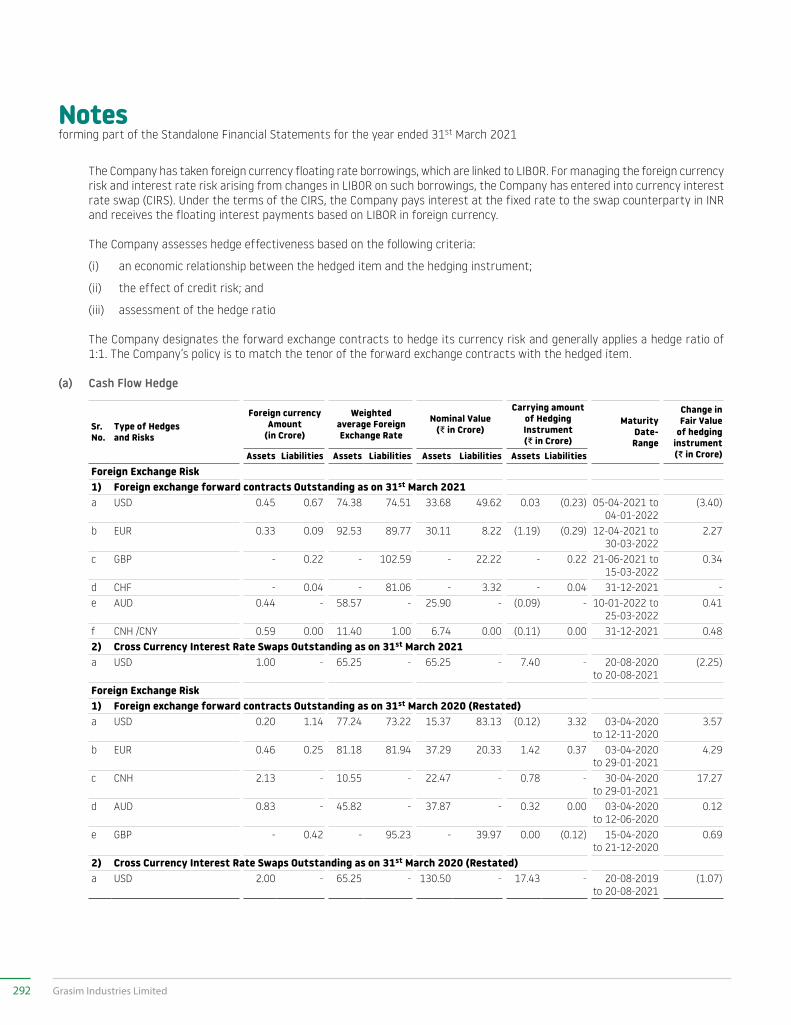
Notesforming part of the Standalone Financial Statements for the year ended 31st March 2021
The Company has taken foreign currency floating rate borrowings, which are linked to LIBOR. For managing the foreign currency risk and interest rate risk arising from changes in LIBOR on such borrowings, the Company has entered into currency interest rate swap (CIRS). Under the terms of the CIRS, the Company pays interest at the fixed rate to the swap counterparty in INR and receives the floating interest payments based on LIBOR in foreign currency.
The Company assesses hedge effectiveness based on the following criteria:
(i) an economic relationship between the hedged item and the hedging instrument;
(ii) the effect of credit risk; and
(iii) assessment of the hedge ratio
The Company designates the forward exchange contracts to hedge its currency risk and generally applies a hedge ratio of 1:1. The Company’s policy is to match the tenor of the forward exchange contracts with the hedged item.
(a) Cash Flow Hedge
Sr. No.
Type of Hedges and Risks
Foreign currency Amount
(in Crore)
Weighted average Foreign Exchange Rate
Nominal Value (D in Crore)
Carrying amount of Hedging Instrument (D in Crore)
Maturity Date- Range
Change in Fair Value
of hedging instrument (D in Crore)Assets Liabilities Assets Liabilities Assets Liabilities Assets Liabilities
Foreign Exchange Risk1) Foreign exchange forward contracts Outstanding as on 31st March 2021a USD 0.45 0.67 74.38 74.51 33.68 49.62 0.03 (0.23) 05-04-2021 to
04-01-2022 (3.40)
b EUR 0.33 0.09 92.53 89.77 30.11 8.22 (1.19) (0.29) 12-04-2021 to 30-03-2022
2.27
c GBP - 0.22 - 102.59 - 22.22 - 0.22 21-06-2021 to 15-03-2022
0.34
d CHF - 0.04 - 81.06 - 3.32 - 0.04 31-12-2021 - e AUD 0.44 - 58.57 - 25.90 - (0.09) - 10-01-2022 to
25-03-2022 0.41
f CNH /CNY 0.59 0.00 11.40 1.00 6.74 0.00 (0.11) 0.00 31-12-2021 0.48 2) Cross Currency Interest Rate Swaps Outstanding as on 31st March 2021a USD 1.00 - 65.25 - 65.25 - 7.40 - 20-08-2020
to 20-08-2021 (2.25)
Foreign Exchange Risk1) Foreign exchange forward contracts Outstanding as on 31st March 2020 (Restated)a USD 0.20 1.14 77.24 73.22 15.37 83.13 (0.12) 3.32 03-04-2020
to 12-11-2020 3.57
b EUR 0.46 0.25 81.18 81.94 37.29 20.33 1.42 0.37 03-04-2020 to 29-01-2021
4.29
c CNH 2.13 - 10.55 - 22.47 - 0.78 - 30-04-2020 to 29-01-2021
17.27
d AUD 0.83 - 45.82 - 37.87 - 0.32 0.00 03-04-2020 to 12-06-2020
0.12
e GBP - 0.42 - 95.23 - 39.97 0.00 (0.12) 15-04-2020 to 21-12-2020
0.69
2) Cross Currency Interest Rate Swaps Outstanding as on 31st March 2020 (Restated)a USD 2.00 - 65.25 - 130.50 - 17.43 - 20-08-2019
to 20-08-2021 (1.07)
292 Grasim Industries Limited
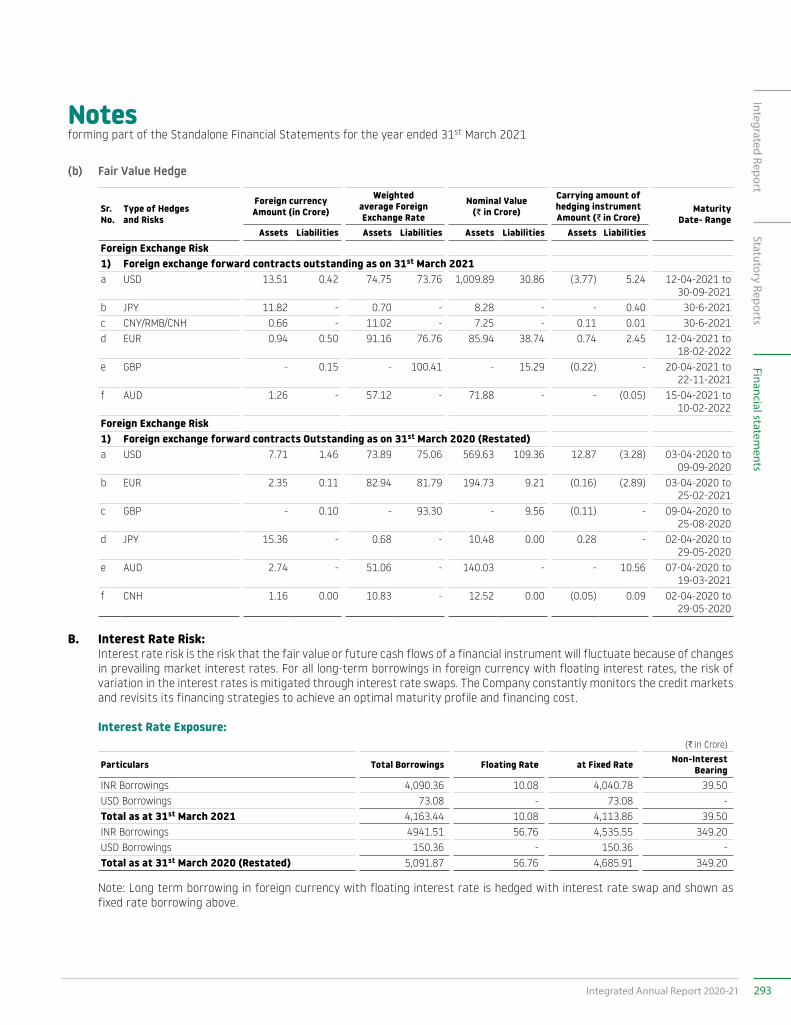
Notesforming part of the Standalone Financial Statements for the year ended 31st March 2021
(b) Fair Value Hedge
Sr. No.
Type of Hedges and Risks
Foreign currency Amount (in Crore)
Weighted average Foreign Exchange Rate
Nominal Value (D in Crore)
Carrying amount of hedging instrument Amount (D in Crore)
Maturity Date- Range
Assets Liabilities Assets Liabilities Assets Liabilities Assets LiabilitiesForeign Exchange Risk1) Foreign exchange forward contracts outstanding as on 31st March 2021a USD 13.51 0.42 74.75 73.76 1,009.89 30.86 (3.77) 5.24 12-04-2021 to
30-09-2021 b JPY 11.82 - 0.70 - 8.28 - - 0.40 30-6-2021 c CNY/RMB/CNH 0.66 - 11.02 - 7.25 - 0.11 0.01 30-6-2021 d EUR 0.94 0.50 91.16 76.76 85.94 38.74 0.74 2.45 12-04-2021 to
18-02-2022 e GBP - 0.15 - 100.41 - 15.29 (0.22) - 20-04-2021 to
22-11-2021 f AUD 1.26 - 57.12 - 71.88 - - (0.05) 15-04-2021 to
10-02-2022 Foreign Exchange Risk1) Foreign exchange forward contracts Outstanding as on 31st March 2020 (Restated)a USD 7.71 1.46 73.89 75.06 569.63 109.36 12.87 (3.28) 03-04-2020 to
09-09-2020 b EUR 2.35 0.11 82.94 81.79 194.73 9.21 (0.16) (2.89) 03-04-2020 to
25-02-2021 c GBP - 0.10 - 93.30 - 9.56 (0.11) - 09-04-2020 to
25-08-2020 d JPY 15.36 - 0.68 - 10.48 0.00 0.28 - 02-04-2020 to
29-05-2020 e AUD 2.74 - 51.06 - 140.03 - - 10.56 07-04-2020 to
19-03-2021 f CNH 1.16 0.00 10.83 - 12.52 0.00 (0.05) 0.09 02-04-2020 to
29-05-2020
B. Interest Rate Risk: Interest rate risk is the risk that the fair value or future cash flows of a financial instrument will fluctuate because of changes
in prevailing market interest rates. For all long-term borrowings in foreign currency with floating interest rates, the risk of variation in the interest rates is mitigated through interest rate swaps. The Company constantly monitors the credit markets and revisits its financing strategies to achieve an optimal maturity profile and financing cost.
Interest Rate Exposure:(C in Crore)
Particulars Total Borrowings Floating Rate at Fixed Rate Non-Interest Bearing
INR Borrowings 4,090.36 10.08 4,040.78 39.50USD Borrowings 73.08 - 73.08 - Total as at 31st March 2021 4,163.44 10.08 4,113.86 39.50 INR Borrowings 4941.51 56.76 4,535.55 349.20USD Borrowings 150.36 - 150.36 - Total as at 31st March 2020 (Restated) 5,091.87 56.76 4,685.91 349.20
Note: Long term borrowing in foreign currency with floating interest rate is hedged with interest rate swap and shown as fixed rate borrowing above.
293Integrated Annual Report 2020-21
Integrated ReportStatutory Reports
Financial statements
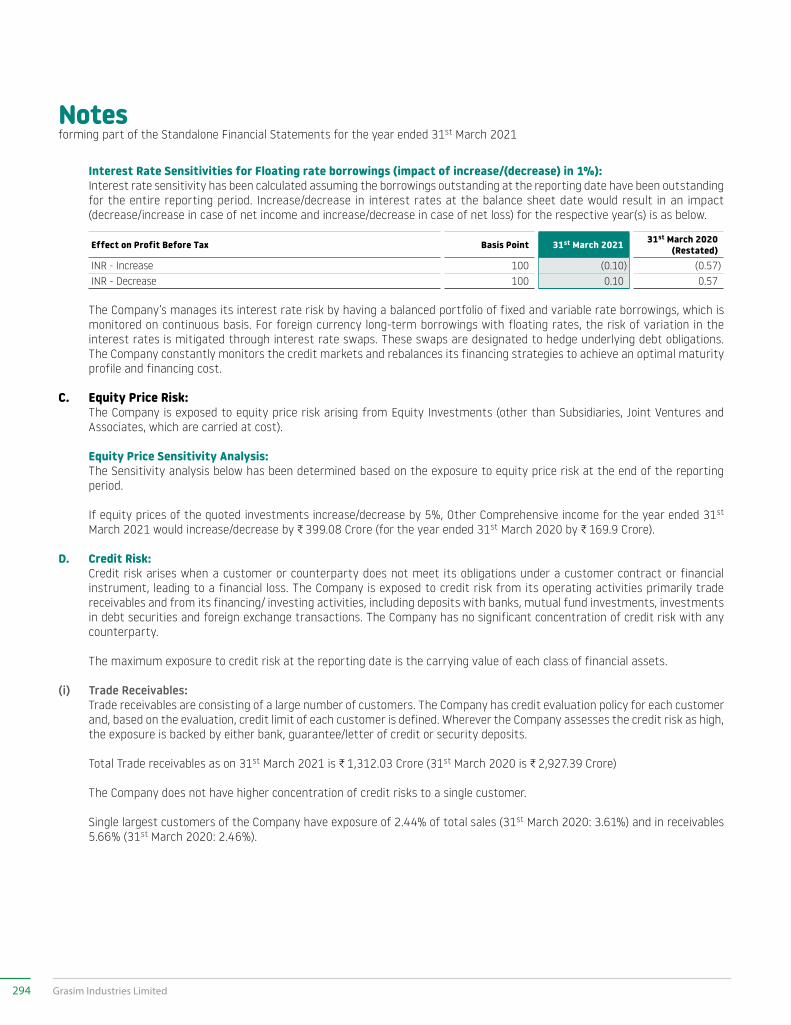
Notesforming part of the Standalone Financial Statements for the year ended 31st March 2021
Interest Rate Sensitivities for Floating rate borrowings (impact of increase/(decrease) in 1%): Interest rate sensitivity has been calculated assuming the borrowings outstanding at the reporting date have been outstanding
for the entire reporting period. Increase/decrease in interest rates at the balance sheet date would result in an impact (decrease/increase in case of net income and increase/decrease in case of net loss) for the respective year(s) is as below.
Effect on Profit Before Tax Basis Point 31st March 2021 31st March 2020(Restated)
INR - Increase 100 (0.10) (0.57)INR - Decrease 100 0.10 0.57
The Company’s manages its interest rate risk by having a balanced portfolio of fixed and variable rate borrowings, which is monitored on continuous basis. For foreign currency long-term borrowings with floating rates, the risk of variation in the interest rates is mitigated through interest rate swaps. These swaps are designated to hedge underlying debt obligations. The Company constantly monitors the credit markets and rebalances its financing strategies to achieve an optimal maturity profile and financing cost.
C. Equity Price Risk: The Company is exposed to equity price risk arising from Equity Investments (other than Subsidiaries, Joint Ventures and
Associates, which are carried at cost).
Equity Price Sensitivity Analysis: The Sensitivity analysis below has been determined based on the exposure to equity price risk at the end of the reporting
period.
If equity prices of the quoted investments increase/decrease by 5%, Other Comprehensive income for the year ended 31st March 2021 would increase/decrease by C 399.08 Crore (for the year ended 31st March 2020 by C 169.9 Crore).
D. Credit Risk: Credit risk arises when a customer or counterparty does not meet its obligations under a customer contract or financial
instrument, leading to a financial loss. The Company is exposed to credit risk from its operating activities primarily trade receivables and from its financing/ investing activities, including deposits with banks, mutual fund investments, investments in debt securities and foreign exchange transactions. The Company has no significant concentration of credit risk with any counterparty.
The maximum exposure to credit risk at the reporting date is the carrying value of each class of financial assets.
(i) Trade Receivables: Trade receivables are consisting of a large number of customers. The Company has credit evaluation policy for each customer
and, based on the evaluation, credit limit of each customer is defined. Wherever the Company assesses the credit risk as high, the exposure is backed by either bank, guarantee/letter of credit or security deposits.
Total Trade receivables as on 31st March 2021 is C 1,312.03 Crore (31st March 2020 is C 2,927.39 Crore)
The Company does not have higher concentration of credit risks to a single customer.
Single largest customers of the Company have exposure of 2.44% of total sales (31st March 2020: 3.61%) and in receivables 5.66% (31st March 2020: 2.46%).
294 Grasim Industries Limited
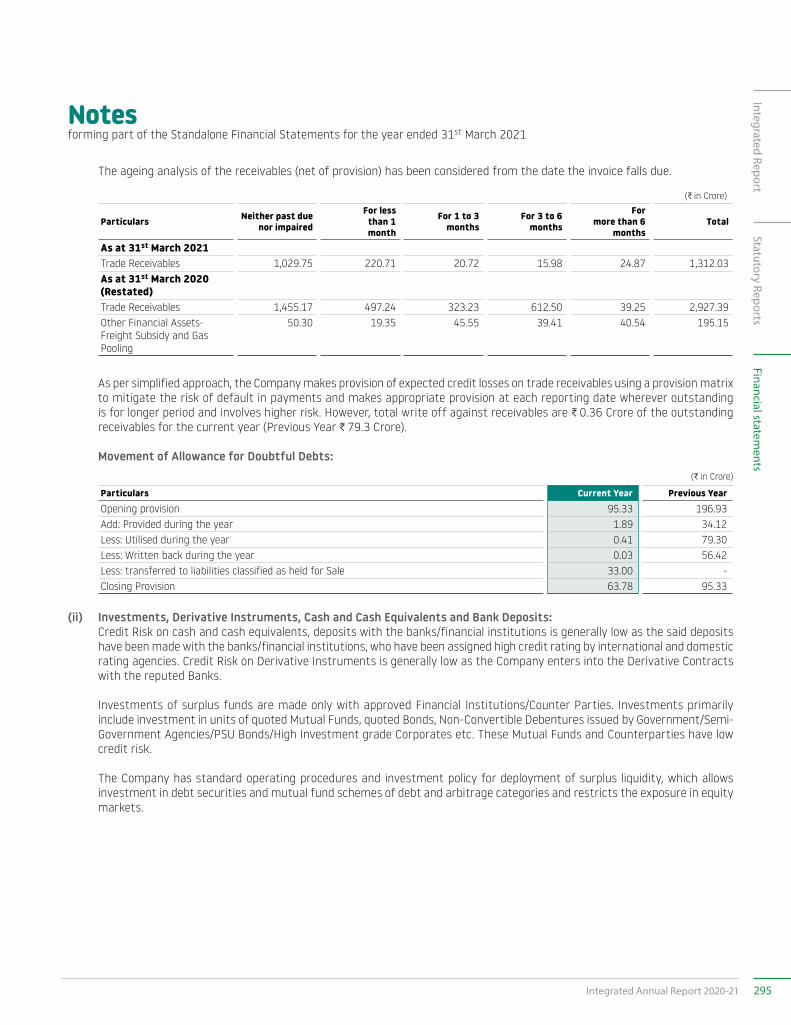
Notesforming part of the Standalone Financial Statements for the year ended 31st March 2021
The ageing analysis of the receivables (net of provision) has been considered from the date the invoice falls due.
(C in Crore)
Particulars Neither past due nor impaired
For less than 1 month
For 1 to 3 months
For 3 to 6 months
For more than 6
monthsTotal
As at 31st March 2021Trade Receivables 1,029.75 220.71 20.72 15.98 24.87 1,312.03As at 31st March 2020 (Restated)Trade Receivables 1,455.17 497.24 323.23 612.50 39.25 2,927.39Other Financial Assets- Freight Subsidy and Gas Pooling
50.30 19.35 45.55 39.41 40.54 195.15
As per simplified approach, the Company makes provision of expected credit losses on trade receivables using a provision matrix to mitigate the risk of default in payments and makes appropriate provision at each reporting date wherever outstanding is for longer period and involves higher risk. However, total write off against receivables are C 0.36 Crore of the outstanding receivables for the current year (Previous Year C 79.3 Crore).
Movement of Allowance for Doubtful Debts:(C in Crore)
Particulars Current Year Previous YearOpening provision 95.33 196.93 Add: Provided during the year 1.89 34.12 Less: Utilised during the year 0.41 79.30 Less: Written back during the year 0.03 56.42 Less: transferred to liabilities classified as held for Sale 33.00 - Closing Provision 63.78 95.33
(ii) Investments, Derivative Instruments, Cash and Cash Equivalents and Bank Deposits: Credit Risk on cash and cash equivalents, deposits with the banks/financial institutions is generally low as the said deposits
have been made with the banks/financial institutions, who have been assigned high credit rating by international and domestic rating agencies. Credit Risk on Derivative Instruments is generally low as the Company enters into the Derivative Contracts with the reputed Banks.
Investments of surplus funds are made only with approved Financial Institutions/Counter Parties. Investments primarily include investment in units of quoted Mutual Funds, quoted Bonds, Non-Convertible Debentures issued by Government/Semi-Government Agencies/PSU Bonds/High Investment grade Corporates etc. These Mutual Funds and Counterparties have low credit risk.
The Company has standard operating procedures and investment policy for deployment of surplus liquidity, which allows investment in debt securities and mutual fund schemes of debt and arbitrage categories and restricts the exposure in equity markets.
295Integrated Annual Report 2020-21
Integrated ReportStatutory Reports
Financial statements
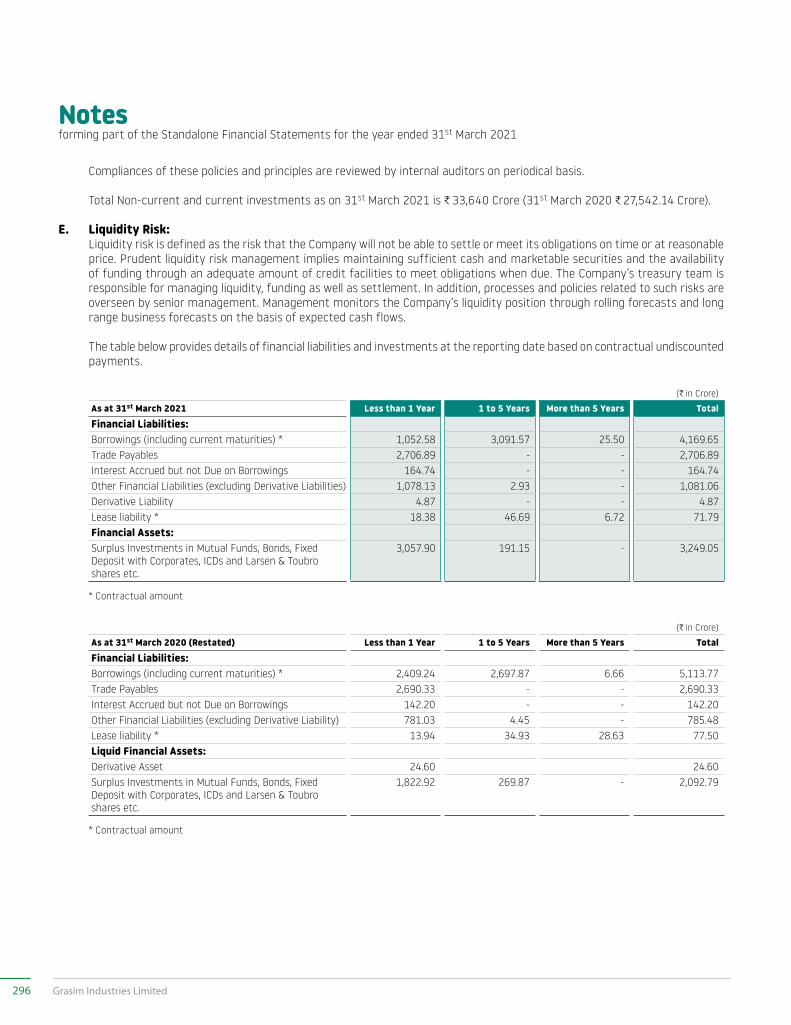
Notesforming part of the Standalone Financial Statements for the year ended 31st March 2021
Compliances of these policies and principles are reviewed by internal auditors on periodical basis.
Total Non-current and current investments as on 31st March 2021 is C 33,640 Crore (31st March 2020 C 27,542.14 Crore).
E. Liquidity Risk: Liquidity risk is defined as the risk that the Company will not be able to settle or meet its obligations on time or at reasonable
price. Prudent liquidity risk management implies maintaining sufficient cash and marketable securities and the availability of funding through an adequate amount of credit facilities to meet obligations when due. The Company’s treasury team is responsible for managing liquidity, funding as well as settlement. In addition, processes and policies related to such risks are overseen by senior management. Management monitors the Company’s liquidity position through rolling forecasts and long range business forecasts on the basis of expected cash flows.
The table below provides details of financial liabilities and investments at the reporting date based on contractual undiscounted payments.
(C in Crore)
As at 31st March 2021 Less than 1 Year 1 to 5 Years More than 5 Years TotalFinancial Liabilities:Borrowings (including current maturities) * 1,052.58 3,091.57 25.50 4,169.65 Trade Payables 2,706.89 - - 2,706.89 Interest Accrued but not Due on Borrowings 164.74 - - 164.74 Other Financial Liabilities (excluding Derivative Liabilities) 1,078.13 2.93 - 1,081.06 Derivative Liability 4.87 - - 4.87 Lease liability * 18.38 46.69 6.72 71.79 Financial Assets:Surplus Investments in Mutual Funds, Bonds, Fixed Deposit with Corporates, ICDs and Larsen & Toubro shares etc.
3,057.90 191.15 - 3,249.05
* Contractual amount
(C in Crore)
As at 31st March 2020 (Restated) Less than 1 Year 1 to 5 Years More than 5 Years TotalFinancial Liabilities:Borrowings (including current maturities) * 2,409.24 2,697.87 6.66 5,113.77 Trade Payables 2,690.33 - - 2,690.33 Interest Accrued but not Due on Borrowings 142.20 - - 142.20 Other Financial Liabilities (excluding Derivative Liability) 781.03 4.45 - 785.48 Lease liability * 13.94 34.93 28.63 77.50 Liquid Financial Assets:Derivative Asset 24.60 24.60 Surplus Investments in Mutual Funds, Bonds, Fixed Deposit with Corporates, ICDs and Larsen & Toubro shares etc.
1,822.92 269.87 - 2,092.79
* Contractual amount
296 Grasim Industries Limited
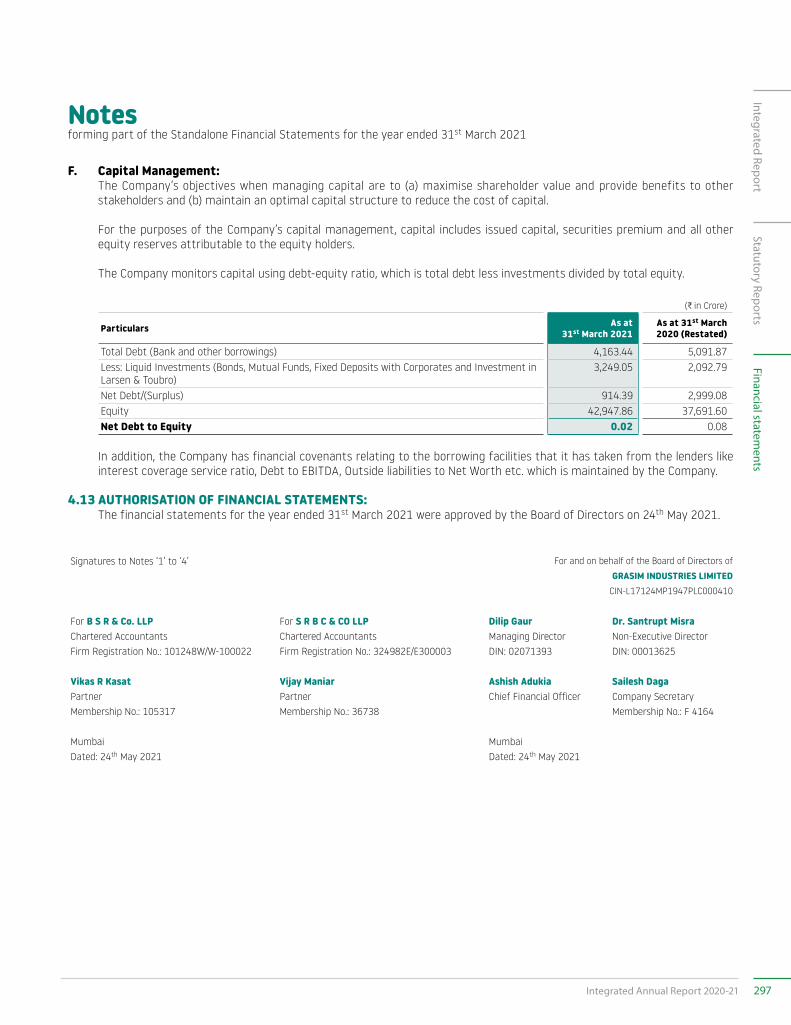
Notesforming part of the Standalone Financial Statements for the year ended 31st March 2021
F. Capital Management: The Company’s objectives when managing capital are to (a) maximise shareholder value and provide benefits to other
stakeholders and (b) maintain an optimal capital structure to reduce the cost of capital.
For the purposes of the Company’s capital management, capital includes issued capital, securities premium and all other equity reserves attributable to the equity holders.
The Company monitors capital using debt-equity ratio, which is total debt less investments divided by total equity.
(C in Crore)
Particulars As at31st March 2021
As at 31st March 2020 (Restated)
Total Debt (Bank and other borrowings) 4,163.44 5,091.87Less: Liquid Investments (Bonds, Mutual Funds, Fixed Deposits with Corporates and Investment in Larsen & Toubro)
3,249.05 2,092.79
Net Debt/(Surplus) 914.39 2,999.08 Equity 42,947.86 37,691.60Net Debt to Equity 0.02 0.08
In addition, the Company has financial covenants relating to the borrowing facilities that it has taken from the lenders like interest coverage service ratio, Debt to EBITDA, Outside liabilities to Net Worth etc. which is maintained by the Company.
4.13 AUTHORISATION OF FINANCIAL STATEMENTS: The financial statements for the year ended 31st March 2021 were approved by the Board of Directors on 24th May 2021.
Signatures to Notes ‘1’ to ‘4’ For and on behalf of the Board of Directors of
GRASIM INDUSTRIES LIMITED CIN-L17124MP1947PLC000410
For B S R & Co. LLP For S R B C & CO LLP Dilip Gaur Dr. Santrupt MisraChartered Accountants Chartered Accountants Managing Director Non-Executive DirectorFirm Registration No.: 101248W/W-100022 Firm Registration No.: 324982E/E300003 DIN: 02071393 DIN: 00013625
Vikas R Kasat Vijay Maniar Ashish Adukia Sailesh DagaPartner Partner Chief Financial Officer Company SecretaryMembership No.: 105317 Membership No.: 36738 Membership No.: F 4164
Mumbai MumbaiDated: 24th May 2021 Dated: 24th May 2021
297Integrated Annual Report 2020-21
Integrated ReportStatutory Reports
Financial statements
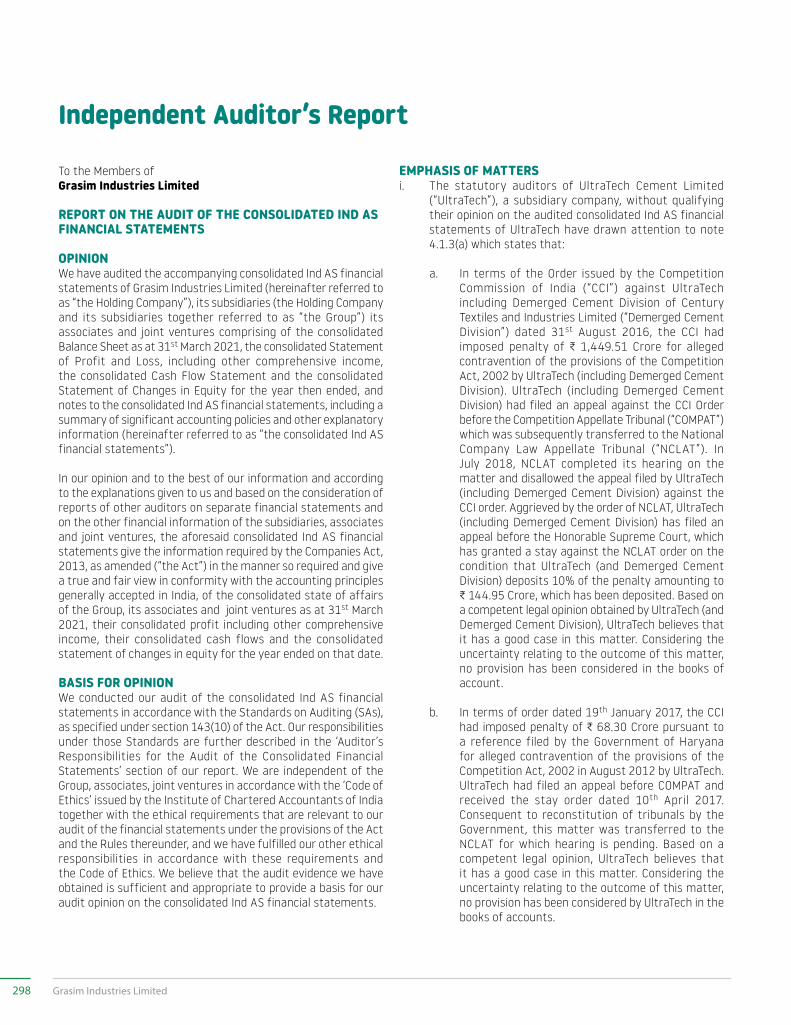
Independent Auditor’s Report
To the Members of Grasim Industries Limited
REPORT ON THE AUDIT OF THE CONSOLIDATED IND AS FINANCIAL STATEMENTS
OPINIONWe have audited the accompanying consolidated Ind AS financial statements of Grasim Industries Limited (hereinafter referred to as “the Holding Company”), its subsidiaries (the Holding Company and its subsidiaries together referred to as “the Group”) its associates and joint ventures comprising of the consolidated Balance Sheet as at 31st March 2021, the consolidated Statement of Profit and Loss, including other comprehensive income, the consolidated Cash Flow Statement and the consolidated Statement of Changes in Equity for the year then ended, and notes to the consolidated Ind AS financial statements, including a summary of significant accounting policies and other explanatory information (hereinafter referred to as “the consolidated Ind AS financial statements”).
In our opinion and to the best of our information and according to the explanations given to us and based on the consideration of reports of other auditors on separate financial statements and on the other financial information of the subsidiaries, associates and joint ventures, the aforesaid consolidated Ind AS financial statements give the information required by the Companies Act, 2013, as amended (“the Act”) in the manner so required and give a true and fair view in conformity with the accounting principles generally accepted in India, of the consolidated state of affairs of the Group, its associates and joint ventures as at 31st March 2021, their consolidated profit including other comprehensive income, their consolidated cash flows and the consolidated statement of changes in equity for the year ended on that date.
BASIS FOR OPINIONWe conducted our audit of the consolidated Ind AS financial statements in accordance with the Standards on Auditing (SAs), as specified under section 143(10) of the Act. Our responsibilities under those Standards are further described in the ‘Auditor’s Responsibilities for the Audit of the Consolidated Financial Statements’ section of our report. We are independent of the Group, associates, joint ventures in accordance with the ‘Code of Ethics’ issued by the Institute of Chartered Accountants of India together with the ethical requirements that are relevant to our audit of the financial statements under the provisions of the Act and the Rules thereunder, and we have fulfilled our other ethical responsibilities in accordance with these requirements and the Code of Ethics. We believe that the audit evidence we have obtained is sufficient and appropriate to provide a basis for our audit opinion on the consolidated Ind AS financial statements.
EMPHASIS OF MATTERSi. The statutory auditors of UltraTech Cement Limited
(“UltraTech”), a subsidiary company, without qualifying their opinion on the audited consolidated Ind AS financial statements of UltraTech have drawn attention to note 4.1.3(a) which states that:
a. In terms of the Order issued by the Competition Commission of India (“CCI”) against UltraTech including Demerged Cement Division of Century Textiles and Industries Limited (“Demerged Cement Division”) dated 31st August 2016, the CCI had imposed penalty of C 1,449.51 Crore for alleged contravention of the provisions of the Competition Act, 2002 by UltraTech (including Demerged Cement Division). UltraTech (including Demerged Cement Division) had filed an appeal against the CCI Order before the Competition Appellate Tribunal (“COMPAT”) which was subsequently transferred to the National Company Law Appellate Tribunal (“NCLAT”). In July 2018, NCLAT completed its hearing on the matter and disallowed the appeal filed by UltraTech (including Demerged Cement Division) against the CCI order. Aggrieved by the order of NCLAT, UltraTech (including Demerged Cement Division) has filed an appeal before the Honorable Supreme Court, which has granted a stay against the NCLAT order on the condition that UltraTech (and Demerged Cement Division) deposits 10% of the penalty amounting to C 144.95 Crore, which has been deposited. Based on a competent legal opinion obtained by UltraTech (and Demerged Cement Division), UltraTech believes that it has a good case in this matter. Considering the uncertainty relating to the outcome of this matter, no provision has been considered in the books of account.
b. In terms of order dated 19th January 2017, the CCI had imposed penalty of C 68.30 Crore pursuant to a reference filed by the Government of Haryana for alleged contravention of the provisions of the Competition Act, 2002 in August 2012 by UltraTech. UltraTech had filed an appeal before COMPAT and received the stay order dated 10th April 2017. Consequent to reconstitution of tribunals by the Government, this matter was transferred to the NCLAT for which hearing is pending. Based on a competent legal opinion, UltraTech believes that it has a good case in this matter. Considering the uncertainty relating to the outcome of this matter, no provision has been considered by UltraTech in the books of accounts.
298 Grasim Industries Limited
c. Statutory auditors of UltraTech Nathdwara Cement Limited (“UNCL”), a wholly owned subsidiary of UltraTech have audited the financial statements and without modifying their opinion on the consolidated financial statements of UNCL for the year ended 31st March 2021 reported that in terms of the Order issued by the CCI against UNCL dated 31st August 2016, the CCI had imposed penalty of C 167.32 Crore for alleged contravention of the provisions of the Competition Act, 2002 by UNCL. UNCL had filed an appeal against the CCI Order before the COMPAT which was subsequently transferred to the NCLAT. In July 2018, NCLAT completed its hearing on the matter and disallowed the appeal filed by UNCL against the CCI order. Aggrieved by the order of NCLAT, UNCL has filed an appeal before the Honorable Supreme Court, which has granted a stay against the NCLAT order on the condition that UNCL deposits l0% of the penalty amounting to C 16.73 Crore, which has been deposited. Based on the legal opinion taken by UltraTech on a similar matter, UNCL believes that it has a good case in this matter. Considering the uncertainty relating to the outcome of this matter, no provision has been considered in the books of accounts of UNCL.
Our opinion is not modified in respect of the above matters.
ii. We draw attention to note 4.4(b)(ii) of the consolidated Ind AS financial statements, the statutory auditors of UltraTech, without modifying their opinion on the consolidated financial statements of UltraTech have explained that there has been a change of plan relating to UNCL’s wholly owned subsidiary, Star Super Cement Industries LLC ("SSCILLC") which was previously classified as held for sale (and discontinued operations). During the current year, UltraTech has re-evaluated the decision to sell SSCILLC and instead decided to make it a part of the continuing operations considering the synergies available with the existing capacity. Consequently, UNCL has sold SSCILLC to UltraTech Cement Middle East Investments Limited ("UCMEIL"), which is a wholly owned subsidiary of UltraTech, on 23rd November 2020. Accordingly, SSCILLC has ceased to be classified as 'held for sale' and the financial statements of SSCILLC previously presented as
discontinued operations have been reclassified as per Ind AS 105 'Non-current Assets Held for Sale and Discontinued Operations' and included in income from continuing operations for all periods presented and required adjustments have been made to the carrying amount of assets and liabilities of SSCILLC. Accordingly, consolidated financial statements for the year ended 31st March 2020 as included in this consolidated Ind AS financial statements have been restated. Our opinion is not modified in respect of the above matter.
iii. We draw attention to note 4.12.6 of the consolidated Ind AS financial statements, the statutory auditors of Aditya Birla Capital Limited (“ABCL”), a subsidiary company, without modifying their opinion on the consolidated financial statements of ABCL describes the uncertainties arising from the COVID 19 pandemic. Our opinion is not modified in respect of the above matters.
KEY AUDIT MATTERSKey audit matters are those matters that, in our professional judgment, were of most significance in our audit of the consolidated Ind AS financial statements for the financial year ended 31st March 2021. These matters were addressed in the context of our audit of the consolidated Ind AS financial statements as a whole, and in forming our opinion thereon, and we do not provide a separate opinion on these matters. For each matter below, our description of how our audit addressed the matter is provided in that context.
We have determined the matters described below to be the key audit matters to be communicated in our report. We have fulfilled the responsibilities described in the Auditor’s responsibilities for the audit of the consolidated Ind AS financial statements section of our report, including in relation to these matters. Accordingly, our audit included the performance of procedures designed to respond to our assessment of the risks of material misstatement of the consolidated Ind AS financial statements. The results of audit procedures performed by us and by other auditors of components not audited by us, as reported by them in their audit reports furnished to us by the management, including those procedures performed to address the matters below, provide the basis for our audit opinion on the accompanying consolidated Ind AS financial statements.
299Integrated Annual Report 2020-21
Integrated ReportStatutory Reports
Financial statements
Key audit matters How our audit addressed the key audit matterAssessment of impairment of Goodwill and Other IntangiblesAs disclosed in note 2.2 and 2.3 of consolidated financial statements, the Group has goodwill of C 20,013.86 Crore and other intangible assets of C 9,254.48 Crore as at 31st March 2021 which represents goodwill/intangibles assets acquired through various business combinations and allocated to cash generating units (“CGU”).
A cash generating unit to which goodwill has been allocated and to which intangible assets belong to is tested for impairment annually, or more frequently when there is an indication that the unit may be impaired.
As disclosed in note 2.2.1, impairment of goodwill and intangible assets is determined by assessing the recoverable amount of each CGU to which these assets relate.
We have identified the annual impairment assessment as key audit matter because of the amounts involved, complexity in assessment, judgmental by nature, significant changes in business environment specifically due to outbreak of Covid-19 and further, is based following key assumptions:
• projected future cash inflows
• expected growth rate, discount rate, terminal growth rate
• benchmarking of price and market multiples
Our audit procedures included the following:
• Tested the design and the operating effectiveness of internal controls over the impairment assessment process including assessment of valuation models used in assessment of impairment in the value of Goodwill and Other Intangibles.
• Obtained an understanding of the process followed by the management in determining the CGU to which goodwill/intangible assets are allocated and determination of recoverable amounts of CGU.
• Evaluated the competence, capabilities and independence of the specialist engaged by the Company and reviewed the valuation reports issued by such specialist.
• Evaluated the model used in determining the value in use of each CGU.
• Engaged valuation expert to assist in evaluating the key assumptions of the valuations.
• Tested the arithmetical accuracy of the computation of recoverable amounts of each CGU.
• Assessed the disclosures provided by the Group in relation to its annual impairment test in note 2.2.1 to consolidated financial statements.
KAM reported in the standalone Ind AS financial statements of the Holding Company
Key audit matters How our audit addressed the key audit matterRegulations – Litigation pertaining to matters related to direct tax and Competition Commission of India (CCI)As disclosed in note 4.1.1 and 4.1.3(c) of the consolidated financial statements, the Company has pending litigations with regards to direct tax matter relating to demerger of financial services business amounting to ` 7,340.16 Crore (including interest of ` 1,468.03 Crore upto 31 March 2021) and order issued by the Competition Commission of India (“CCI”) on the Viscose Staple Fiber (“VSF”) business of the Company amounting to ` 301.62 Crore detailed as under:
• The Company’s tax position has been challenged by the tax authorities and demanded dividend distribution tax alleging that the demerger of the Financial Services Business is not qualifying demerger as per Income Tax Act, 1961 and treating the value of shares allotted by the resulting Company to the shareholders of the Company in consideration of demerger as dividend distributed by the Company to its shareholders.
• CCI has issued an order against the Company alleging abuse of dominant position in VSF business and consequent violations of Competition Act, 2002.
We considered the above as key audit matter as the Company applies significant judgment in estimating the likelihood of the future outcome based on its own past assessments, judicial precedents and opinions of experts/legal counsels. when considering whether, and how much, to provide or in determining the required disclosure for the potential exposure of these matters. This is due to highly complex nature and magnitude of amounts involved along with the fact that resolution of income-tax and CCI proceedings may span over multiple years, may involve protracted litigation and these estimates could change substantially over time as based on regulatory positions as these matters progress.
Our audit procedures included the following:
• Tested the design and operating effectiveness of internal controls related to the assessment of the likely outcome of regulatory and tax matters, and provision made, if any.
• Obtained and read the details of legal and tax disputed matters. Further, read the latest correspondence between the Company and various regulatory authorities.
• Considered evaluation made by the management on direct tax and CCI matters and assessed management’s position through discussions on both the probability of success and the magnitude of any potential loss.
• Read external opinions obtained by the management for direct tax and CCI matters and other evidence to corroborate management’s assessment of the risk profile in respect of them.
• Involved tax expert in assessing the nature and amount of the tax exposure. Assessed management’s conclusions on whether exposures are probable, contingent or remote.
• Obtained direct legal confirmations for CCI matter from the law firm handling such matter to corroborate management’s conclusion.
• Assessed the disclosures in Note 4.1.1 and 4.1.3(c) made in relation to these direct tax and CCI matters for compliance with disclosure requirements.
300 Grasim Industries Limited
KAM as reported by the auditors of UltraTech
Key audit matters How our audit addressed the key audit matterRevenue recognition – Discounts, incentives and rebatesRevenue is measured net of discounts, incentives, rebates etc. given to the customers on UltraTech’s sales.
Due to UltraTech’s presence across different marketing regions within the country and the competitive business environment makes the assessment of various type of discounts, incentives and rebates as complex and judgmental.
Therefore, there is a risk of revenue being misstated as a result of variations in the assessment of discounts, incentives and rebates.
Given the complexity and judgement required to assess the provision for discounts, incentives and rebates, this is a key audit matter.
The procedures performed by the auditors, as reported by them, included the following:
• Assessed UltraTech’s accounting policies relating to revenue, discounts, incentives and rebates by comparing with applicable accounting standards.
• Assessed the design and implementation and testing the operating effectiveness of UltraTech’s internal controls over the provisions, approvals and disbursements of discounts, incentives and rebates.
• Assessed UltraTech’s computations for accrual of discounts, incentives and rebates, on a sample basis, and compared the accruals made with the approved schemes and underlying documents.
• Verified, on a sample basis, the underlying documentation for discounts, incentives and rebates recorded and disbursed during the year.
• Compared the historical trend of payments and reversal of discounts, incentives and rebates to provisions made to assess the current year accruals.
• Examined the manual journals posted to discounts, rebates and incentives to identify unusual or irregular items.
Regulations - Litigations and claimsUltraTech operates in various States within India and is exposed to different Central and State/Local laws, regulations and interpretations thereof. In this regulatory environment, there is an inherent risk of litigations and claims.
Consequently, provisions and contingent liability disclosures may arise from indirect tax proceedings, legal proceedings, including regulatory and other government/department proceedings, as well as investigations by authorities and commercial claims.
UltraTech applies significant judgement in estimating the likelihood of the future outcome in each case and in determining the provisions or disclosures required for each matter.
Resolution of tax and legal proceedings may span over multiple years due to the highly complex nature and magnitude of the legal matters involved and may involve protracted negotiation or litigation.
These estimates could change significantly over time as new facts emerge and each legal case progresses.
Given the inherent complexity and magnitude of potential exposures and the judgement necessary to estimate the amount of provisions required or to determine required disclosures, this is a key audit matter.
The procedures performed by the auditors, as reported by them, included the following:
• Gained an understanding of outstanding litigations against UltraTech from UltraTech’s in-house legal counsel and other key managerial personnel who have knowledge of these matters.
• Read the correspondence between the UltraTech and the various tax/legal authorities and the legal opinions of external legal advisors, where applicable, for significant matters.
• Tested the completeness of the litigations and claims by examining, on a sample basis, UltraTech’s legal expenses and minutes of the board meetings.
• Challenged UltraTech’s estimate of the possible outcome of the disputed cases based on applicable tax laws and legal precedence by involving tax specialists.
• Assessed the adequacy of disclosures in respect of contingent liabilities for tax and legal matters.
301Integrated Annual Report 2020-21
Integrated ReportStatutory Reports
Financial statements
Key audit matters How our audit addressed the key audit matterRecognition and measurement of Income TaxesUltraTech operates in a complex tax jurisdiction and is subject to periodic challenges by tax authorities on various matters relating to claims for tax exemptions/deductions.
The determination of provision for income tax and deferred taxes including write backs of provisions involves significant judgements and estimates and interpreting the prevailing tax laws and rules.
These also involve significant judgment to determine the possible outcome of the uncertain tax positions, consequently having an impact on related accounting and disclosures in the consolidated financial statements.
Considering the complexity and significant level of estimation and judgement, this is a key audit matter.
The procedures performed by the auditors, as reported by them, included the following:
• Obtained an understanding of key tax matters.
• Read and analysed select key correspondences, external legal opinions/ consultations obtained by UltraTech for key tax matters.
• Critically challenged the key assumptions made by UltraTech in estimating current and deferred taxes by involving tax specialists.
• Challenged UltraTech’s estimate of the possible outcome of the disputed tax cases by considering legal precedence and other judicial rulings by involving tax specialists.
• Assessed the adequacy of disclosures for income taxes in the financial statements.
KAM as reported by the auditors of ABCL
Key audit matters How our audit addressed the key audit matterAllowances for Expected Credit LossesAs at 31st March 2021, carrying amount of loan assets measured at amortised cost, aggregated C 59,831.83 (net of expected credit loss of C 1,208.67 Crore), constituting approximately 40% of the Group’s total assets. Significant judgement is used in classifying these loan assets and applying appropriate measurement principles. The allowance for expected credit losses (“ECL”) on such loan assets measured at amortised cost is a critical estimate involving greater level of management judgement.
As part of our risk assessment, we determined that the allowance for ECL on loan assets (including undisbursed commitments) has a high degree of estimation uncertainty, with a potential range of reasonable outcomes for the financial statements.
The elements of estimating ECL which involved increased level of audit focus are the following:
• Qualitative and quantitative factors used in staging the loan assets measured at amortised cost.
• Basis used for estimating Probabilities of Default (“PD”),
• Basis used for estimating Loss Given Default (“LGD”)
• Judgements used in projecting economic scenarios and probability weights applied to reflect future economic conditions.
• Adjustments to model driven ECL results to address emerging trends.
The procedures performed by the auditors, as reported by them, included the following:
• Examined the policies approved by the Board of Directors of the Company that articulate the objectives of managing each portfolio and their business. We have also verified the methodology adopted for computation of ECL (“ECL Model”) that addresses policies approved by the Board of Directors, procedures and controls for assessing and measuring credit risk on all lending exposures measured at amortised cost.
• Additionally, we have confirmed that adjustments to the output of the ECL Model is consistent with the documented rationale and basis for such adjustments and that the amount of adjustment has been approved by the Audit Committee of the Board of Directors.
• Our audit procedures related to the allowance for ECL included the following, among others:
• Testing the design and effectiveness of internal controls over the following:
• completeness and accuracy of the Exposure at Default (“EAD”) and the classification thereof into stages consistent with the definitions applied in accordance with the policy approved by the Board of Directors including the appropriateness of the qualitative factors to be applied.
• Completeness, accuracy and appropriateness of information used in the estimation of the PD and LGD for the different stages depending on the nature of the portfolio; and
• computation of the ECL including methodology used to determine macro economic overlays and adjustments to the output of the ECL Model.
• Also, for a sample of ECL on loan assets to be tested:
• testing the input data such as ratings and period of default and other related information used in estimating the PD;
• evaluating reasonableness of LGD estimates by comparing actual recoveries post the loan asset becoming credit impaired with estimates of LGD.
• evaluating the incorporation of the applicable assumptions into the ECL Model and tested the mathematical accuracy and computation of the allowances by using the same input data used by the Company.
• We have also evaluated the adequacy of the adjustment after stressing the inputs used in determining the output as per the ECL Model and ensured that the adjustment was in conformity with the amount approved by the Audit Committee.
We have also assessed the disclosures made in relation to the ECL allowance to confirm compliance with the provisions of Ind AS 107.
302 Grasim Industries Limited
Key audit matters How our audit addressed the key audit matterInformation Technology and General ControlsThe Group is dependent on its Information Technology (“IT”) due to the significant number of transactions that are processed daily across multiple and discrete IT systems.
Also, IT application controls are critical to ensure that changes to applications and underlying data are made in an appropriate manner. Appropriate controls contribute to mitigating the risk of potential fraud or errors as a result of changes to applications and data.
On account of the pervasive use of its IT systems, the testing of general computer controls of the IT systems used in financial reporting was considered to be a Key Audit Matter.
Auditors of ABCL and its components performed the following audit procedures:
With the assistance of IT specialists, component auditors and we obtained an understanding of the Group’s IT applications, databases and operating systems relevant to financial reporting and the controls environment. For these elements of the IT infrastructure the areas of our focus included access security (including controls over privileged access), program change controls, database management and network operations.
In particular, auditors of components and we:
• tested the design, implementation and operating effectiveness of the Group’s general IT controls over IT systems relevant to financial reporting. This included evaluation of Group’s controls over segregation of duties and access rights being provisioned/modified based on duly approved requested, access for exit cases being revoked in a timely manner and access of all users being rectified during the period of audit;
• tested key automated and manual business controls and logic for the reports generated through the IT infrastructure that were relevant for financial reporting or were used in the exercise of internal controls over financial reporting. Our tests included testing of the compensating controls or alternate procedures to access whether there were any unaddressed IT risks that would materially impact the financial statements.
OTHER INFORMATION The Holding Company’s Board of Directors is responsible for the other information. The other information comprises the information included in the Annual report, but does not include the Ind AS financial statements and our auditor’s report thereon.
Our opinion on the consolidated Ind AS financial statements does not cover the other information and we do not express any form of assurance conclusion thereon.
In connection with our audit of the consolidated Ind AS financial statements, our responsibility is to read the other information and, in doing so, consider whether such other information is materially inconsistent with the consolidated Ind AS financial statements or our knowledge obtained in the audit or otherwise appears to be materially misstated. If, based on the work we have performed, we conclude that there is a material misstatement of this other information, we are required to report that fact. We have nothing to report in this regard.
RESPONSIBILITIES OF MANAGEMENT FOR THE CONSOLIDATED IND AS FINANCIAL STATEMENTSThe Holding Company’s Board of Directors is responsible for the preparation and presentation of these consolidated Ind AS financial statements in terms of the requirements of the Act that give a true and fair view of the consolidated financial position, consolidated financial performance including other comprehensive income, consolidated cash flows and consolidated statement of changes in equity of the Group including its associates and joint ventures in accordance with the accounting
principles generally accepted in India, including the Indian Accounting Standards (Ind AS) specified under section 133 of the Act read with the Companies (Indian Accounting Standards) Rules, 2015, as amended. The respective Board of Directors of the companies included in the Group and of its associates and joint ventures are responsible for maintenance of adequate accounting records in accordance with the provisions of the Act for safeguarding of the assets of the Group and of its associates and joint ventures and for preventing and detecting frauds and other irregularities; selection and application of appropriate accounting policies; making judgments and estimates that are reasonable and prudent; and the design, implementation and maintenance of adequate internal financial controls, that were operating effectively for ensuring the accuracy and completeness of the accounting records, relevant to the preparation and presentation of the consolidated Ind AS financial statements that give a true and fair view and are free from material misstatement, whether due to fraud or error, which have been used for the purpose of preparation of the consolidated Ind AS financial statements by the Directors of the Holding Company, as aforesaid.
In preparing the consolidated Ind AS financial statements, the respective Board of Directors of the companies included in the Group and of its associates and joint ventures are responsible for assessing the ability of the Group and of its associates and joint ventures to continue as a going concern, disclosing, as applicable, matters related to going concern and using the going concern basis of accounting unless management either intends to liquidate the Group or to cease operations, or has no realistic alternative but to do so.
303Integrated Annual Report 2020-21
Integrated ReportStatutory Reports
Financial statements
Those respective Board of Directors of the companies included in the Group and of its associates and joint ventures are also responsible for overseeing the financial reporting process of the Group and of its associates and joint ventures.
AUDITOR’S RESPONSIBILITIES FOR THE AUDIT OF THE CONSOLIDATED IND AS FINANCIAL STATEMENTSOur objectives are to obtain reasonable assurance about whether the consolidated Ind AS financial statements as a whole are free from material misstatement, whether due to fraud or error, and to issue an auditor’s report that includes our opinion. Reasonable assurance is a high level of assurance, but is not a guarantee that an audit conducted in accordance with SAs will always detect a material misstatement when it exists. Misstatements can arise from fraud or error and are considered material if, individually or in the aggregate, they could reasonably be expected to influence the economic decisions of users taken on the basis of these consolidated Ind AS financial statements.
As part of an audit in accordance with SAs, we exercise professional judgment and maintain professional skepticism throughout the audit. We also:
i. Identify and assess the risks of material misstatement of the consolidated Ind AS financial statements, whether due to fraud or error, design and perform audit procedures responsive to those risks, and obtain audit evidence that is sufficient and appropriate to provide a basis for our opinion. The risk of not detecting a material misstatement resulting from fraud is higher than for one resulting from error, as fraud may involve collusion, forgery, intentional omissions, misrepresentations, or the override of internal control.
ii. Obtain an understanding of internal control relevant to the audit in order to design audit procedures that are appropriate in the circumstances. Under section 143(3)(i) of the Act, we are also responsible for expressing our opinion on whether the Holding Company has adequate internal financial controls with reference to financial statements in place and the operating effectiveness of such controls.
iii. Evaluate the appropriateness of accounting policies used and the reasonableness of accounting estimates and related disclosures made by management.
iv. Conclude on the appropriateness of management’s use of the going concern basis of accounting and, based on the audit evidence obtained, whether a material
uncertainty exists related to events or conditions that may cast significant doubt on the ability of the Group and its associates and joint ventures to continue as a going concern. If we conclude that a material uncertainty exists, we are required to draw attention in our auditor’s report to the related disclosures in the consolidated Ind AS financial statements or, if such disclosures are inadequate, to modify our opinion. Our conclusions are based on the audit evidence obtained up to the date of our auditor’s report. However, future events or conditions may cause the Group and its associates and joint ventures to cease to continue as a going concern.
v. Evaluate the overall presentation, structure and content of the consolidated Ind AS financial statements, including the disclosures, and whether the consolidated Ind AS financial statements represent the underlying transactions and events in a manner that achieves fair presentation.
vi. Obtain sufficient appropriate audit evidence regarding the financial information of the entities or business activities within the Group and its associates and joint ventures of which we are the independent auditors and whose financial information we have audited, to express an opinion on the consolidated Ind AS financial statements. We are responsible for the direction, supervision and performance of the audit of the financial statements of such entities included in the consolidated Ind AS financial statements of which we are the independent auditors. For the other entities included in the consolidated Ind AS financial statements, which have been audited by other auditors, such other auditors remain responsible for the direction, supervision and performance of the audits carried out by them. We remain solely responsible for our audit opinion.
We communicate with those charged with governance of the Holding Company and such other entities included in the consolidated Ind AS financial statements of which we are the independent auditors regarding, among other matters, the planned scope and timing of the audit and significant audit findings, including any significant deficiencies in internal control that we identify during our audit.
We also provide those charged with governance with a statement that we have complied with relevant ethical requirements regarding independence, and to communicate with them all relationships and other matters that may reasonably be thought to bear on our independence, and where applicable, related safeguards.
304 Grasim Industries Limited
From the matters communicated with those charged with governance, we determine those matters that were of most significance in the audit of the consolidated Ind AS financial statements for the financial year ended 31st March 2021 and are therefore the key audit matters. We describe these matters in our auditor’s report unless law or regulation precludes public disclosure about the matter or when, in extremely rare circumstances, we determine that a matter should not be communicated in our report because the adverse consequences of doing so would reasonably be expected to outweigh the public interest benefits of such communication.
OTHER MATTERWe did not audit the financial statements and other financial information, in respect of 13 subsidiaries (including subsidiaries, associates and joint ventures of the said subsidiaries), whose financial statements include total assets of C 234,554.92 Crore as at 31st March 2021, and total revenues of C 63,912.90 Crore and net cash outflows of C 495.59 Crore for the year ended on that date. The consolidated Ind AS financial statements also include the Group’s share of net loss of C 41.34 Crore for the year ended 31st March 2021, as considered in the consolidated Ind AS financial statements, in respect of 2 associate and 5 joint ventures. These financial statements and other financial information have not been jointly audited by us and have been audited either singly by one of us or jointly by one of us with other auditors or by other auditors, whose financial statements, other financial information and auditor’s reports have been furnished to us by the management. Our opinion on the consolidated Ind AS financial statements, in so far as it relates to the amounts and disclosures included in respect of these subsidiaries, joint ventures and associates, and our report in terms of sub-sections (3) of Section 143 of the Act, in so far as it relates to the aforesaid subsidiaries, joint ventures and associates, is based solely on the report(s) of such other auditors.
Certain of these joint ventures are located outside India whose financial statements and other financial information have been prepared in accordance with accounting principles generally accepted in their respective countries and which have been audited by other auditors under generally accepted auditing standards applicable in their respective countries. The Holding Company’s management has converted the financial statements of such joint ventures located outside India from accounting principles generally accepted in their respective countries to accounting principles generally accepted in India. We have audited these conversion adjustments made by the Holding Company’s management. Our opinion in so far as it relates to the balances and affairs of such joint ventures located outside India is based
on the report of other auditors and the conversion adjustments prepared by the management of the Holding Company and audited by us.
The accompanying consolidated Ind AS financial statements include unaudited financial statements and other unaudited financial information in respect of 17 subsidiaries, whose financial statements and other financial information reflect total assets of C 123.31 Crore as at 31st March 2021, and total revenues of C 173.49 Crore and net cash inflows of C 30.61 Crore for the year ended on that date. These unaudited financial statements and other unaudited financial information have been furnished to us by the management. The consolidated Ind AS financial statements also include the Group’s share of net loss of C 15.45 Crore for the year ended 31st March 2021, as considered in the consolidated Ind AS financial statements, in respect of 2 associates and 2 joint ventures, whose financial statements, other financial information have not been audited and whose unaudited financial statements, other unaudited financial information have been furnished to us by the Management. Our opinion, in so far as it relates amounts and disclosures included in respect of these subsidiaries, joint ventures and associates, and our report in terms of sub-sections (3) of Section 143 of the Act in so far as it relates to the aforesaid subsidiaries, joint ventures and associates, is based solely on such unaudited financial statements and other unaudited financial information. In our opinion and according to the information and explanations given to us by the Management, these financial statements and other financial information are not material to the Group.
Our opinion above on the consolidated Ind AS financial statements, and our report on Other Legal and Regulatory Requirements below, is not modified in respect of the above matters with respect to our reliance on the work done and the reports of the other auditors and the financial statements and other financial information certified by the Management.
The statutory auditors of ABCL, a subsidiary company, without modifying their conclusion on the consolidated financial statements of ABCL have stated that the determination of the following as at and for the year ended 31st March 2021 is the responsibility of the ABCL’s Appointed Actuaries:
i. Change in Valuation of Liability in Respect of Insurance Policies” includes charge for actuarial valuation of liabilities for life policies in force and charge for the policies in respect of which premium has been discontinued but liability exists as at 31st March 2021, in respect of subsidiary engaged in Life Insurance Segment and “Benefits Paid – Insurance
305Integrated Annual Report 2020-21
Integrated ReportStatutory Reports
Financial statements
Business” includes the estimate of claims Incurred But Not Reported (IBNR) and claims Incurred But Not Enough Reported (IBNER), in respect of subsidiary engaged in Health Insurance Segment. These charges have been determined based on the liabilities duly certified by the subsidiaries’ Appointed Actuaries and in their respective opinions, the assumptions for such valuation are in accordance with the guidelines and norms issued by the Insurance Regulatory and Development Authority of India (IRDAI) and the Institute of Actuaries of India in concurrence with the IRDAI. The respective auditors of these subsidiaries have relied on the Appointed Actuaries certificates in this regard in forming their opinion on the financial statements of the said subsidiaries; and
ii. Other adjustments for the purpose of financial statement confirmed by the Appointed Actuaries in the Life Insurance and Health Insurance Segments are in accordance with Indian Accounting Standard 104 on Insurance Contracts:
a. Assessment of contractual liabilities based on classification of contracts into insurance contracts and investment contracts;
b. Valuation and Classification of Deferred Acquisition Costs and Deferred Origination Fees on Investment Contracts;
c. Grossing up and Classification of the Reinsurance Assets; and
d. Liability Adequacy test as at the reporting dates.
The auditors of ABCL and respective subsidiaries have relied upon the certificates of the Appointed Actuaries in respect of above matters in forming their opinion on the consolidated financial statements of the said subsidiaries.
Our opinion is not modified in respect of the above matters.
REPORT ON OTHER LEGAL AND REGULATORY REQUIREMENTSAs required by Section 143(3) of the Act, based on our audit and on the consideration of report of the other auditors on separate financial statements and the other financial information of subsidiaries, associates and joint ventures, as noted in the ‘other matter’ paragraph we report, to the extent applicable, that:
(a) We have relied upon have sought and obtained all the information and explanations which to the best of our knowledge and belief were necessary for the purposes of our audit of the aforesaid consolidated Ind AS financial statements;
(b) In our opinion, proper books of account as required by law relating to preparation of the aforesaid consolidation of the financial statements have been kept so far as it appears from our examination of those books and reports of the other auditors;
(c) The Consolidated Balance Sheet, the Consolidated Statement of Profit and Loss including the Statement of Other Comprehensive Income, the Consolidated Cash Flow Statement and Consolidated Statement of Changes in Equity dealt with by this Report are in agreement with the books of account maintained for the purpose of preparation of the consolidated Ind AS financial statements;
(d) In our opinion, the aforesaid consolidated Ind AS financial statements comply with the Accounting Standards specified under Section 133 of the Act, read with Companies (Indian Accounting Standards) Rules, 2015, as amended;
(e) On the basis of the written representations received from the directors of the Holding Company as on 31st March 2021 taken on record by the Board of Directors of the Holding Company and the reports of the statutory auditors who are appointed under Section 139 of the Act, of its subsidiary companies, associate companies and joint ventures, none of the directors of the Group’s companies, its associates and joint ventures, incorporated in India, is disqualified as on 31st March 2021 from being appointed as a director in terms of Section 164 (2) of the Act;
(f) With respect to the adequacy and the operating effectiveness of the internal financial controls with reference to consolidated Ind AS financial statements of the Holding Company and its subsidiary companies, associate companies and joint ventures, incorporated in India, refer to our separate Report in “Annexure A” to this report;
(g) In our opinion and based on the consideration of reports of other statutory auditors of the subsidiaries, associates
306 Grasim Industries Limited
and joint ventures incorporated in India, the managerial remuneration for the year ended 31st March 2021 has been paid / provided by the Holding Company, its subsidiaries, associates and joint ventures incorporated in India to their directors in accordance with the provisions of section 197 read with Schedule V to the Act;
(h) With respect to the other matters to be included in the Auditor’s Report in accordance with Rule 11 of the Companies (Audit and Auditors) Rules, 2014, as amended, in our opinion and to the best of our information and according to the explanations given to us and based on the consideration of the report of the other auditors on separate financial statements as also the other financial information of the subsidiaries, associates and joint ventures, as noted in the ‘Other matter’ paragraph:
i. The consolidated Ind AS financial statements disclose the impact of pending litigations on its consolidated
financial position of the Group, its associates and joint ventures in its consolidated Ind AS financial statements – Refer note 4.1 to the consolidated Ind AS financial statements;
ii. The Group, its associates and joint ventures has made provision, as required under the applicable law or accounting standards, for material foreseeable losses, if any, on long-term contracts including derivative contracts- Refer Note 4.9 to the consolidated Ind AS financial statements;
iii. There has been no delay in transferring amounts, required to be transferred, to the Investor Education and Protection Fund by the Holding Company, its subsidiaries, associates and joint ventures, incorporated in India during the year ended 31st March 2021.
For B S R & Co. LLP For S R B C & CO LLPChartered Accountants Chartered AccountantsFirm’s Registration No: 101248W/W-100022 Firm’s Registration No: 324982E/E300003
Vikas R Kasat Vijay ManiarPartner PartnerMembership No: 105317 Membership No: 36738 UDIN: 21105317AAAADQ6828 UDIN: 21036738AAAADW1574
Mumbai Mumbai24th May 2021 24th May 2021
307Integrated Annual Report 2020-21
Integrated ReportStatutory Reports
Financial statements
Annexure A to the Independent Auditor’s Report of even date on the Consolidated Ind AS Financial Statements of Grasim Industries Limited
REPORT ON THE INTERNAL FINANCIAL CONTROLS UNDER CLAUSE (I) OF SUB-SECTION 3 OF SECTION 143 OF THE COMPANIES ACT, 2013 (“THE ACT”)
OPINIONIn conjunction with our audit of the consolidated Ind AS financial statements of Grasim Industries Limited as of and for the year ended 31st March 2021, we have audited the internal financial controls with reference to financial statements of Grasim Industries Limited (hereinafter referred to as the “Holding Company”), its subsidiary companies, its associate companies and its joint ventures, which are companies incorporated in India, as of that date.
In our opinion, the Holding Company, its subsidiary companies, its associate companies and its joint ventures, which are companies incorporated in India, have, maintained in all material respects, adequate internal financial controls system with reference to financial reporting and such internal financial controls with reference to financial statements were operating effectively as at 31st March 2021, based on the internal controls with reference to financial statements criteria established by the Holding Company considering the essential components of internal control stated in the Guidance Note issued by the ICAI.
MANAGEMENT’S RESPONSIBILITY FOR INTERNAL FINANCIAL CONTROLSThe respective Board of Directors of the Holding Company, its subsidiary companies, its associate companies and its joint ventures, which are companies incorporated in India, are responsible for establishing and maintaining internal financial controls based on the internal controls with reference to financial statements criteria established by the Holding Company considering the essential components of internal controls stated in the Guidance Note on Audit of Internal Financial Controls over Financial Reporting (the “Guidance Note”) issued by the Institute of Chartered Accountants of India (the “ICAI”). These responsibilities include the design, implementation and maintenance of adequate internal financial controls that were operating effectively for ensuring the orderly and efficient conduct of its business, including adherence to the respective company’s policies, the safeguarding of its assets, the prevention and detection of frauds and errors, the accuracy and completeness of the accounting records, and the timely preparation of reliable financial information, as required under the Act.
AUDITOR’S RESPONSIBILITYOur responsibility is to express an opinion on the Holding Company’s internal financial controls with reference to financial statements based on our audit. We conducted our audit in accordance the Guidance Note and the Standards on Auditing, issued by the ICAI and deemed to be prescribed under section 143(10) of the Act, to the extent applicable to an audit of internal financial controls, both applicable to an audit of internal financial controls and, both issued by the ICAI. Those Standards and the Guidance Note require that we comply with ethical requirements and plan and perform the audit to obtain reasonable assurance about whether adequate internal financial controls with reference to financial statements was established and maintained and if such controls operated effectively in all material respects.
Our audit involves performing procedures to obtain audit evidence about the adequacy of the internal financial controls system with reference to financial statements and their operating effectiveness. Our audit of internal financial controls with reference to financial statements included obtaining an understanding of internal financial controls with reference to financial statements, assessing the risk that a material weakness exists, and testing and evaluating the design and operating effectiveness of internal controls based on the assessed risk. The procedures selected depend on the auditor’s judgement, including the assessment of the risks of material misstatement of the consolidated Ind AS financial statements, whether due to fraud or error.
We believe that the audit evidence we have obtained and the audit evidence obtained by the other auditors in terms of their reports referred to in the Other Matters paragraph below, is sufficient and appropriate to provide a basis for our audit opinion on the Holding Company’s internal financial controls system with reference to financial statements.
MEANING OF INTERNAL FINANCIAL CONTROLS WITH REFERENCE TO FINANCIAL STATEMENTSA company’s internal financial controls with reference to financial statements is a process designed to provide reasonable assurance regarding the reliability of financial reporting and the preparation of consolidated Ind AS financial statements for external purposes in accordance with generally accepted accounting principles. A company’s internal financial controls with reference to financial statements includes those policies and procedures that (1) pertain to the maintenance of records that, in reasonable detail, accurately and fairly reflect the
308 Grasim Industries Limited
transactions and dispositions of the assets of the company; (2) provide reasonable assurance that transactions are recorded as necessary to permit preparation of consolidated Ind AS financial statements in accordance with generally accepted accounting principles, and that receipts and expenditures of the company are being made only in accordance with authorisations of management and directors of the company; and (3) provide reasonable assurance regarding prevention or timely detection of unauthorised acquisition, use, or disposition of the company’s assets that could have a material effect on the consolidated Ind AS financial statements.
INHERENT LIMITATIONS OF INTERNAL FINANCIAL CONTROLS WITH REFERENCE TO FINANCIAL STATEMENTSBecause of the inherent limitations of internal financial controls with reference to financial statements, including the possibility of collusion or improper management override of controls,
material misstatements due to error or fraud may occur and not be detected. Also, projections of any evaluation of the internal financial controls with reference to financial statements to future periods are subject to the risk that the internal financial controls with reference to financial statements may become inadequate because of changes in conditions, or that the degree of compliance with the policies or procedures may deteriorate.
OTHER MATTERSOur report under Section 143(3)(i) of the Act on the adequacy and operating effectiveness of the internal financial controls with reference to financial statements of the Holding Company, in so far as it relates to these 13 subsidiary companies, 2 associate companies and 2 joint venture, which are companies incorporated in India, is based on the corresponding reports of the auditors of such subsidiaries, associates and joint venture incorporated in India.
For B S R & Co. LLP For S R B C & CO LLPChartered Accountants Chartered AccountantsFirm’s Registration No: 101248W/W-100022 Firm’s Registration No: 324982E/E300003
Vikas R Kasat Vijay ManiarPartner PartnerMembership No: 105317 Membership No: 36738 UDIN: 21105317AAAADQ6828 UDIN: 21036738AAAADW1574
Mumbai Mumbai24th May 2021 24th May 2021
309Integrated Annual Report 2020-21
Integrated ReportStatutory Reports
Financial statements
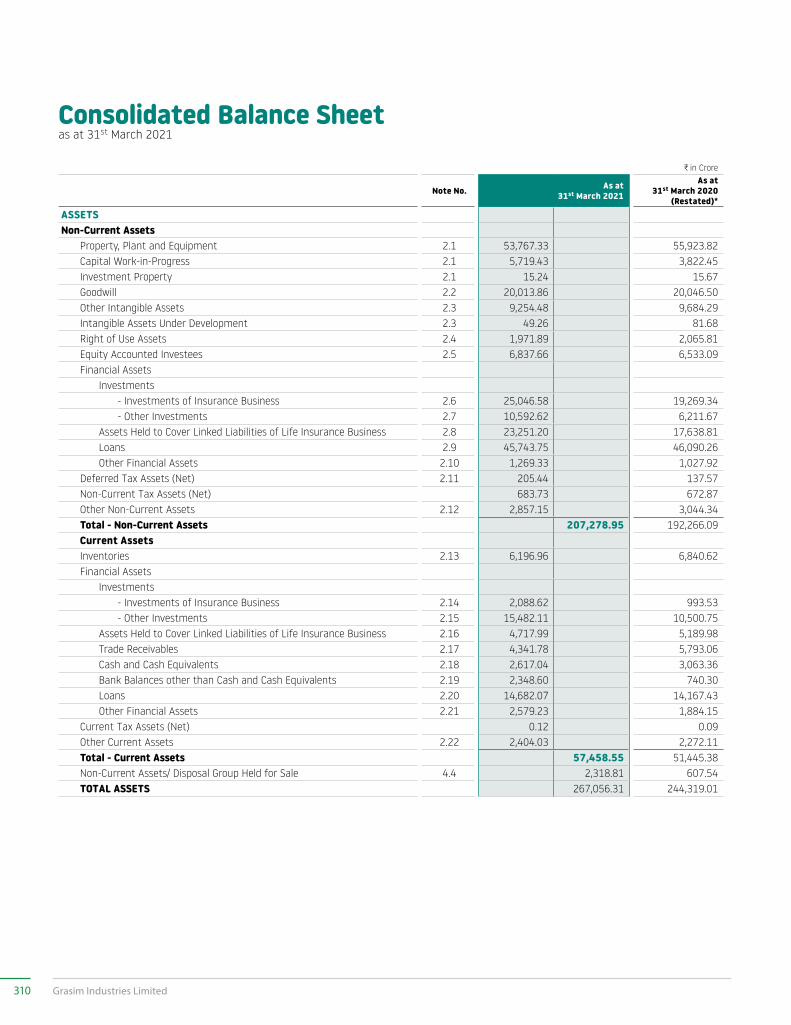
Consolidated Balance Sheetas at 31st March 2021
C in Crore
Note No. As at 31st March 2021
As at 31st March 2020
(Restated)*ASSETSNon-Current Assets Property, Plant and Equipment 2.1 53,767.33 55,923.82 Capital Work-in-Progress 2.1 5,719.43 3,822.45 Investment Property 2.1 15.24 15.67 Goodwill 2.2 20,013.86 20,046.50 Other Intangible Assets 2.3 9,254.48 9,684.29 Intangible Assets Under Development 2.3 49.26 81.68 Right of Use Assets 2.4 1,971.89 2,065.81 Equity Accounted Investees 2.5 6,837.66 6,533.09 Financial Assets Investments - Investments of Insurance Business 2.6 25,046.58 19,269.34 - Other Investments 2.7 10,592.62 6,211.67 Assets Held to Cover Linked Liabilities of Life Insurance Business 2.8 23,251.20 17,638.81 Loans 2.9 45,743.75 46,090.26 Other Financial Assets 2.10 1,269.33 1,027.92 Deferred Tax Assets (Net) 2.11 205.44 137.57 Non-Current Tax Assets (Net) 683.73 672.87 Other Non-Current Assets 2.12 2,857.15 3,044.34 Total - Non-Current Assets 207,278.95 192,266.09 Current Assets Inventories 2.13 6,196.96 6,840.62 Financial Assets Investments - Investments of Insurance Business 2.14 2,088.62 993.53 - Other Investments 2.15 15,482.11 10,500.75 Assets Held to Cover Linked Liabilities of Life Insurance Business 2.16 4,717.99 5,189.98 Trade Receivables 2.17 4,341.78 5,793.06 Cash and Cash Equivalents 2.18 2,617.04 3,063.36 Bank Balances other than Cash and Cash Equivalents 2.19 2,348.60 740.30 Loans 2.20 14,682.07 14,167.43 Other Financial Assets 2.21 2,579.23 1,884.15 Current Tax Assets (Net) 0.12 0.09 Other Current Assets 2.22 2,404.03 2,272.11 Total - Current Assets 57,458.55 51,445.38 Non-Current Assets/ Disposal Group Held for Sale 4.4 2,318.81 607.54 TOTAL ASSETS 267,056.31 244,319.01
310 Grasim Industries Limited
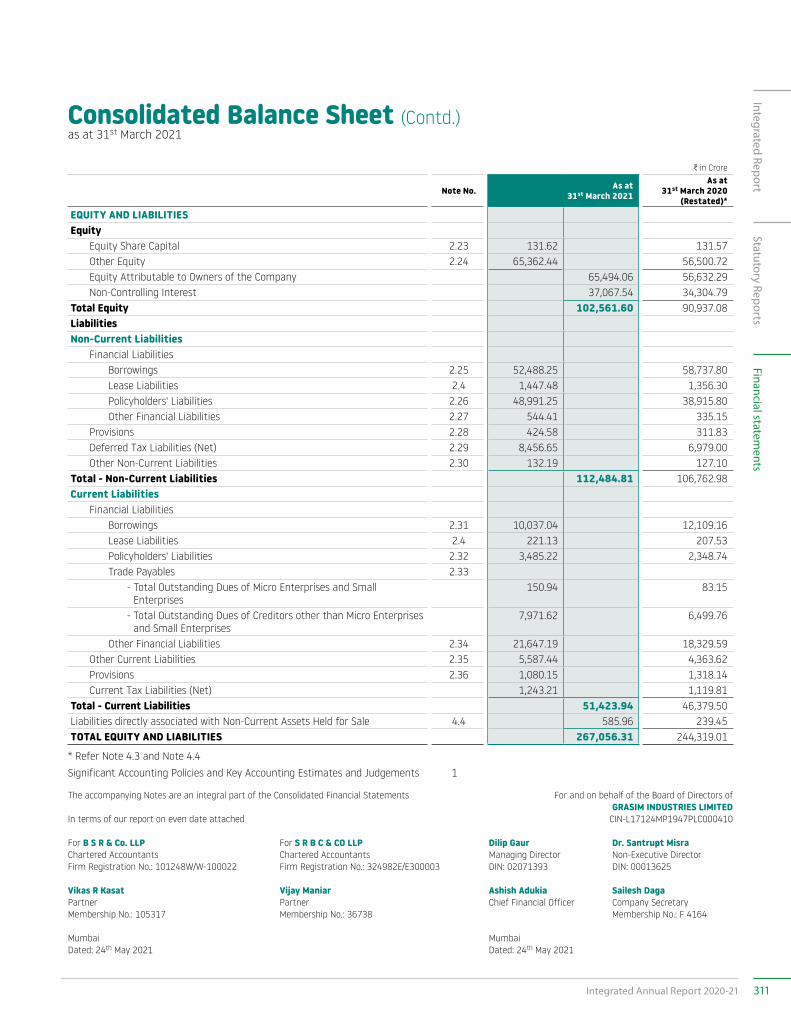
Consolidated Balance Sheet (Contd.)as at 31st March 2021
C in Crore
Note No. As at 31st March 2021
As at 31st March 2020
(Restated)*EQUITY AND LIABILITIESEquity Equity Share Capital 2.23 131.62 131.57 Other Equity 2.24 65,362.44 56,500.72 Equity Attributable to Owners of the Company 65,494.06 56,632.29 Non-Controlling Interest 37,067.54 34,304.79Total Equity 102,561.60 90,937.08LiabilitiesNon-Current Liabilities Financial Liabilities Borrowings 2.25 52,488.25 58,737.80 Lease Liabilities 2.4 1,447.48 1,356.30 Policyholders' Liabilities 2.26 48,991.25 38,915.80 Other Financial Liabilities 2.27 544.41 335.15 Provisions 2.28 424.58 311.83 Deferred Tax Liabilities (Net) 2.29 8,456.65 6,979.00 Other Non-Current Liabilities 2.30 132.19 127.10Total - Non-Current Liabilities 112,484.81 106,762.98Current Liabilities Financial Liabilities Borrowings 2.31 10,037.04 12,109.16 Lease Liabilities 2.4 221.13 207.53 Policyholders' Liabilities 2.32 3,485.22 2,348.74 Trade Payables 2.33 - Total Outstanding Dues of Micro Enterprises and Small
Enterprises150.94 83.15
- Total Outstanding Dues of Creditors other than Micro Enterprises and Small Enterprises
7,971.62 6,499.76
Other Financial Liabilities 2.34 21,647.19 18,329.59 Other Current Liabilities 2.35 5,587.44 4,363.62 Provisions 2.36 1,080.15 1,318.14 Current Tax Liabilities (Net) 1,243.21 1,119.81Total - Current Liabilities 51,423.94 46,379.50Liabilities directly associated with Non-Current Assets Held for Sale 4.4 585.96 239.45TOTAL EQUITY AND LIABILITIES 267,056.31 244,319.01
* Refer Note 4.3 and Note 4.4Significant Accounting Policies and Key Accounting Estimates and Judgements 1
The accompanying Notes are an integral part of the Consolidated Financial Statements For and on behalf of the Board of Directors of GRASIM INDUSTRIES LIMITED
In terms of our report on even date attached CIN-L17124MP1947PLC000410
For B S R & Co. LLP For S R B C & CO LLP Dilip Gaur Dr. Santrupt MisraChartered Accountants Chartered Accountants Managing Director Non-Executive DirectorFirm Registration No.: 101248W/W-100022 Firm Registration No.: 324982E/E300003 DIN: 02071393 DIN: 00013625
Vikas R Kasat Vijay Maniar Ashish Adukia Sailesh DagaPartner Partner Chief Financial Officer Company SecretaryMembership No.: 105317 Membership No.: 36738 Membership No.: F 4164
Mumbai MumbaiDated: 24th May 2021 Dated: 24th May 2021
311Integrated Annual Report 2020-21
Integrated ReportStatutory Reports
Financial statements
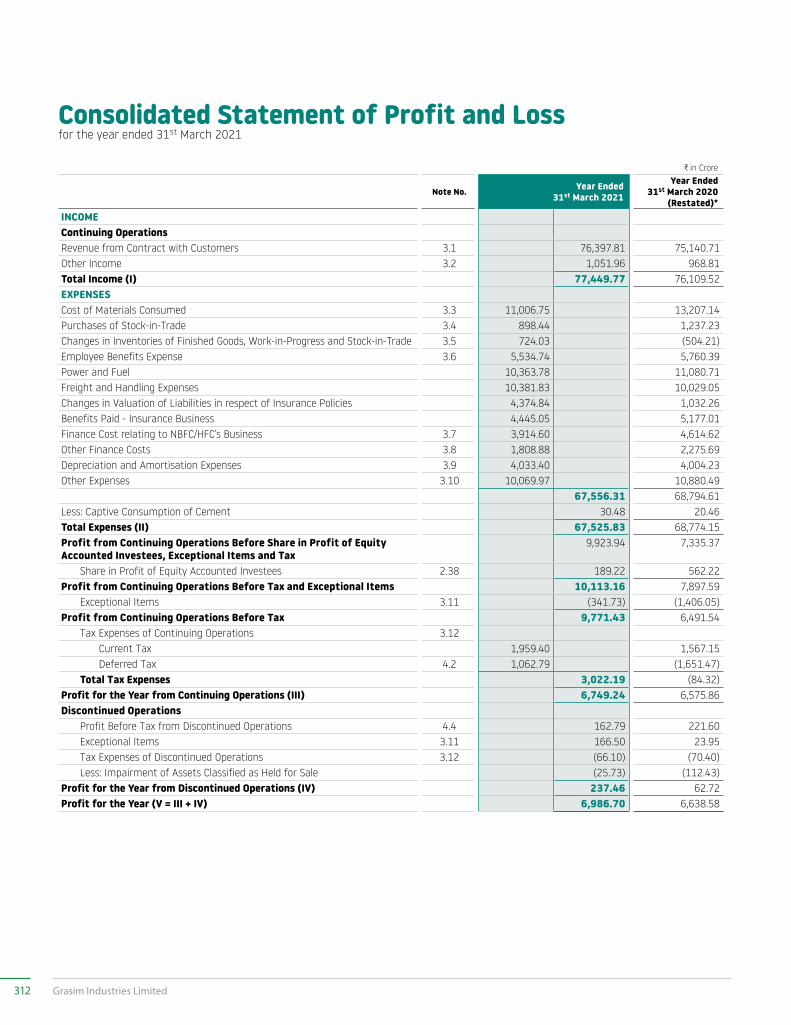
Consolidated Statement of Profit and Lossfor the year ended 31st March 2021
C in Crore
Note No. Year Ended 31st March 2021
Year Ended 31st March 2020
(Restated)*INCOMEContinuing OperationsRevenue from Contract with Customers 3.1 76,397.81 75,140.71Other Income 3.2 1,051.96 968.81Total Income (I) 77,449.77 76,109.52EXPENSESCost of Materials Consumed 3.3 11,006.75 13,207.14Purchases of Stock-in-Trade 3.4 898.44 1,237.23Changes in Inventories of Finished Goods, Work-in-Progress and Stock-in-Trade 3.5 724.03 (504.21)Employee Benefits Expense 3.6 5,534.74 5,760.39Power and Fuel 10,363.78 11,080.71Freight and Handling Expenses 10,381.83 10,029.05Changes in Valuation of Liabilities in respect of Insurance Policies 4,374.84 1,032.26Benefits Paid - Insurance Business 4,445.05 5,177.01Finance Cost relating to NBFC/HFC’s Business 3.7 3,914.60 4,614.62Other Finance Costs 3.8 1,808.88 2,275.69Depreciation and Amortisation Expenses 3.9 4,033.40 4,004.23Other Expenses 3.10 10,069.97 10,880.49
67,556.31 68,794.61Less: Captive Consumption of Cement 30.48 20.46Total Expenses (II) 67,525.83 68,774.15Profit from Continuing Operations Before Share in Profit of Equity Accounted Investees, Exceptional Items and Tax
9,923.94 7,335.37
Share in Profit of Equity Accounted Investees 2.38 189.22 562.22Profit from Continuing Operations Before Tax and Exceptional Items 10,113.16 7,897.59 Exceptional Items 3.11 (341.73) (1,406.05)Profit from Continuing Operations Before Tax 9,771.43 6,491.54 Tax Expenses of Continuing Operations 3.12 Current Tax 1,959.40 1,567.15 Deferred Tax 4.2 1,062.79 (1,651.47) Total Tax Expenses 3,022.19 (84.32)Profit for the Year from Continuing Operations (III) 6,749.24 6,575.86Discontinued Operations Profit Before Tax from Discontinued Operations 4.4 162.79 221.60 Exceptional Items 3.11 166.50 23.95 Tax Expenses of Discontinued Operations 3.12 (66.10) (70.40) Less: Impairment of Assets Classified as Held for Sale (25.73) (112.43)Profit for the Year from Discontinued Operations (IV) 237.46 62.72Profit for the Year (V = III + IV) 6,986.70 6,638.58
312 Grasim Industries Limited
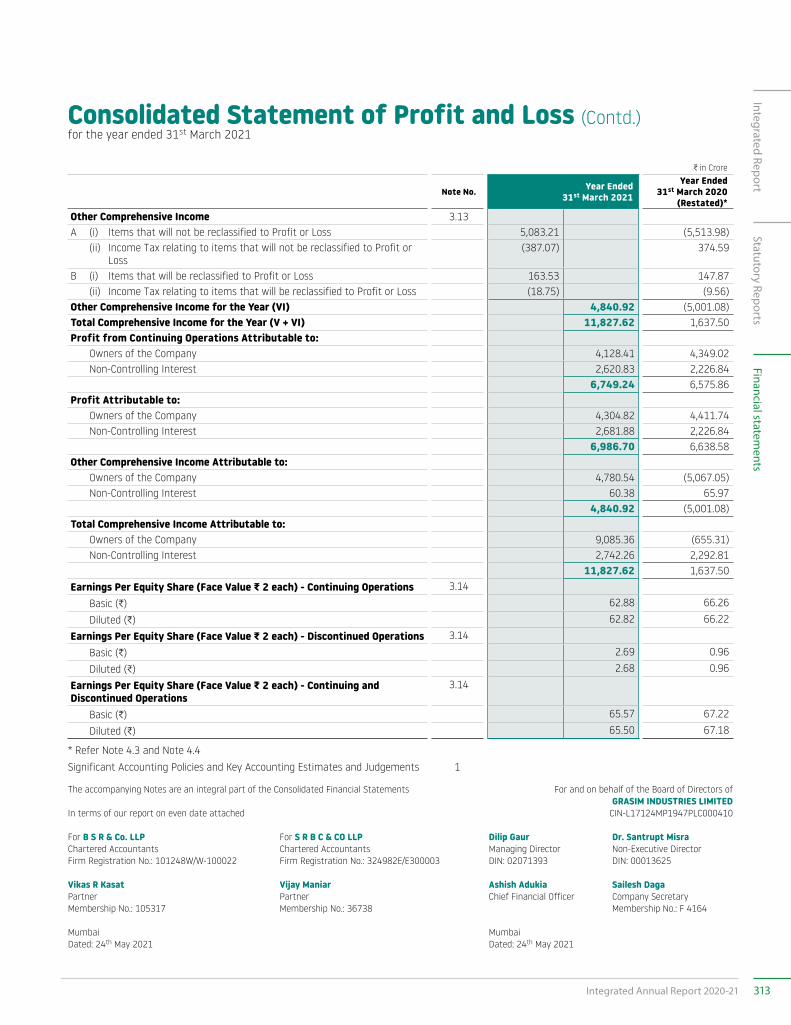
Consolidated Statement of Profit and Loss (Contd.)for the year ended 31st March 2021
C in Crore
Note No. Year Ended 31st March 2021
Year Ended 31st March 2020
(Restated)*Other Comprehensive Income 3.13A (i) Items that will not be reclassified to Profit or Loss 5,083.21 (5,513.98) (ii) Income Tax relating to items that will not be reclassified to Profit or
Loss(387.07) 374.59
B (i) Items that will be reclassified to Profit or Loss 163.53 147.87 (ii) Income Tax relating to items that will be reclassified to Profit or Loss (18.75) (9.56)Other Comprehensive Income for the Year (VI) 4,840.92 (5,001.08)Total Comprehensive Income for the Year (V + VI) 11,827.62 1,637.50Profit from Continuing Operations Attributable to: Owners of the Company 4,128.41 4,349.02 Non-Controlling Interest 2,620.83 2,226.84
6,749.24 6,575.86Profit Attributable to: Owners of the Company 4,304.82 4,411.74 Non-Controlling Interest 2,681.88 2,226.84
6,986.70 6,638.58Other Comprehensive Income Attributable to: Owners of the Company 4,780.54 (5,067.05) Non-Controlling Interest 60.38 65.97
4,840.92 (5,001.08)Total Comprehensive Income Attributable to: Owners of the Company 9,085.36 (655.31) Non-Controlling Interest 2,742.26 2,292.81
11,827.62 1,637.50Earnings Per Equity Share (Face Value G 2 each) - Continuing Operations 3.14
Basic (C) 62.88 66.26
Diluted (C) 62.82 66.22
Earnings Per Equity Share (Face Value G 2 each) - Discontinued Operations 3.14
Basic (C) 2.69 0.96
Diluted (C) 2.68 0.96
Earnings Per Equity Share (Face Value G 2 each) - Continuing and Discontinued Operations
3.14
Basic (C) 65.57 67.22
Diluted (C) 65.50 67.18
* Refer Note 4.3 and Note 4.4Significant Accounting Policies and Key Accounting Estimates and Judgements 1
The accompanying Notes are an integral part of the Consolidated Financial Statements For and on behalf of the Board of Directors of GRASIM INDUSTRIES LIMITED
In terms of our report on even date attached CIN-L17124MP1947PLC000410
For B S R & Co. LLP For S R B C & CO LLP Dilip Gaur Dr. Santrupt MisraChartered Accountants Chartered Accountants Managing Director Non-Executive DirectorFirm Registration No.: 101248W/W-100022 Firm Registration No.: 324982E/E300003 DIN: 02071393 DIN: 00013625
Vikas R Kasat Vijay Maniar Ashish Adukia Sailesh DagaPartner Partner Chief Financial Officer Company SecretaryMembership No.: 105317 Membership No.: 36738 Membership No.: F 4164
Mumbai MumbaiDated: 24th May 2021 Dated: 24th May 2021
313Integrated Annual Report 2020-21
Integrated ReportStatutory Reports
Financial statements
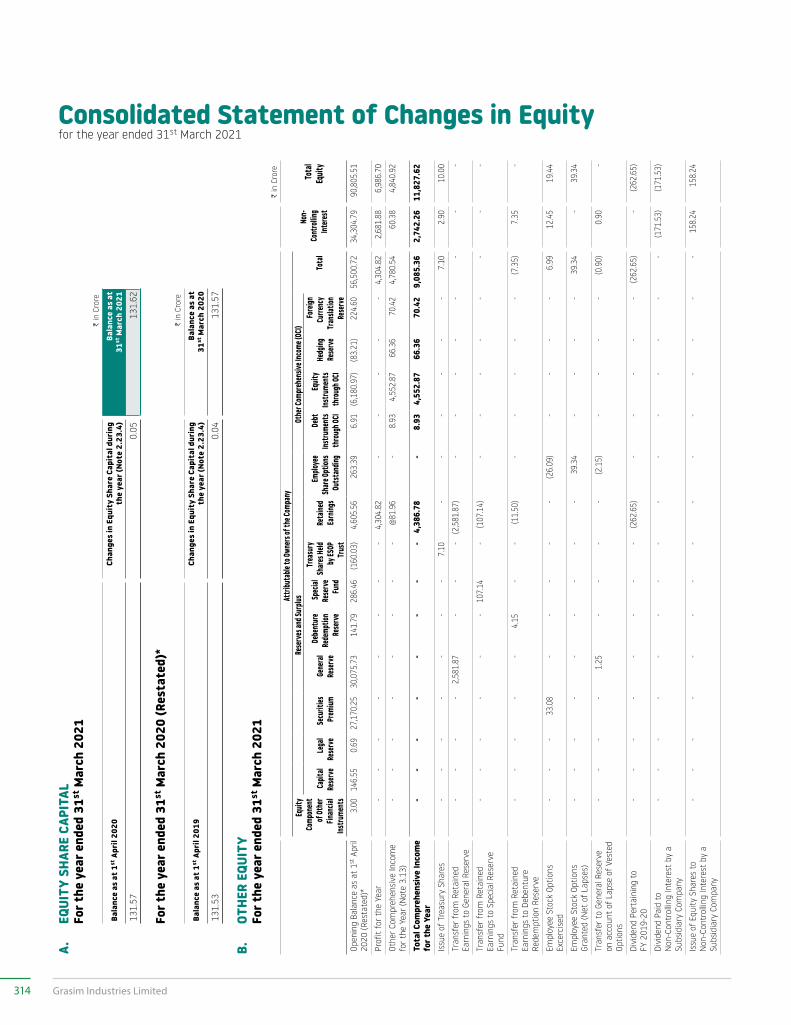
Consolidated Statement of Changes in Equityfor the year ended 31st March 2021
A.
EQUI
TY S
HARE
CAP
ITAL
Fo
r the
yea
r end
ed 3
1st M
arch
202
1C in
Cro
re
Bala
nce
as a
t 1st
Apr
il 20
20Ch
ange
s in
Equ
ity
Shar
e Ca
pita
l dur
ing
the
year
(Not
e 2.
23.4
)Ba
lanc
e as
at
31st
Mar
ch 2
021
131.
57 0
.05
131
.62
Fo
r the
yea
r end
ed 3
1st M
arch
202
0 (R
esta
ted)
*C in
Cro
re
Bala
nce
as a
t 1st
Apr
il 20
19Ch
ange
s in
Equ
ity
Shar
e Ca
pita
l dur
ing
the
year
(Not
e 2.
23.4
)Ba
lanc
e as
at
31st
Mar
ch 2
020
131.
53
0.0
4 1
31.5
7
B.
OTHE
R EQ
UITY
Fo
r the
yea
r end
ed 3
1st M
arch
202
1C in
Cro
re
Attri
buta
ble to
Owne
rs of
the C
ompa
ny
Non-
Cont
rollin
g Int
erest
Tota
l Eq
uity
Equit
y Co
mpon
ent
of Ot
her
Finan
cial
Instru
ment
s
Rese
rves a
nd Su
rplus
Othe
r Com
preh
ensiv
e Inc
ome (
OCI)
Tota
lCa
pital
Rese
rveLe
gal
Rese
rveSe
curit
ies
Prem
iumGe
neral
Re
serve
Debe
ntur
e Re
demp
tion
Rese
rve
Spec
ial
Rese
rve
Fund
Trea
sury
Share
s Held
by
ESOP
Tr
ust
Reta
ined
Earn
ings
Emplo
yee
Share
Optio
ns
Outst
andin
g
Debt
Ins
trume
nts
throu
gh OC
I
Equit
y Ins
trume
nts
throu
gh OC
I
Hedg
ing
Rese
rve
Forei
gn
Curre
ncy
Tran
slatio
n Re
serve
Open
ing
Bala
nce
as a
t 1st
Apr
il 20
20 (R
esta
ted)
*3.
0014
6.55
0.69
27,1
70.2
530
,075
.73
141.
7928
6.46
(160
.03)
4,60
5.56
263.
396.
91(6
,180
.97)
(83.
21)
224.
6056
,500
.72
34,3
04.7
990
,805
.51
Prof
it fo
r the
Yea
r-
--
--
--
-4,
304.
82-
--
--
4,30
4.82
2,68
1.88
6,98
6.70
Othe
r Com
preh
ensi
ve In
com
e fo
r the
Yea
r (N
ote
3.13
)-
--
--
--
-@
81.9
6-
8.93
4,55
2.87
66.3
670
.42
4,78
0.54
60.3
84,
840.
92
Tota
l Com
preh
ensi
ve In
com
e fo
r the
Yea
r-
--
--
--
-4,
386.
78-
8.93
4,55
2.87
66.3
670
.42
9,08
5.36
2,74
2.26
11,8
27.6
2
Issu
e of
Tre
asur
y Sh
ares
--
--
--
-7.
10-
--
--
-7.
102.
9010
.00
Tran
sfer
from
Ret
aine
d Ea
rnin
gs t
o Ge
nera
l Res
erve
--
--
2,58
1.87
--
-(2
,581
.87)
--
--
--
--
Tran
sfer
from
Ret
aine
d Ea
rnin
gs t
o Sp
ecia
l Res
erve
Fu
nd
--
--
--
107.
14-
(107
.14)
--
--
--
--
Tran
sfer
from
Ret
aine
d Ea
rnin
gs t
o De
bent
ure
Rede
mpt
ion
Rese
rve
--
--
-4.
15-
-(1
1.50
)-
--
--
(7.3
5)7.
35-
Empl
oyee
Sto
ck O
ptio
ns
Exce
rcis
ed-
--
33.0
8-
--
--
(26.
09)
--
--
6.99
12.4
519
.44
Empl
oyee
Sto
ck O
ptio
ns
Gran
ted
(Net
of L
apse
s)-
--
--
--
--
39.3
4-
--
-39
.34
-39
.34
Tran
sfer
to
Gene
ral R
eser
ve
on a
ccou
nt o
f Lap
se o
f Ves
ted
Optio
ns
--
--
1.25
--
--
(2.1
5)-
--
-(0
.90)
0.90
-
Divi
dend
Per
tain
ing
to
FY 2
019-
20-
--
--
--
-(2
62.6
5)-
--
--
(262
.65)
-(2
62.6
5)
Divi
dend
Pai
d to
N
on-C
ontr
ollin
g In
tere
st b
y a
Subs
idia
ry C
ompa
ny
--
--
--
--
--
--
--
-(1
71.5
3)(1
71.5
3)
Issu
e of
Equ
ity S
hare
s to
N
on-C
ontr
ollin
g In
tere
st b
y a
Subs
idia
ry C
ompa
ny
--
--
--
--
--
--
--
-15
8.24
158.
24
314 Grasim Industries Limited
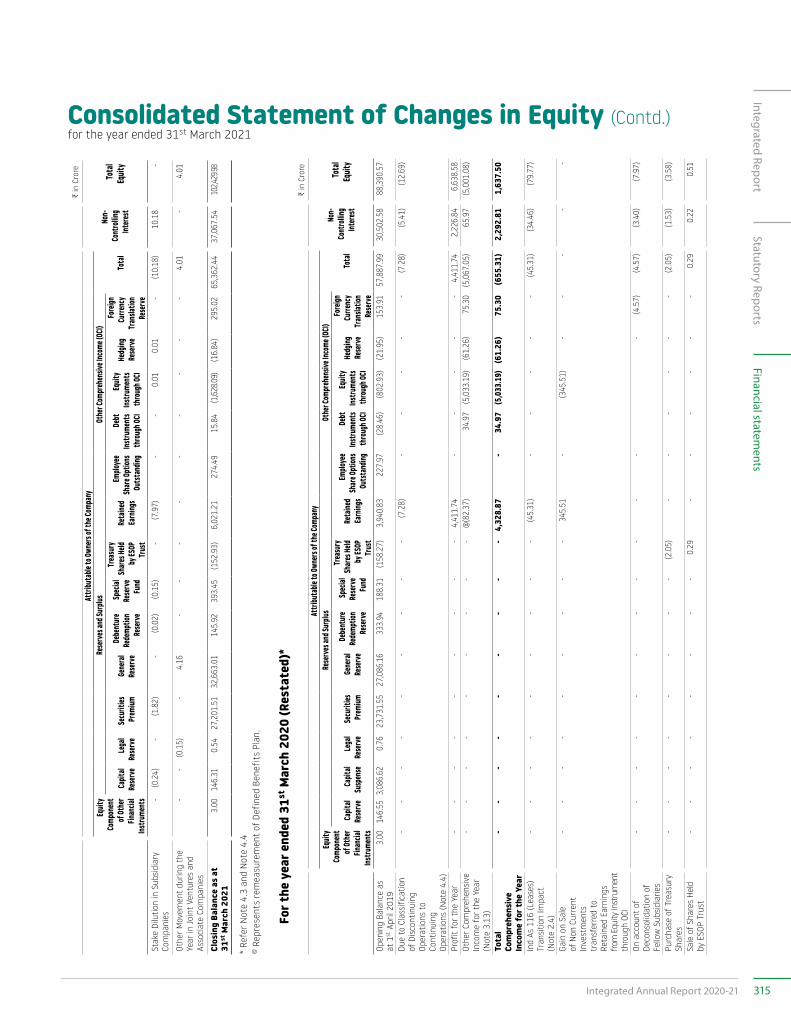
Consolidated Statement of Changes in Equity (Contd.)for the year ended 31st March 2021
C in
Cro
re
Attri
buta
ble to
Owne
rs of
the C
ompa
ny
Non-
Cont
rollin
g Int
erest
Tota
l Eq
uity
Equit
y Co
mpon
ent
of Ot
her
Finan
cial
Instru
ment
s
Rese
rves a
nd Su
rplus
Othe
r Com
preh
ensiv
e Inc
ome (
OCI)
Tota
lCa
pital
Rese
rveLe
gal
Rese
rveSe
curit
ies
Prem
iumGe
neral
Re
serve
Debe
ntur
e Re
demp
tion
Rese
rve
Spec
ial
Rese
rve
Fund
Trea
sury
Share
s Held
by
ESOP
Tr
ust
Reta
ined
Earn
ings
Emplo
yee
Share
Optio
ns
Outst
andin
g
Debt
Ins
trume
nts
throu
gh OC
I
Equit
y Ins
trume
nts
throu
gh OC
I
Hedg
ing
Rese
rve
Forei
gn
Curre
ncy
Tran
slatio
n Re
serve
Stak
e Di
lutio
n in
Sub
sidi
ary
Com
pani
es-
(0.2
4)-
(1.8
2)-
(0.0
2)(0
.15)
-(7
.97)
--
0.01
0.01
-(1
0.18
)10
.18
-
Othe
r Mov
emen
t du
ring
the
Year
in Jo
int
Vent
ures
and
As
soci
ate
Com
pani
es
--
(0.1
5)-
4.16
--
--
--
--
-4.
01-
4.01
Clos
ing
Bala
nce
as a
t 31
st M
arch
202
13.
0014
6.31
0.54
27,2
01.5
132
,663
.01
145.
9239
3.45
(152
.93)
6,02
1.21
274.
4915
.84
(1,62
8.09)
(16.
84)
295.
0265
,362
.44
37,0
67.5
410
2,429
.98
* Re
fer N
ote
4.3
and
Not
e 4.
4@ R
epre
sent
s re
mea
sure
men
t of
Def
ined
Ben
efit
s Pl
an.
Fo
r the
yea
r end
ed 3
1st M
arch
202
0 (R
esta
ted)
*C in
Cro
re
Attri
buta
ble to
Owne
rs of
the C
ompa
ny
Non-
Cont
rollin
g Int
erest
Tota
l Eq
uity
Equit
y Co
mpon
ent
of Ot
her
Finan
cial
Instru
ment
s
Rese
rves a
nd Su
rplus
Othe
r Com
preh
ensiv
e Inc
ome (
OCI)
Tota
lCa
pital
Rese
rveCa
pital
Susp
ense
Lega
l Re
serve
Secu
rities
Pr
emium
Gene
ral
Rese
rve
Debe
ntur
e Re
demp
tion
Rese
rve
Spec
ial
Rese
rve
Fund
Trea
sury
Share
s Held
by
ESOP
Tr
ust
Reta
ined
Earn
ings
Emplo
yee
Share
Optio
ns
Outst
andin
g
Debt
Ins
trume
nts
throu
gh OC
I
Equit
y Ins
trume
nts
throu
gh OC
I
Hedg
ing
Rese
rve
Forei
gn
Curre
ncy
Tran
slatio
n Re
serve
Open
ing
Bala
nce
as
at 1
st A
pril
2019
3.00
146.
553,
086.
620.
7623
,731
.55
27,0
86.1
633
3.94
188.
31(1
58.2
7)3,
940.
8322
7.97
(28.
46)
(802
.93)
(21.
95)
153.
9157
,887
.99
30,5
02.5
888
,390
.57
Due
to C
lass
ifica
tion
of D
isco
ntin
uing
Op
erat
ions
to
Cont
inui
ng
Oper
atio
ns (N
ote
4.4)
--
--
--
--
-(7
.28)
--
--
-(7
.28)
(5.4
1)(1
2.69
)
Prof
it fo
r the
Yea
r-
--
--
--
--
4,41
1.74
--
--
-4,
411.
742,
226.
846,
638.
58Ot
her C
ompr
ehen
sive
In
com
e fo
r the
Yea
r (N
ote
3.13
)
--
--
--
--
-@
(82.
37)
34.9
7(5
,033
.19)
(61.
26)
75.3
0(5
,067
.05)
65.9
7(5
,001
.08)
Tota
l Co
mpr
ehen
sive
In
com
e fo
r the
Yea
r
--
--
--
--
-4,
328.
87-
34.9
7(5
,033
.19)
(61.
26)
75.3
0(6
55.3
1)2,
292.
811,
637.
50
Ind
As 1
16 (L
ease
s)
Tran
sitio
n Im
pact
(N
ote
2.4)
--
--
--
--
-(4
5.31
)-
--
--
(45.
31)
(34.
46)
(79.
77)
Gain
on
Sale
of
Non
Cur
rent
In
vest
men
ts
tran
sfer
red
to
Reta
ined
Ear
ning
s fro
m E
quity
Inst
rum
ent
thro
ugh
OCI
--
--
--
--
-34
5.51
-(3
45.5
1)-
--
--
On a
ccou
nt o
f De
cons
olid
atio
n of
Fe
llow
Sub
sidi
arie
s
--
--
--
--
--
--
(4.5
7)(4
.57)
(3.4
0)(7
.97)
Purc
hase
of T
reas
ury
Shar
es-
--
--
--
-(2
.05)
--
--
--
(2.0
5)(1
.53)
(3.5
8)
Sale
of S
hare
s H
eld
by E
SOP
Trus
t-
--
--
--
-0.
29-
--
--
-0.
290.
220.
51
315Integrated Annual Report 2020-21
Integrated ReportStatutory Reports
Financial statements
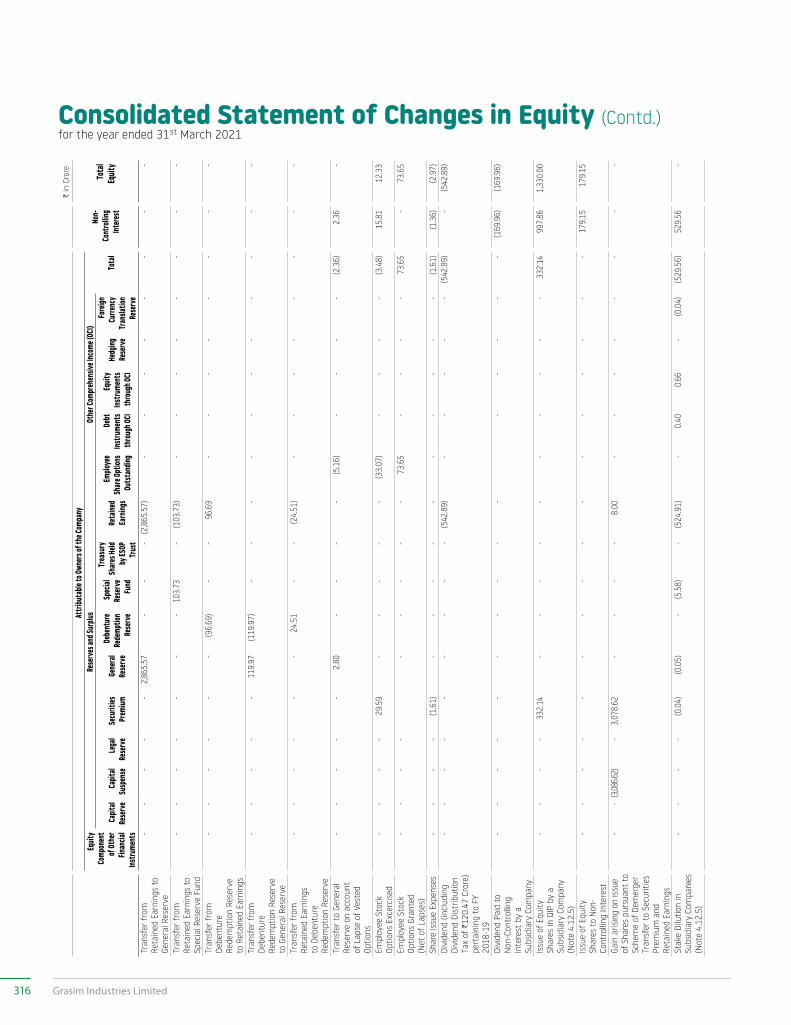
C in
Cro
re
Attri
buta
ble to
Owne
rs of
the C
ompa
ny
Non-
Cont
rollin
g Int
erest
Tota
l Eq
uity
Equit
y Co
mpon
ent
of Ot
her
Finan
cial
Instru
ment
s
Rese
rves a
nd Su
rplus
Othe
r Com
preh
ensiv
e Inc
ome (
OCI)
Tota
lCa
pital
Rese
rveCa
pital
Susp
ense
Lega
l Re
serve
Secu
rities
Pr
emium
Gene
ral
Rese
rve
Debe
ntur
e Re
demp
tion
Rese
rve
Spec
ial
Rese
rve
Fund
Trea
sury
Share
s Held
by
ESOP
Tr
ust
Reta
ined
Earn
ings
Emplo
yee
Share
Optio
ns
Outst
andin
g
Debt
Ins
trume
nts
throu
gh OC
I
Equit
y Ins
trume
nts
throu
gh OC
I
Hedg
ing
Rese
rve
Forei
gn
Curre
ncy
Tran
slatio
n Re
serve
Tran
sfer
from
Re
tain
ed E
arni
ngs
to
Gene
ral R
eser
ve
--
--
-2,
865.
57-
--
(2,8
65.5
7)-
--
--
--
-
Tran
sfer
from
Re
tain
ed E
arni
ngs
to
Spec
ial R
eser
ve F
und
--
--
--
-10
3.73
-(1
03.7
3)-
--
--
--
-
Tran
sfer
from
De
bent
ure
Rede
mpt
ion
Rese
rve
to R
etai
ned
Earn
ings
--
--
--
(96.
69)
--
96.6
9-
--
--
--
-
Tran
sfer
from
De
bent
ure
Rede
mpt
ion
Rese
rve
to G
ener
al R
eser
ve
--
--
-11
9.97
(119
.97)
--
--
--
--
--
-
Tran
sfer
from
Re
tain
ed E
arni
ngs
to D
eben
ture
Re
dem
ptio
n Re
serv
e
--
--
--
24.5
1-
-(2
4.51
)-
--
--
--
-
Tran
sfer
to
Gene
ral
Rese
rve
on a
ccou
nt
of L
apse
of V
este
d Op
tions
--
--
-2.
80-
--
-(5
.16)
--
--
(2.3
6)2.
36-
Empl
oyee
Sto
ck
Optio
ns E
xcer
cise
d-
--
-29
.59
--
--
-(3
3.07
)-
--
-(3
.48)
15.8
112
.33
Empl
oyee
Sto
ck
Optio
ns G
rant
ed
(Net
of L
apse
s)
--
--
--
--
-73
.65
--
--
73.6
5-
73.6
5
Shar
e Is
sue
Expe
nses
--
--
(1.6
1)-
--
--
--
--
-(1
.61)
(1.3
6)(2
.97)
Divi
dend
(inc
ludi
ng
Divi
dend
Dis
trib
utio
n Ta
x of
C12
0.47
Cro
re)
pert
aini
ng t
o FY
20
18-1
9
--
--
--
--
-(5
42.8
9)-
--
--
(542
.89)
-(5
42.8
9)
Divi
dend
Pai
d to
N
on-C
ontr
ollin
g In
tere
st b
y a
Subs
idia
ry C
ompa
ny
--
--
--
--
--
--
--
-(1
69.9
6)(1
69.9
6)
Issu
e of
Equ
ity
Shar
es in
QIP
by
a Su
bsid
iary
Com
pany
(N
ote
4.12
.5)
--
--
332.
14-
--
--
--
--
-33
2.14
997.
861,
330.
00
Issu
e of
Equ
ity
Shar
es t
o N
on-
Cont
rolli
ng In
tere
st
--
--
--
--
--
--
--
--
179.
1517
9.15
Gain
aris
ing
on is
sue
of S
hare
s pu
rsua
nt t
o Sc
hem
e of
Dem
erge
r Tr
ansf
er t
o Se
curit
ies
Prem
ium
and
Re
tain
ed E
arni
ngs
--
(3,08
6.62)
-3,
078.
62-
--
-8.
00-
--
--
--
-
Stak
e Di
lutio
n in
Su
bsid
iary
Com
pani
es
(Not
e 4.
12.5
)
--
--
(0.0
4)(0
.05)
-(5
.58)
-(5
24.9
1)-
0.40
0.66
-(0
.04)
(529
.56)
529.
56-
Consolidated Statement of Changes in Equity (Contd.)for the year ended 31st March 2021
316 Grasim Industries Limited
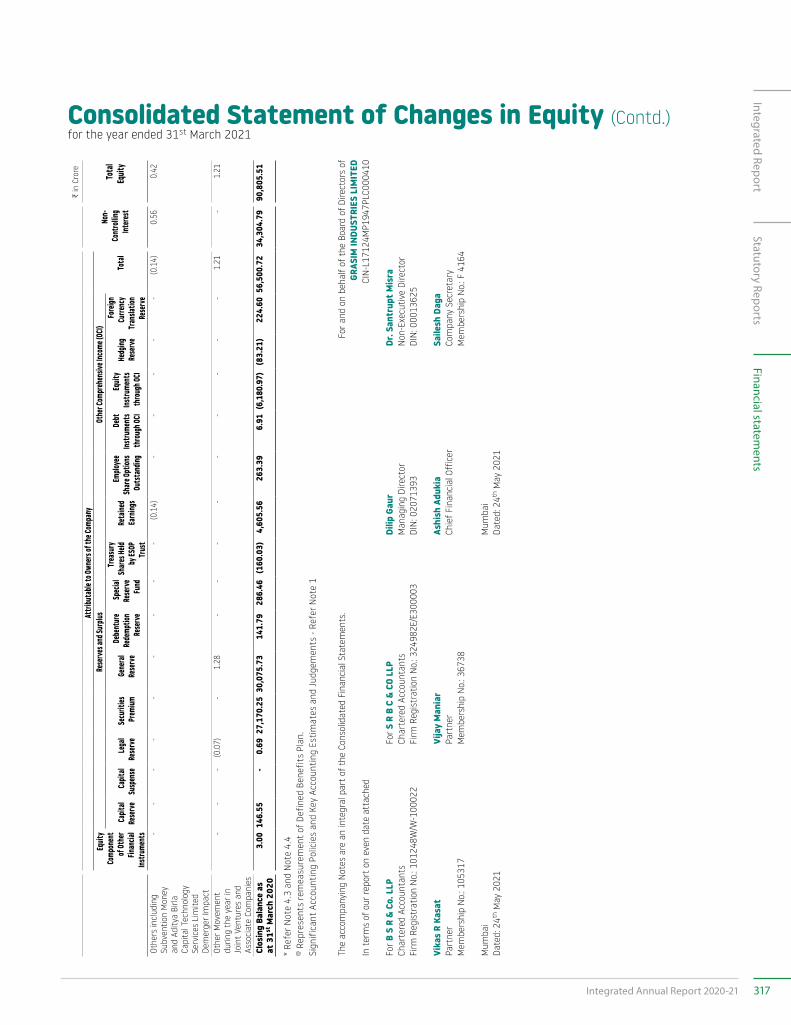
C in
Cro
re
Attri
buta
ble to
Owne
rs of
the C
ompa
ny
Non-
Cont
rollin
g Int
erest
Tota
l Eq
uity
Equit
y Co
mpon
ent
of Ot
her
Finan
cial
Instru
ment
s
Rese
rves a
nd Su
rplus
Othe
r Com
preh
ensiv
e Inc
ome (
OCI)
Tota
lCa
pital
Rese
rveCa
pital
Susp
ense
Lega
l Re
serve
Secu
rities
Pr
emium
Gene
ral
Rese
rve
Debe
ntur
e Re
demp
tion
Rese
rve
Spec
ial
Rese
rve
Fund
Trea
sury
Share
s Held
by
ESOP
Tr
ust
Reta
ined
Earn
ings
Emplo
yee
Share
Optio
ns
Outst
andin
g
Debt
Ins
trume
nts
throu
gh OC
I
Equit
y Ins
trume
nts
throu
gh OC
I
Hedg
ing
Rese
rve
Forei
gn
Curre
ncy
Tran
slatio
n Re
serve
Othe
rs in
clud
ing
Subv
entio
n M
oney
an
d Ad
itya
Birla
Ca
pita
l Tec
hnol
ogy
Serv
ices
Lim
ited
Dem
erge
r Im
pact
--
--
--
--
-(0
.14)
--
--
-(0
.14)
0.56
0.42
Othe
r Mov
emen
t du
ring
the
year
in
Join
t Ve
ntur
es a
nd
Asso
ciat
e Co
mpa
nies
--
-(0
.07)
-1.
28-
--
--
--
--
1.21
-1.
21
Clos
ing
Bala
nce
as
at 3
1st M
arch
202
03.
0014
6.55
-0.
6927
,170
.25
30,0
75.7
314
1.79
286.
46(1
60.0
3)4,
605.
5626
3.39
6.91
(6,1
80.9
7)(8
3.21
)22
4.60
56,5
00.7
234
,304
.79
90,8
05.5
1
* Re
fer N
ote
4.3
and
Not
e 4.
4@ R
epre
sent
s re
mea
sure
men
t of
Def
ined
Ben
efit
s Pl
an.
Sign
ific
ant
Acco
untin
g Po
licie
s an
d Ke
y Ac
coun
ting
Estim
ates
and
Jud
gem
ents
- Re
fer N
ote
1
The
acco
mpa
nyin
g N
otes
are
an
inte
gral
par
t of
the
Cons
olid
ated
Fin
anci
al S
tate
men
ts.
For a
nd o
n be
half
of th
e Bo
ard
of D
irect
ors
of
GRAS
IM IN
DUST
RIES
LIM
ITED
In
ter
ms
of o
ur re
port
on
even
dat
e at
tach
edCI
N-L
1712
4MP1
947P
LC00
0410
For B
S R
& C
o. L
LPFo
r S R
B C
& C
O LL
PDi
lip G
aur
Dr. S
antr
upt M
isra
Char
tere
d Ac
coun
tant
sCh
arte
red
Acco
unta
nts
Man
agin
g Di
rect
orN
on-E
xecu
tive
Dire
ctor
Firm
Reg
istr
atio
n N
o.: 1
0124
8W/W
-100
022
Firm
Reg
istr
atio
n N
o.: 3
2498
2E/E
3000
03DI
N: 0
2071
393
DIN
: 000
1362
5
Vika
s R
Kasa
tVi
jay
Man
iar
Ashi
sh A
duki
aSa
ilesh
Dag
aPa
rtne
rPa
rtne
rCh
ief F
inan
cial
Off
icer
Com
pany
Sec
reta
ryM
embe
rshi
p N
o.: 1
0531
7M
embe
rshi
p N
o.: 3
6738
Mem
bers
hip
No.
: F 4
164
Mum
bai
Mum
bai
Date
d: 2
4th M
ay 2
021
Date
d: 2
4th M
ay 2
021
Consolidated Statement of Changes in Equity (Contd.)for the year ended 31st March 2021
317Integrated Annual Report 2020-21
Integrated ReportStatutory Reports
Financial statements
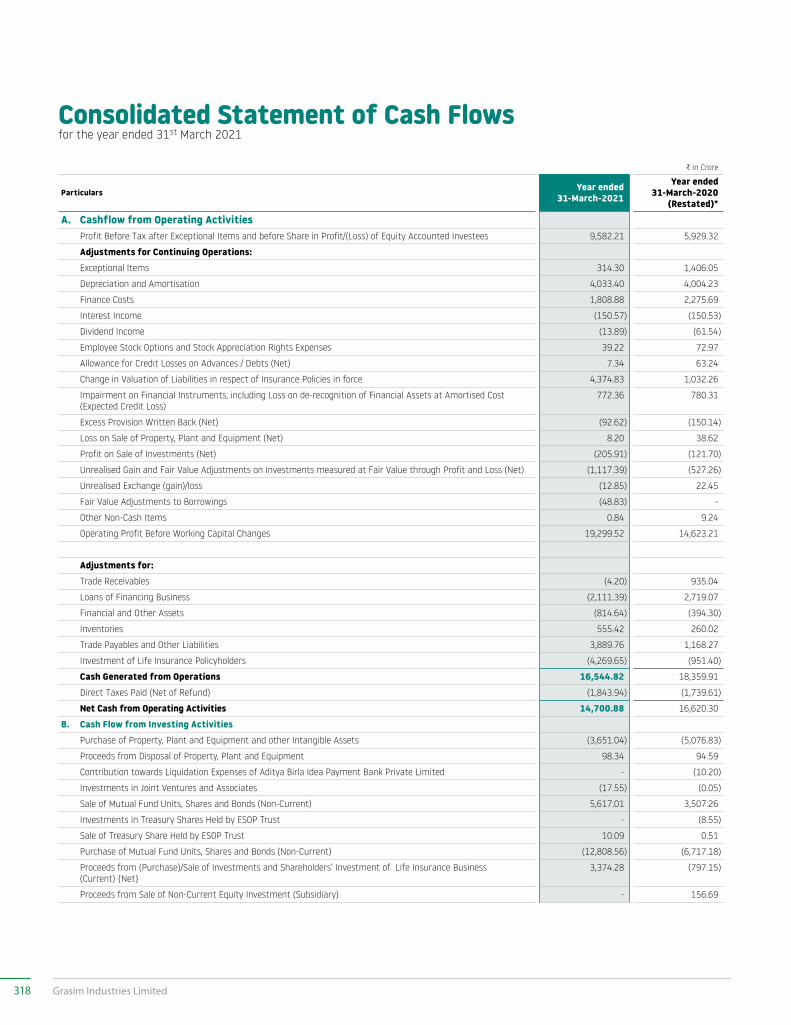
Consolidated Statement of Cash Flowsfor the year ended 31st March 2021
C in Crore
Particulars Year ended31-March-2021
Year ended31-March-2020
(Restated)*
A. Cashflow from Operating Activities Profit Before Tax after Exceptional Items and before Share in Profit/(Loss) of Equity Accounted Investees 9,582.21 5,929.32
Adjustments for Continuing Operations: Exceptional Items 314.30 1,406.05
Depreciation and Amortisation 4,033.40 4,004.23
Finance Costs 1,808.88 2,275.69
Interest Income (150.57) (150.53)
Dividend Income (13.89) (61.54)
Employee Stock Options and Stock Appreciation Rights Expenses 39.22 72.97
Allowance for Credit Losses on Advances / Debts (Net) 7.34 63.24
Change in Valuation of Liabilities in respect of Insurance Policies in force 4,374.83 1,032.26
Impairment on Financial Instruments, including Loss on de-recognition of Financial Assets at Amortised Cost (Expected Credit Loss)
772.36 780.31
Excess Provision Written Back (Net) (92.62) (150.14)
Loss on Sale of Property, Plant and Equipment (Net) 8.20 38.62
Profit on Sale of Investments (Net) (205.91) (121.70)
Unrealised Gain and Fair Value Adjustments on Investments measured at Fair Value through Profit and Loss (Net) (1,117.39) (527.26)
Unrealised Exchange (gain)/loss (12.85) 22.45
Fair Value Adjustments to Borrowings (48.83) -
Other Non-Cash Items 0.84 9.24
Operating Profit Before Working Capital Changes 19,299.52 14,623.21
Adjustments for: Trade Receivables (4.20) 935.04
Loans of Financing Business (2,111.39) 2,719.07
Financial and Other Assets (814.64) (394.30)
Inventories 555.42 260.02
Trade Payables and Other Liabilities 3,889.76 1,168.27
Investment of Life Insurance Policyholders (4,269.65) (951.40)
Cash Generated from Operations 16,544.82 18,359.91
Direct Taxes Paid (Net of Refund) (1,843.94) (1,739.61)
Net Cash from Operating Activities 14,700.88 16,620.30
B. Cash Flow from Investing Activities Purchase of Property, Plant and Equipment and other Intangible Assets (3,651.04) (5,076.83)
Proceeds from Disposal of Property, Plant and Equipment 98.34 94.59
Contribution towards Liquidation Expenses of Aditya Birla Idea Payment Bank Private Limited - (10.20)
Investments in Joint Ventures and Associates (17.55) (0.05)
Sale of Mutual Fund Units, Shares and Bonds (Non-Current) 5,617.01 3,507.26
Investments in Treasury Shares Held by ESOP Trust - (8.55)
Sale of Treasury Share Held by ESOP Trust 10.09 0.51
Purchase of Mutual Fund Units, Shares and Bonds (Non-Current) (12,808.56) (6,717.18)
Proceeds from (Purchase)/Sale of Investments and Shareholders’ Investment of Life Insurance Business (Current) {Net}
3,374.28 (797.15)
Proceeds from Sale of Non-Current Equity Investment (Subsidiary) - 156.69
318 Grasim Industries Limited
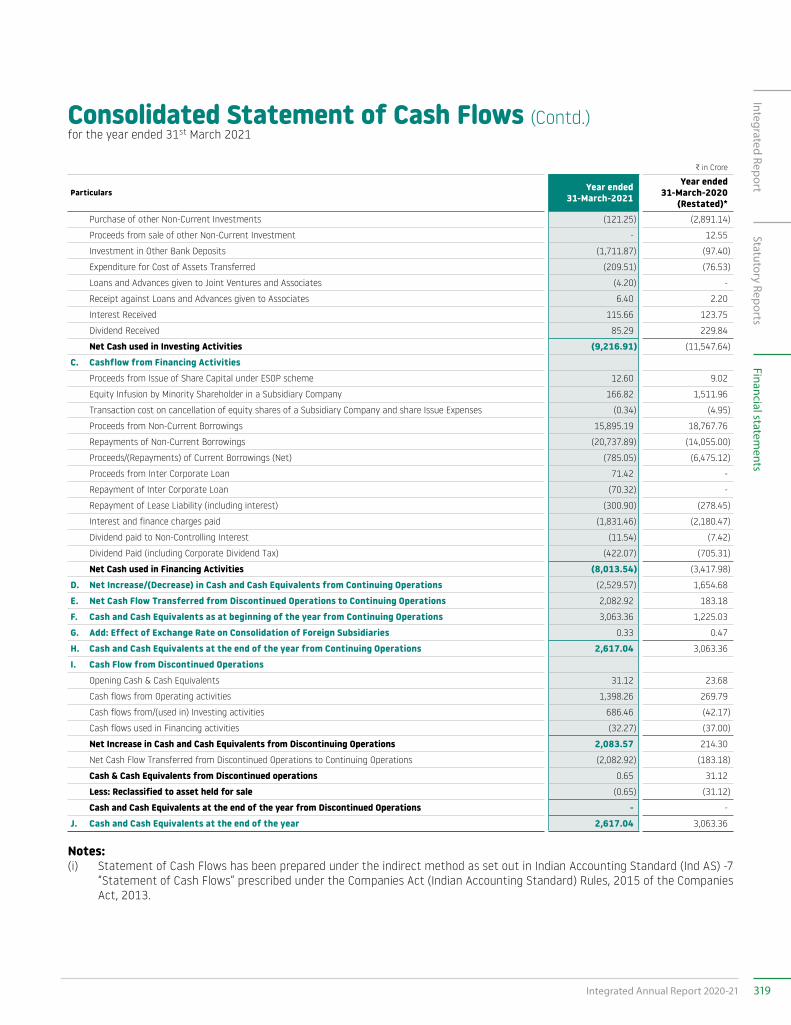
C in Crore
Particulars Year ended31-March-2021
Year ended31-March-2020
(Restated)* Purchase of other Non-Current Investments (121.25) (2,891.14)
Proceeds from sale of other Non-Current Investment - 12.55
Investment in Other Bank Deposits (1,711.87) (97.40)
Expenditure for Cost of Assets Transferred (209.51) (76.53)
Loans and Advances given to Joint Ventures and Associates (4.20) -
Receipt against Loans and Advances given to Associates 6.40 2.20
Interest Received 115.66 123.75
Dividend Received 85.29 229.84
Net Cash used in Investing Activities (9,216.91) (11,547.64)
C. Cashflow from Financing Activities Proceeds from Issue of Share Capital under ESOP scheme 12.60 9.02
Equity Infusion by Minority Shareholder in a Subsidiary Company 166.82 1,511.96
Transaction cost on cancellation of equity shares of a Subsidiary Company and share Issue Expenses (0.34) (4.95)
Proceeds from Non-Current Borrowings 15,895.19 18,767.76
Repayments of Non-Current Borrowings (20,737.89) (14,055.00)
Proceeds/(Repayments) of Current Borrowings (Net) (785.05) (6,475.12)
Proceeds from Inter Corporate Loan 71.42 -
Repayment of Inter Corporate Loan (70.32) -
Repayment of Lease Liability (including interest) (300.90) (278.45)
Interest and finance charges paid (1,831.46) (2,180.47)
Dividend paid to Non-Controlling Interest (11.54) (7.42)
Dividend Paid (including Corporate Dividend Tax) (422.07) (705.31)
Net Cash used in Financing Activities (8,013.54) (3,417.98)
D. Net Increase/(Decrease) in Cash and Cash Equivalents from Continuing Operations (2,529.57) 1,654.68
E. Net Cash Flow Transferred from Discontinued Operations to Continuing Operations 2,082.92 183.18
F. Cash and Cash Equivalents as at beginning of the year from Continuing Operations 3,063.36 1,225.03
G. Add: Effect of Exchange Rate on Consolidation of Foreign Subsidiaries 0.33 0.47
H. Cash and Cash Equivalents at the end of the year from Continuing Operations 2,617.04 3,063.36
I. Cash Flow from Discontinued Operations Opening Cash & Cash Equivalents 31.12 23.68
Cash flows from Operating activities 1,398.26 269.79
Cash flows from/(used in) Investing activities 686.46 (42.17)
Cash flows used in Financing activities (32.27) (37.00)
Net Increase in Cash and Cash Equivalents from Discontinuing Operations 2,083.57 214.30
Net Cash Flow Transferred from Discontinued Operations to Continuing Operations (2,082.92) (183.18)
Cash & Cash Equivalents from Discontinued operations 0.65 31.12
Less: Reclassified to asset held for sale (0.65) (31.12)
Cash and Cash Equivalents at the end of the year from Discontinued Operations - -
J. Cash and Cash Equivalents at the end of the year 2,617.04 3,063.36
Notes:(i) Statement of Cash Flows has been prepared under the indirect method as set out in Indian Accounting Standard (Ind AS) -7
“Statement of Cash Flows” prescribed under the Companies Act (Indian Accounting Standard) Rules, 2015 of the Companies Act, 2013.
Consolidated Statement of Cash Flows (Contd.)for the year ended 31st March 2021
319Integrated Annual Report 2020-21
Integrated ReportStatutory Reports
Financial statements
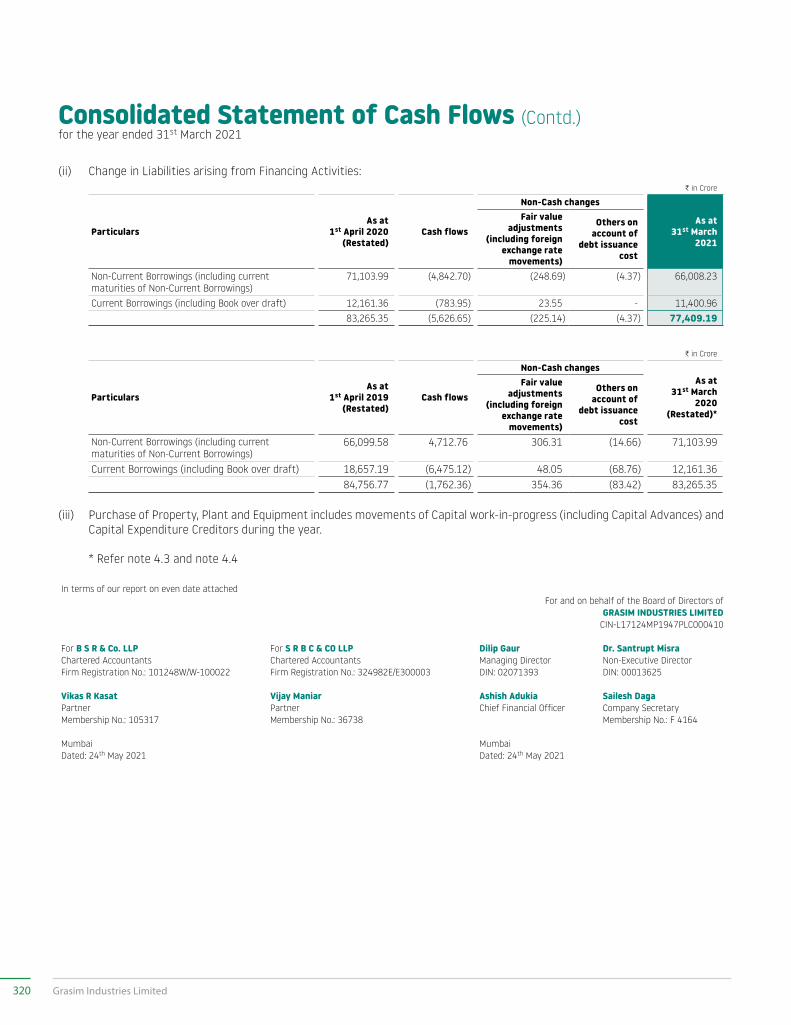
(ii) Change in Liabilities arising from Financing Activities:C in Crore
ParticularsAs at
1st April 2020 (Restated)
Cash flows
Non-Cash changes
As at 31st March
2021
Fair value adjustments
(including foreign exchange rate
movements)
Others on account of
debt issuance cost
Non-Current Borrowings (including current maturities of Non-Current Borrowings)
71,103.99 (4,842.70) (248.69) (4.37) 66,008.23
Current Borrowings (including Book over draft) 12,161.36 (783.95) 23.55 - 11,400.96 83,265.35 (5,626.65) (225.14) (4.37) 77,409.19
C in Crore
ParticularsAs at
1st April 2019 (Restated)
Cash flows
Non-Cash changes As at
31st March 2020
(Restated)*
Fair value adjustments
(including foreign exchange rate
movements)
Others on account of
debt issuance cost
Non-Current Borrowings (including current maturities of Non-Current Borrowings)
66,099.58 4,712.76 306.31 (14.66) 71,103.99
Current Borrowings (including Book over draft) 18,657.19 (6,475.12) 48.05 (68.76) 12,161.36 84,756.77 (1,762.36) 354.36 (83.42) 83,265.35
(iii) Purchase of Property, Plant and Equipment includes movements of Capital work-in-progress (including Capital Advances) and Capital Expenditure Creditors during the year.
* Refer note 4.3 and note 4.4
In terms of our report on even date attachedFor and on behalf of the Board of Directors of
GRASIM INDUSTRIES LIMITED CIN-L17124MP1947PLC000410
For B S R & Co. LLP For S R B C & CO LLP Dilip Gaur Dr. Santrupt MisraChartered Accountants Chartered Accountants Managing Director Non-Executive DirectorFirm Registration No.: 101248W/W-100022 Firm Registration No.: 324982E/E300003 DIN: 02071393 DIN: 00013625
Vikas R Kasat Vijay Maniar Ashish Adukia Sailesh DagaPartner Partner Chief Financial Officer Company SecretaryMembership No.: 105317 Membership No.: 36738 Membership No.: F 4164
Mumbai MumbaiDated: 24th May 2021 Dated: 24th May 2021
Consolidated Statement of Cash Flows (Contd.)for the year ended 31st March 2021
320 Grasim Industries Limited
Notesforming part of the Consolidated Financial Statements for the year ended 31st March 2021
CORPORATE INFORMATIONGrasim Industries Limited (“the Group” or “the Company”) is a limited company incorporated and domiciled in India. The registered office is at Birlagram, Nagda - 456 331, Dist. Ujjain (M.P.), India. The Company is a public limited company and its shares are listed on the BSE Limited, India, and the National Stock Exchange of India Limited, India, and the Company’s Global Depository Receipts are listed on the Luxembourg Stock Exchange.
The Group along with Subsidiaries, Joint Ventures and Associates is engaged primarily in Viscose (Pulp, Fibre and Yarn), Chemicals (Caustic Soda, Epoxy and allied Chemicals), Cement, Financial Services and Others (Insulators, Textiles, Fertilisers and Solar Power).
1. SIGNIFICANT ACCOUNTING POLICIES1.1 Statement of Compliance: These consolidated financial statements are prepared
and presented in accordance with the Indian Accounting Standards (Ind AS) notified under the Companies (Indian Accounting Standards) Rules, 2015, as amended from time to time as notified under Section 133 of the Companies Act, 2013, the relevant provisions of the Companies Act, 2013 (“the Act”) and the guidelines issued by the Securities and Exchange Board of India (SEBI), as applicable.
1.2 Basis of Preparation: The financial statements have been prepared and
presented on the going concern basis and at historical cost, except for the following assets and liabilities, which have been measured as indicated below:
i. Derivative Financial Instruments measured at fair value (covered under para 1.24);
ii. Certain financial assets and liabilities at fair value (refer accounting policy regarding financial instruments (covered under para 1.25);
iii. Assets held for disposal - measured at the lower of its carrying amount and fair value less costs to sell;
iv. Employee’s Defined Benefit Plan as per actuarial valuation;
v. Assets and liabilities acquired under Business Combination measured at fair value; and
vi. Employee share based payments measured at fair value
On account of the regulatory restrictions on transfer of surplus / funds from the life insurance fund to shareholders,
no proportion of the surplus relating to life insurance fund (including in respect of contracts without discretionary participating features) arising out of the adjustments due to application of Ind AS principles can be attributed to shareholders. Therefore, the differences arising from the application of the Ind AS principles to the assets and liabilities of the life insurance fund be retained within the “Life Insurance Policyholders’ Fund”.
Further all income and expenses pertaining to the life insurance fund have been clubbed with respective income and expenses. Assets and Liabilities of Life Insurance fund have been clubbed with respective assets and liabilities.
1.3 Principles of Consolidation: The Consolidated Financial Statements (CFS) comprises
the Financial Statements of Grasim Industries Limited (“the Company”) and its Subsidiaries (herein after referred together as “the Group”), Joint Ventures and Associates. The CFS of the Group have been prepared in accordance with the Indian Accounting Standards on “Consolidated Financial Statements” (Ind AS 110), “Joint Arrangements” (Ind AS 111), “Disclosure of Interest in Other Entities” (Ind AS 112), “Investment in Associates and Joint Ventures” (Ind AS 28) notified under Section 133 of the Companies Act 2013.
(i) Subsidiaries: Subsidiaries are entities controlled by the Group. The
Group controls an entity when it is exposed to, or has rights to, variable returns from its involvement with the entity and has the ability to affect those returns through its power over the entity. The financial statements of subsidiaries are included in the consolidated financial statements from the date on which controls commences until the date on which control ceases.
(ii) Non-Controlling Interest (NCI): Non-controlling interest in the net assets of the
consolidated subsidiaries consists of:
a) The amount of equity attributable to non-controlling shareholders at the date on which the investments in the subsidiary companies were made.
b) The non-controlling share of movements in equity since the date the Parent-Subsidiary relationship comes into existence.
The total comprehensive income of subsidiaries is attributed to the owners of the Company and to the non-controlling interests even if this results in the non-controlling interest having deficit balance.
321Integrated Annual Report 2020-21
Integrated ReportStatutory Reports
Financial statements
Notesforming part of the Consolidated Financial Statements for the year ended 31st March 2021
(iii) Loss of Control: When the Group loses control over a subsidiary, it de-
recognises the assets and liabilities of the subsidiary, and any related NCI and other components of equity. Any interest retained in the former subsidiary is measured at fair value at the date the control is lost. Any resulting gain or loss is recognised in the Statement of Profit and Loss.
(iv) Equity Accounted Investees: An associate is an entity over which the Group has
significant influence. Significant influence is the power to participate in the financial and operating policy decisions of the investee, but is not control or joint control over those policies.
A joint venture is a type of joint arrangement whereby the parties that have joint control of the arrangement have rights to the net assets of the joint venture. Joint control is the contractually agreed sharing of control of an arrangement, which exists only when decisions about the relevant activities require unanimous consent of the parties sharing control.
The considerations made in determining whether significant influence or joint control are similar to those necessary to determine control over the subsidiaries.
The Group’s investments in its associates and joint ventures are accounted for using the equity method. Under the equity method, the investment in an associate or a joint venture is initially recognised at cost. The carrying amount of the investment is adjusted to recognise changes in the Group’s share of net assets of the associate or joint venture since the acquisition date. Goodwill relating to the associate or joint venture is included in the carrying amount of the investment.
When the Group’s share of losses of an equity accounted investee exceed the Group’s interest in that associate or joint venture (which includes any long-term interest that, in substance, form part of Group’s net investment in the associate or joint venture), the Group discontinues recognising its share of further losses. Additional losses are recognised only to the extent that the Group has incurred legal or constructive obligation or made payments on behalf of the associate or joint venture.
Unrealised gains resulting from the transaction between the Group and joint ventures are eliminated
to the extent of the interest in the joint venture, and deferred tax is made on the same.
After application of the equity method, the Group determines whether it is necessary to recognise an impairment loss on its investment in its associate or joint venture. At each reporting date, the Group determines whether there is objective evidence that the investment in the associate or joint venture is impaired. If there is such evidence, the Group calculates the amount of impairment as the difference between the recoverable amount of the associate or joint venture and its carrying value, and then recognises the loss as ‘Share of profit of an associate and a joint venture’ in the Statement of Profit and Loss.
Upon loss of significant influence over the assocdecimaiate or joint control over the joint venture, the Group measures and recognises any retained investment at its fair value. Any difference between the carrying amount of the associate or joint venture upon loss of significant influence or joint control and the fair value of the retained investment and proceeds from disposal is recognised in profit or loss.
(v) Transaction Eliminated on Consolidation The financial statements of the Company, its
Subsidiaries, Joint Ventures and Associates used in the consolidation procedure are drawn upto the same reporting date, i.e., 31st March 2021.
The financial statements of the Company and its subsidiary companies are combined on a line-by-line basis by adding together of like items of assets, liabilities, income and expenses, after eliminating material intra-group balances and intra-group transactions and resulting unrealised profits or losses on intra-group transactions. Unrealised losses are eliminated in the same way as unrealised gains, but only to the extent that there is no evidence of impairment.
1.4 Functional and Presentation Currency: The financial statements are presented in Indian Rupees,
which is the functional currency of the Group and the currency of the primary economic environment in which the Group operates and all values are rounded to the nearest Crore, utpo 2 decimal places except otherwise indicated.
1.5 Business Combination and Goodwill: The Company uses the acquisition method of accounting
to account for business combinations. The acquisition date
322 Grasim Industries Limited
Notesforming part of the Consolidated Financial Statements for the year ended 31st March 2021
is the date on which control is transferred to the acquirer. Judgement is applied in determining the acquisition date and determining whether control is transferred from one party to another. Control exists when the Company is exposed to or has rights to variable returns from its involvement with the entity and has the ability to affect those returns through power over the entity. In assessing control, potential voting rights are considered only if the rights are substantive.
Goodwill is initially measured at cost, being the excess of the aggregate of the consideration transferred and the amount recognised for non-controlling interests, and any previous interest held, over the net identifiable assets acquired and liabilities assumed. If the fair value of the net assets acquired is in excess of the aggregate consideration transferred, the Company re-assesses whether it has correctly identified all of the assets acquired and all of the liabilities assumed, and reviews the procedures used to measure the amounts to be recognised at the acquisition date. If the re-assessment still results in an excess of the fair value of net assets acquired over the aggregate consideration transferred, then the gain is recognised in Other Comprehensive Income (OCI) and accumulated in other equity as capital reserve. However, if there is no clear evidence of bargain purchase, the entity recognises the gain directly in other equity as capital reserve, without routing the same through OCI.
Consideration transferred includes the fair values of the assets transferred, liabilities incurred by the Company to the previous owners of the acquiree, and equity interests issued by the Company. Consideration transferred also includes the fair value of any contingent consideration. Consideration transferred does not include amounts related to the settlement of pre-existing relationships. Any goodwill that arises on account of such business combination is tested annually for impairment.
Any contingent consideration is measured at fair value at the date of acquisition. If an obligation to pay contingent consideration that meets the definition of a financial instrument is classified as equity, then it is not re-measured and the settlement is accounted for within other equity. Otherwise, other contingent consideration is re-measured at fair value at each reporting date and subsequent changes in the fair value of the contingent consideration are recorded in the Statement of Profit and Loss.
A contingent liability of the acquiree is assumed in a business combination only if such a liability represents a present obligation and arises from a past event, and its fair value can be measured reliably. On an acquisition-
by-acquisition basis, the Company recognises any non-controlling interest in the acquiree either at fair value or at the non-controlling interest’s proportionate share of the acquiree’s identifiable net assets. Transaction costs that the Company incurs in connection with a business combination, such as Stamp Duty for title transfer in the name of the Company, finder’s fees, legal fees, due diligence fees, and other professional and consulting fees, are expensed as incurred.
A cash generating unit to which goodwill has been allocated is tested for impairment annually, or more frequently when, there is an indication that the unit may be impaired. If the recoverable amount of the cash generating unit is less than its carrying amount, the impairment loss is allocated first to reduce the carrying amount of any goodwill allocated to the unit and then to the other assets of the unit pro - rata based on the carrying amount of each asset in the unit. Any impairment loss for goodwill is recognised in profit or loss. An impairment loss recognised for goodwill is not reversed in subsequent periods.
Where goodwill has been allocated to a cash generating unit and part of the operation within that unit is disposed of, the goodwill associated with the disposed operation is included in the carrying amount of the operation when determining the gain or loss on disposal. Goodwill disposed in these circumstances is measured based on the relative values of the disposed operation and the portion of the cash generating unit retained.
If the initial accounting for a business combination is incomplete by the end of the reporting period in which the combination occurs, the Group reports provisional amounts for the items for which the accounting is incomplete. Those provisional amounts are adjusted through goodwill during the measurement period, or additional assets or liabilities are recognised, to reflect new information obtained about facts and circumstances that existed at the acquisition date that, if known, would have affected the amounts recognised at that date. These adjustments are called as measurement period adjustments. The measurement period does not exceed one year from the acquisition date.
1.6 Classification of Assets and Liabilities as Current and Non-Current:
All assets and liabilities are classified as current or non-current as per the Group’s normal operating cycle, and other criteria set out in Schedule III of the Companies Act, 2013. Based on the nature of products and the time lag between the acquisition of assets for processing and their realisation in cash and cash equivalents, 12 months period has been considered by the Group as its normal operating cycle.
323Integrated Annual Report 2020-21
Integrated ReportStatutory Reports
Financial statements
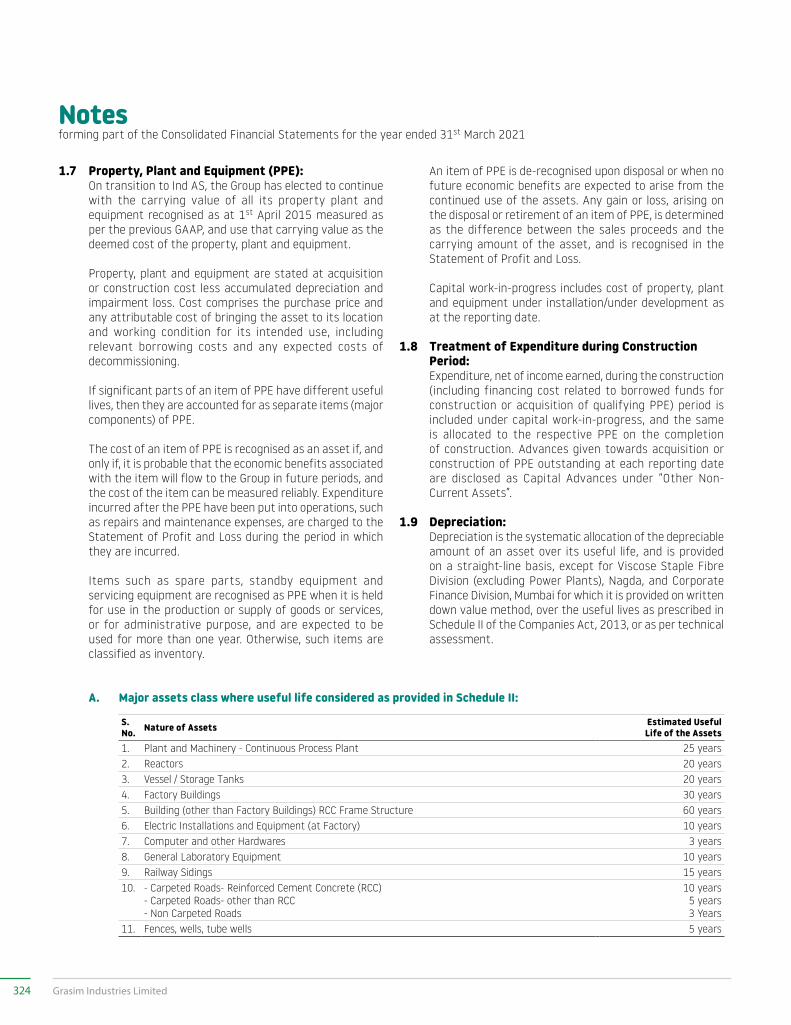
Notesforming part of the Consolidated Financial Statements for the year ended 31st March 2021
1.7 Property, Plant and Equipment (PPE): On transition to Ind AS, the Group has elected to continue
with the carrying value of all its property plant and equipment recognised as at 1st April 2015 measured as per the previous GAAP, and use that carrying value as the deemed cost of the property, plant and equipment.
Property, plant and equipment are stated at acquisition or construction cost less accumulated depreciation and impairment loss. Cost comprises the purchase price and any attributable cost of bringing the asset to its location and working condition for its intended use, including relevant borrowing costs and any expected costs of decommissioning.
If significant parts of an item of PPE have different useful lives, then they are accounted for as separate items (major components) of PPE.
The cost of an item of PPE is recognised as an asset if, and only if, it is probable that the economic benefits associated with the item will flow to the Group in future periods, and the cost of the item can be measured reliably. Expenditure incurred after the PPE have been put into operations, such as repairs and maintenance expenses, are charged to the Statement of Profit and Loss during the period in which they are incurred.
Items such as spare parts, standby equipment and servicing equipment are recognised as PPE when it is held for use in the production or supply of goods or services, or for administrative purpose, and are expected to be used for more than one year. Otherwise, such items are classified as inventory.
An item of PPE is de-recognised upon disposal or when no future economic benefits are expected to arise from the continued use of the assets. Any gain or loss, arising on the disposal or retirement of an item of PPE, is determined as the difference between the sales proceeds and the carrying amount of the asset, and is recognised in the Statement of Profit and Loss.
Capital work-in-progress includes cost of property, plant and equipment under installation/under development as at the reporting date.
1.8 Treatment of Expenditure during Construction Period:
Expenditure, net of income earned, during the construction (including financing cost related to borrowed funds for construction or acquisition of qualifying PPE) period is included under capital work-in-progress, and the same is allocated to the respective PPE on the completion of construction. Advances given towards acquisition or construction of PPE outstanding at each reporting date are disclosed as Capital Advances under “Other Non-Current Assets”.
1.9 Depreciation: Depreciation is the systematic allocation of the depreciable
amount of an asset over its useful life, and is provided on a straight-line basis, except for Viscose Staple Fibre Division (excluding Power Plants), Nagda, and Corporate Finance Division, Mumbai for which it is provided on written down value method, over the useful lives as prescribed in Schedule II of the Companies Act, 2013, or as per technical assessment.
A. Major assets class where useful life considered as provided in Schedule II:
S. No. Nature of Assets Estimated Useful
Life of the Assets1. Plant and Machinery - Continuous Process Plant 25 years2. Reactors 20 years3. Vessel / Storage Tanks 20 years4. Factory Buildings 30 years5. Building (other than Factory Buildings) RCC Frame Structure 60 years6. Electric Installations and Equipment (at Factory) 10 years7. Computer and other Hardwares 3 years8. General Laboratory Equipment 10 years9. Railway Sidings 15 years10. - Carpeted Roads- Reinforced Cement Concrete (RCC)
- Carpeted Roads- other than RCC- Non Carpeted Roads
10 years5 years3 Years
11. Fences, wells, tube wells 5 years
324 Grasim Industries Limited
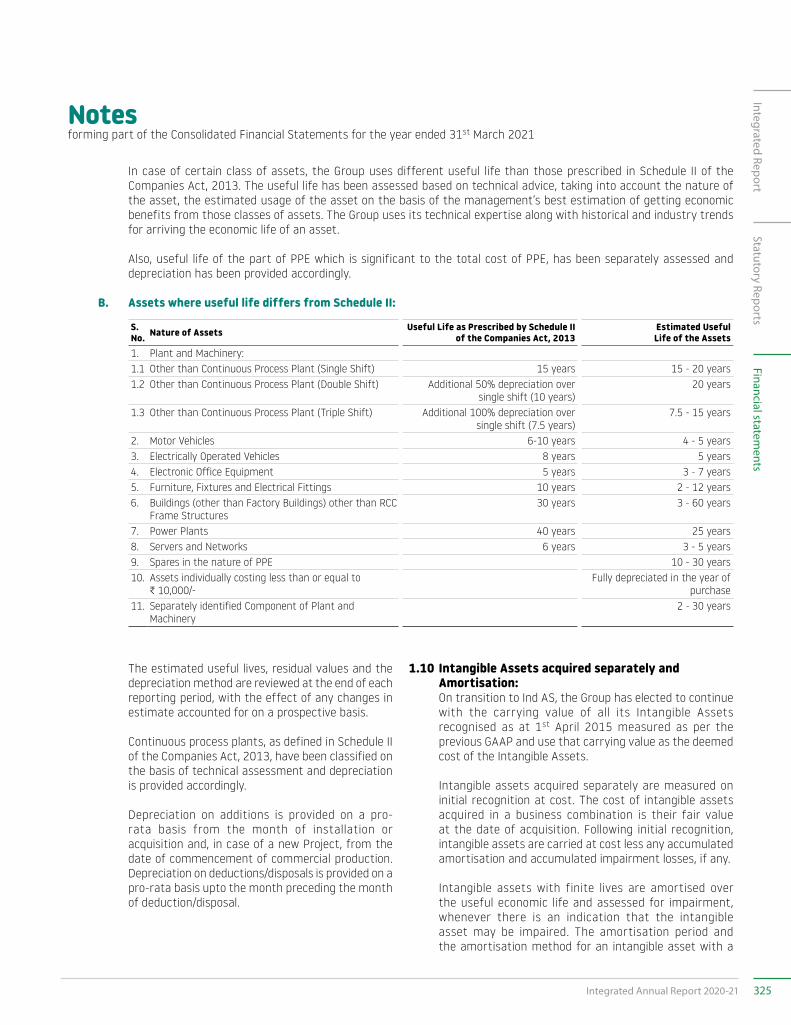
Notesforming part of the Consolidated Financial Statements for the year ended 31st March 2021
The estimated useful lives, residual values and the depreciation method are reviewed at the end of each reporting period, with the effect of any changes in estimate accounted for on a prospective basis.
Continuous process plants, as defined in Schedule II of the Companies Act, 2013, have been classified on the basis of technical assessment and depreciation is provided accordingly.
Depreciation on additions is provided on a pro-rata basis from the month of installation or acquisition and, in case of a new Project, from the date of commencement of commercial production. Depreciation on deductions/disposals is provided on a pro-rata basis upto the month preceding the month of deduction/disposal.
1.10 Intangible Assets acquired separately and Amortisation:
On transition to Ind AS, the Group has elected to continue with the carrying value of all its Intangible Assets recognised as at 1st April 2015 measured as per the previous GAAP and use that carrying value as the deemed cost of the Intangible Assets.
Intangible assets acquired separately are measured on initial recognition at cost. The cost of intangible assets acquired in a business combination is their fair value at the date of acquisition. Following initial recognition, intangible assets are carried at cost less any accumulated amortisation and accumulated impairment losses, if any.
Intangible assets with finite lives are amortised over the useful economic life and assessed for impairment, whenever there is an indication that the intangible asset may be impaired. The amortisation period and the amortisation method for an intangible asset with a
In case of certain class of assets, the Group uses different useful life than those prescribed in Schedule II of the Companies Act, 2013. The useful life has been assessed based on technical advice, taking into account the nature of the asset, the estimated usage of the asset on the basis of the management’s best estimation of getting economic benefits from those classes of assets. The Group uses its technical expertise along with historical and industry trends for arriving the economic life of an asset.
Also, useful life of the part of PPE which is significant to the total cost of PPE, has been separately assessed and depreciation has been provided accordingly.
B. Assets where useful life differs from Schedule II:
S. No. Nature of Assets Useful Life as Prescribed by Schedule II
of the Companies Act, 2013Estimated Useful Life of the Assets
1. Plant and Machinery:1.1 Other than Continuous Process Plant (Single Shift) 15 years 15 - 20 years1.2 Other than Continuous Process Plant (Double Shift) Additional 50% depreciation over
single shift (10 years)20 years
1.3 Other than Continuous Process Plant (Triple Shift) Additional 100% depreciation over single shift (7.5 years)
7.5 - 15 years
2. Motor Vehicles 6-10 years 4 - 5 years3. Electrically Operated Vehicles 8 years 5 years4. Electronic Office Equipment 5 years 3 - 7 years5. Furniture, Fixtures and Electrical Fittings 10 years 2 - 12 years6. Buildings (other than Factory Buildings) other than RCC
Frame Structures30 years 3 - 60 years
7. Power Plants 40 years 25 years8. Servers and Networks 6 years 3 - 5 years9. Spares in the nature of PPE 10 - 30 years10. Assets individually costing less than or equal to
C 10,000/-Fully depreciated in the year of
purchase11. Separately identified Component of Plant and
Machinery2 - 30 years
325Integrated Annual Report 2020-21
Integrated ReportStatutory Reports
Financial statements
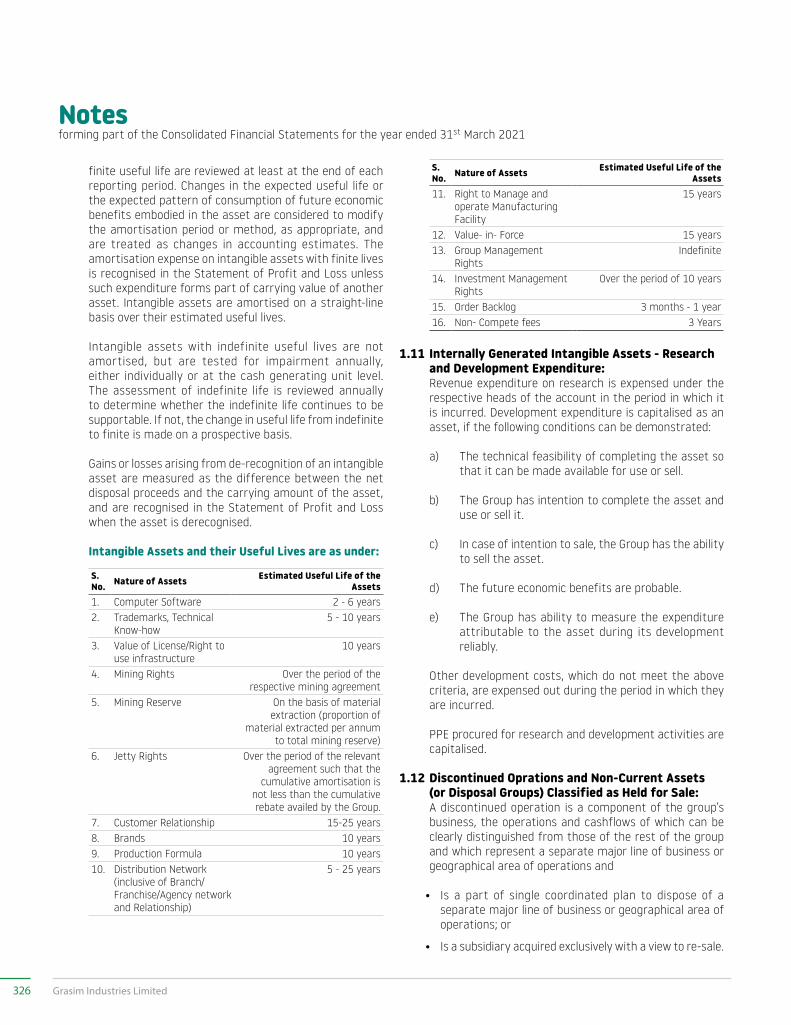
Notesforming part of the Consolidated Financial Statements for the year ended 31st March 2021
finite useful life are reviewed at least at the end of each reporting period. Changes in the expected useful life or the expected pattern of consumption of future economic benefits embodied in the asset are considered to modify the amortisation period or method, as appropriate, and are treated as changes in accounting estimates. The amortisation expense on intangible assets with finite lives is recognised in the Statement of Profit and Loss unless such expenditure forms part of carrying value of another asset. Intangible assets are amortised on a straight-line basis over their estimated useful lives.
Intangible assets with indefinite useful lives are not amortised, but are tested for impairment annually, either individually or at the cash generating unit level. The assessment of indefinite life is reviewed annually to determine whether the indefinite life continues to be supportable. If not, the change in useful life from indefinite to finite is made on a prospective basis.
Gains or losses arising from de-recognition of an intangible asset are measured as the difference between the net disposal proceeds and the carrying amount of the asset, and are recognised in the Statement of Profit and Loss when the asset is derecognised.
Intangible Assets and their Useful Lives are as under:
S. No. Nature of Assets Estimated Useful Life of the
Assets1. Computer Software 2 - 6 years2. Trademarks, Technical
Know-how5 - 10 years
3. Value of License/Right to use infrastructure
10 years
4. Mining Rights Over the period of the respective mining agreement
5. Mining Reserve On the basis of material extraction (proportion of
material extracted per annum to total mining reserve)
6. Jetty Rights Over the period of the relevant agreement such that the
cumulative amortisation is not less than the cumulative rebate availed by the Group.
7. Customer Relationship 15-25 years8. Brands 10 years9. Production Formula 10 years10. Distribution Network
(inclusive of Branch/Franchise/Agency network and Relationship)
5 - 25 years
S. No. Nature of Assets Estimated Useful Life of the
Assets11. Right to Manage and
operate Manufacturing Facility
15 years
12. Value- in- Force 15 years13. Group Management
RightsIndefinite
14. Investment Management Rights
Over the period of 10 years
15. Order Backlog 3 months - 1 year16. Non- Compete fees 3 Years
1.11 Internally Generated Intangible Assets - Research and Development Expenditure:
Revenue expenditure on research is expensed under the respective heads of the account in the period in which it is incurred. Development expenditure is capitalised as an asset, if the following conditions can be demonstrated:
a) The technical feasibility of completing the asset so that it can be made available for use or sell.
b) The Group has intention to complete the asset and use or sell it.
c) In case of intention to sale, the Group has the ability to sell the asset.
d) The future economic benefits are probable.
e) The Group has ability to measure the expenditure attributable to the asset during its development reliably.
Other development costs, which do not meet the above criteria, are expensed out during the period in which they are incurred.
PPE procured for research and development activities are capitalised.
1.12 Discontinued Oprations and Non-Current Assets (or Disposal Groups) Classified as Held for Sale:
A discontinued operation is a component of the group’s business, the operations and cashflows of which can be clearly distinguished from those of the rest of the group and which represent a separate major line of business or geographical area of operations and
• Is a part of single coordinated plan to dispose of a separate major line of business or geographical area of operations; or
• Is a subsidiary acquired exclusively with a view to re-sale.
326 Grasim Industries Limited
Notesforming part of the Consolidated Financial Statements for the year ended 31st March 2021
Classification as a discontinued operation occurs upon disposal or when the operation meets the criteria to be classified as held for sale, if earlier.
When an operation is classified as a discontinued operation, the comparative Statement of Profit and Loss is represented as if the operation had been discontinued from the start of the comparative period.
Non-current assets and disposal groups are classified as held for sale, if their carrying amount is intended to be recovered principally through a sale (rather than through continuing use) when the asset (or disposal group) is available for immediate sale in its present condition, subject only to terms that are usual and customary for sale of such asset (or disposal group), and the sale is highly probable and is expected to qualify for recognition as a completed sale within one year from the date of classification.
Non-current assets and disposal groups, classified as held for sale, are measured at lower of their carrying amount and fair value less costs to sell.
1.13 Impairment of Non-Financial Assets: At the end of each reporting period, the Group reviews the
carrying amounts of non-financial assets to determine whether there is any indication that those assets have suffered an impairment loss. If any such indication exists, the recoverable amount of the asset is estimated in order to determine the extent of the impairment loss (if any). When it is not possible to estimate the recoverable amount of an individual asset, the Group estimates the recoverable amount of the cash generating unit to which the asset belongs. When a reasonable and consistent basis of allocation can be identified, corporate assets are also allocated to individual cash generating units, or otherwise they are allocated to the smallest group of cash generating units, for which a reasonable and consistent allocation basis can be identified.
Intangible assets with indefinite useful lives and intangible assets not yet available for use are tested for impairment at least annually, and whenever there is an indication then the asset may be impaired.
Recoverable amount is the higher of fair value less costs of disposal and value in use. In assessing the value in use, the estimated future cash flows are discounted to their present value using a pre-tax discount rate that reflects current market assessments of the time value of money and the risks specific to the asset for which the estimates of future cash flows have not been adjusted.
If the recoverable amount of an asset (or cash generating unit) is estimated to be less than its carrying amount, the carrying amount of the asset (or cash generating unit) is reduced to its recoverable amount. An impairment loss is recognised immediately in the Statement of Profit and Loss, unless the relevant asset is carried at a revalued amount, in which case the impairment loss is treated as a revaluation decrease.
When an impairment loss subsequently reverses, the carrying amount of the asset (or a cash generating unit) is increased to the revised estimate of its recoverable amount, but, so that, the increased carrying amount does not exceed the carrying amount that would have been determined had no impairment loss been recognised for the asset (or cash generating unit) in the prior years. A reversal of an impairment loss is recognised immediately in the Statement of Profit and Loss, unless the relevant asset is carried at a revalued amount, in which case the reversal of the impairment loss is treated as a revaluation increase.
1.14 Inventories: Inventories are valued at the lower of cost and net
realisable value.
Net realisable value is the estimated selling price in the ordinary course of business, less estimated costs of completion and the estimated costs necessary to make the sale.
Raw materials, stores and spare parts, and packing materials are considered to be realisable at cost, if the finished products, in which they will be used, are expected to be sold at or above cost. The cost is computed on weighted-average basis which includes expenditure incurred for acquiring inventories like purchase price, import duties, taxes (net of tax credit) and other costs incurred in bringing the inventory to the present location and condition.
Cost of finished goods and work-in-progress includes cost of raw material, cost of conversion based on normal capacity and other costs incurred in bringing the inventories to their present location and condition. The cost of finished goods and work-in-progress is computed on weighted-average basis.
In the absence of cost, waste/scrap is valued at estimated net realisable value.
327Integrated Annual Report 2020-21
Integrated ReportStatutory Reports
Financial statements
Notesforming part of the Consolidated Financial Statements for the year ended 31st March 2021
Obsolete, defective, slow moving and unserviceable inventories, if any, are duly provided for.
Proceeds, in respect of sale of raw materials/stores, are credited to the respective heads.
1.15 Product Classification of Insurance Business Insurance contracts are those contracts when the Group
(the insurer) has accepted significant insurance risk from another party (the policyholders) by agreeing to compensate the policyholders, if a specified uncertain future event (the insured event) adversely affects the policyholders. As a general guideline, the Group determines whether it has significant insurance risk, if the benefit payable on death is higher by at least 5% of the fund value at any time during the term of the contract for unit- linked products, or the benefit payable on death is higher by at least 5% of the premium at any time during the term of the contract for other than unit-linked products. Investment contracts are those contracts which are not Insurance Contracts.
1.16 Cash and Cash Equivalents: Cash and Cash Equivalents comprise cash on hand and
cash at bank including fixed deposits with original maturity period of three months or less and short-term highly liquid investments with an original maturity of three months or less.
1.17 Cash Flow Statement: Cash flows are reported using the indirect method,
whereby the net profit before tax is adjusted for the effects of transactions of a non-cash nature, any deferrals or accruals of past or future operating cash receipts or payments and item of income or expenses associated with investing or financing cash flows. The cash flows from operating, investing and financing activities of the Group are segregated.
1.18 Employee Benefits: Short-term Employee Benefits: Short-term employee benefits are recognised as an
expense on accrual basis.
Defined Contribution Plan: Contribution payable to the recognised Provident Fund and
approved Superannuation Scheme, which are substantially defined contribution plans, is recognised as expense in the statement of Profit and Loss, when employees have rendered the service entitling them to the contribution.
The Provident Fund contribution as specified under the law is paid to the Regional Provident Fund Commissioner.
Defined Benefit Plan: The obligation in respect of defined benefit plans, which
covers Gratuity, Pension and other post-employment medical benefits, are provided for on the basis of an actuarial valuation at the end of each financial year, using project unit credit method. Gratuity is funded with an approved trust.
In respect of certain employees, Provident Fund contributions are made to a Trust, administered by the Group. The interest rate payable to the members of the Trust shall not be lower than the statutory rate of interest declared by the Central Government, under the Employees’ Provident Funds and Miscellaneous Provisions Act, 1952, and shortfall, if any, shall be made good by the Group. The Group’s liability is actuarially determined (using the Projected Unit Credit Method) at the end of the year, and any shortfall in the Fund size, maintained by the Trust set-up by the Group, is additionally provided for.
Re-measurement, comprising actuarial gains and losses, the effect of the changes to the asset ceiling (if applicable) and the return on plan assets (excluding net interest), is reflected immediately in the Balance Sheet with a charge or credit recognised in OCI in the period in which they occur.
Re-measurement recognised in OCI is reflected immediately in retained earnings and will not be re-classified to profit or loss in the statement of profit and loss except with respect to life insurance business which relates to restricted life insurance fund relating to Revenue Account of Life Insurance Policyholders, the same has been transferred under “Life insurance contract liabilities and other financial liabilities of the life insurance fund” in the Balance Sheet and the same will not be reclassified to revenue account of insurance business. Defined benefit costs are categorised as follows:
• service cost (including current service cost, past service cost, as well as gains and losses on curtailments and settlements);
• net interest expense or income; and
• Re-measurement.
The Group presents the first two components of defined benefit costs in the statement of Profit and Loss in the line item ‘Employee Benefits Expense’.
The present value of the defined benefit plan liability is calculated using a discount rate, which is determined by reference to market yields at the end of the reporting period on government bonds.
328 Grasim Industries Limited
Notesforming part of the Consolidated Financial Statements for the year ended 31st March 2021
The retirement benefit obligation recognised in the Balance Sheet represents the actual deficit or surplus in the Group’s defined benefit plans. Any surplus resulting from this calculation is limited to the present value of any economic benefits available in the form of refunds from the plans or reductions in the future contribution to the plans.
Other employee benefits A liability is recognised for benefits accruing to employees
in respect of wages and salaries, annual leave and sick leave in the period the related service is rendered.
Liabilities recognised in respect of short-term employee benefits are measured at the undiscounted amount of the benefits expected to be paid in exchange for the related service.
Liabilities recognised in respect of other long-term employee benefits are measured using the projected unit credit method by a qualified independent actuary at the end of each annual reporting period, at the present value of the estimated future cash outflows expected to be made by the Group in respect of services provided by employees up to the reporting date. Remeasurement gains / losses are recognised in the Statement of Profit and Loss in the period in which they arise.
1.19 Employee Share based Payments: Equity-settled transactions: Equity-settled share-based payments to employees are
measured by reference to the fair value of the equity instruments at the grant date using Black - Scholes Model and Binomial Model.
The fair value determined at the grant date of the equity-settled share-based payments, is charged to statement of profit and loss on a systematic basis over the vesting period of the option, based on the Group’s estimate of equity instruments that will eventually vest, with a corresponding increase in other equity.
At the end of each reporting period, the Company revises its estimate of the number of equity instruments expected to vest. The impact of the revision of the original estimates, if any, is recognised in the Statement of Profit and Loss such that the cumulative expense reflects the revised estimate, with a corresponding adjustment to the equity-settled employee benefits reserve.
In case of forfeiture/lapse stock option, which is not vested, amortised portion is reversed by credit to employee compensation expense. In a situation where the stock option expires unexercised, the related balance standing
to the credit of the Employee Stock Options Outstanding Account is transferred within other equity.
Cash-settled Transactions: The cost of cash-settled transactions is measured initially
at fair value at the grant date using a Black Scholes Merton Formula. This fair value is expensed over the period until the vesting date with recognition of a corresponding liability. The liability is remeasured to fair value at each reporting date upto and, including the settlement date, with changes in fair value recognised in employee benefits expense.
1.20 Treasury Shares: The Company has created an Employee Benefit Trust (EBT)
for providing share-based payment to its employees. The Company uses EBT as a vehicle for distributing shares to employees under the Employee stock option scheme. The EBT purchase shares of the Company from the market, for giving shares to employees. The Company treats EBT as its extension and shares held by EBT are treated as treasury shares.
Own equity instruments that are re-acquired (treasury shares) are recognised at cost and deducted from other equity. No gain or loss is recognised in the statement of profit and loss on the purchase, sale, issue or cancellation of the company’s own equity instruments. Share options whenever exercised, would be settled from such treasury shares.
1.21 Foreign Currency Transactions: In preparing the financial statements of the Group,
transactions in foreign currencies, other than the Group’s functional currency, are recognised at the rates of exchange prevailing at the dates of the transactions. At the end of each reporting period, monetary assets and liabilities denominated in foreign currencies are translated at the rate prevailing at that date. Non-monetary items that are measured in terms of historical cost in a foreign currency are not re-translated.
Exchange differences on monetary items are recognised in the Statement of Profit and Loss in the period in which these arise, except for:
• exchange differences on foreign currency borrowings relating to assets under construction for future productive use, which are included in the cost of those assets when they are regarded as an adjustment to interest costs on those foreign currency borrowings;
• exchange differences relating to qualifying effective cash flow hedges and
329Integrated Annual Report 2020-21
Integrated ReportStatutory Reports
Financial statements
Notesforming part of the Consolidated Financial Statements for the year ended 31st March 2021
• Exchange difference arising on re-statement of long-term monetary items that in substance forms part of Group’s net investment in foreign operations, is accumulated in Foreign Currency Translation Reserve (component of OCI) until the disposal of the investment, at which time such exchange difference is recognised in the Statement of Profit and Loss.
1.22 Foreign Operations: The assets and liabilities of foreign operations, including
goodwill and fair value adjustments arising on acquisition are translated into Indian Rupees, the functional currency of the Group, at the exchange rates at the reporting date. The income and expenses of foreign operations are translated into Indian Rupee at the exchange rates at the dates of the transactions or an average rate, if the average rate approximates the actual rate at the date of the transaction. Exchange differences are recognised in OCI and accumulated in other equity (as exchange differences on translating the financial statements of a foreign operation), except to the extent that the exchange differences are allocated to non-controlling interest.
When a foreign operation is disposed of in its entirety or partially such that control, significant influence or joint control is lost, the cumulative amount of exchange differences related to that foreign operation recognised in OCI, is re-classified to the Statement of Profit and Loss as part of the gain or loss on disposal. If the Group disposes of part of its interest in a subsidiary, but retains control, then the relevant proportion of the cumulative amount of foreign exchange differences is re-allocated to NCI. When the Group disposes of only a part of its interest in an Associate or a Joint Venture, while retaining significant influence or joint control, the relevant proportion of the cumulative amount of foreign exchange differences is re-classified to Statement of Profit and Loss.
1.23 Derivative Financial Instruments and Hedge Accounting:
The Group enters into forward contracts to hedge the foreign currency risk of firm commitments and highly probable forecast transactions. Derivatives are initially recognised at fair value at the date the derivative contracts are entered into and are subsequently re-measured to their fair value at the end of each reporting period. The resulting gain or loss is recognised in the Statement of Profit and Loss immediately, unless the derivative is designated and effective as a hedging instrument, in which event the timing of the recognition in the Statement of Profit and Loss depends on the nature of the hedging relationship and the nature of the hedged item.
The Group enters into derivative financial instruments, viz., foreign exchange forward contracts, interest rate swaps and cross currency swaps to manage its exposure to interest rate, foreign exchange rate risks and commodity prices. The Group does not hold derivative financial instruments for speculative purposes.
Hedge Accounting: The Group designates certain hedging instruments in
respect of foreign currency risk, interest rate risk and commodity price risk as cash flow hedges. At the inception of a hedge relationship, the Group formally designates and documents the hedge relationship to which the Group wishes to apply hedge accounting and the risk management objective and strategy for undertaking the hedge. The documentation includes the Group’s risk management objective and strategy for undertaking hedge, the hedging / economic relationship, the hedged item or transaction, the nature of the risk being hedged, hedge ratio and how the entity will assess the effectiveness of changes in the hedging instrument’s fair value in offsetting the exposure to changes in the hedged item’s fair value or cash flows attributable to the hedged risk. Such hedges are expected to be highly effective in achieving offsetting changes in fair value or cash flows, and are assessed on an ongoing basis to determine that they actually have been highly effective throughout the financial reporting periods, for which they were designated.
The effective portion of changes in the fair value of the designated portion of derivatives that qualify as cash flow hedges is recognised in OCI and accumulated under the heading of cash flow hedging reserve. The gain or loss relating to the ineffective portion is recognised immediately in the Statement of Profit and Loss.
Amounts previously recognised in other comprehensive income and accumulated in other equity relating to (effective portion as described above) are re-classified to the Statement of Profit and Loss in the periods when the hedged item affects profit or loss. However, when the hedged forecast transaction results in the recognition of a non-financial asset or a non-financial liability, such gains and losses are transferred from equity and included in the initial measurement of the cost of the non-financial asset or non-financial liability.
Hedge accounting is discontinued when the hedging instrument expires or is sold, terminated, or exercised, without replacement or rollover (as part of the hedging strategy), or if its designation as a hedge is revoked, or when it no longer qualifies for hedge accounting. Any gain or loss recognised in OCI and accumulated in other equity at that time remains in other equity, and is recognised
330 Grasim Industries Limited
Notesforming part of the Consolidated Financial Statements for the year ended 31st March 2021
when the forecast transaction is ultimately recognised in Statement of Profit and Loss. When a forecast transaction is no longer expected to occur, the gain or loss accumulated in other equity is recognised immediately in the Statement of Profit and Loss.
1.24 Fair Value Measurement: The Group measures financial instruments, such as
investments (other than equity investments in Subsidiaries, Joint Ventures and Associates) and derivatives at fair values at each Balance Sheet date.
Fair value is the price that would be received to sell an asset or paid to transfer a liability in an orderly transaction between market participants at the measurement date. The fair value measurement is based on the presumption that the transaction to sell the asset or transfer the liability takes place either:
In the principal market for the asset or liability, or
In the absence of a principal market, in the most advantageous market for the asset or liability.
The principal or the most advantageous market must be accessible by the Group.
The fair value of an asset or a liability is measured using the assumptions that market participants would use when pricing the asset or liability, assuming that market participants act in their economic best interest.
A fair value measurement of a non-financial asset takes into account a market participant’s ability to generate economic benefits by using the asset in its highest and best use or by selling it to another market participant that would use the asset in its highest and best use.
The Group uses valuation techniques that are appropriate in the circumstances and for which sufficient data are available to measure fair value, maximising the use of relevant observable inputs and minimising the use of unobservable inputs.
All assets and liabilities (for which fair value is measured or disclosed in the financial statements) are categorised within the fair value hierarchy, described as follows, based on the lowest level input that is significant to the fair value measurement as a whole:
Level 1 — Quoted (unadjusted) market prices in active markets for identical assets or liabilities.
Level 2 — Valuation techniques for which the lowest level input that is significant to the fair value measurement is directly or indirectly observable other than quoted prices included in level 1.
Level 3 — Valuation techniques for which the lowest level input that is significant to the fair value measurement is unobservable.
For assets and liabilities that are recognised in the financial statements on a recurring basis, the Group determines whether transfers have occurred between levels in the hierarchy by re-assessing categorisation (based on the lowest level input that is significant to the fair value measurement as a whole) at the end of each reporting period.
The Management determines the policies and procedures for both recurring fair value measurement, such as derivative instruments and unquoted financial assets measured at fair value, and for non-recurring measurement, such as assets held for disposal in discontinued operations.
At each reporting date, Management analyses the movements in the values of assets and liabilities, which are required to be remeasured or re-assessed as per the Group’s accounting policies. For this analysis, the Management verifies the major inputs applied in the latest valuation by agreeing the information in the valuation computation to contracts and other relevant documents.
1.25 Financial Instruments: A financial instrument is any contract that gives rise to
a financial asset of one entity and a financial liability or equity instrument of another entity.
Financial Assets Initial Recognition and Measurement: All financial assets are recognised initially at fair value.
However, in the case of financial assets not recorded at fair value through profit or loss, transaction costs that are attributable to the acquisition of the financial asset are added to the fair value. Purchases or sales of financial assets that require delivery of assets within a time frame established by regulation or convention in the marketplace (regular way trades) are recognised on the trade date, i.e., the date that the Group commits to purchase or sell the asset.
Subsequent measurement: For the purposes of subsequent measurement, financial
assets are classified in four categories:
• Debt instruments at amortised cost
331Integrated Annual Report 2020-21
Integrated ReportStatutory Reports
Financial statements
Notesforming part of the Consolidated Financial Statements for the year ended 31st March 2021
• Debt instruments at Fair Value through Other Comprehensive Income (FVTOCI)
• Debt instruments, derivatives and equity instruments, mutual funds at Fair Value
• through Profit or Loss (FVTPL)
• Equity instruments measured at FVTOCI
Debt Instruments at Amortised Cost: A ‘debt instrument’ is measured at amortised cost, if both
the following conditions are met:
a) The asset is held within a business model whose objective is to hold assets for collecting contractual cash flows; and
b) Contractual terms of the asset give rise on specified dates to cash flows that are solely payments of principal and interest (SPPI) on the principal amount outstanding.
After initial measurement, such financial assets are subsequently measured at amortised cost using the effective interest rate (EIR) method. Amortised Cost is calculated by taking into account any discount or premium on acquisition and fees or costs that are an integral part of the EIR. The EIR amortisation is included in finance income in the profit or loss. The losses arising from impairment are recognised in the profit or loss. This category generally applies to trade and other receivables.
Debt instrument at FVTOCI: A ‘debt instrument’ is classified at FVTOCI, if both of the
following criteria are met:
a) The objective of the business model is achieved both by collecting contractual cash flows and selling the financial assets; and
b) The asset’s contractual cash flows represent SPPI on the principal amount outstanding.
Debt instruments included within the FVTOCI category are measured initially as well as at each reporting date at fair value. Fair value movements are recognised in the OCI. However, the Group recognises interest income, impairment losses and reversals, and foreign exchange gain or loss in the Statement of Profit and Loss. On de-recognition of the asset, cumulative gain or loss previously recognised in OCI is reclassified from the equity to the Statement of Profit and Loss. Interest earned whilst holding FVTOCI debt instrument is reported as interest income using the EIR method.
Debt Instrument at FVTPL: FVTPL is a residual category for debt instruments. Any
debt instrument, which does not meet the criteria for categorisation as at amortised cost or as FVTOCI, is classified as at FVTPL.
In addition, the group may elect to designate a debt instrument, which otherwise meets amortised cost or FVTOCI criteria, as at FVTPL. However, such election is allowed only if doing so reduces or eliminates a measurement or recognition inconsistency (referred to as ‘accounting mismatch’).
Debt instruments included within the FVTPL category are measured at fair value with all changes recognised in the Statement of Profit and Loss, except for changes with respect to Policyholders’ investments under the life insurance business (except for assets held to cover linked liabilities) relating to Revenue Account of Life Insurance Policyholders, wherein the fair value movements are included under “Life insurance contract liabilities and other financial liabilities of the life insurance fund” in the Balance Sheet.
Equity Investments Investment in Associates and Joint ventures are out of
scope of Ind AS 109 and it is accounted as per Ind AS 28.
All other equity investments are measured at fair value. Equity instruments, which are held for trading, are classified as at FVTPL. For equity instruments, other than held for trading, the Group has irrevocable option to present in OCI subsequent changes in the fair value. The group makes such election on an instrument-by-instrument basis. The classification is made on initial recognition and is irrevocable.
Where the Group classifies equity instruments as at FVTOCI, then all fair value changes on the instrument, excluding dividends, are recognised in the OCI. There is no recycling of the amounts of profit or loss from OCI to Statement of Profit and Loss, even on sale of investment.
Equity instruments included within the FVTPL category are measured at fair value with all changes recognised in the Statement of Profit and Loss, except for changes with respect to Policyholders’ investments under the life insurance business (except for assets held to cover linked liabilities) relating to Revenue Account of Life Insurance Policyholders, wherein the fair value movements are included under “Life insurance contract liabilities and other financial liabilities of the life insurance fund” in the Balance Sheet.
332 Grasim Industries Limited
Notesforming part of the Consolidated Financial Statements for the year ended 31st March 2021
Impairment of Financial Assets: The Group recognises loss allowances for ECLs on the
following financial instruments that are not measured at FVTPL:
• Loans and advances to customers;
• Debt investment securities;
• Trade and other receivable;
• Lease receivables;
• Irrevocable loan commitments issued; and
• Financial guarantee contracts issued.
With the exception of POCI financial assets (which are considered separately below), ECLs are required to be measured through a loss allowance at an amount equal to:
• 12-month ECL, i.e. that result from those default events on the financial instrument that are possible within 12 months after the reporting date, (referred to as Stage 1); or
• full lifetime ECL, i.e. that result from all possible default events over the life of the financial instrument, (referred to as Stage 2 and Stage 3).
A loss allowance for full lifetime ECL is required for a financial instrument if the credit risk on that financial instrument has increased significantly since initial recognition (and consequently for credit impaired financial assets). For all other financial instruments, ECLs are measured at an amount equal to the 12-month ECL.
The Group’s policy is always to measure loss allowances for lease receivables as lifetime ECL.
ECLs are a probability-weighted estimate of the present value of credit losses. These are measured as the present value of the difference between the cash flows due to the Group under the contract and the cash flows that the Group expects to receive arising from the weighting of multiple future economic scenarios, discounted at the asset’s EIR.
• for undrawn loan commitments, the ECL is the difference between the present value of the difference between the contractual cash flows that are due to the Group if the holder of the commitment draws down the loan and the cash flows that the Group expects to receive if the loan is drawn down; and
• for financial guarantee contracts, the ECL is the difference between the expected payments to reimburse the holder of the guaranteed debt instrument less any amounts that the Group expects to receive from the holder, the debtor or any other party.
The Group measures ECL on an individual basis, or on a collective basis for portfolios of loans that share similar economic risk characteristics. The measurement of the loss allowance is based on the present value of the asset’s expected cash flows using the asset’s original EIR, regardless of whether it is measured on an individual basis or a collective basis.
Credit-impaired financial assets A financial asset is ‘credit-impaired’ when one or more
events that have a detrimental impact on the estimated future cash flows of the financial asset have occurred. Credit-impaired financial assets are referred to as Stage 3 assets. Evidence of credit-impairment includes observable data about the following events:
• significant financial difficulty of the borrower or issuer;
• a breach of contract such as a default or past due event;
• the lender of the borrower, for economic or contractual reasons relating to the borrower’s financial difficulty, having granted to the borrower a concession that the lender would not otherwise consider;
• the disappearance of an active market for a security because of financial difficulties; or
• the purchase of a financial asset at a deep discount that reflects the incurred credit losses.
It may not be possible to identify a single discrete event—instead, the combined effect of several events may have caused financial assets to become credit-impaired. The Group assesses whether debt instruments that are financial assets measured at amortised cost or FVTOCI are credit-impaired at each reporting date. To assess if corporate debt instruments are credit impaired, the Group considers factors such as bond yields, credit ratings and the ability of the borrower to raise funding.
A loan is considered credit-impaired when a concession is granted to the borrower due to a deterioration in the borrower’s financial condition, unless there is evidence that as a result of granting the concession the risk of not receiving the contractual cash flows has reduced significantly and there are no other indicators of impairment. For financial assets where concessions are contemplated but not granted the asset is deemed credit
333Integrated Annual Report 2020-21
Integrated ReportStatutory Reports
Financial statements
Notesforming part of the Consolidated Financial Statements for the year ended 31st March 2021
impaired when there is observable evidence of credit-impairment including meeting the definition of default. The definition of default (see below) includes unlikeliness to pay indicators and a back-stop if amounts are overdue for 90 days or more.
Purchased or originated credit-impaired (POCI) financial assets
POCI financial assets are treated differently because the asset is credit-impaired at initial recognition. For these assets, the Group recognises all changes in lifetime ECL since initial recognition as a loss allowance with any changes recognised in Statement of Profit and Loss. A favorable change for such assets creates an impairment gain.
Definition of default Critical to the determination of ECL is the definition of
default. The definition of default is used in measuring the amount of ECL and in the determination of whether the loss allowance is based on 12-month or lifetime ECL, as default is a component of the probability of default (PD) which affects both the measurement of ECLs and the identification of a significant increase in credit risk.
The Group considers the following as constituting an event of default:
• the borrower is past due more than 90 days on any material credit obligation to the Group; or
• the borrower is unlikely to pay its credit obligations to the Group in full.
The definition of default is appropriately tailored to reflect different characteristics of different types of assets.
When assessing if the borrower is unlikely to pay its credit obligation, the Group takes into account both qualitative and quantitative indicators. The information assessed depends on the type of the asset, for example in corporate lending a qualitative indicator used is the admittance of bankruptcy petition by National Company Low Tribunal (NCLT), which is not relevant for retail lending. Quantitative indicators, such as overdue status and non-payment on another obligation of the same counterparty are key inputs in this analysis. The Group uses a variety of sources of information to assess default which are either developed internally or obtained from external sources. The definition of default is applied consistently to all financial instruments unless information becomes available that demonstrates that another default definition is more appropriate for a particular financial instrument.
Significant increase in credit risk The Group monitors all financial assets, issued irrevocable
loan commitments and financial guarantee contracts that are subject to the impairment requirements to assess whether there has been a significant increase in credit risk since initial recognition. If there has been a significant increase in credit risk the Group will measure the loss allowance based on lifetime rather than 12-month ECL. The Group’s accounting policy is not to use the practical expedient that financial assets with ‘low’ credit risk at the reporting date are deemed not to have had a significant increase in credit risk. As a result, the Group monitors all financial assets, issued irrevocable loan commitments and financial guarantee contracts that are subject to impairment for significant increase in credit risk.
In assessing whether the credit risk on a financial instrument has increased significantly since initial recognition, the Group compares the risk of a default occurring on the financial instrument at the reporting date based on the remaining maturity of the instrument with the risk of a default occurring that was anticipated for the remaining maturity at the current reporting date when the financial instrument was first recognised. In making this assessment, the Group considers both quantitative and qualitative information that is reasonable and supportable, including historical experience and forward-looking information that is available without undue cost or effort, based on the Group’s historical experience and expert credit assessment.
Given that a significant increase in credit risk since initial recognition is a relative measure, a given change, in absolute terms, in the probability of default (PD) will be more significant for a financial instrument with a lower initial PD than compared to a financial instrument with a higher PD.
Modification and derecognition of financial assets A modification of a financial asset occurs when the
contractual terms governing the cash flows of a financial asset are renegotiated or otherwise modified between initial recognition and maturity of the financial asset. A modification affects the amount and/or timing of the contractual cash flows either immediately or at a future date. In addition, the introduction or adjustment of existing covenants of an existing loan may constitute a modification even if these new or adjusted covenants do not yet affect the cash flows immediately but may affect the cash flows depending on whether the covenant is or is not met (e.g. a change to the increase in the interest rate that arises when covenants are breached).
334 Grasim Industries Limited
Notesforming part of the Consolidated Financial Statements for the year ended 31st March 2021
The Group renegotiates loans to customers in financial difficulty to maximise collection and minimise the risk of default. A loan forbearance is granted in cases where although the borrower made all reasonable efforts to pay under the original contractual terms, there is a high risk of default or default has already happened and the borrower is expected to be able to meet the revised terms. The revised terms in most of the cases include an extension of the maturity of the loan, changes to the timing of the cash flows of the loan (principal and interest repayment), reduction in the amount of cash flows due (principal and interest forgiveness) and amendments to covenants.
When a financial asset is modified the Group assesses whether this modification results in derecognition. In accordance with the Group’s policy a modification results in derecognition when it gives rise to substantially different terms. To determine if the modified terms are substantially different from the original contractual terms the Group considers the following:
• Qualitative factors, such as contractual cash flows after modification are no longer SPPI
• change in currency or change of counterparty
• the extent of change in interest rates, maturity, covenants
• If these do not clearly indicate a substantial modification, then;
In the case where the financial asset is derecognised the loss allowance for ECL is remeasured at the date of derecognition to determine the net carrying amount of the asset at that date. The difference between this revised carrying amount and the fair value of the new financial asset with the new terms will lead to a gain or loss on derecognition. The new financial asset will have a loss allowance measured based on 12-month ECL except in the rare occasions where the new loan is considered to be originated-credit impaired. This applies only in the case where the fair value of the new loan is recognised at a significant discount to its revised par amount because there remains a high risk of default which has not been reduced by the modification. The Group monitors credit risk of modified financial assets by evaluating qualitative and quantitative information, such as if the borrower is in past due status under the new terms.
When the contractual terms of a financial asset are modified and the modification does not result in derecognition, the Group determines if the financial asset’s credit risk has increased significantly since initial recognition by comparing:
• the remaining lifetime PD estimated based on data at initial recognition and the original contractual terms; with
• the remaining lifetime PD at the reporting date based on the modified terms.
For financial assets modified, where modification did not result in derecognition, the estimate of PD reflects the Group’s ability to collect the modified cash flows taking into account the Group’s previous experience of similar forbearance action, as well as various behavioural indicators, including the borrower’s payment performance against the modified contractual terms. If the credit risk remains significantly higher than what was expected at initial recognition the loss allowance will continue to be measured at an amount equal to lifetime ECL. The loss allowance on forborne loans will generally only be measured based on 12-month ECL when there is evidence of the borrower’s improved repayment behaviour following modification leading to a reversal of the previous significant increase in credit risk.
Where a modification does not lead to derecognition the Group calculates the modification gain/loss comparing the gross carrying amount before and after the modification (excluding the ECL allowance). Then the Group measures ECL for the modified asset, where the expected cash flows arising from the modified financial asset are included in calculating the expected cash shortfalls from the original asset.
The Group derecognises a financial asset only when the contractual rights to the asset’s cash flows expire (including expiry arising from a modification with substantially different terms), or when the financial asset and substantially all the risks and rewards of ownership of the asset are transferred to another entity. If the Group neither transfers nor retains substantially all the risks and rewards of ownership and continues to control the transferred asset, the Group recognises its retained interest in the asset and an associated liability for amounts it may have to pay. If the Group retains substantially all the risks and rewards of ownership of a transferred financial asset, the Group continues to recognise the financial asset and also recognises a collateralised borrowing for the proceeds received.
On derecognition of a financial asset in its entirety, the difference between the asset’s carrying amount and the sum of the consideration received and receivable and the cumulative gain/loss that had been recognised in OCI and accumulated in equity is recognised in the Statement of Profit and Loss, with the exception of equity investment
335Integrated Annual Report 2020-21
Integrated ReportStatutory Reports
Financial statements
Notesforming part of the Consolidated Financial Statements for the year ended 31st March 2021
designated as measured at FVTOCI, where the cumulative gain/loss previously recognised in OCI is not subsequently reclassified to the Statement of Profit and Loss.
On derecognition of a financial asset other than in its entirety (e.g. when the Group retains an option to repurchase part of a transferred asset), the Group allocates the previous carrying amount of the financial asset between the part it continues to recognise under continuing involvement, and the part it no longer recognises on the basis of the relative fair values of those parts on the date of the transfer. The difference between the carrying amount allocated to the part that is no longer recognised and the sum of the consideration received for the part no longer recognised and any cumulative gain/loss allocated to it that had been recognised in OCI is recognised in the Statement of Profit and Loss. A cumulative gain/loss that had been recognised in OCI is allocated between the part that continues to be recognised and the part that is no longer recognised on the basis of the relative fair values of those parts. This does not apply for equity investments designated as measured at FVTOCI, as the cumulative gain/loss previously recognised in OCI is not subsequently reclassified to the Statement of Profit and Loss.
Write off Loans and debt securities are written off when the Group
has no reasonable expectations of recovering the financial asset (either in its entirety or a portion of it). This is the case when the Group determines that the borrower does not have assets or sources of income that could generate sufficient cash flows to repay the amounts subject to the write-off. A write-off constitutes a derecognition event. The Group may apply enforcement activities to financial assets written off. Recoveries resulting from the Group’s enforcement activities will result in impairment gains.
Presentation of allowance for ECL in the Balance Sheet Loss allowances for ECL are presented in the Balance Sheet
as follows:
• for financial assets measured at amortised cost: as a deduction from the gross carrying amount of the assets;
• for debt instruments measured at FVTOCI: no loss allowance is recognised in the Balance Sheet as the carrying amount is at fair value.
where a financial instrument includes both a drawn and an undrawn component, and the Group cannot identify the ECL on the loan commitment component separately from those on the drawn component: The Group presents a combined loss allowance for both components. The
combined amount is presented as a deduction from the gross carrying amount of the drawn component.
Financial Liabilities and Equity Instruments: Classification as Debt or Equity: Debt and equity instruments, issued by the Group, are
classified as either financial liabilities or as equity, in accordance with the substance of the contractual arrangements and the definitions of a financial liability and an equity instrument.
Equity Instruments: An equity instrument is any contract that evidences a
residual interest in the assets of the Group after deducting all of its liabilities. Equity instruments issued by the Group are recognised at the proceeds received, net of direct issue costs.
Financial Liabilities: Financial liabilities are classified, at initial recognition as
fair value through profit or loss:
• Loans and borrowings,
• Payables, or
• as derivatives designated as hedging instruments in an effective hedge, as appropriate.
All financial liabilities are recognised initially at fair value, and in the case of loans and borrowings and payables are recognised net of directly attributable transaction costs.
The Group’s financial liabilities include trade and other payables, loans and borrowings, including bank overdrafts, financial guarantee contracts and derivative financial instruments.
Subsequent Measurement: The measurement of financial liabilities depends on their
classification, as described below:
Financial Liabilities at FVTPL: Financial liabilities at FVTPL include financial liabilities
held for trading and financial liabilities designated upon initial recognition as at FVTPL. Financial liabilities are classified as held for trading, if they are incurred for the purpose of repurchasing in the near term. This category also includes derivative financial instruments entered into by the Group, that are not designated as hedging instruments in hedge relationships as defined by Ind AS 109. Separated embedded derivatives are also classified as held for trading, unless they are designated as effective hedging instruments.
336 Grasim Industries Limited
Notesforming part of the Consolidated Financial Statements for the year ended 31st March 2021
Gains or losses on liabilities held for trading are recognised in the Statement of Profit and Loss.
Financial liabilities, designated upon initial recognition at FVTPL, are designated as such at the initial date of recognition, and only if the criteria in Ind AS 109 are satisfied.
Loans and Borrowings: After initial recognition, interest-bearing loans and
borrowings are subsequently measured at amortised cost using the Effective Interest Rate (EIR) method. Gains and losses are recognised in the Statement of Profit and Loss, when the liabilities are derecognised as well as through the EIR amortisation process.
Amortised Cost is calculated by taking into account any discount or premium on acquisition and fees or costs that are an integral part of the EIR. The EIR amortisation is included as finance costs in the Statement of Profit and Loss.
Financial Guarantee Contracts: Financial guarantee contracts issued by the Group, are
those contracts that require a payment to be made to reimburse the holder for a loss it incurs, because the specified debtor fails to make a payment when due, in accordance with the terms of a debt instrument. Financial guarantee contracts are recognised initially as a liability at fair value, adjusted for transaction costs that are directly attributable to the issuance of the guarantee. Subsequently, the liability is measured at the higher of the amount of loss allowance determined as per the impairment requirements of Ind AS 109, and the amount recognised less cumulative amortisation.
De-recognition of Financial Liabilities: The Group de-recognises financial liabilities when and only
when, the Group’s obligations are discharged, cancelled or have expired. The difference between the carrying amount of the financial liability de-recognised and the consideration paid and payable is recognised in Statement of Profit and Loss.
Embedded Derivatives: An embedded derivative is a component of a hybrid
(combined) instrument, that also includes a non-derivative host contract – with the effect that some of the cash flows of the combined instrument vary in a way similar to a stand-alone derivative. An embedded derivative causes some or all of the cash flows that would otherwise be required by the contract to be modified according to a specified interest rate, financial instrument price, commodity price,
foreign exchange rate, index of prices or rates, credit rating or credit index, or other variable, provided in the case of a non-financial variable, that the variable is not specific to a party to the contract. Re-assessment only occurs if there is either a change in the terms of the contract that significantly modifies the cash flows, that would otherwise be required or a re-classification of a financial asset out of the fair value through profit or loss. If the hybrid contract contains a host that is a financial asset within the scope of Ind AS 109, the Company does not separate the embedded derivatives. Rather, it applies the classification requirements contained in Ind AS 109 to the entire hybrid contract. Derivatives embedded in all other host contracts are accounted for as separate derivatives and recorded at fair value, if their economic characteristics and risks are not closely related to those of the host contracts, and the host contracts are not held for trading or designated at fair value though profit or loss. These embedded derivatives are measured at fair value with changes in fair value recognised in profit or loss, unless designated as effective hedging instruments.
Offsetting of Financial Instruments: Financial assets and financial liabilities are offset and the
net amount is reported in the Balance Sheet, if there is a currently enforceable legal right to offset the recognised amounts and there is an intention to settle on a net basis, to realise the assets and settle the liabilities simultaneously.
1.26 Revenue Recognition:(a) Revenue from Contracts with Customers
• Revenue is recognised on the basis of approved contracts regarding the transfer of goods or services to a customer for an amount that reflects the consideration to which the entity expects to be entitled in exchange for those goods or services.
• Revenue is measured at the fair value of consideration received or receivable taking into account the amount of discounts, incentives, volume rebates, outgoing taxes on sales. Any amounts receivable from the customer are recognised as revenue after the control over the goods sold are transferred to the customer which is generally on dispatch of goods.
• Variable consideration - This includes incentives, volume rebates, discounts etc. It is estimated at contract inception considering the terms of various schemes with customers and constrained until it is highly probable that a significant revenue reversal in the amount of cumulative revenue recognised will not occur when the associated uncertainty with the variable consideration is subsequently resolved. It is reassessed at end of each reporting period.
337Integrated Annual Report 2020-21
Integrated ReportStatutory Reports
Financial statements
Notesforming part of the Consolidated Financial Statements for the year ended 31st March 2021
• Significant financing component - Generally, the Company receives short-term advances from its customers. Using the practical expedient in Ind AS 115, the Company does not adjust the promised amount of consideration for the effects of a significant financing component if it expects, at contract inception, that the period between the transfer of the promised good or service to the customer and when the customer pays for that good or service will be one year or less.
(b) Revenue from services are recognised as they are rendered based on agreements/arrangements with the concerned parties and recognised net of Service Tax or Goods and Service Tax (GST).
(c) If only one service is identified, the Group recognises revenue when the service is performed. If an ongoing service is identified, as a part of the agreement the period over which revenue is recognised for that service generally determined by the terms of agreement with the customer. For practical purposes, where services are performed by an indeterminate number of acts over a specified period of time, revenue is recognised on a straight line basis over the specified period unless there is evidence that some other method better represents the stage of completion. When a specific act in much more significant than any other acts, the recognition of revenue is postponed until the significant act is executed.
(d) Dividend income is accounted for when the right to receive the income is established.
(e) For all financial instruments measured at amortised cost or at fair value through Other Comprehensive Income, interest income is recorded using the effective interest rate (EIR), which is the rate that exactly discounts the estimated future cash payments or receipts through the expected life of the financial instrument to the gross carrying amount of the financial asset.
(f) Insurance, railway and other claims, where quantum of accruals cannot be ascertained with reasonable certainty, are accounted on acceptance basis.
For Life Insurance Business, revenue is recognised as follows:
Premium Income of Insurance Business: Premium income on Insurance contracts and Investment
Contracts with Discretionary Participative Feature (DPF) is recognised as income when due from policyholders. For unit-linked business, premium income is recognised when the associated units are created. Premium on lapsed
policies is recognised as income when such policies are reinstated. In case of linked business, top - up premium paid by policyholders are considered as single premium and are unitised as prescribed by the regulations. This premium is recognised when the associated units are created.
Fees and Commission Income of Insurance Business: Insurance and investment contract policyholders are
charged for policy administration services, investment management services, surrenders and other contract fees. These fees are recognised as revenue over the period in which the related services are performed. If the fees are for services provided in future periods, then they are deferred and recognised over those future periods.
Reinsurance Premium Reinsurance premium ceded is accounted for at the time
of recognition of the premium income in accordance with the terms and conditions of the relevant treaties with the re-insurers. Impact on account of subsequent revisions to or cancellations of premium is recognised in the year in which they occur.
For Health Insurance Business, Revenue is recognised as follows:
Gross Premium Premium (net of service tax) in respect of insurance
contracts is recognised as income over the contract period or the period of risk, whichever is appropriate, after adjusting for reserve for unexpired risk. Any subsequent revisions to or cancellations of premiums are recognised in the year in which they occur
Reinsurance Premium Premium (net of service tax) in respect of insurance
contracts is recognised as income over the contract period or the period of risk, whichever is appropriate, after adjusting for reserve for unexpired risk. Any subsequent revisions to or cancellations of premiums are recognised in the year in which they occur.
Income from items other than to which Ind AS 109 Financial Instruments and Ind AS 104 Insurance contracts are applicable
Revenue (other than for those items to which Ind AS 109 Financial Instruments are applicable) is measured at fair value of the consideration received or receivable. Ind AS 115 Revenue from contracts with customers outlines a single comprehensive model of accounting for revenue arising from contracts with customers and supersedes current revenue recognition guidance found within Ind ASs.
338 Grasim Industries Limited
Notesforming part of the Consolidated Financial Statements for the year ended 31st March 2021
The Group recognises revenue from contracts with customers based on a five step model as set out in Ind AS 115:
Step 1: Identify contract(s) with a customer: A contract is defined as an agreement between two or more parties that creates enforceable rights and obligations and sets out the criteria for every contract that must be met.
Step 2: Identify performance obligations in the contract: A performance obligation is a promise in a contract with a customer to transfer a good or service to the customer.
Step 3: Determine the transaction price: The transaction price is the amount of consideration to which the Group expects to be entitled in exchange for transferring promised goods or services to a customer, excluding amounts collected on behalf of third parties.
Step 4: Allocate the transaction price to the performance obligations in the contract: For a contract that has more than one performance obligation, the Group allocates the transaction price to each performance obligation in an amount that depicts the amount of consideration to which the Group expects to be entitled in exchange for satisfying each performance obligation.
Step 5: Recognise revenue when (or as) the Group satisfies a performance obligation
1.27 Leases: The Group assesses whether a contract contains a lease,
at the inception of the contract. A contract is, or contains, a lease if the contract conveys the right to control the use of an identified asset for a period of time in exchange for consideration, To assess whether a contract conveys the right to control the use of an identified asset, the Company assesses whether
• the contract involves the use of identified asset;
• the Company has substantially all of the economic benefits from the use of the asset through the period of lease and;
• the Company has the right to direct the use of the asset.
As a lessee The Group recognises a right-of-use asset and a lease
liability at the lease commencement date. The right-of-use asset is initially measured at cost, which comprises the initial amount of the lease liability adjusted for any lease payments made at or before the commencement date, plus any initial direct costs incurred and an estimate
of costs to dismantle and remove the underlying asset or to restore the underlying asset or the site on which it is located, less any lease incentives received.
The right-of-use asset is subsequently depreciated using the straight-line method from the commencement date to the earlier of the end of the useful life of the right-of-use asset or the end of the lease term. The estimated useful lives of right-of-use assets are determined on the same basis as those of property and equipment. In addition, the right-of-use asset is periodically reduced by impairment losses, if any, and adjusted for certain re-measurements of the lease liability.
The lease liability is initially measured at the present value of the lease payments that are not paid at the commencement date, discounted using the interest rate implicit in the lease or, if that rate cannot be readily determined, company’s incremental borrowing rate. Generally, the company uses its incremental borrowing rate as the discount rate.
• Lease payments included in the measurement of the lease liability comprise the following:
• Fixed payments, including in-substance fixed payments;
• Variable lease payments that depend on an index or a rate, initially measured using the index or rate as at the commencement date;
• Amounts expected to be payable under a residual value guarantee; and
• The exercise price under a purchase option that the company is reasonably certain to exercise, lease payments in an optional renewal period if the company is reasonably certain to exercise an extension option, and penalties for early termination of a lease unless the company is reasonably certain not to terminate early
The lease liability is measured at amortised cost using the effective interest method. It is remeasured when there is a change in future lease payments arising from a change in an index or rate, if there is a change in the company’s estimate of the amount expected to be payable under a residual value guarantee, or if company changes its assessment of whether it will exercise a purchase, extension or termination option.
When the lease liability is remeasured in this way, a corresponding adjustment is made to the carrying amount of the right-of-use asset or is recorded in profit or loss if the carrying amount of the right-of-use asset has been reduced to zero.
339Integrated Annual Report 2020-21
Integrated ReportStatutory Reports
Financial statements
Notesforming part of the Consolidated Financial Statements for the year ended 31st March 2021
Covid-19 related Rent Concessions The amendments provide relief to lessees from applying
Ind AS 116 guidance on lease modification accounting for rent concessions arising as a direct consequence of the Covid-19 pandemic. As a practical expedient, a lessee may elect not to assess whether a Covid-19 related rent concession from a lessor is a lease modification. A lessee that makes this election accounts for any change in lease payments resulting from the Covid-19 related rent concession the same way it would account for the change under Ind AS 116 if the change were not a lease modification. The amendments are applicable for annual reporting periods beginning on or after the 1st April 2020.
Short-term leases and leases of low-value assets The Group has elected not to recognise right-of-use assets
and lease liabilities for short-term leases that have a lease term of 12 months or lower and leases of low value assets. The company recognises the lease payments associated with these leases as an expense on a straight-line basis over the lease term.
As a lessor: The Group is not required to make any adjustments on
transition to Ind AS 116 for leases in which it acts as a lessor, except for a sub - lease. The Company accounted for its sub leases in accordance with Ind AS 116 from the date of initial application.
Leasehold Assets Depreciation Leasehold Land and Buildings - Over the period of Lease
1.28 Benefits Paid (Including Claims): For Life Insurance Business Claims and Benefits Paid Gross benefits and claims for life insurance contracts and
for investment contracts with DPF include the cost of all claims arising during the year including internal and external claims handling costs that are directly related to the processing and settlement of claims and policyholder bonuses declared on DPF contracts as well as changes in the gross valuation of insurance and investment contract liabilities with DPF.
Death and other claims are accounted for, when notified. Survival and maturity benefits are accounted when due. Surrenders/Withdrawals under linked - policies are accounted in the respective schemes when the associated units are cancelled. Repudiated claims disputed before judicial authorities are provided for based on Management prudence considering the facts and evidences available, in respect of such claims.
Reinsurance Claims: Reinsurance claims are recognised when the related gross
insurance claim is recognised according to the terms of the relevant contract.
For Health Insurance Business Gross Claims Incurred for Health Insurance Business Claims incurred comprises of claims paid, change in
estimated liability for outstanding claims made following a loss occurrence reported, change in estimated liability for claims incurred but not reported (IBNR) and claims incurred but not enough reported (IBNER) and specific settlement costs comprising legal and investigation fees and other directly attributable expenses.
The provision is made for estimated value of outstanding claims at the Balance Sheet date on the basis of the ultimate amounts that are likely to be paid on each claim, established by the Management in light of past experience and progressively modified for changes as appropriate, on availability of further information and include claim settlement costs likely to be incurred to settle outstanding claims.
Claims are recognised on the date of intimation based on estimates from surveyors/insured in the respective revenue accounts.
The estimated liability for claims incurred but not reported (IBNR) and claims incurred but not enough reported (IBNER) has been estimated by the Appointed Actuary generally accepted actuarial methods for each product category as considered appropriate depending upon the availability of past data as well as appropriateness of the different methods to the different lines of businesses.
Reinsurance Claims Reinsurance claims are recognised when the related gross
insurance claim is recognised according to the terms of the relevant contract.
1.29 Acquisition Costs: Acquisition costs are costs that vary with and are primarily
related to acquisition of insurance contracts. Acquisition costs mainly consists of commission, medical costs, policy printing expenses, stamp duty and other related expenses. These costs are expensed in the year in which they are incurred. Claw-back of the first year commission paid, if any, in future is accounted in the year in which it is recovered.
340 Grasim Industries Limited
Notesforming part of the Consolidated Financial Statements for the year ended 31st March 2021
1.30 Policy Liabilities: Insurance Contracts: The policy liabilities are calculated in accordance with the
accepted actuarial practice, requirements of Insurance Act, 1938, Regulations notified by the Insurance Regulatory and Development Authority of India, and Practice Standards prescribed by the Institute of Actuaries of India.
Investment Contracts: Liability in respect on Investment Contracts is recognised
in accordance with IND AS 104 Insurance Contracts, taking into account accepted actuarial practices.
1.31 Deferred Acquisition Cost (DAC)/Deferment Origination Fees (DOF):
The Group has identified commission, rewards and recognition paid to its agents pertaining to 1st year as acquisition costs. Such acquisition costs are amortised over the period of the policy contract.
The origination fees for Investment Contracts, being premium allocation charges pertaining to the 1st, 2nd and 3rd year have been deferred over the period of the policy contract.
Acquisition cost and Origination fees is deferred only for Investment Contracts.
1.32 Re-insurance Assets: Reinsurance Asset, being net contractual rights receivable
under re-insurance contract, has been recognised on the basis of Actuarial valuation.
1.33 Borrowing Costs: Borrowing cost includes interest expense, amortisation
of discounts, hedge - related cost incurred in connection with foreign currency borrowings, ancillary costs incurred in connection with borrowing of funds and exchange difference, arising from foreign currency borrowings, to the extent they are regarded as an adjustment to the interest cost.
Borrowing costs, that are attributable to the acquisition or construction or production of a qualifying asset, are capitalised as part of the cost of such asset till such time the asset is ready for its intended use. A qualifying asset is an asset that necessarily takes a substantial period of time to get ready for its intended use. All other borrowing costs are recognised as an expense in the period in which they are incurred.
Investment income earned on the temporary investment of specific borrowings, pending their expenditure on qualifying assets, is deducted from the borrowing costs
eligible for capitalisation. All other borrowing costs are recognised in the Statement of Profit and Loss in the period in which they are incurred.
1.34 Government Grants and Subsidies: Government grants are recognised when there is a
reasonable assurance that the same will be received and all attached conditions will be complied with. When the grant relates to an expense item, it is recognised in the Statement of Profit and Loss by way of a deduction to the related expense on a systematic basis over the periods that the related costs, for which it is intended to compensate, are expensed. When the grant relates to an asset, it is recognised as income on a systematic basis over the expected useful life of the related asset.
Government grants, that are receivable towards capital investments under State Investment Promotion Scheme, are recognised in the Statement of Profit and Loss when they become receivable.
The benefit of a government loan at a below-market rate of interest is treated as a government grant, measured as the difference between proceeds received and the fair value of the loan based on prevailing market interest rates, and is being recognised in the Statement of Profit and Loss.
When the Group receives grants of non-monetary assets, the asset and the grant are recorded at fair value amounts and released to profit or loss over the expected useful life in a pattern of consumption of the benefit of the underlying asset.
1.35 Exceptional Item: Exceptional items include income or expense that are
considered to be part of ordinary activities, however, are of such significance and nature that separate disclosure enables the user of Financial Statements to understand the impact in a more meaningful manner Exceptional items are identified by virtue of either their size or nature so as to facilitate comparison with prior periods and to assess underlying trends in the financial performance of the Company.
1.36 Provision for Current and Deferred Tax: Current Income Tax: Current income tax assets and liabilities are measured
at the amount expected to be recovered from or paid to the taxation authorities. The tax rates and tax laws used to compute the amount are those that are enacted or substantively enacted, at the reporting date, in the countries where the Group operates and generates taxable income.
341Integrated Annual Report 2020-21
Integrated ReportStatutory Reports
Financial statements
Notesforming part of the Consolidated Financial Statements for the year ended 31st March 2021
Current income tax, relating to items recognised outside of statement of profit and loss, is recognised outside profit or loss (either in Other Comprehensive Income or in other equity). Current tax items are recognised in correlation to the underlying transaction either in OCI or directly in other equity. The management periodically evaluates positions taken in the tax returns with respect to situations in which applicable tax regulations are subject to interpretation and established provisions, where appropriate.
Deferred Tax: Deferred tax is provided using the liability method on
temporary differences between the tax bases of assets and liabilities, and their carrying amounts for financial reporting purposes at the reporting date.
Deferred tax liabilities are recognised for all taxable temporary differences, except:
When the deferred tax liability arises from the initial recognition of goodwill or an asset or liability in a transaction that is not a business combination and, at the time of the transaction, affects neither the accounting profit nor taxable profit or loss.
In respect of taxable temporary differences associated with investments in subsidiaries, associates and interests in joint ventures, when the timing of the reversal of the temporary differences can be controlled and it is probable that the temporary differences will not reverse in the foreseeable future.
Deferred tax assets are recognised for all deductible temporary differences, the carry forward of unused tax credits and any unused tax losses. Deferred tax assets are recognised to the extent that it is probable that taxable profit will be available, against which the deductible temporary differences, and the carry forward of unused tax credits and unused tax losses can be utilised, except:
• When the deferred tax asset relating to the deductible temporary difference arises from the initial recognition of an asset or liability in a transaction that is not a business combination and, at the time of the transaction, affects neither the accounting profit nor taxable profit or loss.
• In respect of deductible temporary differences associated with investments in subsidiaries, associates and interests in joint ventures, deferred tax assets are recognised only to the extent that it is probable that the temporary differences will reverse in the foreseeable future and taxable profit will be available against which the temporary differences can be utilised.
The carrying amount of deferred tax assets is reviewed at each reporting date and reduced to the extent that it is no longer probable that sufficient taxable profit will be available to allow all or part of the deferred tax asset to be utilised. Unrecognised deferred tax assets are re-assessed at each reporting date, and are recognised to the extent that it has become probable that future taxable profits will allow the deferred tax asset to be recovered.
Deferred tax assets and liabilities are measured at the tax rates that are expected to apply in the year when the asset is realised or the liability is settled, based on tax rates (and tax laws), that have been enacted or substantively enacted at the reporting date.
Deferred tax, relating to items recognised outside profit or loss, is recognised outside profit or loss (either in Other Comprehensive Income or in other equity). Deferred tax items are recognised in correlation to the underlying transaction either in OCI or directly in other equity. Deferred tax assets and deferred tax liabilities are offset, if a legally enforceable right exists to set off current tax assets against current tax liabilities, and the deferred taxes relate to the same taxable entity and the same taxation authority.
Tax benefits acquired as part of a business combination, but not satisfying the criteria for separate recognition at that date, are recognised subsequently if new information about facts and circumstances change. Acquired deferred tax benefits recognised within the measurement period reduce goodwill related to that acquisition if they result from new information obtained about facts and circumstances existing at the acquisition date. If the carrying amount of goodwill is zero, any remaining deferred tax benefits are recognised in OCI / capital reserve depending on the principle explained for bargain purchase gains. All other acquired tax benefits realised are recognised in profit or loss.
1.37 Minimum Alternate Tax (MAT): MAT is recognised as an asset only when and to the extent
there is convincing evidence that the Group will pay normal Income Tax during the specified period. In the year in which the MAT credit becomes eligible to be recognised, it is credited to the Statement of Profit and Loss and is considered as MAT Credit Entitlement. The Group reviews the same at each Balance Sheet date and writes down the carrying amount of MAT Credit Entitlement to the extent that there is no longer convincing evidence to the effect that the Group will pay normal Income Tax during the specified period. Minimum Alternate Tax (MAT) Credit are in the form of unused tax credits, that are carried
342 Grasim Industries Limited
Notesforming part of the Consolidated Financial Statements for the year ended 31st March 2021
forward by the Group for a specified period of time, hence, it is presented with Deferred Tax Asset.
1.38 Provisions and Contingent Liabilities: Provisions are recognised when the Group has a present
obligation (legal or constructive), as a result of a past event, it is probable that the Group will be required to settle the obligation, and a reliable estimate can be made of the amount of the obligation.
If the effect of the time value of money is material, provisions are determined by discounting the expected future cash flows to the net present value using an appropriate pre-tax discount rate that reflects current market assessments of the time value of money and, where appropriate, the risks specific to the liability.
A present obligation that arises from past events, where it is either not probable that an outflow of resources will be required to settle or a reliable estimate of the amount cannot be made, is disclosed as a contingent liability. Contingent liabilities are also disclosed when there is a possible obligation arising from past events, the existence of which will be confirmed only by the occurrence or non-occurrence of one or more uncertain future events, not wholly within the control of the Group.
Claims against the Group, where the possibility of any outflow of resources in settlement is remote, are not disclosed as contingent liabilities.
Contingent assets are not recognised in the financial statements since this may result in the recognition of income that may never be realised. However, when the realisation of income is virtually certain, then the related asset is not a contingent asset, and is recognised.
Warranty Provisions: Provisions for warranty-related costs are recognised as
an expense in the Statement of Profit and Loss when the product is sold or service provided to the customer. Initial recognition is based on historical experience. The initial estimate of warranty-related costs is revised annually.
1.39 Mines Restoration Provisions: An obligation for restoration, rehabilitation and
environmental costs arises when environmental disturbance is caused by the development or ongoing extraction from mines. Costs, arising from restoration at closure of the mines and other site preparation work, are provided for based on their discounted net present value, with a corresponding amount being capitalised at the start
of each project. The amount provided for is recognised, as soon as the obligation to incur such costs arises. These costs are charged to the Statement of Profit and Loss over the life of the operation through the depreciation of the asset and the unwinding of the discount on the provision. The costs are reviewed periodically and are adjusted to reflect known developments, which may have an impact on the cost or life of operations. The cost of the related asset is adjusted for changes in the provision due to factors such as updated cost estimates, new disturbance and revisions to discount rates. The adjusted cost of the asset is depreciated prospectively over the lives of the assets to which they relate. The unwinding of the discount is shown as a finance cost in the Statement of Profit and Loss.
1.40 Segment Reporting: Identification of Segments: Operating Segments are identified based on monitoring
of operating results by the chief operating decision maker (CODM) separately for the purpose of making decision about resource allocation and performance assessment. Segment performance is evaluated based on profit or loss, and is measured consistently with profit or loss of the Group.
Operating Segment is identified based on the nature of products and services, the different risks and returns, and the internal business reporting system.
Segment Policies: The Group prepares its segment information in conformity
with the accounting policies adopted for preparing and presenting the financial statements of the Group as a whole.
Further, inter-segment revenue has been accounted for based on the transaction price agreed to between segments, which is primarily market based.
Unallocated Corporate Items include general corporate income and expenses, which are not attributable to segments.
1.41 Goodwill on Consolidation: Goodwill represents the difference between the Group’s
share in the net worth of Subsidiaries and Joint Ventures, and the cost of acquisition at each point of time of making the investment in the Subsidiaries and Joint Ventures. For this purpose, the Group’s share of net worth is determined on the basis of the latest financial statements, prior to the acquisition after making necessary adjustments
343Integrated Annual Report 2020-21
Integrated ReportStatutory Reports
Financial statements
Notesforming part of the Consolidated Financial Statements for the year ended 31st March 2021
for material events between the date of such financial statements and the date of respective acquisition.
Goodwill that arises out of consolidation is tested for impairment at each reporting date. For the purpose of impairment testing, goodwill is allocated to the respective cash- generating unit (‘CGU’). The impairment loss is recognised if the recoverable amount of the CGU is higher of its value in use and fair value less cost to sell. Impairment losses are immediately recognised in the Statement of Profit and Loss.
1.42 Earnings Per Share (EPS): Basic earnings per share are calculated by dividing the net
profit for the year attributable to equity shareholders by the weighted-average number of equity shares outstanding during the period. The weighted-average number of equity shares outstanding during the period and for all periods presented is adjusted for events such as bonus issue; bonus element in a rights issue to existing shareholders; share split; and reverse share split (consolidation of shares) that have changed the number of equity shares outstanding, without a corresponding change in resources.
For the purpose of calculating diluted earnings per share, the net profit or loss for the year attributable to equity shareholders and the weighted-average number of shares outstanding during the period are adjusted for the effects of all dilutive potential equity shares.
1.43 Significant Accounting Judgements, Estimates and Assumptions:
The preparation of financial statements, in conformity, with the Ind AS requires the judgements, estimates and assumptions to be made, that affect the reported amounts of assets and liabilities on the date of the financial statements, the reported amounts of revenues and expenses during the reporting period and the disclosures relating to contingent liabilities as of the date of the financial statements. Although, these estimates are based on the Management’s best knowledge of current events and actions, uncertainty about these assumptions and estimates could result in outcomes different from the estimates. Difference between actual results and estimates are recognised in the period in which the results are known or materialise. Estimates and underlying assumptions are reviewed on an ongoing basis. Any revision to the accounting estimates is recognised prospectively in the current and future periods.
The key assumptions concerning the future and other key sources of estimation uncertainty at the reporting date, that have a significant risk of causing a material adjustment to the carrying amounts of assets and
liabilities within the next financial year, are described below. The Company based its assumptions and estimates on parameters available when the financial statements were prepared. Existing circumstances and assumptions about future developments, however, may change due to market changes or circumstances arising that are beyond the control of the Company. Such changes are reflected in the assumptions when they occur.
(a) Judgements: In the process of applying the Group’s accounting
policies, the Management has made the following judgements, which have the most significant effect on the amounts recognised in the consolidated financial statements.
Classification of Aditya Birla Sun Life AMC Limited, Aditya Birla Sun Life Trustee Company Private Limited, Aditya Birla Wellness Limited and Aditya Birla Power Composites Limited as Joint Ventures.
1. Aditya Birla Capital Limited, a subsidiary of the Company, holds either directly or through its subsidiaries, more than half of the equity shareholding in the following entities. However, as per the shareholders’ agreement, the Group needs to jointly decide with other shareholders of the respective entity on certain relevant activities. Hence, these entities have been consolidated as per equity method of accounting:
a) Aditya Birla Sun Life AMC Limited
b) Aditya Birla Sun Life Trustee Company Private Limited
c) Aditya Birla Wellness Limited.
2. The Company holds more than half of the equity shareholding in the Aditya Birla Power Composites Limited. However, as per the shareholders’ agreement, the Company needs to jointly decide with other shareholders of the respective entity on certain relevant activities. Hence, these entities have been consolidated as per equity method of accounting:
a) Aditya Birla Power Composites Limited
Classification of Madanpur (North) Coal Company Limited as Investment in an Associate:
A Joint Venture company (JV), “Madanpur (North) Coal Company Limited”, was formed by allocatees of Madanpur North Coal Block. As per Ind AS 111, when all the parties or a group of parties considered collectively are able to direct the activities that significantly affect the returns of the arrangement (i.e., the relevant activities), the parties
344 Grasim Industries Limited
Notesforming part of the Consolidated Financial Statements for the year ended 31st March 2021
control the arrangement collectively. Also, joint control exists only when decisions about the relevant activities require the unanimous consent of all the parties. In terms of the JV agreement between the parties, each JV partner has the right to nominate one director on the Board of the Joint Venture company and major decisions shall be taken by a majority of 75% of the directors present. Since there is no unanimous consent required from the parties, in the judgement of the Management, the Company does not have joint control over the JV. However, considering the Company’s representation in the Board and the extent of its ability to exercise the influence over the decision over the relevant activities, the JV has been considered as an associate and accounted under the equity method.
(b) Estimates and Assumptions: The key assumptions concerning the future and other
key sources of estimation uncertainty at the reporting date, that have a significant risk of causing a material adjustment to the carrying amounts of assets and liabilities within the next financial year, are described below. The Group based its assumptions and estimates on parameters available when the financial statements were prepared. Existing circumstances and assumptions about future developments, however, may change due to market changes or circumstances arising that are beyond the control of the Group. Such changes are reflected in the assumptions when they occur.
i. Estimation of Uncertainties Relating to Global Health Pandemic from COVID-19:
The Company has considered the possible effects that may result from the pandemic relating to COVID-19 on the carrying amounts of receivables, intangibles, investments and other assets. In developing the assumptions relating to the possible future uncertainties in the economic conditions because of this pandemic, the Company has used internal and external sources of information. The Company has reviewed the assumptions used and based on current estimates expects the carrying amount of these assets will be recovered. The impact of COVID-19 on the Company’s financial statements may differ from that estimated as at the date of approval of these financial statements, and the Company will continue to closely monitor any material changes to future economic conditions.
ii. Classification of Lease Ind AS 116: Ind AS 116 Leases requires a lessee to determine the
lease term as the non-cancellable period of a lease adjusted with any option to extend or terminate the lease, if the use of such option is reasonably certain. The Company makes an assessment on the expected lease term on lease by lease basis and thereby assesses whether it is reasonably certain that any options to extend or terminate the contract will be exercised. In evaluating the lease term, the Company considers factors such as any significant leasehold improvements undertaken over the lease term, costs relating to the termination of lease and the importance of the underlying lease to the Company’s operations taking into account the location of the underlying asset and the availability of the suitable alternatives. The lease term in future periods is re-assessed to ensure that the lease term reflects the current economic circumstances. The discount rate is generally based on the incremental borrowing rate specific to the lease being evaluated or for a portfolio of leases with similar characteristics.
iii. Useful Lives of Property, Plant and Equipment and Intangible Assets:
The Group uses its technical expertise along with historical and industry trends for determining the economic life of an asset/component of an asset. The useful lives are reviewed by the Management periodically and revised, if appropriate. In case of a revision, the unamortised depreciable amount is charged over the remaining useful life of the assets.
iv. Mines Restoration Obligation: In determining the fair value of the Mines Restoration
Obligation, assumptions and estimates are made in relation to discount rates, the expected cost of mines restoration and the expected timing of those costs.
v. Measurement of Defined Benefit Obligations: The cost of the defined benefit gratuity plan and
the present value of the gratuity obligation are determined using actuarial valuations. An actuarial valuation involves making various assumptions that may differ from actual developments in the future. These include the determination of the discount
345Integrated Annual Report 2020-21
Integrated ReportStatutory Reports
Financial statements
Notesforming part of the Consolidated Financial Statements for the year ended 31st March 2021
rate, future salary increases and mortality rates. Due to the complexities involved in the valuation and its long-term nature, a defined benefit obligation is highly sensitive to changes in these assumptions. All assumptions are reviewed at each reporting date.
vi. Deferred Tax Assets/Deferred Tax Liabilities: Pursuant to the announcement of the changes
in the corporate tax regime, the companies have an option to either opt for the new tax regime or continue to pay taxes as per the old applicable tax structure together with the other benefits available to the companies including utilisation of the MAT credit available. This requires significant estimation in determining in which year the Company would migrate to the new tax regime basis future year’s taxable profits including the impact of ongoing expansion plans of the Company and consequential utilisation of available MAT credit. Accordingly, in accordance with Ind AS 12 - Income Taxes, deferred tax assets and liabilities are required to be measured at the tax rates that are expected to apply to the year when the asset is realised or the liability is settled, based on tax rates (and tax laws) that have been enacted or substantively enacted at the reporting date.
vii. Recognition and Measurement of Provisions and Contingencies:
Key assumptions about the likelihood and magnitude of an outflow of resources.
viii. Fair Value Measurement of Financial Instruments: When the fair value of financial assets and financial
liabilities recorded in the Balance Sheet cannot be measured based on quoted prices in active markets, their fair values are measured using valuation techniques including the Discounted Cash Flow (DCF) model. The inputs to these models are taken from observable market, where possible, but where this is not feasible, a degree of judgement is required in establishing fair values. Judgements include consideration of input, such as liquidity risk, credit risk and volatility. Changes in assumptions about these factors could affect the reported fair value of financial instruments.
ix. Share-Based Payments: The Group measures the cost of equity-settled
transactions with employees using Black-Scholes Model to determine the fair value of the liability incurred on the grant date. Estimating fair value for share-based payment transactions requires determination of the most appropriate valuation model, which is dependent on the terms and conditions of the grant.
This estimate also requires determination of the most appropriate inputs to the valuation model including the expected life of the share option, volatility and dividend yield and making assumptions about them.
The assumptions and models used for estimating fair value for share-based payment transactions are disclosed in Note 4.5.
x. Disposal Groups: The Company has used comparable market multiple
approach to assess the fair value of the disposal group of assets/liabilities.
Under the market multiple approach value of the equity shares of a company is arrived at by using multiples derived from valuations of comparable companies, as manifested through stock market valuations of listed companies, for which the Company has considered Enterprise Value/Revenue and Enterprise value/EBITDA multiples based on their market price and latest published financials.
xi. Litigations and Contingencies: The Company has ongoing litigations with various
regulatory authorities. Where an outflow of funds is believed to be probable and a reliable estimate of the outcome of the dispute can be made based on the Management’s assessment of specific circumstances of each dispute and relevant external advice,the Management provides for its best estimate of the liability. Such accruals are by nature complex and can take number of years to resolve and can involve estimation uncertainty. Information about
346 Grasim Industries Limited
Notesforming part of the Consolidated Financial Statements for the year ended 31st March 2021
such litigations is provided in Notes to the Financial Statements.
xii. Assessment of Impairment of Investments in Equity Accounted Investees:
The Company reviews its carrying value of investments in Equity Accounted Investees annually, or more frequently when there is indication for impairment. If the recoverable amount is less than its carrying amount, the impairment loss is accounted for. Determining whether the investments in equity accounted investees is impaired requires an estimate in the value in use of investments. The Management carries out impairment assessment for each investment by comparing the carrying value of each investment with the net worth of each company based on audited financials, comparable market price and comparing the performance of the investee companies with projections used for valuations, in particular those relating to the cash flows, sales growth rate, pre-tax discount rate and growth rates used and approved business plans.
xiii. Impairment of Non-Current Assets (Non-Financial):
At the end of each reporting period, the Group reviews the carrying amount of its tangible and intangible assets to determine whether there is any indication that those assets have suffered an impairment loss. If any such indication exists, the recoverable amount, which is the higher of the value in use or fair value less cost to sell, of the asset or cash generating unit, as the case may be, is estimated and impairment loss (if any) is recognised, and the carrying amount is reduced to its recoverable amount. In assessing the value in use, the estimated future cash flows are discounted to their present value using a pre-tax discount rate that reflects current market assessments of the time value of money and the risk specific to the assets for which the estimates of future cash flows have not been adjusted. When it is not possible to estimate the recoverable amount of an individual asset, the Company estimates the recoverable amount of the cash generating unit to which the asset belongs.
When an impairment loss subsequently reverses, the carrying amount of the asset or a cash generating unit is increased to the revised estimate of its recoverable amount, so that the increased carrying amount does not exceed the carrying amount that would have been determined has no impairment loss
been recognised for the asset (or cash generating unit) earlier.
Intangible assets with indefinite useful lives and intangible assets not yet available for use are tested for impairment, at least annually, and whenever there is an indication that the asset may be impaired.
xiv. Impairment of Financial Assets: The measurement of impairment losses across all
categories of financial assets requires judgement, in particular, the estimation of the amount and timing of future cash flows and collateral values when determining impairment losses and the assessment of a significant increase in credit risk. These estimates are driven by a number of factors, changes in which can result in different levels of allowances.
The Company’s ECL calculations are outputs of complex models with a number of underlying assumptions regarding the choice of variable inputs and their inter-dependencies. Elements of the ECL models, that are considered accounting judgements and estimates, include:
a. The Company’s internal credit grading model, which assigns PDs to the individual grades.
b. The Company’s criteria for assessing if there has been a significant increase in credit risk and so allowances for financial assets should be measured on a LTECL basis and the qualitative assessment.
c. The segmentation of financial assets when their ECL is assessed on a collective basis.
d. Development of ECL models, including the various formulas and the choice of inputs.
e. Determination of associations between macroeconomic scenarios and, economic inputs, such as unemployment levels and collateral values, and the effect on PDs, EADs and LGDs.
f. Selection of forward-looking macroeconomic scenarios and their probability weightings, to derive the economic inputs into the ECL models.
347Integrated Annual Report 2020-21
Integrated ReportStatutory Reports
Financial statements
Notesforming part of the Consolidated Financial Statements for the year ended 31st March 2021
It has been the Company’s policy to regularly review its models in the context of actual loss experience and adjust, when necessary.
xv. Business Combination: For the purpose of accounting of business
combination, following key judgements are made:
(a) Fair Valuation of Intangible Assets: The Company has used income approach
(example, relief from royalty, multi-period excess earnings method and incremental cash flows, etc.) for value analysis of intangible assets. The method estimates the value of future cash flows over the life of the Intangible assets accruing to the Company, by virtue of the transaction. The resulting post-tax cashflows for each of the years are recognised at their present value using a Weighted-Average Cost of Capital (‘WACC’) adjusted for risk of achieving the intangible assets projected savings.
(b) Fair Valuation of Tangible Assets: Freehold Land: Freehold land is fair valued using
the sales comparison method using prevailing rates of similar plots of land, circle rates provided by relevant regulatory authorities and other acceptable valuation techniques.
Leasehold Land: Leasehold land is valued basis the leasehold interest for the remaining duration of the lease.
Other Assets: The cost approach has been adopted for fair valuing all the assets. The cost approach includes calculation of replacement cost using price trends applied to historical cost and capitalisation of all the indirect cost, these trends are on the basis of price indices obtained from recognised sources.
(c) Fair Valuation of Loans: The fair value of loans given/borrowed has been
estimated by considering the cash flows, future credit losses and the rate of prepayments for each loan. Projected annual cash flows were then discounted to the present value based on a market rate for similar loans.
The allowance for loan losses, associated with the acquired loans, were evaluated by the Management, and recorded.
(d) Fair Valuation of Current Assets and Liabilities:
The current assets and liabilities are taken at fair value on the date of acquisition.
1.44 Cash Dividend to Equity Holders of the Group: The Group recognises a liability to make cash distributions
to equity holders of the Group when the distribution is authorised and the distribution is no longer at the discretion of the Group. As per the corporate laws in India, a distribution is authorised when it is approved by the shareholders. A corresponding amount is recognised directly in other equity.
348 Grasim Industries Limited
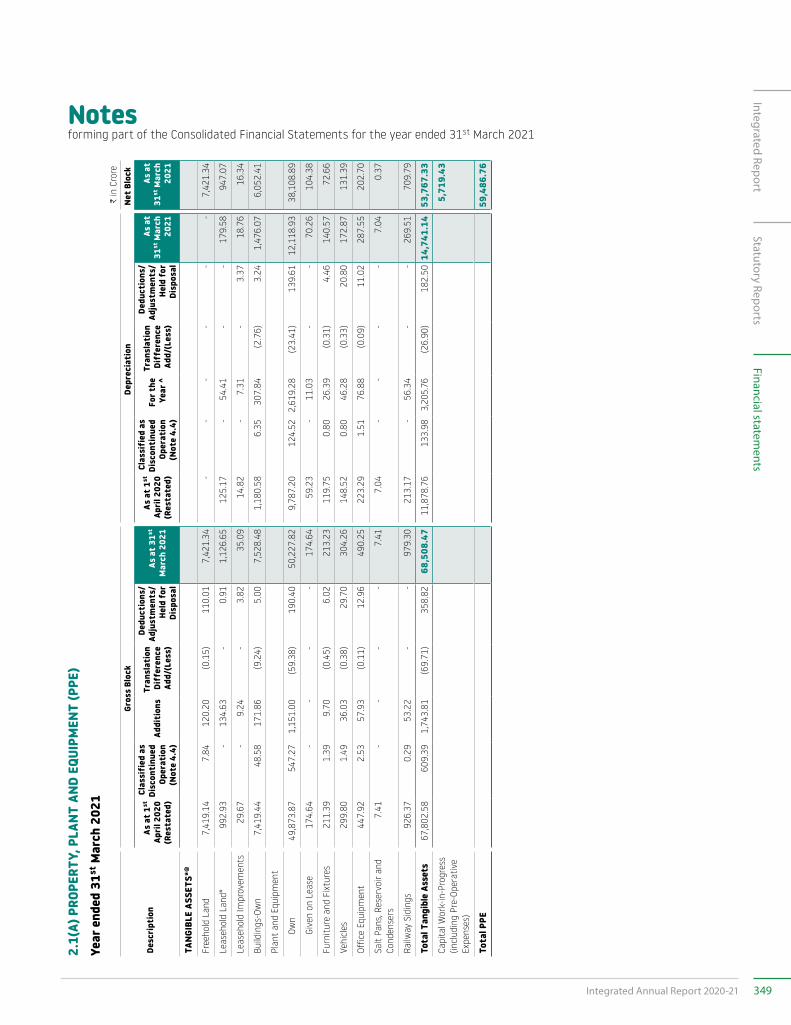
Notesforming part of the Consolidated Financial Statements for the year ended 31st March 2021
2.1(
A) P
ROPE
RTY,
PLA
NT A
ND E
QUIP
MEN
T (P
PE)
Year
end
ed 3
1st M
arch
202
1C in
Cro
re
Desc
ript
ion
Gros
s Bl
ock
Depr
ecia
tion
Net B
lock
As a
t 1st
Ap
ril 2
020
(Res
tate
d)
Clas
sifi
ed a
s Di
scon
tinu
ed
Oper
atio
n (N
ote
4.4)
Addi
tion
sTr
ansl
atio
n Di
ffer
ence
Ad
d/(L
ess)
Dedu
ctio
ns/
Adju
stm
ents
/ He
ld f
or
Disp
osal
As a
t 31st
M
arch
202
1
As a
t 1st
Ap
ril 2
020
(Res
tate
d)
Clas
sifi
ed a
s Di
scon
tinu
ed
Oper
atio
n (N
ote
4.4)
For t
he
Year
^
Tran
slat
ion
Diff
eren
ce
Add/
(Les
s)
Dedu
ctio
ns/
Adju
stm
ents
/ He
ld f
or
Disp
osal
As a
t 31
st M
arch
20
21
As a
t 31
st M
arch
20
21
TANG
IBLE
ASS
ETS*
@
Free
hold
Lan
d7,
419.
147.
8412
0.20
(0.1
5)11
0.01
7,42
1.34
--
--
--
7,42
1.34
Leas
ehol
d La
nd#
992.
93-
134.
63-
0.91
1,12
6.65
125.
17-
54.4
1-
-17
9.58
947.
07
Leas
ehol
d Im
prov
emen
ts29
.67
-9.
24-
3.82
35.0
914
.82
-7.
31-
3.37
18.7
616
.34
Build
ings
-Ow
n7,
419.
4448
.58
171.
86(9
.24)
5.00
7,52
8.48
1,18
0.58
6.35
307.
84(2
.76)
3.24
1,47
6.07
6,05
2.41
Plan
t an
d Eq
uipm
ent
Ow
n49
,873
.87
547.
271,
151.
00(5
9.38
)19
0.40
50,2
27.8
29,
787.
2012
4.52
2,61
9.28
(23.
41)
139.
6112
,118
.93
38,1
08.8
9
Gi
ven
on L
ease
174.
64-
--
-17
4.64
59.2
3-
11.0
3-
-70
.26
104.
38
Furn
iture
and
Fix
ture
s21
1.39
1.39
9.70
(0.4
5)6.
0221
3.23
119.
750.
8026
.39
(0.3
1)4.
4614
0.57
72.6
6
Vehi
cles
299.
801.
4936
.03
(0.3
8)29
.70
304.
2614
8.52
0.80
46.2
8(0
.33)
20.8
017
2.87
131.
39
Offic
e Eq
uipm
ent
447.
922.
5357
.93
(0.1
1)12
.96
490.
2522
3.29
1.51
76.8
8(0
.09)
11.0
228
7.55
202.
70
Salt
Pans
, Res
ervo
ir an
d Co
nden
sers
7.41
--
--
7.41
7.04
--
--
7.04
0.37
Railw
ay S
idin
gs92
6.37
0.29
53.2
2-
-97
9.30
213.
17-
56.3
4-
-26
9.51
709.
79
Tota
l Tan
gibl
e As
sets
67,8
02.5
860
9.39
1,74
3.81
(69.
71)
358.
8268
,508
.47
11,8
78.7
613
3.98
3,20
5.76
(26.
90)
182.
5014
,741
.14
53,7
67.3
3
Capi
tal W
ork-
in-P
rogr
ess
(incl
udin
g Pr
e-Op
erat
ive
Expe
nses
)
5,71
9.43
Tota
l PPE
59,4
86.7
6
349Integrated Annual Report 2020-21
Integrated ReportStatutory Reports
Financial statements
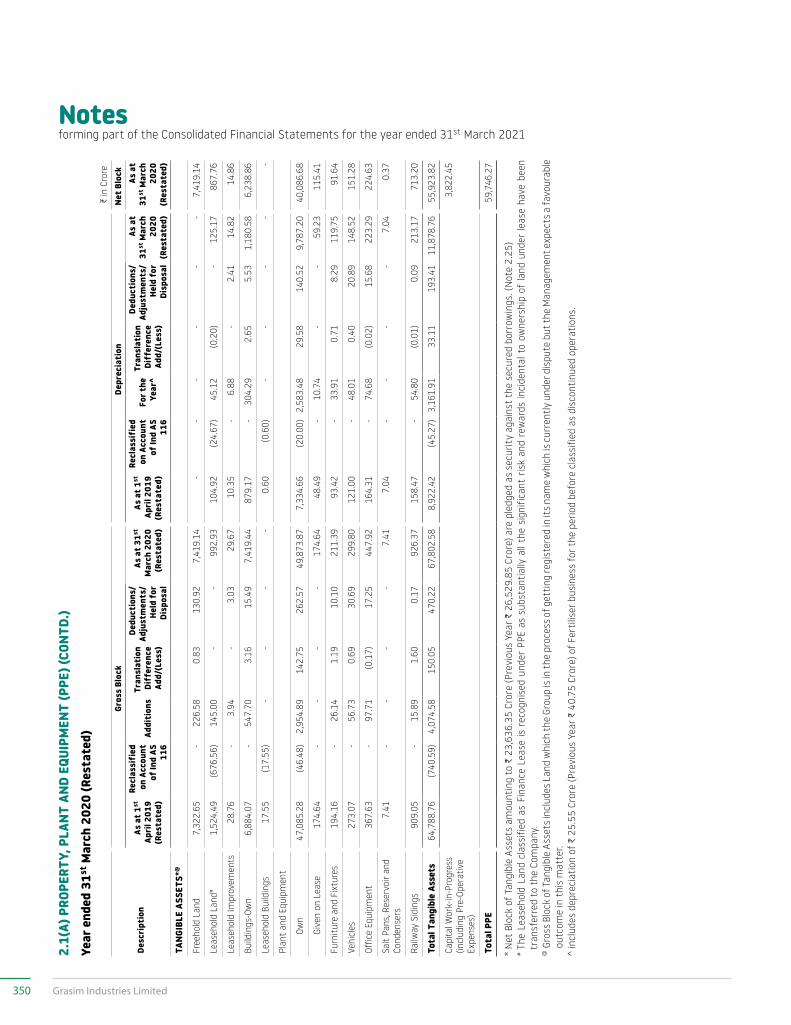
Notesforming part of the Consolidated Financial Statements for the year ended 31st March 2021
2.1(
A) P
ROPE
RTY,
PLA
NT A
ND E
QUIP
MEN
T (P
PE) (
CONT
D.)
Year
end
ed 3
1st M
arch
202
0 (R
esta
ted)
C in
Cro
re
Desc
ript
ion
Gros
s Bl
ock
Depr
ecia
tion
Net B
lock
As a
t 1st
Ap
ril 2
019
(Res
tate
d)
Recl
assi
fied
on
Acc
ount
of
Ind
AS
116
Addi
tion
sTr
ansl
atio
n Di
ffer
ence
Ad
d/(L
ess)
Dedu
ctio
ns/
Adju
stm
ents
/He
ld f
or
Disp
osal
As a
t 31st
M
arch
202
0 (R
esta
ted)
As a
t 1st
Ap
ril 2
019
(Res
tate
d)
Recl
assi
fied
on
Acc
ount
of
Ind
AS
116
For t
he
Year
^
Tran
slat
ion
Diff
eren
ce
Add/
(Les
s)
Dedu
ctio
ns/
Adju
stm
ents
/He
ld f
or
Disp
osal
As a
t 31
st M
arch
20
20
(Res
tate
d)
As a
t 31
st M
arch
20
20
(Res
tate
d)
TANG
IBLE
ASS
ETS*
@
Free
hold
Lan
d7,
322.
65-
226.
580.
8313
0.92
7,41
9.14
--
--
--
7,41
9.14
Leas
ehol
d La
nd#
1,52
4.49
(676
.56)
145.
00-
-99
2.93
104.
92(2
4.67
)45
.12
(0.2
0)-
125.
1786
7.76
Leas
ehol
d Im
prov
emen
ts28
.76
-3.
94-
3.03
29.6
710
.35
-6.
88-
2.41
14.8
214
.86
Build
ings
-Ow
n6,
884.
07-
547.
703.
1615
.49
7,41
9.44
879.
17-
304.
292.
655.
531,
180.
586,
238.
86
Leas
ehol
d Bu
ildin
gs17
.55
(17.
55)
--
--
0.60
(0.6
0)-
--
--
Plan
t an
d Eq
uipm
ent
Ow
n47
,085
.28
(46.
48)
2,95
4.89
142.
7526
2.57
49,8
73.8
77,
334.
66(2
0.00
)2,
583.
4829
.58
140.
529,
787.
2040
,086
.68
Gi
ven
on L
ease
174.
64-
--
-17
4.64
48.4
9-
10.7
4-
-59
.23
115.
41
Furn
iture
and
Fix
ture
s19
4.16
-26
.14
1.19
10.1
021
1.39
93.4
2-
33.9
10.
718.
2911
9.75
91.6
4
Vehi
cles
273.
07-
56.7
30.
6930
.69
299.
8012
1.00
-48
.01
0.40
20.8
914
8.52
151.
28
Offic
e Eq
uipm
ent
367.
63-
97.7
1(0
.17)
17.2
544
7.92
164.
31-
74.6
8(0
.02)
15.6
822
3.29
224.
63
Salt
Pans
, Res
ervo
ir an
d Co
nden
sers
7.41
--
--
7.41
7.04
--
--
7.04
0.37
Railw
ay S
idin
gs90
9.05
-15
.89
1.60
0.17
926.
3715
8.47
-54
.80
(0.0
1)0.
0921
3.17
713.
20
Tota
l Tan
gibl
e As
sets
64,7
88.7
6(7
40.5
9)4,
074.
5815
0.05
470.
2267
,802
.58
8,92
2.42
(45.
27)
3,16
1.91
33.1
119
3.41
11,8
78.7
655
,923
.82
Capi
tal W
ork-
in-P
rogr
ess
(incl
udin
g Pr
e-Op
erat
ive
Expe
nses
)
3,82
2.45
Tota
l PPE
59,7
46.2
7
* N
et B
lock
of T
angi
ble
Asse
ts a
mou
ntin
g to
C 2
3,63
6.35
Cro
re (P
revi
ous
Year
C 2
6,52
9.85
Cro
re) a
re p
ledg
ed a
s se
curi
ty a
gain
st t
he s
ecur
ed b
orro
win
gs. (
Not
e 2.
25)
# The
Lea
seho
ld L
and
clas
sifie
d as
Fin
ance
Lea
se is
rec
ogni
sed
unde
r PP
E as
sub
stan
tially
all
the
sign
ifica
nt r
isk
and
rew
ards
inci
dent
al t
o ow
ners
hip
of la
nd u
nder
leas
e ha
ve b
een
tran
sfer
red
to t
he C
ompa
ny.
@ G
ross
Blo
ck o
f Tan
gibl
e As
sets
incl
udes
Lan
d w
hich
the
Grou
p is
in th
e pr
oces
s of
get
ting
regi
ster
ed in
its
nam
e w
hich
is c
urre
ntly
und
er d
ispu
te b
ut th
e M
anag
emen
t exp
ects
a fa
vour
able
ou
tcom
e in
thi
s m
atte
r.^
incl
udes
dep
reci
atio
n of
C 2
5.55
Cro
re (P
revi
ous
Year
C 4
0.75
Cro
re) o
f Fer
tilis
er b
usin
ess
for t
he p
erio
d be
fore
cla
ssifi
ed a
s di
scon
tinue
d op
erat
ions
.
350 Grasim Industries Limited
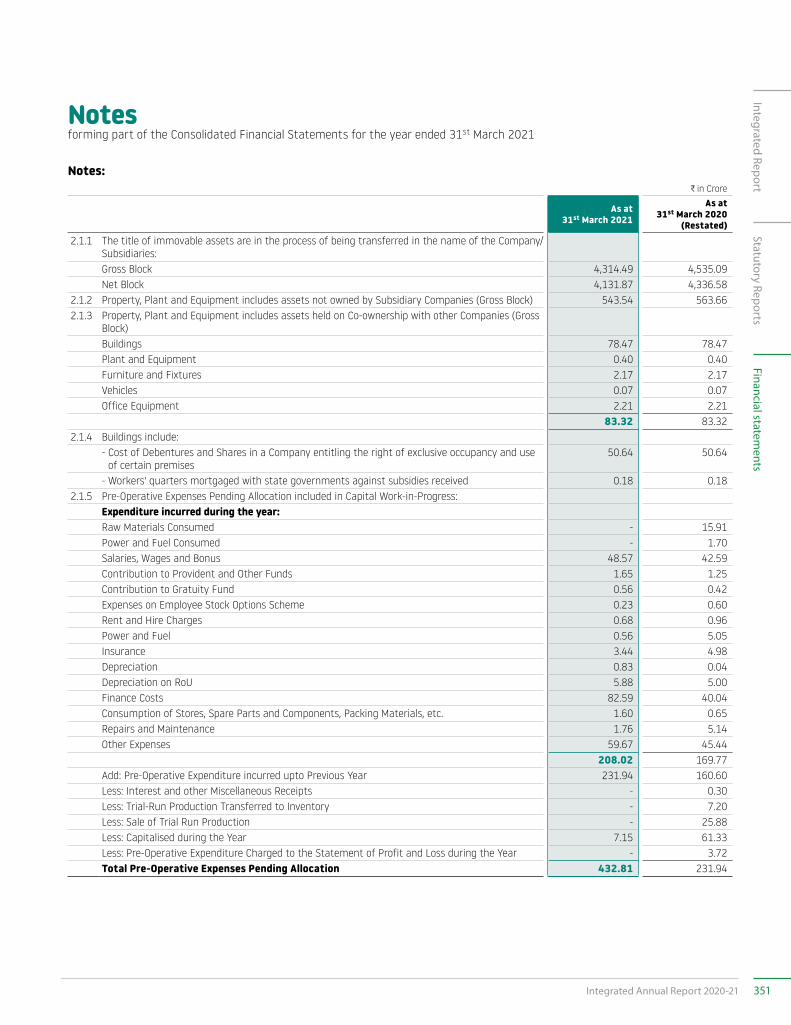
Notesforming part of the Consolidated Financial Statements for the year ended 31st March 2021
Notes:C in Crore
As at 31st March 2021
As at 31st March 2020
(Restated)2.1.1 The title of immovable assets are in the process of being transferred in the name of the Company/
Subsidiaries:Gross Block 4,314.49 4,535.09Net Block 4,131.87 4,336.58
2.1.2 Property, Plant and Equipment includes assets not owned by Subsidiary Companies (Gross Block) 543.54 563.662.1.3 Property, Plant and Equipment includes assets held on Co-ownership with other Companies (Gross
Block)Buildings 78.47 78.47Plant and Equipment 0.40 0.40Furniture and Fixtures 2.17 2.17Vehicles 0.07 0.07Office Equipment 2.21 2.21
83.32 83.322.1.4 Buildings include:
- Cost of Debentures and Shares in a Company entitling the right of exclusive occupancy and use of certain premises
50.64 50.64
- Workers' quarters mortgaged with state governments against subsidies received 0.18 0.182.1.5 Pre-Operative Expenses Pending Allocation included in Capital Work-in-Progress:
Expenditure incurred during the year:Raw Materials Consumed - 15.91Power and Fuel Consumed - 1.70Salaries, Wages and Bonus 48.57 42.59Contribution to Provident and Other Funds 1.65 1.25Contribution to Gratuity Fund 0.56 0.42Expenses on Employee Stock Options Scheme 0.23 0.60Rent and Hire Charges 0.68 0.96Power and Fuel 0.56 5.05Insurance 3.44 4.98Depreciation 0.83 0.04Depreciation on RoU 5.88 5.00Finance Costs 82.59 40.04Consumption of Stores, Spare Parts and Components, Packing Materials, etc. 1.60 0.65Repairs and Maintenance 1.76 5.14Other Expenses 59.67 45.44
208.02 169.77Add: Pre-Operative Expenditure incurred upto Previous Year 231.94 160.60Less: Interest and other Miscellaneous Receipts - 0.30Less: Trial-Run Production Transferred to Inventory - 7.20Less: Sale of Trial Run Production - 25.88Less: Capitalised during the Year 7.15 61.33Less: Pre-Operative Expenditure Charged to the Statement of Profit and Loss during the Year - 3.72Total Pre-Operative Expenses Pending Allocation 432.81 231.94
351Integrated Annual Report 2020-21
Integrated ReportStatutory Reports
Financial statements
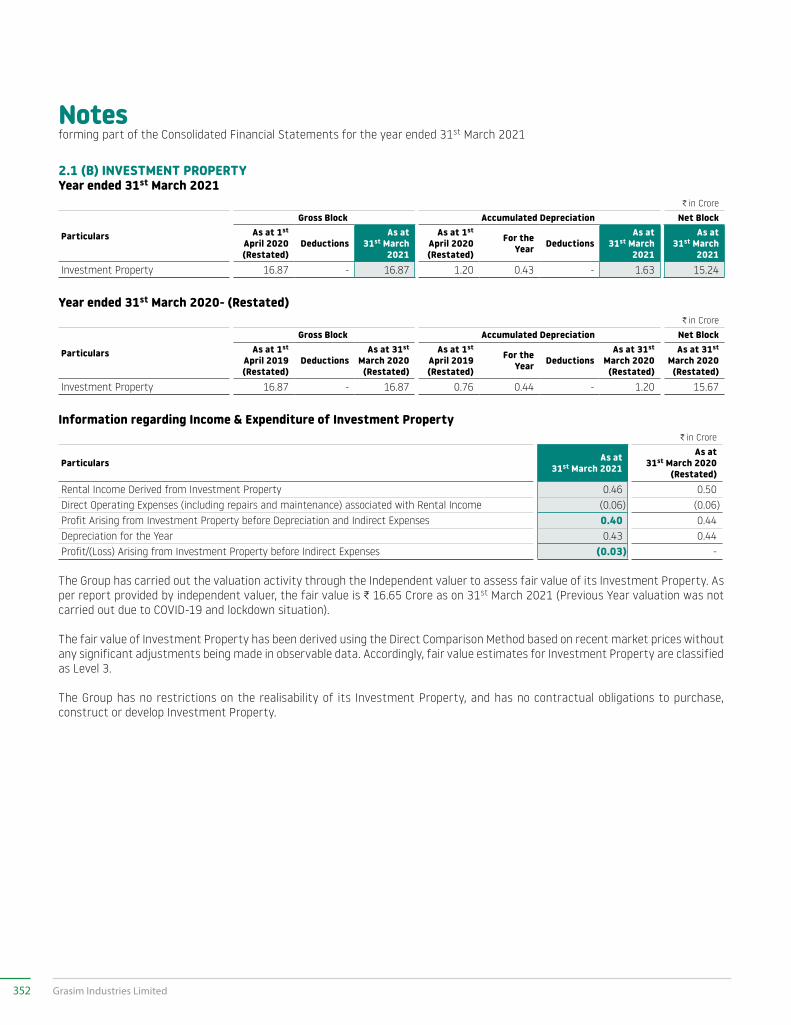
Notesforming part of the Consolidated Financial Statements for the year ended 31st March 2021
2.1 (B) INVESTMENT PROPERTYYear ended 31st March 2021
C in Crore
Particulars
Gross Block Accumulated Depreciation Net BlockAs at 1st
April 2020 (Restated)
DeductionsAs at
31st March 2021
As at 1st April 2020 (Restated)
For the Year Deductions
As at 31st March
2021
As at 31st March
2021Investment Property 16.87 - 16.87 1.20 0.43 - 1.63 15.24
Year ended 31st March 2020- (Restated)C in Crore
Particulars
Gross Block Accumulated Depreciation Net BlockAs at 1st
April 2019 (Restated)
DeductionsAs at 31st
March 2020 (Restated)
As at 1st April 2019 (Restated)
For the Year Deductions
As at 31st March 2020
(Restated)
As at 31st March 2020
(Restated)Investment Property 16.87 - 16.87 0.76 0.44 - 1.20 15.67
Information regarding Income & Expenditure of Investment PropertyC in Crore
Particulars As at 31st March 2021
As at 31st March 2020
(Restated)Rental Income Derived from Investment Property 0.46 0.50 Direct Operating Expenses (including repairs and maintenance) associated with Rental Income (0.06) (0.06)Profit Arising from Investment Property before Depreciation and Indirect Expenses 0.40 0.44 Depreciation for the Year 0.43 0.44 Profit/(Loss) Arising from Investment Property before Indirect Expenses (0.03) -
The Group has carried out the valuation activity through the Independent valuer to assess fair value of its Investment Property. As per report provided by independent valuer, the fair value is C 16.65 Crore as on 31st March 2021 (Previous Year valuation was not carried out due to COVID-19 and lockdown situation).
The fair value of Investment Property has been derived using the Direct Comparison Method based on recent market prices without any significant adjustments being made in observable data. Accordingly, fair value estimates for Investment Property are classified as Level 3.
The Group has no restrictions on the realisability of its Investment Property, and has no contractual obligations to purchase, construct or develop Investment Property.
352 Grasim Industries Limited
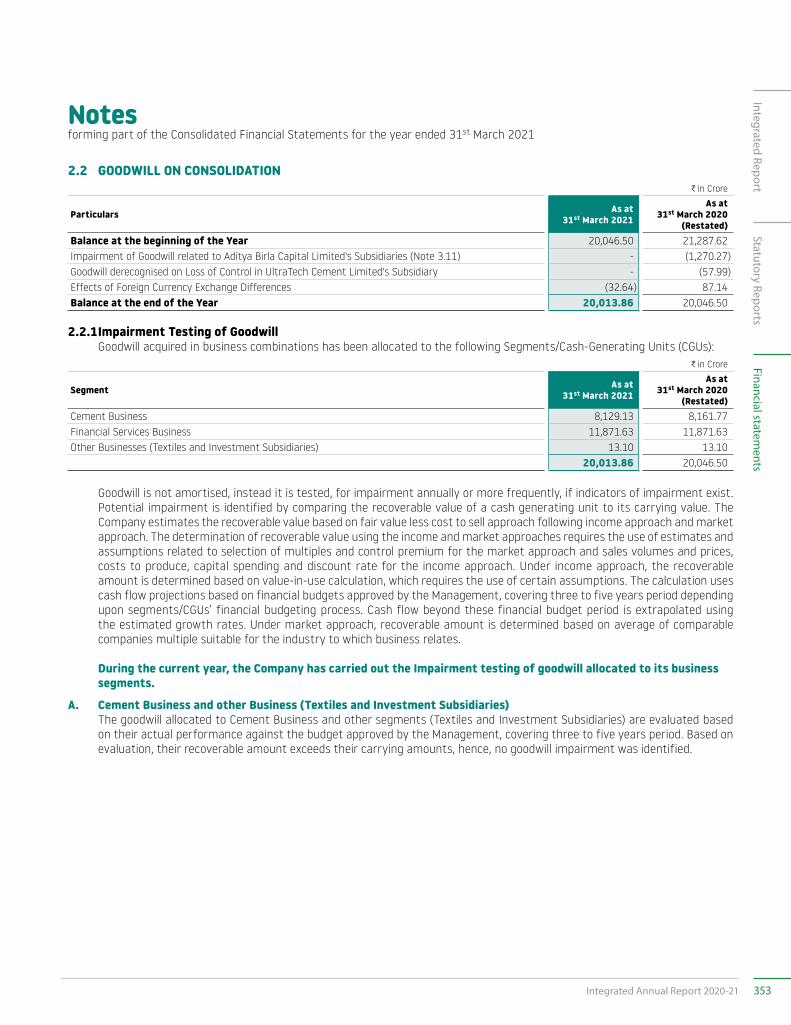
Notesforming part of the Consolidated Financial Statements for the year ended 31st March 2021
2.2 GOODWILL ON CONSOLIDATIONC in Crore
Particulars As at 31st March 2021
As at 31st March 2020
(Restated)Balance at the beginning of the Year 20,046.50 21,287.62 Impairment of Goodwill related to Aditya Birla Capital Limited's Subsidiaries (Note 3.11) - (1,270.27)Goodwill derecognised on Loss of Control in UltraTech Cement Limited's Subsidiary - (57.99)Effects of Foreign Currency Exchange Differences (32.64) 87.14 Balance at the end of the Year 20,013.86 20,046.50
2.2.1 Impairment Testing of Goodwill Goodwill acquired in business combinations has been allocated to the following Segments/Cash-Generating Units (CGUs):
C in Crore
Segment As at 31st March 2021
As at 31st March 2020
(Restated)Cement Business 8,129.13 8,161.77 Financial Services Business 11,871.63 11,871.63 Other Businesses (Textiles and Investment Subsidiaries) 13.10 13.10
20,013.86 20,046.50
Goodwill is not amortised, instead it is tested, for impairment annually or more frequently, if indicators of impairment exist. Potential impairment is identified by comparing the recoverable value of a cash generating unit to its carrying value. The Company estimates the recoverable value based on fair value less cost to sell approach following income approach and market approach. The determination of recoverable value using the income and market approaches requires the use of estimates and assumptions related to selection of multiples and control premium for the market approach and sales volumes and prices, costs to produce, capital spending and discount rate for the income approach. Under income approach, the recoverable amount is determined based on value-in-use calculation, which requires the use of certain assumptions. The calculation uses cash flow projections based on financial budgets approved by the Management, covering three to five years period depending upon segments/CGUs’ financial budgeting process. Cash flow beyond these financial budget period is extrapolated using the estimated growth rates. Under market approach, recoverable amount is determined based on average of comparable companies multiple suitable for the industry to which business relates.
During the current year, the Company has carried out the Impairment testing of goodwill allocated to its business segments.
A. Cement Business and other Business (Textiles and Investment Subsidiaries) The goodwill allocated to Cement Business and other segments (Textiles and Investment Subsidiaries) are evaluated based
on their actual performance against the budget approved by the Management, covering three to five years period. Based on evaluation, their recoverable amount exceeds their carrying amounts, hence, no goodwill impairment was identified.
353Integrated Annual Report 2020-21
Integrated ReportStatutory Reports
Financial statements
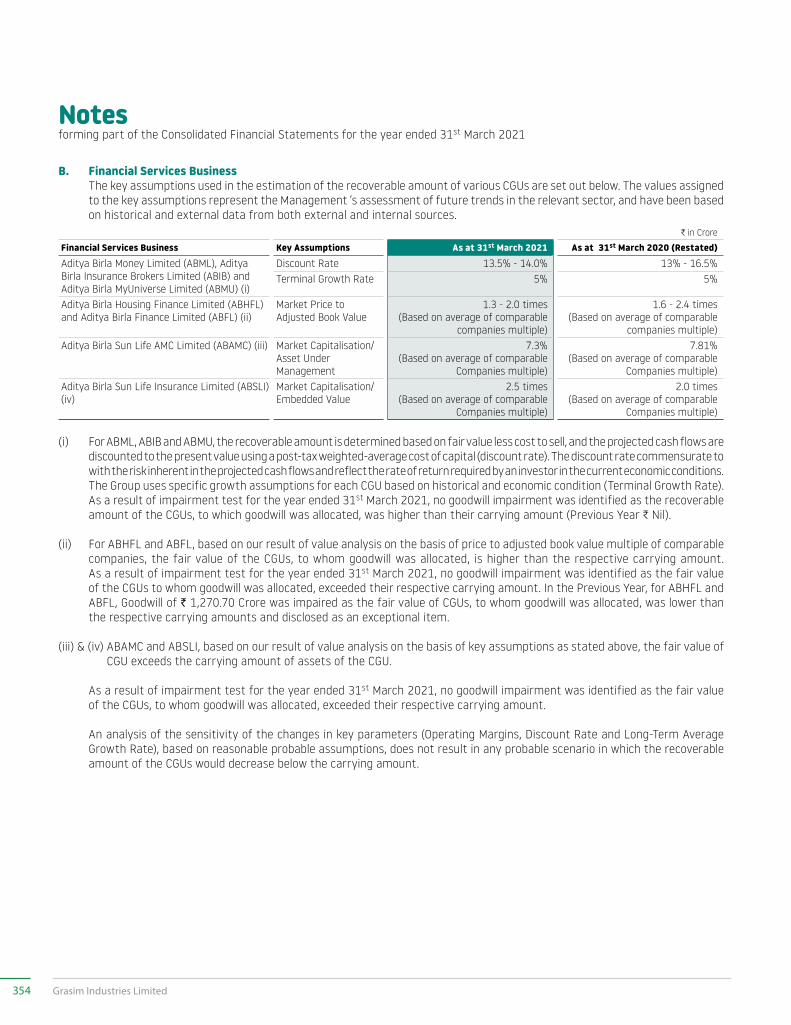
Notesforming part of the Consolidated Financial Statements for the year ended 31st March 2021
B. Financial Services Business The key assumptions used in the estimation of the recoverable amount of various CGUs are set out below. The values assigned
to the key assumptions represent the Management ‘s assessment of future trends in the relevant sector, and have been based on historical and external data from both external and internal sources.
C in Crore
Financial Services Business Key Assumptions As at 31st March 2021 As at 31st March 2020 (Restated)Aditya Birla Money Limited (ABML), Aditya Birla Insurance Brokers Limited (ABIB) and Aditya Birla MyUniverse Limited (ABMU) (i)
Discount Rate 13.5% - 14.0% 13% - 16.5%Terminal Growth Rate 5% 5%
Aditya Birla Housing Finance Limited (ABHFL) and Aditya Birla Finance Limited (ABFL) (ii)
Market Price to Adjusted Book Value
1.3 - 2.0 times (Based on average of comparable
companies multiple)
1.6 - 2.4 times (Based on average of comparable
companies multiple)Aditya Birla Sun Life AMC Limited (ABAMC) (iii) Market Capitalisation/
Asset Under Management
7.3% (Based on average of comparable
Companies multiple)
7.81% (Based on average of comparable
Companies multiple)Aditya Birla Sun Life Insurance Limited (ABSLI) (iv)
Market Capitalisation/Embedded Value
2.5 times (Based on average of comparable
Companies multiple)
2.0 times (Based on average of comparable
Companies multiple)
(i) For ABML, ABIB and ABMU, the recoverable amount is determined based on fair value less cost to sell, and the projected cash flows are discounted to the present value using a post-tax weighted-average cost of capital (discount rate). The discount rate commensurate to with the risk inherent in the projected cash flows and reflect the rate of return required by an investor in the current economic conditions. The Group uses specific growth assumptions for each CGU based on historical and economic condition (Terminal Growth Rate). As a result of impairment test for the year ended 31st March 2021, no goodwill impairment was identified as the recoverable amount of the CGUs, to which goodwill was allocated, was higher than their carrying amount (Previous Year C Nil).
(ii) For ABHFL and ABFL, based on our result of value analysis on the basis of price to adjusted book value multiple of comparable companies, the fair value of the CGUs, to whom goodwill was allocated, is higher than the respective carrying amount. As a result of impairment test for the year ended 31st March 2021, no goodwill impairment was identified as the fair value of the CGUs to whom goodwill was allocated, exceeded their respective carrying amount. In the Previous Year, for ABHFL and ABFL, Goodwill of ` 1,270.70 Crore was impaired as the fair value of CGUs, to whom goodwill was allocated, was lower than the respective carrying amounts and disclosed as an exceptional item.
(iii) & (iv) ABAMC and ABSLI, based on our result of value analysis on the basis of key assumptions as stated above, the fair value of CGU exceeds the carrying amount of assets of the CGU.
As a result of impairment test for the year ended 31st March 2021, no goodwill impairment was identified as the fair value of the CGUs, to whom goodwill was allocated, exceeded their respective carrying amount.
An analysis of the sensitivity of the changes in key parameters (Operating Margins, Discount Rate and Long-Term Average Growth Rate), based on reasonable probable assumptions, does not result in any probable scenario in which the recoverable amount of the CGUs would decrease below the carrying amount.
354 Grasim Industries Limited
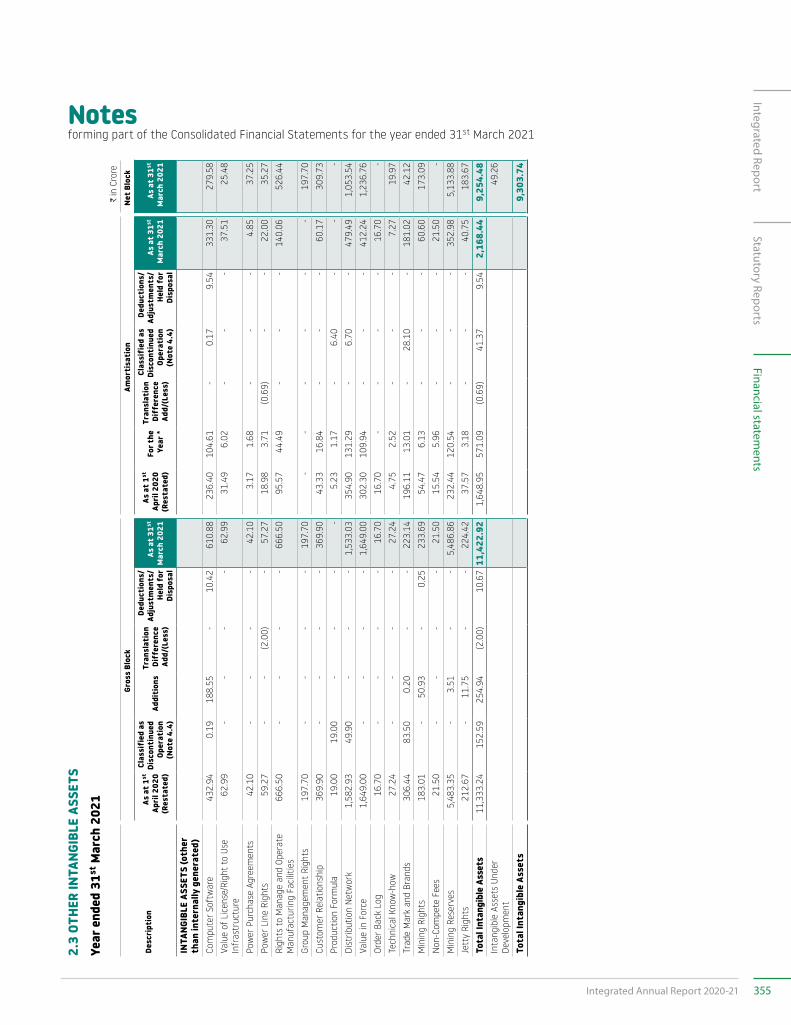
Notesforming part of the Consolidated Financial Statements for the year ended 31st March 2021
2.3
OTHE
R IN
TANG
IBLE
ASS
ETS
Year
end
ed 3
1st M
arch
202
1C
in C
rore
Desc
ript
ion
Gros
s Bl
ock
Amor
tisa
tion
Net B
lock
As a
t 1st
Ap
ril 2
020
(Res
tate
d)
Clas
sifi
ed a
s Di
scon
tinu
ed
Oper
atio
n (N
ote
4.4)
Addi
tion
sTr
ansl
atio
n Di
ffer
ence
Ad
d/(L
ess)
Dedu
ctio
ns/
Adju
stm
ents
/ He
ld f
or
Disp
osal
As a
t 31st
M
arch
202
1
As a
t 1st
Ap
ril 2
020
(Res
tate
d)
For t
he
Year
*
Tran
slat
ion
Diff
eren
ce
Add/
(Les
s)
Clas
sifi
ed a
s Di
scon
tinu
ed
Oper
atio
n (N
ote
4.4)
Dedu
ctio
ns/
Adju
stm
ents
/ He
ld f
or
Disp
osal
As a
t 31st
M
arch
202
1As
at 3
1st
Mar
ch 2
021
INTA
NGIB
LE A
SSET
S (o
ther
th
an in
tern
ally
gen
erat
ed)
Com
pute
r Sof
twar
e43
2.94
0.19
188.
55-
10.4
261
0.88
236.
4010
4.61
-0.
179.
5433
1.30
279.
58Va
lue
of L
icen
se/R
ight
to
Use
Infr
astr
uctu
re62
.99
--
--
62.9
931
.49
6.02
--
-37
.51
25.4
8
Pow
er P
urch
ase
Agre
emen
ts42
.10
--
--
42.1
03.
171.
68-
--
4.85
37.2
5Po
wer
Lin
e Ri
ghts
59.2
7-
-(2
.00)
-57
.27
18.9
83.
71(0
.69)
--
22.0
035
.27
Righ
ts t
o M
anag
e an
d Op
erat
e M
anuf
actu
ring
Faci
litie
s66
6.50
--
--
666.
5095
.57
44.4
9-
--
140.
0652
6.44
Grou
p M
anag
emen
t Ri
ghts
197.
70-
--
-19
7.70
--
--
--
197.
70Cu
stom
er R
elat
ions
hip
369.
90-
--
-36
9.90
43.3
316
.84
--
-60
.17
309.
73Pr
oduc
tion
Form
ula
19.0
019
.00
--
--
5.23
1.17
-6.
40-
--
Dist
ribut
ion
Net
wor
k1,
582.
9349
.90
--
-1,
533.
0335
4.90
131.
29-
6.70
-47
9.49
1,05
3.54
Valu
e in
For
ce1,
649.
00-
--
-1,
649.
0030
2.30
109.
94-
--
412.
241,
236.
76Or
der B
ack
Log
16.7
0-
--
-16
.70
16.7
0-
--
-16
.70
-Te
chni
cal K
now
-how
27.2
4-
--
-27
.24
4.75
2.52
--
-7.
2719
.97
Trad
e M
ark
and
Bran
ds30
6.44
83.5
00.
20-
-22
3.14
196.
1113
.01
-28
.10
-18
1.02
42.1
2M
inin
g Ri
ghts
183.
01-
50.9
3-
0.25
233.
6954
.47
6.13
--
-60
.60
173.
09N
on-C
ompe
te F
ees
21.5
0-
--
-21
.50
15.5
45.
96-
--
21.5
0-
Min
ing
Rese
rves
5,48
3.35
-3.
51-
-5,
486.
8623
2.44
120.
54-
--
352.
985,
133.
88Je
tty
Righ
ts21
2.67
-11
.75
--
224.
4237
.57
3.18
--
-40
.75
183.
67To
tal I
ntan
gibl
e As
sets
11,3
33.2
415
2.59
254.
94(2
.00)
10.6
711
,422
.92
1,64
8.95
571.
09(0
.69)
41.3
79.
542,
168.
449,
254.
48In
tang
ible
Ass
ets
Unde
r De
velo
pmen
t49
.26
Tota
l Int
angi
ble
Asse
ts9,
303.
74
355Integrated Annual Report 2020-21
Integrated ReportStatutory Reports
Financial statements
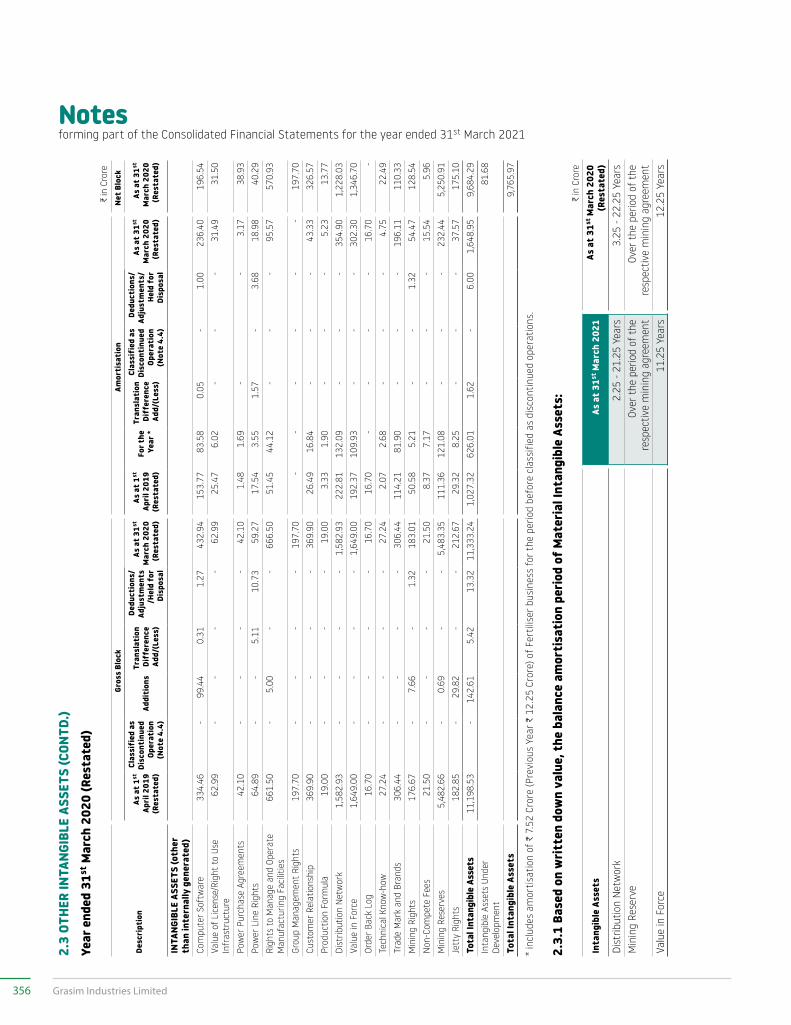
Notesforming part of the Consolidated Financial Statements for the year ended 31st March 2021
2.3
OTHE
R IN
TANG
IBLE
ASS
ETS
(CON
TD.)
Year
end
ed 3
1st M
arch
202
0 (R
esta
ted)
C in
Cro
re
Desc
ript
ion
Gros
s Bl
ock
Amor
tisa
tion
Net B
lock
As a
t 1st
Ap
ril 2
019
(Res
tate
d)
Clas
sifi
ed a
s Di
scon
tinu
ed
Oper
atio
n (N
ote
4.4)
Addi
tion
sTr
ansl
atio
n Di
ffer
ence
Ad
d/(L
ess)
Dedu
ctio
ns/
Adju
stm
ents
/H
eld
for
Disp
osal
As a
t 31st
M
arch
202
0 (R
esta
ted)
As a
t 1st
Ap
ril 2
019
(Res
tate
d)
For t
he
Year
*
Tran
slat
ion
Diff
eren
ce
Add/
(Les
s)
Clas
sifi
ed a
s Di
scon
tinu
ed
Oper
atio
n (N
ote
4.4)
Dedu
ctio
ns/
Adju
stm
ents
/ He
ld f
or
Disp
osal
As a
t 31st
M
arch
202
0 (R
esta
ted)
As a
t 31st
M
arch
202
0 (R
esta
ted)
INTA
NGIB
LE A
SSET
S (o
ther
th
an in
tern
ally
gen
erat
ed)
Com
pute
r Sof
twar
e33
4.46
-99
.44
0.31
1.27
432.
9415
3.77
83.5
80.
05-
1.00
236.
4019
6.54
Valu
e of
Lic
ense
/Rig
ht t
o Us
e In
fras
truc
ture
62.9
9-
--
-62
.99
25.4
76.
02-
--
31.4
931
.50
Pow
er P
urch
ase
Agre
emen
ts42
.10
--
--
42.1
01.
481.
69-
-3.
1738
.93
Pow
er L
ine
Righ
ts64
.89
--
5.11
10.7
359
.27
17.5
43.
551.
57-
3.68
18.9
840
.29
Righ
ts t
o M
anag
e an
d Op
erat
e M
anuf
actu
ring
Faci
litie
s66
1.50
-5.
00-
-66
6.50
51.4
544
.12
--
-95
.57
570.
93
Grou
p M
anag
emen
t Ri
ghts
197.
70-
--
-19
7.70
--
--
--
197.
70Cu
stom
er R
elat
ions
hip
369.
90-
--
-36
9.90
26.4
916
.84
--
-43
.33
326.
57Pr
oduc
tion
Form
ula
19.0
0-
--
-19
.00
3.33
1.90
--
-5.
2313
.77
Dist
ribut
ion
Net
wor
k1,
582.
93-
--
-1,
582.
9322
2.81
132.
09-
--
354.
901,
228.
03Va
lue
in F
orce
1,64
9.00
--
--
1,64
9.00
192.
3710
9.93
--
-30
2.30
1,34
6.70
Orde
r Bac
k Lo
g16
.70
--
--
16.7
016
.70
--
--
16.7
0-
Tech
nica
l Kno
w-h
ow27
.24
--
--
27.2
42.
072.
68-
--
4.75
22.4
9Tr
ade
Mar
k an
d Br
ands
306.
44-
--
-30
6.44
114.
2181
.90
--
-19
6.11
110.
33M
inin
g Ri
ghts
176.
67-
7.66
-1.
3218
3.01
50.5
85.
21-
-1.
3254
.47
128.
54N
on-C
ompe
te F
ees
21.5
0-
--
-21
.50
8.37
7.17
--
-15
.54
5.96
Min
ing
Rese
rves
5,48
2.66
-0.
69-
-5,
483.
3511
1.36
121.
08-
--
232.
445,
250.
91Je
tty
Righ
ts18
2.85
-29
.82
--
212.
6729
.32
8.25
--
-37
.57
175.
10To
tal I
ntan
gibl
e As
sets
11,1
98.5
3-
142.
615.
4213
.32
11,3
33.2
41,
027.
3262
6.01
1.62
-6.
001,
648.
959,
684.
29In
tang
ible
Ass
ets
Unde
r De
velo
pmen
t81
.68
Tota
l Int
angi
ble
Asse
ts9,
765.
97
* in
clud
es a
mor
tisa
tion
of C
7.5
2 Cr
ore
(Pre
viou
s Ye
ar C
12.
25 C
rore
) of F
ertil
iser
bus
ines
s fo
r the
per
iod
befo
re c
lass
ified
as
disc
ontin
ued
oper
atio
ns.
2.3.
1 Ba
sed
on w
ritt
en d
own
valu
e, t
he b
alan
ce a
mor
tisa
tion
per
iod
of M
ater
ial I
ntan
gibl
e As
sets
:C
in C
rore
Inta
ngib
le A
sset
sAs
at 3
1st M
arch
202
1As
at 3
1st M
arch
202
0(R
esta
ted)
Dist
ribut
ion
Net
wor
k2.
25 -
21.2
5 Ye
ars
3.25
- 22
.25
Year
sM
inin
g Re
serv
eOv
er th
e pe
riod
of th
e re
spec
tive
min
ing
agre
emen
tOv
er th
e pe
riod
of th
e re
spec
tive
min
ing
agre
emen
tVa
lue
in F
orce
11.2
5 Ye
ars
12.2
5 Ye
ars
356 Grasim Industries Limited
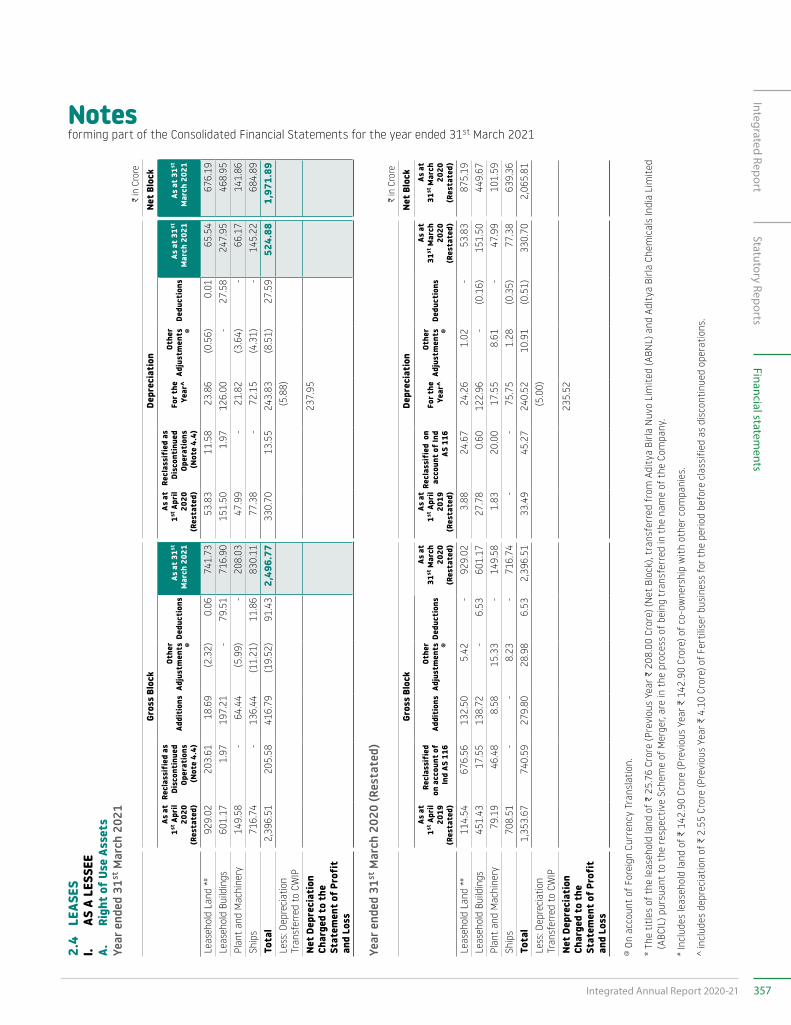
Notesforming part of the Consolidated Financial Statements for the year ended 31st March 2021
2.4
LEA
SES
I. AS
A L
ESSE
EA.
Ri
ght o
f Use
Ass
ets
Year
end
ed 3
1st M
arch
202
1C
in C
rore
Gros
s Bl
ock
Depr
ecia
tion
Net B
lock
As a
t1st
Apr
il 20
20
(Res
tate
d)
Recl
assi
fied
as
Disc
onti
nued
Op
erat
ions
(N
ote
4.4)
Addi
tion
sOt
her
Adju
stm
ents
@
Dedu
ctio
nsAs
at 3
1st
Mar
ch 2
021
As a
t1st
Apr
il 20
20
(Res
tate
d)
Recl
assi
fied
as
Disc
onti
nued
Op
erat
ions
(N
ote
4.4)
For t
he
Year
^
Othe
r Ad
just
men
ts
@De
duct
ions
As a
t 31st
M
arch
202
1As
at 3
1st
Mar
ch 2
021
Leas
ehol
d La
nd *
#92
9.02
203.
6118
.69
(2.3
2)0.
0674
1.73
53.8
311
.58
23.8
6(0
.56)
0.01
65.5
467
6.19
Leas
ehol
d Bu
ildin
gs60
1.17
1.97
197.
21-
79.5
171
6.90
151.
501.
9712
6.00
-27
.58
247.
9546
8.95
Plan
t an
d M
achi
nery
149.
58-
64.4
4(5
.99)
-20
8.03
47.9
9-
21.8
2(3
.64)
-66
.17
141.
86Sh
ips
716.
74-
136.
44(1
1.21
)11
.86
830.
1177
.38
-72
.15
(4.3
1)-
145.
2268
4.89
Tota
l2,
396.
5120
5.58
416.
79(1
9.52
)91
.43
2,49
6.77
330.
7013
.55
243.
83(8
.51)
27.5
952
4.88
1,97
1.89
Less
: Dep
reci
atio
n Tr
ansf
erre
d to
CW
IP(5
.88)
Net D
epre
ciat
ion
Char
ged
to t
he
Stat
emen
t of P
rofi
t an
d Lo
ss
237.
95
Year
end
ed 3
1st M
arch
202
0 (R
esta
ted)
C in
Cro
re
Gros
s Bl
ock
Depr
ecia
tion
Net B
lock
As a
t1st
Apr
il 20
19
(Res
tate
d)
Recl
assi
fied
on
acc
ount
of
Ind
AS 1
16Ad
diti
ons
Othe
r Ad
just
men
ts
@De
duct
ions
As a
t31
st M
arch
20
20
(Res
tate
d)
As a
t1st
Apr
il 20
19
(Res
tate
d)
Recl
assi
fied
on
acco
unt o
f Ind
AS
116
For t
he
Year
^
Othe
r Ad
just
men
ts
@De
duct
ions
As a
t31
st M
arch
20
20
(Res
tate
d)
As a
t31
st M
arch
20
20
(Res
tate
d)
Leas
ehol
d La
nd *
#11
4.54
676.
5613
2.50
5.42
-92
9.02
3.8
8 2
4.67
2
4.26
1
.02
- 5
3.83
8
75.1
9 Le
aseh
old
Build
ings
451.
4317
.55
138.
72-
6.53
601.
17 2
7.78
0
.60
122
.96
- (0
.16)
151.
50 4
49.6
7 Pl
ant
and
Mac
hine
ry79
.19
46.4
88.
5815
.33
-14
9.58
1.8
3 2
0.00
1
7.55
8
.61
- 47
.99
101
.59
Ship
s70
8.51
--
8.23
-71
6.74
- -
75.
75
1.2
8 (0
.35)
77.3
8 6
39.3
6 To
tal
1,35
3.67
740.
5927
9.80
28.9
86.
532,
396.
51 3
3.49
45
.27
240.
5210
.91
(0.5
1)33
0.70
2,06
5.81
Less
: Dep
reci
atio
n Tr
ansf
erre
d to
CW
IP (5
.00)
Net D
epre
ciat
ion
Char
ged
to t
he
Stat
emen
t of P
rofi
t an
d Lo
ss
235
.52
@ O
n ac
coun
t of
For
eign
Cur
renc
y Tr
ansl
atio
n.
* Th
e ti
tles
of t
he le
aseh
old
land
of C
25.
76 C
rore
(Pre
viou
s Ye
ar C
208
.00
Cror
e) (N
et B
lock
), tr
ansf
erre
d fr
om A
dity
a Bi
rla N
uvo
Lim
ited
(ABN
L) a
nd A
dity
a Bi
rla C
hem
ical
s In
dia
Lim
ited
(A
BCIL
) pur
suan
t to
the
res
pect
ive
Sche
me
of M
erge
r, ar
e in
the
pro
cess
of b
eing
tra
nsfe
rred
in t
he n
ame
of t
he C
ompa
ny.
# Inc
lude
s le
aseh
old
land
of C
142
.90
Cror
e (P
revi
ous
Year
C 1
42.9
0 Cr
ore)
of c
o-ow
ners
hip
wit
h ot
her c
ompa
nies
.
^ in
clud
es d
epre
ciat
ion
of C
2.5
5 Cr
ore
(Pre
viou
s Ye
ar C
4.1
0 Cr
ore)
of F
ertil
iser
bus
ines
s fo
r the
per
iod
befo
re c
lass
ified
as
disc
ontin
ued
oper
atio
ns.
357Integrated Annual Report 2020-21
Integrated ReportStatutory Reports
Financial statements
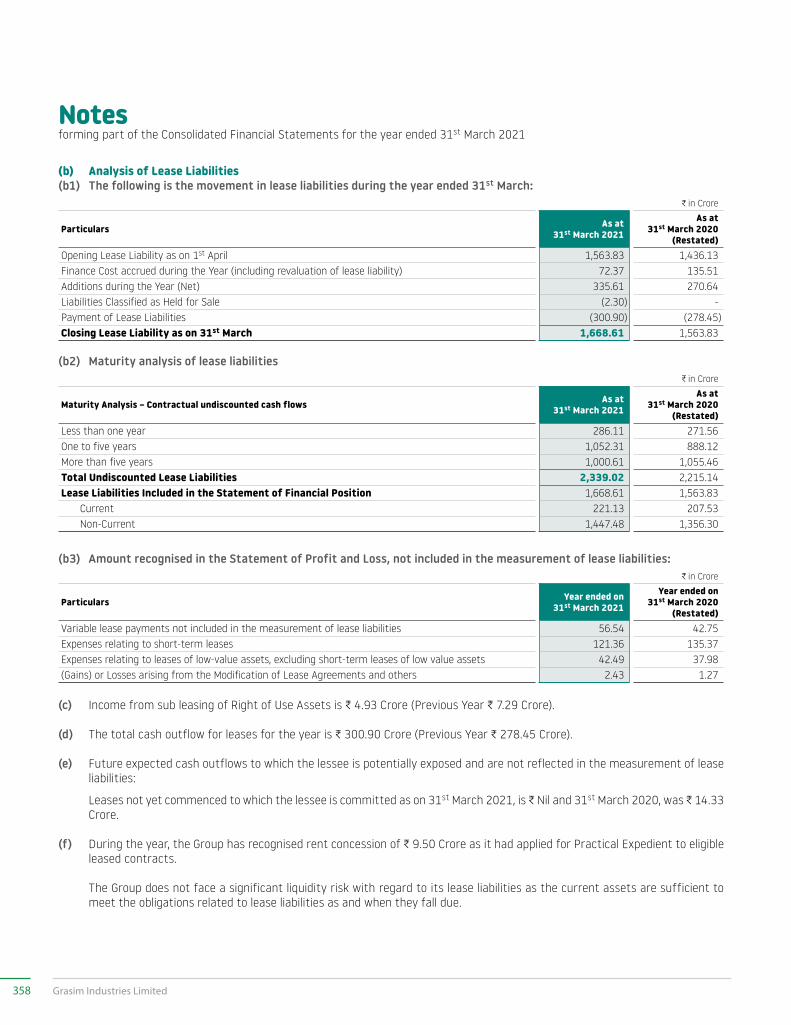
Notesforming part of the Consolidated Financial Statements for the year ended 31st March 2021
(b) Analysis of Lease Liabilities(b1) The following is the movement in lease liabilities during the year ended 31st March:
C in Crore
Particulars As at 31st March 2021
As at 31st March 2020
(Restated)Opening Lease Liability as on 1st April 1,563.83 1,436.13 Finance Cost accrued during the Year (including revaluation of lease liability) 72.37 135.51 Additions during the Year (Net) 335.61 270.64 Liabilities Classified as Held for Sale (2.30) - Payment of Lease Liabilities (300.90) (278.45)Closing Lease Liability as on 31st March 1,668.61 1,563.83
(b2) Maturity analysis of lease liabilitiesC in Crore
Maturity Analysis – Contractual undiscounted cash flows As at 31st March 2021
As at 31st March 2020
(Restated)Less than one year 286.11 271.56 One to five years 1,052.31 888.12 More than five years 1,000.61 1,055.46 Total Undiscounted Lease Liabilities 2,339.02 2,215.14 Lease Liabilities Included in the Statement of Financial Position 1,668.61 1,563.83 Current 221.13 207.53 Non-Current 1,447.48 1,356.30
(b3) Amount recognised in the Statement of Profit and Loss, not included in the measurement of lease liabilities:C in Crore
Particulars Year ended on 31st March 2021
Year ended on 31st March 2020
(Restated)Variable lease payments not included in the measurement of lease liabilities 56.54 42.75 Expenses relating to short-term leases 121.36 135.37 Expenses relating to leases of low-value assets, excluding short-term leases of low value assets 42.49 37.98 (Gains) or Losses arising from the Modification of Lease Agreements and others 2.43 1.27
(c) Income from sub leasing of Right of Use Assets is C 4.93 Crore (Previous Year C 7.29 Crore).
(d) The total cash outflow for leases for the year is C 300.90 Crore (Previous Year C 278.45 Crore).
(e) Future expected cash outflows to which the lessee is potentially exposed and are not reflected in the measurement of lease liabilities:
Leases not yet commenced to which the lessee is committed as on 31st March 2021, is C Nil and 31st March 2020, was C 14.33 Crore.
(f) During the year, the Group has recognised rent concession of C 9.50 Crore as it had applied for Practical Expedient to eligible leased contracts.
The Group does not face a significant liquidity risk with regard to its lease liabilities as the current assets are sufficient to meet the obligations related to lease liabilities as and when they fall due.
358 Grasim Industries Limited
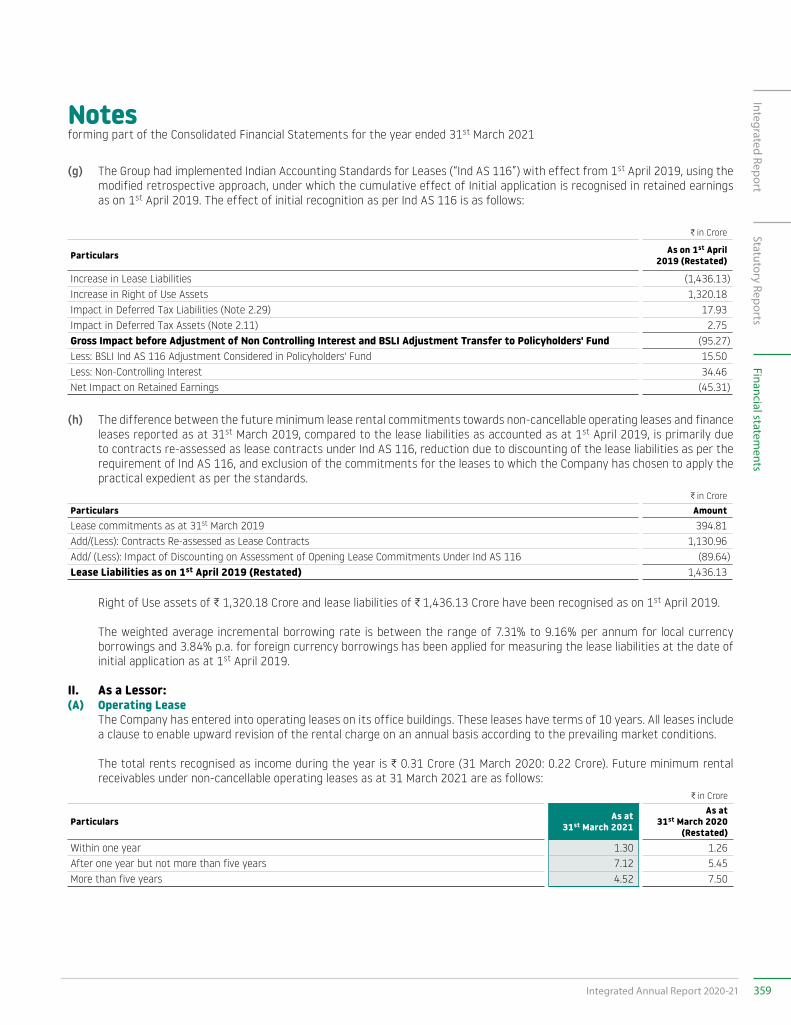
Notesforming part of the Consolidated Financial Statements for the year ended 31st March 2021
(g) The Group had implemented Indian Accounting Standards for Leases (“Ind AS 116”) with effect from 1st April 2019, using the modified retrospective approach, under which the cumulative effect of Initial application is recognised in retained earnings as on 1st April 2019. The effect of initial recognition as per Ind AS 116 is as follows:
C in Crore
Particulars As on 1st April 2019 (Restated)
Increase in Lease Liabilities (1,436.13)Increase in Right of Use Assets 1,320.18 Impact in Deferred Tax Liabilities (Note 2.29) 17.93 Impact in Deferred Tax Assets (Note 2.11) 2.75 Gross Impact before Adjustment of Non Controlling Interest and BSLI Adjustment Transfer to Policyholders' Fund (95.27)Less: BSLI Ind AS 116 Adjustment Considered in Policyholders' Fund 15.50 Less: Non-Controlling Interest 34.46 Net Impact on Retained Earnings (45.31)
(h) The difference between the future minimum lease rental commitments towards non-cancellable operating leases and finance leases reported as at 31st March 2019, compared to the lease liabilities as accounted as at 1st April 2019, is primarily due to contracts re-assessed as lease contracts under Ind AS 116, reduction due to discounting of the lease liabilities as per the requirement of Ind AS 116, and exclusion of the commitments for the leases to which the Company has chosen to apply the practical expedient as per the standards.
C in CroreParticulars AmountLease commitments as at 31st March 2019 394.81 Add/(Less): Contracts Re-assessed as Lease Contracts 1,130.96 Add/ (Less): Impact of Discounting on Assessment of Opening Lease Commitments Under Ind AS 116 (89.64)Lease Liabilities as on 1st April 2019 (Restated) 1,436.13
Right of Use assets of C 1,320.18 Crore and lease liabilities of C 1,436.13 Crore have been recognised as on 1st April 2019.
The weighted average incremental borrowing rate is between the range of 7.31% to 9.16% per annum for local currency borrowings and 3.84% p.a. for foreign currency borrowings has been applied for measuring the lease liabilities at the date of initial application as at 1st April 2019.
II. As a Lessor:(A) Operating Lease The Company has entered into operating leases on its office buildings. These leases have terms of 10 years. All leases include
a clause to enable upward revision of the rental charge on an annual basis according to the prevailing market conditions.
The total rents recognised as income during the year is C 0.31 Crore (31 March 2020: 0.22 Crore). Future minimum rental receivables under non-cancellable operating leases as at 31 March 2021 are as follows:
C in Crore
Particulars As at 31st March 2021
As at 31st March 2020
(Restated)Within one year 1.30 1.26 After one year but not more than five years 7.12 5.45 More than five years 4.52 7.50
359Integrated Annual Report 2020-21
Integrated ReportStatutory Reports
Financial statements
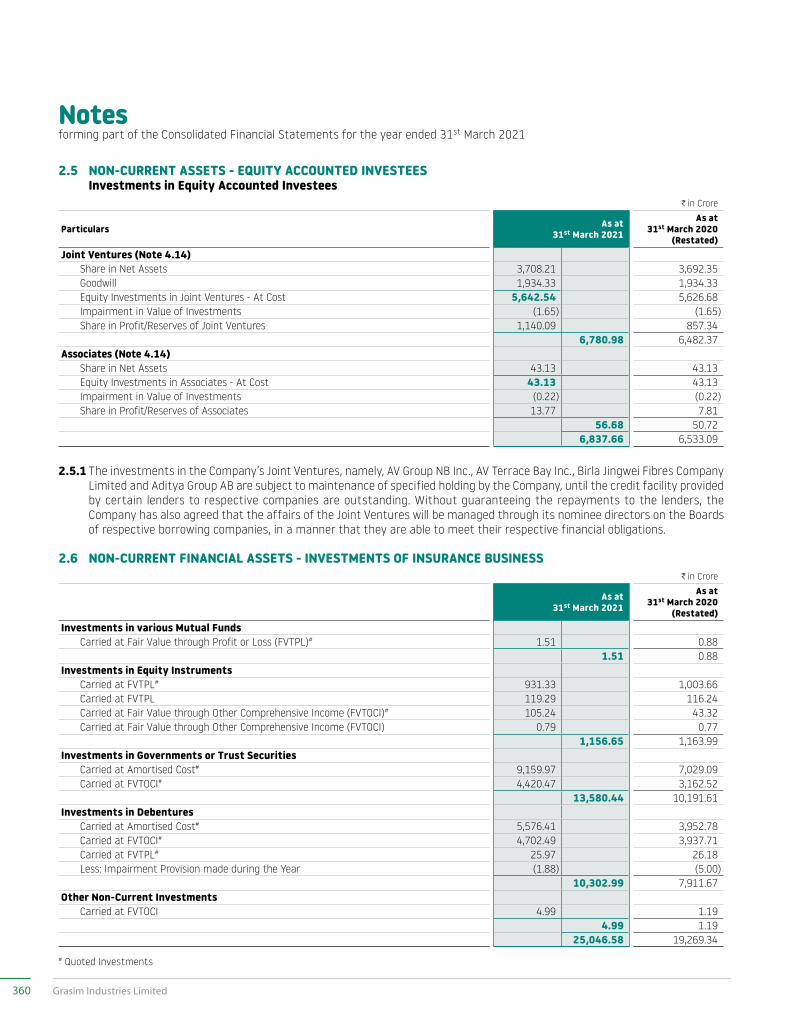
Notesforming part of the Consolidated Financial Statements for the year ended 31st March 2021
2.5 NON-CURRENT ASSETS - EQUITY ACCOUNTED INVESTEES Investments in Equity Accounted Investees
C in Crore
Particulars As at 31st March 2021
As at 31st March 2020
(Restated)Joint Ventures (Note 4.14) Share in Net Assets 3,708.21 3,692.35 Goodwill 1,934.33 1,934.33 Equity Investments in Joint Ventures - At Cost 5,642.54 5,626.68 Impairment in Value of Investments (1.65) (1.65) Share in Profit/Reserves of Joint Ventures 1,140.09 857.34
6,780.98 6,482.37 Associates (Note 4.14) Share in Net Assets 43.13 43.13 Equity Investments in Associates - At Cost 43.13 43.13 Impairment in Value of Investments (0.22) (0.22) Share in Profit/Reserves of Associates 13.77 7.81
56.68 50.72 6,837.66 6,533.09
2.5.1 The investments in the Company’s Joint Ventures, namely, AV Group NB Inc., AV Terrace Bay Inc., Birla Jingwei Fibres Company Limited and Aditya Group AB are subject to maintenance of specified holding by the Company, until the credit facility provided by certain lenders to respective companies are outstanding. Without guaranteeing the repayments to the lenders, the Company has also agreed that the affairs of the Joint Ventures will be managed through its nominee directors on the Boards of respective borrowing companies, in a manner that they are able to meet their respective financial obligations.
2.6 NON-CURRENT FINANCIAL ASSETS - INVESTMENTS OF INSURANCE BUSINESSC in Crore
As at 31st March 2021
As at 31st March 2020
(Restated)Investments in various Mutual Funds Carried at Fair Value through Profit or Loss (FVTPL)# 1.51 0.88
1.51 0.88Investments in Equity Instruments Carried at FVTPL# 931.33 1,003.66 Carried at FVTPL 119.29 116.24 Carried at Fair Value through Other Comprehensive Income (FVTOCI)# 105.24 43.32 Carried at Fair Value through Other Comprehensive Income (FVTOCI) 0.79 0.77
1,156.65 1,163.99Investments in Governments or Trust Securities Carried at Amortised Cost# 9,159.97 7,029.09 Carried at FVTOCI# 4,420.47 3,162.52
13,580.44 10,191.61Investments in Debentures Carried at Amortised Cost# 5,576.41 3,952.78 Carried at FVTOCI# 4,702.49 3,937.71 Carried at FVTPL# 25.97 26.18 Less: Impairment Provision made during the Year (1.88) (5.00)
10,302.99 7,911.67Other Non-Current Investments Carried at FVTOCI 4.99 1.19
4.99 1.1925,046.58 19,269.34
# Quoted Investments
360 Grasim Industries Limited
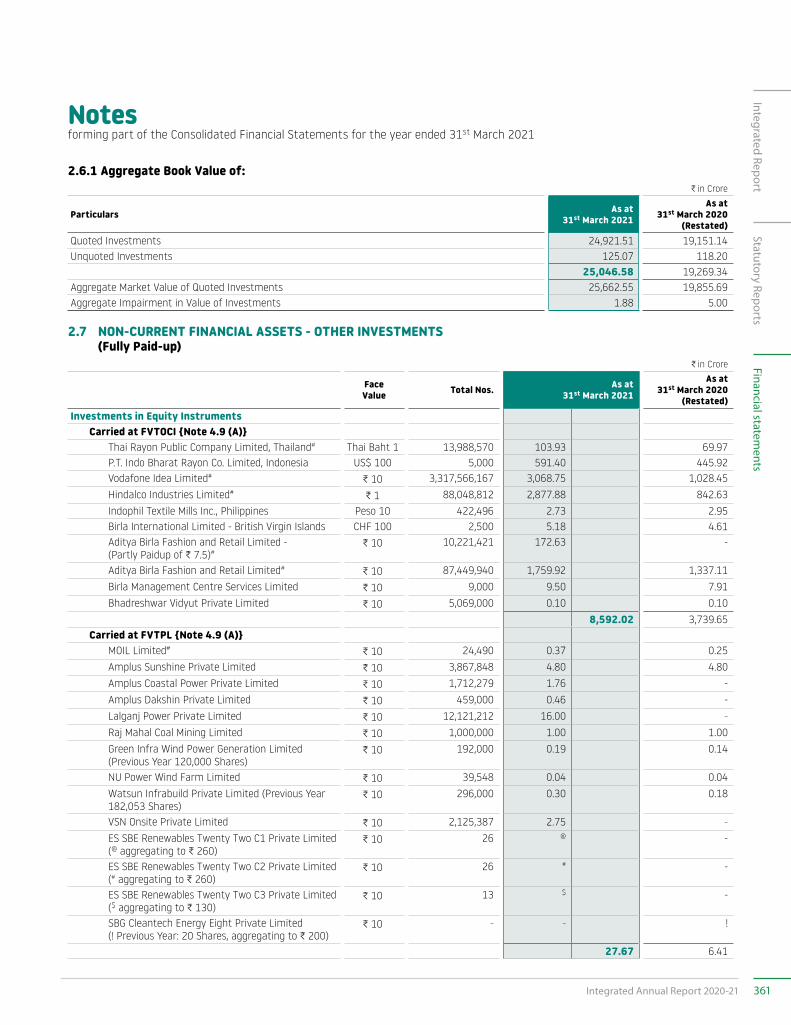
Notesforming part of the Consolidated Financial Statements for the year ended 31st March 2021
2.6.1 Aggregate Book Value of:C in Crore
Particulars As at 31st March 2021
As at 31st March 2020
(Restated)Quoted Investments 24,921.51 19,151.14 Unquoted Investments 125.07 118.20
25,046.58 19,269.34 Aggregate Market Value of Quoted Investments 25,662.55 19,855.69 Aggregate Impairment in Value of Investments 1.88 5.00
2.7 NON-CURRENT FINANCIAL ASSETS - OTHER INVESTMENTS (Fully Paid-up)
C in Crore
Face Value Total Nos. As at
31st March 2021
As at 31st March 2020
(Restated)Investments in Equity Instruments Carried at FVTOCI {Note 4.9 (A)} Thai Rayon Public Company Limited, Thailand# Thai Baht 1 13,988,570 103.93 69.97 P.T. Indo Bharat Rayon Co. Limited, Indonesia US$ 100 5,000 591.40 445.92 Vodafone Idea Limited# C 10 3,317,566,167 3,068.75 1,028.45 Hindalco Industries Limited#
C 1 88,048,812 2,877.88 842.63 Indophil Textile Mills Inc., Philippines Peso 10 422,496 2.73 2.95 Birla International Limited - British Virgin Islands CHF 100 2,500 5.18 4.61 Aditya Birla Fashion and Retail Limited -
(Partly Paidup of C 7.5)#C 10 10,221,421 172.63 -
Aditya Birla Fashion and Retail Limited#C 10 87,449,940 1,759.92 1,337.11
Birla Management Centre Services Limited C 10 9,000 9.50 7.91 Bhadreshwar Vidyut Private Limited C 10 5,069,000 0.10 0.10
8,592.02 3,739.65 Carried at FVTPL {Note 4.9 (A)} MOIL Limited#
C 10 24,490 0.37 0.25 Amplus Sunshine Private Limited C 10 3,867,848 4.80 4.80 Amplus Coastal Power Private Limited C 10 1,712,279 1.76 - Amplus Dakshin Private Limited C 10 459,000 0.46 - Lalganj Power Private Limited C 10 12,121,212 16.00 - Raj Mahal Coal Mining Limited C 10 1,000,000 1.00 1.00 Green Infra Wind Power Generation Limited
(Previous Year 120,000 Shares)C 10 192,000 0.19 0.14
NU Power Wind Farm Limited C 10 39,548 0.04 0.04 Watsun Infrabuild Private Limited (Previous Year
182,053 Shares)C 10 296,000 0.30 0.18
VSN Onsite Private Limited C 10 2,125,387 2.75 - ES SBE Renewables Twenty Two C1 Private Limited
(@ aggregating to C 260)C 10 26 @ -
ES SBE Renewables Twenty Two C2 Private Limited (# aggregating to C 260)
C 10 26 # -
ES SBE Renewables Twenty Two C3 Private Limited ($ aggregating to C 130)
C 10 13 $ -
SBG Cleantech Energy Eight Private Limited (! Previous Year: 20 Shares, aggregating to C 200)
C 10 - - !
27.67 6.41
361Integrated Annual Report 2020-21
Integrated ReportStatutory Reports
Financial statements
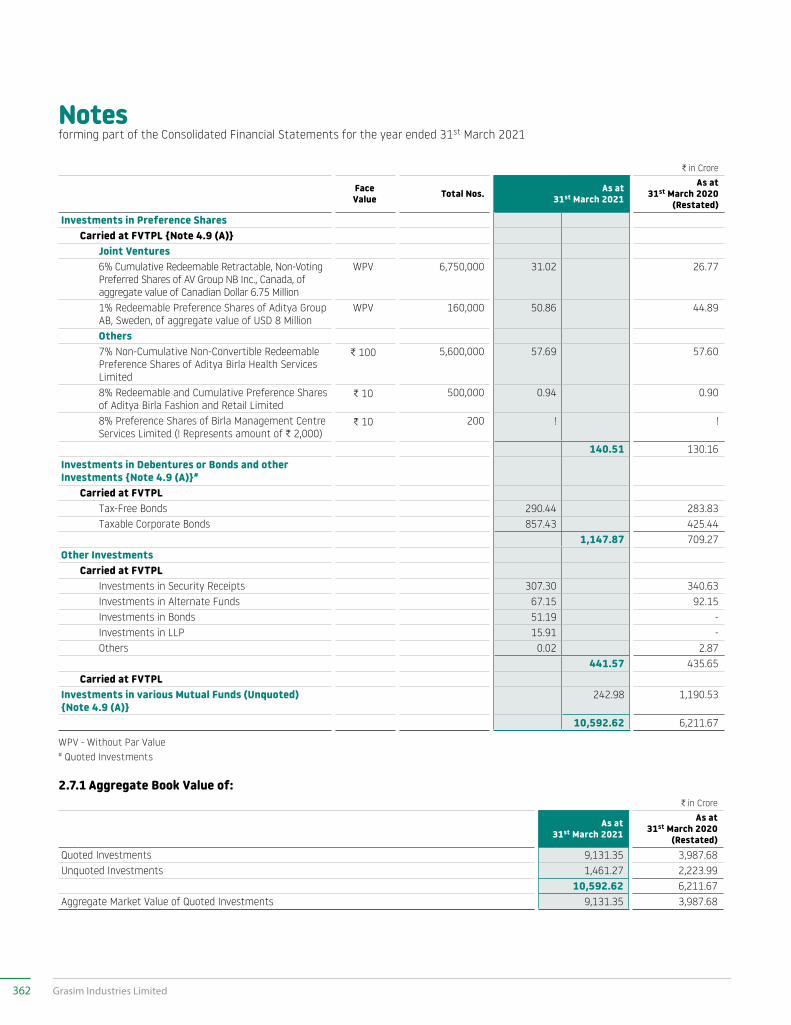
Notesforming part of the Consolidated Financial Statements for the year ended 31st March 2021
C in Crore
Face Value Total Nos. As at
31st March 2021
As at 31st March 2020
(Restated)Investments in Preference Shares Carried at FVTPL {Note 4.9 (A)} Joint Ventures 6% Cumulative Redeemable Retractable, Non-Voting
Preferred Shares of AV Group NB Inc., Canada, of aggregate value of Canadian Dollar 6.75 Million
WPV 6,750,000 31.02 26.77
1% Redeemable Preference Shares of Aditya Group AB, Sweden, of aggregate value of USD 8 Million
WPV 160,000 50.86 44.89
Others 7% Non-Cumulative Non-Convertible Redeemable
Preference Shares of Aditya Birla Health Services Limited
C 100 5,600,000 57.69 57.60
8% Redeemable and Cumulative Preference Shares of Aditya Birla Fashion and Retail Limited
C 10 500,000 0.94 0.90
8% Preference Shares of Birla Management Centre Services Limited ( ! Represents amount of C 2,000)
C 10 200 ! !
140.51 130.16Investments in Debentures or Bonds and other Investments {Note 4.9 (A)}#
Carried at FVTPL Tax-Free Bonds 290.44 283.83 Taxable Corporate Bonds 857.43 425.44
1,147.87 709.27Other Investments Carried at FVTPL Investments in Security Receipts 307.30 340.63 Investments in Alternate Funds 67.15 92.15 Investments in Bonds 51.19 - Investments in LLP 15.91 - Others 0.02 2.87
441.57 435.65 Carried at FVTPLInvestments in various Mutual Funds (Unquoted) {Note 4.9 (A)}
242.98 1,190.53
10,592.62 6,211.67
WPV - Without Par Value # Quoted Investments
2.7.1 Aggregate Book Value of:C in Crore
As at 31st March 2021
As at 31st March 2020
(Restated)Quoted Investments 9,131.35 3,987.68 Unquoted Investments 1,461.27 2,223.99
10,592.62 6,211.67 Aggregate Market Value of Quoted Investments 9,131.35 3,987.68
362 Grasim Industries Limited
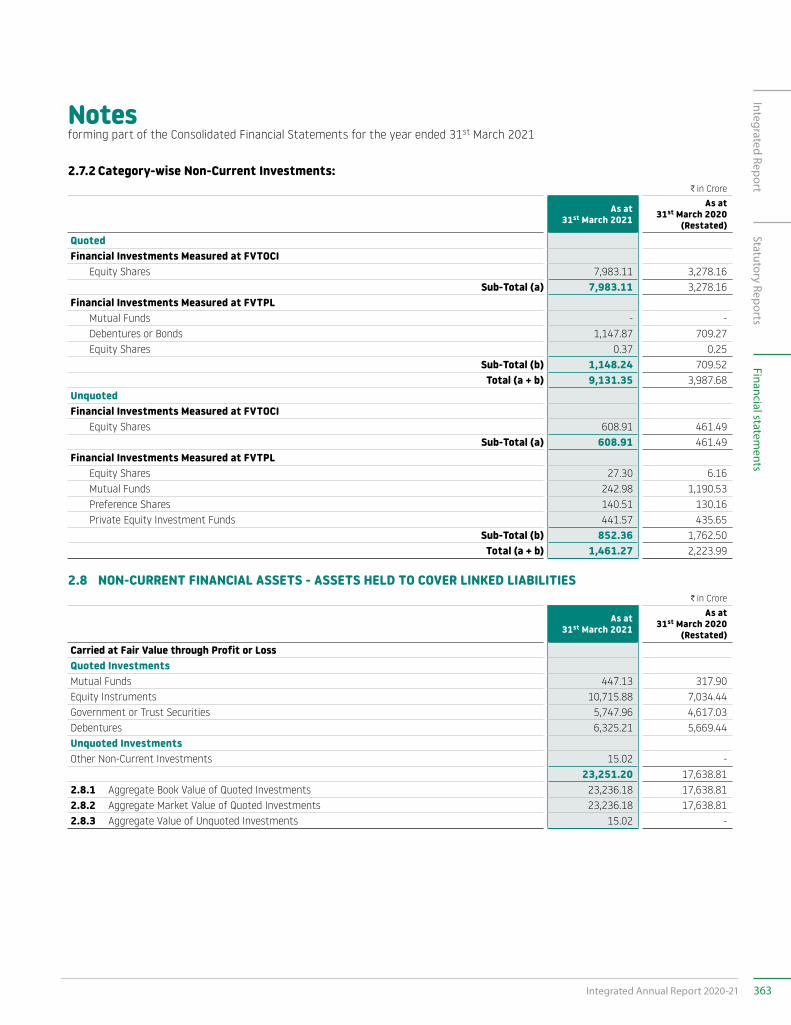
Notesforming part of the Consolidated Financial Statements for the year ended 31st March 2021
2.7.2 Category-wise Non-Current Investments:C in Crore
As at 31st March 2021
As at 31st March 2020
(Restated)QuotedFinancial Investments Measured at FVTOCI Equity Shares 7,983.11 3,278.16
Sub-Total (a) 7,983.11 3,278.16 Financial Investments Measured at FVTPL Mutual Funds - - Debentures or Bonds 1,147.87 709.27 Equity Shares 0.37 0.25
Sub-Total (b) 1,148.24 709.52 Total (a + b) 9,131.35 3,987.68
UnquotedFinancial Investments Measured at FVTOCI Equity Shares 608.91 461.49
Sub-Total (a) 608.91 461.49 Financial Investments Measured at FVTPL Equity Shares 27.30 6.16 Mutual Funds 242.98 1,190.53 Preference Shares 140.51 130.16 Private Equity Investment Funds 441.57 435.65
Sub-Total (b) 852.36 1,762.50 Total (a + b) 1,461.27 2,223.99
2.8 NON-CURRENT FINANCIAL ASSETS - ASSETS HELD TO COVER LINKED LIABILITIESC in Crore
As at 31st March 2021
As at 31st March 2020
(Restated)Carried at Fair Value through Profit or LossQuoted InvestmentsMutual Funds 447.13 317.90 Equity Instruments 10,715.88 7,034.44 Government or Trust Securities 5,747.96 4,617.03 Debentures 6,325.21 5,669.44 Unquoted InvestmentsOther Non-Current Investments 15.02 -
23,251.20 17,638.81 2.8.1 Aggregate Book Value of Quoted Investments 23,236.18 17,638.81 2.8.2 Aggregate Market Value of Quoted Investments 23,236.18 17,638.81 2.8.3 Aggregate Value of Unquoted Investments 15.02 -
363Integrated Annual Report 2020-21
Integrated ReportStatutory Reports
Financial statements
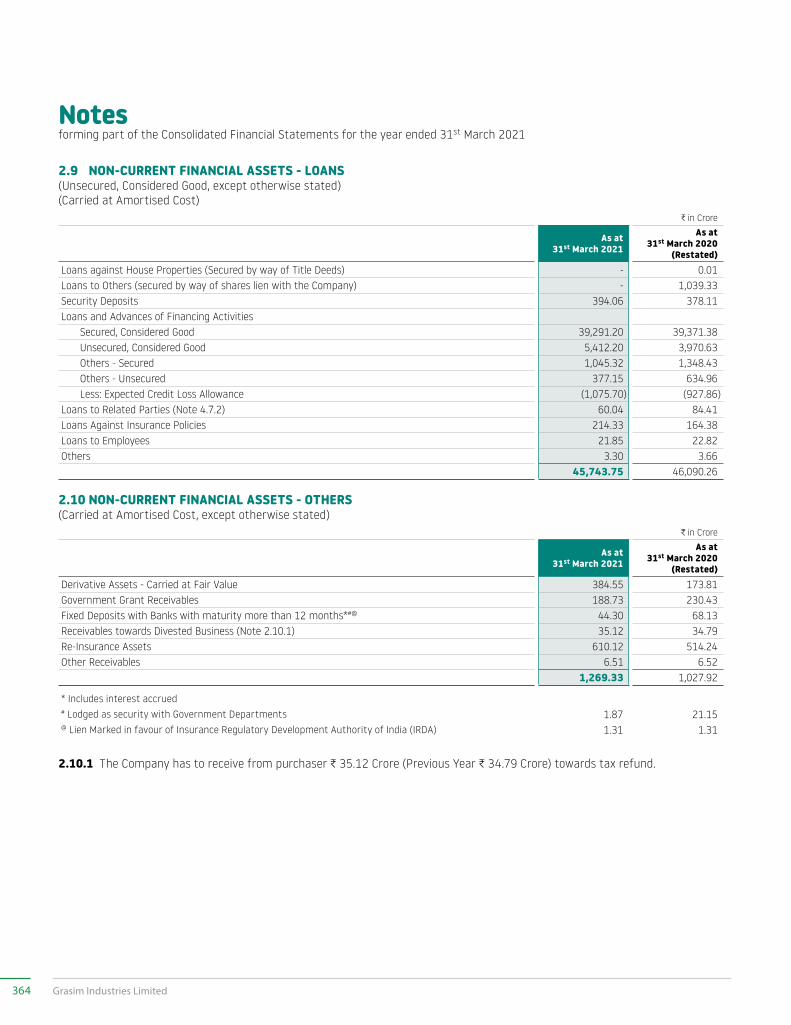
Notesforming part of the Consolidated Financial Statements for the year ended 31st March 2021
2.9 NON-CURRENT FINANCIAL ASSETS - LOANS(Unsecured, Considered Good, except otherwise stated)(Carried at Amortised Cost)
C in Crore
As at 31st March 2021
As at 31st March 2020
(Restated)Loans against House Properties (Secured by way of Title Deeds) - 0.01 Loans to Others (secured by way of shares lien with the Company) - 1,039.33 Security Deposits 394.06 378.11 Loans and Advances of Financing Activities Secured, Considered Good 39,291.20 39,371.38 Unsecured, Considered Good 5,412.20 3,970.63 Others - Secured 1,045.32 1,348.43 Others - Unsecured 377.15 634.96 Less: Expected Credit Loss Allowance (1,075.70) (927.86)Loans to Related Parties (Note 4.7.2) 60.04 84.41 Loans Against Insurance Policies 214.33 164.38 Loans to Employees 21.85 22.82 Others 3.30 3.66
45,743.75 46,090.26
2.10 NON-CURRENT FINANCIAL ASSETS - OTHERS(Carried at Amortised Cost, except otherwise stated)
C in Crore
As at 31st March 2021
As at 31st March 2020
(Restated)Derivative Assets - Carried at Fair Value 384.55 173.81 Government Grant Receivables 188.73 230.43 Fixed Deposits with Banks with maturity more than 12 months*#@ 44.30 68.13 Receivables towards Divested Business (Note 2.10.1) 35.12 34.79 Re-Insurance Assets 610.12 514.24 Other Receivables 6.51 6.52
1,269.33 1,027.92
* Includes interest accrued# Lodged as security with Government Departments 1.87 21.15@ Lien Marked in favour of Insurance Regulatory Development Authority of India (IRDA) 1.31 1.31
2.10.1 The Company has to receive from purchaser C 35.12 Crore (Previous Year C 34.79 Crore) towards tax refund.
364 Grasim Industries Limited
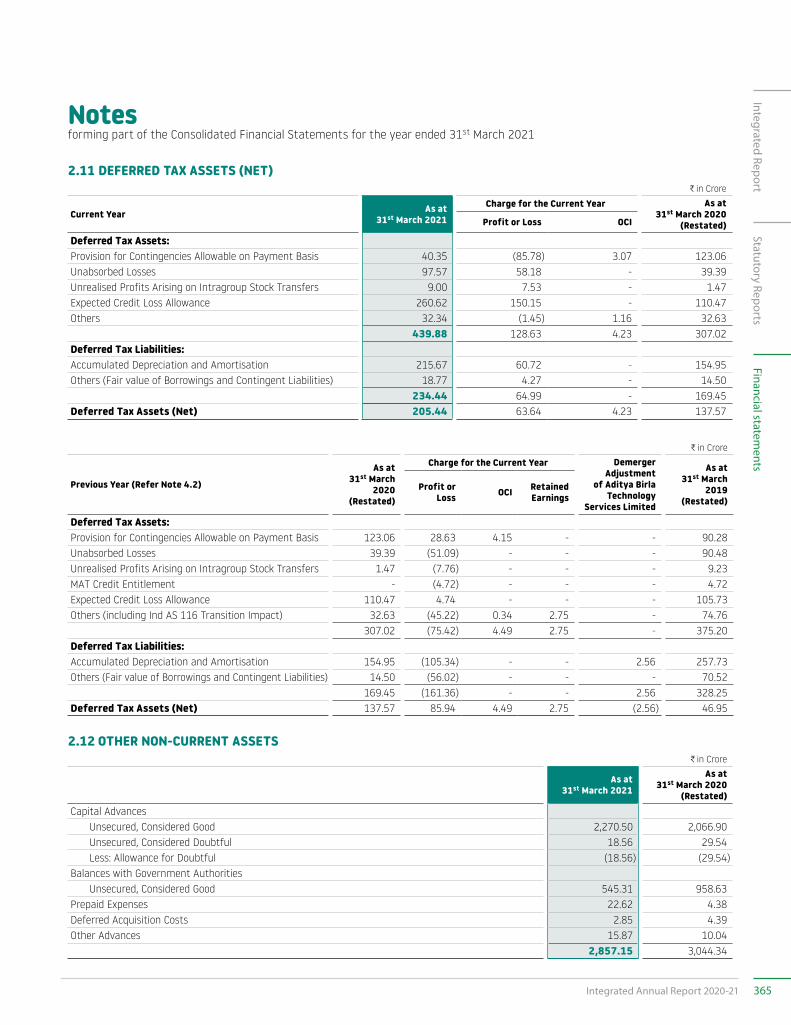
Notesforming part of the Consolidated Financial Statements for the year ended 31st March 2021
2.11 DEFERRED TAX ASSETS (NET)C in Crore
Current Year As at 31st March 2021
Charge for the Current Year As at 31st March 2020
(Restated) Profit or Loss OCI
Deferred Tax Assets:Provision for Contingencies Allowable on Payment Basis 40.35 (85.78) 3.07 123.06 Unabsorbed Losses 97.57 58.18 - 39.39 Unrealised Profits Arising on Intragroup Stock Transfers 9.00 7.53 - 1.47 Expected Credit Loss Allowance 260.62 150.15 - 110.47 Others 32.34 (1.45) 1.16 32.63
439.88 128.63 4.23 307.02 Deferred Tax Liabilities:Accumulated Depreciation and Amortisation 215.67 60.72 - 154.95 Others (Fair value of Borrowings and Contingent Liabilities) 18.77 4.27 - 14.50
234.44 64.99 - 169.45 Deferred Tax Assets (Net) 205.44 63.64 4.23 137.57
C in Crore
Previous Year (Refer Note 4.2)
As at 31st March
2020 (Restated)
Charge for the Current Year Demerger Adjustment
of Aditya Birla Technology
Services Limited
As at 31st March
2019(Restated)
Profit or Loss OCI Retained
Earnings
Deferred Tax Assets:Provision for Contingencies Allowable on Payment Basis 123.06 28.63 4.15 - - 90.28 Unabsorbed Losses 39.39 (51.09) - - - 90.48 Unrealised Profits Arising on Intragroup Stock Transfers 1.47 (7.76) - - - 9.23 MAT Credit Entitlement - (4.72) - - - 4.72 Expected Credit Loss Allowance 110.47 4.74 - - - 105.73 Others (including Ind AS 116 Transition Impact) 32.63 (45.22) 0.34 2.75 - 74.76
307.02 (75.42) 4.49 2.75 - 375.20 Deferred Tax Liabilities:Accumulated Depreciation and Amortisation 154.95 (105.34) - - 2.56 257.73 Others (Fair value of Borrowings and Contingent Liabilities) 14.50 (56.02) - - - 70.52
169.45 (161.36) - - 2.56 328.25 Deferred Tax Assets (Net) 137.57 85.94 4.49 2.75 (2.56) 46.95
2.12 OTHER NON-CURRENT ASSETSC in Crore
As at 31st March 2021
As at 31st March 2020
(Restated)Capital Advances Unsecured, Considered Good 2,270.50 2,066.90 Unsecured, Considered Doubtful 18.56 29.54 Less: Allowance for Doubtful (18.56) (29.54)Balances with Government Authorities Unsecured, Considered Good 545.31 958.63 Prepaid Expenses 22.62 4.38 Deferred Acquisition Costs 2.85 4.39 Other Advances 15.87 10.04
2,857.15 3,044.34
365Integrated Annual Report 2020-21
Integrated ReportStatutory Reports
Financial statements
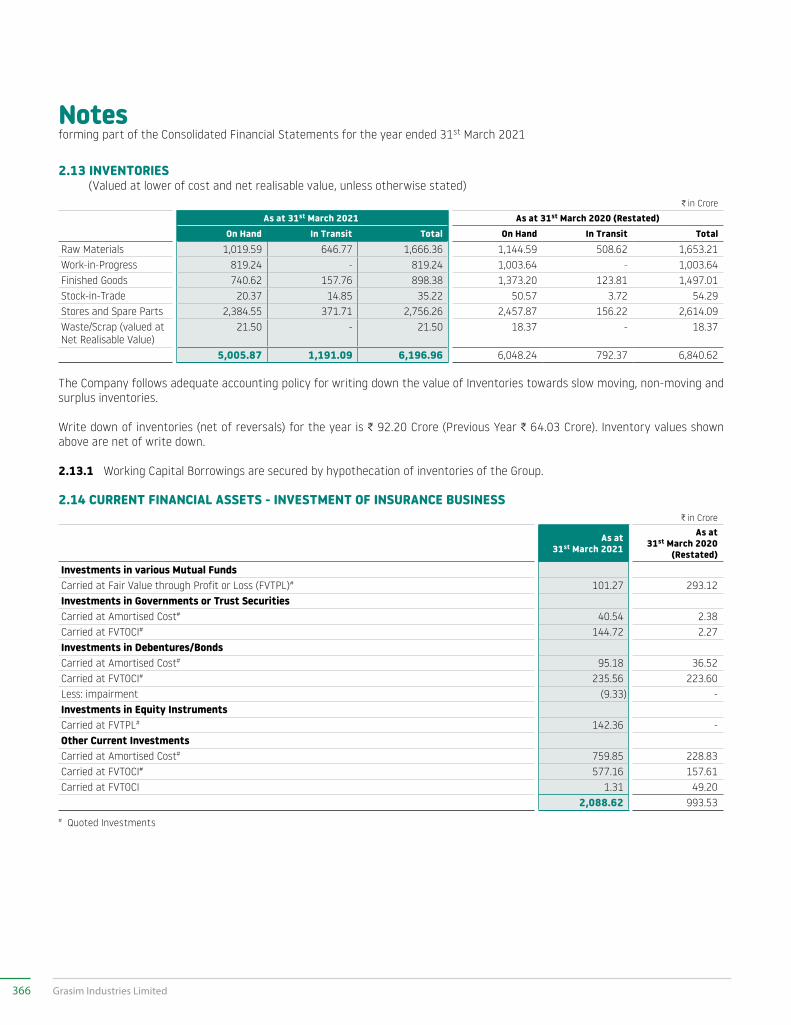
Notesforming part of the Consolidated Financial Statements for the year ended 31st March 2021
2.13 INVENTORIES (Valued at lower of cost and net realisable value, unless otherwise stated)
C in Crore
As at 31st March 2021 As at 31st March 2020 (Restated) On Hand In Transit Total On Hand In Transit Total
Raw Materials 1,019.59 646.77 1,666.36 1,144.59 508.62 1,653.21Work-in-Progress 819.24 - 819.24 1,003.64 - 1,003.64Finished Goods 740.62 157.76 898.38 1,373.20 123.81 1,497.01Stock-in-Trade 20.37 14.85 35.22 50.57 3.72 54.29Stores and Spare Parts 2,384.55 371.71 2,756.26 2,457.87 156.22 2,614.09Waste/Scrap (valued at Net Realisable Value)
21.50 - 21.50 18.37 - 18.37
5,005.87 1,191.09 6,196.96 6,048.24 792.37 6,840.62
The Company follows adequate accounting policy for writing down the value of Inventories towards slow moving, non-moving and surplus inventories.
Write down of inventories (net of reversals) for the year is C 92.20 Crore (Previous Year C 64.03 Crore). Inventory values shown above are net of write down.
2.13.1 Working Capital Borrowings are secured by hypothecation of inventories of the Group.
2.14 CURRENT FINANCIAL ASSETS - INVESTMENT OF INSURANCE BUSINESSC in Crore
As at 31st March 2021
As at 31st March 2020
(Restated)Investments in various Mutual FundsCarried at Fair Value through Profit or Loss (FVTPL)# 101.27 293.12 Investments in Governments or Trust SecuritiesCarried at Amortised Cost# 40.54 2.38 Carried at FVTOCI# 144.72 2.27 Investments in Debentures/BondsCarried at Amortised Cost# 95.18 36.52 Carried at FVTOCI# 235.56 223.60 Less: impairment (9.33) - Investments in Equity InstrumentsCarried at FVTPL# 142.36 - Other Current InvestmentsCarried at Amortised Cost# 759.85 228.83 Carried at FVTOCI# 577.16 157.61 Carried at FVTOCI 1.31 49.20
2,088.62 993.53 # Quoted Investments
366 Grasim Industries Limited
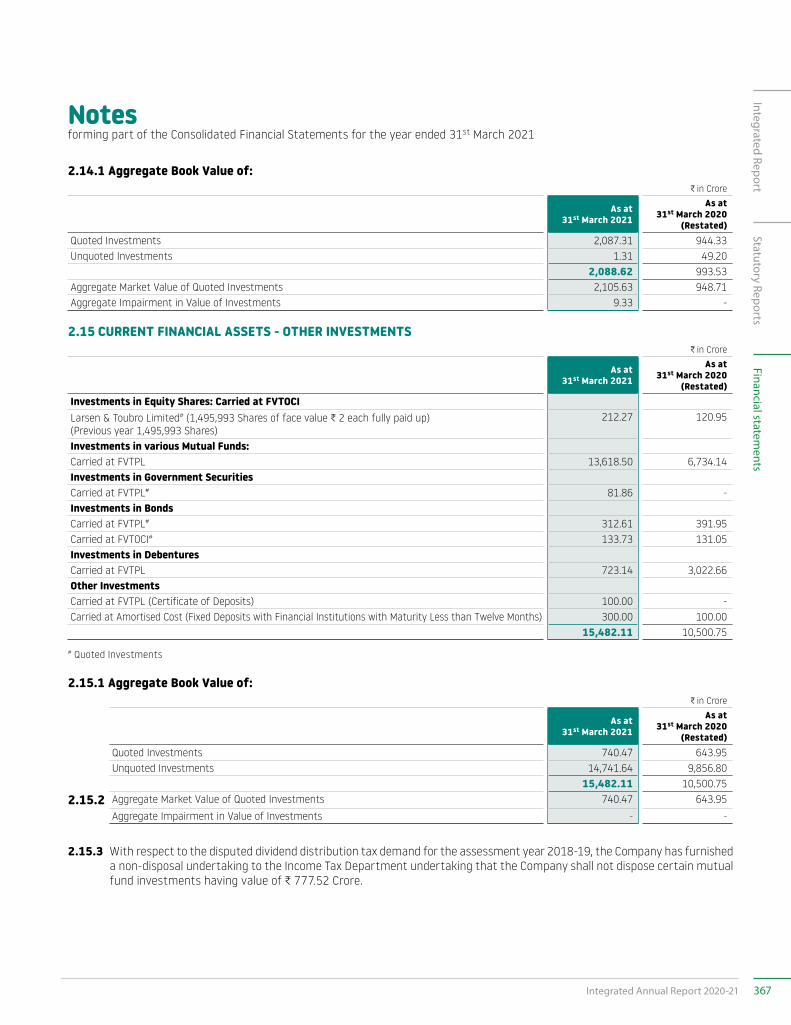
Notesforming part of the Consolidated Financial Statements for the year ended 31st March 2021
2.14.1 Aggregate Book Value of:C in Crore
As at 31st March 2021
As at 31st March 2020
(Restated)Quoted Investments 2,087.31 944.33 Unquoted Investments 1.31 49.20
2,088.62 993.53 Aggregate Market Value of Quoted Investments 2,105.63 948.71 Aggregate Impairment in Value of Investments 9.33 -
2.15 CURRENT FINANCIAL ASSETS - OTHER INVESTMENTSC in Crore
As at 31st March 2021
As at 31st March 2020
(Restated)Investments in Equity Shares: Carried at FVTOCILarsen & Toubro Limited# (1,495,993 Shares of face value C 2 each fully paid up) (Previous year 1,495,993 Shares)
212.27 120.95
Investments in various Mutual Funds:Carried at FVTPL 13,618.50 6,734.14Investments in Government SecuritiesCarried at FVTPL# 81.86 -Investments in BondsCarried at FVTPL# 312.61 391.95Carried at FVTOCI# 133.73 131.05Investments in DebenturesCarried at FVTPL 723.14 3,022.66Other InvestmentsCarried at FVTPL (Certificate of Deposits) 100.00 -Carried at Amortised Cost (Fixed Deposits with Financial Institutions with Maturity Less than Twelve Months) 300.00 100.00
15,482.11 10,500.75
# Quoted Investments
2.15.1 Aggregate Book Value of:C in Crore
As at 31st March 2021
As at 31st March 2020
(Restated)Quoted Investments 740.47 643.95 Unquoted Investments 14,741.64 9,856.80
15,482.11 10,500.75 2.15.2 Aggregate Market Value of Quoted Investments 740.47 643.95
Aggregate Impairment in Value of Investments - -
2.15.3 With respect to the disputed dividend distribution tax demand for the assessment year 2018-19, the Company has furnished a non-disposal undertaking to the Income Tax Department undertaking that the Company shall not dispose certain mutual fund investments having value of C 777.52 Crore.
367Integrated Annual Report 2020-21
Integrated ReportStatutory Reports
Financial statements
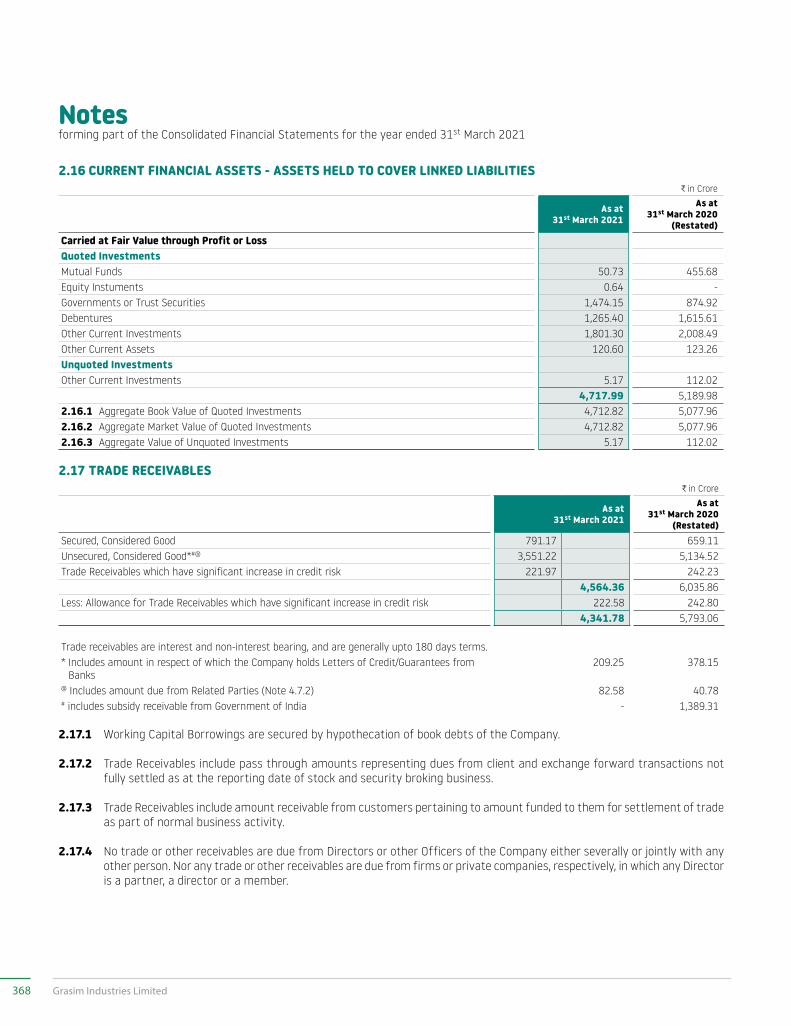
Notesforming part of the Consolidated Financial Statements for the year ended 31st March 2021
2.16 CURRENT FINANCIAL ASSETS - ASSETS HELD TO COVER LINKED LIABILITIESC in Crore
As at 31st March 2021
As at 31st March 2020
(Restated)Carried at Fair Value through Profit or LossQuoted InvestmentsMutual Funds 50.73 455.68 Equity Instuments 0.64 - Governments or Trust Securities 1,474.15 874.92 Debentures 1,265.40 1,615.61 Other Current Investments 1,801.30 2,008.49 Other Current Assets 120.60 123.26 Unquoted InvestmentsOther Current Investments 5.17 112.02
4,717.99 5,189.98 2.16.1 Aggregate Book Value of Quoted Investments 4,712.82 5,077.96 2.16.2 Aggregate Market Value of Quoted Investments 4,712.82 5,077.96 2.16.3 Aggregate Value of Unquoted Investments 5.17 112.02
2.17 TRADE RECEIVABLESC in Crore
As at 31st March 2021
As at 31st March 2020
(Restated)Secured, Considered Good 791.17 659.11 Unsecured, Considered Good*#@ 3,551.22 5,134.52 Trade Receivables which have significant increase in credit risk 221.97 242.23
4,564.36 6,035.86 Less: Allowance for Trade Receivables which have significant increase in credit risk 222.58 242.80
4,341.78 5,793.06
Trade receivables are interest and non-interest bearing, and are generally upto 180 days terms.* Includes amount in respect of which the Company holds Letters of Credit/Guarantees from
Banks209.25 378.15
@ Includes amount due from Related Parties (Note 4.7.2) 82.58 40.78 # includes subsidy receivable from Government of India - 1,389.31
2.17.1 Working Capital Borrowings are secured by hypothecation of book debts of the Company.
2.17.2 Trade Receivables include pass through amounts representing dues from client and exchange forward transactions not fully settled as at the reporting date of stock and security broking business.
2.17.3 Trade Receivables include amount receivable from customers pertaining to amount funded to them for settlement of trade as part of normal business activity.
2.17.4 No trade or other receivables are due from Directors or other Officers of the Company either severally or jointly with any other person. Nor any trade or other receivables are due from firms or private companies, respectively, in which any Director is a partner, a director or a member.
368 Grasim Industries Limited
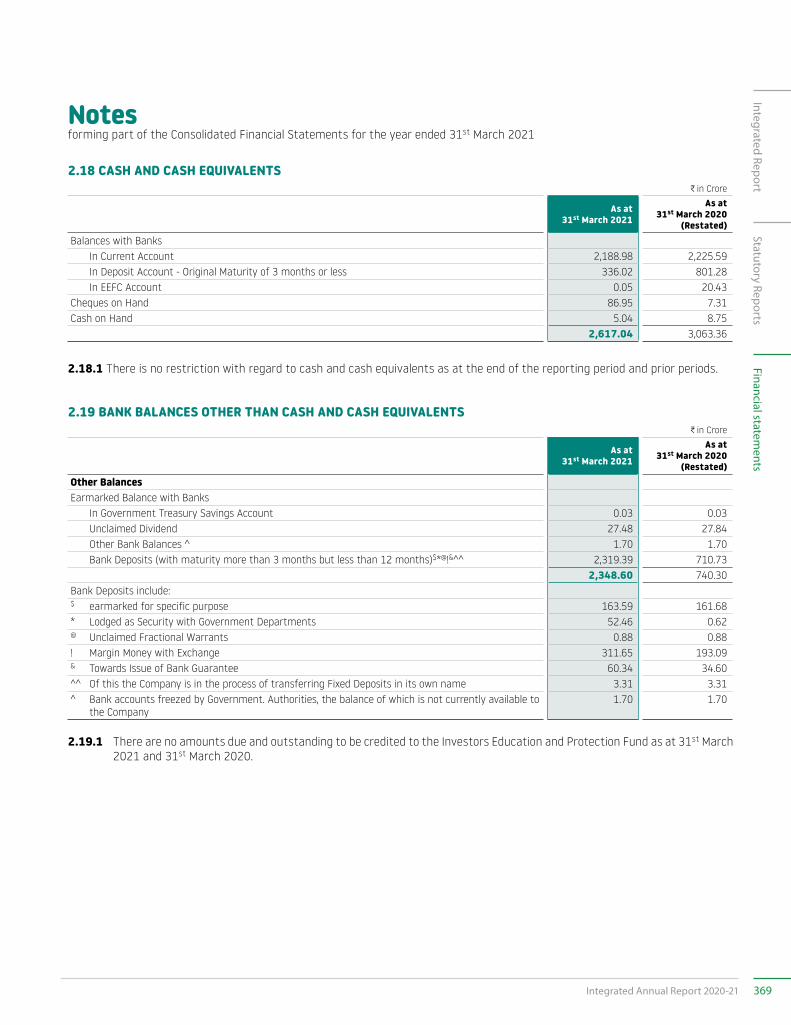
Notesforming part of the Consolidated Financial Statements for the year ended 31st March 2021
2.18 CASH AND CASH EQUIVALENTSC in Crore
As at 31st March 2021
As at 31st March 2020
(Restated)Balances with Banks In Current Account 2,188.98 2,225.59 In Deposit Account - Original Maturity of 3 months or less 336.02 801.28 In EEFC Account 0.05 20.43 Cheques on Hand 86.95 7.31 Cash on Hand 5.04 8.75
2,617.04 3,063.36
2.18.1 There is no restriction with regard to cash and cash equivalents as at the end of the reporting period and prior periods.
2.19 BANK BALANCES OTHER THAN CASH AND CASH EQUIVALENTSC in Crore
As at 31st March 2021
As at 31st March 2020
(Restated)Other BalancesEarmarked Balance with Banks In Government Treasury Savings Account 0.03 0.03 Unclaimed Dividend 27.48 27.84 Other Bank Balances ^ 1.70 1.70 Bank Deposits (with maturity more than 3 months but less than 12 months)$*@!&^^ 2,319.39 710.73
2,348.60 740.30 Bank Deposits include:$ earmarked for specific purpose 163.59 161.68 * Lodged as Security with Government Departments 52.46 0.62 @ Unclaimed Fractional Warrants 0.88 0.88 ! Margin Money with Exchange 311.65 193.09 & Towards Issue of Bank Guarantee 60.34 34.60 ^^ Of this the Company is in the process of transferring Fixed Deposits in its own name 3.31 3.31 ^ Bank accounts freezed by Government. Authorities, the balance of which is not currently available to
the Company 1.70 1.70
2.19.1 There are no amounts due and outstanding to be credited to the Investors Education and Protection Fund as at 31st March 2021 and 31st March 2020.
369Integrated Annual Report 2020-21
Integrated ReportStatutory Reports
Financial statements
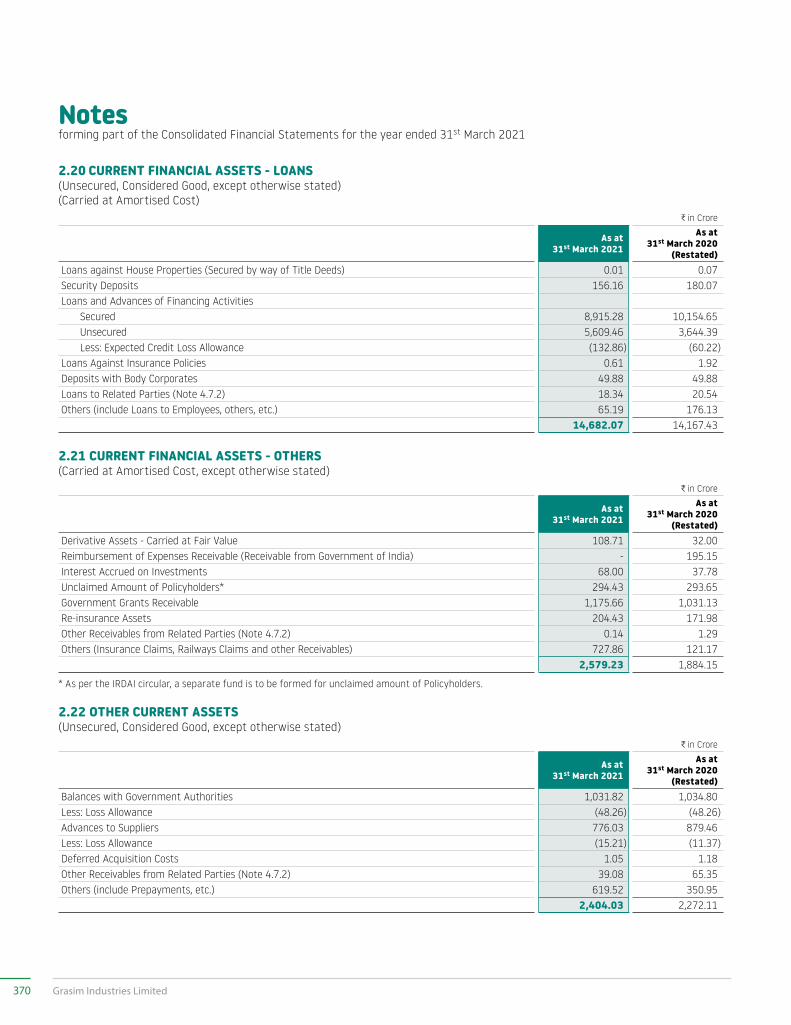
Notesforming part of the Consolidated Financial Statements for the year ended 31st March 2021
2.20 CURRENT FINANCIAL ASSETS - LOANS(Unsecured, Considered Good, except otherwise stated)(Carried at Amortised Cost)
C in Crore
As at 31st March 2021
As at 31st March 2020
(Restated)Loans against House Properties (Secured by way of Title Deeds) 0.01 0.07 Security Deposits 156.16 180.07 Loans and Advances of Financing Activities Secured 8,915.28 10,154.65 Unsecured 5,609.46 3,644.39 Less: Expected Credit Loss Allowance (132.86) (60.22)Loans Against Insurance Policies 0.61 1.92 Deposits with Body Corporates 49.88 49.88 Loans to Related Parties (Note 4.7.2) 18.34 20.54 Others (include Loans to Employees, others, etc.) 65.19 176.13
14,682.07 14,167.43
2.21 CURRENT FINANCIAL ASSETS - OTHERS(Carried at Amortised Cost, except otherwise stated)
C in Crore
As at 31st March 2021
As at 31st March 2020
(Restated)Derivative Assets - Carried at Fair Value 108.71 32.00 Reimbursement of Expenses Receivable (Receivable from Government of India) - 195.15 Interest Accrued on Investments 68.00 37.78 Unclaimed Amount of Policyholders* 294.43 293.65 Government Grants Receivable 1,175.66 1,031.13 Re-insurance Assets 204.43 171.98 Other Receivables from Related Parties (Note 4.7.2) 0.14 1.29 Others (Insurance Claims, Railways Claims and other Receivables) 727.86 121.17
2,579.23 1,884.15
* As per the IRDAI circular, a separate fund is to be formed for unclaimed amount of Policyholders.
2.22 OTHER CURRENT ASSETS(Unsecured, Considered Good, except otherwise stated)
C in Crore
As at 31st March 2021
As at 31st March 2020
(Restated)Balances with Government Authorities 1,031.82 1,034.80 Less: Loss Allowance (48.26) (48.26)Advances to Suppliers 776.03 879.46 Less: Loss Allowance (15.21) (11.37)Deferred Acquisition Costs 1.05 1.18 Other Receivables from Related Parties (Note 4.7.2) 39.08 65.35 Others (include Prepayments, etc.) 619.52 350.95
2,404.03 2,272.11
370 Grasim Industries Limited
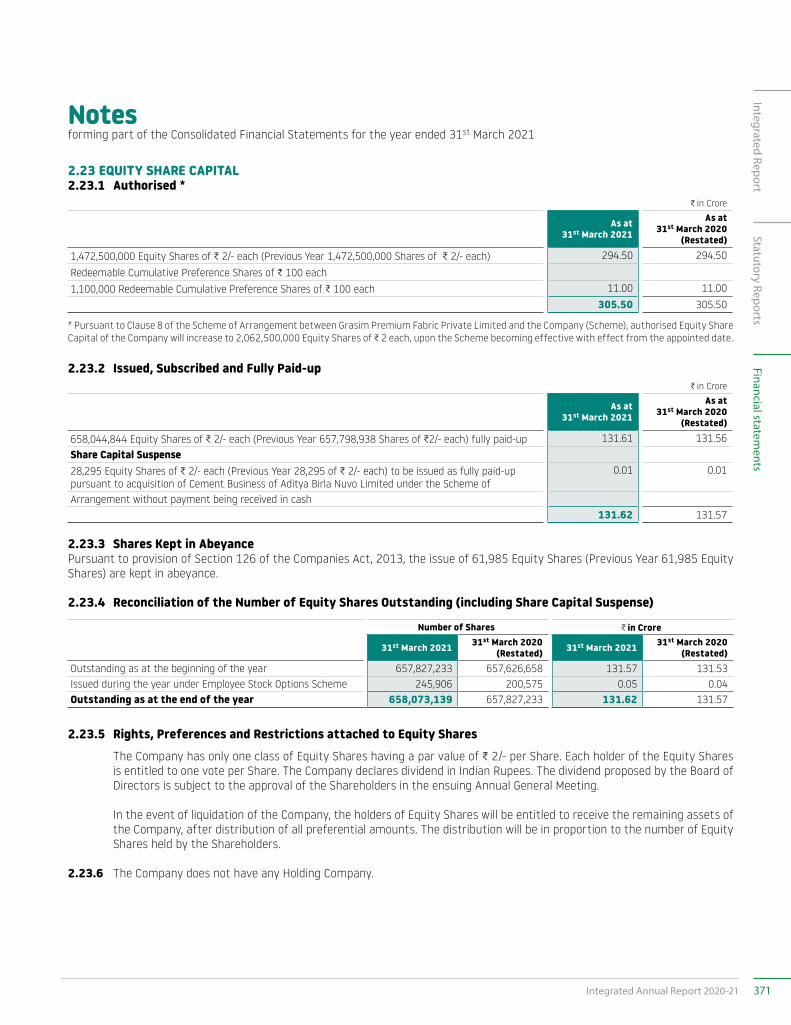
Notesforming part of the Consolidated Financial Statements for the year ended 31st March 2021
2.23 EQUITY SHARE CAPITAL2.23.1 Authorised *
C in Crore
As at 31st March 2021
As at 31st March 2020
(Restated)
1,472,500,000 Equity Shares of C 2/- each (Previous Year 1,472,500,000 Shares of C 2/- each) 294.50 294.50
Redeemable Cumulative Preference Shares of C 100 each1,100,000 Redeemable Cumulative Preference Shares of C 100 each 11.00 11.00
305.50 305.50
* Pursuant to Clause 8 of the Scheme of Arrangement between Grasim Premium Fabric Private Limited and the Company (Scheme), authorised Equity Share Capital of the Company will increase to 2,062,500,000 Equity Shares of C 2 each, upon the Scheme becoming effective with effect from the appointed date.
2.23.2 Issued, Subscribed and Fully Paid-upC in Crore
As at 31st March 2021
As at 31st March 2020
(Restated)
658,044,844 Equity Shares of C 2/- each (Previous Year 657,798,938 Shares of C2/- each) fully paid-up 131.61 131.56 Share Capital Suspense28,295 Equity Shares of C 2/- each (Previous Year 28,295 of C 2/- each) to be issued as fully paid-up pursuant to acquisition of Cement Business of Aditya Birla Nuvo Limited under the Scheme of
0.01 0.01
Arrangement without payment being received in cash 131.62 131.57
2.23.3 Shares Kept in AbeyancePursuant to provision of Section 126 of the Companies Act, 2013, the issue of 61,985 Equity Shares (Previous Year 61,985 Equity Shares) are kept in abeyance.
2.23.4 Reconciliation of the Number of Equity Shares Outstanding (including Share Capital Suspense)
Number of Shares C in Crore
31st March 2021 31st March 2020(Restated) 31st March 2021 31st March 2020
(Restated)Outstanding as at the beginning of the year 657,827,233 657,626,658 131.57 131.53 Issued during the year under Employee Stock Options Scheme 245,906 200,575 0.05 0.04 Outstanding as at the end of the year 658,073,139 657,827,233 131.62 131.57
2.23.5 Rights, Preferences and Restrictions attached to Equity Shares The Company has only one class of Equity Shares having a par value of C 2/- per Share. Each holder of the Equity Shares
is entitled to one vote per Share. The Company declares dividend in Indian Rupees. The dividend proposed by the Board of Directors is subject to the approval of the Shareholders in the ensuing Annual General Meeting.
In the event of liquidation of the Company, the holders of Equity Shares will be entitled to receive the remaining assets of the Company, after distribution of all preferential amounts. The distribution will be in proportion to the number of Equity Shares held by the Shareholders.
2.23.6 The Company does not have any Holding Company.
371Integrated Annual Report 2020-21
Integrated ReportStatutory Reports
Financial statements
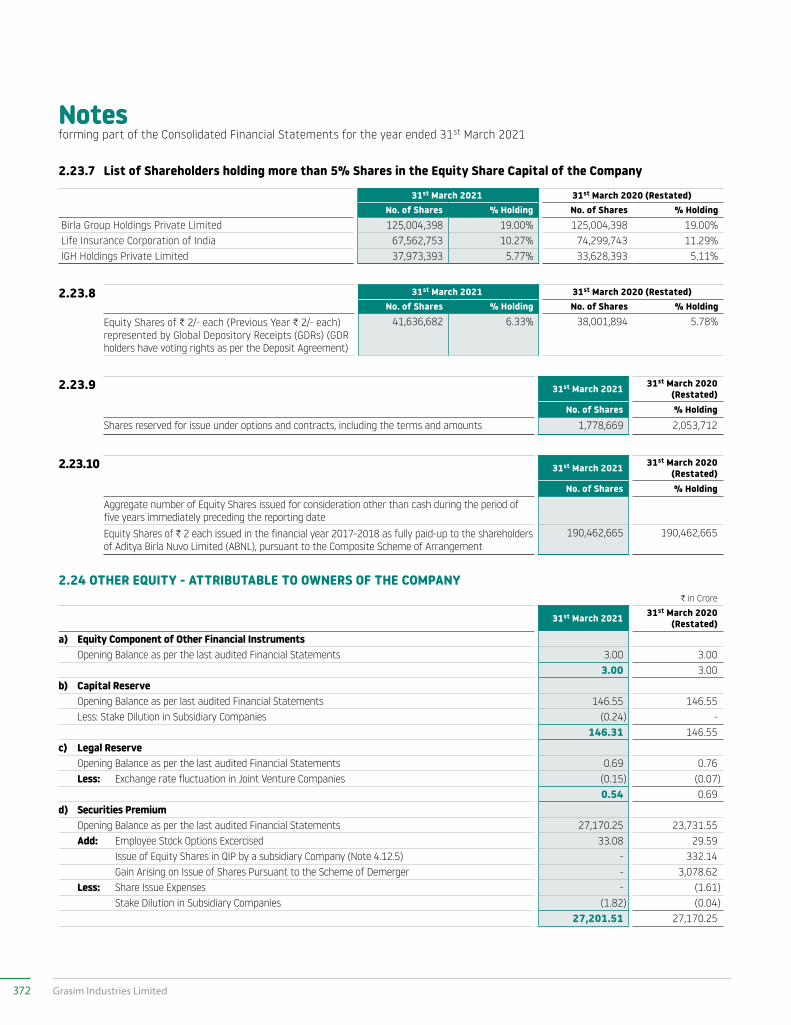
Notesforming part of the Consolidated Financial Statements for the year ended 31st March 2021
2.23.7 List of Shareholders holding more than 5% Shares in the Equity Share Capital of the Company
31st March 2021 31st March 2020 (Restated)No. of Shares % Holding No. of Shares % Holding
Birla Group Holdings Private Limited 125,004,398 19.00% 125,004,398 19.00%Life Insurance Corporation of India 67,562,753 10.27% 74,299,743 11.29%IGH Holdings Private Limited 37,973,393 5.77% 33,628,393 5.11%
2.23.8 31st March 2021 31st March 2020 (Restated)No. of Shares % Holding No. of Shares % Holding
Equity Shares of C 2/- each (Previous Year C 2/- each) represented by Global Depository Receipts (GDRs) (GDR holders have voting rights as per the Deposit Agreement)
41,636,682 6.33% 38,001,894 5.78%
2.23.9 31st March 2021 31st March 2020 (Restated)
No. of Shares % HoldingShares reserved for issue under options and contracts, including the terms and amounts 1,778,669 2,053,712
2.23.10 31st March 2021 31st March 2020 (Restated)
No. of Shares % HoldingAggregate number of Equity Shares issued for consideration other than cash during the period of five years immediately preceding the reporting dateEquity Shares of C 2 each issued in the financial year 2017-2018 as fully paid-up to the shareholders of Aditya Birla Nuvo Limited (ABNL), pursuant to the Composite Scheme of Arrangement
190,462,665 190,462,665
2.24 OTHER EQUITY - ATTRIBUTABLE TO OWNERS OF THE COMPANYC in Crore
31st March 2021 31st March 2020 (Restated)
a) Equity Component of Other Financial Instruments Opening Balance as per the last audited Financial Statements 3.00 3.00
3.00 3.00 b) Capital Reserve Opening Balance as per last audited Financial Statements 146.55 146.55 Less: Stake Dilution in Subsidiary Companies (0.24) -
146.31 146.55 c) Legal Reserve Opening Balance as per the last audited Financial Statements 0.69 0.76 Less: Exchange rate fluctuation in Joint Venture Companies (0.15) (0.07)
0.54 0.69 d) Securities Premium Opening Balance as per the last audited Financial Statements 27,170.25 23,731.55 Add: Employee Stock Options Excercised 33.08 29.59 Issue of Equity Shares in QIP by a subsidiary Company (Note 4.12.5) - 332.14 Gain Arising on Issue of Shares Pursuant to the Scheme of Demerger - 3,078.62 Less: Share Issue Expenses - (1.61) Stake Dilution in Subsidiary Companies (1.82) (0.04)
27,201.51 27,170.25
372 Grasim Industries Limited
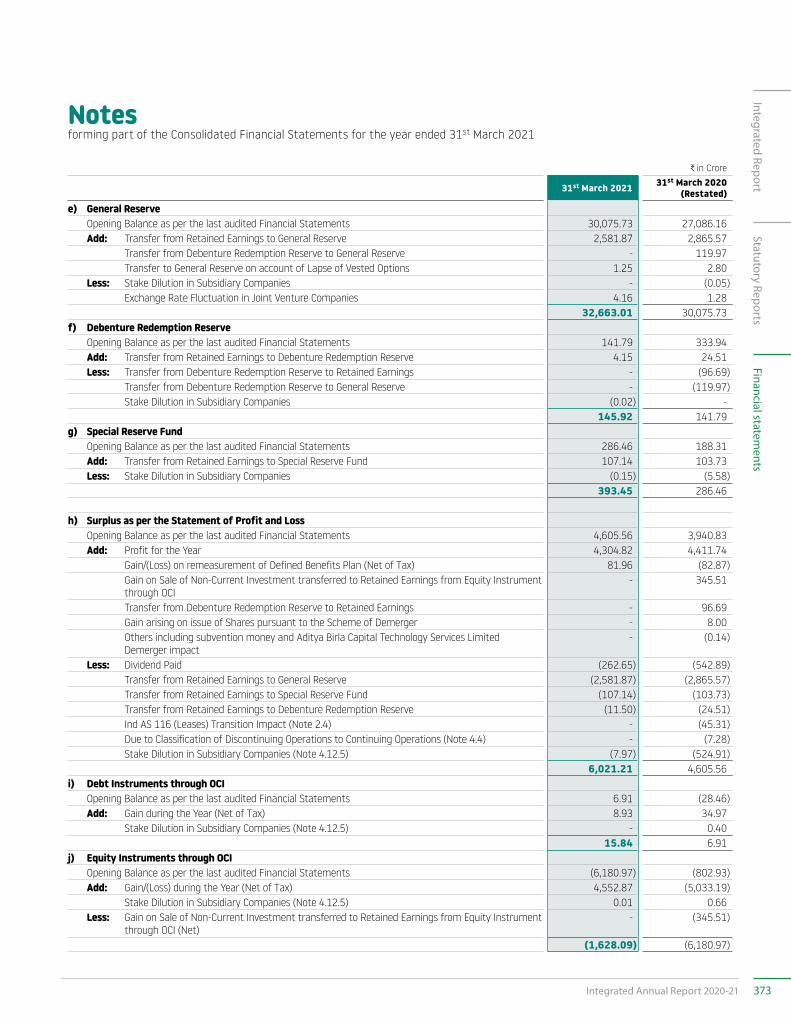
Notesforming part of the Consolidated Financial Statements for the year ended 31st March 2021
C in Crore
31st March 2021 31st March 2020 (Restated)
e) General Reserve Opening Balance as per the last audited Financial Statements 30,075.73 27,086.16 Add: Transfer from Retained Earnings to General Reserve 2,581.87 2,865.57 Transfer from Debenture Redemption Reserve to General Reserve - 119.97 Transfer to General Reserve on account of Lapse of Vested Options 1.25 2.80 Less: Stake Dilution in Subsidiary Companies - (0.05) Exchange Rate Fluctuation in Joint Venture Companies 4.16 1.28
32,663.01 30,075.73 f) Debenture Redemption Reserve Opening Balance as per the last audited Financial Statements 141.79 333.94 Add: Transfer from Retained Earnings to Debenture Redemption Reserve 4.15 24.51 Less: Transfer from Debenture Redemption Reserve to Retained Earnings - (96.69) Transfer from Debenture Redemption Reserve to General Reserve - (119.97) Stake Dilution in Subsidiary Companies (0.02) -
145.92 141.79 g) Special Reserve Fund Opening Balance as per the last audited Financial Statements 286.46 188.31 Add: Transfer from Retained Earnings to Special Reserve Fund 107.14 103.73 Less: Stake Dilution in Subsidiary Companies (0.15) (5.58)
393.45 286.46
h) Surplus as per the Statement of Profit and Loss Opening Balance as per the last audited Financial Statements 4,605.56 3,940.83 Add: Profit for the Year 4,304.82 4,411.74 Gain/(Loss) on remeasurement of Defined Benefits Plan (Net of Tax) 81.96 (82.87) Gain on Sale of Non-Current Investment transferred to Retained Earnings from Equity Instrument
through OCI - 345.51
Transfer from Debenture Redemption Reserve to Retained Earnings - 96.69 Gain arising on issue of Shares pursuant to the Scheme of Demerger - 8.00 Others including subvention money and Aditya Birla Capital Technology Services Limited
Demerger impact - (0.14)
Less: Dividend Paid (262.65) (542.89) Transfer from Retained Earnings to General Reserve (2,581.87) (2,865.57) Transfer from Retained Earnings to Special Reserve Fund (107.14) (103.73) Transfer from Retained Earnings to Debenture Redemption Reserve (11.50) (24.51) Ind AS 116 (Leases) Transition Impact (Note 2.4) - (45.31) Due to Classification of Discontinuing Operations to Continuing Operations (Note 4.4) - (7.28) Stake Dilution in Subsidiary Companies (Note 4.12.5) (7.97) (524.91)
6,021.21 4,605.56 i) Debt Instruments through OCI Opening Balance as per the last audited Financial Statements 6.91 (28.46) Add: Gain during the Year (Net of Tax) 8.93 34.97 Stake Dilution in Subsidiary Companies (Note 4.12.5) - 0.40
15.84 6.91 j) Equity Instruments through OCI Opening Balance as per the last audited Financial Statements (6,180.97) (802.93) Add: Gain/(Loss) during the Year (Net of Tax) 4,552.87 (5,033.19) Stake Dilution in Subsidiary Companies (Note 4.12.5) 0.01 0.66 Less: Gain on Sale of Non-Current Investment transferred to Retained Earnings from Equity Instrument
through OCI (Net) - (345.51)
(1,628.09) (6,180.97)
373Integrated Annual Report 2020-21
Integrated ReportStatutory Reports
Financial statements
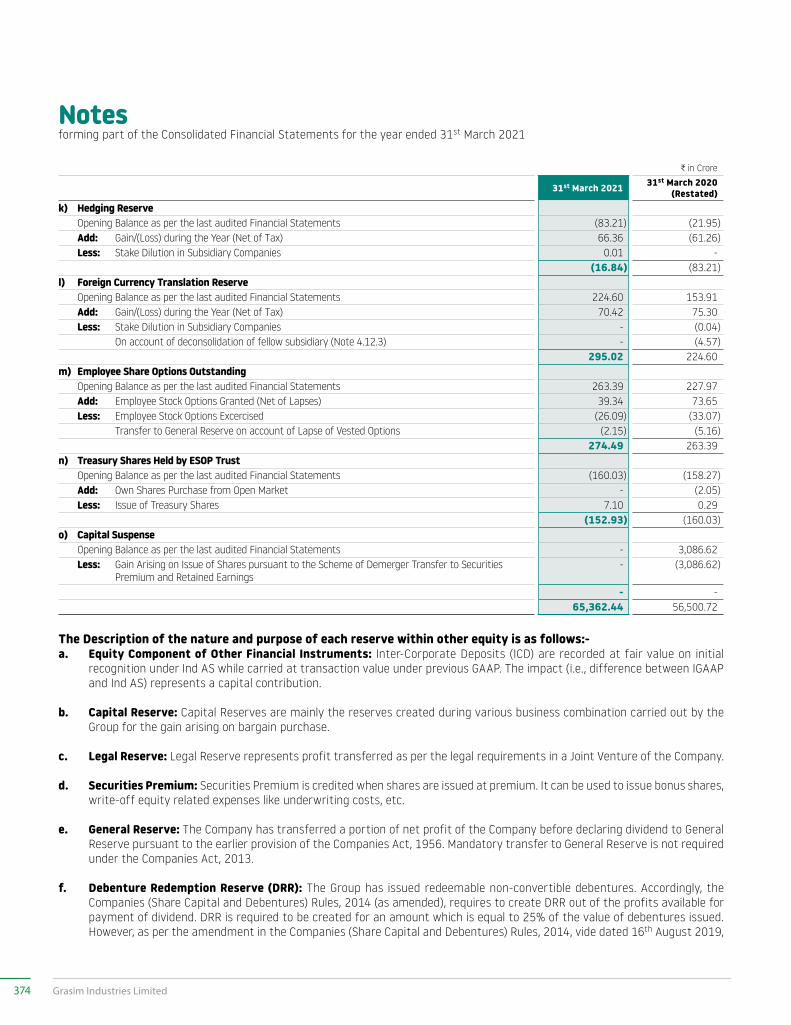
Notesforming part of the Consolidated Financial Statements for the year ended 31st March 2021
C in Crore
31st March 2021 31st March 2020 (Restated)
k) Hedging Reserve Opening Balance as per the last audited Financial Statements (83.21) (21.95) Add: Gain/(Loss) during the Year (Net of Tax) 66.36 (61.26) Less: Stake Dilution in Subsidiary Companies 0.01 -
(16.84) (83.21)l) Foreign Currency Translation Reserve Opening Balance as per the last audited Financial Statements 224.60 153.91 Add: Gain/(Loss) during the Year (Net of Tax) 70.42 75.30 Less: Stake Dilution in Subsidiary Companies - (0.04) On account of deconsolidation of fellow subsidiary (Note 4.12.3) - (4.57)
295.02 224.60 m) Employee Share Options Outstanding Opening Balance as per the last audited Financial Statements 263.39 227.97 Add: Employee Stock Options Granted (Net of Lapses) 39.34 73.65 Less: Employee Stock Options Excercised (26.09) (33.07) Transfer to General Reserve on account of Lapse of Vested Options (2.15) (5.16)
274.49 263.39 n) Treasury Shares Held by ESOP Trust Opening Balance as per the last audited Financial Statements (160.03) (158.27) Add: Own Shares Purchase from Open Market - (2.05) Less: Issue of Treasury Shares 7.10 0.29
(152.93) (160.03)o) Capital Suspense Opening Balance as per the last audited Financial Statements - 3,086.62 Less: Gain Arising on Issue of Shares pursuant to the Scheme of Demerger Transfer to Securities
Premium and Retained Earnings - (3,086.62)
- - 65,362.44 56,500.72
The Description of the nature and purpose of each reserve within other equity is as follows:-a. Equity Component of Other Financial Instruments: Inter-Corporate Deposits (ICD) are recorded at fair value on initial
recognition under Ind AS while carried at transaction value under previous GAAP. The impact (i.e., difference between IGAAP and Ind AS) represents a capital contribution.
b. Capital Reserve: Capital Reserves are mainly the reserves created during various business combination carried out by the Group for the gain arising on bargain purchase.
c. Legal Reserve: Legal Reserve represents profit transferred as per the legal requirements in a Joint Venture of the Company.
d. Securities Premium: Securities Premium is credited when shares are issued at premium. It can be used to issue bonus shares, write-off equity related expenses like underwriting costs, etc.
e. General Reserve: The Company has transferred a portion of net profit of the Company before declaring dividend to General Reserve pursuant to the earlier provision of the Companies Act, 1956. Mandatory transfer to General Reserve is not required under the Companies Act, 2013.
f. Debenture Redemption Reserve (DRR): The Group has issued redeemable non-convertible debentures. Accordingly, the Companies (Share Capital and Debentures) Rules, 2014 (as amended), requires to create DRR out of the profits available for payment of dividend. DRR is required to be created for an amount which is equal to 25% of the value of debentures issued. However, as per the amendment in the Companies (Share Capital and Debentures) Rules, 2014, vide dated 16th August 2019,
374 Grasim Industries Limited
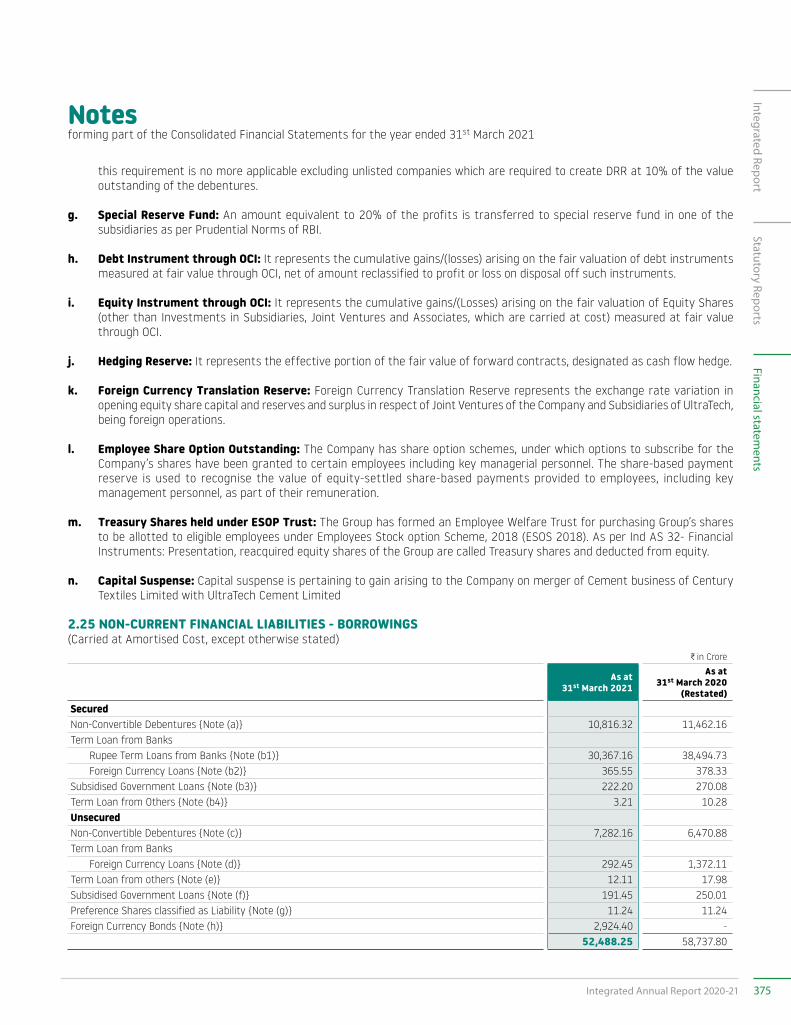
Notesforming part of the Consolidated Financial Statements for the year ended 31st March 2021
this requirement is no more applicable excluding unlisted companies which are required to create DRR at 10% of the value outstanding of the debentures.
g. Special Reserve Fund: An amount equivalent to 20% of the profits is transferred to special reserve fund in one of the subsidiaries as per Prudential Norms of RBI.
h. Debt Instrument through OCI: It represents the cumulative gains/(losses) arising on the fair valuation of debt instruments measured at fair value through OCI, net of amount reclassified to profit or loss on disposal off such instruments.
i. Equity Instrument through OCI: It represents the cumulative gains/(Losses) arising on the fair valuation of Equity Shares (other than Investments in Subsidiaries, Joint Ventures and Associates, which are carried at cost) measured at fair value through OCI.
j. Hedging Reserve: It represents the effective portion of the fair value of forward contracts, designated as cash flow hedge.
k. Foreign Currency Translation Reserve: Foreign Currency Translation Reserve represents the exchange rate variation in opening equity share capital and reserves and surplus in respect of Joint Ventures of the Company and Subsidiaries of UltraTech, being foreign operations.
l. Employee Share Option Outstanding: The Company has share option schemes, under which options to subscribe for the Company’s shares have been granted to certain employees including key managerial personnel. The share-based payment reserve is used to recognise the value of equity-settled share-based payments provided to employees, including key management personnel, as part of their remuneration.
m. Treasury Shares held under ESOP Trust: The Group has formed an Employee Welfare Trust for purchasing Group’s shares to be allotted to eligible employees under Employees Stock option Scheme, 2018 (ESOS 2018). As per Ind AS 32- Financial Instruments: Presentation, reacquired equity shares of the Group are called Treasury shares and deducted from equity.
n. Capital Suspense: Capital suspense is pertaining to gain arising to the Company on merger of Cement business of Century Textiles Limited with UltraTech Cement Limited
2.25 NON-CURRENT FINANCIAL LIABILITIES - BORROWINGS(Carried at Amortised Cost, except otherwise stated)
C in Crore
As at 31st March 2021
As at 31st March 2020
(Restated)SecuredNon-Convertible Debentures {Note (a)} 10,816.32 11,462.16 Term Loan from Banks Rupee Term Loans from Banks {Note (b1)} 30,367.16 38,494.73 Foreign Currency Loans {Note (b2)} 365.55 378.33 Subsidised Government Loans {Note (b3)} 222.20 270.08 Term Loan from Others {Note (b4)} 3.21 10.28 UnsecuredNon-Convertible Debentures {Note (c)} 7,282.16 6,470.88 Term Loan from Banks Foreign Currency Loans {Note (d)} 292.45 1,372.11 Term Loan from others {Note (e)} 12.11 17.98 Subsidised Government Loans {Note (f)} 191.45 250.01 Preference Shares classified as Liability {Note (g)} 11.24 11.24 Foreign Currency Bonds {Note (h)} 2,924.40 -
52,488.25 58,737.80
375Integrated Annual Report 2020-21
Integrated ReportStatutory Reports
Financial statements
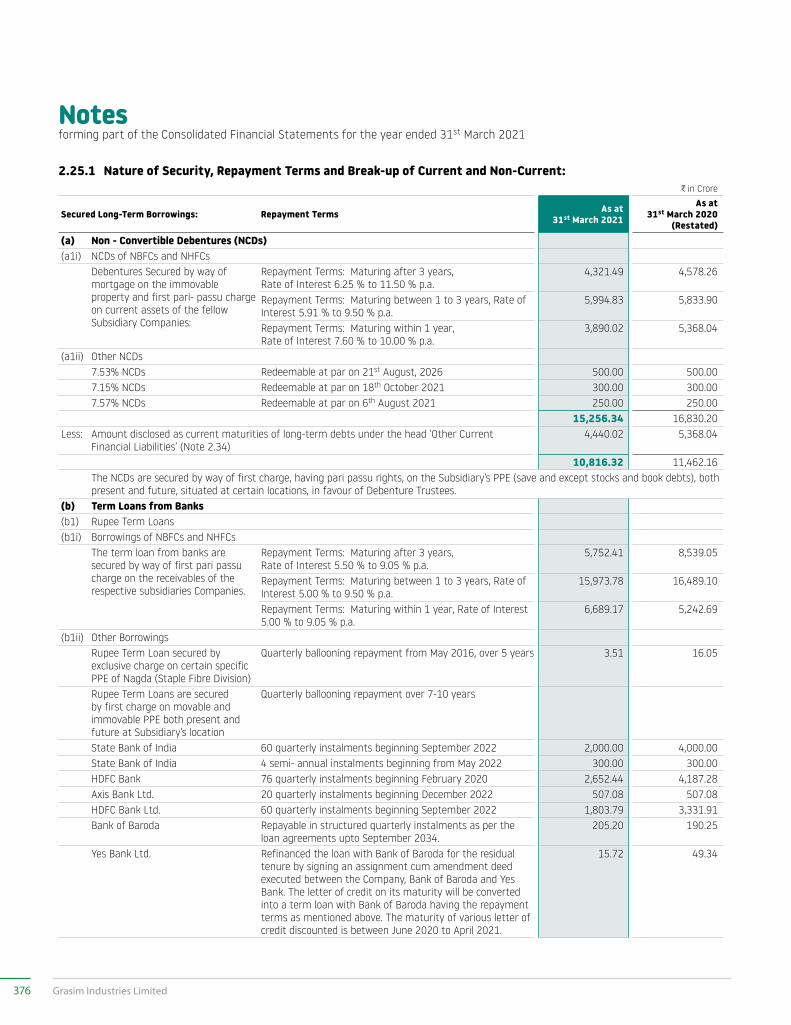
Notesforming part of the Consolidated Financial Statements for the year ended 31st March 2021
2.25.1 Nature of Security, Repayment Terms and Break-up of Current and Non-Current:C in Crore
Secured Long-Term Borrowings: Repayment Terms As at 31st March 2021
As at 31st March 2020
(Restated)(a) Non - Convertible Debentures (NCDs)(a1i) NCDs of NBFCs and NHFCs Debentures Secured by way of
mortgage on the immovable property and first pari- passu charge on current assets of the fellow Subsidiary Companies:
Repayment Terms: Maturing after 3 years, Rate of Interest 6.25 % to 11.50 % p.a.
4,321.49 4,578.26
Repayment Terms: Maturing between 1 to 3 years, Rate of Interest 5.91 % to 9.50 % p.a.
5,994.83 5,833.90
Repayment Terms: Maturing within 1 year, Rate of Interest 7.60 % to 10.00 % p.a.
3,890.02 5,368.04
(a1ii) Other NCDs 7.53% NCDs Redeemable at par on 21st August, 2026 500.00 500.00 7.15% NCDs Redeemable at par on 18th October 2021 300.00 300.00 7.57% NCDs Redeemable at par on 6th August 2021 250.00 250.00
15,256.34 16,830.20 Less: Amount disclosed as current maturities of long-term debts under the head ‘Other Current
Financial Liabilities’ (Note 2.34) 4,440.02 5,368.04
10,816.32 11,462.16 The NCDs are secured by way of first charge, having pari passu rights, on the Subsidiary’s PPE (save and except stocks and book debts), both
present and future, situated at certain locations, in favour of Debenture Trustees.(b) Term Loans from Banks(b1) Rupee Term Loans(b1i) Borrowings of NBFCs and NHFCs The term loan from banks are
secured by way of first pari passu charge on the receivables of the respective subsidiaries Companies.
Repayment Terms: Maturing after 3 years, Rate of Interest 5.50 % to 9.05 % p.a.
5,752.41 8,539.05
Repayment Terms: Maturing between 1 to 3 years, Rate of Interest 5.00 % to 9.50 % p.a.
15,973.78 16,489.10
Repayment Terms: Maturing within 1 year, Rate of Interest 5.00 % to 9.05 % p.a.
6,689.17 5,242.69
(b1ii) Other Borrowings Rupee Term Loan secured by
exclusive charge on certain specific PPE of Nagda (Staple Fibre Division)
Quarterly ballooning repayment from May 2016, over 5 years 3.51 16.05
Rupee Term Loans are secured by first charge on movable and immovable PPE both present and future at Subsidiary’s location
Quarterly ballooning repayment over 7-10 years
State Bank of India 60 quarterly instalments beginning September 2022 2,000.00 4,000.00 State Bank of India 4 semi- annual instalments beginning from May 2022 300.00 300.00 HDFC Bank 76 quarterly instalments beginning February 2020 2,652.44 4,187.28 Axis Bank Ltd. 20 quarterly instalments beginning December 2022 507.08 507.08 HDFC Bank Ltd. 60 quarterly instalments beginning September 2022 1,803.79 3,331.91 Bank of Baroda Repayable in structured quarterly instalments as per the
loan agreements upto September 2034. 205.20 190.25
Yes Bank Ltd. Refinanced the loan with Bank of Baroda for the residual tenure by signing an assignment cum amendment deed executed between the Company, Bank of Baroda and Yes Bank. The letter of credit on its maturity will be converted into a term loan with Bank of Baroda having the repayment terms as mentioned above. The maturity of various letter of credit discounted is between June 2020 to April 2021.
15.72 49.34
376 Grasim Industries Limited
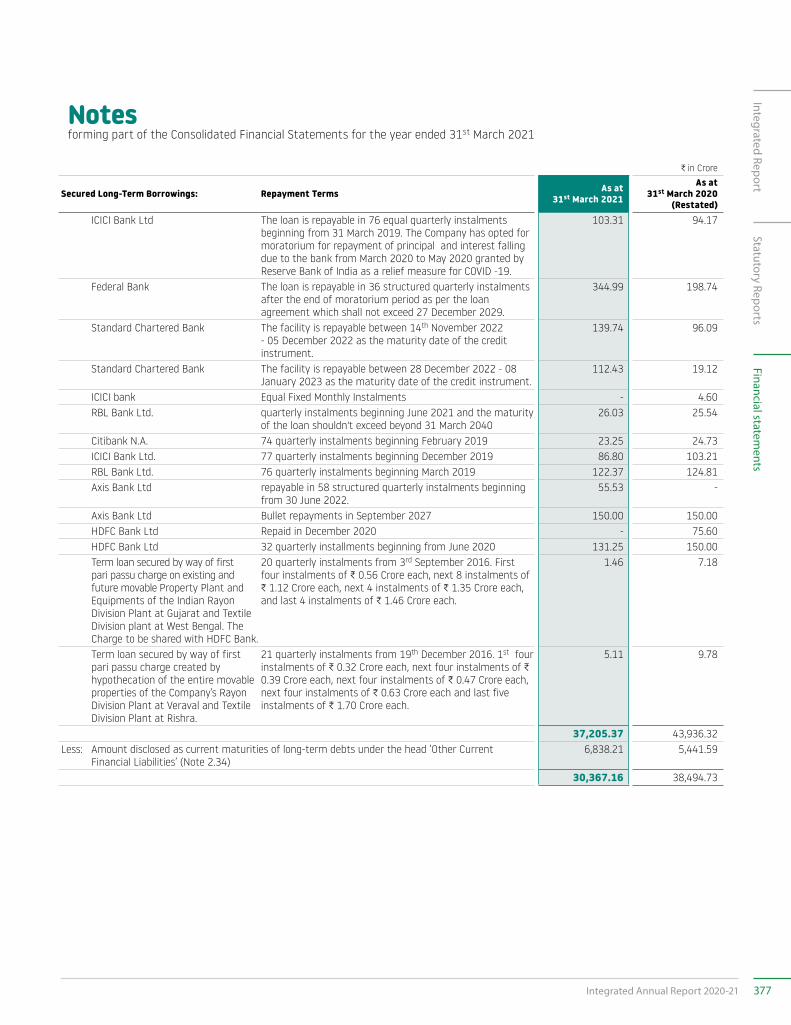
Notesforming part of the Consolidated Financial Statements for the year ended 31st March 2021
C in Crore
Secured Long-Term Borrowings: Repayment Terms As at 31st March 2021
As at 31st March 2020
(Restated) ICICI Bank Ltd The loan is repayable in 76 equal quarterly instalments
beginning from 31 March 2019. The Company has opted for moratorium for repayment of principal and interest falling due to the bank from March 2020 to May 2020 granted by Reserve Bank of India as a relief measure for COVID -19.
103.31 94.17
Federal Bank The loan is repayable in 36 structured quarterly instalments after the end of moratorium period as per the loan agreement which shall not exceed 27 December 2029.
344.99 198.74
Standard Chartered Bank The facility is repayable between 14th November 2022 - 05 December 2022 as the maturity date of the credit instrument.
139.74 96.09
Standard Chartered Bank The facility is repayable between 28 December 2022 - 08 January 2023 as the maturity date of the credit instrument.
112.43 19.12
ICICI bank Equal Fixed Monthly Instalments - 4.60 RBL Bank Ltd. quarterly instalments beginning June 2021 and the maturity
of the loan shouldn't exceed beyond 31 March 2040 26.03 25.54
Citibank N.A. 74 quarterly instalments beginning February 2019 23.25 24.73 ICICI Bank Ltd. 77 quarterly instalments beginning December 2019 86.80 103.21 RBL Bank Ltd. 76 quarterly instalments beginning March 2019 122.37 124.81 Axis Bank Ltd repayable in 58 structured quarterly instalments beginning
from 30 June 2022. 55.53 -
Axis Bank Ltd Bullet repayments in September 2027 150.00 150.00 HDFC Bank Ltd Repaid in December 2020 - 75.60 HDFC Bank Ltd 32 quarterly installments beginning from June 2020 131.25 150.00 Term loan secured by way of first
pari passu charge on existing and future movable Property Plant and Equipments of the Indian Rayon Division Plant at Gujarat and Textile Division plant at West Bengal. The Charge to be shared with HDFC Bank.
20 quarterly instalments from 3rd September 2016. First four instalments of C 0.56 Crore each, next 8 instalments of C 1.12 Crore each, next 4 instalments of C 1.35 Crore each, and last 4 instalments of C 1.46 Crore each.
1.46 7.18
Term loan secured by way of first pari passu charge created by hypothecation of the entire movable properties of the Company’s Rayon Division Plant at Veraval and Textile Division Plant at Rishra.
21 quarterly instalments from 19th December 2016. 1st four instalments of C 0.32 Crore each, next four instalments of C 0.39 Crore each, next four instalments of C 0.47 Crore each, next four instalments of C 0.63 Crore each and last five instalments of C 1.70 Crore each.
5.11 9.78
37,205.37 43,936.32 Less: Amount disclosed as current maturities of long-term debts under the head ‘Other Current
Financial Liabilities’ (Note 2.34) 6,838.21 5,441.59
30,367.16 38,494.73
377Integrated Annual Report 2020-21
Integrated ReportStatutory Reports
Financial statements
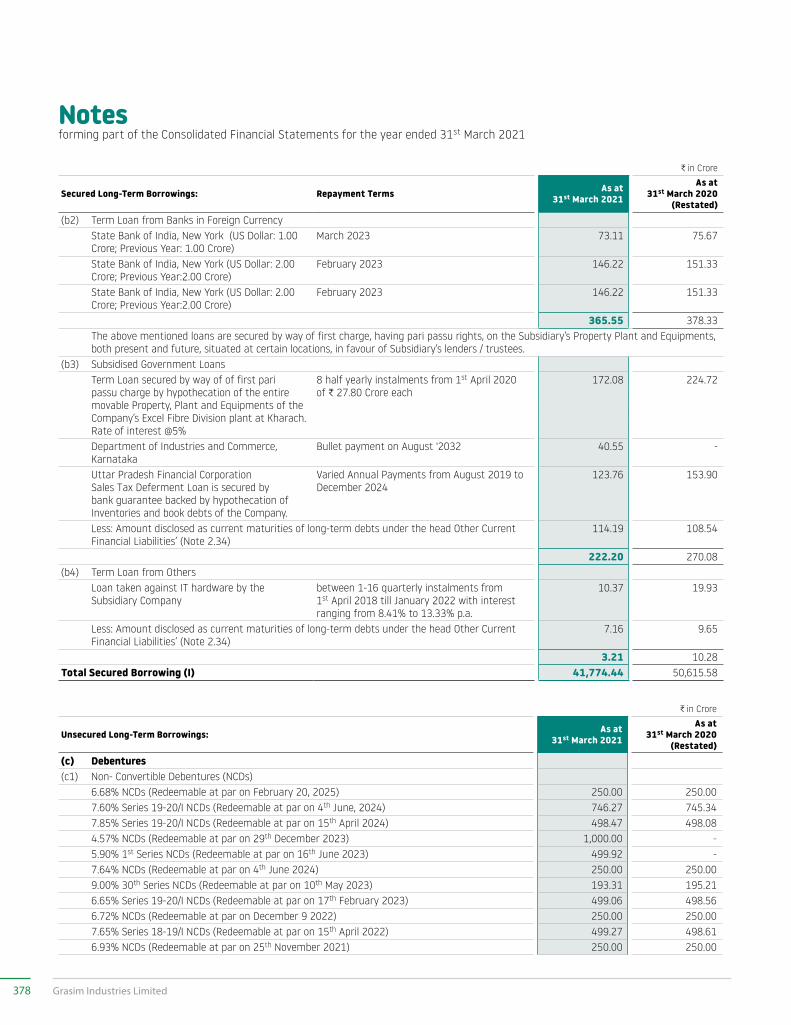
Notesforming part of the Consolidated Financial Statements for the year ended 31st March 2021
C in Crore
Secured Long-Term Borrowings: Repayment Terms As at 31st March 2021
As at 31st March 2020
(Restated)(b2) Term Loan from Banks in Foreign Currency State Bank of India, New York (US Dollar: 1.00
Crore; Previous Year: 1.00 Crore)March 2023 73.11 75.67
State Bank of India, New York (US Dollar: 2.00 Crore; Previous Year:2.00 Crore)
February 2023 146.22 151.33
State Bank of India, New York (US Dollar: 2.00 Crore; Previous Year:2.00 Crore)
February 2023 146.22 151.33
365.55 378.33 The above mentioned loans are secured by way of first charge, having pari passu rights, on the Subsidiary’s Property Plant and Equipments,
both present and future, situated at certain locations, in favour of Subsidiary’s lenders / trustees.(b3) Subsidised Government Loans Term Loan secured by way of of first pari
passu charge by hypothecation of the entire movable Property, Plant and Equipments of the Company’s Excel Fibre Division plant at Kharach.
Rate of interest @5%
8 half yearly instalments from 1st April 2020 of C 27.80 Crore each
172.08 224.72
Department of Industries and Commerce, Karnataka
Bullet payment on August '2032 40.55 -
Uttar Pradesh Financial Corporation Sales Tax Deferment Loan is secured by
bank guarantee backed by hypothecation of Inventories and book debts of the Company.
Varied Annual Payments from August 2019 toDecember 2024
123.76 153.90
Less: Amount disclosed as current maturities of long-term debts under the head Other Current Financial Liabilities’ (Note 2.34)
114.19 108.54
222.20 270.08 (b4) Term Loan from Others Loan taken against IT hardware by the
Subsidiary Companybetween 1-16 quarterly instalments from 1st April 2018 till January 2022 with interest ranging from 8.41% to 13.33% p.a.
10.37 19.93
Less: Amount disclosed as current maturities of long-term debts under the head Other Current Financial Liabilities’ (Note 2.34)
7.16 9.65
3.21 10.28 Total Secured Borrowing (I) 41,774.44 50,615.58
C in Crore
Unsecured Long-Term Borrowings: As at 31st March 2021
As at 31st March 2020
(Restated)(c) Debentures(c1) Non- Convertible Debentures (NCDs) 6.68% NCDs (Redeemable at par on February 20, 2025) 250.00 250.00 7.60% Series 19-20/I NCDs (Redeemable at par on 4th June, 2024) 746.27 745.34 7.85% Series 19-20/I NCDs (Redeemable at par on 15th April 2024) 498.47 498.08 4.57% NCDs (Redeemable at par on 29th December 2023) 1,000.00 - 5.90% 1st Series NCDs (Redeemable at par on 16th June 2023) 499.92 - 7.64% NCDs (Redeemable at par on 4th June 2024) 250.00 250.00 9.00% 30th Series NCDs (Redeemable at par on 10th May 2023) 193.31 195.21 6.65% Series 19-20/I NCDs (Redeemable at par on 17th February 2023) 499.06 498.56 6.72% NCDs (Redeemable at par on December 9 2022) 250.00 250.00 7.65% Series 18-19/I NCDs (Redeemable at par on 15th April 2022) 499.27 498.61 6.93% NCDs (Redeemable at par on 25th November 2021) 250.00 250.00
378 Grasim Industries Limited
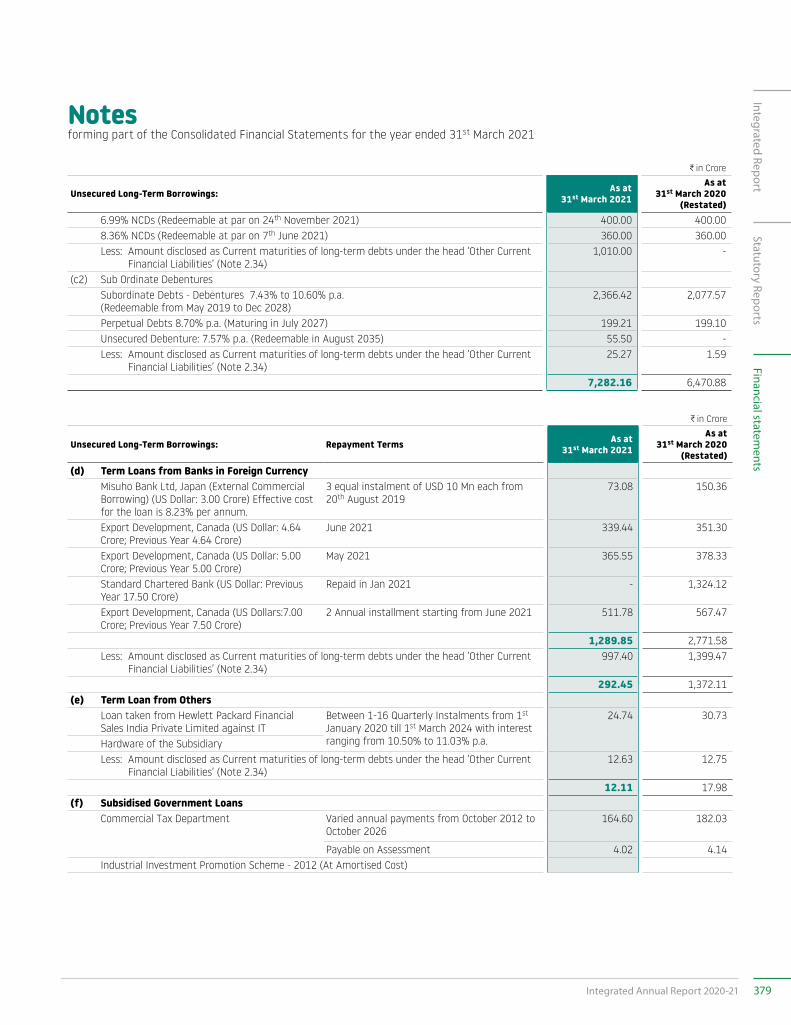
Notesforming part of the Consolidated Financial Statements for the year ended 31st March 2021
C in Crore
Unsecured Long-Term Borrowings: As at 31st March 2021
As at 31st March 2020
(Restated) 6.99% NCDs (Redeemable at par on 24th November 2021) 400.00 400.00 8.36% NCDs (Redeemable at par on 7th June 2021) 360.00 360.00 Less: Amount disclosed as Current maturities of long-term debts under the head ‘Other Current
Financial Liabilities’ (Note 2.34) 1,010.00 -
(c2) Sub Ordinate Debentures Subordinate Debts - Debentures 7.43% to 10.60% p.a.
(Redeemable from May 2019 to Dec 2028) 2,366.42 2,077.57
Perpetual Debts 8.70% p.a. (Maturing in July 2027) 199.21 199.10 Unsecured Debenture: 7.57% p.a. (Redeemable in August 2035) 55.50 - Less: Amount disclosed as Current maturities of long-term debts under the head ‘Other Current
Financial Liabilities’ (Note 2.34) 25.27 1.59
7,282.16 6,470.88
C in Crore
Unsecured Long-Term Borrowings: Repayment Terms As at 31st March 2021
As at 31st March 2020
(Restated)(d) Term Loans from Banks in Foreign Currency Misuho Bank Ltd, Japan (External Commercial
Borrowing) (US Dollar: 3.00 Crore) Effective cost for the loan is 8.23% per annum.
3 equal instalment of USD 10 Mn each from 20th August 2019
73.08 150.36
Export Development, Canada (US Dollar: 4.64 Crore; Previous Year 4.64 Crore)
June 2021 339.44 351.30
Export Development, Canada (US Dollar: 5.00 Crore; Previous Year 5.00 Crore)
May 2021 365.55 378.33
Standard Chartered Bank (US Dollar: Previous Year 17.50 Crore)
Repaid in Jan 2021 - 1,324.12
Export Development, Canada (US Dollars:7.00 Crore; Previous Year 7.50 Crore)
2 Annual installment starting from June 2021 511.78 567.47
1,289.85 2,771.58 Less: Amount disclosed as Current maturities of long-term debts under the head ‘Other Current
Financial Liabilities’ (Note 2.34) 997.40 1,399.47
292.45 1,372.11 (e) Term Loan from Others Loan taken from Hewlett Packard Financial
Sales India Private Limited against IT Between 1-16 Quarterly Instalments from 1st January 2020 till 1st March 2024 with interest ranging from 10.50% to 11.03% p.a.
24.74 30.73
Hardware of the Subsidiary Less: Amount disclosed as Current maturities of long-term debts under the head ‘Other Current
Financial Liabilities’ (Note 2.34) 12.63 12.75
12.11 17.98 (f) Subsidised Government Loans Commercial Tax Department Varied annual payments from October 2012 to
October 2026 164.60 182.03
Payable on Assessment 4.02 4.14 Industrial Investment Promotion Scheme - 2012 (At Amortised Cost)
379Integrated Annual Report 2020-21
Integrated ReportStatutory Reports
Financial statements
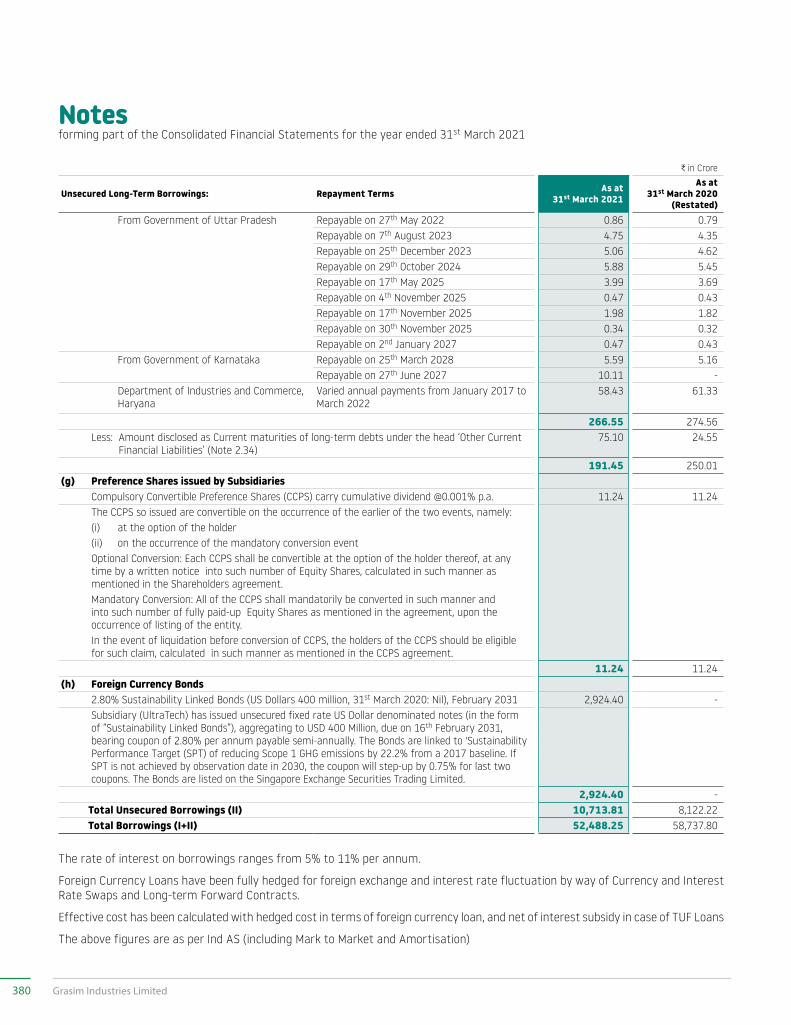
Notesforming part of the Consolidated Financial Statements for the year ended 31st March 2021
C in Crore
Unsecured Long-Term Borrowings: Repayment Terms As at 31st March 2021
As at 31st March 2020
(Restated) From Government of Uttar Pradesh Repayable on 27th May 2022 0.86 0.79
Repayable on 7th August 2023 4.75 4.35 Repayable on 25th December 2023 5.06 4.62 Repayable on 29th October 2024 5.88 5.45 Repayable on 17th May 2025 3.99 3.69 Repayable on 4th November 2025 0.47 0.43 Repayable on 17th November 2025 1.98 1.82 Repayable on 30th November 2025 0.34 0.32 Repayable on 2nd January 2027 0.47 0.43
From Government of Karnataka Repayable on 25th March 2028 5.59 5.16 Repayable on 27th June 2027 10.11 -
Department of Industries and Commerce, Haryana
Varied annual payments from January 2017 to March 2022
58.43 61.33
266.55 274.56 Less: Amount disclosed as Current maturities of long-term debts under the head ‘Other Current
Financial Liabilities’ (Note 2.34) 75.10 24.55
191.45 250.01 (g) Preference Shares issued by Subsidiaries Compulsory Convertible Preference Shares (CCPS) carry cumulative dividend @0.001% p.a. 11.24 11.24 The CCPS so issued are convertible on the occurrence of the earlier of the two events, namely: (i) at the option of the holder (ii) on the occurrence of the mandatory conversion event Optional Conversion: Each CCPS shall be convertible at the option of the holder thereof, at any
time by a written notice into such number of Equity Shares, calculated in such manner as mentioned in the Shareholders agreement.
Mandatory Conversion: All of the CCPS shall mandatorily be converted in such manner and into such number of fully paid-up Equity Shares as mentioned in the agreement, upon the occurrence of listing of the entity.
In the event of liquidation before conversion of CCPS, the holders of the CCPS should be eligible for such claim, calculated in such manner as mentioned in the CCPS agreement.
11.24 11.24 (h) Foreign Currency Bonds 2.80% Sustainability Linked Bonds (US Dollars 400 million, 31st March 2020: Nil), February 2031 2,924.40 - Subsidiary (UltraTech) has issued unsecured fixed rate US Dollar denominated notes (in the form
of “Sustainability Linked Bonds”), aggregating to USD 400 Million, due on 16th February 2031, bearing coupon of 2.80% per annum payable semi-annually. The Bonds are linked to 'Sustainability Performance Target (SPT) of reducing Scope 1 GHG emissions by 22.2% from a 2017 baseline. If SPT is not achieved by observation date in 2030, the coupon will step-up by 0.75% for last two coupons. The Bonds are listed on the Singapore Exchange Securities Trading Limited.
2,924.40 - Total Unsecured Borrowings (II) 10,713.81 8,122.22 Total Borrowings (I+II) 52,488.25 58,737.80
The rate of interest on borrowings ranges from 5% to 11% per annum.
Foreign Currency Loans have been fully hedged for foreign exchange and interest rate fluctuation by way of Currency and Interest Rate Swaps and Long-term Forward Contracts.
Effective cost has been calculated with hedged cost in terms of foreign currency loan, and net of interest subsidy in case of TUF Loans
The above figures are as per Ind AS (including Mark to Market and Amortisation)
380 Grasim Industries Limited
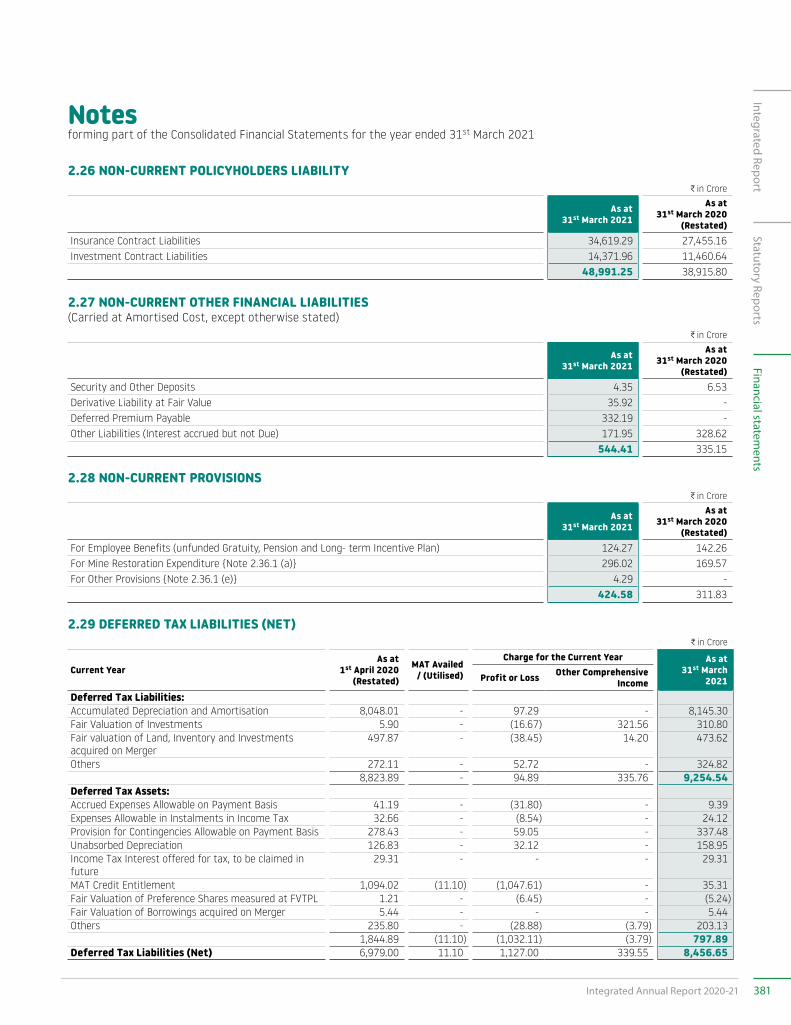
Notesforming part of the Consolidated Financial Statements for the year ended 31st March 2021
2.26 NON-CURRENT POLICYHOLDERS LIABILITYC in Crore
As at 31st March 2021
As at 31st March 2020
(Restated)Insurance Contract Liabilities 34,619.29 27,455.16Investment Contract Liabilities 14,371.96 11,460.64
48,991.25 38,915.80
2.27 NON-CURRENT OTHER FINANCIAL LIABILITIES(Carried at Amortised Cost, except otherwise stated)
C in Crore
As at 31st March 2021
As at 31st March 2020
(Restated)Security and Other Deposits 4.35 6.53 Derivative Liability at Fair Value 35.92 - Deferred Premium Payable 332.19 - Other Liabilities (Interest accrued but not Due) 171.95 328.62
544.41 335.15
2.28 NON-CURRENT PROVISIONSC in Crore
As at 31st March 2021
As at 31st March 2020
(Restated)For Employee Benefits (unfunded Gratuity, Pension and Long- term Incentive Plan) 124.27 142.26 For Mine Restoration Expenditure {Note 2.36.1 (a)} 296.02 169.57 For Other Provisions {Note 2.36.1 (e)} 4.29 -
424.58 311.83
2.29 DEFERRED TAX LIABILITIES (NET)C in Crore
Current YearAs at
1st April 2020 (Restated)
MAT Availed / (Utilised)
Charge for the Current Year As at 31st March
2021Profit or Loss Other Comprehensive Income
Deferred Tax Liabilities:Accumulated Depreciation and Amortisation 8,048.01 - 97.29 - 8,145.30 Fair Valuation of Investments 5.90 - (16.67) 321.56 310.80 Fair valuation of Land, Inventory and Investments acquired on Merger
497.87 - (38.45) 14.20 473.62
Others 272.11 - 52.72 - 324.82 8,823.89 - 94.89 335.76 9,254.54
Deferred Tax Assets:Accrued Expenses Allowable on Payment Basis 41.19 - (31.80) - 9.39 Expenses Allowable in Instalments in Income Tax 32.66 - (8.54) - 24.12 Provision for Contingencies Allowable on Payment Basis 278.43 - 59.05 - 337.48 Unabsorbed Depreciation 126.83 - 32.12 - 158.95 Income Tax Interest offered for tax, to be claimed in future
29.31 - - - 29.31
MAT Credit Entitlement 1,094.02 (11.10) (1,047.61) - 35.31 Fair Valuation of Preference Shares measured at FVTPL 1.21 - (6.45) - (5.24)Fair Valuation of Borrowings acquired on Merger 5.44 - - - 5.44 Others 235.80 - (28.88) (3.79) 203.13
1,844.89 (11.10) (1,032.11) (3.79) 797.89 Deferred Tax Liabilities (Net) 6,979.00 11.10 1,127.00 339.55 8,456.65
381Integrated Annual Report 2020-21
Integrated ReportStatutory Reports
Financial statements
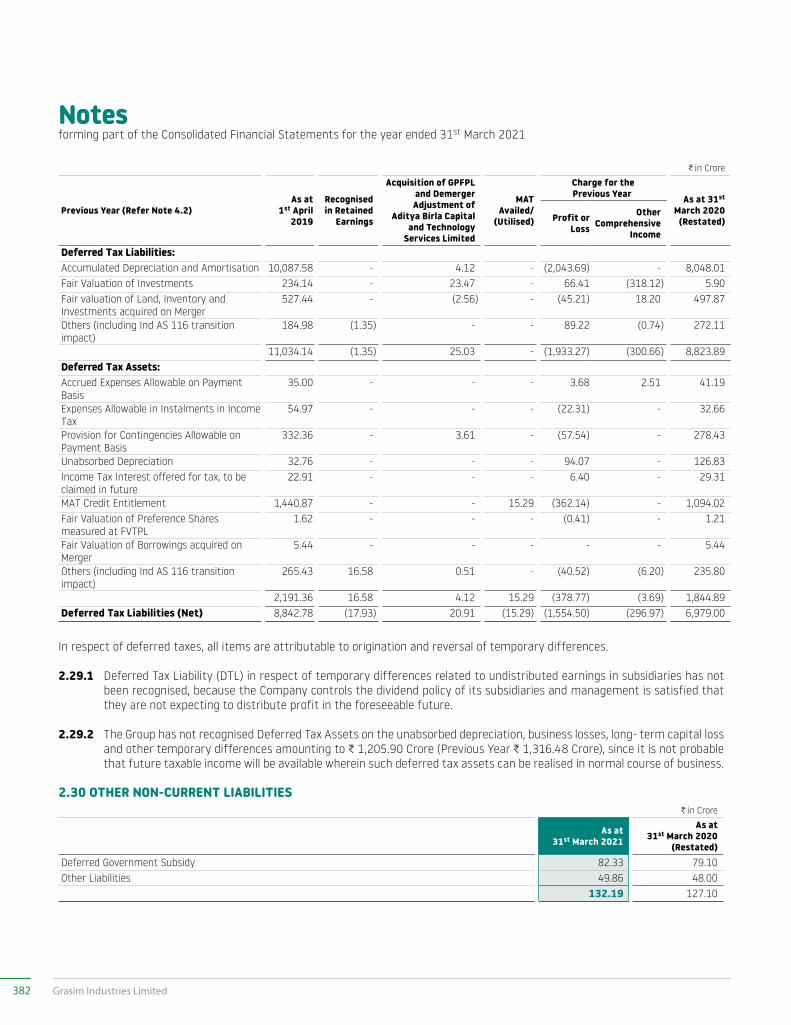
Notesforming part of the Consolidated Financial Statements for the year ended 31st March 2021
C in Crore
Previous Year (Refer Note 4.2)As at
1st April 2019
Recognised in Retained
Earnings
Acquisition of GPFPL and Demerger Adjustment of
Aditya Birla Capital and Technology
Services Limited
MAT Availed/
(Utilised)
Charge for the Previous Year As at 31st
March 2020 (Restated) Profit or
Loss
Other Comprehensive
Income
Deferred Tax Liabilities:Accumulated Depreciation and Amortisation 10,087.58 - 4.12 - (2,043.69) - 8,048.01 Fair Valuation of Investments 234.14 - 23.47 - 66.41 (318.12) 5.90 Fair valuation of Land, Inventory and Investments acquired on Merger
527.44 - (2.56) - (45.21) 18.20 497.87
Others (including Ind AS 116 transition impact)
184.98 (1.35) - - 89.22 (0.74) 272.11
11,034.14 (1.35) 25.03 - (1,933.27) (300.66) 8,823.89 Deferred Tax Assets:Accrued Expenses Allowable on Payment Basis
35.00 - - - 3.68 2.51 41.19
Expenses Allowable in Instalments in Income Tax
54.97 - - - (22.31) - 32.66
Provision for Contingencies Allowable on Payment Basis
332.36 - 3.61 - (57.54) - 278.43
Unabsorbed Depreciation 32.76 - - - 94.07 - 126.83 Income Tax Interest offered for tax, to be claimed in future
22.91 - - - 6.40 - 29.31
MAT Credit Entitlement 1,440.87 - - 15.29 (362.14) - 1,094.02 Fair Valuation of Preference Shares measured at FVTPL
1.62 - - - (0.41) - 1.21
Fair Valuation of Borrowings acquired on Merger
5.44 - - - - - 5.44
Others (including Ind AS 116 transition impact)
265.43 16.58 0.51 - (40.52) (6.20) 235.80
2,191.36 16.58 4.12 15.29 (378.77) (3.69) 1,844.89 Deferred Tax Liabilities (Net) 8,842.78 (17.93) 20.91 (15.29) (1,554.50) (296.97) 6,979.00
In respect of deferred taxes, all items are attributable to origination and reversal of temporary differences.
2.29.1 Deferred Tax Liability (DTL) in respect of temporary differences related to undistributed earnings in subsidiaries has not been recognised, because the Company controls the dividend policy of its subsidiaries and management is satisfied that they are not expecting to distribute profit in the foreseeable future.
2.29.2 The Group has not recognised Deferred Tax Assets on the unabsorbed depreciation, business losses, long- term capital loss and other temporary differences amounting to C 1,205.90 Crore (Previous Year C 1,316.48 Crore), since it is not probable that future taxable income will be available wherein such deferred tax assets can be realised in normal course of business.
2.30 OTHER NON-CURRENT LIABILITIESC in Crore
As at 31st March 2021
As at 31st March 2020
(Restated)Deferred Government Subsidy 82.33 79.10Other Liabilities 49.86 48.00
132.19 127.10
382 Grasim Industries Limited
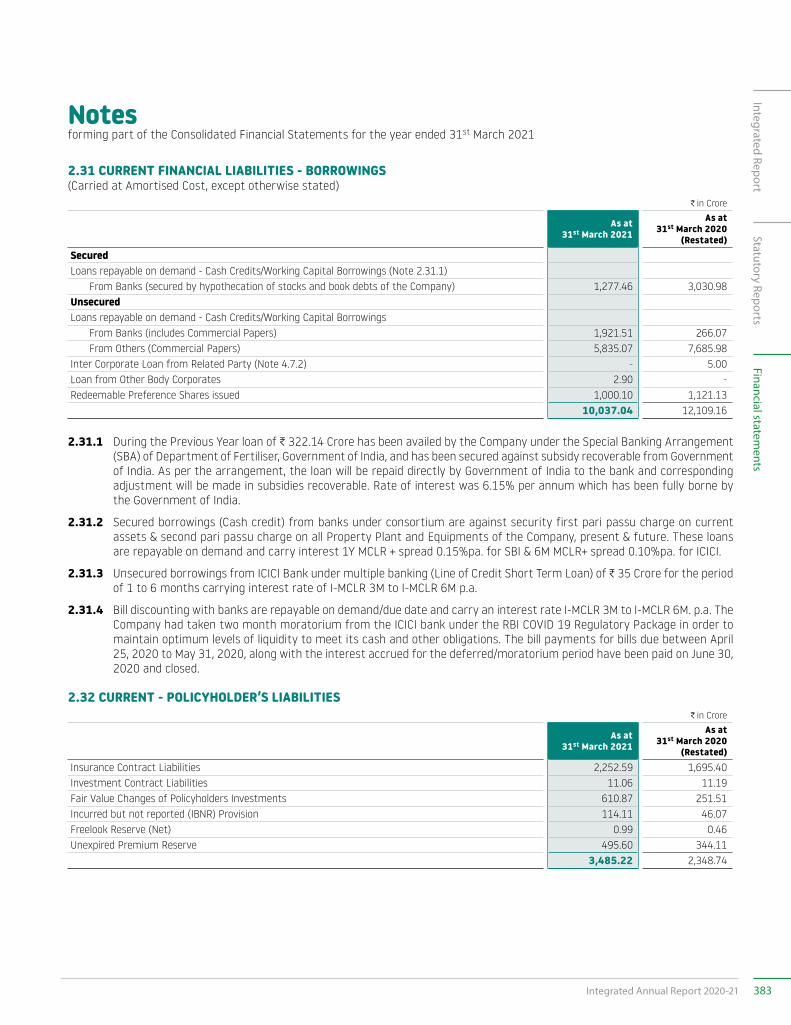
Notesforming part of the Consolidated Financial Statements for the year ended 31st March 2021
2.31 CURRENT FINANCIAL LIABILITIES - BORROWINGS(Carried at Amortised Cost, except otherwise stated)
C in Crore
As at 31st March 2021
As at 31st March 2020
(Restated)SecuredLoans repayable on demand - Cash Credits/Working Capital Borrowings (Note 2.31.1) From Banks (secured by hypothecation of stocks and book debts of the Company) 1,277.46 3,030.98 UnsecuredLoans repayable on demand - Cash Credits/Working Capital Borrowings From Banks (includes Commercial Papers) 1,921.51 266.07 From Others (Commercial Papers) 5,835.07 7,685.98 Inter Corporate Loan from Related Party (Note 4.7.2) - 5.00 Loan from Other Body Corporates 2.90 - Redeemable Preference Shares issued 1,000.10 1,121.13
10,037.04 12,109.16
2.31.1 During the Previous Year loan of C 322.14 Crore has been availed by the Company under the Special Banking Arrangement (SBA) of Department of Fertiliser, Government of India, and has been secured against subsidy recoverable from Government of India. As per the arrangement, the loan will be repaid directly by Government of India to the bank and corresponding adjustment will be made in subsidies recoverable. Rate of interest was 6.15% per annum which has been fully borne by the Government of India.
2.31.2 Secured borrowings (Cash credit) from banks under consortium are against security first pari passu charge on current assets & second pari passu charge on all Property Plant and Equipments of the Company, present & future. These loans are repayable on demand and carry interest 1Y MCLR + spread 0.15%pa. for SBI & 6M MCLR+ spread 0.10%pa. for ICICI.
2.31.3 Unsecured borrowings from ICICI Bank under multiple banking (Line of Credit Short Term Loan) of C 35 Crore for the period of 1 to 6 months carrying interest rate of I-MCLR 3M to I-MCLR 6M p.a.
2.31.4 Bill discounting with banks are repayable on demand/due date and carry an interest rate I-MCLR 3M to I-MCLR 6M. p.a. The Company had taken two month moratorium from the ICICI bank under the RBI COVID 19 Regulatory Package in order to maintain optimum levels of liquidity to meet its cash and other obligations. The bill payments for bills due between April 25, 2020 to May 31, 2020, along with the interest accrued for the deferred/moratorium period have been paid on June 30, 2020 and closed.
2.32 CURRENT - POLICYHOLDER’S LIABILITIESC in Crore
As at 31st March 2021
As at 31st March 2020
(Restated)Insurance Contract Liabilities 2,252.59 1,695.40 Investment Contract Liabilities 11.06 11.19 Fair Value Changes of Policyholders Investments 610.87 251.51 Incurred but not reported (IBNR) Provision 114.11 46.07 Freelook Reserve (Net) 0.99 0.46 Unexpired Premium Reserve 495.60 344.11
3,485.22 2,348.74
383Integrated Annual Report 2020-21
Integrated ReportStatutory Reports
Financial statements
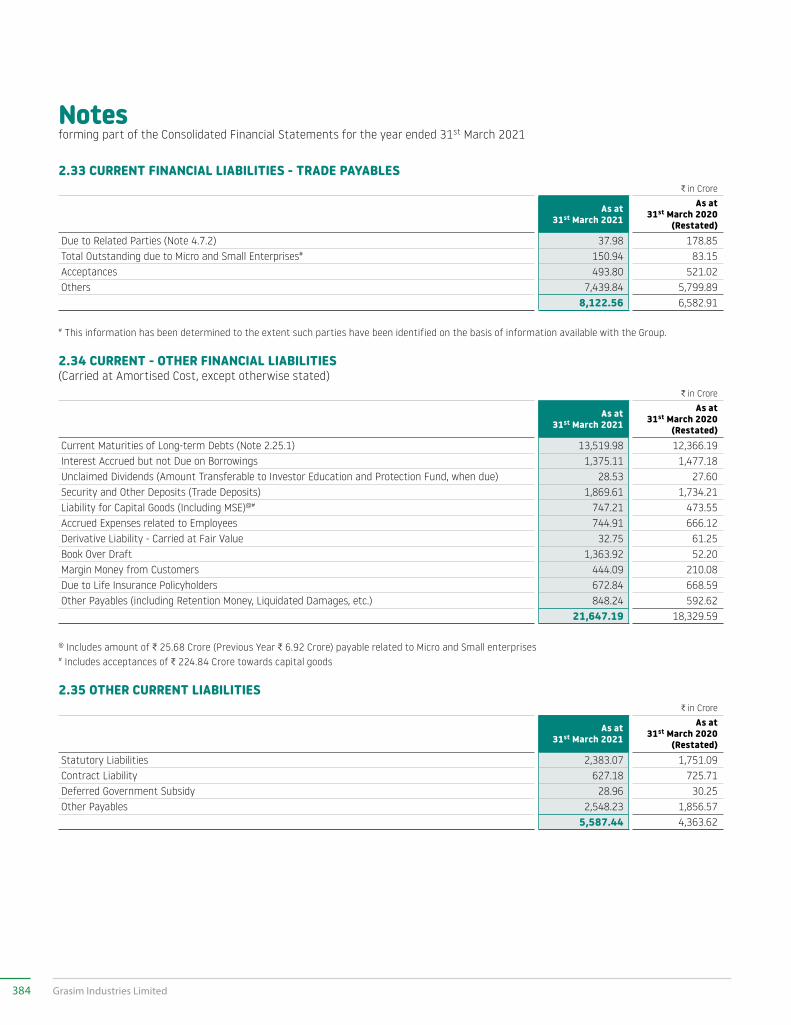
Notesforming part of the Consolidated Financial Statements for the year ended 31st March 2021
2.33 CURRENT FINANCIAL LIABILITIES - TRADE PAYABLESC in Crore
As at 31st March 2021
As at 31st March 2020
(Restated)Due to Related Parties (Note 4.7.2) 37.98 178.85 Total Outstanding due to Micro and Small Enterprises# 150.94 83.15 Acceptances 493.80 521.02 Others 7,439.84 5,799.89
8,122.56 6,582.91
# This information has been determined to the extent such parties have been identified on the basis of information available with the Group.
2.34 CURRENT - OTHER FINANCIAL LIABILITIES(Carried at Amortised Cost, except otherwise stated)
C in Crore
As at 31st March 2021
As at 31st March 2020
(Restated)Current Maturities of Long-term Debts (Note 2.25.1) 13,519.98 12,366.19 Interest Accrued but not Due on Borrowings 1,375.11 1,477.18 Unclaimed Dividends (Amount Transferable to Investor Education and Protection Fund, when due) 28.53 27.60 Security and Other Deposits (Trade Deposits) 1,869.61 1,734.21 Liability for Capital Goods (Including MSE)@# 747.21 473.55 Accrued Expenses related to Employees 744.91 666.12 Derivative Liability - Carried at Fair Value 32.75 61.25 Book Over Draft 1,363.92 52.20 Margin Money from Customers 444.09 210.08 Due to Life Insurance Policyholders 672.84 668.59 Other Payables (including Retention Money, Liquidated Damages, etc.) 848.24 592.62
21,647.19 18,329.59
@ Includes amount of C 25.68 Crore (Previous Year C 6.92 Crore) payable related to Micro and Small enterprises# Includes acceptances of C 224.84 Crore towards capital goods
2.35 OTHER CURRENT LIABILITIESC in Crore
As at 31st March 2021
As at 31st March 2020
(Restated)Statutory Liabilities 2,383.07 1,751.09 Contract Liability 627.18 725.71 Deferred Government Subsidy 28.96 30.25 Other Payables 2,548.23 1,856.57
5,587.44 4,363.62
384 Grasim Industries Limited
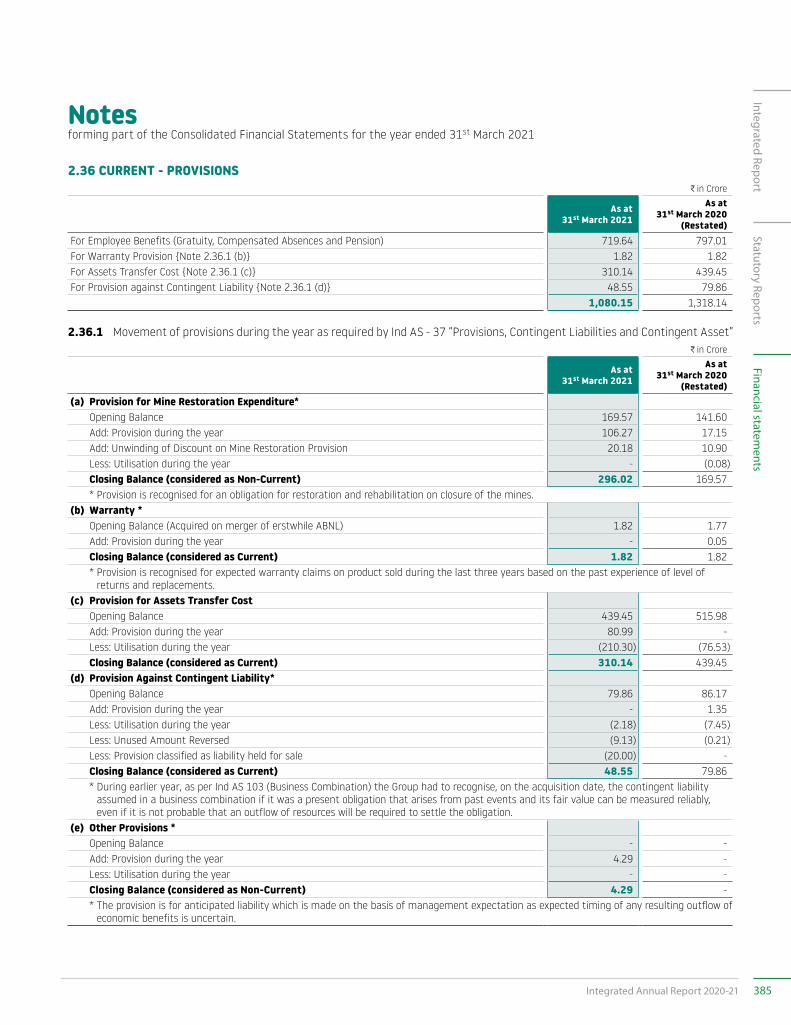
Notesforming part of the Consolidated Financial Statements for the year ended 31st March 2021
2.36 CURRENT - PROVISIONSC in Crore
As at 31st March 2021
As at 31st March 2020
(Restated)For Employee Benefits (Gratuity, Compensated Absences and Pension) 719.64 797.01 For Warranty Provision {Note 2.36.1 (b)} 1.82 1.82 For Assets Transfer Cost {Note 2.36.1 (c)} 310.14 439.45 For Provision against Contingent Liability {Note 2.36.1 (d)} 48.55 79.86
1,080.15 1,318.14
2.36.1 Movement of provisions during the year as required by Ind AS - 37 “Provisions, Contingent Liabilities and Contingent Asset”C in Crore
As at 31st March 2021
As at 31st March 2020
(Restated)(a) Provision for Mine Restoration Expenditure* Opening Balance 169.57 141.60 Add: Provision during the year 106.27 17.15 Add: Unwinding of Discount on Mine Restoration Provision 20.18 10.90 Less: Utilisation during the year - (0.08) Closing Balance (considered as Non-Current) 296.02 169.57 * Provision is recognised for an obligation for restoration and rehabilitation on closure of the mines.(b) Warranty * Opening Balance (Acquired on merger of erstwhile ABNL) 1.82 1.77 Add: Provision during the year - 0.05 Closing Balance (considered as Current) 1.82 1.82 * Provision is recognised for expected warranty claims on product sold during the last three years based on the past experience of level of
returns and replacements.(c) Provision for Assets Transfer Cost Opening Balance 439.45 515.98 Add: Provision during the year 80.99 - Less: Utilisation during the year (210.30) (76.53) Closing Balance (considered as Current) 310.14 439.45 (d) Provision Against Contingent Liability* Opening Balance 79.86 86.17 Add: Provision during the year - 1.35 Less: Utilisation during the year (2.18) (7.45) Less: Unused Amount Reversed (9.13) (0.21) Less: Provision classified as liability held for sale (20.00) - Closing Balance (considered as Current) 48.55 79.86 * During earlier year, as per Ind AS 103 (Business Combination) the Group had to recognise, on the acquisition date, the contingent liability
assumed in a business combination if it was a present obligation that arises from past events and its fair value can be measured reliably, even if it is not probable that an outflow of resources will be required to settle the obligation.
(e) Other Provisions * Opening Balance - - Add: Provision during the year 4.29 - Less: Utilisation during the year - - Closing Balance (considered as Non-Current) 4.29 - * The provision is for anticipated liability which is made on the basis of management expectation as expected timing of any resulting outflow of
economic benefits is uncertain.
385Integrated Annual Report 2020-21
Integrated ReportStatutory Reports
Financial statements
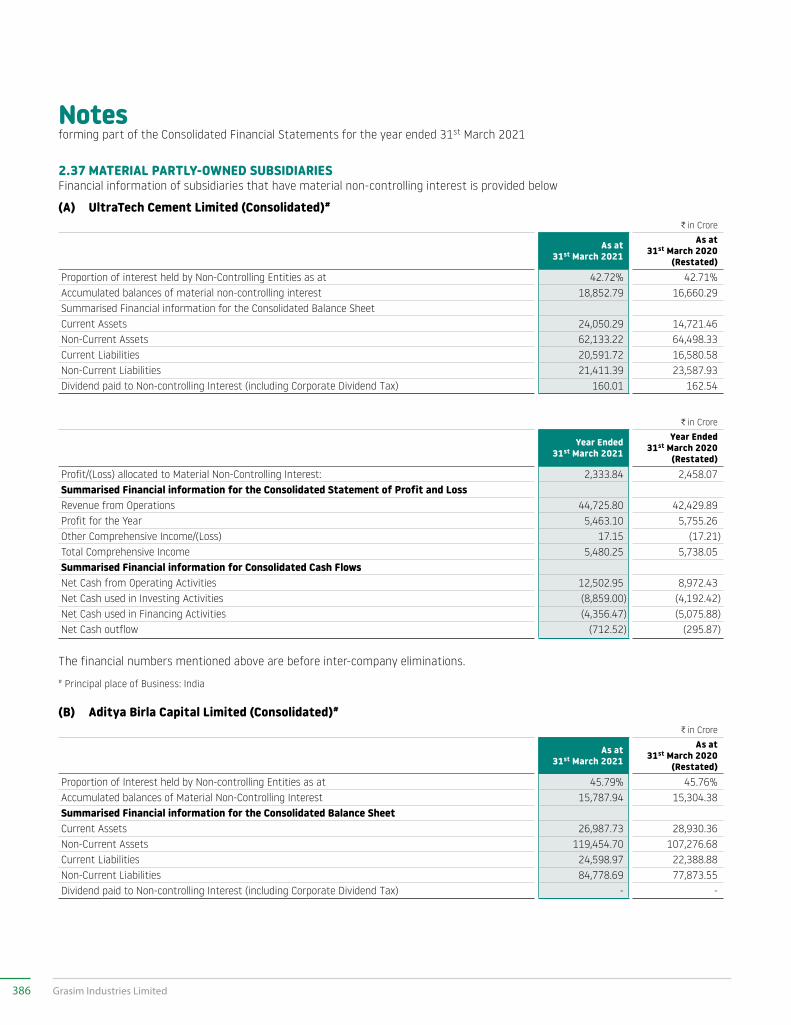
Notesforming part of the Consolidated Financial Statements for the year ended 31st March 2021
2.37 MATERIAL PARTLY-OWNED SUBSIDIARIESFinancial information of subsidiaries that have material non-controlling interest is provided below
(A) UltraTech Cement Limited (Consolidated)#
C in Crore
As at 31st March 2021
As at 31st March 2020
(Restated)Proportion of interest held by Non-Controlling Entities as at 42.72% 42.71%Accumulated balances of material non-controlling interest 18,852.79 16,660.29 Summarised Financial information for the Consolidated Balance SheetCurrent Assets 24,050.29 14,721.46 Non-Current Assets 62,133.22 64,498.33 Current Liabilities 20,591.72 16,580.58 Non-Current Liabilities 21,411.39 23,587.93 Dividend paid to Non-controlling Interest (including Corporate Dividend Tax) 160.01 162.54
C in Crore
Year Ended 31st March 2021
Year Ended 31st March 2020
(Restated)Profit/(Loss) allocated to Material Non-Controlling Interest: 2,333.84 2,458.07Summarised Financial information for the Consolidated Statement of Profit and LossRevenue from Operations 44,725.80 42,429.89Profit for the Year 5,463.10 5,755.26Other Comprehensive Income/(Loss) 17.15 (17.21)Total Comprehensive Income 5,480.25 5,738.05Summarised Financial information for Consolidated Cash FlowsNet Cash from Operating Activities 12,502.95 8,972.43Net Cash used in Investing Activities (8,859.00) (4,192.42)Net Cash used in Financing Activities (4,356.47) (5,075.88)Net Cash outflow (712.52) (295.87)
The financial numbers mentioned above are before inter-company eliminations.# Principal place of Business: India
(B) Aditya Birla Capital Limited (Consolidated)#
C in Crore
As at 31st March 2021
As at 31st March 2020
(Restated)Proportion of Interest held by Non-controlling Entities as at 45.79% 45.76%Accumulated balances of Material Non-Controlling Interest 15,787.94 15,304.38 Summarised Financial information for the Consolidated Balance SheetCurrent Assets 26,987.73 28,930.36 Non-Current Assets 119,454.70 107,276.68 Current Liabilities 24,598.97 22,388.88 Non-Current Liabilities 84,778.69 77,873.55 Dividend paid to Non-controlling Interest (including Corporate Dividend Tax) - -
386 Grasim Industries Limited
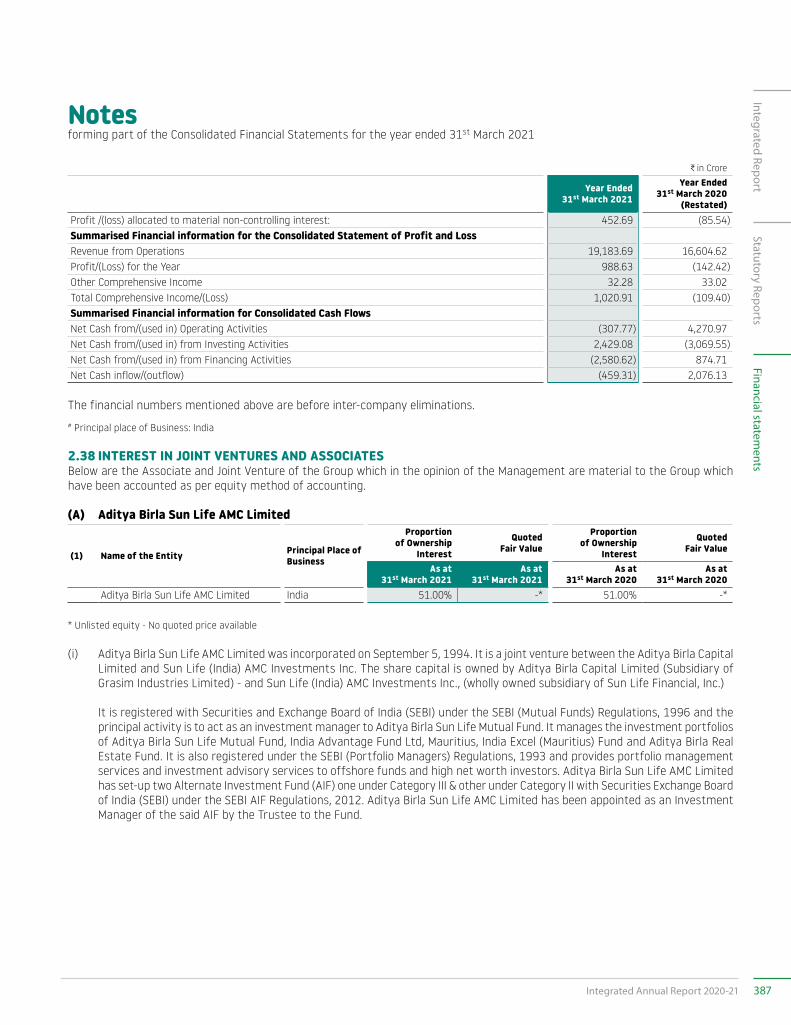
Notesforming part of the Consolidated Financial Statements for the year ended 31st March 2021
C in Crore
Year Ended 31st March 2021
Year Ended 31st March 2020
(Restated)Profit /(loss) allocated to material non-controlling interest: 452.69 (85.54)Summarised Financial information for the Consolidated Statement of Profit and LossRevenue from Operations 19,183.69 16,604.62Profit/(Loss) for the Year 988.63 (142.42)Other Comprehensive Income 32.28 33.02Total Comprehensive Income/(Loss) 1,020.91 (109.40)Summarised Financial information for Consolidated Cash FlowsNet Cash from/(used in) Operating Activities (307.77) 4,270.97 Net Cash from/(used in) from Investing Activities 2,429.08 (3,069.55)Net Cash from/(used in) from Financing Activities (2,580.62) 874.71 Net Cash inflow/(outflow) (459.31) 2,076.13
The financial numbers mentioned above are before inter-company eliminations.# Principal place of Business: India
2.38 INTEREST IN JOINT VENTURES AND ASSOCIATESBelow are the Associate and Joint Venture of the Group which in the opinion of the Management are material to the Group which have been accounted as per equity method of accounting.
(A) Aditya Birla Sun Life AMC Limited
(1) Name of the Entity Principal Place of Business
Proportion of Ownership
Interest
Quoted Fair Value
Proportion of Ownership
Interest
Quoted Fair Value
As at 31st March 2021
As at 31st March 2021
As at 31st March 2020
As at 31st March 2020
Aditya Birla Sun Life AMC Limited India 51.00% -* 51.00% -*
* Unlisted equity - No quoted price available
(i) Aditya Birla Sun Life AMC Limited was incorporated on September 5, 1994. It is a joint venture between the Aditya Birla Capital Limited and Sun Life (India) AMC Investments Inc. The share capital is owned by Aditya Birla Capital Limited (Subsidiary of Grasim Industries Limited) - and Sun Life (India) AMC Investments Inc., (wholly owned subsidiary of Sun Life Financial, Inc.)
It is registered with Securities and Exchange Board of India (SEBI) under the SEBI (Mutual Funds) Regulations, 1996 and the principal activity is to act as an investment manager to Aditya Birla Sun Life Mutual Fund. It manages the investment portfolios of Aditya Birla Sun Life Mutual Fund, India Advantage Fund Ltd, Mauritius, India Excel (Mauritius) Fund and Aditya Birla Real Estate Fund. It is also registered under the SEBI (Portfolio Managers) Regulations, 1993 and provides portfolio management services and investment advisory services to offshore funds and high net worth investors. Aditya Birla Sun Life AMC Limited has set-up two Alternate Investment Fund (AIF) one under Category III & other under Category II with Securities Exchange Board of India (SEBI) under the SEBI AIF Regulations, 2012. Aditya Birla Sun Life AMC Limited has been appointed as an Investment Manager of the said AIF by the Trustee to the Fund.
387Integrated Annual Report 2020-21
Integrated ReportStatutory Reports
Financial statements
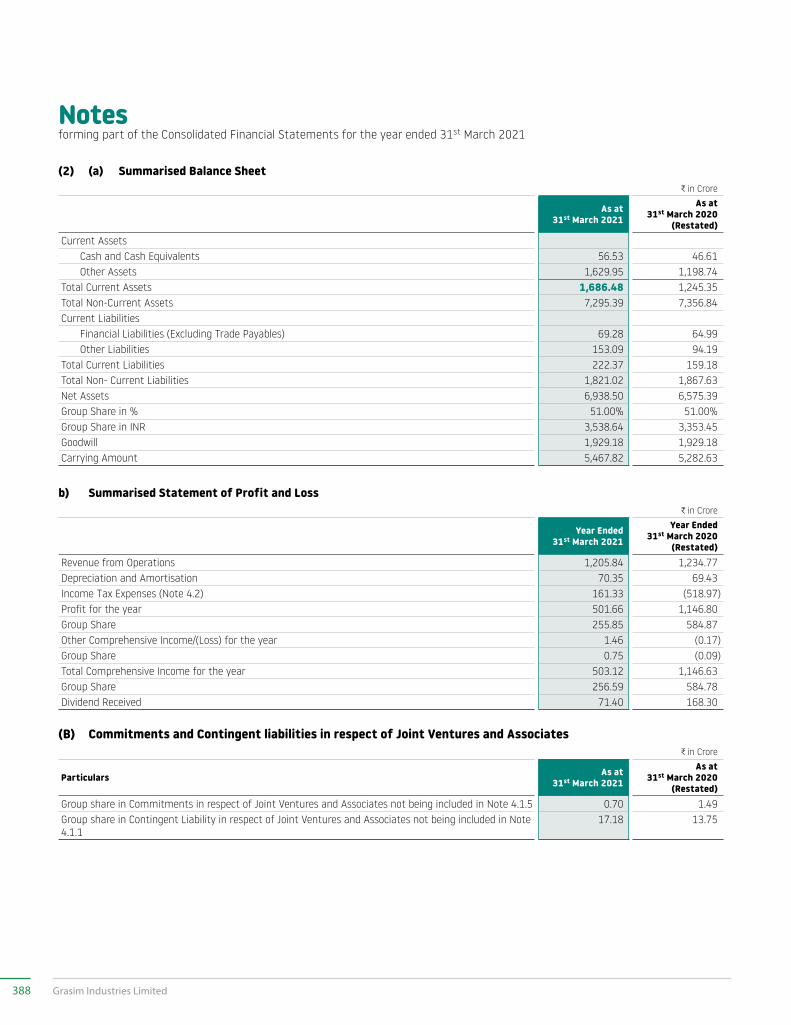
Notesforming part of the Consolidated Financial Statements for the year ended 31st March 2021
(2) (a) Summarised Balance SheetC in Crore
As at 31st March 2021
As at 31st March 2020
(Restated)Current Assets Cash and Cash Equivalents 56.53 46.61 Other Assets 1,629.95 1,198.74 Total Current Assets 1,686.48 1,245.35 Total Non-Current Assets 7,295.39 7,356.84 Current Liabilities Financial Liabilities (Excluding Trade Payables) 69.28 64.99 Other Liabilities 153.09 94.19 Total Current Liabilities 222.37 159.18 Total Non- Current Liabilities 1,821.02 1,867.63 Net Assets 6,938.50 6,575.39 Group Share in % 51.00% 51.00%Group Share in INR 3,538.64 3,353.45 Goodwill 1,929.18 1,929.18 Carrying Amount 5,467.82 5,282.63
b) Summarised Statement of Profit and LossC in Crore
Year Ended 31st March 2021
Year Ended 31st March 2020
(Restated)Revenue from Operations 1,205.84 1,234.77 Depreciation and Amortisation 70.35 69.43 Income Tax Expenses (Note 4.2) 161.33 (518.97)Profit for the year 501.66 1,146.80 Group Share 255.85 584.87 Other Comprehensive Income/(Loss) for the year 1.46 (0.17)Group Share 0.75 (0.09)Total Comprehensive Income for the year 503.12 1,146.63 Group Share 256.59 584.78 Dividend Received 71.40 168.30
(B) Commitments and Contingent liabilities in respect of Joint Ventures and AssociatesC in Crore
Particulars As at 31st March 2021
As at 31st March 2020
(Restated)Group share in Commitments in respect of Joint Ventures and Associates not being included in Note 4.1.5 0.70 1.49 Group share in Contingent Liability in respect of Joint Ventures and Associates not being included in Note 4.1.1
17.18 13.75
388 Grasim Industries Limited
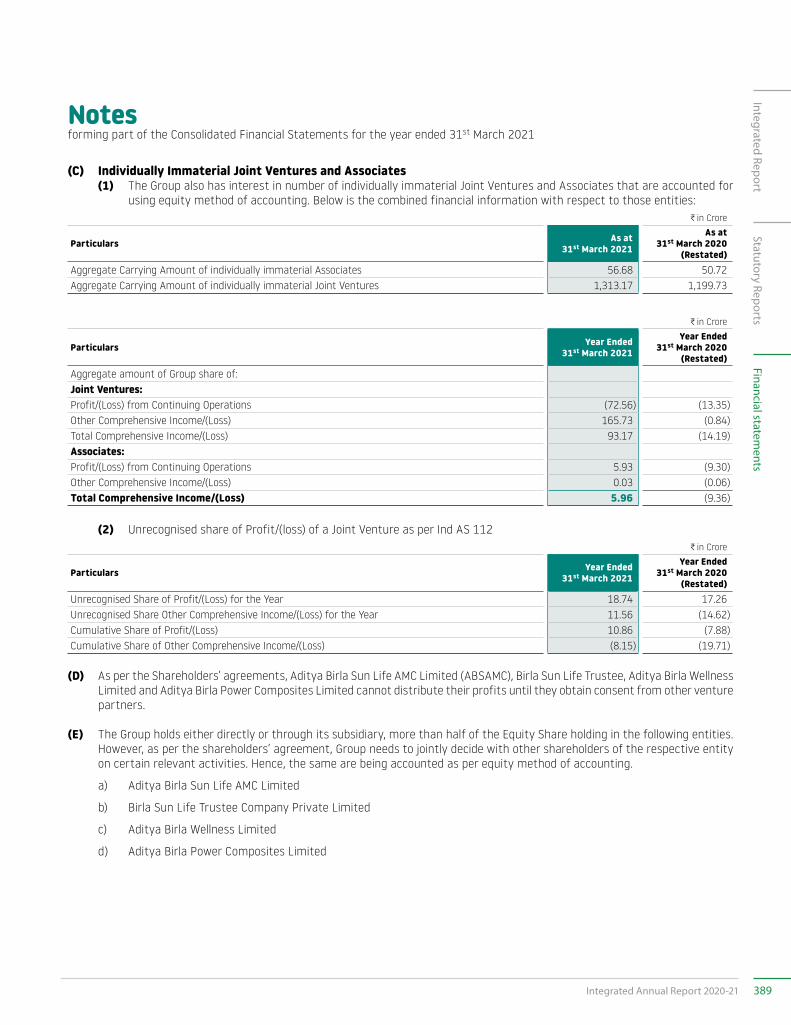
Notesforming part of the Consolidated Financial Statements for the year ended 31st March 2021
(C) Individually Immaterial Joint Ventures and Associates (1) The Group also has interest in number of individually immaterial Joint Ventures and Associates that are accounted for
using equity method of accounting. Below is the combined financial information with respect to those entities:C in Crore
Particulars As at 31st March 2021
As at 31st March 2020
(Restated)Aggregate Carrying Amount of individually immaterial Associates 56.68 50.72 Aggregate Carrying Amount of individually immaterial Joint Ventures 1,313.17 1,199.73
C in Crore
Particulars Year Ended 31st March 2021
Year Ended 31st March 2020
(Restated)Aggregate amount of Group share of: Joint Ventures:Profit/(Loss) from Continuing Operations (72.56) (13.35)Other Comprehensive Income/(Loss) 165.73 (0.84)Total Comprehensive Income/(Loss) 93.17 (14.19)Associates:Profit/(Loss) from Continuing Operations 5.93 (9.30)Other Comprehensive Income/(Loss) 0.03 (0.06)Total Comprehensive Income/(Loss) 5.96 (9.36)
(2) Unrecognised share of Profit/(loss) of a Joint Venture as per Ind AS 112C in Crore
Particulars Year Ended 31st March 2021
Year Ended 31st March 2020
(Restated)Unrecognised Share of Profit/(Loss) for the Year 18.74 17.26 Unrecognised Share Other Comprehensive Income/(Loss) for the Year 11.56 (14.62)Cumulative Share of Profit/(Loss) 10.86 (7.88)Cumulative Share of Other Comprehensive Income/(Loss) (8.15) (19.71)
(D) As per the Shareholders’ agreements, Aditya Birla Sun Life AMC Limited (ABSAMC), Birla Sun Life Trustee, Aditya Birla Wellness Limited and Aditya Birla Power Composites Limited cannot distribute their profits until they obtain consent from other venture partners.
(E) The Group holds either directly or through its subsidiary, more than half of the Equity Share holding in the following entities. However, as per the shareholders’ agreement, Group needs to jointly decide with other shareholders of the respective entity on certain relevant activities. Hence, the same are being accounted as per equity method of accounting.
a) Aditya Birla Sun Life AMC Limited
b) Birla Sun Life Trustee Company Private Limited
c) Aditya Birla Wellness Limited
d) Aditya Birla Power Composites Limited
389Integrated Annual Report 2020-21
Integrated ReportStatutory Reports
Financial statements
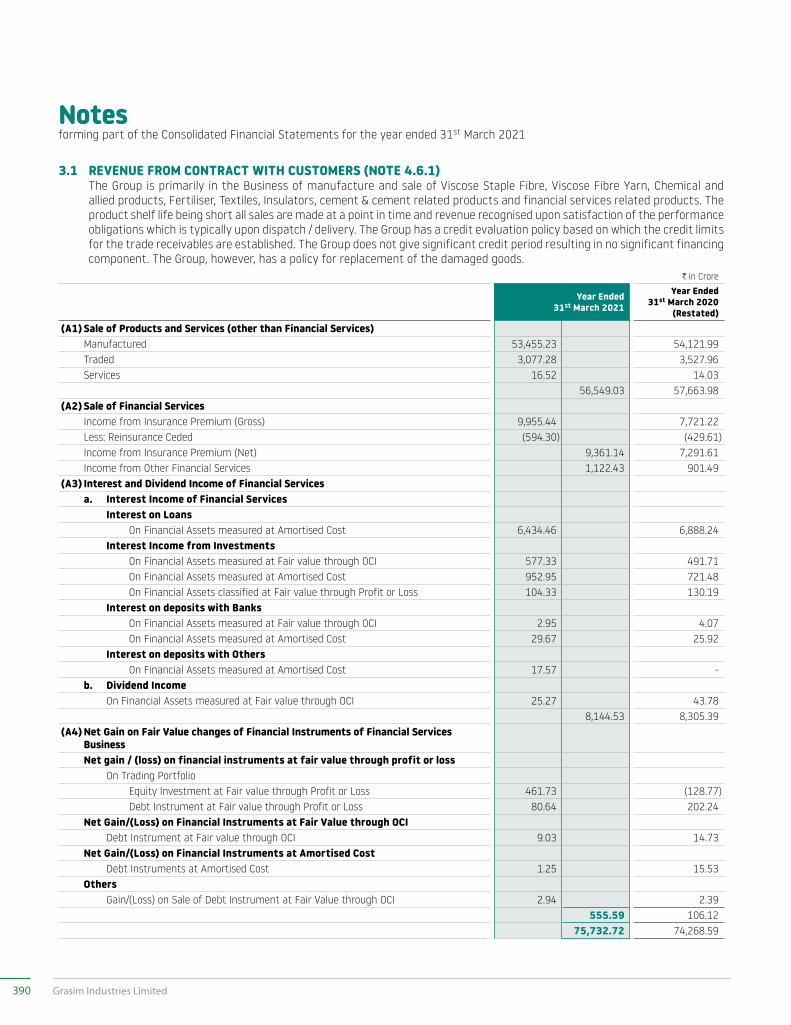
Notesforming part of the Consolidated Financial Statements for the year ended 31st March 2021
3.1 REVENUE FROM CONTRACT WITH CUSTOMERS (NOTE 4.6.1) The Group is primarily in the Business of manufacture and sale of Viscose Staple Fibre, Viscose Fibre Yarn, Chemical and
allied products, Fertiliser, Textiles, Insulators, cement & cement related products and financial services related products. The product shelf life being short all sales are made at a point in time and revenue recognised upon satisfaction of the performance obligations which is typically upon dispatch / delivery. The Group has a credit evaluation policy based on which the credit limits for the trade receivables are established. The Group does not give significant credit period resulting in no significant financing component. The Group, however, has a policy for replacement of the damaged goods.
C in Crore
Year Ended 31st March 2021
Year Ended 31st March 2020
(Restated)(A1) Sale of Products and Services (other than Financial Services) Manufactured 53,455.23 54,121.99 Traded 3,077.28 3,527.96 Services 16.52 14.03
56,549.03 57,663.98 (A2) Sale of Financial Services Income from Insurance Premium (Gross) 9,955.44 7,721.22 Less: Reinsurance Ceded (594.30) (429.61) Income from Insurance Premium (Net) 9,361.14 7,291.61 Income from Other Financial Services 1,122.43 901.49 (A3) Interest and Dividend Income of Financial Services a. Interest Income of Financial Services Interest on Loans On Financial Assets measured at Amortised Cost 6,434.46 6,888.24 Interest Income from Investments On Financial Assets measured at Fair value through OCI 577.33 491.71 On Financial Assets measured at Amortised Cost 952.95 721.48 On Financial Assets classified at Fair value through Profit or Loss 104.33 130.19 Interest on deposits with Banks On Financial Assets measured at Fair value through OCI 2.95 4.07 On Financial Assets measured at Amortised Cost 29.67 25.92 Interest on deposits with Others On Financial Assets measured at Amortised Cost 17.57 - b. Dividend Income On Financial Assets measured at Fair value through OCI 25.27 43.78
8,144.53 8,305.39 (A4) Net Gain on Fair Value changes of Financial Instruments of Financial Services
Business Net gain / (loss) on financial instruments at fair value through profit or loss On Trading Portfolio Equity Investment at Fair value through Profit or Loss 461.73 (128.77) Debt Instrument at Fair value through Profit or Loss 80.64 202.24 Net Gain/(Loss) on Financial Instruments at Fair Value through OCI Debt Instrument at Fair value through OCI 9.03 14.73 Net Gain/(Loss) on Financial Instruments at Amortised Cost Debt Instruments at Amortised Cost 1.25 15.53 Others Gain/(Loss) on Sale of Debt Instrument at Fair Value through OCI 2.94 2.39
555.59 106.12 75,732.72 74,268.59
390 Grasim Industries Limited
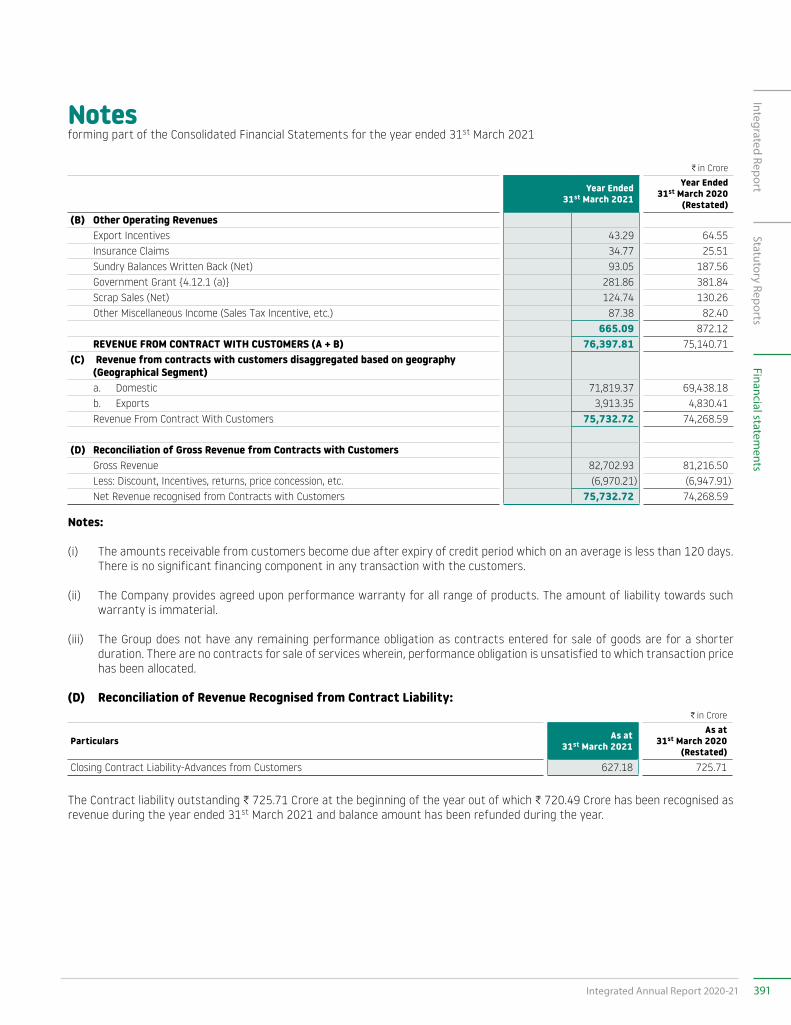
Notesforming part of the Consolidated Financial Statements for the year ended 31st March 2021
C in Crore
Year Ended 31st March 2021
Year Ended 31st March 2020
(Restated)(B) Other Operating Revenues Export Incentives 43.29 64.55 Insurance Claims 34.77 25.51 Sundry Balances Written Back (Net) 93.05 187.56 Government Grant {4.12.1 (a)} 281.86 381.84 Scrap Sales (Net) 124.74 130.26 Other Miscellaneous Income (Sales Tax Incentive, etc.) 87.38 82.40
665.09 872.12 REVENUE FROM CONTRACT WITH CUSTOMERS (A + B) 76,397.81 75,140.71 (C) Revenue from contracts with customers disaggregated based on geography
(Geographical Segment) a. Domestic 71,819.37 69,438.18 b. Exports 3,913.35 4,830.41 Revenue From Contract With Customers 75,732.72 74,268.59
(D) Reconciliation of Gross Revenue from Contracts with Customers Gross Revenue 82,702.93 81,216.50 Less: Discount, Incentives, returns, price concession, etc. (6,970.21) (6,947.91) Net Revenue recognised from Contracts with Customers 75,732.72 74,268.59
Notes:
(i) The amounts receivable from customers become due after expiry of credit period which on an average is less than 120 days. There is no significant financing component in any transaction with the customers.
(ii) The Company provides agreed upon performance warranty for all range of products. The amount of liability towards such warranty is immaterial.
(iii) The Group does not have any remaining performance obligation as contracts entered for sale of goods are for a shorter duration. There are no contracts for sale of services wherein, performance obligation is unsatisfied to which transaction price has been allocated.
(D) Reconciliation of Revenue Recognised from Contract Liability:C in Crore
Particulars As at 31st March 2021
As at 31st March 2020
(Restated)Closing Contract Liability-Advances from Customers 627.18 725.71
The Contract liability outstanding C 725.71 Crore at the beginning of the year out of which C 720.49 Crore has been recognised as revenue during the year ended 31st March 2021 and balance amount has been refunded during the year.
391Integrated Annual Report 2020-21
Integrated ReportStatutory Reports
Financial statements
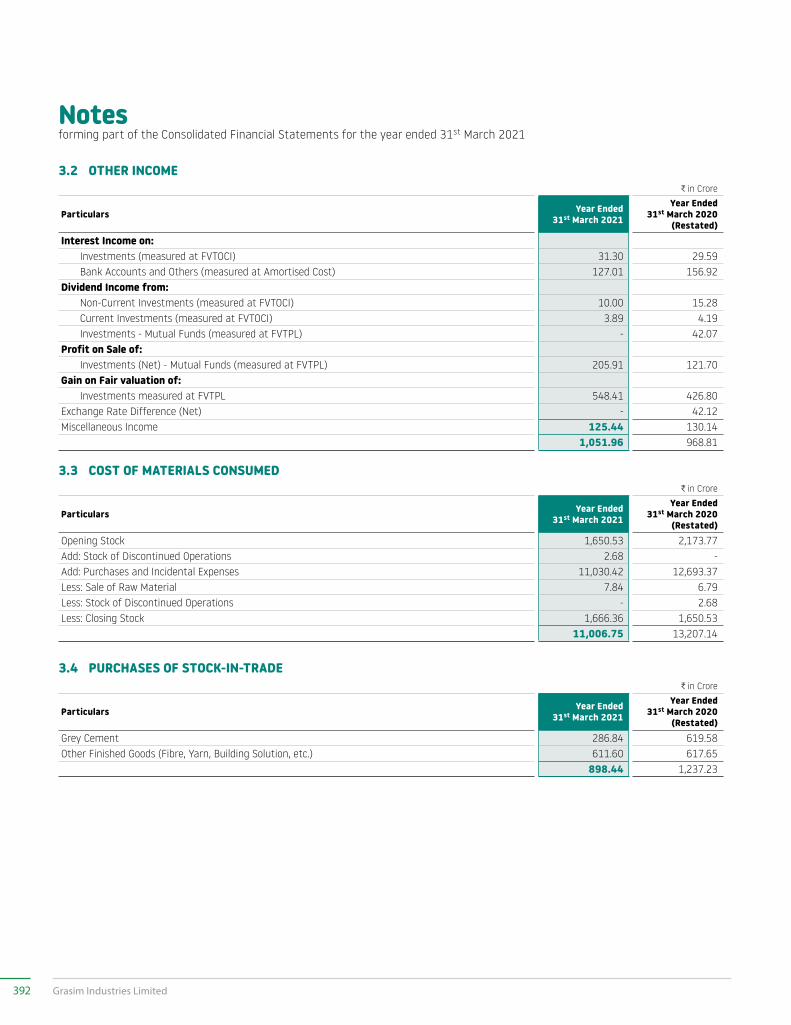
Notesforming part of the Consolidated Financial Statements for the year ended 31st March 2021
3.2 OTHER INCOMEC in Crore
Particulars Year Ended 31st March 2021
Year Ended 31st March 2020
(Restated)Interest Income on: Investments (measured at FVTOCI) 31.30 29.59 Bank Accounts and Others (measured at Amortised Cost) 127.01 156.92 Dividend Income from: Non-Current Investments (measured at FVTOCI) 10.00 15.28 Current Investments (measured at FVTOCI) 3.89 4.19 Investments - Mutual Funds (measured at FVTPL) - 42.07 Profit on Sale of: Investments (Net) - Mutual Funds (measured at FVTPL) 205.91 121.70 Gain on Fair valuation of: Investments measured at FVTPL 548.41 426.80 Exchange Rate Difference (Net) - 42.12 Miscellaneous Income 125.44 130.14
1,051.96 968.81
3.3 COST OF MATERIALS CONSUMEDC in Crore
Particulars Year Ended 31st March 2021
Year Ended 31st March 2020
(Restated)Opening Stock 1,650.53 2,173.77 Add: Stock of Discontinued Operations 2.68 - Add: Purchases and Incidental Expenses 11,030.42 12,693.37 Less: Sale of Raw Material 7.84 6.79 Less: Stock of Discontinued Operations - 2.68 Less: Closing Stock 1,666.36 1,650.53
11,006.75 13,207.14
3.4 PURCHASES OF STOCK-IN-TRADEC in Crore
Particulars Year Ended 31st March 2021
Year Ended 31st March 2020
(Restated)Grey Cement 286.84 619.58 Other Finished Goods (Fibre, Yarn, Building Solution, etc.) 611.60 617.65
898.44 1,237.23
392 Grasim Industries Limited
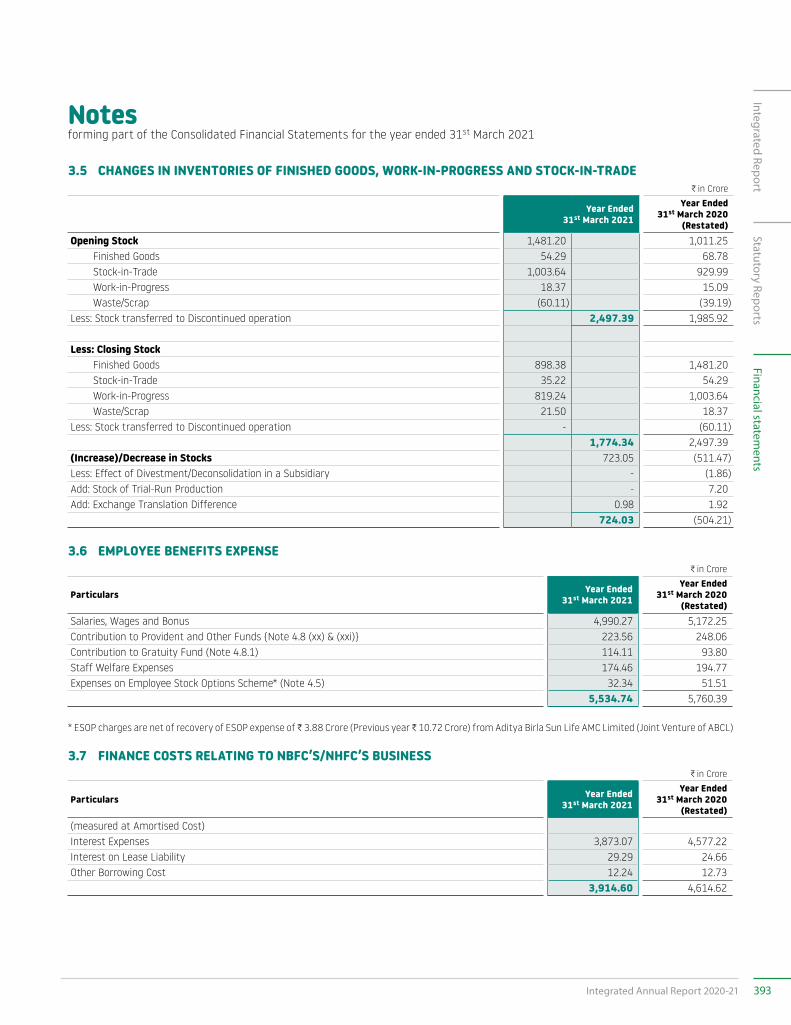
Notesforming part of the Consolidated Financial Statements for the year ended 31st March 2021
3.5 CHANGES IN INVENTORIES OF FINISHED GOODS, WORK-IN-PROGRESS AND STOCK-IN-TRADEC in Crore
Year Ended 31st March 2021
Year Ended 31st March 2020
(Restated)Opening Stock 1,481.20 1,011.25 Finished Goods 54.29 68.78 Stock-in-Trade 1,003.64 929.99 Work-in-Progress 18.37 15.09 Waste/Scrap (60.11) (39.19)Less: Stock transferred to Discontinued operation 2,497.39 1,985.92
Less: Closing Stock Finished Goods 898.38 1,481.20 Stock-in-Trade 35.22 54.29 Work-in-Progress 819.24 1,003.64 Waste/Scrap 21.50 18.37 Less: Stock transferred to Discontinued operation - (60.11)
1,774.34 2,497.39 (Increase)/Decrease in Stocks 723.05 (511.47)Less: Effect of Divestment/Deconsolidation in a Subsidiary - (1.86)Add: Stock of Trial-Run Production - 7.20 Add: Exchange Translation Difference 0.98 1.92
724.03 (504.21)
3.6 EMPLOYEE BENEFITS EXPENSEC in Crore
Particulars Year Ended 31st March 2021
Year Ended 31st March 2020
(Restated)Salaries, Wages and Bonus 4,990.27 5,172.25 Contribution to Provident and Other Funds {Note 4.8 (xx) & (xxi)} 223.56 248.06 Contribution to Gratuity Fund (Note 4.8.1) 114.11 93.80 Staff Welfare Expenses 174.46 194.77 Expenses on Employee Stock Options Scheme* (Note 4.5) 32.34 51.51
5,534.74 5,760.39
* ESOP charges are net of recovery of ESOP expense of C 3.88 Crore (Previous year C 10.72 Crore) from Aditya Birla Sun Life AMC Limited (Joint Venture of ABCL)
3.7 FINANCE COSTS RELATING TO NBFC’S/NHFC’S BUSINESSC in Crore
Particulars Year Ended 31st March 2021
Year Ended 31st March 2020
(Restated)(measured at Amortised Cost)Interest Expenses 3,873.07 4,577.22 Interest on Lease Liability 29.29 24.66 Other Borrowing Cost 12.24 12.73
3,914.60 4,614.62
393Integrated Annual Report 2020-21
Integrated ReportStatutory Reports
Financial statements
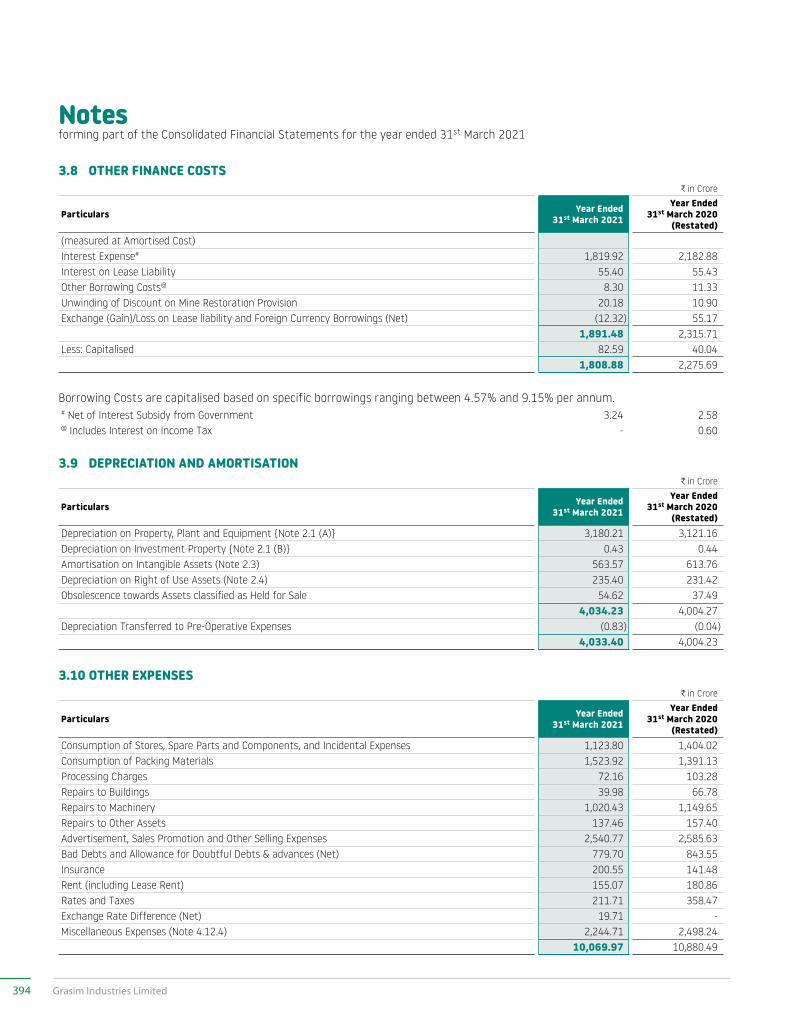
Notesforming part of the Consolidated Financial Statements for the year ended 31st March 2021
3.8 OTHER FINANCE COSTSC in Crore
Particulars Year Ended 31st March 2021
Year Ended 31st March 2020
(Restated)(measured at Amortised Cost)Interest Expense# 1,819.92 2,182.88 Interest on Lease Liability 55.40 55.43 Other Borrowing Costs@ 8.30 11.33 Unwinding of Discount on Mine Restoration Provision 20.18 10.90 Exchange (Gain)/Loss on Lease liability and Foreign Currency Borrowings (Net) (12.32) 55.17
1,891.48 2,315.71 Less: Capitalised 82.59 40.04
1,808.88 2,275.69
Borrowing Costs are capitalised based on specific borrowings ranging between 4.57% and 9.15% per annum.# Net of Interest Subsidy from Government 3.24 2.58 @ Includes Interest on Income Tax - 0.60
3.9 DEPRECIATION AND AMORTISATIONC in Crore
Particulars Year Ended 31st March 2021
Year Ended 31st March 2020
(Restated)Depreciation on Property, Plant and Equipment {Note 2.1 (A)} 3,180.21 3,121.16 Depreciation on Investment Property {Note 2.1 (B)} 0.43 0.44 Amortisation on Intangible Assets (Note 2.3) 563.57 613.76 Depreciation on Right of Use Assets (Note 2.4) 235.40 231.42 Obsolescence towards Assets classified as Held for Sale 54.62 37.49
4,034.23 4,004.27 Depreciation Transferred to Pre-Operative Expenses (0.83) (0.04)
4,033.40 4,004.23
3.10 OTHER EXPENSESC in Crore
Particulars Year Ended 31st March 2021
Year Ended 31st March 2020
(Restated)Consumption of Stores, Spare Parts and Components, and Incidental Expenses 1,123.80 1,404.02 Consumption of Packing Materials 1,523.92 1,391.13 Processing Charges 72.16 103.28 Repairs to Buildings 39.98 66.78 Repairs to Machinery 1,020.43 1,149.65 Repairs to Other Assets 137.46 157.40 Advertisement, Sales Promotion and Other Selling Expenses 2,540.77 2,585.63 Bad Debts and Allowance for Doubtful Debts & advances (Net) 779.70 843.55 Insurance 200.55 141.48 Rent (including Lease Rent) 155.07 180.86 Rates and Taxes 211.71 358.47 Exchange Rate Difference (Net) 19.71 - Miscellaneous Expenses (Note 4.12.4) 2,244.71 2,498.24
10,069.97 10,880.49
394 Grasim Industries Limited
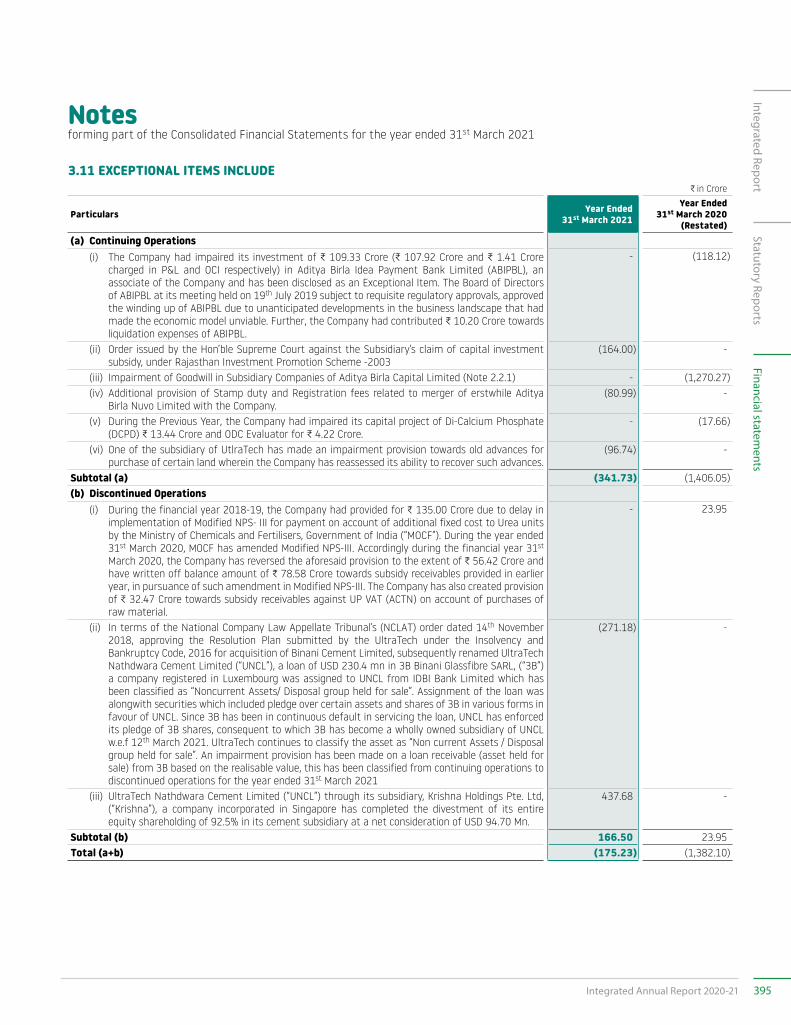
Notesforming part of the Consolidated Financial Statements for the year ended 31st March 2021
3.11 EXCEPTIONAL ITEMS INCLUDEC in Crore
Particulars Year Ended 31st March 2021
Year Ended 31st March 2020
(Restated)(a) Continuing Operations (i) The Company had impaired its investment of C 109.33 Crore (C 107.92 Crore and C 1.41 Crore
charged in P&L and OCI respectively) in Aditya Birla Idea Payment Bank Limited (ABIPBL), an associate of the Company and has been disclosed as an Exceptional Item. The Board of Directors of ABIPBL at its meeting held on 19th July 2019 subject to requisite regulatory approvals, approved the winding up of ABIPBL due to unanticipated developments in the business landscape that had made the economic model unviable. Further, the Company had contributed C 10.20 Crore towards liquidation expenses of ABIPBL.
- (118.12)
(ii) Order issued by the Hon’ble Supreme Court against the Subsidiary’s claim of capital investment subsidy, under Rajasthan Investment Promotion Scheme -2003
(164.00) -
(iii) Impairment of Goodwill in Subsidiary Companies of Aditya Birla Capital Limited (Note 2.2.1) - (1,270.27) (iv) Additional provision of Stamp duty and Registration fees related to merger of erstwhile Aditya
Birla Nuvo Limited with the Company.(80.99) -
(v) During the Previous Year, the Company had impaired its capital project of Di-Calcium Phosphate (DCPD) C 13.44 Crore and ODC Evaluator for C 4.22 Crore.
- (17.66)
(vi) One of the subsidiary of UtlraTech has made an impairment provision towards old advances for purchase of certain land wherein the Company has reassessed its ability to recover such advances.
(96.74) -
Subtotal (a) (341.73) (1,406.05)(b) Discontinued Operations (i) During the financial year 2018-19, the Company had provided for C 135.00 Crore due to delay in
implementation of Modified NPS- III for payment on account of additional fixed cost to Urea units by the Ministry of Chemicals and Fertilisers, Government of India (“MOCF”). During the year ended 31st March 2020, MOCF has amended Modified NPS-III. Accordingly during the financial year 31st March 2020, the Company has reversed the aforesaid provision to the extent of C 56.42 Crore and have written off balance amount of C 78.58 Crore towards subsidy receivables provided in earlier year, in pursuance of such amendment in Modified NPS-III. The Company has also created provision of C 32.47 Crore towards subsidy receivables against UP VAT (ACTN) on account of purchases of raw material.
- 23.95
(ii) In terms of the National Company Law Appellate Tribunal’s (NCLAT) order dated 14th November 2018, approving the Resolution Plan submitted by the UltraTech under the Insolvency and Bankruptcy Code, 2016 for acquisition of Binani Cement Limited, subsequently renamed UltraTech Nathdwara Cement Limited (“UNCL”), a loan of USD 230.4 mn in 3B Binani Glassfibre SARL, (“3B”) a company registered in Luxembourg was assigned to UNCL from IDBI Bank Limited which has been classified as “Noncurrent Assets/ Disposal group held for sale”. Assignment of the loan was alongwith securities which included pledge over certain assets and shares of 3B in various forms in favour of UNCL. Since 3B has been in continuous default in servicing the loan, UNCL has enforced its pledge of 3B shares, consequent to which 3B has become a wholly owned subsidiary of UNCL w.e.f 12th March 2021. UltraTech continues to classify the asset as “Non current Assets / Disposal group held for sale”. An impairment provision has been made on a loan receivable (asset held for sale) from 3B based on the realisable value, this has been classified from continuing operations to discontinued operations for the year ended 31st March 2021
(271.18) -
(iii) UltraTech Nathdwara Cement Limited (“UNCL”) through its subsidiary, Krishna Holdings Pte. Ltd, (“Krishna”), a company incorporated in Singapore has completed the divestment of its entire equity shareholding of 92.5% in its cement subsidiary at a net consideration of USD 94.70 Mn.
437.68 -
Subtotal (b) 166.50 23.95Total (a+b) (175.23) (1,382.10)
395Integrated Annual Report 2020-21
Integrated ReportStatutory Reports
Financial statements
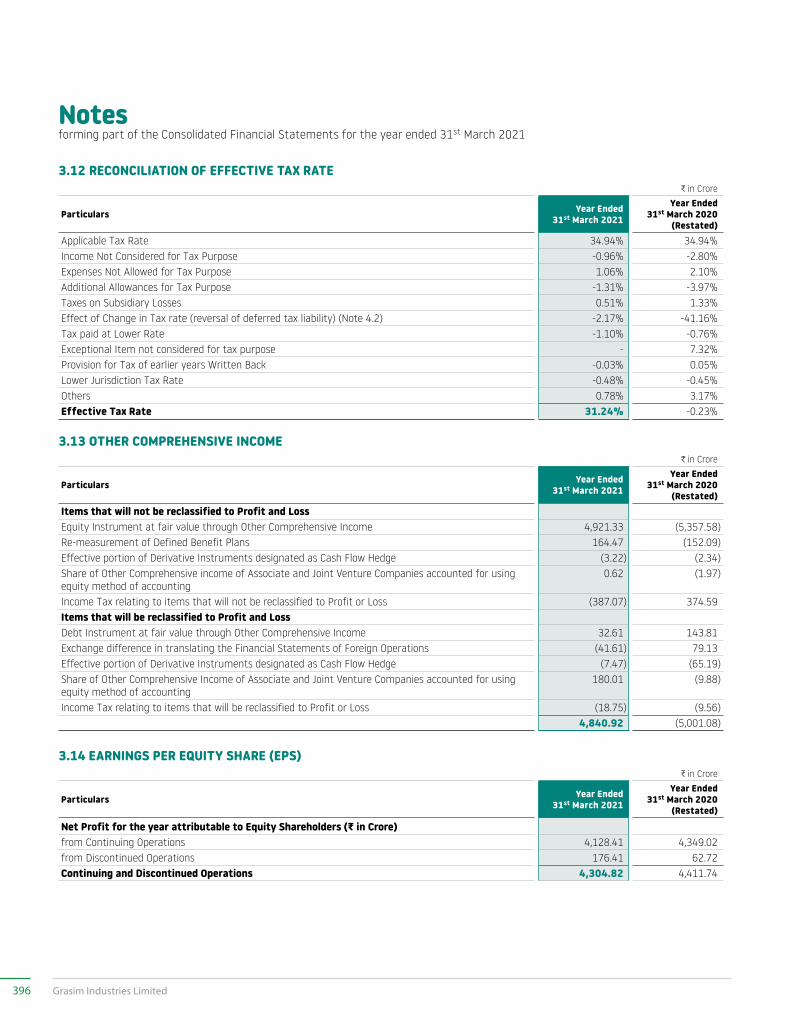
Notesforming part of the Consolidated Financial Statements for the year ended 31st March 2021
3.12 RECONCILIATION OF EFFECTIVE TAX RATEC in Crore
Particulars Year Ended 31st March 2021
Year Ended 31st March 2020
(Restated)Applicable Tax Rate 34.94% 34.94%Income Not Considered for Tax Purpose -0.96% -2.80%Expenses Not Allowed for Tax Purpose 1.06% 2.10%Additional Allowances for Tax Purpose -1.31% -3.97%Taxes on Subsidiary Losses 0.51% 1.33%Effect of Change in Tax rate (reversal of deferred tax liability) (Note 4.2) -2.17% -41.16%Tax paid at Lower Rate -1.10% -0.76%Exceptional Item not considered for tax purpose - 7.32%Provision for Tax of earlier years Written Back -0.03% 0.05%Lower Jurisdiction Tax Rate -0.48% -0.45%Others 0.78% 3.17%Effective Tax Rate 31.24% -0.23%
3.13 OTHER COMPREHENSIVE INCOMEC in Crore
Particulars Year Ended 31st March 2021
Year Ended 31st March 2020
(Restated)Items that will not be reclassified to Profit and LossEquity Instrument at fair value through Other Comprehensive Income 4,921.33 (5,357.58)Re-measurement of Defined Benefit Plans 164.47 (152.09)Effective portion of Derivative Instruments designated as Cash Flow Hedge (3.22) (2.34)Share of Other Comprehensive income of Associate and Joint Venture Companies accounted for using equity method of accounting
0.62 (1.97)
Income Tax relating to items that will not be reclassified to Profit or Loss (387.07) 374.59 Items that will be reclassified to Profit and LossDebt Instrument at fair value through Other Comprehensive Income 32.61 143.81 Exchange difference in translating the Financial Statements of Foreign Operations (41.61) 79.13 Effective portion of Derivative Instruments designated as Cash Flow Hedge (7.47) (65.19)Share of Other Comprehensive Income of Associate and Joint Venture Companies accounted for using equity method of accounting
180.01 (9.88)
Income Tax relating to items that will be reclassified to Profit or Loss (18.75) (9.56) 4,840.92 (5,001.08)
3.14 EARNINGS PER EQUITY SHARE (EPS)C in Crore
Particulars Year Ended 31st March 2021
Year Ended 31st March 2020
(Restated)
Net Profit for the year attributable to Equity Shareholders (G in Crore)from Continuing Operations 4,128.41 4,349.02 from Discontinued Operations 176.41 62.72 Continuing and Discontinued Operations 4,304.82 4,411.74
396 Grasim Industries Limited
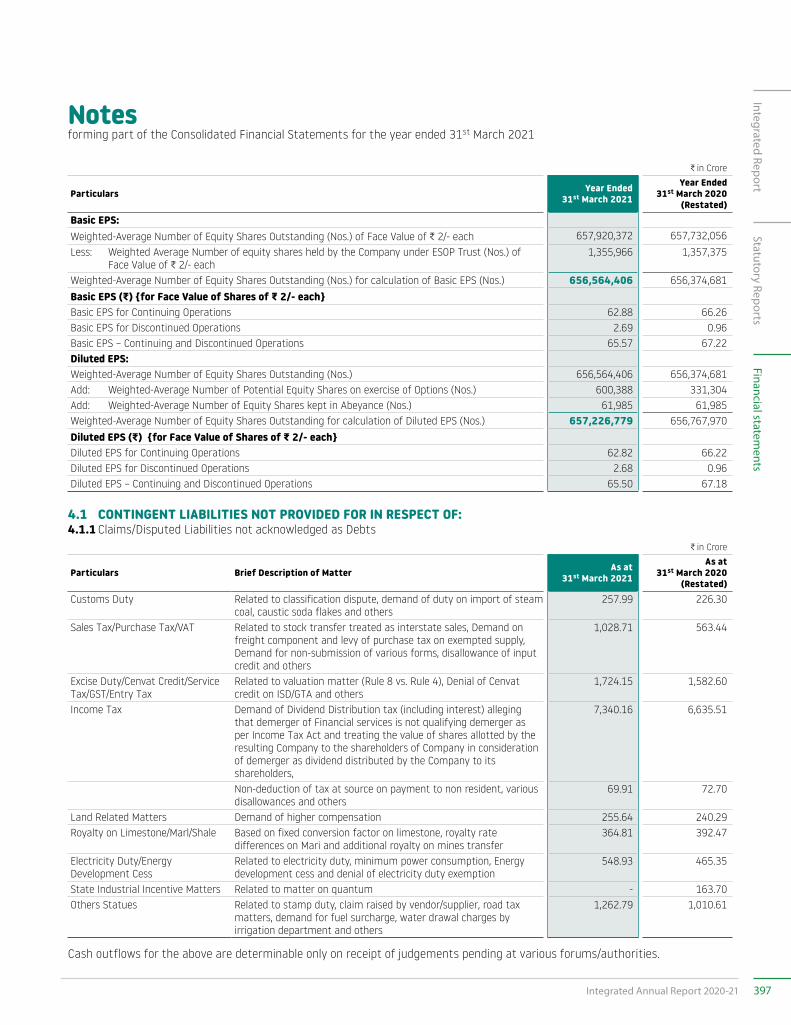
Notesforming part of the Consolidated Financial Statements for the year ended 31st March 2021
C in Crore
Particulars Year Ended 31st March 2021
Year Ended 31st March 2020
(Restated)Basic EPS:Weighted-Average Number of Equity Shares Outstanding (Nos.) of Face Value of C 2/- each 657,920,372 657,732,056 Less: Weighted Average Number of equity shares held by the Company under ESOP Trust (Nos.) of
Face Value of C 2/- each 1,355,966 1,357,375
Weighted-Average Number of Equity Shares Outstanding (Nos.) for calculation of Basic EPS (Nos.) 656,564,406 656,374,681Basic EPS (G) {for Face Value of Shares of G 2/- each}Basic EPS for Continuing Operations 62.88 66.26 Basic EPS for Discontinued Operations 2.69 0.96 Basic EPS – Continuing and Discontinued Operations 65.57 67.22 Diluted EPS:Weighted-Average Number of Equity Shares Outstanding (Nos.) 656,564,406 656,374,681 Add: Weighted-Average Number of Potential Equity Shares on exercise of Options (Nos.) 600,388 331,304 Add: Weighted-Average Number of Equity Shares kept in Abeyance (Nos.) 61,985 61,985 Weighted-Average Number of Equity Shares Outstanding for calculation of Diluted EPS (Nos.) 657,226,779 656,767,970 Diluted EPS (G) {for Face Value of Shares of G 2/- each}Diluted EPS for Continuing Operations 62.82 66.22 Diluted EPS for Discontinued Operations 2.68 0.96 Diluted EPS – Continuing and Discontinued Operations 65.50 67.18
4.1 CONTINGENT LIABILITIES NOT PROVIDED FOR IN RESPECT OF:4.1.1 Claims/Disputed Liabilities not acknowledged as Debts
C in Crore
Particulars Brief Description of Matter As at 31st March 2021
As at 31st March 2020
(Restated)Customs Duty Related to classification dispute, demand of duty on import of steam
coal, caustic soda flakes and others 257.99 226.30
Sales Tax/Purchase Tax/VAT Related to stock transfer treated as interstate sales, Demand on freight component and levy of purchase tax on exempted supply, Demand for non-submission of various forms, disallowance of input credit and others
1,028.71 563.44
Excise Duty/Cenvat Credit/Service Tax/GST/Entry Tax
Related to valuation matter (Rule 8 vs. Rule 4), Denial of Cenvat credit on ISD/GTA and others
1,724.15 1,582.60
Income Tax Demand of Dividend Distribution tax (including interest) alleging that demerger of Financial services is not qualifying demerger as per Income Tax Act and treating the value of shares allotted by the resulting Company to the shareholders of Company in consideration of demerger as dividend distributed by the Company to its shareholders,
7,340.16 6,635.51
Non-deduction of tax at source on payment to non resident, various disallowances and others
69.91 72.70
Land Related Matters Demand of higher compensation 255.64 240.29 Royalty on Limestone/Marl/Shale Based on fixed conversion factor on limestone, royalty rate
differences on Mari and additional royalty on mines transfer 364.81 392.47
Electricity Duty/Energy Development Cess
Related to electricity duty, minimum power consumption, Energy development cess and denial of electricity duty exemption
548.93 465.35
State Industrial Incentive Matters Related to matter on quantum - 163.70 Others Statues Related to stamp duty, claim raised by vendor/supplier, road tax
matters, demand for fuel surcharge, water drawal charges by irrigation department and others
1,262.79 1,010.61
Cash outflows for the above are determinable only on receipt of judgements pending at various forums/authorities.
397Integrated Annual Report 2020-21
Integrated ReportStatutory Reports
Financial statements
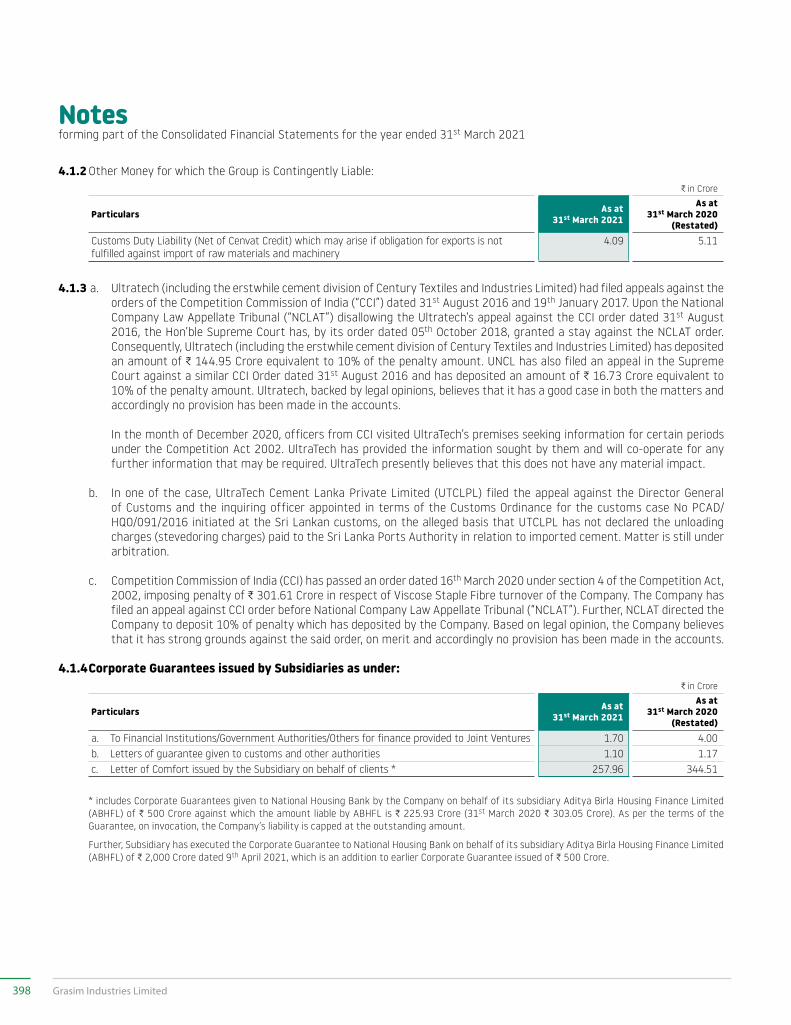
Notesforming part of the Consolidated Financial Statements for the year ended 31st March 2021
4.1.2 Other Money for which the Group is Contingently Liable:C in Crore
Particulars As at 31st March 2021
As at 31st March 2020
(Restated) Customs Duty Liability (Net of Cenvat Credit) which may arise if obligation for exports is not fulfilled against import of raw materials and machinery
4.09 5.11
4.1.3 a. Ultratech (including the erstwhile cement division of Century Textiles and Industries Limited) had filed appeals against the orders of the Competition Commission of India (“CCI”) dated 31st August 2016 and 19th January 2017. Upon the National Company Law Appellate Tribunal (“NCLAT”) disallowing the Ultratech’s appeal against the CCI order dated 31st August 2016, the Hon’ble Supreme Court has, by its order dated 05th October 2018, granted a stay against the NCLAT order. Consequently, Ultratech (including the erstwhile cement division of Century Textiles and Industries Limited) has deposited an amount of C 144.95 Crore equivalent to 10% of the penalty amount. UNCL has also filed an appeal in the Supreme Court against a similar CCI Order dated 31st August 2016 and has deposited an amount of C 16.73 Crore equivalent to 10% of the penalty amount. Ultratech, backed by legal opinions, believes that it has a good case in both the matters and accordingly no provision has been made in the accounts.
In the month of December 2020, officers from CCI visited UltraTech’s premises seeking information for certain periods under the Competition Act 2002. UltraTech has provided the information sought by them and will co-operate for any further information that may be required. UltraTech presently believes that this does not have any material impact.
b. In one of the case, UltraTech Cement Lanka Private Limited (UTCLPL) filed the appeal against the Director General of Customs and the inquiring officer appointed in terms of the Customs Ordinance for the customs case No PCAD/HQO/091/2016 initiated at the Sri Lankan customs, on the alleged basis that UTCLPL has not declared the unloading charges (stevedoring charges) paid to the Sri Lanka Ports Authority in relation to imported cement. Matter is still under arbitration.
c. Competition Commission of India (CCI) has passed an order dated 16th March 2020 under section 4 of the Competition Act, 2002, imposing penalty of C 301.61 Crore in respect of Viscose Staple Fibre turnover of the Company. The Company has filed an appeal against CCI order before National Company Law Appellate Tribunal (“NCLAT”). Further, NCLAT directed the Company to deposit 10% of penalty which has deposited by the Company. Based on legal opinion, the Company believes that it has strong grounds against the said order, on merit and accordingly no provision has been made in the accounts.
4.1.4 Corporate Guarantees issued by Subsidiaries as under:C in Crore
Particulars As at 31st March 2021
As at 31st March 2020
(Restated)a. To Financial Institutions/Government Authorities/Others for finance provided to Joint Ventures 1.70 4.00 b. Letters of guarantee given to customs and other authorities 1.10 1.17 c. Letter of Comfort issued by the Subsidiary on behalf of clients * 257.96 344.51
* includes Corporate Guarantees given to National Housing Bank by the Company on behalf of its subsidiary Aditya Birla Housing Finance Limited (ABHFL) of C 500 Crore against which the amount liable by ABHFL is C 225.93 Crore (31st March 2020 C 303.05 Crore). As per the terms of the Guarantee, on invocation, the Company’s liability is capped at the outstanding amount.
Further, Subsidiary has executed the Corporate Guarantee to National Housing Bank on behalf of its subsidiary Aditya Birla Housing Finance Limited (ABHFL) of C 2,000 Crore dated 9th April 2021, which is an addition to earlier Corporate Guarantee issued of C 500 Crore.
398 Grasim Industries Limited
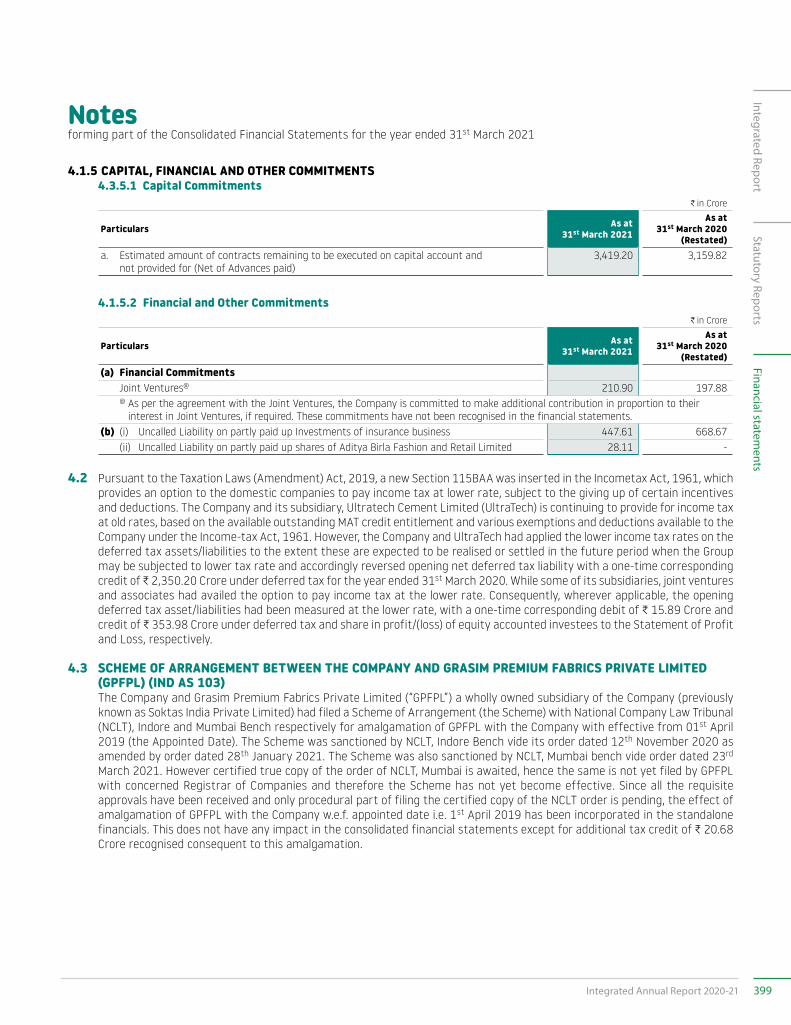
Notesforming part of the Consolidated Financial Statements for the year ended 31st March 2021
4.1.5 CAPITAL, FINANCIAL AND OTHER COMMITMENTS 4.3.5.1 Capital Commitments
C in Crore
Particulars As at 31st March 2021
As at 31st March 2020
(Restated)a. Estimated amount of contracts remaining to be executed on capital account and not provided for (Net of Advances paid)
3,419.20 3,159.82
4.1.5.2 Financial and Other CommitmentsC in Crore
Particulars As at 31st March 2021
As at 31st March 2020
(Restated)(a) Financial Commitments Joint Ventures@ 210.90 197.88 @ As per the agreement with the Joint Ventures, the Company is committed to make additional contribution in proportion to their
interest in Joint Ventures, if required. These commitments have not been recognised in the financial statements.(b) (i) Uncalled Liability on partly paid up Investments of insurance business 447.61 668.67 (ii) Uncalled Liability on partly paid up shares of Aditya Birla Fashion and Retail Limited 28.11 -
4.2 Pursuant to the Taxation Laws (Amendment) Act, 2019, a new Section 115BAA was inserted in the Incometax Act, 1961, which provides an option to the domestic companies to pay income tax at lower rate, subject to the giving up of certain incentives and deductions. The Company and its subsidiary, Ultratech Cement Limited (UltraTech) is continuing to provide for income tax at old rates, based on the available outstanding MAT credit entitlement and various exemptions and deductions available to the Company under the Income-tax Act, 1961. However, the Company and UltraTech had applied the lower income tax rates on the deferred tax assets/liabilities to the extent these are expected to be realised or settled in the future period when the Group may be subjected to lower tax rate and accordingly reversed opening net deferred tax liability with a one-time corresponding credit of C 2,350.20 Crore under deferred tax for the year ended 31st March 2020. While some of its subsidiaries, joint ventures and associates had availed the option to pay income tax at the lower rate. Consequently, wherever applicable, the opening deferred tax asset/liabilities had been measured at the lower rate, with a one-time corresponding debit of C 15.89 Crore and credit of C 353.98 Crore under deferred tax and share in profit/(loss) of equity accounted investees to the Statement of Profit and Loss, respectively.
4.3 SCHEME OF ARRANGEMENT BETWEEN THE COMPANY AND GRASIM PREMIUM FABRICS PRIVATE LIMITED (GPFPL) (IND AS 103)
The Company and Grasim Premium Fabrics Private Limited (“GPFPL”) a wholly owned subsidiary of the Company (previously known as Soktas India Private Limited) had filed a Scheme of Arrangement (the Scheme) with National Company Law Tribunal (NCLT), Indore and Mumbai Bench respectively for amalgamation of GPFPL with the Company with effective from 01st April 2019 (the Appointed Date). The Scheme was sanctioned by NCLT, Indore Bench vide its order dated 12th November 2020 as amended by order dated 28th January 2021. The Scheme was also sanctioned by NCLT, Mumbai bench vide order dated 23rd March 2021. However certified true copy of the order of NCLT, Mumbai is awaited, hence the same is not yet filed by GPFPL with concerned Registrar of Companies and therefore the Scheme has not yet become effective. Since all the requisite approvals have been received and only procedural part of filing the certified copy of the NCLT order is pending, the effect of amalgamation of GPFPL with the Company w.e.f. appointed date i.e. 1st April 2019 has been incorporated in the standalone financials. This does not have any impact in the consolidated financial statements except for additional tax credit of C 20.68 Crore recognised consequent to this amalgamation.
399Integrated Annual Report 2020-21
Integrated ReportStatutory Reports
Financial statements
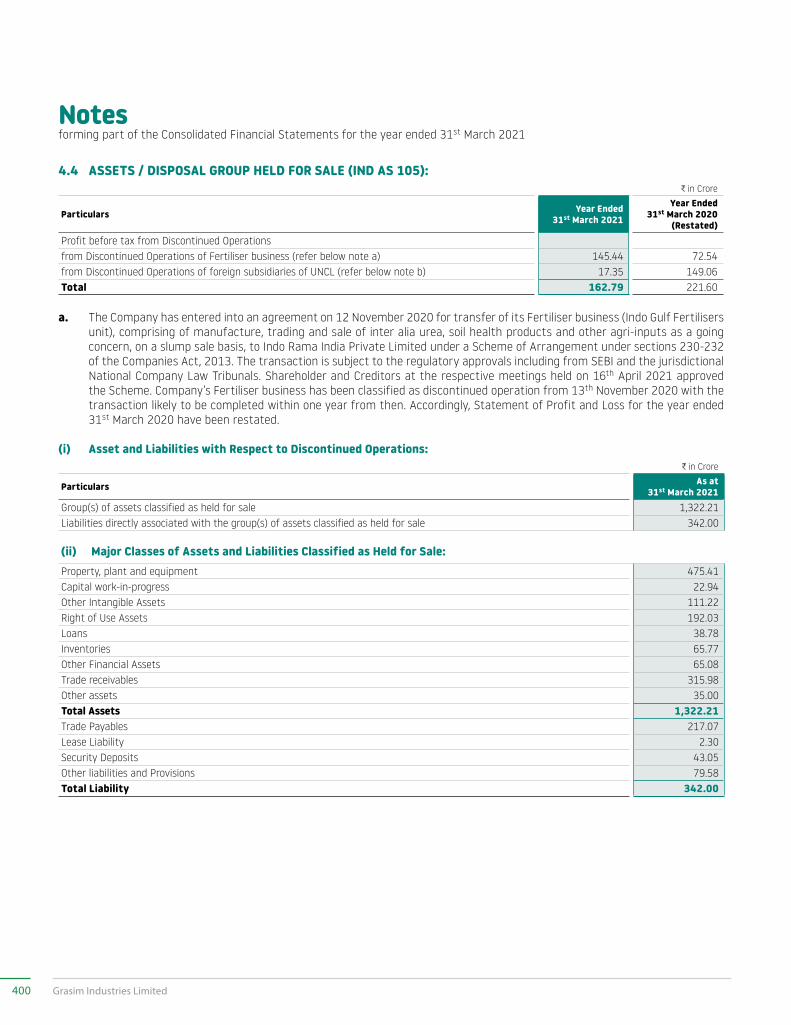
Notesforming part of the Consolidated Financial Statements for the year ended 31st March 2021
4.4 ASSETS / DISPOSAL GROUP HELD FOR SALE (IND AS 105):C in Crore
Particulars Year Ended 31st March 2021
Year Ended 31st March 2020
(Restated)Profit before tax from Discontinued Operationsfrom Discontinued Operations of Fertiliser business (refer below note a) 145.44 72.54 from Discontinued Operations of foreign subsidiaries of UNCL (refer below note b) 17.35 149.06 Total 162.79 221.60
a. The Company has entered into an agreement on 12 November 2020 for transfer of its Fertiliser business (Indo Gulf Fertilisers unit), comprising of manufacture, trading and sale of inter alia urea, soil health products and other agri-inputs as a going concern, on a slump sale basis, to Indo Rama India Private Limited under a Scheme of Arrangement under sections 230-232 of the Companies Act, 2013. The transaction is subject to the regulatory approvals including from SEBI and the jurisdictional National Company Law Tribunals. Shareholder and Creditors at the respective meetings held on 16th April 2021 approved the Scheme. Company’s Fertiliser business has been classified as discontinued operation from 13th November 2020 with the transaction likely to be completed within one year from then. Accordingly, Statement of Profit and Loss for the year ended 31st March 2020 have been restated.
(i) Asset and Liabilities with Respect to Discontinued Operations:C in Crore
Particulars As at 31st March 2021
Group(s) of assets classified as held for sale 1,322.21 Liabilities directly associated with the group(s) of assets classified as held for sale 342.00
(ii) Major Classes of Assets and Liabilities Classified as Held for Sale:Property, plant and equipment 475.41 Capital work-in-progress 22.94 Other Intangible Assets 111.22 Right of Use Assets 192.03 Loans 38.78 Inventories 65.77 Other Financial Assets 65.08 Trade receivables 315.98 Other assets 35.00 Total Assets 1,322.21 Trade Payables 217.07 Lease Liability 2.30 Security Deposits 43.05 Other liabilities and Provisions 79.58 Total Liability 342.00
400 Grasim Industries Limited
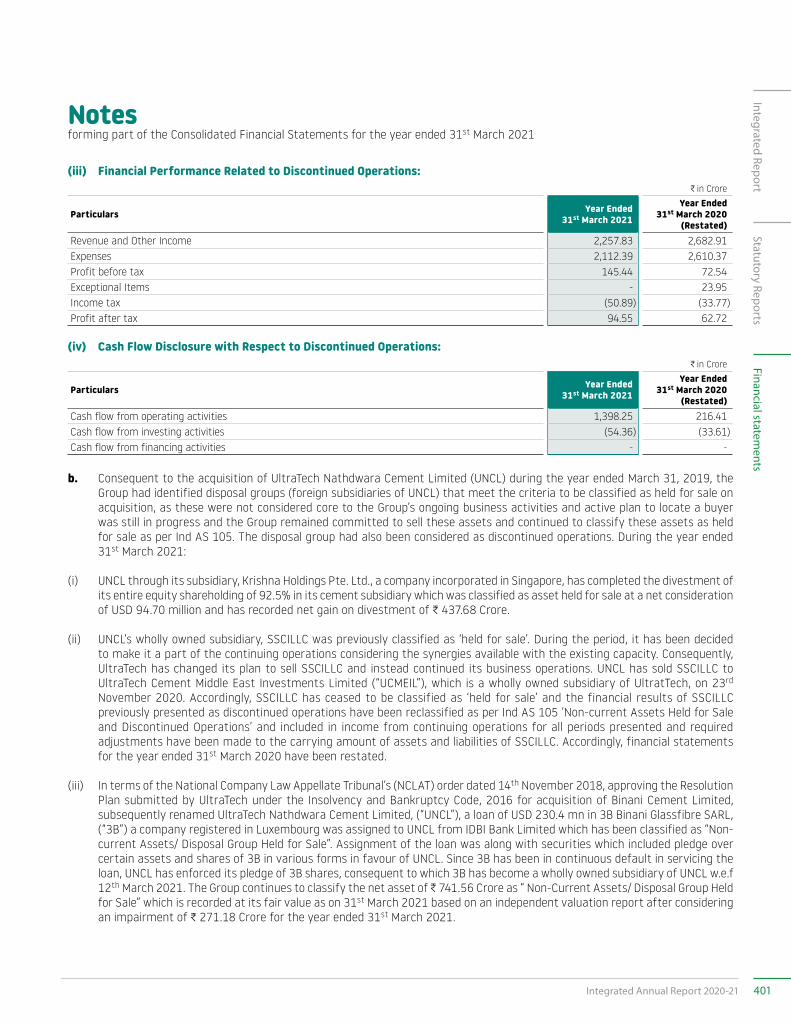
Notesforming part of the Consolidated Financial Statements for the year ended 31st March 2021
(iii) Financial Performance Related to Discontinued Operations:C in Crore
Particulars Year Ended 31st March 2021
Year Ended 31st March 2020
(Restated)Revenue and Other Income 2,257.83 2,682.91 Expenses 2,112.39 2,610.37 Profit before tax 145.44 72.54 Exceptional Items - 23.95 Income tax (50.89) (33.77)Profit after tax 94.55 62.72
(iv) Cash Flow Disclosure with Respect to Discontinued Operations:C in Crore
Particulars Year Ended 31st March 2021
Year Ended 31st March 2020
(Restated)Cash flow from operating activities 1,398.25 216.41 Cash flow from investing activities (54.36) (33.61)Cash flow from financing activities - -
b. Consequent to the acquisition of UltraTech Nathdwara Cement Limited (UNCL) during the year ended March 31, 2019, the Group had identified disposal groups (foreign subsidiaries of UNCL) that meet the criteria to be classified as held for sale on acquisition, as these were not considered core to the Group’s ongoing business activities and active plan to locate a buyer was still in progress and the Group remained committed to sell these assets and continued to classify these assets as held for sale as per Ind AS 105. The disposal group had also been considered as discontinued operations. During the year ended 31st March 2021:
(i) UNCL through its subsidiary, Krishna Holdings Pte. Ltd., a company incorporated in Singapore, has completed the divestment of its entire equity shareholding of 92.5% in its cement subsidiary which was classified as asset held for sale at a net consideration of USD 94.70 million and has recorded net gain on divestment of C 437.68 Crore.
(ii) UNCL’s wholly owned subsidiary, SSCILLC was previously classified as ‘held for sale’. During the period, it has been decided to make it a part of the continuing operations considering the synergies available with the existing capacity. Consequently, UltraTech has changed its plan to sell SSCILLC and instead continued its business operations. UNCL has sold SSCILLC to UltraTech Cement Middle East Investments Limited (“UCMEIL”), which is a wholly owned subsidiary of UltratTech, on 23rd November 2020. Accordingly, SSCILLC has ceased to be classified as ‘held for sale’ and the financial results of SSCILLC previously presented as discontinued operations have been reclassified as per Ind AS 105 ‘Non-current Assets Held for Sale and Discontinued Operations’ and included in income from continuing operations for all periods presented and required adjustments have been made to the carrying amount of assets and liabilities of SSCILLC. Accordingly, financial statements for the year ended 31st March 2020 have been restated.
(iii) In terms of the National Company Law Appellate Tribunal’s (NCLAT) order dated 14th November 2018, approving the Resolution Plan submitted by UltraTech under the Insolvency and Bankruptcy Code, 2016 for acquisition of Binani Cement Limited, subsequently renamed UltraTech Nathdwara Cement Limited, (“UNCL”), a loan of USD 230.4 mn in 3B Binani Glassfibre SARL, (“3B”) a company registered in Luxembourg was assigned to UNCL from IDBI Bank Limited which has been classified as “Non-current Assets/ Disposal Group Held for Sale”. Assignment of the loan was along with securities which included pledge over certain assets and shares of 3B in various forms in favour of UNCL. Since 3B has been in continuous default in servicing the loan, UNCL has enforced its pledge of 3B shares, consequent to which 3B has become a wholly owned subsidiary of UNCL w.e.f 12th March 2021. The Group continues to classify the net asset of C 741.56 Crore as “ Non-Current Assets/ Disposal Group Held for Sale” which is recorded at its fair value as on 31st March 2021 based on an independent valuation report after considering an impairment of C 271.18 Crore for the year ended 31st March 2021.
401Integrated Annual Report 2020-21
Integrated ReportStatutory Reports
Financial statements
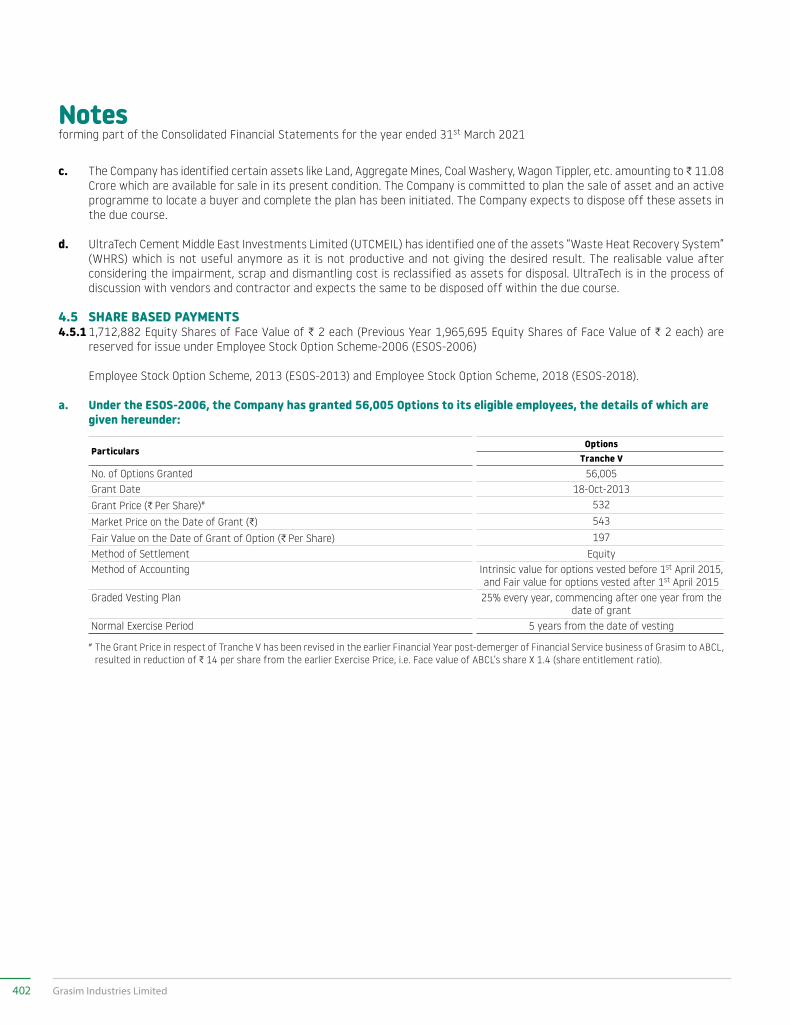
Notesforming part of the Consolidated Financial Statements for the year ended 31st March 2021
c. The Company has identified certain assets like Land, Aggregate Mines, Coal Washery, Wagon Tippler, etc. amounting to C 11.08 Crore which are available for sale in its present condition. The Company is committed to plan the sale of asset and an active programme to locate a buyer and complete the plan has been initiated. The Company expects to dispose off these assets in the due course.
d. UltraTech Cement Middle East Investments Limited (UTCMEIL) has identified one of the assets “Waste Heat Recovery System” (WHRS) which is not useful anymore as it is not productive and not giving the desired result. The realisable value after considering the impairment, scrap and dismantling cost is reclassified as assets for disposal. UltraTech is in the process of discussion with vendors and contractor and expects the same to be disposed off within the due course.
4.5 SHARE BASED PAYMENTS4.5.1 1,712,882 Equity Shares of Face Value of C 2 each (Previous Year 1,965,695 Equity Shares of Face Value of C 2 each) are
reserved for issue under Employee Stock Option Scheme-2006 (ESOS-2006)
Employee Stock Option Scheme, 2013 (ESOS-2013) and Employee Stock Option Scheme, 2018 (ESOS-2018).
a. Under the ESOS-2006, the Company has granted 56,005 Options to its eligible employees, the details of which are given hereunder:
ParticularsOptions
Tranche V No. of Options Granted 56,005Grant Date 18-Oct-2013Grant Price (C Per Share)# 532
Market Price on the Date of Grant (C) 543
Fair Value on the Date of Grant of Option (C Per Share) 197Method of Settlement Equity Method of Accounting Intrinsic value for options vested before 1st April 2015,
and Fair value for options vested after 1st April 2015Graded Vesting Plan 25% every year, commencing after one year from the
date of grantNormal Exercise Period 5 years from the date of vesting
# The Grant Price in respect of Tranche V has been revised in the earlier Financial Year post-demerger of Financial Service business of Grasim to ABCL, resulted in reduction of C 14 per share from the earlier Exercise Price, i.e. Face value of ABCL’s share X 1.4 (share entitlement ratio).
402 Grasim Industries Limited

Notesforming part of the Consolidated Financial Statements for the year ended 31st March 2021
b.
Unde
r the
ESO
S-20
13, t
he C
ompa
ny h
as g
rant
ed 9
64,9
60 O
ptio
ns a
nd R
estr
icte
d St
ock
Unit
s (R
SUs)
to
the
elig
ible
em
ploy
ees
of t
he
Com
pany
and
its
subs
idia
ry, t
he d
etai
ls o
f whi
ch a
re g
iven
her
eund
er:
Part
icul
ars
Opti
ons
RSU’
s T
ranc
he I
Tra
nche
III
Tra
nche
IV
Tra
nche
I T
ranc
he II
T
ranc
he II
I T
ranc
he IV
T
ranc
he V
N
o. o
f Opt
ions
/ RS
U Gr
ante
d62
7,01
512
1,75
030
,440
93,4
9540
,420
31,0
1016
,665
4,16
5Gr
ant
Date
18-O
ct-2
013
15-J
an-2
016
02-A
pr-2
016
18-O
ct-2
013
21-N
ov-2
013
29-J
an-2
014
15-J
an-2
016
02-A
pr-2
016
Gran
t Pr
ice
(C P
er S
hare
)#52
968
675
72
22
22
Mar
ket
Pric
e on
the
Date
of G
rant
(C)#
529
686
757
529
522
686
757
757
Fair
valu
e on
the
date
of G
rant
of o
ptio
n (C
per
sha
re)
199
274
291
520
498
495
687
750
Met
hod
of S
ettle
men
tEq
uity
Equi
tyEq
uity
Equi
tyEq
uity
Equi
tyEq
uity
Equi
tyM
etho
d of
Acc
ount
ing
Intr
insi
c va
lue
for o
ptio
ns v
este
d be
fore
1st
Ap
ril 2
015
and
Fair
valu
e fo
r opt
ions
ves
ted
afte
r 1st
Apr
il 20
15
Fair
Valu
eFa
ir Va
lue
Fair
Valu
eFa
ir Va
lue
Fair
Valu
e
Grad
ed V
estin
g Pl
an25
% e
very
yea
r, co
mm
enci
ng a
fter
one
yea
r fr
om th
e da
te o
f gra
ntBu
llet
vest
ing
at th
e en
d of
thre
e ye
ars
from
the
date
of g
rant
Nor
mal
Exe
rcis
e Pe
riod
5 ye
ars
from
the
date
of v
estin
g5
year
s fr
om th
e da
te o
f ves
ting
# Th
e Gr
ant
Pric
e an
d M
arke
t Pr
ice
in r
espe
ct o
f Tr
anch
es I,
III a
nd IV
has
bee
n re
vise
d in
the
pre
viou
s Fi
nanc
ial Y
ear
post
- de
mer
ger
of F
inan
cial
Ser
vice
bus
ines
s of
Gra
sim
to
ABCL
, re
sult
ing
in r
educ
tion
of C
14
per s
hare
fro
m t
he e
arlie
r Exe
rcis
e Pr
ice
i.e. F
ace
valu
e of
ABC
L’s s
hare
X 1
.4 (s
hare
ent
itle
men
t ra
tio).
c.
Unde
r the
ESO
S-20
18, t
he C
ompa
ny h
as g
rant
ed 1
,799
,303
Opt
ions
and
Res
tric
ted
Stoc
k Un
its
(RSU
s) t
o th
e el
igib
le e
mpl
oyee
s of
the
Co
mpa
ny a
nd it
s su
bsid
iary
, the
det
ails
of w
hich
are
giv
en h
ereu
nder
:
Part
icul
ars
Opti
ons
Tra
nche
I T
ranc
he II
T
ranc
he II
I T
ranc
he IV
T
ranc
he V
N
o. o
f Opt
ions
/ RS
U Gr
ante
d1,
077,
312
26,4
5653
,480
254,
141
68,7
84Gr
ant
Date
17-D
ec-2
018
24-D
ec-2
019
13-M
ar-2
020
12-F
eb-2
021
12-F
eb-2
021
Gran
t Pr
ice
(C P
er S
hare
)84
7.20
742.
3555
9.85
1,23
5.45
1,23
5.45
Mar
ket
Pric
e on
the
Date
of G
rant
(C)#
847.
2074
2.35
559.
851,
235.
451,
235.
45
Fair
valu
e on
the
date
of G
rant
of o
ptio
n (C
per
sha
re)
422.
5334
7.48
266.
7052
4.74
347.
48M
etho
d of
Set
tlem
ent
Equi
tyEq
uity
Equi
tyEq
uity
Equi
tyM
etho
d of
Acc
ount
ing
Fair
Valu
eFa
ir Va
lue
Fair
Valu
eFa
ir Va
lue
Fair
Valu
eGr
aded
Ves
ting
Plan
25%
eve
ry y
ear,
com
men
cing
aft
er o
ne y
ear f
rom
the
date
of
gran
tBu
llet
vest
ing
at th
e en
d of
one
yea
rs fr
om
the
date
of g
rant
25%
eve
ry y
ear,
com
men
cing
aft
er
one
year
from
the
date
of g
rant
Nor
mal
Exe
rcis
e Pe
riod
5 ye
ars
from
the
date
of v
estin
g
403Integrated Annual Report 2020-21
Integrated ReportStatutory Reports
Financial statements
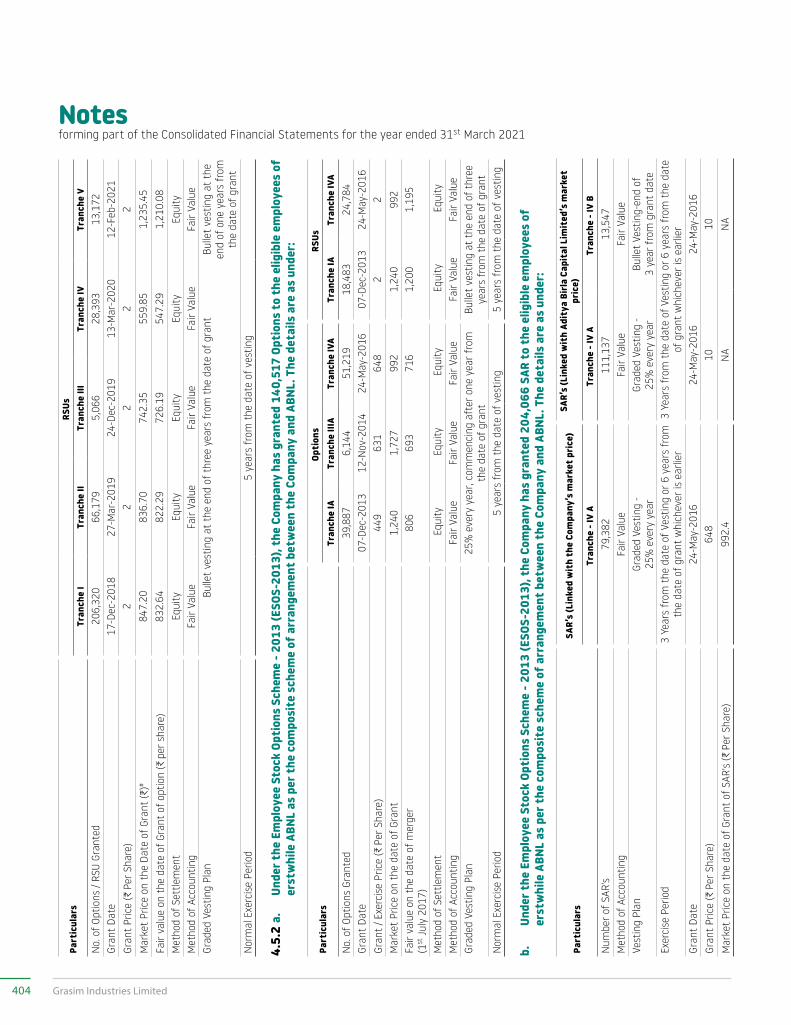
Notesforming part of the Consolidated Financial Statements for the year ended 31st March 2021
Part
icul
ars
RSUs
Tra
nche
I T
ranc
he II
T
ranc
he II
I T
ranc
he IV
T
ranc
he V
N
o. o
f Opt
ions
/ RS
U Gr
ante
d20
6,32
066
,179
5,06
628
,393
13,1
72Gr
ant
Date
17-D
ec-2
018
27-M
ar-2
019
24-D
ec-2
019
13-M
ar-2
020
12-F
eb-2
021
Gran
t Pr
ice
(C P
er S
hare
)2
22
22
Mar
ket
Pric
e on
the
Date
of G
rant
(C)#
847.
2083
6.70
742.
3555
9.85
1,23
5.45
Fair
valu
e on
the
date
of G
rant
of o
ptio
n (C
per
sha
re)
832.
6482
2.29
726.
1954
7.29
1,21
0.08
Met
hod
of S
ettle
men
tEq
uity
Equi
tyEq
uity
Equi
tyEq
uity
Met
hod
of A
ccou
ntin
gFa
ir Va
lue
Fair
Valu
eFa
ir Va
lue
Fair
Valu
eFa
ir Va
lue
Grad
ed V
estin
g Pl
anBu
llet
vest
ing
at th
e en
d of
thre
e ye
ars
from
the
date
of g
rant
Bulle
t ve
stin
g at
the
end
of o
ne y
ears
from
th
e da
te o
f gra
ntN
orm
al E
xerc
ise
Perio
d5
year
s fr
om th
e da
te o
f ves
ting
4.5.
2 a.
Un
der t
he E
mpl
oyee
Sto
ck O
ptio
ns S
chem
e - 2
013
(ESO
S-20
13),
the
Com
pany
has
gra
nted
140
,517
Opt
ions
to
the
elig
ible
em
ploy
ees
of
erst
whi
le A
BNL
as p
er t
he c
ompo
site
sch
eme
of a
rran
gem
ent b
etw
een
the
Com
pany
and
ABN
L. T
he d
etai
ls a
re a
s un
der:
Part
icul
ars
Opti
ons
RSUs
Tra
nche
IA
Tra
nche
IIIA
T
ranc
he IV
A T
ranc
he IA
T
ranc
he IV
A N
o. o
f Opt
ions
Gra
nted
39,8
876,
144
51,2
1918
,483
24,7
84Gr
ant
Date
07-D
ec-2
013
12-N
ov-2
014
24-M
ay-2
016
07-D
ec-2
013
24-M
ay-2
016
Gran
t / E
xerc
ise
Pric
e (C
Per
Sha
re)
449
631
648
22
Mar
ket
Pric
e on
the
date
of G
rant
1,24
01,
727
992
1,24
099
2Fa
ir va
lue
on th
e da
te o
f mer
ger
(1st
July
201
7)80
669
371
61,
200
1,19
5
Met
hod
of S
ettle
men
t E
quity
E
quity
E
quity
E
quity
E
quity
M
etho
d of
Acc
ount
ing
Fair
Valu
eFa
ir Va
lue
Fair
Valu
eFa
ir Va
lue
Fair
Valu
eGr
aded
Ves
ting
Plan
25%
eve
ry y
ear,
com
men
cing
aft
er o
ne y
ear f
rom
th
e da
te o
f gra
ntBu
llet
vest
ing
at th
e en
d of
thre
e ye
ars
from
the
date
of g
rant
Nor
mal
Exe
rcis
e Pe
riod
5 ye
ars
from
the
date
of v
estin
g5
year
s fr
om th
e da
te o
f ves
ting
b.
Unde
r the
Em
ploy
ee S
tock
Opt
ions
Sch
eme
- 201
3 (E
SOS-
2013
), th
e Co
mpa
ny h
as g
rant
ed 2
04,0
66 S
AR t
o th
e el
igib
le e
mpl
oyee
s of
er
stw
hile
ABN
L as
per
the
com
posi
te s
chem
e of
arr
ange
men
t bet
wee
n th
e Co
mpa
ny a
nd A
BNL.
The
det
ails
are
as
unde
r:
Part
icul
ars
SAR’
s (L
inke
d w
ith
the
Com
pany
’s m
arke
t pri
ce)
SAR’
s (L
inke
d w
ith
Adit
ya B
irla
Cap
ital
Lim
ited
’s m
arke
t pr
ice)
Tran
che
- IV
ATr
anch
e - I
V A
Tran
che
- IV
BN
umbe
r of S
AR's
79,3
8211
1,13
713
,547
Met
hod
of A
ccou
ntin
gFa
ir Va
lue
Fair
Valu
eFa
ir Va
lue
Vest
ing
Plan
Grad
ed V
estin
g -
25%
eve
ry y
ear
Grad
ed V
estin
g -
25%
eve
ry y
ear
Bulle
t Ve
stin
g-en
d of
3
year
from
gra
nt d
ate
Exer
cise
Per
iod
3 Ye
ars
from
the
date
of V
estin
g or
6 y
ears
from
th
e da
te o
f gra
nt w
hich
ever
is e
arlie
r3
Year
s fr
om th
e da
te o
f Ves
ting
or 6
yea
rs fr
om th
e da
te
of g
rant
whi
chev
er is
ear
lier
Gran
t Da
te24
-May
-201
624
-May
-201
624
-May
-201
6Gr
ant
Pric
e (C
Per
Sha
re)
648
1010
Mar
ket
Pric
e on
the
date
of G
rant
of S
AR's
(C P
er S
hare
)99
2.4
NA
NA
404 Grasim Industries Limited

Notesforming part of the Consolidated Financial Statements for the year ended 31st March 2021
c.
Unde
r the
Em
ploy
ee S
tock
Opt
ions
Sch
eme
- 201
8 (E
SOS-
2018
), th
e Co
mpa
ny h
as g
rant
ed 1
52,8
11 S
AR.
Th
e de
tails
are
as
unde
r:
Part
icul
ars
SAR'
s (L
inke
d w
ith
the
Com
pany
's m
arke
t pri
ce)
SAR’
s (L
inke
d w
ith
Adit
ya B
irla
Cap
ital
Li
mit
ed’s
mar
ket
pric
e)Tr
anch
e - I
Opt
ions
Tran
che
- III
Opti
ons
Tran
che
- I R
SUTr
anch
e - I
I RSU
Tran
che
- IV
Opti
ons
Num
ber o
f SAR
's96
,628
23,8
1518
,964
609
13,0
65M
etho
d of
Acc
ount
ing
Fair
Valu
eFa
ir Va
lue
Fair
Valu
eFa
ir Va
lue
Fair
Valu
eVe
stin
g Pl
anGr
aded
Ves
ting
- 25%
ev
ery
year
Bulle
t Ve
stin
g -1
Yea
r fr
om th
e da
te o
f Gra
ntBu
llet
Vest
ing-
end
of 3
ye
ar fr
om g
rant
dat
eBu
llet
Vest
ing-
end
of 3
ye
ar fr
om g
rant
dat
eBu
llet
Vest
ing
-1 Y
ear
from
the
date
of G
rant
Exer
cise
Per
iod
3 Ye
ars
from
the
date
of
Ves
ting
or 6
yea
rs
from
the
date
of g
rant
w
hich
ever
is e
arlie
r
3 Ye
ars
from
the
date
of
Ves
ting
3 Ye
ars
from
the
date
of
Ves
ting
or 6
yea
rs
from
the
date
of g
rant
w
hich
ever
is e
arlie
r
3 Ye
ars
from
the
date
of
Ves
ting
or 6
yea
rs
from
the
date
of g
rant
w
hich
ever
is e
arlie
r
3 Ye
ars
from
the
date
of
Ves
ting
Gran
t Da
te17
-Dec
-201
812
-Feb
-202
117
-Dec
-201
827
-Mar
-201
912
-Feb
-202
1Gr
ant
Pric
e (C
Per
Sha
re)
847.
21,
235.
452
210
Mar
ket
Pric
e on
the
date
of G
rant
of S
AR's
(C P
er S
hare
)84
7.2
1,23
5.45
847.
283
6.7
88.5
5
4.5.
3 M
ovem
ent o
f Opt
ions
and
RSU
s Gr
ante
d al
ong
wit
h W
eigh
ted
Aver
age
Exer
cise
Pric
e (W
AEP)
Fo
r opt
ions
refe
rred
to
in 4
.5.1
(a),
(b) a
nd (c
)
Part
icul
ars
Curr
ent Y
ear
Prev
ious
Yea
rNo
s.W
AEP
(D)
Nos.
WAE
P (D
)Ou
tsta
ndin
g at
the
begi
nnin
g of
the
year
1,9
65,6
95
601
2
,172
,121
6
02
Gran
ted
durin
g th
e ye
ar 3
36,0
97
1,1
87
113
,395
4
38
Exer
cise
d du
ring
the
year
273
,371
5
78
187
,945
4
52
Laps
ed d
urin
g th
e ye
ar 3
15,5
39
795
1
31,8
76
699
Ou
tsta
ndin
g at
the
end
of th
e ye
ar 1
,712
,882
6
84
1,9
65,6
95
601
Op
tions
: Unv
este
d at
the
end
of th
e ye
ar 1
,111
,501
7
34
1,0
88,7
86
611
Ex
erci
sabl
e at
the
end
of th
e ye
ar 6
01,3
81
591
8
76,9
09
588
The
wei
ghte
d av
erag
e sh
are
pric
e at
the
dat
e of
exe
rcis
e fo
r op
tions
was
C 9
64.2
5 pe
r sh
are
(31st
Mar
ch 2
020
C 7
19.5
5 pe
r sh
are)
and
wei
ghte
d av
erag
e re
mai
ning
con
trac
tual
life
for t
he s
hare
opt
ions
out
stan
ding
as
at 3
1st M
arch
202
1 w
as 3
.54
year
s (3
1st M
arch
202
0: 3
.19
year
s).
405Integrated Annual Report 2020-21
Integrated ReportStatutory Reports
Financial statements
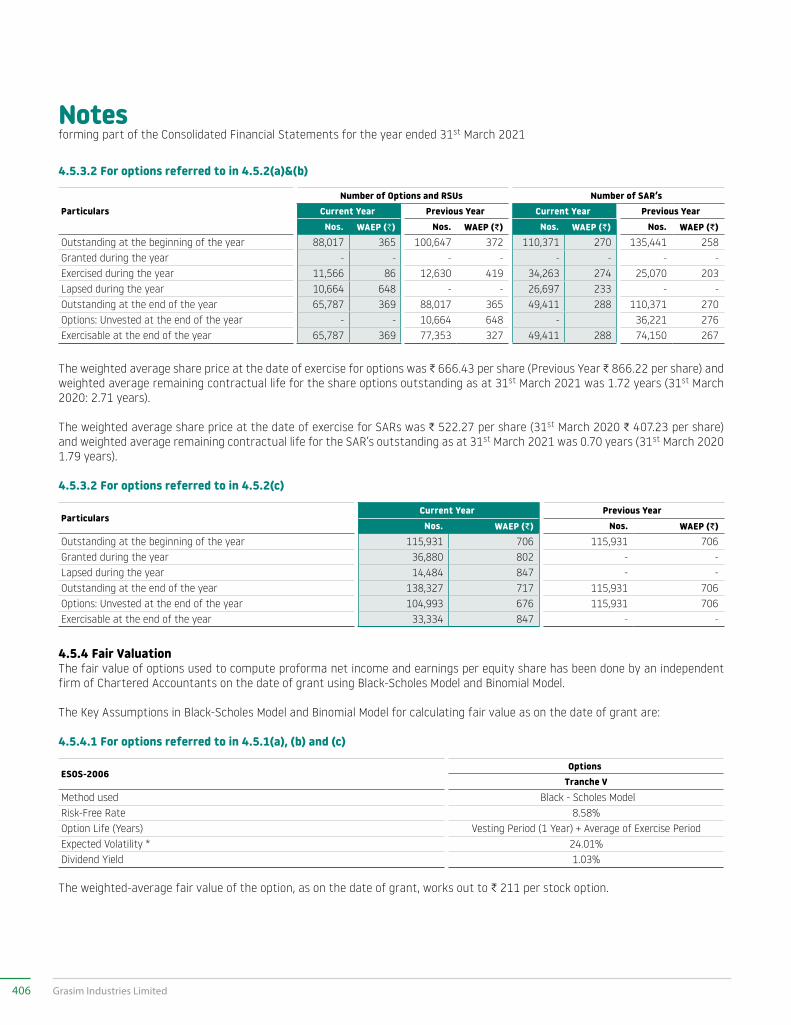
Notesforming part of the Consolidated Financial Statements for the year ended 31st March 2021
4.5.3.2 For options referred to in 4.5.2(a)&(b)
ParticularsNumber of Options and RSUs Number of SAR’s
Current Year Previous Year Current Year Previous YearNos. WAEP (C) Nos. WAEP (D) Nos. WAEP (D) Nos. WAEP (D)
Outstanding at the beginning of the year 88,017 365 100,647 372 110,371 270 135,441 258Granted during the year - - - - - - - -Exercised during the year 11,566 86 12,630 419 34,263 274 25,070 203Lapsed during the year 10,664 648 - - 26,697 233 - -Outstanding at the end of the year 65,787 369 88,017 365 49,411 288 110,371 270Options: Unvested at the end of the year - - 10,664 648 - 36,221 276Exercisable at the end of the year 65,787 369 77,353 327 49,411 288 74,150 267
The weighted average share price at the date of exercise for options was C 666.43 per share (Previous Year C 866.22 per share) and weighted average remaining contractual life for the share options outstanding as at 31st March 2021 was 1.72 years (31st March 2020: 2.71 years).
The weighted average share price at the date of exercise for SARs was C 522.27 per share (31st March 2020 C 407.23 per share) and weighted average remaining contractual life for the SAR’s outstanding as at 31st March 2021 was 0.70 years (31st March 2020 1.79 years).
4.5.3.2 For options referred to in 4.5.2(c)
ParticularsCurrent Year Previous YearNos. WAEP (D) Nos. WAEP (D)
Outstanding at the beginning of the year 115,931 706 115,931 706 Granted during the year 36,880 802 - - Lapsed during the year 14,484 847 - - Outstanding at the end of the year 138,327 717 115,931 706 Options: Unvested at the end of the year 104,993 676 115,931 706 Exercisable at the end of the year 33,334 847 - -
4.5.4 Fair ValuationThe fair value of options used to compute proforma net income and earnings per equity share has been done by an independent firm of Chartered Accountants on the date of grant using Black-Scholes Model and Binomial Model.
The Key Assumptions in Black-Scholes Model and Binomial Model for calculating fair value as on the date of grant are:
4.5.4.1 For options referred to in 4.5.1(a), (b) and (c)
ESOS-2006Options
Tranche V Method used Black - Scholes Model Risk-Free Rate 8.58%Option Life (Years) Vesting Period (1 Year) + Average of Exercise PeriodExpected Volatility * 24.01%Dividend Yield 1.03%
The weighted-average fair value of the option, as on the date of grant, works out to C 211 per stock option.
406 Grasim Industries Limited
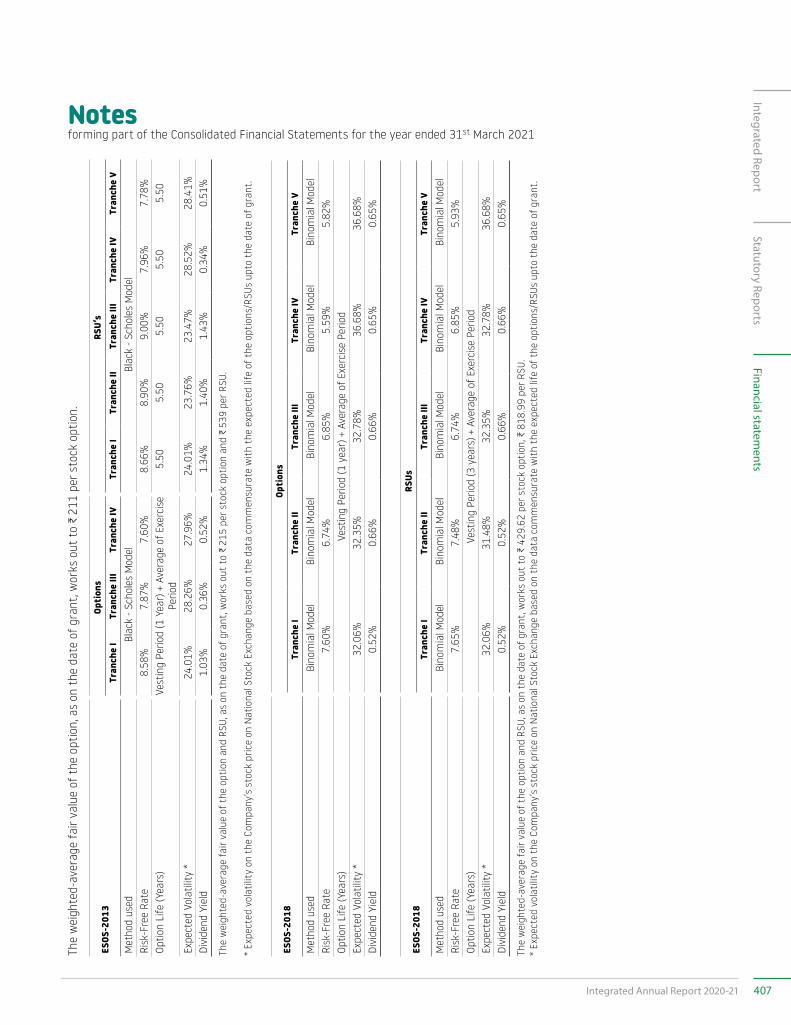
Notesforming part of the Consolidated Financial Statements for the year ended 31st March 2021
The
wei
ghte
d-av
erag
e fa
ir va
lue
of t
he o
ptio
n, a
s on
the
dat
e of
gra
nt, w
orks
out
to
C 2
11 p
er s
tock
opt
ion.
ESOS
-201
3Op
tion
sRS
U’s
Tra
nche
I T
ranc
he II
I T
ranc
he IV
T
ranc
he I
Tra
nche
II
Tra
nche
III
Tra
nche
IV T
ranc
he V
Met
hod
used
Bla
ck -
Scho
les
Mod
el
Bla
ck -
Scho
les
Mod
el
Risk
-Fre
e Ra
te8.
58%
7.87
%7.
60%
8.66
%8.
90%
9.00
%7.
96%
7.78
%Op
tion
Life
(Yea
rs)
Vest
ing
Perio
d (1
Yea
r) +
Ave
rage
of E
xerc
ise
Perio
d5.
505.
505.
505.
505.
50
Expe
cted
Vol
atili
ty *
24.0
1%28
.26%
27.9
6%24
.01%
23.7
6%23
.47%
28.5
2%28
.41%
Divi
dend
Yie
ld
1.03
%0.
36%
0.52
%1.
34%
1.40
%1.
43%
0.34
%0.
51%
The
wei
ghte
d-av
erag
e fa
ir va
lue
of t
he o
ptio
n an
d RS
U, a
s on
the
dat
e of
gra
nt, w
orks
out
to
C 2
15 p
er s
tock
opt
ion
and
C 5
39 p
er R
SU.
*
Expe
cted
vol
atili
ty o
n th
e Co
mpa
ny’s
stoc
k pr
ice
on N
atio
nal S
tock
Exc
hang
e ba
sed
on t
he d
ata
com
men
sura
te w
ith
the
expe
cted
life
of t
he o
ptio
ns/R
SUs
upto
the
dat
e of
gra
nt.
ESOS
-201
8Op
tion
s T
ranc
he I
Tra
nche
II
Tra
nche
III
Tra
nche
IV
Tra
nche
V
Met
hod
used
Bin
omia
l Mod
el
Bin
omia
l Mod
el
Bin
omia
l Mod
el
Bin
omia
l Mod
el
Bin
omia
l Mod
el
Risk
-Fre
e Ra
te7.
60%
6.74
%6.
85%
5.59
%5.
82%
Optio
n Li
fe (Y
ears
)Ve
stin
g Pe
riod
(1 y
ear)
+ A
vera
ge o
f Exe
rcis
e Pe
riod
Expe
cted
Vol
atili
ty *
32.0
6%32
.35%
32.7
8%36
.68%
36.6
8%Di
vide
nd Y
ield
0.
52%
0.66
%0.
66%
0.65
%0.
65%
ESOS
-201
8RS
Us T
ranc
he I
Tra
nche
II
Tra
nche
III
Tra
nche
IV
Tra
nche
V
Met
hod
used
Bin
omia
l Mod
el
Bin
omia
l Mod
el
Bin
omia
l Mod
el
Bin
omia
l Mod
el
Bin
omia
l Mod
el
Risk
-Fre
e Ra
te7.
65%
7.48
%6.
74%
6.85
%5.
93%
Optio
n Li
fe (Y
ears
)Ve
stin
g Pe
riod
(3 y
ears
) + A
vera
ge o
f Exe
rcis
e Pe
riod
Expe
cted
Vol
atili
ty *
32.0
6%31
.48%
32.3
5%32
.78%
36.6
8%Di
vide
nd Y
ield
0.
52%
0.52
%0.
66%
0.66
%0.
65%
The
wei
ghte
d-av
erag
e fa
ir va
lue
of t
he o
ptio
n an
d RS
U, a
s on
the
dat
e of
gra
nt, w
orks
out
to
C 4
29.6
2 pe
r sto
ck o
ptio
n, C
818
.99
per R
SU.
* Ex
pect
ed v
olat
ility
on
the
Com
pany
’s st
ock
pric
e on
Nat
iona
l Sto
ck E
xcha
nge
base
d on
the
dat
a co
mm
ensu
rate
wit
h th
e ex
pect
ed li
fe o
f the
opt
ions
/RSU
s up
to t
he d
ate
of g
rant
.
407Integrated Annual Report 2020-21
Integrated ReportStatutory Reports
Financial statements
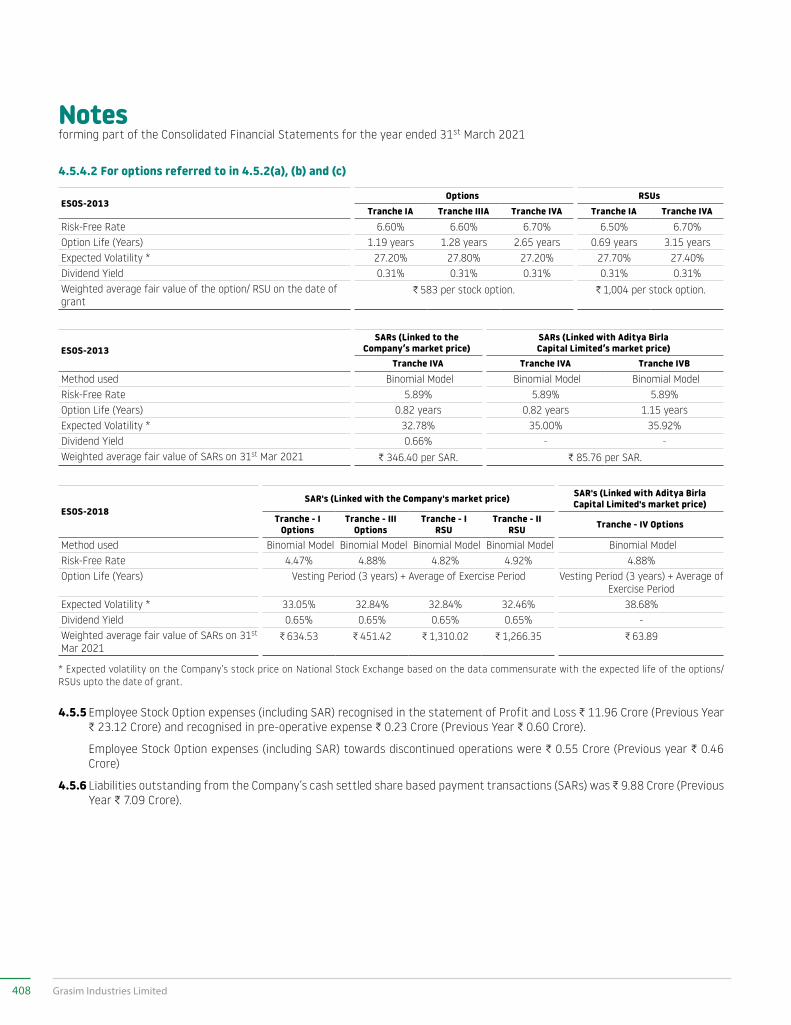
Notesforming part of the Consolidated Financial Statements for the year ended 31st March 2021
4.5.4.2 For options referred to in 4.5.2(a), (b) and (c)
ESOS-2013Options RSUs
Tranche IA Tranche IIIA Tranche IVA Tranche IA Tranche IVA Risk-Free Rate 6.60% 6.60% 6.70% 6.50% 6.70%Option Life (Years) 1.19 years 1.28 years 2.65 years 0.69 years 3.15 yearsExpected Volatility * 27.20% 27.80% 27.20% 27.70% 27.40%Dividend Yield 0.31% 0.31% 0.31% 0.31% 0.31%Weighted average fair value of the option/ RSU on the date of grant
C 583 per stock option. C 1,004 per stock option.
ESOS-2013SARs (Linked to the
Company’s market price)SARs (Linked with Aditya Birla Capital Limited’s market price)
Tranche IVA Tranche IVA Tranche IVB Method used Binomial Model Binomial Model Binomial Model Risk-Free Rate 5.89% 5.89% 5.89%Option Life (Years) 0.82 years 0.82 years 1.15 yearsExpected Volatility * 32.78% 35.00% 35.92%Dividend Yield 0.66% - -Weighted average fair value of SARs on 31st Mar 2021 C 346.40 per SAR. C 85.76 per SAR.
ESOS-2018SAR's (Linked with the Company's market price) SAR's (Linked with Aditya Birla
Capital Limited's market price)Tranche - I
OptionsTranche - III
OptionsTranche - I
RSUTranche - II
RSU Tranche - IV Options
Method used Binomial Model Binomial Model Binomial Model Binomial Model Binomial ModelRisk-Free Rate 4.47% 4.88% 4.82% 4.92% 4.88%Option Life (Years) Vesting Period (3 years) + Average of Exercise Period Vesting Period (3 years) + Average of
Exercise PeriodExpected Volatility * 33.05% 32.84% 32.84% 32.46% 38.68%Dividend Yield 0.65% 0.65% 0.65% 0.65% -Weighted average fair value of SARs on 31st Mar 2021
C 634.53 C 451.42 C 1,310.02 C 1,266.35 C 63.89
* Expected volatility on the Company’s stock price on National Stock Exchange based on the data commensurate with the expected life of the options/RSUs upto the date of grant.
4.5.5 Employee Stock Option expenses (including SAR) recognised in the statement of Profit and Loss C 11.96 Crore (Previous Year C 23.12 Crore) and recognised in pre-operative expense C 0.23 Crore (Previous Year C 0.60 Crore).
Employee Stock Option expenses (including SAR) towards discontinued operations were C 0.55 Crore (Previous year C 0.46 Crore)
4.5.6 Liabilities outstanding from the Company’s cash settled share based payment transactions (SARs) was C 9.88 Crore (Previous Year C 7.09 Crore).
408 Grasim Industries Limited
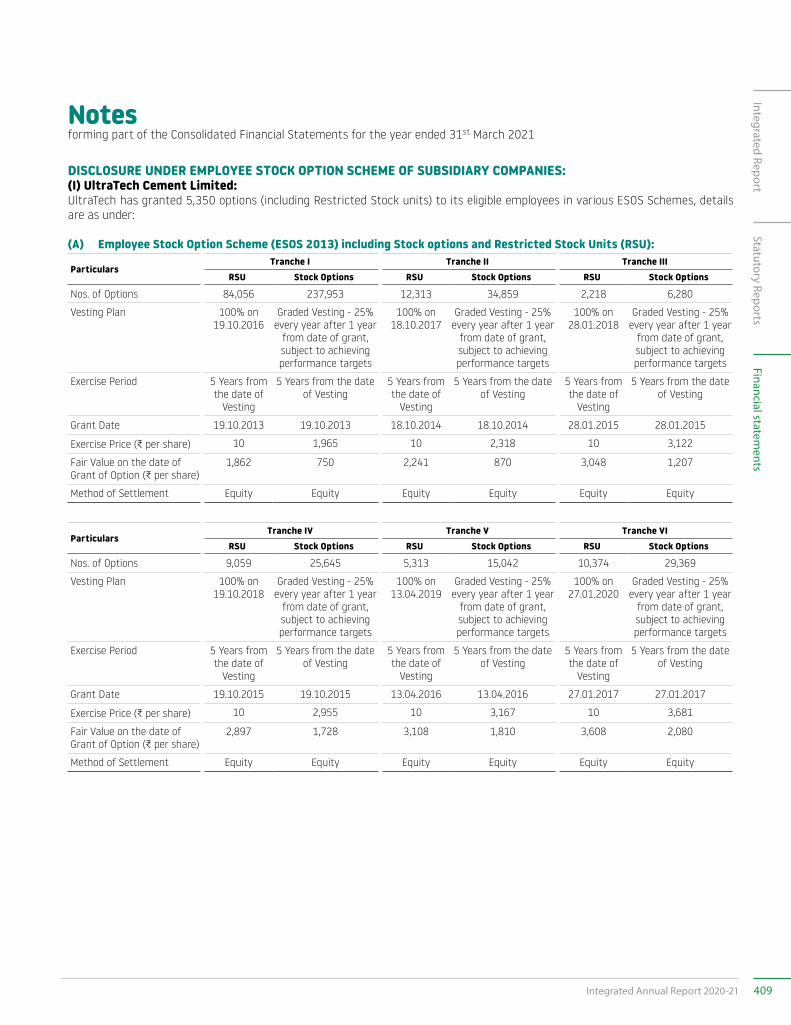
Notesforming part of the Consolidated Financial Statements for the year ended 31st March 2021
DISCLOSURE UNDER EMPLOYEE STOCK OPTION SCHEME OF SUBSIDIARY COMPANIES:(I) UltraTech Cement Limited:UltraTech has granted 5,350 options (including Restricted Stock units) to its eligible employees in various ESOS Schemes, details are as under:
(A) Employee Stock Option Scheme (ESOS 2013) including Stock options and Restricted Stock Units (RSU):
ParticularsTranche I Tranche II Tranche III
RSU Stock Options RSU Stock Options RSU Stock Options
Nos. of Options 84,056 237,953 12,313 34,859 2,218 6,280
Vesting Plan 100% on 19.10.2016
Graded Vesting - 25% every year after 1 year
from date of grant, subject to achieving performance targets
100% on 18.10.2017
Graded Vesting - 25% every year after 1 year
from date of grant, subject to achieving performance targets
100% on 28.01.2018
Graded Vesting - 25% every year after 1 year
from date of grant, subject to achieving performance targets
Exercise Period 5 Years from the date of
Vesting
5 Years from the date of Vesting
5 Years from the date of
Vesting
5 Years from the date of Vesting
5 Years from the date of
Vesting
5 Years from the date of Vesting
Grant Date 19.10.2013 19.10.2013 18.10.2014 18.10.2014 28.01.2015 28.01.2015
Exercise Price (C per share) 10 1,965 10 2,318 10 3,122
Fair Value on the date of Grant of Option (C per share)
1,862 750 2,241 870 3,048 1,207
Method of Settlement Equity Equity Equity Equity Equity Equity
ParticularsTranche IV Tranche V Tranche VI
RSU Stock Options RSU Stock Options RSU Stock Options
Nos. of Options 9,059 25,645 5,313 15,042 10,374 29,369
Vesting Plan 100% on 19.10.2018
Graded Vesting - 25% every year after 1 year
from date of grant, subject to achieving performance targets
100% on 13.04.2019
Graded Vesting - 25% every year after 1 year
from date of grant, subject to achieving performance targets
100% on 27.01.2020
Graded Vesting - 25% every year after 1 year
from date of grant, subject to achieving performance targets
Exercise Period 5 Years from the date of
Vesting
5 Years from the date of Vesting
5 Years from the date of
Vesting
5 Years from the date of Vesting
5 Years from the date of
Vesting
5 Years from the date of Vesting
Grant Date 19.10.2015 19.10.2015 13.04.2016 13.04.2016 27.01.2017 27.01.2017
Exercise Price (C per share) 10 2,955 10 3,167 10 3,681
Fair Value on the date of Grant of Option (C per share)
2,897 1,728 3,108 1,810 3,608 2,080
Method of Settlement Equity Equity Equity Equity Equity Equity
409Integrated Annual Report 2020-21
Integrated ReportStatutory Reports
Financial statements
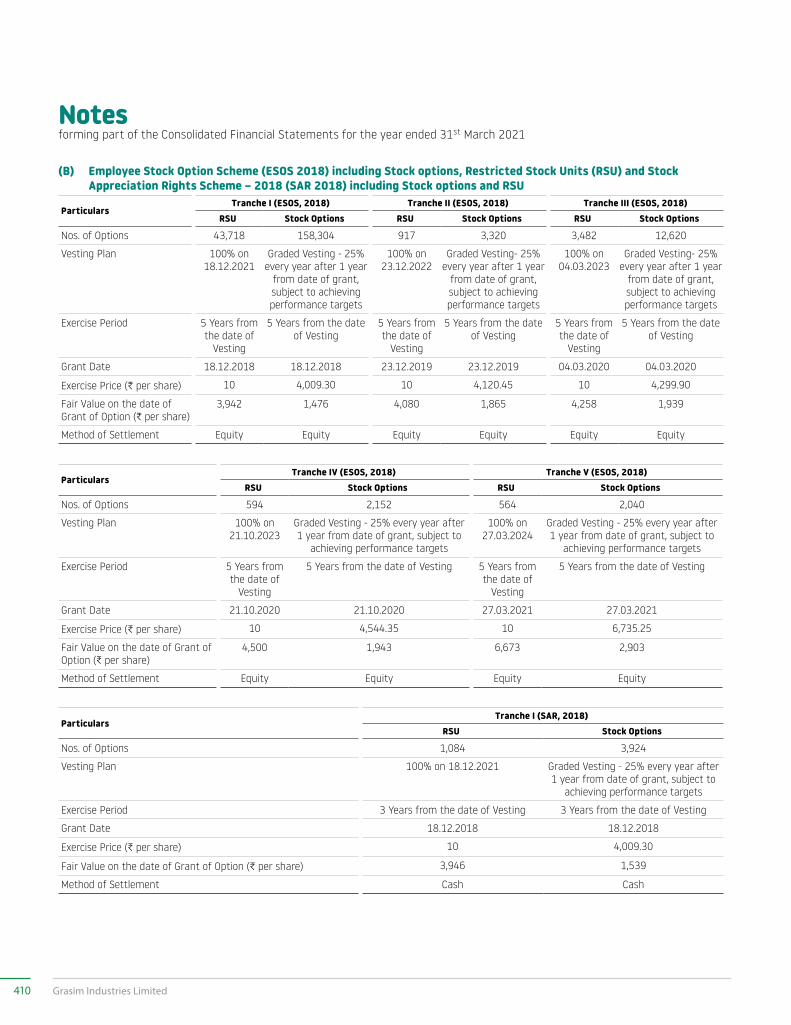
Notesforming part of the Consolidated Financial Statements for the year ended 31st March 2021
(B) Employee Stock Option Scheme (ESOS 2018) including Stock options, Restricted Stock Units (RSU) and Stock Appreciation Rights Scheme – 2018 (SAR 2018) including Stock options and RSU
ParticularsTranche I (ESOS, 2018) Tranche II (ESOS, 2018) Tranche III (ESOS, 2018)
RSU Stock Options RSU Stock Options RSU Stock Options
Nos. of Options 43,718 158,304 917 3,320 3,482 12,620
Vesting Plan 100% on 18.12.2021
Graded Vesting - 25% every year after 1 year
from date of grant, subject to achieving performance targets
100% on 23.12.2022
Graded Vesting- 25% every year after 1 year
from date of grant, subject to achieving performance targets
100% on 04.03.2023
Graded Vesting- 25% every year after 1 year
from date of grant, subject to achieving performance targets
Exercise Period 5 Years from the date of
Vesting
5 Years from the date of Vesting
5 Years from the date of
Vesting
5 Years from the date of Vesting
5 Years from the date of
Vesting
5 Years from the date of Vesting
Grant Date 18.12.2018 18.12.2018 23.12.2019 23.12.2019 04.03.2020 04.03.2020
Exercise Price (C per share) 10 4,009.30 10 4,120.45 10 4,299.90
Fair Value on the date of Grant of Option (C per share)
3,942 1,476 4,080 1,865 4,258 1,939
Method of Settlement Equity Equity Equity Equity Equity Equity
ParticularsTranche IV (ESOS, 2018) Tranche V (ESOS, 2018)
RSU Stock Options RSU Stock Options
Nos. of Options 594 2,152 564 2,040
Vesting Plan 100% on 21.10.2023
Graded Vesting - 25% every year after 1 year from date of grant, subject to
achieving performance targets
100% on 27.03.2024
Graded Vesting - 25% every year after 1 year from date of grant, subject to
achieving performance targets
Exercise Period 5 Years from the date of
Vesting
5 Years from the date of Vesting 5 Years from the date of
Vesting
5 Years from the date of Vesting
Grant Date 21.10.2020 21.10.2020 27.03.2021 27.03.2021
Exercise Price (C per share) 10 4,544.35 10 6,735.25
Fair Value on the date of Grant of Option (C per share)
4,500 1,943 6,673 2,903
Method of Settlement Equity Equity Equity Equity
ParticularsTranche I (SAR, 2018)
RSU Stock Options
Nos. of Options 1,084 3,924
Vesting Plan 100% on 18.12.2021 Graded Vesting - 25% every year after 1 year from date of grant, subject to
achieving performance targets
Exercise Period 3 Years from the date of Vesting 3 Years from the date of Vesting
Grant Date 18.12.2018 18.12.2018
Exercise Price (C per share) 10 4,009.30
Fair Value on the date of Grant of Option (C per share) 3,946 1,539
Method of Settlement Cash Cash
410 Grasim Industries Limited
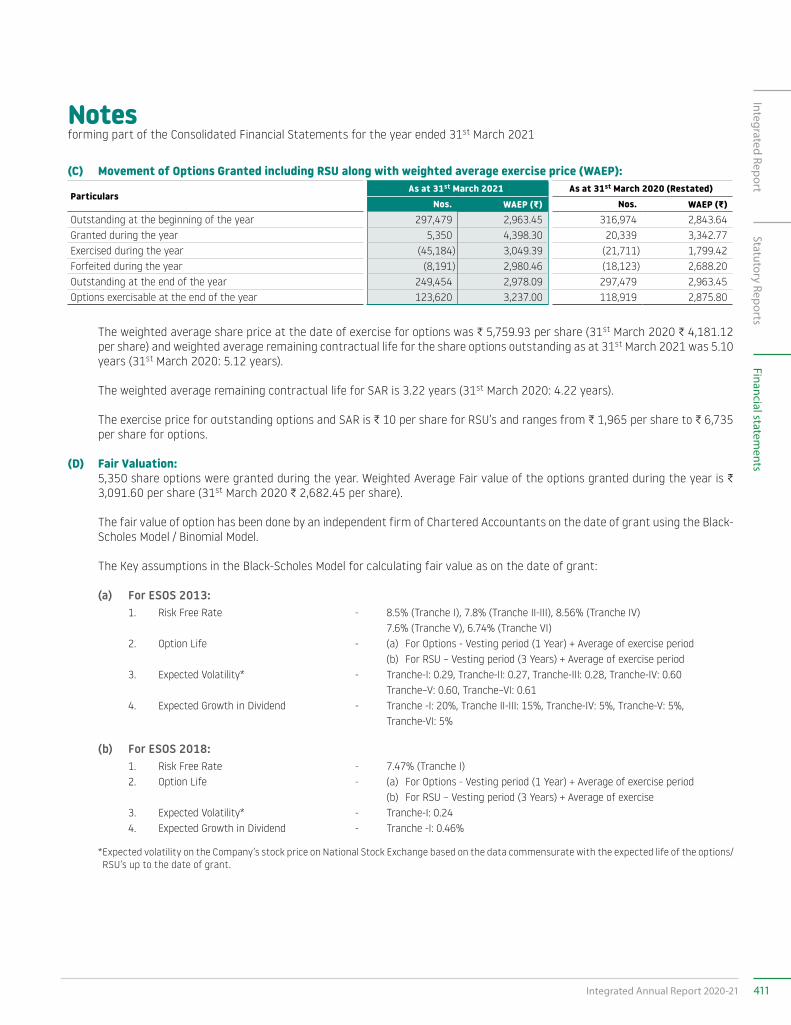
Notesforming part of the Consolidated Financial Statements for the year ended 31st March 2021
(C) Movement of Options Granted including RSU along with weighted average exercise price (WAEP):
ParticularsAs at 31st March 2021 As at 31st March 2020 (Restated)
Nos. WAEP (G) Nos. WAEP (G)Outstanding at the beginning of the year 297,479 2,963.45 316,974 2,843.64Granted during the year 5,350 4,398.30 20,339 3,342.77Exercised during the year (45,184) 3,049.39 (21,711) 1,799.42Forfeited during the year (8,191) 2,980.46 (18,123) 2,688.20Outstanding at the end of the year 249,454 2,978.09 297,479 2,963.45Options exercisable at the end of the year 123,620 3,237.00 118,919 2,875.80
The weighted average share price at the date of exercise for options was C 5,759.93 per share (31st March 2020 C 4,181.12 per share) and weighted average remaining contractual life for the share options outstanding as at 31st March 2021 was 5.10 years (31st March 2020: 5.12 years).
The weighted average remaining contractual life for SAR is 3.22 years (31st March 2020: 4.22 years).
The exercise price for outstanding options and SAR is C 10 per share for RSU’s and ranges from C 1,965 per share to C 6,735 per share for options.
(D) Fair Valuation: 5,350 share options were granted during the year. Weighted Average Fair value of the options granted during the year is C
3,091.60 per share (31st March 2020 C 2,682.45 per share).
The fair value of option has been done by an independent firm of Chartered Accountants on the date of grant using the Black-Scholes Model / Binomial Model.
The Key assumptions in the Black-Scholes Model for calculating fair value as on the date of grant:
(a) For ESOS 2013:1. Risk Free Rate - 8.5% (Tranche I), 7.8% (Tranche II-III), 8.56% (Tranche IV)
7.6% (Tranche V), 6.74% (Tranche VI)2. Option Life - (a) For Options - Vesting period (1 Year) + Average of exercise period
(b) For RSU – Vesting period (3 Years) + Average of exercise period3. Expected Volatility* - Tranche-I: 0.29, Tranche-II: 0.27, Tranche-III: 0.28, Tranche-IV: 0.60
Tranche–V: 0.60, Tranche–VI: 0.614. Expected Growth in Dividend - Tranche -I: 20%, Tranche II-III: 15%, Tranche-IV: 5%, Tranche-V: 5%,
Tranche-VI: 5%
(b) For ESOS 2018:1. Risk Free Rate - 7.47% (Tranche I)2. Option Life - (a) For Options - Vesting period (1 Year) + Average of exercise period
(b) For RSU – Vesting period (3 Years) + Average of exercise 3. Expected Volatility* - Tranche-I: 0.244. Expected Growth in Dividend - Tranche -I: 0.46%
* Expected volatility on the Company’s stock price on National Stock Exchange based on the data commensurate with the expected life of the options/RSU’s up to the date of grant.
411Integrated Annual Report 2020-21
Integrated ReportStatutory Reports
Financial statements
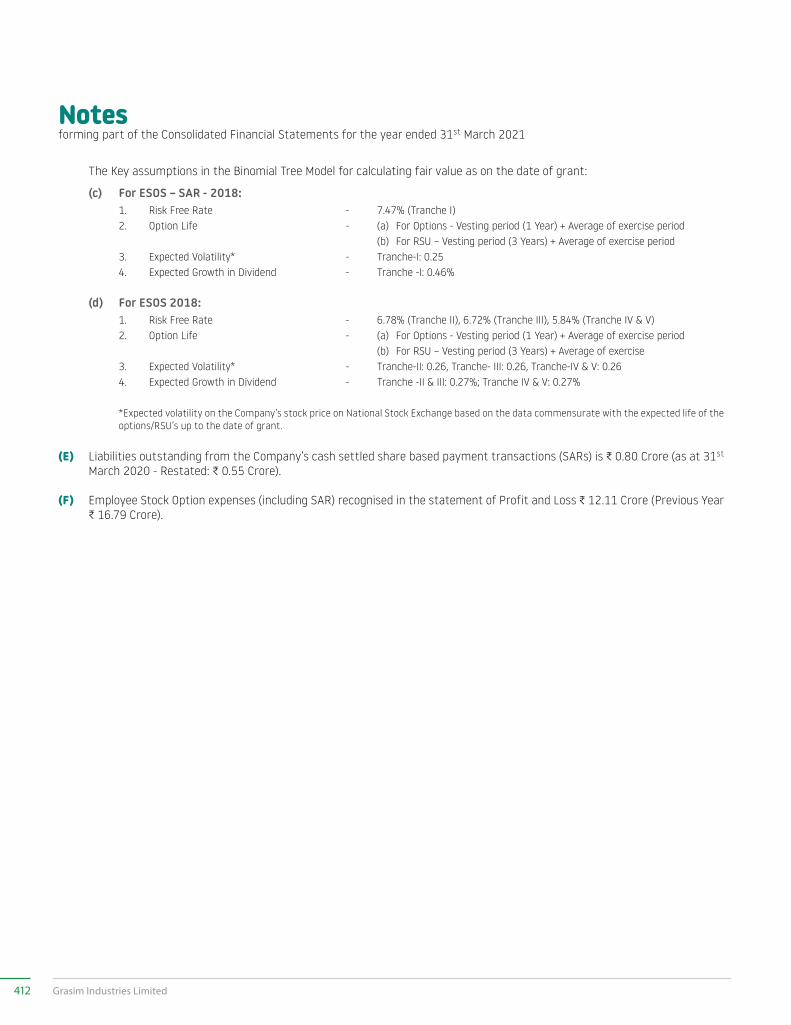
Notesforming part of the Consolidated Financial Statements for the year ended 31st March 2021
The Key assumptions in the Binomial Tree Model for calculating fair value as on the date of grant:
(c) For ESOS – SAR - 2018:1. Risk Free Rate - 7.47% (Tranche I)2. Option Life - (a) For Options - Vesting period (1 Year) + Average of exercise period
(b) For RSU – Vesting period (3 Years) + Average of exercise period3. Expected Volatility* - Tranche-I: 0.254. Expected Growth in Dividend - Tranche -I: 0.46%
(d) For ESOS 2018:1. Risk Free Rate - 6.78% (Tranche II), 6.72% (Tranche III), 5.84% (Tranche IV & V)2. Option Life - (a) For Options - Vesting period (1 Year) + Average of exercise period
(b) For RSU – Vesting period (3 Years) + Average of exercise 3. Expected Volatility* - Tranche-II: 0.26, Tranche- III: 0.26, Tranche-IV & V: 0.264. Expected Growth in Dividend - Tranche -II & III: 0.27%; Tranche IV & V: 0.27%
*Expected volatility on the Company’s stock price on National Stock Exchange based on the data commensurate with the expected life of the options/RSU’s up to the date of grant.
(E) Liabilities outstanding from the Company’s cash settled share based payment transactions (SARs) is C 0.80 Crore (as at 31st March 2020 - Restated: C 0.55 Crore).
(F) Employee Stock Option expenses (including SAR) recognised in the statement of Profit and Loss C 12.11 Crore (Previous Year C 16.79 Crore).
412 Grasim Industries Limited
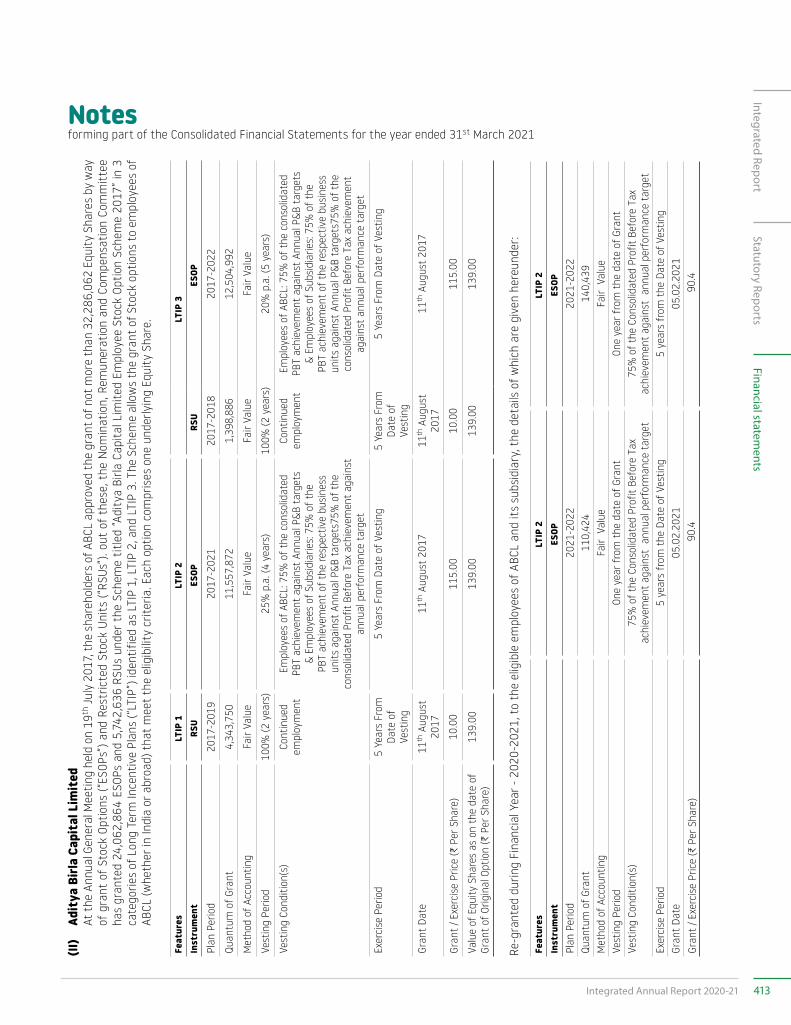
Notesforming part of the Consolidated Financial Statements for the year ended 31st March 2021
(II)
Adit
ya B
irla
Capi
tal L
imit
ed
At th
e An
nual
Gen
eral
Mee
ting
held
on
19th
July
201
7, th
e sh
areh
olde
rs o
f ABC
L ap
prov
ed th
e gr
ant o
f not
mor
e th
an 3
2,28
6,06
2 Eq
uity
Sha
res
by w
ay
of g
rant
of
Stoc
k Op
tions
(“ES
OPs”
) and
Res
tric
ted
Stoc
k Un
its
(“RS
Us”)
. out
of
thes
e, t
he N
omin
atio
n, R
emun
erat
ion
and
Com
pens
atio
n Co
mm
itte
e ha
s gr
ante
d 24
,062
,864
ESO
Ps a
nd 5
,742
,636
RSU
s un
der
the
Sche
me
title
d “A
dity
a Bi
rla C
apita
l Lim
ited
Empl
oyee
Sto
ck O
ptio
n Sc
hem
e 20
17” i
n 3
cate
gorie
s of
Lon
g Te
rm In
cent
ive
Plan
s (“
LTIP
”) id
entif
ied
as L
TIP
1, L
TIP
2, a
nd L
TIP
3. T
he S
chem
e al
low
s th
e gr
ant
of S
tock
opt
ions
to
empl
oyee
s of
AB
CL (w
heth
er in
Indi
a or
abr
oad)
tha
t m
eet
the
elig
ibili
ty c
riter
ia. E
ach
optio
n co
mpr
ises
one
und
erly
ing
Equi
ty S
hare
.
Feat
ures
LTIP
1LT
IP 2
LTIP
3In
stru
men
tRS
UES
OPRS
UES
OP
Plan
Per
iod
2017
-201
920
17-2
021
2017
-201
820
17-2
022
Quan
tum
of G
rant
4,34
3,75
011
,557
,872
1,39
8,88
612
,504
,992
Met
hod
of A
ccou
ntin
gFa
ir Va
lue
Fair
Valu
eFa
ir Va
lue
Fair
Valu
e
Vest
ing
Perio
d10
0% (2
yea
rs)
25%
p.a
. (4
year
s)10
0% (2
yea
rs)
20%
p.a
. (5
year
s)
Vest
ing
Cond
ition
(s)
Cont
inue
d em
ploy
men
tEm
ploy
ees
of A
BCL:
75%
of t
he c
onso
lidat
ed
PBT
achi
evem
ent
agai
nst
Annu
al P
&B t
arge
ts
& Em
ploy
ees
of S
ubsi
diar
ies:
75%
of t
he
PBT
achi
evem
ent
of th
e re
spec
tive
busi
ness
un
its a
gain
st A
nnua
l P&B
tar
gets
75%
of t
he
cons
olid
ated
Pro
fit B
efor
e Ta
x ac
hiev
emen
t ag
ains
t an
nual
per
form
ance
tar
get
Exer
cise
Per
iod
5 Ye
ars
From
Da
te o
f Ve
stin
g
5 Ye
ars
From
Dat
e of
Ves
ting
5 Ye
ars
From
Da
te o
f Ve
stin
g
5 Ye
ars
From
Dat
e of
Ves
ting
Gran
t Da
te11
th A
ugus
t 20
1711
th A
ugus
t 20
1711
th A
ugus
t 20
1711
th A
ugus
t 20
17
Gran
t / E
xerc
ise
Pric
e (C
Per
Sha
re)
10.0
011
5.00
10.0
011
5.00
Valu
e of
Equ
ity S
hare
s as
on
the
date
of
Gran
t of
Orig
inal
Opt
ion
(C P
er S
hare
)13
9.00
139.
0013
9.00
139.
00
Re-g
rant
ed d
urin
g Fi
nanc
ial Y
ear -
202
0-20
21, t
o th
e el
igib
le e
mpl
oyee
s of
ABC
L an
d it
s su
bsid
iary
, the
det
ails
of w
hich
are
giv
en h
ereu
nder
:
Feat
ures
LTIP
2LT
IP 2
Inst
rum
ent
ESOP
ESOP
Plan
Per
iod
2021
-202
220
21-2
022
Quan
tum
of G
rant
110,
424
140,
439
Met
hod
of A
ccou
ntin
gFa
ir V
alue
Fair
Val
ueVe
stin
g Pe
riod
One
year
from
the
date
of G
rant
One
year
from
the
date
of G
rant
Vest
ing
Cond
ition
(s)
75%
of t
he C
onso
lidat
ed P
rofit
Bef
ore
Tax
achi
evem
ent
agai
nst
ann
ual p
erfo
rman
ce t
arge
t75
% o
f the
Con
solid
ated
Pro
fit B
efor
e Ta
x ac
hiev
emen
t ag
ains
t a
nnua
l per
form
ance
tar
get
Exer
cise
Per
iod
5 ye
ars
from
the
Date
of V
estin
g5
year
s fr
om th
e Da
te o
f Ves
ting
Gran
t Da
te05
.02.
2021
05.0
2.20
21Gr
ant
/ Exe
rcis
e Pr
ice
(C P
er S
hare
)90
.490
.4
413Integrated Annual Report 2020-21
Integrated ReportStatutory Reports
Financial statements
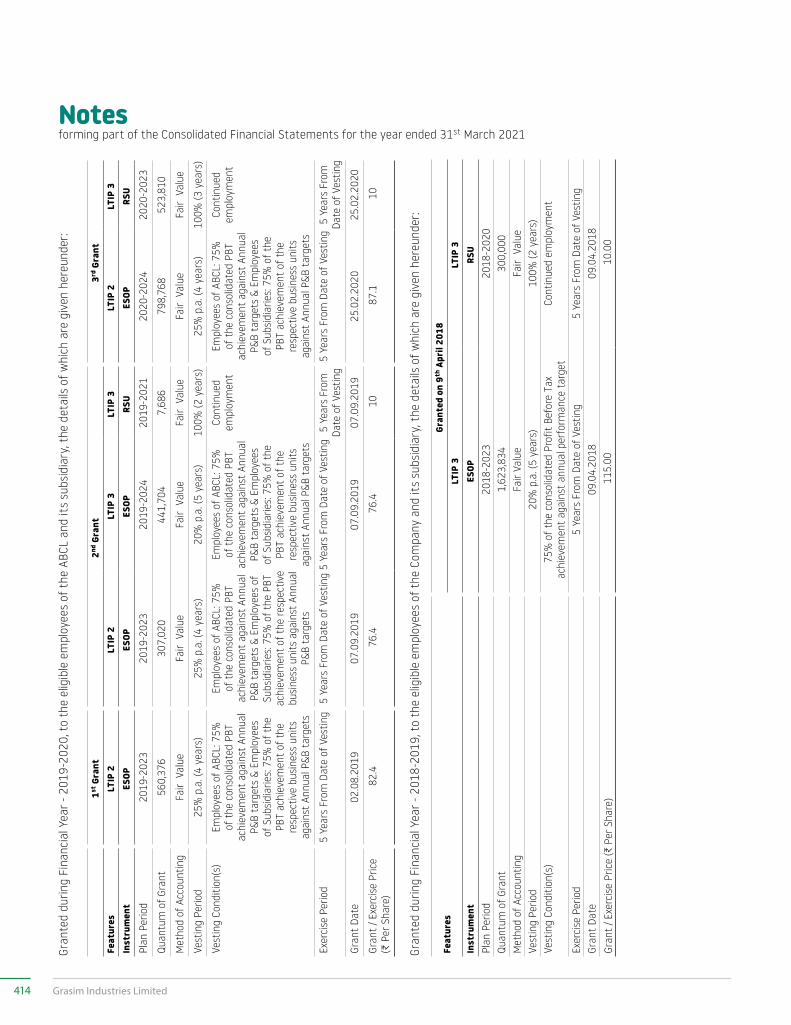
Notesforming part of the Consolidated Financial Statements for the year ended 31st March 2021
Gran
ted
durin
g Fi
nanc
ial Y
ear -
201
9-20
20, t
o th
e el
igib
le e
mpl
oyee
s of
the
ABC
L an
d it
s su
bsid
iary
, the
det
ails
of w
hich
are
giv
en h
ereu
nder
:
1st G
rant
2nd G
rant
3rd G
rant
Feat
ures
LTIP
2LT
IP 2
LTIP
3LT
IP 3
LTIP
2LT
IP 3
Inst
rum
ent
ESOP
ESOP
ESOP
RSU
ESOP
RSU
Plan
Per
iod
2019
-202
320
19-2
023
2019
-202
420
19-2
021
2020
-202
420
20-2
023
Quan
tum
of G
rant
560,
376
307,
020
441,
704
7,68
679
8,76
852
3,81
0
Met
hod
of A
ccou
ntin
gFa
ir V
alue
Fair
Val
ueFa
ir V
alue
Fair
Val
ueFa
ir V
alue
Fair
Val
ue
Vest
ing
Perio
d25
% p
.a. (
4 ye
ars)
25%
p.a
. (4
year
s)20
% p
.a. (
5 ye
ars)
100%
(2 y
ears
)25
% p
.a. (
4 ye
ars)
100%
(3 y
ears
)
Vest
ing
Cond
ition
(s)
Empl
oyee
s of
ABC
L: 7
5%
of th
e co
nsol
idat
ed P
BT
achi
evem
ent
agai
nst
Annu
al
P&B
targ
ets
& Em
ploy
ees
of S
ubsi
diar
ies:
75%
of t
he
PBT
achi
evem
ent
of th
e re
spec
tive
busi
ness
uni
ts
agai
nst
Annu
al P
&B t
arge
ts
Empl
oyee
s of
ABC
L: 7
5%
of th
e co
nsol
idat
ed P
BT
achi
evem
ent
agai
nst
Annu
al
P&B
targ
ets
& Em
ploy
ees
of
Subs
idia
ries:
75%
of t
he P
BT
achi
evem
ent o
f the
resp
ectiv
e bu
sine
ss u
nits
aga
inst
Ann
ual
P&B
targ
ets
Empl
oyee
s of
ABC
L: 7
5%
of th
e co
nsol
idat
ed P
BT
achi
evem
ent
agai
nst
Annu
al
P&B
targ
ets
& Em
ploy
ees
of S
ubsi
diar
ies:
75%
of t
he
PBT
achi
evem
ent
of th
e re
spec
tive
busi
ness
uni
ts
agai
nst
Annu
al P
&B t
arge
ts
Cont
inue
d em
ploy
men
tEm
ploy
ees
of A
BCL:
75%
of
the
cons
olid
ated
PBT
ac
hiev
emen
t ag
ains
t An
nual
P&
B ta
rget
s &
Empl
oyee
s of
Sub
sidi
arie
s: 75
% o
f the
PB
T ac
hiev
emen
t of
the
resp
ectiv
e bu
sine
ss u
nits
ag
ains
t An
nual
P&B
tar
gets
Cont
inue
d em
ploy
men
t
Exer
cise
Per
iod
5 Ye
ars
From
Dat
e of
Ves
ting
5 Ye
ars
From
Dat
e of
Ves
ting
5 Ye
ars
From
Dat
e of
Ves
ting
5 Ye
ars
From
Da
te o
f Ves
ting
5 Ye
ars
From
Dat
e of
Ves
ting
5 Ye
ars
From
Da
te o
f Ves
ting
Gran
t Da
te02
.08.
2019
07.0
9.20
1907
.09.
2019
07.0
9.20
1925
.02.
2020
25.0
2.20
20
Gran
t / E
xerc
ise
Pric
e (C
Per
Sha
re)
82.4
76.4
76.4
1087
.110
Gran
ted
durin
g Fi
nanc
ial Y
ear -
201
8-20
19, t
o th
e el
igib
le e
mpl
oyee
s of
the
Com
pany
and
its
subs
idia
ry, t
he d
etai
ls o
f whi
ch a
re g
iven
her
eund
er:
Feat
ures
Gran
ted
on 9
th A
pril
2018
LTIP
3LT
IP 3
Inst
rum
ent
ESOP
RSU
Plan
Per
iod
2018
-202
320
18-2
020
Quan
tum
of G
rant
1,62
3,83
430
0,00
0M
etho
d of
Acc
ount
ing
Fair
Valu
eFa
ir V
alue
Vest
ing
Perio
d20
% p
.a. (
5 ye
ars)
100%
(2 y
ears
)Ve
stin
g Co
nditi
on(s
) 75
% o
f the
con
solid
ated
Pro
fit B
efor
e Ta
x ac
hiev
emen
t ag
ains
t an
nual
per
form
ance
tar
get
Cont
inue
d em
ploy
men
t
Exer
cise
Per
iod
5 Ye
ars
From
Dat
e of
Ves
ting
5 Ye
ars
From
Dat
e of
Ves
ting
Gran
t Da
te09
.04.
2018
09.0
4.20
18Gr
ant
/ Exe
rcis
e Pr
ice
(C P
er S
hare
)11
5.00
10.0
0
414 Grasim Industries Limited
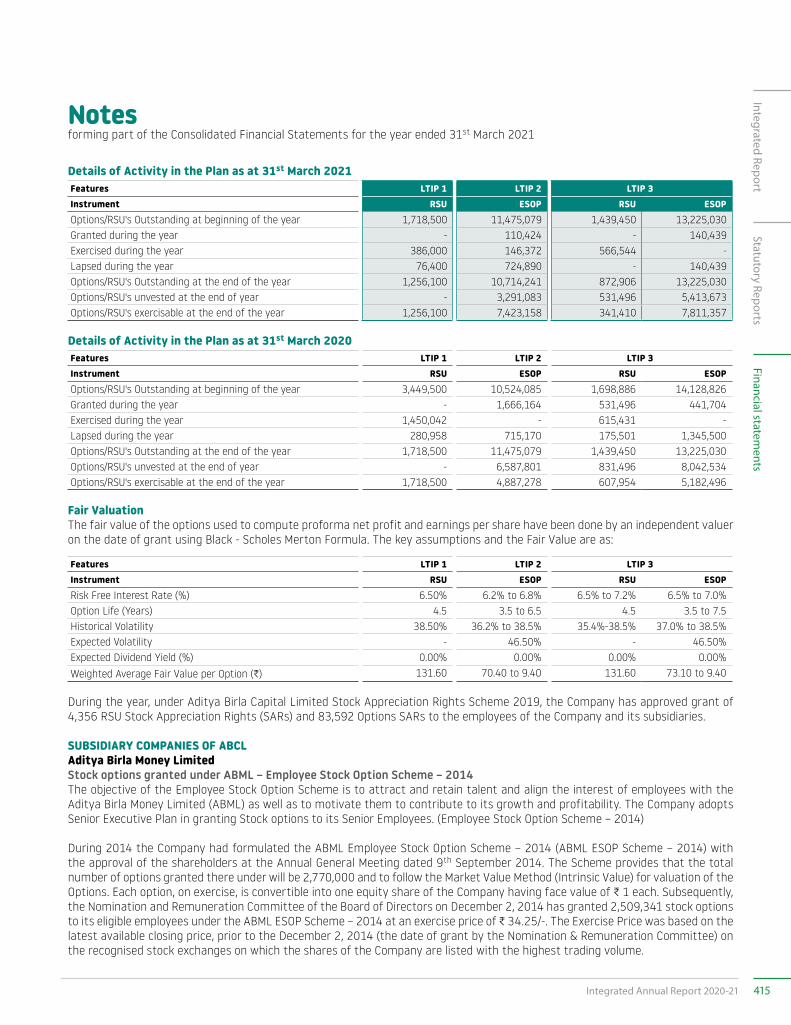
Notesforming part of the Consolidated Financial Statements for the year ended 31st March 2021
Details of Activity in the Plan as at 31st March 2021Features LTIP 1 LTIP 2 LTIP 3Instrument RSU ESOP RSU ESOPOptions/RSU's Outstanding at beginning of the year 1,718,500 11,475,079 1,439,450 13,225,030 Granted during the year - 110,424 - 140,439 Exercised during the year 386,000 146,372 566,544 - Lapsed during the year 76,400 724,890 - 140,439 Options/RSU's Outstanding at the end of the year 1,256,100 10,714,241 872,906 13,225,030 Options/RSU's unvested at the end of year - 3,291,083 531,496 5,413,673 Options/RSU's exercisable at the end of the year 1,256,100 7,423,158 341,410 7,811,357
Details of Activity in the Plan as at 31st March 2020Features LTIP 1 LTIP 2 LTIP 3Instrument RSU ESOP RSU ESOPOptions/RSU's Outstanding at beginning of the year 3,449,500 10,524,085 1,698,886 14,128,826 Granted during the year - 1,666,164 531,496 441,704 Exercised during the year 1,450,042 - 615,431 - Lapsed during the year 280,958 715,170 175,501 1,345,500 Options/RSU's Outstanding at the end of the year 1,718,500 11,475,079 1,439,450 13,225,030 Options/RSU's unvested at the end of year - 6,587,801 831,496 8,042,534 Options/RSU's exercisable at the end of the year 1,718,500 4,887,278 607,954 5,182,496
Fair ValuationThe fair value of the options used to compute proforma net profit and earnings per share have been done by an independent valuer on the date of grant using Black - Scholes Merton Formula. The key assumptions and the Fair Value are as:
Features LTIP 1 LTIP 2 LTIP 3Instrument RSU ESOP RSU ESOPRisk Free Interest Rate (%) 6.50% 6.2% to 6.8% 6.5% to 7.2% 6.5% to 7.0% Option Life (Years) 4.5 3.5 to 6.5 4.5 3.5 to 7.5 Historical Volatility 38.50% 36.2% to 38.5% 35.4%-38.5% 37.0% to 38.5% Expected Volatility - 46.50% - 46.50%Expected Dividend Yield (%) 0.00% 0.00% 0.00% 0.00%Weighted Average Fair Value per Option (C) 131.60 70.40 to 9.40 131.60 73.10 to 9.40
During the year, under Aditya Birla Capital Limited Stock Appreciation Rights Scheme 2019, the Company has approved grant of 4,356 RSU Stock Appreciation Rights (SARs) and 83,592 Options SARs to the employees of the Company and its subsidiaries.
SUBSIDIARY COMPANIES OF ABCLAditya Birla Money LimitedStock options granted under ABML – Employee Stock Option Scheme – 2014The objective of the Employee Stock Option Scheme is to attract and retain talent and align the interest of employees with the Aditya Birla Money Limited (ABML) as well as to motivate them to contribute to its growth and profitability. The Company adopts Senior Executive Plan in granting Stock options to its Senior Employees. (Employee Stock Option Scheme – 2014)
During 2014 the Company had formulated the ABML Employee Stock Option Scheme – 2014 (ABML ESOP Scheme – 2014) with the approval of the shareholders at the Annual General Meeting dated 9th September 2014. The Scheme provides that the total number of options granted there under will be 2,770,000 and to follow the Market Value Method (Intrinsic Value) for valuation of the Options. Each option, on exercise, is convertible into one equity share of the Company having face value of C 1 each. Subsequently, the Nomination and Remuneration Committee of the Board of Directors on December 2, 2014 has granted 2,509,341 stock options to its eligible employees under the ABML ESOP Scheme – 2014 at an exercise price of C 34.25/-. The Exercise Price was based on the latest available closing price, prior to the December 2, 2014 (the date of grant by the Nomination & Remuneration Committee) on the recognised stock exchanges on which the shares of the Company are listed with the highest trading volume.
415Integrated Annual Report 2020-21
Integrated ReportStatutory Reports
Financial statements
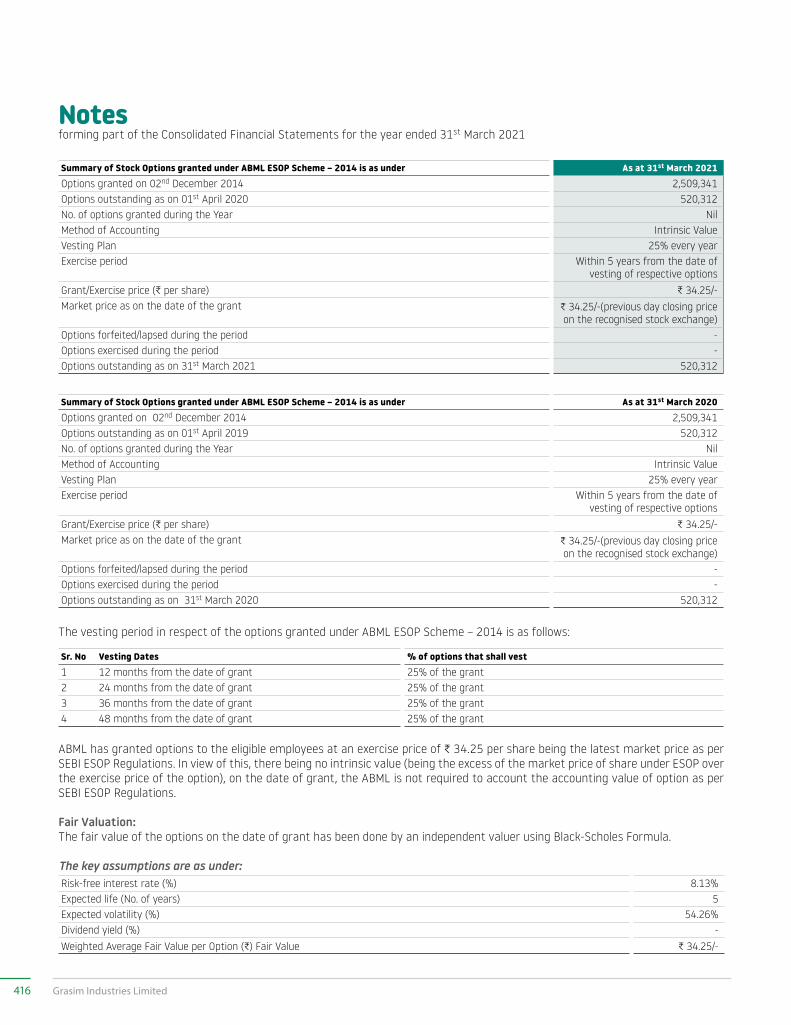
Notesforming part of the Consolidated Financial Statements for the year ended 31st March 2021
Summary of Stock Options granted under ABML ESOP Scheme – 2014 is as under As at 31st March 2021Options granted on 02nd December 2014 2,509,341Options outstanding as on 01st April 2020 520,312No. of options granted during the Year NilMethod of Accounting Intrinsic ValueVesting Plan 25% every yearExercise period Within 5 years from the date of
vesting of respective optionsGrant/Exercise price (C per share) C 34.25/-Market price as on the date of the grant C 34.25/-(previous day closing price
on the recognised stock exchange)Options forfeited/lapsed during the period -Options exercised during the period -Options outstanding as on 31st March 2021 520,312
Summary of Stock Options granted under ABML ESOP Scheme – 2014 is as under As at 31st March 2020Options granted on 02nd December 2014 2,509,341Options outstanding as on 01st April 2019 520,312No. of options granted during the Year NilMethod of Accounting Intrinsic ValueVesting Plan 25% every yearExercise period Within 5 years from the date of
vesting of respective optionsGrant/Exercise price (C per share) C 34.25/-Market price as on the date of the grant C 34.25/-(previous day closing price
on the recognised stock exchange)Options forfeited/lapsed during the period -Options exercised during the period -Options outstanding as on 31st March 2020 520,312
The vesting period in respect of the options granted under ABML ESOP Scheme – 2014 is as follows:
Sr. No Vesting Dates % of options that shall vest1 12 months from the date of grant 25% of the grant2 24 months from the date of grant 25% of the grant3 36 months from the date of grant 25% of the grant4 48 months from the date of grant 25% of the grant
ABML has granted options to the eligible employees at an exercise price of C 34.25 per share being the latest market price as per SEBI ESOP Regulations. In view of this, there being no intrinsic value (being the excess of the market price of share under ESOP over the exercise price of the option), on the date of grant, the ABML is not required to account the accounting value of option as per SEBI ESOP Regulations.
Fair Valuation:The fair value of the options on the date of grant has been done by an independent valuer using Black-Scholes Formula.
The key assumptions are as under:Risk-free interest rate (%) 8.13%Expected life (No. of years) 5Expected volatility (%) 54.26%Dividend yield (%) -Weighted Average Fair Value per Option (C) Fair Value C 34.25/-
416 Grasim Industries Limited
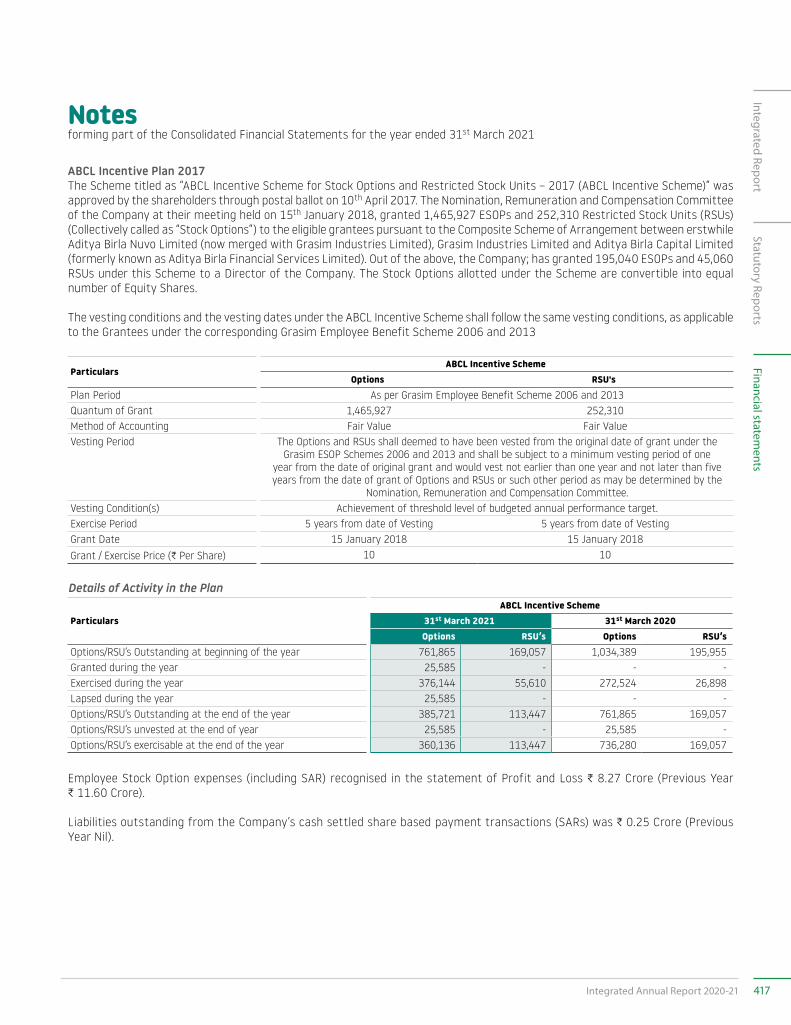
Notesforming part of the Consolidated Financial Statements for the year ended 31st March 2021
ABCL Incentive Plan 2017The Scheme titled as “ABCL Incentive Scheme for Stock Options and Restricted Stock Units – 2017 (ABCL Incentive Scheme)” was approved by the shareholders through postal ballot on 10th April 2017. The Nomination, Remuneration and Compensation Committee of the Company at their meeting held on 15th January 2018, granted 1,465,927 ESOPs and 252,310 Restricted Stock Units (RSUs) (Collectively called as “Stock Options”) to the eligible grantees pursuant to the Composite Scheme of Arrangement between erstwhile Aditya Birla Nuvo Limited (now merged with Grasim Industries Limited), Grasim Industries Limited and Aditya Birla Capital Limited (formerly known as Aditya Birla Financial Services Limited). Out of the above, the Company; has granted 195,040 ESOPs and 45,060 RSUs under this Scheme to a Director of the Company. The Stock Options allotted under the Scheme are convertible into equal number of Equity Shares.
The vesting conditions and the vesting dates under the ABCL Incentive Scheme shall follow the same vesting conditions, as applicable to the Grantees under the corresponding Grasim Employee Benefit Scheme 2006 and 2013
ParticularsABCL Incentive Scheme
Options RSU'sPlan Period As per Grasim Employee Benefit Scheme 2006 and 2013Quantum of Grant 1,465,927 252,310 Method of Accounting Fair Value Fair ValueVesting Period The Options and RSUs shall deemed to have been vested from the original date of grant under the
Grasim ESOP Schemes 2006 and 2013 and shall be subject to a minimum vesting period of one year from the date of original grant and would vest not earlier than one year and not later than five years from the date of grant of Options and RSUs or such other period as may be determined by the
Nomination, Remuneration and Compensation Committee.Vesting Condition(s) Achievement of threshold level of budgeted annual performance target.Exercise Period 5 years from date of Vesting 5 years from date of Vesting Grant Date 15 January 2018 15 January 2018Grant / Exercise Price (C Per Share) 10 10
Details of Activity in the Plan
ParticularsABCL Incentive Scheme
31st March 2021 31st March 2020Options RSU’s Options RSU’s
Options/RSU’s Outstanding at beginning of the year 761,865 169,057 1,034,389 195,955Granted during the year 25,585 - - -Exercised during the year 376,144 55,610 272,524 26,898Lapsed during the year 25,585 - - -Options/RSU’s Outstanding at the end of the year 385,721 113,447 761,865 169,057Options/RSU’s unvested at the end of year 25,585 - 25,585 -Options/RSU’s exercisable at the end of the year 360,136 113,447 736,280 169,057
Employee Stock Option expenses (including SAR) recognised in the statement of Profit and Loss C 8.27 Crore (Previous Year C 11.60 Crore).
Liabilities outstanding from the Company’s cash settled share based payment transactions (SARs) was C 0.25 Crore (Previous Year Nil).
417Integrated Annual Report 2020-21
Integrated ReportStatutory Reports
Financial statements
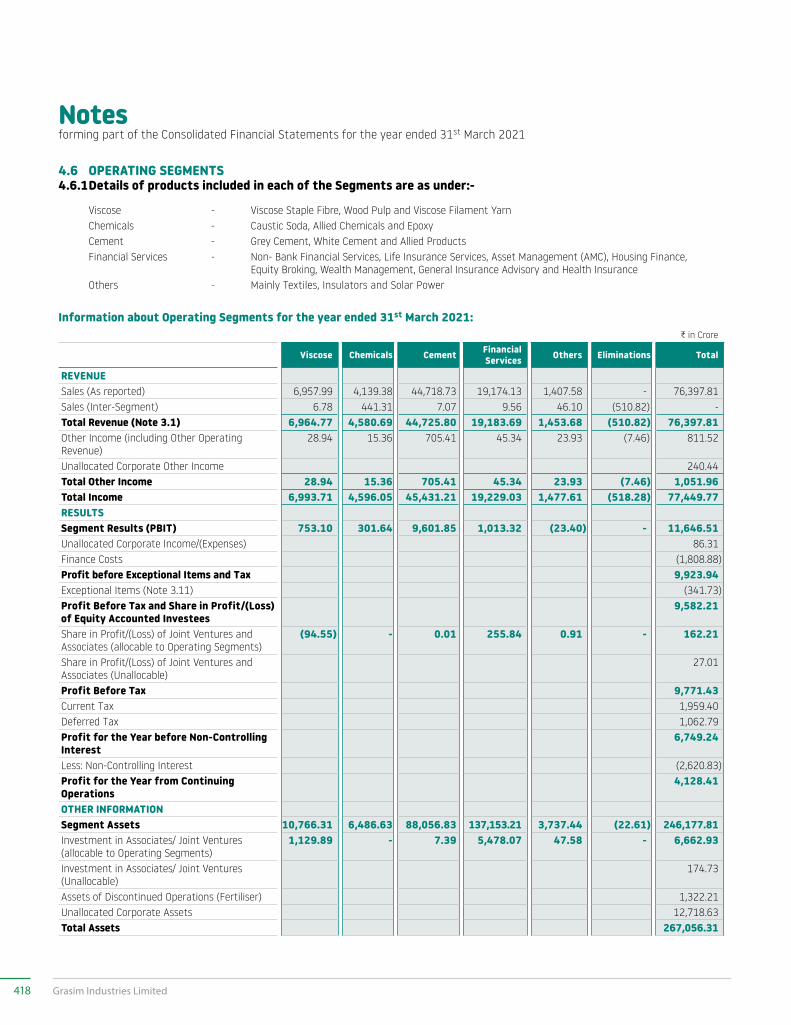
Notesforming part of the Consolidated Financial Statements for the year ended 31st March 2021
4.6 OPERATING SEGMENTS4.6.1 Details of products included in each of the Segments are as under:-
Viscose - Viscose Staple Fibre, Wood Pulp and Viscose Filament YarnChemicals - Caustic Soda, Allied Chemicals and EpoxyCement - Grey Cement, White Cement and Allied ProductsFinancial Services - Non- Bank Financial Services, Life Insurance Services, Asset Management (AMC), Housing Finance,
Equity Broking, Wealth Management, General Insurance Advisory and Health InsuranceOthers - Mainly Textiles, Insulators and Solar Power
Information about Operating Segments for the year ended 31st March 2021:C in Crore
Viscose Chemicals Cement Financial Services Others Eliminations Total
REVENUESales (As reported) 6,957.99 4,139.38 44,718.73 19,174.13 1,407.58 - 76,397.81Sales (Inter-Segment) 6.78 441.31 7.07 9.56 46.10 (510.82) -Total Revenue (Note 3.1) 6,964.77 4,580.69 44,725.80 19,183.69 1,453.68 (510.82) 76,397.81Other Income (including Other Operating Revenue)
28.94 15.36 705.41 45.34 23.93 (7.46) 811.52
Unallocated Corporate Other Income 240.44Total Other Income 28.94 15.36 705.41 45.34 23.93 (7.46) 1,051.96Total Income 6,993.71 4,596.05 45,431.21 19,229.03 1,477.61 (518.28) 77,449.77RESULTSSegment Results (PBIT) 753.10 301.64 9,601.85 1,013.32 (23.40) - 11,646.51Unallocated Corporate Income/(Expenses) 86.31Finance Costs (1,808.88)Profit before Exceptional Items and Tax 9,923.94Exceptional Items (Note 3.11) (341.73)Profit Before Tax and Share in Profit/(Loss) of Equity Accounted Investees
9,582.21
Share in Profit/(Loss) of Joint Ventures and Associates (allocable to Operating Segments)
(94.55) - 0.01 255.84 0.91 - 162.21
Share in Profit/(Loss) of Joint Ventures and Associates (Unallocable)
27.01
Profit Before Tax 9,771.43Current Tax 1,959.40Deferred Tax 1,062.79Profit for the Year before Non-Controlling Interest
6,749.24
Less: Non-Controlling Interest (2,620.83)Profit for the Year from Continuing Operations
4,128.41
OTHER INFORMATIONSegment Assets 10,766.31 6,486.63 88,056.83 137,153.21 3,737.44 (22.61) 246,177.81Investment in Associates/ Joint Ventures (allocable to Operating Segments)
1,129.89 - 7.39 5,478.07 47.58 - 6,662.93
Investment in Associates/ Joint Ventures (Unallocable)
174.73
Assets of Discontinued Operations (Fertiliser) 1,322.21Unallocated Corporate Assets 12,718.63Total Assets 267,056.31
418 Grasim Industries Limited
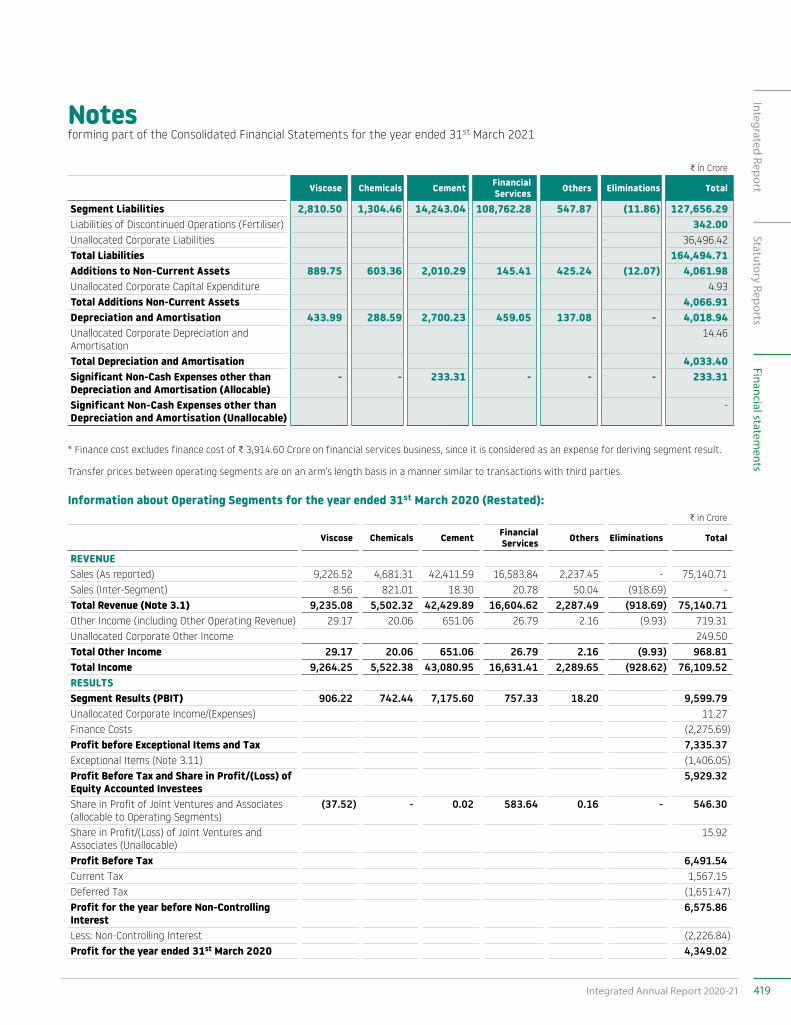
Notesforming part of the Consolidated Financial Statements for the year ended 31st March 2021
C in Crore
Viscose Chemicals Cement Financial Services Others Eliminations Total
Segment Liabilities 2,810.50 1,304.46 14,243.04 108,762.28 547.87 (11.86) 127,656.29Liabilities of Discontinued Operations (Fertiliser) 342.00Unallocated Corporate Liabilities 36,496.42Total Liabilities 164,494.71Additions to Non-Current Assets 889.75 603.36 2,010.29 145.41 425.24 (12.07) 4,061.98Unallocated Corporate Capital Expenditure 4.93Total Additions Non-Current Assets 4,066.91Depreciation and Amortisation 433.99 288.59 2,700.23 459.05 137.08 - 4,018.94Unallocated Corporate Depreciation and Amortisation
14.46
Total Depreciation and Amortisation 4,033.40Significant Non-Cash Expenses other than Depreciation and Amortisation (Allocable)
- - 233.31 - - - 233.31
Significant Non-Cash Expenses other than Depreciation and Amortisation (Unallocable)
-
* Finance cost excludes finance cost of C 3,914.60 Crore on financial services business, since it is considered as an expense for deriving segment result.
Transfer prices between operating segments are on an arm’s length basis in a manner similar to transactions with third parties.
Information about Operating Segments for the year ended 31st March 2020 (Restated): C in Crore
Viscose Chemicals Cement Financial Services Others Eliminations Total
REVENUESales (As reported) 9,226.52 4,681.31 42,411.59 16,583.84 2,237.45 - 75,140.71Sales (Inter-Segment) 8.56 821.01 18.30 20.78 50.04 (918.69) -Total Revenue (Note 3.1) 9,235.08 5,502.32 42,429.89 16,604.62 2,287.49 (918.69) 75,140.71Other Income (including Other Operating Revenue) 29.17 20.06 651.06 26.79 2.16 (9.93) 719.31Unallocated Corporate Other Income 249.50Total Other Income 29.17 20.06 651.06 26.79 2.16 (9.93) 968.81Total Income 9,264.25 5,522.38 43,080.95 16,631.41 2,289.65 (928.62) 76,109.52RESULTSSegment Results (PBIT) 906.22 742.44 7,175.60 757.33 18.20 9,599.79Unallocated Corporate Income/(Expenses) 11.27Finance Costs (2,275.69)Profit before Exceptional Items and Tax 7,335.37Exceptional Items (Note 3.11) (1,406.05)Profit Before Tax and Share in Profit/(Loss) of Equity Accounted Investees
5,929.32
Share in Profit of Joint Ventures and Associates (allocable to Operating Segments)
(37.52) - 0.02 583.64 0.16 - 546.30
Share in Profit/(Loss) of Joint Ventures and Associates (Unallocable)
15.92
Profit Before Tax 6,491.54Current Tax 1,567.15Deferred Tax (1,651.47)Profit for the year before Non-Controlling Interest
6,575.86
Less: Non-Controlling Interest (2,226.84)Profit for the year ended 31st March 2020 4,349.02
419Integrated Annual Report 2020-21
Integrated ReportStatutory Reports
Financial statements
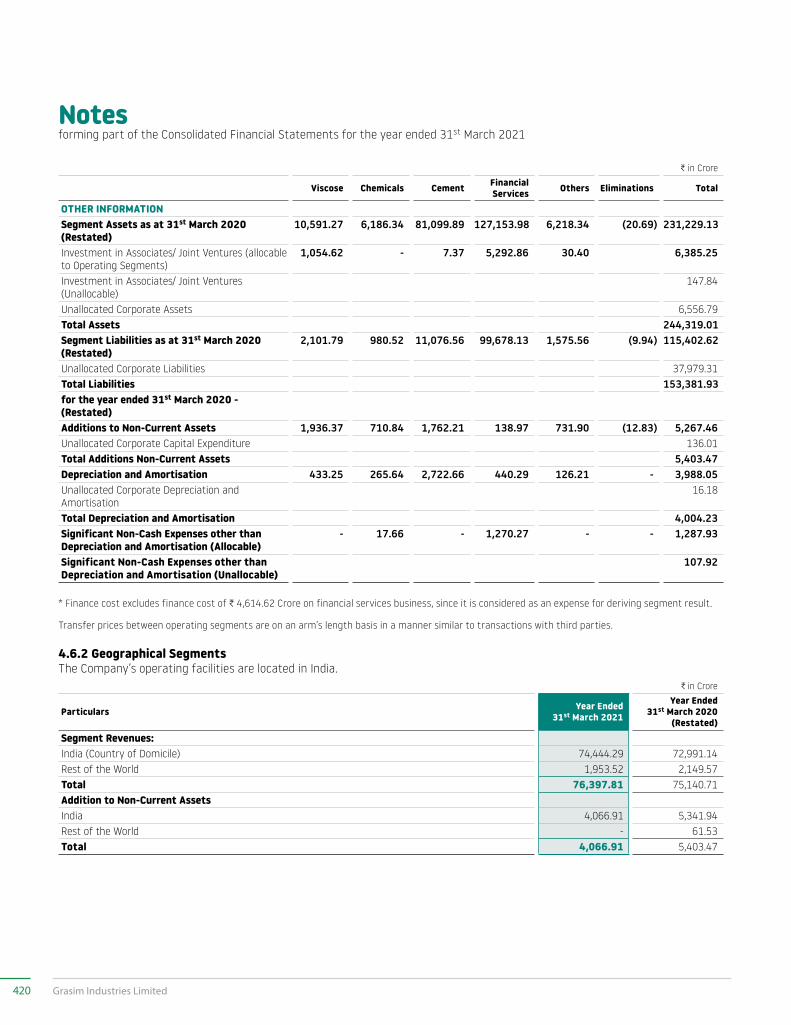
Notesforming part of the Consolidated Financial Statements for the year ended 31st March 2021
C in Crore
Viscose Chemicals Cement Financial Services Others Eliminations Total
OTHER INFORMATIONSegment Assets as at 31st March 2020 (Restated)
10,591.27 6,186.34 81,099.89 127,153.98 6,218.34 (20.69) 231,229.13
Investment in Associates/ Joint Ventures (allocable to Operating Segments)
1,054.62 - 7.37 5,292.86 30.40 6,385.25
Investment in Associates/ Joint Ventures (Unallocable)
147.84
Unallocated Corporate Assets 6,556.79Total Assets 244,319.01Segment Liabilities as at 31st March 2020 (Restated)
2,101.79 980.52 11,076.56 99,678.13 1,575.56 (9.94) 115,402.62
Unallocated Corporate Liabilities 37,979.31Total Liabilities 153,381.93for the year ended 31st March 2020 - (Restated)Additions to Non-Current Assets 1,936.37 710.84 1,762.21 138.97 731.90 (12.83) 5,267.46Unallocated Corporate Capital Expenditure 136.01Total Additions Non-Current Assets 5,403.47Depreciation and Amortisation 433.25 265.64 2,722.66 440.29 126.21 - 3,988.05Unallocated Corporate Depreciation and Amortisation
16.18
Total Depreciation and Amortisation 4,004.23Significant Non-Cash Expenses other than Depreciation and Amortisation (Allocable)
- 17.66 - 1,270.27 - - 1,287.93
Significant Non-Cash Expenses other than Depreciation and Amortisation (Unallocable)
107.92
* Finance cost excludes finance cost of C 4,614.62 Crore on financial services business, since it is considered as an expense for deriving segment result.
Transfer prices between operating segments are on an arm’s length basis in a manner similar to transactions with third parties.
4.6.2 Geographical SegmentsThe Company’s operating facilities are located in India.
C in Crore
Particulars Year Ended 31st March 2021
Year Ended 31st March 2020
(Restated)Segment Revenues:India (Country of Domicile) 74,444.29 72,991.14Rest of the World 1,953.52 2,149.57Total 76,397.81 75,140.71Addition to Non-Current AssetsIndia 4,066.91 5,341.94Rest of the World - 61.53 Total 4,066.91 5,403.47
420 Grasim Industries Limited
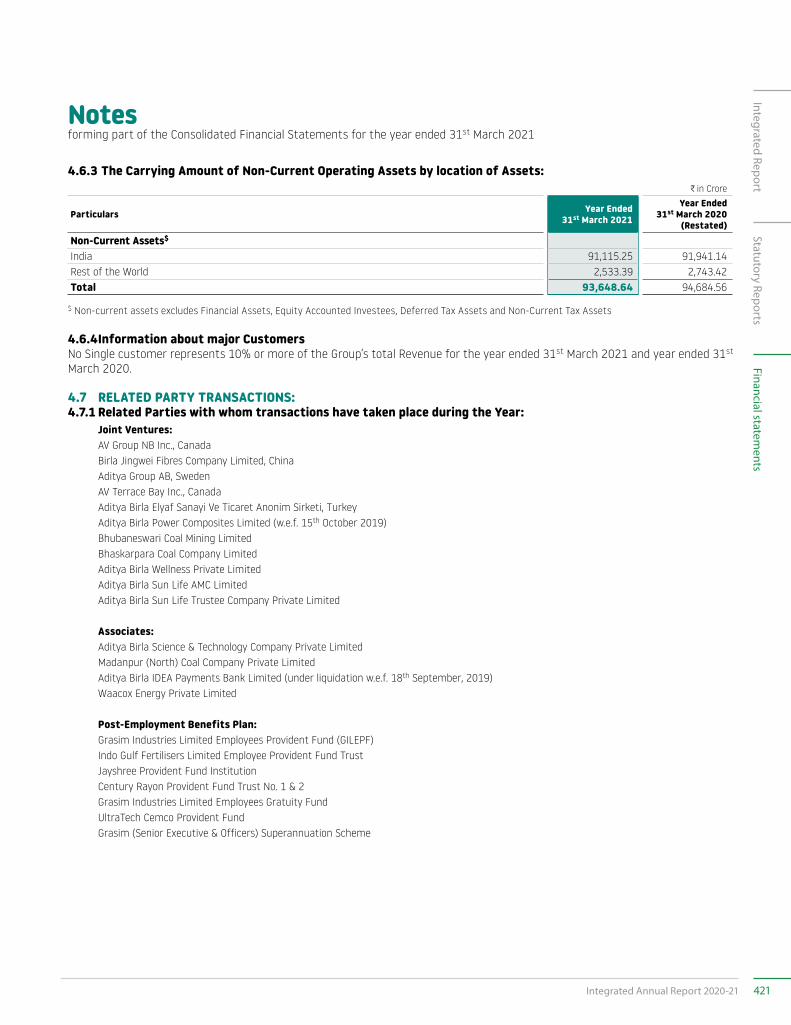
Notesforming part of the Consolidated Financial Statements for the year ended 31st March 2021
4.6.3 The Carrying Amount of Non-Current Operating Assets by location of Assets:C in Crore
Particulars Year Ended 31st March 2021
Year Ended 31st March 2020
(Restated)Non-Current Assets$
India 91,115.25 91,941.14 Rest of the World 2,533.39 2,743.42 Total 93,648.64 94,684.56
$ Non-current assets excludes Financial Assets, Equity Accounted Investees, Deferred Tax Assets and Non-Current Tax Assets
4.6.4 Information about major CustomersNo Single customer represents 10% or more of the Group’s total Revenue for the year ended 31st March 2021 and year ended 31st March 2020.
4.7 RELATED PARTY TRANSACTIONS:4.7.1 Related Parties with whom transactions have taken place during the Year:
Joint Ventures:AV Group NB Inc., CanadaBirla Jingwei Fibres Company Limited, ChinaAditya Group AB, SwedenAV Terrace Bay Inc., CanadaAditya Birla Elyaf Sanayi Ve Ticaret Anonim Sirketi, TurkeyAditya Birla Power Composites Limited (w.e.f. 15th October 2019)Bhubaneswari Coal Mining LimitedBhaskarpara Coal Company LimitedAditya Birla Wellness Private LimitedAditya Birla Sun Life AMC LimitedAditya Birla Sun Life Trustee Company Private Limited
Associates:Aditya Birla Science & Technology Company Private LimitedMadanpur (North) Coal Company Private LimitedAditya Birla IDEA Payments Bank Limited (under liquidation w.e.f. 18th September, 2019)Waacox Energy Private Limited
Post-Employment Benefits Plan:Grasim Industries Limited Employees Provident Fund (GILEPF)Indo Gulf Fertilisers Limited Employee Provident Fund TrustJayshree Provident Fund InstitutionCentury Rayon Provident Fund Trust No. 1 & 2Grasim Industries Limited Employees Gratuity FundUltraTech Cemco Provident FundGrasim (Senior Executive & Officers) Superannuation Scheme
421Integrated Annual Report 2020-21
Integrated ReportStatutory Reports
Financial statements
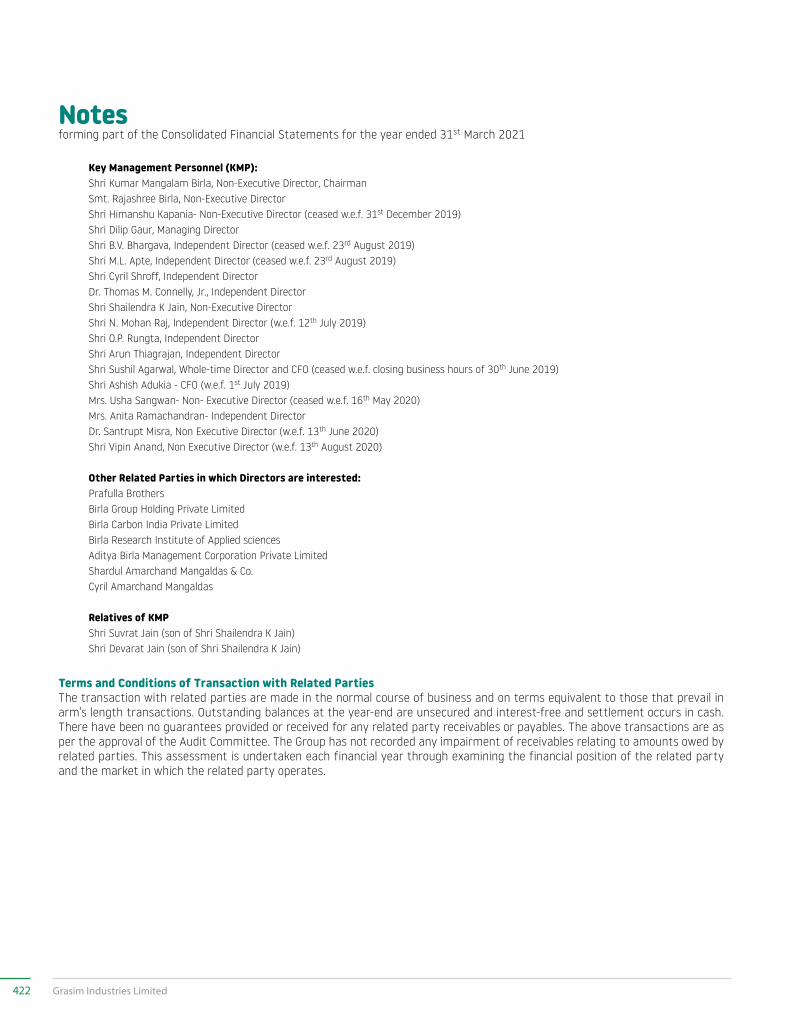
Notesforming part of the Consolidated Financial Statements for the year ended 31st March 2021
Key Management Personnel (KMP):Shri Kumar Mangalam Birla, Non-Executive Director, ChairmanSmt. Rajashree Birla, Non-Executive DirectorShri Himanshu Kapania- Non-Executive Director (ceased w.e.f. 31st December 2019)Shri Dilip Gaur, Managing DirectorShri B.V. Bhargava, Independent Director (ceased w.e.f. 23rd August 2019)Shri M.L. Apte, Independent Director (ceased w.e.f. 23rd August 2019)Shri Cyril Shroff, Independent DirectorDr. Thomas M. Connelly, Jr., Independent DirectorShri Shailendra K Jain, Non-Executive DirectorShri N. Mohan Raj, Independent Director (w.e.f. 12th July 2019)Shri O.P. Rungta, Independent DirectorShri Arun Thiagrajan, Independent DirectorShri Sushil Agarwal, Whole-time Director and CFO (ceased w.e.f. closing business hours of 30th June 2019)Shri Ashish Adukia - CFO (w.e.f. 1st July 2019)Mrs. Usha Sangwan- Non- Executive Director (ceased w.e.f. 16th May 2020)Mrs. Anita Ramachandran- Independent DirectorDr. Santrupt Misra, Non Executive Director (w.e.f. 13th June 2020)Shri Vipin Anand, Non Executive Director (w.e.f. 13th August 2020)
Other Related Parties in which Directors are interested:Prafulla BrothersBirla Group Holding Private LimitedBirla Carbon India Private LimitedBirla Research Institute of Applied sciencesAditya Birla Management Corporation Private LimitedShardul Amarchand Mangaldas & Co.Cyril Amarchand Mangaldas
Relatives of KMPShri Suvrat Jain (son of Shri Shailendra K Jain)Shri Devarat Jain (son of Shri Shailendra K Jain)
Terms and Conditions of Transaction with Related PartiesThe transaction with related parties are made in the normal course of business and on terms equivalent to those that prevail in arm’s length transactions. Outstanding balances at the year-end are unsecured and interest-free and settlement occurs in cash. There have been no guarantees provided or received for any related party receivables or payables. The above transactions are as per the approval of the Audit Committee. The Group has not recorded any impairment of receivables relating to amounts owed by related parties. This assessment is undertaken each financial year through examining the financial position of the related party and the market in which the related party operates.
422 Grasim Industries Limited
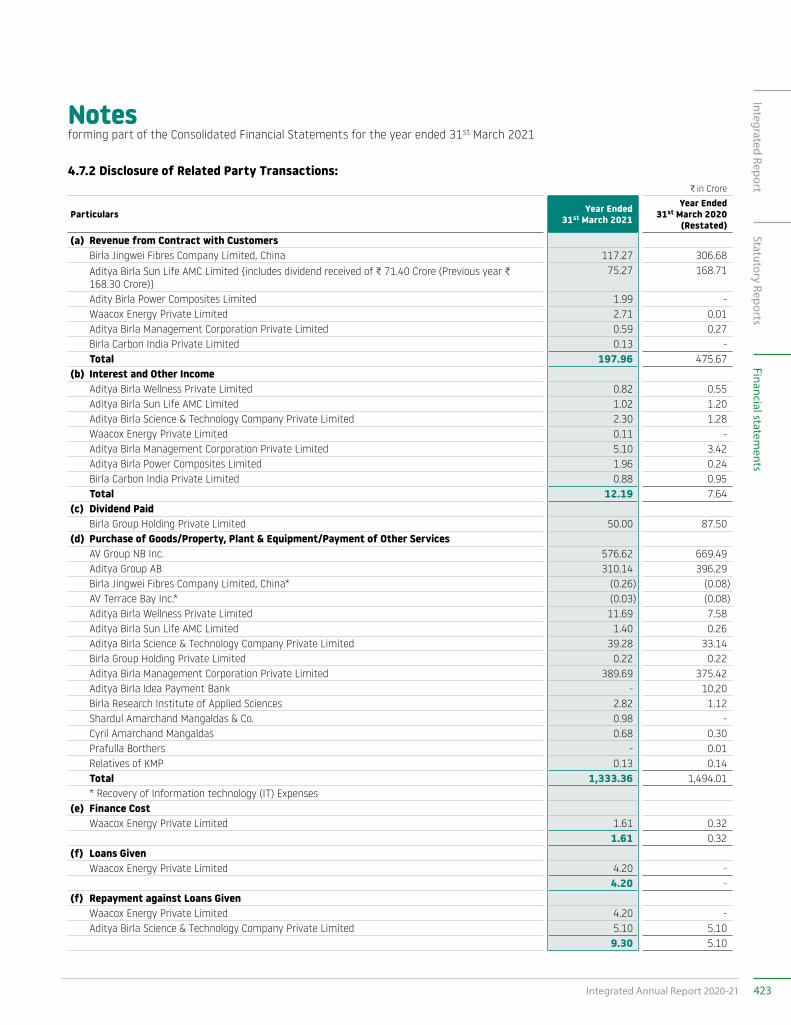
Notesforming part of the Consolidated Financial Statements for the year ended 31st March 2021
4.7.2 Disclosure of Related Party Transactions:C in Crore
Particulars Year Ended 31st March 2021
Year Ended 31st March 2020
(Restated)(a) Revenue from Contract with Customers Birla Jingwei Fibres Company Limited, China 117.27 306.68 Aditya Birla Sun Life AMC Limited {includes dividend received of C 71.40 Crore (Previous year C
168.30 Crore)}75.27 168.71
Adity Birla Power Composites Limited 1.99 - Waacox Energy Private Limited 2.71 0.01 Aditya Birla Management Corporation Private Limited 0.59 0.27 Birla Carbon India Private Limited 0.13 - Total 197.96 475.67(b) Interest and Other Income Aditya Birla Wellness Private Limited 0.82 0.55 Aditya Birla Sun Life AMC Limited 1.02 1.20 Aditya Birla Science & Technology Company Private Limited 2.30 1.28 Waacox Energy Private Limited 0.11 - Aditya Birla Management Corporation Private Limited 5.10 3.42 Aditya Birla Power Composites Limited 1.96 0.24 Birla Carbon India Private Limited 0.88 0.95 Total 12.19 7.64(c) Dividend Paid Birla Group Holding Private Limited 50.00 87.50(d) Purchase of Goods/Property, Plant & Equipment/Payment of Other Services AV Group NB Inc. 576.62 669.49 Aditya Group AB 310.14 396.29 Birla Jingwei Fibres Company Limited, China* (0.26) (0.08) AV Terrace Bay Inc.* (0.03) (0.08) Aditya Birla Wellness Private Limited 11.69 7.58 Aditya Birla Sun Life AMC Limited 1.40 0.26 Aditya Birla Science & Technology Company Private Limited 39.28 33.14 Birla Group Holding Private Limited 0.22 0.22 Aditya Birla Management Corporation Private Limited 389.69 375.42 Aditya Birla Idea Payment Bank - 10.20 Birla Research Institute of Applied Sciences 2.82 1.12 Shardul Amarchand Mangaldas & Co. 0.98 - Cyril Amarchand Mangaldas 0.68 0.30 Prafulla Borthers - 0.01 Relatives of KMP 0.13 0.14 Total 1,333.36 1,494.01 * Recovery of Information technology (IT) Expenses(e) Finance Cost Waacox Energy Private Limited 1.61 0.32
1.61 0.32(f) Loans Given Waacox Energy Private Limited 4.20 -
4.20 -(f) Repayment against Loans Given Waacox Energy Private Limited 4.20 - Aditya Birla Science & Technology Company Private Limited 5.10 5.10
9.30 5.10
423Integrated Annual Report 2020-21
Integrated ReportStatutory Reports
Financial statements
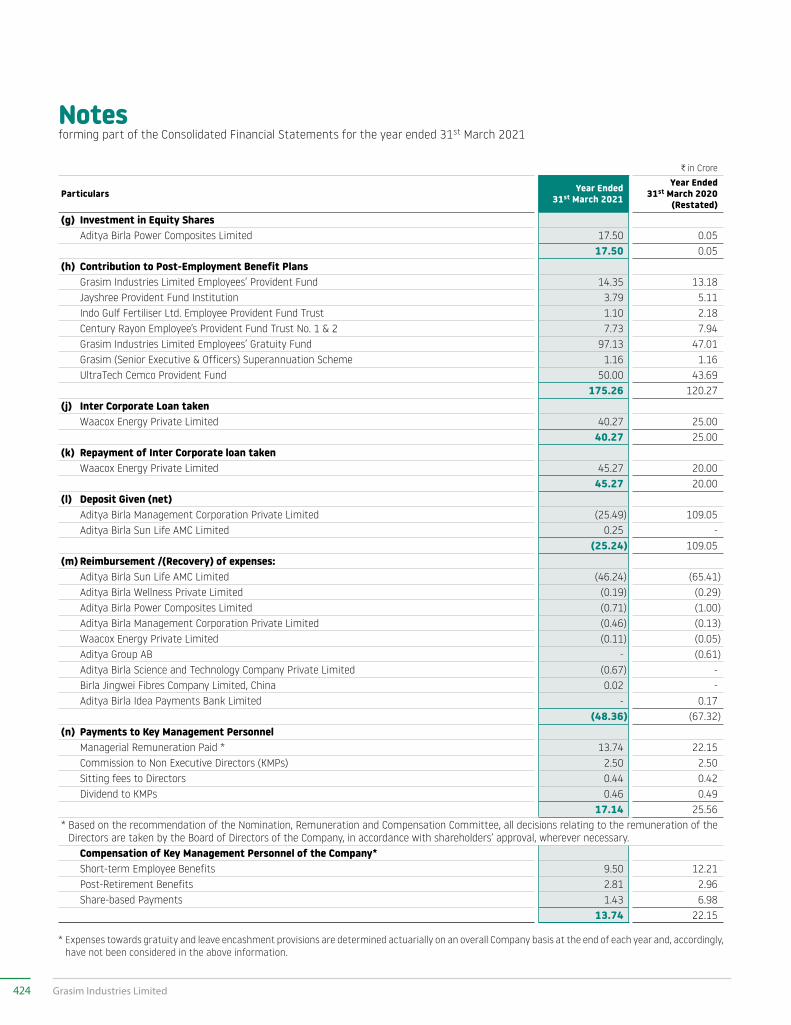
Notesforming part of the Consolidated Financial Statements for the year ended 31st March 2021
C in Crore
Particulars Year Ended 31st March 2021
Year Ended 31st March 2020
(Restated)(g) Investment in Equity Shares Aditya Birla Power Composites Limited 17.50 0.05
17.50 0.05(h) Contribution to Post-Employment Benefit Plans Grasim Industries Limited Employees’ Provident Fund 14.35 13.18 Jayshree Provident Fund Institution 3.79 5.11 Indo Gulf Fertiliser Ltd. Employee Provident Fund Trust 1.10 2.18 Century Rayon Employee’s Provident Fund Trust No. 1 & 2 7.73 7.94 Grasim Industries Limited Employees’ Gratuity Fund 97.13 47.01 Grasim (Senior Executive & Officers) Superannuation Scheme 1.16 1.16 UltraTech Cemco Provident Fund 50.00 43.69
175.26 120.27(j) Inter Corporate Loan taken Waacox Energy Private Limited 40.27 25.00
40.27 25.00(k) Repayment of Inter Corporate loan taken Waacox Energy Private Limited 45.27 20.00
45.27 20.00(l) Deposit Given (net) Aditya Birla Management Corporation Private Limited (25.49) 109.05 Aditya Birla Sun Life AMC Limited 0.25 -
(25.24) 109.05(m) Reimbursement /(Recovery) of expenses: Aditya Birla Sun Life AMC Limited (46.24) (65.41) Aditya Birla Wellness Private Limited (0.19) (0.29) Aditya Birla Power Composites Limited (0.71) (1.00) Aditya Birla Management Corporation Private Limited (0.46) (0.13) Waacox Energy Private Limited (0.11) (0.05) Aditya Group AB - (0.61) Aditya Birla Science and Technology Company Private Limited (0.67) - Birla Jingwei Fibres Company Limited, China 0.02 - Aditya Birla Idea Payments Bank Limited - 0.17
(48.36) (67.32)(n) Payments to Key Management Personnel Managerial Remuneration Paid * 13.74 22.15 Commission to Non Executive Directors (KMPs) 2.50 2.50 Sitting fees to Directors 0.44 0.42 Dividend to KMPs 0.46 0.49
17.14 25.56* Based on the recommendation of the Nomination, Remuneration and Compensation Committee, all decisions relating to the remuneration of the
Directors are taken by the Board of Directors of the Company, in accordance with shareholders’ approval, wherever necessary. Compensation of Key Management Personnel of the Company* Short-term Employee Benefits 9.50 12.21 Post-Retirement Benefits 2.81 2.96 Share-based Payments 1.43 6.98
13.74 22.15
* Expenses towards gratuity and leave encashment provisions are determined actuarially on an overall Company basis at the end of each year and, accordingly, have not been considered in the above information.
424 Grasim Industries Limited
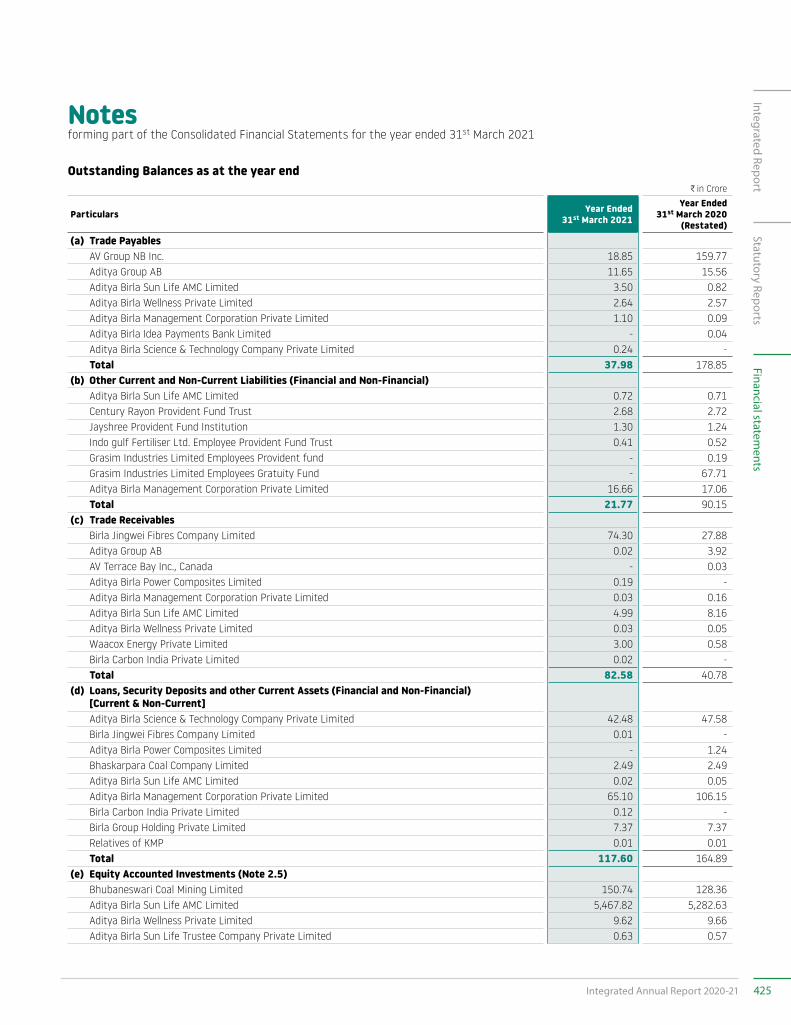
Notesforming part of the Consolidated Financial Statements for the year ended 31st March 2021
Outstanding Balances as at the year endC in Crore
Particulars Year Ended 31st March 2021
Year Ended 31st March 2020
(Restated)(a) Trade Payables AV Group NB Inc. 18.85 159.77 Aditya Group AB 11.65 15.56 Aditya Birla Sun Life AMC Limited 3.50 0.82 Aditya Birla Wellness Private Limited 2.64 2.57 Aditya Birla Management Corporation Private Limited 1.10 0.09 Aditya Birla Idea Payments Bank Limited - 0.04 Aditya Birla Science & Technology Company Private Limited 0.24 - Total 37.98 178.85(b) Other Current and Non-Current Liabilities (Financial and Non-Financial) Aditya Birla Sun Life AMC Limited 0.72 0.71 Century Rayon Provident Fund Trust 2.68 2.72 Jayshree Provident Fund Institution 1.30 1.24 Indo gulf Fertiliser Ltd. Employee Provident Fund Trust 0.41 0.52 Grasim Industries Limited Employees Provident fund - 0.19 Grasim Industries Limited Employees Gratuity Fund - 67.71 Aditya Birla Management Corporation Private Limited 16.66 17.06 Total 21.77 90.15(c) Trade Receivables Birla Jingwei Fibres Company Limited 74.30 27.88 Aditya Group AB 0.02 3.92 AV Terrace Bay Inc., Canada - 0.03 Aditya Birla Power Composites Limited 0.19 - Aditya Birla Management Corporation Private Limited 0.03 0.16 Aditya Birla Sun Life AMC Limited 4.99 8.16 Aditya Birla Wellness Private Limited 0.03 0.05 Waacox Energy Private Limited 3.00 0.58 Birla Carbon India Private Limited 0.02 - Total 82.58 40.78(d) Loans, Security Deposits and other Current Assets (Financial and Non-Financial)
[Current & Non-Current] Aditya Birla Science & Technology Company Private Limited 42.48 47.58 Birla Jingwei Fibres Company Limited 0.01 - Aditya Birla Power Composites Limited - 1.24 Bhaskarpara Coal Company Limited 2.49 2.49 Aditya Birla Sun Life AMC Limited 0.02 0.05 Aditya Birla Management Corporation Private Limited 65.10 106.15 Birla Carbon India Private Limited 0.12 - Birla Group Holding Private Limited 7.37 7.37 Relatives of KMP 0.01 0.01 Total 117.60 164.89(e) Equity Accounted Investments (Note 2.5) Bhubaneswari Coal Mining Limited 150.74 128.36 Aditya Birla Sun Life AMC Limited 5,467.82 5,282.63 Aditya Birla Wellness Private Limited 9.62 9.66 Aditya Birla Sun Life Trustee Company Private Limited 0.63 0.57
425Integrated Annual Report 2020-21
Integrated ReportStatutory Reports
Financial statements
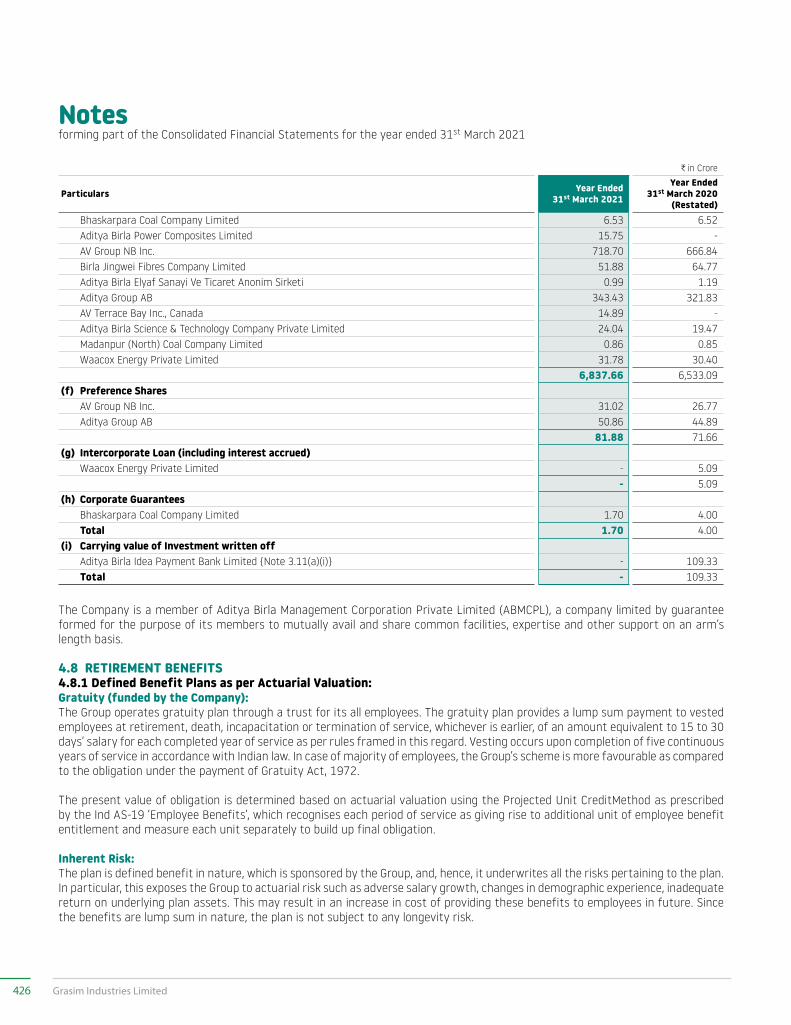
Notesforming part of the Consolidated Financial Statements for the year ended 31st March 2021
C in Crore
Particulars Year Ended 31st March 2021
Year Ended 31st March 2020
(Restated) Bhaskarpara Coal Company Limited 6.53 6.52 Aditya Birla Power Composites Limited 15.75 - AV Group NB Inc. 718.70 666.84 Birla Jingwei Fibres Company Limited 51.88 64.77 Aditya Birla Elyaf Sanayi Ve Ticaret Anonim Sirketi 0.99 1.19 Aditya Group AB 343.43 321.83 AV Terrace Bay Inc., Canada 14.89 - Aditya Birla Science & Technology Company Private Limited 24.04 19.47 Madanpur (North) Coal Company Limited 0.86 0.85 Waacox Energy Private Limited 31.78 30.40
6,837.66 6,533.09(f) Preference Shares AV Group NB Inc. 31.02 26.77 Aditya Group AB 50.86 44.89
81.88 71.66(g) Intercorporate Loan (including interest accrued) Waacox Energy Private Limited - 5.09
- 5.09(h) Corporate Guarantees Bhaskarpara Coal Company Limited 1.70 4.00 Total 1.70 4.00(i) Carrying value of Investment written off Aditya Birla Idea Payment Bank Limited {Note 3.11(a)(i)} - 109.33 Total - 109.33
The Company is a member of Aditya Birla Management Corporation Private Limited (ABMCPL), a company limited by guarantee formed for the purpose of its members to mutually avail and share common facilities, expertise and other support on an arm’s length basis.
4.8 RETIREMENT BENEFITS4.8.1 Defined Benefit Plans as per Actuarial Valuation:Gratuity (funded by the Company):The Group operates gratuity plan through a trust for its all employees. The gratuity plan provides a lump sum payment to vested employees at retirement, death, incapacitation or termination of service, whichever is earlier, of an amount equivalent to 15 to 30 days’ salary for each completed year of service as per rules framed in this regard. Vesting occurs upon completion of five continuous years of service in accordance with Indian law. In case of majority of employees, the Group’s scheme is more favourable as compared to the obligation under the payment of Gratuity Act, 1972.
The present value of obligation is determined based on actuarial valuation using the Projected Unit CreditMethod as prescribed by the Ind AS-19 ‘Employee Benefits’, which recognises each period of service as giving rise to additional unit of employee benefit entitlement and measure each unit separately to build up final obligation.
Inherent Risk:The plan is defined benefit in nature, which is sponsored by the Group, and, hence, it underwrites all the risks pertaining to the plan. In particular, this exposes the Group to actuarial risk such as adverse salary growth, changes in demographic experience, inadequate return on underlying plan assets. This may result in an increase in cost of providing these benefits to employees in future. Since the benefits are lump sum in nature, the plan is not subject to any longevity risk.
426 Grasim Industries Limited
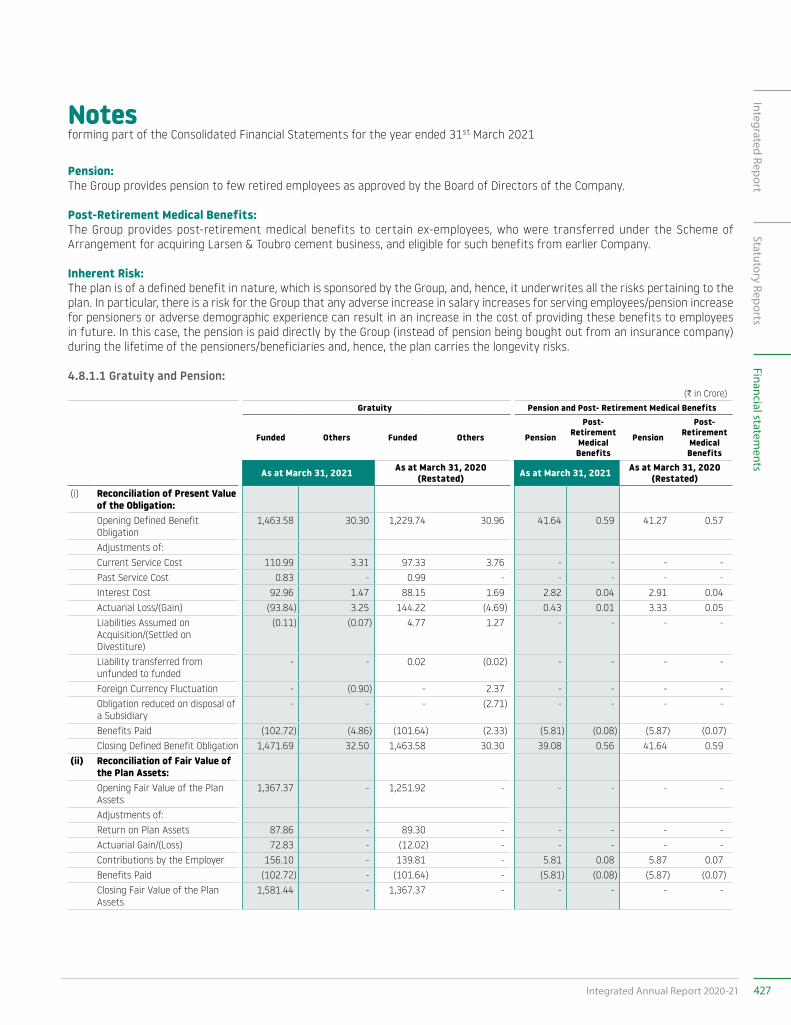
Notesforming part of the Consolidated Financial Statements for the year ended 31st March 2021
Pension:The Group provides pension to few retired employees as approved by the Board of Directors of the Company.
Post-Retirement Medical Benefits: The Group provides post-retirement medical benefits to certain ex-employees, who were transferred under the Scheme of Arrangement for acquiring Larsen & Toubro cement business, and eligible for such benefits from earlier Company.
Inherent Risk:The plan is of a defined benefit in nature, which is sponsored by the Group, and, hence, it underwrites all the risks pertaining to the plan. In particular, there is a risk for the Group that any adverse increase in salary increases for serving employees/pension increase for pensioners or adverse demographic experience can result in an increase in the cost of providing these benefits to employees in future. In this case, the pension is paid directly by the Group (instead of pension being bought out from an insurance company) during the lifetime of the pensioners/beneficiaries and, hence, the plan carries the longevity risks.
4.8.1.1 Gratuity and Pension:(C in Crore)
Gratuity Pension and Post- Retirement Medical Benefits
Funded Others Funded Others Pension
Post- Retirement
Medical Benefits
Pension
Post- Retirement
Medical Benefits
As at March 31, 2021 As at March 31, 2020 (Restated) As at March 31, 2021 As at March 31, 2020
(Restated)(i) Reconciliation of Present Value
of the Obligation:Opening Defined Benefit Obligation
1,463.58 30.30 1,229.74 30.96 41.64 0.59 41.27 0.57
Adjustments of:Current Service Cost 110.99 3.31 97.33 3.76 - - - -Past Service Cost 0.83 - 0.99 - - - - -Interest Cost 92.96 1.47 88.15 1.69 2.82 0.04 2.91 0.04Actuarial Loss/(Gain) (93.84) 3.25 144.22 (4.69) 0.43 0.01 3.33 0.05Liabilities Assumed on Acquisition/(Settled on Divestiture)
(0.11) (0.07) 4.77 1.27 - - - -
Liability transferred from unfunded to funded
- - 0.02 (0.02) - - - -
Foreign Currency Fluctuation - (0.90) - 2.37 - - - -Obligation reduced on disposal of a Subsidiary
- - - (2.71) - - - -
Benefits Paid (102.72) (4.86) (101.64) (2.33) (5.81) (0.08) (5.87) (0.07)Closing Defined Benefit Obligation 1,471.69 32.50 1,463.58 30.30 39.08 0.56 41.64 0.59
(ii) Reconciliation of Fair Value of the Plan Assets:Opening Fair Value of the Plan Assets
1,367.37 - 1,251.92 - - - - -
Adjustments of:Return on Plan Assets 87.86 - 89.30 - - - - -Actuarial Gain/(Loss) 72.83 - (12.02) - - - - -Contributions by the Employer 156.10 - 139.81 - 5.81 0.08 5.87 0.07Benefits Paid (102.72) - (101.64) - (5.81) (0.08) (5.87) (0.07)Closing Fair Value of the Plan Assets
1,581.44 - 1,367.37 - - - - -
427Integrated Annual Report 2020-21
Integrated ReportStatutory Reports
Financial statements
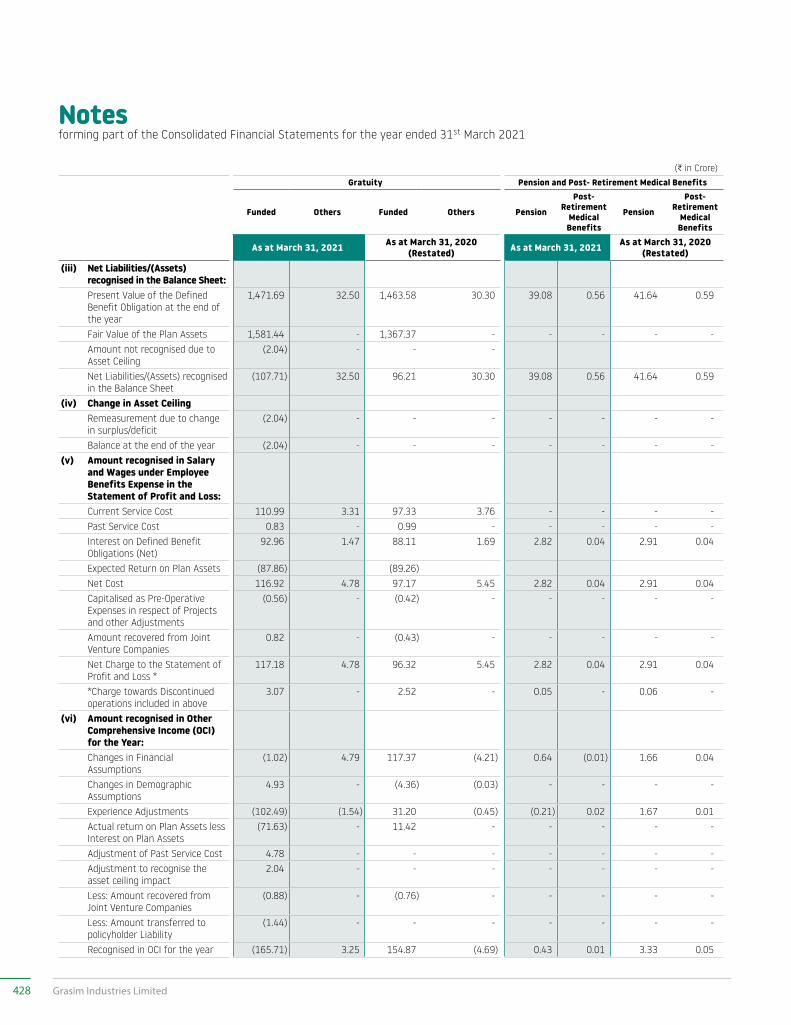
Notesforming part of the Consolidated Financial Statements for the year ended 31st March 2021
(C in Crore)Gratuity Pension and Post- Retirement Medical Benefits
Funded Others Funded Others Pension
Post- Retirement
Medical Benefits
Pension
Post- Retirement
Medical Benefits
As at March 31, 2021 As at March 31, 2020 (Restated) As at March 31, 2021 As at March 31, 2020
(Restated)(iii) Net Liabilities/(Assets)
recognised in the Balance Sheet:Present Value of the Defined Benefit Obligation at the end of the year
1,471.69 32.50 1,463.58 30.30 39.08 0.56 41.64 0.59
Fair Value of the Plan Assets 1,581.44 - 1,367.37 - - - - -Amount not recognised due to Asset Ceiling
(2.04) - - -
Net Liabilities/(Assets) recognised in the Balance Sheet
(107.71) 32.50 96.21 30.30 39.08 0.56 41.64 0.59
(iv) Change in Asset CeilingRemeasurement due to change in surplus/deficit
(2.04) - - - - - - -
Balance at the end of the year (2.04) - - - - - - -(v) Amount recognised in Salary
and Wages under Employee Benefits Expense in the Statement of Profit and Loss:Current Service Cost 110.99 3.31 97.33 3.76 - - - -Past Service Cost 0.83 - 0.99 - - - - -Interest on Defined Benefit Obligations (Net)
92.96 1.47 88.11 1.69 2.82 0.04 2.91 0.04
Expected Return on Plan Assets (87.86) (89.26)Net Cost 116.92 4.78 97.17 5.45 2.82 0.04 2.91 0.04Capitalised as Pre-Operative Expenses in respect of Projects and other Adjustments
(0.56) - (0.42) - - - - -
Amount recovered from Joint Venture Companies
0.82 - (0.43) - - - - -
Net Charge to the Statement of Profit and Loss *
117.18 4.78 96.32 5.45 2.82 0.04 2.91 0.04
*Charge towards Discontinued operations included in above
3.07 - 2.52 - 0.05 - 0.06 -
(vi) Amount recognised in Other Comprehensive Income (OCI) for the Year:Changes in Financial Assumptions
(1.02) 4.79 117.37 (4.21) 0.64 (0.01) 1.66 0.04
Changes in Demographic Assumptions
4.93 - (4.36) (0.03) - - - -
Experience Adjustments (102.49) (1.54) 31.20 (0.45) (0.21) 0.02 1.67 0.01Actual return on Plan Assets less Interest on Plan Assets
(71.63) - 11.42 - - - - -
Adjustment of Past Service Cost 4.78 - - - - - - -Adjustment to recognise the asset ceiling impact
2.04 - - - - - - -
Less: Amount recovered from Joint Venture Companies
(0.88) - (0.76) - - - - -
Less: Amount transferred to policyholder Liability
(1.44) - - - - - - -
Recognised in OCI for the year (165.71) 3.25 154.87 (4.69) 0.43 0.01 3.33 0.05
428 Grasim Industries Limited
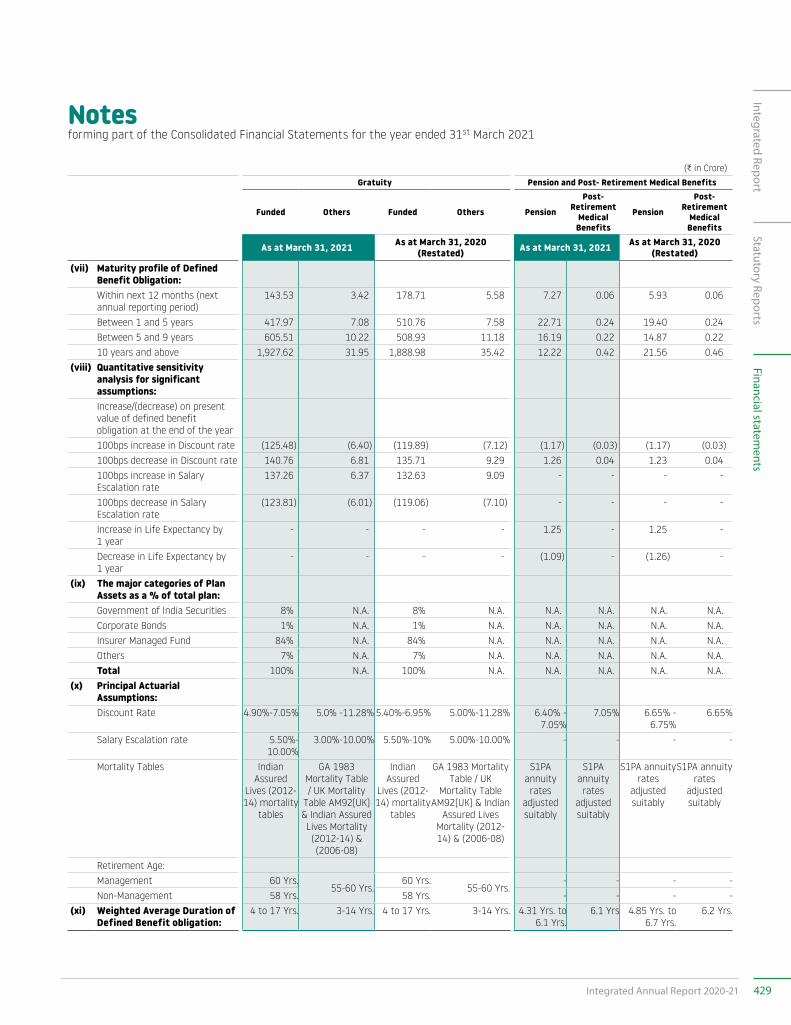
Notesforming part of the Consolidated Financial Statements for the year ended 31st March 2021
(C in Crore)Gratuity Pension and Post- Retirement Medical Benefits
Funded Others Funded Others Pension
Post- Retirement
Medical Benefits
Pension
Post- Retirement
Medical Benefits
As at March 31, 2021 As at March 31, 2020 (Restated) As at March 31, 2021 As at March 31, 2020
(Restated)(vii) Maturity profile of Defined
Benefit Obligation:Within next 12 months (next annual reporting period)
143.53 3.42 178.71 5.58 7.27 0.06 5.93 0.06
Between 1 and 5 years 417.97 7.08 510.76 7.58 22.71 0.24 19.40 0.24Between 5 and 9 years 605.51 10.22 508.93 11.18 16.19 0.22 14.87 0.2210 years and above 1,927.62 31.95 1,888.98 35.42 12.22 0.42 21.56 0.46
(viii) Quantitative sensitivity analysis for significant assumptions:Increase/(decrease) on present value of defined benefit obligation at the end of the year100bps increase in Discount rate (125.48) (6.40) (119.89) (7.12) (1.17) (0.03) (1.17) (0.03)100bps decrease in Discount rate 140.76 6.81 135.71 9.29 1.26 0.04 1.23 0.04100bps increase in Salary Escalation rate
137.26 6.37 132.63 9.09 - - - -
100bps decrease in Salary Escalation rate
(123.81) (6.01) (119.06) (7.10) - - - -
Increase in Life Expectancy by 1 year
- - - - 1.25 - 1.25 -
Decrease in Life Expectancy by 1 year
- - - - (1.09) - (1.26) -
(ix) The major categories of Plan Assets as a % of total plan:Government of India Securities 8% N.A. 8% N.A. N.A. N.A. N.A. N.A.Corporate Bonds 1% N.A. 1% N.A. N.A. N.A. N.A. N.A.Insurer Managed Fund 84% N.A. 84% N.A. N.A. N.A. N.A. N.A.Others 7% N.A. 7% N.A. N.A. N.A. N.A. N.A.Total 100% N.A. 100% N.A. N.A. N.A. N.A. N.A.
(x) Principal Actuarial Assumptions:Discount Rate 4.90%-7.05% 5.0% -11.28% 5.40%-6.95% 5.00%-11.28% 6.40% -
7.05%7.05% 6.65% -
6.75%6.65%
Salary Escalation rate 5.50%-10.00%
3.00%-10.00% 5.50%-10% 5.00%-10.00% - - - -
Mortality Tables Indian Assured
Lives (2012-14) mortality
tables
GA 1983 Mortality Table / UK Mortality
Table AM92[UK] & Indian Assured Lives Mortality (2012-14) & (2006-08)
Indian Assured
Lives (2012-14) mortality
tables
GA 1983 Mortality Table / UK
Mortality Table AM92[UK] & Indian
Assured Lives Mortality (2012-14) & (2006-08)
S1PA annuity rates
adjusted suitably
S1PA annuity rates
adjusted suitably
S1PA annuity rates
adjusted suitably
S1PA annuity rates
adjusted suitably
Retirement Age:Management 60 Yrs.
55-60 Yrs.60 Yrs.
55-60 Yrs.- - - -
Non-Management 58 Yrs. 58 Yrs. - - - -(xi) Weighted Average Duration of
Defined Benefit obligation:4 to 17 Yrs. 3-14 Yrs. 4 to 17 Yrs. 3-14 Yrs. 4.31 Yrs. to
6.1 Yrs.6.1 Yrs 4.85 Yrs. to
6.7 Yrs.6.2 Yrs.
429Integrated Annual Report 2020-21
Integrated ReportStatutory Reports
Financial statements
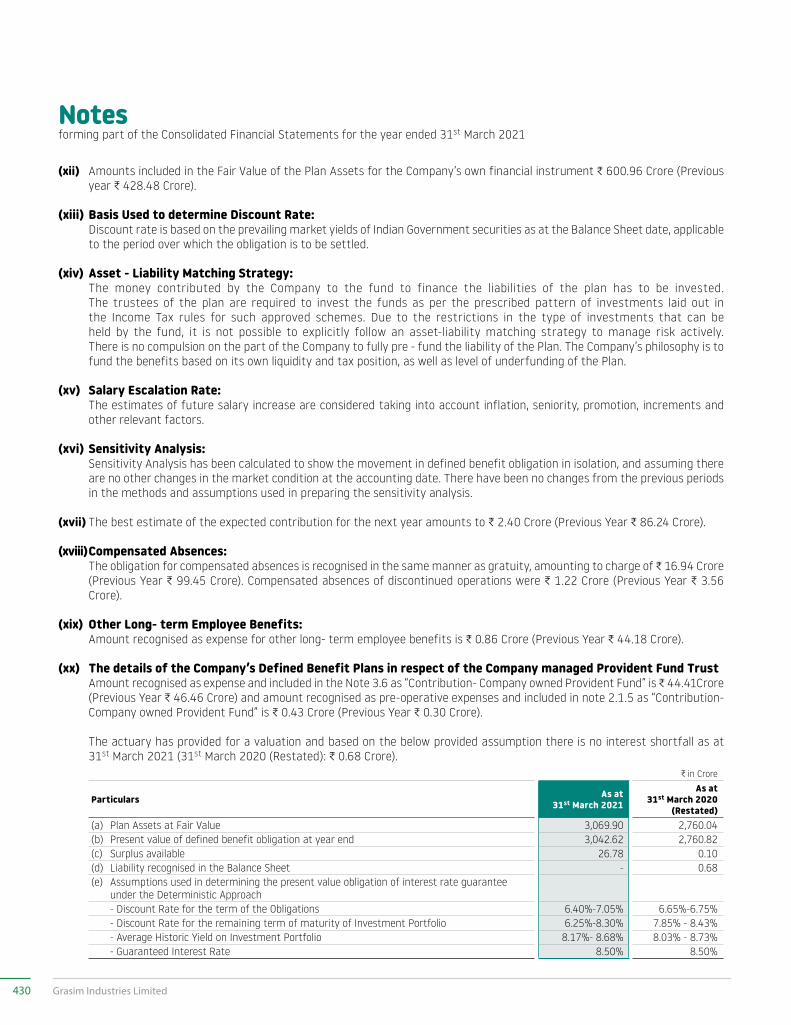
Notesforming part of the Consolidated Financial Statements for the year ended 31st March 2021
(xii) Amounts included in the Fair Value of the Plan Assets for the Company’s own financial instrument C 600.96 Crore (Previous year C 428.48 Crore).
(xiii) Basis Used to determine Discount Rate: Discount rate is based on the prevailing market yields of Indian Government securities as at the Balance Sheet date, applicable
to the period over which the obligation is to be settled.
(xiv) Asset - Liability Matching Strategy: The money contributed by the Company to the fund to finance the liabilities of the plan has to be invested.
The trustees of the plan are required to invest the funds as per the prescribed pattern of investments laid out in the Income Tax rules for such approved schemes. Due to the restrictions in the type of investments that can be held by the fund, it is not possible to explicitly follow an asset-liability matching strategy to manage risk actively. There is no compulsion on the part of the Company to fully pre - fund the liability of the Plan. The Company’s philosophy is to fund the benefits based on its own liquidity and tax position, as well as level of underfunding of the Plan.
(xv) Salary Escalation Rate: The estimates of future salary increase are considered taking into account inflation, seniority, promotion, increments and
other relevant factors.
(xvi) Sensitivity Analysis: Sensitivity Analysis has been calculated to show the movement in defined benefit obligation in isolation, and assuming there
are no other changes in the market condition at the accounting date. There have been no changes from the previous periods in the methods and assumptions used in preparing the sensitivity analysis.
(xvii) The best estimate of the expected contribution for the next year amounts to C 2.40 Crore (Previous Year C 86.24 Crore).
(xviii) Compensated Absences: The obligation for compensated absences is recognised in the same manner as gratuity, amounting to charge of C 16.94 Crore
(Previous Year C 99.45 Crore). Compensated absences of discontinued operations were C 1.22 Crore (Previous Year C 3.56 Crore).
(xix) Other Long- term Employee Benefits: Amount recognised as expense for other long- term employee benefits is C 0.86 Crore (Previous Year C 44.18 Crore).
(xx) The details of the Company’s Defined Benefit Plans in respect of the Company managed Provident Fund Trust Amount recognised as expense and included in the Note 3.6 as “Contribution- Company owned Provident Fund” is C 44.41Crore
(Previous Year C 46.46 Crore) and amount recognised as pre-operative expenses and included in note 2.1.5 as “Contribution- Company owned Provident Fund” is C 0.43 Crore (Previous Year C 0.30 Crore).
The actuary has provided for a valuation and based on the below provided assumption there is no interest shortfall as at 31st March 2021 (31st March 2020 (Restated): C 0.68 Crore).
C in Crore
Particulars As at 31st March 2021
As at 31st March 2020
(Restated)(a) Plan Assets at Fair Value 3,069.90 2,760.04 (b) Present value of defined benefit obligation at year end 3,042.62 2,760.82 (c) Surplus available 26.78 0.10 (d) Liability recognised in the Balance Sheet - 0.68 (e) Assumptions used in determining the present value obligation of interest rate guarantee
under the Deterministic Approach - Discount Rate for the term of the Obligations 6.40%-7.05% 6.65%-6.75% - Discount Rate for the remaining term of maturity of Investment Portfolio 6.25%-8.30% 7.85% - 8.43% - Average Historic Yield on Investment Portfolio 8.17%- 8.68% 8.03% - 8.73% - Guaranteed Interest Rate 8.50% 8.50%
430 Grasim Industries Limited
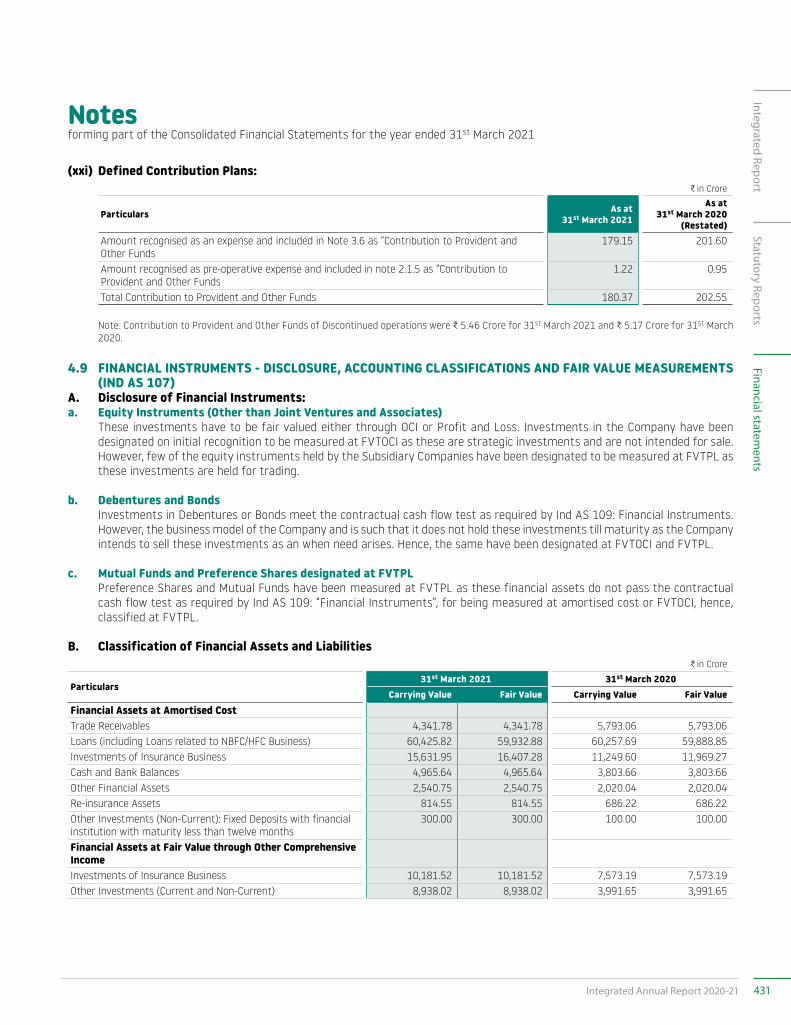
Notesforming part of the Consolidated Financial Statements for the year ended 31st March 2021
(xxi) Defined Contribution Plans:C in Crore
Particulars As at 31st March 2021
As at 31st March 2020
(Restated)Amount recognised as an expense and included in Note 3.6 as “Contribution to Provident and Other Funds
179.15 201.60
Amount recognised as pre-operative expense and included in note 2.1.5 as “Contribution to Provident and Other Funds
1.22 0.95
Total Contribution to Provident and Other Funds 180.37 202.55
Note: Contribution to Provident and Other Funds of Discontinued operations were C 5.46 Crore for 31st March 2021 and C 5.17 Crore for 31st March 2020.
4.9 FINANCIAL INSTRUMENTS - DISCLOSURE, ACCOUNTING CLASSIFICATIONS AND FAIR VALUE MEASUREMENTS (IND AS 107)
A. Disclosure of Financial Instruments:a. Equity Instruments (Other than Joint Ventures and Associates) These investments have to be fair valued either through OCI or Profit and Loss. Investments in the Company have been
designated on initial recognition to be measured at FVTOCI as these are strategic investments and are not intended for sale. However, few of the equity instruments held by the Subsidiary Companies have been designated to be measured at FVTPL as these investments are held for trading.
b. Debentures and Bonds Investments in Debentures or Bonds meet the contractual cash flow test as required by Ind AS 109: Financial Instruments.
However, the business model of the Company and is such that it does not hold these investments till maturity as the Company intends to sell these investments as an when need arises. Hence, the same have been designated at FVTOCI and FVTPL.
c. Mutual Funds and Preference Shares designated at FVTPL Preference Shares and Mutual Funds have been measured at FVTPL as these financial assets do not pass the contractual
cash flow test as required by Ind AS 109: “Financial Instruments”, for being measured at amortised cost or FVTOCI, hence, classified at FVTPL.
B. Classification of Financial Assets and LiabilitiesC in Crore
Particulars31st March 2021 31st March 2020
Carrying Value Fair Value Carrying Value Fair ValueFinancial Assets at Amortised CostTrade Receivables 4,341.78 4,341.78 5,793.06 5,793.06 Loans (including Loans related to NBFC/HFC Business) 60,425.82 59,932.88 60,257.69 59,888.85 Investments of Insurance Business 15,631.95 16,407.28 11,249.60 11,969.27 Cash and Bank Balances 4,965.64 4,965.64 3,803.66 3,803.66 Other Financial Assets 2,540.75 2,540.75 2,020.04 2,020.04 Re-insurance Assets 814.55 814.55 686.22 686.22 Other Investments (Non-Current): Fixed Deposits with financial institution with maturity less than twelve months
300.00 300.00 100.00 100.00
Financial Assets at Fair Value through Other Comprehensive IncomeInvestments of Insurance Business 10,181.52 10,181.52 7,573.19 7,573.19 Other Investments (Current and Non-Current) 8,938.02 8,938.02 3,991.65 3,991.65
431Integrated Annual Report 2020-21
Integrated ReportStatutory Reports
Financial statements
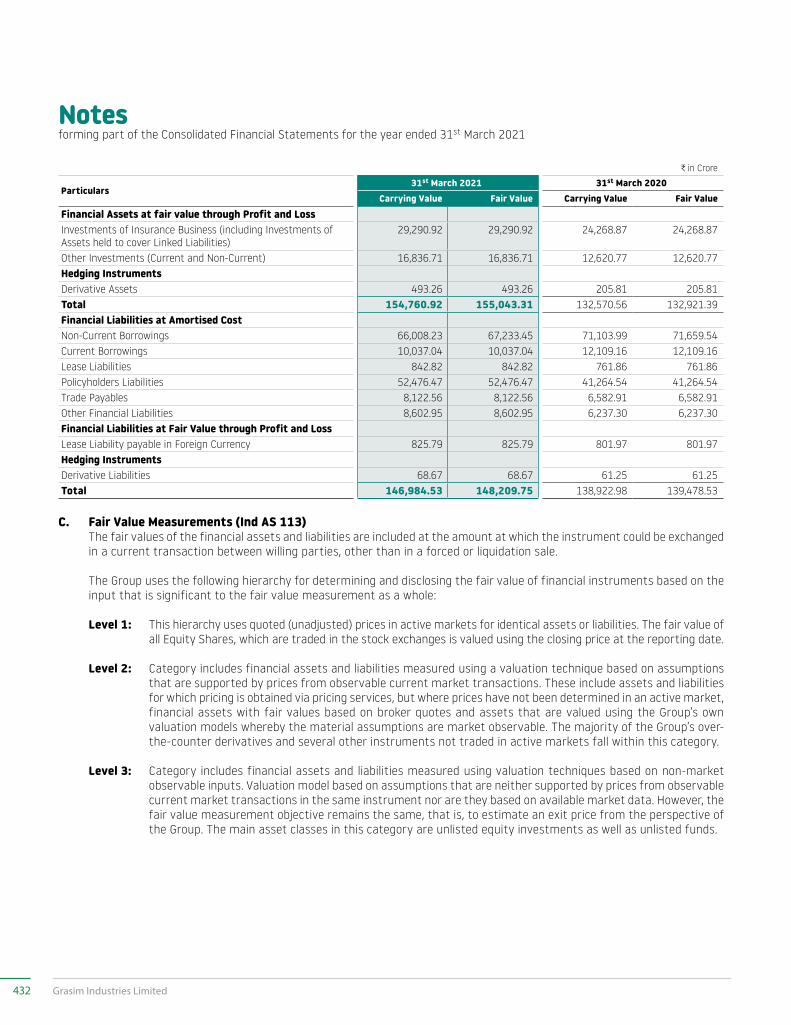
Notesforming part of the Consolidated Financial Statements for the year ended 31st March 2021
C in Crore
Particulars31st March 2021 31st March 2020
Carrying Value Fair Value Carrying Value Fair ValueFinancial Assets at fair value through Profit and LossInvestments of Insurance Business (including Investments of Assets held to cover Linked Liabilities)
29,290.92 29,290.92 24,268.87 24,268.87
Other Investments (Current and Non-Current) 16,836.71 16,836.71 12,620.77 12,620.77 Hedging InstrumentsDerivative Assets 493.26 493.26 205.81 205.81 Total 154,760.92 155,043.31 132,570.56 132,921.39 Financial Liabilities at Amortised CostNon-Current Borrowings 66,008.23 67,233.45 71,103.99 71,659.54 Current Borrowings 10,037.04 10,037.04 12,109.16 12,109.16 Lease Liabilities 842.82 842.82 761.86 761.86 Policyholders Liabilities 52,476.47 52,476.47 41,264.54 41,264.54 Trade Payables 8,122.56 8,122.56 6,582.91 6,582.91 Other Financial Liabilities 8,602.95 8,602.95 6,237.30 6,237.30 Financial Liabilities at Fair Value through Profit and LossLease Liability payable in Foreign Currency 825.79 825.79 801.97 801.97 Hedging InstrumentsDerivative Liabilities 68.67 68.67 61.25 61.25 Total 146,984.53 148,209.75 138,922.98 139,478.53
C. Fair Value Measurements (Ind AS 113) The fair values of the financial assets and liabilities are included at the amount at which the instrument could be exchanged
in a current transaction between willing parties, other than in a forced or liquidation sale.
The Group uses the following hierarchy for determining and disclosing the fair value of financial instruments based on the input that is significant to the fair value measurement as a whole:
Level 1: This hierarchy uses quoted (unadjusted) prices in active markets for identical assets or liabilities. The fair value of all Equity Shares, which are traded in the stock exchanges is valued using the closing price at the reporting date.
Level 2: Category includes financial assets and liabilities measured using a valuation technique based on assumptions that are supported by prices from observable current market transactions. These include assets and liabilities for which pricing is obtained via pricing services, but where prices have not been determined in an active market, financial assets with fair values based on broker quotes and assets that are valued using the Group’s own valuation models whereby the material assumptions are market observable. The majority of the Group’s over-the-counter derivatives and several other instruments not traded in active markets fall within this category.
Level 3: Category includes financial assets and liabilities measured using valuation techniques based on non-market observable inputs. Valuation model based on assumptions that are neither supported by prices from observable current market transactions in the same instrument nor are they based on available market data. However, the fair value measurement objective remains the same, that is, to estimate an exit price from the perspective of the Group. The main asset classes in this category are unlisted equity investments as well as unlisted funds.
432 Grasim Industries Limited
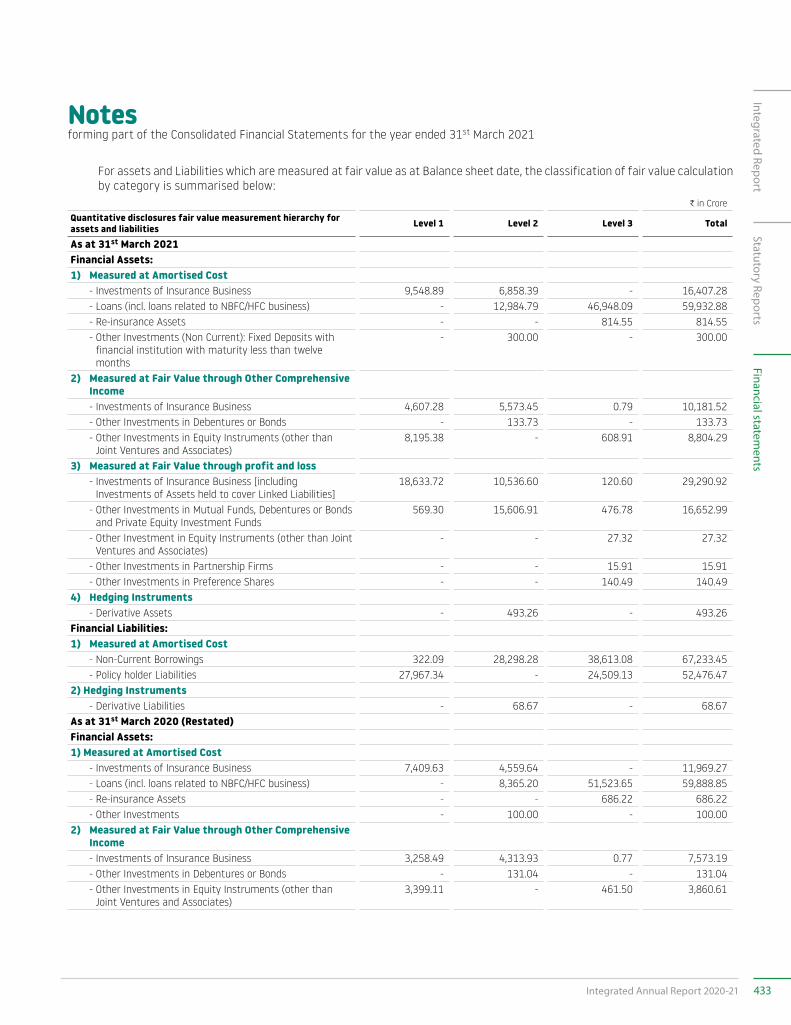
Notesforming part of the Consolidated Financial Statements for the year ended 31st March 2021
For assets and Liabilities which are measured at fair value as at Balance sheet date, the classification of fair value calculation by category is summarised below:
C in CroreQuantitative disclosures fair value measurement hierarchy for assets and liabilities Level 1 Level 2 Level 3 Total
As at 31st March 2021Financial Assets:1) Measured at Amortised Cost - Investments of Insurance Business 9,548.89 6,858.39 - 16,407.28 - Loans (incl. loans related to NBFC/HFC business) - 12,984.79 46,948.09 59,932.88 - Re-insurance Assets - - 814.55 814.55 - Other Investments (Non Current): Fixed Deposits with
financial institution with maturity less than twelve months
- 300.00 - 300.00
2) Measured at Fair Value through Other Comprehensive Income
- Investments of Insurance Business 4,607.28 5,573.45 0.79 10,181.52 - Other Investments in Debentures or Bonds - 133.73 - 133.73 - Other Investments in Equity Instruments (other than
Joint Ventures and Associates)8,195.38 - 608.91 8,804.29
3) Measured at Fair Value through profit and loss - Investments of Insurance Business [including
Investments of Assets held to cover Linked Liabilities]18,633.72 10,536.60 120.60 29,290.92
- Other Investments in Mutual Funds, Debentures or Bonds and Private Equity Investment Funds
569.30 15,606.91 476.78 16,652.99
- Other Investment in Equity Instruments (other than Joint Ventures and Associates)
- - 27.32 27.32
- Other Investments in Partnership Firms - - 15.91 15.91 - Other Investments in Preference Shares - - 140.49 140.494) Hedging Instruments - Derivative Assets - 493.26 - 493.26Financial Liabilities:1) Measured at Amortised Cost - Non-Current Borrowings 322.09 28,298.28 38,613.08 67,233.45 - Policy holder Liabilities 27,967.34 - 24,509.13 52,476.472) Hedging Instruments - Derivative Liabilities - 68.67 - 68.67As at 31st March 2020 (Restated)Financial Assets:1) Measured at Amortised Cost - Investments of Insurance Business 7,409.63 4,559.64 - 11,969.27 - Loans (incl. loans related to NBFC/HFC business) - 8,365.20 51,523.65 59,888.85 - Re-insurance Assets - - 686.22 686.22 - Other Investments - 100.00 - 100.002) Measured at Fair Value through Other Comprehensive
Income - Investments of Insurance Business 3,258.49 4,313.93 0.77 7,573.19 - Other Investments in Debentures or Bonds - 131.04 - 131.04 - Other Investments in Equity Instruments (other than
Joint Ventures and Associates)3,399.11 - 461.50 3,860.61
433Integrated Annual Report 2020-21
Integrated ReportStatutory Reports
Financial statements
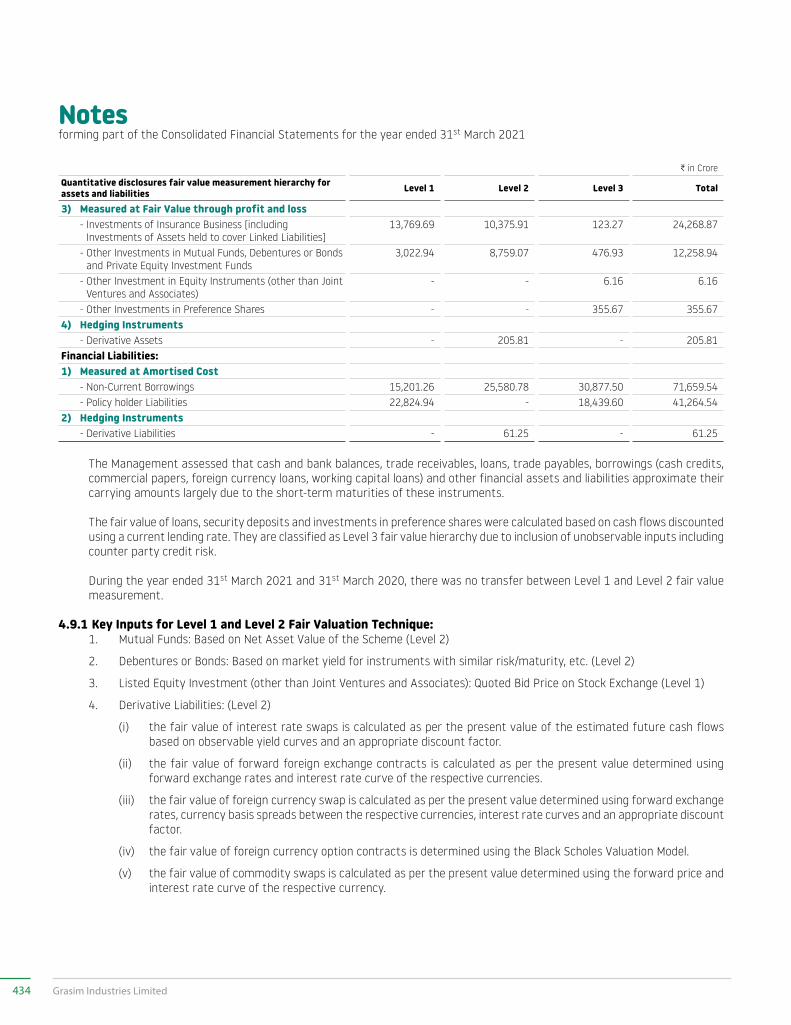
Notesforming part of the Consolidated Financial Statements for the year ended 31st March 2021
C in CroreQuantitative disclosures fair value measurement hierarchy for assets and liabilities Level 1 Level 2 Level 3 Total
3) Measured at Fair Value through profit and loss - Investments of Insurance Business [including
Investments of Assets held to cover Linked Liabilities]13,769.69 10,375.91 123.27 24,268.87
- Other Investments in Mutual Funds, Debentures or Bonds and Private Equity Investment Funds
3,022.94 8,759.07 476.93 12,258.94
- Other Investment in Equity Instruments (other than Joint Ventures and Associates)
- - 6.16 6.16
- Other Investments in Preference Shares - - 355.67 355.674) Hedging Instruments - Derivative Assets - 205.81 - 205.81Financial Liabilities:1) Measured at Amortised Cost - Non-Current Borrowings 15,201.26 25,580.78 30,877.50 71,659.54 - Policy holder Liabilities 22,824.94 - 18,439.60 41,264.542) Hedging Instruments - Derivative Liabilities - 61.25 - 61.25
The Management assessed that cash and bank balances, trade receivables, loans, trade payables, borrowings (cash credits, commercial papers, foreign currency loans, working capital loans) and other financial assets and liabilities approximate their carrying amounts largely due to the short-term maturities of these instruments.
The fair value of loans, security deposits and investments in preference shares were calculated based on cash flows discounted using a current lending rate. They are classified as Level 3 fair value hierarchy due to inclusion of unobservable inputs including counter party credit risk.
During the year ended 31st March 2021 and 31st March 2020, there was no transfer between Level 1 and Level 2 fair value measurement.
4.9.1 Key Inputs for Level 1 and Level 2 Fair Valuation Technique: 1. Mutual Funds: Based on Net Asset Value of the Scheme (Level 2)
2. Debentures or Bonds: Based on market yield for instruments with similar risk/maturity, etc. (Level 2)
3. Listed Equity Investment (other than Joint Ventures and Associates): Quoted Bid Price on Stock Exchange (Level 1)
4. Derivative Liabilities: (Level 2)
(i) the fair value of interest rate swaps is calculated as per the present value of the estimated future cash flows based on observable yield curves and an appropriate discount factor.
(ii) the fair value of forward foreign exchange contracts is calculated as per the present value determined using forward exchange rates and interest rate curve of the respective currencies.
(iii) the fair value of foreign currency swap is calculated as per the present value determined using forward exchange rates, currency basis spreads between the respective currencies, interest rate curves and an appropriate discount factor.
(iv) the fair value of foreign currency option contracts is determined using the Black Scholes Valuation Model.
(v) the fair value of commodity swaps is calculated as per the present value determined using the forward price and interest rate curve of the respective currency.
434 Grasim Industries Limited
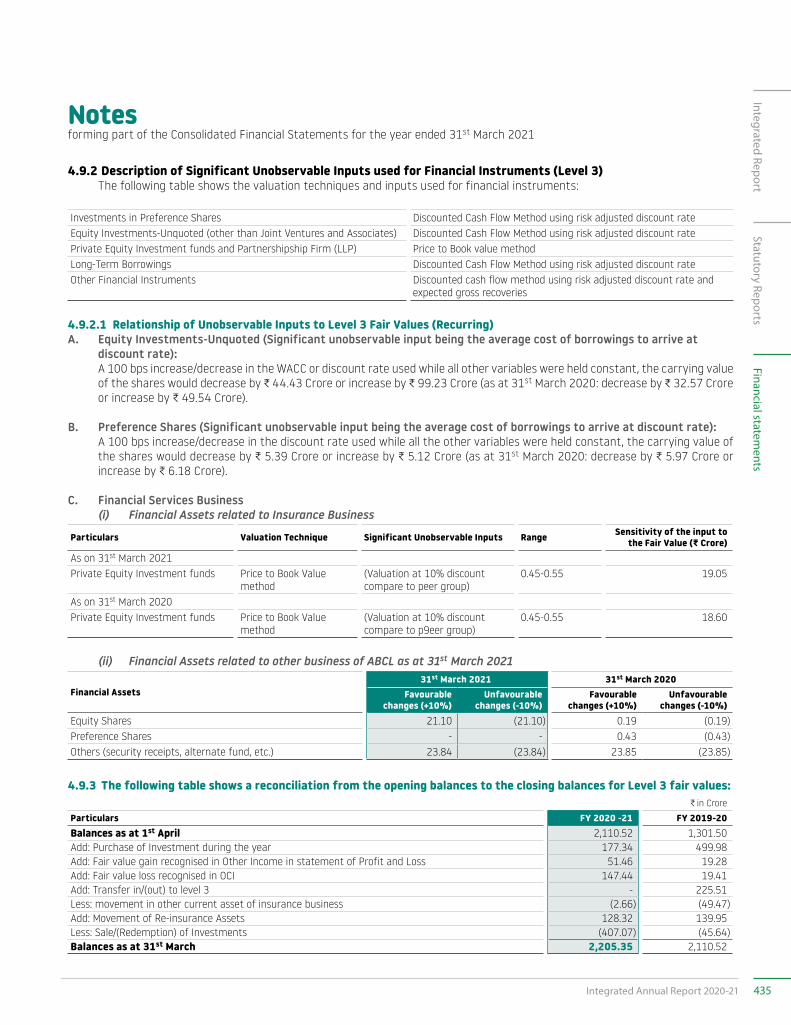
Notesforming part of the Consolidated Financial Statements for the year ended 31st March 2021
4.9.2 Description of Significant Unobservable Inputs used for Financial Instruments (Level 3) The following table shows the valuation techniques and inputs used for financial instruments:
Investments in Preference Shares Discounted Cash Flow Method using risk adjusted discount rateEquity Investments-Unquoted (other than Joint Ventures and Associates) Discounted Cash Flow Method using risk adjusted discount ratePrivate Equity Investment funds and Partnershipship Firm (LLP) Price to Book value methodLong-Term Borrowings Discounted Cash Flow Method using risk adjusted discount rateOther Financial Instruments Discounted cash flow method using risk adjusted discount rate and
expected gross recoveries
4.9.2.1 Relationship of Unobservable Inputs to Level 3 Fair Values (Recurring)A. Equity Investments-Unquoted (Significant unobservable input being the average cost of borrowings to arrive at
discount rate): A 100 bps increase/decrease in the WACC or discount rate used while all other variables were held constant, the carrying value
of the shares would decrease by C 44.43 Crore or increase by C 99.23 Crore (as at 31st March 2020: decrease by C 32.57 Crore or increase by C 49.54 Crore).
B. Preference Shares (Significant unobservable input being the average cost of borrowings to arrive at discount rate): A 100 bps increase/decrease in the discount rate used while all the other variables were held constant, the carrying value of
the shares would decrease by C 5.39 Crore or increase by C 5.12 Crore (as at 31st March 2020: decrease by C 5.97 Crore or increase by C 6.18 Crore).
C. Financial Services Business (i) Financial Assets related to Insurance Business
Particulars Valuation Technique Significant Unobservable Inputs Range Sensitivity of the input to the Fair Value (G Crore)
As on 31st March 2021Private Equity Investment funds Price to Book Value
method(Valuation at 10% discount compare to peer group)
0.45-0.55 19.05
As on 31st March 2020Private Equity Investment funds Price to Book Value
method(Valuation at 10% discount compare to p9eer group)
0.45-0.55 18.60
(ii) Financial Assets related to other business of ABCL as at 31st March 2021
Financial Assets31st March 2021 31st March 2020
Favourable changes (+10%)
Unfavourable changes (-10%)
Favourable changes (+10%)
Unfavourable changes (-10%)
Equity Shares 21.10 (21.10) 0.19 (0.19)Preference Shares - - 0.43 (0.43)Others (security receipts, alternate fund, etc.) 23.84 (23.84) 23.85 (23.85)
4.9.3 The following table shows a reconciliation from the opening balances to the closing balances for Level 3 fair values:C in Crore
Particulars FY 2020 -21 FY 2019-20Balances as at 1st April 2,110.52 1,301.50 Add: Purchase of Investment during the year 177.34 499.98 Add: Fair value gain recognised in Other Income in statement of Profit and Loss 51.46 19.28 Add: Fair value loss recognised in OCI 147.44 19.41 Add: Transfer in/(out) to level 3 - 225.51 Less: movement in other current asset of insurance business (2.66) (49.47)Add: Movement of Re-insurance Assets 128.32 139.95 Less: Sale/(Redemption) of Investments (407.07) (45.64)Balances as at 31st March 2,205.35 2,110.52
435Integrated Annual Report 2020-21
Integrated ReportStatutory Reports
Financial statements
Notesforming part of the Consolidated Financial Statements for the year ended 31st March 2021
4.10 FINANCIAL RISK MANAGEMENT OBJECTIVES (IND AS 107)A Financial Risk Management and Its Policies for Insurance Business Risk Management Framework Insurance Business has an Enterprise Risk Management (ERM) framework covering procedures to identify, assess and mitigate
the key business risks. Aligned with the business planning process, the ERM framework covers all business risks including strategic risk, operational risks, investment risks and insurance risks. The key business risks identified are approved by the Board’s Risk Management Committee and monitored by the Risk Management team thereafter. Insurance Business also has in place an Operational Risk Management (ORM) framework that supports excellence in business processes, system and facilitates matured business decisions to move to a proactive risk assessment and is in the process of implementing the key operational risk components.
Insurance business recognises that information is a critical business asset, and that our ability to operate effectively and succeed in a competitive market depends on our ability to ensure that business information is protected adequately through appropriate controls and proactive measures. Accordingly, Insurance business has an information security framework that ensures all the information assets are safeguarded by establishing comprehensive management processes throughout the organisation.
Insurance Business Investments Function is governed by the Investment Committee and the Asset Liability Management Committee appointed by the Board of Directors. Investment Policy and Operating Guidelines laid down by the Board provide the framework for management and mitigation of the risks associated with investments. Asset Liability Policy and various Asset Liability Management(ALM) strategies are adopted to ensure adequate Asset Liability Management. These policies are reviewed at frequent intervals by the respective Board Committees and approved by the Board.
Insurance Business has a robust Business Continuity framework to ensure resumption of time sensitive activities within the defined time frame at defined levels. Insurance Business is certified against ISO 22301 (Globally accepted standard on Business Continuity).
Insurance Business through its risk management policies has set up systems to continuously monitor its experience with regard to other parameters that affect the value of benefits offered in the products. Such parameters include policy lapses, premium persistency, maintenance expenses and investment returns.
ERM encompasses the following areas:
Governed by risk policies and operating guidelines approved by the Board Committee/Sub Committee of the Board
1. Risk identification
2. Risk response and risk management strategy
3. Risk monitoring, communication and reporting
a. Risk Policies The following risk policies govern and implement effective risk management practices:
Product Design and Pricing Policy, Underwriting and Liability Management Policy, Re-insurance Ceded Policy, Capital Management Policy, Investment Policies, Dealing Room Policy, Broker Empanelment Policy, Valuation Policy, Information Security Policies, Internet and email Usage Policy, Logical Access Security Policy, External Access Security Policy, Physical Access Security Policy, Business Continuity Policy, Operational Risk Management Policy, Fraud Reporting and Investigating Policy, Asset Liability Management Policy, Outsourcing Policy and Anti Money Laundering Policy.”
b. Capital Management Objectives and Policies Insurance Business has established the following capital management objectives, policies and approach to managing
the risks that affect its capital position:
i) To maintain the required level of stability of the Company thereby providing a degree of security to policyholders
ii) To allocate capital efficiently and support the development of business by ensuring that returns on capital employed meet the requirements of its capital providers and shareholders
iii) To retain financial flexibility by maintaining strong liquidity and access to a range of capital markets
iv) To align the profile of assets and liabilities taking account of risks inherent in the business
436 Grasim Industries Limited
Notesforming part of the Consolidated Financial Statements for the year ended 31st March 2021
v) To maintain financial strength to support new business growth and to satisfy the requirements of the policyholders, regulators and stakeholders
vi) To maintain strong credit ratings and healthy capital ratios in order to support its business objectives and maximise shareholders value
Insurance Business have met all of these requirements throughout the financial year. In reporting, financial strength, capital and solvency are measured using the rules prescribed by the Insurance Regulatory Authority of India (IRDAI). These regulatory capital tests are based upon required levels of solvency, capital and a series of prudent assumptions in respect of the type of business written. The company’s Capital Management Policy for its insurance and Non–Insurance Business is to hold sufficient capital to cover the statutory requirements based on the IRDAI directives.
c. Regulatory Framework Regulators are primarily interested in protecting the rights of policyholders and monitor them closely to ensure that the
Insurance Business is satisfactorily managing affairs for their benefits. At the same time, regulators are also interested in ensuring that the Company maintains an appropriate solvency position to meet unforeseeable liabilities arising from economic shocks or natural disasters. The operations of the Company are subject to regulatory requirements within the jurisdictions in which it operates.
Insurance and Financial Risk The principal risk the Company faces under insurance contracts is that the actual claims and benefit payments or the timing
thereof, differ from expectations. This is influenced by the frequency of claims, severity of claims, actual benefits paid and subsequent development of long–term claims. Therefore, the objective of the Company is to ensure that sufficient reserves are available to cover these liabilities.
The risk exposure is mitigated by diversification across a large portfolio of insurance contracts and geographical areas. The variability of risks is also improved by careful selection and implementation of underwriting strategy guidelines, as well as the use of reinsurance arrangements.
1. Life insurance contracts and investment contracts with and without Discretionary Participation Feature (DPF) Ind AS 104 requires products offered by the Insurance Company to classify them in Insurance Contract and Investment
Contract. Each contract needs to be classified in insurance contract and investment contract based on the risk they carry.
A contract would be an insurance contract and investment contracts with DPF if the benefit payable on death is higher by:
at least 5% of the fund value at any time during the life on the contract for unit linked products, or
at 5% of the premium at any time during the life of the contract for other than unit linked products
All other contracts are categorised as Investment Contracts.
For contracts with DPF, the participating nature of these contracts results in a significant portion of the insurance risk being shared with the insured party. For contracts without DPF, the Company charges for death and disability risks on a quarterly basis. Under these contracts the Company has the right to alter these charges to take account of death and disability experience, thereby mitigating the risks to the Company.
The main risks that the Company is exposed to are as follows:
i) Persistency Risk – risk of loss arising due to policyholder experiences (lapses and surrenders) being different than expected
ii) Mortality Risk – risk of loss arising due to policyholder death experience being different than expected
iii) Morbidity Risk – risk of loss arising due to policyholder health experience being different than expected
iv) Longevity Risk – risk of loss arising due to the annuitant living longer than expected
v) Investment Return Risk – risk of loss arising from actual returns being different than expected
vi) Expense Risk – risk of loss arising from expense experience being different than expected
437Integrated Annual Report 2020-21
Integrated ReportStatutory Reports
Financial statements
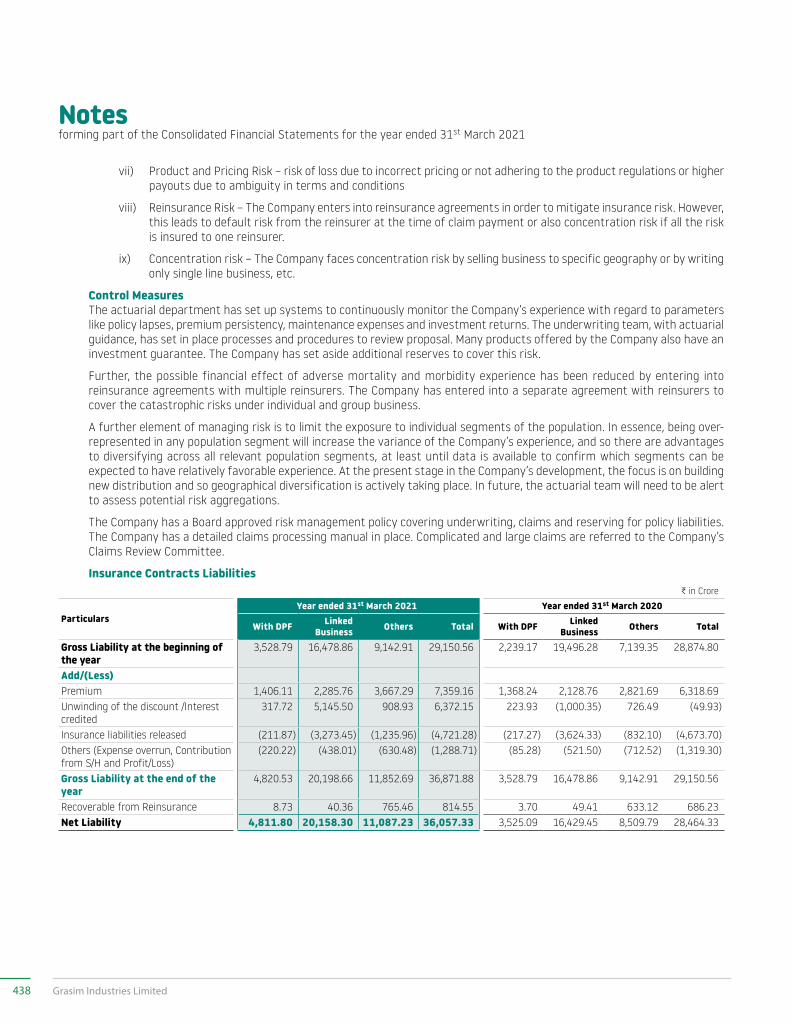
Notesforming part of the Consolidated Financial Statements for the year ended 31st March 2021
vii) Product and Pricing Risk – risk of loss due to incorrect pricing or not adhering to the product regulations or higher payouts due to ambiguity in terms and conditions
viii) Reinsurance Risk – The Company enters into reinsurance agreements in order to mitigate insurance risk. However, this leads to default risk from the reinsurer at the time of claim payment or also concentration risk if all the risk is insured to one reinsurer.
ix) Concentration risk – The Company faces concentration risk by selling business to specific geography or by writing only single line business, etc.
Control Measures The actuarial department has set up systems to continuously monitor the Company’s experience with regard to parameters
like policy lapses, premium persistency, maintenance expenses and investment returns. The underwriting team, with actuarial guidance, has set in place processes and procedures to review proposal. Many products offered by the Company also have an investment guarantee. The Company has set aside additional reserves to cover this risk.
Further, the possible financial effect of adverse mortality and morbidity experience has been reduced by entering into reinsurance agreements with multiple reinsurers. The Company has entered into a separate agreement with reinsurers to cover the catastrophic risks under individual and group business.
A further element of managing risk is to limit the exposure to individual segments of the population. In essence, being over-represented in any population segment will increase the variance of the Company’s experience, and so there are advantages to diversifying across all relevant population segments, at least until data is available to confirm which segments can be expected to have relatively favorable experience. At the present stage in the Company’s development, the focus is on building new distribution and so geographical diversification is actively taking place. In future, the actuarial team will need to be alert to assess potential risk aggregations.
The Company has a Board approved risk management policy covering underwriting, claims and reserving for policy liabilities. The Company has a detailed claims processing manual in place. Complicated and large claims are referred to the Company’s Claims Review Committee.
Insurance Contracts LiabilitiesC in Crore
ParticularsYear ended 31st March 2021 Year ended 31st March 2020
With DPF Linked Business Others Total With DPF Linked
Business Others Total
Gross Liability at the beginning of the year
3,528.79 16,478.86 9,142.91 29,150.56 2,239.17 19,496.28 7,139.35 28,874.80
Add/(Less)Premium 1,406.11 2,285.76 3,667.29 7,359.16 1,368.24 2,128.76 2,821.69 6,318.69 Unwinding of the discount /Interest credited
317.72 5,145.50 908.93 6,372.15 223.93 (1,000.35) 726.49 (49.93)
Insurance liabilities released (211.87) (3,273.45) (1,235.96) (4,721.28) (217.27) (3,624.33) (832.10) (4,673.70)Others (Expense overrun, Contribution from S/H and Profit/Loss)
(220.22) (438.01) (630.48) (1,288.71) (85.28) (521.50) (712.52) (1,319.30)
Gross Liability at the end of the year
4,820.53 20,198.66 11,852.69 36,871.88 3,528.79 16,478.86 9,142.91 29,150.56
Recoverable from Reinsurance 8.73 40.36 765.46 814.55 3.70 49.41 633.12 686.23 Net Liability 4,811.80 20,158.30 11,087.23 36,057.33 3,525.09 16,429.45 8,509.79 28,464.33
438 Grasim Industries Limited
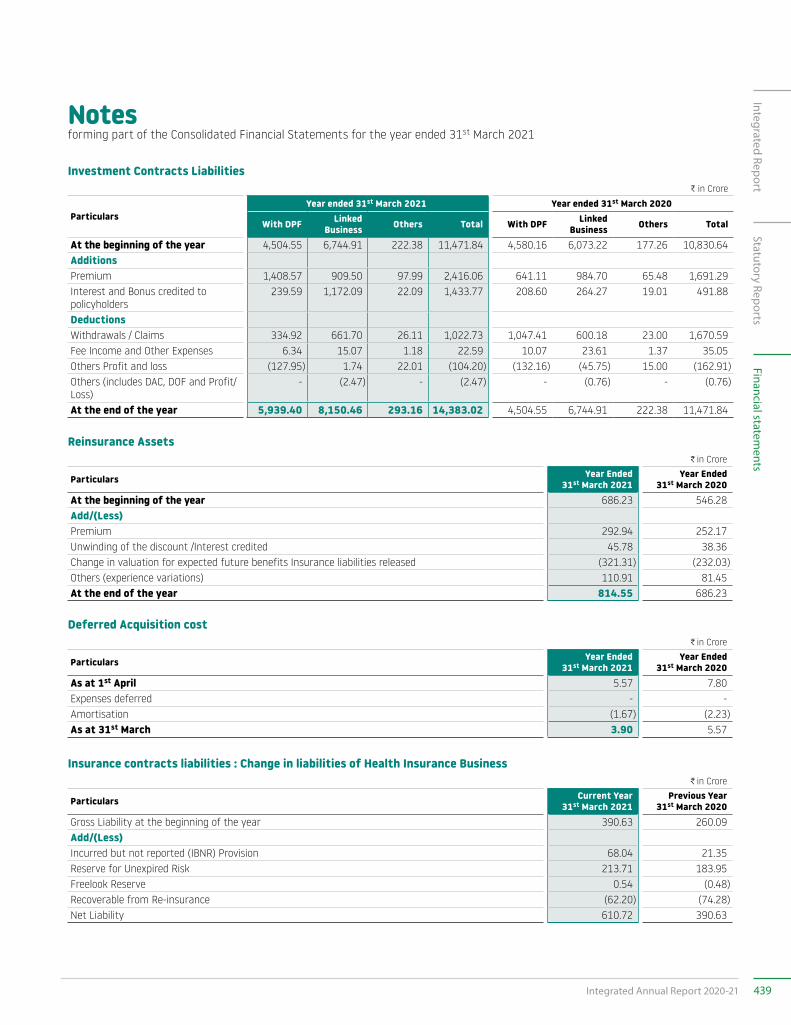
Notesforming part of the Consolidated Financial Statements for the year ended 31st March 2021
Investment Contracts LiabilitiesC in Crore
ParticularsYear ended 31st March 2021 Year ended 31st March 2020
With DPF Linked Business Others Total With DPF Linked
Business Others Total
At the beginning of the year 4,504.55 6,744.91 222.38 11,471.84 4,580.16 6,073.22 177.26 10,830.64 AdditionsPremium 1,408.57 909.50 97.99 2,416.06 641.11 984.70 65.48 1,691.29 Interest and Bonus credited to policyholders
239.59 1,172.09 22.09 1,433.77 208.60 264.27 19.01 491.88
DeductionsWithdrawals / Claims 334.92 661.70 26.11 1,022.73 1,047.41 600.18 23.00 1,670.59 Fee Income and Other Expenses 6.34 15.07 1.18 22.59 10.07 23.61 1.37 35.05 Others Profit and loss (127.95) 1.74 22.01 (104.20) (132.16) (45.75) 15.00 (162.91)Others (includes DAC, DOF and Profit/Loss)
- (2.47) - (2.47) - (0.76) - (0.76)
At the end of the year 5,939.40 8,150.46 293.16 14,383.02 4,504.55 6,744.91 222.38 11,471.84
Reinsurance AssetsC in Crore
Particulars Year Ended 31st March 2021
Year Ended 31st March 2020
At the beginning of the year 686.23 546.28 Add/(Less)Premium 292.94 252.17 Unwinding of the discount /Interest credited 45.78 38.36 Change in valuation for expected future benefits Insurance liabilities released (321.31) (232.03)Others (experience variations) 110.91 81.45 At the end of the year 814.55 686.23
Deferred Acquisition costC in Crore
Particulars Year Ended 31st March 2021
Year Ended 31st March 2020
As at 1st April 5.57 7.80 Expenses deferred - - Amortisation (1.67) (2.23)As at 31st March 3.90 5.57
Insurance contracts liabilities : Change in liabilities of Health Insurance BusinessC in Crore
Particulars Current Year31st March 2021
Previous Year31st March 2020
Gross Liability at the beginning of the year 390.63 260.09 Add/(Less)Incurred but not reported (IBNR) Provision 68.04 21.35 Reserve for Unexpired Risk 213.71 183.95 Freelook Reserve 0.54 (0.48)Recoverable from Re-insurance (62.20) (74.28)Net Liability 610.72 390.63
439Integrated Annual Report 2020-21
Integrated ReportStatutory Reports
Financial statements
Notesforming part of the Consolidated Financial Statements for the year ended 31st March 2021
Key Assumptions The assumptions play vital role in calculating insurance liabilities for the Company. Material judgement is required in determining
the liabilities and in the choice of assumptions. Best estimate assumptions in use are based on historical and current experience, internal data, some judgement and as per guidance notes/actuarial practice standards. However for the purpose of valuation an additional level of prudence has been kept on all the best estimate assumptions known as MfAD (margin for adverse deviation). The Company keeps adequate MfAD, as prescribed in APS 7, issued by the Institute of Actuaries of India (IAI), in all assumptions over the best estimate value.
Best Estimate Assumptions are further evaluated on a continuous basis in order to ensure realistic and reasonable valuations.
Assumptions can vary by type of product, duration, gender etc if the experience of any category is significantly different and data is credible for the respective category.
The key assumptions to which the estimation of liabilities is particularly sensitive are, as follows:
i) Mortality and Morbidity Rates Assumptions are based on historical experience and for new products based on industry / reinsurers data. An appropriate,
but not excessive allowance may be made for expected future improvements. Assumptions may vary by type of product, distribution channel, gender, etc.
An increase in mortality/morbidity rates will usually lead to a larger number/amount of claims (and claims could occur sooner than anticipated), which will increase the liability and reduce profits for the shareholders.
ii) Longevity Assumptions are based on standard industry and national tables, adjusted when appropriate to reflect the Company’s
own risk experience. An appropriate, but not excessive, prudent allowance is made for expected future improvements. Assumptions are normally differentiated by gender, underwriting class and contract type. An increase in longevity rates will lead to an increase in the number of annuity payments to be made, which will increase the liability and reduce profits for the shareholders.
iii) Investment Return and Discount Rate The weighted average rate of return is derived based on a model portfolio that is assumed to back liabilities, consistent
with the long–term asset allocation strategy. These estimates are based on current market returns as well as expectations about future economic and financial developments. An increase in investment return would lead to an increase in profits for the shareholders.
An increase in investment return would lead to an increase in profits for the shareholders.
Life insurance liabilities are determined as the sum of the discounted value of the expected benefits and future administration expenses directly related to the contract, less the discounted value of the expected theoretical premiums that would be required to meet these future cash outflows. Discount rates are based on investment strategy of Company, current industry risk rates, adjusted for the Company’s own risk exposure.
A decrease in the discount rate will increase the value of the insurance liability and therefore reduce profits for the shareholders.
iv) Expenses and Inflation Operating expenses assumptions reflect the projected costs of maintaining and servicing in–force policies and associated
overhead expenses. The current level of expenses is taken as an appropriate expense base, adjusted for expected expense inflation if appropriate.
An increase in the level of expenses would result in an increase in expenditure, thereby reducing profits for the shareholders.
v) Lapse, Surrender and Partial Withdrawal Rates Lapses relate to the termination of policies due to non–payment of premiums. Surrenders relate to the voluntary
termination of policies by policyholders. Policy termination assumptions are determined using statistical measures based on the Company’s experience and usually vary by product type, policy duration and sales trends.
An increase in lapse rates early in the life of the policy would tend to reduce profits for shareholders, but later increases are broadly neutral in effect.
440 Grasim Industries Limited

Notesforming part of the Consolidated Financial Statements for the year ended 31st March 2021
The best estimate assumptions that have the greatest effect on the statement of financial position and the Statement of Profit and Loss of the Company are listed below.
Portfolio assumptions by type of business impacting net liabilities
Mortality rates Investment return Lapse and surrender rates
31-Mar-21 31-Mar-20 31-Mar-21 31-Mar-20 31-Mar-21 31-Mar-20
InsuranceWith DPF 87.5% -
223% of IALM2012-14
67% - 223% of
IALM2012-14
6.95% p.a. 7.10% p.a. PY1 : 10% - 25% PY2 : 7.5% - 10%
PY3 + : 2% (varying by product)
PY1 : 12% - 25% PY2 : 7.5% - 10%
PY3 + : 2% (varying by product)
Linked Business 61% of IALM2012-14
61% of IALM2012-14
a) 9.0% p.a. for assets backing linked liabilities
b) 6.5% p.a. for asset backing non-unit liabilities
a) 9.5% p.a. for assets backing linked liabilities
b) 6.7% p.a. for asset backing non-unit liabilities
PY1 : 10%-35% PY2 : 5% - 25% PY3+: 3% -15%
(varying by product and duration)
PY1 : 10%-23% PY2 : 5% - 8%
PY3+: 3% -15% (varying by product
and duration)
Others 20%-429% of IALM2012-14
20%-429% of IALM2012-14
6.08%-7.7% p.a. 6.65%-8.00% p.a. PY1 : 0%-40% PY2 : 0% - 25% PY3+: 1% -25%
(varying by product and duration)
PY1 : 0%-40% PY2 : 0% - 25% PY3+: 1% -25%
(varying by product and duration)
Portfolio assumptions by type of business impacting net liabilities
Partial Withdrawal Renewal Per Policy Expense Assumptions Inflation31-Mar-21 31-Mar-20 31-Mar-21 31-Mar-20 31-Mar-21 31-Mar-20
InsuranceWith DPF N/A N/A 422-645 Per policy 402-614 Per policy 0.05 0.05
Linked Business 0% - 3% p.a. 0% - 3% p.a. 645 Per policy 614 Per policy 0.05 0.05
Others N/A N/A Max 645 Per policy (varies by product)
Max 614 Per policy (varies by product)
0.05 0.05
*Commission scales have been allowed in accordance with the product filing with IRDA.
Sensitivity AnalysisThe following analysis is performed for reasonably possible movements in key assumptions with all other assumptions held constant, showing the impact on gross liabilities. The correlation of assumptions will have a significant effect in determining the ultimate liabilities, but to demonstrate the impact due to changes in assumptions, assumptions had to be changed on an individual basis. It should be noted that movements in these assumptions are non–linear. The method used for deriving sensitivity information and significant assumptions made did not change from the previous period. The sensitivities are same as shared with Regulators during annual reporting.
C in Crore
Sensitivity ParametersCurrent Year Previous Year
Insurance with DPF
Insurance without DPF
Investment with DPF
Investment without DPF
Insurance with DPF
Insurance without DPF
Investment with DPF
Investment without DPF
Lapses Increased by 10% 4,775.24 31,750.83 5,939.41 8,425.78 3,479.56 25,351.61 4,504.56 6,959.50 Lapses Decreased by 10% 4,867.61 32,365.57 5,939.41 8,462.78 3,580.85 25,865.84 4,504.56 6,971.95 Mortality Increased by 10% 4,845.29 32,238.56 5,939.41 8,451.30 3,555.68 25,767.01 4,504.56 6,967.36 Mortality Decreased by 10% 4,795.78 31,869.35 5,939.41 8,435.37 3,502.03 25,478.24 4,504.56 6,967.16 Expenses Increased by 10% 4,869.06 32,302.88 5,939.41 8,472.72 3,609.50 25,995.97 4,504.56 6,992.25 Expenses Decreased by 10% 4,772.34 31,803.94 5,939.41 8,420.08 3,453.79 25,271.47 4,504.56 6,943.11 Interest Rate Increased by 100 bps 4,820.52 31,928.07 5,939.41 8,621.84 3,528.78 25,560.47 4,504.56 7,029.33 Interest Rate Decreased by 100 bps 4,820.52 32,273.25 5,939.41 8,317.58 3,528.78 25,781.75 4,504.56 6,903.10 Inflation Rate Increased by 100 bps 4,892.88 32,255.39 5,939.41 8,467.98 3,612.50 25,943.32 4,504.56 7,000.22 Inflation Rate Decreased by 100 bps 4,765.17 31,731.88 5,939.41 8,426.97 3,464.75 25,376.18 4,504.56 6,940.78
441Integrated Annual Report 2020-21
Integrated ReportStatutory Reports
Financial statements
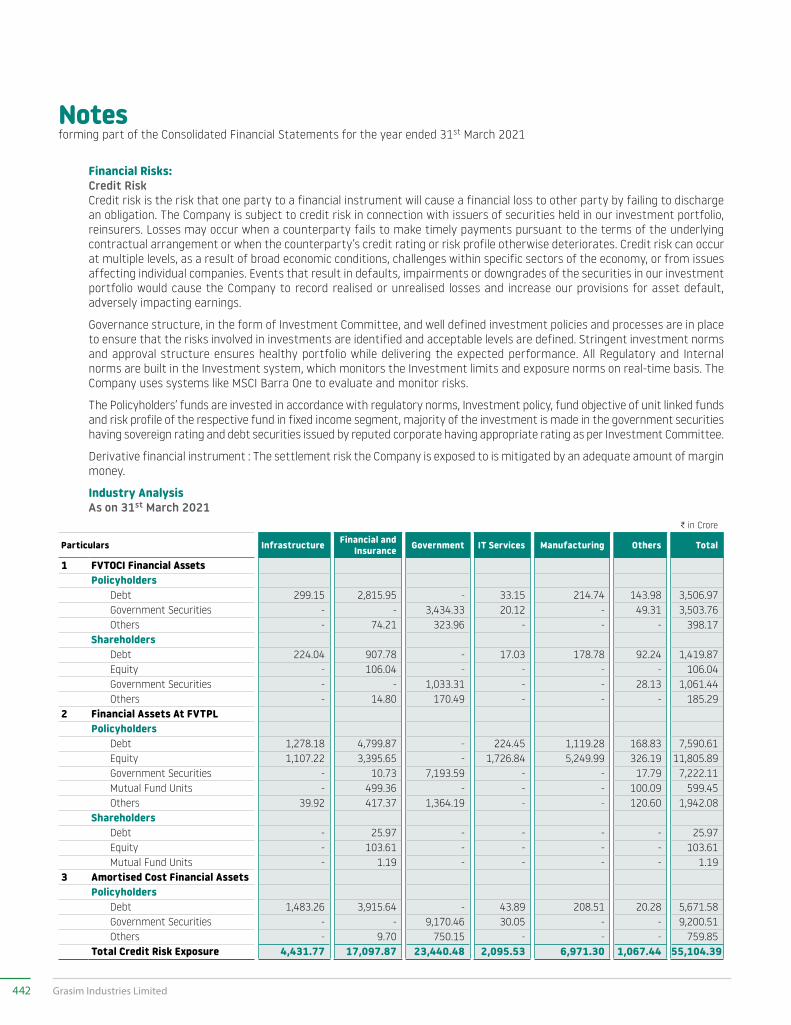
Notesforming part of the Consolidated Financial Statements for the year ended 31st March 2021
Financial Risks: Credit Risk Credit risk is the risk that one party to a financial instrument will cause a financial loss to other party by failing to discharge
an obligation. The Company is subject to credit risk in connection with issuers of securities held in our investment portfolio, reinsurers. Losses may occur when a counterparty fails to make timely payments pursuant to the terms of the underlying contractual arrangement or when the counterparty’s credit rating or risk profile otherwise deteriorates. Credit risk can occur at multiple levels, as a result of broad economic conditions, challenges within specific sectors of the economy, or from issues affecting individual companies. Events that result in defaults, impairments or downgrades of the securities in our investment portfolio would cause the Company to record realised or unrealised losses and increase our provisions for asset default, adversely impacting earnings.
Governance structure, in the form of Investment Committee, and well defined investment policies and processes are in place to ensure that the risks involved in investments are identified and acceptable levels are defined. Stringent investment norms and approval structure ensures healthy portfolio while delivering the expected performance. All Regulatory and Internal norms are built in the Investment system, which monitors the Investment limits and exposure norms on real-time basis. The Company uses systems like MSCI Barra One to evaluate and monitor risks.
The Policyholders’ funds are invested in accordance with regulatory norms, Investment policy, fund objective of unit linked funds and risk profile of the respective fund in fixed income segment, majority of the investment is made in the government securities having sovereign rating and debt securities issued by reputed corporate having appropriate rating as per Investment Committee.
Derivative financial instrument : The settlement risk the Company is exposed to is mitigated by an adequate amount of margin money.
Industry Analysis As on 31st March 2021
C in Crore
Particulars Infrastructure Financial and Insurance Government IT Services Manufacturing Others Total
1 FVTOCI Financial AssetsPolicyholders Debt 299.15 2,815.95 - 33.15 214.74 143.98 3,506.97 Government Securities - - 3,434.33 20.12 - 49.31 3,503.76 Others - 74.21 323.96 - - - 398.17Shareholders Debt 224.04 907.78 - 17.03 178.78 92.24 1,419.87 Equity - 106.04 - - - - 106.04 Government Securities - - 1,033.31 - - 28.13 1,061.44 Others - 14.80 170.49 - - - 185.29
2 Financial Assets At FVTPLPolicyholders Debt 1,278.18 4,799.87 - 224.45 1,119.28 168.83 7,590.61 Equity 1,107.22 3,395.65 - 1,726.84 5,249.99 326.19 11,805.89 Government Securities - 10.73 7,193.59 - - 17.79 7,222.11 Mutual Fund Units - 499.36 - - - 100.09 599.45 Others 39.92 417.37 1,364.19 - - 120.60 1,942.08Shareholders Debt - 25.97 - - - - 25.97 Equity - 103.61 - - - - 103.61 Mutual Fund Units - 1.19 - - - - 1.19
3 Amortised Cost Financial AssetsPolicyholders Debt 1,483.26 3,915.64 - 43.89 208.51 20.28 5,671.58 Government Securities - - 9,170.46 30.05 - - 9,200.51 Others - 9.70 750.15 - - - 759.85Total Credit Risk Exposure 4,431.77 17,097.87 23,440.48 2,095.53 6,971.30 1,067.44 55,104.39
442 Grasim Industries Limited
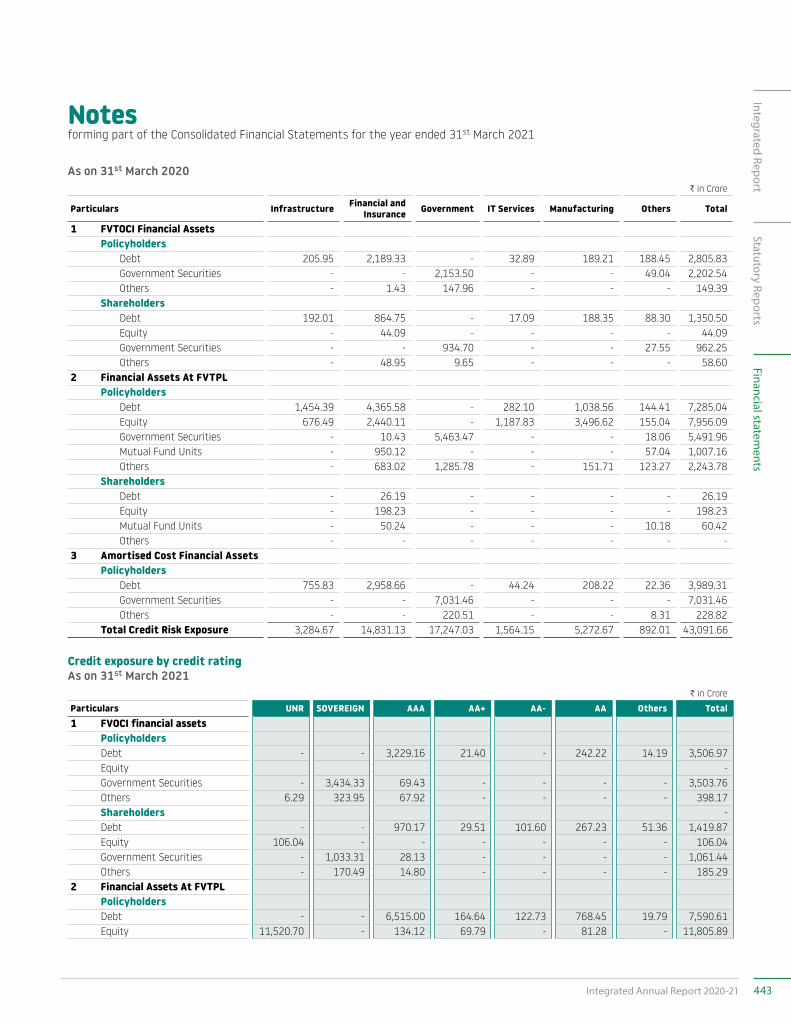
Notesforming part of the Consolidated Financial Statements for the year ended 31st March 2021
As on 31st March 2020C in Crore
Particulars Infrastructure Financial and Insurance Government IT Services Manufacturing Others Total
1 FVTOCI Financial AssetsPolicyholders Debt 205.95 2,189.33 - 32.89 189.21 188.45 2,805.83 Government Securities - - 2,153.50 - - 49.04 2,202.54 Others - 1.43 147.96 - - - 149.39 Shareholders Debt 192.01 864.75 - 17.09 188.35 88.30 1,350.50 Equity - 44.09 - - - - 44.09 Government Securities - - 934.70 - - 27.55 962.25 Others - 48.95 9.65 - - - 58.60
2 Financial Assets At FVTPLPolicyholders Debt 1,454.39 4,365.58 - 282.10 1,038.56 144.41 7,285.04 Equity 676.49 2,440.11 - 1,187.83 3,496.62 155.04 7,956.09 Government Securities - 10.43 5,463.47 - - 18.06 5,491.96 Mutual Fund Units - 950.12 - - - 57.04 1,007.16 Others - 683.02 1,285.78 - 151.71 123.27 2,243.78 Shareholders Debt - 26.19 - - - - 26.19 Equity - 198.23 - - - - 198.23 Mutual Fund Units - 50.24 - - - 10.18 60.42 Others - - - - - - -
3 Amortised Cost Financial AssetsPolicyholders Debt 755.83 2,958.66 - 44.24 208.22 22.36 3,989.31 Government Securities - - 7,031.46 - - - 7,031.46 Others - - 220.51 - - 8.31 228.82 Total Credit Risk Exposure 3,284.67 14,831.13 17,247.03 1,564.15 5,272.67 892.01 43,091.66
Credit exposure by credit ratingAs on 31st March 2021
C in Crore
Particulars UNR SOVEREIGN AAA AA+ AA- AA Others Total1 FVOCI financial assets
PolicyholdersDebt - - 3,229.16 21.40 - 242.22 14.19 3,506.97Equity -Government Securities - 3,434.33 69.43 - - - - 3,503.76Others 6.29 323.95 67.92 - - - - 398.17Shareholders -Debt - - 970.17 29.51 101.60 267.23 51.36 1,419.87Equity 106.04 - - - - - - 106.04Government Securities - 1,033.31 28.13 - - - - 1,061.44Others - 170.49 14.80 - - - - 185.29
2 Financial Assets At FVTPLPolicyholdersDebt - - 6,515.00 164.64 122.73 768.45 19.79 7,590.61Equity 11,520.70 - 134.12 69.79 - 81.28 - 11,805.89
443Integrated Annual Report 2020-21
Integrated ReportStatutory Reports
Financial statements
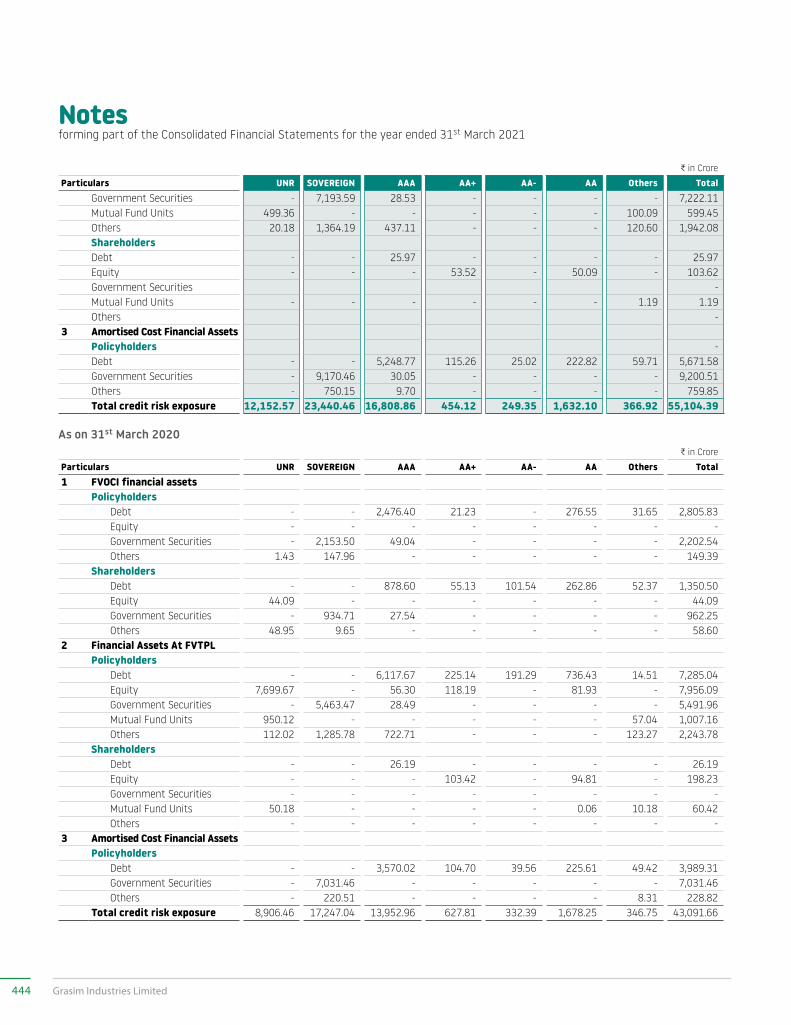
Notesforming part of the Consolidated Financial Statements for the year ended 31st March 2021
C in Crore
Particulars UNR SOVEREIGN AAA AA+ AA- AA Others TotalGovernment Securities - 7,193.59 28.53 - - - - 7,222.11Mutual Fund Units 499.36 - - - - - 100.09 599.45Others 20.18 1,364.19 437.11 - - - 120.60 1,942.08ShareholdersDebt - - 25.97 - - - - 25.97Equity - - - 53.52 - 50.09 - 103.62Government Securities -Mutual Fund Units - - - - - - 1.19 1.19Others -
3 Amortised Cost Financial AssetsPolicyholders -Debt - - 5,248.77 115.26 25.02 222.82 59.71 5,671.58Government Securities - 9,170.46 30.05 - - - - 9,200.51Others - 750.15 9.70 - - - - 759.85Total credit risk exposure 12,152.57 23,440.46 16,808.86 454.12 249.35 1,632.10 366.92 55,104.39
As on 31st March 2020C in Crore
Particulars UNR SOVEREIGN AAA AA+ AA- AA Others Total1 FVOCI financial assets
Policyholders Debt - - 2,476.40 21.23 - 276.55 31.65 2,805.83 Equity - - - - - - - - Government Securities - 2,153.50 49.04 - - - - 2,202.54 Others 1.43 147.96 - - - - - 149.39 Shareholders Debt - - 878.60 55.13 101.54 262.86 52.37 1,350.50 Equity 44.09 - - - - - - 44.09 Government Securities - 934.71 27.54 - - - - 962.25 Others 48.95 9.65 - - - - - 58.60
2 Financial Assets At FVTPLPolicyholders Debt - - 6,117.67 225.14 191.29 736.43 14.51 7,285.04 Equity 7,699.67 - 56.30 118.19 - 81.93 - 7,956.09 Government Securities - 5,463.47 28.49 - - - - 5,491.96 Mutual Fund Units 950.12 - - - - - 57.04 1,007.16 Others 112.02 1,285.78 722.71 - - - 123.27 2,243.78 Shareholders Debt - - 26.19 - - - - 26.19 Equity - - - 103.42 - 94.81 - 198.23 Government Securities - - - - - - - - Mutual Fund Units 50.18 - - - - 0.06 10.18 60.42 Others - - - - - - - -
3 Amortised Cost Financial AssetsPolicyholders Debt - - 3,570.02 104.70 39.56 225.61 49.42 3,989.31 Government Securities - 7,031.46 - - - - - 7,031.46 Others - 220.51 - - - - 8.31 228.82 Total credit risk exposure 8,906.46 17,247.04 13,952.96 627.81 332.39 1,678.25 346.75 43,091.66
444 Grasim Industries Limited
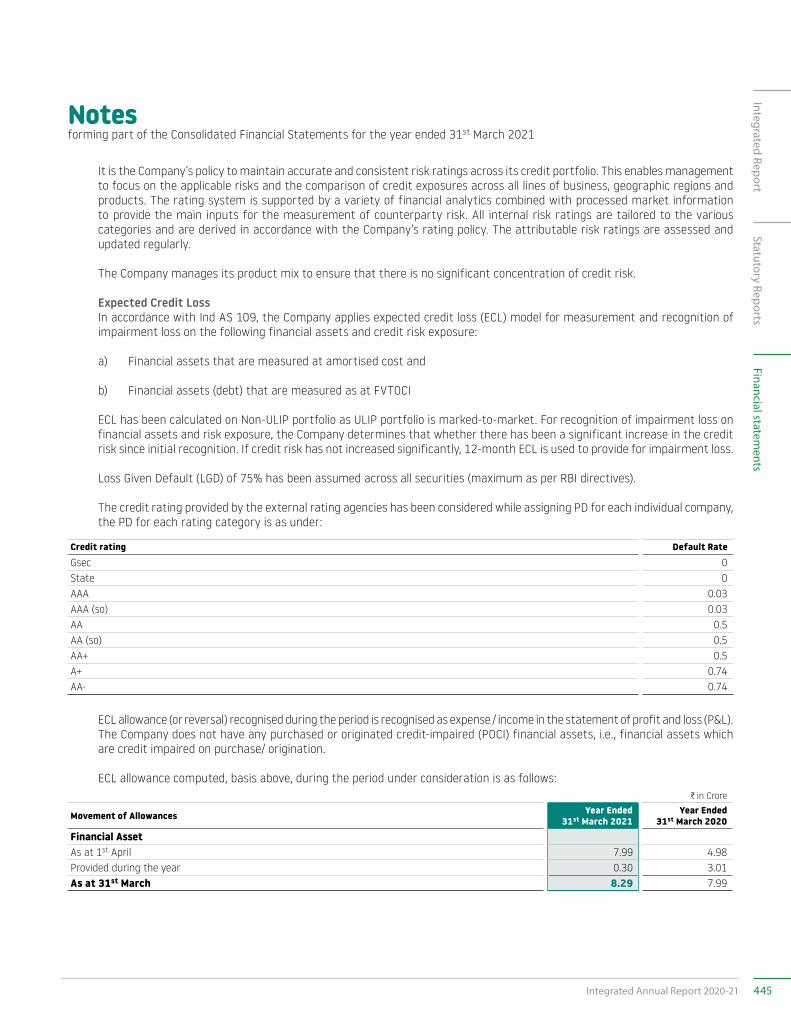
Notesforming part of the Consolidated Financial Statements for the year ended 31st March 2021
It is the Company’s policy to maintain accurate and consistent risk ratings across its credit portfolio. This enables management to focus on the applicable risks and the comparison of credit exposures across all lines of business, geographic regions and products. The rating system is supported by a variety of financial analytics combined with processed market information to provide the main inputs for the measurement of counterparty risk. All internal risk ratings are tailored to the various categories and are derived in accordance with the Company’s rating policy. The attributable risk ratings are assessed and updated regularly.
The Company manages its product mix to ensure that there is no significant concentration of credit risk.
Expected Credit Loss In accordance with Ind AS 109, the Company applies expected credit loss (ECL) model for measurement and recognition of
impairment loss on the following financial assets and credit risk exposure:
a) Financial assets that are measured at amortised cost and
b) Financial assets (debt) that are measured as at FVTOCI
ECL has been calculated on Non-ULIP portfolio as ULIP portfolio is marked-to-market. For recognition of impairment loss on financial assets and risk exposure, the Company determines that whether there has been a significant increase in the credit risk since initial recognition. If credit risk has not increased significantly, 12-month ECL is used to provide for impairment loss.
Loss Given Default (LGD) of 75% has been assumed across all securities (maximum as per RBI directives).
The credit rating provided by the external rating agencies has been considered while assigning PD for each individual company, the PD for each rating category is as under:
Credit rating Default RateGsec 0State 0AAA 0.03AAA (so) 0.03AA 0.5AA (so) 0.5AA+ 0.5A+ 0.74AA- 0.74
ECL allowance (or reversal) recognised during the period is recognised as expense / income in the statement of profit and loss (P&L). The Company does not have any purchased or originated credit-impaired (POCI) financial assets, i.e., financial assets which
are credit impaired on purchase/ origination.
ECL allowance computed, basis above, during the period under consideration is as follows:C in Crore
Movement of Allowances Year Ended 31st March 2021
Year Ended 31st March 2020
Financial AssetAs at 1st April 7.99 4.98 Provided during the year 0.30 3.01 As at 31st March 8.29 7.99
445Integrated Annual Report 2020-21
Integrated ReportStatutory Reports
Financial statements
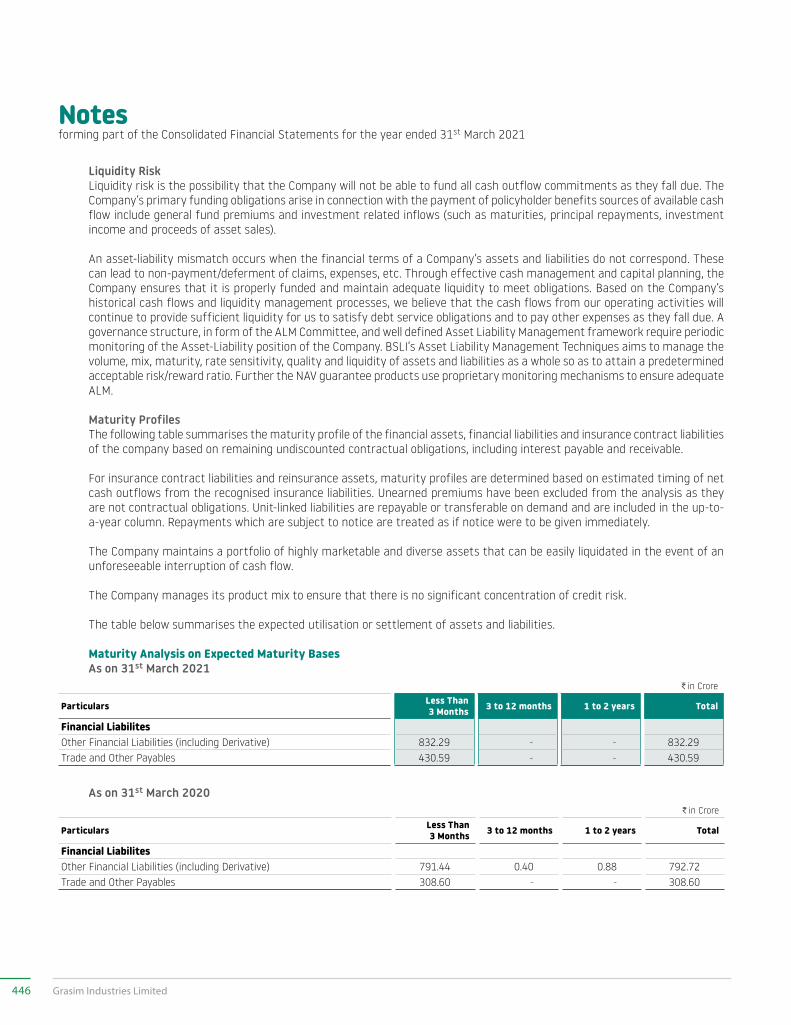
Notesforming part of the Consolidated Financial Statements for the year ended 31st March 2021
Liquidity Risk Liquidity risk is the possibility that the Company will not be able to fund all cash outflow commitments as they fall due. The
Company’s primary funding obligations arise in connection with the payment of policyholder benefits sources of available cash flow include general fund premiums and investment related inflows (such as maturities, principal repayments, investment income and proceeds of asset sales).
An asset-liability mismatch occurs when the financial terms of a Company’s assets and liabilities do not correspond. These can lead to non-payment/deferment of claims, expenses, etc. Through effective cash management and capital planning, the Company ensures that it is properly funded and maintain adequate liquidity to meet obligations. Based on the Company’s historical cash flows and liquidity management processes, we believe that the cash flows from our operating activities will continue to provide sufficient liquidity for us to satisfy debt service obligations and to pay other expenses as they fall due. A governance structure, in form of the ALM Committee, and well defined Asset Liability Management framework require periodic monitoring of the Asset-Liability position of the Company. BSLI’s Asset Liability Management Techniques aims to manage the volume, mix, maturity, rate sensitivity, quality and liquidity of assets and liabilities as a whole so as to attain a predetermined acceptable risk/reward ratio. Further the NAV guarantee products use proprietary monitoring mechanisms to ensure adequate ALM.
Maturity Profiles The following table summarises the maturity profile of the financial assets, financial liabilities and insurance contract liabilities
of the company based on remaining undiscounted contractual obligations, including interest payable and receivable.
For insurance contract liabilities and reinsurance assets, maturity profiles are determined based on estimated timing of net cash outflows from the recognised insurance liabilities. Unearned premiums have been excluded from the analysis as they are not contractual obligations. Unit-linked liabilities are repayable or transferable on demand and are included in the up-to-a-year column. Repayments which are subject to notice are treated as if notice were to be given immediately.
The Company maintains a portfolio of highly marketable and diverse assets that can be easily liquidated in the event of an unforeseeable interruption of cash flow.
The Company manages its product mix to ensure that there is no significant concentration of credit risk.
The table below summarises the expected utilisation or settlement of assets and liabilities.
Maturity Analysis on Expected Maturity Bases As on 31st March 2021
C in Crore
Particulars Less Than 3 Months 3 to 12 months 1 to 2 years Total
Financial LiabilitesOther Financial Liabilities (including Derivative) 832.29 - - 832.29Trade and Other Payables 430.59 - - 430.59
As on 31st March 2020C in Crore
Particulars Less Than 3 Months 3 to 12 months 1 to 2 years Total
Financial LiabilitesOther Financial Liabilities (including Derivative) 791.44 0.40 0.88 792.72 Trade and Other Payables 308.60 - - 308.60
446 Grasim Industries Limited
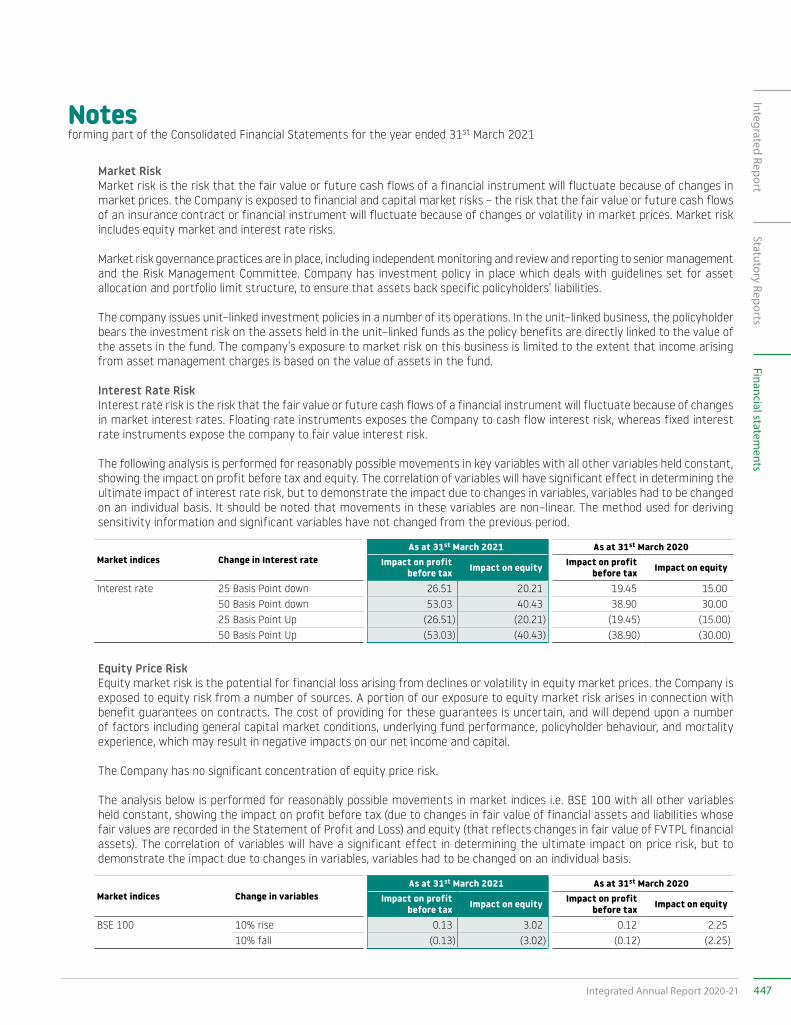
Notesforming part of the Consolidated Financial Statements for the year ended 31st March 2021
Market Risk Market risk is the risk that the fair value or future cash flows of a financial instrument will fluctuate because of changes in
market prices. the Company is exposed to financial and capital market risks – the risk that the fair value or future cash flows of an insurance contract or financial instrument will fluctuate because of changes or volatility in market prices. Market risk includes equity market and interest rate risks.
Market risk governance practices are in place, including independent monitoring and review and reporting to senior management and the Risk Management Committee. Company has investment policy in place which deals with guidelines set for asset allocation and portfolio limit structure, to ensure that assets back specific policyholders’ liabilities.
The company issues unit–linked investment policies in a number of its operations. In the unit–linked business, the policyholder bears the investment risk on the assets held in the unit–linked funds as the policy benefits are directly linked to the value of the assets in the fund. The company’s exposure to market risk on this business is limited to the extent that income arising from asset management charges is based on the value of assets in the fund.
Interest Rate Risk Interest rate risk is the risk that the fair value or future cash flows of a financial instrument will fluctuate because of changes
in market interest rates. Floating rate instruments exposes the Company to cash flow interest risk, whereas fixed interest rate instruments expose the company to fair value interest risk.
The following analysis is performed for reasonably possible movements in key variables with all other variables held constant, showing the impact on profit before tax and equity. The correlation of variables will have significant effect in determining the ultimate impact of interest rate risk, but to demonstrate the impact due to changes in variables, variables had to be changed on an individual basis. It should be noted that movements in these variables are non–linear. The method used for deriving sensitivity information and significant variables have not changed from the previous period.
Market indices Change in Interest rateAs at 31st March 2021 As at 31st March 2020
Impact on profit before tax Impact on equity Impact on profit
before tax Impact on equity
Interest rate 25 Basis Point down 26.51 20.21 19.45 15.00 50 Basis Point down 53.03 40.43 38.90 30.00 25 Basis Point Up (26.51) (20.21) (19.45) (15.00)50 Basis Point Up (53.03) (40.43) (38.90) (30.00)
Equity Price Risk Equity market risk is the potential for financial loss arising from declines or volatility in equity market prices. the Company is
exposed to equity risk from a number of sources. A portion of our exposure to equity market risk arises in connection with benefit guarantees on contracts. The cost of providing for these guarantees is uncertain, and will depend upon a number of factors including general capital market conditions, underlying fund performance, policyholder behaviour, and mortality experience, which may result in negative impacts on our net income and capital.
The Company has no significant concentration of equity price risk.
The analysis below is performed for reasonably possible movements in market indices i.e. BSE 100 with all other variables held constant, showing the impact on profit before tax (due to changes in fair value of financial assets and liabilities whose fair values are recorded in the Statement of Profit and Loss) and equity (that reflects changes in fair value of FVTPL financial assets). The correlation of variables will have a significant effect in determining the ultimate impact on price risk, but to demonstrate the impact due to changes in variables, variables had to be changed on an individual basis.
Market indices Change in variablesAs at 31st March 2021 As at 31st March 2020
Impact on profit before tax Impact on equity Impact on profit
before tax Impact on equity
BSE 100 10% rise 0.13 3.02 0.12 2.25 10% fall (0.13) (3.02) (0.12) (2.25)
447Integrated Annual Report 2020-21
Integrated ReportStatutory Reports
Financial statements
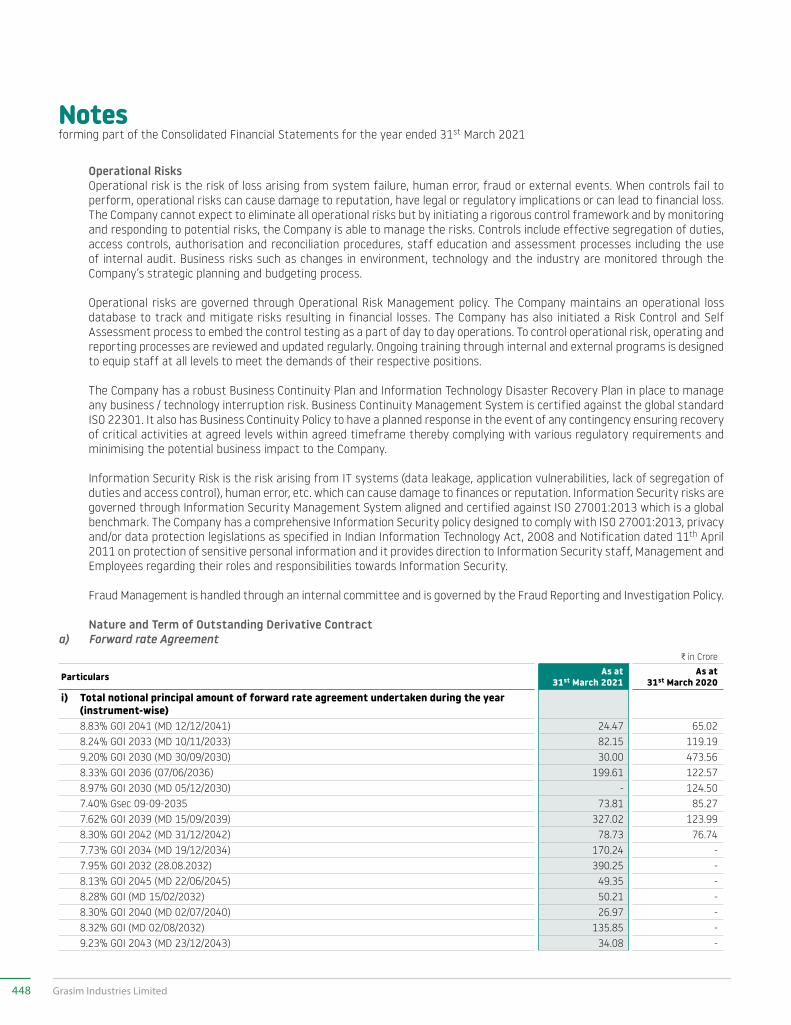
Notesforming part of the Consolidated Financial Statements for the year ended 31st March 2021
Operational Risks Operational risk is the risk of loss arising from system failure, human error, fraud or external events. When controls fail to
perform, operational risks can cause damage to reputation, have legal or regulatory implications or can lead to financial loss. The Company cannot expect to eliminate all operational risks but by initiating a rigorous control framework and by monitoring and responding to potential risks, the Company is able to manage the risks. Controls include effective segregation of duties, access controls, authorisation and reconciliation procedures, staff education and assessment processes including the use of internal audit. Business risks such as changes in environment, technology and the industry are monitored through the Company’s strategic planning and budgeting process.
Operational risks are governed through Operational Risk Management policy. The Company maintains an operational loss database to track and mitigate risks resulting in financial losses. The Company has also initiated a Risk Control and Self Assessment process to embed the control testing as a part of day to day operations. To control operational risk, operating and reporting processes are reviewed and updated regularly. Ongoing training through internal and external programs is designed to equip staff at all levels to meet the demands of their respective positions.
The Company has a robust Business Continuity Plan and Information Technology Disaster Recovery Plan in place to manage any business / technology interruption risk. Business Continuity Management System is certified against the global standard ISO 22301. It also has Business Continuity Policy to have a planned response in the event of any contingency ensuring recovery of critical activities at agreed levels within agreed timeframe thereby complying with various regulatory requirements and minimising the potential business impact to the Company.
Information Security Risk is the risk arising from IT systems (data leakage, application vulnerabilities, lack of segregation of duties and access control), human error, etc. which can cause damage to finances or reputation. Information Security risks are governed through Information Security Management System aligned and certified against ISO 27001:2013 which is a global benchmark. The Company has a comprehensive Information Security policy designed to comply with ISO 27001:2013, privacy and/or data protection legislations as specified in Indian Information Technology Act, 2008 and Notification dated 11th April 2011 on protection of sensitive personal information and it provides direction to Information Security staff, Management and Employees regarding their roles and responsibilities towards Information Security.
Fraud Management is handled through an internal committee and is governed by the Fraud Reporting and Investigation Policy.
Nature and Term of Outstanding Derivative Contract a) Forward rate Agreement
C in Crore
Particulars As at 31st March 2021
As at 31st March 2020
i) Total notional principal amount of forward rate agreement undertaken during the year (instrument-wise)
8.83% GOI 2041 (MD 12/12/2041) 24.47 65.02 8.24% GOI 2033 (MD 10/11/2033) 82.15 119.19 9.20% GOI 2030 (MD 30/09/2030) 30.00 473.56 8.33% GOI 2036 (07/06/2036) 199.61 122.57 8.97% GOI 2030 (MD 05/12/2030) - 124.50 7.40% Gsec 09-09-2035 73.81 85.27 7.62% GOI 2039 (MD 15/09/2039) 327.02 123.99 8.30% GOI 2042 (MD 31/12/2042) 78.73 76.74 7.73% GOI 2034 (MD 19/12/2034) 170.24 - 7.95% GOI 2032 (28.08.2032) 390.25 - 8.13% GOI 2045 (MD 22/06/2045) 49.35 - 8.28% GOI (MD 15/02/2032) 50.21 - 8.30% GOI 2040 (MD 02/07/2040) 26.97 - 8.32% GOI (MD 02/08/2032) 135.85 - 9.23% GOI 2043 (MD 23/12/2043) 34.08 -
448 Grasim Industries Limited
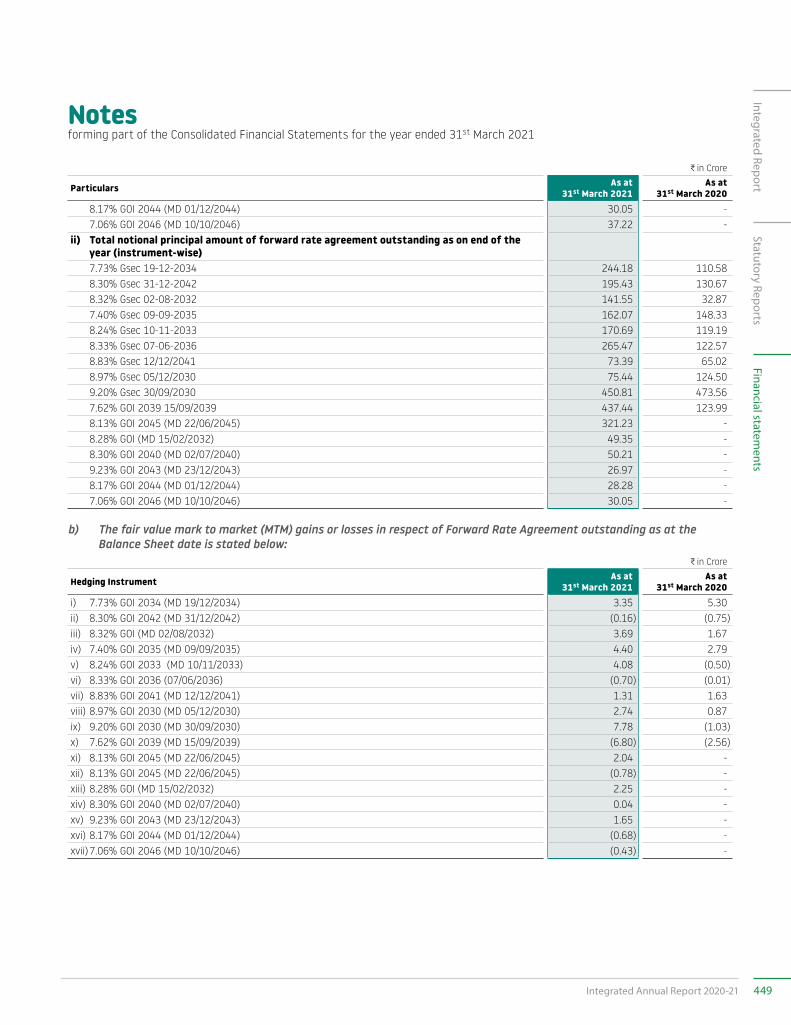
Notesforming part of the Consolidated Financial Statements for the year ended 31st March 2021
C in Crore
Particulars As at 31st March 2021
As at 31st March 2020
8.17% GOI 2044 (MD 01/12/2044) 30.05 - 7.06% GOI 2046 (MD 10/10/2046) 37.22 - ii) Total notional principal amount of forward rate agreement outstanding as on end of the
year (instrument-wise) 7.73% Gsec 19-12-2034 244.18 110.58 8.30% Gsec 31-12-2042 195.43 130.67 8.32% Gsec 02-08-2032 141.55 32.87 7.40% Gsec 09-09-2035 162.07 148.33 8.24% Gsec 10-11-2033 170.69 119.19 8.33% Gsec 07-06-2036 265.47 122.57 8.83% Gsec 12/12/2041 73.39 65.02 8.97% Gsec 05/12/2030 75.44 124.50 9.20% Gsec 30/09/2030 450.81 473.56 7.62% GOI 2039 15/09/2039 437.44 123.99 8.13% GOI 2045 (MD 22/06/2045) 321.23 - 8.28% GOI (MD 15/02/2032) 49.35 - 8.30% GOI 2040 (MD 02/07/2040) 50.21 - 9.23% GOI 2043 (MD 23/12/2043) 26.97 - 8.17% GOI 2044 (MD 01/12/2044) 28.28 - 7.06% GOI 2046 (MD 10/10/2046) 30.05 -
b) The fair value mark to market (MTM) gains or losses in respect of Forward Rate Agreement outstanding as at the Balance Sheet date is stated below:
C in Crore
Hedging Instrument As at 31st March 2021
As at 31st March 2020
i) 7.73% GOI 2034 (MD 19/12/2034) 3.35 5.30 ii) 8.30% GOI 2042 (MD 31/12/2042) (0.16) (0.75)iii) 8.32% GOI (MD 02/08/2032) 3.69 1.67 iv) 7.40% GOI 2035 (MD 09/09/2035) 4.40 2.79 v) 8.24% GOI 2033 (MD 10/11/2033) 4.08 (0.50)vi) 8.33% GOI 2036 (07/06/2036) (0.70) (0.01)vii) 8.83% GOI 2041 (MD 12/12/2041) 1.31 1.63 viii) 8.97% GOI 2030 (MD 05/12/2030) 2.74 0.87 ix) 9.20% GOI 2030 (MD 30/09/2030) 7.78 (1.03)x) 7.62% GOI 2039 (MD 15/09/2039) (6.80) (2.56)xi) 8.13% GOI 2045 (MD 22/06/2045) 2.04 - xii) 8.13% GOI 2045 (MD 22/06/2045) (0.78) - xiii) 8.28% GOI (MD 15/02/2032) 2.25 - xiv) 8.30% GOI 2040 (MD 02/07/2040) 0.04 - xv) 9.23% GOI 2043 (MD 23/12/2043) 1.65 - xvi) 8.17% GOI 2044 (MD 01/12/2044) (0.68) - xvii) 7.06% GOI 2046 (MD 10/10/2046) (0.43) -
449Integrated Annual Report 2020-21
Integrated ReportStatutory Reports
Financial statements
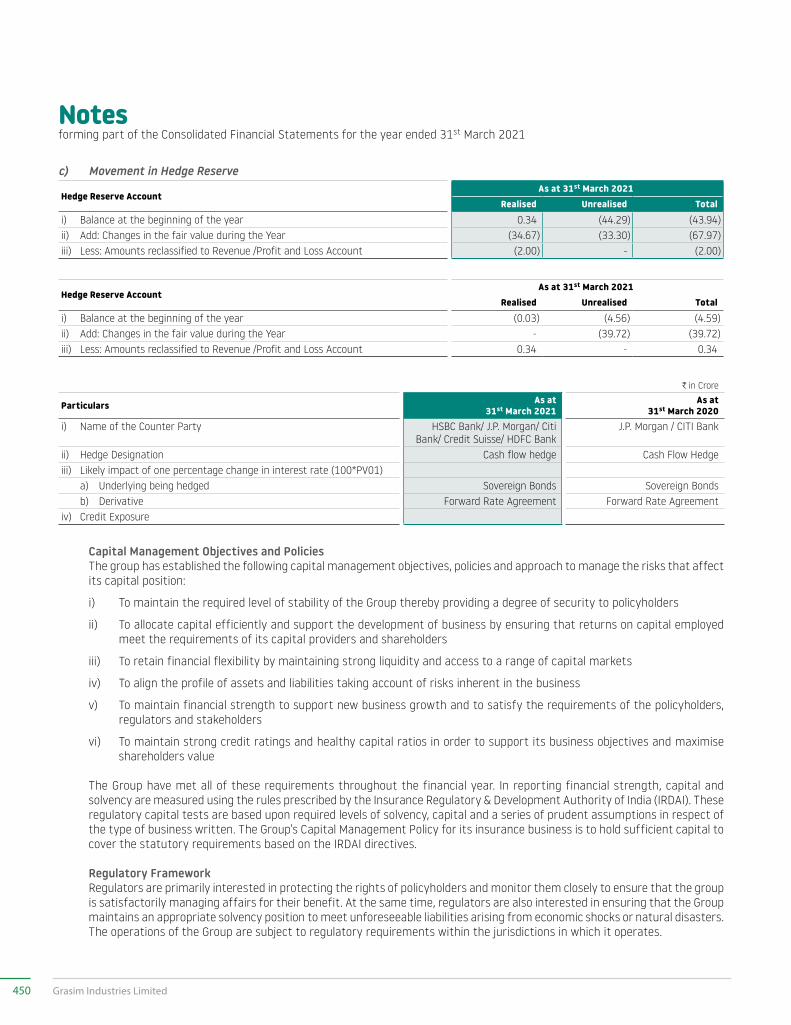
Notesforming part of the Consolidated Financial Statements for the year ended 31st March 2021
c) Movement in Hedge Reserve
Hedge Reserve AccountAs at 31st March 2021
Realised Unrealised Totali) Balance at the beginning of the year 0.34 (44.29) (43.94)ii) Add: Changes in the fair value during the Year (34.67) (33.30) (67.97)iii) Less: Amounts reclassified to Revenue /Profit and Loss Account (2.00) - (2.00)
Hedge Reserve AccountAs at 31st March 2021
Realised Unrealised Totali) Balance at the beginning of the year (0.03) (4.56) (4.59)ii) Add: Changes in the fair value during the Year - (39.72) (39.72)iii) Less: Amounts reclassified to Revenue /Profit and Loss Account 0.34 - 0.34
C in Crore
Particulars As at 31st March 2021
As at 31st March 2020
i) Name of the Counter Party HSBC Bank/ J.P. Morgan/ Citi Bank/ Credit Suisse/ HDFC Bank
J.P. Morgan / CITI Bank
ii) Hedge Designation Cash flow hedge Cash Flow Hedgeiii) Likely impact of one percentage change in interest rate (100*PV01) a) Underlying being hedged Sovereign Bonds Sovereign Bonds b) Derivative Forward Rate Agreement Forward Rate Agreementiv) Credit Exposure
Capital Management Objectives and Policies The group has established the following capital management objectives, policies and approach to manage the risks that affect
its capital position:
i) To maintain the required level of stability of the Group thereby providing a degree of security to policyholders
ii) To allocate capital efficiently and support the development of business by ensuring that returns on capital employed meet the requirements of its capital providers and shareholders
iii) To retain financial flexibility by maintaining strong liquidity and access to a range of capital markets
iv) To align the profile of assets and liabilities taking account of risks inherent in the business
v) To maintain financial strength to support new business growth and to satisfy the requirements of the policyholders, regulators and stakeholders
vi) To maintain strong credit ratings and healthy capital ratios in order to support its business objectives and maximise shareholders value
The Group have met all of these requirements throughout the financial year. In reporting financial strength, capital and solvency are measured using the rules prescribed by the Insurance Regulatory & Development Authority of India (IRDAI). These regulatory capital tests are based upon required levels of solvency, capital and a series of prudent assumptions in respect of the type of business written. The Group’s Capital Management Policy for its insurance business is to hold sufficient capital to cover the statutory requirements based on the IRDAI directives.
Regulatory Framework Regulators are primarily interested in protecting the rights of policyholders and monitor them closely to ensure that the group
is satisfactorily managing affairs for their benefit. At the same time, regulators are also interested in ensuring that the Group maintains an appropriate solvency position to meet unforeseeable liabilities arising from economic shocks or natural disasters. The operations of the Group are subject to regulatory requirements within the jurisdictions in which it operates.
450 Grasim Industries Limited
Notesforming part of the Consolidated Financial Statements for the year ended 31st March 2021
B. Financial Risk Management and its Policies for NBFC and HFC Businesses Credit Risk Credit risk is the risk that the NBFC and HFC will incur a loss because its customers or counterparties fail to discharge their
contractual obligations. The NBFC and HFC manages and controls credit risk by setting limits on the amount of risk it is willing to accept for individual counterparties and for geographical and industry concentrations, and by monitoring exposures in relation to such limits.
The NBFC and HFC has established a credit quality review process to provide early identification of possible changes in the creditworthiness of counterparties, including regular collateral revisions. Counterparty limits are established by the use of a credit risk classification system, which assigns each counterparty a risk rating. Risk ratings are subject to regular revision. The credit quality review process aims to allow the NBFC and HFC to assess the potential loss as a result of the risks to which it is exposed and take corrective action.
Analysis of maximum exposure to credit risk and collateral and other credit enhancements
The NBFC and HFC by way of loan sanction letter and other loan securing documents agrees with its customers on collateral security to be provided by the customers in secured loan exposures that are subject to credit risk. Collateral security enables us to recover all or part of the outstanding exposure by liquidating the collateral asset provided, in cases where the borrower is unable or unwilling to fulfil its primary obligations.
Collateral security accepted could be in the form of:
a) Financial collateral in the form of pledge of equity shares, units of mutual funds, assignment of life insurance policies;
b) Current assets in the form of inventories meant for sale or receivables arising out of the sale of finished goods;
c) Fixed asset (in the form of immovable properties – real estate, Plant and Machinery, Equipment’s);
d) Third-party obligation (in the form of Irrevocable Unconditional Guarantee issued by Bank, Third party);
e) Risk participation from Credit Guarantee Fund Trust for Micro and Small Enterprises (CGTMSE); and
f) Assignment of borrower’s rights and interests under agreements with third parties.
In addition, we also stipulates escrow of cash flows and a Debt Service Reserve Account (DSRA) for project loans. Collateral serves to mitigate the inherent risk of credit loss in an exposure, by either improving recoveries in the event of a default or substituting the borrower.
As part of the assessment of a credit transaction the availability, adequacy and suitability of collateral for the transaction is evaluated and decided upon. The processes includes verification of the title to the collateral offered and valuation by technical experts where warranted. We accept as collateral only securities of good quality and have in place legally effective and enforceable documentation.
For guarantee’s taken, the guarantor’s creditworthiness is assessed during the credit assessment process of the transaction. We have collateral type specific haircuts in place which are reviewed at intervals as appropriate to the type of collateral.
The NBFC and HFC recognises that collateral can be a credit mitigant (alternative source of repayment), but does not replace or dilute the underwriting standards the company adopts to underwrite credit exposures.”
Liquidity Risk Liquidity risk is defined as the risk that the NBFC & HFC will encounter difficulty in meeting obligations associated with financial
liabilities that are settled by delivering cash or another financial asset. Liquidity risk arises because of the possibility that the NBFC & HFC might be unable to meet its payment obligations when they fall due as a result of mismatches in the timing of the cash flows under both normal and stress circumstances.
451Integrated Annual Report 2020-21
Integrated ReportStatutory Reports
Financial statements
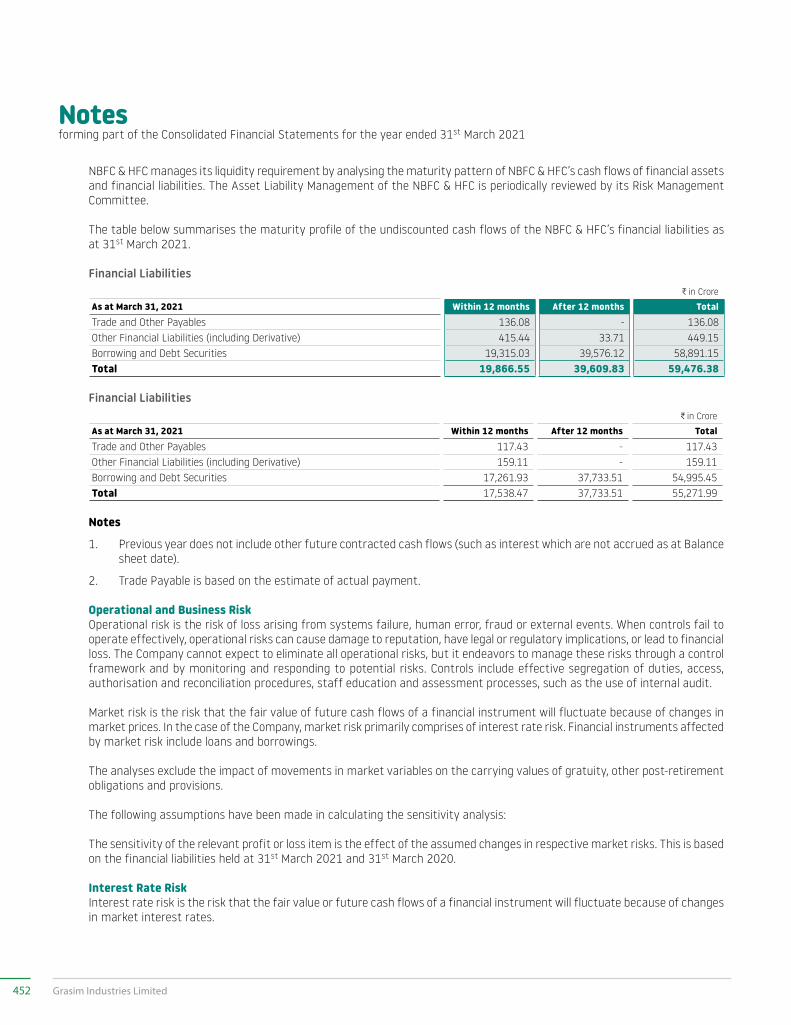
Notesforming part of the Consolidated Financial Statements for the year ended 31st March 2021
NBFC & HFC manages its liquidity requirement by analysing the maturity pattern of NBFC & HFC’s cash flows of financial assets and financial liabilities. The Asset Liability Management of the NBFC & HFC is periodically reviewed by its Risk Management Committee.
The table below summarises the maturity profile of the undiscounted cash flows of the NBFC & HFC’s financial liabilities as at 31st March 2021.
Financial LiabilitiesC in Crore
As at March 31, 2021 Within 12 months After 12 months TotalTrade and Other Payables 136.08 - 136.08 Other Financial Liabilities (including Derivative) 415.44 33.71 449.15Borrowing and Debt Securities 19,315.03 39,576.12 58,891.15 Total 19,866.55 39,609.83 59,476.38
Financial LiabilitiesC in Crore
As at March 31, 2021 Within 12 months After 12 months TotalTrade and Other Payables 117.43 - 117.43 Other Financial Liabilities (including Derivative) 159.11 - 159.11 Borrowing and Debt Securities 17,261.93 37,733.51 54,995.45 Total 17,538.47 37,733.51 55,271.99
Notes
1. Previous year does not include other future contracted cash flows (such as interest which are not accrued as at Balance sheet date).
2. Trade Payable is based on the estimate of actual payment.
Operational and Business Risk Operational risk is the risk of loss arising from systems failure, human error, fraud or external events. When controls fail to
operate effectively, operational risks can cause damage to reputation, have legal or regulatory implications, or lead to financial loss. The Company cannot expect to eliminate all operational risks, but it endeavors to manage these risks through a control framework and by monitoring and responding to potential risks. Controls include effective segregation of duties, access, authorisation and reconciliation procedures, staff education and assessment processes, such as the use of internal audit.
Market risk is the risk that the fair value of future cash flows of a financial instrument will fluctuate because of changes in market prices. In the case of the Company, market risk primarily comprises of interest rate risk. Financial instruments affected by market risk include loans and borrowings.
The analyses exclude the impact of movements in market variables on the carrying values of gratuity, other post-retirement obligations and provisions.
The following assumptions have been made in calculating the sensitivity analysis:
The sensitivity of the relevant profit or loss item is the effect of the assumed changes in respective market risks. This is based on the financial liabilities held at 31st March 2021 and 31st March 2020.
Interest Rate Risk Interest rate risk is the risk that the fair value or future cash flows of a financial instrument will fluctuate because of changes
in market interest rates.
452 Grasim Industries Limited
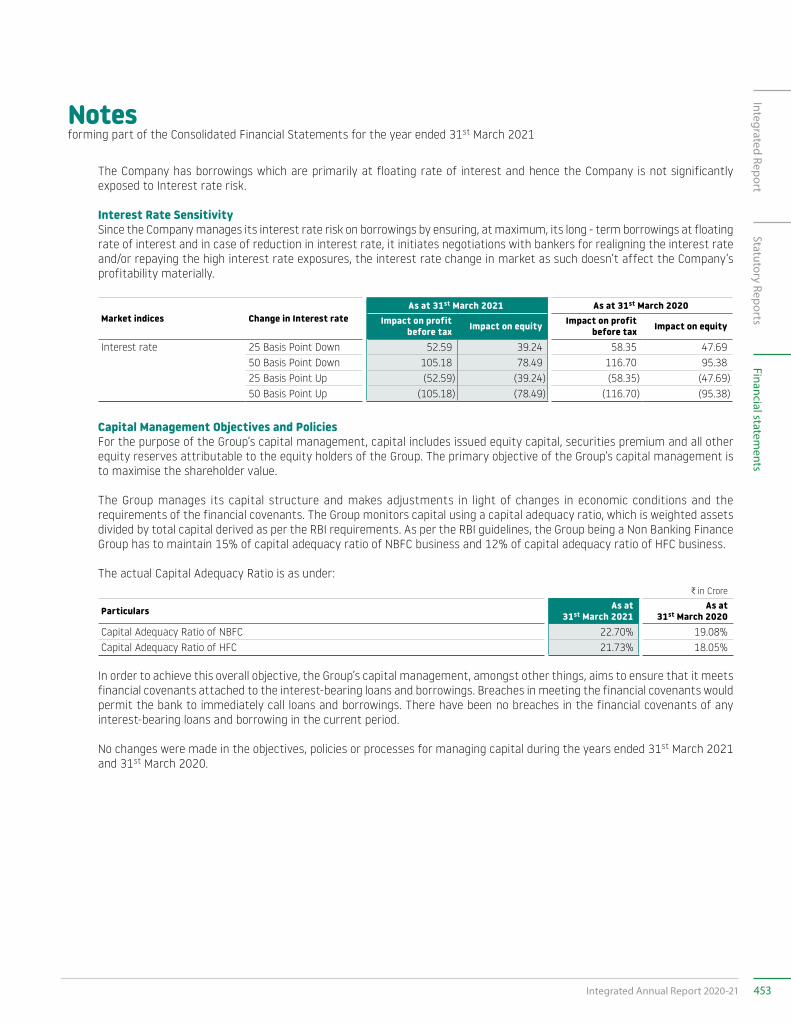
Notesforming part of the Consolidated Financial Statements for the year ended 31st March 2021
The Company has borrowings which are primarily at floating rate of interest and hence the Company is not significantly exposed to Interest rate risk.
Interest Rate Sensitivity Since the Company manages its interest rate risk on borrowings by ensuring, at maximum, its long - term borrowings at floating
rate of interest and in case of reduction in interest rate, it initiates negotiations with bankers for realigning the interest rate and/or repaying the high interest rate exposures, the interest rate change in market as such doesn’t affect the Company’s profitability materially.
Market indices Change in Interest rateAs at 31st March 2021 As at 31st March 2020
Impact on profit before tax Impact on equity Impact on profit
before tax Impact on equity
Interest rate 25 Basis Point Down 52.59 39.24 58.35 47.6950 Basis Point Down 105.18 78.49 116.70 95.3825 Basis Point Up (52.59) (39.24) (58.35) (47.69)50 Basis Point Up (105.18) (78.49) (116.70) (95.38)
Capital Management Objectives and Policies For the purpose of the Group’s capital management, capital includes issued equity capital, securities premium and all other
equity reserves attributable to the equity holders of the Group. The primary objective of the Group’s capital management is to maximise the shareholder value.
The Group manages its capital structure and makes adjustments in light of changes in economic conditions and the requirements of the financial covenants. The Group monitors capital using a capital adequacy ratio, which is weighted assets divided by total capital derived as per the RBI requirements. As per the RBI guidelines, the Group being a Non Banking Finance Group has to maintain 15% of capital adequacy ratio of NBFC business and 12% of capital adequacy ratio of HFC business.
The actual Capital Adequacy Ratio is as under:C in Crore
Particulars As at 31st March 2021
As at 31st March 2020
Capital Adequacy Ratio of NBFC 22.70% 19.08%Capital Adequacy Ratio of HFC 21.73% 18.05%
In order to achieve this overall objective, the Group’s capital management, amongst other things, aims to ensure that it meets financial covenants attached to the interest-bearing loans and borrowings. Breaches in meeting the financial covenants would permit the bank to immediately call loans and borrowings. There have been no breaches in the financial covenants of any interest-bearing loans and borrowing in the current period.
No changes were made in the objectives, policies or processes for managing capital during the years ended 31st March 2021 and 31st March 2020.
453Integrated Annual Report 2020-21
Integrated ReportStatutory Reports
Financial statements
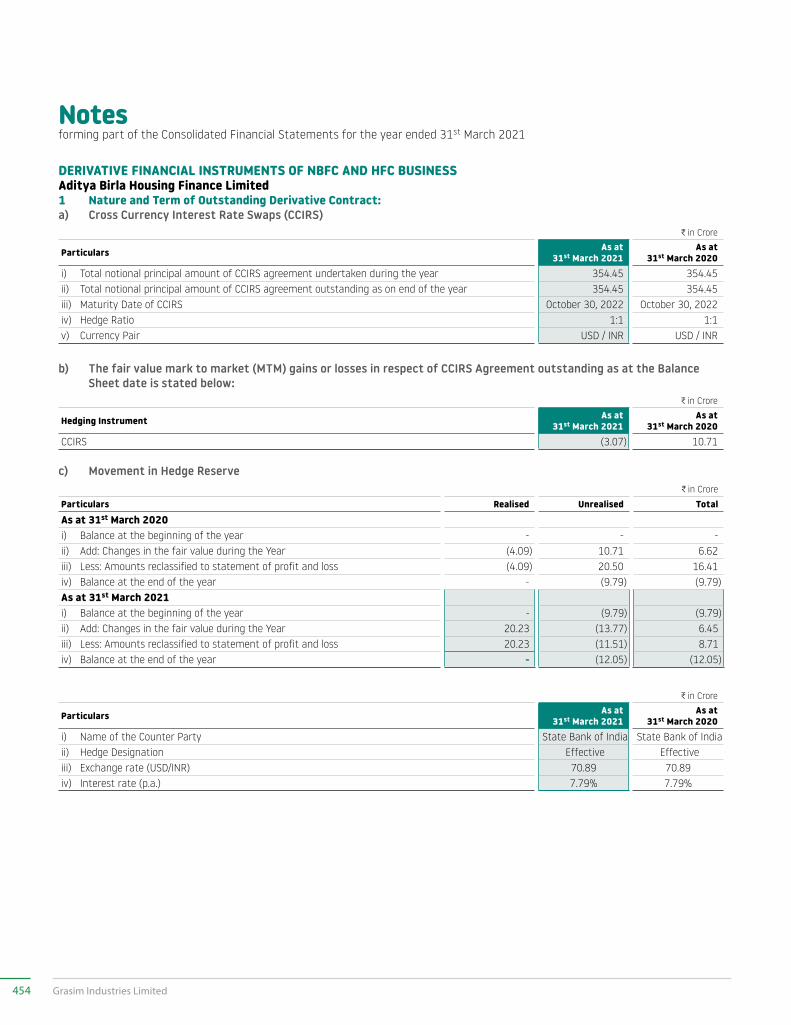
Notesforming part of the Consolidated Financial Statements for the year ended 31st March 2021
DERIVATIVE FINANCIAL INSTRUMENTS OF NBFC AND HFC BUSINESSAditya Birla Housing Finance Limited1 Nature and Term of Outstanding Derivative Contract:a) Cross Currency Interest Rate Swaps (CCIRS)
C in Crore
Particulars As at 31st March 2021
As at 31st March 2020
i) Total notional principal amount of CCIRS agreement undertaken during the year 354.45 354.45 ii) Total notional principal amount of CCIRS agreement outstanding as on end of the year 354.45 354.45 iii) Maturity Date of CCIRS October 30, 2022 October 30, 2022 iv) Hedge Ratio 1:1 1:1 v) Currency Pair USD / INR USD / INR
b) The fair value mark to market (MTM) gains or losses in respect of CCIRS Agreement outstanding as at the Balance Sheet date is stated below:
C in Crore
Hedging Instrument As at 31st March 2021
As at 31st March 2020
CCIRS (3.07) 10.71
c) Movement in Hedge ReserveC in Crore
Particulars Realised Unrealised TotalAs at 31st March 2020i) Balance at the beginning of the year - - - ii) Add: Changes in the fair value during the Year (4.09) 10.71 6.62 iii) Less: Amounts reclassified to statement of profit and loss (4.09) 20.50 16.41 iv) Balance at the end of the year - (9.79) (9.79)As at 31st March 2021i) Balance at the beginning of the year - (9.79) (9.79)ii) Add: Changes in the fair value during the Year 20.23 (13.77) 6.45 iii) Less: Amounts reclassified to statement of profit and loss 20.23 (11.51) 8.71 iv) Balance at the end of the year - (12.05) (12.05)
C in Crore
Particulars As at 31st March 2021
As at 31st March 2020
i) Name of the Counter Party State Bank of India State Bank of India ii) Hedge Designation Effective Effective iii) Exchange rate (USD/INR) 70.89 70.89iv) Interest rate (p.a.) 7.79% 7.79%
454 Grasim Industries Limited
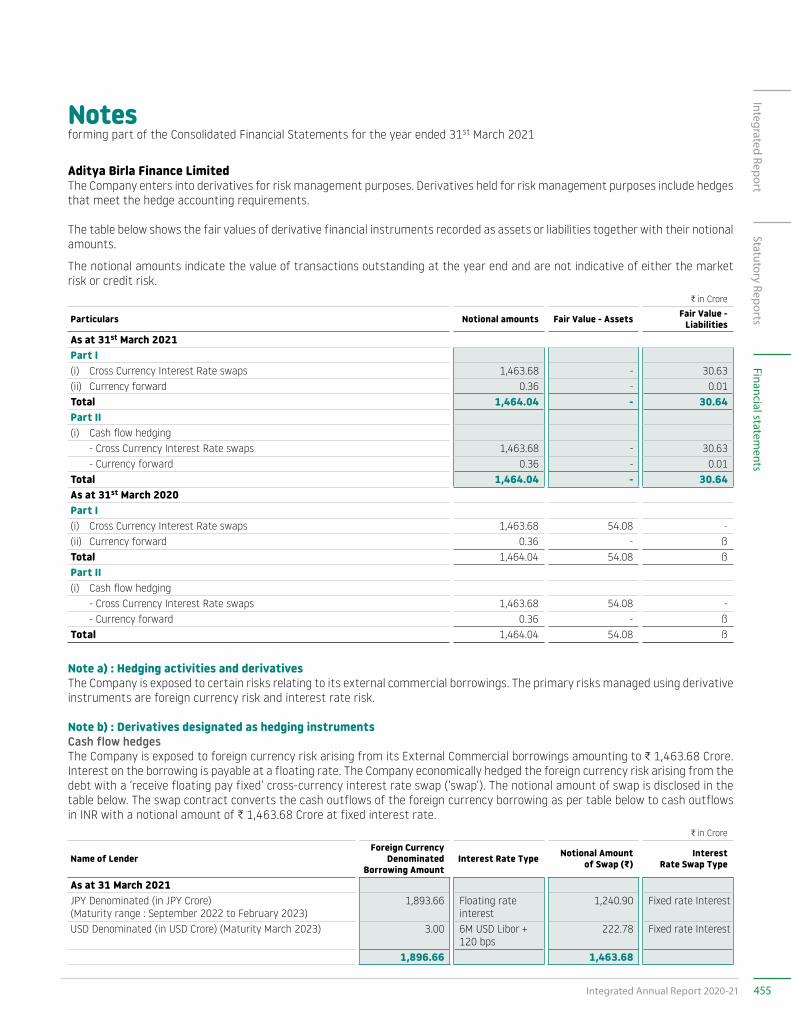
Notesforming part of the Consolidated Financial Statements for the year ended 31st March 2021
Aditya Birla Finance LimitedThe Company enters into derivatives for risk management purposes. Derivatives held for risk management purposes include hedges that meet the hedge accounting requirements.
The table below shows the fair values of derivative financial instruments recorded as assets or liabilities together with their notional amounts.
The notional amounts indicate the value of transactions outstanding at the year end and are not indicative of either the market risk or credit risk.
C in Crore
Particulars Notional amounts Fair Value - Assets Fair Value - Liabilities
As at 31st March 2021Part I(i) Cross Currency Interest Rate swaps 1,463.68 - 30.63 (ii) Currency forward 0.36 - 0.01 Total 1,464.04 - 30.64Part II(i) Cash flow hedging - Cross Currency Interest Rate swaps 1,463.68 - 30.63 - Currency forward 0.36 - 0.01 Total 1,464.04 - 30.64 As at 31st March 2020Part I(i) Cross Currency Interest Rate swaps 1,463.68 54.08 - (ii) Currency forward 0.36 - ß Total 1,464.04 54.08 ß Part II(i) Cash flow hedging - Cross Currency Interest Rate swaps 1,463.68 54.08 - - Currency forward 0.36 - ß Total 1,464.04 54.08 ß
Note a) : Hedging activities and derivativesThe Company is exposed to certain risks relating to its external commercial borrowings. The primary risks managed using derivative instruments are foreign currency risk and interest rate risk.
Note b) : Derivatives designated as hedging instrumentsCash flow hedgesThe Company is exposed to foreign currency risk arising from its External Commercial borrowings amounting to C 1,463.68 Crore. Interest on the borrowing is payable at a floating rate. The Company economically hedged the foreign currency risk arising from the debt with a ‘receive floating pay fixed’ cross-currency interest rate swap (‘swap’). The notional amount of swap is disclosed in the table below. The swap contract converts the cash outflows of the foreign currency borrowing as per table below to cash outflows in INR with a notional amount of C 1,463.68 Crore at fixed interest rate.
C in Crore
Name of LenderForeign Currency
Denominated Borrowing Amount
Interest Rate Type Notional Amount of Swap (G)
Interest Rate Swap Type
As at 31 March 2021JPY Denominated (in JPY Crore) (Maturity range : September 2022 to February 2023)
1,893.66 Floating rate interest
1,240.90 Fixed rate Interest
USD Denominated (in USD Crore) (Maturity March 2023) 3.00 6M USD Libor + 120 bps
222.78 Fixed rate Interest
1,896.66 1,463.68
455Integrated Annual Report 2020-21
Integrated ReportStatutory Reports
Financial statements
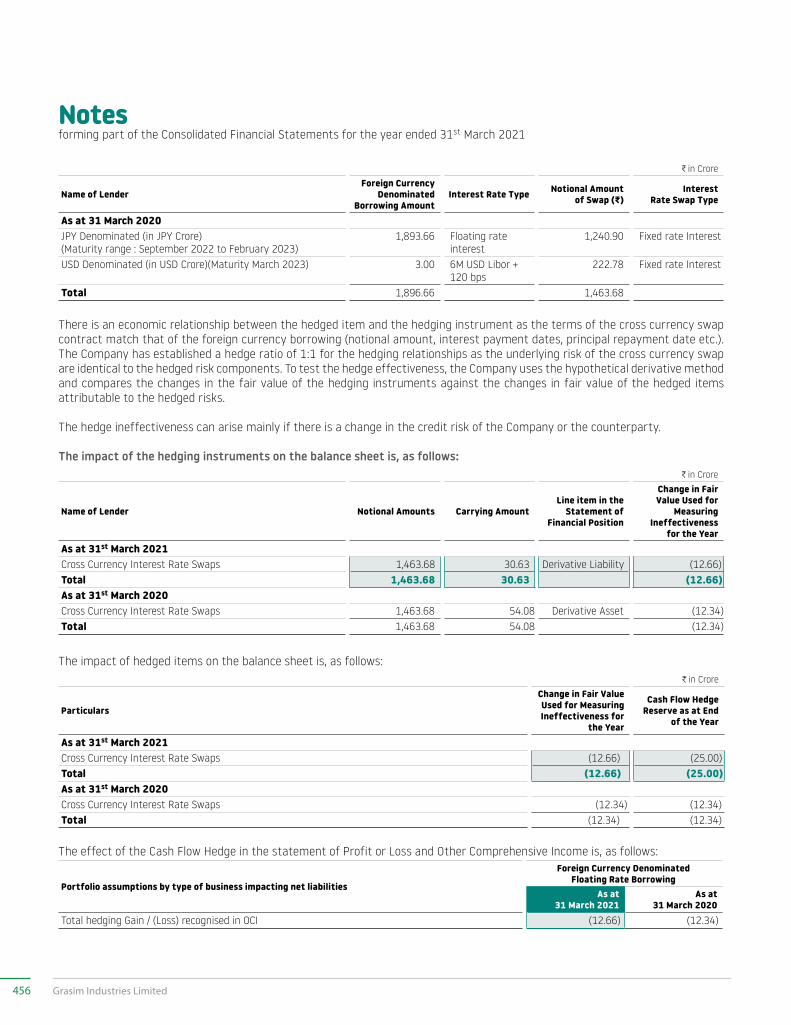
Notesforming part of the Consolidated Financial Statements for the year ended 31st March 2021
C in Crore
Name of LenderForeign Currency
Denominated Borrowing Amount
Interest Rate Type Notional Amount of Swap (G)
Interest Rate Swap Type
As at 31 March 2020JPY Denominated (in JPY Crore) (Maturity range : September 2022 to February 2023)
1,893.66 Floating rate interest
1,240.90 Fixed rate Interest
USD Denominated (in USD Crore)(Maturity March 2023) 3.00 6M USD Libor + 120 bps
222.78 Fixed rate Interest
Total 1,896.66 1,463.68
There is an economic relationship between the hedged item and the hedging instrument as the terms of the cross currency swap contract match that of the foreign currency borrowing (notional amount, interest payment dates, principal repayment date etc.). The Company has established a hedge ratio of 1:1 for the hedging relationships as the underlying risk of the cross currency swap are identical to the hedged risk components. To test the hedge effectiveness, the Company uses the hypothetical derivative method and compares the changes in the fair value of the hedging instruments against the changes in fair value of the hedged items attributable to the hedged risks.
The hedge ineffectiveness can arise mainly if there is a change in the credit risk of the Company or the counterparty.
The impact of the hedging instruments on the balance sheet is, as follows:C in Crore
Name of Lender Notional Amounts Carrying AmountLine item in the
Statement of Financial Position
Change in Fair Value Used for
Measuring Ineffectiveness
for the YearAs at 31st March 2021Cross Currency Interest Rate Swaps 1,463.68 30.63 Derivative Liability (12.66)Total 1,463.68 30.63 (12.66)As at 31st March 2020Cross Currency Interest Rate Swaps 1,463.68 54.08 Derivative Asset (12.34)Total 1,463.68 54.08 (12.34)
The impact of hedged items on the balance sheet is, as follows:C in Crore
Particulars
Change in Fair Value Used for Measuring Ineffectiveness for
the Year
Cash Flow Hedge Reserve as at End
of the Year
As at 31st March 2021Cross Currency Interest Rate Swaps (12.66) (25.00)Total (12.66) (25.00)As at 31st March 2020Cross Currency Interest Rate Swaps (12.34) (12.34)Total (12.34) (12.34)
The effect of the Cash Flow Hedge in the statement of Profit or Loss and Other Comprehensive Income is, as follows:
Portfolio assumptions by type of business impacting net liabilities
Foreign Currency Denominated Floating Rate Borrowing
As at 31 March 2021
As at 31 March 2020
Total hedging Gain / (Loss) recognised in OCI (12.66) (12.34)
456 Grasim Industries Limited
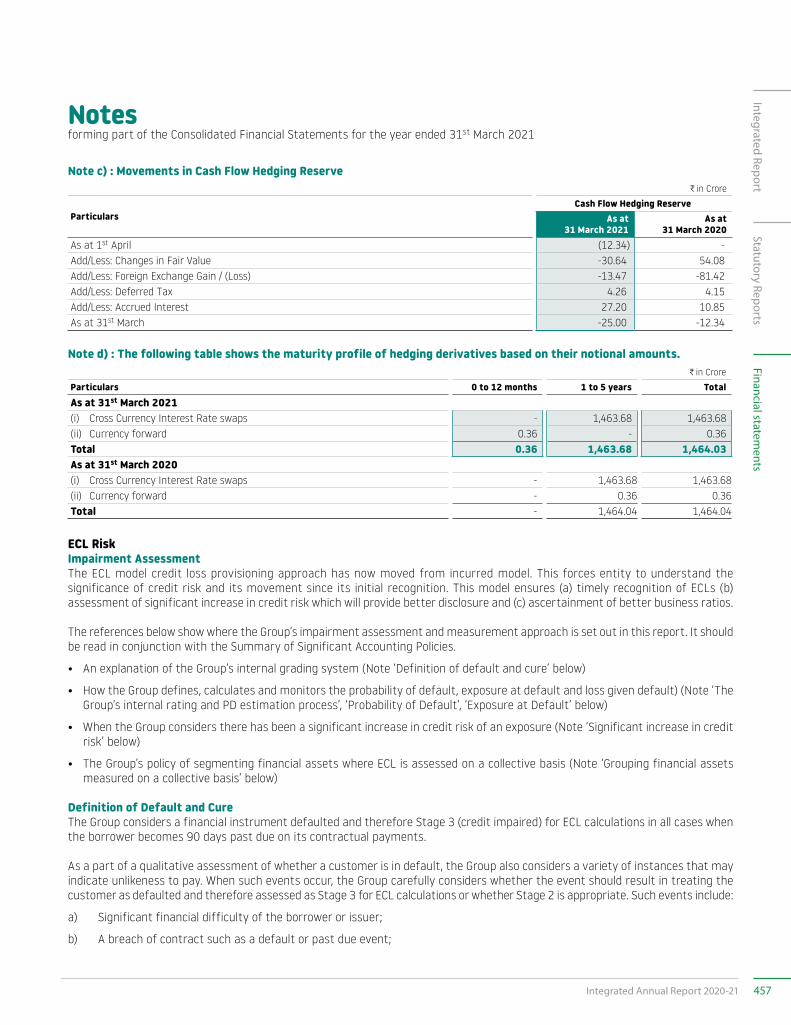
Notesforming part of the Consolidated Financial Statements for the year ended 31st March 2021
Note c) : Movements in Cash Flow Hedging ReserveC in Crore
ParticularsCash Flow Hedging Reserve
As at 31 March 2021
As at 31 March 2020
As at 1st April (12.34) - Add/Less: Changes in Fair Value -30.64 54.08Add/Less: Foreign Exchange Gain / (Loss) -13.47 -81.42Add/Less: Deferred Tax 4.26 4.15Add/Less: Accrued Interest 27.20 10.85As at 31st March -25.00 -12.34
Note d) : The following table shows the maturity profile of hedging derivatives based on their notional amounts.C in Crore
Particulars 0 to 12 months 1 to 5 years TotalAs at 31st March 2021(i) Cross Currency Interest Rate swaps - 1,463.68 1,463.68 (ii) Currency forward 0.36 - 0.36 Total 0.36 1,463.68 1,464.03 As at 31st March 2020(i) Cross Currency Interest Rate swaps - 1,463.68 1,463.68 (ii) Currency forward - 0.36 0.36 Total - 1,464.04 1,464.04
ECL RiskImpairment AssessmentThe ECL model credit loss provisioning approach has now moved from incurred model. This forces entity to understand the significance of credit risk and its movement since its initial recognition. This model ensures (a) timely recognition of ECLs (b) assessment of significant increase in credit risk which will provide better disclosure and (c) ascertainment of better business ratios.
The references below show where the Group’s impairment assessment and measurement approach is set out in this report. It should be read in conjunction with the Summary of Significant Accounting Policies.
• An explanation of the Group’s internal grading system (Note ‘Definition of default and cure’ below)
• How the Group defines, calculates and monitors the probability of default, exposure at default and loss given default) (Note ‘The Group’s internal rating and PD estimation process’, ‘Probability of Default’, ‘Exposure at Default’ below)
• When the Group considers there has been a significant increase in credit risk of an exposure (Note ‘Significant increase in credit risk’ below)
• The Group’s policy of segmenting financial assets where ECL is assessed on a collective basis (Note ‘Grouping financial assets measured on a collective basis’ below)
Definition of Default and CureThe Group considers a financial instrument defaulted and therefore Stage 3 (credit impaired) for ECL calculations in all cases when the borrower becomes 90 days past due on its contractual payments.
As a part of a qualitative assessment of whether a customer is in default, the Group also considers a variety of instances that may indicate unlikeness to pay. When such events occur, the Group carefully considers whether the event should result in treating the customer as defaulted and therefore assessed as Stage 3 for ECL calculations or whether Stage 2 is appropriate. Such events include:
a) Significant financial difficulty of the borrower or issuer;
b) A breach of contract such as a default or past due event;
457Integrated Annual Report 2020-21
Integrated ReportStatutory Reports
Financial statements
Notesforming part of the Consolidated Financial Statements for the year ended 31st March 2021
c) The restructuring of a loan or advance by the Group on terms that the Group would not consider otherwise;
d) It is becoming probable that the borrower will enter bankruptcy or other financial reorganisation; or
e) The disappearance of an active market for a security because of financial difficulties and the customer has delay in his repayments over a month.”
The Group’s internal rating and PD Estimation Processa. Internal Rating: A robust internal credit rating framework is vital for effective credit risk management. It is specified by RBI on
credit risk management that lenders should have an internal rating framework and the lenders must have independent Credit Risk Control Units (CRCU) or equivalents that are responsible for the design or selection, implementation and performance of their internal rating systems. Accordingly we also have an internal rating framework developed along with CRISIL, with ratings being assigned to all the customer/ portfolio pool – (eligible customers for Ratings) and used extensively in internal decision-making.
b. It is further specified in the policy that Internal rating/grading/scoring of the borrower/client is at least Investment grade rating as per ABFL’s internal credit rating model or valid/live external rating.”
Probability of Default (PD)PD is calculated basis likelihood that the borrower will default within one year horison(Basis for Stage 1), For Stage 2 – it is defined as significant increase in credit risk and probability is defined as borrower’s probability to default in lifetime.
Exposure at DefaultGross exposure/potential gross exposure under a facility (i.e. the amount that is legally owed to the lender) at the time of default by a borrower. Exposure at Default gives an estimate of the amount outstanding.
Loss Given Default (LGD)LGD is usually shown as the percentage of Exposure at Default that the lender might lose in case the borrower defaults. It depends, among others, on the type of collateral, its value, borrower rating and the expected proceeds from the sale (e.g. sales proceeds from sales of collaterals/securities) of the assets, NPV net of recovery costs.
Significant Increase in Credit Riska. There is significant increase in credit risk, when there is deterioration in account performance and expected resolution is not
available.
b. Further, for large borrowers after assessing the following Risks in totality and deterioration in each factor, it is then assessed whether there is a significant increase in credit risk
i. Industry Risk
ii. Business Risk
iii. Management Risk
iv. Financial Risk
v. Banking Conduct & Facility level Conduct.
c. Significant increase in credit risk is also gauged through Credit Rating. Credit rating is an opinion of capacity of borrower to meet its financial obligations to the depositor or bondholder (i.e. lender of money) on a particular issue or type of instrument (i.e. a domestic or foreign currency: short or medium or long-term, etc.) in a timely manner. The rating measures the relative risk of an issuers ability and willingness to repay both interest and principal over the period of the rated instrument. i.e. rating signifies the risk of default of the borrower that is rated.
458 Grasim Industries Limited
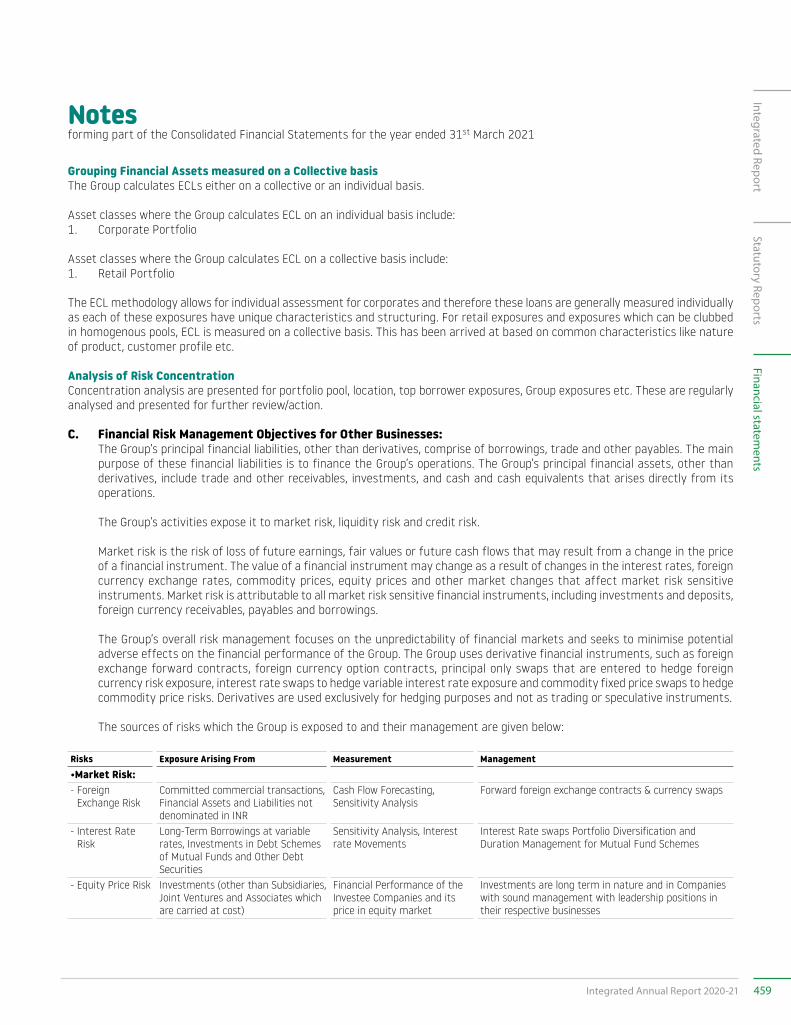
Notesforming part of the Consolidated Financial Statements for the year ended 31st March 2021
Grouping Financial Assets measured on a Collective basisThe Group calculates ECLs either on a collective or an individual basis.
Asset classes where the Group calculates ECL on an individual basis include:1. Corporate Portfolio
Asset classes where the Group calculates ECL on a collective basis include:1. Retail Portfolio
The ECL methodology allows for individual assessment for corporates and therefore these loans are generally measured individually as each of these exposures have unique characteristics and structuring. For retail exposures and exposures which can be clubbed in homogenous pools, ECL is measured on a collective basis. This has been arrived at based on common characteristics like nature of product, customer profile etc.
Analysis of Risk ConcentrationConcentration analysis are presented for portfolio pool, location, top borrower exposures, Group exposures etc. These are regularly analysed and presented for further review/action.
C. Financial Risk Management Objectives for Other Businesses: The Group’s principal financial liabilities, other than derivatives, comprise of borrowings, trade and other payables. The main
purpose of these financial liabilities is to finance the Group’s operations. The Group’s principal financial assets, other than derivatives, include trade and other receivables, investments, and cash and cash equivalents that arises directly from its operations.
The Group’s activities expose it to market risk, liquidity risk and credit risk.
Market risk is the risk of loss of future earnings, fair values or future cash flows that may result from a change in the price of a financial instrument. The value of a financial instrument may change as a result of changes in the interest rates, foreign currency exchange rates, commodity prices, equity prices and other market changes that affect market risk sensitive instruments. Market risk is attributable to all market risk sensitive financial instruments, including investments and deposits, foreign currency receivables, payables and borrowings.
The Group’s overall risk management focuses on the unpredictability of financial markets and seeks to minimise potential adverse effects on the financial performance of the Group. The Group uses derivative financial instruments, such as foreign exchange forward contracts, foreign currency option contracts, principal only swaps that are entered to hedge foreign currency risk exposure, interest rate swaps to hedge variable interest rate exposure and commodity fixed price swaps to hedge commodity price risks. Derivatives are used exclusively for hedging purposes and not as trading or speculative instruments.
The sources of risks which the Group is exposed to and their management are given below:
Risks Exposure Arising From Measurement Management•Market Risk:- Foreign
Exchange RiskCommitted commercial transactions, Financial Assets and Liabilities not denominated in INR
Cash Flow Forecasting, Sensitivity Analysis
Forward foreign exchange contracts & currency swaps
- Interest Rate Risk
Long-Term Borrowings at variable rates, Investments in Debt Schemes of Mutual Funds and Other Debt Securities
Sensitivity Analysis, Interest rate Movements
Interest Rate swaps Portfolio Diversification and Duration Management for Mutual Fund Schemes
- Equity Price Risk Investments (other than Subsidiaries, Joint Ventures and Associates which are carried at cost)
Financial Performance of the Investee Companies and its price in equity market
Investments are long term in nature and in Companies with sound management with leadership positions in their respective businesses
459Integrated Annual Report 2020-21
Integrated ReportStatutory Reports
Financial statements
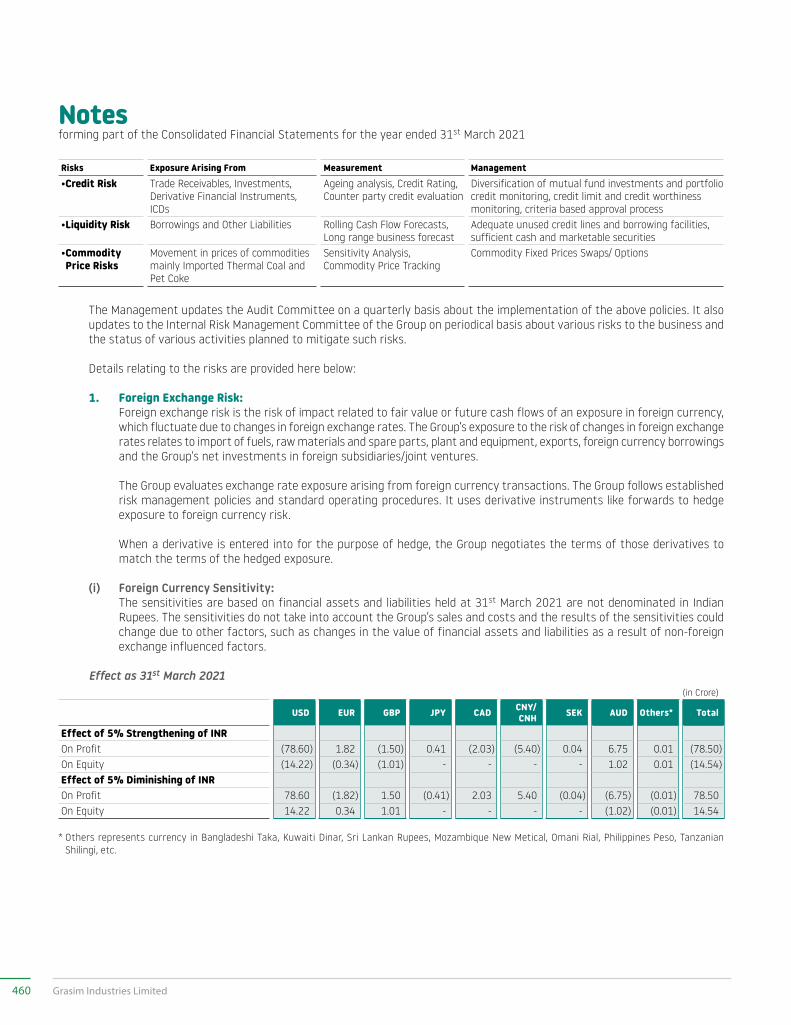
Notesforming part of the Consolidated Financial Statements for the year ended 31st March 2021
Risks Exposure Arising From Measurement Management•Credit Risk Trade Receivables, Investments,
Derivative Financial Instruments, ICDs
Ageing analysis, Credit Rating, Counter party credit evaluation
Diversification of mutual fund investments and portfolio credit monitoring, credit limit and credit worthiness monitoring, criteria based approval process
•Liquidity Risk Borrowings and Other Liabilities Rolling Cash Flow Forecasts, Long range business forecast
Adequate unused credit lines and borrowing facilities, sufficient cash and marketable securities
• Commodity Price Risks
Movement in prices of commodities mainly Imported Thermal Coal and Pet Coke
Sensitivity Analysis, Commodity Price Tracking
Commodity Fixed Prices Swaps/ Options
The Management updates the Audit Committee on a quarterly basis about the implementation of the above policies. It also updates to the Internal Risk Management Committee of the Group on periodical basis about various risks to the business and the status of various activities planned to mitigate such risks.
Details relating to the risks are provided here below:
1. Foreign Exchange Risk: Foreign exchange risk is the risk of impact related to fair value or future cash flows of an exposure in foreign currency,
which fluctuate due to changes in foreign exchange rates. The Group’s exposure to the risk of changes in foreign exchange rates relates to import of fuels, raw materials and spare parts, plant and equipment, exports, foreign currency borrowings and the Group’s net investments in foreign subsidiaries/joint ventures.
The Group evaluates exchange rate exposure arising from foreign currency transactions. The Group follows established risk management policies and standard operating procedures. It uses derivative instruments like forwards to hedge exposure to foreign currency risk.
When a derivative is entered into for the purpose of hedge, the Group negotiates the terms of those derivatives to match the terms of the hedged exposure.
(i) Foreign Currency Sensitivity: The sensitivities are based on financial assets and liabilities held at 31st March 2021 are not denominated in Indian
Rupees. The sensitivities do not take into account the Group’s sales and costs and the results of the sensitivities could change due to other factors, such as changes in the value of financial assets and liabilities as a result of non-foreign exchange influenced factors.
Effect as 31st March 2021(in Crore)
USD EUR GBP JPY CAD CNY/CNH SEK AUD Others* Total
Effect of 5% Strengthening of INROn Profit (78.60) 1.82 (1.50) 0.41 (2.03) (5.40) 0.04 6.75 0.01 (78.50)On Equity (14.22) (0.34) (1.01) - - - - 1.02 0.01 (14.54)Effect of 5% Diminishing of INROn Profit 78.60 (1.82) 1.50 (0.41) 2.03 5.40 (0.04) (6.75) (0.01) 78.50On Equity 14.22 0.34 1.01 - - - - (1.02) (0.01) 14.54
* Others represents currency in Bangladeshi Taka, Kuwaiti Dinar, Sri Lankan Rupees, Mozambique New Metical, Omani Rial, Philippines Peso, Tanzanian Shilingi, etc.
460 Grasim Industries Limited
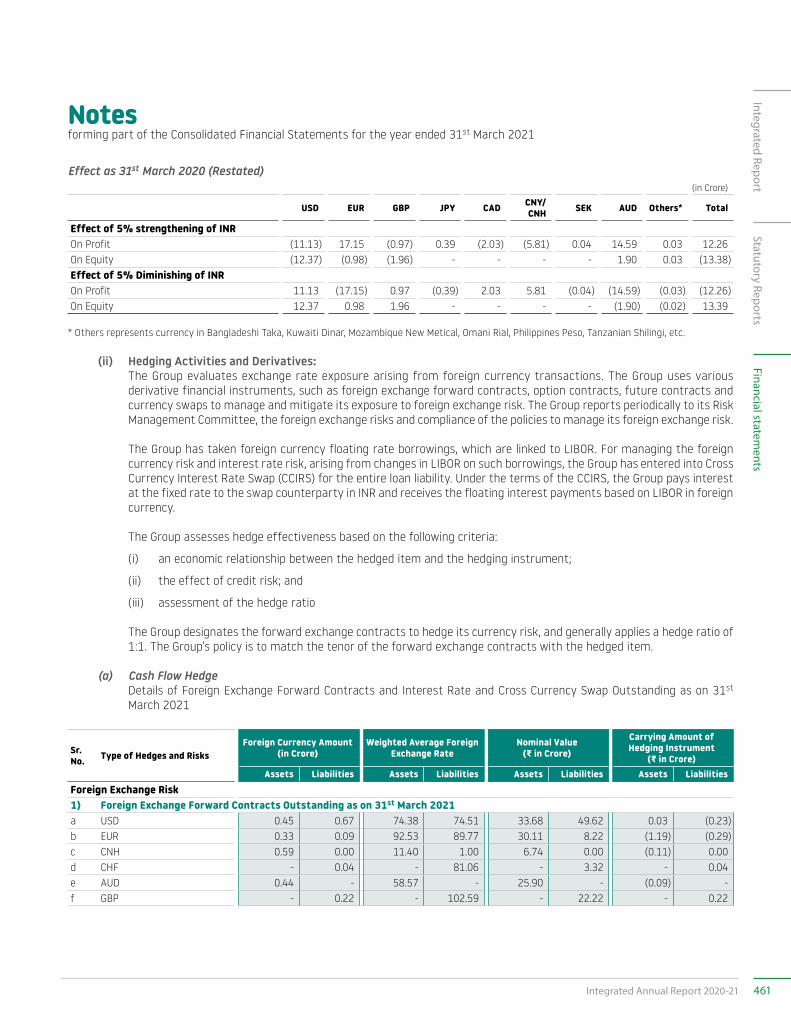
Notesforming part of the Consolidated Financial Statements for the year ended 31st March 2021
Effect as 31st March 2020 (Restated)(in Crore)
USD EUR GBP JPY CAD CNY/CNH SEK AUD Others* Total
Effect of 5% strengthening of INROn Profit (11.13) 17.15 (0.97) 0.39 (2.03) (5.81) 0.04 14.59 0.03 12.26 On Equity (12.37) (0.98) (1.96) - - - - 1.90 0.03 (13.38)Effect of 5% Diminishing of INROn Profit 11.13 (17.15) 0.97 (0.39) 2.03 5.81 (0.04) (14.59) (0.03) (12.26)On Equity 12.37 0.98 1.96 - - - - (1.90) (0.02) 13.39
* Others represents currency in Bangladeshi Taka, Kuwaiti Dinar, Mozambique New Metical, Omani Rial, Philippines Peso, Tanzanian Shilingi, etc.
(ii) Hedging Activities and Derivatives: The Group evaluates exchange rate exposure arising from foreign currency transactions. The Group uses various
derivative financial instruments, such as foreign exchange forward contracts, option contracts, future contracts and currency swaps to manage and mitigate its exposure to foreign exchange risk. The Group reports periodically to its Risk Management Committee, the foreign exchange risks and compliance of the policies to manage its foreign exchange risk.
The Group has taken foreign currency floating rate borrowings, which are linked to LIBOR. For managing the foreign currency risk and interest rate risk, arising from changes in LIBOR on such borrowings, the Group has entered into Cross Currency Interest Rate Swap (CCIRS) for the entire loan liability. Under the terms of the CCIRS, the Group pays interest at the fixed rate to the swap counterparty in INR and receives the floating interest payments based on LIBOR in foreign currency.
The Group assesses hedge effectiveness based on the following criteria:
(i) an economic relationship between the hedged item and the hedging instrument;
(ii) the effect of credit risk; and
(iii) assessment of the hedge ratio
The Group designates the forward exchange contracts to hedge its currency risk, and generally applies a hedge ratio of 1:1. The Group’s policy is to match the tenor of the forward exchange contracts with the hedged item.
(a) Cash Flow Hedge Details of Foreign Exchange Forward Contracts and Interest Rate and Cross Currency Swap Outstanding as on 31st
March 2021
Sr. No. Type of Hedges and Risks
Foreign Currency Amount (in Crore)
Weighted Average Foreign Exchange Rate
Nominal Value (G in Crore)
Carrying Amount of Hedging Instrument
(G in Crore)Assets Liabilities Assets Liabilities Assets Liabilities Assets Liabilities
Foreign Exchange Risk1) Foreign Exchange Forward Contracts Outstanding as on 31st March 2021a USD 0.45 0.67 74.38 74.51 33.68 49.62 0.03 (0.23)b EUR 0.33 0.09 92.53 89.77 30.11 8.22 (1.19) (0.29)c CNH 0.59 0.00 11.40 1.00 6.74 0.00 (0.11) 0.00d CHF - 0.04 - 81.06 - 3.32 - 0.04e AUD 0.44 - 58.57 - 25.90 - (0.09) -f GBP - 0.22 - 102.59 - 22.22 - 0.22
461Integrated Annual Report 2020-21
Integrated ReportStatutory Reports
Financial statements
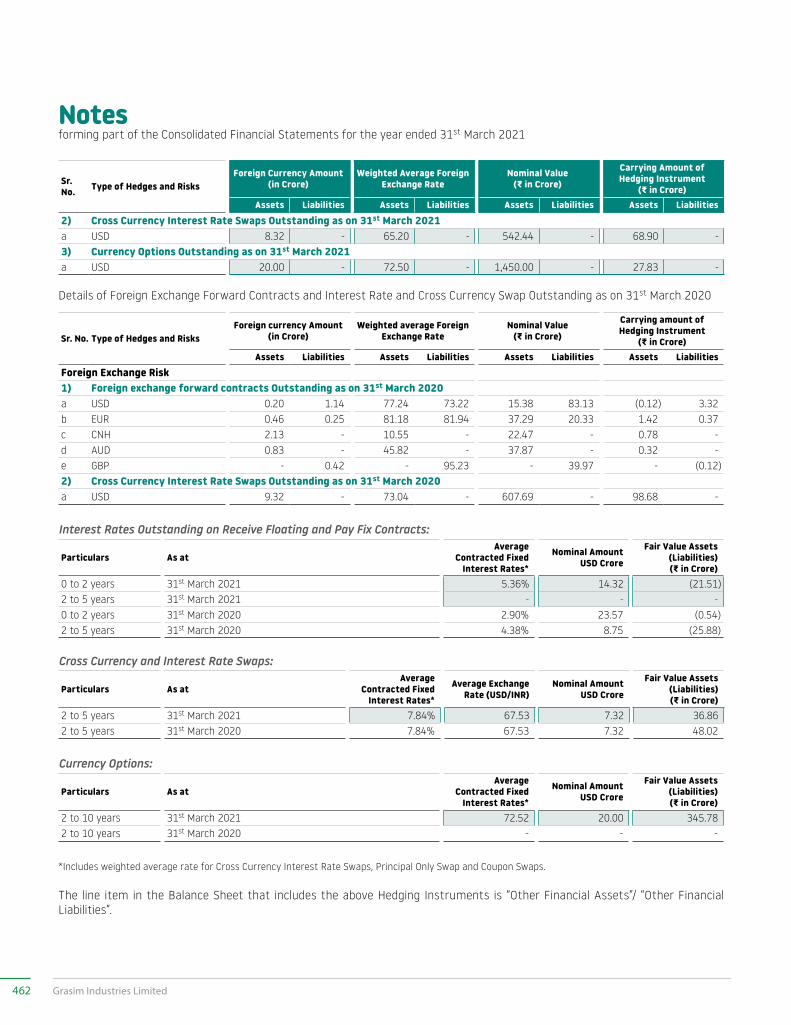
Notesforming part of the Consolidated Financial Statements for the year ended 31st March 2021
Sr. No. Type of Hedges and Risks
Foreign Currency Amount (in Crore)
Weighted Average Foreign Exchange Rate
Nominal Value (G in Crore)
Carrying Amount of Hedging Instrument
(G in Crore)Assets Liabilities Assets Liabilities Assets Liabilities Assets Liabilities
2) Cross Currency Interest Rate Swaps Outstanding as on 31st March 2021a USD 8.32 - 65.20 - 542.44 - 68.90 -3) Currency Options Outstanding as on 31st March 2021a USD 20.00 - 72.50 - 1,450.00 - 27.83 -
Details of Foreign Exchange Forward Contracts and Interest Rate and Cross Currency Swap Outstanding as on 31st March 2020
Sr. No. Type of Hedges and RisksForeign currency Amount
(in Crore)Weighted average Foreign
Exchange RateNominal Value
(G in Crore)
Carrying amount of Hedging Instrument
(G in Crore)Assets Liabilities Assets Liabilities Assets Liabilities Assets Liabilities
Foreign Exchange Risk1) Foreign exchange forward contracts Outstanding as on 31st March 2020a USD 0.20 1.14 77.24 73.22 15.38 83.13 (0.12) 3.32 b EUR 0.46 0.25 81.18 81.94 37.29 20.33 1.42 0.37 c CNH 2.13 - 10.55 - 22.47 - 0.78 - d AUD 0.83 - 45.82 - 37.87 - 0.32 - e GBP - 0.42 - 95.23 - 39.97 - (0.12)2) Cross Currency Interest Rate Swaps Outstanding as on 31st March 2020a USD 9.32 - 73.04 - 607.69 - 98.68 -
Interest Rates Outstanding on Receive Floating and Pay Fix Contracts:
Particulars As atAverage
Contracted Fixed Interest Rates*
Nominal Amount USD Crore
Fair Value Assets (Liabilities) (G in Crore)
0 to 2 years 31st March 2021 5.36% 14.32 (21.51)2 to 5 years 31st March 2021 - - -0 to 2 years 31st March 2020 2.90% 23.57 (0.54)2 to 5 years 31st March 2020 4.38% 8.75 (25.88)
Cross Currency and Interest Rate Swaps:
Particulars As atAverage
Contracted Fixed Interest Rates*
Average Exchange Rate (USD/INR)
Nominal Amount USD Crore
Fair Value Assets (Liabilities) (G in Crore)
2 to 5 years 31st March 2021 7.84% 67.53 7.32 36.862 to 5 years 31st March 2020 7.84% 67.53 7.32 48.02
Currency Options:
Particulars As atAverage
Contracted Fixed Interest Rates*
Nominal Amount USD Crore
Fair Value Assets (Liabilities) (G in Crore)
2 to 10 years 31st March 2021 72.52 20.00 345.782 to 10 years 31st March 2020 - - -
*Includes weighted average rate for Cross Currency Interest Rate Swaps, Principal Only Swap and Coupon Swaps.
The line item in the Balance Sheet that includes the above Hedging Instruments is “Other Financial Assets”/ “Other Financial Liabilities”.
462 Grasim Industries Limited
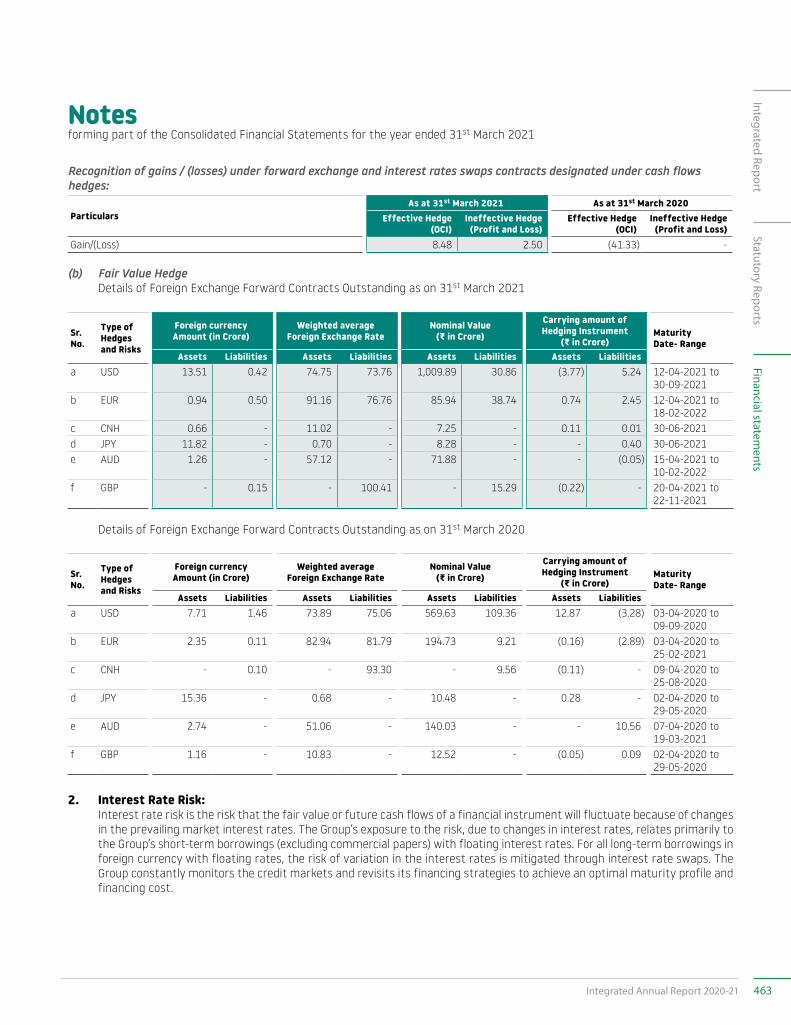
Notesforming part of the Consolidated Financial Statements for the year ended 31st March 2021
Recognition of gains / (losses) under forward exchange and interest rates swaps contracts designated under cash flows hedges:
ParticularsAs at 31st March 2021 As at 31st March 2020
Effective Hedge (OCI)
Ineffective Hedge (Profit and Loss)
Effective Hedge (OCI)
Ineffective Hedge (Profit and Loss)
Gain/(Loss) 8.48 2.50 (41.33) -
(b) Fair Value Hedge Details of Foreign Exchange Forward Contracts Outstanding as on 31st March 2021
Sr. No.
Type of Hedges and Risks
Foreign currency Amount (in Crore)
Weighted average Foreign Exchange Rate
Nominal Value (G in Crore)
Carrying amount of Hedging Instrument
(G in Crore)Maturity Date- Range
Assets Liabilities Assets Liabilities Assets Liabilities Assets Liabilitiesa USD 13.51 0.42 74.75 73.76 1,009.89 30.86 (3.77) 5.24 12-04-2021 to
30-09-2021b EUR 0.94 0.50 91.16 76.76 85.94 38.74 0.74 2.45 12-04-2021 to
18-02-2022c CNH 0.66 - 11.02 - 7.25 - 0.11 0.01 30-06-2021d JPY 11.82 - 0.70 - 8.28 - - 0.40 30-06-2021e AUD 1.26 - 57.12 - 71.88 - - (0.05) 15-04-2021 to
10-02-2022f GBP - 0.15 - 100.41 - 15.29 (0.22) - 20-04-2021 to
22-11-2021
Details of Foreign Exchange Forward Contracts Outstanding as on 31st March 2020
Sr. No.
Type of Hedges and Risks
Foreign currency Amount (in Crore)
Weighted average Foreign Exchange Rate
Nominal Value (G in Crore)
Carrying amount of Hedging Instrument
(G in Crore)Maturity Date- Range
Assets Liabilities Assets Liabilities Assets Liabilities Assets Liabilitiesa USD 7.71 1.46 73.89 75.06 569.63 109.36 12.87 (3.28) 03-04-2020 to
09-09-2020b EUR 2.35 0.11 82.94 81.79 194.73 9.21 (0.16) (2.89) 03-04-2020 to
25-02-2021c CNH - 0.10 - 93.30 - 9.56 (0.11) - 09-04-2020 to
25-08-2020d JPY 15.36 - 0.68 - 10.48 - 0.28 - 02-04-2020 to
29-05-2020e AUD 2.74 - 51.06 - 140.03 - - 10.56 07-04-2020 to
19-03-2021f GBP 1.16 - 10.83 - 12.52 - (0.05) 0.09 02-04-2020 to
29-05-2020
2. Interest Rate Risk: Interest rate risk is the risk that the fair value or future cash flows of a financial instrument will fluctuate because of changes
in the prevailing market interest rates. The Group’s exposure to the risk, due to changes in interest rates, relates primarily to the Group’s short-term borrowings (excluding commercial papers) with floating interest rates. For all long-term borrowings in foreign currency with floating rates, the risk of variation in the interest rates is mitigated through interest rate swaps. The Group constantly monitors the credit markets and revisits its financing strategies to achieve an optimal maturity profile and financing cost.
463Integrated Annual Report 2020-21
Integrated ReportStatutory Reports
Financial statements
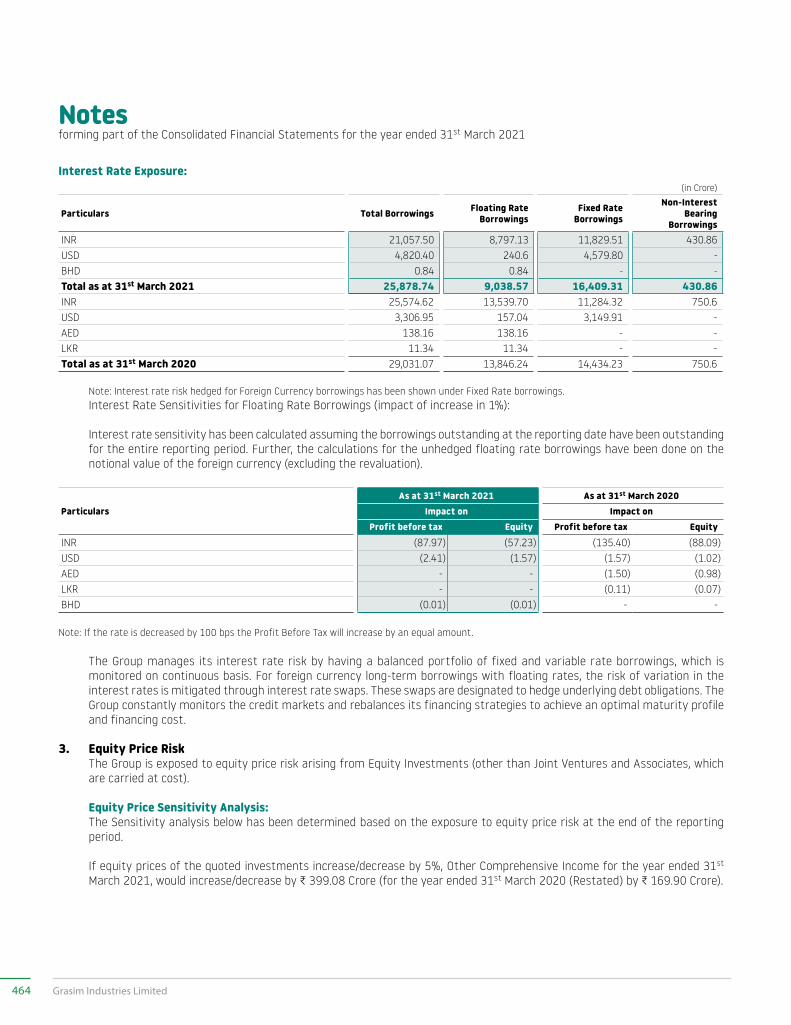
Notesforming part of the Consolidated Financial Statements for the year ended 31st March 2021
Interest Rate Exposure:(in Crore)
Particulars Total Borrowings Floating Rate Borrowings
Fixed Rate Borrowings
Non-Interest Bearing
BorrowingsINR 21,057.50 8,797.13 11,829.51 430.86USD 4,820.40 240.6 4,579.80 -BHD 0.84 0.84 - -Total as at 31st March 2021 25,878.74 9,038.57 16,409.31 430.86INR 25,574.62 13,539.70 11,284.32 750.6USD 3,306.95 157.04 3,149.91 -AED 138.16 138.16 - -LKR 11.34 11.34 - -Total as at 31st March 2020 29,031.07 13,846.24 14,434.23 750.6
Note: Interest rate risk hedged for Foreign Currency borrowings has been shown under Fixed Rate borrowings. Interest Rate Sensitivities for Floating Rate Borrowings (impact of increase in 1%):
Interest rate sensitivity has been calculated assuming the borrowings outstanding at the reporting date have been outstanding for the entire reporting period. Further, the calculations for the unhedged floating rate borrowings have been done on the notional value of the foreign currency (excluding the revaluation).
ParticularsAs at 31st March 2021 As at 31st March 2020
Impact on Impact onProfit before tax Equity Profit before tax Equity
INR (87.97) (57.23) (135.40) (88.09)USD (2.41) (1.57) (1.57) (1.02)AED - - (1.50) (0.98)LKR - - (0.11) (0.07)BHD (0.01) (0.01) - -
Note: If the rate is decreased by 100 bps the Profit Before Tax will increase by an equal amount.
The Group manages its interest rate risk by having a balanced portfolio of fixed and variable rate borrowings, which is monitored on continuous basis. For foreign currency long-term borrowings with floating rates, the risk of variation in the interest rates is mitigated through interest rate swaps. These swaps are designated to hedge underlying debt obligations. The Group constantly monitors the credit markets and rebalances its financing strategies to achieve an optimal maturity profile and financing cost.
3. Equity Price Risk The Group is exposed to equity price risk arising from Equity Investments (other than Joint Ventures and Associates, which
are carried at cost).
Equity Price Sensitivity Analysis: The Sensitivity analysis below has been determined based on the exposure to equity price risk at the end of the reporting
period.
If equity prices of the quoted investments increase/decrease by 5%, Other Comprehensive Income for the year ended 31st March 2021, would increase/decrease by C 399.08 Crore (for the year ended 31st March 2020 (Restated) by C 169.90 Crore).
464 Grasim Industries Limited
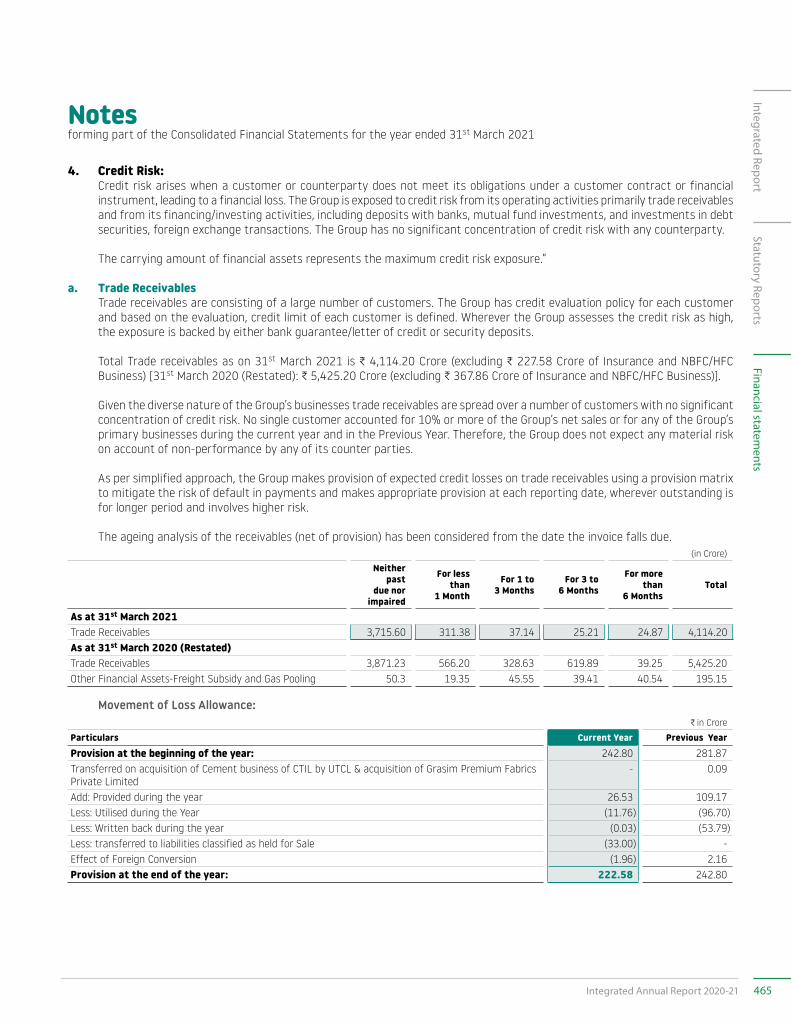
Notesforming part of the Consolidated Financial Statements for the year ended 31st March 2021
4. Credit Risk: Credit risk arises when a customer or counterparty does not meet its obligations under a customer contract or financial
instrument, leading to a financial loss. The Group is exposed to credit risk from its operating activities primarily trade receivables and from its financing/investing activities, including deposits with banks, mutual fund investments, and investments in debt securities, foreign exchange transactions. The Group has no significant concentration of credit risk with any counterparty.
The carrying amount of financial assets represents the maximum credit risk exposure.”
a. Trade Receivables Trade receivables are consisting of a large number of customers. The Group has credit evaluation policy for each customer
and based on the evaluation, credit limit of each customer is defined. Wherever the Group assesses the credit risk as high, the exposure is backed by either bank guarantee/letter of credit or security deposits.
Total Trade receivables as on 31st March 2021 is C 4,114.20 Crore (excluding C 227.58 Crore of Insurance and NBFC/HFC Business) [31st March 2020 (Restated): C 5,425.20 Crore (excluding C 367.86 Crore of Insurance and NBFC/HFC Business)].
Given the diverse nature of the Group’s businesses trade receivables are spread over a number of customers with no significant concentration of credit risk. No single customer accounted for 10% or more of the Group’s net sales or for any of the Group’s primary businesses during the current year and in the Previous Year. Therefore, the Group does not expect any material risk on account of non-performance by any of its counter parties.
As per simplified approach, the Group makes provision of expected credit losses on trade receivables using a provision matrix to mitigate the risk of default in payments and makes appropriate provision at each reporting date, wherever outstanding is for longer period and involves higher risk.
The ageing analysis of the receivables (net of provision) has been considered from the date the invoice falls due.(in Crore)
Neither past
due nor impaired
For less than
1 Month
For 1 to 3 Months
For 3 to 6 Months
For more than
6 MonthsTotal
As at 31st March 2021Trade Receivables 3,715.60 311.38 37.14 25.21 24.87 4,114.20As at 31st March 2020 (Restated)Trade Receivables 3,871.23 566.20 328.63 619.89 39.25 5,425.20Other Financial Assets-Freight Subsidy and Gas Pooling 50.3 19.35 45.55 39.41 40.54 195.15
Movement of Loss Allowance:C in Crore
Particulars Current Year Previous Year Provision at the beginning of the year: 242.80 281.87 Transferred on acquisition of Cement business of CTIL by UTCL & acquisition of Grasim Premium Fabrics Private Limited
- 0.09
Add: Provided during the year 26.53 109.17 Less: Utilised during the Year (11.76) (96.70)Less: Written back during the year (0.03) (53.79)Less: transferred to liabilities classified as held for Sale (33.00) - Effect of Foreign Conversion (1.96) 2.16 Provision at the end of the year: 222.58 242.80
465Integrated Annual Report 2020-21
Integrated ReportStatutory Reports
Financial statements
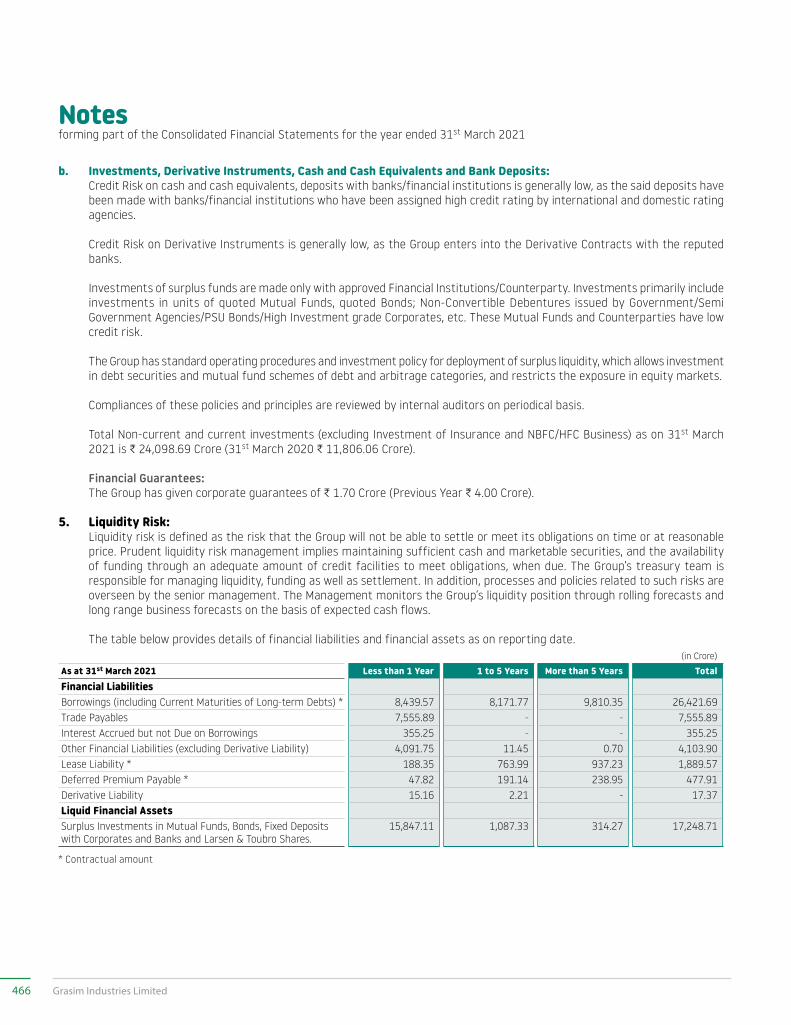
Notesforming part of the Consolidated Financial Statements for the year ended 31st March 2021
b. Investments, Derivative Instruments, Cash and Cash Equivalents and Bank Deposits: Credit Risk on cash and cash equivalents, deposits with banks/financial institutions is generally low, as the said deposits have
been made with banks/financial institutions who have been assigned high credit rating by international and domestic rating agencies.
Credit Risk on Derivative Instruments is generally low, as the Group enters into the Derivative Contracts with the reputed banks.
Investments of surplus funds are made only with approved Financial Institutions/Counterparty. Investments primarily include investments in units of quoted Mutual Funds, quoted Bonds; Non-Convertible Debentures issued by Government/Semi Government Agencies/PSU Bonds/High Investment grade Corporates, etc. These Mutual Funds and Counterparties have low credit risk.
The Group has standard operating procedures and investment policy for deployment of surplus liquidity, which allows investment in debt securities and mutual fund schemes of debt and arbitrage categories, and restricts the exposure in equity markets.
Compliances of these policies and principles are reviewed by internal auditors on periodical basis.
Total Non-current and current investments (excluding Investment of Insurance and NBFC/HFC Business) as on 31st March 2021 is C 24,098.69 Crore (31st March 2020 C 11,806.06 Crore).
Financial Guarantees: The Group has given corporate guarantees of C 1.70 Crore (Previous Year C 4.00 Crore).
5. Liquidity Risk: Liquidity risk is defined as the risk that the Group will not be able to settle or meet its obligations on time or at reasonable
price. Prudent liquidity risk management implies maintaining sufficient cash and marketable securities, and the availability of funding through an adequate amount of credit facilities to meet obligations, when due. The Group’s treasury team is responsible for managing liquidity, funding as well as settlement. In addition, processes and policies related to such risks are overseen by the senior management. The Management monitors the Group’s liquidity position through rolling forecasts and long range business forecasts on the basis of expected cash flows.
The table below provides details of financial liabilities and financial assets as on reporting date.(in Crore)
As at 31st March 2021 Less than 1 Year 1 to 5 Years More than 5 Years TotalFinancial LiabilitiesBorrowings (including Current Maturities of Long-term Debts) * 8,439.57 8,171.77 9,810.35 26,421.69Trade Payables 7,555.89 - - 7,555.89Interest Accrued but not Due on Borrowings 355.25 - - 355.25Other Financial Liabilities (excluding Derivative Liability) 4,091.75 11.45 0.70 4,103.90Lease Liability * 188.35 763.99 937.23 1,889.57Deferred Premium Payable * 47.82 191.14 238.95 477.91Derivative Liability 15.16 2.21 - 17.37Liquid Financial AssetsSurplus Investments in Mutual Funds, Bonds, Fixed Deposits with Corporates and Banks and Larsen & Toubro Shares.
15,847.11 1,087.33 314.27 17,248.71
* Contractual amount
466 Grasim Industries Limited
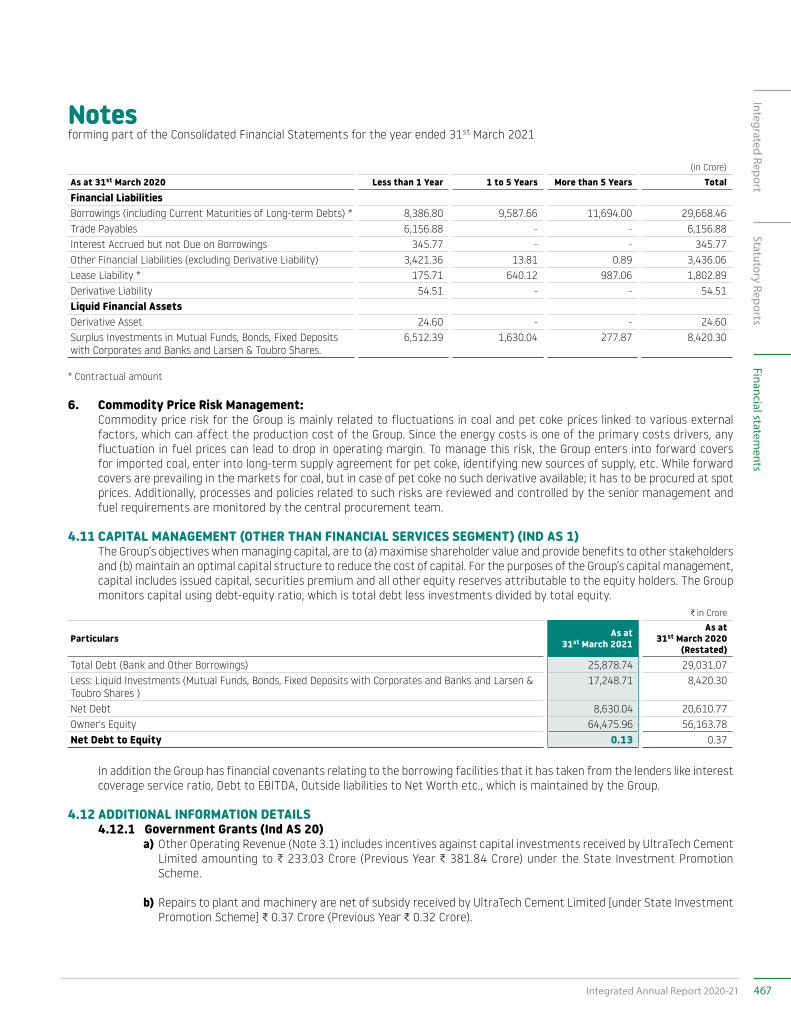
Notesforming part of the Consolidated Financial Statements for the year ended 31st March 2021
(in Crore)
As at 31st March 2020 Less than 1 Year 1 to 5 Years More than 5 Years TotalFinancial LiabilitiesBorrowings (including Current Maturities of Long-term Debts) * 8,386.80 9,587.66 11,694.00 29,668.46Trade Payables 6,156.88 - - 6,156.88Interest Accrued but not Due on Borrowings 345.77 - - 345.77Other Financial Liabilities (excluding Derivative Liability) 3,421.36 13.81 0.89 3,436.06Lease Liability * 175.71 640.12 987.06 1,802.89Derivative Liability 54.51 - - 54.51Liquid Financial AssetsDerivative Asset 24.60 - - 24.60Surplus Investments in Mutual Funds, Bonds, Fixed Deposits with Corporates and Banks and Larsen & Toubro Shares.
6,512.39 1,630.04 277.87 8,420.30
* Contractual amount
6. Commodity Price Risk Management: Commodity price risk for the Group is mainly related to fluctuations in coal and pet coke prices linked to various external
factors, which can affect the production cost of the Group. Since the energy costs is one of the primary costs drivers, any fluctuation in fuel prices can lead to drop in operating margin. To manage this risk, the Group enters into forward covers for imported coal, enter into long-term supply agreement for pet coke, identifying new sources of supply, etc. While forward covers are prevailing in the markets for coal, but in case of pet coke no such derivative available; it has to be procured at spot prices. Additionally, processes and policies related to such risks are reviewed and controlled by the senior management and fuel requirements are monitored by the central procurement team.
4.11 CAPITAL MANAGEMENT (OTHER THAN FINANCIAL SERVICES SEGMENT) (IND AS 1) The Group’s objectives when managing capital, are to (a) maximise shareholder value and provide benefits to other stakeholders
and (b) maintain an optimal capital structure to reduce the cost of capital. For the purposes of the Group’s capital management, capital includes issued capital, securities premium and all other equity reserves attributable to the equity holders. The Group monitors capital using debt-equity ratio, which is total debt less investments divided by total equity.
C in Crore
Particulars As at 31st March 2021
As at 31st March 2020
(Restated)Total Debt (Bank and Other Borrowings) 25,878.74 29,031.07 Less: Liquid Investments (Mutual Funds, Bonds, Fixed Deposits with Corporates and Banks and Larsen & Toubro Shares )
17,248.71 8,420.30
Net Debt 8,630.04 20,610.77 Owner's Equity 64,475.96 56,163.78 Net Debt to Equity 0.13 0.37
In addition the Group has financial covenants relating to the borrowing facilities that it has taken from the lenders like interest coverage service ratio, Debt to EBITDA, Outside liabilities to Net Worth etc., which is maintained by the Group.
4.12 ADDITIONAL INFORMATION DETAILS 4.12.1 Government Grants (Ind AS 20) a) Other Operating Revenue (Note 3.1) includes incentives against capital investments received by UltraTech Cement
Limited amounting to C 233.03 Crore (Previous Year C 381.84 Crore) under the State Investment Promotion Scheme.
b) Repairs to plant and machinery are net of subsidy received by UltraTech Cement Limited [under State Investment Promotion Scheme] C 0.37 Crore (Previous Year C 0.32 Crore).
467Integrated Annual Report 2020-21
Integrated ReportStatutory Reports
Financial statements
Notesforming part of the Consolidated Financial Statements for the year ended 31st March 2021
c) Cost of Materials consumed includes grants towards royalty expense amounting to C 12.26 Crore (Previous Year C 23.44 Crore).
d) Sales Tax deferment loan granted under State Investment Promotion Scheme has been considered as a government grant, and the difference between the fair value and nominal value as on the date being recognised as an income. Accordingly, an amount of C 48.83 Crore (Previous Year: Nil ) has been recognised as an income. Unwinding of interest is accounted as charge to the Statement of Profit and Loss. Every year, change in fair value is accounted for as an interest expense.
e) The Company has received interest-free loans of C 15.87 Crore (Previous year C 0.70 Crore) from a State Government, repayable in full after seven years. Using prevailing market interest rate @ 7.45% p.a. (Previous year in range of 7.50% p.a.) for an equivalent loan, the fair value of loan at initial recognition is estimated at C 10.07 Crore (Previous year C 0.42 Crore). The difference of C 5.80 Crore (Previous year C 0.28 Crore) between gross proceeds and fair value of loan is the government grant, which will be recognised in the Statement of Profit and Loss over the period of loan.
4.12.2 The Supreme Court of India has allowed an appeal filed by the State of Rajasthan in a matter relating to transfer of mining lease in the name of the UltraTech’s wholly-owned subsidiary, Gotan Lime Stone Khanij Udyog Private Limited (“GKUPL”), and has directed the State of Rajasthan to frame and notify its policy relating to transfer of mining lease and thereafter pass appropriate order in respect of the mining lease of GKUPL. The State Government has notified the new policy related to the transfer of new mining lease, based on which the UltraTech has requested the State Government to consider reinstatement of the mines in its favour.
4.12.3 a. During the year ended 31st March 2020, Ultratech’s wholly-owned subsidiary UltraTech Cement Middle East Investments Limited (“UCMEIL”), divested its entire shareholding in Emirates Cement Bangladesh Limited (“ECBL”) and Emirates Power Company Limited (“EPCL”) to Heidelberg Cement Bangladesh Limited at a final Enterprise Value of BDT equivalent USD 30.2 Million and included the gain on divestment of C 8.96 Crore in other income.
b. UltraTech also sold its 37% stake in Awam Minerals LLC on 10th December 2019 for C 21.87 Crore at a profit of C 14.17 Crore.
4.12.4 Under the Sabka Vishwas (Legacy dispute Resolution) Scheme 2019, announced by the Government of India, UltraTech Cement Limited (UltraTech) had provided a one-time expense of C 130.66 Crore as part of other expenses, against various disputed liabilities for the year ended 31st March 2020.
4.12.5 During the year ended 31st March 2020, Aditya Birla Capital Limited (ABCL), a subsidiary of the Company, had made a preferential allotment of 210,000,000 equity shares of C 10 each at a premium of C 90 per share to certain investors, of which the Company has also subscribed 77,000,000 equity shares amounting to C 770 Crore. As a result of which, the Company’s shareholding in ABCL has decreased from 55.98% to 54.24% (owing to investment not in the proportion of original shareholding) and the financial impact of the same has been taken to Other Equity.
4.12.6 Estimation uncertainty relating to COVID-19 global health pandemic in Aditya Birla Capital Limited (ABCL), a subsidiary of the Company:
ABCL recognises the need to make reasonable estimation of the economic impact of this pandemic on the obligation on account of policy liabilities, recoverability of Goodwill, repayment ability of its borrowers, and to make additional provisions as considered appropriate, over-and-above the extant provisions as per the Group’s ECL policy, for expected credit losses. ABCL has segmented its portfolio basis various parameters to ascertain the likely detrimental impact on the credit risk in the portfolio as a result of the economic fallout of COVID-19 and basis its estimates, assumptions and judgements arrived at the additional provision required to take care of the expected credit loss in its financial statements. Given the continued uncertainty over the potential macro-economic condition, the impact of economic fallout of the COVID-19 on the carrying value of assets and obligations of the Group may be different from that expected as at the date of approval of these financial statements. ABCL will continue to closely monitor any material changes to future economic conditions and suitable adjustments as considered appropriate will be given in the respective future period.
468 Grasim Industries Limited
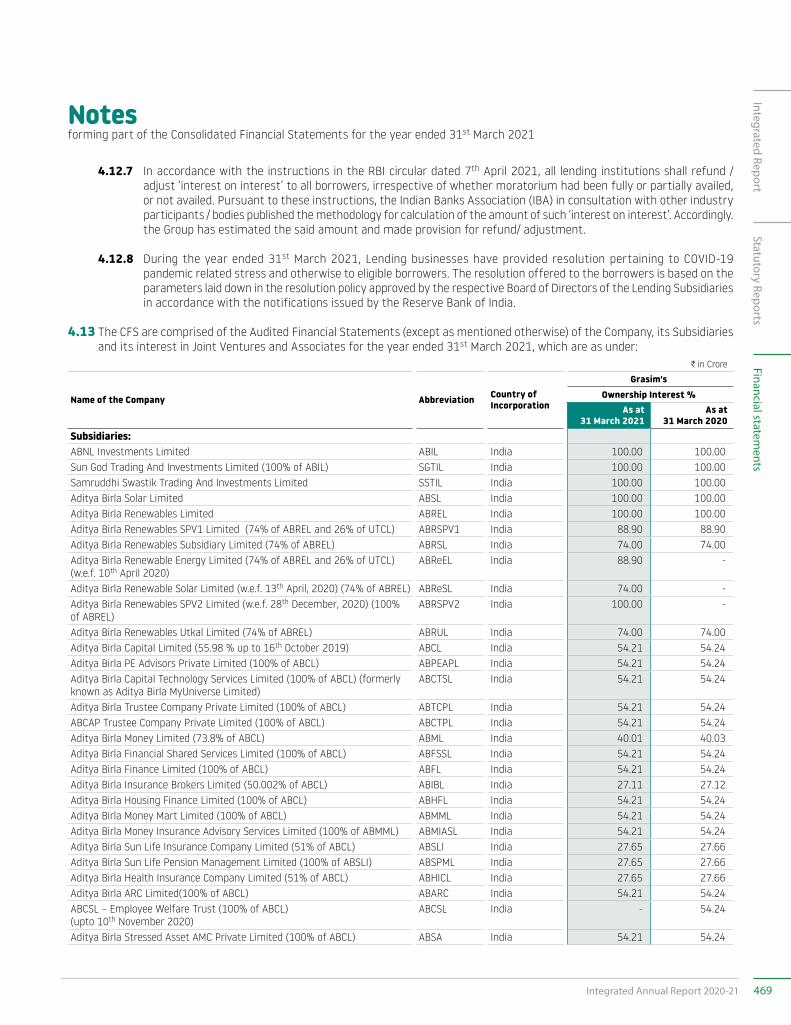
Notesforming part of the Consolidated Financial Statements for the year ended 31st March 2021
4.12.7 In accordance with the instructions in the RBI circular dated 7th April 2021, all lending institutions shall refund / adjust ‘interest on interest’ to all borrowers, irrespective of whether moratorium had been fully or partially availed, or not availed. Pursuant to these instructions, the Indian Banks Association (IBA) in consultation with other industry participants / bodies published the methodology for calculation of the amount of such ‘interest on interest’. Accordingly. the Group has estimated the said amount and made provision for refund/ adjustment.
4.12.8 During the year ended 31st March 2021, Lending businesses have provided resolution pertaining to COVID-19 pandemic related stress and otherwise to eligible borrowers. The resolution offered to the borrowers is based on the parameters laid down in the resolution policy approved by the respective Board of Directors of the Lending Subsidiaries in accordance with the notifications issued by the Reserve Bank of India.
4.13 The CFS are comprised of the Audited Financial Statements (except as mentioned otherwise) of the Company, its Subsidiaries and its interest in Joint Ventures and Associates for the year ended 31st March 2021, which are as under:
C in Crore
Name of the Company Abbreviation Country of Incorporation
Grasim'sOwnership Interest %
As at 31 March 2021
As at 31 March 2020
Subsidiaries:ABNL Investments Limited ABIL India 100.00 100.00Sun God Trading And Investments Limited (100% of ABIL) SGTIL India 100.00 100.00Samruddhi Swastik Trading And Investments Limited SSTIL India 100.00 100.00Aditya Birla Solar Limited ABSL India 100.00 100.00Aditya Birla Renewables Limited ABREL India 100.00 100.00Aditya Birla Renewables SPV1 Limited (74% of ABREL and 26% of UTCL) ABRSPV1 India 88.90 88.90Aditya Birla Renewables Subsidiary Limited (74% of ABREL) ABRSL India 74.00 74.00Aditya Birla Renewable Energy Limited (74% of ABREL and 26% of UTCL) (w.e.f. 10th April 2020)
ABReEL India 88.90 -
Aditya Birla Renewable Solar Limited (w.e.f. 13th April, 2020) (74% of ABREL) ABReSL India 74.00 -Aditya Birla Renewables SPV2 Limited (w.e.f. 28th December, 2020) (100% of ABREL)
ABRSPV2 India 100.00 -
Aditya Birla Renewables Utkal Limited (74% of ABREL) ABRUL India 74.00 74.00Aditya Birla Capital Limited (55.98 % up to 16th October 2019) ABCL India 54.21 54.24Aditya Birla PE Advisors Private Limited (100% of ABCL) ABPEAPL India 54.21 54.24Aditya Birla Capital Technology Services Limited (100% of ABCL) (formerly known as Aditya Birla MyUniverse Limited)
ABCTSL India 54.21 54.24
Aditya Birla Trustee Company Private Limited (100% of ABCL) ABTCPL India 54.21 54.24ABCAP Trustee Company Private Limited (100% of ABCL) ABCTPL India 54.21 54.24Aditya Birla Money Limited (73.8% of ABCL) ABML India 40.01 40.03Aditya Birla Financial Shared Services Limited (100% of ABCL) ABFSSL India 54.21 54.24Aditya Birla Finance Limited (100% of ABCL) ABFL India 54.21 54.24Aditya Birla Insurance Brokers Limited (50.002% of ABCL) ABIBL India 27.11 27.12Aditya Birla Housing Finance Limited (100% of ABCL) ABHFL India 54.21 54.24Aditya Birla Money Mart Limited (100% of ABCL) ABMML India 54.21 54.24Aditya Birla Money Insurance Advisory Services Limited (100% of ABMML) ABMIASL India 54.21 54.24Aditya Birla Sun Life Insurance Company Limited (51% of ABCL) ABSLI India 27.65 27.66Aditya Birla Sun Life Pension Management Limited (100% of ABSLI) ABSPML India 27.65 27.66Aditya Birla Health Insurance Company Limited (51% of ABCL) ABHICL India 27.65 27.66Aditya Birla ARC Limited(100% of ABCL) ABARC India 54.21 54.24ABCSL – Employee Welfare Trust (100% of ABCL) (upto 10th November 2020)
ABCSL India - 54.24
Aditya Birla Stressed Asset AMC Private Limited (100% of ABCL) ABSA India 54.21 54.24
469Integrated Annual Report 2020-21
Integrated ReportStatutory Reports
Financial statements
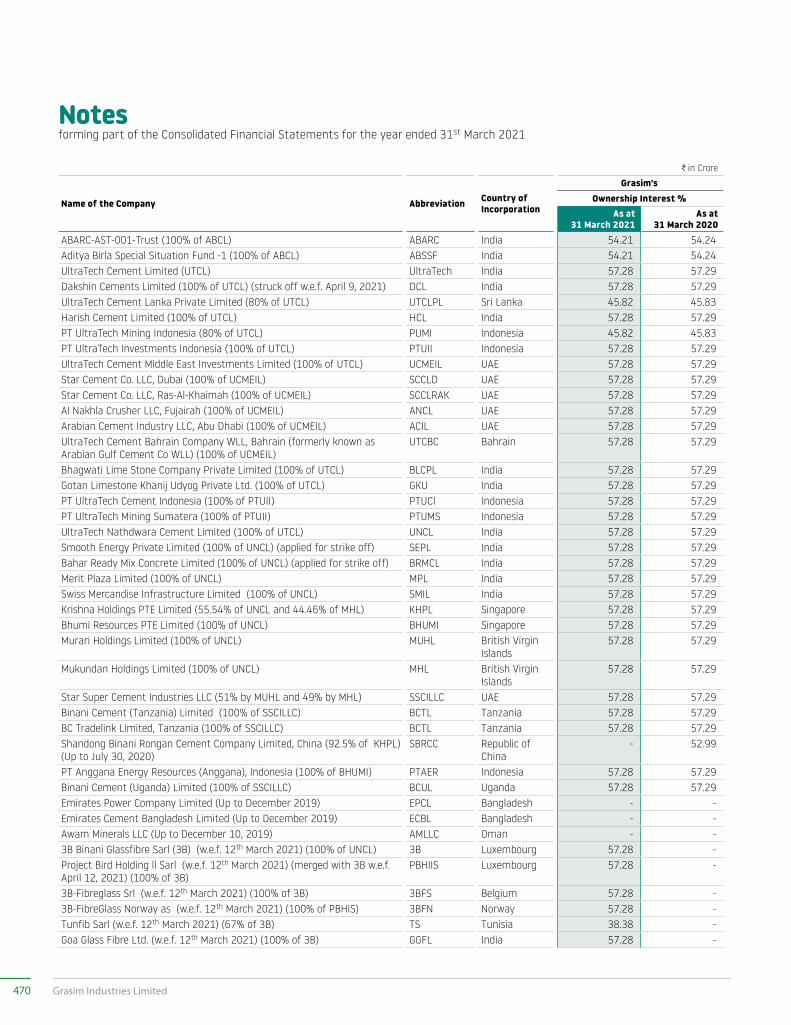
Notesforming part of the Consolidated Financial Statements for the year ended 31st March 2021
C in Crore
Name of the Company Abbreviation Country of Incorporation
Grasim'sOwnership Interest %
As at 31 March 2021
As at 31 March 2020
ABARC-AST-001-Trust (100% of ABCL) ABARC India 54.21 54.24Aditya Birla Special Situation Fund -1 (100% of ABCL) ABSSF India 54.21 54.24UltraTech Cement Limited (UTCL) UltraTech India 57.28 57.29Dakshin Cements Limited (100% of UTCL) (struck off w.e.f. April 9, 2021) DCL India 57.28 57.29UltraTech Cement Lanka Private Limited (80% of UTCL) UTCLPL Sri Lanka 45.82 45.83Harish Cement Limited (100% of UTCL) HCL India 57.28 57.29PT UltraTech Mining Indonesia (80% of UTCL) PUMI Indonesia 45.82 45.83PT UltraTech Investments Indonesia (100% of UTCL) PTUII Indonesia 57.28 57.29UltraTech Cement Middle East Investments Limited (100% of UTCL) UCMEIL UAE 57.28 57.29Star Cement Co. LLC, Dubai (100% of UCMEIL) SCCLD UAE 57.28 57.29Star Cement Co. LLC, Ras-Al-Khaimah (100% of UCMEIL) SCCLRAK UAE 57.28 57.29Al Nakhla Crusher LLC, Fujairah (100% of UCMEIL) ANCL UAE 57.28 57.29Arabian Cement Industry LLC, Abu Dhabi (100% of UCMEIL) ACIL UAE 57.28 57.29UltraTech Cement Bahrain Company WLL, Bahrain (formerly known as Arabian Gulf Cement Co WLL) (100% of UCMEIL)
UTCBC Bahrain 57.28 57.29
Bhagwati Lime Stone Company Private Limited (100% of UTCL) BLCPL India 57.28 57.29Gotan Limestone Khanij Udyog Private Ltd. (100% of UTCL) GKU India 57.28 57.29PT UltraTech Cement Indonesia (100% of PTUII) PTUCI Indonesia 57.28 57.29PT UltraTech Mining Sumatera (100% of PTUII) PTUMS Indonesia 57.28 57.29UltraTech Nathdwara Cement Limited (100% of UTCL) UNCL India 57.28 57.29Smooth Energy Private Limited (100% of UNCL) (applied for strike off) SEPL India 57.28 57.29Bahar Ready Mix Concrete Limited (100% of UNCL) (applied for strike off) BRMCL India 57.28 57.29Merit Plaza Limited (100% of UNCL) MPL India 57.28 57.29Swiss Mercandise Infrastructure Limited (100% of UNCL) SMIL India 57.28 57.29Krishna Holdings PTE Limited (55.54% of UNCL and 44.46% of MHL) KHPL Singapore 57.28 57.29Bhumi Resources PTE Limited (100% of UNCL) BHUMI Singapore 57.28 57.29Murari Holdings Limited (100% of UNCL) MUHL British Virgin
Islands57.28 57.29
Mukundan Holdings Limited (100% of UNCL) MHL British Virgin Islands
57.28 57.29
Star Super Cement Industries LLC (51% by MUHL and 49% by MHL) SSCILLC UAE 57.28 57.29Binani Cement (Tanzania) Limited (100% of SSCILLC) BCTL Tanzania 57.28 57.29BC Tradelink Limited, Tanzania (100% of SSCILLC) BCTL Tanzania 57.28 57.29Shandong Binani Rongan Cement Company Limited, China (92.5% of KHPL) (Up to July 30, 2020)
SBRCC Republic of China
- 52.99
PT Anggana Energy Resources (Anggana), Indonesia (100% of BHUMI) PTAER Indonesia 57.28 57.29Binani Cement (Uganda) Limited (100% of SSCILLC) BCUL Uganda 57.28 57.29Emirates Power Company Limited (Up to December 2019) EPCL Bangladesh - -Emirates Cement Bangladesh Limited (Up to December 2019) ECBL Bangladesh - -Awam Minerals LLC (Up to December 10, 2019) AMLLC Oman - -3B Binani Glassfibre Sarl (3B) (w.e.f. 12th March 2021) (100% of UNCL) 3B Luxembourg 57.28 -Project Bird Holding ll Sarl (w.e.f. 12th March 2021) (merged with 3B w.e.f. April 12, 2021) (100% of 3B)
PBHIIS Luxembourg 57.28 -
3B-Fibreglass Srl (w.e.f. 12th March 2021) (100% of 3B) 3BFS Belgium 57.28 -3B-FibreGlass Norway as (w.e.f. 12th March 2021) (100% of PBHIS) 3BFN Norway 57.28 -Tunfib Sarl (w.e.f. 12th March 2021) (67% of 3B) TS Tunisia 38.38 -Goa Glass Fibre Ltd. (w.e.f. 12th March 2021) (100% of 3B) GGFL India 57.28 -
470 Grasim Industries Limited
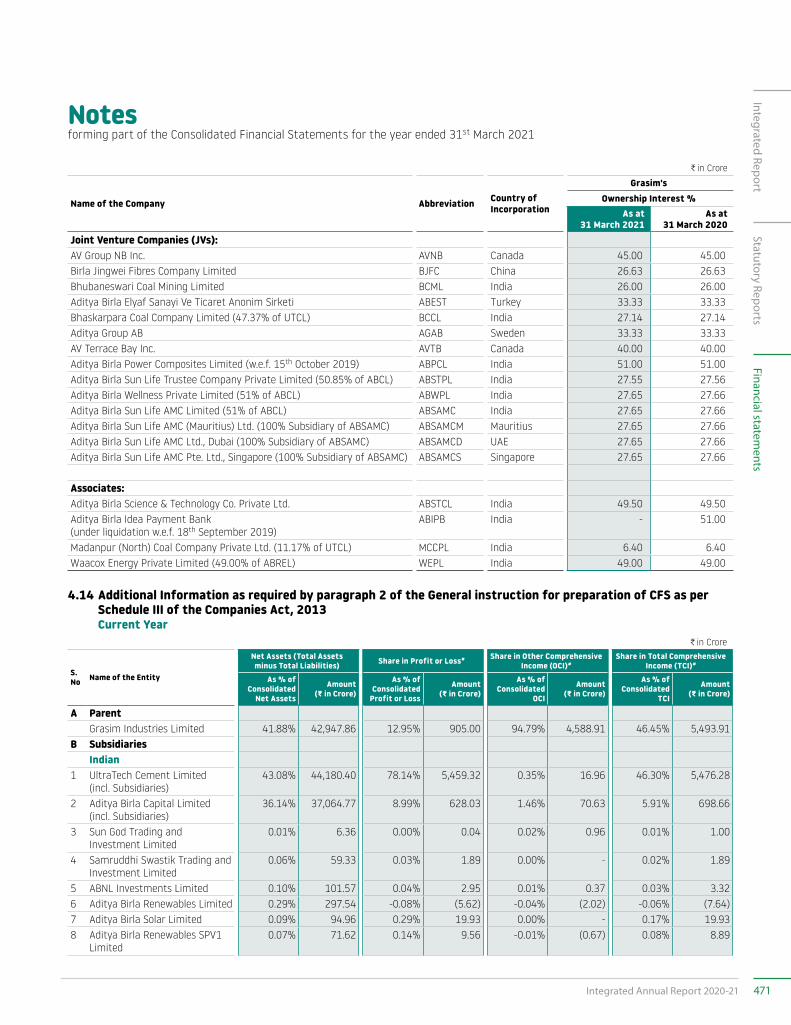
Notesforming part of the Consolidated Financial Statements for the year ended 31st March 2021
C in Crore
Name of the Company Abbreviation Country of Incorporation
Grasim'sOwnership Interest %
As at 31 March 2021
As at 31 March 2020
Joint Venture Companies (JVs):AV Group NB Inc. AVNB Canada 45.00 45.00Birla Jingwei Fibres Company Limited BJFC China 26.63 26.63Bhubaneswari Coal Mining Limited BCML India 26.00 26.00Aditya Birla Elyaf Sanayi Ve Ticaret Anonim Sirketi ABEST Turkey 33.33 33.33Bhaskarpara Coal Company Limited (47.37% of UTCL) BCCL India 27.14 27.14Aditya Group AB AGAB Sweden 33.33 33.33AV Terrace Bay Inc. AVTB Canada 40.00 40.00Aditya Birla Power Composites Limited (w.e.f. 15th October 2019) ABPCL India 51.00 51.00Aditya Birla Sun Life Trustee Company Private Limited (50.85% of ABCL) ABSTPL India 27.55 27.56Aditya Birla Wellness Private Limited (51% of ABCL) ABWPL India 27.65 27.66Aditya Birla Sun Life AMC Limited (51% of ABCL) ABSAMC India 27.65 27.66Aditya Birla Sun Life AMC (Mauritius) Ltd. (100% Subsidiary of ABSAMC) ABSAMCM Mauritius 27.65 27.66Aditya Birla Sun Life AMC Ltd., Dubai (100% Subsidiary of ABSAMC) ABSAMCD UAE 27.65 27.66Aditya Birla Sun Life AMC Pte. Ltd., Singapore (100% Subsidiary of ABSAMC) ABSAMCS Singapore 27.65 27.66
Associates:Aditya Birla Science & Technology Co. Private Ltd. ABSTCL India 49.50 49.50Aditya Birla Idea Payment Bank (under liquidation w.e.f. 18th September 2019)
ABIPB India - 51.00
Madanpur (North) Coal Company Private Ltd. (11.17% of UTCL) MCCPL India 6.40 6.40Waacox Energy Private Limited (49.00% of ABREL) WEPL India 49.00 49.00
4.14 Additional Information as required by paragraph 2 of the General instruction for preparation of CFS as per Schedule III of the Companies Act, 2013
Current YearC in Crore
S. No Name of the Entity
Net Assets (Total Assets minus Total Liabilities) Share in Profit or Loss# Share in Other Comprehensive
Income (OCI)#Share in Total Comprehensive
Income (TCI)#
As % of Consolidated
Net Assets
Amount (G in Crore)
As % of Consolidated
Profit or Loss
Amount (G in Crore)
As % of Consolidated
OCI
Amount (G in Crore)
As % of Consolidated
TCI
Amount (G in Crore)
A ParentGrasim Industries Limited 41.88% 42,947.86 12.95% 905.00 94.79% 4,588.91 46.45% 5,493.91
B SubsidiariesIndian
1 UltraTech Cement Limited (incl. Subsidiaries)
43.08% 44,180.40 78.14% 5,459.32 0.35% 16.96 46.30% 5,476.28
2 Aditya Birla Capital Limited (incl. Subsidiaries)
36.14% 37,064.77 8.99% 628.03 1.46% 70.63 5.91% 698.66
3 Sun God Trading and Investment Limited
0.01% 6.36 0.00% 0.04 0.02% 0.96 0.01% 1.00
4 Samruddhi Swastik Trading and Investment Limited
0.06% 59.33 0.03% 1.89 0.00% - 0.02% 1.89
5 ABNL Investments Limited 0.10% 101.57 0.04% 2.95 0.01% 0.37 0.03% 3.326 Aditya Birla Renewables Limited 0.29% 297.54 -0.08% (5.62) -0.04% (2.02) -0.06% (7.64)7 Aditya Birla Solar Limited 0.09% 94.96 0.29% 19.93 0.00% - 0.17% 19.938 Aditya Birla Renewables SPV1
Limited0.07% 71.62 0.14% 9.56 -0.01% (0.67) 0.08% 8.89
471Integrated Annual Report 2020-21
Integrated ReportStatutory Reports
Financial statements
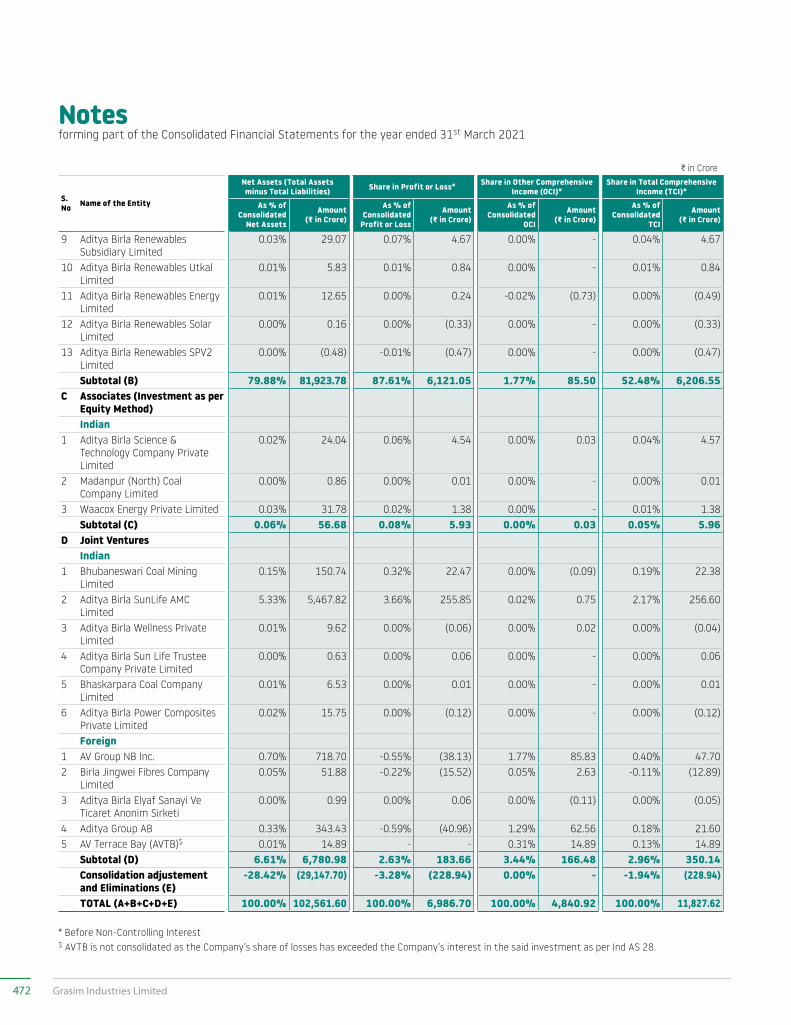
Notesforming part of the Consolidated Financial Statements for the year ended 31st March 2021
C in Crore
S. No Name of the Entity
Net Assets (Total Assets minus Total Liabilities) Share in Profit or Loss# Share in Other Comprehensive
Income (OCI)#Share in Total Comprehensive
Income (TCI)#
As % of Consolidated
Net Assets
Amount (G in Crore)
As % of Consolidated
Profit or Loss
Amount (G in Crore)
As % of Consolidated
OCI
Amount (G in Crore)
As % of Consolidated
TCI
Amount (G in Crore)
9 Aditya Birla Renewables Subsidiary Limited
0.03% 29.07 0.07% 4.67 0.00% - 0.04% 4.67
10 Aditya Birla Renewables Utkal Limited
0.01% 5.83 0.01% 0.84 0.00% - 0.01% 0.84
11 Aditya Birla Renewables Energy Limited
0.01% 12.65 0.00% 0.24 -0.02% (0.73) 0.00% (0.49)
12 Aditya Birla Renewables Solar Limited
0.00% 0.16 0.00% (0.33) 0.00% - 0.00% (0.33)
13 Aditya Birla Renewables SPV2 Limited
0.00% (0.48) -0.01% (0.47) 0.00% - 0.00% (0.47)
Subtotal (B) 79.88% 81,923.78 87.61% 6,121.05 1.77% 85.50 52.48% 6,206.55C Associates (Investment as per
Equity Method)Indian
1 Aditya Birla Science & Technology Company Private Limited
0.02% 24.04 0.06% 4.54 0.00% 0.03 0.04% 4.57
2 Madanpur (North) Coal Company Limited
0.00% 0.86 0.00% 0.01 0.00% - 0.00% 0.01
3 Waacox Energy Private Limited 0.03% 31.78 0.02% 1.38 0.00% - 0.01% 1.38Subtotal (C) 0.06% 56.68 0.08% 5.93 0.00% 0.03 0.05% 5.96
D Joint VenturesIndian
1 Bhubaneswari Coal Mining Limited
0.15% 150.74 0.32% 22.47 0.00% (0.09) 0.19% 22.38
2 Aditya Birla SunLife AMC Limited
5.33% 5,467.82 3.66% 255.85 0.02% 0.75 2.17% 256.60
3 Aditya Birla Wellness Private Limited
0.01% 9.62 0.00% (0.06) 0.00% 0.02 0.00% (0.04)
4 Aditya Birla Sun Life Trustee Company Private Limited
0.00% 0.63 0.00% 0.06 0.00% - 0.00% 0.06
5 Bhaskarpara Coal Company Limited
0.01% 6.53 0.00% 0.01 0.00% - 0.00% 0.01
6 Aditya Birla Power Composites Private Limited
0.02% 15.75 0.00% (0.12) 0.00% - 0.00% (0.12)
Foreign1 AV Group NB Inc. 0.70% 718.70 -0.55% (38.13) 1.77% 85.83 0.40% 47.702 Birla Jingwei Fibres Company
Limited0.05% 51.88 -0.22% (15.52) 0.05% 2.63 -0.11% (12.89)
3 Aditya Birla Elyaf Sanayi Ve Ticaret Anonim Sirketi
0.00% 0.99 0.00% 0.06 0.00% (0.11) 0.00% (0.05)
4 Aditya Group AB 0.33% 343.43 -0.59% (40.96) 1.29% 62.56 0.18% 21.605 AV Terrace Bay (AVTB)$ 0.01% 14.89 - - 0.31% 14.89 0.13% 14.89
Subtotal (D) 6.61% 6,780.98 2.63% 183.66 3.44% 166.48 2.96% 350.14Consolidation adjustement and Eliminations (E)
-28.42% (29,147.70) -3.28% (228.94) 0.00% - -1.94% (228.94)
TOTAL (A+B+C+D+E) 100.00% 102,561.60 100.00% 6,986.70 100.00% 4,840.92 100.00% 11,827.62
# Before Non-Controlling Interest $ AVTB is not consolidated as the Company’s share of losses has exceeded the Company’s interest in the said investment as per Ind AS 28.
472 Grasim Industries Limited
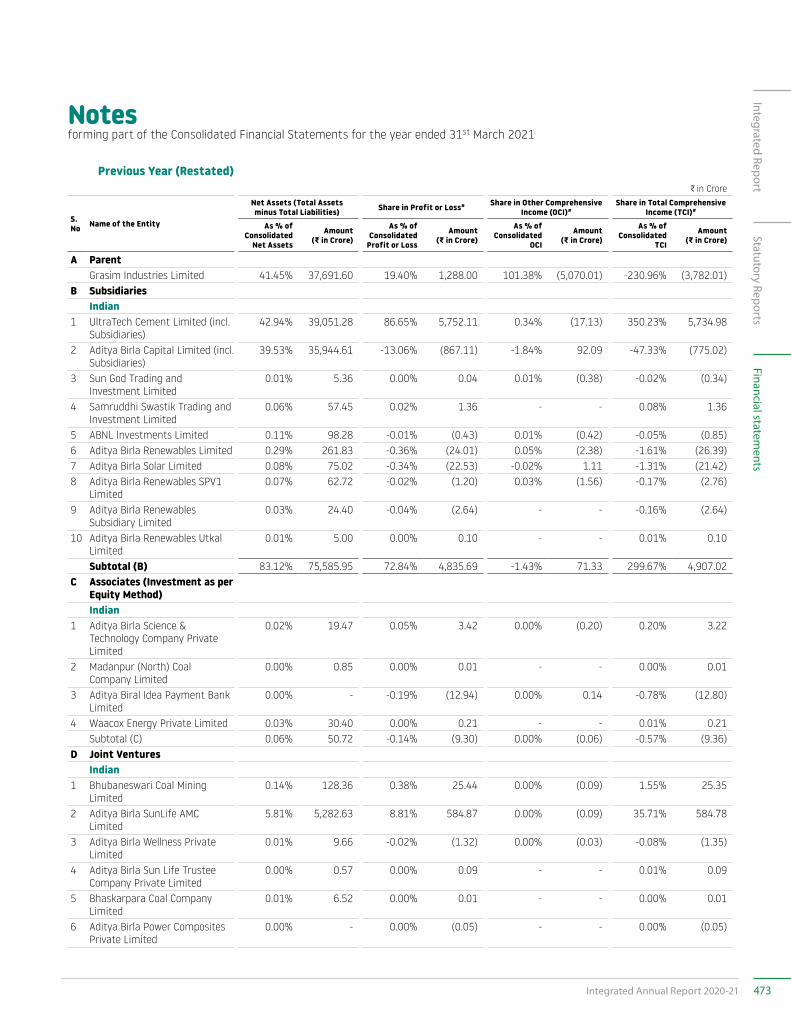
Notesforming part of the Consolidated Financial Statements for the year ended 31st March 2021
Previous Year (Restated)C in Crore
S. No Name of the Entity
Net Assets (Total Assets minus Total Liabilities) Share in Profit or Loss# Share in Other Comprehensive
Income (OCI)#Share in Total Comprehensive
Income (TCI)#
As % of Consolidated
Net Assets
Amount (G in Crore)
As % of Consolidated
Profit or Loss
Amount (G in Crore)
As % of Consolidated
OCI
Amount (G in Crore)
As % of Consolidated
TCI
Amount (G in Crore)
A ParentGrasim Industries Limited 41.45% 37,691.60 19.40% 1,288.00 101.38% (5,070.01) -230.96% (3,782.01)
B SubsidiariesIndian
1 UltraTech Cement Limited (incl. Subsidiaries)
42.94% 39,051.28 86.65% 5,752.11 0.34% (17.13) 350.23% 5,734.98
2 Aditya Birla Capital Limited (incl. Subsidiaries)
39.53% 35,944.61 -13.06% (867.11) -1.84% 92.09 -47.33% (775.02)
3 Sun God Trading and Investment Limited
0.01% 5.36 0.00% 0.04 0.01% (0.38) -0.02% (0.34)
4 Samruddhi Swastik Trading and Investment Limited
0.06% 57.45 0.02% 1.36 - - 0.08% 1.36
5 ABNL Investments Limited 0.11% 98.28 -0.01% (0.43) 0.01% (0.42) -0.05% (0.85)6 Aditya Birla Renewables Limited 0.29% 261.83 -0.36% (24.01) 0.05% (2.38) -1.61% (26.39)7 Aditya Birla Solar Limited 0.08% 75.02 -0.34% (22.53) -0.02% 1.11 -1.31% (21.42)8 Aditya Birla Renewables SPV1
Limited0.07% 62.72 -0.02% (1.20) 0.03% (1.56) -0.17% (2.76)
9 Aditya Birla Renewables Subsidiary Limited
0.03% 24.40 -0.04% (2.64) - - -0.16% (2.64)
10 Aditya Birla Renewables Utkal Limited
0.01% 5.00 0.00% 0.10 - - 0.01% 0.10
Subtotal (B) 83.12% 75,585.95 72.84% 4,835.69 -1.43% 71.33 299.67% 4,907.02 C Associates (Investment as per
Equity Method)Indian
1 Aditya Birla Science & Technology Company Private Limited
0.02% 19.47 0.05% 3.42 0.00% (0.20) 0.20% 3.22
2 Madanpur (North) Coal Company Limited
0.00% 0.85 0.00% 0.01 - - 0.00% 0.01
3 Aditya Biral Idea Payment Bank Limited
0.00% - -0.19% (12.94) 0.00% 0.14 -0.78% (12.80)
4 Waacox Energy Private Limited 0.03% 30.40 0.00% 0.21 - - 0.01% 0.21 Subtotal (C) 0.06% 50.72 -0.14% (9.30) 0.00% (0.06) -0.57% (9.36)
D Joint VenturesIndian
1 Bhubaneswari Coal Mining Limited
0.14% 128.36 0.38% 25.44 0.00% (0.09) 1.55% 25.35
2 Aditya Birla SunLife AMC Limited
5.81% 5,282.63 8.81% 584.87 0.00% (0.09) 35.71% 584.78
3 Aditya Birla Wellness Private Limited
0.01% 9.66 -0.02% (1.32) 0.00% (0.03) -0.08% (1.35)
4 Aditya Birla Sun Life Trustee Company Private Limited
0.00% 0.57 0.00% 0.09 - - 0.01% 0.09
5 Bhaskarpara Coal Company Limited
0.01% 6.52 0.00% 0.01 - - 0.00% 0.01
6 Aditya Birla Power Composites Private Limited
0.00% - 0.00% (0.05) - - 0.00% (0.05)
473Integrated Annual Report 2020-21
Integrated ReportStatutory Reports
Financial statements
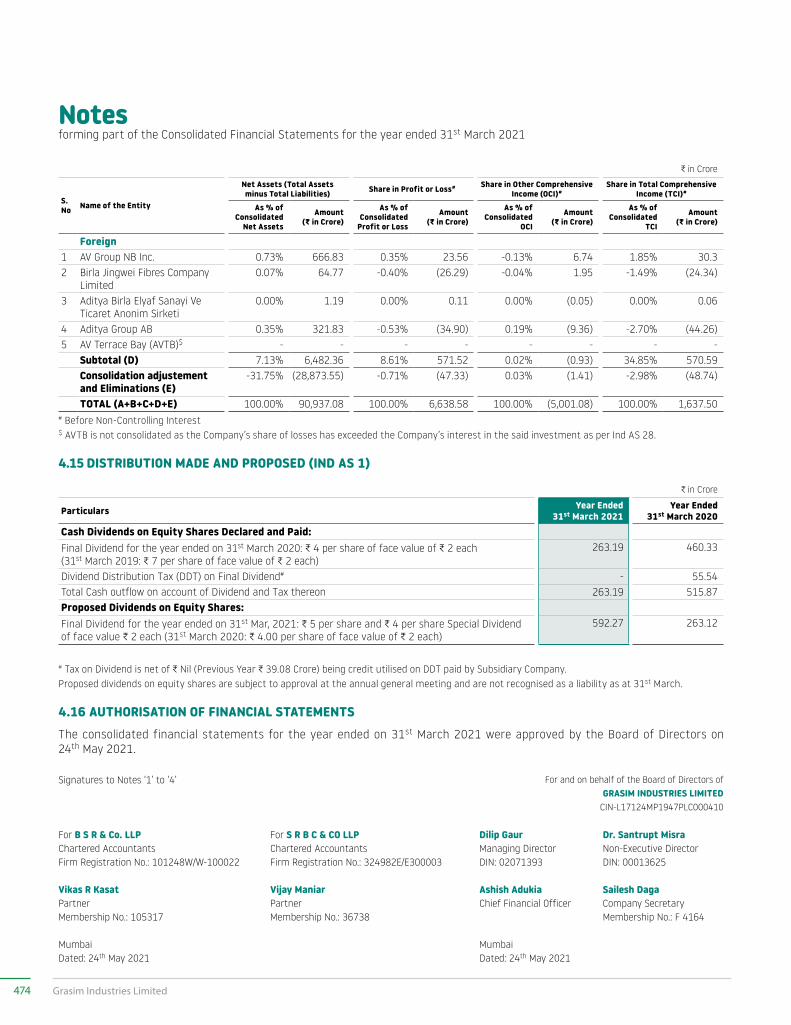
C in Crore
S. No Name of the Entity
Net Assets (Total Assets minus Total Liabilities) Share in Profit or Loss# Share in Other Comprehensive
Income (OCI)#Share in Total Comprehensive
Income (TCI)#
As % of Consolidated
Net Assets
Amount (G in Crore)
As % of Consolidated
Profit or Loss
Amount (G in Crore)
As % of Consolidated
OCI
Amount (G in Crore)
As % of Consolidated
TCI
Amount (G in Crore)
Foreign1 AV Group NB Inc. 0.73% 666.83 0.35% 23.56 -0.13% 6.74 1.85% 30.32 Birla Jingwei Fibres Company
Limited0.07% 64.77 -0.40% (26.29) -0.04% 1.95 -1.49% (24.34)
3 Aditya Birla Elyaf Sanayi Ve Ticaret Anonim Sirketi
0.00% 1.19 0.00% 0.11 0.00% (0.05) 0.00% 0.06
4 Aditya Group AB 0.35% 321.83 -0.53% (34.90) 0.19% (9.36) -2.70% (44.26)5 AV Terrace Bay (AVTB)$ - - - - - - - -
Subtotal (D) 7.13% 6,482.36 8.61% 571.52 0.02% (0.93) 34.85% 570.59 Consolidation adjustement and Eliminations (E)
-31.75% (28,873.55) -0.71% (47.33) 0.03% (1.41) -2.98% (48.74)
TOTAL (A+B+C+D+E) 100.00% 90,937.08 100.00% 6,638.58 100.00% (5,001.08) 100.00% 1,637.50 # Before Non-Controlling Interest$ AVTB is not consolidated as the Company’s share of losses has exceeded the Company’s interest in the said investment as per Ind AS 28.
4.15 DISTRIBUTION MADE AND PROPOSED (IND AS 1)
C in Crore
Particulars Year Ended 31st March 2021
Year Ended 31st March 2020
Cash Dividends on Equity Shares Declared and Paid:Final Dividend for the year ended on 31st March 2020: C 4 per share of face value of C 2 each (31st March 2019: C 7 per share of face value of C 2 each)
263.19 460.33
Dividend Distribution Tax (DDT) on Final Dividend# - 55.54Total Cash outflow on account of Dividend and Tax thereon 263.19 515.87Proposed Dividends on Equity Shares:Final Dividend for the year ended on 31st Mar, 2021: C 5 per share and C 4 per share Special Dividend of face value C 2 each (31st March 2020: C 4.00 per share of face value of C 2 each)
592.27 263.12
# Tax on Dividend is net of C Nil (Previous Year C 39.08 Crore) being credit utilised on DDT paid by Subsidiary Company.Proposed dividends on equity shares are subject to approval at the annual general meeting and are not recognised as a liability as at 31st March.
4.16 AUTHORISATION OF FINANCIAL STATEMENTSThe consolidated financial statements for the year ended on 31st March 2021 were approved by the Board of Directors on 24th May 2021.
Signatures to Notes ‘1’ to ‘4’ For and on behalf of the Board of Directors of GRASIM INDUSTRIES LIMITED
CIN-L17124MP1947PLC000410
For B S R & Co. LLP For S R B C & CO LLP Dilip Gaur Dr. Santrupt MisraChartered Accountants Chartered Accountants Managing Director Non-Executive DirectorFirm Registration No.: 101248W/W-100022 Firm Registration No.: 324982E/E300003 DIN: 02071393 DIN: 00013625
Vikas R Kasat Vijay Maniar Ashish Adukia Sailesh DagaPartner Partner Chief Financial Officer Company SecretaryMembership No.: 105317 Membership No.: 36738 Membership No.: F 4164
Mumbai MumbaiDated: 24th May 2021 Dated: 24th May 2021
Notesforming part of the Consolidated Financial Statements for the year ended 31st March 2021
474 Grasim Industries Limited
GRASIM INDUSTRIES LIMITEDRegistered Office: Birlagram, Nagda-456 331, Dist. Ujjain (M.P.), India
CIN: L17124MP1947PLC000410Tel. No.: 07366-246760/66; Fax No.: 07366-244114/246024
E-mail: [email protected]; Website: www.grasim.com
NOTICE OF THE ANNUAL GENERAL MEETING
NOTICE is hereby given that the 74th Annual General Meeting of GRASIM INDUSTRIES LIMITED will be held on Friday 27th August 2021 at 3.00 p.m. (IST) through video conference (’VC‘)/other audio-visual means (’OAVM‘) to transact the following business:
ORDINARY BUSINESS:1. To receive, consider and adopt the Audited Financial
Statement (Standalone and Consolidated Financial Statement) of the Company for the financial year ended 31st March 2021, and the Reports of the Board and the Auditors thereon.
2. To declare dividend on the equity shares of the Company for the financial year ended 31st March 2021.
3. To appoint a Director in place of Mr. Kumar Mangalam Birla (DIN: 00012813), who retires from office by rotation and being eligible, offers himself for re-appointment.
4. To appoint a Director in place of Dr. Santrupt Misra (DIN: 00013625), who retires from office by rotation and being eligible, offers himself for re-appointment.
5. Re-appointment of M/s. B S R & Co. LLP, Chartered Accountants as the Joint Statutory Auditors of the Company
To consider and if thought fit, to pass the following resolution as an Ordinary Resolution:
“RESOLVED THAT pursuant to the provisions of sections 139, 141 and other applicable provisions, if any, of the Companies Act, 2013 and the Companies (Audit and Auditors) rules, 2014 (including any statutory modification(s) or re-enactment thereof, for the time being in force), M/s. BSR & Co. LLP, Chartered Accountants, Mumbai (Registration No.:101248W/W-100022) be and is hereby appointed as one of the Joint Statutory Auditors of
the Company, for a second term of five consecutive years to hold office from the conclusion of this Annual General Meeting until the conclusion of the 79th Annual General Meeting of the Company, on such remuneration, exclusive of applicable taxes and reimbursement of travelling and out of pocket expenses, as may be mutually agreed by the Board of Directors of the Company and Statutory Auditors from time to time.”
SPECIAL BUSINESS:6. Re-appointment of Mr. Dilip Gaur as a Managing
Director of the Company To consider and, if thought fit, to pass the following
resolution as an Ordinary Resolution:
“RESOLVED THAT pursuant to the provisions of sections 196, 197, 198 and 203 read with Schedule V and any other applicable provisions of the Companies Act, 2013 ('the Act'), the Companies (Appointment and Remuneration of Managerial Personnel) rules, 2014 (including any statutory modification(s) or re-enactment thereof, for the time being in force), the Articles of Association of the Company and all applicable guidelines issued by the Central Government from time to time and subject to such other approvals as may be necessary, consent of the Members be and is hereby accorded for re- appointment of Mr. Dilip Gaur (DIN: 02071393), as the Managing Director of the Company for the period and upon the following terms and conditions, including remuneration and perquisites, as set out hereunder, with further liberty to the Board of Directors (hereinafter referred to as “the Board”, which term shall be deemed to include any Committee constituted or to be constituted by the Board) to alter, modify or revise from time to time, the terms and conditions of appointment and remuneration of Mr. Dilip Gaur, as Managing Director in such manner as may be considered appropriate and in the best interests of the Company and as may be permissible at law:
475Integrated Annual Report 2020-21
Integrated ReportFinancial statem
entsStatutory Reports
Notice (Contd.)
A. Period:
One year w.e.f. 1st April 2021, with the liberty to either party to terminate the appointment on three months’ notice in writing to the other.
B. Remuneration:
a) Basic Salary: C 16,49,000/- (Rupees Sixteen Lakh Forty Nine Thousand only) per month with such increments as the Board may decide from time to time, subject however to a ceiling of C 20,00,000/- (Rupees Twenty Lakh only) per month;
b) Special Allowance: C 16,90,355/- (Rupees Sixteen Lakh Ninety Thousand Three Hundred and Fifty Five only) per month with such increments as the Board may decide from time to time, subject however to a ceiling of C 20,00,000/- (Rupees Twenty Lakh only) per month. This allowance however, will not be taken into account for calculation of benefits such as Provident Fund, Gratuity, Superannuation and Leave encashment;
c) Variable Pay: Performance Bonus linked to the achievement of targets, as may be decided by the Board from time to time, subject to a maximum of C 4,00,00,000/-. (Rupees Four Crore only) per annum;
d) Long-term Incentive Compensation /Employee Stock Option / Restricted Stock Units/ Stock Appreciation Rights: As per the Plan applicable to the Senior Executives of the Company/Aditya Birla Group, including that of any parent/subsidiary company, as may be decided by the Board from time to time.
C. Perquisites
(a) Housing: Free furnished accommodation or House Rent Allowance in lieu of Company provided accommodation;
(b) Reimbursement of expenses at actual pertaining to electricity, gas, water, telephone and other reasonable expenses for the upkeep and maintenance in respect of such accommodation as per the Company’s Policy;
(c) Medical Expenses Reimbursement: Reimbursement of all expenses incurred for self and family at actuals (including domiciliary and medical expenses and insurance premium for medical and hospitalisation policy as applicable), as per the Company’s policy;
(d) Leave Travel Expenses: Leave Travel Expenses for self and family in accordance with the Policy of the Company;
(e) Club fees: Fee of Corporate membership of one Club in India (including admission and annual membership fee);
(f) Two cars for use of the Company’s Business, as per the Company’s Policy;
(g) Reimbursement of entertainment, travelling and all other expenses incurred for the business of the Company, as per the Policy of the Company;
(h) Leave and Encashment of Leave: As per the Policy of the Company;
(i) Personal Accident Insurance Premium: As per the Policy of the Company;
( j) Contr ibut ion towards Provident Fund, Superannuation Fund, National Pension Scheme or Annuity Fund: As per the Policy of the Company;
(k) Gratuity and /or contribution to the Gratuity Fund of the Company: As per the Policy of the Company;
(l) Other Allowances/Benefits, Perquisites: Any other allowances, benefits and perquisites as per the rules applicable to the Senior Executives of the Company and / or which may become applicable in the future and/ or any other allowances, perquisites as the Board may from time to time decide;
(m) Any other one time/ periodic retirement allowances/ benefits as may be decided by the Board at the time of retirement;
(n) In case Mr. Dilip Gaur is elevated to the next higher level of the Company during the tenure of his appointment, the allowances, perquisites and benefits applicable to that level, will also apply to him;
476 Grasim Industries Limited
(o) Annual remuneration review is effective from 1st July each year, as per the Policy of the Company.
D. Subject as aforesaid, the Managing Director shall be governed by such other rules as are applicable to the Senior Executives of the Company from time to time.
E. For the purposes of Gratuity, Provident Fund, Superannuation and other like benefits, if any, the service of Mr. Dilip Gaur, Managing Director, will be considered as continuous service with the Company from the date of his joining the Aditya Birla Group.
F. The aggregate of the remuneration and perquisites as aforesaid, in any financial year, shall not exceed the limit under section 197, 198 read with Schedule V and other applicable provisions of the Act, or any statutory modifications or re-enactments thereof for the time being in force, or otherwise as may be permissible at law.
G. Any revision/change in allowance / perquisite relating to Company provided (furnished/ unfurnished) accommodation and/or HRA in lieu of Company provided accommodation / Car or other allowances/ perquisites, will be adjusted from the existing Special Allowance, subject to the ceiling limit as approved by the Shareholders and as per the policy of the Company.
H. Though considering the provisions of section 188 of the Act 2013, and the applicable rules and Schedule of the Act, Mr. Dilip Gaur would not be holding any office or place of profit by his being a mere director of the Company’s Subsidiaries/ Joint Ventures/Associates, approval be and is hereby granted by way of abundant caution for him to accept the sitting fees/ commission paid/ payable to other directors for attending the meetings of Board(s) of Directors/ Committee(s) of Subsidiaries/ Joint Ventures/ Associates of the Company or companies promoted by the Aditya Birla Group.
I. So long as Mr. Dilip Gaur functions as the Managing Director of the Company, his office shall not be subject to retirement by rotation.”
RESOLVED FURTHER THAT notwithstanding anything herein above stated, wherein any financial year, during the period of his appointment, the Company has no profits or its profits are inadequate, the foregoing amount of remuneration including the perquisites and benefits, as aforesaid, shall be paid to Mr. Dilip Gaur, Managing Director in accordance with the applicable provisions of the Act
and subject to the approval of the Central Government, if required.
RESOLVED FURTHER THAT the Board be and is hereby authorised to do all such acts, deeds, matters and things as may be considered necessary, desirable or expedient to give effect to this Resolution.”
7. Appointment of Mr. V. Chandrasekaran as an Independent Director of the Company
To consider and, if thought fit, to pass the following resolution as an Ordinary Resolution:
“RESOLVED THAT pursuant to the provisions of section 149, 150, 152 and other applicable provisions, if any, of the Companies Act, 2013 (‘the Act’) and the rules made thereunder, read with Schedule IV of the Act and the Securities and Exchange Board of India (Listing Obligations and Disclosure Requirements) Regulations, 2015 (‘Listing Regulations’) [including any statutory modification(s) or re-enactment for the time being in force] and the Articles of Association of the Company; Mr. V. Chandrasekaran (DIN: 03126243), who was appointed by the Board of Directors of the Company, as an Additional Director (Non-Executive and Independent Director) of the Company with effect from 24th May 2021 and who meets the criteria for independence as provided in section 149(6) of the Act along with the rules framed thereunder and regulation 16(1)(b) of the Listing Regulations and who has submitted a declaration to that effect and in respect of whom the Company has received a notice in writing from a Member under section 160(1) of the Act proposing his candidature for the office of Director of the Company and who holds office upto the date of this Annual General Meeting, be and is hereby appointed as an Independent Director of the Company for a term of five consecutive years commencing from 24th May 2021 up to 23rd May 2026, not liable to retire by rotation.”
8. Appointment of Mr. Adesh Kumar Gupta as an Independent Director of the Company
To consider and, if thought fit, to pass the following Resolution as an Ordinary Resolution:
“RESOLVED THAT pursuant to the provisions of section 149, 150, 152 and other applicable provisions, if any, of the Companies Act, 2013 (‘the Act’) and the rules made thereunder, read with Schedule IV of the Act and the Securities and Exchange Board of India (Listing Obligations and Disclosure Requirements) Regulations, 2015 (‘Listing Regulations’) [including any statutory modification(s) or re-enactment for the time being in force] and the Articles of Association of the Company; Mr. Adesh Kumar Gupta
477Integrated Annual Report 2020-21
Integrated ReportFinancial statem
entsStatutory Reports
Notice (Contd.)
(DIN: 00020403), who was appointed by the Board of Directors of the Company, as an Additional Director (Non-Executive and Independent Director) of the Company with effect from 24th May 2021 and who meets the criteria for independence as provided in section 149(6) of the Act along with the rules framed thereunder and regulation 16(1)(b) of the Listing Regulations and who has submitted a declaration to that effect and in respect of whom the Company has received a notice in writing from a Member under section 160(1) of the Act proposing his candidature for the office of Director of the Company and who holds office upto the date of this Annual General Meeting, be and is hereby appointed as an Independent Director of the Company for a term of five consecutive years commencing from 24th May 2021 up to 23rd May 2026, not liable to retire by rotation.”
9. Payment of Commission to Non -Executive Directors of the Company
To consider and, if thought fit, to pass the following Resolution as a Special Resolution:
“RESOLVED THAT pursuant to the provisions of sections 197 and 198, and other applicable provisions of the Companies Act, 2013 ('the Act'), read with relevant rules (including any statutory modification(s) or re-enactment thereof for the time being in force) and the Securities and Exchange Board of India (Listing Obligations and Disclosure Requirements) Regulations, 2015 ('Listing Regulations'), the Non-Executive Directors of the Company (i.e., Directors other than the Managing Director and/or the Whole- time Directors) be paid, remuneration by way of commission, in addition to the sitting fee for attending the meetings of the Board of Directors or Committees thereof, as the Board of Directors may from time to time determine, not exceeding such percentage of the Net Profits as prescribed under section 197 of the Act and/or Listing Regulations and as computed in the manner laid down in section 198 of the Act, or any statutory modification(s) or re-enactment thereof for each relevant financial year commencing from 1st April 2021.
RESOLVED FURTHER THAT the Board of Directors of the Company (including any Committee constituted or to be constituted by the Board) be and is hereby authorised to do all acts and take all such steps as may be necessary, proper or expedient to give effect to this Resolution.”
10. Ratification of the remuneration of Cost Auditors for financial year 2021-22
To consider and, if thought fit, to pass the following Resolution as an Ordinary Resolution:
“RESOLVED THAT pursuant to the provisions of section 148 and other applicable provisions, if any, of the Companies Act, 2013 read with the Companies (Audit and Auditors) Rules, 2014 (including any statutory modification(s) or re-enactment(s) thereof, for the time being in force), the Company hereby ratifies the remuneration payable to the following Cost Auditors who have been appointed by the Board of Directors on the recommendation of the Audit Committee, as the Cost Auditors of the Company, to conduct the audit of cost records of the Company as prescribed under the Companies (Cost Records and Audit) Rules, 2014, as amended, for the financial year ending 31st March 2022:
Name of the Cost Auditors
Division of the Company Remuneration
M/s. D. C. Dave & Co., Cost Accountants, Mumbai (Registration No. 000611)
All Divisions of the Company, except Indo Gulf Fertilisers Unit
Not exceeding C 17.20 Lakh plus applicable taxes and reimbursement of out-of-pocket expenses
M/s. K. G. Goyal and Associate, Cost Accountants, Jaipur (Registration No. FRN-000024)
Indo Gulf Fertilisers Unit (IGF Unit)
Not exceeding C 2.00 Lakh plus applicable taxes and reimbursement of out-of-pocket expenses to be paid on proportionate basis till divestment of IGF Unit
RESOLVED FURTHER THAT the Board of Directors of the Company (including any Committee thereof) be and is hereby authorised to do all such acts and take all such steps as may be necessary, proper or expedient to give effect to this resolution.”
11. Ratification of the remuneration of Cost Auditors for financial year 2020-21
To consider and, if thought fit, to pass the following Resolution as an Ordinary Resolution:
“RESOLVED THAT pursuant to the provisions of section 148 and other applicable provisions, if any, of the Companies Act, 2013 read with the Companies (Audit and Auditors)
478 Grasim Industries Limited
Rules, 2014 (including any statutory modification(s) or re-enactment(s) thereof, for the time being in force), the Company hereby ratifies the remuneration payable to M/s. D. C. Dave & Co., Cost Accountants, Mumbai (Registration No. 000611) who have been appointed as the Cost Auditors of the Company, by the Board of Directors on the recommendation of the Audit Committee, to conduct audit of cost records of all the units/ divisions of the Company as prescribed under the Companies (Cost Records and Audit) Rules, 2014, as amended, for the financial year ending 31st March 2021 at a remuneration not exceeding C 17.20 Lakh plus applicable taxes and reimbursement of out-of-pocket expenses.
RESOLVED FURTHER THAT the Board of Directors of the Company (including any Committee thereof) be and is hereby authorised to do all such acts and take all such steps as may be necessary, proper or expedient to give effect to this resolution.”
By Order of the BoardFor Grasim Industries Limited
Sailesh DagaCompany Secretary
Membership No.: F4164Place: MumbaiDate: 27th July 2021
479Integrated Annual Report 2020-21
Integrated ReportFinancial statem
entsStatutory Reports
Notice (Contd.)
NOTES FOR MEMBERS’ ATTENTION:1. The relevant Explanatory Statement pursuant to section
102 of the Companies Act, 2013 ('the Act'), in respect of the business, set out at Item Nos. 5 to 11 of the Notice, is annexed hereto. The Board of Directors have considered and decided to include Item Nos. 6 to 11 as special business as they are unavoidable in nature. Additional information, pursuant to regulation 36(3) of the Securities and Exchange Board of India (Listing Obligations and Disclosure Requirements) Regulations, 2015 ('Listing Regulations') and Secretarial Standards on General Meetings, in respect of the Directors seeking appointment/ re-appointment at the AGM, is furnished as Annexure to the Notice.
2. In view of the continuing restrictions on the movement of people at several places in the country, due to outbreak of COVID-19, the Ministry of Corporate Affairs, Government of India ('MCA'), and the Securities and Exchange Board of India ('SEBI'), have allowed companies to conduct Annual General Meetings ('AGM') through Video Conference ('VC')/Other Audio-Visual Means ('OAVM') during the calendar year 2021, without the physical presence of Members.
This AGM is being convened in compliance with applicable provisions of the Act and the rules made thereunder; provisions of the Listing Regulations; the provisions of General Circular No. 20/2020 dated 5th May 2020 read with General Circular No. 14/2020 dated 8th April 2020; General Circular No.17/2020 dated 13th April 2020 and General circular No. 02/2021 dated 13th January 2021 issued by the MCA and Circular No. SEBI/HO/CFD/CMD1/CIR/P/2020/79 dated 12th May 2020 and circular No. SEBI/HO/CFD/CMD2/CIR/P/2021/11 dated 15th January 2021 issued by SEBI ('MCA and SEBI Circulars').
3. In accordance with the Secretarial Standard – 2 on General Meetings issued by the Institute of Company Secretaries of India ('ICSI') read with Clarification/Guidance on applicability of Secretarial Standards - 1 and 2 dated 15th April 2020 issued by the ICSI, the proceedings of the AGM will be deemed to be conducted at the Registered Office of the Company at Grasim Staff Club, Birlagram, Nagda-456 331, Dist. Ujjain (Madhya Pradesh), India. Since the AGM will be held through VC/OAVM, the route map of the venue of the Meeting is not annexed hereto.
4. Members attending the AGM through VC/OAVM will be counted for the purpose of reckoning the quorum under section 103 of the Act.
5. Since this AGM is being held pursuant to the MCA and SEBI Circulars through VC/OAVM, physical attendance of Members has been dispensed with. Accordingly, the
facility for appointment of proxies by the Members will not be available for the AGM and hence the Proxy Form and Attendance Slip are not annexed to this Notice.
6. Members of the Company had approved the appointment of M/s. S R B C & Co. LLP, Chartered Accountants (Firm Registration no. 324982E/E300003), as one of the Joint Statutory Auditors for a period of 5 years, at the AGM of the Company held on 22nd September 2017, to hold office upto 75th AGM of the Company. Pursuant to the amendment made by the Companies (Amendment) Act, 2017, effective from 7th May 2018, it is no longer necessary to seek the ratification of the members for continuance of the above appointment. Hence, the Company is not seeking the ratification of the members for the appointment of the Statutory Auditors.
At the AGM of the Company held on 23rd September 2016, Members of the Company had approved the appointment of M/s. B S R & Co. LLP, Chartered Accountants (Firm Registration no. 101248W/W-100022) as one of the Joint Statutory Auditors for a period of 5 years, to hold office upto 74th AGM of the Company. Accordingly, M/s. B S R & Co. LLP are due to retire at the ensuing 74th AGM. The necessary resolution for re-appointment of M/s. B S R & Co. LLP as one of the Joint Statutory Auditors for a second term of 5 consecutive years has been incorporated in this AGM Notice.
7. KFin Technologies Private Limited ('KFinTech'), the Company’s Registrar and Transfer Agent will provide the facility for voting through remote e-voting, for participating in the AGM through VC/OAVM and e-voting (Insta Poll) during the AGM.
8. In terms of the provisions of section 152 of the Act, Mr. Kumar Mangalam Birla and Dr. Santrupt Misra, Directors are liable to retire by rotation at the Meeting. The Nomination and Remuneration Committee and the Board of Directors of the Company commend their respective re-appointments.
9. Details of Directors seeking appointment/re-appointment /retiring by rotation at this Meeting are provided in the “Annexure” to the Notice.
10. Dispatch of Annual Report through electronic mode i. In compliance with the aforesaid MCA and SEBI
Circulars, Notice of the AGM along with the Annual Report for the FY 2020-21 is being sent only through electronic mode to those Members whose email ID are registered with KFinTech/Depositories. Members may note that the Notice and Annual Report for the FY 2020-21 will be available on the Company’s website
480 Grasim Industries Limited
www.grasim.com, website of the Stock Exchanges i.e. BSE Limited and The National Stock Exchange of India Limited at www.bseindia.com and www.nseindia.com respectively, and on the website of KFinTech at https://evoting.kfintech.com.
ii. Members who have still not registered their email ID are requested to update at the earliest:
a) Members holding shares in physical mode and who have not registered/updated their email ID with the Company are requested to register/update their email ID with KFinTech by sending requests at [email protected], with details of folio number and attaching a self-attested copy of PAN card or by logging onto https://ris.kfintech.com/clientservices/mobilereg/mobileemailreg.aspx.
b) Members holding shares in dematerialised mode are requested to register/update their email ID with the relevant Depository Participants.
iii. The Audited Accounts of the Company and its subsidiary companies are available on the Company’s website, www.grasim.com.
11. Procedure for Inspection of Documents During the AGM, the Register of Directors and Key Managerial
Personnel and their Shareholding maintained under section 170 of the Act, the Register of Contracts or arrangements in which Directors are interested under section 189 of the Act and the Certificate from Auditors of the Company certifying that the ESOP Schemes of the Company are being implemented in accordance with the Securities and Exchange Board of India (Share Based Employee Benefits) Regulations, 2014, will be available for inspection through electronic mode.
All documents referred to in the Notice will also be available electronically for inspection without any fee by the Members from the date of circulation of this Notice up to the date of AGM.
Members seeking to inspect such documents can send an e-mail to [email protected]
12. Instructions for remote e-voting and e-voting (Insta Poll) at the AGM
i. In compliance with the provisions of section 108 of the Act, read with rule 20 of the Companies (Management and Administration) rules, 2014, as amended by the Companies (Management and Administration)
Amendment rules, 2015 and regulation 44 of the Listing Regulations, the Company is pleased to provide to its Members facility to exercise their right to vote on resolutions proposed to be considered at the AGM by electronic means and the business may be transacted through e-voting services facilitated by KFinTech. The Members may cast their votes remotely, using an electronic voting system ('remote e-voting') on the dates mentioned herein below.
ii. The voting rights of Members shall be in proportion to their shares in the paid-up equity share capital of the Company as on the cut-off date.
iii. The Members who have cast their vote by remote e-voting prior to the AGM may also join the AGM through VC/OAVM, but shall not be entitled to cast their vote again. A member can opt for only single mode of voting per EVEN, i.e., through remote e-voting or e-voting at the Meeting. If a member casts vote(s) by both modes, then voting done through remote e-voting shall prevail and vote(s) cast at the Meeting shall be treated as 'INVALID'.
iv. The remote e-voting period commences on Tuesday, 24th August 2021 (9.00 a.m. IST) and ends on Thursday, 26th August 2021 (5.00 p.m. IST). During this period, Members of the Company holding shares either in physical form or in dematerialised form, as on Friday, 20th August 2021, i.e., cut-off date, may cast their vote by remote e-voting. A person who is not a Member as on the cut-off date should treat this Notice for information purpose only. The remote e-voting module will be disabled by KFinTech for voting thereafter. Once the vote on a resolution is cast by the Member, he will not be allowed to change it subsequently.
v. A person, whose name is recorded in the Register of Members or in the Register of Beneficial Owners maintained by the Depositories as on the cut-off date only shall be entitled to avail the facility of remote e-voting as well as voting at the AGM.
vi. Mr. Ashish Garg, Practicing Company Secretary (FCS 5181 & C.P. No. 4423) and failing him Mr. Avinash Bagul (FCS 5578 & C.P. No. 19862), partner BNP & Associates, Company Secretaries have been appointed as the Scrutiniser to scrutinise the e-voting (Insta Poll) during the AGM and remote e-voting process in a fair and transparent manner.
481Integrated Annual Report 2020-21
Integrated ReportFinancial statem
entsStatutory Reports
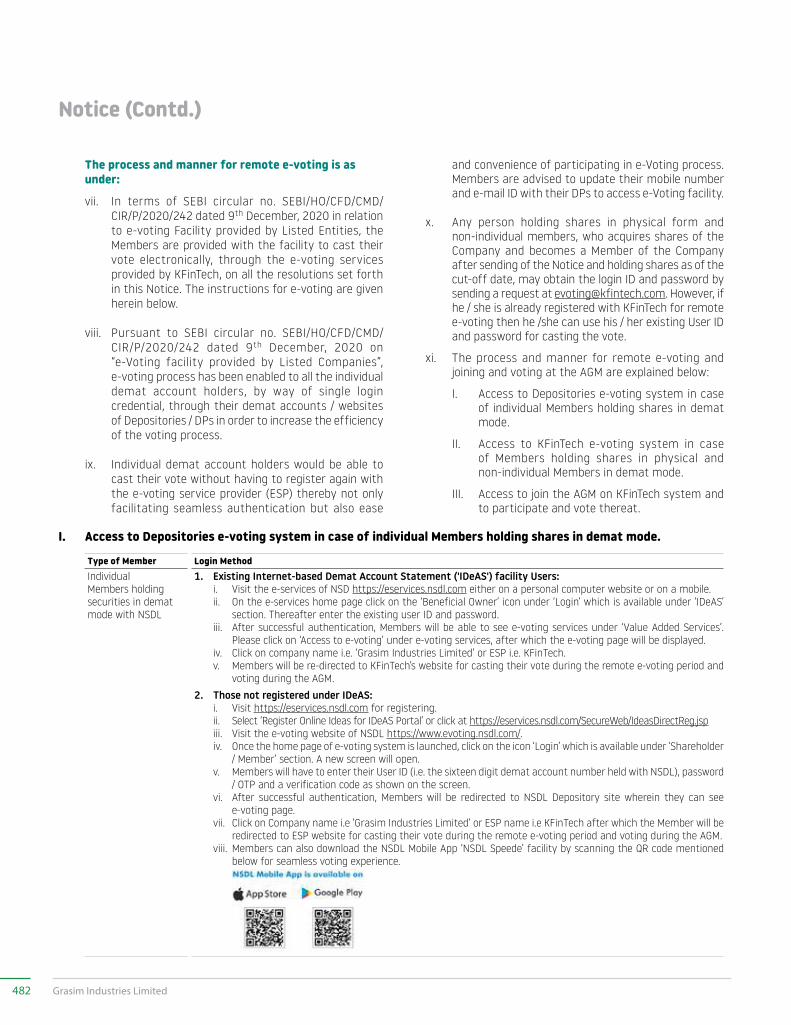
Notice (Contd.)
The process and manner for remote e-voting is as under:
vii. In terms of SEBI circular no. SEBI/HO/CFD/CMD/ CIR/P/2020/242 dated 9th December, 2020 in relation to e-voting Facility provided by Listed Entities, the Members are provided with the facility to cast their vote electronically, through the e-voting services provided by KFinTech, on all the resolutions set forth in this Notice. The instructions for e-voting are given herein below.
viii. Pursuant to SEBI circular no. SEBI/HO/CFD/CMD/CIR/P/2020/242 dated 9th December, 2020 on “e-Voting facility provided by Listed Companies”, e-voting process has been enabled to all the individual demat account holders, by way of single login credential, through their demat accounts / websites of Depositories / DPs in order to increase the efficiency of the voting process.
ix. Individual demat account holders would be able to cast their vote without having to register again with the e-voting service provider (ESP) thereby not only facilitating seamless authentication but also ease
I. Access to Depositories e-voting system in case of individual Members holding shares in demat mode.
Type of Member Login Method IndividualMembers holding securities in demat mode with NSDL
1. Existing Internet-based Demat Account Statement ('IDeAS') facility Users: i. Visit the e-services of NSD https://eservices.nsdl.com either on a personal computer website or on a mobile. ii. On the e-services home page click on the ‘Beneficial Owner’ icon under ‘Login’ which is available under ‘IDeAS’
section. Thereafter enter the existing user ID and password. iii. After successful authentication, Members will be able to see e-voting services under ‘Value Added Services’.
Please click on ‘Access to e-voting’ under e-voting services, after which the e-voting page will be displayed. iv. Click on company name i.e. ‘Grasim Industries Limited’ or ESP i.e. KFinTech. v. Members will be re-directed to KFinTech’s website for casting their vote during the remote e-voting period and
voting during the AGM.2. Those not registered under IDeAS: i. Visit https://eservices.nsdl.com for registering. ii. Select ‘Register Online Ideas for IDeAS Portal’ or click at https://eservices.nsdl.com/SecureWeb/IdeasDirectReg.jsp iii. Visit the e-voting website of NSDL https://www.evoting.nsdl.com/. iv. Once the home page of e-voting system is launched, click on the icon ‘Login’ which is available under ‘Shareholder
/ Member’ section. A new screen will open. v. Members will have to enter their User ID (i.e. the sixteen digit demat account number held with NSDL), password
/ OTP and a verification code as shown on the screen. vi. After successful authentication, Members will be redirected to NSDL Depository site wherein they can see
e-voting page. vii. Click on Company name i.e ‘Grasim Industries Limited’ or ESP name i.e KFinTech after which the Member will be
redirected to ESP website for casting their vote during the remote e-voting period and voting during the AGM. viii. Members can also download the NSDL Mobile App ‘NSDL Speede’ facility by scanning the QR code mentioned
below for seamless voting experience.
and convenience of participating in e-Voting process. Members are advised to update their mobile number and e-mail ID with their DPs to access e-Voting facility.
x. Any person holding shares in physical form and non-individual members, who acquires shares of the Company and becomes a Member of the Company after sending of the Notice and holding shares as of the cut-off date, may obtain the login ID and password by sending a request at [email protected]. However, if he / she is already registered with KFinTech for remote e-voting then he /she can use his / her existing User ID and password for casting the vote.
xi. The process and manner for remote e-voting and joining and voting at the AGM are explained below:
I. Access to Depositories e-voting system in case of individual Members holding shares in demat mode.
II. Access to KFinTech e-voting system in case of Members holding shares in physical and non-individual Members in demat mode.
III. Access to join the AGM on KFinTech system and to participate and vote thereat.
482 Grasim Industries Limited
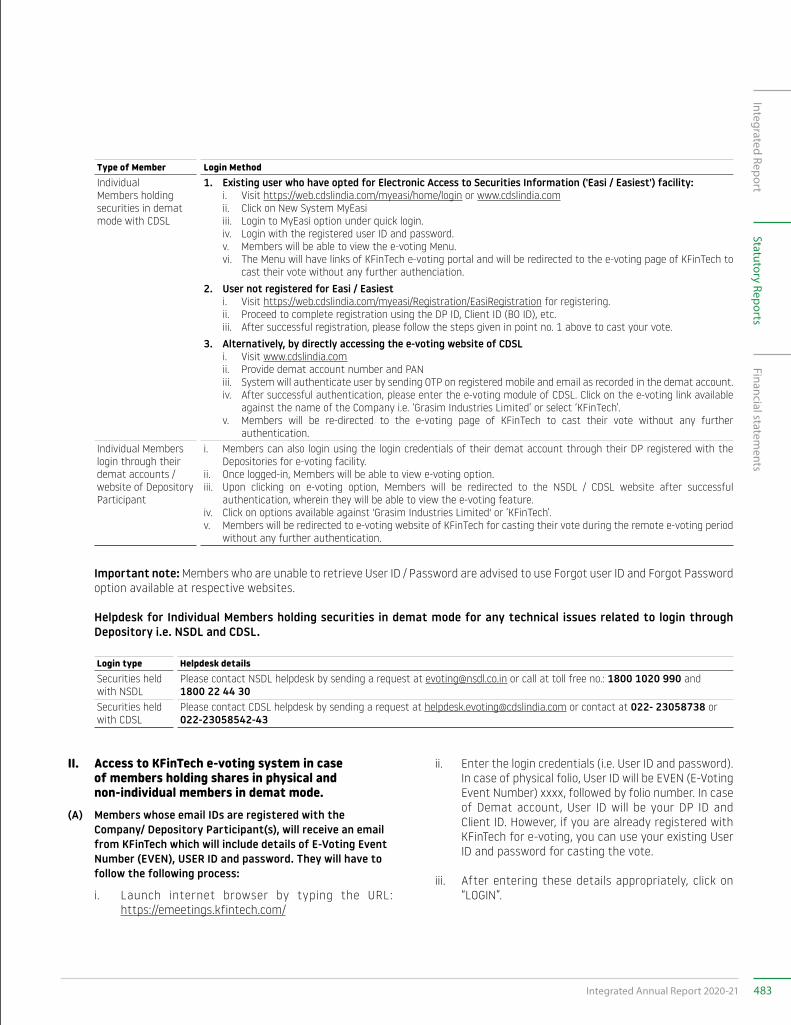
II. Access to KFinTech e-voting system in case of members holding shares in physical and non-individual members in demat mode.
(A) Members whose email IDs are registered with the Company/ Depository Participant(s), will receive an email from KFinTech which will include details of E-Voting Event Number (EVEN), USER ID and password. They will have to follow the following process:
i. Launch internet browser by typing the URL: https://emeetings.kfintech.com/
ii. Enter the login credentials (i.e. User ID and password). In case of physical folio, User ID will be EVEN (E-Voting Event Number) xxxx, followed by folio number. In case of Demat account, User ID will be your DP ID and Client ID. However, if you are already registered with KFinTech for e-voting, you can use your existing User ID and password for casting the vote.
iii. After entering these details appropriately, click on “LOGIN”.
Type of Member Login Method IndividualMembers holding securities in demat mode with CDSL
1. Existing user who have opted for Electronic Access to Securities Information ('Easi / Easiest') facility: i. Visit https://web.cdslindia.com/myeasi/home/login or www.cdslindia.com ii. Click on New System MyEasi iii. Login to MyEasi option under quick login. iv. Login with the registered user ID and password. v. Members will be able to view the e-voting Menu. vi. The Menu will have links of KFinTech e-voting portal and will be redirected to the e-voting page of KFinTech to
cast their vote without any further authenciation.2. User not registered for Easi / Easiest i. Visit https://web.cdslindia.com/myeasi/Registration/EasiRegistration for registering. ii. Proceed to complete registration using the DP ID, Client ID (BO ID), etc. iii. After successful registration, please follow the steps given in point no. 1 above to cast your vote.3. Alternatively, by directly accessing the e-voting website of CDSL i. Visit www.cdslindia.com ii. Provide demat account number and PAN iii. System will authenticate user by sending OTP on registered mobile and email as recorded in the demat account. iv. After successful authentication, please enter the e-voting module of CDSL. Click on the e-voting link available
against the name of the Company i.e. ‘Grasim Industries Limited’ or select ‘KFinTech’. v. Members will be re-directed to the e-voting page of KFinTech to cast their vote without any further
authentication.Individual Members login through their demat accounts / website of Depository Participant
i. Members can also login using the login credentials of their demat account through their DP registered with the Depositories for e-voting facility.
ii. Once logged-in, Members will be able to view e-voting option.iii. Upon clicking on e-voting option, Members will be redirected to the NSDL / CDSL website after successful
authentication, wherein they will be able to view the e-voting feature.iv. Click on options available against 'Grasim Industries Limited' or ‘KFinTech’.v. Members will be redirected to e-voting website of KFinTech for casting their vote during the remote e-voting period
without any further authentication.
Important note: Members who are unable to retrieve User ID / Password are advised to use Forgot user ID and Forgot Password option available at respective websites.
Helpdesk for Individual Members holding securities in demat mode for any technical issues related to login through Depository i.e. NSDL and CDSL.
Login type Helpdesk details Securities held with NSDL
Please contact NSDL helpdesk by sending a request at [email protected] or call at toll free no.: 1800 1020 990 and 1800 22 44 30
Securities held with CDSL
Please contact CDSL helpdesk by sending a request at [email protected] or contact at 022- 23058738 or 022-23058542-43
483Integrated Annual Report 2020-21
Integrated ReportFinancial statem
entsStatutory Reports
Notice (Contd.)
iv. You will now reach password change Menu wherein you are required to mandatorily change your password. The new password shall comprise of minimum 8 characters with at least one upper case (A- Z), one lower case (a-z), one numeric value (0-9) and a special character (@,#,$, etc.,). The system will prompt you to change your password and update your contact details like mobile number, email ID etc. on first login. You may also enter a secret question and answer of your choice to retrieve your password in case you forget it. It is strongly recommended that you do not share your password with any other person and that you take utmost care to keep your password confidential.
v. You need to login again with the new credentials.
vi. On successful login, the system will prompt you to select the “EVEN” i.e., 'Grasim Industries Limited' and click on “Submit”
vii. On the voting page, enter the number of shares (which represents the number of votes) as on the Cut-off Date under “FOR/AGAINST” or alternatively, you may partially enter any number in “FOR” and partially “AGAINST” but the total number in “FOR/AGAINST” taken together shall not exceed your total shareholding as mentioned herein above. You may also choose the option "ABSTAIN". If the Member does not indicate either “FOR” or “AGAINST” it will be treated as “ABSTAIN” and the shares held will not be counted under either head.
viii. Members holding multiple folios/demat accounts shall choose the voting process separately for each folio/ demat accounts.
ix. Voting has to be done for each item of the notice separately. In case you do not desire to cast your vote on any specific item, it will be treated as abstained.
x. You may then cast your vote by selecting an appropriate option and click on “Submit”.
xi. A confirmation box will be displayed. Click “OK” to confirm else “CANCEL” to modify. Once you have voted on the resolution (s), you will not be allowed to modify your vote. During the voting period, Members can login any number of times till they have voted on the Resolution(s).
(B) Members whose email IDs are not registered with the Company/Depository Participant(s), and consequently the Annual Report, Notice of AGM and e-voting instructions cannot be serviced, will have to follow the following process:
i. Members who have not registered their email address and in consequence the Annual Report, Notice of AGM and e-voting instructions cannot be serviced, may temporarily get their email address registered and mobile number provided with KFinTech, by accessing the link: https: //ris.kfintech.com/clientservices/mobilereg/mobileemailreg.aspx. Members are requested to follow the process as guided to capture the email address and mobile number for receiving the soft copy of the notice and e-voting instructions along with the User ID and Password. In case of any queries, member may write to [email protected].
ii. Alternatively, member may send an e-mail request at the email id [email protected] along with scanned copy of the signed copy of the request letter providing the email address, mobile number, self-attested PAN copy and Client Master copy in case of electronic folio and copy of share certificate in case of physical folio for sending the Annual report, Notice of AGM and the e-voting instructions.
iii. After receiving the e-voting instructions, please follow all steps above to cast your vote by electronic means.
III. Access to join the AGM on KFinTech system and to participate and vote thereat.
Member will be provided with a facility to attend the AGM through VC / OAVM platform provided by KFinTech. Members may access the same at https://emeetings.kfintech.com/ by using the e-voting login credentials provided in the email received from the Company/KFinTech. After logging in, click on the Video Conference tab and select the EVEN of the Company. Click on the video symbol and accept the meeting etiquettes to join the meeting. Please note that the members who do not have the User ID and Password for e-Voting or have forgotten the User ID and Password may retrieve the same by following the remote e-Voting instructions mentioned above.
Procedure for joining the AGM though VC/OAVM
i. Member will be able to attend the AGM through VC / OAVM or view the live webcast of the AGM at https://emeetings.kfintech.com/ by using their remote
484 Grasim Industries Limited
e-voting login credentials and selecting the ‘Event’ for Company’s AGM.
Members who do not have the User ID and Password for e-voting or have forgotten the User ID and Password may retrieve the same by following the remote e-voting instructions mentioned in this Notice. Further, Members can also use the OTP based login for logging into the e-voting system.
ii. Facility for joining AGM though VC/ OAVM shall open atleast 30 minutes before the commencement of the Meeting and shall be kept open throughout the AGM.
iii. Members are encouraged to join the Meeting through Laptops/ Desktops with Google Chrome (preferred browser), Safari, Internet Explorer, Microsoft Edge, Mozilla Firefox 22.
iv. Members will be required to grant access to the webcam to enable VC / OAVM. Further, Members connecting from Mobile Devices or Tablets or through Laptop connecting via Mobile Hotspot may experience Audio/Video loss due to fluctuation in their respective network. It is therefore recommended to use Stable Wi-Fi or LAN Connection to mitigate any kind of aforesaid glitches.
v. Facility of joining the AGM through VC / OAVM shall be available on first come first served basis.
Large Members (i.e. Members holding 2% or more shareholding), promoters, institutional investors, directors, key managerial personnel, the Chairpersons of the Audit Committee, Nomination and Remuneration Committee and Stakeholders' Relationship Committee, Auditors, etc. will not be subject to the aforesaid restriction of first come first served basis.
vi. Institutional Members are encouraged to attend and vote at the AGM through VC / OAVM.
vii. In case of joint holders attending the Meeting, only such joint holder who is higher in the order of names will be entitled to vote at the AGM.
viii. Institutional/Corporate Members (i.e. other than individuals/HUF, NRI, etc.) are required to send a scanned copy (PDF/JPG Format) of its board or governing body resolution/authorisation etc., authorising its representative to attend the AGM through VC/OAVM on its behalf and to vote through remote e-voting. The scanned image of the abovementioned documents should be in the name format 'Corporate Name_EVENT
NO.' The said resolution/authorization shall be sent to the Scrutiniser by email through its registered email ID address to [email protected] with a copy marked to [email protected] and [email protected].
SPEAKER REGISTRATION
ix. Members holding shares as on the cut-off date and who would like to express their views or ask questions during the AGM may register themselves as speakers by logging on to https://emeetings.kfintech.com and clicking on the ‘Speaker Registration’ option available on the screen after log in. The Speaker Registration will be open during Monday, 23rd August 2021 (9.00 a.m. IST) to Wednesday, 25th August 2021 (5.00 p.m. IST). Only those members who are registered as Speakers will be allowed to express their views or ask questions. The Company reserves the right to restrict the number of questions and number of Speakers, depending upon availability of time as appropriate for smooth conduct of the AGM.
x. Alternatively, members may also visit https: //emeetings.kfintech.com and click on the tab ‘Post Your Queries’ and post their queries/ views/questions in the window provided, by mentioning their name, demat account number/ folio number, email ID and mobile number. The window will be closed on Wednesday, 25th August 2021 (5.00 p.m. IST).
xi. Members seeking any information with regard to the accounts or any matter to be placed at the AGM, are requested to write to the Company on or before Wednesday, 25th August 2021 through email on [email protected]. The same will be replied by the Company suitably.
OTHER INSTRUCTIONS
a. In case of any queries, please visit Help and FAQs section available at KFinTech website https://evoting.kfintech.com. For any grievances related to e-voting, please contact Mr. Ganesh Patro, Senior Manager, KFin Technologies Private Limited, Selenium Tower B, Plot Nos. 31 & 32, Financial District, Nanakramguda, Serilingampally Mandal, Hyderabad - 500 032 at [email protected], Toll Free No. 1800 309 4001.
b. In case a person has become a Member of the Company after dispatch of AGM Notice but on or before the cut-off date for e-voting and all other members who have not received USER ID and password, he/she may obtain the User ID and Password in the manner as mentioned below:
485Integrated Annual Report 2020-21
Integrated ReportFinancial statem
entsStatutory Reports
Notice (Contd.)
i. If the mobile number of the member is registered against Folio No./ DP ID Client ID, the member may send SMS: MYEPWD <space> E-Voting Event Number+Folio No. or DP ID Client ID to 9212993399
1. Example for NSDL: MYEPWD <SPACE> IN12345612345678 2. Example for CDSL: MYEPWD <SPACE>1402345612345678 3. Example for Physical: MYEPWD <SPACE> XXXX1234567890
ii. If e-mail address or mobile number of the member is registered against Folio No. / DP ID Client ID, then on the home page of https://evoting.kfintech.com/, the member may click “Forgot Password” and enter Folio No. or DP ID Client ID and PAN to generate a password.
iii. Members who may require any technical assistance or support before or during the AGM are requested to contact KFinTech at toll free number 1800-309-4001 or write to them at [email protected].
iv. Members may send an email request to: [email protected]. If the Member is already registered with the KFinTech e-voting platform then such Member can use his / her existing User ID and password for casting the vote through remote e-voting.
13. Information and instructions for e-voting facility (Insta Poll) at AGM
i. Facility to cast vote through e-voting (Insta Poll) at AGM will be made available on the Video Conference screen and will be activated once the e-voting (Insta Poll) is announced at the Meeting.
ii. Those Members, who will be present in the AGM through VC/OAVM facility and have not cast their vote on the Resolutions through remote e-voting and are otherwise not barred from doing so, shall be eligible to vote through e-voting facility (Insta Poll) during the AGM.
iii. The procedure for e-voting (Insta Poll) during the AGM is same as the instructions mentioned above for remote e-voting since the AGM is being held through VC/OAVM. The e-voting window shall be activated upon instructions of the Chairman of the AGM during the AGM. E-voting (Insta Poll) during the AGM is integrated
with the VC/OAVM platform and no separate login is required for the same.
Results of remote e-voting and e-voting (Insta Poll) at the AGM
The Scrutiniser will, after the conclusion of e-voting at the Meeting, scrutinise the votes cast at the Meeting and votes cast through remote e-voting, make a consolidated Scrutiniser’s Report and submit the same to the Chairman. The Scrutiniser’s decision on the validity of the vote shall be final. The result of e-voting along with the consolidated Scrutiniser’s Report, will be displayed at the Registered Office of the Company and will be placed on the website of the Company: www.grasim.com and on the website of KFinTech at: https://evoting.kfintech.com. The result will simultaneously be communicated to the stock exchanges.
14. Book Closure The Register of Members and Share Transfer Books
of the Company will remain closed from Saturday, 14th August 2021 to Friday, 27th August 2021 (both days inclusive) for the purpose of payment of dividend, if any, approved by the Members at the AGM.
15. Dividend related Information i. Subject to the provisions of the Act, dividend as
recommended by the Board and subject to deduction of tax at source, if approved at the Meeting, will be paid to those Members or their mandates, whose names are registered in the Company’s Register of Members:
a) as Beneficial Owners as at the end of the business hours on Friday, 13th August 2021 as per the list to be furnished by National Securities Depository Limited ('NSDL') and Central Depository Services (India) Limited ('CDSL') in respect of the equity shares held in electronic form;
b) whose names appear as Members in the Register of Members of the Company in physical form which are maintained with KFinTech, after giving effect to valid request(s) of transfer of shares in physical form (re-lodgment cases i.e. requests for transfer(s) which were received prior to 1st April 2019 and returned due to deficiency in the documents) lodged with the Company/ KFinTech on or before Friday, 13th August, 2021.
c) equity shares that may be allotted upon exercise of stock options granted under the Employee Stock Option Scheme-2006, Employee Stock
486 Grasim Industries Limited
Option Scheme-2013, before the book closure date shall rank pari passu with the existing equity shares and shall also be entitled to receive dividend, if approved at the Meeting.
ii. In terms of the provisions of the Income Tax Act, 1961, dividend shall be taxed in the hands of Members at applicable rates of tax. The Company has by email dated 22nd June 2021, informed Members about the deduction of tax at source on dividend, a copy of which is also uploaded on the website of the Company viz. https://www.grasim.com/investors/tds-on-dividend. Members are requested to refer to the same for further details.
iii. a) The Company will make the payment of dividend to those Members directly in their bank accounts whose bank account details are available with the Company and those who have given their mandate for receiving dividends directly in their bank accounts through the Electronic Clearing Service ('ECS')/National Electronic Clearing Service ('NECS').
b) In case, the Company is unable to pay dividend to any Member by the electronic mode, due to non-availability of the details of the bank account, the Company shall dispatch the dividend warrant to such Member by post.
c) Members are advised to avail the facility for receipt of dividend through ECS. Members holding shares in dematerialised mode are requested to contact their respective Depository Participants ('DPs') for availing ECS facility/updating their bank account details. Members holding shares in physical form are requested to download the ECS mandate form from the website of the Company at https://www.grasim.com/upload/pdf/ECS_mandate_form_new01.pdf, and send the duly filled in form, along with a photo copy of a cancelled cheque, to the Company’s RTA i.e. KFinTech.
i. To avoid the incidence of fraudulent encashment of dividend warrants, Members are requested to intimate the Company’s RTA under the signature of the Sole/First Joint holder, the following information, so that the bank account number, and name and address of the bank can be printed on dividend warrants:
1) Name of the Sole/First Joint holder and Folio No.
2) Particulars of the bank account, viz.:
i) Name of Bank
ii) Name of the branch with IFS Code,
iii) Complete address of the bank with Pin Code Number,
iv) Account type, whether savings (SB) or current account (CA), and
v) Bank account number allotted by the bank
ii. Members are requested to contact KFinTech for encashing the unclaimed dividend. The detailed dividend history and due dates for transfer to IEPF are available on ‘Investor Centre’ page on the website of the Company, https://www.grasim.com/investors/unpaid-and-unclaimed-dividend-iepf.
d) The Listing Regulations provides for companies to use any of the approved electronic payment facility such as ECS, NECS or RTGS etc. for making payments to Members. The Company or KFinTech is required to maintain bank details of their Members as follows:
− for Members holding secur it ies in dematerialised form, the Company shall seek relevant bank details from the Depositories.
− for Members holding securities in physical mode, the Company shall maintain updated bank details from their end.
16. IEPF related Information
Pursuant to section 124 and other applicable provisions, if any, of the Act, all dividend remaining unpaid and unclaimed for a period of 7 (seven) years from the date of declaration will be transferred to Investor Education and Protection Fund ('IEPF'), established by the Central Government. Accordingly, unpaid and unclaimed dividend for the financial year 2012-13, has been transferred to IEPF.
In terms of the Investor Education and Protection Fund Authority (Accounting, Audit, Transfer and Refund) Rules, 2016 ('IEPF rules'), equity shares in respect of which dividend has not been paid or claimed for 7 (seven) consecutive years or more from the date of declaration will also be transferred to the DEMAT Account opened by the IEPF Authority, pursuant to the IEPF rules.
487Integrated Annual Report 2020-21
Integrated ReportFinancial statem
entsStatutory Reports
Notice (Contd.)
In compliance with the aforesaid rules, the Company has transferred equity shares pertaining to the FY 2012-13 to the DEMAT Account of the IEPF Authority, after providing necessary intimations to the relevant members. Details of unpaid/unclaimed dividend and equity shares for the FY 2012–13 are uploaded on the website of the Company, as well as that of MCA (IEPF) and can be accessed through the link: www.iepf.gov.in. No claim shall lie against the Company in respect of unclaimed dividend amount and equity shares transferred to the IEPF and the DEMAT Account of the IEPF Authority, respectively. Members can, however, claim both the unclaimed dividend amount and the equity shares from the IEPF Authority by making applications in the manner provided in the IEPF rules.
Members, who have so far not encashed the dividend warrant(s) for the FY 2013-14, are requested to make their claims to the Company’s RTA on or before 12th October 2021, failing which the unpaid/unclaimed dividend and the equity shares relating thereto for FY 2013-14 will be transferred to the IEPF. The Company, is in compliance with the aforesaid IEPF rules, and the Company has sent individual notices to those members whose shares are liable to be transferred to Demat account of the IEPF Authority and has also published notice in the newspapers. The Company has also uploaded full details of such unclaimed/unpaid dividend and the related shares due for transfer on the website of the Company, https://www.grasim.com/investors/unpaid-and-unclaimed-dividend-iepf. Members are requested to verify the details and lodge their claims with the Company to avoid transfer of dividend and related shares to IEPF Account.
17. General Information
i. Members are requested to read the 'Shareholder Information' section of the Annual Report for useful information.
ii. SEBI has mandated the submission of Permanent Account Number (PAN) by every participant in the securities market. Members holding shares in electronic form are requested to submit their PAN to their DPs, and those holding shares in physical form are requested to submit their PAN to the Company’s Registrar and Transfer Agent ('RTA').
In terms of the Listing Regulations, it is mandatory to furnish a copy of PAN card to the Company or KFinTech in the following cases viz. deletion of name, transmission of shares and transposition of shares.
iii. If there is any change in the e-mail address already registered with the Company, Members are requested to immediately notify such change to the Company’s RTA, in respect of shares held in physical form, and to their DPs in respect of shares held in electronic form.
iv. In terms of the amendments to the Listing Regulations, with effect from 1st April 2019, requests for effecting transfer of securities in physical form shall not be processed unless the securities are held in dematerialised form with the depository, i.e., NSDL and CDSL. Members are, therefore, requested to demat their physical holding for any further transfer. Members can, however, continue to make request for transmission or transposition of securities held in physical form.
v. Members who hold shares in the dematerialised form and desire a change/correction in the bank account details, should intimate the same to their concerned DPs and not to the Company’s RTA. Members are also requested to give the MICR Code of their banks to their DPs. The Company/Company’s RTA will not entertain any direct request from such Members for change of address, transposition of names, deletion of name of deceased joint holder and change in the bank account details. The said details will be considered as will be furnished by the DPs to the Company.
vi. Members may utilise the facility extended by the RTA for redressal of queries. Members may visit http://karisma.kfintech.com and click on INVESTOR option for query registration through free identity registration process.
vii. KPRISM- Mobile service application by KFinTech:
Members are requested to note that KFinTech has launched a mobile application – KPRISM and website https: //kprism.kfintech.com/ for online service to Members. Members can download the mobile application, register themselves (one time) for availing host of services viz., consolidated portfolio view serviced by KFinTech, dividend status and send requests for change of address, change/update bank mandate. Through the mobile application, Members can download annual reports, standard forms and keep track of upcoming general meetings and dividend disbursements. The mobile application is available for download from Android Play Store.
viii. As per the provisions of section 72 of the Act, facility for making nominations is now available to Individuals holding shares in the Company. Members
488 Grasim Industries Limited
holding shares in physical form may obtain the Nomination Form from the Company’s RTA or can download the form from the Company’s website, viz., https://www.grasim.com/upload/pdf/nomination_form_new01.pdf. Members holding shares in electronic form have to approach their DPs for completing the nomination formalities.
ix. Non-resident Indian Members are requested to inform the Company or RTA or to the concerned DPs, as the case may be, immediately:
(a) the change in the residential status on return to India for permanent settlement.
(b) the particulars of the NRE Account with a Bank in India, if not furnished earlier.
(c) Members are requested to make all correspondence in connection with shares held by them by addressing letters directly to the Company or KFinTech quoting their Folio number or their Client ID number with DP ID number, as the case may be.
x. Members who are holding shares in identical order of names in more than one folio are requested to consider consolidating the different folios into one. Post consolidation, the number of shares would remain the same.
To enable the Company, consolidate the folios, kindly send the following, under a covering letter, addressed to KFinTech:
• share certificate(s)
• copy of PAN Card(s) of all the Members
• Member’s email ID and mobile number
Upon receipt of the above documents, the Company will consolidate the holdings and return the share certificate(s) with necessary endorsements on the reverse thereof. The Member’s details will be updated in the Company’s record. This will not only facilitate speedy communication but also result in faster disbursal of future dividend. Moreover, the possibility of loss/misplacement of dividend warrants will also be eliminated.
It is also recommended that Members consider migrating their shareholding to the electronic mode.
489Integrated Annual Report 2020-21
Integrated ReportFinancial statem
entsStatutory Reports
Notice (Contd.)
ANNEXURE TO THE NOTICEEXPLANATORY STATEMENT SETTING OUT MATERIAL FACTS PURSUANT TO SECTION 102 OF THE COMPANIES ACT, 2013
Item No. 5
M/s. B S R & Co. LLP, Chartered Accountants, Mumbai (Registration No.:101248W/W-100022) ('BSR') were appointed as one of the Joint Statutory Auditors of the Company by the Members at the 69th Annual General Meeting ('AGM') held on 23rd September 2016 to hold office from the conclusion of the 69th AGM till the conclusion of the 74th AGM of the Company to be held in the calendar year 2021.
Accordingly, the present term of BSR gets completed on conclusion of the ensuing AGM. BSR are eligible for re-appointment for a second term of five years in terms of the provisions of section 139 of the Companies Act, 2013 (“the Act”) read with the Companies (Audit and Auditors) Rules, 2014. The Company has received eligibility letter from BSR confirming that their appointment will be in accordance with the provisions of section 139 of the Act.
BSR was constituted on 27th March 1990 as a partnership firm and converted into a limited liability partnership on 14th October 2013. BSR is a member entity of B S R & Affiliates, a network registered with the Institute of Chartered Accountants of India ('ICAI'), and has a pan-India presence with over 159 Partners and Directors in Audit and over 3,900 professionals experienced in Ind AS, Indian GAAP (erstwhile), IFRS and US GAAP. BSR audits various private entities and companies listed on stock exchanges in India across industrial, consumer, financial, technology and infrastructure sectors.
The Audit Committee having considered various parameters like capability to serve a large organisation with multiple manufacturing locations as that of the Company; audit experience; the audit team; market standing of the firm; clientele served; technical knowledge etc. have recommended the re-appointment of BSR to the Board of Directors of the Company, which the Board has accepted and approved, subject to the approval of the Members at a remuneration as may be mutually agreed between the Board of Directors and Statutory Auditors.
None of the Directors, Key Managerial Personnel and their relatives thereof are, in any way, concerned or interested in the said resolution.
The Board accordingly recommends the the Ordinary Resolution set out at item no. 5 of this Notice for your approval.
Item No. 6
Mr. Dilip Gaur (DIN: 02071393), was appointed as the Managing Director of the Company for a period of 5 years, with effect from 1st April 2016 to hold office upto 31st March 2021.
Basis recommendation of Nomination and Remuneration Committee, the Board of Directors of the Company at its Meeting held on 12th February 2021, subject to the approval of the members, re-appointed Mr. DilIp Gaur as the Managing Director of the Company for a period of 1 year with effect from 1st April, 2021, on the terms and conditions including remuneration as recommended by the Nomination and Remuneration Committee and approved by the Board.
Brief Profile of Mr. Dilip Gaur
Mr. Dilip Gaur is the Managing Director of the Company & Business Director of the Aditya Birla Group’s, Global Pulp & Fibre Business. He is also Director of Aditya Birla Management Corporation Private Limited, the apex corporate body that provides strategic direction and vision to the Group Companies.
Mr. Gaur is the current Chairman of CII’s National Committee on Textiles & Apparel, a member of ASEAN- INDIA Economic Forum, Indonesia-India and Indo-Japan CEO’s forum.
Prior to his current assignment, he has done stints within Aditya Birla Group with UltraTech Cement Ltd. as Deputy Managing Director & Chief Manufacturing Officer, with Hindalco as Head of Global Copper Business, with Birla Carbon as Managing Director of the Egyptian business and as President & Country Head of Group’s Edible Oil & Oleo Chemicals business in Malaysia/Philippines.
Mr. Gaur joined Aditya Birla Group in 2004 after spending 24 years at Hindustan Unilever Ltd in Foods, HPC & Specialty Chemicals Business. He was a member of the Foods Management Committee.
Mr. Gaur is a Chemical Engineer by training and has undergone several National & International programmes in Management & Leadership Development including AMP at Harvard. He has spent best part of his professional career in managing transformational changes and turning around fledgling businesses across geographies. He enjoys working in a multi-cultural global business environment, is a firm believer in the Power of ‘Teams’ and extremely passionate about sustainability, climate control and circular economy agenda.
The remuneration and other terms and conditions of Mr. Gaur’s appointment as the Managing Director of the Company as set out in the resolution are subject to your approval. Mr. Dilip Gaur is a member of the following statutory committees of the Board of Directors viz. Audit Committee, Risk Management &
490 Grasim Industries Limited
Sustainability Committee, Stakeholder’s Relationship Committee and Corporate Social Responsibility Committee.
Taking into account the quality of experience, overseas exposure, outstanding leadership, scale of business handled, current needs of the business, present performance and potential assessment, the Board recommends re-appointment of Mr. Dilip Gaur as the Managing Director of the Company, for a period of 1 year, w.e.f. 1st April 2021, on the terms as to remuneration and otherwise as set out in the Resolution at the Item No. 6.
Mr. Dilip Gaur is not related to any Director of the Company. The disclosure relating to Mr. Dilip Gaur, as required under the provisions of Securities and Exchange Board of India (Listing Obligations and Disclosure Requirements) Regulations, 2015, is set out as an Annexure to the Notice.
The Board commends the Ordinary Resolution set out at Item No. 6 of this Notice for the approval by the Members.
Except Mr. Dilip Gaur and his relatives, none of the other Directors, Key Managerial Personnel or their respective relatives are, in any way, concerned or interested, in the resolution set out at Item No. 6 of the Notice.
Item No. 7
As recommended by the Nomination and Remuneration Committee and pursuant to the provisions of sections 149 and 152, read with Schedule IV and other applicable provisions of the Companies Act, 2013 ('Act'), and the rules made thereunder and the Securities and Exchange Board of India (Listing Obligations and Disclosure Requirements) Regulations, 2015 ('Listing Regulations'), the Board of Directors, at its meeting held on 24th May 2021 appointed Mr. V. Chandrasekaran (DIN: 03126243) as an Additional Director (Non-Executive and Independent Director) of the Company for a term of five (5) consecutive years, with effect from 24th May 2021, not liable to retire by rotation, subject to the approval of the Members of the Company at the ensuing Annual General Meeting. As an Additional Director, Mr. V. Chandrasekaran holds office up to the date of this Annual General Meeting and is eligible to be appointed as an Independent Director of the Company. The Company has received a notice from a Member in terms of the provisions of section 160 of the Act, signifying his intention to propose the appointment of Mr. Chandrasekaran as a Director of the Company.
Mr. V. Chandrasekaran has given his consent for appointment as an Independent Director and has also confirmed that he does not suffer from any disqualification in terms of section 164 of the Act.
The Company has received a dec larat ion f rom Mr. V. Chandrasekaran confirming that he fulfils the criteria of
independence as prescribed under section 149 (6) of the Act and regulation 16(1)(b) of the Listing Regulations.
Mr. V. Chandrasekaran is eligible to be appointed as an Independent Director of the Company.
In the opinion of the Board, Mr. V. Chandrasekaran fulfils the conditions specified in the Act, the rules made thereunder and the Listing Regulations for being appointed as an Independent Director, and is independent of the Management.
Brief profile of Mr. V. Chandrasekaran
Mr. V. Chandrasekaran, aged 63 years, is a qualified Chartered Accountant and retired Executive Director (Investment) of LIC of India. He has more than 3 decades of experience in Life Insurance Finance, Housing Finance and Mutual Fund Investment, with adequate exposure to a gamut of Investments. He is involved in Investment decision making processes, Investment Monitoring & Accounting and Investment Research and Risk Management. He serves as an Independent Director on the Board of various companies like Tamilnadu Newsprint & Papers Limited, Tata Investment Corporation Limited, etc.
Mr. V. Chandrasekaran is not related to any other Director of the Company. The disclosures relating to Mr. V. Chandrasekaran as required under the provisions of Listing Regulations and Secretarial Standards on General Meetings, are set out as an Annexure to the Notice. Considering his vast experience and knowledge in diverse areas, the Board recommends the resolution, pertaining to the appointment of Mr. V. Chandrasekaran as an Independent Director, for the approval by the Members of the Company by way of an Ordinary Resolution.
A copy of the letter of appointment as Independent Director setting out the terms and conditions is available for inspection by the Members at https://www.grasim.com/investors/corporate-governance.
Except Mr. V. Chandrasekaran being an appointee and his relatives, none of the other Directors, Key Managerial Personnel or their respective relatives are, in any way, concerned or interested, in the resolution set out at Item No. 7 of the Notice.
Item No. 8
As recommended by the Nomination and Remuneration Committee and pursuant to the provisions of sections 149 and 152, read with Schedule IV and other applicable provisions of the Companies Act, 2013 ('Act'), and the rules made thereunder and the Securities and Exchange Board of India (Listing Obligations and Disclosure Requirements) Regulations, 2015 ('Listing Regulations'), the Board of Directors, at its meeting held on 24th May 2021 appointed Mr. Adesh Kumar Gupta (DIN: 00020403) as an Additional Director (Non-Executive and Independent
491Integrated Annual Report 2020-21
Integrated ReportFinancial statem
entsStatutory Reports
Notice (Contd.)
Director) of the Company for a term of five (5) consecutive years, with effect from 24th May 2021, not liable to retire by rotation, subject to the approval of the Members of the Company at the ensuing Annual General Meeting. As an Additional Director, Mr. Adesh Kumar Gupta holds office up to the date of this Annual General Meeting and is eligible to be appointed as an Independent Director of the Company. The Company has received a notice from a Member in terms of the provisions of section 160 of the Act, signifying his intention to propose the appointment of Mr. Gupta as a Director of the Company.
Mr. Adesh Kumar Gupta has given his consent for appointment as an Independent Director and has also confirmed that he does not suffer from any disqualification in terms of section 164 of the Act.
The Company has received a declaration from Mr. Adesh Kumar Gupta confirming that he fulfils the criteria of independence as prescribed under section 149 (6) of the Act and regulation 16(1)(b) of the Listing Regulations.
Mr. Adesh Kumar Gupta is eligible to be appointed as an Independent Director of the Company.
In the opinion of the Board, Mr. Adesh Kumar Gupta fulfils the conditions specified in the Act, the rules made thereunder and the Listing Regulations for being appointed as an Independent Director, and is independent of the Management
Brief profile of Mr. Adesh Kumar Gupta
Mr. Adesh Kumar Gupta, aged 64 years, is a qualified Chartered Accountant and a Company Secretary. Mr. Gupta is also an Insolvency Professional registered under Insolvency and Bankruptcy Code. He has over 36 years of vast experience in the field of finance and general management. He has sound knowledge of finance and relevant industry. He serves as an Independent Director on the Board of various companies like Zee Entertainment Enterprises Limited, Vinati Organics Limited, CARE Ratings Limited etc. He was the former Whole Time Director & CFO of the Company till 30th June 2015. He was recognised as Best CFO by the Institute of Chartered Accountants, IMA, Business Today. He is Ex Member NACAS as representative of FICCI. NACAS was a statutory organisation constituted by Government of India for setting up Accounting Standards.
Mr. Adesh Kumar Gupta is not related to any other Director of the Company. The disclosures relating to Mr. Adesh Kumar Gupta as required under the provisions of Listing Regulations and Secretarial Standards on General Meetings, are set out as an Annexure to the Notice. Considering his vast experience and knowledge in diverse areas, the Board recommends the Resolution, pertaining to the appointment of Mr. Adesh Kumar
Gupta as an Independent Director, for the approval by the Members of the Company by way of an Ordinary Resolution.
A copy of the letter of appointment as Independent Director setting out the terms and conditions is available for inspection by the Members at https://www.grasim.com/investors/corporate-governance.
Except Mr. Adesh Kumar Gupta being an appointee and his relatives, none of the other Directors, Key Managerial Personnel or their respective relatives are, in any way, concerned or interested, in the resolution set out at Item No. 8 of the Notice.
Item No. 9
At the 69th Annual General Meeting of the Company, held on 23rd September, 2016, the Members of the Company had approved the payment of remuneration by way of commission to the Non-Executive Directors of the Company, of a sum not exceeding one percent per annum of the net profits of the Company, calculated in accordance with the provisions of the Companies Act, 2013, for a period of five years commencing from 1st April 2016.
In view of sections 197 and 198, and other relevant provisions of the Companies Act, 2013, regulation 17(6) of Securities and Exchange Board of India ('Listing Obligations and Disclosure Requirements') Regulation, 2015 ('Listing Regulations'), and taking into account the roles and responsibilities of the directors, it is proposed that the remuneration by way of commission be continued to be paid to the Non-Executive Directors of the Company, of a sum not exceeding such percentage of net profits of the Company, as may be permissible from time to time, calculated in accordance with the provisions of the Companies Act, 2013, for each relevant financial year commencing from 1st April 2021 subject to provisions of Companies Act, 2013 and Listing Regulations. The quantum of remuneration payable to each of the Non-Executive Directors shall be fixed and decided by the Board of Directors after considering the recommendations of the Nomination and Remuneration Committee, and considering attendance, type of meeting, preparations required, etc. This remuneration shall be in addition to the sitting fees payable to the Non-Executive Directors for attending the meetings of the Board or Committee thereof or for any other purpose, whatsoever, as may be decided by the Board, and reimbursement of expenses for participation in the Board and other meetings.
Approval of the Members is sought by way of a Special Resolution under the applicable provisions of the Companies Act, 2013, and the Listing Regulations for payment of remuneration by way of commission to the Non-Executive Directors as set out in the Resolution at Item No. 9 of the Notice.
492 Grasim Industries Limited
Non-Executive Directors and their relatives may be deemed to be concerned or interested in this resolution to the extent of the remuneration that may be received by them. Save and except the above, none of the other Directors, Key Managerial Personnel or their respective relatives are, in any way, concerned or interested, financially or otherwise, in the Resolution set out at Item No. 9 of the Notice.
Item No. 10
The Board of Directors at its Meeting held on 24th May 2021, based on the recommendation of the Audit Committee, had approved the appointment of the following Cost Accountants to conduct the audit of the cost records of the Company for the financial year ending 31st March 2022:
Name of the Cost Auditors Division of the CompanyM/s. D. C. Dave & Co., Cost Accountants, Mumbai (Registration No. 000611)
All Divisions of the Company, except Viscose Filament Yarn - Century Rayon Division and Indo Gulf Fertilisers
M/s. M. R. Dudani & Co., Cost Accountants, Mumbai (Registration No. FRN-104041)
Viscose Filament Yarn – Century Rayon Division
M/s. K. G. Goyal and Associate, Cost Accountants, (Registration No. FRN-000024)
Indo Gulf Fertilisers Unit (IGF Unit)
Due to sudden demise of Mr. M.R. Dudani, proprietor of M/s. M.R. Dudani & Co., the Board of Directors, based on recommendations of the Audit Committee appointed one of the existing Cost Auditor viz. M/s. D.C. Dave & Co., Cost Accountants as the Cost Auditor for Viscose Filament Yarn – Century Rayon division. With this M/s. D.C. Dave & Co., Cost Accountants will act as the Cost Auditor for all the divisions of the Company except Indo Gulf Fertilisers Unit for FY 2021-22.
The details of appointment and remuneration of the Cost Auditors as approved by the Board of Directors vide its resolution dated 27th July 2021 for FY 2021-22, based on the recommendation of the Audit Committee is as under:
Name of the Cost Auditors
Division of the Company Remuneration
M/s. D. C. Dave & Co., Cost Accountants, Mumbai (Registration No. 000611)
All Divisions of the Company, except Indo Gulf Fertilisers
Not exceeding H 17.20 Lakh plus applicable taxes and reimbursement of out-of-pocket expenses
M/s. K. G. Goyal and Associate, Cost Accountants, (Registration No. FRN-000024)
Indo Gulf Fertilisers Unit (IGF Unit)
Not exceeding H 2.00 Lakh plus applicable taxes and reimbursement of out-of-pocket expenses to be paid on proportionate basis till divestment of IGF Unit
The Board’s Report for the financial year ended 31st March 2021 was adopted by the Board at its meeting held on 24th May 2021, and as Mr. M.R. Dudani passed away subsequent to adoption of the Board’s Report by the Board, the above mentioned changes in the appointment of the Cost Auditors for FY 2021-22 are not reflected in the Board’s Report.
In accordance with the provisions of section 148 of the Companies Act, 2013, read with the Companies (Audit and Auditors) Rules, 2014, remuneration payable to the Cost Auditors needs to be ratified by the Members of the Company. Accordingly, consent of the Members is sought for ratification of the remuneration payable to the Cost Auditors, as mentioned above, for the financial year ending 31st March 2022.
The Board commends the Ordinary Resolution set out at Item No. 10 of the Notice for the approval by the Members.
None of the Directors, Key Managerial Personnel or their respective relatives are, in any way, concerned or interested, in the resolution set out at Item No. 10 of the Notice.
Item No. 11
At the Annual General Meeting held on 14th September 2020, the members had ratified the remuneration payable to the Cost Auditors for auditing the cost records of the Company for the financial year ending 31st March 2021 as under:
Name of the Cost Auditors
Division of the Company Remuneration
M/s. D. C. Dave & Co., Cost Accountants, Mumbai (Registration No. 000611)
All Divisions of the Company, except Viscose Filament Yarn - Century Rayon Division
Not exceeding H 15.00 Lakh plus applicable taxes and reimbursement of out-of-pocket expenses
M/s. M. R. Dudani & Co., Cost Accountants, Mumbai (Registration No. FRN-104041)
Viscose Filament Yarn- Century Rayon Division
Not exceeding H 2.20 Lakh plus applicable taxes and reimbursement of out-of-pocket expenses
Mr. M.R. Dudani, proprietor of M/s. M.R. Dudani & Co., Cost Accountants, who was appointed as the Cost Auditor for Viscose Filament Yarn – Century Rayon division passed away before submission of the Cost Audit Report for Viscose Filament Yarn – Century Rayon division for FY 2020-21.
Accordingly, the Board of Directors, based on recommendations of the Audit Committee appointed one of the existing Cost Auditor viz. M/s. D.C. Dave & Co., Cost Accountants as the Cost Auditor for Viscose Filament Yarn – Century Rayon division for FY 2020-21. With this M/s. D.C. Dave & Co., Cost Accountants were appointed as the Cost Auditor for all the units/divisions of
493Integrated Annual Report 2020-21
Integrated ReportFinancial statem
entsStatutory Reports
Notice (Contd.)
the Company for FY 2020-21 at a remuneration not exceeding H 17.20 Lakh plus applicable taxes and reimbursement of out-of-pocket expenses.
In view of the above, the resolution passed at the Annual General Meeting held on 14th September 2020, stands modified to that extent.
In accordance with the provisions of section 148 of the Companies Act, 2013, read with the Companies (Audit and Auditors) Rules, 2014, remuneration payable to the Cost Auditors needs to be ratified by the Members of the Company. Accordingly, consent of the Members is sought for ratification of the remuneration payable to the Cost Auditors, as mentioned above, for the financial year ending 31st March 2021.
The Board commends the Ordinary Resolution set out at Item No. 11 of the Notice for the approval by the Members.
None of the Directors, Key Managerial Personnel or their respective relatives are, in any way, concerned or interested, in the resolution set out at Item No. 11 of the Notice.
By Order of the BoardFor Grasim Industries Limited
Sailesh DagaCompany Secretary
Membership No.: F4164Place: MumbaiDate: 27th July 2021
494 Grasim Industries Limited
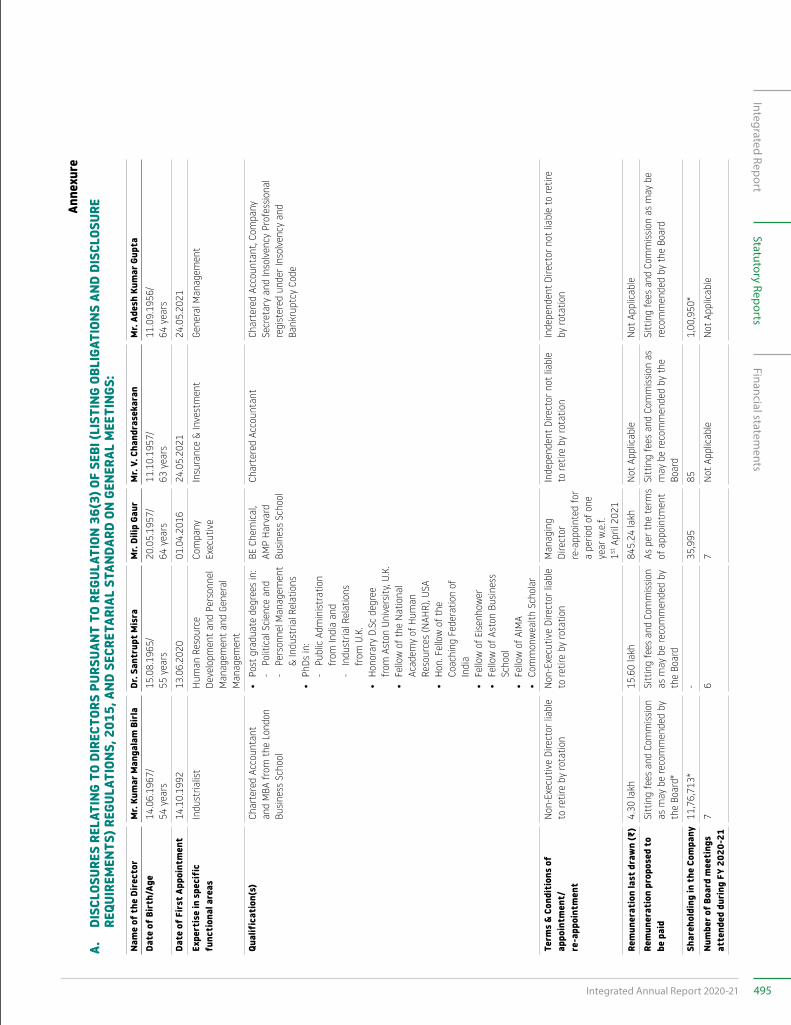
Anne
xure
A.
DISC
LOSU
RES
RELA
TING
TO
DIRE
CTOR
S PU
RSUA
NT T
O RE
GULA
TION
36(
3) O
F SE
BI (L
ISTI
NG O
BLIG
ATIO
NS A
ND D
ISCL
OSUR
E RE
QUIR
EMEN
TS) R
EGUL
ATIO
NS, 2
015,
AND
SEC
RETA
RIAL
STA
NDAR
D ON
GEN
ERAL
MEE
TING
S:
Nam
e of
the
Dir
ecto
rM
r. Ku
mar
Man
gala
m B
irla
Dr. S
antr
upt M
isra
Mr.
Dilip
Gau
rM
r. V.
Cha
ndra
seka
ran
Mr.
Ades
h Ku
mar
Gup
taDa
te o
f Bir
th/A
ge14
.06.
1967
/54
yea
rs15
.08.
1965
/55
yea
rs20
.05.
1957
/64
yea
rs11
.10.
1957
/63
yea
rs11
.09.
1956
/64
yea
rs
Date
of F
irst
App
oint
men
t14
.10.
1992
13.0
6.20
2001
.04.
2016
24.0
5.20
2124
.05.
2021
Expe
rtis
e in
spe
cifi
c fu
ncti
onal
are
asIn
dust
rialis
tH
uman
Res
ourc
e De
velo
pmen
t an
d Pe
rson
nel
Man
agem
ent
and
Gene
ral
Man
agem
ent
Com
pany
Ex
ecut
ive
Insu
ranc
e &
Inve
stm
ent
Gene
ral M
anag
emen
t
Qual
ific
atio
n(s)
Char
tere
d Ac
coun
tant
an
d M
BA fr
om th
e Lo
ndon
Bu
sine
ss S
choo
l
• Po
st g
radu
ate
degr
ees
in:
-
Polit
ical
Sci
ence
and
-
Pers
onne
l Man
agem
ent
& In
dust
rial R
elat
ions
• Ph
Ds in
:
- Pu
blic
Adm
inis
trat
ion
from
Indi
a an
d
- In
dust
rial R
elat
ions
fr
om U
.K.
• H
onor
ary
D.Sc
deg
ree
from
Ast
on U
nive
rsity
, U.K
.•
Fello
w o
f the
Nat
iona
l Ac
adem
y of
Hum
an
Reso
urce
s (N
AHR)
, USA
• H
on. F
ello
w o
f the
Co
achi
ng F
eder
atio
n of
In
dia
• Fe
llow
of E
isen
how
er•
Fello
w o
f Ast
on B
usin
ess
Scho
ol•
Fello
w o
f AIM
A•
Com
mon
wea
lth S
chol
ar
BE C
hem
ical
, AM
P H
arva
rd
Busi
ness
Sch
ool
Char
tere
d Ac
coun
tant
Char
tere
d Ac
coun
tant
, Com
pany
Se
cret
ary
and
Inso
lven
cy P
rofe
ssio
nal
regi
ster
ed u
nder
Inso
lven
cy a
nd
Bank
rupt
cy C
ode
Term
s &
Cond
itio
ns o
f ap
poin
tmen
t/
re-a
ppoi
ntm
ent
Non
-Exe
cutiv
e Di
rect
or li
able
to
retir
e by
rota
tion
Non
-Exe
cutiv
e Di
rect
or li
able
to
retir
e by
rota
tion
Man
agin
g Di
rect
or
re-a
ppoi
nted
for
a pe
riod
of o
ne
year
w.e
.f.
1st A
pril
2021
Inde
pend
ent
Dire
ctor
not
liab
le
to re
tire
by ro
tatio
nIn
depe
nden
t Di
rect
or n
ot li
able
to
retir
e by
rota
tion
Rem
uner
atio
n la
st d
raw
n (G
)4.
30 la
kh15
.60
lakh
845.
24 la
khN
ot A
pplic
able
Not
App
licab
le
Rem
uner
atio
n pr
opos
ed t
o be
pai
dSi
ttin
g fe
es a
nd C
omm
issi
on
as m
ay b
e re
com
men
ded
by
the
Boar
d#
Sitt
ing
fees
and
Com
mis
sion
as
may
be
reco
mm
ende
d by
th
e Bo
ard
As p
er th
e te
rms
of a
ppoi
ntm
ent
Sitt
ing
fees
and
Com
mis
sion
as
may
be
reco
mm
ende
d by
the
Boar
d
Sitt
ing
fees
and
Com
mis
sion
as
may
be
reco
mm
ende
d by
the
Boar
d
Shar
ehol
ding
in t
he C
ompa
ny11
,76,
713*
-35
,995
851,
00,9
50*
Num
ber o
f Boa
rd m
eeti
ngs
atte
nded
dur
ing
FY 2
020-
217
67
Not
App
licab
leN
ot A
pplic
able
495Integrated Annual Report 2020-21
Integrated ReportFinancial statem
entsStatutory Reports
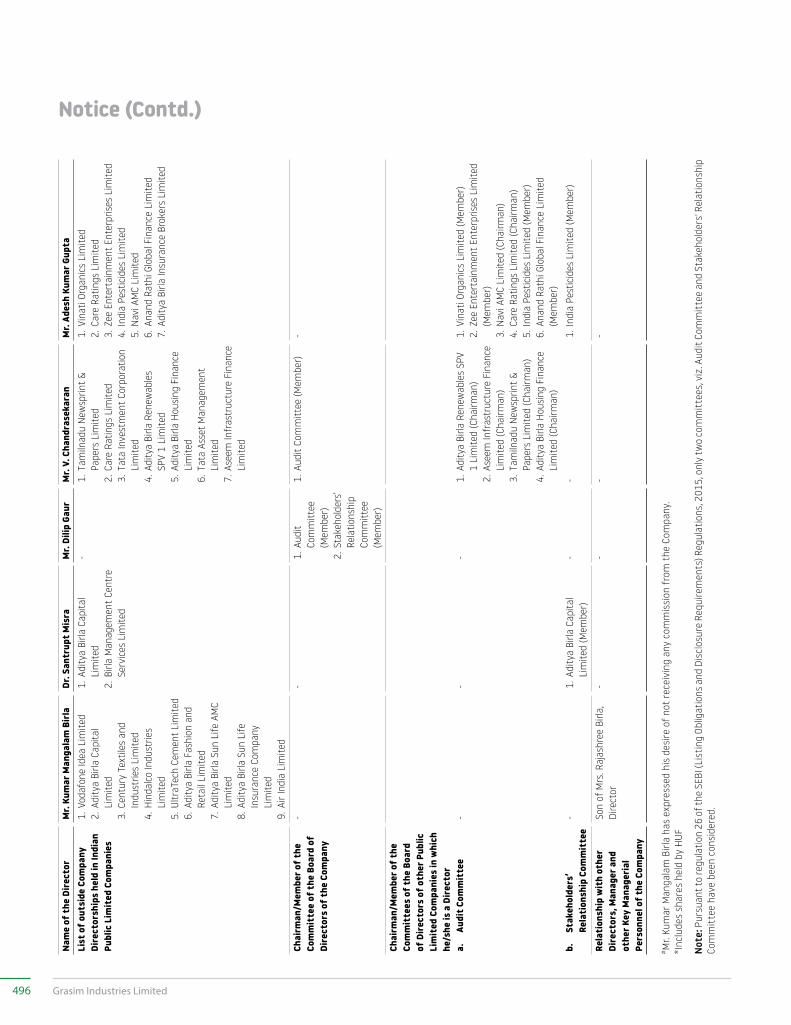
Notice (Contd.)
Nam
e of
the
Dir
ecto
rM
r. Ku
mar
Man
gala
m B
irla
Dr. S
antr
upt M
isra
Mr.
Dilip
Gau
rM
r. V.
Cha
ndra
seka
ran
Mr.
Ades
h Ku
mar
Gup
taLi
st o
f out
side
Com
pany
Di
rect
orsh
ips
held
in In
dian
Pu
blic
Lim
ited
Com
pani
es
1. V
odaf
one
Idea
Lim
ited
2. A
dity
a Bi
rla C
apita
l Li
mite
d3.
Cen
tury
Tex
tiles
and
In
dust
ries
Lim
ited
4. H
inda
lco
Indu
strie
s Li
mite
d5.
Ultr
aTec
h Ce
men
t Li
mite
d6.
Adi
tya
Birla
Fas
hion
and
Re
tail
Lim
ited
7. A
dity
a Bi
rla S
un L
ife A
MC
Lim
ited
8. A
dity
a Bi
rla S
un L
ife
Insu
ranc
e Co
mpa
ny
Lim
ited
9. A
ir In
dia
Lim
ited
1. A
dity
a Bi
rla C
apita
l Li
mite
d2.
Birl
a M
anag
emen
t Ce
ntre
Se
rvic
es L
imite
d
-1.
Tam
ilnad
u N
ewsp
rint
& Pa
pers
Lim
ited
2. C
are
Ratin
gs L
imite
d3.
Tat
a In
vest
men
t Co
rpor
atio
n Li
mite
d4.
Adi
tya
Birla
Ren
ewab
les
SP
V 1
Lim
ited
5. A
dity
a Bi
rla H
ousi
ng F
inan
ce
Lim
ited
6. T
ata
Asse
t M
anag
emen
t Li
mite
d7.
Ase
em In
fras
truc
ture
Fin
ance
Li
mite
d
1. V
inat
i Org
anic
s Li
mite
d2.
Car
e Ra
tings
Lim
ited
3. Z
ee E
nter
tain
men
t En
terp
rises
Lim
ited
4. In
dia
Pest
icid
es L
imite
d5.
Nav
i AM
C Li
mite
d6.
Ana
nd R
athi
Glo
bal F
inan
ce L
imite
d7.
Adi
tya
Birla
Insu
ranc
e Br
oker
s Li
mite
d
Chai
rman
/Mem
ber o
f the
Co
mm
itte
e of
the
Boa
rd o
f Di
rect
ors
of t
he C
ompa
ny
--
1. A
udit
Com
mitt
ee
(Mem
ber)
2. S
take
hold
ers’
Rela
tions
hip
Com
mitt
ee
(Mem
ber)
1. A
udit
Com
mitt
ee (M
embe
r)-
Chai
rman
/Mem
ber o
f the
Co
mm
itte
es o
f the
Boa
rd
of D
irec
tors
of o
ther
Pub
lic
Lim
ited
Com
pani
es in
whi
ch
he/s
he is
a D
irec
tor
a.
Audi
t Com
mit
tee
--
-1.
Adi
tya
Birla
Ren
ewab
les
SPV
1 Li
mite
d (C
hairm
an)
2. A
seem
Infr
astr
uctu
re F
inan
ce
Lim
ited
(Cha
irman
)3.
Tam
ilnad
u N
ewsp
rint
& Pa
pers
Lim
ited
(Cha
irman
)4.
Adi
tya
Birla
Hou
sing
Fin
ance
Li
mite
d (C
hairm
an)
1. V
inat
i Org
anic
s Li
mite
d (M
embe
r)2.
Zee
Ent
erta
inm
ent
Ente
rpris
es L
imite
d (M
embe
r)3.
Nav
i AM
C Li
mite
d (C
hairm
an)
4. C
are
Ratin
gs L
imite
d (C
hairm
an)
5. In
dia
Pest
icid
es L
imite
d (M
embe
r)6.
Ana
nd R
athi
Glo
bal F
inan
ce L
imite
d (M
embe
r)
b.
Stak
ehol
ders
’ Re
lati
onsh
ip C
omm
itte
e-
1. A
dity
a Bi
rla C
apita
l Li
mite
d (M
embe
r)-
-1.
Indi
a Pe
stic
ides
Lim
ited
(Mem
ber)
Rela
tion
ship
wit
h ot
her
Dire
ctor
s, M
anag
er a
nd
othe
r Key
Man
ager
ial
Pers
onne
l of t
he C
ompa
ny
Son
of M
rs. R
ajas
hree
Birl
a,
Dire
ctor
--
--
# Mr.
Kum
ar M
anga
lam
Birl
a ha
s ex
pres
sed
his
desi
re o
f not
rec
eivi
ng a
ny c
omm
issi
on f
rom
the
Com
pany
.*I
nclu
des
shar
es h
eld
by H
UF
Note
: Pur
suan
t to
regu
latio
n 26
of t
he S
EBI (
List
ing
Oblig
atio
ns a
nd D
iscl
osur
e Re
quire
men
ts) R
egul
atio
ns, 2
015,
onl
y tw
o co
mm
itte
es, v
iz. A
udit
Com
mit
tee
and
Stak
ehol
ders
' Rel
atio
nshi
p Co
mm
itte
e ha
ve b
een
cons
ider
ed.
496 Grasim Industries Limited
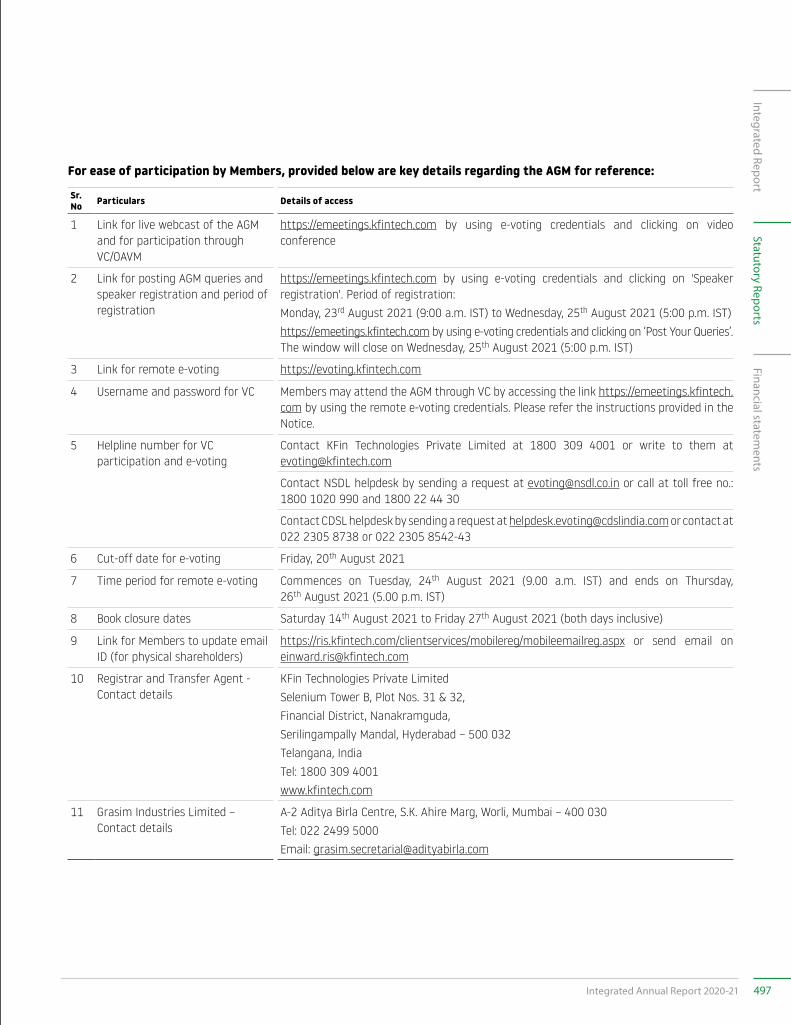
For ease of participation by Members, provided below are key details regarding the AGM for reference:
Sr.No Particulars Details of access
1 Link for live webcast of the AGM and for participation through VC/OAVM
https://emeetings.kfintech.com by using e-voting credentials and clicking on video conference
2 Link for posting AGM queries and speaker registration and period of registration
https://emeetings.kfintech.com by using e-voting credentials and clicking on 'Speaker registration'. Period of registration:Monday, 23rd August 2021 (9:00 a.m. IST) to Wednesday, 25th August 2021 (5:00 p.m. IST)https://emeetings.kfintech.com by using e-voting credentials and clicking on ‘Post Your Queries’. The window will close on Wednesday, 25th August 2021 (5:00 p.m. IST)
3 Link for remote e-voting https://evoting.kfintech.com
4 Username and password for VC Members may attend the AGM through VC by accessing the link https://emeetings.kfintech.com by using the remote e-voting credentials. Please refer the instructions provided in the Notice.
5 Helpline number for VC participation and e-voting
Contact KFin Technologies Private Limited at 1800 309 4001 or write to them at [email protected]
Contact NSDL helpdesk by sending a request at [email protected] or call at toll free no.: 1800 1020 990 and 1800 22 44 30
Contact CDSL helpdesk by sending a request at [email protected] or contact at 022 2305 8738 or 022 2305 8542-43
6 Cut-off date for e-voting Friday, 20th August 2021
7 Time period for remote e-voting Commences on Tuesday, 24th August 2021 (9.00 a.m. IST) and ends on Thursday, 26th August 2021 (5.00 p.m. IST)
8 Book closure dates Saturday 14th August 2021 to Friday 27th August 2021 (both days inclusive)
9 Link for Members to update email ID (for physical shareholders)
https://ris.kfintech.com/clientservices/mobilereg/mobileemailreg.aspx or send email on [email protected]
10 Registrar and Transfer Agent - Contact details
KFin Technologies Private LimitedSelenium Tower B, Plot Nos. 31 & 32,Financial District, Nanakramguda,Serilingampally Mandal, Hyderabad – 500 032Telangana, IndiaTel: 1800 309 4001www.kfintech.com
11 Grasim Industries Limited – Contact details
A-2 Aditya Birla Centre, S.K. Ahire Marg, Worli, Mumbai – 400 030Tel: 022 2499 5000Email: [email protected]
497Integrated Annual Report 2020-21
Integrated ReportFinancial statem
entsStatutory Reports


Grasim Industries Limited
Registered Office:Birlagram, Nagda - 456 331, Madhya Pradesh
Corporate Office:Aditya Birla Centre, ‘A’ Wing, 2nd Floor, S. K. Ahire Marg, Worli, Mumbai - 400 030, Maharashtra
[email protected] | www.grasim.com