graphing and writing linear equations - big ideas math
TRANSCRIPT
Graphing and Writing Linear Equations
4.1 Graphing Linear Equations4.1 Graphing Linear Equations4.2 Slope of a Line 4.2 Slope of a Line 4.3 Graphing Proportional Relationships 4.3 Graphing Proportional Relationships 4.4 Graphing Linear Equations in 4.4 Graphing Linear Equations in
Slope-Intercept Form Slope-Intercept Form 4.5 Graphing Linear Equations in Standard Form 4.5 Graphing Linear Equations in Standard Form 4.6 Writing Equations in Slope-Intercept Form4.6 Writing Equations in Slope-Intercept Form4.7 Writing Equations in Point-Slope Form4.7 Writing Equations in Point-Slope Form
“Okay Descartes, stand on the y - axis and try to intercept the pass when I throw.”
“Here’s an easy example of a line with a
slope of 1.”“You eat one mouse treat the first day.
Two treats the second day. And so on. Get it?”
4
Example 1 Evaluate 2xy + 3(x + y) when x = 4 and y = 7.
2xy + 3(x + y) = 2(4)(7) + 3(4 + 7) Substitute 4 for x and 7 for y.
= 8(7) + 3(4 + 7) Use order of operations.
= 56 + 3(11) Simplify.
= 56 + 33 Multiply.
= 89 Add.
Evaluate the expression when a = 1 —
4 and b = 6.
1. −8ab 2. 16a2 − 4b 3. 5b
— 32a2 4. 12a + (b − a − 4)
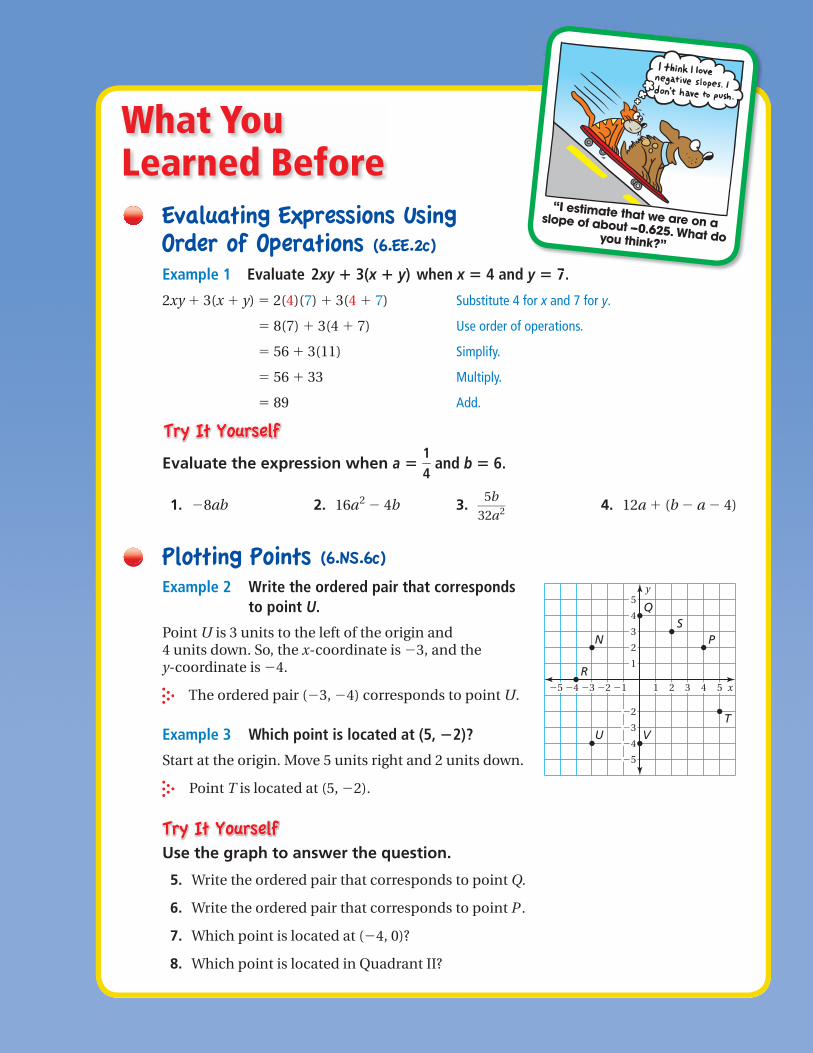
Example 2 Write the ordered pair that corresponds
x
y
3
4
5
2
1
3
4
5
2
4 53212 1345
Q
R
TVU
SPN
to point U.
Point U is 3 units to the left of the origin and 4 units down. So, the x-coordinate is −3, and the y-coordinate is −4.
The ordered pair (−3, −4) corresponds to point U.
Example 3 Which point is located at (5, −2)?
Start at the origin. Move 5 units right and 2 units down.
Point T is located at (5, −2).
Use the graph to answer the question.
5. Write the ordered pair that corresponds to point Q.
6. Write the ordered pair that corresponds to point P .
7. Which point is located at (−4, 0)?
8. Which point is located in Quadrant II?
y 7
“I estimate that we are on a slope of about -0.625. What do you think?”
What You Learned Before
142 Chapter 4 Graphing and Writing Linear Equations
Graphing Linear Equations4.1
How can you recognize a linear equation?
How can you draw its graph?
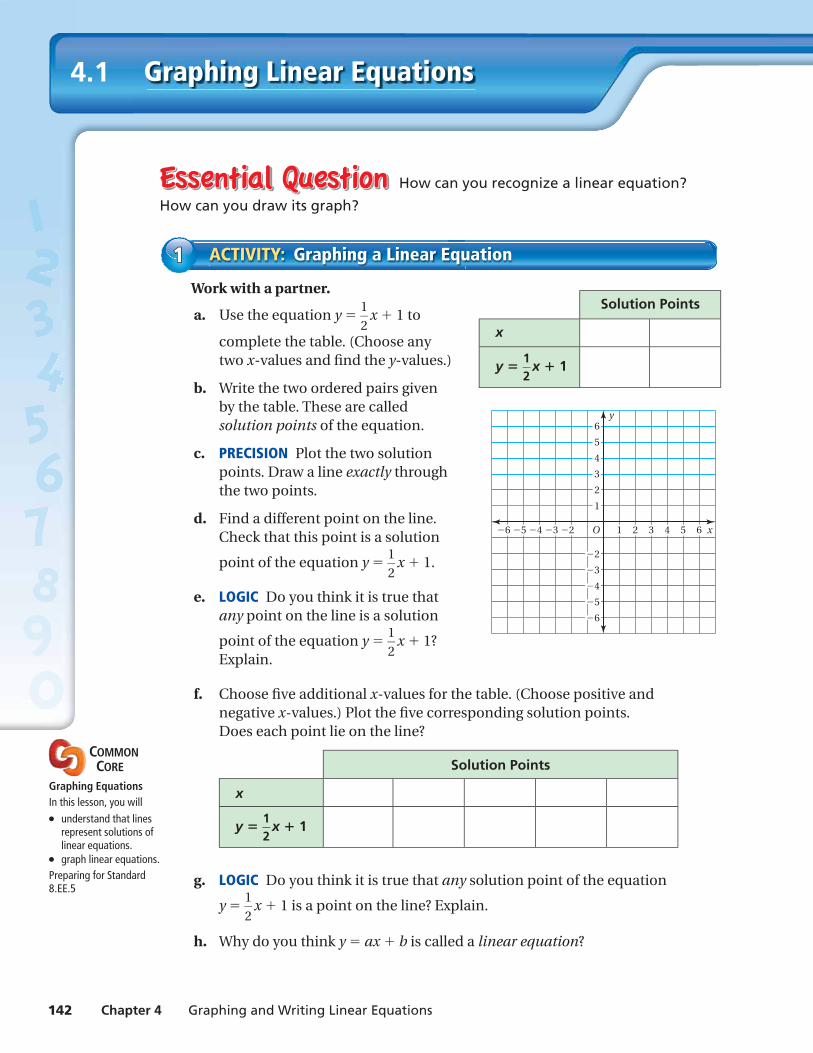
Work with a partner.
a. Use the equation y = 1
— 2
x + 1 to
complete the table. (Choose any two x-values and fi nd the y-values.)
b. Write the two ordered pairs given by the table. These are called solution points of the equation.
c. PRECISION Plot the two solution points. Draw a line exactly through the two points.
d. Find a different point on the line. Check that this point is a solution
point of the equation y = 1
— 2
x + 1.
e. LOGIC Do you think it is true that any point on the line is a solution
point of the equation y = 1
— 2
x + 1? Explain.
f. Choose fi ve additional x-values for the table. (Choose positive and negative x-values.) Plot the fi ve corresponding solution points. Does each point lie on the line?
Solution Points
x
y = 1 —
2 x + 1
g. LOGIC Do you think it is true that any solution point of the equation
y = 1
— 2
x + 1 is a point on the line? Explain.
h. Why do you think y = ax + b is called a linear equation?
ACTIVITY: Graphing a Linear Equation11
Solution Points
x
y = 1 —
2 x + 1
x
y
3
4
5
6
2
1
3
4
5
6
2
4 5 6321O23456
COMMON CORE
Graphing Equations In this lesson, you will● understand that lines
represent solutions of linear equations.
● graph linear equations.Preparing for Standard8.EE.5
Section 4.1 Graphing Linear Equations 143
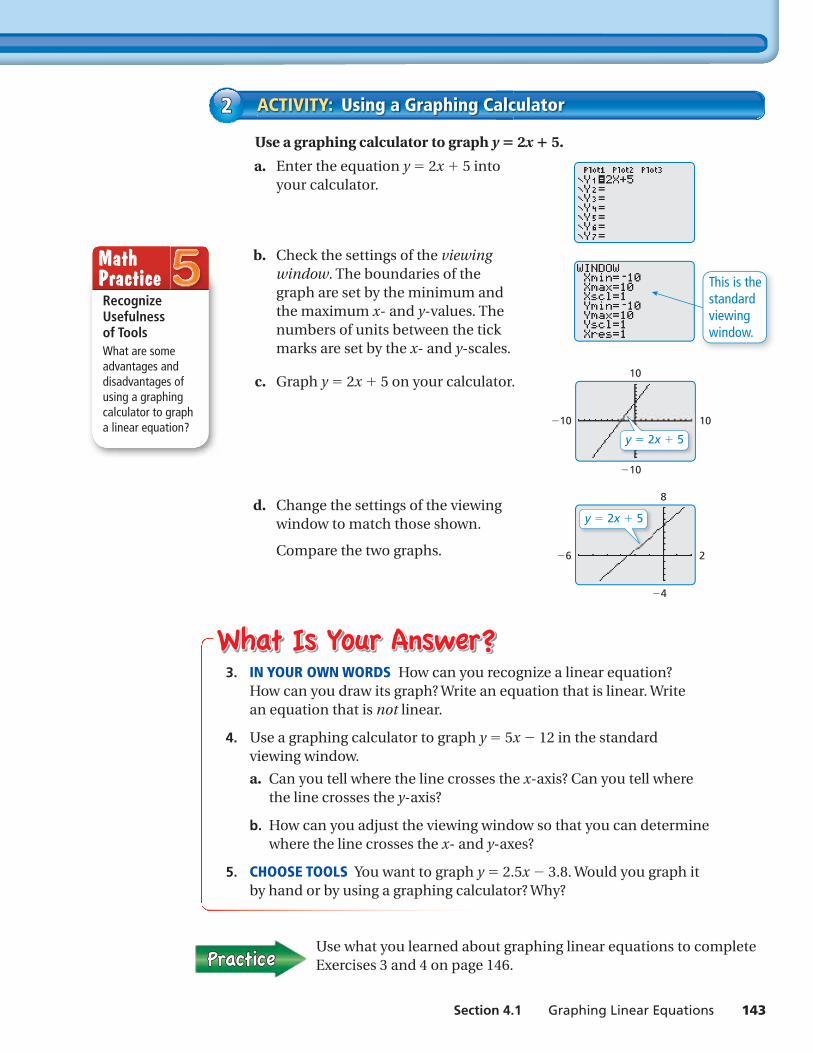
Use a graphing calculator to graph y = 2x + 5.
a. Enter the equation y = 2x + 5 into your calculator.
b. Check the settings of the viewing window. The boundaries of the graph are set by the minimum and the maximum x- and y-values. The numbers of units between the tick marks are set by the x- and y-scales.
c. Graph y = 2x + 5 on your calculator.
d. Change the settings of the viewing window to match those shown.
Compare the two graphs.
ACTIVITY: Using a Graphing Calculator22
Use what you learned about graphing linear equations to complete Exercises 3 and 4 on page 146.
3. IN YOUR OWN WORDS How can you recognize a linear equation? How can you draw its graph? Write an equation that is linear. Write an equation that is not linear.
4. Use a graphing calculator to graph y = 5x − 12 in the standard viewing window.
a. Can you tell where the line crosses the x-axis? Can you tell where the line crosses the y-axis?
b. How can you adjust the viewing window so that you can determine where the line crosses the x- and y-axes?
5. CHOOSE TOOLS You want to graph y = 2.5x − 3.8. Would you graph it by hand or by using a graphing calculator? Why?
This is thestandard viewingwindow.
10 10
10
10
y 2x 5
6 2
4
8
y 2x 5
Recognize Usefulness of ToolsWhat are some advantages and disadvantages of using a graphing calculator to graph a linear equation?
Math Practice
144 Chapter 4 Graphing and Writing Linear Equations
Lesson4.1Lesson Tutorials
Key Vocabularylinear equation, p. 144solution of a linear equation, p. 144
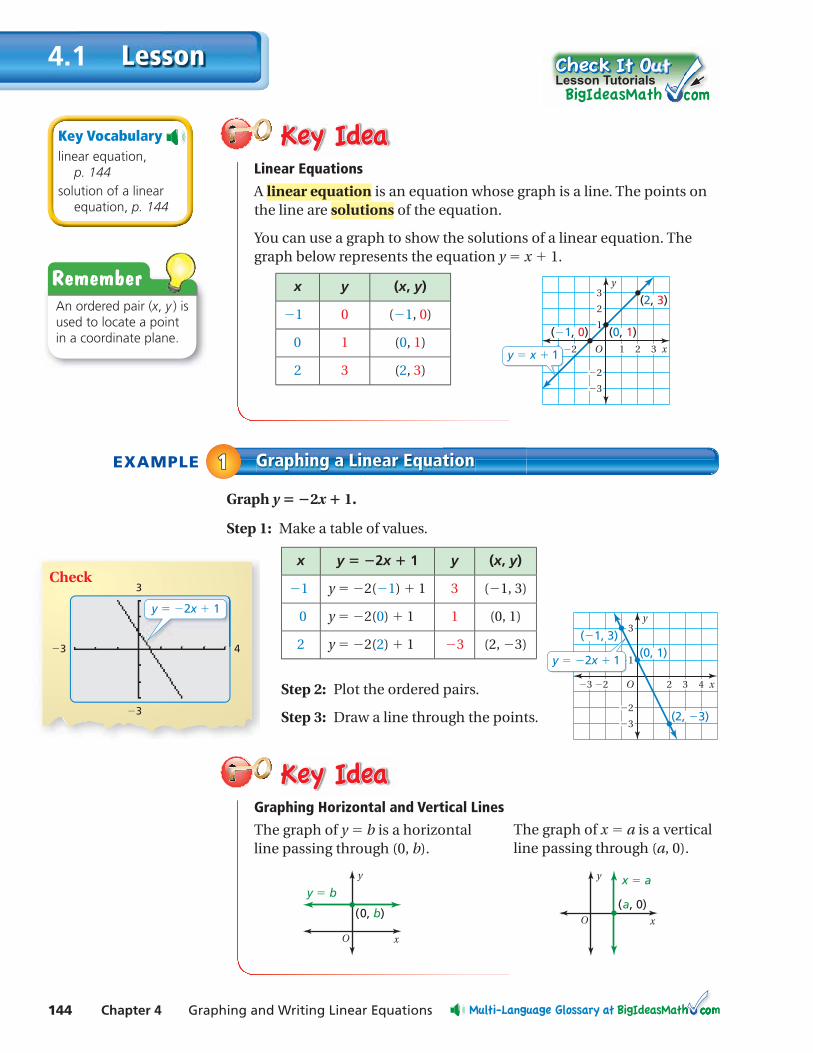
Linear Equations
A linear equation is an equation whose graph is a line. The points on the line are solutions of the equation.
You can use a graph to show the solutions of a linear equation. The graph below represents the equation y = x + 1.
RememberAn ordered pair (x, y ) is used to locate a point in a coordinate plane.
x y (x, y)
−1 0 (−1, 0)
0 1 (0, 1)
2 3 (2, 3)
EXAMPLE Graphing a Linear Equation11
Graph y = −2x + 1.
Step 1: Make a table of values.
Step 2: Plot the ordered pairs.
Step 3: Draw a line through the points.
x
y
1O23 2 3
1
2
3
3
2
(0, 1)( 1, 0)
(2, 3)
y x 1
x
y
23 2 3 4
2
1
3
3
( 1, 3)
(2, 3)
(0, 1)y 2x 1
O
Graphing Horizontal and Vertical Lines
The graph of y = b is a horizontal line passing through (0, b).
The graph of x = a is a vertical line passing through (a, 0).
y
x
(a, 0)
x a
O
y
x
(0, b)
y b
O
x y = −2x + 1 y (x, y)
−1 y = −2(−1) + 1 3 (−1, 3)
0 y = −2(0) + 1 1 (0, 1)
2 y = −2(2) + 1 −3 (2, −3)
Check
43
3
3
y 2x 1
Section 4.1 Graphing Linear Equations 145
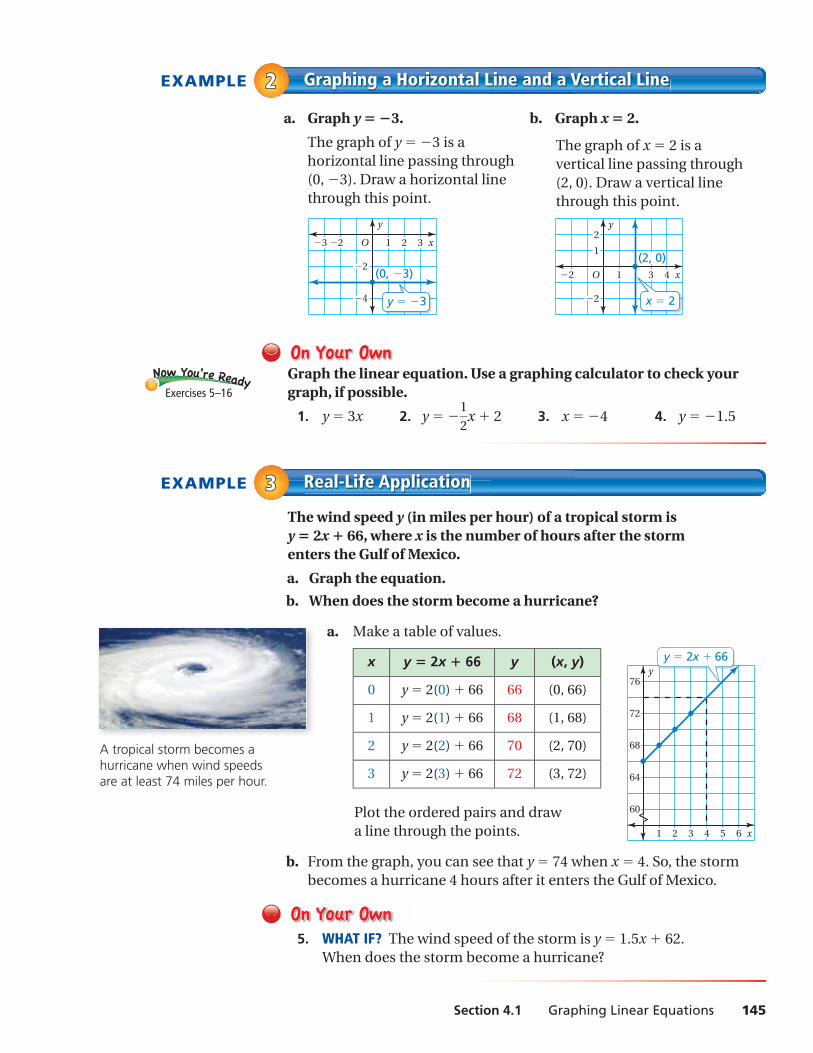
EXAMPLE Graphing a Horizontal Line and a Vertical Line22
a. Graph y = −3. b. Graph x = 2.
The graph of y = −3 is a horizontal line passing through (0, − 3). Draw a horizontal line through this point.
Graph the linear equation. Use a graphing calculator to check your graph, if possible.
1. y = 3x 2. y = − 1
— 2
x + 2 3. x = − 4 4. y = −1.5
EXAMPLE Real-Life Application33The wind speed y (in miles per hour) of a tropical storm is y = 2x + 66, where x is the number of hours after the storm enters the Gulf of Mexico.
a. Graph the equation.
b. When does the storm become a hurricane?
a. Make a table of values.
x y = 2x + 66 y (x, y)
0 y = 2(0) + 66 66 (0, 66)
1 y = 2(1) + 66 68 (1, 68)
2 y = 2(2) + 66 70 (2, 70)
3 y = 2(3) + 66 72 (3, 72)
Plot the ordered pairs and draw a line through the points.
b. From the graph, you can see that y = 74 when x = 4. So, the storm becomes a hurricane 4 hours after it enters the Gulf of Mexico.
5. WHAT IF? The wind speed of the storm is y = 1.5x + 62. When does the storm become a hurricane?
A tropical storm becomes a hurricane when wind speeds are at least 74 miles per hour.
x
y
1 2 3 4 5 6
60
64
68
72
76
y 2x 66
Exercises 5–16
The graph of x = 2 is a vertical line passing through (2, 0). Draw a vertical line through this point.
x
y
1O23 2 3
2
4
(0, 3)
y 3
x
y
1O2 3 4
2
1
2
(2, 0)
x 2
Exercises4.1
9+(-6)=3
3+(-3)=
4+(-9)=
9+(-1)=
146 Chapter 4 Graphing and Writing Linear Equations
1. VOCABULARY What type of graph represents the solutions of the equation y = 2x + 4?
2. WHICH ONE DOESN’T BELONG? Which equation does not belong with the other three? Explain your reasoning.
y = 0.5x − 0.2
4x + 3 = y
y = x 2 + 6
3
— 4
x + 1
— 3
= y
PRECISION Copy and complete the table. Plot the two solution points and draw a line exactly through the two points. Find a different solution point on the line.
3. x
y = 3x − 1
4. x
y = 1 —
3 x + 2
Graph the linear equation. Use a graphing calculator to check your graph, if possible.
5. y = −5x 6. y = 1
— 4
x 7. y = 5 8. x = − 6
9. y = x − 3 10. y = −7x − 1 11. y = − x
— 3
+ 4 12. y = 3
— 4
x − 1
— 2
13. y = − 2
— 3
14. y = 6.75 15. x = − 0.5 16. x = 1
— 4
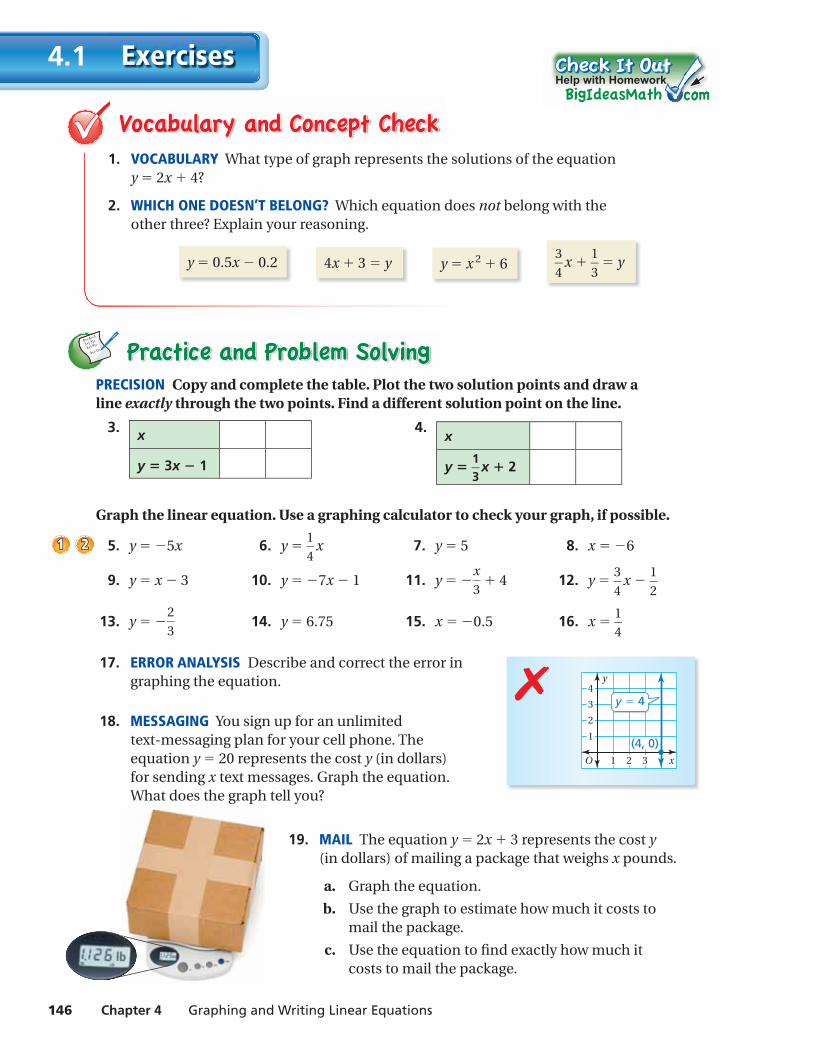
17. ERROR ANALYSIS Describe and correct the error in graphing the equation.
18. MESSAGING You sign up for an unlimited text-messaging plan for your cell phone. The equation y = 20 represents the cost y (in dollars) for sending x text messages. Graph the equation. What does the graph tell you?
19. MAIL The equation y = 2x + 3 represents the cost y (in dollars) of mailing a package that weighs x pounds.
a. Graph the equation.
b. Use the graph to estimate how much it costs to mail the package.
c. Use the equation to fi nd exactly how much it costs to mail the package.
Help with Homework
11 22
x
y
O
1
2
3
4
1 2 3
y 4
(4, 0)
✗
Section 4.1 Graphing Linear Equations 147
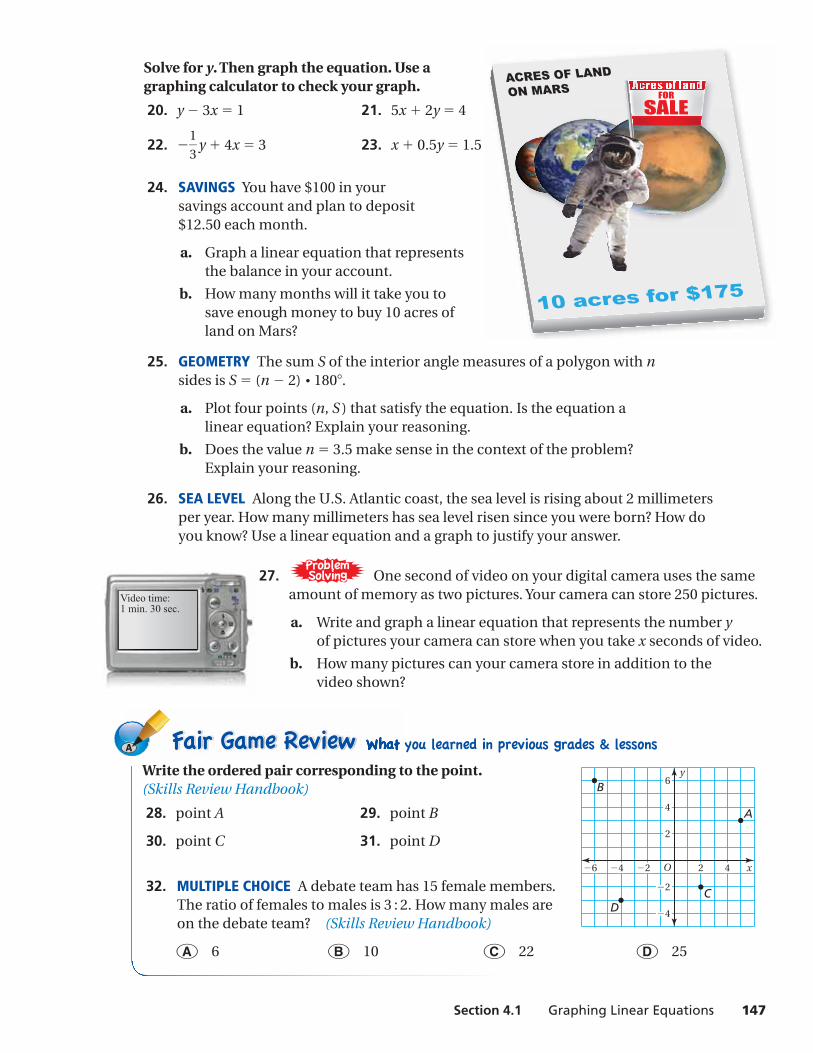
Write the ordered pair corresponding to the point. (Skills Review Handbook)
28. point A 29. point B
30. point C 31. point D
32. MULTIPLE CHOICE A debate team has 15 female members. The ratio of females to males is 3 : 2. How many males are on the debate team? (Skills Review Handbook)
○A 6 ○B 10 ○C 22 ○D 25
Solve for y. Then graph the equation. Use a graphing calculator to check your graph.
20. y − 3x = 1 21. 5x + 2y = 4
22. − 1
— 3
y + 4x = 3 23. x + 0.5y = 1.5
24. SAVINGS You have $100 in your savings account and plan to deposit $12.50 each month.
a. Graph a linear equation that represents the balance in your account.
b. How many months will it take you to save enough money to buy 10 acres of land on Mars?
25. GEOMETRY The sum S of the interior angle measures of a polygon with n sides is S = (n − 2) ⋅ 180°.
a. Plot four points (n, S ) that satisfy the equation. Is the equation a linear equation? Explain your reasoning.
b. Does the value n = 3.5 make sense in the context of the problem? Explain your reasoning.
26. SEA LEVEL Along the U.S. Atlantic coast, the sea level is rising about 2 millimeters per year. How many millimeters has sea level risen since you were born? How do you know? Use a linear equation and a graph to justify your answer.
27. ProblemSolvingProblemSolving One second of video on your digital camera uses the same
amount of memory as two pictures. Your camera can store 250 pictures.
a. Write and graph a linear equation that represents the number y of pictures your camera can store when you take x seconds of video.
b. How many pictures can your camera store in addition to the video shown?
Video time:1 min. 30 sec.
A
y
x2246 4
B
CD
6
4
2
2
4
O
148 Chapter 4 Graphing and Writing Linear Equations
Slope of a Line4.2
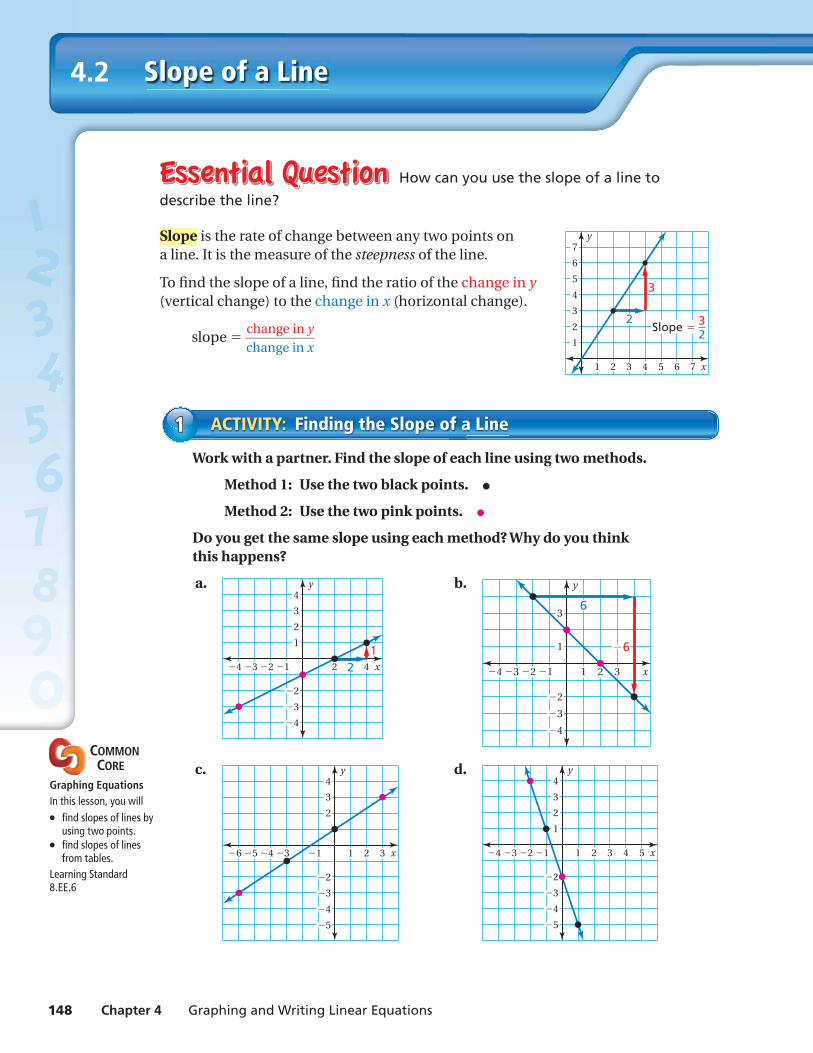
How can you use the slope of a line to
describe the line?
Slope is the rate of change between any two points on a line. It is the measure of the steepness of the line.
To fi nd the slope of a line, fi nd the ratio of the change in y(vertical change) to the change in x (horizontal change).
slope = change in y
— change in x
Work with a partner. Find the slope of each line using two methods.
Method 1: Use the two black points. ●
Method 2: Use the two pink points. ●
Do you get the same slope using each method? Why do you think this happens?
a.
x
y
3
4
2
1
3
4
2
422 134 21
b.
x
y
3
1
3
4
2
21 32 134
6
6
c.
x
y
3
4
2
3
4
5
2
3213 1456
d.
x
y
3
4
2
1
3
4
5
2
3 4 5213 2 14
ACTIVITY: Finding the Slope of a Line11
x
y
3
4
5
6
7
2
1
4 5 6 7321
2Slope
3
32
COMMON CORE
Graphing EquationsIn this lesson, you will● fi nd slopes of lines by
using two points.● fi nd slopes of lines
from tables.Learning Standard8.EE.6
Section 4.2 Slope of a Line 149
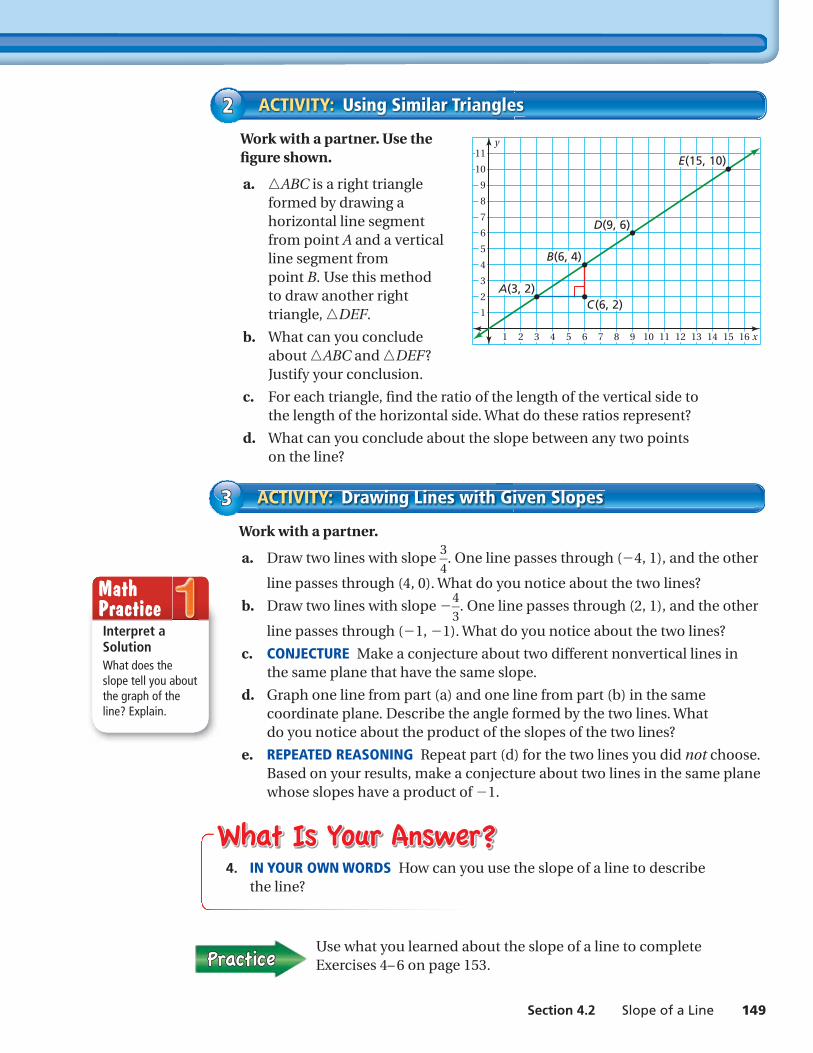
Work with a partner. Use the fi gure shown.
a. △ABC is a right triangle formed by drawing a horizontal line segment from point A and a vertical line segment from point B. Use this method to draw another right triangle, △DEF.
b. What can you conclude about △ABC and △DEF? Justify your conclusion.
c. For each triangle, fi nd the ratio of the length of the vertical side to the length of the horizontal side. What do these ratios represent?
d. What can you conclude about the slope between any two points on the line?
ACTIVITY: Using Similar Triangles22
Use what you learned about the slope of a line to complete Exercises 4– 6 on page 153.
4. IN YOUR OWN WORDS How can you use the slope of a line to describe the line?
Work with a partner.
a. Draw two lines with slope 3
— 4
. One line passes through (− 4, 1), and the other
line passes through (4, 0). What do you notice about the two lines?
b. Draw two lines with slope − 4
— 3
. One line passes through (2, 1), and the other
line passes through (− 1, − 1). What do you notice about the two lines?
c. CONJECTURE Make a conjecture about two different nonvertical lines in the same plane that have the same slope.
d. Graph one line from part (a) and one line from part (b) in the same coordinate plane. Describe the angle formed by the two lines. What do you notice about the product of the slopes of the two lines?
e. REPEATED REASONING Repeat part (d) for the two lines you did not choose. Based on your results, make a conjecture about two lines in the same plane whose slopes have a product of − 1.
ACTIVITY: Drawing Lines with Given Slopes33
x
y
3
4
5
6
7
8
9
10
11
2
1
4 5 6 7 8 9 10 11 12 13 14 15 16321
A(3, 2)
B(6, 4)
D(9, 6)
E(15, 10)
C(6, 2)
Interpret a SolutionWhat does the slope tell you about the graph of the line? Explain.
Math Practice
150 Chapter 4 Graphing and Writing Linear Equations
Lesson4.2Lesson Tutorials
Key Vocabularyslope, p. 150rise, p. 150run, p. 150
Slope
The slope m of a line is a ratio of the y
xO
Rise y2 y1
Run x2 x1
(x1, y1)
(x2, y2)
change in y (the rise) to the change in x (the run) between any two points, (x1, y1) and (x2, y2), on the line.
m = rise
— run
= change in y
— change in x
= y2 − y1 — x2 − x1
Positive Slope Negative Slope
y
xO
y
xO
The line rises from left to right. The line falls from left to right.
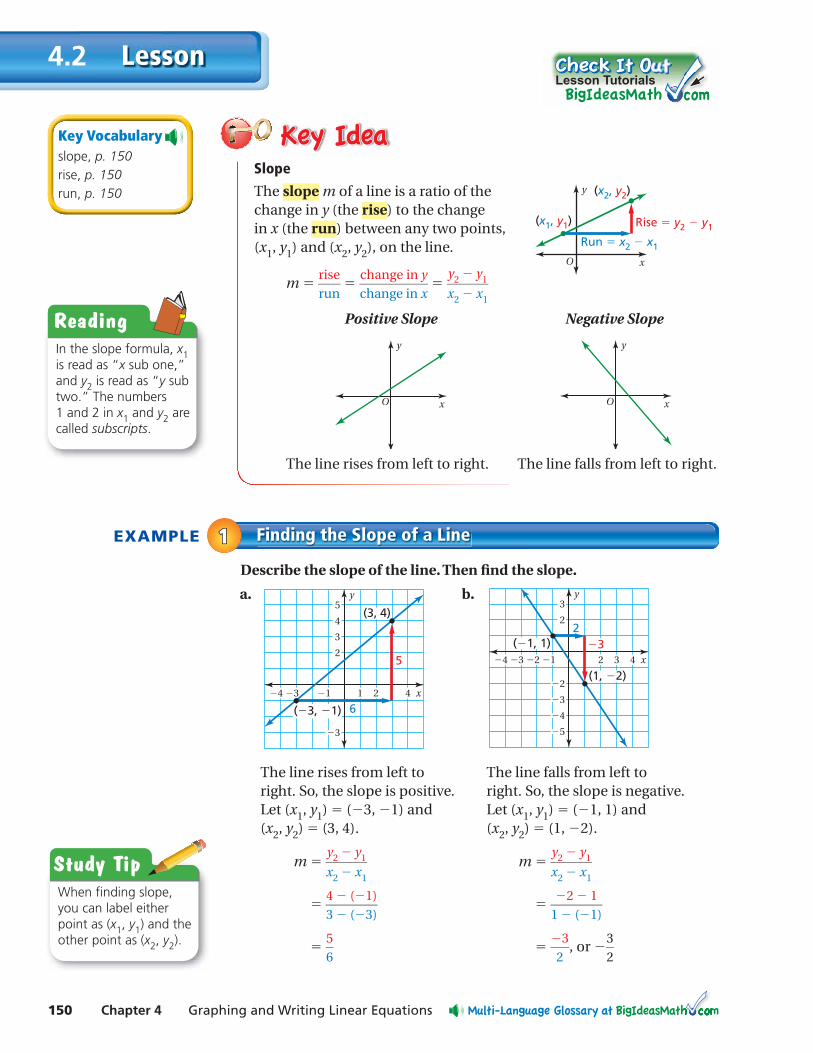
EXAMPLE Finding the Slope of a Line11Describe the slope of the line. Then fi nd the slope.
a.
x
y
134 1 2 4
3
3
2
4
5
6( 3, 1)
(3, 4)
5
b.
x
y
2 134 2 3 4
2
2
3
3
4
5
2( 1, 1)
(1, 2)
3
The line rises from left to The line falls from left to right. So, the slope is positive. right. So, the slope is negative. Let (x1, y1) = (− 3, − 1) and Let (x1, y1) = (− 1, 1) and (x2, y2) = (3, 4). (x2, y2) = (1, − 2).
m = y2 − y1 — x2 − x1
m = y2 − y1 — x2 − x1
= 4 − (− 1)
— 3 − (− 3)
= − 2 − 1
— 1 − (− 1)
= 5
— 6
= −3
— 2
, or − 3
— 2
Study TipWhen fi nding slope, you can label either point as (x1, y1) and the other point as (x2, y2).
ReadingIn the slope formula, x1 is read as “x sub one,” and y2 is read as “y sub two.” The numbers 1 and 2 in x1 and y2 are called subscripts.
Section 4.2 Slope of a Line 151
Find the slope of the line.
1.
x
y
12 13 2 3
1
2
3
4
5
( 2, 3) (3, 2)
2.
x
y
1 214
1
2
3
3
2( 4, 1)
(2, 1)
3.
x
y
12 145
2
1
3
4
5
( 3, 1)
( 5, 4)
Exercises 7–9
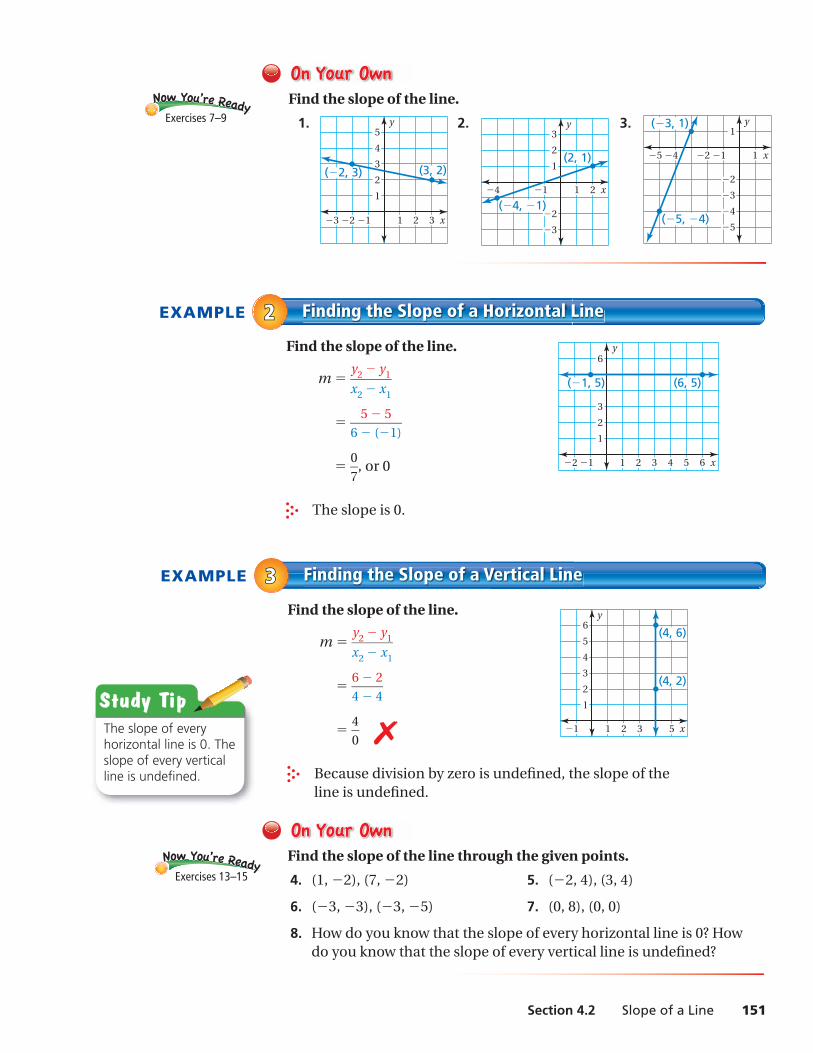
EXAMPLE Finding the Slope of a Horizontal Line22Find the slope of the line.
x
y
3
6
2
1
4 5 63212 1
(6, 5) ( 1, 5) m = y2 − y1 — x2 − x1
= 5 − 5
— 6 − (− 1)
= 0
— 7
, or 0
The slope is 0.
Exercises 13–15
EXAMPLE Finding the Slope of a Vertical Line33Find the slope of the line.
x
y
1 2 3 51
1
2
3
4
5
6(4, 6)
(4, 2)
m = y2 − y1 — x2 − x1
= 6 − 2
— 4 − 4
= 4
— 0
✗ Because division by zero is undefi ned, the slope of the
line is undefi ned.
Find the slope of the line through the given points.
4. (1, − 2), (7, − 2) 5. (− 2, 4), (3, 4)
6. (− 3, − 3), (− 3, − 5) 7. (0, 8), (0, 0)
8. How do you know that the slope of every horizontal line is 0? How do you know that the slope of every vertical line is undefi ned?
Study TipThe slope of every horizontal line is 0. The slope of every vertical line is undefi ned.
152 Chapter 4 Graphing and Writing Linear Equations
Exercises 21 – 24
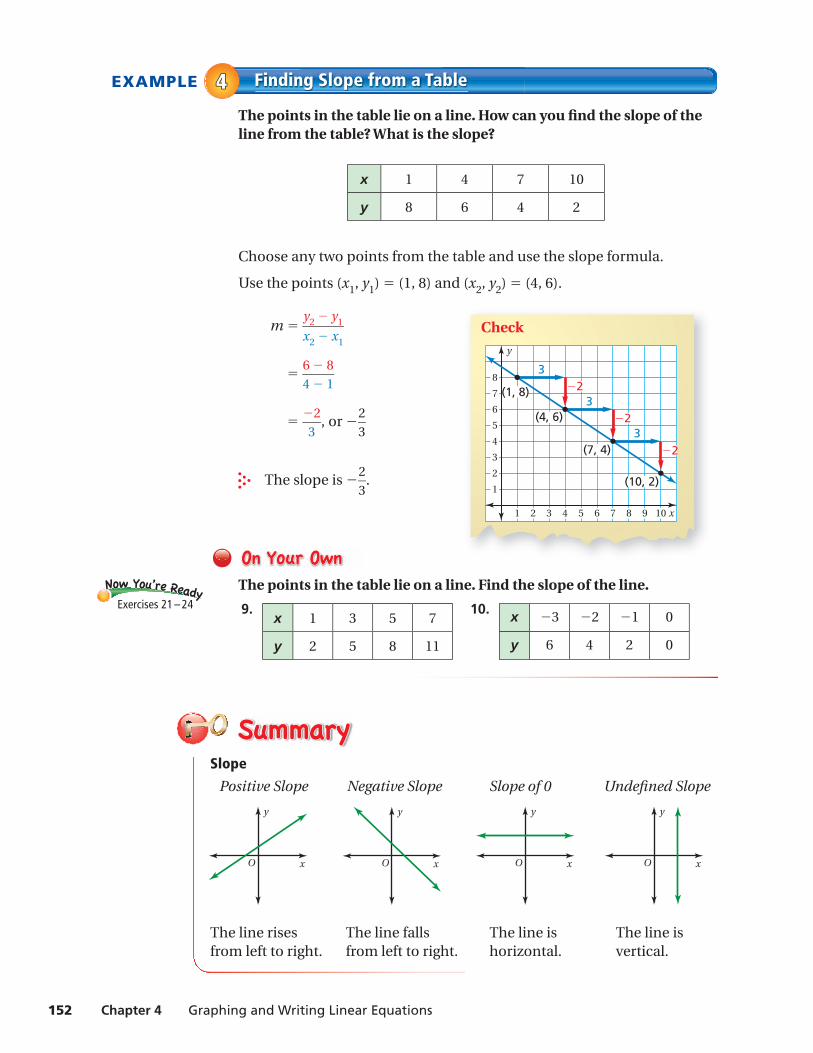
EXAMPLE Finding Slope from a Table44The points in the table lie on a line. How can you fi nd the slope of the line from the table? What is the slope?
x 1 4 7 10
y 8 6 4 2
Choose any two points from the table and use the slope formula.
Use the points (x1, y1) = (1, 8) and (x2, y2) = (4, 6).
m = y2 − y1 — x2 − x1
= 6 − 8
— 4 − 1
= −2
— 3
, or − 2
— 3
The slope is − 2
— 3
.
The points in the table lie on a line. Find the slope of the line.
9. x 1 3 5 7
y 2 5 8 11
10. x −3 −2 −1 0
y 6 4 2 0
Slope
Positive Slope Negative Slope Slope of 0 Undefi ned Slope
The line rises The line falls The line is The line isfrom left to right. from left to right. horizontal. vertical.
y
xO
y
xO
y
xO
y
xO
Check
x
y
3
4
5
6
7
8
2
1
4 5 6 7 8 9 10321
(1, 8)
(4, 6)
(7, 4)
(10, 2)
23
23
23
Section 4.2 Slope of a Line 153
Exercises4.2
9+(-6)=3
3+(-3)=
4+(-9)=
9+(-1)=
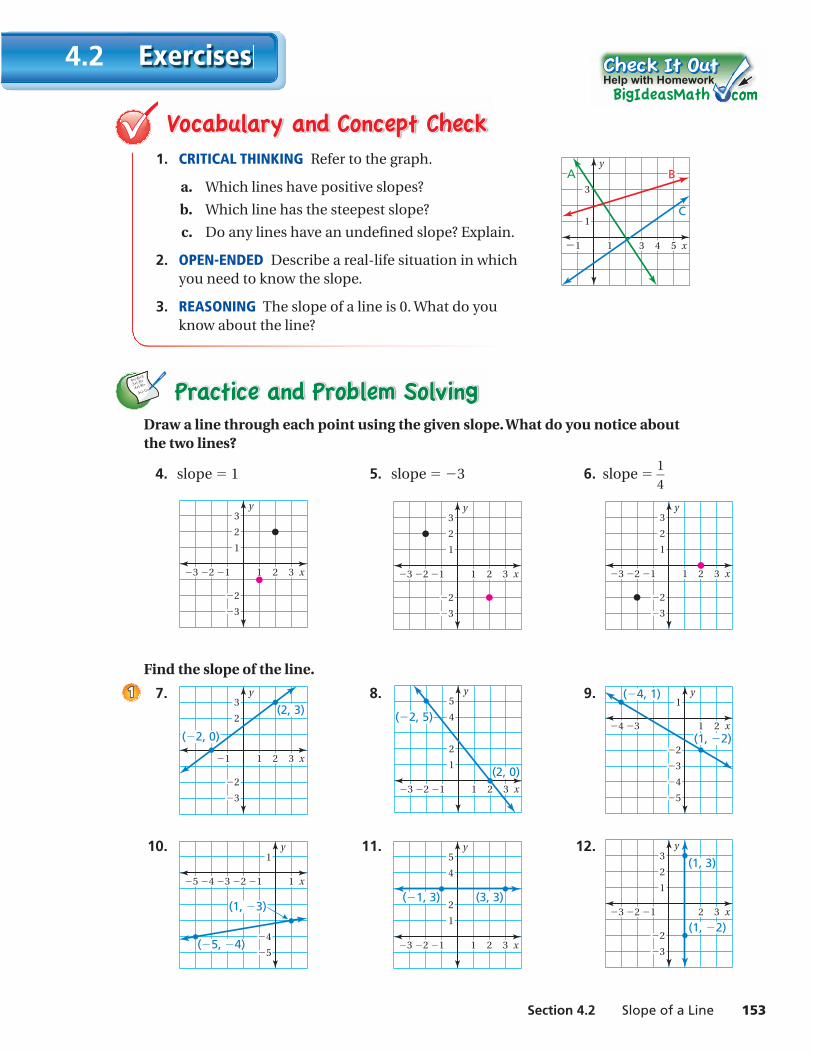
1. CRITICAL THINKING Refer to the graph.
a. Which lines have positive slopes?
b. Which line has the steepest slope?
c. Do any lines have an undefi ned slope? Explain.
2. OPEN-ENDED Describe a real-life situation in which you need to know the slope.
3. REASONING The slope of a line is 0. What do you know about the line?
Draw a line through each point using the given slope. What do you notice about the two lines?
4. slope = 1 5. slope = −3 6. slope = 1
— 4
x
y
12 13 2 3
2
1
2
3
3
x
y
12 13 2 3
2
1
2
3
3
x
y
12 13 2 3
2
1
2
3
3
Find the slope of the line.
7.
x
y
11 2 3
2
2
3
3
( 2, 0)
(2, 3) 8.
x
y
1123 2 3
2
4
5
1
( 2, 5)
(2, 0)
9.
x
y
1 2
2
1
3
4
5
( 4, 1)
(1, 2)4 3
10.
x
y
12 1345
4
1
5( 5, 4)
(1, 3)
11.
x
y
1123 2 3
2
4
5
1
( 1, 3) (3, 3)
12.
x
y
223 1 3
3
2
1
2
3
(1, 2)
(1, 3)
Help with Homework
11
x
y
3 5411
1
3
A B
C
154 Chapter 4 Graphing and Writing Linear Equations
Find the slope of the line through the given points.
13. (4, − 1), (− 2, − 1) 14. (5, − 3), (5, 8) 15. (− 7, 0), (− 7, − 6)
16. (− 3, 1), (− 1, 5) 17. (10, 4), (4, 15) 18. (− 3, 6), (2, 6)
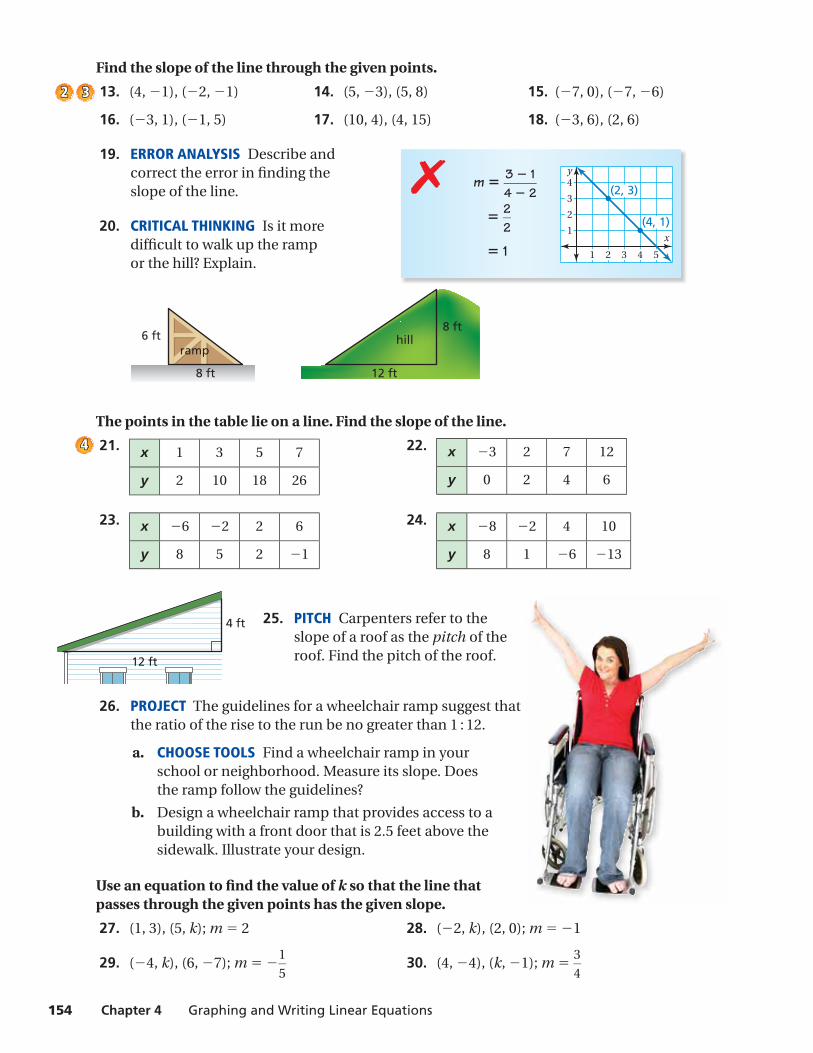
19. ERROR ANALYSIS Describe and correct the error in fi nding the slope of the line.
20. CRITICAL THINKING Is it more diffi cult to walk up the ramp or the hill? Explain.
8 ft 12 ft
8 ft6 ft hill
ramp
The points in the table lie on a line. Find the slope of the line.
21. x 1 3 5 7
y 2 10 18 26
22. x −3 2 7 12
y 0 2 4 6
23. x −6 −2 2 6
y 8 5 2 −1
24. x −8 −2 4 10
y 8 1 −6 −13
25. PITCH Carpenters refer to the slope of a roof as the pitch of the roof. Find the pitch of the roof.
26. PROJECT The guidelines for a wheelchair ramp suggest that the ratio of the rise to the run be no greater than 1 : 12.
a. CHOOSE TOOLS Find a wheelchair ramp in your school or neighborhood. Measure its slope. Does the ramp follow the guidelines?
b. Design a wheelchair ramp that provides access to a building with a front door that is 2.5 feet above the sidewalk. Illustrate your design.
Use an equation to fi nd the value of k so that the line that passes through the given points has the given slope.
27. (1, 3), (5, k); m = 2 28. (− 2, k), (2, 0); m = − 1
29. (− 4, k), (6, − 7); m = − 1
— 5
30. (4, − 4), (k, − 1); m = 3
— 4
33
44
m = 3 − 1 —
4 − 2
= 2 — 2
= 1
✗x
y
54321
1
2
3
4(2, 3)
(4, 1)
12 ft
4 ft
22
6 ft
36 ft
Section 4.2 Slope of a Line 155
Solve the proportion. (Skills Review Handbook)
37. b
— 30
= 5
— 6
38. 7
— 4
= n
— 32
39. 3
— 8
= x
— 20
40. MULTIPLE CHOICE What is the prime factorization of 84? (Skills Review Handbook)
○A 2 × 3 × 7 ○B 22 × 3 × 7 ○C 2 × 32 × 7 ○D 22 × 21
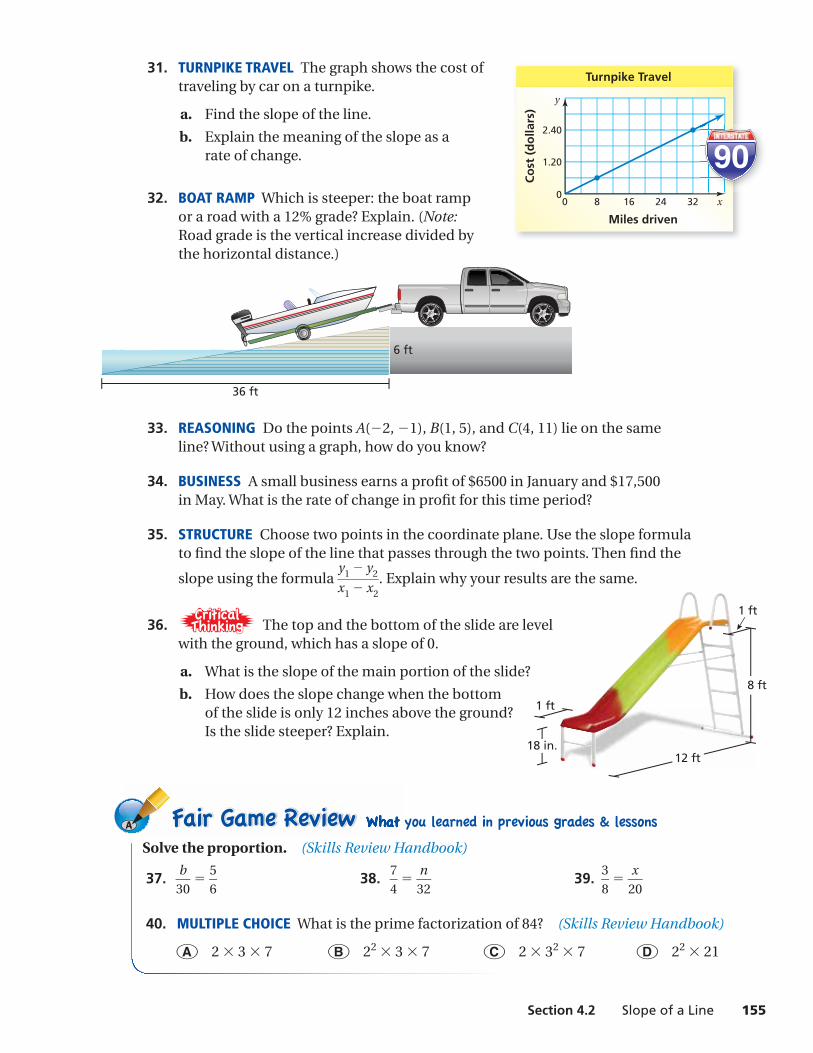
31. TURNPIKE TRAVEL The graph shows the cost of traveling by car on a turnpike.
a. Find the slope of the line.
b. Explain the meaning of the slope as a rate of change.
32. BOAT RAMP Which is steeper: the boat ramp or a road with a 12% grade? Explain. (Note: Road grade is the vertical increase divided by the horizontal distance.)
33. REASONING Do the points A(− 2, − 1), B(1, 5), and C(4, 11) lie on the same line? Without using a graph, how do you know?
34. BUSINESS A small business earns a profi t of $6500 in January and $17,500 in May. What is the rate of change in profi t for this time period?
35. STRUCTURE Choose two points in the coordinate plane. Use the slope formula to fi nd the slope of the line that passes through the two points. Then fi nd the
slope using the formula y1 − y2 — x1 − x2
. Explain why your results are the same.
36. The top and the bottom of the slide are level with the ground, which has a slope of 0.
a. What is the slope of the main portion of the slide?
b. How does the slope change when the bottom of the slide is only 12 inches above the ground? Is the slide steeper? Explain.
1 ft
18 in.12 ft
8 ft
1 ft
00
Miles driven
Turnpike Travel
Co
st (
do
llars
)
x
y
24 32168
1.20
2.40
156 Chapter 4 Graphing and Writing Linear Equations
Lesson Tutorials
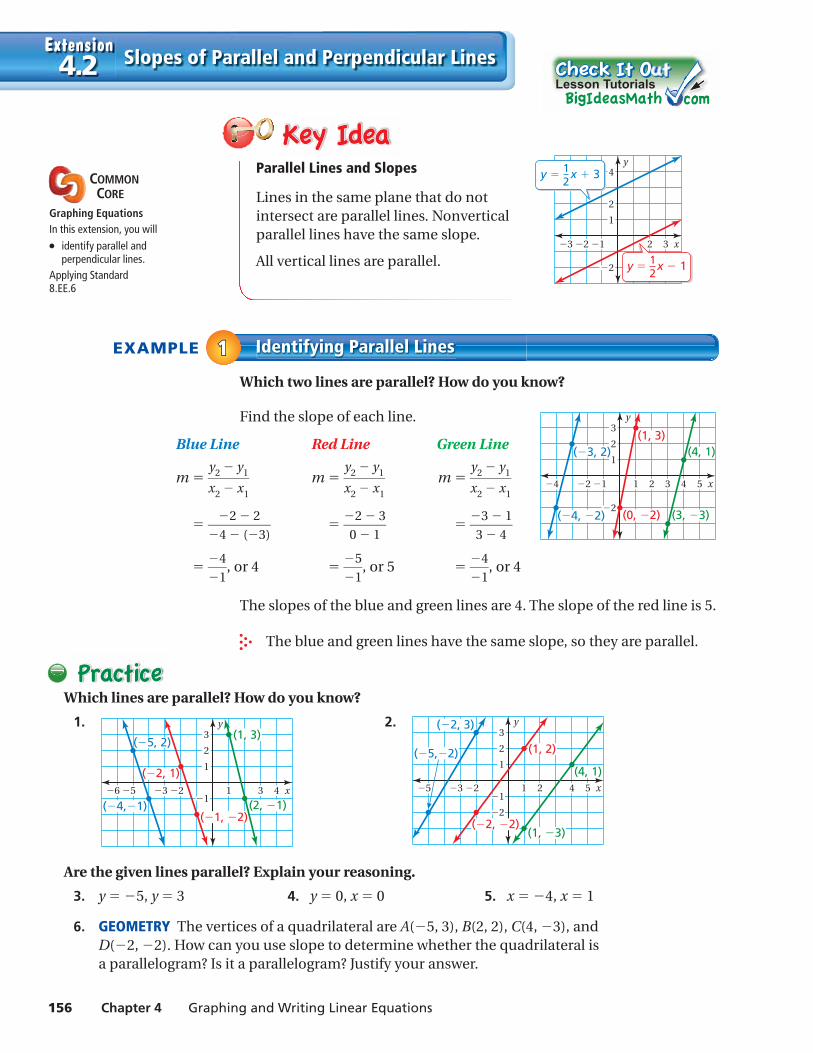
Parallel Lines and Slopes
Lines in the same plane that do not intersect are parallel lines. Nonvertical parallel lines have the same slope.
All vertical lines are parallel.
EXAMPLE Identifying Parallel Lines11Which two lines are parallel? How do you know?
Find the slope of each line.
The slopes of the blue and green lines are 4. The slope of the red line is 5.
The blue and green lines have the same slope, so they are parallel.
x
y3
2
1
2
4 53212 14
( 3, 2)
( 4, 2) (0, 2) (3, 3)
(1, 3)(4, 1)
Which lines are parallel? How do you know?
1.
x
y3
2
1
14312356
( 5, 2)
(2, 1)
( 2, 1)
(1, 3)
( 4, 1)( 1, 2)
2.
x
y3
2
1
1
2
4 521235
( 2, 3)
(1, 3)
(1, 2)
(4, 1)
( 5, 2)
( 2, 2)
Are the given lines parallel? Explain your reasoning.
3. y = − 5, y = 3 4. y = 0, x = 0 5. x = − 4, x = 1
6. GEOMETRY The vertices of a quadrilateral are A(− 5, 3), B(2, 2), C(4, − 3), and D(− 2, − 2). How can you use slope to determine whether the quadrilateral is a parallelogram? Is it a parallelogram? Justify your answer.
Blue Line Red Line Green Line
m = y2 − y1 — x2 − x1
m = y2 − y1 — x2 − x1
m = y2 − y1 — x2 − x1
= − 2 − 2
— − 4 − (− 3)
= − 2 − 3
— 0 − 1
= − 3 − 1
— 3 − 4
= − 4
— − 1
, or 4 = − 5
— − 1
, or 5 = − 4
— − 1
, or 4
x
y
223 1 3
2
1
2
4
y x 112
y x 312COMMON
CORE
Graphing EquationsIn this extension, you will● identify parallel and
perpendicular lines.Applying Standard8.EE.6
Slopes of Parallel and Perpendicular LinesExtension4.2
Extension 4.2 Slopes of Parallel and Perpendicular Lines 157
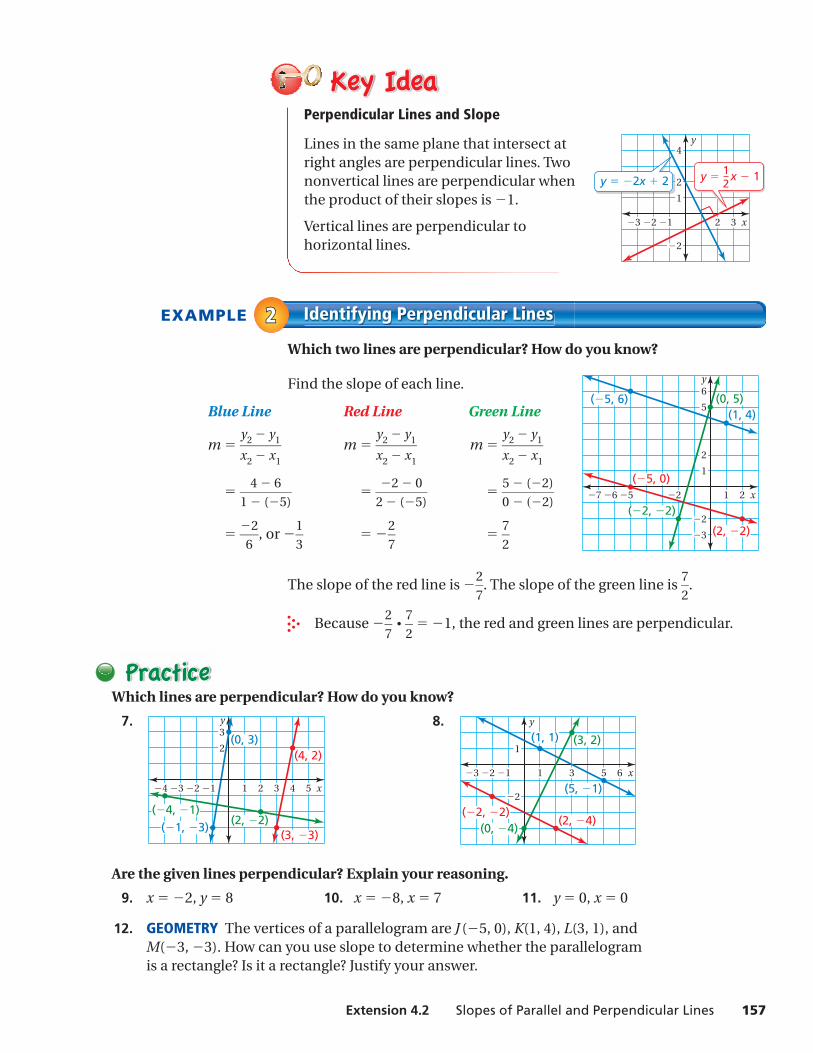
Perpendicular Lines and Slope
Lines in the same plane that intersect at right angles are perpendicular lines. Two nonvertical lines are perpendicular when the product of their slopes is − 1.
Vertical lines are perpendicular to horizontal lines.
EXAMPLE Identifying Perpendicular Lines22Which two lines are perpendicular? How do you know?
Find the slope of each line.
The slope of the red line is − 2
— 7
. The slope of the green line is 7
— 2
.
Because − 2
— 7
⋅ 7
— 2
= − 1, the red and green lines are perpendicular.
Which lines are perpendicular? How do you know?
7.
x
y
21234 1 3 4 5
2
3
(2, 2)(3, 3)
( 1, 3)( 4, 1)
(0, 3)(4, 2)
8.
123 1 3 6 x
y
5
1
2
(2, 4)( 2, 2)
(0, 4)
(1, 1)
(5, 1)
(3, 2)
Are the given lines perpendicular? Explain your reasoning.
9. x = − 2, y = 8 10. x = − 8, x = 7 11. y = 0, x = 0
12. GEOMETRY The vertices of a parallelogram are J (− 5, 0), K(1, 4), L(3, 1), and M(− 3, − 3). How can you use slope to determine whether the parallelogram is a rectangle? Is it a rectangle? Justify your answer.
Blue Line Red Line Green Line
m = y2 − y1 — x2 − x1
m = y2 − y1 — x2 − x1
m = y2 − y1 — x2 − x1
= 4 − 6
— 1 − (− 5)
= − 2 − 0
— 2 − (− 5)
= 5 − (− 2)
— 0 − (− 2)
= − 2
— 6
, or − 1
— 3
= − 2
— 7
= 7
— 2
x
y
223 1 3
2
1
2
4
y 2x 2 y x 112
x
y
2
5
6
1
2
3
212567
( 5, 6)
( 5, 0)
( 2, 2)
(1, 4)(0, 5)
(2, 2)
158 Chapter 4 Graphing and Writing Linear Equations
2.3
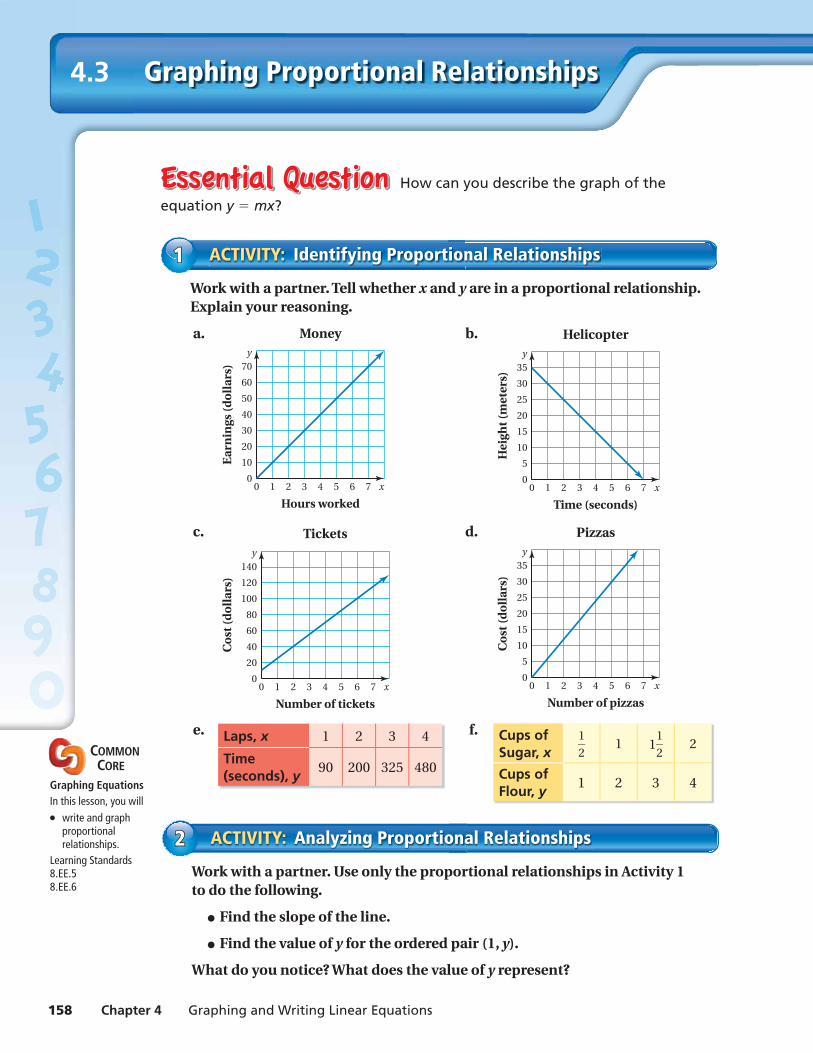
How can you describe the graph of the
equation y = mx?
Work with a partner. Tell whether x and y are in a proportional relationship. Explain your reasoning.
a.
00
20
40
60
30
10
50
70
2 4
Hours worked
Money
Ear
nin
gs (d
oll
ars)
61 3 5 7 x
y
b.
00
10
20
30
15
5
25
35
2 4
Time (seconds)
Helicopter
Hei
ght (
met
ers)
61 3 5 7 x
y
c.
00
40
80
120
60
20
100
140
2 4
Number of tickets
Tickets
Co
st (d
oll
ars)
61 3 5 7 x
y
d.
00
10
20
30
15
5
25
35
2 4
Number of pizzas
Pizzas
Co
st (d
oll
ars)
61 3 5 7 x
y
e. Laps, x 1 2 3 4
Time (seconds), y
90 200 325 480
f. Cups of Sugar, x
1 — 2 1 1
1 — 2 2
Cups of Flour, y
1 2 3 4
ACTIVITY: Identifying Proportional Relationships11
COMMON CORE
Graphing EquationsIn this lesson, you will● write and graph
proportional relationships.
Learning Standards8.EE.58.EE.6
Graphing Proportional Relationships4.3
Work with a partner. Use only the proportional relationships in Activity 1 to do the following.
● Find the slope of the line.
● Find the value of y for the ordered pair (1, y).
What do you notice? What does the value of y represent?
ACTIVITY: Analyzing Proportional Relationships22
Section 4.3 Graphing Proportional Relationships 159
Use what you learned about proportional relationships to complete Exercises 3 – 6 on page 162.
4. IN YOUR OWN WORDS How can you describe the graph of the equation y = mx ? How does the value of m affect the graph of the equation?
5. Give a real-life example of two quantities that are in a proportional relationship. Write an equation that represents the relationship and sketch its graph.
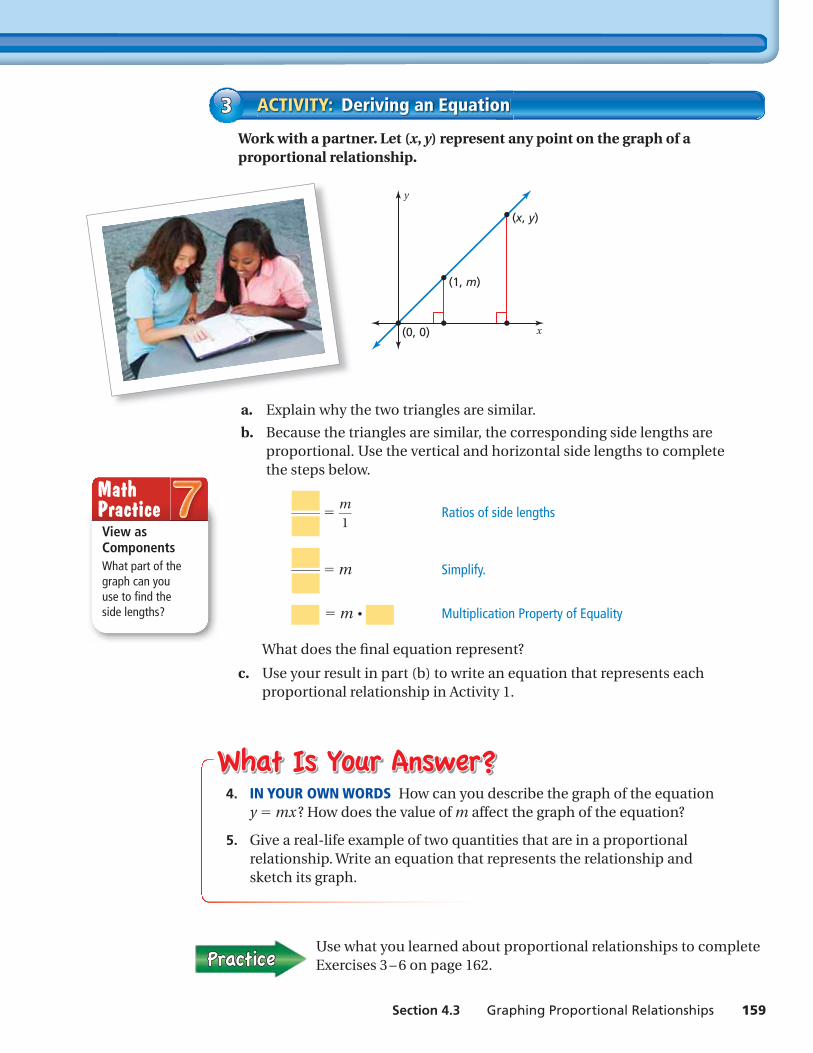
Work with a partner. Let (x, y) represent any point on the graph of a proportional relationship.
y
x(0, 0)
(1, m)
(x, y)
a. Explain why the two triangles are similar.
b. Because the triangles are similar, the corresponding side lengths are proportional. Use the vertical and horizontal side lengths to complete the steps below.
— = m
— 1
Ratios of side lengths
— = m Simplify.
= m ⋅ Multiplication Property of Equality
What does the fi nal equation represent?
c. Use your result in part (b) to write an equation that represents each proportional relationship in Activity 1.
ACTIVITY: Deriving an Equation33
View as ComponentsWhat part of the graph can you use to fi nd the side lengths?
Math Practice
160 Chapter 4 Graphing and Writing Linear Equations
Lesson4.3Lesson Tutorials
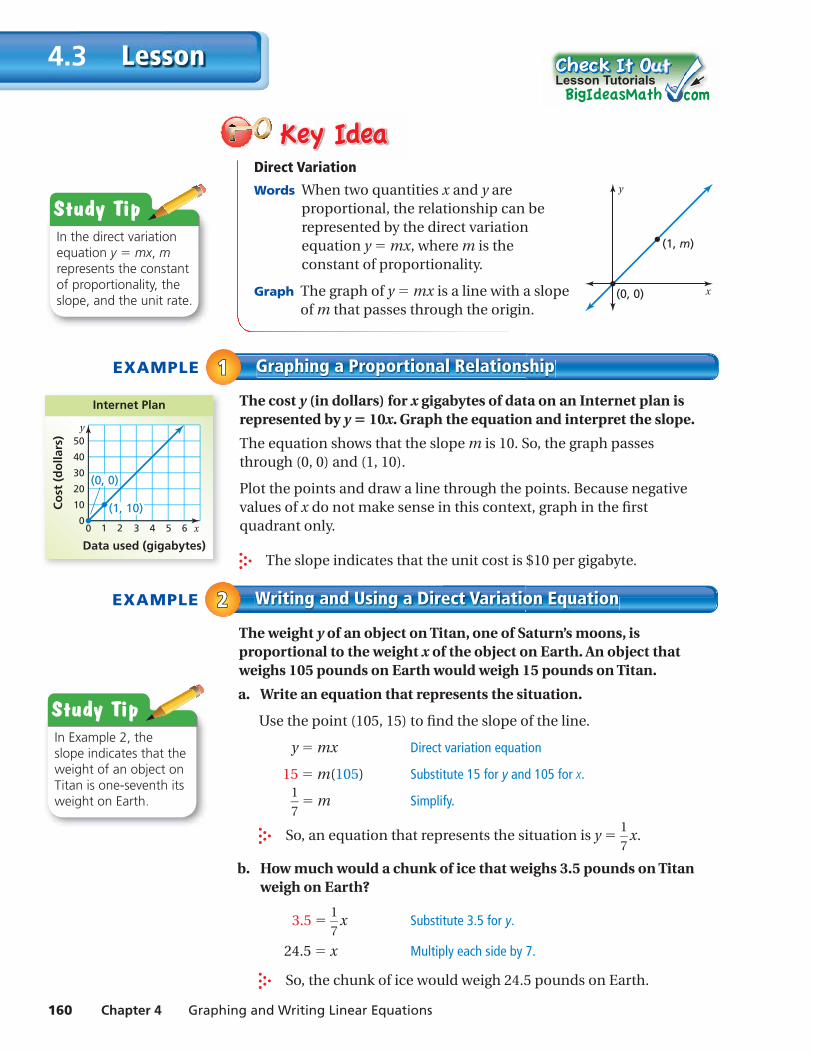
Direct Variation
Words When two quantities x and y are proportional, the relationship can be represented by the direct variation equation y = mx, where m is the constant of proportionality.
Graph The graph of y = mx is a line with a slope of m that passes through the origin.
EXAMPLE Graphing a Proportional Relationship11The cost y (in dollars) for x gigabytes of data on an Internet plan is represented by y = 10x. Graph the equation and interpret the slope.
The equation shows that the slope m is 10. So, the graph passes through (0, 0) and (1, 10).
Plot the points and draw a line through the points. Because negative values of x do not make sense in this context, graph in the fi rst quadrant only.
The slope indicates that the unit cost is $10 per gigabyte.
Study TipIn the direct variation equation y = mx, m represents the constant of proportionality, the slope, and the unit rate.
Study TipIn Example 2, the slope indicates that the weight of an object on Titan is one-seventh its weight on Earth.
EXAMPLE Writing and Using a Direct Variation Equation22The weight y of an object on Titan, one of Saturn’s moons, is proportional to the weight x of the object on Earth. An object that weighs 105 pounds on Earth would weigh 15 pounds on Titan.
a. Write an equation that represents the situation.
Use the point (105, 15) to fi nd the slope of the line.
y = mx Direct variation equation
15 = m(105) Substitute 15 for y and 105 for x.
1
— 7
= m Simplify.
So, an equation that represents the situation is y = 1
— 7
x.
b. How much would a chunk of ice that weighs 3.5 pounds on Titan weigh on Earth?
3.5 = 1
— 7
x Substitute 3.5 for y.
24.5 = x Multiply each side by 7.
So, the chunk of ice would weigh 24.5 pounds on Earth.
y
x(0, 0)
(1, m)
x
y
30
40
20
10
642 531
50
Data used (gigabytes)
Co
st (
do
llars
)
Internet Plan
00
(1, 10)
(0, 0)
Section 4.3 Graphing Proportional Relationships 161
1. WHAT IF? In Example 1, the cost is represented by y = 12x. Graph the equation and interpret the slope.
2. In Example 2, how much would a spacecraft that weighs 3500 kilograms on Earth weigh on Titan?
Exercises 7–8
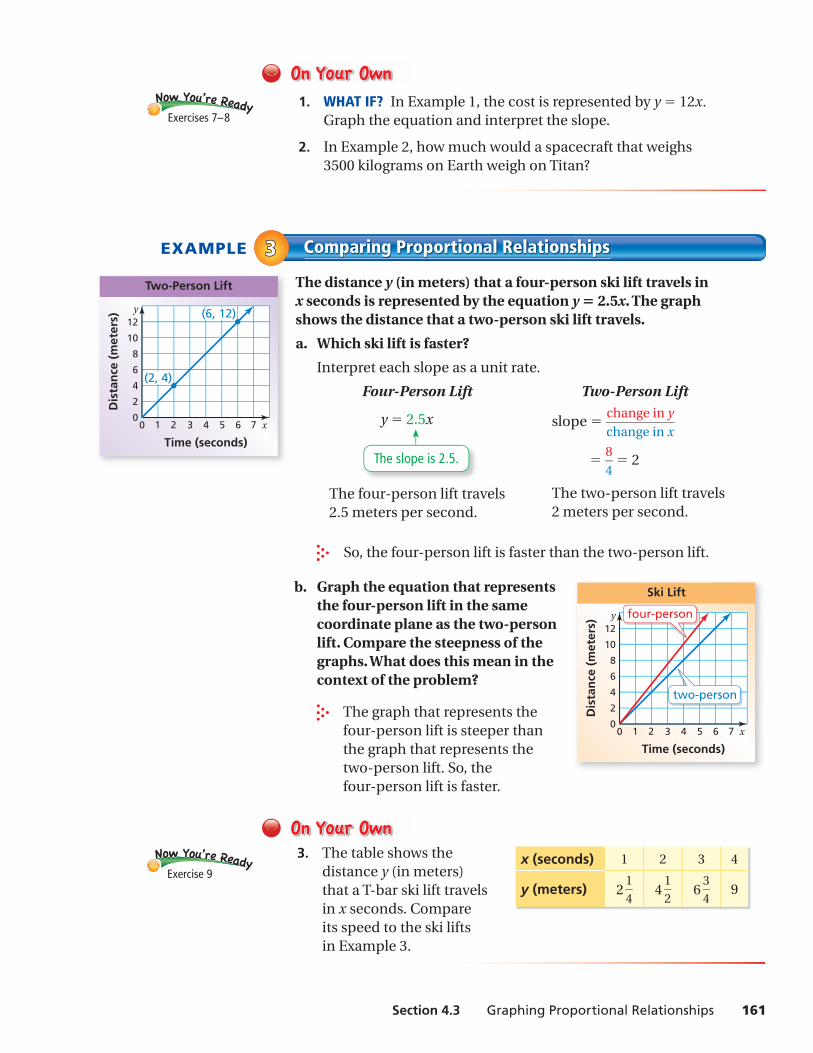
The distance y (in meters) that a four-person ski lift travels in x seconds is represented by the equation y = 2.5x. The graph shows the distance that a two-person ski lift travels.
a. Which ski lift is faster?
Interpret each slope as a unit rate.
Four-Person Lift Two-Person Lift
y = 2.5x
So, the four-person lift is faster than the two-person lift.
b. Graph the equation that represents the four-person lift in the same coordinate plane as the two-person lift. Compare the steepness of the graphs. What does this mean in the context of the problem?
The graph that represents the four-person lift is steeper than the graph that represents the two-person lift. So, the four-person lift is faster.
3. The table shows the distance y (in meters) that a T-bar ski lift travels in x seconds. Compare its speed to the ski lifts in Example 3.
EXAMPLE Comparing Proportional Relationships33
slope = change in y
— change in x
= 8
— 4
= 2
The two-person lift travels 2 meters per second.
The four-person lift travels 2.5 meters per second.
The slope is 2.5.
x
y
6
8
4
2
642 7531
10
12
Time (seconds)
Dis
tan
ce (
met
ers)
Two-Person Lift
(6, 12)
00
(2, 4)
x
y
6
8
4
2
642 7531
10
12
Time (seconds)
Dis
tan
ce (
met
ers)
Ski Lift
00
four-person
two-person
Exercise 9x (seconds) 1 2 3 4
y (meters) 2 1
— 4 4 1
— 2 6 3
— 4 9
162 Chapter 4 Graphing and Writing Linear Equations
Exercises4.3
9+(-6)=3
3+(-3)=
4+(-9)=
9+(-1)=
1. VOCABULARY What point is on the graph of every direct variation equation?
2. REASONING Does the equation y = 2x + 3 represent a proportional relationship? Explain.
Tell whether x and y are in a proportional relationship. Explain your reasoning. If so, write an equation that represents the relationship.
3.
00
10
20
30
15
5
25
35
2 4 61 3 5 7 x
y 4.
00
8
16
24
12
4
20
28
2 4 61 3 5 7 x
y
5. x 3 6 9 12
y 1 2 3 4
6. x 2 5 8 10
y 4 8 13 23
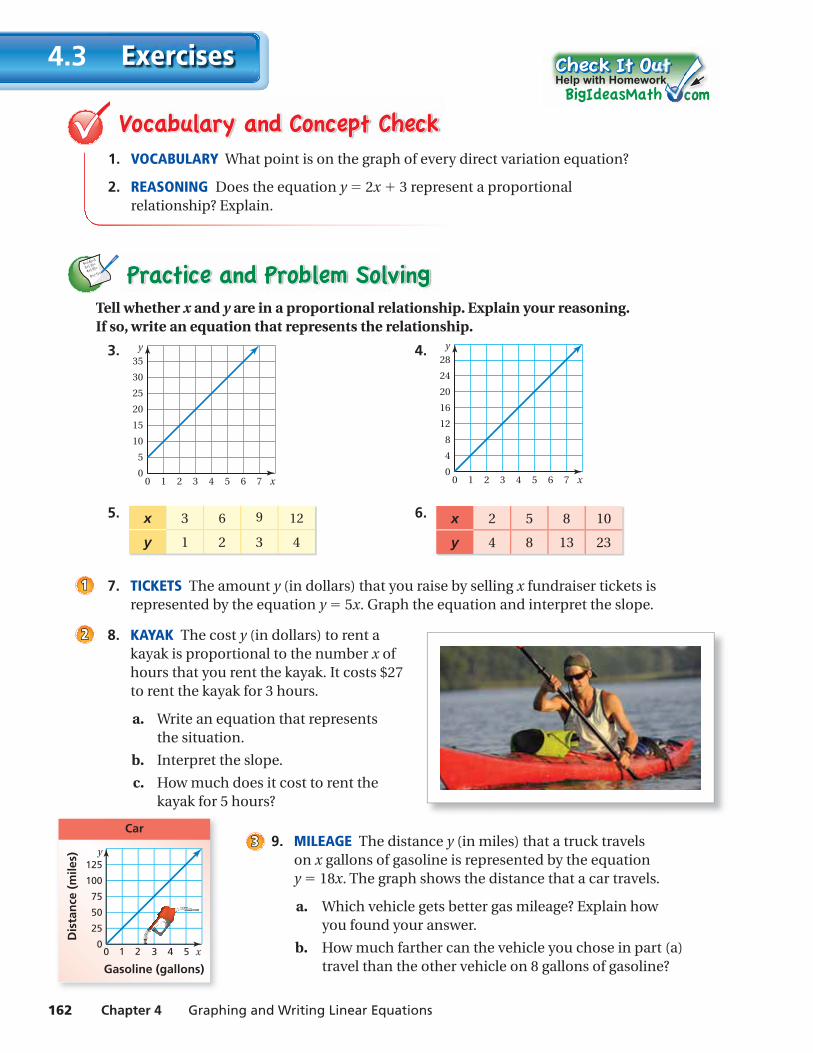
7. TICKETS The amount y (in dollars) that you raise by selling x fundraiser tickets is represented by the equation y = 5x. Graph the equation and interpret the slope.
8. KAYAK The cost y (in dollars) to rent a kayak is proportional to the number x of hours that you rent the kayak. It costs $27 to rent the kayak for 3 hours.
a. Write an equation that represents the situation.
b. Interpret the slope.
c. How much does it cost to rent the kayak for 5 hours?
9. MILEAGE The distance y (in miles) that a truck travels on x gallons of gasoline is represented by the equation y = 18x. The graph shows the distance that a car travels.
a. Which vehicle gets better gas mileage? Explain how you found your answer.
b. How much farther can the vehicle you chose in part (a) travel than the other vehicle on 8 gallons of gasoline?
Help with Homework
11
22
33
x
y
75
100
50
25
42 531
125
Gasoline (gallons)
Dis
tan
ce (
mile
s)
Car
00
Section 4.3 Graphing Proportional Relationships 163
Graph the linear equation. (Section 4.1)
14. y = − 1
— 2
x 15. y = 3x − 3
— 4
16. y = − x
— 3
− 3
— 2
17. MULTIPLE CHOICE What is the value of x? (Section 3.3)
○A 110 ○B 135
○C 315 ○D 522
10. BIOLOGY Toenails grow about 13 millimeters per year. The table shows fi ngernail growth.
a. Do fi ngernails or toenails grow faster?Explain.
b. In the same coordinate plane, graph equations that represent the growth rates of toenails and fi ngernails. Compare the steepness of the graphs. What does this mean in the context of the problem?
11. REASONING The quantities x and y are in a proportional relationship. What do you know about the ratio of y to x for any point (x, y) on the line?
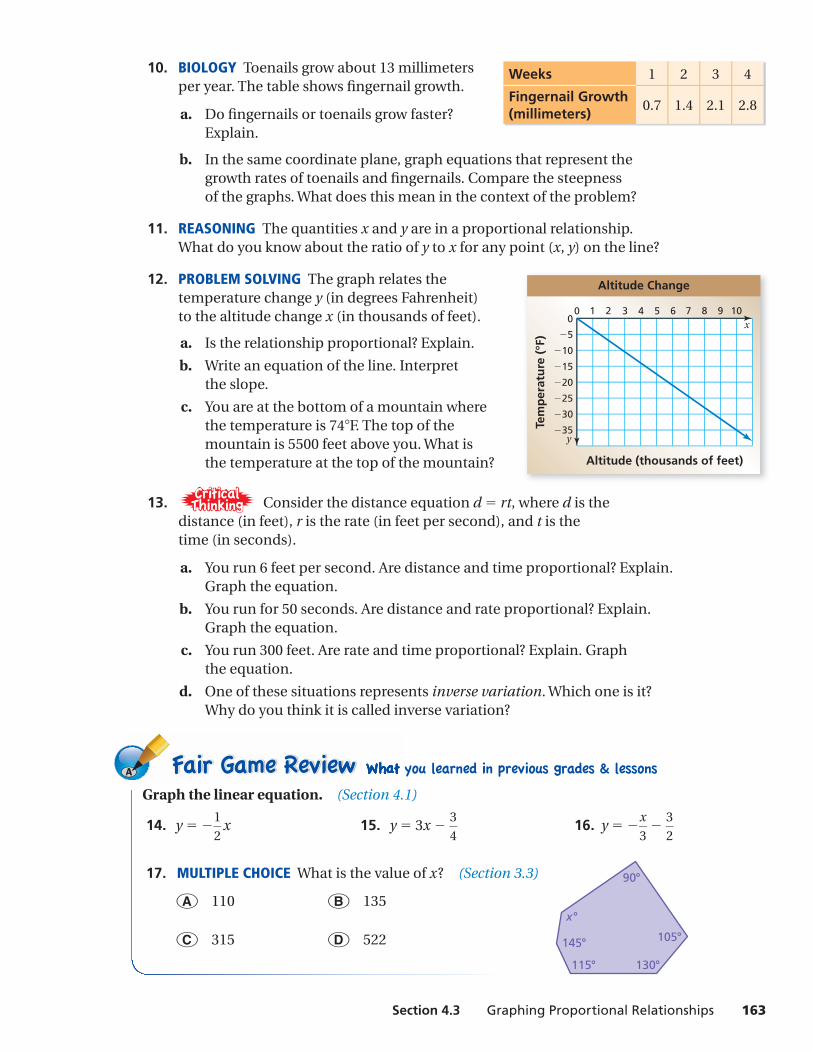
12. PROBLEM SOLVING The graph relates the temperature change y (in degrees Fahrenheit) to the altitude change x (in thousands of feet).
a. Is the relationship proportional? Explain.
b. Write an equation of the line. Interpret the slope.
c. You are at the bottom of a mountain where the temperature is 74°F. The top of the mountain is 5500 feet above you. What is the temperature at the top of the mountain?
13. Consider the distance equation d = rt, where d is the distance (in feet), r is the rate (in feet per second), and t is the time (in seconds).
a. You run 6 feet per second. Are distance and time proportional? Explain. Graph the equation.
b. You run for 50 seconds. Are distance and rate proportional? Explain. Graph the equation.
c. You run 300 feet. Are rate and time proportional? Explain. Graph the equation.
d. One of these situations represents inverse variation. Which one is it? Why do you think it is called inverse variation?
Weeks 1 2 3 4
Fingernail Growth(millimeters)
0.7 1.4 2.1 2.8
x
y
25
20
30
35
642 7 8 9 10531
15
10
5
Altitude (thousands of feet)
Tem
per
atu
re (
°F)
Altitude Change
00
90
105
130115
145
x
164 Chapter 4 Graphing and Writing Linear Equations
4 Study Help
Make process diagrams with examples to help you study these topics.
1. fi nding the slope of a line
2. graphing a proportional relationship
After you complete this chapter, make process diagrams for the following topics.
3. graphing a linear equation using
a. slope and y-intercept
b. x- and y-intercepts
4. writing equations in slope-intercept form
5. writing equations in point-slope form
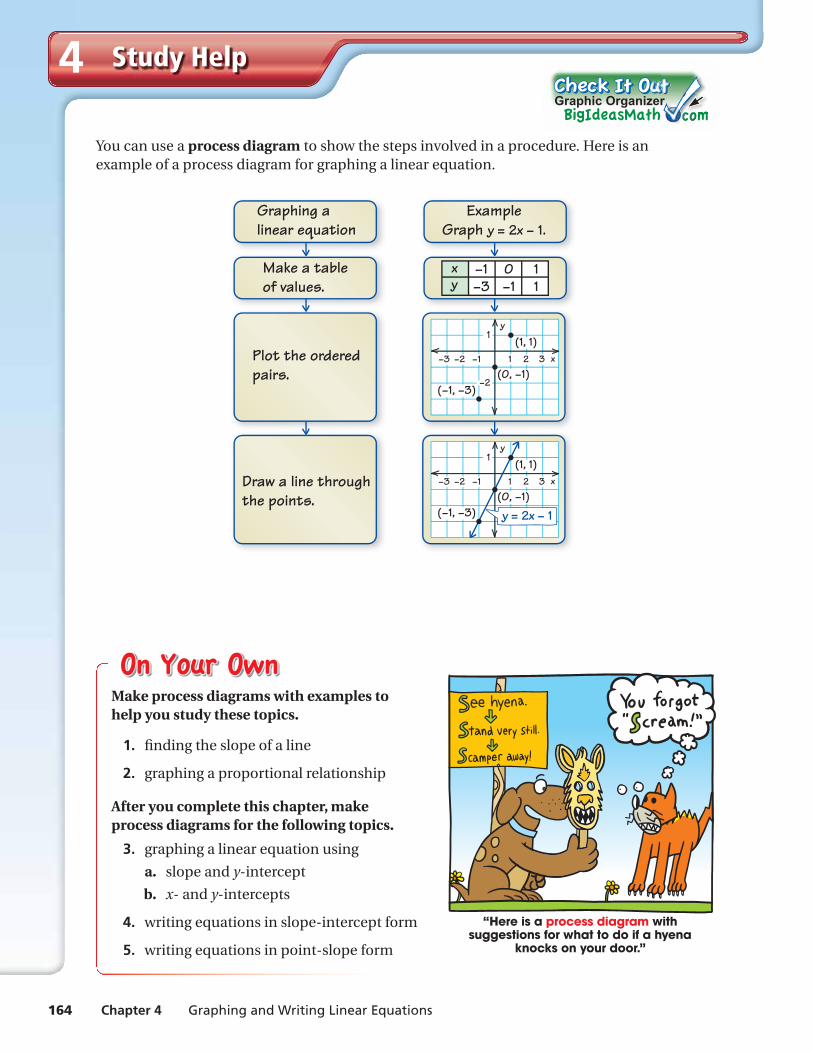
You can use a process diagram to show the steps involved in a procedure. Here is an example of a process diagram for graphing a linear equation.
“Here is a process diagram with suggestions for what to do if a hyena
knocks on your door.”
ExampleGraph y = 2x − 1.
x
y
1−2 −1−3 2 3
−2
11(1, 1)
(0, −1)(−1, −3)
x
y
1−2 −1−3 2 3
11(1, 1)
(0, −1)(−1, −3)
Make a tableof values.
Plot the orderedpairs.
Graphing alinear equation
Draw a line throughthe points.
−1 0 1−3
xy −1 1
y = 2x − 1
Graphic Organizer
4.1–4.3
Sections 4.1–4.3 Quiz 165
Graph the linear equation. (Section 4.1)
1. y = −x + 8 2. y = x
— 3
− 4 3. x = − 1 4. y = 3.5
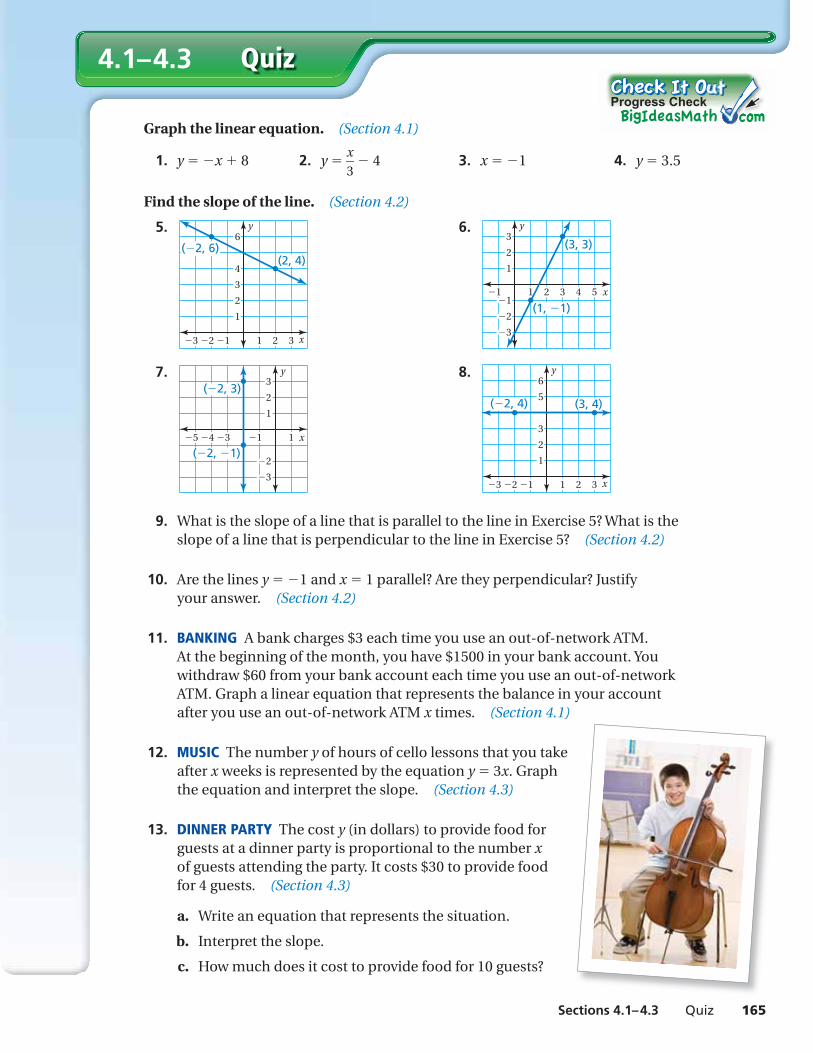
Find the slope of the line. (Section 4.2)
5.
1 2 3 x
y
123
2
4
1
6
3
( 2, 6)(2, 4)
6.
1 2 3 4 5 x
y
1
2
1
3(3, 3)
(1, 1)2
3
1
7.
x
y
145 3 1
3
2
1
2
3
( 2, 1)
( 2, 3) 8.
1 2 3 x
y
123
2
5
1
6
3
( 2, 4) (3, 4)
9. What is the slope of a line that is parallel to the line in Exercise 5? What is the slope of a line that is perpendicular to the line in Exercise 5? (Section 4.2)
10. Are the lines y = − 1 and x = 1 parallel? Are they perpendicular? Justify your answer. (Section 4.2)
11. BANKING A bank charges $3 each time you use an out-of-network ATM. At the beginning of the month, you have $1500 in your bank account. You withdraw $60 from your bank account each time you use an out-of-network ATM. Graph a linear equation that represents the balance in your account after you use an out-of-network ATM x times. (Section 4.1)
12. MUSIC The number y of hours of cello lessons that you take after x weeks is represented by the equation y = 3x. Graph the equation and interpret the slope. (Section 4.3)
13. DINNER PARTY The cost y (in dollars) to provide food for guests at a dinner party is proportional to the number x of guests attending the party. It costs $30 to provide food for 4 guests. (Section 4.3)
a. Write an equation that represents the situation.
b. Interpret the slope.
c. How much does it cost to provide food for 10 guests?
QuizProgress Check
166 Chapter 4 Graphing and Writing Linear Equations
2.3 Graphing Linear Equations in Slope-Intercept Form
4.4
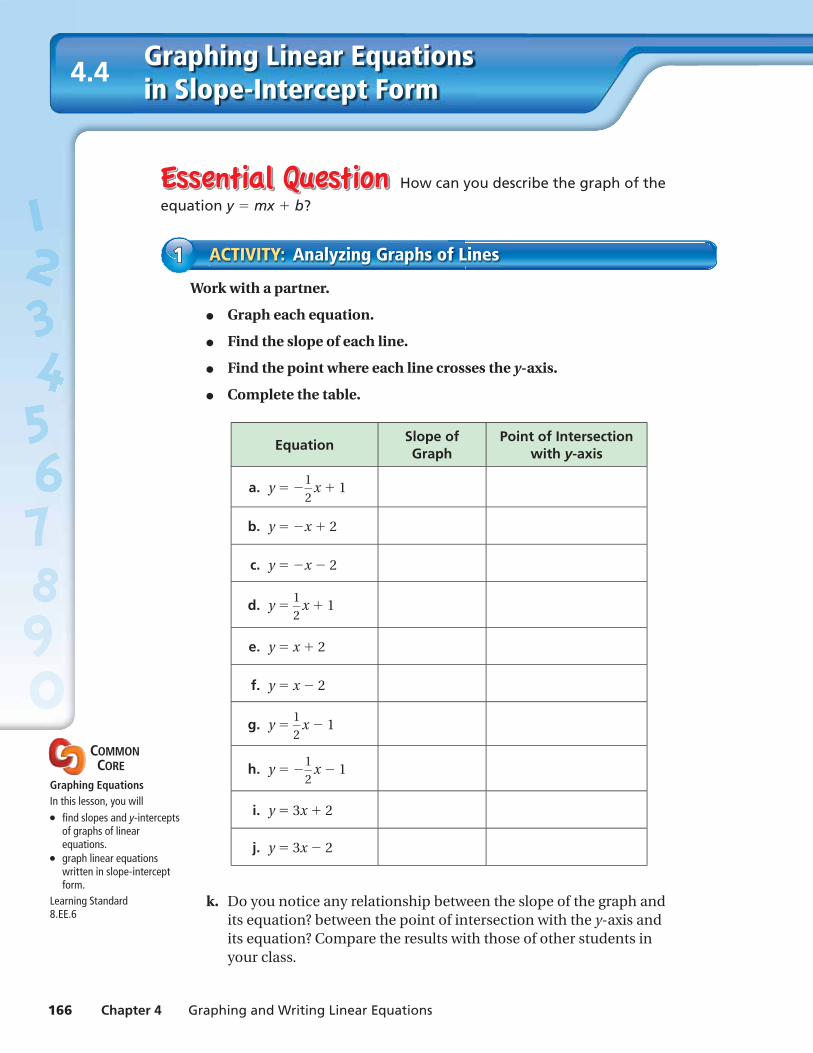
How can you describe the graph of the
equation y = mx + b?
Work with a partner.
● Graph each equation.
● Find the slope of each line.
● Find the point where each line crosses the y-axis.
● Complete the table.
k. Do you notice any relationship between the slope of the graph and its equation? between the point of intersection with the y-axis and its equation? Compare the results with those of other students in your class.
ACTIVITY: Analyzing Graphs of Lines11
COMMON CORE
Graphing EquationsIn this lesson, you will● fi nd slopes and y-intercepts
of graphs of linear equations.
● graph linear equations written in slope-intercept form.
Learning Standard8.EE.6
EquationSlope of Graph
Point of Intersection with y-axis
a. y = − 1
— 2
x + 1
b. y = −x + 2
c. y = −x − 2
d. y = 1
— 2
x + 1
e. y = x + 2
f. y = x − 2
g. y = 1
— 2
x − 1
h. y = − 1
— 2
x − 1
i. y = 3x + 2
j. y = 3x − 2
Section 4.4 Graphing Linear Equations in Slope-Intercept Form 167
Use what you learned about graphing linear equations in slope-intercept form to complete Exercises 4 – 6 on page 170.
3. IN YOUR OWN WORDS How can you describe the graph of the equation y = mx + b ?
a. How does the value of m affect the graph of the equation?
b. How does the value of b affect the graph of the equation?
c. Check your answers to parts (a) and (b) with three equations that are not in Activity 1.
4. LOGIC Why do you think y = mx + b is called the slope-intercept form of the equation of a line? Use drawings or diagrams to support your answer.
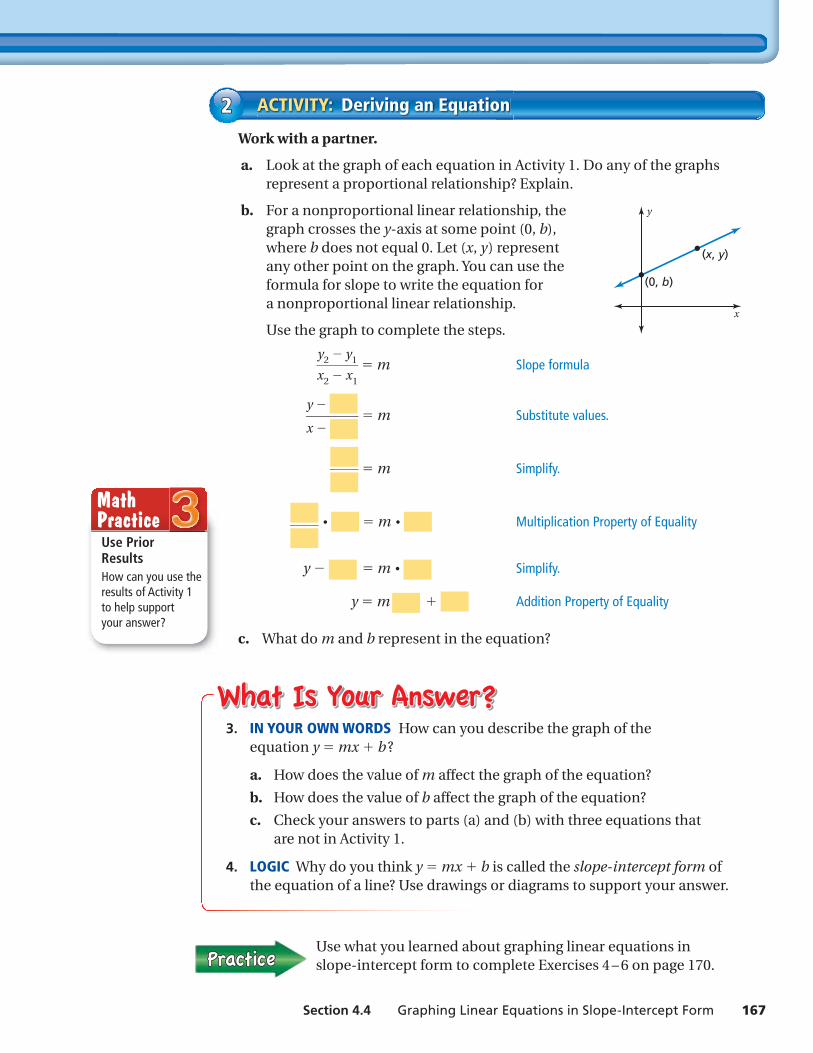
Work with a partner.
a. Look at the graph of each equation in Activity 1. Do any of the graphs represent a proportional relationship? Explain.
b. For a nonproportional linear relationship, the graph crosses the y-axis at some point (0, b), where b does not equal 0. Let (x, y) represent any other point on the graph. You can use the formula for slope to write the equation for a nonproportional linear relationship.
Use the graph to complete the steps.
y2 − y1 — x2 − x1
= m Slope formula
y −
— x −
= m Substitute values.
— = m Simplify.
— ⋅ = m ⋅ Multiplication Property of Equality
y − = m ⋅ Simplify.
y = m + Addition Property of Equality
c. What do m and b represent in the equation?
ACTIVITY: Deriving an Equation22
Use Prior ResultsHow can you use the results of Activity 1 to help support your answer?
Math Practice
y
x
(0, b)
(x, y)
168 Chapter 4 Graphing and Writing Linear Equations
Lesson4.4Lesson Tutorials
Key Vocabularyx-intercept, p. 168y-intercept, p. 168slope-intercept form, p. 168
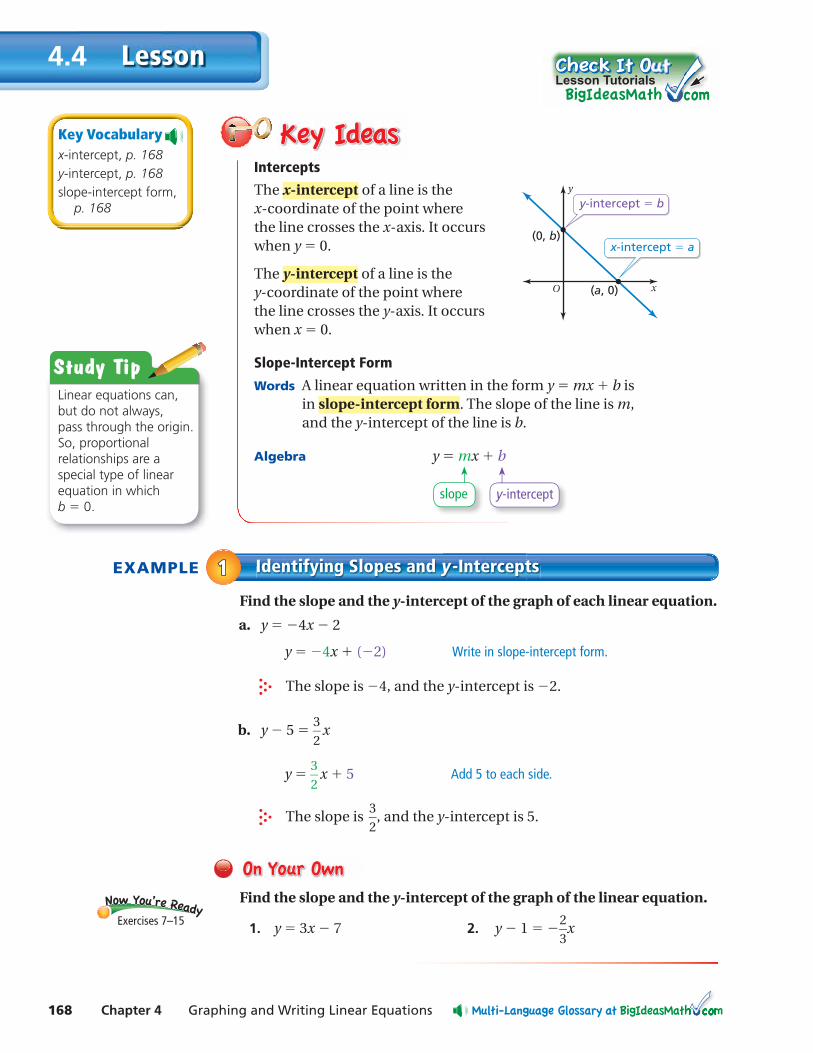
Intercepts
The x-intercept of a line is the x-coordinate of the point where the line crosses the x-axis. It occurs when y = 0.
The y-intercept of a line is the y-coordinate of the point where the line crosses the y-axis. It occurs when x = 0.
Slope-Intercept Form
Words A linear equation written in the form y = mx + b is in slope-intercept form. The slope of the line is m, and the y-intercept of the line is b.
Algebra y = mx + b
slope y-intercept
EXAMPLE Identifying Slopes and y -Intercepts11Find the slope and the y-intercept of the graph of each linear equation.
a. y = −4x − 2
y = −4x + (−2) Write in slope-intercept form.
The slope is −4, and the y-intercept is −2.
b. y − 5 = 3
— 2
x
y = 3
— 2
x + 5 Add 5 to each side.
The slope is 3
— 2
, and the y-intercept is 5.
Find the slope and the y-intercept of the graph of the linear equation.
1. y = 3x − 7 2. y − 1 = − 2
— 3
xExercises 7–15
y
x(a, 0)
(0, b)
O
y-intercept b
x-intercept a
Study TipLinear equations can, but do not always, pass through the origin. So, proportional relationships are a special type of linear equation in which b = 0.
Section 4.4 Graphing Linear Equations in Slope-Intercept Form 169
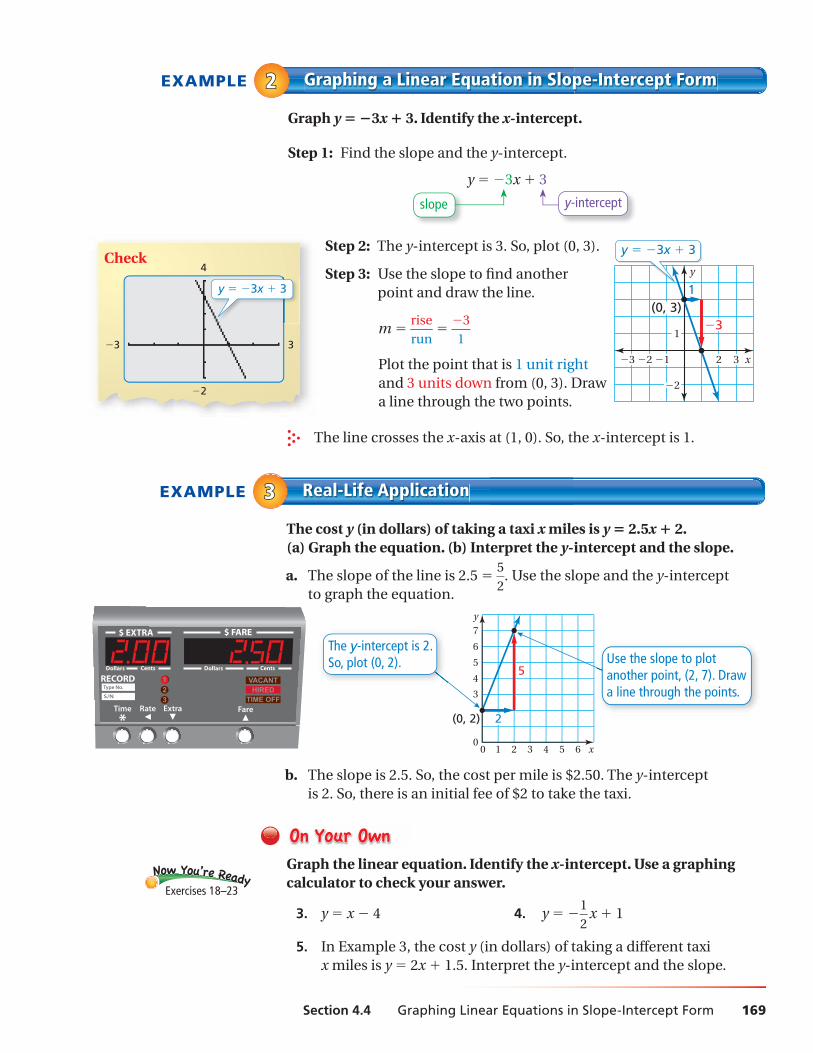
EXAMPLE Graphing a Linear Equation in Slope-Intercept Form22
Graph y = −3x + 3. Identify the x-intercept.
Step 1: Find the slope and the y-intercept.
y = −3x + 3
Step 2: The y-intercept is 3. So, plot (0, 3).
x
y
1
2
23
1
2 3
(0, 3)3
1
y 3x 3
Step 3: Use the slope to fi nd another point and draw the line.
m = rise
— run
= −3
— 1
Plot the point that is 1 unit right and 3 units down from (0, 3). Draw a line through the two points.
The line crosses the x-axis at (1, 0). So, the x-intercept is 1.
slope y-intercept
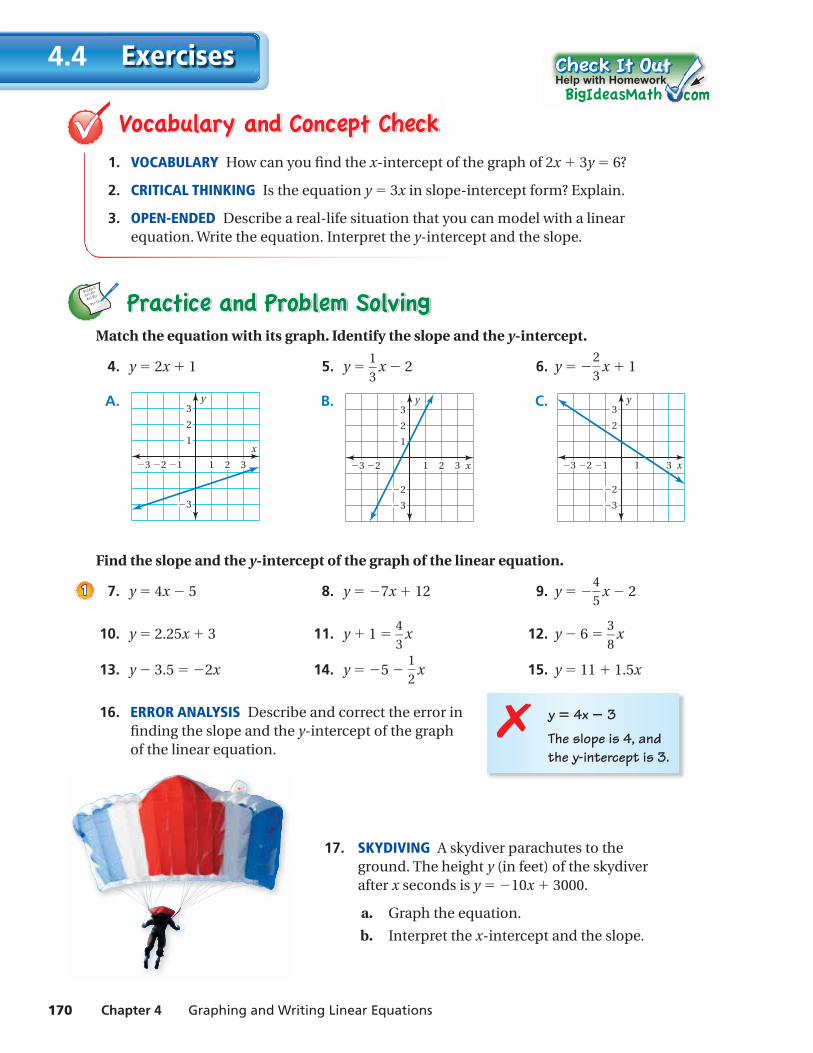
EXAMPLE Real-Life Application33
The cost y (in dollars) of taking a taxi x miles is y = 2.5x + 2. (a) Graph the equation. (b) Interpret the y-intercept and the slope.
a. The slope of the line is 2.5 = 5
— 2
. Use the slope and the y-intercept to graph the equation.
x
y
10 2 3 4 5 6
4
3
0
5
6
7
(0, 2) 2
5
The y-intercept is 2.So, plot (0, 2). Use the slope to plot
another point, (2, 7). Drawa line through the points.
b. The slope is 2.5. So, the cost per mile is $2.50. The y-intercept is 2. So, there is an initial fee of $2 to take the taxi.
Graph the linear equation. Identify the x-intercept. Use a graphing calculator to check your answer.
3. y = x − 4 4. y = − 1
— 2
x + 1
5. In Example 3, the cost y (in dollars) of taking a different taxi x miles is y = 2x + 1.5. Interpret the y-intercept and the slope.
Exercises 18–23
Check
33
2
4
y 3x 3
170 Chapter 4 Graphing and Writing Linear Equations
Exercises4.4
9+(-6)=3
3+(-3)=
4+(-9)=
9+(-1)=
1. VOCABULARY How can you fi nd the x-intercept of the graph of 2x + 3y = 6?
2. CRITICAL THINKING Is the equation y = 3x in slope-intercept form? Explain.
3. OPEN-ENDED Describe a real-life situation that you can model with a linear equation. Write the equation. Interpret the y-intercept and the slope.
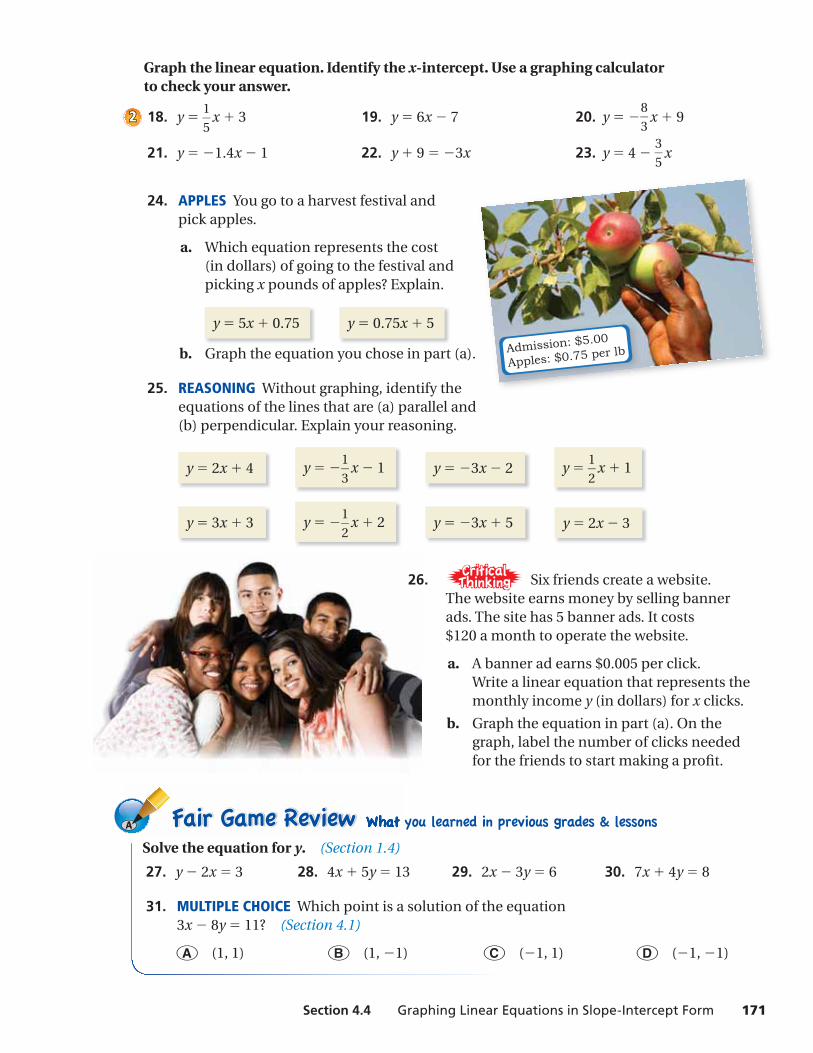
Match the equation with its graph. Identify the slope and the y-intercept.
4. y = 2x + 1 5. y = 1
— 3
x − 2 6. y = − 2
— 3
x + 1
A.
x
y
12 13 2 3
1
2
3
3
B.
x
y
123 2 3
1
2
3
3
2
C.
x
y
12 13 3
2
3
3
2
Find the slope and the y-intercept of the graph of the linear equation.
7. y = 4x − 5 8. y = −7x + 12 9. y = − 4
— 5
x − 2
10. y = 2.25x + 3 11. y + 1 = 4
— 3
x 12. y − 6 = 3
— 8
x
13. y − 3.5 = −2x 14. y = − 5 − 1
— 2
x 15. y = 11 + 1.5x
16. ERROR ANALYSIS Describe and correct the error in fi nding the slope and the y-intercept of the graph of the linear equation.
17. SKYDIVING A skydiver parachutes to the ground. The height y (in feet) of the skydiver after x seconds is y = −10x + 3000.
a. Graph the equation.
b. Interpret the x-intercept and the slope.
Help with Homework
y = 4x − 3
The slope is 4, and the y-intercept is 3.
✗
11
Section 4.4 Graphing Linear Equations in Slope-Intercept Form 171
Solve the equation for y. (Section 1.4)
27. y − 2x = 3 28. 4x + 5y = 13 29. 2x − 3y = 6 30. 7x + 4y = 8
31. MULTIPLE CHOICE Which point is a solution of the equation 3x − 8y = 11? (Section 4.1)
○A (1, 1) ○B (1, −1) ○C (−1, 1) ○D (−1, −1)
Graph the linear equation. Identify the x-intercept. Use a graphing calculator to check your answer.
18. y = 1
— 5
x + 3 19. y = 6x − 7 20. y = − 8
— 3
x + 9
21. y = −1.4x − 1 22. y + 9 = −3x 23. y = 4 − 3
— 5
x
24. APPLES You go to a harvest festival and pick apples.
a. Which equation represents the cost (in dollars) of going to the festival and picking x pounds of apples? Explain.
y = 5x + 0.75
y = 0.75x + 5
b. Graph the equation you chose in part (a).
25. REASONING Without graphing, identify the equations of the lines that are (a) parallel and (b) perpendicular. Explain your reasoning.
y = 2x + 4
y = −
1 —
3 x − 1
y = −3x − 2
y =
1 —
2 x + 1
y = 3x + 3
y = −
1 —
2 x + 2
y = − 3x + 5
y = 2x − 3
26. Six friends create a website. The website earns money by selling banner ads. The site has 5 banner ads. It costs $120 a month to operate the website.
a. A banner ad earns $0.005 per click. Write a linear equation that represents the monthly income y (in dollars) for x clicks.
b. Graph the equation in part (a). On the graph, label the number of clicks needed for the friends to start making a profi t.
22
172 Chapter 4 Graphing and Writing Linear Equations
Graphing Linear Equations in Standard Form
4.5
How can you describe the graph of the
equation ax + by = c?
x
y
3
4
5
2
1
0
8
9
7
6
4 53210 9876
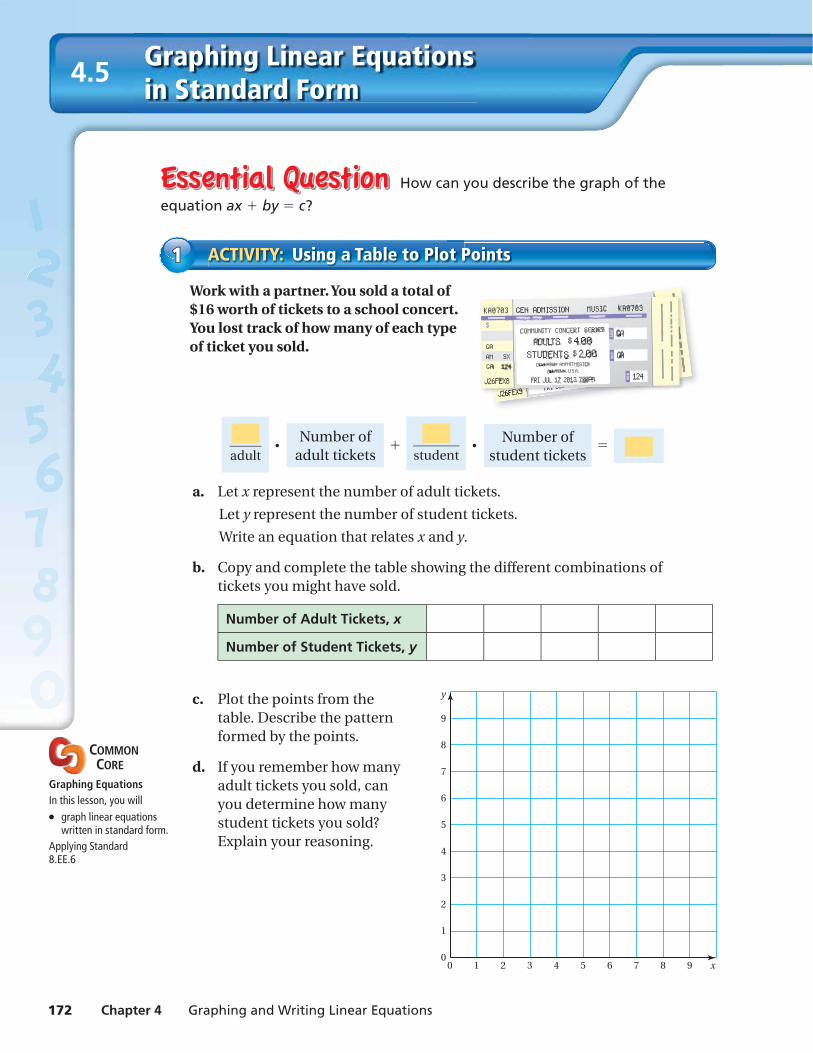
Work with a partner. You sold a total of $16 worth of tickets to a school concert. You lost track of how many of each type of ticket you sold.
— adult
⋅
Number of adult tickets
+ — student
⋅ Number of
student tickets =
a. Let x represent the number of adult tickets.
Let y represent the number of student tickets.
Write an equation that relates x and y.
b. Copy and complete the table showing the different combinations of tickets you might have sold.
Number of Adult Tickets, x
Number of Student Tickets, y
c. Plot the points from the table. Describe the pattern formed by the points.
d. If you remember how many adult tickets you sold, can you determine how many student tickets you sold? Explain your reasoning.
ACTIVITY: Using a Table to Plot Points11
COMMON CORE
Graphing EquationsIn this lesson, you will● graph linear equations
written in standard form.Applying Standard8.EE.6
Section 4.5 Graphing Linear Equations in Standard Form 173
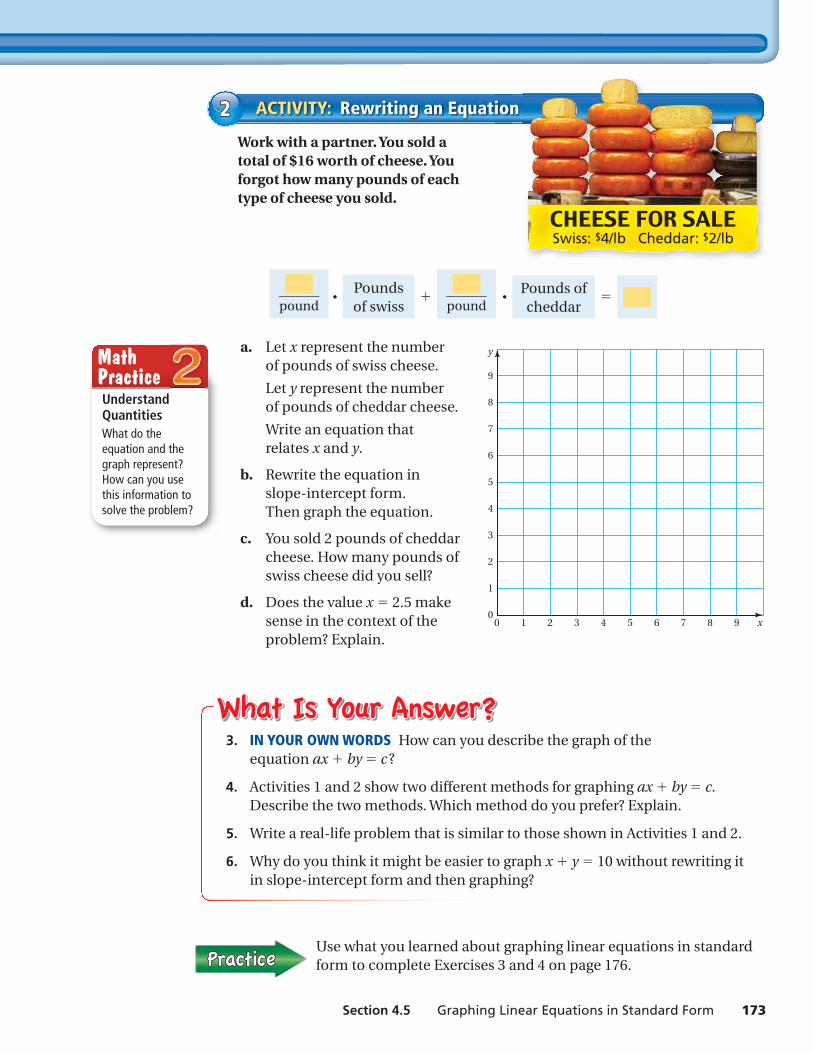
Work with a partner. You sold a total of $16 worth of cheese. You forgot how many pounds of each type of cheese you sold.
— pound
⋅ Pounds
of swiss + —
pound
⋅ Pounds of
cheddar =
a. Let x represent the number of pounds of swiss cheese.
Let y represent the number of pounds of cheddar cheese.
Write an equation that relates x and y.
b. Rewrite the equation in slope-intercept form. Then graph the equation.
c. You sold 2 pounds of cheddar cheese. How many pounds of swiss cheese did you sell?
d. Does the value x = 2.5 make sense in the context of the problem? Explain.
ACTIVITY: Rewriting an Equation22
3. IN YOUR OWN WORDS How can you describe the graph of the equation ax + by = c ?
4. Activities 1 and 2 show two different methods for graphing ax + by = c. Describe the two methods. Which method do you prefer? Explain.
5. Write a real-life problem that is similar to those shown in Activities 1 and 2.
6. Why do you think it might be easier to graph x + y = 10 without rewriting it in slope-intercept form and then graphing?
Use what you learned about graphing linear equations in standard form to complete Exercises 3 and 4 on page 176.
x
y
3
4
5
2
1
0
8
9
7
6
4 53210 9876
Understand QuantitiesWhat do the equation and the graph represent? How can you use this information to solve the problem?
Math Practice
174 Chapter 4 Graphing and Writing Linear Equations
Lesson4.5Lesson Tutorials
Key Vocabularystandard form, p. 174
Study TipAny linear equation can be written in standard form.
Standard Form of a Linear Equation
The standard form of a linear equation is
ax + by = c
where a and b are not both zero.
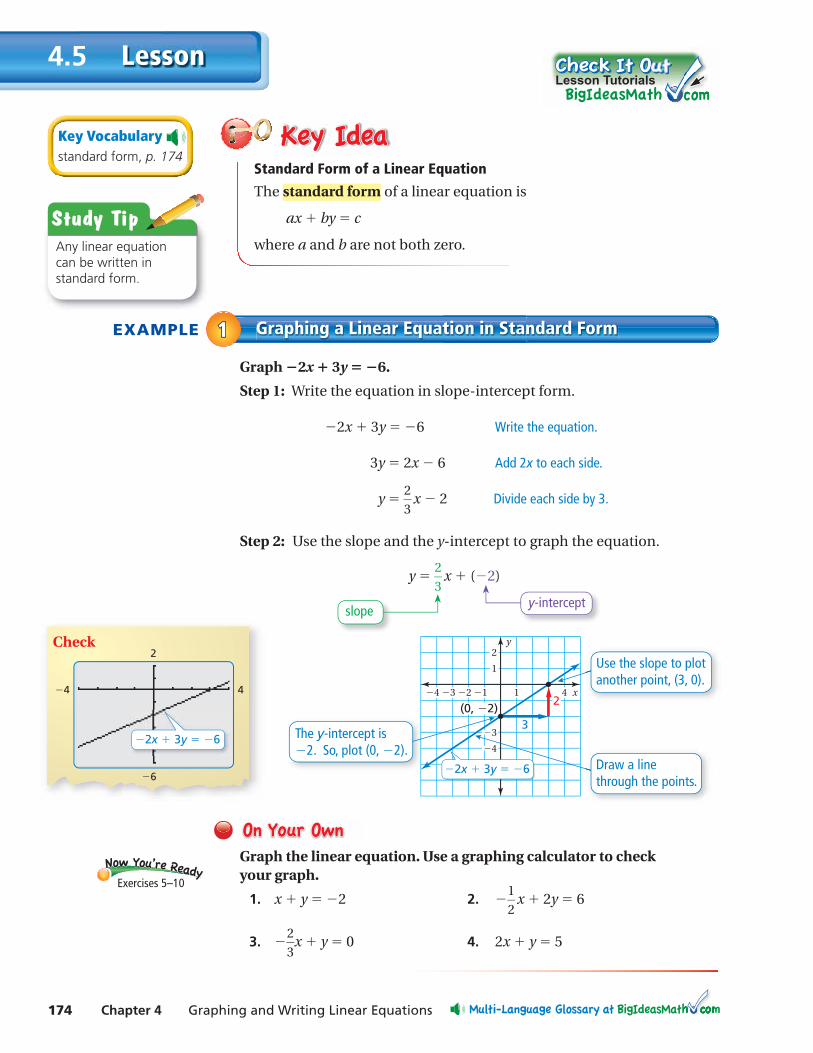
EXAMPLE Graphing a Linear Equation in Standard Form11
Graph −2x + 3y = −6.
Step 1: Write the equation in slope-intercept form.
−2x + 3y = −6 Write the equation.
3y = 2x − 6 Add 2x to each side.
y = 2
— 3
x − 2 Divide each side by 3.
Step 2: Use the slope and the y-intercept to graph the equation.
y = 2
— 3
x + (−2)
Graph the linear equation. Use a graphing calculator to check your graph.
1. x + y = −2 2. − 1
— 2
x + 2y = 6
3. − 2
— 3
x + y = 0 4. 2x + y = 5
slopey-intercept
Exercises 5–10
x
y2
1
3
4
412 134
3
2
The y-intercept is 2. So, plot (0, 2).
(0, 2)
Use the slope to plotanother point, (3, 0).
Draw a linethrough the points.
2x 3y 6
Check
44
6
2
2x 3y 6
Section 4.5 Graphing Linear Equations in Standard Form 175
EXAMPLE Graphing a Linear Equation in Standard Form22
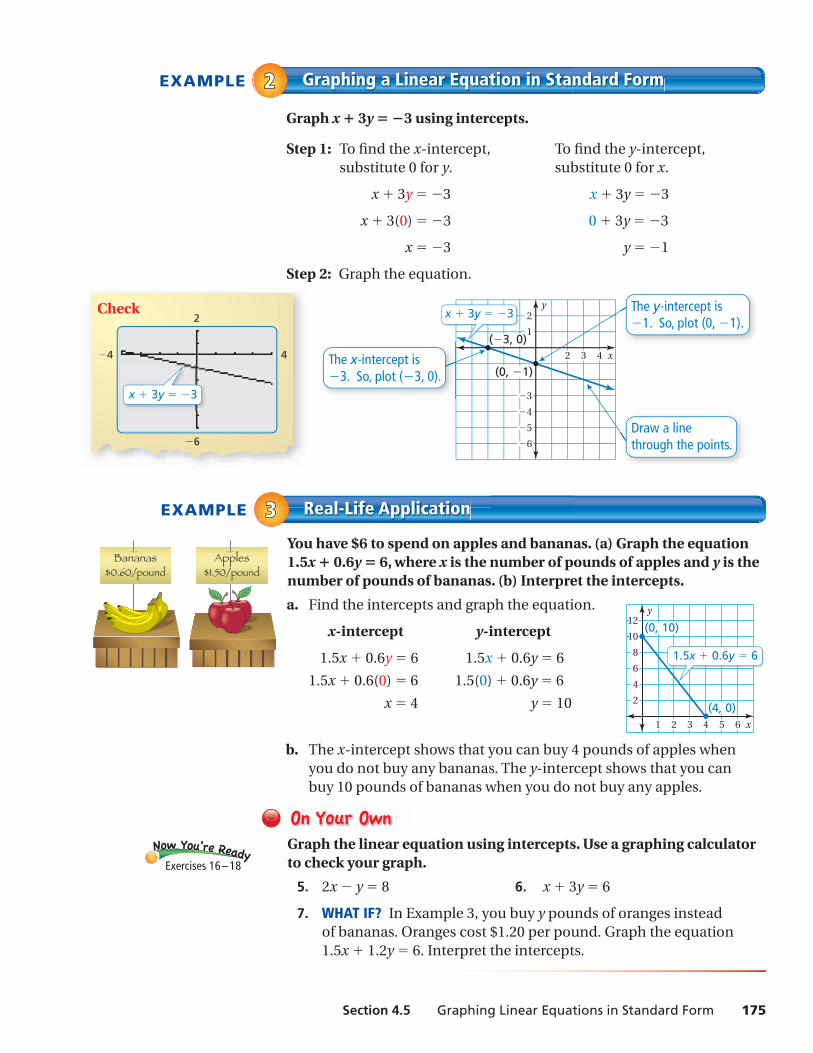
Graph x + 3y = −3 using intercepts.
Step 1: To fi nd the x-intercept, To fi nd the y-intercept, substitute 0 for y. substitute 0 for x.
x + 3y = −3 x + 3y = −3
x + 3(0) = −3 0 + 3y = −3
x = −3 y = −1
Step 2: Graph the equation.
x
y2
1
3
4
5
6
42 3The x-intercept is 3. So, plot ( 3, 0).
The y-intercept is 1. So, plot (0, 1).
( 3, 0)
Draw a linethrough the points.
x 3y 3
(0, 1)
EXAMPLE Real-Life Application33You have $6 to spend on apples and bananas. (a) Graph the equation 1.5x + 0.6y = 6, where x is the number of pounds of apples and y is the number of pounds of bananas. (b) Interpret the intercepts.
a. Find the intercepts and graph the equation.
x-intercept y-intercept
1.5x + 0.6y = 6 1.5x + 0.6y = 6
1.5x + 0.6(0) = 6 1.5(0) + 0.6y = 6
x = 4 y = 10
b. The x-intercept shows that you can buy 4 pounds of apples when you do not buy any bananas. The y-intercept shows that you can buy 10 pounds of bananas when you do not buy any apples.
Graph the linear equation using intercepts. Use a graphing calculator to check your graph.
5. 2x − y = 8 6. x + 3y = 6
7. WHAT IF? In Example 3, you buy y pounds of oranges instead of bananas. Oranges cost $1.20 per pound. Graph the equation 1.5x + 1.2y = 6. Interpret the intercepts.
Exercises 16 – 18
x
y
1 2 3 4 5 6
2
4
6
8
10
12(0, 10)
(4, 0)
1.5x 0.6y 6
Check
44
6
2
x 3y 3
176 Chapter 4 Graphing and Writing Linear Equations
Exercises4.5
9+(-6)=3
3+(-3)=
4+(-9)=
9+(-1)=
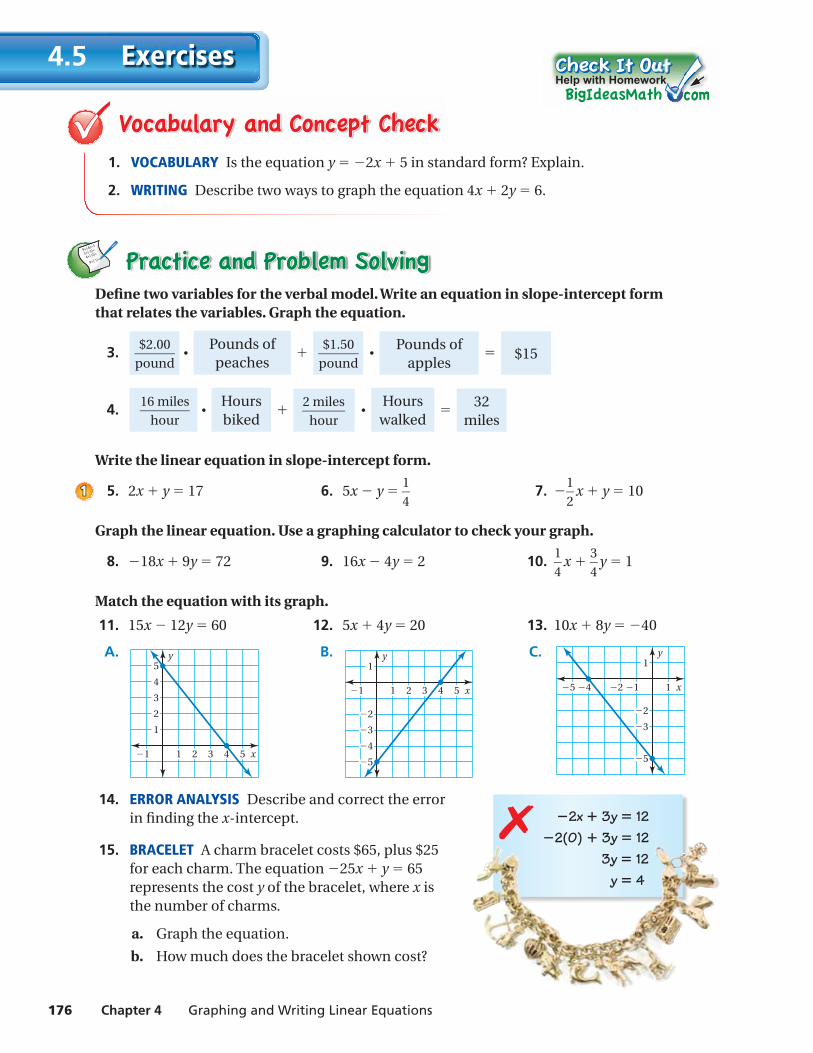
1. VOCABULARY Is the equation y = −2x + 5 in standard form? Explain.
2. WRITING Describe two ways to graph the equation 4x + 2y = 6.
Defi ne two variables for the verbal model. Write an equation in slope-intercept form that relates the variables. Graph the equation.
3. $2.00
— pound
⋅ Pounds of
peaches +
$1.50 —
pound ⋅ Pounds of
apples = $15
4. 16 miles
— hour
⋅
Hours biked
+ 2 miles
— hour
⋅
Hours walked
= 32 miles
Write the linear equation in slope-intercept form.
5. 2x + y = 17 6. 5x − y = 1
— 4
7. − 1
— 2
x + y = 10
Graph the linear equation. Use a graphing calculator to check your graph.
8. −18x + 9y = 72 9. 16x − 4y = 2 10. 1
— 4
x + 3
— 4
y = 1
Match the equation with its graph.
11. 15x − 12y = 60 12. 5x + 4y = 20 13. 10x + 8y = − 40
A.
x
y
1 2 3 4 51
1
2
3
4
5 B.
x
y
1 2 3 4 51
2
1
3
5
4
C.
x
y
12 145
2
1
3
5
14. ERROR ANALYSIS Describe and correct the error in fi nding the x-intercept.
15. BRACELET A charm bracelet costs $65, plus $25 for each charm. The equation − 25x + y = 65 represents the cost y of the bracelet, where x is the number of charms.
a. Graph the equation.
b. How much does the bracelet shown cost?
Help with Homework
11
−2x + 3y = 12 −2(0) + 3y = 12 3y = 12 y = 4
✗
Section 4.5 Graphing Linear Equations in Standard Form 177
The points in the table lie on a line. Find the slope of the line. (Section 4.2)
24. x −2 −1 0 1
y − 10 − 6 − 2 2
25. x 2 4 6 8
y 2 3 4 5
26. MULTIPLE CHOICE Which value of x makes the equation 4x − 12 = 3x − 9 true?(Section 1.3)
○A −1 ○B 0 ○C 1 ○D 3
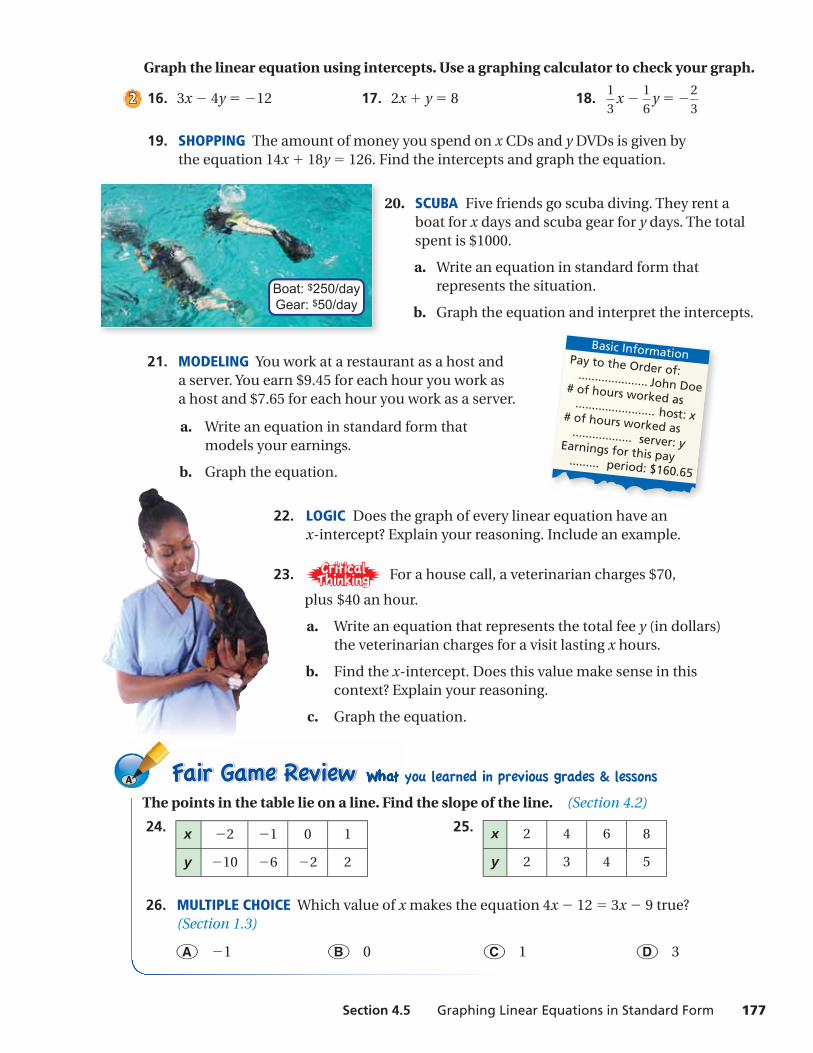
Graph the linear equation using intercepts. Use a graphing calculator to check your graph.
16. 3x − 4y = −12 17. 2x + y = 8 18. 1
— 3
x − 1
— 6
y = − 2
— 3
19. SHOPPING The amount of money you spend on x CDs and y DVDs is given by the equation 14x + 18y = 126. Find the intercepts and graph the equation.
20. SCUBA Five friends go scuba diving. They rent a boat for x days and scuba gear for y days. The total spent is $1000.
a. Write an equation in standard form that represents the situation.
b. Graph the equation and interpret the intercepts.
21. MODELING You work at a restaurant as a host and a server. You earn $9.45 for each hour you work as a host and $7.65 for each hour you work as a server.
a. Write an equation in standard form that models your earnings.
b. Graph the equation.
22. LOGIC Does the graph of every linear equation have an x-intercept? Explain your reasoning. Include an example.
23. For a house call, a veterinarian charges $70,
plus $40 an hour.
a. Write an equation that represents the total fee y (in dollars) the veterinarian charges for a visit lasting x hours.
b. Find the x-intercept. Does this value make sense in this context? Explain your reasoning.
c. Graph the equation.
22
Boat: $250/dayGear: $50/day
Basic InformationPay to the Order of: ..................... John Doe# of hours worked as ........................ host: x# of hours worked as .................. server: yEarnings for this pay ......... period: $160.65
178 Chapter 4 Graphing and Writing Linear Equations
Writing Equations in Slope-Intercept Form
4.6
How can you write an equation of a line when
you are given the slope and the y-intercept of the line?
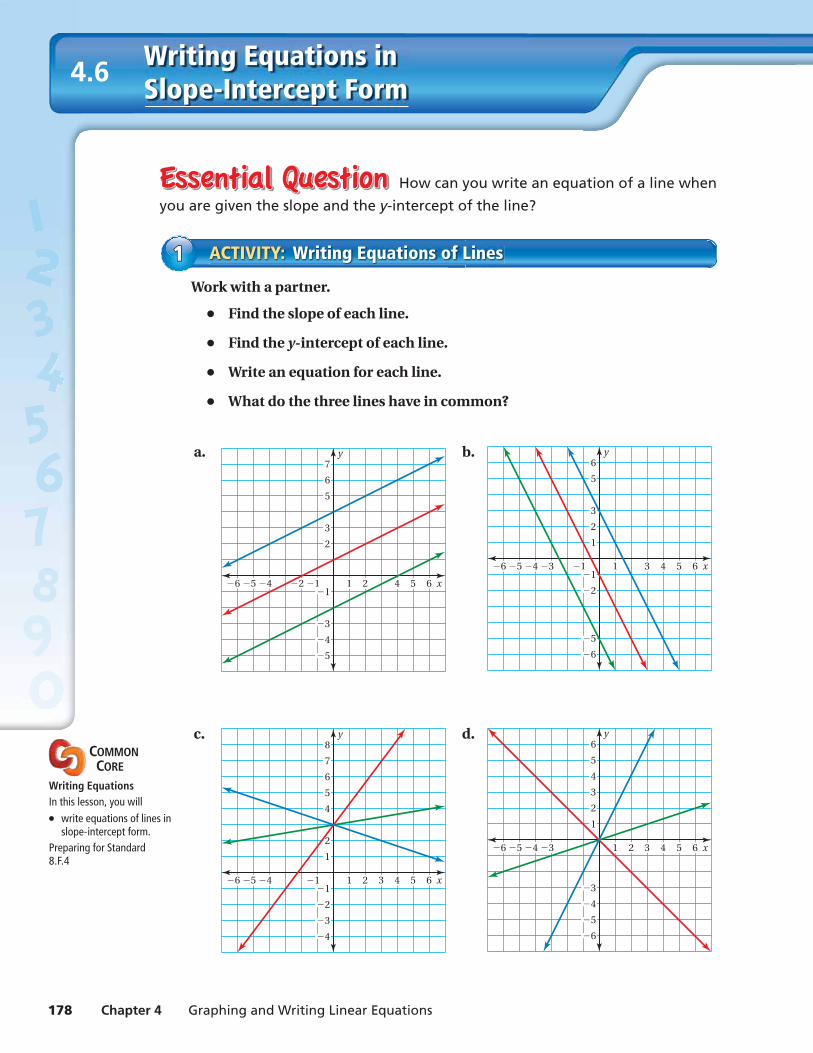
Work with a partner.
● Find the slope of each line.
● Find the y-intercept of each line.
● Write an equation for each line.
● What do the three lines have in common?
a.
21 4 5 6 x
y
12456
2
3
5
6
7
3
4
5
1
b.
31 4 5 6 x
y
13456
2
1
3
5
6
2
5
6
1
c.
2 31 4 5 6 x
y
1456
2
1
4
5
6
7
8
3
4
2
1
d.
31 2 4 5 6 x
y
3456
2
1
3
5
4
6
3
4
5
6
ACTIVITY: Writing Equations of Lines11
COMMON CORE
Writing EquationsIn this lesson, you will● write equations of lines in
slope-intercept form.Preparing for Standard8.F.4
Section 4.6 Writing Equations in Slope-Intercept Form 179
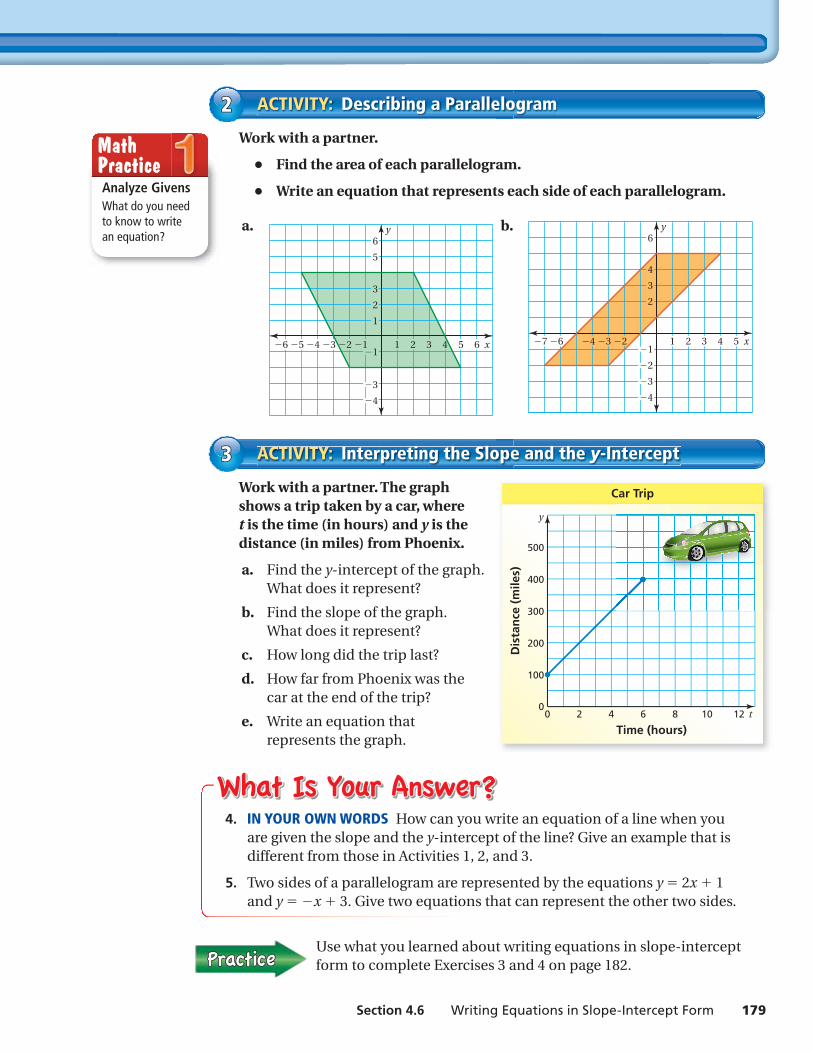
Work with a partner.
● Find the area of each parallelogram.
● Write an equation that represents each side of each parallelogram.
a.
31 2 4 5 6 x
y
3 2 1456
2
1
3
5
6
3
4
1
b.
31 2 4 5 x
y
3 2467
2
3
4
6
3
2
4
1
ACTIVITY: Describing a Parallelogram22
Work with a partner. The graph shows a trip taken by a car, where t is the time (in hours) and y is the distance (in miles) from Phoenix.
a. Find the y-intercept of the graph. What does it represent?
b. Find the slope of the graph. What does it represent?
c. How long did the trip last?
d. How far from Phoenix was the car at the end of the trip?
e. Write an equation that represents the graph.
ACTIVITY: Interpreting the Slope and the y-Intercept33
4. IN YOUR OWN WORDS How can you write an equation of a line when you are given the slope and the y-intercept of the line? Give an example that is different from those in Activities 1, 2, and 3.
5. Two sides of a parallelogram are represented by the equations y = 2x + 1 and y = − x + 3. Give two equations that can represent the other two sides.
Use what you learned about writing equations in slope-intercept form to complete Exercises 3 and 4 on page 182.
2 4 60 8 10 12 t
200
300
400
500
100
0
Time (hours)
Dis
tan
ce (
mile
s)y
Car Trip
Analyze GivensWhat do you need to know to write an equation?
Math Practice
180 Chapter 4 Graphing and Writing Linear Equations
Lesson4.6Lesson Tutorials
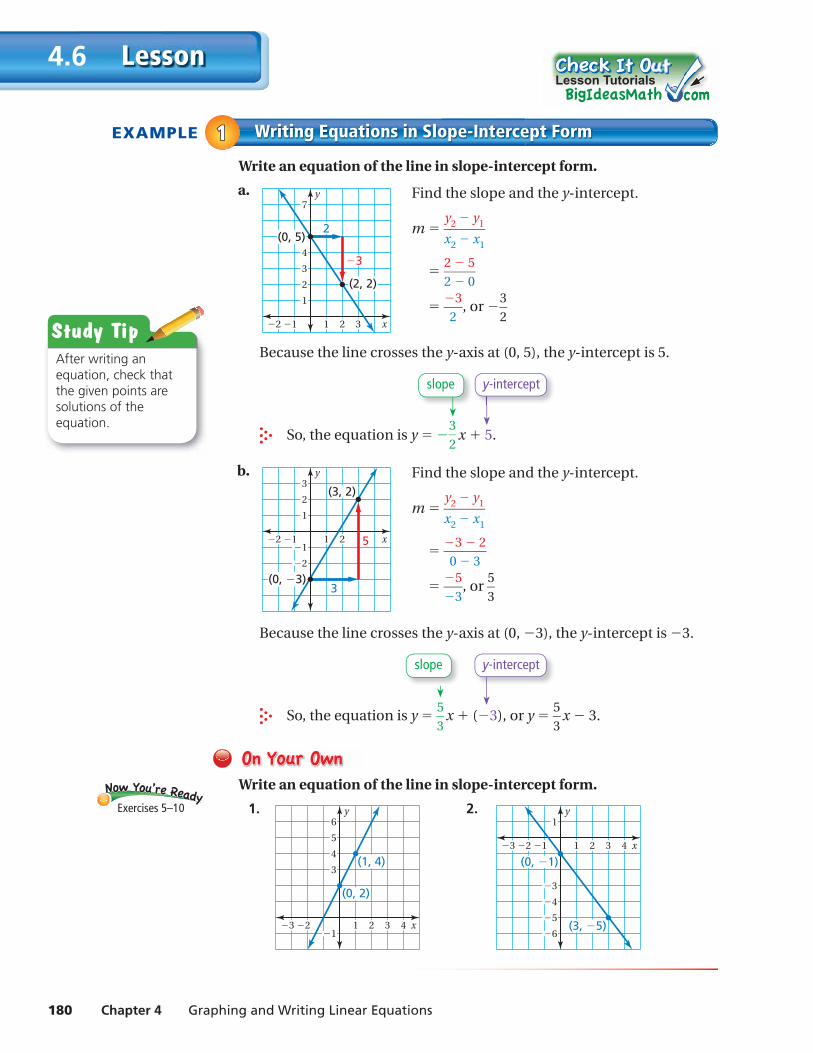
EXAMPLE Writing Equations in Slope-Intercept Form11Write an equation of the line in slope-intercept form.
a.
21 3 x
y
12
2
1
4
7
3
(0, 5)
(2, 2)
3
2
Because the line crosses the y-axis at (0, 5), the y-intercept is 5.
So, the equation is y = − 3
— 2
x + 5.
b.
21 x12
y
2
3
1
(3, 2)
(0, 3)
5
3
2
1
Because the line crosses the y-axis at (0, −3), the y-intercept is −3.
So, the equation is y = 5
— 3
x + (−3), or y = 5
— 3
x − 3.
Write an equation of the line in slope-intercept form.
1.
21 3 4 x
y
23
4
3
1
6
5
(0, 2)
(1, 4)
2.
4321 x12
y
3
(0, 1)
(3, 5)
4
3
1
6
5
slope y-intercept
slope y-intercept
Find the slope and the y-intercept.
m = y2 − y1 — x2 − x1
= 2 − 5
— 2 − 0
= − 3
— 2
, or − 3
— 2
Find the slope and the y-intercept.
m = y2 − y1 — x2 − x1
= − 3 − 2
— 0 − 3
= − 5
— − 3
, or 5
— 3
Exercises 5–10
Study TipAfter writing an equation, check that the given points are solutions of the equation.
Section 4.6 Writing Equations in Slope-Intercept Form 181
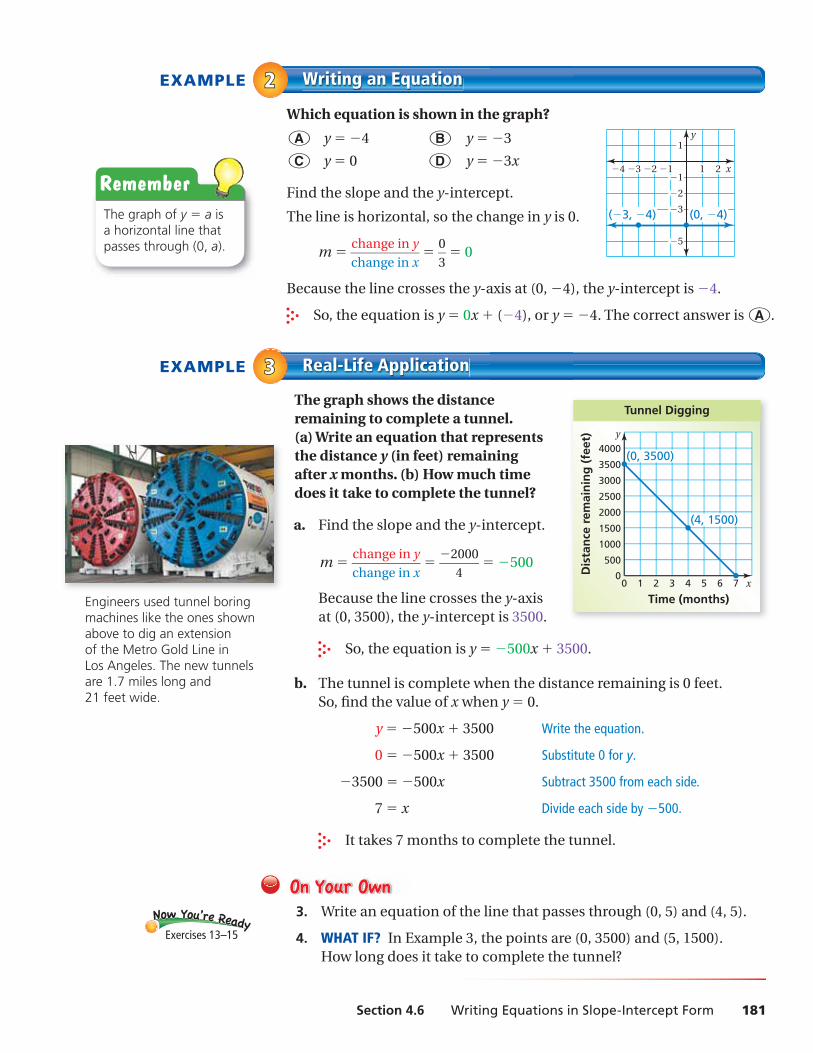
EXAMPLE Writing an Equation22Which equation is shown in the graph?
○A y = −4 ○B y = −3
○C y = 0 ○D y = −3x
Find the slope and the y-intercept.
The line is horizontal, so the change in y is 0.
m = change in y
— change in x
= 0
— 3
= 0
Because the line crosses the y-axis at (0, −4), the y-intercept is −4.
So, the equation is y = 0x + (−4), or y = −4. The correct answer is ○A .
EXAMPLE Real-Life Application33The graph shows the distance remaining to complete a tunnel. (a) Write an equation that represents the distance y (in feet) remaining after x months. (b) How much time does it take to complete the tunnel?
a. Find the slope and the y-intercept.
m = change in y
— change in x
= −2000
— 4
= −500
Because the line crosses the y-axis at (0, 3500), the y-intercept is 3500.
So, the equation is y = −500x + 3500.
b. The tunnel is complete when the distance remaining is 0 feet. So, fi nd the value of x when y = 0.
y = −500x + 3500 Write the equation.
0 = −500x + 3500 Substitute 0 for y.
−3500 = −500x Subtract 3500 from each side.
7 = x Divide each side by − 500.
It takes 7 months to complete the tunnel.
3. Write an equation of the line that passes through (0, 5) and (4, 5).
4. WHAT IF? In Example 3, the points are (0, 3500) and (5, 1500). How long does it take to complete the tunnel?
RememberThe graph of y = a is a horizontal line that passes through (0, a).
Exercises 13–15
21 x
y
1234
( 3, 4) (0, 4)3
2
1
5
1
2 4 60 1 3 5 7 x
2000
3000
4000
1000
1500
2500
3500
500
0
Time (months)D
ista
nce
rem
ain
ing
(fe
et) y
(0, 3500)
(4, 1500)
Tunnel Digging
Engineers used tunnel boring machines like the ones shown above to dig an extension of the Metro Gold Line in Los Angeles. The new tunnels are 1.7 miles long and 21 feet wide.
182 Chapter 4 Graphing and Writing Linear Equations
Exercises4.6
9+(-6)=3
3+(-3)=
4+(-9)=
9+(-1)=
1. PRECISION Explain how to fi nd the slope of a line given the intercepts of the line.
2. WRITING Explain how to write an equation of a line using its graph.
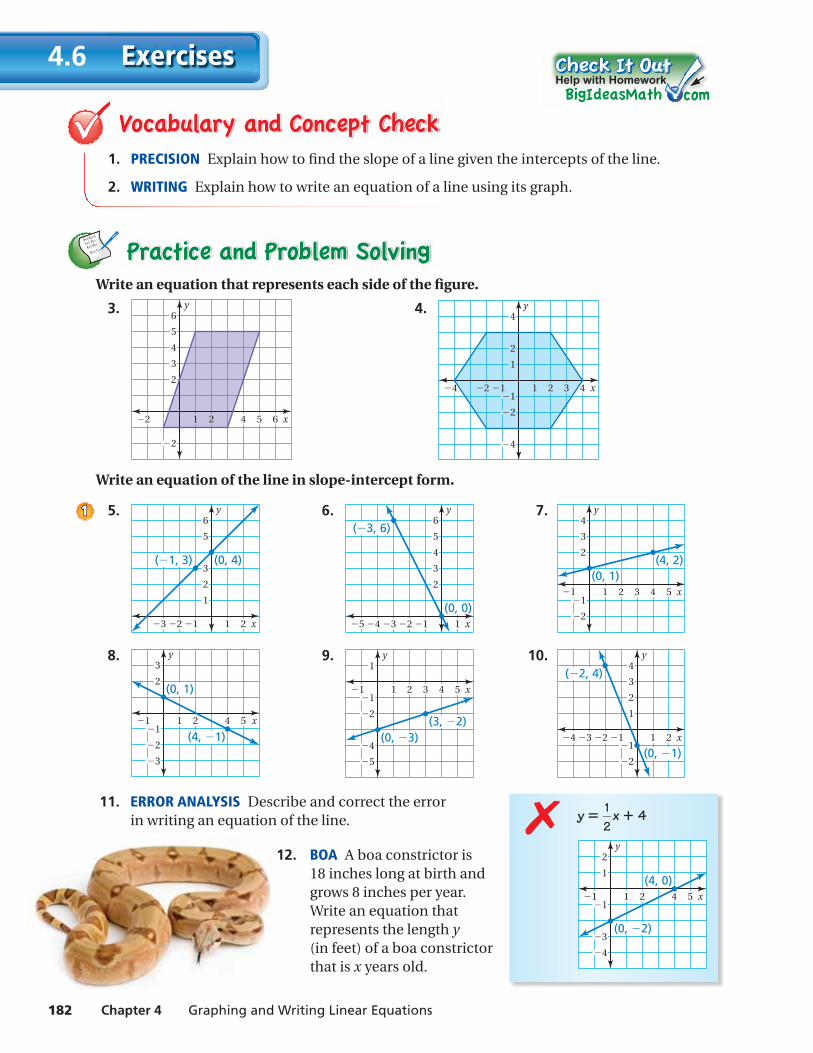
Write an equation that represents each side of the fi gure.
3.
21 5 64 x
y
2
3
4
5
6
2
2
4.
2 3 41 x
y
124
2
4
1
2
4
1
Write an equation of the line in slope-intercept form.
5.
21 x
y
2 13
3
2
1
6
5
(0, 4)( 1, 3)
6.
1 x
y
2 1345
3
2
4
6
5
(0, 0)
( 3, 6) 7.
2 3 4 51 x
y
1
2
1
2
3
4
(4, 2)(0, 1)
8.
2 4 51 x
y
1
2
3
1
2
3
(4, 1)
(0, 1)
9.
2 3 4 51 x
y
1
2
4
5
1
1
(0, 3)(3, 2)
10.
21 x
y
1234
2
1
1
2
3
4
(0, 1)
( 2, 4)
11. ERROR ANALYSIS Describe and correct the error in writing an equation of the line.
12. BOA A boa constrictor is 18 inches long at birth and grows 8 inches per year. Write an equation that represents the length y (in feet) of a boa constrictor that is x years old.
Help with Homework
11
y = 1 — 2 x + 4
2 4 51 x
y
1
3
4
1
1
2
(0, 2)
(4, 0)
✗
Section 4.6 Writing Equations in Slope-Intercept Form 183
Plot the ordered pair in a coordinate plane. (Skills Review Handbook)
20. (1, 4) 21. (−1, −2) 22. (0, 1) 23. (2, 7)
24. MULTIPLE CHOICE Which of the following statements is true? (Section 4.4)
○A The x-intercept is 5.
○B The x-intercept is −2. ○C The y-intercept is 5.
○D The y-intercept is −2.
Write an equation of the line that passes through the points.
13. (2, 5), (0, 5) 14. (−3, 0), (0, 0) 15. (0, −2), (4, −2)
16. WALKATHON One of your friends gives you $10 for a charity walkathon. Another friend gives you an amount per mile. After 5 miles, you have raised $13.50 total. Write an equation that represents the amount y of money you have raised after x miles.
17. BRAKING TIME During each second of braking, an automobile slows by about 10 miles per hour.
a. Plot the points (0, 60) and (6, 0). What do the points represent?
b. Draw a line through the points. What does the line represent?
c. Write an equation of the line.
18. PAPER You have 500 sheets of notebook paper. After 1 week, you have 72% of the sheets left. You use the same number of sheets each week. Write an equation that represents the number y of pages remaining after x weeks.
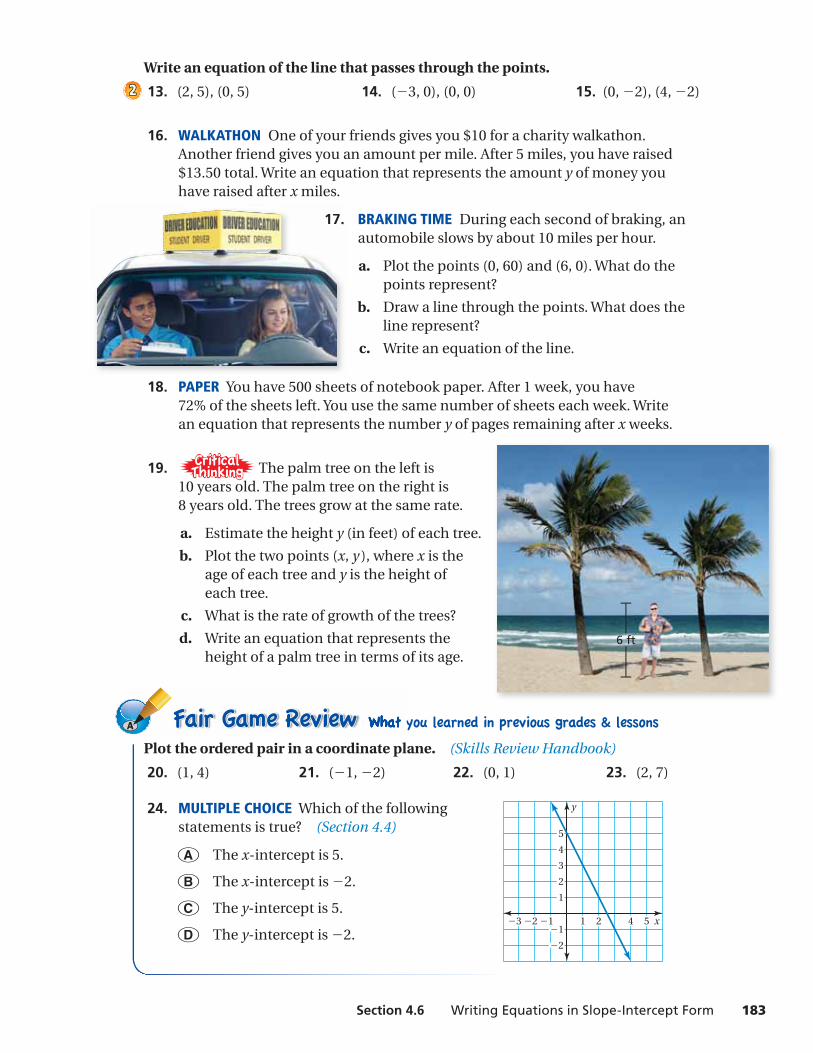
19. The palm tree on the left is 10 years old. The palm tree on the right is 8 years old. The trees grow at the same rate.
a. Estimate the height y (in feet) of each tree.
b. Plot the two points (x, y ), where x is the age of each tree and y is the height of each tree.
c. What is the rate of growth of the trees?
d. Write an equation that represents the height of a palm tree in terms of its age.
22
17.
2 4 51 x
y
123
2
4
3
5
1
2
1
6 ft
184 Chapter 4 Graphing and Writing Linear Equations
Writing Equations in Point-Slope Form
4.7
How can you write an equation of a line when
you are given the slope and a point on the line?
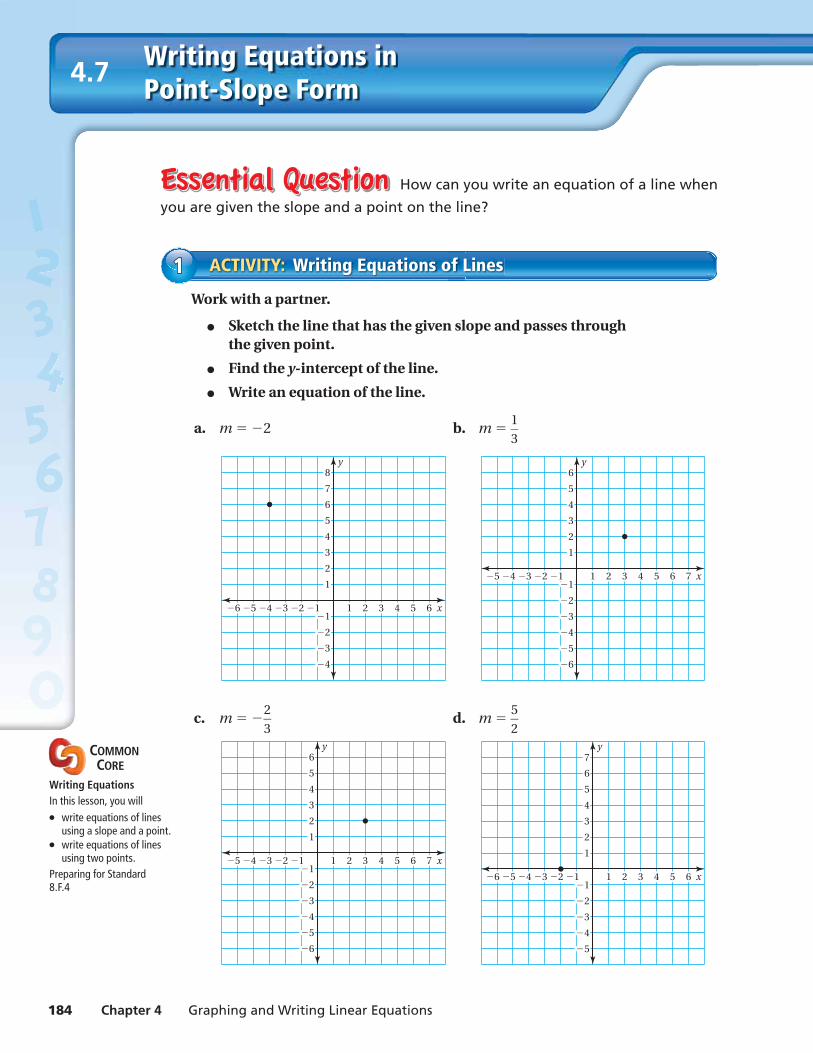
Work with a partner.
● Sketch the line that has the given slope and passes through the given point.
● Find the y-intercept of the line.
● Write an equation of the line.
a. m = −2 b. m = 1
— 3
21 4 5 6 x
y
124 3356
2
3
5
1
4
6
7
8
3
4
2
1
21 4 5 6 7 x
y
124 335
2
3
5
1
4
6
3
4
5
6
2
1
c. m = − 2
— 3
d. m = 5
— 2
21 4 5 6 7 x
y
124 335
2
3
5
1
4
6
3
4
5
6
2
1
21 4 5 6 x
y
124 3356
2
3
5
1
4
6
7
3
4
5
2
1
ACTIVITY: Writing Equations of Lines11
COMMON CORE
Writing EquationsIn this lesson, you will● write equations of lines
using a slope and a point.● write equations of lines
using two points.Preparing for Standard8.F.4
Section 4.7 Writing Equations in Point-Slope Form 185
Use what you learned about writing equations using a slope and a point to complete Exercises 3 – 5 on page 188.
4. Redo Activity 1 using the equation you found in Activity 2. Compare the results. What do you notice?
5. Why do you think y − y1 = m(x − x1) is called the point-slope form of the equation of a line? Why do you think it is important?
6. IN YOUR OWN WORDS How can you write an equation of a line when you are given the slope and a point on the line? Give an example that is different from those in Activity 1.
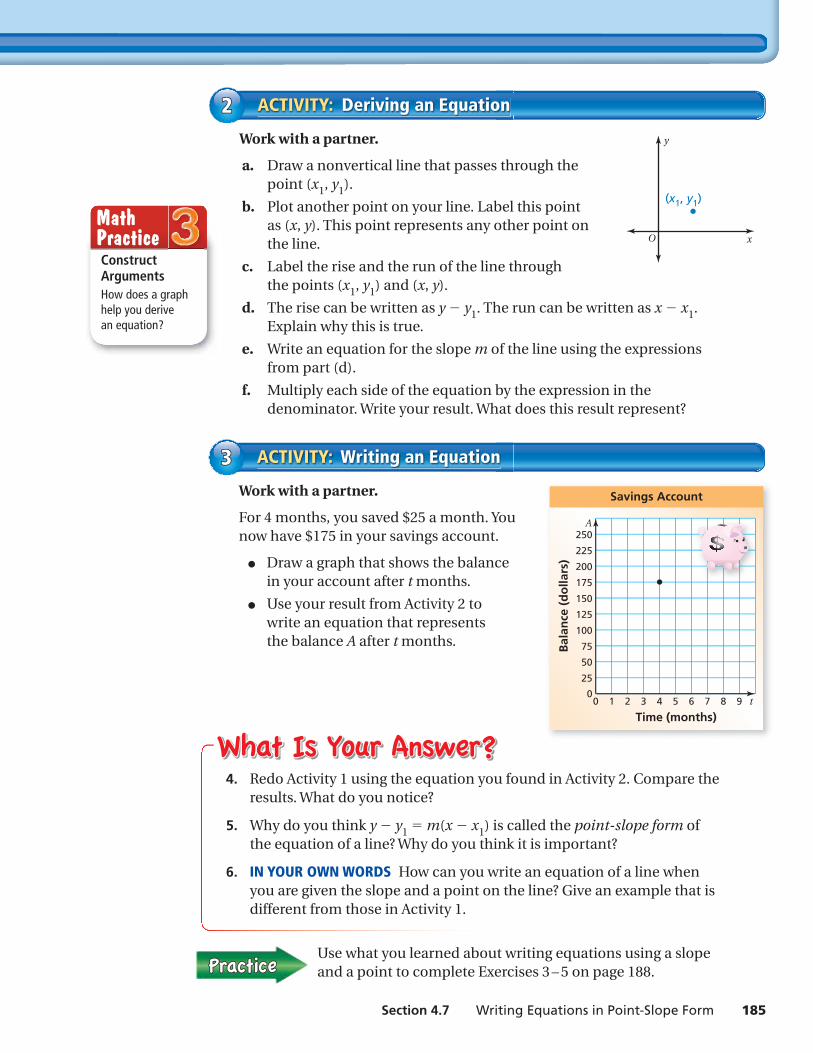
Work with a partner.
For 4 months, you saved $25 a month. You now have $175 in your savings account.
● Draw a graph that shows the balance in your account after t months.
● Use your result from Activity 2 to write an equation that represents the balance A after t months.
ACTIVITY: Writing an Equation33
2 4 60 1 3 5 7 8 9 t
100
150
200
225
250
50
75
125
175
25
0
Time (months)
Bal
ance
(d
olla
rs)
A
Savings Account
Work with a partner.
a. Draw a nonvertical line that passes through the point (x1, y1).
b. Plot another point on your line. Label this point as (x, y). This point represents any other point on the line.
c. Label the rise and the run of the line through the points (x1, y1) and (x, y).
d. The rise can be written as y − y1. The run can be written as x − x1. Explain why this is true.
e. Write an equation for the slope m of the line using the expressions from part (d).
f. Multiply each side of the equation by the expression in the denominator. Write your result. What does this result represent?
ACTIVITY: Deriving an Equation22y
xO
(x1, y1)
Construct ArgumentsHow does a graph help you derive an equation?
Math Practice
186 Chapter 4 Graphing and Writing Linear Equations
Lesson4.7Lesson Tutorials
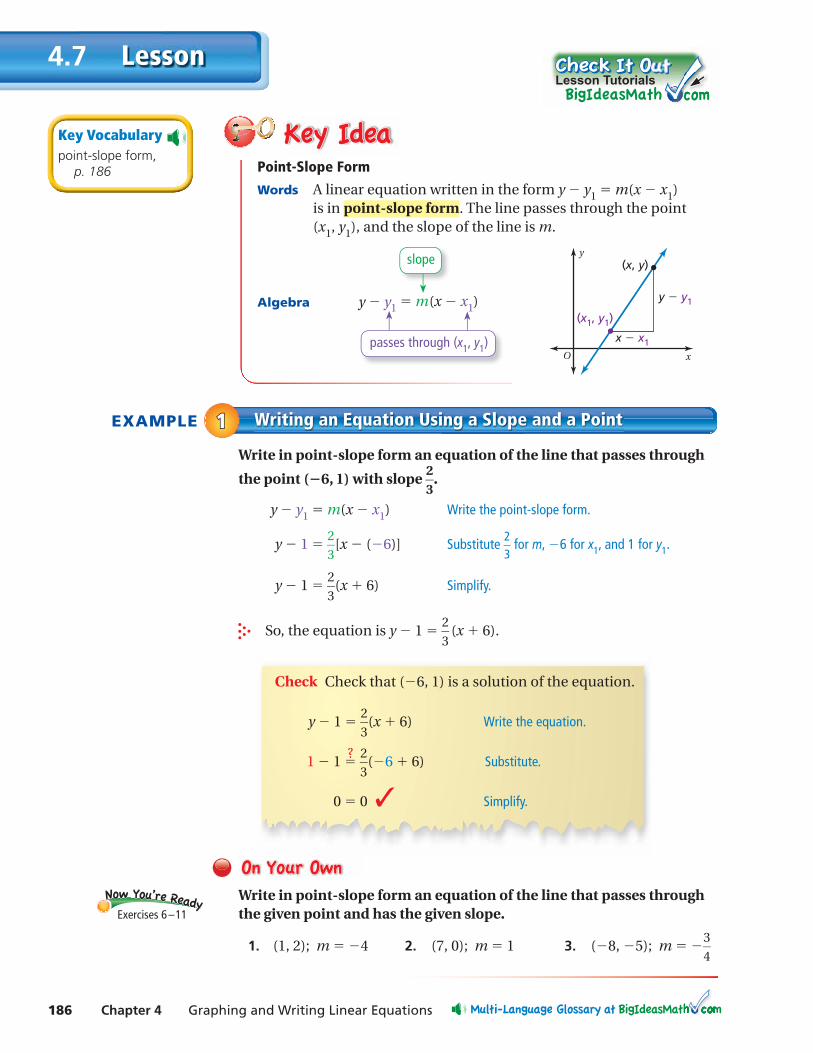
Write in point-slope form an equation of the line that passes through
the point (−6, 1) with slope 2
— 3
.
y − y1 = m(x − x1) Write the point-slope form.
y − 1 = 2
— 3
[x − (− 6)] Substitute 2 —
3 for m, − 6 for x1, and 1 for y1.
y − 1 = 2
— 3
(x + 6) Simplify.
So, the equation is y − 1 = 2
— 3
(x + 6).
Write in point-slope form an equation of the line that passes through the given point and has the given slope.
1. (1, 2); m = − 4 2. (7, 0); m = 1 3. (− 8, − 5); m = − 3
— 4
EXAMPLE Writing an Equation Using a Slope and a Point11
Exercises 6 – 11
Key Vocabularypoint-slope form, p. 186 Point-Slope Form
Words A linear equation written in the form y − y1 = m(x − x1) is in point-slope form. The line passes through the point (x1, y1), and the slope of the line is m.
Algebra y − y1 = m(x − x1)
passes through (x1, y1)
slope y
xO
(x1, y1)
x x1
y y1
(x, y)
Check Check that (− 6, 1) is a solution of the equation.
y − 1 = 2
— 3
(x + 6) Write the equation.
1 − 1 =? 2
— 3
(− 6 + 6) Substitute.
0 = 0 ✓ Simplify.
Section 4.7 Writing Equations in Point-Slope Form 187
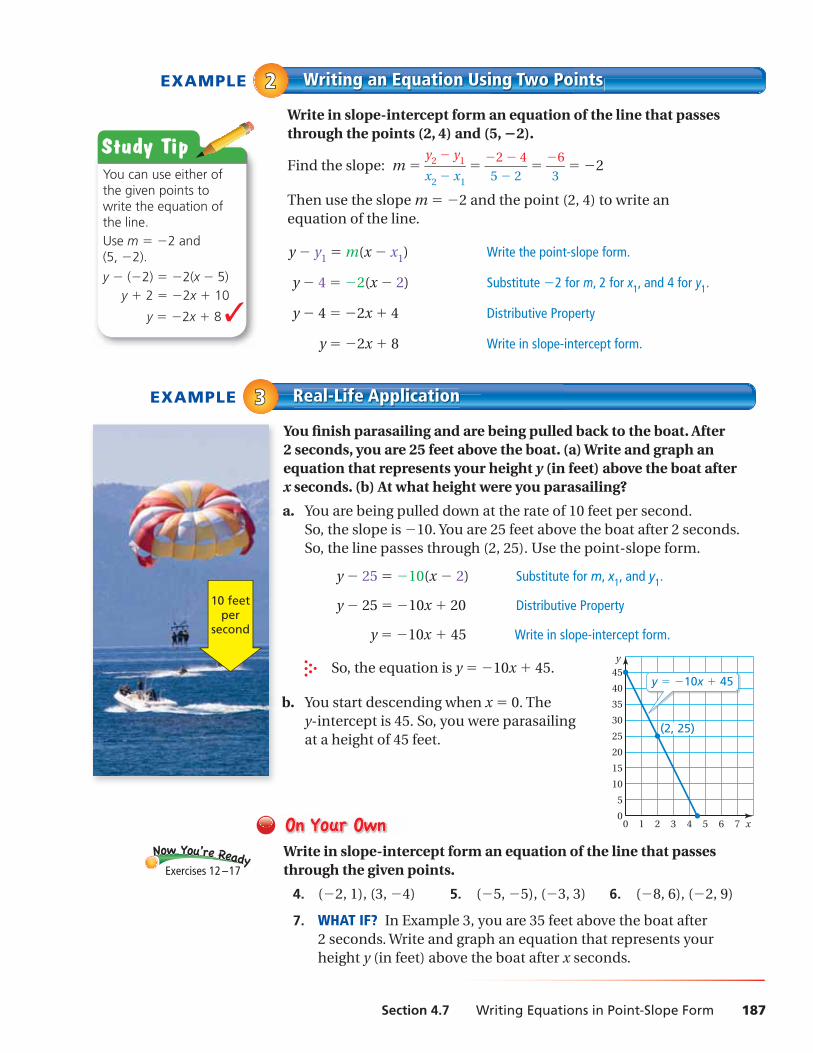
You fi nish parasailing and are being pulled back to the boat. After 2 seconds, you are 25 feet above the boat. (a) Write and graph an equation that represents your height y (in feet) above the boat after x seconds. (b) At what height were you parasailing?
a. You are being pulled down at the rate of 10 feet per second. So, the slope is −10. You are 25 feet above the boat after 2 seconds. So, the line passes through (2, 25). Use the point-slope form.
y − 25 = −10(x − 2) Substitute for m, x1, and y1.
y − 25 = −10x + 20 Distributive Property
y = −10x + 45 Write in slope-intercept form.
So, the equation is y = −10x + 45.
b. You start descending when x = 0. The y-intercept is 45. So, you were parasailing at a height of 45 feet.
Write in slope-intercept form an equation of the line that passes through the given points.
4. (− 2, 1), (3, − 4) 5. (− 5, − 5), (− 3, 3) 6. (− 8, 6), (− 2, 9)
7. WHAT IF? In Example 3, you are 35 feet above the boat after 2 seconds. Write and graph an equation that represents your height y (in feet) above the boat after x seconds.
EXAMPLE Real-Life Application33
10 feetper
second
Exercises 12 – 17
Write in slope-intercept form an equation of the line that passes through the points (2, 4) and (5, −2).
Find the slope: m = y2 − y1 — x2 − x1
= −2 − 4
— 5 − 2
= − 6
— 3
= − 2
Then use the slope m = −2 and the point (2, 4) to write an equation of the line.
y − y1 = m(x − x1) Write the point-slope form.
y − 4 = − 2(x − 2) Substitute −2 for m, 2 for x1, and 4 for y1.
y − 4 = − 2x + 4 Distributive Property
y = − 2x + 8 Write in slope-intercept form.
EXAMPLE Writing an Equation Using Two Points22
Study TipYou can use either of the given points to write the equation of the line.Use m = − 2 and (5, − 2).
y − (− 2) = − 2(x − 5) y + 2 = − 2x + 10
y = − 2x + 8 ✓
5
0
10
15
20
25
30
35
40
45
x65 743210
y
(2, 25)
y 10x 45
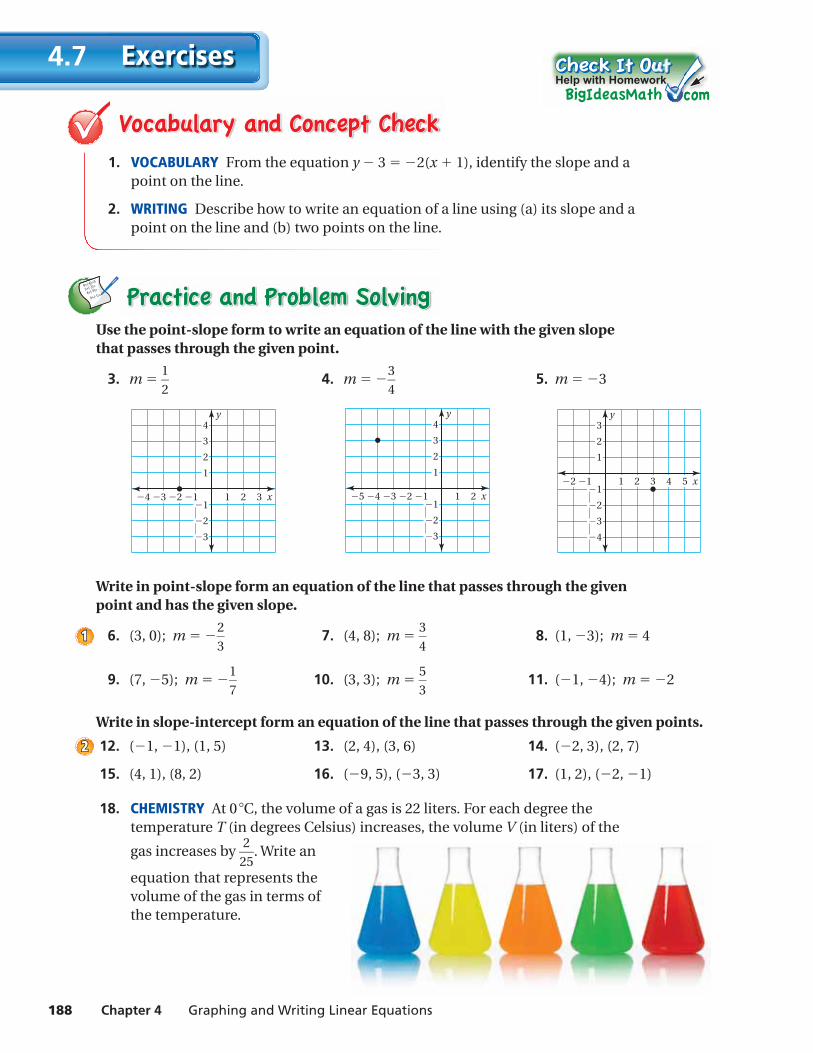
188 Chapter 4 Graphing and Writing Linear Equations
Exercises4.7
9+(-6)=3
3+(-3)=
4+(-9)=
9+(-1)=
1. VOCABULARY From the equation y − 3 = − 2(x + 1), identify the slope and a point on the line.
2. WRITING Describe how to write an equation of a line using (a) its slope and a point on the line and (b) two points on the line.
Use the point-slope form to write an equation of the line with the given slope that passes through the given point.
3. m = 1
— 2
4. m = − 3
— 4
5. m = −3
2 31 x
y
1234
2
4
3
1
2
3
1
21 x
y
12345
2
4
3
1
2
3
1
2 3 4 51 x
y
12
2
3
1
2
3
4
1
Write in point-slope form an equation of the line that passes through the given point and has the given slope.
6. (3, 0); m = − 2
— 3
7. (4, 8); m = 3
— 4
8. (1, −3); m = 4
9. (7, −5); m = − 1
— 7
10. (3, 3); m = 5
— 3
11. (−1, −4); m = −2
Write in slope-intercept form an equation of the line that passes through the given points.
12. (−1, −1), (1, 5) 13. (2, 4), (3, 6) 14. (−2, 3), (2, 7)
15. (4, 1), (8, 2) 16. (−9, 5), (−3, 3) 17. (1, 2), (−2, −1)
18. CHEMISTRY At 0 °C, the volume of a gas is 22 liters. For each degree the temperature T (in degrees Celsius) increases, the volume V (in liters) of the
gas increases by 2
— 25
. Write an
equation that represents the volume of the gas in terms of the temperature.
Help with Homework
11
22
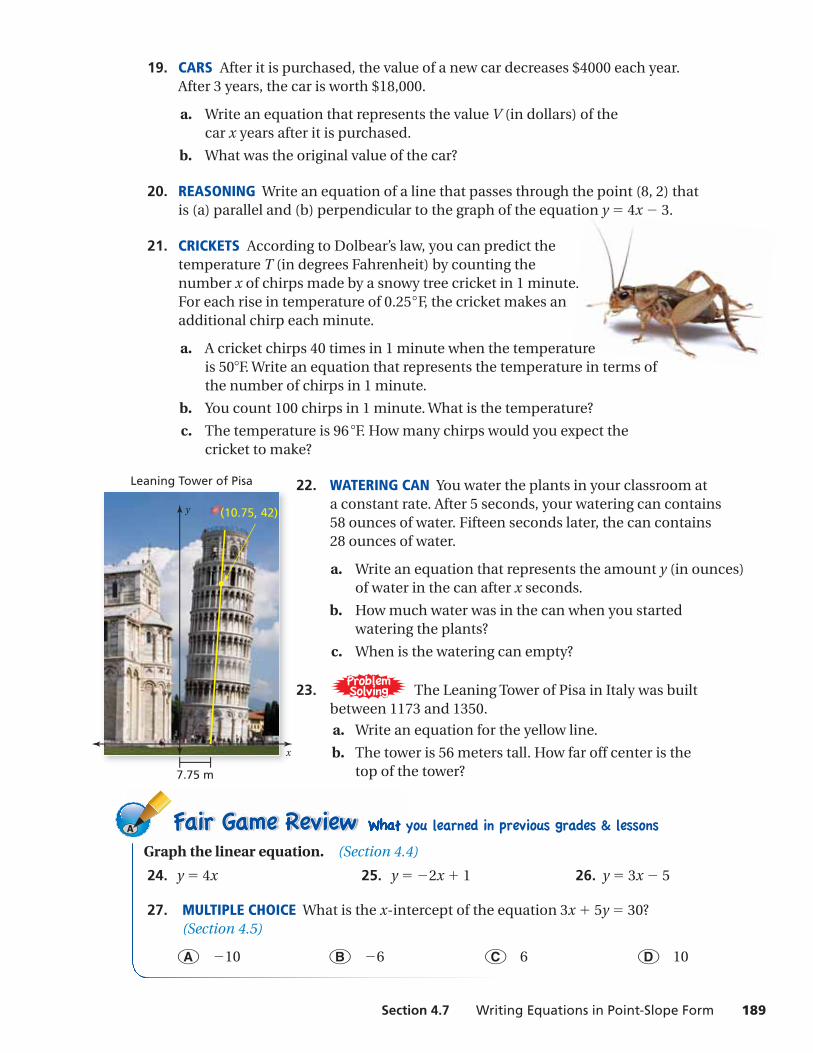
Section 4.7 Writing Equations in Point-Slope Form 189
Graph the linear equation. (Section 4.4)
24. y = 4x 25. y = − 2x + 1 26. y = 3x − 5
27. MULTIPLE CHOICE What is the x-intercept of the equation 3x + 5y = 30? (Section 4.5)
○A −10 ○B −6 ○C 6 ○D 10
19. CARS After it is purchased, the value of a new car decreases $4000 each year. After 3 years, the car is worth $18,000.
a. Write an equation that represents the value V (in dollars) of the car x years after it is purchased.
b. What was the original value of the car?
20. REASONING Write an equation of a line that passes through the point (8, 2) that is (a) parallel and (b) perpendicular to the graph of the equation y = 4x − 3.
21. CRICKETS According to Dolbear’s law, you can predict the temperature T (in degrees Fahrenheit) by counting the number x of chirps made by a snowy tree cricket in 1 minute. For each rise in temperature of 0.25°F, the cricket makes an additional chirp each minute.
a. A cricket chirps 40 times in 1 minute when the temperature is 50°F. Write an equation that represents the temperature in terms of the number of chirps in 1 minute.
b. You count 100 chirps in 1 minute. What is the temperature?
c. The temperature is 96 °F. How many chirps would you expect the cricket to make?
22. WATERING CAN You water the plants in your classroom at a constant rate. After 5 seconds, your watering can contains 58 ounces of water. Fifteen seconds later, the can contains 28 ounces of water.
a. Write an equation that represents the amount y (in ounces) of water in the can after x seconds.
b. How much water was in the can when you started watering the plants?
c. When is the watering can empty?
23. ProblemSolvingProblemSolving The Leaning Tower of Pisa in Italy was built
between 1173 and 1350.
a. Write an equation for the yellow line.
b. The tower is 56 meters tall. How far off center is the top of the tower?
y
x
7.75 m
(10.75, 42)
Leaning Tower of Pisa
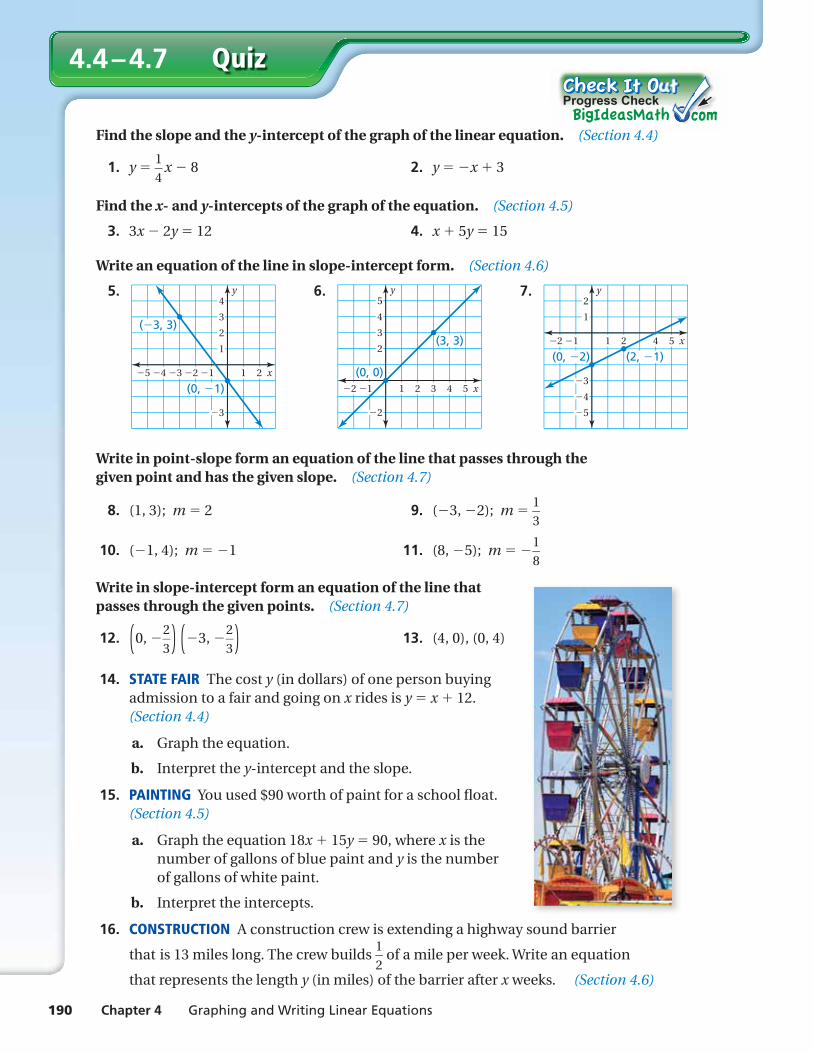
Find the slope and the y-intercept of the graph of the linear equation. (Section 4.4)
1. y = 1
— 4
x − 8 2. y = − x + 3
Find the x- and y-intercepts of the graph of the equation. (Section 4.5)
3. 3x − 2y = 12 4. x + 5y = 15
Write an equation of the line in slope-intercept form. (Section 4.6)
5.
21 x
y
12345
2
4
3
1
3
( 3, 3)
(0, 1)
6.
2 3 4 51 x
y
12
2
4
5
3
2
(3, 3)
(0, 0)
7.
2 4 51 x
y
12
2
1
3
4
5
(0, 2) (2, 1)
Write in point-slope form an equation of the line that passes through the given point and has the given slope. (Section 4.7)
8. (1, 3); m = 2 9. (− 3, − 2); m = 1
— 3
10. (− 1, 4); m = −1 11. (8, − 5); m = − 1
— 8
Write in slope-intercept form an equation of the line that passes through the given points. (Section 4.7)
12. ( 0, − 2
— 3
) ( −3, − 2
— 3
) 13. (4, 0), (0, 4)
14. STATE FAIR The cost y (in dollars) of one person buying admission to a fair and going on x rides is y = x + 12. (Section 4.4)
a. Graph the equation.
b. Interpret the y-intercept and the slope.
15. PAINTING You used $90 worth of paint for a school fl oat. (Section 4.5)
a. Graph the equation 18x + 15y = 90, where x is the number of gallons of blue paint and y is the number of gallons of white paint.
b. Interpret the intercepts.
16. CONSTRUCTION A construction crew is extending a highway sound barrier
that is 13 miles long. The crew builds 1
— 2
of a mile per week. Write an equation
that represents the length y (in miles) of the barrier after x weeks. (Section 4.6)
190 Chapter 4 Graphing and Writing Linear Equations
Quiz4.4 – 4.7
(S ti 4 4)
Progress Check
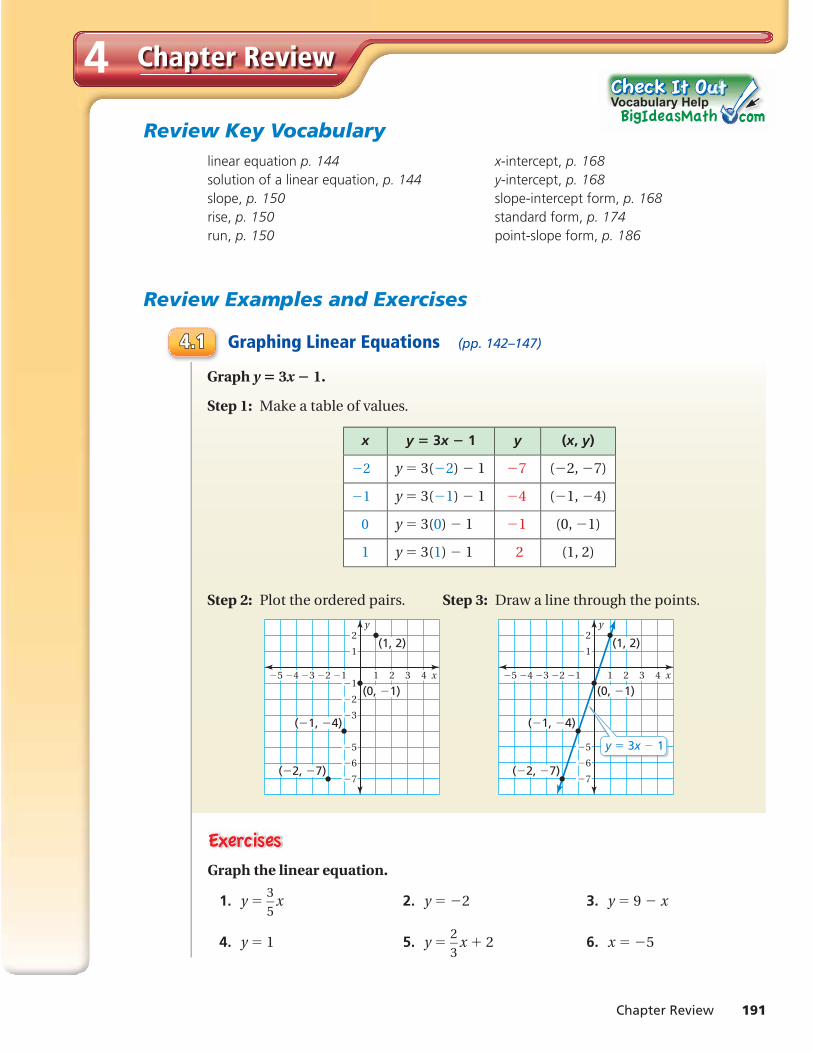
Chapter Review 191
Chapter Review4
Review Examples and Exercises
Review Key Vocabularylinear equation p. 144solution of a linear equation, p. 144slope, p. 150rise, p. 150run, p. 150
x-intercept, p. 168y-intercept, p. 168slope-intercept form, p. 168standard form, p. 174point-slope form, p. 186
Graph the linear equation.
1. y = 3
— 5
x 2. y = −2 3. y = 9 − x
4. y = 1 5. y = 2
— 3
x + 2 6. x = − 5
4.14.1 Graphing Linear Equations (pp. 142–147)
Graph y = 3x − 1.
Step 1: Make a table of values.
Step 2: Plot the ordered pairs. Step 3: Draw a line through the points.
21 3 4 x
y
12345
2
1
2
3
5
6
7
1
(1, 2)
(0, 1)
( 1, 4)
( 2, 7)
21 3 4 x
y
12345
2
1
5
6
7
(1, 2)
(0, 1)
( 1, 4)
( 2, 7)
y 3x 1
Vocabulary Help
x y = 3x − 1 y (x, y)
−2 y = 3(−2) − 1 −7 (−2, −7)
−1 y = 3(−1) − 1 −4 (−1, −4)
0 y = 3(0) − 1 −1 (0, −1)
1 y = 3(1) − 1 2 (1, 2)
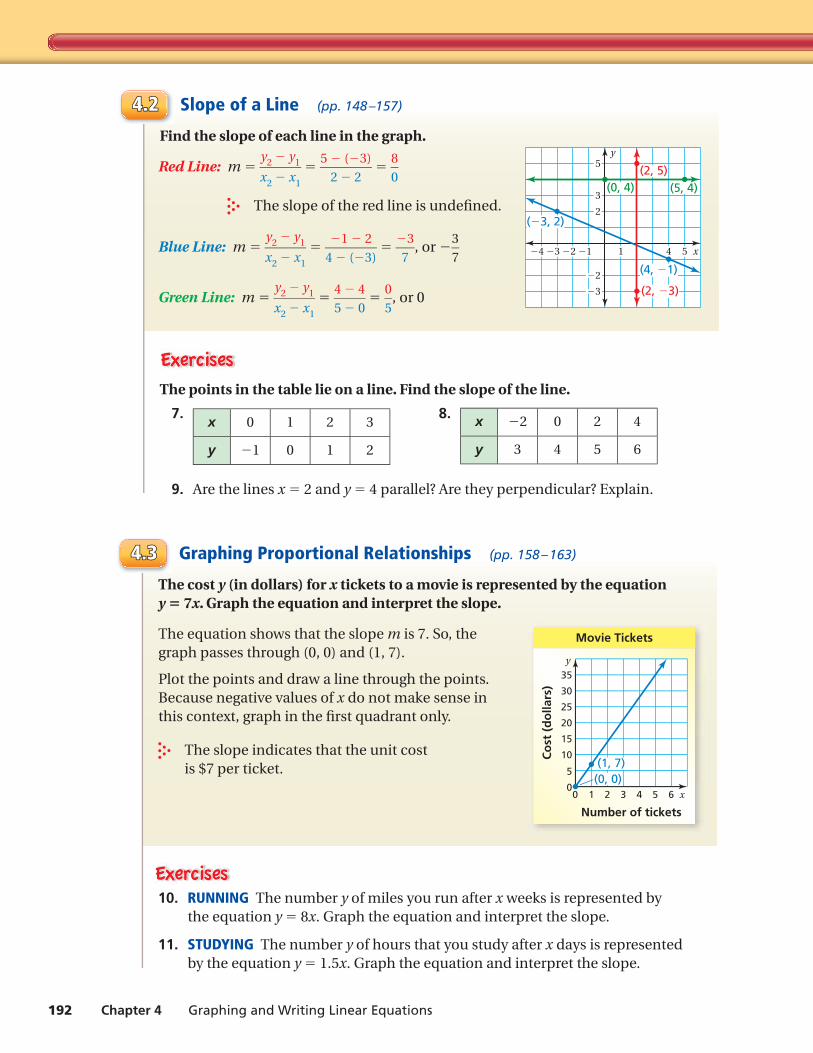
192 Chapter 4 Graphing and Writing Linear Equations
4.24.2 Slope of a Line (pp. 148 –157)
Find the slope of each line in the graph.
Red Line: m = y2 − y1 — x2 − x1
= 5 − (− 3)
— 2 − 2
= 8
— 0
The slope of the red line is undefi ned.
Blue Line: m = y2 − y1 — x2 − x1
= − 1 − 2
— 4 − (− 3)
= − 3
— 7
, or − 3
— 7
Green Line: m = y2 − y1 — x2 − x1
= 4 − 4
— 5 − 0
= 0
— 5
, or 0
The points in the table lie on a line. Find the slope of the line.
7. x 0 1 2 3
y −1 0 1 2
8. x −2 0 2 4
y 3 4 5 6
9. Are the lines x = 2 and y = 4 parallel? Are they perpendicular? Explain.
3
2
2
3
5
x5413 2 14
y
(4, 1)
(2, 3)
( 3, 2)
(2, 5)(0, 4) (5, 4)
4.34.3 Graphing Proportional Relationships (pp. 158 – 163)
The cost y (in dollars) for x tickets to a movie is represented by the equation y = 7x. Graph the equation and interpret the slope.
The equation shows that the slope m is 7. So, the graph passes through (0, 0) and (1, 7).
Plot the points and draw a line through the points. Because negative values of x do not make sense in this context, graph in the fi rst quadrant only.
The slope indicates that the unit cost is $7 per ticket.
10. RUNNING The number y of miles you run after x weeks is represented by the equation y = 8x. Graph the equation and interpret the slope.
11. STUDYING The number y of hours that you study after x days is represented by the equation y = 1.5x. Graph the equation and interpret the slope.
00
Number of tickets
Movie Tickets
Co
st (
do
llars
)
x
y
642 531
10
20
5
15
25
30
35
(0, 0)(1, 7)
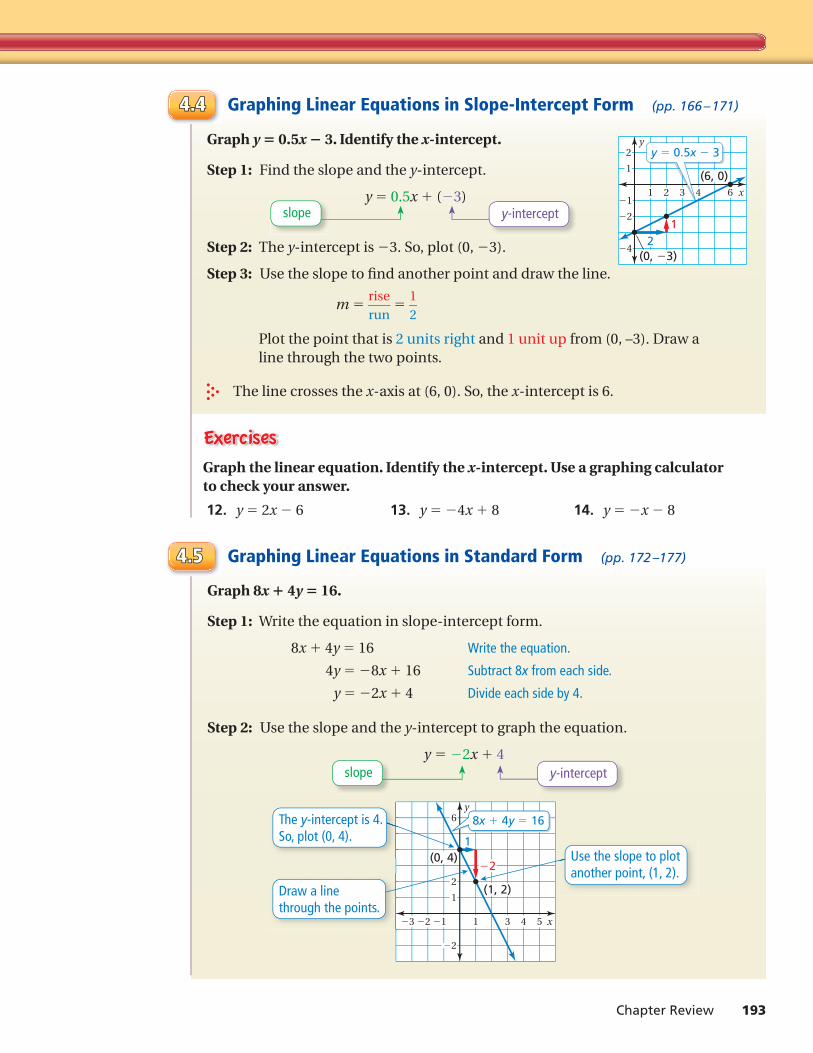
Chapter Review 193
4.44.4 Graphing Linear Equations in Slope-Intercept Form (pp. 166 – 171)
Graph y = 0.5x − 3. Identify the x-intercept.
Step 1: Find the slope and the y-intercept.
y = 0.5x + (−3)
Step 2: The y-intercept is −3. So, plot (0, −3).
Step 3: Use the slope to fi nd another point and draw the line.
m = rise
— run
= 1
— 2
Plot the point that is 2 units right and 1 unit up from (0, –3). Draw a line through the two points.
The line crosses the x-axis at (6, 0). So, the x-intercept is 6.
slope y-intercept
Graph the linear equation. Identify the x-intercept. Use a graphing calculator to check your answer.
12. y = 2x − 6 13. y = −4x + 8 14. y = −x − 8
1 2 3 4 6 x
y
1
2
(6, 0)
(0, 3)
1
4
2
21
y 0.5x 3
4.54.5 Graphing Linear Equations in Standard Form (pp. 172 –177)
Graph 8x + 4y = 16.
Step 1: Write the equation in slope-intercept form.
8x + 4y = 16 Write the equation.
4y = −8x + 16 Subtract 8x from each side.
y = −2x + 4 Divide each side by 4.
Step 2: Use the slope and the y-intercept to graph the equation.
y = −2x + 4
x
y
123
1
2
6
2
(0, 4)
(1, 2)
The y-intercept is 4.So, plot (0, 4).
Draw a linethrough the points.
1 4 53
1
2Use the slope to plotanother point, (1, 2).
8x 4y 16
slope y-intercept
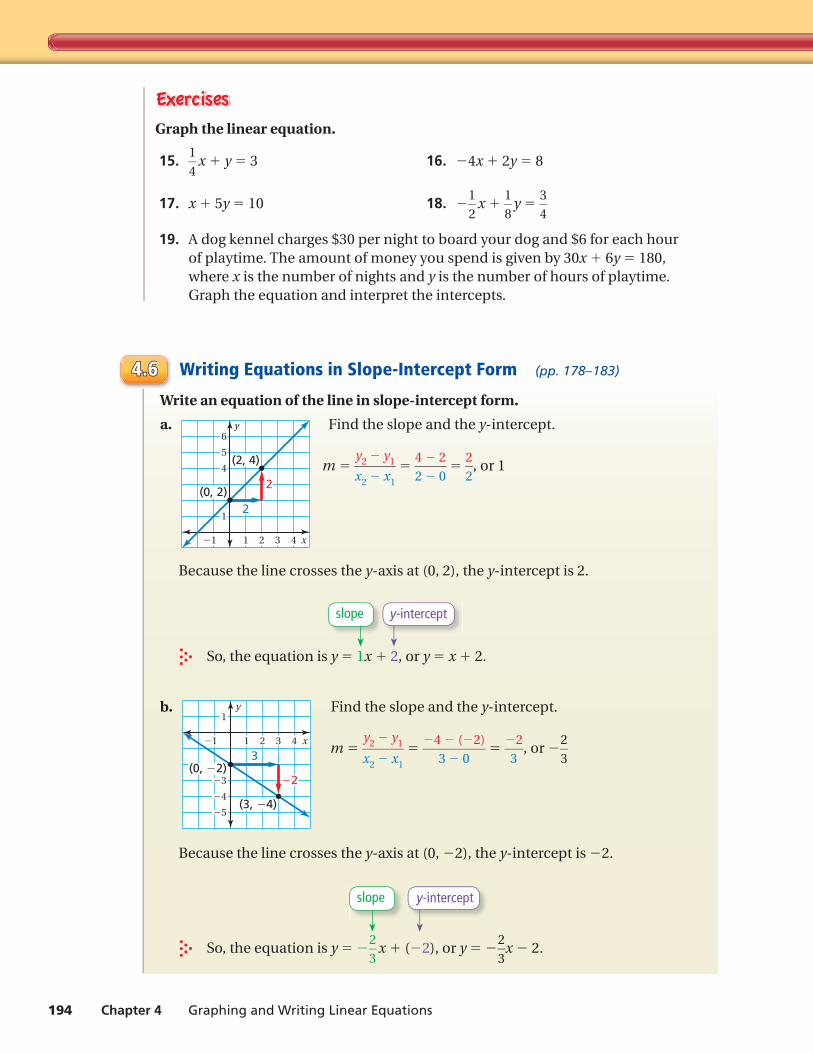
194 Chapter 4 Graphing and Writing Linear Equations
4.64.6 Writing Equations in Slope-Intercept Form (pp. 178–183)
Write an equation of the line in slope-intercept form.
a.
2 3 41 x
y
1
5
6
1
4(2, 4)
(0, 2)2
2
Find the slope and the y-intercept.
m = y2 − y1 — x2 − x1
= 4 − 2
— 2 − 0
= 2
— 2
, or 1
Because the line crosses the y-axis at (0, 2), the y-intercept is 2.
So, the equation is y = 1x + 2, or y = x + 2.
b.
x
y
211 3 4
3
4
5
1
3
(3, 4)
(0, 2)2
Find the slope and the y-intercept.
m = y2 − y1 — x2 − x1
= − 4 − (− 2)
— 3 − 0
= − 2
— 3
, or − 2
— 3
Because the line crosses the y-axis at (0, − 2), the y-intercept is − 2.
So, the equation is y = − 2
— 3
x + (− 2), or y = − 2
— 3
x − 2.
y-interceptslope
y-interceptslope
Graph the linear equation.
15. 1
— 4
x + y = 3 16. −4x + 2y = 8
17. x + 5y = 10 18. − 1
— 2
x + 1
— 8
y = 3
— 4
19. A dog kennel charges $30 per night to board your dog and $6 for each hour of playtime. The amount of money you spend is given by 30x + 6y = 180, where x is the number of nights and y is the number of hours of playtime. Graph the equation and interpret the intercepts.
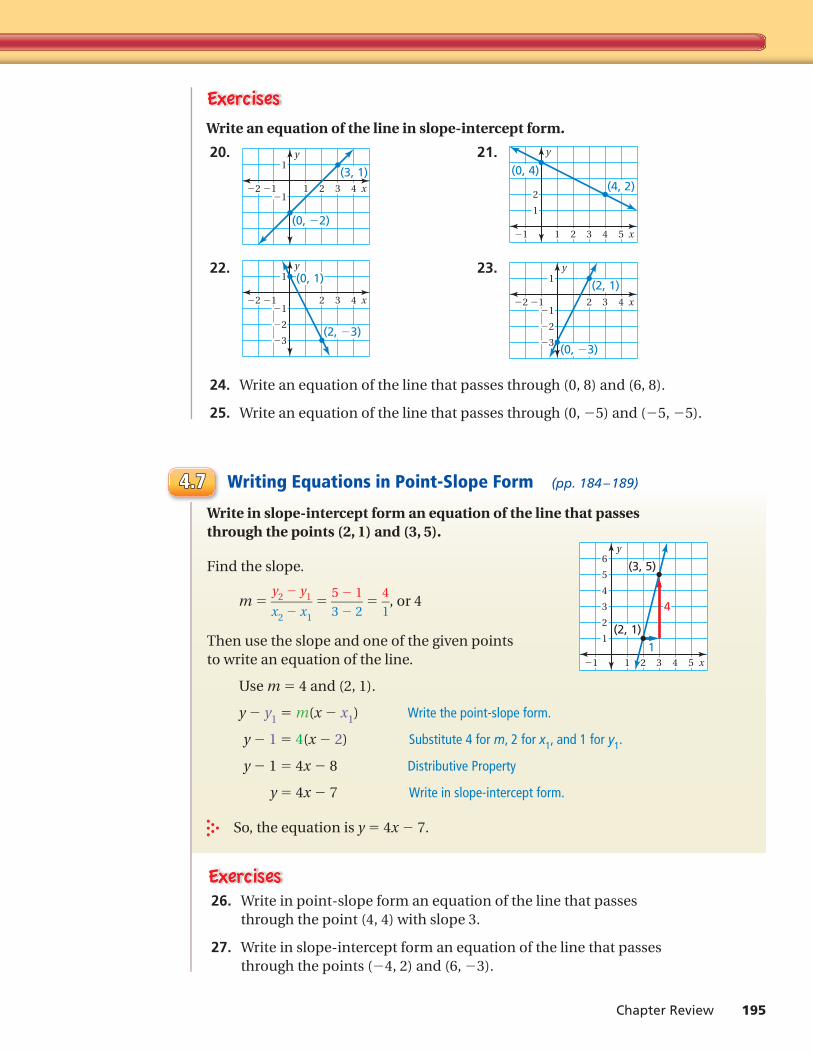
Chapter Review 195
4.74.7 Writing Equations in Point-Slope Form (pp. 184 – 189)
Write in slope-intercept form an equation of the line that passes through the points (2, 1) and (3, 5).
Find the slope.
m = y2 − y1 — x2 − x1
= 5 − 1
— 3 − 2
= 4
— 1
, or 4
Then use the slope and one of the given points to write an equation of the line.
Use m = 4 and (2, 1).
y − y1 = m(x − x1) Write the point-slope form.
y − 1 = 4(x − 2) Substitute 4 for m, 2 for x1, and 1 for y1.
y − 1 = 4x − 8 Distributive Property
y = 4x − 7 Write in slope-intercept form.
So, the equation is y = 4x − 7.
26. Write in point-slope form an equation of the line that passes through the point (4, 4) with slope 3.
27. Write in slope-intercept form an equation of the line that passes through the points (− 4, 2) and (6, − 3).
Write an equation of the line in slope-intercept form.
20.
2 3 41 x
y
121
1(3, 1)
(0, 2)
21.
2 3 4 51 x
y
1
1
2(4, 2)
(0, 4)
22.
2 3 4 x
y
12
1
2
1
3
(0, 1)
(2, 3)
23.
2 3 4 x
y
12
1
2
1
3
(2, 1)
(0, 3)
24. Write an equation of the line that passes through (0, 8) and (6, 8).
25. Write an equation of the line that passes through (0, − 5) and (− 5, − 5).
x
y
211 3 4 5
1
2
3
4
5
6
1
(2, 1)
(3, 5)
4
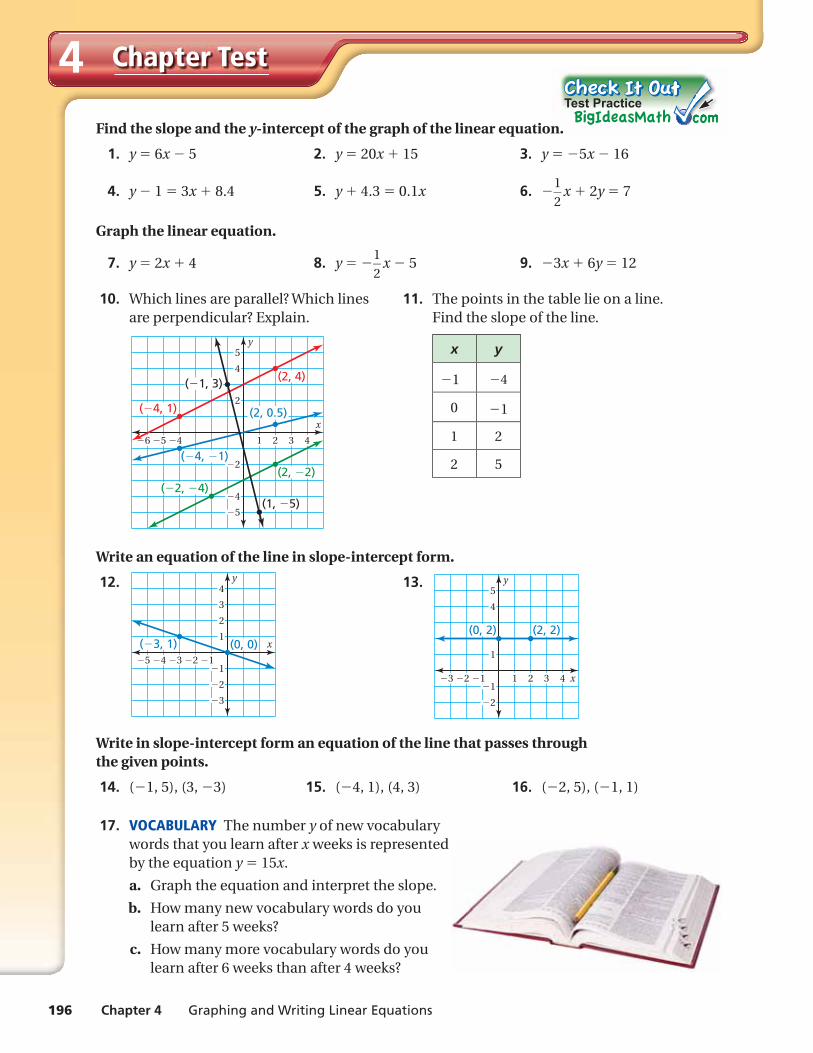
196 Chapter 4 Graphing and Writing Linear Equations
Chapter Test4Find the slope and the y-intercept of the graph of the linear equation.
1. y = 6x − 5 2. y = 20x + 15 3. y = −5x − 16
4. y − 1 = 3x + 8.4 5. y + 4.3 = 0.1x 6. − 1
— 2
x + 2y = 7
Graph the linear equation.
7. y = 2x + 4 8. y = − 1
— 2
x − 5 9. −3x + 6y = 12
10. Which lines are parallel? Which lines 11. The points in the table lie on a line. are perpendicular? Explain. Find the slope of the line.
x y
−1 −4
0 −1
1 2
2 5
2 3 41
x
y
56 4
2
4
5
5
4
2
(2, 4)
(2, 0.5)( 4, 1)
( 1, 3)
(2, 2)
(1, 5)
( 4, 1)
( 2, 4)
Write an equation of the line in slope-intercept form.
12.
x
y
12345
2
3
4
1
1
2
3
( 3, 1) (0, 0)
13.
x
y
123
4
5
1
1
2
(2, 2)(0, 2)
21 3 4
Write in slope-intercept form an equation of the line that passes through the given points.
14. (−1, 5), (3, −3) 15. (−4, 1), (4, 3) 16. (−2, 5), (−1, 1)
17. VOCABULARY The number y of new vocabulary words that you learn after x weeks is represented by the equation y = 15x.
a. Graph the equation and interpret the slope.
b. How many new vocabulary words do you learn after 5 weeks?
c. How many more vocabulary words do you learn after 6 weeks than after 4 weeks?
n.
Test Practice
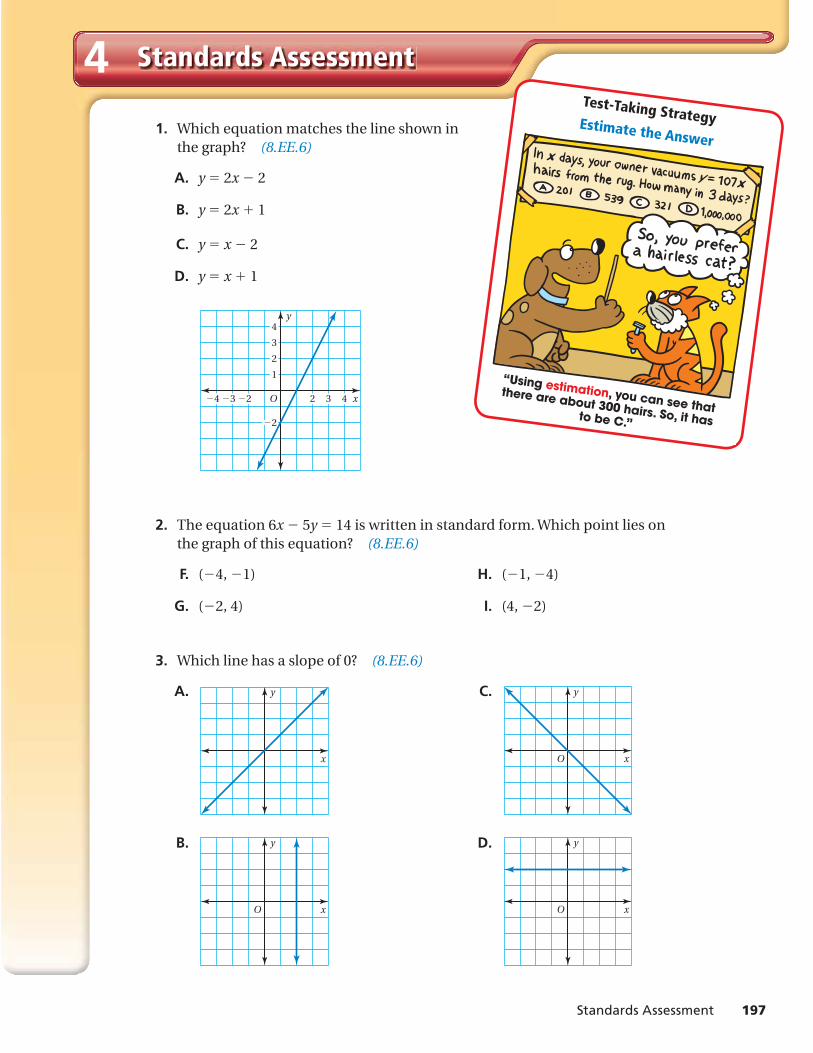
Standards Assessment 197
1. Which equation matches the line shown in the graph? (8.EE.6)
A. y = 2x − 2
B. y = 2x + 1
C. y = x − 2
D. y = x + 1
x
y
3
4
2
1
2
432O234
2. The equation 6x − 5y = 14 is written in standard form. Which point lies on the graph of this equation? (8.EE.6)
F. (− 4, − 1) H. (− 1, − 4)
G. (− 2, 4) I. (4, − 2)
3. Which line has a slope of 0? (8.EE.6)
A.
x
y C.
x
y
O
B.
x
y
O
D.
x
y
O
Standards Assessment4Test-Taking StrategyEstimate the Answer
“Using estimation, you can see that there are about 300 hairs. So, it has to be C.”
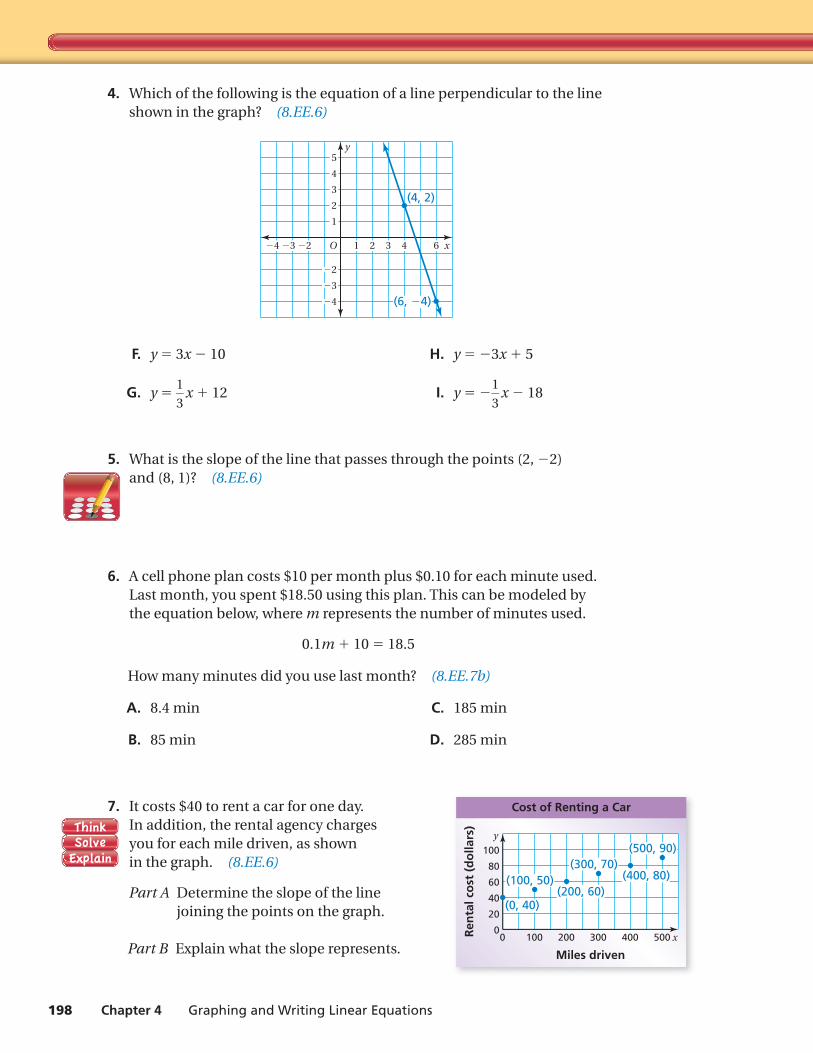
198 Chapter 4 Graphing and Writing Linear Equations
4. Which of the following is the equation of a line perpendicular to the line shown in the graph? (8.EE.6)
y
(4, 2)
(6, 4)
3
4
5
2
1
3
4
2
4 6321234 xO
F. y = 3x − 10 H. y = −3x + 5
G. y = 1
— 3
x + 12 I. y = − 1
— 3
x − 18
5. What is the slope of the line that passes through the points (2, −2) and (8, 1)? (8.EE.6)
6. A cell phone plan costs $10 per month plus $0.10 for each minute used. Last month, you spent $18.50 using this plan. This can be modeled by the equation below, where m represents the number of minutes used.
0.1m + 10 = 18.5
How many minutes did you use last month? (8.EE.7b)
A. 8.4 min C. 185 min
B. 85 min D. 285 min
7. It costs $40 to rent a car for one day. In addition, the rental agency charges you for each mile driven, as shown in the graph. (8.EE.6)
Part A Determine the slope of the line joining the points on the graph.
Part B Explain what the slope represents.0 100 200 300 400 500
0
20
40
60
80
100
Miles driven
Cost of Renting a Car
x
y
Ren
tal c
ost
(d
olla
rs)
(500, 90)
(400, 80)(200, 60)
(300, 70)
(0, 40)
(100, 50)
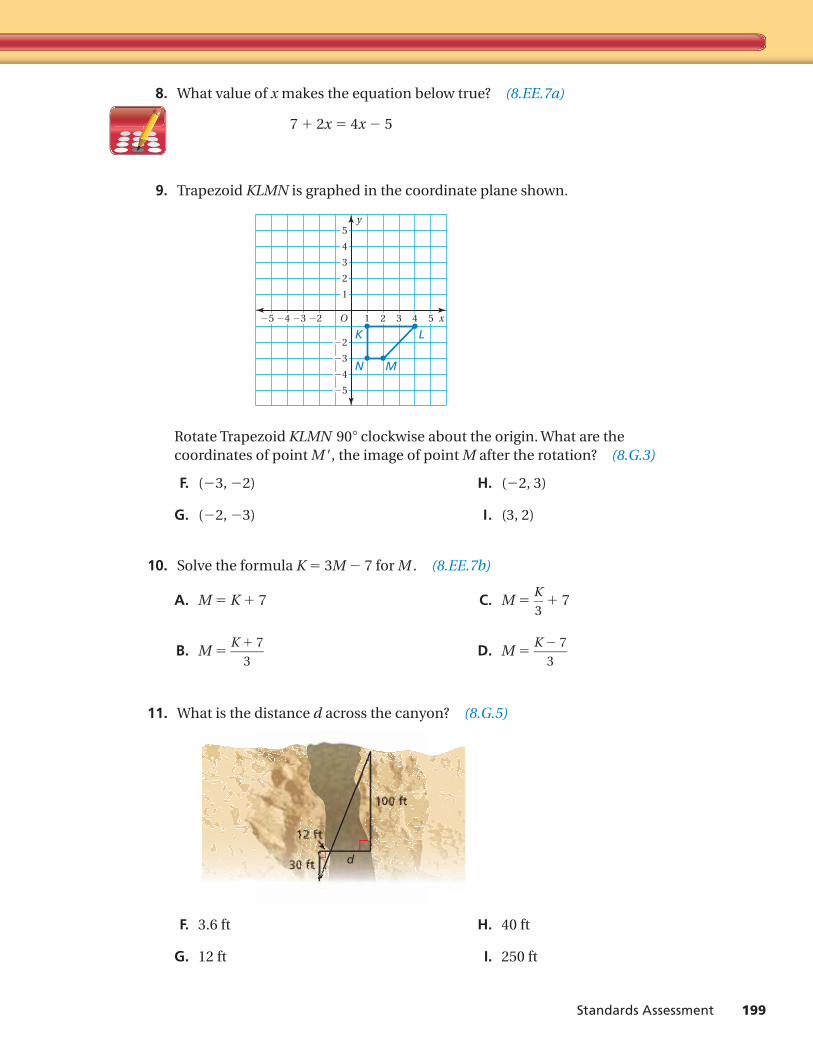
Standards Assessment 199
8. What value of x makes the equation below true? (8.EE.7a)
7 + 2x = 4x − 5
9. Trapezoid KLMN is graphed in the coordinate plane shown.
x
y
3
4
5
2
4
1
5
2
3
4 5321O2345
K
N
L
M
Rotate Trapezoid KLMN 90° clockwise about the origin. What are the coordinates of point M ′, the image of point M after the rotation? (8.G.3)
F. (−3, −2) H. (−2, 3)
G. (−2, −3) I. (3, 2)
10. Solve the formula K = 3M − 7 for M . (8.EE.7b)
A. M = K + 7 C. M = K
— 3
+ 7
B. M = K + 7
— 3
D. M = K − 7
— 3
11. What is the distance d across the canyon? (8.G.5)
d30 ft
100 ft
12 ft
F. 3.6 ft H. 40 ft
G. 12 ft I. 250 ft