government pension fund global holdings of equities - norges
TRANSCRIPT
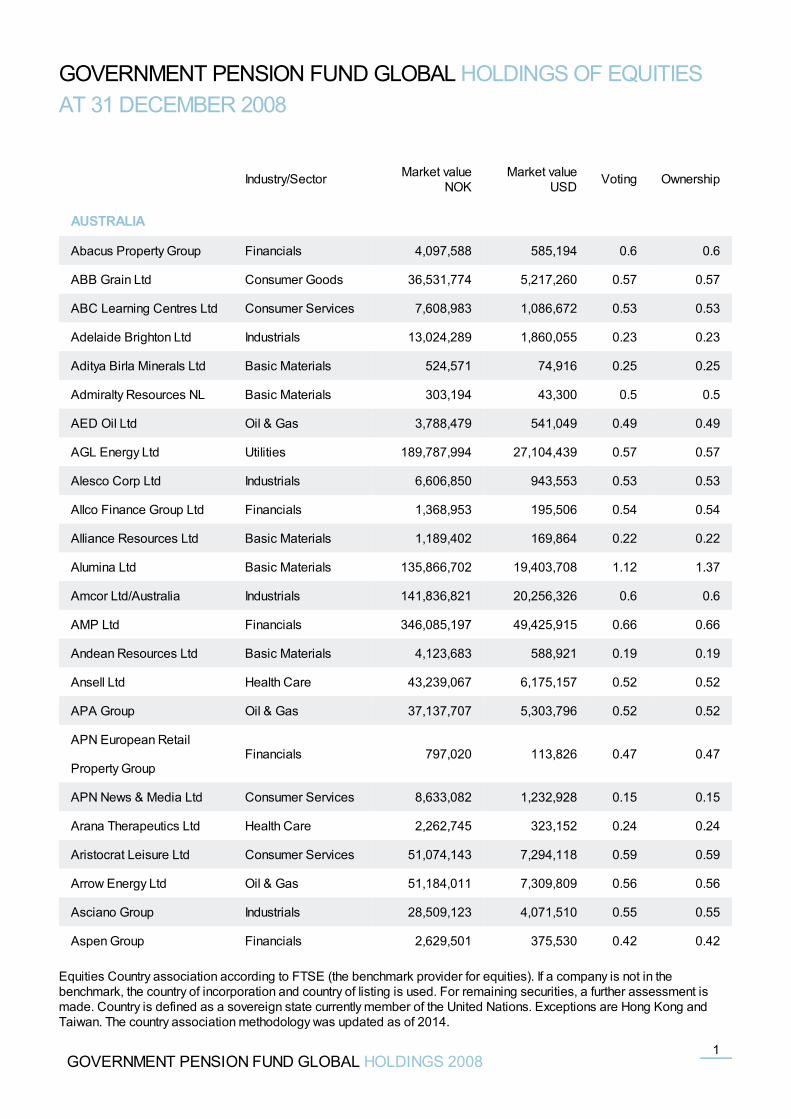
GOVERNMENT PENSION FUND GLOBAL HOLDINGS OF EQUITIESAT 31 DECEMBER 2008
Industry/Sector Market valueNOK
Market valueUSD Voting Ownership
AUSTRALIA
Abacus Property Group Financials 4,097,588 585,194 0.6 0.6
ABB Grain Ltd Consumer Goods 36,531,774 5,217,260 0.57 0.57
ABC Learning Centres Ltd Consumer Services 7,608,983 1,086,672 0.53 0.53
Adelaide Brighton Ltd Industrials 13,024,289 1,860,055 0.23 0.23
Aditya Birla Minerals Ltd Basic Materials 524,571 74,916 0.25 0.25
Admiralty Resources NL Basic Materials 303,194 43,300 0.5 0.5
AED Oil Ltd Oil & Gas 3,788,479 541,049 0.49 0.49
AGL Energy Ltd Utilities 189,787,994 27,104,439 0.57 0.57
Alesco Corp Ltd Industrials 6,606,850 943,553 0.53 0.53
Allco Finance Group Ltd Financials 1,368,953 195,506 0.54 0.54
Alliance Resources Ltd Basic Materials 1,189,402 169,864 0.22 0.22
Alumina Ltd Basic Materials 135,866,702 19,403,708 1.12 1.37
Amcor Ltd/Australia Industrials 141,836,821 20,256,326 0.6 0.6
AMP Ltd Financials 346,085,197 49,425,915 0.66 0.66
Andean Resources Ltd Basic Materials 4,123,683 588,921 0.19 0.19
Ansell Ltd Health Care 43,239,067 6,175,157 0.52 0.52
APA Group Oil & Gas 37,137,707 5,303,796 0.52 0.52
APN European Retail
Property GroupFinancials 797,020 113,826 0.47 0.47
APN News & Media Ltd Consumer Services 8,633,082 1,232,928 0.15 0.15
Arana Therapeutics Ltd Health Care 2,262,745 323,152 0.24 0.24
Aristocrat Leisure Ltd Consumer Services 51,074,143 7,294,118 0.59 0.59
Arrow Energy Ltd Oil & Gas 51,184,011 7,309,809 0.56 0.56
Asciano Group Industrials 28,509,123 4,071,510 0.55 0.55
Aspen Group Financials 2,629,501 375,530 0.42 0.42
GOVERNMENT PENSION FUND GLOBAL HOLDINGS 20081
Equities Country association according to FTSE (the benchmark provider for equities). If a company is not in thebenchmark, the country of incorporation and country of listing is used. For remaining securities, a further assessment ismade. Country is defined as a sovereign state currently member of the United Nations. Exceptions are Hong Kong andTaiwan. The country association methodology was updated as of 2014.
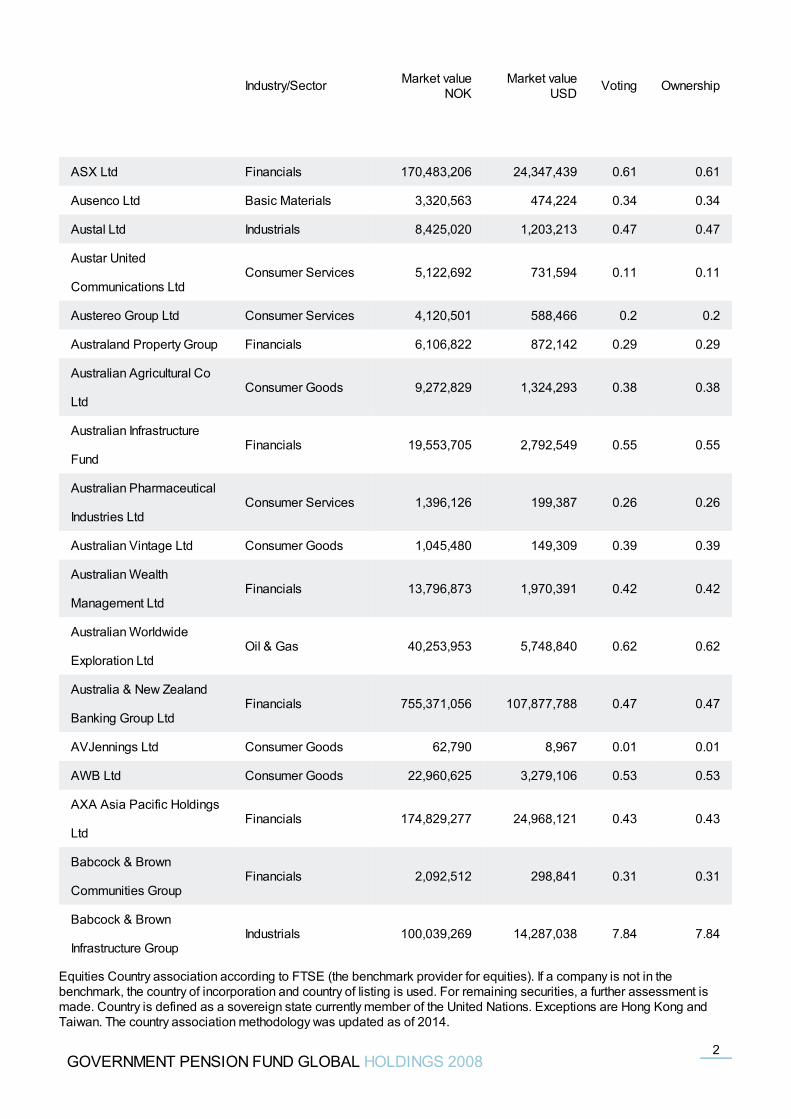
ASX Ltd Financials 170,483,206 24,347,439 0.61 0.61
Ausenco Ltd Basic Materials 3,320,563 474,224 0.34 0.34
Austal Ltd Industrials 8,425,020 1,203,213 0.47 0.47
Austar United
Communications LtdConsumer Services 5,122,692 731,594 0.11 0.11
Austereo Group Ltd Consumer Services 4,120,501 588,466 0.2 0.2
Australand Property Group Financials 6,106,822 872,142 0.29 0.29
Australian Agricultural Co
LtdConsumer Goods 9,272,829 1,324,293 0.38 0.38
Australian Infrastructure
FundFinancials 19,553,705 2,792,549 0.55 0.55
Australian Pharmaceutical
Industries LtdConsumer Services 1,396,126 199,387 0.26 0.26
Australian Vintage Ltd Consumer Goods 1,045,480 149,309 0.39 0.39
Australian Wealth
Management LtdFinancials 13,796,873 1,970,391 0.42 0.42
Australian Worldwide
Exploration LtdOil & Gas 40,253,953 5,748,840 0.62 0.62
Australia & New Zealand
Banking Group LtdFinancials 755,371,056 107,877,788 0.47 0.47
AVJennings Ltd Consumer Goods 62,790 8,967 0.01 0.01
AWB Ltd Consumer Goods 22,960,625 3,279,106 0.53 0.53
AXA Asia Pacific Holdings
LtdFinancials 174,829,277 24,968,121 0.43 0.43
Babcock & Brown
Communities GroupFinancials 2,092,512 298,841 0.31 0.31
Babcock & Brown
Infrastructure GroupIndustrials 100,039,269 14,287,038 7.84 7.84
Industry/Sector Market valueNOK
Market valueUSD Voting Ownership
GOVERNMENT PENSION FUND GLOBAL HOLDINGS 20082
Equities Country association according to FTSE (the benchmark provider for equities). If a company is not in thebenchmark, the country of incorporation and country of listing is used. For remaining securities, a further assessment ismade. Country is defined as a sovereign state currently member of the United Nations. Exceptions are Hong Kong andTaiwan. The country association methodology was updated as of 2014.
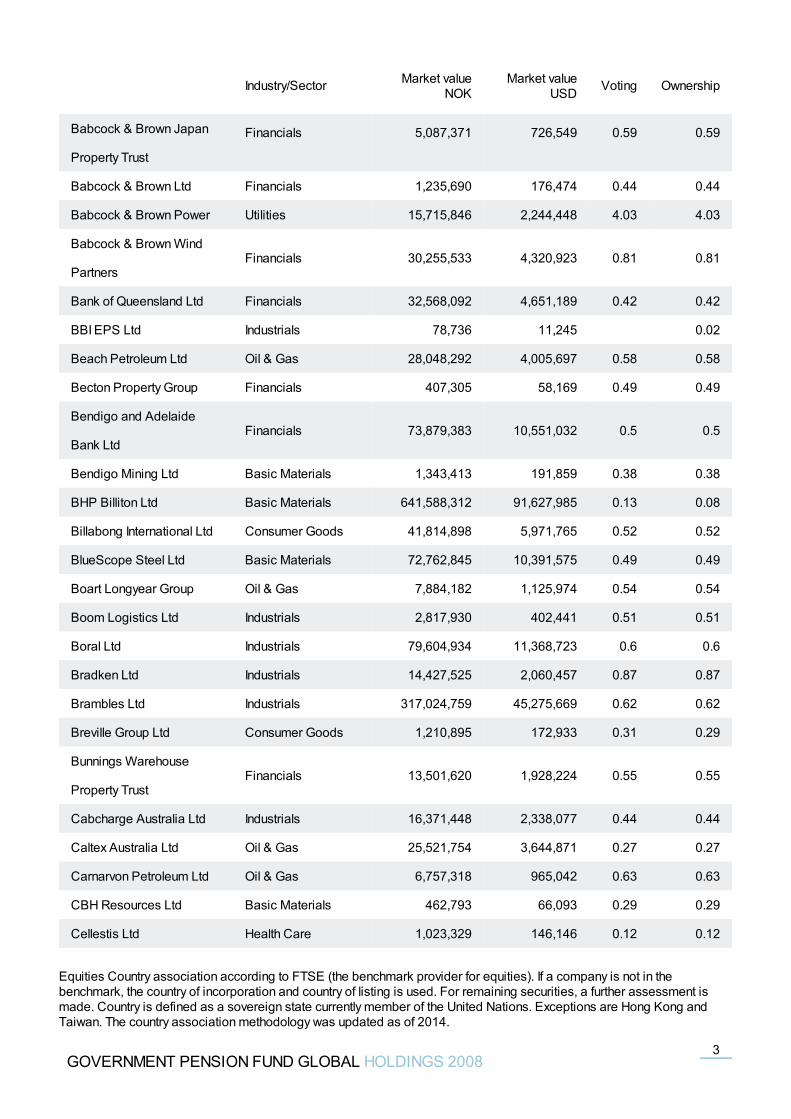
Babcock & Brown Japan
Property Trust
Financials 5,087,371 726,549 0.59 0.59
Babcock & Brown Ltd Financials 1,235,690 176,474 0.44 0.44
Babcock & Brown Power Utilities 15,715,846 2,244,448 4.03 4.03
Babcock & Brown Wind
PartnersFinancials 30,255,533 4,320,923 0.81 0.81
Bank of Queensland Ltd Financials 32,568,092 4,651,189 0.42 0.42
BBI EPS Ltd Industrials 78,736 11,245 0.02
Beach Petroleum Ltd Oil & Gas 28,048,292 4,005,697 0.58 0.58
Becton Property Group Financials 407,305 58,169 0.49 0.49
Bendigo and Adelaide
Bank LtdFinancials 73,879,383 10,551,032 0.5 0.5
Bendigo Mining Ltd Basic Materials 1,343,413 191,859 0.38 0.38
BHP Billiton Ltd Basic Materials 641,588,312 91,627,985 0.13 0.08
Billabong International Ltd Consumer Goods 41,814,898 5,971,765 0.52 0.52
BlueScope Steel Ltd Basic Materials 72,762,845 10,391,575 0.49 0.49
Boart Longyear Group Oil & Gas 7,884,182 1,125,974 0.54 0.54
Boom Logistics Ltd Industrials 2,817,930 402,441 0.51 0.51
Boral Ltd Industrials 79,604,934 11,368,723 0.6 0.6
Bradken Ltd Industrials 14,427,525 2,060,457 0.87 0.87
Brambles Ltd Industrials 317,024,759 45,275,669 0.62 0.62
Breville Group Ltd Consumer Goods 1,210,895 172,933 0.31 0.29
Bunnings Warehouse
Property TrustFinancials 13,501,620 1,928,224 0.55 0.55
Cabcharge Australia Ltd Industrials 16,371,448 2,338,077 0.44 0.44
Caltex Australia Ltd Oil & Gas 25,521,754 3,644,871 0.27 0.27
Carnarvon Petroleum Ltd Oil & Gas 6,757,318 965,042 0.63 0.63
CBH Resources Ltd Basic Materials 462,793 66,093 0.29 0.29
Cellestis Ltd Health Care 1,023,329 146,146 0.12 0.12
Industry/Sector Market valueNOK
Market valueUSD Voting Ownership
GOVERNMENT PENSION FUND GLOBAL HOLDINGS 20083
Equities Country association according to FTSE (the benchmark provider for equities). If a company is not in thebenchmark, the country of incorporation and country of listing is used. For remaining securities, a further assessment ismade. Country is defined as a sovereign state currently member of the United Nations. Exceptions are Hong Kong andTaiwan. The country association methodology was updated as of 2014.
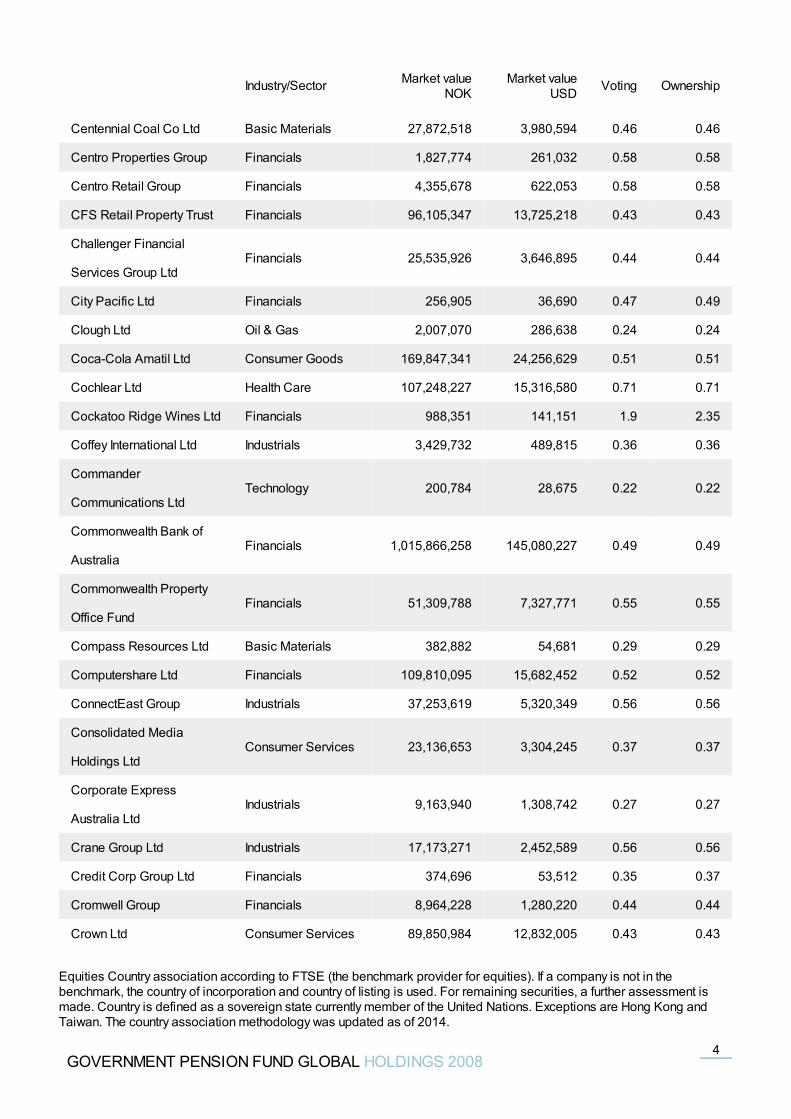
Centennial Coal Co Ltd Basic Materials 27,872,518 3,980,594 0.46 0.46
Centro Properties Group Financials 1,827,774 261,032 0.58 0.58
Centro Retail Group Financials 4,355,678 622,053 0.58 0.58
CFS Retail Property Trust Financials 96,105,347 13,725,218 0.43 0.43
Challenger Financial
Services Group LtdFinancials 25,535,926 3,646,895 0.44 0.44
City Pacific Ltd Financials 256,905 36,690 0.47 0.49
Clough Ltd Oil & Gas 2,007,070 286,638 0.24 0.24
Coca-Cola Amatil Ltd Consumer Goods 169,847,341 24,256,629 0.51 0.51
Cochlear Ltd Health Care 107,248,227 15,316,580 0.71 0.71
Cockatoo Ridge Wines Ltd Financials 988,351 141,151 1.9 2.35
Coffey International Ltd Industrials 3,429,732 489,815 0.36 0.36
Commander
Communications LtdTechnology 200,784 28,675 0.22 0.22
Commonwealth Bank of
AustraliaFinancials 1,015,866,258 145,080,227 0.49 0.49
Commonwealth Property
Office FundFinancials 51,309,788 7,327,771 0.55 0.55
Compass Resources Ltd Basic Materials 382,882 54,681 0.29 0.29
Computershare Ltd Financials 109,810,095 15,682,452 0.52 0.52
ConnectEast Group Industrials 37,253,619 5,320,349 0.56 0.56
Consolidated Media
Holdings LtdConsumer Services 23,136,653 3,304,245 0.37 0.37
Corporate Express
Australia LtdIndustrials 9,163,940 1,308,742 0.27 0.27
Crane Group Ltd Industrials 17,173,271 2,452,589 0.56 0.56
Credit Corp Group Ltd Financials 374,696 53,512 0.35 0.37
Cromwell Group Financials 8,964,228 1,280,220 0.44 0.44
Crown Ltd Consumer Services 89,850,984 12,832,005 0.43 0.43
Industry/Sector Market valueNOK
Market valueUSD Voting Ownership
GOVERNMENT PENSION FUND GLOBAL HOLDINGS 20084
Equities Country association according to FTSE (the benchmark provider for equities). If a company is not in thebenchmark, the country of incorporation and country of listing is used. For remaining securities, a further assessment ismade. Country is defined as a sovereign state currently member of the United Nations. Exceptions are Hong Kong andTaiwan. The country association methodology was updated as of 2014.
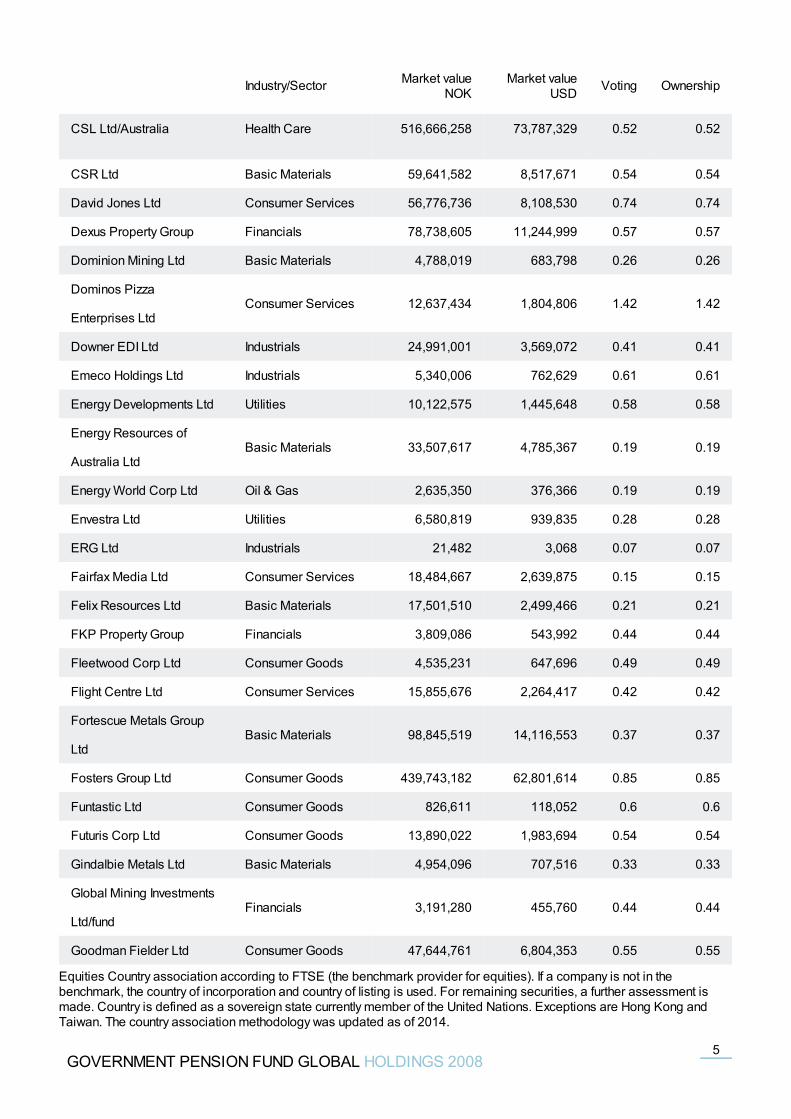
CSL Ltd/Australia Health Care 516,666,258 73,787,329 0.52 0.52
CSR Ltd Basic Materials 59,641,582 8,517,671 0.54 0.54
David Jones Ltd Consumer Services 56,776,736 8,108,530 0.74 0.74
Dexus Property Group Financials 78,738,605 11,244,999 0.57 0.57
Dominion Mining Ltd Basic Materials 4,788,019 683,798 0.26 0.26
Dominos Pizza
Enterprises LtdConsumer Services 12,637,434 1,804,806 1.42 1.42
Downer EDI Ltd Industrials 24,991,001 3,569,072 0.41 0.41
Emeco Holdings Ltd Industrials 5,340,006 762,629 0.61 0.61
Energy Developments Ltd Utilities 10,122,575 1,445,648 0.58 0.58
Energy Resources of
Australia LtdBasic Materials 33,507,617 4,785,367 0.19 0.19
Energy World Corp Ltd Oil & Gas 2,635,350 376,366 0.19 0.19
Envestra Ltd Utilities 6,580,819 939,835 0.28 0.28
ERG Ltd Industrials 21,482 3,068 0.07 0.07
Fairfax Media Ltd Consumer Services 18,484,667 2,639,875 0.15 0.15
Felix Resources Ltd Basic Materials 17,501,510 2,499,466 0.21 0.21
FKP Property Group Financials 3,809,086 543,992 0.44 0.44
Fleetwood Corp Ltd Consumer Goods 4,535,231 647,696 0.49 0.49
Flight Centre Ltd Consumer Services 15,855,676 2,264,417 0.42 0.42
Fortescue Metals Group
LtdBasic Materials 98,845,519 14,116,553 0.37 0.37
Fosters Group Ltd Consumer Goods 439,743,182 62,801,614 0.85 0.85
Funtastic Ltd Consumer Goods 826,611 118,052 0.6 0.6
Futuris Corp Ltd Consumer Goods 13,890,022 1,983,694 0.54 0.54
Gindalbie Metals Ltd Basic Materials 4,954,096 707,516 0.33 0.33
Global Mining Investments
Ltd/fundFinancials 3,191,280 455,760 0.44 0.44
Goodman Fielder Ltd Consumer Goods 47,644,761 6,804,353 0.55 0.55
Industry/Sector Market valueNOK
Market valueUSD Voting Ownership
GOVERNMENT PENSION FUND GLOBAL HOLDINGS 20085
Equities Country association according to FTSE (the benchmark provider for equities). If a company is not in thebenchmark, the country of incorporation and country of listing is used. For remaining securities, a further assessment ismade. Country is defined as a sovereign state currently member of the United Nations. Exceptions are Hong Kong andTaiwan. The country association methodology was updated as of 2014.
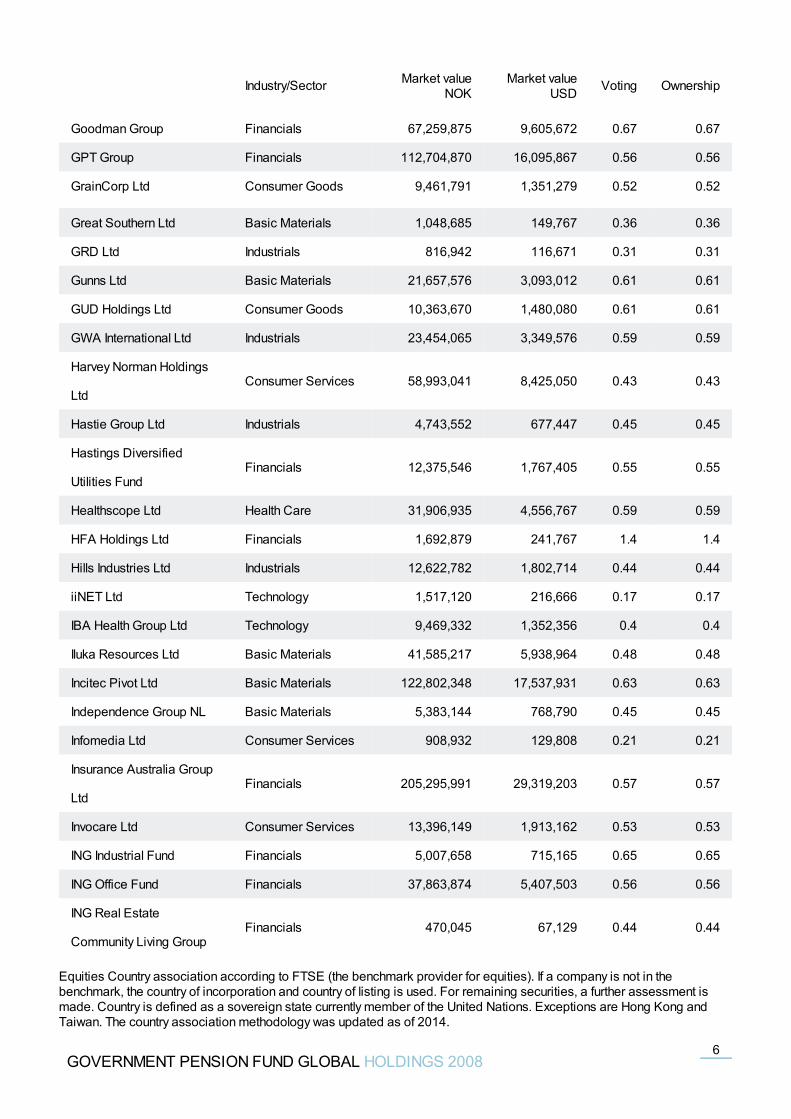
Goodman Group Financials 67,259,875 9,605,672 0.67 0.67
GPT Group Financials 112,704,870 16,095,867 0.56 0.56
GrainCorp Ltd Consumer Goods 9,461,791 1,351,279 0.52 0.52
Great Southern Ltd Basic Materials 1,048,685 149,767 0.36 0.36
GRD Ltd Industrials 816,942 116,671 0.31 0.31
Gunns Ltd Basic Materials 21,657,576 3,093,012 0.61 0.61
GUD Holdings Ltd Consumer Goods 10,363,670 1,480,080 0.61 0.61
GWA International Ltd Industrials 23,454,065 3,349,576 0.59 0.59
Harvey Norman Holdings
LtdConsumer Services 58,993,041 8,425,050 0.43 0.43
Hastie Group Ltd Industrials 4,743,552 677,447 0.45 0.45
Hastings Diversified
Utilities FundFinancials 12,375,546 1,767,405 0.55 0.55
Healthscope Ltd Health Care 31,906,935 4,556,767 0.59 0.59
HFA Holdings Ltd Financials 1,692,879 241,767 1.4 1.4
Hills Industries Ltd Industrials 12,622,782 1,802,714 0.44 0.44
iiNET Ltd Technology 1,517,120 216,666 0.17 0.17
IBA Health Group Ltd Technology 9,469,332 1,352,356 0.4 0.4
Iluka Resources Ltd Basic Materials 41,585,217 5,938,964 0.48 0.48
Incitec Pivot Ltd Basic Materials 122,802,348 17,537,931 0.63 0.63
Independence Group NL Basic Materials 5,383,144 768,790 0.45 0.45
Infomedia Ltd Consumer Services 908,932 129,808 0.21 0.21
Insurance Australia Group
LtdFinancials 205,295,991 29,319,203 0.57 0.57
Invocare Ltd Consumer Services 13,396,149 1,913,162 0.53 0.53
ING Industrial Fund Financials 5,007,658 715,165 0.65 0.65
ING Office Fund Financials 37,863,874 5,407,503 0.56 0.56
ING Real Estate
Community Living GroupFinancials 470,045 67,129 0.44 0.44
Industry/Sector Market valueNOK
Market valueUSD Voting Ownership
GOVERNMENT PENSION FUND GLOBAL HOLDINGS 20086
Equities Country association according to FTSE (the benchmark provider for equities). If a company is not in thebenchmark, the country of incorporation and country of listing is used. For remaining securities, a further assessment ismade. Country is defined as a sovereign state currently member of the United Nations. Exceptions are Hong Kong andTaiwan. The country association methodology was updated as of 2014.
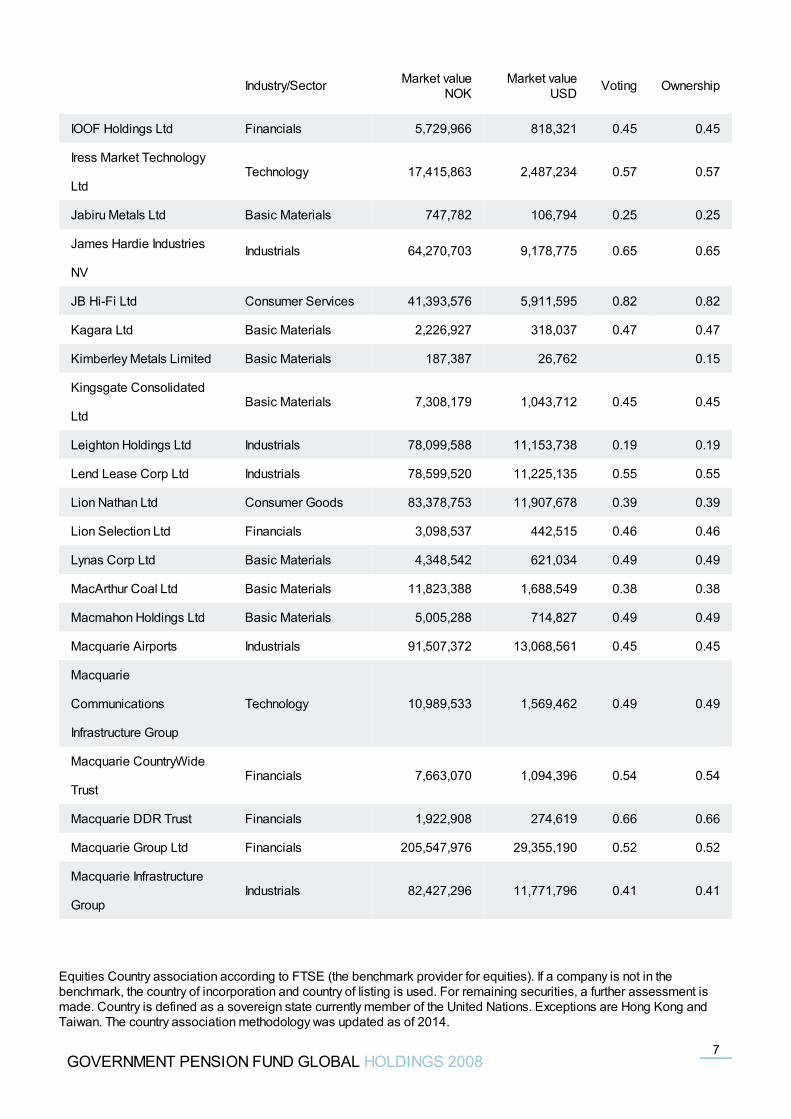
IOOF Holdings Ltd Financials 5,729,966 818,321 0.45 0.45
Iress Market Technology
LtdTechnology 17,415,863 2,487,234 0.57 0.57
Jabiru Metals Ltd Basic Materials 747,782 106,794 0.25 0.25
James Hardie Industries
NVIndustrials 64,270,703 9,178,775 0.65 0.65
JB Hi-Fi Ltd Consumer Services 41,393,576 5,911,595 0.82 0.82
Kagara Ltd Basic Materials 2,226,927 318,037 0.47 0.47
Kimberley Metals Limited Basic Materials 187,387 26,762 0.15
Kingsgate Consolidated
LtdBasic Materials 7,308,179 1,043,712 0.45 0.45
Leighton Holdings Ltd Industrials 78,099,588 11,153,738 0.19 0.19
Lend Lease Corp Ltd Industrials 78,599,520 11,225,135 0.55 0.55
Lion Nathan Ltd Consumer Goods 83,378,753 11,907,678 0.39 0.39
Lion Selection Ltd Financials 3,098,537 442,515 0.46 0.46
Lynas Corp Ltd Basic Materials 4,348,542 621,034 0.49 0.49
MacArthur Coal Ltd Basic Materials 11,823,388 1,688,549 0.38 0.38
Macmahon Holdings Ltd Basic Materials 5,005,288 714,827 0.49 0.49
Macquarie Airports Industrials 91,507,372 13,068,561 0.45 0.45
Macquarie
Communications
Infrastructure Group
Technology 10,989,533 1,569,462 0.49 0.49
Macquarie CountryWide
TrustFinancials 7,663,070 1,094,396 0.54 0.54
Macquarie DDR Trust Financials 1,922,908 274,619 0.66 0.66
Macquarie Group Ltd Financials 205,547,976 29,355,190 0.52 0.52
Macquarie Infrastructure
GroupIndustrials 82,427,296 11,771,796 0.41 0.41
Industry/Sector Market valueNOK
Market valueUSD Voting Ownership
GOVERNMENT PENSION FUND GLOBAL HOLDINGS 20087
Equities Country association according to FTSE (the benchmark provider for equities). If a company is not in thebenchmark, the country of incorporation and country of listing is used. For remaining securities, a further assessment ismade. Country is defined as a sovereign state currently member of the United Nations. Exceptions are Hong Kong andTaiwan. The country association methodology was updated as of 2014.
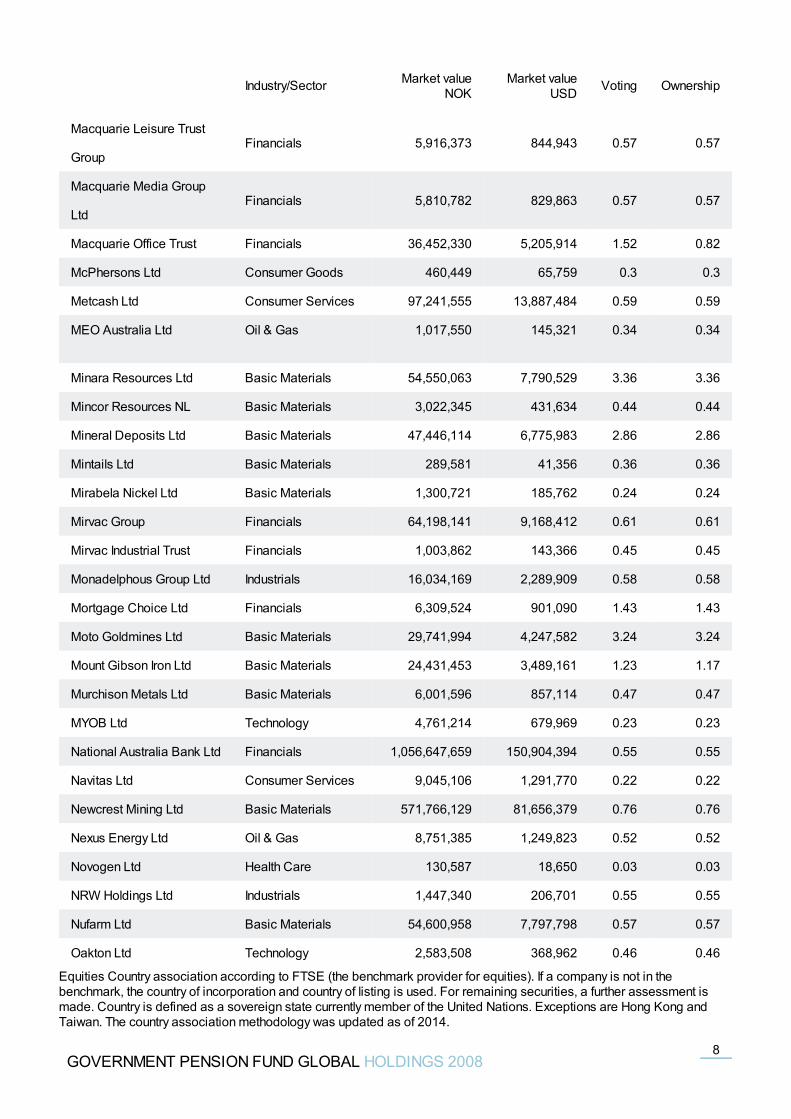
Macquarie Leisure Trust
GroupFinancials 5,916,373 844,943 0.57 0.57
Macquarie Media Group
LtdFinancials 5,810,782 829,863 0.57 0.57
Macquarie Office Trust Financials 36,452,330 5,205,914 1.52 0.82
McPhersons Ltd Consumer Goods 460,449 65,759 0.3 0.3
Metcash Ltd Consumer Services 97,241,555 13,887,484 0.59 0.59
MEO Australia Ltd Oil & Gas 1,017,550 145,321 0.34 0.34
Minara Resources Ltd Basic Materials 54,550,063 7,790,529 3.36 3.36
Mincor Resources NL Basic Materials 3,022,345 431,634 0.44 0.44
Mineral Deposits Ltd Basic Materials 47,446,114 6,775,983 2.86 2.86
Mintails Ltd Basic Materials 289,581 41,356 0.36 0.36
Mirabela Nickel Ltd Basic Materials 1,300,721 185,762 0.24 0.24
Mirvac Group Financials 64,198,141 9,168,412 0.61 0.61
Mirvac Industrial Trust Financials 1,003,862 143,366 0.45 0.45
Monadelphous Group Ltd Industrials 16,034,169 2,289,909 0.58 0.58
Mortgage Choice Ltd Financials 6,309,524 901,090 1.43 1.43
Moto Goldmines Ltd Basic Materials 29,741,994 4,247,582 3.24 3.24
Mount Gibson Iron Ltd Basic Materials 24,431,453 3,489,161 1.23 1.17
Murchison Metals Ltd Basic Materials 6,001,596 857,114 0.47 0.47
MYOB Ltd Technology 4,761,214 679,969 0.23 0.23
National Australia Bank Ltd Financials 1,056,647,659 150,904,394 0.55 0.55
Navitas Ltd Consumer Services 9,045,106 1,291,770 0.22 0.22
Newcrest Mining Ltd Basic Materials 571,766,129 81,656,379 0.76 0.76
Nexus Energy Ltd Oil & Gas 8,751,385 1,249,823 0.52 0.52
Novogen Ltd Health Care 130,587 18,650 0.03 0.03
NRW Holdings Ltd Industrials 1,447,340 206,701 0.55 0.55
Nufarm Ltd Basic Materials 54,600,958 7,797,798 0.57 0.57
Oakton Ltd Technology 2,583,508 368,962 0.46 0.46
Industry/Sector Market valueNOK
Market valueUSD Voting Ownership
GOVERNMENT PENSION FUND GLOBAL HOLDINGS 20088
Equities Country association according to FTSE (the benchmark provider for equities). If a company is not in thebenchmark, the country of incorporation and country of listing is used. For remaining securities, a further assessment ismade. Country is defined as a sovereign state currently member of the United Nations. Exceptions are Hong Kong andTaiwan. The country association methodology was updated as of 2014.
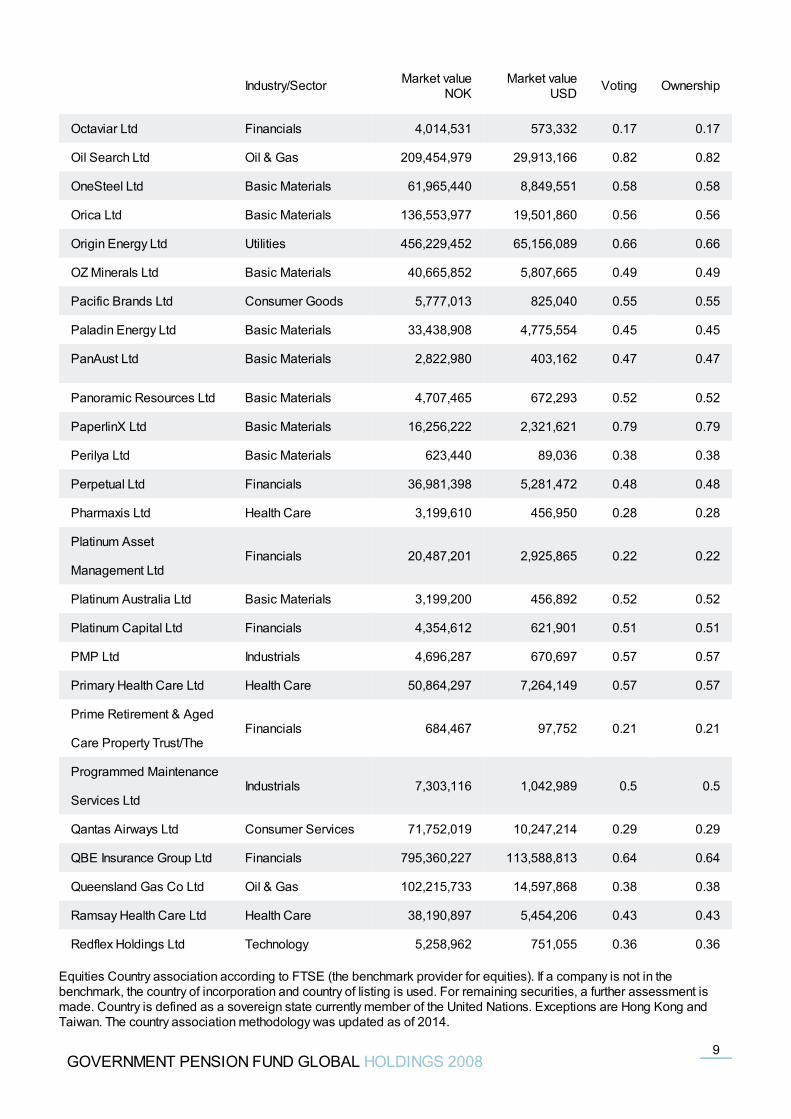
Octaviar Ltd Financials 4,014,531 573,332 0.17 0.17
Oil Search Ltd Oil & Gas 209,454,979 29,913,166 0.82 0.82
OneSteel Ltd Basic Materials 61,965,440 8,849,551 0.58 0.58
Orica Ltd Basic Materials 136,553,977 19,501,860 0.56 0.56
Origin Energy Ltd Utilities 456,229,452 65,156,089 0.66 0.66
OZ Minerals Ltd Basic Materials 40,665,852 5,807,665 0.49 0.49
Pacific Brands Ltd Consumer Goods 5,777,013 825,040 0.55 0.55
Paladin Energy Ltd Basic Materials 33,438,908 4,775,554 0.45 0.45
PanAust Ltd Basic Materials 2,822,980 403,162 0.47 0.47
Panoramic Resources Ltd Basic Materials 4,707,465 672,293 0.52 0.52
PaperlinX Ltd Basic Materials 16,256,222 2,321,621 0.79 0.79
Perilya Ltd Basic Materials 623,440 89,036 0.38 0.38
Perpetual Ltd Financials 36,981,398 5,281,472 0.48 0.48
Pharmaxis Ltd Health Care 3,199,610 456,950 0.28 0.28
Platinum Asset
Management LtdFinancials 20,487,201 2,925,865 0.22 0.22
Platinum Australia Ltd Basic Materials 3,199,200 456,892 0.52 0.52
Platinum Capital Ltd Financials 4,354,612 621,901 0.51 0.51
PMP Ltd Industrials 4,696,287 670,697 0.57 0.57
Primary Health Care Ltd Health Care 50,864,297 7,264,149 0.57 0.57
Prime Retirement & Aged
Care Property Trust/TheFinancials 684,467 97,752 0.21 0.21
Programmed Maintenance
Services LtdIndustrials 7,303,116 1,042,989 0.5 0.5
Qantas Airways Ltd Consumer Services 71,752,019 10,247,214 0.29 0.29
QBE Insurance Group Ltd Financials 795,360,227 113,588,813 0.64 0.64
Queensland Gas Co Ltd Oil & Gas 102,215,733 14,597,868 0.38 0.38
Ramsay Health Care Ltd Health Care 38,190,897 5,454,206 0.43 0.43
Redflex Holdings Ltd Technology 5,258,962 751,055 0.36 0.36
Industry/Sector Market valueNOK
Market valueUSD Voting Ownership
GOVERNMENT PENSION FUND GLOBAL HOLDINGS 20089
Equities Country association according to FTSE (the benchmark provider for equities). If a company is not in thebenchmark, the country of incorporation and country of listing is used. For remaining securities, a further assessment ismade. Country is defined as a sovereign state currently member of the United Nations. Exceptions are Hong Kong andTaiwan. The country association methodology was updated as of 2014.
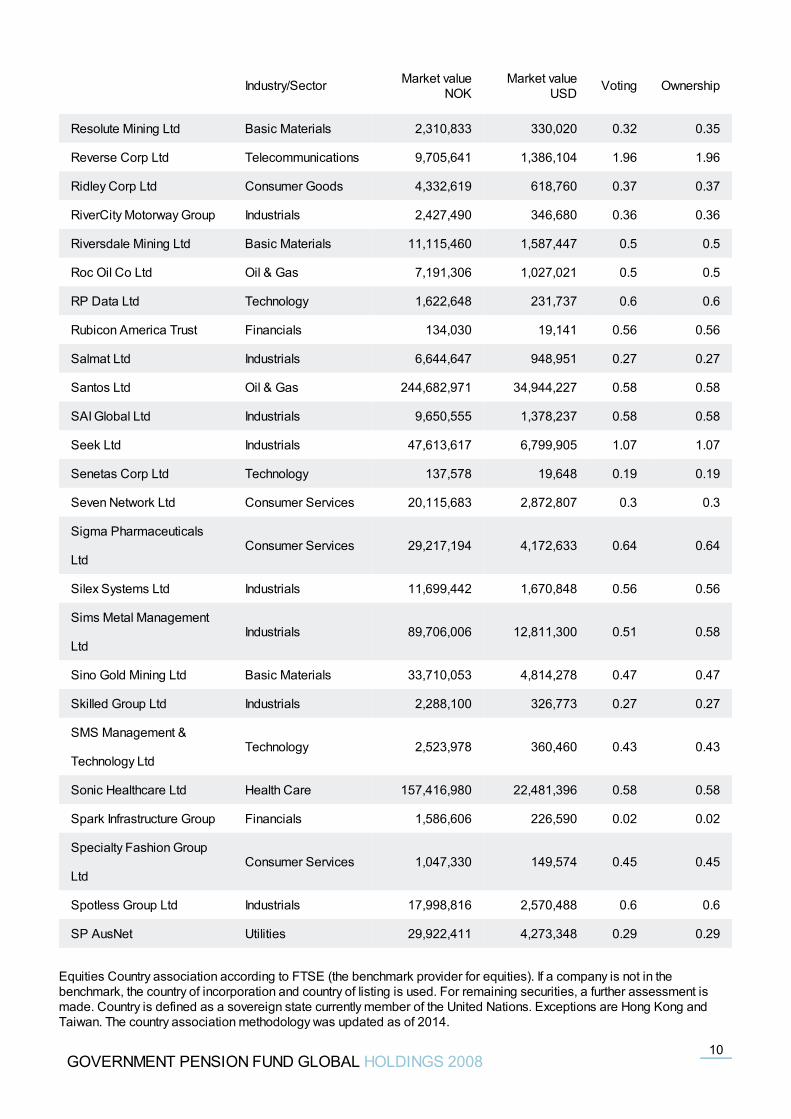
Resolute Mining Ltd Basic Materials 2,310,833 330,020 0.32 0.35
Reverse Corp Ltd Telecommunications 9,705,641 1,386,104 1.96 1.96
Ridley Corp Ltd Consumer Goods 4,332,619 618,760 0.37 0.37
RiverCity Motorway Group Industrials 2,427,490 346,680 0.36 0.36
Riversdale Mining Ltd Basic Materials 11,115,460 1,587,447 0.5 0.5
Roc Oil Co Ltd Oil & Gas 7,191,306 1,027,021 0.5 0.5
RP Data Ltd Technology 1,622,648 231,737 0.6 0.6
Rubicon America Trust Financials 134,030 19,141 0.56 0.56
Salmat Ltd Industrials 6,644,647 948,951 0.27 0.27
Santos Ltd Oil & Gas 244,682,971 34,944,227 0.58 0.58
SAI Global Ltd Industrials 9,650,555 1,378,237 0.58 0.58
Seek Ltd Industrials 47,613,617 6,799,905 1.07 1.07
Senetas Corp Ltd Technology 137,578 19,648 0.19 0.19
Seven Network Ltd Consumer Services 20,115,683 2,872,807 0.3 0.3
Sigma Pharmaceuticals
LtdConsumer Services 29,217,194 4,172,633 0.64 0.64
Silex Systems Ltd Industrials 11,699,442 1,670,848 0.56 0.56
Sims Metal Management
LtdIndustrials 89,706,006 12,811,300 0.51 0.58
Sino Gold Mining Ltd Basic Materials 33,710,053 4,814,278 0.47 0.47
Skilled Group Ltd Industrials 2,288,100 326,773 0.27 0.27
SMS Management &
Technology LtdTechnology 2,523,978 360,460 0.43 0.43
Sonic Healthcare Ltd Health Care 157,416,980 22,481,396 0.58 0.58
Spark Infrastructure Group Financials 1,586,606 226,590 0.02 0.02
Specialty Fashion Group
LtdConsumer Services 1,047,330 149,574 0.45 0.45
Spotless Group Ltd Industrials 17,998,816 2,570,488 0.6 0.6
SP AusNet Utilities 29,922,411 4,273,348 0.29 0.29
Industry/Sector Market valueNOK
Market valueUSD Voting Ownership
GOVERNMENT PENSION FUND GLOBAL HOLDINGS 200810
Equities Country association according to FTSE (the benchmark provider for equities). If a company is not in thebenchmark, the country of incorporation and country of listing is used. For remaining securities, a further assessment ismade. Country is defined as a sovereign state currently member of the United Nations. Exceptions are Hong Kong andTaiwan. The country association methodology was updated as of 2014.
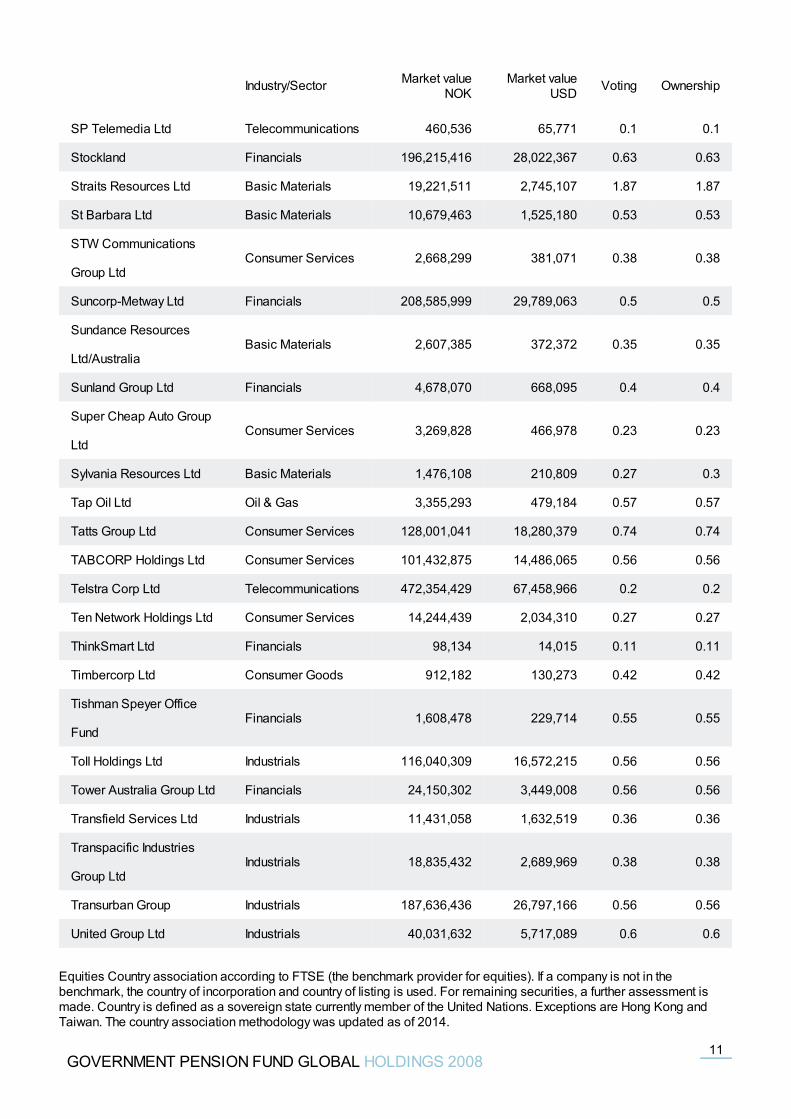
SP Telemedia Ltd Telecommunications 460,536 65,771 0.1 0.1
Stockland Financials 196,215,416 28,022,367 0.63 0.63
Straits Resources Ltd Basic Materials 19,221,511 2,745,107 1.87 1.87
St Barbara Ltd Basic Materials 10,679,463 1,525,180 0.53 0.53
STW Communications
Group LtdConsumer Services 2,668,299 381,071 0.38 0.38
Suncorp-Metway Ltd Financials 208,585,999 29,789,063 0.5 0.5
Sundance Resources
Ltd/AustraliaBasic Materials 2,607,385 372,372 0.35 0.35
Sunland Group Ltd Financials 4,678,070 668,095 0.4 0.4
Super Cheap Auto Group
LtdConsumer Services 3,269,828 466,978 0.23 0.23
Sylvania Resources Ltd Basic Materials 1,476,108 210,809 0.27 0.3
Tap Oil Ltd Oil & Gas 3,355,293 479,184 0.57 0.57
Tatts Group Ltd Consumer Services 128,001,041 18,280,379 0.74 0.74
TABCORP Holdings Ltd Consumer Services 101,432,875 14,486,065 0.56 0.56
Telstra Corp Ltd Telecommunications 472,354,429 67,458,966 0.2 0.2
Ten Network Holdings Ltd Consumer Services 14,244,439 2,034,310 0.27 0.27
ThinkSmart Ltd Financials 98,134 14,015 0.11 0.11
Timbercorp Ltd Consumer Goods 912,182 130,273 0.42 0.42
Tishman Speyer Office
FundFinancials 1,608,478 229,714 0.55 0.55
Toll Holdings Ltd Industrials 116,040,309 16,572,215 0.56 0.56
Tower Australia Group Ltd Financials 24,150,302 3,449,008 0.56 0.56
Transfield Services Ltd Industrials 11,431,058 1,632,519 0.36 0.36
Transpacific Industries
Group LtdIndustrials 18,835,432 2,689,969 0.38 0.38
Transurban Group Industrials 187,636,436 26,797,166 0.56 0.56
United Group Ltd Industrials 40,031,632 5,717,089 0.6 0.6
Industry/Sector Market valueNOK
Market valueUSD Voting Ownership
GOVERNMENT PENSION FUND GLOBAL HOLDINGS 200811
Equities Country association according to FTSE (the benchmark provider for equities). If a company is not in thebenchmark, the country of incorporation and country of listing is used. For remaining securities, a further assessment ismade. Country is defined as a sovereign state currently member of the United Nations. Exceptions are Hong Kong andTaiwan. The country association methodology was updated as of 2014.
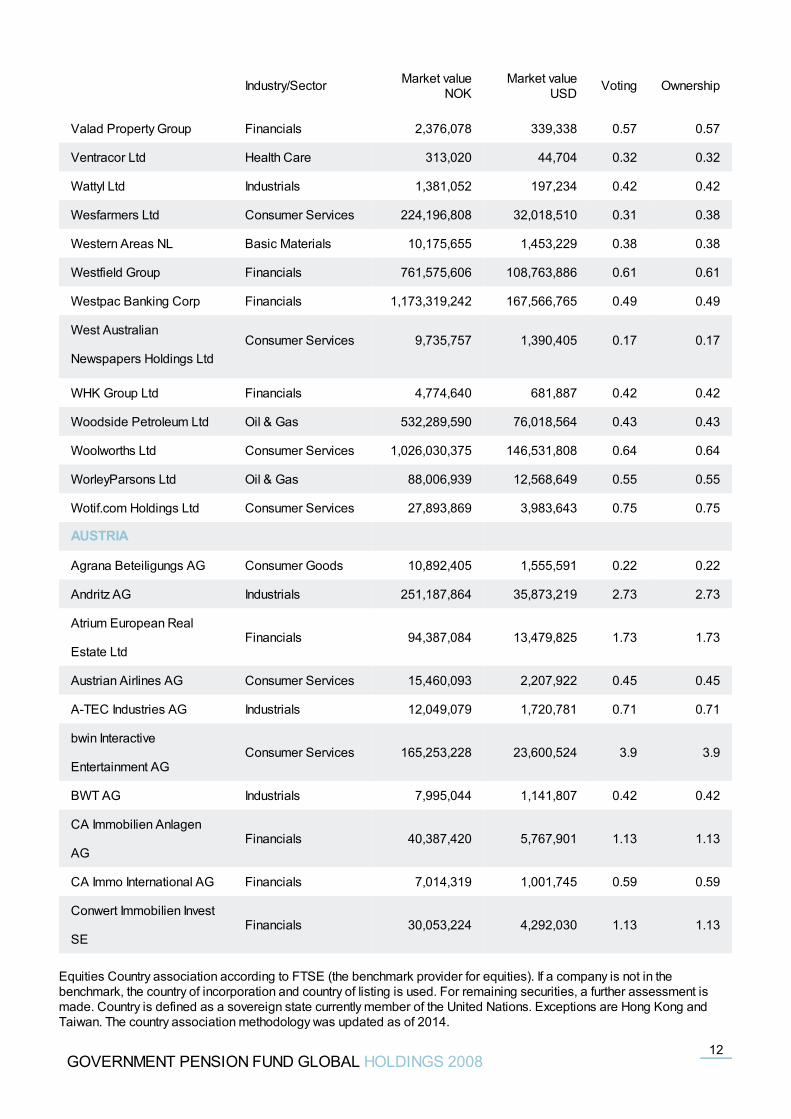
Valad Property Group Financials 2,376,078 339,338 0.57 0.57
Ventracor Ltd Health Care 313,020 44,704 0.32 0.32
Wattyl Ltd Industrials 1,381,052 197,234 0.42 0.42
Wesfarmers Ltd Consumer Services 224,196,808 32,018,510 0.31 0.38
Western Areas NL Basic Materials 10,175,655 1,453,229 0.38 0.38
Westfield Group Financials 761,575,606 108,763,886 0.61 0.61
Westpac Banking Corp Financials 1,173,319,242 167,566,765 0.49 0.49
West Australian
Newspapers Holdings LtdConsumer Services 9,735,757 1,390,405 0.17 0.17
WHK Group Ltd Financials 4,774,640 681,887 0.42 0.42
Woodside Petroleum Ltd Oil & Gas 532,289,590 76,018,564 0.43 0.43
Woolworths Ltd Consumer Services 1,026,030,375 146,531,808 0.64 0.64
WorleyParsons Ltd Oil & Gas 88,006,939 12,568,649 0.55 0.55
Wotif.com Holdings Ltd Consumer Services 27,893,869 3,983,643 0.75 0.75
AUSTRIA
Agrana Beteiligungs AG Consumer Goods 10,892,405 1,555,591 0.22 0.22
Andritz AG Industrials 251,187,864 35,873,219 2.73 2.73
Atrium European Real
Estate LtdFinancials 94,387,084 13,479,825 1.73 1.73
Austrian Airlines AG Consumer Services 15,460,093 2,207,922 0.45 0.45
A-TEC Industries AG Industrials 12,049,079 1,720,781 0.71 0.71
bwin Interactive
Entertainment AGConsumer Services 165,253,228 23,600,524 3.9 3.9
BWT AG Industrials 7,995,044 1,141,807 0.42 0.42
CA Immobilien Anlagen
AGFinancials 40,387,420 5,767,901 1.13 1.13
CA Immo International AG Financials 7,014,319 1,001,745 0.59 0.59
Conwert Immobilien Invest
SEFinancials 30,053,224 4,292,030 1.13 1.13
Industry/Sector Market valueNOK
Market valueUSD Voting Ownership
GOVERNMENT PENSION FUND GLOBAL HOLDINGS 200812
Equities Country association according to FTSE (the benchmark provider for equities). If a company is not in thebenchmark, the country of incorporation and country of listing is used. For remaining securities, a further assessment ismade. Country is defined as a sovereign state currently member of the United Nations. Exceptions are Hong Kong andTaiwan. The country association methodology was updated as of 2014.
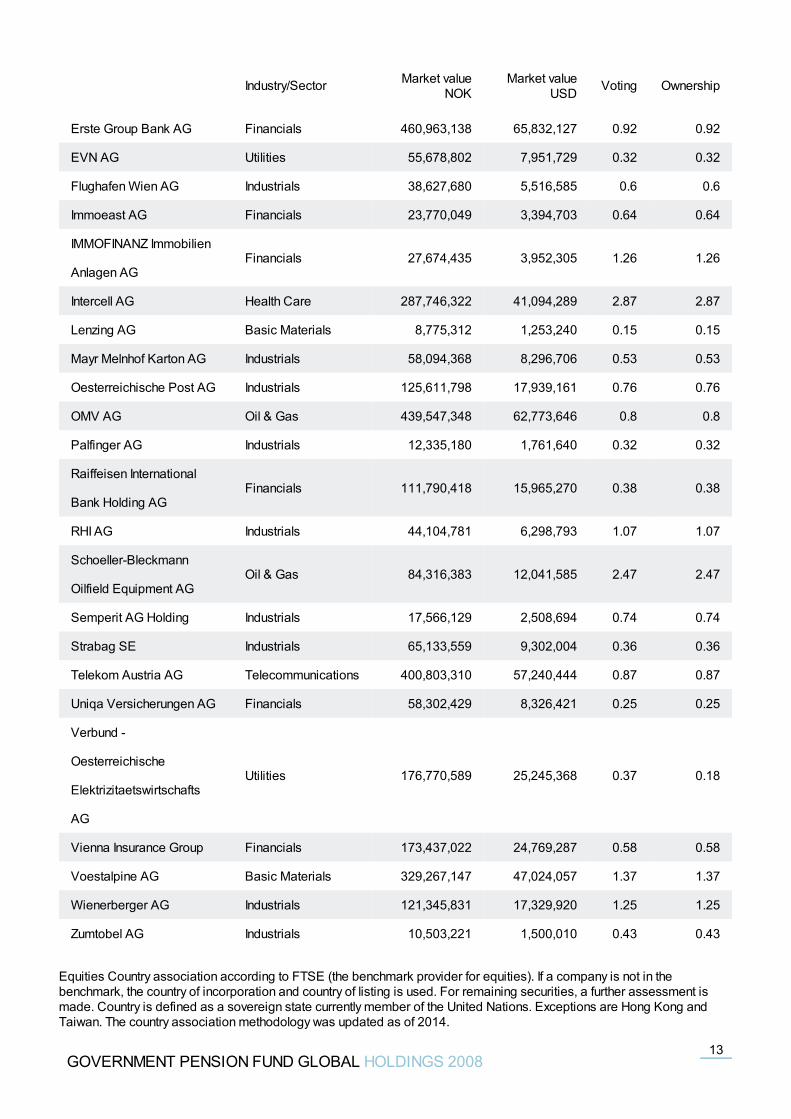
Erste Group Bank AG Financials 460,963,138 65,832,127 0.92 0.92
EVN AG Utilities 55,678,802 7,951,729 0.32 0.32
Flughafen Wien AG Industrials 38,627,680 5,516,585 0.6 0.6
Immoeast AG Financials 23,770,049 3,394,703 0.64 0.64
IMMOFINANZ Immobilien
Anlagen AGFinancials 27,674,435 3,952,305 1.26 1.26
Intercell AG Health Care 287,746,322 41,094,289 2.87 2.87
Lenzing AG Basic Materials 8,775,312 1,253,240 0.15 0.15
Mayr Melnhof Karton AG Industrials 58,094,368 8,296,706 0.53 0.53
Oesterreichische Post AG Industrials 125,611,798 17,939,161 0.76 0.76
OMV AG Oil & Gas 439,547,348 62,773,646 0.8 0.8
Palfinger AG Industrials 12,335,180 1,761,640 0.32 0.32
Raiffeisen International
Bank Holding AGFinancials 111,790,418 15,965,270 0.38 0.38
RHI AG Industrials 44,104,781 6,298,793 1.07 1.07
Schoeller-Bleckmann
Oilfield Equipment AGOil & Gas 84,316,383 12,041,585 2.47 2.47
Semperit AG Holding Industrials 17,566,129 2,508,694 0.74 0.74
Strabag SE Industrials 65,133,559 9,302,004 0.36 0.36
Telekom Austria AG Telecommunications 400,803,310 57,240,444 0.87 0.87
Uniqa Versicherungen AG Financials 58,302,429 8,326,421 0.25 0.25
Verbund -
Oesterreichische
Elektrizitaetswirtschafts
AG
Utilities 176,770,589 25,245,368 0.37 0.18
Vienna Insurance Group Financials 173,437,022 24,769,287 0.58 0.58
Voestalpine AG Basic Materials 329,267,147 47,024,057 1.37 1.37
Wienerberger AG Industrials 121,345,831 17,329,920 1.25 1.25
Zumtobel AG Industrials 10,503,221 1,500,010 0.43 0.43
Industry/Sector Market valueNOK
Market valueUSD Voting Ownership
GOVERNMENT PENSION FUND GLOBAL HOLDINGS 200813
Equities Country association according to FTSE (the benchmark provider for equities). If a company is not in thebenchmark, the country of incorporation and country of listing is used. For remaining securities, a further assessment ismade. Country is defined as a sovereign state currently member of the United Nations. Exceptions are Hong Kong andTaiwan. The country association methodology was updated as of 2014.
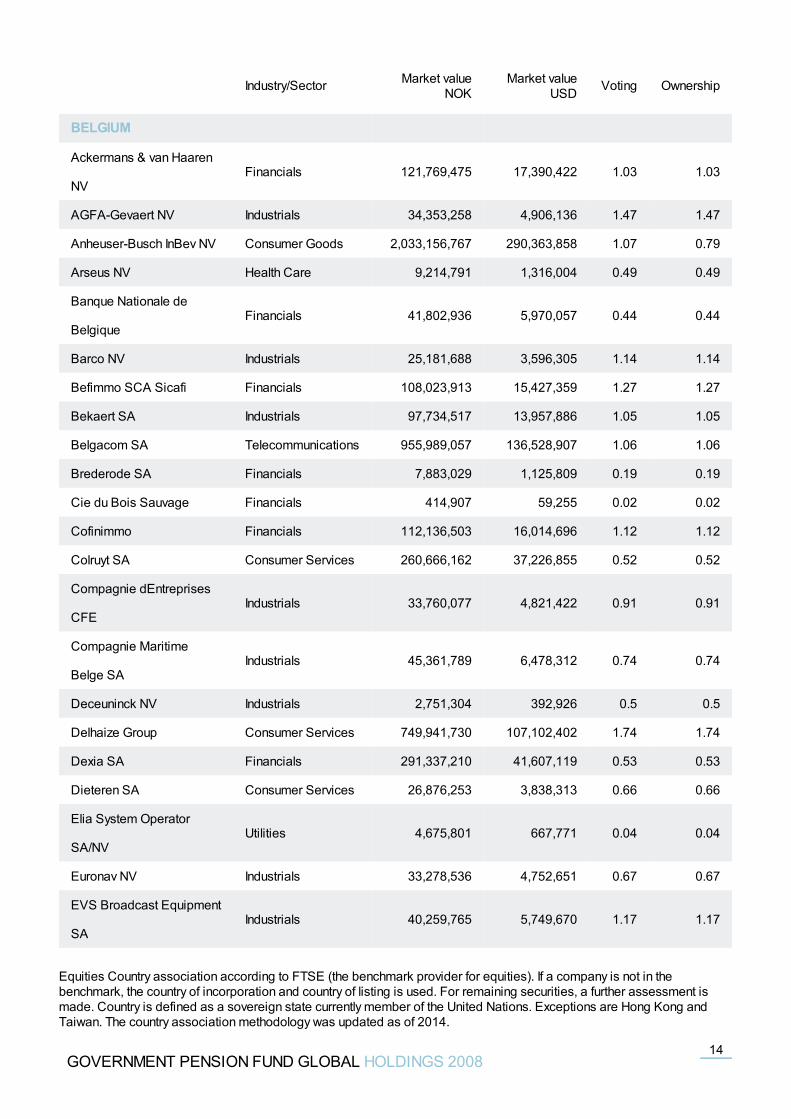
BELGIUM
Ackermans & van Haaren
NVFinancials 121,769,475 17,390,422 1.03 1.03
AGFA-Gevaert NV Industrials 34,353,258 4,906,136 1.47 1.47
Anheuser-Busch InBev NV Consumer Goods 2,033,156,767 290,363,858 1.07 0.79
Arseus NV Health Care 9,214,791 1,316,004 0.49 0.49
Banque Nationale de
BelgiqueFinancials 41,802,936 5,970,057 0.44 0.44
Barco NV Industrials 25,181,688 3,596,305 1.14 1.14
Befimmo SCA Sicafi Financials 108,023,913 15,427,359 1.27 1.27
Bekaert SA Industrials 97,734,517 13,957,886 1.05 1.05
Belgacom SA Telecommunications 955,989,057 136,528,907 1.06 1.06
Brederode SA Financials 7,883,029 1,125,809 0.19 0.19
Cie du Bois Sauvage Financials 414,907 59,255 0.02 0.02
Cofinimmo Financials 112,136,503 16,014,696 1.12 1.12
Colruyt SA Consumer Services 260,666,162 37,226,855 0.52 0.52
Compagnie dEntreprises
CFEIndustrials 33,760,077 4,821,422 0.91 0.91
Compagnie Maritime
Belge SAIndustrials 45,361,789 6,478,312 0.74 0.74
Deceuninck NV Industrials 2,751,304 392,926 0.5 0.5
Delhaize Group Consumer Services 749,941,730 107,102,402 1.74 1.74
Dexia SA Financials 291,337,210 41,607,119 0.53 0.53
Dieteren SA Consumer Services 26,876,253 3,838,313 0.66 0.66
Elia System Operator
SA/NVUtilities 4,675,801 667,771 0.04 0.04
Euronav NV Industrials 33,278,536 4,752,651 0.67 0.67
EVS Broadcast Equipment
SAIndustrials 40,259,765 5,749,670 1.17 1.17
Industry/Sector Market valueNOK
Market valueUSD Voting Ownership
GOVERNMENT PENSION FUND GLOBAL HOLDINGS 200814
Equities Country association according to FTSE (the benchmark provider for equities). If a company is not in thebenchmark, the country of incorporation and country of listing is used. For remaining securities, a further assessment ismade. Country is defined as a sovereign state currently member of the United Nations. Exceptions are Hong Kong andTaiwan. The country association methodology was updated as of 2014.
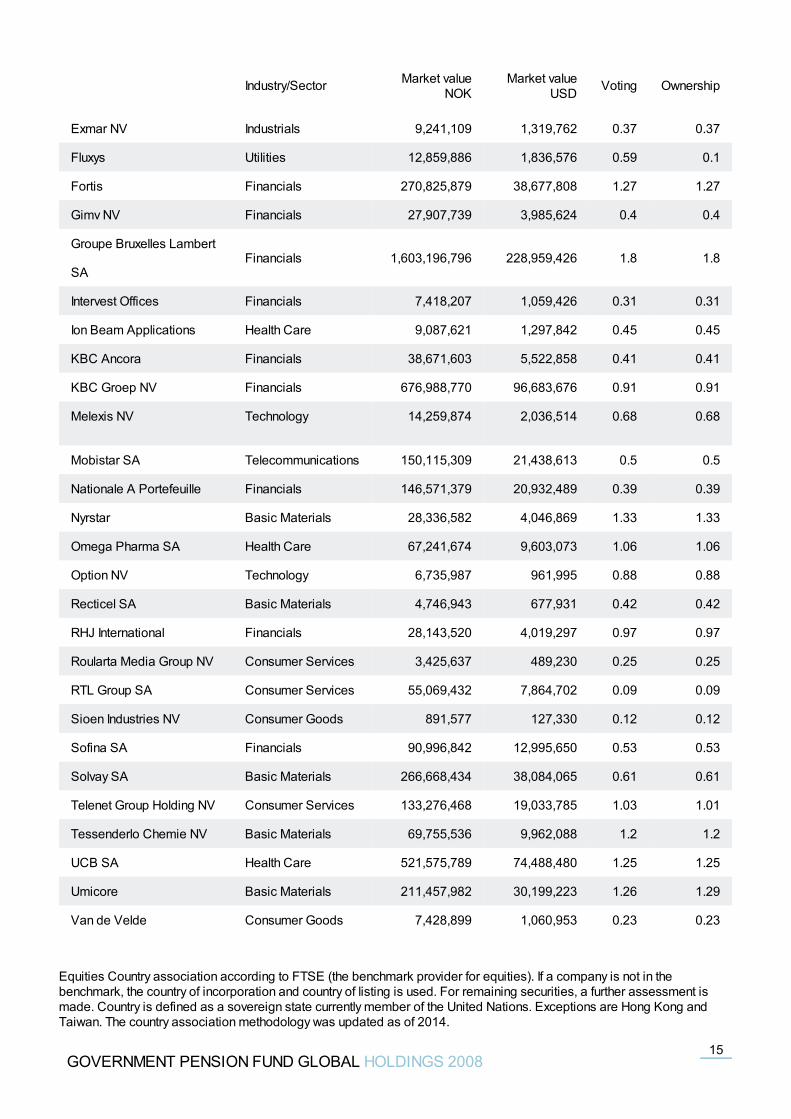
Exmar NV Industrials 9,241,109 1,319,762 0.37 0.37
Fluxys Utilities 12,859,886 1,836,576 0.59 0.1
Fortis Financials 270,825,879 38,677,808 1.27 1.27
Gimv NV Financials 27,907,739 3,985,624 0.4 0.4
Groupe Bruxelles Lambert
SAFinancials 1,603,196,796 228,959,426 1.8 1.8
Intervest Offices Financials 7,418,207 1,059,426 0.31 0.31
Ion Beam Applications Health Care 9,087,621 1,297,842 0.45 0.45
KBC Ancora Financials 38,671,603 5,522,858 0.41 0.41
KBC Groep NV Financials 676,988,770 96,683,676 0.91 0.91
Melexis NV Technology 14,259,874 2,036,514 0.68 0.68
Mobistar SA Telecommunications 150,115,309 21,438,613 0.5 0.5
Nationale A Portefeuille Financials 146,571,379 20,932,489 0.39 0.39
Nyrstar Basic Materials 28,336,582 4,046,869 1.33 1.33
Omega Pharma SA Health Care 67,241,674 9,603,073 1.06 1.06
Option NV Technology 6,735,987 961,995 0.88 0.88
Recticel SA Basic Materials 4,746,943 677,931 0.42 0.42
RHJ International Financials 28,143,520 4,019,297 0.97 0.97
Roularta Media Group NV Consumer Services 3,425,637 489,230 0.25 0.25
RTL Group SA Consumer Services 55,069,432 7,864,702 0.09 0.09
Sioen Industries NV Consumer Goods 891,577 127,330 0.12 0.12
Sofina SA Financials 90,996,842 12,995,650 0.53 0.53
Solvay SA Basic Materials 266,668,434 38,084,065 0.61 0.61
Telenet Group Holding NV Consumer Services 133,276,468 19,033,785 1.03 1.01
Tessenderlo Chemie NV Basic Materials 69,755,536 9,962,088 1.2 1.2
UCB SA Health Care 521,575,789 74,488,480 1.25 1.25
Umicore Basic Materials 211,457,982 30,199,223 1.26 1.29
Van de Velde Consumer Goods 7,428,899 1,060,953 0.23 0.23
Industry/Sector Market valueNOK
Market valueUSD Voting Ownership
GOVERNMENT PENSION FUND GLOBAL HOLDINGS 200815
Equities Country association according to FTSE (the benchmark provider for equities). If a company is not in thebenchmark, the country of incorporation and country of listing is used. For remaining securities, a further assessment ismade. Country is defined as a sovereign state currently member of the United Nations. Exceptions are Hong Kong andTaiwan. The country association methodology was updated as of 2014.
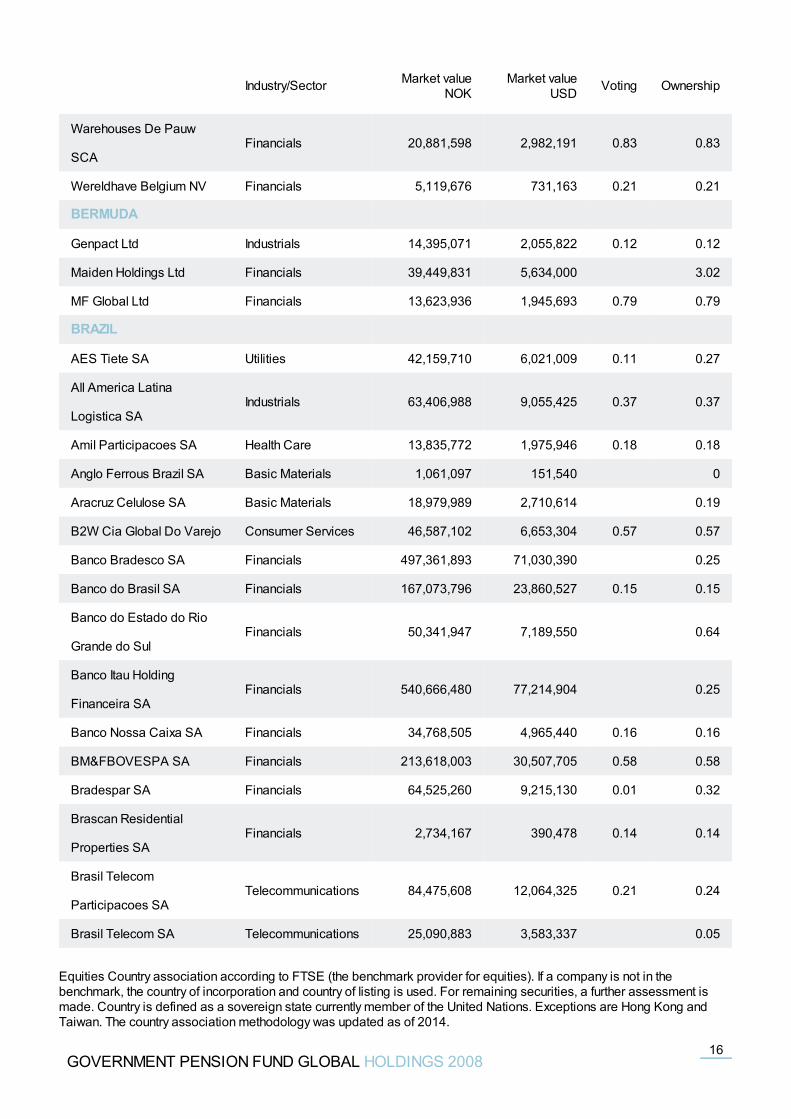
Warehouses De Pauw
SCAFinancials 20,881,598 2,982,191 0.83 0.83
Wereldhave Belgium NV Financials 5,119,676 731,163 0.21 0.21
BERMUDA
Genpact Ltd Industrials 14,395,071 2,055,822 0.12 0.12
Maiden Holdings Ltd Financials 39,449,831 5,634,000 3.02
MF Global Ltd Financials 13,623,936 1,945,693 0.79 0.79
BRAZIL
AES Tiete SA Utilities 42,159,710 6,021,009 0.11 0.27
All America Latina
Logistica SAIndustrials 63,406,988 9,055,425 0.37 0.37
Amil Participacoes SA Health Care 13,835,772 1,975,946 0.18 0.18
Anglo Ferrous Brazil SA Basic Materials 1,061,097 151,540 0
Aracruz Celulose SA Basic Materials 18,979,989 2,710,614 0.19
B2W Cia Global Do Varejo Consumer Services 46,587,102 6,653,304 0.57 0.57
Banco Bradesco SA Financials 497,361,893 71,030,390 0.25
Banco do Brasil SA Financials 167,073,796 23,860,527 0.15 0.15
Banco do Estado do Rio
Grande do SulFinancials 50,341,947 7,189,550 0.64
Banco Itau Holding
Financeira SAFinancials 540,666,480 77,214,904 0.25
Banco Nossa Caixa SA Financials 34,768,505 4,965,440 0.16 0.16
BM&FBOVESPA SA Financials 213,618,003 30,507,705 0.58 0.58
Bradespar SA Financials 64,525,260 9,215,130 0.01 0.32
Brascan Residential
Properties SAFinancials 2,734,167 390,478 0.14 0.14
Brasil Telecom
Participacoes SATelecommunications 84,475,608 12,064,325 0.21 0.24
Brasil Telecom SA Telecommunications 25,090,883 3,583,337 0.05
Industry/Sector Market valueNOK
Market valueUSD Voting Ownership
GOVERNMENT PENSION FUND GLOBAL HOLDINGS 200816
Equities Country association according to FTSE (the benchmark provider for equities). If a company is not in thebenchmark, the country of incorporation and country of listing is used. For remaining securities, a further assessment ismade. Country is defined as a sovereign state currently member of the United Nations. Exceptions are Hong Kong andTaiwan. The country association methodology was updated as of 2014.
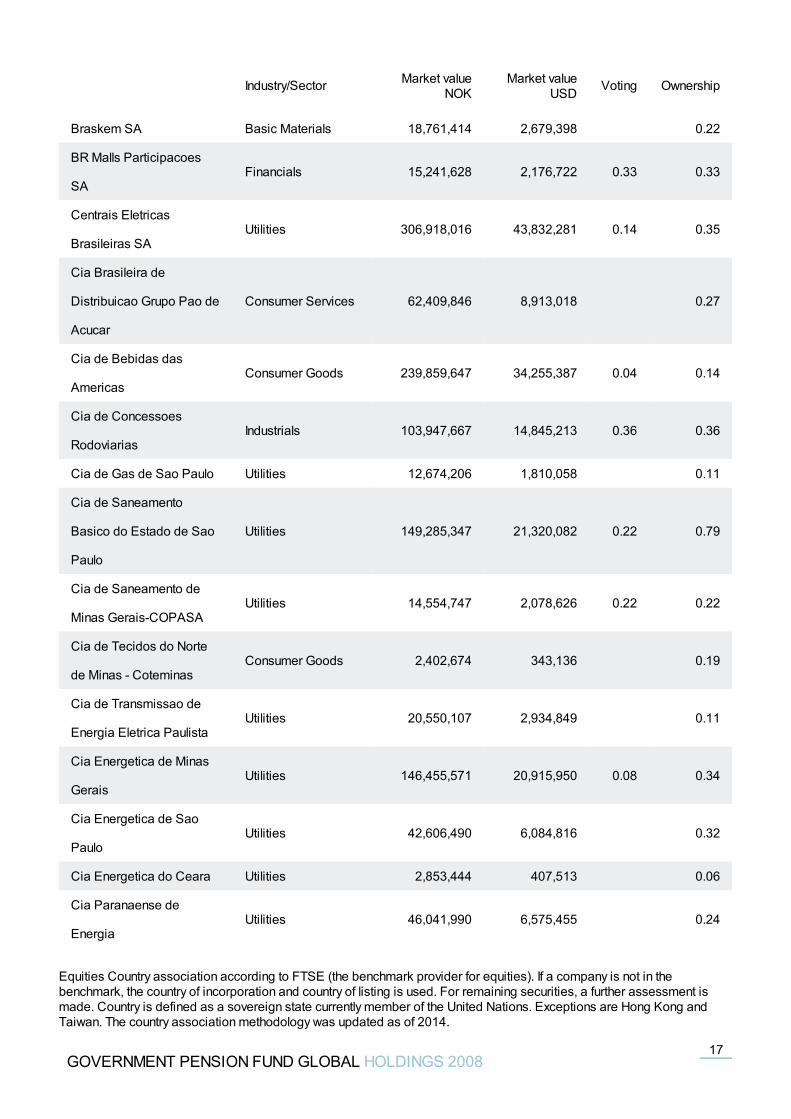
Braskem SA Basic Materials 18,761,414 2,679,398 0.22
BR Malls Participacoes
SAFinancials 15,241,628 2,176,722 0.33 0.33
Centrais Eletricas
Brasileiras SAUtilities 306,918,016 43,832,281 0.14 0.35
Cia Brasileira de
Distribuicao Grupo Pao de
Acucar
Consumer Services 62,409,846 8,913,018 0.27
Cia de Bebidas das
AmericasConsumer Goods 239,859,647 34,255,387 0.04 0.14
Cia de Concessoes
RodoviariasIndustrials 103,947,667 14,845,213 0.36 0.36
Cia de Gas de Sao Paulo Utilities 12,674,206 1,810,058 0.11
Cia de Saneamento
Basico do Estado de Sao
Paulo
Utilities 149,285,347 21,320,082 0.22 0.79
Cia de Saneamento de
Minas Gerais-COPASAUtilities 14,554,747 2,078,626 0.22 0.22
Cia de Tecidos do Norte
de Minas - CoteminasConsumer Goods 2,402,674 343,136 0.19
Cia de Transmissao de
Energia Eletrica PaulistaUtilities 20,550,107 2,934,849 0.11
Cia Energetica de Minas
GeraisUtilities 146,455,571 20,915,950 0.08 0.34
Cia Energetica de Sao
PauloUtilities 42,606,490 6,084,816 0.32
Cia Energetica do Ceara Utilities 2,853,444 407,513 0.06
Cia Paranaense de
EnergiaUtilities 46,041,990 6,575,455 0.24
Industry/Sector Market valueNOK
Market valueUSD Voting Ownership
GOVERNMENT PENSION FUND GLOBAL HOLDINGS 200817
Equities Country association according to FTSE (the benchmark provider for equities). If a company is not in thebenchmark, the country of incorporation and country of listing is used. For remaining securities, a further assessment ismade. Country is defined as a sovereign state currently member of the United Nations. Exceptions are Hong Kong andTaiwan. The country association methodology was updated as of 2014.
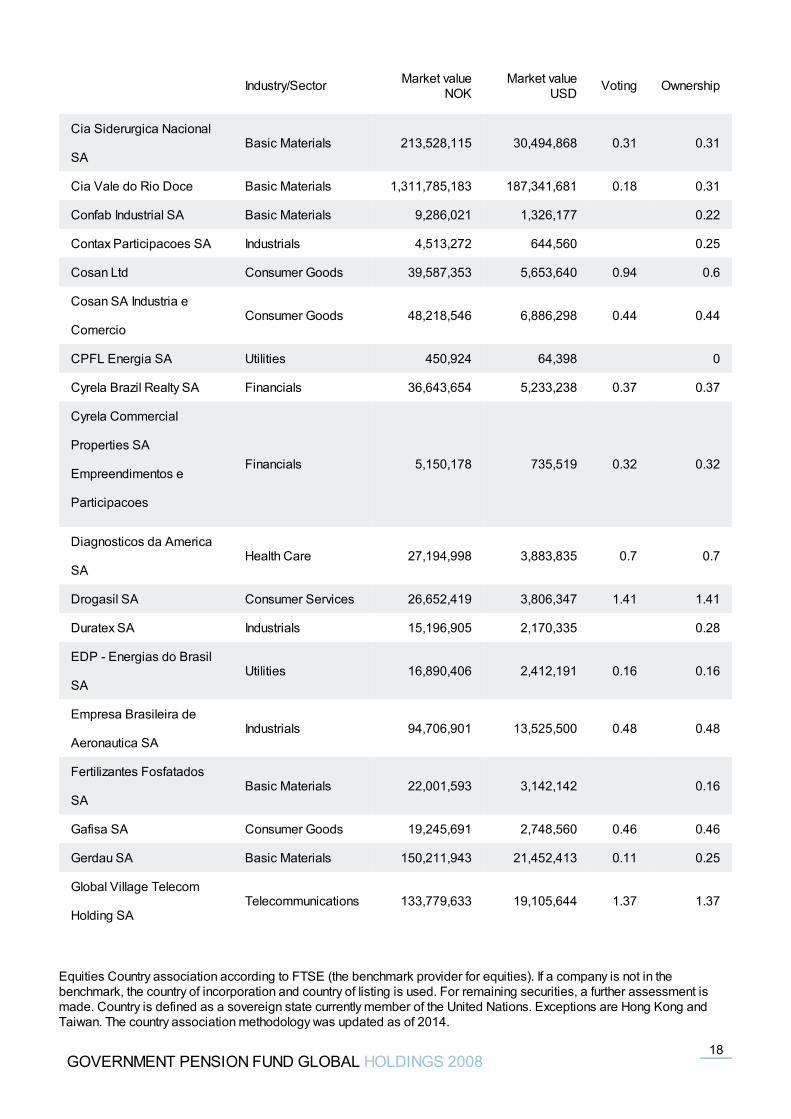
Cia Siderurgica Nacional
SABasic Materials 213,528,115 30,494,868 0.31 0.31
Cia Vale do Rio Doce Basic Materials 1,311,785,183 187,341,681 0.18 0.31
Confab Industrial SA Basic Materials 9,286,021 1,326,177 0.22
Contax Participacoes SA Industrials 4,513,272 644,560 0.25
Cosan Ltd Consumer Goods 39,587,353 5,653,640 0.94 0.6
Cosan SA Industria e
ComercioConsumer Goods 48,218,546 6,886,298 0.44 0.44
CPFL Energia SA Utilities 450,924 64,398 0
Cyrela Brazil Realty SA Financials 36,643,654 5,233,238 0.37 0.37
Cyrela Commercial
Properties SA
Empreendimentos e
Participacoes
Financials 5,150,178 735,519 0.32 0.32
Diagnosticos da America
SAHealth Care 27,194,998 3,883,835 0.7 0.7
Drogasil SA Consumer Services 26,652,419 3,806,347 1.41 1.41
Duratex SA Industrials 15,196,905 2,170,335 0.28
EDP - Energias do Brasil
SAUtilities 16,890,406 2,412,191 0.16 0.16
Empresa Brasileira de
Aeronautica SAIndustrials 94,706,901 13,525,500 0.48 0.48
Fertilizantes Fosfatados
SABasic Materials 22,001,593 3,142,142 0.16
Gafisa SA Consumer Goods 19,245,691 2,748,560 0.46 0.46
Gerdau SA Basic Materials 150,211,943 21,452,413 0.11 0.25
Global Village Telecom
Holding SATelecommunications 133,779,633 19,105,644 1.37 1.37
Industry/Sector Market valueNOK
Market valueUSD Voting Ownership
GOVERNMENT PENSION FUND GLOBAL HOLDINGS 200818
Equities Country association according to FTSE (the benchmark provider for equities). If a company is not in thebenchmark, the country of incorporation and country of listing is used. For remaining securities, a further assessment ismade. Country is defined as a sovereign state currently member of the United Nations. Exceptions are Hong Kong andTaiwan. The country association methodology was updated as of 2014.
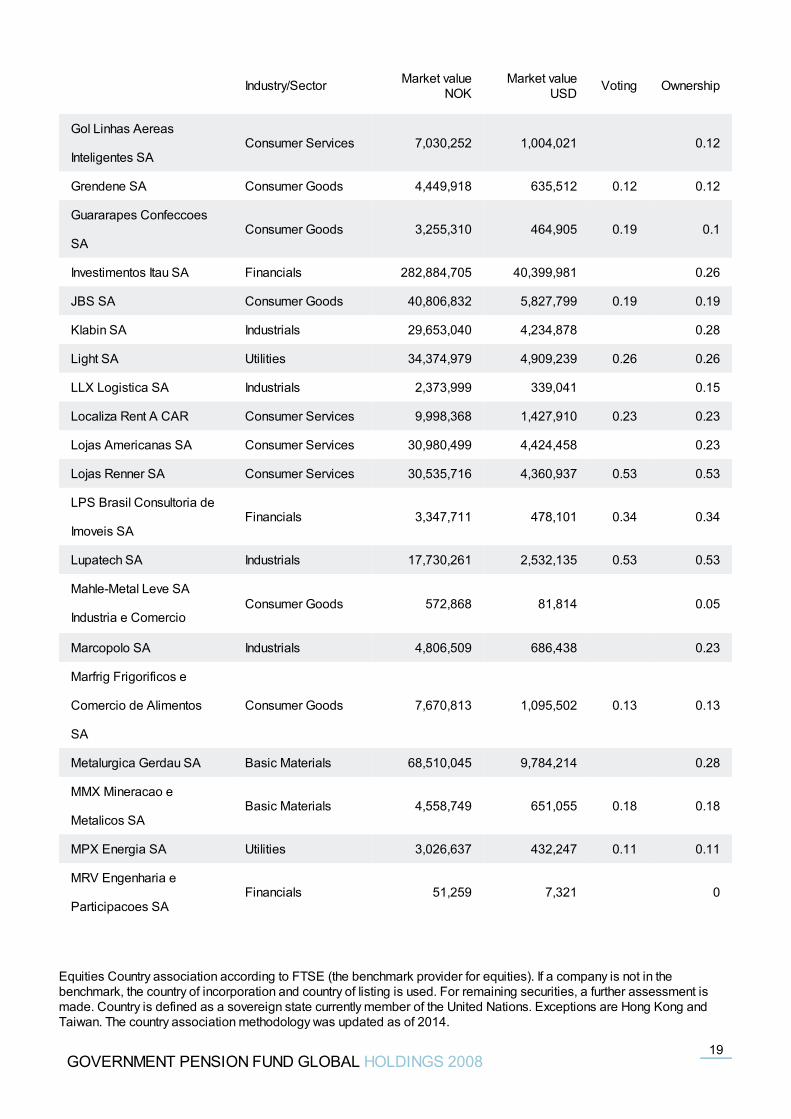
Gol Linhas Aereas
Inteligentes SAConsumer Services 7,030,252 1,004,021 0.12
Grendene SA Consumer Goods 4,449,918 635,512 0.12 0.12
Guararapes Confeccoes
SAConsumer Goods 3,255,310 464,905 0.19 0.1
Investimentos Itau SA Financials 282,884,705 40,399,981 0.26
JBS SA Consumer Goods 40,806,832 5,827,799 0.19 0.19
Klabin SA Industrials 29,653,040 4,234,878 0.28
Light SA Utilities 34,374,979 4,909,239 0.26 0.26
LLX Logistica SA Industrials 2,373,999 339,041 0.15
Localiza Rent A CAR Consumer Services 9,998,368 1,427,910 0.23 0.23
Lojas Americanas SA Consumer Services 30,980,499 4,424,458 0.23
Lojas Renner SA Consumer Services 30,535,716 4,360,937 0.53 0.53
LPS Brasil Consultoria de
Imoveis SAFinancials 3,347,711 478,101 0.34 0.34
Lupatech SA Industrials 17,730,261 2,532,135 0.53 0.53
Mahle-Metal Leve SA
Industria e ComercioConsumer Goods 572,868 81,814 0.05
Marcopolo SA Industrials 4,806,509 686,438 0.23
Marfrig Frigorificos e
Comercio de Alimentos
SA
Consumer Goods 7,670,813 1,095,502 0.13 0.13
Metalurgica Gerdau SA Basic Materials 68,510,045 9,784,214 0.28
MMX Mineracao e
Metalicos SABasic Materials 4,558,749 651,055 0.18 0.18
MPX Energia SA Utilities 3,026,637 432,247 0.11 0.11
MRV Engenharia e
Participacoes SAFinancials 51,259 7,321 0
Industry/Sector Market valueNOK
Market valueUSD Voting Ownership
GOVERNMENT PENSION FUND GLOBAL HOLDINGS 200819
Equities Country association according to FTSE (the benchmark provider for equities). If a company is not in thebenchmark, the country of incorporation and country of listing is used. For remaining securities, a further assessment ismade. Country is defined as a sovereign state currently member of the United Nations. Exceptions are Hong Kong andTaiwan. The country association methodology was updated as of 2014.
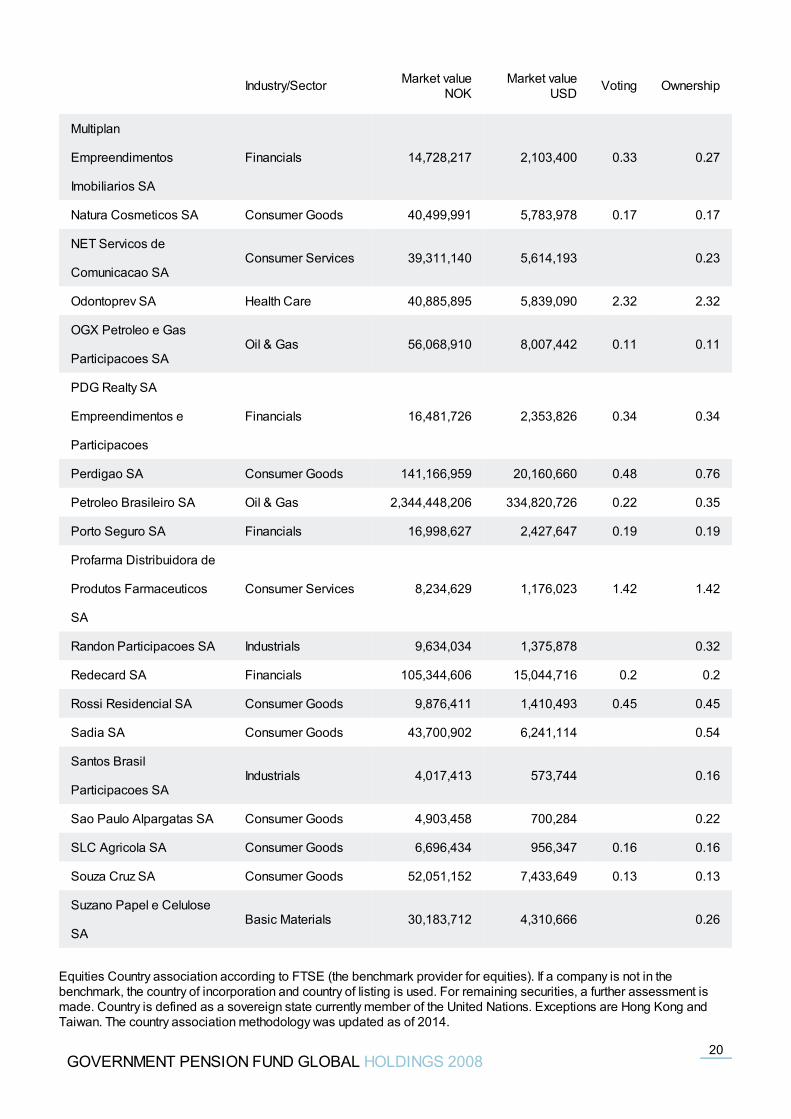
Multiplan
Empreendimentos
Imobiliarios SA
Financials 14,728,217 2,103,400 0.33 0.27
Natura Cosmeticos SA Consumer Goods 40,499,991 5,783,978 0.17 0.17
NET Servicos de
Comunicacao SAConsumer Services 39,311,140 5,614,193 0.23
Odontoprev SA Health Care 40,885,895 5,839,090 2.32 2.32
OGX Petroleo e Gas
Participacoes SAOil & Gas 56,068,910 8,007,442 0.11 0.11
PDG Realty SA
Empreendimentos e
Participacoes
Financials 16,481,726 2,353,826 0.34 0.34
Perdigao SA Consumer Goods 141,166,959 20,160,660 0.48 0.76
Petroleo Brasileiro SA Oil & Gas 2,344,448,206 334,820,726 0.22 0.35
Porto Seguro SA Financials 16,998,627 2,427,647 0.19 0.19
Profarma Distribuidora de
Produtos Farmaceuticos
SA
Consumer Services 8,234,629 1,176,023 1.42 1.42
Randon Participacoes SA Industrials 9,634,034 1,375,878 0.32
Redecard SA Financials 105,344,606 15,044,716 0.2 0.2
Rossi Residencial SA Consumer Goods 9,876,411 1,410,493 0.45 0.45
Sadia SA Consumer Goods 43,700,902 6,241,114 0.54
Santos Brasil
Participacoes SAIndustrials 4,017,413 573,744 0.16
Sao Paulo Alpargatas SA Consumer Goods 4,903,458 700,284 0.22
SLC Agricola SA Consumer Goods 6,696,434 956,347 0.16 0.16
Souza Cruz SA Consumer Goods 52,051,152 7,433,649 0.13 0.13
Suzano Papel e Celulose
SABasic Materials 30,183,712 4,310,666 0.26
Industry/Sector Market valueNOK
Market valueUSD Voting Ownership
GOVERNMENT PENSION FUND GLOBAL HOLDINGS 200820
Equities Country association according to FTSE (the benchmark provider for equities). If a company is not in thebenchmark, the country of incorporation and country of listing is used. For remaining securities, a further assessment ismade. Country is defined as a sovereign state currently member of the United Nations. Exceptions are Hong Kong andTaiwan. The country association methodology was updated as of 2014.
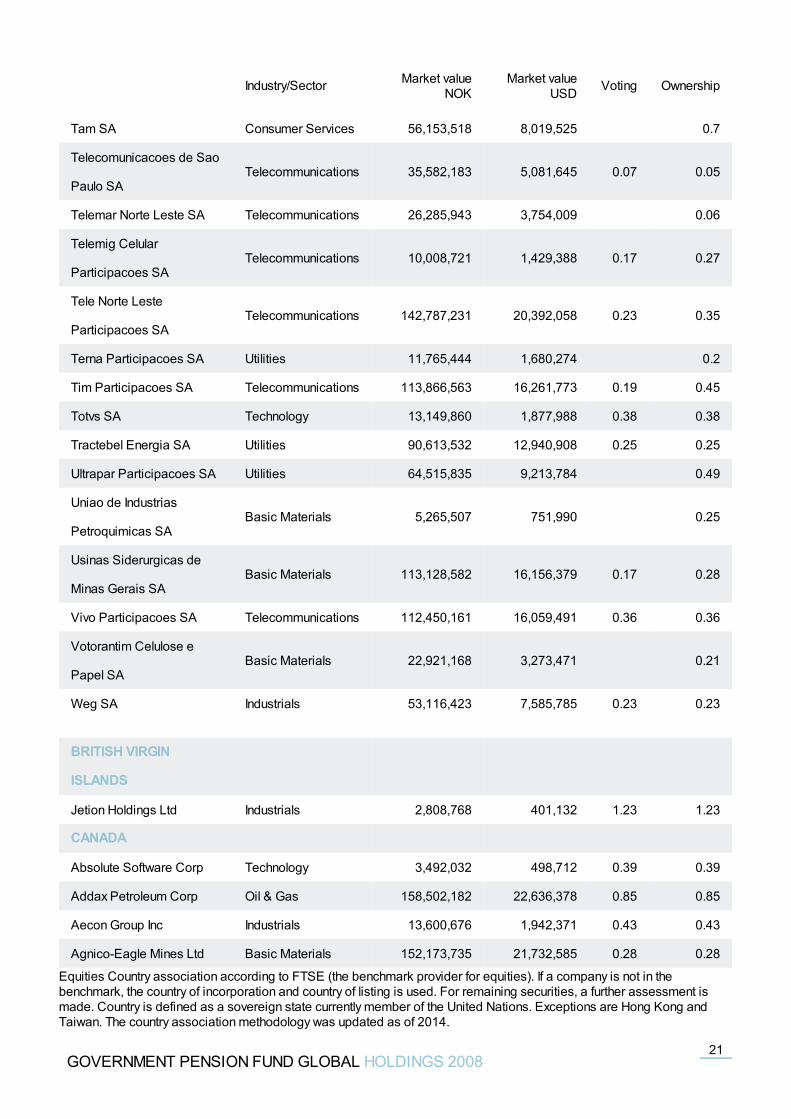
Tam SA Consumer Services 56,153,518 8,019,525 0.7
Telecomunicacoes de Sao
Paulo SATelecommunications 35,582,183 5,081,645 0.07 0.05
Telemar Norte Leste SA Telecommunications 26,285,943 3,754,009 0.06
Telemig Celular
Participacoes SATelecommunications 10,008,721 1,429,388 0.17 0.27
Tele Norte Leste
Participacoes SATelecommunications 142,787,231 20,392,058 0.23 0.35
Terna Participacoes SA Utilities 11,765,444 1,680,274 0.2
Tim Participacoes SA Telecommunications 113,866,563 16,261,773 0.19 0.45
Totvs SA Technology 13,149,860 1,877,988 0.38 0.38
Tractebel Energia SA Utilities 90,613,532 12,940,908 0.25 0.25
Ultrapar Participacoes SA Utilities 64,515,835 9,213,784 0.49
Uniao de Industrias
Petroquimicas SABasic Materials 5,265,507 751,990 0.25
Usinas Siderurgicas de
Minas Gerais SABasic Materials 113,128,582 16,156,379 0.17 0.28
Vivo Participacoes SA Telecommunications 112,450,161 16,059,491 0.36 0.36
Votorantim Celulose e
Papel SABasic Materials 22,921,168 3,273,471 0.21
Weg SA Industrials 53,116,423 7,585,785 0.23 0.23
BRITISH VIRGIN
ISLANDS
Jetion Holdings Ltd Industrials 2,808,768 401,132 1.23 1.23
CANADA
Absolute Software Corp Technology 3,492,032 498,712 0.39 0.39
Addax Petroleum Corp Oil & Gas 158,502,182 22,636,378 0.85 0.85
Aecon Group Inc Industrials 13,600,676 1,942,371 0.43 0.43
Agnico-Eagle Mines Ltd Basic Materials 152,173,735 21,732,585 0.28 0.28
Industry/Sector Market valueNOK
Market valueUSD Voting Ownership
GOVERNMENT PENSION FUND GLOBAL HOLDINGS 200821
Equities Country association according to FTSE (the benchmark provider for equities). If a company is not in thebenchmark, the country of incorporation and country of listing is used. For remaining securities, a further assessment ismade. Country is defined as a sovereign state currently member of the United Nations. Exceptions are Hong Kong andTaiwan. The country association methodology was updated as of 2014.
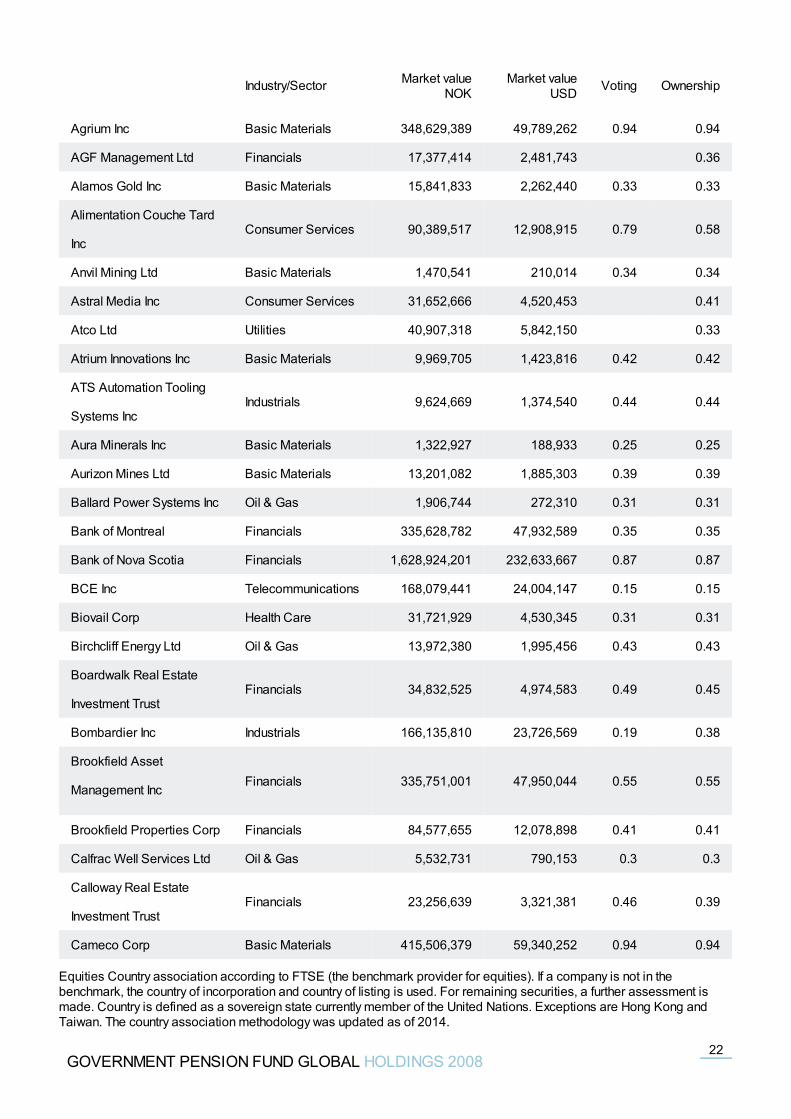
Agrium Inc Basic Materials 348,629,389 49,789,262 0.94 0.94
AGF Management Ltd Financials 17,377,414 2,481,743 0.36
Alamos Gold Inc Basic Materials 15,841,833 2,262,440 0.33 0.33
Alimentation Couche Tard
IncConsumer Services 90,389,517 12,908,915 0.79 0.58
Anvil Mining Ltd Basic Materials 1,470,541 210,014 0.34 0.34
Astral Media Inc Consumer Services 31,652,666 4,520,453 0.41
Atco Ltd Utilities 40,907,318 5,842,150 0.33
Atrium Innovations Inc Basic Materials 9,969,705 1,423,816 0.42 0.42
ATS Automation Tooling
Systems IncIndustrials 9,624,669 1,374,540 0.44 0.44
Aura Minerals Inc Basic Materials 1,322,927 188,933 0.25 0.25
Aurizon Mines Ltd Basic Materials 13,201,082 1,885,303 0.39 0.39
Ballard Power Systems Inc Oil & Gas 1,906,744 272,310 0.31 0.31
Bank of Montreal Financials 335,628,782 47,932,589 0.35 0.35
Bank of Nova Scotia Financials 1,628,924,201 232,633,667 0.87 0.87
BCE Inc Telecommunications 168,079,441 24,004,147 0.15 0.15
Biovail Corp Health Care 31,721,929 4,530,345 0.31 0.31
Birchcliff Energy Ltd Oil & Gas 13,972,380 1,995,456 0.43 0.43
Boardwalk Real Estate
Investment TrustFinancials 34,832,525 4,974,583 0.49 0.45
Bombardier Inc Industrials 166,135,810 23,726,569 0.19 0.38
Brookfield Asset
Management IncFinancials 335,751,001 47,950,044 0.55 0.55
Brookfield Properties Corp Financials 84,577,655 12,078,898 0.41 0.41
Calfrac Well Services Ltd Oil & Gas 5,532,731 790,153 0.3 0.3
Calloway Real Estate
Investment TrustFinancials 23,256,639 3,321,381 0.46 0.39
Cameco Corp Basic Materials 415,506,379 59,340,252 0.94 0.94
Industry/Sector Market valueNOK
Market valueUSD Voting Ownership
GOVERNMENT PENSION FUND GLOBAL HOLDINGS 200822
Equities Country association according to FTSE (the benchmark provider for equities). If a company is not in thebenchmark, the country of incorporation and country of listing is used. For remaining securities, a further assessment ismade. Country is defined as a sovereign state currently member of the United Nations. Exceptions are Hong Kong andTaiwan. The country association methodology was updated as of 2014.
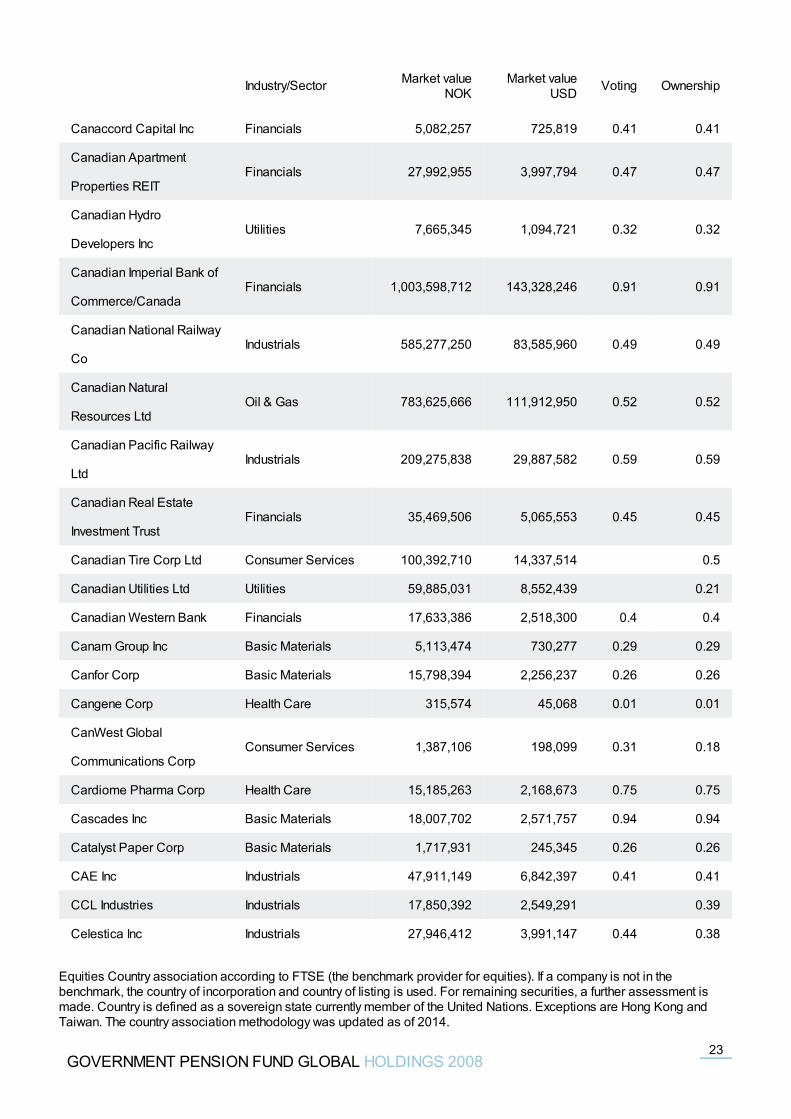
Canaccord Capital Inc Financials 5,082,257 725,819 0.41 0.41
Canadian Apartment
Properties REITFinancials 27,992,955 3,997,794 0.47 0.47
Canadian Hydro
Developers IncUtilities 7,665,345 1,094,721 0.32 0.32
Canadian Imperial Bank of
Commerce/CanadaFinancials 1,003,598,712 143,328,246 0.91 0.91
Canadian National Railway
CoIndustrials 585,277,250 83,585,960 0.49 0.49
Canadian Natural
Resources LtdOil & Gas 783,625,666 111,912,950 0.52 0.52
Canadian Pacific Railway
LtdIndustrials 209,275,838 29,887,582 0.59 0.59
Canadian Real Estate
Investment TrustFinancials 35,469,506 5,065,553 0.45 0.45
Canadian Tire Corp Ltd Consumer Services 100,392,710 14,337,514 0.5
Canadian Utilities Ltd Utilities 59,885,031 8,552,439 0.21
Canadian Western Bank Financials 17,633,386 2,518,300 0.4 0.4
Canam Group Inc Basic Materials 5,113,474 730,277 0.29 0.29
Canfor Corp Basic Materials 15,798,394 2,256,237 0.26 0.26
Cangene Corp Health Care 315,574 45,068 0.01 0.01
CanWest Global
Communications CorpConsumer Services 1,387,106 198,099 0.31 0.18
Cardiome Pharma Corp Health Care 15,185,263 2,168,673 0.75 0.75
Cascades Inc Basic Materials 18,007,702 2,571,757 0.94 0.94
Catalyst Paper Corp Basic Materials 1,717,931 245,345 0.26 0.26
CAE Inc Industrials 47,911,149 6,842,397 0.41 0.41
CCL Industries Industrials 17,850,392 2,549,291 0.39
Celestica Inc Industrials 27,946,412 3,991,147 0.44 0.38
Industry/Sector Market valueNOK
Market valueUSD Voting Ownership
GOVERNMENT PENSION FUND GLOBAL HOLDINGS 200823
Equities Country association according to FTSE (the benchmark provider for equities). If a company is not in thebenchmark, the country of incorporation and country of listing is used. For remaining securities, a further assessment ismade. Country is defined as a sovereign state currently member of the United Nations. Exceptions are Hong Kong andTaiwan. The country association methodology was updated as of 2014.
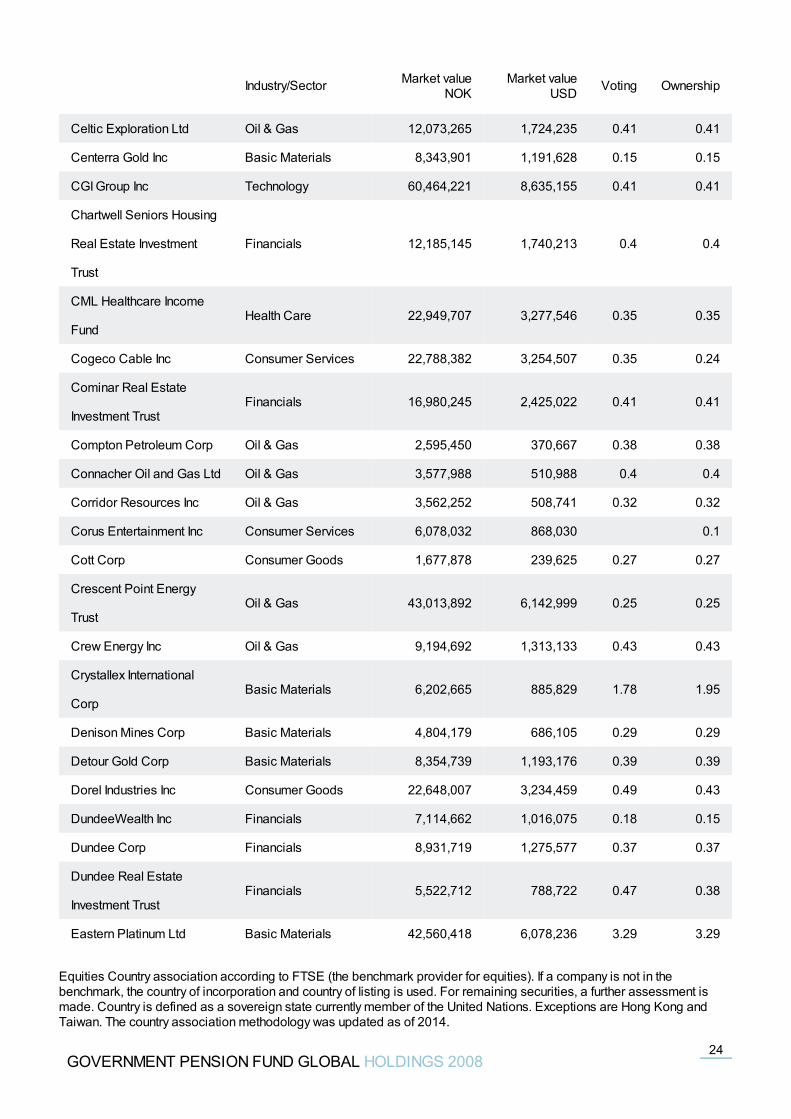
Celtic Exploration Ltd Oil & Gas 12,073,265 1,724,235 0.41 0.41
Centerra Gold Inc Basic Materials 8,343,901 1,191,628 0.15 0.15
CGI Group Inc Technology 60,464,221 8,635,155 0.41 0.41
Chartwell Seniors Housing
Real Estate Investment
Trust
Financials 12,185,145 1,740,213 0.4 0.4
CML Healthcare Income
FundHealth Care 22,949,707 3,277,546 0.35 0.35
Cogeco Cable Inc Consumer Services 22,788,382 3,254,507 0.35 0.24
Cominar Real Estate
Investment TrustFinancials 16,980,245 2,425,022 0.41 0.41
Compton Petroleum Corp Oil & Gas 2,595,450 370,667 0.38 0.38
Connacher Oil and Gas Ltd Oil & Gas 3,577,988 510,988 0.4 0.4
Corridor Resources Inc Oil & Gas 3,562,252 508,741 0.32 0.32
Corus Entertainment Inc Consumer Services 6,078,032 868,030 0.1
Cott Corp Consumer Goods 1,677,878 239,625 0.27 0.27
Crescent Point Energy
TrustOil & Gas 43,013,892 6,142,999 0.25 0.25
Crew Energy Inc Oil & Gas 9,194,692 1,313,133 0.43 0.43
Crystallex International
CorpBasic Materials 6,202,665 885,829 1.78 1.95
Denison Mines Corp Basic Materials 4,804,179 686,105 0.29 0.29
Detour Gold Corp Basic Materials 8,354,739 1,193,176 0.39 0.39
Dorel Industries Inc Consumer Goods 22,648,007 3,234,459 0.49 0.43
DundeeWealth Inc Financials 7,114,662 1,016,075 0.18 0.15
Dundee Corp Financials 8,931,719 1,275,577 0.37 0.37
Dundee Real Estate
Investment TrustFinancials 5,522,712 788,722 0.47 0.38
Eastern Platinum Ltd Basic Materials 42,560,418 6,078,236 3.29 3.29
Industry/Sector Market valueNOK
Market valueUSD Voting Ownership
GOVERNMENT PENSION FUND GLOBAL HOLDINGS 200824
Equities Country association according to FTSE (the benchmark provider for equities). If a company is not in thebenchmark, the country of incorporation and country of listing is used. For remaining securities, a further assessment ismade. Country is defined as a sovereign state currently member of the United Nations. Exceptions are Hong Kong andTaiwan. The country association methodology was updated as of 2014.
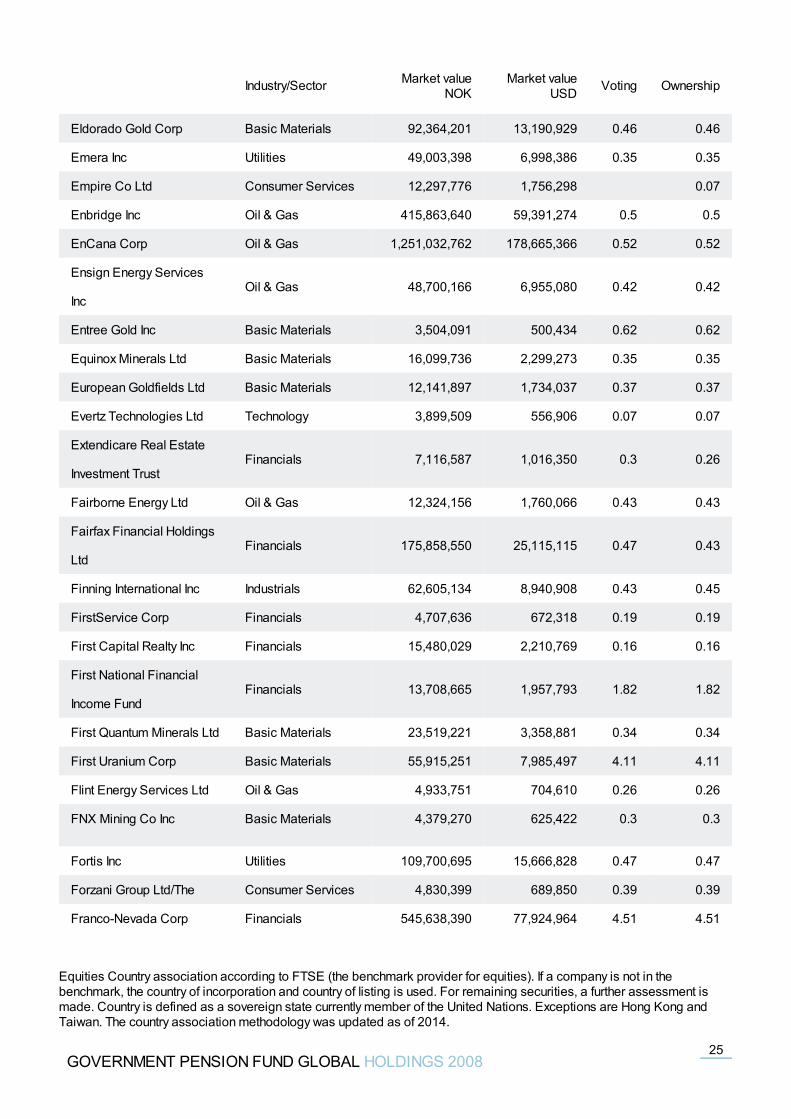
Eldorado Gold Corp Basic Materials 92,364,201 13,190,929 0.46 0.46
Emera Inc Utilities 49,003,398 6,998,386 0.35 0.35
Empire Co Ltd Consumer Services 12,297,776 1,756,298 0.07
Enbridge Inc Oil & Gas 415,863,640 59,391,274 0.5 0.5
EnCana Corp Oil & Gas 1,251,032,762 178,665,366 0.52 0.52
Ensign Energy Services
IncOil & Gas 48,700,166 6,955,080 0.42 0.42
Entree Gold Inc Basic Materials 3,504,091 500,434 0.62 0.62
Equinox Minerals Ltd Basic Materials 16,099,736 2,299,273 0.35 0.35
European Goldfields Ltd Basic Materials 12,141,897 1,734,037 0.37 0.37
Evertz Technologies Ltd Technology 3,899,509 556,906 0.07 0.07
Extendicare Real Estate
Investment TrustFinancials 7,116,587 1,016,350 0.3 0.26
Fairborne Energy Ltd Oil & Gas 12,324,156 1,760,066 0.43 0.43
Fairfax Financial Holdings
LtdFinancials 175,858,550 25,115,115 0.47 0.43
Finning International Inc Industrials 62,605,134 8,940,908 0.43 0.45
FirstService Corp Financials 4,707,636 672,318 0.19 0.19
First Capital Realty Inc Financials 15,480,029 2,210,769 0.16 0.16
First National Financial
Income FundFinancials 13,708,665 1,957,793 1.82 1.82
First Quantum Minerals Ltd Basic Materials 23,519,221 3,358,881 0.34 0.34
First Uranium Corp Basic Materials 55,915,251 7,985,497 4.11 4.11
Flint Energy Services Ltd Oil & Gas 4,933,751 704,610 0.26 0.26
FNX Mining Co Inc Basic Materials 4,379,270 625,422 0.3 0.3
Fortis Inc Utilities 109,700,695 15,666,828 0.47 0.47
Forzani Group Ltd/The Consumer Services 4,830,399 689,850 0.39 0.39
Franco-Nevada Corp Financials 545,638,390 77,924,964 4.51 4.51
Industry/Sector Market valueNOK
Market valueUSD Voting Ownership
GOVERNMENT PENSION FUND GLOBAL HOLDINGS 200825
Equities Country association according to FTSE (the benchmark provider for equities). If a company is not in thebenchmark, the country of incorporation and country of listing is used. For remaining securities, a further assessment ismade. Country is defined as a sovereign state currently member of the United Nations. Exceptions are Hong Kong andTaiwan. The country association methodology was updated as of 2014.
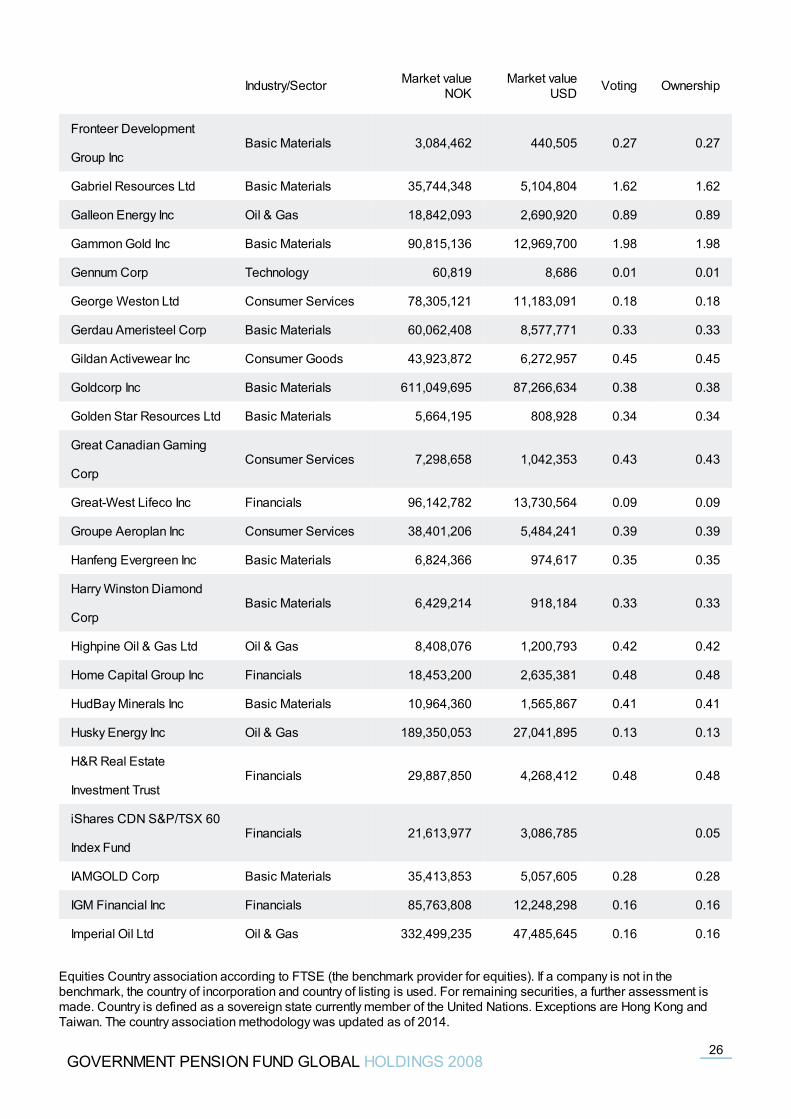
Fronteer Development
Group IncBasic Materials 3,084,462 440,505 0.27 0.27
Gabriel Resources Ltd Basic Materials 35,744,348 5,104,804 1.62 1.62
Galleon Energy Inc Oil & Gas 18,842,093 2,690,920 0.89 0.89
Gammon Gold Inc Basic Materials 90,815,136 12,969,700 1.98 1.98
Gennum Corp Technology 60,819 8,686 0.01 0.01
George Weston Ltd Consumer Services 78,305,121 11,183,091 0.18 0.18
Gerdau Ameristeel Corp Basic Materials 60,062,408 8,577,771 0.33 0.33
Gildan Activewear Inc Consumer Goods 43,923,872 6,272,957 0.45 0.45
Goldcorp Inc Basic Materials 611,049,695 87,266,634 0.38 0.38
Golden Star Resources Ltd Basic Materials 5,664,195 808,928 0.34 0.34
Great Canadian Gaming
CorpConsumer Services 7,298,658 1,042,353 0.43 0.43
Great-West Lifeco Inc Financials 96,142,782 13,730,564 0.09 0.09
Groupe Aeroplan Inc Consumer Services 38,401,206 5,484,241 0.39 0.39
Hanfeng Evergreen Inc Basic Materials 6,824,366 974,617 0.35 0.35
Harry Winston Diamond
CorpBasic Materials 6,429,214 918,184 0.33 0.33
Highpine Oil & Gas Ltd Oil & Gas 8,408,076 1,200,793 0.42 0.42
Home Capital Group Inc Financials 18,453,200 2,635,381 0.48 0.48
HudBay Minerals Inc Basic Materials 10,964,360 1,565,867 0.41 0.41
Husky Energy Inc Oil & Gas 189,350,053 27,041,895 0.13 0.13
H&R Real Estate
Investment TrustFinancials 29,887,850 4,268,412 0.48 0.48
iShares CDN S&P/TSX 60
Index FundFinancials 21,613,977 3,086,785 0.05
IAMGOLD Corp Basic Materials 35,413,853 5,057,605 0.28 0.28
IGM Financial Inc Financials 85,763,808 12,248,298 0.16 0.16
Imperial Oil Ltd Oil & Gas 332,499,235 47,485,645 0.16 0.16
Industry/Sector Market valueNOK
Market valueUSD Voting Ownership
GOVERNMENT PENSION FUND GLOBAL HOLDINGS 200826
Equities Country association according to FTSE (the benchmark provider for equities). If a company is not in thebenchmark, the country of incorporation and country of listing is used. For remaining securities, a further assessment ismade. Country is defined as a sovereign state currently member of the United Nations. Exceptions are Hong Kong andTaiwan. The country association methodology was updated as of 2014.
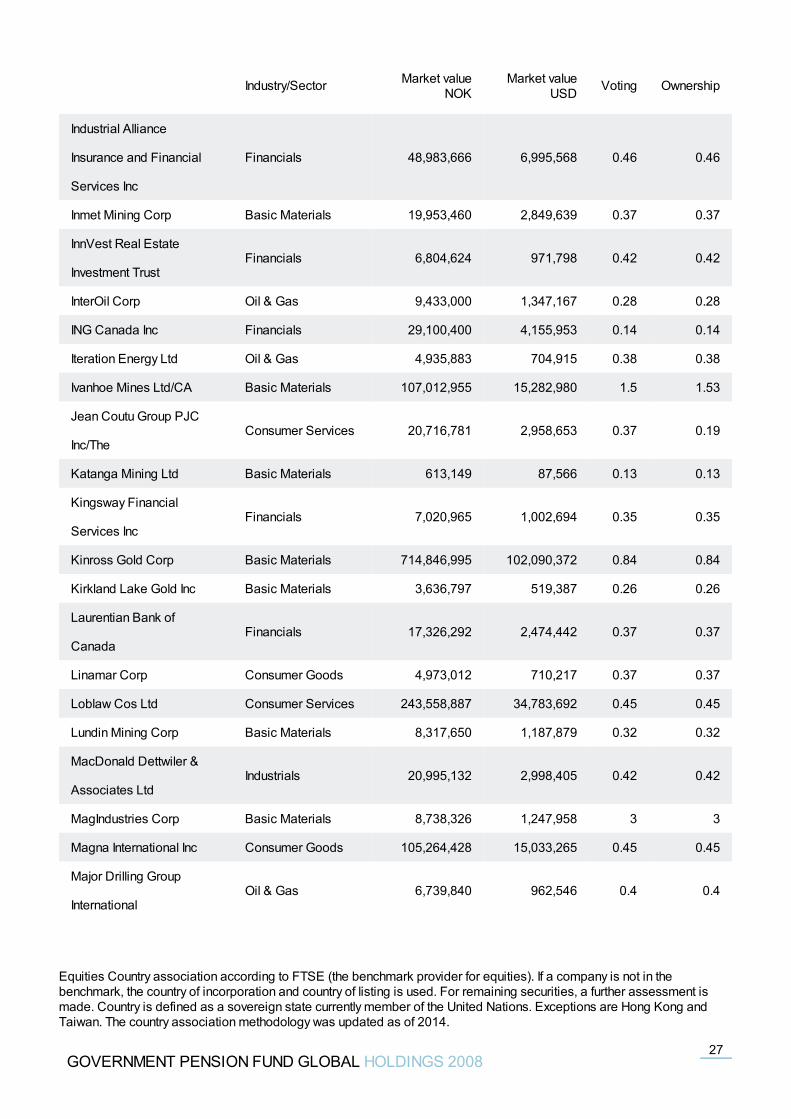
Industrial Alliance
Insurance and Financial
Services Inc
Financials 48,983,666 6,995,568 0.46 0.46
Inmet Mining Corp Basic Materials 19,953,460 2,849,639 0.37 0.37
InnVest Real Estate
Investment TrustFinancials 6,804,624 971,798 0.42 0.42
InterOil Corp Oil & Gas 9,433,000 1,347,167 0.28 0.28
ING Canada Inc Financials 29,100,400 4,155,953 0.14 0.14
Iteration Energy Ltd Oil & Gas 4,935,883 704,915 0.38 0.38
Ivanhoe Mines Ltd/CA Basic Materials 107,012,955 15,282,980 1.5 1.53
Jean Coutu Group PJC
Inc/TheConsumer Services 20,716,781 2,958,653 0.37 0.19
Katanga Mining Ltd Basic Materials 613,149 87,566 0.13 0.13
Kingsway Financial
Services IncFinancials 7,020,965 1,002,694 0.35 0.35
Kinross Gold Corp Basic Materials 714,846,995 102,090,372 0.84 0.84
Kirkland Lake Gold Inc Basic Materials 3,636,797 519,387 0.26 0.26
Laurentian Bank of
CanadaFinancials 17,326,292 2,474,442 0.37 0.37
Linamar Corp Consumer Goods 4,973,012 710,217 0.37 0.37
Loblaw Cos Ltd Consumer Services 243,558,887 34,783,692 0.45 0.45
Lundin Mining Corp Basic Materials 8,317,650 1,187,879 0.32 0.32
MacDonald Dettwiler &
Associates LtdIndustrials 20,995,132 2,998,405 0.42 0.42
MagIndustries Corp Basic Materials 8,738,326 1,247,958 3 3
Magna International Inc Consumer Goods 105,264,428 15,033,265 0.45 0.45
Major Drilling Group
InternationalOil & Gas 6,739,840 962,546 0.4 0.4
Industry/Sector Market valueNOK
Market valueUSD Voting Ownership
GOVERNMENT PENSION FUND GLOBAL HOLDINGS 200827
Equities Country association according to FTSE (the benchmark provider for equities). If a company is not in thebenchmark, the country of incorporation and country of listing is used. For remaining securities, a further assessment ismade. Country is defined as a sovereign state currently member of the United Nations. Exceptions are Hong Kong andTaiwan. The country association methodology was updated as of 2014.
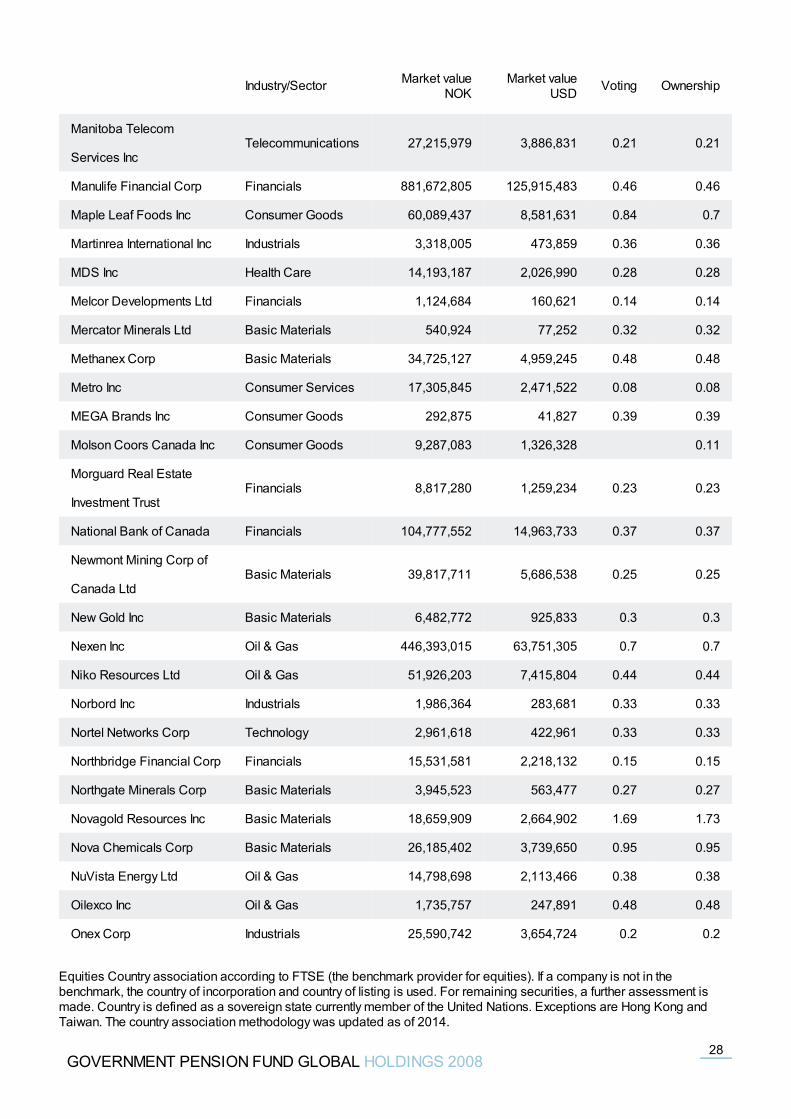
Manitoba Telecom
Services IncTelecommunications 27,215,979 3,886,831 0.21 0.21
Manulife Financial Corp Financials 881,672,805 125,915,483 0.46 0.46
Maple Leaf Foods Inc Consumer Goods 60,089,437 8,581,631 0.84 0.7
Martinrea International Inc Industrials 3,318,005 473,859 0.36 0.36
MDS Inc Health Care 14,193,187 2,026,990 0.28 0.28
Melcor Developments Ltd Financials 1,124,684 160,621 0.14 0.14
Mercator Minerals Ltd Basic Materials 540,924 77,252 0.32 0.32
Methanex Corp Basic Materials 34,725,127 4,959,245 0.48 0.48
Metro Inc Consumer Services 17,305,845 2,471,522 0.08 0.08
MEGA Brands Inc Consumer Goods 292,875 41,827 0.39 0.39
Molson Coors Canada Inc Consumer Goods 9,287,083 1,326,328 0.11
Morguard Real Estate
Investment TrustFinancials 8,817,280 1,259,234 0.23 0.23
National Bank of Canada Financials 104,777,552 14,963,733 0.37 0.37
Newmont Mining Corp of
Canada LtdBasic Materials 39,817,711 5,686,538 0.25 0.25
New Gold Inc Basic Materials 6,482,772 925,833 0.3 0.3
Nexen Inc Oil & Gas 446,393,015 63,751,305 0.7 0.7
Niko Resources Ltd Oil & Gas 51,926,203 7,415,804 0.44 0.44
Norbord Inc Industrials 1,986,364 283,681 0.33 0.33
Nortel Networks Corp Technology 2,961,618 422,961 0.33 0.33
Northbridge Financial Corp Financials 15,531,581 2,218,132 0.15 0.15
Northgate Minerals Corp Basic Materials 3,945,523 563,477 0.27 0.27
Novagold Resources Inc Basic Materials 18,659,909 2,664,902 1.69 1.73
Nova Chemicals Corp Basic Materials 26,185,402 3,739,650 0.95 0.95
NuVista Energy Ltd Oil & Gas 14,798,698 2,113,466 0.38 0.38
Oilexco Inc Oil & Gas 1,735,757 247,891 0.48 0.48
Onex Corp Industrials 25,590,742 3,654,724 0.2 0.2
Industry/Sector Market valueNOK
Market valueUSD Voting Ownership
GOVERNMENT PENSION FUND GLOBAL HOLDINGS 200828
Equities Country association according to FTSE (the benchmark provider for equities). If a company is not in thebenchmark, the country of incorporation and country of listing is used. For remaining securities, a further assessment ismade. Country is defined as a sovereign state currently member of the United Nations. Exceptions are Hong Kong andTaiwan. The country association methodology was updated as of 2014.
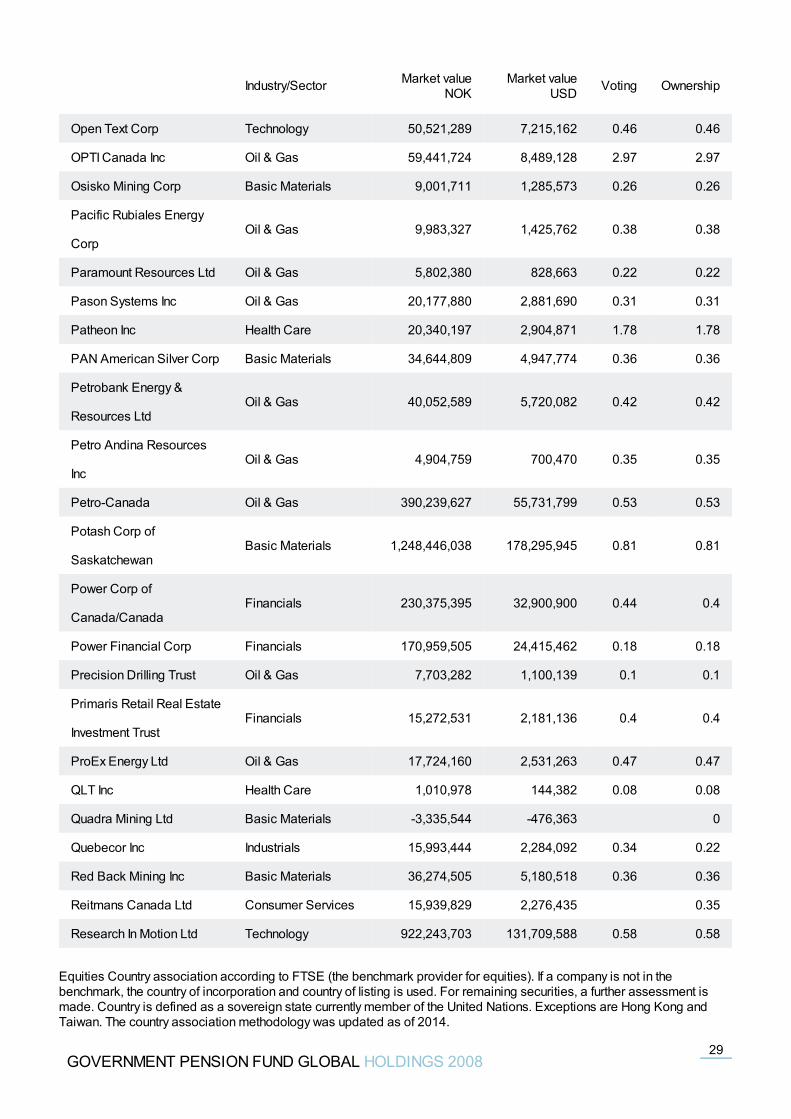
Open Text Corp Technology 50,521,289 7,215,162 0.46 0.46
OPTI Canada Inc Oil & Gas 59,441,724 8,489,128 2.97 2.97
Osisko Mining Corp Basic Materials 9,001,711 1,285,573 0.26 0.26
Pacific Rubiales Energy
CorpOil & Gas 9,983,327 1,425,762 0.38 0.38
Paramount Resources Ltd Oil & Gas 5,802,380 828,663 0.22 0.22
Pason Systems Inc Oil & Gas 20,177,880 2,881,690 0.31 0.31
Patheon Inc Health Care 20,340,197 2,904,871 1.78 1.78
PAN American Silver Corp Basic Materials 34,644,809 4,947,774 0.36 0.36
Petrobank Energy &
Resources LtdOil & Gas 40,052,589 5,720,082 0.42 0.42
Petro Andina Resources
IncOil & Gas 4,904,759 700,470 0.35 0.35
Petro-Canada Oil & Gas 390,239,627 55,731,799 0.53 0.53
Potash Corp of
SaskatchewanBasic Materials 1,248,446,038 178,295,945 0.81 0.81
Power Corp of
Canada/CanadaFinancials 230,375,395 32,900,900 0.44 0.4
Power Financial Corp Financials 170,959,505 24,415,462 0.18 0.18
Precision Drilling Trust Oil & Gas 7,703,282 1,100,139 0.1 0.1
Primaris Retail Real Estate
Investment TrustFinancials 15,272,531 2,181,136 0.4 0.4
ProEx Energy Ltd Oil & Gas 17,724,160 2,531,263 0.47 0.47
QLT Inc Health Care 1,010,978 144,382 0.08 0.08
Quadra Mining Ltd Basic Materials -3,335,544 -476,363 0
Quebecor Inc Industrials 15,993,444 2,284,092 0.34 0.22
Red Back Mining Inc Basic Materials 36,274,505 5,180,518 0.36 0.36
Reitmans Canada Ltd Consumer Services 15,939,829 2,276,435 0.35
Research In Motion Ltd Technology 922,243,703 131,709,588 0.58 0.58
Industry/Sector Market valueNOK
Market valueUSD Voting Ownership
GOVERNMENT PENSION FUND GLOBAL HOLDINGS 200829
Equities Country association according to FTSE (the benchmark provider for equities). If a company is not in thebenchmark, the country of incorporation and country of listing is used. For remaining securities, a further assessment ismade. Country is defined as a sovereign state currently member of the United Nations. Exceptions are Hong Kong andTaiwan. The country association methodology was updated as of 2014.
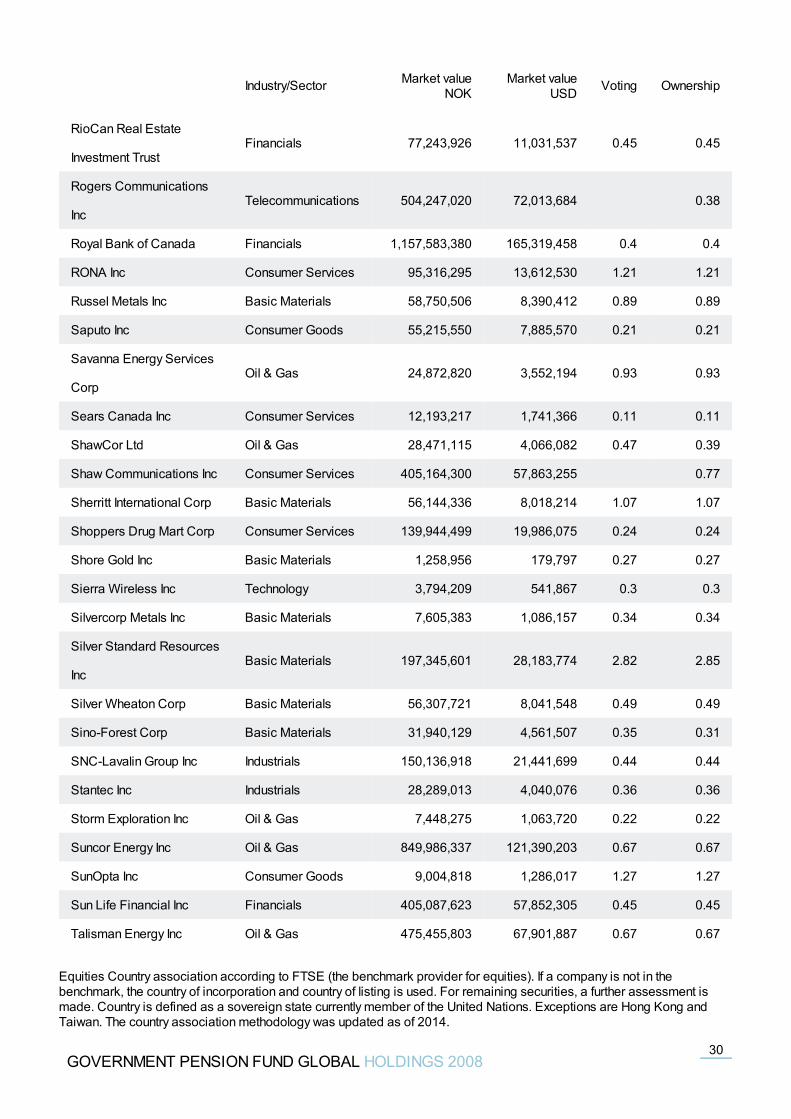
RioCan Real Estate
Investment TrustFinancials 77,243,926 11,031,537 0.45 0.45
Rogers Communications
IncTelecommunications 504,247,020 72,013,684 0.38
Royal Bank of Canada Financials 1,157,583,380 165,319,458 0.4 0.4
RONA Inc Consumer Services 95,316,295 13,612,530 1.21 1.21
Russel Metals Inc Basic Materials 58,750,506 8,390,412 0.89 0.89
Saputo Inc Consumer Goods 55,215,550 7,885,570 0.21 0.21
Savanna Energy Services
CorpOil & Gas 24,872,820 3,552,194 0.93 0.93
Sears Canada Inc Consumer Services 12,193,217 1,741,366 0.11 0.11
ShawCor Ltd Oil & Gas 28,471,115 4,066,082 0.47 0.39
Shaw Communications Inc Consumer Services 405,164,300 57,863,255 0.77
Sherritt International Corp Basic Materials 56,144,336 8,018,214 1.07 1.07
Shoppers Drug Mart Corp Consumer Services 139,944,499 19,986,075 0.24 0.24
Shore Gold Inc Basic Materials 1,258,956 179,797 0.27 0.27
Sierra Wireless Inc Technology 3,794,209 541,867 0.3 0.3
Silvercorp Metals Inc Basic Materials 7,605,383 1,086,157 0.34 0.34
Silver Standard Resources
IncBasic Materials 197,345,601 28,183,774 2.82 2.85
Silver Wheaton Corp Basic Materials 56,307,721 8,041,548 0.49 0.49
Sino-Forest Corp Basic Materials 31,940,129 4,561,507 0.35 0.31
SNC-Lavalin Group Inc Industrials 150,136,918 21,441,699 0.44 0.44
Stantec Inc Industrials 28,289,013 4,040,076 0.36 0.36
Storm Exploration Inc Oil & Gas 7,448,275 1,063,720 0.22 0.22
Suncor Energy Inc Oil & Gas 849,986,337 121,390,203 0.67 0.67
SunOpta Inc Consumer Goods 9,004,818 1,286,017 1.27 1.27
Sun Life Financial Inc Financials 405,087,623 57,852,305 0.45 0.45
Talisman Energy Inc Oil & Gas 475,455,803 67,901,887 0.67 0.67
Industry/Sector Market valueNOK
Market valueUSD Voting Ownership
GOVERNMENT PENSION FUND GLOBAL HOLDINGS 200830
Equities Country association according to FTSE (the benchmark provider for equities). If a company is not in thebenchmark, the country of incorporation and country of listing is used. For remaining securities, a further assessment ismade. Country is defined as a sovereign state currently member of the United Nations. Exceptions are Hong Kong andTaiwan. The country association methodology was updated as of 2014.
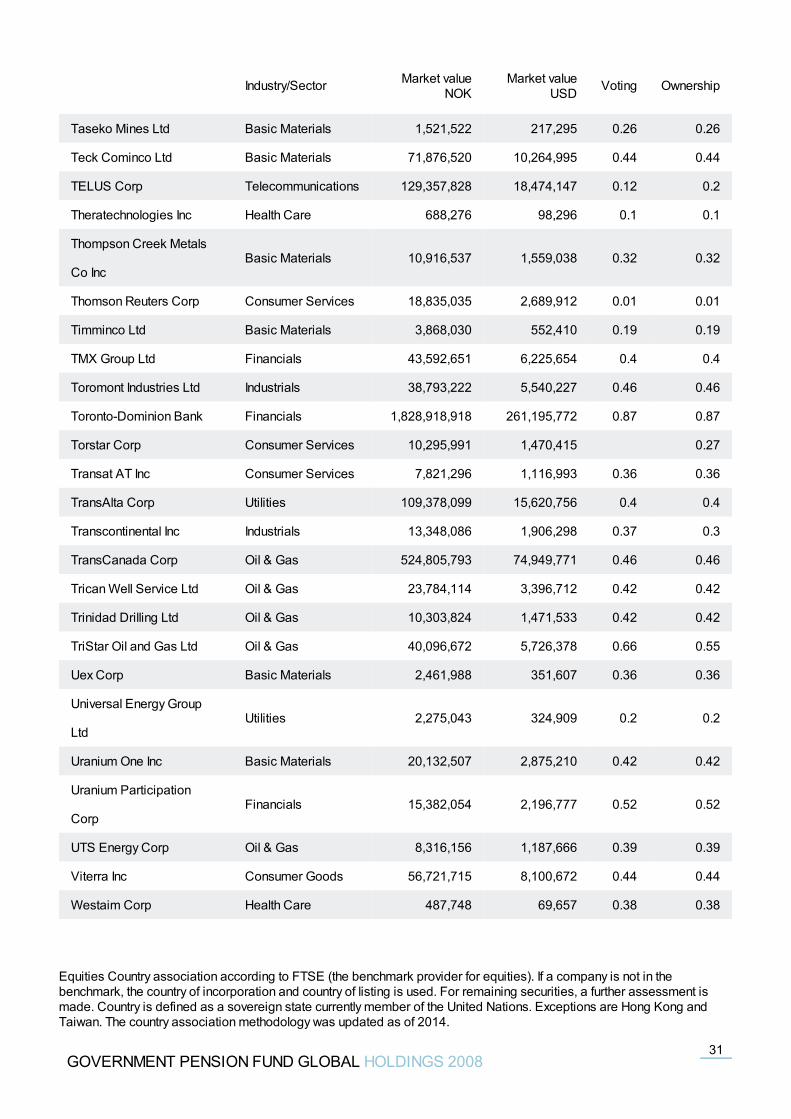
Taseko Mines Ltd Basic Materials 1,521,522 217,295 0.26 0.26
Teck Cominco Ltd Basic Materials 71,876,520 10,264,995 0.44 0.44
TELUS Corp Telecommunications 129,357,828 18,474,147 0.12 0.2
Theratechnologies Inc Health Care 688,276 98,296 0.1 0.1
Thompson Creek Metals
Co IncBasic Materials 10,916,537 1,559,038 0.32 0.32
Thomson Reuters Corp Consumer Services 18,835,035 2,689,912 0.01 0.01
Timminco Ltd Basic Materials 3,868,030 552,410 0.19 0.19
TMX Group Ltd Financials 43,592,651 6,225,654 0.4 0.4
Toromont Industries Ltd Industrials 38,793,222 5,540,227 0.46 0.46
Toronto-Dominion Bank Financials 1,828,918,918 261,195,772 0.87 0.87
Torstar Corp Consumer Services 10,295,991 1,470,415 0.27
Transat AT Inc Consumer Services 7,821,296 1,116,993 0.36 0.36
TransAlta Corp Utilities 109,378,099 15,620,756 0.4 0.4
Transcontinental Inc Industrials 13,348,086 1,906,298 0.37 0.3
TransCanada Corp Oil & Gas 524,805,793 74,949,771 0.46 0.46
Trican Well Service Ltd Oil & Gas 23,784,114 3,396,712 0.42 0.42
Trinidad Drilling Ltd Oil & Gas 10,303,824 1,471,533 0.42 0.42
TriStar Oil and Gas Ltd Oil & Gas 40,096,672 5,726,378 0.66 0.55
Uex Corp Basic Materials 2,461,988 351,607 0.36 0.36
Universal Energy Group
LtdUtilities 2,275,043 324,909 0.2 0.2
Uranium One Inc Basic Materials 20,132,507 2,875,210 0.42 0.42
Uranium Participation
CorpFinancials 15,382,054 2,196,777 0.52 0.52
UTS Energy Corp Oil & Gas 8,316,156 1,187,666 0.39 0.39
Viterra Inc Consumer Goods 56,721,715 8,100,672 0.44 0.44
Westaim Corp Health Care 487,748 69,657 0.38 0.38
Industry/Sector Market valueNOK
Market valueUSD Voting Ownership
GOVERNMENT PENSION FUND GLOBAL HOLDINGS 200831
Equities Country association according to FTSE (the benchmark provider for equities). If a company is not in thebenchmark, the country of incorporation and country of listing is used. For remaining securities, a further assessment ismade. Country is defined as a sovereign state currently member of the United Nations. Exceptions are Hong Kong andTaiwan. The country association methodology was updated as of 2014.
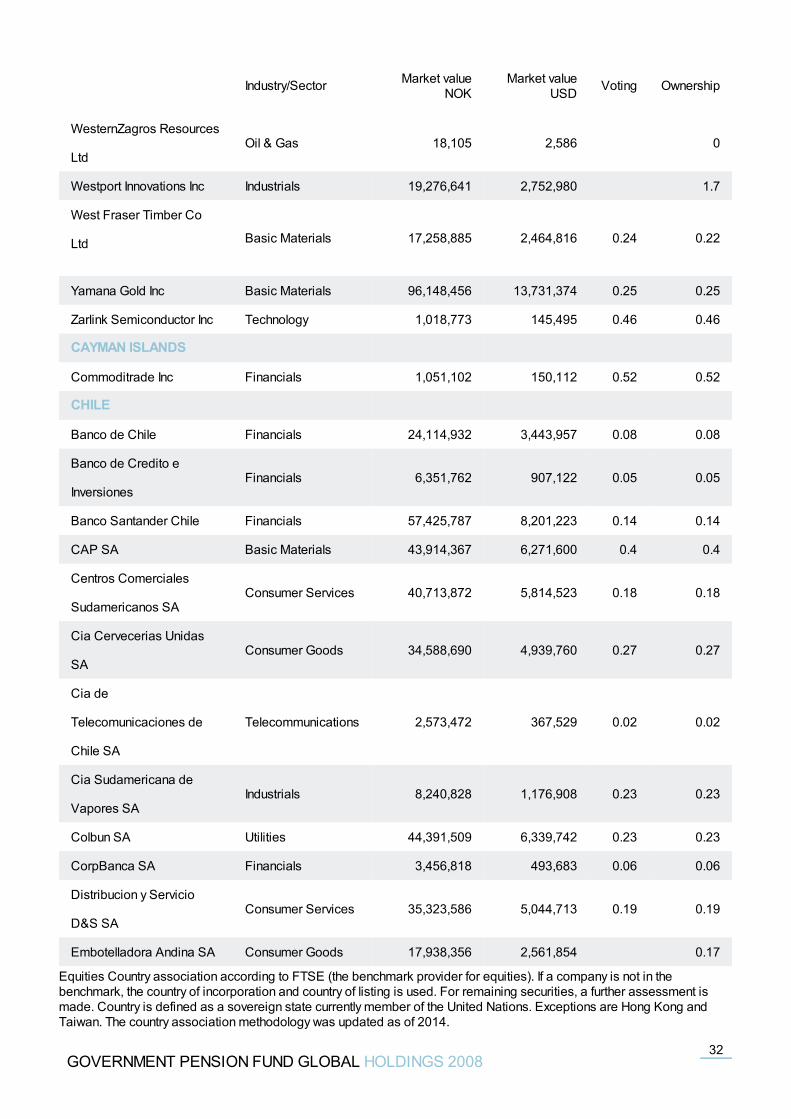
WesternZagros Resources
LtdOil & Gas 18,105 2,586 0
Westport Innovations Inc Industrials 19,276,641 2,752,980 1.7
West Fraser Timber Co
Ltd Basic Materials 17,258,885 2,464,816 0.24 0.22
Yamana Gold Inc Basic Materials 96,148,456 13,731,374 0.25 0.25
Zarlink Semiconductor Inc Technology 1,018,773 145,495 0.46 0.46
CAYMAN ISLANDS
Commoditrade Inc Financials 1,051,102 150,112 0.52 0.52
CHILE
Banco de Chile Financials 24,114,932 3,443,957 0.08 0.08
Banco de Credito e
InversionesFinancials 6,351,762 907,122 0.05 0.05
Banco Santander Chile Financials 57,425,787 8,201,223 0.14 0.14
CAP SA Basic Materials 43,914,367 6,271,600 0.4 0.4
Centros Comerciales
Sudamericanos SAConsumer Services 40,713,872 5,814,523 0.18 0.18
Cia Cervecerias Unidas
SAConsumer Goods 34,588,690 4,939,760 0.27 0.27
Cia de
Telecomunicaciones de
Chile SA
Telecommunications 2,573,472 367,529 0.02 0.02
Cia Sudamericana de
Vapores SAIndustrials 8,240,828 1,176,908 0.23 0.23
Colbun SA Utilities 44,391,509 6,339,742 0.23 0.23
CorpBanca SA Financials 3,456,818 493,683 0.06 0.06
Distribucion y Servicio
D&S SAConsumer Services 35,323,586 5,044,713 0.19 0.19
Embotelladora Andina SA Consumer Goods 17,938,356 2,561,854 0.17
Industry/Sector Market valueNOK
Market valueUSD Voting Ownership
GOVERNMENT PENSION FUND GLOBAL HOLDINGS 200832
Equities Country association according to FTSE (the benchmark provider for equities). If a company is not in thebenchmark, the country of incorporation and country of listing is used. For remaining securities, a further assessment ismade. Country is defined as a sovereign state currently member of the United Nations. Exceptions are Hong Kong andTaiwan. The country association methodology was updated as of 2014.
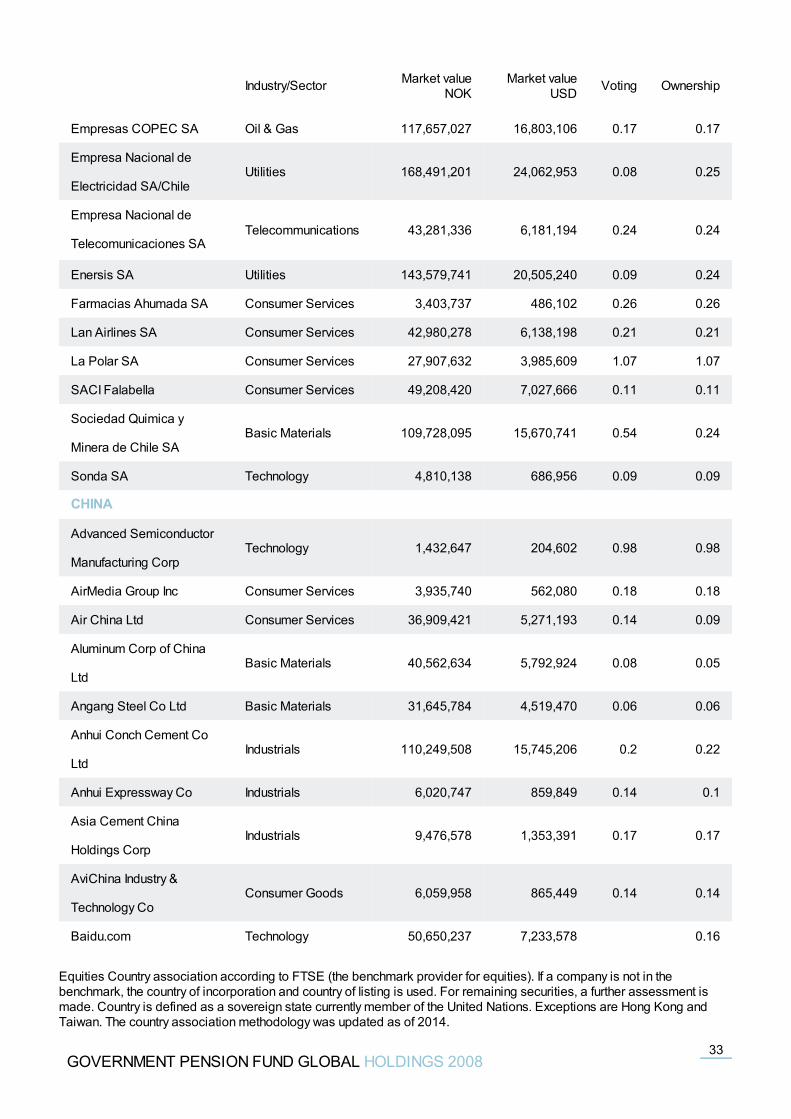
Empresas COPEC SA Oil & Gas 117,657,027 16,803,106 0.17 0.17
Empresa Nacional de
Electricidad SA/ChileUtilities 168,491,201 24,062,953 0.08 0.25
Empresa Nacional de
Telecomunicaciones SATelecommunications 43,281,336 6,181,194 0.24 0.24
Enersis SA Utilities 143,579,741 20,505,240 0.09 0.24
Farmacias Ahumada SA Consumer Services 3,403,737 486,102 0.26 0.26
Lan Airlines SA Consumer Services 42,980,278 6,138,198 0.21 0.21
La Polar SA Consumer Services 27,907,632 3,985,609 1.07 1.07
SACI Falabella Consumer Services 49,208,420 7,027,666 0.11 0.11
Sociedad Quimica y
Minera de Chile SABasic Materials 109,728,095 15,670,741 0.54 0.24
Sonda SA Technology 4,810,138 686,956 0.09 0.09
CHINA
Advanced Semiconductor
Manufacturing CorpTechnology 1,432,647 204,602 0.98 0.98
AirMedia Group Inc Consumer Services 3,935,740 562,080 0.18 0.18
Air China Ltd Consumer Services 36,909,421 5,271,193 0.14 0.09
Aluminum Corp of China
LtdBasic Materials 40,562,634 5,792,924 0.08 0.05
Angang Steel Co Ltd Basic Materials 31,645,784 4,519,470 0.06 0.06
Anhui Conch Cement Co
LtdIndustrials 110,249,508 15,745,206 0.2 0.22
Anhui Expressway Co Industrials 6,020,747 859,849 0.14 0.1
Asia Cement China
Holdings CorpIndustrials 9,476,578 1,353,391 0.17 0.17
AviChina Industry &
Technology CoConsumer Goods 6,059,958 865,449 0.14 0.14
Baidu.com Technology 50,650,237 7,233,578 0.16
Industry/Sector Market valueNOK
Market valueUSD Voting Ownership
GOVERNMENT PENSION FUND GLOBAL HOLDINGS 200833
Equities Country association according to FTSE (the benchmark provider for equities). If a company is not in thebenchmark, the country of incorporation and country of listing is used. For remaining securities, a further assessment ismade. Country is defined as a sovereign state currently member of the United Nations. Exceptions are Hong Kong andTaiwan. The country association methodology was updated as of 2014.
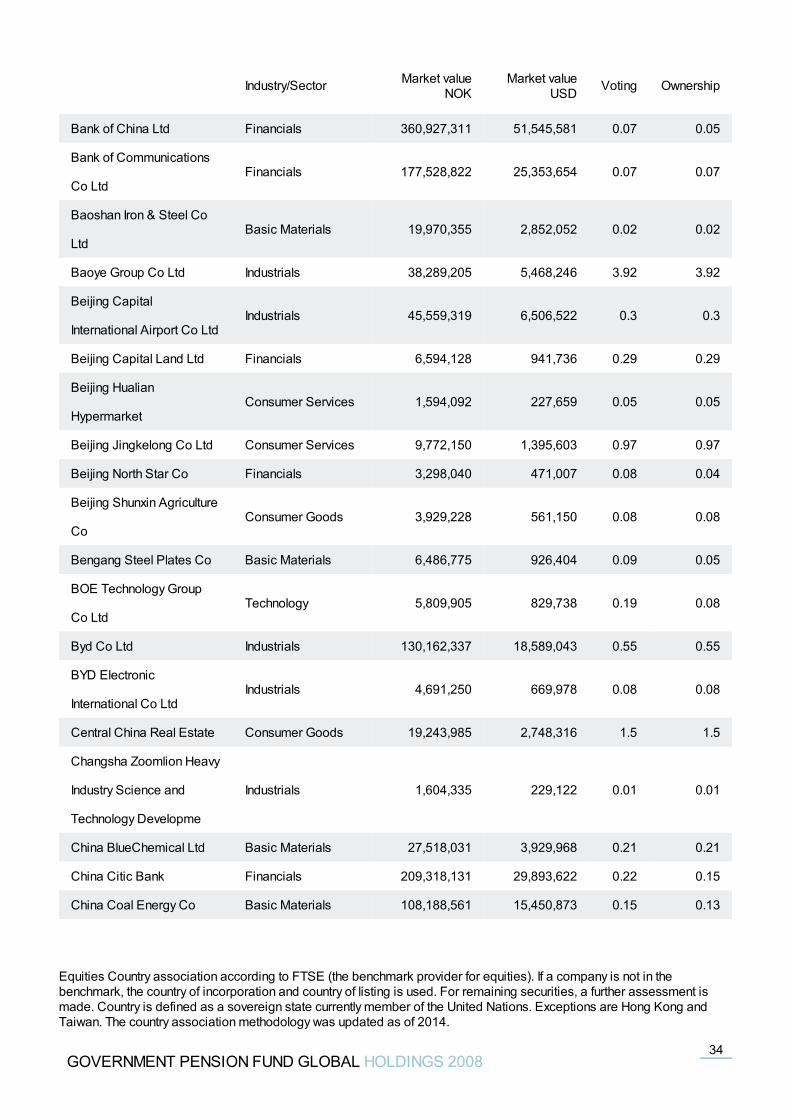
Bank of China Ltd Financials 360,927,311 51,545,581 0.07 0.05
Bank of Communications
Co LtdFinancials 177,528,822 25,353,654 0.07 0.07
Baoshan Iron & Steel Co
LtdBasic Materials 19,970,355 2,852,052 0.02 0.02
Baoye Group Co Ltd Industrials 38,289,205 5,468,246 3.92 3.92
Beijing Capital
International Airport Co LtdIndustrials 45,559,319 6,506,522 0.3 0.3
Beijing Capital Land Ltd Financials 6,594,128 941,736 0.29 0.29
Beijing Hualian
HypermarketConsumer Services 1,594,092 227,659 0.05 0.05
Beijing Jingkelong Co Ltd Consumer Services 9,772,150 1,395,603 0.97 0.97
Beijing North Star Co Financials 3,298,040 471,007 0.08 0.04
Beijing Shunxin Agriculture
CoConsumer Goods 3,929,228 561,150 0.08 0.08
Bengang Steel Plates Co Basic Materials 6,486,775 926,404 0.09 0.05
BOE Technology Group
Co LtdTechnology 5,809,905 829,738 0.19 0.08
Byd Co Ltd Industrials 130,162,337 18,589,043 0.55 0.55
BYD Electronic
International Co LtdIndustrials 4,691,250 669,978 0.08 0.08
Central China Real Estate Consumer Goods 19,243,985 2,748,316 1.5 1.5
Changsha Zoomlion Heavy
Industry Science and
Technology Developme
Industrials 1,604,335 229,122 0.01 0.01
China BlueChemical Ltd Basic Materials 27,518,031 3,929,968 0.21 0.21
China Citic Bank Financials 209,318,131 29,893,622 0.22 0.15
China Coal Energy Co Basic Materials 108,188,561 15,450,873 0.15 0.13
Industry/Sector Market valueNOK
Market valueUSD Voting Ownership
GOVERNMENT PENSION FUND GLOBAL HOLDINGS 200834
Equities Country association according to FTSE (the benchmark provider for equities). If a company is not in thebenchmark, the country of incorporation and country of listing is used. For remaining securities, a further assessment ismade. Country is defined as a sovereign state currently member of the United Nations. Exceptions are Hong Kong andTaiwan. The country association methodology was updated as of 2014.
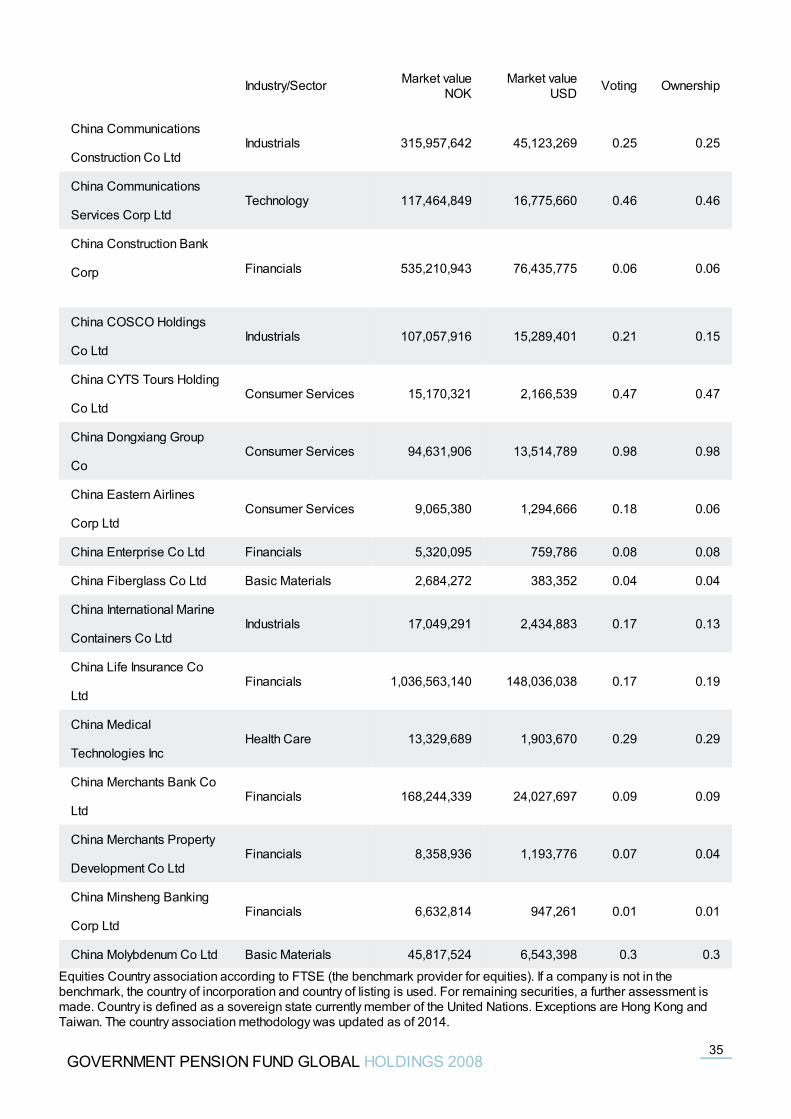
China Communications
Construction Co LtdIndustrials 315,957,642 45,123,269 0.25 0.25
China Communications
Services Corp LtdTechnology 117,464,849 16,775,660 0.46 0.46
China Construction Bank
Corp Financials 535,210,943 76,435,775 0.06 0.06
China COSCO Holdings
Co LtdIndustrials 107,057,916 15,289,401 0.21 0.15
China CYTS Tours Holding
Co LtdConsumer Services 15,170,321 2,166,539 0.47 0.47
China Dongxiang Group
CoConsumer Services 94,631,906 13,514,789 0.98 0.98
China Eastern Airlines
Corp LtdConsumer Services 9,065,380 1,294,666 0.18 0.06
China Enterprise Co Ltd Financials 5,320,095 759,786 0.08 0.08
China Fiberglass Co Ltd Basic Materials 2,684,272 383,352 0.04 0.04
China International Marine
Containers Co LtdIndustrials 17,049,291 2,434,883 0.17 0.13
China Life Insurance Co
LtdFinancials 1,036,563,140 148,036,038 0.17 0.19
China Medical
Technologies IncHealth Care 13,329,689 1,903,670 0.29 0.29
China Merchants Bank Co
LtdFinancials 168,244,339 24,027,697 0.09 0.09
China Merchants Property
Development Co LtdFinancials 8,358,936 1,193,776 0.07 0.04
China Minsheng Banking
Corp LtdFinancials 6,632,814 947,261 0.01 0.01
China Molybdenum Co Ltd Basic Materials 45,817,524 6,543,398 0.3 0.3
Industry/Sector Market valueNOK
Market valueUSD Voting Ownership
GOVERNMENT PENSION FUND GLOBAL HOLDINGS 200835
Equities Country association according to FTSE (the benchmark provider for equities). If a company is not in thebenchmark, the country of incorporation and country of listing is used. For remaining securities, a further assessment ismade. Country is defined as a sovereign state currently member of the United Nations. Exceptions are Hong Kong andTaiwan. The country association methodology was updated as of 2014.
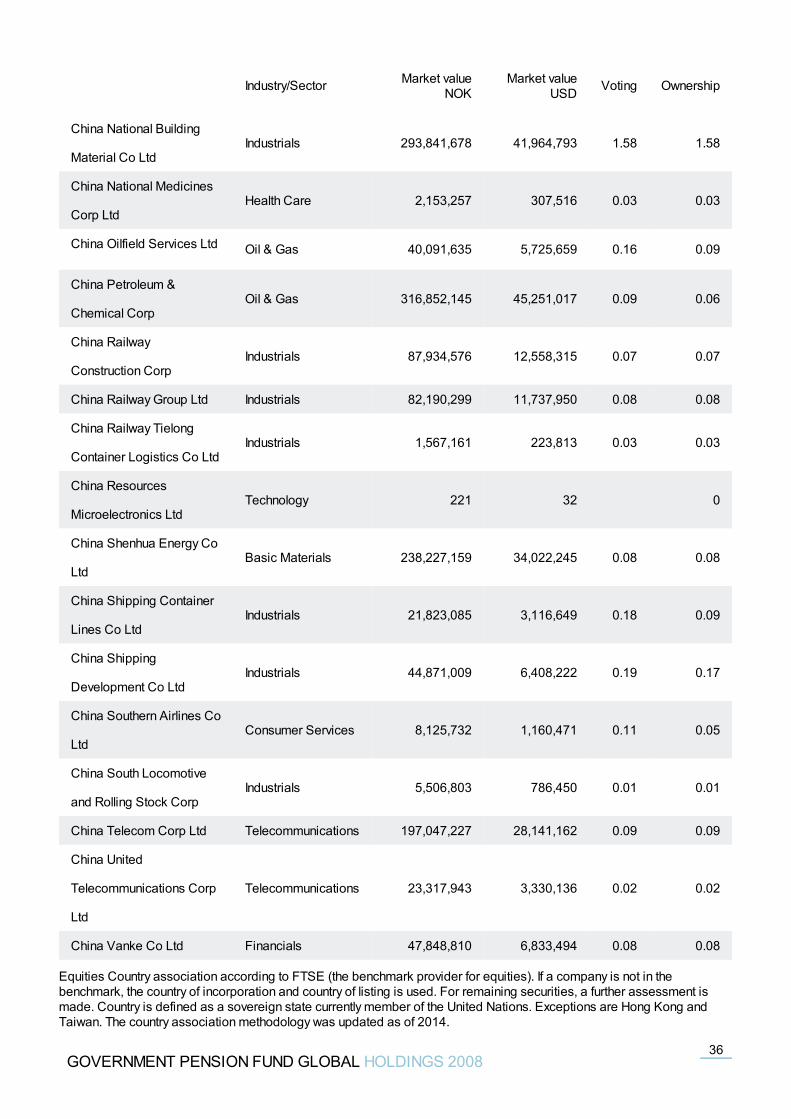
China National Building
Material Co LtdIndustrials 293,841,678 41,964,793 1.58 1.58
China National Medicines
Corp LtdHealth Care 2,153,257 307,516 0.03 0.03
China Oilfield Services Ltd Oil & Gas 40,091,635 5,725,659 0.16 0.09
China Petroleum &
Chemical CorpOil & Gas 316,852,145 45,251,017 0.09 0.06
China Railway
Construction CorpIndustrials 87,934,576 12,558,315 0.07 0.07
China Railway Group Ltd Industrials 82,190,299 11,737,950 0.08 0.08
China Railway Tielong
Container Logistics Co LtdIndustrials 1,567,161 223,813 0.03 0.03
China Resources
Microelectronics LtdTechnology 221 32 0
China Shenhua Energy Co
LtdBasic Materials 238,227,159 34,022,245 0.08 0.08
China Shipping Container
Lines Co LtdIndustrials 21,823,085 3,116,649 0.18 0.09
China Shipping
Development Co LtdIndustrials 44,871,009 6,408,222 0.19 0.17
China Southern Airlines Co
LtdConsumer Services 8,125,732 1,160,471 0.11 0.05
China South Locomotive
and Rolling Stock CorpIndustrials 5,506,803 786,450 0.01 0.01
China Telecom Corp Ltd Telecommunications 197,047,227 28,141,162 0.09 0.09
China United
Telecommunications Corp
Ltd
Telecommunications 23,317,943 3,330,136 0.02 0.02
China Vanke Co Ltd Financials 47,848,810 6,833,494 0.08 0.08
Industry/Sector Market valueNOK
Market valueUSD Voting Ownership
GOVERNMENT PENSION FUND GLOBAL HOLDINGS 200836
Equities Country association according to FTSE (the benchmark provider for equities). If a company is not in thebenchmark, the country of incorporation and country of listing is used. For remaining securities, a further assessment ismade. Country is defined as a sovereign state currently member of the United Nations. Exceptions are Hong Kong andTaiwan. The country association methodology was updated as of 2014.
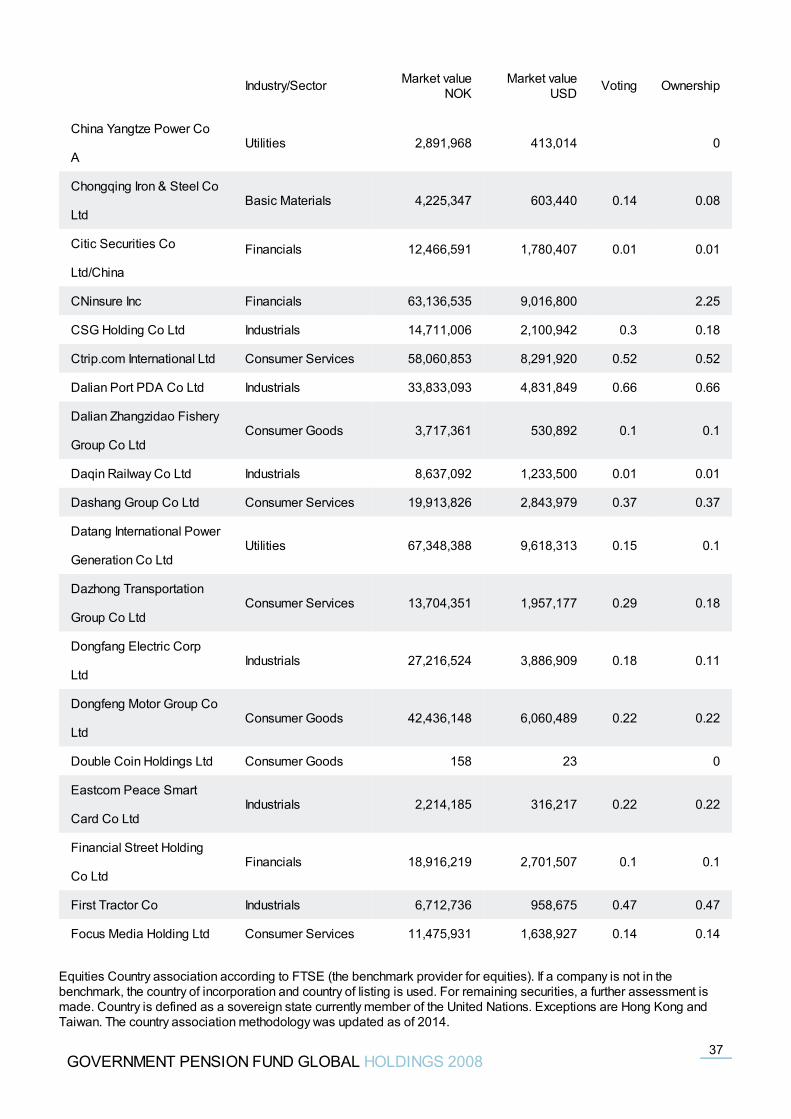
China Yangtze Power Co
AUtilities 2,891,968 413,014 0
Chongqing Iron & Steel Co
LtdBasic Materials 4,225,347 603,440 0.14 0.08
Citic Securities Co
Ltd/China
Financials 12,466,591 1,780,407 0.01 0.01
CNinsure Inc Financials 63,136,535 9,016,800 2.25
CSG Holding Co Ltd Industrials 14,711,006 2,100,942 0.3 0.18
Ctrip.com International Ltd Consumer Services 58,060,853 8,291,920 0.52 0.52
Dalian Port PDA Co Ltd Industrials 33,833,093 4,831,849 0.66 0.66
Dalian Zhangzidao Fishery
Group Co LtdConsumer Goods 3,717,361 530,892 0.1 0.1
Daqin Railway Co Ltd Industrials 8,637,092 1,233,500 0.01 0.01
Dashang Group Co Ltd Consumer Services 19,913,826 2,843,979 0.37 0.37
Datang International Power
Generation Co LtdUtilities 67,348,388 9,618,313 0.15 0.1
Dazhong Transportation
Group Co LtdConsumer Services 13,704,351 1,957,177 0.29 0.18
Dongfang Electric Corp
LtdIndustrials 27,216,524 3,886,909 0.18 0.11
Dongfeng Motor Group Co
LtdConsumer Goods 42,436,148 6,060,489 0.22 0.22
Double Coin Holdings Ltd Consumer Goods 158 23 0
Eastcom Peace Smart
Card Co LtdIndustrials 2,214,185 316,217 0.22 0.22
Financial Street Holding
Co LtdFinancials 18,916,219 2,701,507 0.1 0.1
First Tractor Co Industrials 6,712,736 958,675 0.47 0.47
Focus Media Holding Ltd Consumer Services 11,475,931 1,638,927 0.14 0.14
Industry/Sector Market valueNOK
Market valueUSD Voting Ownership
GOVERNMENT PENSION FUND GLOBAL HOLDINGS 200837
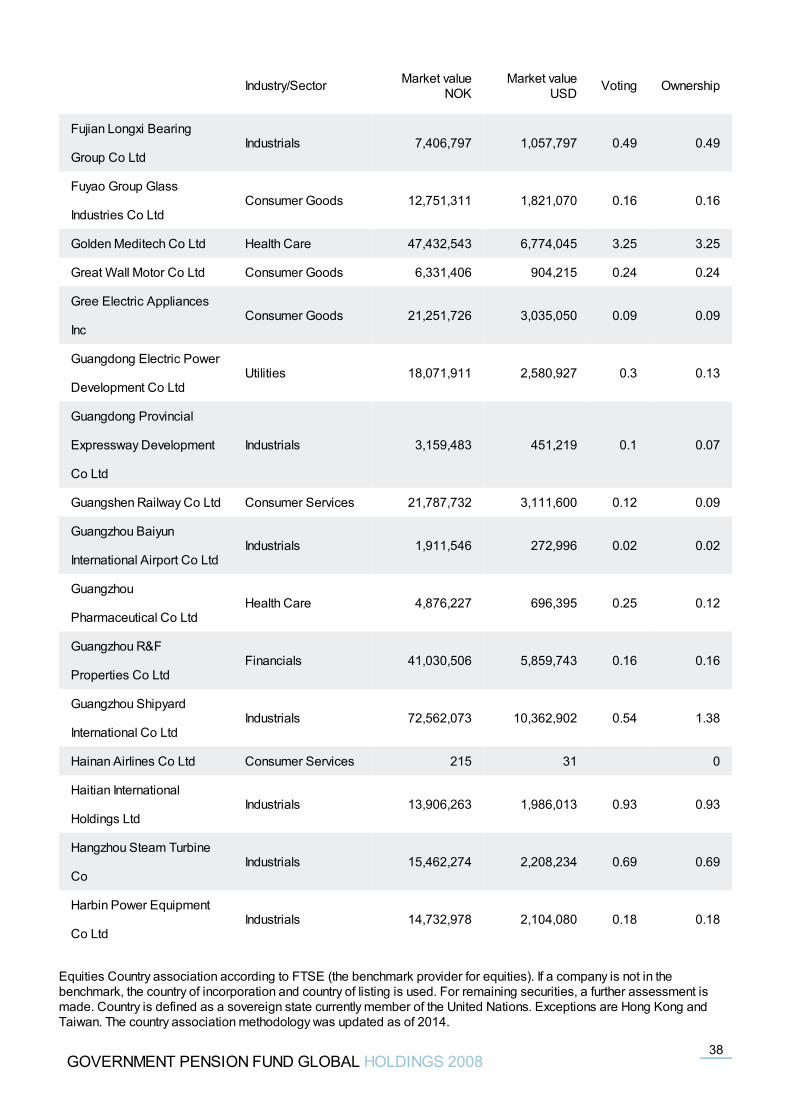
Equities Country association according to FTSE (the benchmark provider for equities). If a company is not in thebenchmark, the country of incorporation and country of listing is used. For remaining securities, a further assessment ismade. Country is defined as a sovereign state currently member of the United Nations. Exceptions are Hong Kong andTaiwan. The country association methodology was updated as of 2014.
Fujian Longxi Bearing
Group Co LtdIndustrials 7,406,797 1,057,797 0.49 0.49
Fuyao Group Glass
Industries Co LtdConsumer Goods 12,751,311 1,821,070 0.16 0.16
Golden Meditech Co Ltd Health Care 47,432,543 6,774,045 3.25 3.25
Great Wall Motor Co Ltd Consumer Goods 6,331,406 904,215 0.24 0.24
Gree Electric Appliances
IncConsumer Goods 21,251,726 3,035,050 0.09 0.09
Guangdong Electric Power
Development Co LtdUtilities 18,071,911 2,580,927 0.3 0.13
Guangdong Provincial
Expressway Development
Co Ltd
Industrials 3,159,483 451,219 0.1 0.07
Guangshen Railway Co Ltd Consumer Services 21,787,732 3,111,600 0.12 0.09
Guangzhou Baiyun
International Airport Co LtdIndustrials 1,911,546 272,996 0.02 0.02
Guangzhou
Pharmaceutical Co LtdHealth Care 4,876,227 696,395 0.25 0.12
Guangzhou R&F
Properties Co LtdFinancials 41,030,506 5,859,743 0.16 0.16
Guangzhou Shipyard
International Co LtdIndustrials 72,562,073 10,362,902 0.54 1.38
Hainan Airlines Co Ltd Consumer Services 215 31 0
Haitian International
Holdings LtdIndustrials 13,906,263 1,986,013 0.93 0.93
Hangzhou Steam Turbine
CoIndustrials 15,462,274 2,208,234 0.69 0.69
Harbin Power Equipment
Co LtdIndustrials 14,732,978 2,104,080 0.18 0.18
Industry/Sector Market valueNOK
Market valueUSD Voting Ownership
GOVERNMENT PENSION FUND GLOBAL HOLDINGS 200838
Equities Country association according to FTSE (the benchmark provider for equities). If a company is not in thebenchmark, the country of incorporation and country of listing is used. For remaining securities, a further assessment ismade. Country is defined as a sovereign state currently member of the United Nations. Exceptions are Hong Kong andTaiwan. The country association methodology was updated as of 2014.
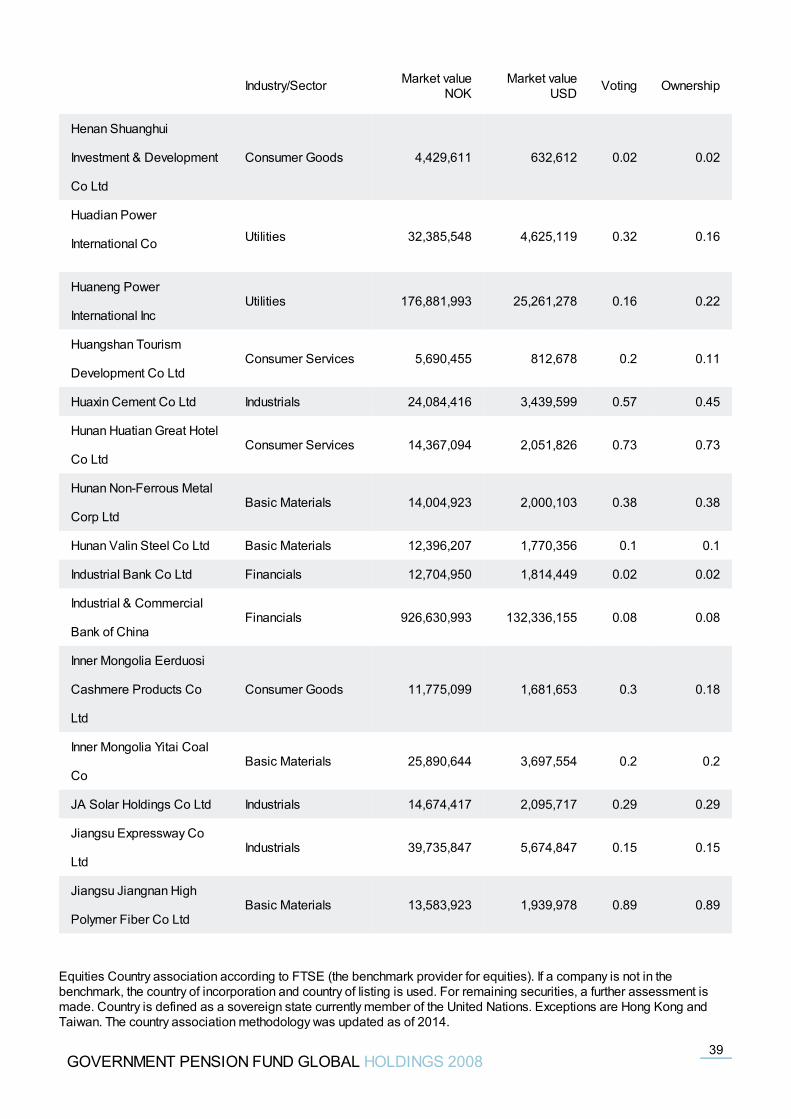
Henan Shuanghui
Investment & Development
Co Ltd
Consumer Goods 4,429,611 632,612 0.02 0.02
Huadian Power
International Co Utilities 32,385,548 4,625,119 0.32 0.16
Huaneng Power
International IncUtilities 176,881,993 25,261,278 0.16 0.22
Huangshan Tourism
Development Co LtdConsumer Services 5,690,455 812,678 0.2 0.11
Huaxin Cement Co Ltd Industrials 24,084,416 3,439,599 0.57 0.45
Hunan Huatian Great Hotel
Co LtdConsumer Services 14,367,094 2,051,826 0.73 0.73
Hunan Non-Ferrous Metal
Corp LtdBasic Materials 14,004,923 2,000,103 0.38 0.38
Hunan Valin Steel Co Ltd Basic Materials 12,396,207 1,770,356 0.1 0.1
Industrial Bank Co Ltd Financials 12,704,950 1,814,449 0.02 0.02
Industrial & Commercial
Bank of ChinaFinancials 926,630,993 132,336,155 0.08 0.08
Inner Mongolia Eerduosi
Cashmere Products Co
Ltd
Consumer Goods 11,775,099 1,681,653 0.3 0.18
Inner Mongolia Yitai Coal
CoBasic Materials 25,890,644 3,697,554 0.2 0.2
JA Solar Holdings Co Ltd Industrials 14,674,417 2,095,717 0.29 0.29
Jiangsu Expressway Co
LtdIndustrials 39,735,847 5,674,847 0.15 0.15
Jiangsu Jiangnan High
Polymer Fiber Co LtdBasic Materials 13,583,923 1,939,978 0.89 0.89
Industry/Sector Market valueNOK
Market valueUSD Voting Ownership
GOVERNMENT PENSION FUND GLOBAL HOLDINGS 200839
Equities Country association according to FTSE (the benchmark provider for equities). If a company is not in thebenchmark, the country of incorporation and country of listing is used. For remaining securities, a further assessment ismade. Country is defined as a sovereign state currently member of the United Nations. Exceptions are Hong Kong andTaiwan. The country association methodology was updated as of 2014.
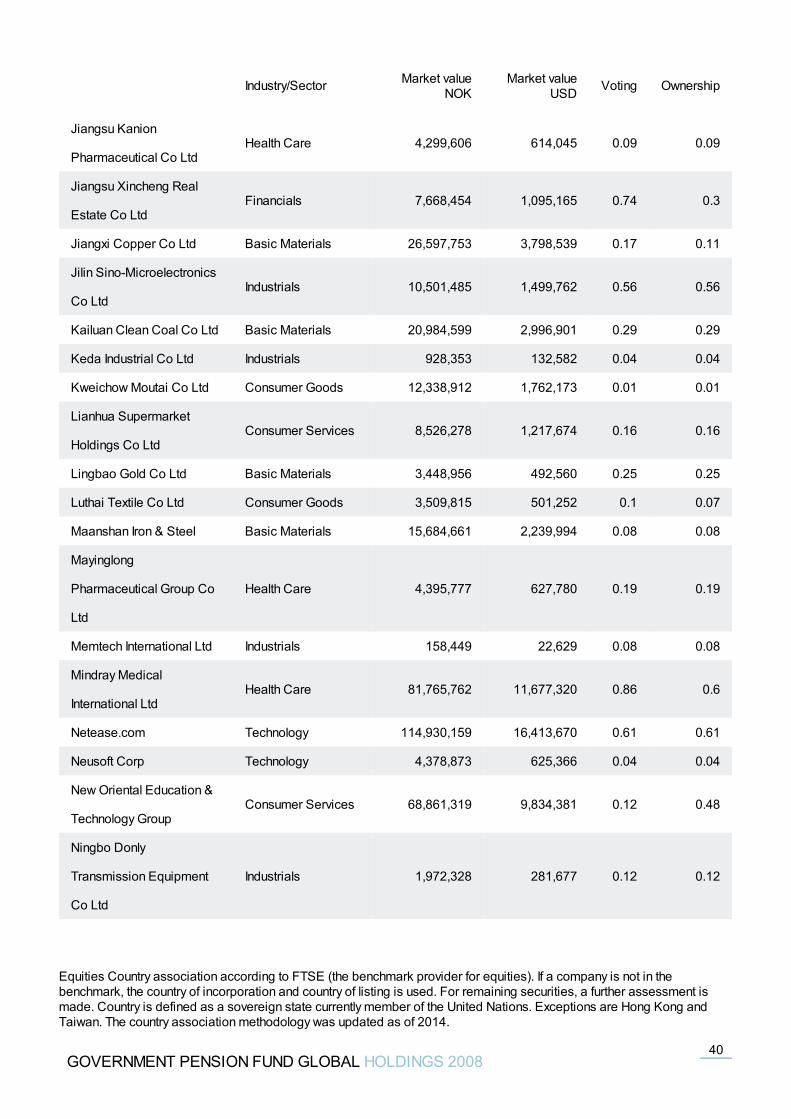
Jiangsu Kanion
Pharmaceutical Co LtdHealth Care 4,299,606 614,045 0.09 0.09
Jiangsu Xincheng Real
Estate Co LtdFinancials 7,668,454 1,095,165 0.74 0.3
Jiangxi Copper Co Ltd Basic Materials 26,597,753 3,798,539 0.17 0.11
Jilin Sino-Microelectronics
Co LtdIndustrials 10,501,485 1,499,762 0.56 0.56
Kailuan Clean Coal Co Ltd Basic Materials 20,984,599 2,996,901 0.29 0.29
Keda Industrial Co Ltd Industrials 928,353 132,582 0.04 0.04
Kweichow Moutai Co Ltd Consumer Goods 12,338,912 1,762,173 0.01 0.01
Lianhua Supermarket
Holdings Co LtdConsumer Services 8,526,278 1,217,674 0.16 0.16
Lingbao Gold Co Ltd Basic Materials 3,448,956 492,560 0.25 0.25
Luthai Textile Co Ltd Consumer Goods 3,509,815 501,252 0.1 0.07
Maanshan Iron & Steel Basic Materials 15,684,661 2,239,994 0.08 0.08
Mayinglong
Pharmaceutical Group Co
Ltd
Health Care 4,395,777 627,780 0.19 0.19
Memtech International Ltd Industrials 158,449 22,629 0.08 0.08
Mindray Medical
International LtdHealth Care 81,765,762 11,677,320 0.86 0.6
Netease.com Technology 114,930,159 16,413,670 0.61 0.61
Neusoft Corp Technology 4,378,873 625,366 0.04 0.04
New Oriental Education &
Technology GroupConsumer Services 68,861,319 9,834,381 0.12 0.48
Ningbo Donly
Transmission Equipment
Co Ltd
Industrials 1,972,328 281,677 0.12 0.12
Industry/Sector Market valueNOK
Market valueUSD Voting Ownership
GOVERNMENT PENSION FUND GLOBAL HOLDINGS 200840
Equities Country association according to FTSE (the benchmark provider for equities). If a company is not in thebenchmark, the country of incorporation and country of listing is used. For remaining securities, a further assessment ismade. Country is defined as a sovereign state currently member of the United Nations. Exceptions are Hong Kong andTaiwan. The country association methodology was updated as of 2014.
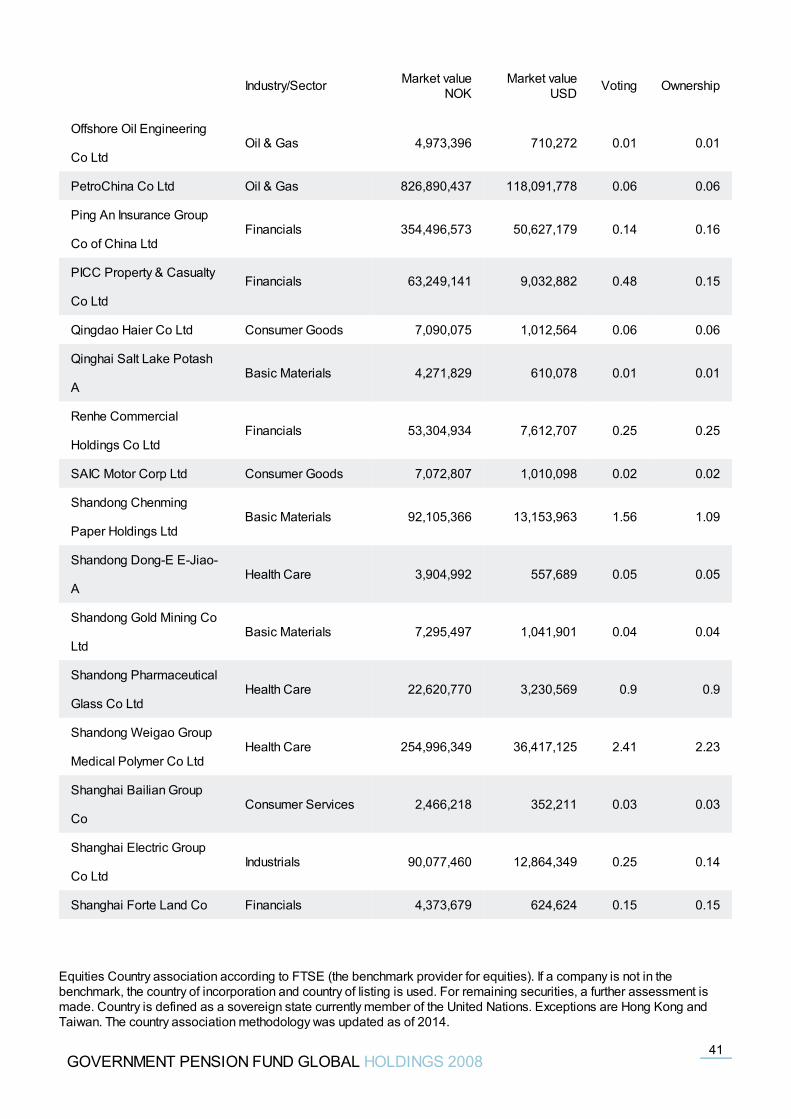
Offshore Oil Engineering
Co LtdOil & Gas 4,973,396 710,272 0.01 0.01
PetroChina Co Ltd Oil & Gas 826,890,437 118,091,778 0.06 0.06
Ping An Insurance Group
Co of China LtdFinancials 354,496,573 50,627,179 0.14 0.16
PICC Property & Casualty
Co LtdFinancials 63,249,141 9,032,882 0.48 0.15
Qingdao Haier Co Ltd Consumer Goods 7,090,075 1,012,564 0.06 0.06
Qinghai Salt Lake Potash
ABasic Materials 4,271,829 610,078 0.01 0.01
Renhe Commercial
Holdings Co LtdFinancials 53,304,934 7,612,707 0.25 0.25
SAIC Motor Corp Ltd Consumer Goods 7,072,807 1,010,098 0.02 0.02
Shandong Chenming
Paper Holdings LtdBasic Materials 92,105,366 13,153,963 1.56 1.09
Shandong Dong-E E-Jiao-
AHealth Care 3,904,992 557,689 0.05 0.05
Shandong Gold Mining Co
LtdBasic Materials 7,295,497 1,041,901 0.04 0.04
Shandong Pharmaceutical
Glass Co LtdHealth Care 22,620,770 3,230,569 0.9 0.9
Shandong Weigao Group
Medical Polymer Co LtdHealth Care 254,996,349 36,417,125 2.41 2.23
Shanghai Bailian Group
CoConsumer Services 2,466,218 352,211 0.03 0.03
Shanghai Electric Group
Co LtdIndustrials 90,077,460 12,864,349 0.25 0.14
Shanghai Forte Land Co Financials 4,373,679 624,624 0.15 0.15
Industry/Sector Market valueNOK
Market valueUSD Voting Ownership
GOVERNMENT PENSION FUND GLOBAL HOLDINGS 200841
Equities Country association according to FTSE (the benchmark provider for equities). If a company is not in thebenchmark, the country of incorporation and country of listing is used. For remaining securities, a further assessment ismade. Country is defined as a sovereign state currently member of the United Nations. Exceptions are Hong Kong andTaiwan. The country association methodology was updated as of 2014.
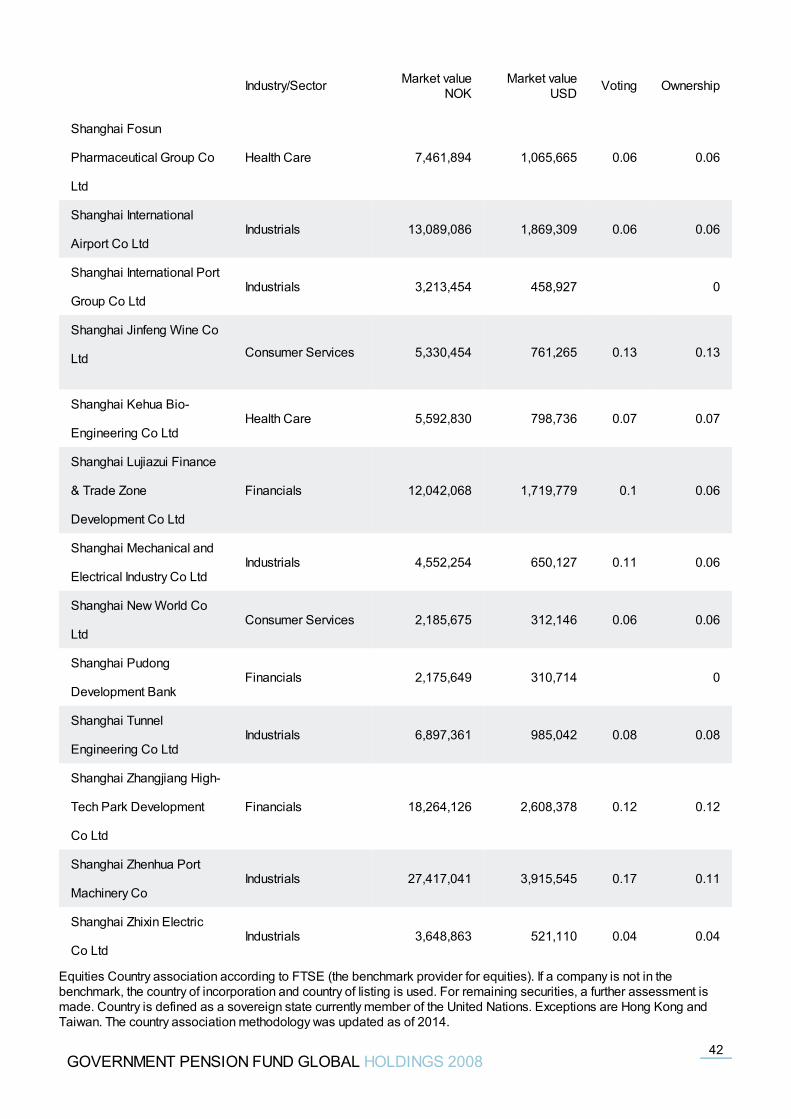
Shanghai Fosun
Pharmaceutical Group Co
Ltd
Health Care 7,461,894 1,065,665 0.06 0.06
Shanghai International
Airport Co LtdIndustrials 13,089,086 1,869,309 0.06 0.06
Shanghai International Port
Group Co LtdIndustrials 3,213,454 458,927 0
Shanghai Jinfeng Wine Co
Ltd Consumer Services 5,330,454 761,265 0.13 0.13
Shanghai Kehua Bio-
Engineering Co LtdHealth Care 5,592,830 798,736 0.07 0.07
Shanghai Lujiazui Finance
& Trade Zone
Development Co Ltd
Financials 12,042,068 1,719,779 0.1 0.06
Shanghai Mechanical and
Electrical Industry Co LtdIndustrials 4,552,254 650,127 0.11 0.06
Shanghai New World Co
LtdConsumer Services 2,185,675 312,146 0.06 0.06
Shanghai Pudong
Development BankFinancials 2,175,649 310,714 0
Shanghai Tunnel
Engineering Co LtdIndustrials 6,897,361 985,042 0.08 0.08
Shanghai Zhangjiang High-
Tech Park Development
Co Ltd
Financials 18,264,126 2,608,378 0.12 0.12
Shanghai Zhenhua Port
Machinery CoIndustrials 27,417,041 3,915,545 0.17 0.11
Shanghai Zhixin Electric
Co LtdIndustrials 3,648,863 521,110 0.04 0.04
Industry/Sector Market valueNOK
Market valueUSD Voting Ownership
GOVERNMENT PENSION FUND GLOBAL HOLDINGS 200842
Equities Country association according to FTSE (the benchmark provider for equities). If a company is not in thebenchmark, the country of incorporation and country of listing is used. For remaining securities, a further assessment ismade. Country is defined as a sovereign state currently member of the United Nations. Exceptions are Hong Kong andTaiwan. The country association methodology was updated as of 2014.
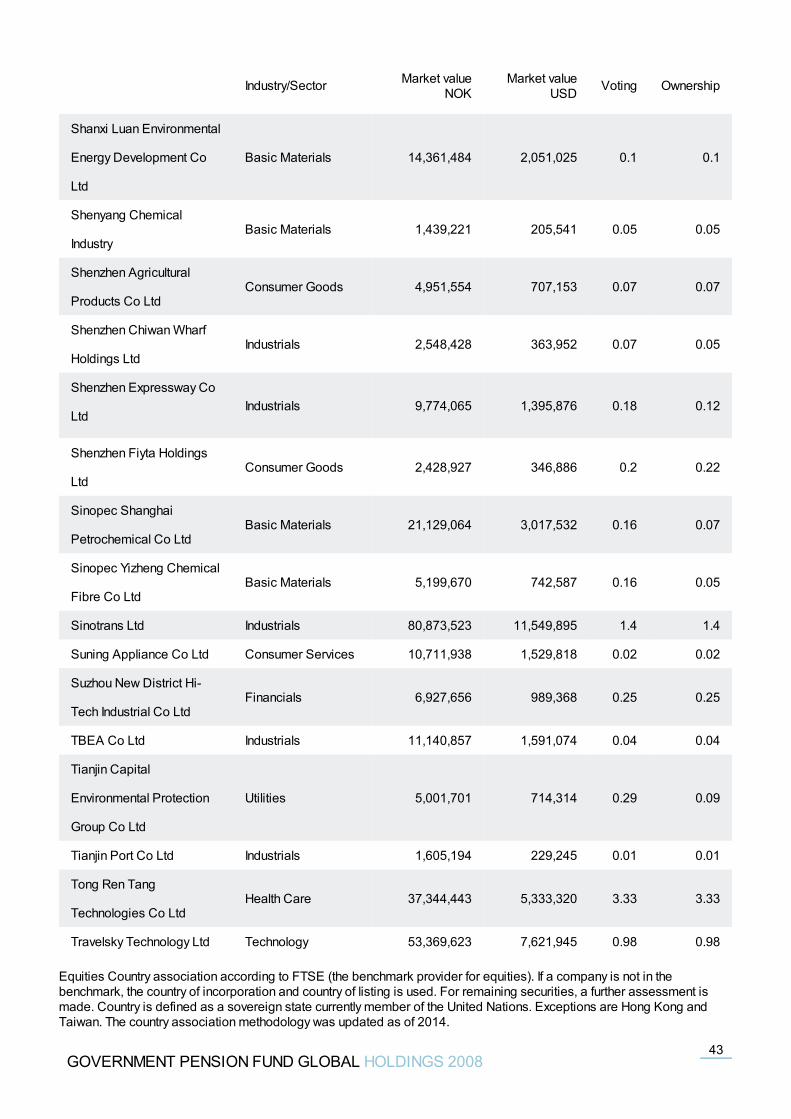
Shanxi Luan Environmental
Energy Development Co
Ltd
Basic Materials 14,361,484 2,051,025 0.1 0.1
Shenyang Chemical
IndustryBasic Materials 1,439,221 205,541 0.05 0.05
Shenzhen Agricultural
Products Co LtdConsumer Goods 4,951,554 707,153 0.07 0.07
Shenzhen Chiwan Wharf
Holdings LtdIndustrials 2,548,428 363,952 0.07 0.05
Shenzhen Expressway Co
LtdIndustrials 9,774,065 1,395,876 0.18 0.12
Shenzhen Fiyta Holdings
LtdConsumer Goods 2,428,927 346,886 0.2 0.22
Sinopec Shanghai
Petrochemical Co LtdBasic Materials 21,129,064 3,017,532 0.16 0.07
Sinopec Yizheng Chemical
Fibre Co LtdBasic Materials 5,199,670 742,587 0.16 0.05
Sinotrans Ltd Industrials 80,873,523 11,549,895 1.4 1.4
Suning Appliance Co Ltd Consumer Services 10,711,938 1,529,818 0.02 0.02
Suzhou New District Hi-
Tech Industrial Co LtdFinancials 6,927,656 989,368 0.25 0.25
TBEA Co Ltd Industrials 11,140,857 1,591,074 0.04 0.04
Tianjin Capital
Environmental Protection
Group Co Ltd
Utilities 5,001,701 714,314 0.29 0.09
Tianjin Port Co Ltd Industrials 1,605,194 229,245 0.01 0.01
Tong Ren Tang
Technologies Co LtdHealth Care 37,344,443 5,333,320 3.33 3.33
Travelsky Technology Ltd Technology 53,369,623 7,621,945 0.98 0.98
Industry/Sector Market valueNOK
Market valueUSD Voting Ownership
GOVERNMENT PENSION FUND GLOBAL HOLDINGS 200843
Equities Country association according to FTSE (the benchmark provider for equities). If a company is not in thebenchmark, the country of incorporation and country of listing is used. For remaining securities, a further assessment ismade. Country is defined as a sovereign state currently member of the United Nations. Exceptions are Hong Kong andTaiwan. The country association methodology was updated as of 2014.
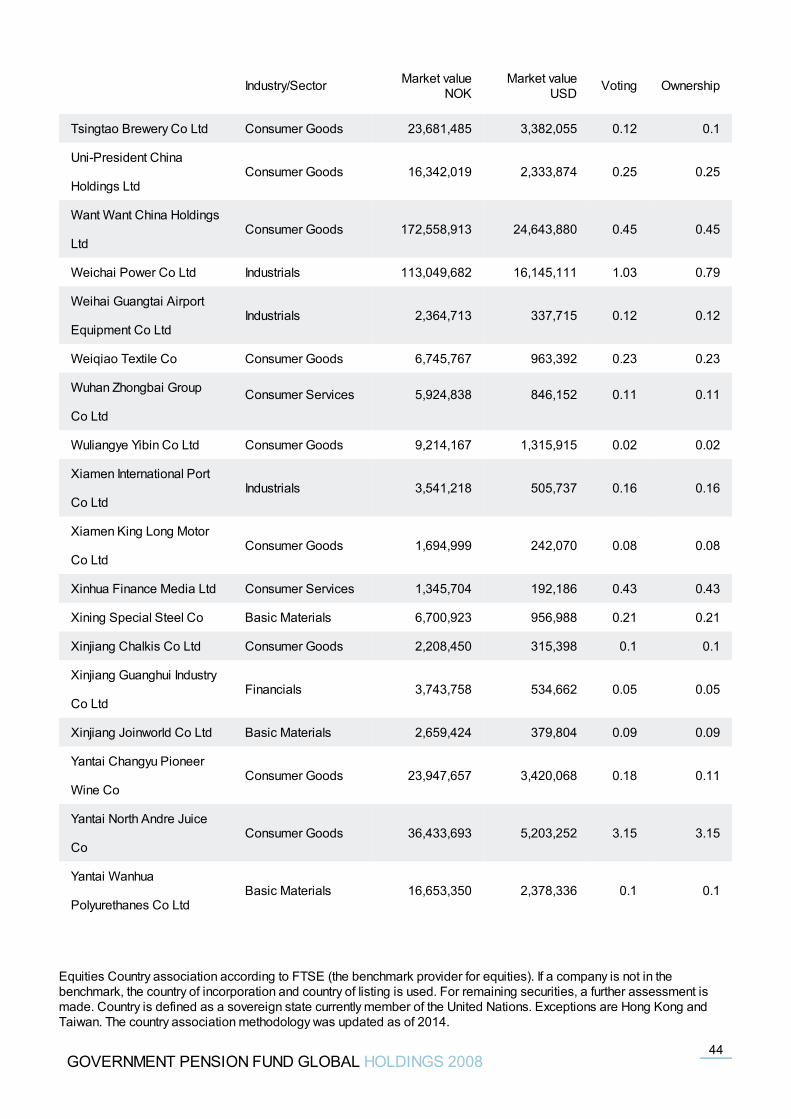
Tsingtao Brewery Co Ltd Consumer Goods 23,681,485 3,382,055 0.12 0.1
Uni-President China
Holdings LtdConsumer Goods 16,342,019 2,333,874 0.25 0.25
Want Want China Holdings
LtdConsumer Goods 172,558,913 24,643,880 0.45 0.45
Weichai Power Co Ltd Industrials 113,049,682 16,145,111 1.03 0.79
Weihai Guangtai Airport
Equipment Co LtdIndustrials 2,364,713 337,715 0.12 0.12
Weiqiao Textile Co Consumer Goods 6,745,767 963,392 0.23 0.23
Wuhan Zhongbai Group
Co LtdConsumer Services 5,924,838 846,152 0.11 0.11
Wuliangye Yibin Co Ltd Consumer Goods 9,214,167 1,315,915 0.02 0.02
Xiamen International Port
Co LtdIndustrials 3,541,218 505,737 0.16 0.16
Xiamen King Long Motor
Co LtdConsumer Goods 1,694,999 242,070 0.08 0.08
Xinhua Finance Media Ltd Consumer Services 1,345,704 192,186 0.43 0.43
Xining Special Steel Co Basic Materials 6,700,923 956,988 0.21 0.21
Xinjiang Chalkis Co Ltd Consumer Goods 2,208,450 315,398 0.1 0.1
Xinjiang Guanghui Industry
Co LtdFinancials 3,743,758 534,662 0.05 0.05
Xinjiang Joinworld Co Ltd Basic Materials 2,659,424 379,804 0.09 0.09
Yantai Changyu Pioneer
Wine CoConsumer Goods 23,947,657 3,420,068 0.18 0.11
Yantai North Andre Juice
CoConsumer Goods 36,433,693 5,203,252 3.15 3.15
Yantai Wanhua
Polyurethanes Co LtdBasic Materials 16,653,350 2,378,336 0.1 0.1
Industry/Sector Market valueNOK
Market valueUSD Voting Ownership
GOVERNMENT PENSION FUND GLOBAL HOLDINGS 200844
Equities Country association according to FTSE (the benchmark provider for equities). If a company is not in thebenchmark, the country of incorporation and country of listing is used. For remaining securities, a further assessment ismade. Country is defined as a sovereign state currently member of the United Nations. Exceptions are Hong Kong andTaiwan. The country association methodology was updated as of 2014.
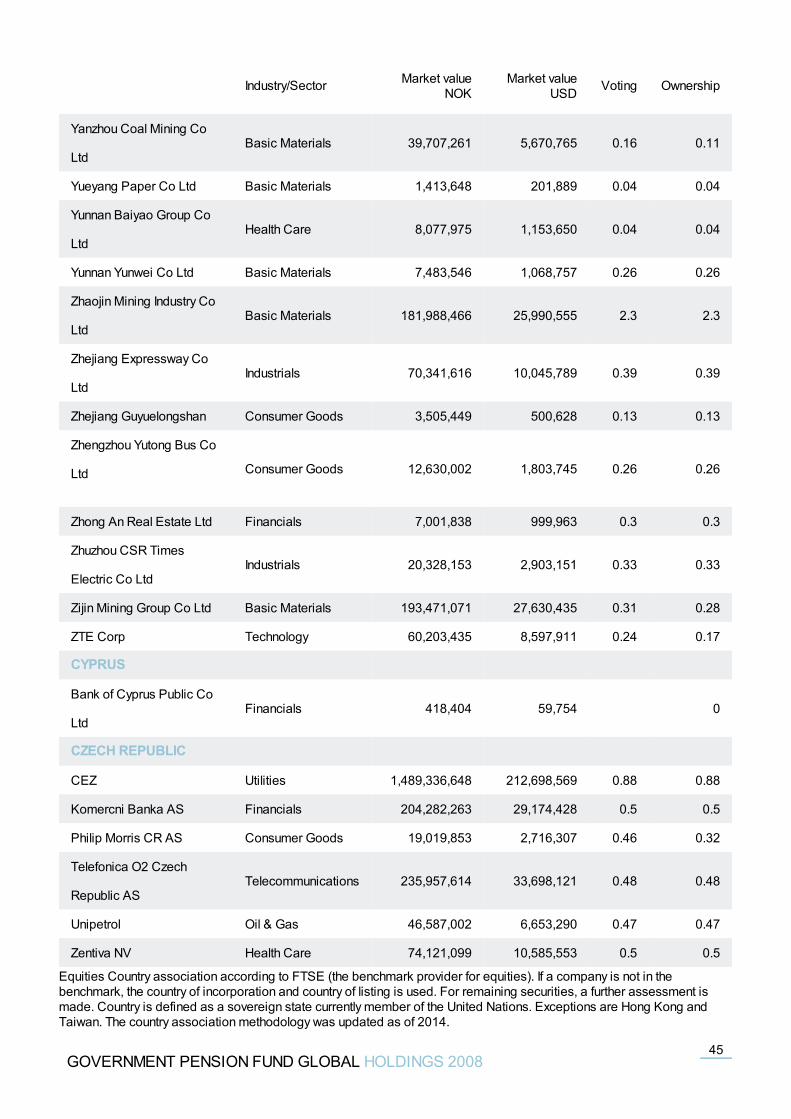
Yanzhou Coal Mining Co
LtdBasic Materials 39,707,261 5,670,765 0.16 0.11
Yueyang Paper Co Ltd Basic Materials 1,413,648 201,889 0.04 0.04
Yunnan Baiyao Group Co
LtdHealth Care 8,077,975 1,153,650 0.04 0.04
Yunnan Yunwei Co Ltd Basic Materials 7,483,546 1,068,757 0.26 0.26
Zhaojin Mining Industry Co
LtdBasic Materials 181,988,466 25,990,555 2.3 2.3
Zhejiang Expressway Co
LtdIndustrials 70,341,616 10,045,789 0.39 0.39
Zhejiang Guyuelongshan Consumer Goods 3,505,449 500,628 0.13 0.13
Zhengzhou Yutong Bus Co
Ltd Consumer Goods 12,630,002 1,803,745 0.26 0.26
Zhong An Real Estate Ltd Financials 7,001,838 999,963 0.3 0.3
Zhuzhou CSR Times
Electric Co LtdIndustrials 20,328,153 2,903,151 0.33 0.33
Zijin Mining Group Co Ltd Basic Materials 193,471,071 27,630,435 0.31 0.28
ZTE Corp Technology 60,203,435 8,597,911 0.24 0.17
CYPRUS
Bank of Cyprus Public Co
LtdFinancials 418,404 59,754 0
CZECH REPUBLIC
CEZ Utilities 1,489,336,648 212,698,569 0.88 0.88
Komercni Banka AS Financials 204,282,263 29,174,428 0.5 0.5
Philip Morris CR AS Consumer Goods 19,019,853 2,716,307 0.46 0.32
Telefonica O2 Czech
Republic ASTelecommunications 235,957,614 33,698,121 0.48 0.48
Unipetrol Oil & Gas 46,587,002 6,653,290 0.47 0.47
Zentiva NV Health Care 74,121,099 10,585,553 0.5 0.5
Industry/Sector Market valueNOK
Market valueUSD Voting Ownership
GOVERNMENT PENSION FUND GLOBAL HOLDINGS 200845
Equities Country association according to FTSE (the benchmark provider for equities). If a company is not in thebenchmark, the country of incorporation and country of listing is used. For remaining securities, a further assessment ismade. Country is defined as a sovereign state currently member of the United Nations. Exceptions are Hong Kong andTaiwan. The country association methodology was updated as of 2014.
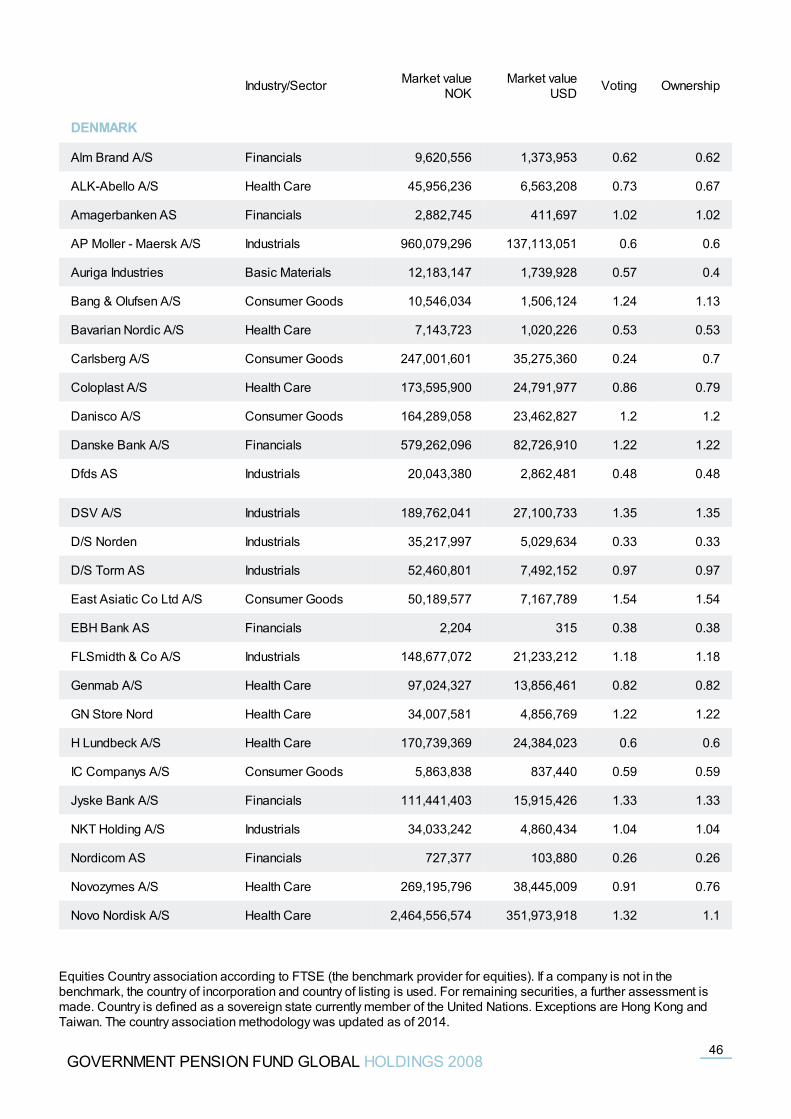
DENMARK
Alm Brand A/S Financials 9,620,556 1,373,953 0.62 0.62
ALK-Abello A/S Health Care 45,956,236 6,563,208 0.73 0.67
Amagerbanken AS Financials 2,882,745 411,697 1.02 1.02
AP Moller - Maersk A/S Industrials 960,079,296 137,113,051 0.6 0.6
Auriga Industries Basic Materials 12,183,147 1,739,928 0.57 0.4
Bang & Olufsen A/S Consumer Goods 10,546,034 1,506,124 1.24 1.13
Bavarian Nordic A/S Health Care 7,143,723 1,020,226 0.53 0.53
Carlsberg A/S Consumer Goods 247,001,601 35,275,360 0.24 0.7
Coloplast A/S Health Care 173,595,900 24,791,977 0.86 0.79
Danisco A/S Consumer Goods 164,289,058 23,462,827 1.2 1.2
Danske Bank A/S Financials 579,262,096 82,726,910 1.22 1.22
Dfds AS Industrials 20,043,380 2,862,481 0.48 0.48
DSV A/S Industrials 189,762,041 27,100,733 1.35 1.35
D/S Norden Industrials 35,217,997 5,029,634 0.33 0.33
D/S Torm AS Industrials 52,460,801 7,492,152 0.97 0.97
East Asiatic Co Ltd A/S Consumer Goods 50,189,577 7,167,789 1.54 1.54
EBH Bank AS Financials 2,204 315 0.38 0.38
FLSmidth & Co A/S Industrials 148,677,072 21,233,212 1.18 1.18
Genmab A/S Health Care 97,024,327 13,856,461 0.82 0.82
GN Store Nord Health Care 34,007,581 4,856,769 1.22 1.22
H Lundbeck A/S Health Care 170,739,369 24,384,023 0.6 0.6
IC Companys A/S Consumer Goods 5,863,838 837,440 0.59 0.59
Jyske Bank A/S Financials 111,441,403 15,915,426 1.33 1.33
NKT Holding A/S Industrials 34,033,242 4,860,434 1.04 1.04
Nordicom AS Financials 727,377 103,880 0.26 0.26
Novozymes A/S Health Care 269,195,796 38,445,009 0.91 0.76
Novo Nordisk A/S Health Care 2,464,556,574 351,973,918 1.32 1.1
Industry/Sector Market valueNOK
Market valueUSD Voting Ownership
GOVERNMENT PENSION FUND GLOBAL HOLDINGS 200846
Equities Country association according to FTSE (the benchmark provider for equities). If a company is not in thebenchmark, the country of incorporation and country of listing is used. For remaining securities, a further assessment ismade. Country is defined as a sovereign state currently member of the United Nations. Exceptions are Hong Kong andTaiwan. The country association methodology was updated as of 2014.
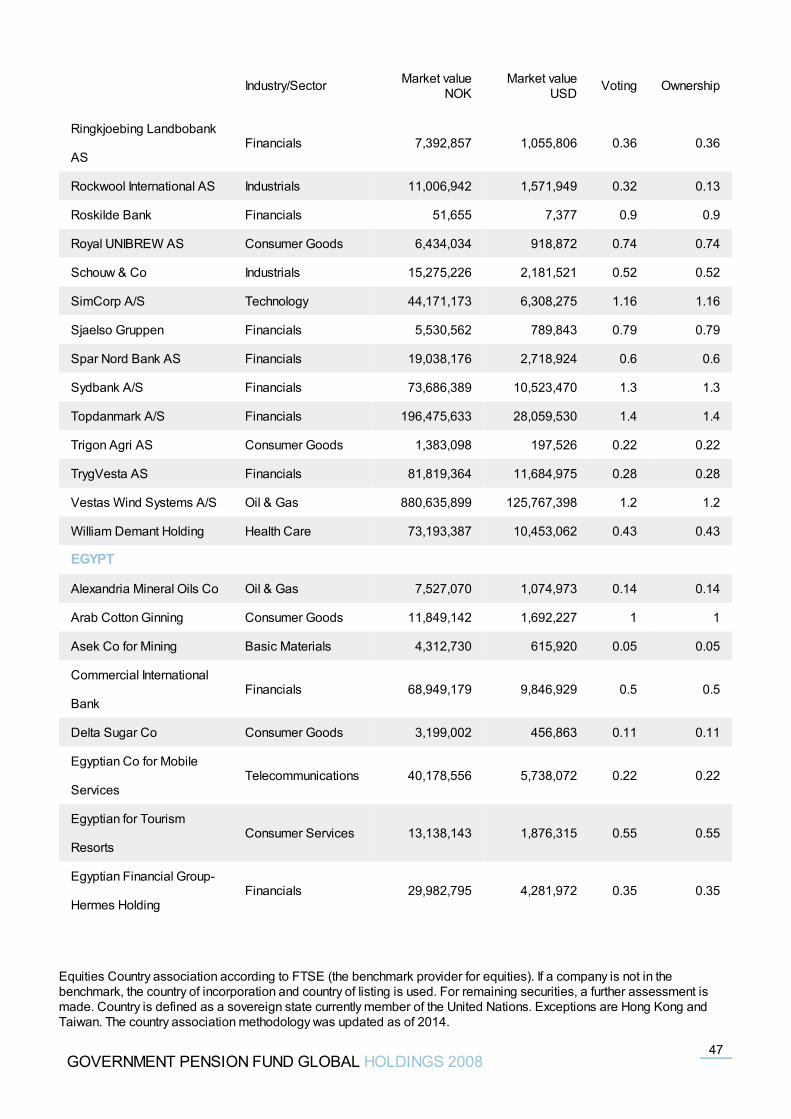
Ringkjoebing Landbobank
ASFinancials 7,392,857 1,055,806 0.36 0.36
Rockwool International AS Industrials 11,006,942 1,571,949 0.32 0.13
Roskilde Bank Financials 51,655 7,377 0.9 0.9
Royal UNIBREW AS Consumer Goods 6,434,034 918,872 0.74 0.74
Schouw & Co Industrials 15,275,226 2,181,521 0.52 0.52
SimCorp A/S Technology 44,171,173 6,308,275 1.16 1.16
Sjaelso Gruppen Financials 5,530,562 789,843 0.79 0.79
Spar Nord Bank AS Financials 19,038,176 2,718,924 0.6 0.6
Sydbank A/S Financials 73,686,389 10,523,470 1.3 1.3
Topdanmark A/S Financials 196,475,633 28,059,530 1.4 1.4
Trigon Agri AS Consumer Goods 1,383,098 197,526 0.22 0.22
TrygVesta AS Financials 81,819,364 11,684,975 0.28 0.28
Vestas Wind Systems A/S Oil & Gas 880,635,899 125,767,398 1.2 1.2
William Demant Holding Health Care 73,193,387 10,453,062 0.43 0.43
EGYPT
Alexandria Mineral Oils Co Oil & Gas 7,527,070 1,074,973 0.14 0.14
Arab Cotton Ginning Consumer Goods 11,849,142 1,692,227 1 1
Asek Co for Mining Basic Materials 4,312,730 615,920 0.05 0.05
Commercial International
BankFinancials 68,949,179 9,846,929 0.5 0.5
Delta Sugar Co Consumer Goods 3,199,002 456,863 0.11 0.11
Egyptian Co for Mobile
ServicesTelecommunications 40,178,556 5,738,072 0.22 0.22
Egyptian for Tourism
ResortsConsumer Services 13,138,143 1,876,315 0.55 0.55
Egyptian Financial Group-
Hermes HoldingFinancials 29,982,795 4,281,972 0.35 0.35
Industry/Sector Market valueNOK
Market valueUSD Voting Ownership
GOVERNMENT PENSION FUND GLOBAL HOLDINGS 200847
Equities Country association according to FTSE (the benchmark provider for equities). If a company is not in thebenchmark, the country of incorporation and country of listing is used. For remaining securities, a further assessment ismade. Country is defined as a sovereign state currently member of the United Nations. Exceptions are Hong Kong andTaiwan. The country association methodology was updated as of 2014.
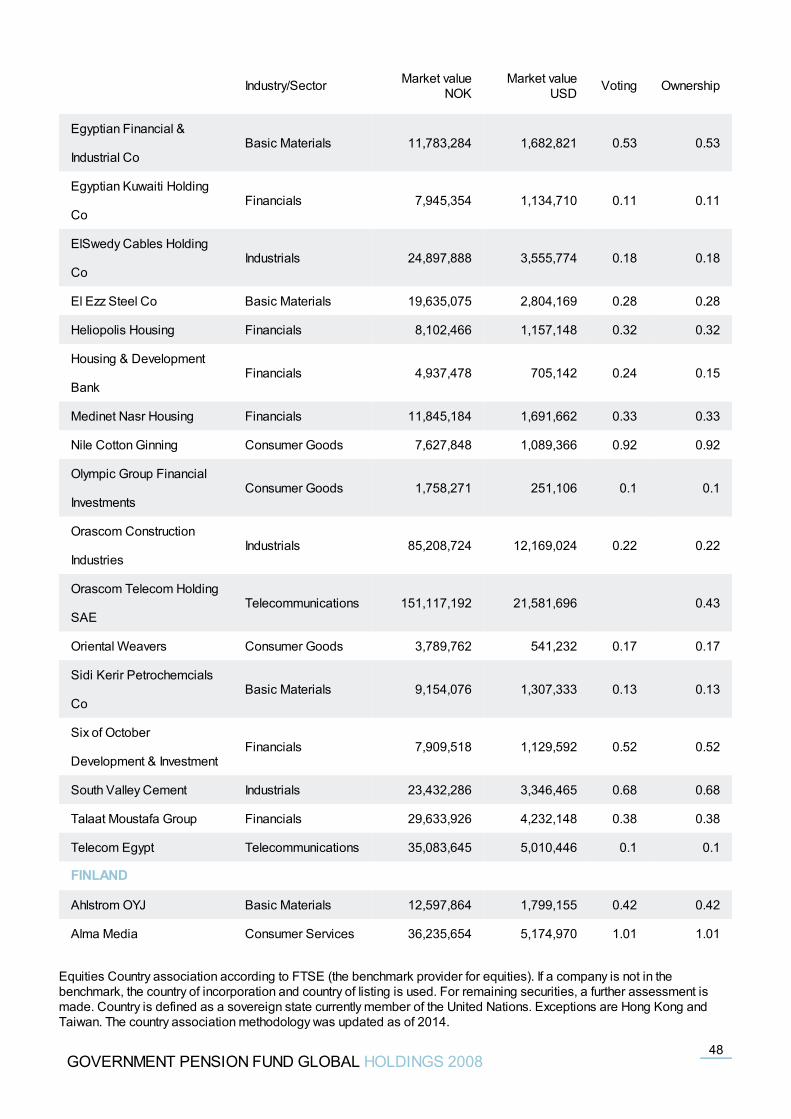
Egyptian Financial &
Industrial CoBasic Materials 11,783,284 1,682,821 0.53 0.53
Egyptian Kuwaiti Holding
CoFinancials 7,945,354 1,134,710 0.11 0.11
ElSwedy Cables Holding
CoIndustrials 24,897,888 3,555,774 0.18 0.18
El Ezz Steel Co Basic Materials 19,635,075 2,804,169 0.28 0.28
Heliopolis Housing Financials 8,102,466 1,157,148 0.32 0.32
Housing & Development
BankFinancials 4,937,478 705,142 0.24 0.15
Medinet Nasr Housing Financials 11,845,184 1,691,662 0.33 0.33
Nile Cotton Ginning Consumer Goods 7,627,848 1,089,366 0.92 0.92
Olympic Group Financial
InvestmentsConsumer Goods 1,758,271 251,106 0.1 0.1
Orascom Construction
IndustriesIndustrials 85,208,724 12,169,024 0.22 0.22
Orascom Telecom Holding
SAETelecommunications 151,117,192 21,581,696 0.43
Oriental Weavers Consumer Goods 3,789,762 541,232 0.17 0.17
Sidi Kerir Petrochemcials
CoBasic Materials 9,154,076 1,307,333 0.13 0.13
Six of October
Development & InvestmentFinancials 7,909,518 1,129,592 0.52 0.52
South Valley Cement Industrials 23,432,286 3,346,465 0.68 0.68
Talaat Moustafa Group Financials 29,633,926 4,232,148 0.38 0.38
Telecom Egypt Telecommunications 35,083,645 5,010,446 0.1 0.1
FINLAND
Ahlstrom OYJ Basic Materials 12,597,864 1,799,155 0.42 0.42
Alma Media Consumer Services 36,235,654 5,174,970 1.01 1.01
Industry/Sector Market valueNOK
Market valueUSD Voting Ownership
GOVERNMENT PENSION FUND GLOBAL HOLDINGS 200848
Equities Country association according to FTSE (the benchmark provider for equities). If a company is not in thebenchmark, the country of incorporation and country of listing is used. For remaining securities, a further assessment ismade. Country is defined as a sovereign state currently member of the United Nations. Exceptions are Hong Kong andTaiwan. The country association methodology was updated as of 2014.
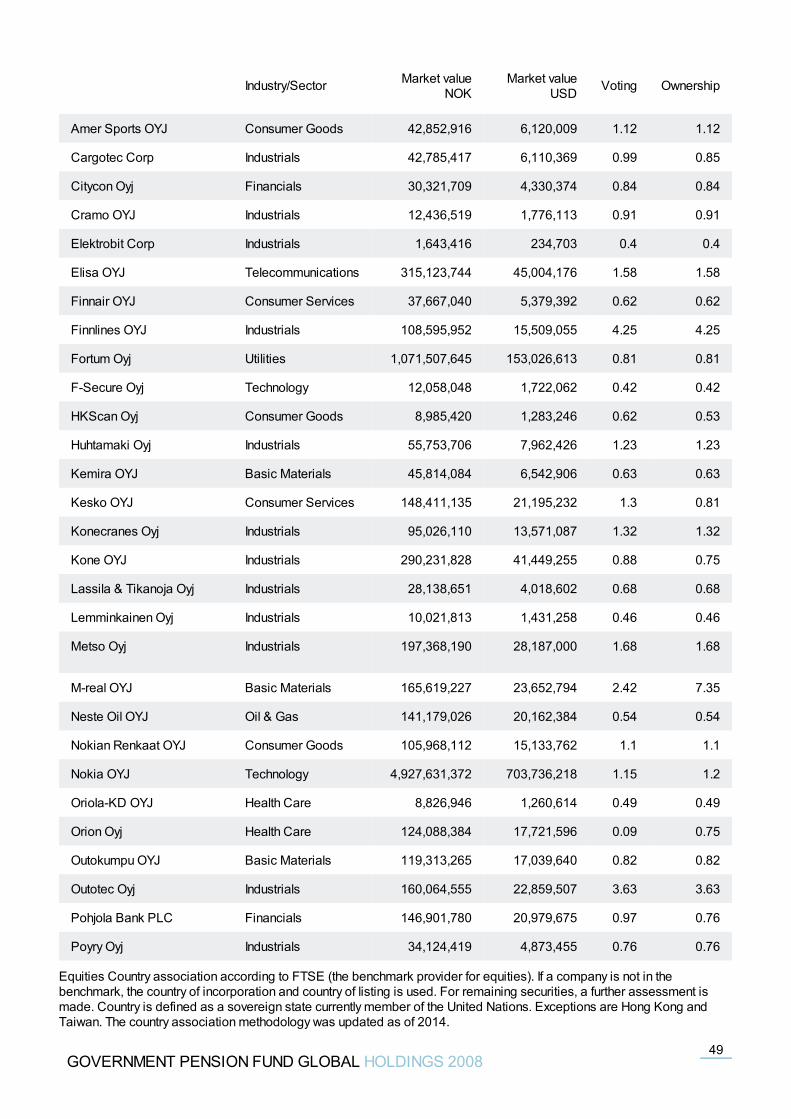
Amer Sports OYJ Consumer Goods 42,852,916 6,120,009 1.12 1.12
Cargotec Corp Industrials 42,785,417 6,110,369 0.99 0.85
Citycon Oyj Financials 30,321,709 4,330,374 0.84 0.84
Cramo OYJ Industrials 12,436,519 1,776,113 0.91 0.91
Elektrobit Corp Industrials 1,643,416 234,703 0.4 0.4
Elisa OYJ Telecommunications 315,123,744 45,004,176 1.58 1.58
Finnair OYJ Consumer Services 37,667,040 5,379,392 0.62 0.62
Finnlines OYJ Industrials 108,595,952 15,509,055 4.25 4.25
Fortum Oyj Utilities 1,071,507,645 153,026,613 0.81 0.81
F-Secure Oyj Technology 12,058,048 1,722,062 0.42 0.42
HKScan Oyj Consumer Goods 8,985,420 1,283,246 0.62 0.53
Huhtamaki Oyj Industrials 55,753,706 7,962,426 1.23 1.23
Kemira OYJ Basic Materials 45,814,084 6,542,906 0.63 0.63
Kesko OYJ Consumer Services 148,411,135 21,195,232 1.3 0.81
Konecranes Oyj Industrials 95,026,110 13,571,087 1.32 1.32
Kone OYJ Industrials 290,231,828 41,449,255 0.88 0.75
Lassila & Tikanoja Oyj Industrials 28,138,651 4,018,602 0.68 0.68
Lemminkainen Oyj Industrials 10,021,813 1,431,258 0.46 0.46
Metso Oyj Industrials 197,368,190 28,187,000 1.68 1.68
M-real OYJ Basic Materials 165,619,227 23,652,794 2.42 7.35
Neste Oil OYJ Oil & Gas 141,179,026 20,162,384 0.54 0.54
Nokian Renkaat OYJ Consumer Goods 105,968,112 15,133,762 1.1 1.1
Nokia OYJ Technology 4,927,631,372 703,736,218 1.15 1.2
Oriola-KD OYJ Health Care 8,826,946 1,260,614 0.49 0.49
Orion Oyj Health Care 124,088,384 17,721,596 0.09 0.75
Outokumpu OYJ Basic Materials 119,313,265 17,039,640 0.82 0.82
Outotec Oyj Industrials 160,064,555 22,859,507 3.63 3.63
Pohjola Bank PLC Financials 146,901,780 20,979,675 0.97 0.76
Poyry Oyj Industrials 34,124,419 4,873,455 0.76 0.76
Industry/Sector Market valueNOK
Market valueUSD Voting Ownership
GOVERNMENT PENSION FUND GLOBAL HOLDINGS 200849
Equities Country association according to FTSE (the benchmark provider for equities). If a company is not in thebenchmark, the country of incorporation and country of listing is used. For remaining securities, a further assessment ismade. Country is defined as a sovereign state currently member of the United Nations. Exceptions are Hong Kong andTaiwan. The country association methodology was updated as of 2014.
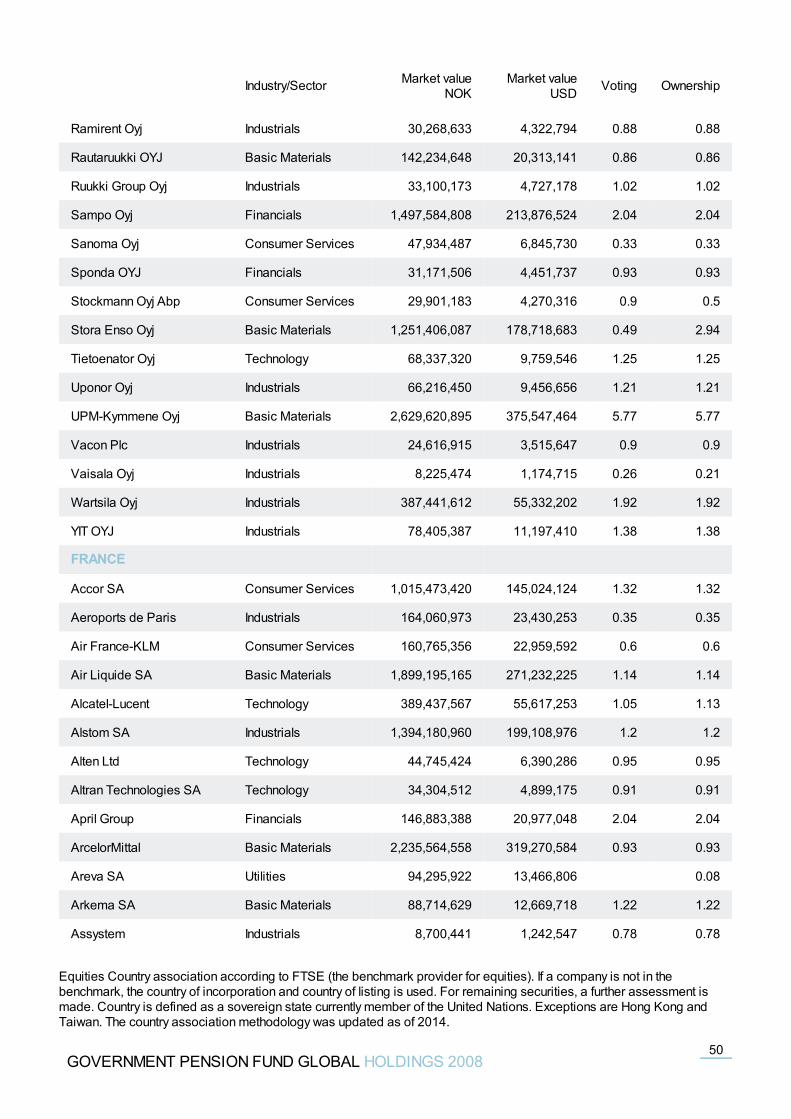
Ramirent Oyj Industrials 30,268,633 4,322,794 0.88 0.88
Rautaruukki OYJ Basic Materials 142,234,648 20,313,141 0.86 0.86
Ruukki Group Oyj Industrials 33,100,173 4,727,178 1.02 1.02
Sampo Oyj Financials 1,497,584,808 213,876,524 2.04 2.04
Sanoma Oyj Consumer Services 47,934,487 6,845,730 0.33 0.33
Sponda OYJ Financials 31,171,506 4,451,737 0.93 0.93
Stockmann Oyj Abp Consumer Services 29,901,183 4,270,316 0.9 0.5
Stora Enso Oyj Basic Materials 1,251,406,087 178,718,683 0.49 2.94
Tietoenator Oyj Technology 68,337,320 9,759,546 1.25 1.25
Uponor Oyj Industrials 66,216,450 9,456,656 1.21 1.21
UPM-Kymmene Oyj Basic Materials 2,629,620,895 375,547,464 5.77 5.77
Vacon Plc Industrials 24,616,915 3,515,647 0.9 0.9
Vaisala Oyj Industrials 8,225,474 1,174,715 0.26 0.21
Wartsila Oyj Industrials 387,441,612 55,332,202 1.92 1.92
YIT OYJ Industrials 78,405,387 11,197,410 1.38 1.38
FRANCE
Accor SA Consumer Services 1,015,473,420 145,024,124 1.32 1.32
Aeroports de Paris Industrials 164,060,973 23,430,253 0.35 0.35
Air France-KLM Consumer Services 160,765,356 22,959,592 0.6 0.6
Air Liquide SA Basic Materials 1,899,195,165 271,232,225 1.14 1.14
Alcatel-Lucent Technology 389,437,567 55,617,253 1.05 1.13
Alstom SA Industrials 1,394,180,960 199,108,976 1.2 1.2
Alten Ltd Technology 44,745,424 6,390,286 0.95 0.95
Altran Technologies SA Technology 34,304,512 4,899,175 0.91 0.91
April Group Financials 146,883,388 20,977,048 2.04 2.04
ArcelorMittal Basic Materials 2,235,564,558 319,270,584 0.93 0.93
Areva SA Utilities 94,295,922 13,466,806 0.08
Arkema SA Basic Materials 88,714,629 12,669,718 1.22 1.22
Assystem Industrials 8,700,441 1,242,547 0.78 0.78
Industry/Sector Market valueNOK
Market valueUSD Voting Ownership
GOVERNMENT PENSION FUND GLOBAL HOLDINGS 200850
Equities Country association according to FTSE (the benchmark provider for equities). If a company is not in thebenchmark, the country of incorporation and country of listing is used. For remaining securities, a further assessment ismade. Country is defined as a sovereign state currently member of the United Nations. Exceptions are Hong Kong andTaiwan. The country association methodology was updated as of 2014.
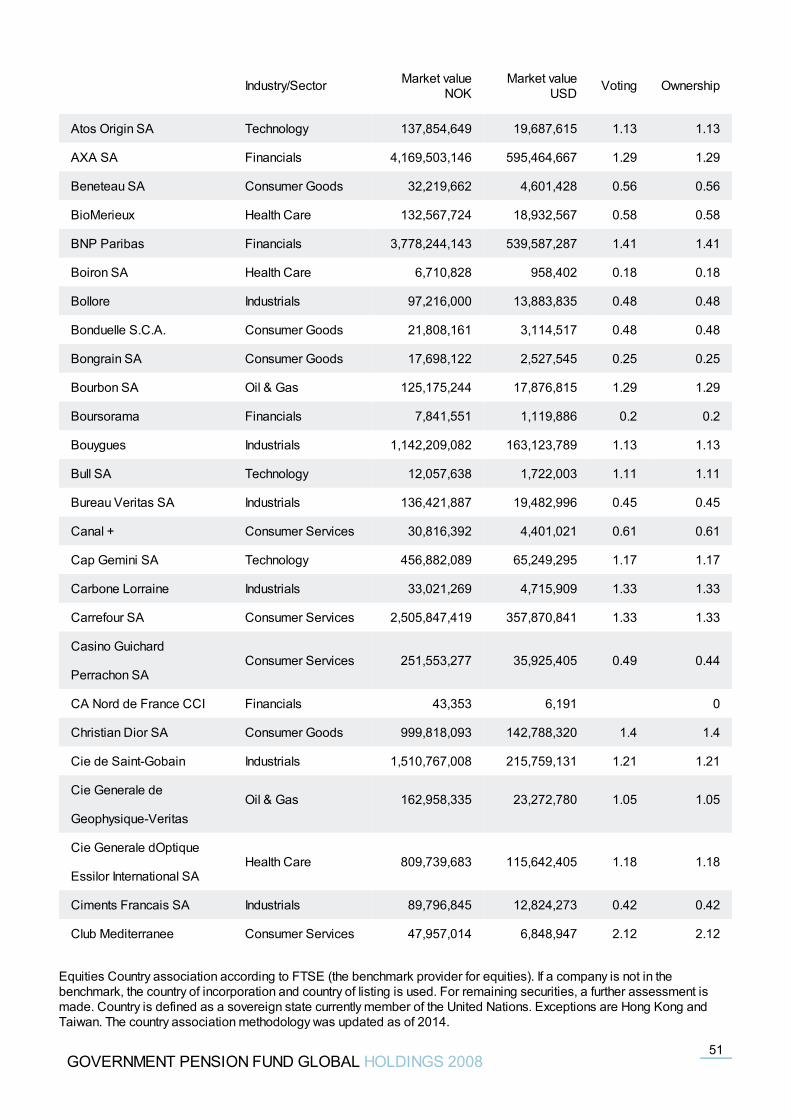
Atos Origin SA Technology 137,854,649 19,687,615 1.13 1.13
AXA SA Financials 4,169,503,146 595,464,667 1.29 1.29
Beneteau SA Consumer Goods 32,219,662 4,601,428 0.56 0.56
BioMerieux Health Care 132,567,724 18,932,567 0.58 0.58
BNP Paribas Financials 3,778,244,143 539,587,287 1.41 1.41
Boiron SA Health Care 6,710,828 958,402 0.18 0.18
Bollore Industrials 97,216,000 13,883,835 0.48 0.48
Bonduelle S.C.A. Consumer Goods 21,808,161 3,114,517 0.48 0.48
Bongrain SA Consumer Goods 17,698,122 2,527,545 0.25 0.25
Bourbon SA Oil & Gas 125,175,244 17,876,815 1.29 1.29
Boursorama Financials 7,841,551 1,119,886 0.2 0.2
Bouygues Industrials 1,142,209,082 163,123,789 1.13 1.13
Bull SA Technology 12,057,638 1,722,003 1.11 1.11
Bureau Veritas SA Industrials 136,421,887 19,482,996 0.45 0.45
Canal + Consumer Services 30,816,392 4,401,021 0.61 0.61
Cap Gemini SA Technology 456,882,089 65,249,295 1.17 1.17
Carbone Lorraine Industrials 33,021,269 4,715,909 1.33 1.33
Carrefour SA Consumer Services 2,505,847,419 357,870,841 1.33 1.33
Casino Guichard
Perrachon SAConsumer Services 251,553,277 35,925,405 0.49 0.44
CA Nord de France CCI Financials 43,353 6,191 0
Christian Dior SA Consumer Goods 999,818,093 142,788,320 1.4 1.4
Cie de Saint-Gobain Industrials 1,510,767,008 215,759,131 1.21 1.21
Cie Generale de
Geophysique-VeritasOil & Gas 162,958,335 23,272,780 1.05 1.05
Cie Generale dOptique
Essilor International SAHealth Care 809,739,683 115,642,405 1.18 1.18
Ciments Francais SA Industrials 89,796,845 12,824,273 0.42 0.42
Club Mediterranee Consumer Services 47,957,014 6,848,947 2.12 2.12
Industry/Sector Market valueNOK
Market valueUSD Voting Ownership
GOVERNMENT PENSION FUND GLOBAL HOLDINGS 200851
Equities Country association according to FTSE (the benchmark provider for equities). If a company is not in thebenchmark, the country of incorporation and country of listing is used. For remaining securities, a further assessment ismade. Country is defined as a sovereign state currently member of the United Nations. Exceptions are Hong Kong andTaiwan. The country association methodology was updated as of 2014.
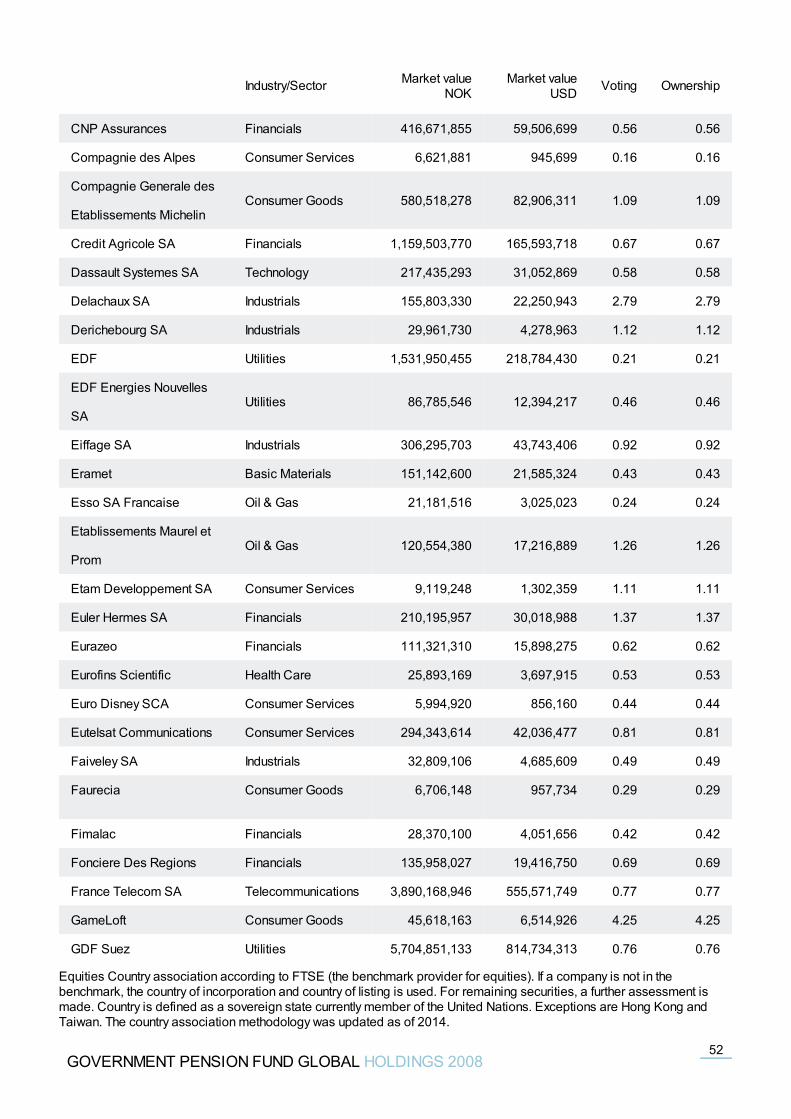
CNP Assurances Financials 416,671,855 59,506,699 0.56 0.56
Compagnie des Alpes Consumer Services 6,621,881 945,699 0.16 0.16
Compagnie Generale des
Etablissements MichelinConsumer Goods 580,518,278 82,906,311 1.09 1.09
Credit Agricole SA Financials 1,159,503,770 165,593,718 0.67 0.67
Dassault Systemes SA Technology 217,435,293 31,052,869 0.58 0.58
Delachaux SA Industrials 155,803,330 22,250,943 2.79 2.79
Derichebourg SA Industrials 29,961,730 4,278,963 1.12 1.12
EDF Utilities 1,531,950,455 218,784,430 0.21 0.21
EDF Energies Nouvelles
SAUtilities 86,785,546 12,394,217 0.46 0.46
Eiffage SA Industrials 306,295,703 43,743,406 0.92 0.92
Eramet Basic Materials 151,142,600 21,585,324 0.43 0.43
Esso SA Francaise Oil & Gas 21,181,516 3,025,023 0.24 0.24
Etablissements Maurel et
PromOil & Gas 120,554,380 17,216,889 1.26 1.26
Etam Developpement SA Consumer Services 9,119,248 1,302,359 1.11 1.11
Euler Hermes SA Financials 210,195,957 30,018,988 1.37 1.37
Eurazeo Financials 111,321,310 15,898,275 0.62 0.62
Eurofins Scientific Health Care 25,893,169 3,697,915 0.53 0.53
Euro Disney SCA Consumer Services 5,994,920 856,160 0.44 0.44
Eutelsat Communications Consumer Services 294,343,614 42,036,477 0.81 0.81
Faiveley SA Industrials 32,809,106 4,685,609 0.49 0.49
Faurecia Consumer Goods 6,706,148 957,734 0.29 0.29
Fimalac Financials 28,370,100 4,051,656 0.42 0.42
Fonciere Des Regions Financials 135,958,027 19,416,750 0.69 0.69
France Telecom SA Telecommunications 3,890,168,946 555,571,749 0.77 0.77
GameLoft Consumer Goods 45,618,163 6,514,926 4.25 4.25
GDF Suez Utilities 5,704,851,133 814,734,313 0.76 0.76
Industry/Sector Market valueNOK
Market valueUSD Voting Ownership
GOVERNMENT PENSION FUND GLOBAL HOLDINGS 200852
Equities Country association according to FTSE (the benchmark provider for equities). If a company is not in thebenchmark, the country of incorporation and country of listing is used. For remaining securities, a further assessment ismade. Country is defined as a sovereign state currently member of the United Nations. Exceptions are Hong Kong andTaiwan. The country association methodology was updated as of 2014.
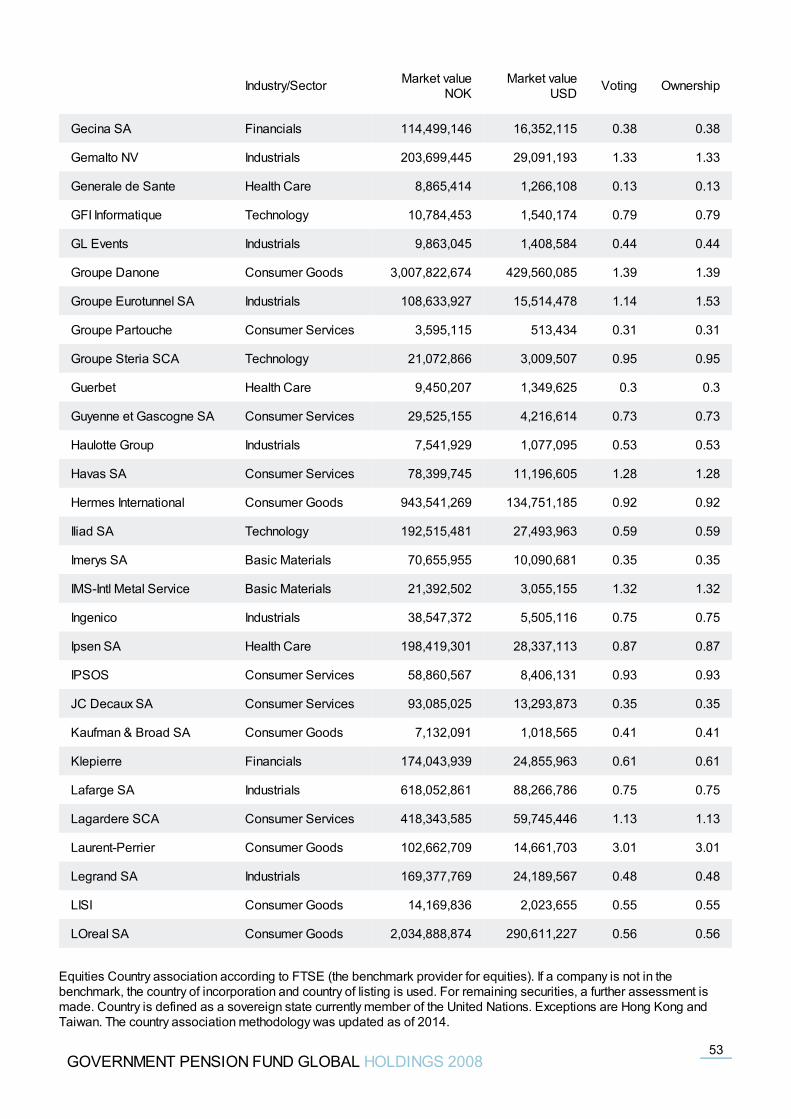
Gecina SA Financials 114,499,146 16,352,115 0.38 0.38
Gemalto NV Industrials 203,699,445 29,091,193 1.33 1.33
Generale de Sante Health Care 8,865,414 1,266,108 0.13 0.13
GFI Informatique Technology 10,784,453 1,540,174 0.79 0.79
GL Events Industrials 9,863,045 1,408,584 0.44 0.44
Groupe Danone Consumer Goods 3,007,822,674 429,560,085 1.39 1.39
Groupe Eurotunnel SA Industrials 108,633,927 15,514,478 1.14 1.53
Groupe Partouche Consumer Services 3,595,115 513,434 0.31 0.31
Groupe Steria SCA Technology 21,072,866 3,009,507 0.95 0.95
Guerbet Health Care 9,450,207 1,349,625 0.3 0.3
Guyenne et Gascogne SA Consumer Services 29,525,155 4,216,614 0.73 0.73
Haulotte Group Industrials 7,541,929 1,077,095 0.53 0.53
Havas SA Consumer Services 78,399,745 11,196,605 1.28 1.28
Hermes International Consumer Goods 943,541,269 134,751,185 0.92 0.92
Iliad SA Technology 192,515,481 27,493,963 0.59 0.59
Imerys SA Basic Materials 70,655,955 10,090,681 0.35 0.35
IMS-Intl Metal Service Basic Materials 21,392,502 3,055,155 1.32 1.32
Ingenico Industrials 38,547,372 5,505,116 0.75 0.75
Ipsen SA Health Care 198,419,301 28,337,113 0.87 0.87
IPSOS Consumer Services 58,860,567 8,406,131 0.93 0.93
JC Decaux SA Consumer Services 93,085,025 13,293,873 0.35 0.35
Kaufman & Broad SA Consumer Goods 7,132,091 1,018,565 0.41 0.41
Klepierre Financials 174,043,939 24,855,963 0.61 0.61
Lafarge SA Industrials 618,052,861 88,266,786 0.75 0.75
Lagardere SCA Consumer Services 418,343,585 59,745,446 1.13 1.13
Laurent-Perrier Consumer Goods 102,662,709 14,661,703 3.01 3.01
Legrand SA Industrials 169,377,769 24,189,567 0.48 0.48
LISI Consumer Goods 14,169,836 2,023,655 0.55 0.55
LOreal SA Consumer Goods 2,034,888,874 290,611,227 0.56 0.56
Industry/Sector Market valueNOK
Market valueUSD Voting Ownership
GOVERNMENT PENSION FUND GLOBAL HOLDINGS 200853
Equities Country association according to FTSE (the benchmark provider for equities). If a company is not in thebenchmark, the country of incorporation and country of listing is used. For remaining securities, a further assessment ismade. Country is defined as a sovereign state currently member of the United Nations. Exceptions are Hong Kong andTaiwan. The country association methodology was updated as of 2014.
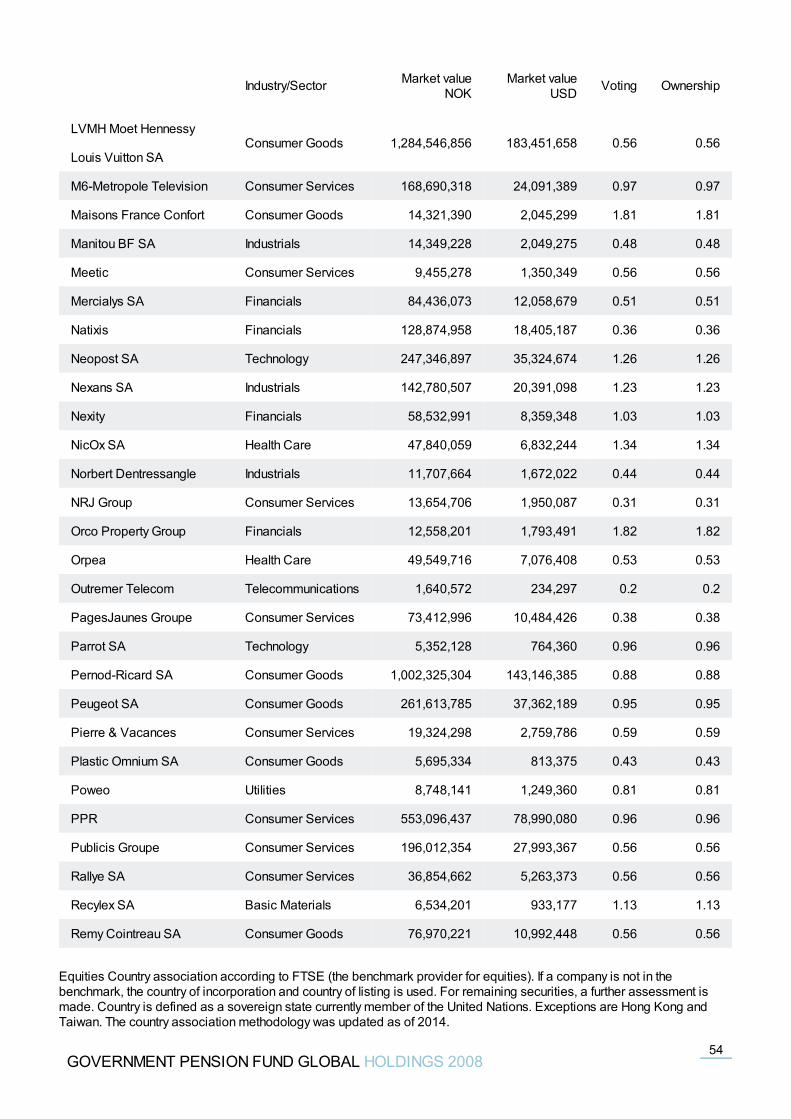
LVMH Moet Hennessy
Louis Vuitton SAConsumer Goods 1,284,546,856 183,451,658 0.56 0.56
M6-Metropole Television Consumer Services 168,690,318 24,091,389 0.97 0.97
Maisons France Confort Consumer Goods 14,321,390 2,045,299 1.81 1.81
Manitou BF SA Industrials 14,349,228 2,049,275 0.48 0.48
Meetic Consumer Services 9,455,278 1,350,349 0.56 0.56
Mercialys SA Financials 84,436,073 12,058,679 0.51 0.51
Natixis Financials 128,874,958 18,405,187 0.36 0.36
Neopost SA Technology 247,346,897 35,324,674 1.26 1.26
Nexans SA Industrials 142,780,507 20,391,098 1.23 1.23
Nexity Financials 58,532,991 8,359,348 1.03 1.03
NicOx SA Health Care 47,840,059 6,832,244 1.34 1.34
Norbert Dentressangle Industrials 11,707,664 1,672,022 0.44 0.44
NRJ Group Consumer Services 13,654,706 1,950,087 0.31 0.31
Orco Property Group Financials 12,558,201 1,793,491 1.82 1.82
Orpea Health Care 49,549,716 7,076,408 0.53 0.53
Outremer Telecom Telecommunications 1,640,572 234,297 0.2 0.2
PagesJaunes Groupe Consumer Services 73,412,996 10,484,426 0.38 0.38
Parrot SA Technology 5,352,128 764,360 0.96 0.96
Pernod-Ricard SA Consumer Goods 1,002,325,304 143,146,385 0.88 0.88
Peugeot SA Consumer Goods 261,613,785 37,362,189 0.95 0.95
Pierre & Vacances Consumer Services 19,324,298 2,759,786 0.59 0.59
Plastic Omnium SA Consumer Goods 5,695,334 813,375 0.43 0.43
Poweo Utilities 8,748,141 1,249,360 0.81 0.81
PPR Consumer Services 553,096,437 78,990,080 0.96 0.96
Publicis Groupe Consumer Services 196,012,354 27,993,367 0.56 0.56
Rallye SA Consumer Services 36,854,662 5,263,373 0.56 0.56
Recylex SA Basic Materials 6,534,201 933,177 1.13 1.13
Remy Cointreau SA Consumer Goods 76,970,221 10,992,448 0.56 0.56
Industry/Sector Market valueNOK
Market valueUSD Voting Ownership
GOVERNMENT PENSION FUND GLOBAL HOLDINGS 200854
Equities Country association according to FTSE (the benchmark provider for equities). If a company is not in thebenchmark, the country of incorporation and country of listing is used. For remaining securities, a further assessment ismade. Country is defined as a sovereign state currently member of the United Nations. Exceptions are Hong Kong andTaiwan. The country association methodology was updated as of 2014.
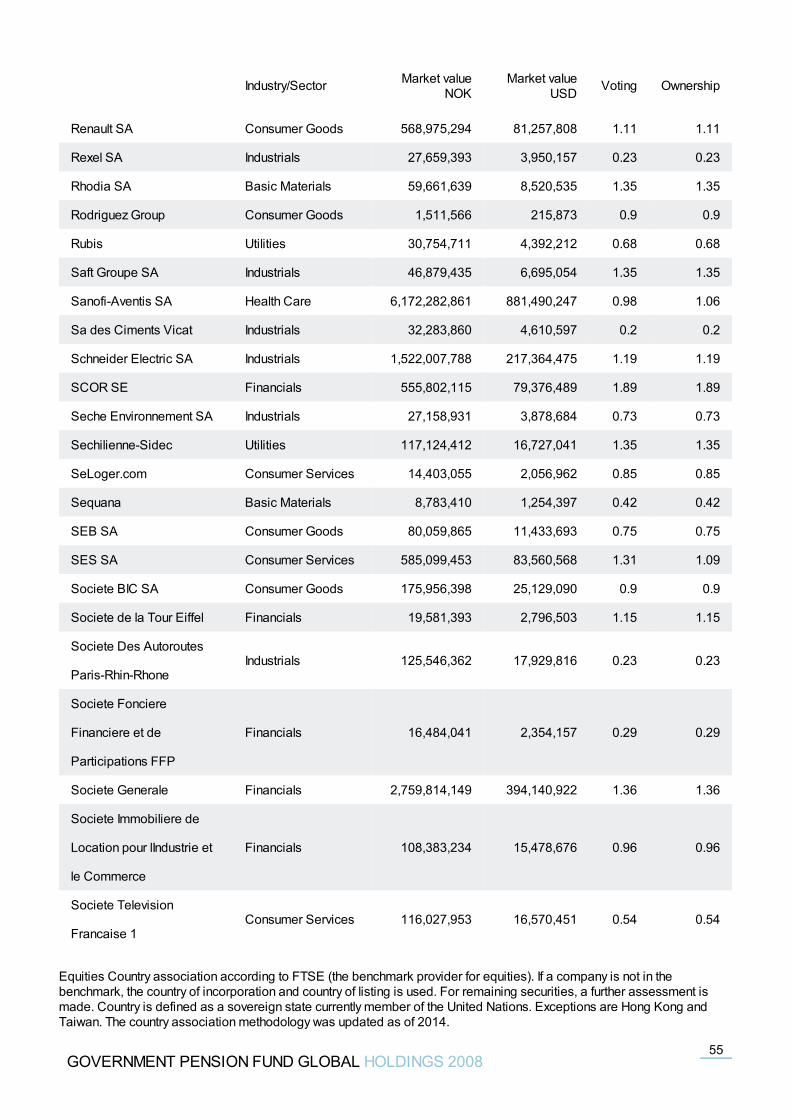
Renault SA Consumer Goods 568,975,294 81,257,808 1.11 1.11
Rexel SA Industrials 27,659,393 3,950,157 0.23 0.23
Rhodia SA Basic Materials 59,661,639 8,520,535 1.35 1.35
Rodriguez Group Consumer Goods 1,511,566 215,873 0.9 0.9
Rubis Utilities 30,754,711 4,392,212 0.68 0.68
Saft Groupe SA Industrials 46,879,435 6,695,054 1.35 1.35
Sanofi-Aventis SA Health Care 6,172,282,861 881,490,247 0.98 1.06
Sa des Ciments Vicat Industrials 32,283,860 4,610,597 0.2 0.2
Schneider Electric SA Industrials 1,522,007,788 217,364,475 1.19 1.19
SCOR SE Financials 555,802,115 79,376,489 1.89 1.89
Seche Environnement SA Industrials 27,158,931 3,878,684 0.73 0.73
Sechilienne-Sidec Utilities 117,124,412 16,727,041 1.35 1.35
SeLoger.com Consumer Services 14,403,055 2,056,962 0.85 0.85
Sequana Basic Materials 8,783,410 1,254,397 0.42 0.42
SEB SA Consumer Goods 80,059,865 11,433,693 0.75 0.75
SES SA Consumer Services 585,099,453 83,560,568 1.31 1.09
Societe BIC SA Consumer Goods 175,956,398 25,129,090 0.9 0.9
Societe de la Tour Eiffel Financials 19,581,393 2,796,503 1.15 1.15
Societe Des Autoroutes
Paris-Rhin-RhoneIndustrials 125,546,362 17,929,816 0.23 0.23
Societe Fonciere
Financiere et de
Participations FFP
Financials 16,484,041 2,354,157 0.29 0.29
Societe Generale Financials 2,759,814,149 394,140,922 1.36 1.36
Societe Immobiliere de
Location pour lIndustrie et
le Commerce
Financials 108,383,234 15,478,676 0.96 0.96
Societe Television
Francaise 1Consumer Services 116,027,953 16,570,451 0.54 0.54
Industry/Sector Market valueNOK
Market valueUSD Voting Ownership
GOVERNMENT PENSION FUND GLOBAL HOLDINGS 200855
Equities Country association according to FTSE (the benchmark provider for equities). If a company is not in thebenchmark, the country of incorporation and country of listing is used. For remaining securities, a further assessment ismade. Country is defined as a sovereign state currently member of the United Nations. Exceptions are Hong Kong andTaiwan. The country association methodology was updated as of 2014.
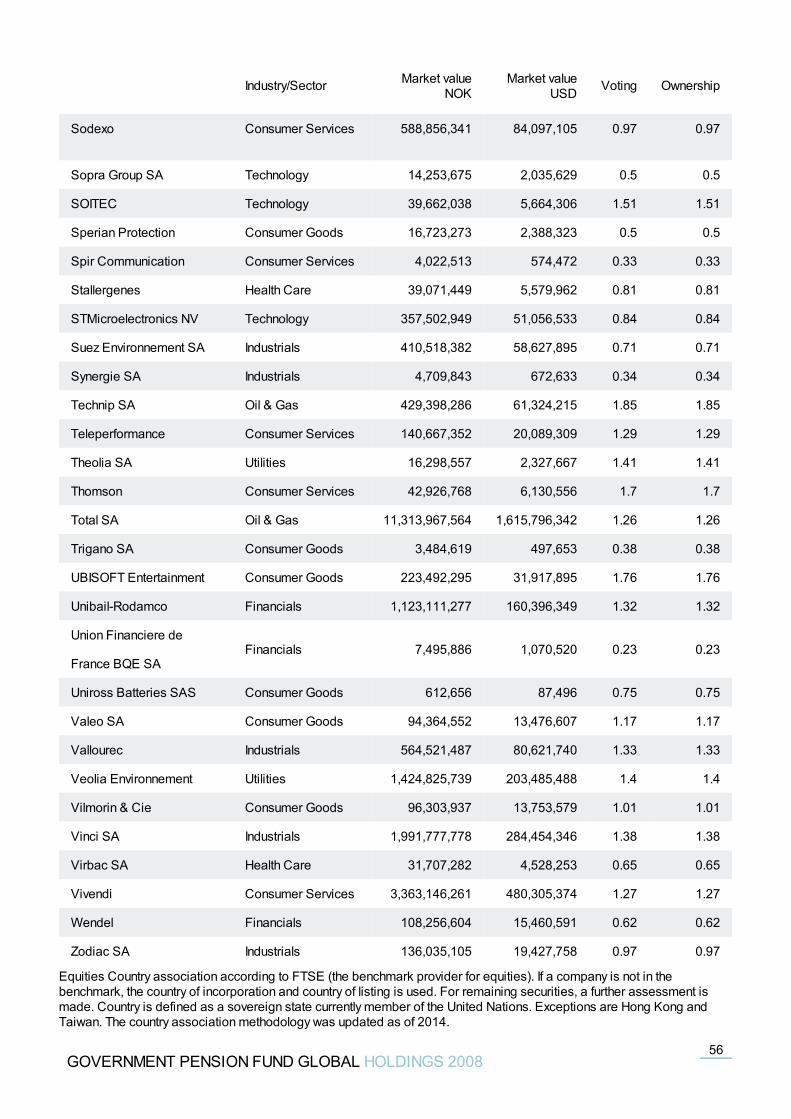
Sodexo Consumer Services 588,856,341 84,097,105 0.97 0.97
Sopra Group SA Technology 14,253,675 2,035,629 0.5 0.5
SOITEC Technology 39,662,038 5,664,306 1.51 1.51
Sperian Protection Consumer Goods 16,723,273 2,388,323 0.5 0.5
Spir Communication Consumer Services 4,022,513 574,472 0.33 0.33
Stallergenes Health Care 39,071,449 5,579,962 0.81 0.81
STMicroelectronics NV Technology 357,502,949 51,056,533 0.84 0.84
Suez Environnement SA Industrials 410,518,382 58,627,895 0.71 0.71
Synergie SA Industrials 4,709,843 672,633 0.34 0.34
Technip SA Oil & Gas 429,398,286 61,324,215 1.85 1.85
Teleperformance Consumer Services 140,667,352 20,089,309 1.29 1.29
Theolia SA Utilities 16,298,557 2,327,667 1.41 1.41
Thomson Consumer Services 42,926,768 6,130,556 1.7 1.7
Total SA Oil & Gas 11,313,967,564 1,615,796,342 1.26 1.26
Trigano SA Consumer Goods 3,484,619 497,653 0.38 0.38
UBISOFT Entertainment Consumer Goods 223,492,295 31,917,895 1.76 1.76
Unibail-Rodamco Financials 1,123,111,277 160,396,349 1.32 1.32
Union Financiere de
France BQE SAFinancials 7,495,886 1,070,520 0.23 0.23
Uniross Batteries SAS Consumer Goods 612,656 87,496 0.75 0.75
Valeo SA Consumer Goods 94,364,552 13,476,607 1.17 1.17
Vallourec Industrials 564,521,487 80,621,740 1.33 1.33
Veolia Environnement Utilities 1,424,825,739 203,485,488 1.4 1.4
Vilmorin & Cie Consumer Goods 96,303,937 13,753,579 1.01 1.01
Vinci SA Industrials 1,991,777,778 284,454,346 1.38 1.38
Virbac SA Health Care 31,707,282 4,528,253 0.65 0.65
Vivendi Consumer Services 3,363,146,261 480,305,374 1.27 1.27
Wendel Financials 108,256,604 15,460,591 0.62 0.62
Zodiac SA Industrials 136,035,105 19,427,758 0.97 0.97
Industry/Sector Market valueNOK
Market valueUSD Voting Ownership
GOVERNMENT PENSION FUND GLOBAL HOLDINGS 200856
Equities Country association according to FTSE (the benchmark provider for equities). If a company is not in thebenchmark, the country of incorporation and country of listing is used. For remaining securities, a further assessment ismade. Country is defined as a sovereign state currently member of the United Nations. Exceptions are Hong Kong andTaiwan. The country association methodology was updated as of 2014.
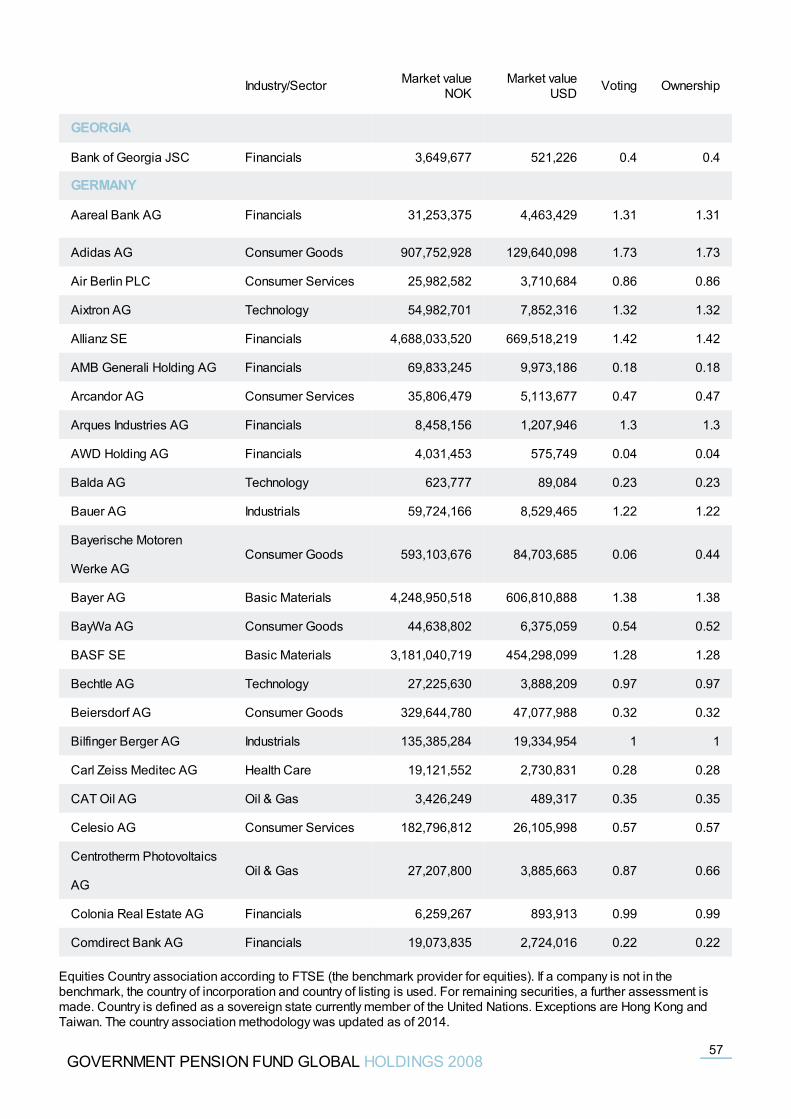
GEORGIA
Bank of Georgia JSC Financials 3,649,677 521,226 0.4 0.4
GERMANY
Aareal Bank AG Financials 31,253,375 4,463,429 1.31 1.31
Adidas AG Consumer Goods 907,752,928 129,640,098 1.73 1.73
Air Berlin PLC Consumer Services 25,982,582 3,710,684 0.86 0.86
Aixtron AG Technology 54,982,701 7,852,316 1.32 1.32
Allianz SE Financials 4,688,033,520 669,518,219 1.42 1.42
AMB Generali Holding AG Financials 69,833,245 9,973,186 0.18 0.18
Arcandor AG Consumer Services 35,806,479 5,113,677 0.47 0.47
Arques Industries AG Financials 8,458,156 1,207,946 1.3 1.3
AWD Holding AG Financials 4,031,453 575,749 0.04 0.04
Balda AG Technology 623,777 89,084 0.23 0.23
Bauer AG Industrials 59,724,166 8,529,465 1.22 1.22
Bayerische Motoren
Werke AGConsumer Goods 593,103,676 84,703,685 0.06 0.44
Bayer AG Basic Materials 4,248,950,518 606,810,888 1.38 1.38
BayWa AG Consumer Goods 44,638,802 6,375,059 0.54 0.52
BASF SE Basic Materials 3,181,040,719 454,298,099 1.28 1.28
Bechtle AG Technology 27,225,630 3,888,209 0.97 0.97
Beiersdorf AG Consumer Goods 329,644,780 47,077,988 0.32 0.32
Bilfinger Berger AG Industrials 135,385,284 19,334,954 1 1
Carl Zeiss Meditec AG Health Care 19,121,552 2,730,831 0.28 0.28
CAT Oil AG Oil & Gas 3,426,249 489,317 0.35 0.35
Celesio AG Consumer Services 182,796,812 26,105,998 0.57 0.57
Centrotherm Photovoltaics
AGOil & Gas 27,207,800 3,885,663 0.87 0.66
Colonia Real Estate AG Financials 6,259,267 893,913 0.99 0.99
Comdirect Bank AG Financials 19,073,835 2,724,016 0.22 0.22
Industry/Sector Market valueNOK
Market valueUSD Voting Ownership
GOVERNMENT PENSION FUND GLOBAL HOLDINGS 200857
Equities Country association according to FTSE (the benchmark provider for equities). If a company is not in thebenchmark, the country of incorporation and country of listing is used. For remaining securities, a further assessment ismade. Country is defined as a sovereign state currently member of the United Nations. Exceptions are Hong Kong andTaiwan. The country association methodology was updated as of 2014.
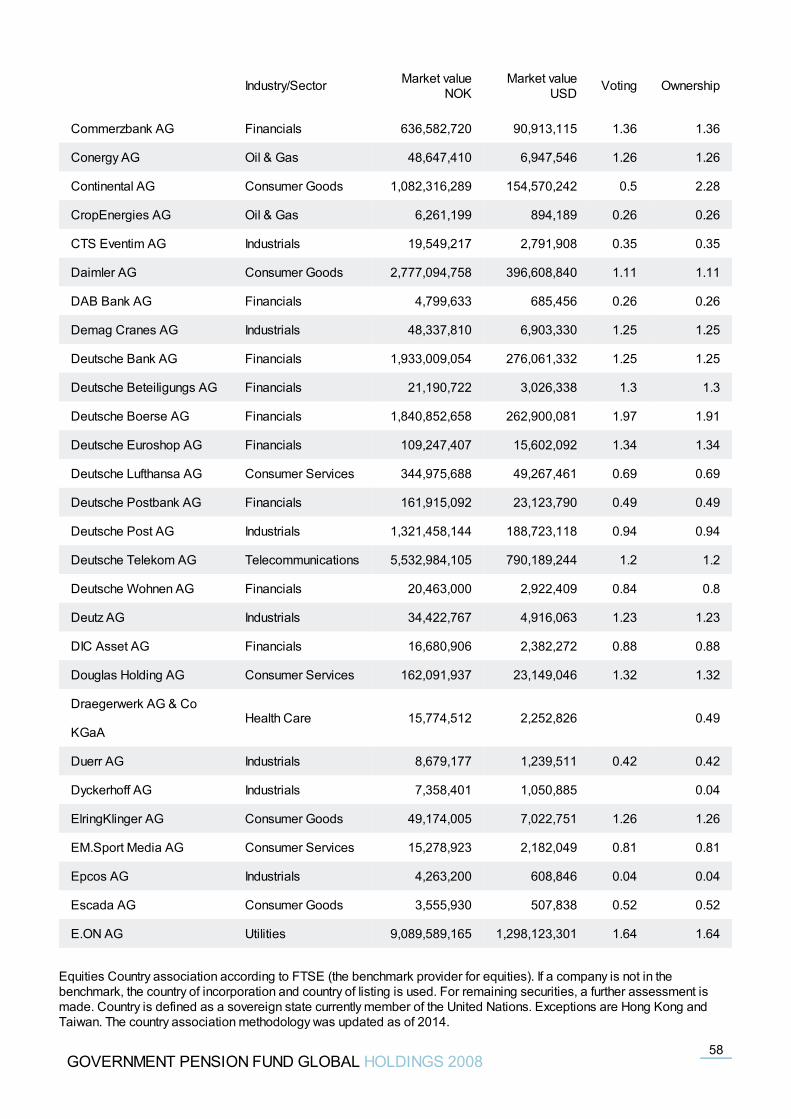
Commerzbank AG Financials 636,582,720 90,913,115 1.36 1.36
Conergy AG Oil & Gas 48,647,410 6,947,546 1.26 1.26
Continental AG Consumer Goods 1,082,316,289 154,570,242 0.5 2.28
CropEnergies AG Oil & Gas 6,261,199 894,189 0.26 0.26
CTS Eventim AG Industrials 19,549,217 2,791,908 0.35 0.35
Daimler AG Consumer Goods 2,777,094,758 396,608,840 1.11 1.11
DAB Bank AG Financials 4,799,633 685,456 0.26 0.26
Demag Cranes AG Industrials 48,337,810 6,903,330 1.25 1.25
Deutsche Bank AG Financials 1,933,009,054 276,061,332 1.25 1.25
Deutsche Beteiligungs AG Financials 21,190,722 3,026,338 1.3 1.3
Deutsche Boerse AG Financials 1,840,852,658 262,900,081 1.97 1.91
Deutsche Euroshop AG Financials 109,247,407 15,602,092 1.34 1.34
Deutsche Lufthansa AG Consumer Services 344,975,688 49,267,461 0.69 0.69
Deutsche Postbank AG Financials 161,915,092 23,123,790 0.49 0.49
Deutsche Post AG Industrials 1,321,458,144 188,723,118 0.94 0.94
Deutsche Telekom AG Telecommunications 5,532,984,105 790,189,244 1.2 1.2
Deutsche Wohnen AG Financials 20,463,000 2,922,409 0.84 0.8
Deutz AG Industrials 34,422,767 4,916,063 1.23 1.23
DIC Asset AG Financials 16,680,906 2,382,272 0.88 0.88
Douglas Holding AG Consumer Services 162,091,937 23,149,046 1.32 1.32
Draegerwerk AG & Co
KGaAHealth Care 15,774,512 2,252,826 0.49
Duerr AG Industrials 8,679,177 1,239,511 0.42 0.42
Dyckerhoff AG Industrials 7,358,401 1,050,885 0.04
ElringKlinger AG Consumer Goods 49,174,005 7,022,751 1.26 1.26
EM.Sport Media AG Consumer Services 15,278,923 2,182,049 0.81 0.81
Epcos AG Industrials 4,263,200 608,846 0.04 0.04
Escada AG Consumer Goods 3,555,930 507,838 0.52 0.52
E.ON AG Utilities 9,089,589,165 1,298,123,301 1.64 1.64
Industry/Sector Market valueNOK
Market valueUSD Voting Ownership
GOVERNMENT PENSION FUND GLOBAL HOLDINGS 200858
Equities Country association according to FTSE (the benchmark provider for equities). If a company is not in thebenchmark, the country of incorporation and country of listing is used. For remaining securities, a further assessment ismade. Country is defined as a sovereign state currently member of the United Nations. Exceptions are Hong Kong andTaiwan. The country association methodology was updated as of 2014.
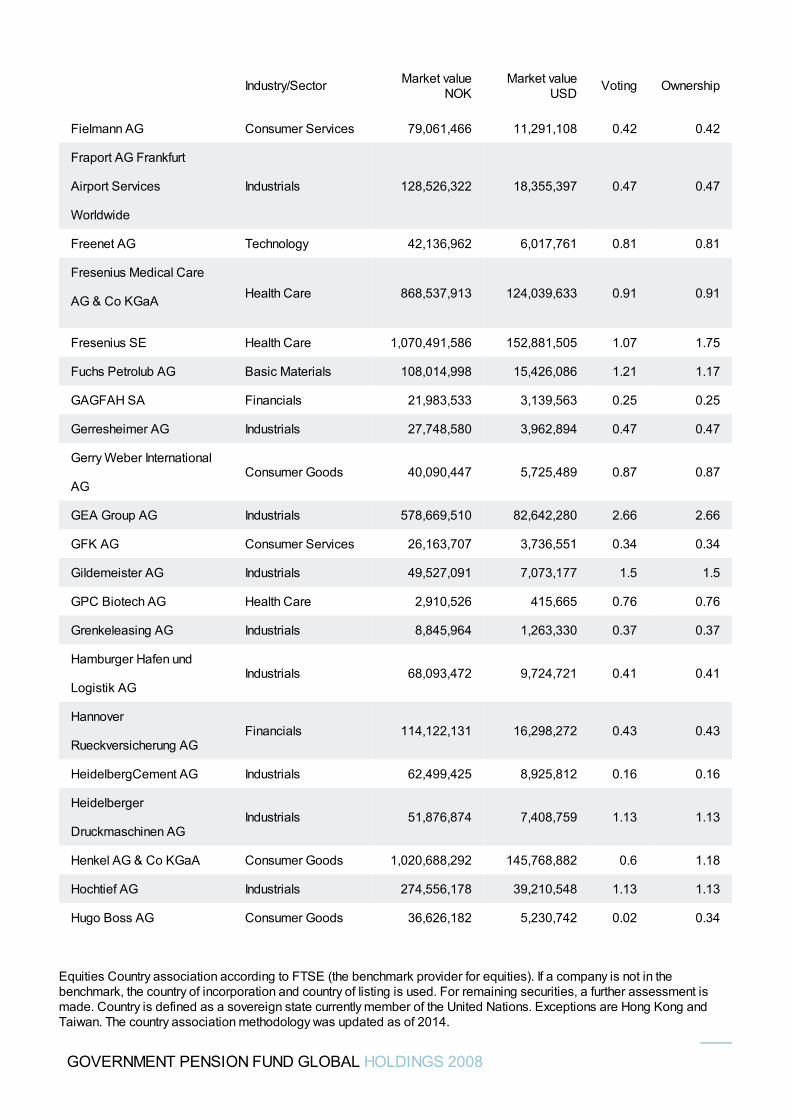
Fielmann AG Consumer Services 79,061,466 11,291,108 0.42 0.42
Fraport AG Frankfurt
Airport Services
Worldwide
Industrials 128,526,322 18,355,397 0.47 0.47
Freenet AG Technology 42,136,962 6,017,761 0.81 0.81
Fresenius Medical Care
AG & Co KGaA Health Care 868,537,913 124,039,633 0.91 0.91
Fresenius SE Health Care 1,070,491,586 152,881,505 1.07 1.75
Fuchs Petrolub AG Basic Materials 108,014,998 15,426,086 1.21 1.17
GAGFAH SA Financials 21,983,533 3,139,563 0.25 0.25
Gerresheimer AG Industrials 27,748,580 3,962,894 0.47 0.47
Gerry Weber International
AGConsumer Goods 40,090,447 5,725,489 0.87 0.87
GEA Group AG Industrials 578,669,510 82,642,280 2.66 2.66
GFK AG Consumer Services 26,163,707 3,736,551 0.34 0.34
Gildemeister AG Industrials 49,527,091 7,073,177 1.5 1.5
GPC Biotech AG Health Care 2,910,526 415,665 0.76 0.76
Grenkeleasing AG Industrials 8,845,964 1,263,330 0.37 0.37
Hamburger Hafen und
Logistik AGIndustrials 68,093,472 9,724,721 0.41 0.41
Hannover
Rueckversicherung AGFinancials 114,122,131 16,298,272 0.43 0.43
HeidelbergCement AG Industrials 62,499,425 8,925,812 0.16 0.16
Heidelberger
Druckmaschinen AGIndustrials 51,876,874 7,408,759 1.13 1.13
Henkel AG & Co KGaA Consumer Goods 1,020,688,292 145,768,882 0.6 1.18
Hochtief AG Industrials 274,556,178 39,210,548 1.13 1.13
Hugo Boss AG Consumer Goods 36,626,182 5,230,742 0.02 0.34
Industry/Sector Market valueNOK
Market valueUSD Voting Ownership
GOVERNMENT PENSION FUND GLOBAL HOLDINGS 2008
Equities Country association according to FTSE (the benchmark provider for equities). If a company is not in thebenchmark, the country of incorporation and country of listing is used. For remaining securities, a further assessment ismade. Country is defined as a sovereign state currently member of the United Nations. Exceptions are Hong Kong andTaiwan. The country association methodology was updated as of 2014.
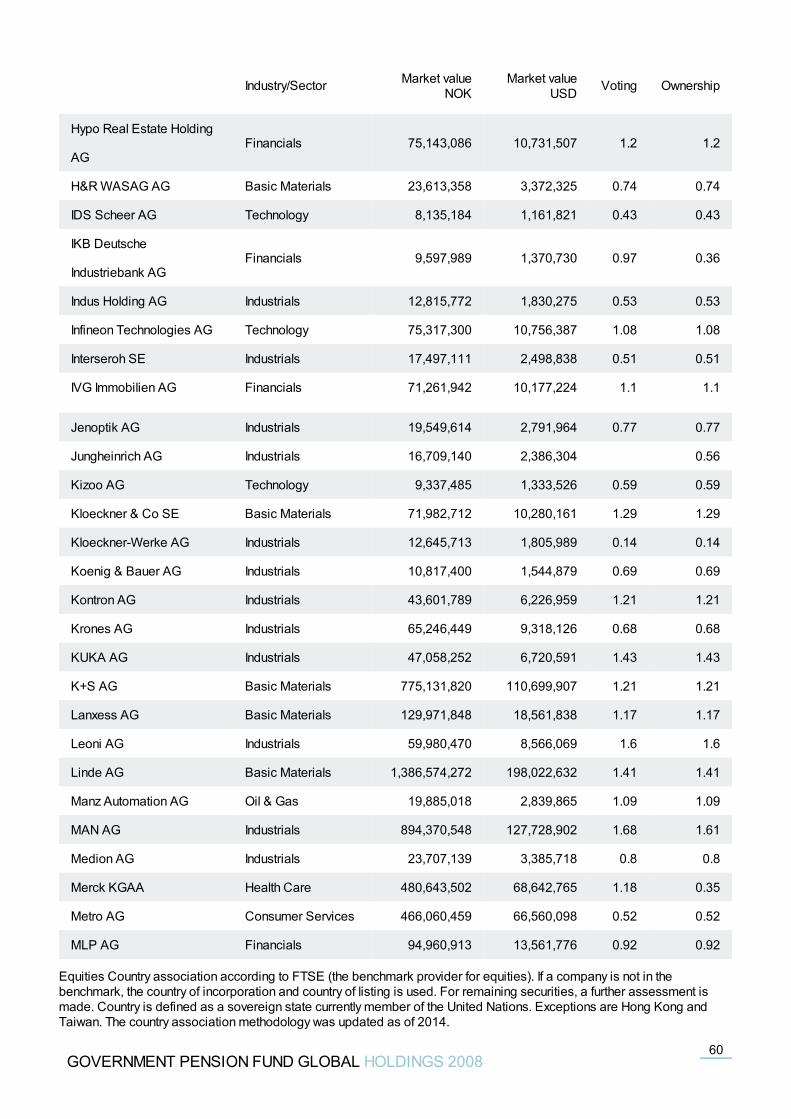
Hypo Real Estate Holding
AGFinancials 75,143,086 10,731,507 1.2 1.2
H&R WASAG AG Basic Materials 23,613,358 3,372,325 0.74 0.74
IDS Scheer AG Technology 8,135,184 1,161,821 0.43 0.43
IKB Deutsche
Industriebank AGFinancials 9,597,989 1,370,730 0.97 0.36
Indus Holding AG Industrials 12,815,772 1,830,275 0.53 0.53
Infineon Technologies AG Technology 75,317,300 10,756,387 1.08 1.08
Interseroh SE Industrials 17,497,111 2,498,838 0.51 0.51
IVG Immobilien AG Financials 71,261,942 10,177,224 1.1 1.1
Jenoptik AG Industrials 19,549,614 2,791,964 0.77 0.77
Jungheinrich AG Industrials 16,709,140 2,386,304 0.56
Kizoo AG Technology 9,337,485 1,333,526 0.59 0.59
Kloeckner & Co SE Basic Materials 71,982,712 10,280,161 1.29 1.29
Kloeckner-Werke AG Industrials 12,645,713 1,805,989 0.14 0.14
Koenig & Bauer AG Industrials 10,817,400 1,544,879 0.69 0.69
Kontron AG Industrials 43,601,789 6,226,959 1.21 1.21
Krones AG Industrials 65,246,449 9,318,126 0.68 0.68
KUKA AG Industrials 47,058,252 6,720,591 1.43 1.43
K+S AG Basic Materials 775,131,820 110,699,907 1.21 1.21
Lanxess AG Basic Materials 129,971,848 18,561,838 1.17 1.17
Leoni AG Industrials 59,980,470 8,566,069 1.6 1.6
Linde AG Basic Materials 1,386,574,272 198,022,632 1.41 1.41
Manz Automation AG Oil & Gas 19,885,018 2,839,865 1.09 1.09
MAN AG Industrials 894,370,548 127,728,902 1.68 1.61
Medion AG Industrials 23,707,139 3,385,718 0.8 0.8
Merck KGAA Health Care 480,643,502 68,642,765 1.18 0.35
Metro AG Consumer Services 466,060,459 66,560,098 0.52 0.52
MLP AG Financials 94,960,913 13,561,776 0.92 0.92
Industry/Sector Market valueNOK
Market valueUSD Voting Ownership
GOVERNMENT PENSION FUND GLOBAL HOLDINGS 200860
Equities Country association according to FTSE (the benchmark provider for equities). If a company is not in thebenchmark, the country of incorporation and country of listing is used. For remaining securities, a further assessment ismade. Country is defined as a sovereign state currently member of the United Nations. Exceptions are Hong Kong andTaiwan. The country association methodology was updated as of 2014.
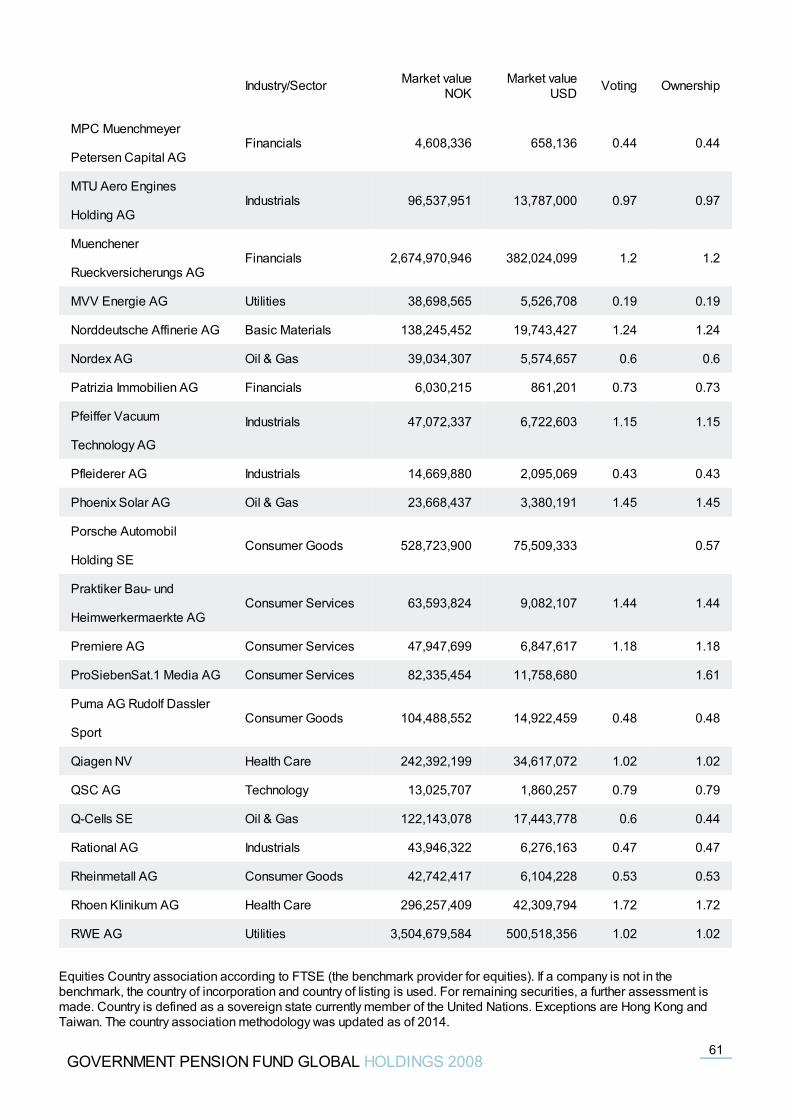
MPC Muenchmeyer
Petersen Capital AGFinancials 4,608,336 658,136 0.44 0.44
MTU Aero Engines
Holding AGIndustrials 96,537,951 13,787,000 0.97 0.97
Muenchener
Rueckversicherungs AGFinancials 2,674,970,946 382,024,099 1.2 1.2
MVV Energie AG Utilities 38,698,565 5,526,708 0.19 0.19
Norddeutsche Affinerie AG Basic Materials 138,245,452 19,743,427 1.24 1.24
Nordex AG Oil & Gas 39,034,307 5,574,657 0.6 0.6
Patrizia Immobilien AG Financials 6,030,215 861,201 0.73 0.73
Pfeiffer Vacuum
Technology AG
Industrials 47,072,337 6,722,603 1.15 1.15
Pfleiderer AG Industrials 14,669,880 2,095,069 0.43 0.43
Phoenix Solar AG Oil & Gas 23,668,437 3,380,191 1.45 1.45
Porsche Automobil
Holding SEConsumer Goods 528,723,900 75,509,333 0.57
Praktiker Bau- und
Heimwerkermaerkte AGConsumer Services 63,593,824 9,082,107 1.44 1.44
Premiere AG Consumer Services 47,947,699 6,847,617 1.18 1.18
ProSiebenSat.1 Media AG Consumer Services 82,335,454 11,758,680 1.61
Puma AG Rudolf Dassler
SportConsumer Goods 104,488,552 14,922,459 0.48 0.48
Qiagen NV Health Care 242,392,199 34,617,072 1.02 1.02
QSC AG Technology 13,025,707 1,860,257 0.79 0.79
Q-Cells SE Oil & Gas 122,143,078 17,443,778 0.6 0.44
Rational AG Industrials 43,946,322 6,276,163 0.47 0.47
Rheinmetall AG Consumer Goods 42,742,417 6,104,228 0.53 0.53
Rhoen Klinikum AG Health Care 296,257,409 42,309,794 1.72 1.72
RWE AG Utilities 3,504,679,584 500,518,356 1.02 1.02
Industry/Sector Market valueNOK
Market valueUSD Voting Ownership
GOVERNMENT PENSION FUND GLOBAL HOLDINGS 200861
Equities Country association according to FTSE (the benchmark provider for equities). If a company is not in thebenchmark, the country of incorporation and country of listing is used. For remaining securities, a further assessment ismade. Country is defined as a sovereign state currently member of the United Nations. Exceptions are Hong Kong andTaiwan. The country association methodology was updated as of 2014.
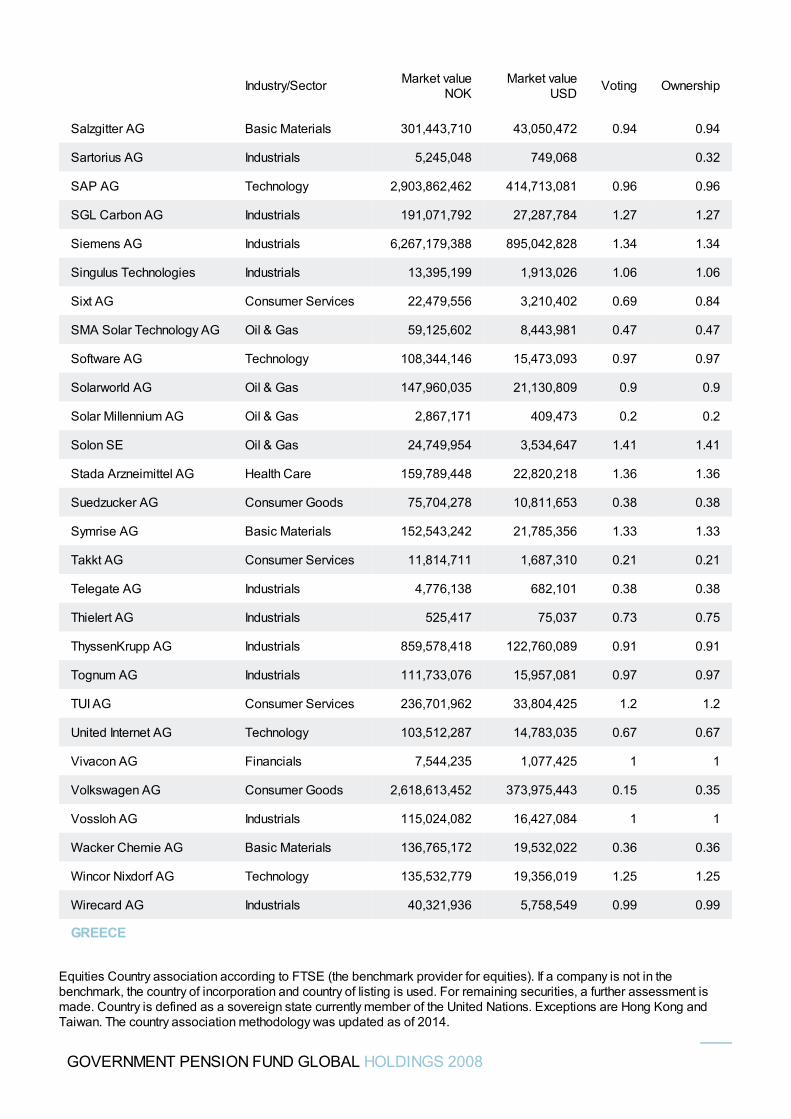
Salzgitter AG Basic Materials 301,443,710 43,050,472 0.94 0.94
Sartorius AG Industrials 5,245,048 749,068 0.32
SAP AG Technology 2,903,862,462 414,713,081 0.96 0.96
SGL Carbon AG Industrials 191,071,792 27,287,784 1.27 1.27
Siemens AG Industrials 6,267,179,388 895,042,828 1.34 1.34
Singulus Technologies Industrials 13,395,199 1,913,026 1.06 1.06
Sixt AG Consumer Services 22,479,556 3,210,402 0.69 0.84
SMA Solar Technology AG Oil & Gas 59,125,602 8,443,981 0.47 0.47
Software AG Technology 108,344,146 15,473,093 0.97 0.97
Solarworld AG Oil & Gas 147,960,035 21,130,809 0.9 0.9
Solar Millennium AG Oil & Gas 2,867,171 409,473 0.2 0.2
Solon SE Oil & Gas 24,749,954 3,534,647 1.41 1.41
Stada Arzneimittel AG Health Care 159,789,448 22,820,218 1.36 1.36
Suedzucker AG Consumer Goods 75,704,278 10,811,653 0.38 0.38
Symrise AG Basic Materials 152,543,242 21,785,356 1.33 1.33
Takkt AG Consumer Services 11,814,711 1,687,310 0.21 0.21
Telegate AG Industrials 4,776,138 682,101 0.38 0.38
Thielert AG Industrials 525,417 75,037 0.73 0.75
ThyssenKrupp AG Industrials 859,578,418 122,760,089 0.91 0.91
Tognum AG Industrials 111,733,076 15,957,081 0.97 0.97
TUI AG Consumer Services 236,701,962 33,804,425 1.2 1.2
United Internet AG Technology 103,512,287 14,783,035 0.67 0.67
Vivacon AG Financials 7,544,235 1,077,425 1 1
Volkswagen AG Consumer Goods 2,618,613,452 373,975,443 0.15 0.35
Vossloh AG Industrials 115,024,082 16,427,084 1 1
Wacker Chemie AG Basic Materials 136,765,172 19,532,022 0.36 0.36
Wincor Nixdorf AG Technology 135,532,779 19,356,019 1.25 1.25
Wirecard AG Industrials 40,321,936 5,758,549 0.99 0.99
GREECE
Industry/Sector Market valueNOK
Market valueUSD Voting Ownership
GOVERNMENT PENSION FUND GLOBAL HOLDINGS 2008
Equities Country association according to FTSE (the benchmark provider for equities). If a company is not in thebenchmark, the country of incorporation and country of listing is used. For remaining securities, a further assessment ismade. Country is defined as a sovereign state currently member of the United Nations. Exceptions are Hong Kong andTaiwan. The country association methodology was updated as of 2014.
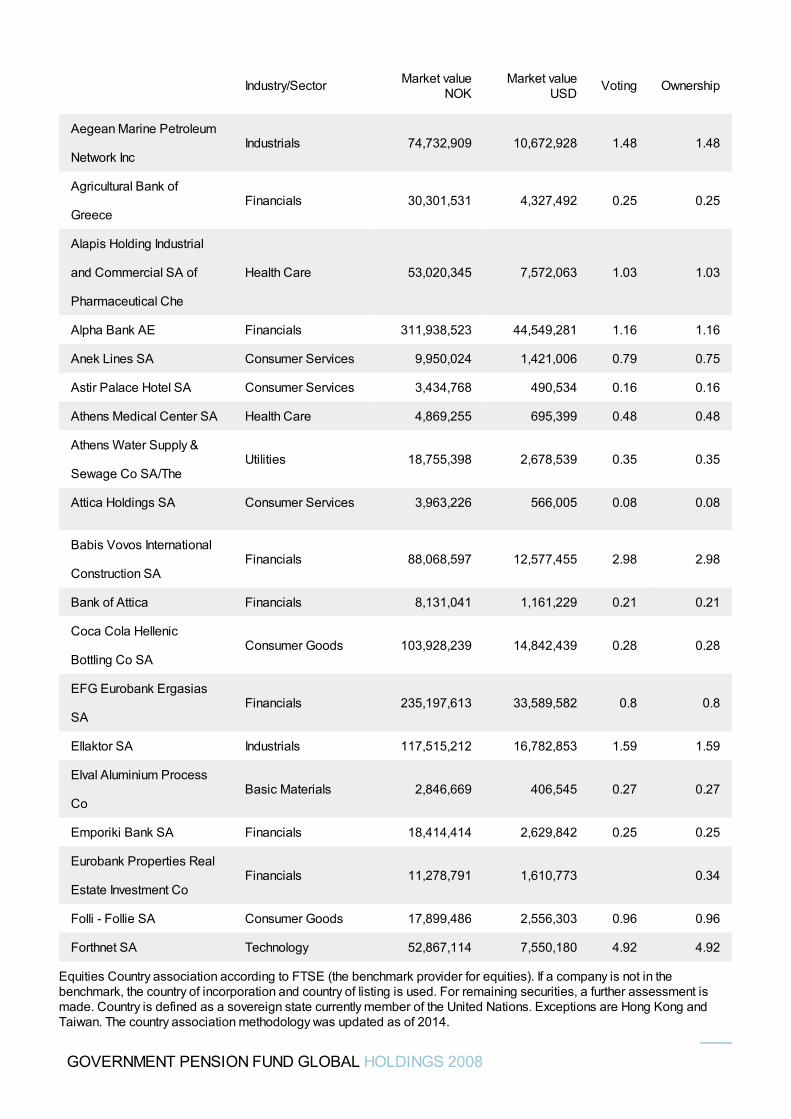
Aegean Marine Petroleum
Network IncIndustrials 74,732,909 10,672,928 1.48 1.48
Agricultural Bank of
GreeceFinancials 30,301,531 4,327,492 0.25 0.25
Alapis Holding Industrial
and Commercial SA of
Pharmaceutical Che
Health Care 53,020,345 7,572,063 1.03 1.03
Alpha Bank AE Financials 311,938,523 44,549,281 1.16 1.16
Anek Lines SA Consumer Services 9,950,024 1,421,006 0.79 0.75
Astir Palace Hotel SA Consumer Services 3,434,768 490,534 0.16 0.16
Athens Medical Center SA Health Care 4,869,255 695,399 0.48 0.48
Athens Water Supply &
Sewage Co SA/TheUtilities 18,755,398 2,678,539 0.35 0.35
Attica Holdings SA Consumer Services 3,963,226 566,005 0.08 0.08
Babis Vovos International
Construction SAFinancials 88,068,597 12,577,455 2.98 2.98
Bank of Attica Financials 8,131,041 1,161,229 0.21 0.21
Coca Cola Hellenic
Bottling Co SAConsumer Goods 103,928,239 14,842,439 0.28 0.28
EFG Eurobank Ergasias
SAFinancials 235,197,613 33,589,582 0.8 0.8
Ellaktor SA Industrials 117,515,212 16,782,853 1.59 1.59
Elval Aluminium Process
CoBasic Materials 2,846,669 406,545 0.27 0.27
Emporiki Bank SA Financials 18,414,414 2,629,842 0.25 0.25
Eurobank Properties Real
Estate Investment CoFinancials 11,278,791 1,610,773 0.34
Folli - Follie SA Consumer Goods 17,899,486 2,556,303 0.96 0.96
Forthnet SA Technology 52,867,114 7,550,180 4.92 4.92
Industry/Sector Market valueNOK
Market valueUSD Voting Ownership
GOVERNMENT PENSION FUND GLOBAL HOLDINGS 2008
Equities Country association according to FTSE (the benchmark provider for equities). If a company is not in thebenchmark, the country of incorporation and country of listing is used. For remaining securities, a further assessment ismade. Country is defined as a sovereign state currently member of the United Nations. Exceptions are Hong Kong andTaiwan. The country association methodology was updated as of 2014.
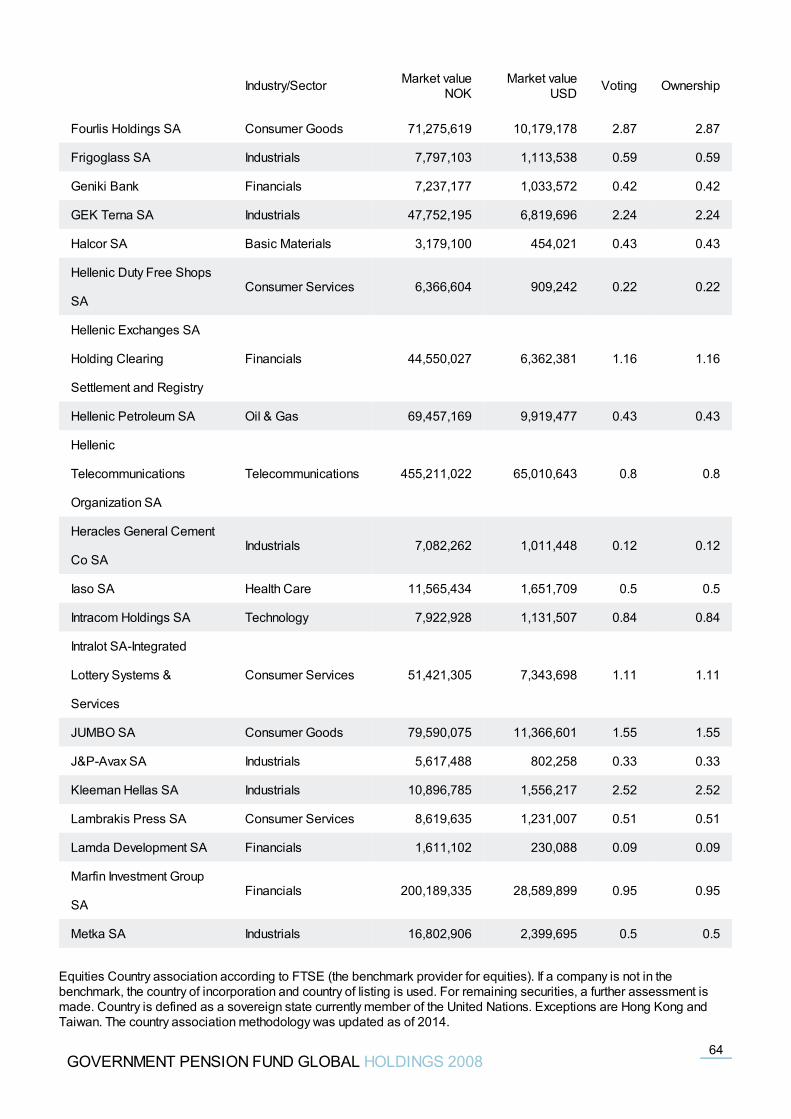
Fourlis Holdings SA Consumer Goods 71,275,619 10,179,178 2.87 2.87
Frigoglass SA Industrials 7,797,103 1,113,538 0.59 0.59
Geniki Bank Financials 7,237,177 1,033,572 0.42 0.42
GEK Terna SA Industrials 47,752,195 6,819,696 2.24 2.24
Halcor SA Basic Materials 3,179,100 454,021 0.43 0.43
Hellenic Duty Free Shops
SAConsumer Services 6,366,604 909,242 0.22 0.22
Hellenic Exchanges SA
Holding Clearing
Settlement and Registry
Financials 44,550,027 6,362,381 1.16 1.16
Hellenic Petroleum SA Oil & Gas 69,457,169 9,919,477 0.43 0.43
Hellenic
Telecommunications
Organization SA
Telecommunications 455,211,022 65,010,643 0.8 0.8
Heracles General Cement
Co SAIndustrials 7,082,262 1,011,448 0.12 0.12
Iaso SA Health Care 11,565,434 1,651,709 0.5 0.5
Intracom Holdings SA Technology 7,922,928 1,131,507 0.84 0.84
Intralot SA-Integrated
Lottery Systems &
Services
Consumer Services 51,421,305 7,343,698 1.11 1.11
JUMBO SA Consumer Goods 79,590,075 11,366,601 1.55 1.55
J&P-Avax SA Industrials 5,617,488 802,258 0.33 0.33
Kleeman Hellas SA Industrials 10,896,785 1,556,217 2.52 2.52
Lambrakis Press SA Consumer Services 8,619,635 1,231,007 0.51 0.51
Lamda Development SA Financials 1,611,102 230,088 0.09 0.09
Marfin Investment Group
SAFinancials 200,189,335 28,589,899 0.95 0.95
Metka SA Industrials 16,802,906 2,399,695 0.5 0.5
Industry/Sector Market valueNOK
Market valueUSD Voting Ownership
GOVERNMENT PENSION FUND GLOBAL HOLDINGS 200864
Equities Country association according to FTSE (the benchmark provider for equities). If a company is not in thebenchmark, the country of incorporation and country of listing is used. For remaining securities, a further assessment ismade. Country is defined as a sovereign state currently member of the United Nations. Exceptions are Hong Kong andTaiwan. The country association methodology was updated as of 2014.
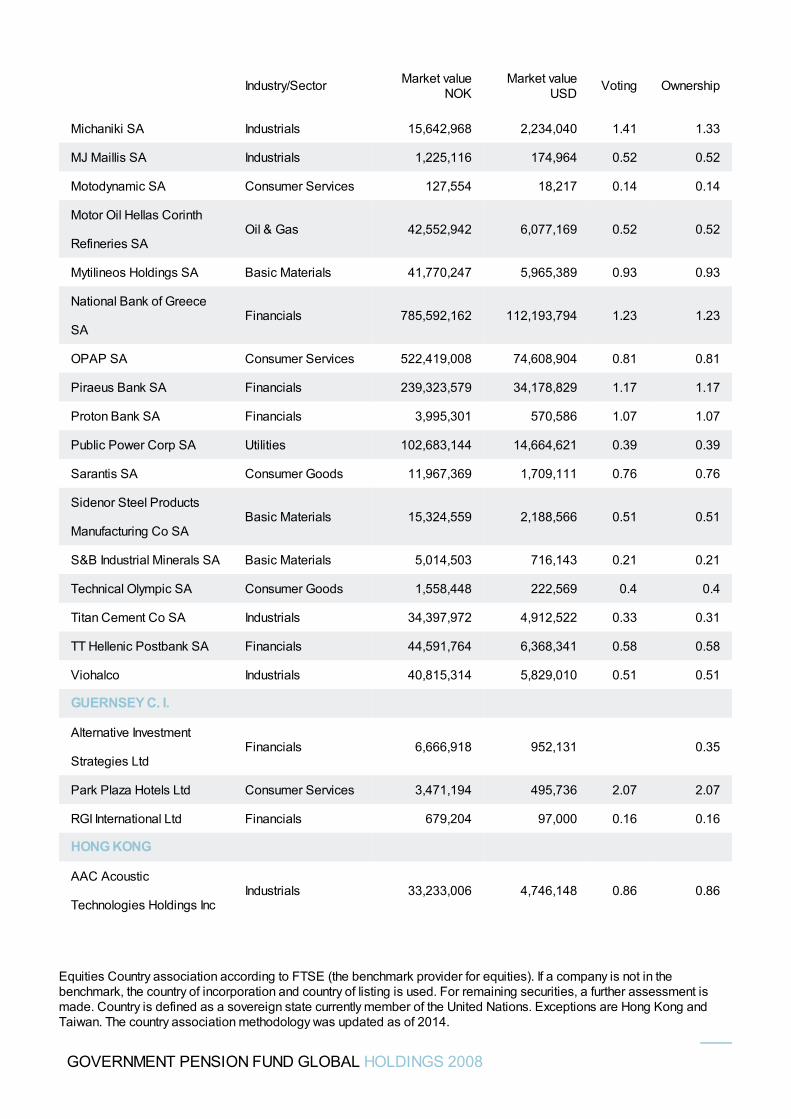
Michaniki SA Industrials 15,642,968 2,234,040 1.41 1.33
MJ Maillis SA Industrials 1,225,116 174,964 0.52 0.52
Motodynamic SA Consumer Services 127,554 18,217 0.14 0.14
Motor Oil Hellas Corinth
Refineries SAOil & Gas 42,552,942 6,077,169 0.52 0.52
Mytilineos Holdings SA Basic Materials 41,770,247 5,965,389 0.93 0.93
National Bank of Greece
SAFinancials 785,592,162 112,193,794 1.23 1.23
OPAP SA Consumer Services 522,419,008 74,608,904 0.81 0.81
Piraeus Bank SA Financials 239,323,579 34,178,829 1.17 1.17
Proton Bank SA Financials 3,995,301 570,586 1.07 1.07
Public Power Corp SA Utilities 102,683,144 14,664,621 0.39 0.39
Sarantis SA Consumer Goods 11,967,369 1,709,111 0.76 0.76
Sidenor Steel Products
Manufacturing Co SABasic Materials 15,324,559 2,188,566 0.51 0.51
S&B Industrial Minerals SA Basic Materials 5,014,503 716,143 0.21 0.21
Technical Olympic SA Consumer Goods 1,558,448 222,569 0.4 0.4
Titan Cement Co SA Industrials 34,397,972 4,912,522 0.33 0.31
TT Hellenic Postbank SA Financials 44,591,764 6,368,341 0.58 0.58
Viohalco Industrials 40,815,314 5,829,010 0.51 0.51
GUERNSEY C. I.
Alternative Investment
Strategies LtdFinancials 6,666,918 952,131 0.35
Park Plaza Hotels Ltd Consumer Services 3,471,194 495,736 2.07 2.07
RGI International Ltd Financials 679,204 97,000 0.16 0.16
HONG KONG
AAC Acoustic
Technologies Holdings IncIndustrials 33,233,006 4,746,148 0.86 0.86
Industry/Sector Market valueNOK
Market valueUSD Voting Ownership
GOVERNMENT PENSION FUND GLOBAL HOLDINGS 2008
Equities Country association according to FTSE (the benchmark provider for equities). If a company is not in thebenchmark, the country of incorporation and country of listing is used. For remaining securities, a further assessment ismade. Country is defined as a sovereign state currently member of the United Nations. Exceptions are Hong Kong andTaiwan. The country association methodology was updated as of 2014.
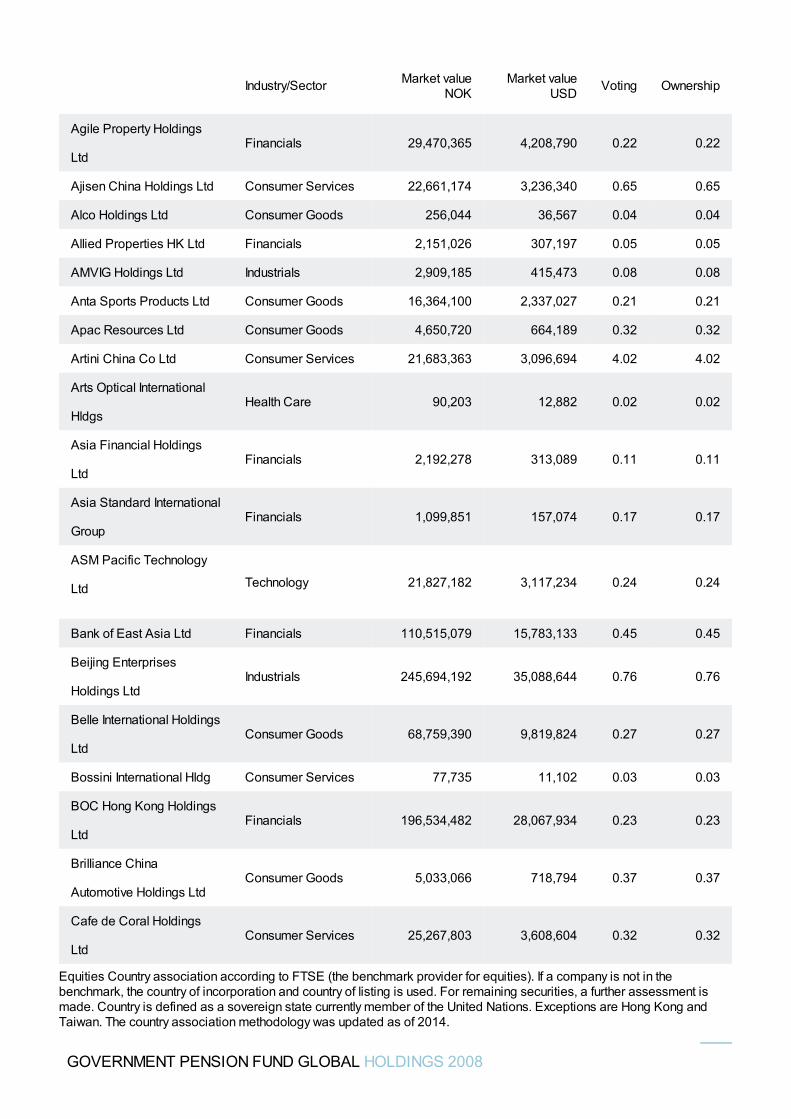
Agile Property Holdings
LtdFinancials 29,470,365 4,208,790 0.22 0.22
Ajisen China Holdings Ltd Consumer Services 22,661,174 3,236,340 0.65 0.65
Alco Holdings Ltd Consumer Goods 256,044 36,567 0.04 0.04
Allied Properties HK Ltd Financials 2,151,026 307,197 0.05 0.05
AMVIG Holdings Ltd Industrials 2,909,185 415,473 0.08 0.08
Anta Sports Products Ltd Consumer Goods 16,364,100 2,337,027 0.21 0.21
Apac Resources Ltd Consumer Goods 4,650,720 664,189 0.32 0.32
Artini China Co Ltd Consumer Services 21,683,363 3,096,694 4.02 4.02
Arts Optical International
HldgsHealth Care 90,203 12,882 0.02 0.02
Asia Financial Holdings
LtdFinancials 2,192,278 313,089 0.11 0.11
Asia Standard International
GroupFinancials 1,099,851 157,074 0.17 0.17
ASM Pacific Technology
Ltd Technology 21,827,182 3,117,234 0.24 0.24
Bank of East Asia Ltd Financials 110,515,079 15,783,133 0.45 0.45
Beijing Enterprises
Holdings LtdIndustrials 245,694,192 35,088,644 0.76 0.76
Belle International Holdings
LtdConsumer Goods 68,759,390 9,819,824 0.27 0.27
Bossini International Hldg Consumer Services 77,735 11,102 0.03 0.03
BOC Hong Kong Holdings
LtdFinancials 196,534,482 28,067,934 0.23 0.23
Brilliance China
Automotive Holdings LtdConsumer Goods 5,033,066 718,794 0.37 0.37
Cafe de Coral Holdings
LtdConsumer Services 25,267,803 3,608,604 0.32 0.32
Industry/Sector Market valueNOK
Market valueUSD Voting Ownership
GOVERNMENT PENSION FUND GLOBAL HOLDINGS 2008
Equities Country association according to FTSE (the benchmark provider for equities). If a company is not in thebenchmark, the country of incorporation and country of listing is used. For remaining securities, a further assessment ismade. Country is defined as a sovereign state currently member of the United Nations. Exceptions are Hong Kong andTaiwan. The country association methodology was updated as of 2014.
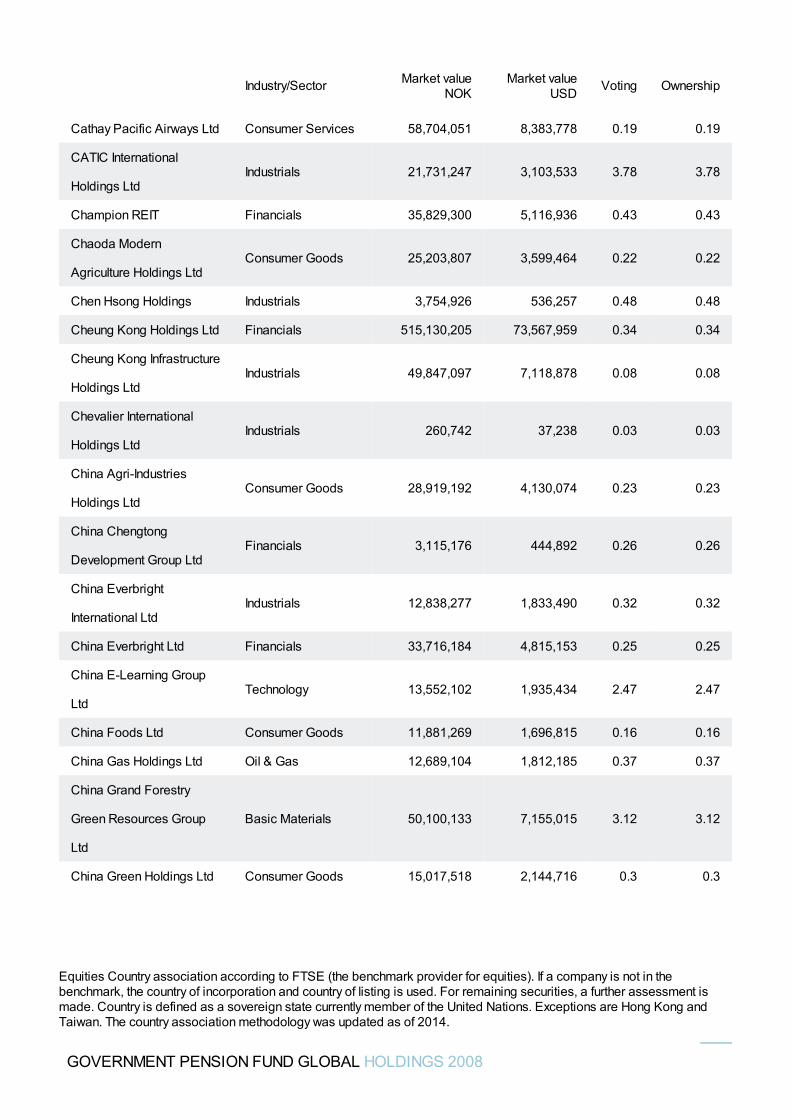
Cathay Pacific Airways Ltd Consumer Services 58,704,051 8,383,778 0.19 0.19
CATIC International
Holdings LtdIndustrials 21,731,247 3,103,533 3.78 3.78
Champion REIT Financials 35,829,300 5,116,936 0.43 0.43
Chaoda Modern
Agriculture Holdings LtdConsumer Goods 25,203,807 3,599,464 0.22 0.22
Chen Hsong Holdings Industrials 3,754,926 536,257 0.48 0.48
Cheung Kong Holdings Ltd Financials 515,130,205 73,567,959 0.34 0.34
Cheung Kong Infrastructure
Holdings LtdIndustrials 49,847,097 7,118,878 0.08 0.08
Chevalier International
Holdings LtdIndustrials 260,742 37,238 0.03 0.03
China Agri-Industries
Holdings LtdConsumer Goods 28,919,192 4,130,074 0.23 0.23
China Chengtong
Development Group LtdFinancials 3,115,176 444,892 0.26 0.26
China Everbright
International LtdIndustrials 12,838,277 1,833,490 0.32 0.32
China Everbright Ltd Financials 33,716,184 4,815,153 0.25 0.25
China E-Learning Group
LtdTechnology 13,552,102 1,935,434 2.47 2.47
China Foods Ltd Consumer Goods 11,881,269 1,696,815 0.16 0.16
China Gas Holdings Ltd Oil & Gas 12,689,104 1,812,185 0.37 0.37
China Grand Forestry
Green Resources Group
Ltd
Basic Materials 50,100,133 7,155,015 3.12 3.12
China Green Holdings Ltd Consumer Goods 15,017,518 2,144,716 0.3 0.3
Industry/Sector Market valueNOK
Market valueUSD Voting Ownership
GOVERNMENT PENSION FUND GLOBAL HOLDINGS 2008
Equities Country association according to FTSE (the benchmark provider for equities). If a company is not in thebenchmark, the country of incorporation and country of listing is used. For remaining securities, a further assessment ismade. Country is defined as a sovereign state currently member of the United Nations. Exceptions are Hong Kong andTaiwan. The country association methodology was updated as of 2014.
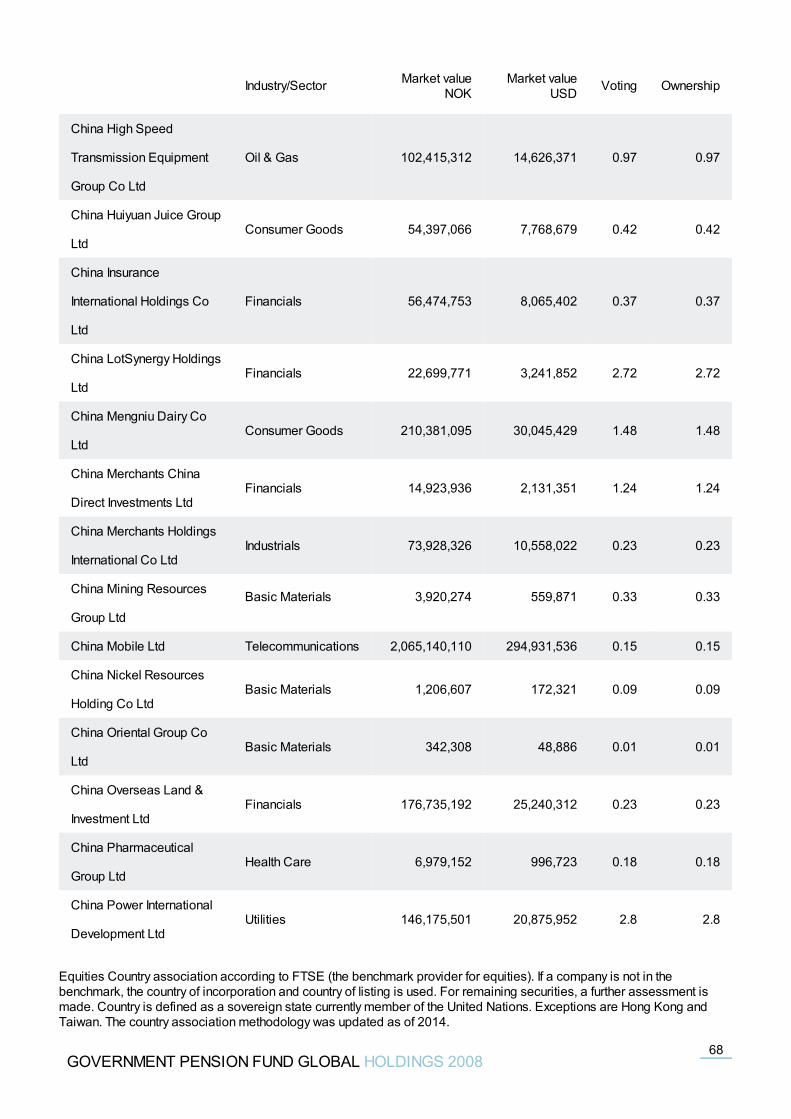
China High Speed
Transmission Equipment
Group Co Ltd
Oil & Gas 102,415,312 14,626,371 0.97 0.97
China Huiyuan Juice Group
LtdConsumer Goods 54,397,066 7,768,679 0.42 0.42
China Insurance
International Holdings Co
Ltd
Financials 56,474,753 8,065,402 0.37 0.37
China LotSynergy Holdings
LtdFinancials 22,699,771 3,241,852 2.72 2.72
China Mengniu Dairy Co
LtdConsumer Goods 210,381,095 30,045,429 1.48 1.48
China Merchants China
Direct Investments LtdFinancials 14,923,936 2,131,351 1.24 1.24
China Merchants Holdings
International Co LtdIndustrials 73,928,326 10,558,022 0.23 0.23
China Mining Resources
Group LtdBasic Materials 3,920,274 559,871 0.33 0.33
China Mobile Ltd Telecommunications 2,065,140,110 294,931,536 0.15 0.15
China Nickel Resources
Holding Co LtdBasic Materials 1,206,607 172,321 0.09 0.09
China Oriental Group Co
LtdBasic Materials 342,308 48,886 0.01 0.01
China Overseas Land &
Investment LtdFinancials 176,735,192 25,240,312 0.23 0.23
China Pharmaceutical
Group LtdHealth Care 6,979,152 996,723 0.18 0.18
China Power International
Development LtdUtilities 146,175,501 20,875,952 2.8 2.8
Industry/Sector Market valueNOK
Market valueUSD Voting Ownership
GOVERNMENT PENSION FUND GLOBAL HOLDINGS 200868
Equities Country association according to FTSE (the benchmark provider for equities). If a company is not in thebenchmark, the country of incorporation and country of listing is used. For remaining securities, a further assessment ismade. Country is defined as a sovereign state currently member of the United Nations. Exceptions are Hong Kong andTaiwan. The country association methodology was updated as of 2014.
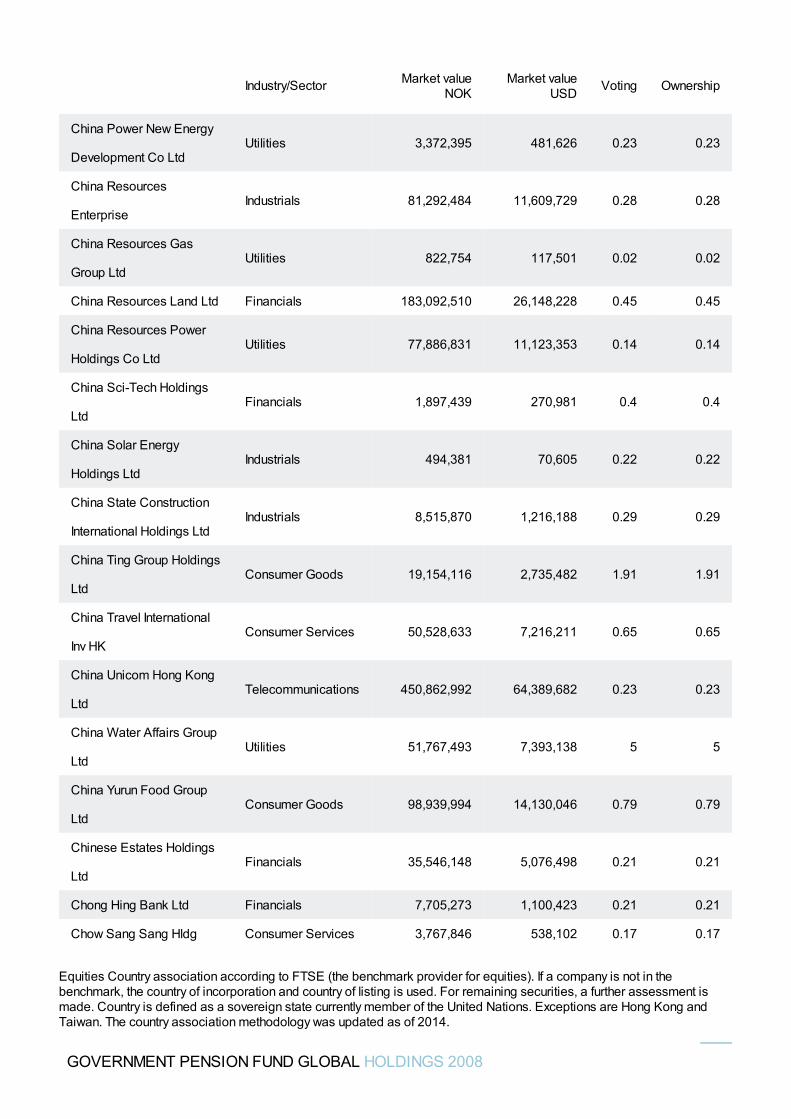
China Power New Energy
Development Co LtdUtilities 3,372,395 481,626 0.23 0.23
China Resources
EnterpriseIndustrials 81,292,484 11,609,729 0.28 0.28
China Resources Gas
Group LtdUtilities 822,754 117,501 0.02 0.02
China Resources Land Ltd Financials 183,092,510 26,148,228 0.45 0.45
China Resources Power
Holdings Co LtdUtilities 77,886,831 11,123,353 0.14 0.14
China Sci-Tech Holdings
LtdFinancials 1,897,439 270,981 0.4 0.4
China Solar Energy
Holdings LtdIndustrials 494,381 70,605 0.22 0.22
China State Construction
International Holdings LtdIndustrials 8,515,870 1,216,188 0.29 0.29
China Ting Group Holdings
LtdConsumer Goods 19,154,116 2,735,482 1.91 1.91
China Travel International
Inv HKConsumer Services 50,528,633 7,216,211 0.65 0.65
China Unicom Hong Kong
LtdTelecommunications 450,862,992 64,389,682 0.23 0.23
China Water Affairs Group
LtdUtilities 51,767,493 7,393,138 5 5
China Yurun Food Group
LtdConsumer Goods 98,939,994 14,130,046 0.79 0.79
Chinese Estates Holdings
LtdFinancials 35,546,148 5,076,498 0.21 0.21
Chong Hing Bank Ltd Financials 7,705,273 1,100,423 0.21 0.21
Chow Sang Sang Hldg Consumer Services 3,767,846 538,102 0.17 0.17
Industry/Sector Market valueNOK
Market valueUSD Voting Ownership
GOVERNMENT PENSION FUND GLOBAL HOLDINGS 2008
Equities Country association according to FTSE (the benchmark provider for equities). If a company is not in thebenchmark, the country of incorporation and country of listing is used. For remaining securities, a further assessment ismade. Country is defined as a sovereign state currently member of the United Nations. Exceptions are Hong Kong andTaiwan. The country association methodology was updated as of 2014.
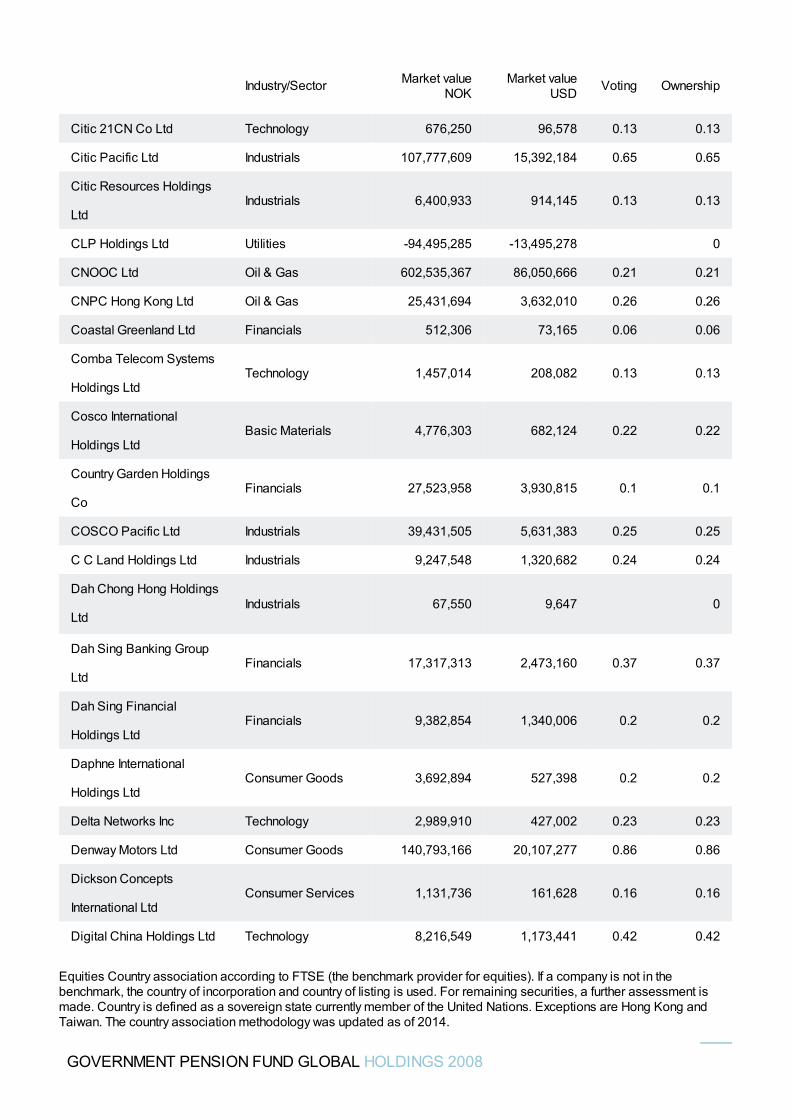
Citic 21CN Co Ltd Technology 676,250 96,578 0.13 0.13
Citic Pacific Ltd Industrials 107,777,609 15,392,184 0.65 0.65
Citic Resources Holdings
LtdIndustrials 6,400,933 914,145 0.13 0.13
CLP Holdings Ltd Utilities -94,495,285 -13,495,278 0
CNOOC Ltd Oil & Gas 602,535,367 86,050,666 0.21 0.21
CNPC Hong Kong Ltd Oil & Gas 25,431,694 3,632,010 0.26 0.26
Coastal Greenland Ltd Financials 512,306 73,165 0.06 0.06
Comba Telecom Systems
Holdings LtdTechnology 1,457,014 208,082 0.13 0.13
Cosco International
Holdings LtdBasic Materials 4,776,303 682,124 0.22 0.22
Country Garden Holdings
CoFinancials 27,523,958 3,930,815 0.1 0.1
COSCO Pacific Ltd Industrials 39,431,505 5,631,383 0.25 0.25
C C Land Holdings Ltd Industrials 9,247,548 1,320,682 0.24 0.24
Dah Chong Hong Holdings
LtdIndustrials 67,550 9,647 0
Dah Sing Banking Group
LtdFinancials 17,317,313 2,473,160 0.37 0.37
Dah Sing Financial
Holdings LtdFinancials 9,382,854 1,340,006 0.2 0.2
Daphne International
Holdings LtdConsumer Goods 3,692,894 527,398 0.2 0.2
Delta Networks Inc Technology 2,989,910 427,002 0.23 0.23
Denway Motors Ltd Consumer Goods 140,793,166 20,107,277 0.86 0.86
Dickson Concepts
International LtdConsumer Services 1,131,736 161,628 0.16 0.16
Digital China Holdings Ltd Technology 8,216,549 1,173,441 0.42 0.42
Industry/Sector Market valueNOK
Market valueUSD Voting Ownership
GOVERNMENT PENSION FUND GLOBAL HOLDINGS 2008
Equities Country association according to FTSE (the benchmark provider for equities). If a company is not in thebenchmark, the country of incorporation and country of listing is used. For remaining securities, a further assessment ismade. Country is defined as a sovereign state currently member of the United Nations. Exceptions are Hong Kong andTaiwan. The country association methodology was updated as of 2014.
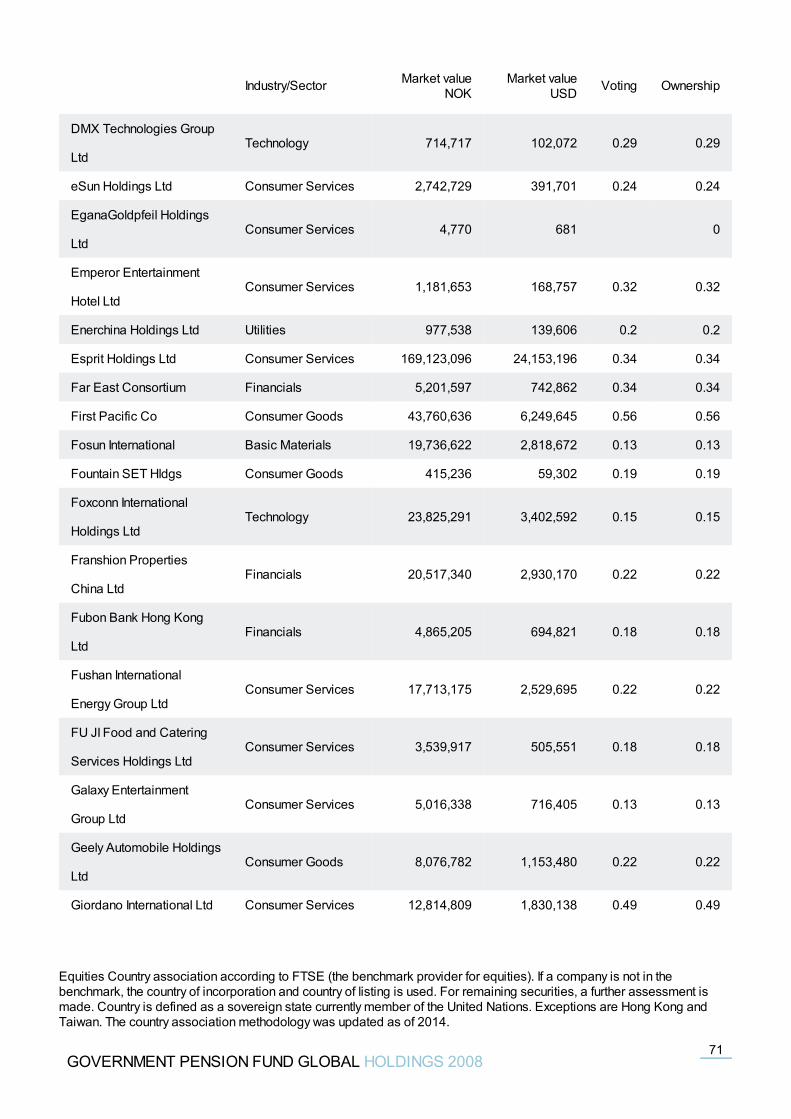
DMX Technologies Group
LtdTechnology 714,717 102,072 0.29 0.29
eSun Holdings Ltd Consumer Services 2,742,729 391,701 0.24 0.24
EganaGoldpfeil Holdings
LtdConsumer Services 4,770 681 0
Emperor Entertainment
Hotel LtdConsumer Services 1,181,653 168,757 0.32 0.32
Enerchina Holdings Ltd Utilities 977,538 139,606 0.2 0.2
Esprit Holdings Ltd Consumer Services 169,123,096 24,153,196 0.34 0.34
Far East Consortium Financials 5,201,597 742,862 0.34 0.34
First Pacific Co Consumer Goods 43,760,636 6,249,645 0.56 0.56
Fosun International Basic Materials 19,736,622 2,818,672 0.13 0.13
Fountain SET Hldgs Consumer Goods 415,236 59,302 0.19 0.19
Foxconn International
Holdings LtdTechnology 23,825,291 3,402,592 0.15 0.15
Franshion Properties
China LtdFinancials 20,517,340 2,930,170 0.22 0.22
Fubon Bank Hong Kong
LtdFinancials 4,865,205 694,821 0.18 0.18
Fushan International
Energy Group LtdConsumer Services 17,713,175 2,529,695 0.22 0.22
FU JI Food and Catering
Services Holdings LtdConsumer Services 3,539,917 505,551 0.18 0.18
Galaxy Entertainment
Group LtdConsumer Services 5,016,338 716,405 0.13 0.13
Geely Automobile Holdings
LtdConsumer Goods 8,076,782 1,153,480 0.22 0.22
Giordano International Ltd Consumer Services 12,814,809 1,830,138 0.49 0.49
Industry/Sector Market valueNOK
Market valueUSD Voting Ownership
GOVERNMENT PENSION FUND GLOBAL HOLDINGS 200871
Equities Country association according to FTSE (the benchmark provider for equities). If a company is not in thebenchmark, the country of incorporation and country of listing is used. For remaining securities, a further assessment ismade. Country is defined as a sovereign state currently member of the United Nations. Exceptions are Hong Kong andTaiwan. The country association methodology was updated as of 2014.
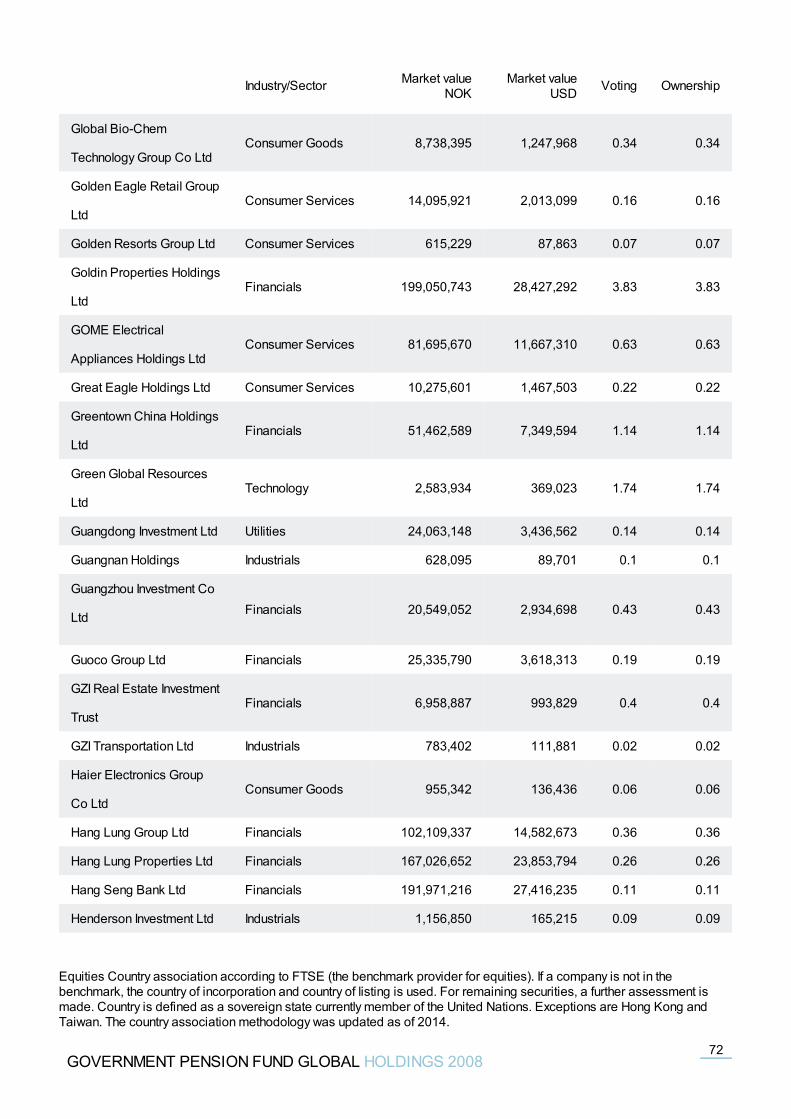
Global Bio-Chem
Technology Group Co LtdConsumer Goods 8,738,395 1,247,968 0.34 0.34
Golden Eagle Retail Group
LtdConsumer Services 14,095,921 2,013,099 0.16 0.16
Golden Resorts Group Ltd Consumer Services 615,229 87,863 0.07 0.07
Goldin Properties Holdings
LtdFinancials 199,050,743 28,427,292 3.83 3.83
GOME Electrical
Appliances Holdings LtdConsumer Services 81,695,670 11,667,310 0.63 0.63
Great Eagle Holdings Ltd Consumer Services 10,275,601 1,467,503 0.22 0.22
Greentown China Holdings
LtdFinancials 51,462,589 7,349,594 1.14 1.14
Green Global Resources
LtdTechnology 2,583,934 369,023 1.74 1.74
Guangdong Investment Ltd Utilities 24,063,148 3,436,562 0.14 0.14
Guangnan Holdings Industrials 628,095 89,701 0.1 0.1
Guangzhou Investment Co
Ltd Financials 20,549,052 2,934,698 0.43 0.43
Guoco Group Ltd Financials 25,335,790 3,618,313 0.19 0.19
GZI Real Estate Investment
TrustFinancials 6,958,887 993,829 0.4 0.4
GZI Transportation Ltd Industrials 783,402 111,881 0.02 0.02
Haier Electronics Group
Co LtdConsumer Goods 955,342 136,436 0.06 0.06
Hang Lung Group Ltd Financials 102,109,337 14,582,673 0.36 0.36
Hang Lung Properties Ltd Financials 167,026,652 23,853,794 0.26 0.26
Hang Seng Bank Ltd Financials 191,971,216 27,416,235 0.11 0.11
Henderson Investment Ltd Industrials 1,156,850 165,215 0.09 0.09
Industry/Sector Market valueNOK
Market valueUSD Voting Ownership
GOVERNMENT PENSION FUND GLOBAL HOLDINGS 200872
Equities Country association according to FTSE (the benchmark provider for equities). If a company is not in thebenchmark, the country of incorporation and country of listing is used. For remaining securities, a further assessment ismade. Country is defined as a sovereign state currently member of the United Nations. Exceptions are Hong Kong andTaiwan. The country association methodology was updated as of 2014.
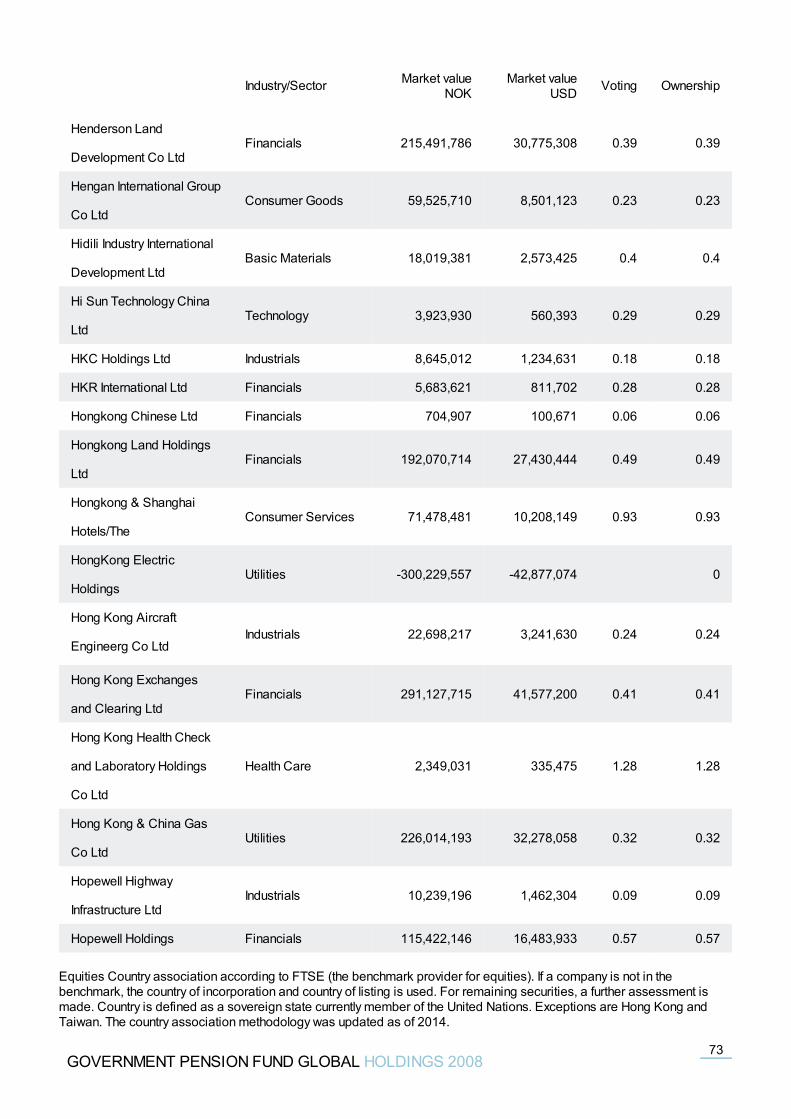
Henderson Land
Development Co LtdFinancials 215,491,786 30,775,308 0.39 0.39
Hengan International Group
Co LtdConsumer Goods 59,525,710 8,501,123 0.23 0.23
Hidili Industry International
Development LtdBasic Materials 18,019,381 2,573,425 0.4 0.4
Hi Sun Technology China
LtdTechnology 3,923,930 560,393 0.29 0.29
HKC Holdings Ltd Industrials 8,645,012 1,234,631 0.18 0.18
HKR International Ltd Financials 5,683,621 811,702 0.28 0.28
Hongkong Chinese Ltd Financials 704,907 100,671 0.06 0.06
Hongkong Land Holdings
LtdFinancials 192,070,714 27,430,444 0.49 0.49
Hongkong & Shanghai
Hotels/TheConsumer Services 71,478,481 10,208,149 0.93 0.93
HongKong Electric
HoldingsUtilities -300,229,557 -42,877,074 0
Hong Kong Aircraft
Engineerg Co LtdIndustrials 22,698,217 3,241,630 0.24 0.24
Hong Kong Exchanges
and Clearing LtdFinancials 291,127,715 41,577,200 0.41 0.41
Hong Kong Health Check
and Laboratory Holdings
Co Ltd
Health Care 2,349,031 335,475 1.28 1.28
Hong Kong & China Gas
Co LtdUtilities 226,014,193 32,278,058 0.32 0.32
Hopewell Highway
Infrastructure LtdIndustrials 10,239,196 1,462,304 0.09 0.09
Hopewell Holdings Financials 115,422,146 16,483,933 0.57 0.57
Industry/Sector Market valueNOK
Market valueUSD Voting Ownership
GOVERNMENT PENSION FUND GLOBAL HOLDINGS 200873
Equities Country association according to FTSE (the benchmark provider for equities). If a company is not in thebenchmark, the country of incorporation and country of listing is used. For remaining securities, a further assessment ismade. Country is defined as a sovereign state currently member of the United Nations. Exceptions are Hong Kong andTaiwan. The country association methodology was updated as of 2014.
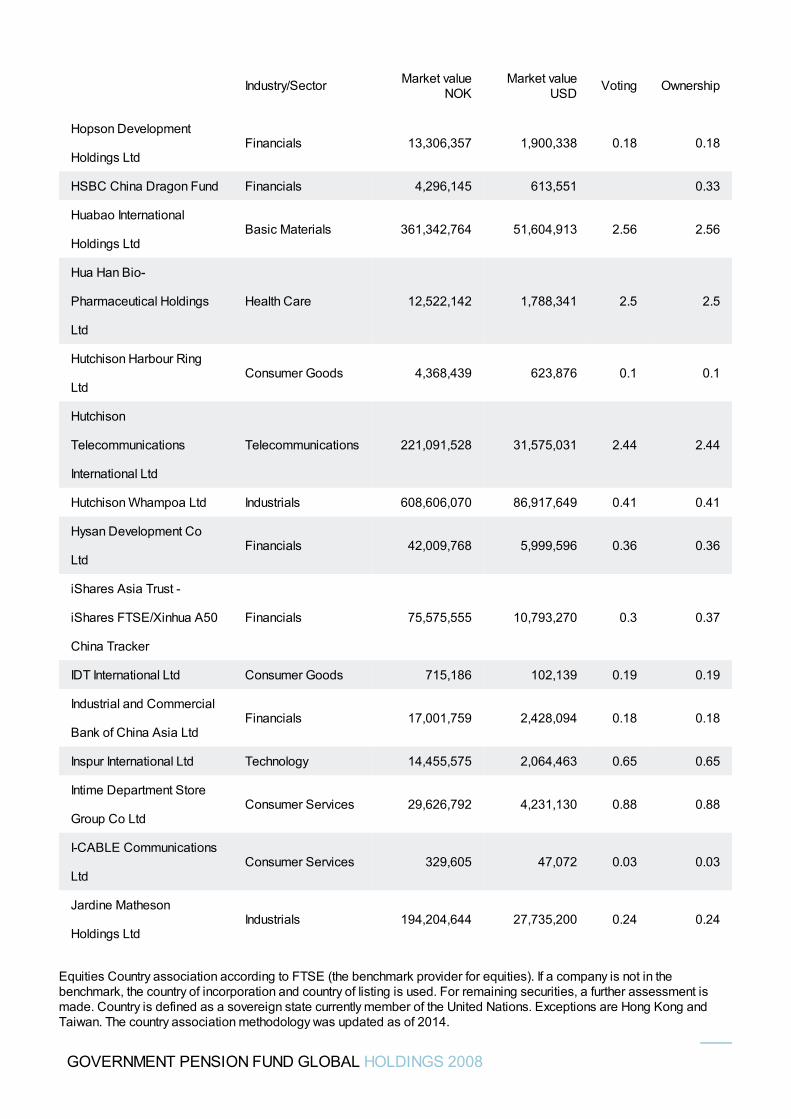
Hopson Development
Holdings LtdFinancials 13,306,357 1,900,338 0.18 0.18
HSBC China Dragon Fund Financials 4,296,145 613,551 0.33
Huabao International
Holdings LtdBasic Materials 361,342,764 51,604,913 2.56 2.56
Hua Han Bio-
Pharmaceutical Holdings
Ltd
Health Care 12,522,142 1,788,341 2.5 2.5
Hutchison Harbour Ring
LtdConsumer Goods 4,368,439 623,876 0.1 0.1
Hutchison
Telecommunications
International Ltd
Telecommunications 221,091,528 31,575,031 2.44 2.44
Hutchison Whampoa Ltd Industrials 608,606,070 86,917,649 0.41 0.41
Hysan Development Co
LtdFinancials 42,009,768 5,999,596 0.36 0.36
iShares Asia Trust -
iShares FTSE/Xinhua A50
China Tracker
Financials 75,575,555 10,793,270 0.3 0.37
IDT International Ltd Consumer Goods 715,186 102,139 0.19 0.19
Industrial and Commercial
Bank of China Asia LtdFinancials 17,001,759 2,428,094 0.18 0.18
Inspur International Ltd Technology 14,455,575 2,064,463 0.65 0.65
Intime Department Store
Group Co LtdConsumer Services 29,626,792 4,231,130 0.88 0.88
I-CABLE Communications
LtdConsumer Services 329,605 47,072 0.03 0.03
Jardine Matheson
Holdings LtdIndustrials 194,204,644 27,735,200 0.24 0.24
Industry/Sector Market valueNOK
Market valueUSD Voting Ownership
GOVERNMENT PENSION FUND GLOBAL HOLDINGS 2008
Equities Country association according to FTSE (the benchmark provider for equities). If a company is not in thebenchmark, the country of incorporation and country of listing is used. For remaining securities, a further assessment ismade. Country is defined as a sovereign state currently member of the United Nations. Exceptions are Hong Kong andTaiwan. The country association methodology was updated as of 2014.
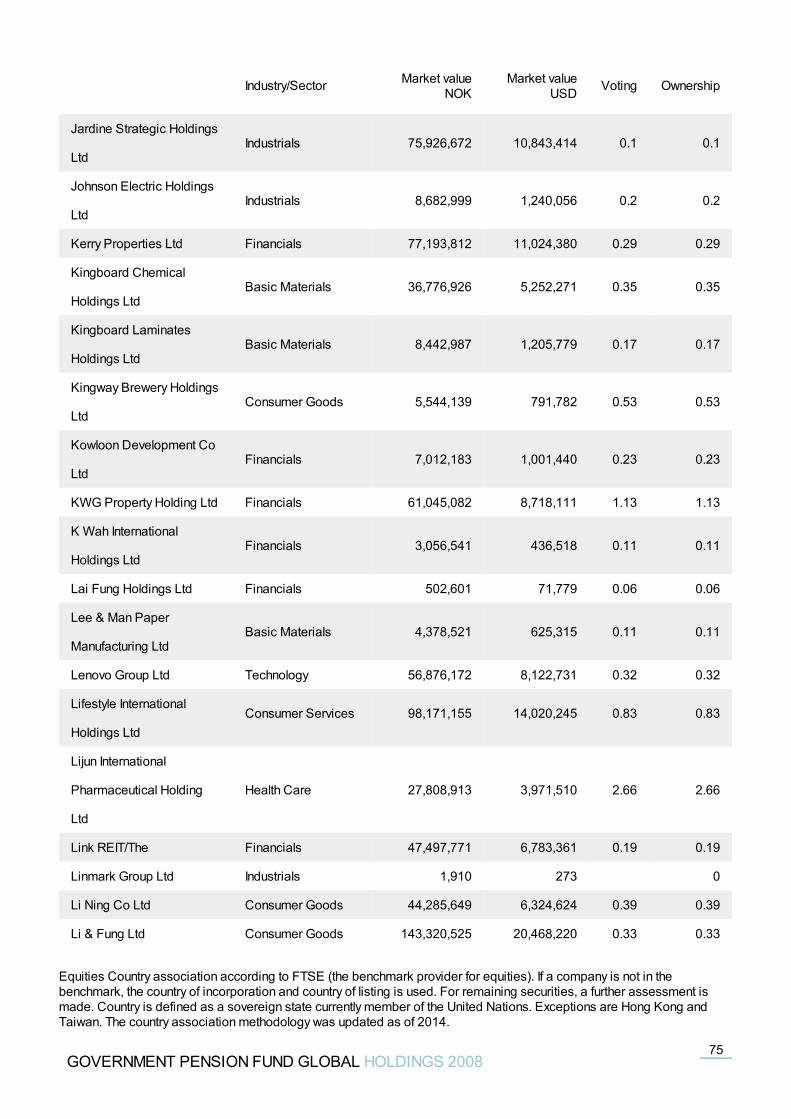
Jardine Strategic Holdings
LtdIndustrials 75,926,672 10,843,414 0.1 0.1
Johnson Electric Holdings
LtdIndustrials 8,682,999 1,240,056 0.2 0.2
Kerry Properties Ltd Financials 77,193,812 11,024,380 0.29 0.29
Kingboard Chemical
Holdings LtdBasic Materials 36,776,926 5,252,271 0.35 0.35
Kingboard Laminates
Holdings LtdBasic Materials 8,442,987 1,205,779 0.17 0.17
Kingway Brewery Holdings
LtdConsumer Goods 5,544,139 791,782 0.53 0.53
Kowloon Development Co
LtdFinancials 7,012,183 1,001,440 0.23 0.23
KWG Property Holding Ltd Financials 61,045,082 8,718,111 1.13 1.13
K Wah International
Holdings LtdFinancials 3,056,541 436,518 0.11 0.11
Lai Fung Holdings Ltd Financials 502,601 71,779 0.06 0.06
Lee & Man Paper
Manufacturing LtdBasic Materials 4,378,521 625,315 0.11 0.11
Lenovo Group Ltd Technology 56,876,172 8,122,731 0.32 0.32
Lifestyle International
Holdings LtdConsumer Services 98,171,155 14,020,245 0.83 0.83
Lijun International
Pharmaceutical Holding
Ltd
Health Care 27,808,913 3,971,510 2.66 2.66
Link REIT/The Financials 47,497,771 6,783,361 0.19 0.19
Linmark Group Ltd Industrials 1,910 273 0
Li Ning Co Ltd Consumer Goods 44,285,649 6,324,624 0.39 0.39
Li & Fung Ltd Consumer Goods 143,320,525 20,468,220 0.33 0.33
Industry/Sector Market valueNOK
Market valueUSD Voting Ownership
GOVERNMENT PENSION FUND GLOBAL HOLDINGS 200875
Equities Country association according to FTSE (the benchmark provider for equities). If a company is not in thebenchmark, the country of incorporation and country of listing is used. For remaining securities, a further assessment ismade. Country is defined as a sovereign state currently member of the United Nations. Exceptions are Hong Kong andTaiwan. The country association methodology was updated as of 2014.
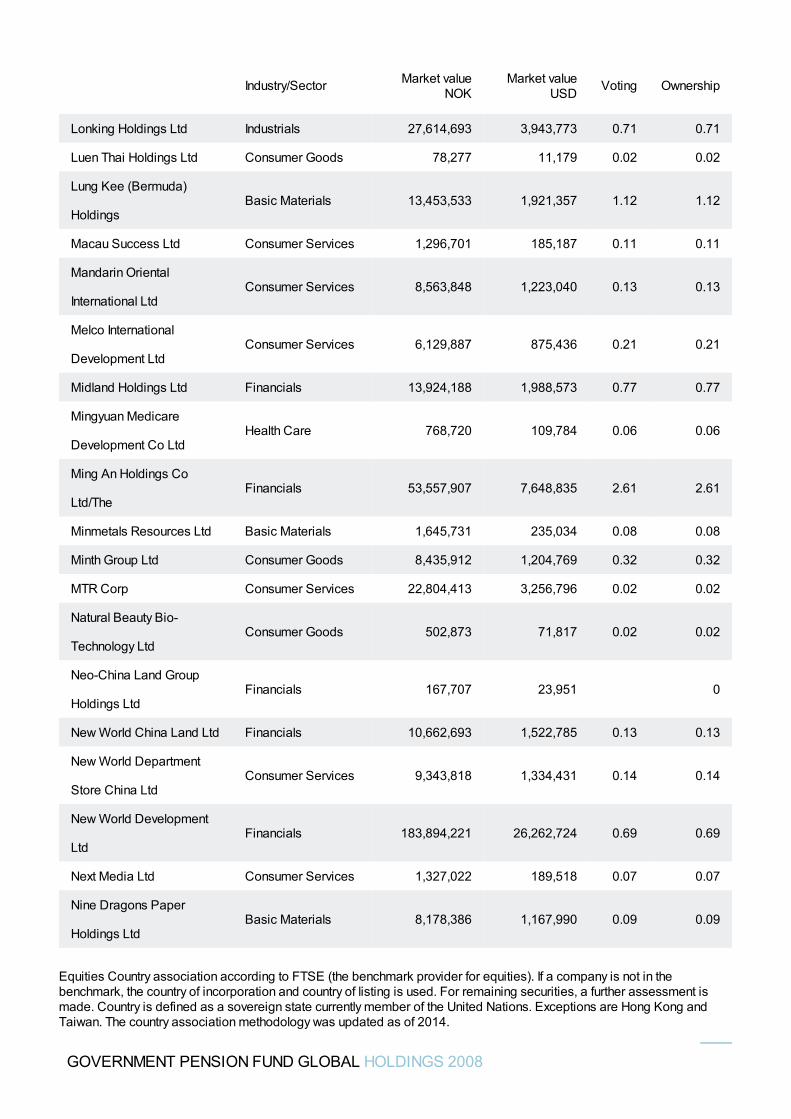
Lonking Holdings Ltd Industrials 27,614,693 3,943,773 0.71 0.71
Luen Thai Holdings Ltd Consumer Goods 78,277 11,179 0.02 0.02
Lung Kee (Bermuda)
HoldingsBasic Materials 13,453,533 1,921,357 1.12 1.12
Macau Success Ltd Consumer Services 1,296,701 185,187 0.11 0.11
Mandarin Oriental
International LtdConsumer Services 8,563,848 1,223,040 0.13 0.13
Melco International
Development LtdConsumer Services 6,129,887 875,436 0.21 0.21
Midland Holdings Ltd Financials 13,924,188 1,988,573 0.77 0.77
Mingyuan Medicare
Development Co LtdHealth Care 768,720 109,784 0.06 0.06
Ming An Holdings Co
Ltd/TheFinancials 53,557,907 7,648,835 2.61 2.61
Minmetals Resources Ltd Basic Materials 1,645,731 235,034 0.08 0.08
Minth Group Ltd Consumer Goods 8,435,912 1,204,769 0.32 0.32
MTR Corp Consumer Services 22,804,413 3,256,796 0.02 0.02
Natural Beauty Bio-
Technology LtdConsumer Goods 502,873 71,817 0.02 0.02
Neo-China Land Group
Holdings LtdFinancials 167,707 23,951 0
New World China Land Ltd Financials 10,662,693 1,522,785 0.13 0.13
New World Department
Store China LtdConsumer Services 9,343,818 1,334,431 0.14 0.14
New World Development
LtdFinancials 183,894,221 26,262,724 0.69 0.69
Next Media Ltd Consumer Services 1,327,022 189,518 0.07 0.07
Nine Dragons Paper
Holdings LtdBasic Materials 8,178,386 1,167,990 0.09 0.09
Industry/Sector Market valueNOK
Market valueUSD Voting Ownership
GOVERNMENT PENSION FUND GLOBAL HOLDINGS 2008
Equities Country association according to FTSE (the benchmark provider for equities). If a company is not in thebenchmark, the country of incorporation and country of listing is used. For remaining securities, a further assessment ismade. Country is defined as a sovereign state currently member of the United Nations. Exceptions are Hong Kong andTaiwan. The country association methodology was updated as of 2014.
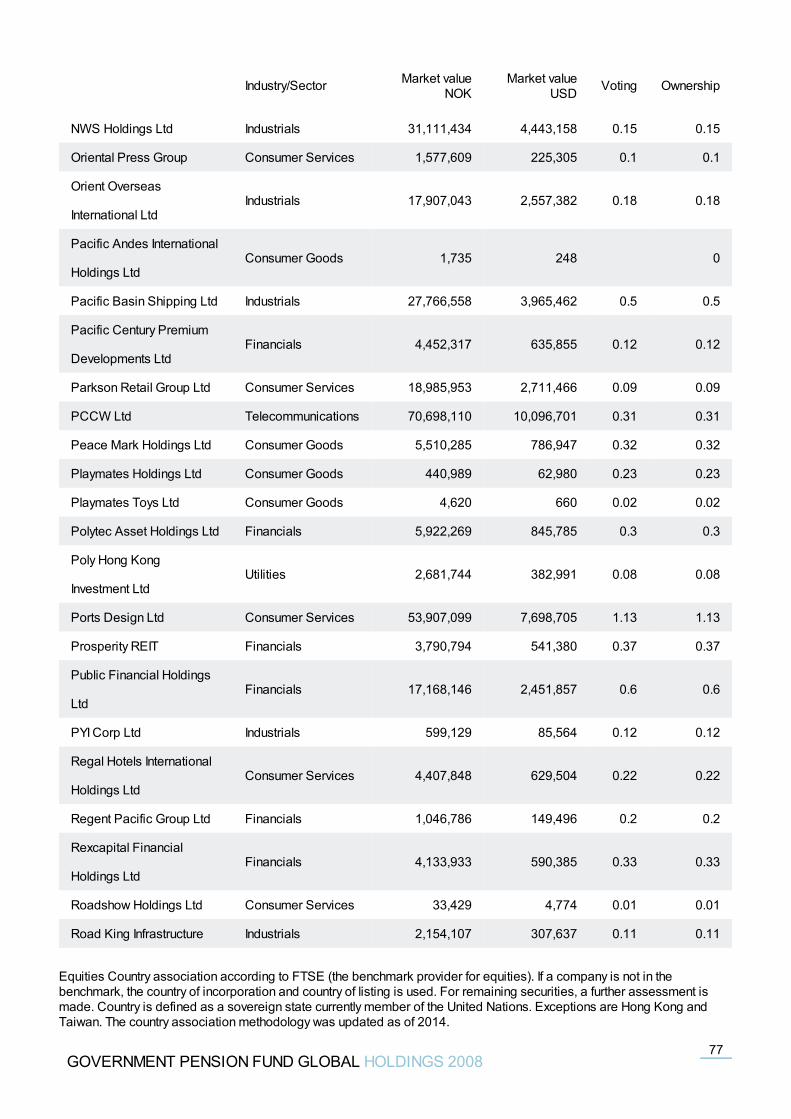
NWS Holdings Ltd Industrials 31,111,434 4,443,158 0.15 0.15
Oriental Press Group Consumer Services 1,577,609 225,305 0.1 0.1
Orient Overseas
International LtdIndustrials 17,907,043 2,557,382 0.18 0.18
Pacific Andes International
Holdings LtdConsumer Goods 1,735 248 0
Pacific Basin Shipping Ltd Industrials 27,766,558 3,965,462 0.5 0.5
Pacific Century Premium
Developments LtdFinancials 4,452,317 635,855 0.12 0.12
Parkson Retail Group Ltd Consumer Services 18,985,953 2,711,466 0.09 0.09
PCCW Ltd Telecommunications 70,698,110 10,096,701 0.31 0.31
Peace Mark Holdings Ltd Consumer Goods 5,510,285 786,947 0.32 0.32
Playmates Holdings Ltd Consumer Goods 440,989 62,980 0.23 0.23
Playmates Toys Ltd Consumer Goods 4,620 660 0.02 0.02
Polytec Asset Holdings Ltd Financials 5,922,269 845,785 0.3 0.3
Poly Hong Kong
Investment LtdUtilities 2,681,744 382,991 0.08 0.08
Ports Design Ltd Consumer Services 53,907,099 7,698,705 1.13 1.13
Prosperity REIT Financials 3,790,794 541,380 0.37 0.37
Public Financial Holdings
LtdFinancials 17,168,146 2,451,857 0.6 0.6
PYI Corp Ltd Industrials 599,129 85,564 0.12 0.12
Regal Hotels International
Holdings LtdConsumer Services 4,407,848 629,504 0.22 0.22
Regent Pacific Group Ltd Financials 1,046,786 149,496 0.2 0.2
Rexcapital Financial
Holdings LtdFinancials 4,133,933 590,385 0.33 0.33
Roadshow Holdings Ltd Consumer Services 33,429 4,774 0.01 0.01
Road King Infrastructure Industrials 2,154,107 307,637 0.11 0.11
Industry/Sector Market valueNOK
Market valueUSD Voting Ownership
GOVERNMENT PENSION FUND GLOBAL HOLDINGS 200877
Equities Country association according to FTSE (the benchmark provider for equities). If a company is not in thebenchmark, the country of incorporation and country of listing is used. For remaining securities, a further assessment ismade. Country is defined as a sovereign state currently member of the United Nations. Exceptions are Hong Kong andTaiwan. The country association methodology was updated as of 2014.
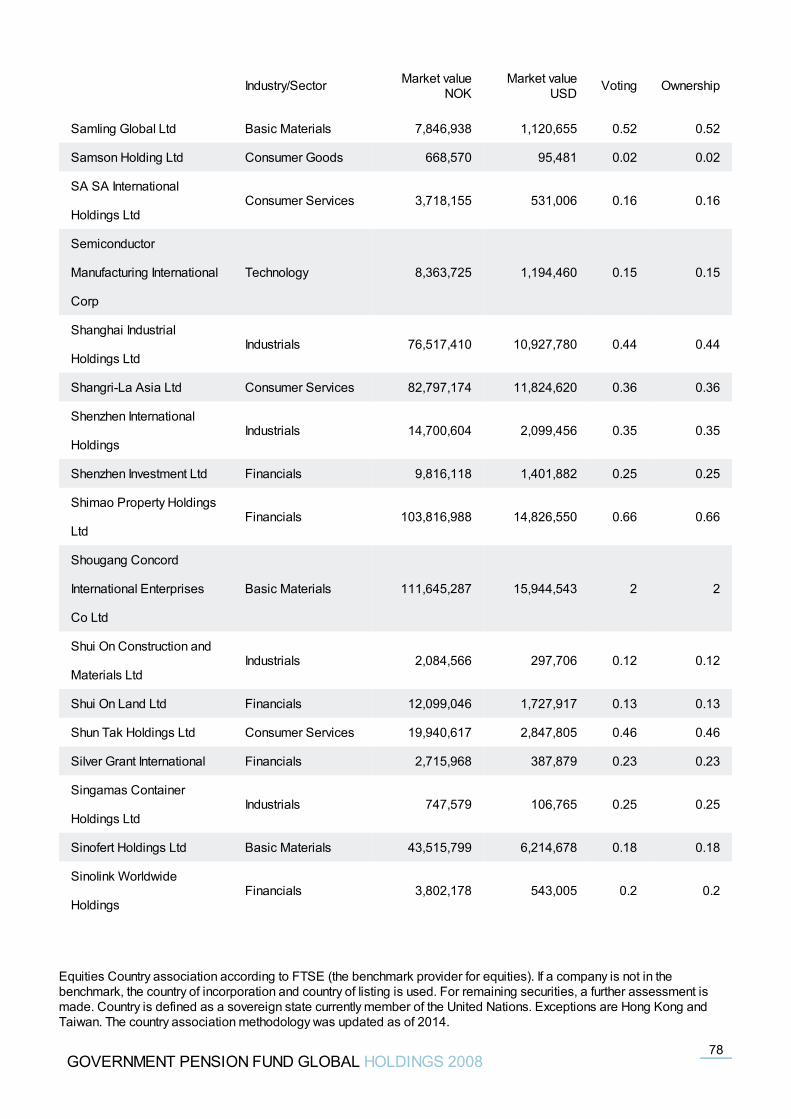
Samling Global Ltd Basic Materials 7,846,938 1,120,655 0.52 0.52
Samson Holding Ltd Consumer Goods 668,570 95,481 0.02 0.02
SA SA International
Holdings LtdConsumer Services 3,718,155 531,006 0.16 0.16
Semiconductor
Manufacturing International
Corp
Technology 8,363,725 1,194,460 0.15 0.15
Shanghai Industrial
Holdings LtdIndustrials 76,517,410 10,927,780 0.44 0.44
Shangri-La Asia Ltd Consumer Services 82,797,174 11,824,620 0.36 0.36
Shenzhen International
HoldingsIndustrials 14,700,604 2,099,456 0.35 0.35
Shenzhen Investment Ltd Financials 9,816,118 1,401,882 0.25 0.25
Shimao Property Holdings
LtdFinancials 103,816,988 14,826,550 0.66 0.66
Shougang Concord
International Enterprises
Co Ltd
Basic Materials 111,645,287 15,944,543 2 2
Shui On Construction and
Materials LtdIndustrials 2,084,566 297,706 0.12 0.12
Shui On Land Ltd Financials 12,099,046 1,727,917 0.13 0.13
Shun Tak Holdings Ltd Consumer Services 19,940,617 2,847,805 0.46 0.46
Silver Grant International Financials 2,715,968 387,879 0.23 0.23
Singamas Container
Holdings LtdIndustrials 747,579 106,765 0.25 0.25
Sinofert Holdings Ltd Basic Materials 43,515,799 6,214,678 0.18 0.18
Sinolink Worldwide
HoldingsFinancials 3,802,178 543,005 0.2 0.2
Industry/Sector Market valueNOK
Market valueUSD Voting Ownership
GOVERNMENT PENSION FUND GLOBAL HOLDINGS 200878
Equities Country association according to FTSE (the benchmark provider for equities). If a company is not in thebenchmark, the country of incorporation and country of listing is used. For remaining securities, a further assessment ismade. Country is defined as a sovereign state currently member of the United Nations. Exceptions are Hong Kong andTaiwan. The country association methodology was updated as of 2014.
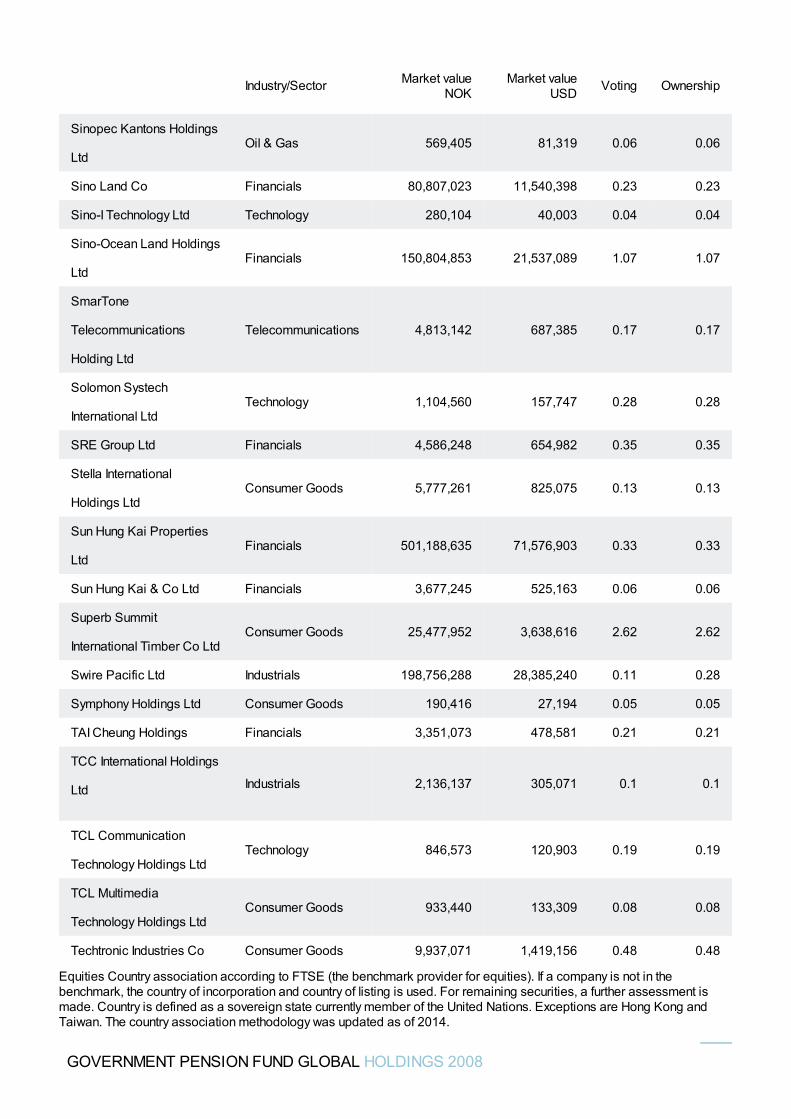
Sinopec Kantons Holdings
LtdOil & Gas 569,405 81,319 0.06 0.06
Sino Land Co Financials 80,807,023 11,540,398 0.23 0.23
Sino-I Technology Ltd Technology 280,104 40,003 0.04 0.04
Sino-Ocean Land Holdings
LtdFinancials 150,804,853 21,537,089 1.07 1.07
SmarTone
Telecommunications
Holding Ltd
Telecommunications 4,813,142 687,385 0.17 0.17
Solomon Systech
International LtdTechnology 1,104,560 157,747 0.28 0.28
SRE Group Ltd Financials 4,586,248 654,982 0.35 0.35
Stella International
Holdings LtdConsumer Goods 5,777,261 825,075 0.13 0.13
Sun Hung Kai Properties
LtdFinancials 501,188,635 71,576,903 0.33 0.33
Sun Hung Kai & Co Ltd Financials 3,677,245 525,163 0.06 0.06
Superb Summit
International Timber Co LtdConsumer Goods 25,477,952 3,638,616 2.62 2.62
Swire Pacific Ltd Industrials 198,756,288 28,385,240 0.11 0.28
Symphony Holdings Ltd Consumer Goods 190,416 27,194 0.05 0.05
TAI Cheung Holdings Financials 3,351,073 478,581 0.21 0.21
TCC International Holdings
Ltd Industrials 2,136,137 305,071 0.1 0.1
TCL Communication
Technology Holdings LtdTechnology 846,573 120,903 0.19 0.19
TCL Multimedia
Technology Holdings LtdConsumer Goods 933,440 133,309 0.08 0.08
Techtronic Industries Co Consumer Goods 9,937,071 1,419,156 0.48 0.48
Industry/Sector Market valueNOK
Market valueUSD Voting Ownership
GOVERNMENT PENSION FUND GLOBAL HOLDINGS 2008
Equities Country association according to FTSE (the benchmark provider for equities). If a company is not in thebenchmark, the country of incorporation and country of listing is used. For remaining securities, a further assessment ismade. Country is defined as a sovereign state currently member of the United Nations. Exceptions are Hong Kong andTaiwan. The country association methodology was updated as of 2014.
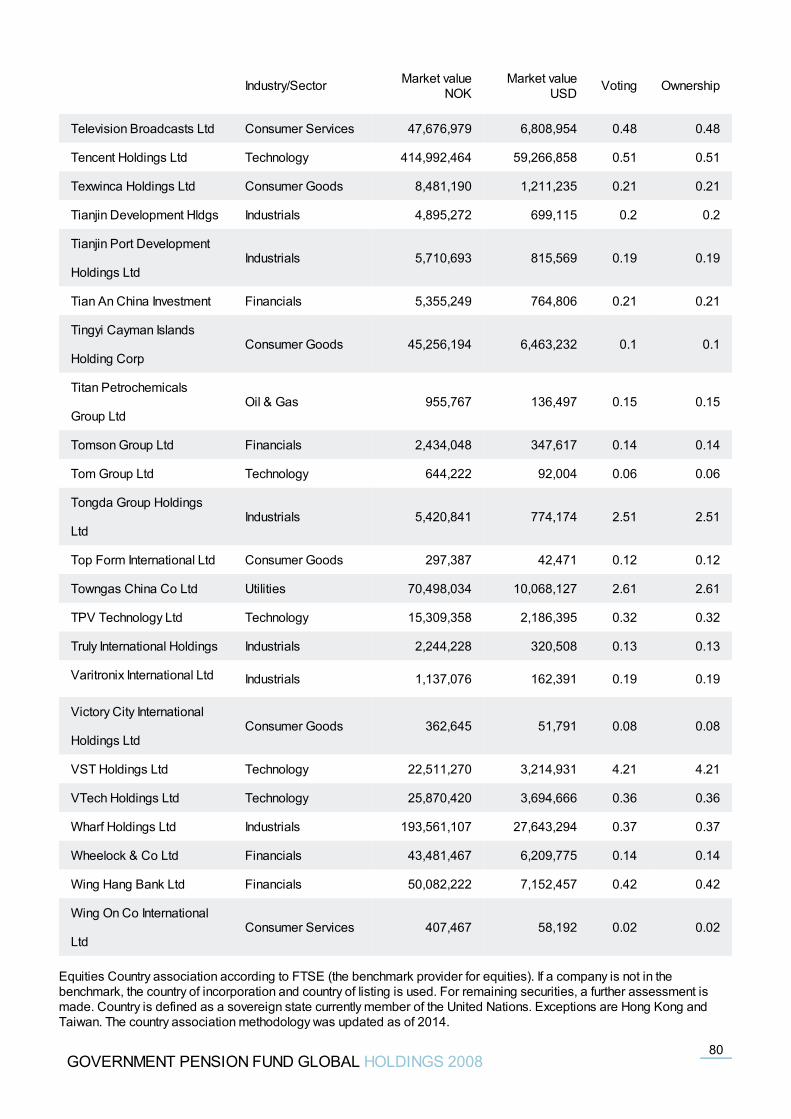
Television Broadcasts Ltd Consumer Services 47,676,979 6,808,954 0.48 0.48
Tencent Holdings Ltd Technology 414,992,464 59,266,858 0.51 0.51
Texwinca Holdings Ltd Consumer Goods 8,481,190 1,211,235 0.21 0.21
Tianjin Development Hldgs Industrials 4,895,272 699,115 0.2 0.2
Tianjin Port Development
Holdings LtdIndustrials 5,710,693 815,569 0.19 0.19
Tian An China Investment Financials 5,355,249 764,806 0.21 0.21
Tingyi Cayman Islands
Holding CorpConsumer Goods 45,256,194 6,463,232 0.1 0.1
Titan Petrochemicals
Group LtdOil & Gas 955,767 136,497 0.15 0.15
Tomson Group Ltd Financials 2,434,048 347,617 0.14 0.14
Tom Group Ltd Technology 644,222 92,004 0.06 0.06
Tongda Group Holdings
LtdIndustrials 5,420,841 774,174 2.51 2.51
Top Form International Ltd Consumer Goods 297,387 42,471 0.12 0.12
Towngas China Co Ltd Utilities 70,498,034 10,068,127 2.61 2.61
TPV Technology Ltd Technology 15,309,358 2,186,395 0.32 0.32
Truly International Holdings Industrials 2,244,228 320,508 0.13 0.13
Varitronix International Ltd Industrials 1,137,076 162,391 0.19 0.19
Victory City International
Holdings LtdConsumer Goods 362,645 51,791 0.08 0.08
VST Holdings Ltd Technology 22,511,270 3,214,931 4.21 4.21
VTech Holdings Ltd Technology 25,870,420 3,694,666 0.36 0.36
Wharf Holdings Ltd Industrials 193,561,107 27,643,294 0.37 0.37
Wheelock & Co Ltd Financials 43,481,467 6,209,775 0.14 0.14
Wing Hang Bank Ltd Financials 50,082,222 7,152,457 0.42 0.42
Wing On Co International
LtdConsumer Services 407,467 58,192 0.02 0.02
Industry/Sector Market valueNOK
Market valueUSD Voting Ownership
GOVERNMENT PENSION FUND GLOBAL HOLDINGS 200880
Equities Country association according to FTSE (the benchmark provider for equities). If a company is not in thebenchmark, the country of incorporation and country of listing is used. For remaining securities, a further assessment ismade. Country is defined as a sovereign state currently member of the United Nations. Exceptions are Hong Kong andTaiwan. The country association methodology was updated as of 2014.
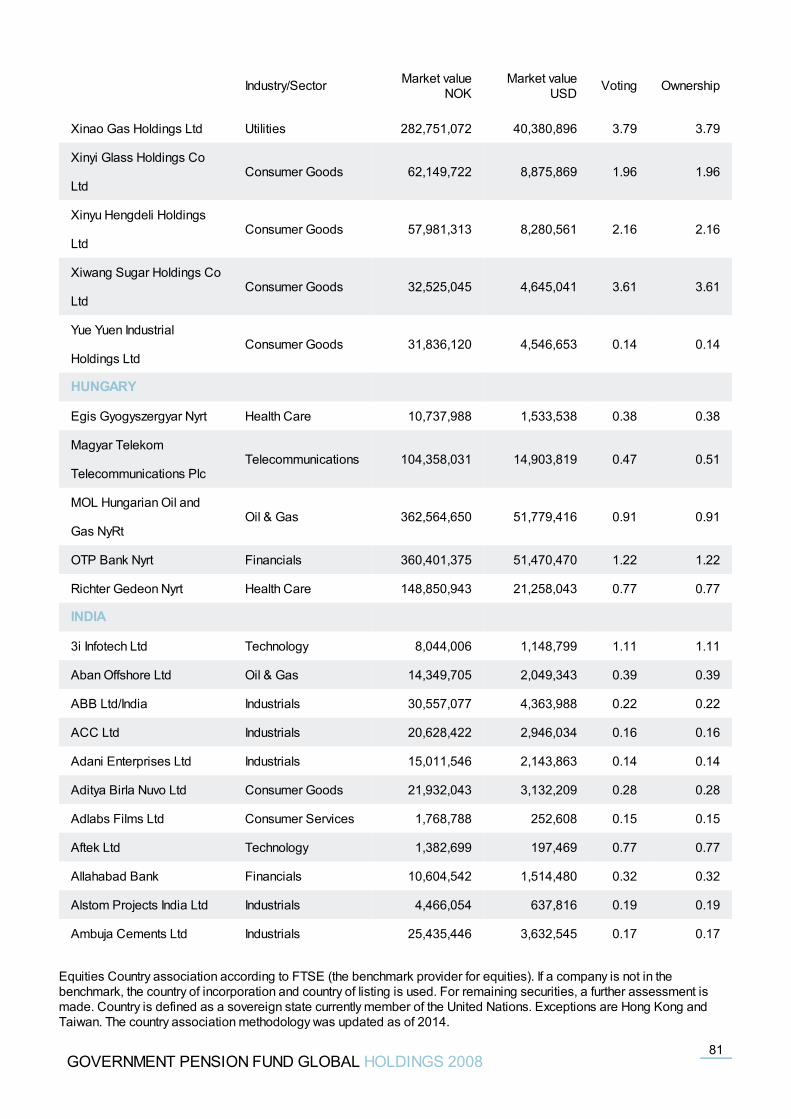
Xinao Gas Holdings Ltd Utilities 282,751,072 40,380,896 3.79 3.79
Xinyi Glass Holdings Co
LtdConsumer Goods 62,149,722 8,875,869 1.96 1.96
Xinyu Hengdeli Holdings
LtdConsumer Goods 57,981,313 8,280,561 2.16 2.16
Xiwang Sugar Holdings Co
LtdConsumer Goods 32,525,045 4,645,041 3.61 3.61
Yue Yuen Industrial
Holdings LtdConsumer Goods 31,836,120 4,546,653 0.14 0.14
HUNGARY
Egis Gyogyszergyar Nyrt Health Care 10,737,988 1,533,538 0.38 0.38
Magyar Telekom
Telecommunications PlcTelecommunications 104,358,031 14,903,819 0.47 0.51
MOL Hungarian Oil and
Gas NyRtOil & Gas 362,564,650 51,779,416 0.91 0.91
OTP Bank Nyrt Financials 360,401,375 51,470,470 1.22 1.22
Richter Gedeon Nyrt Health Care 148,850,943 21,258,043 0.77 0.77
INDIA
3i Infotech Ltd Technology 8,044,006 1,148,799 1.11 1.11
Aban Offshore Ltd Oil & Gas 14,349,705 2,049,343 0.39 0.39
ABB Ltd/India Industrials 30,557,077 4,363,988 0.22 0.22
ACC Ltd Industrials 20,628,422 2,946,034 0.16 0.16
Adani Enterprises Ltd Industrials 15,011,546 2,143,863 0.14 0.14
Aditya Birla Nuvo Ltd Consumer Goods 21,932,043 3,132,209 0.28 0.28
Adlabs Films Ltd Consumer Services 1,768,788 252,608 0.15 0.15
Aftek Ltd Technology 1,382,699 197,469 0.77 0.77
Allahabad Bank Financials 10,604,542 1,514,480 0.32 0.32
Alstom Projects India Ltd Industrials 4,466,054 637,816 0.19 0.19
Ambuja Cements Ltd Industrials 25,435,446 3,632,545 0.17 0.17
Industry/Sector Market valueNOK
Market valueUSD Voting Ownership
GOVERNMENT PENSION FUND GLOBAL HOLDINGS 200881
Equities Country association according to FTSE (the benchmark provider for equities). If a company is not in thebenchmark, the country of incorporation and country of listing is used. For remaining securities, a further assessment ismade. Country is defined as a sovereign state currently member of the United Nations. Exceptions are Hong Kong andTaiwan. The country association methodology was updated as of 2014.
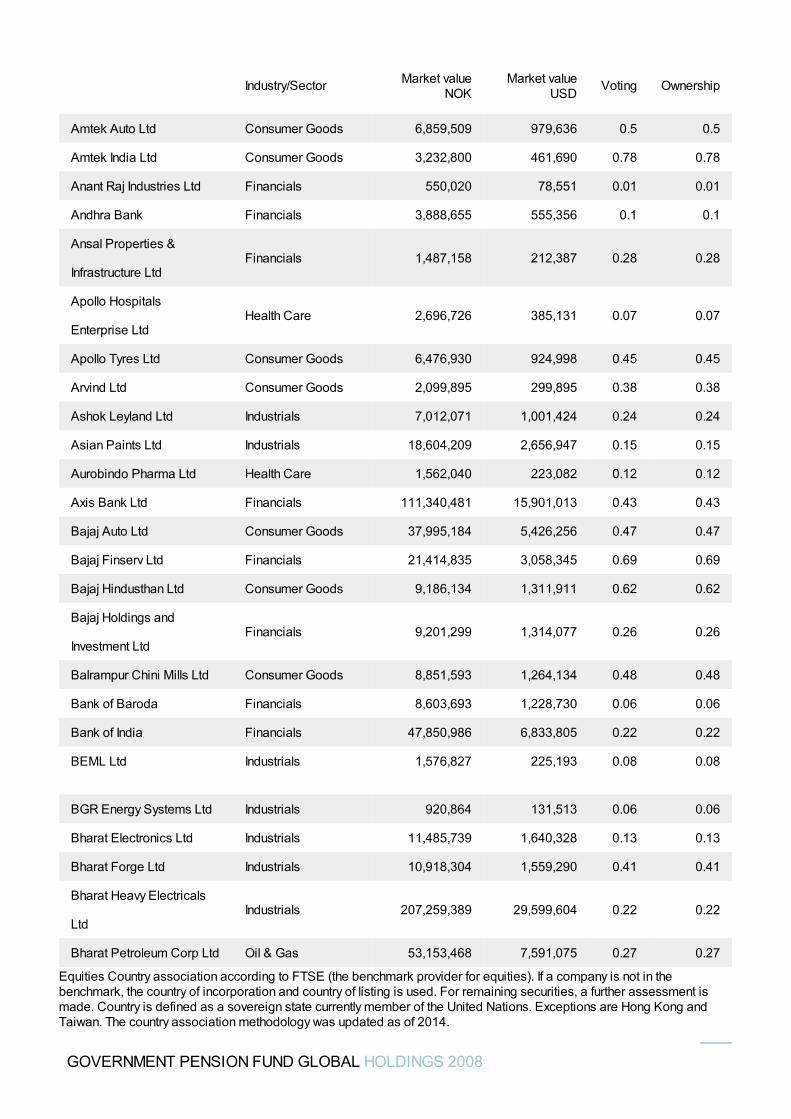
Amtek Auto Ltd Consumer Goods 6,859,509 979,636 0.5 0.5
Amtek India Ltd Consumer Goods 3,232,800 461,690 0.78 0.78
Anant Raj Industries Ltd Financials 550,020 78,551 0.01 0.01
Andhra Bank Financials 3,888,655 555,356 0.1 0.1
Ansal Properties &
Infrastructure LtdFinancials 1,487,158 212,387 0.28 0.28
Apollo Hospitals
Enterprise LtdHealth Care 2,696,726 385,131 0.07 0.07
Apollo Tyres Ltd Consumer Goods 6,476,930 924,998 0.45 0.45
Arvind Ltd Consumer Goods 2,099,895 299,895 0.38 0.38
Ashok Leyland Ltd Industrials 7,012,071 1,001,424 0.24 0.24
Asian Paints Ltd Industrials 18,604,209 2,656,947 0.15 0.15
Aurobindo Pharma Ltd Health Care 1,562,040 223,082 0.12 0.12
Axis Bank Ltd Financials 111,340,481 15,901,013 0.43 0.43
Bajaj Auto Ltd Consumer Goods 37,995,184 5,426,256 0.47 0.47
Bajaj Finserv Ltd Financials 21,414,835 3,058,345 0.69 0.69
Bajaj Hindusthan Ltd Consumer Goods 9,186,134 1,311,911 0.62 0.62
Bajaj Holdings and
Investment LtdFinancials 9,201,299 1,314,077 0.26 0.26
Balrampur Chini Mills Ltd Consumer Goods 8,851,593 1,264,134 0.48 0.48
Bank of Baroda Financials 8,603,693 1,228,730 0.06 0.06
Bank of India Financials 47,850,986 6,833,805 0.22 0.22
BEML Ltd Industrials 1,576,827 225,193 0.08 0.08
BGR Energy Systems Ltd Industrials 920,864 131,513 0.06 0.06
Bharat Electronics Ltd Industrials 11,485,739 1,640,328 0.13 0.13
Bharat Forge Ltd Industrials 10,918,304 1,559,290 0.41 0.41
Bharat Heavy Electricals
LtdIndustrials 207,259,389 29,599,604 0.22 0.22
Bharat Petroleum Corp Ltd Oil & Gas 53,153,468 7,591,075 0.27 0.27
Industry/Sector Market valueNOK
Market valueUSD Voting Ownership
GOVERNMENT PENSION FUND GLOBAL HOLDINGS 2008
Equities Country association according to FTSE (the benchmark provider for equities). If a company is not in thebenchmark, the country of incorporation and country of listing is used. For remaining securities, a further assessment ismade. Country is defined as a sovereign state currently member of the United Nations. Exceptions are Hong Kong andTaiwan. The country association methodology was updated as of 2014.
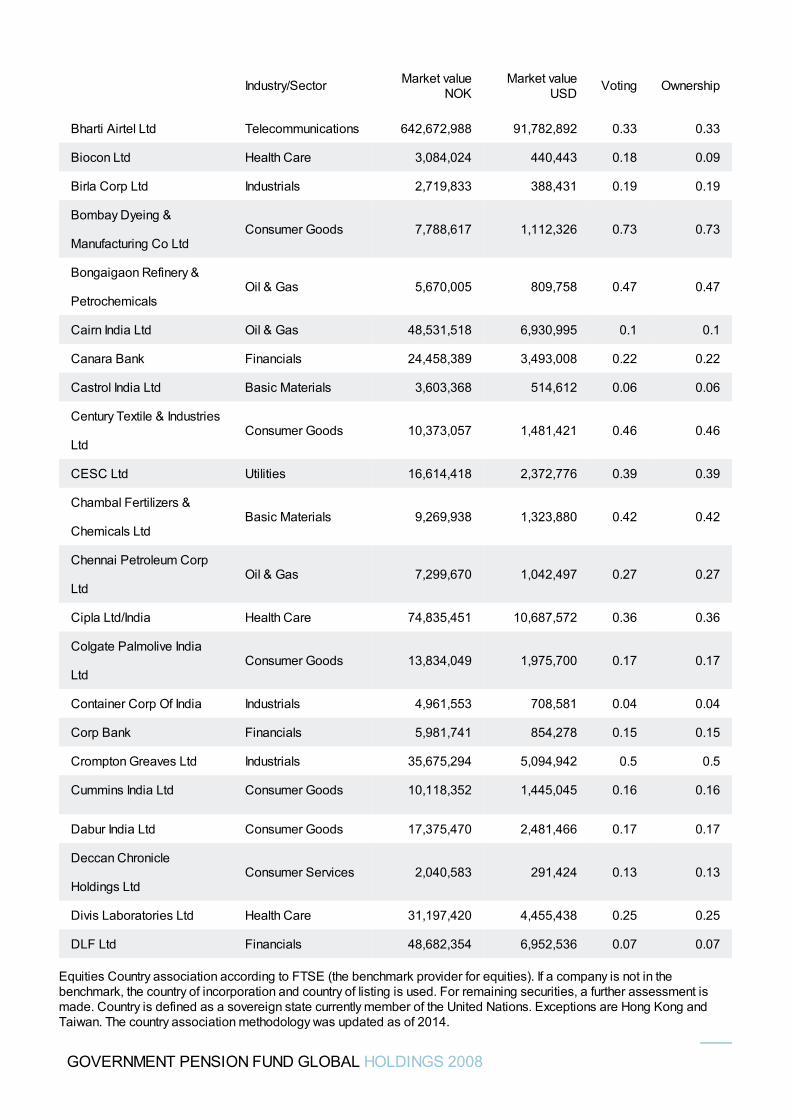
Bharti Airtel Ltd Telecommunications 642,672,988 91,782,892 0.33 0.33
Biocon Ltd Health Care 3,084,024 440,443 0.18 0.09
Birla Corp Ltd Industrials 2,719,833 388,431 0.19 0.19
Bombay Dyeing &
Manufacturing Co LtdConsumer Goods 7,788,617 1,112,326 0.73 0.73
Bongaigaon Refinery &
PetrochemicalsOil & Gas 5,670,005 809,758 0.47 0.47
Cairn India Ltd Oil & Gas 48,531,518 6,930,995 0.1 0.1
Canara Bank Financials 24,458,389 3,493,008 0.22 0.22
Castrol India Ltd Basic Materials 3,603,368 514,612 0.06 0.06
Century Textile & Industries
LtdConsumer Goods 10,373,057 1,481,421 0.46 0.46
CESC Ltd Utilities 16,614,418 2,372,776 0.39 0.39
Chambal Fertilizers &
Chemicals LtdBasic Materials 9,269,938 1,323,880 0.42 0.42
Chennai Petroleum Corp
LtdOil & Gas 7,299,670 1,042,497 0.27 0.27
Cipla Ltd/India Health Care 74,835,451 10,687,572 0.36 0.36
Colgate Palmolive India
LtdConsumer Goods 13,834,049 1,975,700 0.17 0.17
Container Corp Of India Industrials 4,961,553 708,581 0.04 0.04
Corp Bank Financials 5,981,741 854,278 0.15 0.15
Crompton Greaves Ltd Industrials 35,675,294 5,094,942 0.5 0.5
Cummins India Ltd Consumer Goods 10,118,352 1,445,045 0.16 0.16
Dabur India Ltd Consumer Goods 17,375,470 2,481,466 0.17 0.17
Deccan Chronicle
Holdings LtdConsumer Services 2,040,583 291,424 0.13 0.13
Divis Laboratories Ltd Health Care 31,197,420 4,455,438 0.25 0.25
DLF Ltd Financials 48,682,354 6,952,536 0.07 0.07
Industry/Sector Market valueNOK
Market valueUSD Voting Ownership
GOVERNMENT PENSION FUND GLOBAL HOLDINGS 2008
Equities Country association according to FTSE (the benchmark provider for equities). If a company is not in thebenchmark, the country of incorporation and country of listing is used. For remaining securities, a further assessment ismade. Country is defined as a sovereign state currently member of the United Nations. Exceptions are Hong Kong andTaiwan. The country association methodology was updated as of 2014.
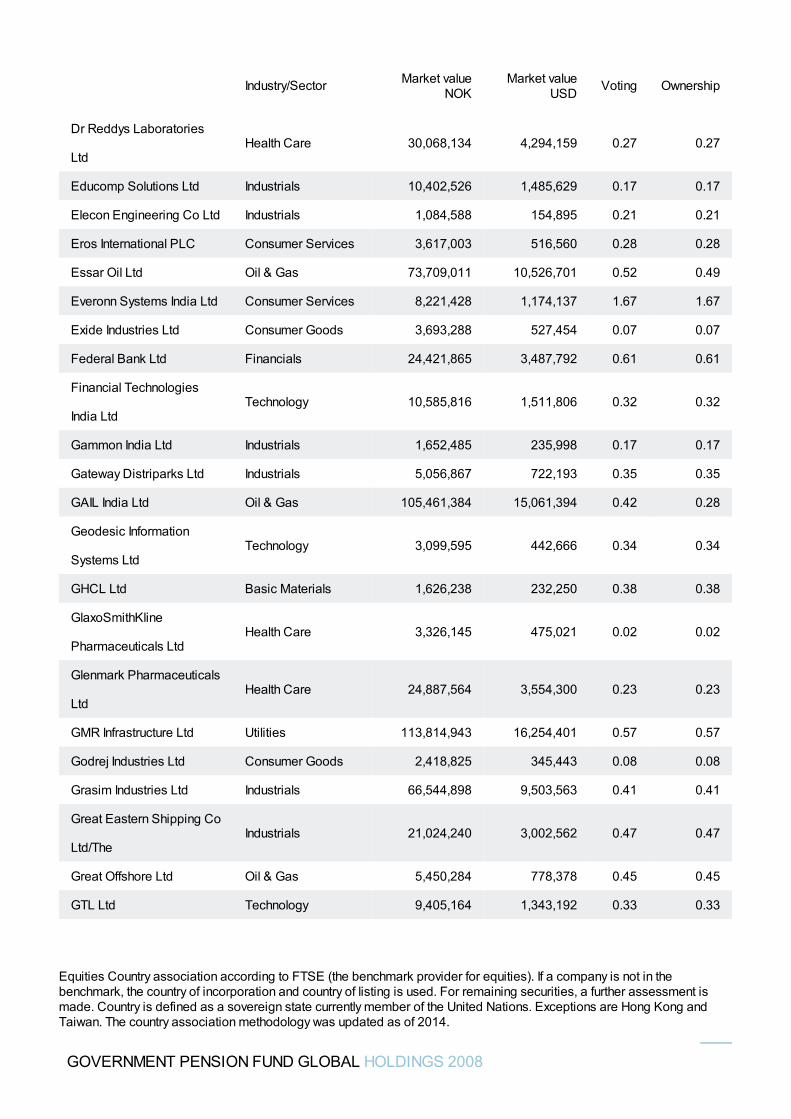
Dr Reddys Laboratories
LtdHealth Care 30,068,134 4,294,159 0.27 0.27
Educomp Solutions Ltd Industrials 10,402,526 1,485,629 0.17 0.17
Elecon Engineering Co Ltd Industrials 1,084,588 154,895 0.21 0.21
Eros International PLC Consumer Services 3,617,003 516,560 0.28 0.28
Essar Oil Ltd Oil & Gas 73,709,011 10,526,701 0.52 0.49
Everonn Systems India Ltd Consumer Services 8,221,428 1,174,137 1.67 1.67
Exide Industries Ltd Consumer Goods 3,693,288 527,454 0.07 0.07
Federal Bank Ltd Financials 24,421,865 3,487,792 0.61 0.61
Financial Technologies
India LtdTechnology 10,585,816 1,511,806 0.32 0.32
Gammon India Ltd Industrials 1,652,485 235,998 0.17 0.17
Gateway Distriparks Ltd Industrials 5,056,867 722,193 0.35 0.35
GAIL India Ltd Oil & Gas 105,461,384 15,061,394 0.42 0.28
Geodesic Information
Systems LtdTechnology 3,099,595 442,666 0.34 0.34
GHCL Ltd Basic Materials 1,626,238 232,250 0.38 0.38
GlaxoSmithKline
Pharmaceuticals LtdHealth Care 3,326,145 475,021 0.02 0.02
Glenmark Pharmaceuticals
LtdHealth Care 24,887,564 3,554,300 0.23 0.23
GMR Infrastructure Ltd Utilities 113,814,943 16,254,401 0.57 0.57
Godrej Industries Ltd Consumer Goods 2,418,825 345,443 0.08 0.08
Grasim Industries Ltd Industrials 66,544,898 9,503,563 0.41 0.41
Great Eastern Shipping Co
Ltd/TheIndustrials 21,024,240 3,002,562 0.47 0.47
Great Offshore Ltd Oil & Gas 5,450,284 778,378 0.45 0.45
GTL Ltd Technology 9,405,164 1,343,192 0.33 0.33
Industry/Sector Market valueNOK
Market valueUSD Voting Ownership
GOVERNMENT PENSION FUND GLOBAL HOLDINGS 2008
Equities Country association according to FTSE (the benchmark provider for equities). If a company is not in thebenchmark, the country of incorporation and country of listing is used. For remaining securities, a further assessment ismade. Country is defined as a sovereign state currently member of the United Nations. Exceptions are Hong Kong andTaiwan. The country association methodology was updated as of 2014.
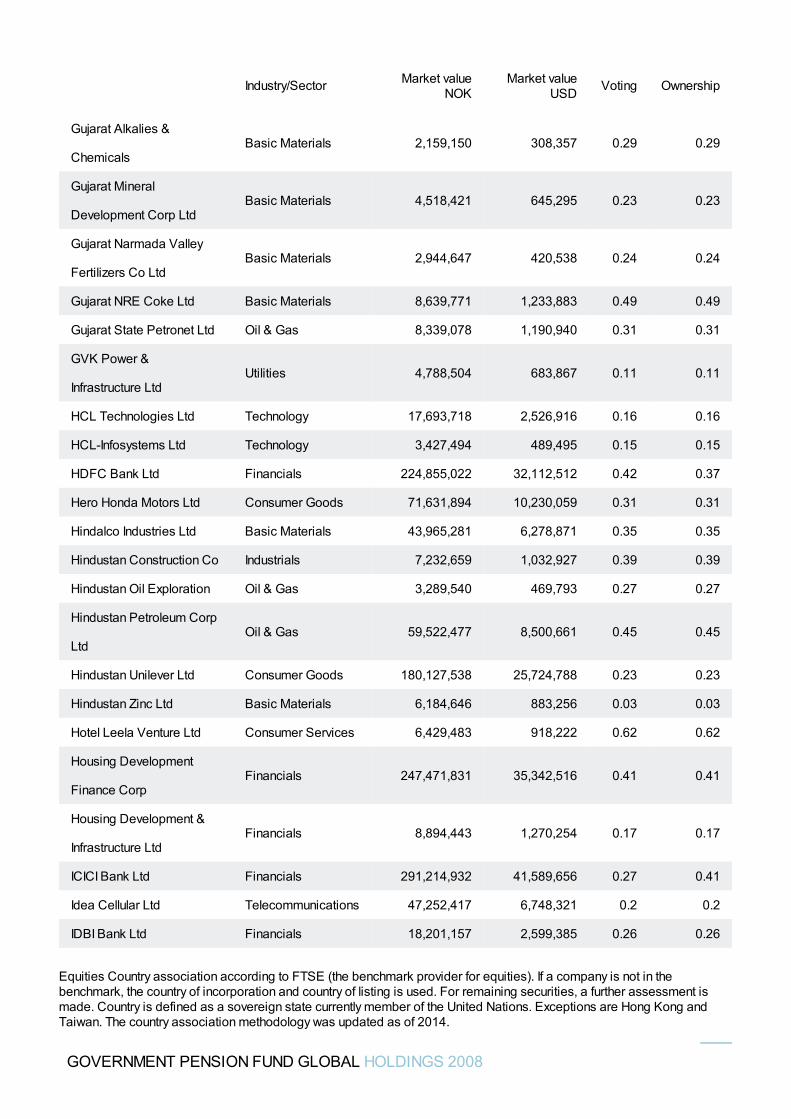
Gujarat Alkalies &
ChemicalsBasic Materials 2,159,150 308,357 0.29 0.29
Gujarat Mineral
Development Corp LtdBasic Materials 4,518,421 645,295 0.23 0.23
Gujarat Narmada Valley
Fertilizers Co LtdBasic Materials 2,944,647 420,538 0.24 0.24
Gujarat NRE Coke Ltd Basic Materials 8,639,771 1,233,883 0.49 0.49
Gujarat State Petronet Ltd Oil & Gas 8,339,078 1,190,940 0.31 0.31
GVK Power &
Infrastructure LtdUtilities 4,788,504 683,867 0.11 0.11
HCL Technologies Ltd Technology 17,693,718 2,526,916 0.16 0.16
HCL-Infosystems Ltd Technology 3,427,494 489,495 0.15 0.15
HDFC Bank Ltd Financials 224,855,022 32,112,512 0.42 0.37
Hero Honda Motors Ltd Consumer Goods 71,631,894 10,230,059 0.31 0.31
Hindalco Industries Ltd Basic Materials 43,965,281 6,278,871 0.35 0.35
Hindustan Construction Co Industrials 7,232,659 1,032,927 0.39 0.39
Hindustan Oil Exploration Oil & Gas 3,289,540 469,793 0.27 0.27
Hindustan Petroleum Corp
LtdOil & Gas 59,522,477 8,500,661 0.45 0.45
Hindustan Unilever Ltd Consumer Goods 180,127,538 25,724,788 0.23 0.23
Hindustan Zinc Ltd Basic Materials 6,184,646 883,256 0.03 0.03
Hotel Leela Venture Ltd Consumer Services 6,429,483 918,222 0.62 0.62
Housing Development
Finance CorpFinancials 247,471,831 35,342,516 0.41 0.41
Housing Development &
Infrastructure LtdFinancials 8,894,443 1,270,254 0.17 0.17
ICICI Bank Ltd Financials 291,214,932 41,589,656 0.27 0.41
Idea Cellular Ltd Telecommunications 47,252,417 6,748,321 0.2 0.2
IDBI Bank Ltd Financials 18,201,157 2,599,385 0.26 0.26
Industry/Sector Market valueNOK
Market valueUSD Voting Ownership
GOVERNMENT PENSION FUND GLOBAL HOLDINGS 2008
Equities Country association according to FTSE (the benchmark provider for equities). If a company is not in thebenchmark, the country of incorporation and country of listing is used. For remaining securities, a further assessment ismade. Country is defined as a sovereign state currently member of the United Nations. Exceptions are Hong Kong andTaiwan. The country association methodology was updated as of 2014.
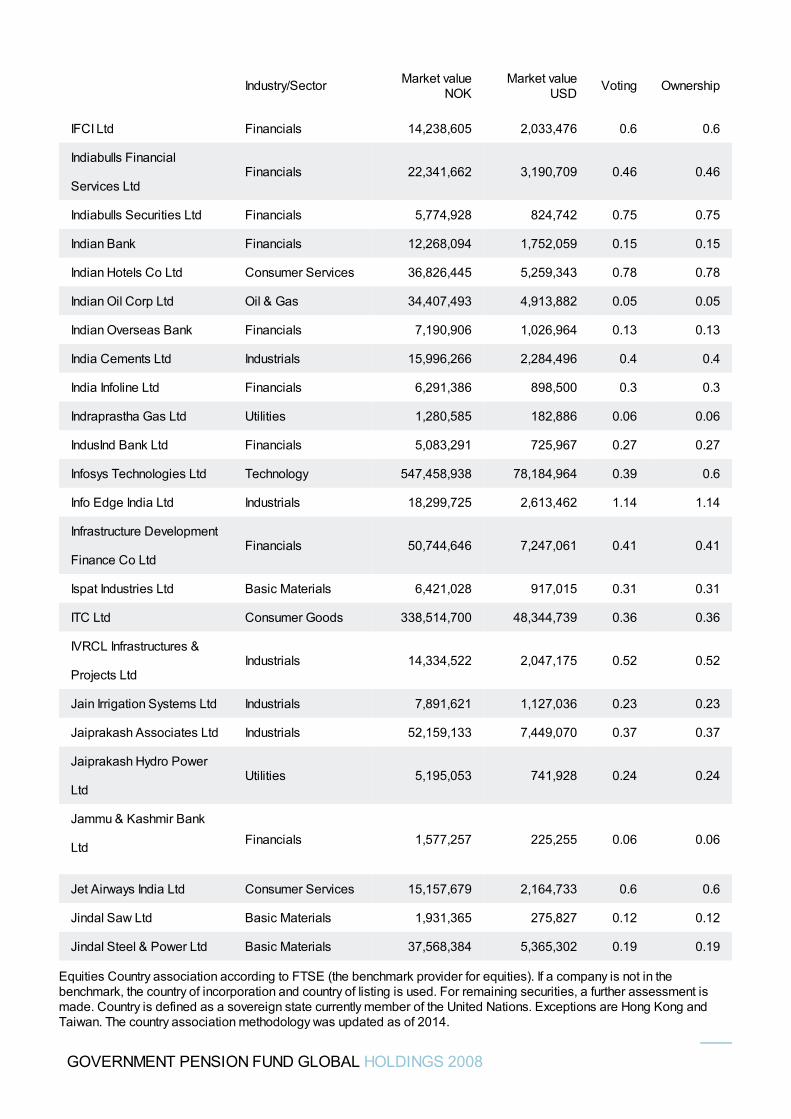
IFCI Ltd Financials 14,238,605 2,033,476 0.6 0.6
Indiabulls Financial
Services LtdFinancials 22,341,662 3,190,709 0.46 0.46
Indiabulls Securities Ltd Financials 5,774,928 824,742 0.75 0.75
Indian Bank Financials 12,268,094 1,752,059 0.15 0.15
Indian Hotels Co Ltd Consumer Services 36,826,445 5,259,343 0.78 0.78
Indian Oil Corp Ltd Oil & Gas 34,407,493 4,913,882 0.05 0.05
Indian Overseas Bank Financials 7,190,906 1,026,964 0.13 0.13
India Cements Ltd Industrials 15,996,266 2,284,496 0.4 0.4
India Infoline Ltd Financials 6,291,386 898,500 0.3 0.3
Indraprastha Gas Ltd Utilities 1,280,585 182,886 0.06 0.06
IndusInd Bank Ltd Financials 5,083,291 725,967 0.27 0.27
Infosys Technologies Ltd Technology 547,458,938 78,184,964 0.39 0.6
Info Edge India Ltd Industrials 18,299,725 2,613,462 1.14 1.14
Infrastructure Development
Finance Co LtdFinancials 50,744,646 7,247,061 0.41 0.41
Ispat Industries Ltd Basic Materials 6,421,028 917,015 0.31 0.31
ITC Ltd Consumer Goods 338,514,700 48,344,739 0.36 0.36
IVRCL Infrastructures &
Projects LtdIndustrials 14,334,522 2,047,175 0.52 0.52
Jain Irrigation Systems Ltd Industrials 7,891,621 1,127,036 0.23 0.23
Jaiprakash Associates Ltd Industrials 52,159,133 7,449,070 0.37 0.37
Jaiprakash Hydro Power
LtdUtilities 5,195,053 741,928 0.24 0.24
Jammu & Kashmir Bank
Ltd Financials 1,577,257 225,255 0.06 0.06
Jet Airways India Ltd Consumer Services 15,157,679 2,164,733 0.6 0.6
Jindal Saw Ltd Basic Materials 1,931,365 275,827 0.12 0.12
Jindal Steel & Power Ltd Basic Materials 37,568,384 5,365,302 0.19 0.19
Industry/Sector Market valueNOK
Market valueUSD Voting Ownership
GOVERNMENT PENSION FUND GLOBAL HOLDINGS 2008
Equities Country association according to FTSE (the benchmark provider for equities). If a company is not in thebenchmark, the country of incorporation and country of listing is used. For remaining securities, a further assessment ismade. Country is defined as a sovereign state currently member of the United Nations. Exceptions are Hong Kong andTaiwan. The country association methodology was updated as of 2014.
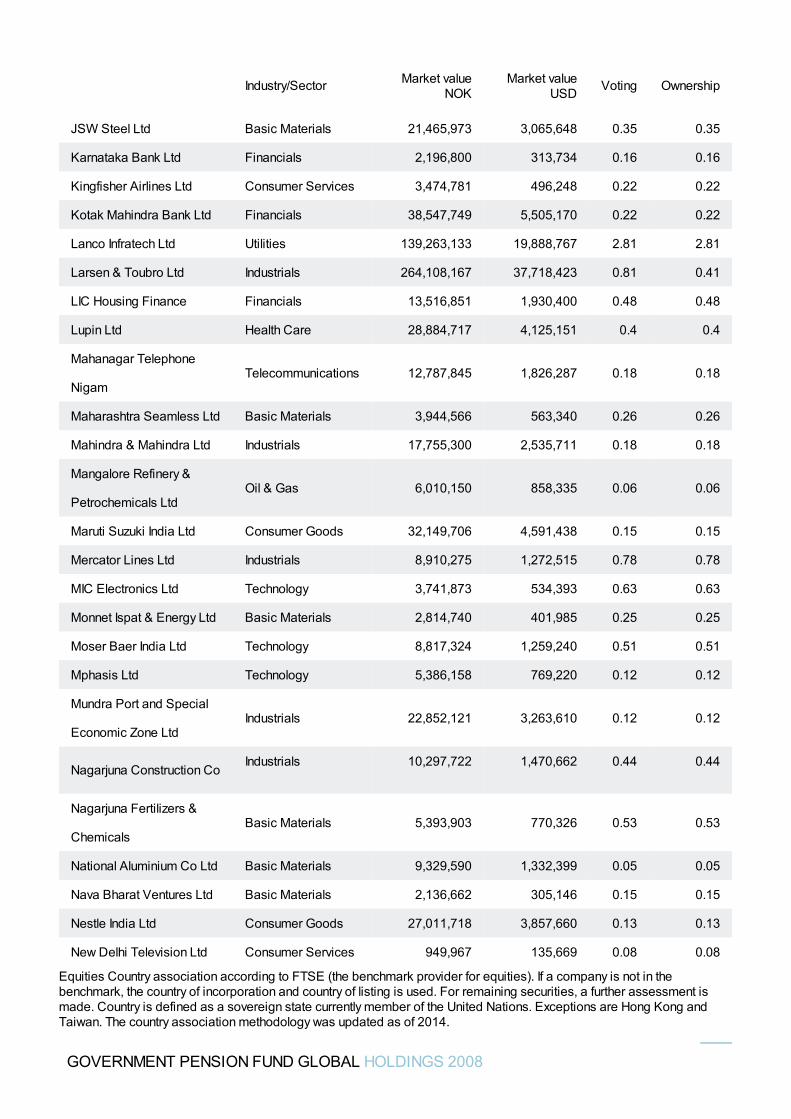
JSW Steel Ltd Basic Materials 21,465,973 3,065,648 0.35 0.35
Karnataka Bank Ltd Financials 2,196,800 313,734 0.16 0.16
Kingfisher Airlines Ltd Consumer Services 3,474,781 496,248 0.22 0.22
Kotak Mahindra Bank Ltd Financials 38,547,749 5,505,170 0.22 0.22
Lanco Infratech Ltd Utilities 139,263,133 19,888,767 2.81 2.81
Larsen & Toubro Ltd Industrials 264,108,167 37,718,423 0.81 0.41
LIC Housing Finance Financials 13,516,851 1,930,400 0.48 0.48
Lupin Ltd Health Care 28,884,717 4,125,151 0.4 0.4
Mahanagar Telephone
NigamTelecommunications 12,787,845 1,826,287 0.18 0.18
Maharashtra Seamless Ltd Basic Materials 3,944,566 563,340 0.26 0.26
Mahindra & Mahindra Ltd Industrials 17,755,300 2,535,711 0.18 0.18
Mangalore Refinery &
Petrochemicals LtdOil & Gas 6,010,150 858,335 0.06 0.06
Maruti Suzuki India Ltd Consumer Goods 32,149,706 4,591,438 0.15 0.15
Mercator Lines Ltd Industrials 8,910,275 1,272,515 0.78 0.78
MIC Electronics Ltd Technology 3,741,873 534,393 0.63 0.63
Monnet Ispat & Energy Ltd Basic Materials 2,814,740 401,985 0.25 0.25
Moser Baer India Ltd Technology 8,817,324 1,259,240 0.51 0.51
Mphasis Ltd Technology 5,386,158 769,220 0.12 0.12
Mundra Port and Special
Economic Zone LtdIndustrials 22,852,121 3,263,610 0.12 0.12
Nagarjuna Construction CoIndustrials 10,297,722 1,470,662 0.44 0.44
Nagarjuna Fertilizers &
ChemicalsBasic Materials 5,393,903 770,326 0.53 0.53
National Aluminium Co Ltd Basic Materials 9,329,590 1,332,399 0.05 0.05
Nava Bharat Ventures Ltd Basic Materials 2,136,662 305,146 0.15 0.15
Nestle India Ltd Consumer Goods 27,011,718 3,857,660 0.13 0.13
New Delhi Television Ltd Consumer Services 949,967 135,669 0.08 0.08
Industry/Sector Market valueNOK
Market valueUSD Voting Ownership
GOVERNMENT PENSION FUND GLOBAL HOLDINGS 2008
Equities Country association according to FTSE (the benchmark provider for equities). If a company is not in thebenchmark, the country of incorporation and country of listing is used. For remaining securities, a further assessment ismade. Country is defined as a sovereign state currently member of the United Nations. Exceptions are Hong Kong andTaiwan. The country association methodology was updated as of 2014.
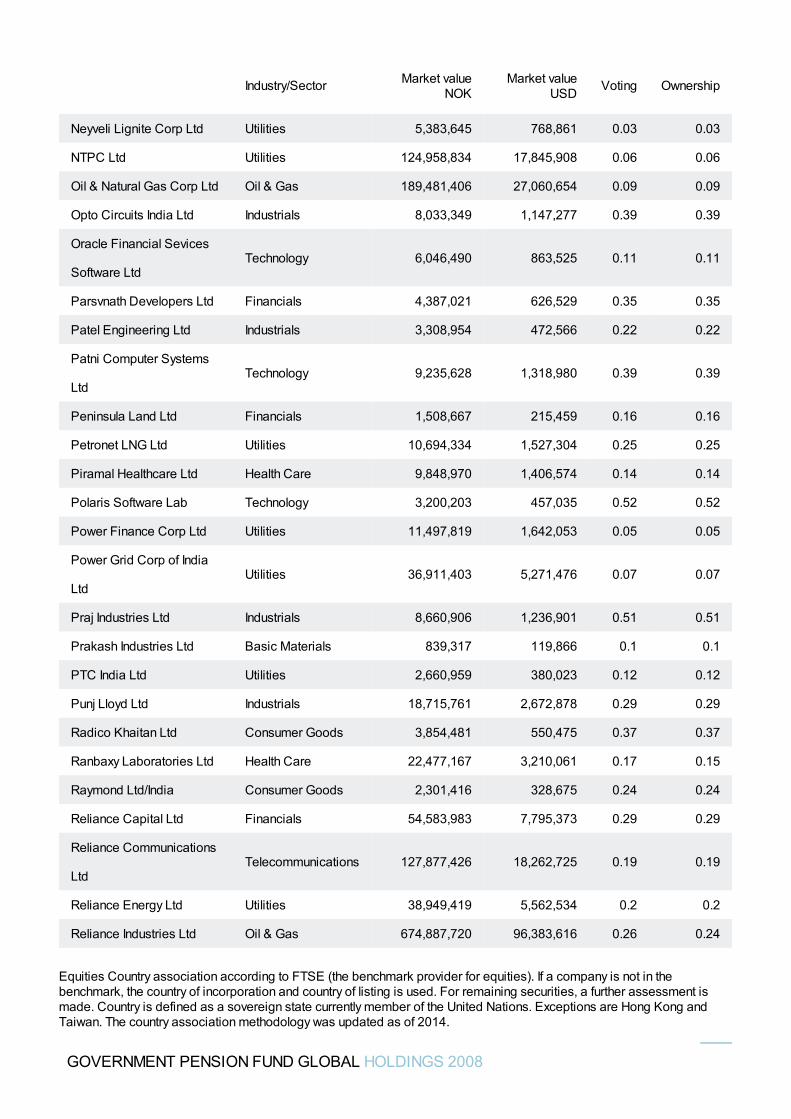
Neyveli Lignite Corp Ltd Utilities 5,383,645 768,861 0.03 0.03
NTPC Ltd Utilities 124,958,834 17,845,908 0.06 0.06
Oil & Natural Gas Corp Ltd Oil & Gas 189,481,406 27,060,654 0.09 0.09
Opto Circuits India Ltd Industrials 8,033,349 1,147,277 0.39 0.39
Oracle Financial Sevices
Software LtdTechnology 6,046,490 863,525 0.11 0.11
Parsvnath Developers Ltd Financials 4,387,021 626,529 0.35 0.35
Patel Engineering Ltd Industrials 3,308,954 472,566 0.22 0.22
Patni Computer Systems
LtdTechnology 9,235,628 1,318,980 0.39 0.39
Peninsula Land Ltd Financials 1,508,667 215,459 0.16 0.16
Petronet LNG Ltd Utilities 10,694,334 1,527,304 0.25 0.25
Piramal Healthcare Ltd Health Care 9,848,970 1,406,574 0.14 0.14
Polaris Software Lab Technology 3,200,203 457,035 0.52 0.52
Power Finance Corp Ltd Utilities 11,497,819 1,642,053 0.05 0.05
Power Grid Corp of India
LtdUtilities 36,911,403 5,271,476 0.07 0.07
Praj Industries Ltd Industrials 8,660,906 1,236,901 0.51 0.51
Prakash Industries Ltd Basic Materials 839,317 119,866 0.1 0.1
PTC India Ltd Utilities 2,660,959 380,023 0.12 0.12
Punj Lloyd Ltd Industrials 18,715,761 2,672,878 0.29 0.29
Radico Khaitan Ltd Consumer Goods 3,854,481 550,475 0.37 0.37
Ranbaxy Laboratories Ltd Health Care 22,477,167 3,210,061 0.17 0.15
Raymond Ltd/India Consumer Goods 2,301,416 328,675 0.24 0.24
Reliance Capital Ltd Financials 54,583,983 7,795,373 0.29 0.29
Reliance Communications
LtdTelecommunications 127,877,426 18,262,725 0.19 0.19
Reliance Energy Ltd Utilities 38,949,419 5,562,534 0.2 0.2
Reliance Industries Ltd Oil & Gas 674,887,720 96,383,616 0.26 0.24
Industry/Sector Market valueNOK
Market valueUSD Voting Ownership
GOVERNMENT PENSION FUND GLOBAL HOLDINGS 2008
Equities Country association according to FTSE (the benchmark provider for equities). If a company is not in thebenchmark, the country of incorporation and country of listing is used. For remaining securities, a further assessment ismade. Country is defined as a sovereign state currently member of the United Nations. Exceptions are Hong Kong andTaiwan. The country association methodology was updated as of 2014.
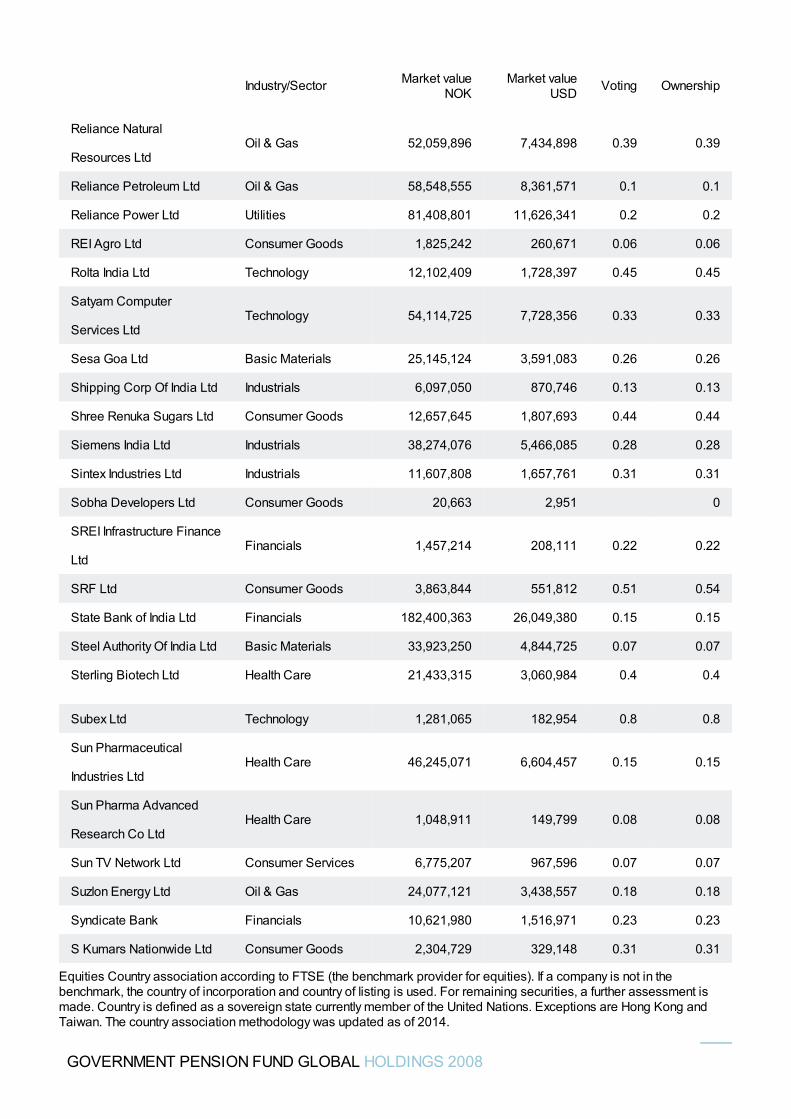
Reliance Natural
Resources LtdOil & Gas 52,059,896 7,434,898 0.39 0.39
Reliance Petroleum Ltd Oil & Gas 58,548,555 8,361,571 0.1 0.1
Reliance Power Ltd Utilities 81,408,801 11,626,341 0.2 0.2
REI Agro Ltd Consumer Goods 1,825,242 260,671 0.06 0.06
Rolta India Ltd Technology 12,102,409 1,728,397 0.45 0.45
Satyam Computer
Services LtdTechnology 54,114,725 7,728,356 0.33 0.33
Sesa Goa Ltd Basic Materials 25,145,124 3,591,083 0.26 0.26
Shipping Corp Of India Ltd Industrials 6,097,050 870,746 0.13 0.13
Shree Renuka Sugars Ltd Consumer Goods 12,657,645 1,807,693 0.44 0.44
Siemens India Ltd Industrials 38,274,076 5,466,085 0.28 0.28
Sintex Industries Ltd Industrials 11,607,808 1,657,761 0.31 0.31
Sobha Developers Ltd Consumer Goods 20,663 2,951 0
SREI Infrastructure Finance
LtdFinancials 1,457,214 208,111 0.22 0.22
SRF Ltd Consumer Goods 3,863,844 551,812 0.51 0.54
State Bank of India Ltd Financials 182,400,363 26,049,380 0.15 0.15
Steel Authority Of India Ltd Basic Materials 33,923,250 4,844,725 0.07 0.07
Sterling Biotech Ltd Health Care 21,433,315 3,060,984 0.4 0.4
Subex Ltd Technology 1,281,065 182,954 0.8 0.8
Sun Pharmaceutical
Industries LtdHealth Care 46,245,071 6,604,457 0.15 0.15
Sun Pharma Advanced
Research Co LtdHealth Care 1,048,911 149,799 0.08 0.08
Sun TV Network Ltd Consumer Services 6,775,207 967,596 0.07 0.07
Suzlon Energy Ltd Oil & Gas 24,077,121 3,438,557 0.18 0.18
Syndicate Bank Financials 10,621,980 1,516,971 0.23 0.23
S Kumars Nationwide Ltd Consumer Goods 2,304,729 329,148 0.31 0.31
Industry/Sector Market valueNOK
Market valueUSD Voting Ownership
GOVERNMENT PENSION FUND GLOBAL HOLDINGS 2008
Equities Country association according to FTSE (the benchmark provider for equities). If a company is not in thebenchmark, the country of incorporation and country of listing is used. For remaining securities, a further assessment ismade. Country is defined as a sovereign state currently member of the United Nations. Exceptions are Hong Kong andTaiwan. The country association methodology was updated as of 2014.
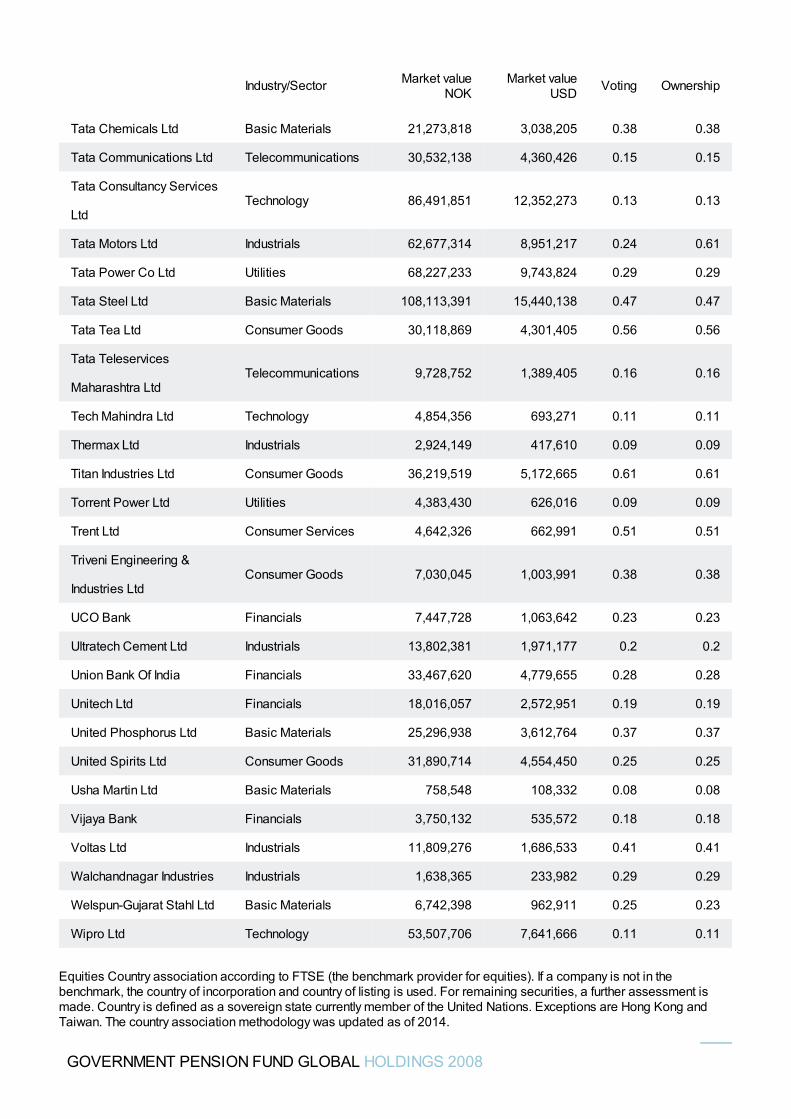
Tata Chemicals Ltd Basic Materials 21,273,818 3,038,205 0.38 0.38
Tata Communications Ltd Telecommunications 30,532,138 4,360,426 0.15 0.15
Tata Consultancy Services
LtdTechnology 86,491,851 12,352,273 0.13 0.13
Tata Motors Ltd Industrials 62,677,314 8,951,217 0.24 0.61
Tata Power Co Ltd Utilities 68,227,233 9,743,824 0.29 0.29
Tata Steel Ltd Basic Materials 108,113,391 15,440,138 0.47 0.47
Tata Tea Ltd Consumer Goods 30,118,869 4,301,405 0.56 0.56
Tata Teleservices
Maharashtra LtdTelecommunications 9,728,752 1,389,405 0.16 0.16
Tech Mahindra Ltd Technology 4,854,356 693,271 0.11 0.11
Thermax Ltd Industrials 2,924,149 417,610 0.09 0.09
Titan Industries Ltd Consumer Goods 36,219,519 5,172,665 0.61 0.61
Torrent Power Ltd Utilities 4,383,430 626,016 0.09 0.09
Trent Ltd Consumer Services 4,642,326 662,991 0.51 0.51
Triveni Engineering &
Industries LtdConsumer Goods 7,030,045 1,003,991 0.38 0.38
UCO Bank Financials 7,447,728 1,063,642 0.23 0.23
Ultratech Cement Ltd Industrials 13,802,381 1,971,177 0.2 0.2
Union Bank Of India Financials 33,467,620 4,779,655 0.28 0.28
Unitech Ltd Financials 18,016,057 2,572,951 0.19 0.19
United Phosphorus Ltd Basic Materials 25,296,938 3,612,764 0.37 0.37
United Spirits Ltd Consumer Goods 31,890,714 4,554,450 0.25 0.25
Usha Martin Ltd Basic Materials 758,548 108,332 0.08 0.08
Vijaya Bank Financials 3,750,132 535,572 0.18 0.18
Voltas Ltd Industrials 11,809,276 1,686,533 0.41 0.41
Walchandnagar Industries Industrials 1,638,365 233,982 0.29 0.29
Welspun-Gujarat Stahl Ltd Basic Materials 6,742,398 962,911 0.25 0.23
Wipro Ltd Technology 53,507,706 7,641,666 0.11 0.11
Industry/Sector Market valueNOK
Market valueUSD Voting Ownership
GOVERNMENT PENSION FUND GLOBAL HOLDINGS 2008
Equities Country association according to FTSE (the benchmark provider for equities). If a company is not in thebenchmark, the country of incorporation and country of listing is used. For remaining securities, a further assessment ismade. Country is defined as a sovereign state currently member of the United Nations. Exceptions are Hong Kong andTaiwan. The country association methodology was updated as of 2014.
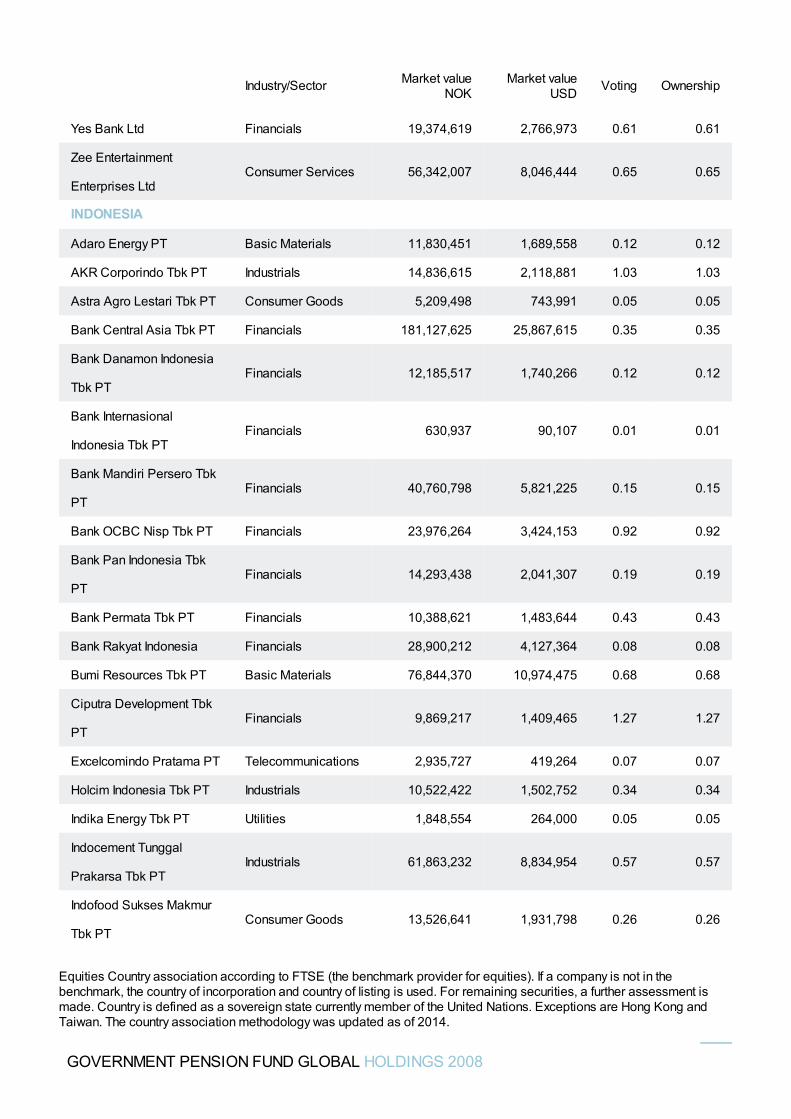
Yes Bank Ltd Financials 19,374,619 2,766,973 0.61 0.61
Zee Entertainment
Enterprises LtdConsumer Services 56,342,007 8,046,444 0.65 0.65
INDONESIA
Adaro Energy PT Basic Materials 11,830,451 1,689,558 0.12 0.12
AKR Corporindo Tbk PT Industrials 14,836,615 2,118,881 1.03 1.03
Astra Agro Lestari Tbk PT Consumer Goods 5,209,498 743,991 0.05 0.05
Bank Central Asia Tbk PT Financials 181,127,625 25,867,615 0.35 0.35
Bank Danamon Indonesia
Tbk PTFinancials 12,185,517 1,740,266 0.12 0.12
Bank Internasional
Indonesia Tbk PTFinancials 630,937 90,107 0.01 0.01
Bank Mandiri Persero Tbk
PTFinancials 40,760,798 5,821,225 0.15 0.15
Bank OCBC Nisp Tbk PT Financials 23,976,264 3,424,153 0.92 0.92
Bank Pan Indonesia Tbk
PTFinancials 14,293,438 2,041,307 0.19 0.19
Bank Permata Tbk PT Financials 10,388,621 1,483,644 0.43 0.43
Bank Rakyat Indonesia Financials 28,900,212 4,127,364 0.08 0.08
Bumi Resources Tbk PT Basic Materials 76,844,370 10,974,475 0.68 0.68
Ciputra Development Tbk
PTFinancials 9,869,217 1,409,465 1.27 1.27
Excelcomindo Pratama PT Telecommunications 2,935,727 419,264 0.07 0.07
Holcim Indonesia Tbk PT Industrials 10,522,422 1,502,752 0.34 0.34
Indika Energy Tbk PT Utilities 1,848,554 264,000 0.05 0.05
Indocement Tunggal
Prakarsa Tbk PTIndustrials 61,863,232 8,834,954 0.57 0.57
Indofood Sukses Makmur
Tbk PTConsumer Goods 13,526,641 1,931,798 0.26 0.26
Industry/Sector Market valueNOK
Market valueUSD Voting Ownership
GOVERNMENT PENSION FUND GLOBAL HOLDINGS 2008
Equities Country association according to FTSE (the benchmark provider for equities). If a company is not in thebenchmark, the country of incorporation and country of listing is used. For remaining securities, a further assessment ismade. Country is defined as a sovereign state currently member of the United Nations. Exceptions are Hong Kong andTaiwan. The country association methodology was updated as of 2014.
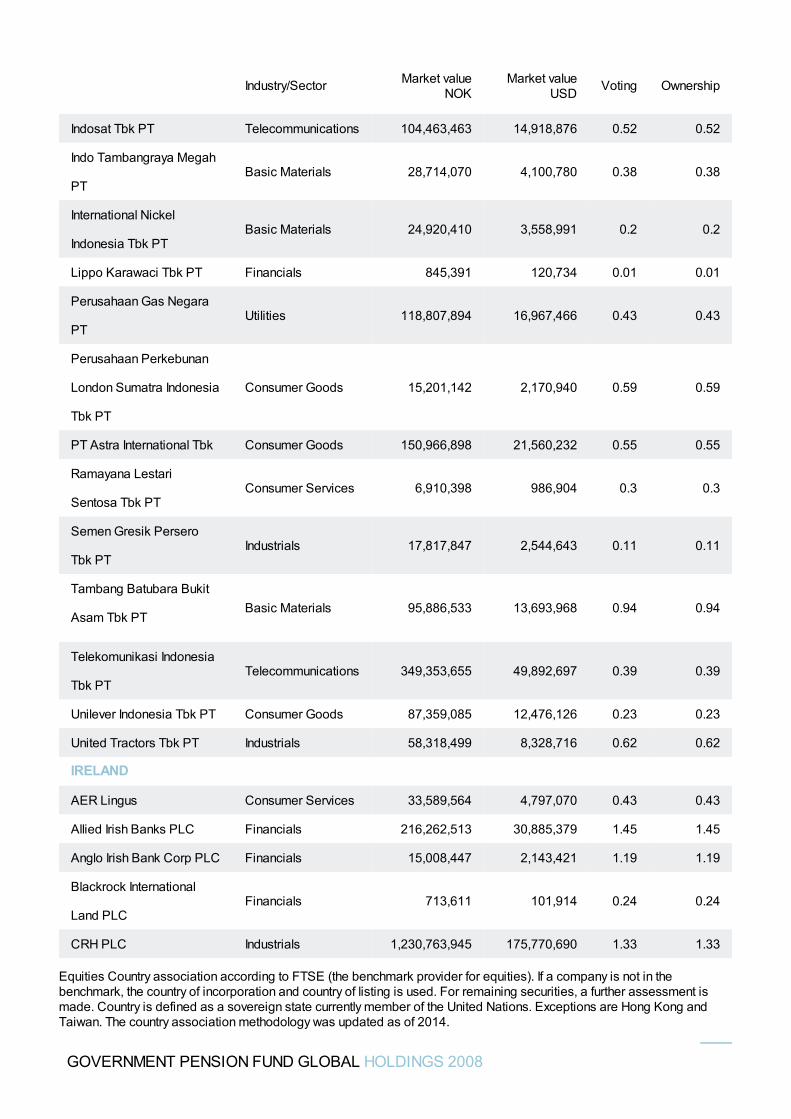
Indosat Tbk PT Telecommunications 104,463,463 14,918,876 0.52 0.52
Indo Tambangraya Megah
PTBasic Materials 28,714,070 4,100,780 0.38 0.38
International Nickel
Indonesia Tbk PTBasic Materials 24,920,410 3,558,991 0.2 0.2
Lippo Karawaci Tbk PT Financials 845,391 120,734 0.01 0.01
Perusahaan Gas Negara
PTUtilities 118,807,894 16,967,466 0.43 0.43
Perusahaan Perkebunan
London Sumatra Indonesia
Tbk PT
Consumer Goods 15,201,142 2,170,940 0.59 0.59
PT Astra International Tbk Consumer Goods 150,966,898 21,560,232 0.55 0.55
Ramayana Lestari
Sentosa Tbk PTConsumer Services 6,910,398 986,904 0.3 0.3
Semen Gresik Persero
Tbk PTIndustrials 17,817,847 2,544,643 0.11 0.11
Tambang Batubara Bukit
Asam Tbk PTBasic Materials 95,886,533 13,693,968 0.94 0.94
Telekomunikasi Indonesia
Tbk PTTelecommunications 349,353,655 49,892,697 0.39 0.39
Unilever Indonesia Tbk PT Consumer Goods 87,359,085 12,476,126 0.23 0.23
United Tractors Tbk PT Industrials 58,318,499 8,328,716 0.62 0.62
IRELAND
AER Lingus Consumer Services 33,589,564 4,797,070 0.43 0.43
Allied Irish Banks PLC Financials 216,262,513 30,885,379 1.45 1.45
Anglo Irish Bank Corp PLC Financials 15,008,447 2,143,421 1.19 1.19
Blackrock International
Land PLCFinancials 713,611 101,914 0.24 0.24
CRH PLC Industrials 1,230,763,945 175,770,690 1.33 1.33
Industry/Sector Market valueNOK
Market valueUSD Voting Ownership
GOVERNMENT PENSION FUND GLOBAL HOLDINGS 2008
Equities Country association according to FTSE (the benchmark provider for equities). If a company is not in thebenchmark, the country of incorporation and country of listing is used. For remaining securities, a further assessment ismade. Country is defined as a sovereign state currently member of the United Nations. Exceptions are Hong Kong andTaiwan. The country association methodology was updated as of 2014.
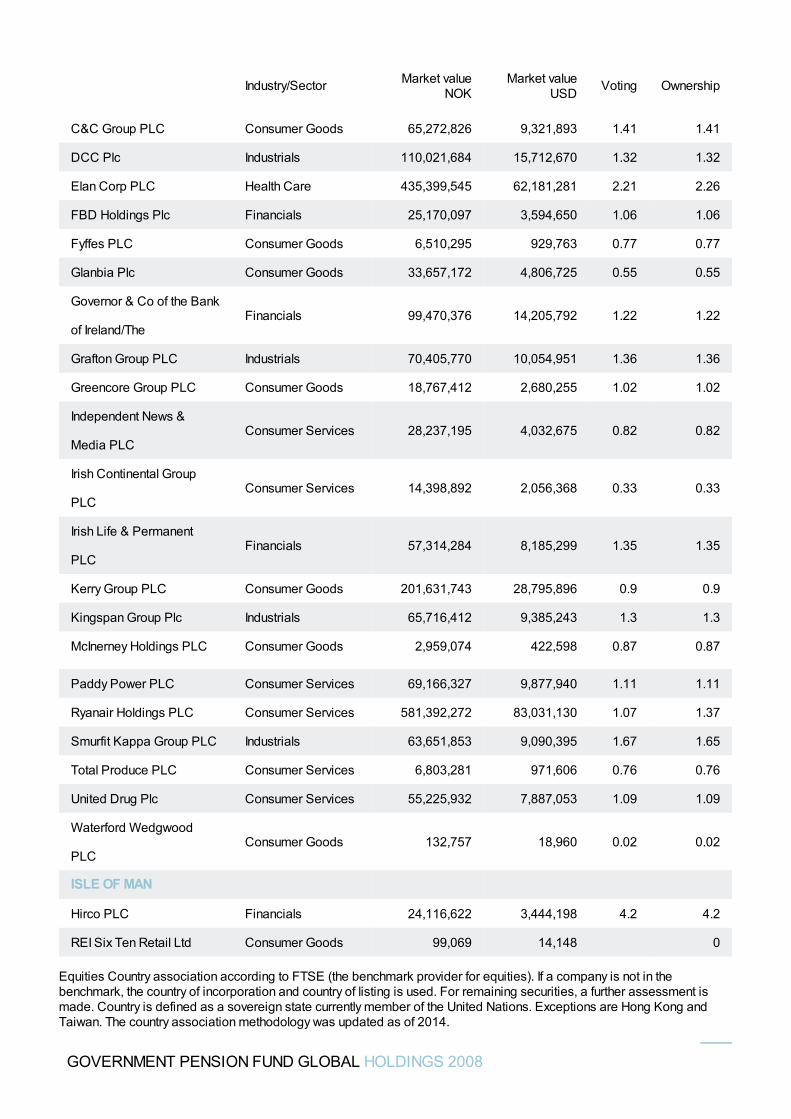
C&C Group PLC Consumer Goods 65,272,826 9,321,893 1.41 1.41
DCC Plc Industrials 110,021,684 15,712,670 1.32 1.32
Elan Corp PLC Health Care 435,399,545 62,181,281 2.21 2.26
FBD Holdings Plc Financials 25,170,097 3,594,650 1.06 1.06
Fyffes PLC Consumer Goods 6,510,295 929,763 0.77 0.77
Glanbia Plc Consumer Goods 33,657,172 4,806,725 0.55 0.55
Governor & Co of the Bank
of Ireland/TheFinancials 99,470,376 14,205,792 1.22 1.22
Grafton Group PLC Industrials 70,405,770 10,054,951 1.36 1.36
Greencore Group PLC Consumer Goods 18,767,412 2,680,255 1.02 1.02
Independent News &
Media PLCConsumer Services 28,237,195 4,032,675 0.82 0.82
Irish Continental Group
PLCConsumer Services 14,398,892 2,056,368 0.33 0.33
Irish Life & Permanent
PLCFinancials 57,314,284 8,185,299 1.35 1.35
Kerry Group PLC Consumer Goods 201,631,743 28,795,896 0.9 0.9
Kingspan Group Plc Industrials 65,716,412 9,385,243 1.3 1.3
McInerney Holdings PLC Consumer Goods 2,959,074 422,598 0.87 0.87
Paddy Power PLC Consumer Services 69,166,327 9,877,940 1.11 1.11
Ryanair Holdings PLC Consumer Services 581,392,272 83,031,130 1.07 1.37
Smurfit Kappa Group PLC Industrials 63,651,853 9,090,395 1.67 1.65
Total Produce PLC Consumer Services 6,803,281 971,606 0.76 0.76
United Drug Plc Consumer Services 55,225,932 7,887,053 1.09 1.09
Waterford Wedgwood
PLCConsumer Goods 132,757 18,960 0.02 0.02
ISLE OF MAN
Hirco PLC Financials 24,116,622 3,444,198 4.2 4.2
REI Six Ten Retail Ltd Consumer Goods 99,069 14,148 0
Industry/Sector Market valueNOK
Market valueUSD Voting Ownership
GOVERNMENT PENSION FUND GLOBAL HOLDINGS 2008
Equities Country association according to FTSE (the benchmark provider for equities). If a company is not in thebenchmark, the country of incorporation and country of listing is used. For remaining securities, a further assessment ismade. Country is defined as a sovereign state currently member of the United Nations. Exceptions are Hong Kong andTaiwan. The country association methodology was updated as of 2014.
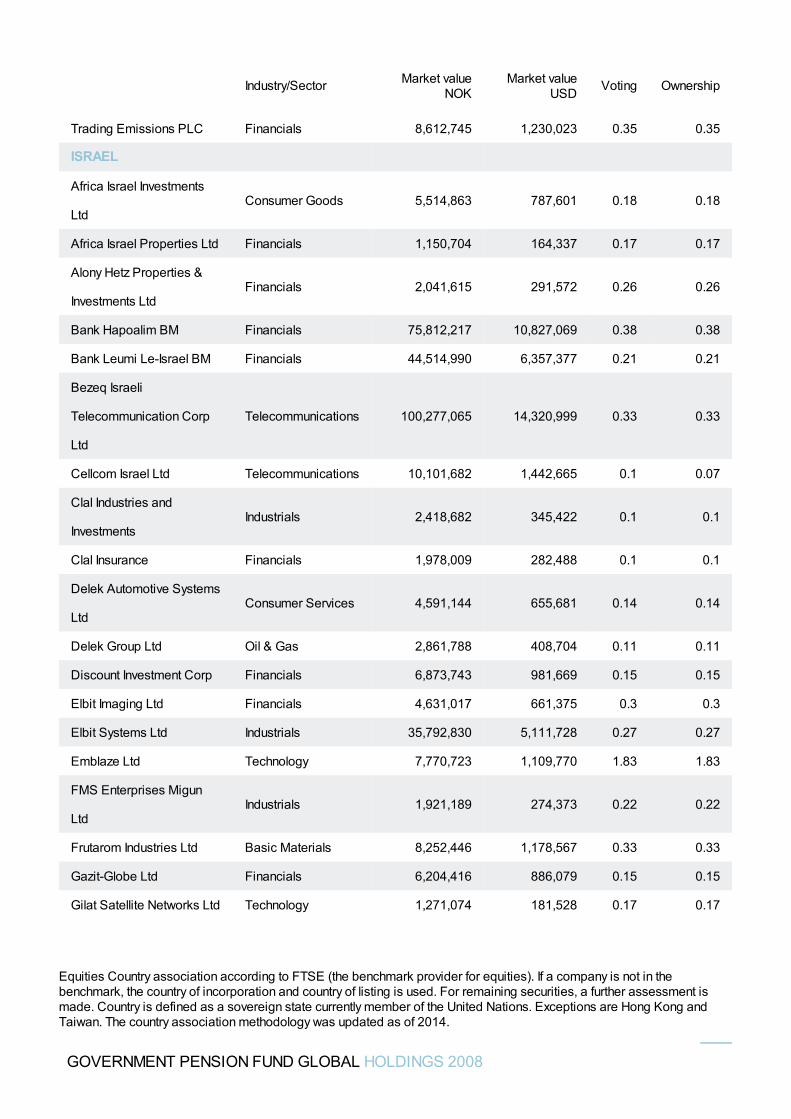
Trading Emissions PLC Financials 8,612,745 1,230,023 0.35 0.35
ISRAEL
Africa Israel Investments
LtdConsumer Goods 5,514,863 787,601 0.18 0.18
Africa Israel Properties Ltd Financials 1,150,704 164,337 0.17 0.17
Alony Hetz Properties &
Investments LtdFinancials 2,041,615 291,572 0.26 0.26
Bank Hapoalim BM Financials 75,812,217 10,827,069 0.38 0.38
Bank Leumi Le-Israel BM Financials 44,514,990 6,357,377 0.21 0.21
Bezeq Israeli
Telecommunication Corp
Ltd
Telecommunications 100,277,065 14,320,999 0.33 0.33
Cellcom Israel Ltd Telecommunications 10,101,682 1,442,665 0.1 0.07
Clal Industries and
InvestmentsIndustrials 2,418,682 345,422 0.1 0.1
Clal Insurance Financials 1,978,009 282,488 0.1 0.1
Delek Automotive Systems
LtdConsumer Services 4,591,144 655,681 0.14 0.14
Delek Group Ltd Oil & Gas 2,861,788 408,704 0.11 0.11
Discount Investment Corp Financials 6,873,743 981,669 0.15 0.15
Elbit Imaging Ltd Financials 4,631,017 661,375 0.3 0.3
Elbit Systems Ltd Industrials 35,792,830 5,111,728 0.27 0.27
Emblaze Ltd Technology 7,770,723 1,109,770 1.83 1.83
FMS Enterprises Migun
LtdIndustrials 1,921,189 274,373 0.22 0.22
Frutarom Industries Ltd Basic Materials 8,252,446 1,178,567 0.33 0.33
Gazit-Globe Ltd Financials 6,204,416 886,079 0.15 0.15
Gilat Satellite Networks Ltd Technology 1,271,074 181,528 0.17 0.17
Industry/Sector Market valueNOK
Market valueUSD Voting Ownership
GOVERNMENT PENSION FUND GLOBAL HOLDINGS 2008
Equities Country association according to FTSE (the benchmark provider for equities). If a company is not in thebenchmark, the country of incorporation and country of listing is used. For remaining securities, a further assessment ismade. Country is defined as a sovereign state currently member of the United Nations. Exceptions are Hong Kong andTaiwan. The country association methodology was updated as of 2014.
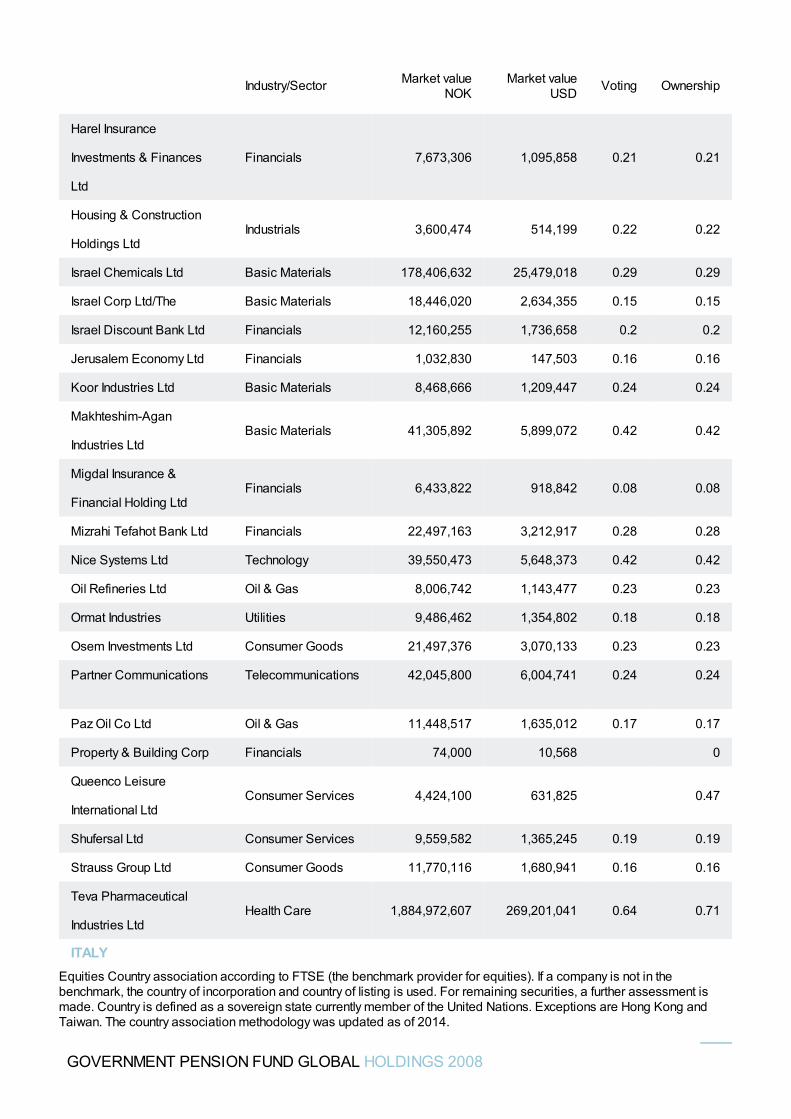
Harel Insurance
Investments & Finances
Ltd
Financials 7,673,306 1,095,858 0.21 0.21
Housing & Construction
Holdings LtdIndustrials 3,600,474 514,199 0.22 0.22
Israel Chemicals Ltd Basic Materials 178,406,632 25,479,018 0.29 0.29
Israel Corp Ltd/The Basic Materials 18,446,020 2,634,355 0.15 0.15
Israel Discount Bank Ltd Financials 12,160,255 1,736,658 0.2 0.2
Jerusalem Economy Ltd Financials 1,032,830 147,503 0.16 0.16
Koor Industries Ltd Basic Materials 8,468,666 1,209,447 0.24 0.24
Makhteshim-Agan
Industries LtdBasic Materials 41,305,892 5,899,072 0.42 0.42
Migdal Insurance &
Financial Holding LtdFinancials 6,433,822 918,842 0.08 0.08
Mizrahi Tefahot Bank Ltd Financials 22,497,163 3,212,917 0.28 0.28
Nice Systems Ltd Technology 39,550,473 5,648,373 0.42 0.42
Oil Refineries Ltd Oil & Gas 8,006,742 1,143,477 0.23 0.23
Ormat Industries Utilities 9,486,462 1,354,802 0.18 0.18
Osem Investments Ltd Consumer Goods 21,497,376 3,070,133 0.23 0.23
Partner Communications Telecommunications 42,045,800 6,004,741 0.24 0.24
Paz Oil Co Ltd Oil & Gas 11,448,517 1,635,012 0.17 0.17
Property & Building Corp Financials 74,000 10,568 0
Queenco Leisure
International LtdConsumer Services 4,424,100 631,825 0.47
Shufersal Ltd Consumer Services 9,559,582 1,365,245 0.19 0.19
Strauss Group Ltd Consumer Goods 11,770,116 1,680,941 0.16 0.16
Teva Pharmaceutical
Industries LtdHealth Care 1,884,972,607 269,201,041 0.64 0.71
ITALY
Industry/Sector Market valueNOK
Market valueUSD Voting Ownership
GOVERNMENT PENSION FUND GLOBAL HOLDINGS 2008
Equities Country association according to FTSE (the benchmark provider for equities). If a company is not in thebenchmark, the country of incorporation and country of listing is used. For remaining securities, a further assessment ismade. Country is defined as a sovereign state currently member of the United Nations. Exceptions are Hong Kong andTaiwan. The country association methodology was updated as of 2014.
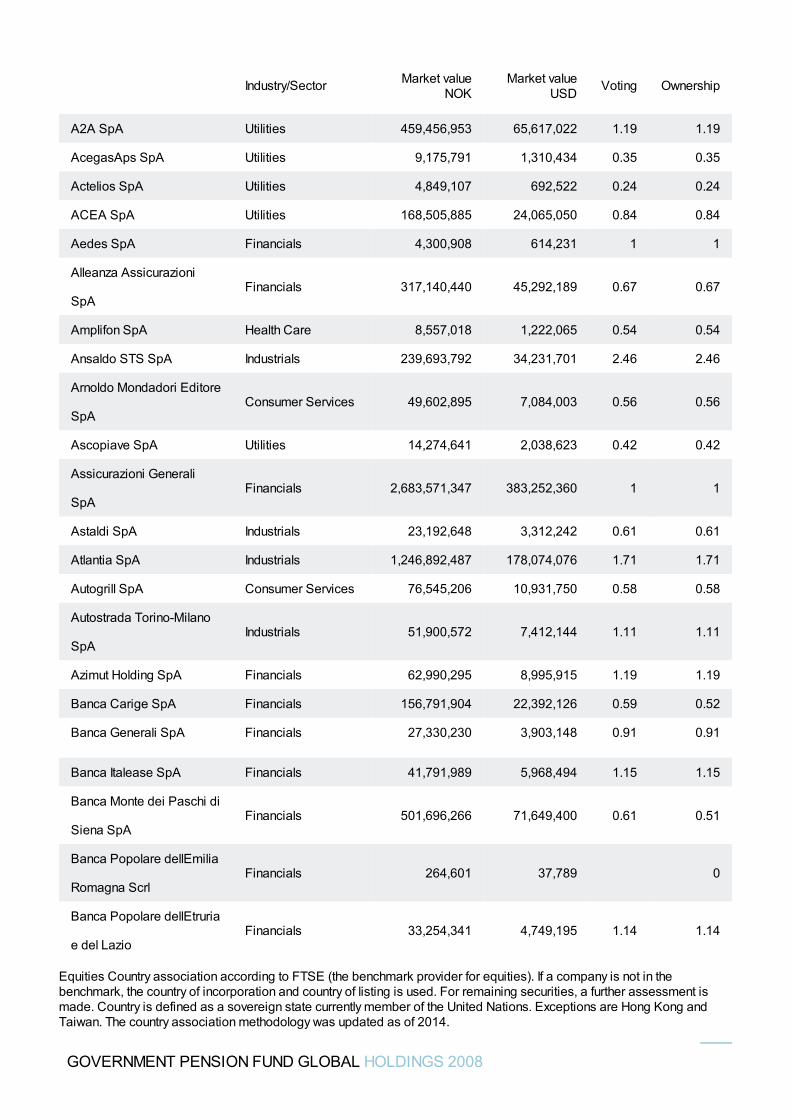
A2A SpA Utilities 459,456,953 65,617,022 1.19 1.19
AcegasAps SpA Utilities 9,175,791 1,310,434 0.35 0.35
Actelios SpA Utilities 4,849,107 692,522 0.24 0.24
ACEA SpA Utilities 168,505,885 24,065,050 0.84 0.84
Aedes SpA Financials 4,300,908 614,231 1 1
Alleanza Assicurazioni
SpAFinancials 317,140,440 45,292,189 0.67 0.67
Amplifon SpA Health Care 8,557,018 1,222,065 0.54 0.54
Ansaldo STS SpA Industrials 239,693,792 34,231,701 2.46 2.46
Arnoldo Mondadori Editore
SpAConsumer Services 49,602,895 7,084,003 0.56 0.56
Ascopiave SpA Utilities 14,274,641 2,038,623 0.42 0.42
Assicurazioni Generali
SpAFinancials 2,683,571,347 383,252,360 1 1
Astaldi SpA Industrials 23,192,648 3,312,242 0.61 0.61
Atlantia SpA Industrials 1,246,892,487 178,074,076 1.71 1.71
Autogrill SpA Consumer Services 76,545,206 10,931,750 0.58 0.58
Autostrada Torino-Milano
SpAIndustrials 51,900,572 7,412,144 1.11 1.11
Azimut Holding SpA Financials 62,990,295 8,995,915 1.19 1.19
Banca Carige SpA Financials 156,791,904 22,392,126 0.59 0.52
Banca Generali SpA Financials 27,330,230 3,903,148 0.91 0.91
Banca Italease SpA Financials 41,791,989 5,968,494 1.15 1.15
Banca Monte dei Paschi di
Siena SpAFinancials 501,696,266 71,649,400 0.61 0.51
Banca Popolare dellEmilia
Romagna ScrlFinancials 264,601 37,789 0
Banca Popolare dellEtruria
e del LazioFinancials 33,254,341 4,749,195 1.14 1.14
Industry/Sector Market valueNOK
Market valueUSD Voting Ownership
GOVERNMENT PENSION FUND GLOBAL HOLDINGS 2008
Equities Country association according to FTSE (the benchmark provider for equities). If a company is not in thebenchmark, the country of incorporation and country of listing is used. For remaining securities, a further assessment ismade. Country is defined as a sovereign state currently member of the United Nations. Exceptions are Hong Kong andTaiwan. The country association methodology was updated as of 2014.
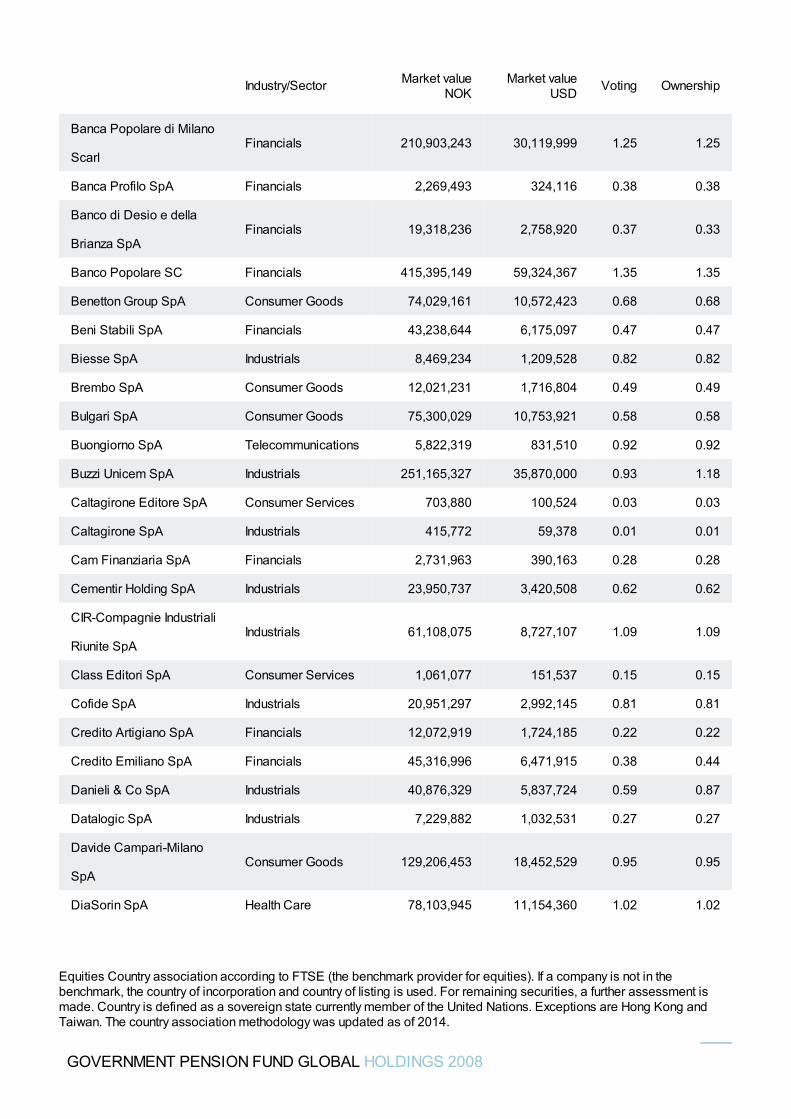
Banca Popolare di Milano
ScarlFinancials 210,903,243 30,119,999 1.25 1.25
Banca Profilo SpA Financials 2,269,493 324,116 0.38 0.38
Banco di Desio e della
Brianza SpAFinancials 19,318,236 2,758,920 0.37 0.33
Banco Popolare SC Financials 415,395,149 59,324,367 1.35 1.35
Benetton Group SpA Consumer Goods 74,029,161 10,572,423 0.68 0.68
Beni Stabili SpA Financials 43,238,644 6,175,097 0.47 0.47
Biesse SpA Industrials 8,469,234 1,209,528 0.82 0.82
Brembo SpA Consumer Goods 12,021,231 1,716,804 0.49 0.49
Bulgari SpA Consumer Goods 75,300,029 10,753,921 0.58 0.58
Buongiorno SpA Telecommunications 5,822,319 831,510 0.92 0.92
Buzzi Unicem SpA Industrials 251,165,327 35,870,000 0.93 1.18
Caltagirone Editore SpA Consumer Services 703,880 100,524 0.03 0.03
Caltagirone SpA Industrials 415,772 59,378 0.01 0.01
Cam Finanziaria SpA Financials 2,731,963 390,163 0.28 0.28
Cementir Holding SpA Industrials 23,950,737 3,420,508 0.62 0.62
CIR-Compagnie Industriali
Riunite SpAIndustrials 61,108,075 8,727,107 1.09 1.09
Class Editori SpA Consumer Services 1,061,077 151,537 0.15 0.15
Cofide SpA Industrials 20,951,297 2,992,145 0.81 0.81
Credito Artigiano SpA Financials 12,072,919 1,724,185 0.22 0.22
Credito Emiliano SpA Financials 45,316,996 6,471,915 0.38 0.44
Danieli & Co SpA Industrials 40,876,329 5,837,724 0.59 0.87
Datalogic SpA Industrials 7,229,882 1,032,531 0.27 0.27
Davide Campari-Milano
SpAConsumer Goods 129,206,453 18,452,529 0.95 0.95
DiaSorin SpA Health Care 78,103,945 11,154,360 1.02 1.02
Industry/Sector Market valueNOK
Market valueUSD Voting Ownership
GOVERNMENT PENSION FUND GLOBAL HOLDINGS 2008
Equities Country association according to FTSE (the benchmark provider for equities). If a company is not in thebenchmark, the country of incorporation and country of listing is used. For remaining securities, a further assessment ismade. Country is defined as a sovereign state currently member of the United Nations. Exceptions are Hong Kong andTaiwan. The country association methodology was updated as of 2014.
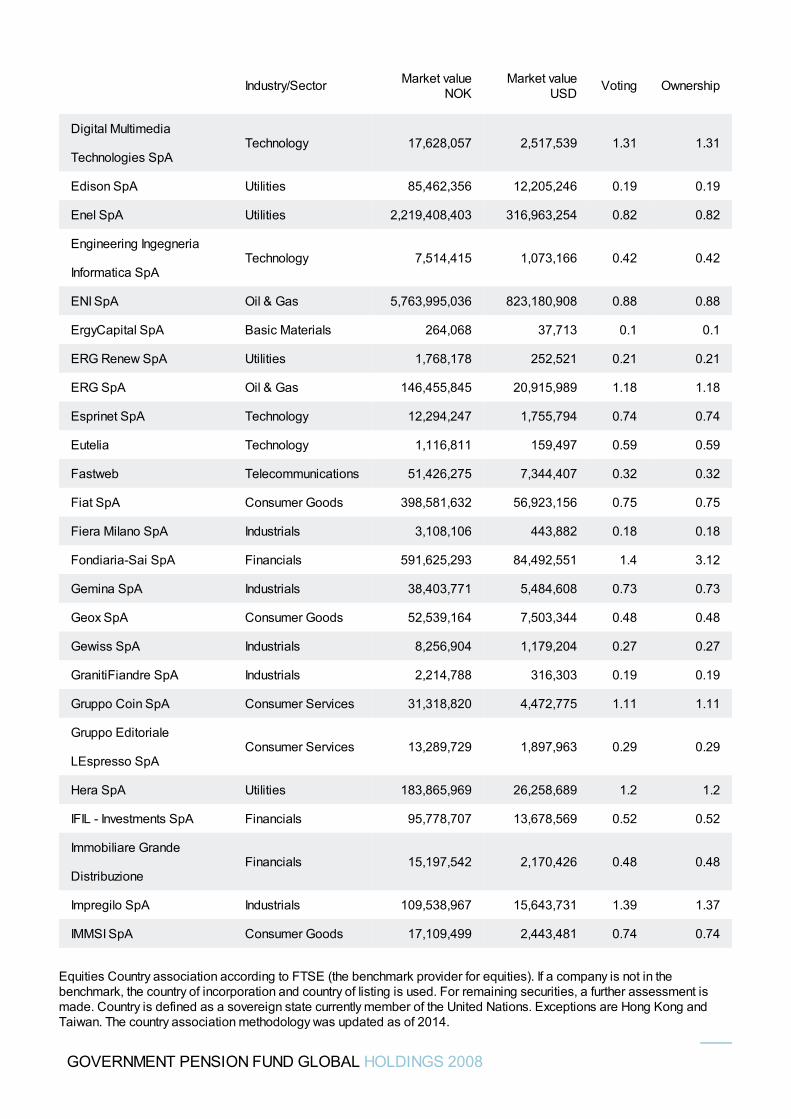
Digital Multimedia
Technologies SpATechnology 17,628,057 2,517,539 1.31 1.31
Edison SpA Utilities 85,462,356 12,205,246 0.19 0.19
Enel SpA Utilities 2,219,408,403 316,963,254 0.82 0.82
Engineering Ingegneria
Informatica SpATechnology 7,514,415 1,073,166 0.42 0.42
ENI SpA Oil & Gas 5,763,995,036 823,180,908 0.88 0.88
ErgyCapital SpA Basic Materials 264,068 37,713 0.1 0.1
ERG Renew SpA Utilities 1,768,178 252,521 0.21 0.21
ERG SpA Oil & Gas 146,455,845 20,915,989 1.18 1.18
Esprinet SpA Technology 12,294,247 1,755,794 0.74 0.74
Eutelia Technology 1,116,811 159,497 0.59 0.59
Fastweb Telecommunications 51,426,275 7,344,407 0.32 0.32
Fiat SpA Consumer Goods 398,581,632 56,923,156 0.75 0.75
Fiera Milano SpA Industrials 3,108,106 443,882 0.18 0.18
Fondiaria-Sai SpA Financials 591,625,293 84,492,551 1.4 3.12
Gemina SpA Industrials 38,403,771 5,484,608 0.73 0.73
Geox SpA Consumer Goods 52,539,164 7,503,344 0.48 0.48
Gewiss SpA Industrials 8,256,904 1,179,204 0.27 0.27
GranitiFiandre SpA Industrials 2,214,788 316,303 0.19 0.19
Gruppo Coin SpA Consumer Services 31,318,820 4,472,775 1.11 1.11
Gruppo Editoriale
LEspresso SpAConsumer Services 13,289,729 1,897,963 0.29 0.29
Hera SpA Utilities 183,865,969 26,258,689 1.2 1.2
IFIL - Investments SpA Financials 95,778,707 13,678,569 0.52 0.52
Immobiliare Grande
DistribuzioneFinancials 15,197,542 2,170,426 0.48 0.48
Impregilo SpA Industrials 109,538,967 15,643,731 1.39 1.37
IMMSI SpA Consumer Goods 17,109,499 2,443,481 0.74 0.74
Industry/Sector Market valueNOK
Market valueUSD Voting Ownership
GOVERNMENT PENSION FUND GLOBAL HOLDINGS 2008
Equities Country association according to FTSE (the benchmark provider for equities). If a company is not in thebenchmark, the country of incorporation and country of listing is used. For remaining securities, a further assessment ismade. Country is defined as a sovereign state currently member of the United Nations. Exceptions are Hong Kong andTaiwan. The country association methodology was updated as of 2014.
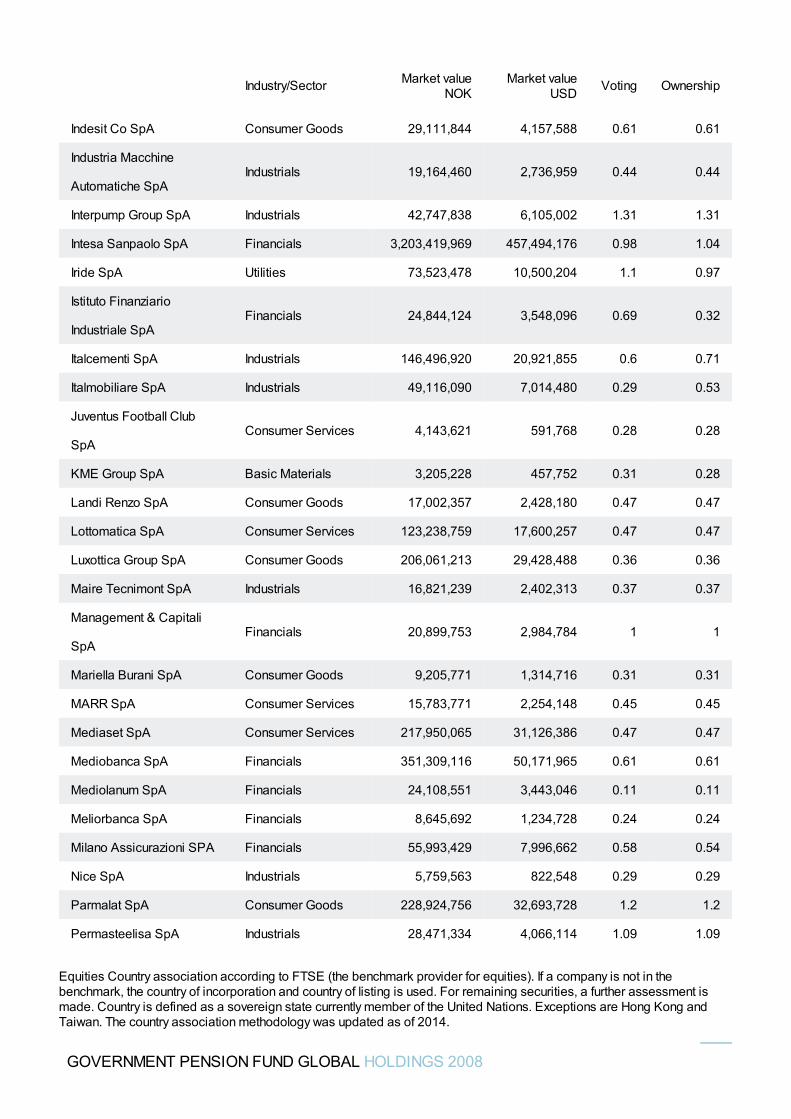
Indesit Co SpA Consumer Goods 29,111,844 4,157,588 0.61 0.61
Industria Macchine
Automatiche SpAIndustrials 19,164,460 2,736,959 0.44 0.44
Interpump Group SpA Industrials 42,747,838 6,105,002 1.31 1.31
Intesa Sanpaolo SpA Financials 3,203,419,969 457,494,176 0.98 1.04
Iride SpA Utilities 73,523,478 10,500,204 1.1 0.97
Istituto Finanziario
Industriale SpAFinancials 24,844,124 3,548,096 0.69 0.32
Italcementi SpA Industrials 146,496,920 20,921,855 0.6 0.71
Italmobiliare SpA Industrials 49,116,090 7,014,480 0.29 0.53
Juventus Football Club
SpAConsumer Services 4,143,621 591,768 0.28 0.28
KME Group SpA Basic Materials 3,205,228 457,752 0.31 0.28
Landi Renzo SpA Consumer Goods 17,002,357 2,428,180 0.47 0.47
Lottomatica SpA Consumer Services 123,238,759 17,600,257 0.47 0.47
Luxottica Group SpA Consumer Goods 206,061,213 29,428,488 0.36 0.36
Maire Tecnimont SpA Industrials 16,821,239 2,402,313 0.37 0.37
Management & Capitali
SpAFinancials 20,899,753 2,984,784 1 1
Mariella Burani SpA Consumer Goods 9,205,771 1,314,716 0.31 0.31
MARR SpA Consumer Services 15,783,771 2,254,148 0.45 0.45
Mediaset SpA Consumer Services 217,950,065 31,126,386 0.47 0.47
Mediobanca SpA Financials 351,309,116 50,171,965 0.61 0.61
Mediolanum SpA Financials 24,108,551 3,443,046 0.11 0.11
Meliorbanca SpA Financials 8,645,692 1,234,728 0.24 0.24
Milano Assicurazioni SPA Financials 55,993,429 7,996,662 0.58 0.54
Nice SpA Industrials 5,759,563 822,548 0.29 0.29
Parmalat SpA Consumer Goods 228,924,756 32,693,728 1.2 1.2
Permasteelisa SpA Industrials 28,471,334 4,066,114 1.09 1.09
Industry/Sector Market valueNOK
Market valueUSD Voting Ownership
GOVERNMENT PENSION FUND GLOBAL HOLDINGS 2008
Equities Country association according to FTSE (the benchmark provider for equities). If a company is not in thebenchmark, the country of incorporation and country of listing is used. For remaining securities, a further assessment ismade. Country is defined as a sovereign state currently member of the United Nations. Exceptions are Hong Kong andTaiwan. The country association methodology was updated as of 2014.
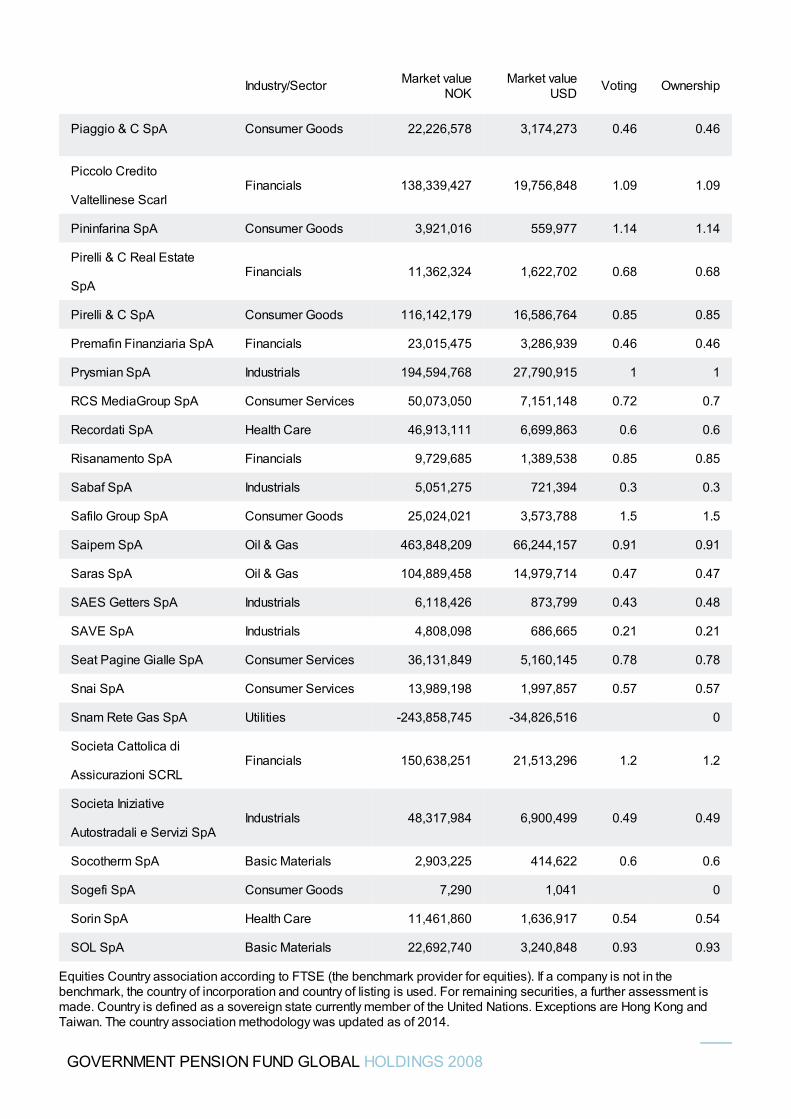
Piaggio & C SpA Consumer Goods 22,226,578 3,174,273 0.46 0.46
Piccolo Credito
Valtellinese ScarlFinancials 138,339,427 19,756,848 1.09 1.09
Pininfarina SpA Consumer Goods 3,921,016 559,977 1.14 1.14
Pirelli & C Real Estate
SpAFinancials 11,362,324 1,622,702 0.68 0.68
Pirelli & C SpA Consumer Goods 116,142,179 16,586,764 0.85 0.85
Premafin Finanziaria SpA Financials 23,015,475 3,286,939 0.46 0.46
Prysmian SpA Industrials 194,594,768 27,790,915 1 1
RCS MediaGroup SpA Consumer Services 50,073,050 7,151,148 0.72 0.7
Recordati SpA Health Care 46,913,111 6,699,863 0.6 0.6
Risanamento SpA Financials 9,729,685 1,389,538 0.85 0.85
Sabaf SpA Industrials 5,051,275 721,394 0.3 0.3
Safilo Group SpA Consumer Goods 25,024,021 3,573,788 1.5 1.5
Saipem SpA Oil & Gas 463,848,209 66,244,157 0.91 0.91
Saras SpA Oil & Gas 104,889,458 14,979,714 0.47 0.47
SAES Getters SpA Industrials 6,118,426 873,799 0.43 0.48
SAVE SpA Industrials 4,808,098 686,665 0.21 0.21
Seat Pagine Gialle SpA Consumer Services 36,131,849 5,160,145 0.78 0.78
Snai SpA Consumer Services 13,989,198 1,997,857 0.57 0.57
Snam Rete Gas SpA Utilities -243,858,745 -34,826,516 0
Societa Cattolica di
Assicurazioni SCRLFinancials 150,638,251 21,513,296 1.2 1.2
Societa Iniziative
Autostradali e Servizi SpAIndustrials 48,317,984 6,900,499 0.49 0.49
Socotherm SpA Basic Materials 2,903,225 414,622 0.6 0.6
Sogefi SpA Consumer Goods 7,290 1,041 0
Sorin SpA Health Care 11,461,860 1,636,917 0.54 0.54
SOL SpA Basic Materials 22,692,740 3,240,848 0.93 0.93
Industry/Sector Market valueNOK
Market valueUSD Voting Ownership
GOVERNMENT PENSION FUND GLOBAL HOLDINGS 2008
Equities Country association according to FTSE (the benchmark provider for equities). If a company is not in thebenchmark, the country of incorporation and country of listing is used. For remaining securities, a further assessment ismade. Country is defined as a sovereign state currently member of the United Nations. Exceptions are Hong Kong andTaiwan. The country association methodology was updated as of 2014.
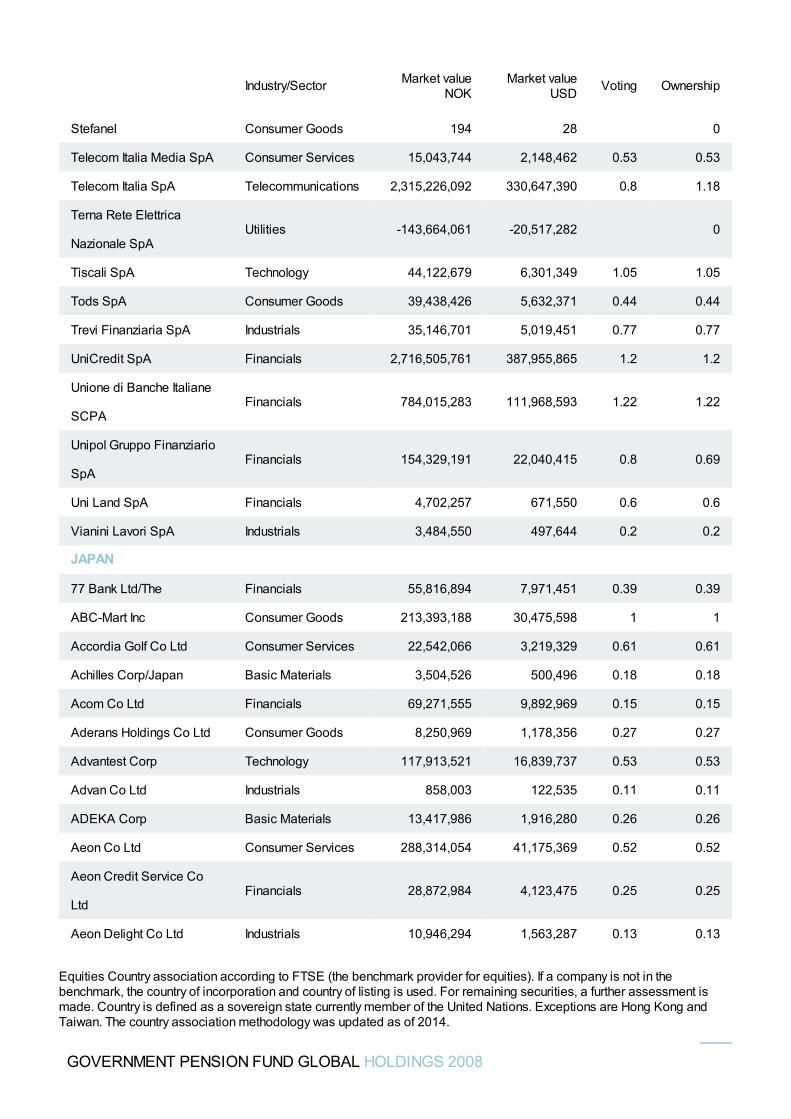
Stefanel Consumer Goods 194 28 0
Telecom Italia Media SpA Consumer Services 15,043,744 2,148,462 0.53 0.53
Telecom Italia SpA Telecommunications 2,315,226,092 330,647,390 0.8 1.18
Terna Rete Elettrica
Nazionale SpAUtilities -143,664,061 -20,517,282 0
Tiscali SpA Technology 44,122,679 6,301,349 1.05 1.05
Tods SpA Consumer Goods 39,438,426 5,632,371 0.44 0.44
Trevi Finanziaria SpA Industrials 35,146,701 5,019,451 0.77 0.77
UniCredit SpA Financials 2,716,505,761 387,955,865 1.2 1.2
Unione di Banche Italiane
SCPAFinancials 784,015,283 111,968,593 1.22 1.22
Unipol Gruppo Finanziario
SpAFinancials 154,329,191 22,040,415 0.8 0.69
Uni Land SpA Financials 4,702,257 671,550 0.6 0.6
Vianini Lavori SpA Industrials 3,484,550 497,644 0.2 0.2
JAPAN
77 Bank Ltd/The Financials 55,816,894 7,971,451 0.39 0.39
ABC-Mart Inc Consumer Goods 213,393,188 30,475,598 1 1
Accordia Golf Co Ltd Consumer Services 22,542,066 3,219,329 0.61 0.61
Achilles Corp/Japan Basic Materials 3,504,526 500,496 0.18 0.18
Acom Co Ltd Financials 69,271,555 9,892,969 0.15 0.15
Aderans Holdings Co Ltd Consumer Goods 8,250,969 1,178,356 0.27 0.27
Advantest Corp Technology 117,913,521 16,839,737 0.53 0.53
Advan Co Ltd Industrials 858,003 122,535 0.11 0.11
ADEKA Corp Basic Materials 13,417,986 1,916,280 0.26 0.26
Aeon Co Ltd Consumer Services 288,314,054 41,175,369 0.52 0.52
Aeon Credit Service Co
LtdFinancials 28,872,984 4,123,475 0.25 0.25
Aeon Delight Co Ltd Industrials 10,946,294 1,563,287 0.13 0.13
Industry/Sector Market valueNOK
Market valueUSD Voting Ownership
GOVERNMENT PENSION FUND GLOBAL HOLDINGS 2008
Equities Country association according to FTSE (the benchmark provider for equities). If a company is not in thebenchmark, the country of incorporation and country of listing is used. For remaining securities, a further assessment ismade. Country is defined as a sovereign state currently member of the United Nations. Exceptions are Hong Kong andTaiwan. The country association methodology was updated as of 2014.
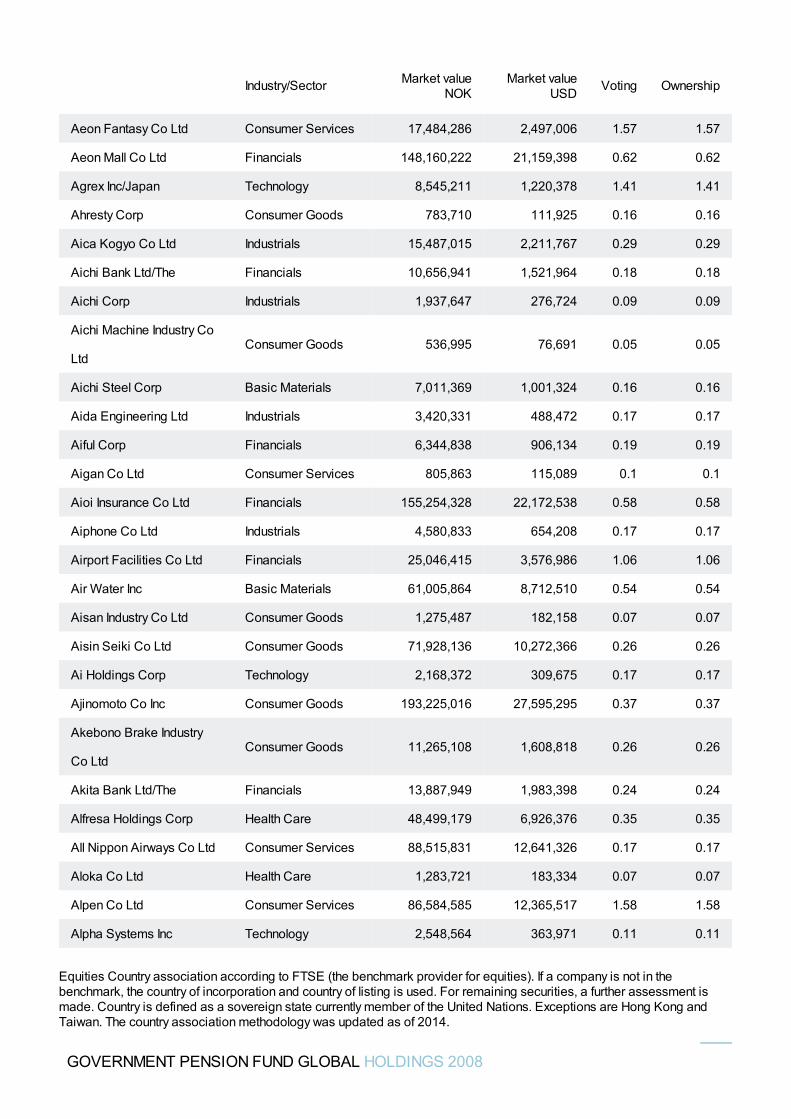
Aeon Fantasy Co Ltd Consumer Services 17,484,286 2,497,006 1.57 1.57
Aeon Mall Co Ltd Financials 148,160,222 21,159,398 0.62 0.62
Agrex Inc/Japan Technology 8,545,211 1,220,378 1.41 1.41
Ahresty Corp Consumer Goods 783,710 111,925 0.16 0.16
Aica Kogyo Co Ltd Industrials 15,487,015 2,211,767 0.29 0.29
Aichi Bank Ltd/The Financials 10,656,941 1,521,964 0.18 0.18
Aichi Corp Industrials 1,937,647 276,724 0.09 0.09
Aichi Machine Industry Co
LtdConsumer Goods 536,995 76,691 0.05 0.05
Aichi Steel Corp Basic Materials 7,011,369 1,001,324 0.16 0.16
Aida Engineering Ltd Industrials 3,420,331 488,472 0.17 0.17
Aiful Corp Financials 6,344,838 906,134 0.19 0.19
Aigan Co Ltd Consumer Services 805,863 115,089 0.1 0.1
Aioi Insurance Co Ltd Financials 155,254,328 22,172,538 0.58 0.58
Aiphone Co Ltd Industrials 4,580,833 654,208 0.17 0.17
Airport Facilities Co Ltd Financials 25,046,415 3,576,986 1.06 1.06
Air Water Inc Basic Materials 61,005,864 8,712,510 0.54 0.54
Aisan Industry Co Ltd Consumer Goods 1,275,487 182,158 0.07 0.07
Aisin Seiki Co Ltd Consumer Goods 71,928,136 10,272,366 0.26 0.26
Ai Holdings Corp Technology 2,168,372 309,675 0.17 0.17
Ajinomoto Co Inc Consumer Goods 193,225,016 27,595,295 0.37 0.37
Akebono Brake Industry
Co LtdConsumer Goods 11,265,108 1,608,818 0.26 0.26
Akita Bank Ltd/The Financials 13,887,949 1,983,398 0.24 0.24
Alfresa Holdings Corp Health Care 48,499,179 6,926,376 0.35 0.35
All Nippon Airways Co Ltd Consumer Services 88,515,831 12,641,326 0.17 0.17
Aloka Co Ltd Health Care 1,283,721 183,334 0.07 0.07
Alpen Co Ltd Consumer Services 86,584,585 12,365,517 1.58 1.58
Alpha Systems Inc Technology 2,548,564 363,971 0.11 0.11
Industry/Sector Market valueNOK
Market valueUSD Voting Ownership
GOVERNMENT PENSION FUND GLOBAL HOLDINGS 2008
Equities Country association according to FTSE (the benchmark provider for equities). If a company is not in thebenchmark, the country of incorporation and country of listing is used. For remaining securities, a further assessment ismade. Country is defined as a sovereign state currently member of the United Nations. Exceptions are Hong Kong andTaiwan. The country association methodology was updated as of 2014.
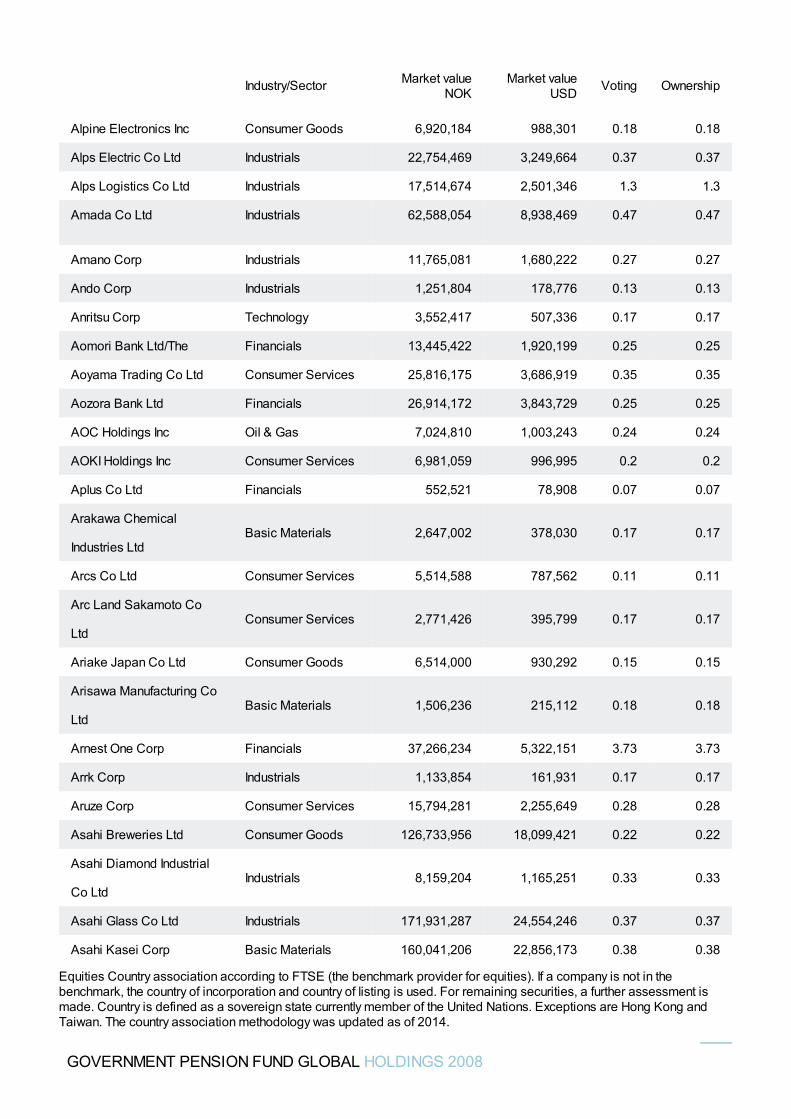
Alpine Electronics Inc Consumer Goods 6,920,184 988,301 0.18 0.18
Alps Electric Co Ltd Industrials 22,754,469 3,249,664 0.37 0.37
Alps Logistics Co Ltd Industrials 17,514,674 2,501,346 1.3 1.3
Amada Co Ltd Industrials 62,588,054 8,938,469 0.47 0.47
Amano Corp Industrials 11,765,081 1,680,222 0.27 0.27
Ando Corp Industrials 1,251,804 178,776 0.13 0.13
Anritsu Corp Technology 3,552,417 507,336 0.17 0.17
Aomori Bank Ltd/The Financials 13,445,422 1,920,199 0.25 0.25
Aoyama Trading Co Ltd Consumer Services 25,816,175 3,686,919 0.35 0.35
Aozora Bank Ltd Financials 26,914,172 3,843,729 0.25 0.25
AOC Holdings Inc Oil & Gas 7,024,810 1,003,243 0.24 0.24
AOKI Holdings Inc Consumer Services 6,981,059 996,995 0.2 0.2
Aplus Co Ltd Financials 552,521 78,908 0.07 0.07
Arakawa Chemical
Industries LtdBasic Materials 2,647,002 378,030 0.17 0.17
Arcs Co Ltd Consumer Services 5,514,588 787,562 0.11 0.11
Arc Land Sakamoto Co
LtdConsumer Services 2,771,426 395,799 0.17 0.17
Ariake Japan Co Ltd Consumer Goods 6,514,000 930,292 0.15 0.15
Arisawa Manufacturing Co
LtdBasic Materials 1,506,236 215,112 0.18 0.18
Arnest One Corp Financials 37,266,234 5,322,151 3.73 3.73
Arrk Corp Industrials 1,133,854 161,931 0.17 0.17
Aruze Corp Consumer Services 15,794,281 2,255,649 0.28 0.28
Asahi Breweries Ltd Consumer Goods 126,733,956 18,099,421 0.22 0.22
Asahi Diamond Industrial
Co LtdIndustrials 8,159,204 1,165,251 0.33 0.33
Asahi Glass Co Ltd Industrials 171,931,287 24,554,246 0.37 0.37
Asahi Kasei Corp Basic Materials 160,041,206 22,856,173 0.38 0.38
Industry/Sector Market valueNOK
Market valueUSD Voting Ownership
GOVERNMENT PENSION FUND GLOBAL HOLDINGS 2008
Equities Country association according to FTSE (the benchmark provider for equities). If a company is not in thebenchmark, the country of incorporation and country of listing is used. For remaining securities, a further assessment ismade. Country is defined as a sovereign state currently member of the United Nations. Exceptions are Hong Kong andTaiwan. The country association methodology was updated as of 2014.
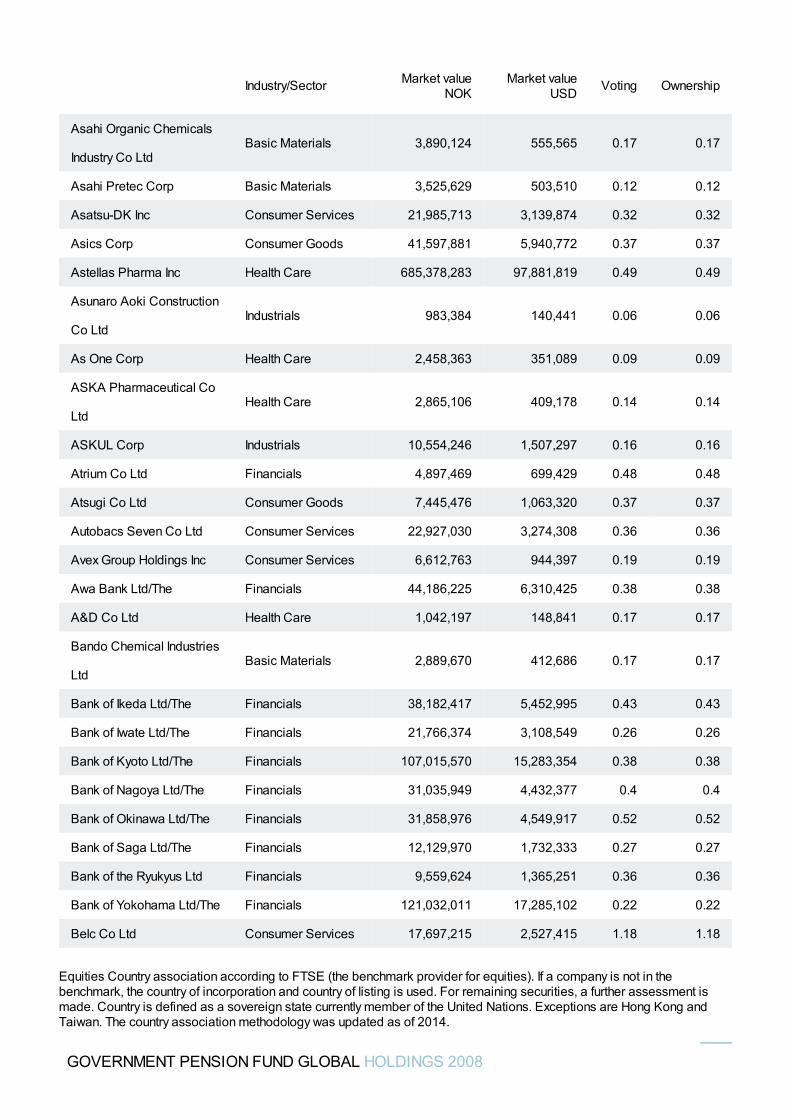
Asahi Organic Chemicals
Industry Co LtdBasic Materials 3,890,124 555,565 0.17 0.17
Asahi Pretec Corp Basic Materials 3,525,629 503,510 0.12 0.12
Asatsu-DK Inc Consumer Services 21,985,713 3,139,874 0.32 0.32
Asics Corp Consumer Goods 41,597,881 5,940,772 0.37 0.37
Astellas Pharma Inc Health Care 685,378,283 97,881,819 0.49 0.49
Asunaro Aoki Construction
Co LtdIndustrials 983,384 140,441 0.06 0.06
As One Corp Health Care 2,458,363 351,089 0.09 0.09
ASKA Pharmaceutical Co
LtdHealth Care 2,865,106 409,178 0.14 0.14
ASKUL Corp Industrials 10,554,246 1,507,297 0.16 0.16
Atrium Co Ltd Financials 4,897,469 699,429 0.48 0.48
Atsugi Co Ltd Consumer Goods 7,445,476 1,063,320 0.37 0.37
Autobacs Seven Co Ltd Consumer Services 22,927,030 3,274,308 0.36 0.36
Avex Group Holdings Inc Consumer Services 6,612,763 944,397 0.19 0.19
Awa Bank Ltd/The Financials 44,186,225 6,310,425 0.38 0.38
A&D Co Ltd Health Care 1,042,197 148,841 0.17 0.17
Bando Chemical Industries
LtdBasic Materials 2,889,670 412,686 0.17 0.17
Bank of Ikeda Ltd/The Financials 38,182,417 5,452,995 0.43 0.43
Bank of Iwate Ltd/The Financials 21,766,374 3,108,549 0.26 0.26
Bank of Kyoto Ltd/The Financials 107,015,570 15,283,354 0.38 0.38
Bank of Nagoya Ltd/The Financials 31,035,949 4,432,377 0.4 0.4
Bank of Okinawa Ltd/The Financials 31,858,976 4,549,917 0.52 0.52
Bank of Saga Ltd/The Financials 12,129,970 1,732,333 0.27 0.27
Bank of the Ryukyus Ltd Financials 9,559,624 1,365,251 0.36 0.36
Bank of Yokohama Ltd/The Financials 121,032,011 17,285,102 0.22 0.22
Belc Co Ltd Consumer Services 17,697,215 2,527,415 1.18 1.18
Industry/Sector Market valueNOK
Market valueUSD Voting Ownership
GOVERNMENT PENSION FUND GLOBAL HOLDINGS 2008
Equities Country association according to FTSE (the benchmark provider for equities). If a company is not in thebenchmark, the country of incorporation and country of listing is used. For remaining securities, a further assessment ismade. Country is defined as a sovereign state currently member of the United Nations. Exceptions are Hong Kong andTaiwan. The country association methodology was updated as of 2014.
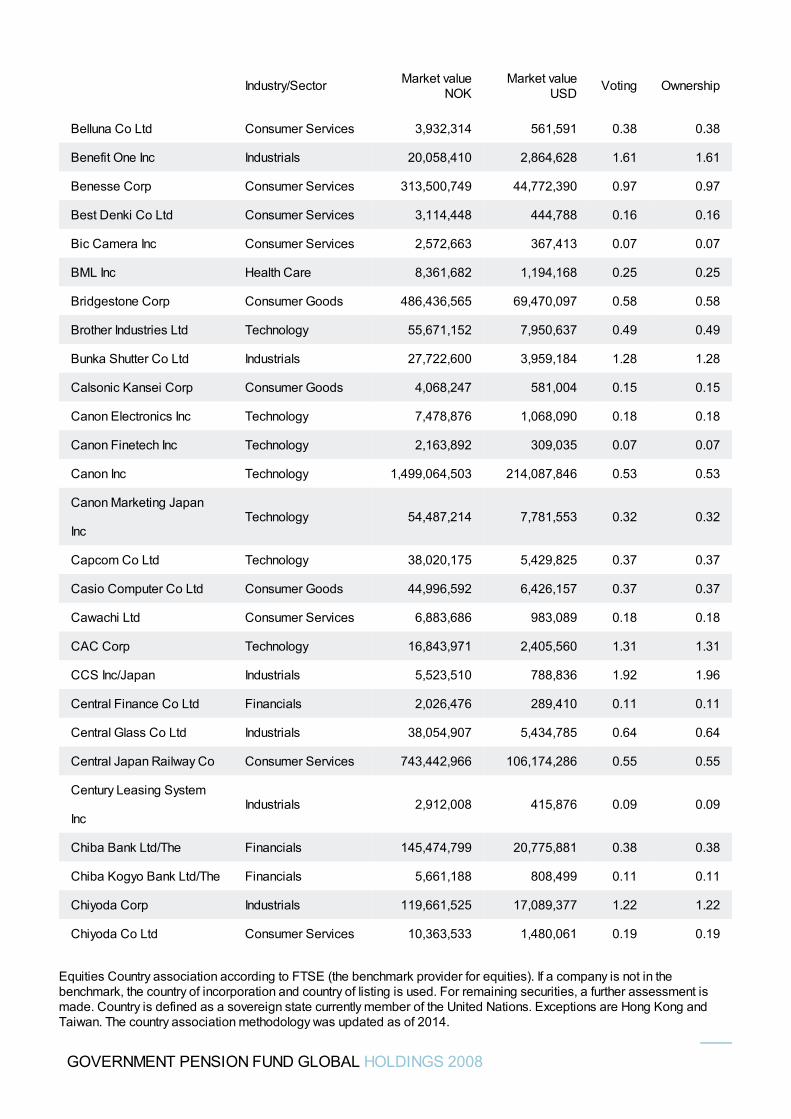
Belluna Co Ltd Consumer Services 3,932,314 561,591 0.38 0.38
Benefit One Inc Industrials 20,058,410 2,864,628 1.61 1.61
Benesse Corp Consumer Services 313,500,749 44,772,390 0.97 0.97
Best Denki Co Ltd Consumer Services 3,114,448 444,788 0.16 0.16
Bic Camera Inc Consumer Services 2,572,663 367,413 0.07 0.07
BML Inc Health Care 8,361,682 1,194,168 0.25 0.25
Bridgestone Corp Consumer Goods 486,436,565 69,470,097 0.58 0.58
Brother Industries Ltd Technology 55,671,152 7,950,637 0.49 0.49
Bunka Shutter Co Ltd Industrials 27,722,600 3,959,184 1.28 1.28
Calsonic Kansei Corp Consumer Goods 4,068,247 581,004 0.15 0.15
Canon Electronics Inc Technology 7,478,876 1,068,090 0.18 0.18
Canon Finetech Inc Technology 2,163,892 309,035 0.07 0.07
Canon Inc Technology 1,499,064,503 214,087,846 0.53 0.53
Canon Marketing Japan
IncTechnology 54,487,214 7,781,553 0.32 0.32
Capcom Co Ltd Technology 38,020,175 5,429,825 0.37 0.37
Casio Computer Co Ltd Consumer Goods 44,996,592 6,426,157 0.37 0.37
Cawachi Ltd Consumer Services 6,883,686 983,089 0.18 0.18
CAC Corp Technology 16,843,971 2,405,560 1.31 1.31
CCS Inc/Japan Industrials 5,523,510 788,836 1.92 1.96
Central Finance Co Ltd Financials 2,026,476 289,410 0.11 0.11
Central Glass Co Ltd Industrials 38,054,907 5,434,785 0.64 0.64
Central Japan Railway Co Consumer Services 743,442,966 106,174,286 0.55 0.55
Century Leasing System
IncIndustrials 2,912,008 415,876 0.09 0.09
Chiba Bank Ltd/The Financials 145,474,799 20,775,881 0.38 0.38
Chiba Kogyo Bank Ltd/The Financials 5,661,188 808,499 0.11 0.11
Chiyoda Corp Industrials 119,661,525 17,089,377 1.22 1.22
Chiyoda Co Ltd Consumer Services 10,363,533 1,480,061 0.19 0.19
Industry/Sector Market valueNOK
Market valueUSD Voting Ownership
GOVERNMENT PENSION FUND GLOBAL HOLDINGS 2008
Equities Country association according to FTSE (the benchmark provider for equities). If a company is not in thebenchmark, the country of incorporation and country of listing is used. For remaining securities, a further assessment ismade. Country is defined as a sovereign state currently member of the United Nations. Exceptions are Hong Kong andTaiwan. The country association methodology was updated as of 2014.
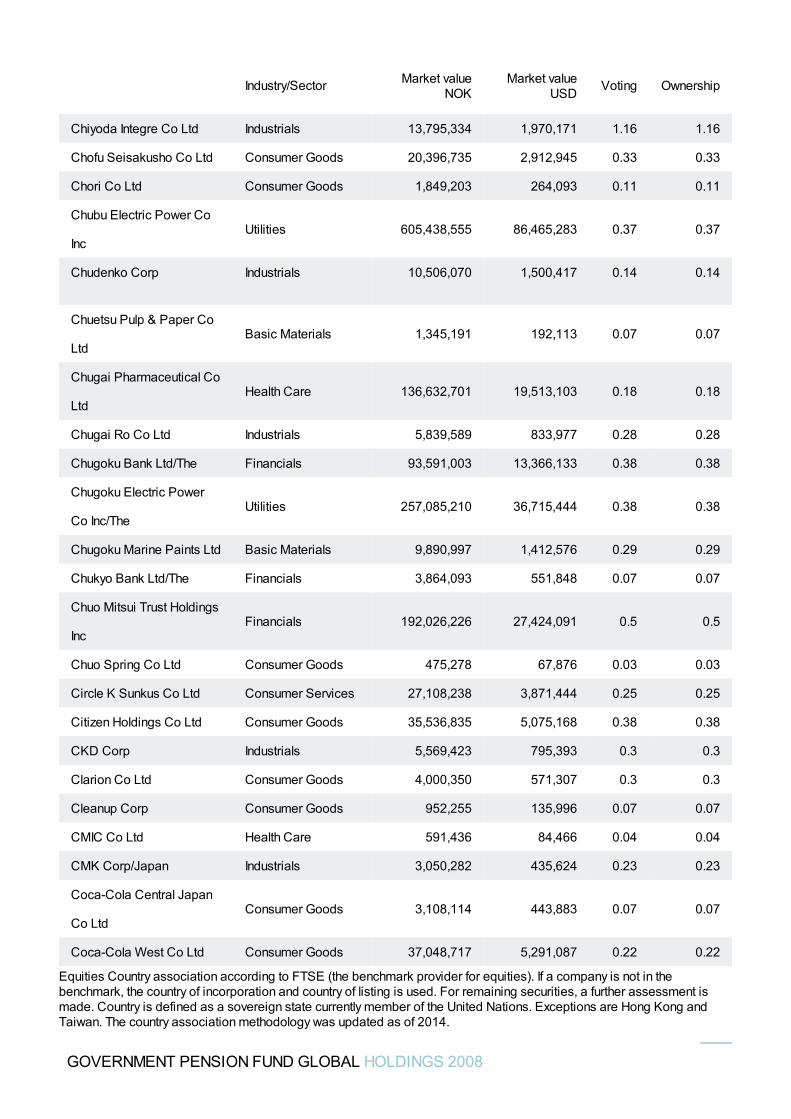
Chiyoda Integre Co Ltd Industrials 13,795,334 1,970,171 1.16 1.16
Chofu Seisakusho Co Ltd Consumer Goods 20,396,735 2,912,945 0.33 0.33
Chori Co Ltd Consumer Goods 1,849,203 264,093 0.11 0.11
Chubu Electric Power Co
IncUtilities 605,438,555 86,465,283 0.37 0.37
Chudenko Corp Industrials 10,506,070 1,500,417 0.14 0.14
Chuetsu Pulp & Paper Co
LtdBasic Materials 1,345,191 192,113 0.07 0.07
Chugai Pharmaceutical Co
LtdHealth Care 136,632,701 19,513,103 0.18 0.18
Chugai Ro Co Ltd Industrials 5,839,589 833,977 0.28 0.28
Chugoku Bank Ltd/The Financials 93,591,003 13,366,133 0.38 0.38
Chugoku Electric Power
Co Inc/TheUtilities 257,085,210 36,715,444 0.38 0.38
Chugoku Marine Paints Ltd Basic Materials 9,890,997 1,412,576 0.29 0.29
Chukyo Bank Ltd/The Financials 3,864,093 551,848 0.07 0.07
Chuo Mitsui Trust Holdings
IncFinancials 192,026,226 27,424,091 0.5 0.5
Chuo Spring Co Ltd Consumer Goods 475,278 67,876 0.03 0.03
Circle K Sunkus Co Ltd Consumer Services 27,108,238 3,871,444 0.25 0.25
Citizen Holdings Co Ltd Consumer Goods 35,536,835 5,075,168 0.38 0.38
CKD Corp Industrials 5,569,423 795,393 0.3 0.3
Clarion Co Ltd Consumer Goods 4,000,350 571,307 0.3 0.3
Cleanup Corp Consumer Goods 952,255 135,996 0.07 0.07
CMIC Co Ltd Health Care 591,436 84,466 0.04 0.04
CMK Corp/Japan Industrials 3,050,282 435,624 0.23 0.23
Coca-Cola Central Japan
Co LtdConsumer Goods 3,108,114 443,883 0.07 0.07
Coca-Cola West Co Ltd Consumer Goods 37,048,717 5,291,087 0.22 0.22
Industry/Sector Market valueNOK
Market valueUSD Voting Ownership
GOVERNMENT PENSION FUND GLOBAL HOLDINGS 2008
Equities Country association according to FTSE (the benchmark provider for equities). If a company is not in thebenchmark, the country of incorporation and country of listing is used. For remaining securities, a further assessment ismade. Country is defined as a sovereign state currently member of the United Nations. Exceptions are Hong Kong andTaiwan. The country association methodology was updated as of 2014.
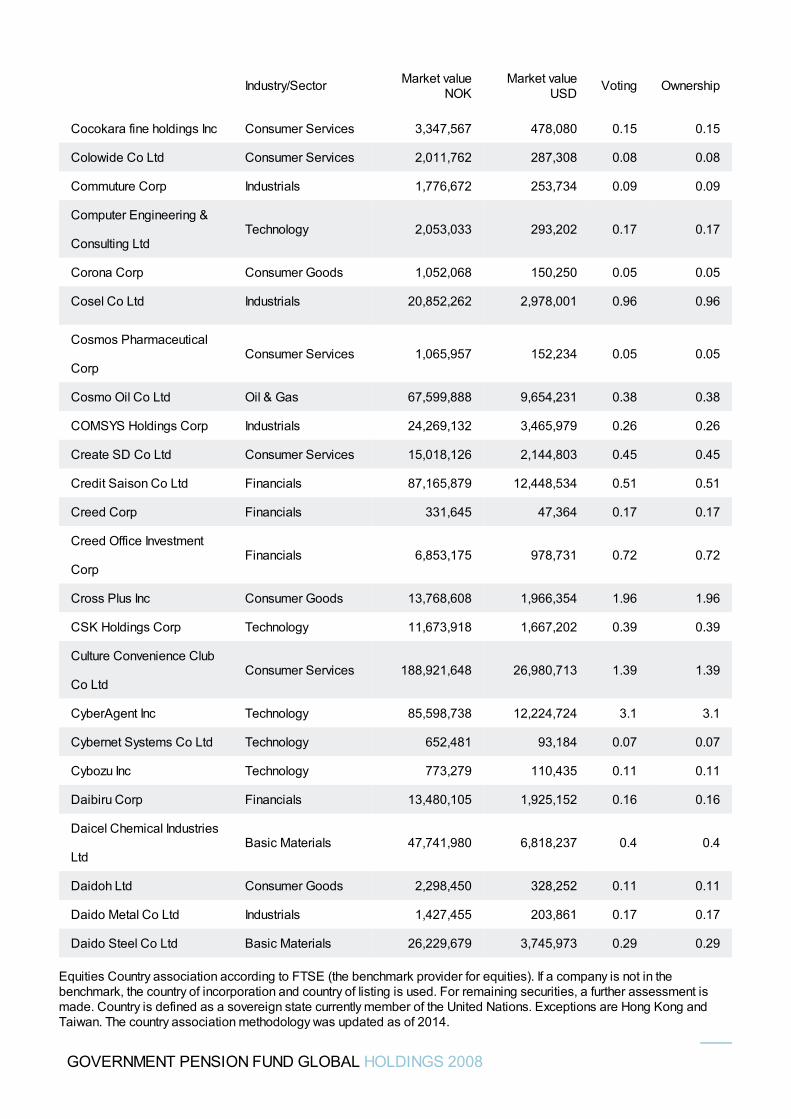
Cocokara fine holdings Inc Consumer Services 3,347,567 478,080 0.15 0.15
Colowide Co Ltd Consumer Services 2,011,762 287,308 0.08 0.08
Commuture Corp Industrials 1,776,672 253,734 0.09 0.09
Computer Engineering &
Consulting LtdTechnology 2,053,033 293,202 0.17 0.17
Corona Corp Consumer Goods 1,052,068 150,250 0.05 0.05
Cosel Co Ltd Industrials 20,852,262 2,978,001 0.96 0.96
Cosmos Pharmaceutical
CorpConsumer Services 1,065,957 152,234 0.05 0.05
Cosmo Oil Co Ltd Oil & Gas 67,599,888 9,654,231 0.38 0.38
COMSYS Holdings Corp Industrials 24,269,132 3,465,979 0.26 0.26
Create SD Co Ltd Consumer Services 15,018,126 2,144,803 0.45 0.45
Credit Saison Co Ltd Financials 87,165,879 12,448,534 0.51 0.51
Creed Corp Financials 331,645 47,364 0.17 0.17
Creed Office Investment
CorpFinancials 6,853,175 978,731 0.72 0.72
Cross Plus Inc Consumer Goods 13,768,608 1,966,354 1.96 1.96
CSK Holdings Corp Technology 11,673,918 1,667,202 0.39 0.39
Culture Convenience Club
Co LtdConsumer Services 188,921,648 26,980,713 1.39 1.39
CyberAgent Inc Technology 85,598,738 12,224,724 3.1 3.1
Cybernet Systems Co Ltd Technology 652,481 93,184 0.07 0.07
Cybozu Inc Technology 773,279 110,435 0.11 0.11
Daibiru Corp Financials 13,480,105 1,925,152 0.16 0.16
Daicel Chemical Industries
LtdBasic Materials 47,741,980 6,818,237 0.4 0.4
Daidoh Ltd Consumer Goods 2,298,450 328,252 0.11 0.11
Daido Metal Co Ltd Industrials 1,427,455 203,861 0.17 0.17
Daido Steel Co Ltd Basic Materials 26,229,679 3,745,973 0.29 0.29
Industry/Sector Market valueNOK
Market valueUSD Voting Ownership
GOVERNMENT PENSION FUND GLOBAL HOLDINGS 2008
Equities Country association according to FTSE (the benchmark provider for equities). If a company is not in thebenchmark, the country of incorporation and country of listing is used. For remaining securities, a further assessment ismade. Country is defined as a sovereign state currently member of the United Nations. Exceptions are Hong Kong andTaiwan. The country association methodology was updated as of 2014.
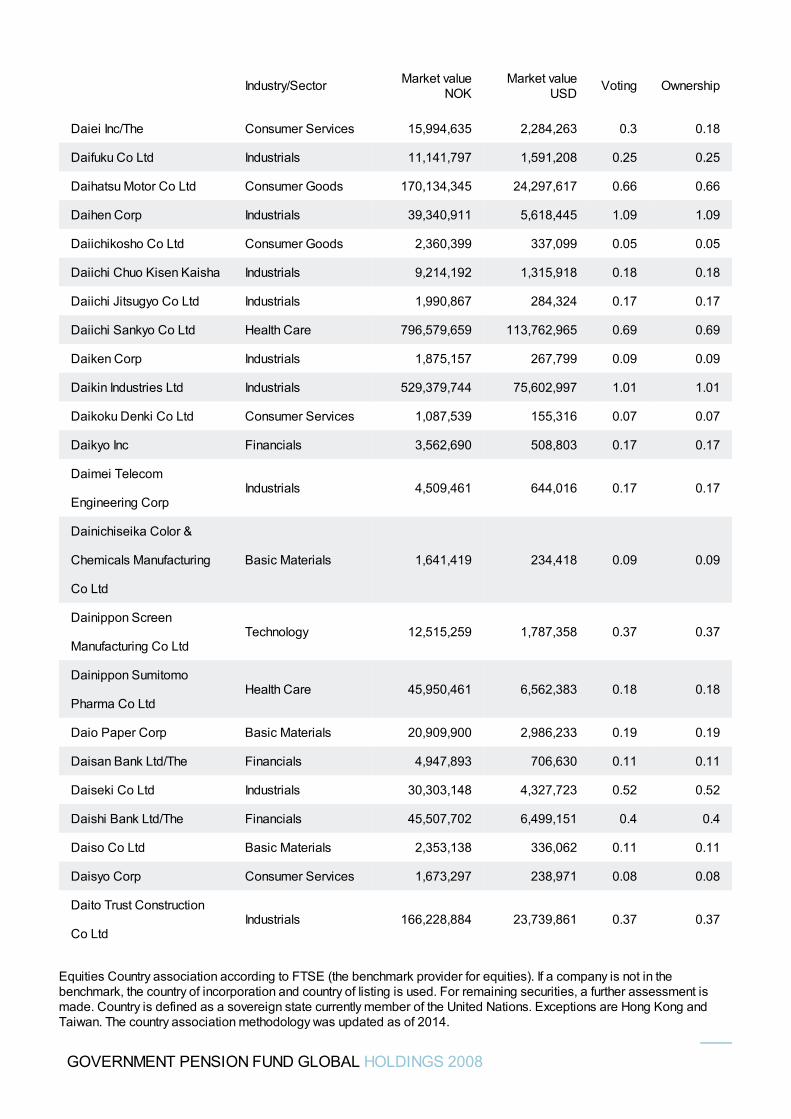
Daiei Inc/The Consumer Services 15,994,635 2,284,263 0.3 0.18
Daifuku Co Ltd Industrials 11,141,797 1,591,208 0.25 0.25
Daihatsu Motor Co Ltd Consumer Goods 170,134,345 24,297,617 0.66 0.66
Daihen Corp Industrials 39,340,911 5,618,445 1.09 1.09
Daiichikosho Co Ltd Consumer Goods 2,360,399 337,099 0.05 0.05
Daiichi Chuo Kisen Kaisha Industrials 9,214,192 1,315,918 0.18 0.18
Daiichi Jitsugyo Co Ltd Industrials 1,990,867 284,324 0.17 0.17
Daiichi Sankyo Co Ltd Health Care 796,579,659 113,762,965 0.69 0.69
Daiken Corp Industrials 1,875,157 267,799 0.09 0.09
Daikin Industries Ltd Industrials 529,379,744 75,602,997 1.01 1.01
Daikoku Denki Co Ltd Consumer Services 1,087,539 155,316 0.07 0.07
Daikyo Inc Financials 3,562,690 508,803 0.17 0.17
Daimei Telecom
Engineering CorpIndustrials 4,509,461 644,016 0.17 0.17
Dainichiseika Color &
Chemicals Manufacturing
Co Ltd
Basic Materials 1,641,419 234,418 0.09 0.09
Dainippon Screen
Manufacturing Co LtdTechnology 12,515,259 1,787,358 0.37 0.37
Dainippon Sumitomo
Pharma Co LtdHealth Care 45,950,461 6,562,383 0.18 0.18
Daio Paper Corp Basic Materials 20,909,900 2,986,233 0.19 0.19
Daisan Bank Ltd/The Financials 4,947,893 706,630 0.11 0.11
Daiseki Co Ltd Industrials 30,303,148 4,327,723 0.52 0.52
Daishi Bank Ltd/The Financials 45,507,702 6,499,151 0.4 0.4
Daiso Co Ltd Basic Materials 2,353,138 336,062 0.11 0.11
Daisyo Corp Consumer Services 1,673,297 238,971 0.08 0.08
Daito Trust Construction
Co LtdIndustrials 166,228,884 23,739,861 0.37 0.37
Industry/Sector Market valueNOK
Market valueUSD Voting Ownership
GOVERNMENT PENSION FUND GLOBAL HOLDINGS 2008
Equities Country association according to FTSE (the benchmark provider for equities). If a company is not in thebenchmark, the country of incorporation and country of listing is used. For remaining securities, a further assessment ismade. Country is defined as a sovereign state currently member of the United Nations. Exceptions are Hong Kong andTaiwan. The country association methodology was updated as of 2014.
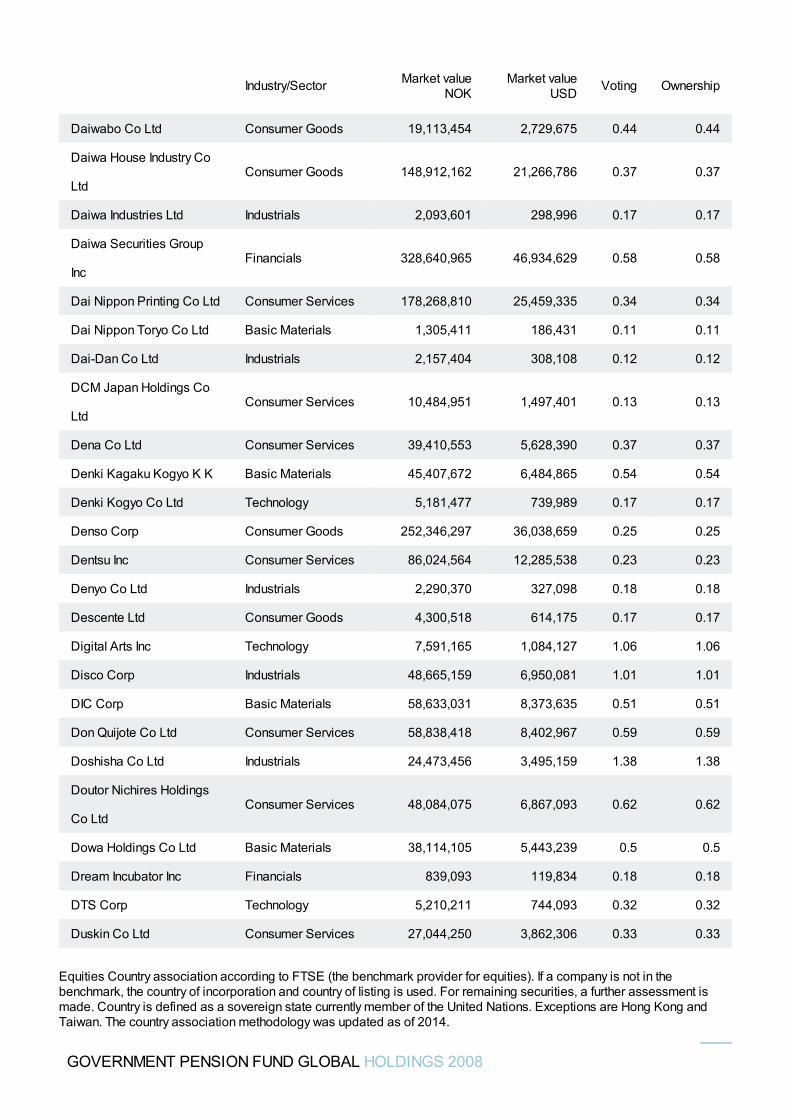
Daiwabo Co Ltd Consumer Goods 19,113,454 2,729,675 0.44 0.44
Daiwa House Industry Co
LtdConsumer Goods 148,912,162 21,266,786 0.37 0.37
Daiwa Industries Ltd Industrials 2,093,601 298,996 0.17 0.17
Daiwa Securities Group
IncFinancials 328,640,965 46,934,629 0.58 0.58
Dai Nippon Printing Co Ltd Consumer Services 178,268,810 25,459,335 0.34 0.34
Dai Nippon Toryo Co Ltd Basic Materials 1,305,411 186,431 0.11 0.11
Dai-Dan Co Ltd Industrials 2,157,404 308,108 0.12 0.12
DCM Japan Holdings Co
LtdConsumer Services 10,484,951 1,497,401 0.13 0.13
Dena Co Ltd Consumer Services 39,410,553 5,628,390 0.37 0.37
Denki Kagaku Kogyo K K Basic Materials 45,407,672 6,484,865 0.54 0.54
Denki Kogyo Co Ltd Technology 5,181,477 739,989 0.17 0.17
Denso Corp Consumer Goods 252,346,297 36,038,659 0.25 0.25
Dentsu Inc Consumer Services 86,024,564 12,285,538 0.23 0.23
Denyo Co Ltd Industrials 2,290,370 327,098 0.18 0.18
Descente Ltd Consumer Goods 4,300,518 614,175 0.17 0.17
Digital Arts Inc Technology 7,591,165 1,084,127 1.06 1.06
Disco Corp Industrials 48,665,159 6,950,081 1.01 1.01
DIC Corp Basic Materials 58,633,031 8,373,635 0.51 0.51
Don Quijote Co Ltd Consumer Services 58,838,418 8,402,967 0.59 0.59
Doshisha Co Ltd Industrials 24,473,456 3,495,159 1.38 1.38
Doutor Nichires Holdings
Co LtdConsumer Services 48,084,075 6,867,093 0.62 0.62
Dowa Holdings Co Ltd Basic Materials 38,114,105 5,443,239 0.5 0.5
Dream Incubator Inc Financials 839,093 119,834 0.18 0.18
DTS Corp Technology 5,210,211 744,093 0.32 0.32
Duskin Co Ltd Consumer Services 27,044,250 3,862,306 0.33 0.33
Industry/Sector Market valueNOK
Market valueUSD Voting Ownership
GOVERNMENT PENSION FUND GLOBAL HOLDINGS 2008
Equities Country association according to FTSE (the benchmark provider for equities). If a company is not in thebenchmark, the country of incorporation and country of listing is used. For remaining securities, a further assessment ismade. Country is defined as a sovereign state currently member of the United Nations. Exceptions are Hong Kong andTaiwan. The country association methodology was updated as of 2014.
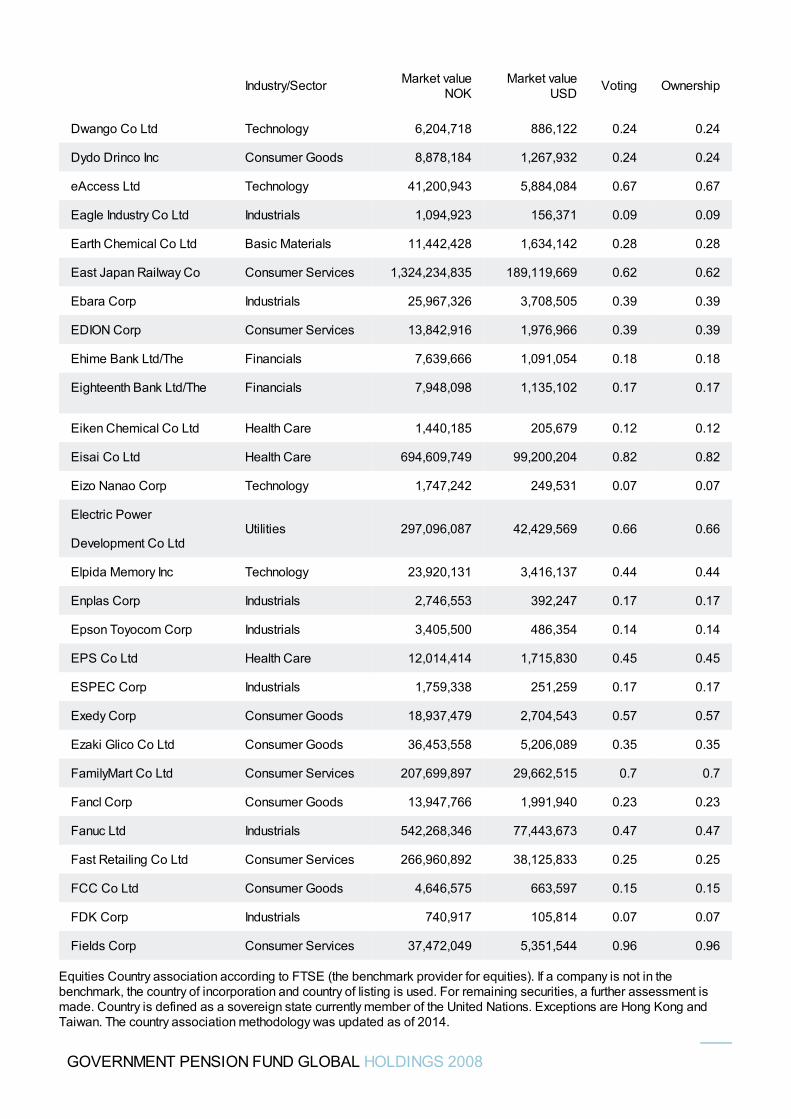
Dwango Co Ltd Technology 6,204,718 886,122 0.24 0.24
Dydo Drinco Inc Consumer Goods 8,878,184 1,267,932 0.24 0.24
eAccess Ltd Technology 41,200,943 5,884,084 0.67 0.67
Eagle Industry Co Ltd Industrials 1,094,923 156,371 0.09 0.09
Earth Chemical Co Ltd Basic Materials 11,442,428 1,634,142 0.28 0.28
East Japan Railway Co Consumer Services 1,324,234,835 189,119,669 0.62 0.62
Ebara Corp Industrials 25,967,326 3,708,505 0.39 0.39
EDION Corp Consumer Services 13,842,916 1,976,966 0.39 0.39
Ehime Bank Ltd/The Financials 7,639,666 1,091,054 0.18 0.18
Eighteenth Bank Ltd/The Financials 7,948,098 1,135,102 0.17 0.17
Eiken Chemical Co Ltd Health Care 1,440,185 205,679 0.12 0.12
Eisai Co Ltd Health Care 694,609,749 99,200,204 0.82 0.82
Eizo Nanao Corp Technology 1,747,242 249,531 0.07 0.07
Electric Power
Development Co LtdUtilities 297,096,087 42,429,569 0.66 0.66
Elpida Memory Inc Technology 23,920,131 3,416,137 0.44 0.44
Enplas Corp Industrials 2,746,553 392,247 0.17 0.17
Epson Toyocom Corp Industrials 3,405,500 486,354 0.14 0.14
EPS Co Ltd Health Care 12,014,414 1,715,830 0.45 0.45
ESPEC Corp Industrials 1,759,338 251,259 0.17 0.17
Exedy Corp Consumer Goods 18,937,479 2,704,543 0.57 0.57
Ezaki Glico Co Ltd Consumer Goods 36,453,558 5,206,089 0.35 0.35
FamilyMart Co Ltd Consumer Services 207,699,897 29,662,515 0.7 0.7
Fancl Corp Consumer Goods 13,947,766 1,991,940 0.23 0.23
Fanuc Ltd Industrials 542,268,346 77,443,673 0.47 0.47
Fast Retailing Co Ltd Consumer Services 266,960,892 38,125,833 0.25 0.25
FCC Co Ltd Consumer Goods 4,646,575 663,597 0.15 0.15
FDK Corp Industrials 740,917 105,814 0.07 0.07
Fields Corp Consumer Services 37,472,049 5,351,544 0.96 0.96
Industry/Sector Market valueNOK
Market valueUSD Voting Ownership
GOVERNMENT PENSION FUND GLOBAL HOLDINGS 2008
Equities Country association according to FTSE (the benchmark provider for equities). If a company is not in thebenchmark, the country of incorporation and country of listing is used. For remaining securities, a further assessment ismade. Country is defined as a sovereign state currently member of the United Nations. Exceptions are Hong Kong andTaiwan. The country association methodology was updated as of 2014.
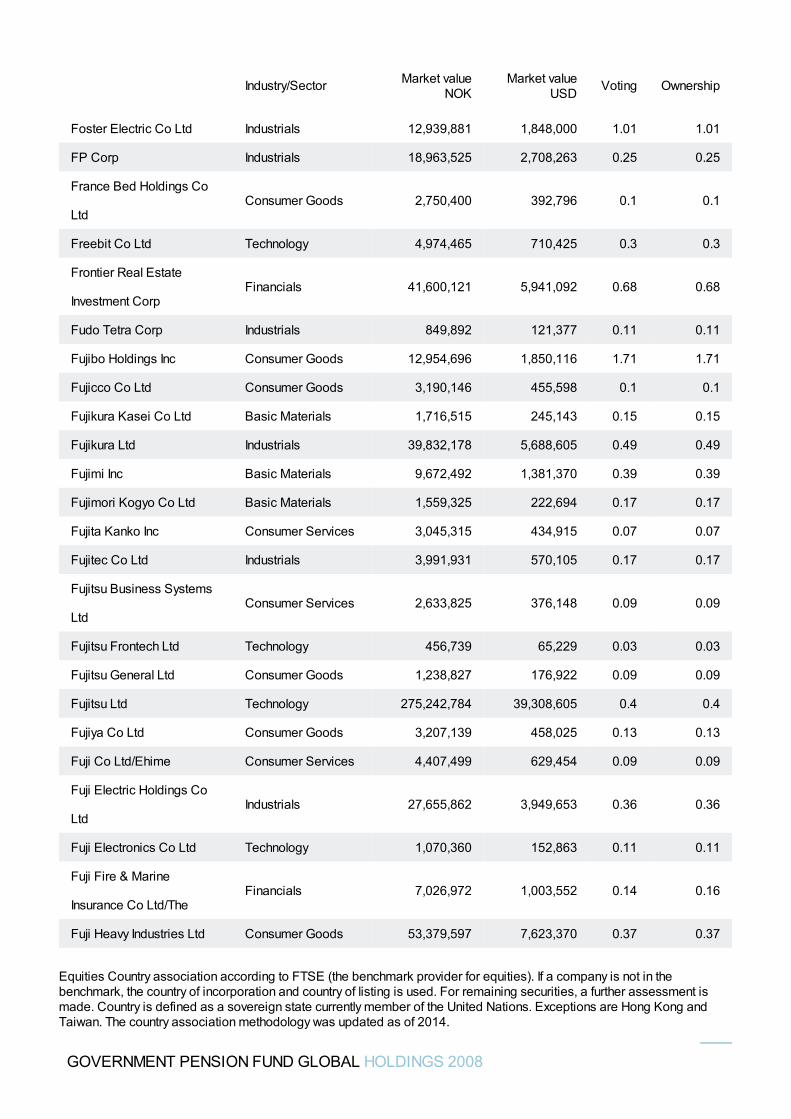
Foster Electric Co Ltd Industrials 12,939,881 1,848,000 1.01 1.01
FP Corp Industrials 18,963,525 2,708,263 0.25 0.25
France Bed Holdings Co
LtdConsumer Goods 2,750,400 392,796 0.1 0.1
Freebit Co Ltd Technology 4,974,465 710,425 0.3 0.3
Frontier Real Estate
Investment CorpFinancials 41,600,121 5,941,092 0.68 0.68
Fudo Tetra Corp Industrials 849,892 121,377 0.11 0.11
Fujibo Holdings Inc Consumer Goods 12,954,696 1,850,116 1.71 1.71
Fujicco Co Ltd Consumer Goods 3,190,146 455,598 0.1 0.1
Fujikura Kasei Co Ltd Basic Materials 1,716,515 245,143 0.15 0.15
Fujikura Ltd Industrials 39,832,178 5,688,605 0.49 0.49
Fujimi Inc Basic Materials 9,672,492 1,381,370 0.39 0.39
Fujimori Kogyo Co Ltd Basic Materials 1,559,325 222,694 0.17 0.17
Fujita Kanko Inc Consumer Services 3,045,315 434,915 0.07 0.07
Fujitec Co Ltd Industrials 3,991,931 570,105 0.17 0.17
Fujitsu Business Systems
LtdConsumer Services 2,633,825 376,148 0.09 0.09
Fujitsu Frontech Ltd Technology 456,739 65,229 0.03 0.03
Fujitsu General Ltd Consumer Goods 1,238,827 176,922 0.09 0.09
Fujitsu Ltd Technology 275,242,784 39,308,605 0.4 0.4
Fujiya Co Ltd Consumer Goods 3,207,139 458,025 0.13 0.13
Fuji Co Ltd/Ehime Consumer Services 4,407,499 629,454 0.09 0.09
Fuji Electric Holdings Co
LtdIndustrials 27,655,862 3,949,653 0.36 0.36
Fuji Electronics Co Ltd Technology 1,070,360 152,863 0.11 0.11
Fuji Fire & Marine
Insurance Co Ltd/TheFinancials 7,026,972 1,003,552 0.14 0.16
Fuji Heavy Industries Ltd Consumer Goods 53,379,597 7,623,370 0.37 0.37
Industry/Sector Market valueNOK
Market valueUSD Voting Ownership
GOVERNMENT PENSION FUND GLOBAL HOLDINGS 2008
Equities Country association according to FTSE (the benchmark provider for equities). If a company is not in thebenchmark, the country of incorporation and country of listing is used. For remaining securities, a further assessment ismade. Country is defined as a sovereign state currently member of the United Nations. Exceptions are Hong Kong andTaiwan. The country association methodology was updated as of 2014.
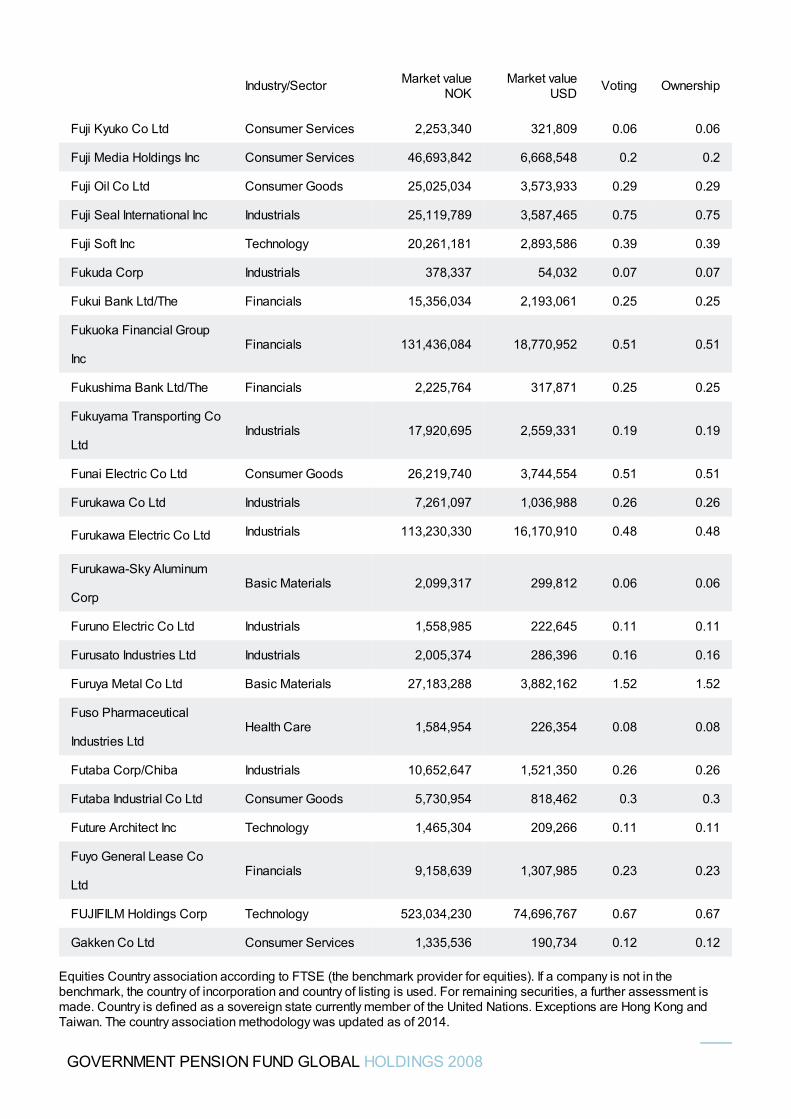
Fuji Kyuko Co Ltd Consumer Services 2,253,340 321,809 0.06 0.06
Fuji Media Holdings Inc Consumer Services 46,693,842 6,668,548 0.2 0.2
Fuji Oil Co Ltd Consumer Goods 25,025,034 3,573,933 0.29 0.29
Fuji Seal International Inc Industrials 25,119,789 3,587,465 0.75 0.75
Fuji Soft Inc Technology 20,261,181 2,893,586 0.39 0.39
Fukuda Corp Industrials 378,337 54,032 0.07 0.07
Fukui Bank Ltd/The Financials 15,356,034 2,193,061 0.25 0.25
Fukuoka Financial Group
IncFinancials 131,436,084 18,770,952 0.51 0.51
Fukushima Bank Ltd/The Financials 2,225,764 317,871 0.25 0.25
Fukuyama Transporting Co
LtdIndustrials 17,920,695 2,559,331 0.19 0.19
Funai Electric Co Ltd Consumer Goods 26,219,740 3,744,554 0.51 0.51
Furukawa Co Ltd Industrials 7,261,097 1,036,988 0.26 0.26
Furukawa Electric Co Ltd Industrials 113,230,330 16,170,910 0.48 0.48
Furukawa-Sky Aluminum
CorpBasic Materials 2,099,317 299,812 0.06 0.06
Furuno Electric Co Ltd Industrials 1,558,985 222,645 0.11 0.11
Furusato Industries Ltd Industrials 2,005,374 286,396 0.16 0.16
Furuya Metal Co Ltd Basic Materials 27,183,288 3,882,162 1.52 1.52
Fuso Pharmaceutical
Industries LtdHealth Care 1,584,954 226,354 0.08 0.08
Futaba Corp/Chiba Industrials 10,652,647 1,521,350 0.26 0.26
Futaba Industrial Co Ltd Consumer Goods 5,730,954 818,462 0.3 0.3
Future Architect Inc Technology 1,465,304 209,266 0.11 0.11
Fuyo General Lease Co
LtdFinancials 9,158,639 1,307,985 0.23 0.23
FUJIFILM Holdings Corp Technology 523,034,230 74,696,767 0.67 0.67
Gakken Co Ltd Consumer Services 1,335,536 190,734 0.12 0.12
Industry/Sector Market valueNOK
Market valueUSD Voting Ownership
GOVERNMENT PENSION FUND GLOBAL HOLDINGS 2008
Equities Country association according to FTSE (the benchmark provider for equities). If a company is not in thebenchmark, the country of incorporation and country of listing is used. For remaining securities, a further assessment ismade. Country is defined as a sovereign state currently member of the United Nations. Exceptions are Hong Kong andTaiwan. The country association methodology was updated as of 2014.
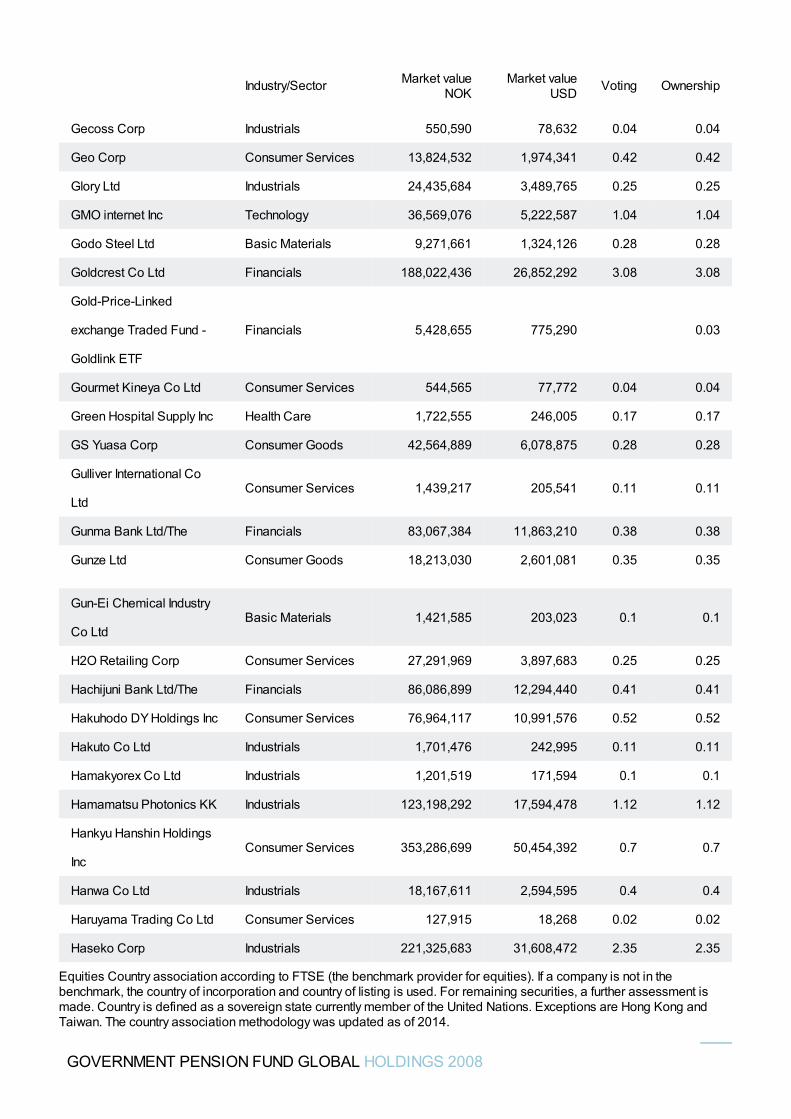
Gecoss Corp Industrials 550,590 78,632 0.04 0.04
Geo Corp Consumer Services 13,824,532 1,974,341 0.42 0.42
Glory Ltd Industrials 24,435,684 3,489,765 0.25 0.25
GMO internet Inc Technology 36,569,076 5,222,587 1.04 1.04
Godo Steel Ltd Basic Materials 9,271,661 1,324,126 0.28 0.28
Goldcrest Co Ltd Financials 188,022,436 26,852,292 3.08 3.08
Gold-Price-Linked
exchange Traded Fund -
Goldlink ETF
Financials 5,428,655 775,290 0.03
Gourmet Kineya Co Ltd Consumer Services 544,565 77,772 0.04 0.04
Green Hospital Supply Inc Health Care 1,722,555 246,005 0.17 0.17
GS Yuasa Corp Consumer Goods 42,564,889 6,078,875 0.28 0.28
Gulliver International Co
LtdConsumer Services 1,439,217 205,541 0.11 0.11
Gunma Bank Ltd/The Financials 83,067,384 11,863,210 0.38 0.38
Gunze Ltd Consumer Goods 18,213,030 2,601,081 0.35 0.35
Gun-Ei Chemical Industry
Co LtdBasic Materials 1,421,585 203,023 0.1 0.1
H2O Retailing Corp Consumer Services 27,291,969 3,897,683 0.25 0.25
Hachijuni Bank Ltd/The Financials 86,086,899 12,294,440 0.41 0.41
Hakuhodo DY Holdings Inc Consumer Services 76,964,117 10,991,576 0.52 0.52
Hakuto Co Ltd Industrials 1,701,476 242,995 0.11 0.11
Hamakyorex Co Ltd Industrials 1,201,519 171,594 0.1 0.1
Hamamatsu Photonics KK Industrials 123,198,292 17,594,478 1.12 1.12
Hankyu Hanshin Holdings
IncConsumer Services 353,286,699 50,454,392 0.7 0.7
Hanwa Co Ltd Industrials 18,167,611 2,594,595 0.4 0.4
Haruyama Trading Co Ltd Consumer Services 127,915 18,268 0.02 0.02
Haseko Corp Industrials 221,325,683 31,608,472 2.35 2.35
Industry/Sector Market valueNOK
Market valueUSD Voting Ownership
GOVERNMENT PENSION FUND GLOBAL HOLDINGS 2008
Equities Country association according to FTSE (the benchmark provider for equities). If a company is not in thebenchmark, the country of incorporation and country of listing is used. For remaining securities, a further assessment ismade. Country is defined as a sovereign state currently member of the United Nations. Exceptions are Hong Kong andTaiwan. The country association methodology was updated as of 2014.
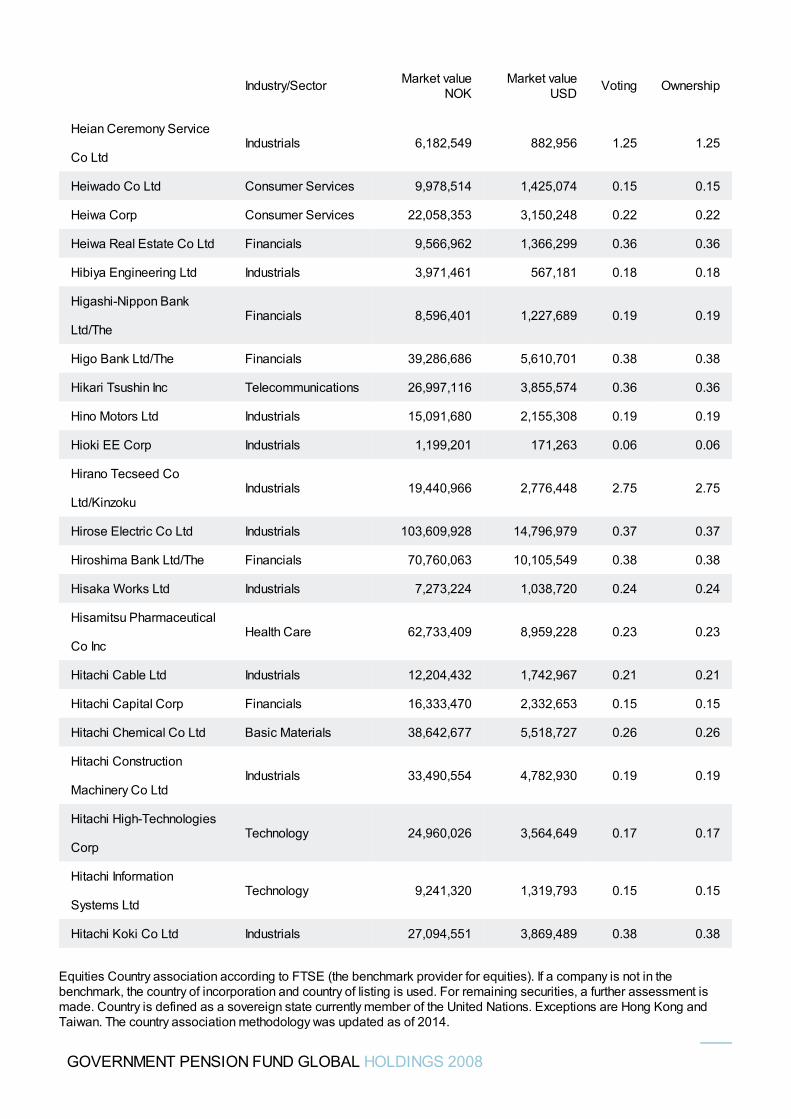
Heian Ceremony Service
Co LtdIndustrials 6,182,549 882,956 1.25 1.25
Heiwado Co Ltd Consumer Services 9,978,514 1,425,074 0.15 0.15
Heiwa Corp Consumer Services 22,058,353 3,150,248 0.22 0.22
Heiwa Real Estate Co Ltd Financials 9,566,962 1,366,299 0.36 0.36
Hibiya Engineering Ltd Industrials 3,971,461 567,181 0.18 0.18
Higashi-Nippon Bank
Ltd/TheFinancials 8,596,401 1,227,689 0.19 0.19
Higo Bank Ltd/The Financials 39,286,686 5,610,701 0.38 0.38
Hikari Tsushin Inc Telecommunications 26,997,116 3,855,574 0.36 0.36
Hino Motors Ltd Industrials 15,091,680 2,155,308 0.19 0.19
Hioki EE Corp Industrials 1,199,201 171,263 0.06 0.06
Hirano Tecseed Co
Ltd/KinzokuIndustrials 19,440,966 2,776,448 2.75 2.75
Hirose Electric Co Ltd Industrials 103,609,928 14,796,979 0.37 0.37
Hiroshima Bank Ltd/The Financials 70,760,063 10,105,549 0.38 0.38
Hisaka Works Ltd Industrials 7,273,224 1,038,720 0.24 0.24
Hisamitsu Pharmaceutical
Co IncHealth Care 62,733,409 8,959,228 0.23 0.23
Hitachi Cable Ltd Industrials 12,204,432 1,742,967 0.21 0.21
Hitachi Capital Corp Financials 16,333,470 2,332,653 0.15 0.15
Hitachi Chemical Co Ltd Basic Materials 38,642,677 5,518,727 0.26 0.26
Hitachi Construction
Machinery Co LtdIndustrials 33,490,554 4,782,930 0.19 0.19
Hitachi High-Technologies
CorpTechnology 24,960,026 3,564,649 0.17 0.17
Hitachi Information
Systems LtdTechnology 9,241,320 1,319,793 0.15 0.15
Hitachi Koki Co Ltd Industrials 27,094,551 3,869,489 0.38 0.38
Industry/Sector Market valueNOK
Market valueUSD Voting Ownership
GOVERNMENT PENSION FUND GLOBAL HOLDINGS 2008
Equities Country association according to FTSE (the benchmark provider for equities). If a company is not in thebenchmark, the country of incorporation and country of listing is used. For remaining securities, a further assessment ismade. Country is defined as a sovereign state currently member of the United Nations. Exceptions are Hong Kong andTaiwan. The country association methodology was updated as of 2014.
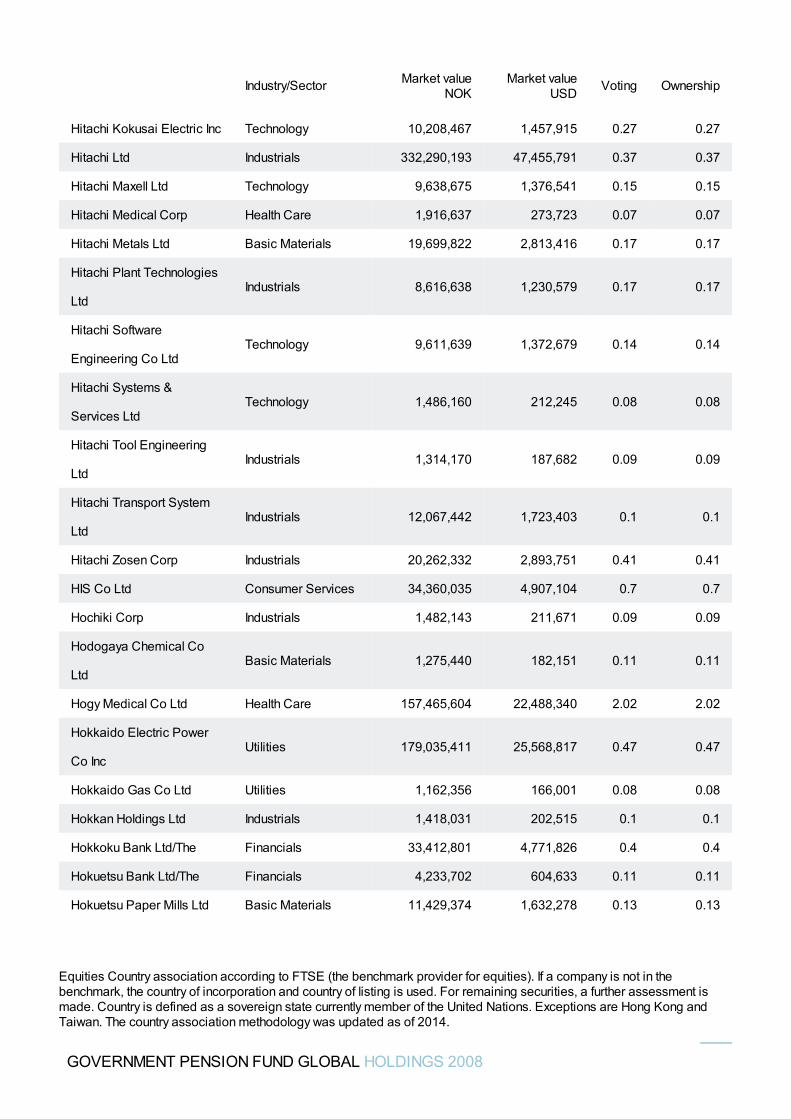
Hitachi Kokusai Electric Inc Technology 10,208,467 1,457,915 0.27 0.27
Hitachi Ltd Industrials 332,290,193 47,455,791 0.37 0.37
Hitachi Maxell Ltd Technology 9,638,675 1,376,541 0.15 0.15
Hitachi Medical Corp Health Care 1,916,637 273,723 0.07 0.07
Hitachi Metals Ltd Basic Materials 19,699,822 2,813,416 0.17 0.17
Hitachi Plant Technologies
LtdIndustrials 8,616,638 1,230,579 0.17 0.17
Hitachi Software
Engineering Co LtdTechnology 9,611,639 1,372,679 0.14 0.14
Hitachi Systems &
Services LtdTechnology 1,486,160 212,245 0.08 0.08
Hitachi Tool Engineering
LtdIndustrials 1,314,170 187,682 0.09 0.09
Hitachi Transport System
LtdIndustrials 12,067,442 1,723,403 0.1 0.1
Hitachi Zosen Corp Industrials 20,262,332 2,893,751 0.41 0.41
HIS Co Ltd Consumer Services 34,360,035 4,907,104 0.7 0.7
Hochiki Corp Industrials 1,482,143 211,671 0.09 0.09
Hodogaya Chemical Co
LtdBasic Materials 1,275,440 182,151 0.11 0.11
Hogy Medical Co Ltd Health Care 157,465,604 22,488,340 2.02 2.02
Hokkaido Electric Power
Co IncUtilities 179,035,411 25,568,817 0.47 0.47
Hokkaido Gas Co Ltd Utilities 1,162,356 166,001 0.08 0.08
Hokkan Holdings Ltd Industrials 1,418,031 202,515 0.1 0.1
Hokkoku Bank Ltd/The Financials 33,412,801 4,771,826 0.4 0.4
Hokuetsu Bank Ltd/The Financials 4,233,702 604,633 0.11 0.11
Hokuetsu Paper Mills Ltd Basic Materials 11,429,374 1,632,278 0.13 0.13
Industry/Sector Market valueNOK
Market valueUSD Voting Ownership
GOVERNMENT PENSION FUND GLOBAL HOLDINGS 2008
Equities Country association according to FTSE (the benchmark provider for equities). If a company is not in thebenchmark, the country of incorporation and country of listing is used. For remaining securities, a further assessment ismade. Country is defined as a sovereign state currently member of the United Nations. Exceptions are Hong Kong andTaiwan. The country association methodology was updated as of 2014.
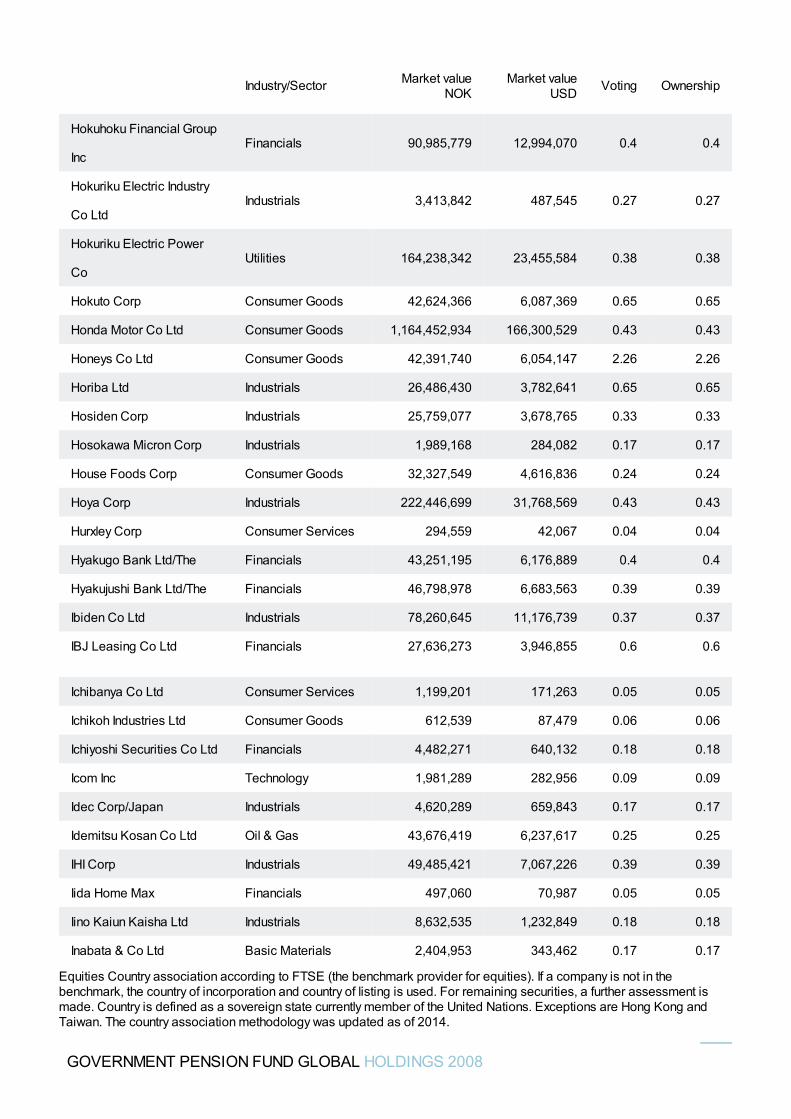
Hokuhoku Financial Group
IncFinancials 90,985,779 12,994,070 0.4 0.4
Hokuriku Electric Industry
Co LtdIndustrials 3,413,842 487,545 0.27 0.27
Hokuriku Electric Power
CoUtilities 164,238,342 23,455,584 0.38 0.38
Hokuto Corp Consumer Goods 42,624,366 6,087,369 0.65 0.65
Honda Motor Co Ltd Consumer Goods 1,164,452,934 166,300,529 0.43 0.43
Honeys Co Ltd Consumer Goods 42,391,740 6,054,147 2.26 2.26
Horiba Ltd Industrials 26,486,430 3,782,641 0.65 0.65
Hosiden Corp Industrials 25,759,077 3,678,765 0.33 0.33
Hosokawa Micron Corp Industrials 1,989,168 284,082 0.17 0.17
House Foods Corp Consumer Goods 32,327,549 4,616,836 0.24 0.24
Hoya Corp Industrials 222,446,699 31,768,569 0.43 0.43
Hurxley Corp Consumer Services 294,559 42,067 0.04 0.04
Hyakugo Bank Ltd/The Financials 43,251,195 6,176,889 0.4 0.4
Hyakujushi Bank Ltd/The Financials 46,798,978 6,683,563 0.39 0.39
Ibiden Co Ltd Industrials 78,260,645 11,176,739 0.37 0.37
IBJ Leasing Co Ltd Financials 27,636,273 3,946,855 0.6 0.6
Ichibanya Co Ltd Consumer Services 1,199,201 171,263 0.05 0.05
Ichikoh Industries Ltd Consumer Goods 612,539 87,479 0.06 0.06
Ichiyoshi Securities Co Ltd Financials 4,482,271 640,132 0.18 0.18
Icom Inc Technology 1,981,289 282,956 0.09 0.09
Idec Corp/Japan Industrials 4,620,289 659,843 0.17 0.17
Idemitsu Kosan Co Ltd Oil & Gas 43,676,419 6,237,617 0.25 0.25
IHI Corp Industrials 49,485,421 7,067,226 0.39 0.39
Iida Home Max Financials 497,060 70,987 0.05 0.05
Iino Kaiun Kaisha Ltd Industrials 8,632,535 1,232,849 0.18 0.18
Inabata & Co Ltd Basic Materials 2,404,953 343,462 0.17 0.17
Industry/Sector Market valueNOK
Market valueUSD Voting Ownership
GOVERNMENT PENSION FUND GLOBAL HOLDINGS 2008
Equities Country association according to FTSE (the benchmark provider for equities). If a company is not in thebenchmark, the country of incorporation and country of listing is used. For remaining securities, a further assessment ismade. Country is defined as a sovereign state currently member of the United Nations. Exceptions are Hong Kong andTaiwan. The country association methodology was updated as of 2014.
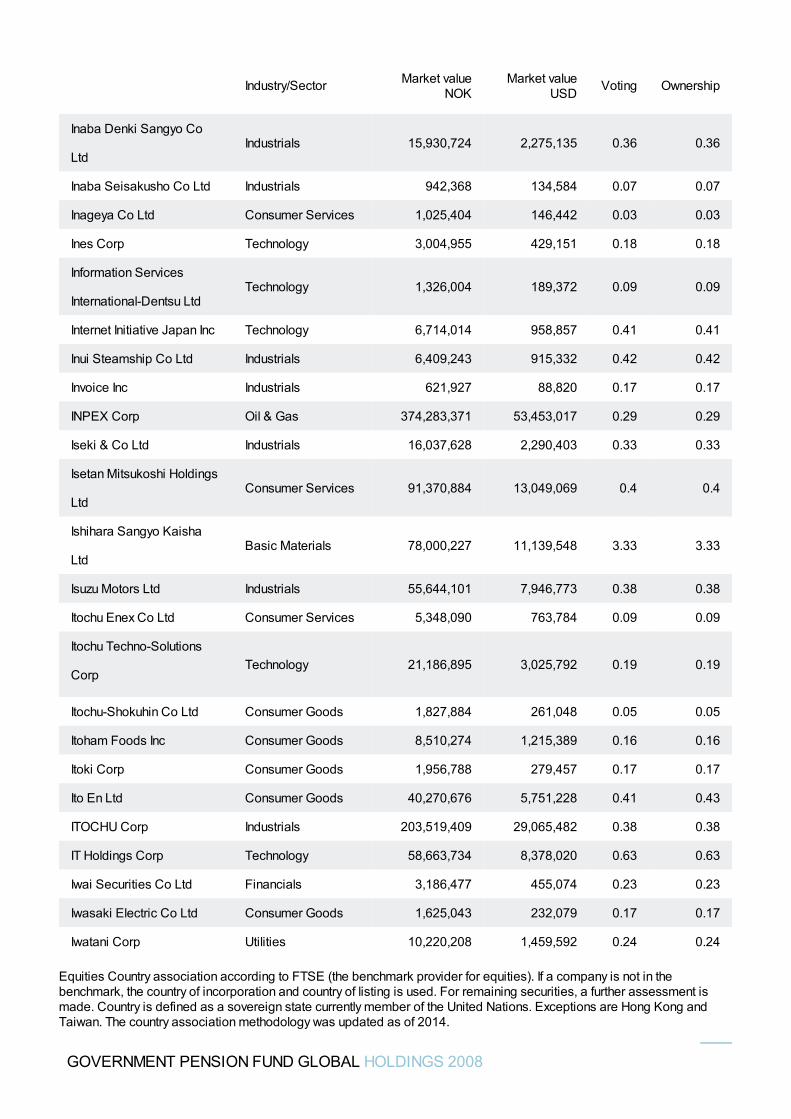
Inaba Denki Sangyo Co
LtdIndustrials 15,930,724 2,275,135 0.36 0.36
Inaba Seisakusho Co Ltd Industrials 942,368 134,584 0.07 0.07
Inageya Co Ltd Consumer Services 1,025,404 146,442 0.03 0.03
Ines Corp Technology 3,004,955 429,151 0.18 0.18
Information Services
International-Dentsu LtdTechnology 1,326,004 189,372 0.09 0.09
Internet Initiative Japan Inc Technology 6,714,014 958,857 0.41 0.41
Inui Steamship Co Ltd Industrials 6,409,243 915,332 0.42 0.42
Invoice Inc Industrials 621,927 88,820 0.17 0.17
INPEX Corp Oil & Gas 374,283,371 53,453,017 0.29 0.29
Iseki & Co Ltd Industrials 16,037,628 2,290,403 0.33 0.33
Isetan Mitsukoshi Holdings
LtdConsumer Services 91,370,884 13,049,069 0.4 0.4
Ishihara Sangyo Kaisha
LtdBasic Materials 78,000,227 11,139,548 3.33 3.33
Isuzu Motors Ltd Industrials 55,644,101 7,946,773 0.38 0.38
Itochu Enex Co Ltd Consumer Services 5,348,090 763,784 0.09 0.09
Itochu Techno-Solutions
CorpTechnology 21,186,895 3,025,792 0.19 0.19
Itochu-Shokuhin Co Ltd Consumer Goods 1,827,884 261,048 0.05 0.05
Itoham Foods Inc Consumer Goods 8,510,274 1,215,389 0.16 0.16
Itoki Corp Consumer Goods 1,956,788 279,457 0.17 0.17
Ito En Ltd Consumer Goods 40,270,676 5,751,228 0.41 0.43
ITOCHU Corp Industrials 203,519,409 29,065,482 0.38 0.38
IT Holdings Corp Technology 58,663,734 8,378,020 0.63 0.63
Iwai Securities Co Ltd Financials 3,186,477 455,074 0.23 0.23
Iwasaki Electric Co Ltd Consumer Goods 1,625,043 232,079 0.17 0.17
Iwatani Corp Utilities 10,220,208 1,459,592 0.24 0.24
Industry/Sector Market valueNOK
Market valueUSD Voting Ownership
GOVERNMENT PENSION FUND GLOBAL HOLDINGS 2008
Equities Country association according to FTSE (the benchmark provider for equities). If a company is not in thebenchmark, the country of incorporation and country of listing is used. For remaining securities, a further assessment ismade. Country is defined as a sovereign state currently member of the United Nations. Exceptions are Hong Kong andTaiwan. The country association methodology was updated as of 2014.
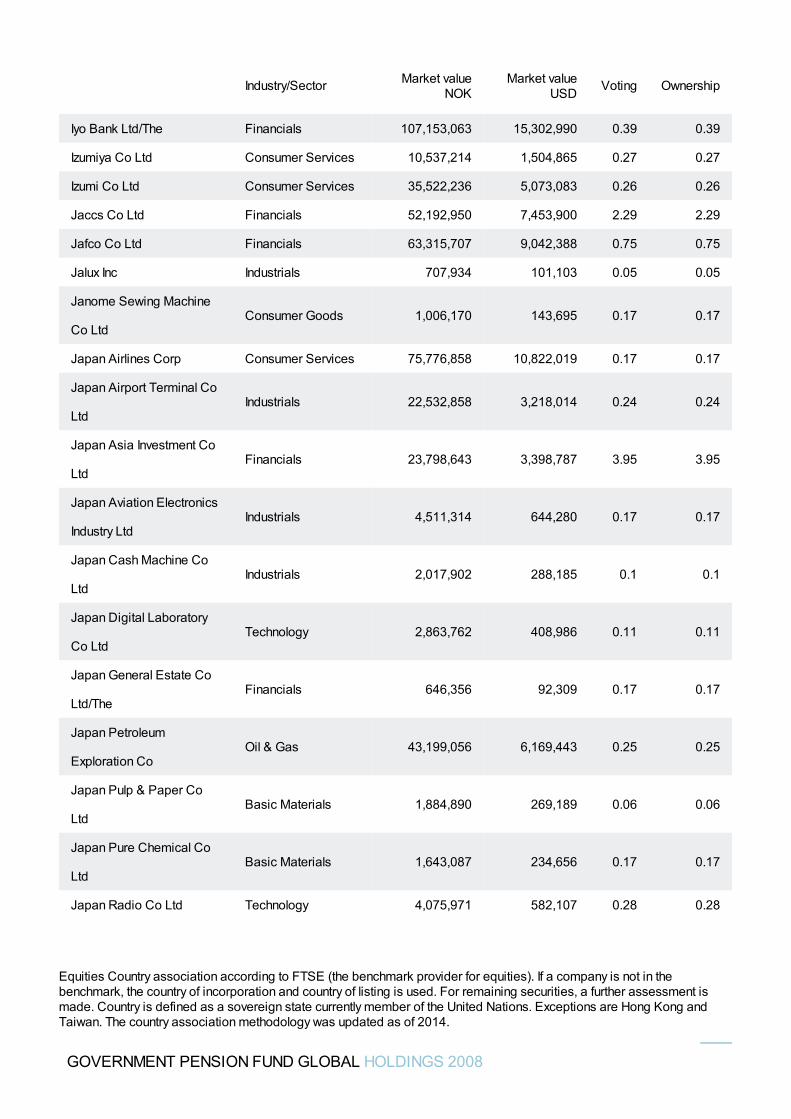
Iyo Bank Ltd/The Financials 107,153,063 15,302,990 0.39 0.39
Izumiya Co Ltd Consumer Services 10,537,214 1,504,865 0.27 0.27
Izumi Co Ltd Consumer Services 35,522,236 5,073,083 0.26 0.26
Jaccs Co Ltd Financials 52,192,950 7,453,900 2.29 2.29
Jafco Co Ltd Financials 63,315,707 9,042,388 0.75 0.75
Jalux Inc Industrials 707,934 101,103 0.05 0.05
Janome Sewing Machine
Co LtdConsumer Goods 1,006,170 143,695 0.17 0.17
Japan Airlines Corp Consumer Services 75,776,858 10,822,019 0.17 0.17
Japan Airport Terminal Co
LtdIndustrials 22,532,858 3,218,014 0.24 0.24
Japan Asia Investment Co
LtdFinancials 23,798,643 3,398,787 3.95 3.95
Japan Aviation Electronics
Industry LtdIndustrials 4,511,314 644,280 0.17 0.17
Japan Cash Machine Co
LtdIndustrials 2,017,902 288,185 0.1 0.1
Japan Digital Laboratory
Co LtdTechnology 2,863,762 408,986 0.11 0.11
Japan General Estate Co
Ltd/TheFinancials 646,356 92,309 0.17 0.17
Japan Petroleum
Exploration CoOil & Gas 43,199,056 6,169,443 0.25 0.25
Japan Pulp & Paper Co
LtdBasic Materials 1,884,890 269,189 0.06 0.06
Japan Pure Chemical Co
LtdBasic Materials 1,643,087 234,656 0.17 0.17
Japan Radio Co Ltd Technology 4,075,971 582,107 0.28 0.28
Industry/Sector Market valueNOK
Market valueUSD Voting Ownership
GOVERNMENT PENSION FUND GLOBAL HOLDINGS 2008
Equities Country association according to FTSE (the benchmark provider for equities). If a company is not in thebenchmark, the country of incorporation and country of listing is used. For remaining securities, a further assessment ismade. Country is defined as a sovereign state currently member of the United Nations. Exceptions are Hong Kong andTaiwan. The country association methodology was updated as of 2014.
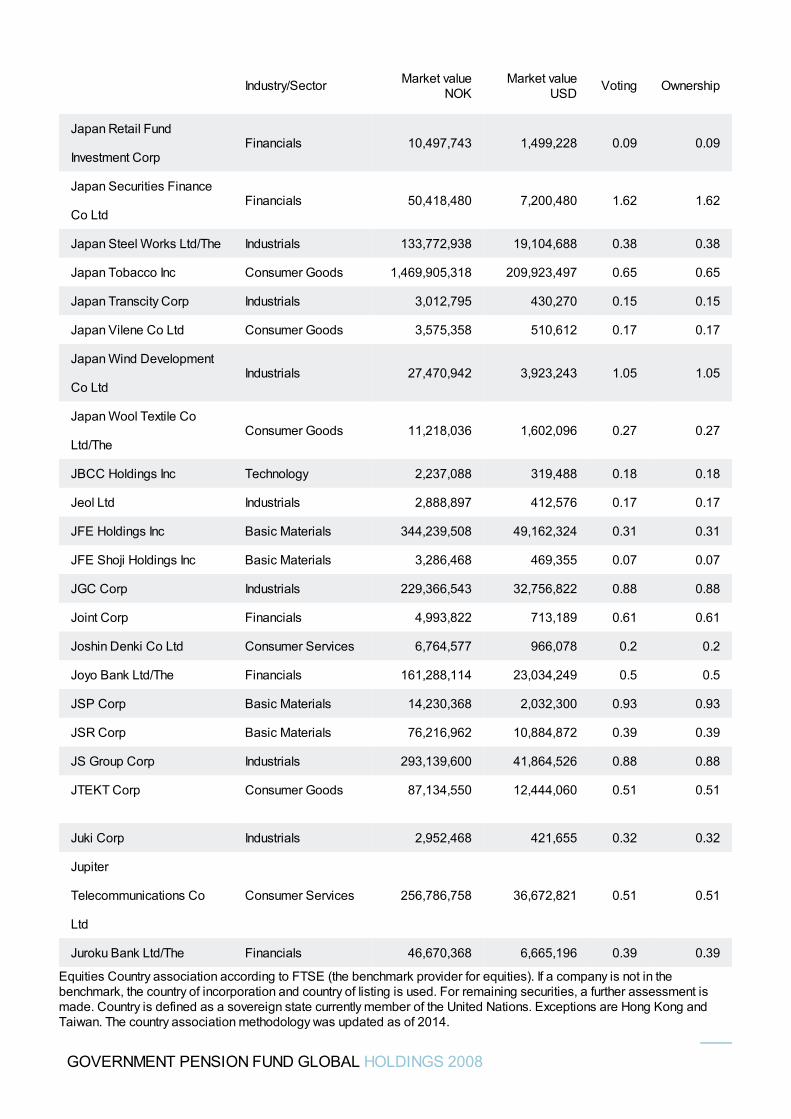
Japan Retail Fund
Investment CorpFinancials 10,497,743 1,499,228 0.09 0.09
Japan Securities Finance
Co LtdFinancials 50,418,480 7,200,480 1.62 1.62
Japan Steel Works Ltd/The Industrials 133,772,938 19,104,688 0.38 0.38
Japan Tobacco Inc Consumer Goods 1,469,905,318 209,923,497 0.65 0.65
Japan Transcity Corp Industrials 3,012,795 430,270 0.15 0.15
Japan Vilene Co Ltd Consumer Goods 3,575,358 510,612 0.17 0.17
Japan Wind Development
Co LtdIndustrials 27,470,942 3,923,243 1.05 1.05
Japan Wool Textile Co
Ltd/TheConsumer Goods 11,218,036 1,602,096 0.27 0.27
JBCC Holdings Inc Technology 2,237,088 319,488 0.18 0.18
Jeol Ltd Industrials 2,888,897 412,576 0.17 0.17
JFE Holdings Inc Basic Materials 344,239,508 49,162,324 0.31 0.31
JFE Shoji Holdings Inc Basic Materials 3,286,468 469,355 0.07 0.07
JGC Corp Industrials 229,366,543 32,756,822 0.88 0.88
Joint Corp Financials 4,993,822 713,189 0.61 0.61
Joshin Denki Co Ltd Consumer Services 6,764,577 966,078 0.2 0.2
Joyo Bank Ltd/The Financials 161,288,114 23,034,249 0.5 0.5
JSP Corp Basic Materials 14,230,368 2,032,300 0.93 0.93
JSR Corp Basic Materials 76,216,962 10,884,872 0.39 0.39
JS Group Corp Industrials 293,139,600 41,864,526 0.88 0.88
JTEKT Corp Consumer Goods 87,134,550 12,444,060 0.51 0.51
Juki Corp Industrials 2,952,468 421,655 0.32 0.32
Jupiter
Telecommunications Co
Ltd
Consumer Services 256,786,758 36,672,821 0.51 0.51
Juroku Bank Ltd/The Financials 46,670,368 6,665,196 0.39 0.39
Industry/Sector Market valueNOK
Market valueUSD Voting Ownership
GOVERNMENT PENSION FUND GLOBAL HOLDINGS 2008
Equities Country association according to FTSE (the benchmark provider for equities). If a company is not in thebenchmark, the country of incorporation and country of listing is used. For remaining securities, a further assessment ismade. Country is defined as a sovereign state currently member of the United Nations. Exceptions are Hong Kong andTaiwan. The country association methodology was updated as of 2014.
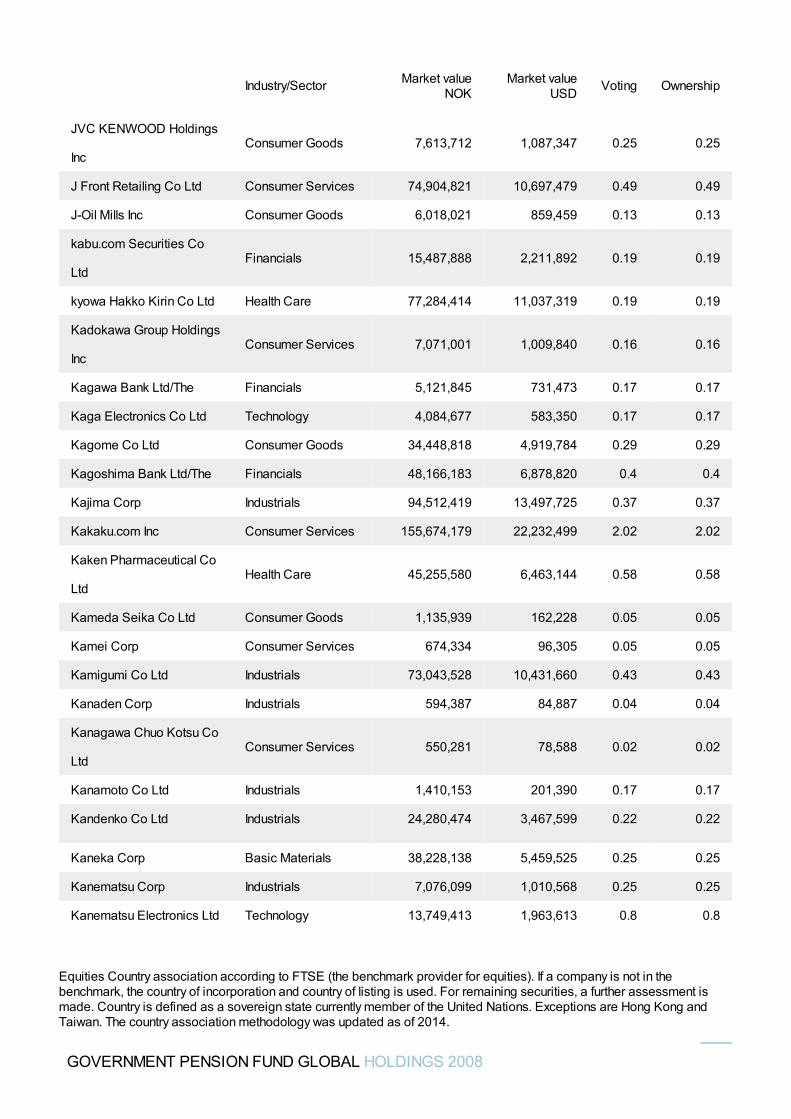
JVC KENWOOD Holdings
IncConsumer Goods 7,613,712 1,087,347 0.25 0.25
J Front Retailing Co Ltd Consumer Services 74,904,821 10,697,479 0.49 0.49
J-Oil Mills Inc Consumer Goods 6,018,021 859,459 0.13 0.13
kabu.com Securities Co
LtdFinancials 15,487,888 2,211,892 0.19 0.19
kyowa Hakko Kirin Co Ltd Health Care 77,284,414 11,037,319 0.19 0.19
Kadokawa Group Holdings
IncConsumer Services 7,071,001 1,009,840 0.16 0.16
Kagawa Bank Ltd/The Financials 5,121,845 731,473 0.17 0.17
Kaga Electronics Co Ltd Technology 4,084,677 583,350 0.17 0.17
Kagome Co Ltd Consumer Goods 34,448,818 4,919,784 0.29 0.29
Kagoshima Bank Ltd/The Financials 48,166,183 6,878,820 0.4 0.4
Kajima Corp Industrials 94,512,419 13,497,725 0.37 0.37
Kakaku.com Inc Consumer Services 155,674,179 22,232,499 2.02 2.02
Kaken Pharmaceutical Co
LtdHealth Care 45,255,580 6,463,144 0.58 0.58
Kameda Seika Co Ltd Consumer Goods 1,135,939 162,228 0.05 0.05
Kamei Corp Consumer Services 674,334 96,305 0.05 0.05
Kamigumi Co Ltd Industrials 73,043,528 10,431,660 0.43 0.43
Kanaden Corp Industrials 594,387 84,887 0.04 0.04
Kanagawa Chuo Kotsu Co
LtdConsumer Services 550,281 78,588 0.02 0.02
Kanamoto Co Ltd Industrials 1,410,153 201,390 0.17 0.17
Kandenko Co Ltd Industrials 24,280,474 3,467,599 0.22 0.22
Kaneka Corp Basic Materials 38,228,138 5,459,525 0.25 0.25
Kanematsu Corp Industrials 7,076,099 1,010,568 0.25 0.25
Kanematsu Electronics Ltd Technology 13,749,413 1,963,613 0.8 0.8
Industry/Sector Market valueNOK
Market valueUSD Voting Ownership
GOVERNMENT PENSION FUND GLOBAL HOLDINGS 2008
Equities Country association according to FTSE (the benchmark provider for equities). If a company is not in thebenchmark, the country of incorporation and country of listing is used. For remaining securities, a further assessment ismade. Country is defined as a sovereign state currently member of the United Nations. Exceptions are Hong Kong andTaiwan. The country association methodology was updated as of 2014.
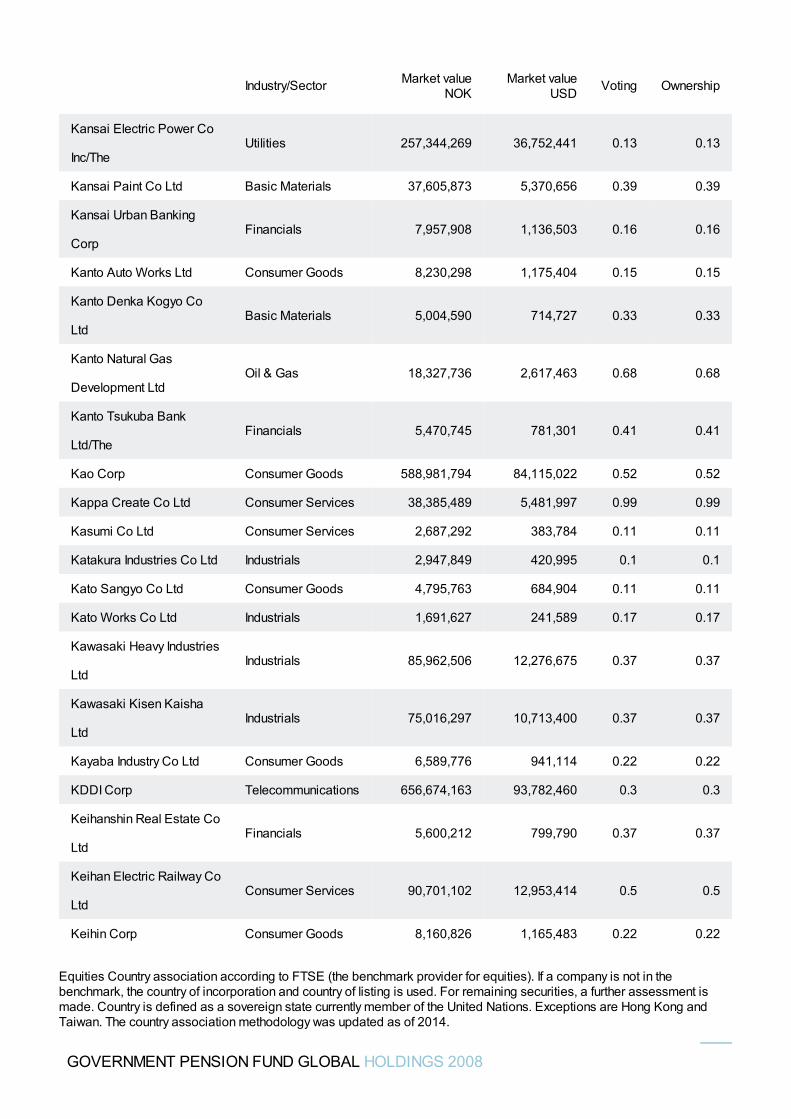
Kansai Electric Power Co
Inc/TheUtilities 257,344,269 36,752,441 0.13 0.13
Kansai Paint Co Ltd Basic Materials 37,605,873 5,370,656 0.39 0.39
Kansai Urban Banking
CorpFinancials 7,957,908 1,136,503 0.16 0.16
Kanto Auto Works Ltd Consumer Goods 8,230,298 1,175,404 0.15 0.15
Kanto Denka Kogyo Co
LtdBasic Materials 5,004,590 714,727 0.33 0.33
Kanto Natural Gas
Development LtdOil & Gas 18,327,736 2,617,463 0.68 0.68
Kanto Tsukuba Bank
Ltd/TheFinancials 5,470,745 781,301 0.41 0.41
Kao Corp Consumer Goods 588,981,794 84,115,022 0.52 0.52
Kappa Create Co Ltd Consumer Services 38,385,489 5,481,997 0.99 0.99
Kasumi Co Ltd Consumer Services 2,687,292 383,784 0.11 0.11
Katakura Industries Co Ltd Industrials 2,947,849 420,995 0.1 0.1
Kato Sangyo Co Ltd Consumer Goods 4,795,763 684,904 0.11 0.11
Kato Works Co Ltd Industrials 1,691,627 241,589 0.17 0.17
Kawasaki Heavy Industries
LtdIndustrials 85,962,506 12,276,675 0.37 0.37
Kawasaki Kisen Kaisha
LtdIndustrials 75,016,297 10,713,400 0.37 0.37
Kayaba Industry Co Ltd Consumer Goods 6,589,776 941,114 0.22 0.22
KDDI Corp Telecommunications 656,674,163 93,782,460 0.3 0.3
Keihanshin Real Estate Co
LtdFinancials 5,600,212 799,790 0.37 0.37
Keihan Electric Railway Co
LtdConsumer Services 90,701,102 12,953,414 0.5 0.5
Keihin Corp Consumer Goods 8,160,826 1,165,483 0.22 0.22
Industry/Sector Market valueNOK
Market valueUSD Voting Ownership
GOVERNMENT PENSION FUND GLOBAL HOLDINGS 2008
Equities Country association according to FTSE (the benchmark provider for equities). If a company is not in thebenchmark, the country of incorporation and country of listing is used. For remaining securities, a further assessment ismade. Country is defined as a sovereign state currently member of the United Nations. Exceptions are Hong Kong andTaiwan. The country association methodology was updated as of 2014.
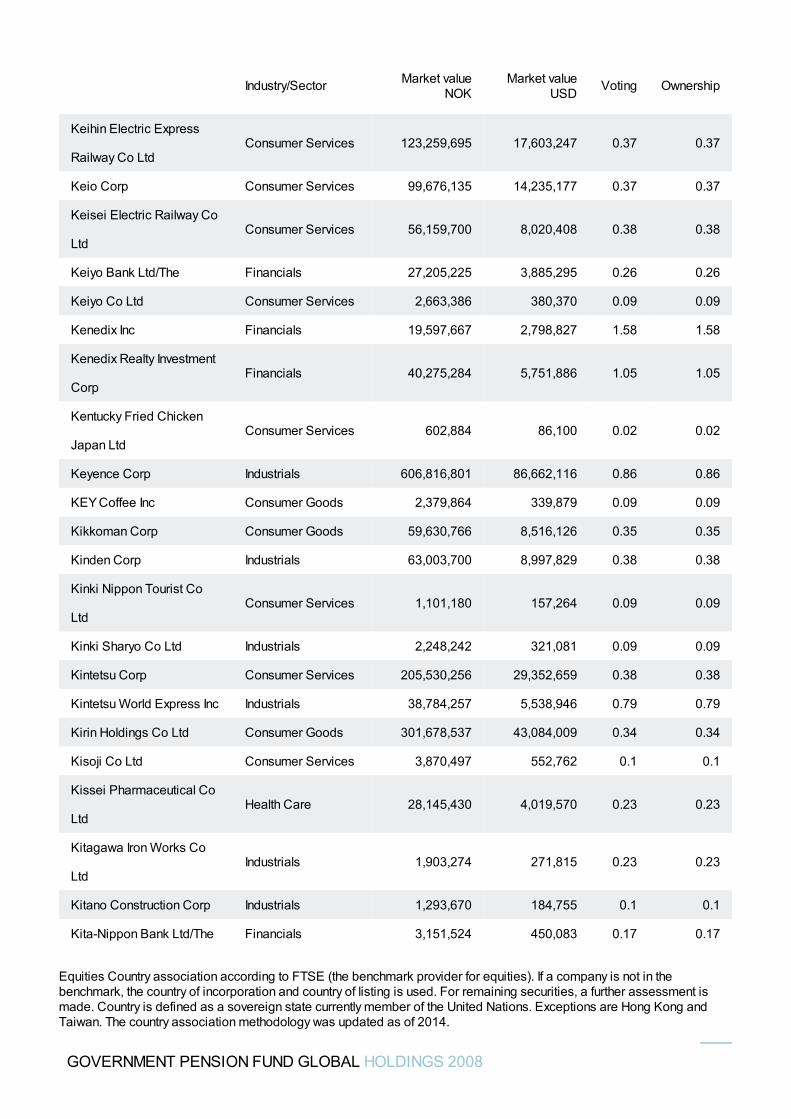
Keihin Electric Express
Railway Co LtdConsumer Services 123,259,695 17,603,247 0.37 0.37
Keio Corp Consumer Services 99,676,135 14,235,177 0.37 0.37
Keisei Electric Railway Co
LtdConsumer Services 56,159,700 8,020,408 0.38 0.38
Keiyo Bank Ltd/The Financials 27,205,225 3,885,295 0.26 0.26
Keiyo Co Ltd Consumer Services 2,663,386 380,370 0.09 0.09
Kenedix Inc Financials 19,597,667 2,798,827 1.58 1.58
Kenedix Realty Investment
CorpFinancials 40,275,284 5,751,886 1.05 1.05
Kentucky Fried Chicken
Japan LtdConsumer Services 602,884 86,100 0.02 0.02
Keyence Corp Industrials 606,816,801 86,662,116 0.86 0.86
KEY Coffee Inc Consumer Goods 2,379,864 339,879 0.09 0.09
Kikkoman Corp Consumer Goods 59,630,766 8,516,126 0.35 0.35
Kinden Corp Industrials 63,003,700 8,997,829 0.38 0.38
Kinki Nippon Tourist Co
LtdConsumer Services 1,101,180 157,264 0.09 0.09
Kinki Sharyo Co Ltd Industrials 2,248,242 321,081 0.09 0.09
Kintetsu Corp Consumer Services 205,530,256 29,352,659 0.38 0.38
Kintetsu World Express Inc Industrials 38,784,257 5,538,946 0.79 0.79
Kirin Holdings Co Ltd Consumer Goods 301,678,537 43,084,009 0.34 0.34
Kisoji Co Ltd Consumer Services 3,870,497 552,762 0.1 0.1
Kissei Pharmaceutical Co
LtdHealth Care 28,145,430 4,019,570 0.23 0.23
Kitagawa Iron Works Co
LtdIndustrials 1,903,274 271,815 0.23 0.23
Kitano Construction Corp Industrials 1,293,670 184,755 0.1 0.1
Kita-Nippon Bank Ltd/The Financials 3,151,524 450,083 0.17 0.17
Industry/Sector Market valueNOK
Market valueUSD Voting Ownership
GOVERNMENT PENSION FUND GLOBAL HOLDINGS 2008
Equities Country association according to FTSE (the benchmark provider for equities). If a company is not in thebenchmark, the country of incorporation and country of listing is used. For remaining securities, a further assessment ismade. Country is defined as a sovereign state currently member of the United Nations. Exceptions are Hong Kong andTaiwan. The country association methodology was updated as of 2014.
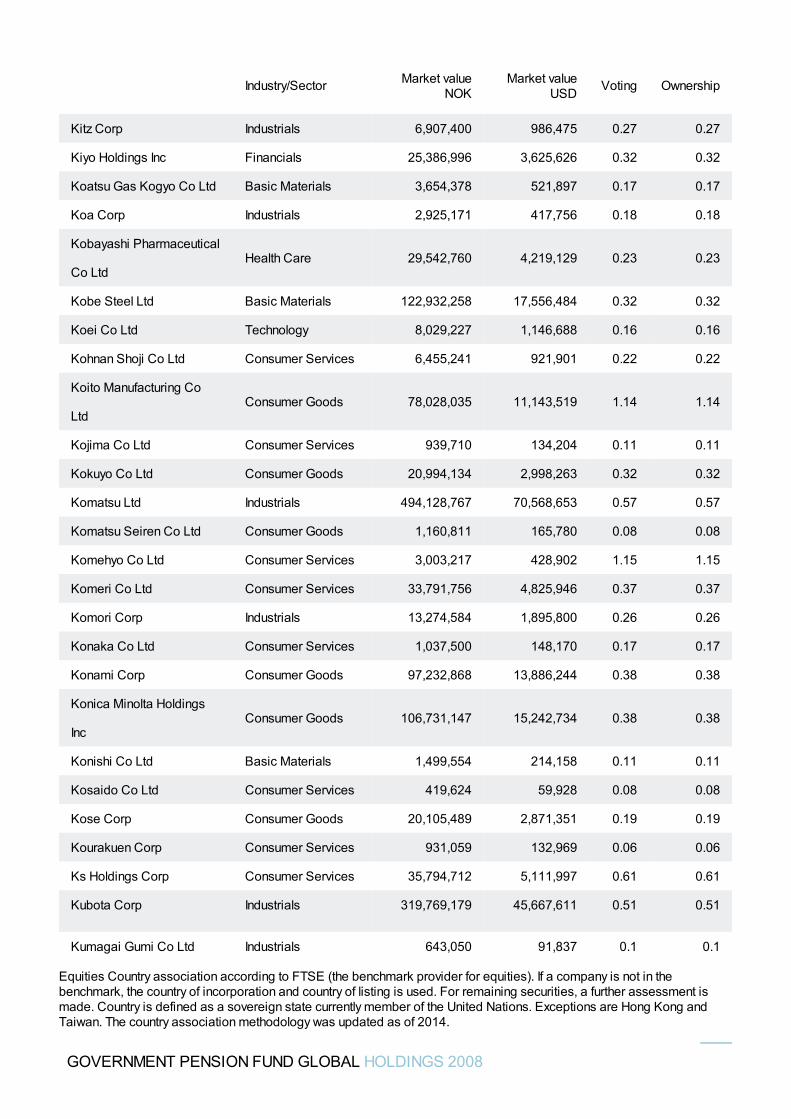
Kitz Corp Industrials 6,907,400 986,475 0.27 0.27
Kiyo Holdings Inc Financials 25,386,996 3,625,626 0.32 0.32
Koatsu Gas Kogyo Co Ltd Basic Materials 3,654,378 521,897 0.17 0.17
Koa Corp Industrials 2,925,171 417,756 0.18 0.18
Kobayashi Pharmaceutical
Co LtdHealth Care 29,542,760 4,219,129 0.23 0.23
Kobe Steel Ltd Basic Materials 122,932,258 17,556,484 0.32 0.32
Koei Co Ltd Technology 8,029,227 1,146,688 0.16 0.16
Kohnan Shoji Co Ltd Consumer Services 6,455,241 921,901 0.22 0.22
Koito Manufacturing Co
LtdConsumer Goods 78,028,035 11,143,519 1.14 1.14
Kojima Co Ltd Consumer Services 939,710 134,204 0.11 0.11
Kokuyo Co Ltd Consumer Goods 20,994,134 2,998,263 0.32 0.32
Komatsu Ltd Industrials 494,128,767 70,568,653 0.57 0.57
Komatsu Seiren Co Ltd Consumer Goods 1,160,811 165,780 0.08 0.08
Komehyo Co Ltd Consumer Services 3,003,217 428,902 1.15 1.15
Komeri Co Ltd Consumer Services 33,791,756 4,825,946 0.37 0.37
Komori Corp Industrials 13,274,584 1,895,800 0.26 0.26
Konaka Co Ltd Consumer Services 1,037,500 148,170 0.17 0.17
Konami Corp Consumer Goods 97,232,868 13,886,244 0.38 0.38
Konica Minolta Holdings
IncConsumer Goods 106,731,147 15,242,734 0.38 0.38
Konishi Co Ltd Basic Materials 1,499,554 214,158 0.11 0.11
Kosaido Co Ltd Consumer Services 419,624 59,928 0.08 0.08
Kose Corp Consumer Goods 20,105,489 2,871,351 0.19 0.19
Kourakuen Corp Consumer Services 931,059 132,969 0.06 0.06
Ks Holdings Corp Consumer Services 35,794,712 5,111,997 0.61 0.61
Kubota Corp Industrials 319,769,179 45,667,611 0.51 0.51
Kumagai Gumi Co Ltd Industrials 643,050 91,837 0.1 0.1
Industry/Sector Market valueNOK
Market valueUSD Voting Ownership
GOVERNMENT PENSION FUND GLOBAL HOLDINGS 2008
Equities Country association according to FTSE (the benchmark provider for equities). If a company is not in thebenchmark, the country of incorporation and country of listing is used. For remaining securities, a further assessment ismade. Country is defined as a sovereign state currently member of the United Nations. Exceptions are Hong Kong andTaiwan. The country association methodology was updated as of 2014.
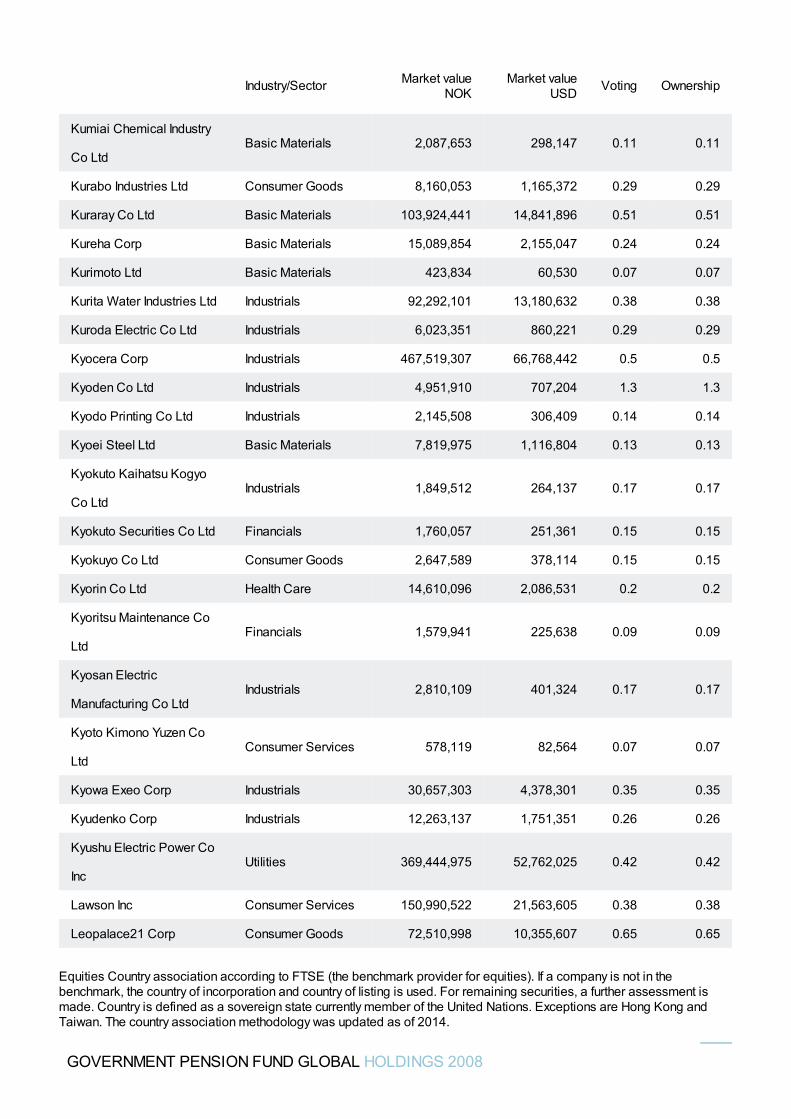
Kumiai Chemical Industry
Co LtdBasic Materials 2,087,653 298,147 0.11 0.11
Kurabo Industries Ltd Consumer Goods 8,160,053 1,165,372 0.29 0.29
Kuraray Co Ltd Basic Materials 103,924,441 14,841,896 0.51 0.51
Kureha Corp Basic Materials 15,089,854 2,155,047 0.24 0.24
Kurimoto Ltd Basic Materials 423,834 60,530 0.07 0.07
Kurita Water Industries Ltd Industrials 92,292,101 13,180,632 0.38 0.38
Kuroda Electric Co Ltd Industrials 6,023,351 860,221 0.29 0.29
Kyocera Corp Industrials 467,519,307 66,768,442 0.5 0.5
Kyoden Co Ltd Industrials 4,951,910 707,204 1.3 1.3
Kyodo Printing Co Ltd Industrials 2,145,508 306,409 0.14 0.14
Kyoei Steel Ltd Basic Materials 7,819,975 1,116,804 0.13 0.13
Kyokuto Kaihatsu Kogyo
Co LtdIndustrials 1,849,512 264,137 0.17 0.17
Kyokuto Securities Co Ltd Financials 1,760,057 251,361 0.15 0.15
Kyokuyo Co Ltd Consumer Goods 2,647,589 378,114 0.15 0.15
Kyorin Co Ltd Health Care 14,610,096 2,086,531 0.2 0.2
Kyoritsu Maintenance Co
LtdFinancials 1,579,941 225,638 0.09 0.09
Kyosan Electric
Manufacturing Co LtdIndustrials 2,810,109 401,324 0.17 0.17
Kyoto Kimono Yuzen Co
LtdConsumer Services 578,119 82,564 0.07 0.07
Kyowa Exeo Corp Industrials 30,657,303 4,378,301 0.35 0.35
Kyudenko Corp Industrials 12,263,137 1,751,351 0.26 0.26
Kyushu Electric Power Co
IncUtilities 369,444,975 52,762,025 0.42 0.42
Lawson Inc Consumer Services 150,990,522 21,563,605 0.38 0.38
Leopalace21 Corp Consumer Goods 72,510,998 10,355,607 0.65 0.65
Industry/Sector Market valueNOK
Market valueUSD Voting Ownership
GOVERNMENT PENSION FUND GLOBAL HOLDINGS 2008
Equities Country association according to FTSE (the benchmark provider for equities). If a company is not in thebenchmark, the country of incorporation and country of listing is used. For remaining securities, a further assessment ismade. Country is defined as a sovereign state currently member of the United Nations. Exceptions are Hong Kong andTaiwan. The country association methodology was updated as of 2014.
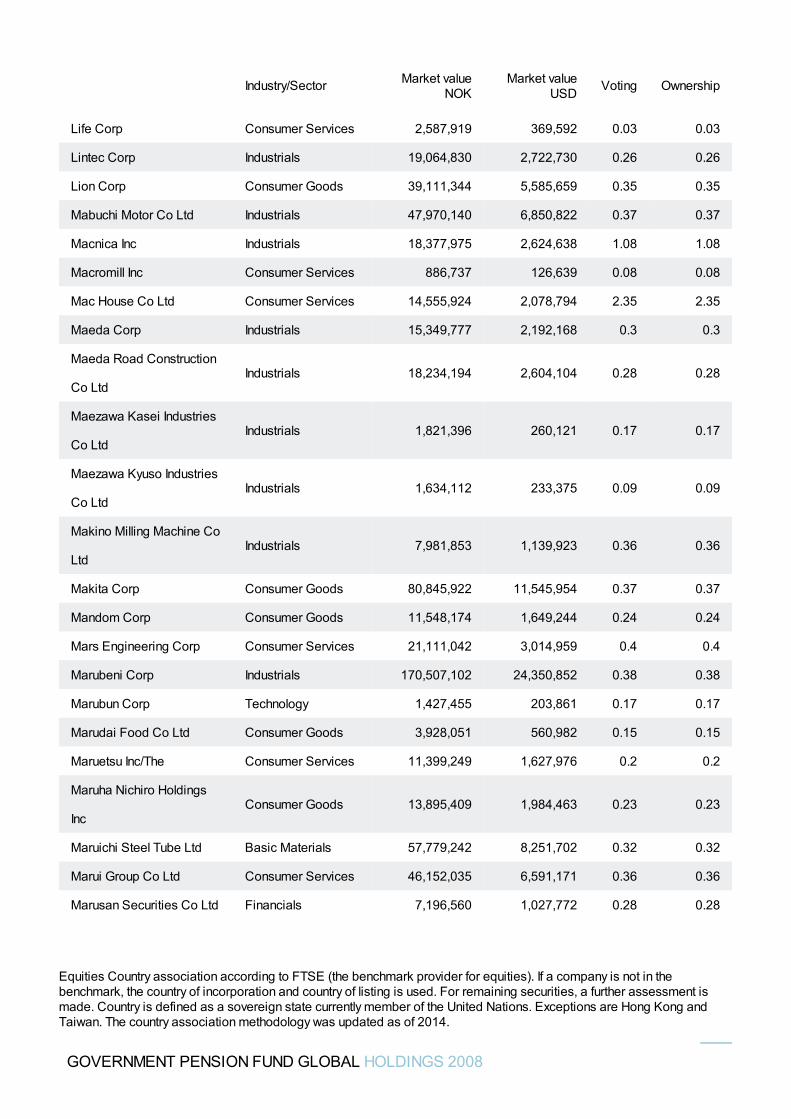
Life Corp Consumer Services 2,587,919 369,592 0.03 0.03
Lintec Corp Industrials 19,064,830 2,722,730 0.26 0.26
Lion Corp Consumer Goods 39,111,344 5,585,659 0.35 0.35
Mabuchi Motor Co Ltd Industrials 47,970,140 6,850,822 0.37 0.37
Macnica Inc Industrials 18,377,975 2,624,638 1.08 1.08
Macromill Inc Consumer Services 886,737 126,639 0.08 0.08
Mac House Co Ltd Consumer Services 14,555,924 2,078,794 2.35 2.35
Maeda Corp Industrials 15,349,777 2,192,168 0.3 0.3
Maeda Road Construction
Co LtdIndustrials 18,234,194 2,604,104 0.28 0.28
Maezawa Kasei Industries
Co LtdIndustrials 1,821,396 260,121 0.17 0.17
Maezawa Kyuso Industries
Co LtdIndustrials 1,634,112 233,375 0.09 0.09
Makino Milling Machine Co
LtdIndustrials 7,981,853 1,139,923 0.36 0.36
Makita Corp Consumer Goods 80,845,922 11,545,954 0.37 0.37
Mandom Corp Consumer Goods 11,548,174 1,649,244 0.24 0.24
Mars Engineering Corp Consumer Services 21,111,042 3,014,959 0.4 0.4
Marubeni Corp Industrials 170,507,102 24,350,852 0.38 0.38
Marubun Corp Technology 1,427,455 203,861 0.17 0.17
Marudai Food Co Ltd Consumer Goods 3,928,051 560,982 0.15 0.15
Maruetsu Inc/The Consumer Services 11,399,249 1,627,976 0.2 0.2
Maruha Nichiro Holdings
IncConsumer Goods 13,895,409 1,984,463 0.23 0.23
Maruichi Steel Tube Ltd Basic Materials 57,779,242 8,251,702 0.32 0.32
Marui Group Co Ltd Consumer Services 46,152,035 6,591,171 0.36 0.36
Marusan Securities Co Ltd Financials 7,196,560 1,027,772 0.28 0.28
Industry/Sector Market valueNOK
Market valueUSD Voting Ownership
GOVERNMENT PENSION FUND GLOBAL HOLDINGS 2008
Equities Country association according to FTSE (the benchmark provider for equities). If a company is not in thebenchmark, the country of incorporation and country of listing is used. For remaining securities, a further assessment ismade. Country is defined as a sovereign state currently member of the United Nations. Exceptions are Hong Kong andTaiwan. The country association methodology was updated as of 2014.
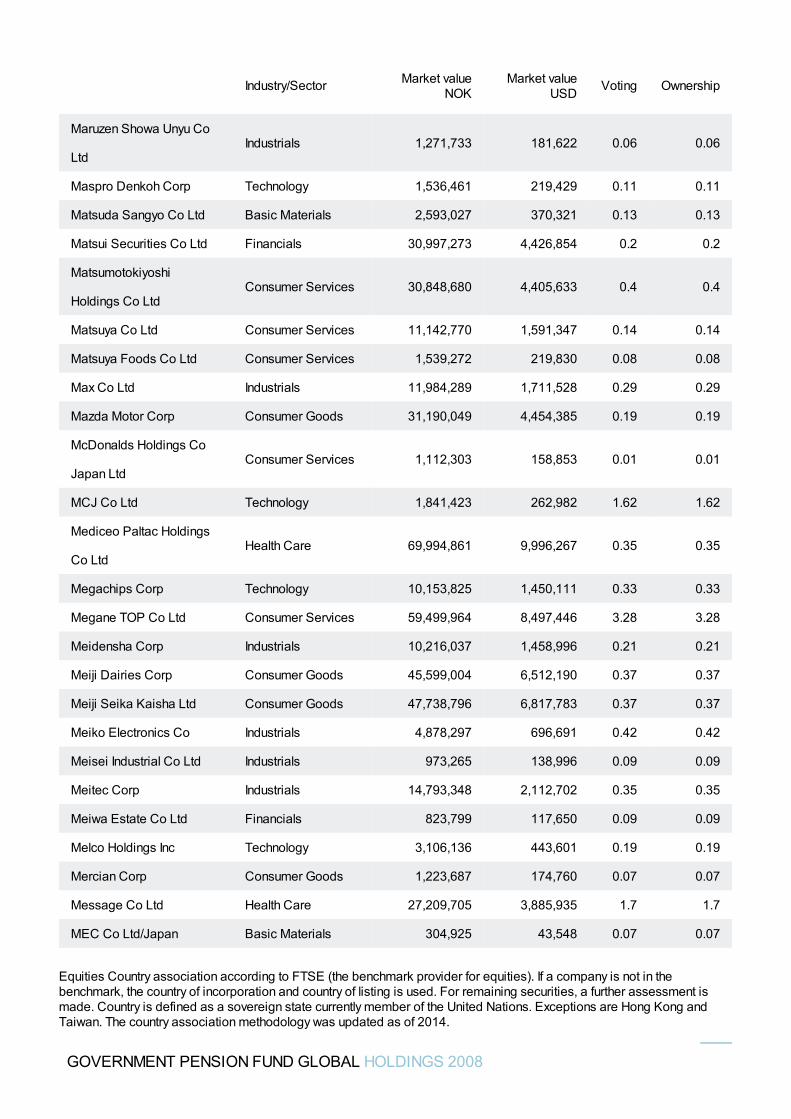
Maruzen Showa Unyu Co
LtdIndustrials 1,271,733 181,622 0.06 0.06
Maspro Denkoh Corp Technology 1,536,461 219,429 0.11 0.11
Matsuda Sangyo Co Ltd Basic Materials 2,593,027 370,321 0.13 0.13
Matsui Securities Co Ltd Financials 30,997,273 4,426,854 0.2 0.2
Matsumotokiyoshi
Holdings Co LtdConsumer Services 30,848,680 4,405,633 0.4 0.4
Matsuya Co Ltd Consumer Services 11,142,770 1,591,347 0.14 0.14
Matsuya Foods Co Ltd Consumer Services 1,539,272 219,830 0.08 0.08
Max Co Ltd Industrials 11,984,289 1,711,528 0.29 0.29
Mazda Motor Corp Consumer Goods 31,190,049 4,454,385 0.19 0.19
McDonalds Holdings Co
Japan LtdConsumer Services 1,112,303 158,853 0.01 0.01
MCJ Co Ltd Technology 1,841,423 262,982 1.62 1.62
Mediceo Paltac Holdings
Co LtdHealth Care 69,994,861 9,996,267 0.35 0.35
Megachips Corp Technology 10,153,825 1,450,111 0.33 0.33
Megane TOP Co Ltd Consumer Services 59,499,964 8,497,446 3.28 3.28
Meidensha Corp Industrials 10,216,037 1,458,996 0.21 0.21
Meiji Dairies Corp Consumer Goods 45,599,004 6,512,190 0.37 0.37
Meiji Seika Kaisha Ltd Consumer Goods 47,738,796 6,817,783 0.37 0.37
Meiko Electronics Co Industrials 4,878,297 696,691 0.42 0.42
Meisei Industrial Co Ltd Industrials 973,265 138,996 0.09 0.09
Meitec Corp Industrials 14,793,348 2,112,702 0.35 0.35
Meiwa Estate Co Ltd Financials 823,799 117,650 0.09 0.09
Melco Holdings Inc Technology 3,106,136 443,601 0.19 0.19
Mercian Corp Consumer Goods 1,223,687 174,760 0.07 0.07
Message Co Ltd Health Care 27,209,705 3,885,935 1.7 1.7
MEC Co Ltd/Japan Basic Materials 304,925 43,548 0.07 0.07
Industry/Sector Market valueNOK
Market valueUSD Voting Ownership
GOVERNMENT PENSION FUND GLOBAL HOLDINGS 2008
Equities Country association according to FTSE (the benchmark provider for equities). If a company is not in thebenchmark, the country of incorporation and country of listing is used. For remaining securities, a further assessment ismade. Country is defined as a sovereign state currently member of the United Nations. Exceptions are Hong Kong andTaiwan. The country association methodology was updated as of 2014.
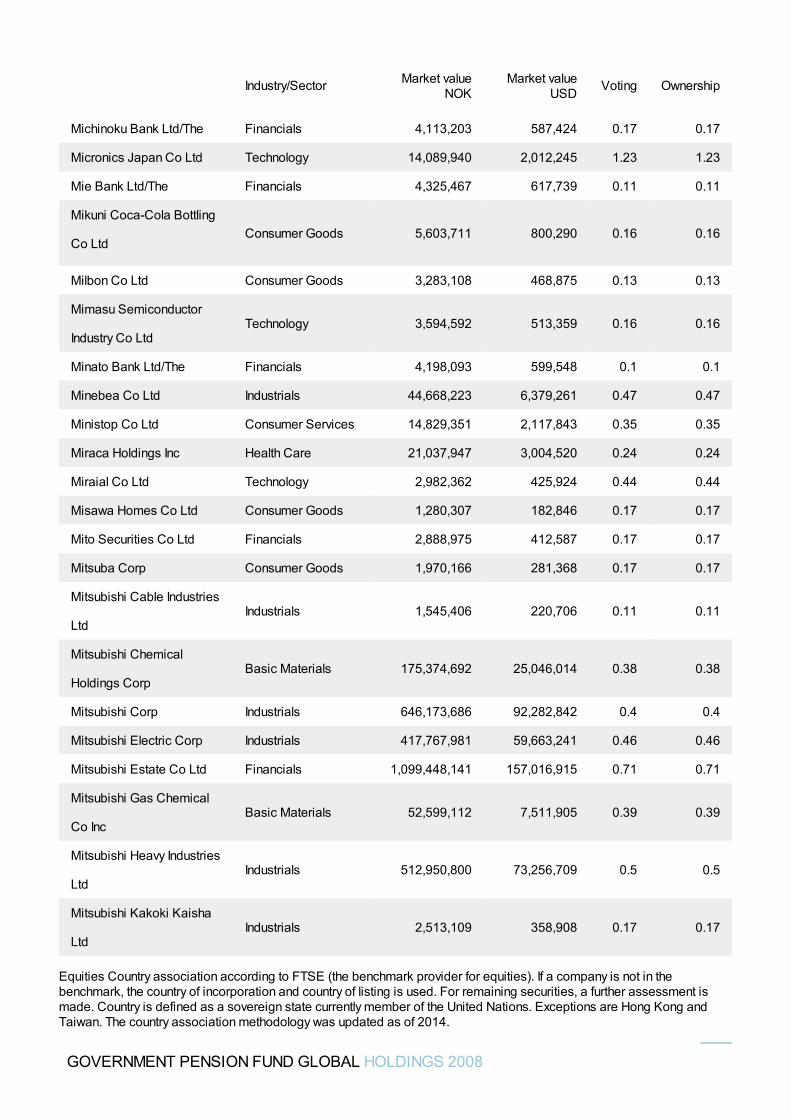
Michinoku Bank Ltd/The Financials 4,113,203 587,424 0.17 0.17
Micronics Japan Co Ltd Technology 14,089,940 2,012,245 1.23 1.23
Mie Bank Ltd/The Financials 4,325,467 617,739 0.11 0.11
Mikuni Coca-Cola Bottling
Co LtdConsumer Goods 5,603,711 800,290 0.16 0.16
Milbon Co Ltd Consumer Goods 3,283,108 468,875 0.13 0.13
Mimasu Semiconductor
Industry Co LtdTechnology 3,594,592 513,359 0.16 0.16
Minato Bank Ltd/The Financials 4,198,093 599,548 0.1 0.1
Minebea Co Ltd Industrials 44,668,223 6,379,261 0.47 0.47
Ministop Co Ltd Consumer Services 14,829,351 2,117,843 0.35 0.35
Miraca Holdings Inc Health Care 21,037,947 3,004,520 0.24 0.24
Miraial Co Ltd Technology 2,982,362 425,924 0.44 0.44
Misawa Homes Co Ltd Consumer Goods 1,280,307 182,846 0.17 0.17
Mito Securities Co Ltd Financials 2,888,975 412,587 0.17 0.17
Mitsuba Corp Consumer Goods 1,970,166 281,368 0.17 0.17
Mitsubishi Cable Industries
LtdIndustrials 1,545,406 220,706 0.11 0.11
Mitsubishi Chemical
Holdings CorpBasic Materials 175,374,692 25,046,014 0.38 0.38
Mitsubishi Corp Industrials 646,173,686 92,282,842 0.4 0.4
Mitsubishi Electric Corp Industrials 417,767,981 59,663,241 0.46 0.46
Mitsubishi Estate Co Ltd Financials 1,099,448,141 157,016,915 0.71 0.71
Mitsubishi Gas Chemical
Co IncBasic Materials 52,599,112 7,511,905 0.39 0.39
Mitsubishi Heavy Industries
LtdIndustrials 512,950,800 73,256,709 0.5 0.5
Mitsubishi Kakoki Kaisha
LtdIndustrials 2,513,109 358,908 0.17 0.17
Industry/Sector Market valueNOK
Market valueUSD Voting Ownership
GOVERNMENT PENSION FUND GLOBAL HOLDINGS 2008
Equities Country association according to FTSE (the benchmark provider for equities). If a company is not in thebenchmark, the country of incorporation and country of listing is used. For remaining securities, a further assessment ismade. Country is defined as a sovereign state currently member of the United Nations. Exceptions are Hong Kong andTaiwan. The country association methodology was updated as of 2014.
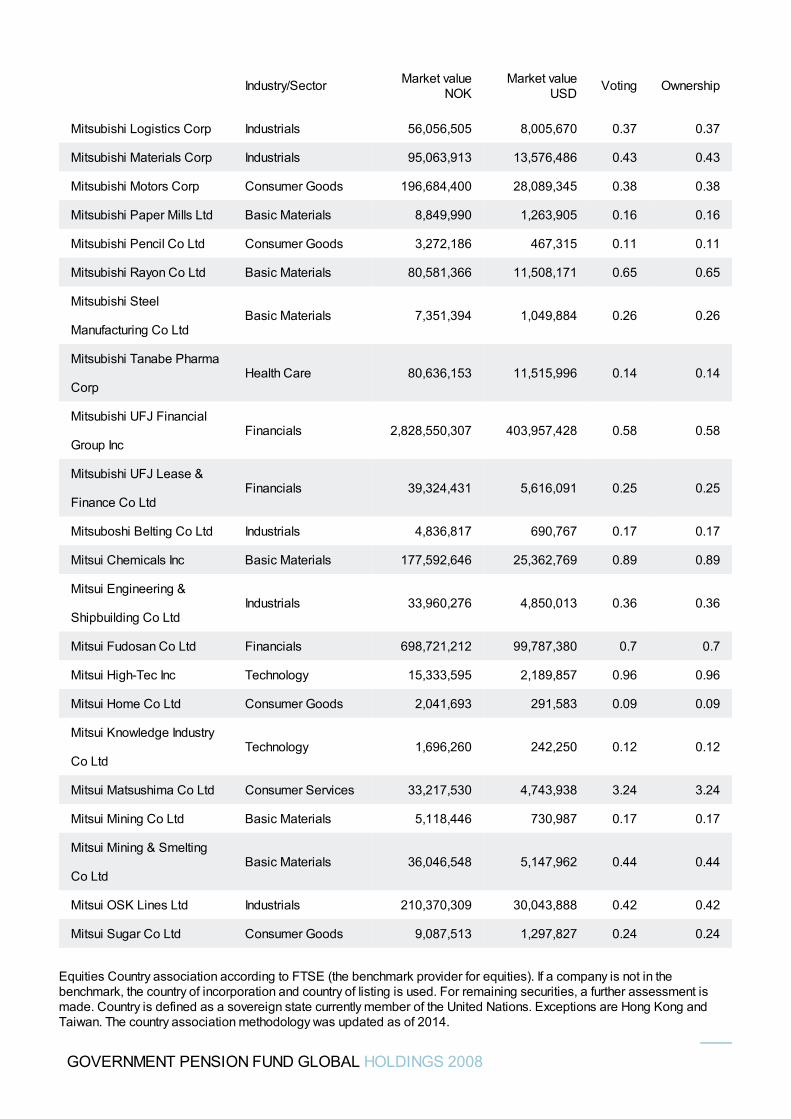
Mitsubishi Logistics Corp Industrials 56,056,505 8,005,670 0.37 0.37
Mitsubishi Materials Corp Industrials 95,063,913 13,576,486 0.43 0.43
Mitsubishi Motors Corp Consumer Goods 196,684,400 28,089,345 0.38 0.38
Mitsubishi Paper Mills Ltd Basic Materials 8,849,990 1,263,905 0.16 0.16
Mitsubishi Pencil Co Ltd Consumer Goods 3,272,186 467,315 0.11 0.11
Mitsubishi Rayon Co Ltd Basic Materials 80,581,366 11,508,171 0.65 0.65
Mitsubishi Steel
Manufacturing Co LtdBasic Materials 7,351,394 1,049,884 0.26 0.26
Mitsubishi Tanabe Pharma
CorpHealth Care 80,636,153 11,515,996 0.14 0.14
Mitsubishi UFJ Financial
Group IncFinancials 2,828,550,307 403,957,428 0.58 0.58
Mitsubishi UFJ Lease &
Finance Co LtdFinancials 39,324,431 5,616,091 0.25 0.25
Mitsuboshi Belting Co Ltd Industrials 4,836,817 690,767 0.17 0.17
Mitsui Chemicals Inc Basic Materials 177,592,646 25,362,769 0.89 0.89
Mitsui Engineering &
Shipbuilding Co LtdIndustrials 33,960,276 4,850,013 0.36 0.36
Mitsui Fudosan Co Ltd Financials 698,721,212 99,787,380 0.7 0.7
Mitsui High-Tec Inc Technology 15,333,595 2,189,857 0.96 0.96
Mitsui Home Co Ltd Consumer Goods 2,041,693 291,583 0.09 0.09
Mitsui Knowledge Industry
Co LtdTechnology 1,696,260 242,250 0.12 0.12
Mitsui Matsushima Co Ltd Consumer Services 33,217,530 4,743,938 3.24 3.24
Mitsui Mining Co Ltd Basic Materials 5,118,446 730,987 0.17 0.17
Mitsui Mining & Smelting
Co LtdBasic Materials 36,046,548 5,147,962 0.44 0.44
Mitsui OSK Lines Ltd Industrials 210,370,309 30,043,888 0.42 0.42
Mitsui Sugar Co Ltd Consumer Goods 9,087,513 1,297,827 0.24 0.24
Industry/Sector Market valueNOK
Market valueUSD Voting Ownership
GOVERNMENT PENSION FUND GLOBAL HOLDINGS 2008
Equities Country association according to FTSE (the benchmark provider for equities). If a company is not in thebenchmark, the country of incorporation and country of listing is used. For remaining securities, a further assessment ismade. Country is defined as a sovereign state currently member of the United Nations. Exceptions are Hong Kong andTaiwan. The country association methodology was updated as of 2014.
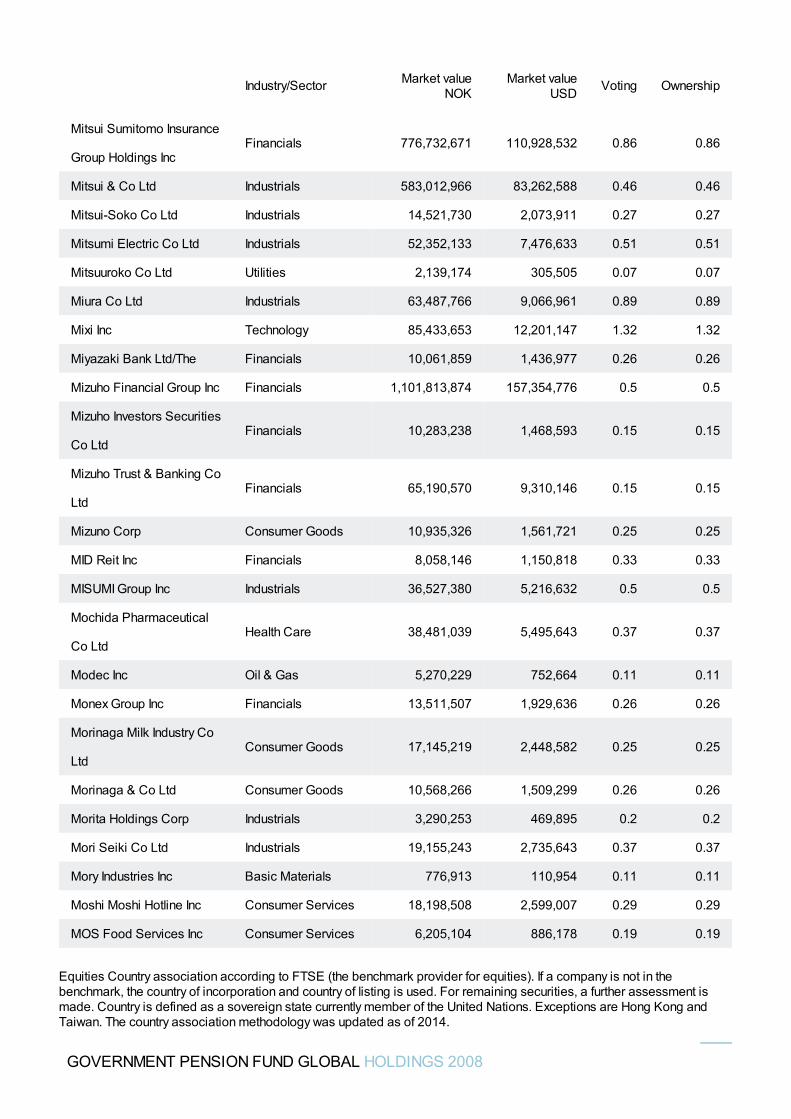
Mitsui Sumitomo Insurance
Group Holdings IncFinancials 776,732,671 110,928,532 0.86 0.86
Mitsui & Co Ltd Industrials 583,012,966 83,262,588 0.46 0.46
Mitsui-Soko Co Ltd Industrials 14,521,730 2,073,911 0.27 0.27
Mitsumi Electric Co Ltd Industrials 52,352,133 7,476,633 0.51 0.51
Mitsuuroko Co Ltd Utilities 2,139,174 305,505 0.07 0.07
Miura Co Ltd Industrials 63,487,766 9,066,961 0.89 0.89
Mixi Inc Technology 85,433,653 12,201,147 1.32 1.32
Miyazaki Bank Ltd/The Financials 10,061,859 1,436,977 0.26 0.26
Mizuho Financial Group Inc Financials 1,101,813,874 157,354,776 0.5 0.5
Mizuho Investors Securities
Co LtdFinancials 10,283,238 1,468,593 0.15 0.15
Mizuho Trust & Banking Co
LtdFinancials 65,190,570 9,310,146 0.15 0.15
Mizuno Corp Consumer Goods 10,935,326 1,561,721 0.25 0.25
MID Reit Inc Financials 8,058,146 1,150,818 0.33 0.33
MISUMI Group Inc Industrials 36,527,380 5,216,632 0.5 0.5
Mochida Pharmaceutical
Co LtdHealth Care 38,481,039 5,495,643 0.37 0.37
Modec Inc Oil & Gas 5,270,229 752,664 0.11 0.11
Monex Group Inc Financials 13,511,507 1,929,636 0.26 0.26
Morinaga Milk Industry Co
LtdConsumer Goods 17,145,219 2,448,582 0.25 0.25
Morinaga & Co Ltd Consumer Goods 10,568,266 1,509,299 0.26 0.26
Morita Holdings Corp Industrials 3,290,253 469,895 0.2 0.2
Mori Seiki Co Ltd Industrials 19,155,243 2,735,643 0.37 0.37
Mory Industries Inc Basic Materials 776,913 110,954 0.11 0.11
Moshi Moshi Hotline Inc Consumer Services 18,198,508 2,599,007 0.29 0.29
MOS Food Services Inc Consumer Services 6,205,104 886,178 0.19 0.19
Industry/Sector Market valueNOK
Market valueUSD Voting Ownership
GOVERNMENT PENSION FUND GLOBAL HOLDINGS 2008
Equities Country association according to FTSE (the benchmark provider for equities). If a company is not in thebenchmark, the country of incorporation and country of listing is used. For remaining securities, a further assessment ismade. Country is defined as a sovereign state currently member of the United Nations. Exceptions are Hong Kong andTaiwan. The country association methodology was updated as of 2014.
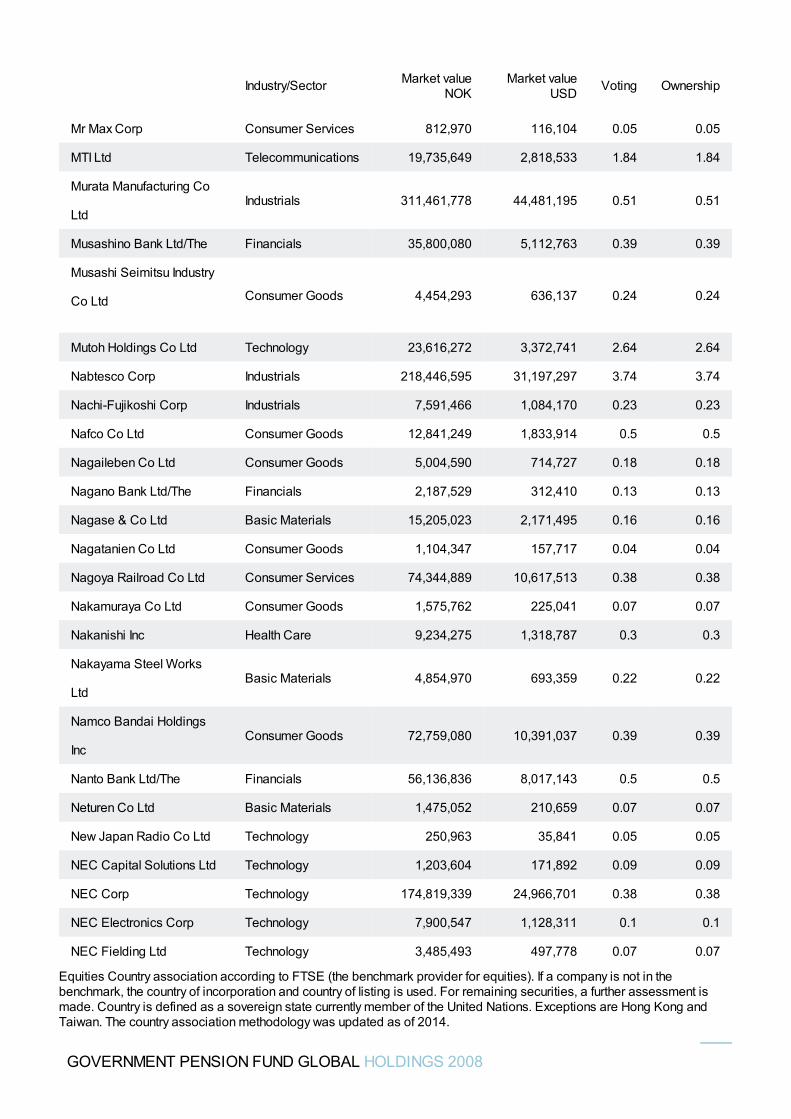
Mr Max Corp Consumer Services 812,970 116,104 0.05 0.05
MTI Ltd Telecommunications 19,735,649 2,818,533 1.84 1.84
Murata Manufacturing Co
LtdIndustrials 311,461,778 44,481,195 0.51 0.51
Musashino Bank Ltd/The Financials 35,800,080 5,112,763 0.39 0.39
Musashi Seimitsu Industry
Co Ltd Consumer Goods 4,454,293 636,137 0.24 0.24
Mutoh Holdings Co Ltd Technology 23,616,272 3,372,741 2.64 2.64
Nabtesco Corp Industrials 218,446,595 31,197,297 3.74 3.74
Nachi-Fujikoshi Corp Industrials 7,591,466 1,084,170 0.23 0.23
Nafco Co Ltd Consumer Goods 12,841,249 1,833,914 0.5 0.5
Nagaileben Co Ltd Consumer Goods 5,004,590 714,727 0.18 0.18
Nagano Bank Ltd/The Financials 2,187,529 312,410 0.13 0.13
Nagase & Co Ltd Basic Materials 15,205,023 2,171,495 0.16 0.16
Nagatanien Co Ltd Consumer Goods 1,104,347 157,717 0.04 0.04
Nagoya Railroad Co Ltd Consumer Services 74,344,889 10,617,513 0.38 0.38
Nakamuraya Co Ltd Consumer Goods 1,575,762 225,041 0.07 0.07
Nakanishi Inc Health Care 9,234,275 1,318,787 0.3 0.3
Nakayama Steel Works
LtdBasic Materials 4,854,970 693,359 0.22 0.22
Namco Bandai Holdings
IncConsumer Goods 72,759,080 10,391,037 0.39 0.39
Nanto Bank Ltd/The Financials 56,136,836 8,017,143 0.5 0.5
Neturen Co Ltd Basic Materials 1,475,052 210,659 0.07 0.07
New Japan Radio Co Ltd Technology 250,963 35,841 0.05 0.05
NEC Capital Solutions Ltd Technology 1,203,604 171,892 0.09 0.09
NEC Corp Technology 174,819,339 24,966,701 0.38 0.38
NEC Electronics Corp Technology 7,900,547 1,128,311 0.1 0.1
NEC Fielding Ltd Technology 3,485,493 497,778 0.07 0.07
Industry/Sector Market valueNOK
Market valueUSD Voting Ownership
GOVERNMENT PENSION FUND GLOBAL HOLDINGS 2008
Equities Country association according to FTSE (the benchmark provider for equities). If a company is not in thebenchmark, the country of incorporation and country of listing is used. For remaining securities, a further assessment ismade. Country is defined as a sovereign state currently member of the United Nations. Exceptions are Hong Kong andTaiwan. The country association methodology was updated as of 2014.
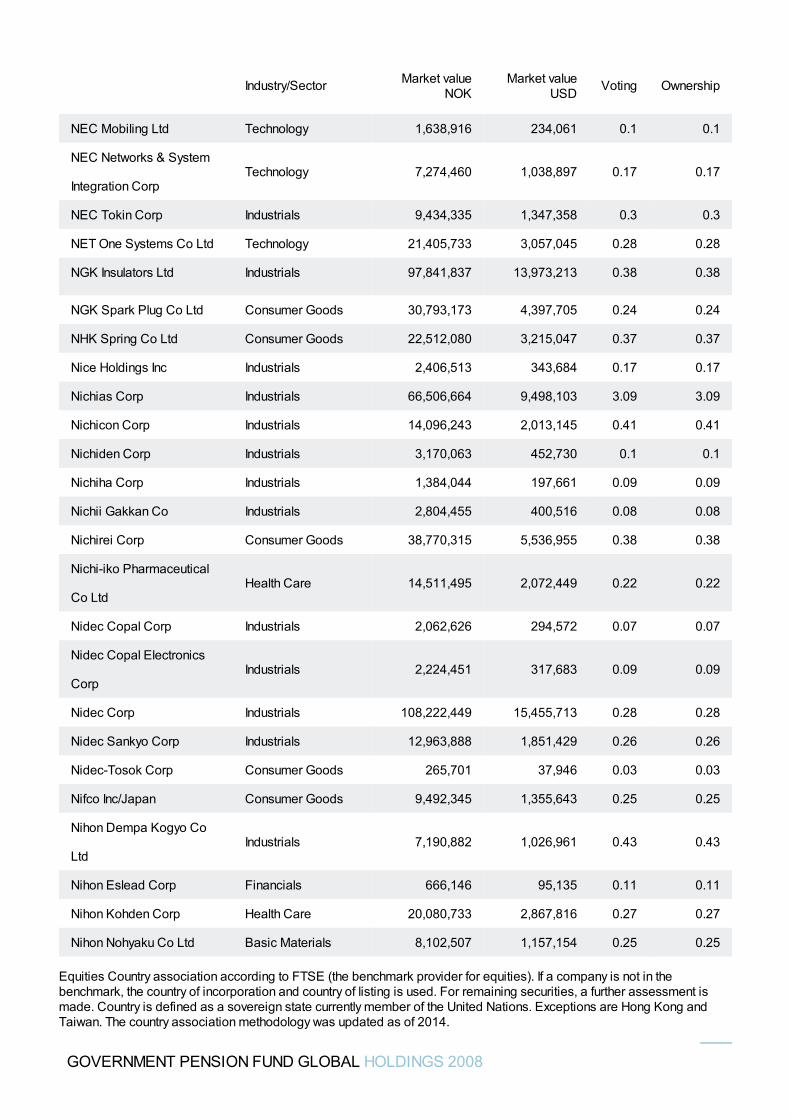
NEC Mobiling Ltd Technology 1,638,916 234,061 0.1 0.1
NEC Networks & System
Integration CorpTechnology 7,274,460 1,038,897 0.17 0.17
NEC Tokin Corp Industrials 9,434,335 1,347,358 0.3 0.3
NET One Systems Co Ltd Technology 21,405,733 3,057,045 0.28 0.28
NGK Insulators Ltd Industrials 97,841,837 13,973,213 0.38 0.38
NGK Spark Plug Co Ltd Consumer Goods 30,793,173 4,397,705 0.24 0.24
NHK Spring Co Ltd Consumer Goods 22,512,080 3,215,047 0.37 0.37
Nice Holdings Inc Industrials 2,406,513 343,684 0.17 0.17
Nichias Corp Industrials 66,506,664 9,498,103 3.09 3.09
Nichicon Corp Industrials 14,096,243 2,013,145 0.41 0.41
Nichiden Corp Industrials 3,170,063 452,730 0.1 0.1
Nichiha Corp Industrials 1,384,044 197,661 0.09 0.09
Nichii Gakkan Co Industrials 2,804,455 400,516 0.08 0.08
Nichirei Corp Consumer Goods 38,770,315 5,536,955 0.38 0.38
Nichi-iko Pharmaceutical
Co LtdHealth Care 14,511,495 2,072,449 0.22 0.22
Nidec Copal Corp Industrials 2,062,626 294,572 0.07 0.07
Nidec Copal Electronics
CorpIndustrials 2,224,451 317,683 0.09 0.09
Nidec Corp Industrials 108,222,449 15,455,713 0.28 0.28
Nidec Sankyo Corp Industrials 12,963,888 1,851,429 0.26 0.26
Nidec-Tosok Corp Consumer Goods 265,701 37,946 0.03 0.03
Nifco Inc/Japan Consumer Goods 9,492,345 1,355,643 0.25 0.25
Nihon Dempa Kogyo Co
LtdIndustrials 7,190,882 1,026,961 0.43 0.43
Nihon Eslead Corp Financials 666,146 95,135 0.11 0.11
Nihon Kohden Corp Health Care 20,080,733 2,867,816 0.27 0.27
Nihon Nohyaku Co Ltd Basic Materials 8,102,507 1,157,154 0.25 0.25
Industry/Sector Market valueNOK
Market valueUSD Voting Ownership
GOVERNMENT PENSION FUND GLOBAL HOLDINGS 2008
Equities Country association according to FTSE (the benchmark provider for equities). If a company is not in thebenchmark, the country of incorporation and country of listing is used. For remaining securities, a further assessment ismade. Country is defined as a sovereign state currently member of the United Nations. Exceptions are Hong Kong andTaiwan. The country association methodology was updated as of 2014.
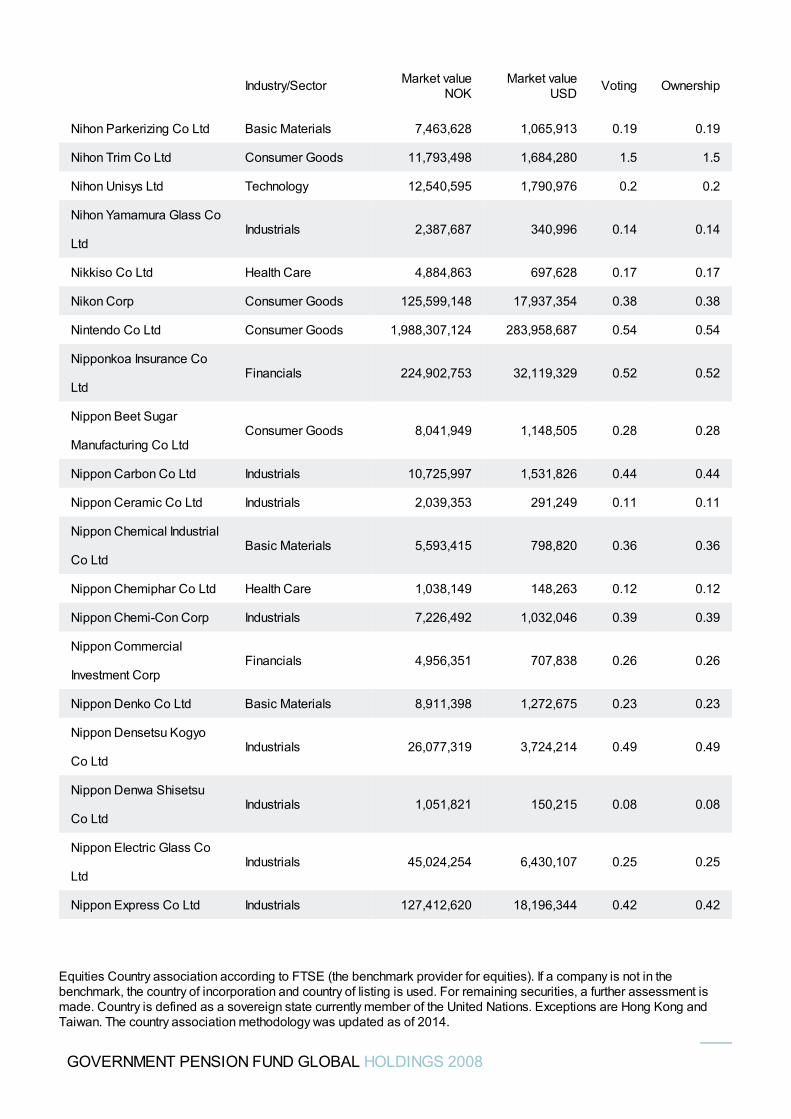
Nihon Parkerizing Co Ltd Basic Materials 7,463,628 1,065,913 0.19 0.19
Nihon Trim Co Ltd Consumer Goods 11,793,498 1,684,280 1.5 1.5
Nihon Unisys Ltd Technology 12,540,595 1,790,976 0.2 0.2
Nihon Yamamura Glass Co
LtdIndustrials 2,387,687 340,996 0.14 0.14
Nikkiso Co Ltd Health Care 4,884,863 697,628 0.17 0.17
Nikon Corp Consumer Goods 125,599,148 17,937,354 0.38 0.38
Nintendo Co Ltd Consumer Goods 1,988,307,124 283,958,687 0.54 0.54
Nipponkoa Insurance Co
LtdFinancials 224,902,753 32,119,329 0.52 0.52
Nippon Beet Sugar
Manufacturing Co LtdConsumer Goods 8,041,949 1,148,505 0.28 0.28
Nippon Carbon Co Ltd Industrials 10,725,997 1,531,826 0.44 0.44
Nippon Ceramic Co Ltd Industrials 2,039,353 291,249 0.11 0.11
Nippon Chemical Industrial
Co LtdBasic Materials 5,593,415 798,820 0.36 0.36
Nippon Chemiphar Co Ltd Health Care 1,038,149 148,263 0.12 0.12
Nippon Chemi-Con Corp Industrials 7,226,492 1,032,046 0.39 0.39
Nippon Commercial
Investment CorpFinancials 4,956,351 707,838 0.26 0.26
Nippon Denko Co Ltd Basic Materials 8,911,398 1,272,675 0.23 0.23
Nippon Densetsu Kogyo
Co LtdIndustrials 26,077,319 3,724,214 0.49 0.49
Nippon Denwa Shisetsu
Co LtdIndustrials 1,051,821 150,215 0.08 0.08
Nippon Electric Glass Co
LtdIndustrials 45,024,254 6,430,107 0.25 0.25
Nippon Express Co Ltd Industrials 127,412,620 18,196,344 0.42 0.42
Industry/Sector Market valueNOK
Market valueUSD Voting Ownership
GOVERNMENT PENSION FUND GLOBAL HOLDINGS 2008
Equities Country association according to FTSE (the benchmark provider for equities). If a company is not in thebenchmark, the country of incorporation and country of listing is used. For remaining securities, a further assessment ismade. Country is defined as a sovereign state currently member of the United Nations. Exceptions are Hong Kong andTaiwan. The country association methodology was updated as of 2014.
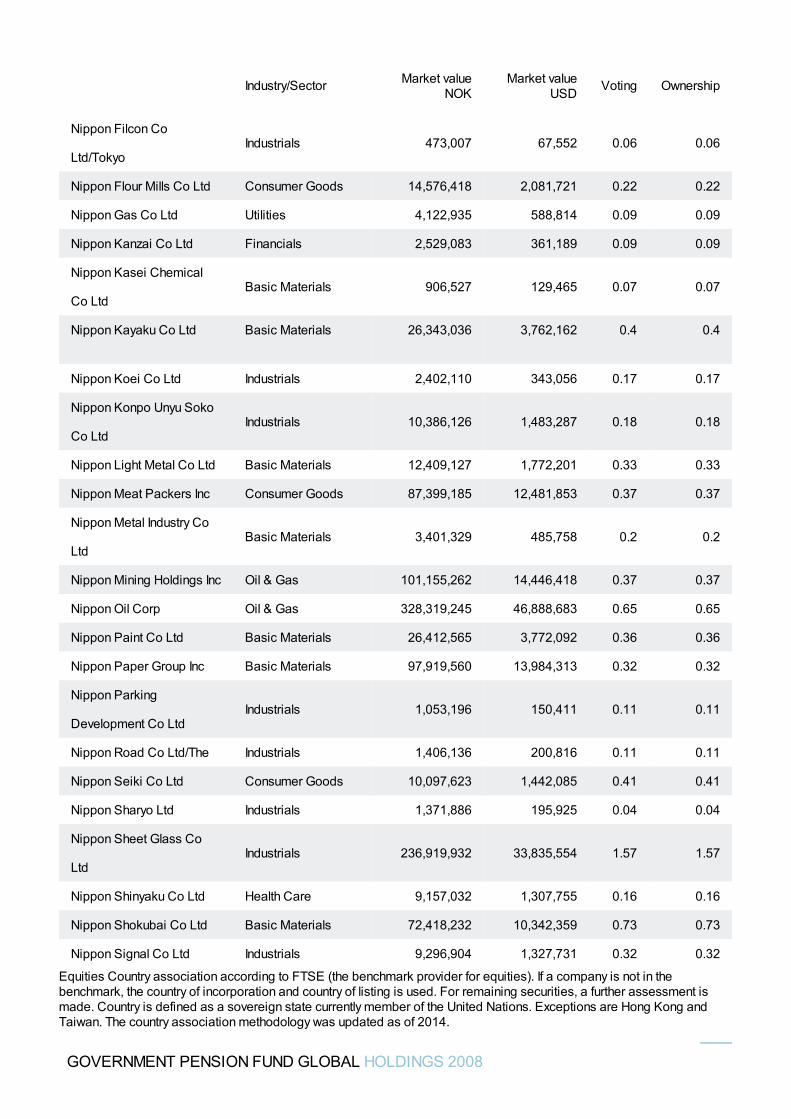
Nippon Filcon Co
Ltd/TokyoIndustrials 473,007 67,552 0.06 0.06
Nippon Flour Mills Co Ltd Consumer Goods 14,576,418 2,081,721 0.22 0.22
Nippon Gas Co Ltd Utilities 4,122,935 588,814 0.09 0.09
Nippon Kanzai Co Ltd Financials 2,529,083 361,189 0.09 0.09
Nippon Kasei Chemical
Co LtdBasic Materials 906,527 129,465 0.07 0.07
Nippon Kayaku Co Ltd Basic Materials 26,343,036 3,762,162 0.4 0.4
Nippon Koei Co Ltd Industrials 2,402,110 343,056 0.17 0.17
Nippon Konpo Unyu Soko
Co LtdIndustrials 10,386,126 1,483,287 0.18 0.18
Nippon Light Metal Co Ltd Basic Materials 12,409,127 1,772,201 0.33 0.33
Nippon Meat Packers Inc Consumer Goods 87,399,185 12,481,853 0.37 0.37
Nippon Metal Industry Co
LtdBasic Materials 3,401,329 485,758 0.2 0.2
Nippon Mining Holdings Inc Oil & Gas 101,155,262 14,446,418 0.37 0.37
Nippon Oil Corp Oil & Gas 328,319,245 46,888,683 0.65 0.65
Nippon Paint Co Ltd Basic Materials 26,412,565 3,772,092 0.36 0.36
Nippon Paper Group Inc Basic Materials 97,919,560 13,984,313 0.32 0.32
Nippon Parking
Development Co LtdIndustrials 1,053,196 150,411 0.11 0.11
Nippon Road Co Ltd/The Industrials 1,406,136 200,816 0.11 0.11
Nippon Seiki Co Ltd Consumer Goods 10,097,623 1,442,085 0.41 0.41
Nippon Sharyo Ltd Industrials 1,371,886 195,925 0.04 0.04
Nippon Sheet Glass Co
LtdIndustrials 236,919,932 33,835,554 1.57 1.57
Nippon Shinyaku Co Ltd Health Care 9,157,032 1,307,755 0.16 0.16
Nippon Shokubai Co Ltd Basic Materials 72,418,232 10,342,359 0.73 0.73
Nippon Signal Co Ltd Industrials 9,296,904 1,327,731 0.32 0.32
Industry/Sector Market valueNOK
Market valueUSD Voting Ownership
GOVERNMENT PENSION FUND GLOBAL HOLDINGS 2008
Equities Country association according to FTSE (the benchmark provider for equities). If a company is not in thebenchmark, the country of incorporation and country of listing is used. For remaining securities, a further assessment ismade. Country is defined as a sovereign state currently member of the United Nations. Exceptions are Hong Kong andTaiwan. The country association methodology was updated as of 2014.
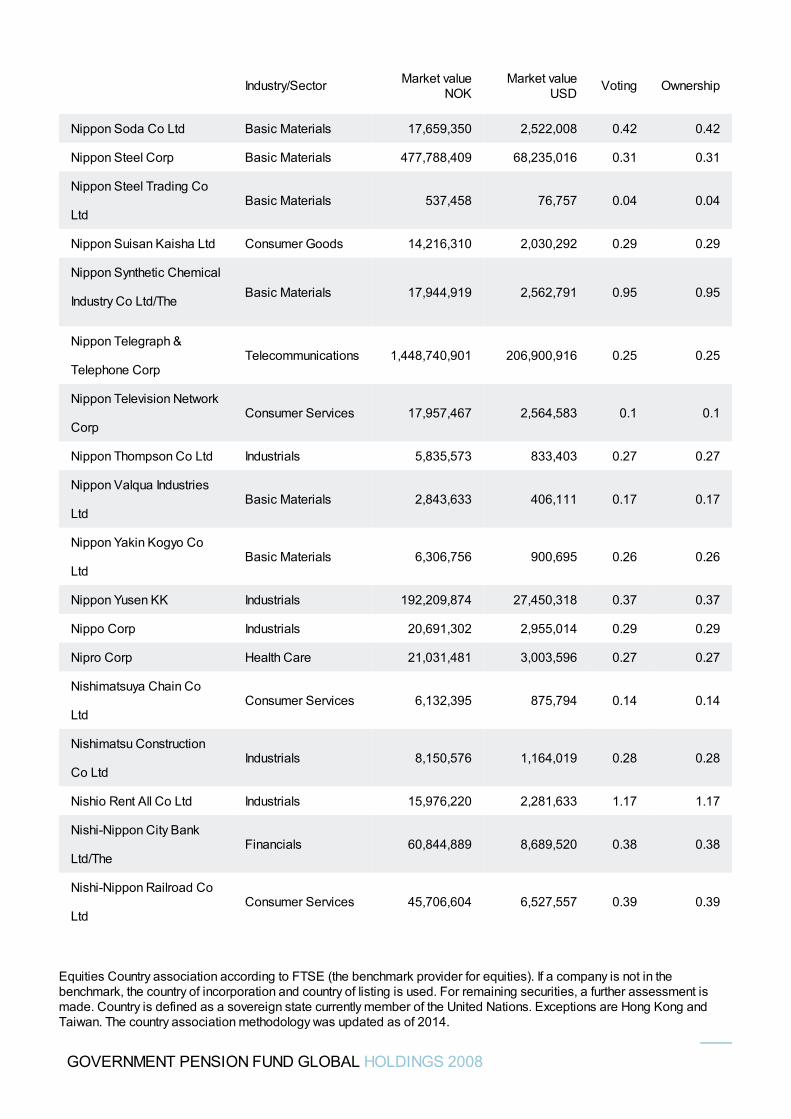
Nippon Soda Co Ltd Basic Materials 17,659,350 2,522,008 0.42 0.42
Nippon Steel Corp Basic Materials 477,788,409 68,235,016 0.31 0.31
Nippon Steel Trading Co
LtdBasic Materials 537,458 76,757 0.04 0.04
Nippon Suisan Kaisha Ltd Consumer Goods 14,216,310 2,030,292 0.29 0.29
Nippon Synthetic Chemical
Industry Co Ltd/TheBasic Materials 17,944,919 2,562,791 0.95 0.95
Nippon Telegraph &
Telephone CorpTelecommunications 1,448,740,901 206,900,916 0.25 0.25
Nippon Television Network
CorpConsumer Services 17,957,467 2,564,583 0.1 0.1
Nippon Thompson Co Ltd Industrials 5,835,573 833,403 0.27 0.27
Nippon Valqua Industries
LtdBasic Materials 2,843,633 406,111 0.17 0.17
Nippon Yakin Kogyo Co
LtdBasic Materials 6,306,756 900,695 0.26 0.26
Nippon Yusen KK Industrials 192,209,874 27,450,318 0.37 0.37
Nippo Corp Industrials 20,691,302 2,955,014 0.29 0.29
Nipro Corp Health Care 21,031,481 3,003,596 0.27 0.27
Nishimatsuya Chain Co
LtdConsumer Services 6,132,395 875,794 0.14 0.14
Nishimatsu Construction
Co LtdIndustrials 8,150,576 1,164,019 0.28 0.28
Nishio Rent All Co Ltd Industrials 15,976,220 2,281,633 1.17 1.17
Nishi-Nippon City Bank
Ltd/TheFinancials 60,844,889 8,689,520 0.38 0.38
Nishi-Nippon Railroad Co
LtdConsumer Services 45,706,604 6,527,557 0.39 0.39
Industry/Sector Market valueNOK
Market valueUSD Voting Ownership
GOVERNMENT PENSION FUND GLOBAL HOLDINGS 2008
Equities Country association according to FTSE (the benchmark provider for equities). If a company is not in thebenchmark, the country of incorporation and country of listing is used. For remaining securities, a further assessment ismade. Country is defined as a sovereign state currently member of the United Nations. Exceptions are Hong Kong andTaiwan. The country association methodology was updated as of 2014.
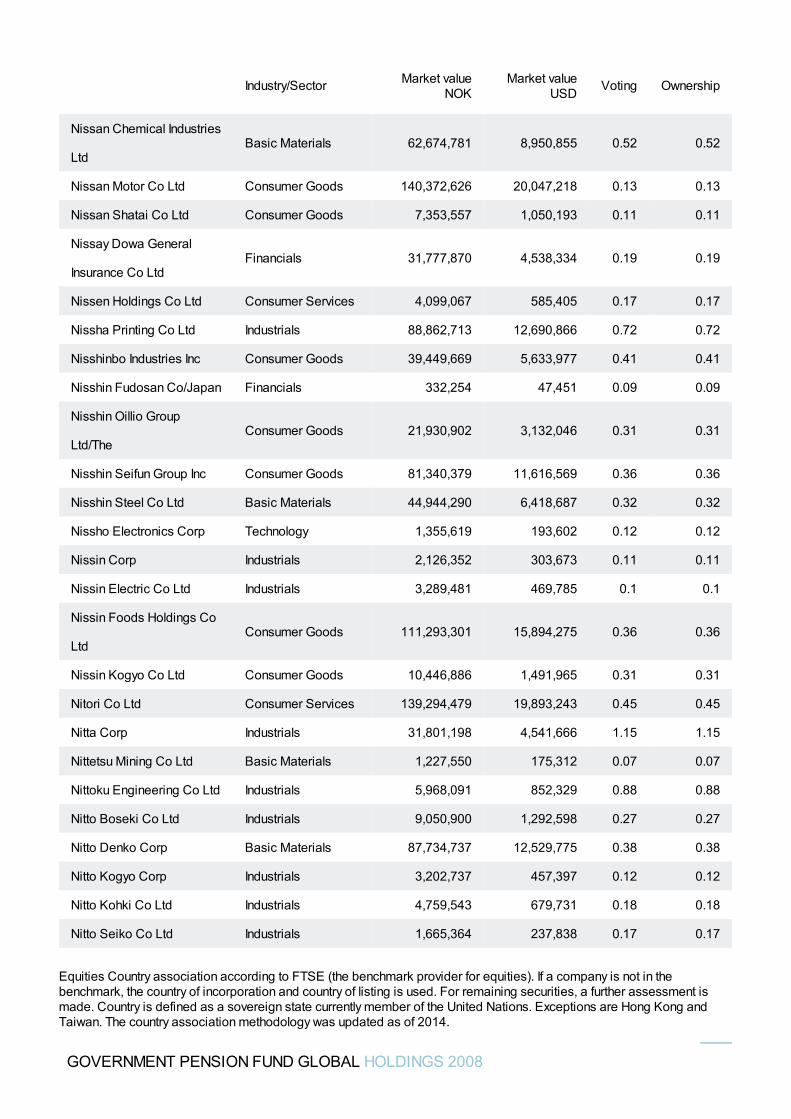
Nissan Chemical Industries
LtdBasic Materials 62,674,781 8,950,855 0.52 0.52
Nissan Motor Co Ltd Consumer Goods 140,372,626 20,047,218 0.13 0.13
Nissan Shatai Co Ltd Consumer Goods 7,353,557 1,050,193 0.11 0.11
Nissay Dowa General
Insurance Co LtdFinancials 31,777,870 4,538,334 0.19 0.19
Nissen Holdings Co Ltd Consumer Services 4,099,067 585,405 0.17 0.17
Nissha Printing Co Ltd Industrials 88,862,713 12,690,866 0.72 0.72
Nisshinbo Industries Inc Consumer Goods 39,449,669 5,633,977 0.41 0.41
Nisshin Fudosan Co/Japan Financials 332,254 47,451 0.09 0.09
Nisshin Oillio Group
Ltd/TheConsumer Goods 21,930,902 3,132,046 0.31 0.31
Nisshin Seifun Group Inc Consumer Goods 81,340,379 11,616,569 0.36 0.36
Nisshin Steel Co Ltd Basic Materials 44,944,290 6,418,687 0.32 0.32
Nissho Electronics Corp Technology 1,355,619 193,602 0.12 0.12
Nissin Corp Industrials 2,126,352 303,673 0.11 0.11
Nissin Electric Co Ltd Industrials 3,289,481 469,785 0.1 0.1
Nissin Foods Holdings Co
LtdConsumer Goods 111,293,301 15,894,275 0.36 0.36
Nissin Kogyo Co Ltd Consumer Goods 10,446,886 1,491,965 0.31 0.31
Nitori Co Ltd Consumer Services 139,294,479 19,893,243 0.45 0.45
Nitta Corp Industrials 31,801,198 4,541,666 1.15 1.15
Nittetsu Mining Co Ltd Basic Materials 1,227,550 175,312 0.07 0.07
Nittoku Engineering Co Ltd Industrials 5,968,091 852,329 0.88 0.88
Nitto Boseki Co Ltd Industrials 9,050,900 1,292,598 0.27 0.27
Nitto Denko Corp Basic Materials 87,734,737 12,529,775 0.38 0.38
Nitto Kogyo Corp Industrials 3,202,737 457,397 0.12 0.12
Nitto Kohki Co Ltd Industrials 4,759,543 679,731 0.18 0.18
Nitto Seiko Co Ltd Industrials 1,665,364 237,838 0.17 0.17
Industry/Sector Market valueNOK
Market valueUSD Voting Ownership
GOVERNMENT PENSION FUND GLOBAL HOLDINGS 2008
Equities Country association according to FTSE (the benchmark provider for equities). If a company is not in thebenchmark, the country of incorporation and country of listing is used. For remaining securities, a further assessment ismade. Country is defined as a sovereign state currently member of the United Nations. Exceptions are Hong Kong andTaiwan. The country association methodology was updated as of 2014.
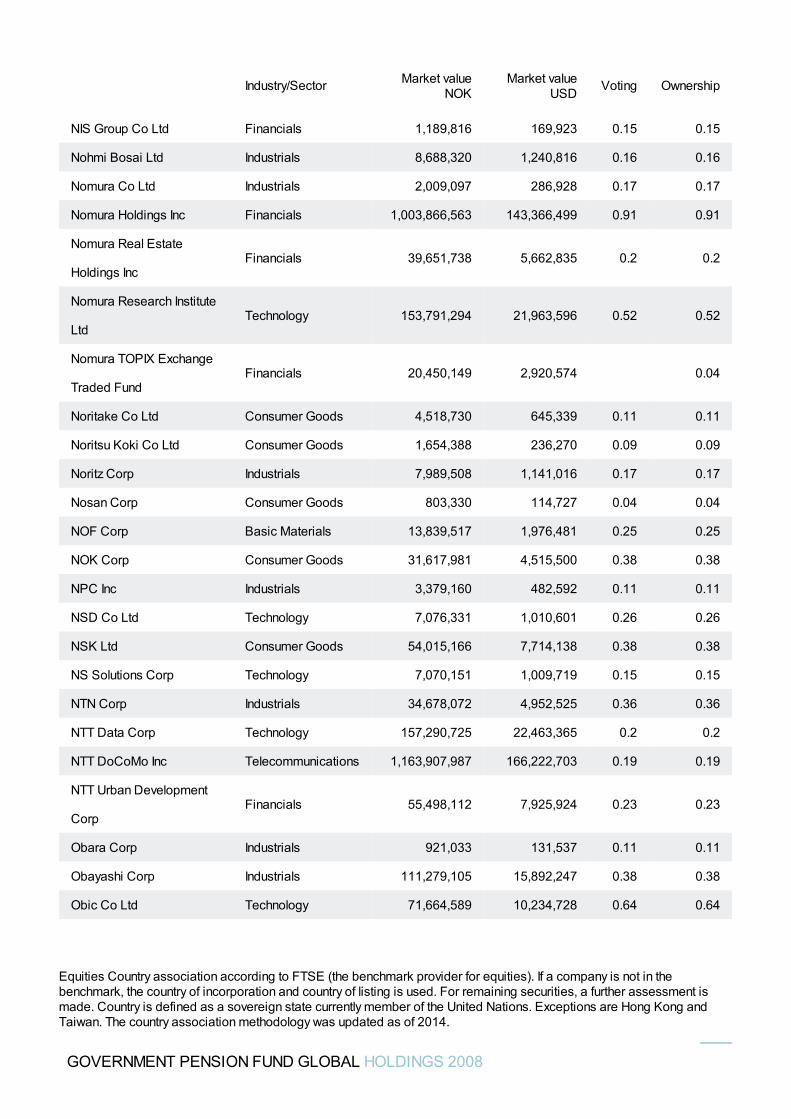
NIS Group Co Ltd Financials 1,189,816 169,923 0.15 0.15
Nohmi Bosai Ltd Industrials 8,688,320 1,240,816 0.16 0.16
Nomura Co Ltd Industrials 2,009,097 286,928 0.17 0.17
Nomura Holdings Inc Financials 1,003,866,563 143,366,499 0.91 0.91
Nomura Real Estate
Holdings IncFinancials 39,651,738 5,662,835 0.2 0.2
Nomura Research Institute
LtdTechnology 153,791,294 21,963,596 0.52 0.52
Nomura TOPIX Exchange
Traded FundFinancials 20,450,149 2,920,574 0.04
Noritake Co Ltd Consumer Goods 4,518,730 645,339 0.11 0.11
Noritsu Koki Co Ltd Consumer Goods 1,654,388 236,270 0.09 0.09
Noritz Corp Industrials 7,989,508 1,141,016 0.17 0.17
Nosan Corp Consumer Goods 803,330 114,727 0.04 0.04
NOF Corp Basic Materials 13,839,517 1,976,481 0.25 0.25
NOK Corp Consumer Goods 31,617,981 4,515,500 0.38 0.38
NPC Inc Industrials 3,379,160 482,592 0.11 0.11
NSD Co Ltd Technology 7,076,331 1,010,601 0.26 0.26
NSK Ltd Consumer Goods 54,015,166 7,714,138 0.38 0.38
NS Solutions Corp Technology 7,070,151 1,009,719 0.15 0.15
NTN Corp Industrials 34,678,072 4,952,525 0.36 0.36
NTT Data Corp Technology 157,290,725 22,463,365 0.2 0.2
NTT DoCoMo Inc Telecommunications 1,163,907,987 166,222,703 0.19 0.19
NTT Urban Development
CorpFinancials 55,498,112 7,925,924 0.23 0.23
Obara Corp Industrials 921,033 131,537 0.11 0.11
Obayashi Corp Industrials 111,279,105 15,892,247 0.38 0.38
Obic Co Ltd Technology 71,664,589 10,234,728 0.64 0.64
Industry/Sector Market valueNOK
Market valueUSD Voting Ownership
GOVERNMENT PENSION FUND GLOBAL HOLDINGS 2008
Equities Country association according to FTSE (the benchmark provider for equities). If a company is not in thebenchmark, the country of incorporation and country of listing is used. For remaining securities, a further assessment ismade. Country is defined as a sovereign state currently member of the United Nations. Exceptions are Hong Kong andTaiwan. The country association methodology was updated as of 2014.
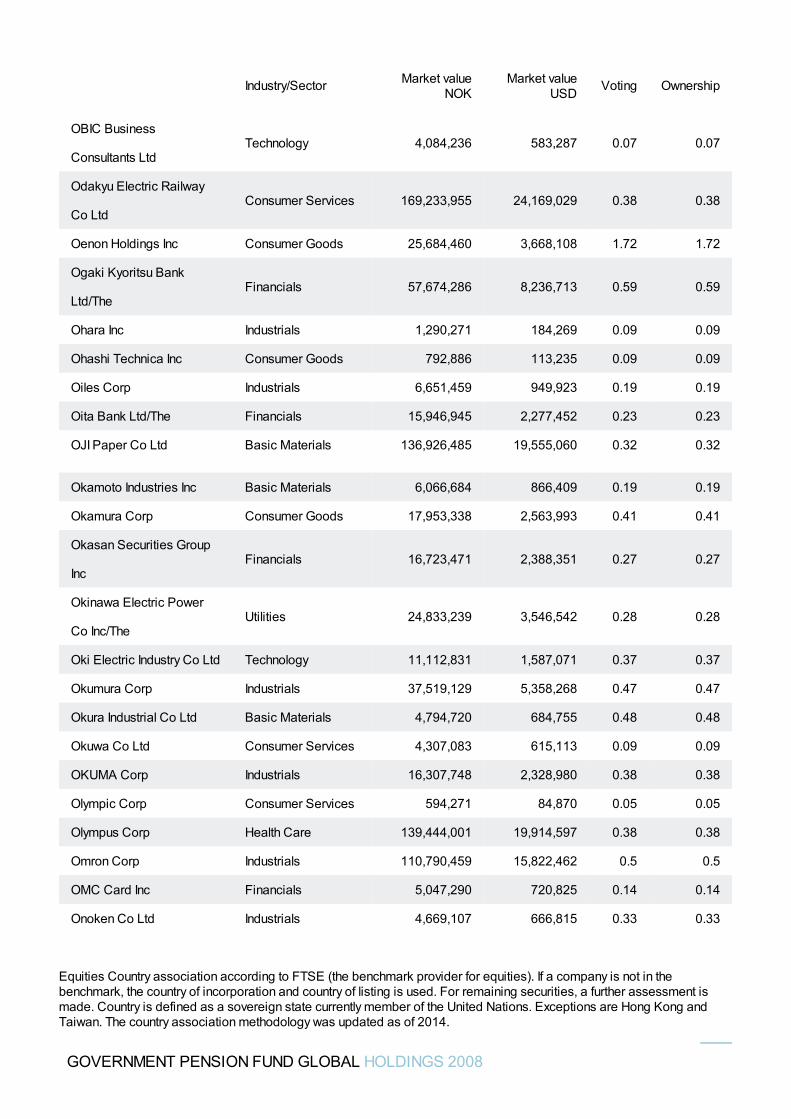
OBIC Business
Consultants LtdTechnology 4,084,236 583,287 0.07 0.07
Odakyu Electric Railway
Co LtdConsumer Services 169,233,955 24,169,029 0.38 0.38
Oenon Holdings Inc Consumer Goods 25,684,460 3,668,108 1.72 1.72
Ogaki Kyoritsu Bank
Ltd/TheFinancials 57,674,286 8,236,713 0.59 0.59
Ohara Inc Industrials 1,290,271 184,269 0.09 0.09
Ohashi Technica Inc Consumer Goods 792,886 113,235 0.09 0.09
Oiles Corp Industrials 6,651,459 949,923 0.19 0.19
Oita Bank Ltd/The Financials 15,946,945 2,277,452 0.23 0.23
OJI Paper Co Ltd Basic Materials 136,926,485 19,555,060 0.32 0.32
Okamoto Industries Inc Basic Materials 6,066,684 866,409 0.19 0.19
Okamura Corp Consumer Goods 17,953,338 2,563,993 0.41 0.41
Okasan Securities Group
IncFinancials 16,723,471 2,388,351 0.27 0.27
Okinawa Electric Power
Co Inc/TheUtilities 24,833,239 3,546,542 0.28 0.28
Oki Electric Industry Co Ltd Technology 11,112,831 1,587,071 0.37 0.37
Okumura Corp Industrials 37,519,129 5,358,268 0.47 0.47
Okura Industrial Co Ltd Basic Materials 4,794,720 684,755 0.48 0.48
Okuwa Co Ltd Consumer Services 4,307,083 615,113 0.09 0.09
OKUMA Corp Industrials 16,307,748 2,328,980 0.38 0.38
Olympic Corp Consumer Services 594,271 84,870 0.05 0.05
Olympus Corp Health Care 139,444,001 19,914,597 0.38 0.38
Omron Corp Industrials 110,790,459 15,822,462 0.5 0.5
OMC Card Inc Financials 5,047,290 720,825 0.14 0.14
Onoken Co Ltd Industrials 4,669,107 666,815 0.33 0.33
Industry/Sector Market valueNOK
Market valueUSD Voting Ownership
GOVERNMENT PENSION FUND GLOBAL HOLDINGS 2008
Equities Country association according to FTSE (the benchmark provider for equities). If a company is not in thebenchmark, the country of incorporation and country of listing is used. For remaining securities, a further assessment ismade. Country is defined as a sovereign state currently member of the United Nations. Exceptions are Hong Kong andTaiwan. The country association methodology was updated as of 2014.
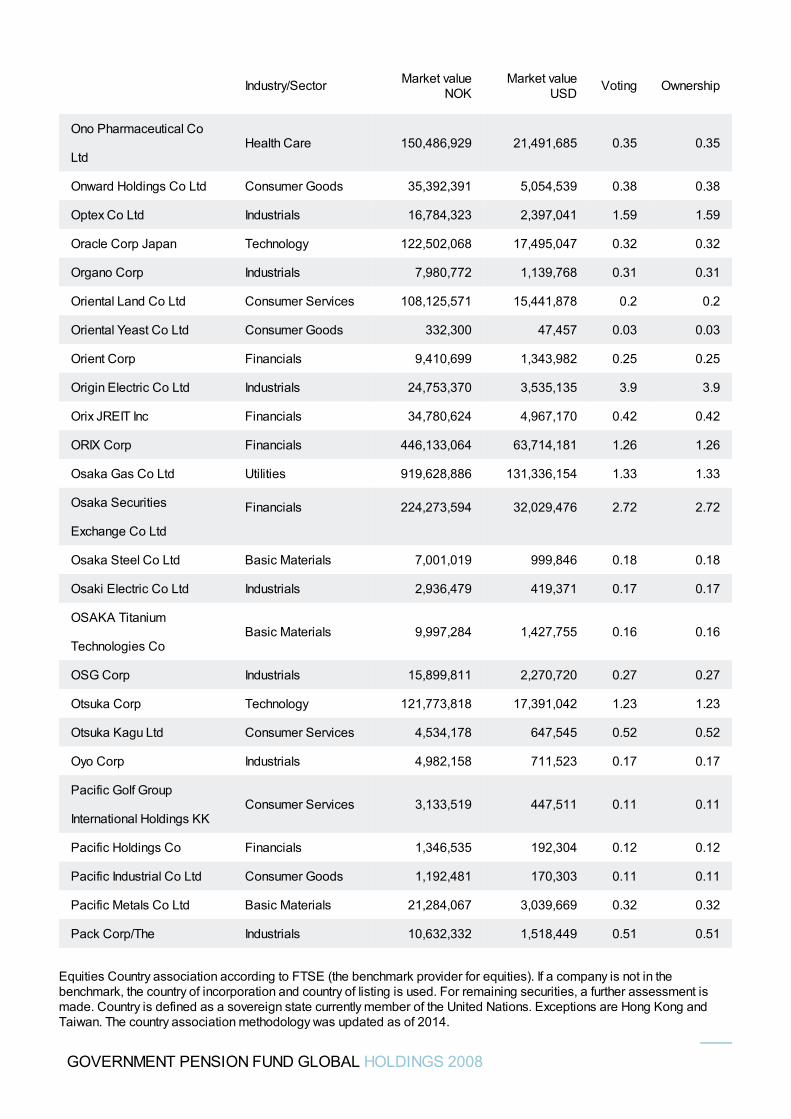
Ono Pharmaceutical Co
LtdHealth Care 150,486,929 21,491,685 0.35 0.35
Onward Holdings Co Ltd Consumer Goods 35,392,391 5,054,539 0.38 0.38
Optex Co Ltd Industrials 16,784,323 2,397,041 1.59 1.59
Oracle Corp Japan Technology 122,502,068 17,495,047 0.32 0.32
Organo Corp Industrials 7,980,772 1,139,768 0.31 0.31
Oriental Land Co Ltd Consumer Services 108,125,571 15,441,878 0.2 0.2
Oriental Yeast Co Ltd Consumer Goods 332,300 47,457 0.03 0.03
Orient Corp Financials 9,410,699 1,343,982 0.25 0.25
Origin Electric Co Ltd Industrials 24,753,370 3,535,135 3.9 3.9
Orix JREIT Inc Financials 34,780,624 4,967,170 0.42 0.42
ORIX Corp Financials 446,133,064 63,714,181 1.26 1.26
Osaka Gas Co Ltd Utilities 919,628,886 131,336,154 1.33 1.33
Osaka Securities
Exchange Co Ltd
Financials 224,273,594 32,029,476 2.72 2.72
Osaka Steel Co Ltd Basic Materials 7,001,019 999,846 0.18 0.18
Osaki Electric Co Ltd Industrials 2,936,479 419,371 0.17 0.17
OSAKA Titanium
Technologies CoBasic Materials 9,997,284 1,427,755 0.16 0.16
OSG Corp Industrials 15,899,811 2,270,720 0.27 0.27
Otsuka Corp Technology 121,773,818 17,391,042 1.23 1.23
Otsuka Kagu Ltd Consumer Services 4,534,178 647,545 0.52 0.52
Oyo Corp Industrials 4,982,158 711,523 0.17 0.17
Pacific Golf Group
International Holdings KKConsumer Services 3,133,519 447,511 0.11 0.11
Pacific Holdings Co Financials 1,346,535 192,304 0.12 0.12
Pacific Industrial Co Ltd Consumer Goods 1,192,481 170,303 0.11 0.11
Pacific Metals Co Ltd Basic Materials 21,284,067 3,039,669 0.32 0.32
Pack Corp/The Industrials 10,632,332 1,518,449 0.51 0.51
Industry/Sector Market valueNOK
Market valueUSD Voting Ownership
GOVERNMENT PENSION FUND GLOBAL HOLDINGS 2008
Equities Country association according to FTSE (the benchmark provider for equities). If a company is not in thebenchmark, the country of incorporation and country of listing is used. For remaining securities, a further assessment ismade. Country is defined as a sovereign state currently member of the United Nations. Exceptions are Hong Kong andTaiwan. The country association methodology was updated as of 2014.
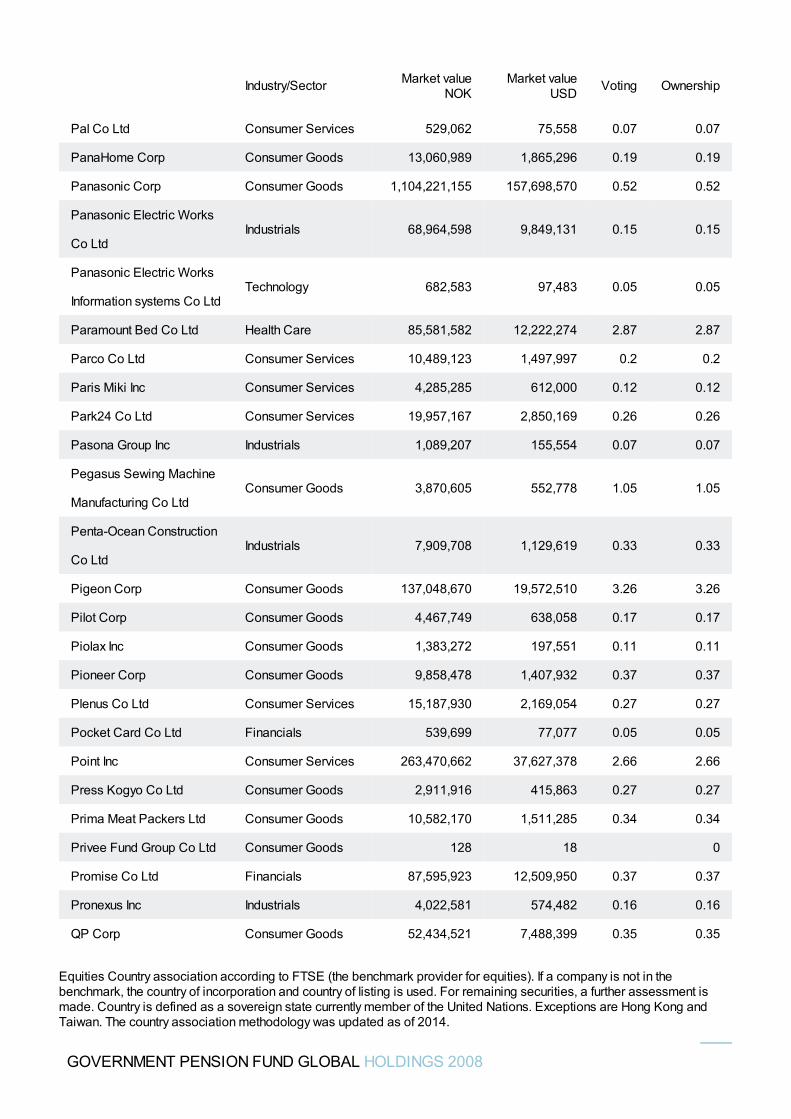
Pal Co Ltd Consumer Services 529,062 75,558 0.07 0.07
PanaHome Corp Consumer Goods 13,060,989 1,865,296 0.19 0.19
Panasonic Corp Consumer Goods 1,104,221,155 157,698,570 0.52 0.52
Panasonic Electric Works
Co LtdIndustrials 68,964,598 9,849,131 0.15 0.15
Panasonic Electric Works
Information systems Co LtdTechnology 682,583 97,483 0.05 0.05
Paramount Bed Co Ltd Health Care 85,581,582 12,222,274 2.87 2.87
Parco Co Ltd Consumer Services 10,489,123 1,497,997 0.2 0.2
Paris Miki Inc Consumer Services 4,285,285 612,000 0.12 0.12
Park24 Co Ltd Consumer Services 19,957,167 2,850,169 0.26 0.26
Pasona Group Inc Industrials 1,089,207 155,554 0.07 0.07
Pegasus Sewing Machine
Manufacturing Co LtdConsumer Goods 3,870,605 552,778 1.05 1.05
Penta-Ocean Construction
Co LtdIndustrials 7,909,708 1,129,619 0.33 0.33
Pigeon Corp Consumer Goods 137,048,670 19,572,510 3.26 3.26
Pilot Corp Consumer Goods 4,467,749 638,058 0.17 0.17
Piolax Inc Consumer Goods 1,383,272 197,551 0.11 0.11
Pioneer Corp Consumer Goods 9,858,478 1,407,932 0.37 0.37
Plenus Co Ltd Consumer Services 15,187,930 2,169,054 0.27 0.27
Pocket Card Co Ltd Financials 539,699 77,077 0.05 0.05
Point Inc Consumer Services 263,470,662 37,627,378 2.66 2.66
Press Kogyo Co Ltd Consumer Goods 2,911,916 415,863 0.27 0.27
Prima Meat Packers Ltd Consumer Goods 10,582,170 1,511,285 0.34 0.34
Privee Fund Group Co Ltd Consumer Goods 128 18 0
Promise Co Ltd Financials 87,595,923 12,509,950 0.37 0.37
Pronexus Inc Industrials 4,022,581 574,482 0.16 0.16
QP Corp Consumer Goods 52,434,521 7,488,399 0.35 0.35
Industry/Sector Market valueNOK
Market valueUSD Voting Ownership
GOVERNMENT PENSION FUND GLOBAL HOLDINGS 2008
Equities Country association according to FTSE (the benchmark provider for equities). If a company is not in thebenchmark, the country of incorporation and country of listing is used. For remaining securities, a further assessment ismade. Country is defined as a sovereign state currently member of the United Nations. Exceptions are Hong Kong andTaiwan. The country association methodology was updated as of 2014.
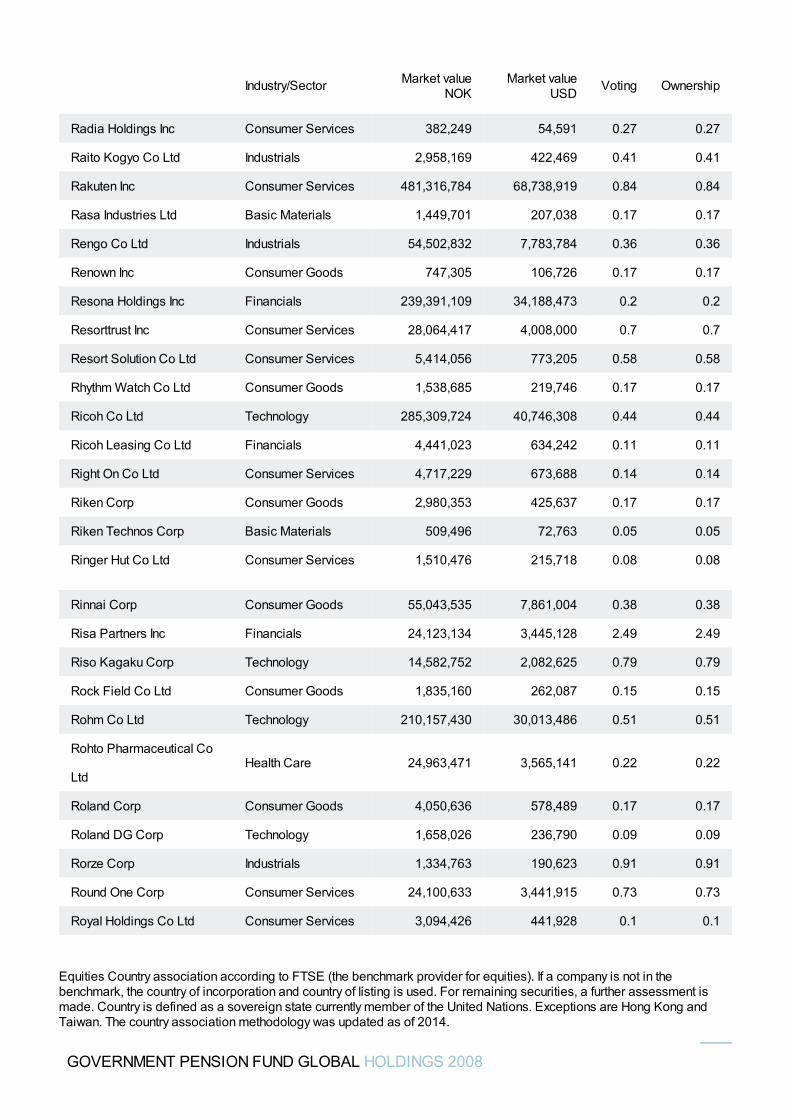
Radia Holdings Inc Consumer Services 382,249 54,591 0.27 0.27
Raito Kogyo Co Ltd Industrials 2,958,169 422,469 0.41 0.41
Rakuten Inc Consumer Services 481,316,784 68,738,919 0.84 0.84
Rasa Industries Ltd Basic Materials 1,449,701 207,038 0.17 0.17
Rengo Co Ltd Industrials 54,502,832 7,783,784 0.36 0.36
Renown Inc Consumer Goods 747,305 106,726 0.17 0.17
Resona Holdings Inc Financials 239,391,109 34,188,473 0.2 0.2
Resorttrust Inc Consumer Services 28,064,417 4,008,000 0.7 0.7
Resort Solution Co Ltd Consumer Services 5,414,056 773,205 0.58 0.58
Rhythm Watch Co Ltd Consumer Goods 1,538,685 219,746 0.17 0.17
Ricoh Co Ltd Technology 285,309,724 40,746,308 0.44 0.44
Ricoh Leasing Co Ltd Financials 4,441,023 634,242 0.11 0.11
Right On Co Ltd Consumer Services 4,717,229 673,688 0.14 0.14
Riken Corp Consumer Goods 2,980,353 425,637 0.17 0.17
Riken Technos Corp Basic Materials 509,496 72,763 0.05 0.05
Ringer Hut Co Ltd Consumer Services 1,510,476 215,718 0.08 0.08
Rinnai Corp Consumer Goods 55,043,535 7,861,004 0.38 0.38
Risa Partners Inc Financials 24,123,134 3,445,128 2.49 2.49
Riso Kagaku Corp Technology 14,582,752 2,082,625 0.79 0.79
Rock Field Co Ltd Consumer Goods 1,835,160 262,087 0.15 0.15
Rohm Co Ltd Technology 210,157,430 30,013,486 0.51 0.51
Rohto Pharmaceutical Co
LtdHealth Care 24,963,471 3,565,141 0.22 0.22
Roland Corp Consumer Goods 4,050,636 578,489 0.17 0.17
Roland DG Corp Technology 1,658,026 236,790 0.09 0.09
Rorze Corp Industrials 1,334,763 190,623 0.91 0.91
Round One Corp Consumer Services 24,100,633 3,441,915 0.73 0.73
Royal Holdings Co Ltd Consumer Services 3,094,426 441,928 0.1 0.1
Industry/Sector Market valueNOK
Market valueUSD Voting Ownership
GOVERNMENT PENSION FUND GLOBAL HOLDINGS 2008
Equities Country association according to FTSE (the benchmark provider for equities). If a company is not in thebenchmark, the country of incorporation and country of listing is used. For remaining securities, a further assessment ismade. Country is defined as a sovereign state currently member of the United Nations. Exceptions are Hong Kong andTaiwan. The country association methodology was updated as of 2014.
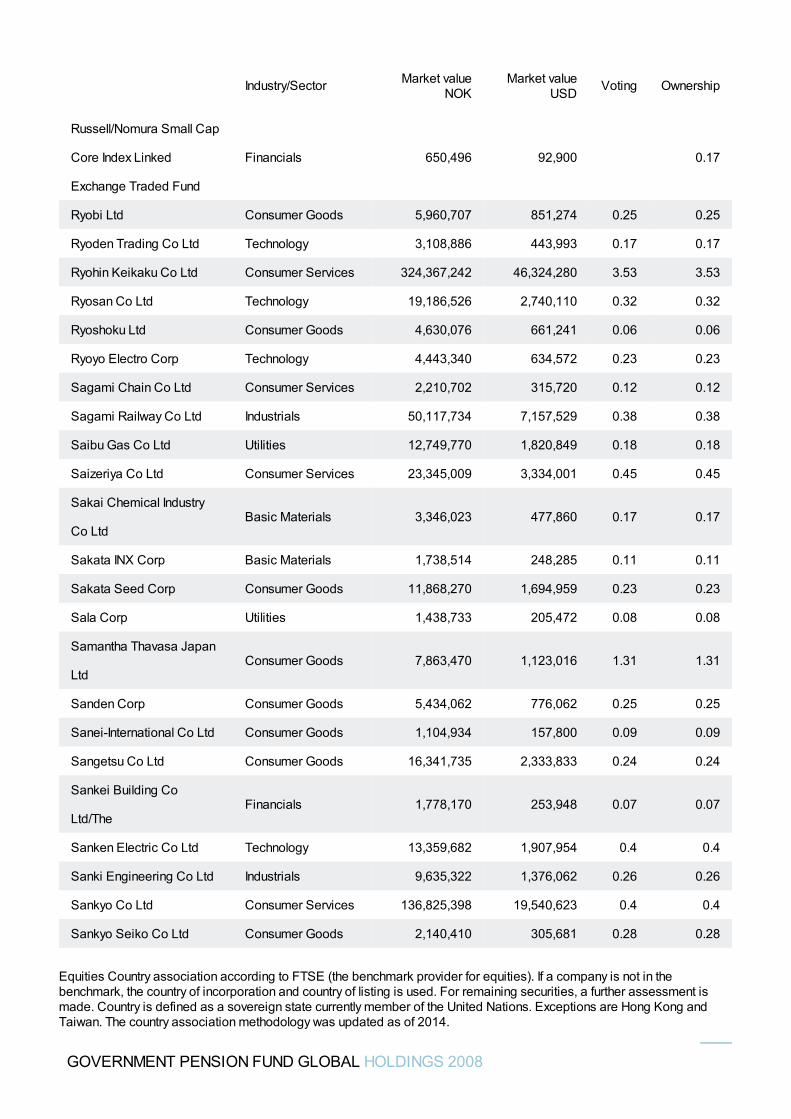
Russell/Nomura Small Cap
Core Index Linked
Exchange Traded Fund
Financials 650,496 92,900 0.17
Ryobi Ltd Consumer Goods 5,960,707 851,274 0.25 0.25
Ryoden Trading Co Ltd Technology 3,108,886 443,993 0.17 0.17
Ryohin Keikaku Co Ltd Consumer Services 324,367,242 46,324,280 3.53 3.53
Ryosan Co Ltd Technology 19,186,526 2,740,110 0.32 0.32
Ryoshoku Ltd Consumer Goods 4,630,076 661,241 0.06 0.06
Ryoyo Electro Corp Technology 4,443,340 634,572 0.23 0.23
Sagami Chain Co Ltd Consumer Services 2,210,702 315,720 0.12 0.12
Sagami Railway Co Ltd Industrials 50,117,734 7,157,529 0.38 0.38
Saibu Gas Co Ltd Utilities 12,749,770 1,820,849 0.18 0.18
Saizeriya Co Ltd Consumer Services 23,345,009 3,334,001 0.45 0.45
Sakai Chemical Industry
Co LtdBasic Materials 3,346,023 477,860 0.17 0.17
Sakata INX Corp Basic Materials 1,738,514 248,285 0.11 0.11
Sakata Seed Corp Consumer Goods 11,868,270 1,694,959 0.23 0.23
Sala Corp Utilities 1,438,733 205,472 0.08 0.08
Samantha Thavasa Japan
LtdConsumer Goods 7,863,470 1,123,016 1.31 1.31
Sanden Corp Consumer Goods 5,434,062 776,062 0.25 0.25
Sanei-International Co Ltd Consumer Goods 1,104,934 157,800 0.09 0.09
Sangetsu Co Ltd Consumer Goods 16,341,735 2,333,833 0.24 0.24
Sankei Building Co
Ltd/TheFinancials 1,778,170 253,948 0.07 0.07
Sanken Electric Co Ltd Technology 13,359,682 1,907,954 0.4 0.4
Sanki Engineering Co Ltd Industrials 9,635,322 1,376,062 0.26 0.26
Sankyo Co Ltd Consumer Services 136,825,398 19,540,623 0.4 0.4
Sankyo Seiko Co Ltd Consumer Goods 2,140,410 305,681 0.28 0.28
Industry/Sector Market valueNOK
Market valueUSD Voting Ownership
GOVERNMENT PENSION FUND GLOBAL HOLDINGS 2008
Equities Country association according to FTSE (the benchmark provider for equities). If a company is not in thebenchmark, the country of incorporation and country of listing is used. For remaining securities, a further assessment ismade. Country is defined as a sovereign state currently member of the United Nations. Exceptions are Hong Kong andTaiwan. The country association methodology was updated as of 2014.
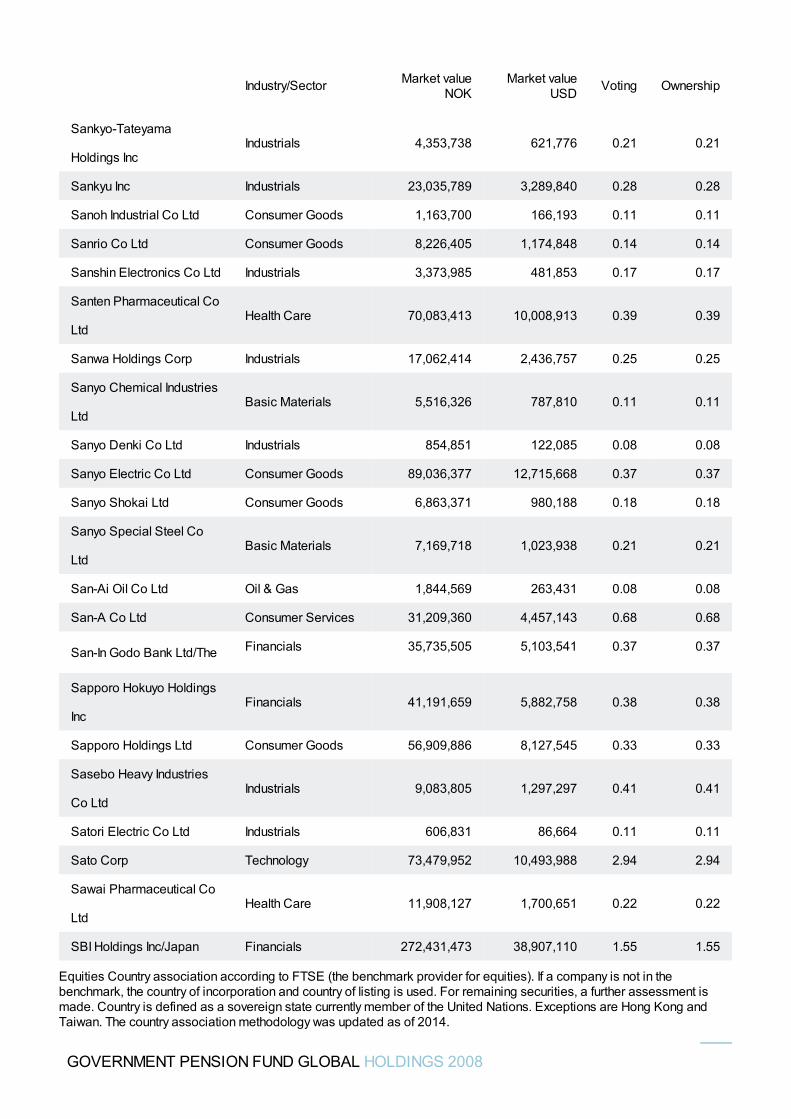
Sankyo-Tateyama
Holdings IncIndustrials 4,353,738 621,776 0.21 0.21
Sankyu Inc Industrials 23,035,789 3,289,840 0.28 0.28
Sanoh Industrial Co Ltd Consumer Goods 1,163,700 166,193 0.11 0.11
Sanrio Co Ltd Consumer Goods 8,226,405 1,174,848 0.14 0.14
Sanshin Electronics Co Ltd Industrials 3,373,985 481,853 0.17 0.17
Santen Pharmaceutical Co
LtdHealth Care 70,083,413 10,008,913 0.39 0.39
Sanwa Holdings Corp Industrials 17,062,414 2,436,757 0.25 0.25
Sanyo Chemical Industries
LtdBasic Materials 5,516,326 787,810 0.11 0.11
Sanyo Denki Co Ltd Industrials 854,851 122,085 0.08 0.08
Sanyo Electric Co Ltd Consumer Goods 89,036,377 12,715,668 0.37 0.37
Sanyo Shokai Ltd Consumer Goods 6,863,371 980,188 0.18 0.18
Sanyo Special Steel Co
LtdBasic Materials 7,169,718 1,023,938 0.21 0.21
San-Ai Oil Co Ltd Oil & Gas 1,844,569 263,431 0.08 0.08
San-A Co Ltd Consumer Services 31,209,360 4,457,143 0.68 0.68
San-In Godo Bank Ltd/The Financials 35,735,505 5,103,541 0.37 0.37
Sapporo Hokuyo Holdings
IncFinancials 41,191,659 5,882,758 0.38 0.38
Sapporo Holdings Ltd Consumer Goods 56,909,886 8,127,545 0.33 0.33
Sasebo Heavy Industries
Co LtdIndustrials 9,083,805 1,297,297 0.41 0.41
Satori Electric Co Ltd Industrials 606,831 86,664 0.11 0.11
Sato Corp Technology 73,479,952 10,493,988 2.94 2.94
Sawai Pharmaceutical Co
LtdHealth Care 11,908,127 1,700,651 0.22 0.22
SBI Holdings Inc/Japan Financials 272,431,473 38,907,110 1.55 1.55
Industry/Sector Market valueNOK
Market valueUSD Voting Ownership
GOVERNMENT PENSION FUND GLOBAL HOLDINGS 2008
Equities Country association according to FTSE (the benchmark provider for equities). If a company is not in thebenchmark, the country of incorporation and country of listing is used. For remaining securities, a further assessment ismade. Country is defined as a sovereign state currently member of the United Nations. Exceptions are Hong Kong andTaiwan. The country association methodology was updated as of 2014.
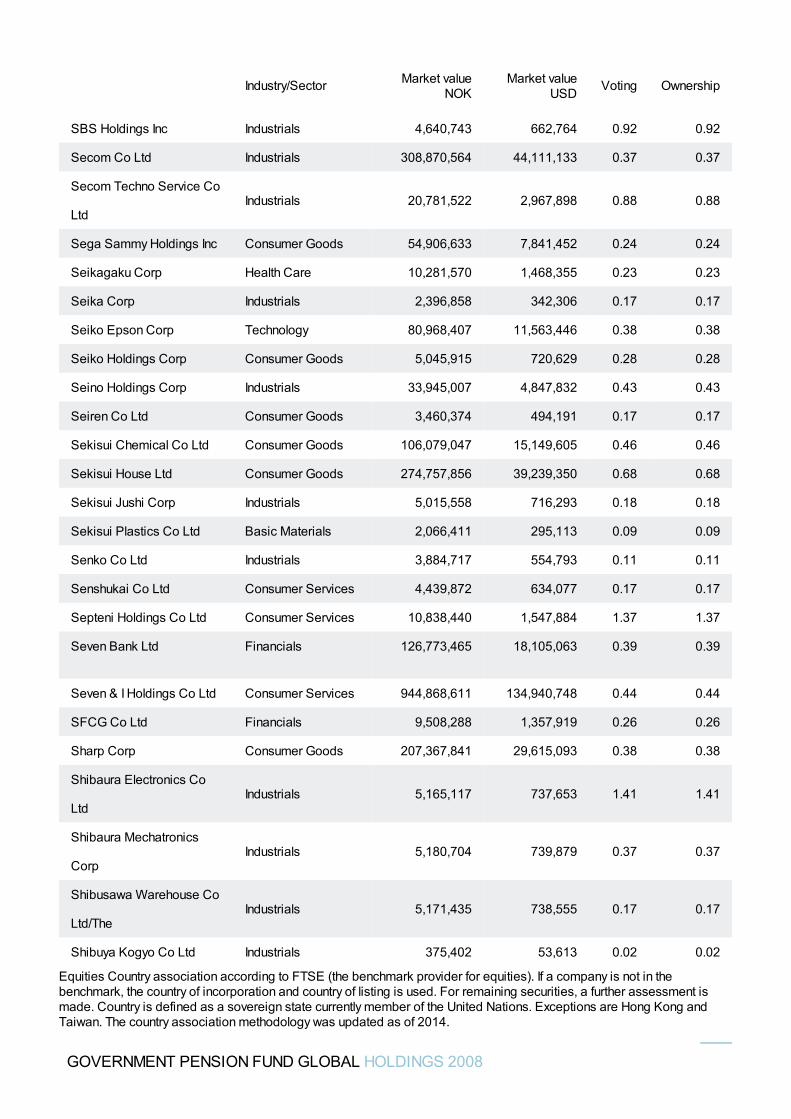
SBS Holdings Inc Industrials 4,640,743 662,764 0.92 0.92
Secom Co Ltd Industrials 308,870,564 44,111,133 0.37 0.37
Secom Techno Service Co
LtdIndustrials 20,781,522 2,967,898 0.88 0.88
Sega Sammy Holdings Inc Consumer Goods 54,906,633 7,841,452 0.24 0.24
Seikagaku Corp Health Care 10,281,570 1,468,355 0.23 0.23
Seika Corp Industrials 2,396,858 342,306 0.17 0.17
Seiko Epson Corp Technology 80,968,407 11,563,446 0.38 0.38
Seiko Holdings Corp Consumer Goods 5,045,915 720,629 0.28 0.28
Seino Holdings Corp Industrials 33,945,007 4,847,832 0.43 0.43
Seiren Co Ltd Consumer Goods 3,460,374 494,191 0.17 0.17
Sekisui Chemical Co Ltd Consumer Goods 106,079,047 15,149,605 0.46 0.46
Sekisui House Ltd Consumer Goods 274,757,856 39,239,350 0.68 0.68
Sekisui Jushi Corp Industrials 5,015,558 716,293 0.18 0.18
Sekisui Plastics Co Ltd Basic Materials 2,066,411 295,113 0.09 0.09
Senko Co Ltd Industrials 3,884,717 554,793 0.11 0.11
Senshukai Co Ltd Consumer Services 4,439,872 634,077 0.17 0.17
Septeni Holdings Co Ltd Consumer Services 10,838,440 1,547,884 1.37 1.37
Seven Bank Ltd Financials 126,773,465 18,105,063 0.39 0.39
Seven & I Holdings Co Ltd Consumer Services 944,868,611 134,940,748 0.44 0.44
SFCG Co Ltd Financials 9,508,288 1,357,919 0.26 0.26
Sharp Corp Consumer Goods 207,367,841 29,615,093 0.38 0.38
Shibaura Electronics Co
LtdIndustrials 5,165,117 737,653 1.41 1.41
Shibaura Mechatronics
CorpIndustrials 5,180,704 739,879 0.37 0.37
Shibusawa Warehouse Co
Ltd/TheIndustrials 5,171,435 738,555 0.17 0.17
Shibuya Kogyo Co Ltd Industrials 375,402 53,613 0.02 0.02
Industry/Sector Market valueNOK
Market valueUSD Voting Ownership
GOVERNMENT PENSION FUND GLOBAL HOLDINGS 2008
Equities Country association according to FTSE (the benchmark provider for equities). If a company is not in thebenchmark, the country of incorporation and country of listing is used. For remaining securities, a further assessment ismade. Country is defined as a sovereign state currently member of the United Nations. Exceptions are Hong Kong andTaiwan. The country association methodology was updated as of 2014.
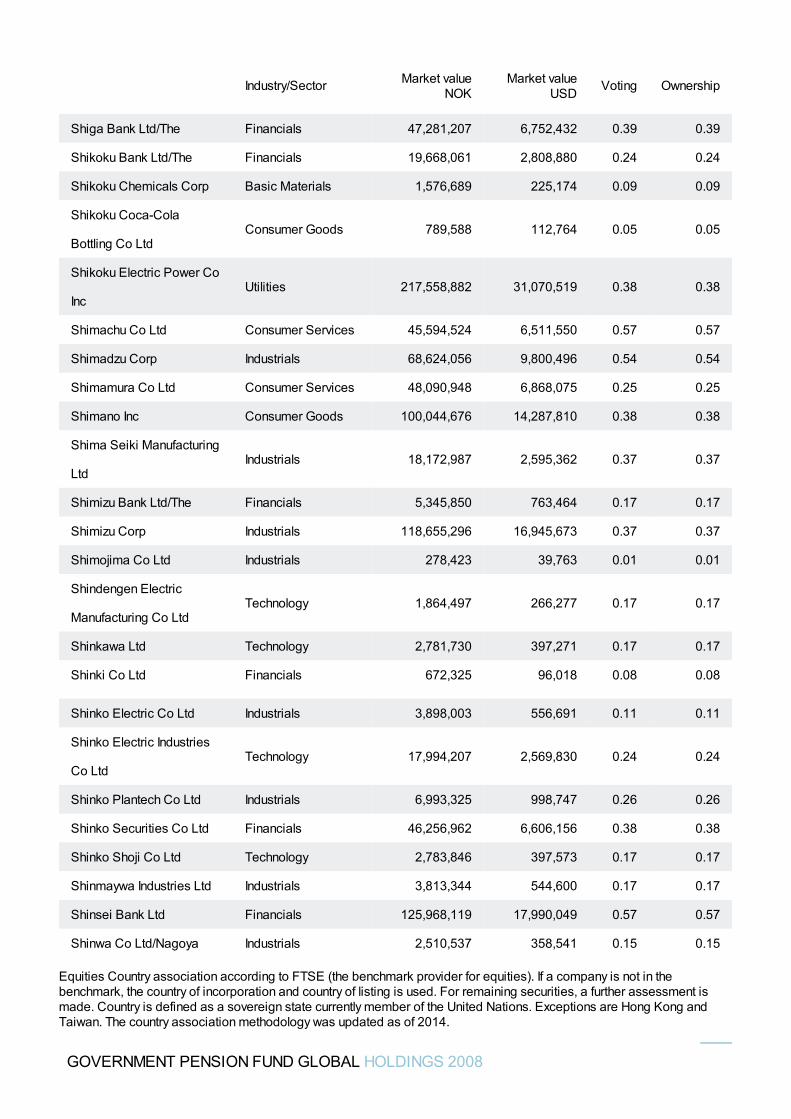
Shiga Bank Ltd/The Financials 47,281,207 6,752,432 0.39 0.39
Shikoku Bank Ltd/The Financials 19,668,061 2,808,880 0.24 0.24
Shikoku Chemicals Corp Basic Materials 1,576,689 225,174 0.09 0.09
Shikoku Coca-Cola
Bottling Co LtdConsumer Goods 789,588 112,764 0.05 0.05
Shikoku Electric Power Co
IncUtilities 217,558,882 31,070,519 0.38 0.38
Shimachu Co Ltd Consumer Services 45,594,524 6,511,550 0.57 0.57
Shimadzu Corp Industrials 68,624,056 9,800,496 0.54 0.54
Shimamura Co Ltd Consumer Services 48,090,948 6,868,075 0.25 0.25
Shimano Inc Consumer Goods 100,044,676 14,287,810 0.38 0.38
Shima Seiki Manufacturing
LtdIndustrials 18,172,987 2,595,362 0.37 0.37
Shimizu Bank Ltd/The Financials 5,345,850 763,464 0.17 0.17
Shimizu Corp Industrials 118,655,296 16,945,673 0.37 0.37
Shimojima Co Ltd Industrials 278,423 39,763 0.01 0.01
Shindengen Electric
Manufacturing Co LtdTechnology 1,864,497 266,277 0.17 0.17
Shinkawa Ltd Technology 2,781,730 397,271 0.17 0.17
Shinki Co Ltd Financials 672,325 96,018 0.08 0.08
Shinko Electric Co Ltd Industrials 3,898,003 556,691 0.11 0.11
Shinko Electric Industries
Co LtdTechnology 17,994,207 2,569,830 0.24 0.24
Shinko Plantech Co Ltd Industrials 6,993,325 998,747 0.26 0.26
Shinko Securities Co Ltd Financials 46,256,962 6,606,156 0.38 0.38
Shinko Shoji Co Ltd Technology 2,783,846 397,573 0.17 0.17
Shinmaywa Industries Ltd Industrials 3,813,344 544,600 0.17 0.17
Shinsei Bank Ltd Financials 125,968,119 17,990,049 0.57 0.57
Shinwa Co Ltd/Nagoya Industrials 2,510,537 358,541 0.15 0.15
Industry/Sector Market valueNOK
Market valueUSD Voting Ownership
GOVERNMENT PENSION FUND GLOBAL HOLDINGS 2008
Equities Country association according to FTSE (the benchmark provider for equities). If a company is not in thebenchmark, the country of incorporation and country of listing is used. For remaining securities, a further assessment ismade. Country is defined as a sovereign state currently member of the United Nations. Exceptions are Hong Kong andTaiwan. The country association methodology was updated as of 2014.
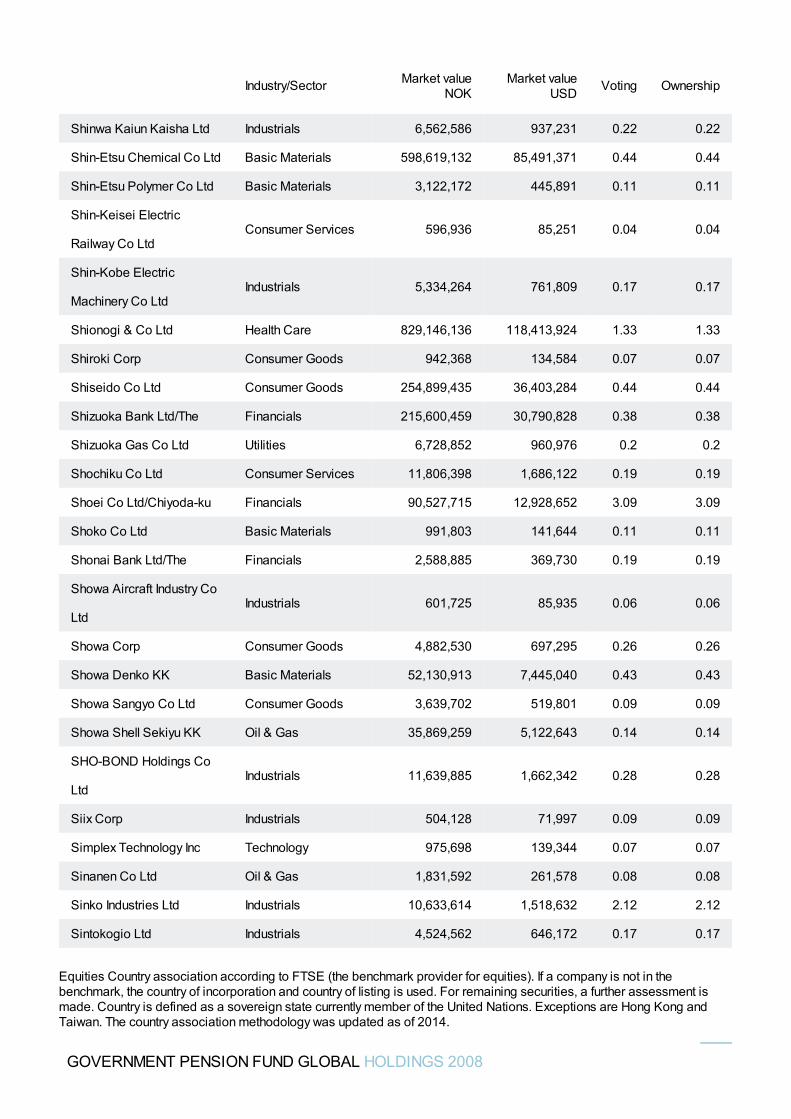
Shinwa Kaiun Kaisha Ltd Industrials 6,562,586 937,231 0.22 0.22
Shin-Etsu Chemical Co Ltd Basic Materials 598,619,132 85,491,371 0.44 0.44
Shin-Etsu Polymer Co Ltd Basic Materials 3,122,172 445,891 0.11 0.11
Shin-Keisei Electric
Railway Co LtdConsumer Services 596,936 85,251 0.04 0.04
Shin-Kobe Electric
Machinery Co LtdIndustrials 5,334,264 761,809 0.17 0.17
Shionogi & Co Ltd Health Care 829,146,136 118,413,924 1.33 1.33
Shiroki Corp Consumer Goods 942,368 134,584 0.07 0.07
Shiseido Co Ltd Consumer Goods 254,899,435 36,403,284 0.44 0.44
Shizuoka Bank Ltd/The Financials 215,600,459 30,790,828 0.38 0.38
Shizuoka Gas Co Ltd Utilities 6,728,852 960,976 0.2 0.2
Shochiku Co Ltd Consumer Services 11,806,398 1,686,122 0.19 0.19
Shoei Co Ltd/Chiyoda-ku Financials 90,527,715 12,928,652 3.09 3.09
Shoko Co Ltd Basic Materials 991,803 141,644 0.11 0.11
Shonai Bank Ltd/The Financials 2,588,885 369,730 0.19 0.19
Showa Aircraft Industry Co
LtdIndustrials 601,725 85,935 0.06 0.06
Showa Corp Consumer Goods 4,882,530 697,295 0.26 0.26
Showa Denko KK Basic Materials 52,130,913 7,445,040 0.43 0.43
Showa Sangyo Co Ltd Consumer Goods 3,639,702 519,801 0.09 0.09
Showa Shell Sekiyu KK Oil & Gas 35,869,259 5,122,643 0.14 0.14
SHO-BOND Holdings Co
LtdIndustrials 11,639,885 1,662,342 0.28 0.28
Siix Corp Industrials 504,128 71,997 0.09 0.09
Simplex Technology Inc Technology 975,698 139,344 0.07 0.07
Sinanen Co Ltd Oil & Gas 1,831,592 261,578 0.08 0.08
Sinko Industries Ltd Industrials 10,633,614 1,518,632 2.12 2.12
Sintokogio Ltd Industrials 4,524,562 646,172 0.17 0.17
Industry/Sector Market valueNOK
Market valueUSD Voting Ownership
GOVERNMENT PENSION FUND GLOBAL HOLDINGS 2008
Equities Country association according to FTSE (the benchmark provider for equities). If a company is not in thebenchmark, the country of incorporation and country of listing is used. For remaining securities, a further assessment ismade. Country is defined as a sovereign state currently member of the United Nations. Exceptions are Hong Kong andTaiwan. The country association methodology was updated as of 2014.
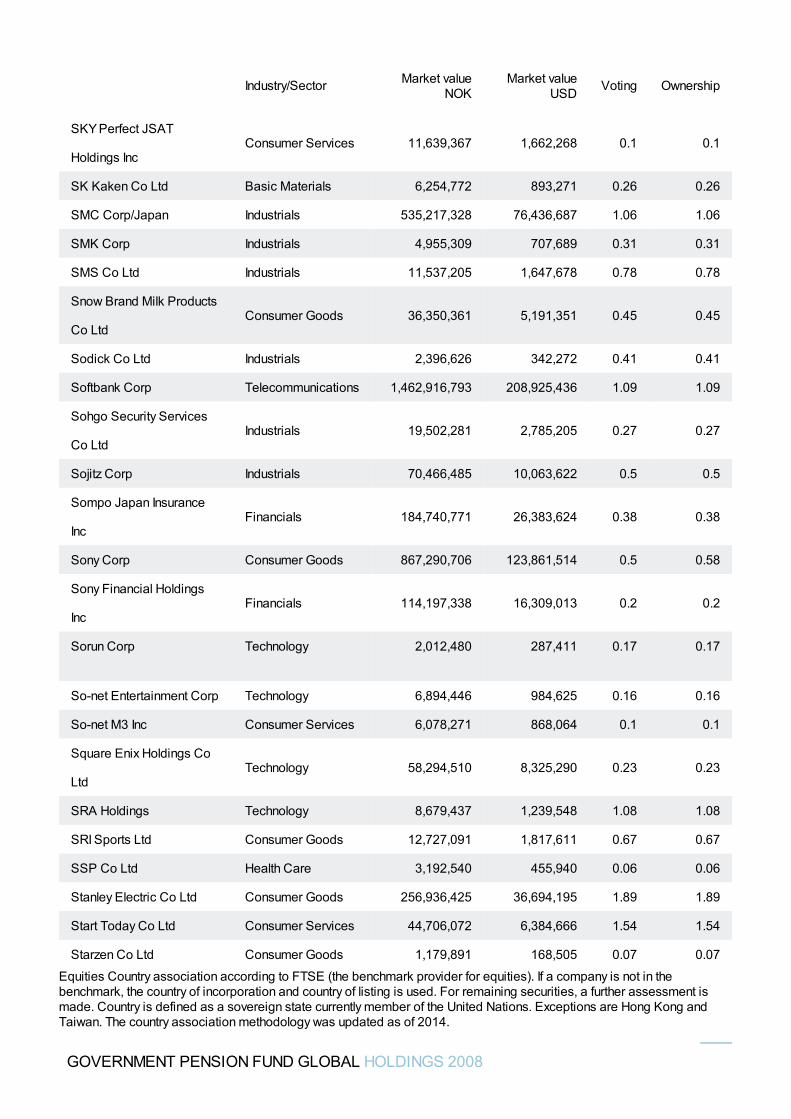
SKY Perfect JSAT
Holdings IncConsumer Services 11,639,367 1,662,268 0.1 0.1
SK Kaken Co Ltd Basic Materials 6,254,772 893,271 0.26 0.26
SMC Corp/Japan Industrials 535,217,328 76,436,687 1.06 1.06
SMK Corp Industrials 4,955,309 707,689 0.31 0.31
SMS Co Ltd Industrials 11,537,205 1,647,678 0.78 0.78
Snow Brand Milk Products
Co LtdConsumer Goods 36,350,361 5,191,351 0.45 0.45
Sodick Co Ltd Industrials 2,396,626 342,272 0.41 0.41
Softbank Corp Telecommunications 1,462,916,793 208,925,436 1.09 1.09
Sohgo Security Services
Co LtdIndustrials 19,502,281 2,785,205 0.27 0.27
Sojitz Corp Industrials 70,466,485 10,063,622 0.5 0.5
Sompo Japan Insurance
IncFinancials 184,740,771 26,383,624 0.38 0.38
Sony Corp Consumer Goods 867,290,706 123,861,514 0.5 0.58
Sony Financial Holdings
IncFinancials 114,197,338 16,309,013 0.2 0.2
Sorun Corp Technology 2,012,480 287,411 0.17 0.17
So-net Entertainment Corp Technology 6,894,446 984,625 0.16 0.16
So-net M3 Inc Consumer Services 6,078,271 868,064 0.1 0.1
Square Enix Holdings Co
LtdTechnology 58,294,510 8,325,290 0.23 0.23
SRA Holdings Technology 8,679,437 1,239,548 1.08 1.08
SRI Sports Ltd Consumer Goods 12,727,091 1,817,611 0.67 0.67
SSP Co Ltd Health Care 3,192,540 455,940 0.06 0.06
Stanley Electric Co Ltd Consumer Goods 256,936,425 36,694,195 1.89 1.89
Start Today Co Ltd Consumer Services 44,706,072 6,384,666 1.54 1.54
Starzen Co Ltd Consumer Goods 1,179,891 168,505 0.07 0.07
Industry/Sector Market valueNOK
Market valueUSD Voting Ownership
GOVERNMENT PENSION FUND GLOBAL HOLDINGS 2008
Equities Country association according to FTSE (the benchmark provider for equities). If a company is not in thebenchmark, the country of incorporation and country of listing is used. For remaining securities, a further assessment ismade. Country is defined as a sovereign state currently member of the United Nations. Exceptions are Hong Kong andTaiwan. The country association methodology was updated as of 2014.
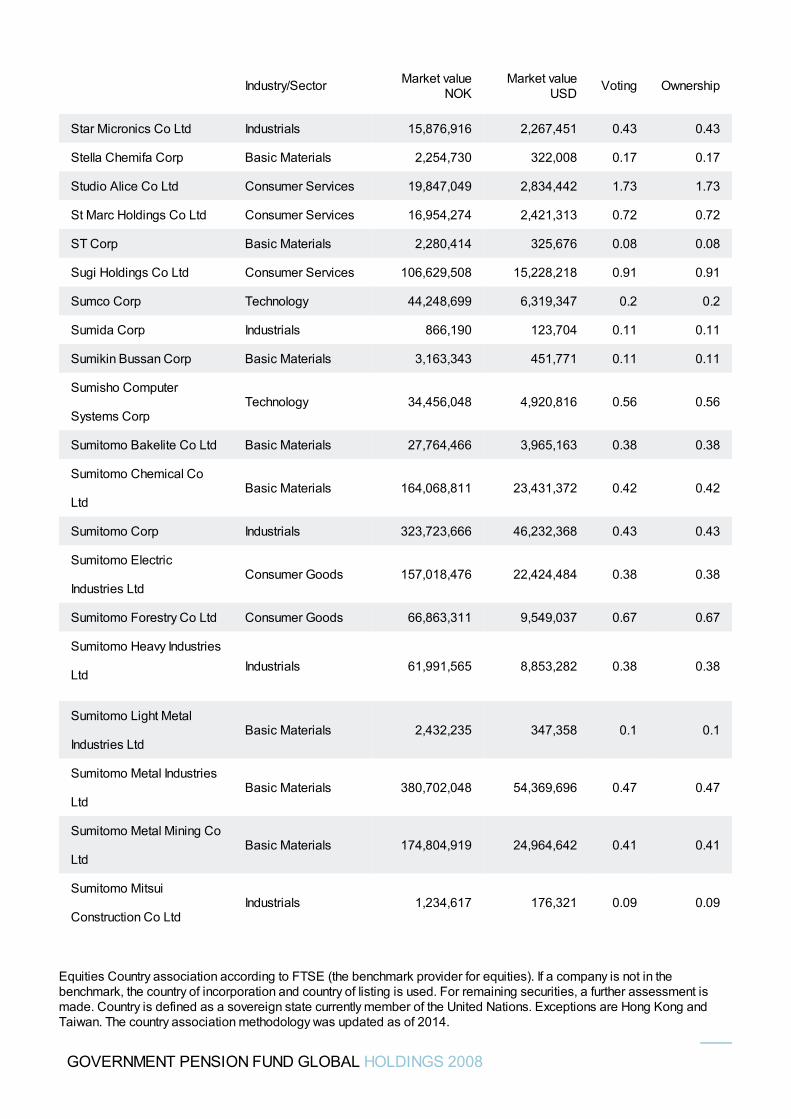
Star Micronics Co Ltd Industrials 15,876,916 2,267,451 0.43 0.43
Stella Chemifa Corp Basic Materials 2,254,730 322,008 0.17 0.17
Studio Alice Co Ltd Consumer Services 19,847,049 2,834,442 1.73 1.73
St Marc Holdings Co Ltd Consumer Services 16,954,274 2,421,313 0.72 0.72
ST Corp Basic Materials 2,280,414 325,676 0.08 0.08
Sugi Holdings Co Ltd Consumer Services 106,629,508 15,228,218 0.91 0.91
Sumco Corp Technology 44,248,699 6,319,347 0.2 0.2
Sumida Corp Industrials 866,190 123,704 0.11 0.11
Sumikin Bussan Corp Basic Materials 3,163,343 451,771 0.11 0.11
Sumisho Computer
Systems CorpTechnology 34,456,048 4,920,816 0.56 0.56
Sumitomo Bakelite Co Ltd Basic Materials 27,764,466 3,965,163 0.38 0.38
Sumitomo Chemical Co
LtdBasic Materials 164,068,811 23,431,372 0.42 0.42
Sumitomo Corp Industrials 323,723,666 46,232,368 0.43 0.43
Sumitomo Electric
Industries LtdConsumer Goods 157,018,476 22,424,484 0.38 0.38
Sumitomo Forestry Co Ltd Consumer Goods 66,863,311 9,549,037 0.67 0.67
Sumitomo Heavy Industries
LtdIndustrials 61,991,565 8,853,282 0.38 0.38
Sumitomo Light Metal
Industries LtdBasic Materials 2,432,235 347,358 0.1 0.1
Sumitomo Metal Industries
LtdBasic Materials 380,702,048 54,369,696 0.47 0.47
Sumitomo Metal Mining Co
LtdBasic Materials 174,804,919 24,964,642 0.41 0.41
Sumitomo Mitsui
Construction Co LtdIndustrials 1,234,617 176,321 0.09 0.09
Industry/Sector Market valueNOK
Market valueUSD Voting Ownership
GOVERNMENT PENSION FUND GLOBAL HOLDINGS 2008
Equities Country association according to FTSE (the benchmark provider for equities). If a company is not in thebenchmark, the country of incorporation and country of listing is used. For remaining securities, a further assessment ismade. Country is defined as a sovereign state currently member of the United Nations. Exceptions are Hong Kong andTaiwan. The country association methodology was updated as of 2014.
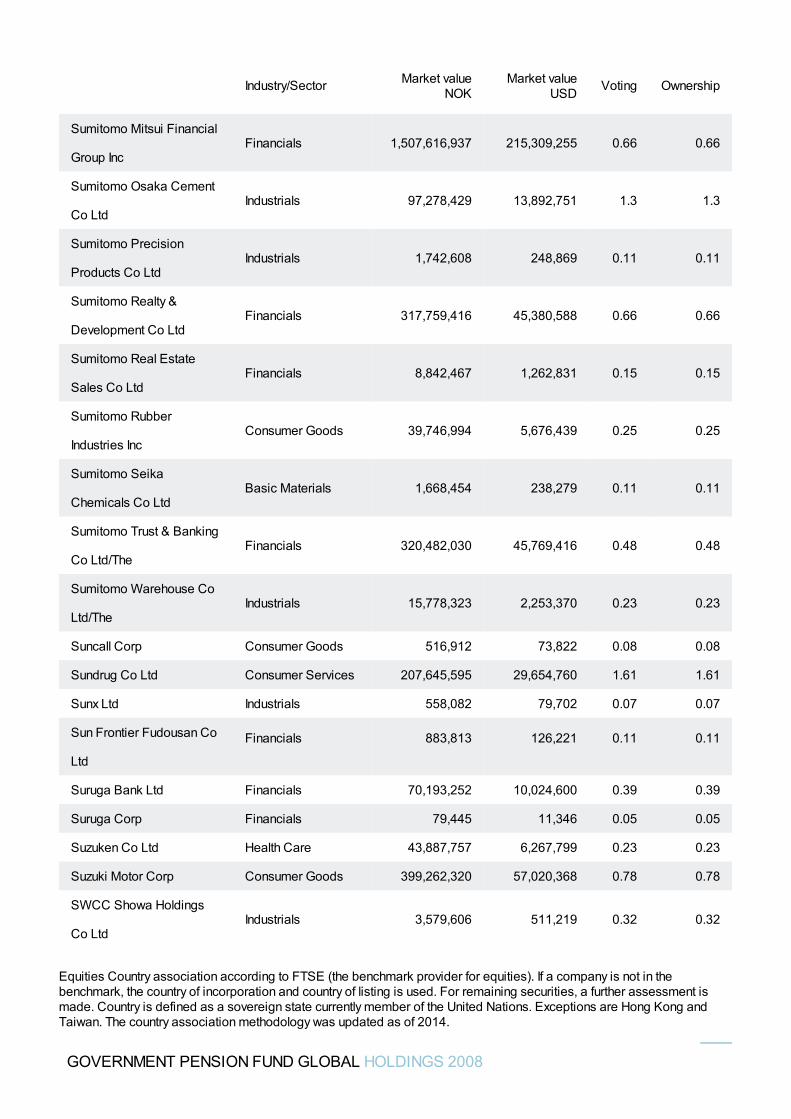
Sumitomo Mitsui Financial
Group IncFinancials 1,507,616,937 215,309,255 0.66 0.66
Sumitomo Osaka Cement
Co LtdIndustrials 97,278,429 13,892,751 1.3 1.3
Sumitomo Precision
Products Co LtdIndustrials 1,742,608 248,869 0.11 0.11
Sumitomo Realty &
Development Co LtdFinancials 317,759,416 45,380,588 0.66 0.66
Sumitomo Real Estate
Sales Co LtdFinancials 8,842,467 1,262,831 0.15 0.15
Sumitomo Rubber
Industries IncConsumer Goods 39,746,994 5,676,439 0.25 0.25
Sumitomo Seika
Chemicals Co LtdBasic Materials 1,668,454 238,279 0.11 0.11
Sumitomo Trust & Banking
Co Ltd/TheFinancials 320,482,030 45,769,416 0.48 0.48
Sumitomo Warehouse Co
Ltd/TheIndustrials 15,778,323 2,253,370 0.23 0.23
Suncall Corp Consumer Goods 516,912 73,822 0.08 0.08
Sundrug Co Ltd Consumer Services 207,645,595 29,654,760 1.61 1.61
Sunx Ltd Industrials 558,082 79,702 0.07 0.07
Sun Frontier Fudousan Co
Ltd
Financials 883,813 126,221 0.11 0.11
Suruga Bank Ltd Financials 70,193,252 10,024,600 0.39 0.39
Suruga Corp Financials 79,445 11,346 0.05 0.05
Suzuken Co Ltd Health Care 43,887,757 6,267,799 0.23 0.23
Suzuki Motor Corp Consumer Goods 399,262,320 57,020,368 0.78 0.78
SWCC Showa Holdings
Co LtdIndustrials 3,579,606 511,219 0.32 0.32
Industry/Sector Market valueNOK
Market valueUSD Voting Ownership
GOVERNMENT PENSION FUND GLOBAL HOLDINGS 2008
Equities Country association according to FTSE (the benchmark provider for equities). If a company is not in thebenchmark, the country of incorporation and country of listing is used. For remaining securities, a further assessment ismade. Country is defined as a sovereign state currently member of the United Nations. Exceptions are Hong Kong andTaiwan. The country association methodology was updated as of 2014.
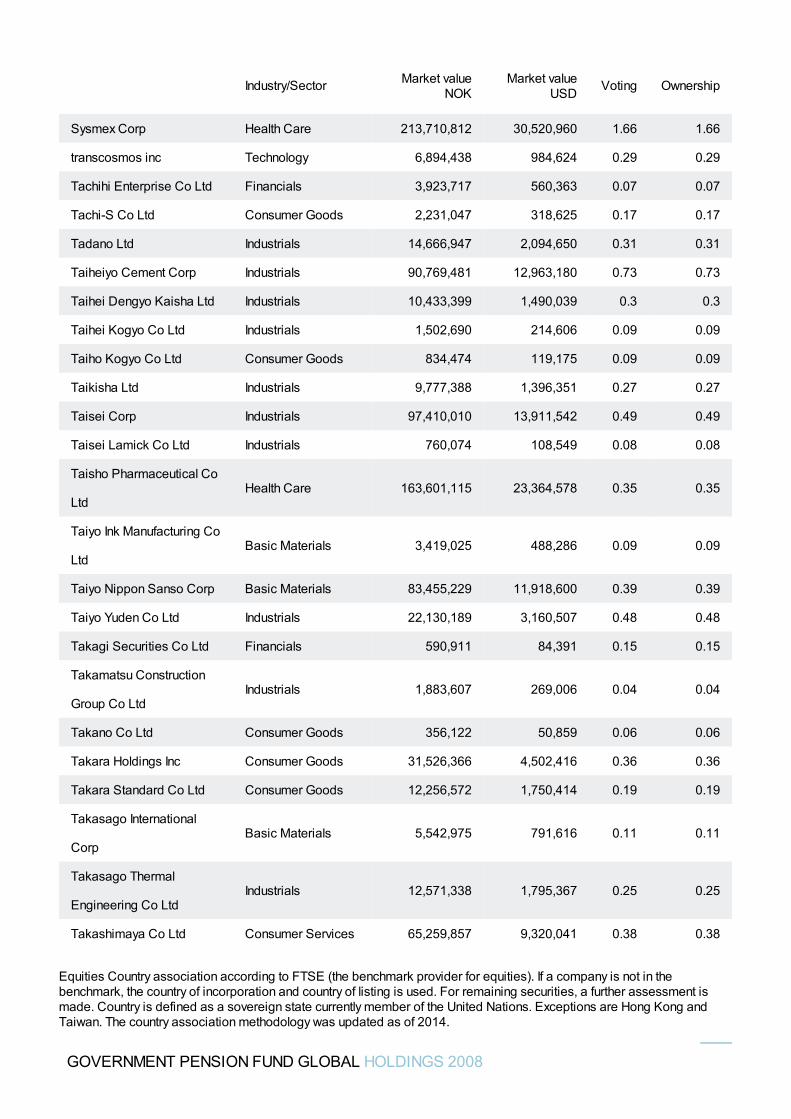
Sysmex Corp Health Care 213,710,812 30,520,960 1.66 1.66
transcosmos inc Technology 6,894,438 984,624 0.29 0.29
Tachihi Enterprise Co Ltd Financials 3,923,717 560,363 0.07 0.07
Tachi-S Co Ltd Consumer Goods 2,231,047 318,625 0.17 0.17
Tadano Ltd Industrials 14,666,947 2,094,650 0.31 0.31
Taiheiyo Cement Corp Industrials 90,769,481 12,963,180 0.73 0.73
Taihei Dengyo Kaisha Ltd Industrials 10,433,399 1,490,039 0.3 0.3
Taihei Kogyo Co Ltd Industrials 1,502,690 214,606 0.09 0.09
Taiho Kogyo Co Ltd Consumer Goods 834,474 119,175 0.09 0.09
Taikisha Ltd Industrials 9,777,388 1,396,351 0.27 0.27
Taisei Corp Industrials 97,410,010 13,911,542 0.49 0.49
Taisei Lamick Co Ltd Industrials 760,074 108,549 0.08 0.08
Taisho Pharmaceutical Co
LtdHealth Care 163,601,115 23,364,578 0.35 0.35
Taiyo Ink Manufacturing Co
LtdBasic Materials 3,419,025 488,286 0.09 0.09
Taiyo Nippon Sanso Corp Basic Materials 83,455,229 11,918,600 0.39 0.39
Taiyo Yuden Co Ltd Industrials 22,130,189 3,160,507 0.48 0.48
Takagi Securities Co Ltd Financials 590,911 84,391 0.15 0.15
Takamatsu Construction
Group Co LtdIndustrials 1,883,607 269,006 0.04 0.04
Takano Co Ltd Consumer Goods 356,122 50,859 0.06 0.06
Takara Holdings Inc Consumer Goods 31,526,366 4,502,416 0.36 0.36
Takara Standard Co Ltd Consumer Goods 12,256,572 1,750,414 0.19 0.19
Takasago International
CorpBasic Materials 5,542,975 791,616 0.11 0.11
Takasago Thermal
Engineering Co LtdIndustrials 12,571,338 1,795,367 0.25 0.25
Takashimaya Co Ltd Consumer Services 65,259,857 9,320,041 0.38 0.38
Industry/Sector Market valueNOK
Market valueUSD Voting Ownership
GOVERNMENT PENSION FUND GLOBAL HOLDINGS 2008
Equities Country association according to FTSE (the benchmark provider for equities). If a company is not in thebenchmark, the country of incorporation and country of listing is used. For remaining securities, a further assessment ismade. Country is defined as a sovereign state currently member of the United Nations. Exceptions are Hong Kong andTaiwan. The country association methodology was updated as of 2014.
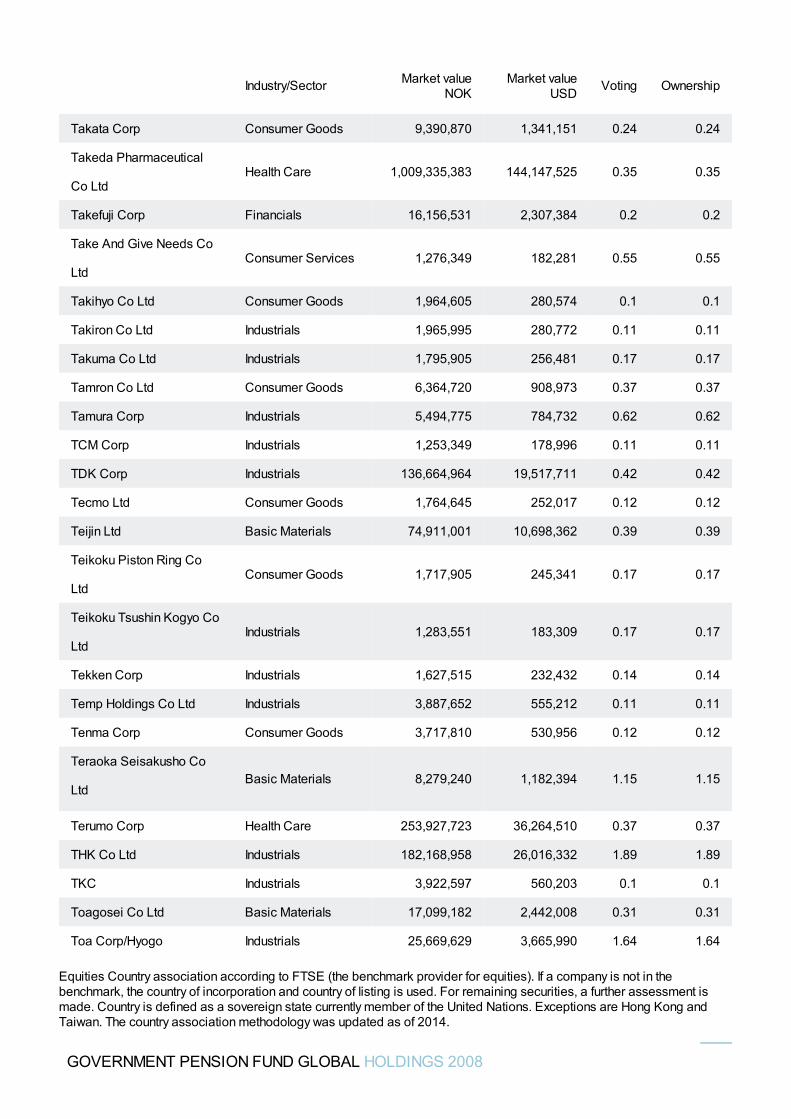
Takata Corp Consumer Goods 9,390,870 1,341,151 0.24 0.24
Takeda Pharmaceutical
Co LtdHealth Care 1,009,335,383 144,147,525 0.35 0.35
Takefuji Corp Financials 16,156,531 2,307,384 0.2 0.2
Take And Give Needs Co
LtdConsumer Services 1,276,349 182,281 0.55 0.55
Takihyo Co Ltd Consumer Goods 1,964,605 280,574 0.1 0.1
Takiron Co Ltd Industrials 1,965,995 280,772 0.11 0.11
Takuma Co Ltd Industrials 1,795,905 256,481 0.17 0.17
Tamron Co Ltd Consumer Goods 6,364,720 908,973 0.37 0.37
Tamura Corp Industrials 5,494,775 784,732 0.62 0.62
TCM Corp Industrials 1,253,349 178,996 0.11 0.11
TDK Corp Industrials 136,664,964 19,517,711 0.42 0.42
Tecmo Ltd Consumer Goods 1,764,645 252,017 0.12 0.12
Teijin Ltd Basic Materials 74,911,001 10,698,362 0.39 0.39
Teikoku Piston Ring Co
LtdConsumer Goods 1,717,905 245,341 0.17 0.17
Teikoku Tsushin Kogyo Co
LtdIndustrials 1,283,551 183,309 0.17 0.17
Tekken Corp Industrials 1,627,515 232,432 0.14 0.14
Temp Holdings Co Ltd Industrials 3,887,652 555,212 0.11 0.11
Tenma Corp Consumer Goods 3,717,810 530,956 0.12 0.12
Teraoka Seisakusho Co
LtdBasic Materials 8,279,240 1,182,394 1.15 1.15
Terumo Corp Health Care 253,927,723 36,264,510 0.37 0.37
THK Co Ltd Industrials 182,168,958 26,016,332 1.89 1.89
TKC Industrials 3,922,597 560,203 0.1 0.1
Toagosei Co Ltd Basic Materials 17,099,182 2,442,008 0.31 0.31
Toa Corp/Hyogo Industrials 25,669,629 3,665,990 1.64 1.64
Industry/Sector Market valueNOK
Market valueUSD Voting Ownership
GOVERNMENT PENSION FUND GLOBAL HOLDINGS 2008
Equities Country association according to FTSE (the benchmark provider for equities). If a company is not in thebenchmark, the country of incorporation and country of listing is used. For remaining securities, a further assessment ismade. Country is defined as a sovereign state currently member of the United Nations. Exceptions are Hong Kong andTaiwan. The country association methodology was updated as of 2014.
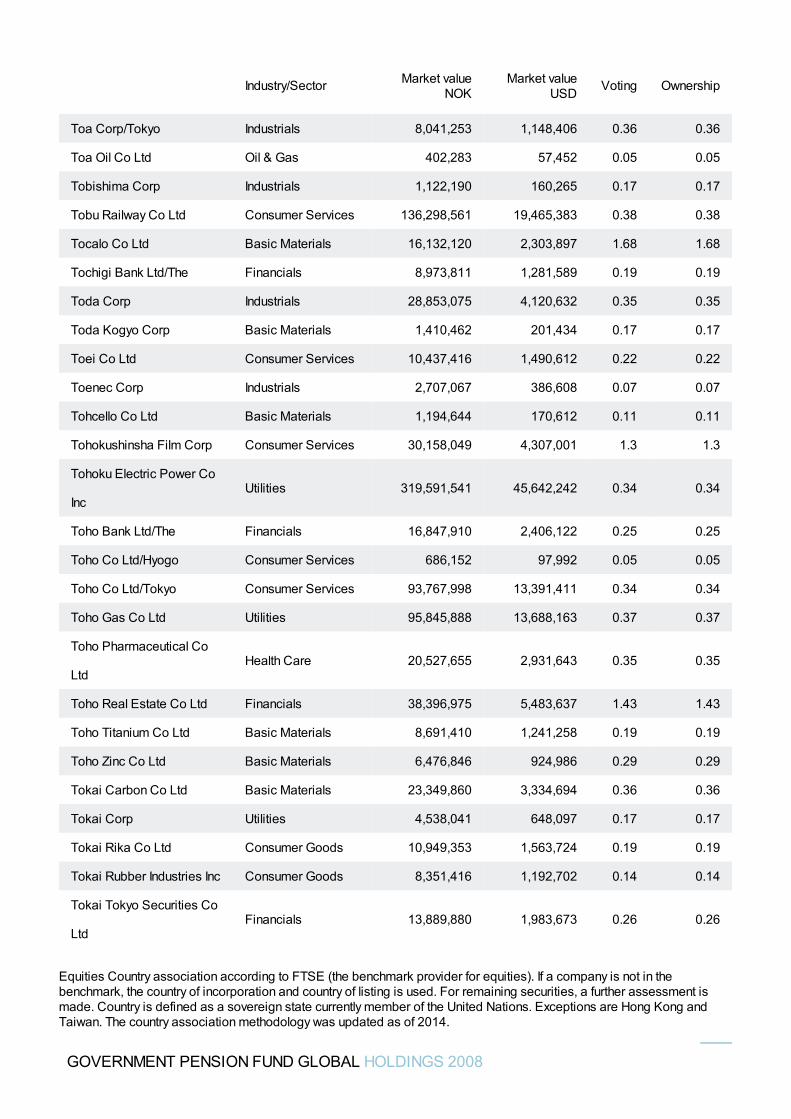
Toa Corp/Tokyo Industrials 8,041,253 1,148,406 0.36 0.36
Toa Oil Co Ltd Oil & Gas 402,283 57,452 0.05 0.05
Tobishima Corp Industrials 1,122,190 160,265 0.17 0.17
Tobu Railway Co Ltd Consumer Services 136,298,561 19,465,383 0.38 0.38
Tocalo Co Ltd Basic Materials 16,132,120 2,303,897 1.68 1.68
Tochigi Bank Ltd/The Financials 8,973,811 1,281,589 0.19 0.19
Toda Corp Industrials 28,853,075 4,120,632 0.35 0.35
Toda Kogyo Corp Basic Materials 1,410,462 201,434 0.17 0.17
Toei Co Ltd Consumer Services 10,437,416 1,490,612 0.22 0.22
Toenec Corp Industrials 2,707,067 386,608 0.07 0.07
Tohcello Co Ltd Basic Materials 1,194,644 170,612 0.11 0.11
Tohokushinsha Film Corp Consumer Services 30,158,049 4,307,001 1.3 1.3
Tohoku Electric Power Co
IncUtilities 319,591,541 45,642,242 0.34 0.34
Toho Bank Ltd/The Financials 16,847,910 2,406,122 0.25 0.25
Toho Co Ltd/Hyogo Consumer Services 686,152 97,992 0.05 0.05
Toho Co Ltd/Tokyo Consumer Services 93,767,998 13,391,411 0.34 0.34
Toho Gas Co Ltd Utilities 95,845,888 13,688,163 0.37 0.37
Toho Pharmaceutical Co
LtdHealth Care 20,527,655 2,931,643 0.35 0.35
Toho Real Estate Co Ltd Financials 38,396,975 5,483,637 1.43 1.43
Toho Titanium Co Ltd Basic Materials 8,691,410 1,241,258 0.19 0.19
Toho Zinc Co Ltd Basic Materials 6,476,846 924,986 0.29 0.29
Tokai Carbon Co Ltd Basic Materials 23,349,860 3,334,694 0.36 0.36
Tokai Corp Utilities 4,538,041 648,097 0.17 0.17
Tokai Rika Co Ltd Consumer Goods 10,949,353 1,563,724 0.19 0.19
Tokai Rubber Industries Inc Consumer Goods 8,351,416 1,192,702 0.14 0.14
Tokai Tokyo Securities Co
LtdFinancials 13,889,880 1,983,673 0.26 0.26
Industry/Sector Market valueNOK
Market valueUSD Voting Ownership
GOVERNMENT PENSION FUND GLOBAL HOLDINGS 2008
Equities Country association according to FTSE (the benchmark provider for equities). If a company is not in thebenchmark, the country of incorporation and country of listing is used. For remaining securities, a further assessment ismade. Country is defined as a sovereign state currently member of the United Nations. Exceptions are Hong Kong andTaiwan. The country association methodology was updated as of 2014.
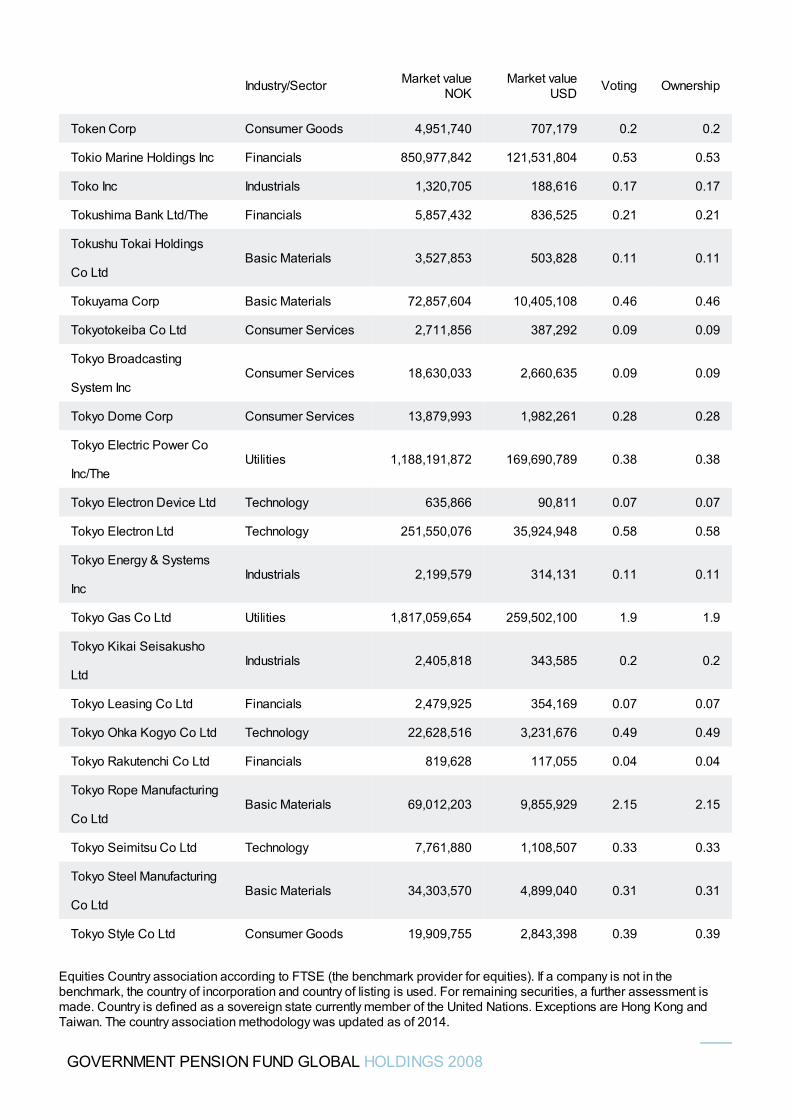
Token Corp Consumer Goods 4,951,740 707,179 0.2 0.2
Tokio Marine Holdings Inc Financials 850,977,842 121,531,804 0.53 0.53
Toko Inc Industrials 1,320,705 188,616 0.17 0.17
Tokushima Bank Ltd/The Financials 5,857,432 836,525 0.21 0.21
Tokushu Tokai Holdings
Co LtdBasic Materials 3,527,853 503,828 0.11 0.11
Tokuyama Corp Basic Materials 72,857,604 10,405,108 0.46 0.46
Tokyotokeiba Co Ltd Consumer Services 2,711,856 387,292 0.09 0.09
Tokyo Broadcasting
System IncConsumer Services 18,630,033 2,660,635 0.09 0.09
Tokyo Dome Corp Consumer Services 13,879,993 1,982,261 0.28 0.28
Tokyo Electric Power Co
Inc/TheUtilities 1,188,191,872 169,690,789 0.38 0.38
Tokyo Electron Device Ltd Technology 635,866 90,811 0.07 0.07
Tokyo Electron Ltd Technology 251,550,076 35,924,948 0.58 0.58
Tokyo Energy & Systems
IncIndustrials 2,199,579 314,131 0.11 0.11
Tokyo Gas Co Ltd Utilities 1,817,059,654 259,502,100 1.9 1.9
Tokyo Kikai Seisakusho
LtdIndustrials 2,405,818 343,585 0.2 0.2
Tokyo Leasing Co Ltd Financials 2,479,925 354,169 0.07 0.07
Tokyo Ohka Kogyo Co Ltd Technology 22,628,516 3,231,676 0.49 0.49
Tokyo Rakutenchi Co Ltd Financials 819,628 117,055 0.04 0.04
Tokyo Rope Manufacturing
Co LtdBasic Materials 69,012,203 9,855,929 2.15 2.15
Tokyo Seimitsu Co Ltd Technology 7,761,880 1,108,507 0.33 0.33
Tokyo Steel Manufacturing
Co LtdBasic Materials 34,303,570 4,899,040 0.31 0.31
Tokyo Style Co Ltd Consumer Goods 19,909,755 2,843,398 0.39 0.39
Industry/Sector Market valueNOK
Market valueUSD Voting Ownership
GOVERNMENT PENSION FUND GLOBAL HOLDINGS 2008
Equities Country association according to FTSE (the benchmark provider for equities). If a company is not in thebenchmark, the country of incorporation and country of listing is used. For remaining securities, a further assessment ismade. Country is defined as a sovereign state currently member of the United Nations. Exceptions are Hong Kong andTaiwan. The country association methodology was updated as of 2014.
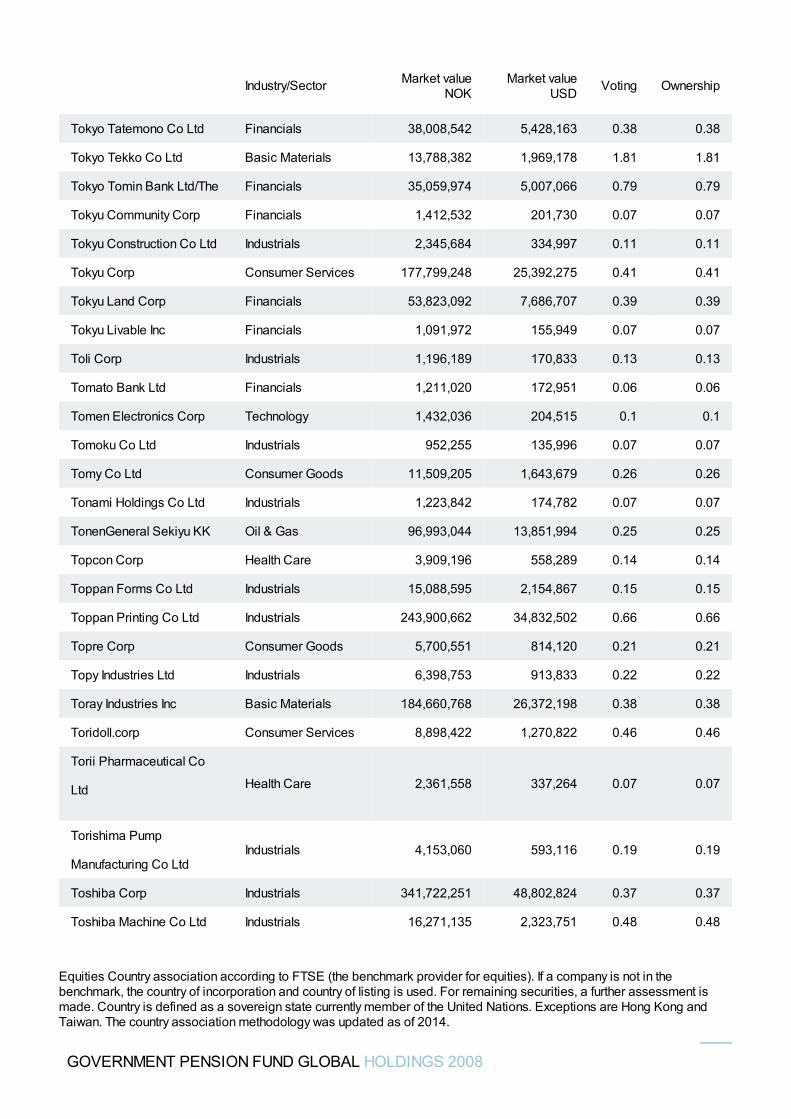
Tokyo Tatemono Co Ltd Financials 38,008,542 5,428,163 0.38 0.38
Tokyo Tekko Co Ltd Basic Materials 13,788,382 1,969,178 1.81 1.81
Tokyo Tomin Bank Ltd/The Financials 35,059,974 5,007,066 0.79 0.79
Tokyu Community Corp Financials 1,412,532 201,730 0.07 0.07
Tokyu Construction Co Ltd Industrials 2,345,684 334,997 0.11 0.11
Tokyu Corp Consumer Services 177,799,248 25,392,275 0.41 0.41
Tokyu Land Corp Financials 53,823,092 7,686,707 0.39 0.39
Tokyu Livable Inc Financials 1,091,972 155,949 0.07 0.07
Toli Corp Industrials 1,196,189 170,833 0.13 0.13
Tomato Bank Ltd Financials 1,211,020 172,951 0.06 0.06
Tomen Electronics Corp Technology 1,432,036 204,515 0.1 0.1
Tomoku Co Ltd Industrials 952,255 135,996 0.07 0.07
Tomy Co Ltd Consumer Goods 11,509,205 1,643,679 0.26 0.26
Tonami Holdings Co Ltd Industrials 1,223,842 174,782 0.07 0.07
TonenGeneral Sekiyu KK Oil & Gas 96,993,044 13,851,994 0.25 0.25
Topcon Corp Health Care 3,909,196 558,289 0.14 0.14
Toppan Forms Co Ltd Industrials 15,088,595 2,154,867 0.15 0.15
Toppan Printing Co Ltd Industrials 243,900,662 34,832,502 0.66 0.66
Topre Corp Consumer Goods 5,700,551 814,120 0.21 0.21
Topy Industries Ltd Industrials 6,398,753 913,833 0.22 0.22
Toray Industries Inc Basic Materials 184,660,768 26,372,198 0.38 0.38
Toridoll.corp Consumer Services 8,898,422 1,270,822 0.46 0.46
Torii Pharmaceutical Co
Ltd Health Care 2,361,558 337,264 0.07 0.07
Torishima Pump
Manufacturing Co LtdIndustrials 4,153,060 593,116 0.19 0.19
Toshiba Corp Industrials 341,722,251 48,802,824 0.37 0.37
Toshiba Machine Co Ltd Industrials 16,271,135 2,323,751 0.48 0.48
Industry/Sector Market valueNOK
Market valueUSD Voting Ownership
GOVERNMENT PENSION FUND GLOBAL HOLDINGS 2008
Equities Country association according to FTSE (the benchmark provider for equities). If a company is not in thebenchmark, the country of incorporation and country of listing is used. For remaining securities, a further assessment ismade. Country is defined as a sovereign state currently member of the United Nations. Exceptions are Hong Kong andTaiwan. The country association methodology was updated as of 2014.
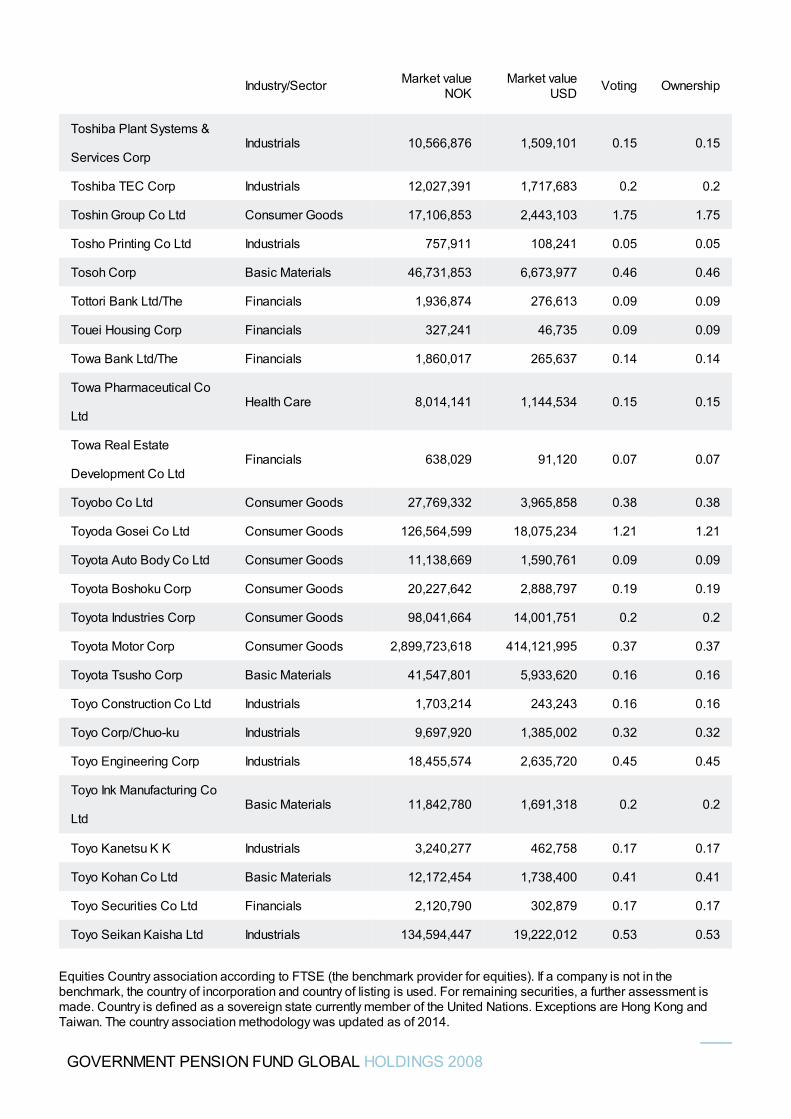
Toshiba Plant Systems &
Services CorpIndustrials 10,566,876 1,509,101 0.15 0.15
Toshiba TEC Corp Industrials 12,027,391 1,717,683 0.2 0.2
Toshin Group Co Ltd Consumer Goods 17,106,853 2,443,103 1.75 1.75
Tosho Printing Co Ltd Industrials 757,911 108,241 0.05 0.05
Tosoh Corp Basic Materials 46,731,853 6,673,977 0.46 0.46
Tottori Bank Ltd/The Financials 1,936,874 276,613 0.09 0.09
Touei Housing Corp Financials 327,241 46,735 0.09 0.09
Towa Bank Ltd/The Financials 1,860,017 265,637 0.14 0.14
Towa Pharmaceutical Co
LtdHealth Care 8,014,141 1,144,534 0.15 0.15
Towa Real Estate
Development Co LtdFinancials 638,029 91,120 0.07 0.07
Toyobo Co Ltd Consumer Goods 27,769,332 3,965,858 0.38 0.38
Toyoda Gosei Co Ltd Consumer Goods 126,564,599 18,075,234 1.21 1.21
Toyota Auto Body Co Ltd Consumer Goods 11,138,669 1,590,761 0.09 0.09
Toyota Boshoku Corp Consumer Goods 20,227,642 2,888,797 0.19 0.19
Toyota Industries Corp Consumer Goods 98,041,664 14,001,751 0.2 0.2
Toyota Motor Corp Consumer Goods 2,899,723,618 414,121,995 0.37 0.37
Toyota Tsusho Corp Basic Materials 41,547,801 5,933,620 0.16 0.16
Toyo Construction Co Ltd Industrials 1,703,214 243,243 0.16 0.16
Toyo Corp/Chuo-ku Industrials 9,697,920 1,385,002 0.32 0.32
Toyo Engineering Corp Industrials 18,455,574 2,635,720 0.45 0.45
Toyo Ink Manufacturing Co
LtdBasic Materials 11,842,780 1,691,318 0.2 0.2
Toyo Kanetsu K K Industrials 3,240,277 462,758 0.17 0.17
Toyo Kohan Co Ltd Basic Materials 12,172,454 1,738,400 0.41 0.41
Toyo Securities Co Ltd Financials 2,120,790 302,879 0.17 0.17
Toyo Seikan Kaisha Ltd Industrials 134,594,447 19,222,012 0.53 0.53
Industry/Sector Market valueNOK
Market valueUSD Voting Ownership
GOVERNMENT PENSION FUND GLOBAL HOLDINGS 2008
Equities Country association according to FTSE (the benchmark provider for equities). If a company is not in thebenchmark, the country of incorporation and country of listing is used. For remaining securities, a further assessment ismade. Country is defined as a sovereign state currently member of the United Nations. Exceptions are Hong Kong andTaiwan. The country association methodology was updated as of 2014.
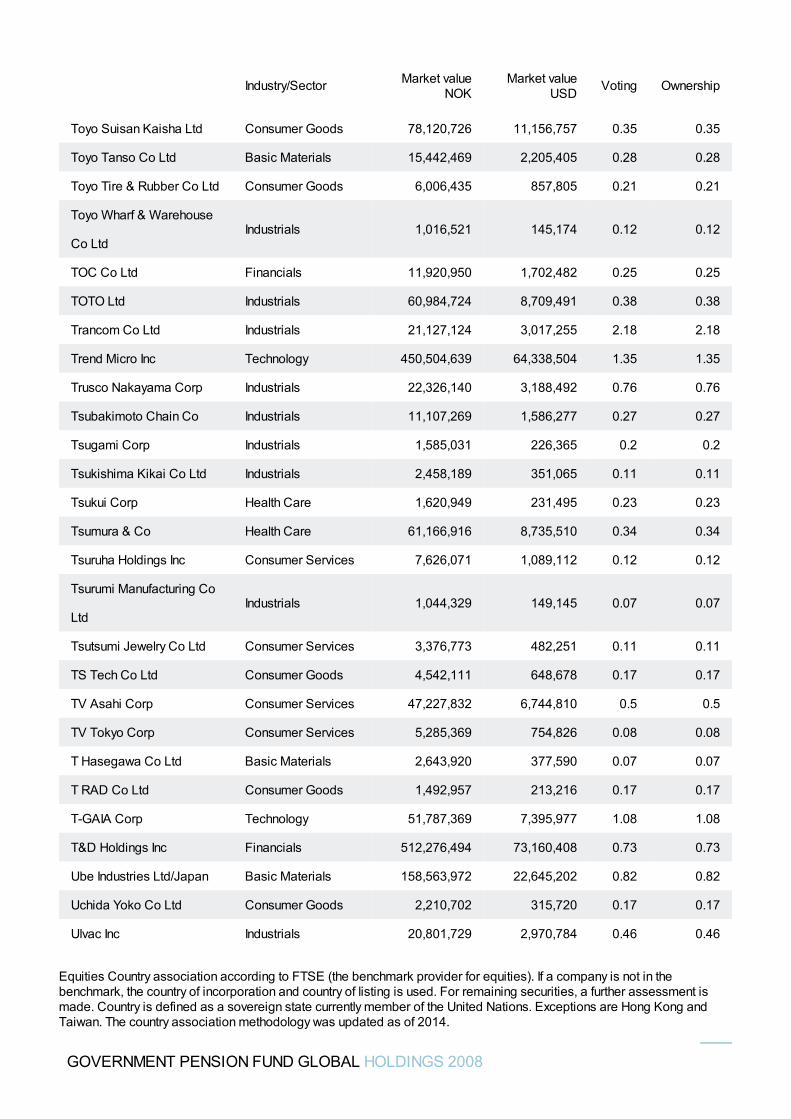
Toyo Suisan Kaisha Ltd Consumer Goods 78,120,726 11,156,757 0.35 0.35
Toyo Tanso Co Ltd Basic Materials 15,442,469 2,205,405 0.28 0.28
Toyo Tire & Rubber Co Ltd Consumer Goods 6,006,435 857,805 0.21 0.21
Toyo Wharf & Warehouse
Co LtdIndustrials 1,016,521 145,174 0.12 0.12
TOC Co Ltd Financials 11,920,950 1,702,482 0.25 0.25
TOTO Ltd Industrials 60,984,724 8,709,491 0.38 0.38
Trancom Co Ltd Industrials 21,127,124 3,017,255 2.18 2.18
Trend Micro Inc Technology 450,504,639 64,338,504 1.35 1.35
Trusco Nakayama Corp Industrials 22,326,140 3,188,492 0.76 0.76
Tsubakimoto Chain Co Industrials 11,107,269 1,586,277 0.27 0.27
Tsugami Corp Industrials 1,585,031 226,365 0.2 0.2
Tsukishima Kikai Co Ltd Industrials 2,458,189 351,065 0.11 0.11
Tsukui Corp Health Care 1,620,949 231,495 0.23 0.23
Tsumura & Co Health Care 61,166,916 8,735,510 0.34 0.34
Tsuruha Holdings Inc Consumer Services 7,626,071 1,089,112 0.12 0.12
Tsurumi Manufacturing Co
LtdIndustrials 1,044,329 149,145 0.07 0.07
Tsutsumi Jewelry Co Ltd Consumer Services 3,376,773 482,251 0.11 0.11
TS Tech Co Ltd Consumer Goods 4,542,111 648,678 0.17 0.17
TV Asahi Corp Consumer Services 47,227,832 6,744,810 0.5 0.5
TV Tokyo Corp Consumer Services 5,285,369 754,826 0.08 0.08
T Hasegawa Co Ltd Basic Materials 2,643,920 377,590 0.07 0.07
T RAD Co Ltd Consumer Goods 1,492,957 213,216 0.17 0.17
T-GAIA Corp Technology 51,787,369 7,395,977 1.08 1.08
T&D Holdings Inc Financials 512,276,494 73,160,408 0.73 0.73
Ube Industries Ltd/Japan Basic Materials 158,563,972 22,645,202 0.82 0.82
Uchida Yoko Co Ltd Consumer Goods 2,210,702 315,720 0.17 0.17
Ulvac Inc Industrials 20,801,729 2,970,784 0.46 0.46
Industry/Sector Market valueNOK
Market valueUSD Voting Ownership
GOVERNMENT PENSION FUND GLOBAL HOLDINGS 2008
Equities Country association according to FTSE (the benchmark provider for equities). If a company is not in thebenchmark, the country of incorporation and country of listing is used. For remaining securities, a further assessment ismade. Country is defined as a sovereign state currently member of the United Nations. Exceptions are Hong Kong andTaiwan. The country association methodology was updated as of 2014.
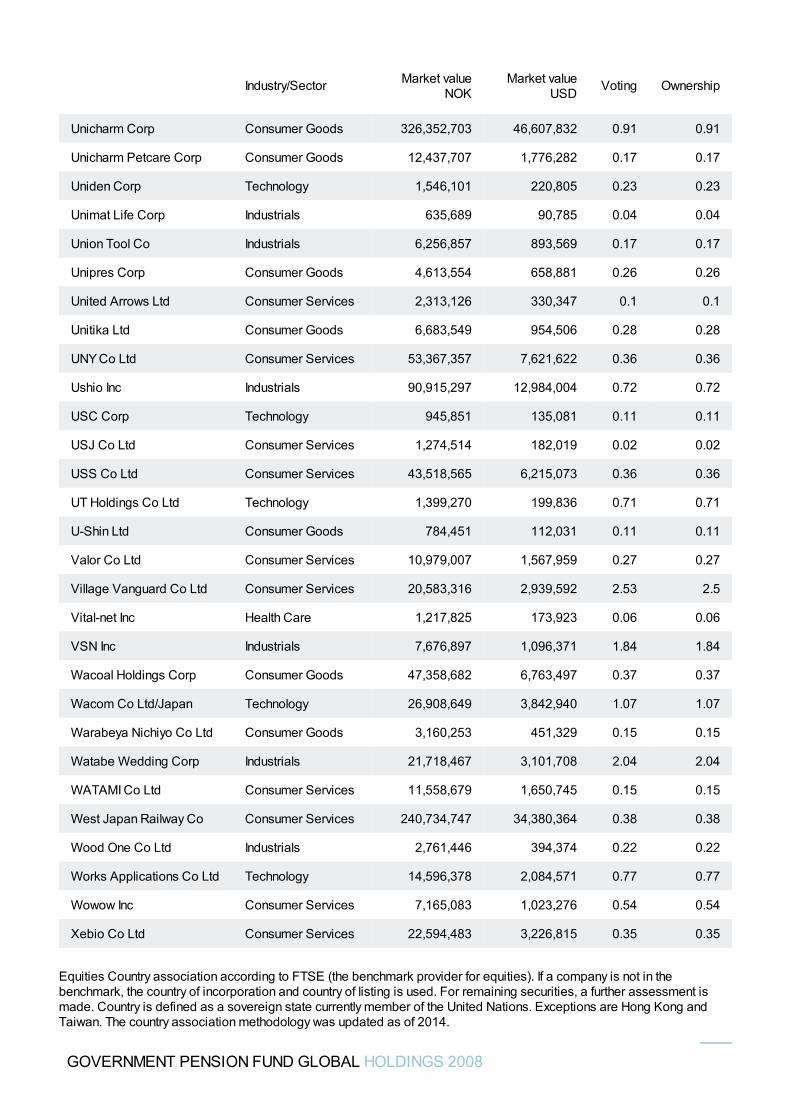
Unicharm Corp Consumer Goods 326,352,703 46,607,832 0.91 0.91
Unicharm Petcare Corp Consumer Goods 12,437,707 1,776,282 0.17 0.17
Uniden Corp Technology 1,546,101 220,805 0.23 0.23
Unimat Life Corp Industrials 635,689 90,785 0.04 0.04
Union Tool Co Industrials 6,256,857 893,569 0.17 0.17
Unipres Corp Consumer Goods 4,613,554 658,881 0.26 0.26
United Arrows Ltd Consumer Services 2,313,126 330,347 0.1 0.1
Unitika Ltd Consumer Goods 6,683,549 954,506 0.28 0.28
UNY Co Ltd Consumer Services 53,367,357 7,621,622 0.36 0.36
Ushio Inc Industrials 90,915,297 12,984,004 0.72 0.72
USC Corp Technology 945,851 135,081 0.11 0.11
USJ Co Ltd Consumer Services 1,274,514 182,019 0.02 0.02
USS Co Ltd Consumer Services 43,518,565 6,215,073 0.36 0.36
UT Holdings Co Ltd Technology 1,399,270 199,836 0.71 0.71
U-Shin Ltd Consumer Goods 784,451 112,031 0.11 0.11
Valor Co Ltd Consumer Services 10,979,007 1,567,959 0.27 0.27
Village Vanguard Co Ltd Consumer Services 20,583,316 2,939,592 2.53 2.5
Vital-net Inc Health Care 1,217,825 173,923 0.06 0.06
VSN Inc Industrials 7,676,897 1,096,371 1.84 1.84
Wacoal Holdings Corp Consumer Goods 47,358,682 6,763,497 0.37 0.37
Wacom Co Ltd/Japan Technology 26,908,649 3,842,940 1.07 1.07
Warabeya Nichiyo Co Ltd Consumer Goods 3,160,253 451,329 0.15 0.15
Watabe Wedding Corp Industrials 21,718,467 3,101,708 2.04 2.04
WATAMI Co Ltd Consumer Services 11,558,679 1,650,745 0.15 0.15
West Japan Railway Co Consumer Services 240,734,747 34,380,364 0.38 0.38
Wood One Co Ltd Industrials 2,761,446 394,374 0.22 0.22
Works Applications Co Ltd Technology 14,596,378 2,084,571 0.77 0.77
Wowow Inc Consumer Services 7,165,083 1,023,276 0.54 0.54
Xebio Co Ltd Consumer Services 22,594,483 3,226,815 0.35 0.35
Industry/Sector Market valueNOK
Market valueUSD Voting Ownership
GOVERNMENT PENSION FUND GLOBAL HOLDINGS 2008
Equities Country association according to FTSE (the benchmark provider for equities). If a company is not in thebenchmark, the country of incorporation and country of listing is used. For remaining securities, a further assessment ismade. Country is defined as a sovereign state currently member of the United Nations. Exceptions are Hong Kong andTaiwan. The country association methodology was updated as of 2014.
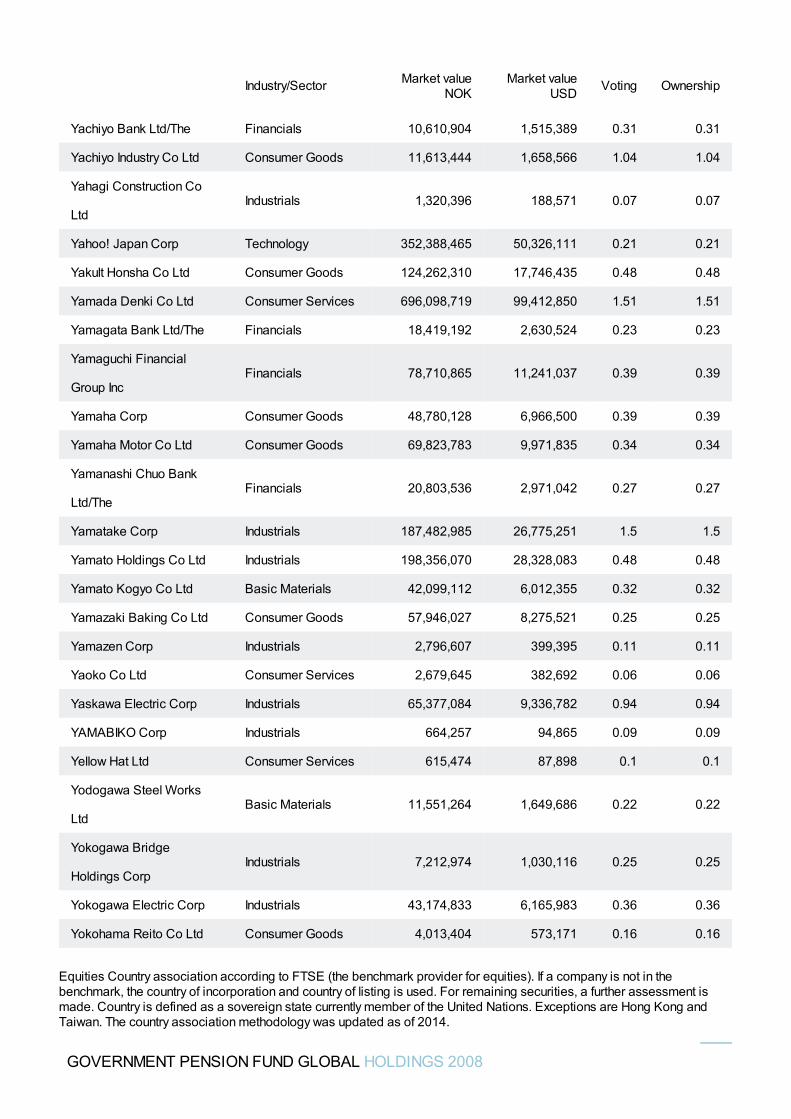
Yachiyo Bank Ltd/The Financials 10,610,904 1,515,389 0.31 0.31
Yachiyo Industry Co Ltd Consumer Goods 11,613,444 1,658,566 1.04 1.04
Yahagi Construction Co
LtdIndustrials 1,320,396 188,571 0.07 0.07
Yahoo! Japan Corp Technology 352,388,465 50,326,111 0.21 0.21
Yakult Honsha Co Ltd Consumer Goods 124,262,310 17,746,435 0.48 0.48
Yamada Denki Co Ltd Consumer Services 696,098,719 99,412,850 1.51 1.51
Yamagata Bank Ltd/The Financials 18,419,192 2,630,524 0.23 0.23
Yamaguchi Financial
Group IncFinancials 78,710,865 11,241,037 0.39 0.39
Yamaha Corp Consumer Goods 48,780,128 6,966,500 0.39 0.39
Yamaha Motor Co Ltd Consumer Goods 69,823,783 9,971,835 0.34 0.34
Yamanashi Chuo Bank
Ltd/TheFinancials 20,803,536 2,971,042 0.27 0.27
Yamatake Corp Industrials 187,482,985 26,775,251 1.5 1.5
Yamato Holdings Co Ltd Industrials 198,356,070 28,328,083 0.48 0.48
Yamato Kogyo Co Ltd Basic Materials 42,099,112 6,012,355 0.32 0.32
Yamazaki Baking Co Ltd Consumer Goods 57,946,027 8,275,521 0.25 0.25
Yamazen Corp Industrials 2,796,607 399,395 0.11 0.11
Yaoko Co Ltd Consumer Services 2,679,645 382,692 0.06 0.06
Yaskawa Electric Corp Industrials 65,377,084 9,336,782 0.94 0.94
YAMABIKO Corp Industrials 664,257 94,865 0.09 0.09
Yellow Hat Ltd Consumer Services 615,474 87,898 0.1 0.1
Yodogawa Steel Works
LtdBasic Materials 11,551,264 1,649,686 0.22 0.22
Yokogawa Bridge
Holdings CorpIndustrials 7,212,974 1,030,116 0.25 0.25
Yokogawa Electric Corp Industrials 43,174,833 6,165,983 0.36 0.36
Yokohama Reito Co Ltd Consumer Goods 4,013,404 573,171 0.16 0.16
Industry/Sector Market valueNOK
Market valueUSD Voting Ownership
GOVERNMENT PENSION FUND GLOBAL HOLDINGS 2008
Equities Country association according to FTSE (the benchmark provider for equities). If a company is not in thebenchmark, the country of incorporation and country of listing is used. For remaining securities, a further assessment ismade. Country is defined as a sovereign state currently member of the United Nations. Exceptions are Hong Kong andTaiwan. The country association methodology was updated as of 2014.
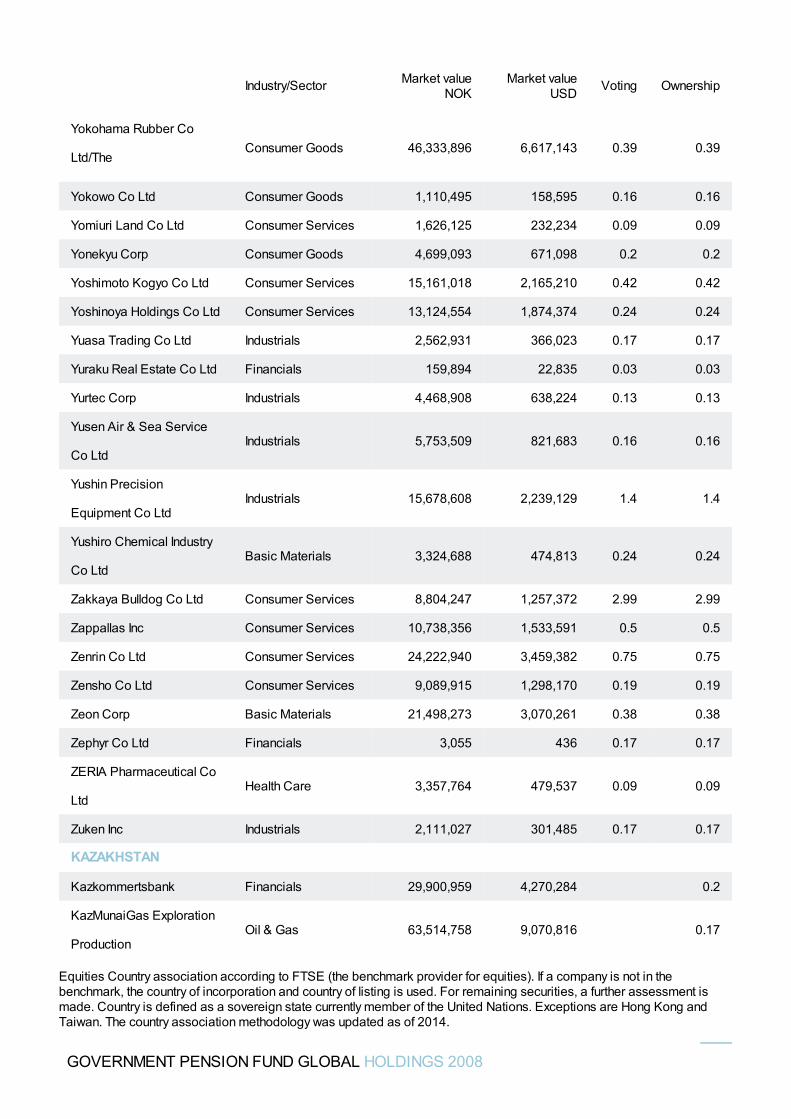
Yokohama Rubber Co
Ltd/TheConsumer Goods 46,333,896 6,617,143 0.39 0.39
Yokowo Co Ltd Consumer Goods 1,110,495 158,595 0.16 0.16
Yomiuri Land Co Ltd Consumer Services 1,626,125 232,234 0.09 0.09
Yonekyu Corp Consumer Goods 4,699,093 671,098 0.2 0.2
Yoshimoto Kogyo Co Ltd Consumer Services 15,161,018 2,165,210 0.42 0.42
Yoshinoya Holdings Co Ltd Consumer Services 13,124,554 1,874,374 0.24 0.24
Yuasa Trading Co Ltd Industrials 2,562,931 366,023 0.17 0.17
Yuraku Real Estate Co Ltd Financials 159,894 22,835 0.03 0.03
Yurtec Corp Industrials 4,468,908 638,224 0.13 0.13
Yusen Air & Sea Service
Co LtdIndustrials 5,753,509 821,683 0.16 0.16
Yushin Precision
Equipment Co LtdIndustrials 15,678,608 2,239,129 1.4 1.4
Yushiro Chemical Industry
Co LtdBasic Materials 3,324,688 474,813 0.24 0.24
Zakkaya Bulldog Co Ltd Consumer Services 8,804,247 1,257,372 2.99 2.99
Zappallas Inc Consumer Services 10,738,356 1,533,591 0.5 0.5
Zenrin Co Ltd Consumer Services 24,222,940 3,459,382 0.75 0.75
Zensho Co Ltd Consumer Services 9,089,915 1,298,170 0.19 0.19
Zeon Corp Basic Materials 21,498,273 3,070,261 0.38 0.38
Zephyr Co Ltd Financials 3,055 436 0.17 0.17
ZERIA Pharmaceutical Co
LtdHealth Care 3,357,764 479,537 0.09 0.09
Zuken Inc Industrials 2,111,027 301,485 0.17 0.17
KAZAKHSTAN
Kazkommertsbank Financials 29,900,959 4,270,284 0.2
KazMunaiGas Exploration
ProductionOil & Gas 63,514,758 9,070,816 0.17
Industry/Sector Market valueNOK
Market valueUSD Voting Ownership
GOVERNMENT PENSION FUND GLOBAL HOLDINGS 2008
Equities Country association according to FTSE (the benchmark provider for equities). If a company is not in thebenchmark, the country of incorporation and country of listing is used. For remaining securities, a further assessment ismade. Country is defined as a sovereign state currently member of the United Nations. Exceptions are Hong Kong andTaiwan. The country association methodology was updated as of 2014.
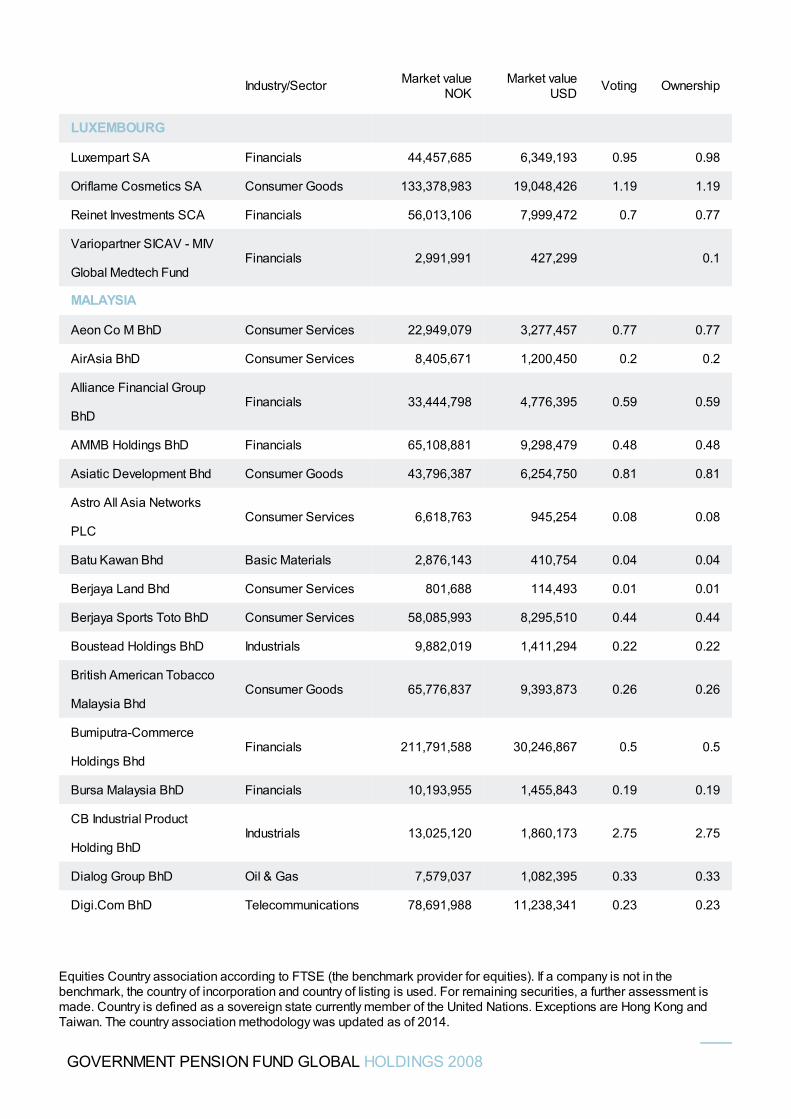
LUXEMBOURG
Luxempart SA Financials 44,457,685 6,349,193 0.95 0.98
Oriflame Cosmetics SA Consumer Goods 133,378,983 19,048,426 1.19 1.19
Reinet Investments SCA Financials 56,013,106 7,999,472 0.7 0.77
Variopartner SICAV - MIV
Global Medtech FundFinancials 2,991,991 427,299 0.1
MALAYSIA
Aeon Co M BhD Consumer Services 22,949,079 3,277,457 0.77 0.77
AirAsia BhD Consumer Services 8,405,671 1,200,450 0.2 0.2
Alliance Financial Group
BhDFinancials 33,444,798 4,776,395 0.59 0.59
AMMB Holdings BhD Financials 65,108,881 9,298,479 0.48 0.48
Asiatic Development Bhd Consumer Goods 43,796,387 6,254,750 0.81 0.81
Astro All Asia Networks
PLCConsumer Services 6,618,763 945,254 0.08 0.08
Batu Kawan Bhd Basic Materials 2,876,143 410,754 0.04 0.04
Berjaya Land Bhd Consumer Services 801,688 114,493 0.01 0.01
Berjaya Sports Toto BhD Consumer Services 58,085,993 8,295,510 0.44 0.44
Boustead Holdings BhD Industrials 9,882,019 1,411,294 0.22 0.22
British American Tobacco
Malaysia BhdConsumer Goods 65,776,837 9,393,873 0.26 0.26
Bumiputra-Commerce
Holdings BhdFinancials 211,791,588 30,246,867 0.5 0.5
Bursa Malaysia BhD Financials 10,193,955 1,455,843 0.19 0.19
CB Industrial Product
Holding BhDIndustrials 13,025,120 1,860,173 2.75 2.75
Dialog Group BhD Oil & Gas 7,579,037 1,082,395 0.33 0.33
Digi.Com BhD Telecommunications 78,691,988 11,238,341 0.23 0.23
Industry/Sector Market valueNOK
Market valueUSD Voting Ownership
GOVERNMENT PENSION FUND GLOBAL HOLDINGS 2008
Equities Country association according to FTSE (the benchmark provider for equities). If a company is not in thebenchmark, the country of incorporation and country of listing is used. For remaining securities, a further assessment ismade. Country is defined as a sovereign state currently member of the United Nations. Exceptions are Hong Kong andTaiwan. The country association methodology was updated as of 2014.
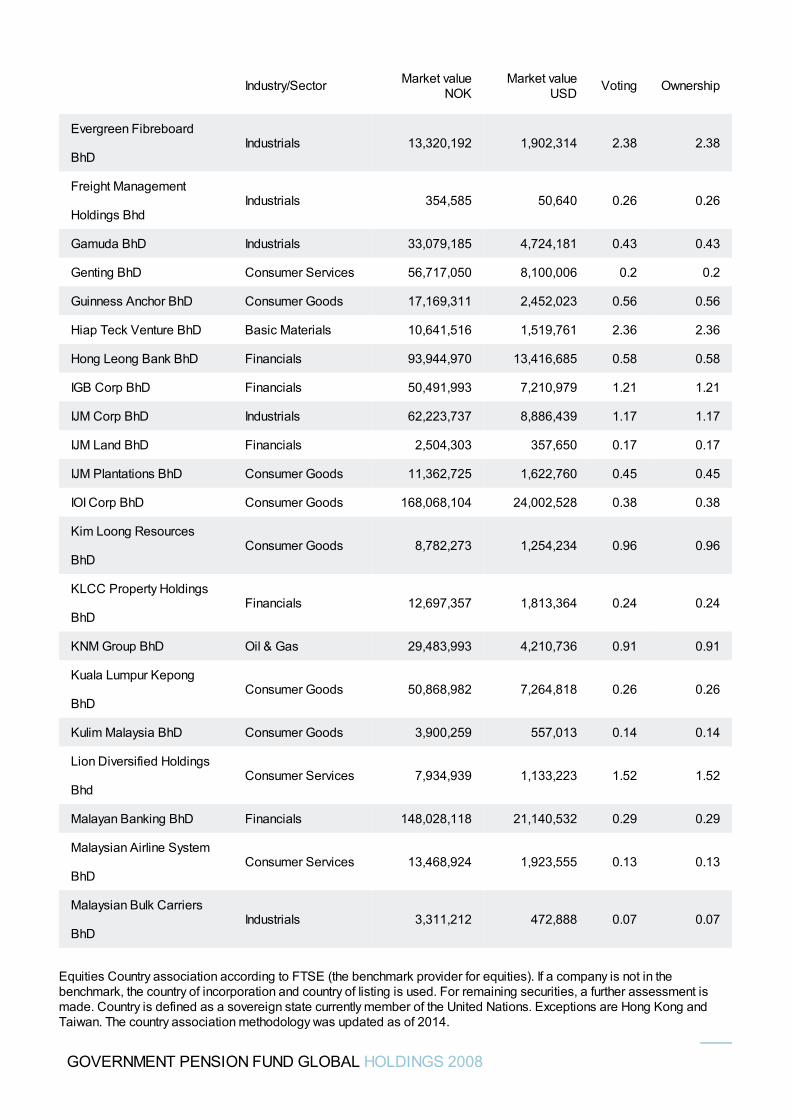
Evergreen Fibreboard
BhDIndustrials 13,320,192 1,902,314 2.38 2.38
Freight Management
Holdings BhdIndustrials 354,585 50,640 0.26 0.26
Gamuda BhD Industrials 33,079,185 4,724,181 0.43 0.43
Genting BhD Consumer Services 56,717,050 8,100,006 0.2 0.2
Guinness Anchor BhD Consumer Goods 17,169,311 2,452,023 0.56 0.56
Hiap Teck Venture BhD Basic Materials 10,641,516 1,519,761 2.36 2.36
Hong Leong Bank BhD Financials 93,944,970 13,416,685 0.58 0.58
IGB Corp BhD Financials 50,491,993 7,210,979 1.21 1.21
IJM Corp BhD Industrials 62,223,737 8,886,439 1.17 1.17
IJM Land BhD Financials 2,504,303 357,650 0.17 0.17
IJM Plantations BhD Consumer Goods 11,362,725 1,622,760 0.45 0.45
IOI Corp BhD Consumer Goods 168,068,104 24,002,528 0.38 0.38
Kim Loong Resources
BhDConsumer Goods 8,782,273 1,254,234 0.96 0.96
KLCC Property Holdings
BhDFinancials 12,697,357 1,813,364 0.24 0.24
KNM Group BhD Oil & Gas 29,483,993 4,210,736 0.91 0.91
Kuala Lumpur Kepong
BhDConsumer Goods 50,868,982 7,264,818 0.26 0.26
Kulim Malaysia BhD Consumer Goods 3,900,259 557,013 0.14 0.14
Lion Diversified Holdings
BhdConsumer Services 7,934,939 1,133,223 1.52 1.52
Malayan Banking BhD Financials 148,028,118 21,140,532 0.29 0.29
Malaysian Airline System
BhDConsumer Services 13,468,924 1,923,555 0.13 0.13
Malaysian Bulk Carriers
BhDIndustrials 3,311,212 472,888 0.07 0.07
Industry/Sector Market valueNOK
Market valueUSD Voting Ownership
GOVERNMENT PENSION FUND GLOBAL HOLDINGS 2008
Equities Country association according to FTSE (the benchmark provider for equities). If a company is not in thebenchmark, the country of incorporation and country of listing is used. For remaining securities, a further assessment ismade. Country is defined as a sovereign state currently member of the United Nations. Exceptions are Hong Kong andTaiwan. The country association methodology was updated as of 2014.
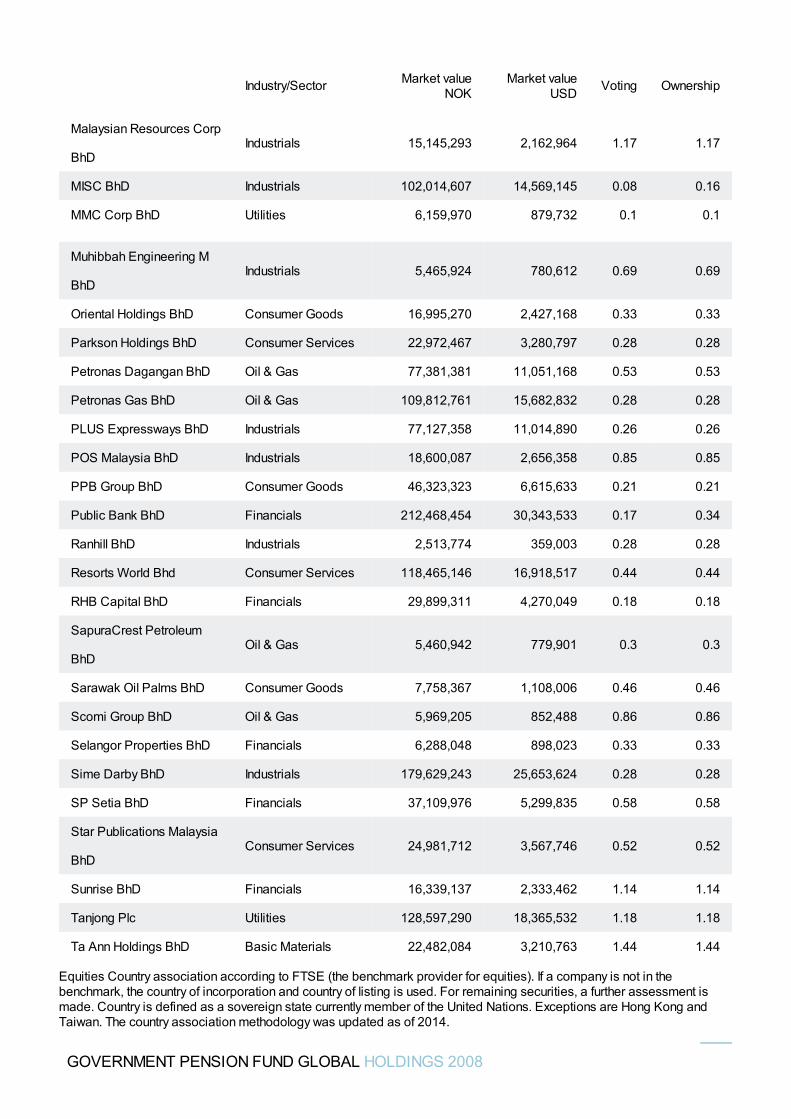
Malaysian Resources Corp
BhDIndustrials 15,145,293 2,162,964 1.17 1.17
MISC BhD Industrials 102,014,607 14,569,145 0.08 0.16
MMC Corp BhD Utilities 6,159,970 879,732 0.1 0.1
Muhibbah Engineering M
BhDIndustrials 5,465,924 780,612 0.69 0.69
Oriental Holdings BhD Consumer Goods 16,995,270 2,427,168 0.33 0.33
Parkson Holdings BhD Consumer Services 22,972,467 3,280,797 0.28 0.28
Petronas Dagangan BhD Oil & Gas 77,381,381 11,051,168 0.53 0.53
Petronas Gas BhD Oil & Gas 109,812,761 15,682,832 0.28 0.28
PLUS Expressways BhD Industrials 77,127,358 11,014,890 0.26 0.26
POS Malaysia BhD Industrials 18,600,087 2,656,358 0.85 0.85
PPB Group BhD Consumer Goods 46,323,323 6,615,633 0.21 0.21
Public Bank BhD Financials 212,468,454 30,343,533 0.17 0.34
Ranhill BhD Industrials 2,513,774 359,003 0.28 0.28
Resorts World Bhd Consumer Services 118,465,146 16,918,517 0.44 0.44
RHB Capital BhD Financials 29,899,311 4,270,049 0.18 0.18
SapuraCrest Petroleum
BhDOil & Gas 5,460,942 779,901 0.3 0.3
Sarawak Oil Palms BhD Consumer Goods 7,758,367 1,108,006 0.46 0.46
Scomi Group BhD Oil & Gas 5,969,205 852,488 0.86 0.86
Selangor Properties BhD Financials 6,288,048 898,023 0.33 0.33
Sime Darby BhD Industrials 179,629,243 25,653,624 0.28 0.28
SP Setia BhD Financials 37,109,976 5,299,835 0.58 0.58
Star Publications Malaysia
BhDConsumer Services 24,981,712 3,567,746 0.52 0.52
Sunrise BhD Financials 16,339,137 2,333,462 1.14 1.14
Tanjong Plc Utilities 128,597,290 18,365,532 1.18 1.18
Ta Ann Holdings BhD Basic Materials 22,482,084 3,210,763 1.44 1.44
Industry/Sector Market valueNOK
Market valueUSD Voting Ownership
GOVERNMENT PENSION FUND GLOBAL HOLDINGS 2008
Equities Country association according to FTSE (the benchmark provider for equities). If a company is not in thebenchmark, the country of incorporation and country of listing is used. For remaining securities, a further assessment ismade. Country is defined as a sovereign state currently member of the United Nations. Exceptions are Hong Kong andTaiwan. The country association methodology was updated as of 2014.
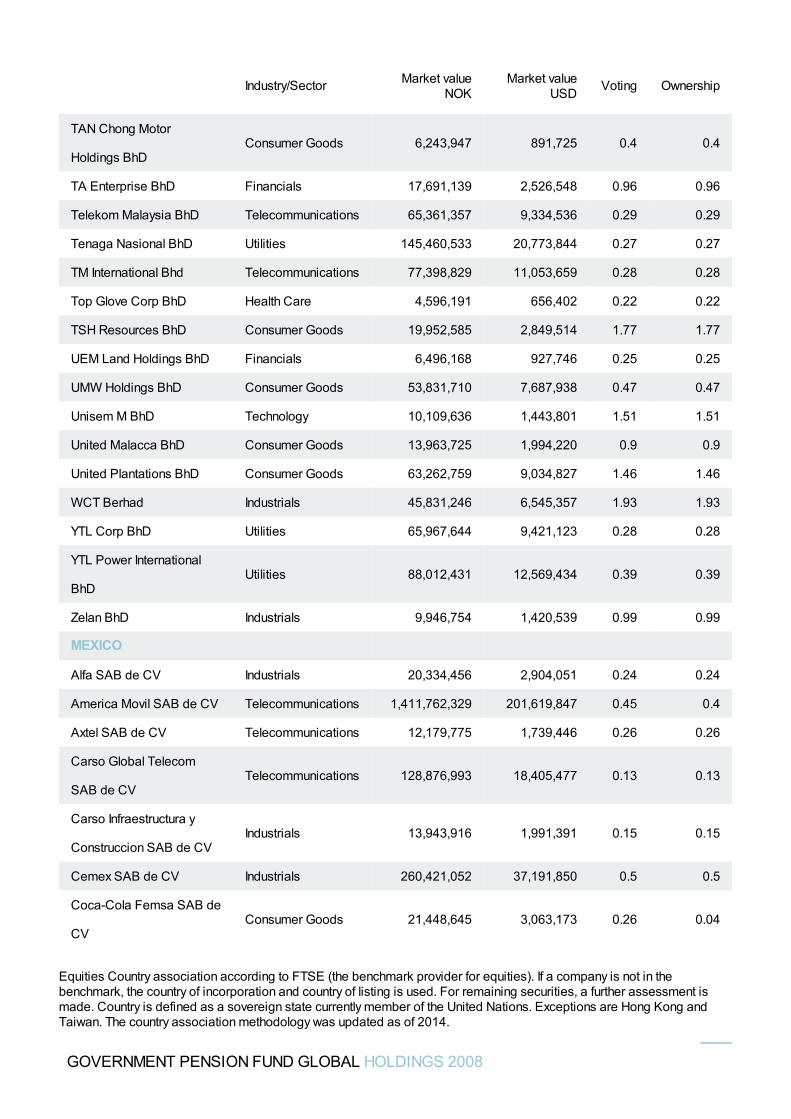
TAN Chong Motor
Holdings BhDConsumer Goods 6,243,947 891,725 0.4 0.4
TA Enterprise BhD Financials 17,691,139 2,526,548 0.96 0.96
Telekom Malaysia BhD Telecommunications 65,361,357 9,334,536 0.29 0.29
Tenaga Nasional BhD Utilities 145,460,533 20,773,844 0.27 0.27
TM International Bhd Telecommunications 77,398,829 11,053,659 0.28 0.28
Top Glove Corp BhD Health Care 4,596,191 656,402 0.22 0.22
TSH Resources BhD Consumer Goods 19,952,585 2,849,514 1.77 1.77
UEM Land Holdings BhD Financials 6,496,168 927,746 0.25 0.25
UMW Holdings BhD Consumer Goods 53,831,710 7,687,938 0.47 0.47
Unisem M BhD Technology 10,109,636 1,443,801 1.51 1.51
United Malacca BhD Consumer Goods 13,963,725 1,994,220 0.9 0.9
United Plantations BhD Consumer Goods 63,262,759 9,034,827 1.46 1.46
WCT Berhad Industrials 45,831,246 6,545,357 1.93 1.93
YTL Corp BhD Utilities 65,967,644 9,421,123 0.28 0.28
YTL Power International
BhDUtilities 88,012,431 12,569,434 0.39 0.39
Zelan BhD Industrials 9,946,754 1,420,539 0.99 0.99
MEXICO
Alfa SAB de CV Industrials 20,334,456 2,904,051 0.24 0.24
America Movil SAB de CV Telecommunications 1,411,762,329 201,619,847 0.45 0.4
Axtel SAB de CV Telecommunications 12,179,775 1,739,446 0.26 0.26
Carso Global Telecom
SAB de CVTelecommunications 128,876,993 18,405,477 0.13 0.13
Carso Infraestructura y
Construccion SAB de CVIndustrials 13,943,916 1,991,391 0.15 0.15
Cemex SAB de CV Industrials 260,421,052 37,191,850 0.5 0.5
Coca-Cola Femsa SAB de
CVConsumer Goods 21,448,645 3,063,173 0.26 0.04
Industry/Sector Market valueNOK
Market valueUSD Voting Ownership
GOVERNMENT PENSION FUND GLOBAL HOLDINGS 2008
Equities Country association according to FTSE (the benchmark provider for equities). If a company is not in thebenchmark, the country of incorporation and country of listing is used. For remaining securities, a further assessment ismade. Country is defined as a sovereign state currently member of the United Nations. Exceptions are Hong Kong andTaiwan. The country association methodology was updated as of 2014.
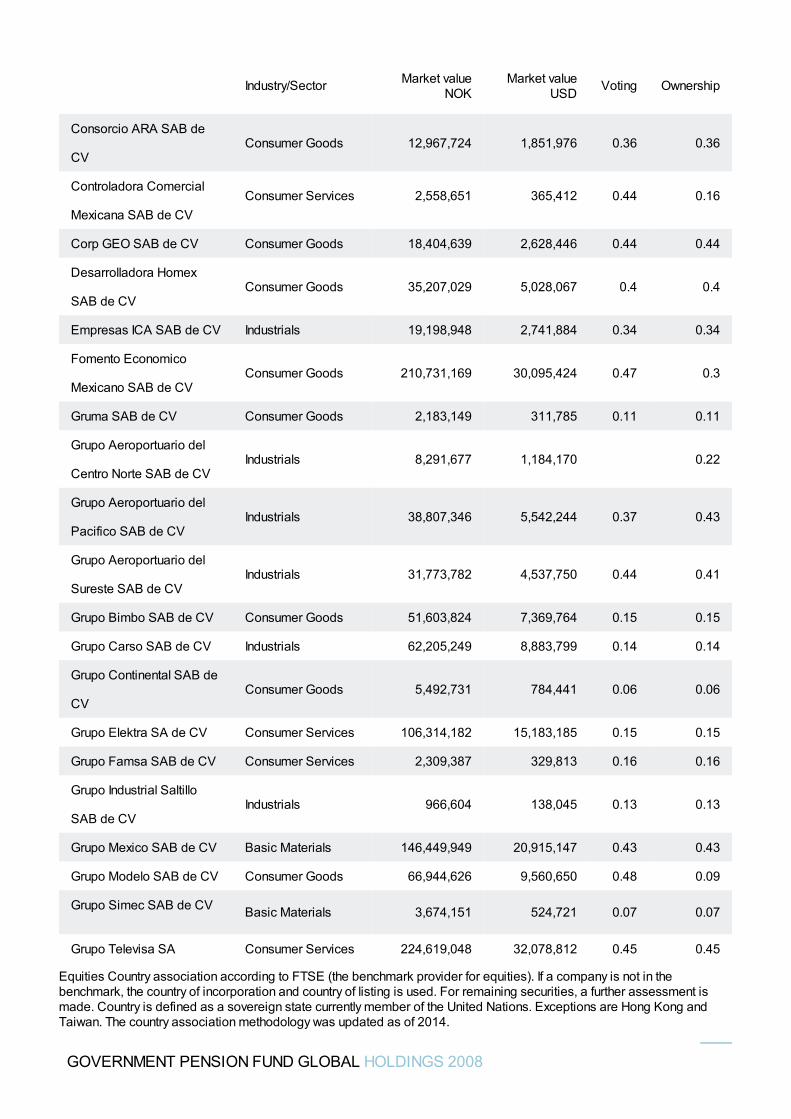
Consorcio ARA SAB de
CVConsumer Goods 12,967,724 1,851,976 0.36 0.36
Controladora Comercial
Mexicana SAB de CVConsumer Services 2,558,651 365,412 0.44 0.16
Corp GEO SAB de CV Consumer Goods 18,404,639 2,628,446 0.44 0.44
Desarrolladora Homex
SAB de CVConsumer Goods 35,207,029 5,028,067 0.4 0.4
Empresas ICA SAB de CV Industrials 19,198,948 2,741,884 0.34 0.34
Fomento Economico
Mexicano SAB de CVConsumer Goods 210,731,169 30,095,424 0.47 0.3
Gruma SAB de CV Consumer Goods 2,183,149 311,785 0.11 0.11
Grupo Aeroportuario del
Centro Norte SAB de CVIndustrials 8,291,677 1,184,170 0.22
Grupo Aeroportuario del
Pacifico SAB de CVIndustrials 38,807,346 5,542,244 0.37 0.43
Grupo Aeroportuario del
Sureste SAB de CVIndustrials 31,773,782 4,537,750 0.44 0.41
Grupo Bimbo SAB de CV Consumer Goods 51,603,824 7,369,764 0.15 0.15
Grupo Carso SAB de CV Industrials 62,205,249 8,883,799 0.14 0.14
Grupo Continental SAB de
CVConsumer Goods 5,492,731 784,441 0.06 0.06
Grupo Elektra SA de CV Consumer Services 106,314,182 15,183,185 0.15 0.15
Grupo Famsa SAB de CV Consumer Services 2,309,387 329,813 0.16 0.16
Grupo Industrial Saltillo
SAB de CVIndustrials 966,604 138,045 0.13 0.13
Grupo Mexico SAB de CV Basic Materials 146,449,949 20,915,147 0.43 0.43
Grupo Modelo SAB de CV Consumer Goods 66,944,626 9,560,650 0.48 0.09
Grupo Simec SAB de CV Basic Materials 3,674,151 524,721 0.07 0.07
Grupo Televisa SA Consumer Services 224,619,048 32,078,812 0.45 0.45
Industry/Sector Market valueNOK
Market valueUSD Voting Ownership
GOVERNMENT PENSION FUND GLOBAL HOLDINGS 2008
Equities Country association according to FTSE (the benchmark provider for equities). If a company is not in thebenchmark, the country of incorporation and country of listing is used. For remaining securities, a further assessment ismade. Country is defined as a sovereign state currently member of the United Nations. Exceptions are Hong Kong andTaiwan. The country association methodology was updated as of 2014.
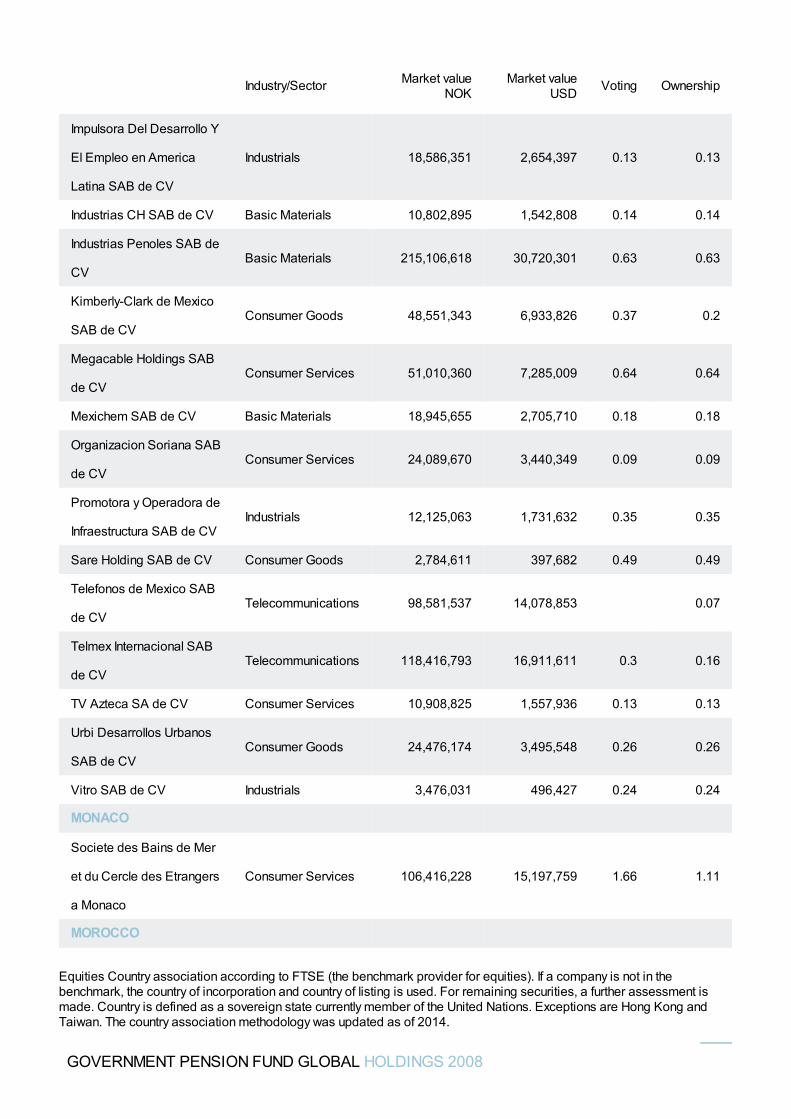
Impulsora Del Desarrollo Y
El Empleo en America
Latina SAB de CV
Industrials 18,586,351 2,654,397 0.13 0.13
Industrias CH SAB de CV Basic Materials 10,802,895 1,542,808 0.14 0.14
Industrias Penoles SAB de
CVBasic Materials 215,106,618 30,720,301 0.63 0.63
Kimberly-Clark de Mexico
SAB de CVConsumer Goods 48,551,343 6,933,826 0.37 0.2
Megacable Holdings SAB
de CVConsumer Services 51,010,360 7,285,009 0.64 0.64
Mexichem SAB de CV Basic Materials 18,945,655 2,705,710 0.18 0.18
Organizacion Soriana SAB
de CVConsumer Services 24,089,670 3,440,349 0.09 0.09
Promotora y Operadora de
Infraestructura SAB de CVIndustrials 12,125,063 1,731,632 0.35 0.35
Sare Holding SAB de CV Consumer Goods 2,784,611 397,682 0.49 0.49
Telefonos de Mexico SAB
de CVTelecommunications 98,581,537 14,078,853 0.07
Telmex Internacional SAB
de CVTelecommunications 118,416,793 16,911,611 0.3 0.16
TV Azteca SA de CV Consumer Services 10,908,825 1,557,936 0.13 0.13
Urbi Desarrollos Urbanos
SAB de CVConsumer Goods 24,476,174 3,495,548 0.26 0.26
Vitro SAB de CV Industrials 3,476,031 496,427 0.24 0.24
MONACO
Societe des Bains de Mer
et du Cercle des Etrangers
a Monaco
Consumer Services 106,416,228 15,197,759 1.66 1.11
MOROCCO
Industry/Sector Market valueNOK
Market valueUSD Voting Ownership
GOVERNMENT PENSION FUND GLOBAL HOLDINGS 2008
Equities Country association according to FTSE (the benchmark provider for equities). If a company is not in thebenchmark, the country of incorporation and country of listing is used. For remaining securities, a further assessment ismade. Country is defined as a sovereign state currently member of the United Nations. Exceptions are Hong Kong andTaiwan. The country association methodology was updated as of 2014.
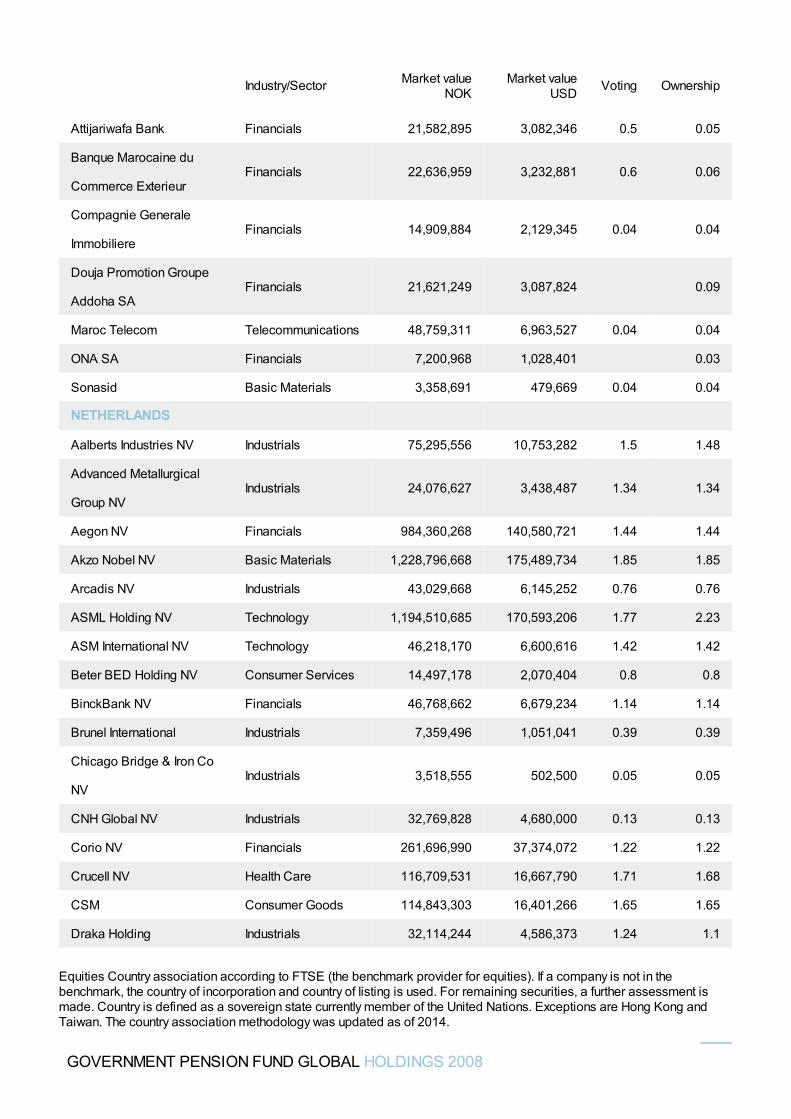
Attijariwafa Bank Financials 21,582,895 3,082,346 0.5 0.05
Banque Marocaine du
Commerce ExterieurFinancials 22,636,959 3,232,881 0.6 0.06
Compagnie Generale
ImmobiliereFinancials 14,909,884 2,129,345 0.04 0.04
Douja Promotion Groupe
Addoha SAFinancials 21,621,249 3,087,824 0.09
Maroc Telecom Telecommunications 48,759,311 6,963,527 0.04 0.04
ONA SA Financials 7,200,968 1,028,401 0.03
Sonasid Basic Materials 3,358,691 479,669 0.04 0.04
NETHERLANDS
Aalberts Industries NV Industrials 75,295,556 10,753,282 1.5 1.48
Advanced Metallurgical
Group NVIndustrials 24,076,627 3,438,487 1.34 1.34
Aegon NV Financials 984,360,268 140,580,721 1.44 1.44
Akzo Nobel NV Basic Materials 1,228,796,668 175,489,734 1.85 1.85
Arcadis NV Industrials 43,029,668 6,145,252 0.76 0.76
ASML Holding NV Technology 1,194,510,685 170,593,206 1.77 2.23
ASM International NV Technology 46,218,170 6,600,616 1.42 1.42
Beter BED Holding NV Consumer Services 14,497,178 2,070,404 0.8 0.8
BinckBank NV Financials 46,768,662 6,679,234 1.14 1.14
Brunel International Industrials 7,359,496 1,051,041 0.39 0.39
Chicago Bridge & Iron Co
NVIndustrials 3,518,555 502,500 0.05 0.05
CNH Global NV Industrials 32,769,828 4,680,000 0.13 0.13
Corio NV Financials 261,696,990 37,374,072 1.22 1.22
Crucell NV Health Care 116,709,531 16,667,790 1.71 1.68
CSM Consumer Goods 114,843,303 16,401,266 1.65 1.65
Draka Holding Industrials 32,114,244 4,586,373 1.24 1.1
Industry/Sector Market valueNOK
Market valueUSD Voting Ownership
GOVERNMENT PENSION FUND GLOBAL HOLDINGS 2008
Equities Country association according to FTSE (the benchmark provider for equities). If a company is not in thebenchmark, the country of incorporation and country of listing is used. For remaining securities, a further assessment ismade. Country is defined as a sovereign state currently member of the United Nations. Exceptions are Hong Kong andTaiwan. The country association methodology was updated as of 2014.
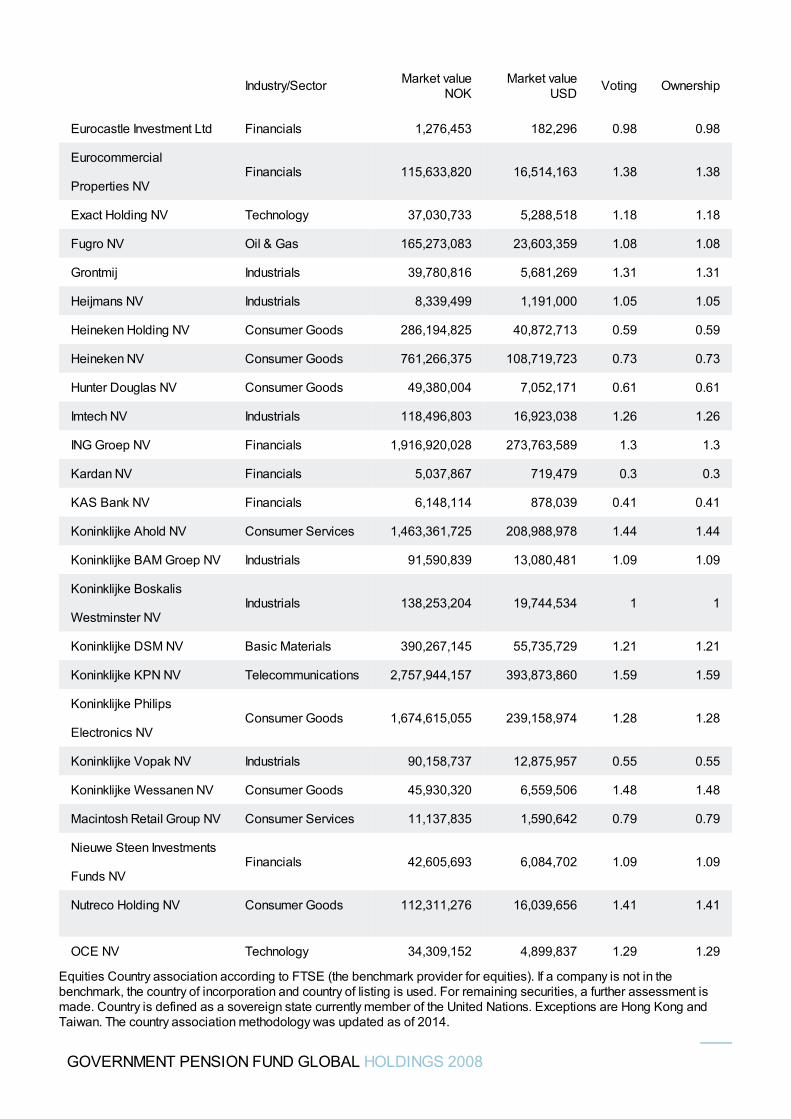
Eurocastle Investment Ltd Financials 1,276,453 182,296 0.98 0.98
Eurocommercial
Properties NVFinancials 115,633,820 16,514,163 1.38 1.38
Exact Holding NV Technology 37,030,733 5,288,518 1.18 1.18
Fugro NV Oil & Gas 165,273,083 23,603,359 1.08 1.08
Grontmij Industrials 39,780,816 5,681,269 1.31 1.31
Heijmans NV Industrials 8,339,499 1,191,000 1.05 1.05
Heineken Holding NV Consumer Goods 286,194,825 40,872,713 0.59 0.59
Heineken NV Consumer Goods 761,266,375 108,719,723 0.73 0.73
Hunter Douglas NV Consumer Goods 49,380,004 7,052,171 0.61 0.61
Imtech NV Industrials 118,496,803 16,923,038 1.26 1.26
ING Groep NV Financials 1,916,920,028 273,763,589 1.3 1.3
Kardan NV Financials 5,037,867 719,479 0.3 0.3
KAS Bank NV Financials 6,148,114 878,039 0.41 0.41
Koninklijke Ahold NV Consumer Services 1,463,361,725 208,988,978 1.44 1.44
Koninklijke BAM Groep NV Industrials 91,590,839 13,080,481 1.09 1.09
Koninklijke Boskalis
Westminster NVIndustrials 138,253,204 19,744,534 1 1
Koninklijke DSM NV Basic Materials 390,267,145 55,735,729 1.21 1.21
Koninklijke KPN NV Telecommunications 2,757,944,157 393,873,860 1.59 1.59
Koninklijke Philips
Electronics NVConsumer Goods 1,674,615,055 239,158,974 1.28 1.28
Koninklijke Vopak NV Industrials 90,158,737 12,875,957 0.55 0.55
Koninklijke Wessanen NV Consumer Goods 45,930,320 6,559,506 1.48 1.48
Macintosh Retail Group NV Consumer Services 11,137,835 1,590,642 0.79 0.79
Nieuwe Steen Investments
Funds NVFinancials 42,605,693 6,084,702 1.09 1.09
Nutreco Holding NV Consumer Goods 112,311,276 16,039,656 1.41 1.41
OCE NV Technology 34,309,152 4,899,837 1.29 1.29
Industry/Sector Market valueNOK
Market valueUSD Voting Ownership
GOVERNMENT PENSION FUND GLOBAL HOLDINGS 2008
Equities Country association according to FTSE (the benchmark provider for equities). If a company is not in thebenchmark, the country of incorporation and country of listing is used. For remaining securities, a further assessment ismade. Country is defined as a sovereign state currently member of the United Nations. Exceptions are Hong Kong andTaiwan. The country association methodology was updated as of 2014.
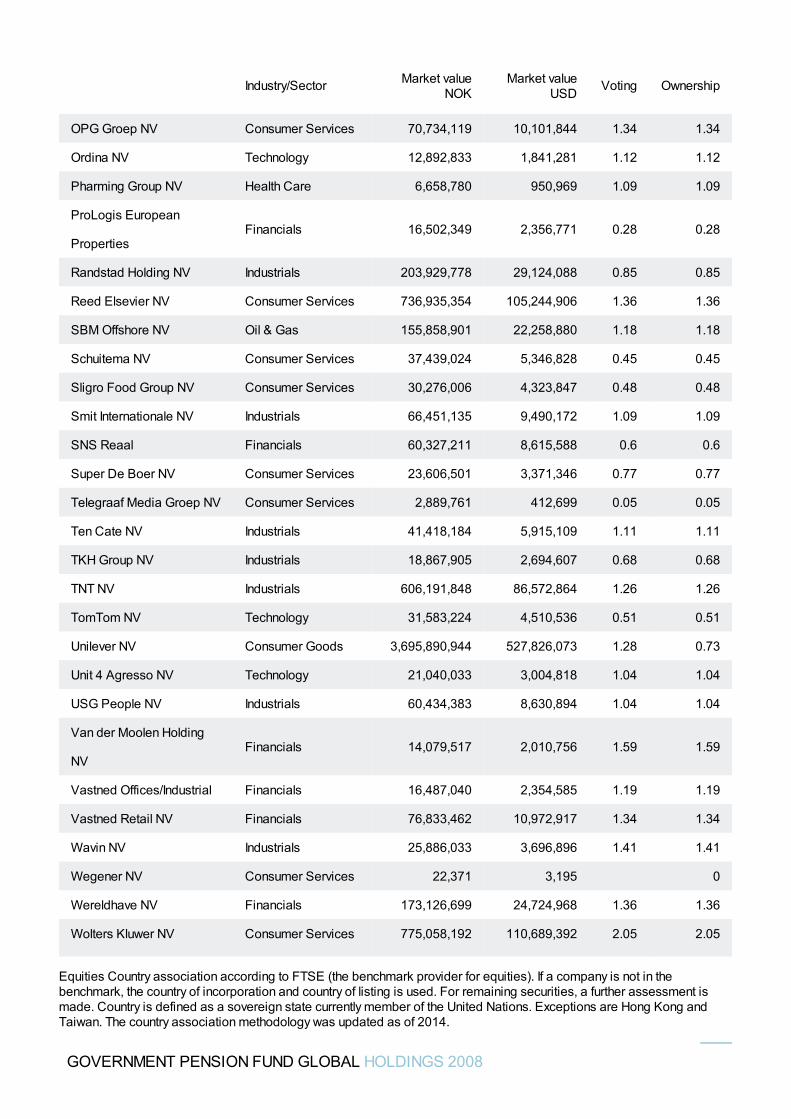
OPG Groep NV Consumer Services 70,734,119 10,101,844 1.34 1.34
Ordina NV Technology 12,892,833 1,841,281 1.12 1.12
Pharming Group NV Health Care 6,658,780 950,969 1.09 1.09
ProLogis European
PropertiesFinancials 16,502,349 2,356,771 0.28 0.28
Randstad Holding NV Industrials 203,929,778 29,124,088 0.85 0.85
Reed Elsevier NV Consumer Services 736,935,354 105,244,906 1.36 1.36
SBM Offshore NV Oil & Gas 155,858,901 22,258,880 1.18 1.18
Schuitema NV Consumer Services 37,439,024 5,346,828 0.45 0.45
Sligro Food Group NV Consumer Services 30,276,006 4,323,847 0.48 0.48
Smit Internationale NV Industrials 66,451,135 9,490,172 1.09 1.09
SNS Reaal Financials 60,327,211 8,615,588 0.6 0.6
Super De Boer NV Consumer Services 23,606,501 3,371,346 0.77 0.77
Telegraaf Media Groep NV Consumer Services 2,889,761 412,699 0.05 0.05
Ten Cate NV Industrials 41,418,184 5,915,109 1.11 1.11
TKH Group NV Industrials 18,867,905 2,694,607 0.68 0.68
TNT NV Industrials 606,191,848 86,572,864 1.26 1.26
TomTom NV Technology 31,583,224 4,510,536 0.51 0.51
Unilever NV Consumer Goods 3,695,890,944 527,826,073 1.28 0.73
Unit 4 Agresso NV Technology 21,040,033 3,004,818 1.04 1.04
USG People NV Industrials 60,434,383 8,630,894 1.04 1.04
Van der Moolen Holding
NVFinancials 14,079,517 2,010,756 1.59 1.59
Vastned Offices/Industrial Financials 16,487,040 2,354,585 1.19 1.19
Vastned Retail NV Financials 76,833,462 10,972,917 1.34 1.34
Wavin NV Industrials 25,886,033 3,696,896 1.41 1.41
Wegener NV Consumer Services 22,371 3,195 0
Wereldhave NV Financials 173,126,699 24,724,968 1.36 1.36
Wolters Kluwer NV Consumer Services 775,058,192 110,689,392 2.05 2.05
Industry/Sector Market valueNOK
Market valueUSD Voting Ownership
GOVERNMENT PENSION FUND GLOBAL HOLDINGS 2008
Equities Country association according to FTSE (the benchmark provider for equities). If a company is not in thebenchmark, the country of incorporation and country of listing is used. For remaining securities, a further assessment ismade. Country is defined as a sovereign state currently member of the United Nations. Exceptions are Hong Kong andTaiwan. The country association methodology was updated as of 2014.
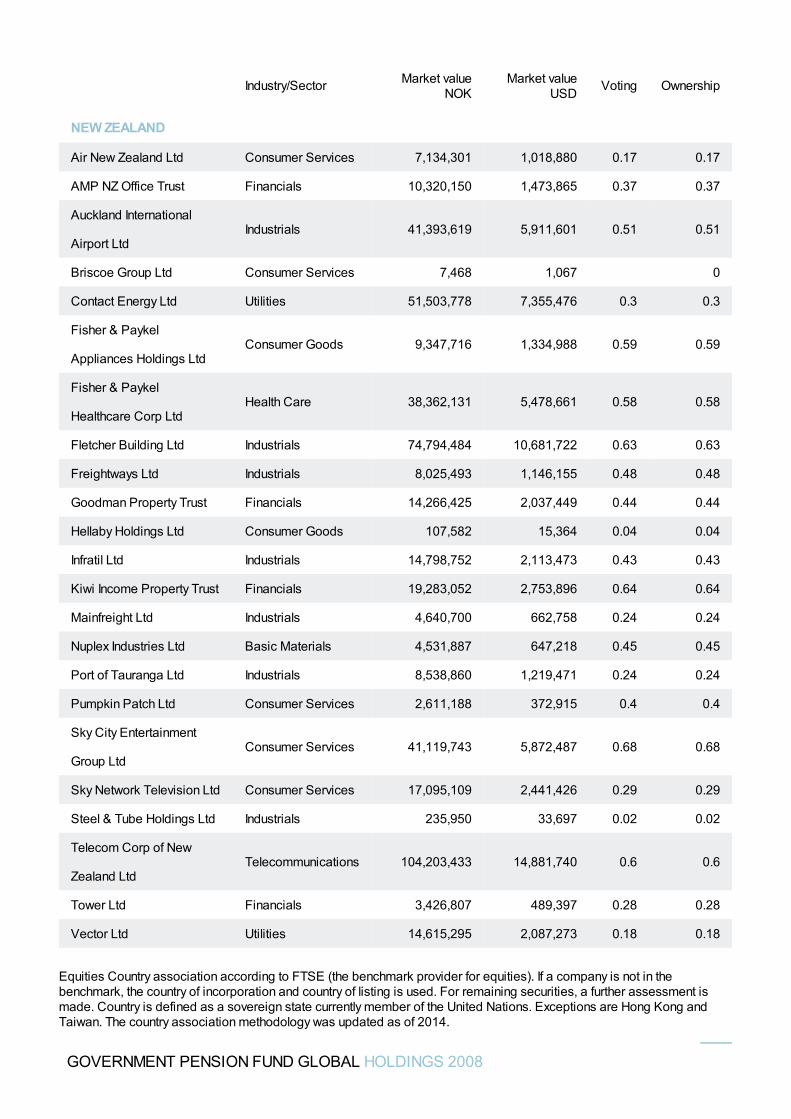
NEW ZEALAND
Air New Zealand Ltd Consumer Services 7,134,301 1,018,880 0.17 0.17
AMP NZ Office Trust Financials 10,320,150 1,473,865 0.37 0.37
Auckland International
Airport LtdIndustrials 41,393,619 5,911,601 0.51 0.51
Briscoe Group Ltd Consumer Services 7,468 1,067 0
Contact Energy Ltd Utilities 51,503,778 7,355,476 0.3 0.3
Fisher & Paykel
Appliances Holdings LtdConsumer Goods 9,347,716 1,334,988 0.59 0.59
Fisher & Paykel
Healthcare Corp LtdHealth Care 38,362,131 5,478,661 0.58 0.58
Fletcher Building Ltd Industrials 74,794,484 10,681,722 0.63 0.63
Freightways Ltd Industrials 8,025,493 1,146,155 0.48 0.48
Goodman Property Trust Financials 14,266,425 2,037,449 0.44 0.44
Hellaby Holdings Ltd Consumer Goods 107,582 15,364 0.04 0.04
Infratil Ltd Industrials 14,798,752 2,113,473 0.43 0.43
Kiwi Income Property Trust Financials 19,283,052 2,753,896 0.64 0.64
Mainfreight Ltd Industrials 4,640,700 662,758 0.24 0.24
Nuplex Industries Ltd Basic Materials 4,531,887 647,218 0.45 0.45
Port of Tauranga Ltd Industrials 8,538,860 1,219,471 0.24 0.24
Pumpkin Patch Ltd Consumer Services 2,611,188 372,915 0.4 0.4
Sky City Entertainment
Group LtdConsumer Services 41,119,743 5,872,487 0.68 0.68
Sky Network Television Ltd Consumer Services 17,095,109 2,441,426 0.29 0.29
Steel & Tube Holdings Ltd Industrials 235,950 33,697 0.02 0.02
Telecom Corp of New
Zealand LtdTelecommunications 104,203,433 14,881,740 0.6 0.6
Tower Ltd Financials 3,426,807 489,397 0.28 0.28
Vector Ltd Utilities 14,615,295 2,087,273 0.18 0.18
Industry/Sector Market valueNOK
Market valueUSD Voting Ownership
GOVERNMENT PENSION FUND GLOBAL HOLDINGS 2008
Equities Country association according to FTSE (the benchmark provider for equities). If a company is not in thebenchmark, the country of incorporation and country of listing is used. For remaining securities, a further assessment ismade. Country is defined as a sovereign state currently member of the United Nations. Exceptions are Hong Kong andTaiwan. The country association methodology was updated as of 2014.
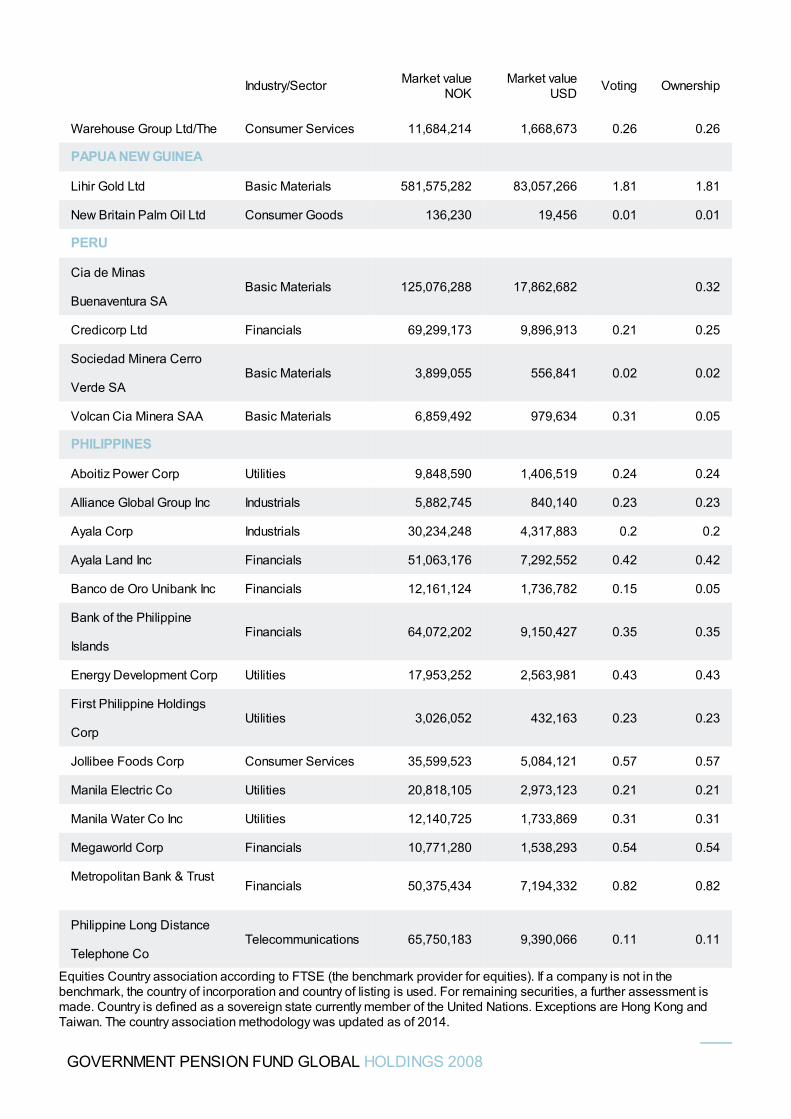
Warehouse Group Ltd/The Consumer Services 11,684,214 1,668,673 0.26 0.26
PAPUA NEW GUINEA
Lihir Gold Ltd Basic Materials 581,575,282 83,057,266 1.81 1.81
New Britain Palm Oil Ltd Consumer Goods 136,230 19,456 0.01 0.01
PERU
Cia de Minas
Buenaventura SABasic Materials 125,076,288 17,862,682 0.32
Credicorp Ltd Financials 69,299,173 9,896,913 0.21 0.25
Sociedad Minera Cerro
Verde SABasic Materials 3,899,055 556,841 0.02 0.02
Volcan Cia Minera SAA Basic Materials 6,859,492 979,634 0.31 0.05
PHILIPPINES
Aboitiz Power Corp Utilities 9,848,590 1,406,519 0.24 0.24
Alliance Global Group Inc Industrials 5,882,745 840,140 0.23 0.23
Ayala Corp Industrials 30,234,248 4,317,883 0.2 0.2
Ayala Land Inc Financials 51,063,176 7,292,552 0.42 0.42
Banco de Oro Unibank Inc Financials 12,161,124 1,736,782 0.15 0.05
Bank of the Philippine
IslandsFinancials 64,072,202 9,150,427 0.35 0.35
Energy Development Corp Utilities 17,953,252 2,563,981 0.43 0.43
First Philippine Holdings
CorpUtilities 3,026,052 432,163 0.23 0.23
Jollibee Foods Corp Consumer Services 35,599,523 5,084,121 0.57 0.57
Manila Electric Co Utilities 20,818,105 2,973,123 0.21 0.21
Manila Water Co Inc Utilities 12,140,725 1,733,869 0.31 0.31
Megaworld Corp Financials 10,771,280 1,538,293 0.54 0.54
Metropolitan Bank & TrustFinancials 50,375,434 7,194,332 0.82 0.82
Philippine Long Distance
Telephone CoTelecommunications 65,750,183 9,390,066 0.11 0.11
Industry/Sector Market valueNOK
Market valueUSD Voting Ownership
GOVERNMENT PENSION FUND GLOBAL HOLDINGS 2008
Equities Country association according to FTSE (the benchmark provider for equities). If a company is not in thebenchmark, the country of incorporation and country of listing is used. For remaining securities, a further assessment ismade. Country is defined as a sovereign state currently member of the United Nations. Exceptions are Hong Kong andTaiwan. The country association methodology was updated as of 2014.
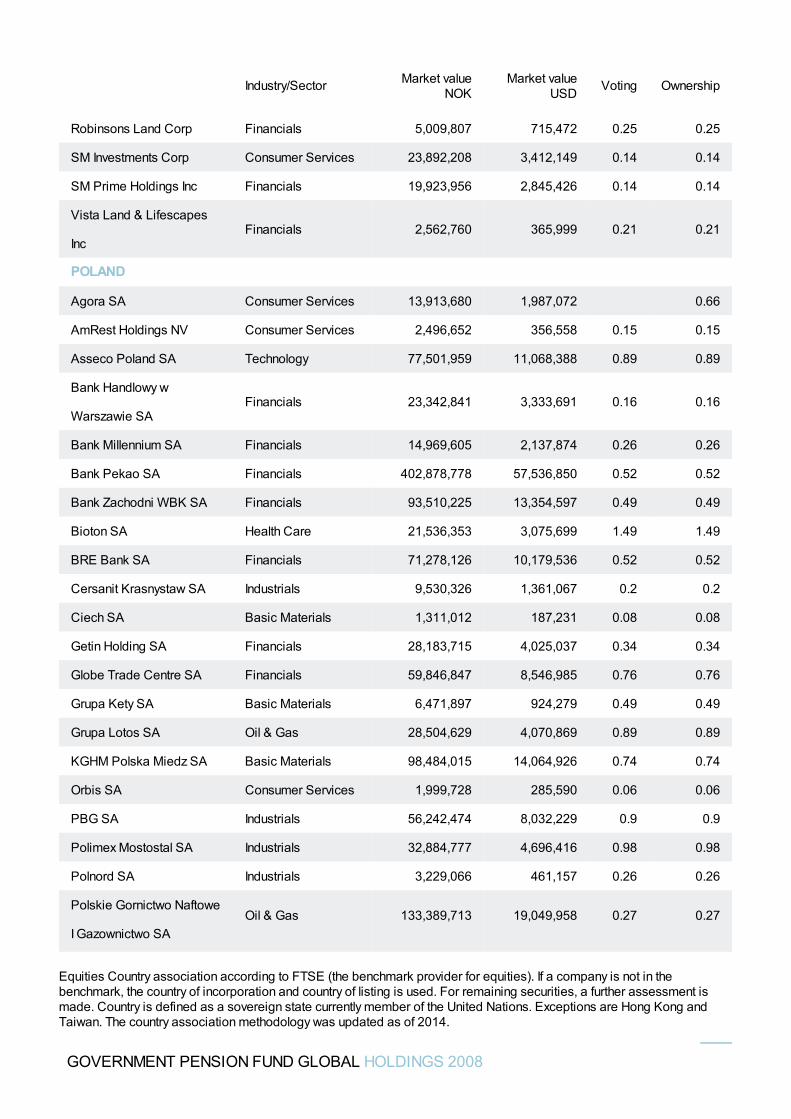
Robinsons Land Corp Financials 5,009,807 715,472 0.25 0.25
SM Investments Corp Consumer Services 23,892,208 3,412,149 0.14 0.14
SM Prime Holdings Inc Financials 19,923,956 2,845,426 0.14 0.14
Vista Land & Lifescapes
IncFinancials 2,562,760 365,999 0.21 0.21
POLAND
Agora SA Consumer Services 13,913,680 1,987,072 0.66
AmRest Holdings NV Consumer Services 2,496,652 356,558 0.15 0.15
Asseco Poland SA Technology 77,501,959 11,068,388 0.89 0.89
Bank Handlowy w
Warszawie SAFinancials 23,342,841 3,333,691 0.16 0.16
Bank Millennium SA Financials 14,969,605 2,137,874 0.26 0.26
Bank Pekao SA Financials 402,878,778 57,536,850 0.52 0.52
Bank Zachodni WBK SA Financials 93,510,225 13,354,597 0.49 0.49
Bioton SA Health Care 21,536,353 3,075,699 1.49 1.49
BRE Bank SA Financials 71,278,126 10,179,536 0.52 0.52
Cersanit Krasnystaw SA Industrials 9,530,326 1,361,067 0.2 0.2
Ciech SA Basic Materials 1,311,012 187,231 0.08 0.08
Getin Holding SA Financials 28,183,715 4,025,037 0.34 0.34
Globe Trade Centre SA Financials 59,846,847 8,546,985 0.76 0.76
Grupa Kety SA Basic Materials 6,471,897 924,279 0.49 0.49
Grupa Lotos SA Oil & Gas 28,504,629 4,070,869 0.89 0.89
KGHM Polska Miedz SA Basic Materials 98,484,015 14,064,926 0.74 0.74
Orbis SA Consumer Services 1,999,728 285,590 0.06 0.06
PBG SA Industrials 56,242,474 8,032,229 0.9 0.9
Polimex Mostostal SA Industrials 32,884,777 4,696,416 0.98 0.98
Polnord SA Industrials 3,229,066 461,157 0.26 0.26
Polskie Gornictwo Naftowe
I Gazownictwo SAOil & Gas 133,389,713 19,049,958 0.27 0.27
Industry/Sector Market valueNOK
Market valueUSD Voting Ownership
GOVERNMENT PENSION FUND GLOBAL HOLDINGS 2008
Equities Country association according to FTSE (the benchmark provider for equities). If a company is not in thebenchmark, the country of incorporation and country of listing is used. For remaining securities, a further assessment ismade. Country is defined as a sovereign state currently member of the United Nations. Exceptions are Hong Kong andTaiwan. The country association methodology was updated as of 2014.
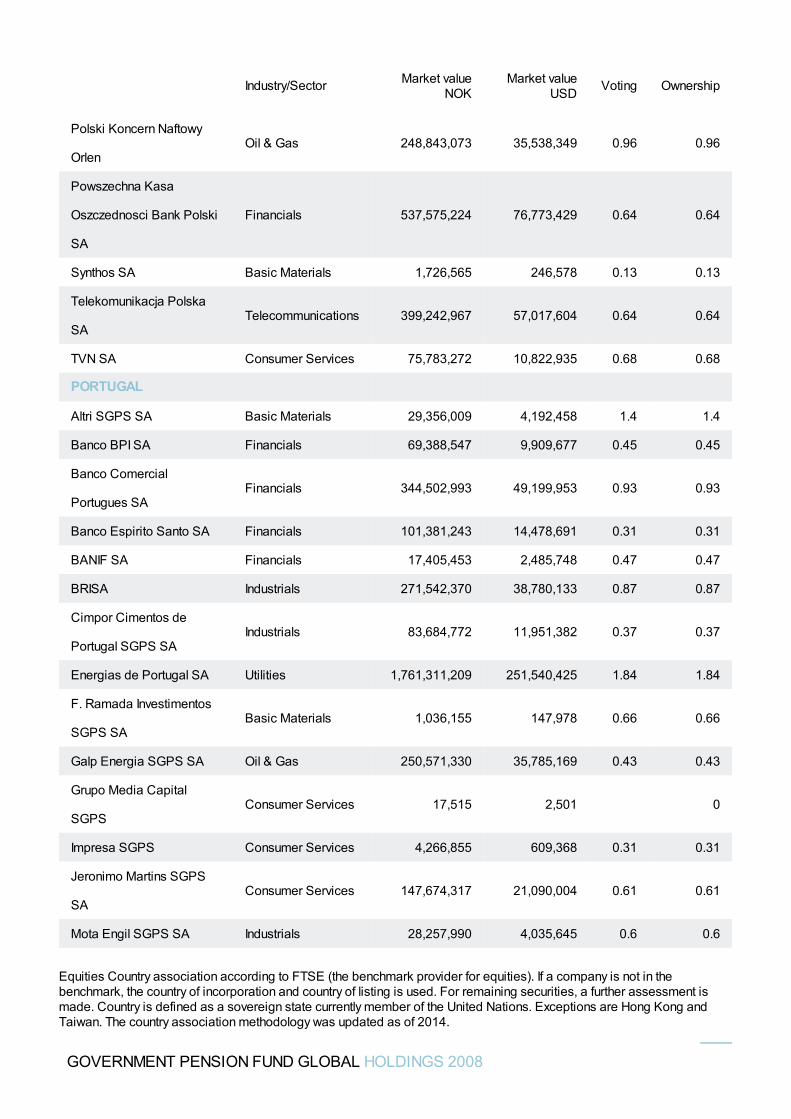
Polski Koncern Naftowy
OrlenOil & Gas 248,843,073 35,538,349 0.96 0.96
Powszechna Kasa
Oszczednosci Bank Polski
SA
Financials 537,575,224 76,773,429 0.64 0.64
Synthos SA Basic Materials 1,726,565 246,578 0.13 0.13
Telekomunikacja Polska
SATelecommunications 399,242,967 57,017,604 0.64 0.64
TVN SA Consumer Services 75,783,272 10,822,935 0.68 0.68
PORTUGAL
Altri SGPS SA Basic Materials 29,356,009 4,192,458 1.4 1.4
Banco BPI SA Financials 69,388,547 9,909,677 0.45 0.45
Banco Comercial
Portugues SAFinancials 344,502,993 49,199,953 0.93 0.93
Banco Espirito Santo SA Financials 101,381,243 14,478,691 0.31 0.31
BANIF SA Financials 17,405,453 2,485,748 0.47 0.47
BRISA Industrials 271,542,370 38,780,133 0.87 0.87
Cimpor Cimentos de
Portugal SGPS SAIndustrials 83,684,772 11,951,382 0.37 0.37
Energias de Portugal SA Utilities 1,761,311,209 251,540,425 1.84 1.84
F. Ramada Investimentos
SGPS SABasic Materials 1,036,155 147,978 0.66 0.66
Galp Energia SGPS SA Oil & Gas 250,571,330 35,785,169 0.43 0.43
Grupo Media Capital
SGPSConsumer Services 17,515 2,501 0
Impresa SGPS Consumer Services 4,266,855 609,368 0.31 0.31
Jeronimo Martins SGPS
SAConsumer Services 147,674,317 21,090,004 0.61 0.61
Mota Engil SGPS SA Industrials 28,257,990 4,035,645 0.6 0.6
Industry/Sector Market valueNOK
Market valueUSD Voting Ownership
GOVERNMENT PENSION FUND GLOBAL HOLDINGS 2008
Equities Country association according to FTSE (the benchmark provider for equities). If a company is not in thebenchmark, the country of incorporation and country of listing is used. For remaining securities, a further assessment ismade. Country is defined as a sovereign state currently member of the United Nations. Exceptions are Hong Kong andTaiwan. The country association methodology was updated as of 2014.
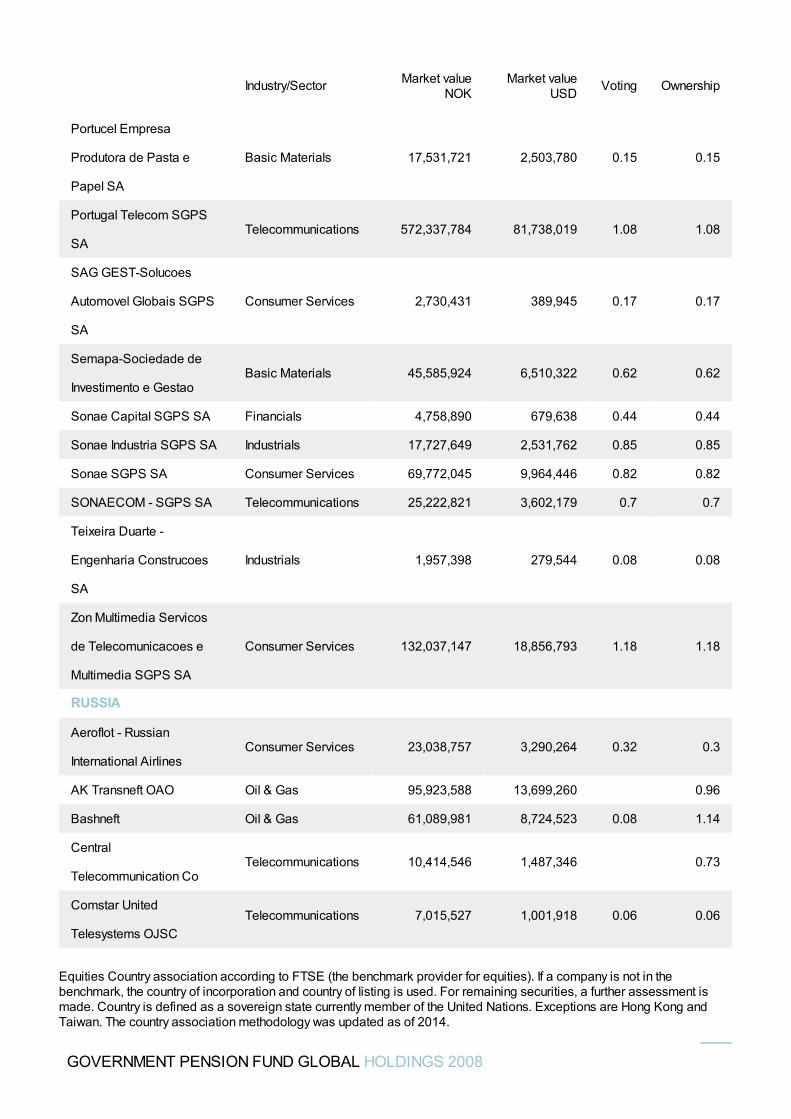
Portucel Empresa
Produtora de Pasta e
Papel SA
Basic Materials 17,531,721 2,503,780 0.15 0.15
Portugal Telecom SGPS
SATelecommunications 572,337,784 81,738,019 1.08 1.08
SAG GEST-Solucoes
Automovel Globais SGPS
SA
Consumer Services 2,730,431 389,945 0.17 0.17
Semapa-Sociedade de
Investimento e GestaoBasic Materials 45,585,924 6,510,322 0.62 0.62
Sonae Capital SGPS SA Financials 4,758,890 679,638 0.44 0.44
Sonae Industria SGPS SA Industrials 17,727,649 2,531,762 0.85 0.85
Sonae SGPS SA Consumer Services 69,772,045 9,964,446 0.82 0.82
SONAECOM - SGPS SA Telecommunications 25,222,821 3,602,179 0.7 0.7
Teixeira Duarte -
Engenharia Construcoes
SA
Industrials 1,957,398 279,544 0.08 0.08
Zon Multimedia Servicos
de Telecomunicacoes e
Multimedia SGPS SA
Consumer Services 132,037,147 18,856,793 1.18 1.18
RUSSIA
Aeroflot - Russian
International AirlinesConsumer Services 23,038,757 3,290,264 0.32 0.3
AK Transneft OAO Oil & Gas 95,923,588 13,699,260 0.96
Bashneft Oil & Gas 61,089,981 8,724,523 0.08 1.14
Central
Telecommunication CoTelecommunications 10,414,546 1,487,346 0.73
Comstar United
Telesystems OJSCTelecommunications 7,015,527 1,001,918 0.06 0.06
Industry/Sector Market valueNOK
Market valueUSD Voting Ownership
GOVERNMENT PENSION FUND GLOBAL HOLDINGS 2008
Equities Country association according to FTSE (the benchmark provider for equities). If a company is not in thebenchmark, the country of incorporation and country of listing is used. For remaining securities, a further assessment ismade. Country is defined as a sovereign state currently member of the United Nations. Exceptions are Hong Kong andTaiwan. The country association methodology was updated as of 2014.
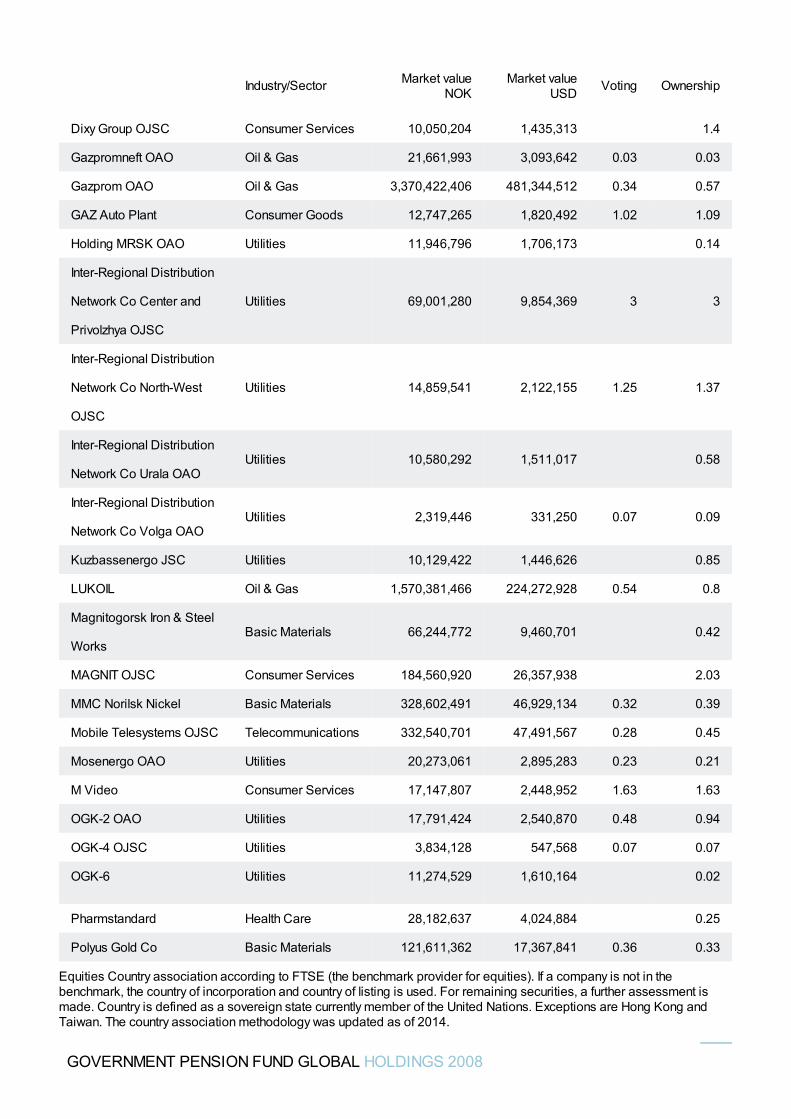
Dixy Group OJSC Consumer Services 10,050,204 1,435,313 1.4
Gazpromneft OAO Oil & Gas 21,661,993 3,093,642 0.03 0.03
Gazprom OAO Oil & Gas 3,370,422,406 481,344,512 0.34 0.57
GAZ Auto Plant Consumer Goods 12,747,265 1,820,492 1.02 1.09
Holding MRSK OAO Utilities 11,946,796 1,706,173 0.14
Inter-Regional Distribution
Network Co Center and
Privolzhya OJSC
Utilities 69,001,280 9,854,369 3 3
Inter-Regional Distribution
Network Co North-West
OJSC
Utilities 14,859,541 2,122,155 1.25 1.37
Inter-Regional Distribution
Network Co Urala OAOUtilities 10,580,292 1,511,017 0.58
Inter-Regional Distribution
Network Co Volga OAOUtilities 2,319,446 331,250 0.07 0.09
Kuzbassenergo JSC Utilities 10,129,422 1,446,626 0.85
LUKOIL Oil & Gas 1,570,381,466 224,272,928 0.54 0.8
Magnitogorsk Iron & Steel
WorksBasic Materials 66,244,772 9,460,701 0.42
MAGNIT OJSC Consumer Services 184,560,920 26,357,938 2.03
MMC Norilsk Nickel Basic Materials 328,602,491 46,929,134 0.32 0.39
Mobile Telesystems OJSC Telecommunications 332,540,701 47,491,567 0.28 0.45
Mosenergo OAO Utilities 20,273,061 2,895,283 0.23 0.21
M Video Consumer Services 17,147,807 2,448,952 1.63 1.63
OGK-2 OAO Utilities 17,791,424 2,540,870 0.48 0.94
OGK-4 OJSC Utilities 3,834,128 547,568 0.07 0.07
OGK-6 Utilities 11,274,529 1,610,164 0.02
Pharmstandard Health Care 28,182,637 4,024,884 0.25
Polyus Gold Co Basic Materials 121,611,362 17,367,841 0.36 0.33
Industry/Sector Market valueNOK
Market valueUSD Voting Ownership
GOVERNMENT PENSION FUND GLOBAL HOLDINGS 2008
Equities Country association according to FTSE (the benchmark provider for equities). If a company is not in thebenchmark, the country of incorporation and country of listing is used. For remaining securities, a further assessment ismade. Country is defined as a sovereign state currently member of the United Nations. Exceptions are Hong Kong andTaiwan. The country association methodology was updated as of 2014.
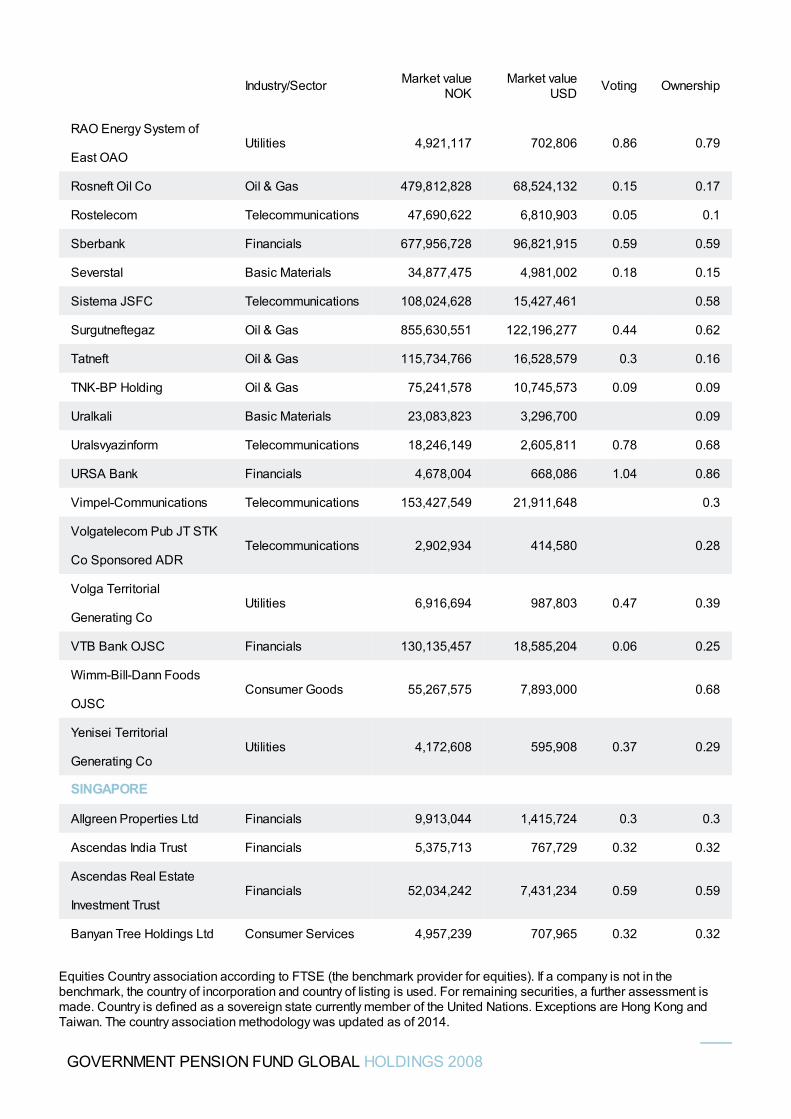
RAO Energy System of
East OAOUtilities 4,921,117 702,806 0.86 0.79
Rosneft Oil Co Oil & Gas 479,812,828 68,524,132 0.15 0.17
Rostelecom Telecommunications 47,690,622 6,810,903 0.05 0.1
Sberbank Financials 677,956,728 96,821,915 0.59 0.59
Severstal Basic Materials 34,877,475 4,981,002 0.18 0.15
Sistema JSFC Telecommunications 108,024,628 15,427,461 0.58
Surgutneftegaz Oil & Gas 855,630,551 122,196,277 0.44 0.62
Tatneft Oil & Gas 115,734,766 16,528,579 0.3 0.16
TNK-BP Holding Oil & Gas 75,241,578 10,745,573 0.09 0.09
Uralkali Basic Materials 23,083,823 3,296,700 0.09
Uralsvyazinform Telecommunications 18,246,149 2,605,811 0.78 0.68
URSA Bank Financials 4,678,004 668,086 1.04 0.86
Vimpel-Communications Telecommunications 153,427,549 21,911,648 0.3
Volgatelecom Pub JT STK
Co Sponsored ADRTelecommunications 2,902,934 414,580 0.28
Volga Territorial
Generating CoUtilities 6,916,694 987,803 0.47 0.39
VTB Bank OJSC Financials 130,135,457 18,585,204 0.06 0.25
Wimm-Bill-Dann Foods
OJSCConsumer Goods 55,267,575 7,893,000 0.68
Yenisei Territorial
Generating CoUtilities 4,172,608 595,908 0.37 0.29
SINGAPORE
Allgreen Properties Ltd Financials 9,913,044 1,415,724 0.3 0.3
Ascendas India Trust Financials 5,375,713 767,729 0.32 0.32
Ascendas Real Estate
Investment TrustFinancials 52,034,242 7,431,234 0.59 0.59
Banyan Tree Holdings Ltd Consumer Services 4,957,239 707,965 0.32 0.32
Industry/Sector Market valueNOK
Market valueUSD Voting Ownership
GOVERNMENT PENSION FUND GLOBAL HOLDINGS 2008
Equities Country association according to FTSE (the benchmark provider for equities). If a company is not in thebenchmark, the country of incorporation and country of listing is used. For remaining securities, a further assessment ismade. Country is defined as a sovereign state currently member of the United Nations. Exceptions are Hong Kong andTaiwan. The country association methodology was updated as of 2014.
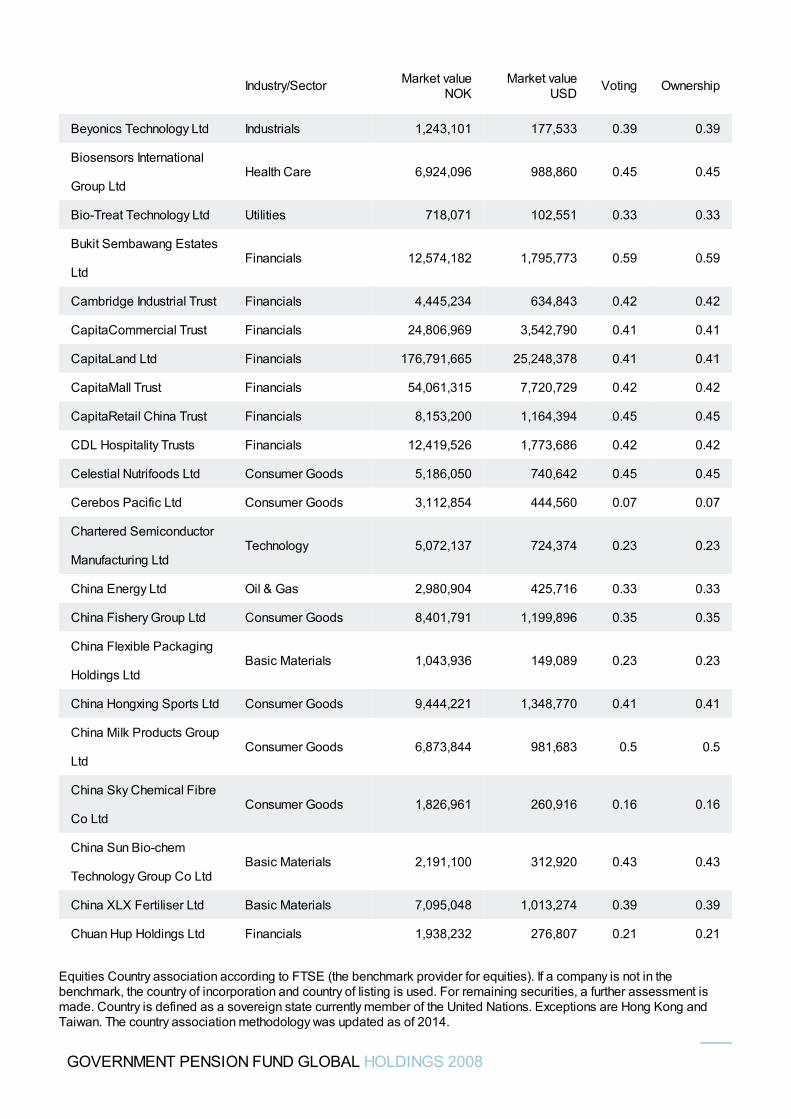
Beyonics Technology Ltd Industrials 1,243,101 177,533 0.39 0.39
Biosensors International
Group LtdHealth Care 6,924,096 988,860 0.45 0.45
Bio-Treat Technology Ltd Utilities 718,071 102,551 0.33 0.33
Bukit Sembawang Estates
LtdFinancials 12,574,182 1,795,773 0.59 0.59
Cambridge Industrial Trust Financials 4,445,234 634,843 0.42 0.42
CapitaCommercial Trust Financials 24,806,969 3,542,790 0.41 0.41
CapitaLand Ltd Financials 176,791,665 25,248,378 0.41 0.41
CapitaMall Trust Financials 54,061,315 7,720,729 0.42 0.42
CapitaRetail China Trust Financials 8,153,200 1,164,394 0.45 0.45
CDL Hospitality Trusts Financials 12,419,526 1,773,686 0.42 0.42
Celestial Nutrifoods Ltd Consumer Goods 5,186,050 740,642 0.45 0.45
Cerebos Pacific Ltd Consumer Goods 3,112,854 444,560 0.07 0.07
Chartered Semiconductor
Manufacturing LtdTechnology 5,072,137 724,374 0.23 0.23
China Energy Ltd Oil & Gas 2,980,904 425,716 0.33 0.33
China Fishery Group Ltd Consumer Goods 8,401,791 1,199,896 0.35 0.35
China Flexible Packaging
Holdings LtdBasic Materials 1,043,936 149,089 0.23 0.23
China Hongxing Sports Ltd Consumer Goods 9,444,221 1,348,770 0.41 0.41
China Milk Products Group
LtdConsumer Goods 6,873,844 981,683 0.5 0.5
China Sky Chemical Fibre
Co LtdConsumer Goods 1,826,961 260,916 0.16 0.16
China Sun Bio-chem
Technology Group Co LtdBasic Materials 2,191,100 312,920 0.43 0.43
China XLX Fertiliser Ltd Basic Materials 7,095,048 1,013,274 0.39 0.39
Chuan Hup Holdings Ltd Financials 1,938,232 276,807 0.21 0.21
Industry/Sector Market valueNOK
Market valueUSD Voting Ownership
GOVERNMENT PENSION FUND GLOBAL HOLDINGS 2008
Equities Country association according to FTSE (the benchmark provider for equities). If a company is not in thebenchmark, the country of incorporation and country of listing is used. For remaining securities, a further assessment ismade. Country is defined as a sovereign state currently member of the United Nations. Exceptions are Hong Kong andTaiwan. The country association methodology was updated as of 2014.
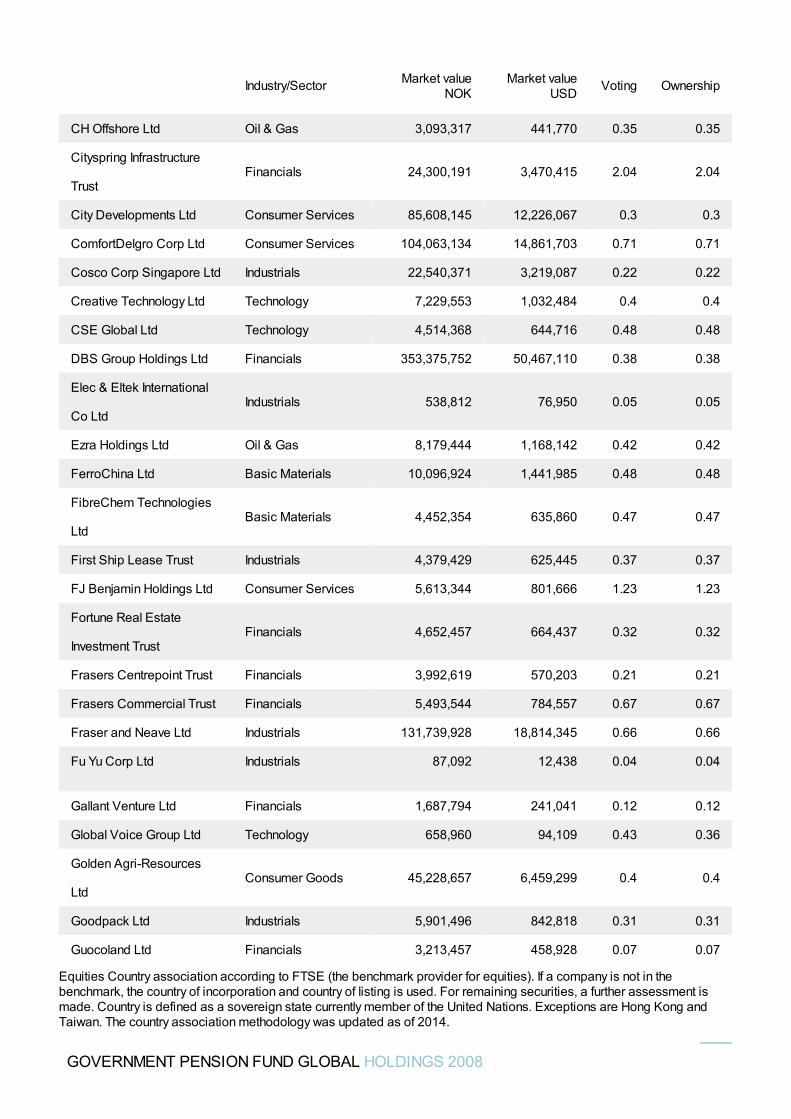
CH Offshore Ltd Oil & Gas 3,093,317 441,770 0.35 0.35
Cityspring Infrastructure
TrustFinancials 24,300,191 3,470,415 2.04 2.04
City Developments Ltd Consumer Services 85,608,145 12,226,067 0.3 0.3
ComfortDelgro Corp Ltd Consumer Services 104,063,134 14,861,703 0.71 0.71
Cosco Corp Singapore Ltd Industrials 22,540,371 3,219,087 0.22 0.22
Creative Technology Ltd Technology 7,229,553 1,032,484 0.4 0.4
CSE Global Ltd Technology 4,514,368 644,716 0.48 0.48
DBS Group Holdings Ltd Financials 353,375,752 50,467,110 0.38 0.38
Elec & Eltek International
Co LtdIndustrials 538,812 76,950 0.05 0.05
Ezra Holdings Ltd Oil & Gas 8,179,444 1,168,142 0.42 0.42
FerroChina Ltd Basic Materials 10,096,924 1,441,985 0.48 0.48
FibreChem Technologies
LtdBasic Materials 4,452,354 635,860 0.47 0.47
First Ship Lease Trust Industrials 4,379,429 625,445 0.37 0.37
FJ Benjamin Holdings Ltd Consumer Services 5,613,344 801,666 1.23 1.23
Fortune Real Estate
Investment TrustFinancials 4,652,457 664,437 0.32 0.32
Frasers Centrepoint Trust Financials 3,992,619 570,203 0.21 0.21
Frasers Commercial Trust Financials 5,493,544 784,557 0.67 0.67
Fraser and Neave Ltd Industrials 131,739,928 18,814,345 0.66 0.66
Fu Yu Corp Ltd Industrials 87,092 12,438 0.04 0.04
Gallant Venture Ltd Financials 1,687,794 241,041 0.12 0.12
Global Voice Group Ltd Technology 658,960 94,109 0.43 0.36
Golden Agri-Resources
LtdConsumer Goods 45,228,657 6,459,299 0.4 0.4
Goodpack Ltd Industrials 5,901,496 842,818 0.31 0.31
Guocoland Ltd Financials 3,213,457 458,928 0.07 0.07
Industry/Sector Market valueNOK
Market valueUSD Voting Ownership
GOVERNMENT PENSION FUND GLOBAL HOLDINGS 2008
Equities Country association according to FTSE (the benchmark provider for equities). If a company is not in thebenchmark, the country of incorporation and country of listing is used. For remaining securities, a further assessment ismade. Country is defined as a sovereign state currently member of the United Nations. Exceptions are Hong Kong andTaiwan. The country association methodology was updated as of 2014.
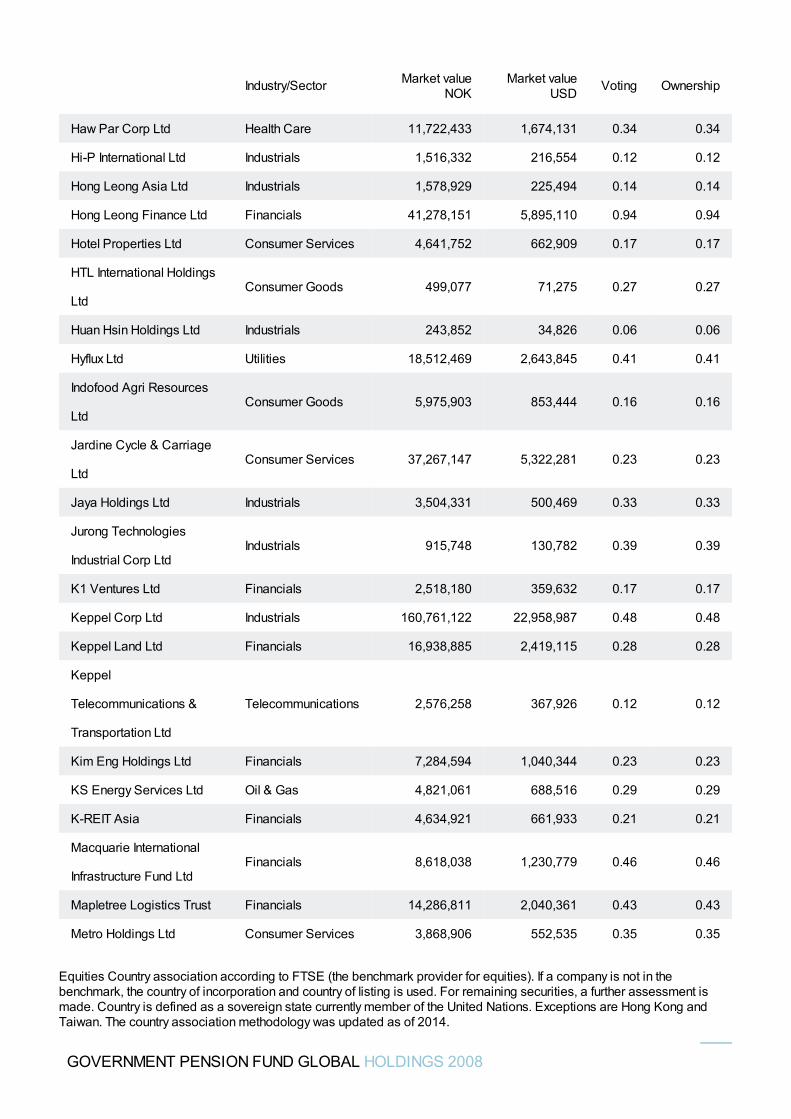
Haw Par Corp Ltd Health Care 11,722,433 1,674,131 0.34 0.34
Hi-P International Ltd Industrials 1,516,332 216,554 0.12 0.12
Hong Leong Asia Ltd Industrials 1,578,929 225,494 0.14 0.14
Hong Leong Finance Ltd Financials 41,278,151 5,895,110 0.94 0.94
Hotel Properties Ltd Consumer Services 4,641,752 662,909 0.17 0.17
HTL International Holdings
LtdConsumer Goods 499,077 71,275 0.27 0.27
Huan Hsin Holdings Ltd Industrials 243,852 34,826 0.06 0.06
Hyflux Ltd Utilities 18,512,469 2,643,845 0.41 0.41
Indofood Agri Resources
LtdConsumer Goods 5,975,903 853,444 0.16 0.16
Jardine Cycle & Carriage
LtdConsumer Services 37,267,147 5,322,281 0.23 0.23
Jaya Holdings Ltd Industrials 3,504,331 500,469 0.33 0.33
Jurong Technologies
Industrial Corp LtdIndustrials 915,748 130,782 0.39 0.39
K1 Ventures Ltd Financials 2,518,180 359,632 0.17 0.17
Keppel Corp Ltd Industrials 160,761,122 22,958,987 0.48 0.48
Keppel Land Ltd Financials 16,938,885 2,419,115 0.28 0.28
Keppel
Telecommunications &
Transportation Ltd
Telecommunications 2,576,258 367,926 0.12 0.12
Kim Eng Holdings Ltd Financials 7,284,594 1,040,344 0.23 0.23
KS Energy Services Ltd Oil & Gas 4,821,061 688,516 0.29 0.29
K-REIT Asia Financials 4,634,921 661,933 0.21 0.21
Macquarie International
Infrastructure Fund LtdFinancials 8,618,038 1,230,779 0.46 0.46
Mapletree Logistics Trust Financials 14,286,811 2,040,361 0.43 0.43
Metro Holdings Ltd Consumer Services 3,868,906 552,535 0.35 0.35
Industry/Sector Market valueNOK
Market valueUSD Voting Ownership
GOVERNMENT PENSION FUND GLOBAL HOLDINGS 2008
Equities Country association according to FTSE (the benchmark provider for equities). If a company is not in thebenchmark, the country of incorporation and country of listing is used. For remaining securities, a further assessment ismade. Country is defined as a sovereign state currently member of the United Nations. Exceptions are Hong Kong andTaiwan. The country association methodology was updated as of 2014.
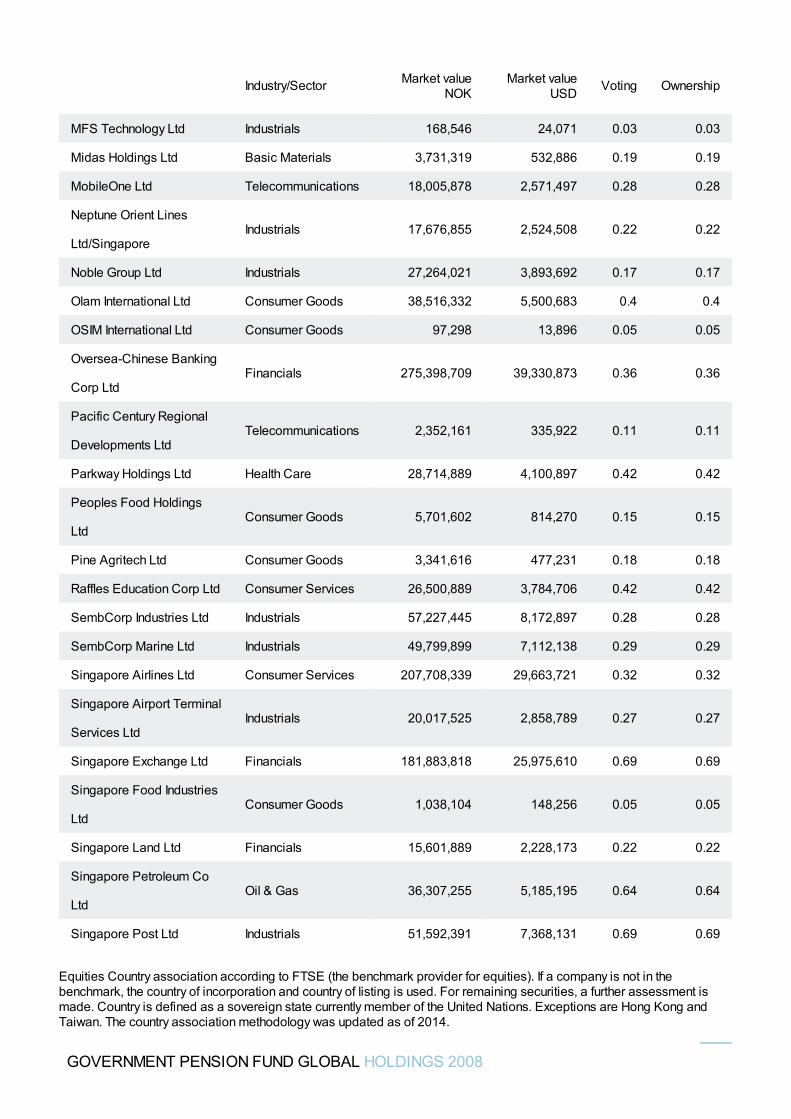
MFS Technology Ltd Industrials 168,546 24,071 0.03 0.03
Midas Holdings Ltd Basic Materials 3,731,319 532,886 0.19 0.19
MobileOne Ltd Telecommunications 18,005,878 2,571,497 0.28 0.28
Neptune Orient Lines
Ltd/SingaporeIndustrials 17,676,855 2,524,508 0.22 0.22
Noble Group Ltd Industrials 27,264,021 3,893,692 0.17 0.17
Olam International Ltd Consumer Goods 38,516,332 5,500,683 0.4 0.4
OSIM International Ltd Consumer Goods 97,298 13,896 0.05 0.05
Oversea-Chinese Banking
Corp LtdFinancials 275,398,709 39,330,873 0.36 0.36
Pacific Century Regional
Developments LtdTelecommunications 2,352,161 335,922 0.11 0.11
Parkway Holdings Ltd Health Care 28,714,889 4,100,897 0.42 0.42
Peoples Food Holdings
LtdConsumer Goods 5,701,602 814,270 0.15 0.15
Pine Agritech Ltd Consumer Goods 3,341,616 477,231 0.18 0.18
Raffles Education Corp Ltd Consumer Services 26,500,889 3,784,706 0.42 0.42
SembCorp Industries Ltd Industrials 57,227,445 8,172,897 0.28 0.28
SembCorp Marine Ltd Industrials 49,799,899 7,112,138 0.29 0.29
Singapore Airlines Ltd Consumer Services 207,708,339 29,663,721 0.32 0.32
Singapore Airport Terminal
Services LtdIndustrials 20,017,525 2,858,789 0.27 0.27
Singapore Exchange Ltd Financials 181,883,818 25,975,610 0.69 0.69
Singapore Food Industries
LtdConsumer Goods 1,038,104 148,256 0.05 0.05
Singapore Land Ltd Financials 15,601,889 2,228,173 0.22 0.22
Singapore Petroleum Co
LtdOil & Gas 36,307,255 5,185,195 0.64 0.64
Singapore Post Ltd Industrials 51,592,391 7,368,131 0.69 0.69
Industry/Sector Market valueNOK
Market valueUSD Voting Ownership
GOVERNMENT PENSION FUND GLOBAL HOLDINGS 2008
Equities Country association according to FTSE (the benchmark provider for equities). If a company is not in thebenchmark, the country of incorporation and country of listing is used. For remaining securities, a further assessment ismade. Country is defined as a sovereign state currently member of the United Nations. Exceptions are Hong Kong andTaiwan. The country association methodology was updated as of 2014.
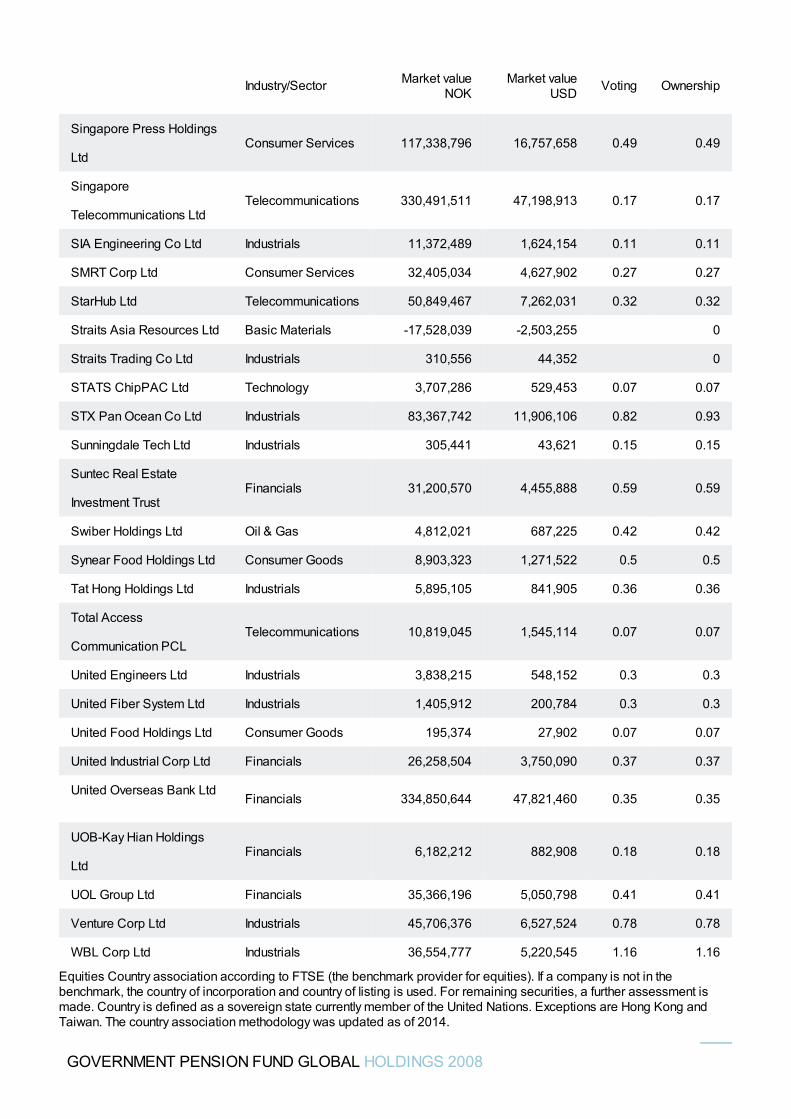
Singapore Press Holdings
LtdConsumer Services 117,338,796 16,757,658 0.49 0.49
Singapore
Telecommunications LtdTelecommunications 330,491,511 47,198,913 0.17 0.17
SIA Engineering Co Ltd Industrials 11,372,489 1,624,154 0.11 0.11
SMRT Corp Ltd Consumer Services 32,405,034 4,627,902 0.27 0.27
StarHub Ltd Telecommunications 50,849,467 7,262,031 0.32 0.32
Straits Asia Resources Ltd Basic Materials -17,528,039 -2,503,255 0
Straits Trading Co Ltd Industrials 310,556 44,352 0
STATS ChipPAC Ltd Technology 3,707,286 529,453 0.07 0.07
STX Pan Ocean Co Ltd Industrials 83,367,742 11,906,106 0.82 0.93
Sunningdale Tech Ltd Industrials 305,441 43,621 0.15 0.15
Suntec Real Estate
Investment TrustFinancials 31,200,570 4,455,888 0.59 0.59
Swiber Holdings Ltd Oil & Gas 4,812,021 687,225 0.42 0.42
Synear Food Holdings Ltd Consumer Goods 8,903,323 1,271,522 0.5 0.5
Tat Hong Holdings Ltd Industrials 5,895,105 841,905 0.36 0.36
Total Access
Communication PCLTelecommunications 10,819,045 1,545,114 0.07 0.07
United Engineers Ltd Industrials 3,838,215 548,152 0.3 0.3
United Fiber System Ltd Industrials 1,405,912 200,784 0.3 0.3
United Food Holdings Ltd Consumer Goods 195,374 27,902 0.07 0.07
United Industrial Corp Ltd Financials 26,258,504 3,750,090 0.37 0.37
United Overseas Bank LtdFinancials 334,850,644 47,821,460 0.35 0.35
UOB-Kay Hian Holdings
LtdFinancials 6,182,212 882,908 0.18 0.18
UOL Group Ltd Financials 35,366,196 5,050,798 0.41 0.41
Venture Corp Ltd Industrials 45,706,376 6,527,524 0.78 0.78
WBL Corp Ltd Industrials 36,554,777 5,220,545 1.16 1.16
Industry/Sector Market valueNOK
Market valueUSD Voting Ownership
GOVERNMENT PENSION FUND GLOBAL HOLDINGS 2008
Equities Country association according to FTSE (the benchmark provider for equities). If a company is not in thebenchmark, the country of incorporation and country of listing is used. For remaining securities, a further assessment ismade. Country is defined as a sovereign state currently member of the United Nations. Exceptions are Hong Kong andTaiwan. The country association methodology was updated as of 2014.
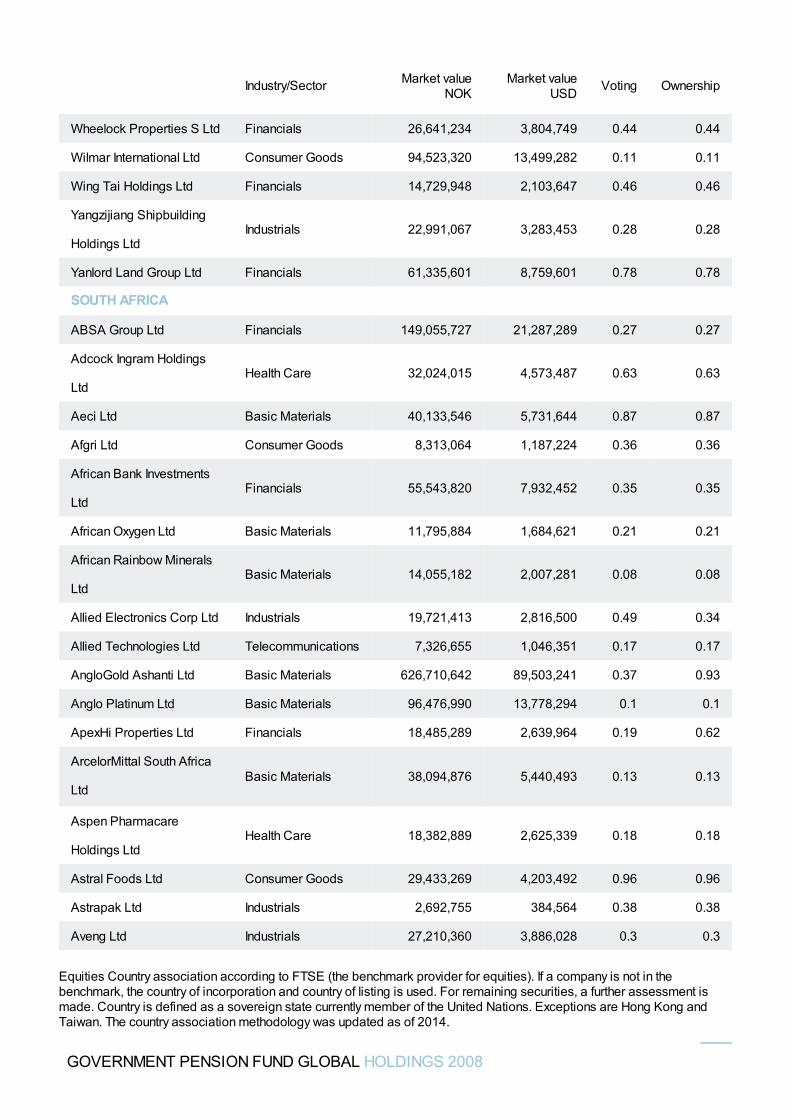
Wheelock Properties S Ltd Financials 26,641,234 3,804,749 0.44 0.44
Wilmar International Ltd Consumer Goods 94,523,320 13,499,282 0.11 0.11
Wing Tai Holdings Ltd Financials 14,729,948 2,103,647 0.46 0.46
Yangzijiang Shipbuilding
Holdings LtdIndustrials 22,991,067 3,283,453 0.28 0.28
Yanlord Land Group Ltd Financials 61,335,601 8,759,601 0.78 0.78
SOUTH AFRICA
ABSA Group Ltd Financials 149,055,727 21,287,289 0.27 0.27
Adcock Ingram Holdings
LtdHealth Care 32,024,015 4,573,487 0.63 0.63
Aeci Ltd Basic Materials 40,133,546 5,731,644 0.87 0.87
Afgri Ltd Consumer Goods 8,313,064 1,187,224 0.36 0.36
African Bank Investments
LtdFinancials 55,543,820 7,932,452 0.35 0.35
African Oxygen Ltd Basic Materials 11,795,884 1,684,621 0.21 0.21
African Rainbow Minerals
LtdBasic Materials 14,055,182 2,007,281 0.08 0.08
Allied Electronics Corp Ltd Industrials 19,721,413 2,816,500 0.49 0.34
Allied Technologies Ltd Telecommunications 7,326,655 1,046,351 0.17 0.17
AngloGold Ashanti Ltd Basic Materials 626,710,642 89,503,241 0.37 0.93
Anglo Platinum Ltd Basic Materials 96,476,990 13,778,294 0.1 0.1
ApexHi Properties Ltd Financials 18,485,289 2,639,964 0.19 0.62
ArcelorMittal South Africa
LtdBasic Materials 38,094,876 5,440,493 0.13 0.13
Aspen Pharmacare
Holdings LtdHealth Care 18,382,889 2,625,339 0.18 0.18
Astral Foods Ltd Consumer Goods 29,433,269 4,203,492 0.96 0.96
Astrapak Ltd Industrials 2,692,755 384,564 0.38 0.38
Aveng Ltd Industrials 27,210,360 3,886,028 0.3 0.3
Industry/Sector Market valueNOK
Market valueUSD Voting Ownership
GOVERNMENT PENSION FUND GLOBAL HOLDINGS 2008
Equities Country association according to FTSE (the benchmark provider for equities). If a company is not in thebenchmark, the country of incorporation and country of listing is used. For remaining securities, a further assessment ismade. Country is defined as a sovereign state currently member of the United Nations. Exceptions are Hong Kong andTaiwan. The country association methodology was updated as of 2014.
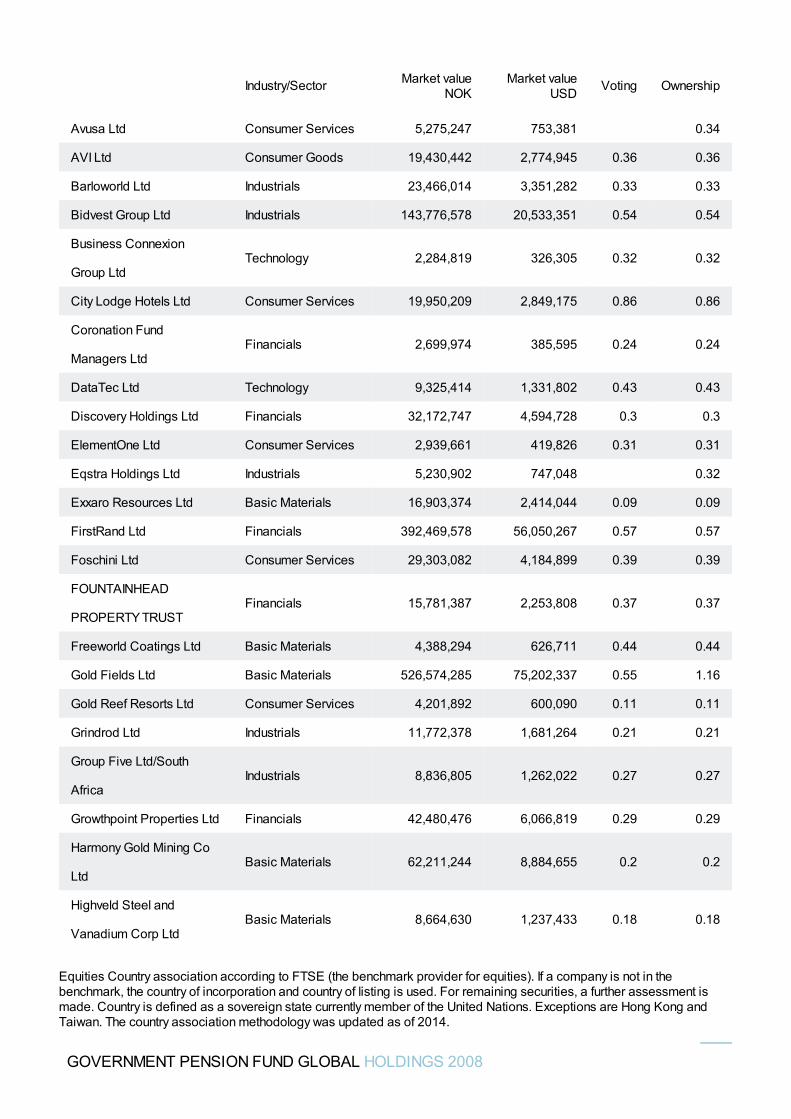
Avusa Ltd Consumer Services 5,275,247 753,381 0.34
AVI Ltd Consumer Goods 19,430,442 2,774,945 0.36 0.36
Barloworld Ltd Industrials 23,466,014 3,351,282 0.33 0.33
Bidvest Group Ltd Industrials 143,776,578 20,533,351 0.54 0.54
Business Connexion
Group LtdTechnology 2,284,819 326,305 0.32 0.32
City Lodge Hotels Ltd Consumer Services 19,950,209 2,849,175 0.86 0.86
Coronation Fund
Managers LtdFinancials 2,699,974 385,595 0.24 0.24
DataTec Ltd Technology 9,325,414 1,331,802 0.43 0.43
Discovery Holdings Ltd Financials 32,172,747 4,594,728 0.3 0.3
ElementOne Ltd Consumer Services 2,939,661 419,826 0.31 0.31
Eqstra Holdings Ltd Industrials 5,230,902 747,048 0.32
Exxaro Resources Ltd Basic Materials 16,903,374 2,414,044 0.09 0.09
FirstRand Ltd Financials 392,469,578 56,050,267 0.57 0.57
Foschini Ltd Consumer Services 29,303,082 4,184,899 0.39 0.39
FOUNTAINHEAD
PROPERTY TRUSTFinancials 15,781,387 2,253,808 0.37 0.37
Freeworld Coatings Ltd Basic Materials 4,388,294 626,711 0.44 0.44
Gold Fields Ltd Basic Materials 526,574,285 75,202,337 0.55 1.16
Gold Reef Resorts Ltd Consumer Services 4,201,892 600,090 0.11 0.11
Grindrod Ltd Industrials 11,772,378 1,681,264 0.21 0.21
Group Five Ltd/South
AfricaIndustrials 8,836,805 1,262,022 0.27 0.27
Growthpoint Properties Ltd Financials 42,480,476 6,066,819 0.29 0.29
Harmony Gold Mining Co
LtdBasic Materials 62,211,244 8,884,655 0.2 0.2
Highveld Steel and
Vanadium Corp LtdBasic Materials 8,664,630 1,237,433 0.18 0.18
Industry/Sector Market valueNOK
Market valueUSD Voting Ownership
GOVERNMENT PENSION FUND GLOBAL HOLDINGS 2008
Equities Country association according to FTSE (the benchmark provider for equities). If a company is not in thebenchmark, the country of incorporation and country of listing is used. For remaining securities, a further assessment ismade. Country is defined as a sovereign state currently member of the United Nations. Exceptions are Hong Kong andTaiwan. The country association methodology was updated as of 2014.
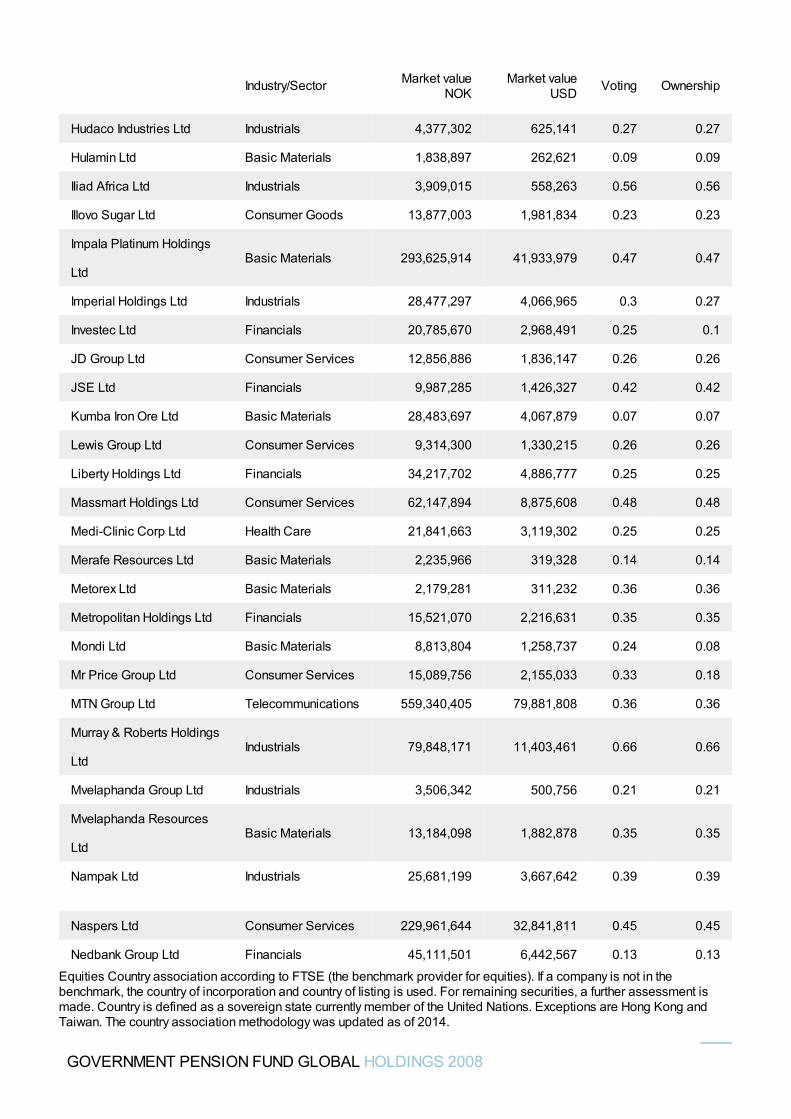
Hudaco Industries Ltd Industrials 4,377,302 625,141 0.27 0.27
Hulamin Ltd Basic Materials 1,838,897 262,621 0.09 0.09
Iliad Africa Ltd Industrials 3,909,015 558,263 0.56 0.56
Illovo Sugar Ltd Consumer Goods 13,877,003 1,981,834 0.23 0.23
Impala Platinum Holdings
LtdBasic Materials 293,625,914 41,933,979 0.47 0.47
Imperial Holdings Ltd Industrials 28,477,297 4,066,965 0.3 0.27
Investec Ltd Financials 20,785,670 2,968,491 0.25 0.1
JD Group Ltd Consumer Services 12,856,886 1,836,147 0.26 0.26
JSE Ltd Financials 9,987,285 1,426,327 0.42 0.42
Kumba Iron Ore Ltd Basic Materials 28,483,697 4,067,879 0.07 0.07
Lewis Group Ltd Consumer Services 9,314,300 1,330,215 0.26 0.26
Liberty Holdings Ltd Financials 34,217,702 4,886,777 0.25 0.25
Massmart Holdings Ltd Consumer Services 62,147,894 8,875,608 0.48 0.48
Medi-Clinic Corp Ltd Health Care 21,841,663 3,119,302 0.25 0.25
Merafe Resources Ltd Basic Materials 2,235,966 319,328 0.14 0.14
Metorex Ltd Basic Materials 2,179,281 311,232 0.36 0.36
Metropolitan Holdings Ltd Financials 15,521,070 2,216,631 0.35 0.35
Mondi Ltd Basic Materials 8,813,804 1,258,737 0.24 0.08
Mr Price Group Ltd Consumer Services 15,089,756 2,155,033 0.33 0.18
MTN Group Ltd Telecommunications 559,340,405 79,881,808 0.36 0.36
Murray & Roberts Holdings
LtdIndustrials 79,848,171 11,403,461 0.66 0.66
Mvelaphanda Group Ltd Industrials 3,506,342 500,756 0.21 0.21
Mvelaphanda Resources
LtdBasic Materials 13,184,098 1,882,878 0.35 0.35
Nampak Ltd Industrials 25,681,199 3,667,642 0.39 0.39
Naspers Ltd Consumer Services 229,961,644 32,841,811 0.45 0.45
Nedbank Group Ltd Financials 45,111,501 6,442,567 0.13 0.13
Industry/Sector Market valueNOK
Market valueUSD Voting Ownership
GOVERNMENT PENSION FUND GLOBAL HOLDINGS 2008
Equities Country association according to FTSE (the benchmark provider for equities). If a company is not in thebenchmark, the country of incorporation and country of listing is used. For remaining securities, a further assessment ismade. Country is defined as a sovereign state currently member of the United Nations. Exceptions are Hong Kong andTaiwan. The country association methodology was updated as of 2014.
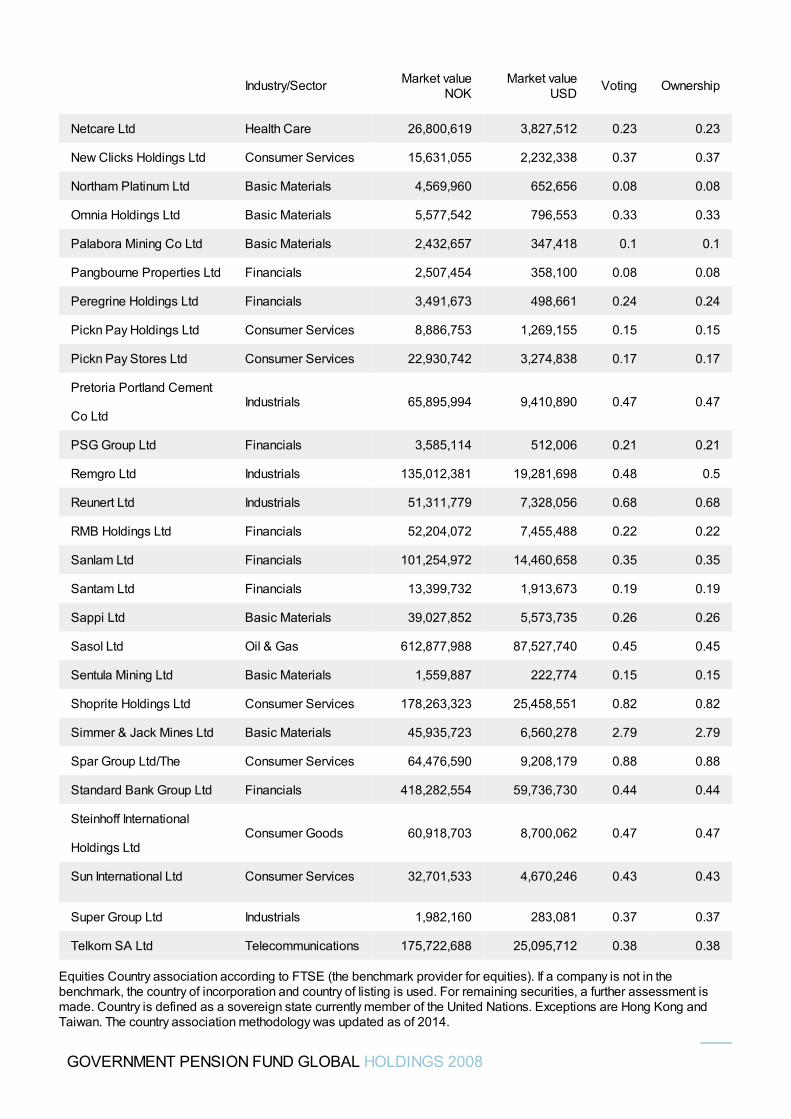
Netcare Ltd Health Care 26,800,619 3,827,512 0.23 0.23
New Clicks Holdings Ltd Consumer Services 15,631,055 2,232,338 0.37 0.37
Northam Platinum Ltd Basic Materials 4,569,960 652,656 0.08 0.08
Omnia Holdings Ltd Basic Materials 5,577,542 796,553 0.33 0.33
Palabora Mining Co Ltd Basic Materials 2,432,657 347,418 0.1 0.1
Pangbourne Properties Ltd Financials 2,507,454 358,100 0.08 0.08
Peregrine Holdings Ltd Financials 3,491,673 498,661 0.24 0.24
Pickn Pay Holdings Ltd Consumer Services 8,886,753 1,269,155 0.15 0.15
Pickn Pay Stores Ltd Consumer Services 22,930,742 3,274,838 0.17 0.17
Pretoria Portland Cement
Co LtdIndustrials 65,895,994 9,410,890 0.47 0.47
PSG Group Ltd Financials 3,585,114 512,006 0.21 0.21
Remgro Ltd Industrials 135,012,381 19,281,698 0.48 0.5
Reunert Ltd Industrials 51,311,779 7,328,056 0.68 0.68
RMB Holdings Ltd Financials 52,204,072 7,455,488 0.22 0.22
Sanlam Ltd Financials 101,254,972 14,460,658 0.35 0.35
Santam Ltd Financials 13,399,732 1,913,673 0.19 0.19
Sappi Ltd Basic Materials 39,027,852 5,573,735 0.26 0.26
Sasol Ltd Oil & Gas 612,877,988 87,527,740 0.45 0.45
Sentula Mining Ltd Basic Materials 1,559,887 222,774 0.15 0.15
Shoprite Holdings Ltd Consumer Services 178,263,323 25,458,551 0.82 0.82
Simmer & Jack Mines Ltd Basic Materials 45,935,723 6,560,278 2.79 2.79
Spar Group Ltd/The Consumer Services 64,476,590 9,208,179 0.88 0.88
Standard Bank Group Ltd Financials 418,282,554 59,736,730 0.44 0.44
Steinhoff International
Holdings LtdConsumer Goods 60,918,703 8,700,062 0.47 0.47
Sun International Ltd Consumer Services 32,701,533 4,670,246 0.43 0.43
Super Group Ltd Industrials 1,982,160 283,081 0.37 0.37
Telkom SA Ltd Telecommunications 175,722,688 25,095,712 0.38 0.38
Industry/Sector Market valueNOK
Market valueUSD Voting Ownership
GOVERNMENT PENSION FUND GLOBAL HOLDINGS 2008
Equities Country association according to FTSE (the benchmark provider for equities). If a company is not in thebenchmark, the country of incorporation and country of listing is used. For remaining securities, a further assessment ismade. Country is defined as a sovereign state currently member of the United Nations. Exceptions are Hong Kong andTaiwan. The country association methodology was updated as of 2014.
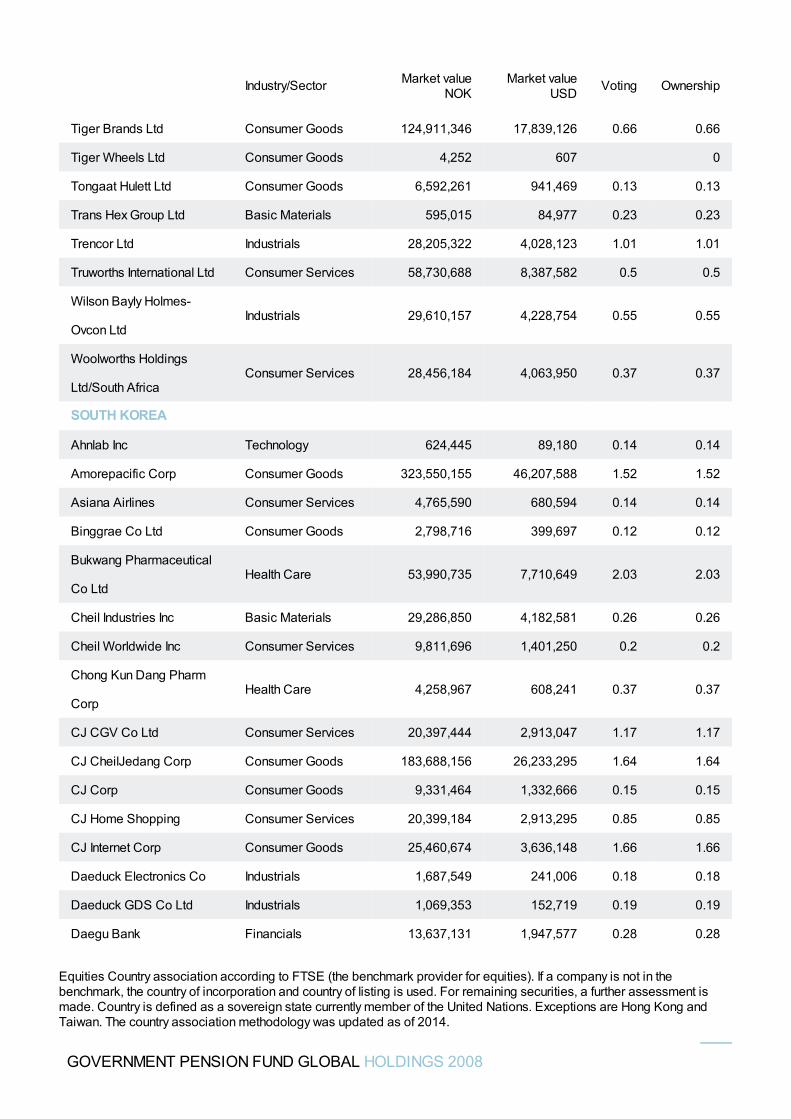
Tiger Brands Ltd Consumer Goods 124,911,346 17,839,126 0.66 0.66
Tiger Wheels Ltd Consumer Goods 4,252 607 0
Tongaat Hulett Ltd Consumer Goods 6,592,261 941,469 0.13 0.13
Trans Hex Group Ltd Basic Materials 595,015 84,977 0.23 0.23
Trencor Ltd Industrials 28,205,322 4,028,123 1.01 1.01
Truworths International Ltd Consumer Services 58,730,688 8,387,582 0.5 0.5
Wilson Bayly Holmes-
Ovcon LtdIndustrials 29,610,157 4,228,754 0.55 0.55
Woolworths Holdings
Ltd/South AfricaConsumer Services 28,456,184 4,063,950 0.37 0.37
SOUTH KOREA
Ahnlab Inc Technology 624,445 89,180 0.14 0.14
Amorepacific Corp Consumer Goods 323,550,155 46,207,588 1.52 1.52
Asiana Airlines Consumer Services 4,765,590 680,594 0.14 0.14
Binggrae Co Ltd Consumer Goods 2,798,716 399,697 0.12 0.12
Bukwang Pharmaceutical
Co LtdHealth Care 53,990,735 7,710,649 2.03 2.03
Cheil Industries Inc Basic Materials 29,286,850 4,182,581 0.26 0.26
Cheil Worldwide Inc Consumer Services 9,811,696 1,401,250 0.2 0.2
Chong Kun Dang Pharm
CorpHealth Care 4,258,967 608,241 0.37 0.37
CJ CGV Co Ltd Consumer Services 20,397,444 2,913,047 1.17 1.17
CJ CheilJedang Corp Consumer Goods 183,688,156 26,233,295 1.64 1.64
CJ Corp Consumer Goods 9,331,464 1,332,666 0.15 0.15
CJ Home Shopping Consumer Services 20,399,184 2,913,295 0.85 0.85
CJ Internet Corp Consumer Goods 25,460,674 3,636,148 1.66 1.66
Daeduck Electronics Co Industrials 1,687,549 241,006 0.18 0.18
Daeduck GDS Co Ltd Industrials 1,069,353 152,719 0.19 0.19
Daegu Bank Financials 13,637,131 1,947,577 0.28 0.28
Industry/Sector Market valueNOK
Market valueUSD Voting Ownership
GOVERNMENT PENSION FUND GLOBAL HOLDINGS 2008
Equities Country association according to FTSE (the benchmark provider for equities). If a company is not in thebenchmark, the country of incorporation and country of listing is used. For remaining securities, a further assessment ismade. Country is defined as a sovereign state currently member of the United Nations. Exceptions are Hong Kong andTaiwan. The country association methodology was updated as of 2014.
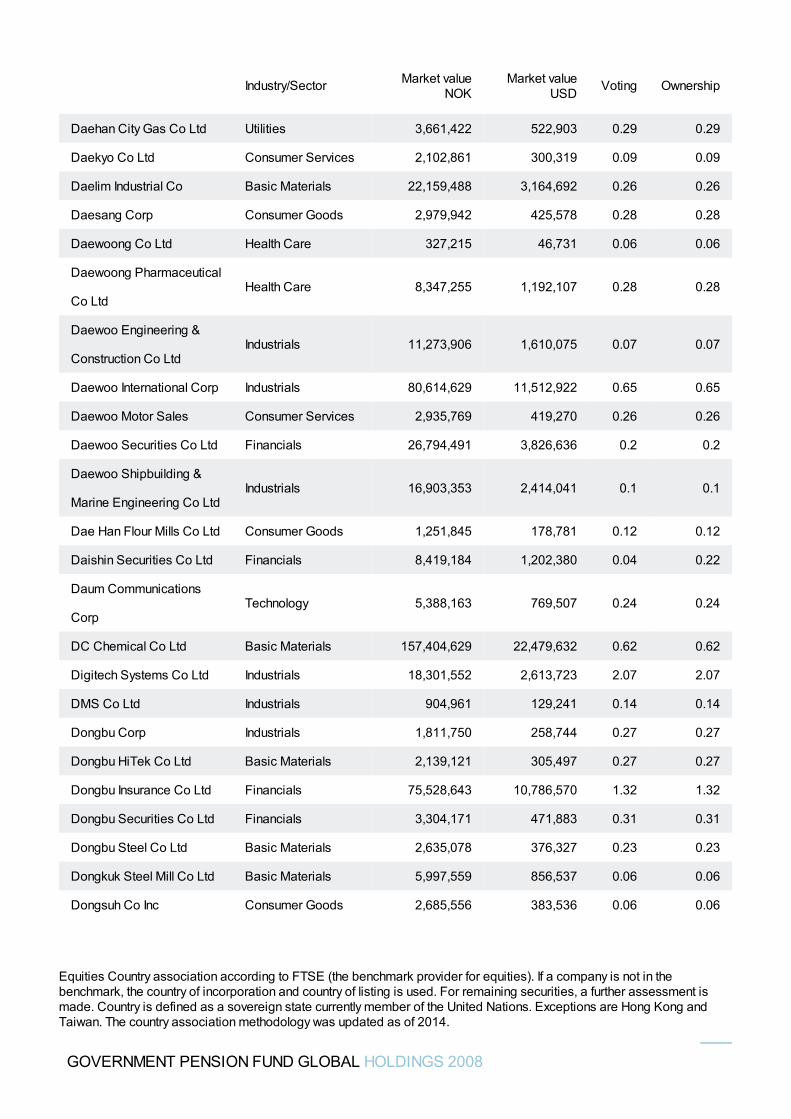
Daehan City Gas Co Ltd Utilities 3,661,422 522,903 0.29 0.29
Daekyo Co Ltd Consumer Services 2,102,861 300,319 0.09 0.09
Daelim Industrial Co Basic Materials 22,159,488 3,164,692 0.26 0.26
Daesang Corp Consumer Goods 2,979,942 425,578 0.28 0.28
Daewoong Co Ltd Health Care 327,215 46,731 0.06 0.06
Daewoong Pharmaceutical
Co LtdHealth Care 8,347,255 1,192,107 0.28 0.28
Daewoo Engineering &
Construction Co LtdIndustrials 11,273,906 1,610,075 0.07 0.07
Daewoo International Corp Industrials 80,614,629 11,512,922 0.65 0.65
Daewoo Motor Sales Consumer Services 2,935,769 419,270 0.26 0.26
Daewoo Securities Co Ltd Financials 26,794,491 3,826,636 0.2 0.2
Daewoo Shipbuilding &
Marine Engineering Co LtdIndustrials 16,903,353 2,414,041 0.1 0.1
Dae Han Flour Mills Co Ltd Consumer Goods 1,251,845 178,781 0.12 0.12
Daishin Securities Co Ltd Financials 8,419,184 1,202,380 0.04 0.22
Daum Communications
CorpTechnology 5,388,163 769,507 0.24 0.24
DC Chemical Co Ltd Basic Materials 157,404,629 22,479,632 0.62 0.62
Digitech Systems Co Ltd Industrials 18,301,552 2,613,723 2.07 2.07
DMS Co Ltd Industrials 904,961 129,241 0.14 0.14
Dongbu Corp Industrials 1,811,750 258,744 0.27 0.27
Dongbu HiTek Co Ltd Basic Materials 2,139,121 305,497 0.27 0.27
Dongbu Insurance Co Ltd Financials 75,528,643 10,786,570 1.32 1.32
Dongbu Securities Co Ltd Financials 3,304,171 471,883 0.31 0.31
Dongbu Steel Co Ltd Basic Materials 2,635,078 376,327 0.23 0.23
Dongkuk Steel Mill Co Ltd Basic Materials 5,997,559 856,537 0.06 0.06
Dongsuh Co Inc Consumer Goods 2,685,556 383,536 0.06 0.06
Industry/Sector Market valueNOK
Market valueUSD Voting Ownership
GOVERNMENT PENSION FUND GLOBAL HOLDINGS 2008
Equities Country association according to FTSE (the benchmark provider for equities). If a company is not in thebenchmark, the country of incorporation and country of listing is used. For remaining securities, a further assessment ismade. Country is defined as a sovereign state currently member of the United Nations. Exceptions are Hong Kong andTaiwan. The country association methodology was updated as of 2014.
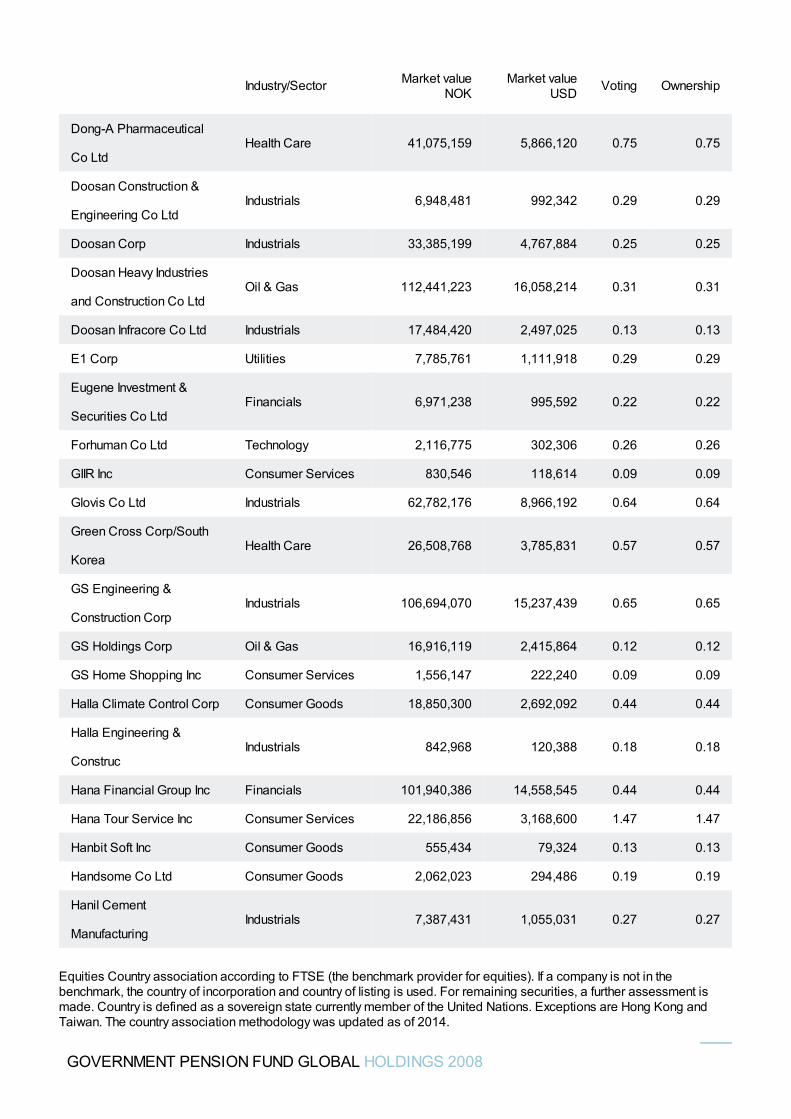
Dong-A Pharmaceutical
Co LtdHealth Care 41,075,159 5,866,120 0.75 0.75
Doosan Construction &
Engineering Co LtdIndustrials 6,948,481 992,342 0.29 0.29
Doosan Corp Industrials 33,385,199 4,767,884 0.25 0.25
Doosan Heavy Industries
and Construction Co LtdOil & Gas 112,441,223 16,058,214 0.31 0.31
Doosan Infracore Co Ltd Industrials 17,484,420 2,497,025 0.13 0.13
E1 Corp Utilities 7,785,761 1,111,918 0.29 0.29
Eugene Investment &
Securities Co LtdFinancials 6,971,238 995,592 0.22 0.22
Forhuman Co Ltd Technology 2,116,775 302,306 0.26 0.26
GIIR Inc Consumer Services 830,546 118,614 0.09 0.09
Glovis Co Ltd Industrials 62,782,176 8,966,192 0.64 0.64
Green Cross Corp/South
KoreaHealth Care 26,508,768 3,785,831 0.57 0.57
GS Engineering &
Construction CorpIndustrials 106,694,070 15,237,439 0.65 0.65
GS Holdings Corp Oil & Gas 16,916,119 2,415,864 0.12 0.12
GS Home Shopping Inc Consumer Services 1,556,147 222,240 0.09 0.09
Halla Climate Control Corp Consumer Goods 18,850,300 2,692,092 0.44 0.44
Halla Engineering &
ConstrucIndustrials 842,968 120,388 0.18 0.18
Hana Financial Group Inc Financials 101,940,386 14,558,545 0.44 0.44
Hana Tour Service Inc Consumer Services 22,186,856 3,168,600 1.47 1.47
Hanbit Soft Inc Consumer Goods 555,434 79,324 0.13 0.13
Handsome Co Ltd Consumer Goods 2,062,023 294,486 0.19 0.19
Hanil Cement
ManufacturingIndustrials 7,387,431 1,055,031 0.27 0.27
Industry/Sector Market valueNOK
Market valueUSD Voting Ownership
GOVERNMENT PENSION FUND GLOBAL HOLDINGS 2008
Equities Country association according to FTSE (the benchmark provider for equities). If a company is not in thebenchmark, the country of incorporation and country of listing is used. For remaining securities, a further assessment ismade. Country is defined as a sovereign state currently member of the United Nations. Exceptions are Hong Kong andTaiwan. The country association methodology was updated as of 2014.
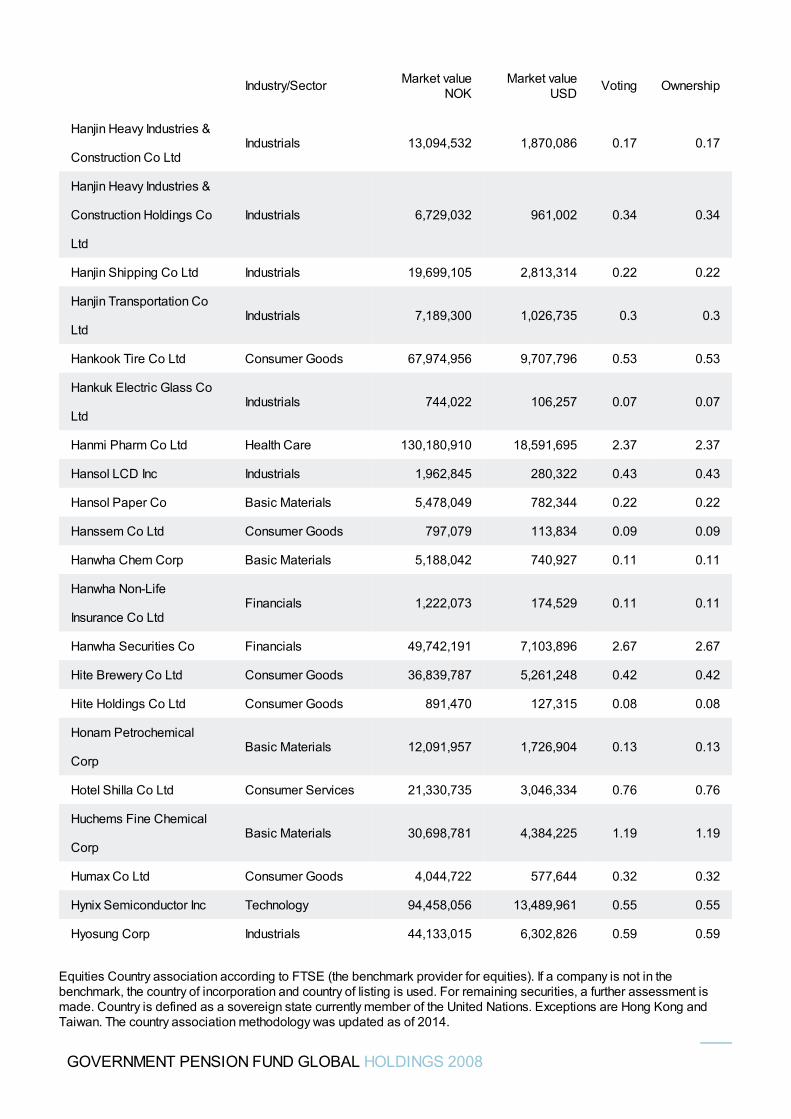
Hanjin Heavy Industries &
Construction Co LtdIndustrials 13,094,532 1,870,086 0.17 0.17
Hanjin Heavy Industries &
Construction Holdings Co
Ltd
Industrials 6,729,032 961,002 0.34 0.34
Hanjin Shipping Co Ltd Industrials 19,699,105 2,813,314 0.22 0.22
Hanjin Transportation Co
LtdIndustrials 7,189,300 1,026,735 0.3 0.3
Hankook Tire Co Ltd Consumer Goods 67,974,956 9,707,796 0.53 0.53
Hankuk Electric Glass Co
LtdIndustrials 744,022 106,257 0.07 0.07
Hanmi Pharm Co Ltd Health Care 130,180,910 18,591,695 2.37 2.37
Hansol LCD Inc Industrials 1,962,845 280,322 0.43 0.43
Hansol Paper Co Basic Materials 5,478,049 782,344 0.22 0.22
Hanssem Co Ltd Consumer Goods 797,079 113,834 0.09 0.09
Hanwha Chem Corp Basic Materials 5,188,042 740,927 0.11 0.11
Hanwha Non-Life
Insurance Co LtdFinancials 1,222,073 174,529 0.11 0.11
Hanwha Securities Co Financials 49,742,191 7,103,896 2.67 2.67
Hite Brewery Co Ltd Consumer Goods 36,839,787 5,261,248 0.42 0.42
Hite Holdings Co Ltd Consumer Goods 891,470 127,315 0.08 0.08
Honam Petrochemical
CorpBasic Materials 12,091,957 1,726,904 0.13 0.13
Hotel Shilla Co Ltd Consumer Services 21,330,735 3,046,334 0.76 0.76
Huchems Fine Chemical
CorpBasic Materials 30,698,781 4,384,225 1.19 1.19
Humax Co Ltd Consumer Goods 4,044,722 577,644 0.32 0.32
Hynix Semiconductor Inc Technology 94,458,056 13,489,961 0.55 0.55
Hyosung Corp Industrials 44,133,015 6,302,826 0.59 0.59
Industry/Sector Market valueNOK
Market valueUSD Voting Ownership
GOVERNMENT PENSION FUND GLOBAL HOLDINGS 2008
Equities Country association according to FTSE (the benchmark provider for equities). If a company is not in thebenchmark, the country of incorporation and country of listing is used. For remaining securities, a further assessment ismade. Country is defined as a sovereign state currently member of the United Nations. Exceptions are Hong Kong andTaiwan. The country association methodology was updated as of 2014.
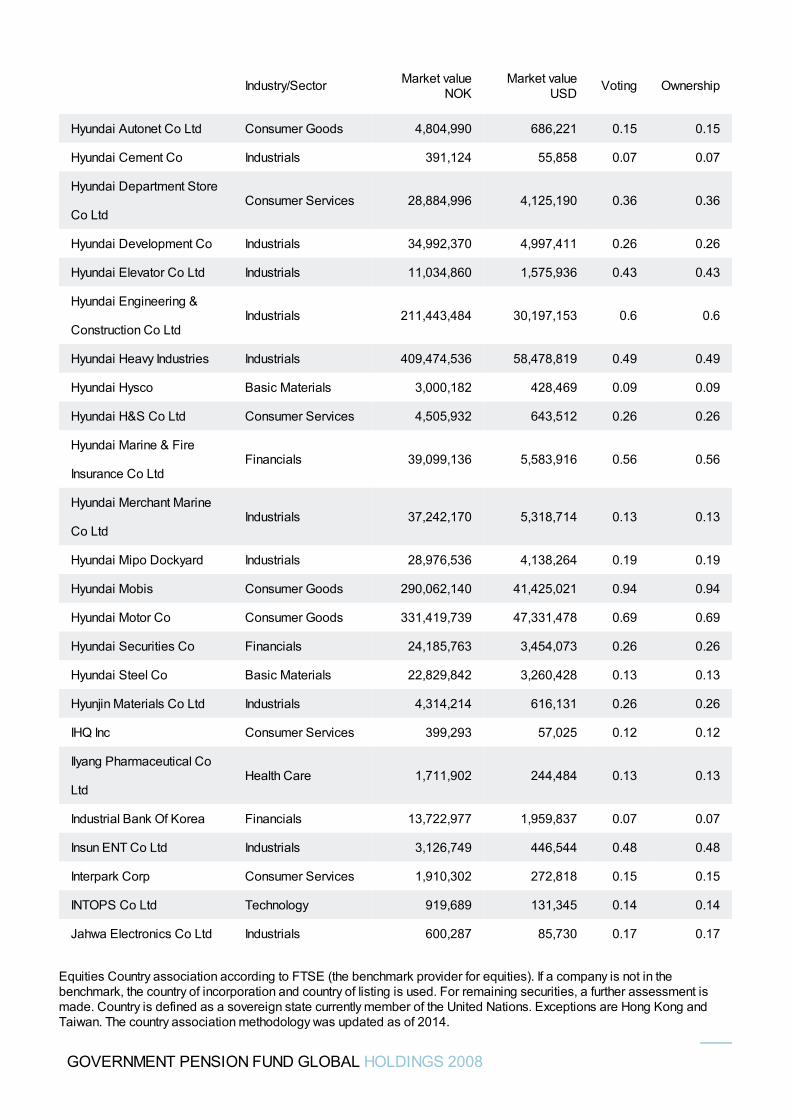
Hyundai Autonet Co Ltd Consumer Goods 4,804,990 686,221 0.15 0.15
Hyundai Cement Co Industrials 391,124 55,858 0.07 0.07
Hyundai Department Store
Co LtdConsumer Services 28,884,996 4,125,190 0.36 0.36
Hyundai Development Co Industrials 34,992,370 4,997,411 0.26 0.26
Hyundai Elevator Co Ltd Industrials 11,034,860 1,575,936 0.43 0.43
Hyundai Engineering &
Construction Co LtdIndustrials 211,443,484 30,197,153 0.6 0.6
Hyundai Heavy Industries Industrials 409,474,536 58,478,819 0.49 0.49
Hyundai Hysco Basic Materials 3,000,182 428,469 0.09 0.09
Hyundai H&S Co Ltd Consumer Services 4,505,932 643,512 0.26 0.26
Hyundai Marine & Fire
Insurance Co LtdFinancials 39,099,136 5,583,916 0.56 0.56
Hyundai Merchant Marine
Co LtdIndustrials 37,242,170 5,318,714 0.13 0.13
Hyundai Mipo Dockyard Industrials 28,976,536 4,138,264 0.19 0.19
Hyundai Mobis Consumer Goods 290,062,140 41,425,021 0.94 0.94
Hyundai Motor Co Consumer Goods 331,419,739 47,331,478 0.69 0.69
Hyundai Securities Co Financials 24,185,763 3,454,073 0.26 0.26
Hyundai Steel Co Basic Materials 22,829,842 3,260,428 0.13 0.13
Hyunjin Materials Co Ltd Industrials 4,314,214 616,131 0.26 0.26
IHQ Inc Consumer Services 399,293 57,025 0.12 0.12
Ilyang Pharmaceutical Co
LtdHealth Care 1,711,902 244,484 0.13 0.13
Industrial Bank Of Korea Financials 13,722,977 1,959,837 0.07 0.07
Insun ENT Co Ltd Industrials 3,126,749 446,544 0.48 0.48
Interpark Corp Consumer Services 1,910,302 272,818 0.15 0.15
INTOPS Co Ltd Technology 919,689 131,345 0.14 0.14
Jahwa Electronics Co Ltd Industrials 600,287 85,730 0.17 0.17
Industry/Sector Market valueNOK
Market valueUSD Voting Ownership
GOVERNMENT PENSION FUND GLOBAL HOLDINGS 2008
Equities Country association according to FTSE (the benchmark provider for equities). If a company is not in thebenchmark, the country of incorporation and country of listing is used. For remaining securities, a further assessment ismade. Country is defined as a sovereign state currently member of the United Nations. Exceptions are Hong Kong andTaiwan. The country association methodology was updated as of 2014.
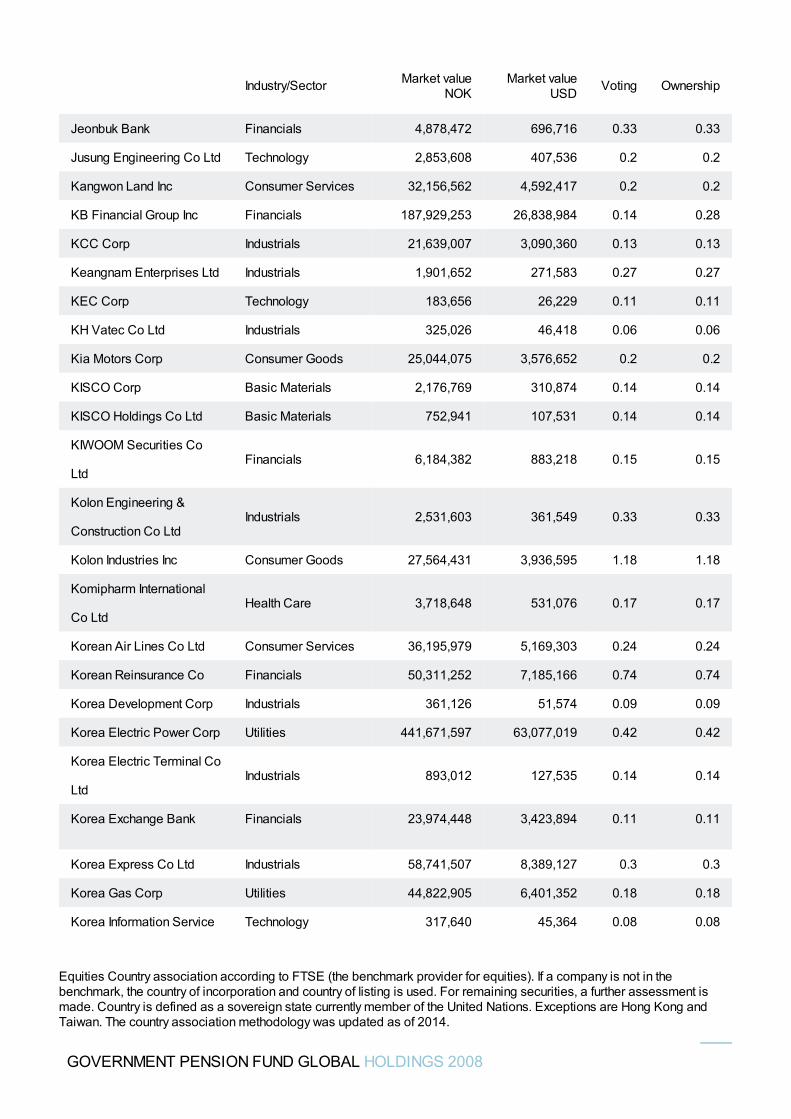
Jeonbuk Bank Financials 4,878,472 696,716 0.33 0.33
Jusung Engineering Co Ltd Technology 2,853,608 407,536 0.2 0.2
Kangwon Land Inc Consumer Services 32,156,562 4,592,417 0.2 0.2
KB Financial Group Inc Financials 187,929,253 26,838,984 0.14 0.28
KCC Corp Industrials 21,639,007 3,090,360 0.13 0.13
Keangnam Enterprises Ltd Industrials 1,901,652 271,583 0.27 0.27
KEC Corp Technology 183,656 26,229 0.11 0.11
KH Vatec Co Ltd Industrials 325,026 46,418 0.06 0.06
Kia Motors Corp Consumer Goods 25,044,075 3,576,652 0.2 0.2
KISCO Corp Basic Materials 2,176,769 310,874 0.14 0.14
KISCO Holdings Co Ltd Basic Materials 752,941 107,531 0.14 0.14
KIWOOM Securities Co
LtdFinancials 6,184,382 883,218 0.15 0.15
Kolon Engineering &
Construction Co LtdIndustrials 2,531,603 361,549 0.33 0.33
Kolon Industries Inc Consumer Goods 27,564,431 3,936,595 1.18 1.18
Komipharm International
Co LtdHealth Care 3,718,648 531,076 0.17 0.17
Korean Air Lines Co Ltd Consumer Services 36,195,979 5,169,303 0.24 0.24
Korean Reinsurance Co Financials 50,311,252 7,185,166 0.74 0.74
Korea Development Corp Industrials 361,126 51,574 0.09 0.09
Korea Electric Power Corp Utilities 441,671,597 63,077,019 0.42 0.42
Korea Electric Terminal Co
LtdIndustrials 893,012 127,535 0.14 0.14
Korea Exchange Bank Financials 23,974,448 3,423,894 0.11 0.11
Korea Express Co Ltd Industrials 58,741,507 8,389,127 0.3 0.3
Korea Gas Corp Utilities 44,822,905 6,401,352 0.18 0.18
Korea Information Service Technology 317,640 45,364 0.08 0.08
Industry/Sector Market valueNOK
Market valueUSD Voting Ownership
GOVERNMENT PENSION FUND GLOBAL HOLDINGS 2008
Equities Country association according to FTSE (the benchmark provider for equities). If a company is not in thebenchmark, the country of incorporation and country of listing is used. For remaining securities, a further assessment ismade. Country is defined as a sovereign state currently member of the United Nations. Exceptions are Hong Kong andTaiwan. The country association methodology was updated as of 2014.
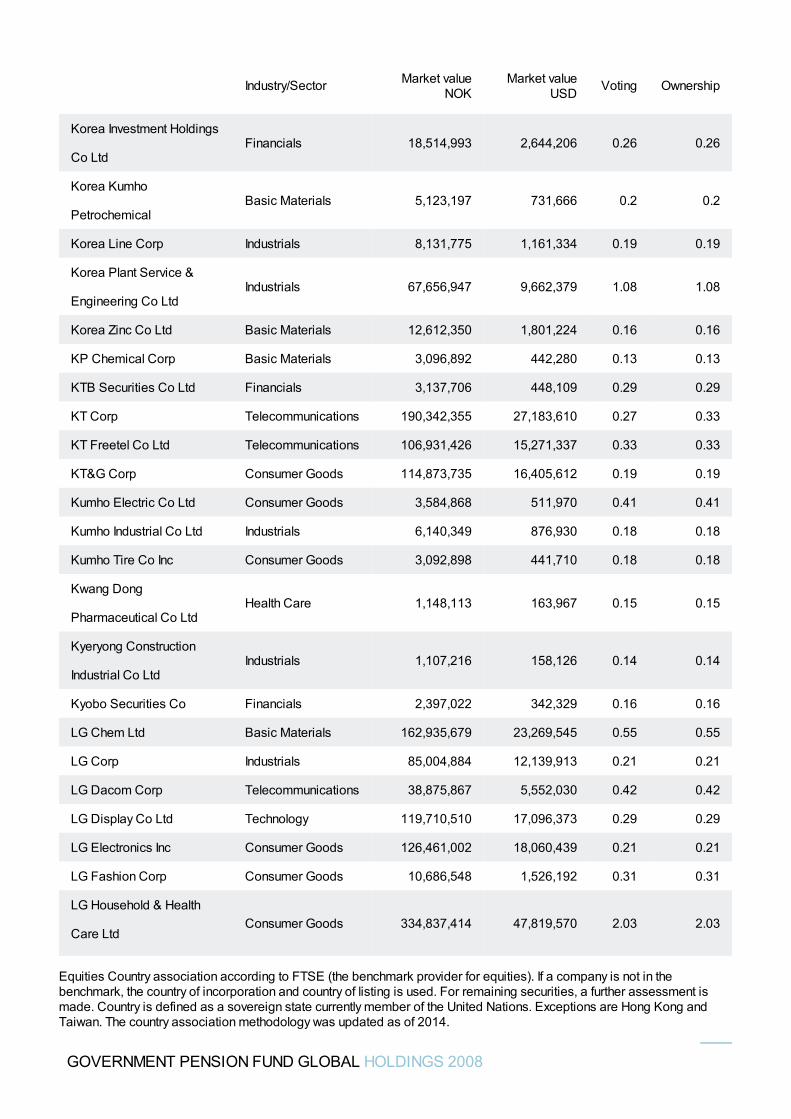
Korea Investment Holdings
Co LtdFinancials 18,514,993 2,644,206 0.26 0.26
Korea Kumho
PetrochemicalBasic Materials 5,123,197 731,666 0.2 0.2
Korea Line Corp Industrials 8,131,775 1,161,334 0.19 0.19
Korea Plant Service &
Engineering Co LtdIndustrials 67,656,947 9,662,379 1.08 1.08
Korea Zinc Co Ltd Basic Materials 12,612,350 1,801,224 0.16 0.16
KP Chemical Corp Basic Materials 3,096,892 442,280 0.13 0.13
KTB Securities Co Ltd Financials 3,137,706 448,109 0.29 0.29
KT Corp Telecommunications 190,342,355 27,183,610 0.27 0.33
KT Freetel Co Ltd Telecommunications 106,931,426 15,271,337 0.33 0.33
KT&G Corp Consumer Goods 114,873,735 16,405,612 0.19 0.19
Kumho Electric Co Ltd Consumer Goods 3,584,868 511,970 0.41 0.41
Kumho Industrial Co Ltd Industrials 6,140,349 876,930 0.18 0.18
Kumho Tire Co Inc Consumer Goods 3,092,898 441,710 0.18 0.18
Kwang Dong
Pharmaceutical Co LtdHealth Care 1,148,113 163,967 0.15 0.15
Kyeryong Construction
Industrial Co LtdIndustrials 1,107,216 158,126 0.14 0.14
Kyobo Securities Co Financials 2,397,022 342,329 0.16 0.16
LG Chem Ltd Basic Materials 162,935,679 23,269,545 0.55 0.55
LG Corp Industrials 85,004,884 12,139,913 0.21 0.21
LG Dacom Corp Telecommunications 38,875,867 5,552,030 0.42 0.42
LG Display Co Ltd Technology 119,710,510 17,096,373 0.29 0.29
LG Electronics Inc Consumer Goods 126,461,002 18,060,439 0.21 0.21
LG Fashion Corp Consumer Goods 10,686,548 1,526,192 0.31 0.31
LG Household & Health
Care LtdConsumer Goods 334,837,414 47,819,570 2.03 2.03
Industry/Sector Market valueNOK
Market valueUSD Voting Ownership
GOVERNMENT PENSION FUND GLOBAL HOLDINGS 2008
Equities Country association according to FTSE (the benchmark provider for equities). If a company is not in thebenchmark, the country of incorporation and country of listing is used. For remaining securities, a further assessment ismade. Country is defined as a sovereign state currently member of the United Nations. Exceptions are Hong Kong andTaiwan. The country association methodology was updated as of 2014.
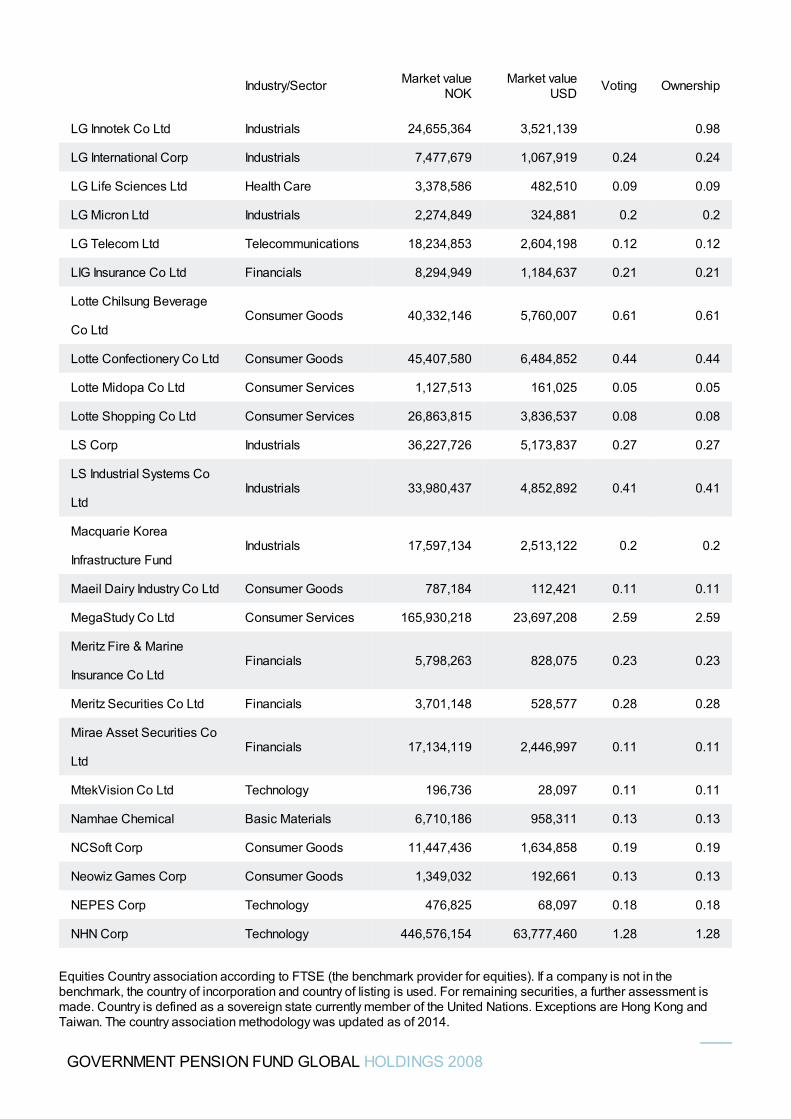
LG Innotek Co Ltd Industrials 24,655,364 3,521,139 0.98
LG International Corp Industrials 7,477,679 1,067,919 0.24 0.24
LG Life Sciences Ltd Health Care 3,378,586 482,510 0.09 0.09
LG Micron Ltd Industrials 2,274,849 324,881 0.2 0.2
LG Telecom Ltd Telecommunications 18,234,853 2,604,198 0.12 0.12
LIG Insurance Co Ltd Financials 8,294,949 1,184,637 0.21 0.21
Lotte Chilsung Beverage
Co LtdConsumer Goods 40,332,146 5,760,007 0.61 0.61
Lotte Confectionery Co Ltd Consumer Goods 45,407,580 6,484,852 0.44 0.44
Lotte Midopa Co Ltd Consumer Services 1,127,513 161,025 0.05 0.05
Lotte Shopping Co Ltd Consumer Services 26,863,815 3,836,537 0.08 0.08
LS Corp Industrials 36,227,726 5,173,837 0.27 0.27
LS Industrial Systems Co
LtdIndustrials 33,980,437 4,852,892 0.41 0.41
Macquarie Korea
Infrastructure FundIndustrials 17,597,134 2,513,122 0.2 0.2
Maeil Dairy Industry Co Ltd Consumer Goods 787,184 112,421 0.11 0.11
MegaStudy Co Ltd Consumer Services 165,930,218 23,697,208 2.59 2.59
Meritz Fire & Marine
Insurance Co LtdFinancials 5,798,263 828,075 0.23 0.23
Meritz Securities Co Ltd Financials 3,701,148 528,577 0.28 0.28
Mirae Asset Securities Co
LtdFinancials 17,134,119 2,446,997 0.11 0.11
MtekVision Co Ltd Technology 196,736 28,097 0.11 0.11
Namhae Chemical Basic Materials 6,710,186 958,311 0.13 0.13
NCSoft Corp Consumer Goods 11,447,436 1,634,858 0.19 0.19
Neowiz Games Corp Consumer Goods 1,349,032 192,661 0.13 0.13
NEPES Corp Technology 476,825 68,097 0.18 0.18
NHN Corp Technology 446,576,154 63,777,460 1.28 1.28
Industry/Sector Market valueNOK
Market valueUSD Voting Ownership
GOVERNMENT PENSION FUND GLOBAL HOLDINGS 2008
Equities Country association according to FTSE (the benchmark provider for equities). If a company is not in thebenchmark, the country of incorporation and country of listing is used. For remaining securities, a further assessment ismade. Country is defined as a sovereign state currently member of the United Nations. Exceptions are Hong Kong andTaiwan. The country association methodology was updated as of 2014.
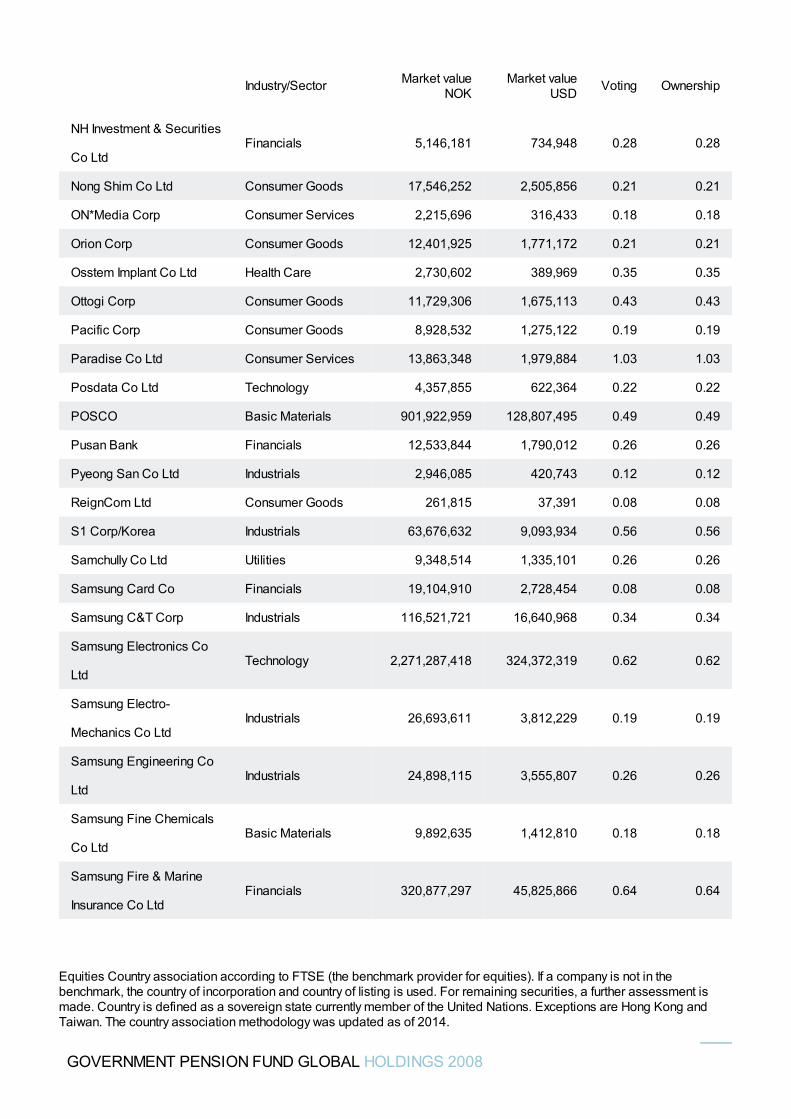
NH Investment & Securities
Co LtdFinancials 5,146,181 734,948 0.28 0.28
Nong Shim Co Ltd Consumer Goods 17,546,252 2,505,856 0.21 0.21
ON*Media Corp Consumer Services 2,215,696 316,433 0.18 0.18
Orion Corp Consumer Goods 12,401,925 1,771,172 0.21 0.21
Osstem Implant Co Ltd Health Care 2,730,602 389,969 0.35 0.35
Ottogi Corp Consumer Goods 11,729,306 1,675,113 0.43 0.43
Pacific Corp Consumer Goods 8,928,532 1,275,122 0.19 0.19
Paradise Co Ltd Consumer Services 13,863,348 1,979,884 1.03 1.03
Posdata Co Ltd Technology 4,357,855 622,364 0.22 0.22
POSCO Basic Materials 901,922,959 128,807,495 0.49 0.49
Pusan Bank Financials 12,533,844 1,790,012 0.26 0.26
Pyeong San Co Ltd Industrials 2,946,085 420,743 0.12 0.12
ReignCom Ltd Consumer Goods 261,815 37,391 0.08 0.08
S1 Corp/Korea Industrials 63,676,632 9,093,934 0.56 0.56
Samchully Co Ltd Utilities 9,348,514 1,335,101 0.26 0.26
Samsung Card Co Financials 19,104,910 2,728,454 0.08 0.08
Samsung C&T Corp Industrials 116,521,721 16,640,968 0.34 0.34
Samsung Electronics Co
LtdTechnology 2,271,287,418 324,372,319 0.62 0.62
Samsung Electro-
Mechanics Co LtdIndustrials 26,693,611 3,812,229 0.19 0.19
Samsung Engineering Co
LtdIndustrials 24,898,115 3,555,807 0.26 0.26
Samsung Fine Chemicals
Co LtdBasic Materials 9,892,635 1,412,810 0.18 0.18
Samsung Fire & Marine
Insurance Co LtdFinancials 320,877,297 45,825,866 0.64 0.64
Industry/Sector Market valueNOK
Market valueUSD Voting Ownership
GOVERNMENT PENSION FUND GLOBAL HOLDINGS 2008
Equities Country association according to FTSE (the benchmark provider for equities). If a company is not in thebenchmark, the country of incorporation and country of listing is used. For remaining securities, a further assessment ismade. Country is defined as a sovereign state currently member of the United Nations. Exceptions are Hong Kong andTaiwan. The country association methodology was updated as of 2014.
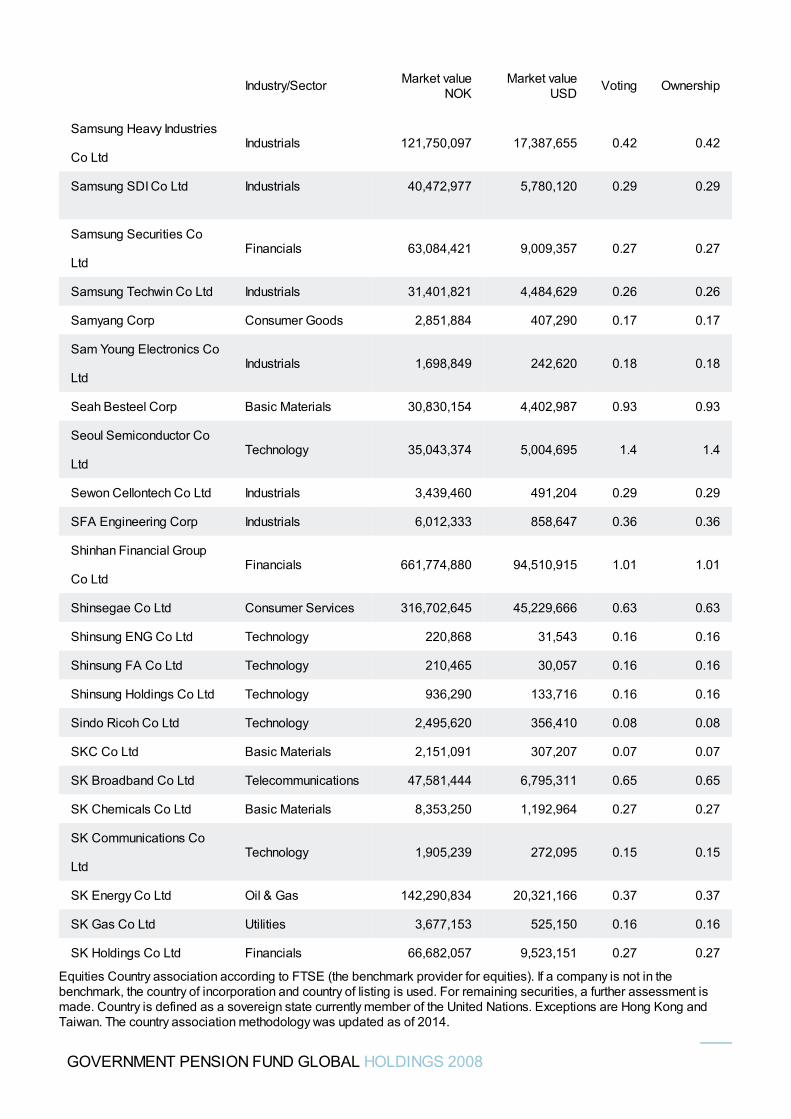
Samsung Heavy Industries
Co LtdIndustrials 121,750,097 17,387,655 0.42 0.42
Samsung SDI Co Ltd Industrials 40,472,977 5,780,120 0.29 0.29
Samsung Securities Co
LtdFinancials 63,084,421 9,009,357 0.27 0.27
Samsung Techwin Co Ltd Industrials 31,401,821 4,484,629 0.26 0.26
Samyang Corp Consumer Goods 2,851,884 407,290 0.17 0.17
Sam Young Electronics Co
LtdIndustrials 1,698,849 242,620 0.18 0.18
Seah Besteel Corp Basic Materials 30,830,154 4,402,987 0.93 0.93
Seoul Semiconductor Co
LtdTechnology 35,043,374 5,004,695 1.4 1.4
Sewon Cellontech Co Ltd Industrials 3,439,460 491,204 0.29 0.29
SFA Engineering Corp Industrials 6,012,333 858,647 0.36 0.36
Shinhan Financial Group
Co LtdFinancials 661,774,880 94,510,915 1.01 1.01
Shinsegae Co Ltd Consumer Services 316,702,645 45,229,666 0.63 0.63
Shinsung ENG Co Ltd Technology 220,868 31,543 0.16 0.16
Shinsung FA Co Ltd Technology 210,465 30,057 0.16 0.16
Shinsung Holdings Co Ltd Technology 936,290 133,716 0.16 0.16
Sindo Ricoh Co Ltd Technology 2,495,620 356,410 0.08 0.08
SKC Co Ltd Basic Materials 2,151,091 307,207 0.07 0.07
SK Broadband Co Ltd Telecommunications 47,581,444 6,795,311 0.65 0.65
SK Chemicals Co Ltd Basic Materials 8,353,250 1,192,964 0.27 0.27
SK Communications Co
LtdTechnology 1,905,239 272,095 0.15 0.15
SK Energy Co Ltd Oil & Gas 142,290,834 20,321,166 0.37 0.37
SK Gas Co Ltd Utilities 3,677,153 525,150 0.16 0.16
SK Holdings Co Ltd Financials 66,682,057 9,523,151 0.27 0.27
Industry/Sector Market valueNOK
Market valueUSD Voting Ownership
GOVERNMENT PENSION FUND GLOBAL HOLDINGS 2008
Equities Country association according to FTSE (the benchmark provider for equities). If a company is not in thebenchmark, the country of incorporation and country of listing is used. For remaining securities, a further assessment ismade. Country is defined as a sovereign state currently member of the United Nations. Exceptions are Hong Kong andTaiwan. The country association methodology was updated as of 2014.
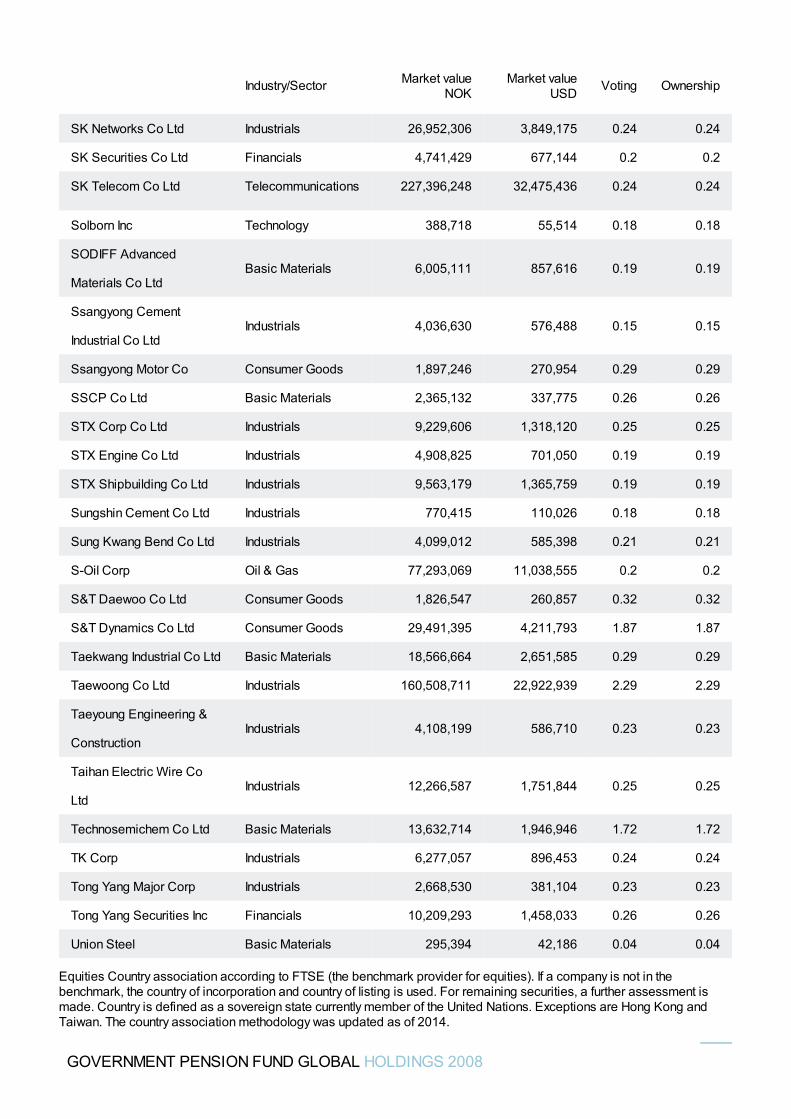
SK Networks Co Ltd Industrials 26,952,306 3,849,175 0.24 0.24
SK Securities Co Ltd Financials 4,741,429 677,144 0.2 0.2
SK Telecom Co Ltd Telecommunications 227,396,248 32,475,436 0.24 0.24
Solborn Inc Technology 388,718 55,514 0.18 0.18
SODIFF Advanced
Materials Co LtdBasic Materials 6,005,111 857,616 0.19 0.19
Ssangyong Cement
Industrial Co LtdIndustrials 4,036,630 576,488 0.15 0.15
Ssangyong Motor Co Consumer Goods 1,897,246 270,954 0.29 0.29
SSCP Co Ltd Basic Materials 2,365,132 337,775 0.26 0.26
STX Corp Co Ltd Industrials 9,229,606 1,318,120 0.25 0.25
STX Engine Co Ltd Industrials 4,908,825 701,050 0.19 0.19
STX Shipbuilding Co Ltd Industrials 9,563,179 1,365,759 0.19 0.19
Sungshin Cement Co Ltd Industrials 770,415 110,026 0.18 0.18
Sung Kwang Bend Co Ltd Industrials 4,099,012 585,398 0.21 0.21
S-Oil Corp Oil & Gas 77,293,069 11,038,555 0.2 0.2
S&T Daewoo Co Ltd Consumer Goods 1,826,547 260,857 0.32 0.32
S&T Dynamics Co Ltd Consumer Goods 29,491,395 4,211,793 1.87 1.87
Taekwang Industrial Co Ltd Basic Materials 18,566,664 2,651,585 0.29 0.29
Taewoong Co Ltd Industrials 160,508,711 22,922,939 2.29 2.29
Taeyoung Engineering &
ConstructionIndustrials 4,108,199 586,710 0.23 0.23
Taihan Electric Wire Co
LtdIndustrials 12,266,587 1,751,844 0.25 0.25
Technosemichem Co Ltd Basic Materials 13,632,714 1,946,946 1.72 1.72
TK Corp Industrials 6,277,057 896,453 0.24 0.24
Tong Yang Major Corp Industrials 2,668,530 381,104 0.23 0.23
Tong Yang Securities Inc Financials 10,209,293 1,458,033 0.26 0.26
Union Steel Basic Materials 295,394 42,186 0.04 0.04
Industry/Sector Market valueNOK
Market valueUSD Voting Ownership
GOVERNMENT PENSION FUND GLOBAL HOLDINGS 2008
Equities Country association according to FTSE (the benchmark provider for equities). If a company is not in thebenchmark, the country of incorporation and country of listing is used. For remaining securities, a further assessment ismade. Country is defined as a sovereign state currently member of the United Nations. Exceptions are Hong Kong andTaiwan. The country association methodology was updated as of 2014.
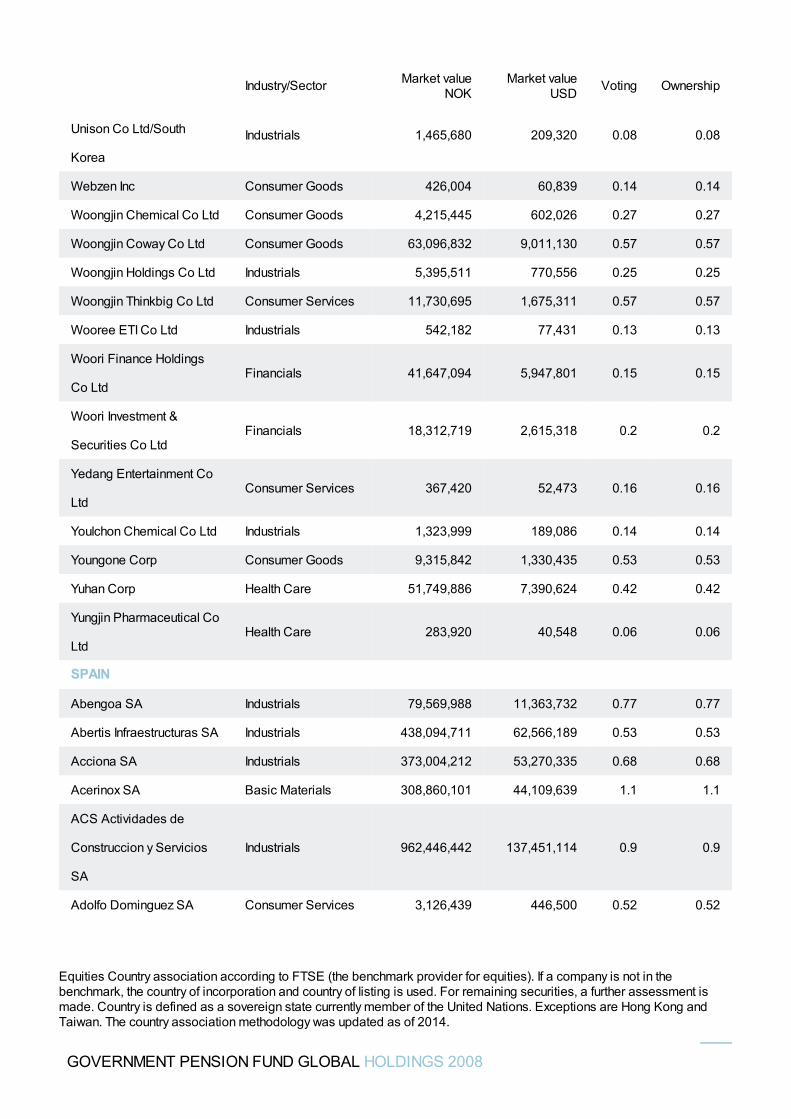
Unison Co Ltd/South
Korea
Industrials 1,465,680 209,320 0.08 0.08
Webzen Inc Consumer Goods 426,004 60,839 0.14 0.14
Woongjin Chemical Co Ltd Consumer Goods 4,215,445 602,026 0.27 0.27
Woongjin Coway Co Ltd Consumer Goods 63,096,832 9,011,130 0.57 0.57
Woongjin Holdings Co Ltd Industrials 5,395,511 770,556 0.25 0.25
Woongjin Thinkbig Co Ltd Consumer Services 11,730,695 1,675,311 0.57 0.57
Wooree ETI Co Ltd Industrials 542,182 77,431 0.13 0.13
Woori Finance Holdings
Co LtdFinancials 41,647,094 5,947,801 0.15 0.15
Woori Investment &
Securities Co LtdFinancials 18,312,719 2,615,318 0.2 0.2
Yedang Entertainment Co
LtdConsumer Services 367,420 52,473 0.16 0.16
Youlchon Chemical Co Ltd Industrials 1,323,999 189,086 0.14 0.14
Youngone Corp Consumer Goods 9,315,842 1,330,435 0.53 0.53
Yuhan Corp Health Care 51,749,886 7,390,624 0.42 0.42
Yungjin Pharmaceutical Co
LtdHealth Care 283,920 40,548 0.06 0.06
SPAIN
Abengoa SA Industrials 79,569,988 11,363,732 0.77 0.77
Abertis Infraestructuras SA Industrials 438,094,711 62,566,189 0.53 0.53
Acciona SA Industrials 373,004,212 53,270,335 0.68 0.68
Acerinox SA Basic Materials 308,860,101 44,109,639 1.1 1.1
ACS Actividades de
Construccion y Servicios
SA
Industrials 962,446,442 137,451,114 0.9 0.9
Adolfo Dominguez SA Consumer Services 3,126,439 446,500 0.52 0.52
Industry/Sector Market valueNOK
Market valueUSD Voting Ownership
GOVERNMENT PENSION FUND GLOBAL HOLDINGS 2008
Equities Country association according to FTSE (the benchmark provider for equities). If a company is not in thebenchmark, the country of incorporation and country of listing is used. For remaining securities, a further assessment ismade. Country is defined as a sovereign state currently member of the United Nations. Exceptions are Hong Kong andTaiwan. The country association methodology was updated as of 2014.
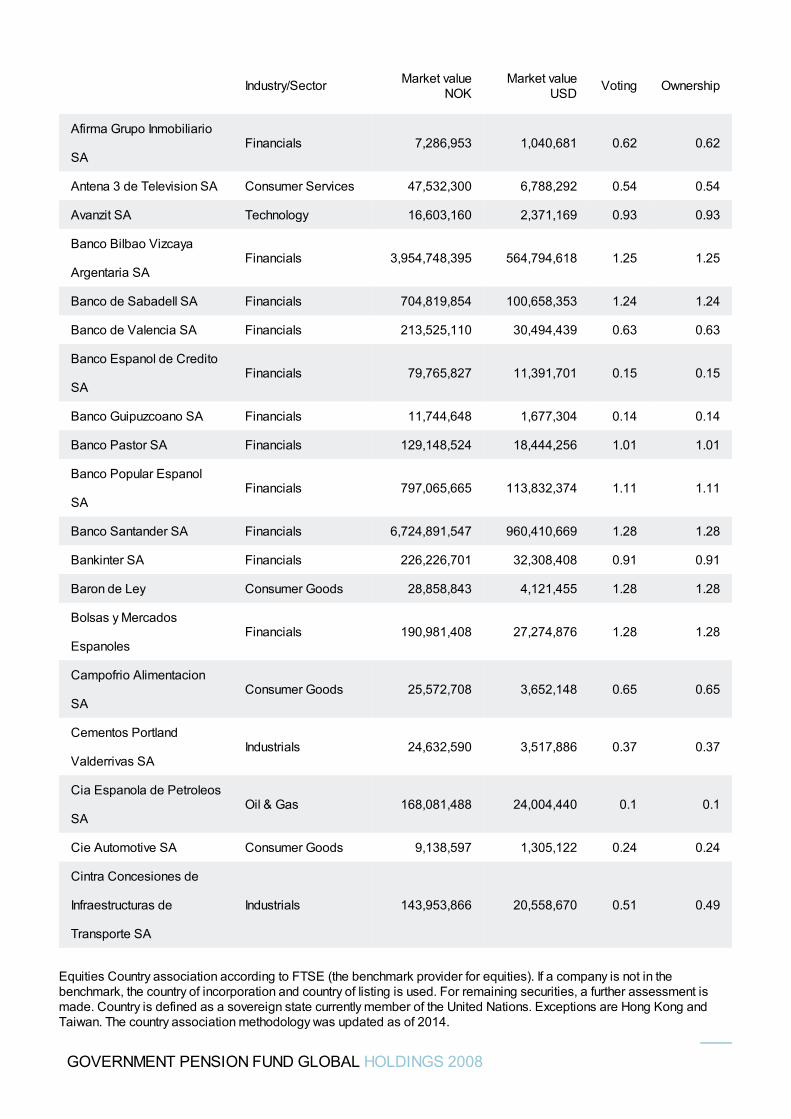
Afirma Grupo Inmobiliario
SAFinancials 7,286,953 1,040,681 0.62 0.62
Antena 3 de Television SA Consumer Services 47,532,300 6,788,292 0.54 0.54
Avanzit SA Technology 16,603,160 2,371,169 0.93 0.93
Banco Bilbao Vizcaya
Argentaria SAFinancials 3,954,748,395 564,794,618 1.25 1.25
Banco de Sabadell SA Financials 704,819,854 100,658,353 1.24 1.24
Banco de Valencia SA Financials 213,525,110 30,494,439 0.63 0.63
Banco Espanol de Credito
SAFinancials 79,765,827 11,391,701 0.15 0.15
Banco Guipuzcoano SA Financials 11,744,648 1,677,304 0.14 0.14
Banco Pastor SA Financials 129,148,524 18,444,256 1.01 1.01
Banco Popular Espanol
SAFinancials 797,065,665 113,832,374 1.11 1.11
Banco Santander SA Financials 6,724,891,547 960,410,669 1.28 1.28
Bankinter SA Financials 226,226,701 32,308,408 0.91 0.91
Baron de Ley Consumer Goods 28,858,843 4,121,455 1.28 1.28
Bolsas y Mercados
EspanolesFinancials 190,981,408 27,274,876 1.28 1.28
Campofrio Alimentacion
SAConsumer Goods 25,572,708 3,652,148 0.65 0.65
Cementos Portland
Valderrivas SAIndustrials 24,632,590 3,517,886 0.37 0.37
Cia Espanola de Petroleos
SAOil & Gas 168,081,488 24,004,440 0.1 0.1
Cie Automotive SA Consumer Goods 9,138,597 1,305,122 0.24 0.24
Cintra Concesiones de
Infraestructuras de
Transporte SA
Industrials 143,953,866 20,558,670 0.51 0.49
Industry/Sector Market valueNOK
Market valueUSD Voting Ownership
GOVERNMENT PENSION FUND GLOBAL HOLDINGS 2008
Equities Country association according to FTSE (the benchmark provider for equities). If a company is not in thebenchmark, the country of incorporation and country of listing is used. For remaining securities, a further assessment ismade. Country is defined as a sovereign state currently member of the United Nations. Exceptions are Hong Kong andTaiwan. The country association methodology was updated as of 2014.
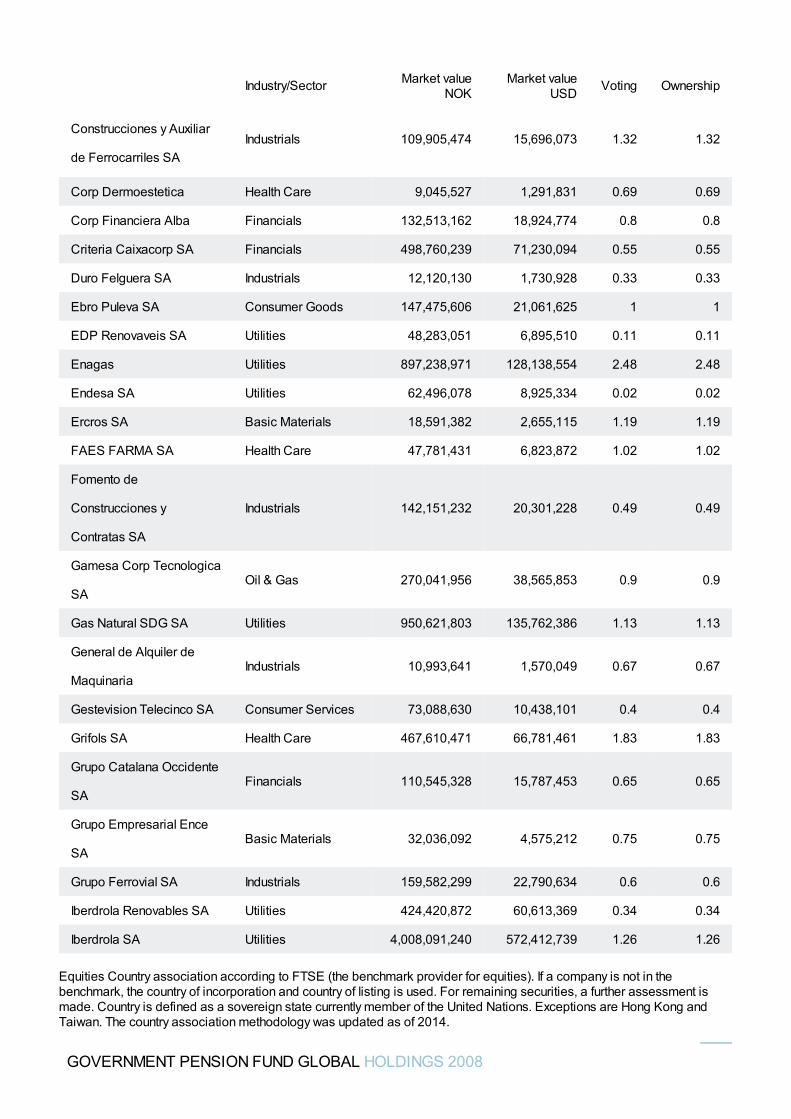
Construcciones y Auxiliar
de Ferrocarriles SAIndustrials 109,905,474 15,696,073 1.32 1.32
Corp Dermoestetica Health Care 9,045,527 1,291,831 0.69 0.69
Corp Financiera Alba Financials 132,513,162 18,924,774 0.8 0.8
Criteria Caixacorp SA Financials 498,760,239 71,230,094 0.55 0.55
Duro Felguera SA Industrials 12,120,130 1,730,928 0.33 0.33
Ebro Puleva SA Consumer Goods 147,475,606 21,061,625 1 1
EDP Renovaveis SA Utilities 48,283,051 6,895,510 0.11 0.11
Enagas Utilities 897,238,971 128,138,554 2.48 2.48
Endesa SA Utilities 62,496,078 8,925,334 0.02 0.02
Ercros SA Basic Materials 18,591,382 2,655,115 1.19 1.19
FAES FARMA SA Health Care 47,781,431 6,823,872 1.02 1.02
Fomento de
Construcciones y
Contratas SA
Industrials 142,151,232 20,301,228 0.49 0.49
Gamesa Corp Tecnologica
SAOil & Gas 270,041,956 38,565,853 0.9 0.9
Gas Natural SDG SA Utilities 950,621,803 135,762,386 1.13 1.13
General de Alquiler de
MaquinariaIndustrials 10,993,641 1,570,049 0.67 0.67
Gestevision Telecinco SA Consumer Services 73,088,630 10,438,101 0.4 0.4
Grifols SA Health Care 467,610,471 66,781,461 1.83 1.83
Grupo Catalana Occidente
SAFinancials 110,545,328 15,787,453 0.65 0.65
Grupo Empresarial Ence
SABasic Materials 32,036,092 4,575,212 0.75 0.75
Grupo Ferrovial SA Industrials 159,582,299 22,790,634 0.6 0.6
Iberdrola Renovables SA Utilities 424,420,872 60,613,369 0.34 0.34
Iberdrola SA Utilities 4,008,091,240 572,412,739 1.26 1.26
Industry/Sector Market valueNOK
Market valueUSD Voting Ownership
GOVERNMENT PENSION FUND GLOBAL HOLDINGS 2008
Equities Country association according to FTSE (the benchmark provider for equities). If a company is not in thebenchmark, the country of incorporation and country of listing is used. For remaining securities, a further assessment ismade. Country is defined as a sovereign state currently member of the United Nations. Exceptions are Hong Kong andTaiwan. The country association methodology was updated as of 2014.
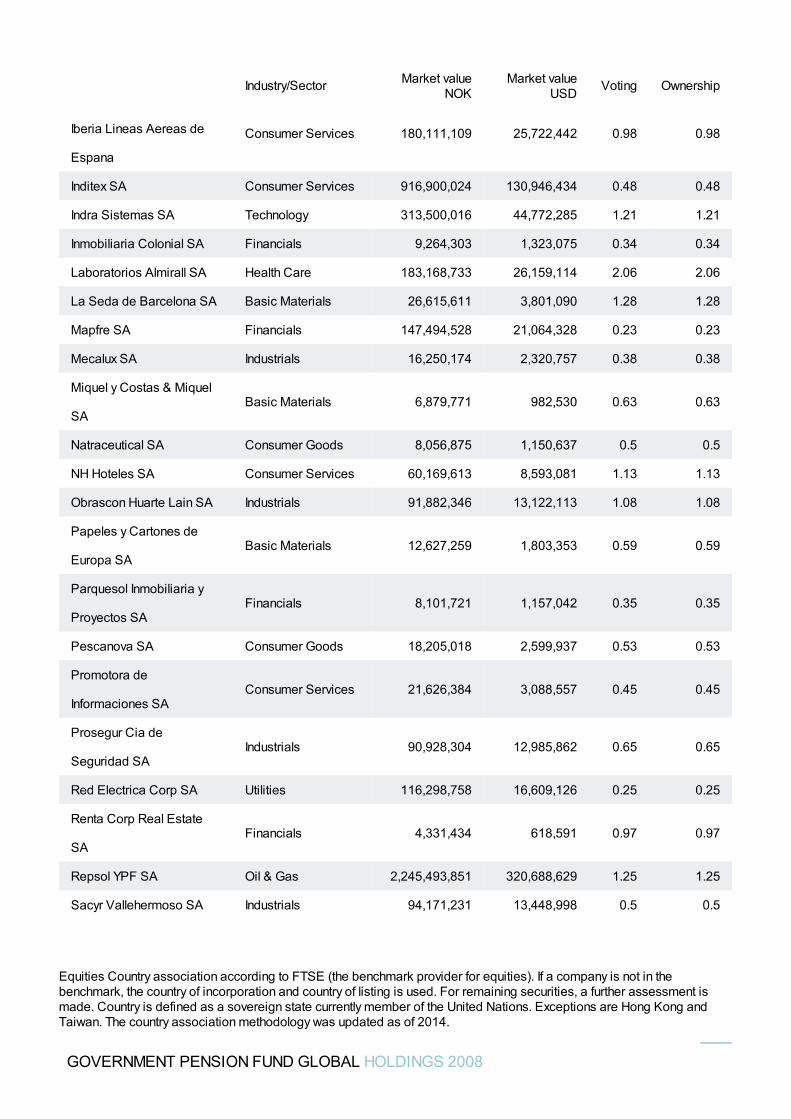
Iberia Lineas Aereas de
Espana
Consumer Services 180,111,109 25,722,442 0.98 0.98
Inditex SA Consumer Services 916,900,024 130,946,434 0.48 0.48
Indra Sistemas SA Technology 313,500,016 44,772,285 1.21 1.21
Inmobiliaria Colonial SA Financials 9,264,303 1,323,075 0.34 0.34
Laboratorios Almirall SA Health Care 183,168,733 26,159,114 2.06 2.06
La Seda de Barcelona SA Basic Materials 26,615,611 3,801,090 1.28 1.28
Mapfre SA Financials 147,494,528 21,064,328 0.23 0.23
Mecalux SA Industrials 16,250,174 2,320,757 0.38 0.38
Miquel y Costas & Miquel
SABasic Materials 6,879,771 982,530 0.63 0.63
Natraceutical SA Consumer Goods 8,056,875 1,150,637 0.5 0.5
NH Hoteles SA Consumer Services 60,169,613 8,593,081 1.13 1.13
Obrascon Huarte Lain SA Industrials 91,882,346 13,122,113 1.08 1.08
Papeles y Cartones de
Europa SABasic Materials 12,627,259 1,803,353 0.59 0.59
Parquesol Inmobiliaria y
Proyectos SAFinancials 8,101,721 1,157,042 0.35 0.35
Pescanova SA Consumer Goods 18,205,018 2,599,937 0.53 0.53
Promotora de
Informaciones SAConsumer Services 21,626,384 3,088,557 0.45 0.45
Prosegur Cia de
Seguridad SAIndustrials 90,928,304 12,985,862 0.65 0.65
Red Electrica Corp SA Utilities 116,298,758 16,609,126 0.25 0.25
Renta Corp Real Estate
SAFinancials 4,331,434 618,591 0.97 0.97
Repsol YPF SA Oil & Gas 2,245,493,851 320,688,629 1.25 1.25
Sacyr Vallehermoso SA Industrials 94,171,231 13,448,998 0.5 0.5
Industry/Sector Market valueNOK
Market valueUSD Voting Ownership
GOVERNMENT PENSION FUND GLOBAL HOLDINGS 2008
Equities Country association according to FTSE (the benchmark provider for equities). If a company is not in thebenchmark, the country of incorporation and country of listing is used. For remaining securities, a further assessment ismade. Country is defined as a sovereign state currently member of the United Nations. Exceptions are Hong Kong andTaiwan. The country association methodology was updated as of 2014.
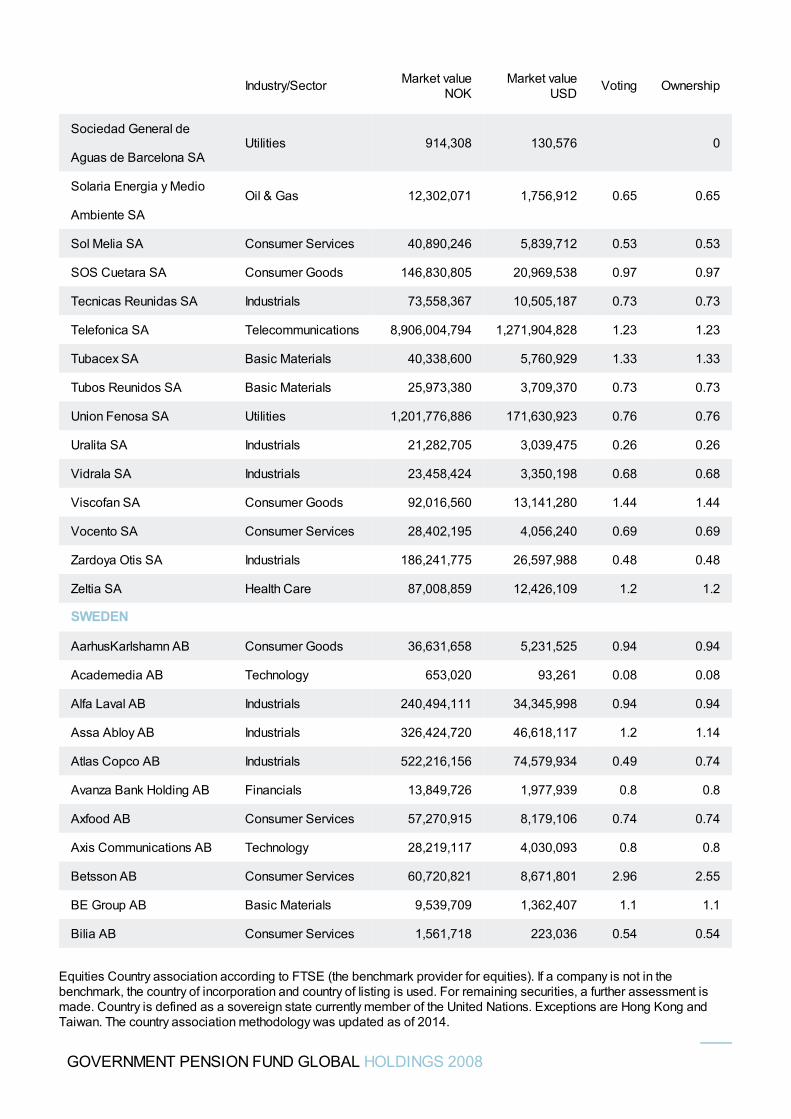
Sociedad General de
Aguas de Barcelona SAUtilities 914,308 130,576 0
Solaria Energia y Medio
Ambiente SAOil & Gas 12,302,071 1,756,912 0.65 0.65
Sol Melia SA Consumer Services 40,890,246 5,839,712 0.53 0.53
SOS Cuetara SA Consumer Goods 146,830,805 20,969,538 0.97 0.97
Tecnicas Reunidas SA Industrials 73,558,367 10,505,187 0.73 0.73
Telefonica SA Telecommunications 8,906,004,794 1,271,904,828 1.23 1.23
Tubacex SA Basic Materials 40,338,600 5,760,929 1.33 1.33
Tubos Reunidos SA Basic Materials 25,973,380 3,709,370 0.73 0.73
Union Fenosa SA Utilities 1,201,776,886 171,630,923 0.76 0.76
Uralita SA Industrials 21,282,705 3,039,475 0.26 0.26
Vidrala SA Industrials 23,458,424 3,350,198 0.68 0.68
Viscofan SA Consumer Goods 92,016,560 13,141,280 1.44 1.44
Vocento SA Consumer Services 28,402,195 4,056,240 0.69 0.69
Zardoya Otis SA Industrials 186,241,775 26,597,988 0.48 0.48
Zeltia SA Health Care 87,008,859 12,426,109 1.2 1.2
SWEDEN
AarhusKarlshamn AB Consumer Goods 36,631,658 5,231,525 0.94 0.94
Academedia AB Technology 653,020 93,261 0.08 0.08
Alfa Laval AB Industrials 240,494,111 34,345,998 0.94 0.94
Assa Abloy AB Industrials 326,424,720 46,618,117 1.2 1.14
Atlas Copco AB Industrials 522,216,156 74,579,934 0.49 0.74
Avanza Bank Holding AB Financials 13,849,726 1,977,939 0.8 0.8
Axfood AB Consumer Services 57,270,915 8,179,106 0.74 0.74
Axis Communications AB Technology 28,219,117 4,030,093 0.8 0.8
Betsson AB Consumer Services 60,720,821 8,671,801 2.96 2.55
BE Group AB Basic Materials 9,539,709 1,362,407 1.1 1.1
Bilia AB Consumer Services 1,561,718 223,036 0.54 0.54
Industry/Sector Market valueNOK
Market valueUSD Voting Ownership
GOVERNMENT PENSION FUND GLOBAL HOLDINGS 2008
Equities Country association according to FTSE (the benchmark provider for equities). If a company is not in thebenchmark, the country of incorporation and country of listing is used. For remaining securities, a further assessment ismade. Country is defined as a sovereign state currently member of the United Nations. Exceptions are Hong Kong andTaiwan. The country association methodology was updated as of 2014.
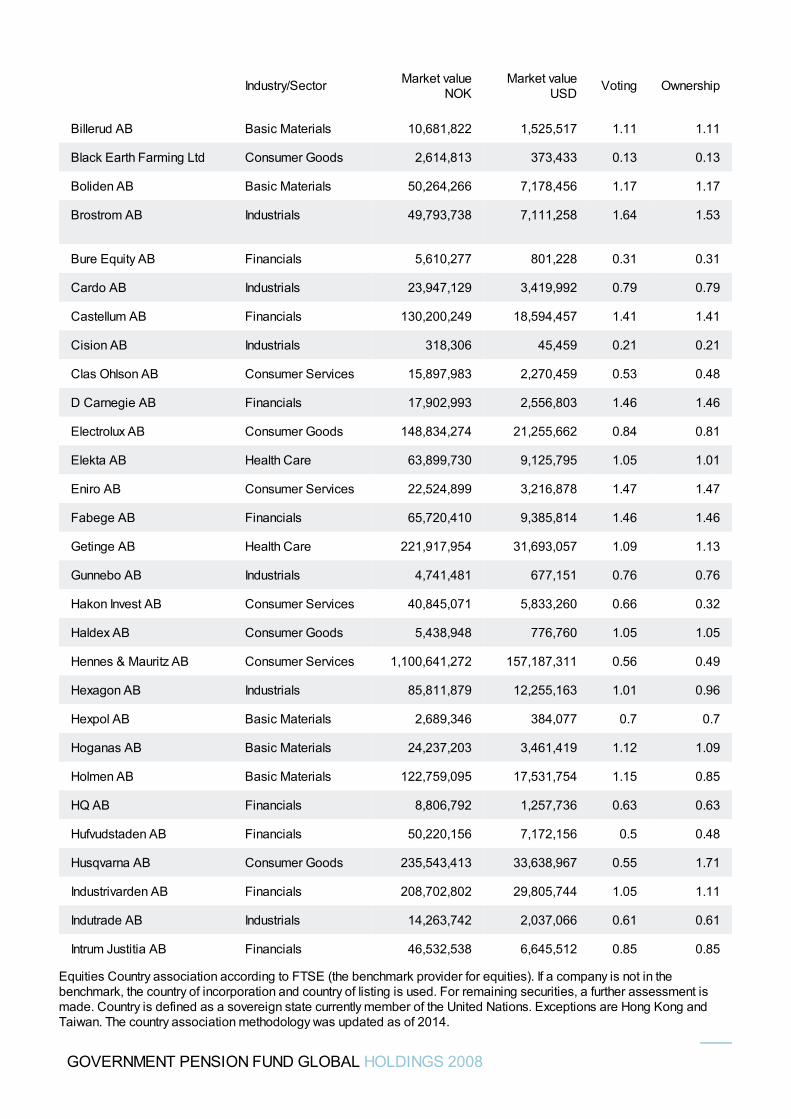
Billerud AB Basic Materials 10,681,822 1,525,517 1.11 1.11
Black Earth Farming Ltd Consumer Goods 2,614,813 373,433 0.13 0.13
Boliden AB Basic Materials 50,264,266 7,178,456 1.17 1.17
Brostrom AB Industrials 49,793,738 7,111,258 1.64 1.53
Bure Equity AB Financials 5,610,277 801,228 0.31 0.31
Cardo AB Industrials 23,947,129 3,419,992 0.79 0.79
Castellum AB Financials 130,200,249 18,594,457 1.41 1.41
Cision AB Industrials 318,306 45,459 0.21 0.21
Clas Ohlson AB Consumer Services 15,897,983 2,270,459 0.53 0.48
D Carnegie AB Financials 17,902,993 2,556,803 1.46 1.46
Electrolux AB Consumer Goods 148,834,274 21,255,662 0.84 0.81
Elekta AB Health Care 63,899,730 9,125,795 1.05 1.01
Eniro AB Consumer Services 22,524,899 3,216,878 1.47 1.47
Fabege AB Financials 65,720,410 9,385,814 1.46 1.46
Getinge AB Health Care 221,917,954 31,693,057 1.09 1.13
Gunnebo AB Industrials 4,741,481 677,151 0.76 0.76
Hakon Invest AB Consumer Services 40,845,071 5,833,260 0.66 0.32
Haldex AB Consumer Goods 5,438,948 776,760 1.05 1.05
Hennes & Mauritz AB Consumer Services 1,100,641,272 157,187,311 0.56 0.49
Hexagon AB Industrials 85,811,879 12,255,163 1.01 0.96
Hexpol AB Basic Materials 2,689,346 384,077 0.7 0.7
Hoganas AB Basic Materials 24,237,203 3,461,419 1.12 1.09
Holmen AB Basic Materials 122,759,095 17,531,754 1.15 0.85
HQ AB Financials 8,806,792 1,257,736 0.63 0.63
Hufvudstaden AB Financials 50,220,156 7,172,156 0.5 0.48
Husqvarna AB Consumer Goods 235,543,413 33,638,967 0.55 1.71
Industrivarden AB Financials 208,702,802 29,805,744 1.05 1.11
Indutrade AB Industrials 14,263,742 2,037,066 0.61 0.61
Intrum Justitia AB Financials 46,532,538 6,645,512 0.85 0.85
Industry/Sector Market valueNOK
Market valueUSD Voting Ownership
GOVERNMENT PENSION FUND GLOBAL HOLDINGS 2008
Equities Country association according to FTSE (the benchmark provider for equities). If a company is not in thebenchmark, the country of incorporation and country of listing is used. For remaining securities, a further assessment ismade. Country is defined as a sovereign state currently member of the United Nations. Exceptions are Hong Kong andTaiwan. The country association methodology was updated as of 2014.
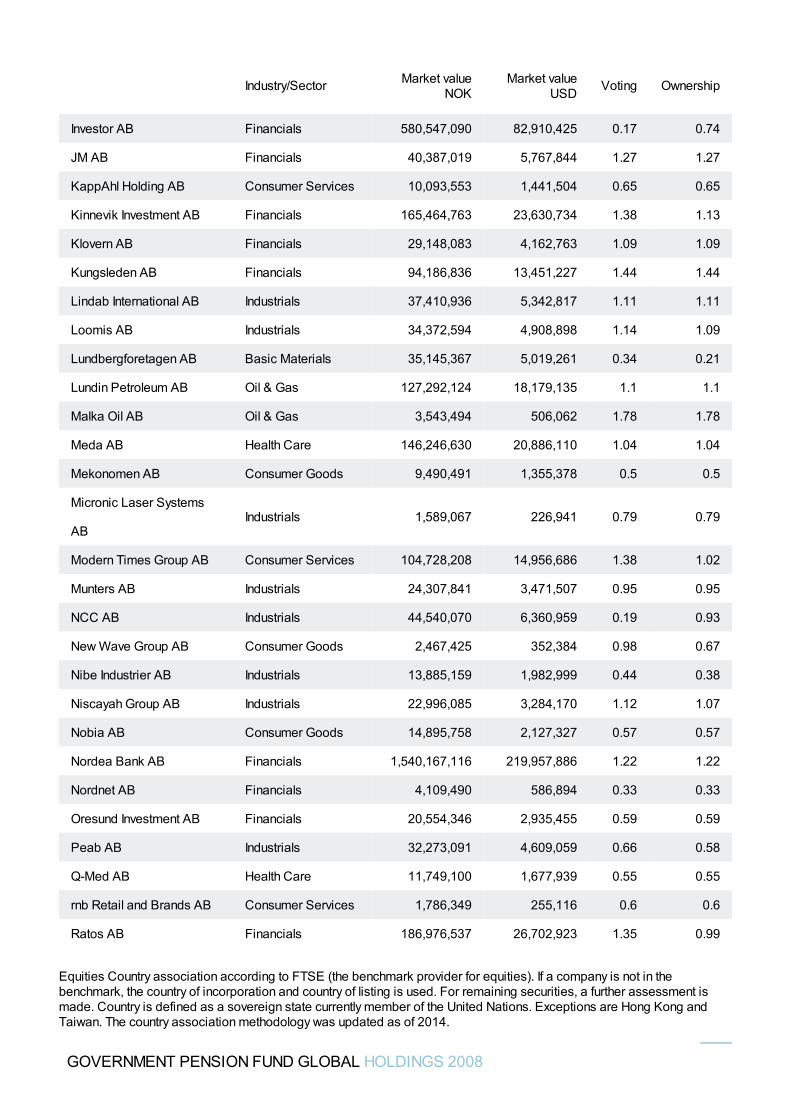
Investor AB Financials 580,547,090 82,910,425 0.17 0.74
JM AB Financials 40,387,019 5,767,844 1.27 1.27
KappAhl Holding AB Consumer Services 10,093,553 1,441,504 0.65 0.65
Kinnevik Investment AB Financials 165,464,763 23,630,734 1.38 1.13
Klovern AB Financials 29,148,083 4,162,763 1.09 1.09
Kungsleden AB Financials 94,186,836 13,451,227 1.44 1.44
Lindab International AB Industrials 37,410,936 5,342,817 1.11 1.11
Loomis AB Industrials 34,372,594 4,908,898 1.14 1.09
Lundbergforetagen AB Basic Materials 35,145,367 5,019,261 0.34 0.21
Lundin Petroleum AB Oil & Gas 127,292,124 18,179,135 1.1 1.1
Malka Oil AB Oil & Gas 3,543,494 506,062 1.78 1.78
Meda AB Health Care 146,246,630 20,886,110 1.04 1.04
Mekonomen AB Consumer Goods 9,490,491 1,355,378 0.5 0.5
Micronic Laser Systems
ABIndustrials 1,589,067 226,941 0.79 0.79
Modern Times Group AB Consumer Services 104,728,208 14,956,686 1.38 1.02
Munters AB Industrials 24,307,841 3,471,507 0.95 0.95
NCC AB Industrials 44,540,070 6,360,959 0.19 0.93
New Wave Group AB Consumer Goods 2,467,425 352,384 0.98 0.67
Nibe Industrier AB Industrials 13,885,159 1,982,999 0.44 0.38
Niscayah Group AB Industrials 22,996,085 3,284,170 1.12 1.07
Nobia AB Consumer Goods 14,895,758 2,127,327 0.57 0.57
Nordea Bank AB Financials 1,540,167,116 219,957,886 1.22 1.22
Nordnet AB Financials 4,109,490 586,894 0.33 0.33
Oresund Investment AB Financials 20,554,346 2,935,455 0.59 0.59
Peab AB Industrials 32,273,091 4,609,059 0.66 0.58
Q-Med AB Health Care 11,749,100 1,677,939 0.55 0.55
rnb Retail and Brands AB Consumer Services 1,786,349 255,116 0.6 0.6
Ratos AB Financials 186,976,537 26,702,923 1.35 0.99
Industry/Sector Market valueNOK
Market valueUSD Voting Ownership
GOVERNMENT PENSION FUND GLOBAL HOLDINGS 2008
Equities Country association according to FTSE (the benchmark provider for equities). If a company is not in thebenchmark, the country of incorporation and country of listing is used. For remaining securities, a further assessment ismade. Country is defined as a sovereign state currently member of the United Nations. Exceptions are Hong Kong andTaiwan. The country association methodology was updated as of 2014.
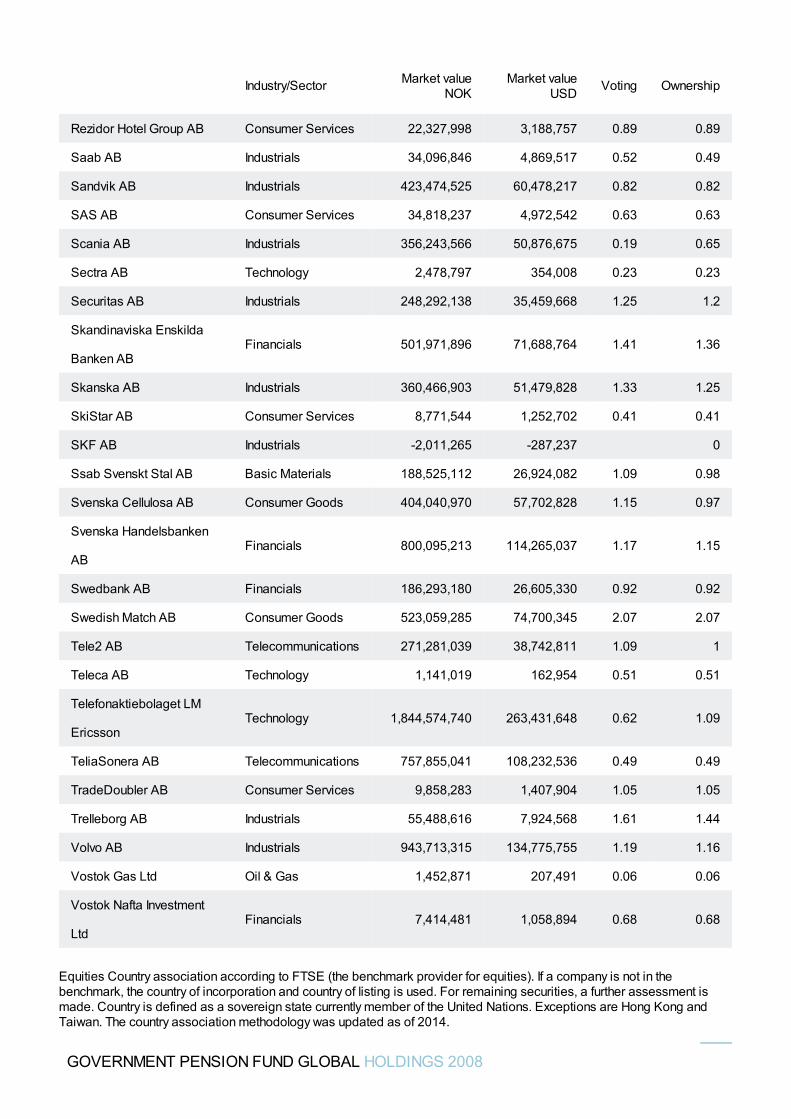
Rezidor Hotel Group AB Consumer Services 22,327,998 3,188,757 0.89 0.89
Saab AB Industrials 34,096,846 4,869,517 0.52 0.49
Sandvik AB Industrials 423,474,525 60,478,217 0.82 0.82
SAS AB Consumer Services 34,818,237 4,972,542 0.63 0.63
Scania AB Industrials 356,243,566 50,876,675 0.19 0.65
Sectra AB Technology 2,478,797 354,008 0.23 0.23
Securitas AB Industrials 248,292,138 35,459,668 1.25 1.2
Skandinaviska Enskilda
Banken ABFinancials 501,971,896 71,688,764 1.41 1.36
Skanska AB Industrials 360,466,903 51,479,828 1.33 1.25
SkiStar AB Consumer Services 8,771,544 1,252,702 0.41 0.41
SKF AB Industrials -2,011,265 -287,237 0
Ssab Svenskt Stal AB Basic Materials 188,525,112 26,924,082 1.09 0.98
Svenska Cellulosa AB Consumer Goods 404,040,970 57,702,828 1.15 0.97
Svenska Handelsbanken
ABFinancials 800,095,213 114,265,037 1.17 1.15
Swedbank AB Financials 186,293,180 26,605,330 0.92 0.92
Swedish Match AB Consumer Goods 523,059,285 74,700,345 2.07 2.07
Tele2 AB Telecommunications 271,281,039 38,742,811 1.09 1
Teleca AB Technology 1,141,019 162,954 0.51 0.51
Telefonaktiebolaget LM
EricssonTechnology 1,844,574,740 263,431,648 0.62 1.09
TeliaSonera AB Telecommunications 757,855,041 108,232,536 0.49 0.49
TradeDoubler AB Consumer Services 9,858,283 1,407,904 1.05 1.05
Trelleborg AB Industrials 55,488,616 7,924,568 1.61 1.44
Volvo AB Industrials 943,713,315 134,775,755 1.19 1.16
Vostok Gas Ltd Oil & Gas 1,452,871 207,491 0.06 0.06
Vostok Nafta Investment
LtdFinancials 7,414,481 1,058,894 0.68 0.68
Industry/Sector Market valueNOK
Market valueUSD Voting Ownership
GOVERNMENT PENSION FUND GLOBAL HOLDINGS 2008
Equities Country association according to FTSE (the benchmark provider for equities). If a company is not in thebenchmark, the country of incorporation and country of listing is used. For remaining securities, a further assessment ismade. Country is defined as a sovereign state currently member of the United Nations. Exceptions are Hong Kong andTaiwan. The country association methodology was updated as of 2014.
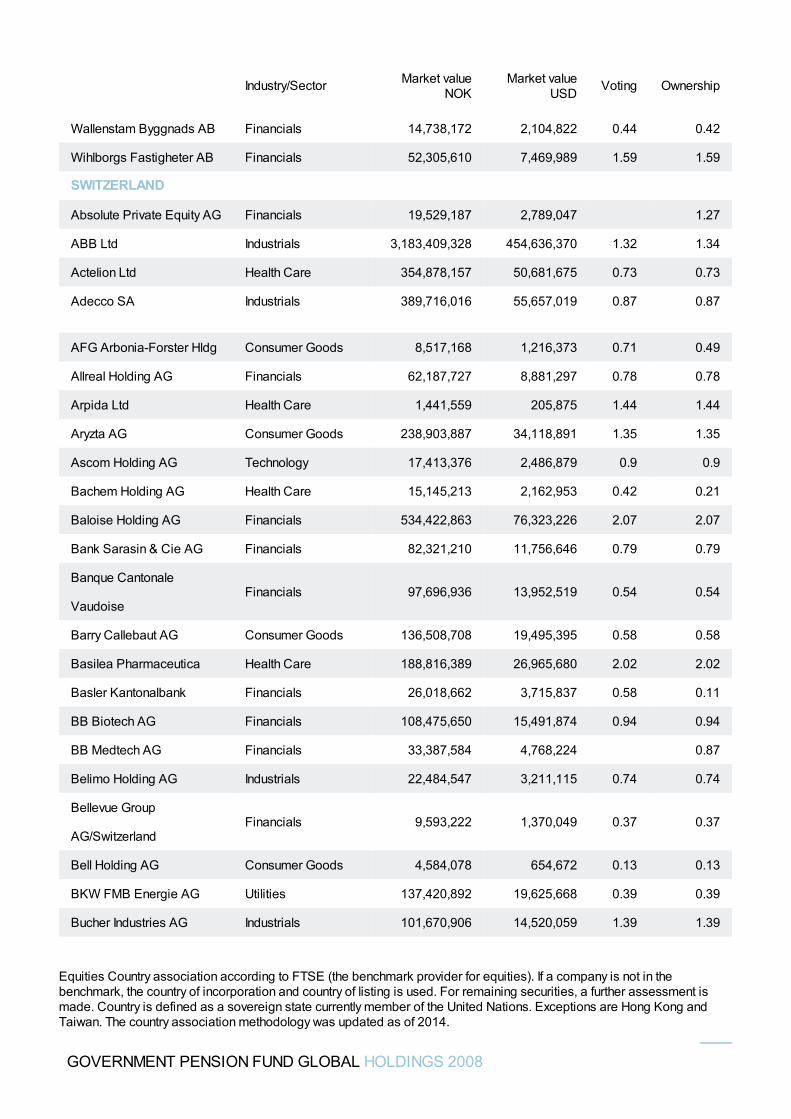
Wallenstam Byggnads AB Financials 14,738,172 2,104,822 0.44 0.42
Wihlborgs Fastigheter AB Financials 52,305,610 7,469,989 1.59 1.59
SWITZERLAND
Absolute Private Equity AG Financials 19,529,187 2,789,047 1.27
ABB Ltd Industrials 3,183,409,328 454,636,370 1.32 1.34
Actelion Ltd Health Care 354,878,157 50,681,675 0.73 0.73
Adecco SA Industrials 389,716,016 55,657,019 0.87 0.87
AFG Arbonia-Forster Hldg Consumer Goods 8,517,168 1,216,373 0.71 0.49
Allreal Holding AG Financials 62,187,727 8,881,297 0.78 0.78
Arpida Ltd Health Care 1,441,559 205,875 1.44 1.44
Aryzta AG Consumer Goods 238,903,887 34,118,891 1.35 1.35
Ascom Holding AG Technology 17,413,376 2,486,879 0.9 0.9
Bachem Holding AG Health Care 15,145,213 2,162,953 0.42 0.21
Baloise Holding AG Financials 534,422,863 76,323,226 2.07 2.07
Bank Sarasin & Cie AG Financials 82,321,210 11,756,646 0.79 0.79
Banque Cantonale
VaudoiseFinancials 97,696,936 13,952,519 0.54 0.54
Barry Callebaut AG Consumer Goods 136,508,708 19,495,395 0.58 0.58
Basilea Pharmaceutica Health Care 188,816,389 26,965,680 2.02 2.02
Basler Kantonalbank Financials 26,018,662 3,715,837 0.58 0.11
BB Biotech AG Financials 108,475,650 15,491,874 0.94 0.94
BB Medtech AG Financials 33,387,584 4,768,224 0.87
Belimo Holding AG Industrials 22,484,547 3,211,115 0.74 0.74
Bellevue Group
AG/SwitzerlandFinancials 9,593,222 1,370,049 0.37 0.37
Bell Holding AG Consumer Goods 4,584,078 654,672 0.13 0.13
BKW FMB Energie AG Utilities 137,420,892 19,625,668 0.39 0.39
Bucher Industries AG Industrials 101,670,906 14,520,059 1.39 1.39
Industry/Sector Market valueNOK
Market valueUSD Voting Ownership
GOVERNMENT PENSION FUND GLOBAL HOLDINGS 2008
Equities Country association according to FTSE (the benchmark provider for equities). If a company is not in thebenchmark, the country of incorporation and country of listing is used. For remaining securities, a further assessment ismade. Country is defined as a sovereign state currently member of the United Nations. Exceptions are Hong Kong andTaiwan. The country association methodology was updated as of 2014.
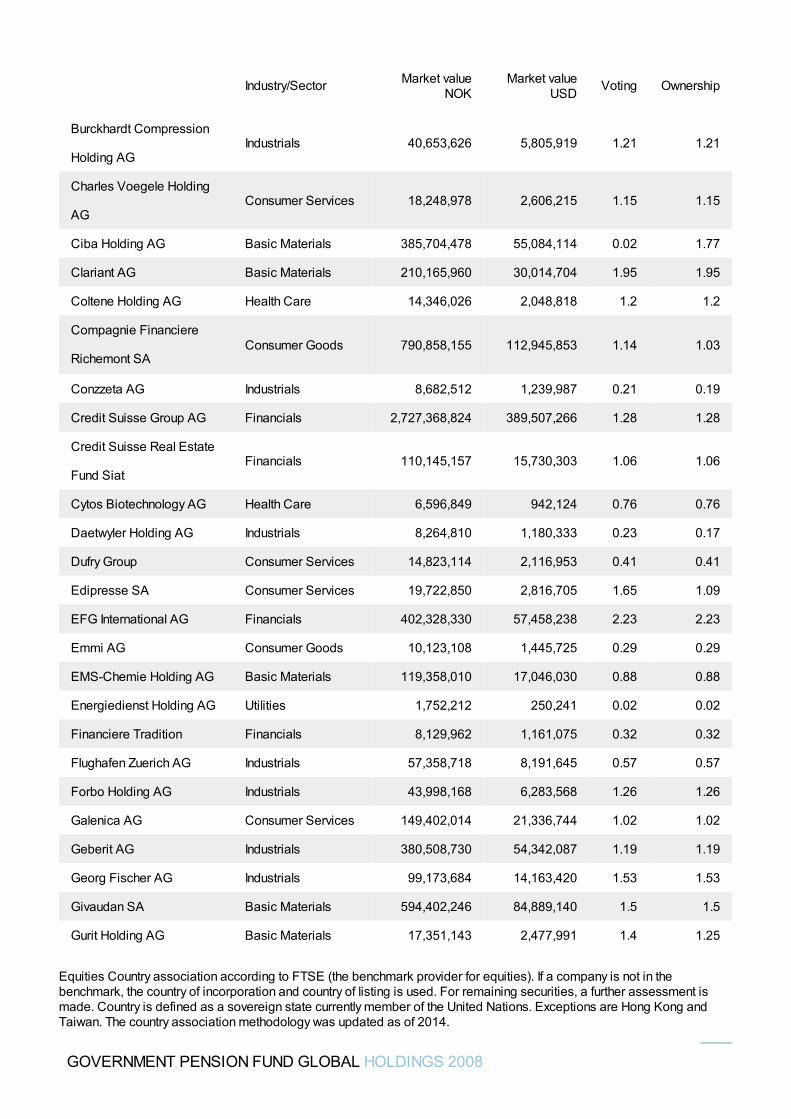
Burckhardt Compression
Holding AGIndustrials 40,653,626 5,805,919 1.21 1.21
Charles Voegele Holding
AGConsumer Services 18,248,978 2,606,215 1.15 1.15
Ciba Holding AG Basic Materials 385,704,478 55,084,114 0.02 1.77
Clariant AG Basic Materials 210,165,960 30,014,704 1.95 1.95
Coltene Holding AG Health Care 14,346,026 2,048,818 1.2 1.2
Compagnie Financiere
Richemont SAConsumer Goods 790,858,155 112,945,853 1.14 1.03
Conzzeta AG Industrials 8,682,512 1,239,987 0.21 0.19
Credit Suisse Group AG Financials 2,727,368,824 389,507,266 1.28 1.28
Credit Suisse Real Estate
Fund SiatFinancials 110,145,157 15,730,303 1.06 1.06
Cytos Biotechnology AG Health Care 6,596,849 942,124 0.76 0.76
Daetwyler Holding AG Industrials 8,264,810 1,180,333 0.23 0.17
Dufry Group Consumer Services 14,823,114 2,116,953 0.41 0.41
Edipresse SA Consumer Services 19,722,850 2,816,705 1.65 1.09
EFG International AG Financials 402,328,330 57,458,238 2.23 2.23
Emmi AG Consumer Goods 10,123,108 1,445,725 0.29 0.29
EMS-Chemie Holding AG Basic Materials 119,358,010 17,046,030 0.88 0.88
Energiedienst Holding AG Utilities 1,752,212 250,241 0.02 0.02
Financiere Tradition Financials 8,129,962 1,161,075 0.32 0.32
Flughafen Zuerich AG Industrials 57,358,718 8,191,645 0.57 0.57
Forbo Holding AG Industrials 43,998,168 6,283,568 1.26 1.26
Galenica AG Consumer Services 149,402,014 21,336,744 1.02 1.02
Geberit AG Industrials 380,508,730 54,342,087 1.19 1.19
Georg Fischer AG Industrials 99,173,684 14,163,420 1.53 1.53
Givaudan SA Basic Materials 594,402,246 84,889,140 1.5 1.5
Gurit Holding AG Basic Materials 17,351,143 2,477,991 1.4 1.25
Industry/Sector Market valueNOK
Market valueUSD Voting Ownership
GOVERNMENT PENSION FUND GLOBAL HOLDINGS 2008
Equities Country association according to FTSE (the benchmark provider for equities). If a company is not in thebenchmark, the country of incorporation and country of listing is used. For remaining securities, a further assessment ismade. Country is defined as a sovereign state currently member of the United Nations. Exceptions are Hong Kong andTaiwan. The country association methodology was updated as of 2014.
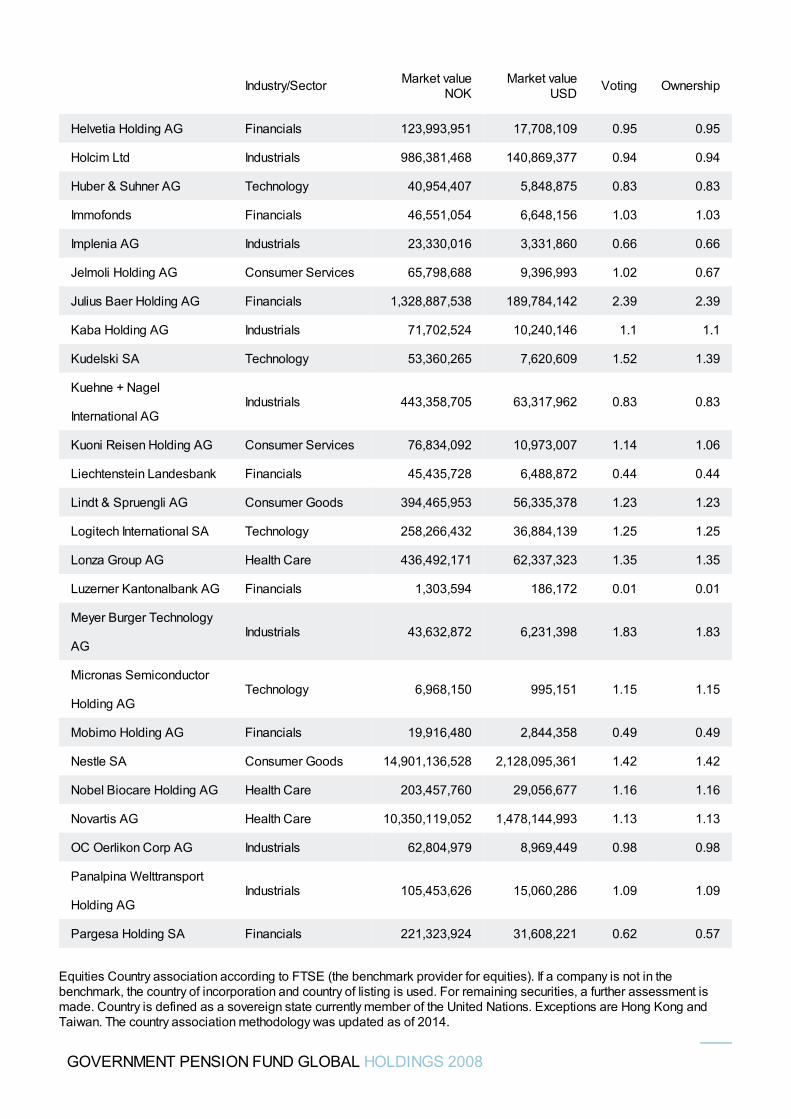
Helvetia Holding AG Financials 123,993,951 17,708,109 0.95 0.95
Holcim Ltd Industrials 986,381,468 140,869,377 0.94 0.94
Huber & Suhner AG Technology 40,954,407 5,848,875 0.83 0.83
Immofonds Financials 46,551,054 6,648,156 1.03 1.03
Implenia AG Industrials 23,330,016 3,331,860 0.66 0.66
Jelmoli Holding AG Consumer Services 65,798,688 9,396,993 1.02 0.67
Julius Baer Holding AG Financials 1,328,887,538 189,784,142 2.39 2.39
Kaba Holding AG Industrials 71,702,524 10,240,146 1.1 1.1
Kudelski SA Technology 53,360,265 7,620,609 1.52 1.39
Kuehne + Nagel
International AGIndustrials 443,358,705 63,317,962 0.83 0.83
Kuoni Reisen Holding AG Consumer Services 76,834,092 10,973,007 1.14 1.06
Liechtenstein Landesbank Financials 45,435,728 6,488,872 0.44 0.44
Lindt & Spruengli AG Consumer Goods 394,465,953 56,335,378 1.23 1.23
Logitech International SA Technology 258,266,432 36,884,139 1.25 1.25
Lonza Group AG Health Care 436,492,171 62,337,323 1.35 1.35
Luzerner Kantonalbank AG Financials 1,303,594 186,172 0.01 0.01
Meyer Burger Technology
AGIndustrials 43,632,872 6,231,398 1.83 1.83
Micronas Semiconductor
Holding AGTechnology 6,968,150 995,151 1.15 1.15
Mobimo Holding AG Financials 19,916,480 2,844,358 0.49 0.49
Nestle SA Consumer Goods 14,901,136,528 2,128,095,361 1.42 1.42
Nobel Biocare Holding AG Health Care 203,457,760 29,056,677 1.16 1.16
Novartis AG Health Care 10,350,119,052 1,478,144,993 1.13 1.13
OC Oerlikon Corp AG Industrials 62,804,979 8,969,449 0.98 0.98
Panalpina Welttransport
Holding AGIndustrials 105,453,626 15,060,286 1.09 1.09
Pargesa Holding SA Financials 221,323,924 31,608,221 0.62 0.57
Industry/Sector Market valueNOK
Market valueUSD Voting Ownership
GOVERNMENT PENSION FUND GLOBAL HOLDINGS 2008
Equities Country association according to FTSE (the benchmark provider for equities). If a company is not in thebenchmark, the country of incorporation and country of listing is used. For remaining securities, a further assessment ismade. Country is defined as a sovereign state currently member of the United Nations. Exceptions are Hong Kong andTaiwan. The country association methodology was updated as of 2014.
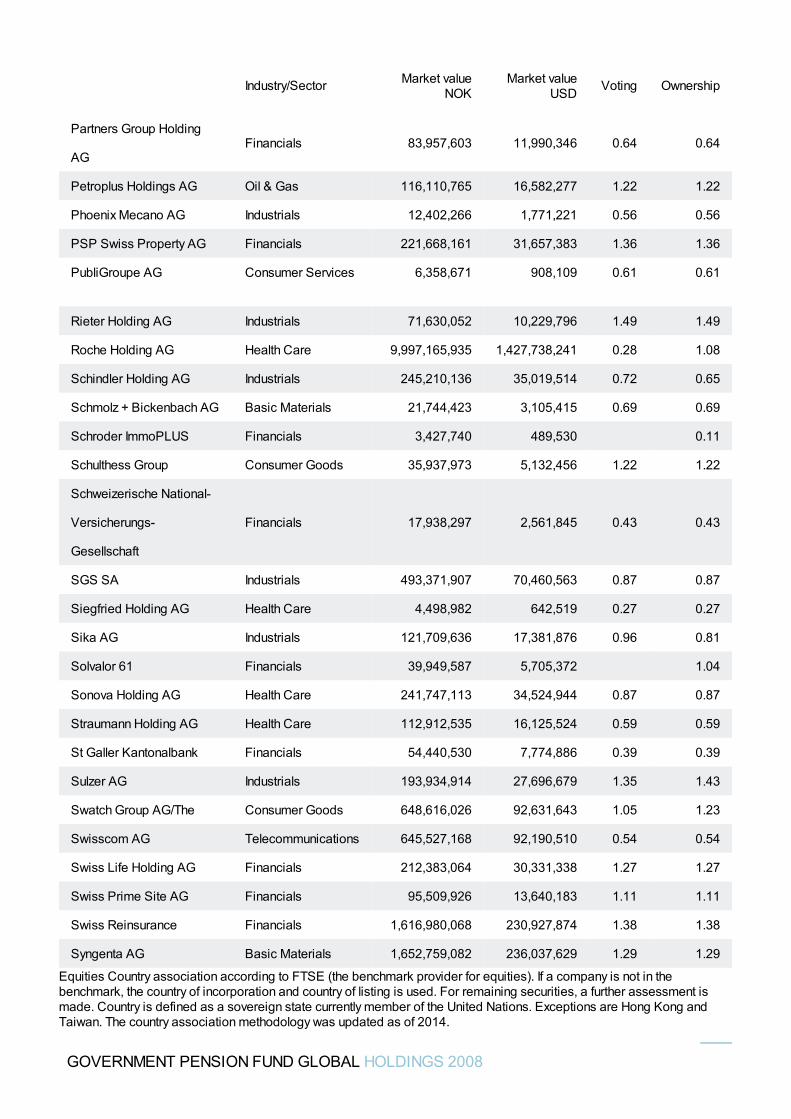
Partners Group Holding
AGFinancials 83,957,603 11,990,346 0.64 0.64
Petroplus Holdings AG Oil & Gas 116,110,765 16,582,277 1.22 1.22
Phoenix Mecano AG Industrials 12,402,266 1,771,221 0.56 0.56
PSP Swiss Property AG Financials 221,668,161 31,657,383 1.36 1.36
PubliGroupe AG Consumer Services 6,358,671 908,109 0.61 0.61
Rieter Holding AG Industrials 71,630,052 10,229,796 1.49 1.49
Roche Holding AG Health Care 9,997,165,935 1,427,738,241 0.28 1.08
Schindler Holding AG Industrials 245,210,136 35,019,514 0.72 0.65
Schmolz + Bickenbach AG Basic Materials 21,744,423 3,105,415 0.69 0.69
Schroder ImmoPLUS Financials 3,427,740 489,530 0.11
Schulthess Group Consumer Goods 35,937,973 5,132,456 1.22 1.22
Schweizerische National-
Versicherungs-
Gesellschaft
Financials 17,938,297 2,561,845 0.43 0.43
SGS SA Industrials 493,371,907 70,460,563 0.87 0.87
Siegfried Holding AG Health Care 4,498,982 642,519 0.27 0.27
Sika AG Industrials 121,709,636 17,381,876 0.96 0.81
Solvalor 61 Financials 39,949,587 5,705,372 1.04
Sonova Holding AG Health Care 241,747,113 34,524,944 0.87 0.87
Straumann Holding AG Health Care 112,912,535 16,125,524 0.59 0.59
St Galler Kantonalbank Financials 54,440,530 7,774,886 0.39 0.39
Sulzer AG Industrials 193,934,914 27,696,679 1.35 1.43
Swatch Group AG/The Consumer Goods 648,616,026 92,631,643 1.05 1.23
Swisscom AG Telecommunications 645,527,168 92,190,510 0.54 0.54
Swiss Life Holding AG Financials 212,383,064 30,331,338 1.27 1.27
Swiss Prime Site AG Financials 95,509,926 13,640,183 1.11 1.11
Swiss Reinsurance Financials 1,616,980,068 230,927,874 1.38 1.38
Syngenta AG Basic Materials 1,652,759,082 236,037,629 1.29 1.29
Industry/Sector Market valueNOK
Market valueUSD Voting Ownership
GOVERNMENT PENSION FUND GLOBAL HOLDINGS 2008
Equities Country association according to FTSE (the benchmark provider for equities). If a company is not in thebenchmark, the country of incorporation and country of listing is used. For remaining securities, a further assessment ismade. Country is defined as a sovereign state currently member of the United Nations. Exceptions are Hong Kong andTaiwan. The country association methodology was updated as of 2014.
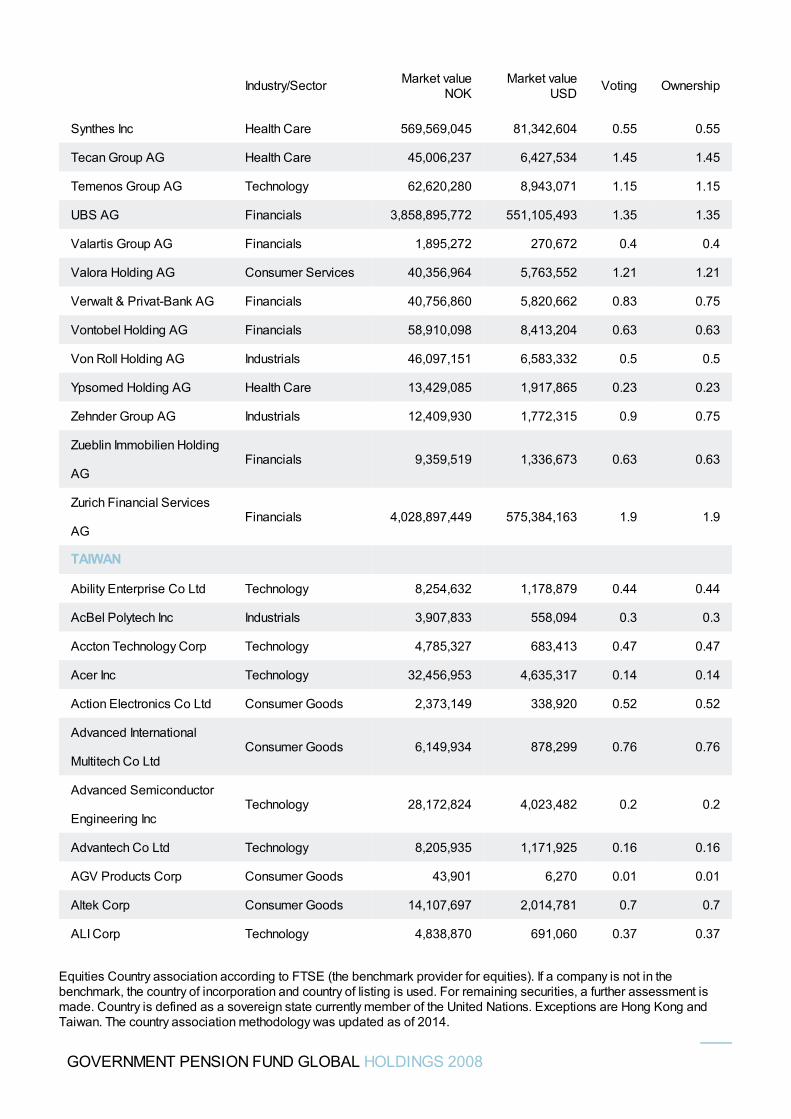
Synthes Inc Health Care 569,569,045 81,342,604 0.55 0.55
Tecan Group AG Health Care 45,006,237 6,427,534 1.45 1.45
Temenos Group AG Technology 62,620,280 8,943,071 1.15 1.15
UBS AG Financials 3,858,895,772 551,105,493 1.35 1.35
Valartis Group AG Financials 1,895,272 270,672 0.4 0.4
Valora Holding AG Consumer Services 40,356,964 5,763,552 1.21 1.21
Verwalt & Privat-Bank AG Financials 40,756,860 5,820,662 0.83 0.75
Vontobel Holding AG Financials 58,910,098 8,413,204 0.63 0.63
Von Roll Holding AG Industrials 46,097,151 6,583,332 0.5 0.5
Ypsomed Holding AG Health Care 13,429,085 1,917,865 0.23 0.23
Zehnder Group AG Industrials 12,409,930 1,772,315 0.9 0.75
Zueblin Immobilien Holding
AGFinancials 9,359,519 1,336,673 0.63 0.63
Zurich Financial Services
AGFinancials 4,028,897,449 575,384,163 1.9 1.9
TAIWAN
Ability Enterprise Co Ltd Technology 8,254,632 1,178,879 0.44 0.44
AcBel Polytech Inc Industrials 3,907,833 558,094 0.3 0.3
Accton Technology Corp Technology 4,785,327 683,413 0.47 0.47
Acer Inc Technology 32,456,953 4,635,317 0.14 0.14
Action Electronics Co Ltd Consumer Goods 2,373,149 338,920 0.52 0.52
Advanced International
Multitech Co LtdConsumer Goods 6,149,934 878,299 0.76 0.76
Advanced Semiconductor
Engineering IncTechnology 28,172,824 4,023,482 0.2 0.2
Advantech Co Ltd Technology 8,205,935 1,171,925 0.16 0.16
AGV Products Corp Consumer Goods 43,901 6,270 0.01 0.01
Altek Corp Consumer Goods 14,107,697 2,014,781 0.7 0.7
ALI Corp Technology 4,838,870 691,060 0.37 0.37
Industry/Sector Market valueNOK
Market valueUSD Voting Ownership
GOVERNMENT PENSION FUND GLOBAL HOLDINGS 2008
Equities Country association according to FTSE (the benchmark provider for equities). If a company is not in thebenchmark, the country of incorporation and country of listing is used. For remaining securities, a further assessment ismade. Country is defined as a sovereign state currently member of the United Nations. Exceptions are Hong Kong andTaiwan. The country association methodology was updated as of 2014.
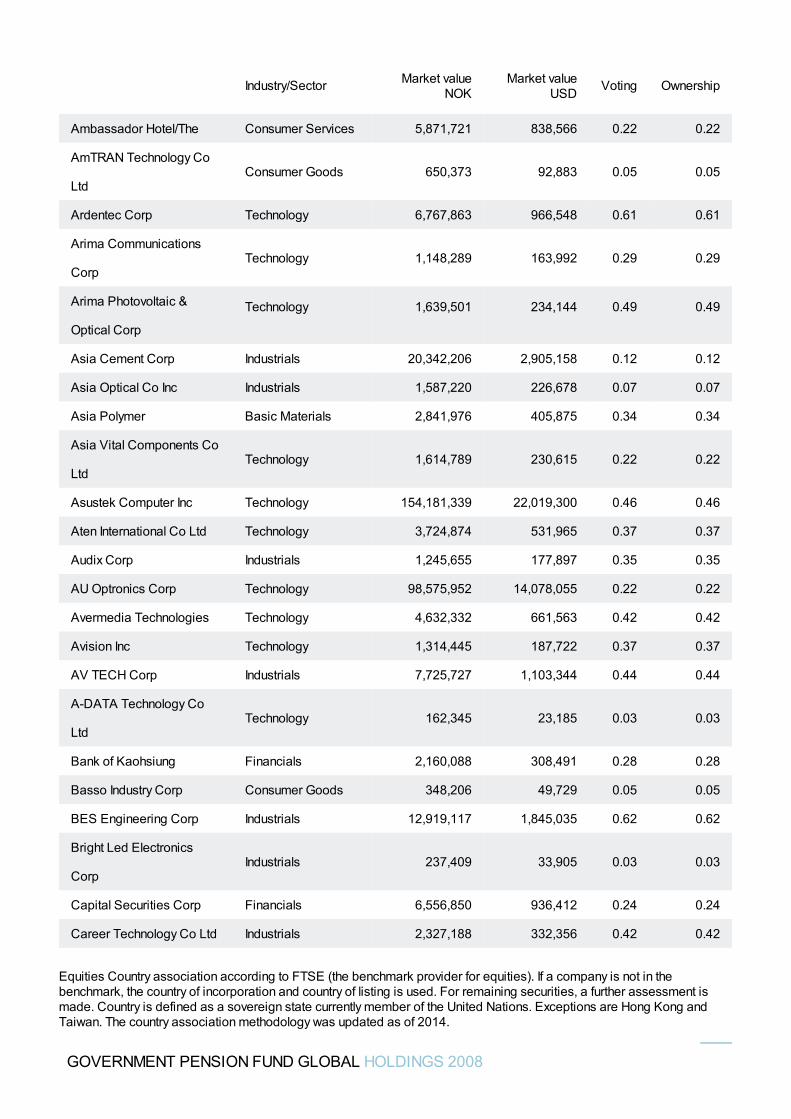
Ambassador Hotel/The Consumer Services 5,871,721 838,566 0.22 0.22
AmTRAN Technology Co
LtdConsumer Goods 650,373 92,883 0.05 0.05
Ardentec Corp Technology 6,767,863 966,548 0.61 0.61
Arima Communications
CorpTechnology 1,148,289 163,992 0.29 0.29
Arima Photovoltaic &
Optical Corp
Technology 1,639,501 234,144 0.49 0.49
Asia Cement Corp Industrials 20,342,206 2,905,158 0.12 0.12
Asia Optical Co Inc Industrials 1,587,220 226,678 0.07 0.07
Asia Polymer Basic Materials 2,841,976 405,875 0.34 0.34
Asia Vital Components Co
LtdTechnology 1,614,789 230,615 0.22 0.22
Asustek Computer Inc Technology 154,181,339 22,019,300 0.46 0.46
Aten International Co Ltd Technology 3,724,874 531,965 0.37 0.37
Audix Corp Industrials 1,245,655 177,897 0.35 0.35
AU Optronics Corp Technology 98,575,952 14,078,055 0.22 0.22
Avermedia Technologies Technology 4,632,332 661,563 0.42 0.42
Avision Inc Technology 1,314,445 187,722 0.37 0.37
AV TECH Corp Industrials 7,725,727 1,103,344 0.44 0.44
A-DATA Technology Co
LtdTechnology 162,345 23,185 0.03 0.03
Bank of Kaohsiung Financials 2,160,088 308,491 0.28 0.28
Basso Industry Corp Consumer Goods 348,206 49,729 0.05 0.05
BES Engineering Corp Industrials 12,919,117 1,845,035 0.62 0.62
Bright Led Electronics
CorpIndustrials 237,409 33,905 0.03 0.03
Capital Securities Corp Financials 6,556,850 936,412 0.24 0.24
Career Technology Co Ltd Industrials 2,327,188 332,356 0.42 0.42
Industry/Sector Market valueNOK
Market valueUSD Voting Ownership
GOVERNMENT PENSION FUND GLOBAL HOLDINGS 2008
Equities Country association according to FTSE (the benchmark provider for equities). If a company is not in thebenchmark, the country of incorporation and country of listing is used. For remaining securities, a further assessment ismade. Country is defined as a sovereign state currently member of the United Nations. Exceptions are Hong Kong andTaiwan. The country association methodology was updated as of 2014.
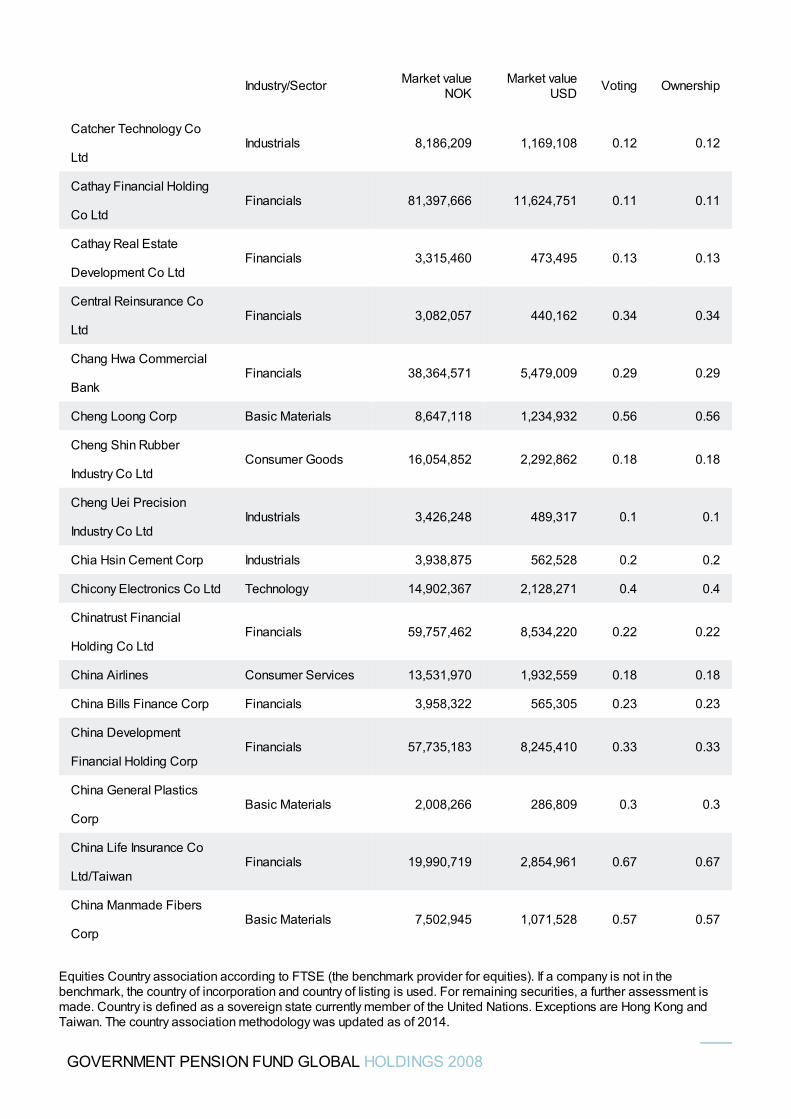
Catcher Technology Co
LtdIndustrials 8,186,209 1,169,108 0.12 0.12
Cathay Financial Holding
Co LtdFinancials 81,397,666 11,624,751 0.11 0.11
Cathay Real Estate
Development Co LtdFinancials 3,315,460 473,495 0.13 0.13
Central Reinsurance Co
LtdFinancials 3,082,057 440,162 0.34 0.34
Chang Hwa Commercial
BankFinancials 38,364,571 5,479,009 0.29 0.29
Cheng Loong Corp Basic Materials 8,647,118 1,234,932 0.56 0.56
Cheng Shin Rubber
Industry Co LtdConsumer Goods 16,054,852 2,292,862 0.18 0.18
Cheng Uei Precision
Industry Co LtdIndustrials 3,426,248 489,317 0.1 0.1
Chia Hsin Cement Corp Industrials 3,938,875 562,528 0.2 0.2
Chicony Electronics Co Ltd Technology 14,902,367 2,128,271 0.4 0.4
Chinatrust Financial
Holding Co LtdFinancials 59,757,462 8,534,220 0.22 0.22
China Airlines Consumer Services 13,531,970 1,932,559 0.18 0.18
China Bills Finance Corp Financials 3,958,322 565,305 0.23 0.23
China Development
Financial Holding CorpFinancials 57,735,183 8,245,410 0.33 0.33
China General Plastics
CorpBasic Materials 2,008,266 286,809 0.3 0.3
China Life Insurance Co
Ltd/TaiwanFinancials 19,990,719 2,854,961 0.67 0.67
China Manmade Fibers
CorpBasic Materials 7,502,945 1,071,528 0.57 0.57
Industry/Sector Market valueNOK
Market valueUSD Voting Ownership
GOVERNMENT PENSION FUND GLOBAL HOLDINGS 2008
Equities Country association according to FTSE (the benchmark provider for equities). If a company is not in thebenchmark, the country of incorporation and country of listing is used. For remaining securities, a further assessment ismade. Country is defined as a sovereign state currently member of the United Nations. Exceptions are Hong Kong andTaiwan. The country association methodology was updated as of 2014.
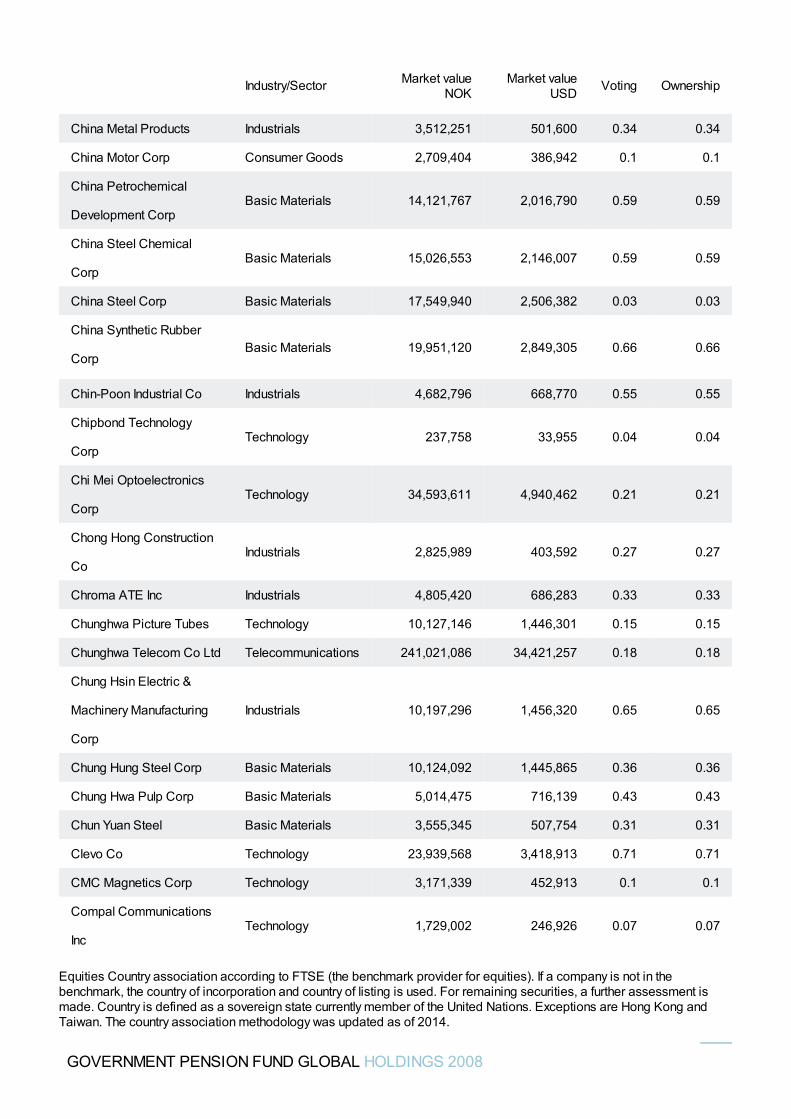
China Metal Products Industrials 3,512,251 501,600 0.34 0.34
China Motor Corp Consumer Goods 2,709,404 386,942 0.1 0.1
China Petrochemical
Development CorpBasic Materials 14,121,767 2,016,790 0.59 0.59
China Steel Chemical
CorpBasic Materials 15,026,553 2,146,007 0.59 0.59
China Steel Corp Basic Materials 17,549,940 2,506,382 0.03 0.03
China Synthetic Rubber
CorpBasic Materials 19,951,120 2,849,305 0.66 0.66
Chin-Poon Industrial Co Industrials 4,682,796 668,770 0.55 0.55
Chipbond Technology
CorpTechnology 237,758 33,955 0.04 0.04
Chi Mei Optoelectronics
CorpTechnology 34,593,611 4,940,462 0.21 0.21
Chong Hong Construction
CoIndustrials 2,825,989 403,592 0.27 0.27
Chroma ATE Inc Industrials 4,805,420 686,283 0.33 0.33
Chunghwa Picture Tubes Technology 10,127,146 1,446,301 0.15 0.15
Chunghwa Telecom Co Ltd Telecommunications 241,021,086 34,421,257 0.18 0.18
Chung Hsin Electric &
Machinery Manufacturing
Corp
Industrials 10,197,296 1,456,320 0.65 0.65
Chung Hung Steel Corp Basic Materials 10,124,092 1,445,865 0.36 0.36
Chung Hwa Pulp Corp Basic Materials 5,014,475 716,139 0.43 0.43
Chun Yuan Steel Basic Materials 3,555,345 507,754 0.31 0.31
Clevo Co Technology 23,939,568 3,418,913 0.71 0.71
CMC Magnetics Corp Technology 3,171,339 452,913 0.1 0.1
Compal Communications
IncTechnology 1,729,002 246,926 0.07 0.07
Industry/Sector Market valueNOK
Market valueUSD Voting Ownership
GOVERNMENT PENSION FUND GLOBAL HOLDINGS 2008
Equities Country association according to FTSE (the benchmark provider for equities). If a company is not in thebenchmark, the country of incorporation and country of listing is used. For remaining securities, a further assessment ismade. Country is defined as a sovereign state currently member of the United Nations. Exceptions are Hong Kong andTaiwan. The country association methodology was updated as of 2014.
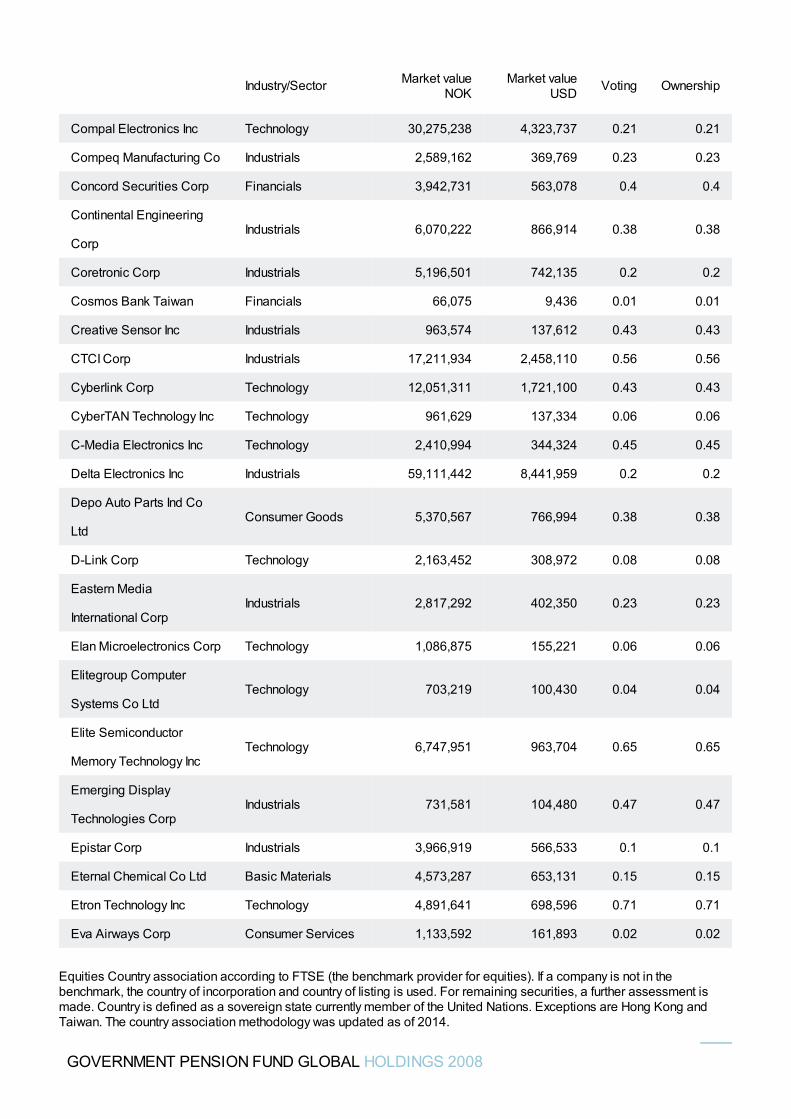
Compal Electronics Inc Technology 30,275,238 4,323,737 0.21 0.21
Compeq Manufacturing Co Industrials 2,589,162 369,769 0.23 0.23
Concord Securities Corp Financials 3,942,731 563,078 0.4 0.4
Continental Engineering
CorpIndustrials 6,070,222 866,914 0.38 0.38
Coretronic Corp Industrials 5,196,501 742,135 0.2 0.2
Cosmos Bank Taiwan Financials 66,075 9,436 0.01 0.01
Creative Sensor Inc Industrials 963,574 137,612 0.43 0.43
CTCI Corp Industrials 17,211,934 2,458,110 0.56 0.56
Cyberlink Corp Technology 12,051,311 1,721,100 0.43 0.43
CyberTAN Technology Inc Technology 961,629 137,334 0.06 0.06
C-Media Electronics Inc Technology 2,410,994 344,324 0.45 0.45
Delta Electronics Inc Industrials 59,111,442 8,441,959 0.2 0.2
Depo Auto Parts Ind Co
LtdConsumer Goods 5,370,567 766,994 0.38 0.38
D-Link Corp Technology 2,163,452 308,972 0.08 0.08
Eastern Media
International CorpIndustrials 2,817,292 402,350 0.23 0.23
Elan Microelectronics Corp Technology 1,086,875 155,221 0.06 0.06
Elitegroup Computer
Systems Co LtdTechnology 703,219 100,430 0.04 0.04
Elite Semiconductor
Memory Technology IncTechnology 6,747,951 963,704 0.65 0.65
Emerging Display
Technologies CorpIndustrials 731,581 104,480 0.47 0.47
Epistar Corp Industrials 3,966,919 566,533 0.1 0.1
Eternal Chemical Co Ltd Basic Materials 4,573,287 653,131 0.15 0.15
Etron Technology Inc Technology 4,891,641 698,596 0.71 0.71
Eva Airways Corp Consumer Services 1,133,592 161,893 0.02 0.02
Industry/Sector Market valueNOK
Market valueUSD Voting Ownership
GOVERNMENT PENSION FUND GLOBAL HOLDINGS 2008
Equities Country association according to FTSE (the benchmark provider for equities). If a company is not in thebenchmark, the country of incorporation and country of listing is used. For remaining securities, a further assessment ismade. Country is defined as a sovereign state currently member of the United Nations. Exceptions are Hong Kong andTaiwan. The country association methodology was updated as of 2014.
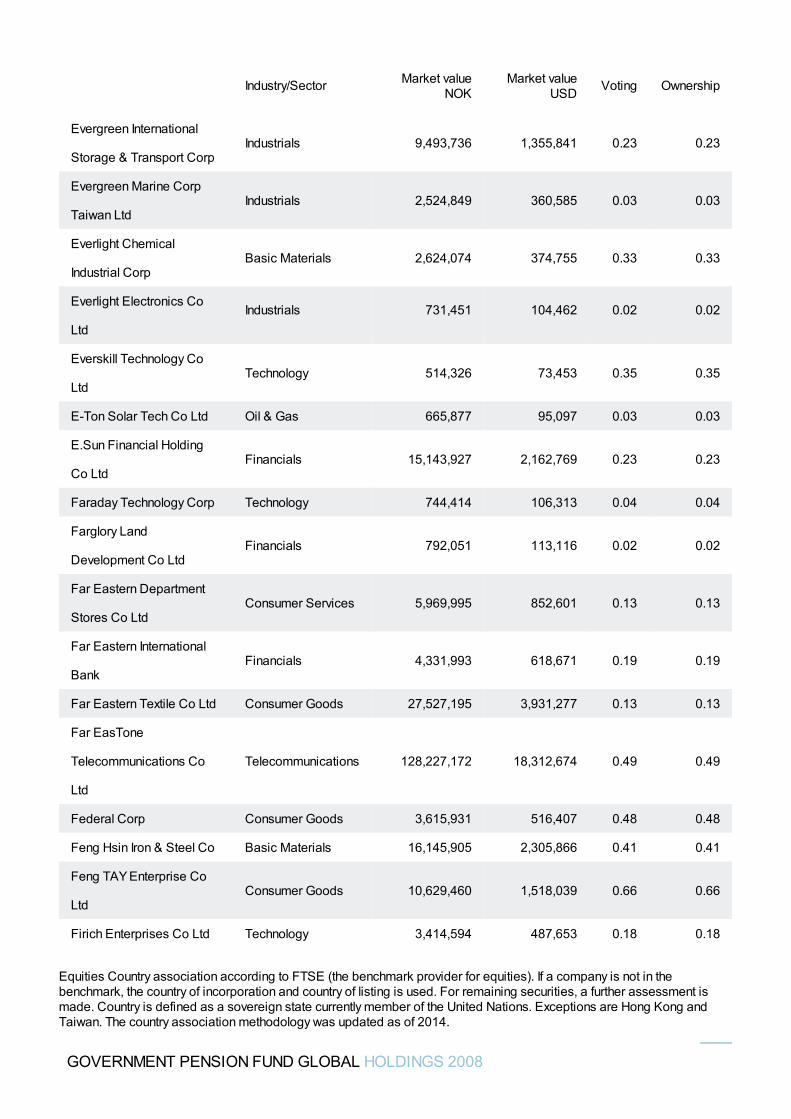
Evergreen International
Storage & Transport CorpIndustrials 9,493,736 1,355,841 0.23 0.23
Evergreen Marine Corp
Taiwan LtdIndustrials 2,524,849 360,585 0.03 0.03
Everlight Chemical
Industrial CorpBasic Materials 2,624,074 374,755 0.33 0.33
Everlight Electronics Co
LtdIndustrials 731,451 104,462 0.02 0.02
Everskill Technology Co
LtdTechnology 514,326 73,453 0.35 0.35
E-Ton Solar Tech Co Ltd Oil & Gas 665,877 95,097 0.03 0.03
E.Sun Financial Holding
Co LtdFinancials 15,143,927 2,162,769 0.23 0.23
Faraday Technology Corp Technology 744,414 106,313 0.04 0.04
Farglory Land
Development Co LtdFinancials 792,051 113,116 0.02 0.02
Far Eastern Department
Stores Co LtdConsumer Services 5,969,995 852,601 0.13 0.13
Far Eastern International
BankFinancials 4,331,993 618,671 0.19 0.19
Far Eastern Textile Co Ltd Consumer Goods 27,527,195 3,931,277 0.13 0.13
Far EasTone
Telecommunications Co
Ltd
Telecommunications 128,227,172 18,312,674 0.49 0.49
Federal Corp Consumer Goods 3,615,931 516,407 0.48 0.48
Feng Hsin Iron & Steel Co Basic Materials 16,145,905 2,305,866 0.41 0.41
Feng TAY Enterprise Co
LtdConsumer Goods 10,629,460 1,518,039 0.66 0.66
Firich Enterprises Co Ltd Technology 3,414,594 487,653 0.18 0.18
Industry/Sector Market valueNOK
Market valueUSD Voting Ownership
GOVERNMENT PENSION FUND GLOBAL HOLDINGS 2008
Equities Country association according to FTSE (the benchmark provider for equities). If a company is not in thebenchmark, the country of incorporation and country of listing is used. For remaining securities, a further assessment ismade. Country is defined as a sovereign state currently member of the United Nations. Exceptions are Hong Kong andTaiwan. The country association methodology was updated as of 2014.
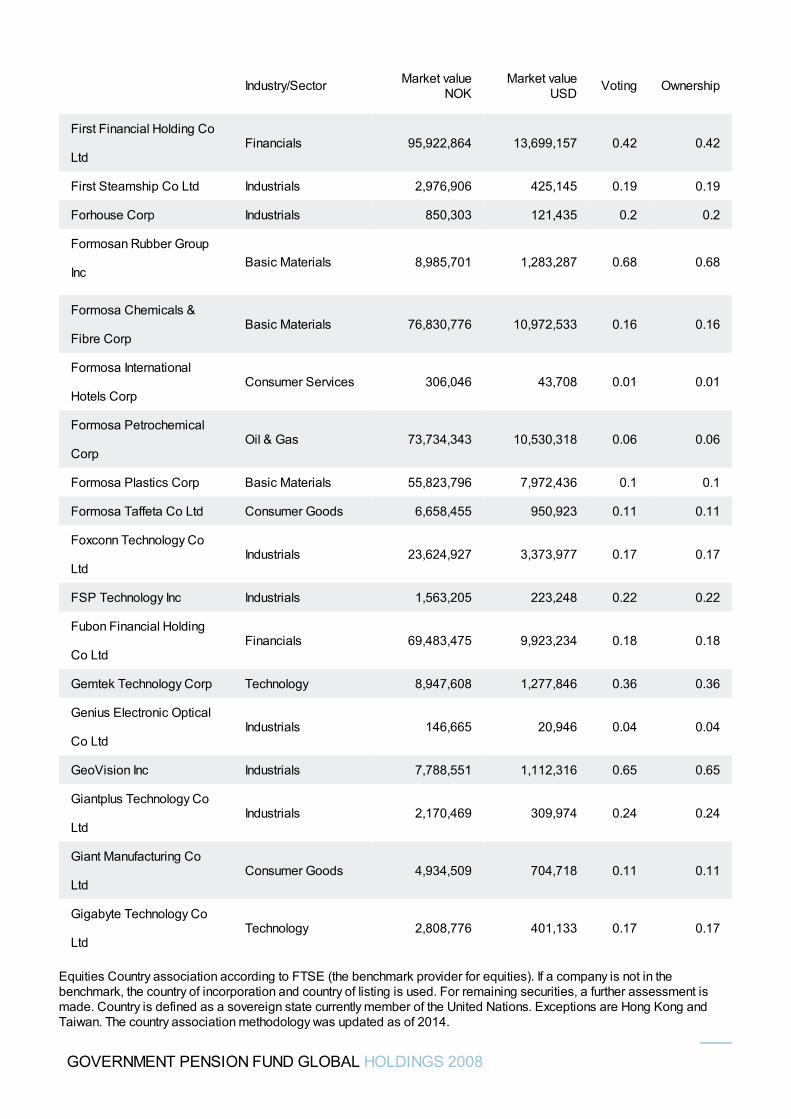
First Financial Holding Co
LtdFinancials 95,922,864 13,699,157 0.42 0.42
First Steamship Co Ltd Industrials 2,976,906 425,145 0.19 0.19
Forhouse Corp Industrials 850,303 121,435 0.2 0.2
Formosan Rubber Group
IncBasic Materials 8,985,701 1,283,287 0.68 0.68
Formosa Chemicals &
Fibre CorpBasic Materials 76,830,776 10,972,533 0.16 0.16
Formosa International
Hotels CorpConsumer Services 306,046 43,708 0.01 0.01
Formosa Petrochemical
CorpOil & Gas 73,734,343 10,530,318 0.06 0.06
Formosa Plastics Corp Basic Materials 55,823,796 7,972,436 0.1 0.1
Formosa Taffeta Co Ltd Consumer Goods 6,658,455 950,923 0.11 0.11
Foxconn Technology Co
LtdIndustrials 23,624,927 3,373,977 0.17 0.17
FSP Technology Inc Industrials 1,563,205 223,248 0.22 0.22
Fubon Financial Holding
Co LtdFinancials 69,483,475 9,923,234 0.18 0.18
Gemtek Technology Corp Technology 8,947,608 1,277,846 0.36 0.36
Genius Electronic Optical
Co LtdIndustrials 146,665 20,946 0.04 0.04
GeoVision Inc Industrials 7,788,551 1,112,316 0.65 0.65
Giantplus Technology Co
LtdIndustrials 2,170,469 309,974 0.24 0.24
Giant Manufacturing Co
LtdConsumer Goods 4,934,509 704,718 0.11 0.11
Gigabyte Technology Co
LtdTechnology 2,808,776 401,133 0.17 0.17
Industry/Sector Market valueNOK
Market valueUSD Voting Ownership
GOVERNMENT PENSION FUND GLOBAL HOLDINGS 2008
Equities Country association according to FTSE (the benchmark provider for equities). If a company is not in thebenchmark, the country of incorporation and country of listing is used. For remaining securities, a further assessment ismade. Country is defined as a sovereign state currently member of the United Nations. Exceptions are Hong Kong andTaiwan. The country association methodology was updated as of 2014.
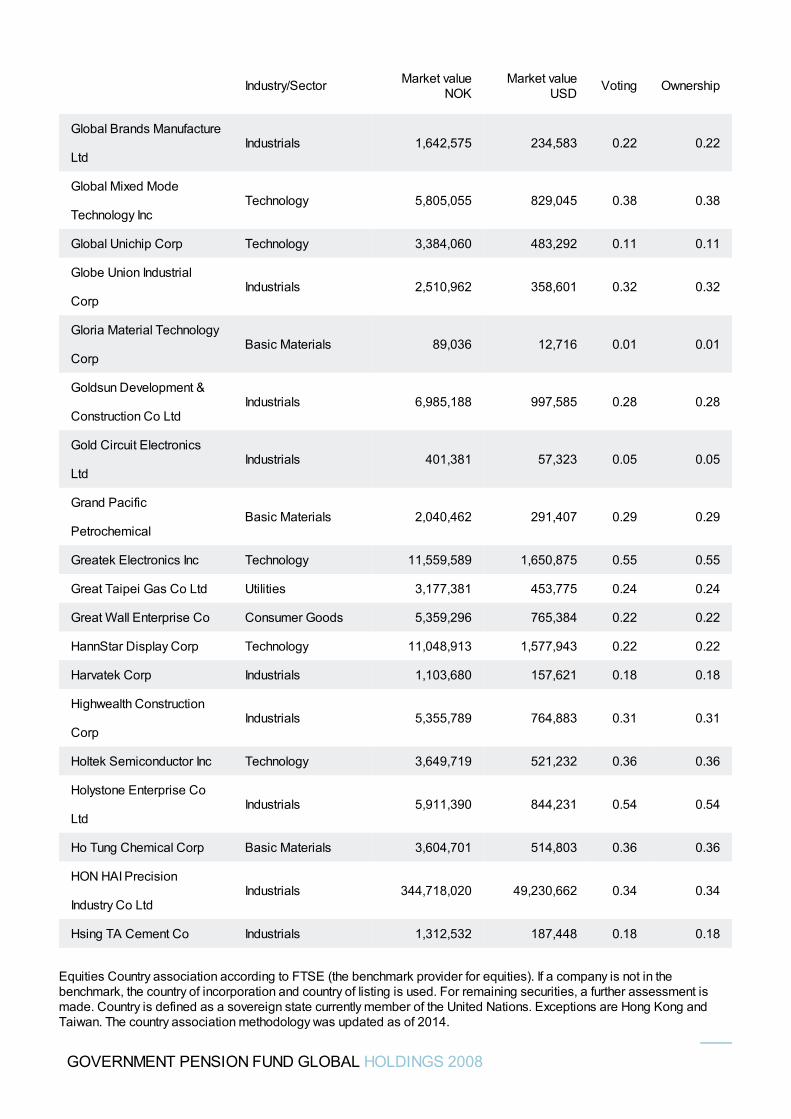
Global Brands Manufacture
LtdIndustrials 1,642,575 234,583 0.22 0.22
Global Mixed Mode
Technology IncTechnology 5,805,055 829,045 0.38 0.38
Global Unichip Corp Technology 3,384,060 483,292 0.11 0.11
Globe Union Industrial
CorpIndustrials 2,510,962 358,601 0.32 0.32
Gloria Material Technology
CorpBasic Materials 89,036 12,716 0.01 0.01
Goldsun Development &
Construction Co LtdIndustrials 6,985,188 997,585 0.28 0.28
Gold Circuit Electronics
LtdIndustrials 401,381 57,323 0.05 0.05
Grand Pacific
PetrochemicalBasic Materials 2,040,462 291,407 0.29 0.29
Greatek Electronics Inc Technology 11,559,589 1,650,875 0.55 0.55
Great Taipei Gas Co Ltd Utilities 3,177,381 453,775 0.24 0.24
Great Wall Enterprise Co Consumer Goods 5,359,296 765,384 0.22 0.22
HannStar Display Corp Technology 11,048,913 1,577,943 0.22 0.22
Harvatek Corp Industrials 1,103,680 157,621 0.18 0.18
Highwealth Construction
CorpIndustrials 5,355,789 764,883 0.31 0.31
Holtek Semiconductor Inc Technology 3,649,719 521,232 0.36 0.36
Holystone Enterprise Co
LtdIndustrials 5,911,390 844,231 0.54 0.54
Ho Tung Chemical Corp Basic Materials 3,604,701 514,803 0.36 0.36
HON HAI Precision
Industry Co LtdIndustrials 344,718,020 49,230,662 0.34 0.34
Hsing TA Cement Co Industrials 1,312,532 187,448 0.18 0.18
Industry/Sector Market valueNOK
Market valueUSD Voting Ownership
GOVERNMENT PENSION FUND GLOBAL HOLDINGS 2008
Equities Country association according to FTSE (the benchmark provider for equities). If a company is not in thebenchmark, the country of incorporation and country of listing is used. For remaining securities, a further assessment ismade. Country is defined as a sovereign state currently member of the United Nations. Exceptions are Hong Kong andTaiwan. The country association methodology was updated as of 2014.
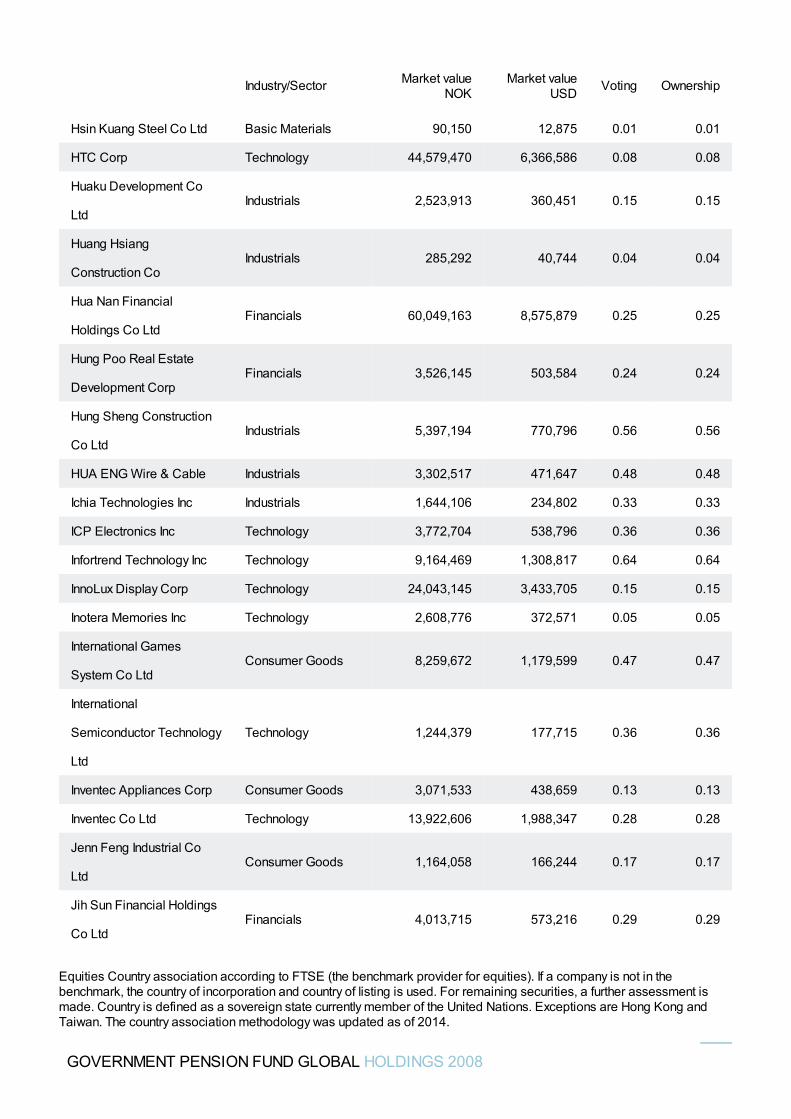
Hsin Kuang Steel Co Ltd Basic Materials 90,150 12,875 0.01 0.01
HTC Corp Technology 44,579,470 6,366,586 0.08 0.08
Huaku Development Co
LtdIndustrials 2,523,913 360,451 0.15 0.15
Huang Hsiang
Construction CoIndustrials 285,292 40,744 0.04 0.04
Hua Nan Financial
Holdings Co LtdFinancials 60,049,163 8,575,879 0.25 0.25
Hung Poo Real Estate
Development CorpFinancials 3,526,145 503,584 0.24 0.24
Hung Sheng Construction
Co LtdIndustrials 5,397,194 770,796 0.56 0.56
HUA ENG Wire & Cable Industrials 3,302,517 471,647 0.48 0.48
Ichia Technologies Inc Industrials 1,644,106 234,802 0.33 0.33
ICP Electronics Inc Technology 3,772,704 538,796 0.36 0.36
Infortrend Technology Inc Technology 9,164,469 1,308,817 0.64 0.64
InnoLux Display Corp Technology 24,043,145 3,433,705 0.15 0.15
Inotera Memories Inc Technology 2,608,776 372,571 0.05 0.05
International Games
System Co LtdConsumer Goods 8,259,672 1,179,599 0.47 0.47
International
Semiconductor Technology
Ltd
Technology 1,244,379 177,715 0.36 0.36
Inventec Appliances Corp Consumer Goods 3,071,533 438,659 0.13 0.13
Inventec Co Ltd Technology 13,922,606 1,988,347 0.28 0.28
Jenn Feng Industrial Co
LtdConsumer Goods 1,164,058 166,244 0.17 0.17
Jih Sun Financial Holdings
Co LtdFinancials 4,013,715 573,216 0.29 0.29
Industry/Sector Market valueNOK
Market valueUSD Voting Ownership
GOVERNMENT PENSION FUND GLOBAL HOLDINGS 2008
Equities Country association according to FTSE (the benchmark provider for equities). If a company is not in thebenchmark, the country of incorporation and country of listing is used. For remaining securities, a further assessment ismade. Country is defined as a sovereign state currently member of the United Nations. Exceptions are Hong Kong andTaiwan. The country association methodology was updated as of 2014.
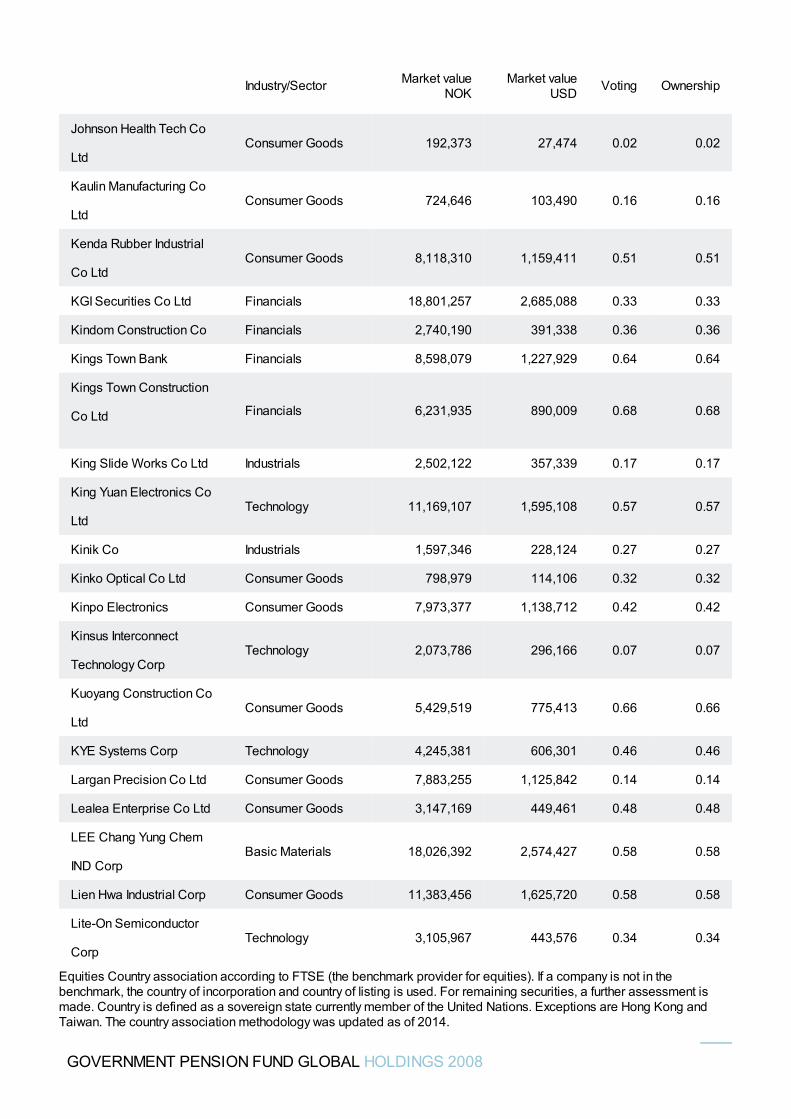
Johnson Health Tech Co
LtdConsumer Goods 192,373 27,474 0.02 0.02
Kaulin Manufacturing Co
LtdConsumer Goods 724,646 103,490 0.16 0.16
Kenda Rubber Industrial
Co LtdConsumer Goods 8,118,310 1,159,411 0.51 0.51
KGI Securities Co Ltd Financials 18,801,257 2,685,088 0.33 0.33
Kindom Construction Co Financials 2,740,190 391,338 0.36 0.36
Kings Town Bank Financials 8,598,079 1,227,929 0.64 0.64
Kings Town Construction
Co Ltd Financials 6,231,935 890,009 0.68 0.68
King Slide Works Co Ltd Industrials 2,502,122 357,339 0.17 0.17
King Yuan Electronics Co
LtdTechnology 11,169,107 1,595,108 0.57 0.57
Kinik Co Industrials 1,597,346 228,124 0.27 0.27
Kinko Optical Co Ltd Consumer Goods 798,979 114,106 0.32 0.32
Kinpo Electronics Consumer Goods 7,973,377 1,138,712 0.42 0.42
Kinsus Interconnect
Technology CorpTechnology 2,073,786 296,166 0.07 0.07
Kuoyang Construction Co
LtdConsumer Goods 5,429,519 775,413 0.66 0.66
KYE Systems Corp Technology 4,245,381 606,301 0.46 0.46
Largan Precision Co Ltd Consumer Goods 7,883,255 1,125,842 0.14 0.14
Lealea Enterprise Co Ltd Consumer Goods 3,147,169 449,461 0.48 0.48
LEE Chang Yung Chem
IND CorpBasic Materials 18,026,392 2,574,427 0.58 0.58
Lien Hwa Industrial Corp Consumer Goods 11,383,456 1,625,720 0.58 0.58
Lite-On Semiconductor
CorpTechnology 3,105,967 443,576 0.34 0.34
Industry/Sector Market valueNOK
Market valueUSD Voting Ownership
GOVERNMENT PENSION FUND GLOBAL HOLDINGS 2008
Equities Country association according to FTSE (the benchmark provider for equities). If a company is not in thebenchmark, the country of incorporation and country of listing is used. For remaining securities, a further assessment ismade. Country is defined as a sovereign state currently member of the United Nations. Exceptions are Hong Kong andTaiwan. The country association methodology was updated as of 2014.
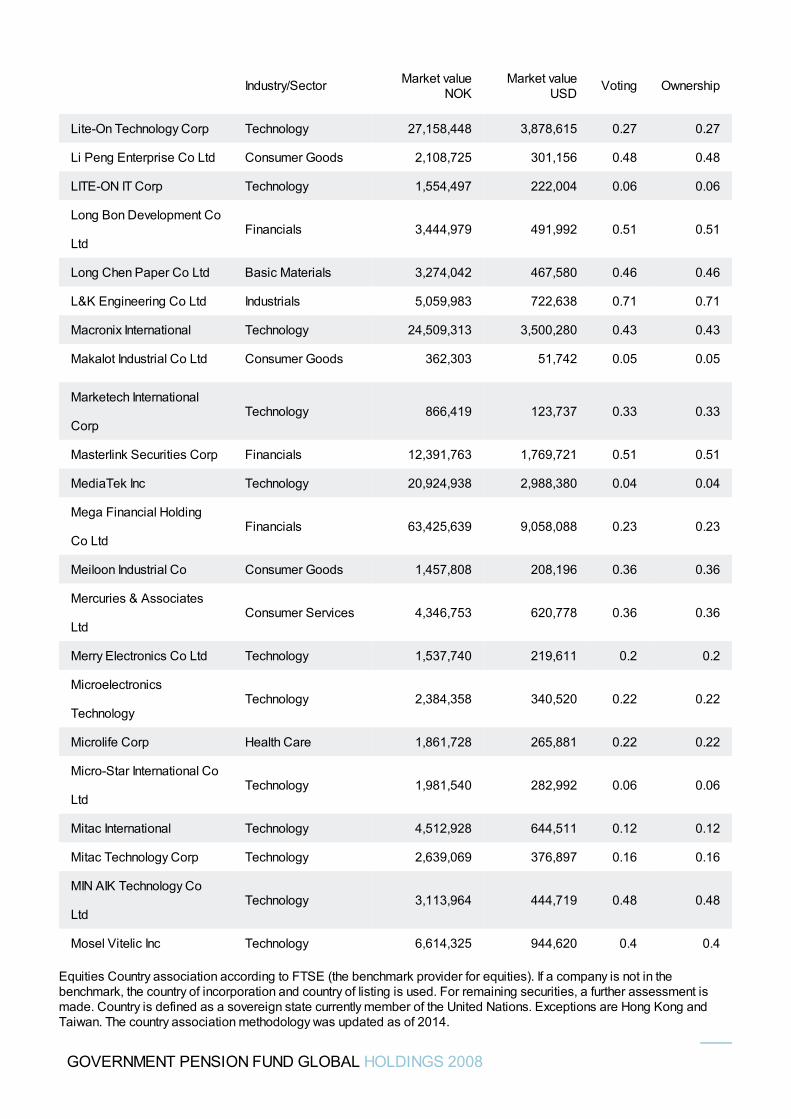
Lite-On Technology Corp Technology 27,158,448 3,878,615 0.27 0.27
Li Peng Enterprise Co Ltd Consumer Goods 2,108,725 301,156 0.48 0.48
LITE-ON IT Corp Technology 1,554,497 222,004 0.06 0.06
Long Bon Development Co
LtdFinancials 3,444,979 491,992 0.51 0.51
Long Chen Paper Co Ltd Basic Materials 3,274,042 467,580 0.46 0.46
L&K Engineering Co Ltd Industrials 5,059,983 722,638 0.71 0.71
Macronix International Technology 24,509,313 3,500,280 0.43 0.43
Makalot Industrial Co Ltd Consumer Goods 362,303 51,742 0.05 0.05
Marketech International
CorpTechnology 866,419 123,737 0.33 0.33
Masterlink Securities Corp Financials 12,391,763 1,769,721 0.51 0.51
MediaTek Inc Technology 20,924,938 2,988,380 0.04 0.04
Mega Financial Holding
Co LtdFinancials 63,425,639 9,058,088 0.23 0.23
Meiloon Industrial Co Consumer Goods 1,457,808 208,196 0.36 0.36
Mercuries & Associates
LtdConsumer Services 4,346,753 620,778 0.36 0.36
Merry Electronics Co Ltd Technology 1,537,740 219,611 0.2 0.2
Microelectronics
TechnologyTechnology 2,384,358 340,520 0.22 0.22
Microlife Corp Health Care 1,861,728 265,881 0.22 0.22
Micro-Star International Co
LtdTechnology 1,981,540 282,992 0.06 0.06
Mitac International Technology 4,512,928 644,511 0.12 0.12
Mitac Technology Corp Technology 2,639,069 376,897 0.16 0.16
MIN AIK Technology Co
LtdTechnology 3,113,964 444,719 0.48 0.48
Mosel Vitelic Inc Technology 6,614,325 944,620 0.4 0.4
Industry/Sector Market valueNOK
Market valueUSD Voting Ownership
GOVERNMENT PENSION FUND GLOBAL HOLDINGS 2008
Equities Country association according to FTSE (the benchmark provider for equities). If a company is not in thebenchmark, the country of incorporation and country of listing is used. For remaining securities, a further assessment ismade. Country is defined as a sovereign state currently member of the United Nations. Exceptions are Hong Kong andTaiwan. The country association methodology was updated as of 2014.
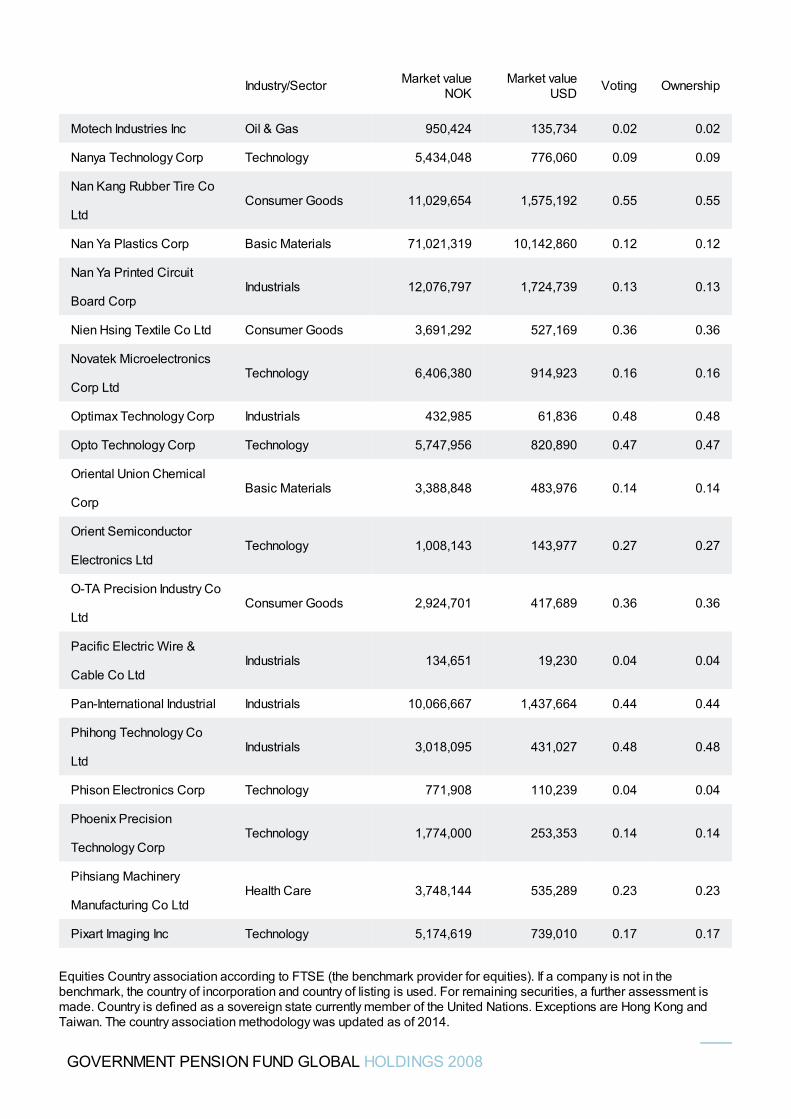
Motech Industries Inc Oil & Gas 950,424 135,734 0.02 0.02
Nanya Technology Corp Technology 5,434,048 776,060 0.09 0.09
Nan Kang Rubber Tire Co
LtdConsumer Goods 11,029,654 1,575,192 0.55 0.55
Nan Ya Plastics Corp Basic Materials 71,021,319 10,142,860 0.12 0.12
Nan Ya Printed Circuit
Board CorpIndustrials 12,076,797 1,724,739 0.13 0.13
Nien Hsing Textile Co Ltd Consumer Goods 3,691,292 527,169 0.36 0.36
Novatek Microelectronics
Corp LtdTechnology 6,406,380 914,923 0.16 0.16
Optimax Technology Corp Industrials 432,985 61,836 0.48 0.48
Opto Technology Corp Technology 5,747,956 820,890 0.47 0.47
Oriental Union Chemical
CorpBasic Materials 3,388,848 483,976 0.14 0.14
Orient Semiconductor
Electronics LtdTechnology 1,008,143 143,977 0.27 0.27
O-TA Precision Industry Co
LtdConsumer Goods 2,924,701 417,689 0.36 0.36
Pacific Electric Wire &
Cable Co LtdIndustrials 134,651 19,230 0.04 0.04
Pan-International Industrial Industrials 10,066,667 1,437,664 0.44 0.44
Phihong Technology Co
LtdIndustrials 3,018,095 431,027 0.48 0.48
Phison Electronics Corp Technology 771,908 110,239 0.04 0.04
Phoenix Precision
Technology CorpTechnology 1,774,000 253,353 0.14 0.14
Pihsiang Machinery
Manufacturing Co LtdHealth Care 3,748,144 535,289 0.23 0.23
Pixart Imaging Inc Technology 5,174,619 739,010 0.17 0.17
Industry/Sector Market valueNOK
Market valueUSD Voting Ownership
GOVERNMENT PENSION FUND GLOBAL HOLDINGS 2008
Equities Country association according to FTSE (the benchmark provider for equities). If a company is not in thebenchmark, the country of incorporation and country of listing is used. For remaining securities, a further assessment ismade. Country is defined as a sovereign state currently member of the United Nations. Exceptions are Hong Kong andTaiwan. The country association methodology was updated as of 2014.
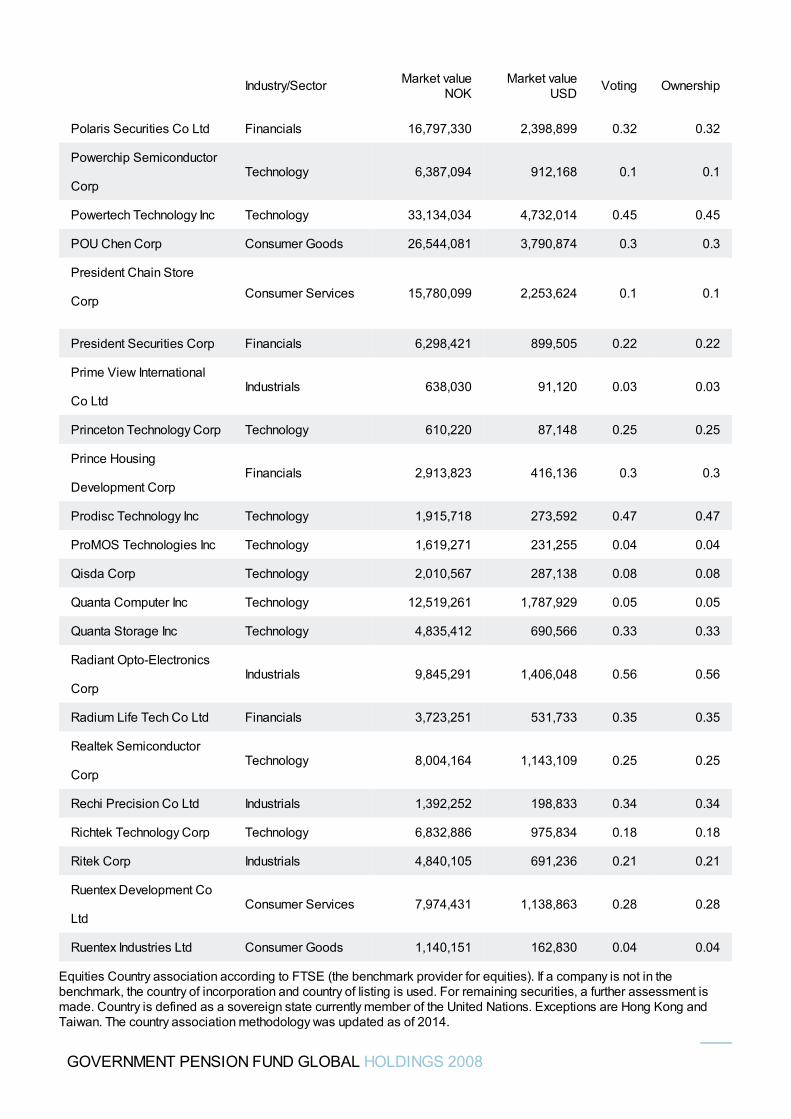
Polaris Securities Co Ltd Financials 16,797,330 2,398,899 0.32 0.32
Powerchip Semiconductor
CorpTechnology 6,387,094 912,168 0.1 0.1
Powertech Technology Inc Technology 33,134,034 4,732,014 0.45 0.45
POU Chen Corp Consumer Goods 26,544,081 3,790,874 0.3 0.3
President Chain Store
Corp Consumer Services 15,780,099 2,253,624 0.1 0.1
President Securities Corp Financials 6,298,421 899,505 0.22 0.22
Prime View International
Co LtdIndustrials 638,030 91,120 0.03 0.03
Princeton Technology Corp Technology 610,220 87,148 0.25 0.25
Prince Housing
Development CorpFinancials 2,913,823 416,136 0.3 0.3
Prodisc Technology Inc Technology 1,915,718 273,592 0.47 0.47
ProMOS Technologies Inc Technology 1,619,271 231,255 0.04 0.04
Qisda Corp Technology 2,010,567 287,138 0.08 0.08
Quanta Computer Inc Technology 12,519,261 1,787,929 0.05 0.05
Quanta Storage Inc Technology 4,835,412 690,566 0.33 0.33
Radiant Opto-Electronics
CorpIndustrials 9,845,291 1,406,048 0.56 0.56
Radium Life Tech Co Ltd Financials 3,723,251 531,733 0.35 0.35
Realtek Semiconductor
CorpTechnology 8,004,164 1,143,109 0.25 0.25
Rechi Precision Co Ltd Industrials 1,392,252 198,833 0.34 0.34
Richtek Technology Corp Technology 6,832,886 975,834 0.18 0.18
Ritek Corp Industrials 4,840,105 691,236 0.21 0.21
Ruentex Development Co
LtdConsumer Services 7,974,431 1,138,863 0.28 0.28
Ruentex Industries Ltd Consumer Goods 1,140,151 162,830 0.04 0.04
Industry/Sector Market valueNOK
Market valueUSD Voting Ownership
GOVERNMENT PENSION FUND GLOBAL HOLDINGS 2008
Equities Country association according to FTSE (the benchmark provider for equities). If a company is not in thebenchmark, the country of incorporation and country of listing is used. For remaining securities, a further assessment ismade. Country is defined as a sovereign state currently member of the United Nations. Exceptions are Hong Kong andTaiwan. The country association methodology was updated as of 2014.
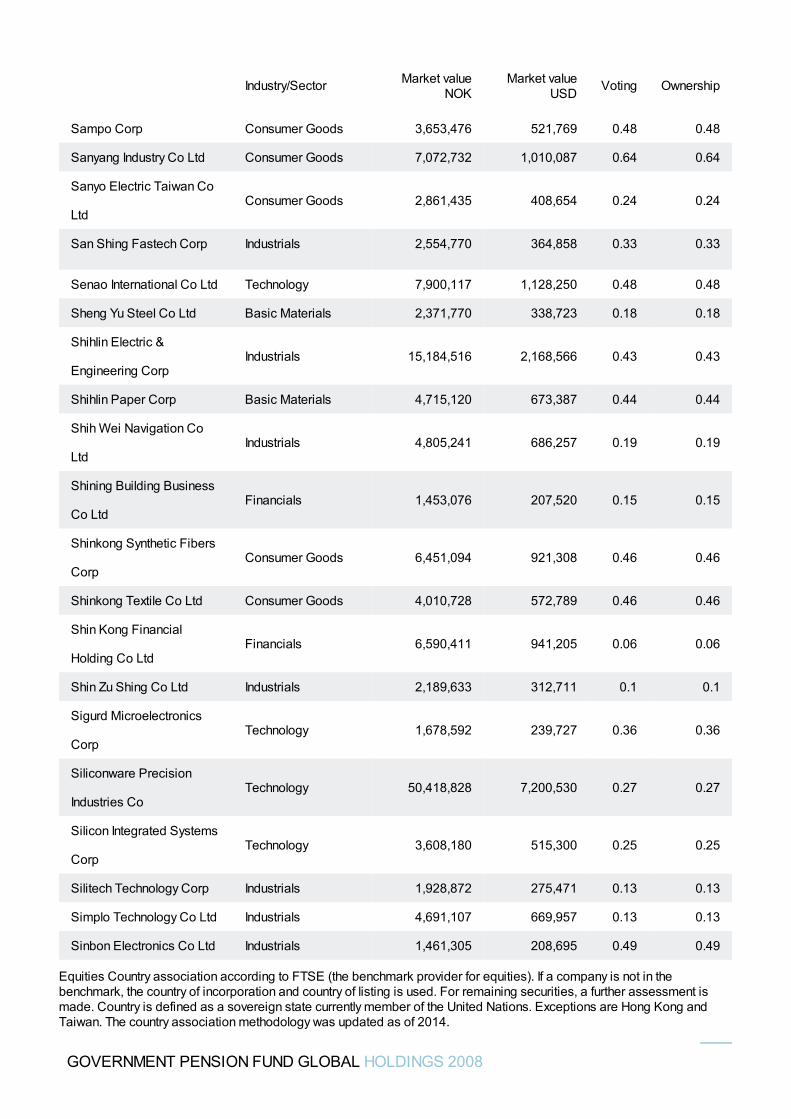
Sampo Corp Consumer Goods 3,653,476 521,769 0.48 0.48
Sanyang Industry Co Ltd Consumer Goods 7,072,732 1,010,087 0.64 0.64
Sanyo Electric Taiwan Co
LtdConsumer Goods 2,861,435 408,654 0.24 0.24
San Shing Fastech Corp Industrials 2,554,770 364,858 0.33 0.33
Senao International Co Ltd Technology 7,900,117 1,128,250 0.48 0.48
Sheng Yu Steel Co Ltd Basic Materials 2,371,770 338,723 0.18 0.18
Shihlin Electric &
Engineering CorpIndustrials 15,184,516 2,168,566 0.43 0.43
Shihlin Paper Corp Basic Materials 4,715,120 673,387 0.44 0.44
Shih Wei Navigation Co
LtdIndustrials 4,805,241 686,257 0.19 0.19
Shining Building Business
Co LtdFinancials 1,453,076 207,520 0.15 0.15
Shinkong Synthetic Fibers
CorpConsumer Goods 6,451,094 921,308 0.46 0.46
Shinkong Textile Co Ltd Consumer Goods 4,010,728 572,789 0.46 0.46
Shin Kong Financial
Holding Co LtdFinancials 6,590,411 941,205 0.06 0.06
Shin Zu Shing Co Ltd Industrials 2,189,633 312,711 0.1 0.1
Sigurd Microelectronics
CorpTechnology 1,678,592 239,727 0.36 0.36
Siliconware Precision
Industries CoTechnology 50,418,828 7,200,530 0.27 0.27
Silicon Integrated Systems
CorpTechnology 3,608,180 515,300 0.25 0.25
Silitech Technology Corp Industrials 1,928,872 275,471 0.13 0.13
Simplo Technology Co Ltd Industrials 4,691,107 669,957 0.13 0.13
Sinbon Electronics Co Ltd Industrials 1,461,305 208,695 0.49 0.49
Industry/Sector Market valueNOK
Market valueUSD Voting Ownership
GOVERNMENT PENSION FUND GLOBAL HOLDINGS 2008
Equities Country association according to FTSE (the benchmark provider for equities). If a company is not in thebenchmark, the country of incorporation and country of listing is used. For remaining securities, a further assessment ismade. Country is defined as a sovereign state currently member of the United Nations. Exceptions are Hong Kong andTaiwan. The country association methodology was updated as of 2014.
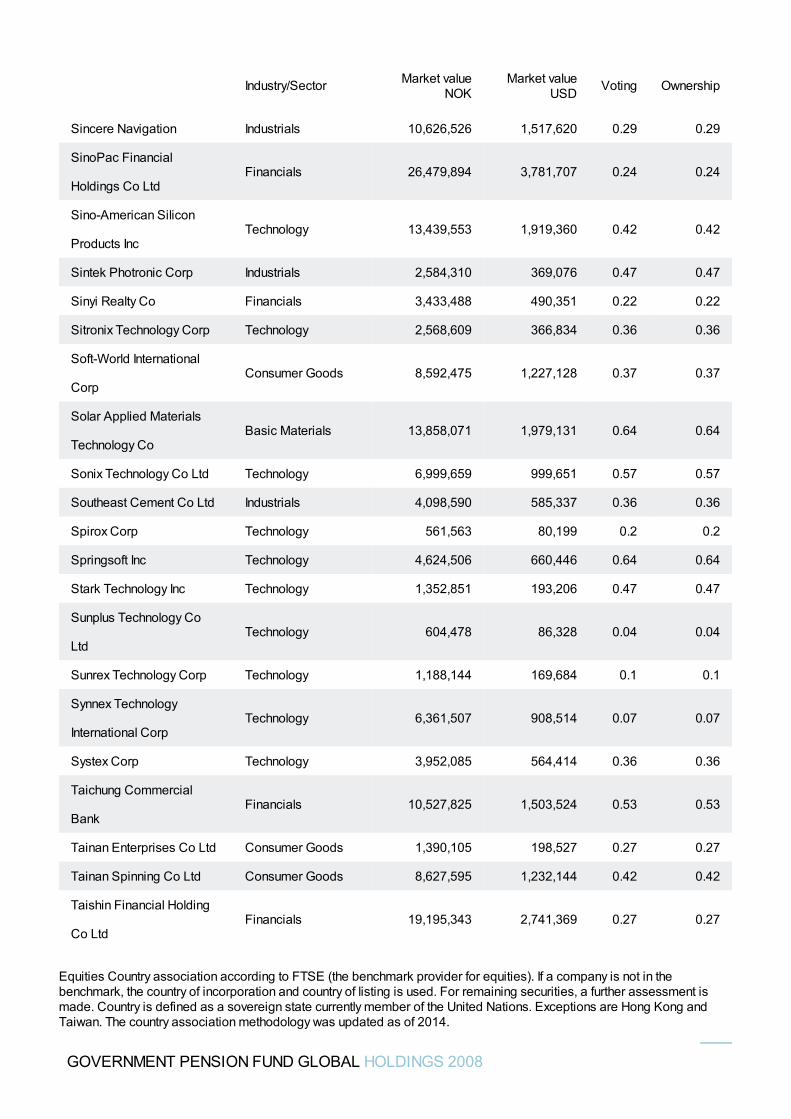
Sincere Navigation Industrials 10,626,526 1,517,620 0.29 0.29
SinoPac Financial
Holdings Co LtdFinancials 26,479,894 3,781,707 0.24 0.24
Sino-American Silicon
Products IncTechnology 13,439,553 1,919,360 0.42 0.42
Sintek Photronic Corp Industrials 2,584,310 369,076 0.47 0.47
Sinyi Realty Co Financials 3,433,488 490,351 0.22 0.22
Sitronix Technology Corp Technology 2,568,609 366,834 0.36 0.36
Soft-World International
CorpConsumer Goods 8,592,475 1,227,128 0.37 0.37
Solar Applied Materials
Technology CoBasic Materials 13,858,071 1,979,131 0.64 0.64
Sonix Technology Co Ltd Technology 6,999,659 999,651 0.57 0.57
Southeast Cement Co Ltd Industrials 4,098,590 585,337 0.36 0.36
Spirox Corp Technology 561,563 80,199 0.2 0.2
Springsoft Inc Technology 4,624,506 660,446 0.64 0.64
Stark Technology Inc Technology 1,352,851 193,206 0.47 0.47
Sunplus Technology Co
LtdTechnology 604,478 86,328 0.04 0.04
Sunrex Technology Corp Technology 1,188,144 169,684 0.1 0.1
Synnex Technology
International CorpTechnology 6,361,507 908,514 0.07 0.07
Systex Corp Technology 3,952,085 564,414 0.36 0.36
Taichung Commercial
BankFinancials 10,527,825 1,503,524 0.53 0.53
Tainan Enterprises Co Ltd Consumer Goods 1,390,105 198,527 0.27 0.27
Tainan Spinning Co Ltd Consumer Goods 8,627,595 1,232,144 0.42 0.42
Taishin Financial Holding
Co LtdFinancials 19,195,343 2,741,369 0.27 0.27
Industry/Sector Market valueNOK
Market valueUSD Voting Ownership
GOVERNMENT PENSION FUND GLOBAL HOLDINGS 2008
Equities Country association according to FTSE (the benchmark provider for equities). If a company is not in thebenchmark, the country of incorporation and country of listing is used. For remaining securities, a further assessment ismade. Country is defined as a sovereign state currently member of the United Nations. Exceptions are Hong Kong andTaiwan. The country association methodology was updated as of 2014.
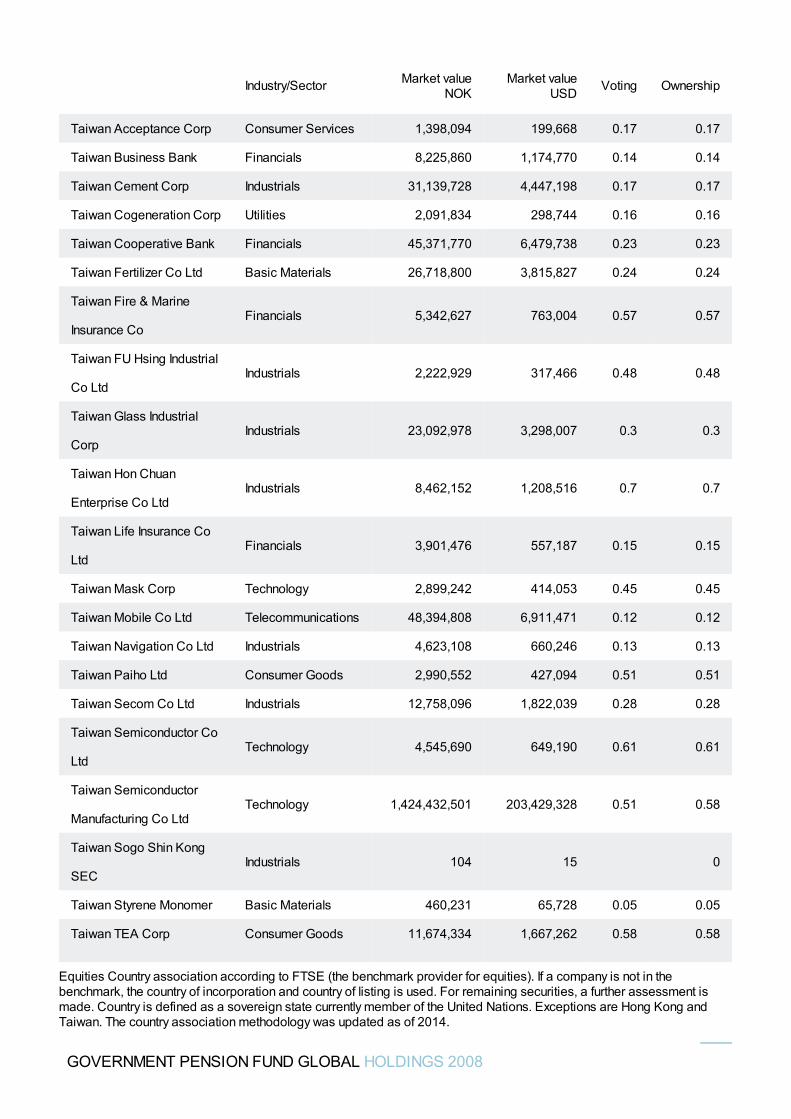
Taiwan Acceptance Corp Consumer Services 1,398,094 199,668 0.17 0.17
Taiwan Business Bank Financials 8,225,860 1,174,770 0.14 0.14
Taiwan Cement Corp Industrials 31,139,728 4,447,198 0.17 0.17
Taiwan Cogeneration Corp Utilities 2,091,834 298,744 0.16 0.16
Taiwan Cooperative Bank Financials 45,371,770 6,479,738 0.23 0.23
Taiwan Fertilizer Co Ltd Basic Materials 26,718,800 3,815,827 0.24 0.24
Taiwan Fire & Marine
Insurance CoFinancials 5,342,627 763,004 0.57 0.57
Taiwan FU Hsing Industrial
Co LtdIndustrials 2,222,929 317,466 0.48 0.48
Taiwan Glass Industrial
CorpIndustrials 23,092,978 3,298,007 0.3 0.3
Taiwan Hon Chuan
Enterprise Co LtdIndustrials 8,462,152 1,208,516 0.7 0.7
Taiwan Life Insurance Co
LtdFinancials 3,901,476 557,187 0.15 0.15
Taiwan Mask Corp Technology 2,899,242 414,053 0.45 0.45
Taiwan Mobile Co Ltd Telecommunications 48,394,808 6,911,471 0.12 0.12
Taiwan Navigation Co Ltd Industrials 4,623,108 660,246 0.13 0.13
Taiwan Paiho Ltd Consumer Goods 2,990,552 427,094 0.51 0.51
Taiwan Secom Co Ltd Industrials 12,758,096 1,822,039 0.28 0.28
Taiwan Semiconductor Co
LtdTechnology 4,545,690 649,190 0.61 0.61
Taiwan Semiconductor
Manufacturing Co LtdTechnology 1,424,432,501 203,429,328 0.51 0.58
Taiwan Sogo Shin Kong
SECIndustrials 104 15 0
Taiwan Styrene Monomer Basic Materials 460,231 65,728 0.05 0.05
Taiwan TEA Corp Consumer Goods 11,674,334 1,667,262 0.58 0.58
Industry/Sector Market valueNOK
Market valueUSD Voting Ownership
GOVERNMENT PENSION FUND GLOBAL HOLDINGS 2008
Equities Country association according to FTSE (the benchmark provider for equities). If a company is not in thebenchmark, the country of incorporation and country of listing is used. For remaining securities, a further assessment ismade. Country is defined as a sovereign state currently member of the United Nations. Exceptions are Hong Kong andTaiwan. The country association methodology was updated as of 2014.
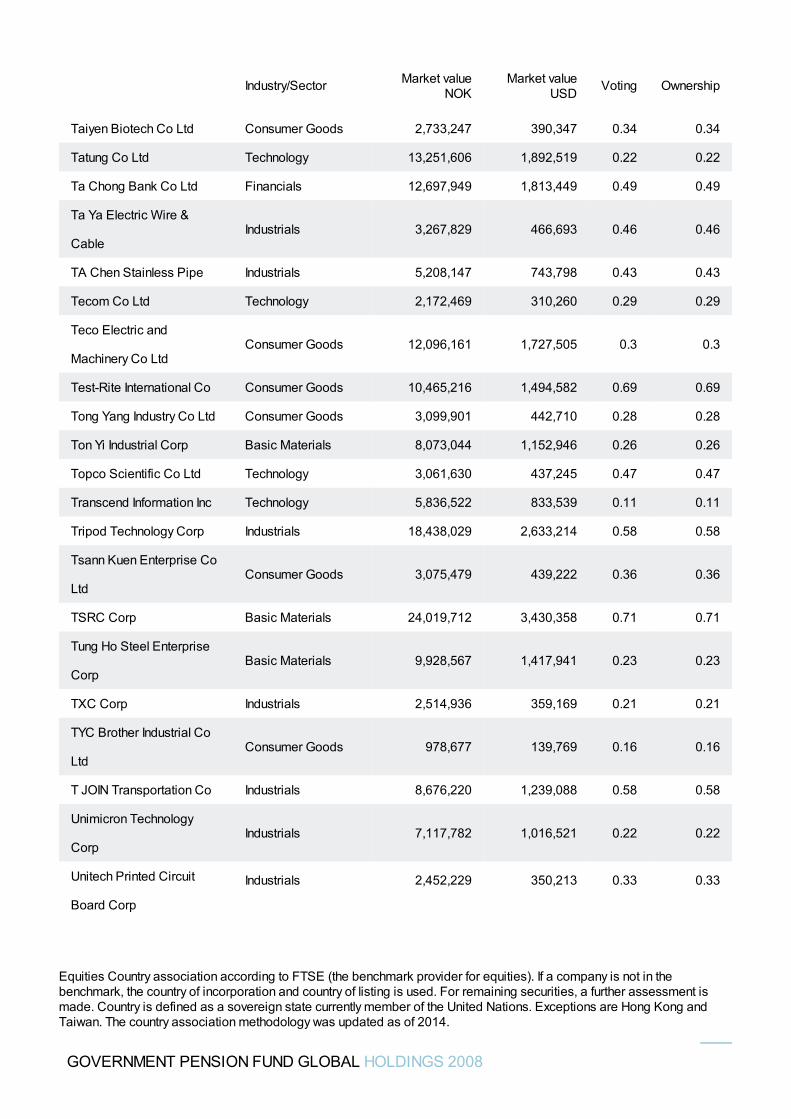
Taiyen Biotech Co Ltd Consumer Goods 2,733,247 390,347 0.34 0.34
Tatung Co Ltd Technology 13,251,606 1,892,519 0.22 0.22
Ta Chong Bank Co Ltd Financials 12,697,949 1,813,449 0.49 0.49
Ta Ya Electric Wire &
CableIndustrials 3,267,829 466,693 0.46 0.46
TA Chen Stainless Pipe Industrials 5,208,147 743,798 0.43 0.43
Tecom Co Ltd Technology 2,172,469 310,260 0.29 0.29
Teco Electric and
Machinery Co LtdConsumer Goods 12,096,161 1,727,505 0.3 0.3
Test-Rite International Co Consumer Goods 10,465,216 1,494,582 0.69 0.69
Tong Yang Industry Co Ltd Consumer Goods 3,099,901 442,710 0.28 0.28
Ton Yi Industrial Corp Basic Materials 8,073,044 1,152,946 0.26 0.26
Topco Scientific Co Ltd Technology 3,061,630 437,245 0.47 0.47
Transcend Information Inc Technology 5,836,522 833,539 0.11 0.11
Tripod Technology Corp Industrials 18,438,029 2,633,214 0.58 0.58
Tsann Kuen Enterprise Co
LtdConsumer Goods 3,075,479 439,222 0.36 0.36
TSRC Corp Basic Materials 24,019,712 3,430,358 0.71 0.71
Tung Ho Steel Enterprise
CorpBasic Materials 9,928,567 1,417,941 0.23 0.23
TXC Corp Industrials 2,514,936 359,169 0.21 0.21
TYC Brother Industrial Co
LtdConsumer Goods 978,677 139,769 0.16 0.16
T JOIN Transportation Co Industrials 8,676,220 1,239,088 0.58 0.58
Unimicron Technology
CorpIndustrials 7,117,782 1,016,521 0.22 0.22
Unitech Printed Circuit
Board Corp
Industrials 2,452,229 350,213 0.33 0.33
Industry/Sector Market valueNOK
Market valueUSD Voting Ownership
GOVERNMENT PENSION FUND GLOBAL HOLDINGS 2008
Equities Country association according to FTSE (the benchmark provider for equities). If a company is not in thebenchmark, the country of incorporation and country of listing is used. For remaining securities, a further assessment ismade. Country is defined as a sovereign state currently member of the United Nations. Exceptions are Hong Kong andTaiwan. The country association methodology was updated as of 2014.
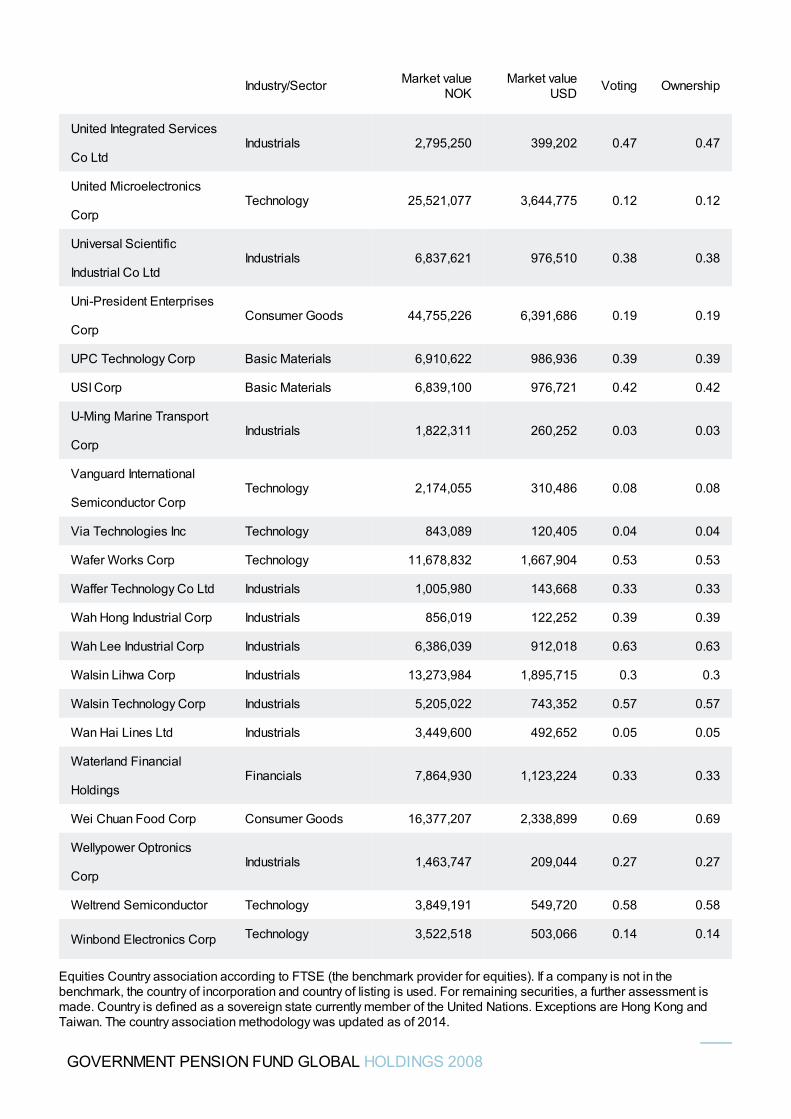
United Integrated Services
Co LtdIndustrials 2,795,250 399,202 0.47 0.47
United Microelectronics
CorpTechnology 25,521,077 3,644,775 0.12 0.12
Universal Scientific
Industrial Co LtdIndustrials 6,837,621 976,510 0.38 0.38
Uni-President Enterprises
CorpConsumer Goods 44,755,226 6,391,686 0.19 0.19
UPC Technology Corp Basic Materials 6,910,622 986,936 0.39 0.39
USI Corp Basic Materials 6,839,100 976,721 0.42 0.42
U-Ming Marine Transport
CorpIndustrials 1,822,311 260,252 0.03 0.03
Vanguard International
Semiconductor CorpTechnology 2,174,055 310,486 0.08 0.08
Via Technologies Inc Technology 843,089 120,405 0.04 0.04
Wafer Works Corp Technology 11,678,832 1,667,904 0.53 0.53
Waffer Technology Co Ltd Industrials 1,005,980 143,668 0.33 0.33
Wah Hong Industrial Corp Industrials 856,019 122,252 0.39 0.39
Wah Lee Industrial Corp Industrials 6,386,039 912,018 0.63 0.63
Walsin Lihwa Corp Industrials 13,273,984 1,895,715 0.3 0.3
Walsin Technology Corp Industrials 5,205,022 743,352 0.57 0.57
Wan Hai Lines Ltd Industrials 3,449,600 492,652 0.05 0.05
Waterland Financial
HoldingsFinancials 7,864,930 1,123,224 0.33 0.33
Wei Chuan Food Corp Consumer Goods 16,377,207 2,338,899 0.69 0.69
Wellypower Optronics
CorpIndustrials 1,463,747 209,044 0.27 0.27
Weltrend Semiconductor Technology 3,849,191 549,720 0.58 0.58
Winbond Electronics Corp Technology 3,522,518 503,066 0.14 0.14
Industry/Sector Market valueNOK
Market valueUSD Voting Ownership
GOVERNMENT PENSION FUND GLOBAL HOLDINGS 2008
Equities Country association according to FTSE (the benchmark provider for equities). If a company is not in thebenchmark, the country of incorporation and country of listing is used. For remaining securities, a further assessment ismade. Country is defined as a sovereign state currently member of the United Nations. Exceptions are Hong Kong andTaiwan. The country association methodology was updated as of 2014.
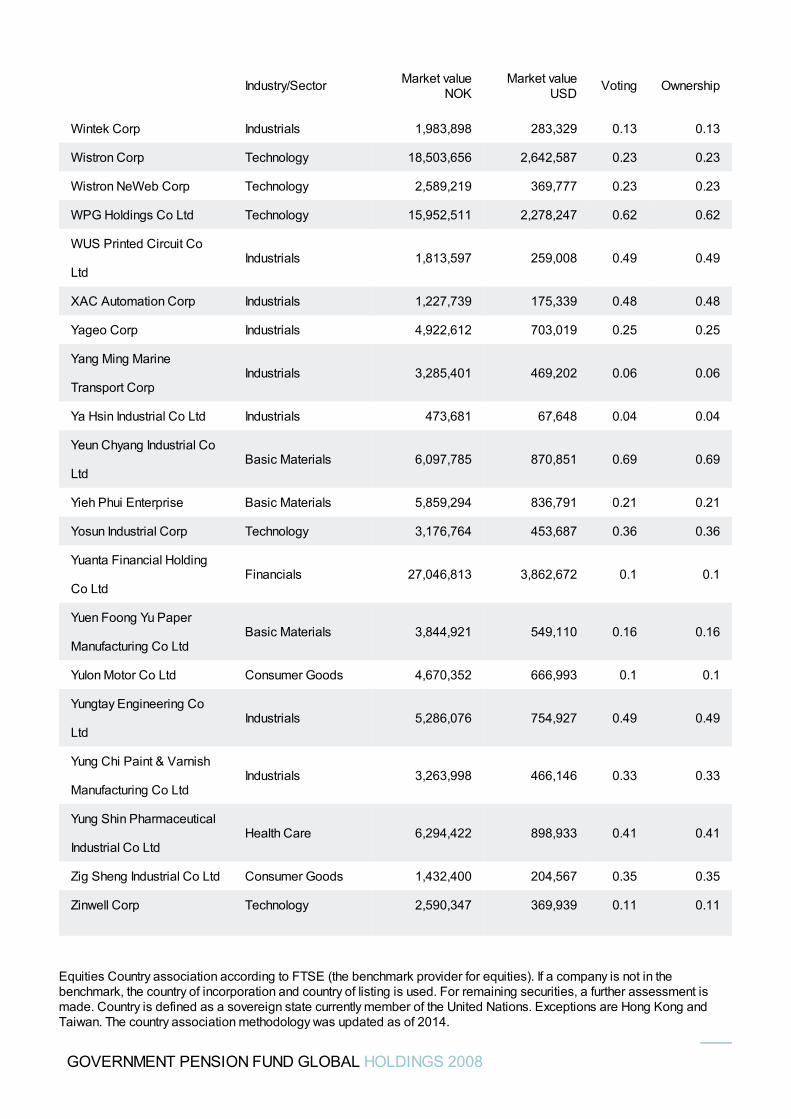
Wintek Corp Industrials 1,983,898 283,329 0.13 0.13
Wistron Corp Technology 18,503,656 2,642,587 0.23 0.23
Wistron NeWeb Corp Technology 2,589,219 369,777 0.23 0.23
WPG Holdings Co Ltd Technology 15,952,511 2,278,247 0.62 0.62
WUS Printed Circuit Co
LtdIndustrials 1,813,597 259,008 0.49 0.49
XAC Automation Corp Industrials 1,227,739 175,339 0.48 0.48
Yageo Corp Industrials 4,922,612 703,019 0.25 0.25
Yang Ming Marine
Transport CorpIndustrials 3,285,401 469,202 0.06 0.06
Ya Hsin Industrial Co Ltd Industrials 473,681 67,648 0.04 0.04
Yeun Chyang Industrial Co
LtdBasic Materials 6,097,785 870,851 0.69 0.69
Yieh Phui Enterprise Basic Materials 5,859,294 836,791 0.21 0.21
Yosun Industrial Corp Technology 3,176,764 453,687 0.36 0.36
Yuanta Financial Holding
Co LtdFinancials 27,046,813 3,862,672 0.1 0.1
Yuen Foong Yu Paper
Manufacturing Co LtdBasic Materials 3,844,921 549,110 0.16 0.16
Yulon Motor Co Ltd Consumer Goods 4,670,352 666,993 0.1 0.1
Yungtay Engineering Co
LtdIndustrials 5,286,076 754,927 0.49 0.49
Yung Chi Paint & Varnish
Manufacturing Co LtdIndustrials 3,263,998 466,146 0.33 0.33
Yung Shin Pharmaceutical
Industrial Co LtdHealth Care 6,294,422 898,933 0.41 0.41
Zig Sheng Industrial Co Ltd Consumer Goods 1,432,400 204,567 0.35 0.35
Zinwell Corp Technology 2,590,347 369,939 0.11 0.11
Industry/Sector Market valueNOK
Market valueUSD Voting Ownership
GOVERNMENT PENSION FUND GLOBAL HOLDINGS 2008
Equities Country association according to FTSE (the benchmark provider for equities). If a company is not in thebenchmark, the country of incorporation and country of listing is used. For remaining securities, a further assessment ismade. Country is defined as a sovereign state currently member of the United Nations. Exceptions are Hong Kong andTaiwan. The country association methodology was updated as of 2014.
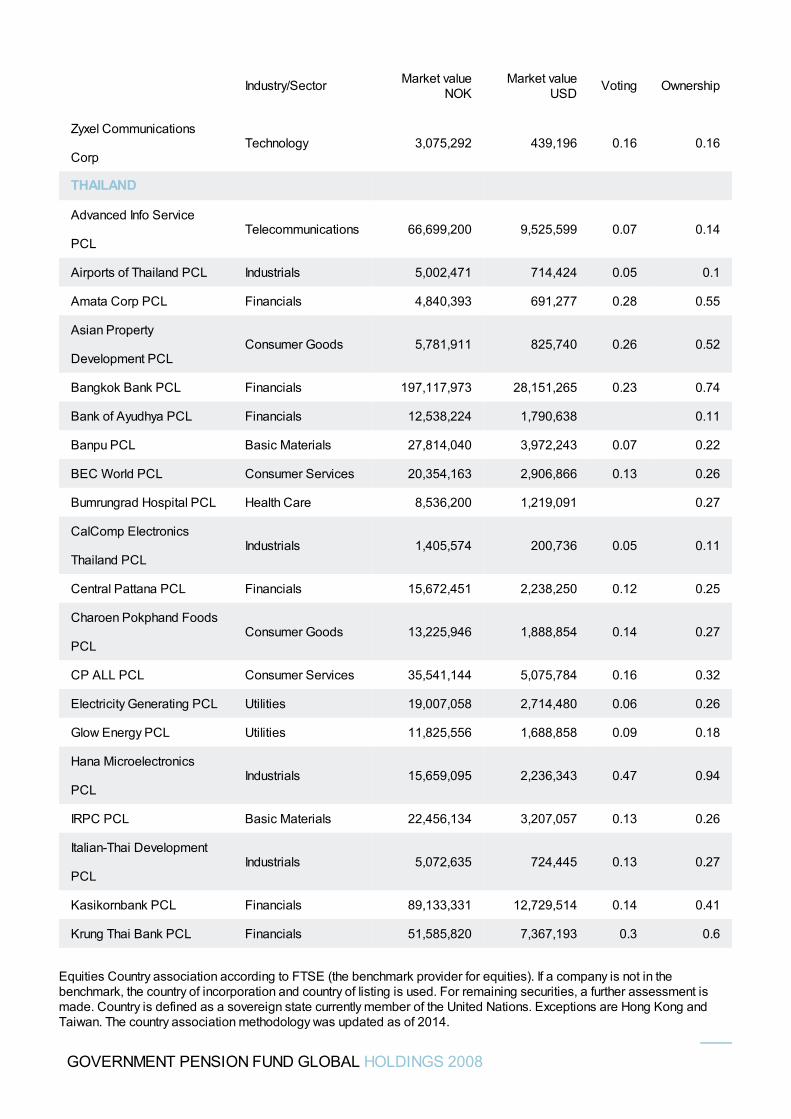
Zyxel Communications
CorpTechnology 3,075,292 439,196 0.16 0.16
THAILAND
Advanced Info Service
PCLTelecommunications 66,699,200 9,525,599 0.07 0.14
Airports of Thailand PCL Industrials 5,002,471 714,424 0.05 0.1
Amata Corp PCL Financials 4,840,393 691,277 0.28 0.55
Asian Property
Development PCLConsumer Goods 5,781,911 825,740 0.26 0.52
Bangkok Bank PCL Financials 197,117,973 28,151,265 0.23 0.74
Bank of Ayudhya PCL Financials 12,538,224 1,790,638 0.11
Banpu PCL Basic Materials 27,814,040 3,972,243 0.07 0.22
BEC World PCL Consumer Services 20,354,163 2,906,866 0.13 0.26
Bumrungrad Hospital PCL Health Care 8,536,200 1,219,091 0.27
CalComp Electronics
Thailand PCLIndustrials 1,405,574 200,736 0.05 0.11
Central Pattana PCL Financials 15,672,451 2,238,250 0.12 0.25
Charoen Pokphand Foods
PCLConsumer Goods 13,225,946 1,888,854 0.14 0.27
CP ALL PCL Consumer Services 35,541,144 5,075,784 0.16 0.32
Electricity Generating PCL Utilities 19,007,058 2,714,480 0.06 0.26
Glow Energy PCL Utilities 11,825,556 1,688,858 0.09 0.18
Hana Microelectronics
PCLIndustrials 15,659,095 2,236,343 0.47 0.94
IRPC PCL Basic Materials 22,456,134 3,207,057 0.13 0.26
Italian-Thai Development
PCLIndustrials 5,072,635 724,445 0.13 0.27
Kasikornbank PCL Financials 89,133,331 12,729,514 0.14 0.41
Krung Thai Bank PCL Financials 51,585,820 7,367,193 0.3 0.6
Industry/Sector Market valueNOK
Market valueUSD Voting Ownership
GOVERNMENT PENSION FUND GLOBAL HOLDINGS 2008
Equities Country association according to FTSE (the benchmark provider for equities). If a company is not in thebenchmark, the country of incorporation and country of listing is used. For remaining securities, a further assessment ismade. Country is defined as a sovereign state currently member of the United Nations. Exceptions are Hong Kong andTaiwan. The country association methodology was updated as of 2014.
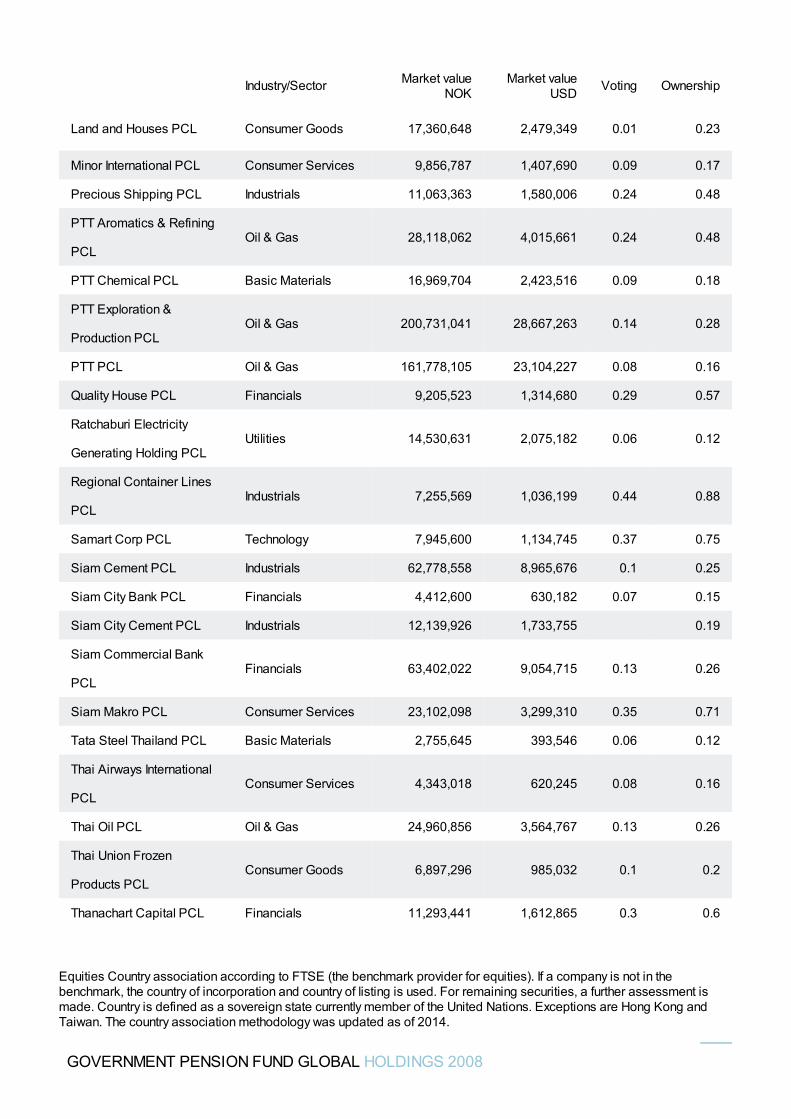
Land and Houses PCL Consumer Goods 17,360,648 2,479,349 0.01 0.23
Minor International PCL Consumer Services 9,856,787 1,407,690 0.09 0.17
Precious Shipping PCL Industrials 11,063,363 1,580,006 0.24 0.48
PTT Aromatics & Refining
PCLOil & Gas 28,118,062 4,015,661 0.24 0.48
PTT Chemical PCL Basic Materials 16,969,704 2,423,516 0.09 0.18
PTT Exploration &
Production PCLOil & Gas 200,731,041 28,667,263 0.14 0.28
PTT PCL Oil & Gas 161,778,105 23,104,227 0.08 0.16
Quality House PCL Financials 9,205,523 1,314,680 0.29 0.57
Ratchaburi Electricity
Generating Holding PCLUtilities 14,530,631 2,075,182 0.06 0.12
Regional Container Lines
PCLIndustrials 7,255,569 1,036,199 0.44 0.88
Samart Corp PCL Technology 7,945,600 1,134,745 0.37 0.75
Siam Cement PCL Industrials 62,778,558 8,965,676 0.1 0.25
Siam City Bank PCL Financials 4,412,600 630,182 0.07 0.15
Siam City Cement PCL Industrials 12,139,926 1,733,755 0.19
Siam Commercial Bank
PCLFinancials 63,402,022 9,054,715 0.13 0.26
Siam Makro PCL Consumer Services 23,102,098 3,299,310 0.35 0.71
Tata Steel Thailand PCL Basic Materials 2,755,645 393,546 0.06 0.12
Thai Airways International
PCLConsumer Services 4,343,018 620,245 0.08 0.16
Thai Oil PCL Oil & Gas 24,960,856 3,564,767 0.13 0.26
Thai Union Frozen
Products PCLConsumer Goods 6,897,296 985,032 0.1 0.2
Thanachart Capital PCL Financials 11,293,441 1,612,865 0.3 0.6
Industry/Sector Market valueNOK
Market valueUSD Voting Ownership
GOVERNMENT PENSION FUND GLOBAL HOLDINGS 2008
Equities Country association according to FTSE (the benchmark provider for equities). If a company is not in thebenchmark, the country of incorporation and country of listing is used. For remaining securities, a further assessment ismade. Country is defined as a sovereign state currently member of the United Nations. Exceptions are Hong Kong andTaiwan. The country association methodology was updated as of 2014.
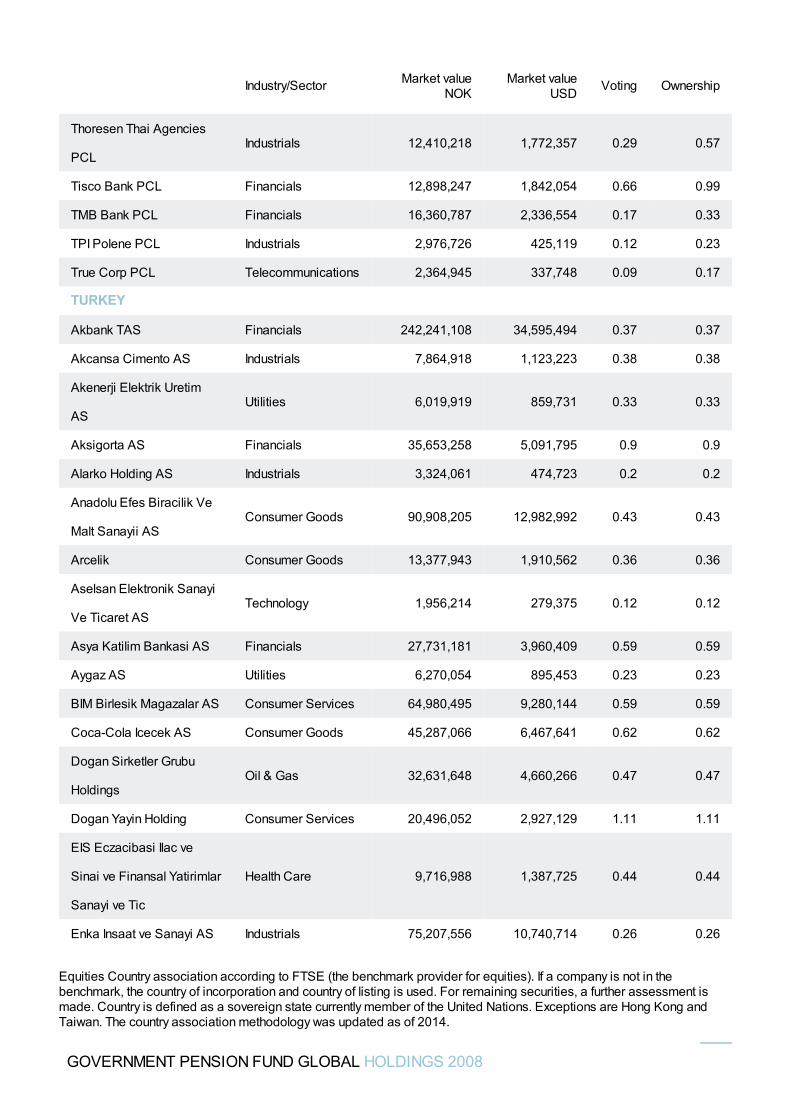
Thoresen Thai Agencies
PCLIndustrials 12,410,218 1,772,357 0.29 0.57
Tisco Bank PCL Financials 12,898,247 1,842,054 0.66 0.99
TMB Bank PCL Financials 16,360,787 2,336,554 0.17 0.33
TPI Polene PCL Industrials 2,976,726 425,119 0.12 0.23
True Corp PCL Telecommunications 2,364,945 337,748 0.09 0.17
TURKEY
Akbank TAS Financials 242,241,108 34,595,494 0.37 0.37
Akcansa Cimento AS Industrials 7,864,918 1,123,223 0.38 0.38
Akenerji Elektrik Uretim
ASUtilities 6,019,919 859,731 0.33 0.33
Aksigorta AS Financials 35,653,258 5,091,795 0.9 0.9
Alarko Holding AS Industrials 3,324,061 474,723 0.2 0.2
Anadolu Efes Biracilik Ve
Malt Sanayii ASConsumer Goods 90,908,205 12,982,992 0.43 0.43
Arcelik Consumer Goods 13,377,943 1,910,562 0.36 0.36
Aselsan Elektronik Sanayi
Ve Ticaret ASTechnology 1,956,214 279,375 0.12 0.12
Asya Katilim Bankasi AS Financials 27,731,181 3,960,409 0.59 0.59
Aygaz AS Utilities 6,270,054 895,453 0.23 0.23
BIM Birlesik Magazalar AS Consumer Services 64,980,495 9,280,144 0.59 0.59
Coca-Cola Icecek AS Consumer Goods 45,287,066 6,467,641 0.62 0.62
Dogan Sirketler Grubu
HoldingsOil & Gas 32,631,648 4,660,266 0.47 0.47
Dogan Yayin Holding Consumer Services 20,496,052 2,927,129 1.11 1.11
EIS Eczacibasi Ilac ve
Sinai ve Finansal Yatirimlar
Sanayi ve Tic
Health Care 9,716,988 1,387,725 0.44 0.44
Enka Insaat ve Sanayi AS Industrials 75,207,556 10,740,714 0.26 0.26
Industry/Sector Market valueNOK
Market valueUSD Voting Ownership
GOVERNMENT PENSION FUND GLOBAL HOLDINGS 2008
Equities Country association according to FTSE (the benchmark provider for equities). If a company is not in thebenchmark, the country of incorporation and country of listing is used. For remaining securities, a further assessment ismade. Country is defined as a sovereign state currently member of the United Nations. Exceptions are Hong Kong andTaiwan. The country association methodology was updated as of 2014.
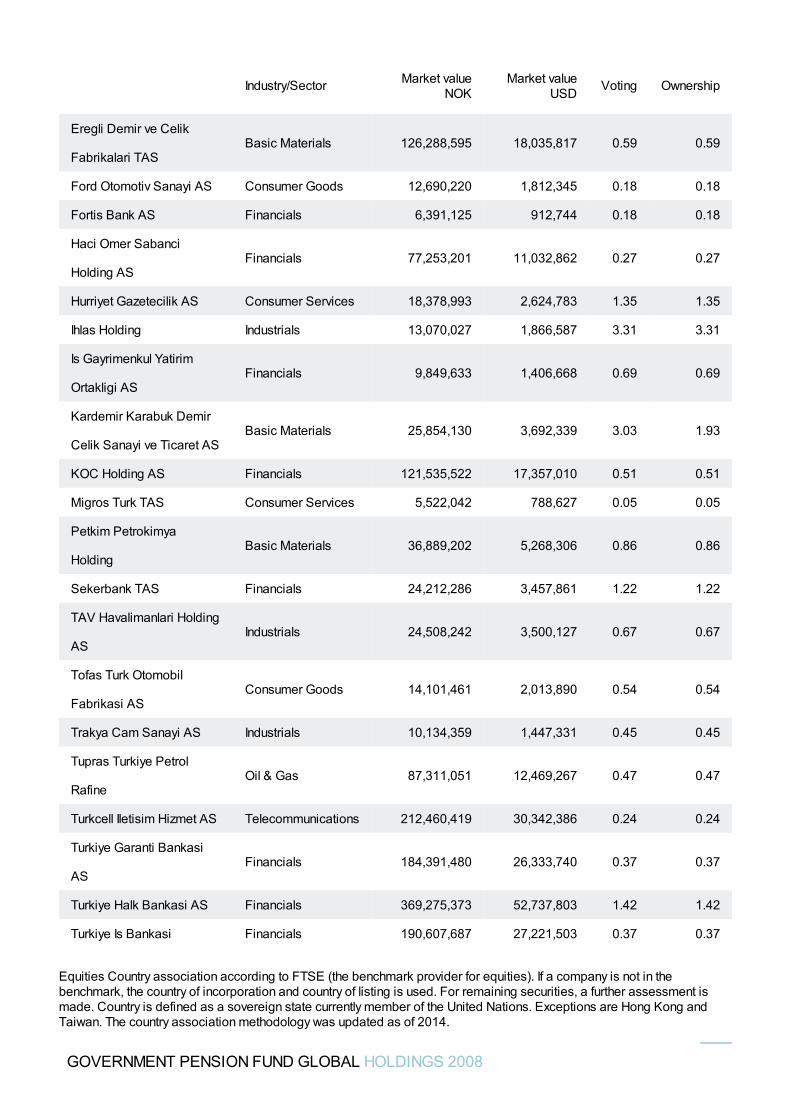
Eregli Demir ve Celik
Fabrikalari TASBasic Materials 126,288,595 18,035,817 0.59 0.59
Ford Otomotiv Sanayi AS Consumer Goods 12,690,220 1,812,345 0.18 0.18
Fortis Bank AS Financials 6,391,125 912,744 0.18 0.18
Haci Omer Sabanci
Holding ASFinancials 77,253,201 11,032,862 0.27 0.27
Hurriyet Gazetecilik AS Consumer Services 18,378,993 2,624,783 1.35 1.35
Ihlas Holding Industrials 13,070,027 1,866,587 3.31 3.31
Is Gayrimenkul Yatirim
Ortakligi ASFinancials 9,849,633 1,406,668 0.69 0.69
Kardemir Karabuk Demir
Celik Sanayi ve Ticaret ASBasic Materials 25,854,130 3,692,339 3.03 1.93
KOC Holding AS Financials 121,535,522 17,357,010 0.51 0.51
Migros Turk TAS Consumer Services 5,522,042 788,627 0.05 0.05
Petkim Petrokimya
HoldingBasic Materials 36,889,202 5,268,306 0.86 0.86
Sekerbank TAS Financials 24,212,286 3,457,861 1.22 1.22
TAV Havalimanlari Holding
ASIndustrials 24,508,242 3,500,127 0.67 0.67
Tofas Turk Otomobil
Fabrikasi ASConsumer Goods 14,101,461 2,013,890 0.54 0.54
Trakya Cam Sanayi AS Industrials 10,134,359 1,447,331 0.45 0.45
Tupras Turkiye Petrol
RafineOil & Gas 87,311,051 12,469,267 0.47 0.47
Turkcell Iletisim Hizmet AS Telecommunications 212,460,419 30,342,386 0.24 0.24
Turkiye Garanti Bankasi
ASFinancials 184,391,480 26,333,740 0.37 0.37
Turkiye Halk Bankasi AS Financials 369,275,373 52,737,803 1.42 1.42
Turkiye Is Bankasi Financials 190,607,687 27,221,503 0.37 0.37
Industry/Sector Market valueNOK
Market valueUSD Voting Ownership
GOVERNMENT PENSION FUND GLOBAL HOLDINGS 2008
Equities Country association according to FTSE (the benchmark provider for equities). If a company is not in thebenchmark, the country of incorporation and country of listing is used. For remaining securities, a further assessment ismade. Country is defined as a sovereign state currently member of the United Nations. Exceptions are Hong Kong andTaiwan. The country association methodology was updated as of 2014.
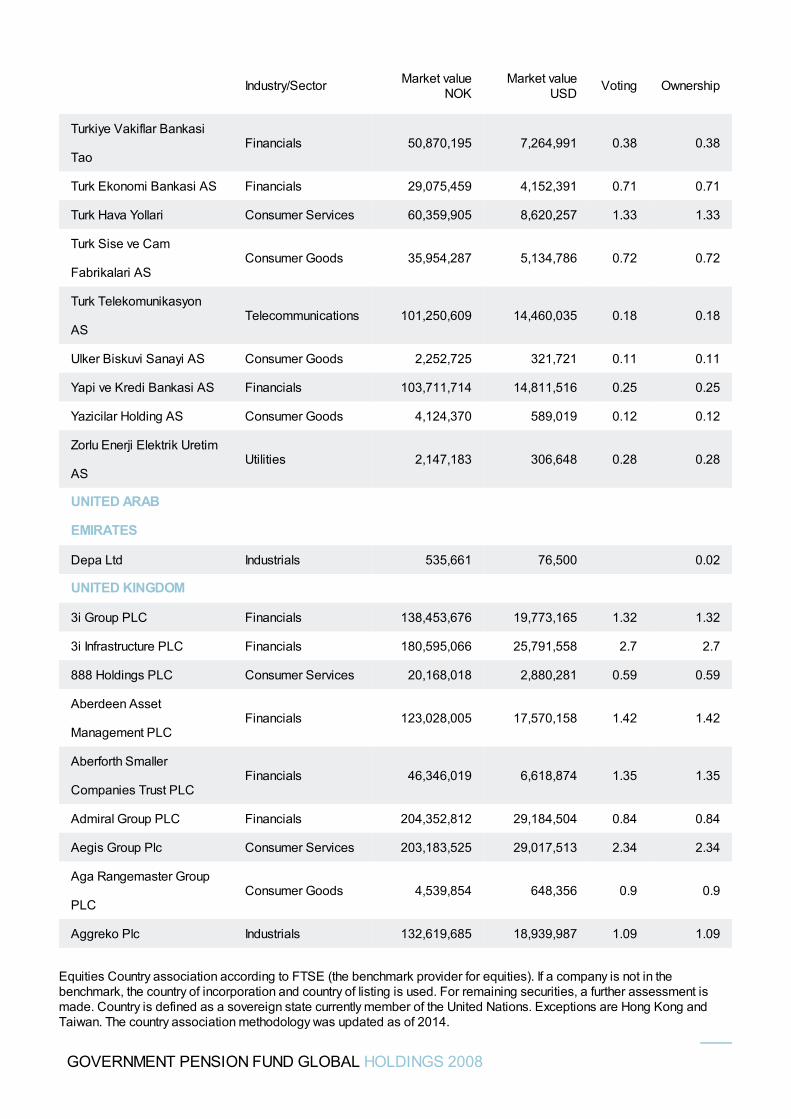
Turkiye Vakiflar Bankasi
TaoFinancials 50,870,195 7,264,991 0.38 0.38
Turk Ekonomi Bankasi AS Financials 29,075,459 4,152,391 0.71 0.71
Turk Hava Yollari Consumer Services 60,359,905 8,620,257 1.33 1.33
Turk Sise ve Cam
Fabrikalari ASConsumer Goods 35,954,287 5,134,786 0.72 0.72
Turk Telekomunikasyon
ASTelecommunications 101,250,609 14,460,035 0.18 0.18
Ulker Biskuvi Sanayi AS Consumer Goods 2,252,725 321,721 0.11 0.11
Yapi ve Kredi Bankasi AS Financials 103,711,714 14,811,516 0.25 0.25
Yazicilar Holding AS Consumer Goods 4,124,370 589,019 0.12 0.12
Zorlu Enerji Elektrik Uretim
ASUtilities 2,147,183 306,648 0.28 0.28
UNITED ARAB
EMIRATES
Depa Ltd Industrials 535,661 76,500 0.02
UNITED KINGDOM
3i Group PLC Financials 138,453,676 19,773,165 1.32 1.32
3i Infrastructure PLC Financials 180,595,066 25,791,558 2.7 2.7
888 Holdings PLC Consumer Services 20,168,018 2,880,281 0.59 0.59
Aberdeen Asset
Management PLCFinancials 123,028,005 17,570,158 1.42 1.42
Aberforth Smaller
Companies Trust PLCFinancials 46,346,019 6,618,874 1.35 1.35
Admiral Group PLC Financials 204,352,812 29,184,504 0.84 0.84
Aegis Group Plc Consumer Services 203,183,525 29,017,513 2.34 2.34
Aga Rangemaster Group
PLCConsumer Goods 4,539,854 648,356 0.9 0.9
Aggreko Plc Industrials 132,619,685 18,939,987 1.09 1.09
Industry/Sector Market valueNOK
Market valueUSD Voting Ownership
GOVERNMENT PENSION FUND GLOBAL HOLDINGS 2008
Equities Country association according to FTSE (the benchmark provider for equities). If a company is not in thebenchmark, the country of incorporation and country of listing is used. For remaining securities, a further assessment ismade. Country is defined as a sovereign state currently member of the United Nations. Exceptions are Hong Kong andTaiwan. The country association methodology was updated as of 2014.
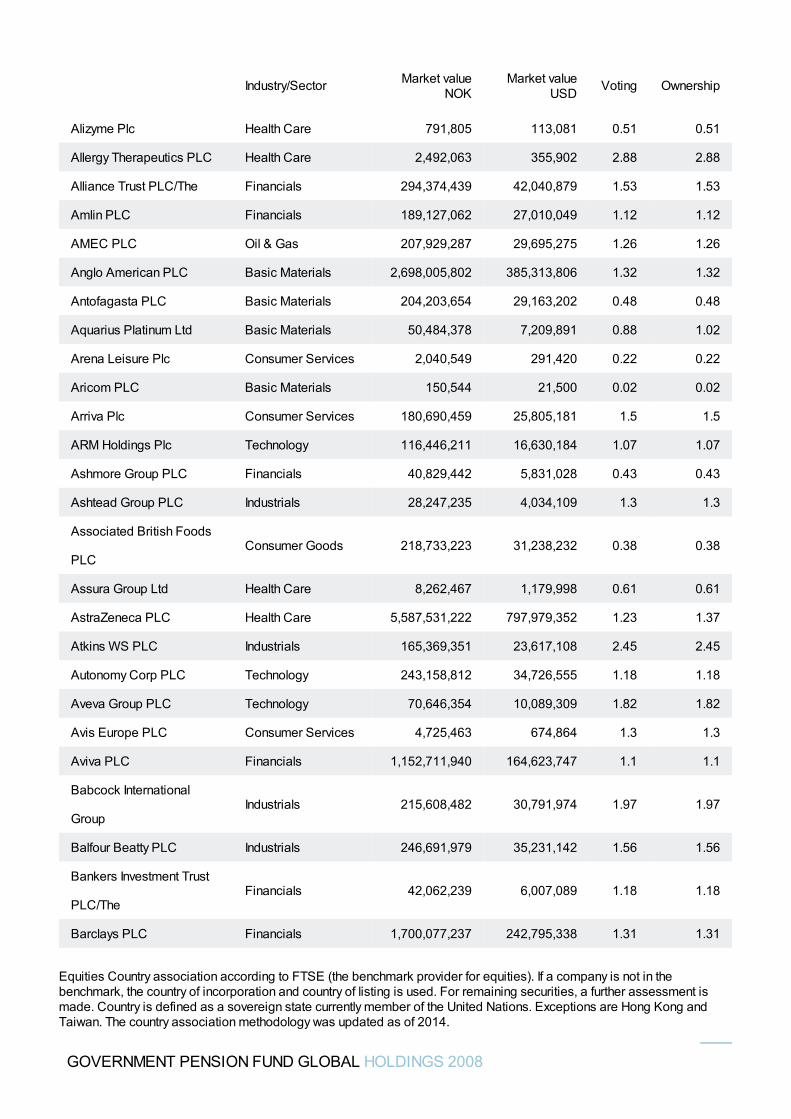
Alizyme Plc Health Care 791,805 113,081 0.51 0.51
Allergy Therapeutics PLC Health Care 2,492,063 355,902 2.88 2.88
Alliance Trust PLC/The Financials 294,374,439 42,040,879 1.53 1.53
Amlin PLC Financials 189,127,062 27,010,049 1.12 1.12
AMEC PLC Oil & Gas 207,929,287 29,695,275 1.26 1.26
Anglo American PLC Basic Materials 2,698,005,802 385,313,806 1.32 1.32
Antofagasta PLC Basic Materials 204,203,654 29,163,202 0.48 0.48
Aquarius Platinum Ltd Basic Materials 50,484,378 7,209,891 0.88 1.02
Arena Leisure Plc Consumer Services 2,040,549 291,420 0.22 0.22
Aricom PLC Basic Materials 150,544 21,500 0.02 0.02
Arriva Plc Consumer Services 180,690,459 25,805,181 1.5 1.5
ARM Holdings Plc Technology 116,446,211 16,630,184 1.07 1.07
Ashmore Group PLC Financials 40,829,442 5,831,028 0.43 0.43
Ashtead Group PLC Industrials 28,247,235 4,034,109 1.3 1.3
Associated British Foods
PLCConsumer Goods 218,733,223 31,238,232 0.38 0.38
Assura Group Ltd Health Care 8,262,467 1,179,998 0.61 0.61
AstraZeneca PLC Health Care 5,587,531,222 797,979,352 1.23 1.37
Atkins WS PLC Industrials 165,369,351 23,617,108 2.45 2.45
Autonomy Corp PLC Technology 243,158,812 34,726,555 1.18 1.18
Aveva Group PLC Technology 70,646,354 10,089,309 1.82 1.82
Avis Europe PLC Consumer Services 4,725,463 674,864 1.3 1.3
Aviva PLC Financials 1,152,711,940 164,623,747 1.1 1.1
Babcock International
GroupIndustrials 215,608,482 30,791,974 1.97 1.97
Balfour Beatty PLC Industrials 246,691,979 35,231,142 1.56 1.56
Bankers Investment Trust
PLC/TheFinancials 42,062,239 6,007,089 1.18 1.18
Barclays PLC Financials 1,700,077,237 242,795,338 1.31 1.31
Industry/Sector Market valueNOK
Market valueUSD Voting Ownership
GOVERNMENT PENSION FUND GLOBAL HOLDINGS 2008
Equities Country association according to FTSE (the benchmark provider for equities). If a company is not in thebenchmark, the country of incorporation and country of listing is used. For remaining securities, a further assessment ismade. Country is defined as a sovereign state currently member of the United Nations. Exceptions are Hong Kong andTaiwan. The country association methodology was updated as of 2014.
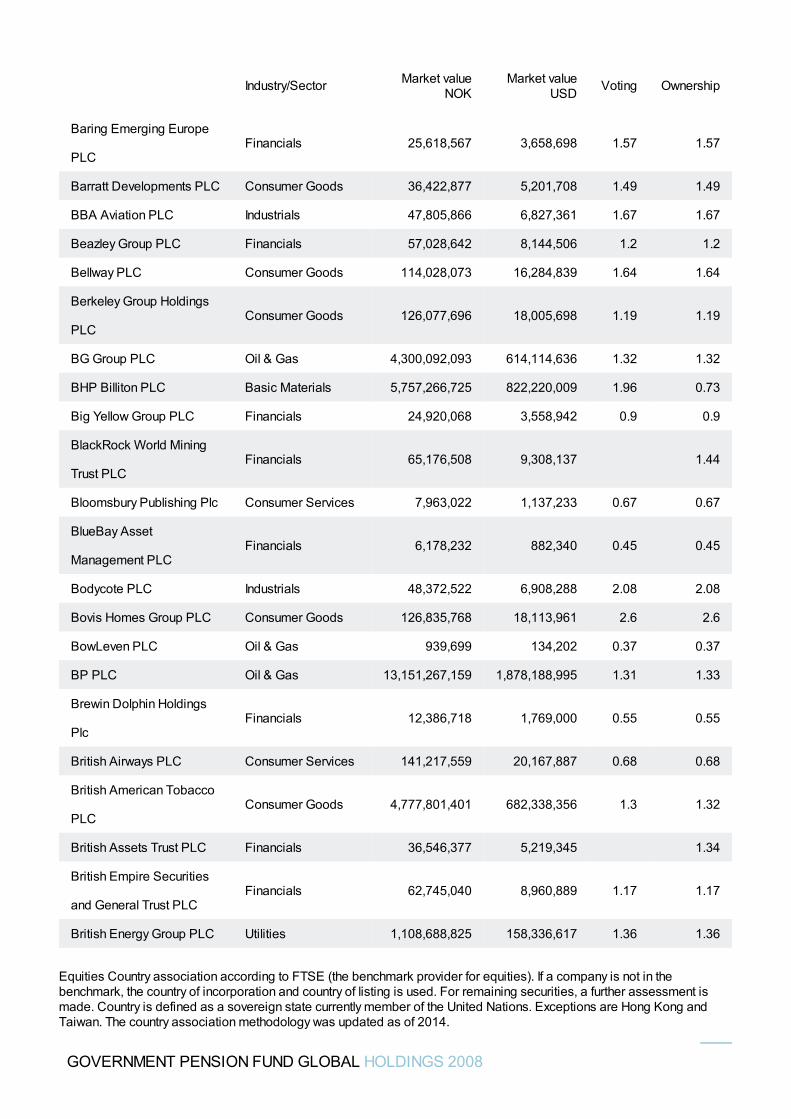
Baring Emerging Europe
PLCFinancials 25,618,567 3,658,698 1.57 1.57
Barratt Developments PLC Consumer Goods 36,422,877 5,201,708 1.49 1.49
BBA Aviation PLC Industrials 47,805,866 6,827,361 1.67 1.67
Beazley Group PLC Financials 57,028,642 8,144,506 1.2 1.2
Bellway PLC Consumer Goods 114,028,073 16,284,839 1.64 1.64
Berkeley Group Holdings
PLCConsumer Goods 126,077,696 18,005,698 1.19 1.19
BG Group PLC Oil & Gas 4,300,092,093 614,114,636 1.32 1.32
BHP Billiton PLC Basic Materials 5,757,266,725 822,220,009 1.96 0.73
Big Yellow Group PLC Financials 24,920,068 3,558,942 0.9 0.9
BlackRock World Mining
Trust PLCFinancials 65,176,508 9,308,137 1.44
Bloomsbury Publishing Plc Consumer Services 7,963,022 1,137,233 0.67 0.67
BlueBay Asset
Management PLCFinancials 6,178,232 882,340 0.45 0.45
Bodycote PLC Industrials 48,372,522 6,908,288 2.08 2.08
Bovis Homes Group PLC Consumer Goods 126,835,768 18,113,961 2.6 2.6
BowLeven PLC Oil & Gas 939,699 134,202 0.37 0.37
BP PLC Oil & Gas 13,151,267,159 1,878,188,995 1.31 1.33
Brewin Dolphin Holdings
PlcFinancials 12,386,718 1,769,000 0.55 0.55
British Airways PLC Consumer Services 141,217,559 20,167,887 0.68 0.68
British American Tobacco
PLCConsumer Goods 4,777,801,401 682,338,356 1.3 1.32
British Assets Trust PLC Financials 36,546,377 5,219,345 1.34
British Empire Securities
and General Trust PLCFinancials 62,745,040 8,960,889 1.17 1.17
British Energy Group PLC Utilities 1,108,688,825 158,336,617 1.36 1.36
Industry/Sector Market valueNOK
Market valueUSD Voting Ownership
GOVERNMENT PENSION FUND GLOBAL HOLDINGS 2008
Equities Country association according to FTSE (the benchmark provider for equities). If a company is not in thebenchmark, the country of incorporation and country of listing is used. For remaining securities, a further assessment ismade. Country is defined as a sovereign state currently member of the United Nations. Exceptions are Hong Kong andTaiwan. The country association methodology was updated as of 2014.
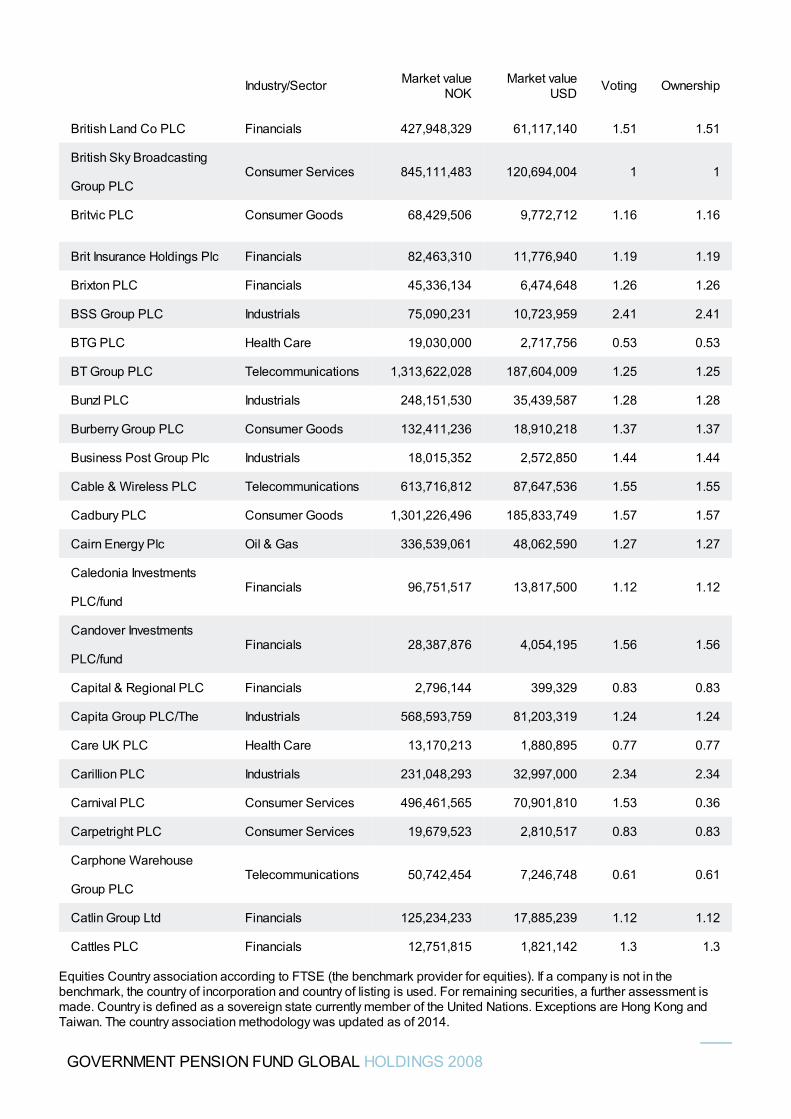
British Land Co PLC Financials 427,948,329 61,117,140 1.51 1.51
British Sky Broadcasting
Group PLCConsumer Services 845,111,483 120,694,004 1 1
Britvic PLC Consumer Goods 68,429,506 9,772,712 1.16 1.16
Brit Insurance Holdings Plc Financials 82,463,310 11,776,940 1.19 1.19
Brixton PLC Financials 45,336,134 6,474,648 1.26 1.26
BSS Group PLC Industrials 75,090,231 10,723,959 2.41 2.41
BTG PLC Health Care 19,030,000 2,717,756 0.53 0.53
BT Group PLC Telecommunications 1,313,622,028 187,604,009 1.25 1.25
Bunzl PLC Industrials 248,151,530 35,439,587 1.28 1.28
Burberry Group PLC Consumer Goods 132,411,236 18,910,218 1.37 1.37
Business Post Group Plc Industrials 18,015,352 2,572,850 1.44 1.44
Cable & Wireless PLC Telecommunications 613,716,812 87,647,536 1.55 1.55
Cadbury PLC Consumer Goods 1,301,226,496 185,833,749 1.57 1.57
Cairn Energy Plc Oil & Gas 336,539,061 48,062,590 1.27 1.27
Caledonia Investments
PLC/fundFinancials 96,751,517 13,817,500 1.12 1.12
Candover Investments
PLC/fundFinancials 28,387,876 4,054,195 1.56 1.56
Capital & Regional PLC Financials 2,796,144 399,329 0.83 0.83
Capita Group PLC/The Industrials 568,593,759 81,203,319 1.24 1.24
Care UK PLC Health Care 13,170,213 1,880,895 0.77 0.77
Carillion PLC Industrials 231,048,293 32,997,000 2.34 2.34
Carnival PLC Consumer Services 496,461,565 70,901,810 1.53 0.36
Carpetright PLC Consumer Services 19,679,523 2,810,517 0.83 0.83
Carphone Warehouse
Group PLCTelecommunications 50,742,454 7,246,748 0.61 0.61
Catlin Group Ltd Financials 125,234,233 17,885,239 1.12 1.12
Cattles PLC Financials 12,751,815 1,821,142 1.3 1.3
Industry/Sector Market valueNOK
Market valueUSD Voting Ownership
GOVERNMENT PENSION FUND GLOBAL HOLDINGS 2008
Equities Country association according to FTSE (the benchmark provider for equities). If a company is not in thebenchmark, the country of incorporation and country of listing is used. For remaining securities, a further assessment ismade. Country is defined as a sovereign state currently member of the United Nations. Exceptions are Hong Kong andTaiwan. The country association methodology was updated as of 2014.
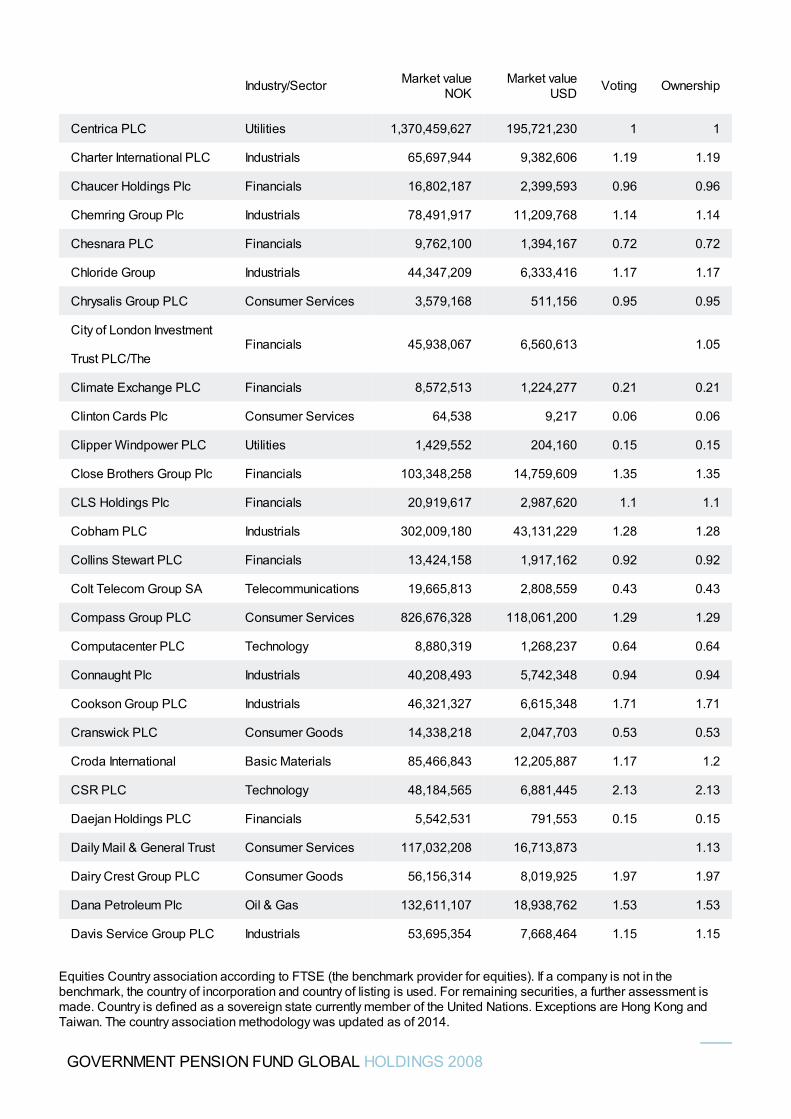
Centrica PLC Utilities 1,370,459,627 195,721,230 1 1
Charter International PLC Industrials 65,697,944 9,382,606 1.19 1.19
Chaucer Holdings Plc Financials 16,802,187 2,399,593 0.96 0.96
Chemring Group Plc Industrials 78,491,917 11,209,768 1.14 1.14
Chesnara PLC Financials 9,762,100 1,394,167 0.72 0.72
Chloride Group Industrials 44,347,209 6,333,416 1.17 1.17
Chrysalis Group PLC Consumer Services 3,579,168 511,156 0.95 0.95
City of London Investment
Trust PLC/TheFinancials 45,938,067 6,560,613 1.05
Climate Exchange PLC Financials 8,572,513 1,224,277 0.21 0.21
Clinton Cards Plc Consumer Services 64,538 9,217 0.06 0.06
Clipper Windpower PLC Utilities 1,429,552 204,160 0.15 0.15
Close Brothers Group Plc Financials 103,348,258 14,759,609 1.35 1.35
CLS Holdings Plc Financials 20,919,617 2,987,620 1.1 1.1
Cobham PLC Industrials 302,009,180 43,131,229 1.28 1.28
Collins Stewart PLC Financials 13,424,158 1,917,162 0.92 0.92
Colt Telecom Group SA Telecommunications 19,665,813 2,808,559 0.43 0.43
Compass Group PLC Consumer Services 826,676,328 118,061,200 1.29 1.29
Computacenter PLC Technology 8,880,319 1,268,237 0.64 0.64
Connaught Plc Industrials 40,208,493 5,742,348 0.94 0.94
Cookson Group PLC Industrials 46,321,327 6,615,348 1.71 1.71
Cranswick PLC Consumer Goods 14,338,218 2,047,703 0.53 0.53
Croda International Basic Materials 85,466,843 12,205,887 1.17 1.2
CSR PLC Technology 48,184,565 6,881,445 2.13 2.13
Daejan Holdings PLC Financials 5,542,531 791,553 0.15 0.15
Daily Mail & General Trust Consumer Services 117,032,208 16,713,873 1.13
Dairy Crest Group PLC Consumer Goods 56,156,314 8,019,925 1.97 1.97
Dana Petroleum Plc Oil & Gas 132,611,107 18,938,762 1.53 1.53
Davis Service Group PLC Industrials 53,695,354 7,668,464 1.15 1.15
Industry/Sector Market valueNOK
Market valueUSD Voting Ownership
GOVERNMENT PENSION FUND GLOBAL HOLDINGS 2008
Equities Country association according to FTSE (the benchmark provider for equities). If a company is not in thebenchmark, the country of incorporation and country of listing is used. For remaining securities, a further assessment ismade. Country is defined as a sovereign state currently member of the United Nations. Exceptions are Hong Kong andTaiwan. The country association methodology was updated as of 2014.
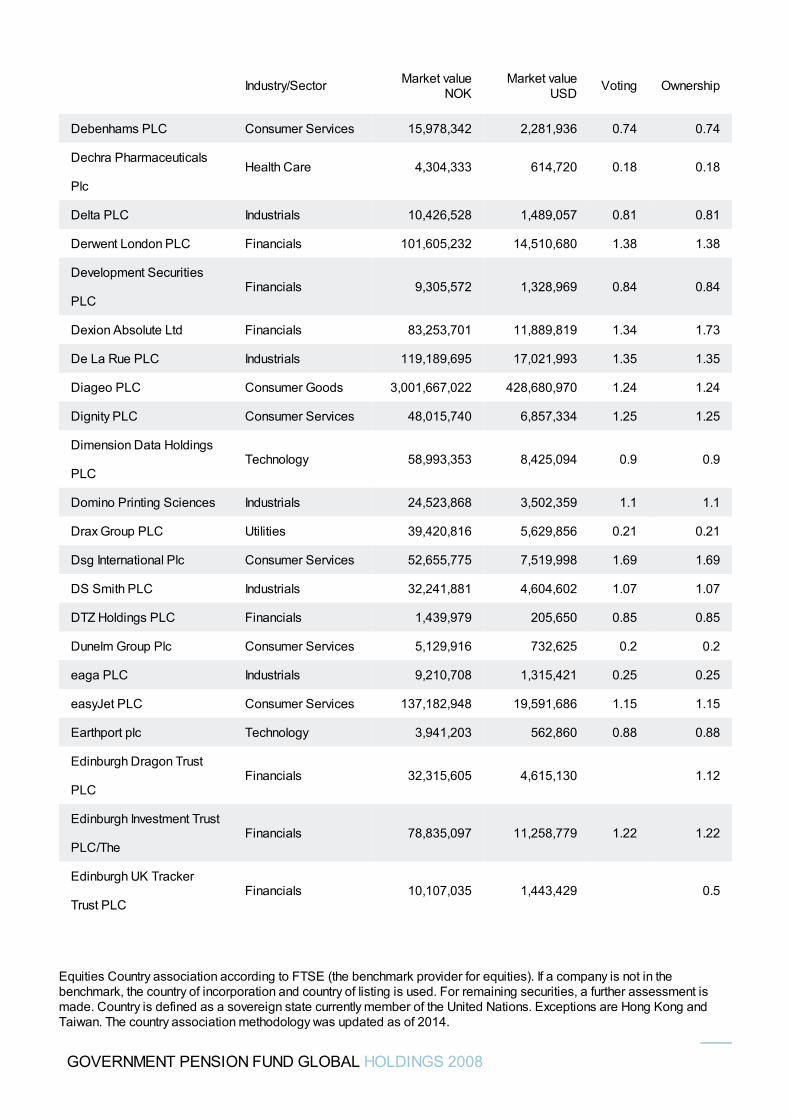
Debenhams PLC Consumer Services 15,978,342 2,281,936 0.74 0.74
Dechra Pharmaceuticals
PlcHealth Care 4,304,333 614,720 0.18 0.18
Delta PLC Industrials 10,426,528 1,489,057 0.81 0.81
Derwent London PLC Financials 101,605,232 14,510,680 1.38 1.38
Development Securities
PLCFinancials 9,305,572 1,328,969 0.84 0.84
Dexion Absolute Ltd Financials 83,253,701 11,889,819 1.34 1.73
De La Rue PLC Industrials 119,189,695 17,021,993 1.35 1.35
Diageo PLC Consumer Goods 3,001,667,022 428,680,970 1.24 1.24
Dignity PLC Consumer Services 48,015,740 6,857,334 1.25 1.25
Dimension Data Holdings
PLCTechnology 58,993,353 8,425,094 0.9 0.9
Domino Printing Sciences Industrials 24,523,868 3,502,359 1.1 1.1
Drax Group PLC Utilities 39,420,816 5,629,856 0.21 0.21
Dsg International Plc Consumer Services 52,655,775 7,519,998 1.69 1.69
DS Smith PLC Industrials 32,241,881 4,604,602 1.07 1.07
DTZ Holdings PLC Financials 1,439,979 205,650 0.85 0.85
Dunelm Group Plc Consumer Services 5,129,916 732,625 0.2 0.2
eaga PLC Industrials 9,210,708 1,315,421 0.25 0.25
easyJet PLC Consumer Services 137,182,948 19,591,686 1.15 1.15
Earthport plc Technology 3,941,203 562,860 0.88 0.88
Edinburgh Dragon Trust
PLCFinancials 32,315,605 4,615,130 1.12
Edinburgh Investment Trust
PLC/TheFinancials 78,835,097 11,258,779 1.22 1.22
Edinburgh UK Tracker
Trust PLCFinancials 10,107,035 1,443,429 0.5
Industry/Sector Market valueNOK
Market valueUSD Voting Ownership
GOVERNMENT PENSION FUND GLOBAL HOLDINGS 2008
Equities Country association according to FTSE (the benchmark provider for equities). If a company is not in thebenchmark, the country of incorporation and country of listing is used. For remaining securities, a further assessment ismade. Country is defined as a sovereign state currently member of the United Nations. Exceptions are Hong Kong andTaiwan. The country association methodology was updated as of 2014.
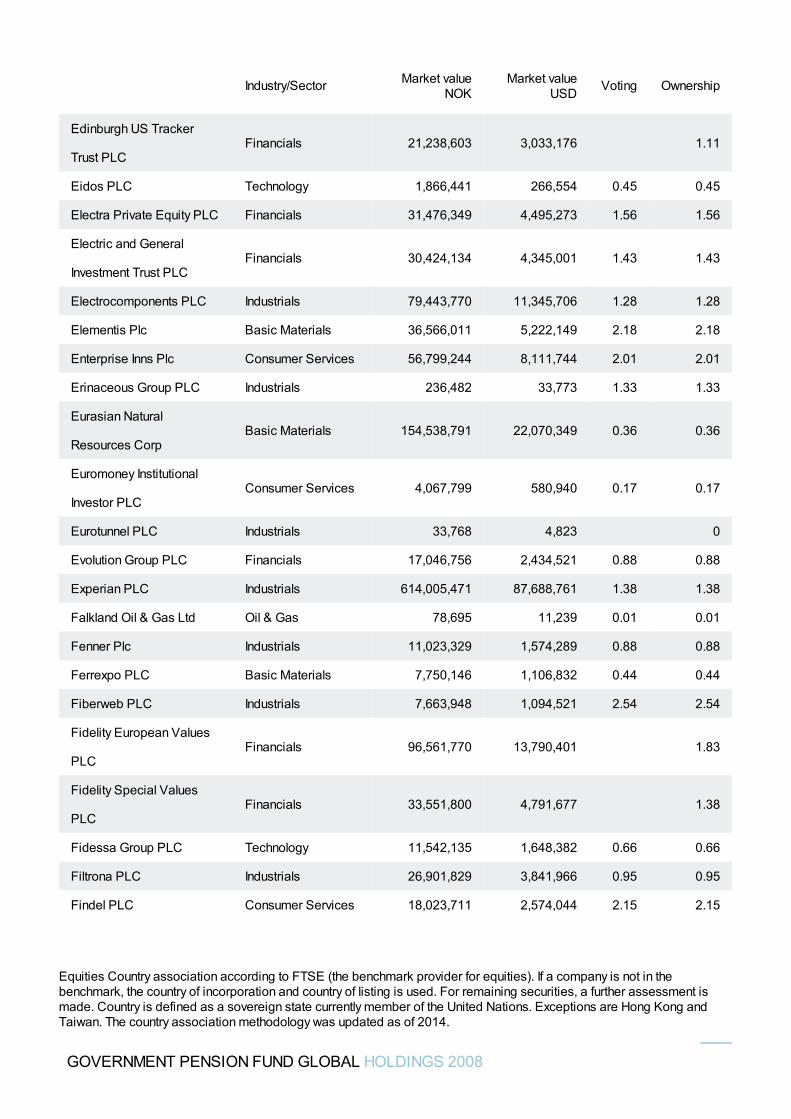
Edinburgh US Tracker
Trust PLCFinancials 21,238,603 3,033,176 1.11
Eidos PLC Technology 1,866,441 266,554 0.45 0.45
Electra Private Equity PLC Financials 31,476,349 4,495,273 1.56 1.56
Electric and General
Investment Trust PLCFinancials 30,424,134 4,345,001 1.43 1.43
Electrocomponents PLC Industrials 79,443,770 11,345,706 1.28 1.28
Elementis Plc Basic Materials 36,566,011 5,222,149 2.18 2.18
Enterprise Inns Plc Consumer Services 56,799,244 8,111,744 2.01 2.01
Erinaceous Group PLC Industrials 236,482 33,773 1.33 1.33
Eurasian Natural
Resources CorpBasic Materials 154,538,791 22,070,349 0.36 0.36
Euromoney Institutional
Investor PLCConsumer Services 4,067,799 580,940 0.17 0.17
Eurotunnel PLC Industrials 33,768 4,823 0
Evolution Group PLC Financials 17,046,756 2,434,521 0.88 0.88
Experian PLC Industrials 614,005,471 87,688,761 1.38 1.38
Falkland Oil & Gas Ltd Oil & Gas 78,695 11,239 0.01 0.01
Fenner Plc Industrials 11,023,329 1,574,289 0.88 0.88
Ferrexpo PLC Basic Materials 7,750,146 1,106,832 0.44 0.44
Fiberweb PLC Industrials 7,663,948 1,094,521 2.54 2.54
Fidelity European Values
PLCFinancials 96,561,770 13,790,401 1.83
Fidelity Special Values
PLCFinancials 33,551,800 4,791,677 1.38
Fidessa Group PLC Technology 11,542,135 1,648,382 0.66 0.66
Filtrona PLC Industrials 26,901,829 3,841,966 0.95 0.95
Findel PLC Consumer Services 18,023,711 2,574,044 2.15 2.15
Industry/Sector Market valueNOK
Market valueUSD Voting Ownership
GOVERNMENT PENSION FUND GLOBAL HOLDINGS 2008
Equities Country association according to FTSE (the benchmark provider for equities). If a company is not in thebenchmark, the country of incorporation and country of listing is used. For remaining securities, a further assessment ismade. Country is defined as a sovereign state currently member of the United Nations. Exceptions are Hong Kong andTaiwan. The country association methodology was updated as of 2014.
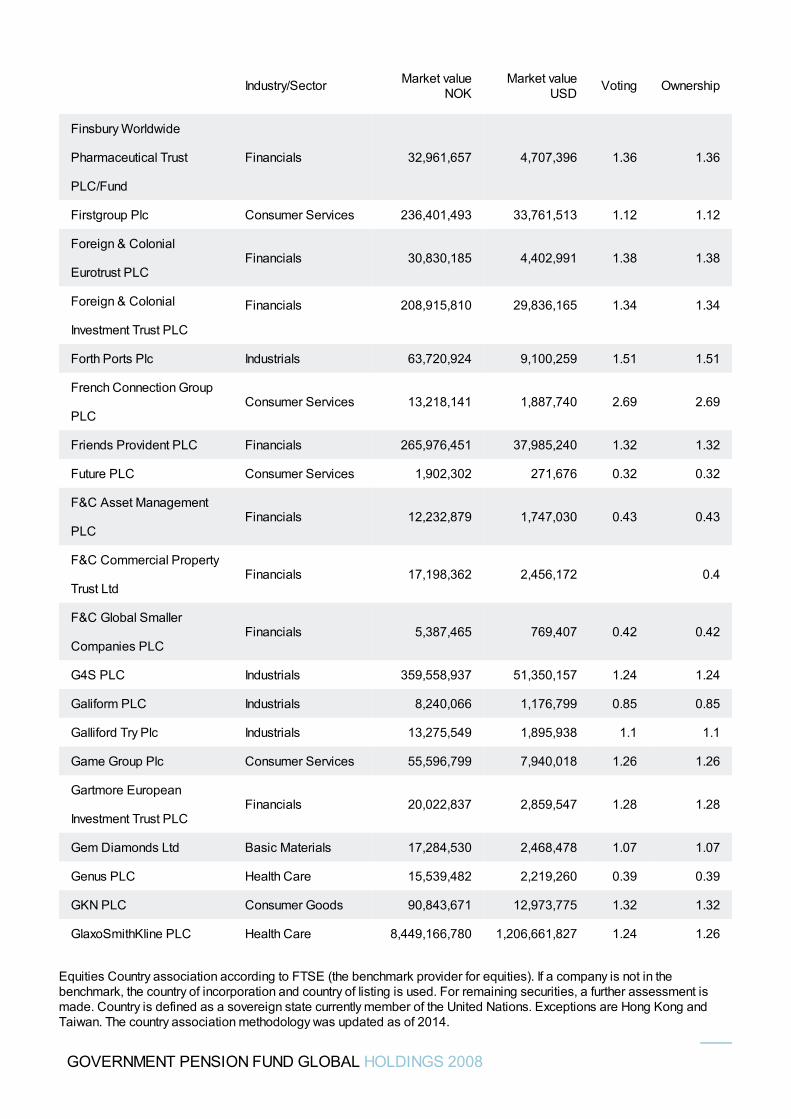
Finsbury Worldwide
Pharmaceutical Trust
PLC/Fund
Financials 32,961,657 4,707,396 1.36 1.36
Firstgroup Plc Consumer Services 236,401,493 33,761,513 1.12 1.12
Foreign & Colonial
Eurotrust PLCFinancials 30,830,185 4,402,991 1.38 1.38
Foreign & Colonial
Investment Trust PLC
Financials 208,915,810 29,836,165 1.34 1.34
Forth Ports Plc Industrials 63,720,924 9,100,259 1.51 1.51
French Connection Group
PLCConsumer Services 13,218,141 1,887,740 2.69 2.69
Friends Provident PLC Financials 265,976,451 37,985,240 1.32 1.32
Future PLC Consumer Services 1,902,302 271,676 0.32 0.32
F&C Asset Management
PLCFinancials 12,232,879 1,747,030 0.43 0.43
F&C Commercial Property
Trust LtdFinancials 17,198,362 2,456,172 0.4
F&C Global Smaller
Companies PLCFinancials 5,387,465 769,407 0.42 0.42
G4S PLC Industrials 359,558,937 51,350,157 1.24 1.24
Galiform PLC Industrials 8,240,066 1,176,799 0.85 0.85
Galliford Try Plc Industrials 13,275,549 1,895,938 1.1 1.1
Game Group Plc Consumer Services 55,596,799 7,940,018 1.26 1.26
Gartmore European
Investment Trust PLCFinancials 20,022,837 2,859,547 1.28 1.28
Gem Diamonds Ltd Basic Materials 17,284,530 2,468,478 1.07 1.07
Genus PLC Health Care 15,539,482 2,219,260 0.39 0.39
GKN PLC Consumer Goods 90,843,671 12,973,775 1.32 1.32
GlaxoSmithKline PLC Health Care 8,449,166,780 1,206,661,827 1.24 1.26
Industry/Sector Market valueNOK
Market valueUSD Voting Ownership
GOVERNMENT PENSION FUND GLOBAL HOLDINGS 2008
Equities Country association according to FTSE (the benchmark provider for equities). If a company is not in thebenchmark, the country of incorporation and country of listing is used. For remaining securities, a further assessment ismade. Country is defined as a sovereign state currently member of the United Nations. Exceptions are Hong Kong andTaiwan. The country association methodology was updated as of 2014.
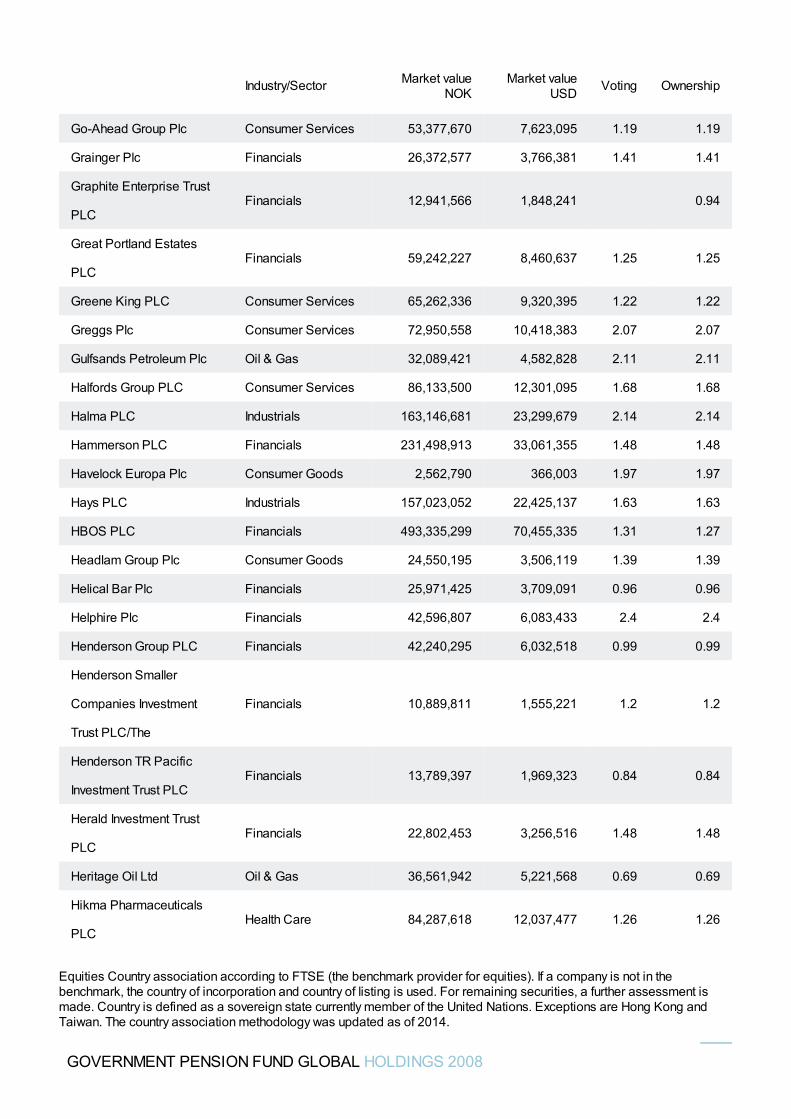
Go-Ahead Group Plc Consumer Services 53,377,670 7,623,095 1.19 1.19
Grainger Plc Financials 26,372,577 3,766,381 1.41 1.41
Graphite Enterprise Trust
PLCFinancials 12,941,566 1,848,241 0.94
Great Portland Estates
PLCFinancials 59,242,227 8,460,637 1.25 1.25
Greene King PLC Consumer Services 65,262,336 9,320,395 1.22 1.22
Greggs Plc Consumer Services 72,950,558 10,418,383 2.07 2.07
Gulfsands Petroleum Plc Oil & Gas 32,089,421 4,582,828 2.11 2.11
Halfords Group PLC Consumer Services 86,133,500 12,301,095 1.68 1.68
Halma PLC Industrials 163,146,681 23,299,679 2.14 2.14
Hammerson PLC Financials 231,498,913 33,061,355 1.48 1.48
Havelock Europa Plc Consumer Goods 2,562,790 366,003 1.97 1.97
Hays PLC Industrials 157,023,052 22,425,137 1.63 1.63
HBOS PLC Financials 493,335,299 70,455,335 1.31 1.27
Headlam Group Plc Consumer Goods 24,550,195 3,506,119 1.39 1.39
Helical Bar Plc Financials 25,971,425 3,709,091 0.96 0.96
Helphire Plc Financials 42,596,807 6,083,433 2.4 2.4
Henderson Group PLC Financials 42,240,295 6,032,518 0.99 0.99
Henderson Smaller
Companies Investment
Trust PLC/The
Financials 10,889,811 1,555,221 1.2 1.2
Henderson TR Pacific
Investment Trust PLCFinancials 13,789,397 1,969,323 0.84 0.84
Herald Investment Trust
PLCFinancials 22,802,453 3,256,516 1.48 1.48
Heritage Oil Ltd Oil & Gas 36,561,942 5,221,568 0.69 0.69
Hikma Pharmaceuticals
PLCHealth Care 84,287,618 12,037,477 1.26 1.26
Industry/Sector Market valueNOK
Market valueUSD Voting Ownership
GOVERNMENT PENSION FUND GLOBAL HOLDINGS 2008
Equities Country association according to FTSE (the benchmark provider for equities). If a company is not in thebenchmark, the country of incorporation and country of listing is used. For remaining securities, a further assessment ismade. Country is defined as a sovereign state currently member of the United Nations. Exceptions are Hong Kong andTaiwan. The country association methodology was updated as of 2014.
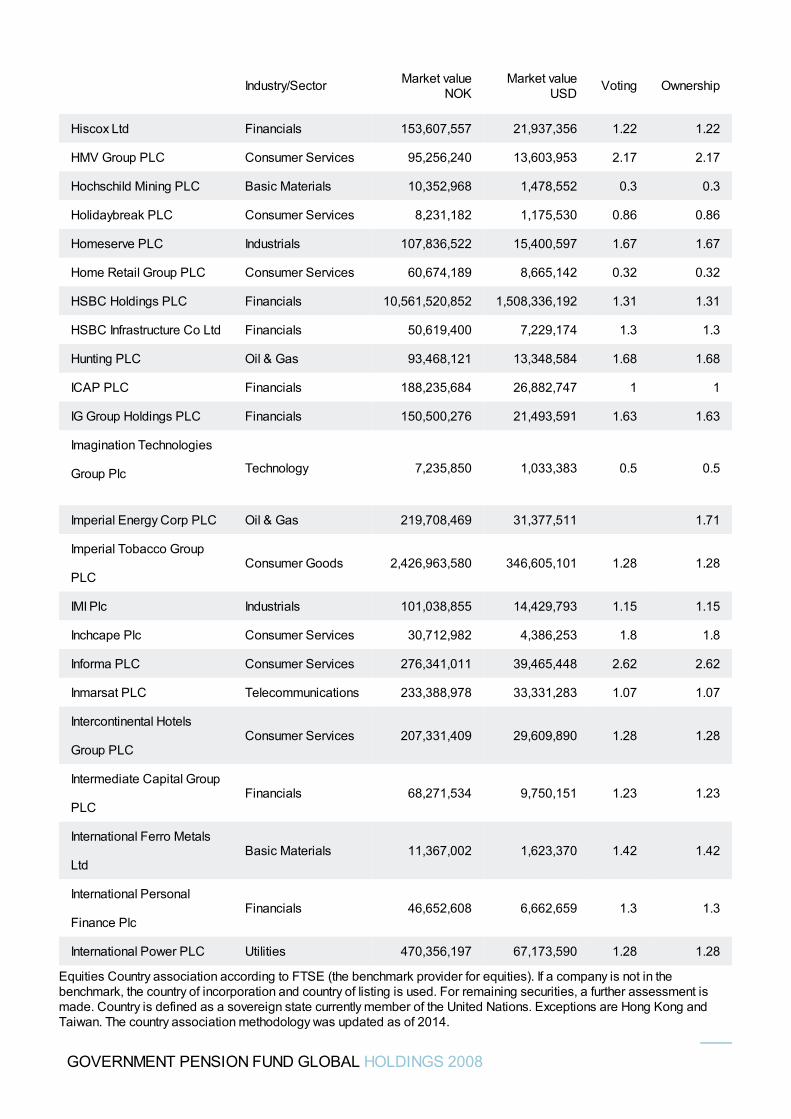
Hiscox Ltd Financials 153,607,557 21,937,356 1.22 1.22
HMV Group PLC Consumer Services 95,256,240 13,603,953 2.17 2.17
Hochschild Mining PLC Basic Materials 10,352,968 1,478,552 0.3 0.3
Holidaybreak PLC Consumer Services 8,231,182 1,175,530 0.86 0.86
Homeserve PLC Industrials 107,836,522 15,400,597 1.67 1.67
Home Retail Group PLC Consumer Services 60,674,189 8,665,142 0.32 0.32
HSBC Holdings PLC Financials 10,561,520,852 1,508,336,192 1.31 1.31
HSBC Infrastructure Co Ltd Financials 50,619,400 7,229,174 1.3 1.3
Hunting PLC Oil & Gas 93,468,121 13,348,584 1.68 1.68
ICAP PLC Financials 188,235,684 26,882,747 1 1
IG Group Holdings PLC Financials 150,500,276 21,493,591 1.63 1.63
Imagination Technologies
Group Plc Technology 7,235,850 1,033,383 0.5 0.5
Imperial Energy Corp PLC Oil & Gas 219,708,469 31,377,511 1.71
Imperial Tobacco Group
PLCConsumer Goods 2,426,963,580 346,605,101 1.28 1.28
IMI Plc Industrials 101,038,855 14,429,793 1.15 1.15
Inchcape Plc Consumer Services 30,712,982 4,386,253 1.8 1.8
Informa PLC Consumer Services 276,341,011 39,465,448 2.62 2.62
Inmarsat PLC Telecommunications 233,388,978 33,331,283 1.07 1.07
Intercontinental Hotels
Group PLCConsumer Services 207,331,409 29,609,890 1.28 1.28
Intermediate Capital Group
PLCFinancials 68,271,534 9,750,151 1.23 1.23
International Ferro Metals
LtdBasic Materials 11,367,002 1,623,370 1.42 1.42
International Personal
Finance PlcFinancials 46,652,608 6,662,659 1.3 1.3
International Power PLC Utilities 470,356,197 67,173,590 1.28 1.28
Industry/Sector Market valueNOK
Market valueUSD Voting Ownership
GOVERNMENT PENSION FUND GLOBAL HOLDINGS 2008
Equities Country association according to FTSE (the benchmark provider for equities). If a company is not in thebenchmark, the country of incorporation and country of listing is used. For remaining securities, a further assessment ismade. Country is defined as a sovereign state currently member of the United Nations. Exceptions are Hong Kong andTaiwan. The country association methodology was updated as of 2014.
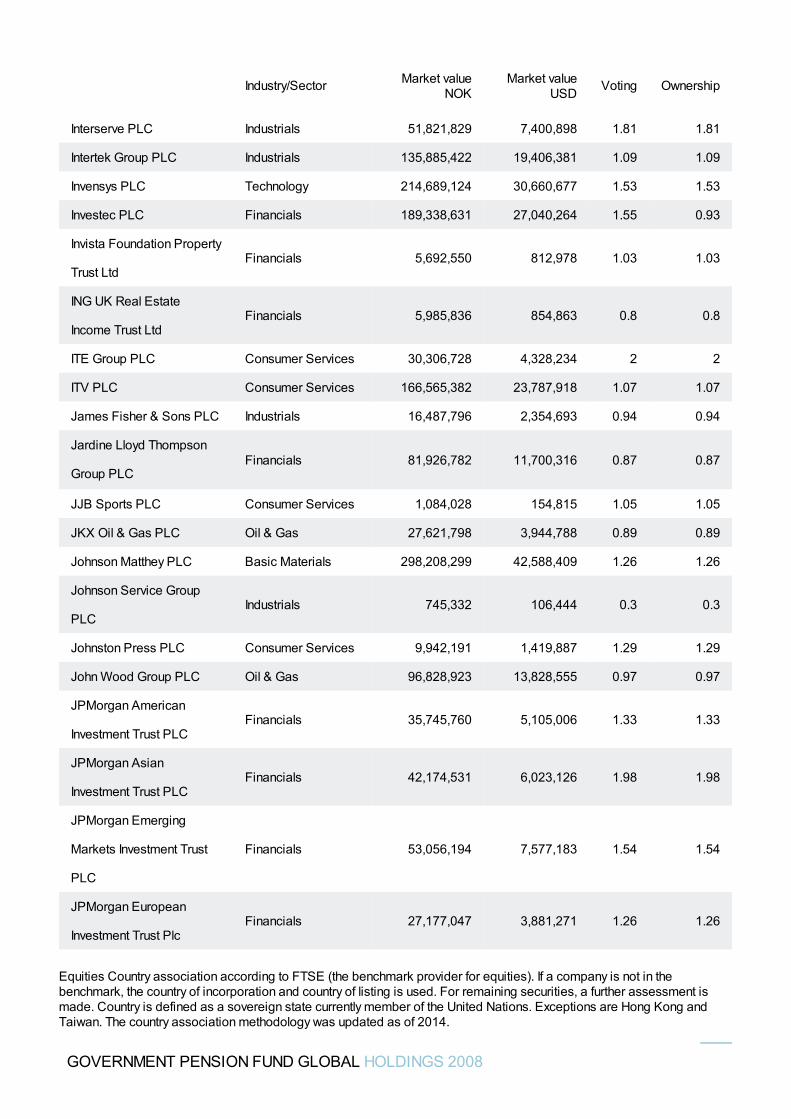
Interserve PLC Industrials 51,821,829 7,400,898 1.81 1.81
Intertek Group PLC Industrials 135,885,422 19,406,381 1.09 1.09
Invensys PLC Technology 214,689,124 30,660,677 1.53 1.53
Investec PLC Financials 189,338,631 27,040,264 1.55 0.93
Invista Foundation Property
Trust LtdFinancials 5,692,550 812,978 1.03 1.03
ING UK Real Estate
Income Trust LtdFinancials 5,985,836 854,863 0.8 0.8
ITE Group PLC Consumer Services 30,306,728 4,328,234 2 2
ITV PLC Consumer Services 166,565,382 23,787,918 1.07 1.07
James Fisher & Sons PLC Industrials 16,487,796 2,354,693 0.94 0.94
Jardine Lloyd Thompson
Group PLCFinancials 81,926,782 11,700,316 0.87 0.87
JJB Sports PLC Consumer Services 1,084,028 154,815 1.05 1.05
JKX Oil & Gas PLC Oil & Gas 27,621,798 3,944,788 0.89 0.89
Johnson Matthey PLC Basic Materials 298,208,299 42,588,409 1.26 1.26
Johnson Service Group
PLCIndustrials 745,332 106,444 0.3 0.3
Johnston Press PLC Consumer Services 9,942,191 1,419,887 1.29 1.29
John Wood Group PLC Oil & Gas 96,828,923 13,828,555 0.97 0.97
JPMorgan American
Investment Trust PLCFinancials 35,745,760 5,105,006 1.33 1.33
JPMorgan Asian
Investment Trust PLCFinancials 42,174,531 6,023,126 1.98 1.98
JPMorgan Emerging
Markets Investment Trust
PLC
Financials 53,056,194 7,577,183 1.54 1.54
JPMorgan European
Investment Trust PlcFinancials 27,177,047 3,881,271 1.26 1.26
Industry/Sector Market valueNOK
Market valueUSD Voting Ownership
GOVERNMENT PENSION FUND GLOBAL HOLDINGS 2008
Equities Country association according to FTSE (the benchmark provider for equities). If a company is not in thebenchmark, the country of incorporation and country of listing is used. For remaining securities, a further assessment ismade. Country is defined as a sovereign state currently member of the United Nations. Exceptions are Hong Kong andTaiwan. The country association methodology was updated as of 2014.
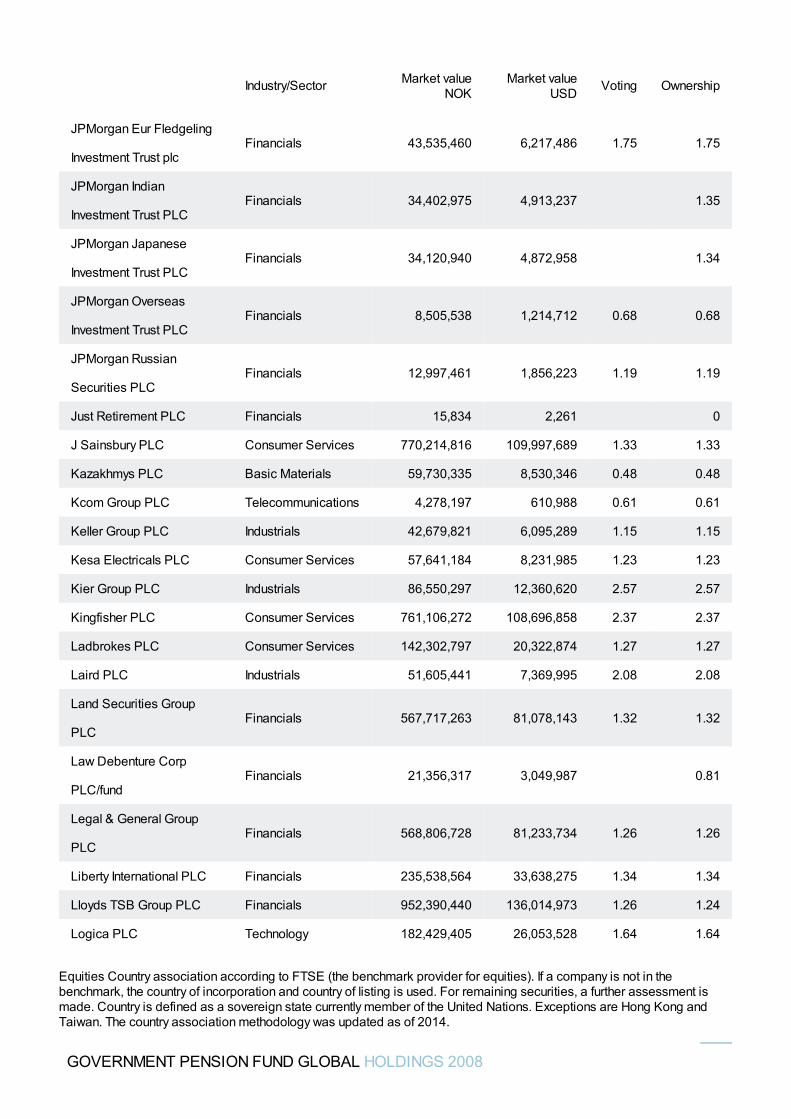
JPMorgan Eur Fledgeling
Investment Trust plcFinancials 43,535,460 6,217,486 1.75 1.75
JPMorgan Indian
Investment Trust PLCFinancials 34,402,975 4,913,237 1.35
JPMorgan Japanese
Investment Trust PLCFinancials 34,120,940 4,872,958 1.34
JPMorgan Overseas
Investment Trust PLCFinancials 8,505,538 1,214,712 0.68 0.68
JPMorgan Russian
Securities PLCFinancials 12,997,461 1,856,223 1.19 1.19
Just Retirement PLC Financials 15,834 2,261 0
J Sainsbury PLC Consumer Services 770,214,816 109,997,689 1.33 1.33
Kazakhmys PLC Basic Materials 59,730,335 8,530,346 0.48 0.48
Kcom Group PLC Telecommunications 4,278,197 610,988 0.61 0.61
Keller Group PLC Industrials 42,679,821 6,095,289 1.15 1.15
Kesa Electricals PLC Consumer Services 57,641,184 8,231,985 1.23 1.23
Kier Group PLC Industrials 86,550,297 12,360,620 2.57 2.57
Kingfisher PLC Consumer Services 761,106,272 108,696,858 2.37 2.37
Ladbrokes PLC Consumer Services 142,302,797 20,322,874 1.27 1.27
Laird PLC Industrials 51,605,441 7,369,995 2.08 2.08
Land Securities Group
PLCFinancials 567,717,263 81,078,143 1.32 1.32
Law Debenture Corp
PLC/fundFinancials 21,356,317 3,049,987 0.81
Legal & General Group
PLCFinancials 568,806,728 81,233,734 1.26 1.26
Liberty International PLC Financials 235,538,564 33,638,275 1.34 1.34
Lloyds TSB Group PLC Financials 952,390,440 136,014,973 1.26 1.24
Logica PLC Technology 182,429,405 26,053,528 1.64 1.64
Industry/Sector Market valueNOK
Market valueUSD Voting Ownership
GOVERNMENT PENSION FUND GLOBAL HOLDINGS 2008
Equities Country association according to FTSE (the benchmark provider for equities). If a company is not in thebenchmark, the country of incorporation and country of listing is used. For remaining securities, a further assessment ismade. Country is defined as a sovereign state currently member of the United Nations. Exceptions are Hong Kong andTaiwan. The country association methodology was updated as of 2014.
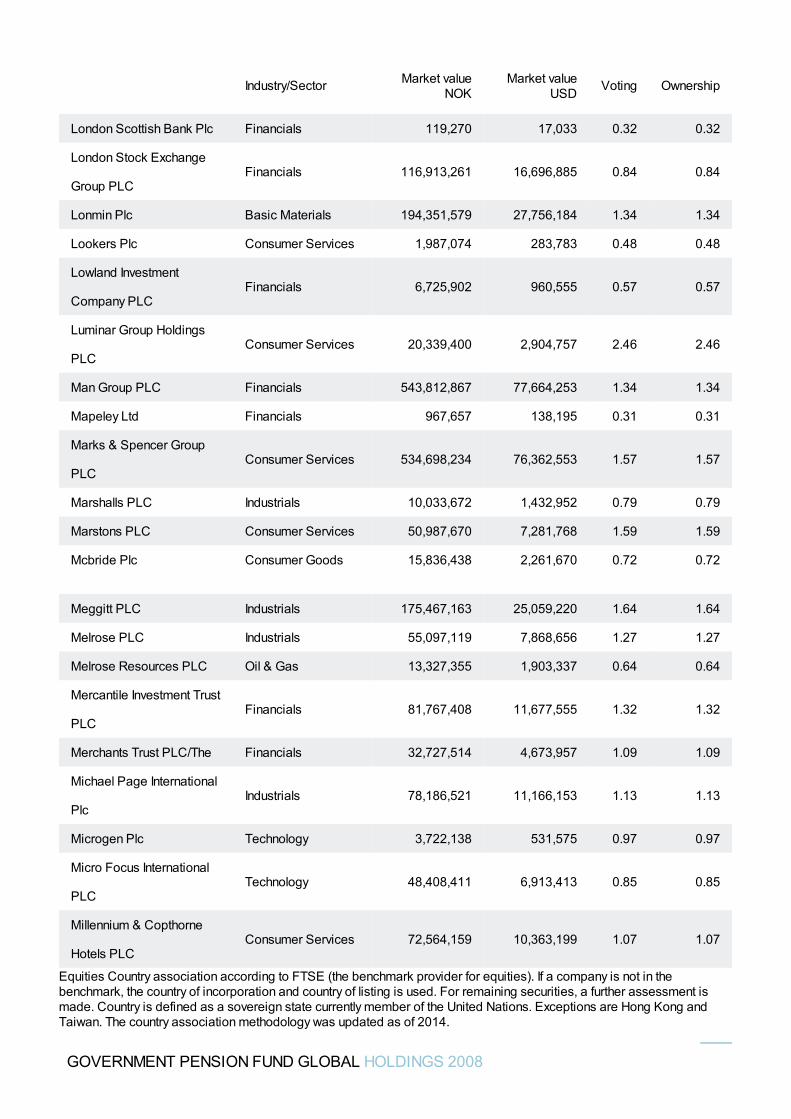
London Scottish Bank Plc Financials 119,270 17,033 0.32 0.32
London Stock Exchange
Group PLCFinancials 116,913,261 16,696,885 0.84 0.84
Lonmin Plc Basic Materials 194,351,579 27,756,184 1.34 1.34
Lookers Plc Consumer Services 1,987,074 283,783 0.48 0.48
Lowland Investment
Company PLCFinancials 6,725,902 960,555 0.57 0.57
Luminar Group Holdings
PLCConsumer Services 20,339,400 2,904,757 2.46 2.46
Man Group PLC Financials 543,812,867 77,664,253 1.34 1.34
Mapeley Ltd Financials 967,657 138,195 0.31 0.31
Marks & Spencer Group
PLCConsumer Services 534,698,234 76,362,553 1.57 1.57
Marshalls PLC Industrials 10,033,672 1,432,952 0.79 0.79
Marstons PLC Consumer Services 50,987,670 7,281,768 1.59 1.59
Mcbride Plc Consumer Goods 15,836,438 2,261,670 0.72 0.72
Meggitt PLC Industrials 175,467,163 25,059,220 1.64 1.64
Melrose PLC Industrials 55,097,119 7,868,656 1.27 1.27
Melrose Resources PLC Oil & Gas 13,327,355 1,903,337 0.64 0.64
Mercantile Investment Trust
PLCFinancials 81,767,408 11,677,555 1.32 1.32
Merchants Trust PLC/The Financials 32,727,514 4,673,957 1.09 1.09
Michael Page International
PlcIndustrials 78,186,521 11,166,153 1.13 1.13
Microgen Plc Technology 3,722,138 531,575 0.97 0.97
Micro Focus International
PLCTechnology 48,408,411 6,913,413 0.85 0.85
Millennium & Copthorne
Hotels PLCConsumer Services 72,564,159 10,363,199 1.07 1.07
Industry/Sector Market valueNOK
Market valueUSD Voting Ownership
GOVERNMENT PENSION FUND GLOBAL HOLDINGS 2008
Equities Country association according to FTSE (the benchmark provider for equities). If a company is not in thebenchmark, the country of incorporation and country of listing is used. For remaining securities, a further assessment ismade. Country is defined as a sovereign state currently member of the United Nations. Exceptions are Hong Kong andTaiwan. The country association methodology was updated as of 2014.
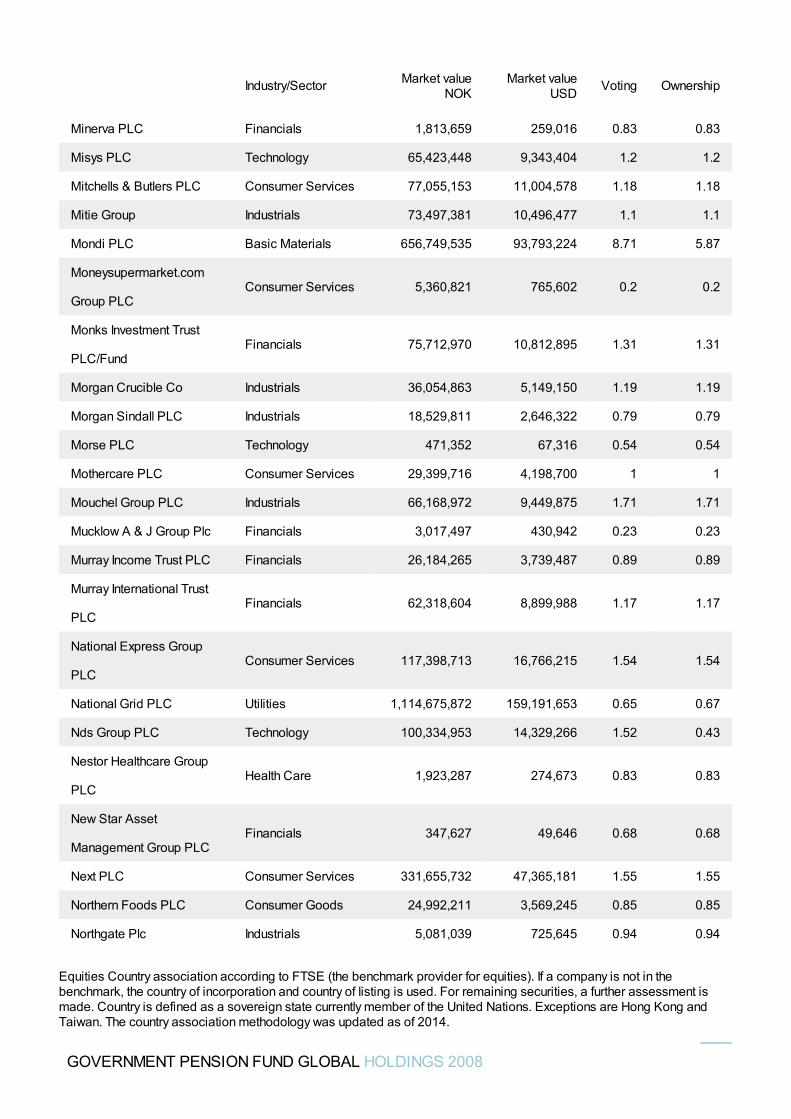
Minerva PLC Financials 1,813,659 259,016 0.83 0.83
Misys PLC Technology 65,423,448 9,343,404 1.2 1.2
Mitchells & Butlers PLC Consumer Services 77,055,153 11,004,578 1.18 1.18
Mitie Group Industrials 73,497,381 10,496,477 1.1 1.1
Mondi PLC Basic Materials 656,749,535 93,793,224 8.71 5.87
Moneysupermarket.com
Group PLCConsumer Services 5,360,821 765,602 0.2 0.2
Monks Investment Trust
PLC/FundFinancials 75,712,970 10,812,895 1.31 1.31
Morgan Crucible Co Industrials 36,054,863 5,149,150 1.19 1.19
Morgan Sindall PLC Industrials 18,529,811 2,646,322 0.79 0.79
Morse PLC Technology 471,352 67,316 0.54 0.54
Mothercare PLC Consumer Services 29,399,716 4,198,700 1 1
Mouchel Group PLC Industrials 66,168,972 9,449,875 1.71 1.71
Mucklow A & J Group Plc Financials 3,017,497 430,942 0.23 0.23
Murray Income Trust PLC Financials 26,184,265 3,739,487 0.89 0.89
Murray International Trust
PLCFinancials 62,318,604 8,899,988 1.17 1.17
National Express Group
PLCConsumer Services 117,398,713 16,766,215 1.54 1.54
National Grid PLC Utilities 1,114,675,872 159,191,653 0.65 0.67
Nds Group PLC Technology 100,334,953 14,329,266 1.52 0.43
Nestor Healthcare Group
PLCHealth Care 1,923,287 274,673 0.83 0.83
New Star Asset
Management Group PLCFinancials 347,627 49,646 0.68 0.68
Next PLC Consumer Services 331,655,732 47,365,181 1.55 1.55
Northern Foods PLC Consumer Goods 24,992,211 3,569,245 0.85 0.85
Northgate Plc Industrials 5,081,039 725,645 0.94 0.94
Industry/Sector Market valueNOK
Market valueUSD Voting Ownership
GOVERNMENT PENSION FUND GLOBAL HOLDINGS 2008
Equities Country association according to FTSE (the benchmark provider for equities). If a company is not in thebenchmark, the country of incorporation and country of listing is used. For remaining securities, a further assessment ismade. Country is defined as a sovereign state currently member of the United Nations. Exceptions are Hong Kong andTaiwan. The country association methodology was updated as of 2014.
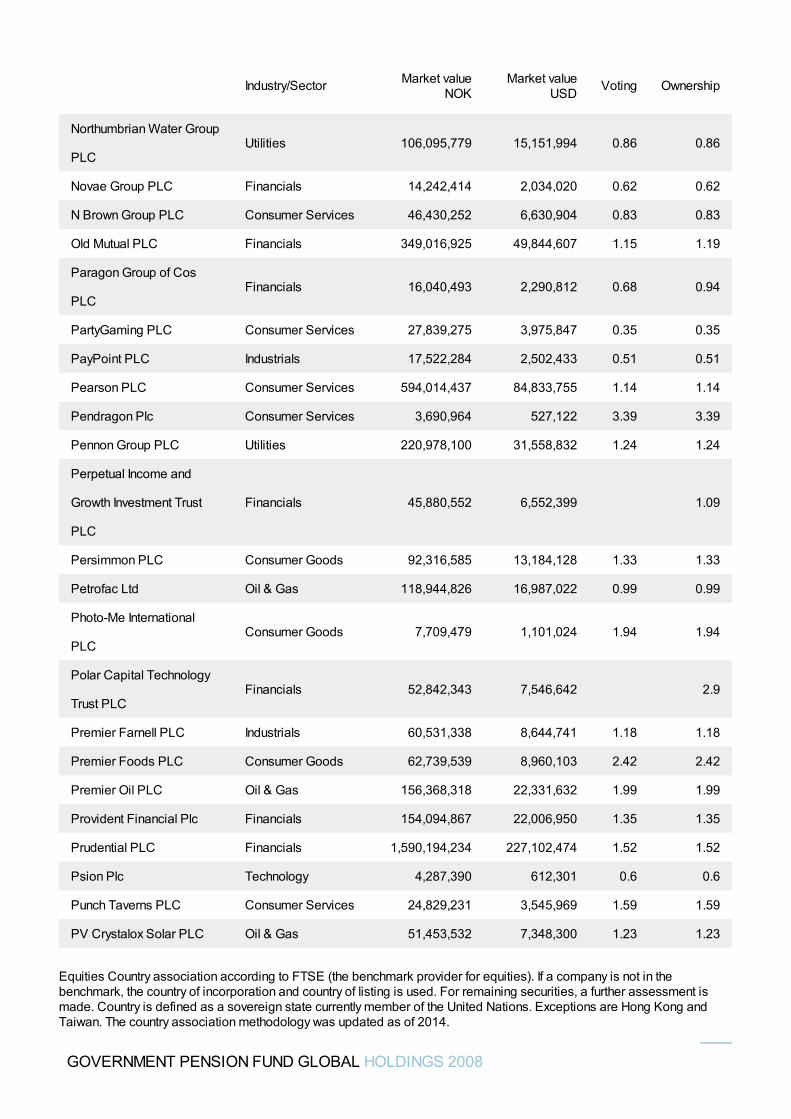
Northumbrian Water Group
PLCUtilities 106,095,779 15,151,994 0.86 0.86
Novae Group PLC Financials 14,242,414 2,034,020 0.62 0.62
N Brown Group PLC Consumer Services 46,430,252 6,630,904 0.83 0.83
Old Mutual PLC Financials 349,016,925 49,844,607 1.15 1.19
Paragon Group of Cos
PLCFinancials 16,040,493 2,290,812 0.68 0.94
PartyGaming PLC Consumer Services 27,839,275 3,975,847 0.35 0.35
PayPoint PLC Industrials 17,522,284 2,502,433 0.51 0.51
Pearson PLC Consumer Services 594,014,437 84,833,755 1.14 1.14
Pendragon Plc Consumer Services 3,690,964 527,122 3.39 3.39
Pennon Group PLC Utilities 220,978,100 31,558,832 1.24 1.24
Perpetual Income and
Growth Investment Trust
PLC
Financials 45,880,552 6,552,399 1.09
Persimmon PLC Consumer Goods 92,316,585 13,184,128 1.33 1.33
Petrofac Ltd Oil & Gas 118,944,826 16,987,022 0.99 0.99
Photo-Me International
PLCConsumer Goods 7,709,479 1,101,024 1.94 1.94
Polar Capital Technology
Trust PLCFinancials 52,842,343 7,546,642 2.9
Premier Farnell PLC Industrials 60,531,338 8,644,741 1.18 1.18
Premier Foods PLC Consumer Goods 62,739,539 8,960,103 2.42 2.42
Premier Oil PLC Oil & Gas 156,368,318 22,331,632 1.99 1.99
Provident Financial Plc Financials 154,094,867 22,006,950 1.35 1.35
Prudential PLC Financials 1,590,194,234 227,102,474 1.52 1.52
Psion Plc Technology 4,287,390 612,301 0.6 0.6
Punch Taverns PLC Consumer Services 24,829,231 3,545,969 1.59 1.59
PV Crystalox Solar PLC Oil & Gas 51,453,532 7,348,300 1.23 1.23
Industry/Sector Market valueNOK
Market valueUSD Voting Ownership
GOVERNMENT PENSION FUND GLOBAL HOLDINGS 2008
Equities Country association according to FTSE (the benchmark provider for equities). If a company is not in thebenchmark, the country of incorporation and country of listing is used. For remaining securities, a further assessment ismade. Country is defined as a sovereign state currently member of the United Nations. Exceptions are Hong Kong andTaiwan. The country association methodology was updated as of 2014.
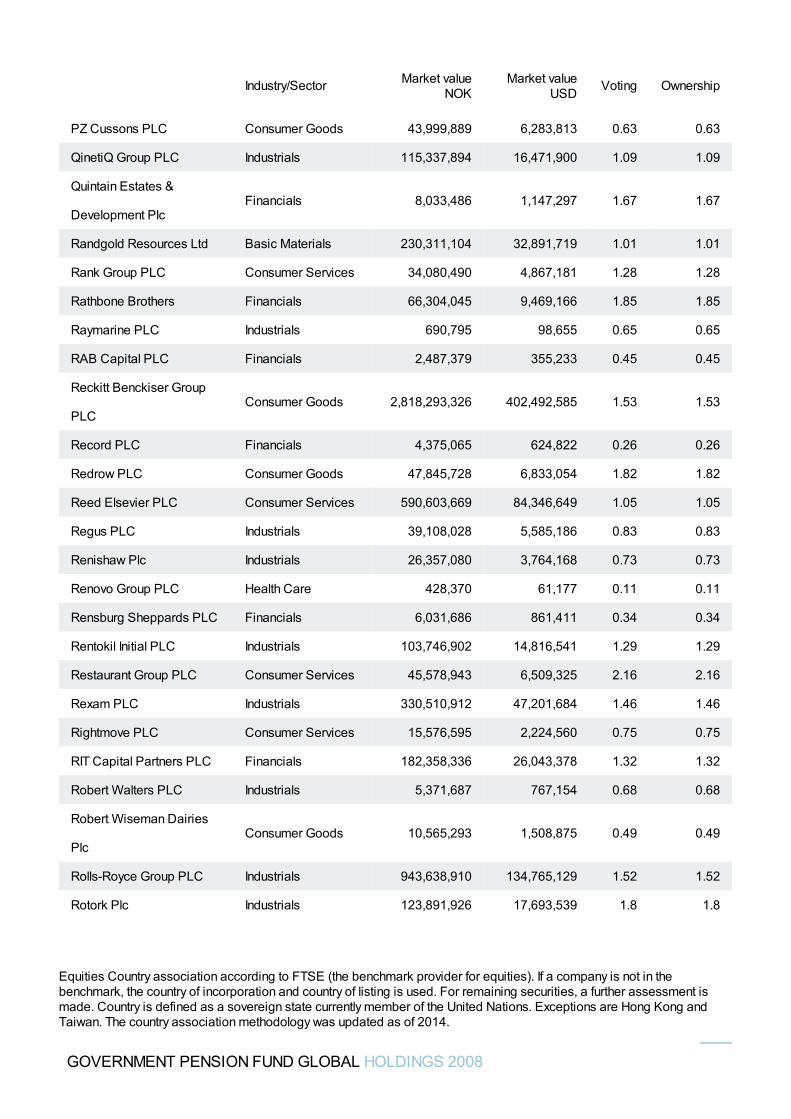
PZ Cussons PLC Consumer Goods 43,999,889 6,283,813 0.63 0.63
QinetiQ Group PLC Industrials 115,337,894 16,471,900 1.09 1.09
Quintain Estates &
Development PlcFinancials 8,033,486 1,147,297 1.67 1.67
Randgold Resources Ltd Basic Materials 230,311,104 32,891,719 1.01 1.01
Rank Group PLC Consumer Services 34,080,490 4,867,181 1.28 1.28
Rathbone Brothers Financials 66,304,045 9,469,166 1.85 1.85
Raymarine PLC Industrials 690,795 98,655 0.65 0.65
RAB Capital PLC Financials 2,487,379 355,233 0.45 0.45
Reckitt Benckiser Group
PLCConsumer Goods 2,818,293,326 402,492,585 1.53 1.53
Record PLC Financials 4,375,065 624,822 0.26 0.26
Redrow PLC Consumer Goods 47,845,728 6,833,054 1.82 1.82
Reed Elsevier PLC Consumer Services 590,603,669 84,346,649 1.05 1.05
Regus PLC Industrials 39,108,028 5,585,186 0.83 0.83
Renishaw Plc Industrials 26,357,080 3,764,168 0.73 0.73
Renovo Group PLC Health Care 428,370 61,177 0.11 0.11
Rensburg Sheppards PLC Financials 6,031,686 861,411 0.34 0.34
Rentokil Initial PLC Industrials 103,746,902 14,816,541 1.29 1.29
Restaurant Group PLC Consumer Services 45,578,943 6,509,325 2.16 2.16
Rexam PLC Industrials 330,510,912 47,201,684 1.46 1.46
Rightmove PLC Consumer Services 15,576,595 2,224,560 0.75 0.75
RIT Capital Partners PLC Financials 182,358,336 26,043,378 1.32 1.32
Robert Walters PLC Industrials 5,371,687 767,154 0.68 0.68
Robert Wiseman Dairies
PlcConsumer Goods 10,565,293 1,508,875 0.49 0.49
Rolls-Royce Group PLC Industrials 943,638,910 134,765,129 1.52 1.52
Rotork Plc Industrials 123,891,926 17,693,539 1.8 1.8
Industry/Sector Market valueNOK
Market valueUSD Voting Ownership
GOVERNMENT PENSION FUND GLOBAL HOLDINGS 2008
Equities Country association according to FTSE (the benchmark provider for equities). If a company is not in thebenchmark, the country of incorporation and country of listing is used. For remaining securities, a further assessment ismade. Country is defined as a sovereign state currently member of the United Nations. Exceptions are Hong Kong andTaiwan. The country association methodology was updated as of 2014.
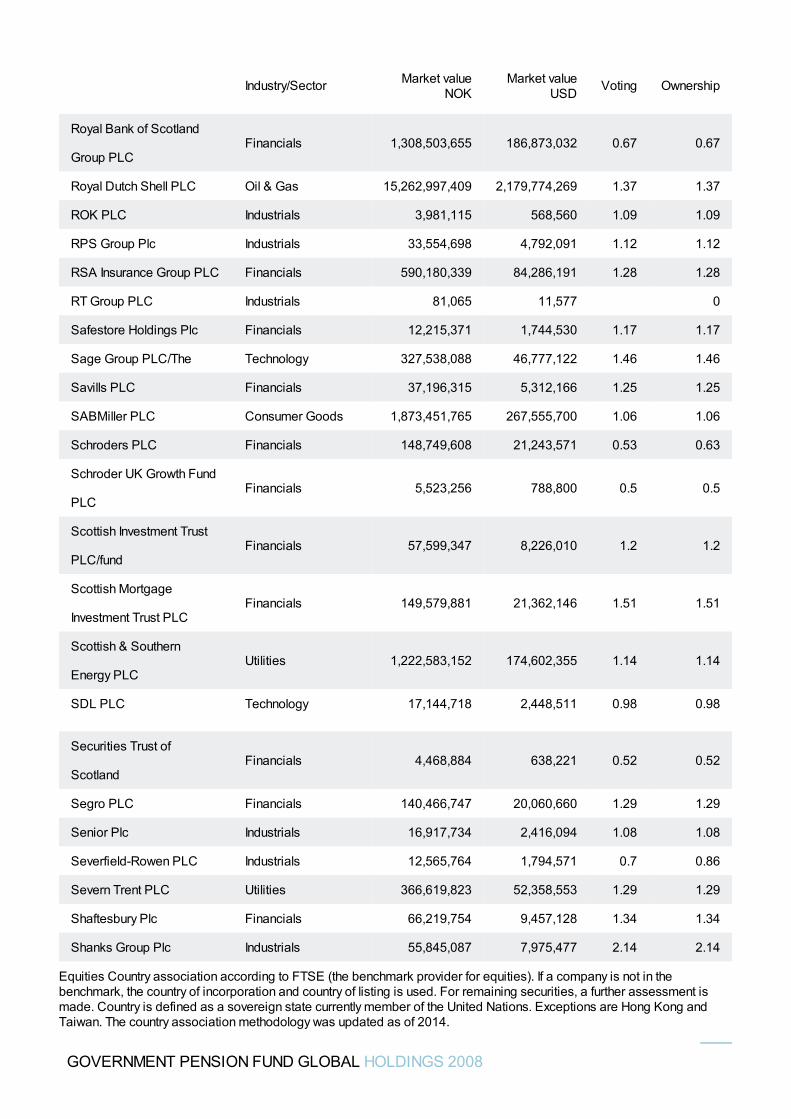
Royal Bank of Scotland
Group PLCFinancials 1,308,503,655 186,873,032 0.67 0.67
Royal Dutch Shell PLC Oil & Gas 15,262,997,409 2,179,774,269 1.37 1.37
ROK PLC Industrials 3,981,115 568,560 1.09 1.09
RPS Group Plc Industrials 33,554,698 4,792,091 1.12 1.12
RSA Insurance Group PLC Financials 590,180,339 84,286,191 1.28 1.28
RT Group PLC Industrials 81,065 11,577 0
Safestore Holdings Plc Financials 12,215,371 1,744,530 1.17 1.17
Sage Group PLC/The Technology 327,538,088 46,777,122 1.46 1.46
Savills PLC Financials 37,196,315 5,312,166 1.25 1.25
SABMiller PLC Consumer Goods 1,873,451,765 267,555,700 1.06 1.06
Schroders PLC Financials 148,749,608 21,243,571 0.53 0.63
Schroder UK Growth Fund
PLCFinancials 5,523,256 788,800 0.5 0.5
Scottish Investment Trust
PLC/fundFinancials 57,599,347 8,226,010 1.2 1.2
Scottish Mortgage
Investment Trust PLCFinancials 149,579,881 21,362,146 1.51 1.51
Scottish & Southern
Energy PLCUtilities 1,222,583,152 174,602,355 1.14 1.14
SDL PLC Technology 17,144,718 2,448,511 0.98 0.98
Securities Trust of
ScotlandFinancials 4,468,884 638,221 0.52 0.52
Segro PLC Financials 140,466,747 20,060,660 1.29 1.29
Senior Plc Industrials 16,917,734 2,416,094 1.08 1.08
Severfield-Rowen PLC Industrials 12,565,764 1,794,571 0.7 0.86
Severn Trent PLC Utilities 366,619,823 52,358,553 1.29 1.29
Shaftesbury Plc Financials 66,219,754 9,457,128 1.34 1.34
Shanks Group Plc Industrials 55,845,087 7,975,477 2.14 2.14
Industry/Sector Market valueNOK
Market valueUSD Voting Ownership
GOVERNMENT PENSION FUND GLOBAL HOLDINGS 2008
Equities Country association according to FTSE (the benchmark provider for equities). If a company is not in thebenchmark, the country of incorporation and country of listing is used. For remaining securities, a further assessment ismade. Country is defined as a sovereign state currently member of the United Nations. Exceptions are Hong Kong andTaiwan. The country association methodology was updated as of 2014.
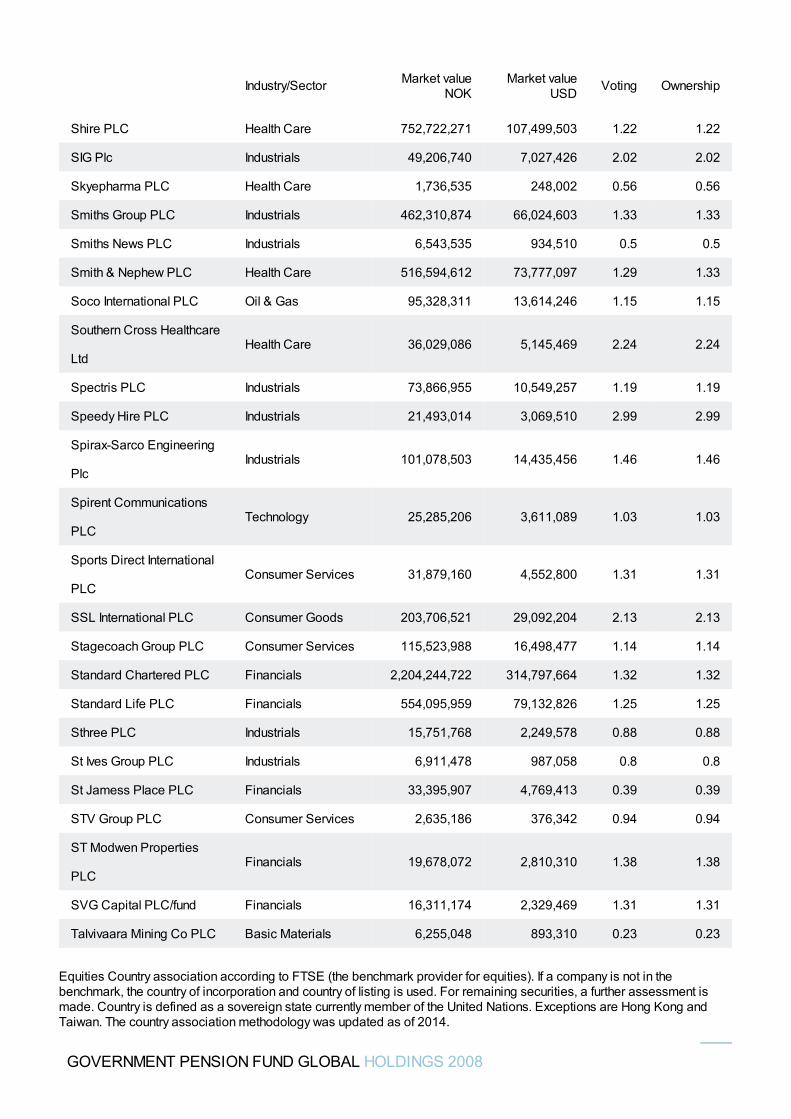
Shire PLC Health Care 752,722,271 107,499,503 1.22 1.22
SIG Plc Industrials 49,206,740 7,027,426 2.02 2.02
Skyepharma PLC Health Care 1,736,535 248,002 0.56 0.56
Smiths Group PLC Industrials 462,310,874 66,024,603 1.33 1.33
Smiths News PLC Industrials 6,543,535 934,510 0.5 0.5
Smith & Nephew PLC Health Care 516,594,612 73,777,097 1.29 1.33
Soco International PLC Oil & Gas 95,328,311 13,614,246 1.15 1.15
Southern Cross Healthcare
LtdHealth Care 36,029,086 5,145,469 2.24 2.24
Spectris PLC Industrials 73,866,955 10,549,257 1.19 1.19
Speedy Hire PLC Industrials 21,493,014 3,069,510 2.99 2.99
Spirax-Sarco Engineering
PlcIndustrials 101,078,503 14,435,456 1.46 1.46
Spirent Communications
PLCTechnology 25,285,206 3,611,089 1.03 1.03
Sports Direct International
PLCConsumer Services 31,879,160 4,552,800 1.31 1.31
SSL International PLC Consumer Goods 203,706,521 29,092,204 2.13 2.13
Stagecoach Group PLC Consumer Services 115,523,988 16,498,477 1.14 1.14
Standard Chartered PLC Financials 2,204,244,722 314,797,664 1.32 1.32
Standard Life PLC Financials 554,095,959 79,132,826 1.25 1.25
Sthree PLC Industrials 15,751,768 2,249,578 0.88 0.88
St Ives Group PLC Industrials 6,911,478 987,058 0.8 0.8
St Jamess Place PLC Financials 33,395,907 4,769,413 0.39 0.39
STV Group PLC Consumer Services 2,635,186 376,342 0.94 0.94
ST Modwen Properties
PLCFinancials 19,678,072 2,810,310 1.38 1.38
SVG Capital PLC/fund Financials 16,311,174 2,329,469 1.31 1.31
Talvivaara Mining Co PLC Basic Materials 6,255,048 893,310 0.23 0.23
Industry/Sector Market valueNOK
Market valueUSD Voting Ownership
GOVERNMENT PENSION FUND GLOBAL HOLDINGS 2008
Equities Country association according to FTSE (the benchmark provider for equities). If a company is not in thebenchmark, the country of incorporation and country of listing is used. For remaining securities, a further assessment ismade. Country is defined as a sovereign state currently member of the United Nations. Exceptions are Hong Kong andTaiwan. The country association methodology was updated as of 2014.
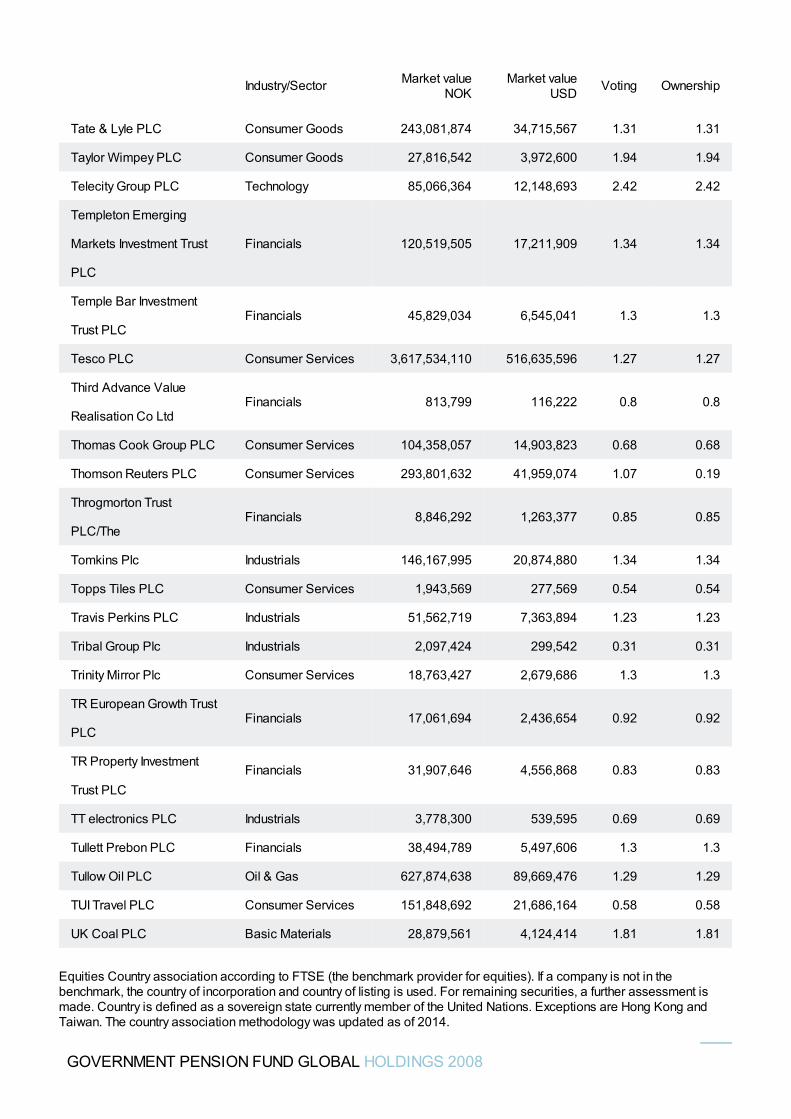
Tate & Lyle PLC Consumer Goods 243,081,874 34,715,567 1.31 1.31
Taylor Wimpey PLC Consumer Goods 27,816,542 3,972,600 1.94 1.94
Telecity Group PLC Technology 85,066,364 12,148,693 2.42 2.42
Templeton Emerging
Markets Investment Trust
PLC
Financials 120,519,505 17,211,909 1.34 1.34
Temple Bar Investment
Trust PLCFinancials 45,829,034 6,545,041 1.3 1.3
Tesco PLC Consumer Services 3,617,534,110 516,635,596 1.27 1.27
Third Advance Value
Realisation Co LtdFinancials 813,799 116,222 0.8 0.8
Thomas Cook Group PLC Consumer Services 104,358,057 14,903,823 0.68 0.68
Thomson Reuters PLC Consumer Services 293,801,632 41,959,074 1.07 0.19
Throgmorton Trust
PLC/TheFinancials 8,846,292 1,263,377 0.85 0.85
Tomkins Plc Industrials 146,167,995 20,874,880 1.34 1.34
Topps Tiles PLC Consumer Services 1,943,569 277,569 0.54 0.54
Travis Perkins PLC Industrials 51,562,719 7,363,894 1.23 1.23
Tribal Group Plc Industrials 2,097,424 299,542 0.31 0.31
Trinity Mirror Plc Consumer Services 18,763,427 2,679,686 1.3 1.3
TR European Growth Trust
PLCFinancials 17,061,694 2,436,654 0.92 0.92
TR Property Investment
Trust PLCFinancials 31,907,646 4,556,868 0.83 0.83
TT electronics PLC Industrials 3,778,300 539,595 0.69 0.69
Tullett Prebon PLC Financials 38,494,789 5,497,606 1.3 1.3
Tullow Oil PLC Oil & Gas 627,874,638 89,669,476 1.29 1.29
TUI Travel PLC Consumer Services 151,848,692 21,686,164 0.58 0.58
UK Coal PLC Basic Materials 28,879,561 4,124,414 1.81 1.81
Industry/Sector Market valueNOK
Market valueUSD Voting Ownership
GOVERNMENT PENSION FUND GLOBAL HOLDINGS 2008
Equities Country association according to FTSE (the benchmark provider for equities). If a company is not in thebenchmark, the country of incorporation and country of listing is used. For remaining securities, a further assessment ismade. Country is defined as a sovereign state currently member of the United Nations. Exceptions are Hong Kong andTaiwan. The country association methodology was updated as of 2014.
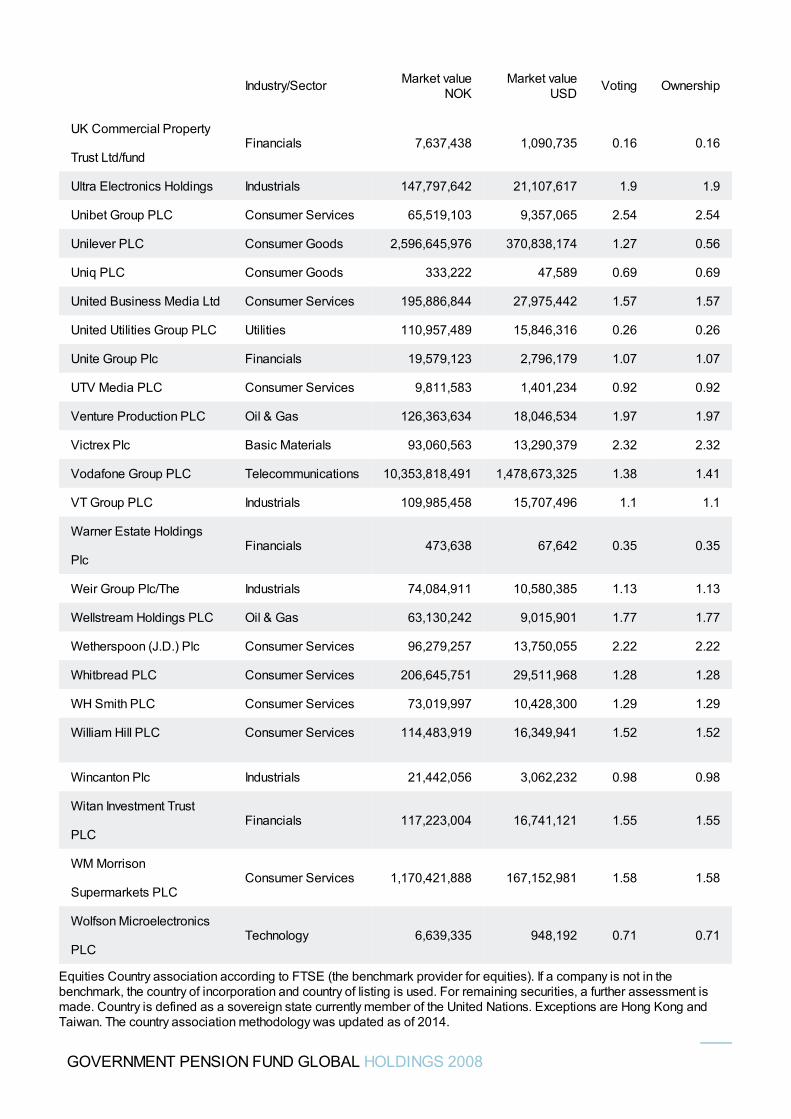
UK Commercial Property
Trust Ltd/fundFinancials 7,637,438 1,090,735 0.16 0.16
Ultra Electronics Holdings Industrials 147,797,642 21,107,617 1.9 1.9
Unibet Group PLC Consumer Services 65,519,103 9,357,065 2.54 2.54
Unilever PLC Consumer Goods 2,596,645,976 370,838,174 1.27 0.56
Uniq PLC Consumer Goods 333,222 47,589 0.69 0.69
United Business Media Ltd Consumer Services 195,886,844 27,975,442 1.57 1.57
United Utilities Group PLC Utilities 110,957,489 15,846,316 0.26 0.26
Unite Group Plc Financials 19,579,123 2,796,179 1.07 1.07
UTV Media PLC Consumer Services 9,811,583 1,401,234 0.92 0.92
Venture Production PLC Oil & Gas 126,363,634 18,046,534 1.97 1.97
Victrex Plc Basic Materials 93,060,563 13,290,379 2.32 2.32
Vodafone Group PLC Telecommunications 10,353,818,491 1,478,673,325 1.38 1.41
VT Group PLC Industrials 109,985,458 15,707,496 1.1 1.1
Warner Estate Holdings
PlcFinancials 473,638 67,642 0.35 0.35
Weir Group Plc/The Industrials 74,084,911 10,580,385 1.13 1.13
Wellstream Holdings PLC Oil & Gas 63,130,242 9,015,901 1.77 1.77
Wetherspoon (J.D.) Plc Consumer Services 96,279,257 13,750,055 2.22 2.22
Whitbread PLC Consumer Services 206,645,751 29,511,968 1.28 1.28
WH Smith PLC Consumer Services 73,019,997 10,428,300 1.29 1.29
William Hill PLC Consumer Services 114,483,919 16,349,941 1.52 1.52
Wincanton Plc Industrials 21,442,056 3,062,232 0.98 0.98
Witan Investment Trust
PLCFinancials 117,223,004 16,741,121 1.55 1.55
WM Morrison
Supermarkets PLCConsumer Services 1,170,421,888 167,152,981 1.58 1.58
Wolfson Microelectronics
PLCTechnology 6,639,335 948,192 0.71 0.71
Industry/Sector Market valueNOK
Market valueUSD Voting Ownership
GOVERNMENT PENSION FUND GLOBAL HOLDINGS 2008
Equities Country association according to FTSE (the benchmark provider for equities). If a company is not in thebenchmark, the country of incorporation and country of listing is used. For remaining securities, a further assessment ismade. Country is defined as a sovereign state currently member of the United Nations. Exceptions are Hong Kong andTaiwan. The country association methodology was updated as of 2014.
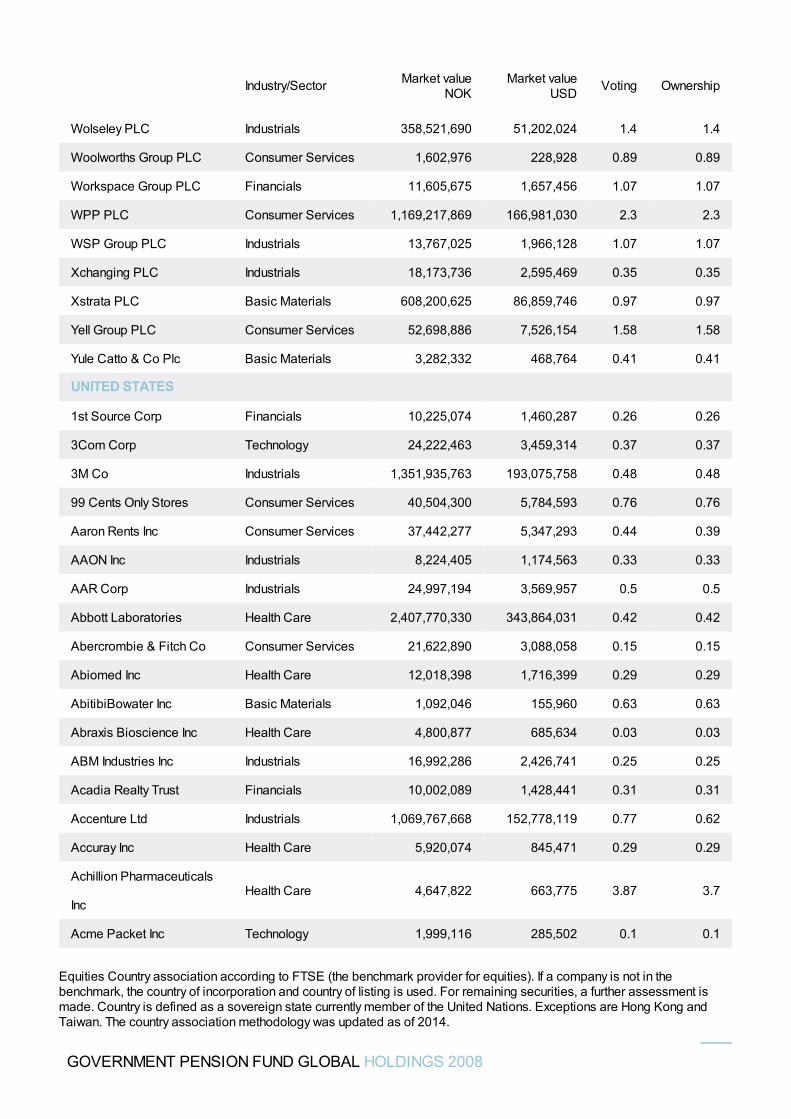
Wolseley PLC Industrials 358,521,690 51,202,024 1.4 1.4
Woolworths Group PLC Consumer Services 1,602,976 228,928 0.89 0.89
Workspace Group PLC Financials 11,605,675 1,657,456 1.07 1.07
WPP PLC Consumer Services 1,169,217,869 166,981,030 2.3 2.3
WSP Group PLC Industrials 13,767,025 1,966,128 1.07 1.07
Xchanging PLC Industrials 18,173,736 2,595,469 0.35 0.35
Xstrata PLC Basic Materials 608,200,625 86,859,746 0.97 0.97
Yell Group PLC Consumer Services 52,698,886 7,526,154 1.58 1.58
Yule Catto & Co Plc Basic Materials 3,282,332 468,764 0.41 0.41
UNITED STATES
1st Source Corp Financials 10,225,074 1,460,287 0.26 0.26
3Com Corp Technology 24,222,463 3,459,314 0.37 0.37
3M Co Industrials 1,351,935,763 193,075,758 0.48 0.48
99 Cents Only Stores Consumer Services 40,504,300 5,784,593 0.76 0.76
Aaron Rents Inc Consumer Services 37,442,277 5,347,293 0.44 0.39
AAON Inc Industrials 8,224,405 1,174,563 0.33 0.33
AAR Corp Industrials 24,997,194 3,569,957 0.5 0.5
Abbott Laboratories Health Care 2,407,770,330 343,864,031 0.42 0.42
Abercrombie & Fitch Co Consumer Services 21,622,890 3,088,058 0.15 0.15
Abiomed Inc Health Care 12,018,398 1,716,399 0.29 0.29
AbitibiBowater Inc Basic Materials 1,092,046 155,960 0.63 0.63
Abraxis Bioscience Inc Health Care 4,800,877 685,634 0.03 0.03
ABM Industries Inc Industrials 16,992,286 2,426,741 0.25 0.25
Acadia Realty Trust Financials 10,002,089 1,428,441 0.31 0.31
Accenture Ltd Industrials 1,069,767,668 152,778,119 0.77 0.62
Accuray Inc Health Care 5,920,074 845,471 0.29 0.29
Achillion Pharmaceuticals
IncHealth Care 4,647,822 663,775 3.87 3.7
Acme Packet Inc Technology 1,999,116 285,502 0.1 0.1
Industry/Sector Market valueNOK
Market valueUSD Voting Ownership
GOVERNMENT PENSION FUND GLOBAL HOLDINGS 2008
Equities Country association according to FTSE (the benchmark provider for equities). If a company is not in thebenchmark, the country of incorporation and country of listing is used. For remaining securities, a further assessment ismade. Country is defined as a sovereign state currently member of the United Nations. Exceptions are Hong Kong andTaiwan. The country association methodology was updated as of 2014.
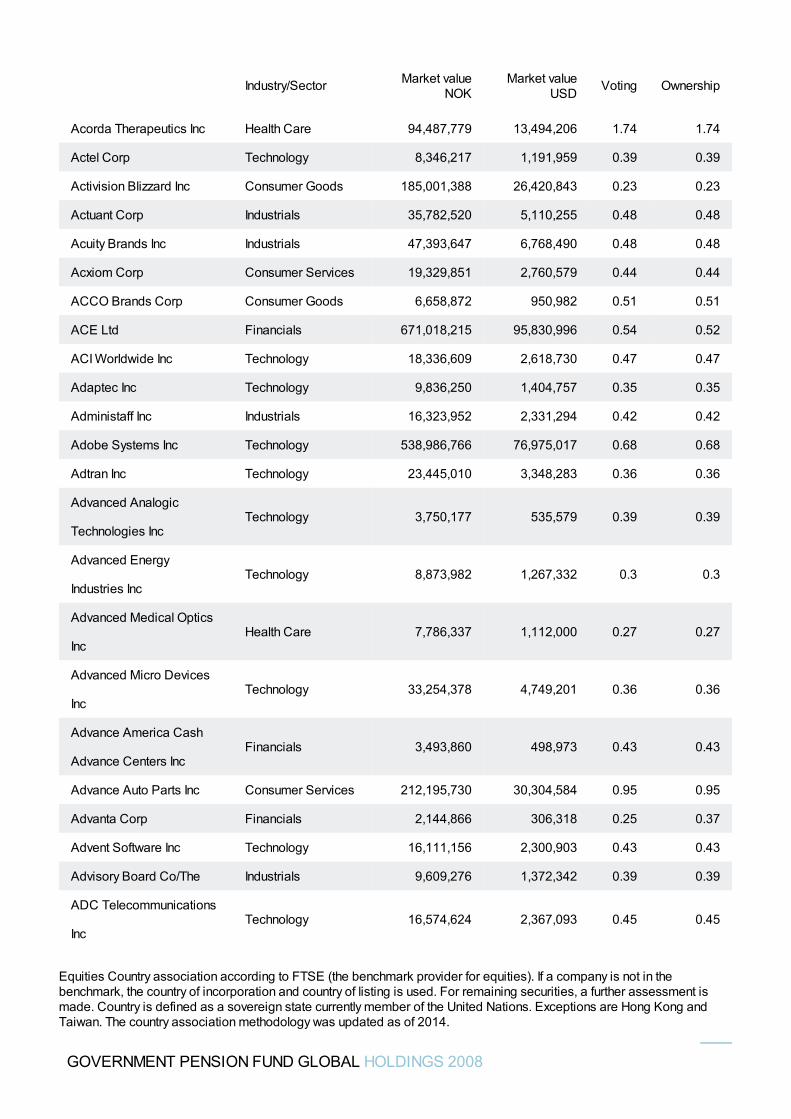
Acorda Therapeutics Inc Health Care 94,487,779 13,494,206 1.74 1.74
Actel Corp Technology 8,346,217 1,191,959 0.39 0.39
Activision Blizzard Inc Consumer Goods 185,001,388 26,420,843 0.23 0.23
Actuant Corp Industrials 35,782,520 5,110,255 0.48 0.48
Acuity Brands Inc Industrials 47,393,647 6,768,490 0.48 0.48
Acxiom Corp Consumer Services 19,329,851 2,760,579 0.44 0.44
ACCO Brands Corp Consumer Goods 6,658,872 950,982 0.51 0.51
ACE Ltd Financials 671,018,215 95,830,996 0.54 0.52
ACI Worldwide Inc Technology 18,336,609 2,618,730 0.47 0.47
Adaptec Inc Technology 9,836,250 1,404,757 0.35 0.35
Administaff Inc Industrials 16,323,952 2,331,294 0.42 0.42
Adobe Systems Inc Technology 538,986,766 76,975,017 0.68 0.68
Adtran Inc Technology 23,445,010 3,348,283 0.36 0.36
Advanced Analogic
Technologies IncTechnology 3,750,177 535,579 0.39 0.39
Advanced Energy
Industries IncTechnology 8,873,982 1,267,332 0.3 0.3
Advanced Medical Optics
IncHealth Care 7,786,337 1,112,000 0.27 0.27
Advanced Micro Devices
IncTechnology 33,254,378 4,749,201 0.36 0.36
Advance America Cash
Advance Centers IncFinancials 3,493,860 498,973 0.43 0.43
Advance Auto Parts Inc Consumer Services 212,195,730 30,304,584 0.95 0.95
Advanta Corp Financials 2,144,866 306,318 0.25 0.37
Advent Software Inc Technology 16,111,156 2,300,903 0.43 0.43
Advisory Board Co/The Industrials 9,609,276 1,372,342 0.39 0.39
ADC Telecommunications
IncTechnology 16,574,624 2,367,093 0.45 0.45
Industry/Sector Market valueNOK
Market valueUSD Voting Ownership
GOVERNMENT PENSION FUND GLOBAL HOLDINGS 2008
Equities Country association according to FTSE (the benchmark provider for equities). If a company is not in thebenchmark, the country of incorporation and country of listing is used. For remaining securities, a further assessment ismade. Country is defined as a sovereign state currently member of the United Nations. Exceptions are Hong Kong andTaiwan. The country association methodology was updated as of 2014.
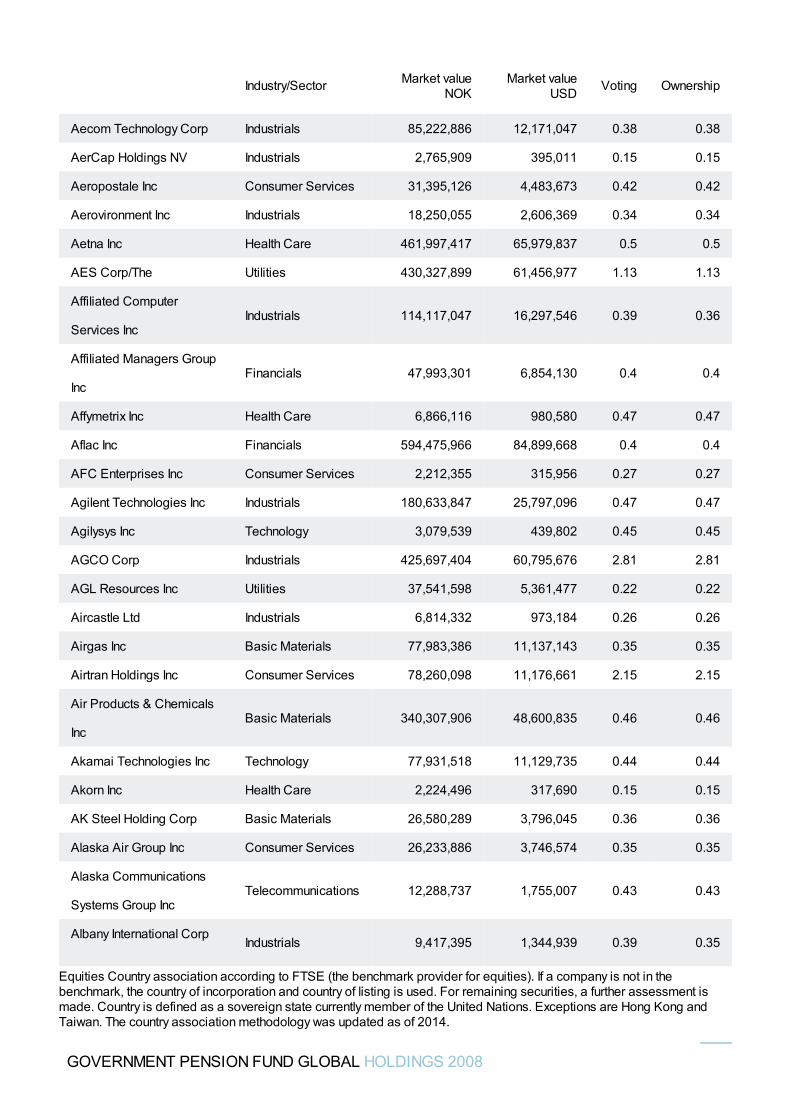
Aecom Technology Corp Industrials 85,222,886 12,171,047 0.38 0.38
AerCap Holdings NV Industrials 2,765,909 395,011 0.15 0.15
Aeropostale Inc Consumer Services 31,395,126 4,483,673 0.42 0.42
Aerovironment Inc Industrials 18,250,055 2,606,369 0.34 0.34
Aetna Inc Health Care 461,997,417 65,979,837 0.5 0.5
AES Corp/The Utilities 430,327,899 61,456,977 1.13 1.13
Affiliated Computer
Services IncIndustrials 114,117,047 16,297,546 0.39 0.36
Affiliated Managers Group
IncFinancials 47,993,301 6,854,130 0.4 0.4
Affymetrix Inc Health Care 6,866,116 980,580 0.47 0.47
Aflac Inc Financials 594,475,966 84,899,668 0.4 0.4
AFC Enterprises Inc Consumer Services 2,212,355 315,956 0.27 0.27
Agilent Technologies Inc Industrials 180,633,847 25,797,096 0.47 0.47
Agilysys Inc Technology 3,079,539 439,802 0.45 0.45
AGCO Corp Industrials 425,697,404 60,795,676 2.81 2.81
AGL Resources Inc Utilities 37,541,598 5,361,477 0.22 0.22
Aircastle Ltd Industrials 6,814,332 973,184 0.26 0.26
Airgas Inc Basic Materials 77,983,386 11,137,143 0.35 0.35
Airtran Holdings Inc Consumer Services 78,260,098 11,176,661 2.15 2.15
Air Products & Chemicals
IncBasic Materials 340,307,906 48,600,835 0.46 0.46
Akamai Technologies Inc Technology 77,931,518 11,129,735 0.44 0.44
Akorn Inc Health Care 2,224,496 317,690 0.15 0.15
AK Steel Holding Corp Basic Materials 26,580,289 3,796,045 0.36 0.36
Alaska Air Group Inc Consumer Services 26,233,886 3,746,574 0.35 0.35
Alaska Communications
Systems Group IncTelecommunications 12,288,737 1,755,007 0.43 0.43
Albany International Corp Industrials 9,417,395 1,344,939 0.39 0.35
Industry/Sector Market valueNOK
Market valueUSD Voting Ownership
GOVERNMENT PENSION FUND GLOBAL HOLDINGS 2008
Equities Country association according to FTSE (the benchmark provider for equities). If a company is not in thebenchmark, the country of incorporation and country of listing is used. For remaining securities, a further assessment ismade. Country is defined as a sovereign state currently member of the United Nations. Exceptions are Hong Kong andTaiwan. The country association methodology was updated as of 2014.
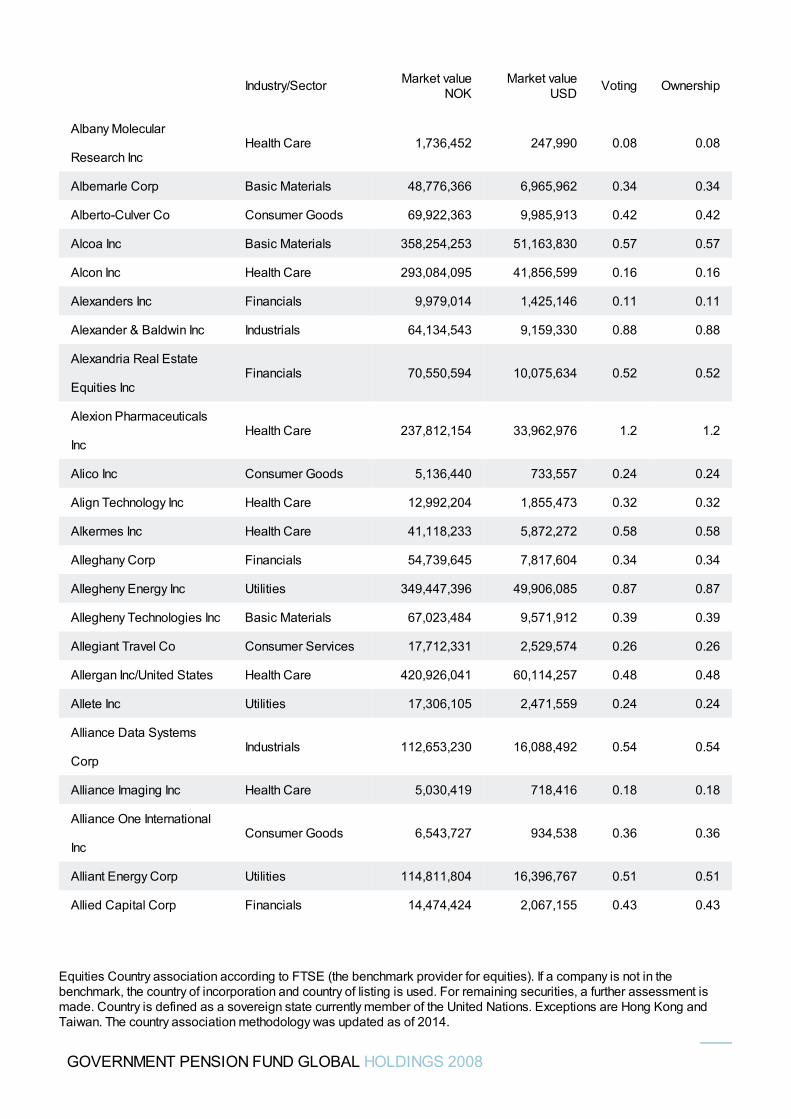
Albany Molecular
Research IncHealth Care 1,736,452 247,990 0.08 0.08
Albemarle Corp Basic Materials 48,776,366 6,965,962 0.34 0.34
Alberto-Culver Co Consumer Goods 69,922,363 9,985,913 0.42 0.42
Alcoa Inc Basic Materials 358,254,253 51,163,830 0.57 0.57
Alcon Inc Health Care 293,084,095 41,856,599 0.16 0.16
Alexanders Inc Financials 9,979,014 1,425,146 0.11 0.11
Alexander & Baldwin Inc Industrials 64,134,543 9,159,330 0.88 0.88
Alexandria Real Estate
Equities IncFinancials 70,550,594 10,075,634 0.52 0.52
Alexion Pharmaceuticals
IncHealth Care 237,812,154 33,962,976 1.2 1.2
Alico Inc Consumer Goods 5,136,440 733,557 0.24 0.24
Align Technology Inc Health Care 12,992,204 1,855,473 0.32 0.32
Alkermes Inc Health Care 41,118,233 5,872,272 0.58 0.58
Alleghany Corp Financials 54,739,645 7,817,604 0.34 0.34
Allegheny Energy Inc Utilities 349,447,396 49,906,085 0.87 0.87
Allegheny Technologies Inc Basic Materials 67,023,484 9,571,912 0.39 0.39
Allegiant Travel Co Consumer Services 17,712,331 2,529,574 0.26 0.26
Allergan Inc/United States Health Care 420,926,041 60,114,257 0.48 0.48
Allete Inc Utilities 17,306,105 2,471,559 0.24 0.24
Alliance Data Systems
CorpIndustrials 112,653,230 16,088,492 0.54 0.54
Alliance Imaging Inc Health Care 5,030,419 718,416 0.18 0.18
Alliance One International
IncConsumer Goods 6,543,727 934,538 0.36 0.36
Alliant Energy Corp Utilities 114,811,804 16,396,767 0.51 0.51
Allied Capital Corp Financials 14,474,424 2,067,155 0.43 0.43
Industry/Sector Market valueNOK
Market valueUSD Voting Ownership
GOVERNMENT PENSION FUND GLOBAL HOLDINGS 2008
Equities Country association according to FTSE (the benchmark provider for equities). If a company is not in thebenchmark, the country of incorporation and country of listing is used. For remaining securities, a further assessment ismade. Country is defined as a sovereign state currently member of the United Nations. Exceptions are Hong Kong andTaiwan. The country association methodology was updated as of 2014.
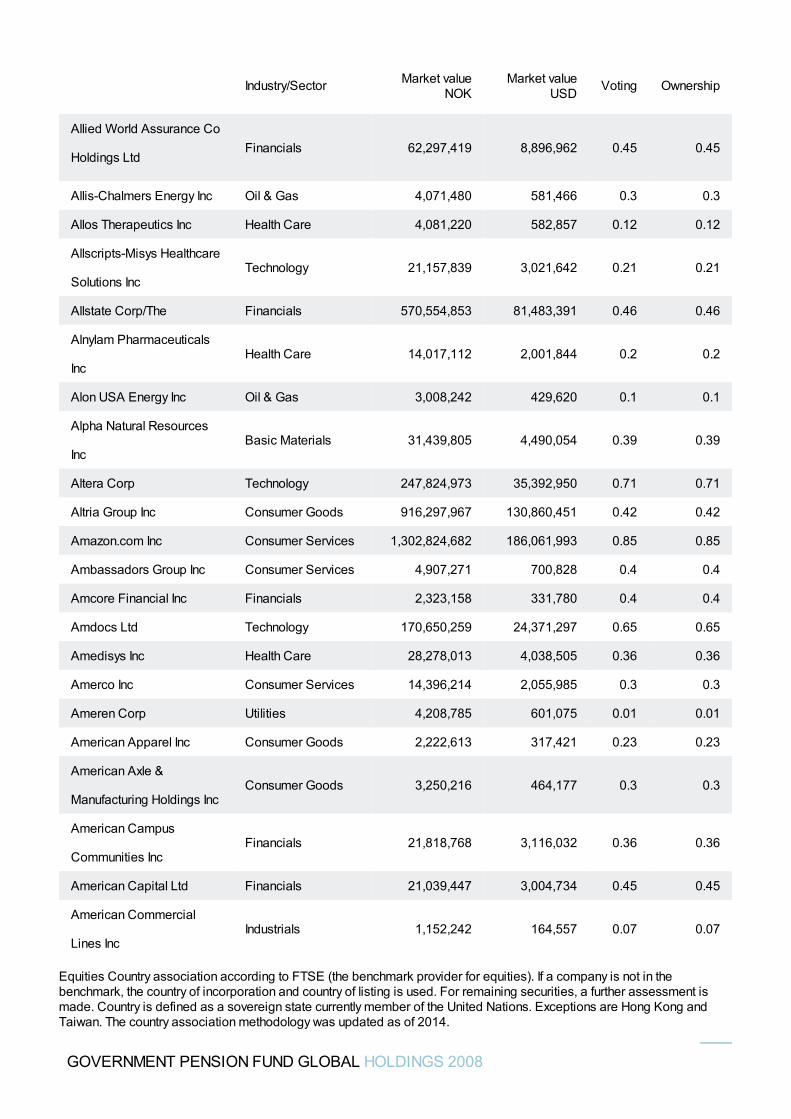
Allied World Assurance Co
Holdings LtdFinancials 62,297,419 8,896,962 0.45 0.45
Allis-Chalmers Energy Inc Oil & Gas 4,071,480 581,466 0.3 0.3
Allos Therapeutics Inc Health Care 4,081,220 582,857 0.12 0.12
Allscripts-Misys Healthcare
Solutions IncTechnology 21,157,839 3,021,642 0.21 0.21
Allstate Corp/The Financials 570,554,853 81,483,391 0.46 0.46
Alnylam Pharmaceuticals
IncHealth Care 14,017,112 2,001,844 0.2 0.2
Alon USA Energy Inc Oil & Gas 3,008,242 429,620 0.1 0.1
Alpha Natural Resources
IncBasic Materials 31,439,805 4,490,054 0.39 0.39
Altera Corp Technology 247,824,973 35,392,950 0.71 0.71
Altria Group Inc Consumer Goods 916,297,967 130,860,451 0.42 0.42
Amazon.com Inc Consumer Services 1,302,824,682 186,061,993 0.85 0.85
Ambassadors Group Inc Consumer Services 4,907,271 700,828 0.4 0.4
Amcore Financial Inc Financials 2,323,158 331,780 0.4 0.4
Amdocs Ltd Technology 170,650,259 24,371,297 0.65 0.65
Amedisys Inc Health Care 28,278,013 4,038,505 0.36 0.36
Amerco Inc Consumer Services 14,396,214 2,055,985 0.3 0.3
Ameren Corp Utilities 4,208,785 601,075 0.01 0.01
American Apparel Inc Consumer Goods 2,222,613 317,421 0.23 0.23
American Axle &
Manufacturing Holdings IncConsumer Goods 3,250,216 464,177 0.3 0.3
American Campus
Communities IncFinancials 21,818,768 3,116,032 0.36 0.36
American Capital Ltd Financials 21,039,447 3,004,734 0.45 0.45
American Commercial
Lines IncIndustrials 1,152,242 164,557 0.07 0.07
Industry/Sector Market valueNOK
Market valueUSD Voting Ownership
GOVERNMENT PENSION FUND GLOBAL HOLDINGS 2008
Equities Country association according to FTSE (the benchmark provider for equities). If a company is not in thebenchmark, the country of incorporation and country of listing is used. For remaining securities, a further assessment ismade. Country is defined as a sovereign state currently member of the United Nations. Exceptions are Hong Kong andTaiwan. The country association methodology was updated as of 2014.
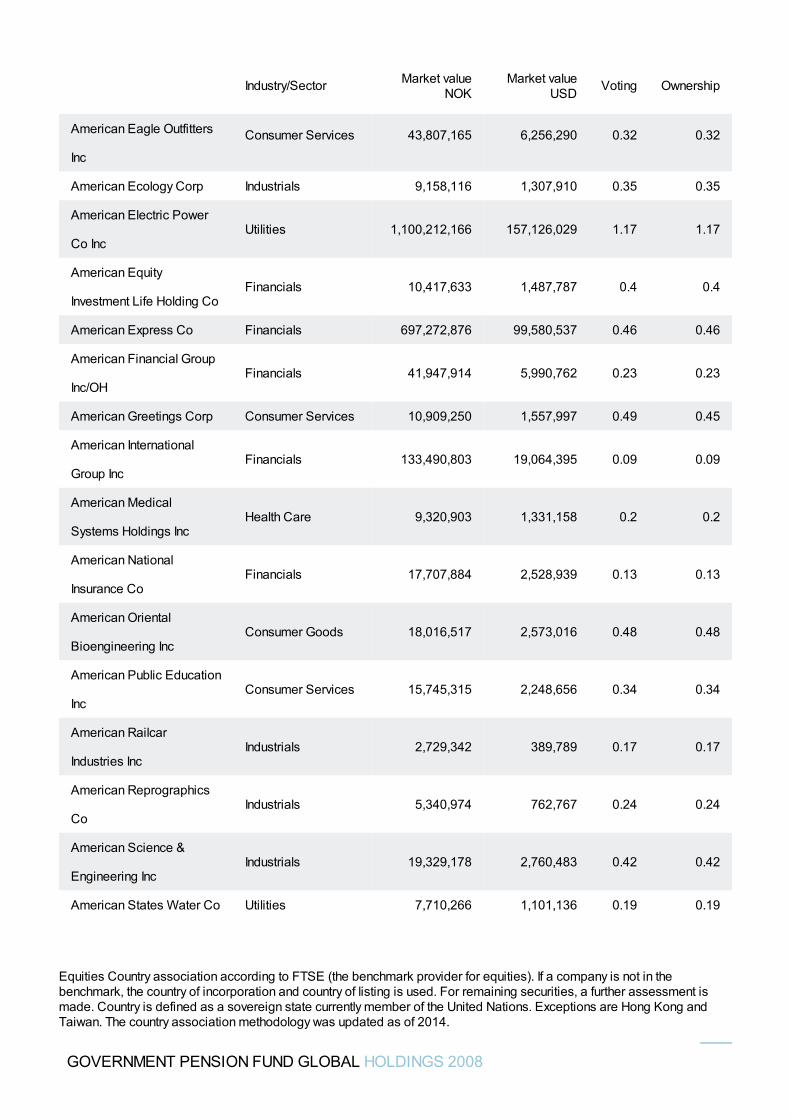
American Eagle Outfitters
Inc
Consumer Services 43,807,165 6,256,290 0.32 0.32
American Ecology Corp Industrials 9,158,116 1,307,910 0.35 0.35
American Electric Power
Co IncUtilities 1,100,212,166 157,126,029 1.17 1.17
American Equity
Investment Life Holding CoFinancials 10,417,633 1,487,787 0.4 0.4
American Express Co Financials 697,272,876 99,580,537 0.46 0.46
American Financial Group
Inc/OHFinancials 41,947,914 5,990,762 0.23 0.23
American Greetings Corp Consumer Services 10,909,250 1,557,997 0.49 0.45
American International
Group IncFinancials 133,490,803 19,064,395 0.09 0.09
American Medical
Systems Holdings IncHealth Care 9,320,903 1,331,158 0.2 0.2
American National
Insurance CoFinancials 17,707,884 2,528,939 0.13 0.13
American Oriental
Bioengineering IncConsumer Goods 18,016,517 2,573,016 0.48 0.48
American Public Education
IncConsumer Services 15,745,315 2,248,656 0.34 0.34
American Railcar
Industries IncIndustrials 2,729,342 389,789 0.17 0.17
American Reprographics
CoIndustrials 5,340,974 762,767 0.24 0.24
American Science &
Engineering IncIndustrials 19,329,178 2,760,483 0.42 0.42
American States Water Co Utilities 7,710,266 1,101,136 0.19 0.19
Industry/Sector Market valueNOK
Market valueUSD Voting Ownership
GOVERNMENT PENSION FUND GLOBAL HOLDINGS 2008
Equities Country association according to FTSE (the benchmark provider for equities). If a company is not in thebenchmark, the country of incorporation and country of listing is used. For remaining securities, a further assessment ismade. Country is defined as a sovereign state currently member of the United Nations. Exceptions are Hong Kong andTaiwan. The country association methodology was updated as of 2014.
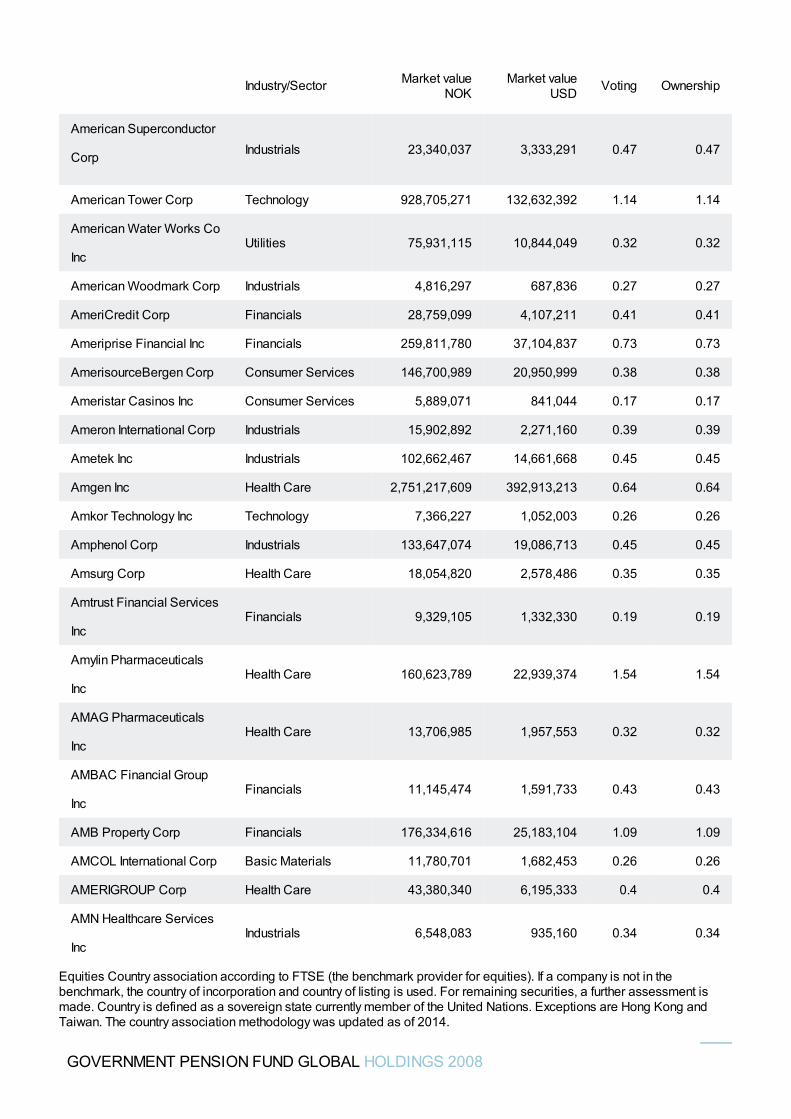
American Superconductor
Corp Industrials 23,340,037 3,333,291 0.47 0.47
American Tower Corp Technology 928,705,271 132,632,392 1.14 1.14
American Water Works Co
IncUtilities 75,931,115 10,844,049 0.32 0.32
American Woodmark Corp Industrials 4,816,297 687,836 0.27 0.27
AmeriCredit Corp Financials 28,759,099 4,107,211 0.41 0.41
Ameriprise Financial Inc Financials 259,811,780 37,104,837 0.73 0.73
AmerisourceBergen Corp Consumer Services 146,700,989 20,950,999 0.38 0.38
Ameristar Casinos Inc Consumer Services 5,889,071 841,044 0.17 0.17
Ameron International Corp Industrials 15,902,892 2,271,160 0.39 0.39
Ametek Inc Industrials 102,662,467 14,661,668 0.45 0.45
Amgen Inc Health Care 2,751,217,609 392,913,213 0.64 0.64
Amkor Technology Inc Technology 7,366,227 1,052,003 0.26 0.26
Amphenol Corp Industrials 133,647,074 19,086,713 0.45 0.45
Amsurg Corp Health Care 18,054,820 2,578,486 0.35 0.35
Amtrust Financial Services
IncFinancials 9,329,105 1,332,330 0.19 0.19
Amylin Pharmaceuticals
IncHealth Care 160,623,789 22,939,374 1.54 1.54
AMAG Pharmaceuticals
IncHealth Care 13,706,985 1,957,553 0.32 0.32
AMBAC Financial Group
IncFinancials 11,145,474 1,591,733 0.43 0.43
AMB Property Corp Financials 176,334,616 25,183,104 1.09 1.09
AMCOL International Corp Basic Materials 11,780,701 1,682,453 0.26 0.26
AMERIGROUP Corp Health Care 43,380,340 6,195,333 0.4 0.4
AMN Healthcare Services
IncIndustrials 6,548,083 935,160 0.34 0.34
Industry/Sector Market valueNOK
Market valueUSD Voting Ownership
GOVERNMENT PENSION FUND GLOBAL HOLDINGS 2008
Equities Country association according to FTSE (the benchmark provider for equities). If a company is not in thebenchmark, the country of incorporation and country of listing is used. For remaining securities, a further assessment ismade. Country is defined as a sovereign state currently member of the United Nations. Exceptions are Hong Kong andTaiwan. The country association methodology was updated as of 2014.
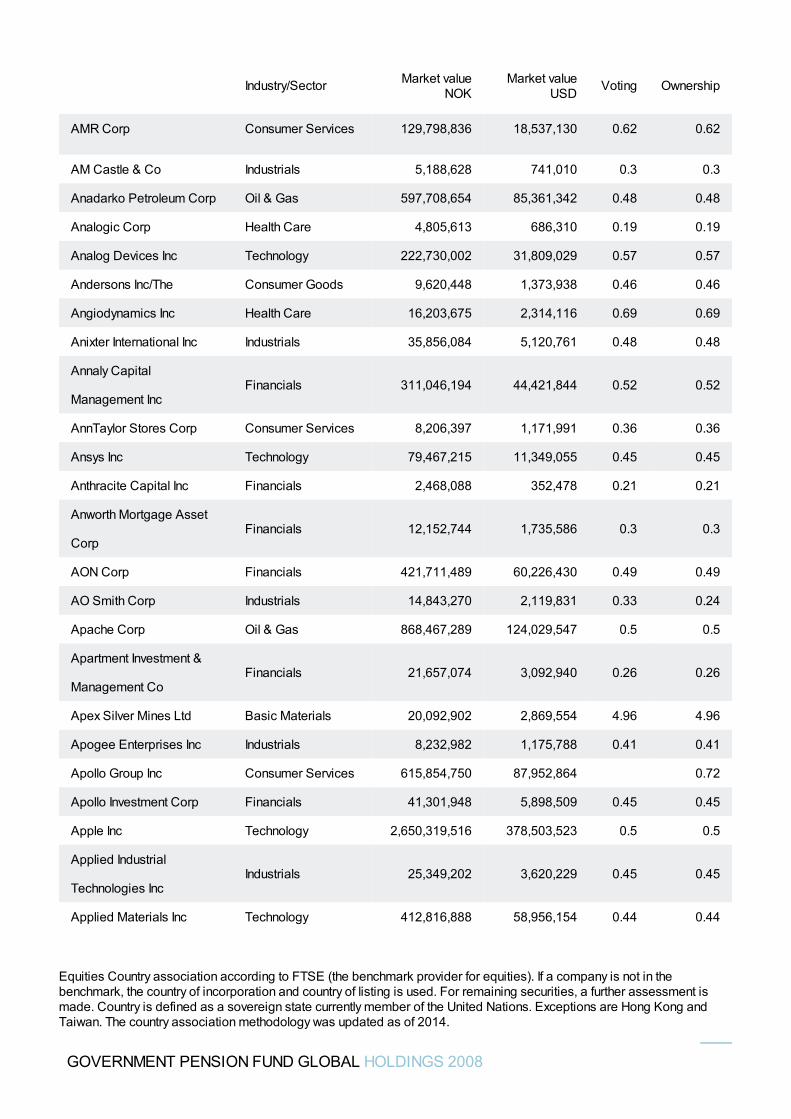
AMR Corp Consumer Services 129,798,836 18,537,130 0.62 0.62
AM Castle & Co Industrials 5,188,628 741,010 0.3 0.3
Anadarko Petroleum Corp Oil & Gas 597,708,654 85,361,342 0.48 0.48
Analogic Corp Health Care 4,805,613 686,310 0.19 0.19
Analog Devices Inc Technology 222,730,002 31,809,029 0.57 0.57
Andersons Inc/The Consumer Goods 9,620,448 1,373,938 0.46 0.46
Angiodynamics Inc Health Care 16,203,675 2,314,116 0.69 0.69
Anixter International Inc Industrials 35,856,084 5,120,761 0.48 0.48
Annaly Capital
Management IncFinancials 311,046,194 44,421,844 0.52 0.52
AnnTaylor Stores Corp Consumer Services 8,206,397 1,171,991 0.36 0.36
Ansys Inc Technology 79,467,215 11,349,055 0.45 0.45
Anthracite Capital Inc Financials 2,468,088 352,478 0.21 0.21
Anworth Mortgage Asset
CorpFinancials 12,152,744 1,735,586 0.3 0.3
AON Corp Financials 421,711,489 60,226,430 0.49 0.49
AO Smith Corp Industrials 14,843,270 2,119,831 0.33 0.24
Apache Corp Oil & Gas 868,467,289 124,029,547 0.5 0.5
Apartment Investment &
Management CoFinancials 21,657,074 3,092,940 0.26 0.26
Apex Silver Mines Ltd Basic Materials 20,092,902 2,869,554 4.96 4.96
Apogee Enterprises Inc Industrials 8,232,982 1,175,788 0.41 0.41
Apollo Group Inc Consumer Services 615,854,750 87,952,864 0.72
Apollo Investment Corp Financials 41,301,948 5,898,509 0.45 0.45
Apple Inc Technology 2,650,319,516 378,503,523 0.5 0.5
Applied Industrial
Technologies IncIndustrials 25,349,202 3,620,229 0.45 0.45
Applied Materials Inc Technology 412,816,888 58,956,154 0.44 0.44
Industry/Sector Market valueNOK
Market valueUSD Voting Ownership
GOVERNMENT PENSION FUND GLOBAL HOLDINGS 2008
Equities Country association according to FTSE (the benchmark provider for equities). If a company is not in thebenchmark, the country of incorporation and country of listing is used. For remaining securities, a further assessment ismade. Country is defined as a sovereign state currently member of the United Nations. Exceptions are Hong Kong andTaiwan. The country association methodology was updated as of 2014.
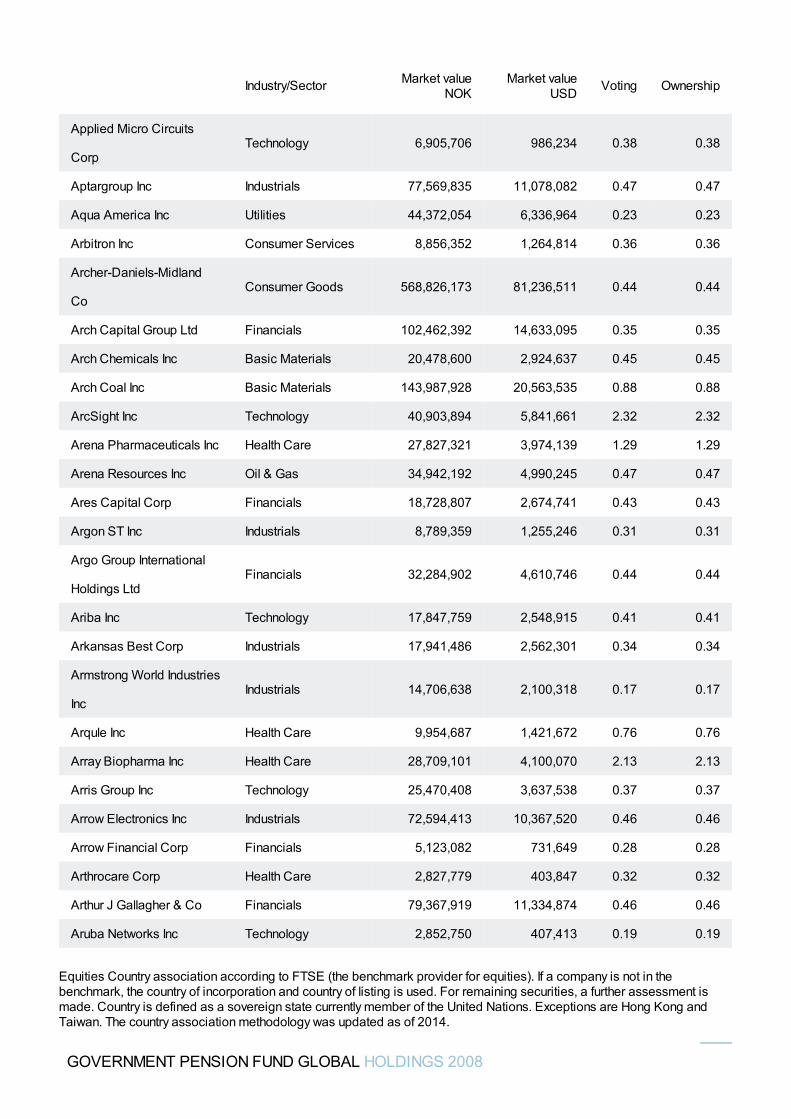
Applied Micro Circuits
CorpTechnology 6,905,706 986,234 0.38 0.38
Aptargroup Inc Industrials 77,569,835 11,078,082 0.47 0.47
Aqua America Inc Utilities 44,372,054 6,336,964 0.23 0.23
Arbitron Inc Consumer Services 8,856,352 1,264,814 0.36 0.36
Archer-Daniels-Midland
CoConsumer Goods 568,826,173 81,236,511 0.44 0.44
Arch Capital Group Ltd Financials 102,462,392 14,633,095 0.35 0.35
Arch Chemicals Inc Basic Materials 20,478,600 2,924,637 0.45 0.45
Arch Coal Inc Basic Materials 143,987,928 20,563,535 0.88 0.88
ArcSight Inc Technology 40,903,894 5,841,661 2.32 2.32
Arena Pharmaceuticals Inc Health Care 27,827,321 3,974,139 1.29 1.29
Arena Resources Inc Oil & Gas 34,942,192 4,990,245 0.47 0.47
Ares Capital Corp Financials 18,728,807 2,674,741 0.43 0.43
Argon ST Inc Industrials 8,789,359 1,255,246 0.31 0.31
Argo Group International
Holdings LtdFinancials 32,284,902 4,610,746 0.44 0.44
Ariba Inc Technology 17,847,759 2,548,915 0.41 0.41
Arkansas Best Corp Industrials 17,941,486 2,562,301 0.34 0.34
Armstrong World Industries
IncIndustrials 14,706,638 2,100,318 0.17 0.17
Arqule Inc Health Care 9,954,687 1,421,672 0.76 0.76
Array Biopharma Inc Health Care 28,709,101 4,100,070 2.13 2.13
Arris Group Inc Technology 25,470,408 3,637,538 0.37 0.37
Arrow Electronics Inc Industrials 72,594,413 10,367,520 0.46 0.46
Arrow Financial Corp Financials 5,123,082 731,649 0.28 0.28
Arthrocare Corp Health Care 2,827,779 403,847 0.32 0.32
Arthur J Gallagher & Co Financials 79,367,919 11,334,874 0.46 0.46
Aruba Networks Inc Technology 2,852,750 407,413 0.19 0.19
Industry/Sector Market valueNOK
Market valueUSD Voting Ownership
GOVERNMENT PENSION FUND GLOBAL HOLDINGS 2008
Equities Country association according to FTSE (the benchmark provider for equities). If a company is not in thebenchmark, the country of incorporation and country of listing is used. For remaining securities, a further assessment ismade. Country is defined as a sovereign state currently member of the United Nations. Exceptions are Hong Kong andTaiwan. The country association methodology was updated as of 2014.
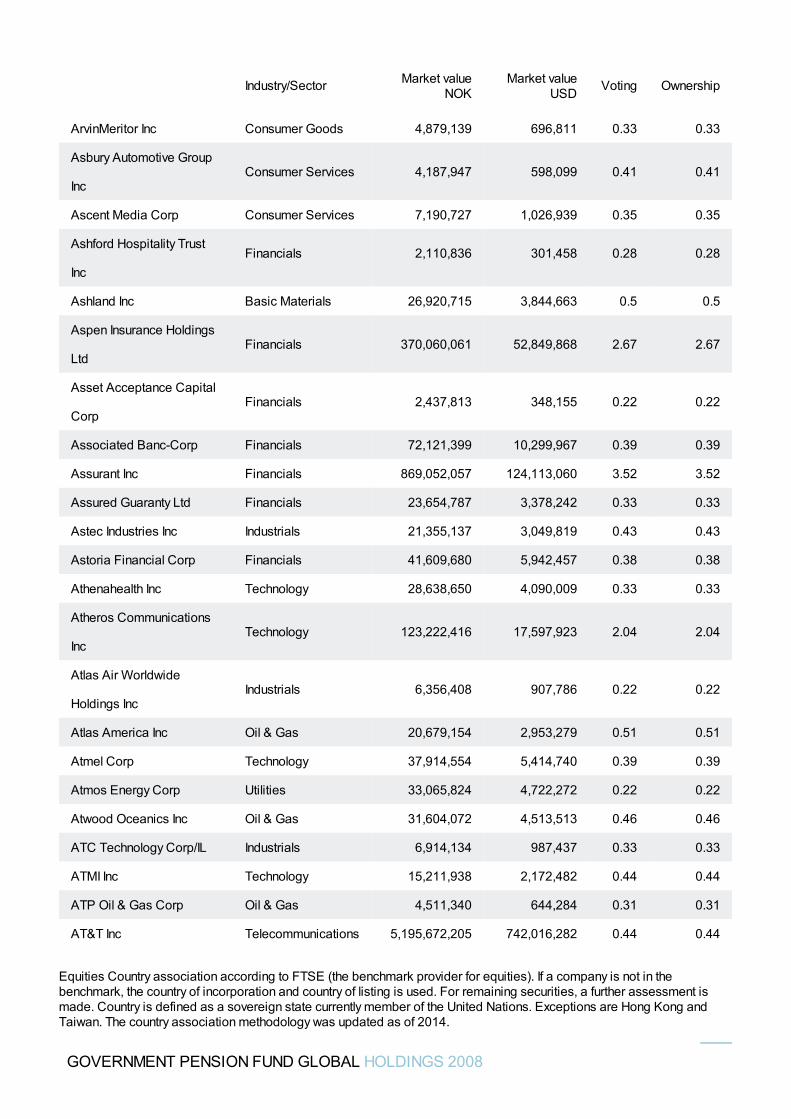
ArvinMeritor Inc Consumer Goods 4,879,139 696,811 0.33 0.33
Asbury Automotive Group
IncConsumer Services 4,187,947 598,099 0.41 0.41
Ascent Media Corp Consumer Services 7,190,727 1,026,939 0.35 0.35
Ashford Hospitality Trust
IncFinancials 2,110,836 301,458 0.28 0.28
Ashland Inc Basic Materials 26,920,715 3,844,663 0.5 0.5
Aspen Insurance Holdings
LtdFinancials 370,060,061 52,849,868 2.67 2.67
Asset Acceptance Capital
CorpFinancials 2,437,813 348,155 0.22 0.22
Associated Banc-Corp Financials 72,121,399 10,299,967 0.39 0.39
Assurant Inc Financials 869,052,057 124,113,060 3.52 3.52
Assured Guaranty Ltd Financials 23,654,787 3,378,242 0.33 0.33
Astec Industries Inc Industrials 21,355,137 3,049,819 0.43 0.43
Astoria Financial Corp Financials 41,609,680 5,942,457 0.38 0.38
Athenahealth Inc Technology 28,638,650 4,090,009 0.33 0.33
Atheros Communications
IncTechnology 123,222,416 17,597,923 2.04 2.04
Atlas Air Worldwide
Holdings IncIndustrials 6,356,408 907,786 0.22 0.22
Atlas America Inc Oil & Gas 20,679,154 2,953,279 0.51 0.51
Atmel Corp Technology 37,914,554 5,414,740 0.39 0.39
Atmos Energy Corp Utilities 33,065,824 4,722,272 0.22 0.22
Atwood Oceanics Inc Oil & Gas 31,604,072 4,513,513 0.46 0.46
ATC Technology Corp/IL Industrials 6,914,134 987,437 0.33 0.33
ATMI Inc Technology 15,211,938 2,172,482 0.44 0.44
ATP Oil & Gas Corp Oil & Gas 4,511,340 644,284 0.31 0.31
AT&T Inc Telecommunications 5,195,672,205 742,016,282 0.44 0.44
Industry/Sector Market valueNOK
Market valueUSD Voting Ownership
GOVERNMENT PENSION FUND GLOBAL HOLDINGS 2008
Equities Country association according to FTSE (the benchmark provider for equities). If a company is not in thebenchmark, the country of incorporation and country of listing is used. For remaining securities, a further assessment ismade. Country is defined as a sovereign state currently member of the United Nations. Exceptions are Hong Kong andTaiwan. The country association methodology was updated as of 2014.
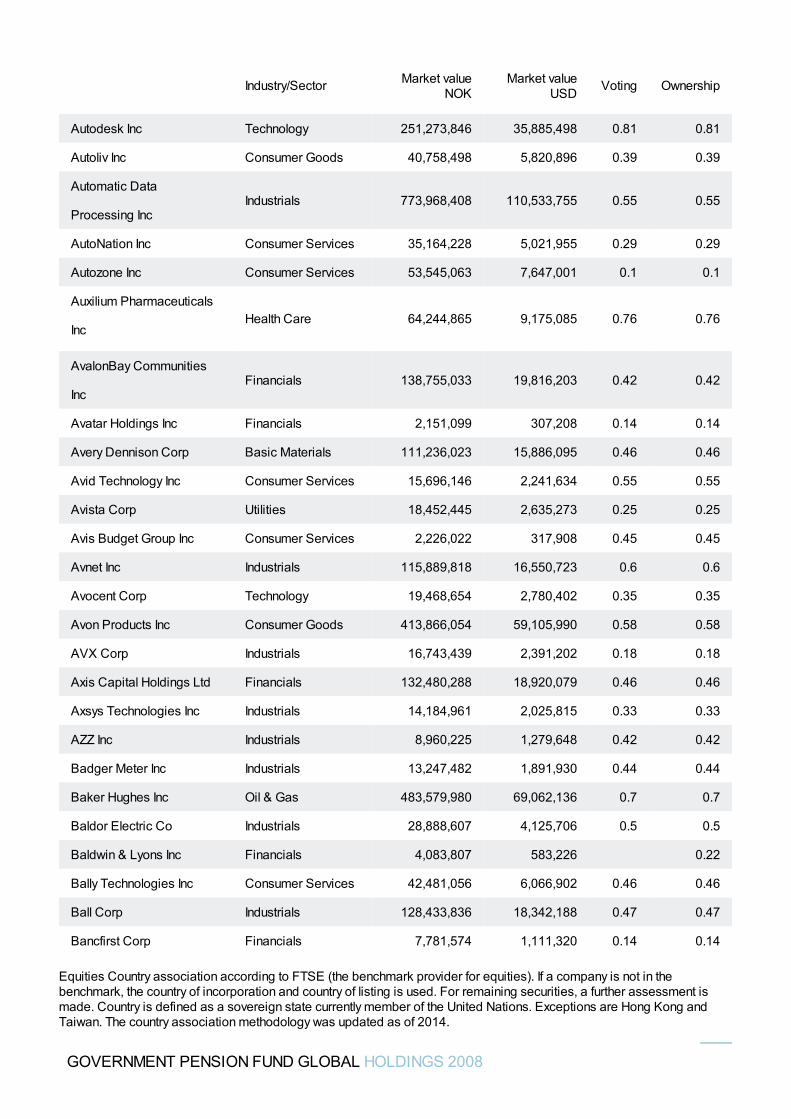
Autodesk Inc Technology 251,273,846 35,885,498 0.81 0.81
Autoliv Inc Consumer Goods 40,758,498 5,820,896 0.39 0.39
Automatic Data
Processing IncIndustrials 773,968,408 110,533,755 0.55 0.55
AutoNation Inc Consumer Services 35,164,228 5,021,955 0.29 0.29
Autozone Inc Consumer Services 53,545,063 7,647,001 0.1 0.1
Auxilium Pharmaceuticals
IncHealth Care 64,244,865 9,175,085 0.76 0.76
AvalonBay Communities
IncFinancials 138,755,033 19,816,203 0.42 0.42
Avatar Holdings Inc Financials 2,151,099 307,208 0.14 0.14
Avery Dennison Corp Basic Materials 111,236,023 15,886,095 0.46 0.46
Avid Technology Inc Consumer Services 15,696,146 2,241,634 0.55 0.55
Avista Corp Utilities 18,452,445 2,635,273 0.25 0.25
Avis Budget Group Inc Consumer Services 2,226,022 317,908 0.45 0.45
Avnet Inc Industrials 115,889,818 16,550,723 0.6 0.6
Avocent Corp Technology 19,468,654 2,780,402 0.35 0.35
Avon Products Inc Consumer Goods 413,866,054 59,105,990 0.58 0.58
AVX Corp Industrials 16,743,439 2,391,202 0.18 0.18
Axis Capital Holdings Ltd Financials 132,480,288 18,920,079 0.46 0.46
Axsys Technologies Inc Industrials 14,184,961 2,025,815 0.33 0.33
AZZ Inc Industrials 8,960,225 1,279,648 0.42 0.42
Badger Meter Inc Industrials 13,247,482 1,891,930 0.44 0.44
Baker Hughes Inc Oil & Gas 483,579,980 69,062,136 0.7 0.7
Baldor Electric Co Industrials 28,888,607 4,125,706 0.5 0.5
Baldwin & Lyons Inc Financials 4,083,807 583,226 0.22
Bally Technologies Inc Consumer Services 42,481,056 6,066,902 0.46 0.46
Ball Corp Industrials 128,433,836 18,342,188 0.47 0.47
Bancfirst Corp Financials 7,781,574 1,111,320 0.14 0.14
Industry/Sector Market valueNOK
Market valueUSD Voting Ownership
GOVERNMENT PENSION FUND GLOBAL HOLDINGS 2008
Equities Country association according to FTSE (the benchmark provider for equities). If a company is not in thebenchmark, the country of incorporation and country of listing is used. For remaining securities, a further assessment ismade. Country is defined as a sovereign state currently member of the United Nations. Exceptions are Hong Kong andTaiwan. The country association methodology was updated as of 2014.
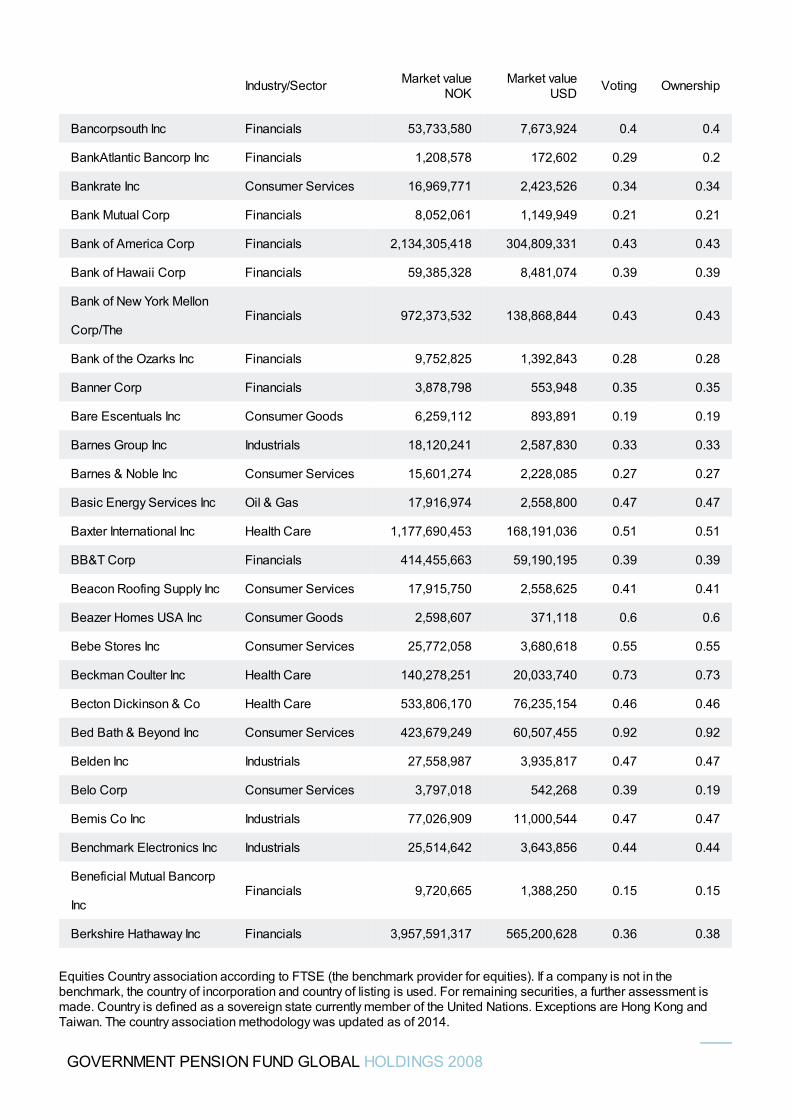
Bancorpsouth Inc Financials 53,733,580 7,673,924 0.4 0.4
BankAtlantic Bancorp Inc Financials 1,208,578 172,602 0.29 0.2
Bankrate Inc Consumer Services 16,969,771 2,423,526 0.34 0.34
Bank Mutual Corp Financials 8,052,061 1,149,949 0.21 0.21
Bank of America Corp Financials 2,134,305,418 304,809,331 0.43 0.43
Bank of Hawaii Corp Financials 59,385,328 8,481,074 0.39 0.39
Bank of New York Mellon
Corp/TheFinancials 972,373,532 138,868,844 0.43 0.43
Bank of the Ozarks Inc Financials 9,752,825 1,392,843 0.28 0.28
Banner Corp Financials 3,878,798 553,948 0.35 0.35
Bare Escentuals Inc Consumer Goods 6,259,112 893,891 0.19 0.19
Barnes Group Inc Industrials 18,120,241 2,587,830 0.33 0.33
Barnes & Noble Inc Consumer Services 15,601,274 2,228,085 0.27 0.27
Basic Energy Services Inc Oil & Gas 17,916,974 2,558,800 0.47 0.47
Baxter International Inc Health Care 1,177,690,453 168,191,036 0.51 0.51
BB&T Corp Financials 414,455,663 59,190,195 0.39 0.39
Beacon Roofing Supply Inc Consumer Services 17,915,750 2,558,625 0.41 0.41
Beazer Homes USA Inc Consumer Goods 2,598,607 371,118 0.6 0.6
Bebe Stores Inc Consumer Services 25,772,058 3,680,618 0.55 0.55
Beckman Coulter Inc Health Care 140,278,251 20,033,740 0.73 0.73
Becton Dickinson & Co Health Care 533,806,170 76,235,154 0.46 0.46
Bed Bath & Beyond Inc Consumer Services 423,679,249 60,507,455 0.92 0.92
Belden Inc Industrials 27,558,987 3,935,817 0.47 0.47
Belo Corp Consumer Services 3,797,018 542,268 0.39 0.19
Bemis Co Inc Industrials 77,026,909 11,000,544 0.47 0.47
Benchmark Electronics Inc Industrials 25,514,642 3,643,856 0.44 0.44
Beneficial Mutual Bancorp
IncFinancials 9,720,665 1,388,250 0.15 0.15
Berkshire Hathaway Inc Financials 3,957,591,317 565,200,628 0.36 0.38
Industry/Sector Market valueNOK
Market valueUSD Voting Ownership
GOVERNMENT PENSION FUND GLOBAL HOLDINGS 2008
Equities Country association according to FTSE (the benchmark provider for equities). If a company is not in thebenchmark, the country of incorporation and country of listing is used. For remaining securities, a further assessment ismade. Country is defined as a sovereign state currently member of the United Nations. Exceptions are Hong Kong andTaiwan. The country association methodology was updated as of 2014.
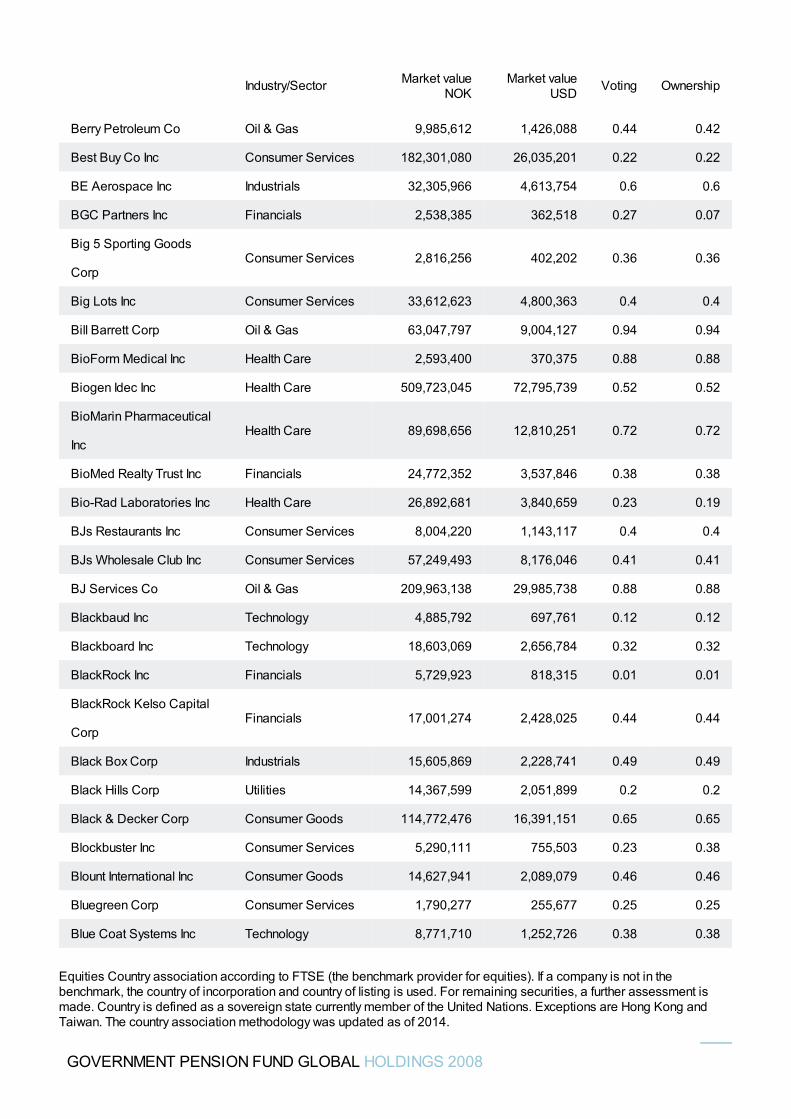
Berry Petroleum Co Oil & Gas 9,985,612 1,426,088 0.44 0.42
Best Buy Co Inc Consumer Services 182,301,080 26,035,201 0.22 0.22
BE Aerospace Inc Industrials 32,305,966 4,613,754 0.6 0.6
BGC Partners Inc Financials 2,538,385 362,518 0.27 0.07
Big 5 Sporting Goods
CorpConsumer Services 2,816,256 402,202 0.36 0.36
Big Lots Inc Consumer Services 33,612,623 4,800,363 0.4 0.4
Bill Barrett Corp Oil & Gas 63,047,797 9,004,127 0.94 0.94
BioForm Medical Inc Health Care 2,593,400 370,375 0.88 0.88
Biogen Idec Inc Health Care 509,723,045 72,795,739 0.52 0.52
BioMarin Pharmaceutical
IncHealth Care 89,698,656 12,810,251 0.72 0.72
BioMed Realty Trust Inc Financials 24,772,352 3,537,846 0.38 0.38
Bio-Rad Laboratories Inc Health Care 26,892,681 3,840,659 0.23 0.19
BJs Restaurants Inc Consumer Services 8,004,220 1,143,117 0.4 0.4
BJs Wholesale Club Inc Consumer Services 57,249,493 8,176,046 0.41 0.41
BJ Services Co Oil & Gas 209,963,138 29,985,738 0.88 0.88
Blackbaud Inc Technology 4,885,792 697,761 0.12 0.12
Blackboard Inc Technology 18,603,069 2,656,784 0.32 0.32
BlackRock Inc Financials 5,729,923 818,315 0.01 0.01
BlackRock Kelso Capital
CorpFinancials 17,001,274 2,428,025 0.44 0.44
Black Box Corp Industrials 15,605,869 2,228,741 0.49 0.49
Black Hills Corp Utilities 14,367,599 2,051,899 0.2 0.2
Black & Decker Corp Consumer Goods 114,772,476 16,391,151 0.65 0.65
Blockbuster Inc Consumer Services 5,290,111 755,503 0.23 0.38
Blount International Inc Consumer Goods 14,627,941 2,089,079 0.46 0.46
Bluegreen Corp Consumer Services 1,790,277 255,677 0.25 0.25
Blue Coat Systems Inc Technology 8,771,710 1,252,726 0.38 0.38
Industry/Sector Market valueNOK
Market valueUSD Voting Ownership
GOVERNMENT PENSION FUND GLOBAL HOLDINGS 2008
Equities Country association according to FTSE (the benchmark provider for equities). If a company is not in thebenchmark, the country of incorporation and country of listing is used. For remaining securities, a further assessment ismade. Country is defined as a sovereign state currently member of the United Nations. Exceptions are Hong Kong andTaiwan. The country association methodology was updated as of 2014.
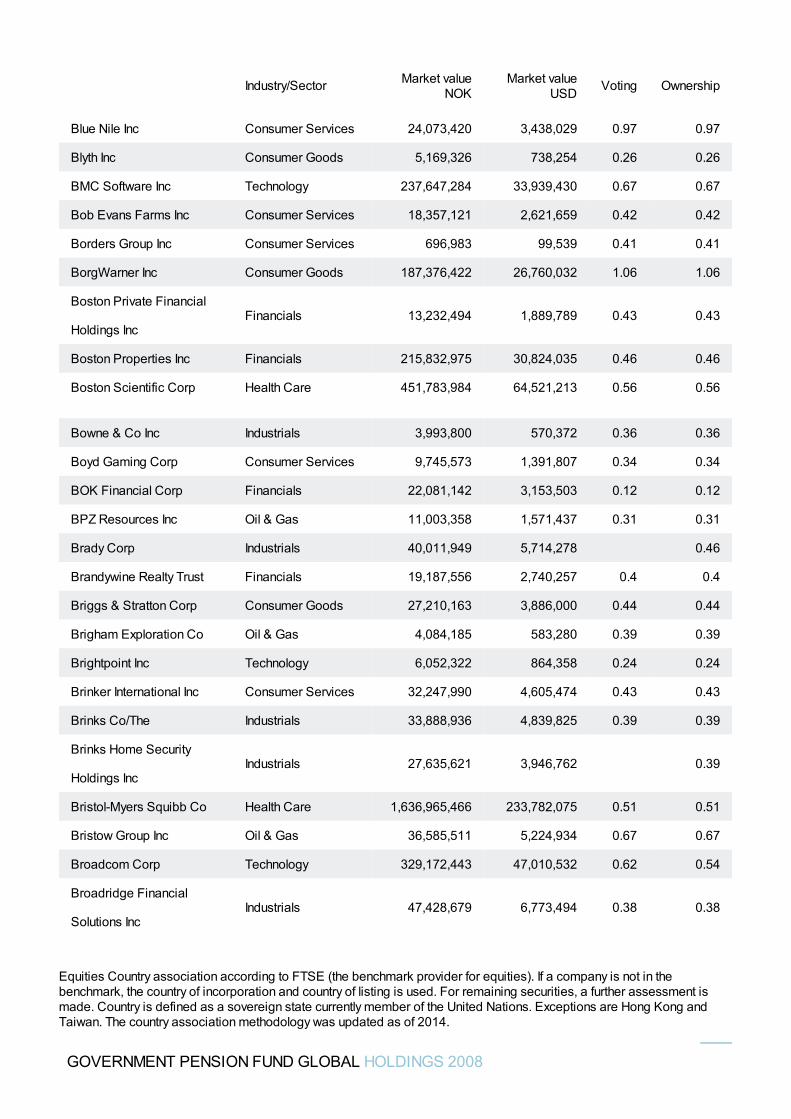
Blue Nile Inc Consumer Services 24,073,420 3,438,029 0.97 0.97
Blyth Inc Consumer Goods 5,169,326 738,254 0.26 0.26
BMC Software Inc Technology 237,647,284 33,939,430 0.67 0.67
Bob Evans Farms Inc Consumer Services 18,357,121 2,621,659 0.42 0.42
Borders Group Inc Consumer Services 696,983 99,539 0.41 0.41
BorgWarner Inc Consumer Goods 187,376,422 26,760,032 1.06 1.06
Boston Private Financial
Holdings IncFinancials 13,232,494 1,889,789 0.43 0.43
Boston Properties Inc Financials 215,832,975 30,824,035 0.46 0.46
Boston Scientific Corp Health Care 451,783,984 64,521,213 0.56 0.56
Bowne & Co Inc Industrials 3,993,800 570,372 0.36 0.36
Boyd Gaming Corp Consumer Services 9,745,573 1,391,807 0.34 0.34
BOK Financial Corp Financials 22,081,142 3,153,503 0.12 0.12
BPZ Resources Inc Oil & Gas 11,003,358 1,571,437 0.31 0.31
Brady Corp Industrials 40,011,949 5,714,278 0.46
Brandywine Realty Trust Financials 19,187,556 2,740,257 0.4 0.4
Briggs & Stratton Corp Consumer Goods 27,210,163 3,886,000 0.44 0.44
Brigham Exploration Co Oil & Gas 4,084,185 583,280 0.39 0.39
Brightpoint Inc Technology 6,052,322 864,358 0.24 0.24
Brinker International Inc Consumer Services 32,247,990 4,605,474 0.43 0.43
Brinks Co/The Industrials 33,888,936 4,839,825 0.39 0.39
Brinks Home Security
Holdings IncIndustrials 27,635,621 3,946,762 0.39
Bristol-Myers Squibb Co Health Care 1,636,965,466 233,782,075 0.51 0.51
Bristow Group Inc Oil & Gas 36,585,511 5,224,934 0.67 0.67
Broadcom Corp Technology 329,172,443 47,010,532 0.62 0.54
Broadridge Financial
Solutions IncIndustrials 47,428,679 6,773,494 0.38 0.38
Industry/Sector Market valueNOK
Market valueUSD Voting Ownership
GOVERNMENT PENSION FUND GLOBAL HOLDINGS 2008
Equities Country association according to FTSE (the benchmark provider for equities). If a company is not in thebenchmark, the country of incorporation and country of listing is used. For remaining securities, a further assessment ismade. Country is defined as a sovereign state currently member of the United Nations. Exceptions are Hong Kong andTaiwan. The country association methodology was updated as of 2014.
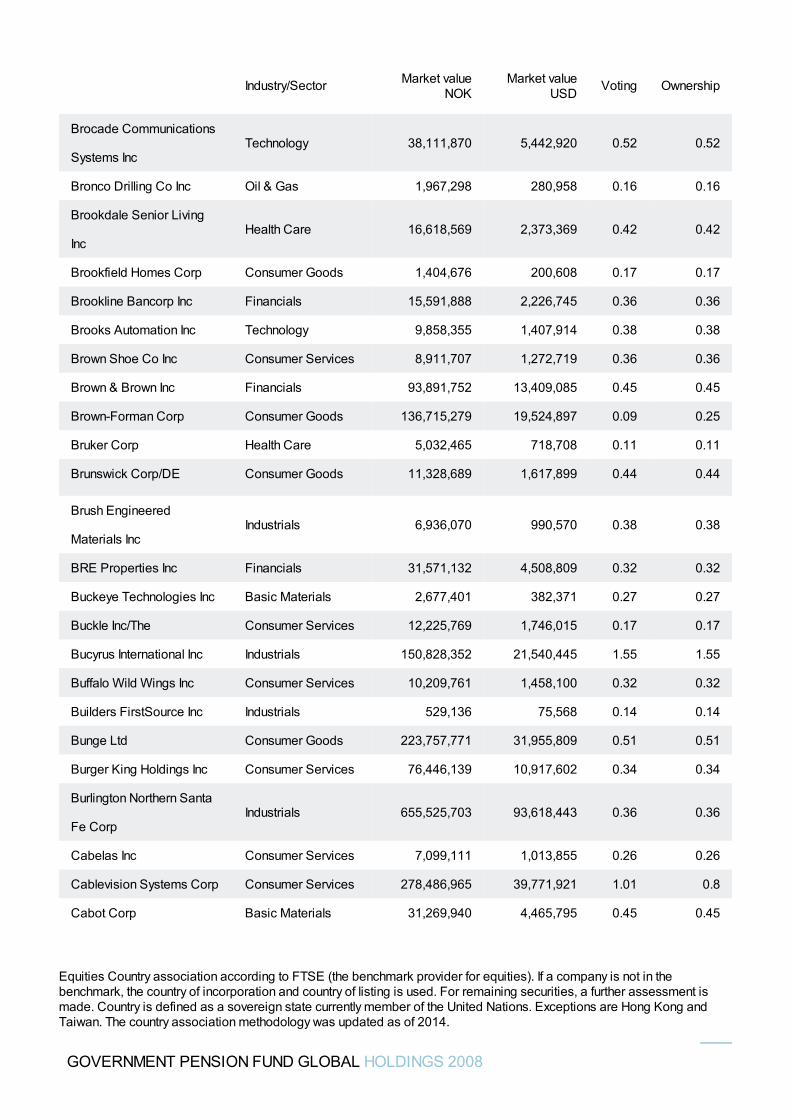
Brocade Communications
Systems IncTechnology 38,111,870 5,442,920 0.52 0.52
Bronco Drilling Co Inc Oil & Gas 1,967,298 280,958 0.16 0.16
Brookdale Senior Living
IncHealth Care 16,618,569 2,373,369 0.42 0.42
Brookfield Homes Corp Consumer Goods 1,404,676 200,608 0.17 0.17
Brookline Bancorp Inc Financials 15,591,888 2,226,745 0.36 0.36
Brooks Automation Inc Technology 9,858,355 1,407,914 0.38 0.38
Brown Shoe Co Inc Consumer Services 8,911,707 1,272,719 0.36 0.36
Brown & Brown Inc Financials 93,891,752 13,409,085 0.45 0.45
Brown-Forman Corp Consumer Goods 136,715,279 19,524,897 0.09 0.25
Bruker Corp Health Care 5,032,465 718,708 0.11 0.11
Brunswick Corp/DE Consumer Goods 11,328,689 1,617,899 0.44 0.44
Brush Engineered
Materials IncIndustrials 6,936,070 990,570 0.38 0.38
BRE Properties Inc Financials 31,571,132 4,508,809 0.32 0.32
Buckeye Technologies Inc Basic Materials 2,677,401 382,371 0.27 0.27
Buckle Inc/The Consumer Services 12,225,769 1,746,015 0.17 0.17
Bucyrus International Inc Industrials 150,828,352 21,540,445 1.55 1.55
Buffalo Wild Wings Inc Consumer Services 10,209,761 1,458,100 0.32 0.32
Builders FirstSource Inc Industrials 529,136 75,568 0.14 0.14
Bunge Ltd Consumer Goods 223,757,771 31,955,809 0.51 0.51
Burger King Holdings Inc Consumer Services 76,446,139 10,917,602 0.34 0.34
Burlington Northern Santa
Fe CorpIndustrials 655,525,703 93,618,443 0.36 0.36
Cabelas Inc Consumer Services 7,099,111 1,013,855 0.26 0.26
Cablevision Systems Corp Consumer Services 278,486,965 39,771,921 1.01 0.8
Cabot Corp Basic Materials 31,269,940 4,465,795 0.45 0.45
Industry/Sector Market valueNOK
Market valueUSD Voting Ownership
GOVERNMENT PENSION FUND GLOBAL HOLDINGS 2008
Equities Country association according to FTSE (the benchmark provider for equities). If a company is not in thebenchmark, the country of incorporation and country of listing is used. For remaining securities, a further assessment ismade. Country is defined as a sovereign state currently member of the United Nations. Exceptions are Hong Kong andTaiwan. The country association methodology was updated as of 2014.
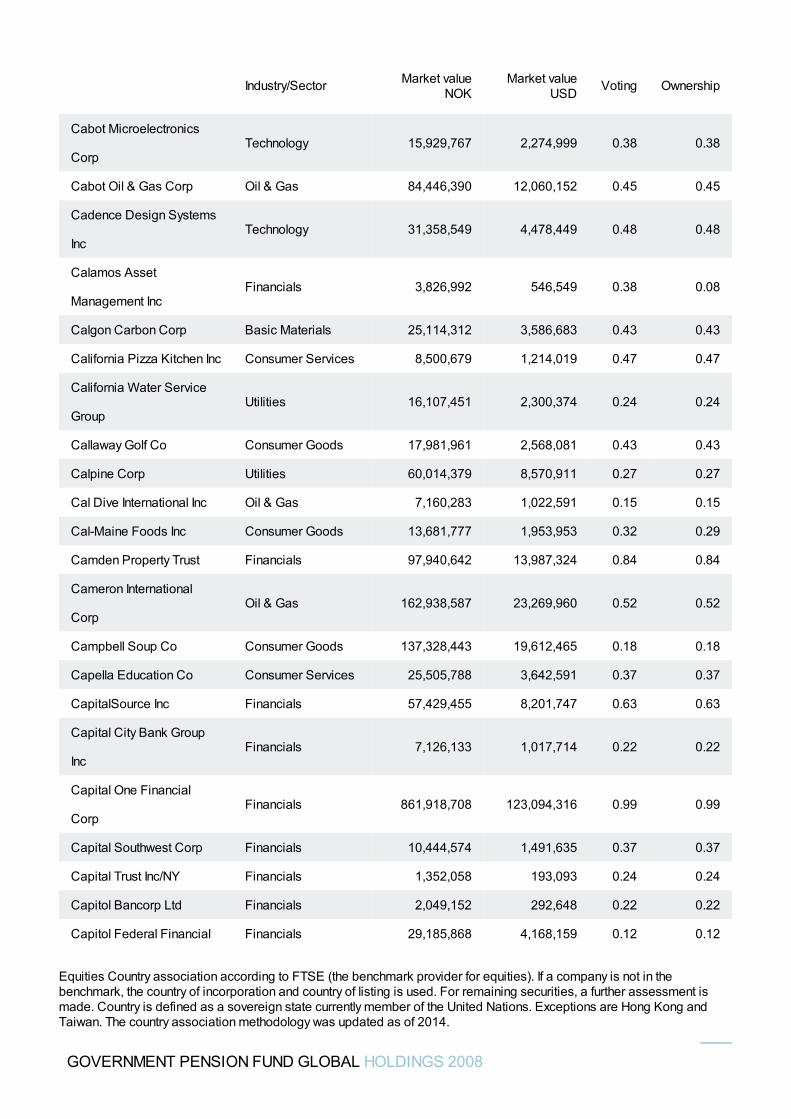
Cabot Microelectronics
CorpTechnology 15,929,767 2,274,999 0.38 0.38
Cabot Oil & Gas Corp Oil & Gas 84,446,390 12,060,152 0.45 0.45
Cadence Design Systems
IncTechnology 31,358,549 4,478,449 0.48 0.48
Calamos Asset
Management IncFinancials 3,826,992 546,549 0.38 0.08
Calgon Carbon Corp Basic Materials 25,114,312 3,586,683 0.43 0.43
California Pizza Kitchen Inc Consumer Services 8,500,679 1,214,019 0.47 0.47
California Water Service
GroupUtilities 16,107,451 2,300,374 0.24 0.24
Callaway Golf Co Consumer Goods 17,981,961 2,568,081 0.43 0.43
Calpine Corp Utilities 60,014,379 8,570,911 0.27 0.27
Cal Dive International Inc Oil & Gas 7,160,283 1,022,591 0.15 0.15
Cal-Maine Foods Inc Consumer Goods 13,681,777 1,953,953 0.32 0.29
Camden Property Trust Financials 97,940,642 13,987,324 0.84 0.84
Cameron International
CorpOil & Gas 162,938,587 23,269,960 0.52 0.52
Campbell Soup Co Consumer Goods 137,328,443 19,612,465 0.18 0.18
Capella Education Co Consumer Services 25,505,788 3,642,591 0.37 0.37
CapitalSource Inc Financials 57,429,455 8,201,747 0.63 0.63
Capital City Bank Group
IncFinancials 7,126,133 1,017,714 0.22 0.22
Capital One Financial
CorpFinancials 861,918,708 123,094,316 0.99 0.99
Capital Southwest Corp Financials 10,444,574 1,491,635 0.37 0.37
Capital Trust Inc/NY Financials 1,352,058 193,093 0.24 0.24
Capitol Bancorp Ltd Financials 2,049,152 292,648 0.22 0.22
Capitol Federal Financial Financials 29,185,868 4,168,159 0.12 0.12
Industry/Sector Market valueNOK
Market valueUSD Voting Ownership
GOVERNMENT PENSION FUND GLOBAL HOLDINGS 2008
Equities Country association according to FTSE (the benchmark provider for equities). If a company is not in thebenchmark, the country of incorporation and country of listing is used. For remaining securities, a further assessment ismade. Country is defined as a sovereign state currently member of the United Nations. Exceptions are Hong Kong andTaiwan. The country association methodology was updated as of 2014.
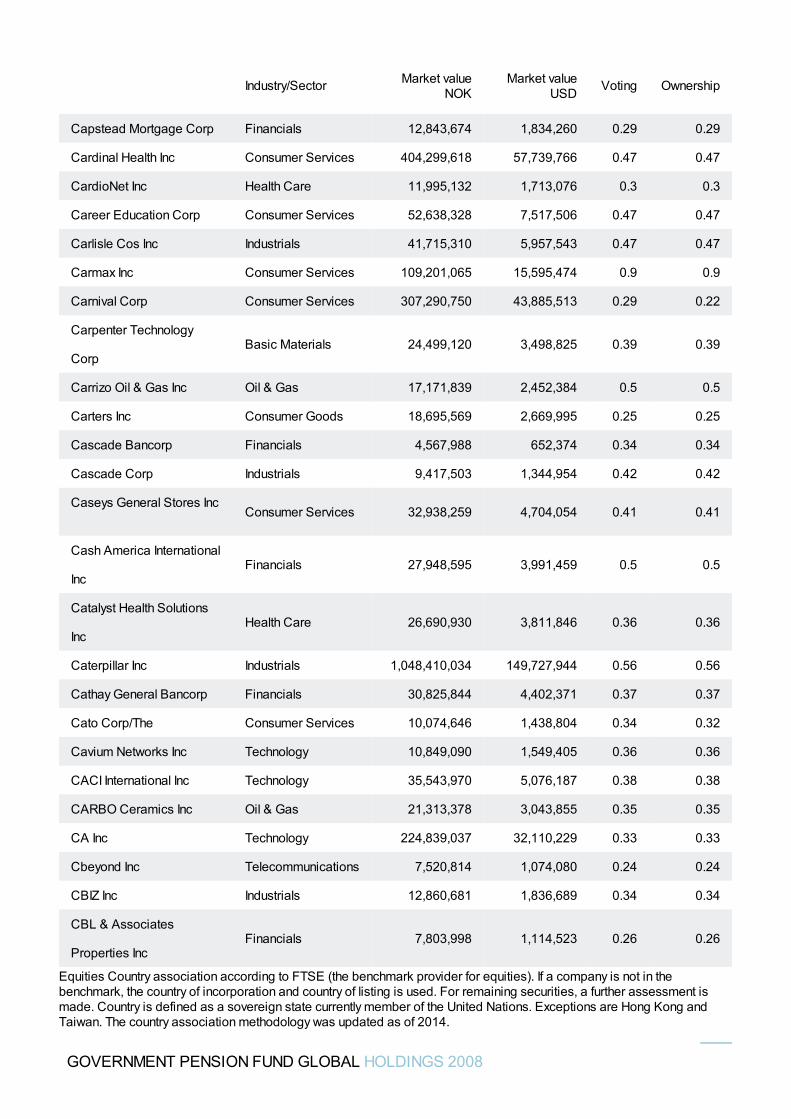
Capstead Mortgage Corp Financials 12,843,674 1,834,260 0.29 0.29
Cardinal Health Inc Consumer Services 404,299,618 57,739,766 0.47 0.47
CardioNet Inc Health Care 11,995,132 1,713,076 0.3 0.3
Career Education Corp Consumer Services 52,638,328 7,517,506 0.47 0.47
Carlisle Cos Inc Industrials 41,715,310 5,957,543 0.47 0.47
Carmax Inc Consumer Services 109,201,065 15,595,474 0.9 0.9
Carnival Corp Consumer Services 307,290,750 43,885,513 0.29 0.22
Carpenter Technology
CorpBasic Materials 24,499,120 3,498,825 0.39 0.39
Carrizo Oil & Gas Inc Oil & Gas 17,171,839 2,452,384 0.5 0.5
Carters Inc Consumer Goods 18,695,569 2,669,995 0.25 0.25
Cascade Bancorp Financials 4,567,988 652,374 0.34 0.34
Cascade Corp Industrials 9,417,503 1,344,954 0.42 0.42
Caseys General Stores IncConsumer Services 32,938,259 4,704,054 0.41 0.41
Cash America International
IncFinancials 27,948,595 3,991,459 0.5 0.5
Catalyst Health Solutions
IncHealth Care 26,690,930 3,811,846 0.36 0.36
Caterpillar Inc Industrials 1,048,410,034 149,727,944 0.56 0.56
Cathay General Bancorp Financials 30,825,844 4,402,371 0.37 0.37
Cato Corp/The Consumer Services 10,074,646 1,438,804 0.34 0.32
Cavium Networks Inc Technology 10,849,090 1,549,405 0.36 0.36
CACI International Inc Technology 35,543,970 5,076,187 0.38 0.38
CARBO Ceramics Inc Oil & Gas 21,313,378 3,043,855 0.35 0.35
CA Inc Technology 224,839,037 32,110,229 0.33 0.33
Cbeyond Inc Telecommunications 7,520,814 1,074,080 0.24 0.24
CBIZ Inc Industrials 12,860,681 1,836,689 0.34 0.34
CBL & Associates
Properties IncFinancials 7,803,998 1,114,523 0.26 0.26
Industry/Sector Market valueNOK
Market valueUSD Voting Ownership
GOVERNMENT PENSION FUND GLOBAL HOLDINGS 2008
Equities Country association according to FTSE (the benchmark provider for equities). If a company is not in thebenchmark, the country of incorporation and country of listing is used. For remaining securities, a further assessment ismade. Country is defined as a sovereign state currently member of the United Nations. Exceptions are Hong Kong andTaiwan. The country association methodology was updated as of 2014.
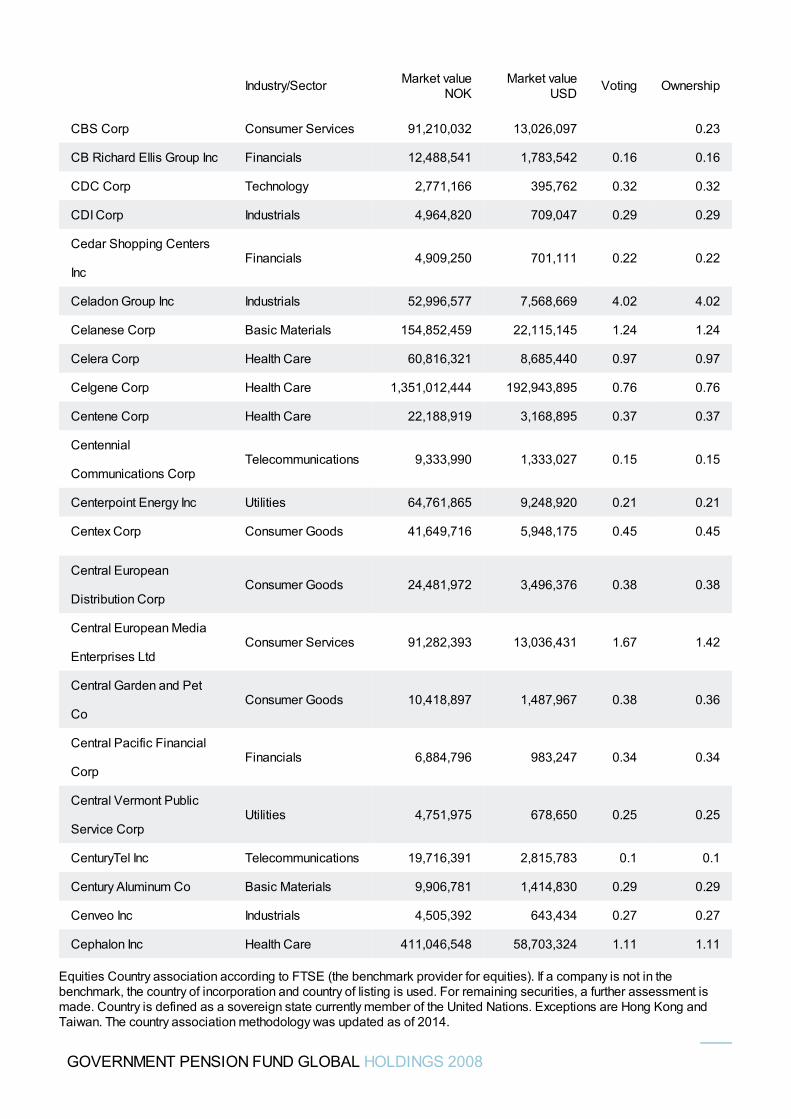
CBS Corp Consumer Services 91,210,032 13,026,097 0.23
CB Richard Ellis Group Inc Financials 12,488,541 1,783,542 0.16 0.16
CDC Corp Technology 2,771,166 395,762 0.32 0.32
CDI Corp Industrials 4,964,820 709,047 0.29 0.29
Cedar Shopping Centers
IncFinancials 4,909,250 701,111 0.22 0.22
Celadon Group Inc Industrials 52,996,577 7,568,669 4.02 4.02
Celanese Corp Basic Materials 154,852,459 22,115,145 1.24 1.24
Celera Corp Health Care 60,816,321 8,685,440 0.97 0.97
Celgene Corp Health Care 1,351,012,444 192,943,895 0.76 0.76
Centene Corp Health Care 22,188,919 3,168,895 0.37 0.37
Centennial
Communications CorpTelecommunications 9,333,990 1,333,027 0.15 0.15
Centerpoint Energy Inc Utilities 64,761,865 9,248,920 0.21 0.21
Centex Corp Consumer Goods 41,649,716 5,948,175 0.45 0.45
Central European
Distribution CorpConsumer Goods 24,481,972 3,496,376 0.38 0.38
Central European Media
Enterprises LtdConsumer Services 91,282,393 13,036,431 1.67 1.42
Central Garden and Pet
CoConsumer Goods 10,418,897 1,487,967 0.38 0.36
Central Pacific Financial
CorpFinancials 6,884,796 983,247 0.34 0.34
Central Vermont Public
Service CorpUtilities 4,751,975 678,650 0.25 0.25
CenturyTel Inc Telecommunications 19,716,391 2,815,783 0.1 0.1
Century Aluminum Co Basic Materials 9,906,781 1,414,830 0.29 0.29
Cenveo Inc Industrials 4,505,392 643,434 0.27 0.27
Cephalon Inc Health Care 411,046,548 58,703,324 1.11 1.11
Industry/Sector Market valueNOK
Market valueUSD Voting Ownership
GOVERNMENT PENSION FUND GLOBAL HOLDINGS 2008
Equities Country association according to FTSE (the benchmark provider for equities). If a company is not in thebenchmark, the country of incorporation and country of listing is used. For remaining securities, a further assessment ismade. Country is defined as a sovereign state currently member of the United Nations. Exceptions are Hong Kong andTaiwan. The country association methodology was updated as of 2014.
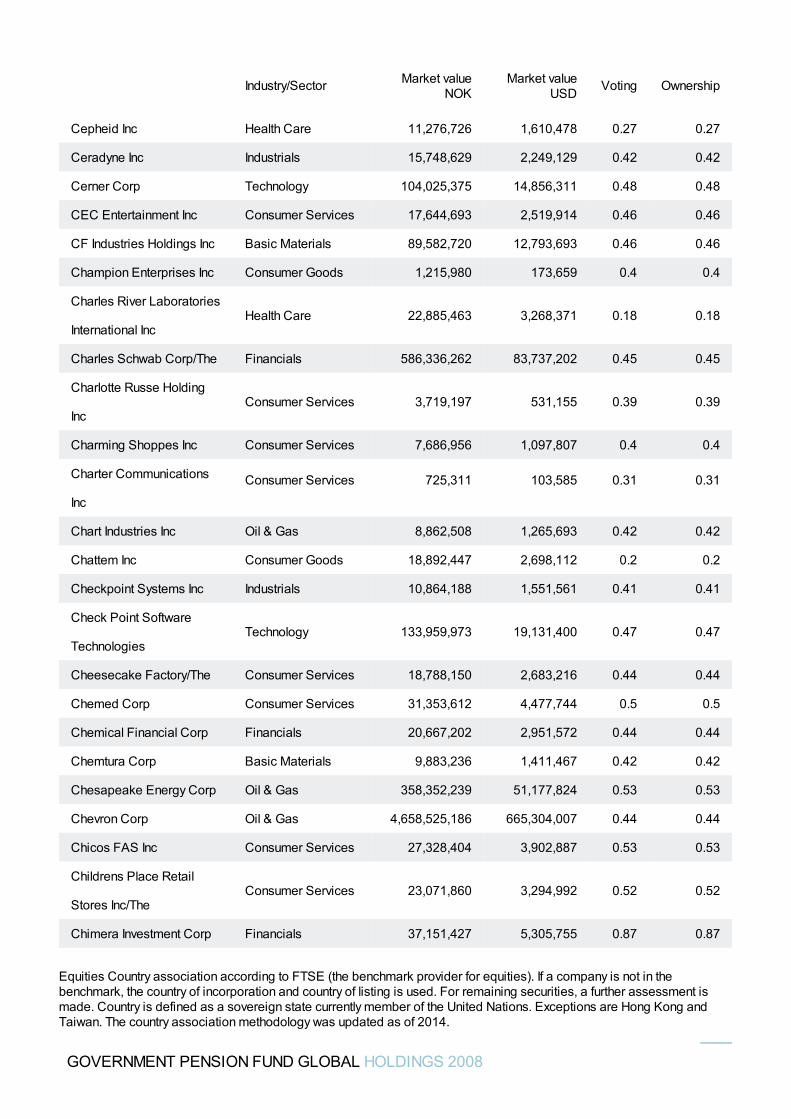
Cepheid Inc Health Care 11,276,726 1,610,478 0.27 0.27
Ceradyne Inc Industrials 15,748,629 2,249,129 0.42 0.42
Cerner Corp Technology 104,025,375 14,856,311 0.48 0.48
CEC Entertainment Inc Consumer Services 17,644,693 2,519,914 0.46 0.46
CF Industries Holdings Inc Basic Materials 89,582,720 12,793,693 0.46 0.46
Champion Enterprises Inc Consumer Goods 1,215,980 173,659 0.4 0.4
Charles River Laboratories
International IncHealth Care 22,885,463 3,268,371 0.18 0.18
Charles Schwab Corp/The Financials 586,336,262 83,737,202 0.45 0.45
Charlotte Russe Holding
IncConsumer Services 3,719,197 531,155 0.39 0.39
Charming Shoppes Inc Consumer Services 7,686,956 1,097,807 0.4 0.4
Charter Communications
Inc
Consumer Services 725,311 103,585 0.31 0.31
Chart Industries Inc Oil & Gas 8,862,508 1,265,693 0.42 0.42
Chattem Inc Consumer Goods 18,892,447 2,698,112 0.2 0.2
Checkpoint Systems Inc Industrials 10,864,188 1,551,561 0.41 0.41
Check Point Software
TechnologiesTechnology 133,959,973 19,131,400 0.47 0.47
Cheesecake Factory/The Consumer Services 18,788,150 2,683,216 0.44 0.44
Chemed Corp Consumer Services 31,353,612 4,477,744 0.5 0.5
Chemical Financial Corp Financials 20,667,202 2,951,572 0.44 0.44
Chemtura Corp Basic Materials 9,883,236 1,411,467 0.42 0.42
Chesapeake Energy Corp Oil & Gas 358,352,239 51,177,824 0.53 0.53
Chevron Corp Oil & Gas 4,658,525,186 665,304,007 0.44 0.44
Chicos FAS Inc Consumer Services 27,328,404 3,902,887 0.53 0.53
Childrens Place Retail
Stores Inc/TheConsumer Services 23,071,860 3,294,992 0.52 0.52
Chimera Investment Corp Financials 37,151,427 5,305,755 0.87 0.87
Industry/Sector Market valueNOK
Market valueUSD Voting Ownership
GOVERNMENT PENSION FUND GLOBAL HOLDINGS 2008
Equities Country association according to FTSE (the benchmark provider for equities). If a company is not in thebenchmark, the country of incorporation and country of listing is used. For remaining securities, a further assessment ismade. Country is defined as a sovereign state currently member of the United Nations. Exceptions are Hong Kong andTaiwan. The country association methodology was updated as of 2014.
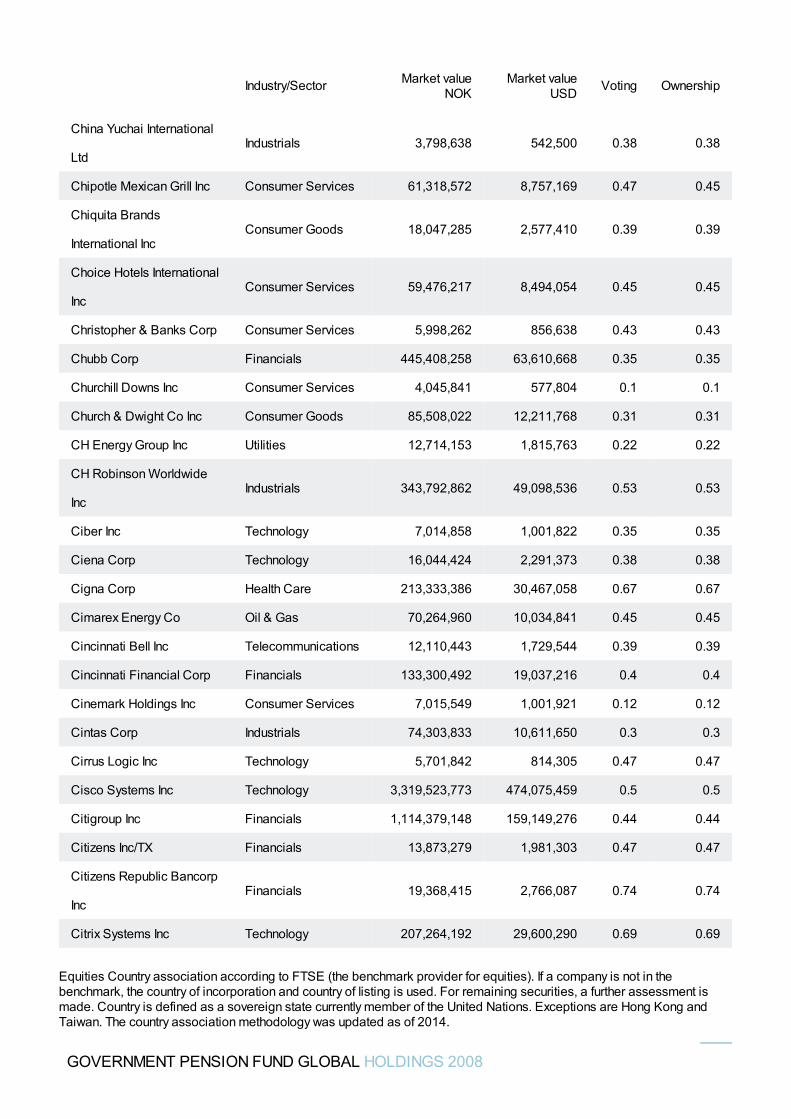
China Yuchai International
LtdIndustrials 3,798,638 542,500 0.38 0.38
Chipotle Mexican Grill Inc Consumer Services 61,318,572 8,757,169 0.47 0.45
Chiquita Brands
International IncConsumer Goods 18,047,285 2,577,410 0.39 0.39
Choice Hotels International
IncConsumer Services 59,476,217 8,494,054 0.45 0.45
Christopher & Banks Corp Consumer Services 5,998,262 856,638 0.43 0.43
Chubb Corp Financials 445,408,258 63,610,668 0.35 0.35
Churchill Downs Inc Consumer Services 4,045,841 577,804 0.1 0.1
Church & Dwight Co Inc Consumer Goods 85,508,022 12,211,768 0.31 0.31
CH Energy Group Inc Utilities 12,714,153 1,815,763 0.22 0.22
CH Robinson Worldwide
IncIndustrials 343,792,862 49,098,536 0.53 0.53
Ciber Inc Technology 7,014,858 1,001,822 0.35 0.35
Ciena Corp Technology 16,044,424 2,291,373 0.38 0.38
Cigna Corp Health Care 213,333,386 30,467,058 0.67 0.67
Cimarex Energy Co Oil & Gas 70,264,960 10,034,841 0.45 0.45
Cincinnati Bell Inc Telecommunications 12,110,443 1,729,544 0.39 0.39
Cincinnati Financial Corp Financials 133,300,492 19,037,216 0.4 0.4
Cinemark Holdings Inc Consumer Services 7,015,549 1,001,921 0.12 0.12
Cintas Corp Industrials 74,303,833 10,611,650 0.3 0.3
Cirrus Logic Inc Technology 5,701,842 814,305 0.47 0.47
Cisco Systems Inc Technology 3,319,523,773 474,075,459 0.5 0.5
Citigroup Inc Financials 1,114,379,148 159,149,276 0.44 0.44
Citizens Inc/TX Financials 13,873,279 1,981,303 0.47 0.47
Citizens Republic Bancorp
IncFinancials 19,368,415 2,766,087 0.74 0.74
Citrix Systems Inc Technology 207,264,192 29,600,290 0.69 0.69
Industry/Sector Market valueNOK
Market valueUSD Voting Ownership
GOVERNMENT PENSION FUND GLOBAL HOLDINGS 2008
Equities Country association according to FTSE (the benchmark provider for equities). If a company is not in thebenchmark, the country of incorporation and country of listing is used. For remaining securities, a further assessment ismade. Country is defined as a sovereign state currently member of the United Nations. Exceptions are Hong Kong andTaiwan. The country association methodology was updated as of 2014.
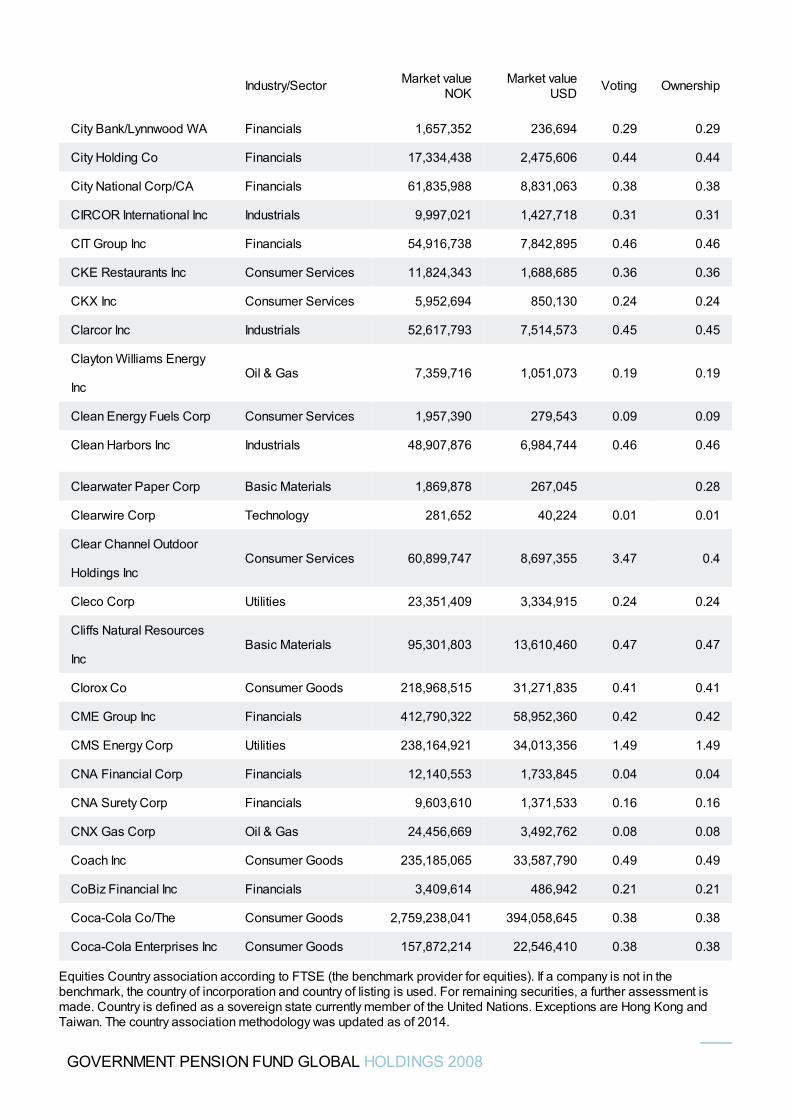
City Bank/Lynnwood WA Financials 1,657,352 236,694 0.29 0.29
City Holding Co Financials 17,334,438 2,475,606 0.44 0.44
City National Corp/CA Financials 61,835,988 8,831,063 0.38 0.38
CIRCOR International Inc Industrials 9,997,021 1,427,718 0.31 0.31
CIT Group Inc Financials 54,916,738 7,842,895 0.46 0.46
CKE Restaurants Inc Consumer Services 11,824,343 1,688,685 0.36 0.36
CKX Inc Consumer Services 5,952,694 850,130 0.24 0.24
Clarcor Inc Industrials 52,617,793 7,514,573 0.45 0.45
Clayton Williams Energy
IncOil & Gas 7,359,716 1,051,073 0.19 0.19
Clean Energy Fuels Corp Consumer Services 1,957,390 279,543 0.09 0.09
Clean Harbors Inc Industrials 48,907,876 6,984,744 0.46 0.46
Clearwater Paper Corp Basic Materials 1,869,878 267,045 0.28
Clearwire Corp Technology 281,652 40,224 0.01 0.01
Clear Channel Outdoor
Holdings IncConsumer Services 60,899,747 8,697,355 3.47 0.4
Cleco Corp Utilities 23,351,409 3,334,915 0.24 0.24
Cliffs Natural Resources
IncBasic Materials 95,301,803 13,610,460 0.47 0.47
Clorox Co Consumer Goods 218,968,515 31,271,835 0.41 0.41
CME Group Inc Financials 412,790,322 58,952,360 0.42 0.42
CMS Energy Corp Utilities 238,164,921 34,013,356 1.49 1.49
CNA Financial Corp Financials 12,140,553 1,733,845 0.04 0.04
CNA Surety Corp Financials 9,603,610 1,371,533 0.16 0.16
CNX Gas Corp Oil & Gas 24,456,669 3,492,762 0.08 0.08
Coach Inc Consumer Goods 235,185,065 33,587,790 0.49 0.49
CoBiz Financial Inc Financials 3,409,614 486,942 0.21 0.21
Coca-Cola Co/The Consumer Goods 2,759,238,041 394,058,645 0.38 0.38
Coca-Cola Enterprises Inc Consumer Goods 157,872,214 22,546,410 0.38 0.38
Industry/Sector Market valueNOK
Market valueUSD Voting Ownership
GOVERNMENT PENSION FUND GLOBAL HOLDINGS 2008
Equities Country association according to FTSE (the benchmark provider for equities). If a company is not in thebenchmark, the country of incorporation and country of listing is used. For remaining securities, a further assessment ismade. Country is defined as a sovereign state currently member of the United Nations. Exceptions are Hong Kong andTaiwan. The country association methodology was updated as of 2014.
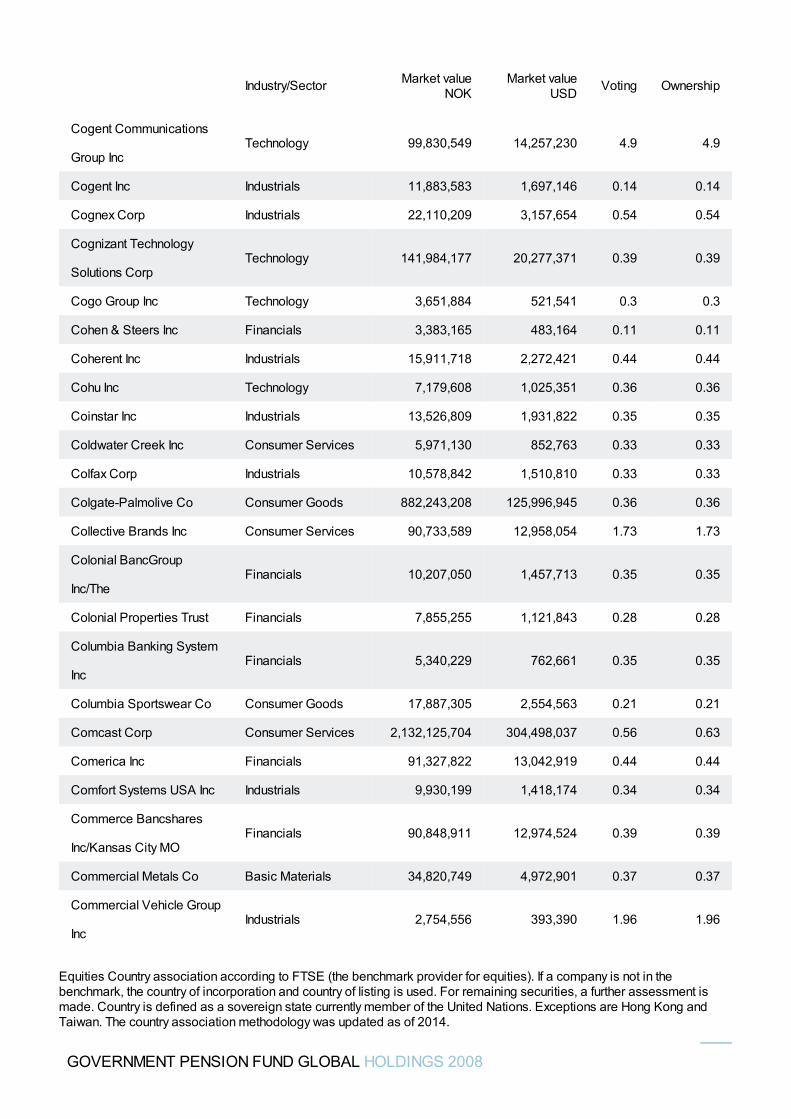
Cogent Communications
Group IncTechnology 99,830,549 14,257,230 4.9 4.9
Cogent Inc Industrials 11,883,583 1,697,146 0.14 0.14
Cognex Corp Industrials 22,110,209 3,157,654 0.54 0.54
Cognizant Technology
Solutions CorpTechnology 141,984,177 20,277,371 0.39 0.39
Cogo Group Inc Technology 3,651,884 521,541 0.3 0.3
Cohen & Steers Inc Financials 3,383,165 483,164 0.11 0.11
Coherent Inc Industrials 15,911,718 2,272,421 0.44 0.44
Cohu Inc Technology 7,179,608 1,025,351 0.36 0.36
Coinstar Inc Industrials 13,526,809 1,931,822 0.35 0.35
Coldwater Creek Inc Consumer Services 5,971,130 852,763 0.33 0.33
Colfax Corp Industrials 10,578,842 1,510,810 0.33 0.33
Colgate-Palmolive Co Consumer Goods 882,243,208 125,996,945 0.36 0.36
Collective Brands Inc Consumer Services 90,733,589 12,958,054 1.73 1.73
Colonial BancGroup
Inc/TheFinancials 10,207,050 1,457,713 0.35 0.35
Colonial Properties Trust Financials 7,855,255 1,121,843 0.28 0.28
Columbia Banking System
IncFinancials 5,340,229 762,661 0.35 0.35
Columbia Sportswear Co Consumer Goods 17,887,305 2,554,563 0.21 0.21
Comcast Corp Consumer Services 2,132,125,704 304,498,037 0.56 0.63
Comerica Inc Financials 91,327,822 13,042,919 0.44 0.44
Comfort Systems USA Inc Industrials 9,930,199 1,418,174 0.34 0.34
Commerce Bancshares
Inc/Kansas City MOFinancials 90,848,911 12,974,524 0.39 0.39
Commercial Metals Co Basic Materials 34,820,749 4,972,901 0.37 0.37
Commercial Vehicle Group
IncIndustrials 2,754,556 393,390 1.96 1.96
Industry/Sector Market valueNOK
Market valueUSD Voting Ownership
GOVERNMENT PENSION FUND GLOBAL HOLDINGS 2008
Equities Country association according to FTSE (the benchmark provider for equities). If a company is not in thebenchmark, the country of incorporation and country of listing is used. For remaining securities, a further assessment ismade. Country is defined as a sovereign state currently member of the United Nations. Exceptions are Hong Kong andTaiwan. The country association methodology was updated as of 2014.
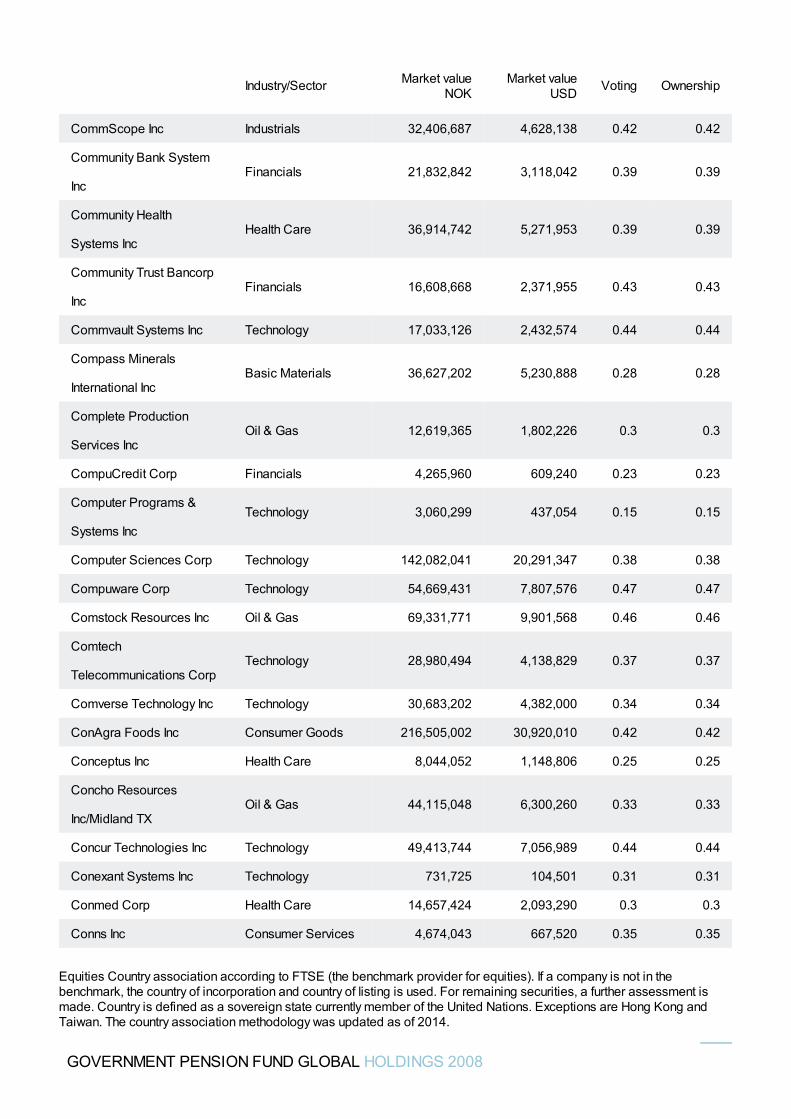
CommScope Inc Industrials 32,406,687 4,628,138 0.42 0.42
Community Bank System
IncFinancials 21,832,842 3,118,042 0.39 0.39
Community Health
Systems IncHealth Care 36,914,742 5,271,953 0.39 0.39
Community Trust Bancorp
IncFinancials 16,608,668 2,371,955 0.43 0.43
Commvault Systems Inc Technology 17,033,126 2,432,574 0.44 0.44
Compass Minerals
International IncBasic Materials 36,627,202 5,230,888 0.28 0.28
Complete Production
Services IncOil & Gas 12,619,365 1,802,226 0.3 0.3
CompuCredit Corp Financials 4,265,960 609,240 0.23 0.23
Computer Programs &
Systems IncTechnology 3,060,299 437,054 0.15 0.15
Computer Sciences Corp Technology 142,082,041 20,291,347 0.38 0.38
Compuware Corp Technology 54,669,431 7,807,576 0.47 0.47
Comstock Resources Inc Oil & Gas 69,331,771 9,901,568 0.46 0.46
Comtech
Telecommunications CorpTechnology 28,980,494 4,138,829 0.37 0.37
Comverse Technology Inc Technology 30,683,202 4,382,000 0.34 0.34
ConAgra Foods Inc Consumer Goods 216,505,002 30,920,010 0.42 0.42
Conceptus Inc Health Care 8,044,052 1,148,806 0.25 0.25
Concho Resources
Inc/Midland TXOil & Gas 44,115,048 6,300,260 0.33 0.33
Concur Technologies Inc Technology 49,413,744 7,056,989 0.44 0.44
Conexant Systems Inc Technology 731,725 104,501 0.31 0.31
Conmed Corp Health Care 14,657,424 2,093,290 0.3 0.3
Conns Inc Consumer Services 4,674,043 667,520 0.35 0.35
Industry/Sector Market valueNOK
Market valueUSD Voting Ownership
GOVERNMENT PENSION FUND GLOBAL HOLDINGS 2008
Equities Country association according to FTSE (the benchmark provider for equities). If a company is not in thebenchmark, the country of incorporation and country of listing is used. For remaining securities, a further assessment ismade. Country is defined as a sovereign state currently member of the United Nations. Exceptions are Hong Kong andTaiwan. The country association methodology was updated as of 2014.
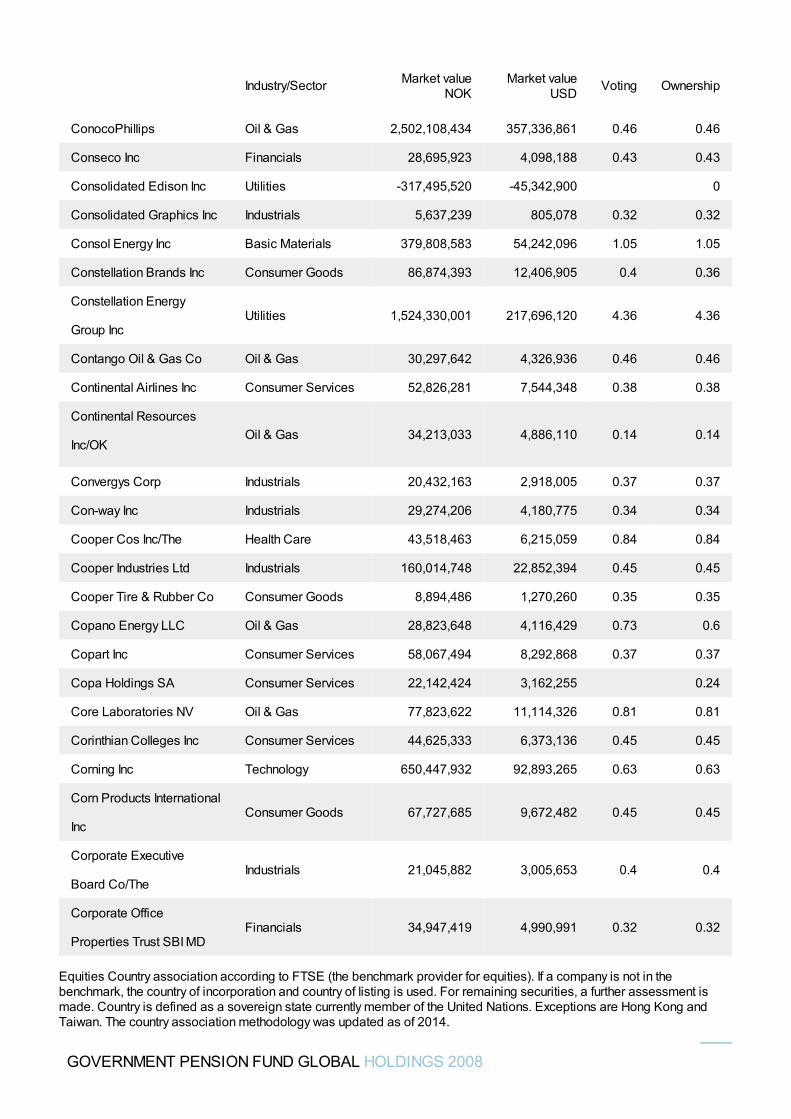
ConocoPhillips Oil & Gas 2,502,108,434 357,336,861 0.46 0.46
Conseco Inc Financials 28,695,923 4,098,188 0.43 0.43
Consolidated Edison Inc Utilities -317,495,520 -45,342,900 0
Consolidated Graphics Inc Industrials 5,637,239 805,078 0.32 0.32
Consol Energy Inc Basic Materials 379,808,583 54,242,096 1.05 1.05
Constellation Brands Inc Consumer Goods 86,874,393 12,406,905 0.4 0.36
Constellation Energy
Group IncUtilities 1,524,330,001 217,696,120 4.36 4.36
Contango Oil & Gas Co Oil & Gas 30,297,642 4,326,936 0.46 0.46
Continental Airlines Inc Consumer Services 52,826,281 7,544,348 0.38 0.38
Continental Resources
Inc/OKOil & Gas 34,213,033 4,886,110 0.14 0.14
Convergys Corp Industrials 20,432,163 2,918,005 0.37 0.37
Con-way Inc Industrials 29,274,206 4,180,775 0.34 0.34
Cooper Cos Inc/The Health Care 43,518,463 6,215,059 0.84 0.84
Cooper Industries Ltd Industrials 160,014,748 22,852,394 0.45 0.45
Cooper Tire & Rubber Co Consumer Goods 8,894,486 1,270,260 0.35 0.35
Copano Energy LLC Oil & Gas 28,823,648 4,116,429 0.73 0.6
Copart Inc Consumer Services 58,067,494 8,292,868 0.37 0.37
Copa Holdings SA Consumer Services 22,142,424 3,162,255 0.24
Core Laboratories NV Oil & Gas 77,823,622 11,114,326 0.81 0.81
Corinthian Colleges Inc Consumer Services 44,625,333 6,373,136 0.45 0.45
Corning Inc Technology 650,447,932 92,893,265 0.63 0.63
Corn Products International
IncConsumer Goods 67,727,685 9,672,482 0.45 0.45
Corporate Executive
Board Co/TheIndustrials 21,045,882 3,005,653 0.4 0.4
Corporate Office
Properties Trust SBI MDFinancials 34,947,419 4,990,991 0.32 0.32
Industry/Sector Market valueNOK
Market valueUSD Voting Ownership
GOVERNMENT PENSION FUND GLOBAL HOLDINGS 2008
Equities Country association according to FTSE (the benchmark provider for equities). If a company is not in thebenchmark, the country of incorporation and country of listing is used. For remaining securities, a further assessment ismade. Country is defined as a sovereign state currently member of the United Nations. Exceptions are Hong Kong andTaiwan. The country association methodology was updated as of 2014.
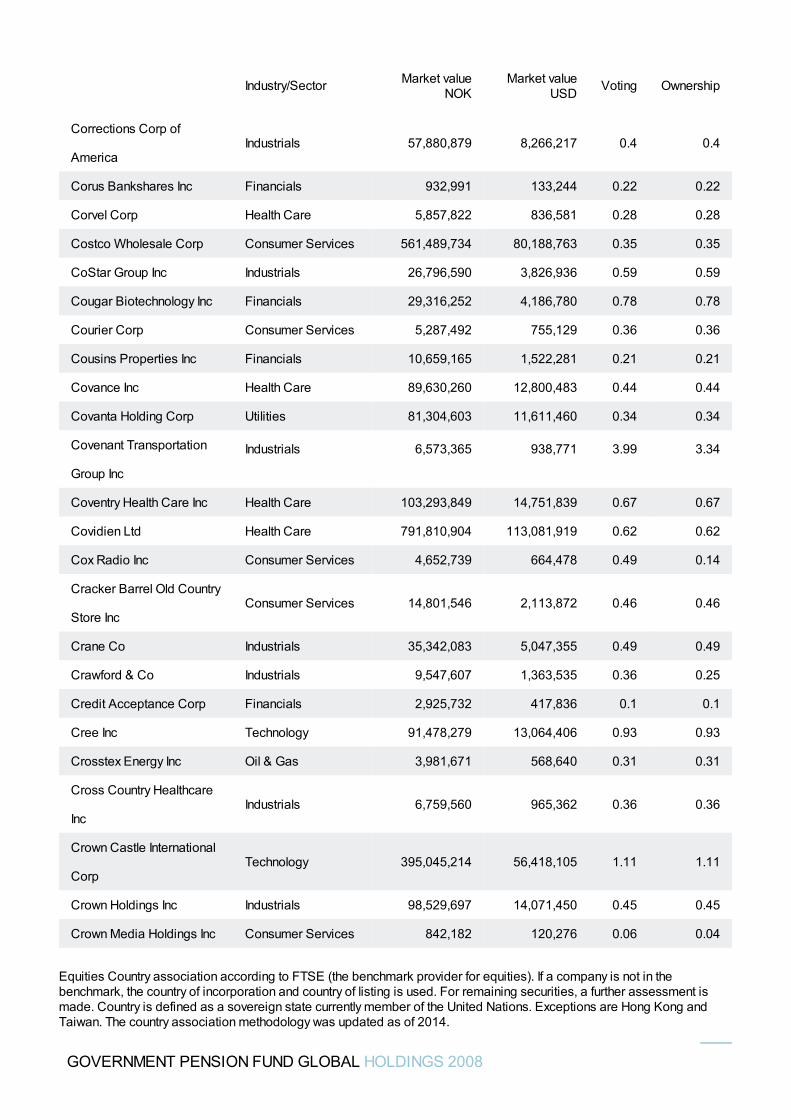
Corrections Corp of
AmericaIndustrials 57,880,879 8,266,217 0.4 0.4
Corus Bankshares Inc Financials 932,991 133,244 0.22 0.22
Corvel Corp Health Care 5,857,822 836,581 0.28 0.28
Costco Wholesale Corp Consumer Services 561,489,734 80,188,763 0.35 0.35
CoStar Group Inc Industrials 26,796,590 3,826,936 0.59 0.59
Cougar Biotechnology Inc Financials 29,316,252 4,186,780 0.78 0.78
Courier Corp Consumer Services 5,287,492 755,129 0.36 0.36
Cousins Properties Inc Financials 10,659,165 1,522,281 0.21 0.21
Covance Inc Health Care 89,630,260 12,800,483 0.44 0.44
Covanta Holding Corp Utilities 81,304,603 11,611,460 0.34 0.34
Covenant Transportation
Group Inc
Industrials 6,573,365 938,771 3.99 3.34
Coventry Health Care Inc Health Care 103,293,849 14,751,839 0.67 0.67
Covidien Ltd Health Care 791,810,904 113,081,919 0.62 0.62
Cox Radio Inc Consumer Services 4,652,739 664,478 0.49 0.14
Cracker Barrel Old Country
Store IncConsumer Services 14,801,546 2,113,872 0.46 0.46
Crane Co Industrials 35,342,083 5,047,355 0.49 0.49
Crawford & Co Industrials 9,547,607 1,363,535 0.36 0.25
Credit Acceptance Corp Financials 2,925,732 417,836 0.1 0.1
Cree Inc Technology 91,478,279 13,064,406 0.93 0.93
Crosstex Energy Inc Oil & Gas 3,981,671 568,640 0.31 0.31
Cross Country Healthcare
IncIndustrials 6,759,560 965,362 0.36 0.36
Crown Castle International
CorpTechnology 395,045,214 56,418,105 1.11 1.11
Crown Holdings Inc Industrials 98,529,697 14,071,450 0.45 0.45
Crown Media Holdings Inc Consumer Services 842,182 120,276 0.06 0.04
Industry/Sector Market valueNOK
Market valueUSD Voting Ownership
GOVERNMENT PENSION FUND GLOBAL HOLDINGS 2008
Equities Country association according to FTSE (the benchmark provider for equities). If a company is not in thebenchmark, the country of incorporation and country of listing is used. For remaining securities, a further assessment ismade. Country is defined as a sovereign state currently member of the United Nations. Exceptions are Hong Kong andTaiwan. The country association methodology was updated as of 2014.
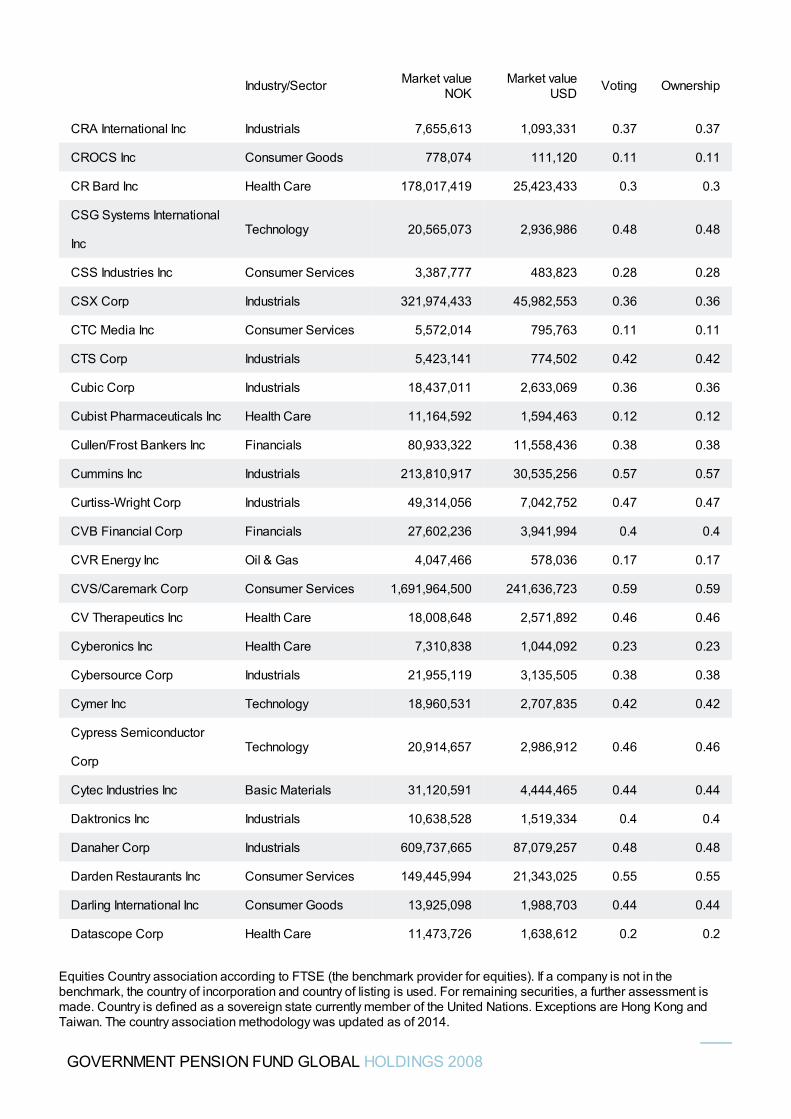
CRA International Inc Industrials 7,655,613 1,093,331 0.37 0.37
CROCS Inc Consumer Goods 778,074 111,120 0.11 0.11
CR Bard Inc Health Care 178,017,419 25,423,433 0.3 0.3
CSG Systems International
IncTechnology 20,565,073 2,936,986 0.48 0.48
CSS Industries Inc Consumer Services 3,387,777 483,823 0.28 0.28
CSX Corp Industrials 321,974,433 45,982,553 0.36 0.36
CTC Media Inc Consumer Services 5,572,014 795,763 0.11 0.11
CTS Corp Industrials 5,423,141 774,502 0.42 0.42
Cubic Corp Industrials 18,437,011 2,633,069 0.36 0.36
Cubist Pharmaceuticals Inc Health Care 11,164,592 1,594,463 0.12 0.12
Cullen/Frost Bankers Inc Financials 80,933,322 11,558,436 0.38 0.38
Cummins Inc Industrials 213,810,917 30,535,256 0.57 0.57
Curtiss-Wright Corp Industrials 49,314,056 7,042,752 0.47 0.47
CVB Financial Corp Financials 27,602,236 3,941,994 0.4 0.4
CVR Energy Inc Oil & Gas 4,047,466 578,036 0.17 0.17
CVS/Caremark Corp Consumer Services 1,691,964,500 241,636,723 0.59 0.59
CV Therapeutics Inc Health Care 18,008,648 2,571,892 0.46 0.46
Cyberonics Inc Health Care 7,310,838 1,044,092 0.23 0.23
Cybersource Corp Industrials 21,955,119 3,135,505 0.38 0.38
Cymer Inc Technology 18,960,531 2,707,835 0.42 0.42
Cypress Semiconductor
CorpTechnology 20,914,657 2,986,912 0.46 0.46
Cytec Industries Inc Basic Materials 31,120,591 4,444,465 0.44 0.44
Daktronics Inc Industrials 10,638,528 1,519,334 0.4 0.4
Danaher Corp Industrials 609,737,665 87,079,257 0.48 0.48
Darden Restaurants Inc Consumer Services 149,445,994 21,343,025 0.55 0.55
Darling International Inc Consumer Goods 13,925,098 1,988,703 0.44 0.44
Datascope Corp Health Care 11,473,726 1,638,612 0.2 0.2
Industry/Sector Market valueNOK
Market valueUSD Voting Ownership
GOVERNMENT PENSION FUND GLOBAL HOLDINGS 2008
Equities Country association according to FTSE (the benchmark provider for equities). If a company is not in thebenchmark, the country of incorporation and country of listing is used. For remaining securities, a further assessment ismade. Country is defined as a sovereign state currently member of the United Nations. Exceptions are Hong Kong andTaiwan. The country association methodology was updated as of 2014.
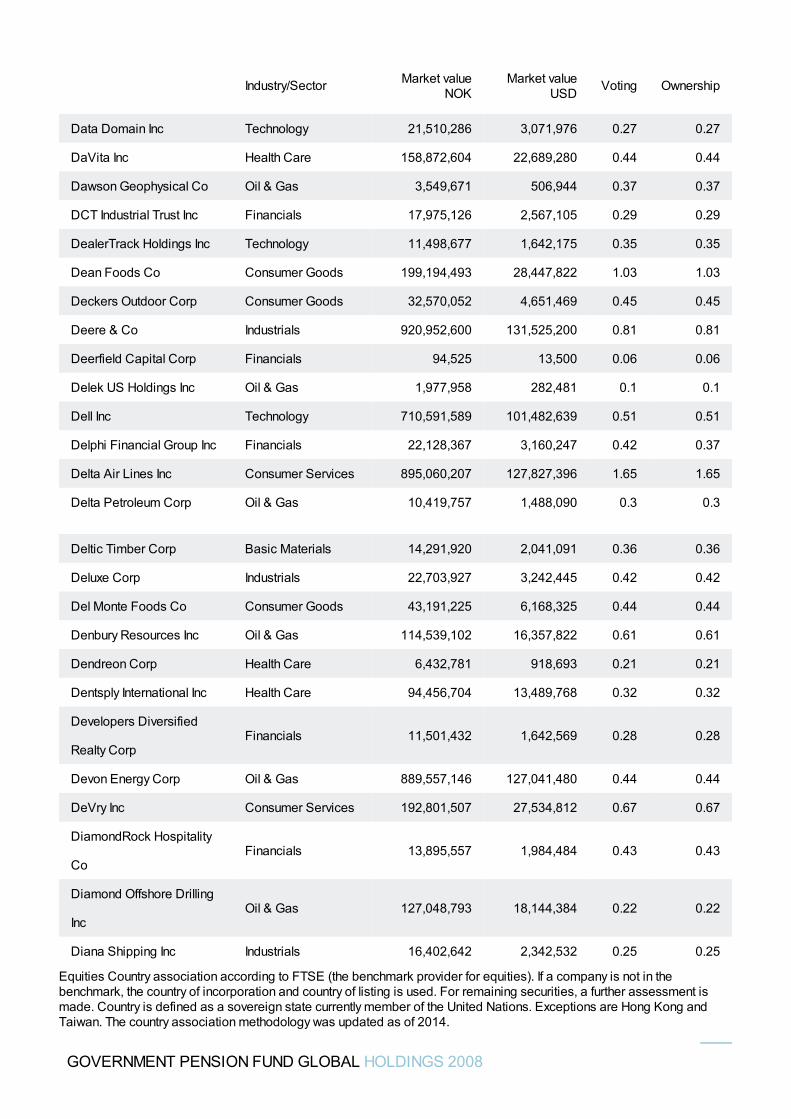
Data Domain Inc Technology 21,510,286 3,071,976 0.27 0.27
DaVita Inc Health Care 158,872,604 22,689,280 0.44 0.44
Dawson Geophysical Co Oil & Gas 3,549,671 506,944 0.37 0.37
DCT Industrial Trust Inc Financials 17,975,126 2,567,105 0.29 0.29
DealerTrack Holdings Inc Technology 11,498,677 1,642,175 0.35 0.35
Dean Foods Co Consumer Goods 199,194,493 28,447,822 1.03 1.03
Deckers Outdoor Corp Consumer Goods 32,570,052 4,651,469 0.45 0.45
Deere & Co Industrials 920,952,600 131,525,200 0.81 0.81
Deerfield Capital Corp Financials 94,525 13,500 0.06 0.06
Delek US Holdings Inc Oil & Gas 1,977,958 282,481 0.1 0.1
Dell Inc Technology 710,591,589 101,482,639 0.51 0.51
Delphi Financial Group Inc Financials 22,128,367 3,160,247 0.42 0.37
Delta Air Lines Inc Consumer Services 895,060,207 127,827,396 1.65 1.65
Delta Petroleum Corp Oil & Gas 10,419,757 1,488,090 0.3 0.3
Deltic Timber Corp Basic Materials 14,291,920 2,041,091 0.36 0.36
Deluxe Corp Industrials 22,703,927 3,242,445 0.42 0.42
Del Monte Foods Co Consumer Goods 43,191,225 6,168,325 0.44 0.44
Denbury Resources Inc Oil & Gas 114,539,102 16,357,822 0.61 0.61
Dendreon Corp Health Care 6,432,781 918,693 0.21 0.21
Dentsply International Inc Health Care 94,456,704 13,489,768 0.32 0.32
Developers Diversified
Realty CorpFinancials 11,501,432 1,642,569 0.28 0.28
Devon Energy Corp Oil & Gas 889,557,146 127,041,480 0.44 0.44
DeVry Inc Consumer Services 192,801,507 27,534,812 0.67 0.67
DiamondRock Hospitality
CoFinancials 13,895,557 1,984,484 0.43 0.43
Diamond Offshore Drilling
IncOil & Gas 127,048,793 18,144,384 0.22 0.22
Diana Shipping Inc Industrials 16,402,642 2,342,532 0.25 0.25
Industry/Sector Market valueNOK
Market valueUSD Voting Ownership
GOVERNMENT PENSION FUND GLOBAL HOLDINGS 2008
Equities Country association according to FTSE (the benchmark provider for equities). If a company is not in thebenchmark, the country of incorporation and country of listing is used. For remaining securities, a further assessment ismade. Country is defined as a sovereign state currently member of the United Nations. Exceptions are Hong Kong andTaiwan. The country association methodology was updated as of 2014.
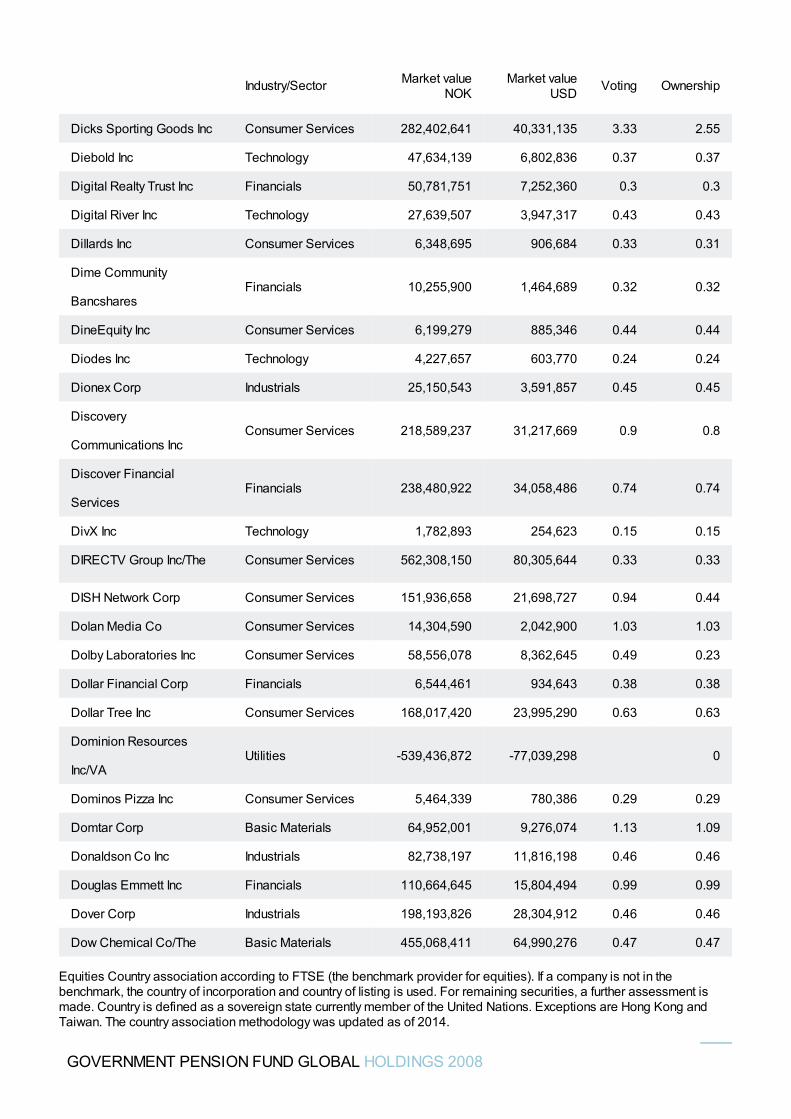
Dicks Sporting Goods Inc Consumer Services 282,402,641 40,331,135 3.33 2.55
Diebold Inc Technology 47,634,139 6,802,836 0.37 0.37
Digital Realty Trust Inc Financials 50,781,751 7,252,360 0.3 0.3
Digital River Inc Technology 27,639,507 3,947,317 0.43 0.43
Dillards Inc Consumer Services 6,348,695 906,684 0.33 0.31
Dime Community
BancsharesFinancials 10,255,900 1,464,689 0.32 0.32
DineEquity Inc Consumer Services 6,199,279 885,346 0.44 0.44
Diodes Inc Technology 4,227,657 603,770 0.24 0.24
Dionex Corp Industrials 25,150,543 3,591,857 0.45 0.45
Discovery
Communications IncConsumer Services 218,589,237 31,217,669 0.9 0.8
Discover Financial
ServicesFinancials 238,480,922 34,058,486 0.74 0.74
DivX Inc Technology 1,782,893 254,623 0.15 0.15
DIRECTV Group Inc/The Consumer Services 562,308,150 80,305,644 0.33 0.33
DISH Network Corp Consumer Services 151,936,658 21,698,727 0.94 0.44
Dolan Media Co Consumer Services 14,304,590 2,042,900 1.03 1.03
Dolby Laboratories Inc Consumer Services 58,556,078 8,362,645 0.49 0.23
Dollar Financial Corp Financials 6,544,461 934,643 0.38 0.38
Dollar Tree Inc Consumer Services 168,017,420 23,995,290 0.63 0.63
Dominion Resources
Inc/VAUtilities -539,436,872 -77,039,298 0
Dominos Pizza Inc Consumer Services 5,464,339 780,386 0.29 0.29
Domtar Corp Basic Materials 64,952,001 9,276,074 1.13 1.09
Donaldson Co Inc Industrials 82,738,197 11,816,198 0.46 0.46
Douglas Emmett Inc Financials 110,664,645 15,804,494 0.99 0.99
Dover Corp Industrials 198,193,826 28,304,912 0.46 0.46
Dow Chemical Co/The Basic Materials 455,068,411 64,990,276 0.47 0.47
Industry/Sector Market valueNOK
Market valueUSD Voting Ownership
GOVERNMENT PENSION FUND GLOBAL HOLDINGS 2008
Equities Country association according to FTSE (the benchmark provider for equities). If a company is not in thebenchmark, the country of incorporation and country of listing is used. For remaining securities, a further assessment ismade. Country is defined as a sovereign state currently member of the United Nations. Exceptions are Hong Kong andTaiwan. The country association methodology was updated as of 2014.
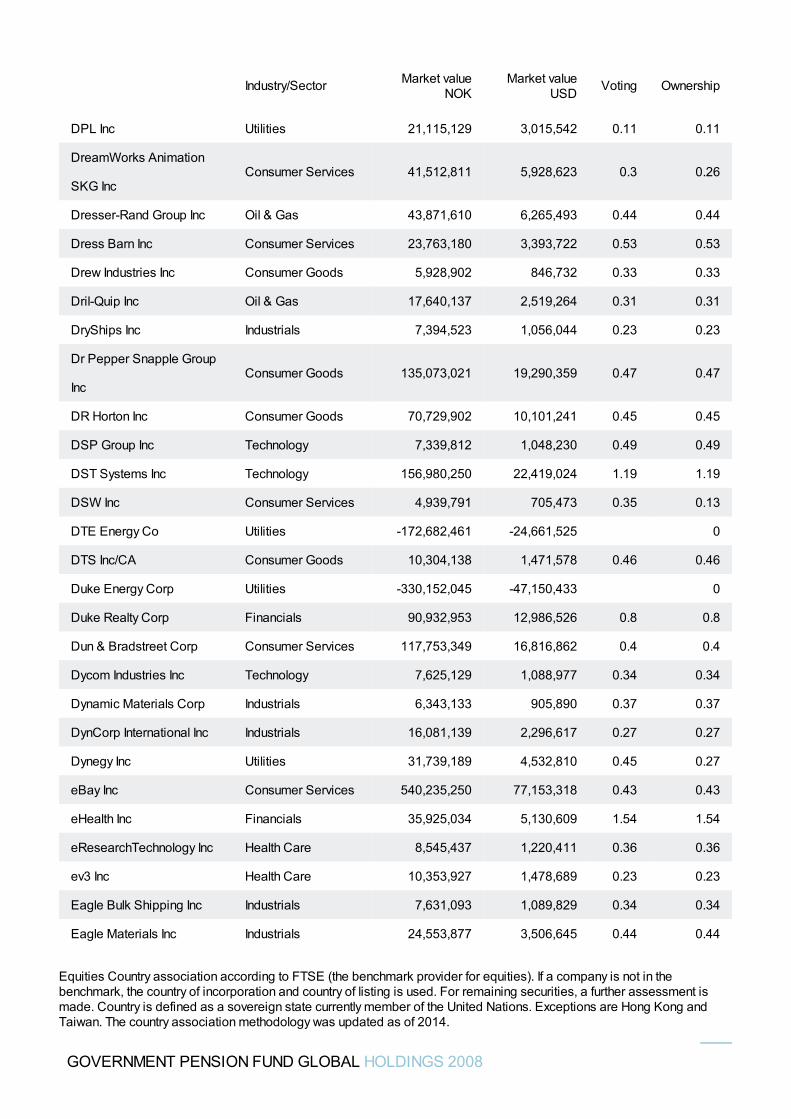
DPL Inc Utilities 21,115,129 3,015,542 0.11 0.11
DreamWorks Animation
SKG IncConsumer Services 41,512,811 5,928,623 0.3 0.26
Dresser-Rand Group Inc Oil & Gas 43,871,610 6,265,493 0.44 0.44
Dress Barn Inc Consumer Services 23,763,180 3,393,722 0.53 0.53
Drew Industries Inc Consumer Goods 5,928,902 846,732 0.33 0.33
Dril-Quip Inc Oil & Gas 17,640,137 2,519,264 0.31 0.31
DryShips Inc Industrials 7,394,523 1,056,044 0.23 0.23
Dr Pepper Snapple Group
IncConsumer Goods 135,073,021 19,290,359 0.47 0.47
DR Horton Inc Consumer Goods 70,729,902 10,101,241 0.45 0.45
DSP Group Inc Technology 7,339,812 1,048,230 0.49 0.49
DST Systems Inc Technology 156,980,250 22,419,024 1.19 1.19
DSW Inc Consumer Services 4,939,791 705,473 0.35 0.13
DTE Energy Co Utilities -172,682,461 -24,661,525 0
DTS Inc/CA Consumer Goods 10,304,138 1,471,578 0.46 0.46
Duke Energy Corp Utilities -330,152,045 -47,150,433 0
Duke Realty Corp Financials 90,932,953 12,986,526 0.8 0.8
Dun & Bradstreet Corp Consumer Services 117,753,349 16,816,862 0.4 0.4
Dycom Industries Inc Technology 7,625,129 1,088,977 0.34 0.34
Dynamic Materials Corp Industrials 6,343,133 905,890 0.37 0.37
DynCorp International Inc Industrials 16,081,139 2,296,617 0.27 0.27
Dynegy Inc Utilities 31,739,189 4,532,810 0.45 0.27
eBay Inc Consumer Services 540,235,250 77,153,318 0.43 0.43
eHealth Inc Financials 35,925,034 5,130,609 1.54 1.54
eResearchTechnology Inc Health Care 8,545,437 1,220,411 0.36 0.36
ev3 Inc Health Care 10,353,927 1,478,689 0.23 0.23
Eagle Bulk Shipping Inc Industrials 7,631,093 1,089,829 0.34 0.34
Eagle Materials Inc Industrials 24,553,877 3,506,645 0.44 0.44
Industry/Sector Market valueNOK
Market valueUSD Voting Ownership
GOVERNMENT PENSION FUND GLOBAL HOLDINGS 2008
Equities Country association according to FTSE (the benchmark provider for equities). If a company is not in thebenchmark, the country of incorporation and country of listing is used. For remaining securities, a further assessment ismade. Country is defined as a sovereign state currently member of the United Nations. Exceptions are Hong Kong andTaiwan. The country association methodology was updated as of 2014.
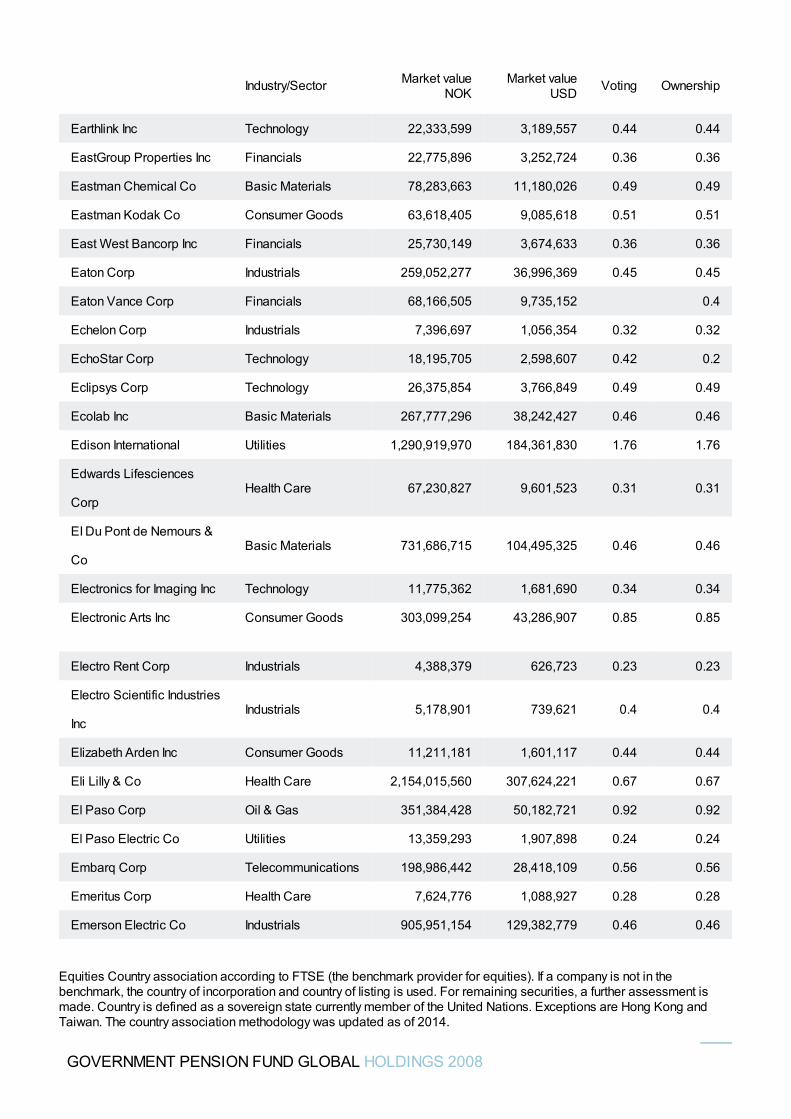
Earthlink Inc Technology 22,333,599 3,189,557 0.44 0.44
EastGroup Properties Inc Financials 22,775,896 3,252,724 0.36 0.36
Eastman Chemical Co Basic Materials 78,283,663 11,180,026 0.49 0.49
Eastman Kodak Co Consumer Goods 63,618,405 9,085,618 0.51 0.51
East West Bancorp Inc Financials 25,730,149 3,674,633 0.36 0.36
Eaton Corp Industrials 259,052,277 36,996,369 0.45 0.45
Eaton Vance Corp Financials 68,166,505 9,735,152 0.4
Echelon Corp Industrials 7,396,697 1,056,354 0.32 0.32
EchoStar Corp Technology 18,195,705 2,598,607 0.42 0.2
Eclipsys Corp Technology 26,375,854 3,766,849 0.49 0.49
Ecolab Inc Basic Materials 267,777,296 38,242,427 0.46 0.46
Edison International Utilities 1,290,919,970 184,361,830 1.76 1.76
Edwards Lifesciences
CorpHealth Care 67,230,827 9,601,523 0.31 0.31
EI Du Pont de Nemours &
CoBasic Materials 731,686,715 104,495,325 0.46 0.46
Electronics for Imaging Inc Technology 11,775,362 1,681,690 0.34 0.34
Electronic Arts Inc Consumer Goods 303,099,254 43,286,907 0.85 0.85
Electro Rent Corp Industrials 4,388,379 626,723 0.23 0.23
Electro Scientific Industries
IncIndustrials 5,178,901 739,621 0.4 0.4
Elizabeth Arden Inc Consumer Goods 11,211,181 1,601,117 0.44 0.44
Eli Lilly & Co Health Care 2,154,015,560 307,624,221 0.67 0.67
El Paso Corp Oil & Gas 351,384,428 50,182,721 0.92 0.92
El Paso Electric Co Utilities 13,359,293 1,907,898 0.24 0.24
Embarq Corp Telecommunications 198,986,442 28,418,109 0.56 0.56
Emeritus Corp Health Care 7,624,776 1,088,927 0.28 0.28
Emerson Electric Co Industrials 905,951,154 129,382,779 0.46 0.46
Industry/Sector Market valueNOK
Market valueUSD Voting Ownership
GOVERNMENT PENSION FUND GLOBAL HOLDINGS 2008
Equities Country association according to FTSE (the benchmark provider for equities). If a company is not in thebenchmark, the country of incorporation and country of listing is used. For remaining securities, a further assessment ismade. Country is defined as a sovereign state currently member of the United Nations. Exceptions are Hong Kong andTaiwan. The country association methodology was updated as of 2014.
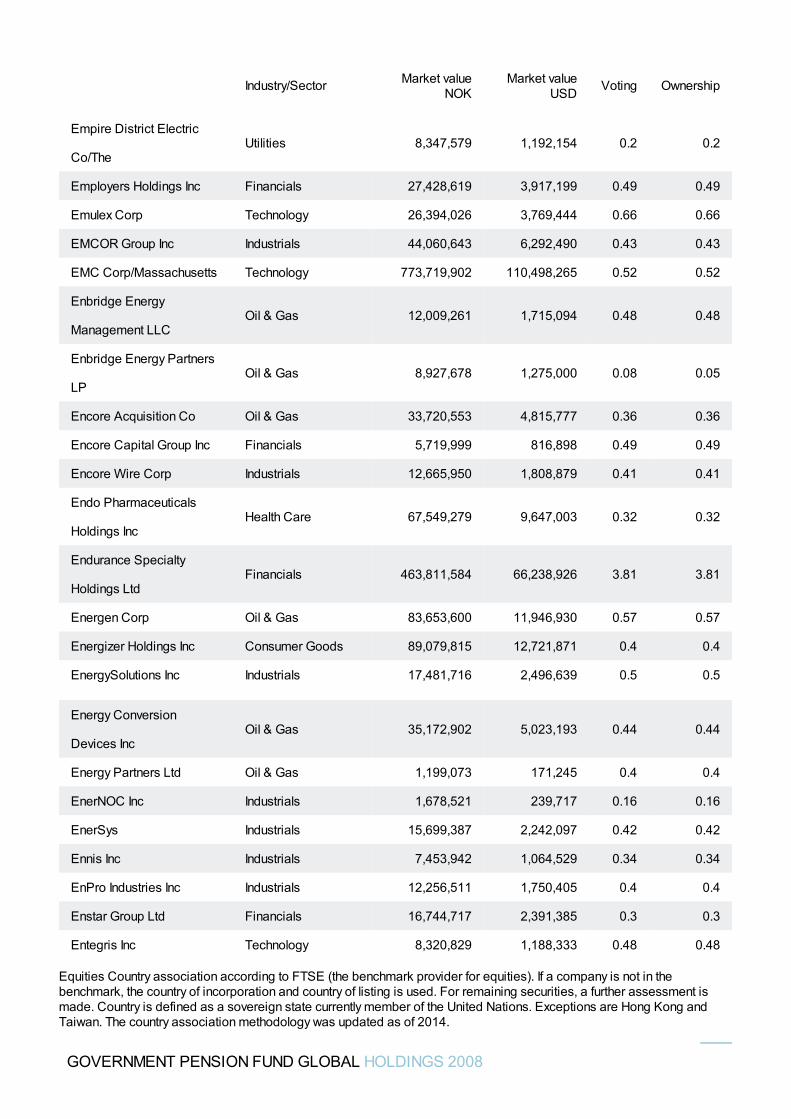
Empire District Electric
Co/TheUtilities 8,347,579 1,192,154 0.2 0.2
Employers Holdings Inc Financials 27,428,619 3,917,199 0.49 0.49
Emulex Corp Technology 26,394,026 3,769,444 0.66 0.66
EMCOR Group Inc Industrials 44,060,643 6,292,490 0.43 0.43
EMC Corp/Massachusetts Technology 773,719,902 110,498,265 0.52 0.52
Enbridge Energy
Management LLCOil & Gas 12,009,261 1,715,094 0.48 0.48
Enbridge Energy Partners
LPOil & Gas 8,927,678 1,275,000 0.08 0.05
Encore Acquisition Co Oil & Gas 33,720,553 4,815,777 0.36 0.36
Encore Capital Group Inc Financials 5,719,999 816,898 0.49 0.49
Encore Wire Corp Industrials 12,665,950 1,808,879 0.41 0.41
Endo Pharmaceuticals
Holdings IncHealth Care 67,549,279 9,647,003 0.32 0.32
Endurance Specialty
Holdings LtdFinancials 463,811,584 66,238,926 3.81 3.81
Energen Corp Oil & Gas 83,653,600 11,946,930 0.57 0.57
Energizer Holdings Inc Consumer Goods 89,079,815 12,721,871 0.4 0.4
EnergySolutions Inc Industrials 17,481,716 2,496,639 0.5 0.5
Energy Conversion
Devices IncOil & Gas 35,172,902 5,023,193 0.44 0.44
Energy Partners Ltd Oil & Gas 1,199,073 171,245 0.4 0.4
EnerNOC Inc Industrials 1,678,521 239,717 0.16 0.16
EnerSys Industrials 15,699,387 2,242,097 0.42 0.42
Ennis Inc Industrials 7,453,942 1,064,529 0.34 0.34
EnPro Industries Inc Industrials 12,256,511 1,750,405 0.4 0.4
Enstar Group Ltd Financials 16,744,717 2,391,385 0.3 0.3
Entegris Inc Technology 8,320,829 1,188,333 0.48 0.48
Industry/Sector Market valueNOK
Market valueUSD Voting Ownership
GOVERNMENT PENSION FUND GLOBAL HOLDINGS 2008
Equities Country association according to FTSE (the benchmark provider for equities). If a company is not in thebenchmark, the country of incorporation and country of listing is used. For remaining securities, a further assessment ismade. Country is defined as a sovereign state currently member of the United Nations. Exceptions are Hong Kong andTaiwan. The country association methodology was updated as of 2014.
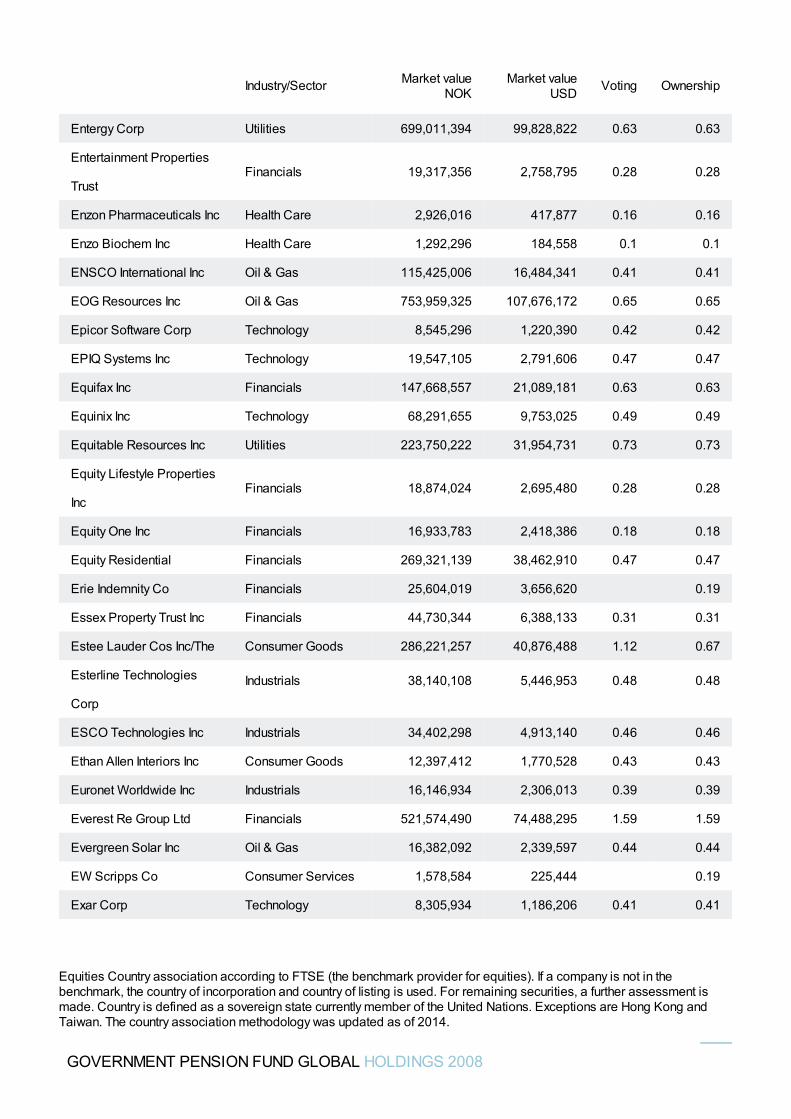
Entergy Corp Utilities 699,011,394 99,828,822 0.63 0.63
Entertainment Properties
TrustFinancials 19,317,356 2,758,795 0.28 0.28
Enzon Pharmaceuticals Inc Health Care 2,926,016 417,877 0.16 0.16
Enzo Biochem Inc Health Care 1,292,296 184,558 0.1 0.1
ENSCO International Inc Oil & Gas 115,425,006 16,484,341 0.41 0.41
EOG Resources Inc Oil & Gas 753,959,325 107,676,172 0.65 0.65
Epicor Software Corp Technology 8,545,296 1,220,390 0.42 0.42
EPIQ Systems Inc Technology 19,547,105 2,791,606 0.47 0.47
Equifax Inc Financials 147,668,557 21,089,181 0.63 0.63
Equinix Inc Technology 68,291,655 9,753,025 0.49 0.49
Equitable Resources Inc Utilities 223,750,222 31,954,731 0.73 0.73
Equity Lifestyle Properties
IncFinancials 18,874,024 2,695,480 0.28 0.28
Equity One Inc Financials 16,933,783 2,418,386 0.18 0.18
Equity Residential Financials 269,321,139 38,462,910 0.47 0.47
Erie Indemnity Co Financials 25,604,019 3,656,620 0.19
Essex Property Trust Inc Financials 44,730,344 6,388,133 0.31 0.31
Estee Lauder Cos Inc/The Consumer Goods 286,221,257 40,876,488 1.12 0.67
Esterline Technologies
Corp
Industrials 38,140,108 5,446,953 0.48 0.48
ESCO Technologies Inc Industrials 34,402,298 4,913,140 0.46 0.46
Ethan Allen Interiors Inc Consumer Goods 12,397,412 1,770,528 0.43 0.43
Euronet Worldwide Inc Industrials 16,146,934 2,306,013 0.39 0.39
Everest Re Group Ltd Financials 521,574,490 74,488,295 1.59 1.59
Evergreen Solar Inc Oil & Gas 16,382,092 2,339,597 0.44 0.44
EW Scripps Co Consumer Services 1,578,584 225,444 0.19
Exar Corp Technology 8,305,934 1,186,206 0.41 0.41
Industry/Sector Market valueNOK
Market valueUSD Voting Ownership
GOVERNMENT PENSION FUND GLOBAL HOLDINGS 2008
Equities Country association according to FTSE (the benchmark provider for equities). If a company is not in thebenchmark, the country of incorporation and country of listing is used. For remaining securities, a further assessment ismade. Country is defined as a sovereign state currently member of the United Nations. Exceptions are Hong Kong andTaiwan. The country association methodology was updated as of 2014.
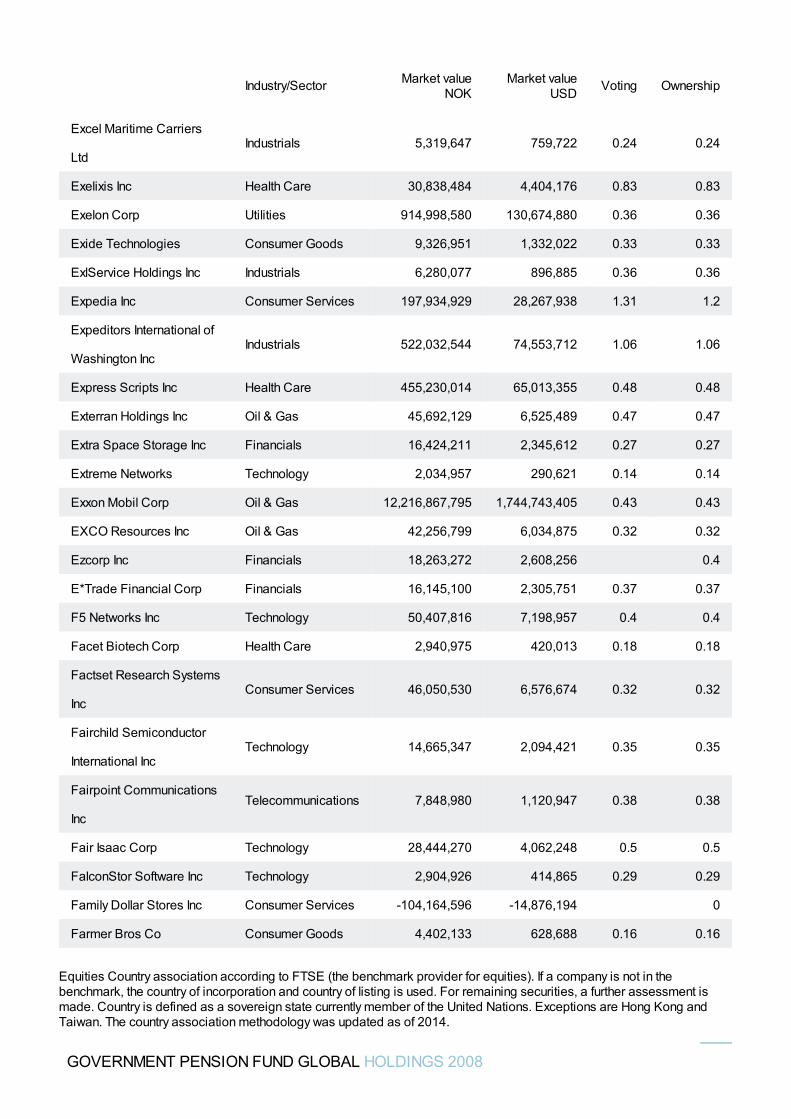
Excel Maritime Carriers
LtdIndustrials 5,319,647 759,722 0.24 0.24
Exelixis Inc Health Care 30,838,484 4,404,176 0.83 0.83
Exelon Corp Utilities 914,998,580 130,674,880 0.36 0.36
Exide Technologies Consumer Goods 9,326,951 1,332,022 0.33 0.33
ExlService Holdings Inc Industrials 6,280,077 896,885 0.36 0.36
Expedia Inc Consumer Services 197,934,929 28,267,938 1.31 1.2
Expeditors International of
Washington IncIndustrials 522,032,544 74,553,712 1.06 1.06
Express Scripts Inc Health Care 455,230,014 65,013,355 0.48 0.48
Exterran Holdings Inc Oil & Gas 45,692,129 6,525,489 0.47 0.47
Extra Space Storage Inc Financials 16,424,211 2,345,612 0.27 0.27
Extreme Networks Technology 2,034,957 290,621 0.14 0.14
Exxon Mobil Corp Oil & Gas 12,216,867,795 1,744,743,405 0.43 0.43
EXCO Resources Inc Oil & Gas 42,256,799 6,034,875 0.32 0.32
Ezcorp Inc Financials 18,263,272 2,608,256 0.4
E*Trade Financial Corp Financials 16,145,100 2,305,751 0.37 0.37
F5 Networks Inc Technology 50,407,816 7,198,957 0.4 0.4
Facet Biotech Corp Health Care 2,940,975 420,013 0.18 0.18
Factset Research Systems
IncConsumer Services 46,050,530 6,576,674 0.32 0.32
Fairchild Semiconductor
International IncTechnology 14,665,347 2,094,421 0.35 0.35
Fairpoint Communications
IncTelecommunications 7,848,980 1,120,947 0.38 0.38
Fair Isaac Corp Technology 28,444,270 4,062,248 0.5 0.5
FalconStor Software Inc Technology 2,904,926 414,865 0.29 0.29
Family Dollar Stores Inc Consumer Services -104,164,596 -14,876,194 0
Farmer Bros Co Consumer Goods 4,402,133 628,688 0.16 0.16
Industry/Sector Market valueNOK
Market valueUSD Voting Ownership
GOVERNMENT PENSION FUND GLOBAL HOLDINGS 2008
Equities Country association according to FTSE (the benchmark provider for equities). If a company is not in thebenchmark, the country of incorporation and country of listing is used. For remaining securities, a further assessment ismade. Country is defined as a sovereign state currently member of the United Nations. Exceptions are Hong Kong andTaiwan. The country association methodology was updated as of 2014.
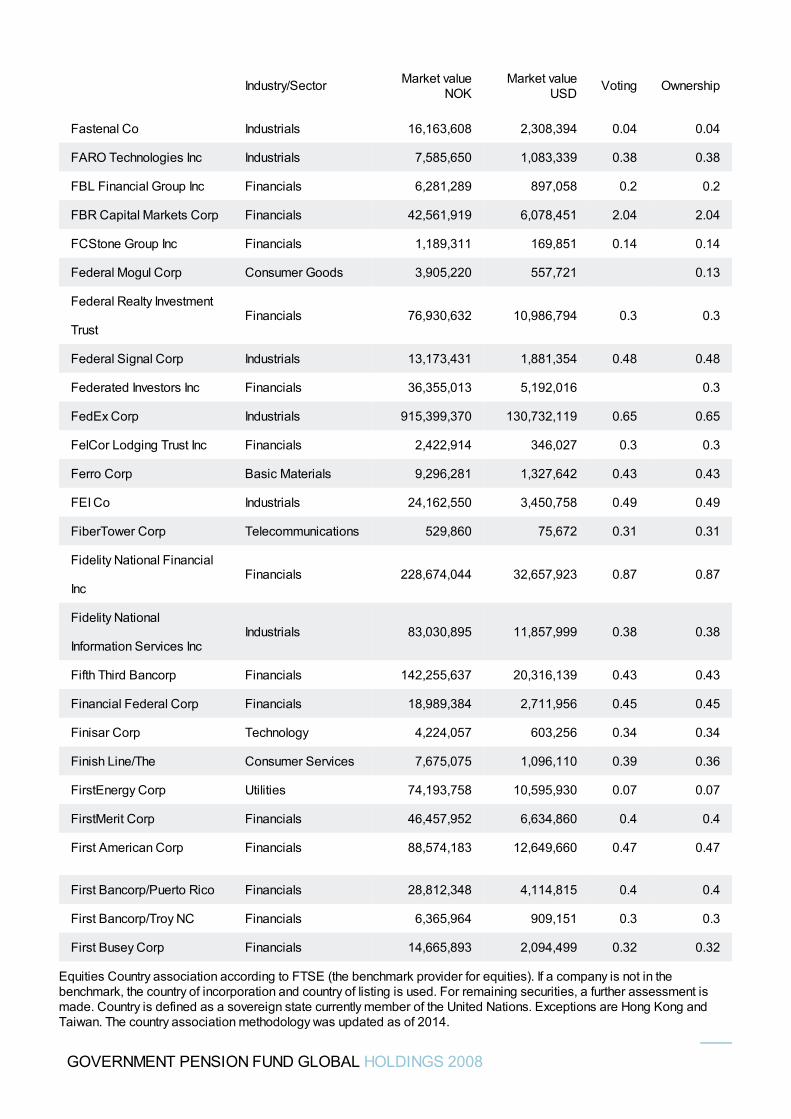
Fastenal Co Industrials 16,163,608 2,308,394 0.04 0.04
FARO Technologies Inc Industrials 7,585,650 1,083,339 0.38 0.38
FBL Financial Group Inc Financials 6,281,289 897,058 0.2 0.2
FBR Capital Markets Corp Financials 42,561,919 6,078,451 2.04 2.04
FCStone Group Inc Financials 1,189,311 169,851 0.14 0.14
Federal Mogul Corp Consumer Goods 3,905,220 557,721 0.13
Federal Realty Investment
TrustFinancials 76,930,632 10,986,794 0.3 0.3
Federal Signal Corp Industrials 13,173,431 1,881,354 0.48 0.48
Federated Investors Inc Financials 36,355,013 5,192,016 0.3
FedEx Corp Industrials 915,399,370 130,732,119 0.65 0.65
FelCor Lodging Trust Inc Financials 2,422,914 346,027 0.3 0.3
Ferro Corp Basic Materials 9,296,281 1,327,642 0.43 0.43
FEI Co Industrials 24,162,550 3,450,758 0.49 0.49
FiberTower Corp Telecommunications 529,860 75,672 0.31 0.31
Fidelity National Financial
IncFinancials 228,674,044 32,657,923 0.87 0.87
Fidelity National
Information Services IncIndustrials 83,030,895 11,857,999 0.38 0.38
Fifth Third Bancorp Financials 142,255,637 20,316,139 0.43 0.43
Financial Federal Corp Financials 18,989,384 2,711,956 0.45 0.45
Finisar Corp Technology 4,224,057 603,256 0.34 0.34
Finish Line/The Consumer Services 7,675,075 1,096,110 0.39 0.36
FirstEnergy Corp Utilities 74,193,758 10,595,930 0.07 0.07
FirstMerit Corp Financials 46,457,952 6,634,860 0.4 0.4
First American Corp Financials 88,574,183 12,649,660 0.47 0.47
First Bancorp/Puerto Rico Financials 28,812,348 4,114,815 0.4 0.4
First Bancorp/Troy NC Financials 6,365,964 909,151 0.3 0.3
First Busey Corp Financials 14,665,893 2,094,499 0.32 0.32
Industry/Sector Market valueNOK
Market valueUSD Voting Ownership
GOVERNMENT PENSION FUND GLOBAL HOLDINGS 2008
Equities Country association according to FTSE (the benchmark provider for equities). If a company is not in thebenchmark, the country of incorporation and country of listing is used. For remaining securities, a further assessment ismade. Country is defined as a sovereign state currently member of the United Nations. Exceptions are Hong Kong andTaiwan. The country association methodology was updated as of 2014.
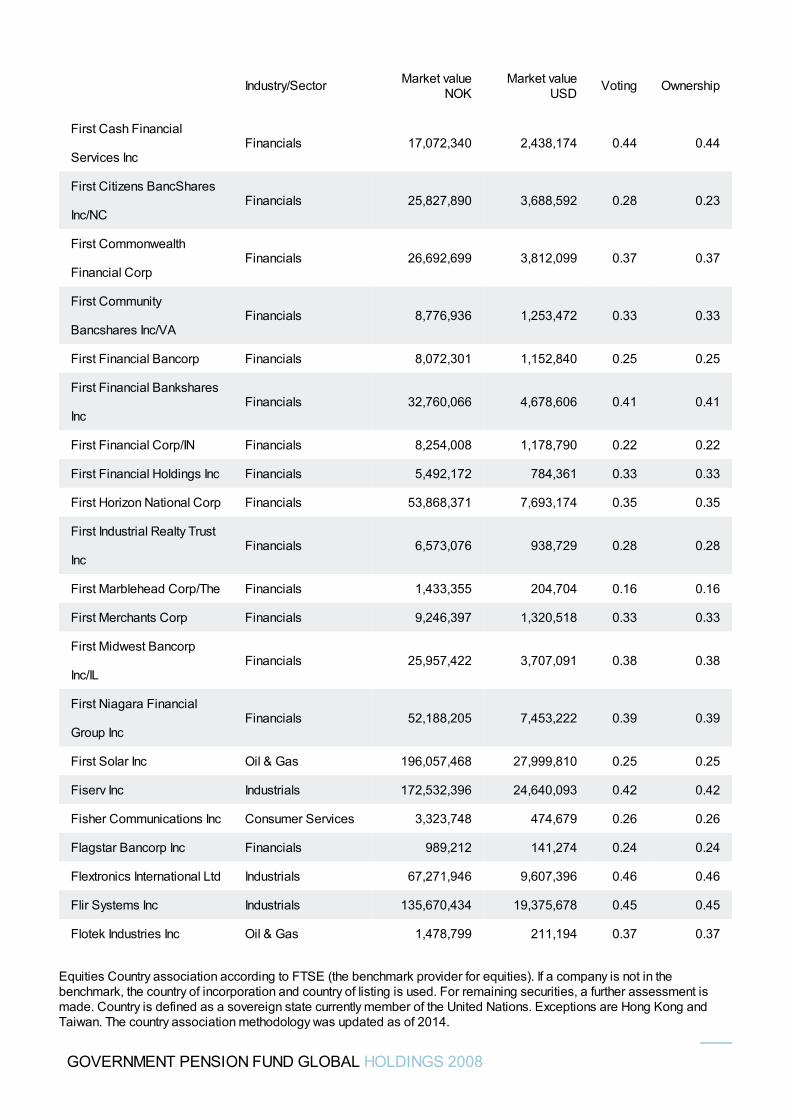
First Cash Financial
Services IncFinancials 17,072,340 2,438,174 0.44 0.44
First Citizens BancShares
Inc/NCFinancials 25,827,890 3,688,592 0.28 0.23
First Commonwealth
Financial CorpFinancials 26,692,699 3,812,099 0.37 0.37
First Community
Bancshares Inc/VAFinancials 8,776,936 1,253,472 0.33 0.33
First Financial Bancorp Financials 8,072,301 1,152,840 0.25 0.25
First Financial Bankshares
IncFinancials 32,760,066 4,678,606 0.41 0.41
First Financial Corp/IN Financials 8,254,008 1,178,790 0.22 0.22
First Financial Holdings Inc Financials 5,492,172 784,361 0.33 0.33
First Horizon National Corp Financials 53,868,371 7,693,174 0.35 0.35
First Industrial Realty Trust
IncFinancials 6,573,076 938,729 0.28 0.28
First Marblehead Corp/The Financials 1,433,355 204,704 0.16 0.16
First Merchants Corp Financials 9,246,397 1,320,518 0.33 0.33
First Midwest Bancorp
Inc/ILFinancials 25,957,422 3,707,091 0.38 0.38
First Niagara Financial
Group IncFinancials 52,188,205 7,453,222 0.39 0.39
First Solar Inc Oil & Gas 196,057,468 27,999,810 0.25 0.25
Fiserv Inc Industrials 172,532,396 24,640,093 0.42 0.42
Fisher Communications Inc Consumer Services 3,323,748 474,679 0.26 0.26
Flagstar Bancorp Inc Financials 989,212 141,274 0.24 0.24
Flextronics International Ltd Industrials 67,271,946 9,607,396 0.46 0.46
Flir Systems Inc Industrials 135,670,434 19,375,678 0.45 0.45
Flotek Industries Inc Oil & Gas 1,478,799 211,194 0.37 0.37
Industry/Sector Market valueNOK
Market valueUSD Voting Ownership
GOVERNMENT PENSION FUND GLOBAL HOLDINGS 2008
Equities Country association according to FTSE (the benchmark provider for equities). If a company is not in thebenchmark, the country of incorporation and country of listing is used. For remaining securities, a further assessment ismade. Country is defined as a sovereign state currently member of the United Nations. Exceptions are Hong Kong andTaiwan. The country association methodology was updated as of 2014.
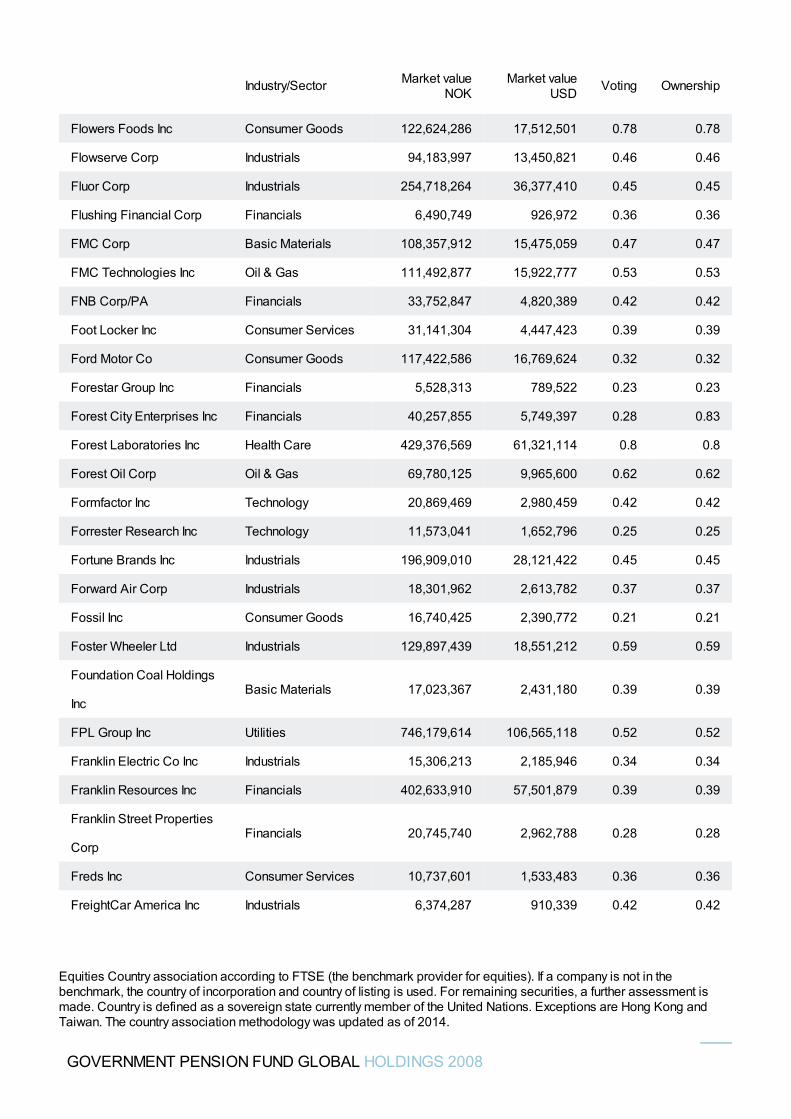
Flowers Foods Inc Consumer Goods 122,624,286 17,512,501 0.78 0.78
Flowserve Corp Industrials 94,183,997 13,450,821 0.46 0.46
Fluor Corp Industrials 254,718,264 36,377,410 0.45 0.45
Flushing Financial Corp Financials 6,490,749 926,972 0.36 0.36
FMC Corp Basic Materials 108,357,912 15,475,059 0.47 0.47
FMC Technologies Inc Oil & Gas 111,492,877 15,922,777 0.53 0.53
FNB Corp/PA Financials 33,752,847 4,820,389 0.42 0.42
Foot Locker Inc Consumer Services 31,141,304 4,447,423 0.39 0.39
Ford Motor Co Consumer Goods 117,422,586 16,769,624 0.32 0.32
Forestar Group Inc Financials 5,528,313 789,522 0.23 0.23
Forest City Enterprises Inc Financials 40,257,855 5,749,397 0.28 0.83
Forest Laboratories Inc Health Care 429,376,569 61,321,114 0.8 0.8
Forest Oil Corp Oil & Gas 69,780,125 9,965,600 0.62 0.62
Formfactor Inc Technology 20,869,469 2,980,459 0.42 0.42
Forrester Research Inc Technology 11,573,041 1,652,796 0.25 0.25
Fortune Brands Inc Industrials 196,909,010 28,121,422 0.45 0.45
Forward Air Corp Industrials 18,301,962 2,613,782 0.37 0.37
Fossil Inc Consumer Goods 16,740,425 2,390,772 0.21 0.21
Foster Wheeler Ltd Industrials 129,897,439 18,551,212 0.59 0.59
Foundation Coal Holdings
IncBasic Materials 17,023,367 2,431,180 0.39 0.39
FPL Group Inc Utilities 746,179,614 106,565,118 0.52 0.52
Franklin Electric Co Inc Industrials 15,306,213 2,185,946 0.34 0.34
Franklin Resources Inc Financials 402,633,910 57,501,879 0.39 0.39
Franklin Street Properties
CorpFinancials 20,745,740 2,962,788 0.28 0.28
Freds Inc Consumer Services 10,737,601 1,533,483 0.36 0.36
FreightCar America Inc Industrials 6,374,287 910,339 0.42 0.42
Industry/Sector Market valueNOK
Market valueUSD Voting Ownership
GOVERNMENT PENSION FUND GLOBAL HOLDINGS 2008
Equities Country association according to FTSE (the benchmark provider for equities). If a company is not in thebenchmark, the country of incorporation and country of listing is used. For remaining securities, a further assessment ismade. Country is defined as a sovereign state currently member of the United Nations. Exceptions are Hong Kong andTaiwan. The country association methodology was updated as of 2014.
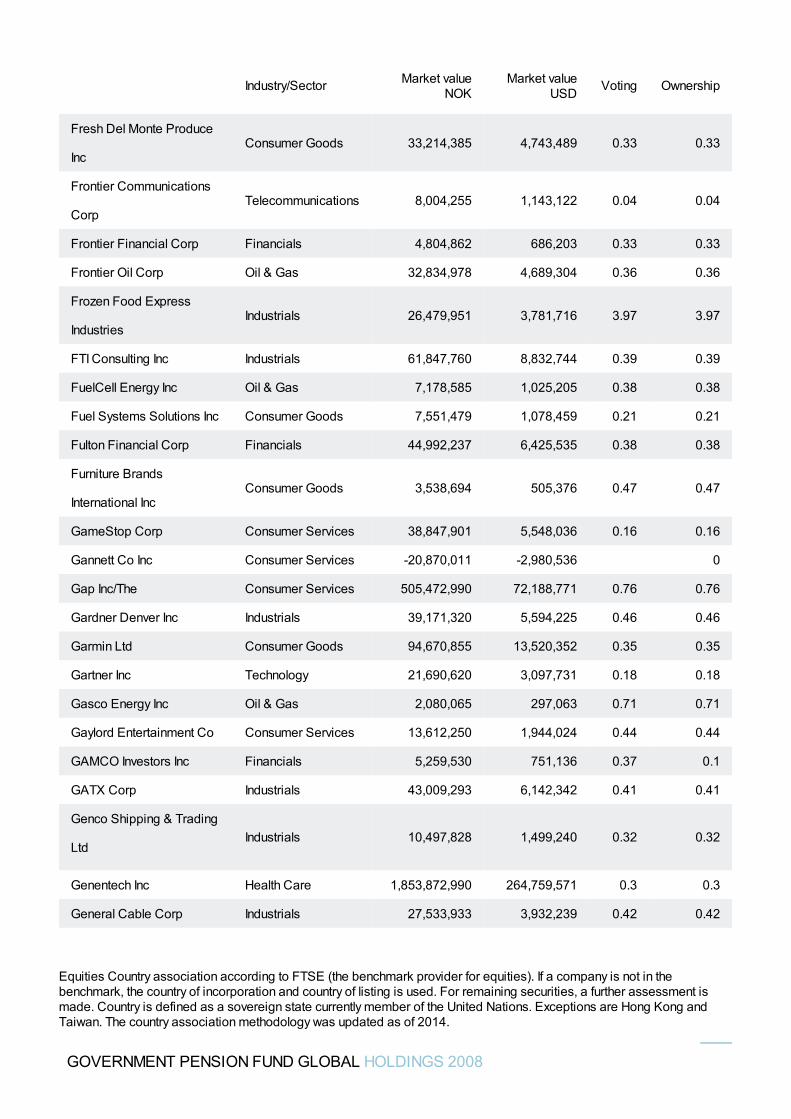
Fresh Del Monte Produce
IncConsumer Goods 33,214,385 4,743,489 0.33 0.33
Frontier Communications
CorpTelecommunications 8,004,255 1,143,122 0.04 0.04
Frontier Financial Corp Financials 4,804,862 686,203 0.33 0.33
Frontier Oil Corp Oil & Gas 32,834,978 4,689,304 0.36 0.36
Frozen Food Express
IndustriesIndustrials 26,479,951 3,781,716 3.97 3.97
FTI Consulting Inc Industrials 61,847,760 8,832,744 0.39 0.39
FuelCell Energy Inc Oil & Gas 7,178,585 1,025,205 0.38 0.38
Fuel Systems Solutions Inc Consumer Goods 7,551,479 1,078,459 0.21 0.21
Fulton Financial Corp Financials 44,992,237 6,425,535 0.38 0.38
Furniture Brands
International IncConsumer Goods 3,538,694 505,376 0.47 0.47
GameStop Corp Consumer Services 38,847,901 5,548,036 0.16 0.16
Gannett Co Inc Consumer Services -20,870,011 -2,980,536 0
Gap Inc/The Consumer Services 505,472,990 72,188,771 0.76 0.76
Gardner Denver Inc Industrials 39,171,320 5,594,225 0.46 0.46
Garmin Ltd Consumer Goods 94,670,855 13,520,352 0.35 0.35
Gartner Inc Technology 21,690,620 3,097,731 0.18 0.18
Gasco Energy Inc Oil & Gas 2,080,065 297,063 0.71 0.71
Gaylord Entertainment Co Consumer Services 13,612,250 1,944,024 0.44 0.44
GAMCO Investors Inc Financials 5,259,530 751,136 0.37 0.1
GATX Corp Industrials 43,009,293 6,142,342 0.41 0.41
Genco Shipping & Trading
LtdIndustrials 10,497,828 1,499,240 0.32 0.32
Genentech Inc Health Care 1,853,872,990 264,759,571 0.3 0.3
General Cable Corp Industrials 27,533,933 3,932,239 0.42 0.42
Industry/Sector Market valueNOK
Market valueUSD Voting Ownership
GOVERNMENT PENSION FUND GLOBAL HOLDINGS 2008
Equities Country association according to FTSE (the benchmark provider for equities). If a company is not in thebenchmark, the country of incorporation and country of listing is used. For remaining securities, a further assessment ismade. Country is defined as a sovereign state currently member of the United Nations. Exceptions are Hong Kong andTaiwan. The country association methodology was updated as of 2014.
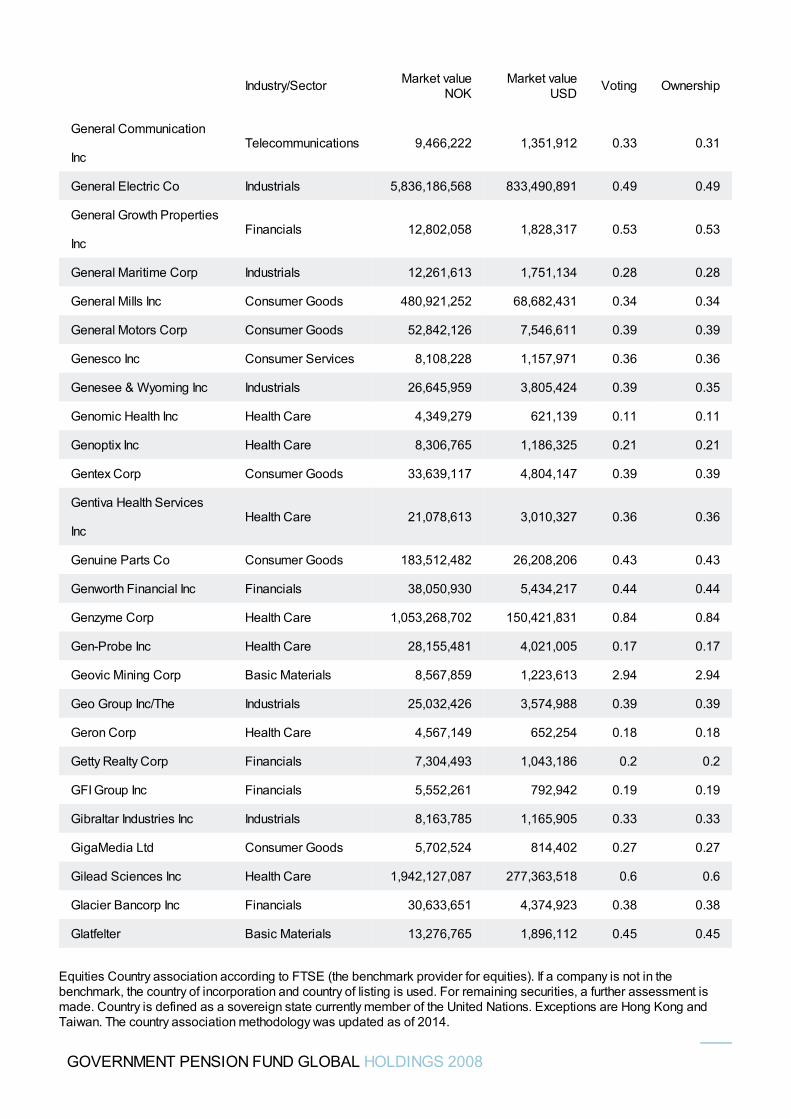
General Communication
IncTelecommunications 9,466,222 1,351,912 0.33 0.31
General Electric Co Industrials 5,836,186,568 833,490,891 0.49 0.49
General Growth Properties
IncFinancials 12,802,058 1,828,317 0.53 0.53
General Maritime Corp Industrials 12,261,613 1,751,134 0.28 0.28
General Mills Inc Consumer Goods 480,921,252 68,682,431 0.34 0.34
General Motors Corp Consumer Goods 52,842,126 7,546,611 0.39 0.39
Genesco Inc Consumer Services 8,108,228 1,157,971 0.36 0.36
Genesee & Wyoming Inc Industrials 26,645,959 3,805,424 0.39 0.35
Genomic Health Inc Health Care 4,349,279 621,139 0.11 0.11
Genoptix Inc Health Care 8,306,765 1,186,325 0.21 0.21
Gentex Corp Consumer Goods 33,639,117 4,804,147 0.39 0.39
Gentiva Health Services
IncHealth Care 21,078,613 3,010,327 0.36 0.36
Genuine Parts Co Consumer Goods 183,512,482 26,208,206 0.43 0.43
Genworth Financial Inc Financials 38,050,930 5,434,217 0.44 0.44
Genzyme Corp Health Care 1,053,268,702 150,421,831 0.84 0.84
Gen-Probe Inc Health Care 28,155,481 4,021,005 0.17 0.17
Geovic Mining Corp Basic Materials 8,567,859 1,223,613 2.94 2.94
Geo Group Inc/The Industrials 25,032,426 3,574,988 0.39 0.39
Geron Corp Health Care 4,567,149 652,254 0.18 0.18
Getty Realty Corp Financials 7,304,493 1,043,186 0.2 0.2
GFI Group Inc Financials 5,552,261 792,942 0.19 0.19
Gibraltar Industries Inc Industrials 8,163,785 1,165,905 0.33 0.33
GigaMedia Ltd Consumer Goods 5,702,524 814,402 0.27 0.27
Gilead Sciences Inc Health Care 1,942,127,087 277,363,518 0.6 0.6
Glacier Bancorp Inc Financials 30,633,651 4,374,923 0.38 0.38
Glatfelter Basic Materials 13,276,765 1,896,112 0.45 0.45
Industry/Sector Market valueNOK
Market valueUSD Voting Ownership
GOVERNMENT PENSION FUND GLOBAL HOLDINGS 2008
Equities Country association according to FTSE (the benchmark provider for equities). If a company is not in thebenchmark, the country of incorporation and country of listing is used. For remaining securities, a further assessment ismade. Country is defined as a sovereign state currently member of the United Nations. Exceptions are Hong Kong andTaiwan. The country association methodology was updated as of 2014.
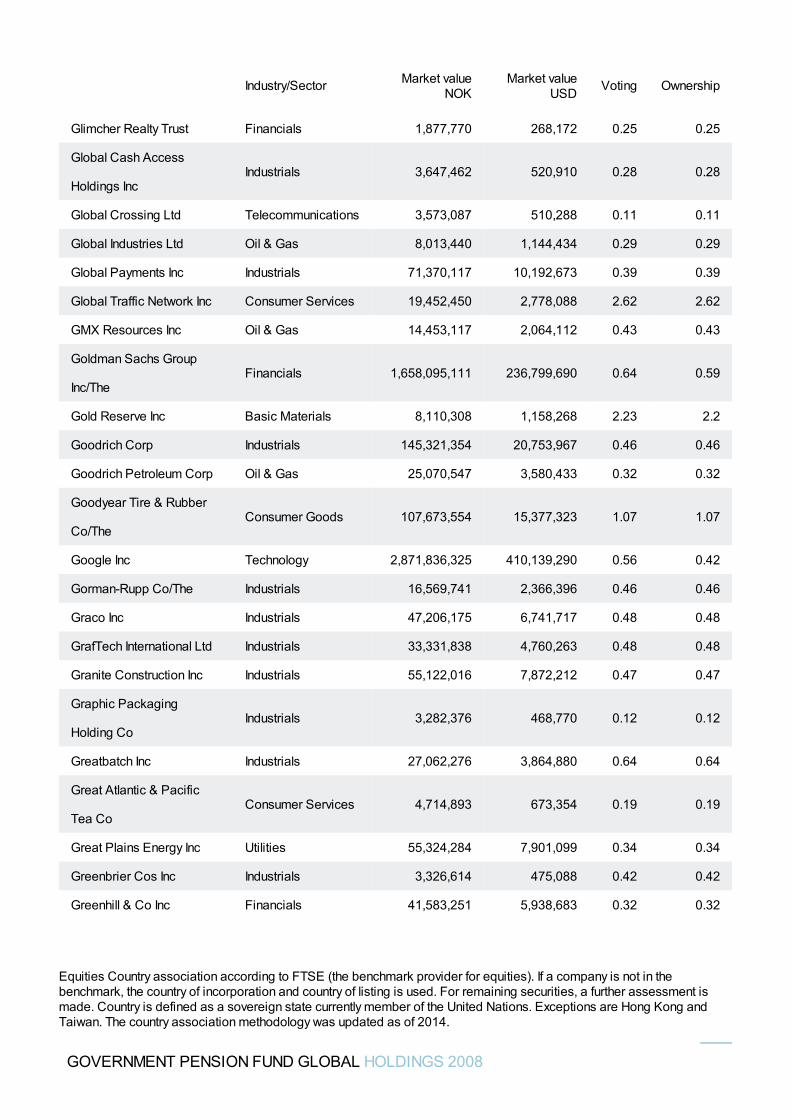
Glimcher Realty Trust Financials 1,877,770 268,172 0.25 0.25
Global Cash Access
Holdings IncIndustrials 3,647,462 520,910 0.28 0.28
Global Crossing Ltd Telecommunications 3,573,087 510,288 0.11 0.11
Global Industries Ltd Oil & Gas 8,013,440 1,144,434 0.29 0.29
Global Payments Inc Industrials 71,370,117 10,192,673 0.39 0.39
Global Traffic Network Inc Consumer Services 19,452,450 2,778,088 2.62 2.62
GMX Resources Inc Oil & Gas 14,453,117 2,064,112 0.43 0.43
Goldman Sachs Group
Inc/TheFinancials 1,658,095,111 236,799,690 0.64 0.59
Gold Reserve Inc Basic Materials 8,110,308 1,158,268 2.23 2.2
Goodrich Corp Industrials 145,321,354 20,753,967 0.46 0.46
Goodrich Petroleum Corp Oil & Gas 25,070,547 3,580,433 0.32 0.32
Goodyear Tire & Rubber
Co/TheConsumer Goods 107,673,554 15,377,323 1.07 1.07
Google Inc Technology 2,871,836,325 410,139,290 0.56 0.42
Gorman-Rupp Co/The Industrials 16,569,741 2,366,396 0.46 0.46
Graco Inc Industrials 47,206,175 6,741,717 0.48 0.48
GrafTech International Ltd Industrials 33,331,838 4,760,263 0.48 0.48
Granite Construction Inc Industrials 55,122,016 7,872,212 0.47 0.47
Graphic Packaging
Holding CoIndustrials 3,282,376 468,770 0.12 0.12
Greatbatch Inc Industrials 27,062,276 3,864,880 0.64 0.64
Great Atlantic & Pacific
Tea CoConsumer Services 4,714,893 673,354 0.19 0.19
Great Plains Energy Inc Utilities 55,324,284 7,901,099 0.34 0.34
Greenbrier Cos Inc Industrials 3,326,614 475,088 0.42 0.42
Greenhill & Co Inc Financials 41,583,251 5,938,683 0.32 0.32
Industry/Sector Market valueNOK
Market valueUSD Voting Ownership
GOVERNMENT PENSION FUND GLOBAL HOLDINGS 2008
Equities Country association according to FTSE (the benchmark provider for equities). If a company is not in thebenchmark, the country of incorporation and country of listing is used. For remaining securities, a further assessment ismade. Country is defined as a sovereign state currently member of the United Nations. Exceptions are Hong Kong andTaiwan. The country association methodology was updated as of 2014.
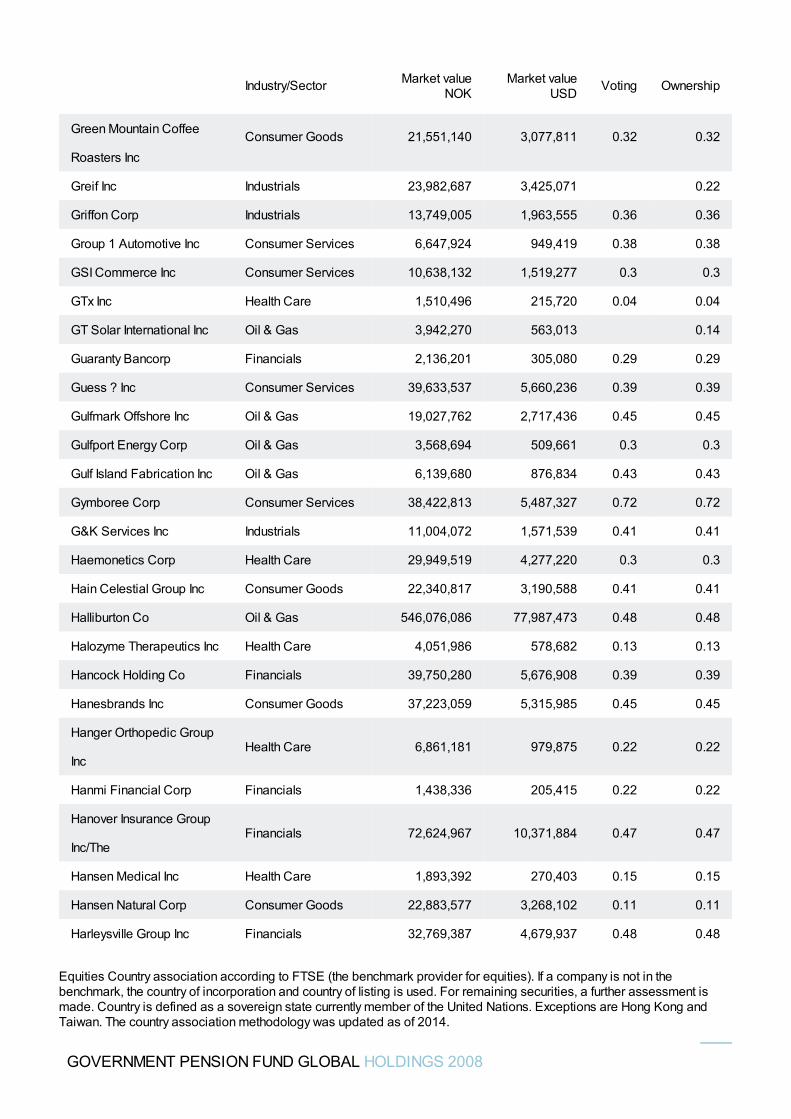
Green Mountain Coffee
Roasters IncConsumer Goods 21,551,140 3,077,811 0.32 0.32
Greif Inc Industrials 23,982,687 3,425,071 0.22
Griffon Corp Industrials 13,749,005 1,963,555 0.36 0.36
Group 1 Automotive Inc Consumer Services 6,647,924 949,419 0.38 0.38
GSI Commerce Inc Consumer Services 10,638,132 1,519,277 0.3 0.3
GTx Inc Health Care 1,510,496 215,720 0.04 0.04
GT Solar International Inc Oil & Gas 3,942,270 563,013 0.14
Guaranty Bancorp Financials 2,136,201 305,080 0.29 0.29
Guess ? Inc Consumer Services 39,633,537 5,660,236 0.39 0.39
Gulfmark Offshore Inc Oil & Gas 19,027,762 2,717,436 0.45 0.45
Gulfport Energy Corp Oil & Gas 3,568,694 509,661 0.3 0.3
Gulf Island Fabrication Inc Oil & Gas 6,139,680 876,834 0.43 0.43
Gymboree Corp Consumer Services 38,422,813 5,487,327 0.72 0.72
G&K Services Inc Industrials 11,004,072 1,571,539 0.41 0.41
Haemonetics Corp Health Care 29,949,519 4,277,220 0.3 0.3
Hain Celestial Group Inc Consumer Goods 22,340,817 3,190,588 0.41 0.41
Halliburton Co Oil & Gas 546,076,086 77,987,473 0.48 0.48
Halozyme Therapeutics Inc Health Care 4,051,986 578,682 0.13 0.13
Hancock Holding Co Financials 39,750,280 5,676,908 0.39 0.39
Hanesbrands Inc Consumer Goods 37,223,059 5,315,985 0.45 0.45
Hanger Orthopedic Group
IncHealth Care 6,861,181 979,875 0.22 0.22
Hanmi Financial Corp Financials 1,438,336 205,415 0.22 0.22
Hanover Insurance Group
Inc/TheFinancials 72,624,967 10,371,884 0.47 0.47
Hansen Medical Inc Health Care 1,893,392 270,403 0.15 0.15
Hansen Natural Corp Consumer Goods 22,883,577 3,268,102 0.11 0.11
Harleysville Group Inc Financials 32,769,387 4,679,937 0.48 0.48
Industry/Sector Market valueNOK
Market valueUSD Voting Ownership
GOVERNMENT PENSION FUND GLOBAL HOLDINGS 2008
Equities Country association according to FTSE (the benchmark provider for equities). If a company is not in thebenchmark, the country of incorporation and country of listing is used. For remaining securities, a further assessment ismade. Country is defined as a sovereign state currently member of the United Nations. Exceptions are Hong Kong andTaiwan. The country association methodology was updated as of 2014.
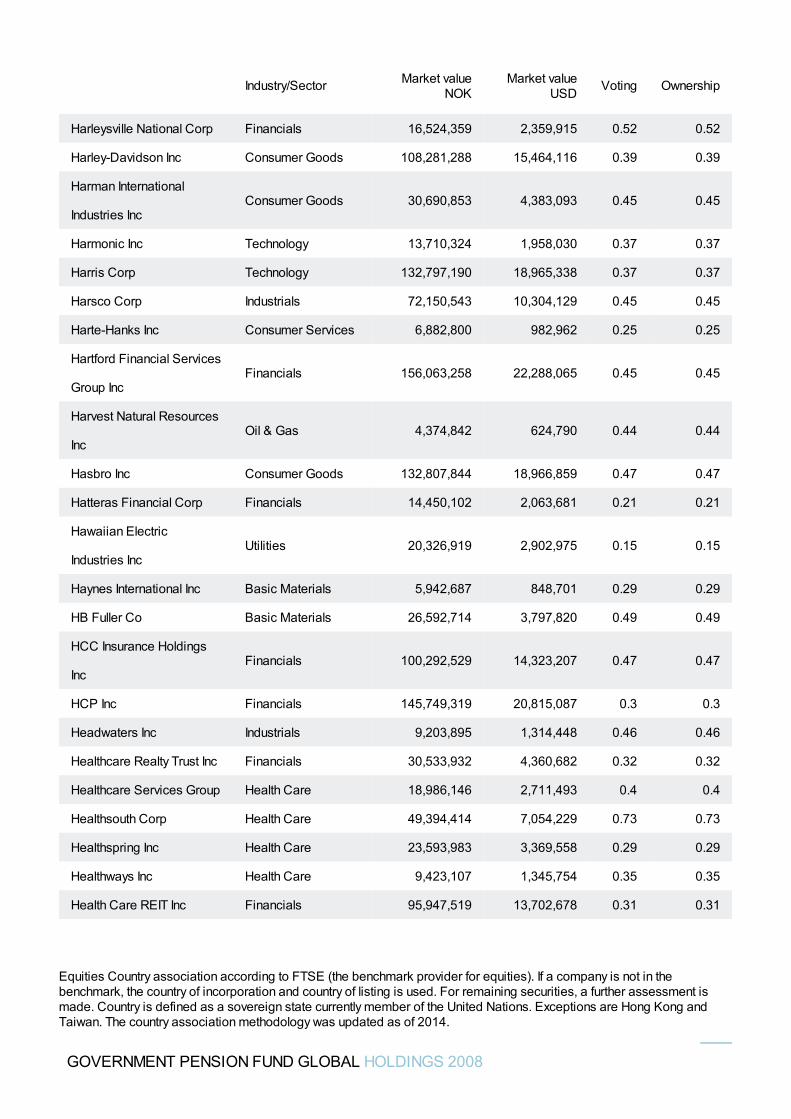
Harleysville National Corp Financials 16,524,359 2,359,915 0.52 0.52
Harley-Davidson Inc Consumer Goods 108,281,288 15,464,116 0.39 0.39
Harman International
Industries IncConsumer Goods 30,690,853 4,383,093 0.45 0.45
Harmonic Inc Technology 13,710,324 1,958,030 0.37 0.37
Harris Corp Technology 132,797,190 18,965,338 0.37 0.37
Harsco Corp Industrials 72,150,543 10,304,129 0.45 0.45
Harte-Hanks Inc Consumer Services 6,882,800 982,962 0.25 0.25
Hartford Financial Services
Group IncFinancials 156,063,258 22,288,065 0.45 0.45
Harvest Natural Resources
IncOil & Gas 4,374,842 624,790 0.44 0.44
Hasbro Inc Consumer Goods 132,807,844 18,966,859 0.47 0.47
Hatteras Financial Corp Financials 14,450,102 2,063,681 0.21 0.21
Hawaiian Electric
Industries IncUtilities 20,326,919 2,902,975 0.15 0.15
Haynes International Inc Basic Materials 5,942,687 848,701 0.29 0.29
HB Fuller Co Basic Materials 26,592,714 3,797,820 0.49 0.49
HCC Insurance Holdings
IncFinancials 100,292,529 14,323,207 0.47 0.47
HCP Inc Financials 145,749,319 20,815,087 0.3 0.3
Headwaters Inc Industrials 9,203,895 1,314,448 0.46 0.46
Healthcare Realty Trust Inc Financials 30,533,932 4,360,682 0.32 0.32
Healthcare Services Group Health Care 18,986,146 2,711,493 0.4 0.4
Healthsouth Corp Health Care 49,394,414 7,054,229 0.73 0.73
Healthspring Inc Health Care 23,593,983 3,369,558 0.29 0.29
Healthways Inc Health Care 9,423,107 1,345,754 0.35 0.35
Health Care REIT Inc Financials 95,947,519 13,702,678 0.31 0.31
Industry/Sector Market valueNOK
Market valueUSD Voting Ownership
GOVERNMENT PENSION FUND GLOBAL HOLDINGS 2008
Equities Country association according to FTSE (the benchmark provider for equities). If a company is not in thebenchmark, the country of incorporation and country of listing is used. For remaining securities, a further assessment ismade. Country is defined as a sovereign state currently member of the United Nations. Exceptions are Hong Kong andTaiwan. The country association methodology was updated as of 2014.
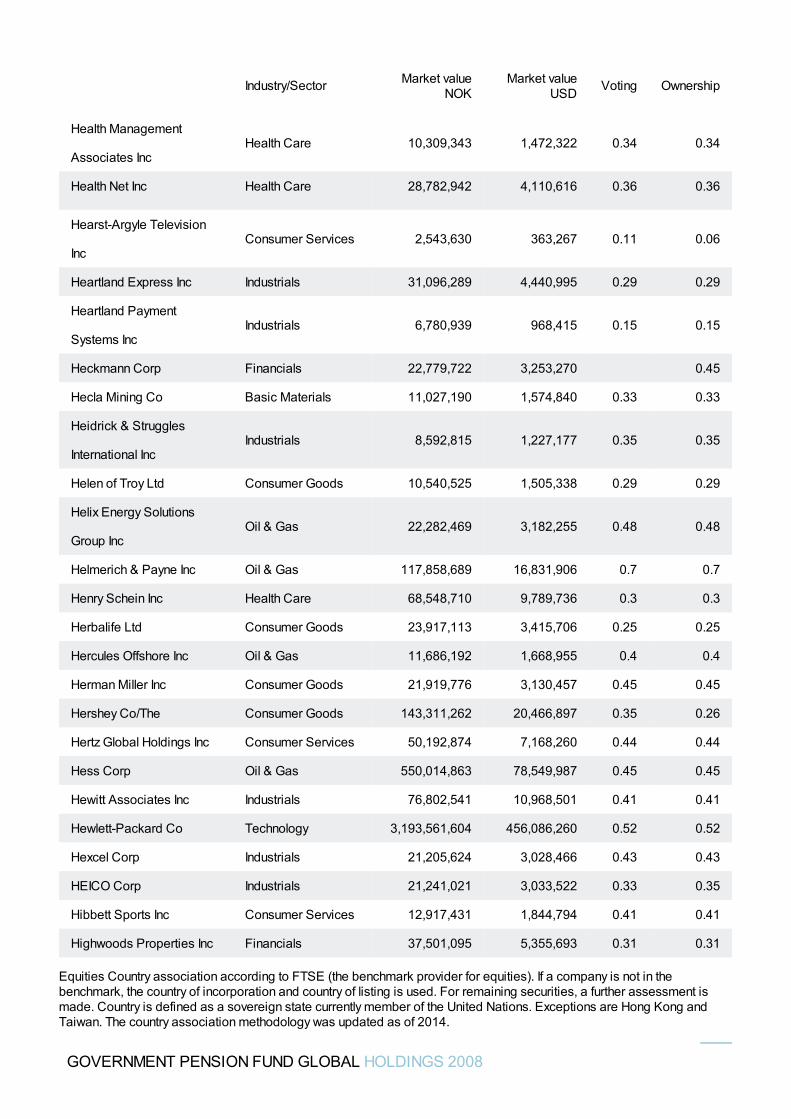
Health Management
Associates IncHealth Care 10,309,343 1,472,322 0.34 0.34
Health Net Inc Health Care 28,782,942 4,110,616 0.36 0.36
Hearst-Argyle Television
IncConsumer Services 2,543,630 363,267 0.11 0.06
Heartland Express Inc Industrials 31,096,289 4,440,995 0.29 0.29
Heartland Payment
Systems IncIndustrials 6,780,939 968,415 0.15 0.15
Heckmann Corp Financials 22,779,722 3,253,270 0.45
Hecla Mining Co Basic Materials 11,027,190 1,574,840 0.33 0.33
Heidrick & Struggles
International IncIndustrials 8,592,815 1,227,177 0.35 0.35
Helen of Troy Ltd Consumer Goods 10,540,525 1,505,338 0.29 0.29
Helix Energy Solutions
Group IncOil & Gas 22,282,469 3,182,255 0.48 0.48
Helmerich & Payne Inc Oil & Gas 117,858,689 16,831,906 0.7 0.7
Henry Schein Inc Health Care 68,548,710 9,789,736 0.3 0.3
Herbalife Ltd Consumer Goods 23,917,113 3,415,706 0.25 0.25
Hercules Offshore Inc Oil & Gas 11,686,192 1,668,955 0.4 0.4
Herman Miller Inc Consumer Goods 21,919,776 3,130,457 0.45 0.45
Hershey Co/The Consumer Goods 143,311,262 20,466,897 0.35 0.26
Hertz Global Holdings Inc Consumer Services 50,192,874 7,168,260 0.44 0.44
Hess Corp Oil & Gas 550,014,863 78,549,987 0.45 0.45
Hewitt Associates Inc Industrials 76,802,541 10,968,501 0.41 0.41
Hewlett-Packard Co Technology 3,193,561,604 456,086,260 0.52 0.52
Hexcel Corp Industrials 21,205,624 3,028,466 0.43 0.43
HEICO Corp Industrials 21,241,021 3,033,522 0.33 0.35
Hibbett Sports Inc Consumer Services 12,917,431 1,844,794 0.41 0.41
Highwoods Properties Inc Financials 37,501,095 5,355,693 0.31 0.31
Industry/Sector Market valueNOK
Market valueUSD Voting Ownership
GOVERNMENT PENSION FUND GLOBAL HOLDINGS 2008
Equities Country association according to FTSE (the benchmark provider for equities). If a company is not in thebenchmark, the country of incorporation and country of listing is used. For remaining securities, a further assessment ismade. Country is defined as a sovereign state currently member of the United Nations. Exceptions are Hong Kong andTaiwan. The country association methodology was updated as of 2014.
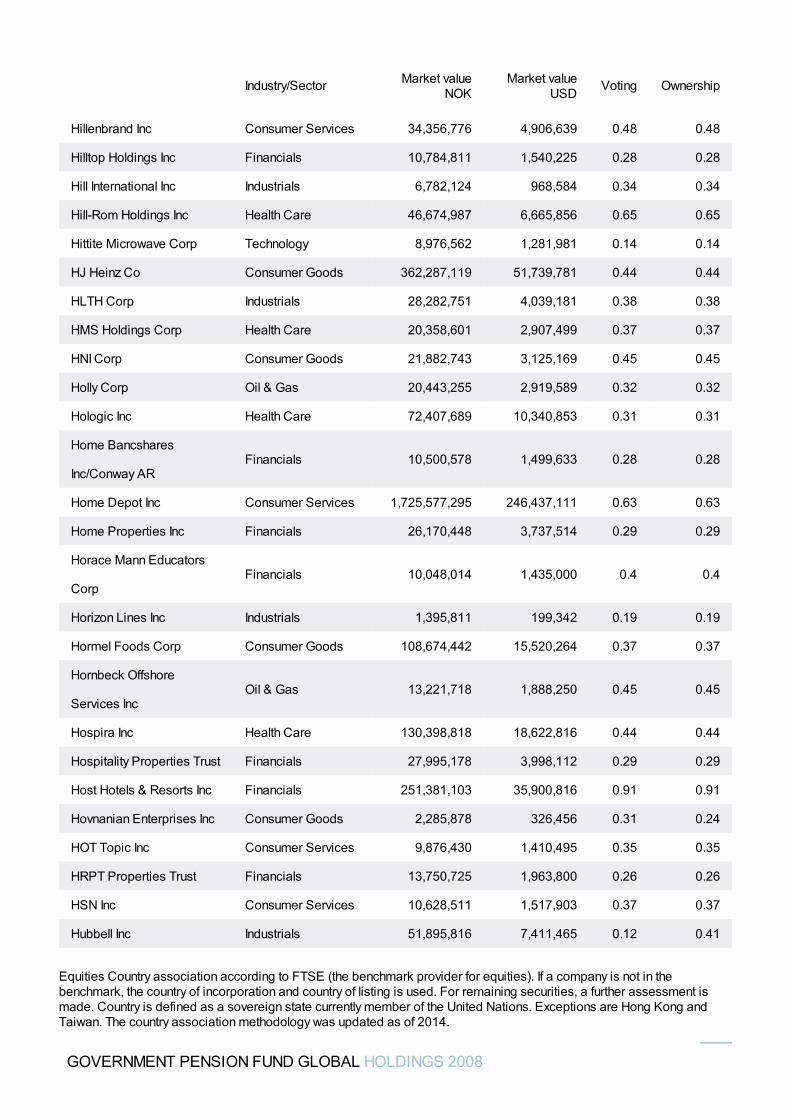
Hillenbrand Inc Consumer Services 34,356,776 4,906,639 0.48 0.48
Hilltop Holdings Inc Financials 10,784,811 1,540,225 0.28 0.28
Hill International Inc Industrials 6,782,124 968,584 0.34 0.34
Hill-Rom Holdings Inc Health Care 46,674,987 6,665,856 0.65 0.65
Hittite Microwave Corp Technology 8,976,562 1,281,981 0.14 0.14
HJ Heinz Co Consumer Goods 362,287,119 51,739,781 0.44 0.44
HLTH Corp Industrials 28,282,751 4,039,181 0.38 0.38
HMS Holdings Corp Health Care 20,358,601 2,907,499 0.37 0.37
HNI Corp Consumer Goods 21,882,743 3,125,169 0.45 0.45
Holly Corp Oil & Gas 20,443,255 2,919,589 0.32 0.32
Hologic Inc Health Care 72,407,689 10,340,853 0.31 0.31
Home Bancshares
Inc/Conway ARFinancials 10,500,578 1,499,633 0.28 0.28
Home Depot Inc Consumer Services 1,725,577,295 246,437,111 0.63 0.63
Home Properties Inc Financials 26,170,448 3,737,514 0.29 0.29
Horace Mann Educators
CorpFinancials 10,048,014 1,435,000 0.4 0.4
Horizon Lines Inc Industrials 1,395,811 199,342 0.19 0.19
Hormel Foods Corp Consumer Goods 108,674,442 15,520,264 0.37 0.37
Hornbeck Offshore
Services IncOil & Gas 13,221,718 1,888,250 0.45 0.45
Hospira Inc Health Care 130,398,818 18,622,816 0.44 0.44
Hospitality Properties Trust Financials 27,995,178 3,998,112 0.29 0.29
Host Hotels & Resorts Inc Financials 251,381,103 35,900,816 0.91 0.91
Hovnanian Enterprises Inc Consumer Goods 2,285,878 326,456 0.31 0.24
HOT Topic Inc Consumer Services 9,876,430 1,410,495 0.35 0.35
HRPT Properties Trust Financials 13,750,725 1,963,800 0.26 0.26
HSN Inc Consumer Services 10,628,511 1,517,903 0.37 0.37
Hubbell Inc Industrials 51,895,816 7,411,465 0.12 0.41
Industry/Sector Market valueNOK
Market valueUSD Voting Ownership
GOVERNMENT PENSION FUND GLOBAL HOLDINGS 2008
Equities Country association according to FTSE (the benchmark provider for equities). If a company is not in thebenchmark, the country of incorporation and country of listing is used. For remaining securities, a further assessment ismade. Country is defined as a sovereign state currently member of the United Nations. Exceptions are Hong Kong andTaiwan. The country association methodology was updated as of 2014.
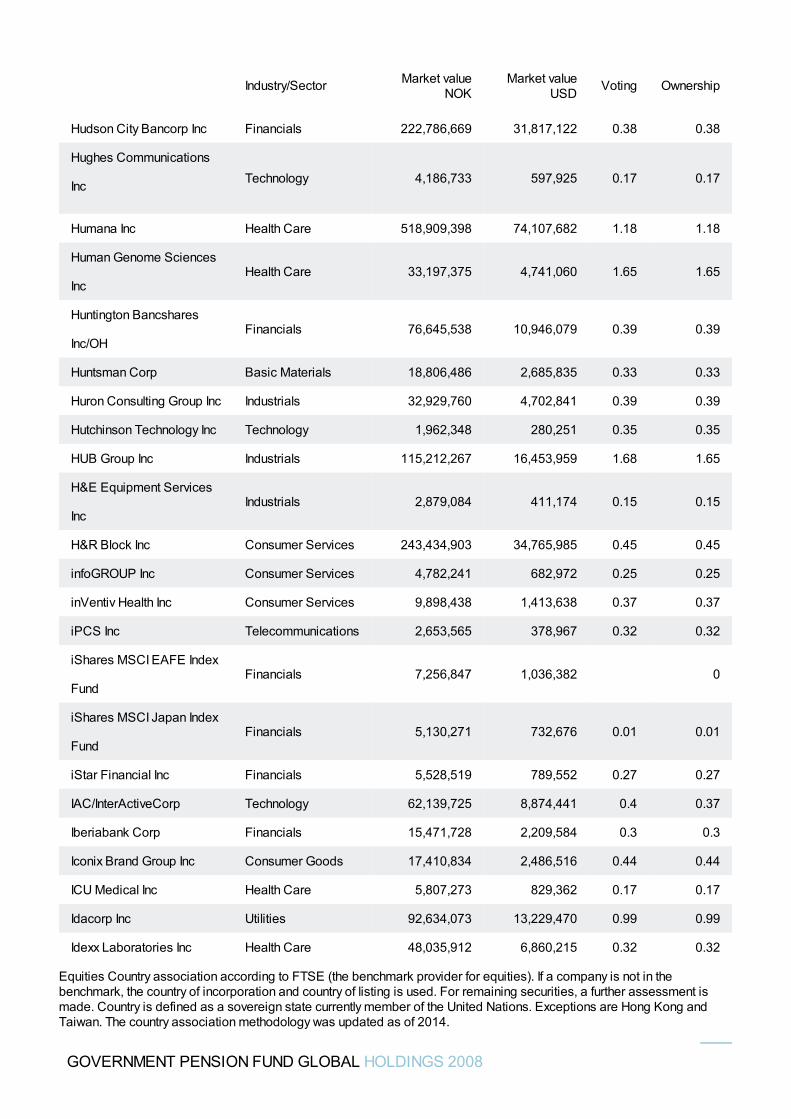
Hudson City Bancorp Inc Financials 222,786,669 31,817,122 0.38 0.38
Hughes Communications
Inc Technology 4,186,733 597,925 0.17 0.17
Humana Inc Health Care 518,909,398 74,107,682 1.18 1.18
Human Genome Sciences
IncHealth Care 33,197,375 4,741,060 1.65 1.65
Huntington Bancshares
Inc/OHFinancials 76,645,538 10,946,079 0.39 0.39
Huntsman Corp Basic Materials 18,806,486 2,685,835 0.33 0.33
Huron Consulting Group Inc Industrials 32,929,760 4,702,841 0.39 0.39
Hutchinson Technology Inc Technology 1,962,348 280,251 0.35 0.35
HUB Group Inc Industrials 115,212,267 16,453,959 1.68 1.65
H&E Equipment Services
IncIndustrials 2,879,084 411,174 0.15 0.15
H&R Block Inc Consumer Services 243,434,903 34,765,985 0.45 0.45
infoGROUP Inc Consumer Services 4,782,241 682,972 0.25 0.25
inVentiv Health Inc Consumer Services 9,898,438 1,413,638 0.37 0.37
iPCS Inc Telecommunications 2,653,565 378,967 0.32 0.32
iShares MSCI EAFE Index
FundFinancials 7,256,847 1,036,382 0
iShares MSCI Japan Index
FundFinancials 5,130,271 732,676 0.01 0.01
iStar Financial Inc Financials 5,528,519 789,552 0.27 0.27
IAC/InterActiveCorp Technology 62,139,725 8,874,441 0.4 0.37
Iberiabank Corp Financials 15,471,728 2,209,584 0.3 0.3
Iconix Brand Group Inc Consumer Goods 17,410,834 2,486,516 0.44 0.44
ICU Medical Inc Health Care 5,807,273 829,362 0.17 0.17
Idacorp Inc Utilities 92,634,073 13,229,470 0.99 0.99
Idexx Laboratories Inc Health Care 48,035,912 6,860,215 0.32 0.32
Industry/Sector Market valueNOK
Market valueUSD Voting Ownership
GOVERNMENT PENSION FUND GLOBAL HOLDINGS 2008
Equities Country association according to FTSE (the benchmark provider for equities). If a company is not in thebenchmark, the country of incorporation and country of listing is used. For remaining securities, a further assessment ismade. Country is defined as a sovereign state currently member of the United Nations. Exceptions are Hong Kong andTaiwan. The country association methodology was updated as of 2014.
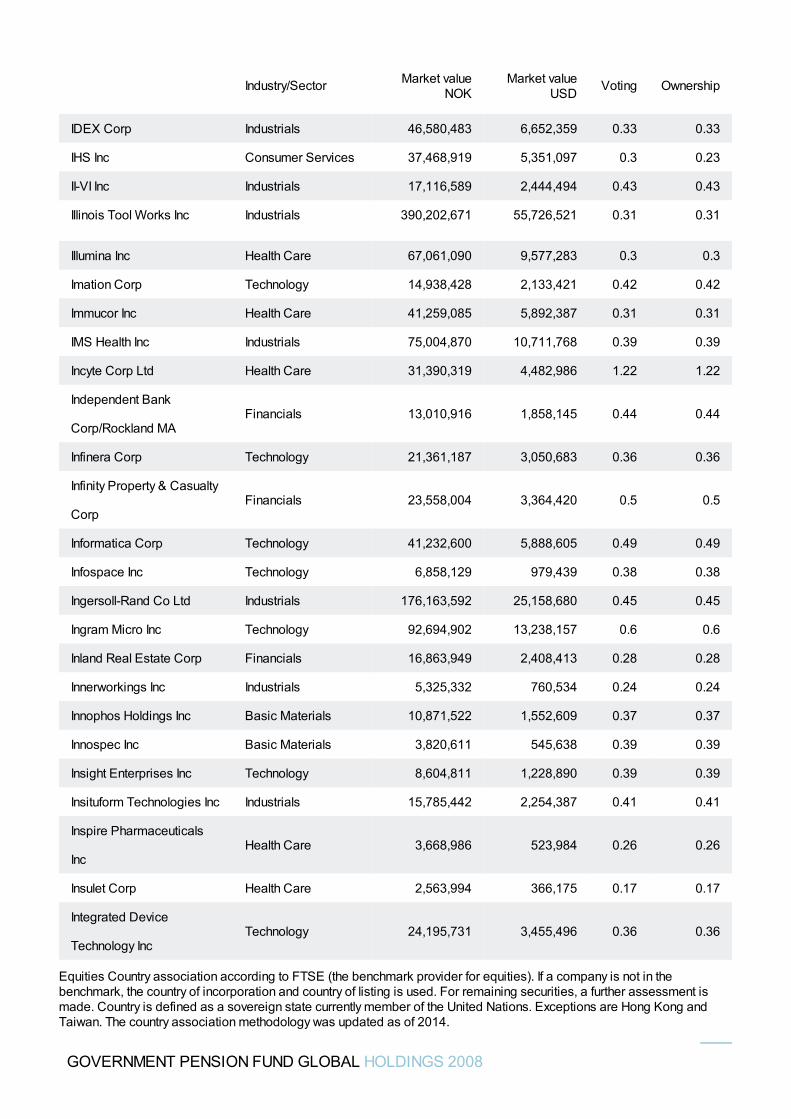
IDEX Corp Industrials 46,580,483 6,652,359 0.33 0.33
IHS Inc Consumer Services 37,468,919 5,351,097 0.3 0.23
II-VI Inc Industrials 17,116,589 2,444,494 0.43 0.43
Illinois Tool Works Inc Industrials 390,202,671 55,726,521 0.31 0.31
Illumina Inc Health Care 67,061,090 9,577,283 0.3 0.3
Imation Corp Technology 14,938,428 2,133,421 0.42 0.42
Immucor Inc Health Care 41,259,085 5,892,387 0.31 0.31
IMS Health Inc Industrials 75,004,870 10,711,768 0.39 0.39
Incyte Corp Ltd Health Care 31,390,319 4,482,986 1.22 1.22
Independent Bank
Corp/Rockland MAFinancials 13,010,916 1,858,145 0.44 0.44
Infinera Corp Technology 21,361,187 3,050,683 0.36 0.36
Infinity Property & Casualty
CorpFinancials 23,558,004 3,364,420 0.5 0.5
Informatica Corp Technology 41,232,600 5,888,605 0.49 0.49
Infospace Inc Technology 6,858,129 979,439 0.38 0.38
Ingersoll-Rand Co Ltd Industrials 176,163,592 25,158,680 0.45 0.45
Ingram Micro Inc Technology 92,694,902 13,238,157 0.6 0.6
Inland Real Estate Corp Financials 16,863,949 2,408,413 0.28 0.28
Innerworkings Inc Industrials 5,325,332 760,534 0.24 0.24
Innophos Holdings Inc Basic Materials 10,871,522 1,552,609 0.37 0.37
Innospec Inc Basic Materials 3,820,611 545,638 0.39 0.39
Insight Enterprises Inc Technology 8,604,811 1,228,890 0.39 0.39
Insituform Technologies Inc Industrials 15,785,442 2,254,387 0.41 0.41
Inspire Pharmaceuticals
IncHealth Care 3,668,986 523,984 0.26 0.26
Insulet Corp Health Care 2,563,994 366,175 0.17 0.17
Integrated Device
Technology IncTechnology 24,195,731 3,455,496 0.36 0.36
Industry/Sector Market valueNOK
Market valueUSD Voting Ownership
GOVERNMENT PENSION FUND GLOBAL HOLDINGS 2008
Equities Country association according to FTSE (the benchmark provider for equities). If a company is not in thebenchmark, the country of incorporation and country of listing is used. For remaining securities, a further assessment ismade. Country is defined as a sovereign state currently member of the United Nations. Exceptions are Hong Kong andTaiwan. The country association methodology was updated as of 2014.
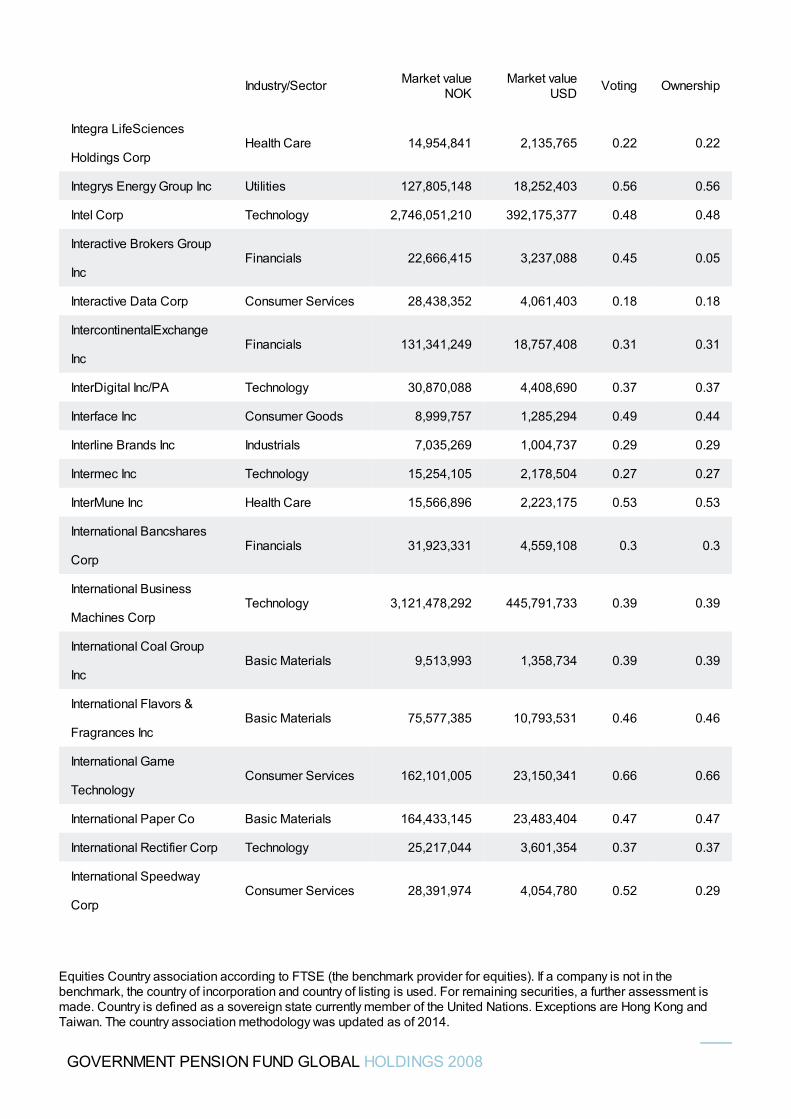
Integra LifeSciences
Holdings CorpHealth Care 14,954,841 2,135,765 0.22 0.22
Integrys Energy Group Inc Utilities 127,805,148 18,252,403 0.56 0.56
Intel Corp Technology 2,746,051,210 392,175,377 0.48 0.48
Interactive Brokers Group
IncFinancials 22,666,415 3,237,088 0.45 0.05
Interactive Data Corp Consumer Services 28,438,352 4,061,403 0.18 0.18
IntercontinentalExchange
IncFinancials 131,341,249 18,757,408 0.31 0.31
InterDigital Inc/PA Technology 30,870,088 4,408,690 0.37 0.37
Interface Inc Consumer Goods 8,999,757 1,285,294 0.49 0.44
Interline Brands Inc Industrials 7,035,269 1,004,737 0.29 0.29
Intermec Inc Technology 15,254,105 2,178,504 0.27 0.27
InterMune Inc Health Care 15,566,896 2,223,175 0.53 0.53
International Bancshares
CorpFinancials 31,923,331 4,559,108 0.3 0.3
International Business
Machines CorpTechnology 3,121,478,292 445,791,733 0.39 0.39
International Coal Group
IncBasic Materials 9,513,993 1,358,734 0.39 0.39
International Flavors &
Fragrances IncBasic Materials 75,577,385 10,793,531 0.46 0.46
International Game
TechnologyConsumer Services 162,101,005 23,150,341 0.66 0.66
International Paper Co Basic Materials 164,433,145 23,483,404 0.47 0.47
International Rectifier Corp Technology 25,217,044 3,601,354 0.37 0.37
International Speedway
CorpConsumer Services 28,391,974 4,054,780 0.52 0.29
Industry/Sector Market valueNOK
Market valueUSD Voting Ownership
GOVERNMENT PENSION FUND GLOBAL HOLDINGS 2008
Equities Country association according to FTSE (the benchmark provider for equities). If a company is not in thebenchmark, the country of incorporation and country of listing is used. For remaining securities, a further assessment ismade. Country is defined as a sovereign state currently member of the United Nations. Exceptions are Hong Kong andTaiwan. The country association methodology was updated as of 2014.
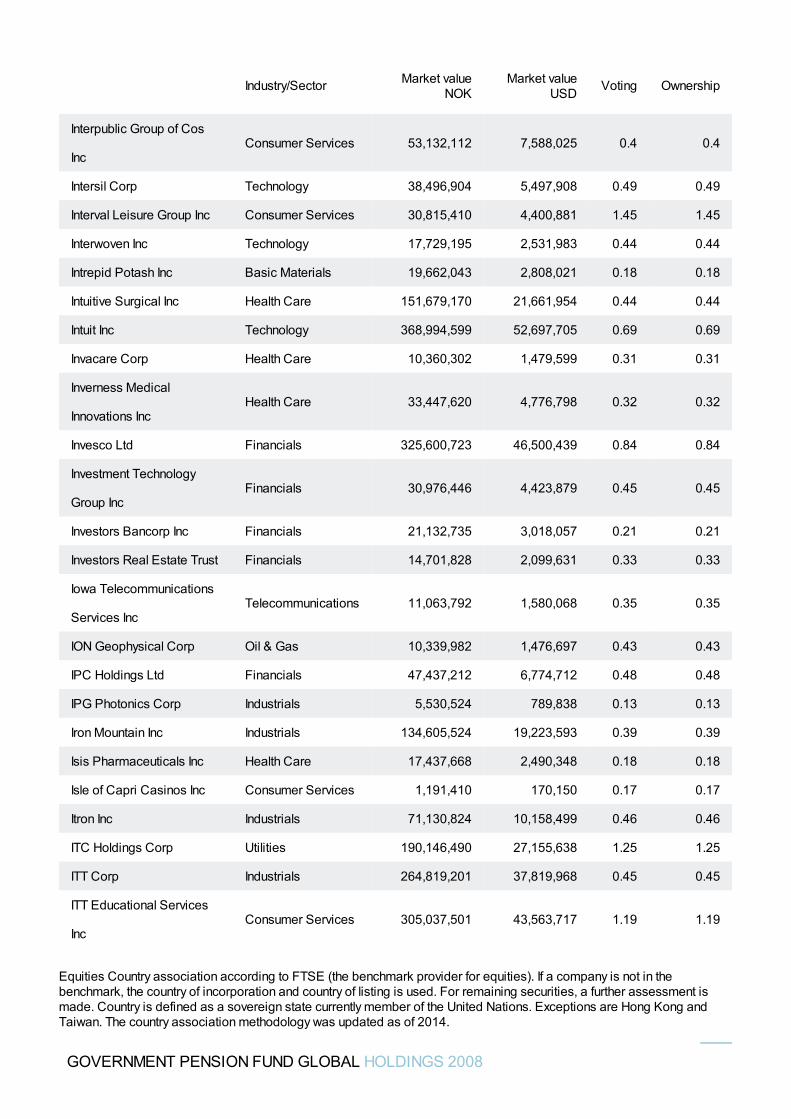
Interpublic Group of Cos
IncConsumer Services 53,132,112 7,588,025 0.4 0.4
Intersil Corp Technology 38,496,904 5,497,908 0.49 0.49
Interval Leisure Group Inc Consumer Services 30,815,410 4,400,881 1.45 1.45
Interwoven Inc Technology 17,729,195 2,531,983 0.44 0.44
Intrepid Potash Inc Basic Materials 19,662,043 2,808,021 0.18 0.18
Intuitive Surgical Inc Health Care 151,679,170 21,661,954 0.44 0.44
Intuit Inc Technology 368,994,599 52,697,705 0.69 0.69
Invacare Corp Health Care 10,360,302 1,479,599 0.31 0.31
Inverness Medical
Innovations IncHealth Care 33,447,620 4,776,798 0.32 0.32
Invesco Ltd Financials 325,600,723 46,500,439 0.84 0.84
Investment Technology
Group IncFinancials 30,976,446 4,423,879 0.45 0.45
Investors Bancorp Inc Financials 21,132,735 3,018,057 0.21 0.21
Investors Real Estate Trust Financials 14,701,828 2,099,631 0.33 0.33
Iowa Telecommunications
Services IncTelecommunications 11,063,792 1,580,068 0.35 0.35
ION Geophysical Corp Oil & Gas 10,339,982 1,476,697 0.43 0.43
IPC Holdings Ltd Financials 47,437,212 6,774,712 0.48 0.48
IPG Photonics Corp Industrials 5,530,524 789,838 0.13 0.13
Iron Mountain Inc Industrials 134,605,524 19,223,593 0.39 0.39
Isis Pharmaceuticals Inc Health Care 17,437,668 2,490,348 0.18 0.18
Isle of Capri Casinos Inc Consumer Services 1,191,410 170,150 0.17 0.17
Itron Inc Industrials 71,130,824 10,158,499 0.46 0.46
ITC Holdings Corp Utilities 190,146,490 27,155,638 1.25 1.25
ITT Corp Industrials 264,819,201 37,819,968 0.45 0.45
ITT Educational Services
IncConsumer Services 305,037,501 43,563,717 1.19 1.19
Industry/Sector Market valueNOK
Market valueUSD Voting Ownership
GOVERNMENT PENSION FUND GLOBAL HOLDINGS 2008
Equities Country association according to FTSE (the benchmark provider for equities). If a company is not in thebenchmark, the country of incorporation and country of listing is used. For remaining securities, a further assessment ismade. Country is defined as a sovereign state currently member of the United Nations. Exceptions are Hong Kong andTaiwan. The country association methodology was updated as of 2014.
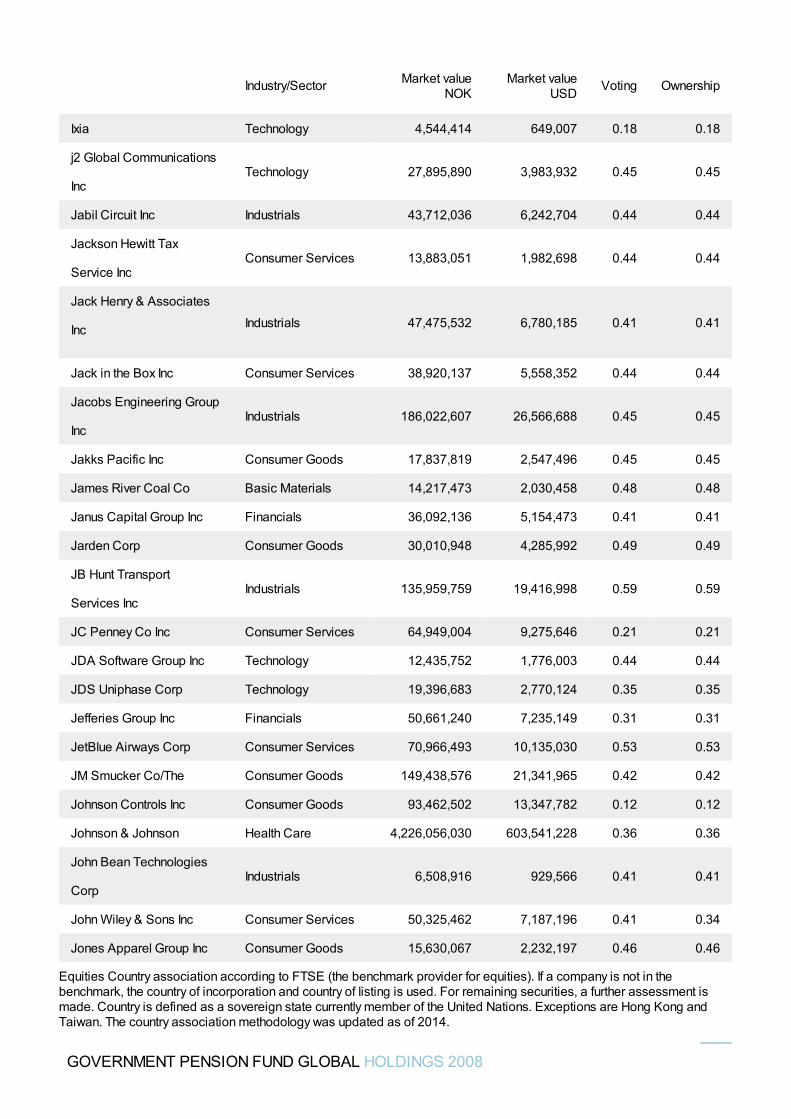
Ixia Technology 4,544,414 649,007 0.18 0.18
j2 Global Communications
IncTechnology 27,895,890 3,983,932 0.45 0.45
Jabil Circuit Inc Industrials 43,712,036 6,242,704 0.44 0.44
Jackson Hewitt Tax
Service IncConsumer Services 13,883,051 1,982,698 0.44 0.44
Jack Henry & Associates
Inc Industrials 47,475,532 6,780,185 0.41 0.41
Jack in the Box Inc Consumer Services 38,920,137 5,558,352 0.44 0.44
Jacobs Engineering Group
IncIndustrials 186,022,607 26,566,688 0.45 0.45
Jakks Pacific Inc Consumer Goods 17,837,819 2,547,496 0.45 0.45
James River Coal Co Basic Materials 14,217,473 2,030,458 0.48 0.48
Janus Capital Group Inc Financials 36,092,136 5,154,473 0.41 0.41
Jarden Corp Consumer Goods 30,010,948 4,285,992 0.49 0.49
JB Hunt Transport
Services IncIndustrials 135,959,759 19,416,998 0.59 0.59
JC Penney Co Inc Consumer Services 64,949,004 9,275,646 0.21 0.21
JDA Software Group Inc Technology 12,435,752 1,776,003 0.44 0.44
JDS Uniphase Corp Technology 19,396,683 2,770,124 0.35 0.35
Jefferies Group Inc Financials 50,661,240 7,235,149 0.31 0.31
JetBlue Airways Corp Consumer Services 70,966,493 10,135,030 0.53 0.53
JM Smucker Co/The Consumer Goods 149,438,576 21,341,965 0.42 0.42
Johnson Controls Inc Consumer Goods 93,462,502 13,347,782 0.12 0.12
Johnson & Johnson Health Care 4,226,056,030 603,541,228 0.36 0.36
John Bean Technologies
CorpIndustrials 6,508,916 929,566 0.41 0.41
John Wiley & Sons Inc Consumer Services 50,325,462 7,187,196 0.41 0.34
Jones Apparel Group Inc Consumer Goods 15,630,067 2,232,197 0.46 0.46
Industry/Sector Market valueNOK
Market valueUSD Voting Ownership
GOVERNMENT PENSION FUND GLOBAL HOLDINGS 2008
Equities Country association according to FTSE (the benchmark provider for equities). If a company is not in thebenchmark, the country of incorporation and country of listing is used. For remaining securities, a further assessment ismade. Country is defined as a sovereign state currently member of the United Nations. Exceptions are Hong Kong andTaiwan. The country association methodology was updated as of 2014.
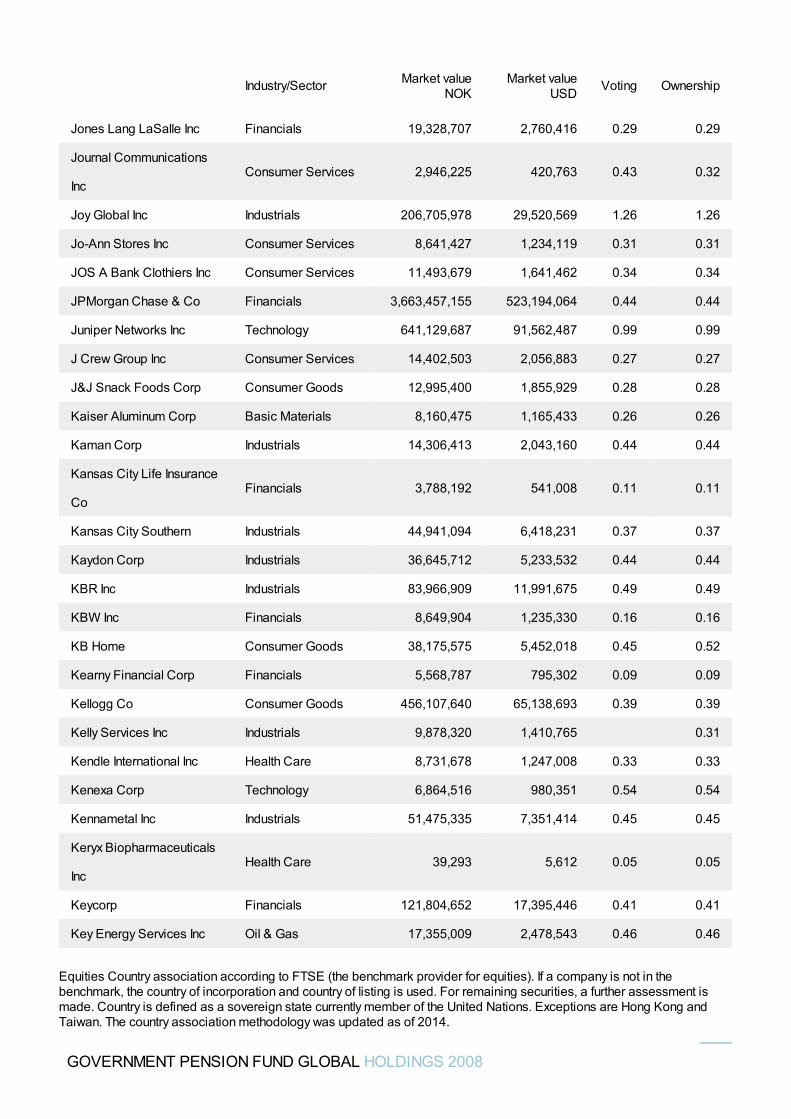
Jones Lang LaSalle Inc Financials 19,328,707 2,760,416 0.29 0.29
Journal Communications
IncConsumer Services 2,946,225 420,763 0.43 0.32
Joy Global Inc Industrials 206,705,978 29,520,569 1.26 1.26
Jo-Ann Stores Inc Consumer Services 8,641,427 1,234,119 0.31 0.31
JOS A Bank Clothiers Inc Consumer Services 11,493,679 1,641,462 0.34 0.34
JPMorgan Chase & Co Financials 3,663,457,155 523,194,064 0.44 0.44
Juniper Networks Inc Technology 641,129,687 91,562,487 0.99 0.99
J Crew Group Inc Consumer Services 14,402,503 2,056,883 0.27 0.27
J&J Snack Foods Corp Consumer Goods 12,995,400 1,855,929 0.28 0.28
Kaiser Aluminum Corp Basic Materials 8,160,475 1,165,433 0.26 0.26
Kaman Corp Industrials 14,306,413 2,043,160 0.44 0.44
Kansas City Life Insurance
CoFinancials 3,788,192 541,008 0.11 0.11
Kansas City Southern Industrials 44,941,094 6,418,231 0.37 0.37
Kaydon Corp Industrials 36,645,712 5,233,532 0.44 0.44
KBR Inc Industrials 83,966,909 11,991,675 0.49 0.49
KBW Inc Financials 8,649,904 1,235,330 0.16 0.16
KB Home Consumer Goods 38,175,575 5,452,018 0.45 0.52
Kearny Financial Corp Financials 5,568,787 795,302 0.09 0.09
Kellogg Co Consumer Goods 456,107,640 65,138,693 0.39 0.39
Kelly Services Inc Industrials 9,878,320 1,410,765 0.31
Kendle International Inc Health Care 8,731,678 1,247,008 0.33 0.33
Kenexa Corp Technology 6,864,516 980,351 0.54 0.54
Kennametal Inc Industrials 51,475,335 7,351,414 0.45 0.45
Keryx Biopharmaceuticals
IncHealth Care 39,293 5,612 0.05 0.05
Keycorp Financials 121,804,652 17,395,446 0.41 0.41
Key Energy Services Inc Oil & Gas 17,355,009 2,478,543 0.46 0.46
Industry/Sector Market valueNOK
Market valueUSD Voting Ownership
GOVERNMENT PENSION FUND GLOBAL HOLDINGS 2008
Equities Country association according to FTSE (the benchmark provider for equities). If a company is not in thebenchmark, the country of incorporation and country of listing is used. For remaining securities, a further assessment ismade. Country is defined as a sovereign state currently member of the United Nations. Exceptions are Hong Kong andTaiwan. The country association methodology was updated as of 2014.
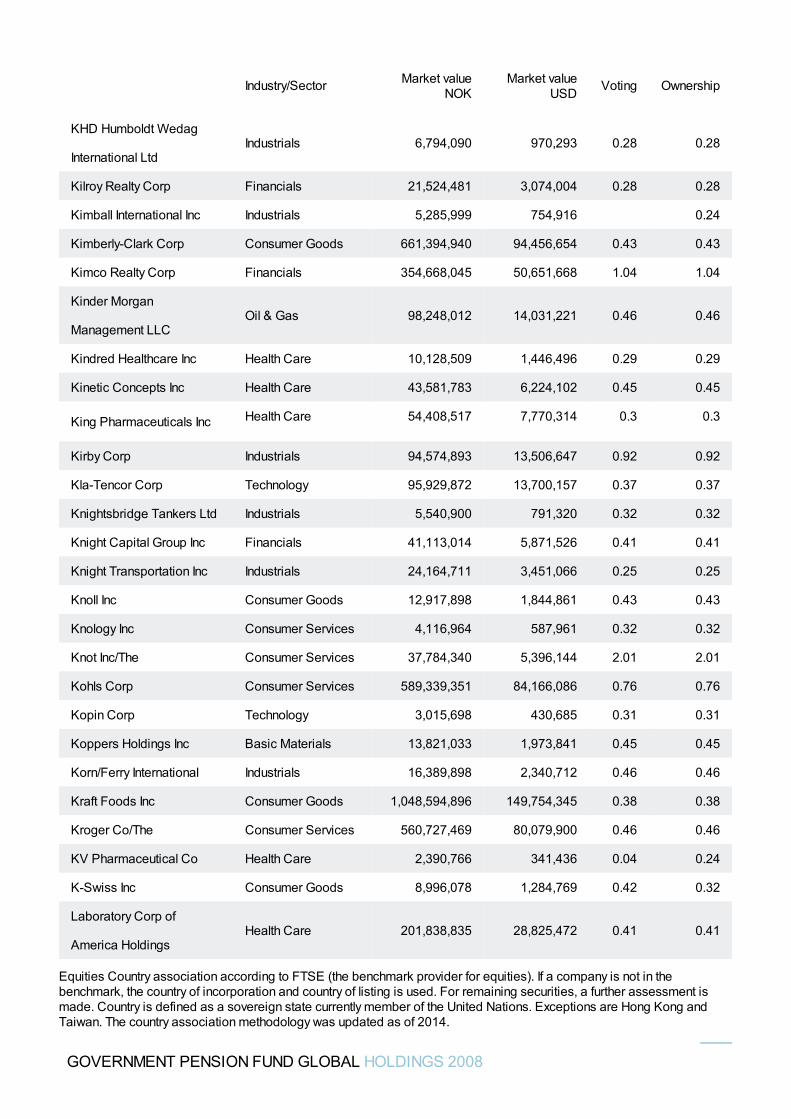
KHD Humboldt Wedag
International LtdIndustrials 6,794,090 970,293 0.28 0.28
Kilroy Realty Corp Financials 21,524,481 3,074,004 0.28 0.28
Kimball International Inc Industrials 5,285,999 754,916 0.24
Kimberly-Clark Corp Consumer Goods 661,394,940 94,456,654 0.43 0.43
Kimco Realty Corp Financials 354,668,045 50,651,668 1.04 1.04
Kinder Morgan
Management LLCOil & Gas 98,248,012 14,031,221 0.46 0.46
Kindred Healthcare Inc Health Care 10,128,509 1,446,496 0.29 0.29
Kinetic Concepts Inc Health Care 43,581,783 6,224,102 0.45 0.45
King Pharmaceuticals Inc Health Care 54,408,517 7,770,314 0.3 0.3
Kirby Corp Industrials 94,574,893 13,506,647 0.92 0.92
Kla-Tencor Corp Technology 95,929,872 13,700,157 0.37 0.37
Knightsbridge Tankers Ltd Industrials 5,540,900 791,320 0.32 0.32
Knight Capital Group Inc Financials 41,113,014 5,871,526 0.41 0.41
Knight Transportation Inc Industrials 24,164,711 3,451,066 0.25 0.25
Knoll Inc Consumer Goods 12,917,898 1,844,861 0.43 0.43
Knology Inc Consumer Services 4,116,964 587,961 0.32 0.32
Knot Inc/The Consumer Services 37,784,340 5,396,144 2.01 2.01
Kohls Corp Consumer Services 589,339,351 84,166,086 0.76 0.76
Kopin Corp Technology 3,015,698 430,685 0.31 0.31
Koppers Holdings Inc Basic Materials 13,821,033 1,973,841 0.45 0.45
Korn/Ferry International Industrials 16,389,898 2,340,712 0.46 0.46
Kraft Foods Inc Consumer Goods 1,048,594,896 149,754,345 0.38 0.38
Kroger Co/The Consumer Services 560,727,469 80,079,900 0.46 0.46
KV Pharmaceutical Co Health Care 2,390,766 341,436 0.04 0.24
K-Swiss Inc Consumer Goods 8,996,078 1,284,769 0.42 0.32
Laboratory Corp of
America HoldingsHealth Care 201,838,835 28,825,472 0.41 0.41
Industry/Sector Market valueNOK
Market valueUSD Voting Ownership
GOVERNMENT PENSION FUND GLOBAL HOLDINGS 2008
Equities Country association according to FTSE (the benchmark provider for equities). If a company is not in thebenchmark, the country of incorporation and country of listing is used. For remaining securities, a further assessment ismade. Country is defined as a sovereign state currently member of the United Nations. Exceptions are Hong Kong andTaiwan. The country association methodology was updated as of 2014.
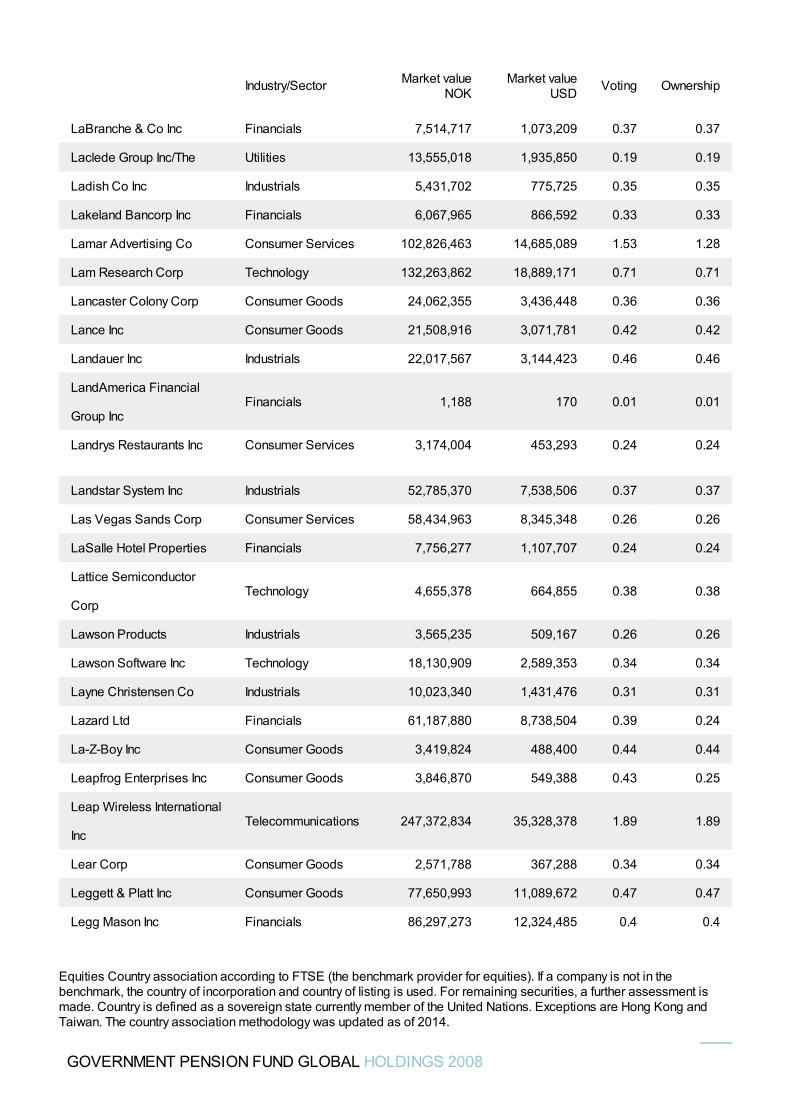
LaBranche & Co Inc Financials 7,514,717 1,073,209 0.37 0.37
Laclede Group Inc/The Utilities 13,555,018 1,935,850 0.19 0.19
Ladish Co Inc Industrials 5,431,702 775,725 0.35 0.35
Lakeland Bancorp Inc Financials 6,067,965 866,592 0.33 0.33
Lamar Advertising Co Consumer Services 102,826,463 14,685,089 1.53 1.28
Lam Research Corp Technology 132,263,862 18,889,171 0.71 0.71
Lancaster Colony Corp Consumer Goods 24,062,355 3,436,448 0.36 0.36
Lance Inc Consumer Goods 21,508,916 3,071,781 0.42 0.42
Landauer Inc Industrials 22,017,567 3,144,423 0.46 0.46
LandAmerica Financial
Group IncFinancials 1,188 170 0.01 0.01
Landrys Restaurants Inc Consumer Services 3,174,004 453,293 0.24 0.24
Landstar System Inc Industrials 52,785,370 7,538,506 0.37 0.37
Las Vegas Sands Corp Consumer Services 58,434,963 8,345,348 0.26 0.26
LaSalle Hotel Properties Financials 7,756,277 1,107,707 0.24 0.24
Lattice Semiconductor
CorpTechnology 4,655,378 664,855 0.38 0.38
Lawson Products Industrials 3,565,235 509,167 0.26 0.26
Lawson Software Inc Technology 18,130,909 2,589,353 0.34 0.34
Layne Christensen Co Industrials 10,023,340 1,431,476 0.31 0.31
Lazard Ltd Financials 61,187,880 8,738,504 0.39 0.24
La-Z-Boy Inc Consumer Goods 3,419,824 488,400 0.44 0.44
Leapfrog Enterprises Inc Consumer Goods 3,846,870 549,388 0.43 0.25
Leap Wireless International
IncTelecommunications 247,372,834 35,328,378 1.89 1.89
Lear Corp Consumer Goods 2,571,788 367,288 0.34 0.34
Leggett & Platt Inc Consumer Goods 77,650,993 11,089,672 0.47 0.47
Legg Mason Inc Financials 86,297,273 12,324,485 0.4 0.4
Industry/Sector Market valueNOK
Market valueUSD Voting Ownership
GOVERNMENT PENSION FUND GLOBAL HOLDINGS 2008
Equities Country association according to FTSE (the benchmark provider for equities). If a company is not in thebenchmark, the country of incorporation and country of listing is used. For remaining securities, a further assessment ismade. Country is defined as a sovereign state currently member of the United Nations. Exceptions are Hong Kong andTaiwan. The country association methodology was updated as of 2014.
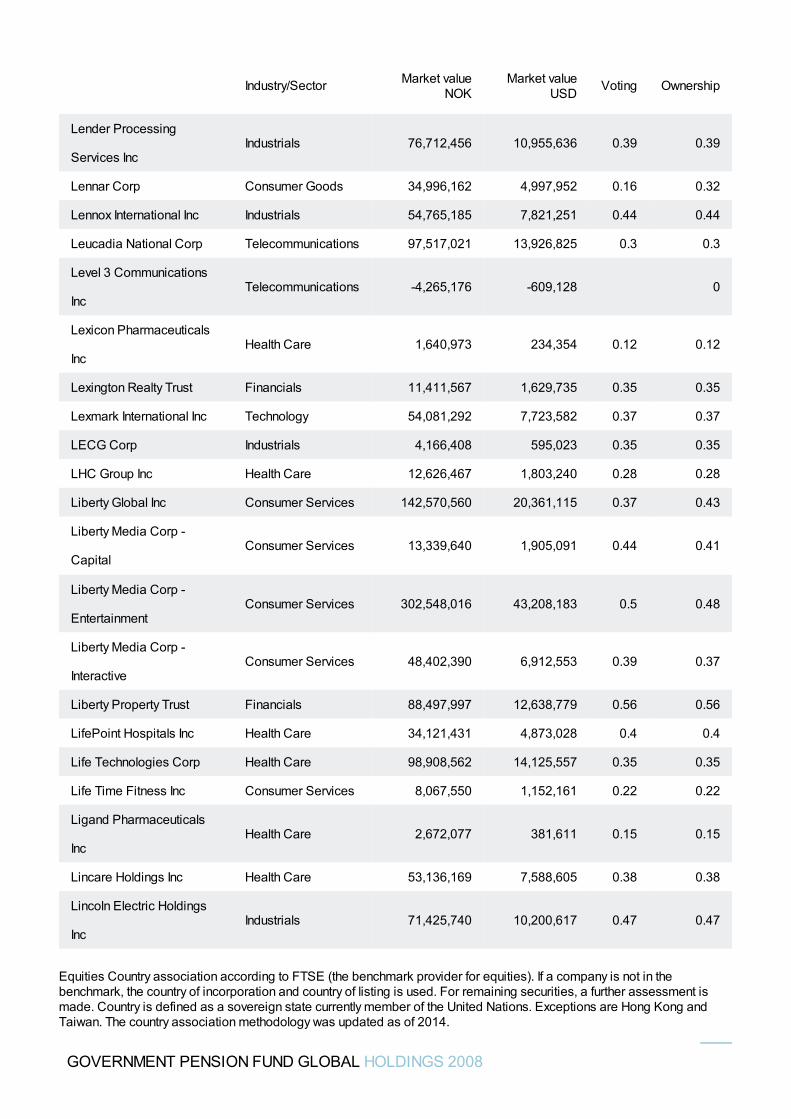
Lender Processing
Services IncIndustrials 76,712,456 10,955,636 0.39 0.39
Lennar Corp Consumer Goods 34,996,162 4,997,952 0.16 0.32
Lennox International Inc Industrials 54,765,185 7,821,251 0.44 0.44
Leucadia National Corp Telecommunications 97,517,021 13,926,825 0.3 0.3
Level 3 Communications
IncTelecommunications -4,265,176 -609,128 0
Lexicon Pharmaceuticals
IncHealth Care 1,640,973 234,354 0.12 0.12
Lexington Realty Trust Financials 11,411,567 1,629,735 0.35 0.35
Lexmark International Inc Technology 54,081,292 7,723,582 0.37 0.37
LECG Corp Industrials 4,166,408 595,023 0.35 0.35
LHC Group Inc Health Care 12,626,467 1,803,240 0.28 0.28
Liberty Global Inc Consumer Services 142,570,560 20,361,115 0.37 0.43
Liberty Media Corp -
CapitalConsumer Services 13,339,640 1,905,091 0.44 0.41
Liberty Media Corp -
EntertainmentConsumer Services 302,548,016 43,208,183 0.5 0.48
Liberty Media Corp -
InteractiveConsumer Services 48,402,390 6,912,553 0.39 0.37
Liberty Property Trust Financials 88,497,997 12,638,779 0.56 0.56
LifePoint Hospitals Inc Health Care 34,121,431 4,873,028 0.4 0.4
Life Technologies Corp Health Care 98,908,562 14,125,557 0.35 0.35
Life Time Fitness Inc Consumer Services 8,067,550 1,152,161 0.22 0.22
Ligand Pharmaceuticals
IncHealth Care 2,672,077 381,611 0.15 0.15
Lincare Holdings Inc Health Care 53,136,169 7,588,605 0.38 0.38
Lincoln Electric Holdings
IncIndustrials 71,425,740 10,200,617 0.47 0.47
Industry/Sector Market valueNOK
Market valueUSD Voting Ownership
GOVERNMENT PENSION FUND GLOBAL HOLDINGS 2008
Equities Country association according to FTSE (the benchmark provider for equities). If a company is not in thebenchmark, the country of incorporation and country of listing is used. For remaining securities, a further assessment ismade. Country is defined as a sovereign state currently member of the United Nations. Exceptions are Hong Kong andTaiwan. The country association methodology was updated as of 2014.
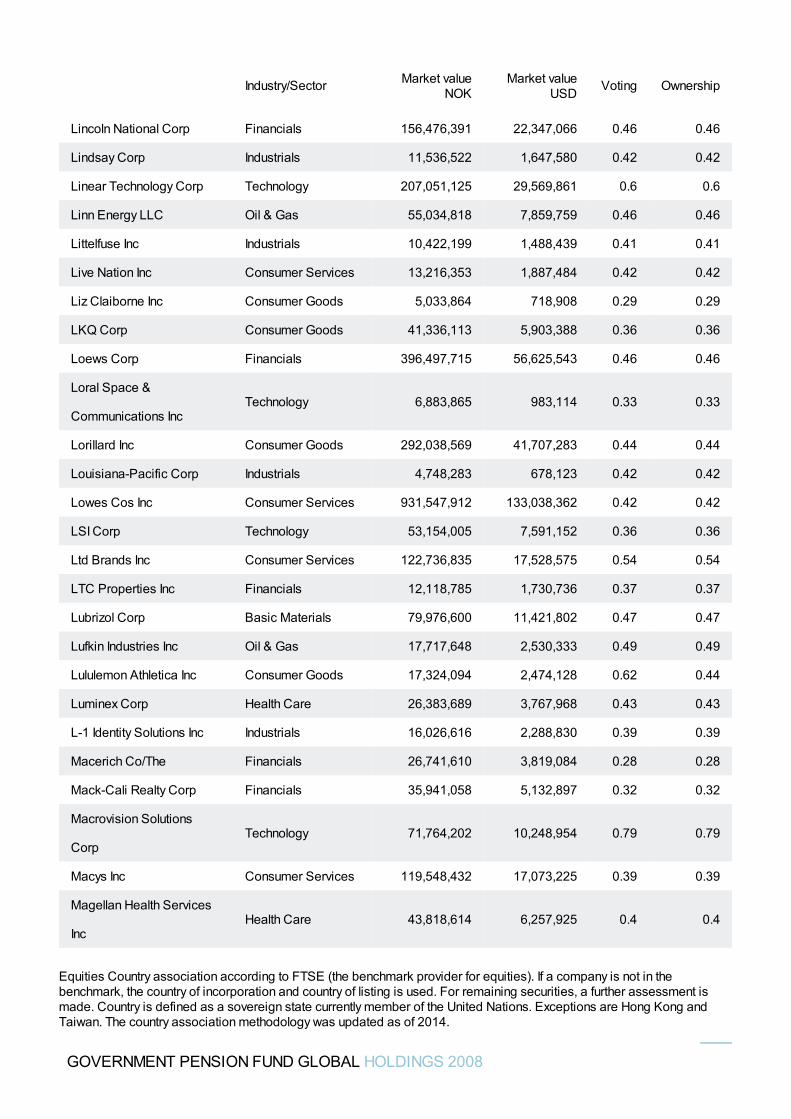
Lincoln National Corp Financials 156,476,391 22,347,066 0.46 0.46
Lindsay Corp Industrials 11,536,522 1,647,580 0.42 0.42
Linear Technology Corp Technology 207,051,125 29,569,861 0.6 0.6
Linn Energy LLC Oil & Gas 55,034,818 7,859,759 0.46 0.46
Littelfuse Inc Industrials 10,422,199 1,488,439 0.41 0.41
Live Nation Inc Consumer Services 13,216,353 1,887,484 0.42 0.42
Liz Claiborne Inc Consumer Goods 5,033,864 718,908 0.29 0.29
LKQ Corp Consumer Goods 41,336,113 5,903,388 0.36 0.36
Loews Corp Financials 396,497,715 56,625,543 0.46 0.46
Loral Space &
Communications IncTechnology 6,883,865 983,114 0.33 0.33
Lorillard Inc Consumer Goods 292,038,569 41,707,283 0.44 0.44
Louisiana-Pacific Corp Industrials 4,748,283 678,123 0.42 0.42
Lowes Cos Inc Consumer Services 931,547,912 133,038,362 0.42 0.42
LSI Corp Technology 53,154,005 7,591,152 0.36 0.36
Ltd Brands Inc Consumer Services 122,736,835 17,528,575 0.54 0.54
LTC Properties Inc Financials 12,118,785 1,730,736 0.37 0.37
Lubrizol Corp Basic Materials 79,976,600 11,421,802 0.47 0.47
Lufkin Industries Inc Oil & Gas 17,717,648 2,530,333 0.49 0.49
Lululemon Athletica Inc Consumer Goods 17,324,094 2,474,128 0.62 0.44
Luminex Corp Health Care 26,383,689 3,767,968 0.43 0.43
L-1 Identity Solutions Inc Industrials 16,026,616 2,288,830 0.39 0.39
Macerich Co/The Financials 26,741,610 3,819,084 0.28 0.28
Mack-Cali Realty Corp Financials 35,941,058 5,132,897 0.32 0.32
Macrovision Solutions
CorpTechnology 71,764,202 10,248,954 0.79 0.79
Macys Inc Consumer Services 119,548,432 17,073,225 0.39 0.39
Magellan Health Services
IncHealth Care 43,818,614 6,257,925 0.4 0.4
Industry/Sector Market valueNOK
Market valueUSD Voting Ownership
GOVERNMENT PENSION FUND GLOBAL HOLDINGS 2008
Equities Country association according to FTSE (the benchmark provider for equities). If a company is not in thebenchmark, the country of incorporation and country of listing is used. For remaining securities, a further assessment ismade. Country is defined as a sovereign state currently member of the United Nations. Exceptions are Hong Kong andTaiwan. The country association methodology was updated as of 2014.
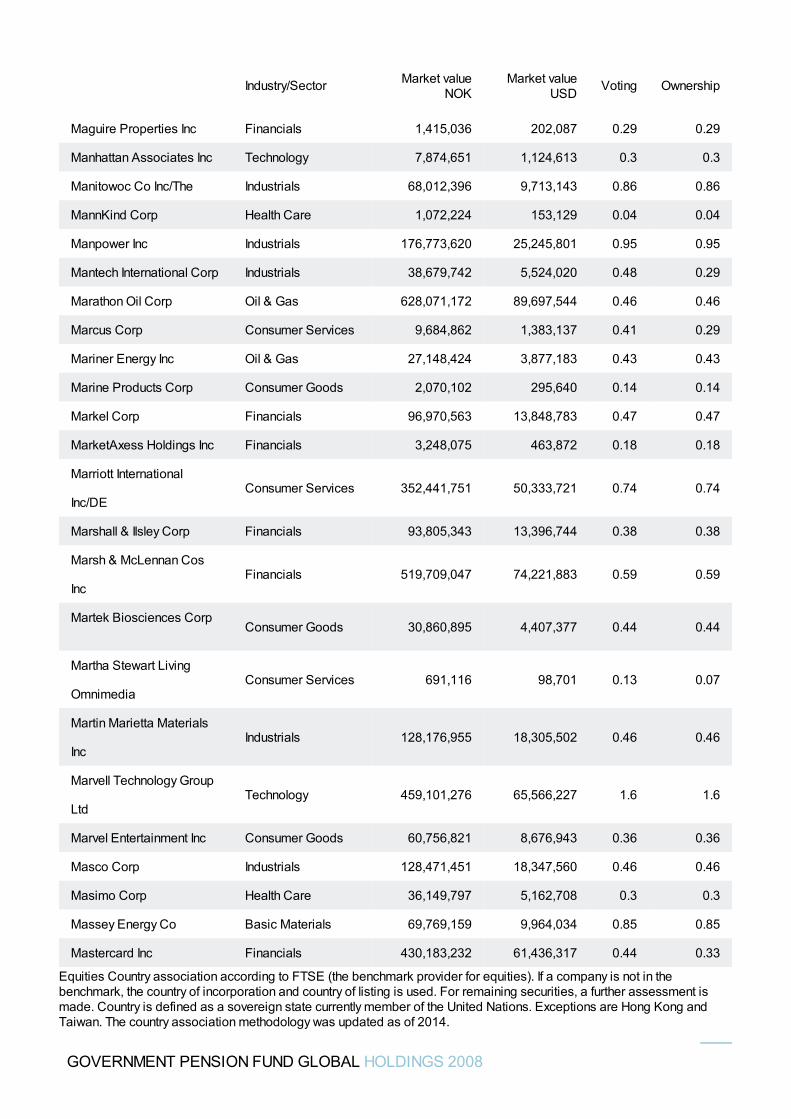
Maguire Properties Inc Financials 1,415,036 202,087 0.29 0.29
Manhattan Associates Inc Technology 7,874,651 1,124,613 0.3 0.3
Manitowoc Co Inc/The Industrials 68,012,396 9,713,143 0.86 0.86
MannKind Corp Health Care 1,072,224 153,129 0.04 0.04
Manpower Inc Industrials 176,773,620 25,245,801 0.95 0.95
Mantech International Corp Industrials 38,679,742 5,524,020 0.48 0.29
Marathon Oil Corp Oil & Gas 628,071,172 89,697,544 0.46 0.46
Marcus Corp Consumer Services 9,684,862 1,383,137 0.41 0.29
Mariner Energy Inc Oil & Gas 27,148,424 3,877,183 0.43 0.43
Marine Products Corp Consumer Goods 2,070,102 295,640 0.14 0.14
Markel Corp Financials 96,970,563 13,848,783 0.47 0.47
MarketAxess Holdings Inc Financials 3,248,075 463,872 0.18 0.18
Marriott International
Inc/DEConsumer Services 352,441,751 50,333,721 0.74 0.74
Marshall & Ilsley Corp Financials 93,805,343 13,396,744 0.38 0.38
Marsh & McLennan Cos
IncFinancials 519,709,047 74,221,883 0.59 0.59
Martek Biosciences CorpConsumer Goods 30,860,895 4,407,377 0.44 0.44
Martha Stewart Living
OmnimediaConsumer Services 691,116 98,701 0.13 0.07
Martin Marietta Materials
IncIndustrials 128,176,955 18,305,502 0.46 0.46
Marvell Technology Group
LtdTechnology 459,101,276 65,566,227 1.6 1.6
Marvel Entertainment Inc Consumer Goods 60,756,821 8,676,943 0.36 0.36
Masco Corp Industrials 128,471,451 18,347,560 0.46 0.46
Masimo Corp Health Care 36,149,797 5,162,708 0.3 0.3
Massey Energy Co Basic Materials 69,769,159 9,964,034 0.85 0.85
Mastercard Inc Financials 430,183,232 61,436,317 0.44 0.33
Industry/Sector Market valueNOK
Market valueUSD Voting Ownership
GOVERNMENT PENSION FUND GLOBAL HOLDINGS 2008
Equities Country association according to FTSE (the benchmark provider for equities). If a company is not in thebenchmark, the country of incorporation and country of listing is used. For remaining securities, a further assessment ismade. Country is defined as a sovereign state currently member of the United Nations. Exceptions are Hong Kong andTaiwan. The country association methodology was updated as of 2014.
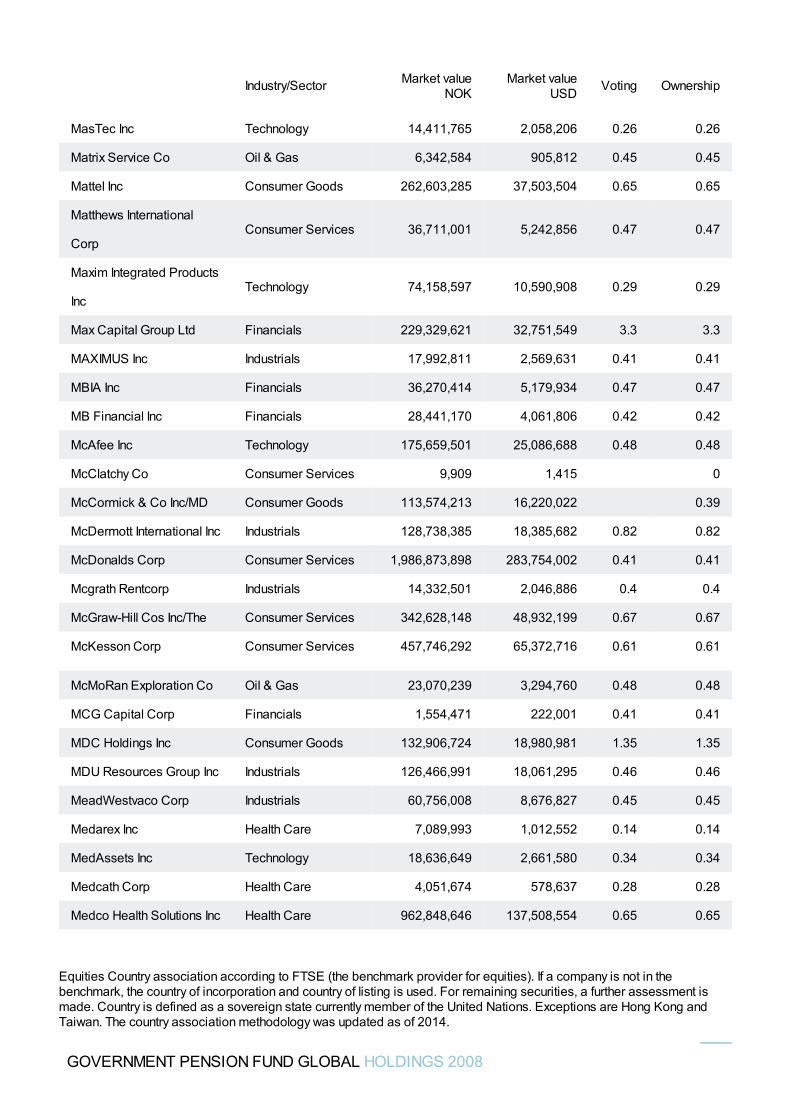
MasTec Inc Technology 14,411,765 2,058,206 0.26 0.26
Matrix Service Co Oil & Gas 6,342,584 905,812 0.45 0.45
Mattel Inc Consumer Goods 262,603,285 37,503,504 0.65 0.65
Matthews International
CorpConsumer Services 36,711,001 5,242,856 0.47 0.47
Maxim Integrated Products
IncTechnology 74,158,597 10,590,908 0.29 0.29
Max Capital Group Ltd Financials 229,329,621 32,751,549 3.3 3.3
MAXIMUS Inc Industrials 17,992,811 2,569,631 0.41 0.41
MBIA Inc Financials 36,270,414 5,179,934 0.47 0.47
MB Financial Inc Financials 28,441,170 4,061,806 0.42 0.42
McAfee Inc Technology 175,659,501 25,086,688 0.48 0.48
McClatchy Co Consumer Services 9,909 1,415 0
McCormick & Co Inc/MD Consumer Goods 113,574,213 16,220,022 0.39
McDermott International Inc Industrials 128,738,385 18,385,682 0.82 0.82
McDonalds Corp Consumer Services 1,986,873,898 283,754,002 0.41 0.41
Mcgrath Rentcorp Industrials 14,332,501 2,046,886 0.4 0.4
McGraw-Hill Cos Inc/The Consumer Services 342,628,148 48,932,199 0.67 0.67
McKesson Corp Consumer Services 457,746,292 65,372,716 0.61 0.61
McMoRan Exploration Co Oil & Gas 23,070,239 3,294,760 0.48 0.48
MCG Capital Corp Financials 1,554,471 222,001 0.41 0.41
MDC Holdings Inc Consumer Goods 132,906,724 18,980,981 1.35 1.35
MDU Resources Group Inc Industrials 126,466,991 18,061,295 0.46 0.46
MeadWestvaco Corp Industrials 60,756,008 8,676,827 0.45 0.45
Medarex Inc Health Care 7,089,993 1,012,552 0.14 0.14
MedAssets Inc Technology 18,636,649 2,661,580 0.34 0.34
Medcath Corp Health Care 4,051,674 578,637 0.28 0.28
Medco Health Solutions Inc Health Care 962,848,646 137,508,554 0.65 0.65
Industry/Sector Market valueNOK
Market valueUSD Voting Ownership
GOVERNMENT PENSION FUND GLOBAL HOLDINGS 2008
Equities Country association according to FTSE (the benchmark provider for equities). If a company is not in thebenchmark, the country of incorporation and country of listing is used. For remaining securities, a further assessment ismade. Country is defined as a sovereign state currently member of the United Nations. Exceptions are Hong Kong andTaiwan. The country association methodology was updated as of 2014.
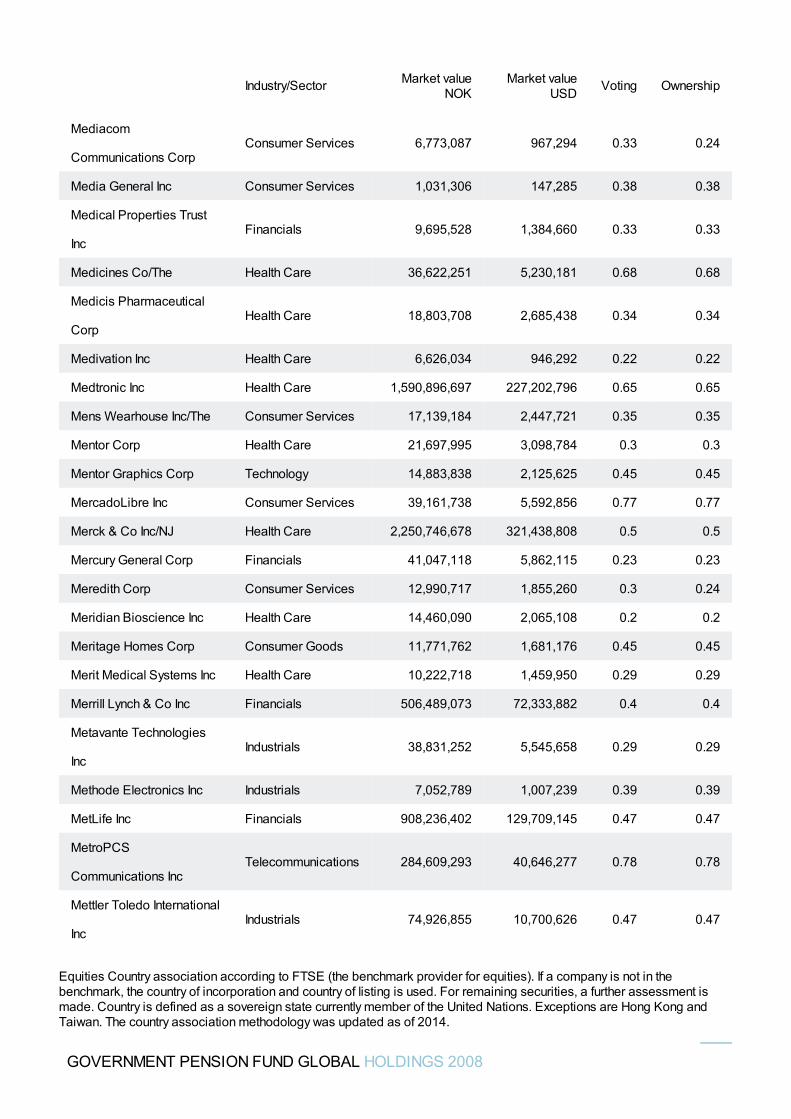
Mediacom
Communications CorpConsumer Services 6,773,087 967,294 0.33 0.24
Media General Inc Consumer Services 1,031,306 147,285 0.38 0.38
Medical Properties Trust
IncFinancials 9,695,528 1,384,660 0.33 0.33
Medicines Co/The Health Care 36,622,251 5,230,181 0.68 0.68
Medicis Pharmaceutical
CorpHealth Care 18,803,708 2,685,438 0.34 0.34
Medivation Inc Health Care 6,626,034 946,292 0.22 0.22
Medtronic Inc Health Care 1,590,896,697 227,202,796 0.65 0.65
Mens Wearhouse Inc/The Consumer Services 17,139,184 2,447,721 0.35 0.35
Mentor Corp Health Care 21,697,995 3,098,784 0.3 0.3
Mentor Graphics Corp Technology 14,883,838 2,125,625 0.45 0.45
MercadoLibre Inc Consumer Services 39,161,738 5,592,856 0.77 0.77
Merck & Co Inc/NJ Health Care 2,250,746,678 321,438,808 0.5 0.5
Mercury General Corp Financials 41,047,118 5,862,115 0.23 0.23
Meredith Corp Consumer Services 12,990,717 1,855,260 0.3 0.24
Meridian Bioscience Inc Health Care 14,460,090 2,065,108 0.2 0.2
Meritage Homes Corp Consumer Goods 11,771,762 1,681,176 0.45 0.45
Merit Medical Systems Inc Health Care 10,222,718 1,459,950 0.29 0.29
Merrill Lynch & Co Inc Financials 506,489,073 72,333,882 0.4 0.4
Metavante Technologies
IncIndustrials 38,831,252 5,545,658 0.29 0.29
Methode Electronics Inc Industrials 7,052,789 1,007,239 0.39 0.39
MetLife Inc Financials 908,236,402 129,709,145 0.47 0.47
MetroPCS
Communications IncTelecommunications 284,609,293 40,646,277 0.78 0.78
Mettler Toledo International
IncIndustrials 74,926,855 10,700,626 0.47 0.47
Industry/Sector Market valueNOK
Market valueUSD Voting Ownership
GOVERNMENT PENSION FUND GLOBAL HOLDINGS 2008
Equities Country association according to FTSE (the benchmark provider for equities). If a company is not in thebenchmark, the country of incorporation and country of listing is used. For remaining securities, a further assessment ismade. Country is defined as a sovereign state currently member of the United Nations. Exceptions are Hong Kong andTaiwan. The country association methodology was updated as of 2014.
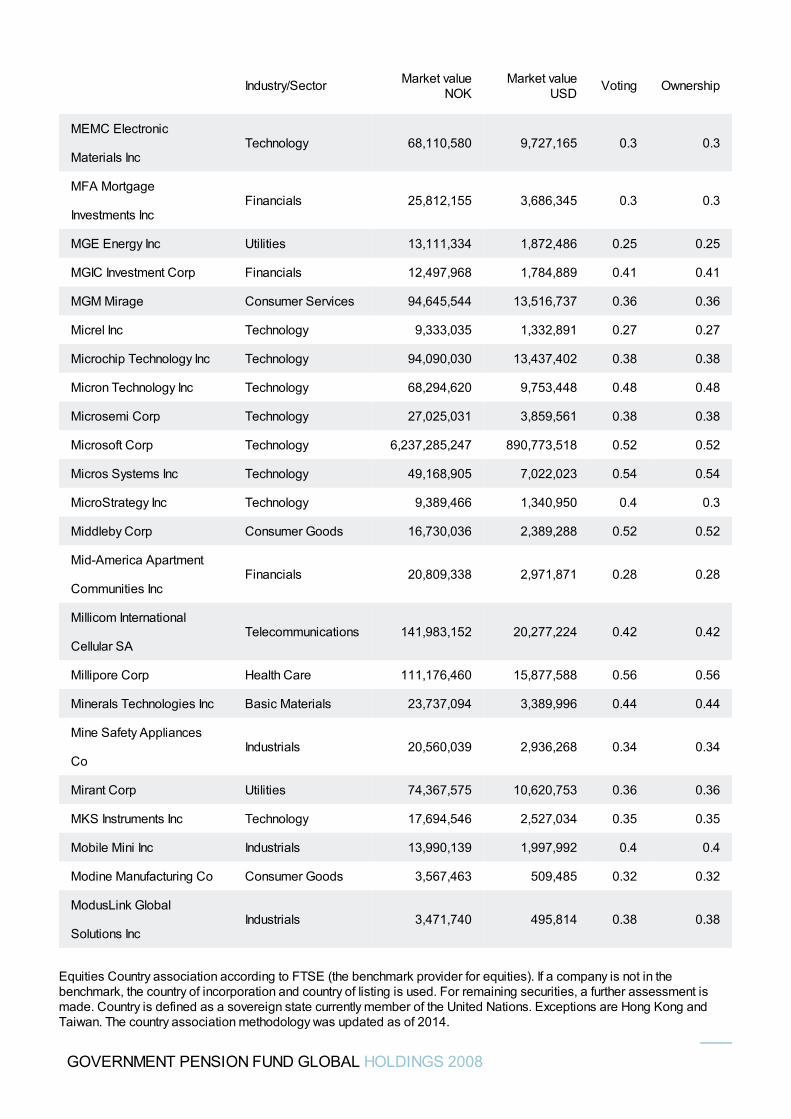
MEMC Electronic
Materials IncTechnology 68,110,580 9,727,165 0.3 0.3
MFA Mortgage
Investments IncFinancials 25,812,155 3,686,345 0.3 0.3
MGE Energy Inc Utilities 13,111,334 1,872,486 0.25 0.25
MGIC Investment Corp Financials 12,497,968 1,784,889 0.41 0.41
MGM Mirage Consumer Services 94,645,544 13,516,737 0.36 0.36
Micrel Inc Technology 9,333,035 1,332,891 0.27 0.27
Microchip Technology Inc Technology 94,090,030 13,437,402 0.38 0.38
Micron Technology Inc Technology 68,294,620 9,753,448 0.48 0.48
Microsemi Corp Technology 27,025,031 3,859,561 0.38 0.38
Microsoft Corp Technology 6,237,285,247 890,773,518 0.52 0.52
Micros Systems Inc Technology 49,168,905 7,022,023 0.54 0.54
MicroStrategy Inc Technology 9,389,466 1,340,950 0.4 0.3
Middleby Corp Consumer Goods 16,730,036 2,389,288 0.52 0.52
Mid-America Apartment
Communities IncFinancials 20,809,338 2,971,871 0.28 0.28
Millicom International
Cellular SATelecommunications 141,983,152 20,277,224 0.42 0.42
Millipore Corp Health Care 111,176,460 15,877,588 0.56 0.56
Minerals Technologies Inc Basic Materials 23,737,094 3,389,996 0.44 0.44
Mine Safety Appliances
CoIndustrials 20,560,039 2,936,268 0.34 0.34
Mirant Corp Utilities 74,367,575 10,620,753 0.36 0.36
MKS Instruments Inc Technology 17,694,546 2,527,034 0.35 0.35
Mobile Mini Inc Industrials 13,990,139 1,997,992 0.4 0.4
Modine Manufacturing Co Consumer Goods 3,567,463 509,485 0.32 0.32
ModusLink Global
Solutions IncIndustrials 3,471,740 495,814 0.38 0.38
Industry/Sector Market valueNOK
Market valueUSD Voting Ownership
GOVERNMENT PENSION FUND GLOBAL HOLDINGS 2008
Equities Country association according to FTSE (the benchmark provider for equities). If a company is not in thebenchmark, the country of incorporation and country of listing is used. For remaining securities, a further assessment ismade. Country is defined as a sovereign state currently member of the United Nations. Exceptions are Hong Kong andTaiwan. The country association methodology was updated as of 2014.
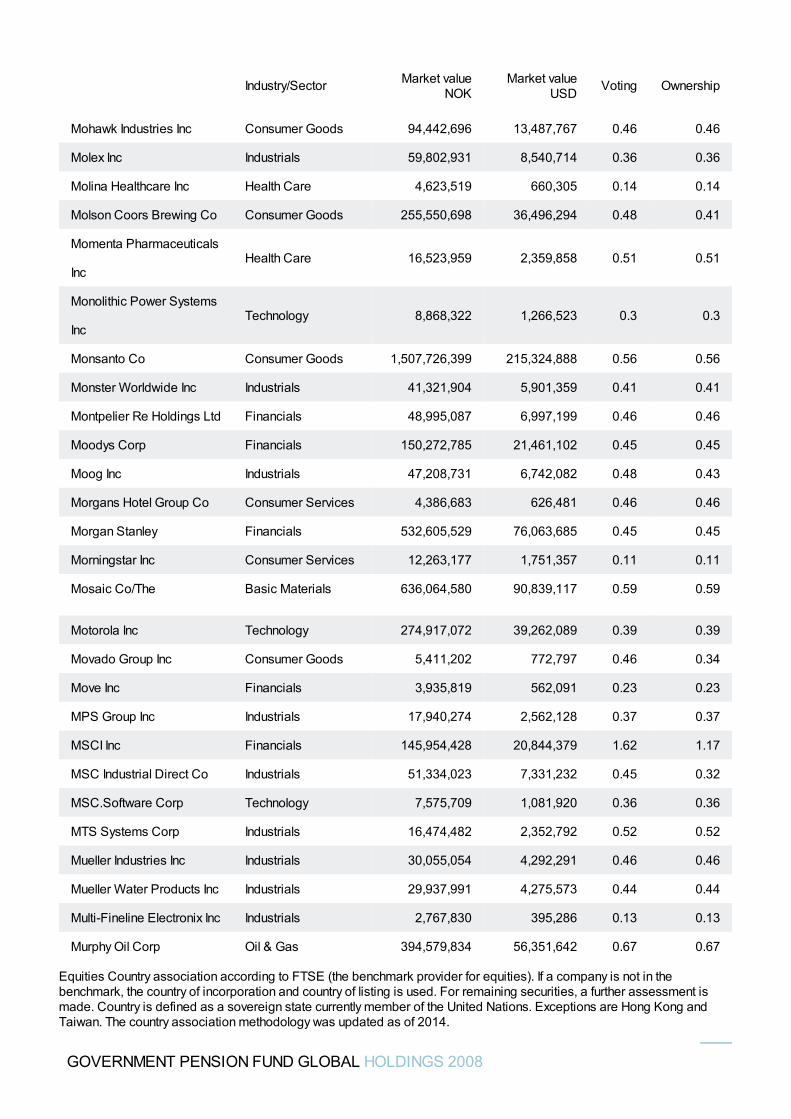
Mohawk Industries Inc Consumer Goods 94,442,696 13,487,767 0.46 0.46
Molex Inc Industrials 59,802,931 8,540,714 0.36 0.36
Molina Healthcare Inc Health Care 4,623,519 660,305 0.14 0.14
Molson Coors Brewing Co Consumer Goods 255,550,698 36,496,294 0.48 0.41
Momenta Pharmaceuticals
IncHealth Care 16,523,959 2,359,858 0.51 0.51
Monolithic Power Systems
IncTechnology 8,868,322 1,266,523 0.3 0.3
Monsanto Co Consumer Goods 1,507,726,399 215,324,888 0.56 0.56
Monster Worldwide Inc Industrials 41,321,904 5,901,359 0.41 0.41
Montpelier Re Holdings Ltd Financials 48,995,087 6,997,199 0.46 0.46
Moodys Corp Financials 150,272,785 21,461,102 0.45 0.45
Moog Inc Industrials 47,208,731 6,742,082 0.48 0.43
Morgans Hotel Group Co Consumer Services 4,386,683 626,481 0.46 0.46
Morgan Stanley Financials 532,605,529 76,063,685 0.45 0.45
Morningstar Inc Consumer Services 12,263,177 1,751,357 0.11 0.11
Mosaic Co/The Basic Materials 636,064,580 90,839,117 0.59 0.59
Motorola Inc Technology 274,917,072 39,262,089 0.39 0.39
Movado Group Inc Consumer Goods 5,411,202 772,797 0.46 0.34
Move Inc Financials 3,935,819 562,091 0.23 0.23
MPS Group Inc Industrials 17,940,274 2,562,128 0.37 0.37
MSCI Inc Financials 145,954,428 20,844,379 1.62 1.17
MSC Industrial Direct Co Industrials 51,334,023 7,331,232 0.45 0.32
MSC.Software Corp Technology 7,575,709 1,081,920 0.36 0.36
MTS Systems Corp Industrials 16,474,482 2,352,792 0.52 0.52
Mueller Industries Inc Industrials 30,055,054 4,292,291 0.46 0.46
Mueller Water Products Inc Industrials 29,937,991 4,275,573 0.44 0.44
Multi-Fineline Electronix Inc Industrials 2,767,830 395,286 0.13 0.13
Murphy Oil Corp Oil & Gas 394,579,834 56,351,642 0.67 0.67
Industry/Sector Market valueNOK
Market valueUSD Voting Ownership
GOVERNMENT PENSION FUND GLOBAL HOLDINGS 2008
Equities Country association according to FTSE (the benchmark provider for equities). If a company is not in thebenchmark, the country of incorporation and country of listing is used. For remaining securities, a further assessment ismade. Country is defined as a sovereign state currently member of the United Nations. Exceptions are Hong Kong andTaiwan. The country association methodology was updated as of 2014.
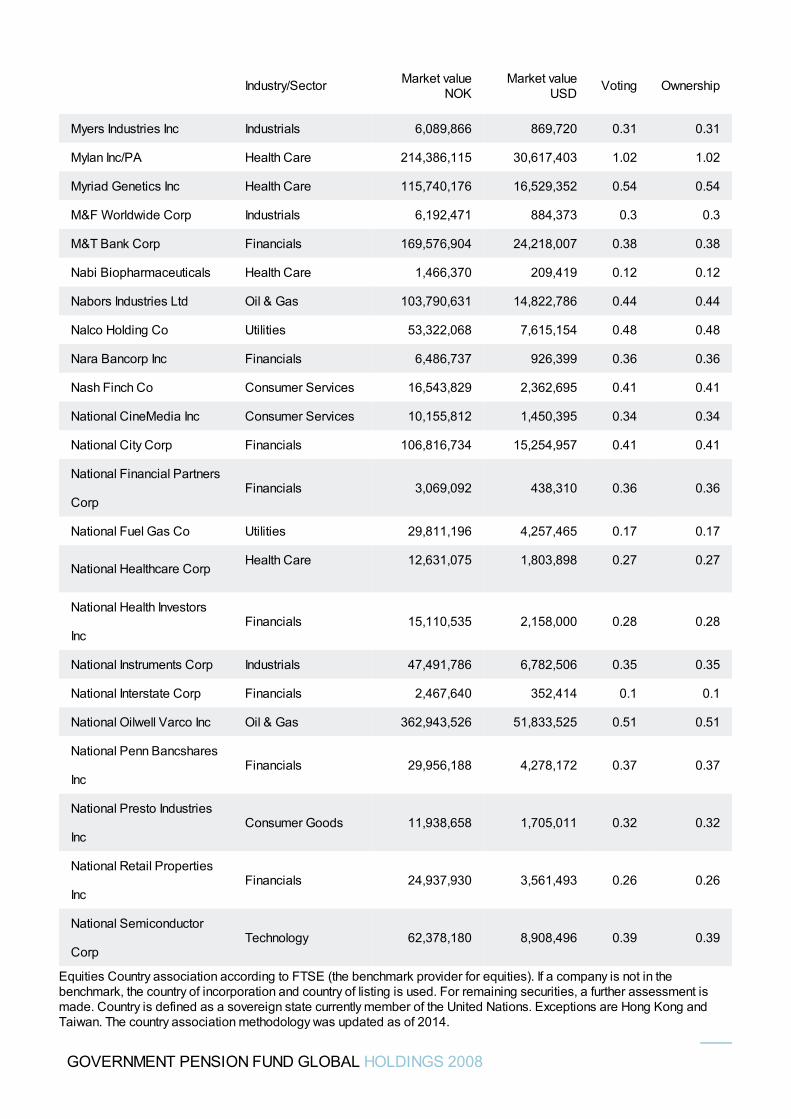
Myers Industries Inc Industrials 6,089,866 869,720 0.31 0.31
Mylan Inc/PA Health Care 214,386,115 30,617,403 1.02 1.02
Myriad Genetics Inc Health Care 115,740,176 16,529,352 0.54 0.54
M&F Worldwide Corp Industrials 6,192,471 884,373 0.3 0.3
M&T Bank Corp Financials 169,576,904 24,218,007 0.38 0.38
Nabi Biopharmaceuticals Health Care 1,466,370 209,419 0.12 0.12
Nabors Industries Ltd Oil & Gas 103,790,631 14,822,786 0.44 0.44
Nalco Holding Co Utilities 53,322,068 7,615,154 0.48 0.48
Nara Bancorp Inc Financials 6,486,737 926,399 0.36 0.36
Nash Finch Co Consumer Services 16,543,829 2,362,695 0.41 0.41
National CineMedia Inc Consumer Services 10,155,812 1,450,395 0.34 0.34
National City Corp Financials 106,816,734 15,254,957 0.41 0.41
National Financial Partners
CorpFinancials 3,069,092 438,310 0.36 0.36
National Fuel Gas Co Utilities 29,811,196 4,257,465 0.17 0.17
National Healthcare CorpHealth Care 12,631,075 1,803,898 0.27 0.27
National Health Investors
IncFinancials 15,110,535 2,158,000 0.28 0.28
National Instruments Corp Industrials 47,491,786 6,782,506 0.35 0.35
National Interstate Corp Financials 2,467,640 352,414 0.1 0.1
National Oilwell Varco Inc Oil & Gas 362,943,526 51,833,525 0.51 0.51
National Penn Bancshares
IncFinancials 29,956,188 4,278,172 0.37 0.37
National Presto Industries
IncConsumer Goods 11,938,658 1,705,011 0.32 0.32
National Retail Properties
IncFinancials 24,937,930 3,561,493 0.26 0.26
National Semiconductor
CorpTechnology 62,378,180 8,908,496 0.39 0.39
Industry/Sector Market valueNOK
Market valueUSD Voting Ownership
GOVERNMENT PENSION FUND GLOBAL HOLDINGS 2008
Equities Country association according to FTSE (the benchmark provider for equities). If a company is not in thebenchmark, the country of incorporation and country of listing is used. For remaining securities, a further assessment ismade. Country is defined as a sovereign state currently member of the United Nations. Exceptions are Hong Kong andTaiwan. The country association methodology was updated as of 2014.
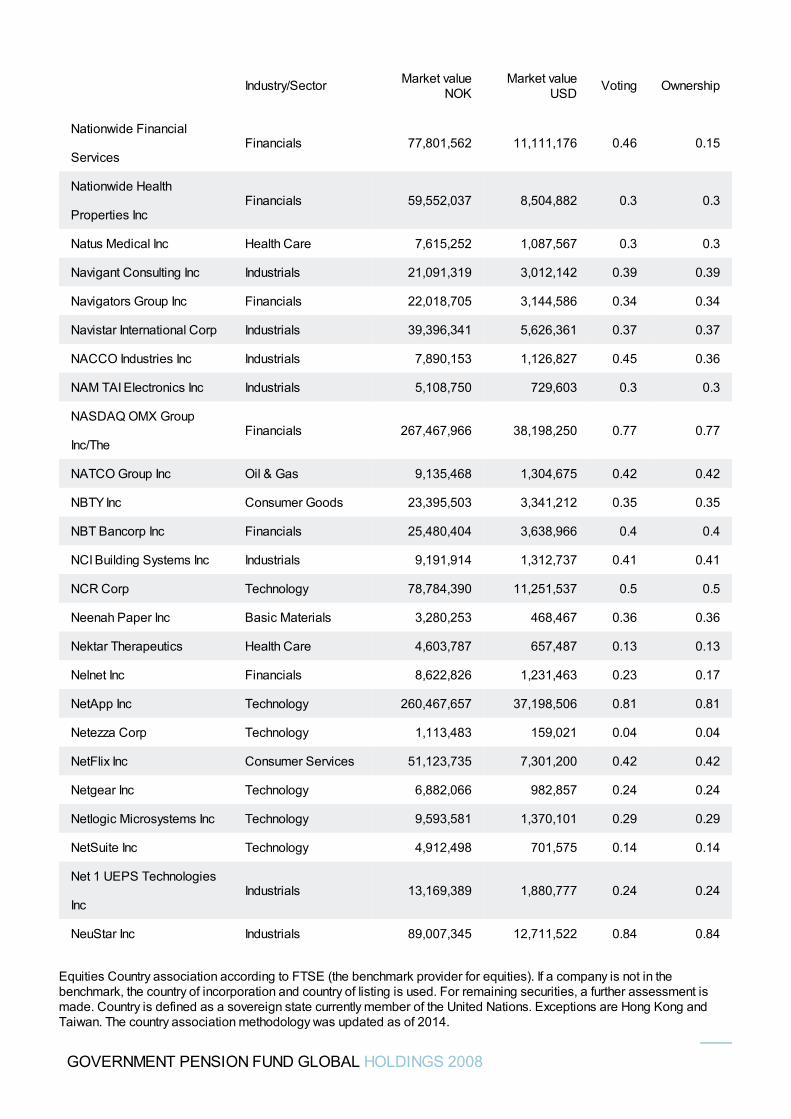
Nationwide Financial
ServicesFinancials 77,801,562 11,111,176 0.46 0.15
Nationwide Health
Properties IncFinancials 59,552,037 8,504,882 0.3 0.3
Natus Medical Inc Health Care 7,615,252 1,087,567 0.3 0.3
Navigant Consulting Inc Industrials 21,091,319 3,012,142 0.39 0.39
Navigators Group Inc Financials 22,018,705 3,144,586 0.34 0.34
Navistar International Corp Industrials 39,396,341 5,626,361 0.37 0.37
NACCO Industries Inc Industrials 7,890,153 1,126,827 0.45 0.36
NAM TAI Electronics Inc Industrials 5,108,750 729,603 0.3 0.3
NASDAQ OMX Group
Inc/TheFinancials 267,467,966 38,198,250 0.77 0.77
NATCO Group Inc Oil & Gas 9,135,468 1,304,675 0.42 0.42
NBTY Inc Consumer Goods 23,395,503 3,341,212 0.35 0.35
NBT Bancorp Inc Financials 25,480,404 3,638,966 0.4 0.4
NCI Building Systems Inc Industrials 9,191,914 1,312,737 0.41 0.41
NCR Corp Technology 78,784,390 11,251,537 0.5 0.5
Neenah Paper Inc Basic Materials 3,280,253 468,467 0.36 0.36
Nektar Therapeutics Health Care 4,603,787 657,487 0.13 0.13
Nelnet Inc Financials 8,622,826 1,231,463 0.23 0.17
NetApp Inc Technology 260,467,657 37,198,506 0.81 0.81
Netezza Corp Technology 1,113,483 159,021 0.04 0.04
NetFlix Inc Consumer Services 51,123,735 7,301,200 0.42 0.42
Netgear Inc Technology 6,882,066 982,857 0.24 0.24
Netlogic Microsystems Inc Technology 9,593,581 1,370,101 0.29 0.29
NetSuite Inc Technology 4,912,498 701,575 0.14 0.14
Net 1 UEPS Technologies
IncIndustrials 13,169,389 1,880,777 0.24 0.24
NeuStar Inc Industrials 89,007,345 12,711,522 0.84 0.84
Industry/Sector Market valueNOK
Market valueUSD Voting Ownership
GOVERNMENT PENSION FUND GLOBAL HOLDINGS 2008
Equities Country association according to FTSE (the benchmark provider for equities). If a company is not in thebenchmark, the country of incorporation and country of listing is used. For remaining securities, a further assessment ismade. Country is defined as a sovereign state currently member of the United Nations. Exceptions are Hong Kong andTaiwan. The country association methodology was updated as of 2014.
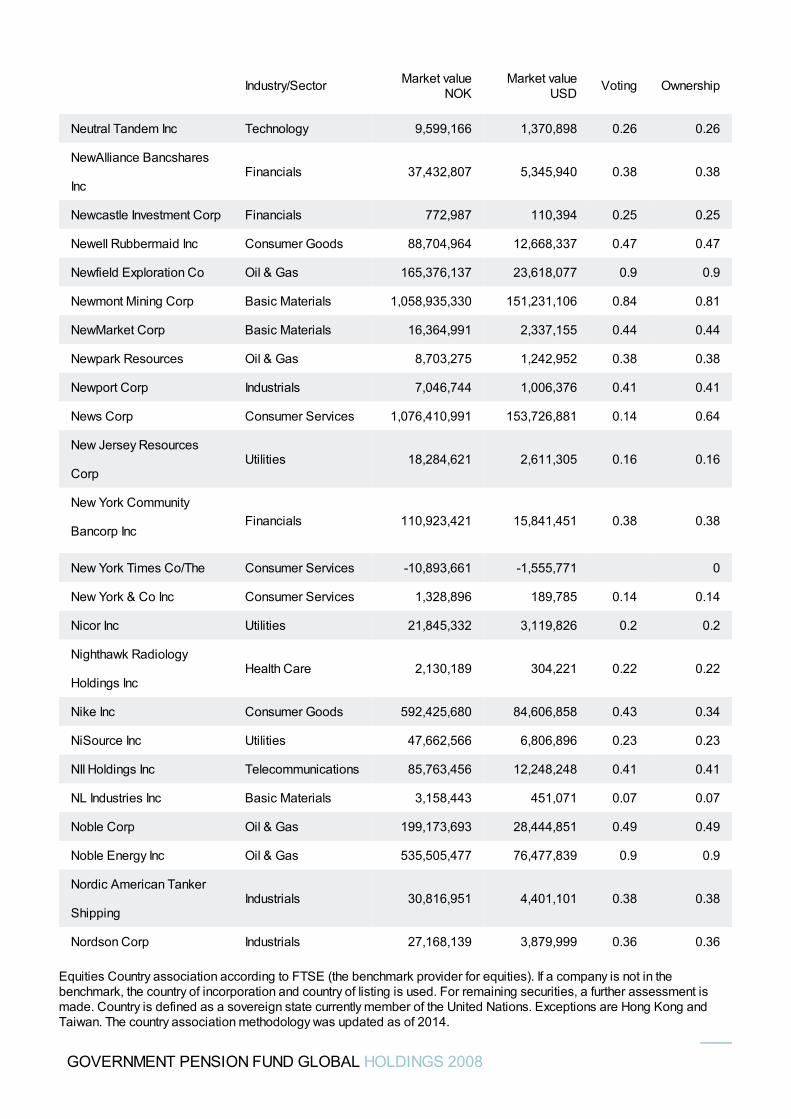
Neutral Tandem Inc Technology 9,599,166 1,370,898 0.26 0.26
NewAlliance Bancshares
IncFinancials 37,432,807 5,345,940 0.38 0.38
Newcastle Investment Corp Financials 772,987 110,394 0.25 0.25
Newell Rubbermaid Inc Consumer Goods 88,704,964 12,668,337 0.47 0.47
Newfield Exploration Co Oil & Gas 165,376,137 23,618,077 0.9 0.9
Newmont Mining Corp Basic Materials 1,058,935,330 151,231,106 0.84 0.81
NewMarket Corp Basic Materials 16,364,991 2,337,155 0.44 0.44
Newpark Resources Oil & Gas 8,703,275 1,242,952 0.38 0.38
Newport Corp Industrials 7,046,744 1,006,376 0.41 0.41
News Corp Consumer Services 1,076,410,991 153,726,881 0.14 0.64
New Jersey Resources
CorpUtilities 18,284,621 2,611,305 0.16 0.16
New York Community
Bancorp IncFinancials 110,923,421 15,841,451 0.38 0.38
New York Times Co/The Consumer Services -10,893,661 -1,555,771 0
New York & Co Inc Consumer Services 1,328,896 189,785 0.14 0.14
Nicor Inc Utilities 21,845,332 3,119,826 0.2 0.2
Nighthawk Radiology
Holdings IncHealth Care 2,130,189 304,221 0.22 0.22
Nike Inc Consumer Goods 592,425,680 84,606,858 0.43 0.34
NiSource Inc Utilities 47,662,566 6,806,896 0.23 0.23
NII Holdings Inc Telecommunications 85,763,456 12,248,248 0.41 0.41
NL Industries Inc Basic Materials 3,158,443 451,071 0.07 0.07
Noble Corp Oil & Gas 199,173,693 28,444,851 0.49 0.49
Noble Energy Inc Oil & Gas 535,505,477 76,477,839 0.9 0.9
Nordic American Tanker
ShippingIndustrials 30,816,951 4,401,101 0.38 0.38
Nordson Corp Industrials 27,168,139 3,879,999 0.36 0.36
Industry/Sector Market valueNOK
Market valueUSD Voting Ownership
GOVERNMENT PENSION FUND GLOBAL HOLDINGS 2008
Equities Country association according to FTSE (the benchmark provider for equities). If a company is not in thebenchmark, the country of incorporation and country of listing is used. For remaining securities, a further assessment ismade. Country is defined as a sovereign state currently member of the United Nations. Exceptions are Hong Kong andTaiwan. The country association methodology was updated as of 2014.
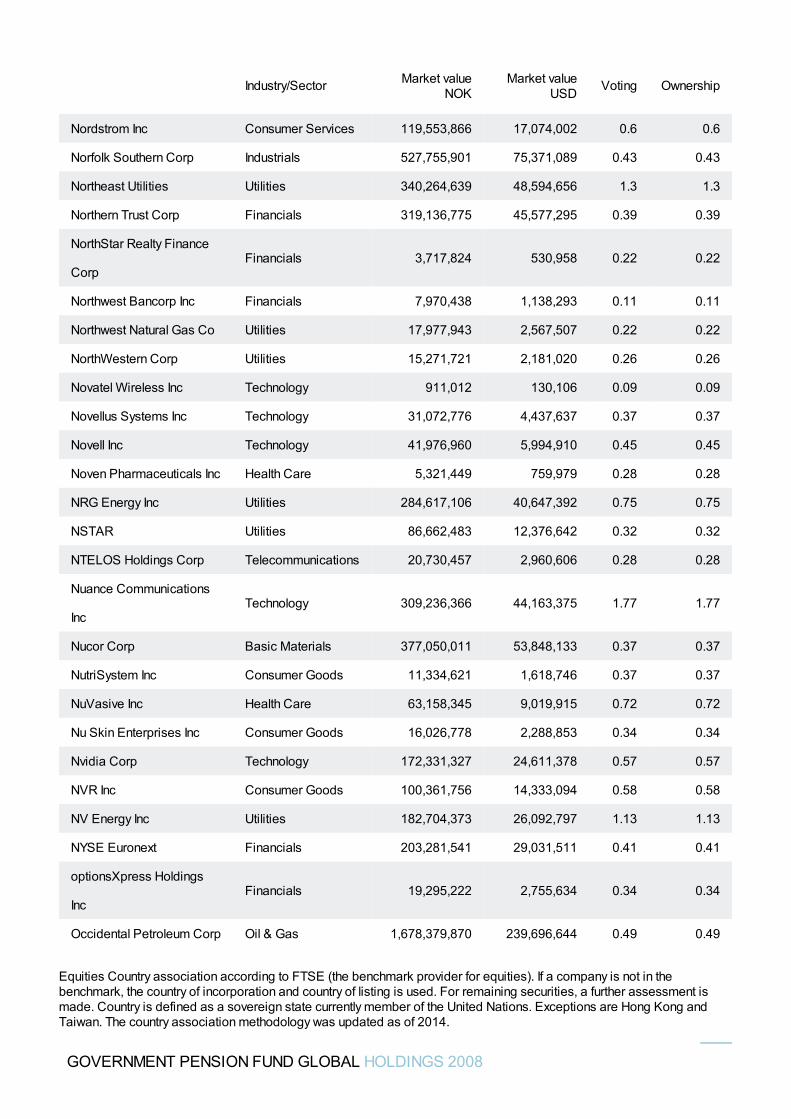
Nordstrom Inc Consumer Services 119,553,866 17,074,002 0.6 0.6
Norfolk Southern Corp Industrials 527,755,901 75,371,089 0.43 0.43
Northeast Utilities Utilities 340,264,639 48,594,656 1.3 1.3
Northern Trust Corp Financials 319,136,775 45,577,295 0.39 0.39
NorthStar Realty Finance
CorpFinancials 3,717,824 530,958 0.22 0.22
Northwest Bancorp Inc Financials 7,970,438 1,138,293 0.11 0.11
Northwest Natural Gas Co Utilities 17,977,943 2,567,507 0.22 0.22
NorthWestern Corp Utilities 15,271,721 2,181,020 0.26 0.26
Novatel Wireless Inc Technology 911,012 130,106 0.09 0.09
Novellus Systems Inc Technology 31,072,776 4,437,637 0.37 0.37
Novell Inc Technology 41,976,960 5,994,910 0.45 0.45
Noven Pharmaceuticals Inc Health Care 5,321,449 759,979 0.28 0.28
NRG Energy Inc Utilities 284,617,106 40,647,392 0.75 0.75
NSTAR Utilities 86,662,483 12,376,642 0.32 0.32
NTELOS Holdings Corp Telecommunications 20,730,457 2,960,606 0.28 0.28
Nuance Communications
IncTechnology 309,236,366 44,163,375 1.77 1.77
Nucor Corp Basic Materials 377,050,011 53,848,133 0.37 0.37
NutriSystem Inc Consumer Goods 11,334,621 1,618,746 0.37 0.37
NuVasive Inc Health Care 63,158,345 9,019,915 0.72 0.72
Nu Skin Enterprises Inc Consumer Goods 16,026,778 2,288,853 0.34 0.34
Nvidia Corp Technology 172,331,327 24,611,378 0.57 0.57
NVR Inc Consumer Goods 100,361,756 14,333,094 0.58 0.58
NV Energy Inc Utilities 182,704,373 26,092,797 1.13 1.13
NYSE Euronext Financials 203,281,541 29,031,511 0.41 0.41
optionsXpress Holdings
IncFinancials 19,295,222 2,755,634 0.34 0.34
Occidental Petroleum Corp Oil & Gas 1,678,379,870 239,696,644 0.49 0.49
Industry/Sector Market valueNOK
Market valueUSD Voting Ownership
GOVERNMENT PENSION FUND GLOBAL HOLDINGS 2008
Equities Country association according to FTSE (the benchmark provider for equities). If a company is not in thebenchmark, the country of incorporation and country of listing is used. For remaining securities, a further assessment ismade. Country is defined as a sovereign state currently member of the United Nations. Exceptions are Hong Kong andTaiwan. The country association methodology was updated as of 2014.
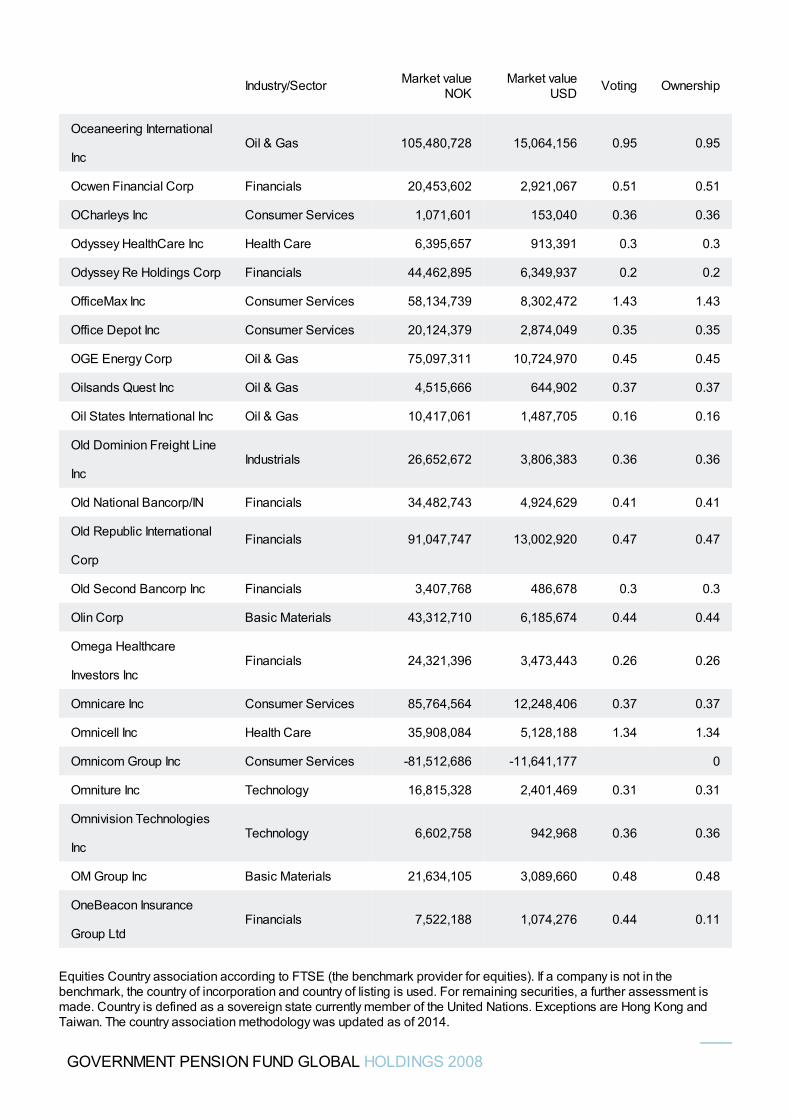
Oceaneering International
IncOil & Gas 105,480,728 15,064,156 0.95 0.95
Ocwen Financial Corp Financials 20,453,602 2,921,067 0.51 0.51
OCharleys Inc Consumer Services 1,071,601 153,040 0.36 0.36
Odyssey HealthCare Inc Health Care 6,395,657 913,391 0.3 0.3
Odyssey Re Holdings Corp Financials 44,462,895 6,349,937 0.2 0.2
OfficeMax Inc Consumer Services 58,134,739 8,302,472 1.43 1.43
Office Depot Inc Consumer Services 20,124,379 2,874,049 0.35 0.35
OGE Energy Corp Oil & Gas 75,097,311 10,724,970 0.45 0.45
Oilsands Quest Inc Oil & Gas 4,515,666 644,902 0.37 0.37
Oil States International Inc Oil & Gas 10,417,061 1,487,705 0.16 0.16
Old Dominion Freight Line
IncIndustrials 26,652,672 3,806,383 0.36 0.36
Old National Bancorp/IN Financials 34,482,743 4,924,629 0.41 0.41
Old Republic International
CorpFinancials 91,047,747 13,002,920 0.47 0.47
Old Second Bancorp Inc Financials 3,407,768 486,678 0.3 0.3
Olin Corp Basic Materials 43,312,710 6,185,674 0.44 0.44
Omega Healthcare
Investors IncFinancials 24,321,396 3,473,443 0.26 0.26
Omnicare Inc Consumer Services 85,764,564 12,248,406 0.37 0.37
Omnicell Inc Health Care 35,908,084 5,128,188 1.34 1.34
Omnicom Group Inc Consumer Services -81,512,686 -11,641,177 0
Omniture Inc Technology 16,815,328 2,401,469 0.31 0.31
Omnivision Technologies
IncTechnology 6,602,758 942,968 0.36 0.36
OM Group Inc Basic Materials 21,634,105 3,089,660 0.48 0.48
OneBeacon Insurance
Group LtdFinancials 7,522,188 1,074,276 0.44 0.11
Industry/Sector Market valueNOK
Market valueUSD Voting Ownership
GOVERNMENT PENSION FUND GLOBAL HOLDINGS 2008
Equities Country association according to FTSE (the benchmark provider for equities). If a company is not in thebenchmark, the country of incorporation and country of listing is used. For remaining securities, a further assessment ismade. Country is defined as a sovereign state currently member of the United Nations. Exceptions are Hong Kong andTaiwan. The country association methodology was updated as of 2014.
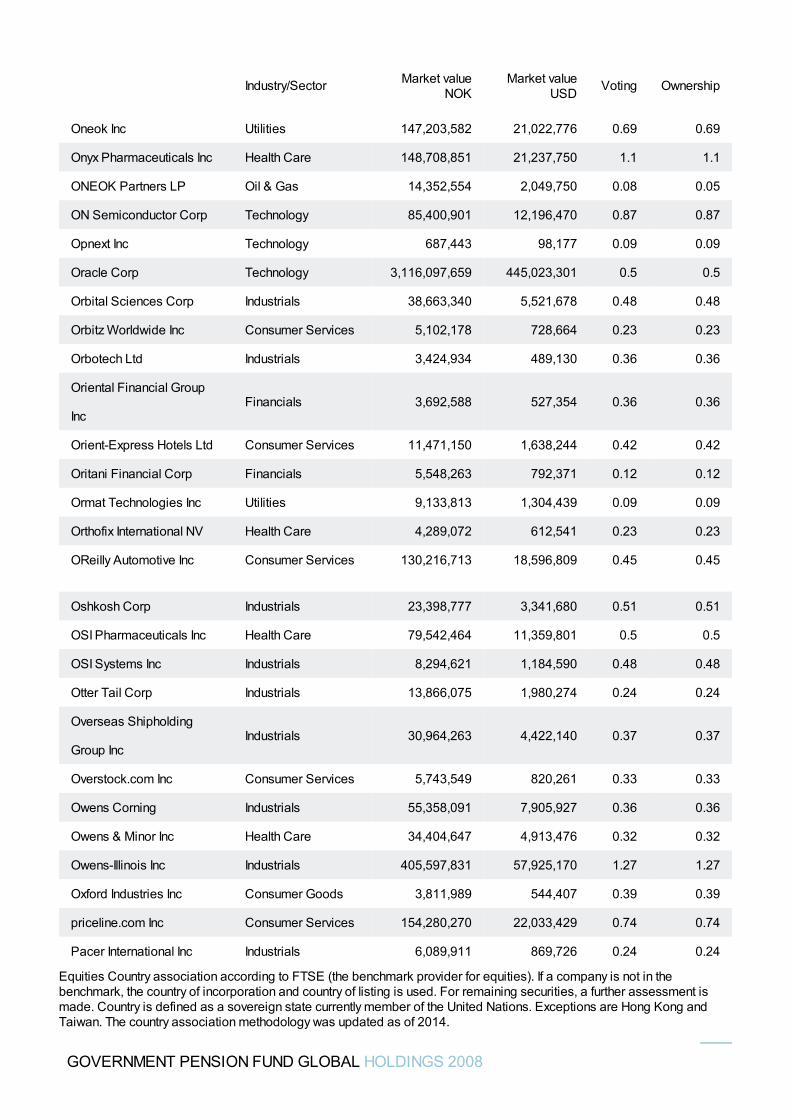
Oneok Inc Utilities 147,203,582 21,022,776 0.69 0.69
Onyx Pharmaceuticals Inc Health Care 148,708,851 21,237,750 1.1 1.1
ONEOK Partners LP Oil & Gas 14,352,554 2,049,750 0.08 0.05
ON Semiconductor Corp Technology 85,400,901 12,196,470 0.87 0.87
Opnext Inc Technology 687,443 98,177 0.09 0.09
Oracle Corp Technology 3,116,097,659 445,023,301 0.5 0.5
Orbital Sciences Corp Industrials 38,663,340 5,521,678 0.48 0.48
Orbitz Worldwide Inc Consumer Services 5,102,178 728,664 0.23 0.23
Orbotech Ltd Industrials 3,424,934 489,130 0.36 0.36
Oriental Financial Group
IncFinancials 3,692,588 527,354 0.36 0.36
Orient-Express Hotels Ltd Consumer Services 11,471,150 1,638,244 0.42 0.42
Oritani Financial Corp Financials 5,548,263 792,371 0.12 0.12
Ormat Technologies Inc Utilities 9,133,813 1,304,439 0.09 0.09
Orthofix International NV Health Care 4,289,072 612,541 0.23 0.23
OReilly Automotive Inc Consumer Services 130,216,713 18,596,809 0.45 0.45
Oshkosh Corp Industrials 23,398,777 3,341,680 0.51 0.51
OSI Pharmaceuticals Inc Health Care 79,542,464 11,359,801 0.5 0.5
OSI Systems Inc Industrials 8,294,621 1,184,590 0.48 0.48
Otter Tail Corp Industrials 13,866,075 1,980,274 0.24 0.24
Overseas Shipholding
Group IncIndustrials 30,964,263 4,422,140 0.37 0.37
Overstock.com Inc Consumer Services 5,743,549 820,261 0.33 0.33
Owens Corning Industrials 55,358,091 7,905,927 0.36 0.36
Owens & Minor Inc Health Care 34,404,647 4,913,476 0.32 0.32
Owens-Illinois Inc Industrials 405,597,831 57,925,170 1.27 1.27
Oxford Industries Inc Consumer Goods 3,811,989 544,407 0.39 0.39
priceline.com Inc Consumer Services 154,280,270 22,033,429 0.74 0.74
Pacer International Inc Industrials 6,089,911 869,726 0.24 0.24
Industry/Sector Market valueNOK
Market valueUSD Voting Ownership
GOVERNMENT PENSION FUND GLOBAL HOLDINGS 2008
Equities Country association according to FTSE (the benchmark provider for equities). If a company is not in thebenchmark, the country of incorporation and country of listing is used. For remaining securities, a further assessment ismade. Country is defined as a sovereign state currently member of the United Nations. Exceptions are Hong Kong andTaiwan. The country association methodology was updated as of 2014.
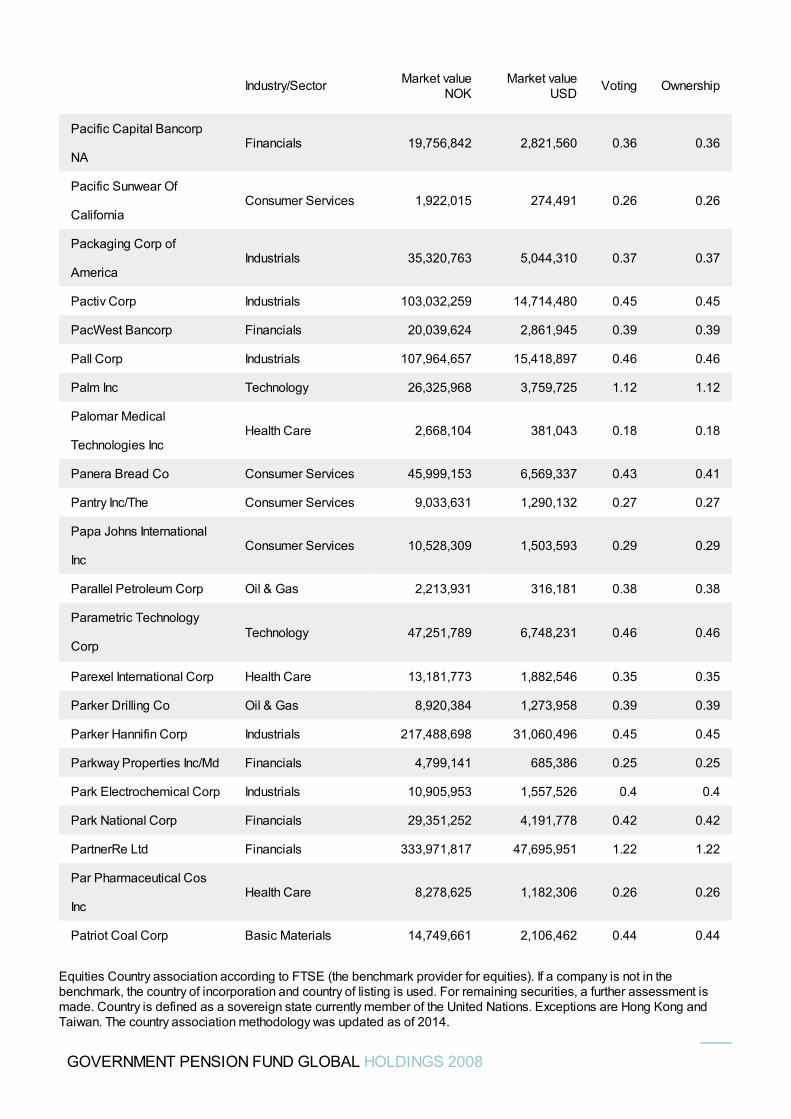
Pacific Capital Bancorp
NAFinancials 19,756,842 2,821,560 0.36 0.36
Pacific Sunwear Of
CaliforniaConsumer Services 1,922,015 274,491 0.26 0.26
Packaging Corp of
AmericaIndustrials 35,320,763 5,044,310 0.37 0.37
Pactiv Corp Industrials 103,032,259 14,714,480 0.45 0.45
PacWest Bancorp Financials 20,039,624 2,861,945 0.39 0.39
Pall Corp Industrials 107,964,657 15,418,897 0.46 0.46
Palm Inc Technology 26,325,968 3,759,725 1.12 1.12
Palomar Medical
Technologies IncHealth Care 2,668,104 381,043 0.18 0.18
Panera Bread Co Consumer Services 45,999,153 6,569,337 0.43 0.41
Pantry Inc/The Consumer Services 9,033,631 1,290,132 0.27 0.27
Papa Johns International
IncConsumer Services 10,528,309 1,503,593 0.29 0.29
Parallel Petroleum Corp Oil & Gas 2,213,931 316,181 0.38 0.38
Parametric Technology
CorpTechnology 47,251,789 6,748,231 0.46 0.46
Parexel International Corp Health Care 13,181,773 1,882,546 0.35 0.35
Parker Drilling Co Oil & Gas 8,920,384 1,273,958 0.39 0.39
Parker Hannifin Corp Industrials 217,488,698 31,060,496 0.45 0.45
Parkway Properties Inc/Md Financials 4,799,141 685,386 0.25 0.25
Park Electrochemical Corp Industrials 10,905,953 1,557,526 0.4 0.4
Park National Corp Financials 29,351,252 4,191,778 0.42 0.42
PartnerRe Ltd Financials 333,971,817 47,695,951 1.22 1.22
Par Pharmaceutical Cos
IncHealth Care 8,278,625 1,182,306 0.26 0.26
Patriot Coal Corp Basic Materials 14,749,661 2,106,462 0.44 0.44
Industry/Sector Market valueNOK
Market valueUSD Voting Ownership
GOVERNMENT PENSION FUND GLOBAL HOLDINGS 2008
Equities Country association according to FTSE (the benchmark provider for equities). If a company is not in thebenchmark, the country of incorporation and country of listing is used. For remaining securities, a further assessment ismade. Country is defined as a sovereign state currently member of the United Nations. Exceptions are Hong Kong andTaiwan. The country association methodology was updated as of 2014.
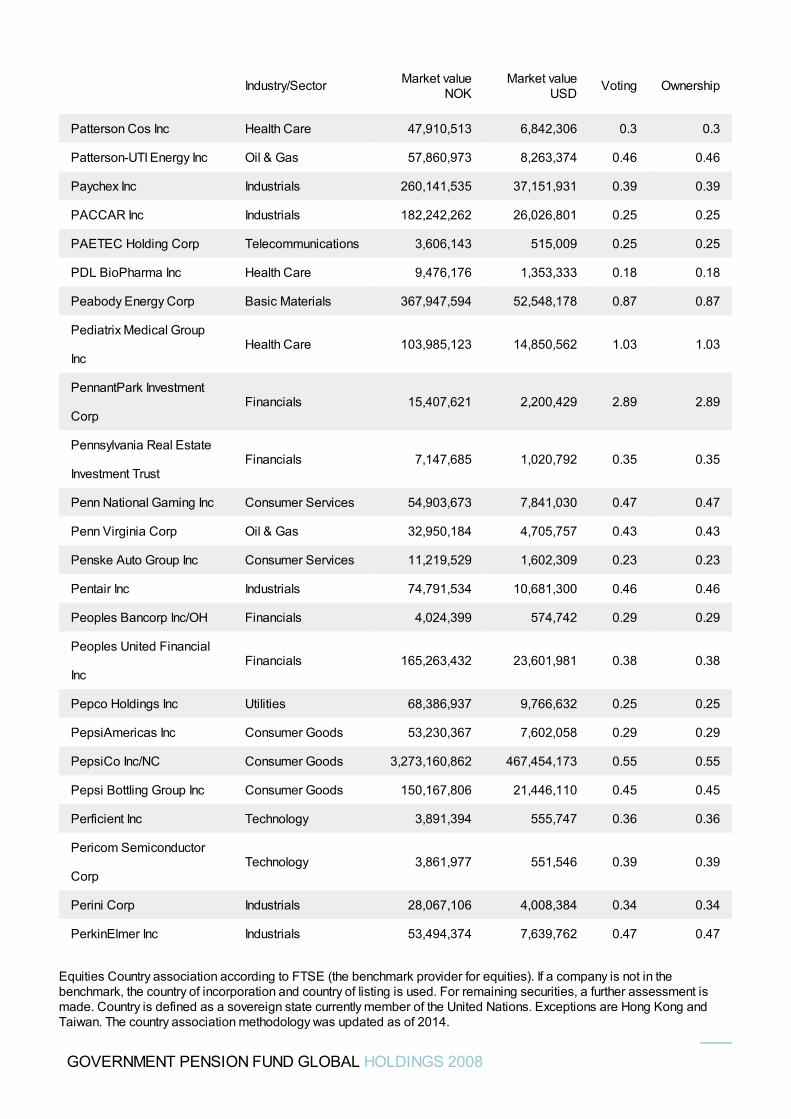
Patterson Cos Inc Health Care 47,910,513 6,842,306 0.3 0.3
Patterson-UTI Energy Inc Oil & Gas 57,860,973 8,263,374 0.46 0.46
Paychex Inc Industrials 260,141,535 37,151,931 0.39 0.39
PACCAR Inc Industrials 182,242,262 26,026,801 0.25 0.25
PAETEC Holding Corp Telecommunications 3,606,143 515,009 0.25 0.25
PDL BioPharma Inc Health Care 9,476,176 1,353,333 0.18 0.18
Peabody Energy Corp Basic Materials 367,947,594 52,548,178 0.87 0.87
Pediatrix Medical Group
IncHealth Care 103,985,123 14,850,562 1.03 1.03
PennantPark Investment
CorpFinancials 15,407,621 2,200,429 2.89 2.89
Pennsylvania Real Estate
Investment TrustFinancials 7,147,685 1,020,792 0.35 0.35
Penn National Gaming Inc Consumer Services 54,903,673 7,841,030 0.47 0.47
Penn Virginia Corp Oil & Gas 32,950,184 4,705,757 0.43 0.43
Penske Auto Group Inc Consumer Services 11,219,529 1,602,309 0.23 0.23
Pentair Inc Industrials 74,791,534 10,681,300 0.46 0.46
Peoples Bancorp Inc/OH Financials 4,024,399 574,742 0.29 0.29
Peoples United Financial
IncFinancials 165,263,432 23,601,981 0.38 0.38
Pepco Holdings Inc Utilities 68,386,937 9,766,632 0.25 0.25
PepsiAmericas Inc Consumer Goods 53,230,367 7,602,058 0.29 0.29
PepsiCo Inc/NC Consumer Goods 3,273,160,862 467,454,173 0.55 0.55
Pepsi Bottling Group Inc Consumer Goods 150,167,806 21,446,110 0.45 0.45
Perficient Inc Technology 3,891,394 555,747 0.36 0.36
Pericom Semiconductor
CorpTechnology 3,861,977 551,546 0.39 0.39
Perini Corp Industrials 28,067,106 4,008,384 0.34 0.34
PerkinElmer Inc Industrials 53,494,374 7,639,762 0.47 0.47
Industry/Sector Market valueNOK
Market valueUSD Voting Ownership
GOVERNMENT PENSION FUND GLOBAL HOLDINGS 2008
Equities Country association according to FTSE (the benchmark provider for equities). If a company is not in thebenchmark, the country of incorporation and country of listing is used. For remaining securities, a further assessment ismade. Country is defined as a sovereign state currently member of the United Nations. Exceptions are Hong Kong andTaiwan. The country association methodology was updated as of 2014.
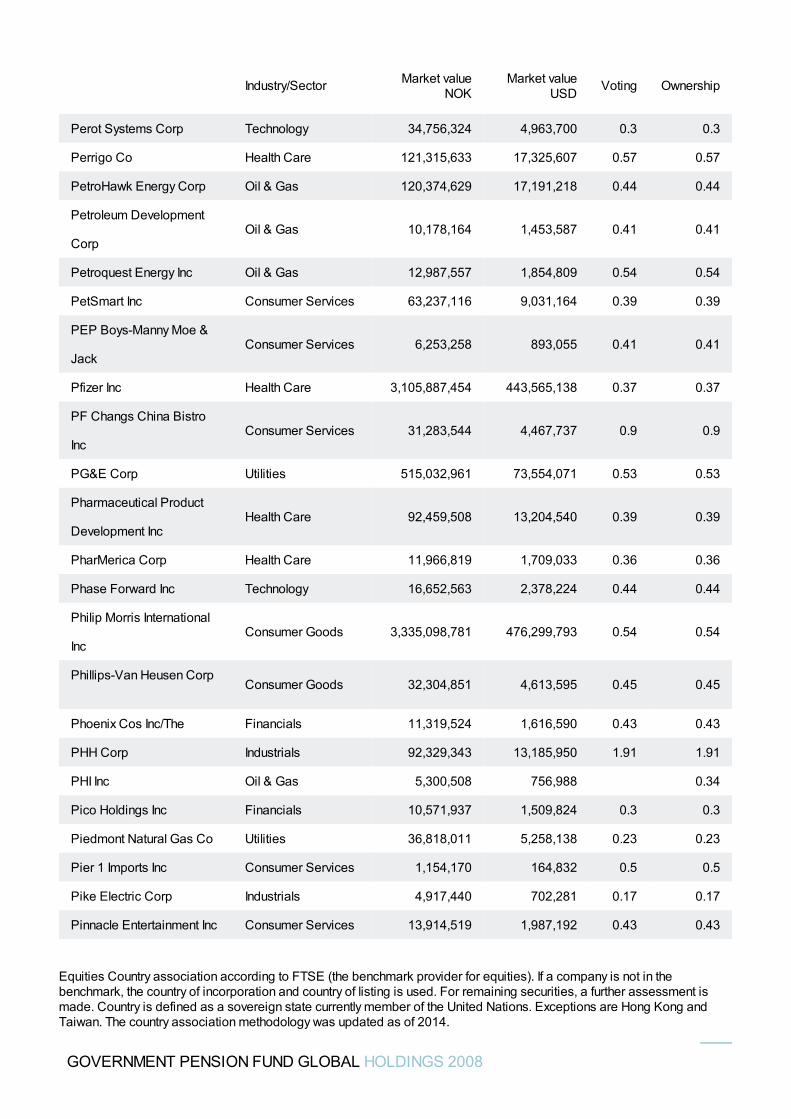
Perot Systems Corp Technology 34,756,324 4,963,700 0.3 0.3
Perrigo Co Health Care 121,315,633 17,325,607 0.57 0.57
PetroHawk Energy Corp Oil & Gas 120,374,629 17,191,218 0.44 0.44
Petroleum Development
CorpOil & Gas 10,178,164 1,453,587 0.41 0.41
Petroquest Energy Inc Oil & Gas 12,987,557 1,854,809 0.54 0.54
PetSmart Inc Consumer Services 63,237,116 9,031,164 0.39 0.39
PEP Boys-Manny Moe &
JackConsumer Services 6,253,258 893,055 0.41 0.41
Pfizer Inc Health Care 3,105,887,454 443,565,138 0.37 0.37
PF Changs China Bistro
IncConsumer Services 31,283,544 4,467,737 0.9 0.9
PG&E Corp Utilities 515,032,961 73,554,071 0.53 0.53
Pharmaceutical Product
Development IncHealth Care 92,459,508 13,204,540 0.39 0.39
PharMerica Corp Health Care 11,966,819 1,709,033 0.36 0.36
Phase Forward Inc Technology 16,652,563 2,378,224 0.44 0.44
Philip Morris International
IncConsumer Goods 3,335,098,781 476,299,793 0.54 0.54
Phillips-Van Heusen CorpConsumer Goods 32,304,851 4,613,595 0.45 0.45
Phoenix Cos Inc/The Financials 11,319,524 1,616,590 0.43 0.43
PHH Corp Industrials 92,329,343 13,185,950 1.91 1.91
PHI Inc Oil & Gas 5,300,508 756,988 0.34
Pico Holdings Inc Financials 10,571,937 1,509,824 0.3 0.3
Piedmont Natural Gas Co Utilities 36,818,011 5,258,138 0.23 0.23
Pier 1 Imports Inc Consumer Services 1,154,170 164,832 0.5 0.5
Pike Electric Corp Industrials 4,917,440 702,281 0.17 0.17
Pinnacle Entertainment Inc Consumer Services 13,914,519 1,987,192 0.43 0.43
Industry/Sector Market valueNOK
Market valueUSD Voting Ownership
GOVERNMENT PENSION FUND GLOBAL HOLDINGS 2008
Equities Country association according to FTSE (the benchmark provider for equities). If a company is not in thebenchmark, the country of incorporation and country of listing is used. For remaining securities, a further assessment ismade. Country is defined as a sovereign state currently member of the United Nations. Exceptions are Hong Kong andTaiwan. The country association methodology was updated as of 2014.
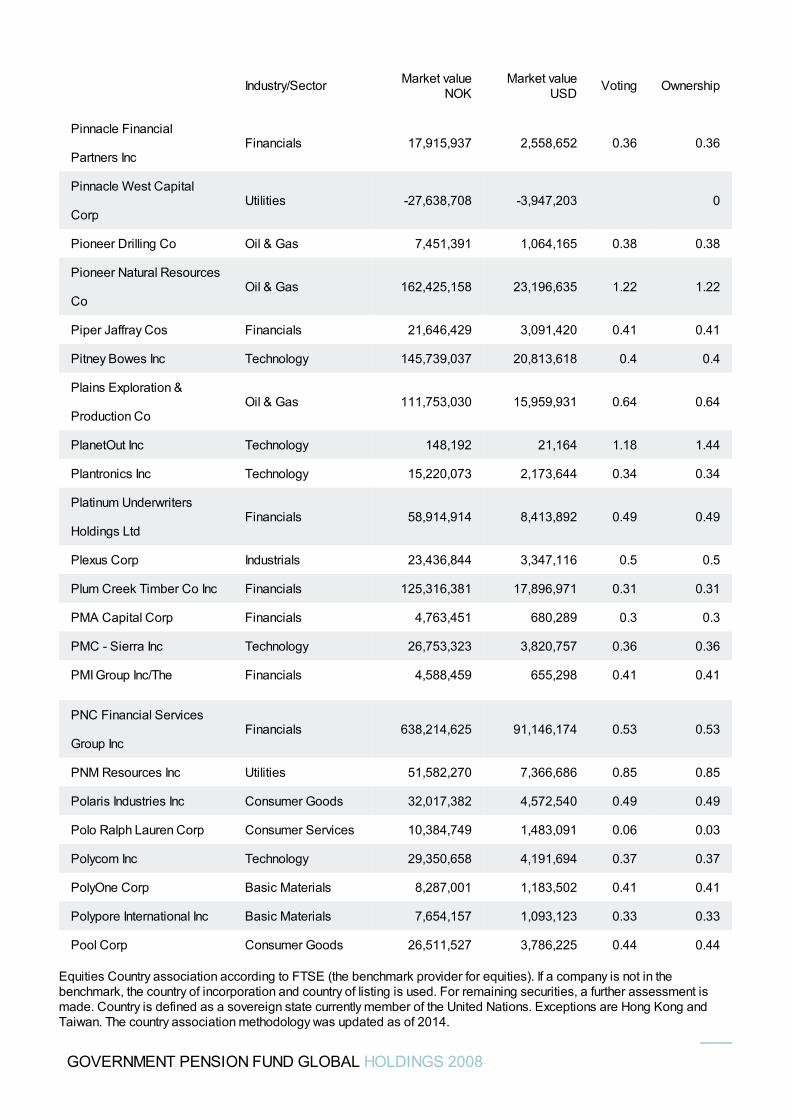
Pinnacle Financial
Partners IncFinancials 17,915,937 2,558,652 0.36 0.36
Pinnacle West Capital
CorpUtilities -27,638,708 -3,947,203 0
Pioneer Drilling Co Oil & Gas 7,451,391 1,064,165 0.38 0.38
Pioneer Natural Resources
CoOil & Gas 162,425,158 23,196,635 1.22 1.22
Piper Jaffray Cos Financials 21,646,429 3,091,420 0.41 0.41
Pitney Bowes Inc Technology 145,739,037 20,813,618 0.4 0.4
Plains Exploration &
Production CoOil & Gas 111,753,030 15,959,931 0.64 0.64
PlanetOut Inc Technology 148,192 21,164 1.18 1.44
Plantronics Inc Technology 15,220,073 2,173,644 0.34 0.34
Platinum Underwriters
Holdings LtdFinancials 58,914,914 8,413,892 0.49 0.49
Plexus Corp Industrials 23,436,844 3,347,116 0.5 0.5
Plum Creek Timber Co Inc Financials 125,316,381 17,896,971 0.31 0.31
PMA Capital Corp Financials 4,763,451 680,289 0.3 0.3
PMC - Sierra Inc Technology 26,753,323 3,820,757 0.36 0.36
PMI Group Inc/The Financials 4,588,459 655,298 0.41 0.41
PNC Financial Services
Group IncFinancials 638,214,625 91,146,174 0.53 0.53
PNM Resources Inc Utilities 51,582,270 7,366,686 0.85 0.85
Polaris Industries Inc Consumer Goods 32,017,382 4,572,540 0.49 0.49
Polo Ralph Lauren Corp Consumer Services 10,384,749 1,483,091 0.06 0.03
Polycom Inc Technology 29,350,658 4,191,694 0.37 0.37
PolyOne Corp Basic Materials 8,287,001 1,183,502 0.41 0.41
Polypore International Inc Basic Materials 7,654,157 1,093,123 0.33 0.33
Pool Corp Consumer Goods 26,511,527 3,786,225 0.44 0.44
Industry/Sector Market valueNOK
Market valueUSD Voting Ownership
GOVERNMENT PENSION FUND GLOBAL HOLDINGS 2008
Equities Country association according to FTSE (the benchmark provider for equities). If a company is not in thebenchmark, the country of incorporation and country of listing is used. For remaining securities, a further assessment ismade. Country is defined as a sovereign state currently member of the United Nations. Exceptions are Hong Kong andTaiwan. The country association methodology was updated as of 2014.
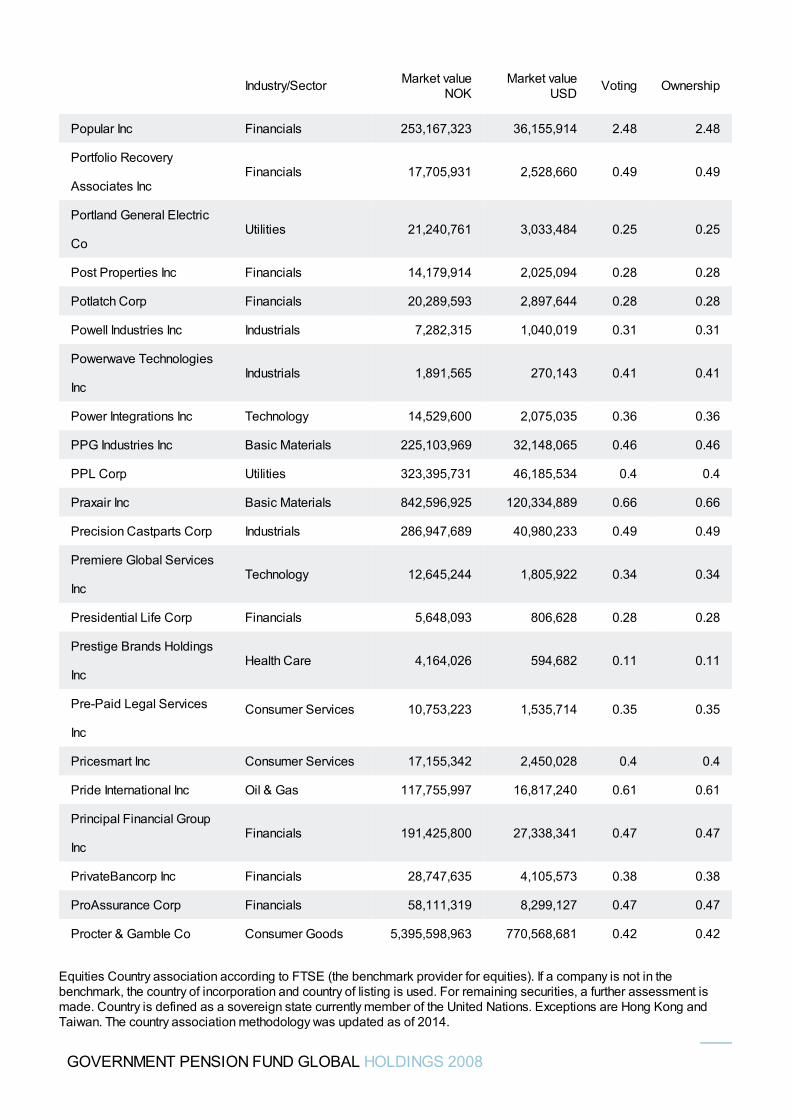
Popular Inc Financials 253,167,323 36,155,914 2.48 2.48
Portfolio Recovery
Associates IncFinancials 17,705,931 2,528,660 0.49 0.49
Portland General Electric
CoUtilities 21,240,761 3,033,484 0.25 0.25
Post Properties Inc Financials 14,179,914 2,025,094 0.28 0.28
Potlatch Corp Financials 20,289,593 2,897,644 0.28 0.28
Powell Industries Inc Industrials 7,282,315 1,040,019 0.31 0.31
Powerwave Technologies
IncIndustrials 1,891,565 270,143 0.41 0.41
Power Integrations Inc Technology 14,529,600 2,075,035 0.36 0.36
PPG Industries Inc Basic Materials 225,103,969 32,148,065 0.46 0.46
PPL Corp Utilities 323,395,731 46,185,534 0.4 0.4
Praxair Inc Basic Materials 842,596,925 120,334,889 0.66 0.66
Precision Castparts Corp Industrials 286,947,689 40,980,233 0.49 0.49
Premiere Global Services
IncTechnology 12,645,244 1,805,922 0.34 0.34
Presidential Life Corp Financials 5,648,093 806,628 0.28 0.28
Prestige Brands Holdings
IncHealth Care 4,164,026 594,682 0.11 0.11
Pre-Paid Legal Services
Inc
Consumer Services 10,753,223 1,535,714 0.35 0.35
Pricesmart Inc Consumer Services 17,155,342 2,450,028 0.4 0.4
Pride International Inc Oil & Gas 117,755,997 16,817,240 0.61 0.61
Principal Financial Group
IncFinancials 191,425,800 27,338,341 0.47 0.47
PrivateBancorp Inc Financials 28,747,635 4,105,573 0.38 0.38
ProAssurance Corp Financials 58,111,319 8,299,127 0.47 0.47
Procter & Gamble Co Consumer Goods 5,395,598,963 770,568,681 0.42 0.42
Industry/Sector Market valueNOK
Market valueUSD Voting Ownership
GOVERNMENT PENSION FUND GLOBAL HOLDINGS 2008
Equities Country association according to FTSE (the benchmark provider for equities). If a company is not in thebenchmark, the country of incorporation and country of listing is used. For remaining securities, a further assessment ismade. Country is defined as a sovereign state currently member of the United Nations. Exceptions are Hong Kong andTaiwan. The country association methodology was updated as of 2014.
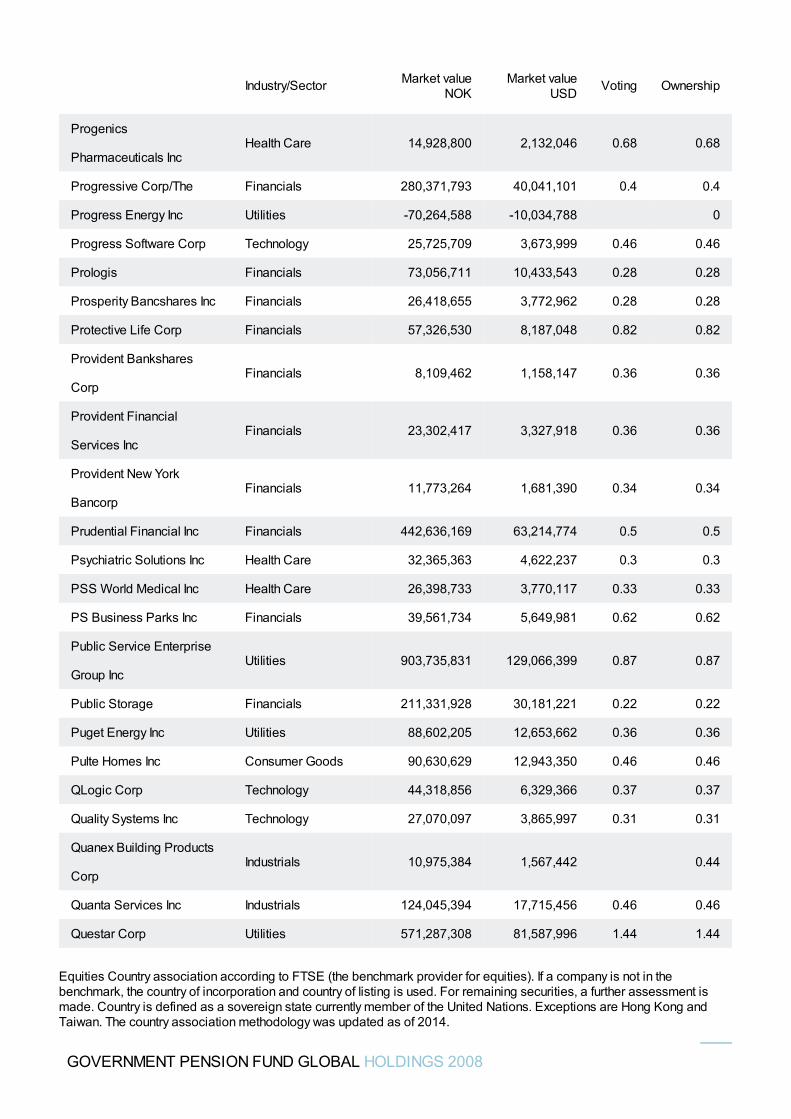
Progenics
Pharmaceuticals IncHealth Care 14,928,800 2,132,046 0.68 0.68
Progressive Corp/The Financials 280,371,793 40,041,101 0.4 0.4
Progress Energy Inc Utilities -70,264,588 -10,034,788 0
Progress Software Corp Technology 25,725,709 3,673,999 0.46 0.46
Prologis Financials 73,056,711 10,433,543 0.28 0.28
Prosperity Bancshares Inc Financials 26,418,655 3,772,962 0.28 0.28
Protective Life Corp Financials 57,326,530 8,187,048 0.82 0.82
Provident Bankshares
CorpFinancials 8,109,462 1,158,147 0.36 0.36
Provident Financial
Services IncFinancials 23,302,417 3,327,918 0.36 0.36
Provident New York
BancorpFinancials 11,773,264 1,681,390 0.34 0.34
Prudential Financial Inc Financials 442,636,169 63,214,774 0.5 0.5
Psychiatric Solutions Inc Health Care 32,365,363 4,622,237 0.3 0.3
PSS World Medical Inc Health Care 26,398,733 3,770,117 0.33 0.33
PS Business Parks Inc Financials 39,561,734 5,649,981 0.62 0.62
Public Service Enterprise
Group IncUtilities 903,735,831 129,066,399 0.87 0.87
Public Storage Financials 211,331,928 30,181,221 0.22 0.22
Puget Energy Inc Utilities 88,602,205 12,653,662 0.36 0.36
Pulte Homes Inc Consumer Goods 90,630,629 12,943,350 0.46 0.46
QLogic Corp Technology 44,318,856 6,329,366 0.37 0.37
Quality Systems Inc Technology 27,070,097 3,865,997 0.31 0.31
Quanex Building Products
CorpIndustrials 10,975,384 1,567,442 0.44
Quanta Services Inc Industrials 124,045,394 17,715,456 0.46 0.46
Questar Corp Utilities 571,287,308 81,587,996 1.44 1.44
Industry/Sector Market valueNOK
Market valueUSD Voting Ownership
GOVERNMENT PENSION FUND GLOBAL HOLDINGS 2008
Equities Country association according to FTSE (the benchmark provider for equities). If a company is not in thebenchmark, the country of incorporation and country of listing is used. For remaining securities, a further assessment ismade. Country is defined as a sovereign state currently member of the United Nations. Exceptions are Hong Kong andTaiwan. The country association methodology was updated as of 2014.
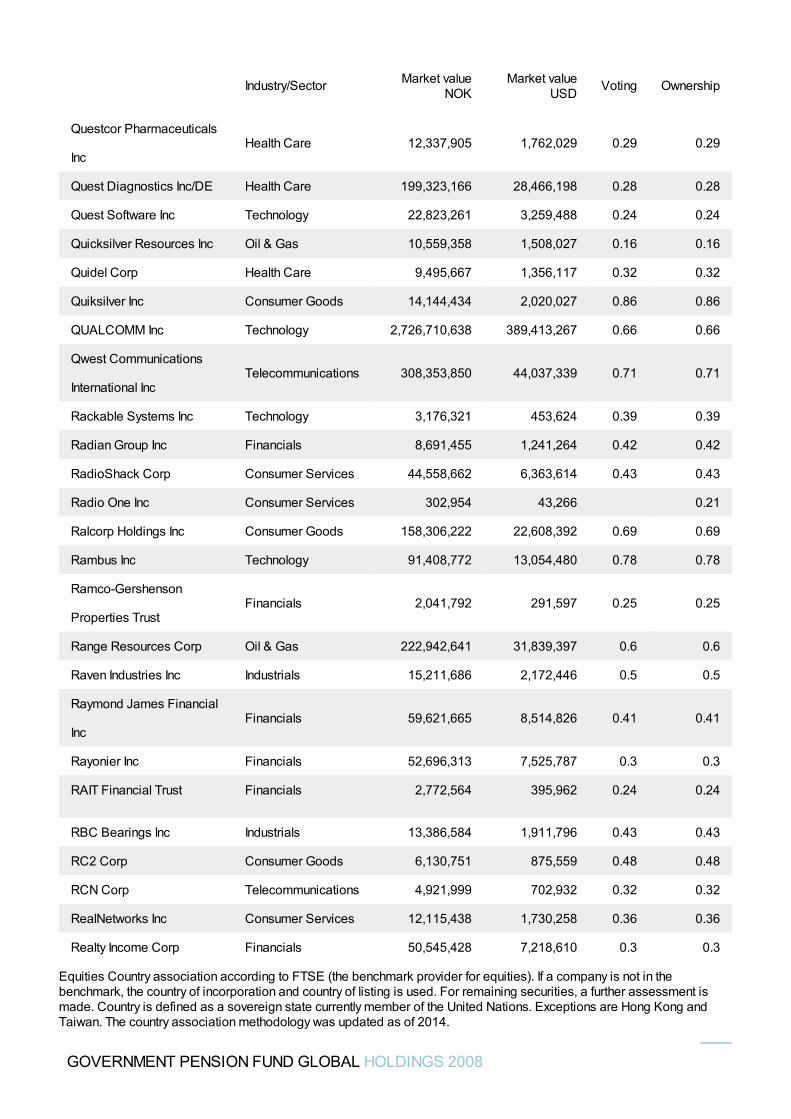
Questcor Pharmaceuticals
IncHealth Care 12,337,905 1,762,029 0.29 0.29
Quest Diagnostics Inc/DE Health Care 199,323,166 28,466,198 0.28 0.28
Quest Software Inc Technology 22,823,261 3,259,488 0.24 0.24
Quicksilver Resources Inc Oil & Gas 10,559,358 1,508,027 0.16 0.16
Quidel Corp Health Care 9,495,667 1,356,117 0.32 0.32
Quiksilver Inc Consumer Goods 14,144,434 2,020,027 0.86 0.86
QUALCOMM Inc Technology 2,726,710,638 389,413,267 0.66 0.66
Qwest Communications
International IncTelecommunications 308,353,850 44,037,339 0.71 0.71
Rackable Systems Inc Technology 3,176,321 453,624 0.39 0.39
Radian Group Inc Financials 8,691,455 1,241,264 0.42 0.42
RadioShack Corp Consumer Services 44,558,662 6,363,614 0.43 0.43
Radio One Inc Consumer Services 302,954 43,266 0.21
Ralcorp Holdings Inc Consumer Goods 158,306,222 22,608,392 0.69 0.69
Rambus Inc Technology 91,408,772 13,054,480 0.78 0.78
Ramco-Gershenson
Properties TrustFinancials 2,041,792 291,597 0.25 0.25
Range Resources Corp Oil & Gas 222,942,641 31,839,397 0.6 0.6
Raven Industries Inc Industrials 15,211,686 2,172,446 0.5 0.5
Raymond James Financial
IncFinancials 59,621,665 8,514,826 0.41 0.41
Rayonier Inc Financials 52,696,313 7,525,787 0.3 0.3
RAIT Financial Trust Financials 2,772,564 395,962 0.24 0.24
RBC Bearings Inc Industrials 13,386,584 1,911,796 0.43 0.43
RC2 Corp Consumer Goods 6,130,751 875,559 0.48 0.48
RCN Corp Telecommunications 4,921,999 702,932 0.32 0.32
RealNetworks Inc Consumer Services 12,115,438 1,730,258 0.36 0.36
Realty Income Corp Financials 50,545,428 7,218,610 0.3 0.3
Industry/Sector Market valueNOK
Market valueUSD Voting Ownership
GOVERNMENT PENSION FUND GLOBAL HOLDINGS 2008
Equities Country association according to FTSE (the benchmark provider for equities). If a company is not in thebenchmark, the country of incorporation and country of listing is used. For remaining securities, a further assessment ismade. Country is defined as a sovereign state currently member of the United Nations. Exceptions are Hong Kong andTaiwan. The country association methodology was updated as of 2014.
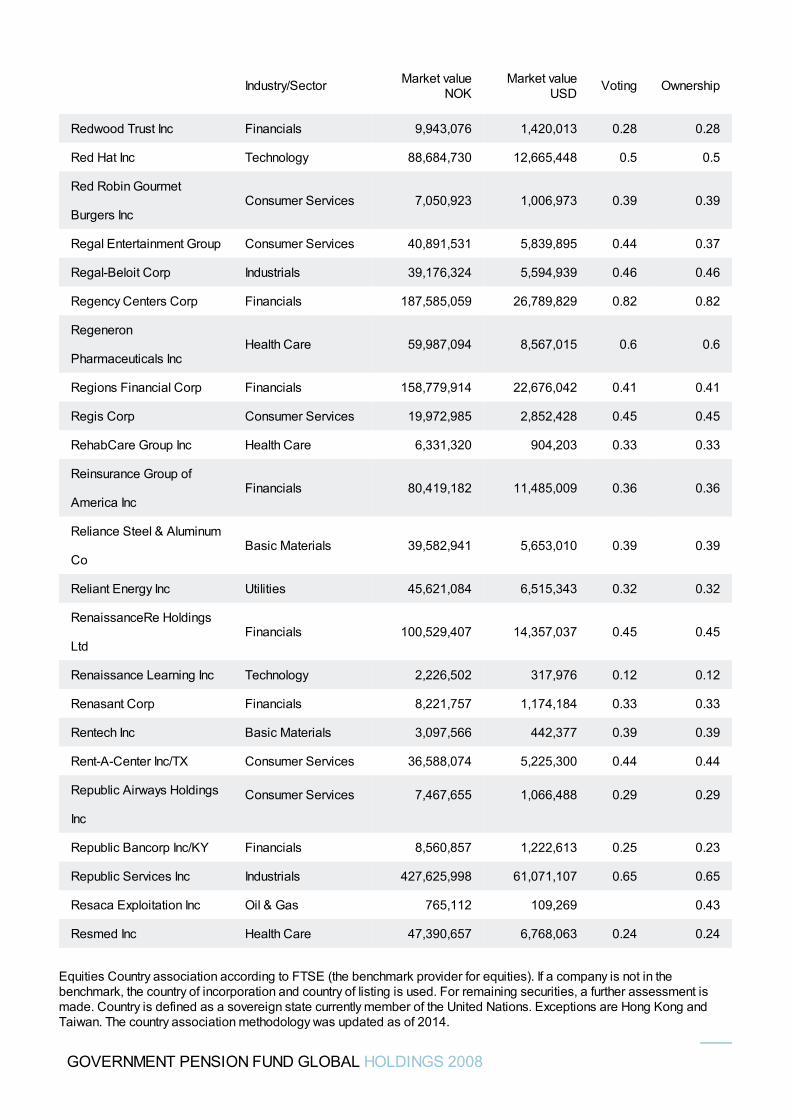
Redwood Trust Inc Financials 9,943,076 1,420,013 0.28 0.28
Red Hat Inc Technology 88,684,730 12,665,448 0.5 0.5
Red Robin Gourmet
Burgers IncConsumer Services 7,050,923 1,006,973 0.39 0.39
Regal Entertainment Group Consumer Services 40,891,531 5,839,895 0.44 0.37
Regal-Beloit Corp Industrials 39,176,324 5,594,939 0.46 0.46
Regency Centers Corp Financials 187,585,059 26,789,829 0.82 0.82
Regeneron
Pharmaceuticals IncHealth Care 59,987,094 8,567,015 0.6 0.6
Regions Financial Corp Financials 158,779,914 22,676,042 0.41 0.41
Regis Corp Consumer Services 19,972,985 2,852,428 0.45 0.45
RehabCare Group Inc Health Care 6,331,320 904,203 0.33 0.33
Reinsurance Group of
America IncFinancials 80,419,182 11,485,009 0.36 0.36
Reliance Steel & Aluminum
CoBasic Materials 39,582,941 5,653,010 0.39 0.39
Reliant Energy Inc Utilities 45,621,084 6,515,343 0.32 0.32
RenaissanceRe Holdings
LtdFinancials 100,529,407 14,357,037 0.45 0.45
Renaissance Learning Inc Technology 2,226,502 317,976 0.12 0.12
Renasant Corp Financials 8,221,757 1,174,184 0.33 0.33
Rentech Inc Basic Materials 3,097,566 442,377 0.39 0.39
Rent-A-Center Inc/TX Consumer Services 36,588,074 5,225,300 0.44 0.44
Republic Airways Holdings
Inc
Consumer Services 7,467,655 1,066,488 0.29 0.29
Republic Bancorp Inc/KY Financials 8,560,857 1,222,613 0.25 0.23
Republic Services Inc Industrials 427,625,998 61,071,107 0.65 0.65
Resaca Exploitation Inc Oil & Gas 765,112 109,269 0.43
Resmed Inc Health Care 47,390,657 6,768,063 0.24 0.24
Industry/Sector Market valueNOK
Market valueUSD Voting Ownership
GOVERNMENT PENSION FUND GLOBAL HOLDINGS 2008
Equities Country association according to FTSE (the benchmark provider for equities). If a company is not in thebenchmark, the country of incorporation and country of listing is used. For remaining securities, a further assessment ismade. Country is defined as a sovereign state currently member of the United Nations. Exceptions are Hong Kong andTaiwan. The country association methodology was updated as of 2014.
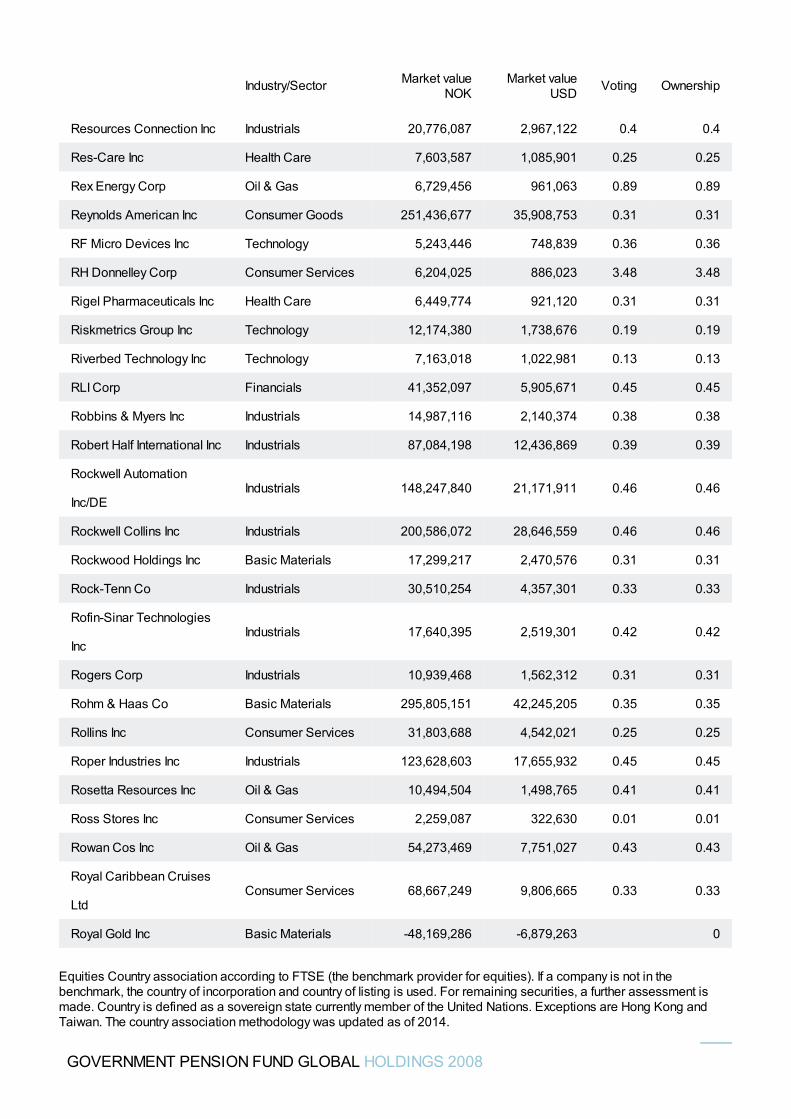
Resources Connection Inc Industrials 20,776,087 2,967,122 0.4 0.4
Res-Care Inc Health Care 7,603,587 1,085,901 0.25 0.25
Rex Energy Corp Oil & Gas 6,729,456 961,063 0.89 0.89
Reynolds American Inc Consumer Goods 251,436,677 35,908,753 0.31 0.31
RF Micro Devices Inc Technology 5,243,446 748,839 0.36 0.36
RH Donnelley Corp Consumer Services 6,204,025 886,023 3.48 3.48
Rigel Pharmaceuticals Inc Health Care 6,449,774 921,120 0.31 0.31
Riskmetrics Group Inc Technology 12,174,380 1,738,676 0.19 0.19
Riverbed Technology Inc Technology 7,163,018 1,022,981 0.13 0.13
RLI Corp Financials 41,352,097 5,905,671 0.45 0.45
Robbins & Myers Inc Industrials 14,987,116 2,140,374 0.38 0.38
Robert Half International Inc Industrials 87,084,198 12,436,869 0.39 0.39
Rockwell Automation
Inc/DEIndustrials 148,247,840 21,171,911 0.46 0.46
Rockwell Collins Inc Industrials 200,586,072 28,646,559 0.46 0.46
Rockwood Holdings Inc Basic Materials 17,299,217 2,470,576 0.31 0.31
Rock-Tenn Co Industrials 30,510,254 4,357,301 0.33 0.33
Rofin-Sinar Technologies
IncIndustrials 17,640,395 2,519,301 0.42 0.42
Rogers Corp Industrials 10,939,468 1,562,312 0.31 0.31
Rohm & Haas Co Basic Materials 295,805,151 42,245,205 0.35 0.35
Rollins Inc Consumer Services 31,803,688 4,542,021 0.25 0.25
Roper Industries Inc Industrials 123,628,603 17,655,932 0.45 0.45
Rosetta Resources Inc Oil & Gas 10,494,504 1,498,765 0.41 0.41
Ross Stores Inc Consumer Services 2,259,087 322,630 0.01 0.01
Rowan Cos Inc Oil & Gas 54,273,469 7,751,027 0.43 0.43
Royal Caribbean Cruises
LtdConsumer Services 68,667,249 9,806,665 0.33 0.33
Royal Gold Inc Basic Materials -48,169,286 -6,879,263 0
Industry/Sector Market valueNOK
Market valueUSD Voting Ownership
GOVERNMENT PENSION FUND GLOBAL HOLDINGS 2008
Equities Country association according to FTSE (the benchmark provider for equities). If a company is not in thebenchmark, the country of incorporation and country of listing is used. For remaining securities, a further assessment ismade. Country is defined as a sovereign state currently member of the United Nations. Exceptions are Hong Kong andTaiwan. The country association methodology was updated as of 2014.
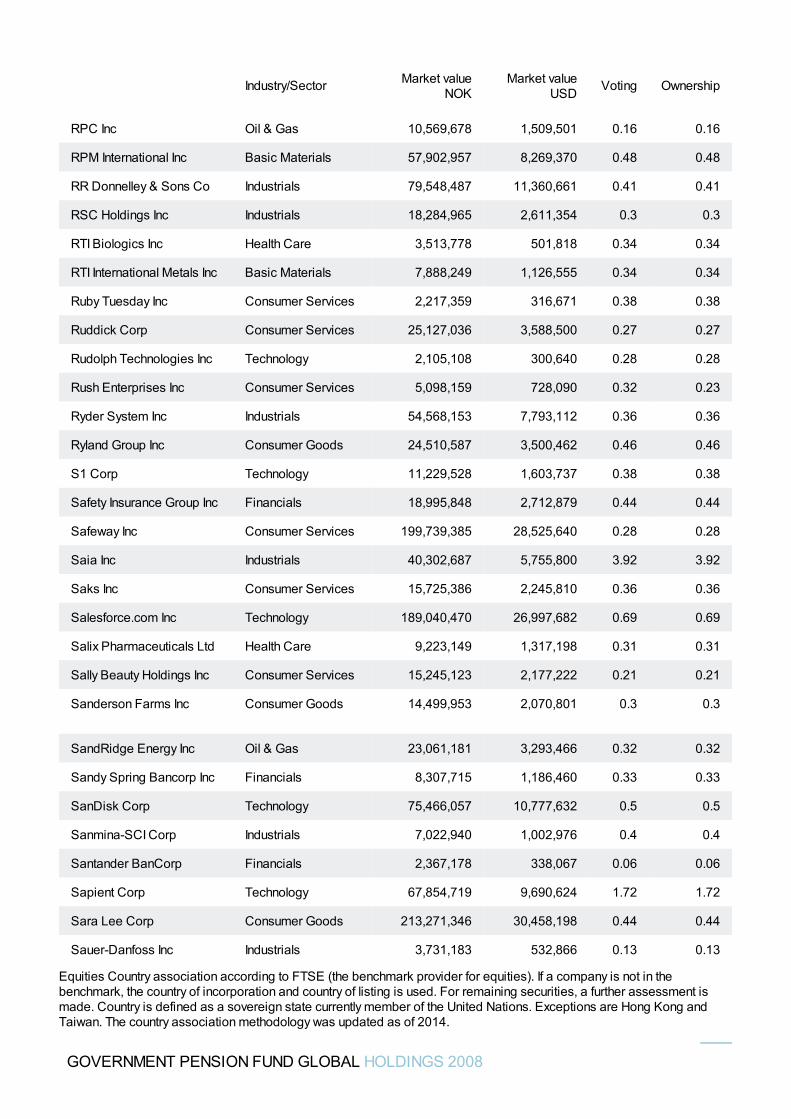
RPC Inc Oil & Gas 10,569,678 1,509,501 0.16 0.16
RPM International Inc Basic Materials 57,902,957 8,269,370 0.48 0.48
RR Donnelley & Sons Co Industrials 79,548,487 11,360,661 0.41 0.41
RSC Holdings Inc Industrials 18,284,965 2,611,354 0.3 0.3
RTI Biologics Inc Health Care 3,513,778 501,818 0.34 0.34
RTI International Metals Inc Basic Materials 7,888,249 1,126,555 0.34 0.34
Ruby Tuesday Inc Consumer Services 2,217,359 316,671 0.38 0.38
Ruddick Corp Consumer Services 25,127,036 3,588,500 0.27 0.27
Rudolph Technologies Inc Technology 2,105,108 300,640 0.28 0.28
Rush Enterprises Inc Consumer Services 5,098,159 728,090 0.32 0.23
Ryder System Inc Industrials 54,568,153 7,793,112 0.36 0.36
Ryland Group Inc Consumer Goods 24,510,587 3,500,462 0.46 0.46
S1 Corp Technology 11,229,528 1,603,737 0.38 0.38
Safety Insurance Group Inc Financials 18,995,848 2,712,879 0.44 0.44
Safeway Inc Consumer Services 199,739,385 28,525,640 0.28 0.28
Saia Inc Industrials 40,302,687 5,755,800 3.92 3.92
Saks Inc Consumer Services 15,725,386 2,245,810 0.36 0.36
Salesforce.com Inc Technology 189,040,470 26,997,682 0.69 0.69
Salix Pharmaceuticals Ltd Health Care 9,223,149 1,317,198 0.31 0.31
Sally Beauty Holdings Inc Consumer Services 15,245,123 2,177,222 0.21 0.21
Sanderson Farms Inc Consumer Goods 14,499,953 2,070,801 0.3 0.3
SandRidge Energy Inc Oil & Gas 23,061,181 3,293,466 0.32 0.32
Sandy Spring Bancorp Inc Financials 8,307,715 1,186,460 0.33 0.33
SanDisk Corp Technology 75,466,057 10,777,632 0.5 0.5
Sanmina-SCI Corp Industrials 7,022,940 1,002,976 0.4 0.4
Santander BanCorp Financials 2,367,178 338,067 0.06 0.06
Sapient Corp Technology 67,854,719 9,690,624 1.72 1.72
Sara Lee Corp Consumer Goods 213,271,346 30,458,198 0.44 0.44
Sauer-Danfoss Inc Industrials 3,731,183 532,866 0.13 0.13
Industry/Sector Market valueNOK
Market valueUSD Voting Ownership
GOVERNMENT PENSION FUND GLOBAL HOLDINGS 2008
Equities Country association according to FTSE (the benchmark provider for equities). If a company is not in thebenchmark, the country of incorporation and country of listing is used. For remaining securities, a further assessment ismade. Country is defined as a sovereign state currently member of the United Nations. Exceptions are Hong Kong andTaiwan. The country association methodology was updated as of 2014.
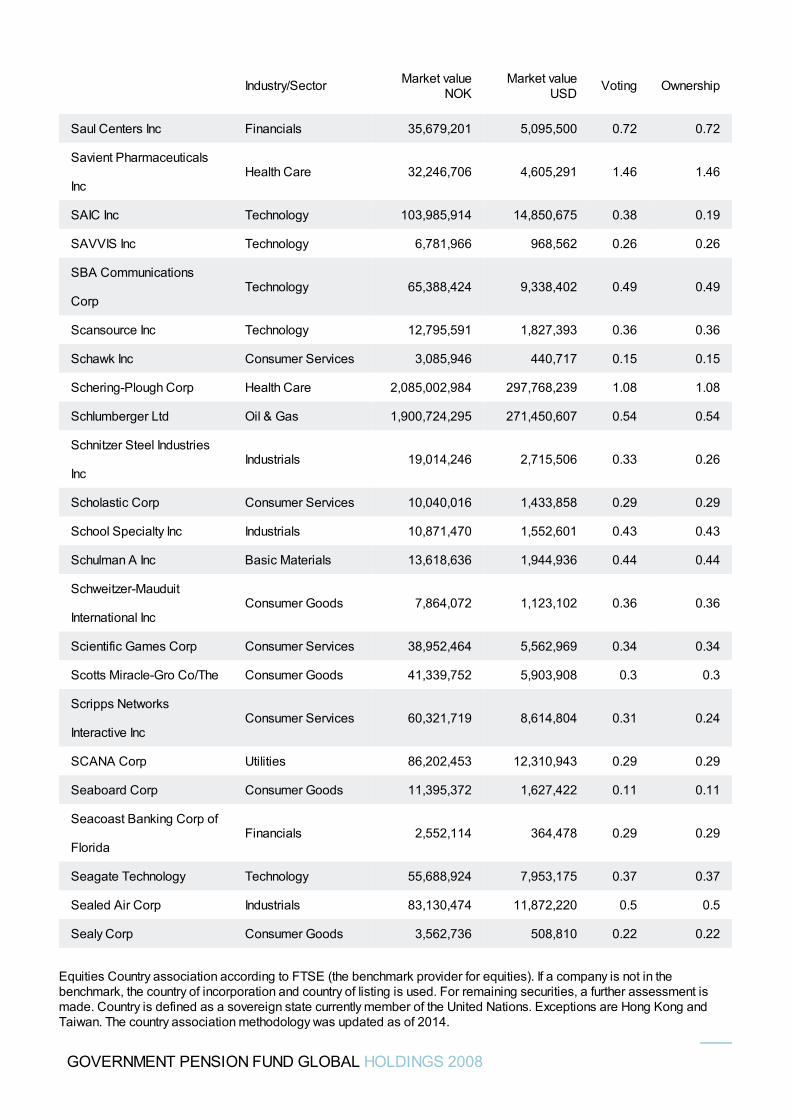
Saul Centers Inc Financials 35,679,201 5,095,500 0.72 0.72
Savient Pharmaceuticals
IncHealth Care 32,246,706 4,605,291 1.46 1.46
SAIC Inc Technology 103,985,914 14,850,675 0.38 0.19
SAVVIS Inc Technology 6,781,966 968,562 0.26 0.26
SBA Communications
CorpTechnology 65,388,424 9,338,402 0.49 0.49
Scansource Inc Technology 12,795,591 1,827,393 0.36 0.36
Schawk Inc Consumer Services 3,085,946 440,717 0.15 0.15
Schering-Plough Corp Health Care 2,085,002,984 297,768,239 1.08 1.08
Schlumberger Ltd Oil & Gas 1,900,724,295 271,450,607 0.54 0.54
Schnitzer Steel Industries
IncIndustrials 19,014,246 2,715,506 0.33 0.26
Scholastic Corp Consumer Services 10,040,016 1,433,858 0.29 0.29
School Specialty Inc Industrials 10,871,470 1,552,601 0.43 0.43
Schulman A Inc Basic Materials 13,618,636 1,944,936 0.44 0.44
Schweitzer-Mauduit
International IncConsumer Goods 7,864,072 1,123,102 0.36 0.36
Scientific Games Corp Consumer Services 38,952,464 5,562,969 0.34 0.34
Scotts Miracle-Gro Co/The Consumer Goods 41,339,752 5,903,908 0.3 0.3
Scripps Networks
Interactive IncConsumer Services 60,321,719 8,614,804 0.31 0.24
SCANA Corp Utilities 86,202,453 12,310,943 0.29 0.29
Seaboard Corp Consumer Goods 11,395,372 1,627,422 0.11 0.11
Seacoast Banking Corp of
FloridaFinancials 2,552,114 364,478 0.29 0.29
Seagate Technology Technology 55,688,924 7,953,175 0.37 0.37
Sealed Air Corp Industrials 83,130,474 11,872,220 0.5 0.5
Sealy Corp Consumer Goods 3,562,736 508,810 0.22 0.22
Industry/Sector Market valueNOK
Market valueUSD Voting Ownership
GOVERNMENT PENSION FUND GLOBAL HOLDINGS 2008
Equities Country association according to FTSE (the benchmark provider for equities). If a company is not in thebenchmark, the country of incorporation and country of listing is used. For remaining securities, a further assessment ismade. Country is defined as a sovereign state currently member of the United Nations. Exceptions are Hong Kong andTaiwan. The country association methodology was updated as of 2014.
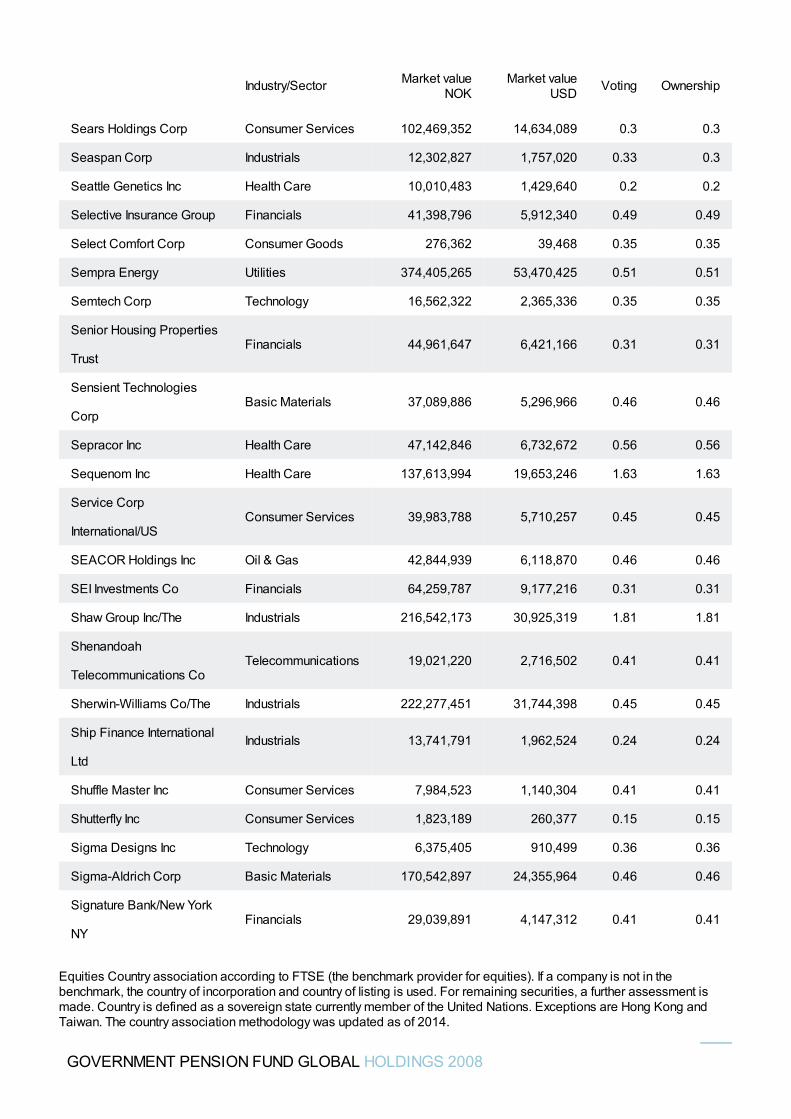
Sears Holdings Corp Consumer Services 102,469,352 14,634,089 0.3 0.3
Seaspan Corp Industrials 12,302,827 1,757,020 0.33 0.3
Seattle Genetics Inc Health Care 10,010,483 1,429,640 0.2 0.2
Selective Insurance Group Financials 41,398,796 5,912,340 0.49 0.49
Select Comfort Corp Consumer Goods 276,362 39,468 0.35 0.35
Sempra Energy Utilities 374,405,265 53,470,425 0.51 0.51
Semtech Corp Technology 16,562,322 2,365,336 0.35 0.35
Senior Housing Properties
TrustFinancials 44,961,647 6,421,166 0.31 0.31
Sensient Technologies
CorpBasic Materials 37,089,886 5,296,966 0.46 0.46
Sepracor Inc Health Care 47,142,846 6,732,672 0.56 0.56
Sequenom Inc Health Care 137,613,994 19,653,246 1.63 1.63
Service Corp
International/USConsumer Services 39,983,788 5,710,257 0.45 0.45
SEACOR Holdings Inc Oil & Gas 42,844,939 6,118,870 0.46 0.46
SEI Investments Co Financials 64,259,787 9,177,216 0.31 0.31
Shaw Group Inc/The Industrials 216,542,173 30,925,319 1.81 1.81
Shenandoah
Telecommunications CoTelecommunications 19,021,220 2,716,502 0.41 0.41
Sherwin-Williams Co/The Industrials 222,277,451 31,744,398 0.45 0.45
Ship Finance International
LtdIndustrials 13,741,791 1,962,524 0.24 0.24
Shuffle Master Inc Consumer Services 7,984,523 1,140,304 0.41 0.41
Shutterfly Inc Consumer Services 1,823,189 260,377 0.15 0.15
Sigma Designs Inc Technology 6,375,405 910,499 0.36 0.36
Sigma-Aldrich Corp Basic Materials 170,542,897 24,355,964 0.46 0.46
Signature Bank/New York
NYFinancials 29,039,891 4,147,312 0.41 0.41
Industry/Sector Market valueNOK
Market valueUSD Voting Ownership
GOVERNMENT PENSION FUND GLOBAL HOLDINGS 2008
Equities Country association according to FTSE (the benchmark provider for equities). If a company is not in thebenchmark, the country of incorporation and country of listing is used. For remaining securities, a further assessment ismade. Country is defined as a sovereign state currently member of the United Nations. Exceptions are Hong Kong andTaiwan. The country association methodology was updated as of 2014.
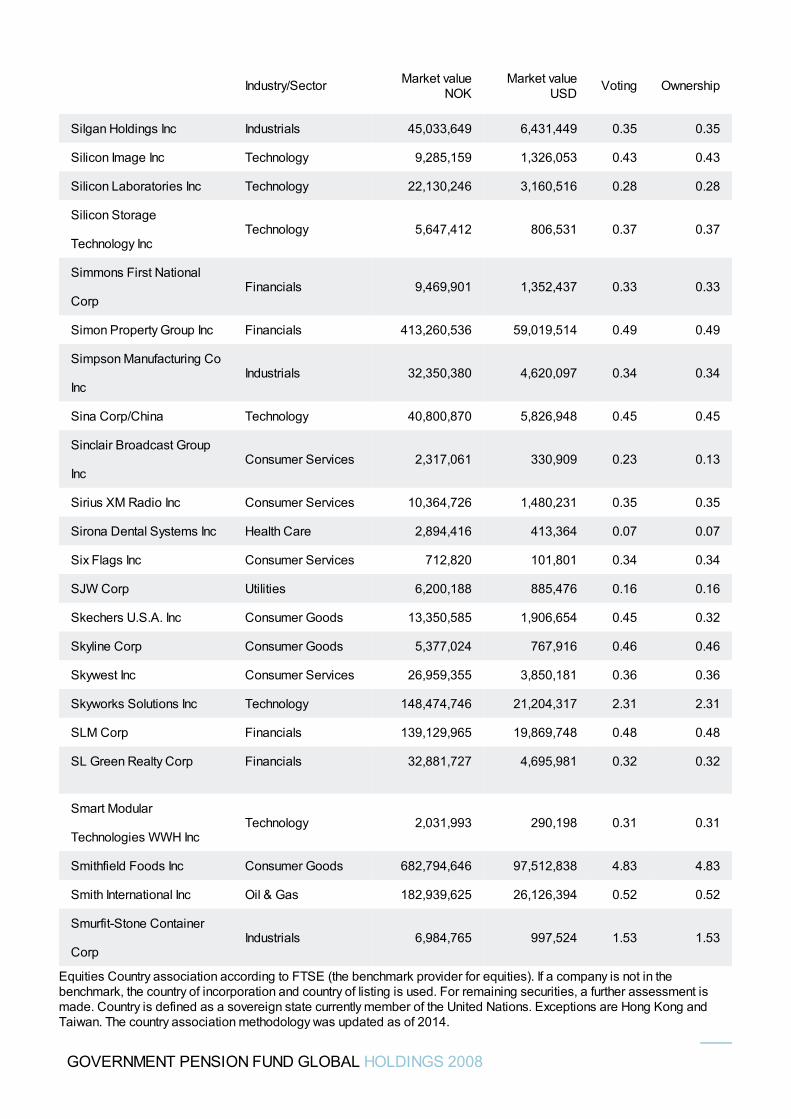
Silgan Holdings Inc Industrials 45,033,649 6,431,449 0.35 0.35
Silicon Image Inc Technology 9,285,159 1,326,053 0.43 0.43
Silicon Laboratories Inc Technology 22,130,246 3,160,516 0.28 0.28
Silicon Storage
Technology IncTechnology 5,647,412 806,531 0.37 0.37
Simmons First National
CorpFinancials 9,469,901 1,352,437 0.33 0.33
Simon Property Group Inc Financials 413,260,536 59,019,514 0.49 0.49
Simpson Manufacturing Co
IncIndustrials 32,350,380 4,620,097 0.34 0.34
Sina Corp/China Technology 40,800,870 5,826,948 0.45 0.45
Sinclair Broadcast Group
IncConsumer Services 2,317,061 330,909 0.23 0.13
Sirius XM Radio Inc Consumer Services 10,364,726 1,480,231 0.35 0.35
Sirona Dental Systems Inc Health Care 2,894,416 413,364 0.07 0.07
Six Flags Inc Consumer Services 712,820 101,801 0.34 0.34
SJW Corp Utilities 6,200,188 885,476 0.16 0.16
Skechers U.S.A. Inc Consumer Goods 13,350,585 1,906,654 0.45 0.32
Skyline Corp Consumer Goods 5,377,024 767,916 0.46 0.46
Skywest Inc Consumer Services 26,959,355 3,850,181 0.36 0.36
Skyworks Solutions Inc Technology 148,474,746 21,204,317 2.31 2.31
SLM Corp Financials 139,129,965 19,869,748 0.48 0.48
SL Green Realty Corp Financials 32,881,727 4,695,981 0.32 0.32
Smart Modular
Technologies WWH IncTechnology 2,031,993 290,198 0.31 0.31
Smithfield Foods Inc Consumer Goods 682,794,646 97,512,838 4.83 4.83
Smith International Inc Oil & Gas 182,939,625 26,126,394 0.52 0.52
Smurfit-Stone Container
CorpIndustrials 6,984,765 997,524 1.53 1.53
Industry/Sector Market valueNOK
Market valueUSD Voting Ownership
GOVERNMENT PENSION FUND GLOBAL HOLDINGS 2008
Equities Country association according to FTSE (the benchmark provider for equities). If a company is not in thebenchmark, the country of incorporation and country of listing is used. For remaining securities, a further assessment ismade. Country is defined as a sovereign state currently member of the United Nations. Exceptions are Hong Kong andTaiwan. The country association methodology was updated as of 2014.
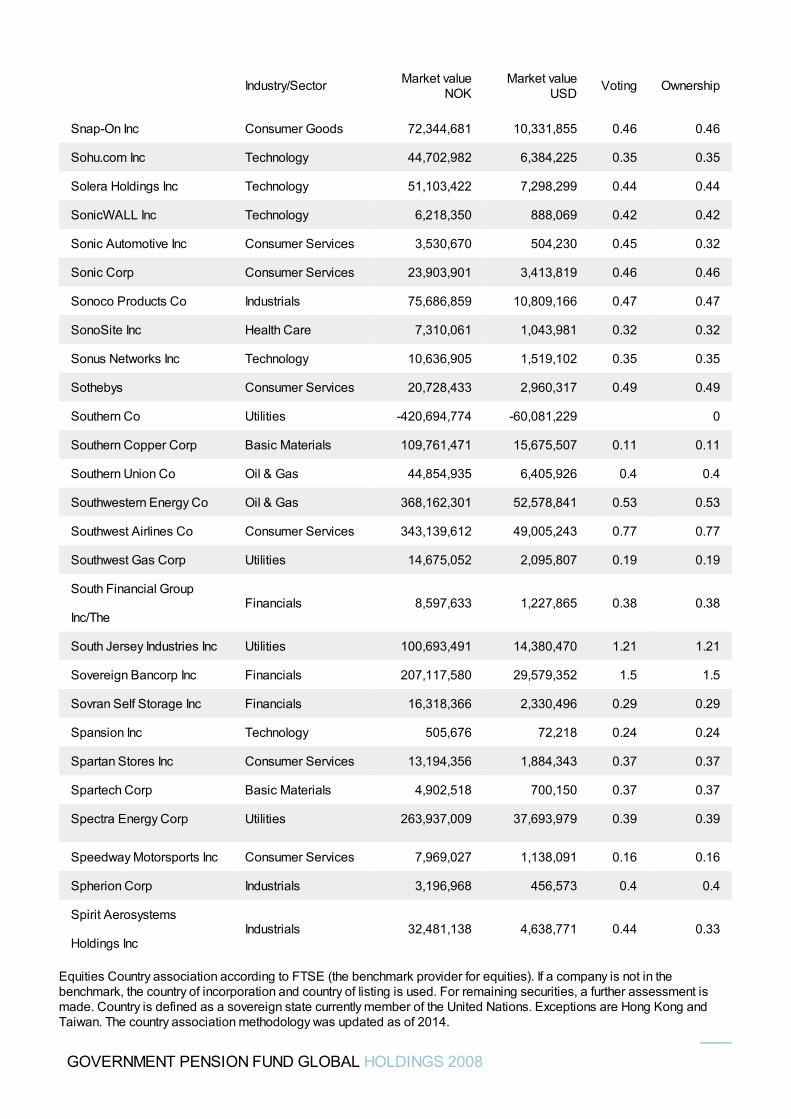
Snap-On Inc Consumer Goods 72,344,681 10,331,855 0.46 0.46
Sohu.com Inc Technology 44,702,982 6,384,225 0.35 0.35
Solera Holdings Inc Technology 51,103,422 7,298,299 0.44 0.44
SonicWALL Inc Technology 6,218,350 888,069 0.42 0.42
Sonic Automotive Inc Consumer Services 3,530,670 504,230 0.45 0.32
Sonic Corp Consumer Services 23,903,901 3,413,819 0.46 0.46
Sonoco Products Co Industrials 75,686,859 10,809,166 0.47 0.47
SonoSite Inc Health Care 7,310,061 1,043,981 0.32 0.32
Sonus Networks Inc Technology 10,636,905 1,519,102 0.35 0.35
Sothebys Consumer Services 20,728,433 2,960,317 0.49 0.49
Southern Co Utilities -420,694,774 -60,081,229 0
Southern Copper Corp Basic Materials 109,761,471 15,675,507 0.11 0.11
Southern Union Co Oil & Gas 44,854,935 6,405,926 0.4 0.4
Southwestern Energy Co Oil & Gas 368,162,301 52,578,841 0.53 0.53
Southwest Airlines Co Consumer Services 343,139,612 49,005,243 0.77 0.77
Southwest Gas Corp Utilities 14,675,052 2,095,807 0.19 0.19
South Financial Group
Inc/TheFinancials 8,597,633 1,227,865 0.38 0.38
South Jersey Industries Inc Utilities 100,693,491 14,380,470 1.21 1.21
Sovereign Bancorp Inc Financials 207,117,580 29,579,352 1.5 1.5
Sovran Self Storage Inc Financials 16,318,366 2,330,496 0.29 0.29
Spansion Inc Technology 505,676 72,218 0.24 0.24
Spartan Stores Inc Consumer Services 13,194,356 1,884,343 0.37 0.37
Spartech Corp Basic Materials 4,902,518 700,150 0.37 0.37
Spectra Energy Corp Utilities 263,937,009 37,693,979 0.39 0.39
Speedway Motorsports Inc Consumer Services 7,969,027 1,138,091 0.16 0.16
Spherion Corp Industrials 3,196,968 456,573 0.4 0.4
Spirit Aerosystems
Holdings IncIndustrials 32,481,138 4,638,771 0.44 0.33
Industry/Sector Market valueNOK
Market valueUSD Voting Ownership
GOVERNMENT PENSION FUND GLOBAL HOLDINGS 2008
Equities Country association according to FTSE (the benchmark provider for equities). If a company is not in thebenchmark, the country of incorporation and country of listing is used. For remaining securities, a further assessment ismade. Country is defined as a sovereign state currently member of the United Nations. Exceptions are Hong Kong andTaiwan. The country association methodology was updated as of 2014.
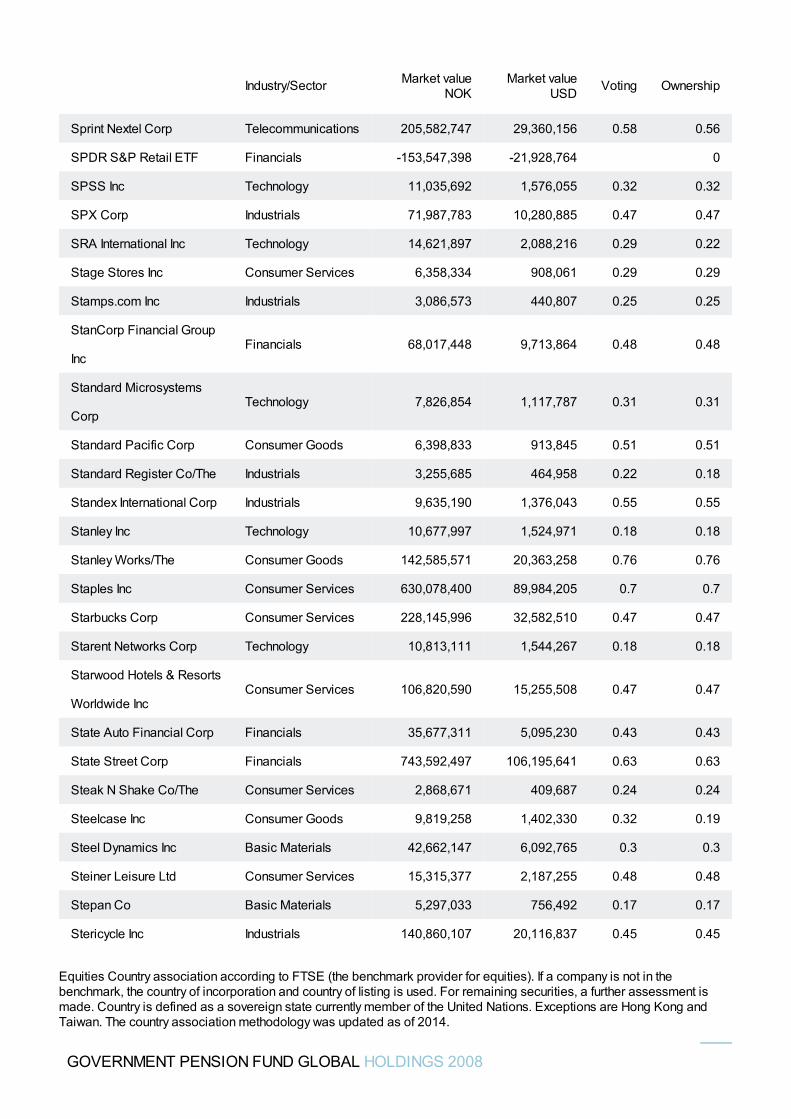
Sprint Nextel Corp Telecommunications 205,582,747 29,360,156 0.58 0.56
SPDR S&P Retail ETF Financials -153,547,398 -21,928,764 0
SPSS Inc Technology 11,035,692 1,576,055 0.32 0.32
SPX Corp Industrials 71,987,783 10,280,885 0.47 0.47
SRA International Inc Technology 14,621,897 2,088,216 0.29 0.22
Stage Stores Inc Consumer Services 6,358,334 908,061 0.29 0.29
Stamps.com Inc Industrials 3,086,573 440,807 0.25 0.25
StanCorp Financial Group
IncFinancials 68,017,448 9,713,864 0.48 0.48
Standard Microsystems
CorpTechnology 7,826,854 1,117,787 0.31 0.31
Standard Pacific Corp Consumer Goods 6,398,833 913,845 0.51 0.51
Standard Register Co/The Industrials 3,255,685 464,958 0.22 0.18
Standex International Corp Industrials 9,635,190 1,376,043 0.55 0.55
Stanley Inc Technology 10,677,997 1,524,971 0.18 0.18
Stanley Works/The Consumer Goods 142,585,571 20,363,258 0.76 0.76
Staples Inc Consumer Services 630,078,400 89,984,205 0.7 0.7
Starbucks Corp Consumer Services 228,145,996 32,582,510 0.47 0.47
Starent Networks Corp Technology 10,813,111 1,544,267 0.18 0.18
Starwood Hotels & Resorts
Worldwide IncConsumer Services 106,820,590 15,255,508 0.47 0.47
State Auto Financial Corp Financials 35,677,311 5,095,230 0.43 0.43
State Street Corp Financials 743,592,497 106,195,641 0.63 0.63
Steak N Shake Co/The Consumer Services 2,868,671 409,687 0.24 0.24
Steelcase Inc Consumer Goods 9,819,258 1,402,330 0.32 0.19
Steel Dynamics Inc Basic Materials 42,662,147 6,092,765 0.3 0.3
Steiner Leisure Ltd Consumer Services 15,315,377 2,187,255 0.48 0.48
Stepan Co Basic Materials 5,297,033 756,492 0.17 0.17
Stericycle Inc Industrials 140,860,107 20,116,837 0.45 0.45
Industry/Sector Market valueNOK
Market valueUSD Voting Ownership
GOVERNMENT PENSION FUND GLOBAL HOLDINGS 2008
Equities Country association according to FTSE (the benchmark provider for equities). If a company is not in thebenchmark, the country of incorporation and country of listing is used. For remaining securities, a further assessment ismade. Country is defined as a sovereign state currently member of the United Nations. Exceptions are Hong Kong andTaiwan. The country association methodology was updated as of 2014.
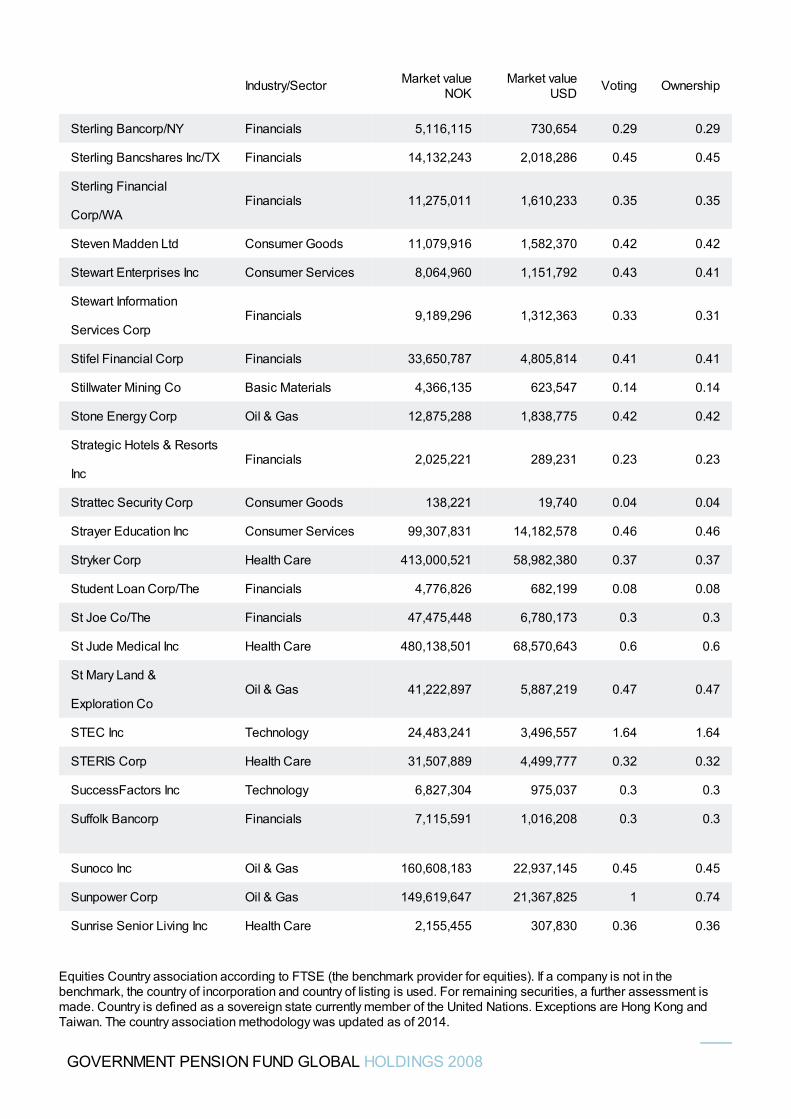
Sterling Bancorp/NY Financials 5,116,115 730,654 0.29 0.29
Sterling Bancshares Inc/TX Financials 14,132,243 2,018,286 0.45 0.45
Sterling Financial
Corp/WAFinancials 11,275,011 1,610,233 0.35 0.35
Steven Madden Ltd Consumer Goods 11,079,916 1,582,370 0.42 0.42
Stewart Enterprises Inc Consumer Services 8,064,960 1,151,792 0.43 0.41
Stewart Information
Services CorpFinancials 9,189,296 1,312,363 0.33 0.31
Stifel Financial Corp Financials 33,650,787 4,805,814 0.41 0.41
Stillwater Mining Co Basic Materials 4,366,135 623,547 0.14 0.14
Stone Energy Corp Oil & Gas 12,875,288 1,838,775 0.42 0.42
Strategic Hotels & Resorts
IncFinancials 2,025,221 289,231 0.23 0.23
Strattec Security Corp Consumer Goods 138,221 19,740 0.04 0.04
Strayer Education Inc Consumer Services 99,307,831 14,182,578 0.46 0.46
Stryker Corp Health Care 413,000,521 58,982,380 0.37 0.37
Student Loan Corp/The Financials 4,776,826 682,199 0.08 0.08
St Joe Co/The Financials 47,475,448 6,780,173 0.3 0.3
St Jude Medical Inc Health Care 480,138,501 68,570,643 0.6 0.6
St Mary Land &
Exploration CoOil & Gas 41,222,897 5,887,219 0.47 0.47
STEC Inc Technology 24,483,241 3,496,557 1.64 1.64
STERIS Corp Health Care 31,507,889 4,499,777 0.32 0.32
SuccessFactors Inc Technology 6,827,304 975,037 0.3 0.3
Suffolk Bancorp Financials 7,115,591 1,016,208 0.3 0.3
Sunoco Inc Oil & Gas 160,608,183 22,937,145 0.45 0.45
Sunpower Corp Oil & Gas 149,619,647 21,367,825 1 0.74
Sunrise Senior Living Inc Health Care 2,155,455 307,830 0.36 0.36
Industry/Sector Market valueNOK
Market valueUSD Voting Ownership
GOVERNMENT PENSION FUND GLOBAL HOLDINGS 2008
Equities Country association according to FTSE (the benchmark provider for equities). If a company is not in thebenchmark, the country of incorporation and country of listing is used. For remaining securities, a further assessment ismade. Country is defined as a sovereign state currently member of the United Nations. Exceptions are Hong Kong andTaiwan. The country association methodology was updated as of 2014.
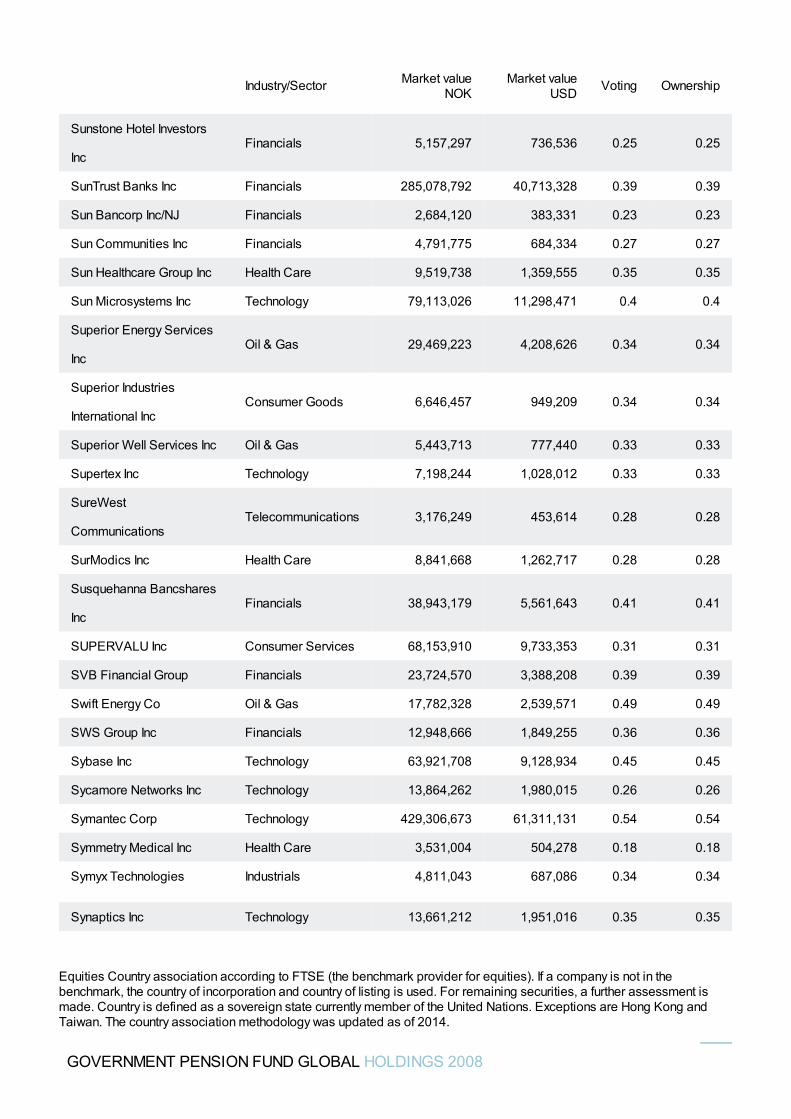
Sunstone Hotel Investors
IncFinancials 5,157,297 736,536 0.25 0.25
SunTrust Banks Inc Financials 285,078,792 40,713,328 0.39 0.39
Sun Bancorp Inc/NJ Financials 2,684,120 383,331 0.23 0.23
Sun Communities Inc Financials 4,791,775 684,334 0.27 0.27
Sun Healthcare Group Inc Health Care 9,519,738 1,359,555 0.35 0.35
Sun Microsystems Inc Technology 79,113,026 11,298,471 0.4 0.4
Superior Energy Services
IncOil & Gas 29,469,223 4,208,626 0.34 0.34
Superior Industries
International IncConsumer Goods 6,646,457 949,209 0.34 0.34
Superior Well Services Inc Oil & Gas 5,443,713 777,440 0.33 0.33
Supertex Inc Technology 7,198,244 1,028,012 0.33 0.33
SureWest
CommunicationsTelecommunications 3,176,249 453,614 0.28 0.28
SurModics Inc Health Care 8,841,668 1,262,717 0.28 0.28
Susquehanna Bancshares
IncFinancials 38,943,179 5,561,643 0.41 0.41
SUPERVALU Inc Consumer Services 68,153,910 9,733,353 0.31 0.31
SVB Financial Group Financials 23,724,570 3,388,208 0.39 0.39
Swift Energy Co Oil & Gas 17,782,328 2,539,571 0.49 0.49
SWS Group Inc Financials 12,948,666 1,849,255 0.36 0.36
Sybase Inc Technology 63,921,708 9,128,934 0.45 0.45
Sycamore Networks Inc Technology 13,864,262 1,980,015 0.26 0.26
Symantec Corp Technology 429,306,673 61,311,131 0.54 0.54
Symmetry Medical Inc Health Care 3,531,004 504,278 0.18 0.18
Symyx Technologies Industrials 4,811,043 687,086 0.34 0.34
Synaptics Inc Technology 13,661,212 1,951,016 0.35 0.35
Industry/Sector Market valueNOK
Market valueUSD Voting Ownership
GOVERNMENT PENSION FUND GLOBAL HOLDINGS 2008
Equities Country association according to FTSE (the benchmark provider for equities). If a company is not in thebenchmark, the country of incorporation and country of listing is used. For remaining securities, a further assessment ismade. Country is defined as a sovereign state currently member of the United Nations. Exceptions are Hong Kong andTaiwan. The country association methodology was updated as of 2014.
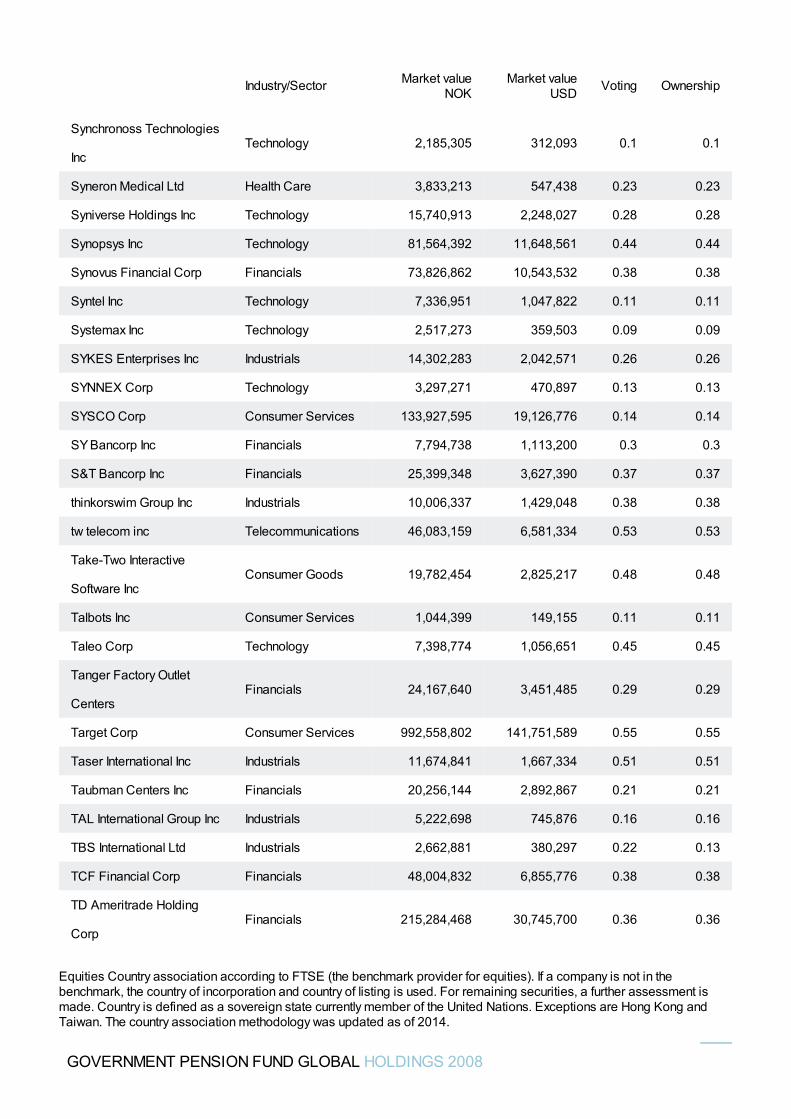
Synchronoss Technologies
IncTechnology 2,185,305 312,093 0.1 0.1
Syneron Medical Ltd Health Care 3,833,213 547,438 0.23 0.23
Syniverse Holdings Inc Technology 15,740,913 2,248,027 0.28 0.28
Synopsys Inc Technology 81,564,392 11,648,561 0.44 0.44
Synovus Financial Corp Financials 73,826,862 10,543,532 0.38 0.38
Syntel Inc Technology 7,336,951 1,047,822 0.11 0.11
Systemax Inc Technology 2,517,273 359,503 0.09 0.09
SYKES Enterprises Inc Industrials 14,302,283 2,042,571 0.26 0.26
SYNNEX Corp Technology 3,297,271 470,897 0.13 0.13
SYSCO Corp Consumer Services 133,927,595 19,126,776 0.14 0.14
SY Bancorp Inc Financials 7,794,738 1,113,200 0.3 0.3
S&T Bancorp Inc Financials 25,399,348 3,627,390 0.37 0.37
thinkorswim Group Inc Industrials 10,006,337 1,429,048 0.38 0.38
tw telecom inc Telecommunications 46,083,159 6,581,334 0.53 0.53
Take-Two Interactive
Software IncConsumer Goods 19,782,454 2,825,217 0.48 0.48
Talbots Inc Consumer Services 1,044,399 149,155 0.11 0.11
Taleo Corp Technology 7,398,774 1,056,651 0.45 0.45
Tanger Factory Outlet
CentersFinancials 24,167,640 3,451,485 0.29 0.29
Target Corp Consumer Services 992,558,802 141,751,589 0.55 0.55
Taser International Inc Industrials 11,674,841 1,667,334 0.51 0.51
Taubman Centers Inc Financials 20,256,144 2,892,867 0.21 0.21
TAL International Group Inc Industrials 5,222,698 745,876 0.16 0.16
TBS International Ltd Industrials 2,662,881 380,297 0.22 0.13
TCF Financial Corp Financials 48,004,832 6,855,776 0.38 0.38
TD Ameritrade Holding
CorpFinancials 215,284,468 30,745,700 0.36 0.36
Industry/Sector Market valueNOK
Market valueUSD Voting Ownership
GOVERNMENT PENSION FUND GLOBAL HOLDINGS 2008
Equities Country association according to FTSE (the benchmark provider for equities). If a company is not in thebenchmark, the country of incorporation and country of listing is used. For remaining securities, a further assessment ismade. Country is defined as a sovereign state currently member of the United Nations. Exceptions are Hong Kong andTaiwan. The country association methodology was updated as of 2014.
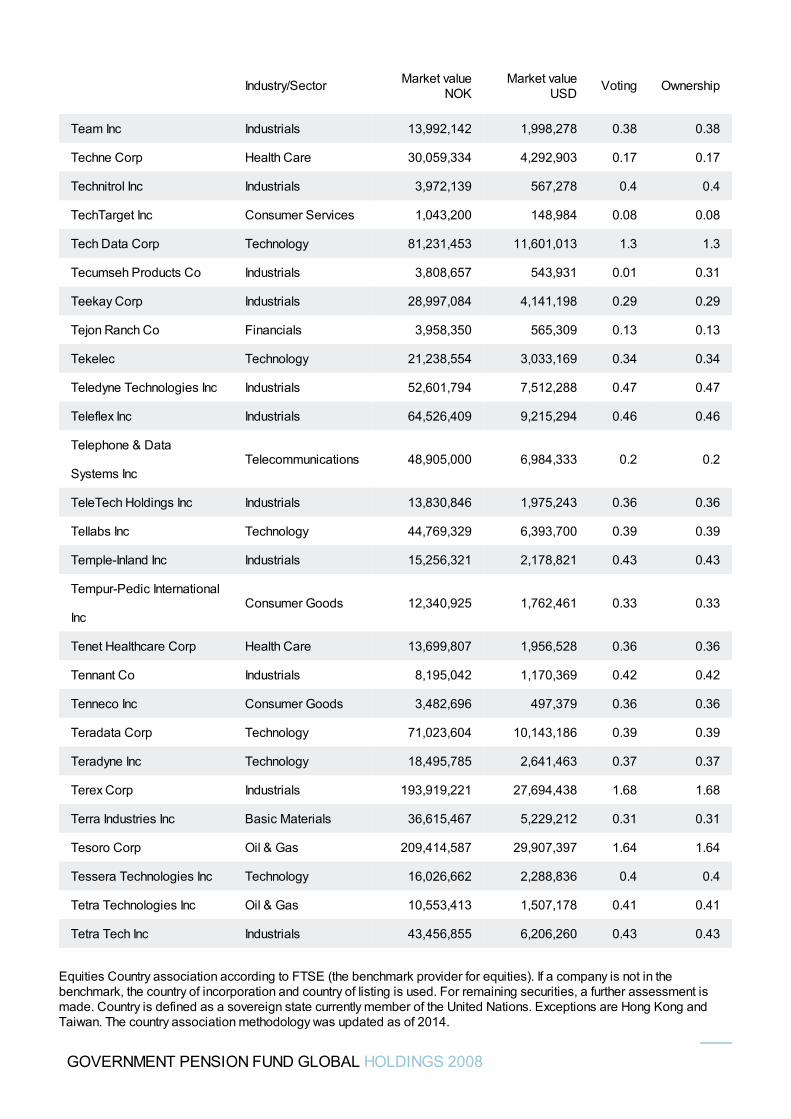
Team Inc Industrials 13,992,142 1,998,278 0.38 0.38
Techne Corp Health Care 30,059,334 4,292,903 0.17 0.17
Technitrol Inc Industrials 3,972,139 567,278 0.4 0.4
TechTarget Inc Consumer Services 1,043,200 148,984 0.08 0.08
Tech Data Corp Technology 81,231,453 11,601,013 1.3 1.3
Tecumseh Products Co Industrials 3,808,657 543,931 0.01 0.31
Teekay Corp Industrials 28,997,084 4,141,198 0.29 0.29
Tejon Ranch Co Financials 3,958,350 565,309 0.13 0.13
Tekelec Technology 21,238,554 3,033,169 0.34 0.34
Teledyne Technologies Inc Industrials 52,601,794 7,512,288 0.47 0.47
Teleflex Inc Industrials 64,526,409 9,215,294 0.46 0.46
Telephone & Data
Systems IncTelecommunications 48,905,000 6,984,333 0.2 0.2
TeleTech Holdings Inc Industrials 13,830,846 1,975,243 0.36 0.36
Tellabs Inc Technology 44,769,329 6,393,700 0.39 0.39
Temple-Inland Inc Industrials 15,256,321 2,178,821 0.43 0.43
Tempur-Pedic International
IncConsumer Goods 12,340,925 1,762,461 0.33 0.33
Tenet Healthcare Corp Health Care 13,699,807 1,956,528 0.36 0.36
Tennant Co Industrials 8,195,042 1,170,369 0.42 0.42
Tenneco Inc Consumer Goods 3,482,696 497,379 0.36 0.36
Teradata Corp Technology 71,023,604 10,143,186 0.39 0.39
Teradyne Inc Technology 18,495,785 2,641,463 0.37 0.37
Terex Corp Industrials 193,919,221 27,694,438 1.68 1.68
Terra Industries Inc Basic Materials 36,615,467 5,229,212 0.31 0.31
Tesoro Corp Oil & Gas 209,414,587 29,907,397 1.64 1.64
Tessera Technologies Inc Technology 16,026,662 2,288,836 0.4 0.4
Tetra Technologies Inc Oil & Gas 10,553,413 1,507,178 0.41 0.41
Tetra Tech Inc Industrials 43,456,855 6,206,260 0.43 0.43
Industry/Sector Market valueNOK
Market valueUSD Voting Ownership
GOVERNMENT PENSION FUND GLOBAL HOLDINGS 2008
Equities Country association according to FTSE (the benchmark provider for equities). If a company is not in thebenchmark, the country of incorporation and country of listing is used. For remaining securities, a further assessment ismade. Country is defined as a sovereign state currently member of the United Nations. Exceptions are Hong Kong andTaiwan. The country association methodology was updated as of 2014.
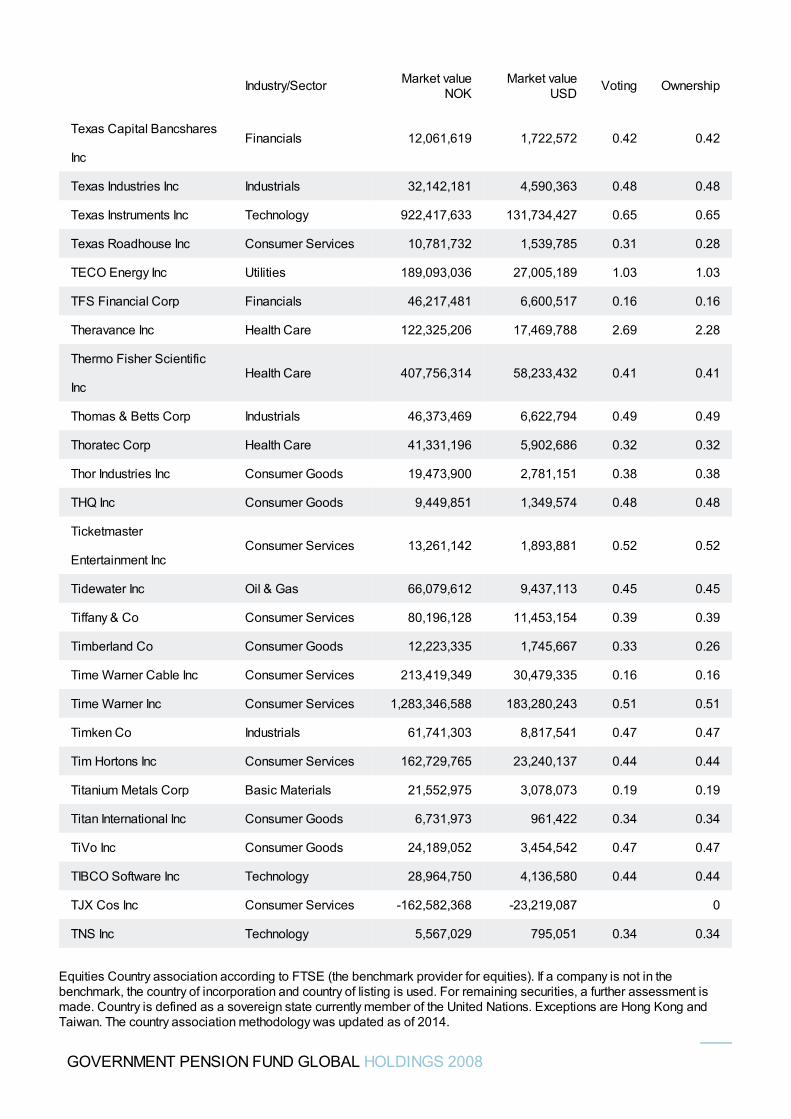
Texas Capital Bancshares
IncFinancials 12,061,619 1,722,572 0.42 0.42
Texas Industries Inc Industrials 32,142,181 4,590,363 0.48 0.48
Texas Instruments Inc Technology 922,417,633 131,734,427 0.65 0.65
Texas Roadhouse Inc Consumer Services 10,781,732 1,539,785 0.31 0.28
TECO Energy Inc Utilities 189,093,036 27,005,189 1.03 1.03
TFS Financial Corp Financials 46,217,481 6,600,517 0.16 0.16
Theravance Inc Health Care 122,325,206 17,469,788 2.69 2.28
Thermo Fisher Scientific
IncHealth Care 407,756,314 58,233,432 0.41 0.41
Thomas & Betts Corp Industrials 46,373,469 6,622,794 0.49 0.49
Thoratec Corp Health Care 41,331,196 5,902,686 0.32 0.32
Thor Industries Inc Consumer Goods 19,473,900 2,781,151 0.38 0.38
THQ Inc Consumer Goods 9,449,851 1,349,574 0.48 0.48
Ticketmaster
Entertainment IncConsumer Services 13,261,142 1,893,881 0.52 0.52
Tidewater Inc Oil & Gas 66,079,612 9,437,113 0.45 0.45
Tiffany & Co Consumer Services 80,196,128 11,453,154 0.39 0.39
Timberland Co Consumer Goods 12,223,335 1,745,667 0.33 0.26
Time Warner Cable Inc Consumer Services 213,419,349 30,479,335 0.16 0.16
Time Warner Inc Consumer Services 1,283,346,588 183,280,243 0.51 0.51
Timken Co Industrials 61,741,303 8,817,541 0.47 0.47
Tim Hortons Inc Consumer Services 162,729,765 23,240,137 0.44 0.44
Titanium Metals Corp Basic Materials 21,552,975 3,078,073 0.19 0.19
Titan International Inc Consumer Goods 6,731,973 961,422 0.34 0.34
TiVo Inc Consumer Goods 24,189,052 3,454,542 0.47 0.47
TIBCO Software Inc Technology 28,964,750 4,136,580 0.44 0.44
TJX Cos Inc Consumer Services -162,582,368 -23,219,087 0
TNS Inc Technology 5,567,029 795,051 0.34 0.34
Industry/Sector Market valueNOK
Market valueUSD Voting Ownership
GOVERNMENT PENSION FUND GLOBAL HOLDINGS 2008
Equities Country association according to FTSE (the benchmark provider for equities). If a company is not in thebenchmark, the country of incorporation and country of listing is used. For remaining securities, a further assessment ismade. Country is defined as a sovereign state currently member of the United Nations. Exceptions are Hong Kong andTaiwan. The country association methodology was updated as of 2014.
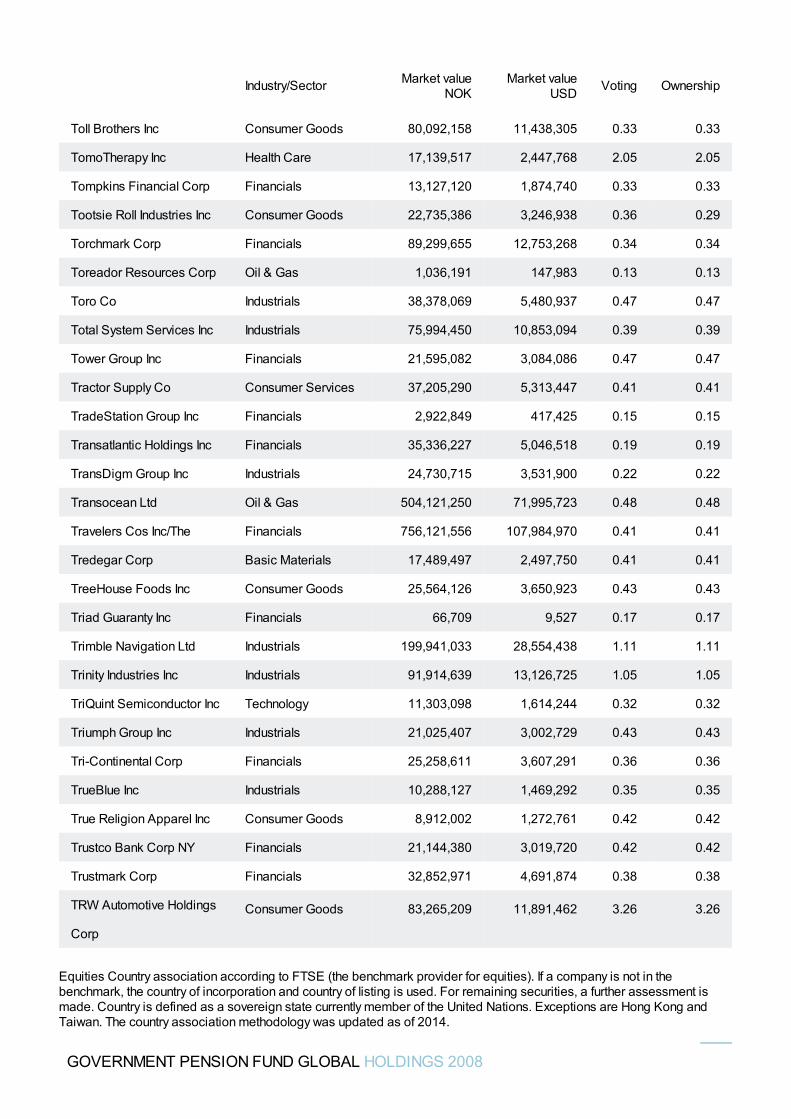
Toll Brothers Inc Consumer Goods 80,092,158 11,438,305 0.33 0.33
TomoTherapy Inc Health Care 17,139,517 2,447,768 2.05 2.05
Tompkins Financial Corp Financials 13,127,120 1,874,740 0.33 0.33
Tootsie Roll Industries Inc Consumer Goods 22,735,386 3,246,938 0.36 0.29
Torchmark Corp Financials 89,299,655 12,753,268 0.34 0.34
Toreador Resources Corp Oil & Gas 1,036,191 147,983 0.13 0.13
Toro Co Industrials 38,378,069 5,480,937 0.47 0.47
Total System Services Inc Industrials 75,994,450 10,853,094 0.39 0.39
Tower Group Inc Financials 21,595,082 3,084,086 0.47 0.47
Tractor Supply Co Consumer Services 37,205,290 5,313,447 0.41 0.41
TradeStation Group Inc Financials 2,922,849 417,425 0.15 0.15
Transatlantic Holdings Inc Financials 35,336,227 5,046,518 0.19 0.19
TransDigm Group Inc Industrials 24,730,715 3,531,900 0.22 0.22
Transocean Ltd Oil & Gas 504,121,250 71,995,723 0.48 0.48
Travelers Cos Inc/The Financials 756,121,556 107,984,970 0.41 0.41
Tredegar Corp Basic Materials 17,489,497 2,497,750 0.41 0.41
TreeHouse Foods Inc Consumer Goods 25,564,126 3,650,923 0.43 0.43
Triad Guaranty Inc Financials 66,709 9,527 0.17 0.17
Trimble Navigation Ltd Industrials 199,941,033 28,554,438 1.11 1.11
Trinity Industries Inc Industrials 91,914,639 13,126,725 1.05 1.05
TriQuint Semiconductor Inc Technology 11,303,098 1,614,244 0.32 0.32
Triumph Group Inc Industrials 21,025,407 3,002,729 0.43 0.43
Tri-Continental Corp Financials 25,258,611 3,607,291 0.36 0.36
TrueBlue Inc Industrials 10,288,127 1,469,292 0.35 0.35
True Religion Apparel Inc Consumer Goods 8,912,002 1,272,761 0.42 0.42
Trustco Bank Corp NY Financials 21,144,380 3,019,720 0.42 0.42
Trustmark Corp Financials 32,852,971 4,691,874 0.38 0.38
TRW Automotive Holdings
Corp
Consumer Goods 83,265,209 11,891,462 3.26 3.26
Industry/Sector Market valueNOK
Market valueUSD Voting Ownership
GOVERNMENT PENSION FUND GLOBAL HOLDINGS 2008
Equities Country association according to FTSE (the benchmark provider for equities). If a company is not in thebenchmark, the country of incorporation and country of listing is used. For remaining securities, a further assessment ismade. Country is defined as a sovereign state currently member of the United Nations. Exceptions are Hong Kong andTaiwan. The country association methodology was updated as of 2014.
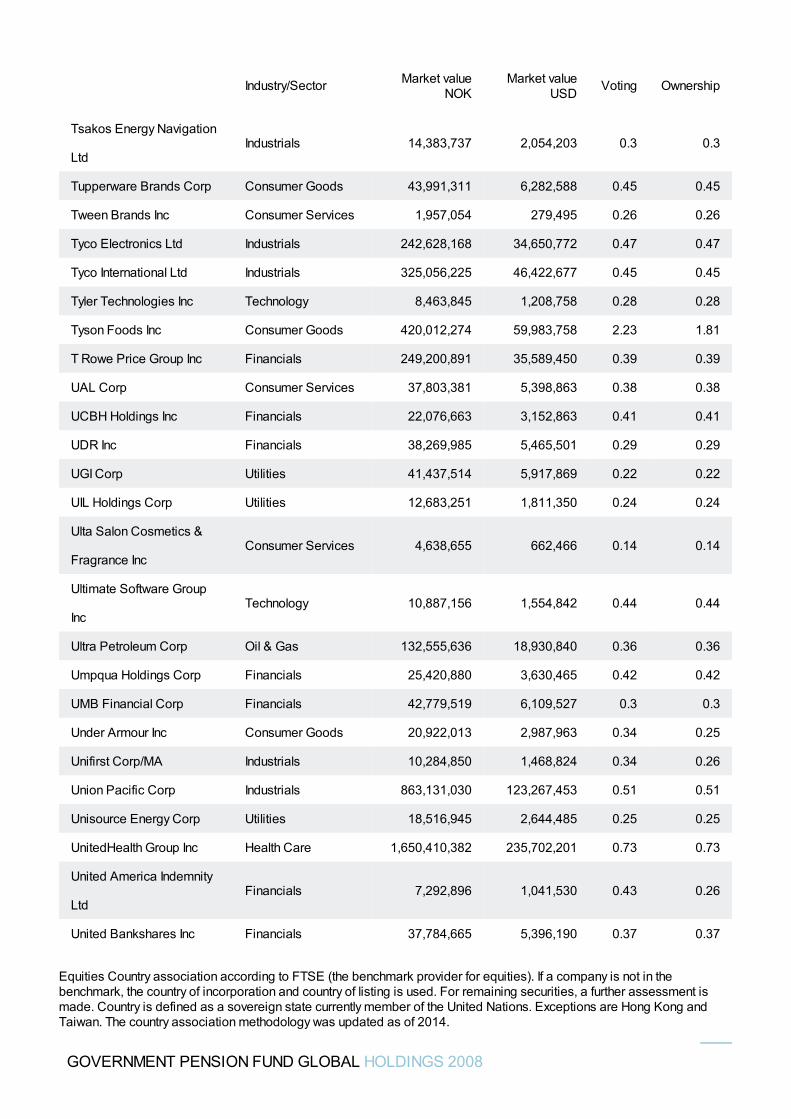
Tsakos Energy Navigation
LtdIndustrials 14,383,737 2,054,203 0.3 0.3
Tupperware Brands Corp Consumer Goods 43,991,311 6,282,588 0.45 0.45
Tween Brands Inc Consumer Services 1,957,054 279,495 0.26 0.26
Tyco Electronics Ltd Industrials 242,628,168 34,650,772 0.47 0.47
Tyco International Ltd Industrials 325,056,225 46,422,677 0.45 0.45
Tyler Technologies Inc Technology 8,463,845 1,208,758 0.28 0.28
Tyson Foods Inc Consumer Goods 420,012,274 59,983,758 2.23 1.81
T Rowe Price Group Inc Financials 249,200,891 35,589,450 0.39 0.39
UAL Corp Consumer Services 37,803,381 5,398,863 0.38 0.38
UCBH Holdings Inc Financials 22,076,663 3,152,863 0.41 0.41
UDR Inc Financials 38,269,985 5,465,501 0.29 0.29
UGI Corp Utilities 41,437,514 5,917,869 0.22 0.22
UIL Holdings Corp Utilities 12,683,251 1,811,350 0.24 0.24
Ulta Salon Cosmetics &
Fragrance IncConsumer Services 4,638,655 662,466 0.14 0.14
Ultimate Software Group
IncTechnology 10,887,156 1,554,842 0.44 0.44
Ultra Petroleum Corp Oil & Gas 132,555,636 18,930,840 0.36 0.36
Umpqua Holdings Corp Financials 25,420,880 3,630,465 0.42 0.42
UMB Financial Corp Financials 42,779,519 6,109,527 0.3 0.3
Under Armour Inc Consumer Goods 20,922,013 2,987,963 0.34 0.25
Unifirst Corp/MA Industrials 10,284,850 1,468,824 0.34 0.26
Union Pacific Corp Industrials 863,131,030 123,267,453 0.51 0.51
Unisource Energy Corp Utilities 18,516,945 2,644,485 0.25 0.25
UnitedHealth Group Inc Health Care 1,650,410,382 235,702,201 0.73 0.73
United America Indemnity
LtdFinancials 7,292,896 1,041,530 0.43 0.26
United Bankshares Inc Financials 37,784,665 5,396,190 0.37 0.37
Industry/Sector Market valueNOK
Market valueUSD Voting Ownership
GOVERNMENT PENSION FUND GLOBAL HOLDINGS 2008
Equities Country association according to FTSE (the benchmark provider for equities). If a company is not in thebenchmark, the country of incorporation and country of listing is used. For remaining securities, a further assessment ismade. Country is defined as a sovereign state currently member of the United Nations. Exceptions are Hong Kong andTaiwan. The country association methodology was updated as of 2014.
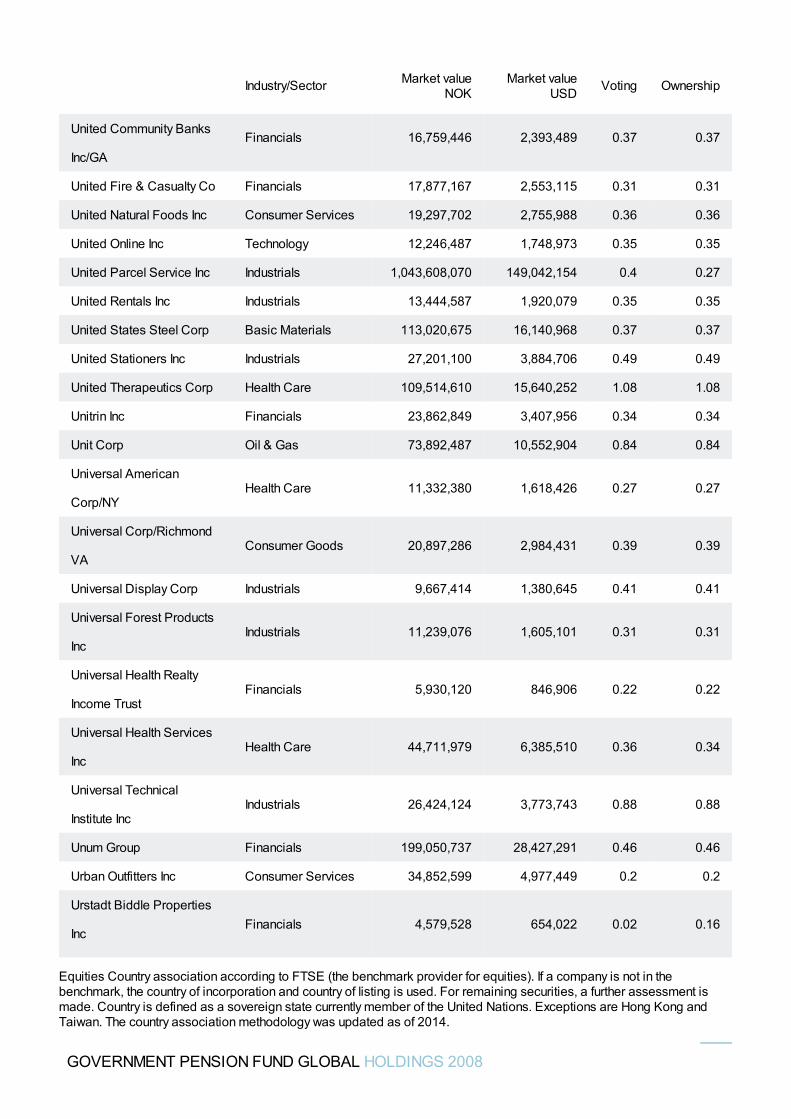
United Community Banks
Inc/GAFinancials 16,759,446 2,393,489 0.37 0.37
United Fire & Casualty Co Financials 17,877,167 2,553,115 0.31 0.31
United Natural Foods Inc Consumer Services 19,297,702 2,755,988 0.36 0.36
United Online Inc Technology 12,246,487 1,748,973 0.35 0.35
United Parcel Service Inc Industrials 1,043,608,070 149,042,154 0.4 0.27
United Rentals Inc Industrials 13,444,587 1,920,079 0.35 0.35
United States Steel Corp Basic Materials 113,020,675 16,140,968 0.37 0.37
United Stationers Inc Industrials 27,201,100 3,884,706 0.49 0.49
United Therapeutics Corp Health Care 109,514,610 15,640,252 1.08 1.08
Unitrin Inc Financials 23,862,849 3,407,956 0.34 0.34
Unit Corp Oil & Gas 73,892,487 10,552,904 0.84 0.84
Universal American
Corp/NYHealth Care 11,332,380 1,618,426 0.27 0.27
Universal Corp/Richmond
VAConsumer Goods 20,897,286 2,984,431 0.39 0.39
Universal Display Corp Industrials 9,667,414 1,380,645 0.41 0.41
Universal Forest Products
IncIndustrials 11,239,076 1,605,101 0.31 0.31
Universal Health Realty
Income TrustFinancials 5,930,120 846,906 0.22 0.22
Universal Health Services
IncHealth Care 44,711,979 6,385,510 0.36 0.34
Universal Technical
Institute IncIndustrials 26,424,124 3,773,743 0.88 0.88
Unum Group Financials 199,050,737 28,427,291 0.46 0.46
Urban Outfitters Inc Consumer Services 34,852,599 4,977,449 0.2 0.2
Urstadt Biddle Properties
IncFinancials 4,579,528 654,022 0.02 0.16
Industry/Sector Market valueNOK
Market valueUSD Voting Ownership
GOVERNMENT PENSION FUND GLOBAL HOLDINGS 2008
Equities Country association according to FTSE (the benchmark provider for equities). If a company is not in thebenchmark, the country of incorporation and country of listing is used. For remaining securities, a further assessment ismade. Country is defined as a sovereign state currently member of the United Nations. Exceptions are Hong Kong andTaiwan. The country association methodology was updated as of 2014.
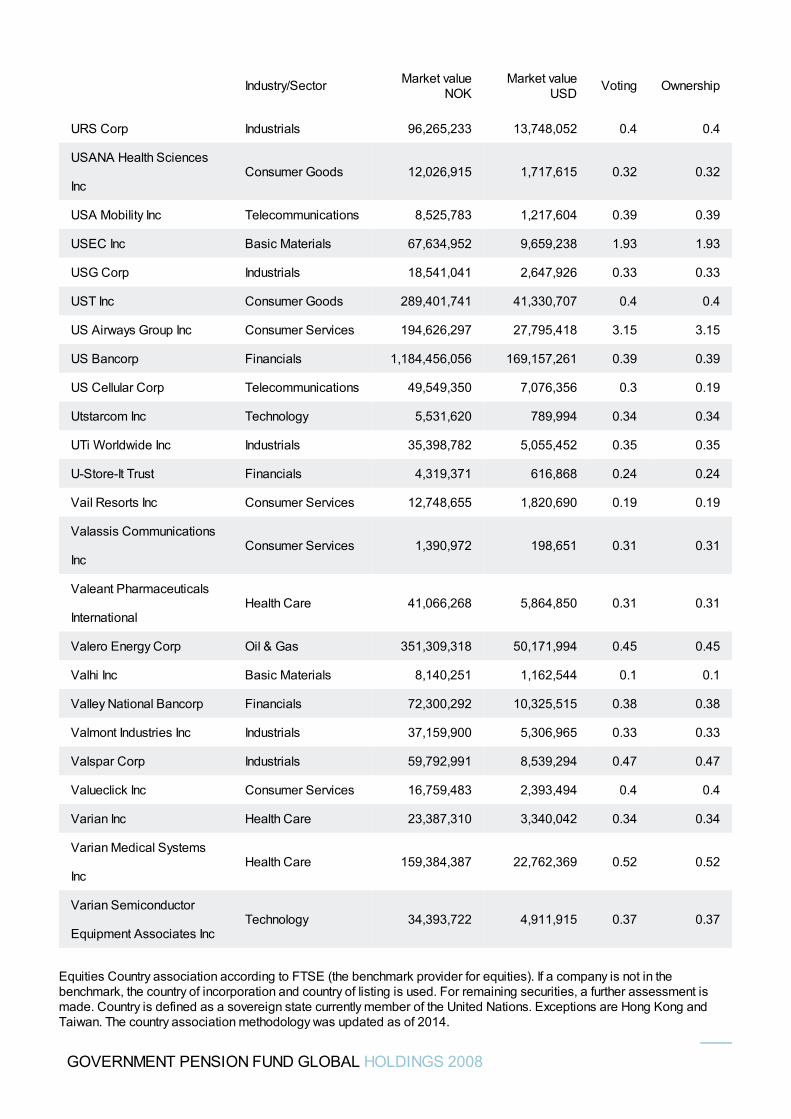
URS Corp Industrials 96,265,233 13,748,052 0.4 0.4
USANA Health Sciences
IncConsumer Goods 12,026,915 1,717,615 0.32 0.32
USA Mobility Inc Telecommunications 8,525,783 1,217,604 0.39 0.39
USEC Inc Basic Materials 67,634,952 9,659,238 1.93 1.93
USG Corp Industrials 18,541,041 2,647,926 0.33 0.33
UST Inc Consumer Goods 289,401,741 41,330,707 0.4 0.4
US Airways Group Inc Consumer Services 194,626,297 27,795,418 3.15 3.15
US Bancorp Financials 1,184,456,056 169,157,261 0.39 0.39
US Cellular Corp Telecommunications 49,549,350 7,076,356 0.3 0.19
Utstarcom Inc Technology 5,531,620 789,994 0.34 0.34
UTi Worldwide Inc Industrials 35,398,782 5,055,452 0.35 0.35
U-Store-It Trust Financials 4,319,371 616,868 0.24 0.24
Vail Resorts Inc Consumer Services 12,748,655 1,820,690 0.19 0.19
Valassis Communications
IncConsumer Services 1,390,972 198,651 0.31 0.31
Valeant Pharmaceuticals
InternationalHealth Care 41,066,268 5,864,850 0.31 0.31
Valero Energy Corp Oil & Gas 351,309,318 50,171,994 0.45 0.45
Valhi Inc Basic Materials 8,140,251 1,162,544 0.1 0.1
Valley National Bancorp Financials 72,300,292 10,325,515 0.38 0.38
Valmont Industries Inc Industrials 37,159,900 5,306,965 0.33 0.33
Valspar Corp Industrials 59,792,991 8,539,294 0.47 0.47
Valueclick Inc Consumer Services 16,759,483 2,393,494 0.4 0.4
Varian Inc Health Care 23,387,310 3,340,042 0.34 0.34
Varian Medical Systems
IncHealth Care 159,384,387 22,762,369 0.52 0.52
Varian Semiconductor
Equipment Associates IncTechnology 34,393,722 4,911,915 0.37 0.37
Industry/Sector Market valueNOK
Market valueUSD Voting Ownership
GOVERNMENT PENSION FUND GLOBAL HOLDINGS 2008
Equities Country association according to FTSE (the benchmark provider for equities). If a company is not in thebenchmark, the country of incorporation and country of listing is used. For remaining securities, a further assessment ismade. Country is defined as a sovereign state currently member of the United Nations. Exceptions are Hong Kong andTaiwan. The country association methodology was updated as of 2014.
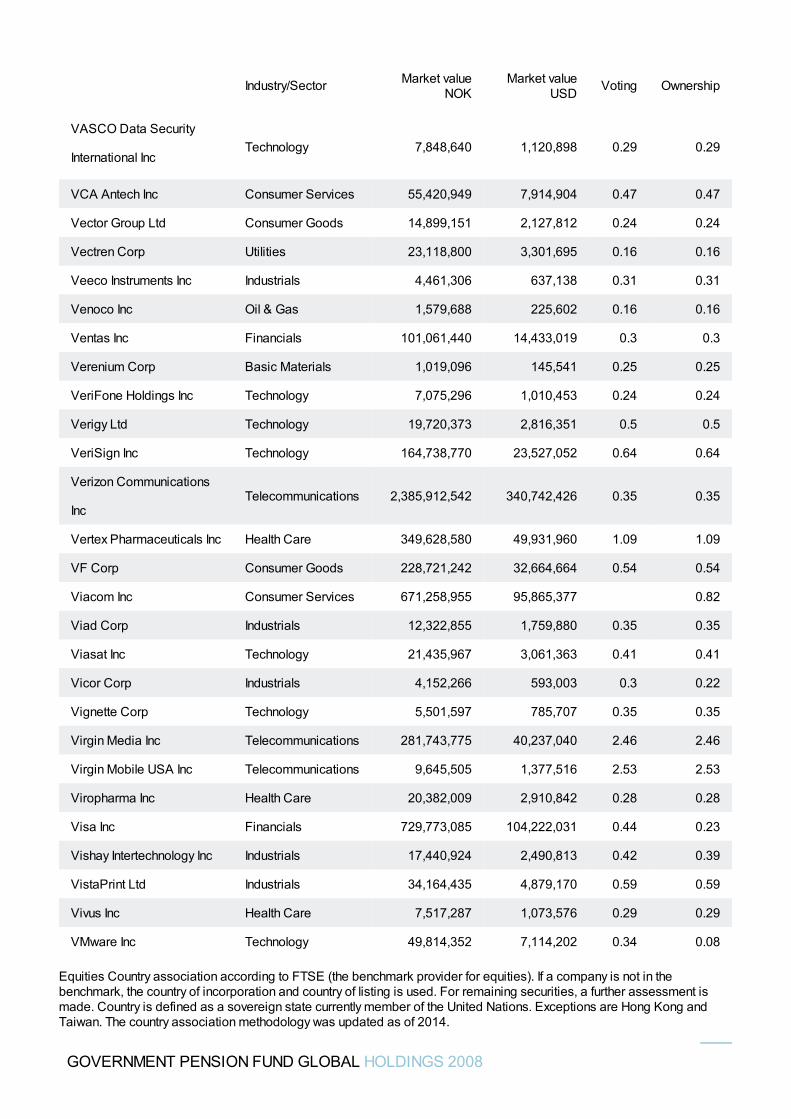
VASCO Data Security
International IncTechnology 7,848,640 1,120,898 0.29 0.29
VCA Antech Inc Consumer Services 55,420,949 7,914,904 0.47 0.47
Vector Group Ltd Consumer Goods 14,899,151 2,127,812 0.24 0.24
Vectren Corp Utilities 23,118,800 3,301,695 0.16 0.16
Veeco Instruments Inc Industrials 4,461,306 637,138 0.31 0.31
Venoco Inc Oil & Gas 1,579,688 225,602 0.16 0.16
Ventas Inc Financials 101,061,440 14,433,019 0.3 0.3
Verenium Corp Basic Materials 1,019,096 145,541 0.25 0.25
VeriFone Holdings Inc Technology 7,075,296 1,010,453 0.24 0.24
Verigy Ltd Technology 19,720,373 2,816,351 0.5 0.5
VeriSign Inc Technology 164,738,770 23,527,052 0.64 0.64
Verizon Communications
IncTelecommunications 2,385,912,542 340,742,426 0.35 0.35
Vertex Pharmaceuticals Inc Health Care 349,628,580 49,931,960 1.09 1.09
VF Corp Consumer Goods 228,721,242 32,664,664 0.54 0.54
Viacom Inc Consumer Services 671,258,955 95,865,377 0.82
Viad Corp Industrials 12,322,855 1,759,880 0.35 0.35
Viasat Inc Technology 21,435,967 3,061,363 0.41 0.41
Vicor Corp Industrials 4,152,266 593,003 0.3 0.22
Vignette Corp Technology 5,501,597 785,707 0.35 0.35
Virgin Media Inc Telecommunications 281,743,775 40,237,040 2.46 2.46
Virgin Mobile USA Inc Telecommunications 9,645,505 1,377,516 2.53 2.53
Viropharma Inc Health Care 20,382,009 2,910,842 0.28 0.28
Visa Inc Financials 729,773,085 104,222,031 0.44 0.23
Vishay Intertechnology Inc Industrials 17,440,924 2,490,813 0.42 0.39
VistaPrint Ltd Industrials 34,164,435 4,879,170 0.59 0.59
Vivus Inc Health Care 7,517,287 1,073,576 0.29 0.29
VMware Inc Technology 49,814,352 7,114,202 0.34 0.08
Industry/Sector Market valueNOK
Market valueUSD Voting Ownership
GOVERNMENT PENSION FUND GLOBAL HOLDINGS 2008
Equities Country association according to FTSE (the benchmark provider for equities). If a company is not in thebenchmark, the country of incorporation and country of listing is used. For remaining securities, a further assessment ismade. Country is defined as a sovereign state currently member of the United Nations. Exceptions are Hong Kong andTaiwan. The country association methodology was updated as of 2014.
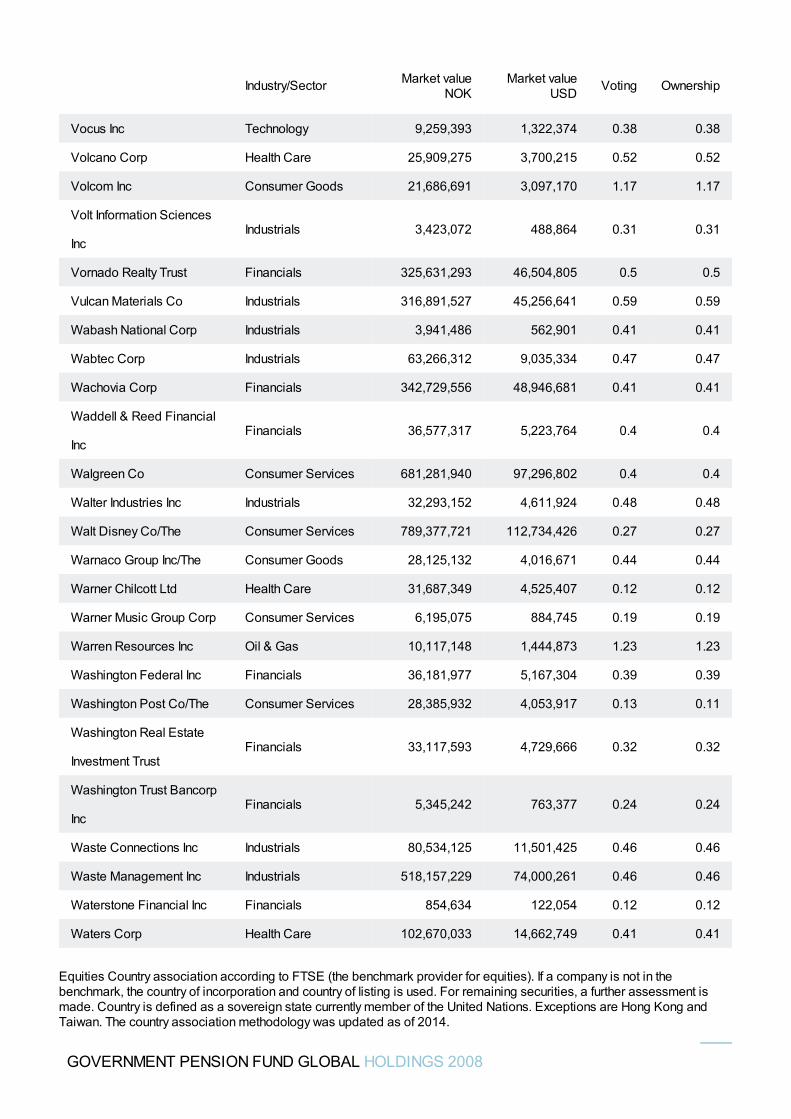
Vocus Inc Technology 9,259,393 1,322,374 0.38 0.38
Volcano Corp Health Care 25,909,275 3,700,215 0.52 0.52
Volcom Inc Consumer Goods 21,686,691 3,097,170 1.17 1.17
Volt Information Sciences
IncIndustrials 3,423,072 488,864 0.31 0.31
Vornado Realty Trust Financials 325,631,293 46,504,805 0.5 0.5
Vulcan Materials Co Industrials 316,891,527 45,256,641 0.59 0.59
Wabash National Corp Industrials 3,941,486 562,901 0.41 0.41
Wabtec Corp Industrials 63,266,312 9,035,334 0.47 0.47
Wachovia Corp Financials 342,729,556 48,946,681 0.41 0.41
Waddell & Reed Financial
IncFinancials 36,577,317 5,223,764 0.4 0.4
Walgreen Co Consumer Services 681,281,940 97,296,802 0.4 0.4
Walter Industries Inc Industrials 32,293,152 4,611,924 0.48 0.48
Walt Disney Co/The Consumer Services 789,377,721 112,734,426 0.27 0.27
Warnaco Group Inc/The Consumer Goods 28,125,132 4,016,671 0.44 0.44
Warner Chilcott Ltd Health Care 31,687,349 4,525,407 0.12 0.12
Warner Music Group Corp Consumer Services 6,195,075 884,745 0.19 0.19
Warren Resources Inc Oil & Gas 10,117,148 1,444,873 1.23 1.23
Washington Federal Inc Financials 36,181,977 5,167,304 0.39 0.39
Washington Post Co/The Consumer Services 28,385,932 4,053,917 0.13 0.11
Washington Real Estate
Investment TrustFinancials 33,117,593 4,729,666 0.32 0.32
Washington Trust Bancorp
IncFinancials 5,345,242 763,377 0.24 0.24
Waste Connections Inc Industrials 80,534,125 11,501,425 0.46 0.46
Waste Management Inc Industrials 518,157,229 74,000,261 0.46 0.46
Waterstone Financial Inc Financials 854,634 122,054 0.12 0.12
Waters Corp Health Care 102,670,033 14,662,749 0.41 0.41
Industry/Sector Market valueNOK
Market valueUSD Voting Ownership
GOVERNMENT PENSION FUND GLOBAL HOLDINGS 2008
Equities Country association according to FTSE (the benchmark provider for equities). If a company is not in thebenchmark, the country of incorporation and country of listing is used. For remaining securities, a further assessment ismade. Country is defined as a sovereign state currently member of the United Nations. Exceptions are Hong Kong andTaiwan. The country association methodology was updated as of 2014.
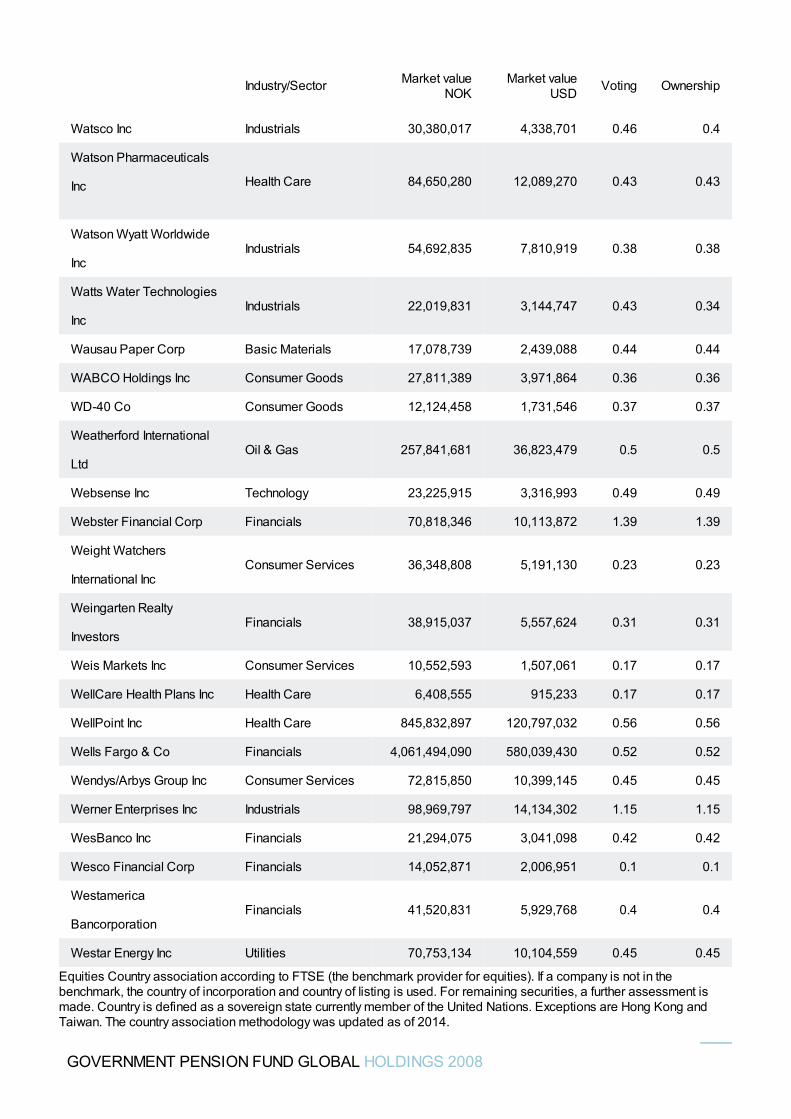
Watsco Inc Industrials 30,380,017 4,338,701 0.46 0.4
Watson Pharmaceuticals
Inc Health Care 84,650,280 12,089,270 0.43 0.43
Watson Wyatt Worldwide
IncIndustrials 54,692,835 7,810,919 0.38 0.38
Watts Water Technologies
IncIndustrials 22,019,831 3,144,747 0.43 0.34
Wausau Paper Corp Basic Materials 17,078,739 2,439,088 0.44 0.44
WABCO Holdings Inc Consumer Goods 27,811,389 3,971,864 0.36 0.36
WD-40 Co Consumer Goods 12,124,458 1,731,546 0.37 0.37
Weatherford International
LtdOil & Gas 257,841,681 36,823,479 0.5 0.5
Websense Inc Technology 23,225,915 3,316,993 0.49 0.49
Webster Financial Corp Financials 70,818,346 10,113,872 1.39 1.39
Weight Watchers
International IncConsumer Services 36,348,808 5,191,130 0.23 0.23
Weingarten Realty
InvestorsFinancials 38,915,037 5,557,624 0.31 0.31
Weis Markets Inc Consumer Services 10,552,593 1,507,061 0.17 0.17
WellCare Health Plans Inc Health Care 6,408,555 915,233 0.17 0.17
WellPoint Inc Health Care 845,832,897 120,797,032 0.56 0.56
Wells Fargo & Co Financials 4,061,494,090 580,039,430 0.52 0.52
Wendys/Arbys Group Inc Consumer Services 72,815,850 10,399,145 0.45 0.45
Werner Enterprises Inc Industrials 98,969,797 14,134,302 1.15 1.15
WesBanco Inc Financials 21,294,075 3,041,098 0.42 0.42
Wesco Financial Corp Financials 14,052,871 2,006,951 0.1 0.1
Westamerica
BancorporationFinancials 41,520,831 5,929,768 0.4 0.4
Westar Energy Inc Utilities 70,753,134 10,104,559 0.45 0.45
Industry/Sector Market valueNOK
Market valueUSD Voting Ownership
GOVERNMENT PENSION FUND GLOBAL HOLDINGS 2008
Equities Country association according to FTSE (the benchmark provider for equities). If a company is not in thebenchmark, the country of incorporation and country of listing is used. For remaining securities, a further assessment ismade. Country is defined as a sovereign state currently member of the United Nations. Exceptions are Hong Kong andTaiwan. The country association methodology was updated as of 2014.
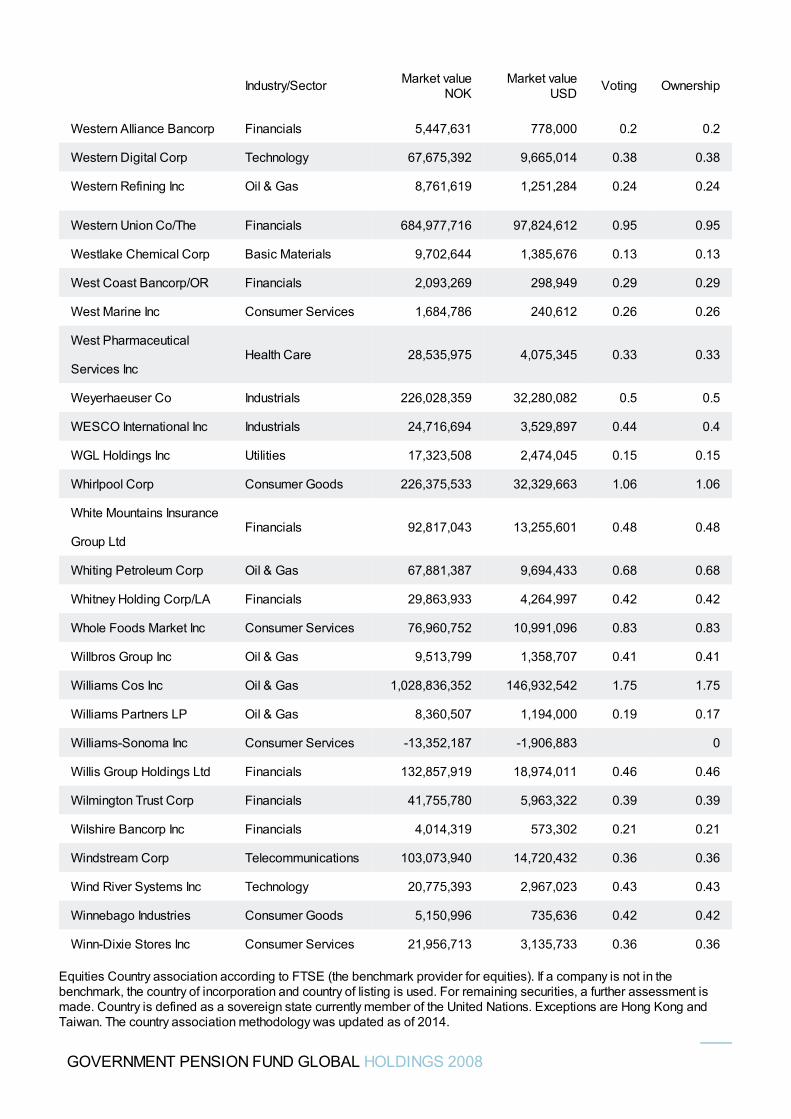
Western Alliance Bancorp Financials 5,447,631 778,000 0.2 0.2
Western Digital Corp Technology 67,675,392 9,665,014 0.38 0.38
Western Refining Inc Oil & Gas 8,761,619 1,251,284 0.24 0.24
Western Union Co/The Financials 684,977,716 97,824,612 0.95 0.95
Westlake Chemical Corp Basic Materials 9,702,644 1,385,676 0.13 0.13
West Coast Bancorp/OR Financials 2,093,269 298,949 0.29 0.29
West Marine Inc Consumer Services 1,684,786 240,612 0.26 0.26
West Pharmaceutical
Services IncHealth Care 28,535,975 4,075,345 0.33 0.33
Weyerhaeuser Co Industrials 226,028,359 32,280,082 0.5 0.5
WESCO International Inc Industrials 24,716,694 3,529,897 0.44 0.4
WGL Holdings Inc Utilities 17,323,508 2,474,045 0.15 0.15
Whirlpool Corp Consumer Goods 226,375,533 32,329,663 1.06 1.06
White Mountains Insurance
Group LtdFinancials 92,817,043 13,255,601 0.48 0.48
Whiting Petroleum Corp Oil & Gas 67,881,387 9,694,433 0.68 0.68
Whitney Holding Corp/LA Financials 29,863,933 4,264,997 0.42 0.42
Whole Foods Market Inc Consumer Services 76,960,752 10,991,096 0.83 0.83
Willbros Group Inc Oil & Gas 9,513,799 1,358,707 0.41 0.41
Williams Cos Inc Oil & Gas 1,028,836,352 146,932,542 1.75 1.75
Williams Partners LP Oil & Gas 8,360,507 1,194,000 0.19 0.17
Williams-Sonoma Inc Consumer Services -13,352,187 -1,906,883 0
Willis Group Holdings Ltd Financials 132,857,919 18,974,011 0.46 0.46
Wilmington Trust Corp Financials 41,755,780 5,963,322 0.39 0.39
Wilshire Bancorp Inc Financials 4,014,319 573,302 0.21 0.21
Windstream Corp Telecommunications 103,073,940 14,720,432 0.36 0.36
Wind River Systems Inc Technology 20,775,393 2,967,023 0.43 0.43
Winnebago Industries Consumer Goods 5,150,996 735,636 0.42 0.42
Winn-Dixie Stores Inc Consumer Services 21,956,713 3,135,733 0.36 0.36
Industry/Sector Market valueNOK
Market valueUSD Voting Ownership
GOVERNMENT PENSION FUND GLOBAL HOLDINGS 2008
Equities Country association according to FTSE (the benchmark provider for equities). If a company is not in thebenchmark, the country of incorporation and country of listing is used. For remaining securities, a further assessment ismade. Country is defined as a sovereign state currently member of the United Nations. Exceptions are Hong Kong andTaiwan. The country association methodology was updated as of 2014.
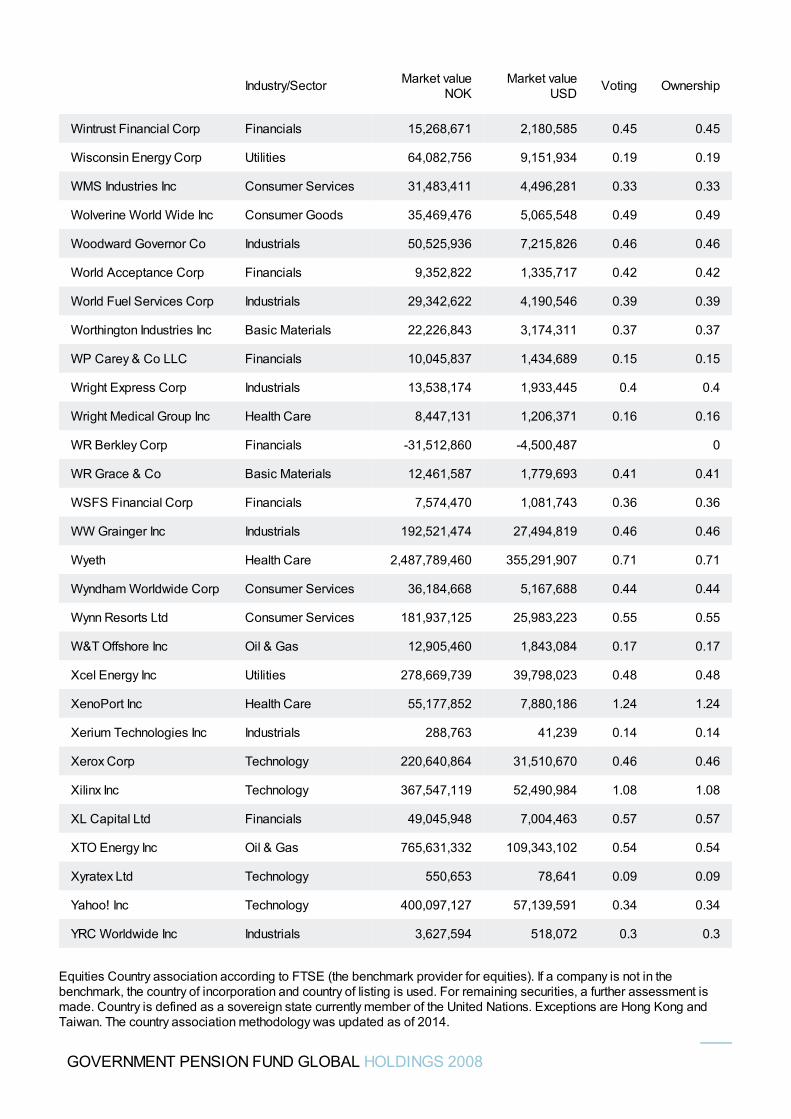
Wintrust Financial Corp Financials 15,268,671 2,180,585 0.45 0.45
Wisconsin Energy Corp Utilities 64,082,756 9,151,934 0.19 0.19
WMS Industries Inc Consumer Services 31,483,411 4,496,281 0.33 0.33
Wolverine World Wide Inc Consumer Goods 35,469,476 5,065,548 0.49 0.49
Woodward Governor Co Industrials 50,525,936 7,215,826 0.46 0.46
World Acceptance Corp Financials 9,352,822 1,335,717 0.42 0.42
World Fuel Services Corp Industrials 29,342,622 4,190,546 0.39 0.39
Worthington Industries Inc Basic Materials 22,226,843 3,174,311 0.37 0.37
WP Carey & Co LLC Financials 10,045,837 1,434,689 0.15 0.15
Wright Express Corp Industrials 13,538,174 1,933,445 0.4 0.4
Wright Medical Group Inc Health Care 8,447,131 1,206,371 0.16 0.16
WR Berkley Corp Financials -31,512,860 -4,500,487 0
WR Grace & Co Basic Materials 12,461,587 1,779,693 0.41 0.41
WSFS Financial Corp Financials 7,574,470 1,081,743 0.36 0.36
WW Grainger Inc Industrials 192,521,474 27,494,819 0.46 0.46
Wyeth Health Care 2,487,789,460 355,291,907 0.71 0.71
Wyndham Worldwide Corp Consumer Services 36,184,668 5,167,688 0.44 0.44
Wynn Resorts Ltd Consumer Services 181,937,125 25,983,223 0.55 0.55
W&T Offshore Inc Oil & Gas 12,905,460 1,843,084 0.17 0.17
Xcel Energy Inc Utilities 278,669,739 39,798,023 0.48 0.48
XenoPort Inc Health Care 55,177,852 7,880,186 1.24 1.24
Xerium Technologies Inc Industrials 288,763 41,239 0.14 0.14
Xerox Corp Technology 220,640,864 31,510,670 0.46 0.46
Xilinx Inc Technology 367,547,119 52,490,984 1.08 1.08
XL Capital Ltd Financials 49,045,948 7,004,463 0.57 0.57
XTO Energy Inc Oil & Gas 765,631,332 109,343,102 0.54 0.54
Xyratex Ltd Technology 550,653 78,641 0.09 0.09
Yahoo! Inc Technology 400,097,127 57,139,591 0.34 0.34
YRC Worldwide Inc Industrials 3,627,594 518,072 0.3 0.3
Industry/Sector Market valueNOK
Market valueUSD Voting Ownership
GOVERNMENT PENSION FUND GLOBAL HOLDINGS 2008
Equities Country association according to FTSE (the benchmark provider for equities). If a company is not in thebenchmark, the country of incorporation and country of listing is used. For remaining securities, a further assessment ismade. Country is defined as a sovereign state currently member of the United Nations. Exceptions are Hong Kong andTaiwan. The country association methodology was updated as of 2014.
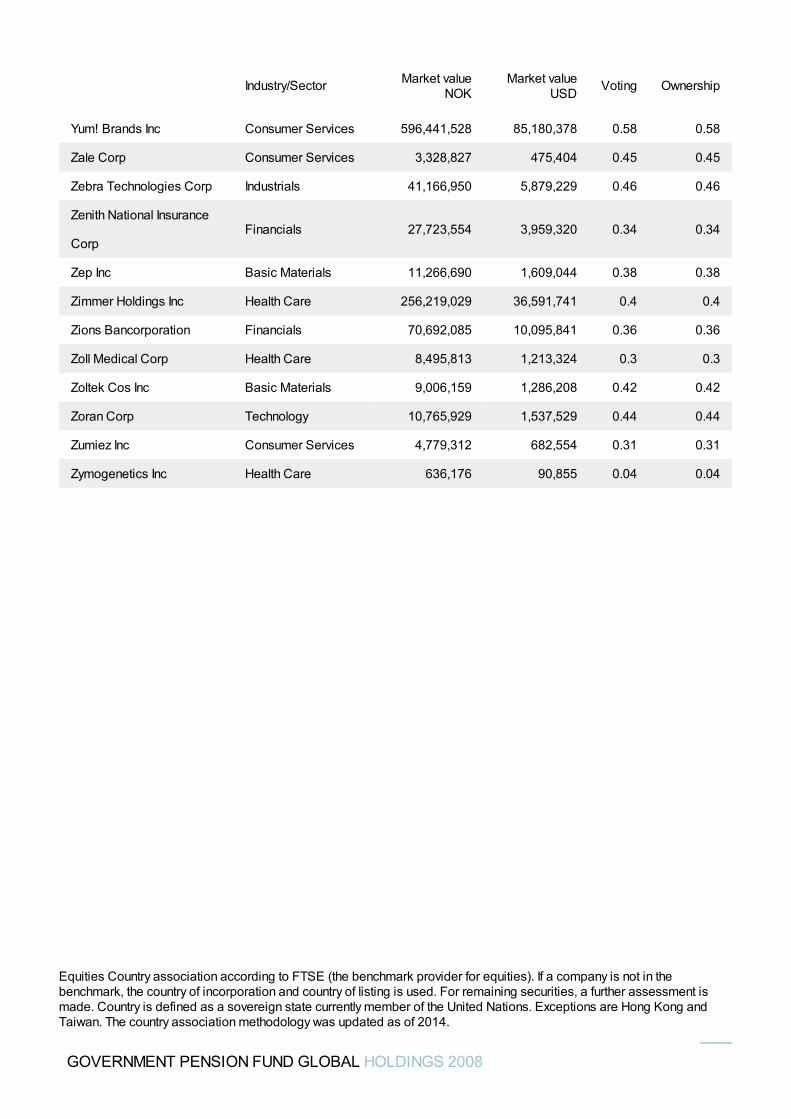
Yum! Brands Inc Consumer Services 596,441,528 85,180,378 0.58 0.58
Zale Corp Consumer Services 3,328,827 475,404 0.45 0.45
Zebra Technologies Corp Industrials 41,166,950 5,879,229 0.46 0.46
Zenith National Insurance
CorpFinancials 27,723,554 3,959,320 0.34 0.34
Zep Inc Basic Materials 11,266,690 1,609,044 0.38 0.38
Zimmer Holdings Inc Health Care 256,219,029 36,591,741 0.4 0.4
Zions Bancorporation Financials 70,692,085 10,095,841 0.36 0.36
Zoll Medical Corp Health Care 8,495,813 1,213,324 0.3 0.3
Zoltek Cos Inc Basic Materials 9,006,159 1,286,208 0.42 0.42
Zoran Corp Technology 10,765,929 1,537,529 0.44 0.44
Zumiez Inc Consumer Services 4,779,312 682,554 0.31 0.31
Zymogenetics Inc Health Care 636,176 90,855 0.04 0.04
Industry/Sector Market valueNOK
Market valueUSD Voting Ownership
GOVERNMENT PENSION FUND GLOBAL HOLDINGS 2008
Equities Country association according to FTSE (the benchmark provider for equities). If a company is not in thebenchmark, the country of incorporation and country of listing is used. For remaining securities, a further assessment ismade. Country is defined as a sovereign state currently member of the United Nations. Exceptions are Hong Kong andTaiwan. The country association methodology was updated as of 2014.