global plasmaspheric tec and its relative contribution to gps tec
TRANSCRIPT
ARTICLE IN PRESS
Contents lists available at ScienceDirect
Journal ofAtmospheric and Solar-Terrestrial Physics
Journal of Atmospheric and Solar-Terrestrial Physics 70 (2008) 1541– 1548
1364-68
doi:10.1
� Cor
E-m
journal homepage: www.elsevier.com/locate/jastp
Global plasmaspheric TEC and its relative contribution to GPS TEC
E. Yizengaw a,�, M.B. Moldwin a, D. Galvan a, B.A. Iijima b, A. Komjathy b, A.J. Mannucci b
a Institute of Geophysics and Planetary Physics, University of California Los Angeles, CA 90095, USAb Jet Propulsion Laboratory, Pasadena, CA, USA
a r t i c l e i n f o
Article history:
Received 10 December 2007
Received in revised form
8 April 2008
Accepted 18 April 2008Available online 18 May 2008
Keywords:
Ionosphere
Plasmasphere
Top-side ionosphere
GPS TEC
26/$ - see front matter & 2008 Elsevier Ltd
016/j.jastp.2008.04.022
responding author. Tel.: +1310 206 4380; fax
ail address: [email protected] (E. Yizen
a b s t r a c t
The plasmaspheric electron content is directly estimated from the global positioning
system (GPS) data onboard JASON-1 Satellite for the first time. Similarly, the ground-
based GPS total electron content (TEC) is estimated using about 1000 GPS receivers
distributed around the globe. The relative contribution of the plasmaspheric electron
content to the ground-based GPS TEC is then estimated globally using these two
independent simultaneous measurements; namely ground-based GPS TEC and JASON-1
GPS TEC. Results presented here include data from 3 months of different solar cycle
conditions (October 2003, May 2005, and December 2006). The global comparison
between the two independent measurements was performed by dividing the data into
three different regions; equatorial, mid- and high-latitude regions. This division is
essential as the GPS raypaths traverse different distances through the plasmasphere at
different latitudes. The raypath length through the plasmasphere decreases as latitude
increases. The relative contribution of the plasmaspheric electron content exhibits a
diurnal variation that depends on latitude with minimum contribution (�10%) during
daytime and maximum (up to 60%) at night. The contribution is also maximum at the
equatorial region where the GPS raypath traverses a long distance through the
plasmasphere compared to its length in mid- and high-latitude regions. Finally, the solar
cycle variation of plasmaspheric contribution is also reported globally.
& 2008 Elsevier Ltd. All rights reserved.
1. Introduction
Global satellite navigation system’s radio signalstraverse through the ionized upper atmosphere of theEarth called the ionosphere and plasmasphere. Thesesignals are refracted by the plasma, which leads toposition errors due to the frequency-dependent slowingof the wave. Although correction of this effect can, inprinciple, be made with dual frequency receivers, manysystems use single-frequency receivers, which require theuse of combined ionosphere–plasmasphere electron den-sity models to correct for these delays. Usually, suchmodels mainly represent the plasma density in theionospheric F2 layer. Near-real-time updates to monthly
. All rights reserved.
: +1310 206 3051.
gaw).
climatological models for various military and civilianusers have been made available since the early 1990s. Thetotal electron content (TEC) along the propagation pathbetween the satellite and receivers can be estimated bymonitoring the dual frequency signals transmitted fromglobal positioning system (GPS) satellites using GPSreceivers on the ground or onboard low Earth orbiting(LEO) satellites (e.g., Soicher, 1977; Klobuchar, 1997;Jakowski et al., 2005; Yizengaw et al., 2004, 2005a, b,2007). Since the GPS satellites orbit at an altitude of20,200 km (4.2 L), the signals emitted from these satelliteshave long paths through the tenuous hydrogen plasma ofthe plasmasphere. The plasmasphere is the torus of cold,dense, co-rotating plasma, surrounding the Earth out to3–7 Re, and is populated by ionospheric outflow. Thequestion addressed here is how much does the plasma-sphere contribute to ground-based GPS TEC measure-ments?
ARTICLE IN PRESS
LEO−Plasmapause−GPS Schematic
1 Re2 Re3 Re4 Re
−60 −40 −20 0 20 40 600
0.2
0.4
0.6
0.8
1
1.2
1.4
1.6
1.8Vertical Distance between Jason−1 Orbit and Lpp = 4
Dis
tanc
e (x
104 k
m)
Latitude (deg)
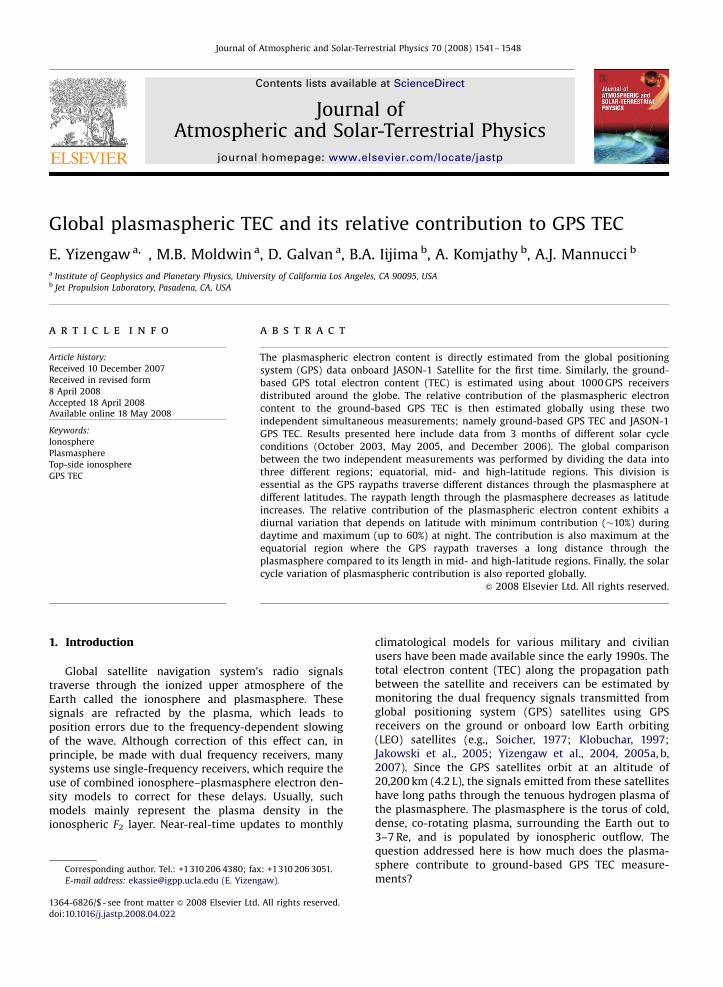
Fig. 1. (Top panel) the schematic carton that shows the vertical raypaths
between the orbital altitude of JASON-1 and GPS satellites as a function
of latitude. The blue circles represent surface of the Earth, JASON and
GPS orbital altitudes. The oval-shaped blue curve depicts the roughly
estimated (�L ¼ 4) plasmapause location. The raypath length inside the
pasmasphere (red color) shows the longest distance at low latitudes
compared to its length at high latitudes and (bottom panel) the raypath
length as a function of latitude.
E. Yizengaw et al. / Journal of Atmospheric and Solar-Terrestrial Physics 70 (2008) 1541–15481542
Although a number of studies have addressed thisissue in the last decade (e.g. Lunt et al., 1999a, b; Costeret al., 2003; Belehaki et al., 2004), most of these studies ofthe plasmaspheric contribution to the GPS TEC were notobservational comparisons. They were mostly model datacomparisons or observational studies from very limitedgeographic locations. The plasmaspheric electron contentwas estimated by Lunt et al. (1999a) using the combina-tion of Sheffield University plasmasphere ionospheremodel and GPS TEC recorded at a mid-latitude station.In a separate study Lunt et al. (1999b) presented the firstexperimental plasmaspheric electron density measure-ments, but only at high latitudes. They performed twoindependent observations, namely GPS TEC and NavyIonospheric Monitoring System (NIMS) TEC. The plasma-spheric electron contents were then estimated by differ-encing the GPS TEC from the corresponding estimates ofNIMS TEC. They reported that the electron contentattributable to the plasmasphere decreases with increas-ing latitude, giving an estimate of 2 TECU for theplasmaspheric contribution at Aberystwyth (50.41N).Breed and Goodwin (1997) determined the medianplasmaspheric TEC over Salisbury (34.81S) from thedifference between GPS TEC and Faraday rotation TEC.For December 1992 they obtain a value of 7.2 TECU.Another technique of estimating the plasmasphericelectron content was by using the difference betweenGPS TEC and TEC calculated from a combination of aChapman profile above the F2 peak height and electrondensity profiles observed by ground-based ionosonde atAthens (381N, 23.51E) (e.g., Belehaki et al., 2004). Theyfound a clear diurnal variation of the plasmasphericelectron content and concluded that the plasmaspherecan contribute to the GPS TEC up to 50% during nighttimeand up to 10% during daytime.
According to the basic physics of plasmasphericprocesses, the ionosphere in conjugate hemispheres actas sources of plasma along the interconnecting flux tubeforming a plasmaspheric reservoir. There is diurnalinterchange between ionosphere and plasmasphere, withdownward diffusion from the latter helping maintain thenighttime F2-layer. However, the normal trend could beinterrupted during geomagnetically active periods.Geomagnetic storm activity can cause rapid contractionof the plasmapause and depletion of the flux tubes insidethe plasmasphere (e.g., Park, 1971). A gradual replenish-ment of the plasmaspheric flux tubes then takes placefrom the underlying ionosphere over a period of manydays. The underlying physics indicates that the diurnalinterchange between ionosphere and plasmasphere maybe significant, particularly on the lower L-shell flux tubes.
The plasmaspheric contribution to the ground-basedGPS TEC varies as a function of latitude. The contributionincreases as latitude decreases due to the GPS raypathlength decreasing with increasing latitude as shown inFig. 1. The top panel in the figure shows a schematicshowing the vertical raypaths between the orbital altitudeof Jason-1 and GPS satellites as a function of latitude. Theplot is generated using the dipole field line equation, andthe blue circles represent surface of the Earth, JASON andGPS orbital altitudes. The oval-shaped blue curve depicts
the plasmapause location, roughly at L ¼ 4. The red colorrepresents the raypath length inside the pasmasphere,showing the longest distance at low latitudes compared tohigh latitudes. The raypath length as a function of latitudeis shown in the bottom panel of Fig. 1. As can be seen inthe figure, the maximum GPS raypath length occurs at theequator and decreases toward higher latitudes. Therefore,estimation of the plasmaspheric electron content con-tribution to GPS TEC using purely experimental measure-ments at a global scale, which has not previously beenreported, is essential. The objective of this paper is topresent the value of plasmaspheric electron content andits percentage contribution to ground-based GPS TEC and
ARTICLE IN PRESS
14
12
10
8
6
4
2
00 4 8 12 16 20 24
Local Time (hr)
0 4 8 12 16 20 24Local Time (hr)
60
50
40
30
20
10
0
VTE
C (x
1016
el/m
2 )V
TEC
(x10
16 e
l/m2 )
DOY 282, 2003
GPS sites at EA−latitude (SCUB)GPS sites at Mid−latitude (NLIB)GPS sites at High−latitude (FAIR)
JASON top−side GPS TEC
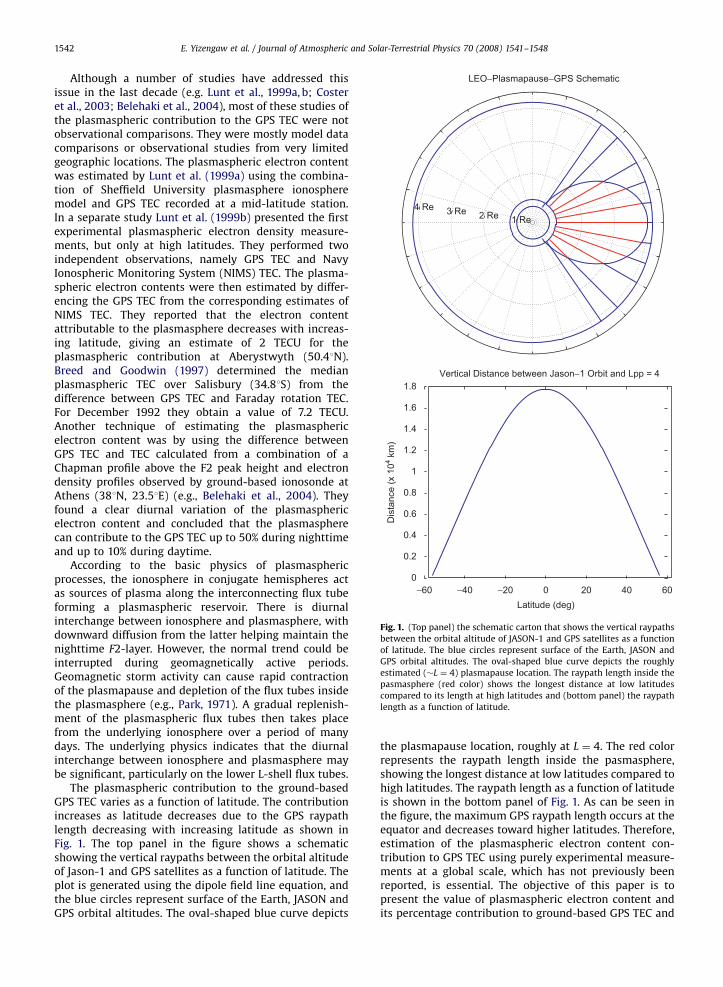
Fig. 2. (Top panel) typical examples of plasmaspheric vertical TEC
directly estimated on 9 October 2003 from GPS data on JASON-1 satellite.
The black curves represent vertical TEC obtained from segments of
observations of many GPS satellites and the red curve represents the
15 min local time average values of TEC. (Bottom panel) ground-based
GPS TEC at equatorial latitudes (solid circles), mid-latitudes (solid
squares), and high latitudes (open triangles).
E. Yizengaw et al. / Journal of Atmospheric and Solar-Terrestrial Physics 70 (2008) 1541–1548 1543
thus to the degradation of GPS navigation and commu-nication systems using experimentally and independentlyobtained measurements. Ground-based GPS receivers areused to estimate vertical GPS TEC. Similarly, the GPSreceiver on board the JASON satellite is used to estimatethe electron content above the satellite orbital altitude(1335 km), which is purely a plasmaspheric electroncontent. Using the combination of these two independentmeasurements, the plasmaspheric electron content con-tribution is estimated globally during night and daytime.
2. Ground-based GPS TEC and JASON GPS TEC
The dual frequency GPS signals transmitted by GPSsatellites and recorded by receivers on the ground or onboard LEO satellites provide vertical TEC between thereceiver and the GPS satellites (e.g., Mannucci et al., 1998;Yizengaw et al., 2004), which are orbiting at 20,200 kmaltitude (�4.2 L) at �551 inclination. About 1000 GPSreceivers around the world are used to obtain theground-based GPS TEC for this study. Using a similarestimation technique, the plasmaspheric GPS TEC iscalculated from measurements recorded by GPS receiverson board the JASON-1 satellite. Unlike TOPEX, JASON-1 isorbiting with a dual frequency GPS receiver, which allowsthe estimation of the TEC above the satellite orbitalaltitude. The GPS receiver on JASON continuously receivessignals broadcasted by each GPS satellite at two spreadspectrum L-band radio signals: f1 ¼ 1.57542 and f2 ¼
1.2276 GHz. In a first-order approximation the differentialphase advance of these radio signals is proportional to theintegrated number of free electrons along the transmis-sion between the transmitter and receiver. This integratedelectron density (slant TEC) is then mapped to the verticalby using a single-layer approximation (Mannucci et al.,1998), providing the vertical TEC values of the plasma-sphere.
The JASON-1 small satellite (Menard and Fu, 2003) isorbiting at an altitude of 1335 km and orbital inclination661, and was launched in December 2001. The JASON-1mission is dedicated to ocean and climate forecasting, incontinuation with the successful TOPEX-POSEIDON satel-lite (Fu et al., 1994) launched in 1992.
3. Results and discussion
Using the same technique as the CHAMP GPS TECtechnique (Mannucci et al., 2005), JASON GPS TEC hasbeen estimated with high accuracy. Ground-based GPSTEC values must also be calibrated for receiver andsatellite differential group delay biases (Mannucci et al.,1998, 1999). Ground-based receiver biases and satellitebiases are available from an ionospheric mapping systemthat produces daily estimates (Iijima et al., 1999). The biasof the JASON receiver is estimated by assuming that theminimum TEC measured by the receiver is zero, whichoccurs at high latitudes. TEC is a positive definite quantity.All TEC values are then adjusted by a fixed quantity so thatthe JASON GPS TEC is never below zero. This method couldunderestimate TEC if the minimum GPS TEC measured by
JASON is actually greater than zero. Applying thistechnique continuously over several months suggests thatthe error in the JASON GPS TEC used here is at most toolow by 1 TECU.
Top panel of Fig. 2 shows typical examples of verticalTEC of the plasmasphere estimated from GPS data onJASON-1 satellite for 1 day, on 9 October 2003. The blackmarkers represent vertical TEC obtained from segments ofobservations of many GPS satellites in view. Plots of thiskind were used to obtain average values of TEC for acertain time interval throughout the day, and the redcurve in Fig. 2 represents the 15 min local time average ofall. The TEC values presented here are vertical TEC valuesconverted from slant TEC values of elevation anglesgreater than 601. Detailed information about the conver-sion of slant to vertical TEC is described in Mannucci et al.(1998); Yizengaw et al. (2004) and the reference therein.The two peaks at 03:00 and �15:00 LT corresponds to theequatorial crossing of JASON-1. For visual comparison the
ARTICLE IN PRESS
E. Yizengaw et al. / Journal of Atmospheric and Solar-Terrestrial Physics 70 (2008) 1541–15481544
ground-based GPS vertical TEC observed at the equatorialanomaly (solid circle), mid-latitude (solid square), andhigh latitude (open triangle) are shown in the bottompanel of Fig. 2. The three stations that representequatorial, mid, and high latitudes, respectively, are SCUB(Santiago de Cuba, 284.241E, 20.011N geographic; 31.751Ngeomagnetic), NLIB (North Liberty, 268.431E, 41.771Ngeographic; 52.841N geomagnetic), and FAIR (Fairbanks,212.501E, 64.981N geographic; 65.301N geomagnetic). Thevertical TEC shown here is estimated considering allsatellites in view with elevation of greater than 701 angles.The data gap shown in ground-based GPS TEC is eitherwhen the observation was at lower elevation angles (lessthan 701) or no data were available during the corre-sponding time interval. As can be seen in Fig. 2 (top panel)
100
80
60
40
20
01.0
0.8
0.6
0.4
0.2
0.080
60
40
20
00 4 8 12
MLT (h
40
60
20
0
−20
−40
−60
0 100Geog. Longit
Geo
g. L
atitu
de (°
N)
Per
cent
age
Con
tr. (%
)R
atio
(JTE
C /
GTE
C)
GP
S T
EC
(TE
CU
)
GPS TEC (GTEC)JASON TEC (JTEC)
(JTEC / GTEC)
(JTEC / GTEC)*100
October 2003 (Equa
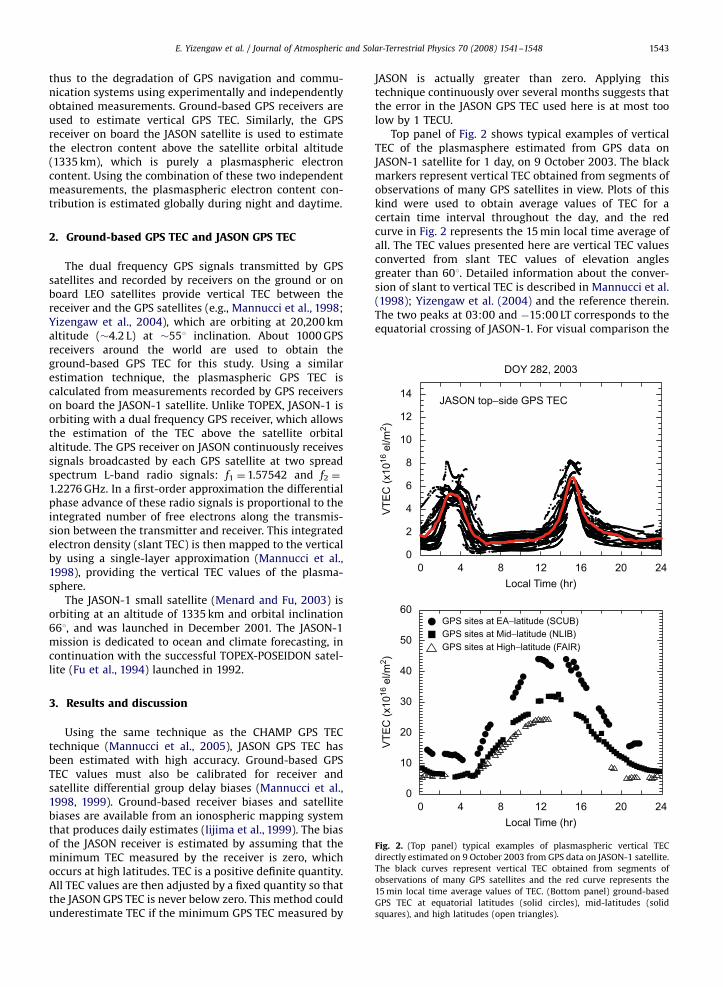
Fig. 3. (Top panel) monthly average diurnal variation of ground-based GPS TE
panel) the ratio of plasmaspheric electron content to the ground-based GPS TE
electron content to the GPS TEC. (Bottom panel) the location of the global groun
GPS TEC data. The shaded region depicts the locations of GPS receivers in the reg
the northern and southern hemisphere show the maximum latitudes range co
the plasmasphere has significant TEC values at the lowlatitudes, where the GPS raypath traverse long distancethrough the plasmasphere compared to its length at mid-and high-latitude regions. The TEC values at low latitudesreached more than 7 TECU, and there is insignificantdifference between nighttime and daytime plasmasphericTEC values as shown in Fig. 2 centered at 03:00 and�15:00 LT, respectively.
Specific passes of JASON were chosen for directcomparison with ground-based data with considerationfor time (LT and UT), longitude, and latitudinal proximity.All ground-based measurements that occurred within5 min of UT, 21 in latitude, and 51 in longitude of JASONvertical TEC measurement were included. However, wefurther restricted both the ground-based and JASON
16 20 24r)
200 300ude (°E)
.0
torial−latitude)20
16
12
8
4
0 JAS
ON
TE
C (T
EC
U)
C (solid circles) and plasmaspheric electron content (stars), (top middle
C, (bottom middle panel) the percentage contribution of plasmaspheric
d-based GPS receivers that provides coincidence data points with JASON
ion of interest, the equatorial region in October 2003. The dashed lines in
vered by JASON satellite.
ARTICLE IN PRESS
E. Yizengaw et al. / Journal of Atmospheric and Solar-Terrestrial Physics 70 (2008) 1541–1548 1545
vertical TEC measurements to those converted from slantTEC of an elevation angle of 801 or more. The 801 elevationcut off will put a window of 101 around the point directlyabove the observation site, which give assurance that bothindependent measurements pass through approximatelythe same area, inferring the electron content of the sameregion from different altitudes. A daily database thatcombines the two independent measurements that fellwithin these specific windows of comparison was thendeveloped for 3 months. Different months were chosen toaccommodate different solar cycle conditions, dependingon the data availability, especially JASON GPS TECavailability. Thus, the 3 months in this study are October2003, May 2005, and December 2006, which are con-sidered as solar maximum (F10.7 ¼ 135.1), solar medium(F10.7 ¼ 91.6), and solar minimum (F10.7 ¼ 73.2) condi-tion, respectively. The F10.7 values given here are monthly
100
80
60
40
20
01.0
0.8
0.6
0.4
0.2
0.080
60
40
20
0
60
40
20
0
−20
−40
−60
Geo
g. L
atitu
de (°
N)
Per
cent
age
Con
tr. (%
)R
atio
(JTE
C /
GTE
C)
GP
S T
EC
(TE
CU
)
0 100Geog. Longit
MLT (h0 4 8 12
October 2003 (M
GPS TEC (GTEC)JASON TEC (JTEC)
(JTEC / GTEC)
(JTEC / GTEC)∗100.0
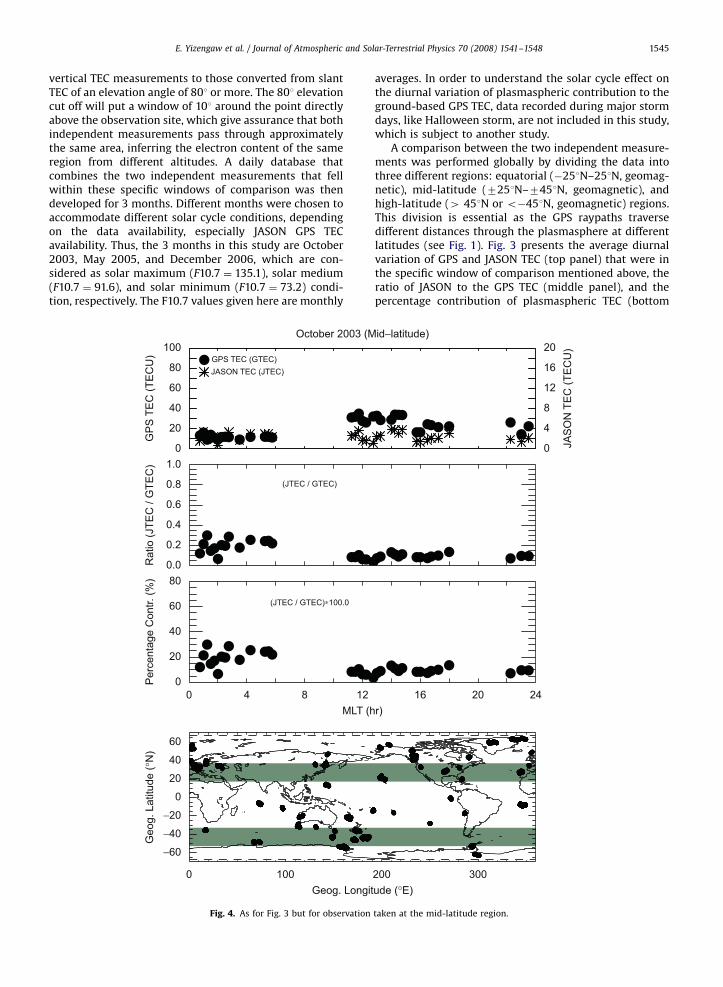
Fig. 4. As for Fig. 3 but for observation
averages. In order to understand the solar cycle effect onthe diurnal variation of plasmaspheric contribution to theground-based GPS TEC, data recorded during major stormdays, like Halloween storm, are not included in this study,which is subject to another study.
A comparison between the two independent measure-ments was performed globally by dividing the data intothree different regions: equatorial (�251N–251N, geomag-netic), mid-latitude (7251N–7451N, geomagnetic), andhigh-latitude (4 451N or o�451N, geomagnetic) regions.This division is essential as the GPS raypaths traversedifferent distances through the plasmasphere at differentlatitudes (see Fig. 1). Fig. 3 presents the average diurnalvariation of GPS and JASON TEC (top panel) that were inthe specific window of comparison mentioned above, theratio of JASON to the GPS TEC (middle panel), and thepercentage contribution of plasmaspheric TEC (bottom
200 300ude (°E)
r)16 20 24
20
16
12
8
4
0 JAS
ON
TE
C (T
EC
U)
id−latitude)
taken at the mid-latitude region.
ARTICLE IN PRESS
E. Yizengaw et al. / Journal of Atmospheric and Solar-Terrestrial Physics 70 (2008) 1541–15481546
panel) observed at the equatorial region. This averagediurnal variation is calculated by binning all points into a15 min local time average, assuming the longitudinaldifference of the plasmaspheric electron content isinsignificant as shown in Fig. 2. The JASON TEC valuesobserved at the same local time interval, even if thesatellite was at different longitude, converge into approxi-mately the same value as shown in Fig. 2. Therefore, as canbe seen in the bottom panel of Fig. 3, the plasmaspherehas a more significant contribution at night than duringthe day. The nighttime contribution can exceed 50%,which is when the ionospheric electron content is low.However, during the daytime, when the ionosphereelectron content is high, the plasmasphere contributionremains typically about 10%. This is expected since theelectron density in the bottom-side ionosphere is con-stantly changing diurnally and is higher during thedaytime than at night. Although this is the first compar-ison performed at the equatorial region, the result is ingeneral agreement with the average plasmaspheric con-tribution reported at different specific mid- and high-latitude locations (e.g., Lunt et al., 1999b; Breed andGoodwin, 1997; Belehaki et al., 2004).
The average diurnal variation of the plasmasphericelectron content contribution observed in the mid-latitude region is presented in Fig. 4. The figure is in theidentical format as Fig. 3. Similarly, Fig. 4 also reveals adifference between nighttime and daytime percentagecontribution. However, during nighttime the magnitude issmaller than that observed at equatorial latitudes. At mid-latitude the average nighttime contribution is about 20%,whereas during daytime the contribution is about 10%. Forcompleteness we also have looked at similar diurnalvariation at high-latitude regions (not shown here), andfound almost no difference between daytime and night-time contribution. This may be due to almost no plasma-spheric crossing of the GPS raypath for GPS receiverslocated at the high-latitude (outside the plasmapause thatis aligned with the mid-latitude trough (Yizengaw andMoldwin, 2005; Yizengaw et al., 2005c)) region. The GPSraypath, looking upward almost at zenith angle (elevationangle 4801), that encounters high L-shell flux tubeoutside the plasmapause may have very low electrondensity and consequently have very small additionalelectron content contribution from the plasmasphere.Similarly, Lunt et al. (1999b), using TEC observation byGPS and NIMS satellites, found that the plasmasphericelectron content at 50.41N was about 1.6 TECU comparedto almost 0.0 TECU at 53.41N latitudes. Their observationalresult at a specific location is consistent with the result
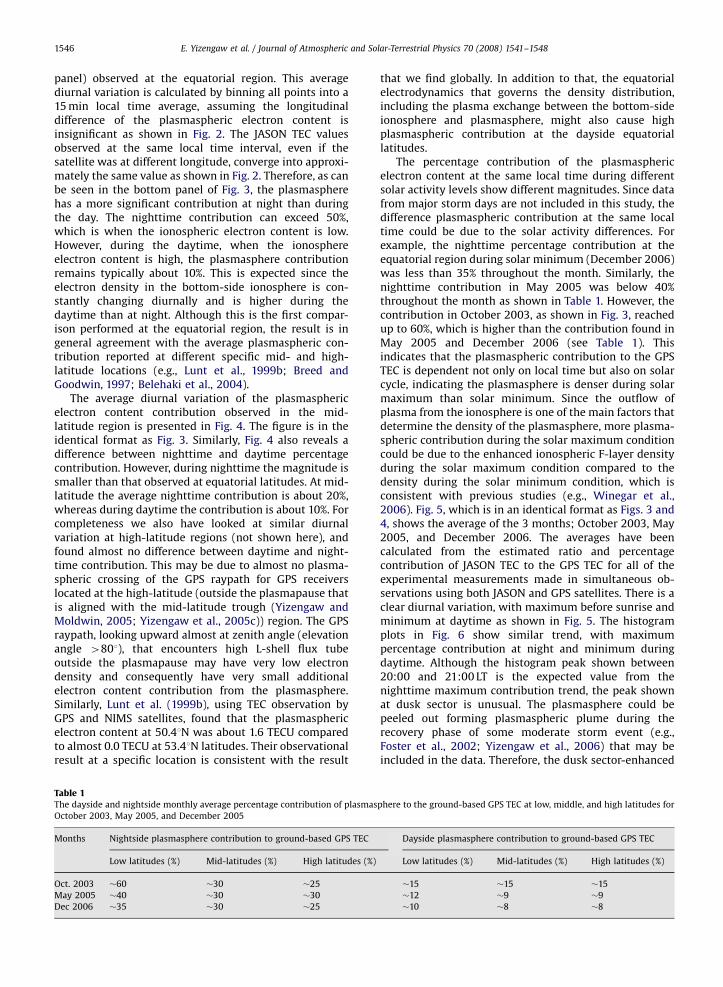
Table 1The dayside and nightside monthly average percentage contribution of plasmas
October 2003, May 2005, and December 2005
Months Nightside plasmasphere contribution to ground-based GPS TEC
Low latitudes (%) Mid-latitudes (%) High latitudes (%)
Oct. 2003 �60 �30 �25
May 2005 �40 �30 �30
Dec 2006 �35 �30 �25
that we find globally. In addition to that, the equatorialelectrodynamics that governs the density distribution,including the plasma exchange between the bottom-sideionosphere and plasmasphere, might also cause highplasmaspheric contribution at the dayside equatoriallatitudes.
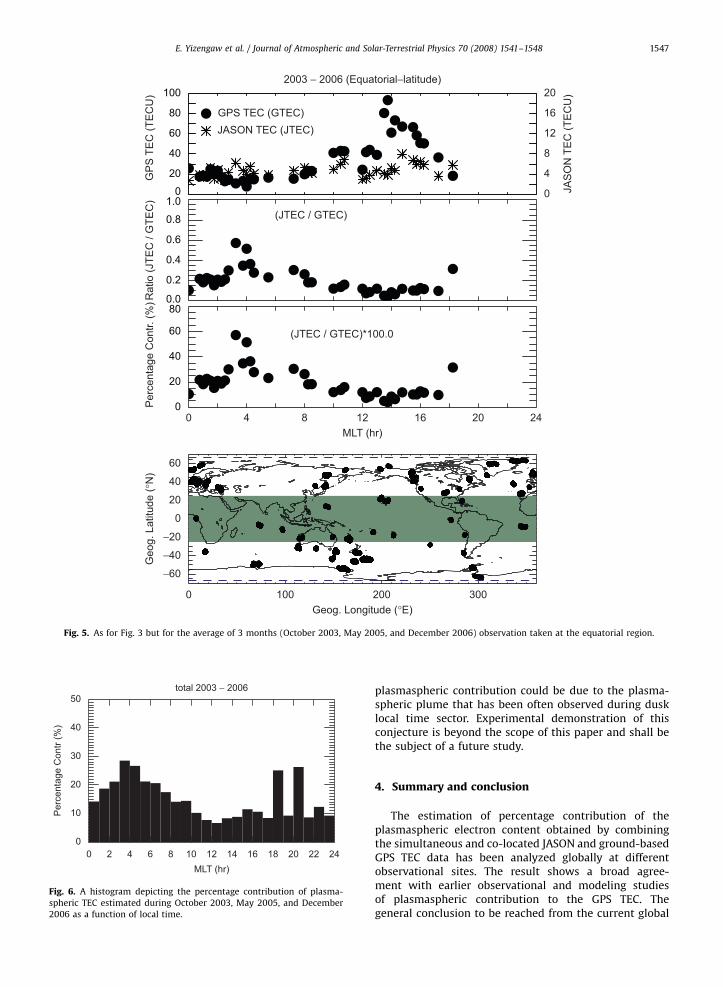
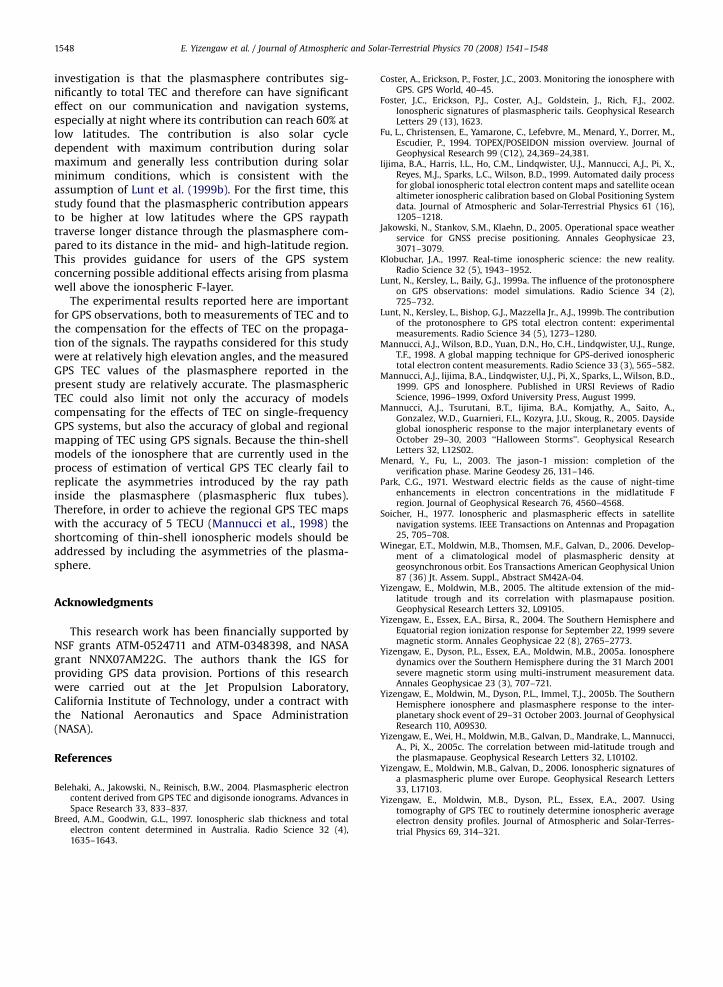
The percentage contribution of the plasmasphericelectron content at the same local time during differentsolar activity levels show different magnitudes. Since datafrom major storm days are not included in this study, thedifference plasmaspheric contribution at the same localtime could be due to the solar activity differences. Forexample, the nighttime percentage contribution at theequatorial region during solar minimum (December 2006)was less than 35% throughout the month. Similarly, thenighttime contribution in May 2005 was below 40%throughout the month as shown in Table 1. However, thecontribution in October 2003, as shown in Fig. 3, reachedup to 60%, which is higher than the contribution found inMay 2005 and December 2006 (see Table 1). Thisindicates that the plasmaspheric contribution to the GPSTEC is dependent not only on local time but also on solarcycle, indicating the plasmasphere is denser during solarmaximum than solar minimum. Since the outflow ofplasma from the ionosphere is one of the main factors thatdetermine the density of the plasmasphere, more plasma-spheric contribution during the solar maximum conditioncould be due to the enhanced ionospheric F-layer densityduring the solar maximum condition compared to thedensity during the solar minimum condition, which isconsistent with previous studies (e.g., Winegar et al.,2006). Fig. 5, which is in an identical format as Figs. 3 and4, shows the average of the 3 months; October 2003, May2005, and December 2006. The averages have beencalculated from the estimated ratio and percentagecontribution of JASON TEC to the GPS TEC for all of theexperimental measurements made in simultaneous ob-servations using both JASON and GPS satellites. There is aclear diurnal variation, with maximum before sunrise andminimum at daytime as shown in Fig. 5. The histogramplots in Fig. 6 show similar trend, with maximumpercentage contribution at night and minimum duringdaytime. Although the histogram peak shown between20:00 and 21:00 LT is the expected value from thenighttime maximum contribution trend, the peak shownat dusk sector is unusual. The plasmasphere could bepeeled out forming plasmaspheric plume during therecovery phase of some moderate storm event (e.g.,Foster et al., 2002; Yizengaw et al., 2006) that may beincluded in the data. Therefore, the dusk sector-enhanced
phere to the ground-based GPS TEC at low, middle, and high latitudes for
Dayside plasmasphere contribution to ground-based GPS TEC
Low latitudes (%) Mid-latitudes (%) High latitudes (%)
�15 �15 �15
�12 �9 �9
�10 �8 �8
ARTICLE IN PRESS
100
80
60
40
20
01.0
0.8
0.6
0.4
0.2
0.080
60
40
20
00 4 8 12 16 20 24
MLT (hr)
40
60
20
0
−20
−40
−60
0 100 200 300Geog. Longitude (°E)
Geo
g. L
atitu
de (°
N)
Per
cent
age
Con
tr. (%
)Rat
io (J
TEC
/ G
TEC
)G
PS
TE
C (T
EC
U)
GPS TEC (GTEC)JASON TEC (JTEC)
(JTEC / GTEC)
(JTEC / GTEC)*100.0
2003 − 2006 (Equatorial−latitude)20
16
12
8
4
0 JAS
ON
TE
C (T
EC
U)
Fig. 5. As for Fig. 3 but for the average of 3 months (October 2003, May 2005, and December 2006) observation taken at the equatorial region.
50
40
30
20
10
00 2 4 6 8 10 12 14 16 18 20 22 24
MLT (hr)
total 2003 − 2006
Per
cent
age
Con
tr (%
)
Fig. 6. A histogram depicting the percentage contribution of plasma-
spheric TEC estimated during October 2003, May 2005, and December
2006 as a function of local time.
E. Yizengaw et al. / Journal of Atmospheric and Solar-Terrestrial Physics 70 (2008) 1541–1548 1547
plasmaspheric contribution could be due to the plasma-spheric plume that has been often observed during dusklocal time sector. Experimental demonstration of thisconjecture is beyond the scope of this paper and shall bethe subject of a future study.
4. Summary and conclusion
The estimation of percentage contribution of theplasmaspheric electron content obtained by combiningthe simultaneous and co-located JASON and ground-basedGPS TEC data has been analyzed globally at differentobservational sites. The result shows a broad agree-ment with earlier observational and modeling studiesof plasmaspheric contribution to the GPS TEC. Thegeneral conclusion to be reached from the current global
ARTICLE IN PRESS
E. Yizengaw et al. / Journal of Atmospheric and Solar-Terrestrial Physics 70 (2008) 1541–15481548
investigation is that the plasmasphere contributes sig-nificantly to total TEC and therefore can have significanteffect on our communication and navigation systems,especially at night where its contribution can reach 60% atlow latitudes. The contribution is also solar cycledependent with maximum contribution during solarmaximum and generally less contribution during solarminimum conditions, which is consistent with theassumption of Lunt et al. (1999b). For the first time, thisstudy found that the plasmaspheric contribution appearsto be higher at low latitudes where the GPS raypathtraverse longer distance through the plasmasphere com-pared to its distance in the mid- and high-latitude region.This provides guidance for users of the GPS systemconcerning possible additional effects arising from plasmawell above the ionospheric F-layer.
The experimental results reported here are importantfor GPS observations, both to measurements of TEC and tothe compensation for the effects of TEC on the propaga-tion of the signals. The raypaths considered for this studywere at relatively high elevation angles, and the measuredGPS TEC values of the plasmasphere reported in thepresent study are relatively accurate. The plasmasphericTEC could also limit not only the accuracy of modelscompensating for the effects of TEC on single-frequencyGPS systems, but also the accuracy of global and regionalmapping of TEC using GPS signals. Because the thin-shellmodels of the ionosphere that are currently used in theprocess of estimation of vertical GPS TEC clearly fail toreplicate the asymmetries introduced by the ray pathinside the plasmasphere (plasmaspheric flux tubes).Therefore, in order to achieve the regional GPS TEC mapswith the accuracy of 5 TECU (Mannucci et al., 1998) theshortcoming of thin-shell ionospheric models should beaddressed by including the asymmetries of the plasma-sphere.
Acknowledgments
This research work has been financially supported byNSF grants ATM-0524711 and ATM-0348398, and NASAgrant NNX07AM22G. The authors thank the IGS forproviding GPS data provision. Portions of this researchwere carried out at the Jet Propulsion Laboratory,California Institute of Technology, under a contract withthe National Aeronautics and Space Administration(NASA).
References
Belehaki, A., Jakowski, N., Reinisch, B.W., 2004. Plasmaspheric electroncontent derived from GPS TEC and digisonde ionograms. Advances inSpace Research 33, 833–837.
Breed, A.M., Goodwin, G.L., 1997. Ionospheric slab thickness and totalelectron content determined in Australia. Radio Science 32 (4),1635–1643.
Coster, A., Erickson, P., Foster, J.C., 2003. Monitoring the ionosphere withGPS. GPS World, 40–45.
Foster, J.C., Erickson, P.J., Coster, A.J., Goldstein, J., Rich, F.J., 2002.Ionospheric signatures of plasmaspheric tails. Geophysical ResearchLetters 29 (13), 1623.
Fu, L., Christensen, E., Yamarone, C., Lefebvre, M., Menard, Y., Dorrer, M.,Escudier, P., 1994. TOPEX/POSEIDON mission overview. Journal ofGeophysical Research 99 (C12), 24,369–24,381.
Iijima, B.A., Harris, I.L., Ho, C.M., Lindqwister, U.J., Mannucci, A.J., Pi, X.,Reyes, M.J., Sparks, L.C., Wilson, B.D., 1999. Automated daily processfor global ionospheric total electron content maps and satellite oceanaltimeter ionospheric calibration based on Global Positioning Systemdata. Journal of Atmospheric and Solar-Terrestrial Physics 61 (16),1205–1218.
Jakowski, N., Stankov, S.M., Klaehn, D., 2005. Operational space weatherservice for GNSS precise positioning. Annales Geophysicae 23,3071–3079.
Klobuchar, J.A., 1997. Real-time ionospheric science: the new reality.Radio Science 32 (5), 1943–1952.
Lunt, N., Kersley, L., Baily, G.J., 1999a. The influence of the protonosphereon GPS observations: model simulations. Radio Science 34 (2),725–732.
Lunt, N., Kersley, L., Bishop, G.J., Mazzella Jr., A.J., 1999b. The contributionof the protonosphere to GPS total electron content: experimentalmeasurements. Radio Science 34 (5), 1273–1280.
Mannucci, A.J., Wilson, B.D., Yuan, D.N., Ho, C.H., Lindqwister, U.J., Runge,T.F., 1998. A global mapping technique for GPS-derived ionospherictotal electron content measurements. Radio Science 33 (3), 565–582.
Mannucci, A.J., Iijima, B.A., Lindqwister, U.J., Pi, X., Sparks, L., Wilson, B.D.,1999. GPS and Ionosphere. Published in URSI Reviews of RadioScience, 1996–1999, Oxford University Press, August 1999.
Mannucci, A.J., Tsurutani, B.T., Iijima, B.A., Komjathy, A., Saito, A.,Gonzalez, W.D., Guarnieri, F.L., Kozyra, J.U., Skoug, R., 2005. Daysideglobal ionospheric response to the major interplanetary events ofOctober 29–30, 2003 ‘‘Halloween Storms’’. Geophysical ResearchLetters 32, L12S02.
Menard, Y., Fu, L., 2003. The jason-1 mission: completion of theverification phase. Marine Geodesy 26, 131–146.
Park, C.G., 1971. Westward electric fields as the cause of night-timeenhancements in electron concentrations in the midlatitude Fregion. Journal of Geophysical Research 76, 4560–4568.
Soicher, H., 1977. Ionospheric and plasmaspheric effects in satellitenavigation systems. IEEE Transactions on Antennas and Propagation25, 705–708.
Winegar, E.T., Moldwin, M.B., Thomsen, M.F., Galvan, D., 2006. Develop-ment of a climatological model of plasmaspheric density atgeosynchronous orbit. Eos Transactions American Geophysical Union87 (36) Jt. Assem. Suppl., Abstract SM42A-04.
Yizengaw, E., Moldwin, M.B., 2005. The altitude extension of the mid-latitude trough and its correlation with plasmapause position.Geophysical Research Letters 32, L09105.
Yizengaw, E., Essex, E.A., Birsa, R., 2004. The Southern Hemisphere andEquatorial region ionization response for September 22, 1999 severemagnetic storm. Annales Geophysicae 22 (8), 2765–2773.
Yizengaw, E., Dyson, P.L., Essex, E.A., Moldwin, M.B., 2005a. Ionospheredynamics over the Southern Hemisphere during the 31 March 2001severe magnetic storm using multi-instrument measurement data.Annales Geophysicae 23 (3), 707–721.
Yizengaw, E., Moldwin, M., Dyson, P.L., Immel, T.J., 2005b. The SouthernHemisphere ionosphere and plasmasphere response to the inter-planetary shock event of 29–31 October 2003. Journal of GeophysicalResearch 110, A09S30.
Yizengaw, E., Wei, H., Moldwin, M.B., Galvan, D., Mandrake, L., Mannucci,A., Pi, X., 2005c. The correlation between mid-latitude trough andthe plasmapause. Geophysical Research Letters 32, L10102.
Yizengaw, E., Moldwin, M.B., Galvan, D., 2006. Ionospheric signatures ofa plasmaspheric plume over Europe. Geophysical Research Letters33, L17103.
Yizengaw, E., Moldwin, M.B., Dyson, P.L., Essex, E.A., 2007. Usingtomography of GPS TEC to routinely determine ionospheric averageelectron density profiles. Journal of Atmospheric and Solar-Terres-trial Physics 69, 314–321.