global disposable gloves market
TRANSCRIPT

GLOBAL DISPOSABLE GLOVES MARKET
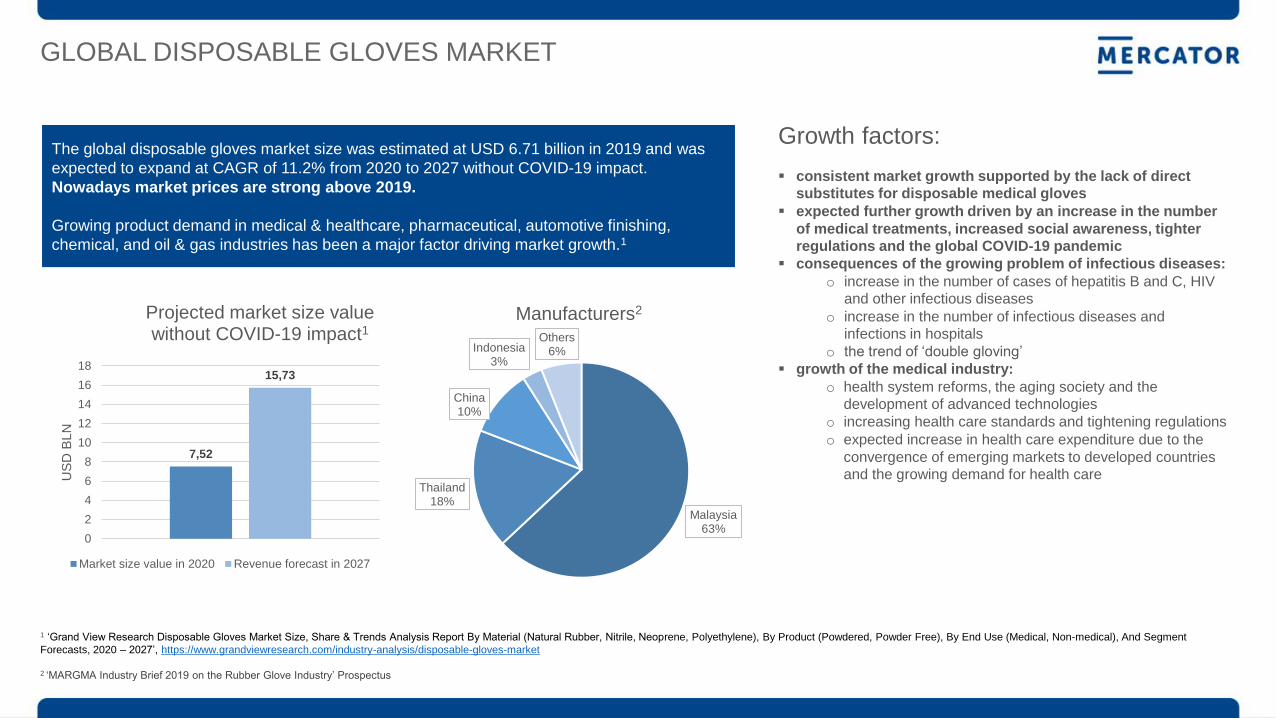
The global disposable gloves market size was estimated at USD 6.71 billion in 2019 and was
expected to expand at CAGR of 11.2% from 2020 to 2027 without COVID-19 impact.
Nowadays market prices are strong above 2019.
Growing product demand in medical & healthcare, pharmaceutical, automotive finishing,
chemical, and oil & gas industries has been a major factor driving market growth.1
7,52
15,73
0
2
4
6
8
10
12
14
16
18
US
D B
LN
Projected market size value without COVID-19 impact1
Market size value in 2020 Revenue forecast in 2027
1 ‘Grand View Research Disposable Gloves Market Size, Share & Trends Analysis Report By Material (Natural Rubber, Nitrile, Neoprene, Polyethylene), By Product (Powdered, Powder Free), By End Use (Medical, Non-medical), And Segment
Forecasts, 2020 – 2027’, https://www.grandviewresearch.com/industry-analysis/disposable-gloves-market 2 ‘MARGMA Industry Brief 2019 on the Rubber Glove Industry’ Prospectus
Growth factors: consistent market growth supported by the lack of direct
substitutes for disposable medical gloves expected further growth driven by an increase in the number
of medical treatments, increased social awareness, tighter
regulations and the global COVID-19 pandemic consequences of the growing problem of infectious diseases:
o increase in the number of cases of hepatitis B and C, HIV
and other infectious diseases o increase in the number of infectious diseases and
infections in hospitals o the trend of ‘double gloving’
growth of the medical industry: o health system reforms, the aging society and the
development of advanced technologies o increasing health care standards and tightening regulations o expected increase in health care expenditure due to the
convergence of emerging markets to developed countries
and the growing demand for health care
Malaysia 63%
Thailand 18%
China 10%
Indonesia 3%
Others 6%
Manufacturers2
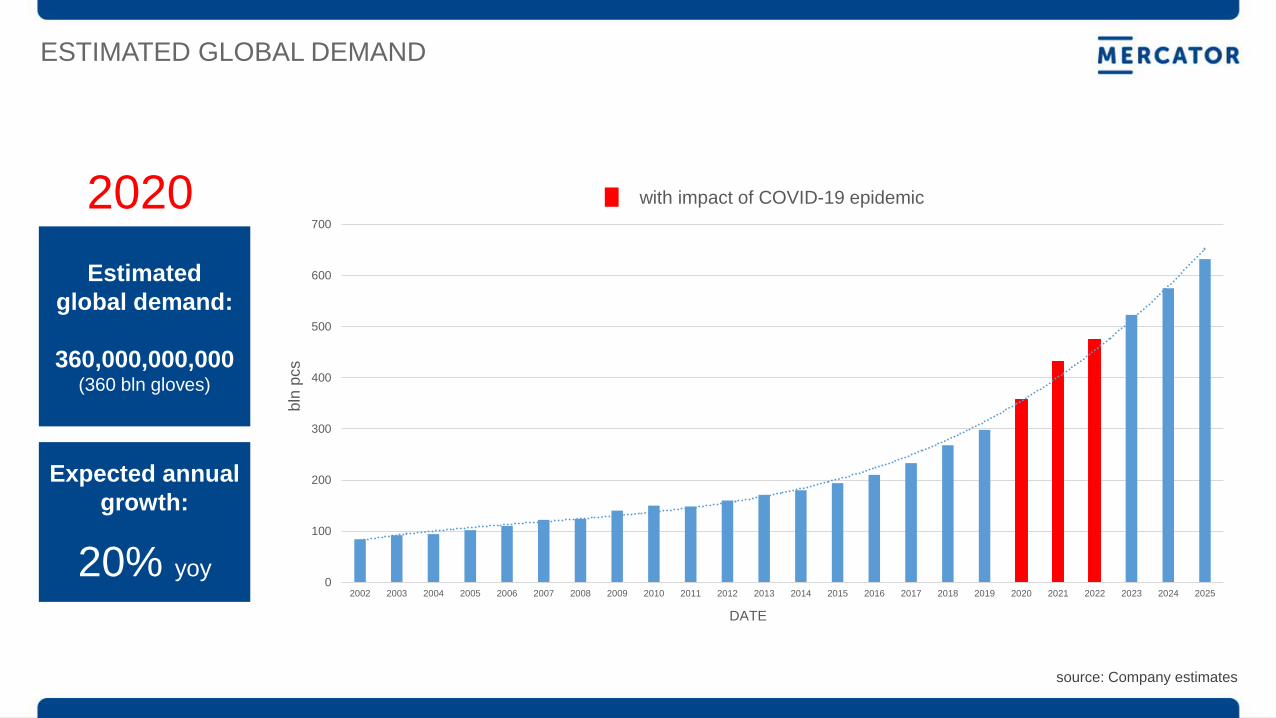
ESTIMATED GLOBAL DEMAND
Estimated
global demand:
360,000,000,000 (360 bln gloves)
2020
Expected annual
growth:
20% yoy
source: Company estimates
0
100
200
300
400
500
600
700
2002 2003 2004 2005 2006 2007 2008 2009 2010 2011 2012 2013 2014 2015 2016 2017 2018 2019 2020 2021 2022 2023 2024 2025
bln
pcs
DATE
with impact of COVID-19 epidemic
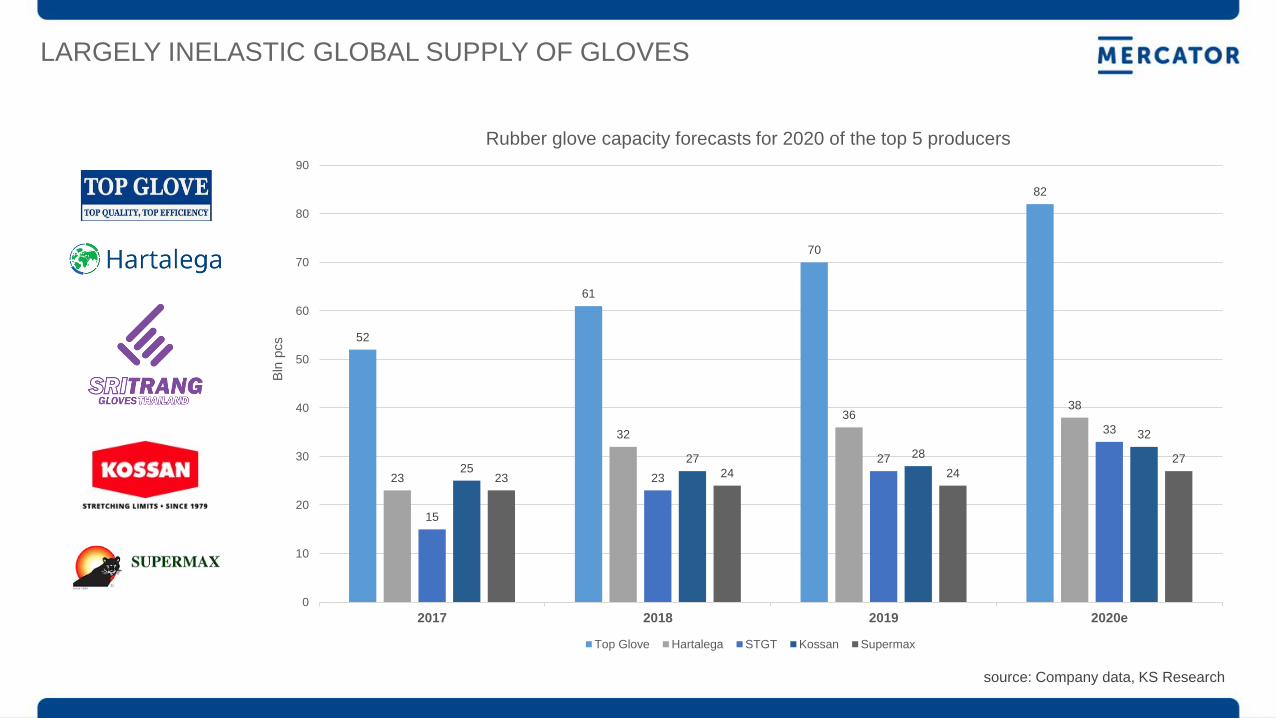
LARGELY INELASTIC GLOBAL SUPPLY OF GLOVES
52
61
70
82
23
32
36 38
15
23
27
33
25 27 28
32
23 24 24
27
0
10
20
30
40
50
60
70
80
90
2017 2018 2019 2020e
Bln
pcs
Rubber glove capacity forecasts for 2020 of the top 5 producers
Top Glove Hartalega STGT Kossan Supermax
source: Company data, KS Research
MESSAGE FROM THE MANUFACTURER #1:
„The best is yet to come – new peaks ahead”
Top Glove Corporation presented on 17th Sept. 2020:
1) Surge in global demand will continue for at least next 2 years:
• Estimated strong global demand - starting 282 bn pcs in 2019, +55 bn pcs, +20%
in 2020, +85 bn pcs, +25% in 2021, +63 bn pcs, +15% in 2022)
• Surge in global demand of 200 bn pcs from 2020 to 2022 will outstrip the
estimated new supply from major manufacturers in Malaysia, Thailand and China
• New entrants will take up to 2 years to start production and not competitive due
to small scale and unable to acces to raw material
• Vaccine will take years to be available for everyone globally
• Post pandemic growth will be higher than pre-pandemic due to heightened
awareness in medical and non-medical sectors
2) ASP (avg. sales price) will continue to rise:
• Lead time is increasing every month – Top Glove sales order book for nitrile
gloves: pre-pandemic period – from 30 to 40 days, June 2020 – 540 days, July
2020 590 days, September 2020 – 620 days
• Nitrile raw material supply is constraint
• Top Glove said about ASP growth in Q4 2020 at +30%
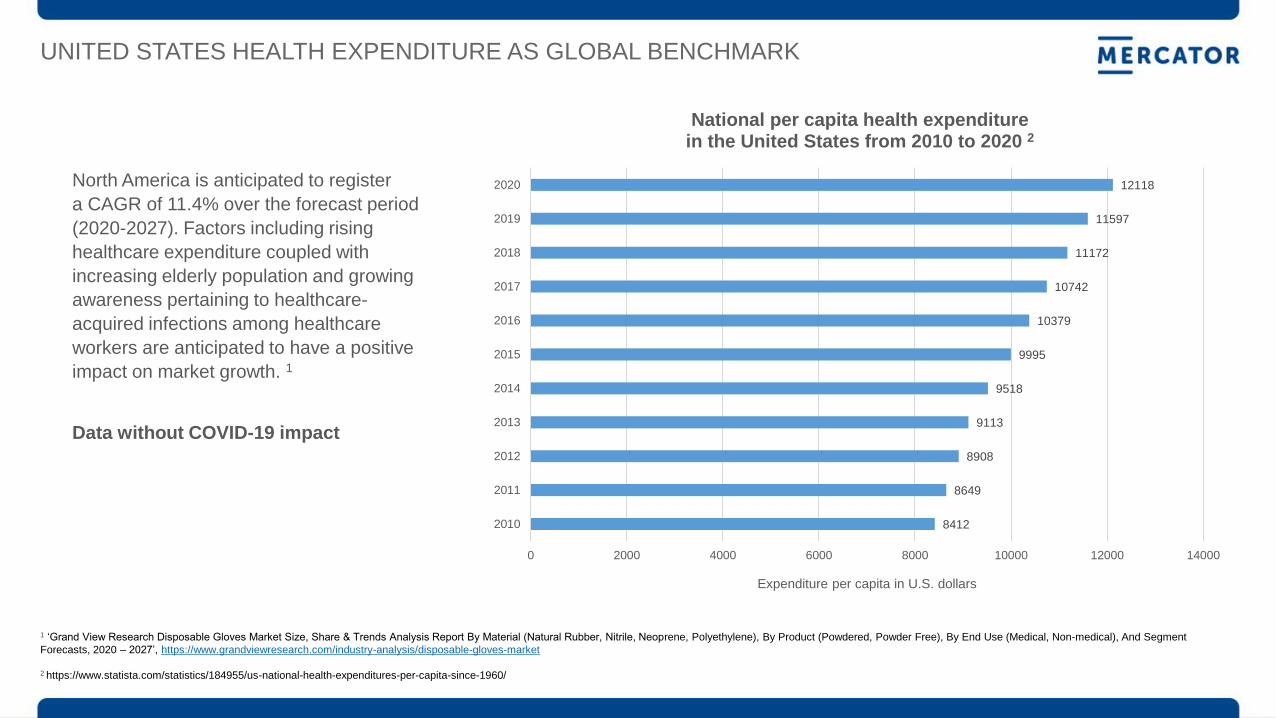
North America is anticipated to register
a CAGR of 11.4% over the forecast period
(2020-2027). Factors including rising
healthcare expenditure coupled with
increasing elderly population and growing
awareness pertaining to healthcare-
acquired infections among healthcare
workers are anticipated to have a positive
impact on market growth. 1
Data without COVID-19 impact
UNITED STATES HEALTH EXPENDITURE AS GLOBAL BENCHMARK
8412
8649
8908
9113
9518
9995
10379
10742
11172
11597
12118
0 2000 4000 6000 8000 10000 12000 14000
2010
2011
2012
2013
2014
2015
2016
2017
2018
2019
2020
Expenditure per capita in U.S. dollars
National per capita health expenditure in the United States from 2010 to 2020 2
1 ‘Grand View Research Disposable Gloves Market Size, Share & Trends Analysis Report By Material (Natural Rubber, Nitrile, Neoprene, Polyethylene), By Product (Powdered, Powder Free), By End Use (Medical, Non-medical), And Segment
Forecasts, 2020 – 2027’, https://www.grandviewresearch.com/industry-analysis/disposable-gloves-market
2 https://www.statista.com/statistics/184955/us-national-health-expenditures-per-capita-since-1960/
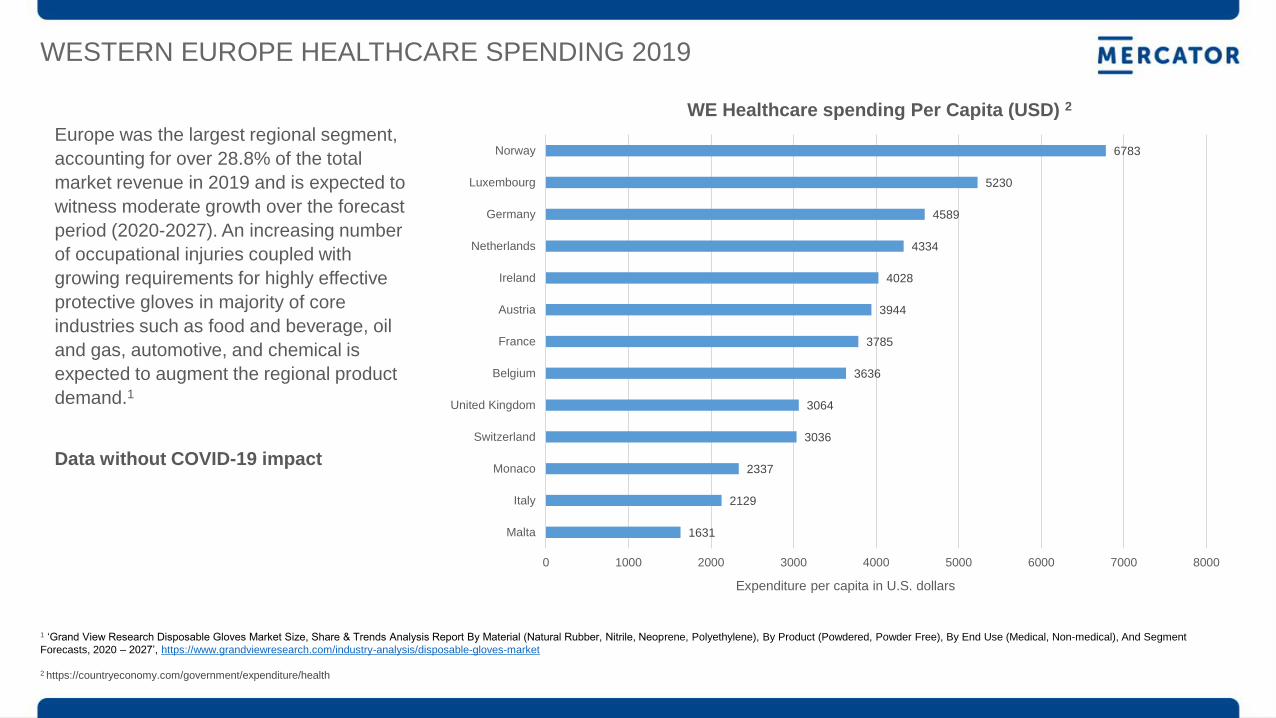
WESTERN EUROPE HEALTHCARE SPENDING 2019
Europe was the largest regional segment,
accounting for over 28.8% of the total
market revenue in 2019 and is expected to
witness moderate growth over the forecast
period (2020-2027). An increasing number
of occupational injuries coupled with
growing requirements for highly effective
protective gloves in majority of core
industries such as food and beverage, oil
and gas, automotive, and chemical is
expected to augment the regional product
demand.1
Data without COVID-19 impact
1 ‘Grand View Research Disposable Gloves Market Size, Share & Trends Analysis Report By Material (Natural Rubber, Nitrile, Neoprene, Polyethylene), By Product (Powdered, Powder Free), By End Use (Medical, Non-medical), And Segment
Forecasts, 2020 – 2027’, https://www.grandviewresearch.com/industry-analysis/disposable-gloves-market
2 https://countryeconomy.com/government/expenditure/health
1631
2129
2337
3036
3064
3636
3785
3944
4028
4334
4589
5230
6783
0 1000 2000 3000 4000 5000 6000 7000 8000
Malta
Italy
Monaco
Switzerland
United Kingdom
Belgium
France
Austria
Ireland
Netherlands
Germany
Luxembourg
Norway
Expenditure per capita in U.S. dollars
WE Healthcare spending Per Capita (USD) 2
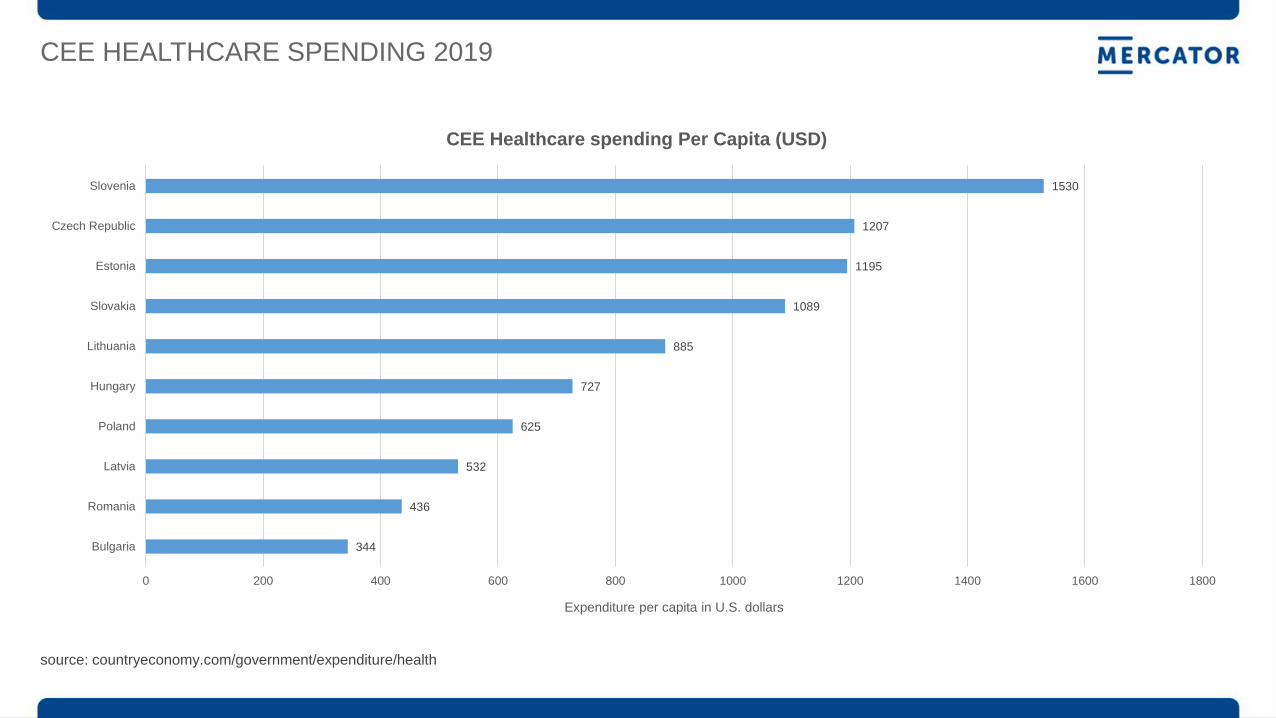
CEE HEALTHCARE SPENDING 2019
source: countryeconomy.com/government/expenditure/health
344
436
532
625
727
885
1089
1195
1207
1530
0 200 400 600 800 1000 1200 1400 1600 1800
Bulgaria
Romania
Latvia
Poland
Hungary
Lithuania
Slovakia
Estonia
Czech Republic
Slovenia
Expenditure per capita in U.S. dollars
CEE Healthcare spending Per Capita (USD)
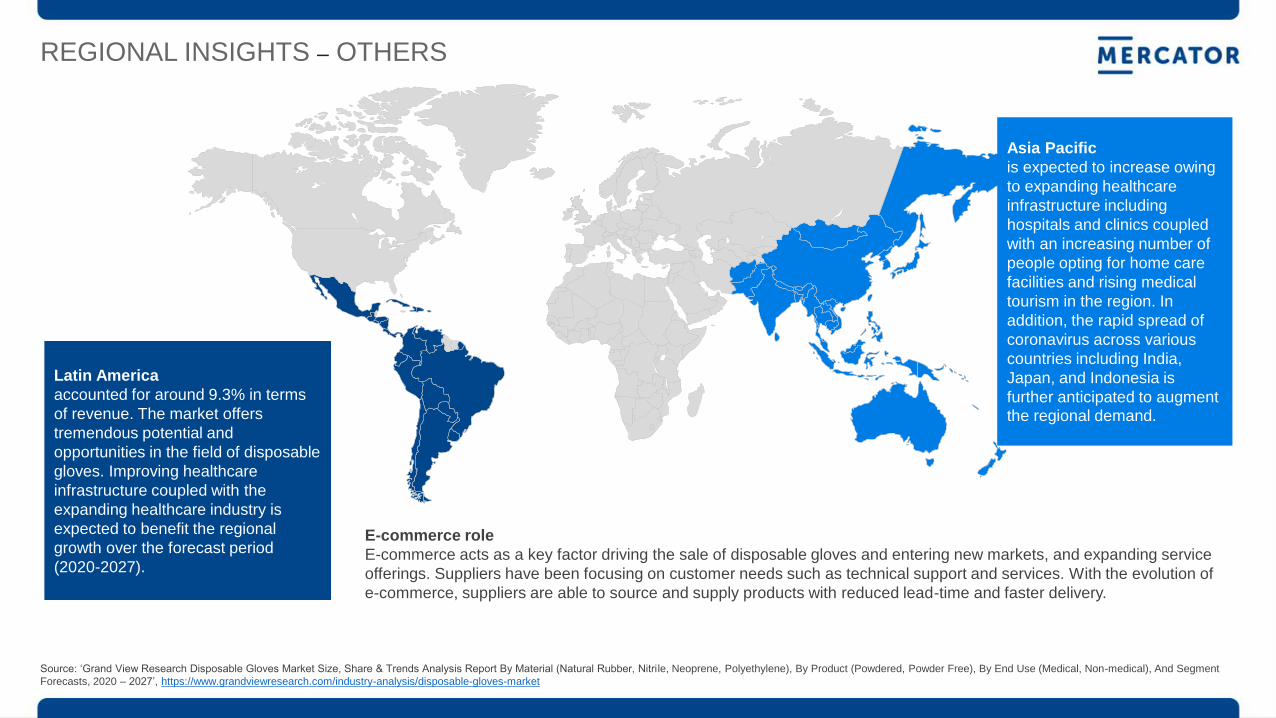
Latin America
accounted for around 9.3% in terms
of revenue. The market offers
tremendous potential and
opportunities in the field of disposable
gloves. Improving healthcare
infrastructure coupled with the
expanding healthcare industry is
expected to benefit the regional
growth over the forecast period
(2020-2027).
Asia Pacific
is expected to increase owing
to expanding healthcare
infrastructure including
hospitals and clinics coupled
with an increasing number of
people opting for home care
facilities and rising medical
tourism in the region. In
addition, the rapid spread of
coronavirus across various
countries including India,
Japan, and Indonesia is
further anticipated to augment the regional demand.
E-commerce role
E-commerce acts as a key factor driving the sale of disposable gloves and entering new markets, and expanding service
offerings. Suppliers have been focusing on customer needs such as technical support and services. With the evolution of
e-commerce, suppliers are able to source and supply products with reduced lead-time and faster delivery.
REGIONAL INSIGHTS – OTHERS
Source: ‘Grand View Research Disposable Gloves Market Size, Share & Trends Analysis Report By Material (Natural Rubber, Nitrile, Neoprene, Polyethylene), By Product (Powdered, Powder Free), By End Use (Medical, Non-medical), And Segment
Forecasts, 2020 – 2027’, https://www.grandviewresearch.com/industry-analysis/disposable-gloves-market

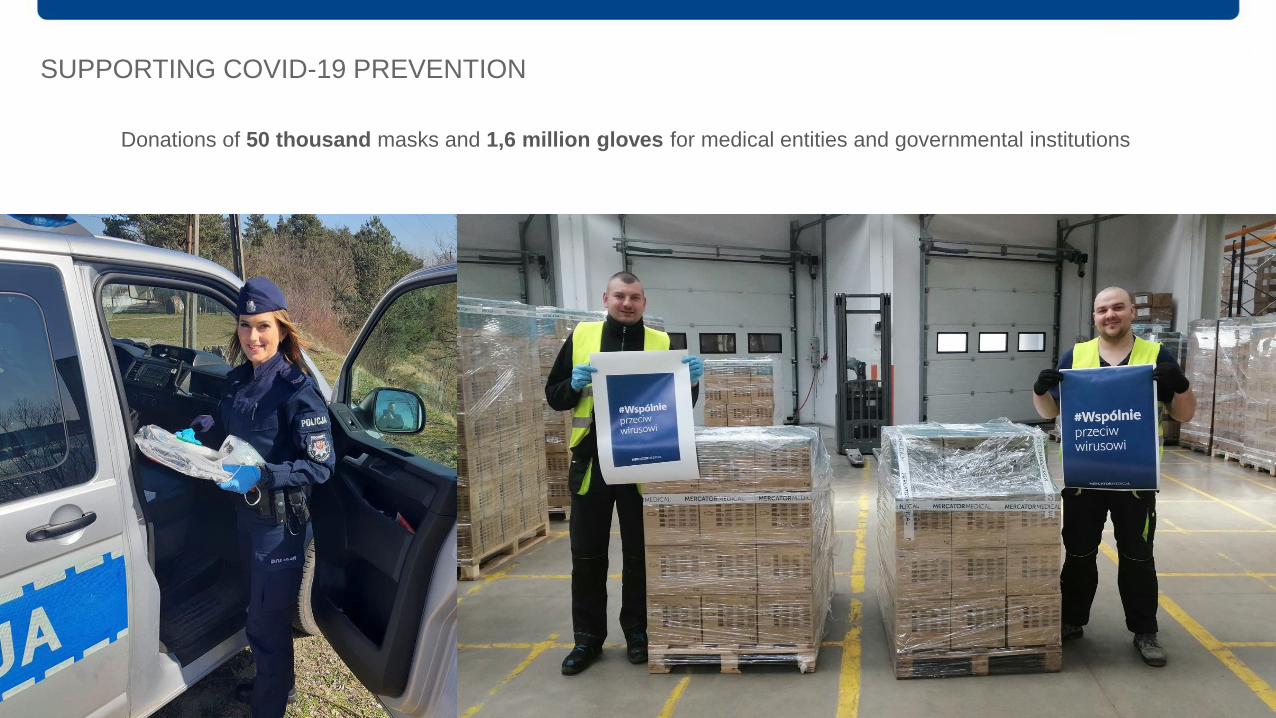
SUPPORTING COVID-19 PREVENTION
Donations of 50 thousand masks and 1,6 million gloves for medical entities and governmental institutions


148 169
227
264
301
420
540
258
578,0
136
375
Sales revenues (million PLN)
+124%
Revenues in Q1 2020 +67% yoy,
+175% yoy in Q2 2020 mainly due to rising
prices of gloves, distribution business
growth and optimalization of production
activities. (final change from NR to NBR
and changes in product portfolio)
Revenues in H1 2020 higher than in
entire year 2019
H1 2020: distribution segment +110% yoy
(PLN 312,9m), production segment +163%
yoy (PLN 302,5m).
Gloves accounted for 96.4% of the
revenues, non-woven products segment –
3.2%, medical dressings segment – 0.4%.
2013 2014 2015 2016 2017 2018 2019
+175%
Long term growing scale of
operations regardless of the
business environment, taking
advantage of the opportunities
in 2020 (pandemic)
DYNAMIC GROWTH OF SALES
H1 19 H1 20 Q2 19 Q2 20
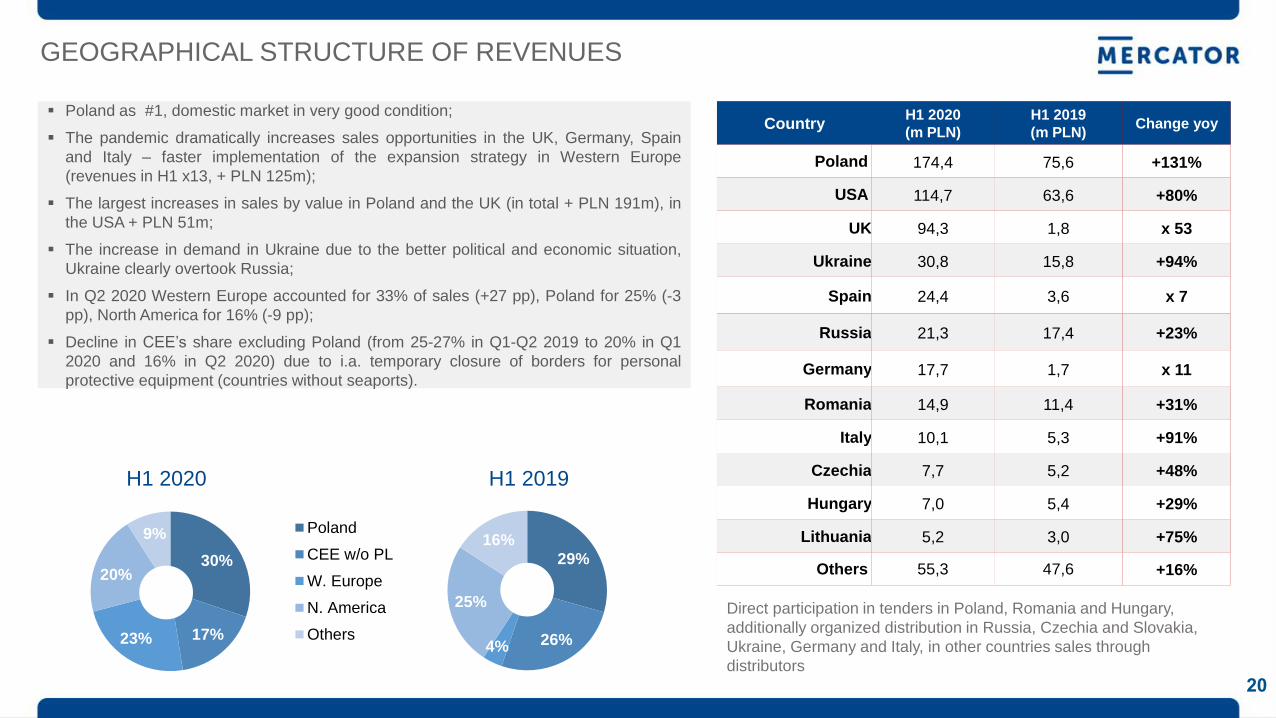
20
Country H1 2020
(m PLN)
H1 2019
(m PLN) Change yoy
Poland 174,4 75,6 +131%
USA 114,7 63,6 +80%
UK 94,3 1,8 x 53
Ukraine 30,8 15,8 +94%
Spain 24,4 3,6 x 7
Russia 21,3 17,4 +23%
Germany 17,7 1,7 x 11
Romania 14,9 11,4 +31%
Italy 10,1 5,3 +91%
Czechia 7,7 5,2 +48%
Hungary 7,0 5,4 +29%
Lithuania 5,2 3,0 +75%
Others 55,3 47,6 +16%
Direct participation in tenders in Poland, Romania and Hungary,
additionally organized distribution in Russia, Czechia and Slovakia,
Ukraine, Germany and Italy, in other countries sales through
distributors
30%
17% 23%
20%
9%
H1 2020
Poland
CEE w/o PL
W. Europe
N. America
Others
29%
26% 4%
25%
16%
H1 2019
GEOGRAPHICAL STRUCTURE OF REVENUES
Poland as #1, domestic market in very good condition;
The pandemic dramatically increases sales opportunities in the UK, Germany, Spain
and Italy – faster implementation of the expansion strategy in Western Europe
(revenues in H1 x13, + PLN 125m);
The largest increases in sales by value in Poland and the UK (in total + PLN 191m), in
the USA + PLN 51m;
The increase in demand in Ukraine due to the better political and economic situation,
Ukraine clearly overtook Russia;
In Q2 2020 Western Europe accounted for 33% of sales (+27 pp), Poland for 25% (-3
pp), North America for 16% (-9 pp);
Decline in CEE’s share excluding Poland (from 25-27% in Q1-Q2 2019 to 20% in Q1
2020 and 16% in Q2 2020) due to i.a. temporary closure of borders for personal
protective equipment (countries without seaports).
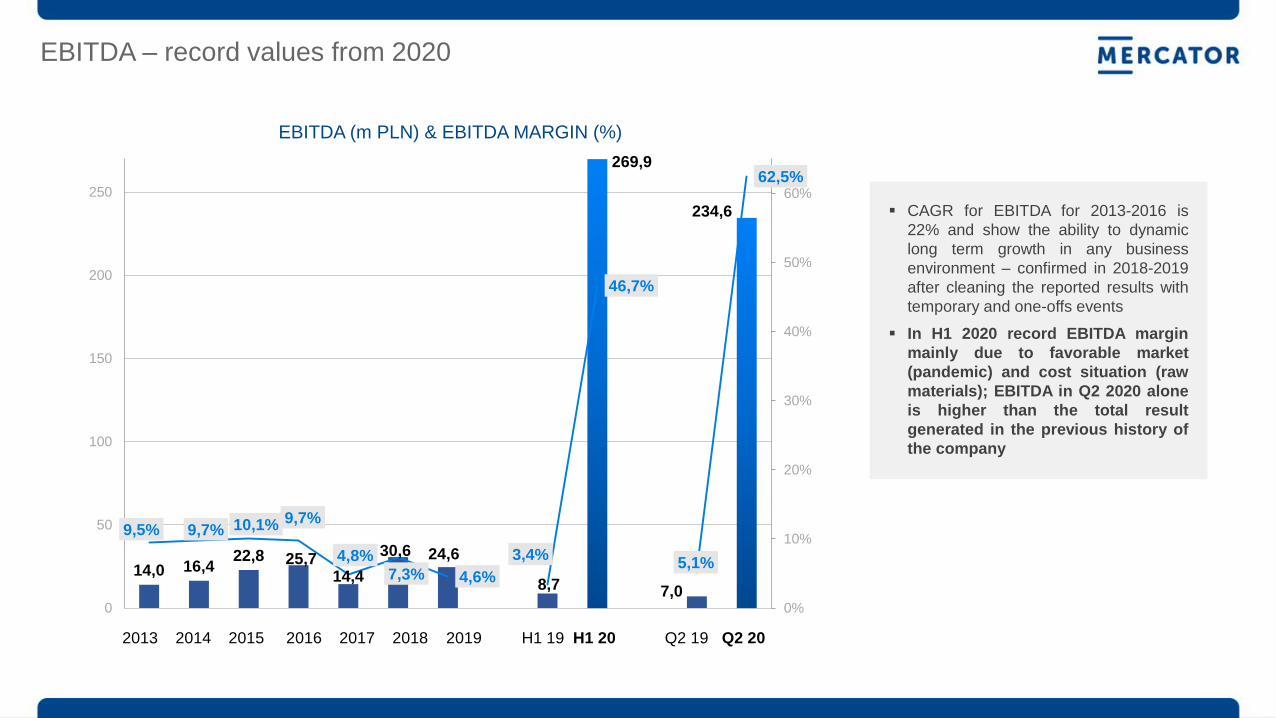
14,0 16,4 22,8 25,7
14,4
30,6 24,6
8,7
269,9
7,0
234,6
9,5% 9,7% 10,1% 9,7%
4,8% 7,3% 4,6%
3,4%
46,7%
5,1%
62,5%
0%
10%
20%
30%
40%
50%
60%
0
50
100
150
200
250
EBITDA (m PLN) & EBITDA MARGIN (%)
2013 2014 2015 2016 2017 2018 2019 H1 19 H1 20 Q2 19 Q2 20
EBITDA – record values from 2020
CAGR for EBITDA for 2013-2016 is
22% and show the ability to dynamic
long term growth in any business
environment – confirmed in 2018-2019
after cleaning the reported results with
temporary and one-offs events
In H1 2020 record EBITDA margin
mainly due to favorable market
(pandemic) and cost situation (raw
materials); EBITDA in Q2 2020 alone
is higher than the total result
generated in the previous history of
the company
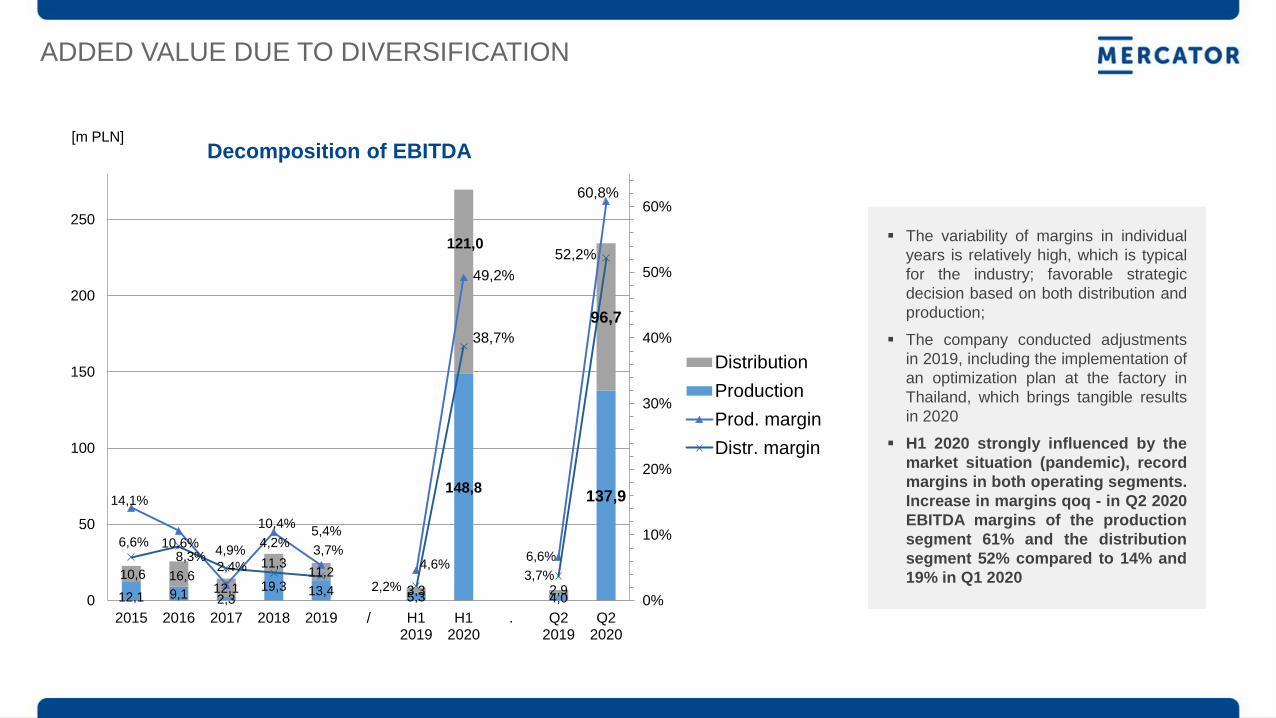
12,1 9,1 2,3 19,3 13,4 5,3
148,8
4,0
137,9
10,6 16,6 12,1
11,3 11,2
3,3
121,0
2,9
96,7
14,1%
10,6%
2,4%
10,4% 5,4%
4,6%
49,2%
6,6%
60,8%
6,6% 8,3%
4,9% 4,2%
3,7%
2,2%
38,7%
3,7%
52,2%
0%
10%
20%
30%
40%
50%
60%
0
50
100
150
200
250
2015 2016 2017 2018 2019 / H12019
H12020
. Q22019
Q22020
Decomposition of EBITDA
Distribution
Production
Prod. margin
Distr. margin
[m PLN]
ADDED VALUE DUE TO DIVERSIFICATION
The variability of margins in individual
years is relatively high, which is typical
for the industry; favorable strategic
decision based on both distribution and
production;
The company conducted adjustments
in 2019, including the implementation of
an optimization plan at the factory in
Thailand, which brings tangible results
in 2020
H1 2020 strongly influenced by the
market situation (pandemic), record
margins in both operating segments.
Increase in margins qoq - in Q2 2020
EBITDA margins of the production
segment 61% and the distribution
segment 52% compared to 14% and
19% in Q1 2020
23
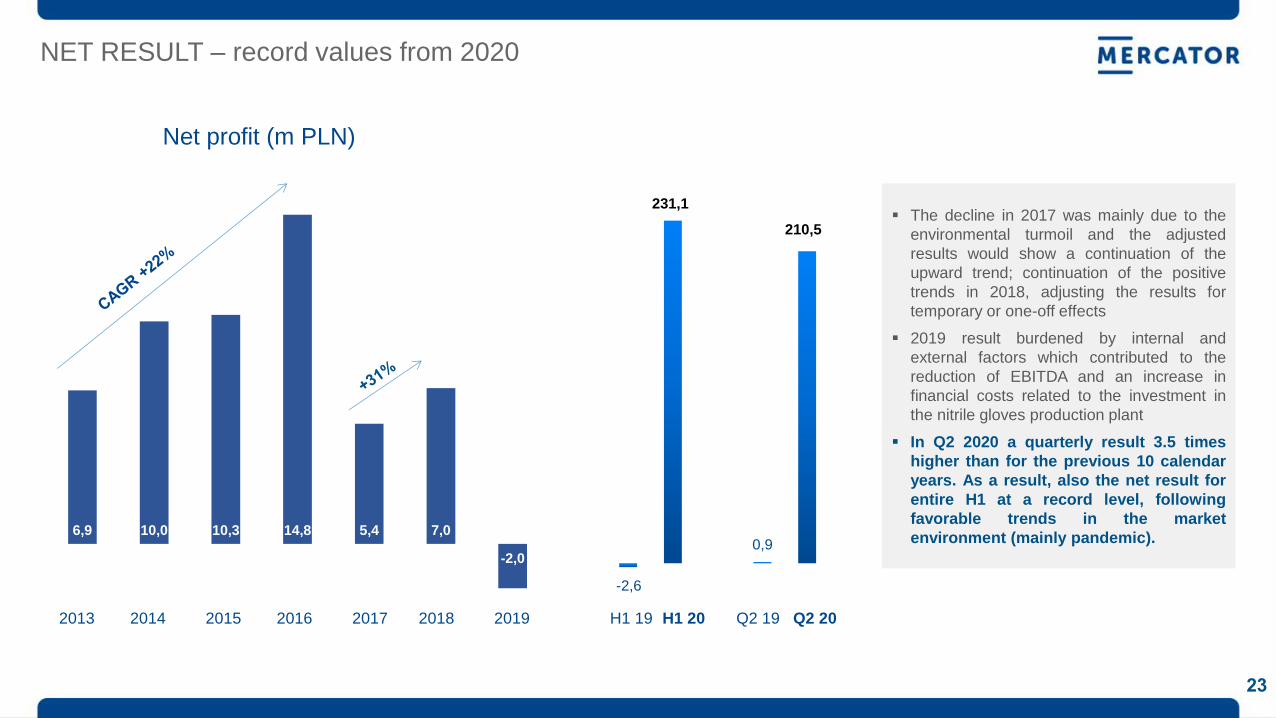
6,9 10,0 10,3 14,8 5,4 7,0
-2,0
Net profit (m PLN)
2013 2014 2015 2016 2017 2018 2019 H1 19 H1 20 Q2 19 Q2 20
-2,6
231,1
0,9
210,5 The decline in 2017 was mainly due to the
environmental turmoil and the adjusted
results would show a continuation of the
upward trend; continuation of the positive
trends in 2018, adjusting the results for
temporary or one-off effects
2019 result burdened by internal and
external factors which contributed to the
reduction of EBITDA and an increase in
financial costs related to the investment in
the nitrile gloves production plant
In Q2 2020 a quarterly result 3.5 times
higher than for the previous 10 calendar
years. As a result, also the net result for
entire H1 at a record level, following
favorable trends in the market
environment (mainly pandemic).
NET RESULT – record values from 2020
24
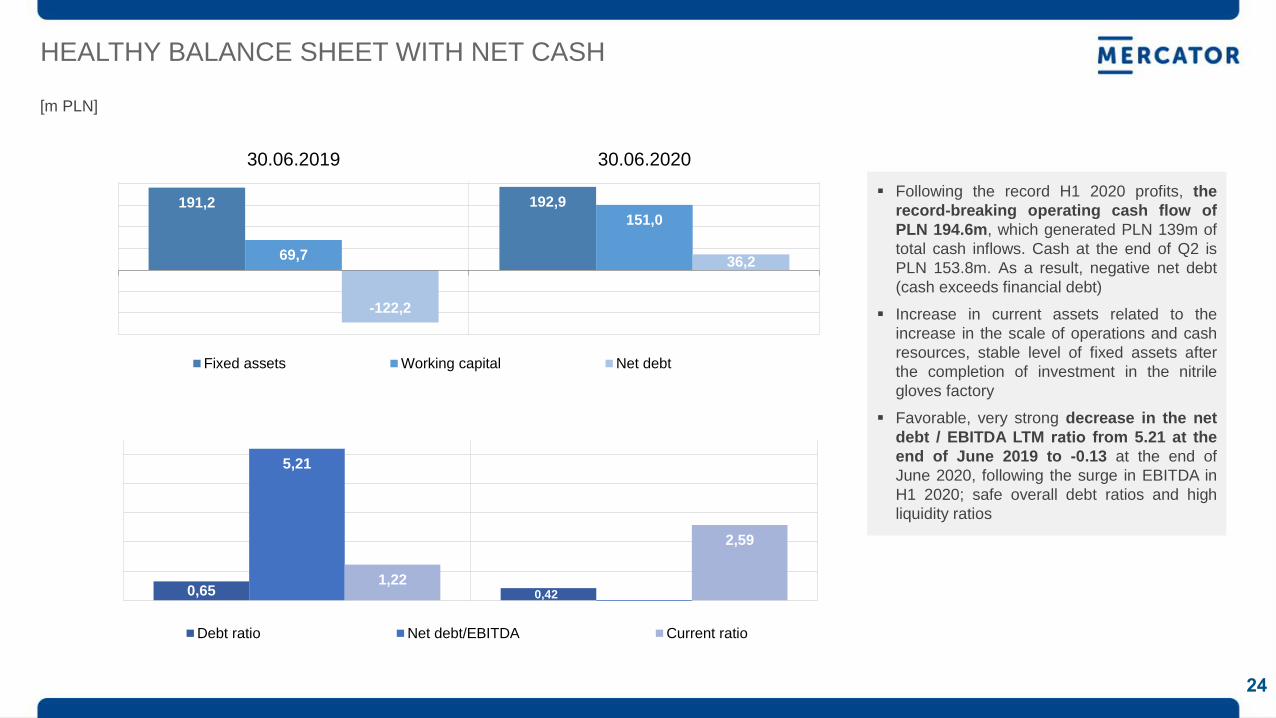
Following the record H1 2020 profits, the
record-breaking operating cash flow of
PLN 194.6m, which generated PLN 139m of
total cash inflows. Cash at the end of Q2 is
PLN 153.8m. As a result, negative net debt
(cash exceeds financial debt)
Increase in current assets related to the
increase in the scale of operations and cash
resources, stable level of fixed assets after
the completion of investment in the nitrile
gloves factory
Favorable, very strong decrease in the net
debt / EBITDA LTM ratio from 5.21 at the
end of June 2019 to -0.13 at the end of
June 2020, following the surge in EBITDA in
H1 2020; safe overall debt ratios and high
liquidity ratios
[m PLN]
191,2 192,9
69,7
151,0
-122,2
36,2
30.06.2019 30.06.2020
Fixed assets Working capital Net debt
0,65 0,42
5,21
1,22
2,59
Debt ratio Net debt/EBITDA Current ratio
HEALTHY BALANCE SHEET WITH NET CASH
What next?
• Oct 2020 – possible publication of preliminary, estimated financial results for Q3 2020
• 28th Oct 2020 – GM in order to raise the buy-back price
• 16th Nov 2020 – publication of the Q3 2020 financial report
• Q4 2020 / Q1 2021 – publication of the 2021+ strategy (principles: dividend and smart investments);
high profits, good prospects and a healthy balance sheet with no investment debt (repaid loans
in Q3 2020) are a favorable basis for developing a strategy of increasing value for shareholders
in the coming years
• Jan 2021 – possible publication of preliminary, estimated financial results for Q4 2020
CONTACT FOR INVESTORS:
Bogna Sikorska [email protected] +48 501 239 339
Adrian Boczkowski [email protected] +48 506 324 456