global demand for steel drives extensive land-use change in brazil's iron quadrangle
TRANSCRIPT

Global Environmental Change 26 (2014) 63–72
Global demand for steel drives extensive land-use change in Brazil’sIron Quadrangle
Laura J. Sonter a,*, Damian J. Barrett a,b, Britaldo S. Soares-Filho c, Chris J. Moran d
a The University of Queensland, Sustainable Minerals Institute, Centre for Water in the Minerals Industry, Qld 4072, Australiab CSIRO Land and Water, Water in the Resources Sector, ACT 2601, Australiac Universidade Federal de Minas Gerais, Centro de Sensoriamento Remoto, MG 31270-900, Brazild The University of Queensland, Sustainable Minerals Institute, Qld 4072, Australia
A R T I C L E I N F O
Article history:
Received 4 July 2013
Received in revised form 2 February 2014
Accepted 29 March 2014
Available online
Keywords:
Atlantic Forest
Charcoal
Deforestation
Mining
Plantations
Regrowth
A B S T R A C T
Global demand for minerals is often considered an insignificant driver of land-use change because mines
are small. We (1) investigated evidence supporting a link between global demand for steel and land-use
change in Brazil’s Iron Quadrangle, and (2) quantified the extent of land-use change and associated impacts
on native vegetation. Historic land-use change was quantified using Landsat TM, relationships between
demand for steel and land-use change were investigated using a simple linear model, and future scenarios
were simulated using a calibrated land-use change model. Results support our hypothesis that global
demand for steel drives extensive land-use change in the Iron Quadrangle, where increased steel
production was correlated with increased iron ore production and mine expansion, and with increased
charcoal production and plantation expansion. The direct impacts of mining on native vegetation were
disproportionate to their relatively small spatial extent, while direct impacts of plantations were spatially
extensive, as were their impacts on surrounding native vegetation. Additionally, evidence of two indirect
impacts emerged during 1990–2010. Plantation expansion decreased native forest regrowth, while
competition for land between mining companies and urban developers increased deforestation pressures.
In combination, global demand for steel affected the majority of land in the Iron Quadrangle; however,
many impacts were poorly captured by current land management approaches. Similar processes may
operate in other mining regions, where global demand for minerals drives production of multiple resources
(non-renewable and renewable) and thus extensive land-use change.
� 2014 Elsevier Ltd. All rights reserved.
Contents lists available at ScienceDirect
Global Environmental Change
jo ur n al h o mep ag e: www .e lsev ier . co m / loc ate /g lo envc h a
1. Introduction
Global demand for minerals is often considered an insignificantdriver of extensive land-use change because the area impacted bymining is small (Sonter et al., 2013a). Instead, most attention isgiven to drivers of agricultural production, since agricultural landuses are spatially extensive (e.g. McAlpine et al., 2009; Schmitzet al., 2012). However, we hypothesize that global demand forminerals drives more extensive land-use change than is currentlyrecognized, given society’s global reliance on mineral resources(Prior et al., 2012; Scholz and Wellmer, 2013) and considering theembodied land requirements of mineral supply chains (Hubacek
* Corresponding author. Tel.: +61 7 3346 4027; fax: +61 7 3346 4045.
E-mail addresses: [email protected] (L.J. Sonter), [email protected]
(D.J. Barrett), [email protected] (B.S. Soares-Filho), [email protected]
(C.J. Moran).
http://dx.doi.org/10.1016/j.gloenvcha.2014.03.014
0959-3780/� 2014 Elsevier Ltd. All rights reserved.
and Giljum, 2003). In this paper, we focus specifically on globaldemand for steel driving extensive land-use change in Brazil.Hypothesized causal pathways are conceptualized in Fig. 1 anddescribed in detail below.
Global demand for steel has accelerated over the past century,fueled largely by industrialization of Asian countries (Goldewijket al., 2011; World Steel Association, 2012). The minerals requiredto manufacture steel, however, are produced by a small number ofsupplier countries. Brazil is currently the world’s leading producerof key steel feedstocks (Gurmendi, 2013), exporting 66% of theirmined iron ore (258.8 Mt of 391.1 Mt) and 23% of their pig iron andsteel (8 Mt of 35.2 Mt) to international markets each year (MME,2010).
Converting mined iron ore into pig iron and steel requires acarbon source. While most countries utilize coking coal for thispurpose, the Brazilian steel industry has long substituted coal withcharcoal (AMS, 2009). Using charcoal removes the country’sdependence on foreign energy supplies (Gurmendi, 2013) and

Fig. 1. Hypothesized causal pathways between increasing global demand for steel
and regional land-use change in Brazil’s Iron Quadrangle (QF). Broken arrows
represent underlying driving forces and solid arrows represent proximate causes of
land-use change. Inset illustrates the location of Minas Gerais in Brazil (top) and the
distribution of 2010 mines in QF (bottom).
L.J. Sonter et al. / Global Environmental Change 26 (2014) 63–7264
increases the quality of steel produced (Nogueira and Coelho,2009). In 2011, more than one third of Brazilian pig iron and steelwas produced using charcoal (EPE, 2012).
Brazilian charcoal has been historically produced from nativeforests; however, mounting international pressure to reducedeforestation and mitigate GHG emissions has caused a recentshift to ‘carbon-neutral’ plantation charcoal production (Gouvelloet al., 2010; Fig. 2). Plantation charcoal production is land intensive(Fearnside, 1995); to produce 10 Mt of hot metal requires at least1.3 Mha of highly productive (40 m3 ha�1 yr�1) Eucalyptus planta-tions (Piketty et al., 2009). As a result, demand for charcoalcontinues to outweigh plantation production capacity. In 2012,almost half the charcoal used in Brazilian pig iron production wasderived from native forests (AMS, 2012).
Multiple factors have limited plantation expansion to meetcharcoal demands for steelmaking in the past, including highproduction costs (relative to coal or native charcoal production),lack of financial credit to establish plantations, and weakinstitutional governance for environmental licensing (ABRAF,2011; Piketty et al., 2009; van Kooten et al., 2002). Over the pastdecade, multiple factors have been introduced to increaseplantation production. Carbon credits became available underthe World Bank’s Clean Development Mechanism (CDM) tosupport industrial-scale production (World Bank, 2002) andBrazil’s Low Carbon Emission Agriculture Program (ProgramaABC) began to offer low-interest loans for landholders to establishfarm-scale production (Soares-Filho, 2013). Additionally, govern-ment policies in Minas Gerais (Brazil’s largest charcoal-producing
Fig. 2. Production of charcoal from native forests (native charcoal) and plantations
(plantation charcoal) in Minas Gerais.
Source: IBGE (2012).
state) now stipulate that native charcoal use in steelmaking mustbe limited to 5% of all charcoal used by 2017 (PROFOR, 2012).
In the future, global demand for steel is projected to increase;Hatayama et al. (2010) estimate a six-fold increase from Asia by2025. In response, the Brazilian government and steel makingindustry have committed to triple production by 2030 (MME,2010). Brazil’s forestry sector is also expected to overcome thecurrent plantation charcoal deficit during this time (AMS, 2009)given increasing enforcement of Brazil’s deforestation legislation(Nepstad et al., 2011) and increasing financial incentives toproduce plantation charcoal.
Despite these production commitments, consequences forregional land-use change and associated impacts on nativevegetation have yet to be analyzed. Therefore, our objectiveswere to: (1) investigate evidence supporting a link betweenincreasing global demand for steel and land-use change in Brazil’sIron Quadrangle; and (2) quantify the extent of land-use changeand associated impacts on native vegetation. We focused onBrazil’s Iron Quadrangle, since it produces approximately 65% ofBrazilian iron and steel (Gurmendi, 2013) and is an increasinglyimportant region for plantation charcoal production.
2. Methods
2.1. Study region
The Iron Quadrangle (Quadrilatero Ferrıfero; QF) occupies 4% ofBrazil’s south-eastern state of Minas Gerais (Fig. 1) and is located inthe Atlantic Forest biome, one of the world’s most threatened yetbio-diverse ecosystems (Myers et al., 2000; Ribeiro et al., 2009).Remnant vegetation in QF is ecologically and socially significant(Jacobi and do Carmo, 2008; Sonter et al., 2014a), as indicated by its‘APA’ status (a federally protected unit permitting sustainable landuse; IBAMA, 2010) and its UNESCO ‘geopark’ classification(Anastasia et al., 2010). Iron ore mining in QF has had a longand important history; QF currently produces 60% of Brazil’s ironore (InfoMine, 2012) and contains 75% of its economically viablereserve (Rosiere et al., 2008).
The QF is also an important charcoal production region. Sixtypercent of Brazilian-produced charcoal originates from the state ofMinas Gerais (AMS, 2009), 90% of which is used in pig iron and steelproduction (EPE, 2012). Charcoal in Minas Gerais is largelyproduced from short-rotation Eucalyptus plantations (E. grandis x
urophylla; Fig. 2; IBGE, 2006), which cover 1.4 Mha (or 2.5%) of thestate (ABRAF, 2011; IEF, 2008). These plantations exist at twoscales: industrial and farm-scale operations. Industrial operationsare defined as non-family farms of 20–450 ha (Kroger, 2012) andoccur outside QF where they utilize CDM credits to support high-yield plantations (World Bank, 2002). It is unlikely industrialoperations will occur inside the QF boundary in the near future,given a lack of large contiguous tracts of available land. In QF, farm-scale operations are dominant. These are smaller and morefragmented than industrial operations and are less likely to becertified or monitored in terms of their social and environmentalpractices (May, 2006). Approximately half the plantations in QFproduce charcoal, the rest produce cellulose for paper production,or other wood materials (IBGE, 2012).
In addition to iron mining and plantations, QF has a largeurban area, incorporating the state’s capital, Belo Horizonte(IBGE, 2010a). Urbanization in Belo Horizonte is driven bypopulation growth and a rural to urban migration, which iscaused by increasing demand for higher living standards (IGBE,2010a). The QF also contains an extensive cattle-grazing legacy,which is now in decline due to increasing land value, low pastureproductivity and high labor costs (IBGE, 2006). Remaining

Fig. 3. Land use transitions observed during 1990–2010. Arrow weight depicts
relative land use transition rates; quantitative land use transition rates can be found
in Section 3.1.
L.J. Sonter et al. / Global Environmental Change 26 (2014) 63–72 65
pastures in QF are predominantly family-owned, low-densitycattle grazing properties.
2.2. Land-use change data
Four land cover maps were produced by classifying Landsat TMdata (30 m resolution). Two scenes cover QF (217,064 and 218,064)and four orthorectified image pairs (one from each scene) wereacquired (from USGS Glovis) over a 20 year period. Image pairswere dated: 24 June 1993/25 July 1990, 08 July 2001/26 June 2000,24 July 2004/31 July 2004, 07 August 2009/01 August 2010, forscenes 217,064 and 218,064 respectively. Images were convertedto exoatmospheric reflectance using published post-launch gainand offset values (NASA Goddard Space Flight Center, 2011). Imagepairs were geographically joined and clipped to the study region,which was defined by intersecting local municipalities (IBGE,2005; Appendix A) with QF geographical boundary (CODEMIG,2010).
The 2010 image was classified into six land cover classes (forest,grass, mine, plantation, urban and water) using a supervisedclassification and image processing software (ENVI version 4.8;Exelis Visual Information Solutions, 2010). The classificationscheme utilized the Spectral Angle Mapper algorithm with bands1–7 (excluding thermal band 6), NDVI and Tasseled Cap. Trainingpixels for each class were selected based on field knowledge andhigher-resolution Quickbird imagery. Each training class had adistinct spectral signature (Jeffries-Matusita and TransformedDivergence separability statistics >1.9 for all comparisons;Richards, 1999).
Pre-2010 images (1990, 2000, 2004) were classified using animage differencing and thresholding method (applied to NDVI) toidentify pixels that had undergone land cover change (Jensen,2005). This method required: (1) the classified 2010 land covermap, (2) a ‘change image’ (e.g. NDVI2004 subtracted fromNDVI2010), and (3) a threshold value to identify ‘change’ and‘no change’ pixels (a 10% change threshold in NDVI difference wasapplied). Pixels in the binary mask (of change regions) wereclassified using end members based on the spectral signatures oftraining pixels collected from the 2010 image. ‘No change’ pixelswere excluded from classification. This approach reducesomission and commission errors (Jensen, 2005); however,accuracy depends on the threshold value and its ability to detectland cover change.
An accuracy assessment was performed to detect omission andcommission errors. A stratified random sampling protocol wasused (Foody, 2011; Stehman, 2009) and sample locations weregenerated in ENVI. Ground truth information was collected fromhigher-resolution imagery in which land cover classes were clearlyvisible. Due to data limitations, only the 2010 and 1990 land covermaps were assessed using Quickbird imagery (2010) and anorthorectified digital photograph (1990). For the 1990 map,‘change regions’ were sampled for accuracy assessment to avoidresampling stable pixels. Classification accuracy was above 90% forall land cover classes (Appendix B).
Land cover classes were converted to land use classes, includingnative forest (unmanaged forests, including native forest re-growth), native grass (unmanaged native grass), field (non-nativegrass), mine (current and abandoned mining operations), planta-tion (planted and managed tree crops, usually Eucalyptus mono-cultures), urban and water bodies. Land cover to land useconversions were performed using decision rules developed fromthe classification time series (Appendix C). Additionally, a nativevegetation map (SEMAD, 2010) was used to separate native grass(Campo, Canga and Cerrado) from field, which was typically eitherlow-density cattle pastures, abandoned cattle pastures or clearedland in transition to urban.
2.3. Spatial land-use change model
The land-use change simulation model was developed using themodeling platform Dinamica EGO (Soares-Filho et al., 2013). Themodel consisted of two parts: a spatially explicit model oflandscape dynamics, which allocated land use transitions in thelandscape, and a scenario generation model, which projectedfuture land use transition rates (Section 2.4).
The spatial model was calibrated by calculating conditionalprobabilities between spatially distributed landscape attributesand land use transitions. The Bayesian Weights of Evidence(WoE; Bonham-Carter, 1994) was used to calculate WoEcoefficients for five land use transitions (Fig. 3): deforestation(native forest to field), regrowth (field to native forest),plantation expansion (field to plantation), mine expansion(native forest to mine, native grass to mine, field to mine) andurbanization (native forest to urban, native grass to urban, fieldto urban). Seven landscape attributes were used: distribution ofprotected areas (IBAMA, 2010), distribution of mining leases(CODEMIG, 2010), slope (calculated from Shuttle Radar Topog-raphy Mission [SRTM] digital elevation model; USGS, 2006) anddistance to fields, native forests, urban and mines (calculatedfrom classified land use maps). Spatial autocorrelation betweenlandscape attributes was not significant (Crammer coefficient<0.5; Bonham-Carter, 1994).
The spatial model was calibrated using 1990–2000 WoEcoefficients, however all time periods produced similar trends(Appendix D). The calibrated model produced a spatial probabili-ty map for each land use transition. These maps were validated bysimulating land-use change from 2000 to 2010 (using 2000–2010transition rates) and comparing the 2010 simulated land use mapwith the 2010 classified map, using fuzzy logic and an exponentialdecay function at multiple increasing windows (Soares-Filhoet al., 2013). The calibrated model performed significantly betterfor all transitions than a null model, which was calibrated with2000–2010 transition rates but evenly distributed spatialprobably (Appendix E). Nevertheless, regrowth had relativelylower predictive capability than other land use transitions due toits relatively rare occurrence (5% minimum similarity betweenthe simulated and observed 2010 land use maps at 15 haresolution), as did plantation expansion (14% minimum similarityat 15 ha resolution) since many closely suitable sites wereavailable.
2.4. Scenario generation model
Future land use transitions rates were calculated for threescenarios: business as usual (BAU), increasing demand for steel
(DEMAND), and overcoming the plantation charcoal deficit
(PLANTCHAR). BAU assumed land use transition rates remainedconstant through time, DEMAND aimed to meet Brazil’s increasingsteel production targets but maintained the current plantationcharcoal deficit (equal to the 1.7 Mt of native charcoal currentlyused in Brazilian steelmaking; IEF, 2008), and PLANTCHAR aimed

Fig. 4. Simple linear model showing relationships between: (A) Brazilian pig iron production and iron ore production (R2 = 0.83; n = 20; observed annual data from 1990 to
2010); (B) Brazilian iron ore production and QF mine area (R2 = 0.99; n = 4; observed annual data from 1990, 2000, 2004, 2010); (C) Brazilian pig iron production and Minas
Gerais plantation charcoal production (R2 = 0.49; n = 20; observed annual data from 1990 to 2010); (D) Minas Gerais plantation charcoal production and QF plantation area
(R2 = 0.91; n = 4; observed annual data from 1990, 2000, 2004, 2010). Projections are extrapolations of historic linear trends under future pig iron production projections
obtained from PNM (MME 2010) for 2015, 2022 and 2030. Confidence intervals are the 95% confidence level for model predictions.
Fig. 5. Observed and projected land use transition rates for: (A) plantation expansion (field to plantation), (B) mine expansion (native forest to mine, native grass to mine, field
to mine), (C) deforestation (native forest to field), and (D) regrowth (field to native forest). Error bars on observed rates and BAU projected rates represent transition detection
errors quantified from accuracy assessment of land use change observations. Error bars on projected DAMAND and PLANTCHAR rates are calculated from the 95% confidence
intervals shown in Fig. 4B and D.
L.J. Sonter et al. / Global Environmental Change 26 (2014) 63–7266
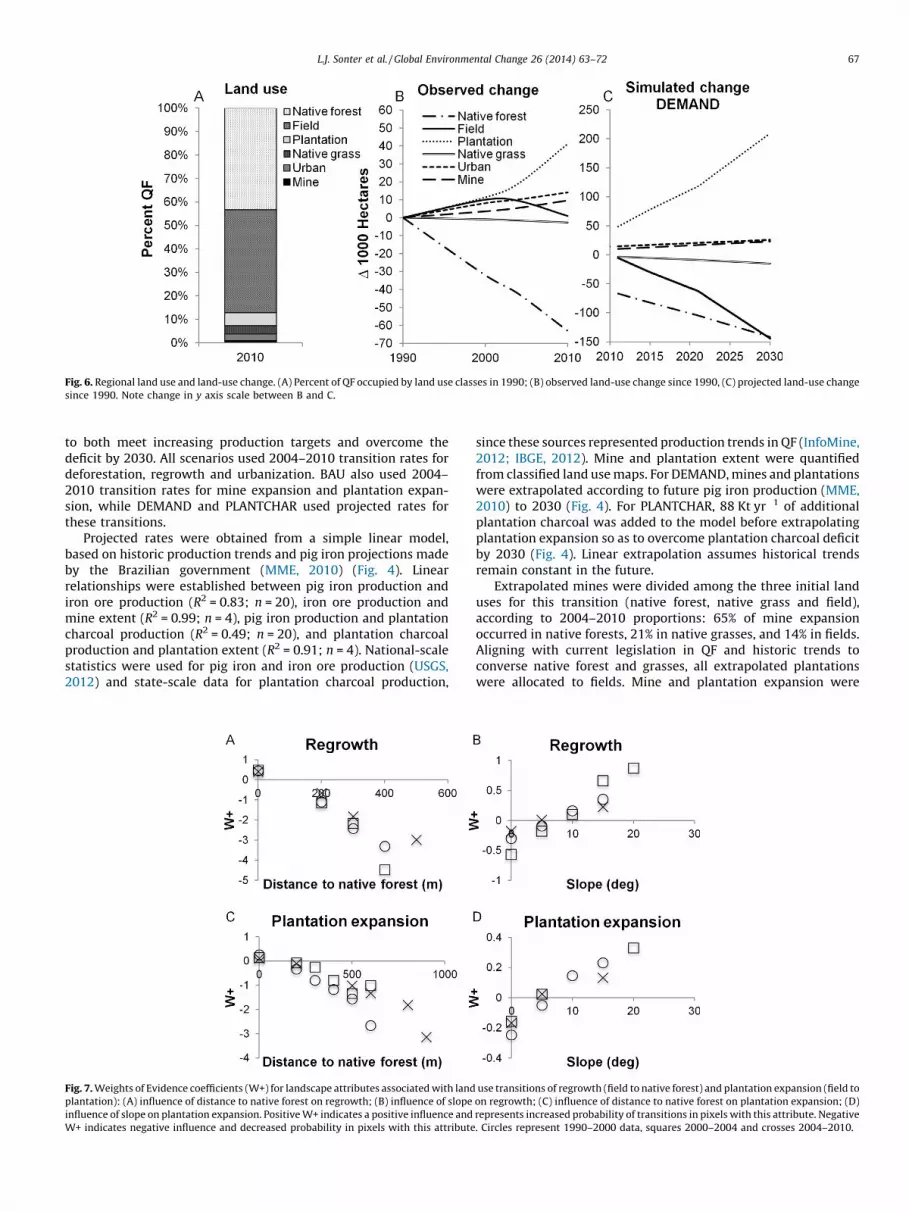
Fig. 6. Regional land use and land-use change. (A) Percent of QF occupied by land use classes in 1990; (B) observed land-use change since 1990, (C) projected land-use change
since 1990. Note change in y axis scale between B and C.
L.J. Sonter et al. / Global Environmental Change 26 (2014) 63–72 67
to both meet increasing production targets and overcome thedeficit by 2030. All scenarios used 2004–2010 transition rates fordeforestation, regrowth and urbanization. BAU also used 2004–2010 transition rates for mine expansion and plantation expan-sion, while DEMAND and PLANTCHAR used projected rates forthese transitions.
Projected rates were obtained from a simple linear model,based on historic production trends and pig iron projections madeby the Brazilian government (MME, 2010) (Fig. 4). Linearrelationships were established between pig iron production andiron ore production (R2 = 0.83; n = 20), iron ore production andmine extent (R2 = 0.99; n = 4), pig iron production and plantationcharcoal production (R2 = 0.49; n = 20), and plantation charcoalproduction and plantation extent (R2 = 0.91; n = 4). National-scalestatistics were used for pig iron and iron ore production (USGS,2012) and state-scale data for plantation charcoal production,
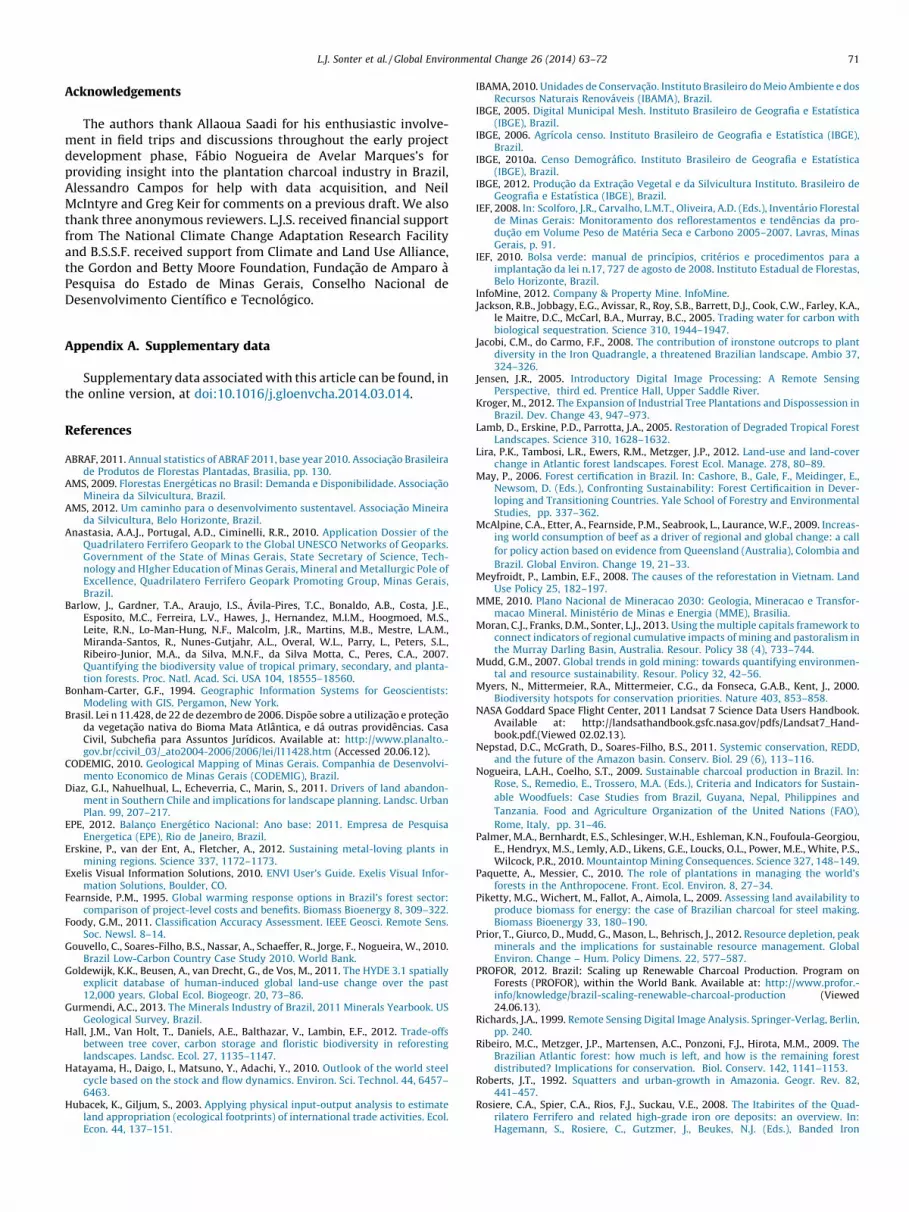
Fig. 7. Weights of Evidence coefficients (W+) for landscape attributes associated with land
plantation): (A) influence of distance to native forest on regrowth; (B) influence of slope
influence of slope on plantation expansion. Positive W+ indicates a positive influence and
W+ indicates negative influence and decreased probability in pixels with this attribute
since these sources represented production trends in QF (InfoMine,2012; IBGE, 2012). Mine and plantation extent were quantifiedfrom classified land use maps. For DEMAND, mines and plantationswere extrapolated according to future pig iron production (MME,2010) to 2030 (Fig. 4). For PLANTCHAR, 88 Kt yr�1 of additionalplantation charcoal was added to the model before extrapolatingplantation expansion so as to overcome plantation charcoal deficitby 2030 (Fig. 4). Linear extrapolation assumes historical trendsremain constant in the future.
Extrapolated mines were divided among the three initial landuses for this transition (native forest, native grass and field),according to 2004–2010 proportions: 65% of mine expansionoccurred in native forests, 21% in native grasses, and 14% in fields.Aligning with current legislation in QF and historic trends toconverse native forest and grasses, all extrapolated plantationswere allocated to fields. Mine and plantation expansion were
use transitions of regrowth (field to native forest) and plantation expansion (field to
on regrowth; (C) influence of distance to native forest on plantation expansion; (D)
represents increased probability of transitions in pixels with this attribute. Negative
. Circles represent 1990–2000 data, squares 2000–2004 and crosses 2004–2010.

Fig. 8. Land use maps for observed data (A: 1990 and B: 2010) and simulated data (C: 2030 under DEMAND) in the central QF. Black dashed line shows the QF urban-mining
interface.
L.J. Sonter et al. / Global Environmental Change 26 (2014) 63–7268
converted to annual transition rates (Fig. 5A and B) and these wereused to simulate future scenarios. All land use transitions wereallocated to the landscape at 1 ha spatial resolution at annualiterations from 2010 to 2030. Simulated land use maps werecompared with the 2010 land use map to quantify land-use changeand impacts on native vegetation.
3. Results
3.1. Observed land-use change during 1990–2010
QF underwent extensive land-use change during 1990–2010(Fig. 6). More than 9500 ha (0.5%) of available land transitioned tomining and 41,000 ha (9%) transitioned to plantations. Urban andfield extent grew by 30% and 5%, respectively. Multiple land usetransitions impacted native vegetation (Fig. 3). In total 63,000 ha(7%) of native forests and 2700 ha (4%) of native grasses werecleared, which caused native vegetation extent (45% of land in2010) to fall below the combined extent of mines, urban areas,plantations and fields (55%) by 2010 (Fig. 6).
Native forest loss was caused by the expansion of multiple landuses (Fig. 3). Deforestation (native forest to field) caused thegreatest loss during 1990–2010, at an average rate of 2500 ha yr�1;however, rates significantly declined from 3020 ha yr�1 to2360 ha yr�1 (Fig. 5C). More than 3.6% of native forests were alsocleared by mine expansion, and another 3.6% by urbanization.During 1990–2010, the annual rate of mine expansion significantlyincreased over time (Fig. 5B), while the annual rate of urbanizationremained constant. During 1990–2010, plantation expansionoccurred at an average rate of 1500 ha yr�1; however, ratessignificantly increased from 590 ha yr�1 to 2500 ha yr�1 (Fig. 5A).Regrowth (field to native forest) equaled 9000 ha during 1990–2010; however, rates significantly declined from 630 ha yr�1 to250 ha yr�1 (Fig. 5D).
Table 1Observed and projected land use area (1000 ha) during 1990–2030 at 5 yearly interval
Land use Observed BAU DEM
1990 2010 2015 2020 2025 2030
Field 868 869 864 858 852 847
Urban 43 57 60 63 66 68
Mine 8 17 21 24 27 31
Native forest 921 858 845 832 820 807
Plantation 69 110 123 136 149 162
Native grass 71 69 68 67 66 65
3.2. Spatial distribution of land use transitions
WoE coefficients represent the influence of landscape attributeson the spatial distribution of land use transitions (Appendix D).Deforestation (native forest to field) occurred close to fields, farfrom mines, outside protected areas and on flat slopes. Regrowth(field to native forest) occurred close to native forests and on steepslopes, as did plantation expansion (field to plantation) (Fig. 7).Urbanization (native forest to urban, native grass to urban, field tourban) occurred close to urban areas and outside protected areas.Mine expansion (native forest to mine, native grass to mine, field tomine) occurred where iron ore existed, close to current miningoperations and outside protected areas.
3.3. Simulated land-use change during 2010–2030
All projected transitions were successfully allocated to thelandscape (i.e. global constraints on the simulation model weremet), illustrating sufficient land was available to meet projectediron ore and plantation charcoal production by 2030. Under BAU,mines expanded by 13,000 ha (to occupy 2% of QF) and plantationsexpanded by 52,000 ha (to occupy 8%) by 2030. Under DEMAND,mines expanded to 4% of QF and plantations to 14% (Fig. 8), whileunder PLANTCHAR plantations reached 17%.
Sixty-five percent of mine expansion occurred in native forestsand 21% in native grasses during 2004–2010. Holding thisproportion constant and simulating land-use change under BAU,mines cleared 8600 ha of native forests and 2700 ha of nativegrasses during 2010–2030. Under DEMAND, native forest loss bymine expansion increased to 36,800 ha and native grass lossincreased to 11,600 ha. Alternatively, plantation expansion wasallocated exclusively to fields, causing a regional decline in fields of52,000 ha, 168,500 ha and 213,000 ha under BAU, DEMAND andPLANTCHAR, respectively (Table 1).
s.
AND PLANTCHAR
2015 2020 2025 2030 2015 2020 2025 2030
839 811 769 724 828 789 736 680
60 62 65 68 60 62 65 67
31 43 58 74 31 43 58 74
839 820 800 780 839 820 800 779
147 180 228 279 158 203 261 323
66 63 60 56 66 63 60 56

L.J. Sonter et al. / Global Environmental Change 26 (2014) 63–72 69
4. Discussion
Results support our hypothesis that global demand for steeldrives extensive land-use change in Brazil’s Iron Quadrangle. Usinga simple linear model, we found increasing pig iron production wascorrelated with mine expansion and plantation expansion. Remotesensing observations indicate direct impacts of mining on nativevegetation were disproportionate to their small spatial extent,while those of plantations were spatially extensive, as were theirimpacts on surrounding native vegetation. Evidence of two indirectimpacts also emerged during 1990–2010. Plantation expansiondecreased native forest regrowth, while mining-urban interactionsincreased deforestation pressures. These findings suggest demandfor steel affects the majority of land in QF and simulated scenariossuggest these impacts could intensify during 2010–2030.
Increased pig iron production was correlated with increasediron ore production and mine expansion (Fig. 4A and B). Mineexpansion in QF cleared native forests and native grasses (Fig. 3),thereby impacting the biodiversity of these ecosystems. Mining-related impacts on biodiversity are often disregarded since theyare typically small-scale and localized compared to those causedby other land uses (Sonter et al., 2013a). This was true in QF where7.5 times more native vegetation was cleared by non-mining landuses during 1990–2010. Mine expansion, however, was dependenton underlying geology and thus associated impacts were confinedto ecosystems with certain lithologies. In QF, iron ore depositsoccur along high-relief rocky outcrops, where vegetation isdominated by Campo Rupestre, an endemic, bio-diverse and highlythreatened rocky grassland ecosystem (Jacobi and do Carmo,2008). Model simulations suggest mine expansion will clear 35% ofrocky grasslands between 2010 and 2030 under DEMAND (Fig. 9).Therefore, while the impacts of mine expansion on nativevegetation were relatively small in area, impacts on this specificecosystem were disproportionately large. Spatially disproportion-ate impacts on biodiversity can have important conservationimplications when not identified or managed correctly. Forexample, Brazilian legislation requires compensation for vegeta-tion clearing (offsetting; Sonter et al., 2014a) at a rate proportionalto the area impacted. Offsetting, however, ignores risks toecosystems associated with historical impacts (caused by othermines or land users) and thus disregards their remaining extent.
Increasing pig iron production was also correlated withincreased plantation charcoal production and plantation expan-sion (Fig. 4C and D). Unlike mine expansion, plantation expansionwas spatially extensive, occupying 6% of QF in 2010 and potentially12% by 2030 under DEMAND (Fig. 6). Extensive plantationexpansion was possible due to the extent of field availability;
Fig. 9. Native vegetation cleared by mine expansion under DEMAND since
20% of 2010 fields were converted to plantations by 2030 underDEMAND, and a further 5% under PLANTCHAR. This findingsuggests sufficient land is available in QF to overcome its share ofBrazil’s plantation charcoal deficit, which, if achieved, wouldreduce pressures on native forests outside QF to supply thisresource. It also supports broader findings on land availability inSouth America to establish plantations for climate changemitigation (Piketty et al., 2009; Zomer et al., 2008) and, sinceplantations were allocated exclusively to fields, simulated resultssuggest plantation expansion can be achieved without competitionwith urban and mining land uses (Meyfroidt and Lambin, 2008;Piketty et al., 2009).
Plantation expansion is also expected to affect surroundingnative vegetation. Ecological benefits, such as enhancing soilstability and increasing conservation value are possible (Paquetteand Messier, 2010; Ribeiro et al., 2009). However, plantations oftenhave negative impacts on surrounding biodiversity and this isespecially true for Eucalyptus monocultures since they support fewnative species (Hall et al., 2012). The specific nature of theseimpacts will be dependent on both the landscape matrix andforestry management practices (Barlow et al., 2007; Lamb et al.,2005). In this regard, a mix of farm-scale plantations with otherland uses may be more favorable to maintain landscape diversitythan industrial operations found outside QF. Nevertheless, in QF,plantation certification is rare and best-practice management isuncommon (May, 2006). Additionally, fast-growing exotics speciescan have negative impacts on ecosystem services, such as reducedwater availability (Jackson et al., 2005). While quantifying thesetradeoffs with other ecosystem services is beyond our scope, it isimportant to recognize that current environmental licensing doesnot require any tradeoff management.
Several indirect impacts of land-use change on native vegeta-tion also emerged during 1990–2010. One indirect impact wascaused by plantation expansion slowing native forest regrowthrates. In QF, a small amount of regrowth occurred during 1990–2010 (Fig. 3), as it did in other parts of the Atlantic Forest (Lira et al.,2012; Teixeira et al., 2009). In QF, however, regrowth ratesdeclined significantly over time (Fig. 5D). Two observationssuggest this was indirectly caused by extensive plantationexpansion. First, the land area available for regrowth (i.e. fields)declined; four percent of fields in 1990 were used by plantations in2010 and simulations suggest 25% of fields would be used byplantations in 2030 under DEMAND. Second, the most suitableland for regrowth also declined. In QF, regrowth was most likely tooccur close to rivers and on steep hill slopes, which were sites alsofavored for plantation expansion (Fig. 7), possibly due to lowopportunity costs (Piketty et al., 2009). These observations suggest
1990. (A) Area of vegetation cleared, (B) percent of vegetation cleared.

L.J. Sonter et al. / Global Environmental Change 26 (2014) 63–7270
a tradeoff emerged in QF between plantations and regrowth, whereplantation expansion increased on marginal agricultural land thatwould have otherwise regrown with native forest species.
Tradeoffs between plantation expansion and native forestregrowth have been found elsewhere, caused by emergingdemands for land use (Meyfroidt and Lambin, 2008; Diaz et al.,2011). In QF, it is also possible this tradeoff was enhanced byrecent revisions to Brazil’s Forest Code. Under this policy,protected vegetation on private property must remain intactand, if cleared, revegetation with native forest species is required(Brasil, 2006). In the Atlantic Forest biome, protected vegetationincludes Areas of Permanent Preservation (APP; native forests onsteep slopes, hilltops and riparian zones) and 20% of native forestson privately owned land. Changes to the Forest Code now permitsmall-scale farmers to partially reforest APP with agro-forestry orsmall-scale tree lots for sustainable wood (including charcoal)production (Soares-Filho, 2013). These changes—and theirperception prior to formal declaration—help explain the observedextent and location of plantation expansion in QF (Figs. 6 and 7)and the decline in regrowth rates (Fig. 5D). Providing financialincentives for regrowth to land holders, such as the new BolsaVerde program (IEF, 2010), may enhance regrowth opportunitiesin QF; however, our results suggest that to be effective, incentivesmust exceed both the opportunity costs of plantations and thefinancial incentives currently encouraging their establishment inBrazil.
Evidence suggests deforestation pressures in QF also increasedduring 1990–2010, given that native forest extent declined(Fig. 6) yet high deforestation rates persisted (Fig. 5C). Evidencealso suggests one potential indirect impact that increaseddeforestation pressures emerged from mining-urban interac-tions. In QF, urban extent tripled during 1990–2010 (Fig. 6) andcleared 3.6% of the region’s native vegetation (Fig. 3). Urbaniza-tion in mining regions is often driven by increasing socio-economic opportunities (e.g. employment) associated with agrowing mining industry (e.g. rapid urbanization followedexpansion of the Carajas iron ore mine in Para; Roberts, 1992).Belo Horizonte, however, is already a highly urbanized city and, assuch, it is unlikely mine expansion directly drives urbanization inQF. Rather, urbanization has been indirectly affected bycompetition for land between mining companies and urbandevelopers, which is particularly intense along the southeasternboundary of Belo Horizonte where both land availability anddistance between mines and urban areas have declined (Fig. 8).This competition has escalated land value in these locations andcaused rapid land acquisition and development. Land use changesimulations suggest competition will intensify during 2010–2030as the distance between mines and urban areas continues todecline (Fig. 8).
Another indirect impact increasing deforestation pressureswas potentially caused by plantation expansion. During 1990–2010, the average rate of plantation expansion (field toplantation; Fig. 5A) was of the same order of magnitude asdeforestation (native forest to field; Fig. 5C). This finding suggeststhree potential processes are operating. Native forests areconverted to fields before transitioning to plantations, to avoidthe illegal nature of a native forest to plantation transition.However, no direct evidence of native forest to field to plantationwas observed at the pixel-scale during 1990–2010, suggestingeither environmental legislation has been effectively enforced inQF or a lag-time greater than 20 years exists. Alternatively, fieldsare ‘displaced’ by plantation expansion into native forests. Thisprocess would require an active driver maintaining field extent;however, given the mountainous and hilly terrain of QF, it isunsuitable for agribusiness, farming and ranching. Therefore it ispossible that the deforestation transition captures fields in
transition to urban, rather land in transition to plantations ornewly established cattle grazing pastures. To conclude this withcertainty would require a detailed analysis of the forces drivingdeforestation in QF.
Results suggest global demand for steel drives iron oreproduction, mine expansion, plantation charcoal production andplantation expansion (Fig. 1). In QF, these relationships wereapproximately linear during 1990–2010 (Fig. 4) and thussimulated scenarios utilized linear projections. However, increas-ing QF productive capacity through infrastructure extensions mayaccelerate iron ore production relative to increasing demand forsteel (Gurmendi, 2013). Similarly changes in production efficien-cies may accelerate mine expansion relative to increasing iron oreproduction if ore grades decline (Mudd, 2007; Prior et al., 2012), orslow mine expansion rates if mineral extraction technologiesimprove (InfoMine, 2012; USGS, 2012). Changes in external factorsmay also be influential, for example climate change mitigationincentives may accelerate plantation charcoal production andplantation expansion rates relative to increasing demand for steel(World Bank, 2002). These factors indicate the diversity of forcespotentially influencing the link between global demand for steel,projection trajectories and regional land-use change in QF in thefuture.
While this study focused on demand for steel driving land-usechange in QF, similar processes may operate elsewhere (Sonteret al., 2014b). In other steel producing regions, mine expansion canbe expected to have spatially disproportionate impacts ongeologically dependent ecosystems (Erskine et al., 2012), land-forms (Palmer et al., 2010) and livelihoods (Sonter et al., 2013b).Additionally, extensive plantation expansion for charcoal produc-tion can be expected to become more common as steel producingcountries and companies begin to investigate opportunities toreduce greenhouse gas emissions (Weldegiorgis and Franks, 2013).Demand for other minerals is also expected to drive extensiveland-use change where mineral resource extraction intersects withthe production of other resources and land uses (Moran et al.,2013).
5. Conclusion
Global demand for minerals is often considered an insignifi-cant driver of land-use change because the area impacted bymining is small. However, results from Brazil’s Iron Quadranglesuggest increasing demand for steel drives extensive land-usechange and has far-reaching impacts on native vegetation. Thedirect impacts of mining were disproportionate to their spatialextent since mine expansion caused a decline in specific, highlythreatened, endemic ecosystems. Comparatively, plantationexpansion was spatially extensive, as were the impacts ofplantations on surrounding native vegetation. Evidence of twoindirect impacts on native vegetation also emerged during1990–2010. Plantation expansion decreased native forestregrowth by rapidly consuming available fields; while competi-tion for land between mining companies and urban developersincreased deforestation pressures. In combination, these impactsaffected the majority of land in QF; however, many were poorlycaptured by current land management approaches, indicatingimplications for achieving long-term sustainable developmentgoals. In the future, these processes may intensify in QF as globaldemand for steel increases; although production trajectories andland-use transition rates will be dependent on other drivingforces operating at multiple scales. In other mining regions,similar processes may operate where global demand forminerals drives the production of multiple resources (non-renewable and renewable) and is expressed through extensiveland-use change.
L.J. Sonter et al. / Global Environmental Change 26 (2014) 63–72 71
Acknowledgements
The authors thank Allaoua Saadi for his enthusiastic involve-ment in field trips and discussions throughout the early projectdevelopment phase, Fabio Nogueira de Avelar Marques’s forproviding insight into the plantation charcoal industry in Brazil,Alessandro Campos for help with data acquisition, and NeilMcIntyre and Greg Keir for comments on a previous draft. We alsothank three anonymous reviewers. L.J.S. received financial supportfrom The National Climate Change Adaptation Research Facilityand B.S.S.F. received support from Climate and Land Use Alliance,the Gordon and Betty Moore Foundation, Fundacao de Amparo aPesquisa do Estado de Minas Gerais, Conselho Nacional deDesenvolvimento Cientıfico e Tecnologico.
Appendix A. Supplementary data
Supplementary data associated with this article can be found, inthe online version, at doi:10.1016/j.gloenvcha.2014.03.014.
References
ABRAF, 2011. Annual statistics of ABRAF 2011, base year 2010. Associacao Brasileirade Produtos de Florestas Plantadas, Brasilia, pp. 130.
AMS, 2009. Florestas Energeticas no Brasil: Demanda e Disponibilidade. AssociacaoMineira da Silvicultura, Brazil.
AMS, 2012. Um caminho para o desenvolvimento sustentavel. Associacao Mineirada Silvicultura, Belo Horizonte, Brazil.
Anastasia, A.A.J., Portugal, A.D., Ciminelli, R.R., 2010. Application Dossier of theQuadrilatero Ferrifero Geopark to the Global UNESCO Networks of Geoparks.Government of the State of Minas Gerais, State Secretary of Science, Tech-nology and HIgher Education of Minas Gerais, Mineral and Metallurgic Pole ofExcellence, Quadrilatero Ferrifero Geopark Promoting Group, Minas Gerais,Brazil.
Barlow, J., Gardner, T.A., Araujo, I.S., Avila-Pires, T.C., Bonaldo, A.B., Costa, J.E.,Esposito, M.C., Ferreira, L.V., Hawes, J., Hernandez, M.I.M., Hoogmoed, M.S.,Leite, R.N., Lo-Man-Hung, N.F., Malcolm, J.R., Martins, M.B., Mestre, L.A.M.,Miranda-Santos, R., Nunes-Gutjahr, A.L., Overal, W.L., Parry, L., Peters, S.L.,Ribeiro-Junior, M.A., da Silva, M.N.F., da Silva Motta, C., Peres, C.A., 2007.Quantifying the biodiversity value of tropical primary, secondary, and planta-tion forests. Proc. Natl. Acad. Sci. USA 104, 18555–18560.
Bonham-Carter, G.F., 1994. Geographic Information Systems for Geoscientists:Modeling with GIS. Pergamon, New York.
Brasil. Lei n 11.428, de 22 de dezembro de 2006. Dispoe sobre a utilizacao e protecaoda vegetacao nativa do Bioma Mata Atlantica, e da outras providencias. CasaCivil, Subchefia para Assuntos Jurıdicos. Available at: http://www.planalto.-gov.br/ccivil_03/_ato2004-2006/2006/lei/l11428.htm (Accessed 20.06.12).
CODEMIG, 2010. Geological Mapping of Minas Gerais. Companhia de Desenvolvi-mento Economico de Minas Gerais (CODEMIG), Brazil.
Diaz, G.I., Nahuelhual, L., Echeverria, C., Marin, S., 2011. Drivers of land abandon-ment in Southern Chile and implications for landscape planning. Landsc. UrbanPlan. 99, 207–217.
EPE, 2012. Balanco Energetico Nacional: Ano base: 2011. Empresa de PesquisaEnergetica (EPE), Rio de Janeiro, Brazil.
Erskine, P., van der Ent, A., Fletcher, A., 2012. Sustaining metal-loving plants inmining regions. Science 337, 1172–1173.
Exelis Visual Information Solutions, 2010. ENVI User’s Guide. Exelis Visual Infor-mation Solutions, Boulder, CO.
Fearnside, P.M., 1995. Global warming response options in Brazil’s forest sector:comparison of project-level costs and benefits. Biomass Bioenergy 8, 309–322.
Foody, G.M., 2011. Classification Accuracy Assessment. IEEE Geosci. Remote Sens.Soc. Newsl. 8–14.
Gouvello, C., Soares-Filho, B.S., Nassar, A., Schaeffer, R., Jorge, F., Nogueira, W., 2010.Brazil Low-Carbon Country Case Study 2010. World Bank.
Goldewijk, K.K., Beusen, A., van Drecht, G., de Vos, M., 2011. The HYDE 3.1 spatiallyexplicit database of human-induced global land-use change over the past12,000 years. Global Ecol. Biogeogr. 20, 73–86.
Gurmendi, A.C., 2013. The Minerals Industry of Brazil, 2011 Minerals Yearbook. USGeological Survey, Brazil.
Hall, J.M., Van Holt, T., Daniels, A.E., Balthazar, V., Lambin, E.F., 2012. Trade-offsbetween tree cover, carbon storage and floristic biodiversity in reforestinglandscapes. Landsc. Ecol. 27, 1135–1147.
Hatayama, H., Daigo, I., Matsuno, Y., Adachi, Y., 2010. Outlook of the world steelcycle based on the stock and flow dynamics. Environ. Sci. Technol. 44, 6457–6463.
Hubacek, K., Giljum, S., 2003. Applying physical input-output analysis to estimateland appropriation (ecological footprints) of international trade activities. Ecol.Econ. 44, 137–151.
IBAMA, 2010. Unidades de Conservacao. Instituto Brasileiro do Meio Ambiente e dosRecursos Naturais Renovaveis (IBAMA), Brazil.
IBGE, 2005. Digital Municipal Mesh. Instituto Brasileiro de Geografia e Estatıstica(IBGE), Brazil.
IBGE, 2006. Agrıcola censo. Instituto Brasileiro de Geografia e Estatıstica (IBGE),Brazil.
IBGE, 2010a. Censo Demografico. Instituto Brasileiro de Geografia e Estatıstica(IBGE), Brazil.
IBGE, 2012. Producao da Extracao Vegetal e da Silvicultura Instituto. Brasileiro deGeografia e Estatıstica (IBGE), Brazil.
IEF, 2008. In: Scolforo, J.R., Carvalho, L.M.T., Oliveira, A.D. (Eds.), Inventario Florestalde Minas Gerais: Monitoramento dos reflorestamentos e tendencias da pro-ducao em Volume Peso de Materia Seca e Carbono 2005–2007. Lavras, MinasGerais, p. 91.
IEF, 2010. Bolsa verde: manual de princıpios, criterios e procedimentos para aimplantacao da lei n.17, 727 de agosto de 2008. Instituto Estadual de Florestas,Belo Horizonte, Brazil.
InfoMine, 2012. Company & Property Mine. InfoMine.Jackson, R.B., Jobbagy, E.G., Avissar, R., Roy, S.B., Barrett, D.J., Cook, C.W., Farley, K.A.,
le Maitre, D.C., McCarl, B.A., Murray, B.C., 2005. Trading water for carbon withbiological sequestration. Science 310, 1944–1947.
Jacobi, C.M., do Carmo, F.F., 2008. The contribution of ironstone outcrops to plantdiversity in the Iron Quadrangle, a threatened Brazilian landscape. Ambio 37,324–326.
Jensen, J.R., 2005. Introductory Digital Image Processing: A Remote SensingPerspective, third ed. Prentice Hall, Upper Saddle River.
Kroger, M., 2012. The Expansion of Industrial Tree Plantations and Dispossession inBrazil. Dev. Change 43, 947–973.
Lamb, D., Erskine, P.D., Parrotta, J.A., 2005. Restoration of Degraded Tropical ForestLandscapes. Science 310, 1628–1632.
Lira, P.K., Tambosi, L.R., Ewers, R.M., Metzger, J.P., 2012. Land-use and land-coverchange in Atlantic forest landscapes. Forest Ecol. Manage. 278, 80–89.
May, P., 2006. Forest certification in Brazil. In: Cashore, B., Gale, F., Meidinger, E.,Newsom, D. (Eds.), Confronting Sustainability: Forest Certificaition in Dever-loping and Transitioning Countries. Yale School of Forestry and EnvironmentalStudies, pp. 337–362.
McAlpine, C.A., Etter, A., Fearnside, P.M., Seabrook, L., Laurance, W.F., 2009. Increas-ing world consumption of beef as a driver of regional and global change: a call
for policy action based on evidence from Queensland (Australia), Colombia and
Brazil. Global Environ. Change 19, 21–33.Meyfroidt, P., Lambin, E.F., 2008. The causes of the reforestation in Vietnam. Land
Use Policy 25, 182–197.MME, 2010. Plano Nacional de Mineracao 2030: Geologia, Mineracao e Transfor-
macao Mineral. Ministerio de Minas e Energia (MME), Brasilia.Moran, C.J., Franks, D.M., Sonter, L.J., 2013. Using the multiple capitals framework to
connect indicators of regional cumulative impacts of mining and pastoralism inthe Murray Darling Basin, Australia. Resour. Policy 38 (4), 733–744.
Mudd, G.M., 2007. Global trends in gold mining: towards quantifying environmen-tal and resource sustainability. Resour. Policy 32, 42–56.
Myers, N., Mittermeier, R.A., Mittermeier, C.G., da Fonseca, G.A.B., Kent, J., 2000.Biodiversity hotspots for conservation priorities. Nature 403, 853–858.
NASA Goddard Space Flight Center, 2011 Landsat 7 Science Data Users Handbook.Available at: http://landsathandbook.gsfc.nasa.gov/pdfs/Landsat7_Hand-book.pdf.(Viewed 02.02.13).
Nepstad, D.C., McGrath, D., Soares-Filho, B.S., 2011. Systemic conservation, REDD,and the future of the Amazon basin. Conserv. Biol. 29 (6), 113–116.
Nogueira, L.A.H., Coelho, S.T., 2009. Sustainable charcoal production in Brazil. In:Rose, S., Remedio, E., Trossero, M.A. (Eds.), Criteria and Indicators for Sustain-
able Woodfuels: Case Studies from Brazil, Guyana, Nepal, Philippines and
Tanzania. Food and Agriculture Organization of the United Nations (FAO),
Rome, Italy, pp. 31–46.Palmer, M.A., Bernhardt, E.S., Schlesinger, W.H., Eshleman, K.N., Foufoula-Georgiou,
E., Hendryx, M.S., Lemly, A.D., Likens, G.E., Loucks, O.L., Power, M.E., White, P.S.,Wilcock, P.R., 2010. Mountaintop Mining Consequences. Science 327, 148–149.
Paquette, A., Messier, C., 2010. The role of plantations in managing the world’sforests in the Anthropocene. Front. Ecol. Environ. 8, 27–34.
Piketty, M.G., Wichert, M., Fallot, A., Aimola, L., 2009. Assessing land availability toproduce biomass for energy: the case of Brazilian charcoal for steel making.Biomass Bioenergy 33, 180–190.
Prior, T., Giurco, D., Mudd, G., Mason, L., Behrisch, J., 2012. Resource depletion, peakminerals and the implications for sustainable resource management. GlobalEnviron. Change – Hum. Policy Dimens. 22, 577–587.
PROFOR, 2012. Brazil: Scaling up Renewable Charcoal Production. Program onForests (PROFOR), within the World Bank. Available at: http://www.profor.-info/knowledge/brazil-scaling-renewable-charcoal-production (Viewed24.06.13).
Richards, J.A., 1999. Remote Sensing Digital Image Analysis. Springer-Verlag, Berlin,pp. 240.
Ribeiro, M.C., Metzger, J.P., Martensen, A.C., Ponzoni, F.J., Hirota, M.M., 2009. TheBrazilian Atlantic forest: how much is left, and how is the remaining forestdistributed? Implications for conservation. Biol. Conserv. 142, 1141–1153.
Roberts, J.T., 1992. Squatters and urban-growth in Amazonia. Geogr. Rev. 82,441–457.
Rosiere, C.A., Spier, C.A., Rios, F.J., Suckau, V.E., 2008. The Itabirites of the Quad-rilatero Ferrifero and related high-grade iron ore deposits: an overview. In:Hagemann, S., Rosiere, C., Gutzmer, J., Beukes, N.J. (Eds.), Banded Iron

L.J. Sonter et al. / Global Environmental Change 26 (2014) 63–7272
Formation-Related High-Grade Iron Ore. Soc. Economic Geologists, Inc,Littleton, pp. 223–254.
Schmitz, C., Biewald, A., Lotze-Campen, H., Popp, A., Dietrich, J.P., Bodirsky, B.,Krause, M., Weindl, I., 2012. Trading more food: implications for land use,greenhouse gas emissions, and the food system. Global Environ. Change – Hum.Policy Dimens. 22, 189–209.
Scholz, R.W., Wellmer, F.W., 2013. Approaching a dynamic view on the availabilityof mineral resources: What we may learn from the case of phosphorus? GlobalEnviron. Change – Hum. Policy Dimens. 23, 11–27.
SEMAD, 2010. Mapeamento da Cobertura Vegetal. Secretaria de Estado de MeioAmbiente e Desenvolvimento Sustentavel (SEMAD), Minas Gerais, Brazil.
Soares-Filho, B.S., 2013. Impacto da revisao do Codigo Florestal: como viabilizar ogrande desafio?.. Secretaria de Assuntos Estrategicos da Presidencia da Repub-lica Brasilia, Brazil.
Soares-Filho,B.S., Rodrigues, H., Follador, M., 2013. A hybrid analytical-heuristic methodfor calibrating land-use change models. Environ. Model. Softw. 43, 80–87.
Sonter, L.J., Barrett, D.J., Moran, C.J., Soares-Filho, B.S., 2013a. A Land System Sciencemeta-analysis suggests we underestimate intensive land uses in land-use changedynamics. J. Land Use Sci., http://dx.doi.org/10.1080/1747423X.2013.871356.
Sonter, L.J., Moran, C.J., Barrett, D.J., 2013b. Modeling the impact of revegetation onregional water quality: a collective approach to manage the cumulative impactsof mining in the Bowen Basin, Australia. Resour. Policy 38 (4), 670–677.
Sonter, L.J., Barrett, D.J., Soares-Filho, B.S., 2014a. Offsetting the impacts of mining toachieve no net loss of native vegetation. Conserv. Biol., http://dx.doi.org/10.1111/cobi.12260.
Sonter, L.J., Moran, C.J., Barrett, D.J., Soares-Filho, B.S., 2014b. Processes of land usechange in mining regions. J. Clean. Prod., http://dx.doi.org/10.1016/j.jcle-pro.2014.03.084.
Stehman, S.V., 2009. Sampling designs for accuracy assessment of land cover. Int. J.Remote Sens. 30, 5243–5272.
Teixeira, A.M.G., Soares-Filho, B.S., Freitas, S.R., Metzger, J.P., 2009. Modelinglandscape dynamics in an Atlantic Rainforest region: implications for conser-vation. Forest Ecol. Manage. 257, 1219–1230.
USGS, 2006. Shuttle Radar Topography Mission (SRTM). Global Land Cover Facility.University of Maryland, Maryland.
USGS, 2012. Mineral Resources Data System 1990–2011. US Geological Survey(USGS), Reston, VA.
van Kooten, G.C., Shaikh, S.L., Suchanek, P., 2002. Mitigating climate change byplanting trees: the transaction costs trap. Land Econ. 78, 559–572.
Weldegiorgis, F.S., Franks, D.M., 2013. Social dimensions of energy supply alter-natives in steelmaking: comparison of biomass and coal production scenarios inAustralia. J. Clean. Prod., doi:1016/j.jclepro.2013.09.056.
World Bank, 2002. Brazil – PCF Minas Gerais Plantar Project. World Bank,Washington, DC.
World Steel Association, 2012. Steel Statistical Yearbook 2011. World Steel Associ-ation, Brussels, Belgium.
Zomer, R.J., Trabucco, A., Bossio, D.A., Verchot, L.V., 2008. Climate changemitigation: a spatial analysis of global land suitability for clean developmentmechanism afforestation and reforestation. Agric. Ecosyst. Environ. 126,67–80.