ghg estimation and climate adaptation - inclusive and sustainable
TRANSCRIPT

Sustainable Cities Integrated Approach Pilot in India
GHG Estimation and Climate Adaptation
Training Module on
Ministry of Housing and Urban AffairsGovernment of India
WET WASTE
DRY WASTE
DOMESTICHAZARDOUS
WASTE
E-WASTE


GHG Estimation and Climate Adaptation
Training Module on
Ministry of Housing and Urban AffairsGovernment of India
Sustainable Cities Integrated Approach Pilot in India
May, 2022

TITLETraining Module on GHG Estimation and Climate Adaptation
PUBLISHERNational Institute of Urban Affairs, New Delhi
RESEARCH PROJECTSustainable Cities Integrated Approach Pilot in IndiaComponent 3: Partnerships, Knowledge Management and Capacity Building
Copyright © NIUA (2022)Year of Publishing 2022
CONTENTThe given module is prepared by compiling information sourced from various knowledge products and training modules prepared by Ministry of Housing and Urban Affairs (MoHUA), National Institute of Urban Affairs (NIUA) and Central Public Health and Environmental Engineering Organization (CPHEEO) for knowledge dissemination and capacity building of municipal officials.
DISCLAIMERWhile every effort has been made to ensure the correctness of data/information used in this report, neither the authors nor NIUA accepts any legal liability for the accuracy or inferences drawn from the material contained therein or for any consequences arising from the use of this material. No part of this report may be reproduced in any form (electronic or mechanical) without prior permission from or intimation to NIUA.
THE FULL MODULE SHOULD BE REFERENCED AS FOLLOWSNIUA (2022) “Training Module on GHG Estimation and Climate Adaptation”. Text from this report can be quoted provided the source is acknowledged.

PROJECT TEAMCore TeamMs. Paramita Datta Dey, Programme Lead Mr. Kaustubh Parihar, Project Associate Ms. Tavishi Darbari, Research Associate Ms. Sonali Mehra, Research Associate Mr. Gaurav Thapak, Research Associate
EXPERTSDr. Girija Bharat, Founding Director, Mu Gamma ConsultantsMr. Pravinjith KP, Director, Ecoparadigm
DESIGN TEAMMr. Deep Pahwa, Creative LeadMr. Devender Singh Rawat, Senior Design AssociateMr. Bhavnesh Bhanot, Senior Design AssociateMr. Tehan Katar, Graphic DesignerMs. Preeti Shukla, Design Associate

iv Sustainable Cities Integrated Approach Pilot in India

BASIC PROJECT INFORMATION
Project Title Sustainable Cities Integrated Approach Pilot in India
Project Component Component 3 - Partnerships, Knowledge management and capacity building
Project Deliverable Delivery of tailored training and capacity building activities in 5 pilot cities – Bhopal, Guntur, Jaipur, Mysuru and Vijayawada
Project start date December 2019
Duration of Project 2 Years
About this Module This module is a part of the second deliverable for the project to provide training modules for three sectors.
ABOUT THE PROJECT“Sustainable Cities Integrated Approach Pilot in India” is one of the child projects under
GEF’s Sustainable Cities Programme in the GEF 6 cycle. The aim of the project is to integrate
sustainability strategies into urban planning and management to create a favourable
environment for investment in infrastructure and service delivery, thus building resilience
of pilot cities. The three main project components comprise- Sustainable Urban Planning
and Management, Investment Projects and Technology Demonstration and Partnerships
and Knowledge Management Platform.
National Institute of Urban Affairs (NIUA) has been engaged to undertake the implementation
of Component 3 – Partnerships, Knowledge Management and Capacity Building. As a part
of this component of the Project, a Training and Assistance Needs Assessment (TANA) was
conducted from February 2020 to August 2020 for the ULBs of five cities - Bhopal, Jaipur,
Mysuru, Vijayawada and Guntur to assess and identify the needs of the ULB officials to
prepare on-the-job training modules.
ABOUT THE TRAINING MODULEBased on the results of TANA, training modules on Solid Waste, Wastewater and Water
Management have been developed by NIUA. The modules are an outcome of the activity 2
of the project which included the following tasks:
• On the basis of TANA results, training modules were prepared for relevant
stakeholders
• For developing the Module & Pedagogy, NIUA has synergized the experience of
practitioners and subject experts.
• The modules have been finalized in coordination with experts and officials from
cities.
This module on GHG Estimation and Climate Adaptation is a part of the series of modules
that would supplement the training activities.
vGHG Estimation and Climate Adaptation

vi Sustainable Cities Integrated Pilot Project In India

Contents
1 Climate Change and Urban Services
20 Estimating GHG Emission for Solid Waste Management
52 Estimating GHG emissions for Wastewater Treatment Technologies
72 Climate Adaptation Strategies in the Water Sector
90 Legal Instruments Addressing Climate Change Impacts on Water Resources
viiGHG Estimation and Climate Adaptation

List of Figures
Figure 1.1: Model of Green House Gas impact 2
Figure 1.2: Indicators of Climate Change 4
Figure 1.3: Climate change impacts 6
Figure 1.4: Global Warming Impacts 8
Figure 1.5: Yearly CO2 emissions in Million MtCO
2, 1960-2019 9
Figure 1.6: Hydrological and Storm-related indicators of climate change impacts 11
Figure 1.7: Sectoral Impacts of Climate Change 12
Figure 1.8: Waste Management hierarchy for minimization of GHG emissions 15
Figure 2.1: Technology gradient for waste management 25
Figure 2.2: Material-Energy life cycle flows with associated GHG sources and sinks 31
Figure 3.1: Total global emissions in 2011 = 6,702 million metric tons of CO
2 equivalent 55
Figure 3.2: Estimated greenhouse gas emissions of a wastewater treatment plant 57
Figure 3.3: Comparison of GHG Emissions between Conventional STPs and Natural STPs 68
Figure 4.1: General measures for Climate Adaptation 76
Figure 4.2: Climate adaptation measures for utilities 75
Figure 4.3: Adaptation measures for addressing impacts of climate 78
Figure 4.4: Key learning from Climate Change Adaptation in Water Sector 79
Figure 4.5: Mitigation and adaptation in the urban water cycle 80
Figure 4.6: Stages of the urban water cycle 81
Figure 4.7: System boundary 81
Figure 4.8: Dovetailing climate adaptation strategies in other utilities 87
Figure 5.1: Relevant National Policies 96
viii Sustainable Cities Integrated Approach Pilot in India

ixGHG Estimation and Climate Adaptation

List of Tables
Table 1.1: GHG mitigation strategies for various sectors 7
Table 2.1: Comparison of Solid Waste Technologies 27
Table 2.2: Global Warming Potential and Atmospheric Lifetime for major Greenhouse Gases 30
Table 2.3: Emission Calculation 33
Table 2.4: Technical GHG Mitigation Opportunities by Waste Management component 41
Table 2.5: Summary of adaptation, mitigation and sustainable development issues for the waste sector 44
Table 3.1: Emissions from wastewater treatment global (Tg CO2 Eq.) 55
Table 3.2: Comparison of GHG emissions across Wastewater treatment Technologies 58
Table 3.3: Input data for calculating Total CO2 emissions
for 1MLD treatment plant 62
Table 3.4: Emission from wastewater technologies for Typical 1MLD 67
Table 4.1: Response of conventional versus flexible systems to changing conditions 77
Table 4.2: GHGs Emission from water and wastewater services 82
Table 5.1: Overview of vulnerability to climate change of select states in India 92
Table 5.2: Rivers Covered under NRCP in 4 Indian states 98
Table 5.3: Key Recommendations from Andhra Pradesh SAPCC: Interventions for management and sustainability of water resources 99
Table 5.4: Key Recommendations from Karnataka SAPCC: Interventions for management and sustainability of water resources 101
Table 5.5: Key Recommendations from Madhya Pradesh SAPCC: Interventions for management and sustainability of water resources 104
Table 5.6: Key Recommendations from Rajasthan SAPCC: Interventions for management and sustainability of water resources 106
x Sustainable Cities Integrated Approach Pilot in India

xiGHG Estimation and Climate Adaptation

List of abbreviations and acronyms
ACCCRN Asian Cities Climate Change Resilient Network
AOB Ammonia Oxidizing Bacteria
BMC Bhopal Municipal Corporation
BOD Biological Oxyegn Demand
CCS Carbon Capture and Storage
CDM Clean Development Mechanism
CMWSSB Chennai Metro Water Supply and Sewerage Board
COD Chemical Oxygen Demand
EMCP Enhanced Malaria Control Project
EPR Extended Producer Responsibility
FAS Free Air Space
FSSM Fecal Sludge and Septage Management
GHG Greenhouse Gas
GWP Global Warming Potential
IDRC International Development Research Centre
IPCC Intergovernmental Panel on Climate Change
IUWM Integrated Urban Water Management
JDA Jaipur Development Authority
JJM Jal Jeevan Mission
xii Sustainable Cities Integrated Approach Pilot in India

JNNURM Jawaharlal Nehru National Urban Renewal Mission
JSA Jal Shakti Abhiyan
LCA Life Cycle Assessment
LULC Land Use Land Cover
MBT Mechanical Biological Treatment
MJSA MukhyaMantri Jal Swavlamban Abhiyaan
MoEFCC Ministry of Environment and Forests & Climate Change
MRF Material Recovery Facility
MSW Municipal Solid Waste
NAFCC National Adaptation Fund for Climate Change
NAPCC National Action Plan on Climate Change
NEP National Environment Policy
NLCP National Lake Conservation Plan
NOB Nitrite Oxidizing Bacteria
NPCA National Plan for Conservation of Aquatic Ecosystems
NRCP National River Conservation Plan
xiiiGHG Estimation and Climate Adaptation

1Chapter
Climate Change and Urban Services

Training Outcomes
• Able to understand the importance of water and waste management• Able to understand the importance of conservation of water.• The important concepts and definitions on climate change • An understanding of climate change and urban services in India
Chapter Contents
1.1 Introduction
1.2 Why learn about climate change?
1.3 Concepts and definitions
1.4 Current global scenario of GHG emissions
1.5 Relevance of GHG emission reduction in developing countries
1.6 Impact of Climate Change
1.7 Waste management and climate change impact
1.8 Climate change and water management in India
References
Summary
This chapter seeks to introduce the concepts and phenomena related to climate change. From an urban perspective, it is also important to know how the urban services impact and interact with climate and how climate impacts the urban services.
Training Objectives
• To understand the basics of climate change and its impact on water and waste resources
• To identify impact of climate change and its sectoral implications on water and waste sector
• To recognise the risks faced in water and waste management in India.
1GHG Estimation and Climate Adaptation

1.1 Introduction The last sixteen decades have witnessed gradual changes in climate, indicating a trend
towards global warming. Several geographical factors such as latitude, distance from the
sea, vegetation, topography, etc. cause extensive climate fluctuations from place to place.
Climate also varies over time, seasons and year, or over larger scales of times. The Earth has
witnessed extreme climate change variations including the ice ages and extreme periods
on account of natural factors such as volcanic eruptions, changes in the Earth’s orbit, and
the amount of energy released from the sun. According to the Intergovernmental Panel on
Climate Change (IPCC), anthropogenic (human-induced), climate change or the greenhouse
gases (GHGs) emitted from human activities since the Industrial Revolution leading to
climate change as observed in the warming of the atmosphere and oceans, melting of
glaciers, and rise in sea level has extensive impacts on human and natural systems.
Climate refers to weather averaged over an extended period, typically considered 30-year
intervals, the standard averaging period by the World Meteorological Organisation (WMO).
Climate change may be defined as the long-term variation of temperature and weather
patterns in a particular location or the earth as a whole.
Figure 1.1: Model of Green House Gas impact
Source – IPCC (2007)
2 Sustainable Cities Integrated Approach Pilot in India

1.2 Why learn about climate change?Throughout history, people and societies have adjusted to and coped with changes in
climate and extremes with varying degrees of success. Climate change (drought in particular)
has been at least partly responsible for the rise and fall of civilizations. Earth’s climate has
been relatively stable for the past 12,000 years and this stability has been crucial for the
development of our modern civilization and life as we know it. Modern life is tailored to the
stable climate that we have become accustomed to. As our climate changes, we will have to
learn to adapt. The faster the climate changes, the harder it could be.
While climate change is a global issue, it is felt on a local scale. Cities and municipalities
are therefore at the frontline of adaptation. In the absence of national or international
climate policy direction, cities and local communities around the world have been focusing
on solving their own climate problems. They are working to build flood defenses, plan for
heatwaves and higher temperatures, install water-permeable pavements to better deal with
floods and stormwater and improve water storage and use.
Although the major impacts of climate change induced by greenhouse gases include a
rise in the number of extreme weather events, famine caused by food supply disruptions,
and increased wildfires, there are other impacts caused due to increased waste, which is
also gaining attention among scientists. Rapid urbanization, climate change, inadequate
maintenance of water and wastewater infrastructures and poor solid waste management
lead to flooding, water scarcity, water pollution, adverse health effects and rehabilitation
costs that may overwhelm the resilience of cities. These megatrends pose urgent challenges
in cities as the cost of inaction is high.
1.3 ConceptsandDefinitionsThis section discusses in brief the concepts and definitions around climate change. These
include greenhouse effect, climate change and adaptation.
Greenhouse effectThe sun radiates solar energy on the earth, much of it is released back into space, and the
rest is absorbed by the surface of the Earth and the atmosphere. The energy received by the
earth from the sun is balanced by the flow of energy to space from the earth. This exchange
of energy maintains the global mean temperature and any disturbance in the amount of
incoming or outgoing energy disrupts the earth’s radiative equilibrium; causing global
temperatures to rise or fall. The greenhouse effect refers to the increased concentrations
of GHGs (mainly carbon dioxide, methane, and nitrous oxide) or the rising levels of GHGs
in the atmosphere contributing to global warming or increased temperatures in the earth’s
atmosphere and at its surface (see Figure 1.1).
3GHG Estimation and Climate Adaptation

The greenhouse effect is intensified when further GHGs (such
as CO2) are added to the atmosphere causing warming of Earth’s
climate. The greenhouse effect is the main cause of climate
change. While many of these GHGs occur naturally, human
activities have led to the rise in the concentration of some of
these, carbon dioxide (CO2) being the largest contributor to global
warming. Other GHGs are emitted in lesser quantities such as
methane, nitrous oxide, fluorinated gases. The recent IPCC report,
Sixth Assessment Report (AR6) 2021 underlines the continued
increase in GHG concentration in the atmosphere since the fifth assessment report in
2011. According to the report Carbon dioxide (CO2), has reached annual averages of 410
ppm, 1866 ppb for methane (CH4), and 332 ppb for nitrous oxide (N2O) in 2019 (IPCC,
2021). Climate change is also caused by natural factors such as changes in solar radiation
or volcanic activity (estimated for plus or minus 0.1°C to total warming between 1890
and 2010). The IPCC AR6 also points out that for every 1000 GtCO2 of cumulative CO
2
emissions is estimated to cause an approximate 0.27°C to 0.63°C increase in global surface
temperature.
Figure 1.2: Indicators of Climate Change
Source – IPCC (2001)
The new IPCC report is “a code
red for humanity”UN Secretary-General
António Guterres
4 Sustainable Cities Integrated Approach Pilot in India

Source of Greenhouse gasesGlobally, greenhouse gas emissions have grown by 50% from 1990 to 2018 (Ge, et al.,
2020). While emissions dipped notably in 2016, recent data suggests that carbon dioxide
emissions rose each year since then. Globally, the primary sources of greenhouse gas
emissions are electricity and heat (31%), agriculture (11%), transportation (15%), forestry
(6%) and manufacturing (12%). Energy production of all types accounts for 72% of all
emissions. The energy sector includes transportation, electricity and heat, buildings,
manufacturing and construction, fugitive emissions and other fuel combustion.
The other top sectors that produce emissions are agriculture, such as livestock and crop
cultivation (12%); land use, land-use change and forestry, such as deforestation (6.5%);
industrial processes of chemicals, cement and more (5.6%); and waste, including landfills
and waste water (3.2%).
Change in ClimateThe estimated rise in global average temperature by around 1°C since pre-industrial times1,
is mainly attributed to emissions of GHGs, aerosols, and changes in land use and land cover
(LULC) altering the atmospheric composition, and subsequently energy balance of the
earth. It is expected to reach 1.5°C between 2030 and 2052 in the current circumstances.
Climate change has contributed to a significant increase in weather and climate extremes2
globally (e.g., heat waves, droughts, heavy precipitation, and severe cyclones), changes in
precipitation and wind patterns (including shifts in the global monsoon systems), warming
and acidification of the global oceans, melting of sea ice and glaciers, rising sea levels, and
changes in land and ocean ecosystems.
1 This change in climate refers to the human induced changes. For climate change mitigation, these human induced changes are of central focus, while climate change impact studies concern with the total warming (both natural and human induced). 2 An extreme weather event is defined as an event that is rare (rarer than the 10th or 90th percentile of a probability density function) at a particular place and time of year which may vary from place to place. When a pattern of extreme weather persists for a longer period of time or a season, it may be classified as an extreme climate event (e.g., drought or heavy rainfall over a season) IPCC DDC Glossary (ipcc-data.org).
5GHG Estimation and Climate Adaptation
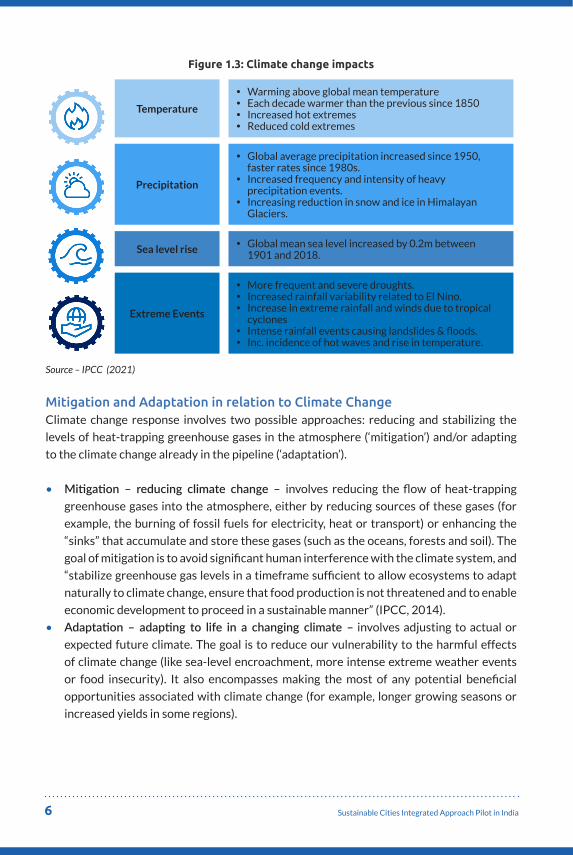
Figure 1.3: Climate change impacts
� Warming above global mean temperature� Each decade warmer than the previous since 1850� Increased hot extremes� Reduced cold extremes
� Global average precipitation increased since 1950, faster rates since 1980s.
� Increased frequency and intensity of heavy precipitation events.
� Increasing reduction in snow and ice in Himalayan Glaciers.
� Global mean sea level increased by 0.2m between 1901 and 2018.
Temperature
Precipitation
Sea level rise
Extreme Events
� More frequent and severe droughts.� Increased rainfall variability related to El Nino.� Increase in extreme rainfall and winds due to tropical
cyclones� Intense rainfall events causing landslides & floods.� Inc. incidence of hot waves and rise in temperature.
Source – IPCC (2021)
Mitigation and Adaptation in relation to Climate ChangeClimate change response involves two possible approaches: reducing and stabilizing the
levels of heat-trapping greenhouse gases in the atmosphere (‘mitigation’) and/or adapting
to the climate change already in the pipeline (‘adaptation’).
• Mitigation – reducing climate change – involves reducing the flow of heat-trapping
greenhouse gases into the atmosphere, either by reducing sources of these gases (for
example, the burning of fossil fuels for electricity, heat or transport) or enhancing the
“sinks” that accumulate and store these gases (such as the oceans, forests and soil). The
goal of mitigation is to avoid significant human interference with the climate system, and
“stabilize greenhouse gas levels in a timeframe sufficient to allow ecosystems to adapt
naturally to climate change, ensure that food production is not threatened and to enable
economic development to proceed in a sustainable manner” (IPCC, 2014).
• Adaptation – adapting to life in a changing climate – involves adjusting to actual or
expected future climate. The goal is to reduce our vulnerability to the harmful effects
of climate change (like sea-level encroachment, more intense extreme weather events
or food insecurity). It also encompasses making the most of any potential beneficial
opportunities associated with climate change (for example, longer growing seasons or
increased yields in some regions).
6 Sustainable Cities Integrated Approach Pilot in India

For better understanding, the mitigation strategies currently adopted for various sectors
including waste management is provided in the Table 1.1 along with projections for 2030.
Table 1.1: GHG mitigation strategies for various sectors
Sector Key mitigation technologies and practices currently commercially available
Key mitigation technologies and practices projected to be commercialized before 2030
Energy supply
Improved supply and distribution efficiency; fuel switching from coal to gas; nuclear power; renewable heat and power (hydropower, solar, wind, geothermal and bioenergy); combined heat and power; early applications of Carbon Capture and Storage (CCS, e.g. storage of removed CO
2 from natural gas).
CCS for gas, biomass and coal-fired electricity generating facilities; advanced nuclear power; advanced renewable energy, including tidal and waves energy, concentrating solar, and solar PV.
Transport
More fuel-efficient vehicles; hybrid vehicles; cleaner diesel vehicles; biofuels; modal shifts from road transport to rail and public transport systems; non-motorised transport (cycling, walking); land-use and transport planning.
Second generation biofuels; higher efficiency aircraft; advanced electric and hybrid vehicles with more powerful and reliable batteries.
Buildings
Efficient lighting and daylighting; more efficient electrical appliances and heating and cooling devices; improved cook stoves, improved insulation; passive and active solar design for heating and cooling; alternative refrigeration fluids, recovery and recycle of fluorinated gases.
Integrated design of commercial buildings including technologies, such as intelligent meters that provide feedback and control; solar PV integrated in buildings.
Industry
More efficient end-use electrical equipment; heat and power recovery; material recycling and substitution; control of non CO
2 gas
emissions; and a wide array of process-specific technologies.
Advanced energy efficiency; CCS for cement, ammonia, and iron manufacture; inert electrodes for aluminium manufacture.
Agriculture
Improved crop and grazing land management to increase soil carbon storage; restoration of cultivated peaty soils and degraded lands; improved rice cultivation techniques and livestock and manure management to reduce CH
4 emissions; improved nitrogen fertilizer
application techniques to reduce N
20 emissions; dedicated energy crops to replace
fossil fuel use; improved energy efficiency.
Improvements of crops yields.
Forestry/ forests
Afforestation; reforestation; forest management; reduced deforestation; harvested wood product management; use of forestry products for bioenergy to replace fossil fuel use.
Tree species improvement to increase biomass productivity and carbon sequestration. Improved remote sensing technologies for analysis of vegetation/ soil carbon sequestration potential and mapping land use change.
Waste management
Landfill methane recovery; waste incineration with energy recovery; composting of organic waste; controlled waste water treatment; recycling and waste minimization.
Bio covers and biofilters to optimize CH
4 oxidation.
7GHG Estimation and Climate Adaptation

According to the 2014 report on Climate Change Impacts, Adaptation and Vulnerability
from the United Nations Intergovernmental Panel on Climate Change, governments at
various levels are also getting better at adaptation. Climate change is starting to be factored
into a variety of development plans: how to manage the increasingly extreme disasters
we are seeing and their associated risks, how to protect coastlines and deal with sea-level
encroachment, how to best manage land and forests, how to deal with and plan for reduced
water availability, how to develop resilient crop varieties and how to protect energy and
public infrastructure.
Figure 1.4: Global Warming Impacts
With every increment of global warming, changes get larger in regional mean temperature,
precipitation and soil moisture.
a) Annual mean temperature change (°C) at 1°C global warming
Warming at 1°C affects all continents and is generally larger over land than over the oceans in both observations and models. Across most regions, observed and simluated patterns are consistent.
b) Annual mean temperature change (°C) relative to 1850-1900
Across warming levels, land areas warm more than oceans, and the Arctic and Antarctica warm more than the tropics.
Observe change per 1°C global warming Simulated change per 1°C global warming
Simulated change at 1.5° global warming
Simulated changes at 2°C global warming
Simulated changes at 4°C global warming
0 0.5 1 1.5 2 2.5 3 3.5 4 4.5 5 5.5 6 6.5 7
Change (°C)
Warmer
Source – IPCC (2021)
8 Sustainable Cities Integrated Approach Pilot in India

1.4. Current Global Scenario of GHG EmissionsThe economic progress achieved in the past six decades, along with a rapid expansion of
global population, has come with a colossal environmental cost. While global GDP per capita
has nearly tripled since 1960, CO2 emissions have quadrupled during the same period.
In December 2015, the Paris Agreement was adopted and set a worldwide common goal to
limit temperature increase to +2/1.5°C. Today, the world’s top three emitters – China, the
United States, and India – account for around 50% of global CO2 emissions, and the world’s
top 20 emitters account for 80%.3
Figure 1.5: Yearly CO2 emissions in Million MtCO2, 1960-2019
Source – UNCTAD
As per the Paris Agreement, yearly cuts of 8% are required to keep the planet under the
global warming threshold of 2 degrees Celsius. As shown in Figure 1.5, the list of top
emitters includes both developed and developing countries alike. Therefore, equal efforts
from all governments across the globe despite the development divide is the need of the
hour to win the battle against climate change.
Efforts are being taken by various countries across the globe to becoming more energy
efficient and reduce their yearly CO2 emission rates. Data from UN climate change news
reports that, in developed countries, between the years 1990-2018, there is a reduction in
GHG emissions by about 13 %. Developed countries, in the view of future demands, beyond
2020, have set their emission targets and expanded their policies and responsibilities with
the focus on increasing the use of renewable energy in electricity production phasing out
coal, carbon pricing and electrifying road transport.
3Mott, G., Razo, C. and Hamwey, R., 2021. Carbon emissions anywhere threaten development everywhere. [online] UNCTAD|Prosperity for all. Available at: <https://unctad.org/news/carbon-emissions-anywhere-threaten-development-everywhere>
9GHG Estimation and Climate Adaptation

Similarly, many developing countries are also taking steps that can significantly help in
reducing the greenhouse gas emissions and meet the desired targets. A few countries
implement ratio targets, such as China (” lower carbon dioxide emissions per unit of GDP by
60% to 65% from the 2005 level”) and India (“reducing the emissions intensity of GDP by
20–25%, over 2005 levels, by 2020”).4
1.5. Relevance of GHG emission reductions in developing countries
Developing countries and emerging economies would not only considerably reduce
their GHG emissions at comparably low costs, but would also significantly contribute to
improving public health conditions and environmental protection if they were to put in
place sustainable waste management systems. GHG emissions produced by the waste
management sector in developing countries and emerging economies are highly relevant,
in particular because of the high percentage of biodegradable components contained in the
waste streams. Over and above this, stepping up recycling could further reduce emissions,
although it must be pointed out that the recyclable components of waste in developing
countries and emerging economies are lower than in industrialised countries.
1.6 Impact of Climate ChangeAccording to the IPCC, an increase in temperature will imply large-scale impacts on human
life and the environment. The increased mean temperature in most land and ocean regions
leading to extreme weather in most inhabited regions, heavy precipitation in several
regions, and high probability of drought and precipitation deficits in some regions, rise
in sea level to be 0.2 m between 1901-2018 exposing small islands, low-lying coastal
areas and deltas to several impacts, including increased saltwater intrusion, flooding, and
damage to infrastructure and other adverse impacts on biodiversity and ecosystems which
is expected to rise with a sea-level rise at 2°C above pre-industrial levels.
4Enerdata| Intelligence+Consulting. 2021. GHG emissions in developing countries - issues and perspectives for COP-26. [online] Available at: <https://www.enerdata.net/publications/executive-briefing/ghg-emissions-trends-developing-countries-cop26.html>
10 Sustainable Cities Integrated Approach Pilot in India

Figure 1.6: Hydrological and Storm-related indicators of climate change impacts
Source – IPCC (2001)
11GHG Estimation and Climate Adaptation

Changes in Climate and implicationsThe Global surface temperature is estimated to have increased by 1.09 [0.95 to 1.20]
degrees C more in 2011–2020 than 1850–1900. With a 0.5 degree C increase in global
temperature, there will be visible impacts on the frequency of hot extremes including
heatwaves. Projections indicate a rise by more than 1.5 °C above pre-industrial levels in
the next two decades.
Figure 1.7: Sectoral Impacts of Climate Change
Health � Heat stress – Change in patterns of
diseases � Increase in endemic morbidity and
mortality � Increase in abundance/toxicity of
Cholera in South Asia
Coastal Zones � Sea level rise � Increased intensity of tropical cyclones � Coastal inundation to impact infrastructure � Threat to stability of wetlands, mangroves and coral reefs
Water � Water stress and severe Glacial melting
Agriculture and Food security � Crop Yields impacting food security � Soil moisture � Evapotranspiration leading to
desertification
Reduced
Terrestrial Ecosystems � Risk of extinction for several species � Incidence of forest fires
INC
Source- Authors
Climate adaptation measuresThe earth is undergoing rapid changes as a result of increased human activities. These
changes in natural cycles are seen at the global and regional scales, and they impact the
urban water cycle and its management. Components of the urban water cycle, like water
supply, wastewater treatment, and urban drainage are generally planned for life-spans over
several decades. Hence there is a need for us to pay heed to these changes in the context
of how these systems will be designed and operated in the ‘City of the Future’.
12 Sustainable Cities Integrated Approach Pilot in India

Climate change and variability are affecting water resources and their management in many
parts of the country. Water plays an important role in adaptation to climate change, and as
such needs to be given central priority in national strategies for sustainable development
and pubic security. Severe weather fluctuations, such as frequent and severe storms and
hurricanes have an impact on the Sustainable Development Goals (SDGs).
Cities concentrate population, infrastructure, economic activity and wealth, and will
therefore be disproportionately affected by the local impacts of climate change. In addition,
cities located in coastal areas and/or on the banks of rivers are particularly vulnerable to sea-
level rise and flooding. Cities are also characterised by the predominance of impermeable
surfaces – which are less capable of absorbing increased rainfall and therefore increase the
intensity of rainfall-runoff – and are prone to the urban heat island effect which amplifies
heat waves. Unplanned urbanization contributes exceedingly to the derangement of urban
environments, especially when it extends over fragile lands.
Overly populated cities are also prone to overuse of their natural resources; the depletion
is further intensified by their uneven distribution. Slums, characterised by high density and
poor geology often located on the edges of sanitation corridors on untenable land overridden
by legal issues, make it difficult for water sanitation and other basic infrastructure servicing.
These may form a substantial ecological footprint, with overflowing waste and wastewater
in poorly drained settlements further discharged into the ground, polluting groundwater
aquifers.
1.7 Waste Management and Climate Change ImpactEvery waste management practice generates GHG, both directly (i.e. emissions from the
process itself) and indirectly (i.e. through energy consumption). However, the overall climate
impact or benefit of the waste management system will depend on net GHGs, accounting
for both emissions and indirect, downstream GHG savings. The actual magnitude of these
emissions is difficult to determine because of poor data on worldwide waste generation,
composition and management and inaccuracies in emissions models. Although currently
OECD countries generate the highest levels of methane from landfills, those of developing
nations are anticipated to increase significantly as better waste management practices lead
to more anaerobic, methane producing conditions in landfills.
13GHG Estimation and Climate Adaptation

Estimates of GHG emissions from waste management practices tend to be based on life-
cycle assessment (LCA) methods. These studies have provided extremely useful analyses of
the potential climate impacts and benefits of various waste management options. However,
due to data availability and resources, LCA studies are primarily focused on scenarios
appropriate for developed countries. The climate benefits of waste practices result from
avoided landfill emissions, reduced raw material extraction and manufacturing, recovered
materials and energy replacing virgin materials and fossil-fuel energy sources, carbon
bound in soil through compost application, and carbon storage due to recalcitrant materials
in landfills. In particular, there is general global consensus that the climate benefits of waste
avoidance and recycling far outweigh the benefits from any waste treatment technology,
even where energy is recovered during the process. Although waste prevention is found
at the top of the ‘waste management hierarchy’ it generally receives the least allocation of
resources and effort.
A range of activities focused on waste and climate change are currently being led by
international organizations. There is clear recognition of the considerable climate benefit
that could be achieved through improved management of wastes. Programmes, such as
Integrated Waste Management, Cleaner Production, and Sustainable Consumption and
Production could be measures to mitigate climate impact. There is also strong interest
in Clean Development Mechanism (CDM) projects in the waste sector. CDM activity has
focused mainly on landfill gas capture (where gas is flared or used to generate energy) due
to the reduction in methane emissions that can be achieved.
However, there is a lack of a cohesive approach, which has resulted in gaps, duplication, and
regional disparity is programmes offered. A central mechanism is needed to collaborate with
existing organizations to ensure accessibility to and dissemination of relevant information
across the globe, effective use of resources to achieve climate benefit through integrated
waste management, promotion of best practice, and rapid transfer of simple, effective,
proven technologies and knowledge to developing countries.
Waste management hierarchy promotes the 4R followed by landfill, incineration and
controlled dump which favours minimisation of GHG emissions
The climate benefits of waste practices result from avoided landfill emissions, reduced raw
material extraction and manufacturing, recovered materials and energy replacing virgin
materials and fossil-fuel energy sources, carbon bound in soil through compost application,
and carbon storage due to recalcitrant materials in landfills. In particular, there is general
global consensus that the climate benefits of waste avoidance and recycling far outweigh
the benefits from any waste treatment technology, even where energy is recovered during
the process. Although waste prevention is found at the top of the ‘waste management
14 Sustainable Cities Integrated Approach Pilot in India

hierarchy’ it generally receives the least allocation of resources and effort. The informal
waste sector makes a significant, but typically ignored, contribution to resource recovery
and GHG savings in cities of developing nations.
Figure 1.8: Waste Management hierarchy for minimization of GHG emissions
Waste minimization and sustainable use/multi-use of products (Reuse of carry bags, packaging jars, bottles, boxes, wrappings, etc.)
Processing organic waste to recover compost (Windrow, in-vessel & ver-mi-compost, etc.) and Biogas/CNG
Processing of non-biodegrad-able recyclable (combustible & non-combustible) waste to recover commercially valuable material (plas tic, paper, metal, glass, etc.)
Processing of non-recyclable & combustible waste to energy (RDF, etc.) before final disposal
Source - Authors
Methane emissions from landfill are generally considered to represent the major source of
climate impact in the waste sector. Waste contains organic material, such as food, paper,
wood, and garden trimmings. Once waste is deposited in a landfill, microbes begin to
consume the carbon in organic material, which causes decomposition. Under the anaerobic
conditions prevalent in landfills, the microbial communities contain methane-producing
bacteria. As the microbes gradually decompose organic matter over time, methane
(approximately 50%), carbon dioxide (approximately 50%) and other trace amounts of
gaseous compounds (< 1%) are generated and form landfill gas. Methane and carbon
dioxide (CO2) are greenhouse gases (GHG), whose presence in the atmosphere contribute
to global warming and climate change. Methane is a particularly potent GHG, and is
currently considered to have a global warming potential (GWP) 25 times that of CO2 when
a time horizon of 100 years is considered. Controlled burning, in waste incinerators, also
generates CO2 emissions. Where incinerators generate energy, GHG may also be credited –
this is discussed in the following section. Where incinerators do not generate energy, they
will be net energy users, which will also contribute to their total GHG emissions. Advanced
thermal treatment technologies, such as gasification and pyrolysis, may emit fewer
emissions compared to mass-burn incineration. Aerobic composting processes directly emit
varying levels of methane and nitrous oxide, depending on how the process is managed in
practice. Closed systems, such as enclosed maturation bays or housed windrows, reduce
emissions through use of air filters (often bio- filters) to treat air exiting the facility. CO2 will
be gradually released as the compost further degrades and becomes integrated with soil-
plant systems.
15GHG Estimation and Climate Adaptation

However, there is a lack of a cohesive approach, which has resulted in gaps, duplication, and
regional disparity is programmes offered. A central mechanism is needed to collaborate with
existing organizations to ensure accessibility to and dissemination of relevant information
across the globe, effective use of resources to achieve climate benefit through integrated
waste management, promotion of best practice, and rapid transfer of simple, effective,
proven technologies and knowledge to developing countries.
1.8 Climate Change and Water Management in IndiaFor a developing nation like India, with over 1.3 billion population and already existing
high levels of social vulnerability and climate variability, climate change is an enormous
challenge. The IPCC Special Report on Ocean and Cryosphere in a Changing Climate, calls
attention to the warming oceans, shrinking cryosphere, and melting glaciers that directly
impact water security in several ways (IPCC, 2019). Climate change impacts hydrological
resources and water availability through an increase in the intensity of extreme precipitation
events and rises in the intensity of flooding in several areas especially humid regions (Tabari,
2020) increased frequency of droughts, exacerbate the already falling groundwater tables,
melting glaciers, sea-level rise impacting water security, human and system health, and
other socioeconomic impacts such as migration and conflicts (World Bank, 2019).
The Indian subcontinent is anticipated to have increased precipitation during summer and
an increase in extreme weather events including cyclones, floods, and droughts, and induce
long-term changes in the mean renewable water supply (IPCC, 2021). The frequency of
droughts has increased since the 1960s due to increased monsoon precipitation (Mishra,
et al., 2016). The country is already facing several extreme events as recorded in the
previous decade, in the form of droughts. The droughts of 2016 covering around 10 states,
affected 330 million people with economic losses of $100 billion, and the 2017 droughts
that severely impacted several areas of western India (Goyal & Surampalli, 2018) may be
less severe than those expected events in the future (Aadhar & Mishra, 2020). Similarly,
an increase in floods on account of the three-fold increase in precipitation has been
observed in many regions (Ali, et al., 2019), due to high frequency in rainy days and heavy
rainfall especially in the peninsular region of India (Guhathakurta, et al., 2011). Several
devastating flooding events especially in the last two decades, including the 2005 floods in
Mumbai, the 2013 floods in Uttarakhand, the 2015 floods in Chennai, and the 2018 floods
in Kerala established the above (Hunt & Menon, 2020). Global warming is also expected
to raise the sea level thus altering seawater, the fresh water and groundwater equations
and also increasing the frequency of coastal flooding in coastal cities (Vitousek, et al.,
2017). Increased frequency of heatwaves, heavy precipitation events, droughts, increase in
intense tropical cyclones, sea-level rise, flooding, saltwater intrusion are the major impacts
of climate change in urban areas or cities. Also, developing and least developed countries
16 Sustainable Cities Integrated Approach Pilot in India

will face disproportionate and severe impacts. Water management and water withdrawals
have altered the amount, seasonality, and variability of river discharge, especially in small
and human-dominated catchments and also cause droughts in several regions (IPCC, 2021).
The human induced warming is intensified locally in Cities with increased severity of heatwaves. Urbanization also increases mean and heavy precipitation over and/or downwind of cities and resulting runoff intensity (IPCC, 2021)
Urban areas are to address the issues of water availability (due to reduced ground resources,
and increased water demand on account of higher temperatures and rising population) and
water quality (on account of increased runoff resulting in erosion and sedimentation and
damage to water infrastructure due to flooding). The IPCC AR6 reinforces improved land
and water management for reducing climate change and adapting to some of its adverse
consequences (IPCC, 2021). The National Action Plan on Climate Change (NAPCC) by
the Government of India (GoI), in 2008, commissions the National Water Mission (NWM)
for addressing the challenge of climate change in the water sector. With the main goal
of ensuring integrated water resource management helping to conserve water, minimizing
wastage and ensuring more equitable distribution both across and within states, several
initiatives for water supply and demand management and institutional reforms are being
led by the NWM including the recent launch of ‘Catch the Rain’ campaign launched in 2021
for creation of rainwater harvesting structures and improving storage capacities.
17GHG Estimation and Climate Adaptation

References1. Aadhar, S. & Mishra, V., 2020. On the Projected Decline in Droughts Over South Asia in CMIP6
Multimodel Ensemble. Journal of Geophysical Research: Atmospheres, October.125(20).2. Abushammala, M. F. et al., 2011. Regional landfills methane emission inventory in Malaysia.
Waste Management & Research: The Journal for a Sustainable Circular Economy, 29(8), pp. 863-873.
3. Ali, H., Modi, P. & Mishra, V., 2019. Increased flood risk in Indian sub-continent under the warming climate. Weather and Climate Extremes, Volume 25.
4. Danilenko, A., Dickson, E. & Jacobsen, M., 2010. Climate Change and Urban Water Utilities: Challenges and Opportunities. Washington, DC: World Bank.
5. Goyal, M. K. & Surampalli, R. Y., 2018. Impact of Climate Change on Water Resources in India. Journal of Environmental Engineering, 144(7).
6. Guhathakurta, P., Sreejith, O. P. & Menon, P. A., 2011. Impact of climate change on extreme rainfall events and flood risk in India. Journal of Earth System Science, 120(3), pp. 359-373.
7. Hunt, K. M. R. & Menon, A., 2020. The 2018 Kerala floods: a climate change perspective. Climate Dynamics, 54(4).
8. IPCC, 2001. Technical Summary. In: J. T. Houghton, et al. eds. Climate Change 2001: The Scientific Basis. Contribution of Working Group I to the Third Assessment Report of the Intergovernmental Panel on Climate Change. Cambridge, U.K. and New York, U.S.A.: Cambridge University Press, pp. 21-83.
9. IPCC, 2007. Climate Change 2007 - The Physical Science Basis. Contribution of Working Group I to the Fourth Assessment Report of the IPC. Cambridge and New York: Cambridge University Press.
10. IPCC, 2014. Technical Summary. In: C. B. Field, et al. eds. Climate Change 2014: Impacts, Adaptation, and Vulnerability. Part A: Global and Sectoral Aspects. Contribution of Working Group II to the Fifth Assessment Report of the Intergovernmental Panel on Climate Change. Cambridge, United Kingdom and New York, NY, USA: Cambridge University Press, pp. 35-94.
11. IPCC, 2019. Summary for Policymakers. In: H. Pörtner, et al. eds. IPCC Special Report on the Ocean and Cryosphere in a Changing Climate. s.l.:In Press.
12. IPCC, 2021. Summary for Policymakers. In: V. Masson-Delmotte, et al. eds. Climate Change 2021: The Physical Science Basis. Contribution of Working Group I to the Sixth Assessment Report of the Intergovernmental Panel on Climate Change. s.l.:Cambridge University Press.
13. Mishra, V. et al., 2016. On the frequency of the 2015 monsoon season drought in the Indo-Gangetic Plain. Geophysical Research Letters, 43(23), pp. 12,102-12,112.
14. Tabari, H., 2020. Climate change impact on flood and extreme precipitation increases with water availability. Scientific Reports, Volume 10.
15. USEPA, 2006. United States Environmental Protection Agency. [Online] Available at: https://www.epa.gov/ghgreporting/ghgrp-waste [Accessed August 2021].
16. Vitousek, S. et al., 2017. Doubling of coastal flooding frequency within decades due to sea-level rise. Scientific Reports, Volume 7.
17. World Bank, 2019. World Development Report 2019: The Changing Nature of Work, Washington, D.C.: World Bank.
18 Sustainable Cities Integrated Approach Pilot in India

19GHG Estimation and Climate Adaptation

2Chapter
Estimating GHG Emission for Solid Waste Management
20 Sustainable Cities Integrated Approach Pilot in India

Training Outcomes
• Develop an understanding of mitigation and adaptation measures and strategies to manage GHG emissions from SWM
• Understanding of available tools to assess savings in GHG emissions from different technologies.
• Acquire knowledge on selection of appropriate technology options based on net GHG calculations.
Chapter Contents
2.1 Waste Management and Climate Change impact
2.2 GHG emissions in relation to SWM process/technologies
2.3 Detailed account of various SWM technologies and its climate relevance
2.4 Available estimation methods for calculating GHG emissions in SWM technology
2.5 Strategies to manage GHG emissions
2.6 Strategies for Climate Change planning and Adaptation for waste management
2.7 Climate change adaptation measures integrated in Waste management systems
References
Recap
The previous chapter introduced in brief the concepts related to climate change and the global scenario and relevance of GHG emission. It also dealt with the waste management and water supply sector to understand their impact on climate change.
Training Objectives
• To get an overview of the GHG emissions from waste management activities and their contribution to climate change.
• Understand the GHG estimation model to quantify the GHG emissions from individual treatment technologies.
21GHG Estimation and Climate Adaptation

2.1. Introduction (Ahluwalia & Patel, 2018)Greenhouse gases (GHGs) have been a source of growing concern on account of changing
climate patterns and extreme weather events throughout the planet. However, over the last
century and a half, human activities have added considerably to GHGs in the atmosphere,
and that continues to result in global warming, causing the earth’s average temperature to
rise and thereby leading to change in climatic patterns. Solid waste sector is a significant
contributor of GHG emissions globally. Greenhouse gases are emitted not only while the
waste is managed (as during transportation) but also when it is left to decay in dumpsites.
A significant amount of embodied emissions is associated with poor waste management,
which can be avoided with proper handling, resource recovery and recycling.
The main channels through which solid waste management affects GHG emissions are
listed below:
• Consumption without regard for resource conservation creates excess demand for
extraction and manufacturing of goods from virgin materials, all of which contributes
to greenhouse gas emissions in varying amounts at different stages of production and
consumption.
• Mixing wet waste with dry waste at the source of generation results in several negative
downstream effects.
• The increased volume of unprocessed mixed waste adds to transport demand which in
turn increases fossil fuel consumption for collection and transportation of waste from
the source of generation to the landfill sites.
• When the mixed waste is dumped at landfill sites, it releases methane gas that is
generated from anaerobic decomposition of biodegradable waste present in the waste.
• Leachate oozing out of decomposing biodegradable matter releases nitrous oxide.
• Any act of burning of waste releases carbon dioxide and other harmful gases
Of all these activities, the International Solid Waste Alliance (2009) estimates that emissions
from landfill sites, due to decomposition of biodegradable waste, are the biggest source of
GHG emissions from waste sector global
2.1.1. Linkages of Greenhouse Gases and Solid Waste ManagementGHGs have been a source of growing concern on account of changing climate patterns
and extreme weather events throughout the planet. GHGs create a natural blanket around
the Earth’s atmosphere by preventing some of the sun’s heat energy from radiating back
into space, thus keeping the earth warm. However, over the last century and a half, human
activities have added considerably to GHGs in the atmosphere, and that continues to result
in global warming, causing the earth’s average temperature to rise and thereby leading to
change in climatic patterns.
22 Sustainable Cities Integrated Approach Pilot in India

Solid waste sector is a significant contributor of GHG emissions globally. The
InterGovernmental Panel on Climate Change (IPCC) estimated that post-consumer waste
accounted for up to 5 per cent of the total global GHG emissions in 2005 (IPCC 2007).
Greenhouse gases are emitted not only while the waste is managed (as during transportation)
but also when it is left to decay in dumpsites. A significant amount of embodied emissions
is associated with poor waste management, which can be avoided with proper handling,
resource recovery and recycling. Waste minimisation at source in all sectors of an economy
has considerable downstream GHG reduction potential. GHG emissions from solid waste
disposal on land as reported to UNFCCC by India in 2015- 16 increased at the rate of 3.1
per cent per annum between 2000 and 2010.
Waste management activities generate carbon dioxide (CO2, ~ 50 per cent), methane (CH4,
~ 50 per cent) and nitrous oxide (N2O, < 1 per cent) gas, among others. As per IPCC (2007),
the global warming potential of methane and nitrous oxide are 25 times and 298 times
higher than that of carbon dioxide over a 100-year period. However, in the short run, i.e. a
20-year horizon, the same gases are 72 times and 289 times stronger than carbon dioxide
in global warming potential, respectively. Clearly, the choice of time horizon can have a
profound effect on the estimate of climate impact of emissions. (Fuglestveldt et al 2001).
Waste prevention and recycling are real ways to help to mitigate climate change. The
greenhouse gases emissions from solid waste and landfill activities have a significant
contribution in climate change. The main source of manmade methane gas is from landfills.
Due to aerobic and anaerobic degradation, greenhouse gases like methane, carbon dioxide,
and nitrogen dioxide are produced from the landfill, which contributes directly to global
warming. Methane, also popular as a potent greenhouse gas that is 28 times potent than
carbon dioxide, which can trap heat in the atmosphere.
Waste prevention and recycling-jointly referred to as waste reduction-help us better
manage the solid waste we generate. But preventing waste and recycling also are potent
strategies for reducing greenhouse gases. Together they:
• Reduce emissions from energy consumption. Recycling saves energy. That’s because
making goods from recycled materials typically requires less energy than making goods
from virgin materials. And waste prevention is even more effective. Less energy is
needed to extract, transport, and process raw materials and to manufacture products
when people reuse things or when products are made with less material. The payoff?
When energy demand decreases, fewer fossil fuels are burned and less carbon dioxide
is emitted to the atmosphere.
23GHG Estimation and Climate Adaptation

• Reduce emissions from incinerators. Diverting certain materials from incinerators
through waste prevention and recycling reduces greenhouse gas emissions to the
atmosphere.
• Reduce methane emissions from landfills. Waste prevention and recycling (including
composting) divert organic wastes from landfills, reducing the methane released when
these materials decompose.
• Increase storage of carbon in trees. Forests take large amounts of carbon dioxide out of
the atmosphere and store it in wood, in a process called carbon sequestration. Waste
prevention and recycling of paper products can leave more trees standing in the forest,
continuing to absorb carbon dioxide from the atmosphere.
These changes present complex challenges to the waste management industry that must be
addressed and planned for. For example, one challenge is an increasing frequency of large-
scale weather events and natural disasters, which are creating more debris that must be
managed and which affects the characteristics of landfilled waste. Landfill design needs to
incorporate precipitation changes and increased threats due to weather variability, flooding,
and sea-level rise. Precipitation changes affect gas generation rates and require a diligent
reaction to maintain effective gas collection. Because of weather pattern changes, risks of
cover material erosion and swales have increased for landfills in both wet and dry climates,
which may require stronger natural caps or the use of emerging technologies for alternate
cover. Additionally, landfills are affected by an increase in the variability of precipitation and
rapid changes between weather extremes.
It is clear that waste management facilities must adapt to these changes in addition to
scenario building for pandemics to maintain effective operations. Adaptations available
include making changes to landfill design and planning, such as incorporating precipitation
changes into the modeling of leachate and gas generation or increasing the distance
between the bottom liner and groundwater. Systems should be regularly evaluated and
areas needing repairs should be corrected quickly and diligently. Gas generation models
should be updated regularly and collection systems need to be expanded or adjusted to
account for precipitation increases or decreases.
More frequent and intense storms are creating challenges for cover material management,
liquids management, and maintaining slope stability. Facilities should implement innovative
uses of both existing technology and new or emerging technologies. Communities with
waste management facilities should include waste management infrastructure in emergency
management plans, including maintaining landfills and collections operations and using
landfills as both temporary debris storage and as an option for final disposal.
Since climate change effects vary by region and locale, many facilities are developing a
specific plan for adaptation and management. To reduce the inevitable costs of adaptation
24 Sustainable Cities Integrated Approach Pilot in India
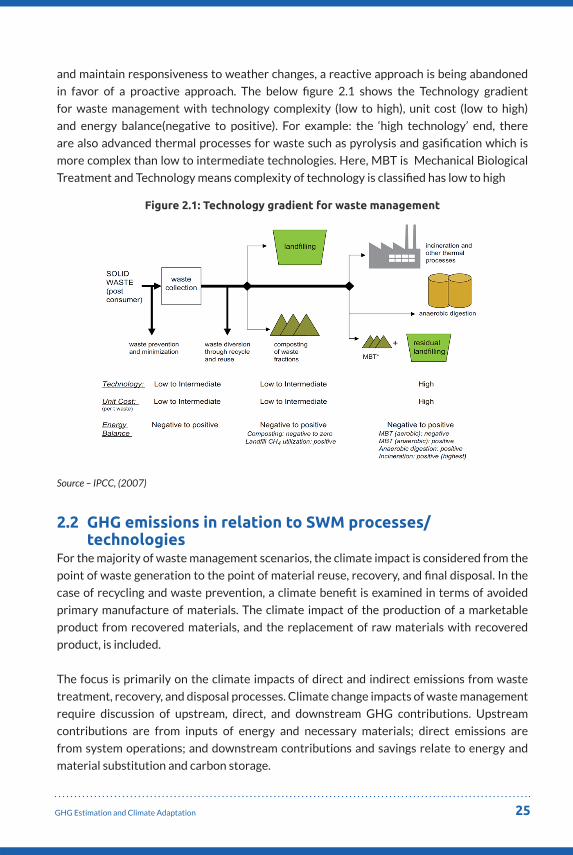
and maintain responsiveness to weather changes, a reactive approach is being abandoned
in favor of a proactive approach. The below figure 2.1 shows the Technology gradient
for waste management with technology complexity (low to high), unit cost (low to high)
and energy balance(negative to positive). For example: the ‘high technology’ end, there
are also advanced thermal processes for waste such as pyrolysis and gasification which is
more complex than low to intermediate technologies. Here, MBT is Mechanical Biological
Treatment and Technology means complexity of technology is classified has low to high
Figure 2.1: Technology gradient for waste management
Source – IPCC, (2007)
2.2 GHG emissions in relation to SWM processes/ technologies
For the majority of waste management scenarios, the climate impact is considered from the
point of waste generation to the point of material reuse, recovery, and final disposal. In the
case of recycling and waste prevention, a climate benefit is examined in terms of avoided
primary manufacture of materials. The climate impact of the production of a marketable
product from recovered materials, and the replacement of raw materials with recovered
product, is included.
The focus is primarily on the climate impacts of direct and indirect emissions from waste
treatment, recovery, and disposal processes. Climate change impacts of waste management
require discussion of upstream, direct, and downstream GHG contributions. Upstream
contributions are from inputs of energy and necessary materials; direct emissions are
from system operations; and downstream contributions and savings relate to energy and
material substitution and carbon storage.
25GHG Estimation and Climate Adaptation

Brief description of SWM technologies To understand the GHG emissions of various SWM processes, it is paramount to have an
idea of the technologies perse. Below is a brief description of each technology/ process
in SWM. The available waste processing technologies are broadly classified into three
categories.
• Disposal of waste
• Biological treatment
• Thermal treatment
These processes can be classified into three groups based on the technique adopted – Disposal
techniques, Aerobic and Anaerobic decomposition of waste, Thermal decomposition. The
disposal of waste is the most basic form which involves only containment. Sanitary landfills
are examples of this process. Decomposing the solid waste can be undertaken using two
methods – Aerobic and Anaerobic. The process of decomposing the waste in the presence
of air is called Aerobic process. Composting and Mechanical Biological Recovery of waste
are examples of this process. Anaerobic decomposition of waste is in the absence of air
and Biogas and biomethanation are examples of these processes. Thermal decomposition
is destruction of waste using by burning. Incineration technology is an example of this
process.
In biological process, the biodegradable organic portion of waste is broken down into
gaseous products (CO2, Methane gas etc.) and water molecules leaving behind carbon
rich byproduct called compost. CO2 emissions coming from biological process are not
considered to contribute to global warming since this carbon has a biogenic origin, i.e. this
carbon has been previously fixed biologically. Although generated in small amounts, N2O
and CH4 have a great contribution to global warming since they have a warming potential
28 (CH4) and 265 (N2O) times higher than that of CO
2. Biological processes can be further
divided into two categories-
• Aerobic treatment (in presence of Oxygen)
• Anaerobic treatment (absence of Oxygen)
Thermal process is applied to destroy the harmful potential of wastes together with energy
recovery. In this process, the waste components are incinerated in controlled oxygen supply
so that maximum heat energy can be recovered without causing the air pollution. During
incineration, the waste undergoes chemical changes to release gaseous byproduct, water
vapour along with heat energy. The heat energy can be utilized for generating electricity
through boiler. The efficiency of heat recovery depends upon the calorific value of
incinerated waste.
26 Sustainable Cities Integrated Approach Pilot in India

Th
e d
iffe
ren
t ty
pes
of w
aste
man
agem
ent
pro
cess
es/t
ech
no
logy
an
d it
s G
HG
lin
kage
s is
elic
ited
in t
he
tab
le b
elo
w:
Tab
le 2
.1: C
om
par
iso
n o
f So
lid
Was
te T
echn
olo
gie
s
Par
amet
ers
Sani
tary
land
fill
Co
mpo
stin
gA
naer
obi
c di
gest
ion
(Bio
gas
plan
ts/
bio
-m
etha
nati
on
plan
ts)
Ther
mal
tre
atm
ent
/ In
cine
rati
on
Bas
ic P
roce
ssD
isp
osa
lB
iolo
gica
l tre
atm
ent
Bio
logi
cal t
reat
men
tT
her
mal
tre
atm
ent
Idea
l Typ
es o
f W
aste
Mu
nic
ipal
so
lid w
aste
, co
nst
ruct
ion
an
d
dem
olit
ion
was
te,
was
tew
ater
slu
dge
, n
on
-haz
ard
ou
s in
du
stri
al w
aste
s
Foo
d w
aste
(in
clu
din
g w
aste
s fr
om
ho
use
ho
lds,
res
tau
ran
ts
and
mar
kets
), fa
ts/o
ils/
grea
se, p
aper
an
d c
ard
bo
ard
, la
nd
scap
ing
and
gar
den
was
te
(e.g
. hed
ge-c
lipp
ings
, lea
ves)
Foo
d w
aste
(in
clu
din
g w
aste
s fr
om
ho
use
ho
lds,
re
stau
ran
ts a
nd
m
arke
ts),
fats
/oils
/gr
ease
, sla
ugh
terh
ou
se
was
te (d
epen
din
g lo
cal
regu
lati
on
s), a
nd
gar
den
w
aste
Mix
ed m
un
icip
al s
olid
was
te, m
edic
al
was
te, d
emo
litio
n w
oo
d, a
uto
sh
red
der
re
sid
ue,
dri
ed s
ewag
e sl
ud
ge, a
nd
so
me
ind
ust
rial
so
lid w
aste
s
Gre
enh
ou
se G
as
Em
issi
on
s
Sign
ifica
nt;
can
be
cap
ture
d b
y la
nd
fill
gas
reco
very
Red
uce
dSi
gnifi
can
t; c
aptu
red
an
d
use
d t
o g
ener
ate
ener
gy
Co
nsi
der
ed r
enew
able
& b
ioge
nic
ori
gin
is
usu
ally
in t
he
ran
ge o
f 33
-50
per
cen
t w
hic
h is
co
nsi
der
ed a
s 4
0-6
0%
clim
ate
neu
tral
Pri
mar
y o
utp
ut
Lan
dfi
ll ga
s (w
her
e re
cove
red
), le
ach
ate
Co
mp
ost
Met
han
e, d
iges
tate
Ash
an
d e
mis
sio
n o
f flu
e ga
s (p
arti
cula
te
mat
ter,
hea
vy m
etal
s, d
ioxi
ns,
su
lfu
r d
ioxi
de
and
hyd
roch
lori
c ac
id
Seco
nd
ary
ou
tpu
tE
lect
rici
ty a
nd
/or
hea
t (w
her
e la
nd
fill
gas
is
reco
vere
d)
--E
lect
rici
ty a
nd
/or
hea
t;
liqu
id o
r so
lid fe
rtili
zer
Hea
t an
d s
om
etim
es e
lect
rici
ty
27GHG Estimation and Climate Adaptation

Par
amet
ers
Sani
tary
land
fill
Co
mpo
stin
gA
naer
obi
c di
gest
ion
(Bio
gas
plan
ts/
bio
-m
etha
nati
on
plan
ts)
Ther
mal
tre
atm
ent
/ In
cine
rati
on
Typ
es o
f GH
G
emis
sio
ns
Typ
ical
ly, L
and
fill
gas
is c
om
po
sed
of a
bo
ut
50
% m
eth
ane,
45
%
carb
on
dio
xid
e, a
nd
5%
o
ther
gas
es in
clu
din
g hy
dro
gen
su
lfid
es
and
vo
lati
le o
rgan
ic
com
po
un
ds
Mic
rob
ial a
ctiv
itie
s o
f an
aero
bic
an
d a
ero
bic
co
nd
itio
ns
du
rin
g co
mp
ost
ing
pro
cess
lead
s to
th
e p
rod
uct
ion
of C
O2, C
H4,
N2O
an
d N
H3, w
ith
th
e C
O2
and
CH
4 p
rod
uct
ion
giv
en
by in
suffi
cien
t O
2 a
nd
N2O
d
epen
din
g o
n t
he
tem
per
atu
re
and
nit
rate
co
nte
nt
and
ae
rati
on
rat
e.A
was
te p
ile b
ein
g co
mp
ost
ed,
that
is m
anag
ed t
o e
nsu
re r
apid
d
eco
mp
osi
tio
n a
nd
low
od
ors
w
ill h
ave
low
GH
G. V
alu
es
fro
m t
he
liter
atu
re s
ugg
est
that
max
imu
m e
mis
sio
ns
fro
m
pile
s w
ou
ld b
e 2
.5 p
erce
nt
of t
he
init
ial C
arb
on
an
d 1
.5
per
cen
t o
f th
e in
itia
l Nit
roge
n
to v
ola
tiliz
e as
CH
4 a
nd
N2O
. If
a p
ile c
on
tain
s 7
5 p
erce
nt
org
anic
mat
ter
on
a d
ry w
eigh
t b
asis
wit
h a
C:N
rat
io o
f 30
:1,
this
wo
uld
tra
nsl
ate
to a
bo
ut
on
e to
n o
f Car
bo
n e
volv
ing
as m
eth
ane
for
each
10
0 d
ry
ton
s. T
hat
sam
e p
ile w
ou
ld
hav
e 0
.02
to
ns
of N
itro
gen
th
at w
ou
ld e
volv
e as
N2O
. It
sho
uld
be
no
ted
th
at t
hes
e ar
e co
nse
rvat
ive
esti
mat
es
and
act
ual
GH
G r
elea
se c
an
easi
ly b
e an
ord
er o
f mag
nit
ud
e lo
wer
. (W
est
Co
ast
Co
nfe
ren
ce,
n.d
.)
Bio
gas
con
sist
s o
f 60
%-
70
% m
eth
ane,
30
%-4
0%
ca
rbo
n d
ioxi
de
and
tra
ce
amo
un
ts o
f oth
er g
ases
(e
g. H
ydro
gen
su
lfid
e,
amm
on
ia, h
ydro
gen
, n
itro
gen
gas
, car
bo
n
mo
nox
ide
( (U
niv
ersi
ty
of N
ort
h T
exas
Lib
rari
es
Gov
ern
men
t D
ocu
men
ts
Dep
artm
ent,
20
11
)
Clim
ate
rele
van
t ga
ses
emit
ted
fro
m
inci
ner
atio
n a
re m
ain
ly C
O2 (c
arb
on
d
ioxi
de)
as
wel
l as
N2O
(nit
rou
s ox
ide)
, N
Ox
(oxi
des
of n
itro
gen
) NH
3 (a
mm
on
ia)
and
org
anic
C, m
easu
red
as
tota
l ca
rbo
n. C
H4 (m
eth
ane)
is n
ot
gen
erat
ed
in w
aste
inci
ner
atio
n d
uri
ng
no
rmal
o
per
atio
n. I
t o
nly
ari
ses
in p
arti
cula
r,
exce
pti
on
al, c
ases
an
d t
o a
sm
all
exte
nt
(fro
m w
aste
rem
ain
ing
in t
he
was
te b
un
ker)
, so
th
at in
qu
anti
tati
ve
term
s C
H4 is
no
t to
be
rega
rded
as
clim
ate-
rele
van
t fo
r in
cin
erat
ion
. CO
2
con
stit
ute
s th
e ch
ief c
limat
e-re
leva
nt
emis
sio
n o
f was
te in
cin
erat
ion
an
d is
co
nsi
der
ably
hig
her
, by
no
t le
ss t
han
10
, th
an t
he
oth
er e
mis
sio
ns.
Th
e in
cin
erat
ion
of 1
Mg
of m
un
icip
al
was
te in
MSW
inci
ner
ato
rs is
ass
oci
ated
w
ith
th
e p
rod
uct
ion
/rel
ease
of a
bo
ut
0.7
to
1.2
Mg
of c
arb
on
dio
xid
e (C
O2
ou
tpu
t). T
he
pro
po
rtio
n o
f car
bo
n o
f b
ioge
nic
ori
gin
is u
sual
ly in
th
e ra
nge
of
33
to
50
per
cen
t. T
he
clim
ate-
rele
van
t C
O2 e
mis
sio
ns
fro
m w
aste
inci
ner
atio
n
are
det
erm
ined
by
the
pro
po
rtio
n o
f w
aste
wh
ose
car
bo
n c
om
po
un
ds
are
assu
med
to
be
of f
oss
il o
rigi
n. T
he
allo
cati
on
to
foss
il o
r b
ioge
nic
car
bo
n
has
a c
ruci
al in
flu
ence
on
th
e ca
lcu
late
d
amo
un
ts o
f clim
ate-
rele
van
t C
O2
emis
sio
ns.
(IP
CC
, n.d
.)
28 Sustainable Cities Integrated Approach Pilot in India

Par
amet
ers
Sani
tary
land
fill
Co
mpo
stin
gA
naer
obi
c di
gest
ion
(Bio
gas
plan
ts/
bio
-m
etha
nati
on
plan
ts)
Ther
mal
tre
atm
ent
/ In
cine
rati
on
En
ergy
co
nver
sio
n
effi
cien
cy (k
Wh
/to
nn
e o
f mu
nic
ipal
so
lid w
aste
)
65
(lan
dfi
ll ga
s)--
16
5 -
24
55
00
- 6
00
Cap
ital
co
sts
(US$
/an
nu
al t
on
ne)
5 -
52
(US$
/to
nn
e ov
er
lifet
ime)
30
-40
02
20
-66
01
90
-10
00
Op
erat
ing
cost
s (U
S$/t
on
ne)
7 –
30
(bu
t ca
n b
e as
h
igh
as
12
0)
12
-10
02
2-5
71
2-5
5
Car
bo
n F
inan
ce
po
ten
tial
Yes
(wh
ere
lan
dfi
ll ga
s is
re
cove
red
)Ye
sYe
s (w
her
e b
ioga
s is
re
cove
red
)Ye
s (w
her
e en
ergy
is r
ecov
ered
)
CD
M (C
arb
on
fi
nan
ce
met
ho
do
logy
)A
MS-
III.G
.A
MS-
III.F
.A
MS-
III.A
F.A
MS-
III.A
.O.
AM
S-II
I.E.
Mas
s R
edu
ctio
n o
f W
aste
(%)
--5
0%
50
%8
0-8
5%
Lan
d R
equ
irem
ent
(m2/t
on
ne)
Gen
eral
ly la
rge
0.0
65
– 1
0.8
1.6
1 –
6.4
5M
uch
sm
alle
r th
an t
hat
for
lan
dfi
ll b
ut
ash
mu
st b
e d
isp
ose
d
Op
erat
ion
al
com
ple
xity
Req
uir
es s
pec
ializ
ed
trai
nin
g, c
aref
ul
mai
nte
nan
ce, a
nd
po
st-
clo
sure
car
e
Pro
per
tra
inin
g re
qu
ired
Pro
per
tra
inin
g re
qu
ired
Tech
nic
ally
co
mp
lex,
req
uir
es h
igh
ly
skill
ed t
rain
ing
and
car
efu
l mai
nte
nan
ce
Ave
rage
Ran
ge o
f W
aste
Th
rou
ghp
ut
(to
nn
es/d
ay)
50
-10
,00
02
.5 -
30
00
.5 -
50
05
– 1
00
0 (c
om
mo
n r
ange
is 2
00
– 7
00
)
Sour
ce -
Aut
hors
29GHG Estimation and Climate Adaptation

2.3 Available estimation methods for calculating GHG emissions in SWM technologies
Greenhouse Gases and Global Warming Potential - Two characteristics of atmospheric
gases determine the strength of their greenhouse effect. The first is their ability to absorb
energy and radiate it (their “radiative efficiency”). The second is the atmospheric lifetime,
which measures how long the gas stays in the atmosphere before natural processes (e.g.,
chemical reactions) remove it. These characteristics are incorporated in the Global Warming
Potential (GWP), a measure of the radiative effect (i.e. the strength of their greenhouse
effect) of each unit of gas (by weight) over a specified period of time, expressed relative to
the radiative effect of carbon dioxide (CO2). This is often calculated over 100 years, though
it can be done for any time period. Gases with high GWPs will warm the Earth more than an
equal amount of CO2 over the same time period. A gas with a long lifetime, but relatively low
radiative efficiency, may end up exerting more warming influence than a gas that leaves the
atmosphere faster than the time window of interest but has a comparatively high radiative
efficiency, and this would be reflected in a higher GWP.
The table 2.2 presents atmospheric lifetime and GWP values for major greenhouse
gases from the Fifth IPCC Assessment Report (AR5) released in 2014. These values are
periodically updated by the scientific community as new research refines estimates of
radiative properties and atmospheric removal mechanisms (sinks) for each gas. Despite
carbon dioxide’s comparatively low GWP among major greenhouse gases, the large human-
caused increase in its atmospheric concentration has caused the majority of global warming.
Likewise, methane is responsible for a large portion of recent warming despite having a GWP
much lower than several other greenhouse gases because emissions have increased drastically.
Table 2.2: Global Warming Potential and Atmospheric Lifetime for major Greenhouse Gases
Greenhouse gas Chemical formula
Global Warming Potential, 100-year time horizon
Atmospheric Lifetime (years)
Carbon Dioxide CO2
1 100*
Methane CH4
28 12
Nitrous Oxide N2O 265 121
Chlorofluorocarbon-12 (CFC-12)
CCl2F
210,200 100
Hydrofluorocarbon-23 (HFC-23)
CHF3
12,400 222
Sulfur Hexafluoride SF6
23,500 3,200
Nitrogen Trifluoride NF3
16,100 500
* No single lifetime can be given for carbon dioxide because it moves throughout the earth system at differing rates. Some carbon dioxide will be absorbed very quickly, while some will remain in the atmosphere for thousands of years.
Source – IPCC (2014)
30 Sustainable Cities Integrated Approach Pilot in India

Figure2.2:Material-EnergylifecycleflowswithassociatedGHGsourcesandsinks
Virgin Inputs
Energy Use
RecyclingAvoided Fossil
Fuel Use
Avoided Fossil Fuel Use
Carbon in Long-Term Storage in Landfill
Carbon Storage in the Soil
Avoid Fossil Fuel Use
Increased Forest Carbon Sequestration
Landfilling
Combustion
Composting
Waste Management
Energy
Materials Extracted: Trees, Ore,Oil, etc.
Raw Materials Acquisition
Energy and Non-Energy-Related Emissions
Energy and Non-Energy- Related Emissions
Energy-Related Emissions
RecoveredEnergy
Uncontrolled CH4
or Fugitive and Combusted Ch
4 and
Recovered Energy
Reduced Carbon Sequestration in
ForestsManufacturing
Life Cycle Stage GHG Emissions Sinks & Emission Offsets
Source – EPA, (2002)
Organic biomass decomposes anaerobically in a sanitary landfill. Landfill gas, a by-product
of the anaerobic decomposition is composed of methane (typically about 50%) with the
balance being carbon dioxide and other gases. Methane, which has a Global Warming
Potential 21 times greater than carbon dioxide, is the second most common greenhouse
gas after carbon dioxide.
Greenhouse gas emissions from waste management can readily be reduced. Within the
European Union, the rate of GHG emissions from waste has declined from 69 mtCO2e per
year to 32 million tCO2e per year from 1990 to 2007 (ISWA, 2009).
Methodology for estimating the GHG emissions of an area (city, state or country)The calculation method used in the SWM-GHG estimation spreadsheet (provided as
annex to this document, as an excel spread sheet), follows the Life Cycle Assessment (LCA)
method. Different waste management strategies/processes/technologies can be compared
by calculating the GHG emissions of the different processes adopted, treatment and
recycling (typically glass, paper and cardboard, plastics, metals, organic waste) and disposed
of waste fractions over their whole life cycle – from “cradle to grave”, adopted in a given
area/place like a city, town or state/country. The spreadsheet sums up the emissions of all
residual waste or recycling streams respectively and calculates the total GHG emissions
of all process stages in CO2 equivalents. The emissions calculated also include all future
31GHG Estimation and Climate Adaptation

emissions caused by a given quantity of treated waste, including transportation of that
particular waste from its generation point until its final destination. This means that
when waste is sent to landfill, for example, the calculated GHG emissions, given in tonne
CO2 equivalents per tonne waste, include the cumulated emissions this waste amount
will generate during its degradation. This method corresponds to the “Tier 1” approach
described in IPCC (1996, 2006).
How to use the GHG emission calculation spreadsheetThe spreadsheet has certain ‘fixed values’ (these are universal values used for GHG
calculations), ‘indicative values’ (fields marked in orange colour), which can be changed if
exact values for the place is available and the ‘Input values’ (fields marked in green colour,
which needs to be filled based on the best data and latest information available or derived
from laboratory analysis.
The spreadsheet calculates the GHG emissions and provides a report with charts to
understand the good practices or bad practices adopted by the given city/town and so on,
vis-à-vis the GHG emissions.
Calculation methodThe GHG emissions are calculated based on the net emissions from:
• Processing of waste - technologies and techniques for processing SW (like composting,
incineration, bio gas, bio-methanation, recycling etc.,). This also includes avoided
emissions due to recycling of the products, vis-à-vis the emissions caused if virgin
material was to be used to make the product. This avoided cost also includes the Life
Cycle Emissions for making the product pre-waste scenario. Hence, GHG emissions
for processing of waste includes ‘Pre’ and ‘Post’ Waste processing emissions. The
processing waste also includes the additives used which may sometimes lead to GHG
emissions – like chemicals used.
• Transportation of waste – to and fro from the point of generation of the waste, to
the waste processing facility and to the final consumption or disposal of the processed
waste.
• Energy consumption (Electricity and fuel) – The energy consumption of waste
treatment/processing facility is also considered for the calculations. This energy could
be in the form of electricity consumption for processing or fuel used.
Each type of waste (like plastics, metal, organic matter, glass, paper, textiles) have available
GHG constants which are suggested values. In case of non-availability of specific GHG
emission values, these constants could be used. These suggested values are already
provided in the spreadsheet.
32 Sustainable Cities Integrated Approach Pilot in India

An
em
issi
on
for
any
was
te s
trea
m is
th
us
calc
ula
ted
as
follo
ws:
Tab
le 2
.3: E
mis
sio
n C
alcu
lati
on
GH
G e
mis
sio
n o
f P
last
ic
(or
any
oth
er
type
of
was
te)
for
a gi
ven
city
=
Self
em
issi
on
fro
m
pro
cess
ing
+Tr
ansp
ort
atio
n+
Use
of
addi
tive
s+
Ener
gy
cons
umpt
ion
-A
void
ed e
mis
sio
ns
if a
ny
GH
G e
mis
sio
ns
in C
O2
Eq
uiv
alen
t
(Su
gges
ted
va
lue
of G
HG
em
issi
on
fa
cto
r in
CO
2
Eq
uiv
alen
t X
Q
uan
tity
of
Pla
stic
was
te)
(Su
gges
ted
val
ue
of G
HG
em
issi
on
fa
cto
r in
CO
2
Eq
uiv
alen
t X
d
ista
nce
tra
velle
d
in K
ms)
(ver
y n
eglig
ible
fo
r m
ost
of t
he
tech
no
logi
es
curr
entl
y av
aila
ble
)
(Su
gges
ted
va
lue
of G
HG
em
issi
on
fa
cto
r in
CO
2
Eq
uiv
alen
t X
Ele
ctri
city
co
nsu
mp
tio
n
for
the
par
ticu
lar
tech
no
logy
u
sed
)
(Su
gges
ted
val
ue
of
GH
G e
mis
sio
n fa
cto
r in
CO
2 E
qu
ival
ent
for
the
par
ticu
lar
pro
du
ct
man
ufa
ctu
rin
g)
IPC
C (2
006)
33GHG Estimation and Climate Adaptation

Example of a case study of Bangalore City:The GHG emissions of Bangalore City based on the SWM practices currently adopted is
given below to understand how to use the GHG spreadsheet. Input values used are for
5000 tonnes per day of SWM.
Input values used for the GHG Computation
MSW generated 5000 TPD Actual %
Biodegradables (Wet Waste) TPDRecyclables
40%
-Paper TPD 8%
-Plastic /Rubber TPD 8%
-Metal TPD 2%
-Glass TPD 2%
-Rags/ Textiles TPD 3%
-Others 17%
Sub total Recyclables TPD
40%
Scenario 1: The city uses composting, RDF and SLF technologies to process its SWOverall GHG emissions in Kg CO
2 equivalent per day for the city of Bangalore is found to
be negative. The technologies of composting, RDF and Sanitary Landfill processess used
currently helps the city to mitigate GHG effectively.
34 Sustainable Cities Integrated Approach Pilot in India

Scenario 2: The city does not process its wastes and dumps it into landfills without capturing methane gas. Such a scenario, the GHG emissions will be positive, which means the city contributes to faster climate change impacts.
Scenario 3: The scenario of utilising various technologies to treat waste is applied to the city of Bangalore. The corresponding GHG emission scenario is given in the chart below:
35GHG Estimation and Climate Adaptation

Estimating the GHG emissions for Waste TransportationMSW transportation consumed a significant amount of fossil fuel and led to GHG
emissions due to fossil-fuel combustion. Two major types of fossil fuel are used for waste
transportation in developing Asia, namely diesel and natural gas
Total GHG emissions from combustion of any kind of fossil fuel during waste transportation
can be calculated as follows:
EmissionsT Energy EFx x=Fuel(units)
Waste(tonnes)
MJ( )unit ( )kfCO2
MJ
• EmissionsT – Emissions from transportation (kg CO2/tonne of waste transported)
• Fuel (units) – Total amount of fossil fuel consumption per month, (diesel in Liters
and Natural gas in kg)
• Waste (tonnes) – Total amount of waste transported per month
• Energy (MJ/unit) – Energy content of the fossil fuel (e.g. Diesel 36.42 MJ/L, Natural
gas 37.92 MJ/kg)
• EF – CO2 emission factor of the fuel (e.g. diesel: 0.074 kg CO2/MJ,
Natural gas: 0.056 kg CO2/MJ)
Estimation of GHG emissions from landfillingThe amount of methane generated at the disposal sites would depend on many factors
such as quantity and composition of waste, moisture content, pH, and waste management
practices. In general, methane production increases with higher organic content and higher
moisture content in the disposal sites.
The following mathematical formula has been used in IPCC model to quantify GHG
emissions from the landfilling or open dumping. The IPCC Guidelines (pp 6.10-6.11,
Reference Manual) present the FOD method in three equations. The first equation is to be
used for an individual landfill, or possibly a group of specific landfills. A second equation,
suitable for national and regional estimates, calculates emissions from all solid waste
deposited in SWDS in one year. The purpose of the third equation is to estimate current
annual emissions from waste disposal in current and previous years
EQUATION - 1
EQUATION - 1
CH4 generated in year t (Gg/yr) = x [(A k MSWT (x) MSWF (x) L0(x)) e–k(t – x)]
for x = initial year to t
Where:
• t = year of inventory
• x = years for which input data should be added
36 Sustainable Cities Integrated Approach Pilot in India

• A = (1 – e–k) / k ; normalisation factor which corrects the summation k = Methane
generation rate constant (1/yr)
• MSWT (x) = Total municipal solid waste (MSW) generated in year x (Gg/yr) MSWF (x) =
Fraction of MSW disposed at SWDS in year x
• L0 (x) = Methane generation potential [MCF (x) • DOC (x) • DOCF • F • 16 / 12 (Gg
CH4/Gg waste)]
• MCF (x) = Methane correction factor in year x (fraction)
• DOC (x) = Degradable organic carbon (DOC) in year x (fraction) (Gg C/Gg waste) DOCF
= Fraction of DOC dissimilated
• F = Fraction by volume of CH4 in landfill gas 16 / 12 = Conversion from C to CH4
Sum the obtained results for all years (x).
EQUATION -2CH4 emitted in year t (Gg/yr) = [CH4 generated in year t – R(t)] • (1 – OX)
Where:
• R(t) = Recovered CH4 in inventory year t (Gg/yr) OX = Oxidation factor (fraction)
Note that CH4 recovered (R(t)) must be subtracted from the amount generated before
applying the oxidation factor, because only landfill gas that is not captured is subject to
oxidation in the upper layer of the landfill. In addition, the unit for the methane generation
potential should be expressed by weight (Gg CH4/Gg waste) and not volume (m3/Mg waste)
as currently written in the IPCC Guidelines in order to make the outcome of the default and
FOD methods consistent.
EQUATION - 3CH4 emissions (Gg/yr) = [(MSWT • MSWF • L0 ) – R] • (1 – OX)
Where:
• MSWT = Total MSW generated (Gg/yr)
• MSWF = Fraction of MSW disposed at SWDS
• L0 = Methane generation potential [MCF • DOC • DOCF • F • 16/12 (Gg CH4/Gg waste)]
• MCF = Methane correction factor (fraction)
• DOC = Degradable organic carbon [fraction (Gg C/Gg MSW)]
• DOCF = Fraction DOC dissimilated
• F = Fraction by volume of CH4 in landfill gas
• R = Recovered CH4 (Gg/yr)
• OX = Oxidation factor (fraction)
Note that all of the model parameters can change over time, depending upon waste disposal trends and waste management practices. Good practice is described below for each of the above model parameters
37GHG Estimation and Climate Adaptation

Estimation of GHG Emissions from CompostingAs far as GHG emissions from organic waste degradation are concerned, composting is an
aerobic degradation process whereby a large fraction of the degradable organic carbon
in the waste material is converted into CO2. Such CO
2 emissions have biogenic origin and
would not be taken into account for GHG calculation. CH4 can be formed due to anaerobic
degradation of waste in deep layers of composting piles. However, such CH4
is oxidised to
a large extent in the aerobic sections of the compost piles. Composting can also produce
emissions of N2O in minor concentrations.
As CH4 and N
2O emissions from fossil fuel combustion assumed to be negligible, and thus it
was not included in this equation.
Emissions Operation Energy EFx x=Fuel(units)
Waste(tonnes)
MJ( )unit ( )kfCO2
MJ
• Emissions operation – Emissions from Operational activities (kg CO2/tonne of waste
transported)
• Fuel (L) – Total amount of fossil fuel consumption per month
• Waste (tonnes) – Total amount of organic waste utilisation per month
• Energy (MJ/unit) – Energy content of the fossil fuel (e.g. Diesel 36.42 MJ/L)
• EF – CO2 Emission Factor of the fuel (e.g. diesel: 0.074 kg CO2/MJ)
GHG emission from waste degradation is calculated as follows:
Emission Degradation
= ECH4 x GWP
CH4 x E
N2O x GWP
N2O
Where:
• Emissions Degradation – Emissions from organic waste degradation (kg CO2/tonne of organic
waste) ECH4- Emissions of CH4 during organic waste degradation (kg of CH4/tonne of
waste); in this model, the default value of 0.4 (average value given by IPCC (IPCC, 2006))
is used. This value should be changed if the site specific data is obtained.
• GWPCH4 - Global warming potential of CH4 (21 kg CO2/kg of CH4)2
• EN2
O - Emissions of N2O during waste degradation (kg of N2O/tonne of waste); in this
model, the default value of 0.3 (average value given by IPCC (IPCC, 2006)) is used. This
value should be changed if the site specific data is obtained.
• GWPN2
O- Global warming potential of N2O (310 kg CO2/kg of N2O)2
Total GHG emissions from composting is calculated by adding GHG emissions from
operation and waste degradation
Total GHG emissions from composting = Emissions Operation + Emission Degradation
38 Sustainable Cities Integrated Approach Pilot in India

Estimation of GHG Emissions from Anaerobic DigestionAmong the biological treatment methods, anaerobic digestion would be the most cost-
effective, due to the potential of high-energy recovery linked to the process and its limited
environmental impact.
• Emissions Operation
= (FC x NCVFF
x EFCO2
) x (EC xEFel
)
• Emissions Operation
– Emissions from operational activities (kg CO2/tonne of organic waste)
• FC - Fuel consumption apportioned to the activity type (mass or volume/tonne of organic
waste) NCVFF
- Net calorific value of the fossil fuel consumed (MJ/unit mass or volume)
• EFCO2- Emission factor of CO
2 by combustion of fossil fuel (kg of CO
2/MJ)
• EC - Electricity consumption for operation activities (MWh/tonne of organic waste)
• EFel
- Emission factor of country grid electricity production (kg CO2-eq/MWh)
• GHG emissions (mainly CH4) due leakages from the anaerobic digestion system can be
calculated as follows:
• Emissions Treatment
= ECH4
x DM x 1000 x GWPCH4
• Emissions Treatment
– Emissions from treatment of organic waste (kg CO2/tonne of organic
waste)
• ECH4 – Emissions of CH
4 due to leakages (kg of CH4/kg of dry matter)
• DM – Dry matter percentage in the influent (%) (DM =100 - % of water in the influent)
1000 – Conversion factor to calculate dry matter content per tonne of organic waste
GWPCH4 – Global warming potential of CH4 (21 kg CO
2/kg of CH
4)
Total GHG emissions from anaerobic digestion can be calculated by adding GHG emissions
from operational activities and GHG emissions due to leakages.
Total GHG emissions = Emissions Operation
+ Emissions Treatment
Estimation of GHG Emissions from IncinerationThe application of waste-to-energy technologies which are well-designed to suit the local
situation would significantly contribute to GHG mitigation and energy recovery. All in all
low efficiencies of incineration may result higher GHG emissions from overall combustion
process. Incineration process is releasing a significant amount of CO2 into the atmosphere
and thus makes a real contribution to the greenhouse effect. However, as recommended in
the IPCC guidelines, only the climate-relevant CO2 emissions from the combustion of fossil
based waste are considered for GHG emissions estimation (IPCC, 2006).
GHG emissions due to utilization of fossil fuel and grid electricity for plant operation can be
quantified as explained in the following formula.
Emissions Operation = (FC x NCVFF x EFCO2) x (EC x EFel )
39GHG Estimation and Climate Adaptation

• Emissions Operation – Emissions from operation (kg CO2/tonne of combustibles)
• FC – Fuel consumption for on-site activities (mass or volume/tonne of combustibles)
• NCVFF –Net calorific value of the fossil fuel consumed (MJ/unit mass or volume) EFCO2 –
Emission factor of CO2 by combustion of fossil fuel (kg of CO2/MJ)
• EC – Electricity consumption for on-site activities (MWh/tonne of combustibles) EFel –
Emission factor of country grid electricity production (kg CO2-eq/MWh)
• IPCC recommended Tier 2 approach was adapted (IPCC, 2006) in this simulation to
quantify the fossil CO2 emissions from combustion of one tonne of wet MSW.
• CE = (SWi x dmi x CFi x FCFi x OFi ) x 44/12
• CE - Combustion Emissions kg CO2/tonne of waste)
• SWi-total amount of solid waste of type i (wet weight) incinerated (kg/tonne of waste)
dmi - dry matter content in the waste (partially wet weight) incinerated
• CFi -fraction of carbon in the dry matter (total carbon content), (fraction; 0.0-1.0) FCFi -
fraction of fossil carbon in the total carbon, (fraction; 0.0-1.0)
• OFi - oxidation factor, (fraction; 0.0 – 100%) 44/12 - conversion factor from C to CO2
• i - type of fossil based waste incinerated such as textiles, rubber and leather, plastics
When waste is incinerated, most of the carbon in the combustion product oxidises to
CO2. However, a minor fraction may oxidise incompletely due to the inefficiencies in the
combustion process, which leave some of the carbon unburned or partly oxidised. However,
for waste incineration, it was assumed that the combustion efficiencies are close to 100
percent so that OFi can be assumed as 1.
Once the quantification was done for CO2 emissions from the above phases, life cycle GHG
emissions from incineration can be calculated as follows;
• Total GHG emissions from incineration (kg of CO2-eq/tonne) = OE + CE TE – Operation
emissions (kg CO2-eq/tonne of combustibles)
• CE – Combustion Emissions (kg CO2-eq/tonne of combustibles)
40 Sustainable Cities Integrated Approach Pilot in India

2.4 Strategies to manage GHG emissions from SWM – Mitigation and Adaptation measures
Greenhouse gas mitigation opportunities- Efforts to reduce emissions from the municipal
solid waste sector include generating less waste, improving the efficiency of waste collection,
expanding recycling, methane avoidance (aerobic composting, anaerobic digestion with
combustion of produced methane and capture, treatment and use of landfill gas). Energy
generated from methane combustion can displace other fossil fuels either as a process
energy resource or as electricity. Suitable technology options by waste management
component are provided in Table 2.3 below.
Table 2.3: Technical GHG Mitigation Opportunities by Waste Management component
Waste Management Component Technology Options
Waste ReductionDesign of longer-lasting and reusable products; reduced consumption.
Waste Collection Use of alternative, non-fossil fuels (bio-fuel, etc.)
Recycling/ Material Recovery
Materials recovery facility (MRF) to process source separated materials or mixed waste, although source separated is the preferred option as the materials would have less contamination from other discards. MRFs use a combination of manual and mechanical sorting options. waste pickers could be used as a source of labor for manual sorting stages
Composting/Anaerobic Digestion
Institute composting programs ideally with source separated organics. As with recyclables source separated materials reduce the contamination associated with recovery from mixed waste. Compost the organic material after digestion to produce a useful soil conditioner and avoid landfill disposal. Finished compost applied to soils is also an important method to reduce GHG emissions by reducing nitrogen requirements and associated GHG emissions.
Incineration/Waste-to-energy/ Refused derived fuel (RDF)
Use the combustible fraction of waste as a fuel either in a dedicated combustion facility (incineration) with or without energy recovery or as RDF in a solid fuel boiler.
LandfillCapture the methane generated in disposal sites and flare or use as a renewable energy resource.
41GHG Estimation and Climate Adaptation

Policy Recommendations for reducing GHG EmissionsGovernments have a range of policy options to encourage waste management practices that
will reduce greenhouse gas emissions. Practical approaches that could be applied in most
cities include:
Public education to inform people about their options to reduce waste generation and
increase recycling and composting. Pricing mechanisms, such as product charges can
stimulate consumer behavior to reduce waste generation and increase recycling. A product
charge is a cost assessment added to the price of a product and is tied to the cost of
the desired waste management system. Consumers would pay for the waste management
service when they buy the product. The fees collected would be directed to municipalities
relative to the waste generated. An example of this economic mechanism is an excise tax
on tires assessed by most states in the US. Product charges are a policy mechanism often
better implemented by regional or national governments.
Another pricing mechanism well suited to urban areas is user charges tied to quantity of
waste disposed. Consumers who separate recyclables pay a lower fee for waste disposal.
This pricing policy can work well in locations where waste collection is from individual
households so that waste quantities for disposal can be readily monitored. However, it may
not be practical in many areas in developing countries, particularly in those where there are
communal collection points associated with multi-unit households (such as apartment user
charges tied to quantity or volume).
Preferential procurement policies and pricing to stimulate demand for products made with
recycled post-consumer waste. Use of compost in public parks and other property owned
by cities.
GHG Mitigation Opportunities from Waste Management activities Technology Options
• Waste Reduction: Design of longer-lasting and reusable products; reduced consumption.
• Waste Collection: Use of alternative, non-fossil fuels (bio-fuel, natural gas).
• Recycling/Materials Recovery: Materials recovery facility (MRF) to process source
separated materials or mixed waste, although source separated is the preferred option
as the materials would have less contamination from other discards. MRFs use a
combination of manual and mechanical sorting options. Waste pickers could be used as
a source of labor for manual sorting stages.
42 Sustainable Cities Integrated Approach Pilot in India

• Incineration/Waste-to-energy/Refuse–Derived Fuel (RDF): Use the combustible
fraction of waste as a fuel either in a dedicated combustion facility (incineration) with or
without energy recovery or as RDF in a solid fuel boiler.
• Landfill: Capture the methane generated in disposal sites and flare or use as a renewable
energy resource.
• Mitigation – reducing climate change – involves reducing the flow of heat-trapping
greenhouse gases into the atmosphere, either by reducing sources of these gases (for
example, the burning of fossil fuels for electricity, heat or transport) or enhancing the
“sinks” that accumulate and store these gases (such as the oceans, forests and soil).
(IPCC, 2014)
• Adaptation – adapting to life in a changing climate – involves adjusting to actual or
expected future climate. The goal is to reduce our vulnerability to the harmful effects
of climate change (like sea-level encroachment, more intense extreme weather events
or food insecurity).
Throughout history, people and societies have adjusted to and coped with changes in
climate and extremes with varying degrees of success. Climate change (drought in particular)
has been at least partly responsible for the rise and fall of civilizations. Earth’s climate has
been relatively stable for the past 12,000 years and this stability has been crucial for the
development of our modern civilization and life as we know it. Modern life is tailored to
the stable climate we have become accustomed to. As our climate changes, we will have
to learn to adapt. The faster the climate changes, the harder it could be. According to the
2014 report on Climate Change Impacts, Adaptation and Vulnerability from the IPCC,
governments at various levels are also getting better at adaptation. Climate change is
starting to be factored into a variety of development plans: how to manage the increasingly
extreme disasters we are seeing and their associated risks, how to protect coastlines and
deal with sea-level encroachment, how to best manage land and forests, how to deal with
and plan for reduced water availability, how to develop resilient crop varieties and how to
protect energy and public infrastructure.
43GHG Estimation and Climate Adaptation

Tab
le 2
.4: S
umm
ary
of
adap
tati
on,
mit
igat
ion
and
sus
tain
able
dev
elo
pm
ent
issu
es f
or
the
was
te s
ecto
r
Tech
nolo
gies
an
d pr
acti
ces
Vul
nera
bilit
y to
cl
imat
e ch
ange
Ada
ptat
ion
impl
icat
ions
&
str
ateg
ies
to
min
imiz
e em
issi
ons
Sust
aina
ble
deve
lopm
ent
dim
ensi
ons
C
om
men
tsSo
cial
Eco
nom
icEn
viro
nmen
tal
Rec
yclin
g, r
euse
&
was
te
min
imiz
atio
n
Ind
irec
t lo
w
vuln
erab
ility
or
no
vu
lner
abili
ty
Min
imal
imp
acti
on
sU
sual
ly p
osi
tive
N
egat
ive
for
was
te
scav
engi
ng
wit
ho
ut
pu
blic
h
ealt
h o
r sa
fety
co
ntr
ols
Po
siti
ve
Job
cre
atio
nP
osi
tive
N
egat
ive
for
was
te
scav
engi
ng
fro
m o
pen
d
um
psi
tes
wit
h a
ir a
nd
w
ater
po
lluti
on
Ind
irec
t b
enefi
ts
for
red
uci
ng
GH
G
emis
sio
ns
fro
m w
aste
R
edu
ces
use
of
ener
gy a
nd
raw
m
ater
ials
. Req
uir
es
imp
lem
enta
tio
n o
f h
ealt
h a
nd
saf
ety
pro
visi
on
s fo
r w
ork
ers
Co
ntr
olle
d
lan
dfi
llin
g:
lan
dfi
ll ga
s re
cove
ry a
nd
u
tiliz
atio
n
Ind
irec
t lo
w
vuln
erab
ility
or
po
siti
ve e
ffec
ts:
Hig
her
tem
per
atu
res
incr
ease
rat
es o
f m
icro
bia
l met
han
e ox
idat
ion
rat
es in
co
ver
mat
eria
ls
Min
imal
imp
licat
ion
s M
ay b
e re
gula
tory
m
and
ates
or
eco
no
mic
ince
nti
ves
Rep
lace
s fo
ssil
fuel
s fo
r p
roce
ss h
eat
or
elec
tric
al g
ener
atio
n
Po
siti
ve
Od
ou
r re
du
ctio
n (n
on
-C
H g
ases
)
Po
siti
ve
Job
cre
atio
n
En
ergy
rec
over
y p
ote
nti
al
Po
siti
ve
Neg
ativ
e fo
r im
pro
per
ly m
anag
ed
site
s w
ith
air
an
d
wat
er p
ollu
tio
n
Pri
mar
y co
ntr
ol
on
lan
dfi
ll C
H4
emis
sio
ns
>1
20
0 c
om
mer
cial
p
roje
cts
Imp
ort
ant
loca
l so
urc
e o
f ren
ewab
le
ener
gy: r
epla
ces
foss
il fu
els
Lan
dfi
llgas
pro
ject
s co
mp
rise
12
% o
f an
nu
al r
egis
tere
d
CE
Rs
un
der
CD
M3
O
xid
atio
n o
f CH
4 a
nd
N
MV
OC
s in
cov
er
so it
is
a sm
alle
r se
con
dar
y co
ntr
ol o
n
emis
sio
ns
44 Sustainable Cities Integrated Approach Pilot in India

Tech
nolo
gies
an
d pr
acti
ces
Vul
nera
bilit
y to
cl
imat
e ch
ange
Ada
ptat
ion
impl
icat
ions
&
str
ateg
ies
to
min
imiz
e em
issi
ons
Sust
aina
ble
deve
lopm
ent
dim
ensi
ons
C
om
men
tsSo
cial
Eco
nom
icEn
viro
nmen
tal
Co
ntr
olle
d
lan
dfi
llin
g w
ith
ou
t la
nd
fill
gas
reco
very
Ind
irec
t o
w
vuln
erab
ility
or
po
siti
ve e
ffec
ts:
Hig
her
tem
per
atu
res
incr
ease
rat
es o
f m
icro
bia
l met
han
e ox
idat
ion
rat
es in
co
ver
mat
eria
ls
Min
imal
imp
licat
ion
s G
as m
on
ito
rin
g an
d
con
tro
l sti
ll re
qu
ired
Po
siti
ve
Od
ou
r re
du
ctio
n (n
on
-C
H g
ases
)
Po
siti
ve J
ob
cr
eati
on
Po
siti
ve
Neg
ativ
e fo
r im
pro
per
ly m
anag
ed
site
s w
ith
air
an
d
wat
er p
ollu
tio
n
Use
of c
over
so
ils
and
oxi
dat
ion
in
cove
r so
ils r
edu
ce
rate
of C
H4 a
nd
N
MV
OC
em
issi
on
s
Op
tim
izin
g m
icro
bia
l m
eth
ane
oxid
atio
n in
la
nd
fill
cove
r so
ils (‘
bio
co
vers
’)
Ind
irec
t lo
w
vuln
erab
ility
or
po
siti
ve e
ffec
ts:
dec
reas
ed r
ates
at
hig
her
tem
per
atu
res
Min
imal
imp
licat
ion
o
r p
osi
tive
eff
ects
Po
siti
ve
Od
ou
r re
du
ctio
n (n
on
-C
H g
ases
)
Po
siti
ve
Job
cre
atio
nP
osi
tive
N
egat
ive
for
imp
rop
erly
des
ign
ed
or
man
aged
bio
-co
vers
wit
h
GH
G e
mis
sio
ns
and
N
MV
OC
em
issi
on
s
Imp
ort
ant
se
con
dar
y co
ntr
ol o
n
lan
dfi
ll C
H4
emis
sio
ns
and
em
issi
on
s o
f N
MV
OC
s U
tiliz
es o
ther
se
con
dar
y m
ater
ials
(c
om
po
st, c
om
po
sted
sl
ud
ges)
Lo
w-c
ost
low
-tec
hn
o
logy
str
ateg
y fo
r d
evel
op
ing
co
un
trie
s
Un
con
tro
lled
d
isp
osa
l (o
pen
d
um
pin
g &
b
urn
ing)
Hig
hly
vu
lner
able
D
etri
men
tal e
ffec
ts:
war
mer
tem
p.
pro
mo
tes
pat
ho
gen
gr
ow
th a
nd
dis
ease
se
cto
rs
Exa
cerb
ates
ad
apta
tio
n p
rob
lem
s R
eco
mm
end
im
ple
men
tati
on
of
mo
re c
on
tro
lled
d
isp
osa
l an
d
recy
clin
g p
ract
ices
Neg
ativ
eN
egat
ive
Neg
ativ
eC
on
sid
er a
lter
nat
ive
low
er-c
ost
med
ium
te
chn
olo
gy s
olu
tio
ns
(e.g
. lan
dfi
ll w
ith
co
ntr
olle
d
was
te p
lace
men
t,
com
pac
tio
n, a
nd
d
aily
cov
er m
ater
ials
)
45GHG Estimation and Climate Adaptation

Tech
nolo
gies
an
d pr
acti
ces
Vul
nera
bilit
y to
cl
imat
e ch
ange
Ada
ptat
ion
impl
icat
ions
&
str
ateg
ies
to
min
imiz
e em
issi
ons
Sust
aina
ble
deve
lopm
ent
dim
ensi
ons
C
om
men
tsSo
cial
Eco
nom
icEn
viro
nmen
tal
Th
erm
al
pro
cess
es
l in
clu
din
g in
cin
erat
ion
, in
du
stri
al c
o-
com
bu
stio
n, a
nd
m
ore
ad
van
ced
p
roce
sses
fo
r w
aste
-to
- en
ergy
(e.g
., fl
uid
ized
bed
te
chn
olo
gy w
ith
ad
van
ced
flu
e ga
s cl
ean
ing)
Low
vu
lner
abili
tyM
inim
al im
plic
atio
ns
Req
uir
es s
ou
rce
con
tro
l an
d e
mis
sio
n
con
tro
ls t
o p
reve
nt
emis
sio
ns
of h
eavy
met
als,
aci
d
gase
s. d
ioxi
ns
and
o
ther
air
tox
ics
Po
siti
ve
Od
ou
r re
du
ctio
n (n
on
-C
H g
ases
)
Po
siti
ve
Job
cre
atio
n
En
ergy
rec
over
y p
ote
nti
al
Po
siti
ve
Neg
ativ
e fo
r im
pro
per
ly d
esig
ned
o
r m
anag
ed fa
cilit
ies
wit
ho
ut
air
po
lluti
on
co
ntr
ols
Red
uce
s G
HG
em
issi
on
s re
lati
ve t
o
lan
dfi
llin
g C
ost
ly, b
ut
can
p
rovi
de
sign
ifica
nt
mit
igat
ion
po
ten
tial
fo
r th
e w
aste
sec
tor.
esp
ecia
lly in
th
e sh
ort
ter
m
Rep
lace
s fo
ssil
fuel
s
Aer
ob
ic
bio
logi
cal
trea
tmen
t (c
om
po
stin
g)
Als
o a
co
mp
on
ent
of m
ech
anic
al
bio
logi
cal
trea
tmen
t (M
BT
)
Ind
irec
t lo
w
vuln
erab
ility
or
po
siti
ve e
ffec
ts:
Hig
her
tem
per
atu
res
incr
ease
rat
es o
f b
iolo
gica
l pro
cess
es
Min
imal
imp
licat
ion
s o
r p
osi
tive
eff
ects
P
rod
uce
s C
02
(b
iom
ass)
an
d
com
po
st
Red
uce
s vo
lum
e,
stab
ilize
s o
rgan
ic
C, a
nd
des
troy
s p
ath
oge
ns
Po
siti
ve
Od
ou
r re
du
ctio
n (n
on
-C
H g
ases
)
Po
siti
ve
Job
cre
atio
n
Use
of c
om
po
st
pro
du
cts
Po
siti
ve
Neg
ativ
e fo
r im
pro
per
ly d
esig
ned
o
r m
anag
ed fa
cilit
ies
wit
h o
do
urs
, air
an
d
wat
er p
ollu
tio
n
Red
uce
s G
HG
em
issi
on
s C
an p
rod
uce
u
sefu
l sec
on
dar
y m
ater
ials
(co
mp
ost
) p
rovi
ded
th
ere
is
qu
alif
y co
ntr
ol o
n
mat
eria
l in
pu
ts a
nd
o
per
atio
ns
Can
em
it N
20
an
d
CH
4 u
nd
er r
edu
ced
ae
rati
on
or
anae
rob
ic
con
dit
ion
s
46 Sustainable Cities Integrated Approach Pilot in India

Tech
nolo
gies
an
d pr
acti
ces
Vul
nera
bilit
y to
cl
imat
e ch
ange
Ada
ptat
ion
impl
icat
ions
&
str
ateg
ies
to
min
imiz
e em
issi
ons
Sust
aina
ble
deve
lopm
ent
dim
ensi
ons
C
om
men
tsSo
cial
Eco
nom
icEn
viro
nmen
tal
An
aero
bic
b
iolo
gica
l tr
eatm
ent
(a
nae
rob
ic
dig
esti
on
) A
lso
a
com
po
nen
t o
f m
ech
anic
al-
bio
logi
cal
trea
tmen
t (M
BT
)
Ind
irec
t o
w
vuln
erab
ility
or
po
siti
ve e
ffec
ts:
Hig
her
tem
per
atu
res
incr
ease
rat
es o
f b
iolo
gica
l pro
cess
es
Min
imal
imp
licat
ion
s P
rod
uce
s C
H4, C
O2
and
bio
solid
s u
nd
er
hig
hly
co
ntr
olle
d
con
dit
ion
s B
ioso
lids
req
uir
e m
anag
emen
t
Po
siti
ve
Od
ou
r re
du
ctio
n (n
on
-C
H g
ases
)
Po
siti
ve
Job
cre
atio
n
En
ergy
rec
over
y p
ote
nti
al
Use
of r
esid
ual
b
io s
olid
s
Po
siti
ve
Neg
ativ
e fo
r im
pro
per
ly d
esig
ned
o
r m
anag
ed fa
cilit
ies
wit
h o
do
urs
, air
an
d
wat
er p
olu
tio
n
Red
uce
s G
HG
em
issi
on
s C
H4 in
bio
gas
can
re
pla
ce fo
ssil
fuel
s fo
r p
roce
ss h
eat
or
elec
tric
al g
ener
atio
n
Can
em
it m
ino
r q
uan
titi
es o
f CH
4
du
rin
g st
art-
up
s,
shu
t-d
ow
ns
and
m
alfu
nct
ion
s
Was
tew
ater
co
ntr
ol a
nd
tr
eatm
ent
(aer
ob
ic o
r an
aero
bic
)
Hig
hly
vu
lner
able
D
etri
men
tal e
ffec
ts
in a
bse
nce
of
was
tew
ater
co
ntr
ol
and
tre
atm
ent:
w
arm
er te
mp
erat
ure
s p
rom
ote
pat
ho
gen
gr
ow
th a
nd
po
or
pu
blic
hea
lth
Larg
e ad
apta
tio
n
imp
licat
ion
s H
igh
po
ten
tial
fo
r re
du
cin
g u
nco
ntr
olle
d G
HG
em
issi
on
s R
esid
ual
s (b
ioso
lids)
fr
om
aer
ob
ic
trea
tmen
t m
ay
be
anae
rob
ical
ly
dig
este
d
Po
siti
ve
Od
ou
r re
du
ctio
n (n
on
-C
H g
ases
)
Po
siti
ve
Job
cre
atio
n
En
ergy
rec
over
y p
ote
nti
al fr
om
an
aero
bic
p
roce
sses
U
se o
f slu
dge
s an
d o
ther
re
sid
ual
b
ioso
lids
Po
siti
ve
Neg
ativ
e fo
r im
pro
per
ly d
esig
ned
o
r m
anag
ed fa
cilit
ies
wit
h o
do
urs
, air
an
d
wat
er p
ollu
tio
n a
nd
G
HG
em
issi
on
s
Wid
e ra
nge
o
f ava
ilab
le
tech
no
logi
es t
o
colle
ct, t
reat
, re
cycl
e an
d r
e-u
se
was
tew
ater
W
ide
ran
ge o
f co
sts
CH
4 fr
om
an
aero
bic
p
roce
sses
rep
lace
s fo
ssil
fuel
s fo
r p
roce
ss h
eat
or
elec
tric
al g
ener
atio
n
Nee
d t
o d
esig
n
and
op
erat
e to
m
inim
ize
N20
an
d
CH
4 e
mis
sio
ns
du
rin
g tr
ansp
ort
an
d
trea
tmen
t
Sour
ce -
Bog
ner,
et a
l. (2
007)
47GHG Estimation and Climate Adaptation

2.5 Strategies for Climate Change Planning and Adaptation for Waste Management Facilities
Scientists and experts agree that climate change is a present-day threat to communities
across the world, manifesting in both predictable and unpredictable ways. Coastal storms
are increasing in strength and frequency, forest fires are becoming much larger and more
destructive, annual precipitation is changing and increasing in variability, and widespread
flooding is becoming more common.
These changes present complex challenges to the waste management industry that must be
addressed and planned for. For example, one challenge is an increasing frequency of large-
scale weather events and natural disasters, which are creating more debris that must be
managed and which affects the characteristics of landfilled waste. Landfill design needs to
incorporate precipitation changes and increased threats due to weather variability, flooding,
and sea-level rise. Precipitation changes affect gas generation rates and require a diligent
reaction to maintain effective gas collection. Because of weather pattern changes, risks of
cover material erosion and swales have increased for landfills in both wet and dry climates,
which may require stronger natural caps or the use of emerging technologies for alternate
cover. Additionally, landfills are affected by an increase in the variability of precipitation and
rapid changes between weather extremes.
It is clear that waste management facilities must adapt to these changes in addition to
scenario building for pandemics to maintain effective operations. Adaptations available
include making changes to landfill design and planning, such as incorporating precipitation
changes into the modeling of leachate and gas generation or increasing the distance between
the bottom liner and groundwater.
Systems should be regularly evaluated and areas needing repairs should be corrected quickly
and diligently. Gas generation models should be updated regularly and collection systems
need to be expanded or adjusted to account for precipitation increases or decreases.
More frequent and intense storms are creating challenges for cover material management,
liquids management, and maintaining slope stability. Facilities should implement innovative
uses of both existing technology and new or emerging technologies. Communities with
waste management facilities should include waste management infrastructure in emergency
management plans, including maintaining landfills and collections operations and using
landfills as both temporary debris storage and as an option for final disposal.
Since climate change effects vary by region and locale, many facilities are developing a
specific plan for adaptation and management. To reduce the inevitable costs of adaptation
and maintain responsiveness to weather changes, a reactive approach is being abandoned
in favor of a proactive approach.
48 Sustainable Cities Integrated Approach Pilot in India

Adaptation potential in the SWM value chain is somehow understated as compared to
mitigation. The ill-effects of excessive rainfall and cyclones on landfills cannot be overstated,
common effects being leachate overflow, water contamination and landfill slides. Even old
landfills situated on floodplains can be an issue of grave concern. Such facilities need hydraulic
protection from any such unforeseen calamities. Similarly, waste collection equipment and
transportation fleet must be examined for their resilience under the changing climatic
conditions of an area. Adaptation measures need to be practiced locally and the results
are more or less immediate as compared to mitigation wherein the results are long term. A
road map to assess the adaptive capacity of urban waste management systems and to frame
them within the overall city adaptation/ disaster management strategy is required. IEC
and awareness generation activities for implementing 3Rs effectively is need of the hour.
A capacity building programme focusing on adaptation and mitigation aspects is must for
municipal functionaries.
2.6 Climate change adaptation measures integrated in waste management systems
Extreme weather events • Frequent collection at scheduled times (based on extreme weather forecasts) reduces
risk of waste bags sitting at the curbside for too long and being carried away into streets
or waterways by heavy rainfall, heavy wind, landslides or snow.
• Frequent collection is possible when shorter routes are designed making use of multiple
decentralised transfer stations.
• Covered collection trucks and underground waste containers prevent waste from
drifting away with extreme wind.
• Disposal sites must be compacted each day to force waste disposed to settle, preventing
deadly landfill slides (most dangerous for communities living off waste salvaged in or
around dump sites).
• Emergency recovery plans in place and up to date to cover a full range of weather events
projected over the lifetime of the specific waste infrastructure.
• Landfill leachate collection system planned with enough capacity for heavy rainfall events.
• Extreme weather events generate a lot of waste from single use emergency equipment
(water bottles, tents, plastic sheets, etc). Adapting these materials to be biodegradable
or easily reusable and recyclable means lowering the impact of such disasters in a city’s
systems.
• Extreme weather events often generate immense amounts of debris waste from
buildings as well as other destroyed materials and landscapes. Establishing a disaster
waste management plan helps prepare cities for these extreme waste loads and better
plan for recycling materials.
49GHG Estimation and Climate Adaptation

Drought • Diverting organic waste from landfill through segregated organics collection contributes
to preventing landfill fire outbursts.
• Fire-safety structures for landfills, including periodical cover with dry material.
Sea level rise • Ensure the location of new waste disposal sites - historically close to rivers - is not
vulnerable to sea level rise projected over the lifetime of the site.
Extreme heat • Decentralised organic waste treatment plants (such as composting and anaerobic
digestion) to reduce transporting distances, increase organic waste recovery and reduce
risk of dumpsite fire.
• Decentralised waste transfer stations to allow for smaller waste collection vehicles
and shorter trips for each worker, especially when the city relies on a labour-intensive
system.
• Implement frequent organic waste segregate collection, distributing food waste caddies
(reduces odours, pest and insects from rapidly degrading material) and promoting home
composting where collection is not present.
• Scheduled collection: waste can be put outside only in a 2 hour buffer from the scheduled
time of collection to avoid insects, pests (as well as risk of waste bags being carried away
by extreme events).
• Protected and well aerated sorting facilities for resource salvagers/waste pickers to sort
waste.
• Install water fountains across the city to reduce consumption of disposable bottles that
steeply increase during heat waves.
Flooding • Prevent waste blocking the drainage system by achieving universal waste collection and
reducing litter by placing segregate street bins and promoting educational campaigns.
• Ensure landfill has more than one access route and effective drainage systems.
• Ensure waste transfer stations, disposal sites and storage areas are elevated and safe
from floods, for example avoiding flood plains (low-lying near rivers or coastal areas) and
develop adaptation plans for established sites located in flood areas.
• Aerated elevated or closed curbside collection containers.
• Adopt a post-flood action plan: floods will carry large quantities of waste that will end
up in the open once the water level lowers down; cities should have a plan in order to
quickly collect it and divert as much as possible, and to safely dispose of the residual
waste.
50 Sustainable Cities Integrated Approach Pilot in India

References1. Abuja, 2018. Federal Ministry of Environment. First Biennial Update, s.l.: United Nations
Framework Convention on Climate Change (Federal Ministry of Environment).
2. Agency for Toxic Substances and Disease Registry, 2001. Landfill Gas Primer - An Overview for Environmental Health Professionals. [Online] Available at: https://www.atsdr.cdc.gov/hac/landfill/html/ch5.html
3. Bogner, J. et al., 2007. Waste Management. In: B. Metz, et al. eds. Climate Change 2007: Mitigation. Contribution of Working Group III to the Fourth Assessment Report of the Intergovernmental Panel on Climate Change. Cambridge, United Kingdom and New York, NY, USA: Cambridge University Press.
4. CPHEEO, 2016. Swachh Bharat Mission Municipal Solid Waste Management Manual (Part II), s.l.: s.n.
5. CRS, 2011. Anaerobic Digestion: Greenhouse Gas Emission Reduction and Energy Generation, s.l.: Congressional Research Service.
6. EPA, 2002. Solid Waste Management and Greenhouse Gases: A Life-Cycle Assessment of Emissions and Sinks, s.l.: EPA.
7. Gentil, E. T. C. a. E. A., 2009. Greenhouse gas accounting and waste management.. Waste Management & Research, pp. 696-706.
8. IPCC, 1996. Good Practice Guidance and Uncertainty Management in National Greenhouse Gas Inventories, s.l.: Intergovernmental Panel on Climate Change.
9. IPCC, 2006. 2006 IPCC Guidelines for National Greenhouse Gas Inventories, Kanagawa, Japan: Institute for Global Environmental Strategies.
10. IPCC, 2007. Climate Change 2007: Working Group I: The Physical Science Basis. [Online] Available at: https://archive.ipcc.ch/publications_and_data/ar4/wg1/en/faqs.html [Accessed 2021].
11. IPCC, 2014. AR5 Climate Change 2014: Mitigation of Climate Change. [Online] Available at: https://www.ipcc.ch/report/ar5/wg3/
12. IPCC, 2018. Summary for Policymakers. In: V. Masson-Delmotte, et al. eds. Global Warming of 1.5°C. Geneva: World Meteorological Organization.
13. ISWA, 2009. ISWA WHITE PAPER - Waste and Climate Change. s.l.:International Solid Waste Association.
14. Lindholm, E.-L., Stendahl, J., Berg, S. & Hansson, P.-A., 2011. Greenhouse gas balance of harvesting stumps and logging residues for energy in Sweden. Scandinavian Journal of Forest Research, 26(6).
15. Madhu, 2019. Differencebetween. [Online] Available at: https://www.differencebetween.com/difference-between-pyrolysis-and-gasification/ [Accessed 2021].
16. Nema, S. K., 2002. Plasma Pyrolysis and Medical Waste. Current Science, 83(3).
17. Smith, D., 2001. Waste Management Options and Climate Change, s.l.: European Commission.
51GHG Estimation and Climate Adaptation

3Chapter
Estimating GHG emissions for Wastewater Treatment Technologies
52 Sustainable Cities Integrated Approach Pilot in India

Training Outcomes
• Understand the linkages between wastewater treatment and GHG emissions
• Gain exposure on various estimation methods for calculating GHG emissions across various wastewater treatment technologies
• Explore various mitigation and adaptation measures to manage GHG emissions from wastewater treatment plants
Chapter Contents
3.1 Current Global Scenario of GHG Emissions
3.2 GHG Emissions and Wastewater Treatment
3.3 Wastewater Technologies and their Relevance with respect to the Climate Change
3.4 GHG Emissions Estimation for various Wastewater Treatment Technologies and Processes
References
Recap
The previous chapter dealt in detail with the GHG emissions from the various solid waste processes. It explored in detail the methodologies to estimate the GHG emissions in the solid waste sector in urban areas.
Training Objectives
• To understand the linkages between wastewater treatment and GHG emissions
• To analyze GHG emissions across various treatment Technologies• To get an overview of the estimation methods for calculating GHG
emissions across various wastewater treatment technologies• To explore different mitigation and adaptation measures to manage
GHG emissions from wastewater treatment plants
53GHG Estimation and Climate Adaptation

3.1 GHG Emissions and Wastewater TreatmentWhile efficient wastewater treatment is essential to protect human health, the environment
and surrounding water quality, the greenhouse gases (GHG) emitted from wastewater
treatment processes contribute to its carbon footprint. According to the Intergovernmental
Panel on Climate Change (IPCC) reports, greenhouse gas emission from the waste sector
corresponds to approximately 3% of the anthropogenic emissions on a global scale, and
wastewater treatment constitutes approximately 20% of the waste sector (IPCC 2014).
Wastewater Treatment Plants (WWTPs) produce three of the most important GHGs-
namely carbon dioxide (CO2), methane (CH
4), and Nitrous Oxide (N
2O) during the treatment
processes and additionally generate CO2 and CH
4 from the energy demands of the plant5.
However, the overall impact of the wastewater treatment systems on climate change may
depend on the net GHGs emissions, accounting for both emissions and GHG savings. Hence,
the role of wastewater treatment facilities in mitigation of GHG emissions is very crucial.
All wastewater treatment plants contribute to the greenhouse gas emissions either directly
or indirectly. While the indirect greenhouse gas emissions can be attributed to the electricity
consumption by the plant, the direct CO2, CH
4 and N
2O emissions in wastewater treatment
plant are from the treatment processes. These emissions directly depend on the type of
treatment technology being used.
In aerobic processes, CO2 is emitted due to the breakdown of organic matter in the
treatment tanks, whereas in the anaerobic system, the fraction of biomass is converted
into CO2 and CH
4 through endogenous respiration. The degradation of wastewater and
waste sludge in anaerobic treatment can produce CH4. The rate of the CH
4 emissions
depends on the quantity of the waste and temperature inside the system. The CH4
emission increases with increase in temperature and sludge quantity. The principal factor
in determining the CH4 generation potential of wastewater is the amount of degradable
organic material in the wastewater. Common parameters used to measure the organic
component of the wastewater are the Biochemical Oxygen Demand (BOD) and Chemical
Oxygen Demand (COD). Under the same conditions, wastewater with higher COD, or
BOD concentrations will generally yield more CH4 than wastewater with lower COD (or
BOD) concentrations.
The nitrification and denitrification processes lead to emission of N2O due to degradation
of nitrates, urea, protein and other nitrogen components in the wastewater. Nitrification is
an aerobic process converting ammonia and other nitrogen compounds into nitrate (NO3),
5 Yerushalmi, L., Shahabadi, M. and Haghighat, F., 2011. Effect of Process Parameters on Greenhouse Gas Generation by WastewaterTreatment Plants. Water Environment Research, (1061-4303).
54 Sustainable Cities Integrated Approach Pilot in India

while denitrification occurs under anoxic conditions (without free oxygen), and involves the
biological conversion of nitrate into dinitrogen gas (N2). Nitrous oxide can be an intermediate
product of both processes, but is more often associated with denitrification.6
Wastewater treatment stands as the fifth largest source for contributing anthropogenic methane emission of about 9% of global CH
4 emission in 2000 and sixth largest
contributor to the N2O emissions accounting about 3% of global N
2O emissions
worldwide. (Anastasios Zouboulis et al. 2015)
Table 3.1: Emissions from wastewater treatment global (Tg CO2 Eq.)
GHGs 1990 2005 2007 2008 2009 2010 2011
CH4 (Total waste emissions) 164.0 130.5 129.8 129.8 131.9 131.4 124.7
Wastewater treatment 15.9 16.5 16.7 16.6 16.6 16.6 16.4
N2O (Total waste emissions) 3.8 6.4 6.5 6.7 6.8 6.7 6.8
Wastewater treatment 3.5 4.7 4.8 4.8 4.9 5.0 5.1
Source - EPA (2013)
The global warming potential (GWP) is calculated in terms of CO2 equivalent, which means
the global warming potential of the emissions are expressed in relation to carbon dioxide.
Residence time of gases in the atmosphere is around 100 years. GWP values for CO2, CH
4
and N2O are 1, 28 and 265 as per GWP (IPCC, 2014). Even the small amount of gas with
high GWP potential has greater effect than the low GWP gases. For instance, 1 kg of N2O
emission will have the same GWP of 265 kg of CO2.3
Figure 3.1: Total global emissions in 2011 = 6,702 million metric tons of CO2 equivalent
Carbon Dioxide
84%
Methane
9%
Nitrous Oxide
5%
Flourinated Gases
2%
Source - EPA (2009)
6 Doorn, M., Towprayoon, S., Vieira, S., Irving, W., Palmer, C., Pipatti, R. and Wang, C., 2006. Chapter 6 WASTEWATER TREATMENT AND DISCHARGE. In: IPCC Guidelines for National Greenhouse Gas Inventories. [online] IPCC Guidelines for National Greenhouse Gas Inventories. Available at: https://www.ipcc-nggip.iges.or.jp/public/2006gl/pdf/5_Volume5/V5_6_Ch6_Wastewater.pdf
55GHG Estimation and Climate Adaptation

GHG Emissions across Various Wastewater Treatment TechnologiesFor estimating the direct and indirect GHG emissions from the wastewater treatment
plants, the processes involved across the value chain attributing to GHG emissions can be
broadly classified into three scopes:
• Scope 1: Emission from the Waste Water Treatment Plant (WWTP)
• CO2 emission in the secondary treatment process, due to breakdown of organic
compounds - endogenous respiration
• CH4 emission during Operation and maintenance of settlers and clarifiers
• N2O emissions during nitrification and denitrification processes
• N2O emissions from treated effluents being discharged into natural bodies
• CH4 and CO
2 emission due to sludge disposal
• Scope 2: Emission from energy consumption (for e.g. electricity consumed by raw
sewage pumps, return sludge pumps blowers and aerators, etc.)
• Scope 3: GHG emission from transportation and other activities of organization (for
e.g. GHG emissions that occur during the production of the chemicals that are used in
the WWTP).
To estimate the GHG emissions of the wastewater treatment plants (WWTP) in a comparable
way the considered emissions have to be listed. The selected boundaries are from Scope3
and are listed below (Bridle Consulting, 2007):
• CO2 and N
2O emissions at bio-treatment, endogenous respiration, BOD oxidation
nitrification CO2 credit and nitrogen removal
• Energy use of plant, for aeration, mixing and pumping which leads to CO2 emissions
• Sludge digestion, biogas CH4 and CO
2
• Sludge disposal, truck emissions trip to reuse/disposal site, CO2 emissions mineralization
• Power credit by use of biogas
• GHG emissions from chemical use
In figure 3.2 given below, a Wastewater treatment plant is schematically displayed. The
different boxes show the treatment processes. The GHGs that can be released during the
treatment processes are given in the circles. The numbers in the figure correspond with the
numbers of the list of boundaries. Emissions that are not taken into account are indirect
emissions from employers that occur when they travel towards work, thus for example the
emissions of the car that is used by an employee. This is not taken into account as it is very
specific for each WWTP and will be small compared to the other sources (Laura Snip, 2009).
56 Sustainable Cities Integrated Approach Pilot in India

Figure 3.2: Estimated greenhouse gas emissions of a wastewater treatment plant
Anoxic treatment
Sludge recycle Sludge treatment
Pumping power
Nitrate recycle
Settler
Biogas
Effluent
Sludge waste and disposal
CO2
CO2
CO2
CO2
CO2
CO2
CO2
CO2
CO2
CH4
CO2
CH4
1
2
22
45
3
11
2
6
N2O
N2O
N2O Aeration
power
Aerobic treatment
Chemicals
Influent
Pumping power
Heating power
Source - Laura Snip (2009)
3.2 Wastewater Technologies and their Relevance with respect to the Climate Change
Several designs and technologies of sewage treatment plants (STP) are available and the
primary objective is always to produce water that is biologically and chemically safe and
is also non-corrosive and non-scaling. Depending on the requirement, the appropriate
selection and design of STPs and implementation of sanitation systems is selected. The basic
criterion for efficacy of any good STP is to remove harmful chemical as well as biological
contaminants, but there are other parameters such as land utilization, capital investments,
power consumption and manpower requirements that play an equally important part in the
selection of a technology.
We may categorize the wastewater treatment processes into four broad methods: physical
methods, chemical methods, biological methods and energy intensive methods.
• Physical methods of wastewater treatment represent a body of technologies that are
largely solid-liquid separation techniques, of which filtration plays a dominant role.
• Chemical methods depend on chemical interactions of the contaminants that are being
removed from water.
• Biological methods depend on microorganisms for the degradation of organic matter
both in aerobic and anaerobic systems.
• Energy intensive treatments include thermal methods such as sterilisation to provide
high quality water fit for drinking; and/or are also used for processing of sludge
57GHG Estimation and Climate Adaptation

Few of the popular technologies for secondary treatment of wastewater which are
particularly suited for buildings and apartments include the following:
• Activated Sludge Process (ASP)
• Extended Aeration (EA)
• Fluidized Aerobic Bed Reactor (FAB)
• Moving Bed Biofilm Reactor (MBBR)
• Sequencing Batch Reactors (SBR)
• Membrane Bioreactor (MBR)
• Natural treatment systems such as Root zone, Decentralized treatment system (DTS),
Soil bio technology (SBT), DEWATS (referred to as Natural STP in the subsequent
sections of this chapter).
The following Table 3.2 gives a list of popular technologies and the corresponding GHG
emissions:
Table 3.2: Comparison of GHG emissions across Wastewater treatment Technologies
Parameters Activated sludge process
Sequence batch
reactor
Membrane bio reactor
Moving bed
biofilm reactor
Natural sewage
treatment system
Basic Process
Biological treatment includes addition of chemicals
Biological treatment includes addition of chemicals
Biological treatment includes addition of chemicals
Biological treatment includes addition of chemicals
Biological treatment without any chemical addition
Input
Raw sewage from domestic and municipalities
Organic effluents from industrial processes
Moderate strength effluents from industrial processes
Raw sewage from domestic and municipalities
Effluents from industrial processes
Raw sewage from domestic and municipalities.
Effluents from industrial processes
Raw sewage from domestic and municipalities.
Effluents from industrial processes
Raw sewage from domestic and municipalities
58 Sustainable Cities Integrated Approach Pilot in India
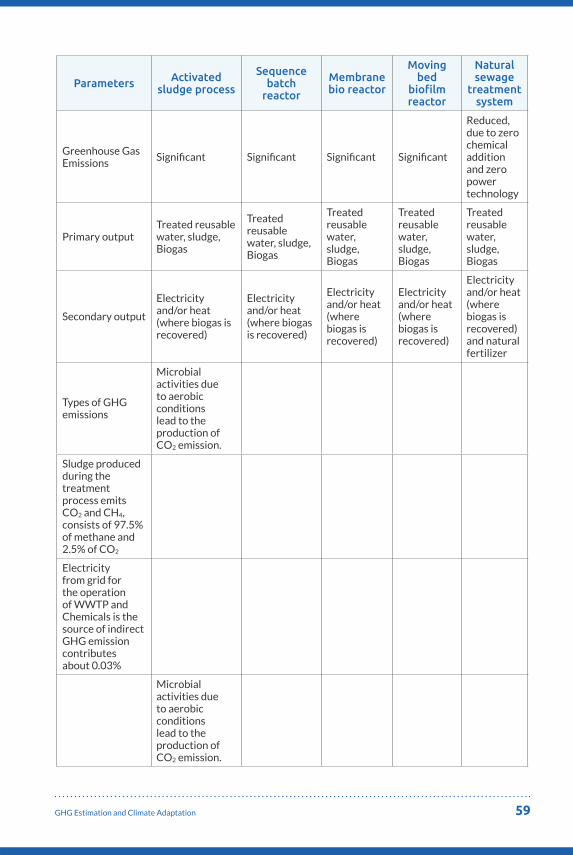
Parameters Activated sludge process
Sequence batch
reactor
Membrane bio reactor
Moving bed
biofilm reactor
Natural sewage
treatment system
Greenhouse Gas Emissions
Significant Significant Significant Significant
Reduced, due to zero chemical addition and zero power technology
Primary outputTreated reusable water, sludge, Biogas
Treated reusable water, sludge, Biogas
Treated reusable water, sludge, Biogas
Treated reusable water, sludge, Biogas
Treated reusable water, sludge, Biogas
Secondary output
Electricity and/or heat (where biogas is recovered)
Electricity and/or heat (where biogas is recovered)
Electricity and/or heat (where biogas is recovered)
Electricity and/or heat (where biogas is recovered)
Electricity and/or heat (where biogas is recovered) and natural fertilizer
Types of GHG emissions
Microbial activities due to aerobic conditions lead to the production of CO2 emission.
Sludge produced during the treatment process emits CO2 and CH4, consists of 97.5% of methane and 2.5% of CO2
Electricity from grid for the operation of WWTP and Chemicals is the source of indirect GHG emission contributes about 0.03%
Microbial activities due to aerobic conditions lead to the production of CO2 emission.
59GHG Estimation and Climate Adaptation

Parameters Activated sludge process
Sequence batch
reactor
Membrane bio reactor
Moving bed
biofilm reactor
Natural sewage
treatment system
Sludge produced during the treatment process emits CO2 and CH4, consists of 97.7 % of methane and 2.3 % of CO2
Electricity from grid for the operation of WWTP and chemicals is the source of indirect GHG emission.
Microbial activities due to aerobic conditions lead to the production of CO2 emission.
Sludge produced during the treatment process emits CO2 and CH4. consists of 97.7% of methane and 2.3 % of CO2
Electricity from grid for the operation of WWTP and chemicals is the source of indirect GHG emission.
Microbial activities due to aerobic conditions lead to the production of CO2 emission.
60 Sustainable Cities Integrated Approach Pilot in India

Parameters Activated sludge process
Sequence batch
reactor
Membrane bio reactor
Moving bed
biofilm reactor
Natural sewage
treatment system
Sludge produced during the treatment process emits CO2 and CH4. 97.7% of methane and 2.3 % of CO2
Electricity from grid for the operation of WWTP and chemicals is the source of indirect GHG emission contributes about
Microbial activities due to aerobic conditions lead to the production of CO, CH4 and N2O gases.
Sludge produced during the treatment process emits CO2 and CH4. consists of 65% of methane and 35% of CO2
The methane can be recovered and it can get reduced to
Capital costs (Rs. /KLD)
20000-40000
30000-50000 40000-7000025000-50000
18000-40000
Operating costs (Rs. /KLD)
2000-4000 3000-6000 4000-7000 3000-5000 600-1000
61GHG Estimation and Climate Adaptation

Parameters Activated sludge process
Sequence batch
reactor
Membrane bio reactor
Moving bed
biofilm reactor
Natural sewage
treatment system
Land Requirement (m2/MLD)
1500-2500 200-2000 200-2000 200-2000 200-2000
Operational complexity
Requires specialized training, careful maintenance, and trained operator
Requires specialized training, careful maintenance, and trained operator
Requires specialized training, careful maintenance, and trained operator
Requires specialized training, careful maintenance, and trained operator
Requires Trained operator
Population (person)
>150 >150 >150 >150 >1
Source – Authors
3.3 GHG Emissions Estimation for various Wastewater Treatment Technologies and Processes
For the ease of estimating the GHG emissions across various value chain points of the
wastewater treatment processes, the calculating method is explained as per the three broad
scopes discussed in Section 3.2.1 of the chapter.
Calculation of emissions under Scope 1 - Emissions from waste water treatment plantsThe Input data for calculating the Total CO
2 emissions for 1MLD treatment plant is listed
in Table 3.3:
Table 3.3: Input data for calculating Total CO2 emissions for 1MLD treatment plant
Common inputs for all technologies
Input data Values Unit
Population 9000
Percapita wastewater 115 LPCD
Flow rate 1000 m3/day
BOD in 0.36 kg/m3
BOD out 0.01 kg/m3
COD in 0.6 kg/m3
COD out 0.05 kg/m3
Source: Author
62 Sustainable Cities Integrated Approach Pilot in India
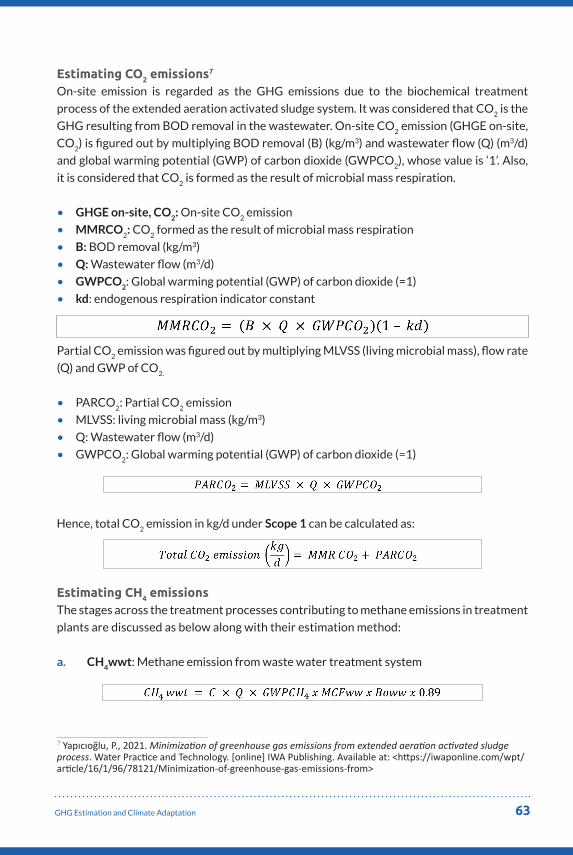
Estimating CO2 emissions7
On-site emission is regarded as the GHG emissions due to the biochemical treatment
process of the extended aeration activated sludge system. It was considered that CO2 is the
GHG resulting from BOD removal in the wastewater. On-site CO2 emission (GHGE on-site,
CO2) is figured out by multiplying BOD removal (B) (kg/m3) and wastewater flow (Q) (m3/d)
and global warming potential (GWP) of carbon dioxide (GWPCO2), whose value is ‘1’. Also,
it is considered that CO2 is formed as the result of microbial mass respiration.
• GHGE on-site, CO2: On-site CO
2 emission
• MMRCO2: CO
2 formed as the result of microbial mass respiration
• B: BOD removal (kg/m3)
• Q: Wastewater flow (m3/d)
• GWPCO2: Global warming potential (GWP) of carbon dioxide (=1)
• kd: endogenous respiration indicator constant
Partial CO2 emission was figured out by multiplying MLVSS (living microbial mass), flow rate
(Q) and GWP of CO2.
• PARCO2: Partial CO
2 emission
• MLVSS: living microbial mass (kg/m3)
• Q: Wastewater flow (m3/d)
• GWPCO2: Global warming potential (GWP) of carbon dioxide (=1)
Hence, total CO2 emission in kg/d under Scope 1 can be calculated as:
Estimating CH4 emissionsThe stages across the treatment processes contributing to methane emissions in treatment
plants are discussed as below along with their estimation method:
a. CH4wwt: Methane emission from waste water treatment system
7 Yapıcıoğlu, P., 2021. Minimization of greenhouse gas emissions from extended aeration activated sludge process. Water Practice and Technology. [online] IWA Publishing. Available at: <https://iwaponline.com/wpt/article/16/1/96/78121/Minimization-of-greenhouse-gas-emissions-from>
63GHG Estimation and Climate Adaptation

b. CH4st: Methane emission from sludge treatment
c. CH4wwd: Methane emission from waste water discharge
d. CH4F: Methane emission from anaerobic decay of the final sludge
e. CH4fuww: fugitive from waste water treatment
f. CH4fust: fugitive from sludge treatment
g. CH4flaring: Methane emission due to incomplete flaring
• C - COD removal (kg/m3)
• Q - Wastewater flow (m3/d)
• GWPCH4 - Global warming potential (GWP) of CH
4
• kd - endogenous respiration indicator constant
• MLSSd - Microbial death kg/m3
• MCFld- Methane correction factor for discharge to lake
• MCF- Methane correction factor for disposal site
• MCFww -Methane correction factor for WWT Table 2
• MCFst - Methane correction factor for sludge treatment system
• Boww -Methane producing capacity of the wastewater in kg/ kg COD
• DOCf- Fraction of DOC dissimilated to biogas
• DOCs-Degradable organic content of the untreated sludge
• F -Fraction of CH4 in biogas
• CFES -Capture efficiency of the biogas recovery equipment in the sludge treatment systems
• MEPst- Methane emission potential of the sludge treatment systems
• MEPww-Methane emission potential of wastewater treatment systems
Therefore, the total CH4 emissions in kg/d under Scope 1 can be calculated as:
𝐶𝐶𝐻𝐻4𝑇𝑇𝑇𝑇𝑇𝑇𝑇𝑇𝑇𝑇 = 𝐶𝐶𝐻𝐻4𝑤𝑤𝑤𝑤𝑇𝑇 + 𝐶𝐶𝐻𝐻4𝑠𝑠𝑇𝑇 + 𝐶𝐶𝐻𝐻4𝑤𝑤𝑤𝑤 + 𝐶𝐶𝐻𝐻4𝐹𝐹 + 𝐶𝐶𝐻𝐻4𝑓𝑓𝑇𝑇 + 𝐶𝐶𝐻𝐻4𝑓𝑓𝑇𝑇
𝑁𝑁2𝑂𝑂 = 𝑇𝑇𝑇𝑇𝑇𝑇𝑇𝑇𝑇𝑇 𝑛𝑛𝑛𝑛𝑇𝑇𝑛𝑛𝑇𝑇𝑛𝑛𝑛𝑛𝑛𝑛 (𝑘𝑘𝑛𝑛𝑚𝑚3) × 𝐸𝐸𝑚𝑚𝑛𝑛𝑠𝑠𝑠𝑠𝑛𝑛𝑇𝑇𝑛𝑛 𝑓𝑓𝑇𝑇𝑓𝑓𝑇𝑇𝑇𝑇𝑛𝑛 × 44
28
𝐺𝐺𝐻𝐻𝐺𝐺 𝑛𝑛𝑇𝑇𝑛𝑛𝑓𝑓𝑇𝑇𝑛𝑛𝑛𝑛𝑓𝑓𝑛𝑛𝑇𝑇𝑒𝑒 = 𝐸𝐸𝐶𝐶𝑡𝑡𝑡𝑡𝑡𝑡𝑡𝑡𝑡𝑡 × 𝐸𝐸𝐹𝐹𝑒𝑒𝑡𝑡𝑒𝑒𝑒𝑒𝑡𝑡𝑒𝑒𝑒𝑒𝑒𝑒𝑒𝑒𝑡𝑡𝑒𝑒
𝐺𝐺𝐻𝐻𝐺𝐺𝐸𝐸𝑓𝑓ℎ𝑛𝑛𝑚𝑚𝑛𝑛𝑓𝑓𝑇𝑇𝑇𝑇 = 𝐿𝐿𝑚𝑚𝑒𝑒𝑡𝑡ℎ𝑡𝑡𝑎𝑎𝑡𝑡𝑡𝑡 × 𝐸𝐸𝐹𝐹𝑚𝑚𝑒𝑒𝑡𝑡ℎ𝑡𝑡𝑎𝑎𝑡𝑡𝑡𝑡
𝐺𝐺𝐻𝐻𝐺𝐺𝐸𝐸 𝑠𝑠𝑇𝑇𝑠𝑠𝑠𝑠𝑛𝑛𝑛𝑛 = 𝐿𝐿𝑠𝑠𝑡𝑡𝑠𝑠𝑠𝑠𝑠𝑠𝑒𝑒 × 𝐿𝐿𝑡𝑡𝑒𝑒𝑚𝑚𝑒𝑒 × 𝐸𝐸𝐹𝐹𝑡𝑡𝑒𝑒𝑚𝑚𝑒𝑒
𝐺𝐺𝐻𝐻𝐺𝐺𝐸𝐸 𝑇𝑇𝑓𝑓𝑓𝑓 − 𝑠𝑠𝑛𝑛𝑇𝑇𝑛𝑛 = 𝐺𝐺𝐻𝐻𝐺𝐺𝐸𝐸𝑛𝑛𝑇𝑇𝑛𝑛𝑓𝑓𝑇𝑇𝑛𝑛𝑛𝑛𝑓𝑓𝑛𝑛𝑇𝑇𝑒𝑒 + 𝐺𝐺𝐻𝐻𝐺𝐺𝐸𝐸𝑓𝑓ℎ𝑛𝑛𝑚𝑚𝑛𝑛𝑓𝑓𝑇𝑇𝑇𝑇 + 𝐺𝐺𝐻𝐻𝐺𝐺𝐸𝐸𝑠𝑠𝑇𝑇𝑠𝑠𝑠𝑠𝑛𝑛𝑛𝑛
𝐺𝐺𝐻𝐻𝐺𝐺𝐸𝐸𝑇𝑇𝑛𝑛𝑇𝑇𝑛𝑛𝑠𝑠𝐺𝐺𝑇𝑇𝑛𝑛𝑇𝑇𝑇𝑇𝑇𝑇𝑛𝑛𝑇𝑇𝑛𝑛 = 𝐹𝐹𝑠𝑠𝑛𝑛𝑇𝑇 𝑓𝑓𝑇𝑇𝑛𝑛𝑠𝑠𝑠𝑠𝑚𝑚𝐺𝐺𝑇𝑇𝑛𝑛𝑇𝑇𝑛𝑛 ( 𝐿𝐿𝐷𝐷𝑇𝑇𝑒𝑒) × 𝐸𝐸𝑚𝑚𝑛𝑛𝑠𝑠𝑠𝑠𝑛𝑛𝑇𝑇𝑛𝑛 𝑓𝑓𝑇𝑇𝑓𝑓𝑇𝑇𝑇𝑇𝑛𝑛 (𝑘𝑘𝑛𝑛 𝐶𝐶𝑂𝑂2
𝐿𝐿 )
64 Sustainable Cities Integrated Approach Pilot in India

Estimating N2O emissionsThe inputs required for estimating the N
2O emissions include:
• Total Nitrogen (kg/m3)
• Emission Factor (=0.005)
𝐶𝐶𝐻𝐻4𝑇𝑇𝑇𝑇𝑇𝑇𝑇𝑇𝑇𝑇 = 𝐶𝐶𝐻𝐻4𝑤𝑤𝑤𝑤𝑇𝑇 + 𝐶𝐶𝐻𝐻4𝑠𝑠𝑇𝑇 + 𝐶𝐶𝐻𝐻4𝑤𝑤𝑤𝑤 + 𝐶𝐶𝐻𝐻4𝐹𝐹 + 𝐶𝐶𝐻𝐻4𝑓𝑓𝑇𝑇 + 𝐶𝐶𝐻𝐻4𝑓𝑓𝑇𝑇
𝑁𝑁2𝑂𝑂 = 𝑇𝑇𝑇𝑇𝑇𝑇𝑇𝑇𝑇𝑇 𝑛𝑛𝑛𝑛𝑇𝑇𝑛𝑛𝑇𝑇𝑛𝑛𝑛𝑛𝑛𝑛 (𝑘𝑘𝑛𝑛𝑚𝑚3) × 𝐸𝐸𝑚𝑚𝑛𝑛𝑠𝑠𝑠𝑠𝑛𝑛𝑇𝑇𝑛𝑛 𝑓𝑓𝑇𝑇𝑓𝑓𝑇𝑇𝑇𝑇𝑛𝑛 × 44
28
𝐺𝐺𝐻𝐻𝐺𝐺 𝑛𝑛𝑇𝑇𝑛𝑛𝑓𝑓𝑇𝑇𝑛𝑛𝑛𝑛𝑓𝑓𝑛𝑛𝑇𝑇𝑒𝑒 = 𝐸𝐸𝐶𝐶𝑡𝑡𝑡𝑡𝑡𝑡𝑡𝑡𝑡𝑡 × 𝐸𝐸𝐹𝐹𝑒𝑒𝑡𝑡𝑒𝑒𝑒𝑒𝑡𝑡𝑒𝑒𝑒𝑒𝑒𝑒𝑒𝑒𝑡𝑡𝑒𝑒
𝐺𝐺𝐻𝐻𝐺𝐺𝐸𝐸𝑓𝑓ℎ𝑛𝑛𝑚𝑚𝑛𝑛𝑓𝑓𝑇𝑇𝑇𝑇 = 𝐿𝐿𝑚𝑚𝑒𝑒𝑡𝑡ℎ𝑡𝑡𝑎𝑎𝑡𝑡𝑡𝑡 × 𝐸𝐸𝐹𝐹𝑚𝑚𝑒𝑒𝑡𝑡ℎ𝑡𝑡𝑎𝑎𝑡𝑡𝑡𝑡
𝐺𝐺𝐻𝐻𝐺𝐺𝐸𝐸 𝑠𝑠𝑇𝑇𝑠𝑠𝑠𝑠𝑛𝑛𝑛𝑛 = 𝐿𝐿𝑠𝑠𝑡𝑡𝑠𝑠𝑠𝑠𝑠𝑠𝑒𝑒 × 𝐿𝐿𝑡𝑡𝑒𝑒𝑚𝑚𝑒𝑒 × 𝐸𝐸𝐹𝐹𝑡𝑡𝑒𝑒𝑚𝑚𝑒𝑒
𝐺𝐺𝐻𝐻𝐺𝐺𝐸𝐸 𝑇𝑇𝑓𝑓𝑓𝑓 − 𝑠𝑠𝑛𝑛𝑇𝑇𝑛𝑛 = 𝐺𝐺𝐻𝐻𝐺𝐺𝐸𝐸𝑛𝑛𝑇𝑇𝑛𝑛𝑓𝑓𝑇𝑇𝑛𝑛𝑛𝑛𝑓𝑓𝑛𝑛𝑇𝑇𝑒𝑒 + 𝐺𝐺𝐻𝐻𝐺𝐺𝐸𝐸𝑓𝑓ℎ𝑛𝑛𝑚𝑚𝑛𝑛𝑓𝑓𝑇𝑇𝑇𝑇 + 𝐺𝐺𝐻𝐻𝐺𝐺𝐸𝐸𝑠𝑠𝑇𝑇𝑠𝑠𝑠𝑠𝑛𝑛𝑛𝑛
𝐺𝐺𝐻𝐻𝐺𝐺𝐸𝐸𝑇𝑇𝑛𝑛𝑇𝑇𝑛𝑛𝑠𝑠𝐺𝐺𝑇𝑇𝑛𝑛𝑇𝑇𝑇𝑇𝑇𝑇𝑛𝑛𝑇𝑇𝑛𝑛 = 𝐹𝐹𝑠𝑠𝑛𝑛𝑇𝑇 𝑓𝑓𝑇𝑇𝑛𝑛𝑠𝑠𝑠𝑠𝑚𝑚𝐺𝐺𝑇𝑇𝑛𝑛𝑇𝑇𝑛𝑛 ( 𝐿𝐿𝐷𝐷𝑇𝑇𝑒𝑒) × 𝐸𝐸𝑚𝑚𝑛𝑛𝑠𝑠𝑠𝑠𝑛𝑛𝑇𝑇𝑛𝑛 𝑓𝑓𝑇𝑇𝑓𝑓𝑇𝑇𝑇𝑇𝑛𝑛 (𝑘𝑘𝑛𝑛 𝐶𝐶𝑂𝑂2
𝐿𝐿 )
Calculation of emissions from indirect sources under Scope 28
There are three constituents of off-site greenhouse gas emissions considered for estimation
in this method. Electricity consumption for the operation of extended aeration process in
the plant was used to estimate the off-site emissions. The second constituent is the off-
site emission from methanol (chemical) use for denitrification for the removal of nitrogen
in the extended aeration process. The other constituent of off-site emission is the sludge
stabilization process.
Theoff-siteemissionrelatedtotheelectricityconsumptionThe off-site emission related to the electricity consumption is figured out by multiplying
the electricity consumption (ECtotal
) (kWh) of the extended aeration process and the specific
emission factor (EFelectricity
) of the electricity consumption (kg CO2e/kWh).
Electricity consumption of the extended aeration process is obtained from the electricity
bills and the electricity meters in the treatment plant. Electricity consumption of the plant
contains the energy demand of the blower and air pumps (ECblower&air pumps)
for the aeration
process and the energy depletion of the sludge pumps (ECsludge pumps)
. EFelectricity
is 0.497 kg
CO2e/kWh (International Energy Agency (IEA), 2016). The estimation model for total off-
site emissions from electricity is based on the IPCC (D.Kyung, 2015).
• GHG electricity: The off-site emission related to the electricity consumption
• ECtotal
- Electricity consumption (kWh)
• EFelectricity
- Emission factor of the electricity consumption (kg CO2e/kWh)
𝐶𝐶𝐻𝐻4𝑇𝑇𝑇𝑇𝑇𝑇𝑇𝑇𝑇𝑇 = 𝐶𝐶𝐻𝐻4𝑤𝑤𝑤𝑤𝑇𝑇 + 𝐶𝐶𝐻𝐻4𝑠𝑠𝑇𝑇 + 𝐶𝐶𝐻𝐻4𝑤𝑤𝑤𝑤 + 𝐶𝐶𝐻𝐻4𝐹𝐹 + 𝐶𝐶𝐻𝐻4𝑓𝑓𝑇𝑇 + 𝐶𝐶𝐻𝐻4𝑓𝑓𝑇𝑇
𝑁𝑁2𝑂𝑂 = 𝑇𝑇𝑇𝑇𝑇𝑇𝑇𝑇𝑇𝑇 𝑛𝑛𝑛𝑛𝑇𝑇𝑛𝑛𝑇𝑇𝑛𝑛𝑛𝑛𝑛𝑛 (𝑘𝑘𝑛𝑛𝑚𝑚3) × 𝐸𝐸𝑚𝑚𝑛𝑛𝑠𝑠𝑠𝑠𝑛𝑛𝑇𝑇𝑛𝑛 𝑓𝑓𝑇𝑇𝑓𝑓𝑇𝑇𝑇𝑇𝑛𝑛 × 44
28
𝐺𝐺𝐻𝐻𝐺𝐺 𝑛𝑛𝑇𝑇𝑛𝑛𝑓𝑓𝑇𝑇𝑛𝑛𝑛𝑛𝑓𝑓𝑛𝑛𝑇𝑇𝑒𝑒 = 𝐸𝐸𝐶𝐶𝑡𝑡𝑡𝑡𝑡𝑡𝑡𝑡𝑡𝑡 × 𝐸𝐸𝐹𝐹𝑒𝑒𝑡𝑡𝑒𝑒𝑒𝑒𝑡𝑡𝑒𝑒𝑒𝑒𝑒𝑒𝑒𝑒𝑡𝑡𝑒𝑒
𝐺𝐺𝐻𝐻𝐺𝐺𝐸𝐸𝑓𝑓ℎ𝑛𝑛𝑚𝑚𝑛𝑛𝑓𝑓𝑇𝑇𝑇𝑇 = 𝐿𝐿𝑚𝑚𝑒𝑒𝑡𝑡ℎ𝑡𝑡𝑎𝑎𝑡𝑡𝑡𝑡 × 𝐸𝐸𝐹𝐹𝑚𝑚𝑒𝑒𝑡𝑡ℎ𝑡𝑡𝑎𝑎𝑡𝑡𝑡𝑡
𝐺𝐺𝐻𝐻𝐺𝐺𝐸𝐸 𝑠𝑠𝑇𝑇𝑠𝑠𝑠𝑠𝑛𝑛𝑛𝑛 = 𝐿𝐿𝑠𝑠𝑡𝑡𝑠𝑠𝑠𝑠𝑠𝑠𝑒𝑒 × 𝐿𝐿𝑡𝑡𝑒𝑒𝑚𝑚𝑒𝑒 × 𝐸𝐸𝐹𝐹𝑡𝑡𝑒𝑒𝑚𝑚𝑒𝑒
𝐺𝐺𝐻𝐻𝐺𝐺𝐸𝐸 𝑇𝑇𝑓𝑓𝑓𝑓 − 𝑠𝑠𝑛𝑛𝑇𝑇𝑛𝑛 = 𝐺𝐺𝐻𝐻𝐺𝐺𝐸𝐸𝑛𝑛𝑇𝑇𝑛𝑛𝑓𝑓𝑇𝑇𝑛𝑛𝑛𝑛𝑓𝑓𝑛𝑛𝑇𝑇𝑒𝑒 + 𝐺𝐺𝐻𝐻𝐺𝐺𝐸𝐸𝑓𝑓ℎ𝑛𝑛𝑚𝑚𝑛𝑛𝑓𝑓𝑇𝑇𝑇𝑇 + 𝐺𝐺𝐻𝐻𝐺𝐺𝐸𝐸𝑠𝑠𝑇𝑇𝑠𝑠𝑠𝑠𝑛𝑛𝑛𝑛
𝐺𝐺𝐻𝐻𝐺𝐺𝐸𝐸𝑇𝑇𝑛𝑛𝑇𝑇𝑛𝑛𝑠𝑠𝐺𝐺𝑇𝑇𝑛𝑛𝑇𝑇𝑇𝑇𝑇𝑇𝑛𝑛𝑇𝑇𝑛𝑛 = 𝐹𝐹𝑠𝑠𝑛𝑛𝑇𝑇 𝑓𝑓𝑇𝑇𝑛𝑛𝑠𝑠𝑠𝑠𝑚𝑚𝐺𝐺𝑇𝑇𝑛𝑛𝑇𝑇𝑛𝑛 ( 𝐿𝐿𝐷𝐷𝑇𝑇𝑒𝑒) × 𝐸𝐸𝑚𝑚𝑛𝑛𝑠𝑠𝑠𝑠𝑛𝑛𝑇𝑇𝑛𝑛 𝑓𝑓𝑇𝑇𝑓𝑓𝑇𝑇𝑇𝑇𝑛𝑛 (𝑘𝑘𝑛𝑛 𝐶𝐶𝑂𝑂2
𝐿𝐿 )
Calculation of emissions under Scope 3 – Transportation and other utilitiesThe inputs required for estimating the emissions from transportation and other utilities
comprise:
• Fuel consumption L/day
• Emission factor for Diesel (kg CO2/L)
8Yapıcıoglu, P., 2021. Minimization of greenhouse gas emissions from extended aeration activated sludge process. Water Practice and Technology. [online] IWA Publishing. Available at: <https://iwaponline.com/wpt/article/16/1/96/78121/Minimization-of-greenhouse-gas-emissions-from>
65GHG Estimation and Climate Adaptation

GHGE transportation: The off-site emission related to transportation
𝐶𝐶𝐻𝐻4𝑇𝑇𝑇𝑇𝑇𝑇𝑇𝑇𝑇𝑇 = 𝐶𝐶𝐻𝐻4𝑤𝑤𝑤𝑤𝑇𝑇 + 𝐶𝐶𝐻𝐻4𝑠𝑠𝑇𝑇 + 𝐶𝐶𝐻𝐻4𝑤𝑤𝑤𝑤 + 𝐶𝐶𝐻𝐻4𝐹𝐹 + 𝐶𝐶𝐻𝐻4𝑓𝑓𝑇𝑇 + 𝐶𝐶𝐻𝐻4𝑓𝑓𝑇𝑇
𝑁𝑁2𝑂𝑂 = 𝑇𝑇𝑇𝑇𝑇𝑇𝑇𝑇𝑇𝑇 𝑛𝑛𝑛𝑛𝑇𝑇𝑛𝑛𝑇𝑇𝑛𝑛𝑛𝑛𝑛𝑛 (𝑘𝑘𝑛𝑛𝑚𝑚3) × 𝐸𝐸𝑚𝑚𝑛𝑛𝑠𝑠𝑠𝑠𝑛𝑛𝑇𝑇𝑛𝑛 𝑓𝑓𝑇𝑇𝑓𝑓𝑇𝑇𝑇𝑇𝑛𝑛 × 44
28
𝐺𝐺𝐻𝐻𝐺𝐺 𝑛𝑛𝑇𝑇𝑛𝑛𝑓𝑓𝑇𝑇𝑛𝑛𝑛𝑛𝑓𝑓𝑛𝑛𝑇𝑇𝑒𝑒 = 𝐸𝐸𝐶𝐶𝑡𝑡𝑡𝑡𝑡𝑡𝑡𝑡𝑡𝑡 × 𝐸𝐸𝐹𝐹𝑒𝑒𝑡𝑡𝑒𝑒𝑒𝑒𝑡𝑡𝑒𝑒𝑒𝑒𝑒𝑒𝑒𝑒𝑡𝑡𝑒𝑒
𝐺𝐺𝐻𝐻𝐺𝐺𝐸𝐸𝑓𝑓ℎ𝑛𝑛𝑚𝑚𝑛𝑛𝑓𝑓𝑇𝑇𝑇𝑇 = 𝐿𝐿𝑚𝑚𝑒𝑒𝑡𝑡ℎ𝑡𝑡𝑎𝑎𝑡𝑡𝑡𝑡 × 𝐸𝐸𝐹𝐹𝑚𝑚𝑒𝑒𝑡𝑡ℎ𝑡𝑡𝑎𝑎𝑡𝑡𝑡𝑡
𝐺𝐺𝐻𝐻𝐺𝐺𝐸𝐸 𝑠𝑠𝑇𝑇𝑠𝑠𝑠𝑠𝑛𝑛𝑛𝑛 = 𝐿𝐿𝑠𝑠𝑡𝑡𝑠𝑠𝑠𝑠𝑠𝑠𝑒𝑒 × 𝐿𝐿𝑡𝑡𝑒𝑒𝑚𝑚𝑒𝑒 × 𝐸𝐸𝐹𝐹𝑡𝑡𝑒𝑒𝑚𝑚𝑒𝑒
𝐺𝐺𝐻𝐻𝐺𝐺𝐸𝐸 𝑇𝑇𝑓𝑓𝑓𝑓 − 𝑠𝑠𝑛𝑛𝑇𝑇𝑛𝑛 = 𝐺𝐺𝐻𝐻𝐺𝐺𝐸𝐸𝑛𝑛𝑇𝑇𝑛𝑛𝑓𝑓𝑇𝑇𝑛𝑛𝑛𝑛𝑓𝑓𝑛𝑛𝑇𝑇𝑒𝑒 + 𝐺𝐺𝐻𝐻𝐺𝐺𝐸𝐸𝑓𝑓ℎ𝑛𝑛𝑚𝑚𝑛𝑛𝑓𝑓𝑇𝑇𝑇𝑇 + 𝐺𝐺𝐻𝐻𝐺𝐺𝐸𝐸𝑠𝑠𝑇𝑇𝑠𝑠𝑠𝑠𝑛𝑛𝑛𝑛
𝐺𝐺𝐻𝐻𝐺𝐺𝐸𝐸𝑇𝑇𝑛𝑛𝑇𝑇𝑛𝑛𝑠𝑠𝐺𝐺𝑇𝑇𝑛𝑛𝑇𝑇𝑇𝑇𝑇𝑇𝑛𝑛𝑇𝑇𝑛𝑛 = 𝐹𝐹𝑠𝑠𝑛𝑛𝑇𝑇 𝑓𝑓𝑇𝑇𝑛𝑛𝑠𝑠𝑠𝑠𝑚𝑚𝐺𝐺𝑇𝑇𝑛𝑛𝑇𝑇𝑛𝑛 ( 𝐿𝐿𝐷𝐷𝑇𝑇𝑒𝑒) × 𝐸𝐸𝑚𝑚𝑛𝑛𝑠𝑠𝑠𝑠𝑛𝑛𝑇𝑇𝑛𝑛 𝑓𝑓𝑇𝑇𝑓𝑓𝑇𝑇𝑇𝑇𝑛𝑛 (𝑘𝑘𝑛𝑛 𝐶𝐶𝑂𝑂2
𝐿𝐿 )
Total CO
2e emission from the treatment plant is summation of Scope 1, Scope 2 and Scope 3
emission. For different type of treatment plants, the emission varies with respect to design
aspects of the respective technology. The following table represents the emissions from six
different types of treatment technologies.
Theoff-siteemissionfromthechemicaluseMethanol addition as an added carbon source for denitrification to achieve nitrogen
removal leads to the other off-site emission in the aeration tank. It can be estimated by
means of multiplying daily methanol consumption (Lmethanol
) (kg/d) and the emission factor
of methanol (EFmethanol
) (D.Kyung, 2015). The emission factor of methanol is 1.54 kgCO2e/kg
methanol (Yapıcıoglu, 2021; D.Kyung, 2015). The off-site emission of the chemical use could
be estimated using the equation below (D.Kyung, 2015).
• GHGE chemical: The off-site emission of the chemical use
• Lmethanol
- Daily methanol consumption (kg/d)
• EFmethanol
- Emission factor of methanol (kg CO2/kg methanol)
𝐶𝐶𝐻𝐻4𝑇𝑇𝑇𝑇𝑇𝑇𝑇𝑇𝑇𝑇 = 𝐶𝐶𝐻𝐻4𝑤𝑤𝑤𝑤𝑇𝑇 + 𝐶𝐶𝐻𝐻4𝑠𝑠𝑇𝑇 + 𝐶𝐶𝐻𝐻4𝑤𝑤𝑤𝑤 + 𝐶𝐶𝐻𝐻4𝐹𝐹 + 𝐶𝐶𝐻𝐻4𝑓𝑓𝑇𝑇 + 𝐶𝐶𝐻𝐻4𝑓𝑓𝑇𝑇
𝑁𝑁2𝑂𝑂 = 𝑇𝑇𝑇𝑇𝑇𝑇𝑇𝑇𝑇𝑇 𝑛𝑛𝑛𝑛𝑇𝑇𝑛𝑛𝑇𝑇𝑛𝑛𝑛𝑛𝑛𝑛 (𝑘𝑘𝑛𝑛𝑚𝑚3) × 𝐸𝐸𝑚𝑚𝑛𝑛𝑠𝑠𝑠𝑠𝑛𝑛𝑇𝑇𝑛𝑛 𝑓𝑓𝑇𝑇𝑓𝑓𝑇𝑇𝑇𝑇𝑛𝑛 × 44
28
𝐺𝐺𝐻𝐻𝐺𝐺 𝑛𝑛𝑇𝑇𝑛𝑛𝑓𝑓𝑇𝑇𝑛𝑛𝑛𝑛𝑓𝑓𝑛𝑛𝑇𝑇𝑒𝑒 = 𝐸𝐸𝐶𝐶𝑡𝑡𝑡𝑡𝑡𝑡𝑡𝑡𝑡𝑡 × 𝐸𝐸𝐹𝐹𝑒𝑒𝑡𝑡𝑒𝑒𝑒𝑒𝑡𝑡𝑒𝑒𝑒𝑒𝑒𝑒𝑒𝑒𝑡𝑡𝑒𝑒
𝐺𝐺𝐻𝐻𝐺𝐺𝐸𝐸𝑓𝑓ℎ𝑛𝑛𝑚𝑚𝑛𝑛𝑓𝑓𝑇𝑇𝑇𝑇 = 𝐿𝐿𝑚𝑚𝑒𝑒𝑡𝑡ℎ𝑡𝑡𝑎𝑎𝑡𝑡𝑡𝑡 × 𝐸𝐸𝐹𝐹𝑚𝑚𝑒𝑒𝑡𝑡ℎ𝑡𝑡𝑎𝑎𝑡𝑡𝑡𝑡
𝐺𝐺𝐻𝐻𝐺𝐺𝐸𝐸 𝑠𝑠𝑇𝑇𝑠𝑠𝑠𝑠𝑛𝑛𝑛𝑛 = 𝐿𝐿𝑠𝑠𝑡𝑡𝑠𝑠𝑠𝑠𝑠𝑠𝑒𝑒 × 𝐿𝐿𝑡𝑡𝑒𝑒𝑚𝑚𝑒𝑒 × 𝐸𝐸𝐹𝐹𝑡𝑡𝑒𝑒𝑚𝑚𝑒𝑒
𝐺𝐺𝐻𝐻𝐺𝐺𝐸𝐸 𝑇𝑇𝑓𝑓𝑓𝑓 − 𝑠𝑠𝑛𝑛𝑇𝑇𝑛𝑛 = 𝐺𝐺𝐻𝐻𝐺𝐺𝐸𝐸𝑛𝑛𝑇𝑇𝑛𝑛𝑓𝑓𝑇𝑇𝑛𝑛𝑛𝑛𝑓𝑓𝑛𝑛𝑇𝑇𝑒𝑒 + 𝐺𝐺𝐻𝐻𝐺𝐺𝐸𝐸𝑓𝑓ℎ𝑛𝑛𝑚𝑚𝑛𝑛𝑓𝑓𝑇𝑇𝑇𝑇 + 𝐺𝐺𝐻𝐻𝐺𝐺𝐸𝐸𝑠𝑠𝑇𝑇𝑠𝑠𝑠𝑠𝑛𝑛𝑛𝑛
𝐺𝐺𝐻𝐻𝐺𝐺𝐸𝐸𝑇𝑇𝑛𝑛𝑇𝑇𝑛𝑛𝑠𝑠𝐺𝐺𝑇𝑇𝑛𝑛𝑇𝑇𝑇𝑇𝑇𝑇𝑛𝑛𝑇𝑇𝑛𝑛 = 𝐹𝐹𝑠𝑠𝑛𝑛𝑇𝑇 𝑓𝑓𝑇𝑇𝑛𝑛𝑠𝑠𝑠𝑠𝑚𝑚𝐺𝐺𝑇𝑇𝑛𝑛𝑇𝑇𝑛𝑛 ( 𝐿𝐿𝐷𝐷𝑇𝑇𝑒𝑒) × 𝐸𝐸𝑚𝑚𝑛𝑛𝑠𝑠𝑠𝑠𝑛𝑛𝑇𝑇𝑛𝑛 𝑓𝑓𝑇𝑇𝑓𝑓𝑇𝑇𝑇𝑇𝑛𝑛 (𝑘𝑘𝑛𝑛 𝐶𝐶𝑂𝑂2
𝐿𝐿 )
Theoff-siteemissionfromthesludgestabilizationprocess(IWAPublishing,2021)The other resource of off-site GHG emissions is the sludge stabilization process. Lime
is used for the stabilization of waste activated sludge. It can be figured out by means of
multiplying daily lime consumption (Lsludge
) (kg/d) and the emission factor of lime (EFlime
)
(IPCC 2006). The emission factor of lime is 0.43971 kgCO2e/kg lime. CaCO
3 is used as the
chemical.
• GHGE sludge: The off-site emission of the sludge stabilization process
• Llime
– Daily lime consumption for stabilization of sludge (CaCO3 dose) (kglime/kgsludge)
• Lsludge
- Daily sludge (kg sludge/d)
• EFlime
- Emission factor of Lime (kg CO2/kg Lime)
𝐶𝐶𝐻𝐻4𝑇𝑇𝑇𝑇𝑇𝑇𝑇𝑇𝑇𝑇 = 𝐶𝐶𝐻𝐻4𝑤𝑤𝑤𝑤𝑇𝑇 + 𝐶𝐶𝐻𝐻4𝑠𝑠𝑇𝑇 + 𝐶𝐶𝐻𝐻4𝑤𝑤𝑤𝑤 + 𝐶𝐶𝐻𝐻4𝐹𝐹 + 𝐶𝐶𝐻𝐻4𝑓𝑓𝑇𝑇 + 𝐶𝐶𝐻𝐻4𝑓𝑓𝑇𝑇
𝑁𝑁2𝑂𝑂 = 𝑇𝑇𝑇𝑇𝑇𝑇𝑇𝑇𝑇𝑇 𝑛𝑛𝑛𝑛𝑇𝑇𝑛𝑛𝑇𝑇𝑛𝑛𝑛𝑛𝑛𝑛 (𝑘𝑘𝑛𝑛𝑚𝑚3) × 𝐸𝐸𝑚𝑚𝑛𝑛𝑠𝑠𝑠𝑠𝑛𝑛𝑇𝑇𝑛𝑛 𝑓𝑓𝑇𝑇𝑓𝑓𝑇𝑇𝑇𝑇𝑛𝑛 × 44
28
𝐺𝐺𝐻𝐻𝐺𝐺 𝑛𝑛𝑇𝑇𝑛𝑛𝑓𝑓𝑇𝑇𝑛𝑛𝑛𝑛𝑓𝑓𝑛𝑛𝑇𝑇𝑒𝑒 = 𝐸𝐸𝐶𝐶𝑡𝑡𝑡𝑡𝑡𝑡𝑡𝑡𝑡𝑡 × 𝐸𝐸𝐹𝐹𝑒𝑒𝑡𝑡𝑒𝑒𝑒𝑒𝑡𝑡𝑒𝑒𝑒𝑒𝑒𝑒𝑒𝑒𝑡𝑡𝑒𝑒
𝐺𝐺𝐻𝐻𝐺𝐺𝐸𝐸𝑓𝑓ℎ𝑛𝑛𝑚𝑚𝑛𝑛𝑓𝑓𝑇𝑇𝑇𝑇 = 𝐿𝐿𝑚𝑚𝑒𝑒𝑡𝑡ℎ𝑡𝑡𝑎𝑎𝑡𝑡𝑡𝑡 × 𝐸𝐸𝐹𝐹𝑚𝑚𝑒𝑒𝑡𝑡ℎ𝑡𝑡𝑎𝑎𝑡𝑡𝑡𝑡
𝐺𝐺𝐻𝐻𝐺𝐺𝐸𝐸 𝑠𝑠𝑇𝑇𝑠𝑠𝑠𝑠𝑛𝑛𝑛𝑛 = 𝐿𝐿𝑠𝑠𝑡𝑡𝑠𝑠𝑠𝑠𝑠𝑠𝑒𝑒 × 𝐿𝐿𝑡𝑡𝑒𝑒𝑚𝑚𝑒𝑒 × 𝐸𝐸𝐹𝐹𝑡𝑡𝑒𝑒𝑚𝑚𝑒𝑒
𝐺𝐺𝐻𝐻𝐺𝐺𝐸𝐸 𝑇𝑇𝑓𝑓𝑓𝑓 − 𝑠𝑠𝑛𝑛𝑇𝑇𝑛𝑛 = 𝐺𝐺𝐻𝐻𝐺𝐺𝐸𝐸𝑛𝑛𝑇𝑇𝑛𝑛𝑓𝑓𝑇𝑇𝑛𝑛𝑛𝑛𝑓𝑓𝑛𝑛𝑇𝑇𝑒𝑒 + 𝐺𝐺𝐻𝐻𝐺𝐺𝐸𝐸𝑓𝑓ℎ𝑛𝑛𝑚𝑚𝑛𝑛𝑓𝑓𝑇𝑇𝑇𝑇 + 𝐺𝐺𝐻𝐻𝐺𝐺𝐸𝐸𝑠𝑠𝑇𝑇𝑠𝑠𝑠𝑠𝑛𝑛𝑛𝑛
𝐺𝐺𝐻𝐻𝐺𝐺𝐸𝐸𝑇𝑇𝑛𝑛𝑇𝑇𝑛𝑛𝑠𝑠𝐺𝐺𝑇𝑇𝑛𝑛𝑇𝑇𝑇𝑇𝑇𝑇𝑛𝑛𝑇𝑇𝑛𝑛 = 𝐹𝐹𝑠𝑠𝑛𝑛𝑇𝑇 𝑓𝑓𝑇𝑇𝑛𝑛𝑠𝑠𝑠𝑠𝑚𝑚𝐺𝐺𝑇𝑇𝑛𝑛𝑇𝑇𝑛𝑛 ( 𝐿𝐿𝐷𝐷𝑇𝑇𝑒𝑒) × 𝐸𝐸𝑚𝑚𝑛𝑛𝑠𝑠𝑠𝑠𝑛𝑛𝑇𝑇𝑛𝑛 𝑓𝑓𝑇𝑇𝑓𝑓𝑇𝑇𝑇𝑇𝑛𝑛 (𝑘𝑘𝑛𝑛 𝐶𝐶𝑂𝑂2
𝐿𝐿 )
The off-site emission under Scope 1 is the total of the emissions from electricity and
chemical consumption and sludge stabilization process. It can be estimated as below:
𝐶𝐶𝐻𝐻4𝑇𝑇𝑇𝑇𝑇𝑇𝑇𝑇𝑇𝑇 = 𝐶𝐶𝐻𝐻4𝑤𝑤𝑤𝑤𝑇𝑇 + 𝐶𝐶𝐻𝐻4𝑠𝑠𝑇𝑇 + 𝐶𝐶𝐻𝐻4𝑤𝑤𝑤𝑤 + 𝐶𝐶𝐻𝐻4𝐹𝐹 + 𝐶𝐶𝐻𝐻4𝑓𝑓𝑇𝑇 + 𝐶𝐶𝐻𝐻4𝑓𝑓𝑇𝑇
𝑁𝑁2𝑂𝑂 = 𝑇𝑇𝑇𝑇𝑇𝑇𝑇𝑇𝑇𝑇 𝑛𝑛𝑛𝑛𝑇𝑇𝑛𝑛𝑇𝑇𝑛𝑛𝑛𝑛𝑛𝑛 (𝑘𝑘𝑛𝑛𝑚𝑚3) × 𝐸𝐸𝑚𝑚𝑛𝑛𝑠𝑠𝑠𝑠𝑛𝑛𝑇𝑇𝑛𝑛 𝑓𝑓𝑇𝑇𝑓𝑓𝑇𝑇𝑇𝑇𝑛𝑛 × 44
28
𝐺𝐺𝐻𝐻𝐺𝐺 𝑛𝑛𝑇𝑇𝑛𝑛𝑓𝑓𝑇𝑇𝑛𝑛𝑛𝑛𝑓𝑓𝑛𝑛𝑇𝑇𝑒𝑒 = 𝐸𝐸𝐶𝐶𝑡𝑡𝑡𝑡𝑡𝑡𝑡𝑡𝑡𝑡 × 𝐸𝐸𝐹𝐹𝑒𝑒𝑡𝑡𝑒𝑒𝑒𝑒𝑡𝑡𝑒𝑒𝑒𝑒𝑒𝑒𝑒𝑒𝑡𝑡𝑒𝑒
𝐺𝐺𝐻𝐻𝐺𝐺𝐸𝐸𝑓𝑓ℎ𝑛𝑛𝑚𝑚𝑛𝑛𝑓𝑓𝑇𝑇𝑇𝑇 = 𝐿𝐿𝑚𝑚𝑒𝑒𝑡𝑡ℎ𝑡𝑡𝑎𝑎𝑡𝑡𝑡𝑡 × 𝐸𝐸𝐹𝐹𝑚𝑚𝑒𝑒𝑡𝑡ℎ𝑡𝑡𝑎𝑎𝑡𝑡𝑡𝑡
𝐺𝐺𝐻𝐻𝐺𝐺𝐸𝐸 𝑠𝑠𝑇𝑇𝑠𝑠𝑠𝑠𝑛𝑛𝑛𝑛 = 𝐿𝐿𝑠𝑠𝑡𝑡𝑠𝑠𝑠𝑠𝑠𝑠𝑒𝑒 × 𝐿𝐿𝑡𝑡𝑒𝑒𝑚𝑚𝑒𝑒 × 𝐸𝐸𝐹𝐹𝑡𝑡𝑒𝑒𝑚𝑚𝑒𝑒
𝐺𝐺𝐻𝐻𝐺𝐺𝐸𝐸 𝑇𝑇𝑓𝑓𝑓𝑓 − 𝑠𝑠𝑛𝑛𝑇𝑇𝑛𝑛 = 𝐺𝐺𝐻𝐻𝐺𝐺𝐸𝐸𝑛𝑛𝑇𝑇𝑛𝑛𝑓𝑓𝑇𝑇𝑛𝑛𝑛𝑛𝑓𝑓𝑛𝑛𝑇𝑇𝑒𝑒 + 𝐺𝐺𝐻𝐻𝐺𝐺𝐸𝐸𝑓𝑓ℎ𝑛𝑛𝑚𝑚𝑛𝑛𝑓𝑓𝑇𝑇𝑇𝑇 + 𝐺𝐺𝐻𝐻𝐺𝐺𝐸𝐸𝑠𝑠𝑇𝑇𝑠𝑠𝑠𝑠𝑛𝑛𝑛𝑛
𝐺𝐺𝐻𝐻𝐺𝐺𝐸𝐸𝑇𝑇𝑛𝑛𝑇𝑇𝑛𝑛𝑠𝑠𝐺𝐺𝑇𝑇𝑛𝑛𝑇𝑇𝑇𝑇𝑇𝑇𝑛𝑛𝑇𝑇𝑛𝑛 = 𝐹𝐹𝑠𝑠𝑛𝑛𝑇𝑇 𝑓𝑓𝑇𝑇𝑛𝑛𝑠𝑠𝑠𝑠𝑚𝑚𝐺𝐺𝑇𝑇𝑛𝑛𝑇𝑇𝑛𝑛 ( 𝐿𝐿𝐷𝐷𝑇𝑇𝑒𝑒) × 𝐸𝐸𝑚𝑚𝑛𝑛𝑠𝑠𝑠𝑠𝑛𝑛𝑇𝑇𝑛𝑛 𝑓𝑓𝑇𝑇𝑓𝑓𝑇𝑇𝑇𝑇𝑛𝑛 (𝑘𝑘𝑛𝑛 𝐶𝐶𝑂𝑂2
𝐿𝐿 )
66 Sustainable Cities Integrated Approach Pilot in India
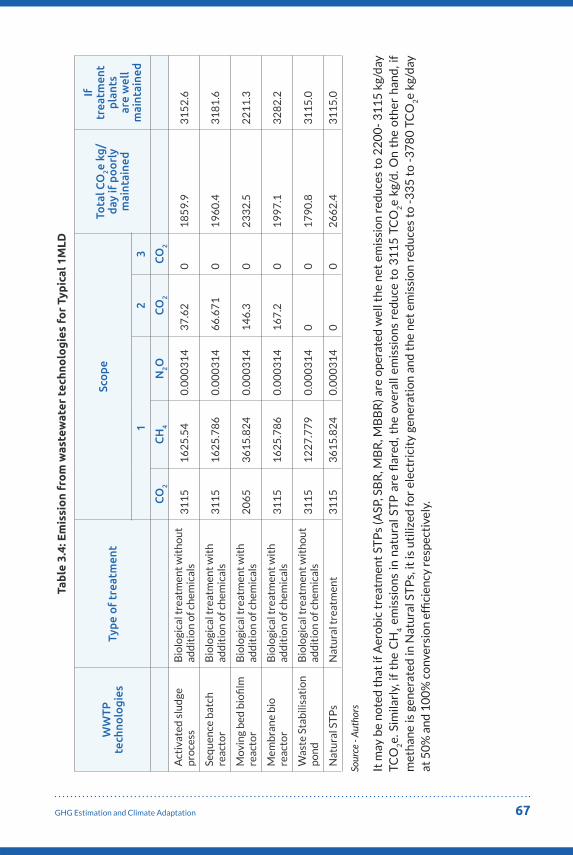
Tab
le 3
.4: E
mis
sio
n fr
om
was
tew
ater
tec
hno
log
ies
for
Typ
ical
1M
LD
WW
TP
tech
nolo
gies
Type
of
trea
tmen
tSc
ope
Tota
l CO
2e kg
/da
y if
po
orl
y m
aint
aine
d
If
trea
tmen
t pl
ants
ar
e w
ell
mai
ntai
ned
12
3
CO
2C
H4
N2O
CO
2C
O2
Act
ivat
ed s
lud
ge
pro
cess
Bio
logi
cal t
reat
men
t w
ith
ou
t ad
dit
ion
of c
hem
ical
s3
11
51
62
5.5
40
.00
03
14
37
.62
01
85
9.9
31
52
.6
Seq
uen
ce b
atch
re
acto
rB
iolo
gica
l tre
atm
ent
wit
h
add
itio
n o
f ch
emic
als
31
15
16
25
.78
60
.00
03
14
66
.67
10
19
60
.43
18
1.6
Mov
ing
bed
bio
film
re
acto
rB
iolo
gica
l tre
atm
ent
wit
h
add
itio
n o
f ch
emic
als
20
65
36
15
.82
40
.00
03
14
14
6.3
02
33
2.5
22
11
.3
Mem
bra
ne
bio
re
acto
rB
iolo
gica
l tre
atm
ent
wit
h
add
itio
n o
f ch
emic
als
31
15
16
25
.78
60
.00
03
14
16
7.2
01
99
7.1
32
82
.2
Was
te S
tab
ilisa
tio
n
po
nd
Bio
logi
cal t
reat
men
t w
ith
ou
t ad
dit
ion
of c
hem
ical
s3
11
51
22
7.7
79
0.0
00
31
40
01
79
0.8
31
15
.0
Nat
ura
l ST
Ps
Nat
ura
l tre
atm
ent
31
15
36
15
.82
40
.00
03
14
00
26
62
.43
11
5.0
Sour
ce -
Aut
hors
It m
ay b
e n
ote
d t
hat
if A
ero
bic
tre
atm
ent
STP
s (A
SP, S
BR
, MB
R, M
BB
R) a
re o
per
ated
wel
l th
e n
et e
mis
sio
n r
edu
ces
to 2
20
0-
31
15
kg/
day
TC
O2e.
Sim
ilarl
y, if
th
e C
H4 e
mis
sio
ns
in n
atu
ral S
TP
are
flar
ed, t
he
over
all e
mis
sio
ns
red
uce
to
31
15
TC
O2e
kg/d
. On
th
e o
ther
han
d, i
f m
eth
ane
is g
ener
ated
in N
atu
ral S
TP
s, it
is u
tiliz
ed f
or
elec
tric
ity
gen
erat
ion
an
d t
he
net
em
issi
on
red
uce
s to
-3
35
to
-3
78
0 T
CO
2e
kg/d
ay
at 5
0%
an
d 1
00
% c
onv
ersi
on
effi
cien
cy r
esp
ecti
vely
.
67GHG Estimation and Climate Adaptation

3.4 Strategies to manage GHG emissions from wastewater treatment plant – Mitigation and Adaptation measures
It can be noted in Table 3.4, the emissions are largely influenced by the operating conditions.
A well-managed STP operating within the design parameters generate between 2200 -
3115 kg CO2/ MLD of emissions. However, the same plants can produce almost twice
(4300 - 5800 kg CO2/ MLD) when operated badly. Hence, the most efficient method for
reducing GHG emission is by modifying the operational condition of wastewater treatment
plant, but the modification may not always be the best solution due to the operational
limitations. Nowadays, most of the technologies available to remove GHGs are expensive
or even not suitable to be applied to gaseous streams of the WWTPs.
N2O emissions will depend mainly on the operational conditions (NO
2 − and O
2
concentrations) of the reactor systems. To reduce N2O emission, high Sludge retention time
should be maintained to reduce the concentration of ammonia and nitrate in the media.
Furthermore, large bioreactor volumes are recommended to dispose of systems able to
buffer loadings and reduce the risk of transient oxygen depletion. N2O emissions can be
also reduced if nitrous oxide stripping by aeration is limited since microorganisms would
have more time to consume it.
Figure 3.3: Comparison of GHG Emissions between Conventional STPs and Natural STPs
A well-managed conventional technology working within its design parametersLow GHG emission
Energy Capture/Harnessing Energy cannot be harnessed in conventional STPs. On the contrary, it consumes energy and, emits GHG to the tune of 37 to 167 KG per MLD
Reliability of technologyDue to its heavy dependency on mechanical moving parts, these technologies are prone to failures. This increases the GHG emissions by more than double its usual levels
Tolerance to Shock loadingCannot withstand shock loading. self-regulating capacity of these types of technologies is poor and this leads to higher emissions when increased wastewater flows
GHG emissions Scenario
Comparison of GHG Emissions
between Conventional
STPs and Natural STPs
Conventional STP Natural Treatment Systems or Natural STP
A well-managed Natural STP working within its design parametersLow GHG emissions comparable to conventional STP
Energy Capture/ Harnessing Comparison of GHG Emissions between Conventional Aerobic STP’s and Natural Bio STP Anerobic System
Reliability of technologySince the Natural STPs do not have any mechanical parts, the breakdowns are almost nil. Hence, the GHG emissions are stable during the lifetime of this system
Tolerance to Shock loadingThe Natural STPs are adept to withstanding shock loading. Hence, GHG emissions are stable during the lifetime of the system
Source – Authors
68 Sustainable Cities Integrated Approach Pilot in India

Proper sealing of sludge digestion tank and disposal tanks can avoid GHG gas leakages,
while it can be captured by hoods and burnt together with the biogas generated in the
sludge digestion tank.
High values of SRT applied to the bioreactor promotes endogenous respiration of biomass,
which increases the rate of oxidation of COD to CO2 and reduces sludge production. The
reduction in sludge production reduces methane production thereby decreasing the CO2
emission.
Another possible option for reducing GHG emission is by trapping and treating them. There
are number of technologies available to destroy or capture the emissions. For N2O removal,
traditional technologies such as selective catalytic reduction and non-selective catalytic
reduction are currently used to control N2O emission.
Many biological technologies have been initialized in the early 90’s based on bio-filter
system, which are capable of oxidizing CH4 into CO
2. This allows major reduction in GHG
emission. Since the global warming potential of carbon dioxide is lower than that of methane.
Removal of CO2 gas can be possible through physical/chemical sorption and membrane
separation methods. But the application of the system is associated with high capital and
operational cost. So now a days CO2
sequestration by cultivating microalgae is considered
as attractive alternate method for carbon dioxide trapping.
Other ways to mitigate indirect emissions and enhance efficiency of the plant is by using
energy efficient units and operation techniques. Use of renewable source for the generation
of electricity or heat energy can reduce major indirect GHG emissions in the plant.
Natural STPs, on the other hand, permits capture of methane and flaring or even use as
renewable energy source. This can offset almost 345 kg to 3700kg/ MLD (sink), depending
on the technology used. Further, they also have an advantage of higher reliability as they
are not dependent on electricity or chemicals for the treatment.
69GHG Estimation and Climate Adaptation

References1. IWA Publishing , 2021. Minimization of greenhouse gas emissions from extended aeration
activated sludge process. In: Water Practice & Technology. Volume 16, Issue 1 ed. s.l.:s.n.
2. D.Kyung, M. K. J. W. L., 2015. Investigation of GHG emission sources and reducing GHG emissions in a municipal wastewater treatment plant. Journal of Cleaner Production, 15 May, Volume 95, pp. Pages 117-123.
3. Enerdata, E. E. 2., 2021. GHG emissions in developing countries - issues and perspectives for COP-26. [Online] Available at: https://www.enerdata.net/publications/executive-briefing/ghg-emissions-trends-developing-countries-cop26.html
4. International Energy Agency (IEA), 2016. In: Key World Energy Statistics 2016. Paris, France: OECD Publishing, p. p. 80..
5. IPCC, 2014. AR5 Synthesis Report: Climate Change 2014, s.l.: IPCC.
6. Laura Snip, 2009. Quantifying the greenhouse gas emissions of wastewater treatment plants. Thesis project Systems and Control ed. s.l.:s.n.
7. UNCTAD, C. R., 2021. Carbon emissions anywhere threaten development everywhere.
8. Yapıcıoglu, P., 2021. Minimization of greenhouse gas emissions from extended aeration activated sludge process. Water Practice and Technology, 1 January, 16(1), pp. 96-107.
70 Sustainable Cities Integrated Approach Pilot in India

71GHG Estimation and Climate Adaptation

4Chapter
Climate Adaptation Strategies in the Water Sector
72 Sustainable Cities Integrated Approach Pilot in India

Training Outcomes
• Able to understand climate adaptation strategies and measures for utilities
• Gather an understanding of the GHG emissions calculations • Gather an understanding of dovetailing strategies for utilities
Chapter Contents
4.1 Introduction
4.2 Climate change adaptations
4.3 Choosing flexibility
4.4 Water-energy nexus
4.5 Calculating GHG emissions
4.6 Case studies
4.7 Dovetailing climate adaptation strategies in other utilities
References
Recap
The previous chapter explores the various tools and methodologies to estimate GHG emissions across different Wastewater Treatment technologies.
Training Objectives
• To identify available climate adaptation strategies on water resources in the select Indian cities
• To provide a step by step guidance on calculation of GHG emissions in the domain of water management
• To highlight the lessons learnt from the two case studies provided • To suggest dovetailing climate adaptation strategies for utillities
73GHG Estimation and Climate Adaptation

4.1 IntroductionClimate change and variability affect water resources and their management in many parts
of the country. Water also plays a key role in climate change adaptation, and therefore,
needs to be prioritized in national strategies for sustainable development and pubic
security. Dense population, economic inequity, inadequate infrastructure, and poor
planning exacerbate the climate change
Impacts on water resources in urban areas. These also form a substantial ecological footprint,
with overflowing waste and wastewater in poorly drained settlements further discharged
into the ground, polluting groundwater aquifers. While many integrated climate adaptation
approaches exist in the country, this chapter offers evidence to suggest measures towards
climate change adaptation in the water sector.
Figure 4.1: General measures for Climate Adaptation
Source – Authors
4.2 Climate Change AdaptationsSound planning should consider all driving forces. In some cases, placing the focus
exclusively on climate change may lead a city to miss more obvious leverage points, which
might be more cost-effectively addressed and lead to better results and greater co-benefits.
Urban planning should, therefore, emphasise assessments and the attribution of impacts to
driving forces.
Climate change manifestations through alterations in the water cycle pose significant risks
to the urban water system including water supply, wastewater and stormwater. Extreme
weather events already pose a serious threat to water and wastewater infrastructure, with
predictions indicating an increased occurrence of such extreme events cities are to pay high
priority to the same.
74 Sustainable Cities Integrated Approach Pilot in India

Figure 4.2: Climate adaptation measures for utilities
Climate Adaptation measures for Utilities
Climate Adaptation Water Supply and Sanitation assessments
Adjusting infrastructure designs and introducing flexibility in water systems operations
Implementing disaster response strategy to reduce effects of water service disruptions, such as sanitation and domestic water supply
Separation of storm water and sanitary sewers
Flood protection infrastructure to prevent contamination of water supply sources
Source – Authors
Wastewater systemsThe consequential impact of climate change on wastewater treatment infrastructure
is extensive. The infrastructure of collection lines and wastewater treatment, including
outfalls, pipelines and tanks, can be physically damaged by coastal flooding linked to
sea-level rise and also by flooding caused by increased precipitation. The functionality of
wastewater treatment can also be reduced by flooding: in the case of cities with combined
sewer systems, heavy rainfall events can overwhelm wastewater treatment capacity, which
usually results in increased overflows. Extreme events such as floods and droughts threaten
the wastewater treatment plants by diluting or concentrating inflows. In coastal areas,
flooding can lead to increased salinity of influents that can drastically alter the biological
processes and impact the reuse of treated wastewater.
Stormwater and drainage systemsDrainage or stormwater systems will be most affected by the increased occurrence and
intensity of the precipitation. Intense rainfall and a resultant increase in stormwater can
surpass the capacity of stormwater entry points or cause sewer overflows in combined
sewer systems, causing street flooding and associated health impacts. Combined sewer
overflows challenge both stormwater and wastewater: excess stormwater cause overflows,
conveyance of wastewater with combined pipes posing additional challenges. Moreover,
drying and shrinking soils caused by droughts can generate cracks in stormwater drains
and sewers, causing not only contamination but also increasing maintenance costs.
Changes in vegetation and soil characteristics due to increased temperatures and higher
rates of evapotranspiration can also change attenuation and infiltration rates, affecting soil
retention capacity.
75GHG Estimation and Climate Adaptation

While enhancing financial capacity seems to play a role in driving current adaptation
responses, it is to a lesser degree than could be expected: several cities around the world
have started to initiate adaptation, often irrespective of national frameworks being in place.
City networks are also being set up: these can stimulate national policies and act as a positive
example, providing an important venue for the transfer of knowledge and technology. City
networks exchange good practices on a wide range of issues— one example is Connecting
Delta Cities.
Ultimately, the success of adaptation in cities critically depends on the availability of
necessary resources, not only financial and natural but also linked to knowledge, technical
capability, institutional resources and targeted tools (Bakker & van Schaik, 2009).
In general, the design of urban water supply, wastewater and stormwater infrastructure
have built-in spare capacity to account for future growth in demand. Utilities across the
globe encounter issues in integrating coping strategies into planning practices.
Water managers are also often forced to implement rationing or supply interruptions
measures if reductions in water supplies are not planned already. These measures are not
only unpopular but also costly since the hydraulic shocks associated with intermittent
supply damage water supply infrastructure – decreasing the lifespan of equipment – and
lead to increased maintenance and repair costs (Danilenko, et al., 2010).
4.3 ChoosingflexibilityCurrent water management infrastructure tends to be inflexible and rigid towards changing
circumstances, yet projections of climate change show that variability can change capacity
requirements either regionally or across the year. More sustainable urban water management
systems are designed to cope with varying and unpredictable conditions and achieve this
through the implementation of flexible, and often decentralised options and technologies
that take into account a range of future scenarios. A flexible system is characterised by its
ability to adapt to changing requirements.
Table 4.1 provides examples of a flexible urban water system response to changing
conditions as opposed to typical systems. Additional information on flexible solutions are
available in modules of the SWITCH Training Kit, a series of modules developed under the
project SWITCH – Managing Water for the City of the Future (Module 3 on water supply
and Module 4 on stormwater management and Module 5 on wastewater management)
(ICLEI European Secretariat, 2011).
76 Sustainable Cities Integrated Approach Pilot in India

Table4.1:Responseofconventionalversusflexiblesystemstochangingconditions
Urban Water Management
Aspect
Non-Exhaustive examples of
Climate Change impacts
Current System response example
Potential response to a changing climate from a
flexible system
Water SupplyReduced water supply either seasonally or throughout the year
Increasing water supply through additional infrastructures such as dams, boreholes, desalination plants or bulk supply of water
Demand reduction through efficiency increases, active leakage management, behaviour change or pricing policies
Sourcing of alternative supplies for non-potable demand: rainwater harvesting, reuse of treated wastewater
Increasing sustainable storage capacity eg. Aquifer storage and recovery
Wastewater Management
Increased inflow of pollution caused by flooding
Improving treatment technology
Control of pollution at source and use of natural treatment techniques
Flooding of wastewater treatment plants located near rivers or coasts
Construction of protective barriers or lifting of equipment
Use and appropriate citing of natural treatment techniques
Stormwater Management
Increased stormwater flows and combined sewer overflows
Improving and extending the infrastructure conveying stormwater away from the city
Attenuation of runoff through the use of Sustainable Urban Drainage Systems options, such as green roofs, porous paving, rainwater harvesting, detention ponds and basins
Source – ICLEI European Secretariat (2011)
Integrated Urban Water Management (IUWM) is a widely recognised integrated planning
approach. Module 1 of the SWITCH Training Kit, elaborates further on IUWM (ICLEI
European Secretariat, 2011). The Module of Urban Water Management developed under
SCIAP in India but NIUA, of which this module is a part, discusses in detail the approaches
of IUWM, Water Sensitive Urban Design (WSUD), and a few others. Decentralisation often
defines the flexibility of non-conventional urban water systems. Decentralisation reduces
the sensitivity by spreading risk which may be elaborated by the example of heightened
risk faced by a city dependent on one or more large wastewater treatment plants as against
a city that operates several smaller-scale natural treatment systems located in different
areas. Decentralised solutions are often faster to install and more cost-effective to build
and maintain. These considerations are particularly important in the face of changing
conditions, which can easily render large investments in new treatment facilities or water
supply infrastructure redundant.
77GHG Estimation and Climate Adaptation

Figure 4.3: Adaptation measures for addressing impacts of climate
HOW | Suggested Actions for Climate Adaptation
ADAPTATION FOR ADDRESSING IMPACTS OG CLIMATE CHANGE
Building additional water storage infrastructure
Diversifying water supply sources
Improving water flow and drainage system for flood control
� Green roofs, street trees, wetlands, and porous paving
� Increasing coverage control of community water supply infrastructure
Water Storage Water Supply Water Management
Infrastructure
� Appropriate conservation measures
� Presevation of riparian wetlands within river basins upstream
Smart Technologi
Water Use Efficiency
WaterConservation
River Basin Management
Integrating smart technologies in water supply, sewerage services
Enhancing and Promoting Water Use Efficiency
Integrated water resources management within river basins
Source – Authors
4.4 Water-Energy NexusThe water and energy nexus in urban water utilities play a vital role in the current
context. Water management is heavily reliant on energy for activities such as pumping,
transportation, desalination, domestic water heating and the treatment of drinking water
and wastewater. Water is also integral to energy production, through hydroelectric dams
but also steam turbines and fossil fuel processing. The links between the two resources are
becoming ever more apparent, particularly in the context of increasing resource scarcity
and climate change.
At a time when many cities are trying to reduce greenhouse gas emissions to mitigate
climate change, the intensive energy use of classic and conventional water infrastructure
is a disadvantage. In planning mitigation and adaptation actions, cities must consider this
interconnection between energy and water, to reduce the likelihood of unintended impacts.
78 Sustainable Cities Integrated Approach Pilot in India

Various sustainable water management options have the added advantage of reducing
energy consumption, although in some situations more decentralised solutions can increase
energy consumption, highlighting the need for constructive dialogue between water and
energy managers (Kenway, 2010).
Figure 4.4: Key learning from Climate Change Adaptation in Water Sector
Urban water system vulnerableto climate change Consequences severe without foresight and strategic planning
Climate change not always gradual or linear Cities to be for abrupt change
Adaptation is not newCity and water managers
are used to dealing with uncertainty and change
Adapting can happen at different scalesDifferent scales, from the household level through to major infrastructure
The urban water cycle cannot be adapted in isolation
Integrated management between systems such as
energy, transport and health
Water management to account for all pressures on water systems
Including those unrelated to climate change such as population growth,
land use changes and pollution.
Many cities are adaptation champions
Other cities can learn from success stories
Most vulnerable people bear the brunt of climate changeResponses to climate change must take their needs into account
Cooperation with researchers and local experts is essential Decision makers need them to better grasp implications of uncertainty & take effective action
Adaptation can improve quality of life Improve functioning of urban systems
Source – Authors
4.5 Calculating GHG emissions for water management (WaCCliM, 2017)
IntroductionThe Energy Performance and Carbon Emissions Assessment and Monitoring (ECAM)
tool is a web-based tool that is part of the knowledge platform developed by the Water
and Wastewater Companies for Climate Mitigation (WaCCliM) project. This Tool offers a
solution for utilities to quantify their GHG emissions and contribution to NDCs through
reducing indirect and direct emissions from energy use and wastewater management.
It is the first of its kind to allow for a holistic approach of the urban water cycle to drive
GHG emission reduction in utilities, even those with limited data availability. It promotes
transparency, accuracy, completeness, comparability and consistency.
79GHG Estimation and Climate Adaptation

This Tool is a carbon footprint tool for water and wastewater utilities, is a cornerstone of this
approach. It also helps utilities understand their overall energy usage and total greenhouse
gas emissions at a system-wide level and indicates areas to reduce emissions, considering all
components of the urban water cycle, from water supply to wastewater treatment, sludge
management and water reuse. The mitigation-focused ECAM Tool integrates well with
WaCCliM’s activities in support of adaptation, which improve the capacity of utilities to
develop climate risk plans, analyse the co-benefits of mitigation and adaptation measures,
and prioritise measures for more climate risk-resilient water and wastewater systems.
Figure 4.5: Mitigation and adaptation in the urban water cycle
Source: (wacclim)
Holistic ApproachTypically in the water sector, emissions are assessed separately. The ECAM tool however,
has been developed to facilitate the assessment of systems via a holistic approach,
considering all stages of the urban water cycle and the interlinkages between stages Figure
4.6. The aim is to maintain the overview on the entire urban water cycle in the analysis, to
convey the notion that sub-systems are inter-related.
80 Sustainable Cities Integrated Approach Pilot in India

Figure 4.6: Stages of the urban water cycle
Source: (WaCCliM, 2017)
The applied framework of the urban water cycle includes the water supply and wastewater
management processes (water abstraction and transmission systems, water treatment,
water transport and distribution, wastewater collection, wastewater treatment and
wastewater interception and discharge). Figure 4.7 shows the utility boundaries considered
in ECAM Tool, the part under the dash lines.
Figure 4.7: System boundary
Source: (WaCCliM, 2017)
81GHG Estimation and Climate Adaptation

In ECAM the user experience starts with Tier A- Initial GHG assessment, which includes
the whole water supply and wastewater handling services allowing a user to make a
straightforward assessment with back-of-the-envelope calculations. The experience
continues with Tier B – Detailed GHG assessment, in which the user can introduce more
accurate values to calculate the GHG emissions of the drinking water and wastewater
systems and can evaluate Energy Performance within the advanced assessment to identify
potential energy savings for the 6 stages of the water cycle (Abstraction, Treatment,
Distribution and Collection, Treatment, Discharge) and their individual facilities (pump
stations, plants, network divisions) can be characterized. Some of the assessment results are
compared with known benchmarks so that inefficiencies can be highlighted, and decision
makers can prioritize improvements in the utilities’ most promising stages.
The GHG estimationTwo categories of GHG emissions are included in ECAM. GHG emissions associated
with electricity use scope 2 – (indirect emissions) and the GHG emissions not related
to electricity use, which group the Scope 1 (direct emissions) and scope 3 (other indirect
emissions) emissions per the IPCC definitions (see Table 4 2). The “non-electricity related”
GHG emissions are associated with activities within the boundary of the utility, or which are
a consequence of the services provided outside of the utility boundary.
Table 4.2: GHGs Emission from water and wastewater services
The energy assessment focuses on electricity consumption at each stage of the utility for
process related usage. At each stage of the urban water cycle, the user may enter sub-stages
representing the different facilities of that particular stage (e.g. different treatment plants,
different pump stages or distribution networks). At the stage level, the energy performance
can only be assessed in terms of relative importance of the stage in comparison to the entire
water cycle. At sub-stage level, energy performance indicators are calculated to assess if
there is a potential to reduce consumption or improve energy production by comparing
82 Sustainable Cities Integrated Approach Pilot in India

to benchmark values. These performance indicators (e.g.: standardized pumping energy,
treatment energy), when documented at the sub-stage level (i.e.: at the facility level), are
then averaged to provide an overview of the overall efficiency of the stage.
4.6 Case Studies
Climate proofing of water and sanitation sector, Surat
BackgroundPlanning for adaptation of Surat’s vulnerability to climate
change is determined both by its exposure to several
climate change threats, including rising temperatures,
sea-level rise and devastating floods such as the flood
in 1994 and 2006. Surat, an industrial hub also known
as the diamond city of India, lies in the southern part
of the Indian state of Gujarat, with an approximate area
of 326.51 km2 and unprecedented growth in the post-
independence causing strain on the depleting resources.
However, Surat has been ranked as the most Climate-
Smart City (with the highest five-star ranking) in the
Climate Smart Cities Assessment Framework 2.0 of
cities in India, announced in June 2021.
ObjectivesoftheprogramsundertakeninSurat • To reduce the energy utilised in the water supply sector (energy efficiency measures and
use of renewable energy)
• To augment reuse of treated wastewater for industrial use
Approach Surat has been a pioneer city in implementing energy efficiency efforts in the water
supply sector. In 1997, a biogas electricity generation pilot project was implemented with
support from India’s national Ministry of Non-Conventional Energy Sources (MNES), under
the UNDP and National Program on Energy Recovery from Urban and Industrial Waste.
In 1999, a biogas electricity generation project was implemented at the Anjana Sewage
Treatment Plant. To enhance energy efficiency in the water supply sector Energy Efficiency
Cell was established in 2001, that reduced energy use significantly strategizing
• energy audits,
• maintaining a database and monitoring,
• specific energy conservation measures at grids for potable water, and
• bill monitoring
CITY PROFILE
SURAT CITY
Geographical Area: 326km²
Population: 4.47 million
Climate Adaptation Strategies
Climate Adaptation strategies by the Utility
� Energy efficiency cell � Reuse of treated waste
water for industrial use � Biogas generation � Renewable energy use for
water utilities such as wind power, solar power etc
83GHG Estimation and Climate Adaptation

Moving towards renewable energy sources such as the biogas plant implementation of
0.5 MWe at Anjana Sewage Treatment Plant of Surat Municipal Council in 2003 and the
commissioning of the 3 MW Wind Power Plant, are early initiatives towards reductions in
GHGs. In recent years (2019), Surat has become the first city in India to use solar power for
meeting energy needs for the city’s water supply.
ResultsThe total energy savings until 2014 was reported as 25,62,79,666 KWH, amounting to Rs.
214 cr. until 2014 with 4,02,310 tonnes of GHG saved.
Lessons learnt • Rising from a crisis - Continuous learnings from several subsequent floods and extreme
events in the city have brought stakeholders together to support SMC in implementing
adaptation measures.
• Showcased the ability of wastewater realizing industrial water security without tapping
freshwater resources while highlighting the ability of the PPP model.
• Government policies, regulations, and programs. SMC’s efforts to build water
management infrastructure align with the state government’s policy for promoting
recycled water for non-potable use and minimizing groundwater withdrawals, although
several of these initiatives began even before the Government of Gujrat’s Reuse &
Recycle of Treated Wastewater Action Plan 2019 was laid. The Action plan supports
replication and extension of the reuse in Surat to 70% of total sewage. Support from
Government programs such as SBM (Urban), AMRUT, Smart City Mission, 15th Finance
Commission have been encouraging.
• Bilateral funds and programs have also played an instrumental role in facilitating
innovative solutions towards climate adaptation. Often the implementation of
infrastructure projects depends on the availability of funds and technical support. The
UNDP/GEF assisted the Sewage Gas Based Power Plant at Anjana Sewage Treatment
Plant, (first in the country) in 1999.
Conclusion Though the water supply and sanitation sector have lower GHG emissions when compared
to other economic sectors, water utilities are realising the need for contributing towards
reductions in GHG emissions through their low carbon commitments, implementing
alternatives to improve their energy efficiency and reduce the GHG emissions. The efforts
of Surat in reducing energy consumption in water supply systems consequently contribute
towards the national goal of a 33-35% reduction in GHG emissions by 2030. The state of
Gujarat emits the highest amount of CO2 (90MT) which is around 18% of the total emissions
in the country.9
9https://www.orfonline.org/research/how-indian-states-are-promoting-sustainable-industry/
84 Sustainable Cities Integrated Approach Pilot in India
Circular economy through reuse of treated wastewater and energy recovery from wastewater sludge, Chennai
BackgroundWith a population of about 7.4 million people, the capital city of Tamil Nadu State produces
830 MLD of water catering to 8,76,891 consumers.
To respond to the rising water crisis and the uncertainties of climate change in the future as
against an ever-increasing demand due to urban population growth, supply augmentation
for the current Chennai Metro Water Supply and Sewerage Board (CMWSSB) was
considered necessary.
ObjectivesoftheprogramsundertakeninChennai • To reduce the energy utilised in the water supply sector (energy efficiency measures and
use of renewable energy)
• To augment reuse of treated wastewater for industrial use
Approach With growing industries, rising urban population and increasing water demand in the
background of extreme events that impact water supply, CMWSSB worked towards
allocating water resources for industrial use while meeting the rising needs for potable
water for households. Recycling and reusing of wastewater for industrial users were initially
tried at a small scale which CMWSSB scaled up to two tertiary treatment plants in 2015. The
Water Reuse Project with energy-recovery systems, not just helped in augmenting reuse
of treated wastewater for industrial osmosis plants of 45 MLD capacity each at two of the
existing wastewater treatment plants and supply to industries instead of using freshwater.
The main sources of water then included water from reservoirs and groundwater is now
replaced by 16% desalination 10% recycled wastewater 65% reservoirs 9% groundwater.
Results • Reduced cost of operation and reduced risks of water scarcity for industrial users
• Reduced expenses on water purchase for Industries (CPCL, MFL, and MPL) has resulted
in annual savings of Rs 164 million.
• Increased sustainability of CMWSSB providing additional revenue for the utility
• Reduced load on freshwater resources
• This means that the use of an equivalent amount of fresh water is being avoided,
indirectly augmenting available freshwater to meet the city’s increasing water needs.
• Reduced GHG emissions –Installation of energy recovery plants at seven of the
twelve WWTPs with a total installed capacity of 7 megawatts (MW) has reduced the
dependency on electricity from the city’s grid and thereby reduces the emission of
GHGs.
85GHG Estimation and Climate Adaptation

Lessons learnt • The success of the PPP models in ensuring performance and service standards is
highlighted. Private participation also encourages contribution to capital and operating
costs while assuring financial viability.
• Government support and regulations- The national, state, and municipal legislation
and policies provide crucial support. Increased water costs for enterprises, as well as
the zero-discharge regulation, have been strong factors for promoting use of treated
wastewater. The Water Reuse Plan of CMWSSB and the Greater Chennai Corporation’s
bylaw mandating all stakeholders to recycle wastewater has played a vital role.
• Proactive planning and Innovative thinking- As a drought proofing measure and for
augmentation of water supply to Chennai City, CMWSS Board has set up a 100MLD
capacity Seawater Desalination Plant at Nemmeli and Minjur. The Chembarambakkam
530mld Water Treatment Plant has technologies to ensure least water losses from the
plant with automated SCADA control and compact plant layout & optimum land usage
saving land area.
Conclusion These results from the case study mark a case of augmentation of water supply in addition
to the reduction in greenhouse gas emissions, by CMWSSB’s efforts in recycling and reuse
between 60 and 75 per cent of the city’s wastewater for industrial and indirect potable
reuse. This has build resilience in water supply and improved water security supporting
climate adaptation. The revenue earned has strengthened the CMWSSB’s financial
sustainability. The energy recovery system through the biogas power generation from
wastewater treatment plants has reduced the electricity demand from the grids and hence
contributed towards reduced GHGs.
4.7 Dovetailing climate adaptation strategies in other utilities
Build climate-resilient Water Supply and Sanitation infrastructure.Climate Resilient infrastructure would need to be planned, designed, built and operated for
facing climate change events and adapting to the same. For cities to ensure that climate
resilience of water and sanitation infrastructure the following aspects are to be covered;
• Risk Assessments for assessing the climate resilience of water and sanitation
infrastructure should also include Hazard risk assessments and vulnerability assessments.
• Integrating innovative advanced technologies such as real-time weather forecasting
and early warning systems with water supply services
• Strengthening cost-effective approaches to provide potable water supply services
during climate extreme events such as floods, cyclones or droughts
• Enhancing exigency planning for hazard events
86 Sustainable Cities Integrated Approach Pilot in India

• Strengthening Water Supply and Sanitation infrastructure based on the risk assessments
(such as flood proofing including flood barriers to protect infrastructure etc)
• Integrating Public-Private Partnerships in Climate Resilient Infrastructure for cities
See Climate Resilient Infrastructure Planning in Vishakhapatnam city, https://www.teriin.
org/eventdocs/files/Case-Study-Vishakhapatnam.pdf
Figure 4.8: Dovetailing climate adaptation strategies in other utilities
Water conservation measures and Rainwater harvestingMost Indian cities receive around 900 mm of average annual rainfall and also have several
natural water bodies, yet these water resources are not utilised effectively. Conservation
of water resources and rainwater harvesting will help utilities bridge the demand supply
gap and adapt to drought like scenarios. The Jal Jeevan Mission (JJM) launched for
India’s Water sector in 2019, not only focussed on functional tap water connections for
100% of households in India, and improving water infrastructure but also brings about a
transformative shift from traditional linear water supply delivery to the circular economy
of water conservation. The ‘Jal Shakti Abhiyan: Catch the Rain’ campaign as a Jan Andolan
(mass movement) launched for encouraging water conservation at the grassroots level is
an important step towards water adaptation. The City Water Balance Plan, the City Used
Water/Recycle/Reuse Plan, and the City Aquifer Management Plan under the JJM are
noteworthy in the management of water.
Please see the case study on the Revival of Mansagar Lake, Jaipur at https://smartnet.niua.org/sites/default/files/resources/Doc%203_Revival%20of%20Mansagar%20Lake.pdf
87GHG Estimation and Climate Adaptation

Augmentation of water storage capacityIncreasing water storage options and enhancing water-saving opportunities is considered
one of the most effective climate adaptations measures. Enhancing surface water storage
options by rejuvenating lakes and water bodies and increasing the amount of groundwater
storage availability promotes adaptive capacity especially to extreme events like droughts
and enables meeting the growing water needs.
Refer to the NITI Ayog, 2017, Selected Best Practices in Water Management at http://social.niti.gov.in/uploads/sample/water_index_report2.pdf
Reuse of treated wastewaterWhile the Draft National Policy on the Safe Reuse of Treated Wastewater (2020) is under
finalisation, there is extensive pressure to reuse treated wastewater especially for industrial
use and address the rising water scarcity in the cities. Several states such as Gujrat, Tamil
Nadu, Haryana, Karnataka have set mandatory targets for the reuse of wastewater.
According to a recent report by the World-Wide Fund, around 30 Indian cities are to face
serious water shortage and diversifying water sources early will be immensely useful.
Please see A Qualitative Framework to Evaluate the Extent of Integrated Urban Water Management in Indian Cities & Applying the Framework to Delhi https://www.niua.org/sites/default/files/NIUA-UNESCO_White%20Paper.pdf5
Energy Efficiency and optimisation of operations in Water Supply and Sewerage The highest expenditure on water utilities is for electricity consumption. Energy efficiency
measures will save energy costs and make them reduce their carbon footprint. Also, while
most utilities are grappling under growing demand and reducing supply, reuse of wastewater,
deep well pumping, large scale desalination all demand increased energy. Hence adopting
energy-efficient measures and shifting to renewable sources of energy is vital. At the same
time wastewater treatment is of grave concern to all cities in India, the amount of GHGs
released through the untreated wastewater and sludge can be reduced and cleaner energy
is used in the water supply for the utilities.
Please see, GDI, 2016, Wastewater Systems and Energy Saving in Urban India at http://re.indiaenvironmentportal.org.in/files/file/Wastewater%20systems%20and%20energy%20saving%20in%20urban%20India.pdf
88 Sustainable Cities Integrated Approach Pilot in India

References1. Bakker, M. H. N. & van Schaik, H., 2009. Climate change adaptation in the water sector:
Financial issues. [Online] Available at: https://www.researchgate.net/publication/304036693_Climate_change_adaptation_in_the_water_sector_Financial_issues_Perspective_Document_for_the_5th_World_Water_Forum [Accessed 31 August 2021].
2. Danilenko, A., Dickson, E. & Jacobsen, M., 2010. Climate Change and Urban Water Utilities: Challenges and Opportunities. Washington, DC: World Bank.
3. ICLEI European Secretariat, 2011. The SWITCH Training Kit - Integrated Urban Water Management in the City of the Future, Freiburg: ICLEI European Secretariat GmBH.
4. Kenway, S., 2010. Water-energy nexus needs more study, s.l.: s.n.
5. Nakakubo, T., Yoshida, N. & Hattori, Y., 2017. Analysis of greenhouse gas emission reductions by collaboratively updating equipment in sewage treatment and municipal solid waste incineration plants. Journal of Cleaner Production, Volume 168, pp. 803-813.
89GHG Estimation and Climate Adaptation
5Chapter
Legal Instruments Addressing Climate Change Impacts on Water Resources
90 Sustainable Cities Integrated Approach Pilot in India

Training Outcomes
• Improved knowledge base and better understanding on the national/state/city level policies and programmes related to water-climate change linkages.
• Participation and inclusion of the public and different stakeholders• Facilitating review and amendments of water resource management
based on monitoring and updates of policy analyses
Chapter Contents
5.1 Introduction
5.2 National Policies Addressing Climate Change Challenges
5.3 State level policies addressing climate change challenges
5.4 City-Level Policies/Programs Addressing Climate Change Challenges in Water Sources Management
References
Recap
The previous chapter dealt with climate change adaptation measures for utilities in the water sector, choosing flexibility and water energy nexus. The chapter also provides a guide for calculating GHG emissions in the domain of water management.
Training Objectives
• Present an overview of national/state/city level policies and programmes in addressing climate change challenges in water sources management.
• Study the linkages of water and climate change with policy action. • Review the trends of related policy decisions in India over time.• Rethink the current policy approaches towards water management in
India given the need to act for climate change.
91GHG Estimation and Climate Adaptation

5.1 Introduction In India, the impacts of climate variability on water resources are likely to affect the key
economic sectors of irrigated agriculture, installed power capacity, reduced water flows
during the dry season, droughts, floods during the wet season, water supply, urban storm/
flooding, etc. In 2019, water shortage was identified as one of the key reasons for the
crisis faced by India’s coal-fired energy sector (Woods & Schlissel, 2019). Between 2013
and 2017, water shortage forced the shutdown of 61 coal-fired plants, resulting in nearly
17,000 gigawatt-hours of lost power. Research indicates that water-related challenges are
likely to worsen as the impacts of climate change in terms of aggravating the duration and
severity of extreme weather events like flooding and drought.
Over the years, various national, state, and municipal level laws and policies have been
devised and enforced by the respective Ministries and Departments of the Government
of India, State Governments as well as Urban Local Bodies (ULBs) to ensure sustainable
management of water resources for combating climate change. In this section, selected
four Indian four states (and cities) are in focus. These are Andhra Pradesh (Vijayawada
and Guntur), Karnataka (Mysore), Madhya Pradesh (Bhopal), and Rajasthan (Jaipur). In a
2020-study titled ‘Climate Vulnerability Assessment for Adaptation Planning in India Using
a Common Framework’ (DST, GoI, 2020), the states of Rajasthan, Madhya Pradesh, Andhra
Pradesh, and Karnataka were categorized as “moderately vulnerable to climate change” and
they ranked 14, 15, 17 and 18 respectively in the pan-India assessment (refer Table 51).
Table 5.1: Overview of vulnerability to climate change of select states in India
States Status of Vulnerability Key Related Driver(s) of vulnerability
Andhra Pradesh
State-specific assessment: * � Krishna District (Vijaywada):
Relatively High Vulnerable (0.583)
� Guntur District: Relatively Low Vulnerable (0.49)
All-India district-level assessment � Guntur: Vulnerability index (VI):
0.625; Rank: 114th
� Lack of access to an improved drinking water source (in 2 districts in the+ state)
� 74.8% of households in Guntur with an improved drinking water source
Karnataka
State-specific assessment: * � Mysore: Relatively Low
Vulnerable (0.68)
All-India district-level assessment � Mysore: VI: 0.545; Rank: 372nd
� Lack of access to an improved drinking water source (in 11 districts in the state)
� 95.6% of households with improved drinking water facilities and 51.28% groundwater depletion in Mysore
92 Sustainable Cities Integrated Approach Pilot in India

States Status of Vulnerability Key Related Driver(s) of vulnerability
Madhya Pradesh
State-specific assessment: * � Bhopal: Relatively Very Low
Vulnerable (0.43)
All-India district-level assessment � Bhopal: VI: 0.531; Rank: 409th
� Low groundwater availability (in 29 districts in the state)
� Water-borne diseases (in 2 districts in the state)
� 16.5% groundwater availability in Bhopal
� 555 cases of water-borne diseases (Diarrhea/Dysentery) per 1,00,000 population reported in Bhopal
Rajasthan
State-specific assessment: * � Jaipur: Relatively Low Vulnerable
(0.44);
All-India district-level assessment � Jaipur: VI: 0.506; Rank: 491st
� Water-borne diseases (in 1 district in the state)
� 9 water-borne diseases per 1000 population in Jaipur
Source – Adapted from DST, GoI (2020)
* District Level: Relatively High Vulnerable (0.587-665); Relatively Moderate Vulnerable (0.509-0.586); Relatively Low Vulnerable (0.432-0.508)
5.2 National Policies Addressing Climate Change Challenges The Government of India launched the National Action Plan for Climate Change (NAPCC),
2008 to mitigate and adapt to the climate change impacts. In 2009, all state governments
and Union Territories (UTs) were directed to prepare State Action Plans on Climate Change
(SAPCC), based on the strategy outlined in the national plan. The SAPCC of Rajasthan was
submitted in 2010, of Andhra Pradesh and Madhya Pradesh in 2012, and Karnataka in
2013. The NAPCC has 8 sub-missions with an aim to fulfil India’s developmental objectives
on reducing emission intensity. The National Water Mission aims for water conservation by
reducing wastage and ensuring equal distribution of water resources across states through
integrated management programs. Five goals were identified to attain this objective:
• Comprehensive water database to be shared in public domain and assessment of
impacts;
• Promotion of state action for water conservation;
• Focus on vulnerable/overexploited areas;
• Increasing water use efficiency by 20%; and
• Promotion of integrated water resources management.
Two other Missions of the NAPCC focus on water conservation to some extent. The
National Mission on Sustainable Habitat focuses on ensuring water supply through making
rainwater harvesting mandatory as well as conducting regular water and energy audits. The
National Mission on Sustainable Agriculture aims to optimize utilization of water resources
for farm management, achieve low-input sustainable agriculture through enhanced water
use efficiency, undertake micro-irrigation for efficient use of water (40 MHa), and practice
water conservation in 35 MHa of rainfed areas (2009 – 2017).
93GHG Estimation and Climate Adaptation

The National Adaptation Fund for Climate Change (NAFCC), 2015 was created to meet
the costs of climate change adaptation projects of States/UTs. The NAFCC prioritises
projects that build climate resilience in the areas identified under the National and State
Action Plans. The NAFCC also covers vulnerability and climate impact assessment, capacity
building of various stakeholders, and effective knowledge management. An account of the
NAFCC projects in the four Indian states in focus is given below.
• The project on ‘Climate Resilient Interventions in Dairy Sector in Coastal and Arid
Areas in Andhra Pradesh’ (DoAH, GoAP, 2017) implemented by the State Department
of Animal Husbandry aimed to establish community-based shelters for heat/cyclone
resilience through provision for rainwater harvesting/ponds for ensuring adequate
water availability, and others.
• The project on ‘Conservation and management of indigenous varieties of livestock
(Cattle and Sheep) in the wake of climate change in Karnataka’ (DoAHaVS, GoK, 2016)
implemented by the State Department of Animal Husbandry and Veterinary Services
aimed to enhance fodder production during the lean period of water flow (to facilitate
milk/meat production as well as increase the life span of livestock).
• The project on ‘Enhancing Adaptive Capacity to Climate Change through Developing
Climate-Smart Villages in three Vulnerable Districts (Sehore, Rajgarh and Satna) of
Madhya Pradesh’ (UD&ED, GoMP, 2017) focused on water-smart interventions like
lined farm ponds and broad bed furrow planting.
• In Rajasthan, the project ‘MukhyaMantri Jal Swavlamban Abhiyaan’ (MJSA) For Climate
Change Adaptation and Water Harvesting in Arthuna, Anandpuri and Sajjangarh blocks
of District Banswara (2016-2017)’ (RD&PRD, GoR, 2018) was implemented by the
State Department of Watershed Development & Soil Conservation in 70 villages. The
key objectives were to:
• Develop ‘self-reliant’ villages in terms of water requirement;
• Enhance adaptation and improve resilience;
• Improve groundwater management;
• Improve drinking water availability;
• Increase crop production.
The main project activities included water conservation and water harvesting along
with extensive plantation. The scope of Watershed, Groundwater, Agriculture,
Horticulture, Public Health Engineering, Water Resources, Livelihood, and Forest
Departments were converged to achieve the objectives of MJSA.
94 Sustainable Cities Integrated Approach Pilot in India

The Draft National Policy on Safe Reuse of Treated Water (SRTW) (April 2021) promotes
the management of the hydrological cycle by integrating the existing and proposed policies
on sanitation, faecal sludge management, and the reuse of used industrial water. The Draft
Policy works on a wider context of river basin planning and relevant actions to address
climate change. Ranging from the national to the local level, the Policy mandates the
reuse of treated used water for various non-potable uses, creates a mechanism to support
SRTW, and proposes a model policy framework for States to develop/modify their policy,
regulation and implementation instruments.
Jal Shakti Abhiyan (JSA) is a time-bound water conservation campaign implemented in
two phases: the first phase from July 1 to September 15, 2019, for all States and Union
Territories; and the second one from October 1 to November 30, 2019, for States and
UTs receiving retreating monsoon (including Andhra Pradesh and Karnataka) (MoJS, GoI,
2019). The JSA aimed at making water conservation a Jan Andolan through asset creation
and communication. Various target interventions were made in the water-stressed districts
(least availability of groundwater): a) Water conservation and rainwater harvesting; b)
Renovation of traditional and other water bodies/tanks; c) Reuse/recharge structures; d)
Watershed development; and e) Intensive afforestation. Most of these interventions helped
address the impacts of climate change on water resources, either directly or indirectly.
National Water Policy (NWP) aims to govern the development of water resources and
ensure their optimum utilization. The first National Water Policy was adopted in 1987, was
reviewed in 2002 and later in 2012. The NWP 2012 emphasizes climate change stating
the need for “mitigation at the micro-level by enhancing the capabilities of community to
adopt climate-resilient technological options”. The NWP states that coping strategies must
be adopted to deal with climate change. References to climate change are made at several
places in the policy document. The Policy asserts the need to keep water-related impacts
of climate change in mind while taking decisions related to water resources management.
The details of this NWP 2012 can be found in the module on Urban Water Management
of this series.
95GHG Estimation and Climate Adaptation

Figure 5.1: Relevant National Policies
Source: Author
The National Fecal Sludge and Septage Management (FSSM) Policy, 2017 is to facilitate
nationwide implementation of FSSM services in all ULBs to promote ‘safe and sustainable
sanitation in every urban household in India. In addition, it aims to promote good sanitation
habits with improved onsite sanitation services to achieve public health benefits, with a
special focus on poor populations. This Policy will thus help to address the climate change
impacts on sanitation systems and related FSSM services. The details of this policy can be
found in the module on Urban Waste Water and Septage Management of this series.
96 Sustainable Cities Integrated Approach Pilot in India

National Vector Borne Disease Control Program (NVBDCP) is aimed at preventing and
controlling six vector-borne diseases (VBDs) including malaria. Such diseases are transmitted
through vectors like mosquitos and ticks, could be water-related (though not transmitted by
the faeco-oral route). Malaria causing female anopheles mosquito thrives in polluted water
bodies, irrigation wells, etc. Therefore, prolonged rains, and stagnant water aid in disease
transmission, and hence needs proper management. Climate is one of the key factors that
influence the distribution of diseases borne by these vectors that spread pathogens causing
illness. Protection and conservation of water bodies can contribute to reducing these
Vector-Borne Diseases, and help address the impacts of climate change. Under NVBDCP,
an Enhanced Malaria Control Project (EMCP) was implemented in 100 districts of 8 States
(including Andhra Pradesh, Madhya Pradesh, and Rajasthan) inhabited by tribal populations
that led to a 45% decline in malaria cases. Monitoring and close surveillance under this
program will help identify climate-related changes to vector-borne disease trends and bring
about corrective action including those related to water resources management.
National Lake Conservation Plan (NLCP) of India aims at the conservation and management
of polluted and degraded lakes in urban/peri-urban areas. The key activities include
desilting, de-weeding, interception and diversion of sewage entering lakes, etc (MoEFCC,
GoI, 2008). It was initiated in 2001 and covered 63 lakes in 14 states. The scheme included
six lakes of Rajasthan, 16 in Karnataka and four lakes in Madhya Pradesh. In February
2013, for better coordination and smooth implementation of activities, NLCP was merged
with National Wetland Conservation Programme (NWCP). Deutsche Gesellschaft für
Internationale Zusammenarbeit GmbH (GIZ) in association with the National Plan for
Conservation of Aquatic Ecosystems (NPCA) of the MoEFCC is implementing a project on
‘Wetlands Management for Biodiversity and Climate Security’ (2018-2022) in 3-4 Ramsar
sites (MoEFCC, GoI, 2016) located in the states of Himachal Pradesh, Odisha, and Tamil
Nadu, to secure and enhance wetland biodiversity and ecosystem services.
97GHG Estimation and Climate Adaptation

National River Conservation Plan (NRCP), 1995 aimed at preventing river pollution and
improving the river water quality. The activities included construction of STPs, riverfront
development, low-cost sanitation, afforestation etc. NRCP covered polluted stretches of
33 rivers in 76 towns spread over 15 Indian states. The Ministry of Environment, Forest
& Climate Change (MoEFCC) is currently working on pollution abatement of rivers under
NRCP, excluding Ganga and its tributaries. The rivers covered under NRCP in the four
Indian states in focus are given in Table 5.2.
Table 5.2: Rivers Covered under NRCP in 4 Indian states
State Rivers covered under NRCP
Andhra Pradesh Godavari, Krishna, Pennar, Tungabhadra
Karnataka Bhadra, Cauvery, Pennar, Tunga, Tungabhadra
Madhya Pradesh Narmada, Tapi, Wainganga
Rajasthan Ghaggar, Sabarmati
Source - Manda (2021)
The National Environment Policy (NEP), 2006 of the MoEFCC aims at mainstreaming
environmental concerns into all developmental activities. It outlines conservation strategies
for the existing environmental resources (including water resources) through regulatory
reforms as well as promotes intersectoral collaboration and periodic evaluations of the
current policies.
Jawaharlal Nehru National Urban Renewal Mission (JNNURM), 2005 is an urban
modernization program involving integrated development of infrastructure services in cities
related to water supply and sanitation, sewerage, solid waste management, etc. to provide
basic services to the urban poor. It also included the provision of wastewater management
services related to the recycling of wastewater.
In addition, many states have adopted Demand Side Management Application programs
like Drip irrigation systems for increasing water-energy efficiency, which has the potential
to reduce the amount of greenhouse gas emissions.
98 Sustainable Cities Integrated Approach Pilot in India

5.3 State Level Policies Addressing Climate Change Challenges
Andhra PradeshThe Government of Andhra Pradesh has taken several measures for climate change
adaptation (especially for the vulnerable sections living below the poverty line), including
programs to improve safe water provision, better living conditions, and public health.
Andhra Pradesh State Action Plan for Climate Change 2012 aims to reduce the impact of
climate change and achieve environmental sustainability. The key sectors covered under the
action plan are Forests and biodiversity, Transportation/ urban development (including water
supply system), and Health/Industries/energy. An indicative list of sectoral adaptation/
mitigation interventions related to water resource management is given in Table 5.3.
Table 5.3: Key Recommendations from Andhra Pradesh SAPCC: Interventions for management and sustainability of water resources
Sector Key interventions
Agriculture
� Development and dissemination of new crop varieties resilient to water stress
� Extension program for change of cropping timings and patterns, the efficiency of water use, etc.
Forestry & Biodiversity
� Soil and Water Conservation in forest lands
Energy � Improve the efficiency of electrical equipment, including water pumping
equipment used in agriculture
Industries � Protection and disaster mitigation activities to reduce risks to industrial
areas (e.g., seawalls, improving drainage, alternate water supply sources etc.)
Urban Development
� Safe water supply as per norms for the urban population � Study and remodel existing water supply, sanitation, and sewerage
systems to reduce climate change vulnerability � Protection and restoration of existing water bodies in urban areas,
creation of new water bodies � Restoring efficiency of drainage network of municipalities to avoid
flooding � Mandatory rainwater harvesting systems in Government buildings,
larger homes and apartment blocks, commercial establishments, offices, schools/colleges, academic/research establishments, and industrial units
� Recovery of phosphates nitrates etc. from wastewater
Source – EPTRI (2012)
99GHG Estimation and Climate Adaptation

In 2017, based on the Model Building Byelaws 2016 of the Government of India, the
Municipal Administration and Urban Development of the Government of Andhra Pradesh
brought out the Andhra Pradesh Building Rules, 2017 (MA&UDD, GoAP, 2017). This
legislation promotes climate-resilient construction mandating water conservation measures
like rainwater harvesting and groundwater recharge for improving the environmental
conditions for building and construction under Category “A” (5000 sq. m - 20000 sq. m).
This State Bylaw applies to both the cities of Guntur and Vijayawada.
The Rajiv Aarogyasri Community Health Insurance (RACHI) in Andhra Pradesh is a social
insurance scheme with a private-public partnership model that aims to improve equity of
access to healthcare for the poor. It is predicted that there might be increasing demands
for this healthcare service resulting from climate-related ill health of the local population.
Climate-related illnesses are linked to extreme weather events like heat stress, and the
prevalence of water-borne illnesses. It is imperative to monitor these trends as it will enable
the authorities to take preventive measures (such as warnings before heatwaves and water
stress) to protect public health, especially that of a vulnerable population.
The ‘Andhra Pradesh Wastewater Reuse & Recycle Policy’, 2017 aims at effective Water
Resource Management for ULBs and acts as a mitigation measure for the effects of climate
change in the state. It promotes the reuse of treated wastewater in irrigation enabling
more freshwater to be used for specific municipal purposes (MA&UDD, GoAP, 2017). The
aspects covered in this policy include expanding collection and treatment of wastewater,
updating/creating standards, and practices for using treated wastewater in the irrigation
and industry sectors. It highlights the importance of increasing surface water utilization and
decreasing the use of groundwater for municipal uses.
KarnatakaClimate change impacts are evident in the state of Karnataka. The historical trends show a
6% decline in rainfall between 1951 and 2004, especially in the coastal and north interior
districts of the state. Karnataka State Action Plan on Climate Change (SAPCC) entails a
comprehensive action plan covering the key sectors and defines about 200 action points to
combat climate change; some of the relevant interventions are given in Table 5.4.
100 Sustainable Cities Integrated Approach Pilot in India

Table5.4:KeyRecommendationsfromKarnatakaSAPCC: Interventions for management and sustainability of water resources
Sector Key interventions
Agriculture
� Reevaluating all agriculture-related policies to integrate climate change issues.
� Promotion of Dryland farming � Rendering theft of sprinkler pipes unviable
Water Resources
� Enforcement of Karnataka Groundwater Act � Creation of Policy body for restricting groundwater use � Introduction of a groundwater cess � Introduction of capital subsidy for RWH structures � Integrated water resources management in public buildings � Revision of pricing policy for irrigation water
Coastal zone � Promotion of effluent treatment plants
Other interventions
� Regional research on climate change � Documentation of adaptation practices � SAPCC updation, as needed
Source – EMPRI (2011)
Karnataka State Water Policy aims at:
• providing drinking water at the rate of 55 litres per capita per day (LPCD) in rural areas,
70 LPCD in towns, 100 LPCD in city municipal council areas and 135 LPCD in city
corporation areas;
• creating irrigation potential of 45 lakh hectares under irrigation projects, and an
additional 16 lakh hectares by individual farmers using groundwater.
It promotes the creation of a legislative, administrative, and infrastructural environment to
ensure equitable distribution and utilization of water resources in the state. The State Policy
is in line with the National Water Policy of 2012 in many aspects in terms of recommending
interventions such as rainwater harvesting and groundwater recharge. But the State Policy
does not refer to issues related to climate change which are featured very prominently in
the National Water Policy 2012. In this context, a study was conducted to review the State
Water Policy of 2002 and provide recommendations for modifying it in line with the National
Water Policy, 2012. These recommendations were needed to address climate change and
aspects such as awareness generation, preparedness, coping mechanism, etc. at the state
level. In 2019, The new Karnataka State Water Policy was drafted by the Karnataka Jnana
Aayoga Task Group. It states that per capita water consumption for domestic use should
come down from 135 LPCD to 80-100 LPCD (Karnataka State Water Policy 2019).
101GHG Estimation and Climate Adaptation

The Government of Karnataka’s State Urban Wastewater Reuse Policy, 2017 provides
a comprehensive framework for wastewater reuse, aiming at cost recovery, equity, and
sustainability for urban wastewater management (UDD, GoK, 2017). It focuses on the
industrial reuse of treated wastewater for the financial sustainability of ULBs and mitigating
water supply risks. The policy covers all Class I and II cities of the state. Reuse of at least
20% secondary treated wastewater (of the total urban wastewater generated) is targeted
for identified urban centres by 2020. It advocates the preparation of Integrated Urban
Water Management plans by cities.
Karnataka State Fecal Sludge and Septage Management (FSSM) Policy, 2017 recognizes
the good practices of treating and disposing of septage/faecal sludge and regulation of the
sanitation value chain (GoK, 2017). It aims to achieve 100% coverage of safe sanitation,
promotion of non-sewer sanitation models, safe handling/containment of faecal sludge/
septage, scheduled desludging, environmental improvement, better public health, newer
employment opportunities and greater institutional capacities for FSSM in the state.
Karnataka Groundwater (Regulation and Control of Development and Management) Act,
2011, through the constitution of an empowered Groundwater Authority, is a key legal
instrument for reducing groundwater exploitation. It mandates obtaining permissions for
drilling bore wells and drawing water for water-intensive crops in notified areas. It also aims
to take necessary steps for rainwater harvesting and identify rainwater-recharge-worthy
areas in the state.
To address knowledge deficits in water resources management and for providing a platform
for the inclusion of stakeholders in decision processes, the Government of Karnataka
established the Karnataka Water Resources Authority under the Ministry for Water
Resources in 2008. As mentioned above, an additional Groundwater Authority has been
established under the Karnataka Groundwater Act 2011.
Karnataka Drinking Water and Sanitation Policy 2002 is implemented to manage different
institutional structures (across departments and institutions) and challenges related to the
delivery of drinking water and sanitation services for urban Karnataka, with a likelihood of
addressing the related climate change challenges.
The Karnataka Town and Country Planning Act, 1961, and its subsequent amendment in
2004 prescribed the preparation of Master Plans by planning authorities. The prescribed
use of solar water heaters and rainwater harvesting systems are two prominent examples
where policy decisions were made mandatory through first Structure Plans and then Master
Plans.
102 Sustainable Cities Integrated Approach Pilot in India

Water resources are under severe threat in Karnataka. The state is endowed with limited
water resources that are stressed and depleting. The State Water Resources Department
has initiated comprehensive actions on conservation needs, replenishment, supply and the
participation of common people in watershed management.
The State Departments of Agriculture, Horticulture, Animal Husbandry and Krishi Vigyan
Kendra had taken up several water conservation measures to address climate change
impacts (GWP-India, 2016):
• Soil conservation, rainwater harvesting
• Advising farmers to go for mulching and use of micro-irrigation
• Introducing drought-resistant varieties of crops.
• Awareness of water conservation.
• Increasing green cover area by encouraging area expansion programme of different
perennial horticulture crops.
• Creation of water harvesting structures in farmers’ fields.
As agriculture is the largest water-consuming sector, the state of Karnataka has been
investing a large share of its budget on major, medium, and minor irrigation facilities, large
budget funds were invested on such irrigation structures. The state is also promoting the
adoption of water-efficient technologies such as drip and sprinkler irrigation techniques to
enhance the water productivity and reduce the cost of cultivation.
Madhya PradeshMadhya Pradesh SAPCC aims to address concerns and outline strategies for the development
of a climate-resilient state. As per Madhya Pradesh SAPCC, the key strategies for adaptation
to climate change under the water sector are the increase the water use efficiency for
irrigation, domestic and industrial purposes. The strategies and recommendations of the
SAPCC will strengthen the developmental planning process of the state with policy-level
interventions helping low carbon growth. The strategies and activities pertinent to the key
economic sectors are given in Table 5.5.
103GHG Estimation and Climate Adaptation

Table 5.5: Key Recommendations from Madhya Pradesh SAPCC: Interventions for management and sustainability of water resources
Sector Key interventions
Forests & Biodiversity
� Ensure soil and water conservation measures in forest management � Capacity Building activities for forest officials and communities
Water Resources
� Comprehensive water database (in the public domain) and assessment of the climate change impacts on water resources
� Promote surface water development � Water conservation, and augmentation/preservation for areas with
heavily depleted groundwater � Increase water use efficiency for irrigation, domestic and industrial
purposes � Promote basin level integrated watershed management � Capacity building of professionals from various departments/
organizations/ PRI/ULBs � Building Institutional mechanism for Climate Change Action Plan
Agriculture sector
� Promoting the use of water conservation technologies � Enhancing dissemination of new and appropriate technologies and
strengthening further research - Promotion of energy-efficient water pumps
� Agriculture information management (water security)
Horticulture � Soil and water conservation through demonstration of best practices
Animal Husbandry
� Ensuring availability of adequate water for livestock � Ensure adequate housing for livestock to overcome heat stress -
Identification and management of dedicated water bodies for the cattle to cool off
� Integrate livestock water requirements in watershed management programs
� Strengthening fish rearing practices in an integrated manner with the management of reservoirs and watersheds
� Make quality fish seeds available to fishers - Promote research on developing fish seeds that are suitable for different waterbodies
Health Sector
� Strengthening support systems for environment management - Identify measures for source reduction for all vector-borne, water-borne diseases
� Awareness on Health Issues – Public health education about various vector-borne, water-borne, and other climate-related diseases
� Capacity building of rural health activists on vector- & water-borne diseases as well as techniques to purify drinking water
Urban Development & Transport
� Enhancing Energy Efficiency in Residential in-built environment – a) Follow norms related to urban water supply, sewage treatment facility, etc. b) Adoption of energy efficiency measures for urban water supply and sewerage equipment of ULBs
� Urban Water Supply – a) Promote water-efficient garden irrigation techniques, reduce leakage in the domestic supply system, water recycling b) Awareness among people about Reduce and Recycle techniques for wastewater
� Urban Storm Water Management � Wastewater Management – a) Pilot project for segregation at the
household level of black and grey water b) Strengthening institutional and technical capacities of ULBs for effective O&M of sewerage system, and recycling and reuse of wastewater for non-potable uses
� Creation and Adoption of benchmarks for sustainable management of water supply, wastewater, stormwater drainage and solid waste management
104 Sustainable Cities Integrated Approach Pilot in India

Sector Key interventions
Energy � Undertake demand-side management to improve efficiency and reduce
GHG emissions - Promote Energy Efficiency in Street lighting and Water Pumping, Buildings
Industry
� Build strict rules and regulations for upcoming industrial zone keeping in view optimum management of water resources
� Devise an integrated water management plan for industrial clusters � Creation of green zones and water harvesting structures in industrial
clusters
Rural development
� Promotion of water efficiency in agriculture and other uses � Coordination and integration with the Climate Change action plans of
departments like forest water, agriculture, energy and health so that climate resilience of the communities is ensured
Environment
� Improve understanding of climate change at policy level on- water, food security, land-use change, disease transmission, Greenhouse Gas emissions, Clean Development Mechanism etc. in collaboration with relevant institutes/departments
Source – H&ED, GoMP (2014)
Madhya Pradesh State Level Policy for Wastewater Recycle & Fecal Sludge Management,
2017 is to ensure the improved health status of the urban population, especially the
underprivileged, through the provision of sustainable sanitation services and protection of
the environment. The Policy guides recycling, reuse of treated effluent and safe disposal of
sludge, financial management and cost analysis, standards/regulations/quality assurances,
legislation and institutional framework, public awareness and IEC & other priority issues
(UD&HD, GoMP, 2017).
Madhya Pradesh State Water Policy 2003 addresses the exploitation of groundwater
resources for drinking water purposes. The Policy entails maintenance and modernization
of key water resources, groundwater development, water allocation priorities, drinking
water and quality control, irrigation and land management, rationalization of water rates,
the importance of participation in water management, institutional participation including
that of non-governmental institutions, the establishment of water zone and watershed
management, flood control and management, scarcity area management, science and
technology, as well as provision of training and capacity building (GoMP, 2003).
RajasthanThe state of Rajasthan has the highest climate sensitivity, maximum vulnerability, and
lowest adaptive capacity, affected by severe droughts, water shortage, and abrupt rise
in surface temperature. The Rajasthan Action Plan on Climate Change aims to enhance
resilience in the state by addressing current and likely impacts of climate change on key
sectors, enhance adaptive capacities of the vulnerable communities, and tap potential
opportunities for mitigation. The key interventions for water resource management
identified in the Rajasthan SAPCC are given in Table 5.6.
105GHG Estimation and Climate Adaptation

Table 5.6: Key Recommendations from Rajasthan SAPCC: Interventions for management and sustainability of water resources
Sector Key interventions
Water Resources
� Groundwater management with focused attention on overexploited areas
� Enhancing preparedness for drought monitoring, drought mitigation and development of early warning system
� Enhancing Water Conservation Measures � Improving Water Use Efficiency � Developing a comprehensive water database for assessment of climate
change impacts on water resources
Agriculture & Animal Husbandry
� Enhancing the productivity of crops and livestock - Development of climate-hardy cultivars which are tolerant to droughts, thermal extremes, and are less water consumptive.
Human health
� Research-based prioritization of vulnerable regions/populations for targeted health interventions - Study the regional pattern of climate-sensitive diseases & disease outbreaks including waterborne diseases
� Strengthen disaster management plan specific to the health sector - for management of sanitation, water, etc.
Forests & Biodiversity
� Measures to address land degradation and desertification including water resources management
Enhanced energy efficiency and use of renewable energy
� Demand-side measures including energy efficiency – Waste-to-energy- Greenhouse gases from municipal solid waste disposal, domestic wastewater disposal, and industrial wastewater disposal.
� Reduction of transmission and distribution losses - providing tariff concession on solar water heaters
Urban Governance and Sustainable Habitat
� Urban stormwater drainage infrastructure improvement related to an increase in frequency and intensity of extreme rainfall
� Restrict/control land use in areas prone to flash-flood � Preparedness and Mitigation Plan – community participation through
awareness programs on extreme weather events, good practices to avoid the spread of water-borne diseases and training on monitoring river water levels to prevent future disasters
� State directive (to ULBs) to incorporate water harvesting and wastewater treatment and dual water supply for other uses than drinking, in building by-laws for a reduction in mean annual rainfall in some areas
� Amendments to existing urban policies to incorporate water conservation and harvesting principles
� Calculation of water footprint, linking with tax rebates for business owners and individuals
� Promoting green buildings as a mitigation strategy – procurement of water-saving equipment
Strategic Knowledge on Climate Change
� Climate change vulnerability assessment and strategies for better preparedness - Hydrology and water resources is a key sector
� Dissemination and Capacity Building on climate change for government officials including Department of Water Resources & Irrigation
� Technical capacity building for the advancement of research on climate change - Hydrological Modeling (of groundwater, surface water and basin hydrology).
Source – TERI (2010)
106 Sustainable Cities Integrated Approach Pilot in India

To overcome water shortage in the state, Rajasthan State Sewerage and Wastewater Policy,
2016 promotes the use of potable water only for drinking purposes, and reuse of water
(of a certain standard after proper treatment) for non-potable uses. It also aims to achieve
scientific disposal of waste to ensure 100% sanitized cities. It is to be noted that only 2% of
the population of Jaipur is provided with partial sewerage coverage. The Policy takes into
consideration various national and state legislations like the Effluent Quality Guidelines for
health protection measures in aquaculture use of wastewater and Quality Guidelines for
health protection in using human wastes for aquaculture.
Rajasthan State Water Policy, 2010 proposes an integrated approach to planning,
development, and sustainable management of water resources. The policy focuses on
Integrated Water Resources Management, with a holistic and bottom-up approach. It
addresses issues related to water supply and development, sustainable irrigation, water
resources infrastructure, water conservation, water quality, environmental management,
water pricing, legal support, capacity building, research, monitoring and evaluation of water
policy and action plans. Rajasthan State Water Resource Planning Department (RSWRP) is
the implementing organization. Water Resource Vision 2045 has been prepared to highlight
the short term (up to 2015) and long term (up to 2045) thrust areas and action plans which
are the pre-requisites for successful implementation of the State Water Policy and Plan.
Rajasthan State Environment Policy, 2010 is in line with the objectives and underlying
principles of the National Environment Policy, 2006, and addresses state-specific specific
issues related to the key sectors like agriculture, animal husbandry, mining, industry,
tourism, energy, and basic urban services and infrastructure, most of which are linked to
climate change impacts.
Rajasthan Farmers Participation in Management of Irrigation System Act 2000 aims to
promote and secure distribution of water among its users, sustenance of the irrigation
system, efficient utilization of water to optimize agricultural production, and environmental
protection. It encourages the involvement of farmers by promoting a sense of ownership
for irrigation. It specifies a water budget and operational plan for the implementation of
these activities.
107GHG Estimation and Climate Adaptation

5.4 City-Level Policies/Programs Addressing Climate Change Challenges in Water Sources Management
MysoreMysore City Sanitation Plan 2011 is a key planning tool and vision document for achieving
city-wide sanitation. It aims at improving water supply services that are likely to provide
resilient solutions for the challenges of diminishing water sources and impacts of climate
change.
Mysore Urban Development Authority Master Plan 2031 envisions a balanced and equitable
urban growth for Mysore through suggested interventions for new land use plans and zonal
regulations. The plan mandates rainwater harvesting for all plots that are more than 200 sq
m. in extent. It also calls for conservation and preservation of open spaces including water
bodies of the city.
Rockefeller Foundation’s Asian Cities Climate Change Resilient Network (ACCCRN) program
aims at improving climate resilience and enables local governments to assess climate risks
related to urbanization, poverty and vulnerability and formulate resilience strategies. Under
ACCRN, the Mysore City resilience strategy was developed (CDIA, 2015). Following the
strategy document, a resilient, integrated, stormwater drainage project was adopted for
the city of Mysore. This project was aimed to increase the capacity of urban drainage and
address drainage problems (caused by solid waste disposal and untreated sewage discharge
into open drains), thereby reducing the negative impacts of increased floods linked to
climate change.
JaipurJaipur Development Authority (JDA) developed Building By-Laws for Rainwater Harvesting
& Recycling applicable for all plot sizes measuring 300 Sqm or more in their plot (JDA,
2013). JDA constructed RWH structures in all their office buildings, residential buildings,
community centres, etc. This initiative is likely to address the challenge of depleting
groundwater and address climate change impacts in the city of Jaipur.
Vijayawada-GunturThe ‘Cities and Climate Change’ initiative of the International Development Research Centre
(IDRC), Canada has piloted a comprehensive integrated rural-urban water management for
climate-based adaptations (IAdapt) program in the city of Vijayawada (Athena Infonomics,
2018). Athena Infonomics is the implementing partner of the project. The city of Vijayawada
is being showcased as a model city at the national level as a “replicable and scalable model”.
108 Sustainable Cities Integrated Approach Pilot in India

A bottom-up stakeholder-centric rural-urban platform has been established. A Decision
Support Tool is used to simulate and predict climate adaptation scenarios for its effective
integration into water resource programs; in other words, to move from conventional water
management approaches to an ‘Integrated Approach’ based on the principles of IWRM and
IUWM. The essence of the program lies in establishing a connection between the main
stakeholders and facilitate scientific and inclusive decision making. The end objective is to
replicate activities at the state level culminating into policy framework, the first-of-its-kind
in India.
BhopalUnder the Bhopal Smart City Program, Rainwater Harvesting (RWH) System will be installed
for city buildings. Bhopal Municipal Corporation (BMC) is one of the 98 smart cities of the
Government of India under the National Smart Cities Mission. As per the plan for Bhopal,
Area Based Development plans have adapted the Sustainable Urban Drainage System
Strategy. All buildings should have an RWH System with Storm Water Detention Capacity
to reduce peak run-off that will be utilized by the building itself to meet its water needs
(Saha, 2017).
Climate change is all a global, regional, national, and local challenge. The policy instruments
discussed in this section are extremely relevant in this ever-changing world. The social
and economic challenges of the ongoing COVID-19 pandemic were further compounded
by the climate disasters like Cyclone Amphan in 2020 and Cyclone Yaas in 2021 (Climate
Action Tracker, 2020). Research indicates that with the currently implemented policies,
India can achieve its Nationally Determined Contribution target. Under policy projections,
greenhouse gas emissions (excluding Land Use, Land-Use Change and Forestry, LULUCF)
was likely to reach a level of 2.8-2.9 GtCO2e in 2020 and 3.8–4.1 GtCO2e in 2030. The
economic standstill is due to the pandemic is leading to sharp reductions in greenhouse
emissions in the short term, but they will start increasing again at an earlier rate unless
India develops a focused and sustainable COVID-19 recovery strategy. Water management
entailing sustainable management of quality and quantity of water resources plays a key
role in achieving the national targets. With an accelerating population and economy and
rapidly changing climate, India needs to pay importance and address its challenges related
to water resources to ensure a long-term supply of safe water for all concerned.
109GHG Estimation and Climate Adaptation

References1. Athena Infonomics, 2018. Athena Institutionalizes RURBAN Platform for Integrated Rural-
Urban Water Management for Climate-Based Adaptations in Indian Cities (IAdapt). [Online] Available at: https://www.athenainfonomics.com/institutionalize-rurban/ [Accessed August 2021].
2. CDIA, 2015. Mysore City Corporation Gives Green Light for CDIA Resilient Project Development. [Online] Available at: https://cdia.asia/2015/03/24/mysore-city-corporation-gives-green-light-for-cdia-resilient-project-development/ [Accessed August 2021].
3. Climate Action Tracker, 2020. India - Climate Action Tracker. [Online] Available at: https://climateactiontracker.org/countries/india/ [Accessed August 2021].
4. DoAH, GoAP, 2017. Project Proposal (DPR) for funding under National Adaptation Fund for Climate Change, Hyderabad: Department of Animal Husbandry, Government of Andhra Pradesh.
5. DoAHaVS, GoK, 2016. Detailed Project Report - Conservation and management of indigenous varieties of livestock (Cattle and Sheep) in the wake of climate change in Karnataka, s.l.: Department of Animal Husbandry and Veterinary Services, Government of Karnataka.
6. DST, GoI, 2020. Climate Vulnerability Assessment for Adaptation Planning in India Using a Common Framework, New Delhi: Department of Science and Technology, Government of India.
7. EMPRI, 2011. Draft Karnataka State Action Plan on Climate Change, Bangalore: Environmental Management & Policy Research Institute.
8. EPTRI, 2012. State Action Plan on Climate Change for Andhra Pradesh, Hyderabad: Environment Protection Training and Research Institute.
9. GoK, 2017. Karnataka State Faecal Sludge and Septage Management Policy, Bangalore: Government of Karnataka.
10. GoMP, 2003. Madhya Pradesh State Water Policy, Bhopal: Government of Madhya Pradesh.
11. GWP-India, 2016. Review of Karnataka State Water Policy (2002) & Draft Karnataka State Water Policy-2016 in line with National Water Policy, 2012 in Context of Climate Change, New Delhi: India Water Partnership - Global Water Partnership.
12. H&ED, GoMP, 2014. Madhya Pradesh State Action Plan on Climate Change, Bhopal: Housing and Environment Department Government of Madhya Pradesh.
13. JDA, 2013. Rainwater Harvesting and Recycling - Experience in Jaipur. [Online] Available at: http://cdn.cseindia.org/userfiles/WHarvesting%20&%20Recycling.pdf [Accessed August 2021].
14. MA&UDD, GoAP, 2017. Policy Wastewater Reuse & Recycle for Urban Local Bodies in Andhra Pradesh. s.l.:Municipal Administration & Urban Development Department, Government of Andhra Pradesh.
110 Sustainable Cities Integrated Approach Pilot in India

15. MA&UDD, GoAP, 2017. The Andhra Pradesh Building Rules - 2017. Hyderabad: s.n.
16. Manda, U. S., 2021. National River Conservation Plan - PSCNotes.in. [Online] Available at: https://pscnotes.in/national-river-conservation-plan-upsc/ [Accessed August 2021].
17. MoEFCC, GoI, 2008. Guidelines for National Lake Conservation Plan. New Delhi: Ministry of Environment, Forest and Climate Change, Government of India.
18. MoEFCC, GoI, 2016. National Plan for Conservation of Aquatic Eco-systems. New Delhi: Ministry of Environment, Forest and Climate Change, Government of India.
19. MoJS, GoI, 2019. Jal Shakti Abhiyan. [Online] Available at: https://ejalshakti.gov.in/JSA/JSA/Home.aspx [Accessed August 2021].
20. RD&PRD, GoR, 2018. Detailed Project Report on Mukhyamantri Jal Swavlamban Abhiyaan for Climate Change Adaptation and Water Harvesting, Jaipur: Rural Development & Panchayati Raj Department, Government of Rajasthan.
21. Saha, K., 2017. A Remote Sensing Approach to Smart City Development in India: Case of Bhopal City, Madhya Pradesh. New Delhi, Association for Computing Machinery, pp. 70-75.
22. TERI, 2010. Rajasthan State Action Plan on Climate Change, New Delhi: The Energy and Resources Institute.
23. UD&ED, GoMP, 2017. Increasing Adaptive Capacity to Climate Change through Developing Climate-Smart Villages in Select Vulnerable Districts of Madhya Pradesh, Bhopal: Urban Development and Environment Department, Government of Madhya Pradesh.
24. UD&HD, GoMP, 2017. Madhya Pradesh State Level Policy for Waste Water Recycle & Reuse and Feacal Sludge Management, Bhopal: Urban Development & Housing Department, Government of Madhya Pradesh.
25. UDD, GoK, 2017. Urban Waste Water Reuse Policy, Bangalore: Urban Development Departmenr, Government of Karnataka.
26. Woods, B. & Schlissel, D., 2019. Risks Growing for India’s Coal Sector, s.l.: Institute for Energy Economics and Financial Analysis.
111GHG Estimation and Climate Adaptation
Adaptation — It is the adjustment in natural or human systems to climate change (including
climate variability and extremes) is known as adaptation. It is the process sought to cope
with the consequences of climate change.
Climate — Climate refers to the average weather, in terms of the mean, and its variability
over a certain time span and area.
Climate Change — The change in the state of the climate that can be ascertained by changes
in the mean and/or the variability of its properties, and that lasts for extended period of
time.
Climate-proofing — These are the actions taken to improve the resilience and resistance of
infrastructure to climate change impacts, risks, hazards, and climate extremes.
Greenhouse Gases — GHG are chemical compounds found in the Earth’s atmosphere, such
as carbon dioxide, methane, water vapor, and other human-made gases, that allow much of
the solar radiation to enter the atmosphere, where the energy strikes the Earth and warms
the surface.
Mitigation — Mitigation refers to an action aimed towards reduction or prevention of
greenhouse gas emissions. It can also include developing and deploying new technologies,
using renewable energies like wind and solar, or making older equipment more energy
efficient etc.
Resilience — Resilience is the ability of a social or ecological system to absorb disturbances
while retaining the same basic structure and ways of functioning, the capacity for self-
organization and the capacity to adapt to stress and change.
Sensitivity — Sensitivity is the degree to which a a system (natural or human) is affected to
change in climate.
Vulnerability — Vulnerability is the degree to which a system is susceptible to, or unable
to cope with, adverse effects of climate change, including climate variability and extremes.
Vulnerability is a function of the character, magnitude and rate of climate variation to which
a system is exposed, its sensitivity and its adaptive capacity.
Glossary
112 Sustainable Cities Integrated Approach Pilot in India

Notes:
113GHG Estimation and Climate Adaptation

Notes:
114 Sustainable Cities Integrated Approach Pilot in India


National Institute of Urban Affairs1st Floor, Core 4B, India Habitat Centre, Lodhi Road, New Delhi - 110003, INDIA
Phone: (+91 11) 24617517, 24617543, 24617595 • Fax: (+91 11) 24617513
• Email: [email protected] • Website: www.niua.org