geomorphology reveals active décollement geometry in the central himalayan seismic gap...
TRANSCRIPT
LITHOSPHERE | Volume 7 | Number 3 | www.gsapubs.org 1
Morell_L407 2nd pages / 1 of 10
RESEARCH
Geomorphology reveals active décollement geometry in the central Himalayan seismic gap
Kristin D. Morell1,*, Mike Sandiford1, C.P. Rajendran2, Kusala Rajendran3, Abaz Alimanovic1, David Fink4, and Jaishri Sanwal2
1SCHOOL OF EARTH SCIENCES, UNIVERSITY OF MELBOURNE, MELBOURNE, VICTORIA, 3010, AUSTRALIA2JAWAHARLAL NEHRU CENTRE FOR ADVANCED SCIENTIFIC RESEARCH, BANGALORE, 560064, INDIA3CENTRE FOR EARTH SCIENCE, INDIAN INSTITUTE OF SCIENCE, BANGALORE, 560012, INDIA4AUSTRALIAN NUCLEAR SCIENCE AND TECHNOLOGY ORGANISATION, PMB1, MENAI, NEW SOUTH WALES, 2234, AUSTRALIA
ABSTRACT
The ~700-km-long “central seismic gap” is the most prominent segment of the Himalayan front not to have ruptured in a major earthquake during the last 200–500 yr. This prolonged seismic quiescence has led to the proposition that this region, with a population >10 million, is over-due for a great earthquake. Despite the region’s recognized seismic risk, the geometry of faults likely to host large earthquakes remains poorly understood. Here, we place new constraints on the spatial distribution of rock uplift within the western ~400 km of the central seismic gap using topographic and river profile analyses together with basinwide erosion rate estimates from cosmogenic 10Be. The data sets show a distinctive physiographic transition at the base of the high Himalaya in the state of Uttarakhand, India, characterized by abrupt strike-normal increases in channel steepness and a tenfold increase in erosion rates. When combined with previously published geophysical imaging and seismicity data sets, we interpret the observed spatial distribution of erosion rates and channel steepness to reflect the landscape response to spatially variable rock uplift due to a structurally coherent ramp-flat system of the Main Himalayan Thrust. Although it remains unresolved whether the kinematics of the Main Himalayan Thrust ramp involve an emergent fault or duplex, the landscape and erosion rate patterns suggest that the décollement beneath the state of Uttarakhand provides a sufficiently large and coherent fault segment capable of hosting a great earthquake.
INTRODUCTION
Historical records and damage to long-stand-ing structures indicate that the central Himalayan seismic gap, defined as the region between the historical A.D. 1905 and A.D. 1934 events (Khat-tri, 1987), last experienced large earthquakes in A.D. 1803 and A.D. 1505 (Fig. 1A; Bilham, 1995; Seeber and Armbruster, 1981; Kumar et al., 2006). The absence of large seismic events in this region for more than 200–500 yr, despite Indo-Eurasian convergence of ~20 mm/yr (Bil-ham et al., 1997; Larson et al., 1999), has led many to suggest that this region is primed for a great earthquake (e.g., Khattri and Tyagi, 1983; Khattri, 1987; Bilham et al., 2001; Rajendran and Rajendran, 2005). Considering the high population of the central seismic gap (>10 million people), and the history of devastating earthquakes across the entire Himalaya since at least the thirteenth century (i.e., 7 June A.D. 1255; Sapkota et al., 2012), it has been recog-nized for almost three decades that there is a need to mitigate the seismic hazard in this area (e.g., Khattri, 1987). Although the vulnerabil-
ity of this region to large earthquakes has been identified for quite some time, the active struc-tures that could potentially host a large seismic event remain poorly understood across much of the central seismic gap, particularly within the western half of the gap that spans the state of Uttarakhand, India (Fig. 1A). Since earthquake magnitude relates to rupture area (Wells and Coppersmith, 1994), and therefore is a function of fault geometry, understanding which fault segments have accommodated slip over time scales of 103–104 yr is relevant to assessing where rupture might occur next in this region of the Himalaya and how large such an event could be.
Assessment of the geometry and location of active structures in the Uttarakhand region has proven challenging to date, primarily because the Main Himalayan Thrust, which is considered the fault most likely to rupture during a large earthquake (Banerjee and Bürgmann, 2002), is buried beneath the subsurface, and active seismicity often does not align with surficially mapped structures (e.g., Ni and Baranzangi, 1984). Recent receiver function analyses have successfully imaged, for the first time, the two-dimensional (2-D) ramp-flat geometry of the Main Himalayan Thrust in Uttarakhand (Fig. 2; Caldwell et al., 2013), but how this megathrust
potentially varies along strike remains poorly understood. Because the magnitude of large earthquakes depends in part on how far they can extend laterally along strike, geomorphic indi-cators sensitive to variations in subsurface strain accumulation can provide important insights into the spatial distribution of rock uplift rates across active fault structures, especially when active faults are poorly exposed (e.g., Kirby et al., 2003; Whipple, 2004; Wobus et al., 2006b). For example, geomorphic and topographic met-rics measured prior to the 2008 M
w 7.9 Sichuan
earthquake (Xu et al., 2009) recognized the seismic hazard in this region (Kirby et al., 2000, 2003), while the geodetic catalog (e.g., Shen et al., 2005) indicated no such seismic threat (Kirby et al., 2008; Kirby and Ouimet, 2011). In this study, we use a series of complementary geomorphic data sets as proxies for the spatial patterns of rock uplift across the hinterland of the Uttarakhand Himalaya, including longitudi-nal profile analysis, swath topographic profiles, and basinwide erosion rate estimates from in situ cosmogenic 10Be concentrations. When viewed in the context of published geophysical imagery and seismicity patterns, we use these results to place new constraints on the along- and across-strike geometry of the active, and potentially seismogenic, faults in this region.
LITHOSPHERE doi:10.1130/L407.1
© 2015 Geological Society of America | For permission to copy, contact [email protected]
*Present address: School of Earth and Ocean Sci-ences, University of Victoria, Victoria, British Colum-bia, V8P 5C2, Canada.
MORELL ET AL.
2 www.gsapubs.org | Volume 7 | Number 3 | LITHOSPHERE
Morell_L407 2nd pages / 2 of 10
BACKGROUND
It has long been recognized that India-Eurasia convergence has been largely accommodated along three north-dipping thrusts (Heim and Gansser, 1939). The Main Central Thrust, the northernmost, overthrusts the high-grade Greater Himalayan Sequence atop the lower-grade Lesser Himalayan Sequence (Fig. 1B). The Main Boundary Thrust and Main Frontal Thrust imbricate progressively younger and less-meta-morphosed sedimentary sequences toward the foreland (Valdiya, 1980; Srivastava and Mitra, 1994; Célérier et al., 2009a). All of these thrusts are interpreted to sole into the Main Himalayan Thrust, the detachment at the base of the Hima-layan wedge, which exhibits a ramp-flat geom-etry at depth (Fig. 2; Nábĕlek et al., 2009). Under this backdrop, and given that the Main Central Thrust appears to be currently seismically inac-tive (Ni and Baranzangi, 1984), many early work-ers interpreted the Himalaya to have evolved as a sequence of foreland-propagating thrust sheets (e.g., Srivastava and Mitra, 1994; Célérier et al., 2009a). More recent work has revealed increas-ing evidence for fault activity within the hinter-land, however. For instance, the South Tibetan Detachment has been recognized as a potentially active north-dipping normal fault near the range crest, with the Tethyan Himalayan Sequence in its hanging wall (Fig. 1B; Hodges et al., 2001; Hurtado et al., 2001; McDermott et al., 2013).
In particular, there has been increasing evi-dence for significant active deformation along the base of the high Himalaya, ~100 km north of the Main Frontal Thrust. Seeber and Gornitz (1983) were some of the first to note that north-ward increases in stream gradient indices could be related to higher rates of rock uplift in the high Himalaya by comparison to lower regions. Subsequent observations across the lower–high Himalaya transition in Central Nepal (physio-graphic transition 2 of Nepal [NPT
2]; Fig. 1A)
have been largely consistent with this interpreta-tion (e.g., Jackson and Bilham, 1994; Hodges et al., 2001). Compared to the lower Himalaya, the Nepalese high Himalaya exhibits steeper channel gradients (Wobus et al., 2006a), younger thermo-chronologic ages (Wobus et al., 2003; Bollinger et al., 2006; Robert et al., 2009; Herman et al., 2010; Nadin and Martin, 2012), increased seis-mic activity (Pandey et al., 1995, 1999), and greater rates of vertical velocity (e.g., Jackson and Bilham, 1994; Lavé and Avouac, 2001) and erosion (Wobus et al., 2005; Godard et al., 2014). Given that these changes across the NPT
2
also spatially coincide with geophysical images of the ramp in the Main Himalayan Thrust (Nábĕlek et al., 2009), they have been widely attributed to increases in rock uplift rate and
MCT zone
Elev
/dep
th (k
m)
Distance (km)
MFTMHT
MBT
0 50 100 150 200
-20
0
A. A’.
Indian crust
A
EQ nodal planes
LHS
UPT2
GHS
B & C
LH HH10
-10STD
MHT
MCT UPT2MCMMCTCTTTB
MHT
MCTMMCMCTCTCTCTUPT2C
81°E
80°E
80°E
79°E
79°E
78°E77°E
31°N
32°N
30°N
30°N
29°N
STD
MBT
LHS
A.
A’.B
GHS
UPT2
MFTN
Dehra DunGHS
THS
100 km
MCTzone
A
95°90°85°80°75°
95°90°85°80°75°
30º
35º 1555
1905
1505 1934 1897
1950
CENTRAL SEISMICGAP
1833
NPT2UPT2Part BN
Uttarakhand
1803
India
Nepal
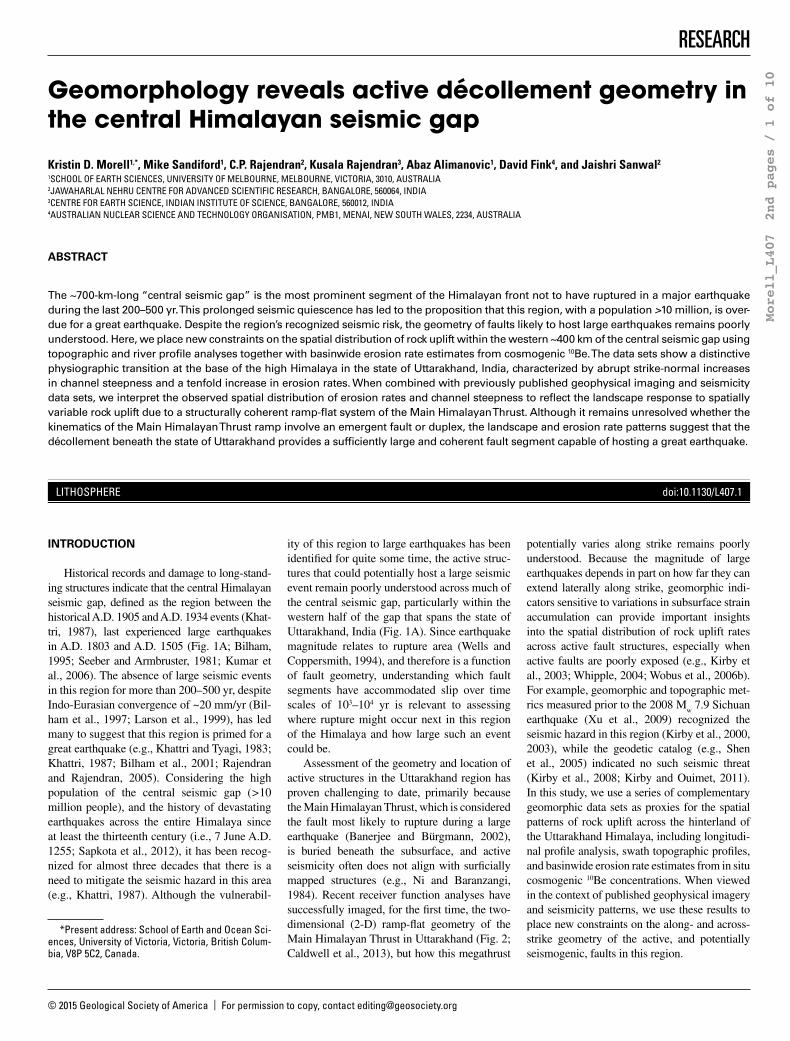
Figure 1. (A) Date and rupture patches for large historical Himalayan earth-quakes (Rajendran and Rajendran, 2005; Kumar et al., 2006) with reference to the Uttarakhand region of the central seismic gap, and the physiographic transition 2 of Uttarakhand (UPT2) and Nepal (NPT2) (Wobus et al., 2006a). (B) Simplified geologic map for area shown in A (Célérier et al., 2009a; Webb et al., 2011). Focal mechanisms of all earthquakes within the recording period (Mw 5–7) are shown with location as white circle. Earthquake locations are based on Ni and Baranzangi (1984) and the National Earthquake Information Cen-ter (NEIC) catalog (earthquake.usgs.gov). Focal mechanisms are based on Ni and Baranzangi (1984) or the Global Centroid-Moment-Tensor (CMT) catalog (globalcmt.org). STD—South Tibetan Detachment; THS—Tethyan Himalayan Sequence; MCT—Main Central Thrust; GHS—Greater Himalayan Sequence; LHS—Lesser Himalayan Sequence; MBT—Main Boundary Thrust; MFT—Main Frontal Thrust.
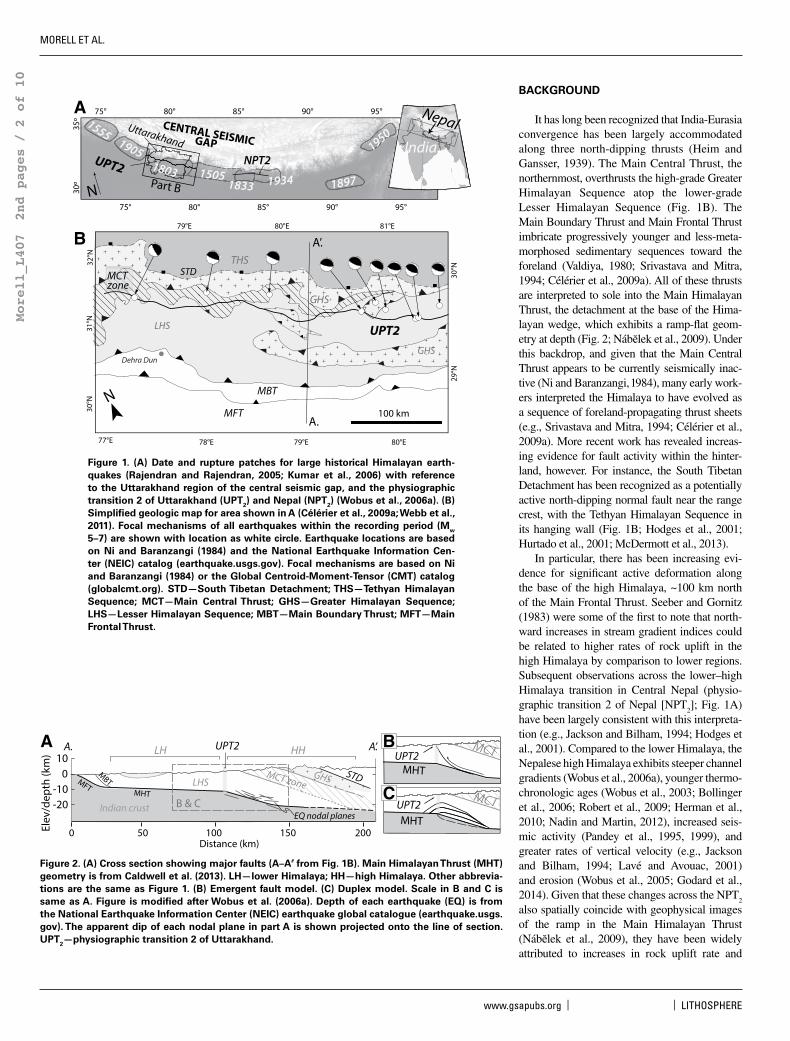
Figure 2. (A) Cross section showing major faults (A–A′ from Fig. 1B). Main Himalayan Thrust (MHT) geometry is from Caldwell et al. (2013). LH—lower Himalaya; HH—high Himalaya. Other abbrevia-tions are the same as Figure 1. (B) Emergent fault model. (C) Duplex model. Scale in B and C is same as A. Figure is modified after Wobus et al. (2006a). Depth of each earthquake (EQ) is from the National Earthquake Information Center (NEIC) earthquake global catalogue (earthquake.usgs.gov). The apparent dip of each nodal plane in part A is shown projected onto the line of section. UPT2—physiographic transition 2 of Uttarakhand.
LITHOSPHERE | Volume 7 | Number 3 | www.gsapubs.org 3
Morell_L407 2nd pages / 3 of 10
Active décollement geometry in the central Himalayan seismic gap | RESEARCH
erosion due to slip along the Main Himalayan Thrust ramp at midcrustal depths (e.g., Wobus et al., 2003, 2006a; Bollinger et al., 2006; Rob-ert et al., 2009; Herman et al., 2010). The exact kinematics of this system remain controversial, however, and it continues to be debated whether the system is best characterized by either: (1) a fault that surfaces at the NPT
2 and soles into the
Main Himalayan Thrust ramp (e.g., Wobus et al., 2006a); (2) an accreting duplex on the ramp that involves underplating of the Indian plate (e.g., Bollinger et al., 2006; Robert et al., 2009; Her-man et al., 2010); or (3) a passive fold above the ramp (Fig. 2; e.g., Cattin and Avouac, 2000).
Previous studies in Uttarakhand, ~500 km to the northwest of Central Nepal, have likewise noted similar across-strike variations across the lower–high Himalaya transition, which also appear to correspond with the Main Himalayan Thrust ramp (Figs. 1 and 2). Across Uttarakhand, the geophysically imaged Main Himalayan Thrust ramp (Caldwell et al., 2013) coincides with: (1) an ~50-km-wide zone of increased microseismicity (Mahesh et al., 2013); (2) the hypocentral location of moderate earthquakes (M
w 5–7) with thrust-type focal mechanisms
(Figs. 1B and 2A; Ni and Baranzangi, 1984); (3) significant gradients in both 40Ar/39Ar cool-ing ages (Célérier et al., 2009b) and erosion rates (Vance et al., 2003); and (4) increases in stream gradient indices (Rajendran and Rajen-dran, 2005) and channel steepness (Scherler et al., 2014). In this paper, we compile these exist-ing data sets and present new topographic and erosion rate data that reveal the spatial distribu-tion of topography and erosion across the entire Uttarakhand region.
METHODS
In order to evaluate the potential geomor-phic response to vertical rates of rock uplift, we used basin-averaged erosion rate estimates derived from cosmogenic 10Be, river channel profile analysis, and calculations of local relief, hillslope gradient, and elevation. Our analysis is predicated on the notion that, in actively uplift-ing and eroding settings such as the Himalaya, hillslope and fluvial erosion rates actively adjust to balance rock uplift rates, as long as the influ-ences of climate and substrate erodibility can be excluded. Thus, spatial variations in erosion rate and geomorphology can elucidate information about tectonic forcings that shape the landscape (e.g., Kirby and Whipple, 2012).
Topographic and Geomorphic Methods
The geomorphic analyses we present here include a combination of physiographic met-
rics and longitudinal profile analysis, based on elevation data from either the ~90 m Shuttle Radar Topography Mission (SRTM; jpl.nasa.gov/srtm/) or the ~30 m Advanced Space-borne Thermal Emission and Reflection Radi-ometer (ASTER) data set (asterweb.jpl.nasa.gov). The physiographic metrics we use are based on the SRTM data set and include plan-view maps of elevation, hillslope angles, and local relief accompanied by a series of swath profiles for each of these maps. In this study, hillslope angles were calculated from elevation data using a 3 by 3 pixel calculation averaged over a circle with radius of ~4.5 km, and local relief was estimated using a ~4.5-km-radius moving circle.
The longitudinal profile analyses employed here are derived from the ASTER data set and are based on the observed power-law relation-ship between local channel slope (S), steepness (ks), concavity (q), and contributing drainage area (A) of the form (i.e., Hack, 1973):
= −θS k As . (1)
When normalized for downstream changes in drainage area, by using a fixed reference con-cavity, it has been shown that for bedrock chan-nels, the normalized channel steepness index, k
sn, scales with rock uplift rate, provided the
effects of climate and lithology are accounted for (e.g., Wobus et al., 2006b; Kirby and Whip-ple, 2012).
In this study, normalized steepness values (k
sn) were obtained for all channels with contrib-
uting drainage area >107 m2 by forced regres-sion of a log-log plot of slope-area data calcu-lated over a 1 km moving window. Handpicked reaches were then identified in longitudinal profiles of trunk streams and compared against the 1 km regressions. In our analysis, the data were smoothed over a moving window of 10 km in order to sufficiently reduce the noise in the ASTER data set. A reference concavity of 0.45 was used in the calculations in order to com-pare this data set to other similar global studies (i.e., Wobus et al., 2006b; Ouimet et al., 2009). The units on k
sn (m0.9) therefore derive from the
regressions based on this reference concavity.
Erosion Rate Methods
To supplement results from the topographic analyses, we collected samples of modern river sand at the mouths of 14 small tributaries (drainage areas from ~10 to 100 km2) to esti-mate basin-averaged erosion rates from con-centrations of the in situ–produced cosmogenic nuclide 10Be in quartz (e.g., Lal, 1991; Brown et al., 1995; Granger et al., 1996; Gosse and Phil-
lips, 2001). Our sampling strategy was to: (1) collect samples from active river channels away from fluvial terraces, landslides, and/or debris flows; (2) sample tributaries that were at least 10 km2 in size, in order to avoid the effects of landslides on mixing (Niemi et al., 2005); (3) sample drainage areas that were small enough to capture potential changes in erosion rate both across and along strike; and (4) sample basins that are currently unglaciated, to eliminate the need to account for the influence of snow or gla-ciation on the shielding of cosmic rays and 10Be concentrations (e.g., Wittmann et al., 2007). Given the relief and subbasin size, we assumed rapid sediment transport and negligible storage, allowing measured 10Be concentrations to rep-resent a spatially averaged rate of channel and hillslope lowering for the watershed above each sample (e.g., Lal, 1991; Granger et al., 1996; Gosse and Phillips, 2001).
Beryllium-10 was extracted from quartz at the University of Melbourne, and samples were ana-lyzed at the Australian National Tandem Research Accelerator (ANTARES) Accelerator Mass Spec-trometry (AMS) Facility, Australian National Tandem for Applied Research (ANSTO), Menai, Australia. Quartz was extracted from 250 g of the 800–500 μm size fraction sand via multiple sequences of standard heavy liquid mineral separations and HF acid etching, until each con-tained less than 200 ppm of Al. A 1279 ppm 9Be spike (prepared from beryl crystal) was added to each sample prior to quartz digestion, and Be extraction was performed following standard methods. Final Be hydroxide solutions were treated for boron removal and converted to BeO at the Cosmogenic Geochemistry Laboratory at ANSTO, Sydney. All BeO samples were mixed with niobium powder, and 10Be was measured by AMS at the ANTARES Facility (Fink and Smith, 2007). Measured 10Be/Be ratios were corrected by full chemistry procedural blanks (7.4 ± 1.6 × 10⁻¹⁵; n = 4; 2 blanks), and normal-ized using NIST-4325 standard reference mate-rial (Table 1).
The CRONUS online 10Be/26Al calculator (http://hess.ess.washington.edu/math/, accessed August 2013; Balco et al., 2008) was used to calculate production rates and basin-averaged erosion rates from the concentration of 10Be in each sample. These calculations were per-formed assuming a bulk rock density of 2.5 g/cm3 and the scaling scheme of Lal (1991) and Stone (2000). Estimates of topographic shield-ing, effective latitude, and effective basin eleva-tion were calculated following methods in Balco et al. (2008) and Portenga and Bierman (2011). Because the CRONUS calculator only calcu-lates erosion rates for a single point, we used the methods of Portenga and Bierman (2011) to
MORELL ET AL.
4 www.gsapubs.org | Volume 7 | Number 3 | LITHOSPHERE
Morell_L407 2nd pages / 4 of 10
calculate a hypsometrically weighted effective elevation and latitude for each sample, and these results were then used as inputs into CRONUS.
RESULTS
Topographic and Geomorphic Analyses
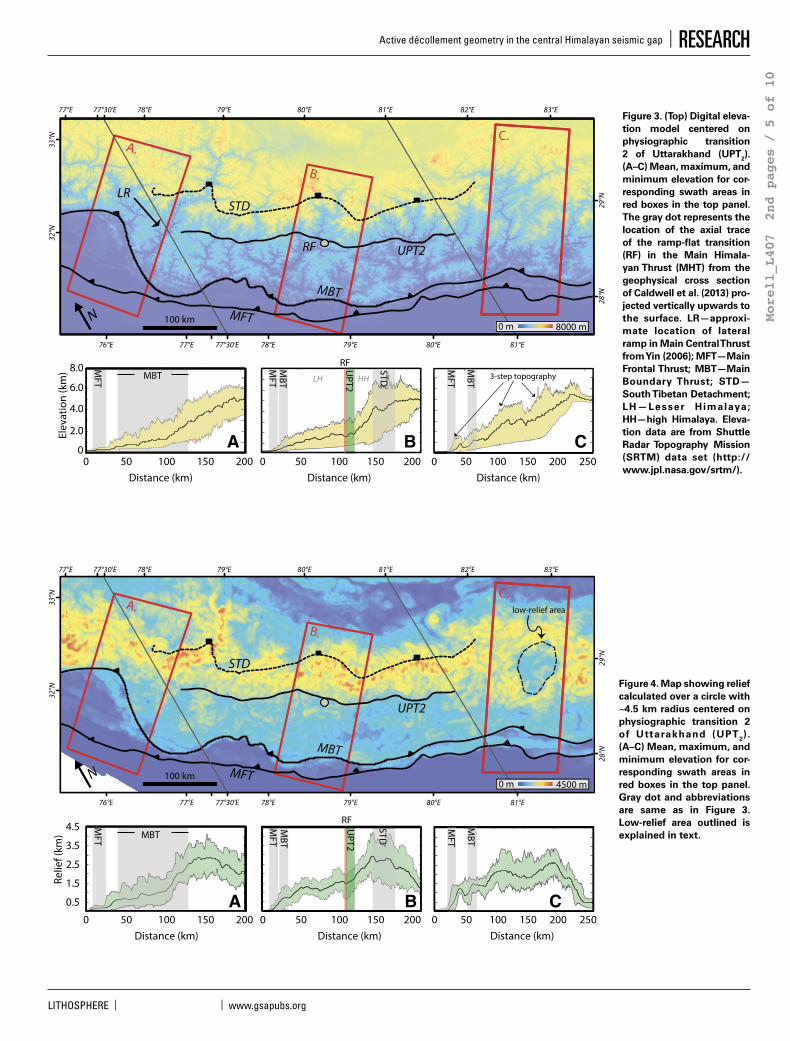
Our analyses reveal an ~30,000 km2 area within Uttarakhand that displays significant across-strike variations in elevation (Fig. 3), local relief (Fig. 4), hillslope angles (Fig. 5), and channel steepness (Figs. 6 and 7) that persist for kilometers along strike. Within this region, the most prominent spatial variations in landscape morphology occur at the boundary between the lower and high Himalaya, where there are sharp northward increases in eleva-tion, relief, hillslopes, and channel steepness. We term this dividing line the physiographic transition 2 of Uttarakhand (UPT
2) for con-
sistency with earlier work (e.g., Hodges et al., 2001; Wobus et al., 2006a). South of the UPT
2,
elevation, local relief, hillslope angles, and ksn
are relatively constant over an area greater than ~12,000 km2 (Figs. 3–6). North of the UPT
2,
topography, relief, and ksn
increase progressively perpendicular to strike for ~50 km, and hillslope angles show a step-function increase, yet each of these properties remains relatively invariant
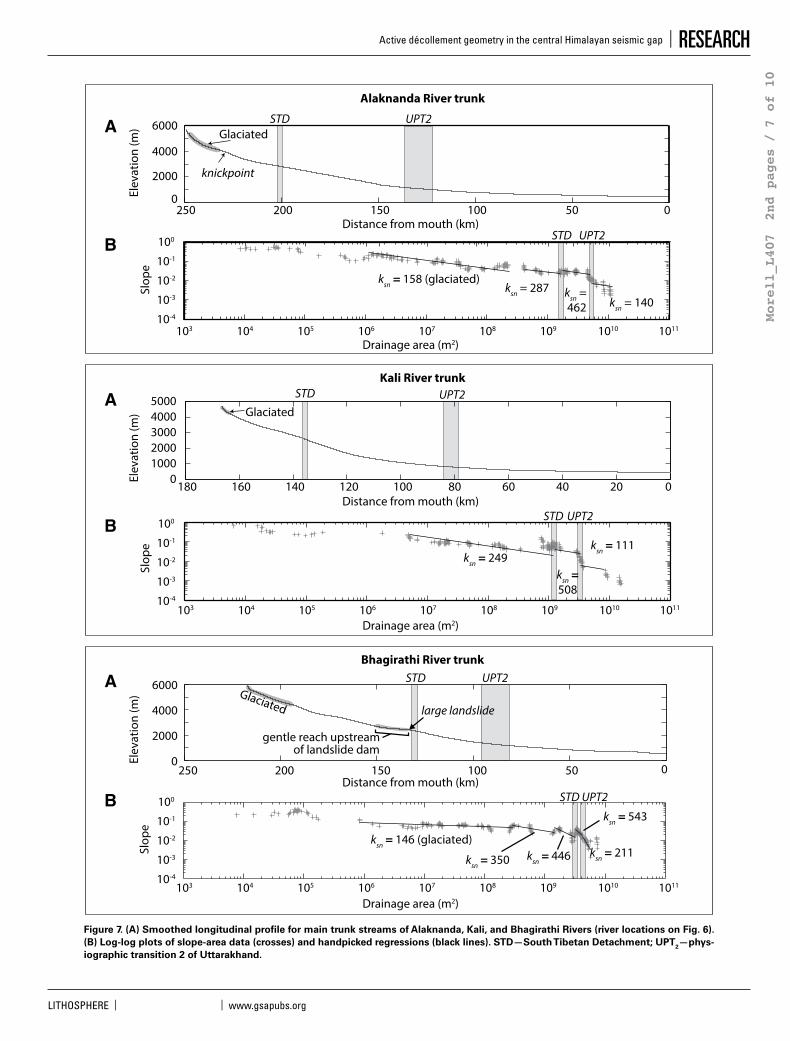
along strike. Excluding glaciated regions, there are subtle convex-up knick zones near the South Tibetan Detachment (at ~3000 m), but down-stream reaches are otherwise relatively smooth and concave-up (Fig. 7).
Our results suggest that the UPT2 can be
traced reliably for ~400 km along strike as shown in Figures 3–6, but this well-defined feature terminates to the east of ~81°E and to the west of ~77.5°E. The along-strike extent of the UPT
2 was determined based on spatial pat-
terns of gradient, slope, ksn
, and elevation, as all four of these metrics increase abruptly at the UPT
2 and decrease approximately at the South
Tibetan Detachment. To the west of longitude ~77.5°E and to the east of ~81°E, one or all of these criteria were not met. The high Himalayan region to the east of ~81°E exhibits significantly lower relief, hillslope gradients, and k
sn than
adjacent along-strike regions in Uttarakhand (Figs. 3–5). Similarly, while channel steepness values in the lower Himalaya of Uttarakhand are relatively low, k
sn values to the west of ~77.5°E
are much higher (Fig. 6), and the abrupt step in topography characteristic of the UPT
2 becomes
more diffuse westward (Figs. 3–5).A comparison of these results against pub-
lished data sets in Uttarakhand indicates that: (1) the UPT
2 corresponds with the axial trace of the
ramp-flat transition in the Main Himalayan Thrust
at depth (Fig. 2; gray dot on Figs. 3–5; Caldwell et al., 2013); (2) the UPT
2 crosscuts lithologic
contacts mapped by previous workers (Fig. 1B; e.g., Valdiya, 1980; Srivastava and Mitra, 1994; Célérier et al., 2009a); (3) mean annual precipi-tation generally increases northward across the UPT
2 (Fig. 8; Bookhagen and Burbank, 2006);
and (4) the decreases in local relief, hillslopes, and k
sn values at ~3000 m elevation coincide
approximately with the mapped trace of the South Tibetan Detachment (Figs. 3–6; Webb et al., 2011). Overall, the landscape patterns we observe in Uttarakhand agree with similar mor-phologic data sets published within the region (Seeber and Gornitz, 1983; Rajendran and Rajen-dran, 2005; Scherler et al., 2014).
Basin-Averaged Erosion Rates
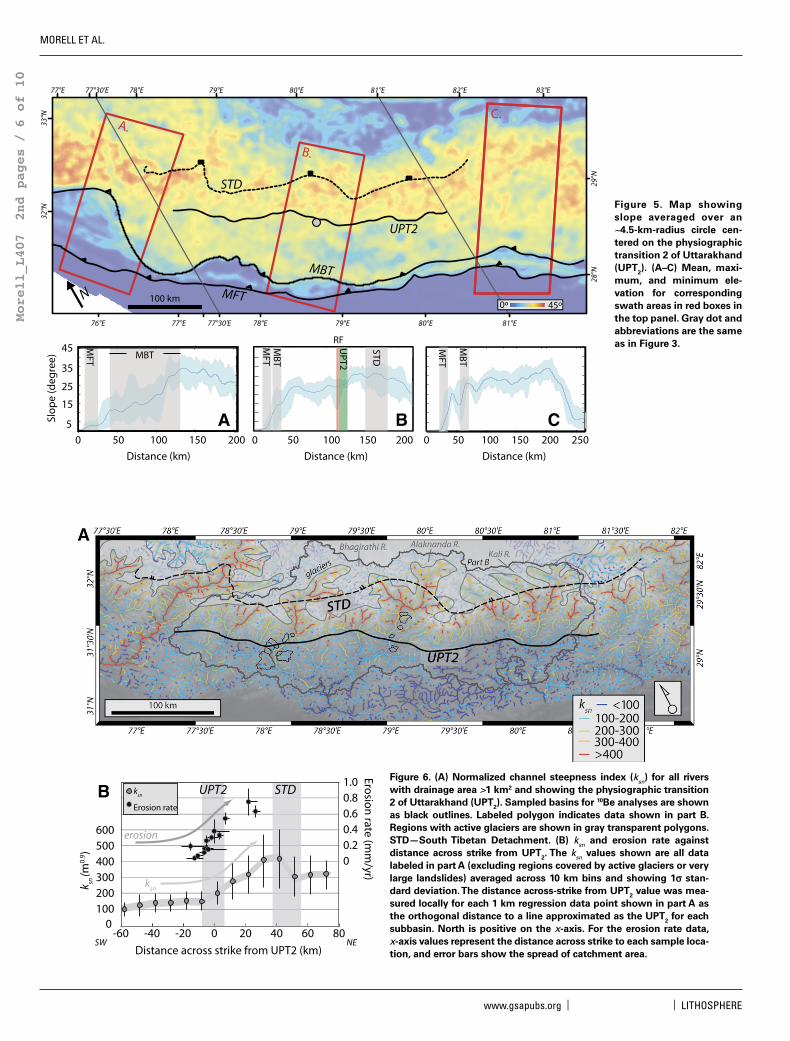
Our data show a tenfold range in basin-aver-aged erosion rates across the UPT
2 and strong
relationships among erosion rate, channel steep-ness, and distance across strike (Table 1; Fig. 6). The highest erosion rates (~0.6–0.8 mm/yr) occur in watersheds farthest north, within the high Himalaya region containing steep hill-slopes and high channel steepness. The lowest erosion rates (~0.06–0.2 mm/yr) occur south of the UPT
2, in basins with lower channel steep-
ness and gentler hillslope gradients. Excluding
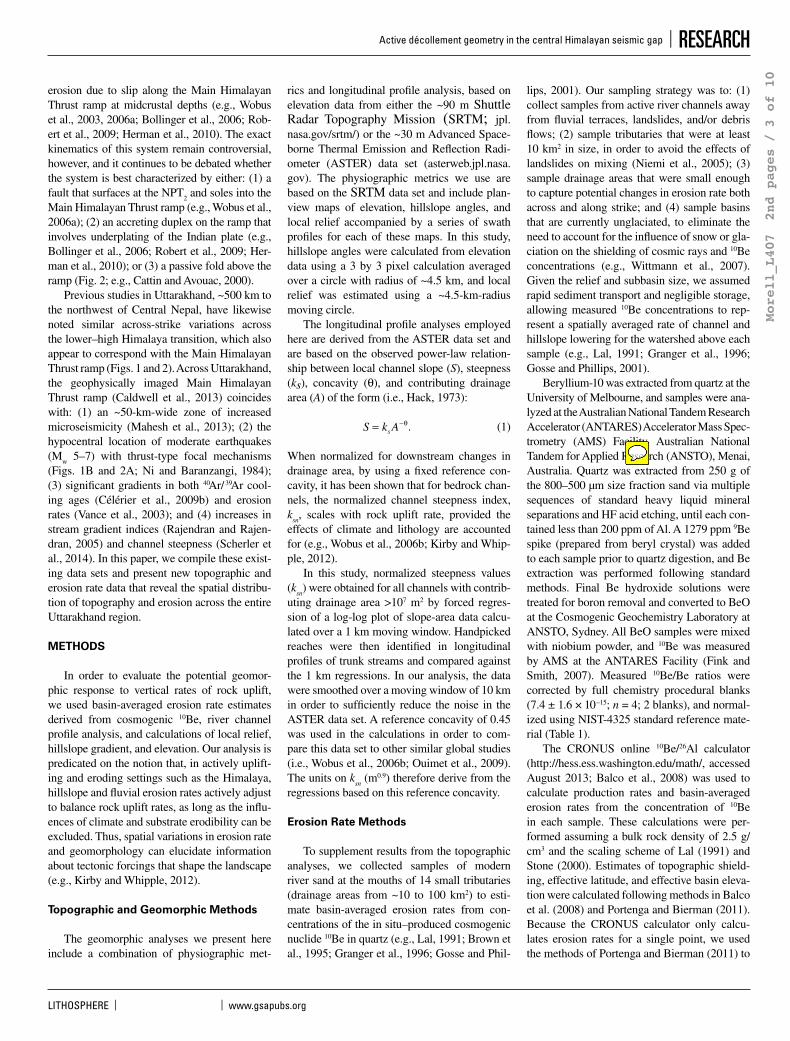
TABLE 1. RESULTS OF COSMOGENIC EROSION RATE DATA AND CHARACTERISTICS OF SAMPLED BASINS
Sample* Latitude(°N)†
Longitude(°E)†
Distance from UPT2
(km)§
Drainage area(km2)
Mean ksn(m0.9)#
Effective elevation
(m)
Sample mass
(g)
Mass 9Be carrier(mg)
10Be/9Be(×10–15)**
[10Be](104 atm g–1)††
Production rate(atm g–1 yr–1)§§
Erosion rate(mm/yr)##
1(IN1203) 30.460 79.523 21.6 45.6 241 ± 55 2764 20.388 0.3344 21.6 ± 4.6 2.37 ± 0.50 24.5 0.75 ± 0.17 (±0.18)2(IN1206) 30.499 79.536 26.0 19.5 226 ± 44 2712 20.787 0.3271 26.4 ± 3.3 2.78 ± 0.36 24.3 0.64 ± 0.08 (±0.10)3(IN1214) 30.373 79.351 2.8 10.3 150 ± 19 1900 20.450 0.3619 28.6 ± 3.8 3.38 ± 0.46 14.5 0.34 ± 0.05 (±0.05)4(IN1217) 30.273 79.330 –5.4 11.5 N/A 1723 20.528 0.3393 34.5 ± 7.2 3.81 ± 0.80 13.1 0.28 ± 0.06 (±0.06)5(IN1218) 30.262 79.304 –7.0 19.3 124 ± 24 1649 20.359 0.3151 81.8 ± 11.4 8.46 ± 1.20 12.4 0.12 ± 0.02 (±0.02)6(IN1224) 30.683 78.255 –21.1 171.5 116 ± 22 1755 20.442 0.3674 44.3 ± 10.5 5.32 ± 1.26 13.2 0.20 ± 0.05 (±0.05)7(IN1228) 30.648 78.429 –13.1 87.4 150 ± 36 1932 10.758 0.3678 90.8 ± 8.4 2.08 ± 1.99 15.2 0.06 ± 0.01 (±0.01)8(IN1230) 30.691 78.393 –11.0 13.5 150 ± 44 1840 20.423 0.3667 113.6 ± 10.8 13.6 ± 1.34 14.2 0.08 ± 0.01 (±0.01)9(IN1232) 30.755 78.316 –6.4 25.6 137 ± 24 1878 19.254 0.3302 54.0 ± 7.0 6.84 ± 0.90 14.7 0.17 ± 0.02 (±0.03)10(IN1234) 30.787 78.350 –2.2 37.3 148 ± 20 2045 18.182 0.2631 30.3 ± 4.3 4.08 ± 5.80 16.3 0.31 ± 0.04 (±0.05)11(IN1235) 30.794 78.393 –4.3 41.1 163 ± 37 2197 12.458 0.3483 46.1 ± 7.5 8.61 ± 1.42 17.9 0.16 ± 0.03 (±0.03)12(IN1240) 30.783 78.576 6.6 9.0 N/A 2364 20.447 0.3693 22.4 ± 3.2 2.71 ± 0.40 19.8 0.55 ± 0.08 (±0.09)13(IN1242) 30.811 78.568 11.2 13.8 195 ± 48 2993 20.399 0.3442 116.3 ± 9.2 13.1 ± 1.08 29.3 0.16 ± 0.01 (±0.02)14(IN1247) 30.786 78.509 –0.5 28.4 186 ± 37 2427 20.358 0.3525 33.6 ± 11.5 3.89 ± 1.33 20.3 0.39 ± 0.15 (±0.15)
Note: Production and erosion rates determined using the CRONUS 10Be/26Al online calculator version 2.2, main calculator 2.1, objective function 2.0, production con-stants 2.2.1, and muons 1.1.
*Sample in italics was excluded from the analyses because it yielded an erosion rate as much as three times smaller than adjacent basins. Sample location is shown in Figure 6A. Sample number in parentheses represents field designation.
†Mean latitude and longitude of entire basin based on WGS 1984 datum.§Across-strike distance from physiographic transition 2 of Uttarakhand (UPT2). North is positive.#Mean of ksn data shown in Figure 9 for each basin, with 1σ uncertainty. Fields with N/A indicate samples with upstream drainage area smaller than the smoothing
window needed to sufficiently reduce noise in the digital elevation model.**Standard Reference Material (SRM) for 10Be, NIST-4325, issued by the National Institute of Standards and Technology (NIST, Gaithersburg, Maryland, USA;
www.nist.gov), was employed for normalization of all measured 10Be/Be ratios using the new nominal 10Be/Be ratio for NIST-4325 of 27,900 × 10–15 and 10Be half life of 1.387 ± 0.012 m.y.
††Final analytical error in concentrations are derived from a quadrature sum of the standard mean error in an accelerator mass spectrometry (AMS) ratio, 2% for AMS standard reproducibility, and 1% in Be spike assay.
§§Sum of production rate from both spallation and muon capture.##1σ standard uncertainty based on analytical error. External uncertainty is shown in parentheses.
LITHOSPHERE | Volume 7 | Number 3 | www.gsapubs.org 5
Morell_L407 2nd pages / 5 of 10
Active décollement geometry in the central Himalayan seismic gap | RESEARCH
A.
B.
C.
UPT2
STD
B0 50 100 150 200 250
Distance (km)
0
2.0
4.0
6.0
8.0
Elev
atio
n (k
m)
0 50 100 150 200Distance (km)
0 50 100 150 200Distance (km)
C
3-step topography
MFT
MBT
A U
PT2
STD
MFT LH HH
MBTMBT
MFT
N 100 km
LR
83°E82°E
81°E
81°E
80°E
80°E
79°E
79°E
78°E
78°E
77°30'E
77°30'E
77°E
77°E
76°E
32°N
33°N
29°N
28°N
8000 m0 mMFT
MBT
UPT2
RF
RF
A.
B.
C.
UPT2
STD
0 50 100 150 200 250Distance (km)
0 50 100 150 200Distance (km)
0 50 100 150 200Distance (km)
N
MFT
UPT2
STD
0.5
1.5
2.5
3.5
4.5
Rel
ief (
km)
low-relief area
MBTMBT
MFT
MFT
MBT
100 km
RF
B CA
83°E82°E
81°E
81°E
80°E
80°E
79°E
79°E
78°E
78°E
77°30'E
77°30'E
77°E
77°E
76°E
32°N
33°N
29°N
28°N
4500 m0 mMFT
MBT
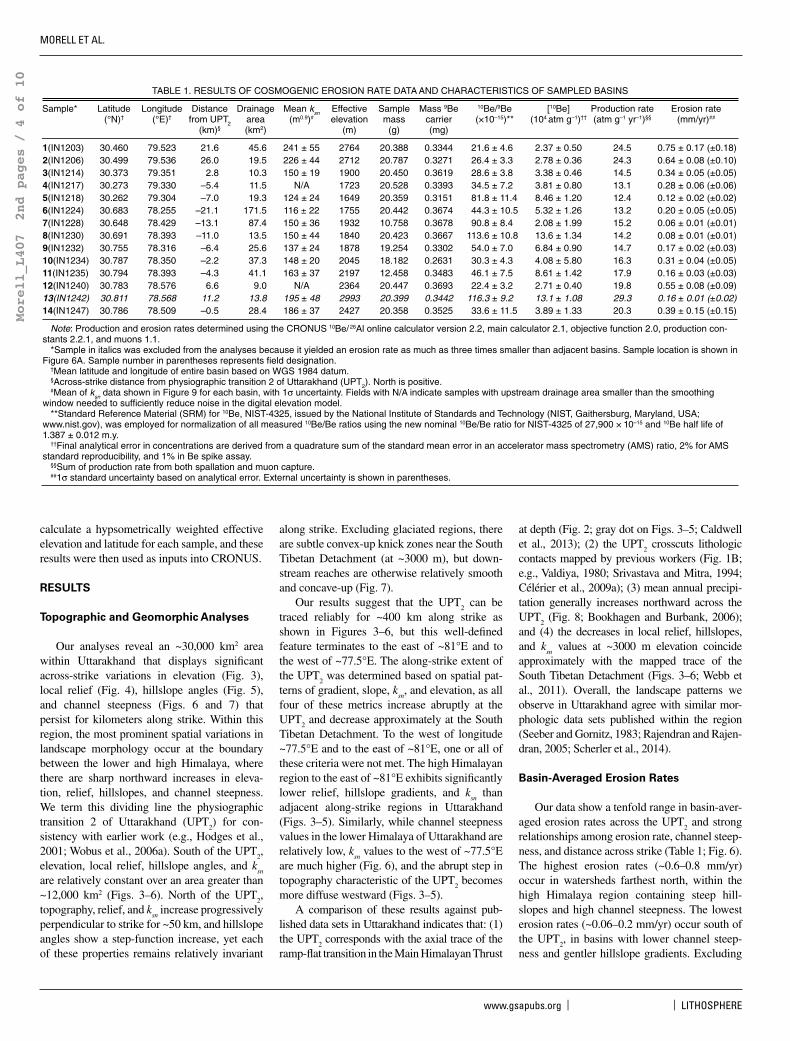
Figure 3. (Top) Digital eleva-tion model centered on physiographic transition 2 of Uttarakhand (UPT2). (A–C) Mean, maximum, and minimum elevation for cor-responding swath areas in red boxes in the top panel. The gray dot represents the location of the axial trace of the ramp-flat transition (RF) in the Main Himala-yan Thrust (MHT) from the geophysical cross section of Caldwell et al. (2013) pro-jected vertically upwards to the surface. LR—approxi-mate location of lateral ramp in Main Central Thrust from Yin (2006); MFT—Main Frontal Thrust; MBT—Main Boundary Thrust; STD—South Tibetan Detachment; LH—Lesser Himalaya; HH—high Himalaya. Eleva-tion data are from Shuttle Radar Topography Mission (SRTM) data set (http://www .jpl .nasa .gov /srtm/).
Figure 4. Map showing relief calculated over a circle with ~4.5 km radius centered on physiographic transition 2 of Utta rak hand (UPT2). (A–C) Mean, maximum, and minimum elevation for cor-responding swath areas in red boxes in the top panel. Gray dot and abbreviations are same as in Figure 3. Low-relief area outlined is explained in text.
MORELL ET AL.
6 www.gsapubs.org | Volume 7 | Number 3 | LITHOSPHERE
Morell_L407 2nd pages / 6 of 10
A.
B.
C.
UPT2
STD
0 50 100 150 200 250Distance (km)
0 50 100 150 200Distance (km)
0 50 100 150 200Distance (km)
N
MFT
MBT
UPT2
STD5
15
25
35
45
Slop
e (d
egre
e) MBT
MFT
MFT
MBT
100 km
RF
B CA
83°E82°E
81°E
81°E
80°E
80°E
79°E
79°E
78°E
78°E
77°30'E
77°30'E
77°E
77°E
76°E
32°N
33°N
29°N
28°N
45º0ºMFT
MBT
-60 -40 -20 0 20 40 60 800
100200300400500600
Distance across strike from UPT2 (km)
ksn
(m0.
9 )
UPT2
ksn
STD
SW
B ksn
Erosion rate
Erosio
n rate (m
m/yr)
00.20.4
0.80.6
1.0
NE
erosion
Figure 6. (A) Normalized channel steepness index (ksn) for all rivers with drainage area >1 km2 and showing the physiographic transition 2 of Uttarakhand (UPT2). Sampled basins for 10Be analyses are shown as black outlines. Labeled polygon indicates data shown in part B. Regions with active glaciers are shown in gray transparent polygons. STD—South Tibetan Detachment. (B) ksn and erosion rate against distance across strike from UPT2. The ksn values shown are all data labeled in part A (excluding regions covered by active glaciers or very large landslides) averaged across 10 km bins and showing 1s stan-dard deviation. The distance across-strike from UPT2 value was mea-sured locally for each 1 km regression data point shown in part A as the orthogonal distance to a line approximated as the UPT2 for each subbasin. North is positive on the x-axis. For the erosion rate data, x-axis values represent the distance across strike to each sample loca-tion, and error bars show the spread of catchment area.
Figure 5. Map showing slope averaged over an ~4.5-km-radius circle cen-tered on the physiographic transition 2 of Uttarakhand (UPT2). (A–C) Mean, maxi-mum, and minimum ele-vation for corresponding swath areas in red boxes in the top panel. Gray dot and abbreviations are the same as in Figure 3.
LITHOSPHERE | Volume 7 | Number 3 | www.gsapubs.org 7
Morell_L407 2nd pages / 7 of 10
Active décollement geometry in the central Himalayan seismic gap | RESEARCH
0501001502002500
2000
4000
6000
Distance from mouth (km)
Elev
atio
n (m
)
103 104 105 106 107 108 109 1010 101110-4
10-3
10-2
10-1
100
Drainage area (m2)
Slop
e
UPT2
UPT2A
B
ksn = 158 (glaciated)ksn = 287
ksn = 140
STD
STD
knickpoint
0204060801001201401601800
10002000300040005000
Elev
atio
n (m
)
Distance from mouth (km)
Slop
e
10-4
10-3
10-2
10-1
100
103 104 105 106 107 108 109 1010 1011
Drainage area (m2)
ksn = 462
ksn = 249ksn =508
ksn = 111
UPT2STD
STD UPT2
A
B
501001502002500
2000
4000
6000
Elev
atio
n (m
)
Drainage area (m2)103 104 105 106 107 108 109 1010 1011
Slop
e
10-4
10-3
10-2
10-1
100
Distance from mouth (km)0
large landslide
STD
gentle reach upstreamof landslide dam
UPT2
ksn = 146 (glaciated)
ksn = 350 ksn = 446
ksn = 543
ksn = 211
A
B
Alaknanda River trunk
Kali River trunk
Bhagirathi River trunk
UPT2STD
Glaciated
Glaciated
Glaciated
Figure 7. (A) Smoothed longitudinal profile for main trunk streams of Alaknanda, Kali, and Bhagirathi Rivers (river locations on Fig. 6). (B) Log-log plots of slope-area data (crosses) and handpicked regressions (black lines). STD—South Tibetan Detachment; UPT2—phys-iographic transition 2 of Uttarakhand.
MORELL ET AL.
8 www.gsapubs.org | Volume 7 | Number 3 | LITHOSPHERE
Morell_L407 2nd pages / 8 of 10
those samples with drainage areas that cross the UPT
2 (samples 9, 10, and 11; Table 1), the
average erosion rate for samples in the region south of UPT
2 is ~0.2 mm/yr, whereas the aver-
age erosion rate north of the UPT2 is ~0.6 mm/
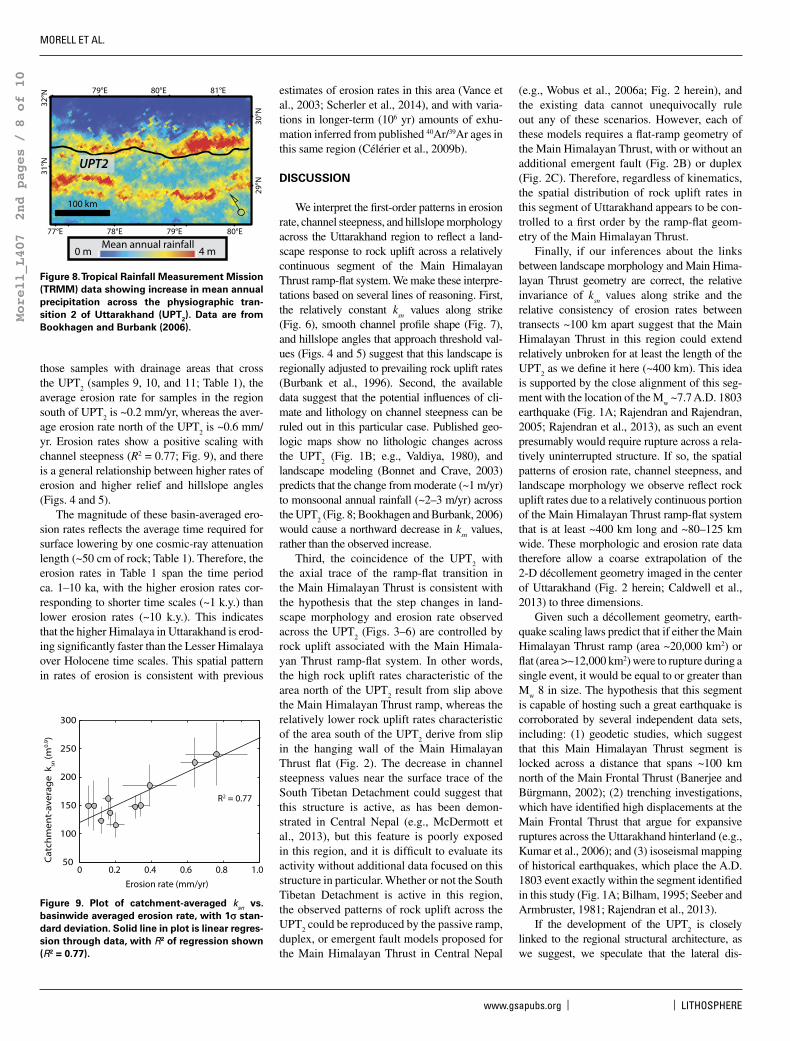
yr. Erosion rates show a positive scaling with channel steepness (R2 = 0.77; Fig. 9), and there is a general relationship between higher rates of erosion and higher relief and hillslope angles (Figs. 4 and 5).
The magnitude of these basin-averaged ero-sion rates reflects the average time required for surface lowering by one cosmic-ray attenuation length (~50 cm of rock; Table 1). Therefore, the erosion rates in Table 1 span the time period ca. 1–10 ka, with the higher erosion rates cor-responding to shorter time scales (~1 k.y.) than lower erosion rates (~10 k.y.). This indicates that the higher Himalaya in Uttarakhand is erod-ing significantly faster than the Lesser Himalaya over Holocene time scales. This spatial pattern in rates of erosion is consistent with previous
estimates of erosion rates in this area (Vance et al., 2003; Scherler et al., 2014), and with varia-tions in longer-term (106 yr) amounts of exhu-mation inferred from published 40Ar/39Ar ages in this same region (Célérier et al., 2009b).
DISCUSSION
We interpret the first-order patterns in erosion rate, channel steepness, and hillslope morphology across the Uttarakhand region to reflect a land-scape response to rock uplift across a relatively continuous segment of the Main Himalayan Thrust ramp-flat system. We make these interpre-tations based on several lines of reasoning. First, the relatively constant k
sn values along strike
(Fig. 6), smooth channel profile shape (Fig. 7), and hillslope angles that approach threshold val-ues (Figs. 4 and 5) suggest that this landscape is regionally adjusted to prevailing rock uplift rates (Burbank et al., 1996). Second, the available data suggest that the potential influences of cli-mate and lithology on channel steepness can be ruled out in this particular case. Published geo-logic maps show no lithologic changes across the UPT
2 (Fig. 1B; e.g., Valdiya, 1980), and
landscape modeling (Bonnet and Crave, 2003) predicts that the change from moderate (~1 m/yr) to monsoonal annual rainfall (~2–3 m/yr) across the UPT
2 (Fig. 8; Bookhagen and Burbank, 2006)
would cause a northward decrease in ksn values,
rather than the observed increase.Third, the coincidence of the UPT
2 with
the axial trace of the ramp-flat transition in the Main Himalayan Thrust is consistent with the hypothesis that the step changes in land-scape morphology and erosion rate observed across the UPT
2 (Figs. 3–6) are controlled by
rock uplift associated with the Main Himala-yan Thrust ramp-flat system. In other words, the high rock uplift rates characteristic of the area north of the UPT
2 result from slip above
the Main Himalayan Thrust ramp, whereas the relatively lower rock uplift rates characteristic of the area south of the UPT
2 derive from slip
in the hanging wall of the Main Himalayan Thrust flat (Fig. 2). The decrease in channel steepness values near the surface trace of the South Tibetan Detachment could suggest that this structure is active, as has been demon-strated in Central Nepal (e.g., McDermott et al., 2013), but this feature is poorly exposed in this region, and it is difficult to evaluate its activity without additional data focused on this structure in particular. Whether or not the South Tibetan Detachment is active in this region, the observed patterns of rock uplift across the UPT
2 could be reproduced by the passive ramp,
duplex, or emergent fault models proposed for the Main Himalayan Thrust in Central Nepal
(e.g., Wobus et al., 2006a; Fig. 2 herein), and the existing data cannot unequivocally rule out any of these scenarios. However, each of these models requires a flat-ramp geometry of the Main Himalayan Thrust, with or without an additional emergent fault (Fig. 2B) or duplex (Fig. 2C). Therefore, regardless of kinematics, the spatial distribution of rock uplift rates in this segment of Uttarakhand appears to be con-trolled to a first order by the ramp-flat geom-etry of the Main Himalayan Thrust.
Finally, if our inferences about the links between landscape morphology and Main Hima-layan Thrust geometry are correct, the relative invariance of k
sn values along strike and the
relative consistency of erosion rates between transects ~100 km apart suggest that the Main Himalayan Thrust in this region could extend relatively unbroken for at least the length of the UPT
2 as we define it here (~400 km). This idea
is supported by the close alignment of this seg-ment with the location of the M
w ~7.7 A.D. 1803
earthquake (Fig. 1A; Rajendran and Rajendran, 2005; Rajendran et al., 2013), as such an event presumably would require rupture across a rela-tively uninterrupted structure. If so, the spatial patterns of erosion rate, channel steepness, and landscape morphology we observe reflect rock uplift rates due to a relatively continuous portion of the Main Himalayan Thrust ramp-flat system that is at least ~400 km long and ~80–125 km wide. These morphologic and erosion rate data therefore allow a coarse extrapolation of the 2-D décollement geometry imaged in the center of Uttarakhand (Fig. 2 herein; Caldwell et al., 2013) to three dimensions.
Given such a décollement geometry, earth-quake scaling laws predict that if either the Main Himalayan Thrust ramp (area ~20,000 km2) or flat (area >~12,000 km2) were to rupture during a single event, it would be equal to or greater than M
w 8 in size. The hypothesis that this segment
is capable of hosting such a great earthquake is corroborated by several independent data sets, including: (1) geodetic studies, which suggest that this Main Himalayan Thrust segment is locked across a distance that spans ~100 km north of the Main Frontal Thrust (Banerjee and Bürgmann, 2002); (2) trenching investigations, which have identified high displacements at the Main Frontal Thrust that argue for expansive ruptures across the Uttarakhand hinterland (e.g., Kumar et al., 2006); and (3) isoseismal mapping of historical earthquakes, which place the A.D. 1803 event exactly within the segment identified in this study (Fig. 1A; Bilham, 1995; Seeber and Armbruster, 1981; Rajendran et al., 2013).
If the development of the UPT2 is closely
linked to the regional structural architecture, as we suggest, we speculate that the lateral dis-
81°E
80°E
80°E
79°E
79°E
78°E77°E
31°N
32°N
30°N
29°N
UPT2
4 m0 mMean annual rainfall
100 km
R2 = 0.77
50
100
150
200
250
300
0 0.2 0.4 0.6 0.8 1.0Erosion rate (mm/yr)
Cat
chm
ent-
aver
age
ksn
(m0.
9 )
Figure 8. Tropical Rainfall Measurement Mission (TRMM) data showing increase in mean annual precipitation across the physiographic tran-sition 2 of Uttarakhand (UPT2). Data are from Bookhagen and Burbank (2006).
Figure 9. Plot of catchment-averaged ksn vs. basinwide averaged erosion rate, with 1s stan-dard deviation. Solid line in plot is linear regres-sion through data, with R2 of regression shown (R2 = 0.77).
LITHOSPHERE | Volume 7 | Number 3 | www.gsapubs.org 9
Morell_L407 2nd pages / 9 of 10
Active décollement geometry in the central Himalayan seismic gap | RESEARCH
continuity of the UPT2 at ~77.5°E and ~88°E
could reflect lateral variations in this architec-ture, which could restrict the rupture length of earthquakes and effectively segment the moun-tain belt (e.g., Béjar-Pizarro et al., 2013). While this hypothesis remains tentative and cannot be robustly addressed by the data sets in this paper, segmentation of this type is supported by geo-logic and structural data within the region, which depict a lateral ramp in the Main Central Thrust near ~77.5°E, at the northwest boundary of the segment identified in this study (Fig. 3, LR; Yin, 2006). This concept is further supported by the fact that the estimated rupture patches for the A.D. 1905 and 1803 earthquakes terminate at, and do not cross the boundaries of, the identified segment (Fig. 1A). Some reports on the rupture extent of the A.D. 1505 earthquake do extend across the eastern boundary of the proposed segment (e.g., Bilham and Ambraseys, 2005), but there has been debate over the location and magnitude of this particular event (Ambraseys and Jackson, 2003; Rajendran and Rajendran, 2005; Rajendran et al., 2013), in part because the record becomes less reliable further back in time. Regardless of whether there are such lateral variations in active fault structure, our results highlight a prominent segment of the Main Himalayan Thrust ramp-flat system in the Uttarakhand region of the central seismic gap that appears to be sufficiently large and likely continuous enough to host a great earthquake, and our findings further underscore the utility in using tectonic geomorphology to reveal potentially seismogenic faults.
CONCLUSIONS
New topographic and erosion rate analyses in the western half of the central Himalayan seismic gap delineate an ~400-km-long physio-graphic transition in the hinterland of the state of Uttarakhand, India (UPT
2), defined by north-
ward increases in physiographic metrics, channel steepness, and an order of magnitude increase in basin-averaged erosion rates. The spatial corre-spondence of the UPT
2 with the geophysically
imaged ramp-flat transition in the underlying Main Himalayan Thrust suggests that the cross-strike variations in erosion rate and landscape morphology we observe across the UPT
2 reflect
a landscape response to rock uplift above the Main Himalayan Thrust ramp-flat system. The lateral continuation of the UPT
2 for hundreds of
kilometers along strike, and the relative invari-ance of channel steepness values along its entire length suggest that this ramp-flat system is ~400 km long and more than ~80 km wide, and it is therefore likely large enough to host a great earthquake. The discontinuation of a well-defined UPT
2 to the west of longitude ~77.5°E
and to the east of ~81°E may reflect along-strike changes in this décollement geometry, which could result in the seismic segmentation of the Main Himalayan Thrust and potentially restrict the size of large earthquakes. While this hypoth-esis remains speculative, it is supported by inde-pendent records of historical seismicity, and by reports of along-strike variations in the geometry of the Main Central Thrust at the northwestern boundary of the proposed segment.
ACKNOWLEDGMENTSThis study was funded primarily by the Australia-India Stra-tegic Research Fund (AISRF) and the Australian Research Council (ARC). Thanks to Kelin Whipple and an anonymous reviewer for their comments, and to Duane Devecchio and Christine Regalla for their input on an early version of this manuscript. We also thank Eric Kirby for editorial handling.
REFERENCES CITEDAmbraseys, M., and Jackson, D., 2003, A note on early earth-
quakes in northern India and southern Tibet: Current Science, v. 84, no. 4, p. 570–582.
Balco, G., Stone, J.O., Lifton, N.A., and Dunai, T.J., 2008, A complete and easily accessible means of calculating surface exposure ages or erosion rates from 10Be and 26Al measurements: Quaternary Geochronology, v. 3, no. 3, p. 174–195, doi:10.1016/j.quageo.2007.12.001.
Banerjee, P., and Bürgmann, R., 2002, Convergence across the northwest Himalaya from GPS measurements: Geophysical Research Letters, v. 29, no. 13, p. 0-1–30-4, doi:10.1029 /2002GL015184.
Béjar-Pizarro, M., Socquet, A., Armijo, R., Carrizo, D., Genrich, J., and Simons, M., 2013, Andean structural control on interseismic coupling in the North Chile subduction zone: Nature Geoscience, v. 6, no. 6, p. 462–467, doi: 10.1038 /ngeo1802.
Bilham, R., 1995, Entertaining a great earthquake in western Nepal: Historic inactivity and geodetic tests for the pres-ent state of strain: Journal of Nepal Geological Society, v. 11, no. 1, p. 73–78.
Bilham, R., and Ambraseys, N., 2005, Apparent Himalayan slip defined from the summation of seismic moments for Himalayan earthquakes, 1500–2000: Current Sci-ence, v. 88, no. 10, p. 1658–1663.
Bilham, R., Larson, K.P., Freymueller, J.T., et al., 1997, GPS mea-surements of present-day convergence across the Nepal Himalaya: Nature, v. 386, p. 61–64, doi:10.1038 /386061a0.
Bilham, R., Gaur, V.K., and Molnar, P., 2001, Himalayan seismic hazard: Science, v. 293, p. 1442, doi:10.1126 /science .1062584.
Bollinger, L., Henry, P., and Avouac, J.P., 2006, Mountain building in the Nepal Himalaya: Thermal and kinematic model: Earth and Planetary Science Letters, v. 244, p. 58–71, doi:10.1016/j.epsl.2006.01.045.
Bonnet, S., and Crave, A., 2003, Landscape response to cli-mate change: Insights from experimental modeling and implications for tectonics versus climatic uplift of topography: Geology, v. 31, no. 123–126, doi:10.1130 /0091 -7613 (2003) 031 <0123:LRTCCI>2.0.CO;2.
Bookhagen, B., and Burbank, D., 2006, Topography, relief and TRMM-derived rainfall variations along the Hima-laya: Geophysical Research Letters, v. 33, p. L08405, doi:10.1029/2006GL026037.
Brown, E.T., Stallard, R.F., Larsen, M.C., Raisbeck, G.M., and Yiou, F., 1995, Denudation rate determined from the accumulation of in situ–produced 10Be in the Luquillo Experimental Forest, Puerto Rico: Earth and Planetary Science Letters, v. 129, p. 193–202, doi:10.1016/0012 -821X (94) 00249-X.
Burbank, D.W., Leland, J., Fielding, E., Anderson, R., Bro-zovic, N., Reid, M., and Duncan, C., 1996, Bedrock inci-sion, rock uplift and threshold hillslopes in the north-western Himalayas: Nature, v. 379, no. 8, p. 505–510.
Caldwell, W., Klemperer, S., Lawrence, J., Rai, S.S., and Ash-ish, 2013, Characterizing the Main Himalayan thrust in the Garhwal Himalaya, India, with receiver function
CCP stacking: Earth and Planetary Science Letters, v. 367, p. 15–27, doi:10.1016/j.epsl.2013.02.009.
Cattin, R., and Avouac, J.P., 2000, Modeling mountain building and the seismic cycle in the Himalaya of Nepal: Journal of Geophysical Research, v. 105, no. B6, p. 13,389–13,407, doi:10.1029/2000JB900032.
Célérier, J., Harrison, M.T., and Webb, A.A.G., 2009a, The Kumaun and Garhwal Lesser Himalaya, India: Part 1. Structure and stratigraphy: Geological Society of Amer-ica Bulletin, v. 121, no. 9–10, p. 1262–1280, doi:10.1130 /B26344.1.
Célérier, J., Harrison, T.M., Beyssac, O., Herman, F., Dunlap, W.J., and Webb, A.A.G., 2009b, The Kumaun and Gar-hwal Lesser Himalaya, India: Part 2. Thermal and defor-mation histories: Geological Society of America Bulle-tin, v. 121, no. 9–10, p. 1281–1297, doi:10.1130/B26343.1.
Fink, D., and Smith, A.M., 2007, An inter-comparison of 10Be and 26Al AMS reference standards and the 10Be half-life: Nuclear Instruments and Methods, v. 259, p. 600–609, doi:10.1016/j.nimb.2007.01.299.
Godard, V., Bourles, D.L., Spinabella, F., Burbank, D.W., Bookhagen, B., Fisher, G.B., Mouline, A., and Léanni, L., 2014, Dominance of tectonics over climate in Himala-yan denudation: Geology, v. 42, no. 3, p. 243–246, doi: 10.1130 /G35342.1.
Gosse, J., and Phillips, F., 2001, Terrestrial in situ cosmogenic nuclides: Theory and application: Quaternary Science Reviews, v. 20, no. 14, p. 1475–1560, doi:10.1016/S0277 -3791(00)00171-2.
Granger, D.E., Kirchner, J.W., and Finkel, R., 1996, Spatially averaged long-term erosion rates measured from in situ–produced cosmogenic nuclides in alluvial sedi-ment: The Journal of Geology, v. 104, p. 249–257, doi: 10.1086 /629823.
Hack, J.T., 1973, Stream profile analysis and stream-gradient index: U.S. Geological Survey Journal of Research, v. 1, p. 421–429.
Heim, A., and Gansser, A., 1939, Central Himalaya: Geological Observations of the Swiss Expedition 1936: Delhi, India, Hindustan Publishing, 246 p.
Herman, F., Copeland, P., Avouac, J.P., Bollinger, L., Mahéo, G., Le Fort, P., Rai, S.S., Foster, D., Pecher, A., Stüwe, K., and Henry, P., 2010, Exhumation, crustal deformation, and thermal structure of the Nepal Himalaya derived from the inversion of thermochronological and ther-mobarometric data and modeling of the topography: Journal of Geophysical Research, v. 115, p. B06407, doi: 10.1029 /2008JB006126.
Hodges, K., Hurtado, J.M., and Whipple, K., 2001, Southward extrusion of Tibetan crust and its effect on Himalayan tectonics: Tectonics, v. 20, no. 6, p. 799–809, doi: 10.1029 /2001TC001281.
Hurtado, J.M., Jr., Hodges, K.V., and Whipple, K.X., 2001, Neo-tectonics of the Thakkhola graben and implications for recent activity on the South Tibetan fault system in the central Nepal Himalaya: Geological Society of America Bulletin, v. 113, no. 2, p. 222–240, doi:10.1130/0016 -7606 (2001) 113 < 0222 :NOTTGA>2.0.CO;2.
Jackson, M., and Bilham, R., 1994, Constraints on Himala-yan deformation inferred from vertical velocity fields in Nepal and Tibet: Journal of Geophysical Research, v. 99, no. B7, p. 13,897–13,912, doi:10.1029/94JB00714.
Khattri, K.M., and Tyagi, A.K., 1983, Seismicity patterns in the Himalayan plate boundary and identification of the areas of high seismic potential: Tectonophysics, v. 96, no. 3, p. 281–297, doi:10.1016/0040-1951(83)90222-6.
Khattri, K.N., 1987, Great earthquakes, seismicity gaps and potential for earthquake disaster along the Himalaya plate boundary: Tectonophysics, v. 138, no. 1, p. 79–92, doi: 10.1016 /0040 -1951 (87)90067-9.
Kirby, E., and Ouimet, W.B., 2011, Tectonic geomorphology along the eastern margin of Tibet: Insights into the pat-tern and processes of active deformation adjacent to the Sichuan Basin, in Gloaguen, R., and Ratschbacher, L., eds., Growth and Collapse of the Tibetan Plateau: Geological Society of London Special Publication 353, p. 165–188, doi:10.1144/SP353.9.
Kirby, E., and Whipple, K., 2012, Expression of active tecton-ics in erosional landscapes: Journal of Structural Geol-ogy, v. 44, p. 54–75, doi:10.1016/j.jsg.2012.07.009.
Kirby, E., Whipple, K.X., Burchfiel, B.C., Tang, W., Berger, G., Sun, Z., and Chen, Z., 2000, Neotectonics of the Min
MORELL ET AL.
10 www.gsapubs.org | Volume 7 | Number 3 | LITHOSPHERE
Morell_L407 2nd pages / 10 of 10
Shan, China: Implications for mechanisms driving Qua-ternary deformation along the eastern margin of the Tibetan Plateau: Geological Society of America Bulletin, v. 112, no. 3, p. 375–393, doi:10.1130/0016 -7606 (2000) 112 < 375 :NOTMSC>2.0.CO;2.
Kirby, E., Whipple, K.X., Tang, W., and Chen, Z., 2003, Distri-bution of active rock uplift along the eastern margin of the Tibetan Plateau: Inferences from bedrock channel longitudinal profiles: Journal of Geophysical Research, v. 108, p. 2217, doi:10.1029/2001JB000861.
Kirby, E., Whipple, K., and Harkins, N., 2008, Topography reveals seismic hazard: Nature Geoscience, v. 1, p. 485–487, doi:10.1038/ngeo265.
Kumar, S., Wesnousky, S.G., Rockwell, T.K., Briggs, R.W., Thakur, V.C., and Jayangondaperumal, R., 2006, Paleo-seismic evidence of great surface rupture earthquakes along the Indian Himalaya: Journal of Geophysical Research, v. 111, p. B03304, doi:10.1029/2004JB003309.
Lal, D., 1991, Cosmic ray labeling of erosion surfaces: In situ nuclide production rates and erosion models: Earth and Planetary Science Letters, v. 104, p. 424–439, doi:10.1016 /0012 -821X (91) 90220-C.
Larson, K.M., Burgmann, R., Bilham, R., and Freymueller, J.T., 1999, Kinematics of the India-Eurasia collision zone from GPS measurements: Journal of Geophysi-cal Research, v. 104, no. B1, p. 1077–1093, doi:10.1029 /1998JB900043.
Lavé, J., and Avouac, J.P., 2001, Fluvial incision and tectonic uplift across the Himalayas of central Nepal: Journal of Geophysical Research, v. 106, no. B11, p. 26,561–26,591, doi: 10.1029 /2001JB000359.
Mahesh, P., Rai, S.S., Sivaram, K., Paul, A., Gupta, S., Sarma, R., and Gaur, V.K., 2013, One-dimensional reference velocity model and precise locations of earthquake hypocenters in the Kumaon-Garhwal Himalaya: Bulletin of the Seismological Society of America, v. 103, no. 1, p. 328–339, doi:10.1785/0120110328.
McDermott, J., Whipple, K., Hodges, K.V., and van Soest, M., 2013, Evidence for Plio-Pleistocene north-south exten-sion at the southern margin of the Tibetan Plateau, Nyalam region: Tectonics, v. 32, p. 317–333, doi:10.1002 /tect .20018.
Nábĕlek, J., Hetényi, G., Vergne, J., Sapkota, S., Kafle, B., Jiang, M., Su, H., Chen, J., Huang, B.S., and Team, H.C., 2009, Underplating in the Himalaya-Tibet collision zone revealed by the Hi-CLIMB experiment: Science, v. 325, no. 5946, p. 1371–1374, doi:10.1126/science.1167719.
Nadin, E.S., and Martin, A.J., 2012, Apatite thermochronom-etry within a knickzone near the Higher Himalaya front, central Nepal: No resolvable fault motion in the past one million years: Tectonics, v. 31, no. 2, p. TC2010, doi: 10.1029 /2011TC003000.
Ni, J., and Baranzangi, M., 1984, Seismotectonics of the Himalayan collision zone: Geometry of the underthrust-ing Indian plate beneath the Himalaya: Journal of Geophysical Research, v. 89, p. 1147–1163, doi:10.1029 /JB089iB02p01147.
Niemi, N., Oskin, M., Burbank, D.W., Heimsath, A., and Gabet, E., 2005, Effects of bedrock landslides on cosmogenically determined erosion rates: Earth and Planetary Science Letters, v. 237, p. 480–498, doi:10.1016/j .epsl .2005 .07.009.
Ouimet, W.B., Whipple, K., and Granger, D., 2009, Beyond threshold hillslopes: Channel adjustment to base-level
fall in tectonically active mountain ranges: Geology, v. 37, no. 9, doi:10.1130/G30013A.1.
Pandey, M., Tandukar, R.P., Avouac, J.P., Lavé, J., and Mas-sot, J.P., 1995, Interseismic strain accumulation on the Himalayan crustal ramp (Nepal): Geophysical Research Letters, v. 22, no. 7, p. 751–754, doi:10.1029/94GL02971.
Pandey, M., Tandukar, R.P., Avouac, J.P., Vergne, J., and Héri-tier, T., 1999, Seismotectonics of the Nepal Himalaya from a local seismic network: Journal of Asian Earth Sciences, v. 17, no. 5–6, p. 703–712, doi:10.1016/S1367 -9120 (99) 00034-6.
Portenga, E., and Bierman, P.R., 2011, Understanding Earth’s eroding surface with 10Be: GSA Today, v. 21, no. 8, p. 4–10, doi:10.1130/G111A.1.
Rajendran, C.P., and Rajendran, K., 2005, The status of cen-tral seismic gap: A perspective based on the spatial and temporal aspects of the large Himalayan earth-quakes: Tectonophysics, v. 395, p. 19–39, doi:10.1016/j .tecto .2004 .09.009.
Rajendran, C.P., Rajendran, K., Sanwal, J., and Sandiford, M., 2013, Archeological and historical database on the medieval earthquakes of the central Himalaya: Ambi-guities and inferences: Seismological Research Letters, v. 84, no. 6, p. 1098–1108, doi:10.1785/0220130077.
Robert, X., van der Beek, P., Braun, J., Perry, C., Dubille, M., and Mugnier, J.L., 2009, Assessing Quaternary reacti-vation of the Main Central thrust zone (central Nepal Himalaya): New thermochronologic data and numerical modeling: Geology, v. 37, no. 8, p. 731–734, doi:10.1130 /G25736A.1.
Sapkota, S.N., Bollinger, L., Klinger, Y., Tapponnier, P., Gaud-emer, Y., and Tiwari, D., 2012, Primary surface ruptures of the great Himalayan earthquakes in 1934 and 1255: Nature Geoscience, v. 6, no. 1, p. 71–76, doi:10.1038 /NGEO1669.
Scherler, D., Bookhagen, B., and Strecker, M.R., 2014, Tec-tonic control on 10Be-derived erosion rates in the Garh-wal Himalaya, India: Journal of Geophysical Research–Earth Surface, v. 119, no. 2, p. 83–105, doi:10.1002 /2013JF002955.
Seeber, L., and Armbruster, J., 1981, Great detachment earthquake along the Himalayan arc and long-term forecasting, in Simpson, D.W., and Richards, P.G., eds., Earthquake Prediction: Washington, D.C., American Geophysical Union, p. 259–277, doi:10.1029 /ME004p0259.
Seeber, L., and Gornitz, V., 1983, River profiles along the Himalayan arc as indicators of active tectonics: Tectono-physics, v. 92, no. 4, p. 335–367, doi:10.1016/0040 -1951 (83) 90201-9.
Shen, Z.K., Lü, J., Wang, M., and Bürgmann, R., 2005, Con-temporary crustal deformation around the southeast borderland of the Tibetan Plateau: Journal of Geo-physical Research, v. 110, no. B11, p. 409, doi:10.1029 /2004JB003421.
Srivastava, P., and Mitra, G., 1994, Thrust geometries and deep structure of the Outer and Lesser Himalaya, Kumaon and Garhwal (India): Implications for evolution of the Himala-yan fold-and-thrust belt: Tectonics, v. 13, no. 1, p. 89–109, doi:10.1029/93TC01130.
Stone, J., 2000, Air pressure and cosmogenic isotope produc-tion: Journal of Geophysical Research, v. 105, p. 23,753–23,759, doi:10.1029/2000JB900181.
Valdiya, K.S., 1980, Geology of Kumaun Lesser Himalaya, Interim Record: Dehradun, India, Wadia Institute of Hima-layan Geology, 290 p.
Vance, D., Bickle, M., Ivy-Ochs, S., and Kubik, P.W., 2003, Ero-sion and exhumation in the Himalaya from cosmogenic isotope inventories of river sediments: Earth and Plan-etary Science Letters, v. 206, p. 273–288, doi:10.1016 /S0012 -821X (02)01102-0.
Webb, A.A.G., Yin, A., Harrison, T.M., Célérier, J., Gehrels, G., Manning, C., and Grove, M., 2011, Cenozoic tectonic history of the Himachal Himalaya (northwestern India) and its constraints on the formation mechanism of the Himalayan orogen: Geosphere, v. 7, no. 4, p. 1013–1061, doi:10.1130/GES00627.1.
Wells, D.L., and Coppersmith, K.J., 1994, New empirical rela-tionships among magnitude, rupture length, rupture width, rupture area, and surface displacement: Bulletin of the Seismological Society of America, v. 84, no. 4, p. 974–1002.
Whipple, K., 2004, Bedrock rivers and the geomorphology of active orogens: Annual Review of Earth and Planetary Science Letters, v. 32, p. 151–185, doi:10.1146/annurev .earth.32.101802.120356.
Wittmann, H., von Blackenburg, F., Kruesmann, T., Norton, K.P., and Kubik, P.W., 2007, Relation between rock uplift and denudation from cosmogenic nuclides in river sediment in the Central Alps of Switzerland: Journal of Geophysical Research, v. 112, p. F04010, doi:10.1029 /2006JF000729.
Wobus, C., Hodges, K., and Whipple, K., 2003, Has focused denudation sustained active thrusting at the Himalayan topographic front?: Geology, v. 31, no. 10, p. 861–864, doi:10.1130/G19730.1.
Wobus, C., Heimsath, A., Whipple, K., and Hodges, K., 2005, Active out-of-sequence thrust faulting in the central Nep-alese Himalaya: Nature, v. 434, p. 1008–1011, doi:10.1038 /nature03499.
Wobus, C., Whipple, K., and Hodges, K., 2006a, Neotecton-ics of the central Nepalese Himalaya: Constraints from geomorphology, detrital 40Ar/39Ar thermochronology, and thermal modeling: Tectonics, v. 25, no. 4, p. TC4011, doi:10.1029/2005TC001935.
Wobus, C., Whipple, K., Kirby, E., Snyder, N., Johnson, J., Spy-ropolou, K., Crosby, B., and Sheehan, D., 2006b, Tecton-ics from topography: Procedures, promise, and pitfalls, in Willet, S.D., Hovius, N., Brandon, M.T., and Fisher, D.M., eds., Tectonics, Climate, and Landscape Evolu-tion: Geological Society of America Special Paper 398, p. 55–74, doi:10.1130/2006.2398(04).
Xu, X., Wen, X., Yu, G., Chen, G., Klinger, Y., Hubbard, J., and Shaw, J., 2009, Coseismic reverse- and oblique-slip sur-face faulting generated by the 2008 Mw 7.9 Wenchuan earthquake, China: Geology, v. 37, no. 6, p. 515–518, doi: 10.1130 /G25462A.1.
Yin, A., 2006, Cenozoic tectonic evolution of the Himalayan orogen as constrained by along-strike variation of struc-tural geometry, exhumation history, and foreland sedi-mentation: Earth-Science Reviews, v. 76, p. 1–131, doi: 10.1016 /j .earscirev.2005.05.004.
MANUSCRIPT RECEIVED 17 JULY 2014 REVISED MANUSCRIPT RECEIVED 11 DECEMBER 2014 MANUSCRIPT ACCEPTED 26 JANUARY 2015
Printed in the USA