geoenvironment and metabolism of shillong city ecosystem
TRANSCRIPT
GEOENVIRONMENT AND METABOLISM OF SHILLONG CITY ECOSYSTEM
ABSTRACT
/~-~~.' .
[
I ,.' , I ~', . 0
, II :01 \. _ '/ ~') !:;
BY \?~. <" . , "' \ \'
VAN JENNIFER JOAN WALLANG .
SUBMITTED IN FULFILLMENT OF THE DEGREE OF DOCTOR OF PHILOSOPHY
IN ENVIRONMENTAL SCIENCE NORTH·EASTERN HILL UNIVERSITY
SHILLONG 2009

I
ABSTRACT
Geoenvironment has been a key area of concern particularly during the last
few decades due to increasing manifestation of adverse impact of
anthropogenic forces on most parts of the earth. The top stratum of the
earth's crust with diverse geological and geomorphic setting as well as under
different climate regime, having interface with the hydrosphere, atmosphere
and biosphere has borne the brunt of exploitation of earth's resources
throughout the human civilization, more so in the post industrial era. The
resultant impact on the structure and function of earth ecosystem is now all
too apparent. It is often felt that there is a need for continuous evaluation and
appraisal of the environment in terms of the physical parameters of the earth
system vis-a-vis the man made ecosystems. Geoenvironmental study in
combination with metabolism analysis in spatio-temporal context can be a
very effective tool for rational evaluation of changing status of the environment
and overall functioning of the ecosystem.
The geoenvironmental view of resource exploitation takes into account both
the mass of minerals produced and the masses of overburden, wastes and
by-products created. This view lead to a recognition that the material flows
driven by human activities can be seen as part of a broader anthropogenic
transformation of the earth's surface which has implications not only for
supplies and environmental costs of materials, but also for the nature of the
lands on which we live and the landscapes surrounding our daily lives.
Materials flow accounting and quantification of the urban metabolism can help
II
in the development of indicators of the degree to which a city is becoming
more sustainable in its behavior. Integrated appraisal of geoenvironment
together with urban metabolism is an emerging field of applied research which
has received ample attention of researchers in recent times. In a number of
cities world over, the planners and researchers are engaged in evolving a
holistic model of urban development based on modern ecological principles.
Shillong, the capital city of Meghalaya, is a growing urban centre with three
and half lakh population, covering about 208 km2 land. The growth has caused
an immense pressure on the available resources and environment resulting
into an imbalance in the city ecosystem. Therefore there is a need of regular
monitoring of environment and inventorisation of the resources for proper
planning and management of the city ecsystem. In doing so the status of
geoenvironment has to be known for present and future development
activities. In absence of a comprehensive base line data on the different
geoenvironmental parameters it is difficult to comprehend any change that
has taken place in terms of quantum and rate. Present study aims to fill in this
gap in our knowledge on the dynamics, structure and function of Shillong city
ecosystem. This study also intends to generate the base line data on
Geoenvironment and Metabolism of Shillong city which can be used for
monitoring of change and in planning for sustainable development of the city.
With availability of high resolution satellite data with repetitive coverage of the
earth, development in location based technology viz., Global Positioning
System (GPS) and enhanced capability of value addition to geospatial
database in Geographic Information System (GIS) platform, have proved to
III
be a valuable tool for evaluation of resources, appraisal of geoenvironmental
status of a region as well as for assessing their spatio-temporal variability.
Therefore, for the present study basic spatial data was generated based on
satellite data (IRS LlSS III, FCC) and Survey of India (Sol) topomaps in
1 :50000 scale. Preprocessing of topomaps and satellite data was done in GIS
environment using the Orthoengine module of Geomatica 9.1 giving input of
same projection parameters as earth model. Extensive fieldwork was carried
out, both along and across strike for identifying the geological and
geomorphological attributes. Satellite images (IRS LlSS III, FCC) and OEM
were studied for identifying the susceptible areas for landslides. On-site
investigation and documentation of the existing landslides were carried out to
develop an inventory. Flash flood prone areas were identified based on their
record in news media and the actual events that happened during the year
2003 and 2004. The prefield maps were edited and finalized based on the
field inputs and a spatial database was generated in GIS environment.
Morphometric analysis was carried out based on the drainage segments and
elevation contours extracted from Survey of India topomaps in 1 :50000 scale.
The LULC thematic mapping was done through standard visual interpretation
techniques. Different thematic layers were prepared after digitizing and their
attributes were entered accordingly. Thematic information gathered from
laboratory analysis and fieldwork has been brought to GIS platform for further
processing and analysis. Published geological maps, soil map, boundary
map, municipal ward and township map, meteorological data, water sources
location, water supply and production pattern, ground water level, water
quality and consumption of construction materials data were used as
IV
collateral data. The GIS database generated in the form of raster, vector and
attribute data was integrated for generation of composite data sets and
queries buildings.
Shillong Master Plan Area is a Precambrian terrain with low grade
metamorphic rocks occupying more than 90% of the total area. The oldest
lithounit of the study area is composed of granite gneiss, forming part of the
Basement Gneissic Complex. They are overlain by the Shillong Group of
metasediments following an intervening hiatus marked by a conglomerate
horizon. These sediments were deposited in a Proterozoic intracratonic basin
under fluvial environment. Stratigraphically older horizon within the Shillong
Group is mainly argillaceous, which are well exposed in northern and
southern part of the basin, while the upper horizons are predominantly
arenaceous with intermittent argillaceous and impersistent conglomerate
beds. The Shillong Group of rocks are intruded by mafic sills and dykes which
have undergone amphibolite facies metamorphism. They are now found as
discontinuous bodies exposed at places as well as under a thin veneer of
quartzites and locally known as Khasi greenstones. The youngest event of the
Precambrian sequence in Shillong Plateau is marked by emplacement of acid
intrusives which form batholiths, stocks and bosses. A small part of a
batholithic porphyritic granite known as Mylliem granite is exposed in the
western part of the study area. The quratzites of Shillong Group of rocks and
Khasi greenstones are affected by numerous cross cutting quartz veins, which
mark a post deformational phenomenon. Colluvial hill wash and a few patches
of alluvium constitute the Quaternary sediments of the area which locally
occur along the hill slopes and in intermittent valleys.
v
Both diastrophic and non-diastrophic structures are recorded in the study
area. Non-diastrophic structures include primary sedimentary structures like
bedding plane, current bedding and ripple marks, mostly symmetrical and
sharp crested, which are well preserved in the arenaceous member of the
Shillong Group. Deformation structures are well developed in Shillong Group
of rocks which include at least three phases of folding resulting in both
plunging and non-plunging types. Three sets of joints trending NNE-SSW,
ENE-WS and NW-SE have been encountered in the quartzites. Minor local
faults and shears can be deciphered from brecciation within quartzites at
some places. Lineaments trending NE-SW conforming to the structural trend
of the area are commonly found in higher frequency towards north. Average
lineament density is 0.4 - 3 km-2 while lineament frequency varies between
-3.25 - 0.7 km-1. Major drainage control in the area is found to be due to the
predominant NE-SW trending lineaments. A major shear zone known as
Tyrsad-Barapani shear trending NE-SW occur in the northern part that affect
mainly the Phyllites of Shillong Group near Tyrsad and between Mawiong
and Umiam along the GS Road. The Shillong Master Plan Area is part of the
central upland of the greater Shillong Plateau with elevation varying between
1400-1900m amsl. A gently undulating plateau top, the Laitkor range trending
East-West direction with an average elevation of 1900 m above msl, is a
prominent landmark in the southern extremity of the Shillong town. The
Shillong Peak (1964 m) and Laitkor peak (1960 m) forms the highest points in
the area of mapping. The main urban growth center of Shillong Master Plan
Area is situated on a broad topographic low with several flat topped low relief
VI
hillocks and gently undulating valleys. Polo ground or Umkhrah valley skirts
the northern edge of the town and is situated at a much lesser elevation.
The present day landscape of the study area is the result of a competing
interaction of lithology and structure as well as climatic factors. Mass
movements have played a major role in evolution of the numerous hillslopes
while geomorphic work by high gradient rivers is evidently a controlling factor
for the present day landscape development. Because of effective transfer of
eroded debris, both from fluvial erosion and mass movement, the valleys are
deeply incised bordered with cliff faces. Sheet erosion due to non-channel
overland flow is very effective in the study area particularly during monsoon
when precipitation may be as high as >1000 mm.
Broadly the geomorphology of Shillong Master Plan Area can be subdivided
into two major geomorphic domains viz., plateau landform and fluvio
denudational landforms. The entire area comprises mostly of erosional
landform which can be further subdivided into three categories viz., highly
dissected, moderately dissected and less dissected. The fluvio-denudational
landforms can be further subdivided into sub-domains namely, the narrow
infilled valleys and the terraces. Narrow valley fills and recent terraces have
been deposited along the main streams cutting through the erosional
surfaces.
OEM profiles shows that the area is having an undulating topography within
the plateau domain with various degree of erosional dissection imparting the
corrugation. Slopes vary between 2° -35°. The main urban agglomeration of
the city is developed in and around the moderate slope category which form
VII
-28% of the total area. Out of the eight aspect classes representing direction
of slope viz., NNW (18.87%), WNW (14.66%), NNE (13.66%), ESE (12.19%),
ENE (11.68%), SSE (12.18%), SSW (8.87%) and WSW (7.90%), the
maximum of slopes are found to be sloping towards NNW.
Oentritic, sub-dentritic, trellis and rectangular type drainage could be
delineated in the study area. The main drainage of Shillong town is
constituted by northwesterly flowing Wah Umkhrah and Umshirpi streams
which are following the general strike of the area. These two streams join
near Beadon and Bishop falls to forms the westerly flowing Wah Ro-Ro, a
joint controlled deep gorge and a tributary to Wah Umiam. The major trend of
rivers synchronizes with the major structural trend of the region which is NE
SW, while a set of tributaries have developed as a result of erosional
dissection across the structural trend and also following offset faults and joints
across this trend. The lower plateau region in the central part of the area is
characterized by moderately high drainage density with subdendritic to trellis
type of drainage pattern. Rectangular drainage developed at many places is
directly controlled by the two dominant joint patterns viz. NE-SW and NW-SE.
The development of soil cover in the study area is highly irregular and range
in thickness from a thin veneer to more than 10m at places. Inceptisol, and
ultisols are the two major soil types of the study area. Ultisols are found in
places dominated by quartzites and inceptisols occur in places where
amphibolites are emplaced. The soils developed on the hills sides and/or
escarpments are moderately shallow to deep, loamy skeletal to fine,
excessively drained and subjected to moderate to very severe erosion
VIII
hazards. These soils have well developed B horizon. Entisols have also been
observed on very recent geomorphic surface along Wah Umkhrah and its
tributary in the Polo ground area and the minor valley fills in the area.
The fourth-order drainage basin is occupied by diverse lithological units and
covers almost 80% of the area under study. The variation in size of the fourth
order drainage basins is largely due to physiographic and structural conditions
prevailing in these drainage basins. Higher drainage development giving high
mean bifurcation ratio is found in highly dissected drainage basins with strong
structural control while elongated basins with high value of weighted mean
bifurcation ratio shows variation in lithology dominated by Khasi greenstones,
quartzites, weathered mantle and valley filled sediments, while lower values
drain through pure quartzitic area. Higher drainage development giving high
drainage density and stream frequency is characteristically found in the
quartzite dominated terrain while lowest drainage development is found in the
area occupied by the valley filled sediments. Values of elongation ratio range
from 0.5 to 0.7 and circulatory ratios vary from 0.3 to 0.6. High values of
elongation ratio and circularity values, especially in the south-western and
south-eastern part is due to the combination of lithology and structural control
and suggest an intermediate shape with a tendency to elongation associated
with strong relief and steep slope. In the southeastern part the basins show a
fully elongated shape, the central basin show a stronger tendency to circular
shape, the northern basins show a slight tendency to circularity and the
southwestern basins show an intermediate shape with a tendency to
elongation. The elongated shape of the basins indicates a young stage of
evolution, while the intermediate shape with a tendency to circularity suggests
IX
an early mature stage. Lower values of the basins in northern part may be
due to strong structural control on the drainage development. Minimum
infiltration number shown by the Wah Umkhrah basin is possibly due to its
lower catchment being in valley fill sediments, while the sub-basins draining
the metasediments of Shillong Group show an invariably higher infiltration
number.
The high hypsometric integral values of Wah Umiam (tributaries), Wah
Umkhrah, Wah Umkhen, Wah Umkhen (tributaries) represents younger stage
of development with deep incised and high down cutting with concave-down
hypsometric curve, while Urn Baniun and Wah Tamdong show lower values
with hypsometric curve approach monadock stage (Le. old stage) of
geomorphic development and Umshirpi, Wah Umbah, Wah Sheila
(tributaries), Phud-Umsning (tributaries) and Phud Mawiong have the shape
of mature landform. Concavity of the hypsometric curve (Eh) shows that sub
basin 02, 03, 04, 05 and 06 are least incised, and sub-basin 07, 08, 010
and 011 are least eroded while most erosion prevails in sub-basin 01and 09.
From the position of the slope inflection point, a* and h* it is found that degree
of peneplanation caused by strong erosion is highest in 01and 09 followed by
08, 010 and 011 with the least in 02, 03, 04, 05, 06. 07, 01 and 09 sub
basin show least effect of diffusive process, while those of 07, 08, 010 and
011 show moderate diffusive erosion in the upstream segments and consist
large mass accumulation at the sub-basin mouth.
Morphometric studies show differential tectonic upliftment in the study area
which is reflected in the hypsometric parameters. A measure of a relative
x
terrain uplift varying from 0.78 to 0.90 indicates high upliftment in the SWand
SE sides compared to the NE corner. In general the longitudinal profiles of the
trunk channels shows major structural controls. Differences in the materials
along the course of a stream commonly caused an abrupt change from low
concave to flat profile. The longitudinal profiles of most of the trunk channels
show the presence of one or more knick points which is related to offset faults
in the region. A number of waterfalls dotting the study area are found to have
been formed following these offset faults across the general strike in the
Shillong quartzite, suggestive of profile adjustments to the continuous tectonic
activities. The analysis of morphometric parameters of the drainage network
showed that drainage development is largely controlled by structure and
lithology.
Limited hydrological data used in this study indicates that groundwater occur
both under artesian as well as water table condition with moderate to high
yield. Occurrence of ground water in Shillong group of rocks is under water
table condition in the weathered zones of underlying hard rocks whereas in
consolidated rocks it occurs under semi-confined condition. In general depth
of water level is shallower in topographic depression than in the upland areas
or slopes. The water of the area is mildly acidic to alkaline, soft and poorly
mineralized. The elements present in the water are far less than the toxic limit
excepting Fe which shows concentration more than 0.3 mgllitre. Average
chemical quality of the water sources is within safe limits as per national and
WHO certified values. However, a higher degree of mineralization would have
made the water more suitable to public health. The near deficiency of vital
elements is due to non-availability of these elements in the Shillong group of
XI
rocks. Further, due to higher gradient, available elements are also washed
away during heavy precipitation.
Six land use classes have been identified namely, built up land, dense forest,
open forest, scrub, agricultural crop land and water bodies. For the year 2000,
built up land occupies 8.96 % of the study area. Water bodies cover 4.28 % of
the area and are mainly represented by the Umiam lake and Wards lake.
Agricultural crop land usually bun cultivation covers 6.58 %, with scrubs
occupying 10.03 % of the study area. The area covers under pure pine and
pine with broad leaf trees has been classed as dense forest which occupies
50.92 % with open forest consisting 19.2 % of the study area. Similarly, for the
year 2005, built up land, dense forest, open forest, scrub, agricultural crop
land and water bodies cover 9.35 %, 50.04 %, 18.90 %, 10.15 % and 6.93 %
and 4.38 % respectively. From the analysis it has been observed that there
has been a change in the landusel landcover pattern within a span of five
years. Area under dense forest has reduced to 7.74 km2 which is replaced
either by open forest, scrubs and agriculture and urbanization. A decrease of
2.28 km2 is observed in open forest mainly due to deforestation, agricultural
activities and urbanization. The reserved and protected forest forms almost a
complete ring around Shillong comprises around 12.26 % of the total study
area. Although agriculture area has increased to 0.71 km2 mainly due to bun
cultivation, this can create severe erosion problem and increase of siltation
rate. Built up land class has an increase of 0.80 km2, this is due to rapid
expansion over the years where the town has spread to the forests areas
which once skirted the town. Built up land have expanded especially towards
northeastern part of the study area.
XII
The twin hazards of landslides and flash floods are recurrent
geoenvironmental hazards causing loss of life and extensive damage of
properties along certain sectors of the city and adjacent areas. With growing
anthropogenic activities and urban development, these twin problems have
become more acute over the study years. As many as 60 minor and major
landslides have been documented through on site inventorisation during the
study years within the city, some of which are recurring type while most of
them being found in new localities. Their distribution is predominantly along
NH-40 apart from those in thickly populated urban areas. Most of the slides
include slumping, debris fall and flow. The factors that have a direct bearing
on the stability of the study area are: the changes in the slope gradient both
natural and man-made, changes in antecedent moisture content, vegetation
and lithology. Most of the slides in the study area are confined to the regolith
overlying the parent rocks. An integrated study of the causal factors using
remote sensing data analysis, GIS and field investigation in respect of
geological, geomorphological and meteorological parameters suggest that a
multiple of factors are responsible for landslide in the study area.
Landslide prone areas within urban areas are mostly debris fall and are
located on steep hill slopes where the settlements have come up in a
haphazard and unplanned manner. Unnatural load imposed on the rocks by
the haphazard civil structures without slope management is another triggering
factor. Landslides are mostly encountered along the NH 40 that cause
frequent disruption of vehicular traffic. Majority of the recent failures along the
NH 40 are characterized by slumps with an average width of about 30 m and
XIII
a length of 50 m from the toe to the highest back scarp. Toe cutting through
unscientific method has been attributed as the main causative factor for these
slides. The study suggests that high positive pore pressure developed in the
fissile rocks and thin soil cover overlying bedrocks due to seepage of water
from continuous precipitation is the triggering factor for slope failure.
Landslide occurrence is higher in quartzite and phyllite. Correlation of
landslide frequency with respect to lineament density shows that most of the
slides are confined to areas with lineament density 1-3km-1 having NE-SW
trend conforming to the structural trend of the area. Flash floods have been
recorded in recent years in few localities particularly the topographic lows
around Polo ground areas. The immediate cause of flash floods is however,
constriction of the floodplain of Wah Umkhrah river by settlement,
uncontrolled input of debris from the surrounding cliffs following high intensity
rain and high relief of the terrain.
Siltation, though not a major cause of concern as of now, is slowly showing
the sign of becoming a major problem in near future. Numerous rock and
sand quarry sites are located along streams in and around the Shillong town.
These quarries discharge huge quantum of silt on regular basis to the streams
which is beyond the capacity and competence of the rivers to dissipate
downstream. This result in aggradations of riverbeds and many a times leads
artificial damming that becomes a cause of flashflood during rainy season.
Urbanization of steep hill slopes involving development of roads, expansion of
habitation and new commercial establishments have come up in a haphazard
way at the expense of forest. This also has contributed to enormous silt
generation in the study area.
XIV
The extraction of stones aggregates and sand is the most significant human
contribution through material production to the geomorphic change in Shillong
city landscape. From the limited study carried out during last few years it is
found that the production of stone aggregates and sand has increased
substantially and has become the largest source of primary aggregates used
in Shillong city. The quarries located within the study area are worked as
small enterprises and produce 61 % and 72% of stones aggregates and sand
consumed respectively for construction projects. This is because people
seeking stone aggregates, sand and gravel tend to procure these materials
that they need from the nearest and most convenient place. Active quarries
or former quarries are not yet reclaimed due to which the scar faces of these
extractive activities are vividly visible in the landscape. Such direct landform
reshaping by such activities is high in areas of Nongthymmai, Laitkor,
Pynthorumkhrah, Mawdiangdiang, Mawlai, Mawpat, Umroi and Umlynka. Out
of 730 Mt of construction waste produced during the year 2006-2007, a
considerable part of this dumping of waste may be seen as a massive human
contribution to changing the geomorphology of Shillong city through material
aggregates extraction in some of the localities.
Increase in local production of stone aggregates and sand for consumption by
different engineering projects in Shillong city, has raised the amount of
siltation in the streams located near the quarry sites viz., Wah Umkhrah,
Umshirpi and creating new level land which have been landfilled raising the
height of the ground surface. This material transfer is modifying the landscape
at a rapid pace, particularly at the sites of extraction and waste disposal. With
xv
the present pace of urban growth, the waste materials are bound to increase.
The rapid growth of urban areas with relatively weak planning and
environmental controls means that the geomorphic changes related to urban
ecology are likely to become more extensive in the near future.
Materials flow accounting and quantification of the urban metabolism has
helped in the development of indicators of the degree to which the Shillong
Master Plan Area is becoming more susceptible in its behaviour vis-a-vis the
geoenvironmental setup. The study suggests recycling of construction
materials to reduce the rate of geomorphic transformation by reuse and
disposal of construction material. The examination of geomorphic
consequences of urban growth activities confirms the importance of looking at
and encouraging of re-use of materials everywhere. It is important to identify
the key areas of intervention to reduce off-site impacts and cost.
In terms of land consumption, both material extraction and dumping of wastes
if continues at present rate, the demand for large areas of land for such
activities will grow. Since these areas have become unsuitable for other
productive use and agriculture, the pressure will mount on the fringe areas to
feed the city or for housing and infrastructure development which is bound to
be unsustainable in the long run. The excavations of materials for major
developments requiring substantial earth removal and relocation needs to be
examined to find ways and means for more balanced use of earth resources.
The present study takes a holistic look into the geoenvironmental status of
the Shillong urban agglomeration and its adjoining areas. The urban
ecosystem has been analysed with the concept of urban material metabolism
XVI
and it has been tried to find a link between the physical and biological
parameters vis-a-vis their spatio-temporal variability. Lithological units,
landforms and prevalent geomorphic setting are focused as platform to
understand the urban ecosystem. This study has brought out a set of baseline
data pertaining to the physical attributes which is expected to fill an
information gap and be useful as future reference to understand and manage
their spatio-temporal variability vis-a-vis changing status of the urban
ecosystem in a scenario of ever increasing human interference with the
natural systems. The study however, can be treated as the first approximation
considering the resolution of mapping adopted. A further high resolution
study, taking advantage of advanced technology available, both in temporal
and spatial contexts and with direct field measurement of attributes to
calibrate the changes imposed, will be the next step in right direction.
'. ,,~ J , • ..-
--.- ----
GEOENVIRONMENT AND METABOlISM,OF SHILLONG CITY ECOSYSTEM
BY
VAN JENNIFER JOAN WALLANG
THESIS SUBMITTED IN
FULFILLMENT OF THE DEGREE OF DOCTOR OF PHILOSOPHY IN ENVIRONMENTAL SCIENCE
NORTH·EASTERN HILL UNIVERSITY SHILLONG
2009


D6DrCAT6D TO My LAT6 CfRANDMOT~6R
NORTH· EASTERN HILL UNIVERSITY DEPARTMENT OF ENVIRONMENTAL STUDIES
December, 2009
I, Van Jennifer Joan Wallang, hereby declare that the subject matter of this thesis entitled,
"Geoenvironment and Metabolism of Shillong City Ecosystem" is the record of work done by
me, that the contents of this thesis did not form basis of the award of any previous degree to me
or to the best of my knowledge to anybody else, and that the thesis has not been submitted by
me for any research degree in any other Universityllnstitute.
This is being submitted to the North-Eastern Hill University, Shillong for the award of the degree
of Doctor of Philosophy in Environmental Science.
(Van Jennifer Joan Wallang)
~~ Dr. P. Phukan
Joint Supervisor Department of Geological Sciences
Gauhati University
~cuz: Prof. B. K. Tiwari Supervisor
ACKNOWLEDGEMENTS
My first thank you goes to my God and Lord Jesus Christ who is the source of strength and
wisdom. All Blessing, Honour and Glory go to God.
I place on record my deep sense of gratitude, respect and indebtedness to my supervisor
Professor B. K. Tiwari and joint supervisor Dr. P. Phukan for always being there for
consultations, valuable suggestions and all out support. Without their supervision and
meticulous care, this research work would not have seen the light of day.
I would also like to thank Professor O. P. Singh, Head of Department of Environmental Studies,
NEHU, for encouragement and providing necessary laboratory facilities.
Much thanks go to all the faculty members and staff of Department of Environmental Studies,
NEHU, for their kind help. I wish to express my gratitude to Dr. S. Phukan, Prof. B. S. Mipun,
Dr. D. Walia, Dr. H. J. Syiemlieh and Mr David Feral Marbaniang for encouragements and
valuable advice.
My heartfelt gratitude and appreciation goes to Dr. J. J. Dickie, my work colleagues and
Rev Fr. I. Warpakma, Principal of St. Anthony's College, Shillong, for all the support extended
towards me.
I would also like to give a special thank you to Mr. A. D. Kharbudon from PWD (Roads), Govt. of
Meghalaya, Shillong division for the valuable technical advice.
I appreciate immensely the wholehearted support I received from my fellow research scholars
Miss M. Lynser, Mr. A. Alam, Mr. H. Tynsong, and Miss Batriti Nongbri.
Above all, I wish to express my love and gratitude to my parents, Mr. V. Kharkongor and
Mrs. V. Wallang, my brothers and sisters and my aunty, Sr. Anita for their prayers, love,
tenderness and encouragement.
Shillong Dated: 10 '/2,;' Oq (Van Jennifer Joan Wallang)
CONTENTS
DESCRIPTION PAGE NO
LIST OF FIGURES i-iii
LIST OF TABLES iv-v
CHAPTER I GENERAL INTRODUCTION 1-10
CHAPTER II STUDY AREA and METHODOLOGY 11-29
CHAPTER III GEOLOGY and GEOMORPHOLOGY 30-90
CHAPTER IV MORPHOMETRIC ANALYSIS 91-146
CHAPTER V WATER RESOURCES 147-166
CHAPTER VI LAND USE lLANO COVER ANALYSIS 167-179
CHAPTER VII LANDSLIDE AND FLASHFLOOD 180-205
CHAPTER VIII URBAN METABOLISM 206-218
CHAPTER IX GENERAL DISCUSSION 219-233
SUMMARY 234-248
REFERENCES 249-265
APPENDICES 266-268
List of Figures
Sf. No. Description Page No.
Figure 2.1 A panoramic view of the study area 11 Figure 2.2 Location map of the study area shown as overlay on the IRS LlSS III 12
FCC image Figure 2.3 Base map showing the Shillong Master Plan Area 13 Figure 2.4 Mean monthly maximum and minimum temperature of the study 15
area Figure 2.5 Mean monthly variation in rainfall of the study area 16 Figure 3.1 Geological map of the study area modified after GSI (1989) 41 Figure 3.2 Basal conglomerates comprising of pebbles of quartz exposed in 43
west of Union Christian College, Barapani Figure 3.3 Exposure of Quartzite (A) and well bedded Phyllite (B) of lower 44
Shillong Group Figure 3.4 Highly deformed quartz-sericite-schists from the barapani shear zone 46 Figure 3.5 Khasi Greenstone with columnar joints 47 Figure 3.6 Grey porphyritic Mylliem Granite 48 Figure 3.7 Xenolith 'X' of quartzite in Mylliem Granite 48 Figure 3.8 Quartz viens'Q' within quartzite 49 Figure 3.9 Colluvial debris comprising of pebbles of quartz embedded 50
in semi-consolidated ferruginous matrix exposed in a road section near Sericulture Farm
Figure 3.10 Narrow alluvial tract in Polo ground 50 Figure 3.11 Shillong Quartzites with medium scale cross stratification as 51
internal bedding structure Figure 3.12 Open fold in Shillong quartzites underlying rounded hillock 53 Figure 3.13 Steep dipping rocks showing folding exposed at road section 53
in Mawdiangdiang Figure 3.14 Lineament map of the study area 55 Figure 3.15 lineaments density map of the study area generated through 55
interpolation of lineaments extracted from DEM and satellite Figure 3.16 Rose diagram showing the Lineament trends 56 Figure 3.17 Geomorphology of the study area 59 Figure 3.18 Areal coverage by major geomorphic units 60 Figure 3.19 Erosional scarp face developed along joints 61 Figure 3.20 A cliff face by the side ofa narrow gorge developed along Wah 61
Umkhen due to deeper down cutting Figure 3.21 A typical landscape along the Shillong City. Small elongate 62
intermontane valleys have developed within moderately dissected plateau terrain. The valley is extensively used for cultivation. Sparse vegetation is due to poor development of soil profile
Figure 3.22 Erosional Pre-Cambrian hilts interspersed with narrow valleys 62 Figure 3.23 An intermontane valley filled used for cultivation and settlements 63
near ICAR complexes, Barapani. Figure 3.24 A well developed valley along the Wah Umkhrah in Polo Ground 63
area Figure 3.25 Drainage network of the study area 65 Figure 3.26 Umiam lake 67 Figure 3.27 Wards lake 67 Figure 3.28 A water fall formed across general strike 68
Figure 3.29
Figure 3.30 Figure 3.31 Figure 3.32 Figure 3.33 Figure 3.34 Figure 3.35 Figure 3.36 Figure 3.37 Figure 3.38 Figure 3.39 Figure 3.40 Figure 3.41 Figure 3.42 Figure 3.43 Figure 3.44 Figure 3.45 Figure 3.46 Figure 3.47
Figure 4.1 Figure 4.2
Figure 4.3
Figure 4.4
Figure 4.5 Figure 4.6 Figure 4.7 Figure 4.8 Figure 4.9 Figure 4.10 Figure 4.11 Figure 4.12 Figure 4.13 Figure 4.14 Figure 4.15 Figure 4.16 Figure 4.17 Figure 4.18 Figure 4.19 Figure 4.20 Figure 5.1 Figure 5.2 Figure 5.3 Figure 5.4 Figure 5.5 Figure 5.6 Figure 6.1 Figure 6.2
\I
DEM derived from Survey ofIndia elevation contours at 20m 69 interval DEM profile along AA' 70 DEM profile across BB' 71 DEM profile across CC' 71 DEM profile across DD' 72 DEM profile across EE' 73 DEM profile across FF' 73 DEM profile across GG' 74 DEM profile along HH' 74 DEM profile along II' 75 DEM profile along JJ' 76 DEM profile along KK' 77 Slope map of the study area 78 Aerial extent of slope classes in the study area 82 Aspect map derived from a 30m DEM 83 Aerial extent of aspect of the study area 84 Shaded Relief derived from a 30m DEM 85 Elevation Map derived from a 30m DEM 86 Partial weathered soil ofB horizon overlying bed rock (Quartzites) 88 Humus in A horizon is very thin and supports less vegetation Fourth-order drainage sub-basins in the study area 99 Semi Log plots of stream order vs. stream number in different drainage 107 sub-basins of the study area Semi Log plot of stream order vs. stream length for various drainage III sub-basins of the study area Semi Log plot of stream order vs. mean stream length for various 112 drainage sub-basins of the study area Log-Log plot of basin area (Au) vs. stream length (Lu) 114 Log - Log plot of drainage density vs stream frequency 117 Relation between different shape parameters 119 Graphical plot of elongation ratio vs. bifurcation ratio 121 Hypsometric curve of Urn Baniun sub-basin 127 Hypsometric curve of Wah Umiam (t) sub-basin 128 Hypsometric curve ofUmshirpi sub-basin 129 Hypsometric curve of Wah Umkhrah sub-basin 130 Hypsometric curve of Wah Umkhen sub-basin 131 Hypsometric curve of Wah Umkhen(t) sub-basin 132 Hypsometric curve of Wah Umbah sub-basin 133 Hypsometric curve of Wah Sheila sub-basin 134 Hypsometric curve of Wah Tamdong sub-basin 135 Hypsometric curve ofPhud-Umsning (t) sub-basin 136 Hypsometric curve of Phud Mawiong sub-basin 137 Longitudinal profile of fourth order sub-basins of the study area 144 Total water availability for Greater Shillong Planning Area 157 Water level map of Shillong Master Plan Area 160 The extrapolated map of pH value of water in the study area 162 Distribution of Chloride content (mg/I) in the water of the study area 163 Distribution of ofIron content (mg/I) in the water of the study area 164 Distribution of Turbidity (NTU) in the water of the study area 165 Land use map of the study area for the year 2000 173 Land use map of the study area for the year 2005 174
III
Figure 6.3 Location of Protected and Reserved forests in the study area 176
Figure 6.4 Landuse / landcover change during the period 2000-2005 178 Figure 7.1 Distribution of landslide and flashflood in Shillong Master Plan Area 186 Figure 7.2 Debris fall and slumping 187 Figure 7.3 Newspaper clipping, The Shillong Times dated 9th October 2004 187 Figure 7.4 Glimpses of Landslides in Shillong Master Plan Area 190 Figure 7.5 Distribution of landslide in different land use classes 192 Figure 7.6 Breakage of the retaining wall in umlynka after heavy incessant rainfall 193
where three people died on the spot Figure 7.7 Distribution of landslide in diffrent Drainage density classes 194 Figure 7.8 a. Breakage of the retention wall by the strem side during flash flood
b. Debris fall near the stream at 4th mile, Upper Shillong 195
Figure 7.9 Distribution of landslides in various slope classes 196 Figure 7.10 Distribution of landslide in various lineaments density classes 198 Figure 7.11 Variation in mean annual rainfall 200 Figure 7.12 Daily variation in rainfall for the year 2003 and 2004 200 Figure 7.13 Monthly average rainfall for the last 30 years (1975 to 2005) 200 Figure 7.14 Encroachment of the settlement areas towards the river bank 202 Figure 7.15 Dumping of garbage directly into river 202 Figure 7.16 Inundation due to flash floods along Wah Umkbrah river affecting life 203
and properties Figure 7.17 Quarry sites of quartzite and arnphibolites for sand and aggregates 204 Figure 7.18 Huge quantum of silt is generated from the quarries that find their 204
way to the nearest river. The photograph shows heavy siltation of Wah umkbrah at the quarry sites .The siltation reduce the channel capacity and aid in flash flood
Figure 7.19 a. Forest clearing for cultivation in rural fringe 205 b. Bun method of potato cultivation located near the stream
Figure 8.1 Summary of resource flow of SUA urban construction 216
IV
List of Tables
SI. No. Description Page No.
Table 2.1 Decadal growth of population of ShiIlong Master Plan Area 14 Table 2.2 Sobel Kernels in two principal directions 19 Table 2.3 Symbols and parameters used in morphometric analysis 22 Table 3.1 General lithostratigraphic sequence of ShiIlong Plateau 33 Table 3.2 Lithostratigraphy of the study area 42 Table 3.3 Areal coverage of different geomorphic domain 58 Table 3.4 Slope classes ofthe study area 82 Table 3.5 Aspect classes of the study area 84 Table 3.6 Soil type in and around Shillong Master Plan Area 87
(NSSB-LUP pub\. 52) Table 4.1 Fourth-order drainage sub basins of the study area 98 Table 4.2 The lithological units of the fourth-order drainage sub-basin 100 Table 4.3 Morphometric analysis: linear and aerial aspects for the sub-basin 01 101 Table 4.4 Morphometric analysis: linear and aerial aspects for the sub-basinD2 101 Table 4.5 Morphometric analysis: linear and aerial aspects for the sub-basin 03 102 Table 4.6 Morphometric analysis: linear and aerial aspects for the sub-basin D4 102 Table 4.7 Morphometric analysis: linear and aerial aspects for the sub-basin 05 103 Table 4.8 Morphometric analysis: linear and aerial aspects for the sub-basin 06 103 Table 4.9 Morphometric analysis: linear and aerial aspects for the sub-basin D7 104 Table 4.10 Morphometric analysis: linear and aerial aspects for the sub-basin D8 104 Table 4.11 Morphometric analysis: linear and aerial aspects for the sub-basin D9 105 Table 4.12 Morphometric analysis: linear and aerial aspects for the sub-basin 010 105 Table 4.13 Morphometric analysis: linear and aerial aspects for the sub-basin 011 106 Table 4.14 Bifurcation Ratio and Weighted Mean Bifurcation Ratio of 109
fourth-order drainage sub-basin Table 4.15 Stream length and basin area of fourth-order drainage sub-basins 114 Table 4.16 Drainage density, drainage texture and drainage frequency of 116
fourth-order drainage sub-basin Table 4.17 Shape parameters of forth-order drainage sub-basin ] 18 Table 4.18 Computed values of infiltration number (If), length of overland flow 122
(Lg), constant of channel maintenance (C) and Drainage density of fourth-order drainage sub-basin
Table 4.19 Relief parameters of fourth-order drainage sub-basin 124 Table 4.20 Ruggedness numbers of fourth-order drainage sub-basin 126 Table 4.21 Data used for drawing ofhypsometric curve shown in Figure 4.9 127
(after Schumm, 1956) Table 4.22 Data used for drawing of hypsometric curve shown in Figure 4.10 128
(after Schumm, 1956) Table 4.23 Data used for drawing of hypsometric curve shown in figure 4.11 129
(after Schumm, 1956) Table 4.24 Data used for drawing ofhypsometric curve shown in figure 4.12 130
(after Schumm, 1956) Table 4.25 Data used for drawing of hypsometric curve shown in figure 4.13 131
(after Schumm, 1956)
v
Table 4.26 Data used for drawing of hypsometric curve shown in figure 4.14 132 (after Schumm, 1956)
Table 4.27 Data used for drawing of hypsometric curve shown in figure 4.15 133 (after Schumm, 1956)
Table 4.28 Data used for drawing of hypsometric curve shown in figure 4.16 134 (after Schumm, 1956)
Table 4.29 Data used for drawing of hypsometric curve shown in figure 4.17 135 (after Schumm, 1956)
Table 4.30 Data used for drawing of hypsometric curve shown in figure 4.18 136 (after Schumm, 1956)
Table 4.31 Data used for drawing of hypsometric curve shown in figure 4.19 137 (after Schumm, 1956)
Table 4.32 Hypsometric integral of fourth-order drainage sub-basin 139 Table 4.33 Hypsometric parameters of fourth order drainage sub-basin 140 Table 5.1 Quantity of discharge from 5MB sources 154 Table 5.2 Names of Localities covered by different water sources 154 Table 5.3 Quantity of water supplied by PheD under various water supply 155
schemes Table 5.4 Water availability in Greater Shillong Planning Area 157 Table 5.5 Hydrogeological data of well in Shillong Master Plan Area 159 Table 5.6 Chemical analysis of drinking water in the study area 161 Table 6.1 Distribution of area under different land use classes during years 172
2000 and 2005 Table 6.2 Area covered by Reserved and Protected Forests 175 Table 6.3 List of localities and villages adjoining/falling under Reserved and 176
Protected forest Table 6.4 Land use changes in 2000-2005 178 Table 7.1 Inventory and characterization of landslides in the study area 188 Table 7.2 Distribution of Landslides in different land use classes 192 Table 7.3 Landslide frequency in different Drainage density classes 194 Table 7.4 Landslide distribution in various slope classes 196 Table 7.5 Landslide distribution in lithology 197 Table 7.6 Landslide distribution and lineament density 198 Table 8.1 Summary of urban construction in Shillong Urban Agglomeration 212 Table 8.2 Per unit requirements of construction materials 213 Table 8.3 Trends of resource consumption for urban construction in SUA 214
CHAPTER!
GENERAL INTRODUCTION
Geoenvironment has been a key area of concern particularly during the last few
decades due to increasing manifestation of adverse impact of anthropogenic forces on
most parts of the earth. The top stratum of the earth's crust with diverse geological
and geomorphic setting as well as under different climate regime, having interface
with the hydrosphere, atmosphere and biosphere has borne the brunt of exploitation of
earth's resources throughout the human civilization, more so in the post industrial era.
The resultant impact on the structure and function of earth ecosystem is now all too
apparent. It is often felt that there is a need for continuous evaluation and appraisal of
the environment in terms of the physical parameters of the earth system vis-a-vis the
man made ecosystems. Geoenvironmental study in combination with metabolism
analysis in spatio-temporal context can be a very effective tool for rational evaluation
of changing status of the environment and overall functioning of the ecosystem.
Availability of high resolution satellite data with repetitive coverage of the earth,
development in location based technology viz., Global Positioning System (GPS) and
enhanced capability of value addition to geospatial database in Geographic
Information System (GIS) platform have proved to be a valuable tool for evaluation
of resources, appraisal of geoenvironmental status of a region as well as for assessing
their spatio-temporal variability. Digital techniques employed in generating spatial
information on natural resources greatly enhance the decision support system
providing direct field feedback to an open access technology disseminating
information to the public. An essential prerequisite to the assessment of any change in
geoenvironmental parameters due to anthropogenic activities or otherwise, is a set of
benchmark database. Reliable baseline data is however, still lacking in many parts of
the world in spite of the giant stride in relevant technological fields during last few
decades. In the backdrop of these technological developments, it is imperative and
prudent to prepare basic inventory of natural resources. This approach is also quite
useful for planning and development of urban growth centres with optimal utilization
of the natural resources in an ecofriendly and cost effective manner.
Knowledge of geomorphology, lithology, stratigraphy, structure and groundwater
conditions are fundamental for the study of geoenvironment of any place.
Geoenvironment approach towards management and conservation of urban resources
has proved to be a successful strategy for mitigating environmental problems of cities.
Development through geoenvironmental management has been a key area of interest
throughout the world for quite some time now. The planners and development
managers have amply realized the importance of geoenvironmental studies and have
drawn few guidelines for making environmental appraisal of megacities and projects
likely to be executed in future. In Indian cities in general and hill cities in particular, a
number of studies on geoenvironmental aspects have been carried out. Sharma and
Nathawat (1993) worked out land transformation and environment degradation that
resulted from human interference in the fragile ecosystem of Jaipur and its environs.
The outcome of the study enabled the planners and administrators in formulating
development plan guidelines for maintaining the environment and deciding the
parameters for evaluating the quality of life. The geoenvironmental appraisal of
Jammu district was made by Vaid et.a!. (1998) where a field traverse was made with
2
analysis of water and soil samples. Thematic maps were prepared depicting various
geoenvironmental parameters, viz., geology and geomorphology, depth to
groundwater, groundwater quality and land use / land capability. Geoenvironmental
degradation of Jammu district was identified on account of various geological and
anthropogenic factors. The study suggested that the geoenvironmental aspects derived
from the study need to be taken into account for any further development plans in the
district, along with measures for mitigation of environmental hazards. An in-depth
study on the physical, socio-economic and urban environmental problems caused due
to unplanned growth of Gorakhpur city was conducted by Singh et.at (1998). They
prepared a planning proposal to improve the housing conditions, land use, health and
sanitation, educational and recreational facilities of the city. Shanna (2001) while
assessing the natural slope condition using Kinematic analysis identified unstable
zones around Nainital township and found that the geoenvironmental setup of the
town is prone to mass movement. Gupta (2001) worked on the geological and
anthropogenic hazards of Delhi metropolis, and found that geoenvironmentally Delhi
suffers from a host of natural as well as anthropogenicaUy induced hazards. He
concluded that it is imperative to pay more attention to the geological parameters in
order to rectify landuse mismatches. Singh and Sangwan (2001) have reported that
urbanization in Haryana is characterized by an appreciable increase in its urban
population, declining pace of growth and a considerable change in pattern of
urbanization since independence. Spatially the focus of urbanization in Haryana had
shifted to the region surrounding Delhi, strongly supported by industrial development
and liberization of economy. Geo-environmental scenario of Bangalore Metropolitan
region has been studied by Hedge (2002).
3
Geoenvironmental issues of the northeastern India was studied by Barman and
Bhattacharjee (2008) highlighting the emerging geoenvironmental problems and their
present status in northeastern India. They explained how the assessment of the
geoenvironmental potential and geo-factors of this region can help to formulate
strategies for sustainable management by mitigating the probable geoenvironmental
hazards. Bhagabati (2008) focused on environmental problems, such as deforestation,
land degradation, flood and bank erosion, loss of biodiversity and human-animal
conflict with the existing physical background and growing population pressure on
the northeastern region. Bora (2008) broadly discussed the water resources of
northeast India in term of potential and development pattern, and classified these
resources into four sectors, viz., hydropower, irrigation, navigation and flood
management. He concluded that geo-tectonics combined with high seismicity are
major problem in water resources development as well as hydropower generation.
Agarwal (1993) reported that the urban structure of northeastern India is steadily
evolving towards a higher degree of primacy and the rapid rate of urbanization has
caused strain on the basic urban services and amenities.
Literature on the status of geoenvironment of Shillong city is very scanty. A few
snapshots are available in the form of abstracts and brief reports which, however, do
not cover all aspects of the problem. The geoenvironmental appraisal of Shillong
Urban Complex was first made by Kumar (1988) where he worked out the terrain
characteristics and slope elements of Shillong area. Thematic maps on land use,
surface and ground water resources were also prepared as part of the study. It was
followed by Roy et. al. (1988) who analyzed base line data on geofactors and
prepared thematic maps on geology, geomorphology, slope, landuse and
environmental hazards with the help of field data and aerial photographs. The State
4
Council of Science, Technology and Environment, Shillong commissioned a study on
the use and applicability of remotely sensed data in geoenvironmental mapping and
appraisal of Greater Shillong region (SCSTE, 2002). An account of the socio
economic and geographical aspects for the Shillong Urban Agglomeration and
proposed New Shillong City can be found in the Project Report on New Shillong
(DOUA, 1997). Meghalaya State Pollution Control Board (2002) has also prepared a
report entitled, "The State of Environment of Shillong City". The proposal of Master
Plan of Shillong (1991-2011) prepared by, Directorate of Urban Affairs Meghalaya
aims to achieve the objectives such as integration of various areas within the Shillong
city, development of transport and communication network and functional disposition
of urban areas(DOUA, 1991).
The geoenvironmental view of resource exploitation takes into account both the mass
of minerals produced and the masses of overburden, wastes and by-products created.
Knowledge of me degree and magnitude of the "rucksack" associated with mineral
working is an important contribution to "geoindicators" or sustainability indicators
which monitor consumption of natural resources and the impact of that consumption
(Lawson and Douglas, 1998). The impacts of such rapid transfers of materials from
the natural environment to the urban and industrial built environment are two-fold, a
removal of material from the earth's surface (a change in geomorphology) and the
accumulation of a stock of concrete and other materials elsewhere in cities (a change
in urban morphology) (Douglas and Lawson, 2001). The metabolism of cities and
industries transform the natural landscapes and has emerged as a highly efficient
geological and geomorphological agent in comparison with the rates at which rivers
and water running over the ground changes the landscape.
5
In order to appreciate the position of the flows of concern to urban ecology within the
spatial and temporal scales of geological processes, we have to consider human urban
activity as one of the sets of actions by organisms that contribute to the earth surface
component of the rock cycle. This rock cycle contains many shorter term, localized
re-distributions and circulations of chemical elements between the mineral material of
the earths crust and the organisms that live within it and on it. Such biogeochemical
cycling is fundamental to life and is part of biological production and decay. The
biogeochemical cycling is best interpreted in the way ecologists, such as Odum
(1971), examine turnover of material in natural ecosystems such as tropical forests or
coral reefs. However, it can be conceptually extended to incorporate an urban system,
in which the urban fabric is added as an additional repository of substances, alongside
the lithosphere, biosphere, hydrosphere and atmosphere (Odum, 1971). Urban fabric
is often constantly being renewed through demolition creating a recycling opportunity
for crushed concrete to be used as aggregate. The urban fabric can thus be interpreted
as the "urban deposit" (Wilburn and Goonan, 1998), a form of renewable resource,
constantly being restocked with new structures. In this way, people's activities are
seen as part of the processes changing the earth's surface at geological scales (Douglas
and Lawson, 2001).Viewing cities as centres of accumulation of materials is repeating
a geomorphological view of a city as a recent earth surface deposit where structures
and drainage have greatly modified earth surface processes. This view then lead to a
recognition that the material flows driven by human activities can be seen as part of a
broader anthropogenic transformation of the earth's surface which has implications
not only for supplies and environmental costs of materials, but also for the nature of
the lands and seas on which we live and the landscapes surrounding our daily lives.
6
The role of human activity in earth surface processes and geological transformations
has long been acknowledged. Sherlock's (1922) studies provide many illustrations of
the quantities of material involved in mining, construction and urban processes. In the
concern over making land use and urban life more sustainable in the 1990's, much
greater attention than ever before has been paid to the ecological footprints of cities
(Rees 1994) and the environmental "rucksack" of mining (Bringezu and SchUtz 1996).
The importance of the analysis of materials flows, the study of product life cycles, and
resource and waste accounting (Ayres and Ayres, 1996; Masini and Ayres, 1996).
Analyses of materials fluxes, with parameters of direct geomorphological interest,
have been produced for China, Germany, Japan, the Netherlands and the USA (Chen
and Qiao 2000; Adriaanse et al. 1997, De Marco et. al. 1999). Girardet has calculated
the resource use in Greater London's metabolism (Sustainable London Trust, 1996).
Geoenvironmental view of national earth resource exploitation which considers both
the mass of minerals produced by national extractive industries and masses of
overburden, wastes and by-products was created by Lawson and Douglas, (1998) to
see how those flows compare with the rates of change of the surface of those
countries by natural erosive processes. Materials flow accounting and quantification
of the urban metabolism can help in the development of indicators of the degree to
which a country or a city is becoming more sustainable in its behavior. The
geomorphic work associated with urban and industrial growth thus involves materials
use, the hidden flows, such as mining and construction waste, and the accelerated
erosion by natural processes. Hence metabolism of a city can be seen as the process
of transforming all the materials and commodities for sustaining the city's economic
activities (Huang and Hsu, 2003).
7
Integrated appraisal of geoenvironment together with urban metabolism is an
emerging field of applied research which has received ample attention of researchers
in recent times. In a number of cities world over, the planners and researchers are
engaged in evolving a holistic model of urban development based on modem
ecological principles. The development managers and planners have used the
geoenvironmental approach of different parameters to study specific areas for
sustainable development.
Shillong, the capital city of Meghalaya, is a growing urban centre that has witnessed
high population growth particularly after 1972 when a separate state of Meghalaya
was formed with Shillong as the State Capital. It has a three and half lakhs population
as per census 2001. The early growth of Shillong was due to the expansion of offices
and commercial activities to serve the administrative popUlation. However, after
independence the importance of Shillong grew as an educational centre for the people
of the northeastern states. This accelerated the immigration of people from
neighbouring states as well as from other parts of the country. This growth causes an
immense pressure on the available resources and environment resulting into an
imbalance in the city ecosystem. Therefore there is a need of regular monitoring of
environment and inventorisation of the resources for proper planning and
management of the city. In doing so the status of geoenvironment has to be known for
present and future development activities. So far no work has been carried out on the
Geoenvironment Metabolism of Shillong City Ecosystem. Some data are available on
the Geoenvironment of Shillong but an integrated metabolism approach towards
problem using modem tools and techniques is lacking. Present study aims to fill in
this gap in our knowledge on the dynamics, structure and function of city ecosystems.
In absence of a comprehensive base line data on the different geoenvironmental
8
parameters it is difficult to comprehend any change that has been taken place in terms
of quantum and rate. This study intends to provide the base line data on
Geoenvironment and Metabolism of Shillong city which can be used for monitoring
of future change and in planning for sustainable development of the city.
The study aims to conduct an integrated analysis of the multidisciplinary spatial and
aspatial auxiliary data pertaining to geoenvironment and metabolism. It involves
study of lithological and geomorphological attributes of the area, lineament
identification, slope analysis and delineation of potential landslide prone zone, to
evaluate the land use/land cover and its changes in spatial and temporal context,
drainage pattern identification and drainage analysis as well as water quality analysis,
and geoenvironmental hazards. The urban metabolism has been studied to learn the
materials flow for construction major engineering projects such as roads, bridges,
storm water drainage and buildings. An attempt has been made to integrate the
geoenivironment and metabolism and their common areas of influence to address the
issue of establishing the rate of transformation of the land surface of Shillong city by
human action in terms of the annual quantities of rock materials extracted and the
volumes of waste created by human activities.
The thesis has been divided into 9 chapters. Chapter-l introduces the problem and sets
the objectives of the work. Chapter-2 describes the location, salient features of the
study area and the methodology followed. Chapter-3 deals with geological settings
and geomorphology while the results of morphometric parameters of the fourth-order
drainage basins and the stage of geomorphic development is given in Chapter-4.
Chapter-5 gives an account of water availability from ground water and surface water
sources, evualuation of water quality and hydro geomorphological study for ground
9
water prospects. Chapter-6 discusses the land use/ land cover change of the study area
between 2000 and 2005. Chapter-7 reports the causal factors of landslides and flash
flood while the study on metabolism on consumption of construction materials and
discharge of wastes is given in Chapter-8. General discussion of the research is given
in Chapter-9.
10
Study area
CHAPTER 2
STUDY AREA AND METHODOLOGY
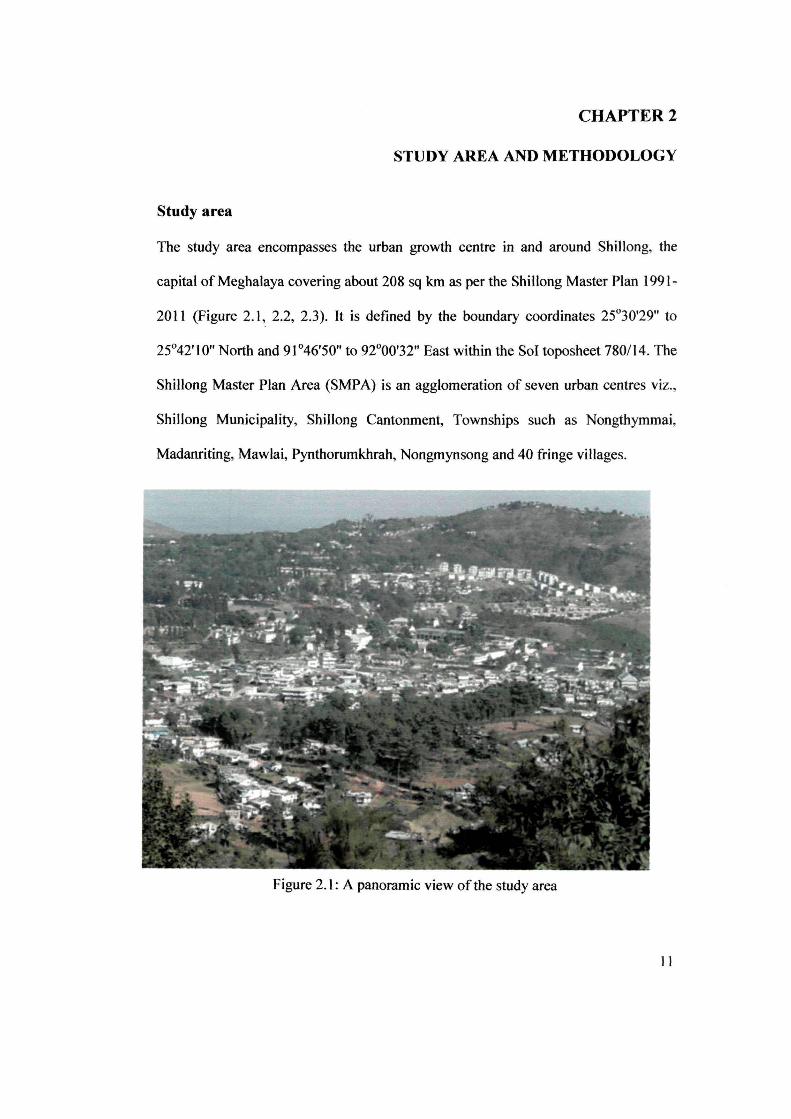
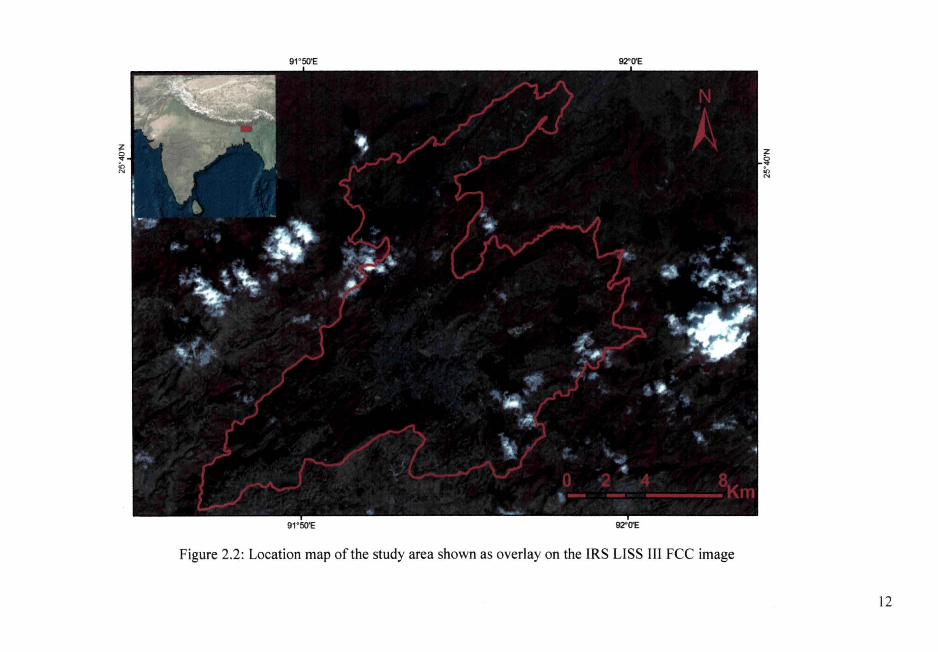
The study area encompasses the urban growth centre in and around Shillong, the
capital of Meghalaya covering about 208 sq km as per the Shillong Master Plan 199]-
2011 (Figure 2.1,. 2.2, 2.3). It is defined by the boundary coordinates 25°30'29" to
25°42'] 0" North and 91 °46'50" to 92°00'32" East within the SoT toposheet 780114. The
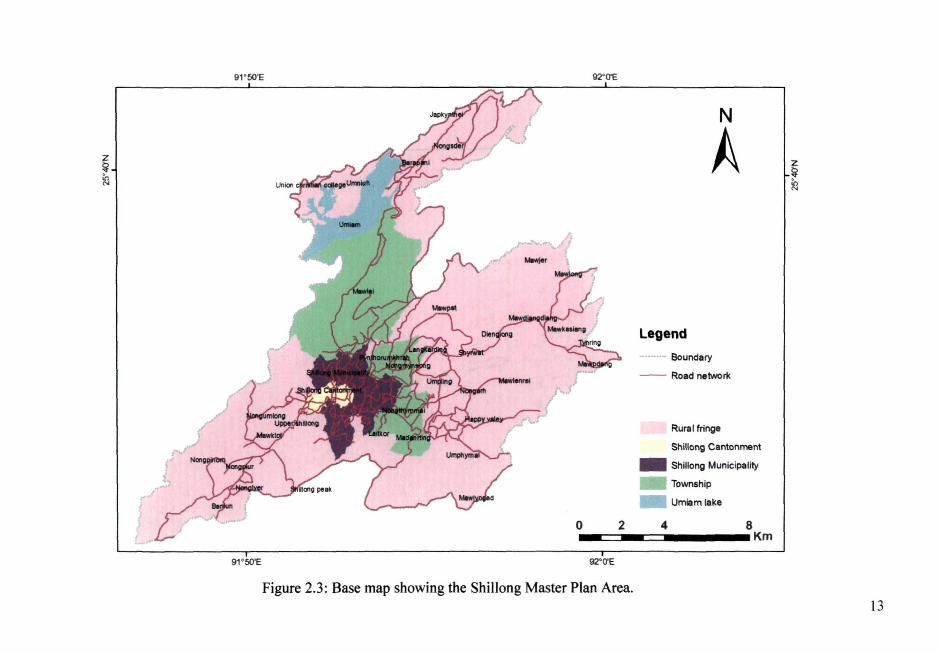
Shillong Master Plan Area (SMPA) is an agglomeration of seven urban centres viz.,
Shillong Municipality, Shillong Cantonment, Townships such as Nongthymmai,
Madanriting, Mawlai, Pynthorumkhrah, Nongmynsong and 40 fringe villages.
Figure 2.1: A panoramic view of the study area
11
z ~ 10 N
Figure 2.2: Location map of the study area shown as overlay on the IRS LISS III FCC image
12
z ~ ~
91 ' 50'E
91 ' 50'E
92'O'E
N
A
Legend ,.,_ .. - Boundary
-- Road networll
Rura I fringe
Shillong Cantonment
_ Shillong Municipality
_ Township
_ Umiamlake
4 8 .. c=~-==-........ Km
Figure 2.3: Base map showing the Shillong Master Plan Area.
z ~ in N
13
The total area of the Shillong municipality is 10.36 sq km with 27 separate single
member wards under the administration of Shillong Municipal Board (SMB) while
Shillong Cantonment has its own Cantonment Board. The Cantonment and
Townships constitute Shillong Urban Agglomeration (SUA).
Accessibility
The Shillong city is well connected with rest of the states of northeast India through
NH-40 and NH-44. The main gateway for rail and air connectivity is through
Guwahati which is at a distance of about 100km towards north. Towards south, the
city is connected with Jowai, the district headquarters of Jaintia Hills at a distance of
65km while towards west Cherrapunjee is located at a distance of about 55km. Within
the study area there is a network of good all weathered roads, besides numerous foot
tracks and fair weather jeepable roads that connect the interior parts of the area.
Helicopter service is available between Shillong-Guwahati and Shillong-Tura. The
only airport at Umroi is 35 km from Shillong.
Demographic profile
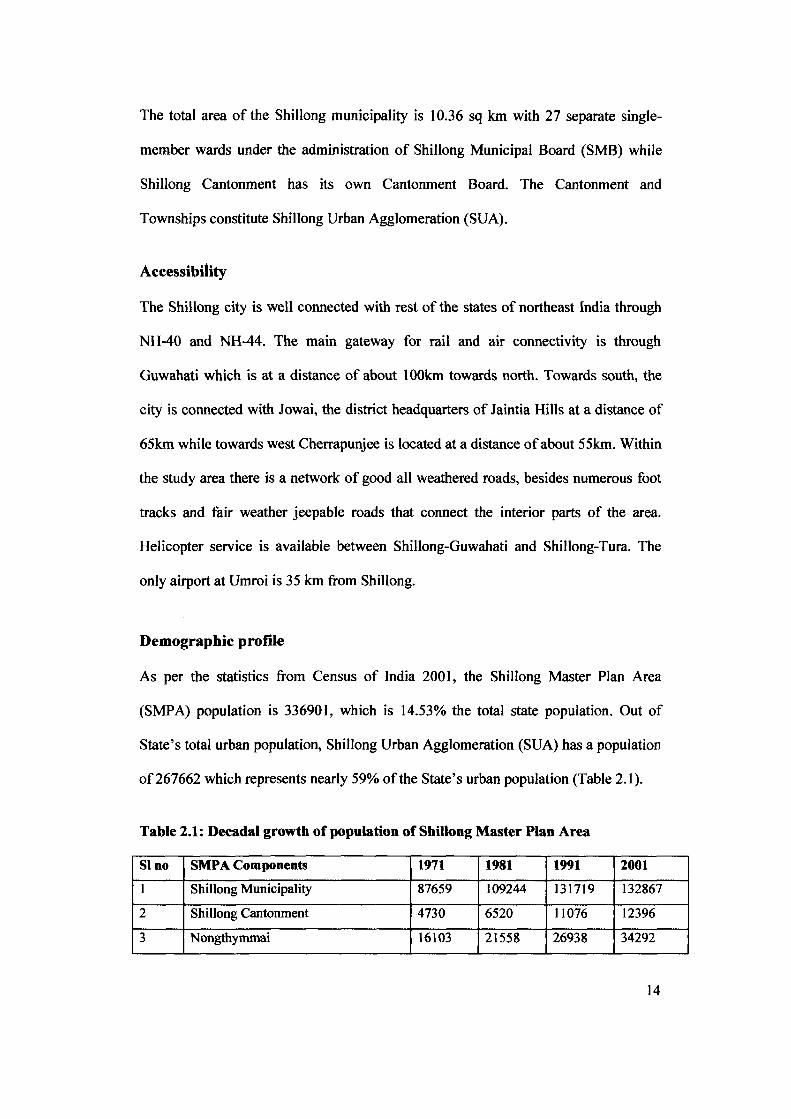
As per the statistics from Census of India 2001, the Shillong Master Plan Area
(SMPA) population is 33690 I, which is 14.53% the total state population. Out of
State's total urban population, Shillong Urban Agglomeration (SUA) has a population
of267662 which represents nearly 59% of the State's urban population (Table 2.1).
Table 2.1: Decadal growth of population of Shillong Master Plan Area
Sino SMPA Components 1971 1981 1991 2001
1 Shillong Municipality 87659 109244 131719 132867
2 Shillong Cantonment 4730 6520 11076 12396
3 Nongthymmai 16103 21558 26938 34292
14
4 Mawlai 14260 20405 30964 38303
5 Madanrting - 6165 8987 16318
6 Pynthorumkhrah - 10711 13682 22115
7 Nongmynsong - - - 11371
Shillong Urban Agglomeration 122752 174703 223366 267662
8 32 Villages 32848 42571 47747 63711
9 8 Villages - - - 5528
Total 155600 217274 271113 336901
(Source: Master Plan of Shillong and Reports of Census of India 1991, 2001)
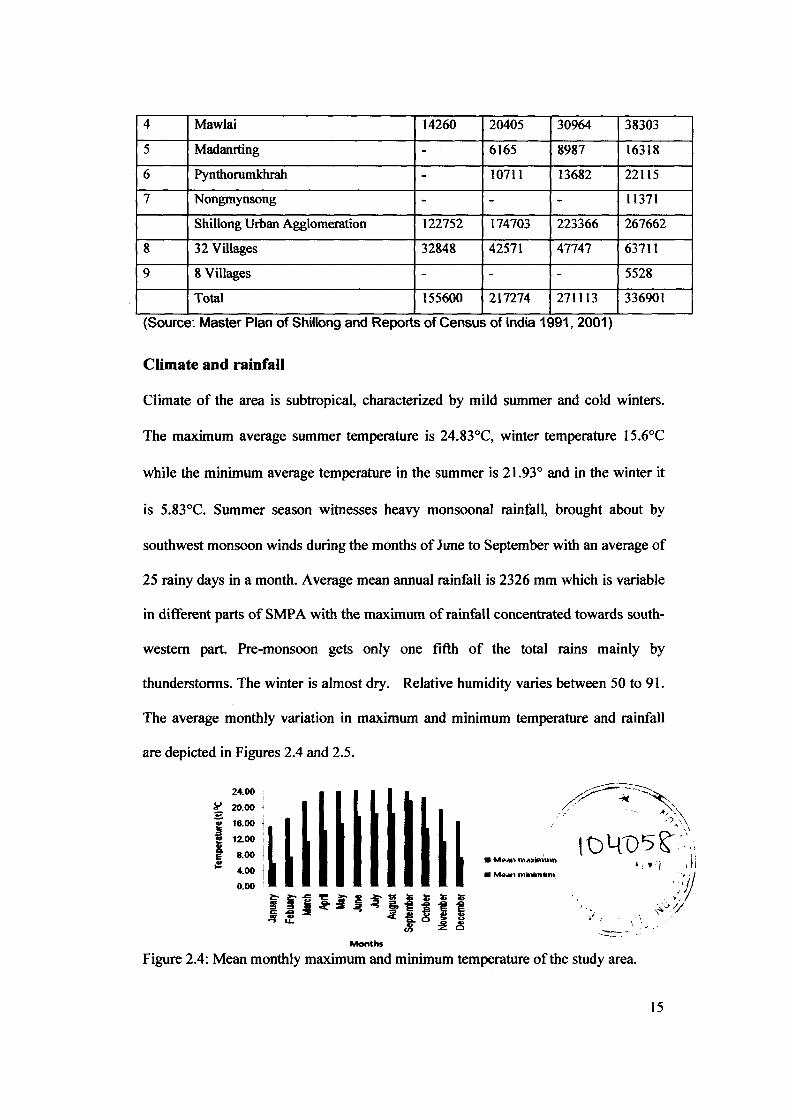
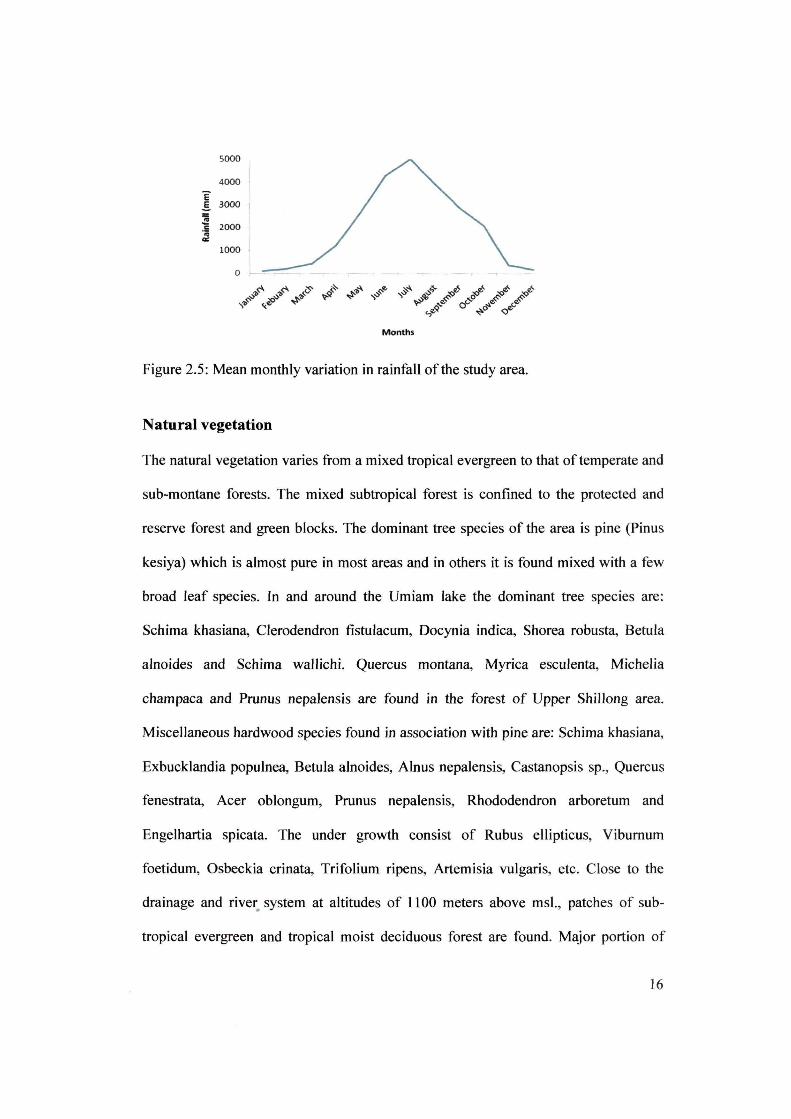
Climate and rainfaU
Climate of the area is subtropical, characterized by mild summer and cold winters.
The maximum average summer temperature is 24.83°C, winter temperature 15.6°C
while the minimum average temperature in the summer is 21.93° and in the winter it
is 5.83°C. Summer season witnesses heavy monsoonal rainfall, brought about by
southwest monsoon winds during the months of June to September with an average of
25 rainy days in a month. Average mean annual rainfall is 2326 mm which is variable
in different parts of SMP A with the maximum of rainfall concentrated towards south-
western part. Pre-monsoon gets only one fifth of the total rains mainly by
thunderstorms. The winter is almost dry. Relative humidity varies between 50 to 91.
The average monthly variation in maximum and minimum temperature and rainfall
are depicted in Figures 2.4 and 2.5.
24.00 '
:t' 20.00 E:
!5.... 18.00 1;; 12.00
f 8.00 ~ 4.00
0.00
Mortths
• Me., minimilm
",
.1.'
l
Figure 2.4: Mean monthly maximum and minimum temperature of the study area.
15
5000
4000
e-.g 3000 -.!! 2000 .Ii: .. '" 1000
o
Months
Figure 2.5: Mean monthly variation in rainfall of the study area.
Natural vegetation
The natural vegetation varies from a mixed tropical evergreen to that of temperate and
sub-montane forests. The mixed subtropical forest is confined to the protected and
reserve forest and green blocks. The dominant tree species of the area is pine (pinus
kesiya) which is almost pure in most areas and in others it is found mixed with a few
broad leaf species. In and around the Umiam lake the dominant tree species are:
Schima khasiana, Clerodendron fistulacum, Docynia indica, Shorea robusta, Betula
alnoides and Schima wallichi. Quercus montana, Myrica esculenta, Michelia
champaca and Prunus nepalensis are found in the forest of Upper Shillong area.
Miscellaneous hardwood species found in association with pine are: Schima khasiana,
Exbucklandia populnea, Betula alnoides, Alnus nepalensis, Castanopsis sp., Quercus
fenestrata, Acer oblongum, Prunus nepalensis, Rhododendron arboretum and
Engelhartia spicata. The under growth consist of Rubus ellipticus, Viburnum
foetidum, Osbeckia crinata, Trifolium ripens, Artemisia vulgaris, etc. Close to the
drainage and river. system at altitudes of 1100 meters above ms!., patches of sub-
tropical evergreen and tropical moist deciduous forest are found. Major portion of
16
these forest are formed by Castanopsis indica, Quercus serrata, Cinnamomum sp.,
Michelia champaca, Syzygium jambos, Duabanga sp., Acer sp., etc. Pinus kesiya is
found mixed with these species.
Methodology and Database
The outline of work elements and research design adopted for this study involved
collection, compilation and collation of background information. This was followed
by procuring satellite data (IRS LISS III, FCC) and Survey of India (Sol) topomaps in
1 :50000 scale. Basic spatial data was generated based on satellite data (IRS LISS III,
FCC) and Survey of India (Sol) topomaps in 1 :50000 scale. Preprocessing of
topomaps and satellite data was done in GIS environment using the Orthoengine
module of Geomatica 9.1 and giving input of same projection parameters using UTM
projection of zone 46 (900E-96°E) and row R (24°N-32'N), datum in 'D076' Indian
(India, Nepal) and Everest Ellipsoid (1956) as earth model.
The IRS LISS III, FCC images were georeferenced collecting GCPs from the Sol
toposheets by picking identical points in both topomap and satellite imagery. The
projection parameters for georeferencing the satellite images were same as that of the
toposheet. The study area boundary was first geocoded by picking identical points
from the topomap and then followed by vectorisation as polygon from the raster
Shillong Master Plan Area boundary map and the area was noted directly from the
attribute table of the layer. In the case of municipal ward and township boundary map,
total RMS error was not taken into consideration as the original map was
geometrically not accurate. The technique of rubber sheeting was applied to this map
to correct the shape. Reconnaissance survey was conducted to identify the key area of
interest.
17
Satellite data (IRS LISS III, FCC) and Survey of India topomaps in 1 :50000 scale
were studied for extraction of information on lithology and structure as well as
geomorphology. Integrating these studies and available collateral data in the form of
published literatures, maps etc. prefield maps were prepared for geology and
geomorphology which were used as basis for identification of traverses for detailed
field study. The recording of surface irregularities and relief patterns on satellite
imagery facilitated the mapping of these geomorphic units. Besides standard visual
interpretation technique as described by Lilles and Kiefer (1999) was used for
indentifying individual landforms.
Extensive fieldwork was carried out, both along and across strike for identifying the
geological and geomorphological attributes. The prefield maps were edited and
finalized based on the field inputs and a spatial database was generated in GIS
environment. All positional data were recorded as latitude/longitude waypoints in a
handheld GPS (Garmin eTrex Vista) with 6-10m spatial resolution and the location
based information were integrated as attribute of the point vector layer representing
the GPS waypoints.
Remote sensing techniques were employed to delineate the lineament occurring in
SMP A in order to examine the structural characteristics of the terrain. For manual
lineament extraction, the image (IRS L3 FCC) was first smoothened with an average
low pass filter in order to eliminate the noise using Geomatica Focus 9.2. Following
the smoothened process, Sobel's directional filter (NE-SW) was applied to make the
lineaments prominent, as the dominant structural trend of the area is NE-SW (Suzen
and Toprak, 1998, Table 2.2). After the filtering operation, the lineaments were
digitized manually.
18
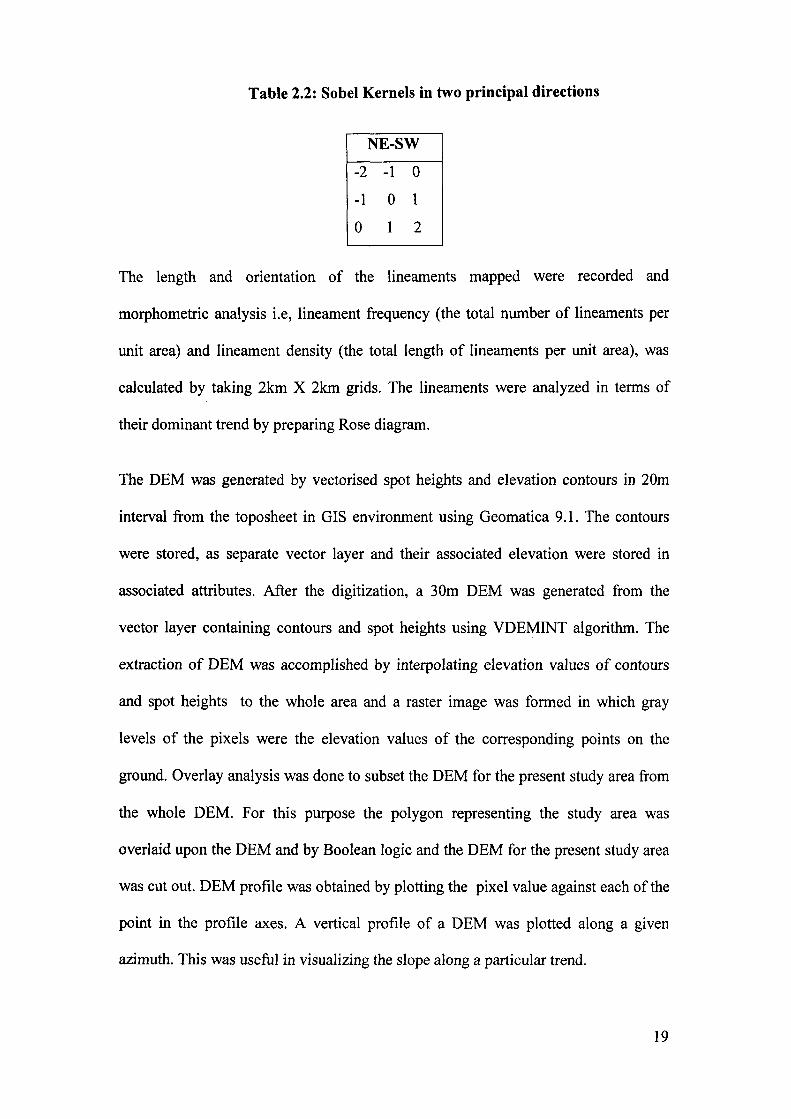
Table 2.2: Sobel Kernels in two principal directions
NE-SW
-2 -1 0
-1 0 1
o 1 2
The length and orientation of the lineaments mapped were recorded and
morphometric analysis i.e, lineament frequency (the total number of lineaments per
unit area) and lineament density (the total length of lineaments per unit area), was
calculated by taking 2km X 2km grids. The lineaments were analyzed in terms of
their dominant trend by preparing Rose diagram.
The DEM was generated by vectorised spot heights and elevation contours in 20m
interval from the toposheet in GIS environment using Geomatica 9.1. The contours
were stored, as separate vector layer and their associated elevation were stored in
associated attributes. After the digitization, a 30m DEM was generated from the
vector layer containing contours and spot heights using VDEMINT algorithm. The
extraction of DEM was accomplished by interpolating elevation values of contours
and spot heights to the whole area and a raster image was formed in which gray
levels of the pixels were the elevation values of the corresponding points on the
ground. Overlay analysis was done to subset the DEM for the present study area from
the whole DEM. For this purpose the polygon representing the study area was
overlaid upon the DEM and by Boolean logic and the DEM for the present study area
was cut out. DEM profile was obtained by plotting the pixel value against each of the
point in the profile axes. A vertical profile of a DEM was plotted along a given
azimuth. This was useful in visualizing the slope along a particular trend.
19
Gradient was expressed in degrees or percentage and aspect in degrees was converted
to a compass bearing.
The gradient is given by the equation:
Tan G = [(dZ/dXi +(dZ/dy)2]~, where Z is altitude and X and Y are the
co-ordinates axes.
The aspect is given by the equation: Tan A = '6Z/'6Y /'6 Z/'6X (1t <A<1t)
The derivation of slope and aspect from DEM was created using SLP algorithm for
slope and ASP algorithm for aspect. The slope calculation algorithm was based on a
best plane determination method, using a grid of 3·3. Thus the slope of a 10 m-sided
grid was calculated by interpolation on a ground pixel size of 30x30 m square.The
process of generating Shaded relief was done interactively with the user selecting
different sun azimuth and elevation positions. As a result of shadows the structural
features present as part of the topography were highlighted e.g., linear features
trending N-S were highlighted with sun azimuth of 90° while E-W trending features
were highlighted with a sun azimuth of 180°. Shaded relief was generated using REL
algorithm with input parameter of 31So azimuth angle and 30° elevation of the sun.
An elevation map was created from DEM using Pseudo Colour Transformation
(PCT). The soil map of Meghalaya prepared by National Bureau of Soil Survey and
Land Use Planning prepared in 1,2S0,000 scale and printed in I,SOO,OOO scale was
used for the study.
Morphometric analysis was carried out based on the drainage segments and elevation
contours extracted from Survey of India topomaps in 1 :SOOOO scale. The digital
database was created through on-screen digitization the attributes were assigned in
GIS environment. All measurements were directly computed from the vector data
20
extracted from the topomaps. The drainage segments were digitized as lines
separately and hierarchial stream order was assigned to all (Strahler, 1952). Detailed
morphometry the fourth order basins within the study area were delineated following
surface water divide from Suvey of India topomaps. Topological polygons were
created in Geomatica 9.1 and the relevant attribute tables were generated. IRS LlSS
III images were used as supplementary spatial datasource. Linear, aerial and relief
aspects of the basin were computed in GIS environment followed by simple linear
regression analysis to see the mutual dependency of the variables viz., stream order
vs. stream number, stream order vs. stream length etc. For hypsometric analysis, the
elevation contour were victorised in GIS environment as lines using Geomatica 9.1
for the topomaps and their corresponding elevation values were entered in the
attribute table. The elevation contours and the basin boundary were merged in a single
layer and converted into polygon for further analysis.
The morphometric parameters of the drainage basins were directly computed from
the vector data extracted from the topomaps (basic parameters) or were derived from
the measured data. The data in the first category included area, length, perimeter,
relief, maximum order of the streams, number of streams in each order, and the total
length of streams for each of the basins. Those of the second category were the
bifurcation ratios, elongation factor, circularity index, shape factor, drainage density,
stream frequency, texture ratio, relief ratio, length of overland flow, constant channel
maintenance and infiltration number (Table 2.3). Information on the geological
attributes was based on available collateral data in the form of published maps and
documents of Geological Survey of India and individual workers, satellite image
interpretation and field inputs.
21
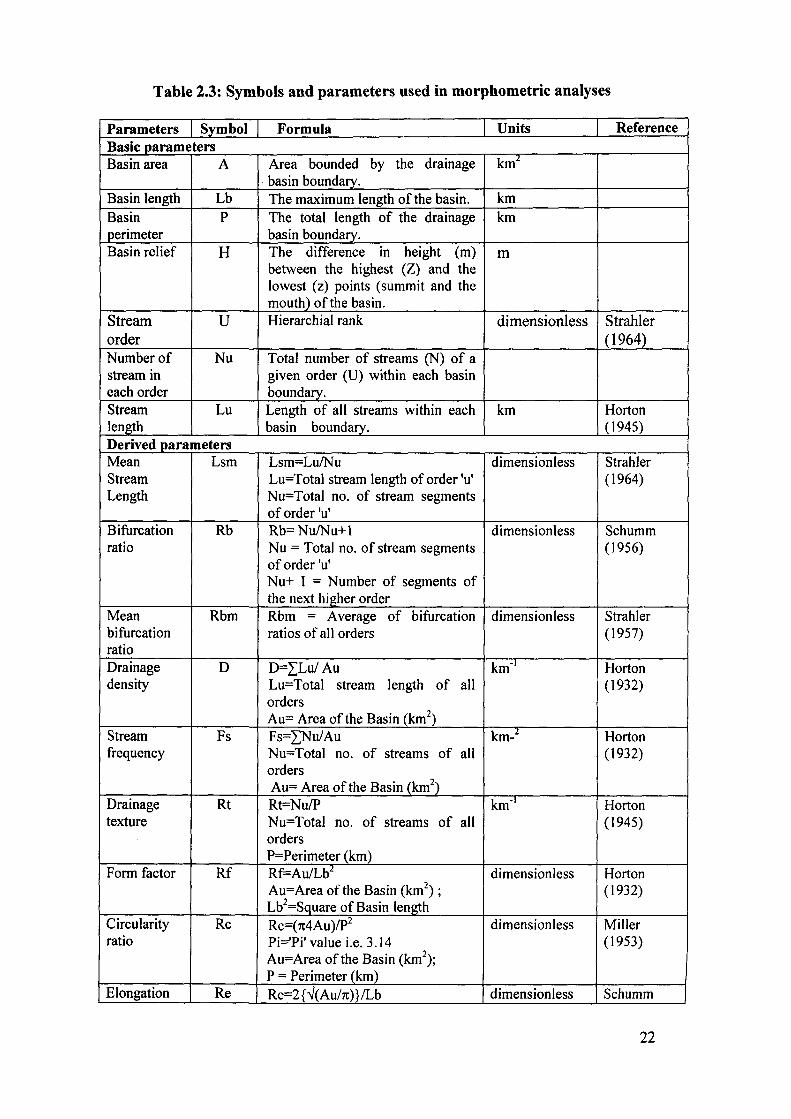
Table 2.3: Symbols and parameters used in morphometric analyses
Parameters Symbol Formula Units Reference Basic parameters Basin area A Area bounded by the drainage kml
, basin boundary. Basin length Lb The maximum length of the basin. km Basin P The total length of the drainage km perimeter basin boundary. Basin relief H The difference in height (m) m
between the highest (Z) and the lowest (z) points (summit and the mouth) of the basin.
Stream U Hierarchial rank dimensionless Strahler order (1964) Number of Nu Total number of streams (N) of a stream in given order (U) within each basin each order boundary. Stream Lu Length of all streams within each km Horton length basin boundary. (1945) Derived parameters Mean Lsm Lsm=LulNu dimensionless Strahler Stream Lu=Total stream length of order 'u' (1964) Length Nu=Total no. of stream segments
of order 'u' Bifurcation Rb Rb=NulNu+l dimensionless Schumm ratio Nu = Total no. of stream segments (1956)
of order 'u' Nu+ I = Number of segments of the next higher order
Mean Rbm Rbm = Average of bifurcation dimensionless Strahler bifurcation ratios of all orders (1957) ratio Drainage D D=ILui Au km-! Horton density Lu=Total stream length of all (1932)
orders Au= Area of the Basin(km2)
Stream Fs Fs=INuiAu km_.l Horton frequency Nu=Total no. of streams of all (1932)
orders Au= Area of the Basin (km2)
Drainage Rt Rt=NuIP km- l Horton texture Nu=Total no. of streams of all (1945)
orders P=Perimeter (km)
Form factor Rf Rf==AulLb2 dimensionless Horton Au=Area of the Basin (km2
) ; (1932) Lb2=Square of Basin length
Circularity Rc Rc==( n4Au )1P2 dimensionless Miller ratio Pi=='Pi' value i.e. 3.14 (1953)
AU'=Area of the Basin (km2); P == Perimeter (km)
Elongation Re Re==2{ v/(Au/n) }/Lb dimensionless Schumm
22
ratio Au=Area of the Basin (kmL) (1956) Pi='Pi' value i.e. 3.14; Lb=Basin length
Length of Lg Lg=AuJ2·ILu, km Horton overland Au=Drainage Area; Lu=Total (1945) flow stream length Constant C C=I/D km-L.km- I Schumm channel of D= Drainage density; (1956) maintenance Infiltration If If=D.Fs km-l
number D= Drainage density; Fs= stream frequency
For linear aspects number of streams (Nu) for each order and their length (Lu) were
counted and noted from the attribute table. All the values were tabulated in an excel
sheet. For graphical plot of stream order vs stream number, stream order and vs
stream length a regression equation was used, which is
y=a+bx. ____ (l)
Where 'b' is the regression Coefficient calculated from the relation:
b~Ixy- IxIy/n IX2 -Cix)'ln
Again the value of 'a' can be calculated from
a= y- b x
where, y= Mean of y x =Meanofx
By plotting the values of 'x', 'a' and 'b' in the regression equation, we get the value
of 'y' for corresponding number of stream number and stream length. Plotting the
antilog values of 'y' against 'x' the stream order vs stream number and stream order
and vs stream length were drawn.
The mean bifurcation ratio (Rbm) was calculated as the arithmetic mean bifurcation
ratio and weight mean bifurcation ratio using Strahler (1957) method by taking into
consideration the actual number of streams that were involved in the ratio.
23
For aerial aspect the drainage area (Au) and basin perimeter (P) were noted from the
attribute table and the maximum basin was measured using measuring tool in
Geomatica 9.1. Drainage Density (D), Stream Frequency (Fs), Elongation Ratio (Re),
Circularity Ratio (Rc), Form Factor (Rt), Length of overland flow (Lg), Constant
Channel of Maintenance (C) and Infiltration Number (It) were calculated in the excel
sheet using formula given in Table 2.3.
For the present study hypsometric curves were drawn and classified following
Strahler (1964), pertaining to hypsometry of the fourth-order drainage basins where
the ordinate represent the basin elevation (h) normalized against its maximum height
(H), while abscissa represents the corresponding area (a) normalized against the total
basin area (A). Two ratios were used for construction the hypsometric curve.
Relative height or hIH; where 'h' was the highest elevation between each pair of
contours above the base and 'H' was the total basin height, and Relative area or alA;
where 'a' was the area enclosed by a pair of contours and 'A' was the total basin area.
The curve also shows the three segments as proposed by Willgoose and Hancock
(1998). The "toe" of the curve is the downward concave part of the curve on the right
- hand side; the "head" of the curve is the upward concave part of the left-hand side;
and the body of the curve is the upward concave segment in the center of the curve
between the toe and the head. The toe and the head represent the downstream mouth
and the upstream water-divide segments respectively of the catchment.
The hypsometric parameters were measured following Strahler (1964). The abscissa
was the relative area given by alA and the ordinate was the relative elevation given by
hIH. The maximum concavity of the hypsometric curve (Eh) was measured from the
profile A-C of a hypothetical plane that joins the maximum (head) and the minimum
24
(toe) elevations of the catchment. Line A-C is the profile of a hypothetical plane. The
hinge both at the river mouth and at the catchment head, represents an ideal planar
landform surface that would develop under uniform boundary conditions, especially of
catchment erodability. Inflection Point (I) represents the junction between the head and
the body segment of the curve. The coordinates of the Inflection Point (I) i. e. change
over from either concave to convex on alA and hIH were measured by a * and h * ,
respectively. Apart from these, the position of head, body and toe of the curve was
depicted by the ordinate values corresponding respectively to aIA=O.2, 0.5 and 0.8, for
finer height definition of the toe aIA=0.9 value was used. These parameters are shown
as h (0.2), h (0.5), h (0.8) and h (0.9) respectively.
Hypsometric Integral was measured following Wood and Snell (1960) that expresses
the relative proportion of upland to lowland within a sample region, designated as Ea
and is defined:
Ea = Mean Elevation - Minimum Elevation Maximum Elevation - Minimum Elevation
Where Mean Elevation was calculated with the help of statistical method by
calculating average area (x) and average contour (y) from the hypsometric analysis
data following the statistical formula: Ixy/Lx.
Tectonic uplift and downwasting due to erosion are the two competing factors that
control the landscape form and its evolution. The shape of hypsometric curves depends
on the degree and type of downwasting apart from the catchment geometry. Landscape
evolution can be formulated as a continuity equation relating uplift, elevation and
erosion for sediment transport (WiUgoose and Hancock, 1998).
Dzldt = U-~qs (1)
25
Where u= tectonic uplift; z = elevation at any point; t = time; qs = mass flux of
combined fluvial and diffusive downwasting processes
For comparison of catchments in terms of relative uplift in finite time-frame equation
(1) can be written as:
U=z+qs (2)
For comparing the tectonic uplift in subcatchments z in equation (2) can be replaced
by the mean elevation (hm) of the subcatchment (Sinha-Roy, 1981), obtained from
the elevation covering 50% of the area and normalized against the maximum height
of the master drainage basin. The hm values can be estimated from the hypsometric
curve. Thus the equation (2) can be written as:
U = hm + (1 - Ea) (3)
The equation (3) was used for the present study to assess the tectonic uplift along the
river channel. Here U is the relative tectonic uplift in the individual sub-basin, hm is
the mean elevation of the sub-basin and Ea is hypsometric integral.
Longitudinal Profiles were plotted by taking the longest stream channel of a
considered basin on Sol topomaps of 1 :50000 of 20m interval. The distance from the
source to the intersect contour elevation was measured and the profile was
constructed using distance as abscissa and elevation as ordinate in the GIS
environment for total eleven basins.
Available data on hydrological aspects particularly on status of ground water in the
Shillong Master Plan Area is very scanty. Considering limited scope for primary data
collection, the present study for water resources was made based on the secondary
data available with agencies like Public Health Engineering Department, Government
of Meghalaya and Shillong Municipal Board, Government of Meghalaya, Shillong.
26
Data on ground water level and water quality were collected from Public Health
Engineering Department (PheD), Government of Meghalaya and Meghalaya State
Pollution Control Board. The analysis for water supply and production was confined
to Greater Shillong Planning Area due to non-availability of data for the whole study
area. Thirty six sample points were obtained for hydrogeological data of wells during
dry seasons, and 66 sample data were obtained for the water quality distributed over
the study area from various sources such as gravity, deep tube wells, hand pumps,
springs, dug wells, Wards lake and Umiam lake. The location of these sources were
brought to GIS format, and were used for extrapolation over the study area by kriging
methods for water level, pH value, chloride content (mg/l), turbidity (NTU) and iron
content (mg/l). Areas where data was not available were designated as unclassified in
the thematic map.
For generation of spatial database for temporal analysis of land use Iland cover, the
primary datasets inputs included Sol toposheet 76 0114 in 1 :50000 scale and its
corresponding IRS 1 C and 1 D Geocoded FCC of LISS III. The interpretation was
done in three phases such as pre-field interpretation, field verification and post-field
analysis. Study of changes in land use pattern using remotely sensed data was based
on the comparison of the time sequential data. Differences in surface phenomenon
over time was determined and evaluated by visual interpretation with local knowledge
(Garg et al. 1988). The LULC thematic mapping was prepared through standard
visual interpretation techniques (Lilles and Kiefer, 1999) for two different years.
Satellite images (IRS LISS III, FCC) and DEM were studied for identifying the
susceptible areas for landslides. On-site investigation and documentation of the
existing landslides were carried out to develop an inventory. Flash flood prone areas
27
were identified based on their record in news media and the actual events that
happened during the year 2003 and 2004. Information points gathered from fieldwork
was brought to GIS platform for further processing and analysis. A map of landslide
and flash flood occurance was prepared in 1 :50,000 scale using the GIS software
ARC IINFO to evaluate the distribution and frequency of landslide. To understand the
causal factors for landslides as well as flashfloods, a convergence of evidence method
was followed. For the purpose, the GIS database in the form of vector and attribute
data was integrated with relavent spatial maps using overlay analysis of the landslide
and flashflood map over thematic layers of lithology, slope, drainage, landuse and
structure for generation of composite data sets, queries buildings etc. Meteorological
parameters were used to find out the causal factors for a similar geoenvironmental
condition.
To analyse the volumes of materials shifted in major urban construction projects, data
on the material inputs to, and waste outflow from Shillong Urban Areas (SUA) were
used. The urban construction projects included in this research are road, building,
bridge, and storm water drainage. The construction materials include stone
aggregates, sand, cement and bitumen. Data for major urban construction projects
were gathered for three years i.e., April 2005- March 2006, April 2006-March 2007,
and April 2007-March 2008, from the Public Works Department, Government of
Meghalaya and Shillong Municipal Board. The quantities of construction materials
required per unit length or area for different projects and construction waste were
based as per the data provided by these organizations. From these records an overall
figure for materials movement in and out the city for each major urban construction
project was computed. Data on local production for stone aggregate and sand was
collected through field survey and interview with the producers. Study was conducted
28
in Shillong Urban Areas (SUA) only. The repair of National Highway (NH) passing
through the city was not considered as data pertaining to the same was not available.
The toposheet 78 0/14, scale 1 :50,000 was collected from Survey of India,
northeastern region, Shillong. IRS LISS III, FCC images of23.5 meter resolution with
path -111and row-54 whose date of acquisition is 24th March, 2000 and 6th November,
2005 was collected from National Remote Sensing Agency (NRSA), Hyderbad.The
study area boundary, municipal ward and towndship boundary was prepared on
1 :50,000 scale with the help of data collected from Urban Affairs Department of
Government of Meghalaya. Reserve and protected forest map was obtained from
Forest Department of Government of Meghalaya. From Meterological Department,
Government of India, Shillong, metrological data was procured. Hydrological data,
water quality data, consumption and data on distribution pattern of water was
collected from Public Health Engennering Department (PHeD), Government of
Meghalaya ; Shillong Municipal Board (SMB) and Meghalaya State Pollution Control
Board (MSPCB), Government of Meghalaya. Plinth area of buildings was collected
from Meghalaya Urban Development Authority (MUDA), Government of
Meghalaya. Data on length of roads, bridges and storm water drainage was collected
from Public Work Department (PWD), Government of Meghalaya.
29
Introduction
CHAPTER 3
GEOLOGICAL SETTING AND GEOMORPHOLOGY
Geology of an area is primarily responsible for the evolution of the landform under
the operation of physico-chemical processes on the earth's surface. Therefore, the
prerequisite of any geoenvironmental appraisal is the knowledge of geology of the
area. Geomorphology involves both terrain evaluation and investigation of the
processes which shape the land form (Fairbridge, 1968). Geomorphic knowledge
plays a valuable role in the management of land resources, planned utilization of land
and mitigation of geohazards. Urbanization and development are related to
topographic, hydrographic and socio-economic features. Therefore, geomorphology
comes in the forefront wherever land-man interaction and environmental exploitation
takes place (Kumar and Pandey, 1989, Coates, 1974). As a result, contemporary
geomorphological studies have begun to consider ecological factors in greater depth
(Viles, 1988).
Scientific research on the geology of Shillong Plateau was first initiated by Oldham
(1858). Medilicot (1869), Bose (1901), Palmer (1924), Dasgupta (1934), Chatterjee
(1937), Fox (1949), Pasoe (1950) made fundamental contribution to the subject. Singh
(1968) carried out geomorphological studies of Shillong Plateau, followed by
Chatterjee (1968), Machatchek (1969) Majumdar (1986), and Roy et.a!. (1988).
30
However, Anon(1974) and Mazumdar (1978) gave a very generalised regional
physiography while discussing the geological framework of the northeastern India.
Photogeological and photogeomorphological maps of Shillong Plateau were prepared
by Chopra (1984) confining to the southern fringes of Meghalaya. Although the
Plateau has been studied fairly well, scientific analyses of the geomorphology of the
human inhabited regions of the area is scare. The puporse of this research is to
conduct a detailed geological and geomorphological mapping for Shillong Master
Plan Area in the scale of 1 :50,000. The study also brings out comphrehensive
topograghical information of the study area using Digital Elevation Model.
Regional Geology
The geology and geomorphology of Shillong Plateau in relation to its regional
framework relevant to the present area is discussed hereunder:
The Shillong Plateau is dominantly covered by Precambrian rocks characterized by
basement gnessic complex of para and ortho gneisses, amphibolite, granulite, etc.
Towards south and southeast, thick piles of sediments belonging to Cretaceous and
Cenozoic are unconformably overlying the Precambrian rocks. A NE-SW trending
Proterozoic shallow basin has developed in an intracratonic setting in central and
eastern part of the plateau. The sediments deposited in this basin are now known as
the Shillong Group comprising mainly an argillaceous and arenaceous sequence
unconformably overlying the gneisses. The Shillong quarzite, having a general trend
ofNE-SW similar to the northern part of the Eastern-Ghat trend, are commonly found
interbedded with thin layer of phyllite. There were two Precambrian intrusive events
leading to the emplacement of metabasic Khasi greenstone and a number of granite
bodies. The well known Mylliem granite marks the stabilization of the Shillong craton
31
towards the later part of Proterozoic. Another Cretaceous basaltic emplacement took
place in the south eastern part of Shillong Plateau resulting in what is now known as
the Sylhet Traps composed of basalt, alkali basalt and acid tuff. The Cretaceous Khasi
Group divided into two formations viz., lower ladukata and upper Mahadek is
composed of coarse to fine sandstone and conglomerate. During Paleocene-Eocene,
laintia Group of rocks composed of both carbonates and clastics were deposited in a
fluctuating transgressive-regressive regime. The laintia Group is divided into three
formations, viz., Simsang, SheIla, and Langpar. In the Oligocene and Miocene time
the Garo Group was formed over laintia Group composed of sandstone, siltstone,
clay-marl, conglomerate and feldspathic sandstone. Garo Group is further divided into
three formations, Chengapara Baghmara and Kopili. Alluvium development in
Meghalaya is not significant in the northern part. Along the southern fringe bordering
Bangladesh and along few narrow intermontanne lows viz., Wah Umkhrah valley,
discontinuous alluvial deposits are encountered. The general lithostratigraphic setup
of the Shillong Plateau is given in Table 3.1 (G.S.!, 1974).
32
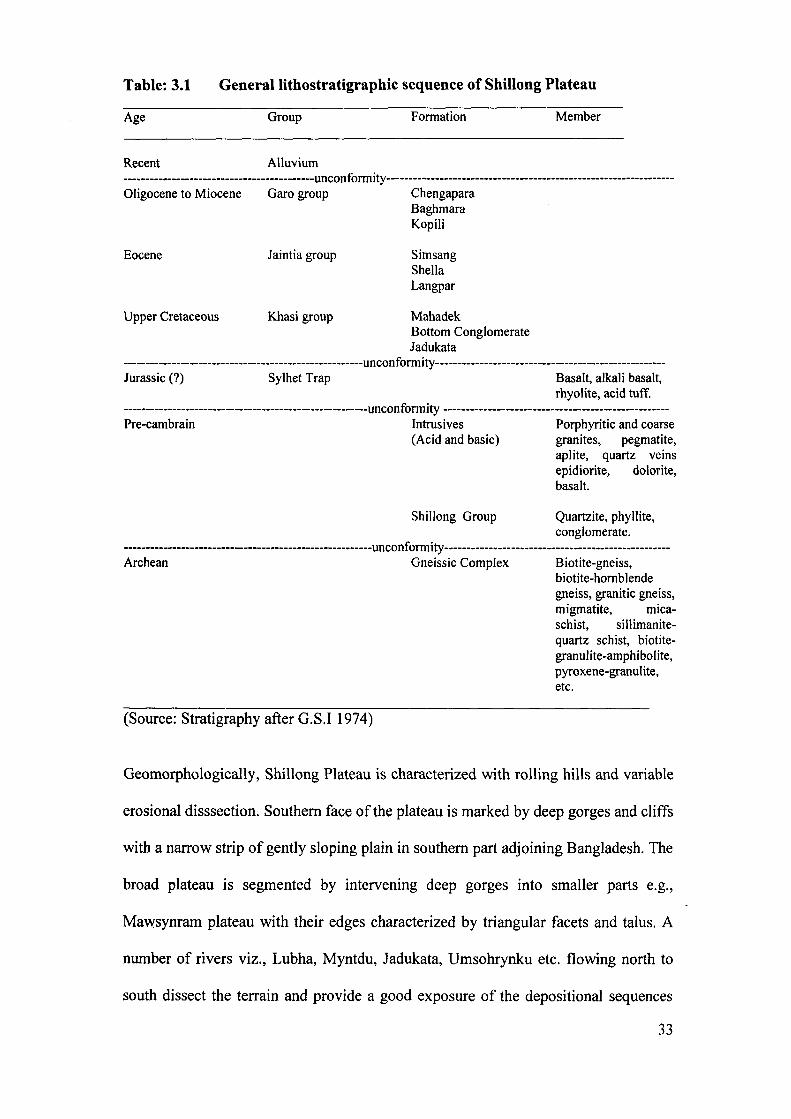
Table: 3.1 General lithostratigraphic sequence of Shillong Plateau
Age Group Formation Member
Recent Alluvium -------------------------------------------unconformity-----------------------------------------------------------------Oligocene to Miocene Garo group Chengapara
Eocene Jaintia group
Upper Cretaceous Khasi group
Baghmara Kopili
Simsang Sheila Langpar
Mahadek Bottom Conglomerate Jadukata
------------------------------------------------------unconformity----------------------------------------------------Jurassic (?) Sylhet Trap Basalt, alkali basalt,
rhyolite, acid tuff. -------------------------------------------------------unconformity ---------------------------------------------------Pre-cambrain Intrusives Porphyritic and coarse
(Acid and basic) granites, pegmatite, aplite, quartz veins epidiorite, dolorite, basalt.
Shillong Group Quartzite, phyllite, conglomerate.
--------------------------------------------------------unconformity---------------------------------------------------Archean Gneissic Complex Biotite-gneiss,
(Source: Stratigraphy after G.SJ 1974)
biotite-hornblende gneiss, granitic gneiss, migmatite, micaschist, siIlimanitequartz schist, biotitegranulite-amphibolite, pyroxene-granulite, etc.
Geomorphologically, Shillong Plateau is characterized with rolling hills and variable
erosional disssection. Southern face of the plateau is marked by deep gorges and cliffs
with a narrow strip of gently sloping plain in southern part adjoining Bangladesh. The
broad plateau is segmented by intervening deep gorges into smaller parts e.g.,
Mawsynram plateau with their edges characterized by triangular facets and talus. A
number of rivers viz., Lubha, Myntdu, Jadukata, Umsohrynku etc. flowing north to
south dissect the terrain and provide a good exposure of the depositional sequences
33
along the southern shelf. Some of these rivers haye deeply incised down to the
basement. Narrow gorges have formed along the two prominent joint systems of the
plateau which also influence the drainage pattern in some regions. Control of
structural trend on the river regime is also apparent from the river courses like that of
Umiam flowing along the prominent strike. The narrow, E-W trending sedimentary
terrain in the southern part of Shillong Plateau show development of moderately
dissected structural hills viz., the Barail range where the sediment sequence has been
subjected to both ductile and brittle deformation.
Review of literature
The earliest geological study on the Khasi hills region was initiated by Oldham
(1858). He discovered two types of metamorphic rocks in the Khasi hills. The older,
and more altered group, is represented by alternating bands of gneiss, quartzite and
schist, greatly traversed by viens of fine crystalline granite. The younger group of
rocks is "essentially slaty" consisting of blue and gray flaky schists with some
micaceous and quartzose layers.
Medlicott (1869) really laid down the foundation of the geology of the Khasi hills. He
mapped a portion of the Shillong plateau. He concluded that the metamorphic rocks
are divisible into an older "Gneiss Series" and a younger "Shillong Series" which
consists of a considerable thickness of quartzite, locally largely conglomeratic. He
noted compact, sharply bedded varieties and also coarse forms, in which, false
bedding is closely seen. He stated that the Khasi greenstones is undoubtedly an
igneous rock, a dense basic trap in which the feldspathic element is subordinate, and
for the porphyritic granites. He opined that "there can be little doubt that these
granitic masses are truely intruded" and so he assigned to it a younger age than the
34
Khasi greenstone. The contact between the Sylhet Trap and the metamorphics was
tentatively considered a fault. Later Talukdar (1966) confirmed his opinion. Bose
(1901) found xenoliths of quartzite of the Shillong Series in the granites, which was
observed to be cut obliquely across the strike of the rocks of the Shillong Series.
Palmer (1924) dealt with the main structural features of the Shillong Plateau and
indicated that the plateau is an ancient mass of the gneiss. He mapped the southern
contact of a granitic pluton and stated that "the granite is a structureless aggregation
of large porphyrictic pink orthoclase, quartz and biotite. Bradshaw (1925) confirmed
the earlier reports of Palmer and observed that the porphyrictic granite is to some
extent foliated to the south which he believed to be a primary structure induced at the
time of intrusion when the rock was in a semi-molten condition. Dasgupta (1934)
noted that the orientation of the granite is fairly parallel to the tectonic axis of the
Khasi hills and states that the granite intrusion took place in early Precambrian. Fox
(1949) described that in Meghalaya the terrain is made up largely of a complex in
which an older series of banded gneissic hornblendic rocks and other foliated types
were intruded by younger pink granite. Pascoe (1950) stated that the dip and strike of
the Shillong quartzites along the Mylliem granite boundary are quite independent of
the granite, and the contortions of the quartzites must have been effected before the
granite was intruded.
Choudhury (1962) stated that "the Khasi greenstones are derived from basic igneous
rocks and had undergone regional metamorphism alongwith the quartzites of the
Shillong Series prior to the intrusion of the Mylliem granite. The mineralogy
indicated that the Khasi greenstone belong to the almandine-amphibolite facies.
Gannser (1964) reported that the greenschist facies of most of the Shillong rocks
35
contrasted with the high grade metamorphics reported to be influenced by granite
contacts." He subdivided the Archaean Shillong rocks into the Shillong Group and an
older gneisses and granites.
Mathur and Evans (1964) opined that the drainage directions of Shillong Plateau are
strikingly adjusted to the fracture directions riddling the entire region. Bhattarcharjee
(1968) stated that during the Precambrian, the Shillong Plateau experienced alternate
period of igneous activity and sedimentation till all the depositional activities ceased
after the intrusion of the Mylliem granite. Sarkar (1968) concluded that the granite of
the Shillong Plateau is about 795 million years old. Machatchek (1969) observed that
in Shillong Plateau when a traverse is taken from Shillong peak to Barapani it reveals
a three step structure of the plateau with an elevation difference of about 400 m
between the successive steps. The abrupt scarp junction between different topographic
levels may be partly supported by the fold movements and partly due to younger
block movement fragmenting a more extensive erosion surface to separate levels.
Murthy et.al., (1969) reported that the Dawki fault is actually a system of fault, where
three major E-W faults have been mapped between Jadakuta river and and
Therriaghat and have been named as Dawki fault-I, Dawki fault-II, Dawki fault-III.
They concluded that each of these fault exhibits different geometric type along its
trace. Mazumdar (1971) reported that the porphyrictic granite of the Khasi hills were
late tectonic plutons, intrusive as diapirs with contact aureole in some parts. The
Khasi greenstones were intrusive into the Shillong Group and metamorphosed
together with the latter their emplacement seemed to be related to a tensional field.
About the Shillong Group he stated that they lie uncomformably over gneissic
complex with migmatitic granitoids and that they were laid down in a molasse setting.
36
Baroah (1971) marked at least three phases of deformation in the rocks of the Shillong
Group.
Anon (1974) was of the view that the present physiographic configuration of the
Plateau was attained through different geological events since Mesozoic to the present
day as indicated by the polycyclic erosional surfaces at various levels. Mazumdar
(1976) stated that a number of discordant granitic plutons intrude the basement
gneissic complex and the overlying Proterozoic metasediments of the Shillong Group
in the Meghalaya plateau and observed that the strike of the Shillong Group remains
characteristically NE-SW with alternate rolling dips and steep subvertical zones. A
synthesis of the tectonic pattern of northeastern India was carried out by Nandy
(1980) based on the MSS imagery, where he was able to distinguished various
tectonic and geologic domains of the region viz., Shillong Platform and Mikir hills,
Surma basin, Naga-Lusai- Arakan Yoma fold belts, Central Burma Molasse basin,
Mishmi block, Eastern Himalaya fold belt, Trans-Himalayan region and Bengal -
Brahmuptra basins. He also observed that the boundaries of the tectonic domain are
marked and identified by pronounced lineaments which are either straight or curved
which includes the Dawki fault, Jamuna lineaments, Tista and Padma lineaments,
Main boundary fault of the Himalaya, Siang fracture, Tangspo suture, Mishmi and
lohit thrust, Naga and Disang thrust, axial zone, Volcanic line of Burma and Red river
faults. He also stated that the most prominent lineament is the NE-SW fault which
delimits the northwestern boundary of the outcrop of the Shillong Groups extends
upto Mikir Hills. A shear zone extending from Tyrsad to Barapani was described by
De (1981) on the evidence of slikenslide. Rahman (1981) stated that the average
composition of the Khasi greenstone (metadolerite) of Shillong area corresponds to
the common tholeiitic basalt and dolerite. He observed skeletal structures of
37
pyroxene, complex twin in plagioclase and relict ophitic structure in the greenstone.
Bhattacharjee and Rahman (1985) on the basis of lithological and structural evidences
separated the Shillong Group into two divisions - a lower argillaceous (Manai
formation) and an upper areanceous division (Mawphlang formation). Mazumdar
(1986) was of the opinion that plutons of the Meghalaya plateau (viz., Mylliem,
Nongpoh, south Khasi) were late to post-tectonic fracture controlled diapers resulting
from major thermal event subsequent to the evolution and metamorphism of the
Shillong Group of metasediments. He concludes that most of these fractures are
vertical, the rivers controlled by these have not deviated from the strike of the
fractures and overall the area exhibits a very pronounced structural control on
physiography.
Rahman (1987) stated that the Mylliem Granite is normal two-feldspar biotite
granite. The granitic magma was believed to have been intruded along the trough of
the tectonically controlled synclinal basin and exerted lateral pressure on the wall
rocks, which in turn warped around the granite body. All evidences clearly suggested
that the pink color of the Mylliem granite was due to dominance of pink colored
microcline which contained higher proportions of ferric oxide impurities than the gray
granite. Besides, the enrichment of Sr and alkalis and impoverishment of CaO and
MgO contents of the pink granite compared with the gray granites suggests that
former was the late fraction of crystallization of the later. Rahman and Borah (1990)
studied the Khasi greenstone occurring as intrusives within the metasediments of the
Shillong Group and stated that the meta-dolerite had initially a mineral assemblage of
clino-pyroxene-calcic plagioclase-iron ore of a basic igneous rock. The low grade
38
metamorphosed greenstones have the composition - actinolite-chlorite-albite-epidote,
equivalent to low greenschist facies, preserving some of the original igneous textures.
Rahman (1991) studied the emplacement of some Precambrian granite plutons in the
Shillong plateau and observed that the general lie of the granite body to be E-W to
NE-SW and thereby followed the tectonic axis or the major lineament ENE-WSW of
the Shillong plateau. The thermal aureoles around the granite plutons were very
narrow (maximum of 400 m). He was of the opinion that low temperature granitic
magma was emplaced at comparatively higher level of the crust as post-tectonic high
level pluton. Ghosh et al. (1991) were of the opinion that a protracted thermal event
during the Proterozoic and early Paleozoic (500-700 Ma), possibly related to mantle
upwelling, might have triggered the generation of granitoids of the Shillong Plateau.
Rahman (1996) stated that the Mylliem granite is a funnel-shaped pluton emplaced in
a synformal basin formed by the downwarping in the metasediments of the Shillong
Group. The granite was post-tectonic in origin. A recent study on structural history of
metasedimentary rocks belonging to Shillong Group of rocks by Mitra (1998) has
established four phases of fold deformation in Shillong Group of rocks. The earlier
structure is very tight to isoclinal folds (F ,) on bedding plane (So). These folds have a
high amplitude/wave length ratio, with pervasive axial linear cleavage (S,). They have
been affected by coaxial, open to tight, upright F2 folds with axial plane striking
NNE-SSW and having an axial planer crenulation cleavage (S2). Both F, and F2 folds
are of buckling origin. In more schistose units NE trending open recumbent folds (F3)
affecting S, and S2 planes represent structures of third generation conjugate folds and
kink band (F4) with axial plane striking N-S, E-W and chevron folds with NW-SE
striking axial plane.
39
Results and Discussion
Lithostratigraphy of study area
Shillong Master Planning Area is characterized by low grade metamorphic rocks of
Shillong group of Precambrian age. The rocks are dominantly quartzites with sub
ordinate phyllites and slates, quartz-sericite schist and conglomerate. These rocks are
intruded by mafic sills and dykes comprised of epidiorite, dolerite, amphibolites,
pyroxenite rocks known as Khasi greenstones which occur mostly as sills concordant
with the formation and acid intrusive such as Mylliem Granite. A part of the
southwestern fringe of the study area is covered by the Mylliem Granite, which is a
batholithic intrusive body (Figure 3.1). The general lithostratigraphy of the study area
worked out from field investigation and based on collateral data is given in Table 3.2
40
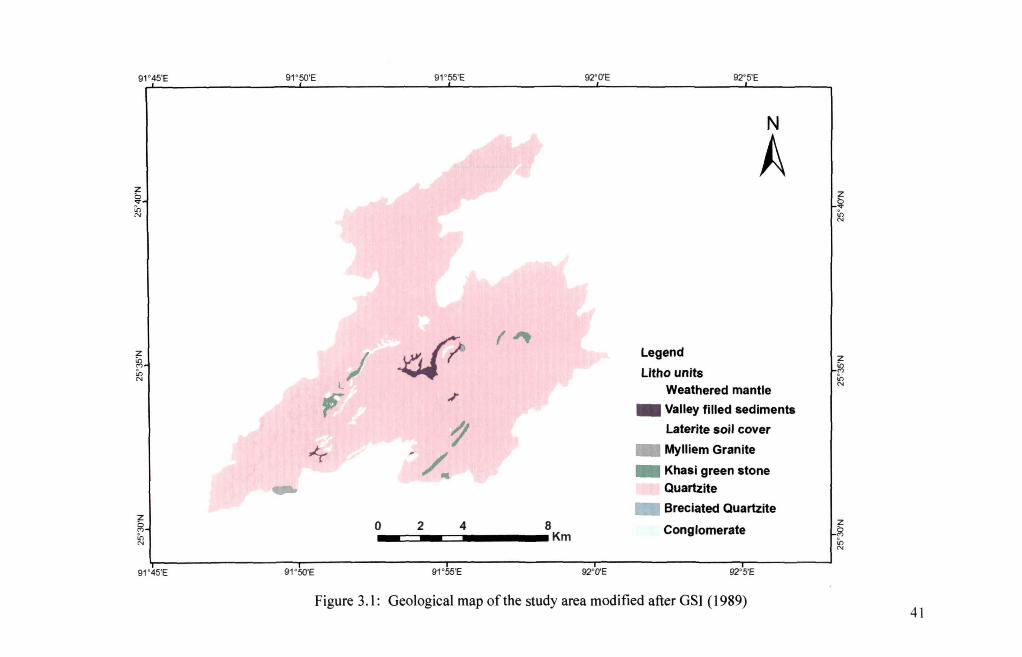
91 ' 45'E
z ~ ~ N
~i
~i 91 ' 45'E
91 ' 50'E 91 ' 55'E 92'O'E 92' 5'E
N
A
~ ("..
; " legend
litho units l Weathered mantle t7 ... .I"
_ Valley filled sediments
laterite soil cover
,y / _ Mylliem Granite
... _ Khasi green stone
Quartzite
_ Breciated Quartzite
0 2 4 8 Conglomerate Km
I I 91 ' 50'E 91 ' 55'E 92'O'E 92'5'E
Figure 3.1: Geological map of the study area modified after GS} (1 989)
z ~ ~ N
~~
~~
41
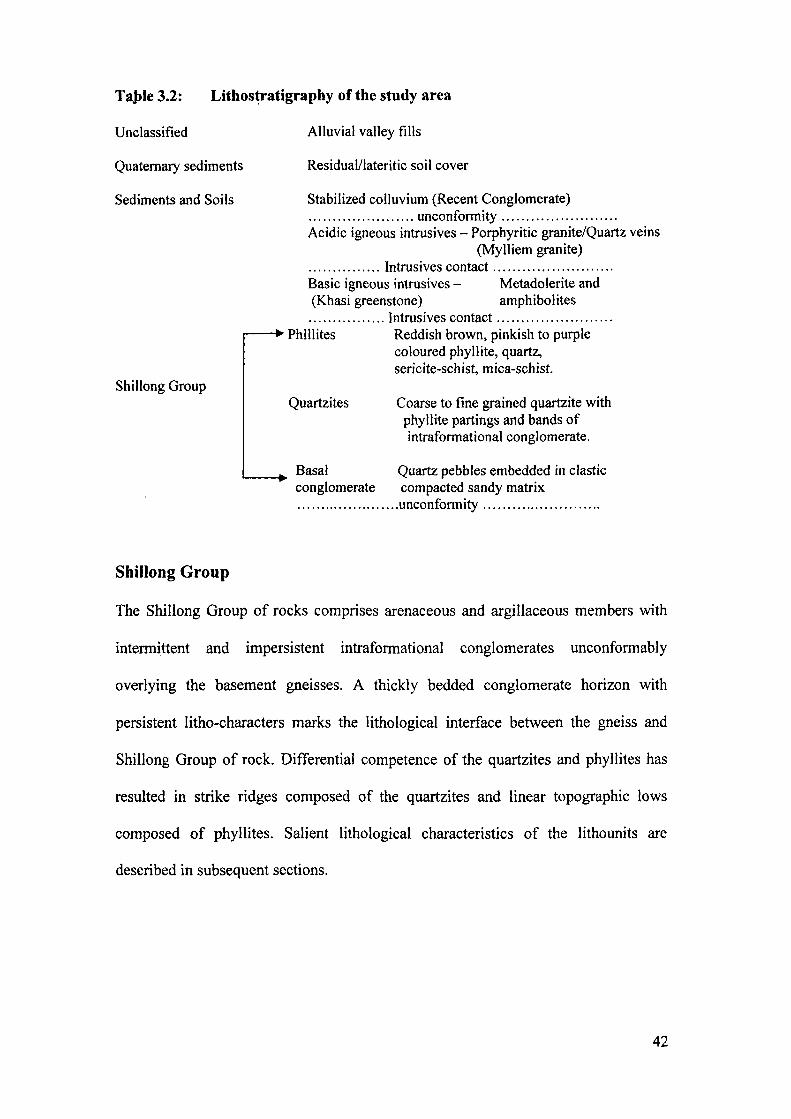
TaJ>le 3.2: Lithos~ratigraphy of the study area
Unclassified Alluvial valley fills
Quaternary sediments Residual/lateritic soil cover
Sediments and Soils Stabilized colluvium (Recent Conglomerate) · ..................... unconformity ....................... . Acidic igneous intrusives - Porphyritic granite/Quartz veins
Shillong Group
Shillong Group
(Mylliem granite) · .............. Intrusives contact ........................ . Basic igneous intrusives - Metadolerite and (Khasi greenstone) amphibolites · ............... Intrusives contact ....................... .
.---. Phlllites Reddish brown, pinkish to purple coloured phyllite, quartz, sericite-schist, mica-schist.
Quartzites Coarse to fine grained quartzite with phyllite partings and bands of intraformational conglomerate.
1--._. Basal Quartz pebbles embedded in clastic conglomerate compacted sandy matrix ...................... unconformity ....................... ..
The Shillong Group of rocks comprises arenaceous and argillaceous members with
intennittent and impersistent intrafonnational conglomerates unconfonnably
overlying the basement gneisses. A thickly bedded conglomerate horizon with
persistent litho-characters marks the lithological interface between the gneiss and
Shillong Group of rock. Differential competence of the quartzites and phyllites has
resulted in strike ridges composed of the quartzites and linear topographic lows
composed of phyllites. Salient lithological characteristics of the lithounits are
described in subsequent sections.
42
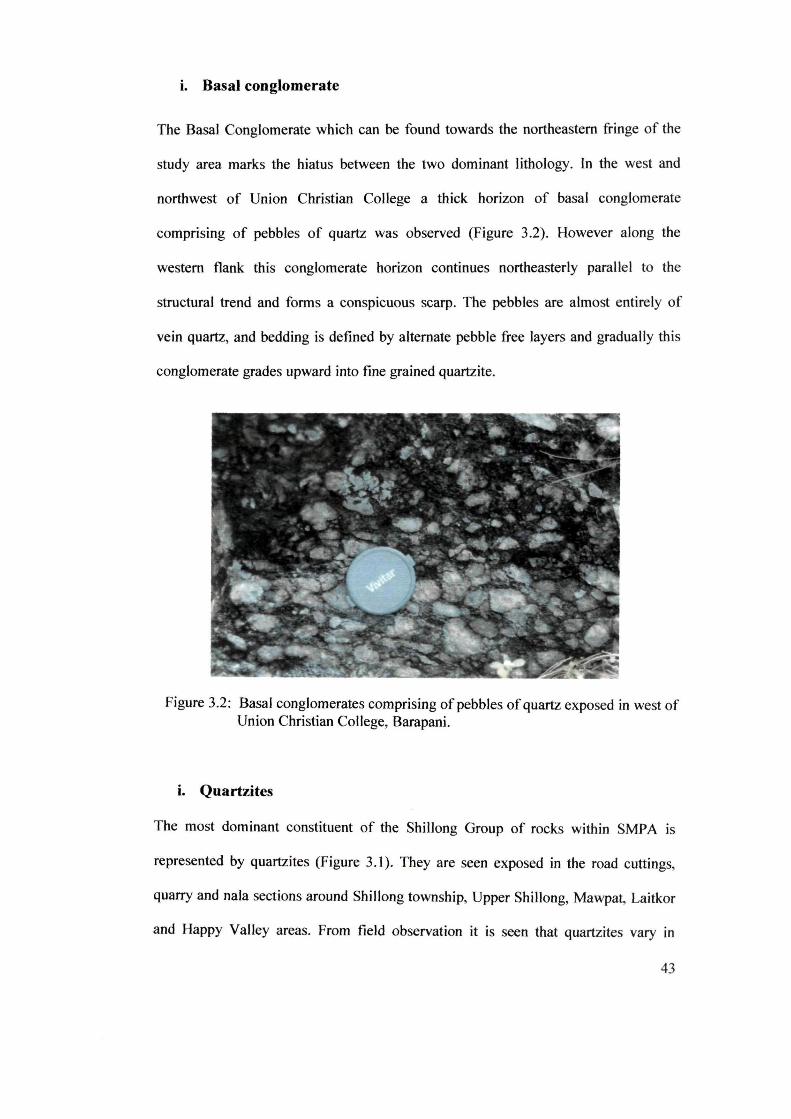
i. Basal conglomerate
The Basal Conglomerate which can be found towards the northeastern fringe of the
study area marks the hiatus between the two dominant lithology. In the west and
northwest of Union Christian College a thick horizon of basal conglomerate
comprising of pebbles of quartz was observed (Figure 3.2). However along the
western flank this conglomerate horizon continues northeasterly parallel to the
structural trend and forms a conspicuous scarp. The pebbles are almost entirely of
vein quartz, and bedding is defined by alternate pebble free layers and gradually this
conglomerate grades upward into fine grained quartzite.
Figure 3.2: Basal conglomerates comprising of pebbles of quartz exposed in west of Union Christian College, Barapani.
i. Quartzites
The most dominant constituent of the Shillong Group of rocks within SMPA is
represented by quartzites (Figure 3.1). They are seen exposed in the road cuttings,
quarry and nala sections around Shillong township, Upper Shillong, Mawpat, Laitkor
and Happy Valley areas. From field observation it is seen that quartzites vary in
43
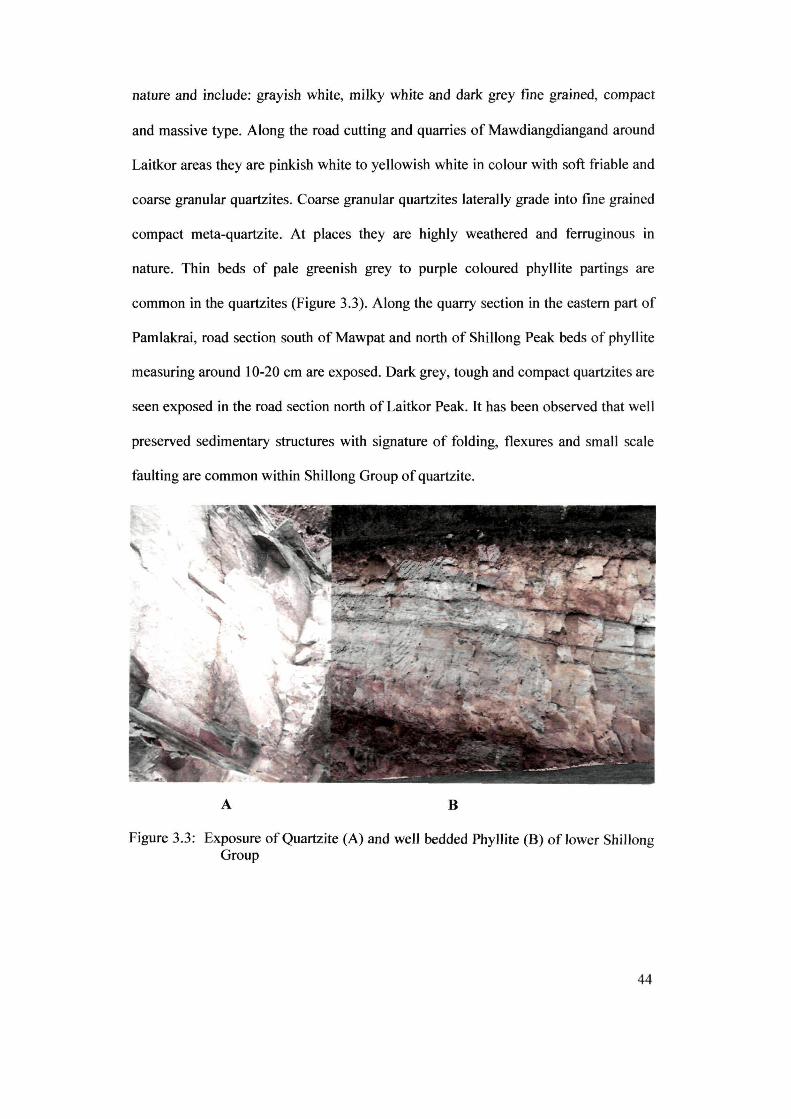
nature and include: grayish white, milky white and dark grey fine grained, compact
and massive type. Along the road cutting and quarries of Mawdiangdiangand around
Laitkor areas they are pinkish white to yellowish white in colour with soft friable and
coarse granular quartzites. Coarse granular quartzites laterally grade into fine grained
compact meta-quartzite. At places they are highly weathered and ferruginous in
nature. Thin beds of pale greenish grey to purple coloured phyllite partings are
common in the quartzites (Figure 3.3). Along the quarry section in the eastern part of
Pamlakrai, road section south of Mawpat and north of Shillong Peak beds of phyllite
measuring around 10-20 cm are exposed. Dark grey, tough and compact quartzites are
seen exposed in the road section north of Laitkor Peak. It has been observed that well
preserved sedimentary structures with signature of folding, flexures and small scale
faulting are common within Shillong Group of quartzite.
A B
Figure 3.3: Exposure of Quartzite (A) and well bedded Phyllite (B) of lower Shillong Group
44
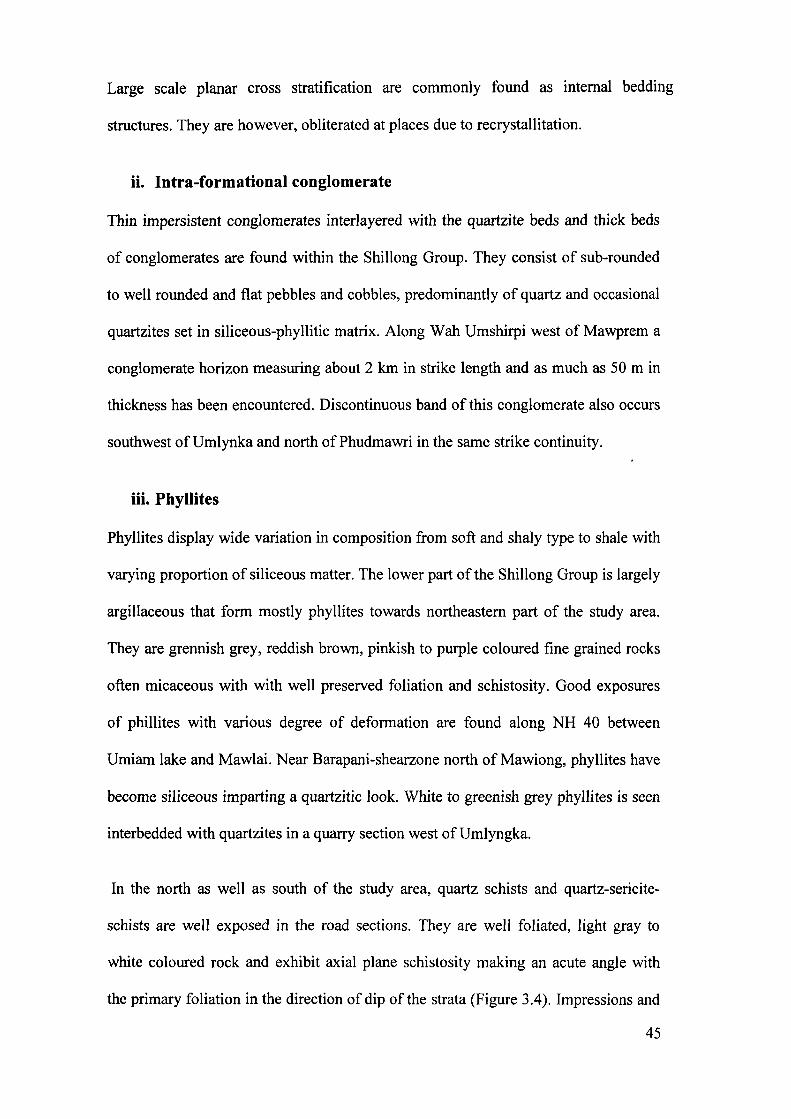
Large scale planar cross stratification are commonly found as internal bedding
structures. They are however, obliterated at places due to recrystallitation.
ii. Intra-formational conglomerate
Thin impersistent conglomerates interlayered with the quartzite beds and thick beds
of conglomerates are found within the Shillong Group. They consist of sub-rounded
to well rounded and flat pebbles and cobbles, predominantly of quartz and occasional
quartzites set in siliceous-phyllitic matrix. Along Wah Umshirpi west of Mawprem a
conglomerate horizon measuring about 2 km in strike length and as much as 50 m in
thickness has been encountered. Discontinuous band of this conglomerate also occurs
southwest ofUmlynka and north ofPhudmawri in the same strike continuity.
iii. Phyllites
Phyllites display wide variation in composition from soft and shaly type to shale with
varying proportion of siliceous matter. The lower part of the Shillong Group is largely
argillaceous that form mostly phyllites towards northeastern part of the study area.
They are grennish grey, reddish brown, pinkish to purple coloured fine grained rocks
often micaceous with with well preserved foliation and schistosity. Good exposures
of phillites with various degree of deformation are found along NH 40 between
Umiam lake and Mawlai. Near Barapani-shearzone north of Mawiong, phyllites have
become siliceous imparting a quartzitic look. White to greenish grey phyllites is seen
interbedded with quartzites in a quarry section west of Umlyngka.
In the north as well as south of the study area, quartz schists and quartz-sericite
schists are well exposed in the road sections. They are well foliated, light gray to
white coloured rock and exhibit axial plane schistosity making an acute angle with
the primary foliation in the direction of dip of the strata (Figure 3.4). Impressions and
45
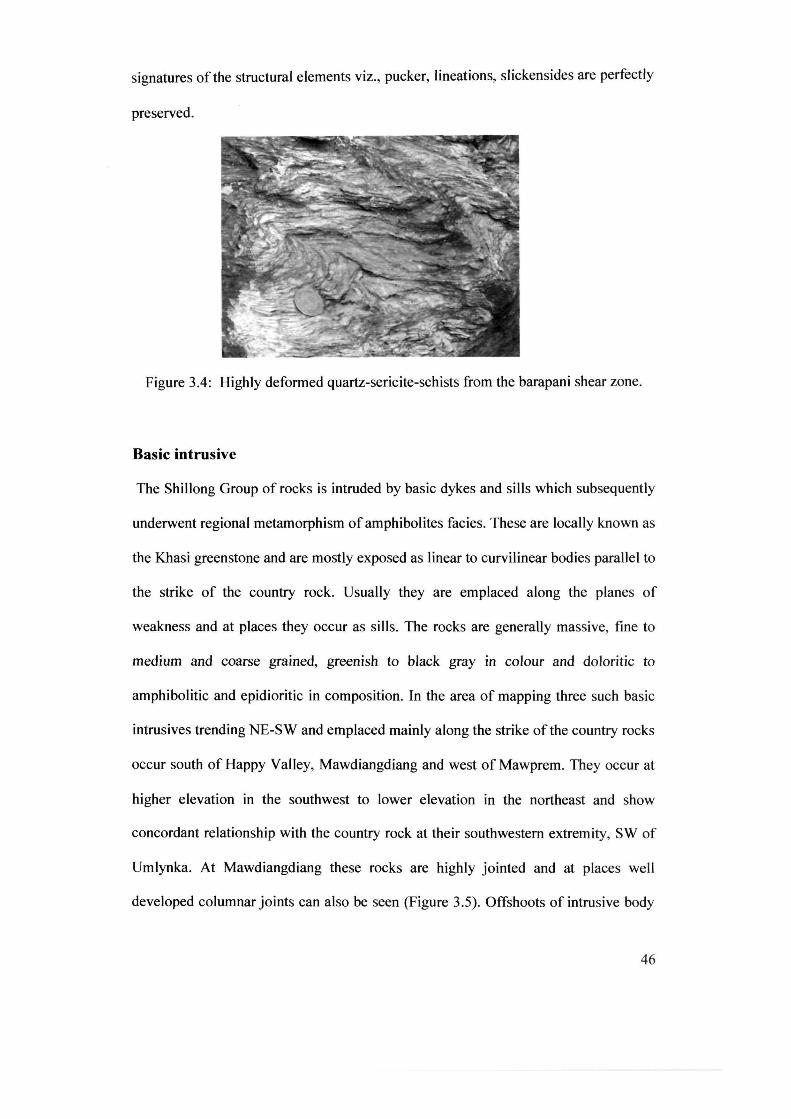
signatures of the structural elements viz. , pucker, lineations, slickensides are perfectly
preserved.
Figure 3.4: Highly deformed quartz-sericite-schists from the barapani shear zone.
Basic intrusive
The Shillong Group of rocks is intruded by basic dykes and sills which subsequently
underwent regional metamorphism of amphibolites facies. These are locally known as
the Khasi greenstone and are mostly exposed as linear to curvilinear bodies parallel to
the strike of the country rock. Usually they are emplaced along the planes of
weakness and at places they occur as sills. The rocks are generally massive, fine to
medium and coarse grained, greenish to black gray in colour and doloritic to
amphibolitic and epidioritic in composition. In the area of mapping three such basic
intrusives trending NE-SW and emplaced mainly along the strike of the country rocks
occur south of Happy Valley, Mawdiangdiang and west of Mawprem. They occur at
higher elevation in the southwest to lower elevation in the northeast and show
concordant relationship with the country rock at their southwestern extremity, SW of
Umlynka. At Mawdiangdiang these rocks are highly jointed and at places well
developed columnar joints can also be seen (Figure 3.5). Offshoots of intrusive body
46
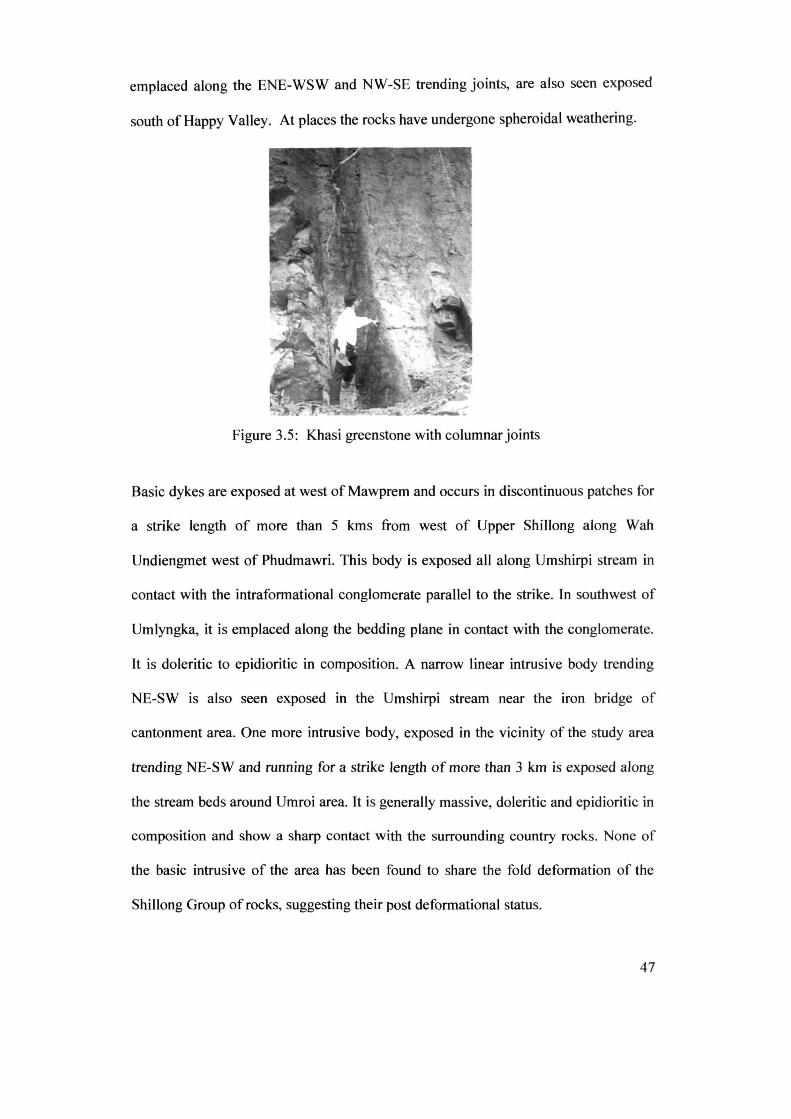
emplaced along the ENE-WSW and NW-SE trending joints, are also seen exposed
south of Happy Valley. At places the rocks have undergone spheroidal weathering.
Figure 3.5: Khasi greenstone with columnar joints
Basic dykes are exposed at west of Mawprem and occurs in discontinuous patches for
a strike length of more than 5 kms from west of Upper Shillong along Wah
Undiengmet west of Phudmawri. This body is exposed all along Umshirpi stream in
contact with the intraformational conglomerate parallel to the strike. In southwest of
Umlyngka, it is emplaced along the bedding plane in contact with the conglomerate.
It is doleritic to epidioritic in composition. A narrow linear intrusive body trending
NE-SW is also seen exposed in the Umshirpi stream near the iron bridge of
cantonment area. One more intrusive body, exposed in the vicinity of the study area
trending NE-SW and running for a strike length of more than 3 km is exposed along
the stream beds around Umroi area. It is generally massive, doleritic and epidioritic in
composition and show a sharp contact with the surrounding country rocks. None of
the basic intrusive of the area has been found to share the fold deformation of the
Shillong Group of rocks, suggesting their post deformational status.
47
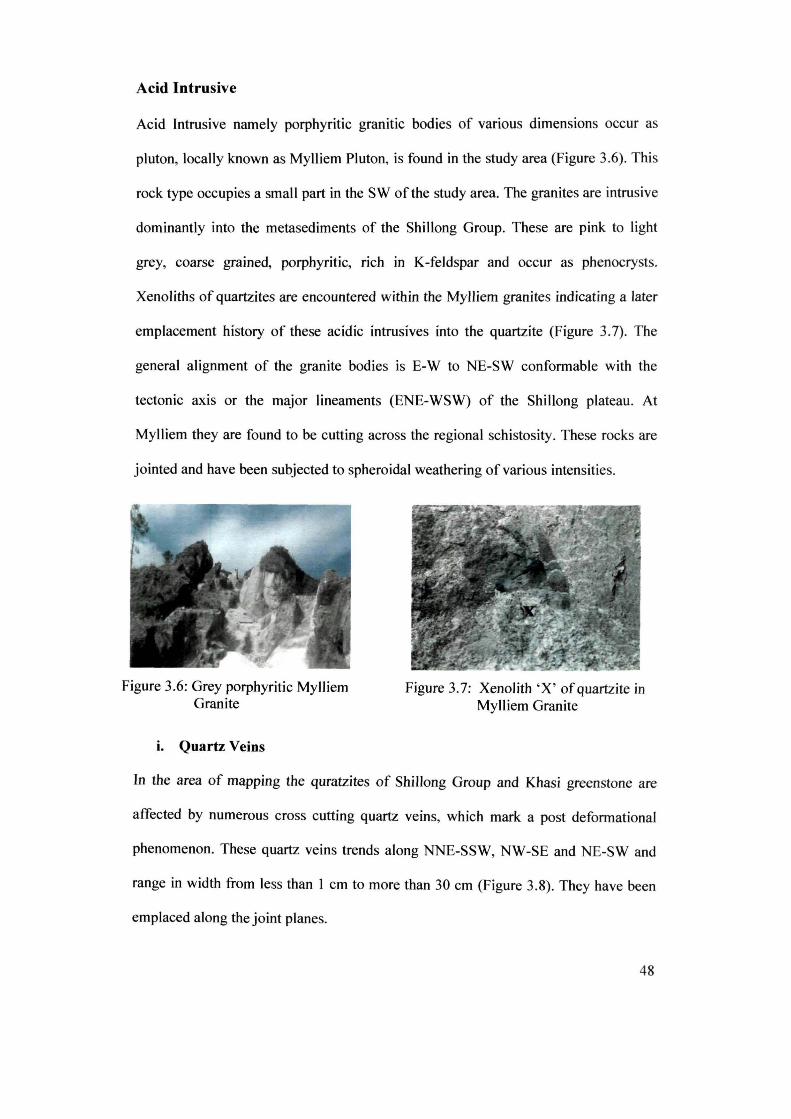
Acid Intrusive
Acid Intrusive namely porphyritic granitic bodies of various dimensions occur as
pluton, locally known as Mylliem Pluton, is found in the study area (Figure 3.6). This
rock type occupies a small part in the SW of the study area. The granites are intrusive
dominantly into the metasediments of the Shillong Group. These are pink to light
grey, coarse grained, porphyritic, rich in K-feldspar and occur as phenocrysts.
Xenoliths of quartzites are encountered within the Mylliem granites indicating a later
emplacement history of these acidic intrusives into the quartzite (Figure 3.7). The
general alignment of the granite bodies is E-W to NE-SW conformable with the
tectonic axis or the major lineaments (ENE-WSW) of the Shillong plateau. At
Mylliem they are found to be cutting across the regional schistosity. These rocks are
jointed and have been subjected to spheroidal weathering of various intensities.
Figure 3.6: Grey porphyritic Mylliem Granite
i. Quartz Veins
Figure 3.7: Xenolith 'X' of quartzite in Mylliem Granite
In the area of mapping the quratzites of Shillong Group and Khasi greenstone are
affected by numerous cross cutting quartz veins, which mark a post deformational
phenomenon. These quartz veins trends along NNE-SSW, NW -SE and NE-SW and
range in width from less than 1 cm to more than 30 cm (Figure 3.8). They have been
emplaced along the joint planes.
48
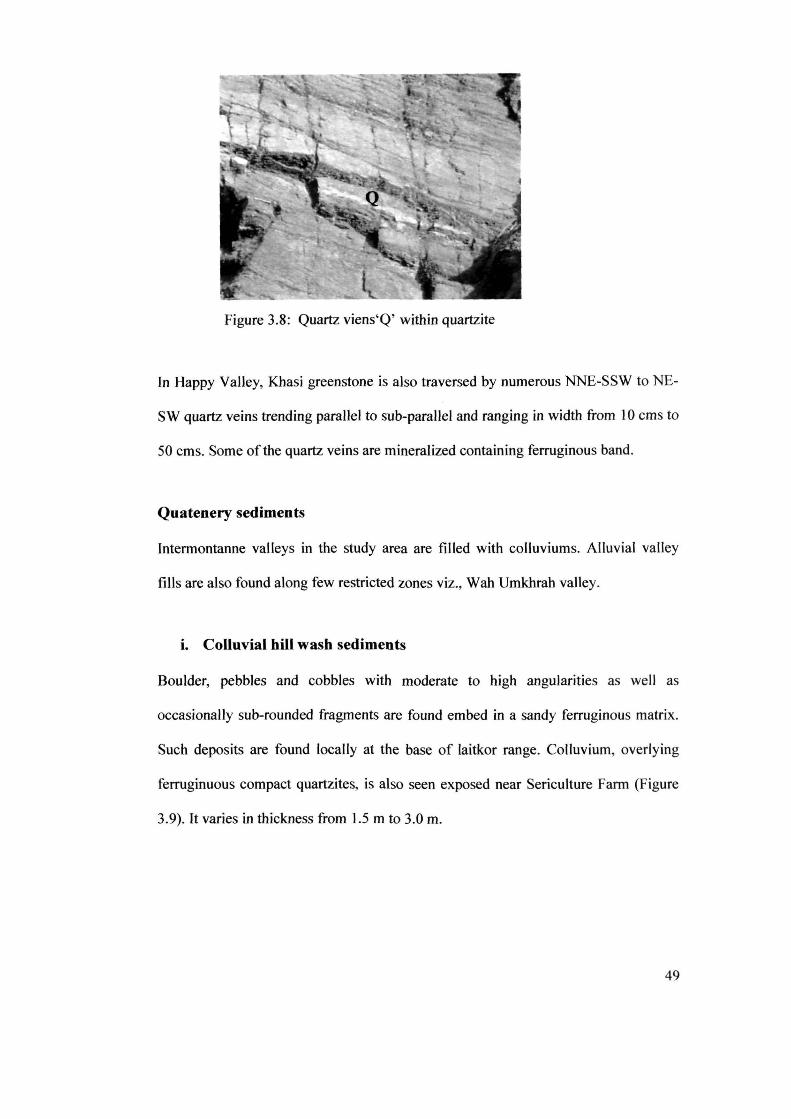
Figure 3.8: Quartz viens'Q' within quartzite
In Happy Valley, Khasi greenstone is also traversed by numerous NNE-SSW to NE
SW quartz veins trending parallel to sub-parallel and ranging in width from 10 ems to
50 ems. Some of the quartz veins are mineralized containing ferruginous band.
Quatenery sediments
Intermontanne valleys in the study area are filled with colluviums. Alluvial valley
fills are also found along few restricted zones viz., Wah Umkhrah valley.
i. Colluvial hill wash sediments
Boulder, pebbles and cobbles with moderate to high angularities as well as
occasionally sub-rounded fragments are found embed in a sandy ferruginous matrix.
Such deposits are found locally at the base of laitkor range. Colluvium, overlying
ferruginuous compact quartzites, is also seen exposed near Sericulture Farm (Figure
3.9). It varies in thickness from 1.5 m to 3.0 m.
49
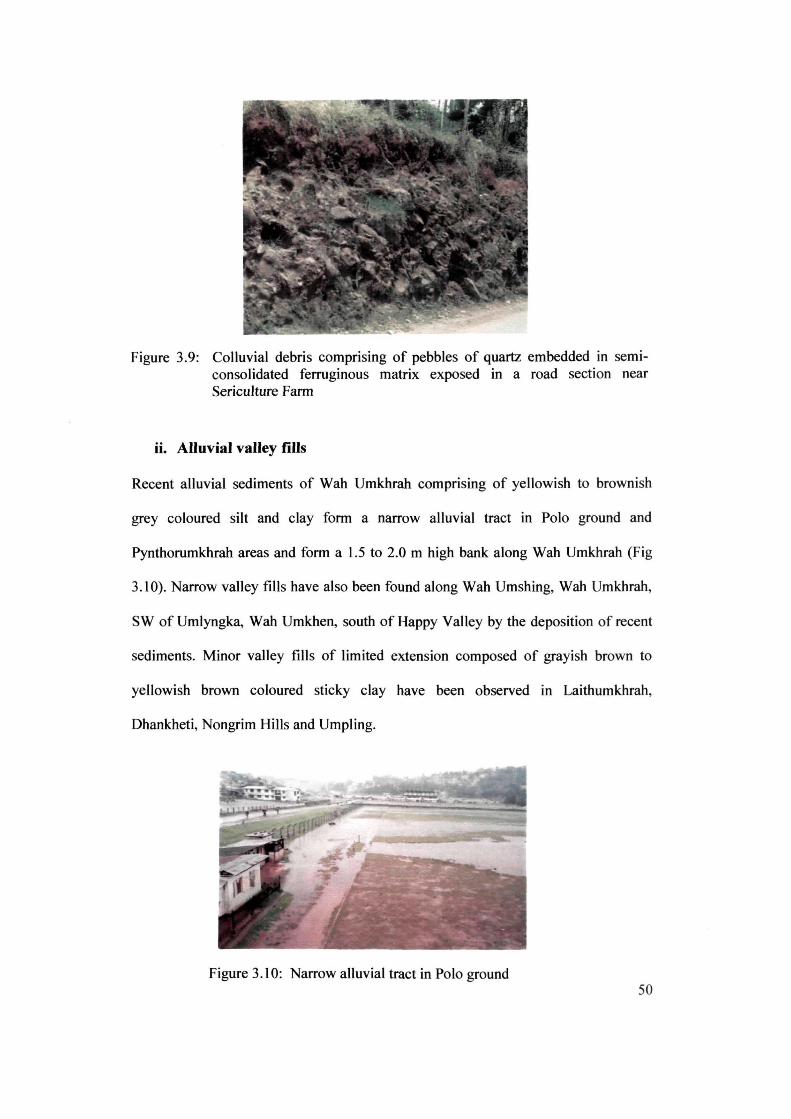
Figure 3.9: Colluvial debris comprising of pebbles of quartz embedded in semiconsolidated ferruginous matrix exposed in a road section near Sericulture Farm
ii. Alluvial valley fills
Recent alluvial sediments of Wah Umkhrah comprising of yellowish to brownish
grey coloured silt and clay form a narrow alluvial tract in Polo ground and
Pynthorumkhrah areas and form a 1.5 to 2.0 m high bank along Wah Umkhrah (Fig
3.10). Narrow valley fills have also been found along Wah Umshing, Wah Umkhrah,
SW of Umlyngka, Wah Umkhen, south of Happy Valley by the deposition of recent
sediments. Minor valley fills of limited extension composed of grayish brown to
yellowish brown coloured sticky clay have been observed in Laithumkhrah,
Dhankheti, Nongrim Hills and Umpling.
Figure 3.10: Narrow alluvial tract in Polo ground 50
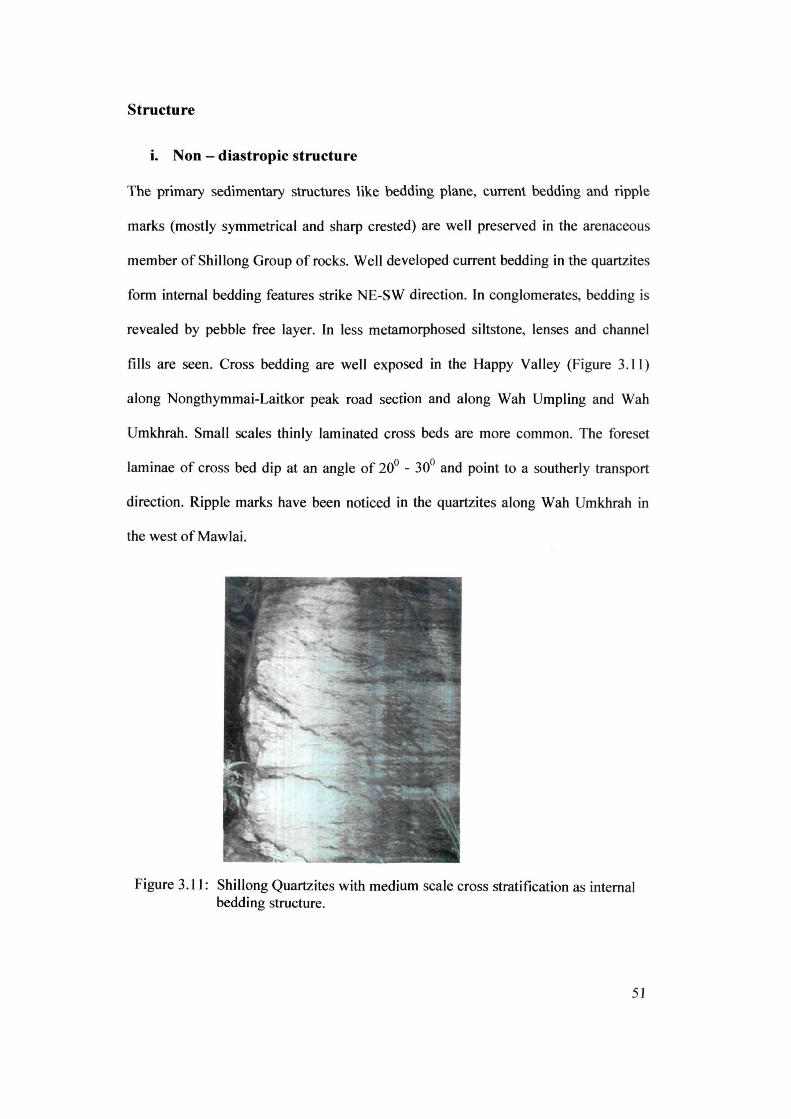
Structure
i. Non - diastropic structure
The primary sedimentary structures like bedding plane, current bedding and ripple
marks (mostly symmetrical and sharp crested) are well preserved in the arenaceous
member of Shillong Group of rocks. Well developed current bedding in the quartzites
form internal bedding features strike NE-SW direction. In conglomerates, bedding is
revealed by pebble free layer. In less metamorphosed siltstone, lenses and channel
fills are seen. Cross bedding are well exposed in the Happy Valley (Figure 3.11)
along Nongthymmai-Laitkor peak road section and along Wah Umpling and Wah
Umkhrah. Small scales thinly laminated cross beds are more common. The foreset
laminae of cross bed dip at an angle of 20° - 30° and point to a southerly transport
direction. Ripple marks have been noticed in the quartzites along Wah Umkhrah in
the west of Mawlai.
Figure 3.11: Shillong Quartzites with medium scale cross stratification as internal bedding structure.
51
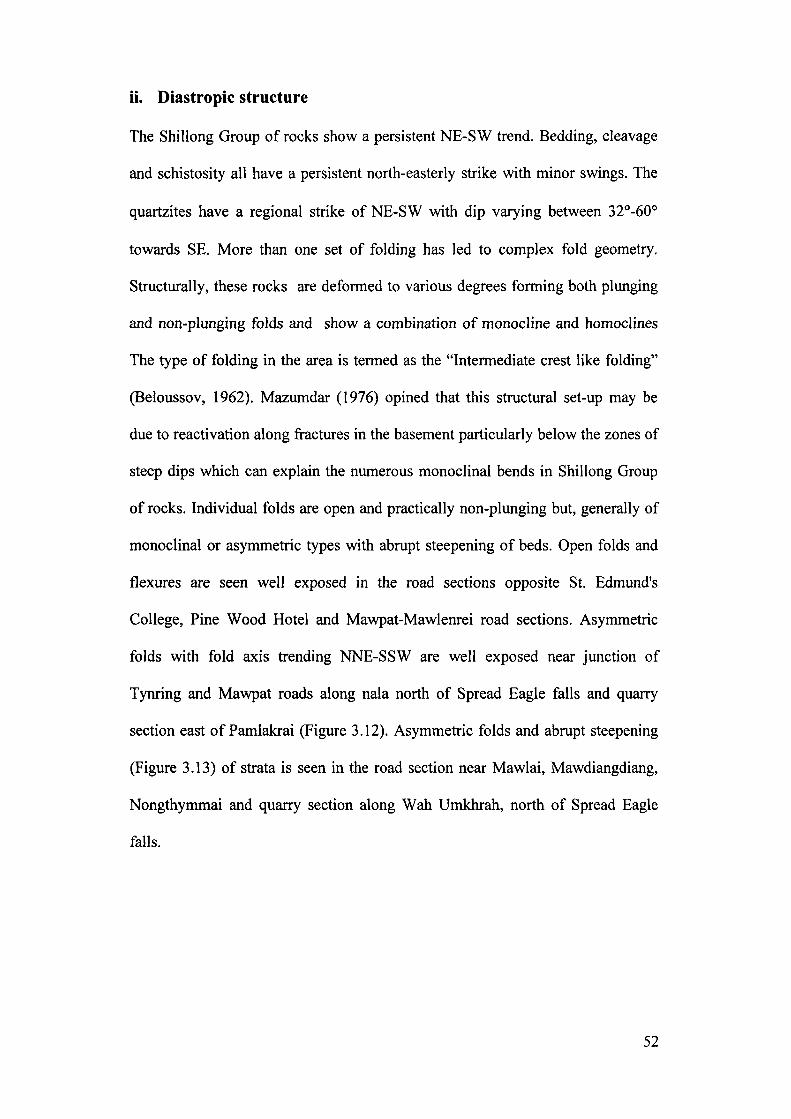
ii. Diastropic structure
The Shillong Group of rocks show a persistent NE-SW trend. Bedding, cleavage
and schistosity all have a persistent north-easterly strike with minor swings. The
quartzites have a regional strike of NE-SW with dip varying between 32°-60°
towards SE. More than one set of folding has led to complex fold geometry.
Structurally, these rocks are deformed to various degrees forming both plunging
and non-plunging folds and show a combination of monocline and homoclines
The type of folding in the area is termed as the "Intermediate crest like folding"
(Beloussov, 1962). Mazumdar (1976) opined that this structural set-up may be
due to reactivation along fractures in the basement particularly below the zones of
steep dips which can explain the numerous monoclinal bends in Shillong Group
of rocks. Individual folds are open and practically non-plunging but, generally of
monoclinal or asymmetric types with abrupt steepening of beds. Open folds and
flexures are seen well exposed in the road sections opposite St. Edmund's
College, Pine Wood Hotel and Mawpat-Mawlenrei road sections. Asymmetric
folds with fold axis trending NNE-SSW are well exposed near junction of
Tynring and Mawpat roads along nala north of Spread Eagle falls and quarry
section east of Pamlakrai (Figure 3.12). Asymmetric folds and abrupt steepening
(Figure 3.13) of strata is seen in the road section near Mawlai, Mawdiangdiang,
Nongthymmai and quarry section along Wah Umkhrah, north of Spread Eagle
falls.
52
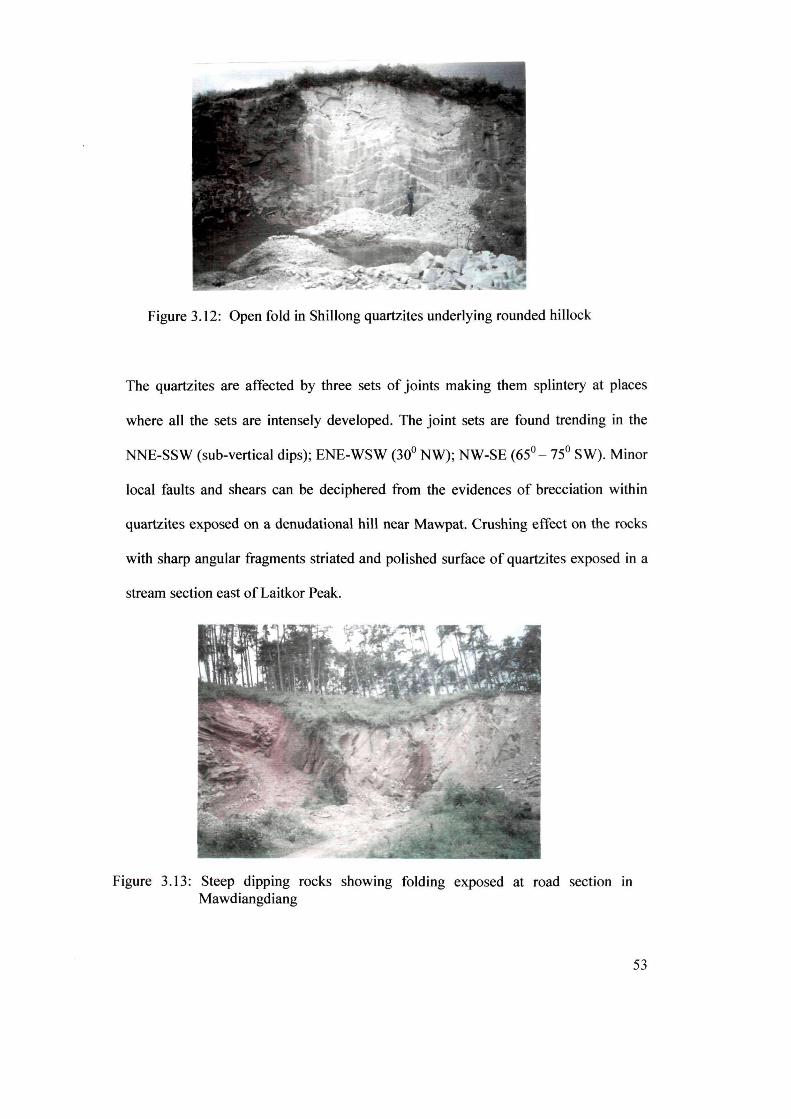
Figure 3.12: Open fold in Shillong quartzites underlying rounded hillock
The quartzites are affected by three sets of joints making them splintery at places
where all the sets are intensely developed. The joint sets are found trending in the
NNE-SSW (sub-vertical dips); ENE-WSW (300 NW); NW-SE (650 _ 750 SW). Minor
local faults and shears can be deciphered from the evidences of brecciation within
quartzites exposed on a denudational hill near Mawpat. Crushing effect on the rocks
with sharp angular fragments striated and polished surface of quartzites exposed in a
stream section east ofLaitkor Peak.
Figure 3.13: Steep dipping rocks showing folding exposed at road section in Mawdiangdiang
53
No major fault or thrust could be identified within the study area. However, a number
of prominent lineaments and a major shear zone known as Tyrsad-Barapani shear
occur in the northern part having NE-SW trend. The shear zone has affected the
phyllites which can be very well seen near Tyrsad area and between Mawiong and
Umiam along the NH-40. It is a narrow zone of intensely sheared phyllites with
nearly vertical foliation plane and characterized by kink bands in the inter foliation
zones. Sulphur leaching is prominently seen at some places within this shear zone.
The weak zone is expected to act as a conduit for mineralized fluid movement.
iii. Lineaments
More than 56 lineaments of> lkm length have been traced within the study area
(Figure 3.14). However, most of the major lineaments are of 3 -10 km in length with
a maximum of ~ 13 km. Majority of the lineaments are rectilinear while a few are
curvilinear. Most of them occur in intersecting sets. Average lineament density for the
whole study area is found to be 0.4 - 3 km- I (Figure 3.15) with lineament frequency as
3.3 - 0.7 km-2 • Statistical analysis shows that most of the prominent lineaments in the
study area show NE-SW trend (Figure 3.16) conforming to the general structural
trend. These linear structures have played a significant role in guiding the drainage
pattern.
54
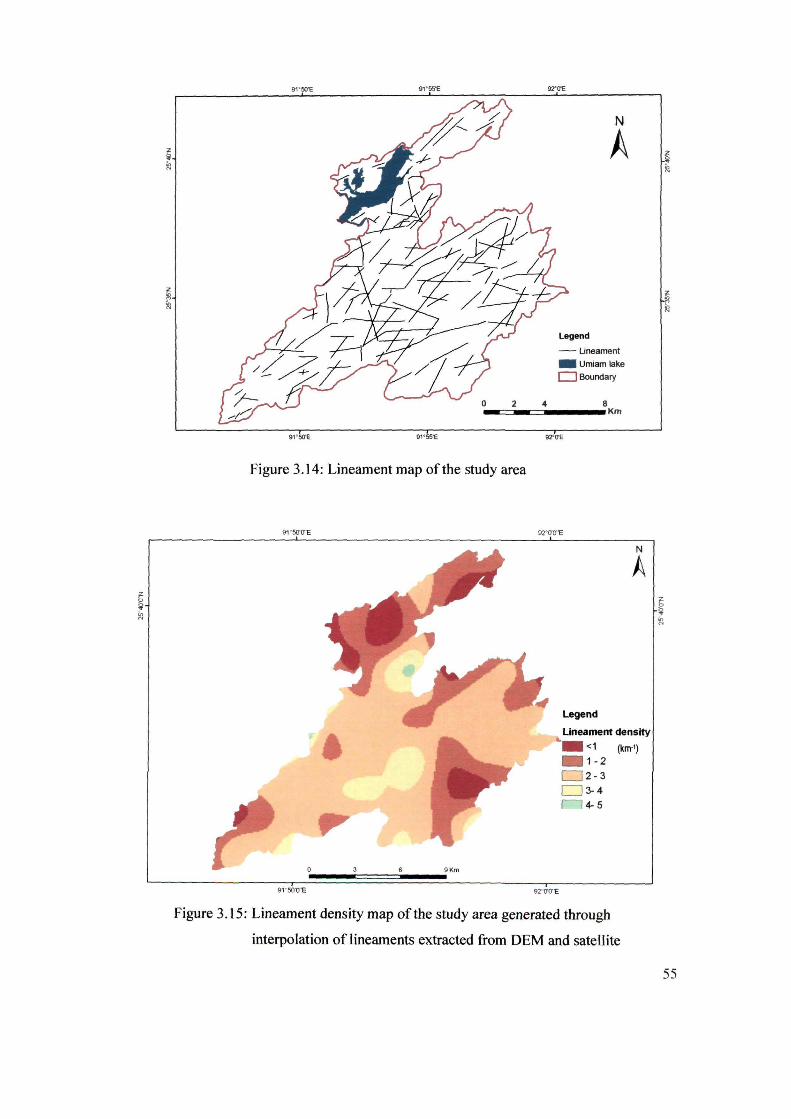
9, ' SO'E
9"SO'E 9 ' ''SS'E
92"O'E
N
A
Legend
-Uneament
_ Umiam lake
o Boundary
2 4 8 _ Km
92"O'E
Figure 3.14: Lineament map of the study area
9, ' SO'O"E
9 Km
gz"O'O''E
9Z'O'O' 'E
N
A
Legend
Lineament density
_ <1 (km·1) _ 1-2 0 2-3
0 3-4 11 4-5
Figure 3.15: Lineament density map of the study area generated through
interpolation of lineaments extracted from OEM and satellite
55
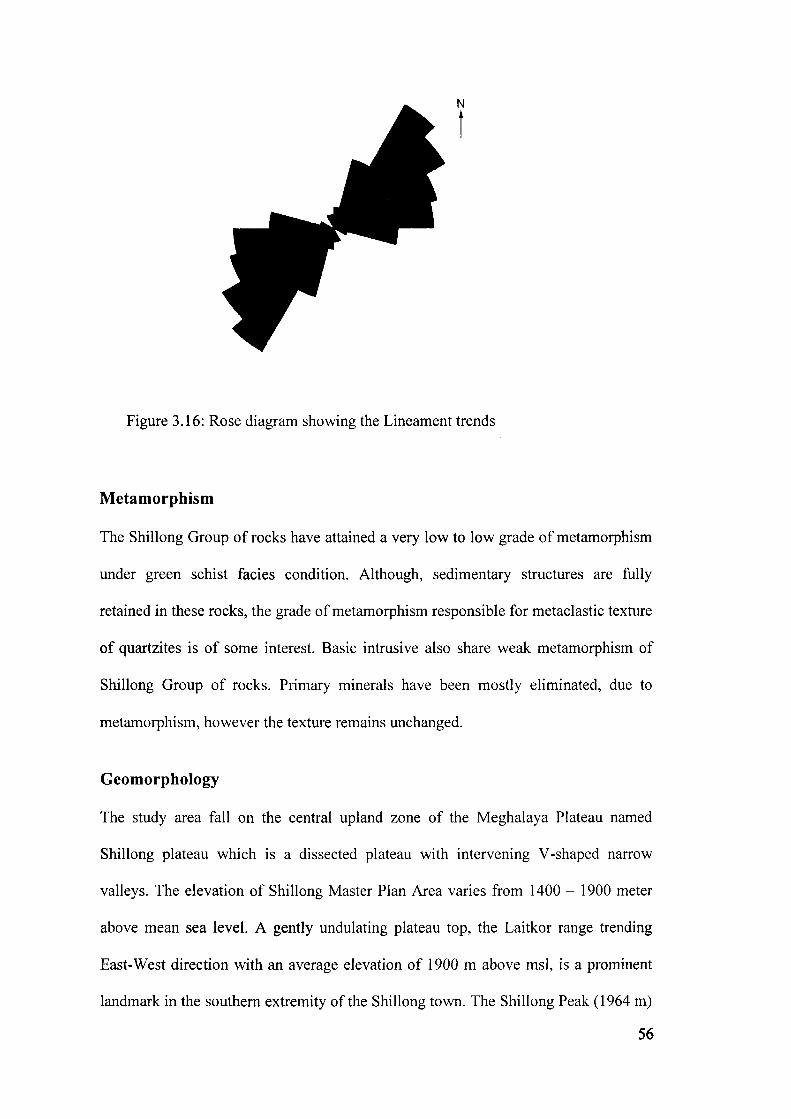
N
t
Figure 3.16: Rose diagram showing the Lineament trends
Metamorphism
The Shillong Group of rocks have attained a very low to low grade of metamorphism
under green schist facies condition. Although, sedimentary structures are fully
retained in these rocks, the grade of metamorphism responsible for metaclastic texture
of quartzites is of some interest. Basic intrusive also share weak metamorphism of
Shillong Group of rocks. Primary minerals have been mostly eliminated, due to
metamorphism, however the texture remains unchanged.
Geomorphology
The study area fall on the central upland zone of the Meghalaya Plateau named
Shillong plateau which is a dissected plateau with intervening V -shaped narrow
valleys. The elevation of Shillong Master Plan Area varies from 1400 - 1900 meter
above mean sea level. A gently undulating plateau top, the Laitkor range trending
East-West direction with an average elevation of 1900 m above msl, is a prominent
landmark in the southern extremity of the Shillong town. The Shillong Peak (1964 m)
56
and Laitkor peak (1960 m) form the highest points in the area of mapping. The main
urban growth center of Shillong Master Plan Area is situated on a broad topographic
low with several flat topped low relief hillocks and gently undulating valleys.
Pologround or Umkhrah valley skirts the northern edge of the town and is situated at
a much lesser height.
The present day landscape of the study area is the result of a competing interaction of
lithology and structure as well as climatic factors. Mass movements have played a
major role in evolution of the numerous hillslopes while geomorphic work by high
gradient rivers is evidently a controlling factor for the present day landscape
development. Because of effective transfer of eroded debris, both from fluvial erosion
and mass movement, the Valleys are deeply incised bordered with cliff faces. Sheet
erosion due to non-channel overland flow is very effective in the study area
particularly during monsoon when precipitation may be as high as > 1 OOOOmm.
Broadly the geomorphology of Shillong Master Plan Area can be subdivided into two
major geomorphic domains viz., plateau landform and fluvio denudationallandforms.
Almost the entire area comprises erosional landform which can be further subdivided
into three categories viz., highly dissected, moderately dissected and less dissected.
The fluvio denudational landforms can be further subdivided into sub-domains
namely, the narrow Infilled valleys and the terraces. Narrow valley fills and recent
terraces have been deposited along the main streams cutting through the erosional
surfaces.
The five major geomorphic units delineated in the study area are: the structural hills,
recent terraces, residual hills, alluvial valleys and large static water bodies. The
structural hills can be further differentiated into three categories viz., highly dissected,
57
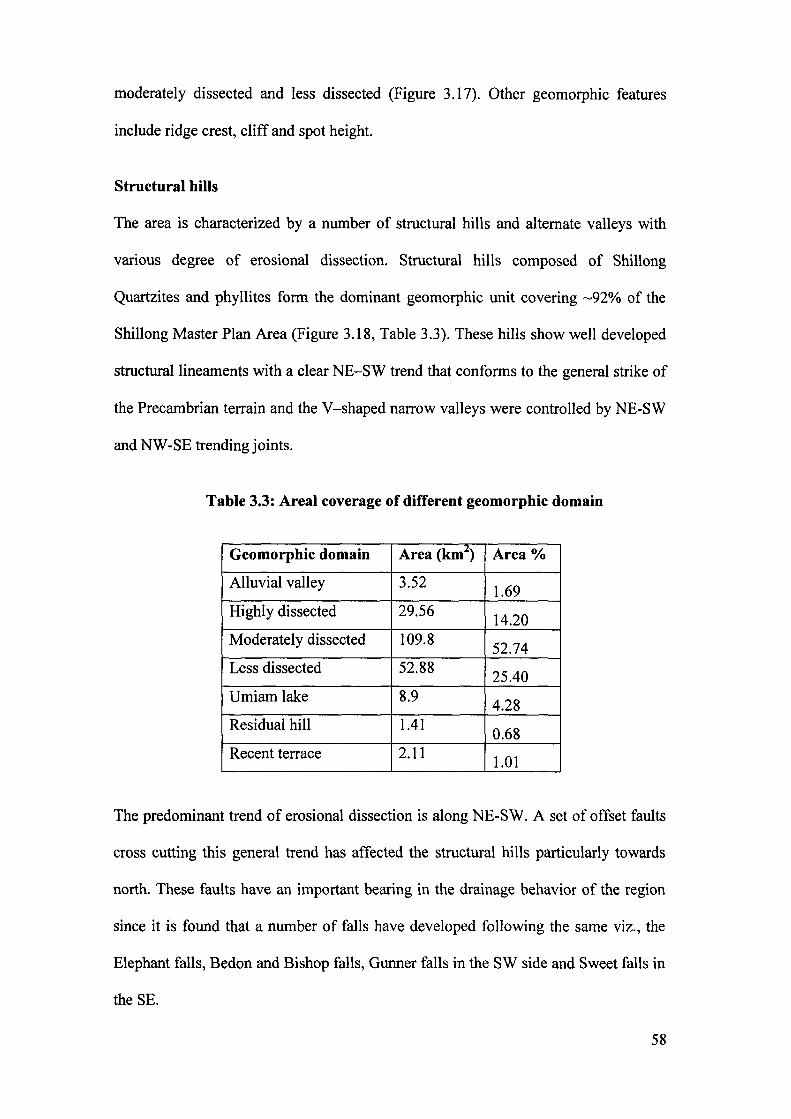
moderately dissected and less dissected (Figure 3.17). Other geomorphic features
include ridge crest, cliff and spot height.
Structural hills
The area is characterized by a number of structural hills and alternate valleys with
various degree of erosional dissection. Structural hills composed of Shillong
Quartzites and phyllites form the dominant geomorphic unit covering -92% of the
Shillong Master Plan Area (Figure 3.18, Table 3.3). These hills show well developed
structural lineaments with a clear NE-SW trend that conforms to the general strike of
the Precambrian terrain and the V-shaped narrow valleys were controlled by NE-SW
and NW-SE trending joints.
Table 3.3: Areal coverage of different geomorphic domain
Geomorphic domain Area (kml) Area %
Alluvial valley 3.52 1.69
Highly dissected 29.56 14.20
Moderately dissected 109.8 52.74
Less dissected 52.88 25.40
Umiam lake 8.9 4.28
Residual hill 1.41 0.68
Recent terrace 2.11 1.01
The predominant trend of erosional dissection is along NE-SW. A set of offset faults
cross cutting this general trend has affected the structural hills particularly towards
north. These faults have an important bearing in the drainage behavior of the region
since it is found that a number of falls have developed following the same viz., the
Elephant falls, Bedon and Bishop falls, Gunner falls in the SW side and Sweet falls in
the SE.
58
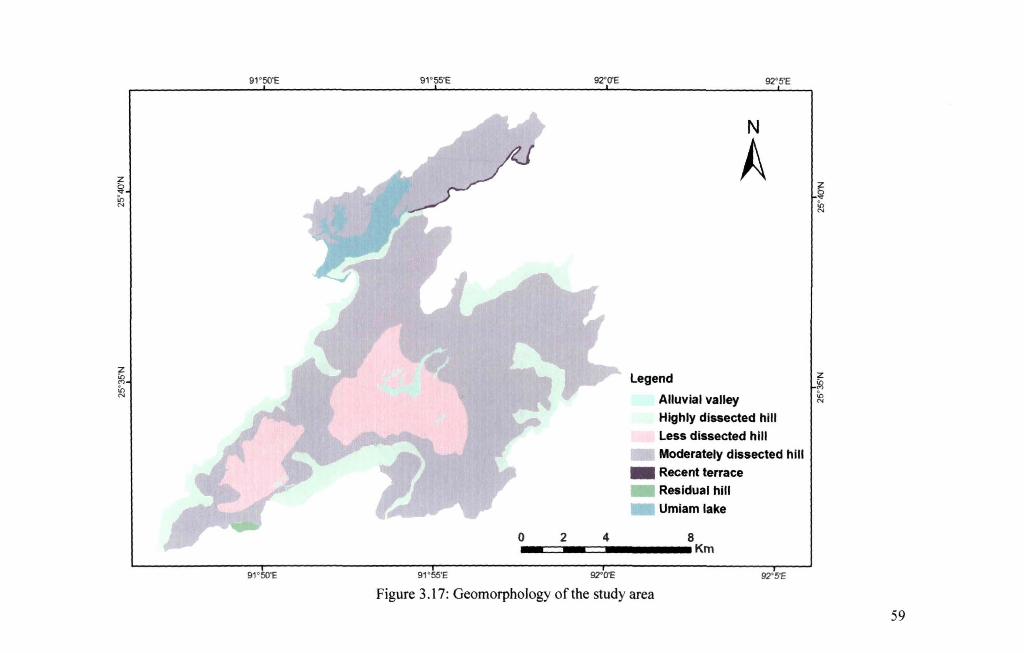
z ~ to N
z ~ to N
91 ' 50'E
91 ' 50'E
91 ' SS'E
91 ' SS'E
92' O'E 92'5'E
N
A
Legend
Alluvial valley
Highly dissected hill
Less dissected hill
Moderately dissected hill _ Recent terrace
Residual hill
Umiam lake
o 2 8 .. ~~-=~ ........ Km 4
92'O'E 92'5'E
Figure 3.17: Geomorphology of the study area
"? ~ II) N
z ~ II) N
59
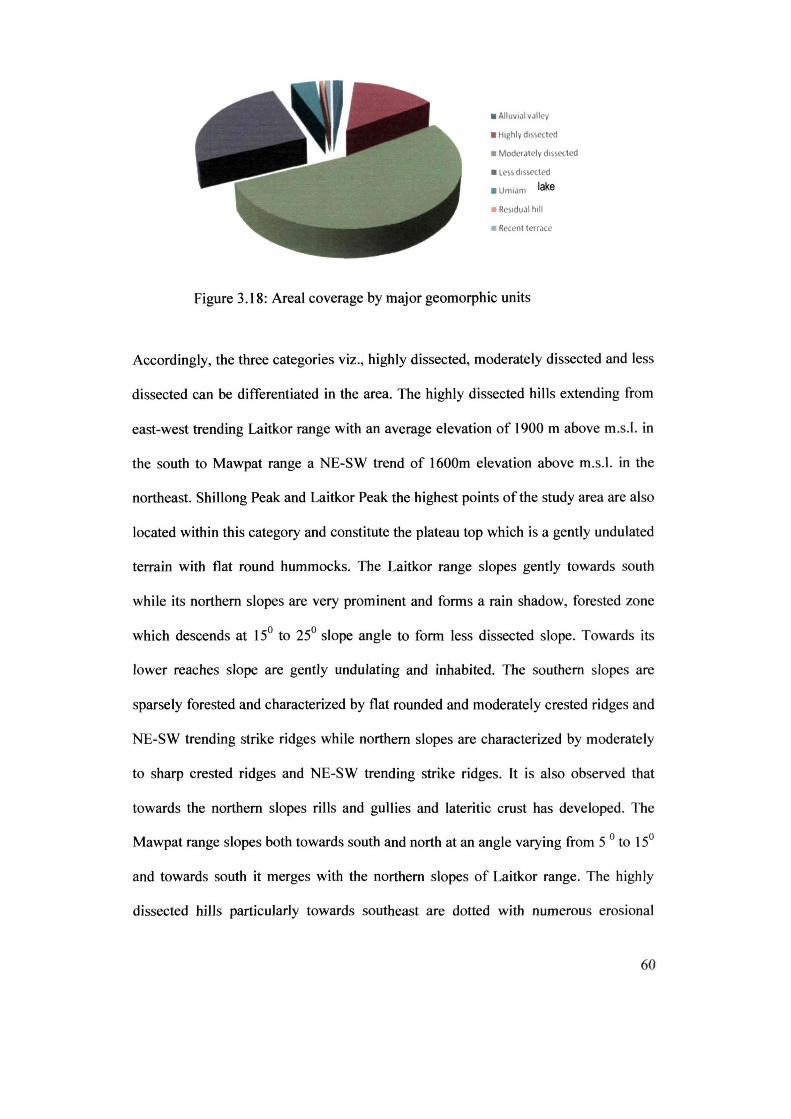
• Alluvial valley
• Highly dissected
• Moderately dissected
• Less dissected
. Umlam lake
• Residual hili
• Recent terrace
Figure 3.18: Areal coverage by major geomorphic units
Accordingly, the three categories viz., highly dissected, moderately dissected and less
dissected can be differentiated in the area. The highly dissected hills extending from
east-west trending Laitkor range with an average elevation of 1900 m above m.s.\. in
the south to Mawpat range a NE-SW trend of 1600m elevation above m.s.\. in the
northeast. Shillong Peak and Laitkor Peak the highest points of the study area are also
located within this category and constitute the plateau top which is a gently undulated
terrain with flat round hummocks. The Laitkor range slopes gently towards south
while its northern slopes are very prominent and forms a rain shadow, forested zone
which descends at 15° to 25° slope angle to form less dissected slope. Towards its
lower reaches slope are gently undulating and inhabited. The southern slopes are
sparsely forested and characterized by flat rounded and moderately crested ridges and
NE-SW trending strike ridges while northern slopes are characterized by moderately
to sharp crested ridges and NE-SW trending strike ridges. It is also observed that
towards the northern slopes rills and gullies and lateritic crust has developed. The
Mawpat range slopes both towards south and north at an angle varying from 5 ° to 15°
and towards south it merges with the northern slopes of Laitkor range. The highly
dissected hills particularly towards southeast are dotted with numerous erosional
60
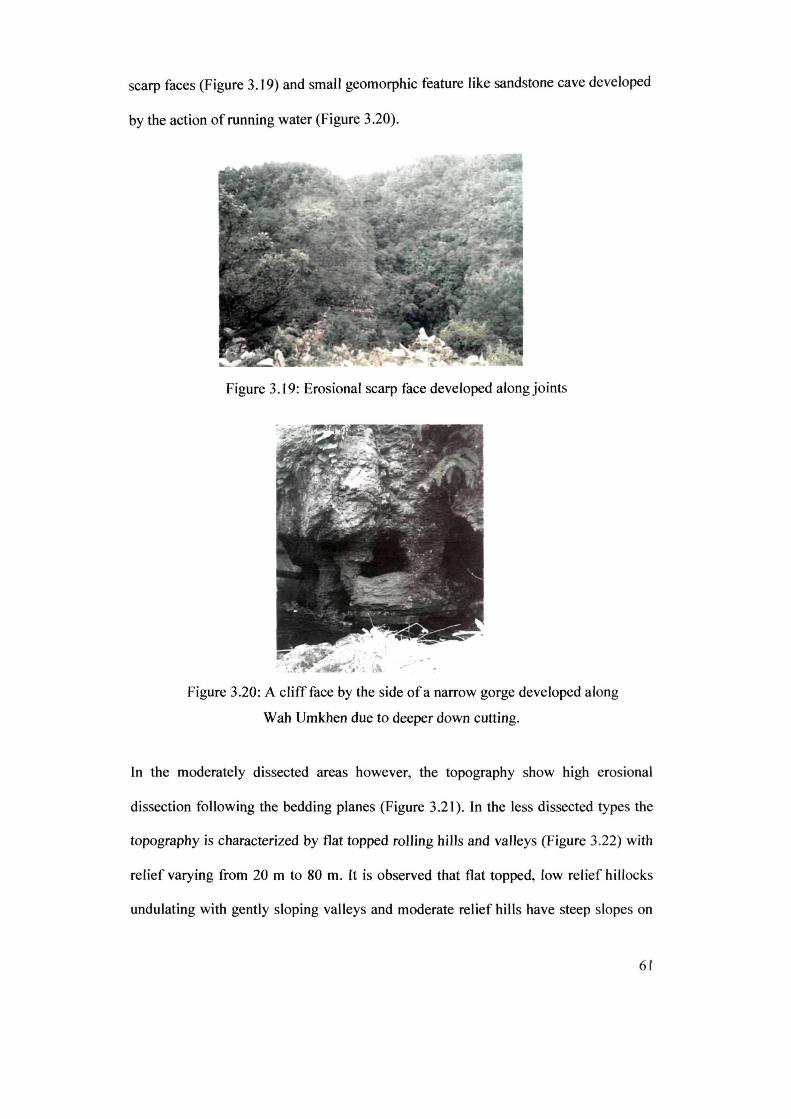
scarp faces (Figure 3.19) and small geomorphic feature like sandstone cave developed
by the action of running water (Figure 3.20).
Figure 3.19: Erosional scarp face developed along joints
Figure 3.20: A cliffface by the side ofa narrow gorge developed along
Wah Umkhen due to deeper down cutting.
In the moderately dissected areas however, the topography show high erosional
dissection following the bedding planes (Figure 3.21). In the less dissected types the
topography is characterized by flat topped rolling hills and valleys (Figure 3.22) with
relief varying from 20 m to 80 m. It is observed that flat topped, low relief hillocks
undulating with gently sloping valleys and moderate relief hills have steep slopes on
61
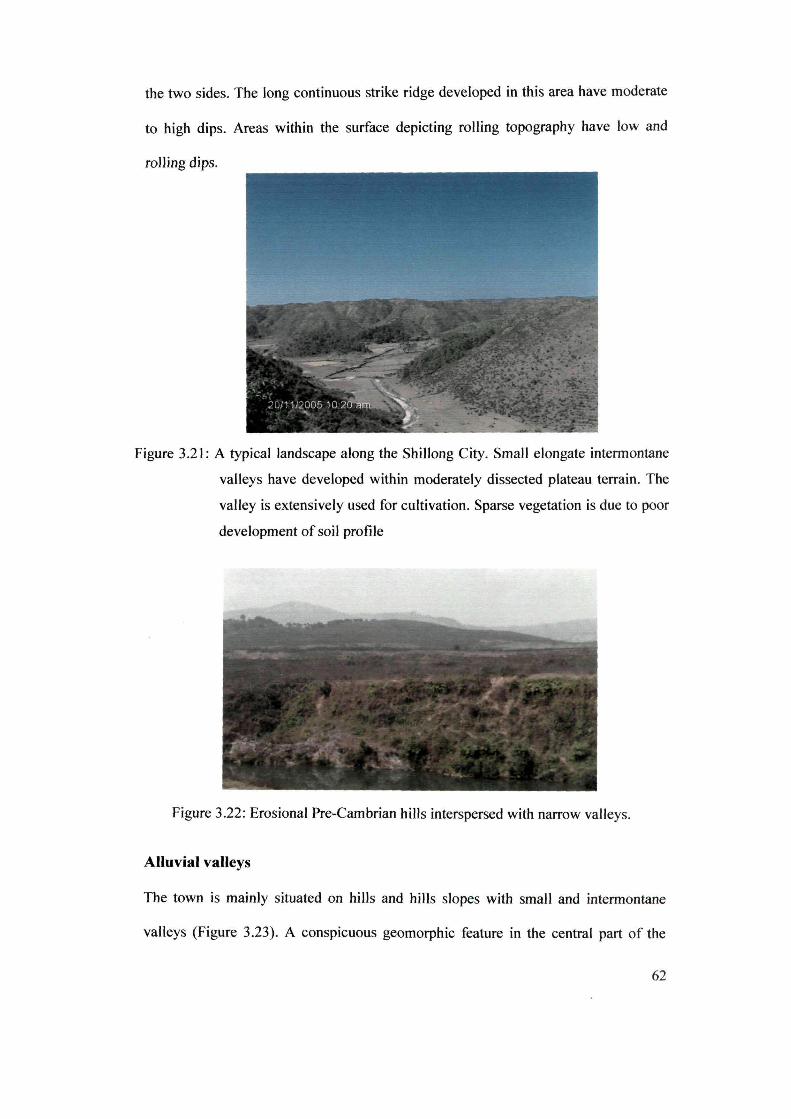
the two sides. The long continuous strike ridge developed in this area have moderate
to high dips. Areas within the surface depicting rolling topography have low and
rolling dips.
Figure 3.21: A typical landscape along the Shillong City. Small elongate intermontane
valleys have developed within moderately dissected plateau terrain. The
valley is extensively used for cultivation. Sparse vegetation is due to poor
development of soil profile
Figure 3.22: Erosional Pre-Cambrian hills interspersed with narrow valleys.
Alluvial valleys
The town is mainly situated on hills and hills slopes with small and intermontane
valleys (Figure 3.23). A conspicuous geomorphic feature in the central part of the
62
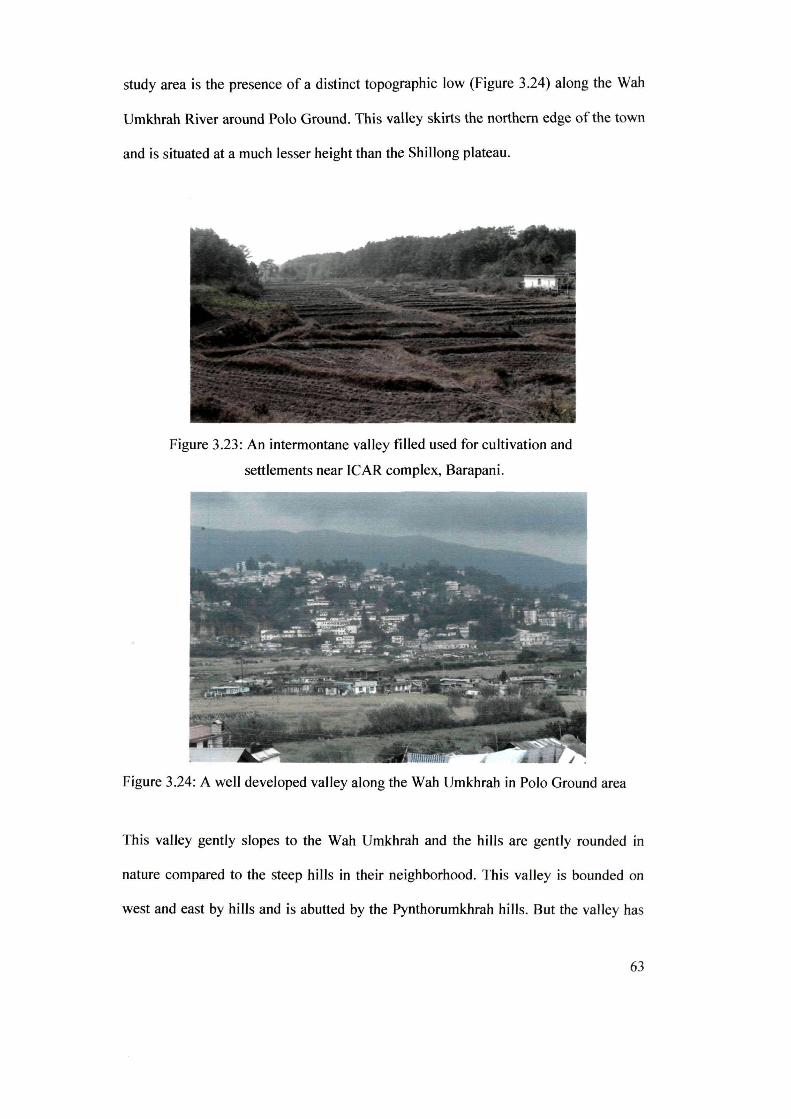
study area is the presence of a distinct topographic low (Figure 3.24) along the Wah
Umkhrah River around Polo Ground. This valley skirts the northern edge of the town
and is situated at a much lesser height than the Shillong plateau.
Figure 3.23: An intermontane valley filled used for cultivation and
settlements near leAR complex, Barapani.
Figure 3.24: A well developed valley along the Wah Umkhrah in Polo Ground area
This valley gently slopes to the Wah Umkhrah and the hills are gently rounded in
nature compared to the steep hills in their neighborhood. This valley is bounded on
west and east by hills and is abutted by the Pynthorumkhrah hills. But the valley has
63
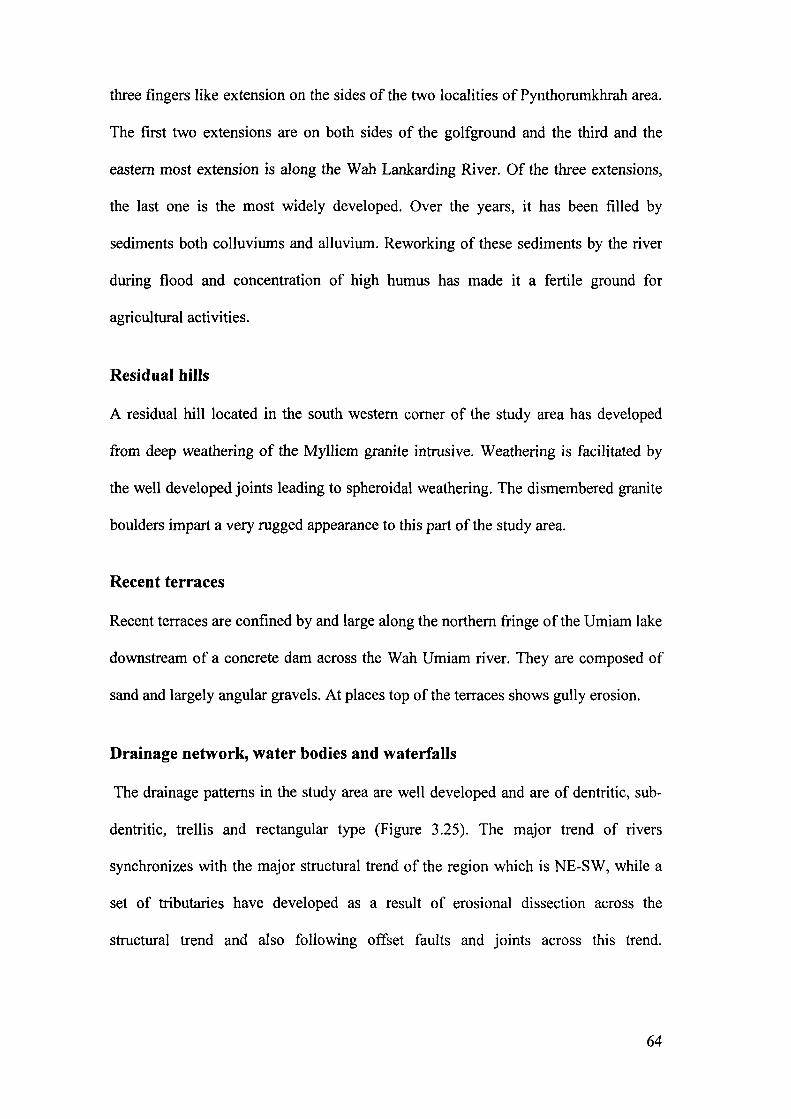
three fingers like extension on the sides of the two localities of Pynthorumkhrah area.
The first two extensions are on both sides of the golfground and the third and the
eastern most extension is along the Wah Lankarding River. Of the three extensions,
the last one is the most widely developed. Over the years, it has been filled by
sediments both colluviums and alluvium. Reworking of these sediments by the river
during flood and concentration of high humus has made it a fertile ground for
agricultural activities.
Residual hills
A residual hill located in the south western comer of the study area has developed
from deep weathering of the Mylliem granite intrusive. Weathering is facilitated by
the well developed joints leading to spheroidal weathering. The dismembered granite
boulders impart a very rugged appearance to this part of the study area.
Recent terraces
Recent terraces are confined by and large along the northern fringe of the Umiam lake
downstream of a concrete dam across the Wah Umiam river. They are composed of
sand and largely angular gravels. At places top ofthe terraces shows gully erosion.
Drainage network, water bodies and waterfalls
The drainage patterns in the study area are well developed and are of dentritic, sub
dentritic, trellis and rectangular type (Figure 3.25). The major trend of rivers
synchronizes with the major structural trend of the region which is NE-SW, while a
set of tributaries have developed as a result of erosional dissection across the
structural trend and also following offset faults and joints across this trend.
64
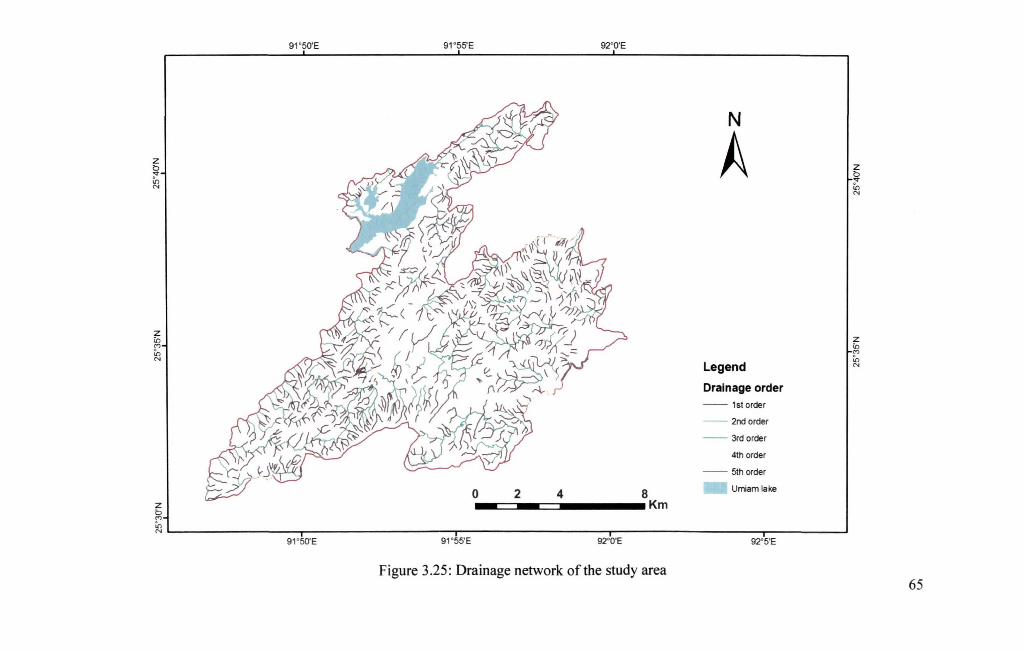
z o .... fn N
Z in
'" fn N
z o '"
91 ' SO'E 91 ' SS'E 92' O'E
8 .. ~~-==-......... Km
N
A
Legend
Drainage order
-- 1storder
-- 2nd order
-- 3rdorder
4th order
-- Sth order
Umiam lake
~ IL---------------------r--------------------------r-------------------------Ir-------------------------,------------~ 91 ' 5O'E 91 ' S5'E 92'O'E 92'S'E
Figure 3.25: Drainage network of the study area
z o .... fn N
Z in
'" fn N
65
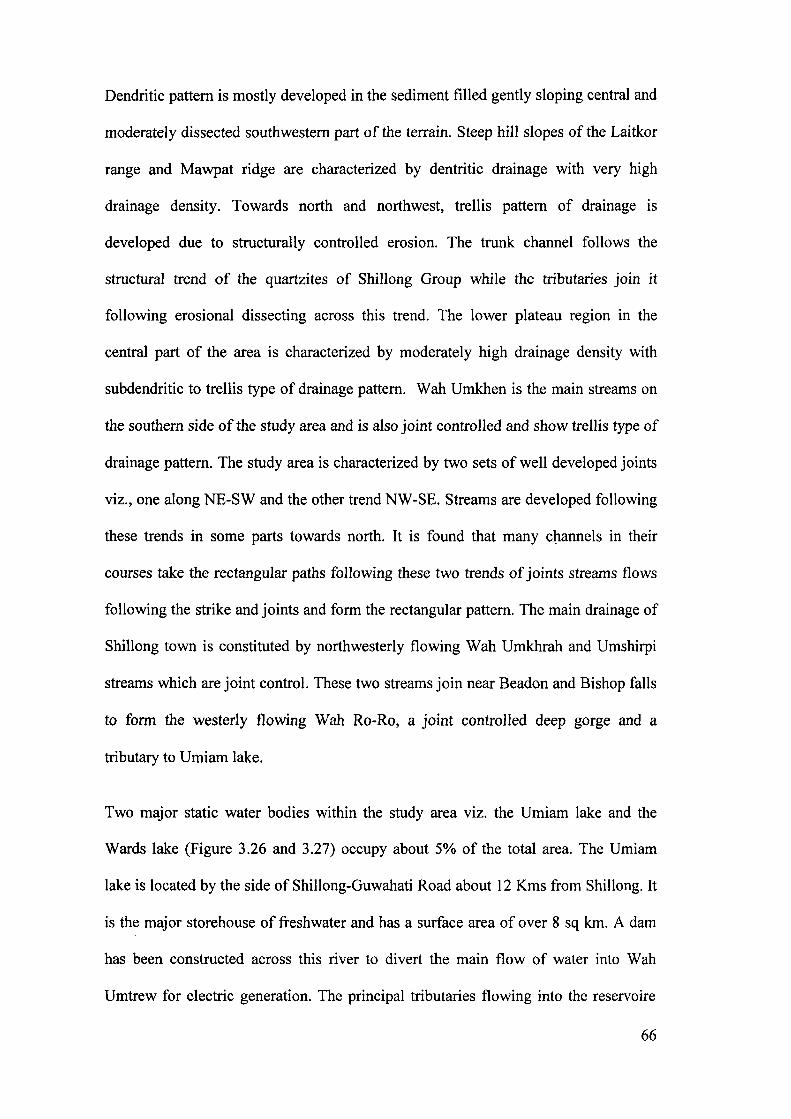
Dendritic pattern is mostly developed in the sediment filled gently sloping central and
moderately dissected southwestern part of the terrain. Steep hill slopes of the Laitkor
range and Mawpat ridge are characterized by dentritic drainage with very high
drainage density. Towards north and northwest, trellis pattern of drainage is
developed due to structurally controlled erosion. The trunk channel follows the
structural trend of the quartzites of Shillong Group while the tributaries join it
following erosional dissecting across this trend. The lower plateau region in the
central part of the area is characterized by moderately high drainage density with
subdendritic to trellis type of drainage pattern. Wah Umkhen is the main streams on
the southern side of the study area and is also joint controlled and show trellis type of
drainage pattern. The study area is characterized by two sets of well developed joints
viz., one along NE-SW and the other trend NW-SE. Streams are developed following
these trends in some parts towards north. It is found that many cl1annels in their
courses take the rectangular paths following these two trends of joints streams flows
following the strike and joints and form the rectangular pattern. The main drainage of
Shillong town is constituted by northwesterly flowing Wah Umkhrah and Umshirpi
streams which are joint control. These two streams join near Beadon and Bishop falls
to form the westerly flowing Wah Ro-Ro, a joint controlled deep gorge and a
tributary to Umiam lake.
Two major static water bodies within the study area viz. the Umiam lake and the
Wards lake (Figure 3.26 and 3.27) occupy about 5% of the total area. The Umiam
lake is located by the side of Shillong-Guwahati Road about 12 Kms from Shillong. It
is the major storehouse of freshwater and has a surface area of over 8 sq km. A dam
has been constructed across this river to divert the main flow of water into Wah
Umtrew for electric generation. The principal tributaries flowing into the reservoire
66
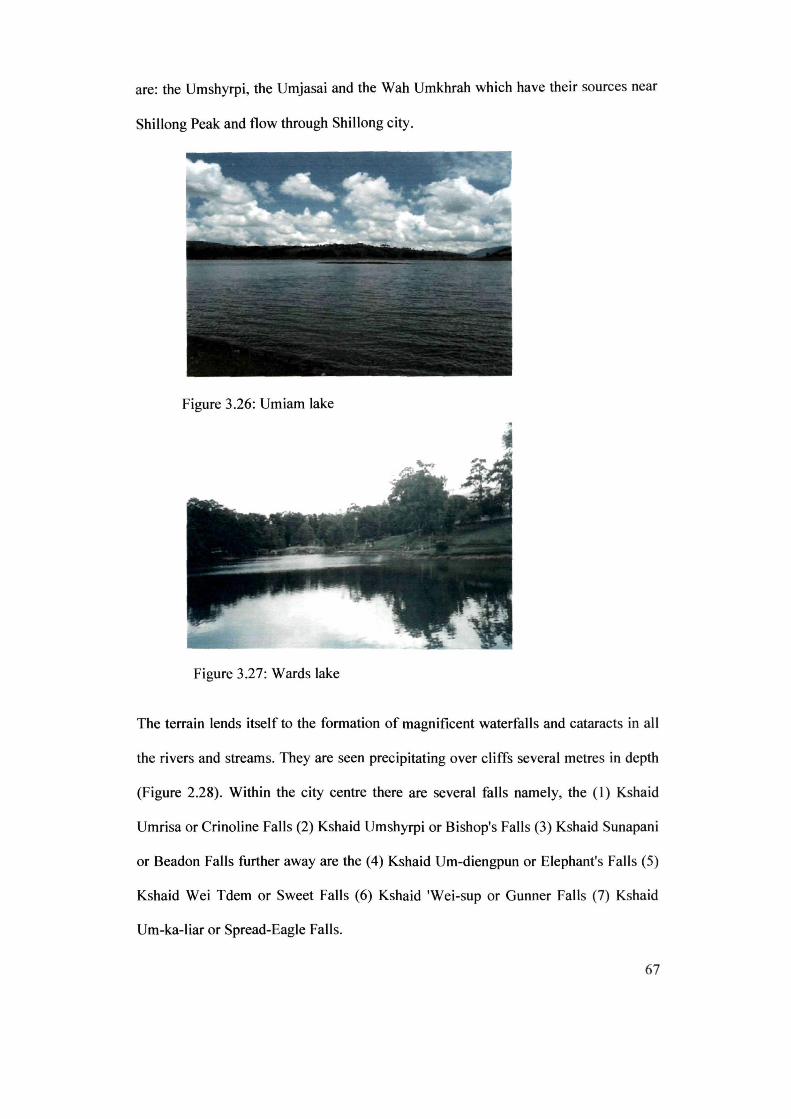
are: the Umshyrpi, the Umjasai and the Wah Umkhrah which have their sources near
Shillong Peak and flow through Shillong city.
Figure 3.26: Umiam lake
Figure 3.27: Wards lake
The terrain lends itself to the formation of magnificent waterfalls and cataracts in all
the rivers and streams. They are seen precipitating over cliffs several metres in depth
(Figure 2.28). Within the city centre there are several falls namely, the (I) Kshaid
Umrisa or Crinoline Falls (2) Kshaid Umshyrpi or Bishop's Falls (3) Kshaid Sunapani
or Beadon Falls further away are the (4) Kshaid Um-diengpun or Elephant's Falls (5)
Kshaid Wei Tdem or Sweet Falls (6) Kshaid 'Wei-sup or Gunner Falls (7) Kshaid
Um-ka-liar or Spread-Eagle Falls.
67
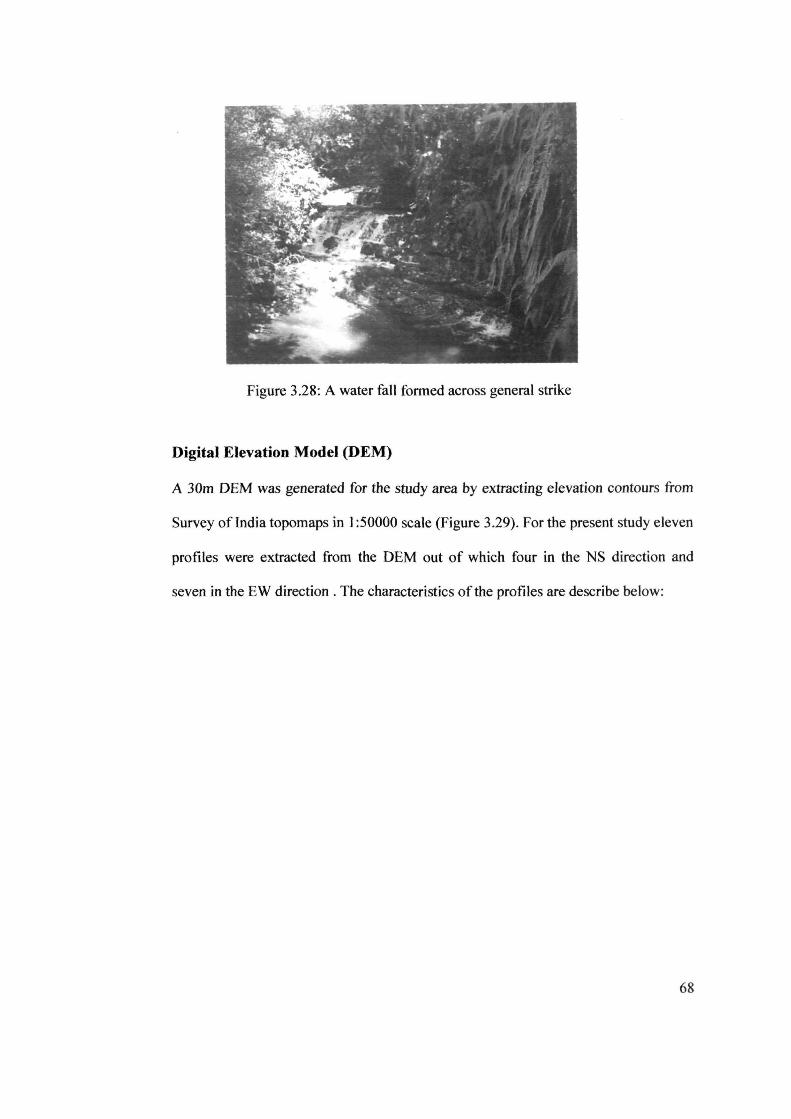
Figure 3.28: A water fall fonned across general strike
Digital Elevation Model (DEM)
A 30m DEM was generated for the study area by extracting elevation contours from
Survey of India topomaps in 1 :50000 scale (Figure 3.29). For the present study eleven
profiles were extracted from the DEM out of which four in the NS direction and
seven in the EW direction. The characteristics of the profiles are describe below:
68
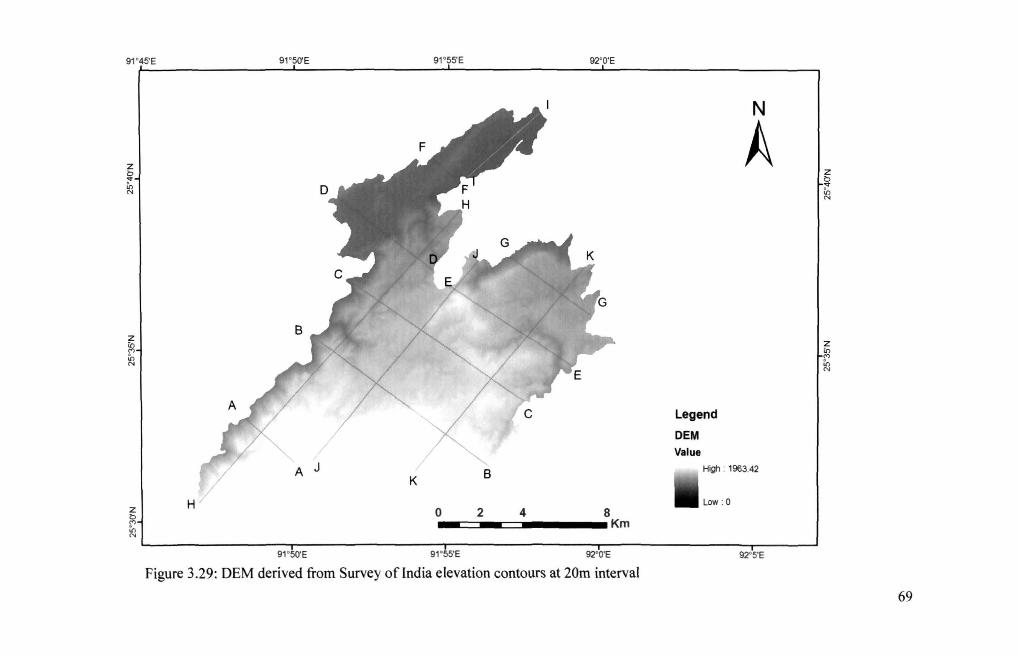
91 ' 45'E r-
Z b .. U, N
z ~ U, N
Z b (")
U, N
91 ' 5O'E
H
91 ' 5O'E
91 ' 55'E 92' O'E
o 2 4 8 .. ~~-==-......... Km
91 ' S5'E 92'O'E
Figure 3.29: OEM derived from Survey ofIndia elevation contours at 20m interval
Legend
OEM Value
N
A
High : 1963.42
Low : O
92"5'E
Z b .. U, N
Z in (")
U, N
69
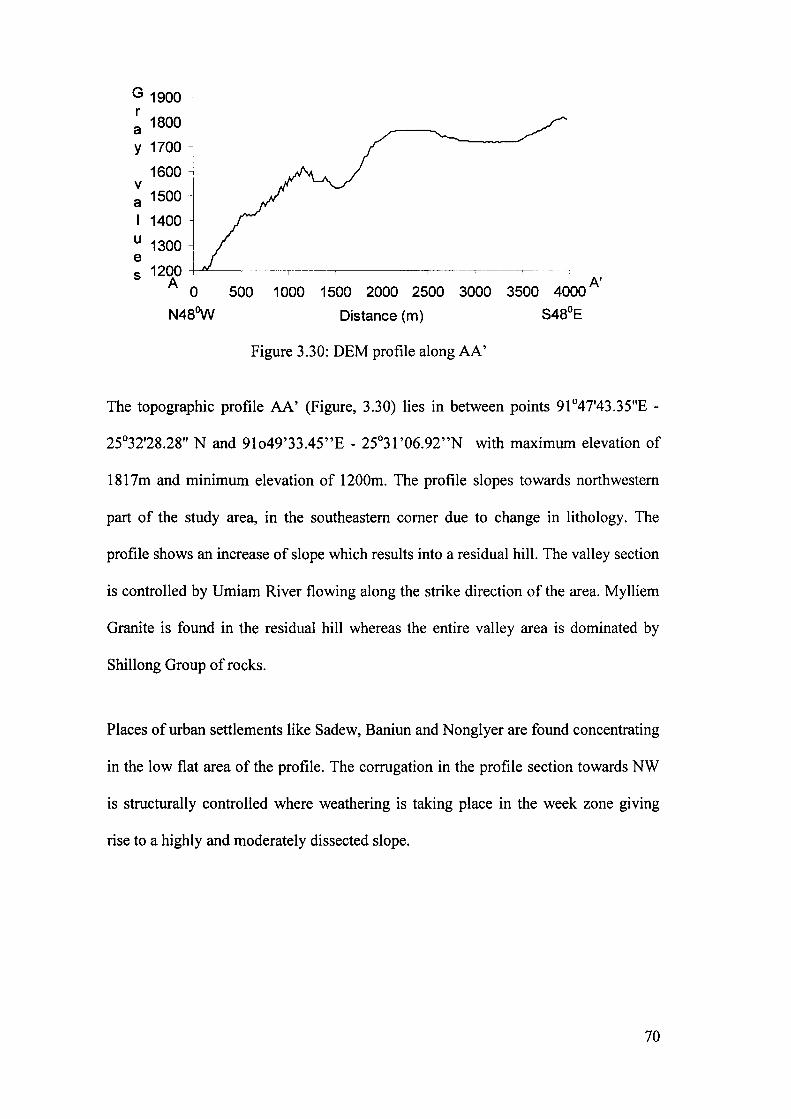
G 1900 r a 1800
y 1700
1600 v a 1500
I 1400
u 1300 e s 1200 -f--L'~-----,~--~,---- -~------~~ -,
A 0 500 1000 1500 2000 2500 3000 3500 4000 A'
N48W Distance (m)
Figure 3.30: DEM profile along AA'
The topographic profile AA' (Figure, 3.30) lies in between points 91°47'43.35"E -
25°32'28.28" N and 91049'33.45"E - 25°31 '06.92"N with maximum elevation of
1817m and minimum elevation of 1200m. The profile slopes towards northwestern
part of the study area, in the southeastern comer due to change in lithology. The
profile shows an increase of slope which results into a residual hill. The valley section
is controlled by Umiam River flowing along the strike direction of the area. Mylliem
Granite is found in the residual hill whereas the entire valley area is dominated by
Shillong Group of rocks.
Places of urban settlements like Sadew, Baniun and Nonglyer are found concentrating
in the low flat area of the profile. The corrugation in the profile section towards NW
is structurally controlled where weathering is taking place in the week zone giving
rise to a highly and moderately dissected slope.
70
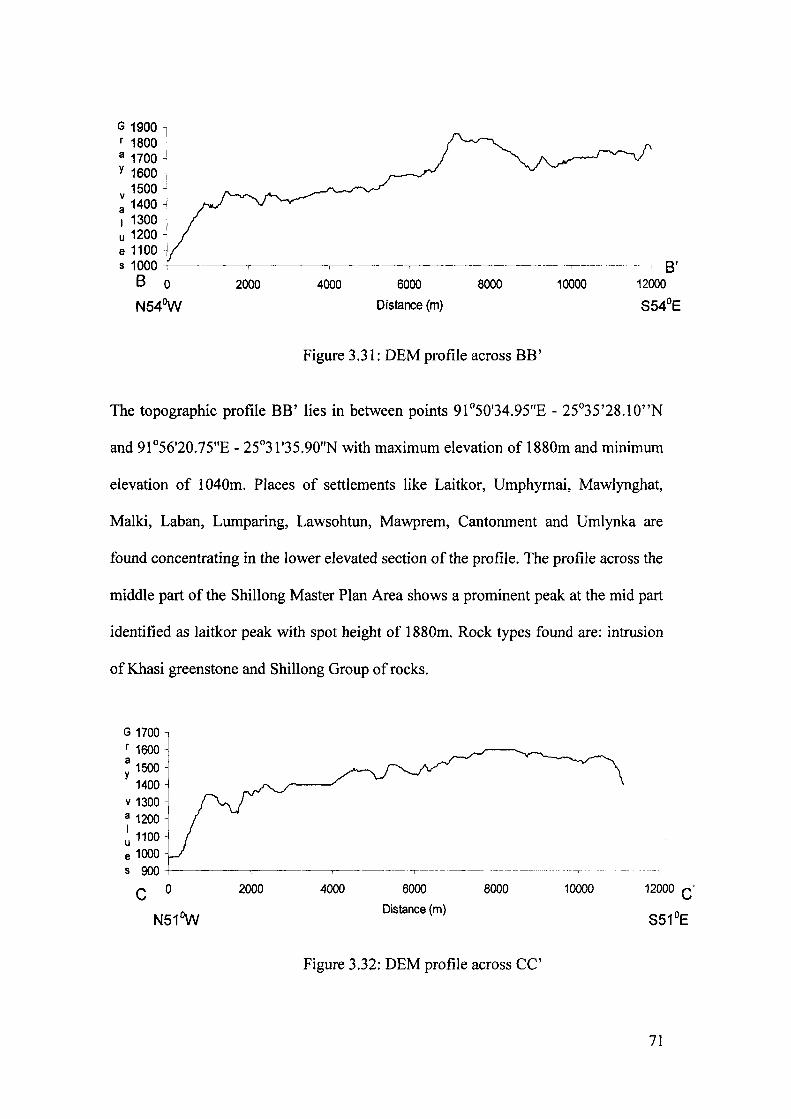
G 1900 r 1800 a 1700 y 1600 v 1500 a 1400 I 1300 u 1200 e 1100 s 1000 +-~~~----,-~--,-----~~--.-----------,---------- ~ --,-----~~ ----~~--, 8'
8 0 2000 4000 6000 8000 10000 12000
N540VV Distance (m) S54°E
Figure 3.31: DEM profile across BB'
The topographic profile BB' lies in between points 91°S0'34.9S"E - 2So35'28.10"N
and 91°56'20.75"E - 25°31'35.90"N with maximum elevation of 1880m and minimum
elevation of 1040m. Places of settlements like Laitkor, Umphymai, Mawlynghat,
Malki, Laban, Lumparing, Lawsohtun, Mawprem, Cantonment and Umlynka are
found concentrating in the lower elevated section of the profile. The profile across the
middle part of the Shillong Master Plan Area shows a prominent peak at the mid part
identified as laitkor peak with spot height of 1880m. Rock types found are: intrusion
of Khasi greenstone and Shillong Group of rocks.
G 1700 l r 1600i a 1500 y 1400
v 1300 a 1200
~ 1100 e 1000 s 900 +----~---~- ------,--~- -~-~-~-~ ~T-~-----~~
C 0 2000 4000 6000 8000
N510VV Distance (m)
Figure 3.32: DEM profile across CC'
10000
71
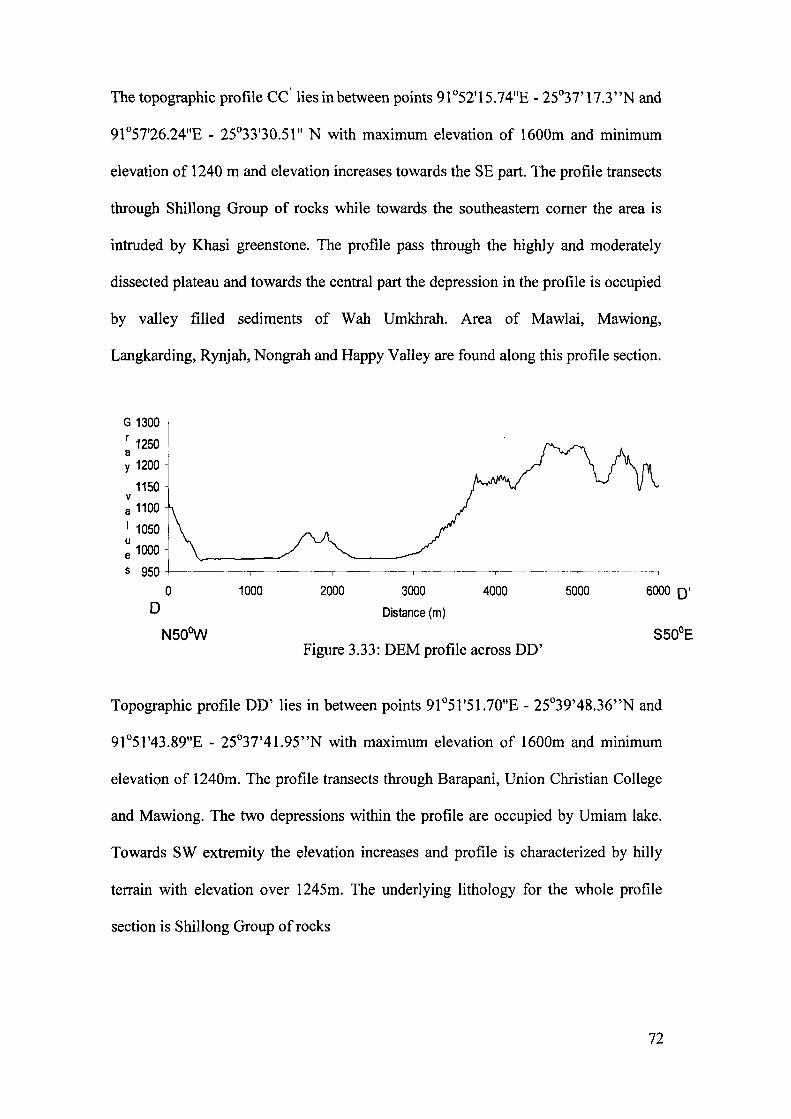
The topographic profile CC' lies in between points 91 °52'15.7 4"E - 25°37' 17.3' 'N and
91°57'26.24"E - 25°33'30.51" N with maximum elevation of 1600m and minimum
elevation of 1240 m and elevation increases towards the SE part. The profile transects
through Shillong Group of rocks while towards the southeastern comer the area is
intruded by Khasi greenstone. The profile pass through the highly and moderately
dissected plateau and towards the central part the depression in the profile is occupied
by valley filled sediments of Wah Umkhrah. Area of Mawlai, Mawiong,
Langkarding, Rynjah, Nongrah and Happy Valley are found along this profile section.
G 1300 ] r 1250 a >
y 1200
1150 v a 1100
I 1050 u e 1000 s 950 +-----,------,-----------,--------------,-
o o
N500W
1000 2000 3000
Distance (m)
4000
Figure 3.33: DEM profile across DD'
5000 6000 0'
Topographic profile DD' lies in between points 91°51'51.70"E - 25°39'48.36"N and
91°51'43.89"E - 25°37'41.95"N with maximum elevation of 1600m and minimum
elevation of 1240m. The profile transects through Barapani, Union Christian College
and Mawiong. The two depressions within the profile are occupied by Umiam lake.
Towards SW extremity the elevation increases and profile is characterized by hilly
terrain with elevation over 1245m. The underlying lithology for the whole profile
section is Shillong Group of rocks
72
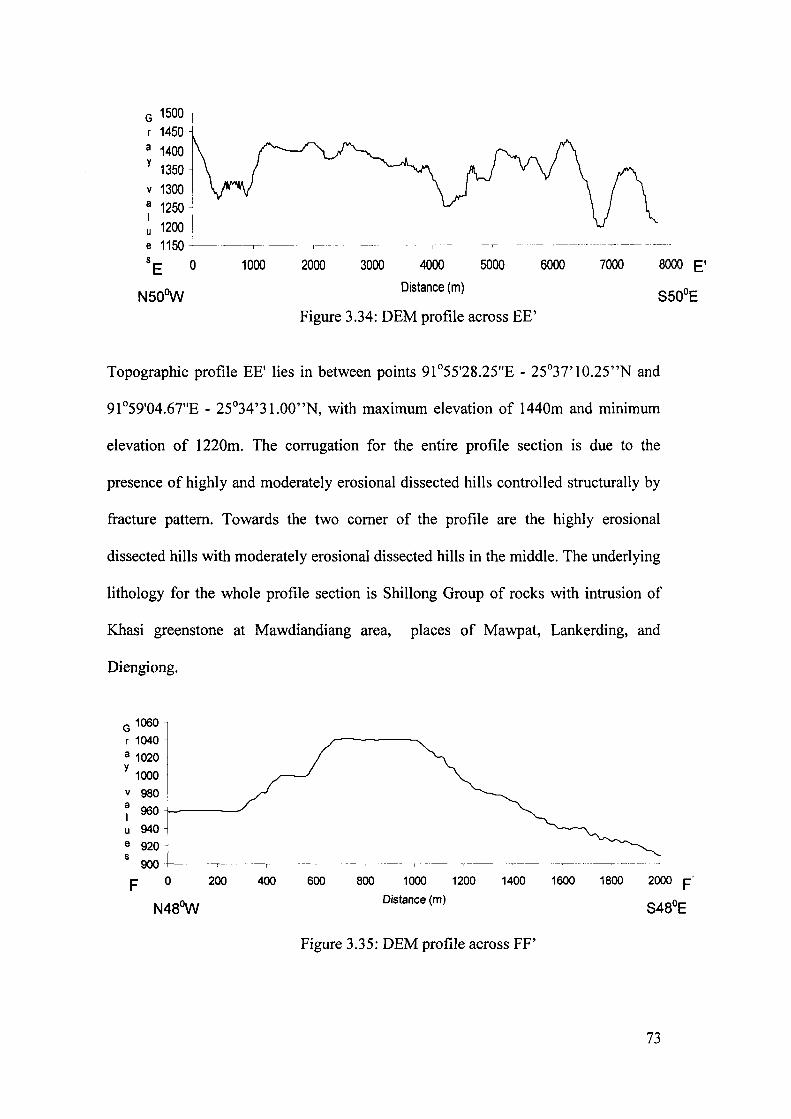
G 1500 r 1450 a 1400 y 1350
v 1300
~ 1250 ] u 1200 !
I e 1150 +1 ~~---,-~-
sE 0 1000
N500W
2000 3000 4000
Distance (m)
5000
-~ r~----- --- - -r-" --- - -----l
6000 7000 8000 E'
S500E Figure 3.34: DEM profile across EE'
Topographic profile EE' lies in between points 91°55'28.25"E - 25°37'10.25"N and
91°59'04.67"E - 25°34'31.00"N, with maximum elevation of 1440m and minimum
elevation of 1220m. The corrugation for the entire profile section is due to the
presence of highly and moderately erosional dissected hills controlled structurally by
fracture pattern. Towards the two comer of the profile are the highly erosional
dissected hills with moderately erosional dissected hills in the middle. The underlying
lithology for the whole profile section is Shillong Group of rocks with intrusion of
Khasi greenstone at Mawdiandiang area, places of Mawpat, Lankerding, and
Diengiong.
G 1060 r 1040 a 1020 y 1000
v 980 a 960 -l-----~ I u 940 e 920 s
900
F o 200
N480W
400 600 800 1000 1200 1400 1600 1800 2000 F' Distance (m)
Figure 3.35: DEM profile across FF'
73
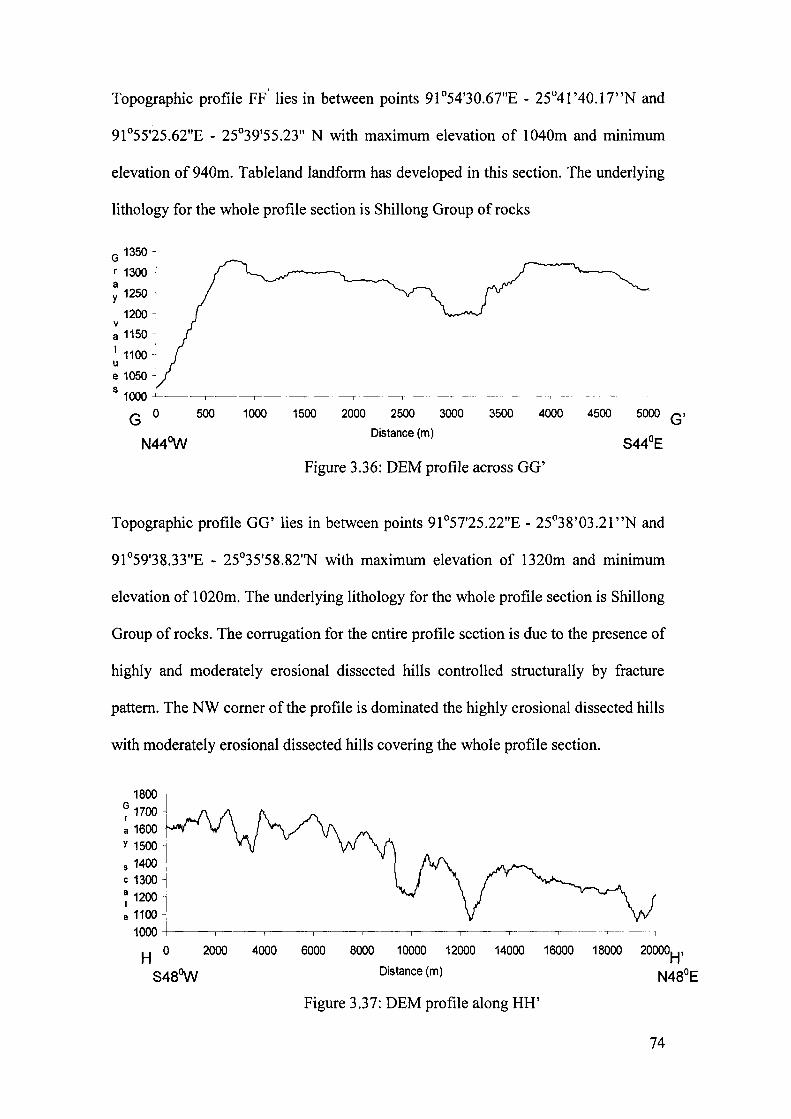
Topographic profile FF' lies in between points 91°54'30.67"E - 25°41 '40.l7"N and
91°55'25.62"E - 25°39'55.23" N with maximum elevation of 1040m and minimum
elevation of 940m. Tableland landform has developed in this section. The underlying
lithology for the whole profile section is Shillong Group of rocks
G 1350
r 1300 a y 1250
1200 v a 1150
I 1100 u e 1050 s 1000 ~_--,-__ ---,---__ --.--_--,-__ ---,---__ ,----- _~--,---- ____ -,---- __ ~ ___ -, ______ ,
G 0
N44W
500 1000 1500 2000 2500 3000 3500 4000 4500 5000 G' Distance (m)
S440E
Figure 3.36: DEM profile across GG'
Topographic profile GG' lies in between points 91°57'25.22"E - 25°38'03.21 "N and
91°59'38.33"E - 25°35'58.82''N with maximum elevation of 1320m and minimum
elevation of 1020m. The underlying lithology for the whole profile section is Shillong
Group of rocks. The corrugation for the entire profile section is due to the presence of
highly and moderately erosional dissected hills controlled structurally by fracture
pattern. The NW comer of the profile is dominated the highly erosional dissected hills
with moderately erosional dissected hills covering the whole profile section.
1800 G 1700 r a 1600 y 1500 ~
s 1400 c 1300 a 1200 I e 1100
1000 +----,--~----,-----,____-~--__._--,___-___r_I ----,---- --,-~------,
H 0
S48W
2000 4000 6000 8000 10000 12000 14000 16000 18000 20000H, Distance (m) N48°E
Figure 3.37: DEM profile along HH'
74
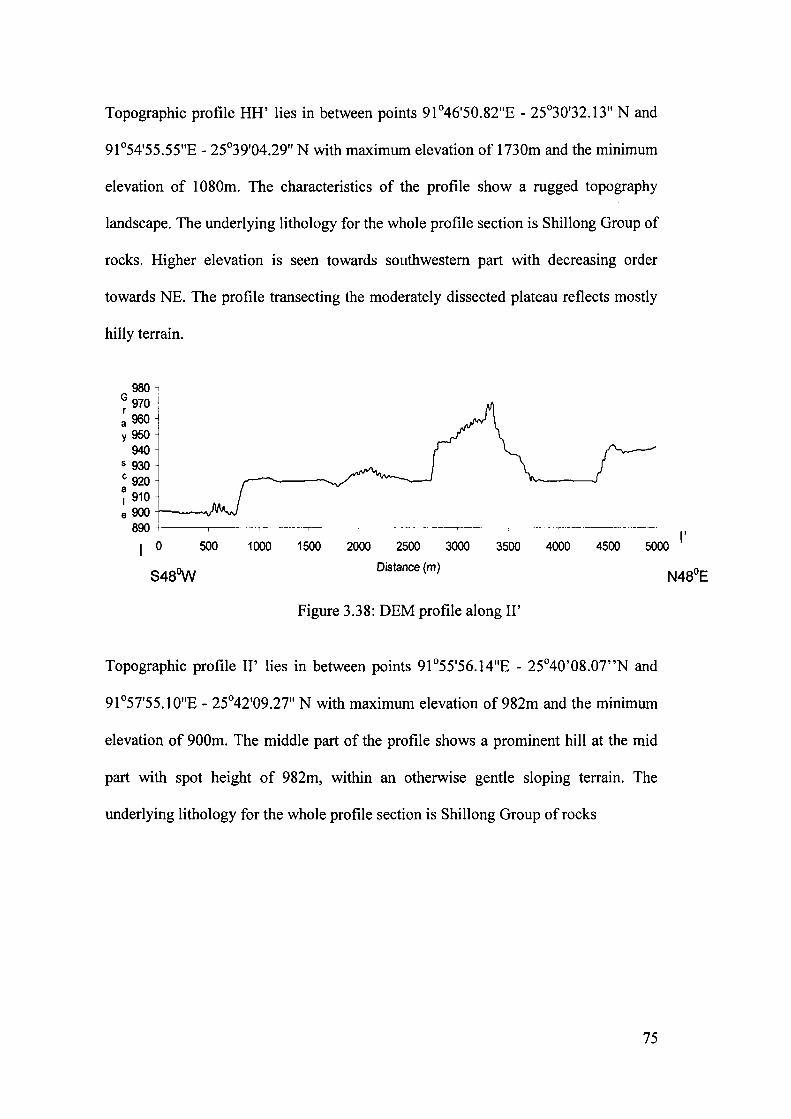
Topographic profile HH' lies in between points 91°46'50.82"E - 25°30'32.13" N and
91°54'55.55"E - 25°39'04.29" N with maximum elevation of 1730m and the minimum
elevation of 1080m. The characteristics of the profile show a rugged topography
landscape. The underlying lithology for the whole profile section is Shillong Group of
rocks. Higher elevation is seen towards southwestern part with decreasing order
towards NE. The profile transecting the moderately dissected plateau reflects mostly
hilly terrain.
980 G 970 r a 960 y9SO
940 5930 c 920 a 910 I e 900 -t-............ --./
890 +-------,---
o SOO
S4SOW
1000
.--.. --- ---y----------,--------------T"
1500 2000 2500
- --~-------,--- --~-- 1--------~----··------1
I' 3000 3500 4000 4500 5000
Distance (m)
Figure 3.38: DEM profile along II'
Topographic profile II' lies in between points 91°55'56.l4"E - 25°40'08.07"N and
91°57'55.l0"E - 25°42'09.27" N with maximum elevation of 982m and the minimum
elevation of 900m. The middle part of the profile shows a prominent hill at the mid
part with spot height of 982m, within an otherwise gentle sloping terrain. The
underlying lithology for the whole profile section is Shillong Group of rocks
75
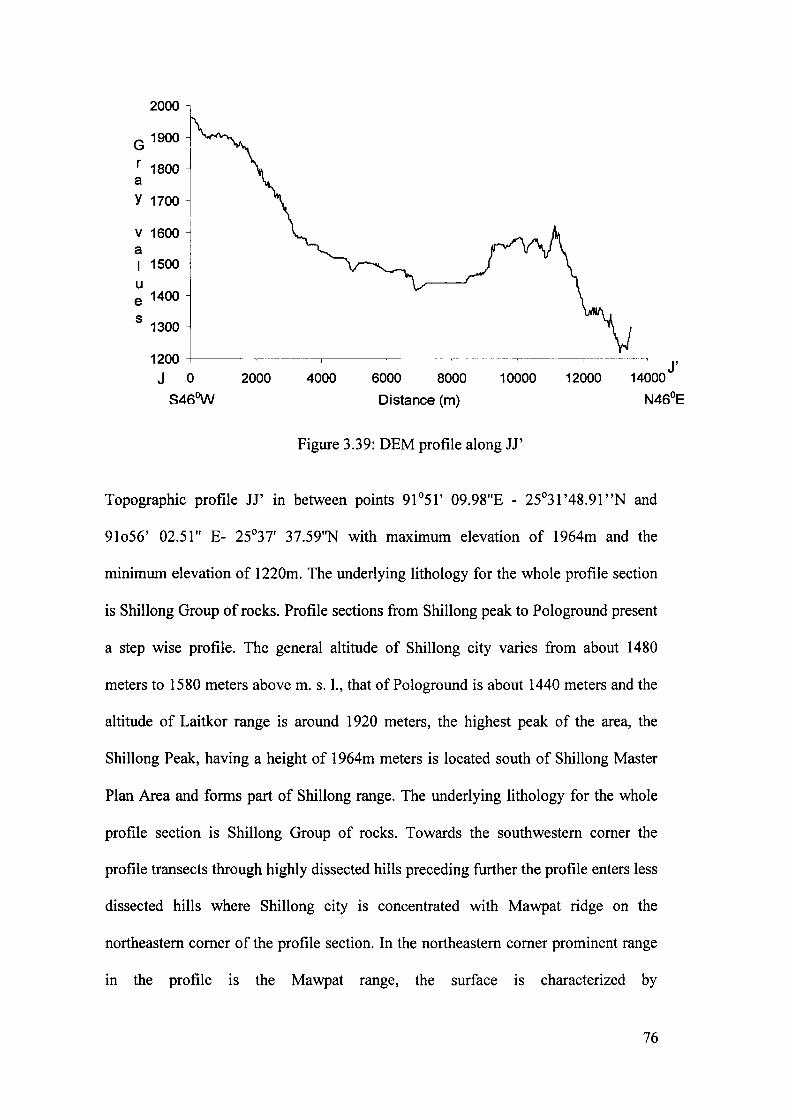
2000
G 1900
r 1800 a y 1700
v 1600 a I 1500
u e 1400
s 1300
1200
J a 2000 4000 6000
.. --.. ~.-. --, ....... _- .. "' J' 8000 10000 12000 14000
S460W Distance (m)
Figure 3.39: DEM profile along JJ'
Topographic profile JJ' in between points 91°51' 09.98"E - 25°31'48.91"N and
91056' 02.51" E- 25°37' 37.59''N with maximum elevation of 1964m and the
minimum elevation of 1220m. The underlying lithology for the whole profile section
is Shillong Group of rocks. Profile sections from Shillong peak to Pologround present
a step wise profile. The general altitude of Shillong city varies from about 1480
meters to 1580 meters above m. s. 1., that of Polo ground is about 1440 meters and the
altitude of Laitkor range is around 1920 meters, the highest peak of the area, the
Shillong Peak, having a height of 1964m meters is located south of Shillong Master
Plan Area and forms part of Shillong range. The underlying lithology for the whole
profile section is Shillong Group of rocks. Towards the southwestern corner the
profile transects through highly dissected hills preceding further the profile enters less
dissected hills where Shillong city is concentrated with Mawpat ridge on the
northeastern corner of the profile section. In the northeastern corner prominent range
in the profile is the Mawpat range, the surface is characterized by
76
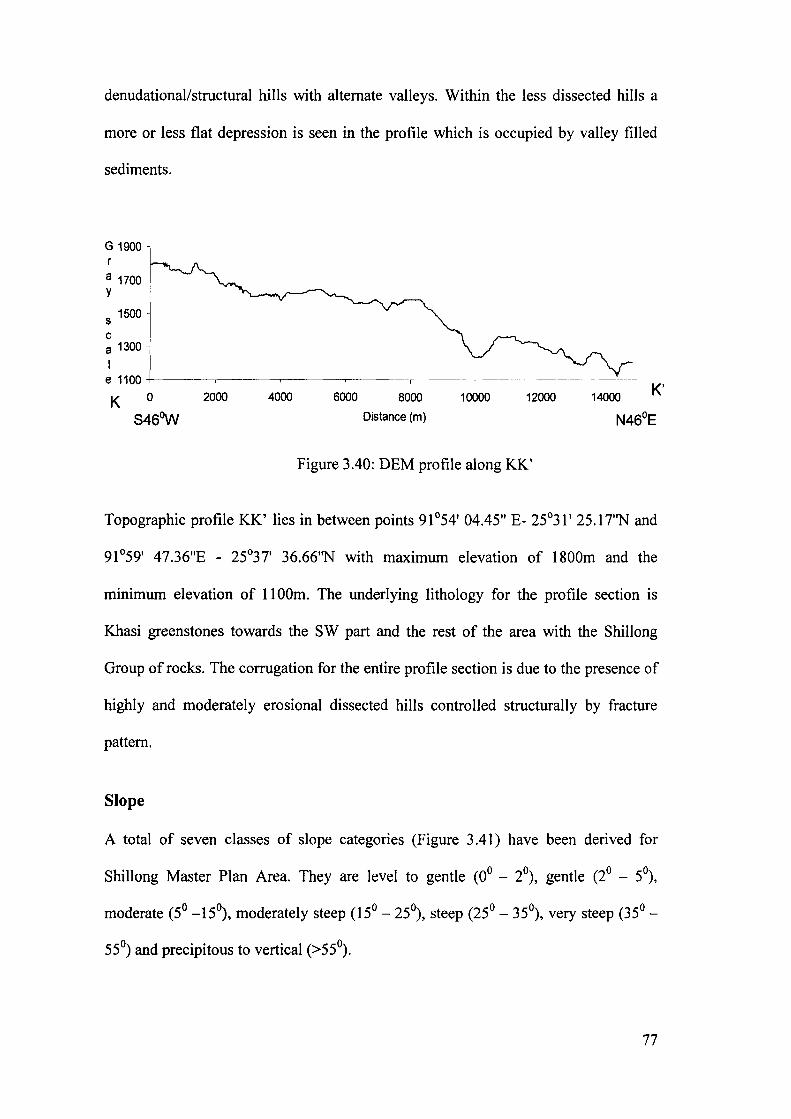
denudational/structural hills with alternate valleys. Within the less dissected hills a
more or less flat depression is seen in the profile which is occupied by valley filled
sediments.
G 1900 r
a 1700 y
s 1500 c a 1300 I e 1100 +-------,------~---,,----~--T~~ -,---------------- - ~------
K 0
S460W
2000 4000 6000 8000 10000 12000
Distance (m)
Figure 3.40: DEM profile along KK'
K'
Topographic profile KK' lies in between points 91 °54' 04.45" E- 25°31' 25.l7''N and
91°59' 47.36"E - 25°37' 36.66''N with maximum elevation of 1800m and the
minimum elevation of 1100m. The underlying lithology for the profile section is
Khasi greenstones towards the SW part and the rest of the area with the Shillong
Group of rocks. The corrugation for the entire profile section is due to the presence of
highly and moderately erosional dissected hills controlled structurally by fracture
pattern.
Slope
A total of seven classes of slope categories (Figure 3.41) have been derived for
Shillong Master Plan Area. They are level to gentle (0° - 2°), gentle (2° - 5°),
moderate (5° -15°), moderately steep (15° - 25°), steep (25° - 35°), very steep (35° -
55°) and precipitous to vertical (>55°).
77
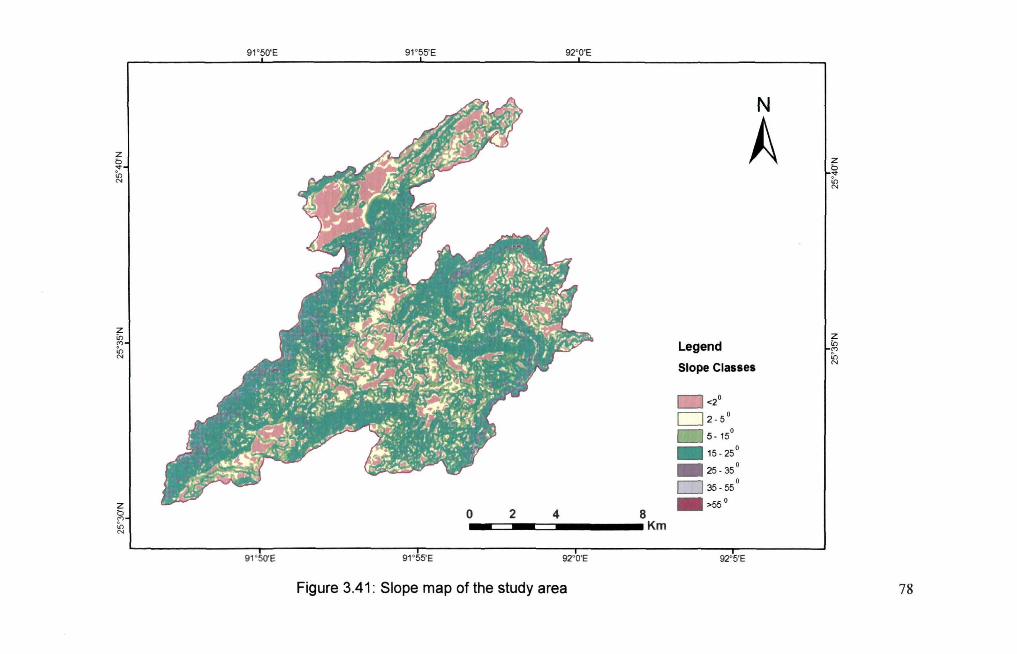
z a '<t 1n N
Z in
'" 1n N
z a '" 1n N
91 ' 50'E
91 ' 5O'E
91 ' 55'E 92' O'E
o 2 4 8 _-===--==-____ Km
91 ' 55'E 92' O'E
Figure 3.41 : Slope map of the study area
N
A
Legend
Slope Classes
<20
0 2-5 °
5 - 15°
. 15_25°
_ 25_35°
0 35-55°
. >550
92"5'E
z a ..,. 1n N
Z in
'" 1n N
78
Slope Class: 0° - 2°
It represents a plain to slightly sloping area. Valley filled areas of Pologround,
Pasture, Wards Lake, Barabazaar, Golflink, Pynthorumkhrah, Lankerding, Umsawti,
Umlynka, Mawshbuit, Umroi and Plateau top areas of Mawlenrei, Tynring and
Mawkasiang fall in this category. These areas are suitable for agricultural use and
permanent settlements. This slope range is locally available on hills tops also.
Slope Class: 2° - SO
It is a gentle slope category and occurs in the top of Laitkor range and its southern
slopes. Settlements of Upper Shillong, Happy Valley, N ongrah and most of the rural
settlements of Shillong situated in Umniuh, Nongsder, Umroi, Mawdiangdiang,
Tynring, Nonglyer and Umphyrnai also falls in this category. On the lower Shillong
surface, this slope category occurs in Pynthorumkhrah, Phudmawri, Mawroh,
Umshing and Lankerding areas. It is also available in limited areas in Laitumkhrah,
around Wards Lake, Laban, Jailroad, Police Bazaar, Nongmynsong, Bishnupur,
Lachumiere, Refugee colony, top of the low relief hillocks in lower Shillong areas
also fall in this slope category. A large part of the area near Rangmen, Mawkhasiang
and Mawlong also falls in this slope category. This slope range is suitable for
agricultural use and permanent heavy structure settlements.
Slope Class: SO _ISO
This is the most dominant slope category in the study area and represents undulating
uplands. It includes pediments and hill slopes. Rocky surface with thin soil cover are
main features in this category. Much of the area on the north as well as in the south in
the Greater Shillong falls within this slope category i.e.,Umladew, Union Christian
College, Mawlendep, Barapani, Mawiong, Lummawblei, Nongkseh, Umjajew,
79
Mawkenroh, Shyrwat, Mawpat, Mawjer, Mawlenrei, Lummawsiang, Laitkor,
Umphyrnai, Mawlyngad, Nongumlong, Sadew, Baniun, Laitjem, Mawklot and
Shillong peak . A large part of Lower Shillong surface falls in this category namely,
Nongarh, Rynjah, Mawkhar, Jaiaw, Nongthymmai, Farm, Lumparing, Rait Laban,
Jhalupara, Kyntonmasar, Phudmawrie, Umpling, Mawdetbaki, Langkerding, Happy
Valley, Malki, Kenchestrace, Upper Shillong and Madanriting. This slope category is
still favorable for agricultural use and construction of settlements. This slope is
difficult for road development with favorable gradient and needs deep cuts on slopes
involving removal of toe and lateral support which induces slope in-equilibrium and
slides. Landslides are observed in Malki, Laban, Lawsohtun, Nongthymmai, GS Road
Mawiong. Slope category <150 is suitable for construction of lighter structure while
150 slope marks the limit for difficult road building. Development of these slopes for
housing and other construction activities involves extensive earth cutting and leveling
of the ground which results in siltation of down slope streams besides promoting
gully erosion.
Slope Class: 15° - 25°
This category represents moderately steep slope and occupies areas between Laitkor
range and Shillong town and other hill slope areas on eastern, western and northern
sides of Shillong namely, Barapani, Mawiong, Umjajew, Mawpat, Laitkor and
Nongpiur. These slopes are forested and drained by 2nd and 3rd order streams.
Deforestation of such slopes is resulting in increased run off and intensive soil
erosion which is evidenced by development of rills and gullys on such slopes. Urban
invasion of such slopes is causing slope failures and slides as observed along GS
Road in Barapani area. The gradient is a formidable obstruction in road development.
80
Slope Class: 25° _35°
This represents a steep slope category and occupies valley slopes of Wah Umiam and
Wah Umkhen nalas. In the Shillong town such slopes have been observed locally
along Laitkor range, valley slopes of Wah Umkhrah, Wah Umshirpi streams and their
tributaries. Loss of vegetation cover on such slopes leads to high degree of erosion
and soil loss. Steep slope ranging 15°-35° can be utilized for terrace cultivation,
horticulture and afforestation.
Slope Class: 35° - 55°
This represents vertical steep slope and any development activities will leads to
intensive denudation and sliding. This slope category is locally available along Raid
Laban, Umlynka, Mawiong, Mawpat ridge, Wah Umiam, Wah Ro-Ro, Wah Shella
and Wah Umkhen. Precipitous slope above 35° should not be disturbed.
Slope Class: >55°
This slope category represents precipitous to vertical slope and observed in the areas
locally along deep gorges of Mawiong, Mawpat ridge, Wah Umiam, Wah Ro-Ro and
Umkhen. Intensive denudation, sliding, rockfall are the characteristic features of this
category.
It is evident from the data in Table 3.4 and Figure 3.42 that most of the study area is
under 2° -35° i.e., gentle, moderate, moderately steep and steep slope. The main urban
agglomeration of the city is developed in and around this slope category with 23.31 % ,
of the total area falling under moderately slope followed by steep and moderate slope
with 21 % and 17.51 %, 15.26% by gentle slope and 13.72% by level to gentle slope.
81
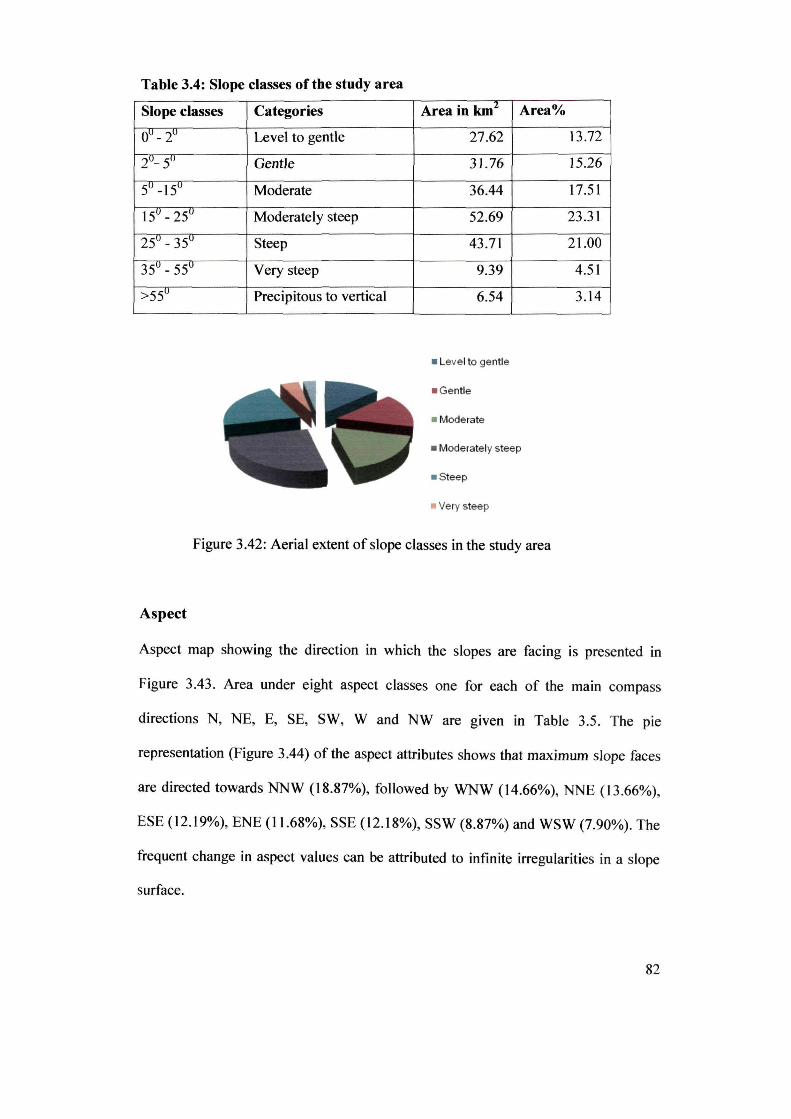
Table 3.4: Slope classes of the study area
Slope classes Categories Area in km2 Area%
OU _ 2u Level to gentle 27.62 13.72
2u- 5u Gentle 31.76 15.26
5u _15u Moderate 36.44 17.51
15u _ 25u Moderately steep 52.69 23.31
25u _ 35u Steep 43.71 21.00
35u _ 55u Very steep 9.39 4.51
>55u Precipitous to vertical 6.54 3.14
_ Level to gentle
- Gentle
- Moderate
- Moderately steep
- Steep
- Very steep
Figure 3.42: Aerial extent of slope classes in the study area
Aspect
Aspect map showing the direction in which the slopes are facing is presented in
Figure 3.43. Area under eight aspect classes one for each of the main compass
directions N, NE, E, SE, SW, Wand NW are given in Table 3.5. The pie
representation (Figure 3.44) of the aspect attributes shows that maximum slope faces
are directed towards NNW (18.87%), followed by WNW (14.66%), NNE (1 3.66%),
ESE (12.19%), ENE (11.68%), SSE (12.18%), SSW (8.87%) and WSW (7.90%). The
frequent change in aspect values can be attributed to infinite irregularities in a slope
surface.
82
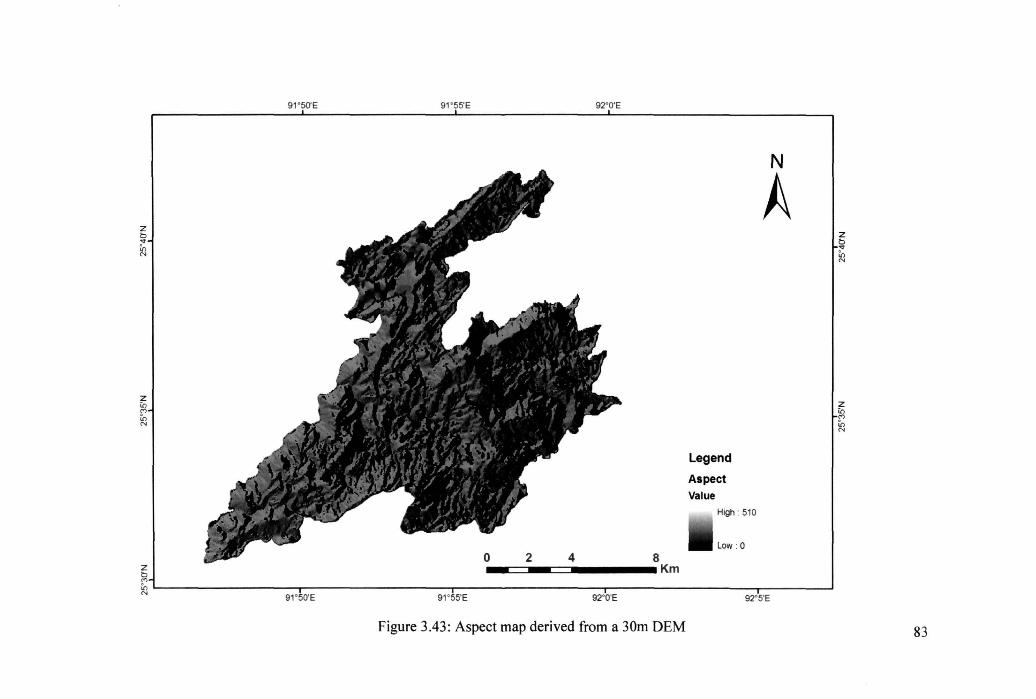
Z b
" In N
z [0
'" In N
Z b M
91 °SO'E 91 °55'E 92"0'E
8 .. c=~-==-........ Km
Legend
Aspect Value
High : 510
Low : O
N
A
o LI ________________________ ~------------------------~------------------------~~----------------------__ ,-__________ ~ ~ 91"kE 91 °~5'E 92o'o'E 92"'5'E
Figure 3.43: Aspect map derived from a 30m OEM
z ~ In N
z [0
'" In N
83
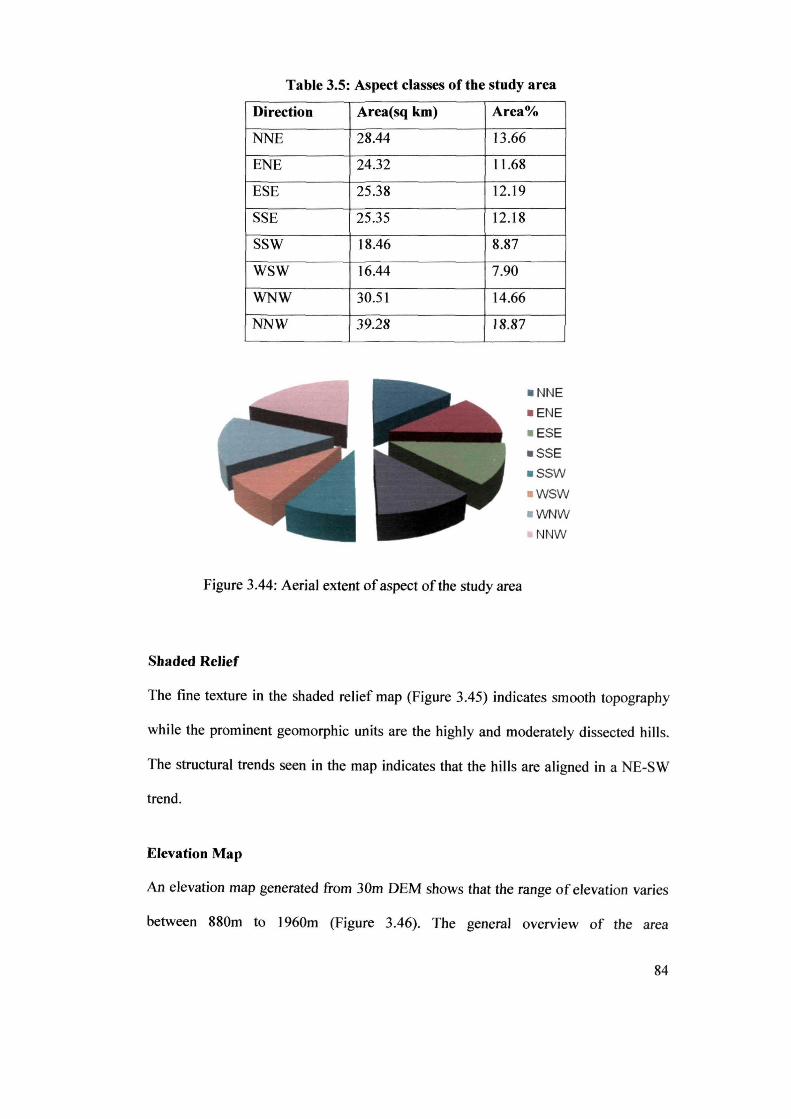
Table 3.5: Aspect classes of the study area
Direction Area(sq km) Area%
NNE 28.44 13.66
ENE 24.32 11.68
ESE 25.38 12.19
SSE 25.35 12.18
SSW 18.46 8.87
WSW 16.44 7.90
WNW 30.51 14.66
NNW 39.28 18.87
- NNE
- ENE
- ESE
- SSE
- SSW
- WSW
- WNW
NNW
Figure 3.44: Aerial extent of aspect of the study area
Shaded Relief
The fine texture in the shaded relief map (Figure 3.45) indicates smooth topography
while the prominent geomorphic units are the highly and moderately dissected hills.
The structural trends seen in the map indicates that the hills are aligned in a NE-SW
trend.
Elevation Map
An elevation map generated from 30m OEM shows that the range of elevation varies
between 880m to 1960m (Figure 3.46). The general overview of the area
84
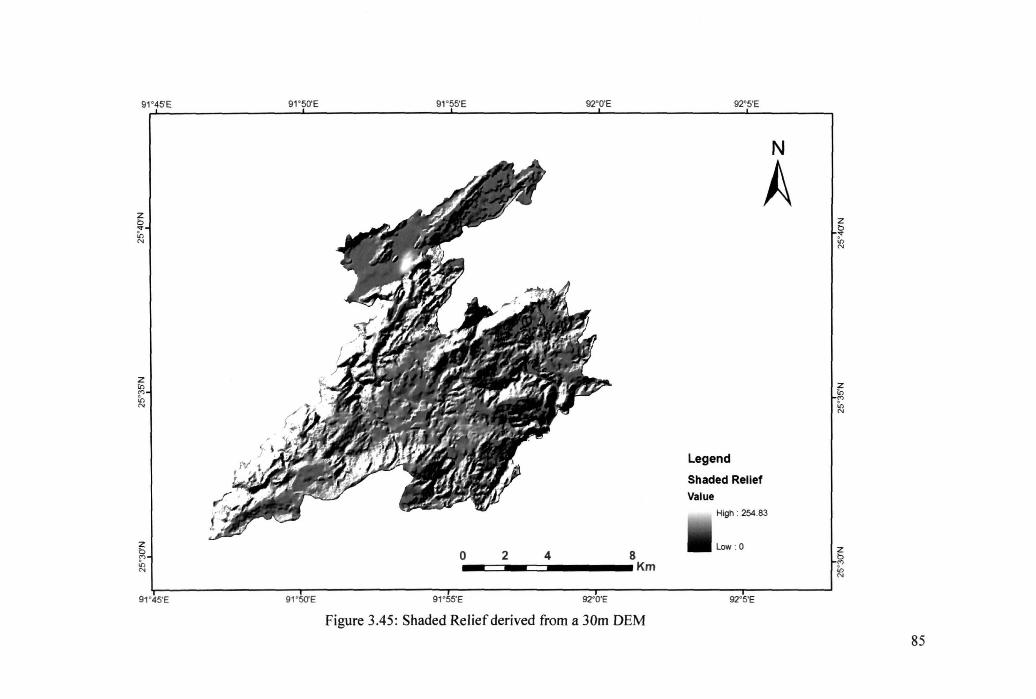
91°45'E
z ~ .,. ~ N
Z in
'" ~ N
z ~ l!l
91°45'E
91°50'E
91 · 5O'E
91°55'E 92°0'E
8 .. ~~-==-......... Km o 2 4
91°55'E 92"O'E
Figure 3.45: Shaded Relief derived from a 30m OEM
92"5'E
legend
Shaded Relief
Value
N
A
High : 254.83
l ow : O
92°5'E
z ~ .,. ~ N
Z in
'" ~ N
z
~ II) N
85
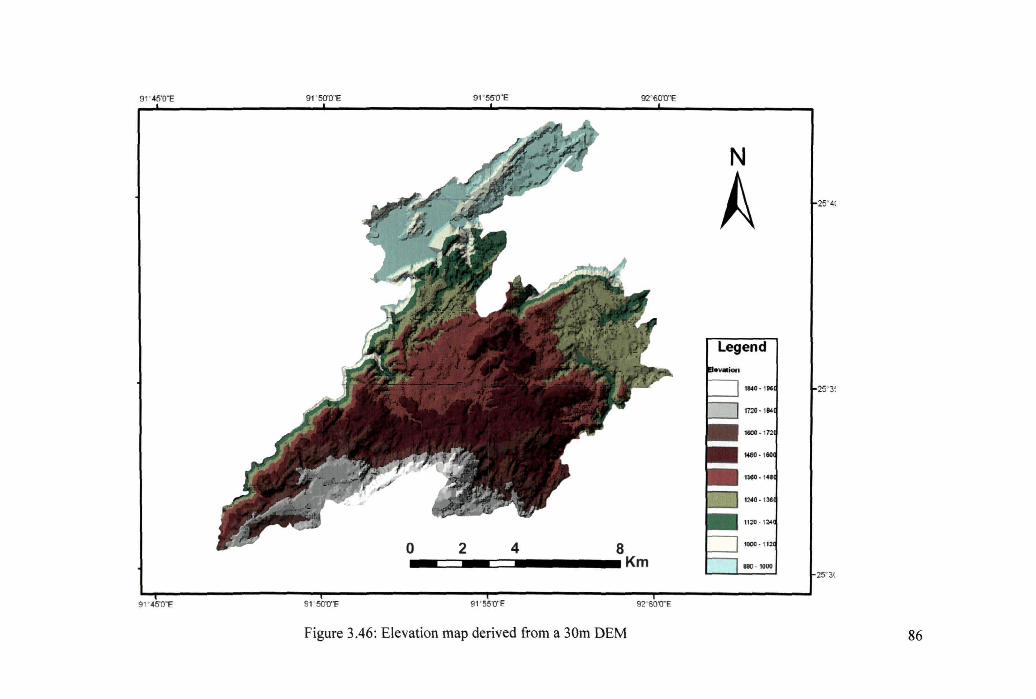
91 ' <45'O"E 91 5O'O"E 91' 55'O"E 92' 60'O"E
N
A 2S' 4(
L~:~.j ~m 1m,
1<00 '
M60 .
1* ·
I~O ·
1120 ·
~ o 2 4 8
Km 1180 • 1000 1 t25' 3(
i 91'45'O"E 91 SO'O''E 91 ' 55'O"E 92"60'O"E
Figure 3.46: Elevation map derived from a 30m DEM 86
shows that elevation of the area decreases gradually towards the north with highest
elevation concentrated towards south.
Soil
Three main order of soil (Table 3.6) can be seen in the study area. The soil consist of,
Inceptisol and Ultisol according to NSSB-LUP. Entisols have also been observed through
field study which is found on very recent geomorphic surfaces. The diversity in climate
and physiographic division are responsible for variation in soil types in the study area.
Temperature with igneous and metamorphic rocks in different stages of weathering
largely governs the nature and extends of soil occurring, therefore the overall soil
development is Ultisols with Inceptisols occuring in places where local amphibolites are
emplaced. The soils developed on the hills sides and/or escarpments are moderately
shallow to deep, loamy skeletal to fine, excessively drained and subjected to moderate to
very severe erosion hazards. These soils have structural to well developed textural B
horizon and are of Umbric Dystrochrepts, Typic Kandihumutls and Typic Kandiudutls
sub group.
Table 3.6: Soil type in and around Shillong Master Plan Area (NSSB-LUP publ. 52)
Mapping unit Sub group Great group Sub order Order
01 Typic Kandiudutls Kandiudults Udults Uitisol
04 Typic Kandihumutls Kandihumults Hamults Ultisol
05 Typic Kandihumutls Kandihumults Hamults Ultisol
07 Umbric Dystrochrepts Dystrochrepts Ochrepts Inceptisol
87
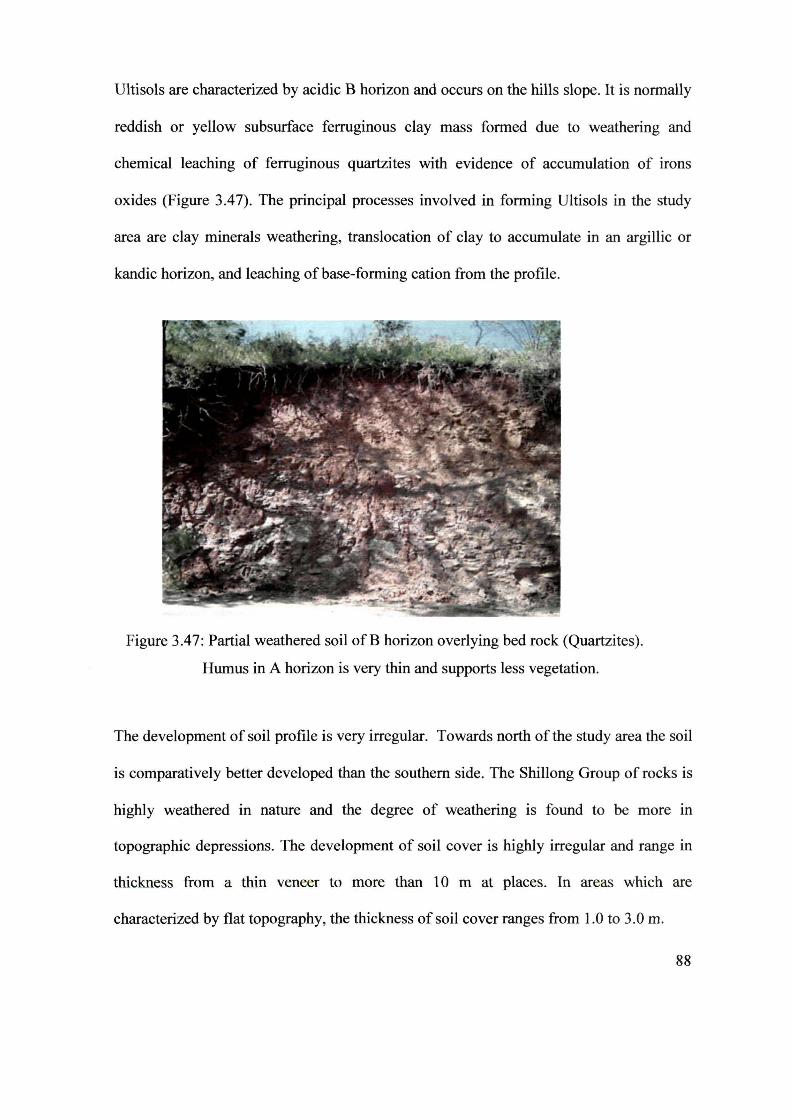
Ultisols are characterized by acidic B horizon and occurs on the hills slope. It is normally
reddish or yellow subsurface ferruginous clay mass formed due to weathering and
chemical leaching of ferruginous quartzites with evidence of accumulation of irons
oxides (Figure 3.47). The principal processes involved in forming Ultisols in the study
area are clay minerals weathering, translocation of clay to accumulate in an argillic or
kandic horizon, and leaching of base-forming cation from the profile.
Figure 3.47: Partial weathered soil ofB horizon overlying bed rock (Quartzites).
Humus in A horizon is very thin and supports less vegetation.
The development of soil profile is very irregular. Towards north of the study area the soil
is comparatively better developed than the southern side. The Shillong Group of rocks is
highly weathered in nature and the degree of weathering is found to be more in
topographic depressions. The development of soil cover is highly irregular and range in
thickness from a thin veneer to more than 10m at places. In areas which are
characterized by flat topography, the thickness of soil cover ranges from 1.0 to 3.0 m.
88
Inceptsols comprising yellowish brown to greyish brown silt, and clay occurred mainly
on the plateau top with thickness varying from 2.0 to 6.0 m and are the beginning of B
horizon. Since metabasics are more prone to weathering than the quartzites, the areas
around Happy Valley, Mawdiangdiang, Phudmawri and Mawlai where metabasics are
emplaced in the quartzites, an acute tendency of oxidation is seen in the quartzite and
they are overlain by a thick laterite capping.
Beside the above soil types it has been observed from field study that entisols are found
on very recent geomorphic surfaces. It is brownish grey to dark coloured sandy clay
loam, found on valley fills along Umkhrah river and its tributary in the Polo ground area
and the minor valley fills in the area. Entisols have no diagnostic pedogenic horizons.
The soil productivity is high and fertile, poorly drained and seasonally flooded. These
valley fills are heavy loams and contain larger amount of organic matter. It is found that
this soil, with their level topography, proximity for water for irrigation, and periodic
nutrients replenishment by flood water sediments, can support agricultural activities in
the valley filled areas.
The chemical analysis of soils reveals that all the soils are mildly acidic in nature with pH
ranging from 4.8 to 6.2. Electrical conductivity is well within normal limits. Organic
carbon is usually high but the soils have been found to be poor in phosphorous and
potash. Alluvial fills having loam contain higher organic matter and retain good amount
of moisture which make it good for paddy cultivation.
89
Although snapshots on geological framework of Shillong Master plan Area are found in
publisned literature (Roy et.al., 1988) detailed geological map in 1 :50,000 scale is not
available in this context. The present study has brought out the minor details for example
the presence of basic dykes (Khasi greenstones). On the other hand information on the
comphrensive geomorphological parameters and landscape development was almost non
existent. The present study will help to fill in this information gap and enhance the
uderstanding of landscape development in Shillong Master Plan Area.
90
Introduction
CHAPTER 4
MORPHOMETRIC ANALYSIS
Morphometric analysis refers the measurement and mathematical evaluation of the
configuration of the earth surface and the shape of the dimension of the landforms. It
incorporates quantitative study of the area, altitude, volume, slope and profile of the land
and the drainage basin characteristics of the area concerned. Drainage basin may be used
to subdivide the landscape of the area. The drainage basin is most commonly analyzed in
morphemetry as they form ideal aerial unit for interpretation and analyzed of fluvially
originated landform where they exhibit an example of open system of operation with its
various components such as, stream segments, basin length, basin parameter and basin
area which indicates the nature of development of the basin. Studies on development of
drainage basin and sub-basin helps in interlocking the evolution and shaping of a
landscape. As a quantitative measure of drainage network, morphometric analysis gives a
foundation of hydrological study. Pioneer works of Strahler (1952, 1957), Horton (1932,
1956) are the basic foundation for morphometric analysis. Subsequently Bloom (2002)
and Keller and Pinter (1996) have further propagated the morphometric analysis. Stream
profile analysis and stream gradient index by Hack (1973) was another milestone in
morphometric analysis. Many workers have used the principles developed by these
pioneers to quantitatively study the drainage basin as a tool for landscape analysis
91
(Sharma, 1987, Raj et. aI., 1999, Awasthi, 2001). Drainage basins form the fundamental
unit of morphometric analysis for quantitative evaluation of the form characteristics of a
particular unit of landform. A quantitative analysis of the drainage basin in terms of
various morphometric parameters is necessary to understand the relationship between
forms and the processes.
Horton (1945) applied quantitative morphological analysis or morphometry in the study
of the erosional development of streams and their drainage basins. Since then, methods of
morphometrical analyses of drainage basins were further developed by several
geomorphologists among these are: Strahler (1952, 1954), Schumm (1956), Morisawa
(1957, 1958), Scheidegger (1965), Shreve (1967), Gregory (1966, 1968), Selby (1968),
Smart (1967, 1969), Gregory and Walling (1973). Morphometric analysis provides
quantitative description of the basin geometry and helps to understand initial slope or
inequalities in the rocks hardness, structural controls, recent diastrophism, geological and
geomorphic history of drainage basin (Strahler, 1964). Landforms are created via
erosional and depositional processes, the geometry of which is controlled by the
processes that shape them. Therefore morphometric analysis provides data that yield
insights into these processes. Morphometric analyses require measurement of linear
features, gradient of channel network and contributing ground slopes of the drainage
basin (Nautiyal, 1994). The morphometric analysis for individual sub-basins has been
achieved through measurements of linear, aerial and relief aspect of the basin and slope
contribution (Nag and Chakraborthy, 2003). Whereas the first two categories of
measurement are planimetric, the third category treats the vertical inequalities of the
drainage basin forms.
92
The study presents the results of detailed morphometric analysis of the fourth-order
drainage basins and discusses their features and characteristics. The study also probes the
stages of geomorphic development of the sub-basin drainage with the help of different
morphometric parameters viz., stream order, stream number, stream length, mean stream
length, bifurcation ratios, elongation factor, circularity index, shape factor, drainage
density, stream frequency, texture ratio, relief ratio, length of overland flow, constant
channel maintenance, infiltration number, hypsometric curve and index and longitudinal
profiles.
Review of literature
During a study of stream profile and streambed materials in the Shenandoah Valley, Hack
(1957) found that a simple logarithmic graph of the stream profile provides the basis for a
useful system of analysis. In this graph, the origin of the graph is at the drainage divide,
which forms the source of the stream. The vertical coordinate is an arithmetic scale and
represents the altitude or height above a datum. The horizontal coordinate is a logarithmic
scale and represents the stream length or distance from the source. Hack (1960) stated
that in an erosionally graded landscape, the longitudinal profile of a stream is a property
of stream geometry that can provide clue to the underlying materials as well as an insight
into geologic processes and the geomorphic history of the area. Hack (1973) devised a
method of analyzing the longitudinal profile and developed a new unit of measurement
called the stream-gradient index. The index serves as an aid to geological mapping, as it
permits comparisons to be made of stream of different sizes, analogus to data on
magnetic intensities.
93
Hypsometric analysis is the study of the distribution of ground surface area or horizontal
cross sectional area of a landmass with respect to elevation (Strahler, 1957b). The
elevation characteristics of drainage basins are best depicted in and analyzed by
hypsometric curves that are non-dimensional measure of the proportion of the catchment
area above a given elevation (Strahler, 1952, 1957). The important elements for analyzing
the landscape are the hypsometric curve and hypsometric integral values. The integral is a
numerical index which may be used in the classification and in the comparison of
different landscapes (Strahler, 1952).
Different workers have used the hypsometric curves for different purposes. Schumm
(1956), Strahler (1964), Leopold et al. (1964) and Hurterz et al. (1999) have suggested
that hypsometric curve are related to geomorphic and tectonic evolution of drainage
basins. Hutchinson and Dowling (1991) and Wyatt (1993) used hypsometry to study the
regional altitude frequency of continents in order to estimate the erosion-related
sediments yields. The significances of the shape of the hypsometric curves has been
recognized by Strahler (1952, 1957,1964) who on the basis of hypsometry identifed three
types of landforms, namely, young, mature and monadock. Recently, Sinha-Roy (2002)
derived an empirical relationship involving the mean elevation and the hypsometric
integral to determine the relative tectonic uplift of the sub-catchments of Banas drainage
basin. He concluded that the tectonic uplift deduced from hypsometry is relatively greater
in the SW part of the Banas drainage basin than in the Nand NW parts, which was due to
differential vertical movements of several tectonic sub-blocks.
94
The longitudinal profile is a graph of distance verses elevation. The construction of
longitudinal profile provides an interpretation of the surface history as they are the
erosional curves and the river course flows from the source to mouth at any stage of
evolution (Kumar and Pandey, 1981). Stream networks have regular geometric properties
that can be quantitatively described. In an erosionally graded landscape, the longitudinal
profile of a stream is a property of stream geometry that can provide clues to underlying
materials as well as insight into geologic processes and the geomorphic history of the
area (Hack, 1960). The longitudinal profile is the least transient expression of fluvial
processes reflecting geological influences such as the available relief or tectonic history
and base level changes on the processes of erosion and deposition and of the distribution
of outcrops of different lithology (Richards, 1982). Long profile (gradient) adjustments
are emphasized as being necessary to maintain sediments transport with the available
discharge and given channel characteristics (Mackin, 1948).
Longitudinal profiles of streams channels are due to increase of discharge (Gilbert, 1877)
and the decrease of bed material grain size due to abrasion during transportation
downstream (Chorley, 1969). The nature of the channel or of the deposits in which it is
excavated may also exercise some influence on the shape of the longitudinal profile. The
longitudinal profile also reveals the gradient required by the river to transport its normal
bed load. Hack (1957) has shown that the change of slope downstream (concavity) is
influenced by change in size of debris downstream. The more quickly the bed materials
decrease in size downstream, the more concave is the longitudinal profile. Conversely,
where particle size increases downstream, the profile has a small concavity. If the rate of
increase of particle size downstream is large enough, the profile is a straight line or may
95
be convex to the sky. The flattening of the profile downstream is undoubtedly related to
the increase in volume, which goes with increase in drainage area. The uniform / graded
up-concavity of the profile shape is indicative of absence of across channel structural
lineament. A stream profile marked by abrupt change in gradient is called an interrupted
profile. Sharp inflections in the interrupted profile are called knickpoints. The behavior of
the knickpoints or the point at which the abrupt break in slope occurs is governed by the
discharge regimen and by the structure across channel and composition of the bed and
bank material of the river (Leopold, 1964). While working on the river profiles along the
Himalayan arc, Seeber and Gornitz (1983) concluded that in a steady state condition,
when climate and the rate of uplift is equal to the rate of incision, the longitudinal profile
of the river would be graded.
Remote sensing techniques using satellite images are a convenient tool for morphometric
analysis. Many workers have carried out morphometric analysis using remote sensing
techniques. Srivastava (1997) studied the drainage pattern of Jharia coalfield (Bihar)
using remote sensing technology. Nag (1998) carried out morphometric analysis of
Chaka subbasin in Purulia district, while Nag and Chakraborty (2003) deciphered the
influence of rock types and structures in the development of drainage network in hard
rock area. Biswas et.a!. (1999) studied part ofNayagram Block in the Midnapore District,
West Bengal in terms of the morphometric parameters viz., stream length, bifurcation
ratio, drainage density, stream frequency, texture ratio, form factor, circularity ratio and
elongation ratio for prioritization of sub-watersheds of the area. Srinivasa-vittala et.a!.
(2004) used remote sensing and GIS techniques in morphometric analysis of sub
watersheds in Pawagada area of Tumkur district, Kanataka. Recently, Chopra et.a!.
96
(2005) carried out morphometric analysis using remote sensing data, GIS techniques in
Bhagra-Phungotri and hara Maja sub-watersheds of Gurdaspur district, Punjab. They
found out that both sub-watersheds show dendritic to sub dendrictic drainage pattern
having moderate drainage texture, high burfication ratio and low drainage density
indicating that the area is underlain by resistant permeable rocks with strong structural
control on the drainage. Ratnam et.al. (2005) identified twent-four suitable sites for check
dam construction based on micro-watershed priotization by using remote sensing data,
GIS techniques and also through morphometric studies of Tarafeni watershed in
Midanpur district, West Bengal. Their findings show that integrated study of Sediment
Yield Index model and morphemetric analysis yield good result in prioritization of
watersheds. AI-Sulaimi et.al. (1997) concluded a detailed morphometric analysis of the
endoeric drainage basins in Kuwait and discussed their genesis and impact on the present
day arid environmental conditions. The role of the studied drainage systems in the
occurrence of mobile sand and sand dunes, rainwater harvesting, and land capability was
also emphasised. Morphometric analysis at sub-watershed level was carried out by
Srinivasa Vittala et al. (2004). They concluded that the terrain exhibited dendritic to sub
dendritic drainage pattern.
97
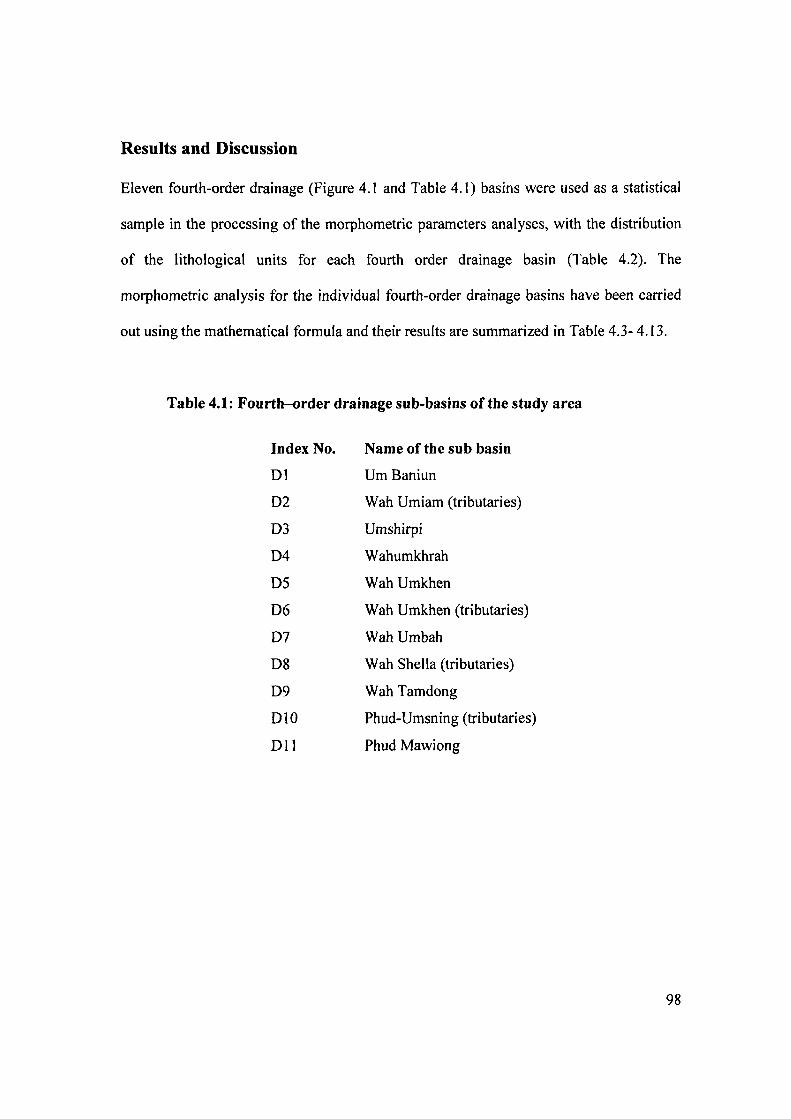
Results and Discussion
Eleven fourth-order drainage (Figure 4.1 and Table 4.1) basins were used as a statistical
sample in the processing of the morphometric parameters analyses, with the distribution
of the lithological units for each fourth order drainage basin (Table 4.2). The
morphometric analysis for the individual fourth-order drainage basins have been carried
out using the mathematical formula and their results are summarized in Table 4.3- 4. I 3.
Table 4.1: Fourth-order drainage sub-basins ofthe study area
Index No. Name of the sub basin
Dl Urn Baniun
D2 Wah Umiam (tributaries)
D3 Umshirpi
D4 Wahumkhrah
DS Wah Umkhen
D6 Wah Umkhen (tributaries)
D7 Wah Umbah
D8 Wah SheIla (tributaries)
D9 Wah Tamdong
DIO Phud-Umsning (tributaries)
Dll Phud Mawiong
98
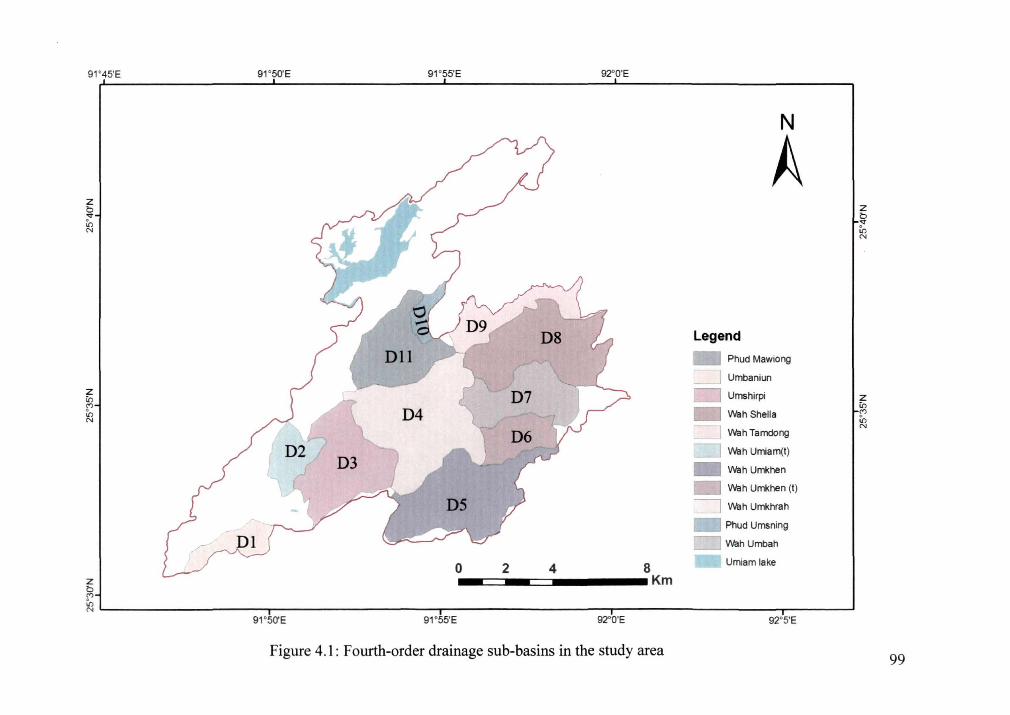
91 ' 45'E
Z b .... ro N
Z in C'l ro N
z g ro N
91 ' 50'E 91 ' 55'E 92' O'E
8 Km
91 ' 50'E 91 ' 55'E 92'-O'E
Figure 4.1: Fourth-order drainage sub-basins in the study area
N
A
Legend
_ Phud Mawiong
1 Umbaniun
Umshirpi
_ 'NahShelia
'Nah Tamdong
'Nah Umiam(l)
_ 'Nah Umkhen
_ 'Nah Umkhen (I)
~ 'Nah Umkhrah
Phud Umsning
'Nah Umbah
Umiam lake
92' 5'E
Z b .... ro N
~~
99
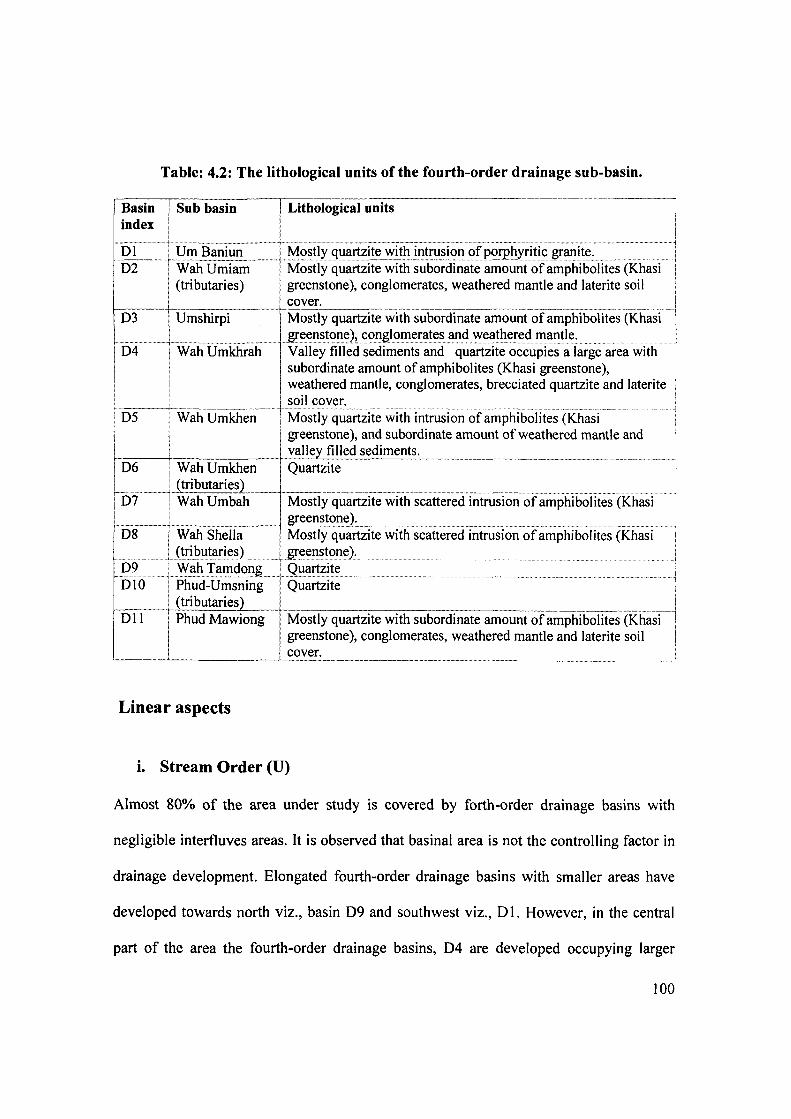
Table: 4.2: The lithological units of the fourth-order drainage sub-basin.
Basin I Sub basin index
Lithological units
·_········ .. · .......... · ........ ···, ............ · ............ • ............ • .... ·c ...... · ............ ·· .............. ··+ .. ·c .. · .. , .... · ........ :c ........................ •· .... • ..... : ...................................................................................................................................................... . j
..................................... j
01 i Urn Baniun Mostly quartzite with intrusion of porphyritic granite . .. bf ............ rwah .. umTam ...... ·······Mostiy .. quartzlte-w"fih .. subordlnateamounio{amp .. hibofites (Khasi ... i I (tributaries)! greenstone), conglomerates, weathered mantle and laterite soil
cover. ~--" -,-~ ,,~, --~~ --~,----------.--'" --~-. -.~.
03 ! Umshirpi Mostly quartzite with subordinate amount of amphibolites (Khasi ! h 1SJ:~~I?~!c:>I?~)!(;I:)I?gll:)l!I~~~!~~~~~~~!e~~~I!I~I?!I~:
04 I Wah Umkhrah Valley filled sediments and quartzite occupies a large area with subordinate amount of amphibolites (Khasi greenstone),
, weathered mantle, conglomerates, brecciated quartzite and laterite .. I i soil cover. ~-~: --· .... ·---.. - .. · .............. · .. ·1-.... -· .. · .. ·· .. -.. ·................ . .. . ........ -;-....... .:. ..... . . I 05 : Wah Umkhen : Mostly quartzIte WIth mtruslOn of amphlbohtes (Khasl !" i greenstone), and subordinate amount of weathered mantle and
valle filled sediments. f-----+--------j---.JL-..-------.-.. -----...... - .... --........ - .. _ ............... .. ! Wah Umkhen Quartzite 06 I (tributaries) ~ .. _ .. _.--1'-.... ................ .. ....... - ........ _ ................................................................................................................................................................................................................................................. ..
07 ! Wah Umbah Mostly quartzite with scattered intrusion of amphibolites (Khasi I
........................................ L ...................................................................................... SJ:~~I?~!c:>I?~t ................................................................................................................................................................................................... " ..................................... j 08 I Wah Sheila Mostly quartzite with scattered intrusion of amphibolites (Khasi
.......... L(!~i~ll!~r:i~~) .... 'SJ:eenstoI?~t 091"Y~hI~I!I~on Qll~!:1:z:i!~ 010 I Phud-Umsning Quartzite
I (tributaries) 011 i Phud Mawiong
I
Mostly quartzite with subordinate amount of amphibolites" (Khasi -j greenstone), conglomerates, weathered mantle and laterite soil cover.
Linear aspects
i. Stream Order (U)
Almost 80% of the area under study is covered by forth-order drainage basins with
negligible interfluves areas. It is observed that basinal area is not the controlling factor in
drainage development. Elongated fourth-order drainage basins with smaller areas have
developed towards north viz., basin 09 and southwest viz., 01. However, in the central
part of the area the fourth-order drainage basins, 04 are developed occupying larger
100
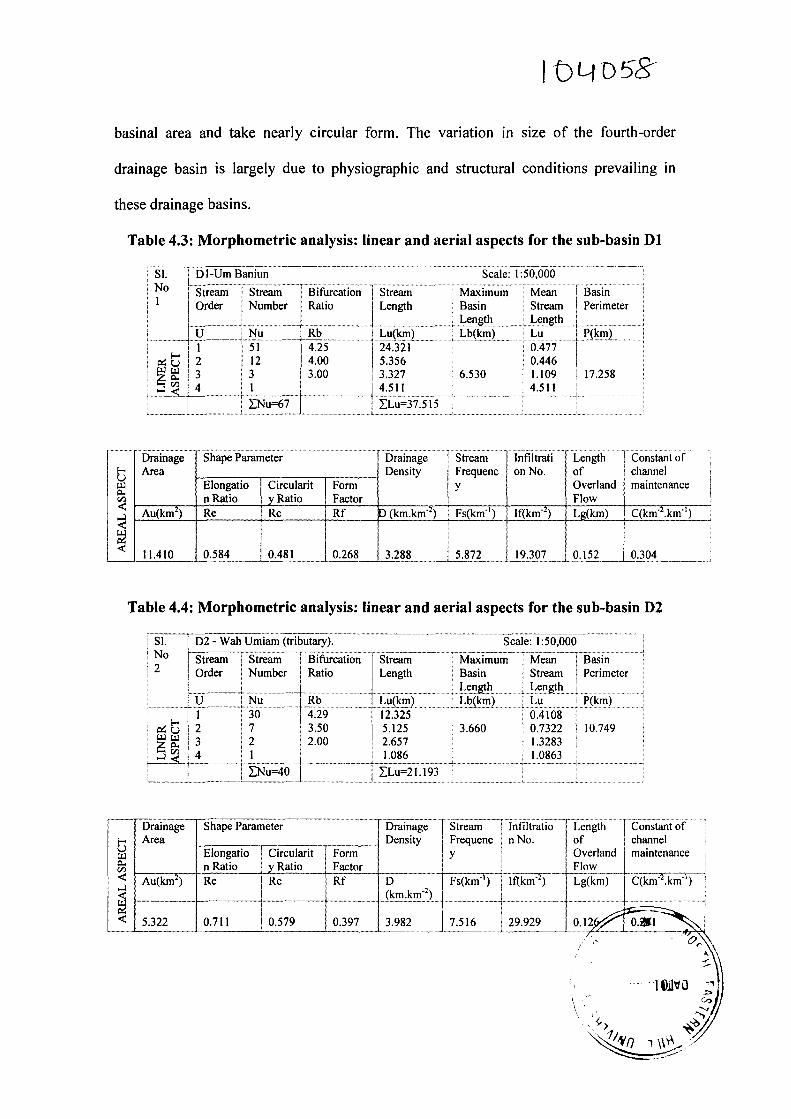
I
basinal area and take nearly circular form. The variation in size of the fourth-order
drainage basin is largely due to physiographic and structural conditions prevailing in
these drainage basins.
Table 4.3: Morphometric analysis: linear and aerial aspects for the sub-basin Dl
, DI-Um Baniun Scale: 1:50,000
i Stre Bifurcation TStream Maximum: MeanTBasln I Order Ratio i Length Basin erimeter
1_. . ............•..... ~c::lll:>~,'. .................... . : I U Nu Rb i Lu(krn) • Lb(krn) Lu
i:--bT~---·--·--- -~~--.---- ::~~·-··-r~~;~C·-----·----··--T~·::~~-- I
~ Ee I 3 ! 3 3.00 i 3.327 6.530 1.109 i 17.258
...l ~ 14 i ~U=67 I ~~:~3i~5-i5-~----·_-.i!.2I.-I----+.-...................... _ ... 1....... ....... . ......... ..................................................... l....... . ........ , ............................. .J. ............ .
Drainage ..... .... Shape Parameter .......
Drainage Stream . ............ ............. .. , .
Constant of Infiltrati Length E- Area Density Frequenc on No. of channel u >I.l Elongatio Circularit Form y Overland maintenance ~ IZl n Ratio yRatio Factor Flow < Au(krnz) Re Rc Rf D (km.km·z) f Fs(km·l) If(km-z) Lg(km) C(km,z.km· ) ...l
, <
L.872 ___ _ 12:?_07_ Jl,152_1.304 _____ .___. ~
11.410 0.584 0.481 0.268 3.288
Table 4.4: Morphometric analysis: linear and aerial aspects for the sub-basin D2
Drainage Shape Paranleter-------------········-··----Oralnage-······ ··Stream-·-·-T···infiit~atfo Length ···Constant of E- Area Density Frequenc I n No. irl Elongatio-ici-rc-ularit- --P-orm--"--- y:
of channel Overland maintenance Flow ~ n Ratio I y Ratio Factor I 3 I--A-u-:-(krn-, .... z')-~R-"-e==-----+I .... Rc..;C==-=---t--::.-R::::f=---li-=-D-------+---F-s(-:-k-m·,) -+1-1fi=(k-m'2)-- Lg(km) -C(k~k;;'i)--~
~ r-----.--. ------------ -.-....... -.-----.- -.. ---. .. __ .<~!E.~~1!!~2)_.___ .. _ .. --.t L.......... ...... .......L_5._32_2_.......J.._O_.7_1_1_........L_O_.5_79 __ -'--0._39_7_-'--3_.9_82 ___ J_7._5_16_J. 29.929
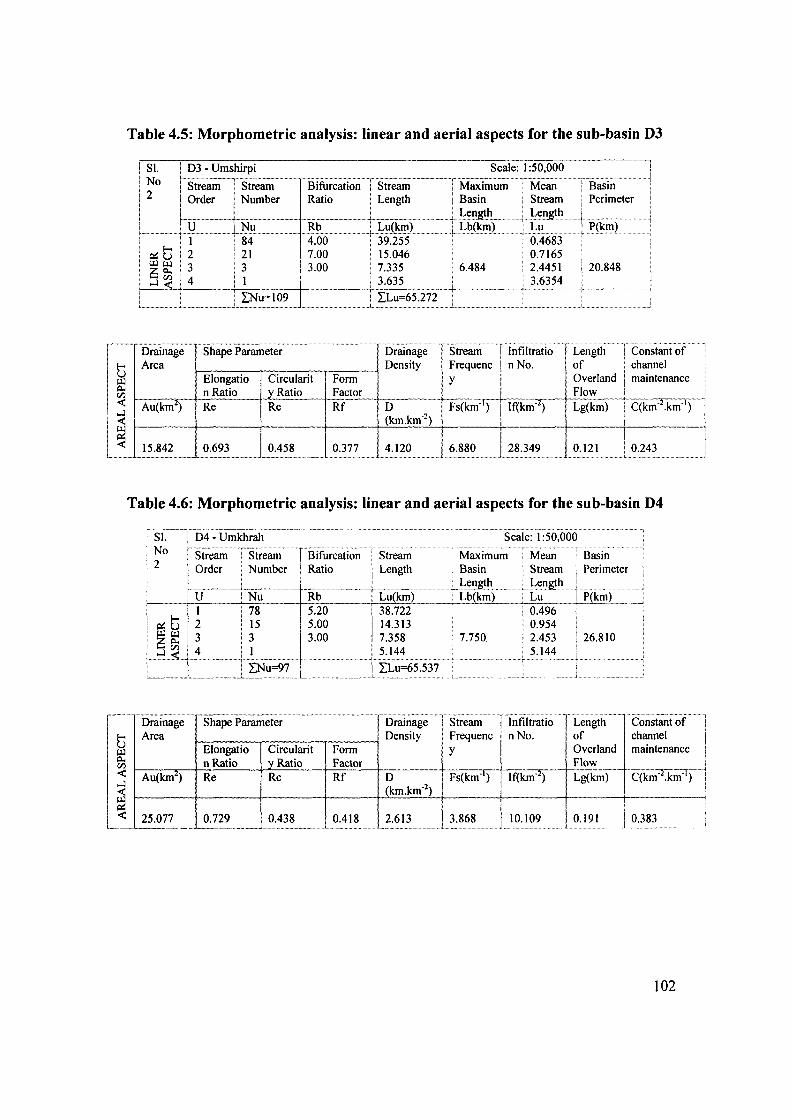
Table 4.5: Morphometric analysis: linear and aerial aspects for the sub-basin D3
! Sl. 1 No I 2
D3 - Umshirpi Scale: 1:50,000\
I Stream l Stream BifurcationTSireamTMaximum MeanTBasin 'Order I Number Ratio I Length [ Basin Stream I Perimeter
,--I uJ~~ Rbt\~(~)lt~(f.~j. Lu ngthl~(~II1) ········1 1 I : 84 4.00 i 39.255 . 0.4683 !
~ ~ ! 2 i 21 I 7.00 15.046 0.7165 ~ ~ , 3 l 3 i 3.00 . 7.335 6.484 2.4451 i 20.848
I ... ~ ~ ...... : ..... ~.._ ..... j ..... ~U=1 09J........... . ....... ! .. ~~~~?·~?~ .... --t==~--=t=~~~5~ .............. j ........••. =~-~=-=J Drainage Shape Parameter Drainage Stream ·······rtnfiitratio ..... Length Constant of
!
f-! Area Density Frequenc ! nNo. of channel i U Elongatio Circularit Form y i Overland maintenanc ~ I
e ~ n Ratio y Ratio Factor Vl -< Au(krnz) Re I Rc Rf D ~ -< (km.km-z) ~ -< 15.842 0.693 0.458 0.377 4.120
........... -.......... _ ....
! Fs(km- I
) I If(km'z) !
6.880 128.349
Flow Lg(km)
0.121 ..........
C(km·~.km·1
0.243
-J ) :
~ j
Table 4.6: Morphometric analysis: linear and aerial aspects for the sub-basin D4
--SI.---TD4-~Dmkhrilh- ......--- .................................... Scaie:T50~boo
No rSt;eam-T·StreamrBif~rcationT Stream Maximum 2 l Order i Number I Ratio i Length Basin Stream· Perimeter
f--U.-----i-NU- I Rb ··---tLU(kmj--- . ·-fbW~j---·-t~l1gth-jp(kmj-: I i 78 5.20 i 38.722 ; 0.496
~ t; I 2 . 15 5.00 I 14.313 1 0.954 i
1_~~I.I:3 .._ 3.001;}~; 7.750 1 ~:i~!J~6.8\O l_. ____ ._ ... J._ .. ____. __ l~~:~? ___ ....................... _J~~~:??~?~? ... ...... ....... :
Drainage Shape Parameter Drainage Stream Tinfiitrat-io Frequenc i n No. y I ---~ ,-;,---.. -~----Fs(km- ) If(km- )
f-! Area r-:::-:----:--....-::::---:--:--.=----/ Density ~ Elongatio Circularit Form ~ n Ratio y Ratio Factor ~ ~A-u(~krn-,"'1)--/~R~e~=--~R~c~=---~R7f~~-~D~
~ (km.km-2)
-< 25.077 0.729 0.438 0.418 2.613 3.868 10.109
Length of Overland Flow --"--"-'---'--"-' Lg(km)
0.191 L ____ ~ ____ ..... _ ... _ .. L_ .. __ .. _ ... __ .. _._. __ ... " .......... __ ....... _ .......... _ ... _ ....... 1 .............. _ ........ __ ... _ .. __ ............................... . L .. _ .................................................. .
Constant of channel maintenance
0.383
102
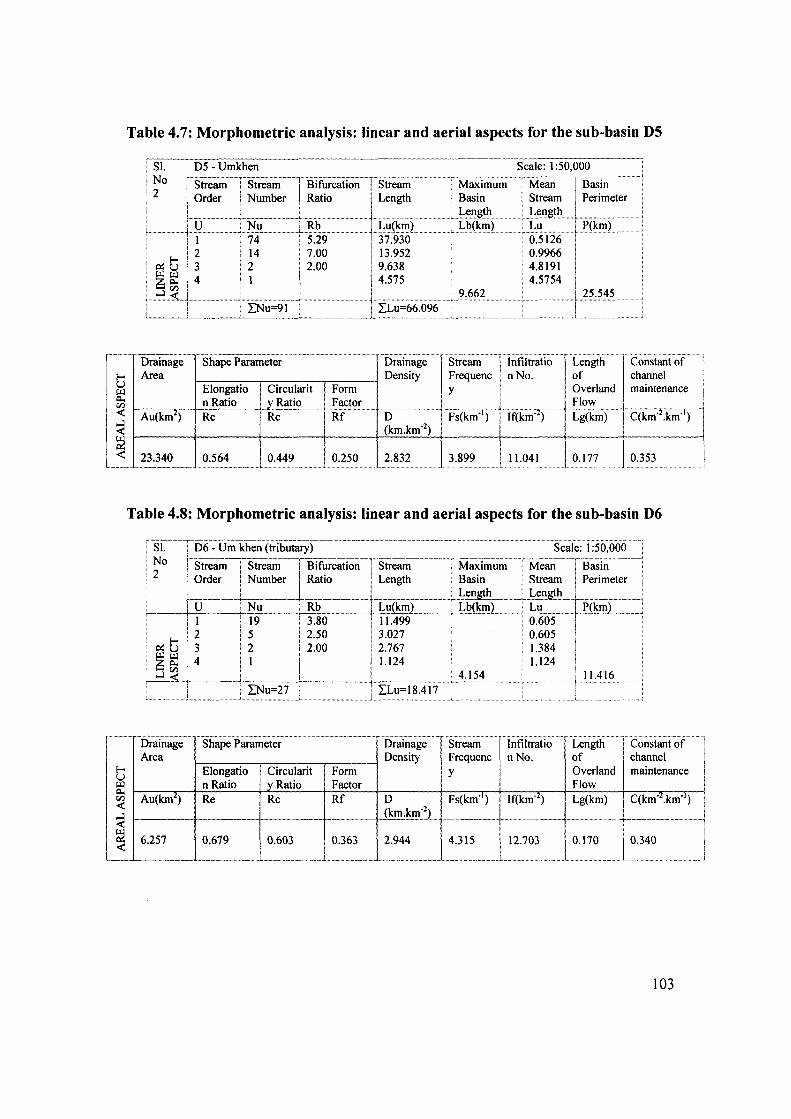
Table 4.7: Morphometric analysis: linear and aerial aspects for the sub-basin D5
Scale: 1 :50,000
" ......................................... _ •••• M •••••••••••••••••••• _ ........ .
Drainage Drainage Stream !- Area Density Frequenc frl Elongatio Circularit Form y
~ -A~(~z)----~~~iQ---- ···i~~!!Q---- -1i~!Qr. D ....... ··························-F;(k~;r)
l ~ .. 23340 . 0:'64.. 0.449 02" :::~~ 3899
r······················-·- ·····Length Constant of I Infiltratio
I nNo. of channel Overland maintenance Flow
Tif(km:1) Lg(km) ····C(km~~:km:rj
I
I 11.041 0.177 0.353 .... 1
----_. ---'--- ................ _ ..... _. __ . __ ... _._._ .. -Shape Parameter
Table 4.8: Morphometric analysis: linear and aerial aspects for the sub-basin D6
~C----[-D6 -umIhen-(iTlb"iitary)--------------· Scale: 1 :50,000
! ~o r-~r-r~:m-r -!-~-t~=r ·~~~~cation-r~:::-······--~:~mum·r~;::T~~~:::~···:
~.-- IlL~~==l.~==:· ~·~·····_··········~1~1~k~I::.::.:.~~t~~L-.~......t~~~~~=l~(k~i~.-.~J . IIi 19 3.80 i I 1.499 0.605 I . , !- I 2 : 5 2.50 i 3.027 0.605 i . ; ~ U i 3 , 2 2.00 i 2.767 1.384 ·1'
, ~ r.1.l i 4 iIi 1 124 1.124 I
: ...l ~J- .. -.-J ... --.--... ....... L~.-...-. 4.154 ........ ~ ... 11 . .4 ........ 1 ... 6 ........................ , i i LNu=27 t ILu=18.417
........... !. . ...................................................... 1 ......................................................... k •••••••• ,. .. .................. L. ..
~::age I-I=-:-Shia_Pe_······~p;-ar_am,······-:et::7er_······_·· ~---'r=---l g~~~~e ~~~:~~r~n~~~atio ~;ngth C E1ongatio Circularit Form y Ii Overland
Constant of channel maintenance
I
! i 1
I I
r.1.l n Ratio y Ratio Factor Flow ~ ~~-,;--~~~-~~~--~~~~~-----~~-,;--~~~--~~---,-~~~--r.-4 ~ Au(km<) Re Rc Rf D Fs(km- ) If(km-' ) Lg(km) C(km-<.km- )
(km.km-2)
~ 1-----+---.- r------·-- -----.--- -'---···----····-··-+-·-·---·---··f-··---·-···-----+-··· ... -....... -......... ---.. + .. -... - ........ -...... -............... -.--,
~ 6.257 0.679 0.603 0.363 2.944 4.315 12.703 0.170 0.340
.. _--- '---------_ ... _ ... _-_ ...• -_. ......................... ___ .. _ .................... _ .. .1 ....•..............•.••................. l .......................... _ .... .
103
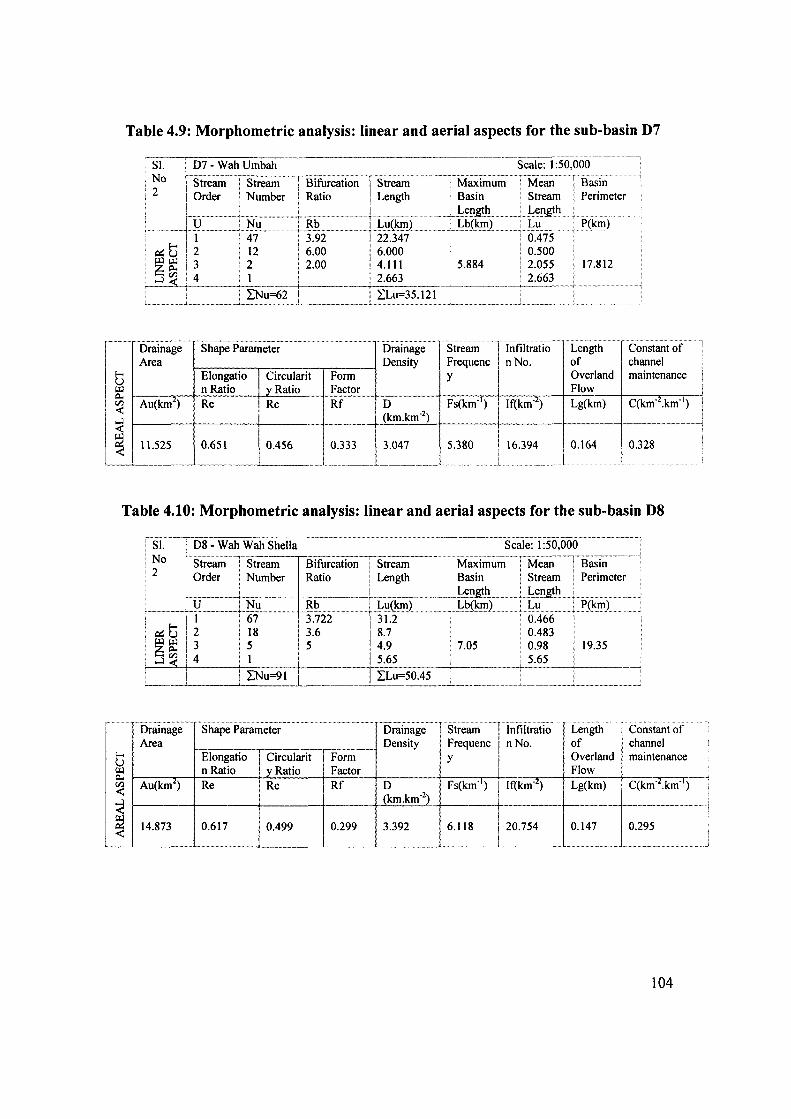
Table 4.9: Morphometric analysis: linear and aerial aspects for the sub-basin D7
. SI. i 07· Wah Umbah No 1-- ................... , ..... := .. : .. " ................... : ................ .,.. ... :: .............................................. .
2 I Stream Bifurcation i Stream I Order Ratio! Length
L. ' i U''IN'\;
. I""'}'" ··················i·····4·7······ ~ t) ! 2 i 12 ~ ~ i 3 ' 2 2: [J'J , 4 1
~--t-------+--....... 1_ .1 LNu=62
-.......... ---..... -..... ---- ..... 1"-.. ---........ -..... - ............... .
Maximum . Mean I Basin Basin i Stream I Perimeter
.I.c.~llgth,I.c.~llgth ... L t---~:·-.-~:-2~-------·-------... +iIi:~~ Lb(km)r6.~751~(~I!l)
6.00 I 6.000 ; 0.500 II .
2.00 i 4.111 5.884 i 2.055 17.812 i ______ I 2.66~ __ ~ _________ i 2.6~=± _____ J
I LLu=35.121 ; i ___ ._. ______________________ .L ___________________________________________ . ___________ .L _____________ ._. ________ . _____________ . .i
Drainage Drainage Stream Tinflitraiio Length Constant of Area Density Frequenc I nNo. of channel
f- Form y Overland maintenance U I ~ Factor I Flow Q... [J'J Au( Rf 0 Fs(km- ) i If(km· ) Lg(km) oct: (km.km·2) l ....l oct: ~ 11.525 0.651 I 0.456 0.333 3.047 5.380 16.394 0.164 0.328 oct:
--- ~, .. -- -----.--~ .. -... ~
Table 4.10: Morphometric analysis: linear and aerial aspects for the sub-basin D8
t'---___ L ___ . ___ ,_LN_u_=9 __ 1-'--_. __________ ~~~=~_~~~_ ... _____ ._. ____ ..... _, ___ ... ______ J_ .. __ .. __ ... ___ ,
............. ..... _ .... _ .... _ ...... __ . __ ... _-•••••••• - •••••• - ••••• ~ •••• '< •••••••
'Stream--rinflitraifo ..................... - .. - .... - .... ~ .....
Drainage Shape Parameter Drainage Length Constant of Area -·-----r--·---r----·-·--·--- Density Frequenc I nNo. of channel
f- Elongatio Circularit Form y ,
Overland maintenance U I ~ n Ratio y Ratio Factor I Flow Q... [J'J Au(km2) Re Rc Rf 0 Fs(km- ) If(km-') Lg(km) C(km-2.km- l
) oct:
(km.klll~2_ ~ -------
~ 14.873 0.617 0.499 0.299 3.392 6.118 20.754 0.147 0.295
104
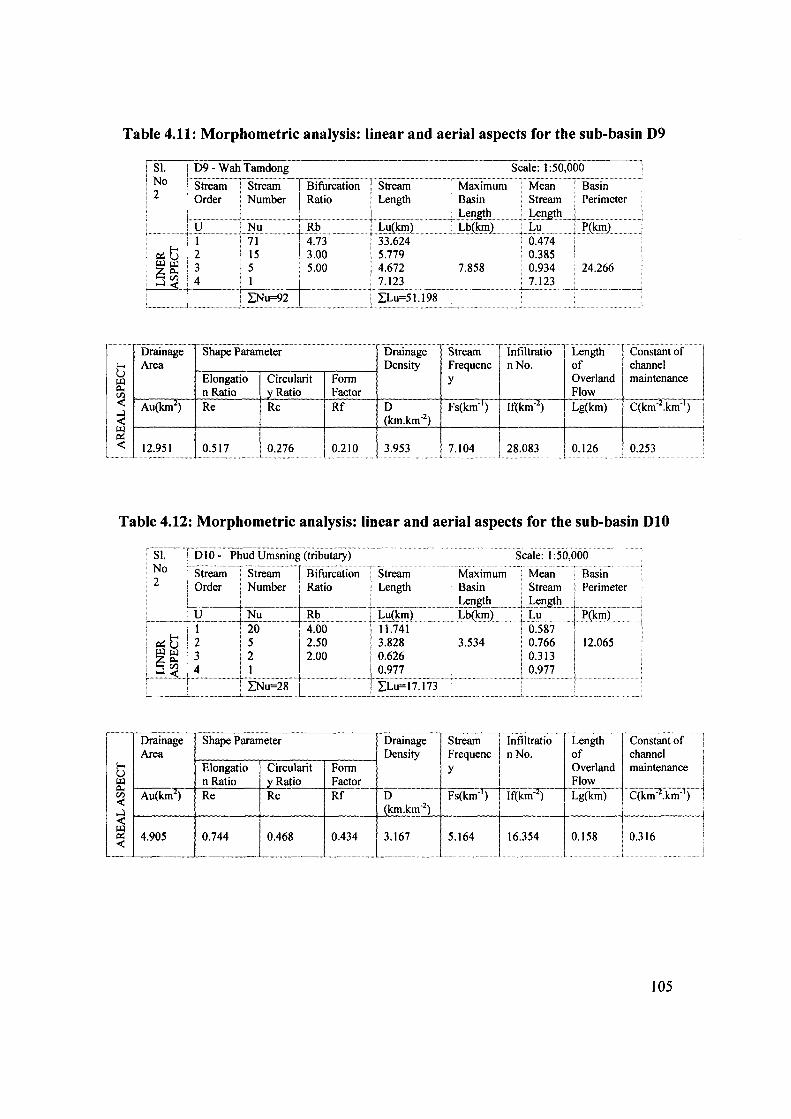
Table 4.11: Morphometric analysis: linear and aerial aspects for the sub-basin D9
....................
~ U U..l ~ CIl
< ..l < ~ <
...................
! Sl. ! No
12
I D9 - Wah Tamdong
!Stream---' StreWn I Order Number
liy-·i Nu -'-: ~r~-r~! ~ ~ i 3 ,5 5 C1l i4 1
~u=92
. _ ........ ............................ ................................ _ ..................... Drainage Shape Parameter Area
Scale: 1 :50,000
Bifurcation'TStream Maximum 'Mean TSasin Ratio I Length Basin 'Stream t Perimeter
! ................~~I.!.gt.h.. ...L~e.l.!gth Rbl~~(klIlj._~~(~) ; Lu ......y(~~) ... ........ .. i 4.73 I 33.624:0.474 3.00 i 5.779 0.385 5.00 i 4.672 7.858 0.934 I 24.266
i 7.123 ,7.123!, -.----'----------t----------'
.. 1 ... I ~Lu=5L198
........................... i............ . ................ b •••••••••••
. ................................ .... _ ......... _ ...... . .....
Drainage Stream Infiltratio Length Constant of Density Frequenc nNo. of channel
E1ongatio Circularit Form y Overland maintenance n Ratio y Ratio Factor Flow
Au(Ianz) Re Rc Rf D Fs(km-I) If(km·z) Lg(km) C(km-z.km-I) (km.km-z)
12.951 0.517 0.276 0.210 3.953 7.104 28.083 0.126 0.253 •••••••••• ~.MH_H ••••••• , ............ ······.··.·.···.·H· ... ···
I
Table 4.12: Morphometric analysis: linear and aerial aspects for the sub-basin DI0
No 2
t-'Stream Stream ! Order Number
Bifurcation ,Stream Ratio j Length
.... -................ - ... '" ........... _ ... .
Maximum Basin
Scale: 1 :50,000 ............... - .............. .,. ..... .
• Basin I Perimeter
L-----+-::-:- {~~~ •••••••••••••• jt.~j .. _ .. __ ._!:-~!!S!.~ __ .... __ ..... . 1--· ........- ... -, I U Nu ry---- 20
: ~ ~ ! 2 5 [ ~ ~ 13 2 I,:._~~ t 4 1
1'- ~u=28 -! --_ .. _--j ....... , ...... _ ... __ .. __ .. -
2.50 i 3.828 2.00 i 0.626
\ 0.977 '1'
i ~Lu=17.173 I
Drainage Area
Drainage
f-=-,-----,,--.,.--,:-:----:-...,-----r---:-------i Density Elongatio Circularit Form
Shape Parameter
n Ratio y Ratio Re Rc
4.905 0.744 0.468 0.434 3.167
Lb(~)
3.534
Lu , 0.587 I 0.766 I 0.313 J 0.977
fP(km)
12.065
stream-rinfiltratlo .. Length- '''Const8iit of ····1 Frequenc I n No. of channel i y! Overland maintenance !
Fs(kn?)-t"If(km:1)--- -f~km)---C-(km~~km:r)----j !
5.164 16.354 0.158 0.316
... _-- '----_ ...... - _ .. __ .. _._- _ ....... _-_ .. ------.. - ........ -.. _....... ......... . .... _ .... __ .... _..... . ......... _ ...... . .... _ .......... 1... ........... _._ .... _ ............................................... .
105
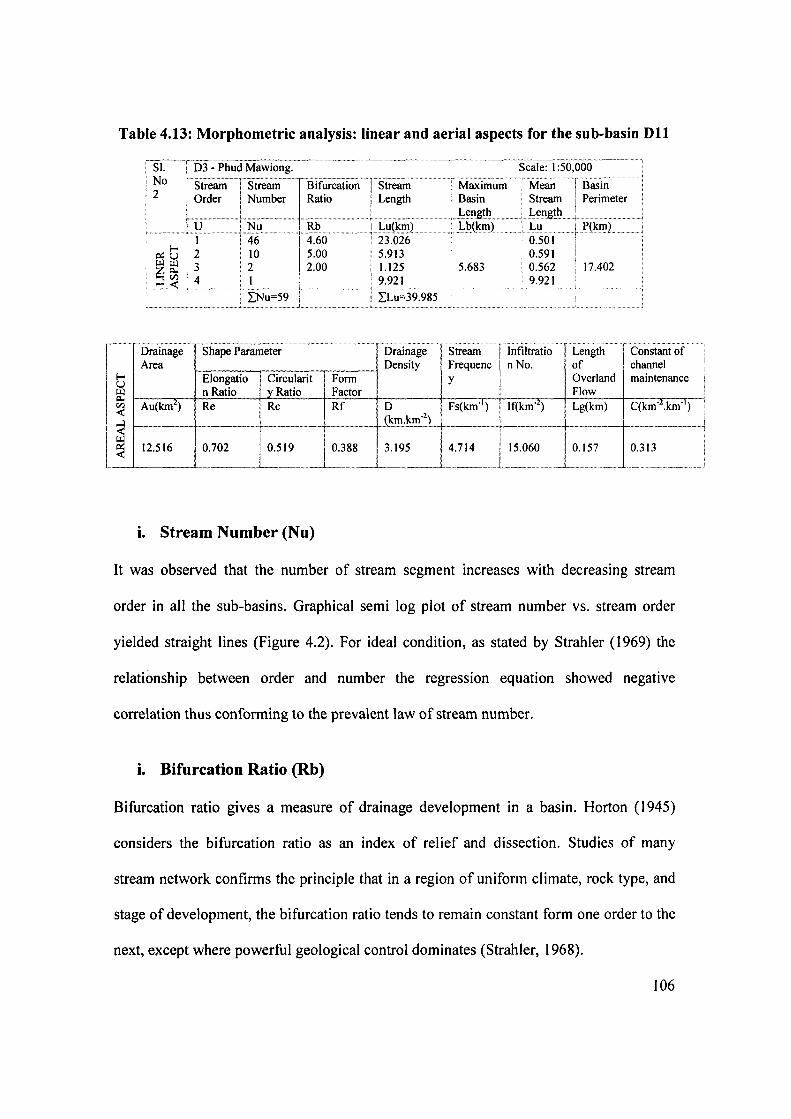
I
Table 4.13: Morphometric analysis: linear and aerial aspects for the sub-basin D11
E-U ~ i:I. Vl
, S\. j No 12
Drainage Area
Au(km")
I D3 - Phud Mawiong. Scale: 1 :50,000
ISirea:m- jStr;;a:m.············ !EB:iitifbu;r:cc;aattiioonnT Stream-Maximum:Mean "[Basinl I Order Ratio i Length Basin : Stream . Perimeter '
.......... i__ ...•.. !-.~!lg!~... . ........... L!-.e:!lg!~.L... : Rb 4.60 5.00 2.00
Shape Parameter
E1ongatio Circularit n Ratio y Ratio Re Rc
..............
Form Factor Rf
km)!:-~(~I!l) : Lu+~(~I!l)
;~9~;6'~:~~: i 1.125 5.683 0.562 t 17.402 9.921 9.921
LLu=39.985
Drainage Stream 'TInfiit~atio Length Constant of Density Frequenc I nNo. of channel
y Overland maintenance ! Flow
D Fs(km- ) If(km-' ) Lg(km) C(km-l.km- ) <
I~ (km.km-2
)
12.516 0.702 0.519 0.388 3.195 4.714 15.060 0.157 0.313
~--'-
i. Stream Number (Nu)
It was observed that the number of stream segment increases with decreasing stream
order in all the sub-basins. Graphical semi log plot of stream number vs. stream order
yielded straight lines (Figure 4.2). For ideal condition, as stated by Strahler (1969) the
relationship between order and number the regression equation showed negative
correlation thus conforming to the prevalent law of stream number.
i. Bifurcation Ratio (Rb)
Bifurcation ratio gives a measure of drainage development in a basin. Horton (1945)
considers the bifurcation ratio as an index of relief and dissection. Studies of many
stream network confirms the principle that in a region of uniform climate, rock type, and
stage of development, the bifurcation ratio tends to remain constant form one order to the
next, except where powerful geological control dominates (Strahler, 1968).
106
i
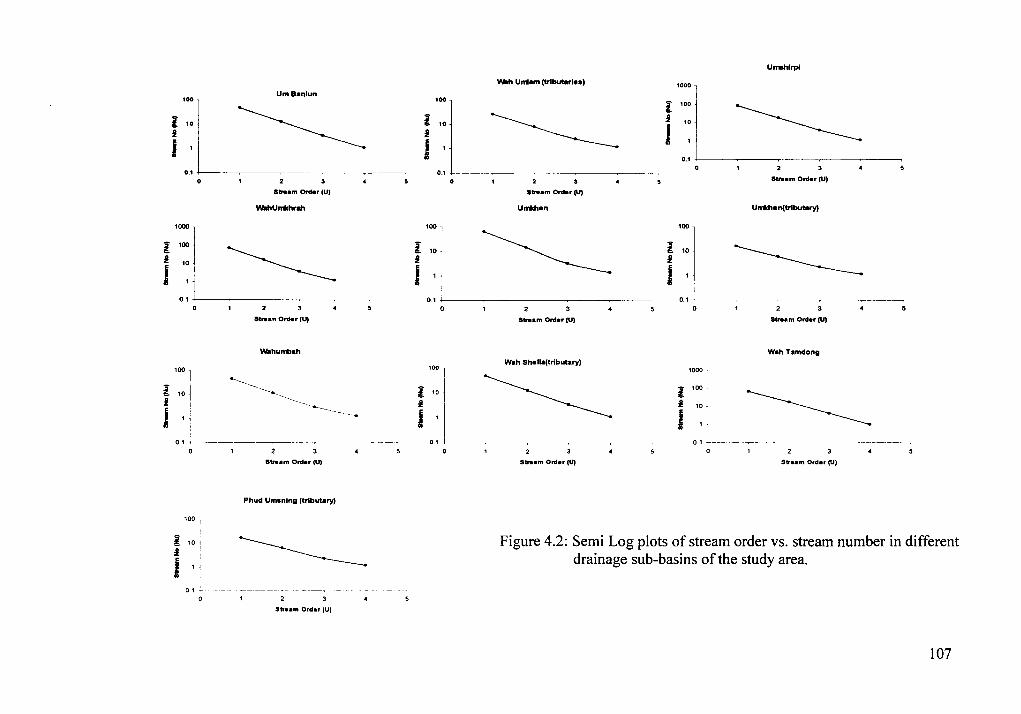
Woh U""am (trlbutarle.)
1~1
i~:L_ ... ~ 100
! 10
i
I
stream Order (U)
Urrldlen
~ 0.1 +I------__ ------__ --------~------__ ----~
100
l 10
J
J 0.1
o 2 3 4
Sham Order (U)
Wah Shena(tributary)
~ -_.- -~------
Sham Ord.r (U)
Umshirpi
i 10
I 1 ~ ! '~:: j
0.1 ~.
100
! 10
i
I
sv.em Ord.r (U)
Urrldlen(trlbutaryI
~ 0.1 ~I------~------~------__ ------~----~
o 4
Sham Ord.r,UJ
Wah Tamdong
1000
j': ~ 0.1
Str.am Order (U)
Figure 4.2: Semi Log plots of stream order vs. stream number in different drainage sub-basins of the study area.
107
The bifurcation ratio is of fundamental importance in drainage basin analysis as it is the
foremost parameter to link the hydrological regime of a watershed under topological and
climatic regime (Raj et. aI., 1999). This parameter is important in understanding the
shape of the basin and also helps in deciphering the runoff behavior. Lower bifurcation
ratio values of the watersheds show that the drainage pattern is not distorted (Nag, 1998).
In case of the present study as seen from the data in Table 4.3- 4.13 this ratio is not
uniform from one order to the next. According to Schumm (1956), because of chance of
irregularities, bifurcation ratio between the successive pairs of orders differs within the
basin even if a general trend of geometric series exists.
The mean bifurcation ratio (Rb) varies from a minimum of 2 in a flat or rolling drainage
basin to 3 or 4 in mountainous or highly dissected drainage basins (Horton, 1945). For
the present study mean bifurcation ratio for all fourth-order drainage basins range
between 4.76 of Wah Umkhen to 2.63 (Phud-Umshing) (Table 4.14) i.e. the variation of
bifurcation ratio of different orders over a mean value is rather small, indicating variation
in lithology, strong structural control and stage drainage development. The calculated
weighted mean ranges from 3.07 for Phud-Umshing to 5.45 for Wah Umkhen. Structural
effects cause basin elongation (Chorley, 1969) as apparent from the tabulated values, the
higher values of bifurcation ratio are found for the elongated drainage basins dominated
by Khasi greenstone, quartzites, weathered mantle and valley filled sediments, covering
the hilly terrain with strong structural effects mostly in the south and southwestern part.
On the other hand the lower values are shown by the drainage basins that drain through
pure quartzitic area. Thus these variations in bifurcation ratio are dependent upon the
lithological and geological development of drainage basin (Strahler, 1971). The elongated
108
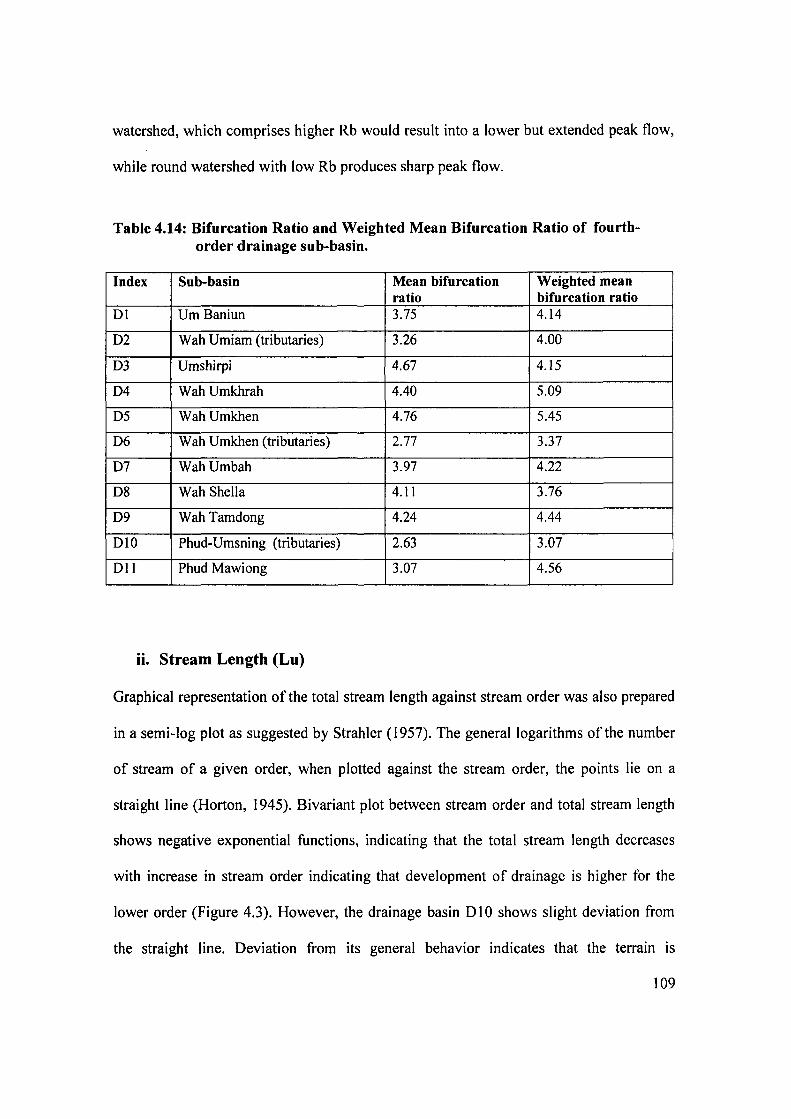
watershed, which comprises higher Rb would result into a lower but extended peak flow,
while round watershed with low Rb produces sharp peak flow.
Table 4.14: Bifurcation Ratio and Weighted Mean Bifurcation Ratio of fourthorder drainage sub-basin.
Index Sub-basin Mean bifurcation Weighted mean ratio bifurcation ratio
01 Um Baniun 3.75 4.14
02 Wah Umiam (tributaries) 3.26 4.00
03 Umshirpi 4.67 4.15
04 Wah Umkhrah 4.40 5.09
05 WahUmkhen 4.76 5.45
06 Wah Umkhen (tributaries) 2.77 3.37
07 Wah Umbah 3.97 4.22
08 Wah Shella 4.11 3.76
09 Wah Tamdong 4.24 4.44
010 Phud-Umsning (tributaries) 2.63 3.07
OIl Phud Mawiong 3.07 4.56
ii. Stream Length (Lu)
Graphical representation of the total stream length against stream order was also prepared
in a semi-log plot as suggested by Strahler (1957). The general logarithms of the number
of stream of a given order, when plotted against the stream order, the points lie on a
straight line (Horton, 1945). Bivariant plot between stream order and total stream length
shows negative exponential functions, indicating that the total stream length decreases
with increase in stream order indicating that development of drainage is higher for the
lower order (Figure 4.3). However, the drainage basin D 1 0 shows slight deviation from
the straight line. Deviation from its general behavior indicates that the terrain is
109
characterized by high relief and/or moderately steep slopes, underlain the various
lithology and probable uplift across the basin (Singh and Singh 1997).
iii. Mean stream length (Lu)
The mean stream length of a channel is a dimensional property and reveals the
characteristic size of drainage network components and its contributing basin surfaces
(Strahler, 1964). The values of mean stream length are plotted against respective stream
order (Figure 4.4). These line diagrams show the relationship between mean stream
length and the stream order for each drainage basin. The relationship reveals more or less
a straight line regression of positive exponential form as postulated by Strahler (1971).
110
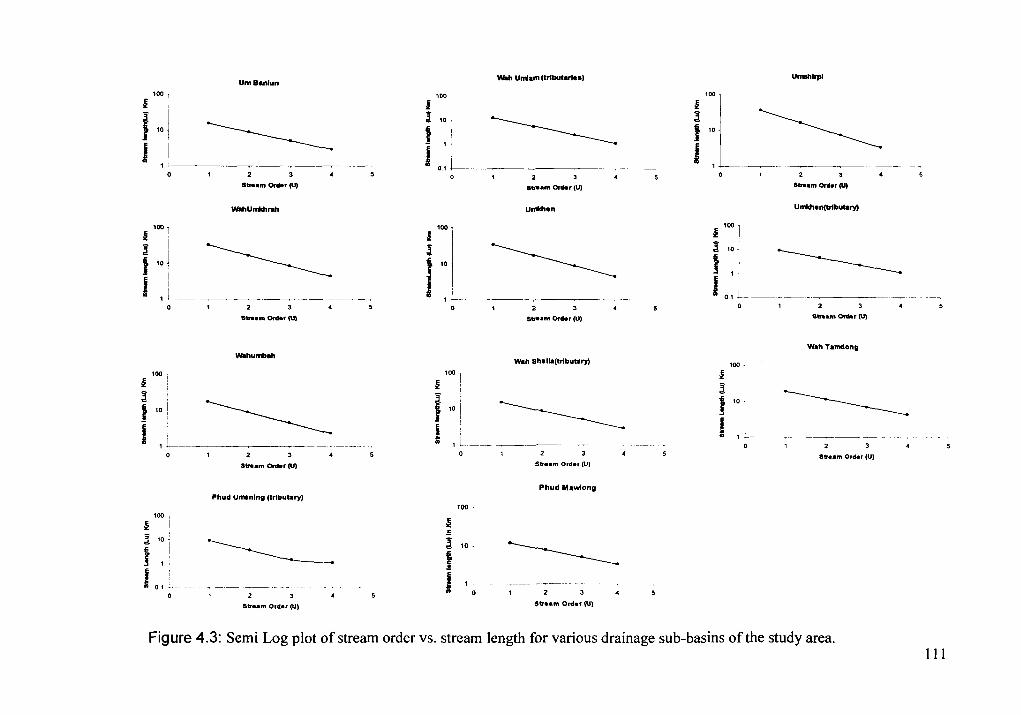
UmSanlun Wah Umlarn(trlbutarles, Urnshlrpl
100
'1 i'~L~~ I
1,0 i ----------- -----------10 t 1
J J ,---~ 0.1
2
Stream Order (U) Stream Order (U) Stream Ord.r (U'
WahUmlchrah Umlchen Umlchen(trlbutary!
100 I 100 1 100
I I ~
----------~ ----------
~ 101 ~ t 10 J 10 i
I I
, J
J J 01 ~ 0 3
Stntam Order tu') stre.m Order (0) Stream Ons.r (U)
Wah Tamdong Wahu_eh
Wah Shella(trlbutary) 100 I
100 100
I l i
l I
~
----------3"
'
10
1 ~ t 10 ,'0 -----------I ! ! I
., OJ 1 1-------
2 Str.am Order (UJ Stream Order (U) Str.am Ord.r (U)
Phud Mawlong Phud Unwnlnll (tributary)
100 I 100 !
l \ ~ ~ 10 1
.5
~ ~ 10 i ---------j I J 01 •. -.-----.-..,.-~ ... -.-.-. I ,. ..
0
Stream Otdet (U, Str.am Onl., (U)
Figure 4.3: Semi Log plot of stream order vs. stream length for various drainage sub-basins of the study area. III
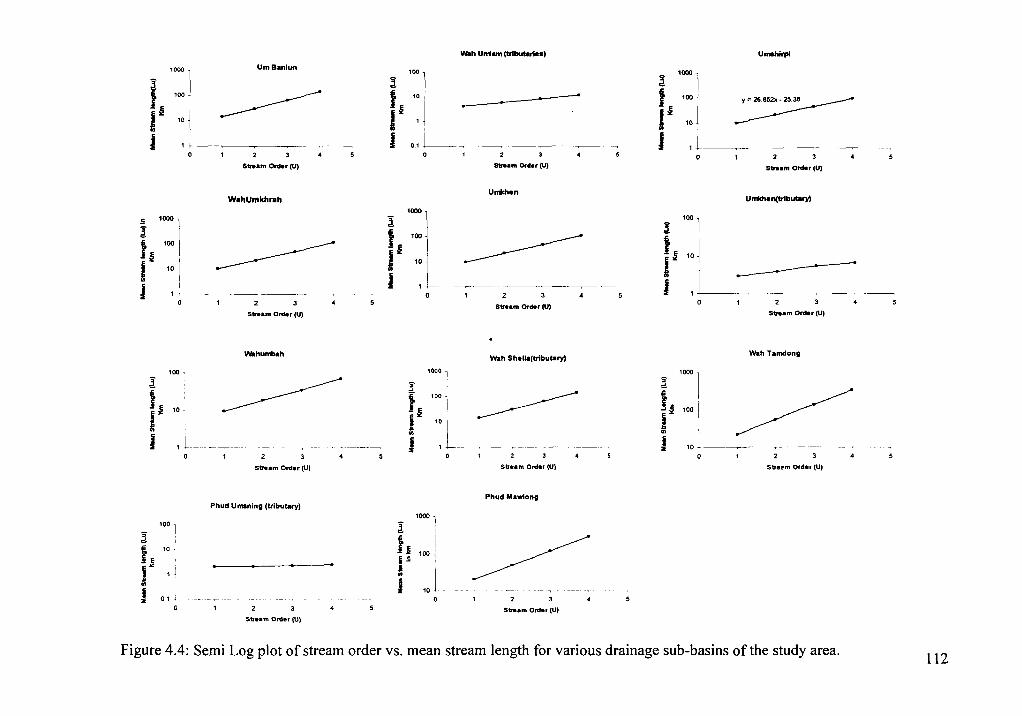
'000
i~ 'DO
! CO
I
S
l t~ I I
'0
'000
'00
'0
,~-
0
'00 , ,
'0 j t
UmBaniun
~
Slr .. m Order IU)
WahUmkhrah
~ 2
Stream Order (U)
Wohu""'h
~ l
t~ I I , L-----~
stream Order (U,
Phud Urnsnlng (Irlbutary)
~ '00 1
6 10 l
Ie I f' 1 j Ii: i 0.1 ~ :I
0
S".am Ord.r (U)
Wah Umlam (tributorI •• ) Umshirpl
i '::L.-------- i ':: I~ - I~ i ' W
j 0' i , -I----~~~~~ ~
'000
l t 100
-~ J 10
I o
'000
Sham OrR, (U)
Uml<hen
~ •
Stream Order (U)
Wah SheUa(tributory)
i 100 _______
j~ -------i '0
Ii:
!
;1
t~ is ! j
'000
'00
'0
Str.am Order (Ul
Phud Mawlong
~ Str.am Order lUI
Slrum Order IU)
Umlchen(trlbulary)
100
l
---------t ~ 10
I I I'
Stream Order (U)
Wah Tamdong
~ 1000 1
r· ~ r,ooj ~ ! ,0L~-~---- -_-~-_---- __ ---
Str •• m Order (U)
Figure 4.4: Semi Log plot of stream order vs. mean stream length for various drainage sub-basins of the study area. 112
Aerial aspects
i. Drainage area
Basin area is hydrologically important because it directly affects the size of the storm
hydrograph and the magnitude of peak and mean runoff (Chorley, 1969). The maximum
flood discharge per unit area is inversely related to size of the basin, because the most
intense storms are usually of the smallest size (More, 1967). The computed data,
tabulated basin wise (Table 4.15) shows that the maximum basin area of about 25.08 km2
was found for the drainage basin D4 while the drainage basin DID covers the minimum
basin area of 4.9Ikm2• As such it is expected that the D4 basin will produce a smaller
peak flood flow than that of DID if magnitude and intensity of rainfall along with other
factors remain same. In the study area Wah Umiam is the main outlet in the western part,
Wah Umkhen in the southeastern part and Wah Sheila and Wah Tamdong are the main
outlets in northeastern part.
In order to find out the relationship between the basin area and the total stream length for
the respective basins, a regression line was constructed using a double-log graph paper. It
was found that the drainage area bears a power function relationship with total stream
length, which is shown in Figure 4.5. The relationship of stream length to basin area is
important because plots of basin area draining into various locations along the main
stream (Le., area-distance curve) give an idea of pattern of runoff and also because the
relationship of total stream lengths of all orders to basin area is one of the most sensitive
and variable morphometric parameter and one which controls the texture of landscape
dissection and the spacing of stream (Chorley, 1969).
113
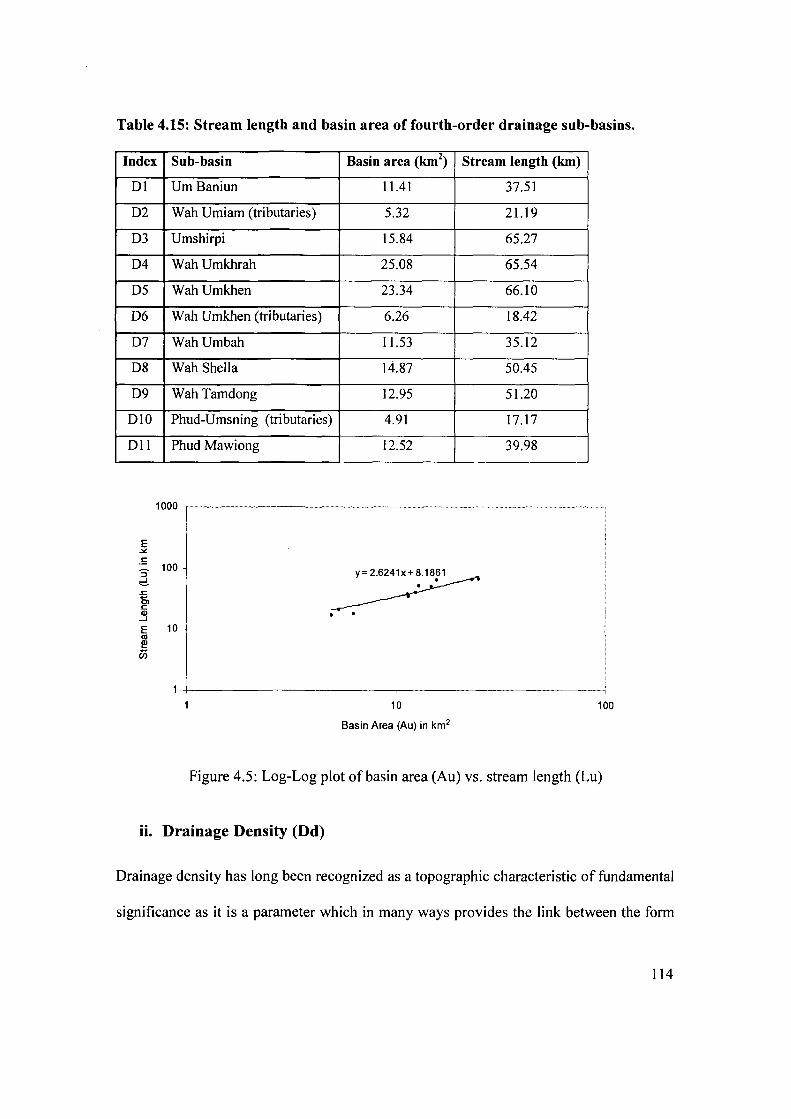
Table 4.15: Stream length and basin area of fourth-order drainage sub-basins.
Index Sub-basin Basin area (km2) Stream length (km)
01 Urn Baniun 11.41 37.51
02 Wah Umiam (tributaries) 5.32 21.19
03 Umshirpi 15.84 65.27
04 Wah Umkhrah 25.08 65.54
05 Wah Umkhen 23.34 66.10
06 Wah Umkhen (tributaries) 6.26 18.42
07 Wah Umbah 11.53 35.12
08 Wah SheIla 14.87 50.45
09 Wah Tamdong 12.95 51.20
010 Phud-Umsning (tributaries) 4.91 17.17
011 Phud Mawiong
E .>0:
.= 100 '5' d. .c 0, c .3 E 10 III !!!
U5
12.52 39.98
~ .
10
Basin Area (Au) in km2
100
Figure 4.5: Log-Log plot of basin area (Au) vs. stream length (Lu)
ii. Drainage Density (Dd)
Drainage density has long been recognized as a topographic characteristic of fundamental
significance as it is a parameter which in many ways provides the link between the form
114
attributes of the basin and the processes operating along the stream course (Gregory and
Welling, 1973). It reflects the landuse and affects infiltration and the basin response time
between precipitation and discharge. It is also of geomorphological interest particularly
for the development of slopes. Drainage density affects the runoff pattern, in that a high
drainage density removes surface runoff rapidly, decreasing the lag time and increasing
the peak of the hydrograph (Chorley, 1969). It is observed in the regions of impermeable
subsurface material with mountainous relief. Higher drainage density is characteristics of
impermeable but erodable lithology of the basin. On the other hand, low drainage
densities indicate that most rainfall infiltrates the ground and fewer channels are required
to carry the runoff. Low drainage densities are observed in regions underlain by
permeable material with low relief.
The value of drainage density thus obtained shows that drainage density of fourth-order
drainage basins of the study area range between 4.l2 to 2.61km.km-2 (Table 4.16).
Almost uniform drainage density with small standard deviation (±O.4S) for the given
drainage basins indicates common geological control on drainage development in the
area. That lithology is a controlling factor is apparent from the fact that the drainage basin
D4 showing lowest drainage density drains the central part of the study area and is
characterized by unconsolidated sediment fills while D3 showing the highest drainage
density drains through amphibolites (Khasi greenstones) and Precambrian metasediments
(Shillong quartzite).The higher value indicates the more runoff than infiltration from
precipitation, which also indicates the hilly terrain of consolidated material.
115
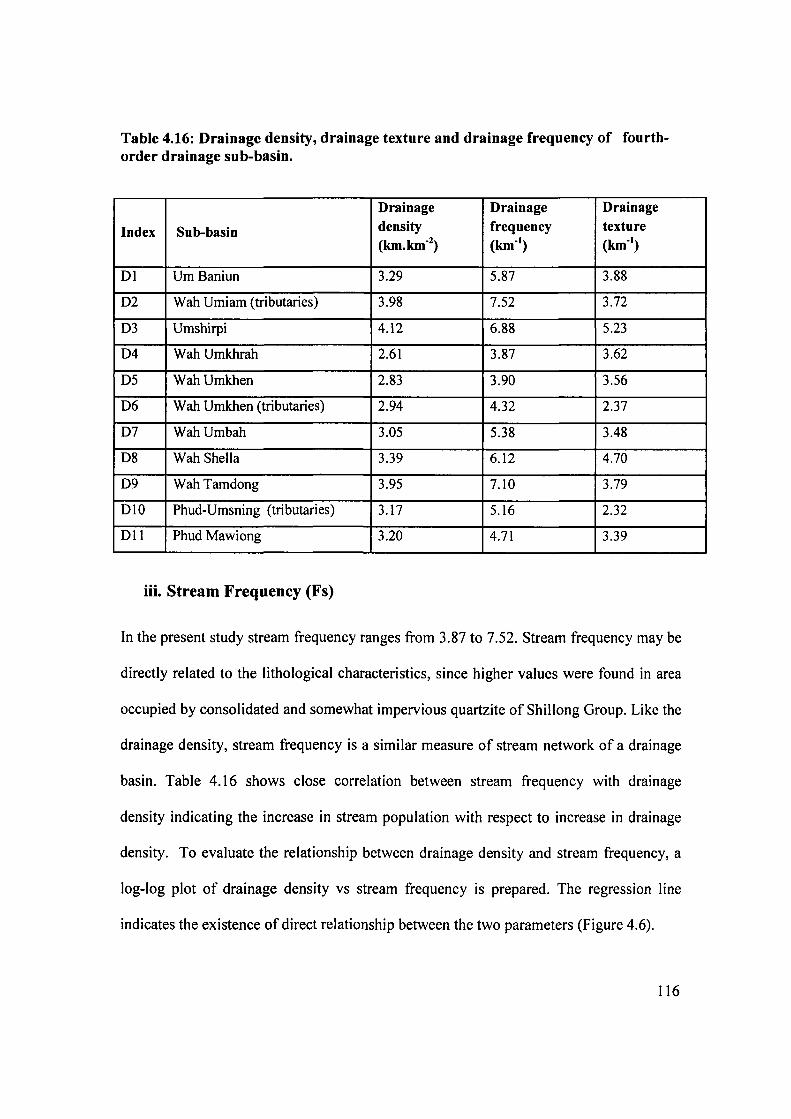
Table 4.16: Drainage density, drainage texture and drainage frequency of fourthorder drainage sub-basin.
Drainage Drainage Drainage
Index Sub-basin density frequency texture (km.km-2
) (km-I) (km-I
)
01 Urn Baniun 3.29 5.87 3.88
02 Wah Umiam (tributaries) 3.98 7.52 3.72
03 Umshirpi 4.12 6.88 5.23
04 Wah Umkhrah 2.61 3.87 3.62
05 WahUmkhen 2.83 3.90 3.56
06 Wah Umkhen (tributaries) 2.94 4.32 2.37
07 Wah Umbah 3.05 5.38 3.48
08 Wah She1la 3.39 6.12 4.70
09 Wah Tamdong 3.95 7.10 3.79
010 Phud-Umsning (tributaries) 3.17 5.16 2.32
011 Phud Mawiong 3.20 4.71 3.39
iii. Stream Frequency (Fs)
In the present study stream frequency ranges from 3.87 to 7.52. Stream frequency may be
directly related to the lithological characteristics, since higher values were found in area
occupied by consolidated and somewhat impervious quartzite of Shillong Group. Like the
drainage density, stream frequency is a similar measure of stream network of a drainage
basin. Table 4.16 shows close correlation between stream frequency with drainage
density indicating the increase in stream population with respect to increase in drainage
density. To evaluate the relationship between drainage density and stream frequency, a
log-log plot of drainage density vs stream frequency is prepared. The regression line
indicates the existence of direct relationship between the two parameters (Figure 4.6).
1 16
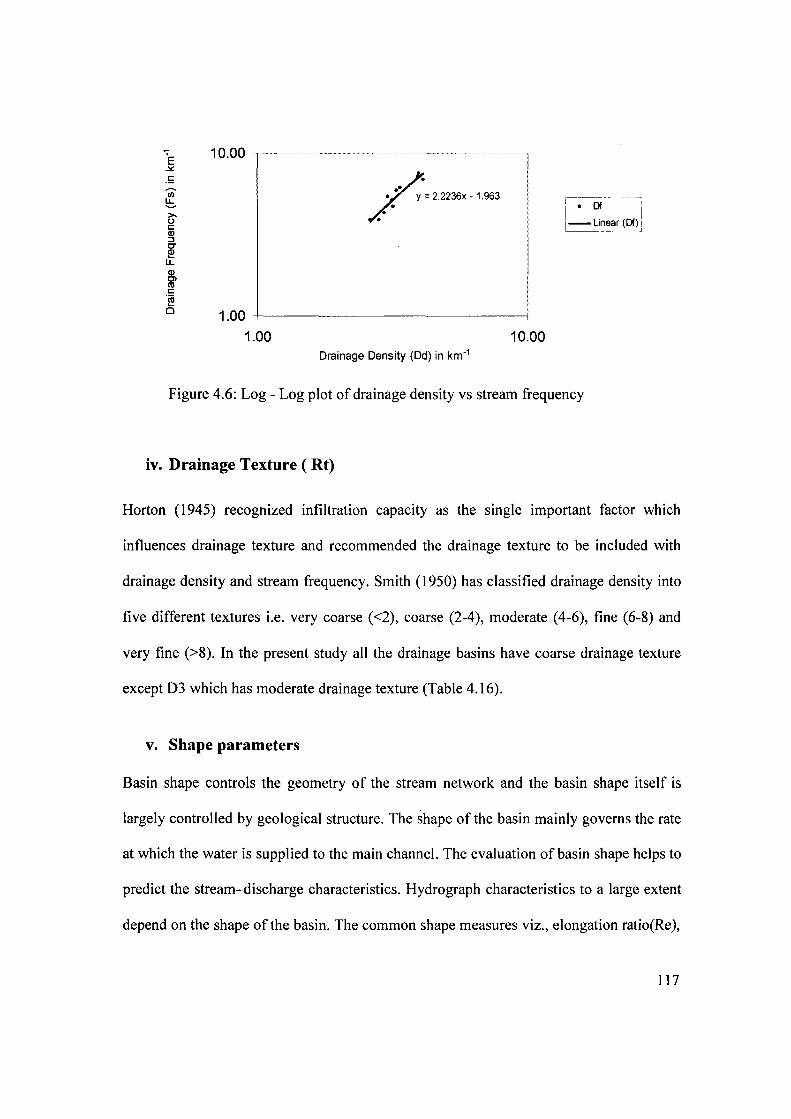
10.00
.. / • :. y = 2.2236x - 1.963
1.00 +---------------j
1.00 10.00 Drainage Density (Dd) in km-1
I • Of i 1-Linear (Of) : ~ ___ . _____ J
Figure 4.6: Log - Log plot of drainage density vs stream frequency
iv. Drainage Texture (Rt)
Horton (1945) recognized infiltration capacity as the single important factor which
influences drainage texture and recommended the drainage texture to be included with
drainage density and stream frequency. Smith (1950) has classified drainage density into
five different textures i.e. very coarse «2), coarse (2-4), moderate (4-6), fine (6-8) and
very fine (>8). In the present study all the drainage basins have coarse drainage texture
except 03 which has moderate drainage texture (Table 4.16).
v. Shape parameters
Basin shape controls the geometry of the stream network and the basin shape itself is
largely controlled by geological structure. The shape of the basin mainly governs the rate
at which the water is supplied to the main channel. The evaluation of basin shape helps to
predict the stream-discharge characteristics. Hydrograph characteristics to a large extent
depend on the shape of the basin. The common shape measures viz., elongation ratio(Re),
117
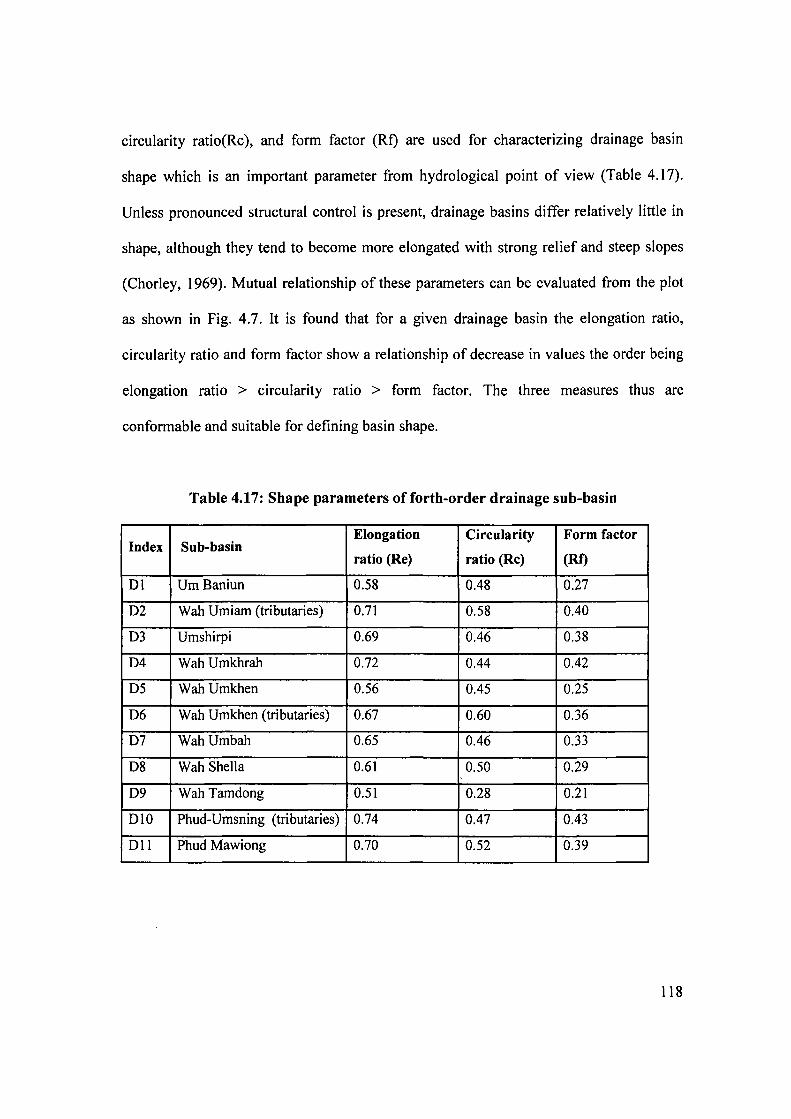
circularity ratio(Rc), and form factor (Rt) are used for characterizing drainage basin
shape which is an important parameter from hydrological point of view (Table 4.17).
Unless pronounced structural control is present, drainage basins differ relatively little in
shape, although they tend to become more elongated with strong relief and steep slopes
(Chorley, 1969). Mutual relationship of these parameters can be evaluated from the plot
as shown in Fig. 4.7. It is found that for a given drainage basin the elongation ratio,
circularity ratio and form factor show a relationship of decrease in values the order being
elongation ratio > circularity ratio > form factor. The three measures thus are
conformable and suitable for defining basin shape.
Table 4.17: Shape parameters of forth-order drainage sub-basin
Elongation Circularity Form factor Index Sub-basin
ratio (Re) ratio (Rc) (Rf)
Dl Urn Baniun 0.58 0.48 0.27
D2 Wah Umiam (tributaries) 0.71 0.58 0.40
D3 Umshirpi 0.69 0.46 0.38
D4 Wah Umkhrah 0.72 0.44 0.42
D5 WahUmkhen 0.56 0.45 0.25
D6 Wah Umkhen (tributaries) 0.67 0.60 0.36
D7 Wah Umbah 0.65 0.46 0.33
D8 Wah SheBa 0.61 0.50 0.29
D9 Wah Tamdong 0.51 0.28 0.21
DIO Phud-Umsning (tributaries) 0.74 0.47 0.43
Dll Phud Mawiong 0.70 0.52 0.39
118
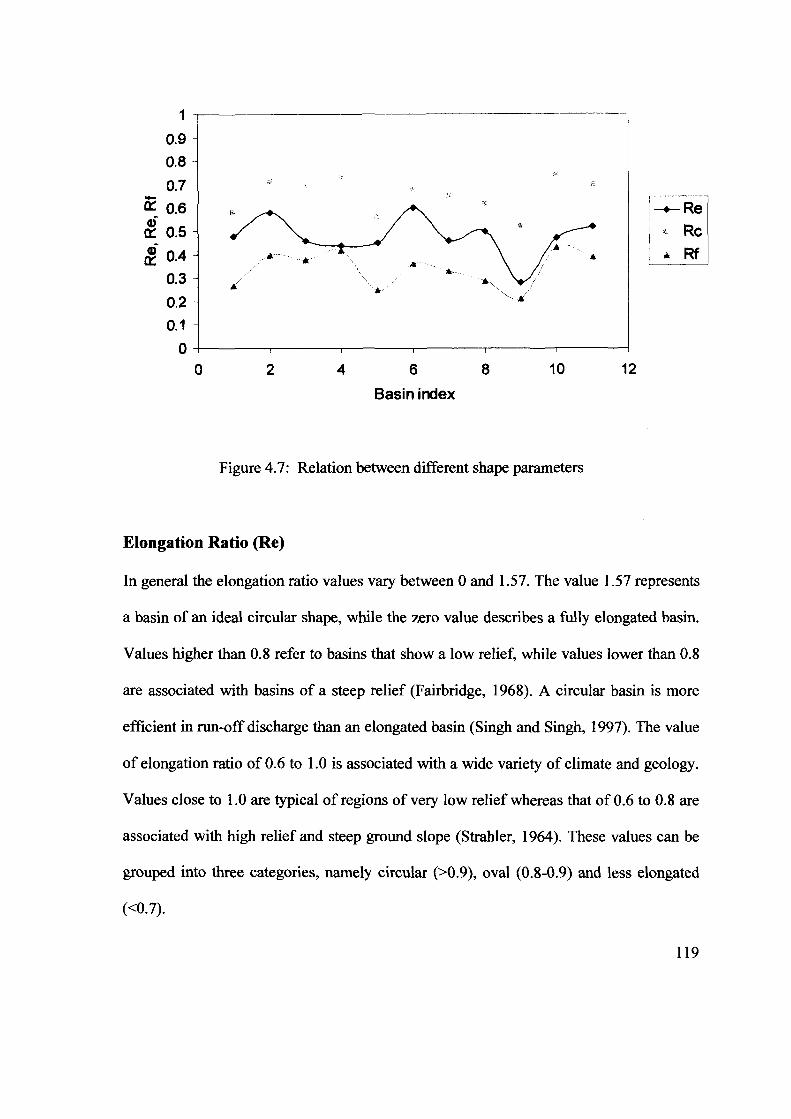
1
0.9 0.8
0.7 -a:: 0.6 ()
0.5 a:: () 0.4 a::
0.3
0.2 0.1
0 0
-0-
~;;.;;
/.~ .. •
2 4 6
Basin index
8 10
Figure 4.7: Relation between different shape parameters
Elongation Ratio (Re)
12
-+-- Re , Rc
• Rf
In general the elongation ratio values vary between 0 and 1.57. The value 1.57 represents
a basin of an ideal circular shape, while the zero value describes a fully elongated basin.
Values higher than 0.8 refer to basins that show a low relief, while values lower than 0.8
are associated with basins of a steep relief (Fairbridge, 1968). A circular basin is more
efficient in run-off discharge than an elongated basin (Singh and Singh, 1997). The value
of elongation ratio of 0.6 to 1.0 is associated with a wide variety of climate and geology.
Values close to 1.0 are typical of regions of very low relief whereas that of 0.6 to 0.8 are
associated with high relief and steep ground slope (Strahler, 1964). These values can be
grouped into three categories, namely circular (>0.9), oval (0.8-0.9) and less elongated
«0.7).
119
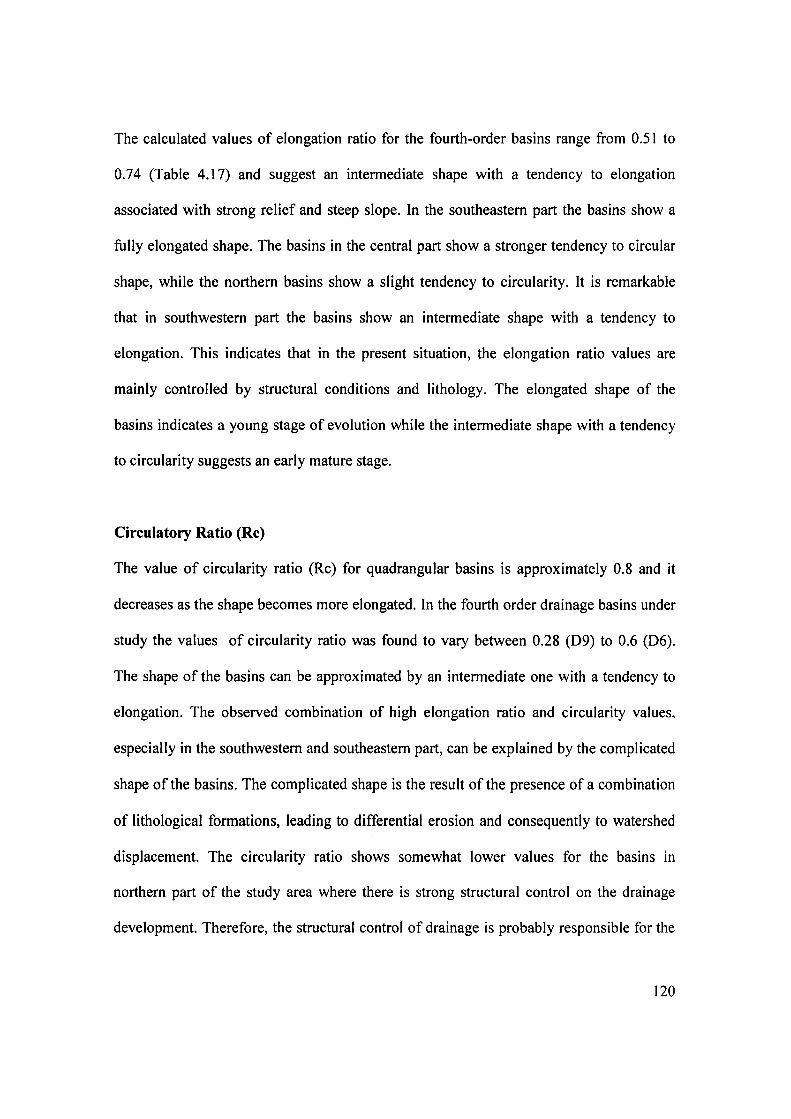
The calculated values of elongation ratio for the fourth-order basins range from 0.51 to
0.74 (Table 4.17) and suggest an intermediate shape with a tendency to elongation
associated with strong relief and steep slope. In the southeastern part the basins show a
fully elongated shape. The basins in the central part show a stronger tendency to circular
shape, while the northern basins show a slight tendency to circularity. It is remarkable
that in southwestern part the basins show an intermediate shape with a tendency to
elongation. This indicates that in the present situation, the elongation ratio values are
mainly controlled by structural conditions and lithology. The elongated shape of the
basins indicates a young stage of evolution while the intermediate shape with a tendency
to circularity suggests an early mature stage.
Circulatory Ratio (Rc)
The value of circularity ratio (Rc) for quadrangular basins is approximately 0.8 and it
decreases as the shape becomes more elongated. In the fourth order drainage basins under
study the values of circularity ratio was found to vary between 0.28 (D9) to 0.6 (D6).
The shape of the basins can be approximated by an intermediate one with a tendency to
elongation. The observed combination of high elongation ratio and circularity values,
especially in the southwestern and southeastern part, can be explained by the complicated
shape of the basins. The complicated shape is the result of the presence of a combination
of lithological formations, leading to differential erosion and consequently to watershed
displacement. The circularity ratio shows somewhat lower values for the basins in
northern part of the study area where there is strong structural control on the drainage
development. Therefore, the structural control of drainage is probably responsible for the
120
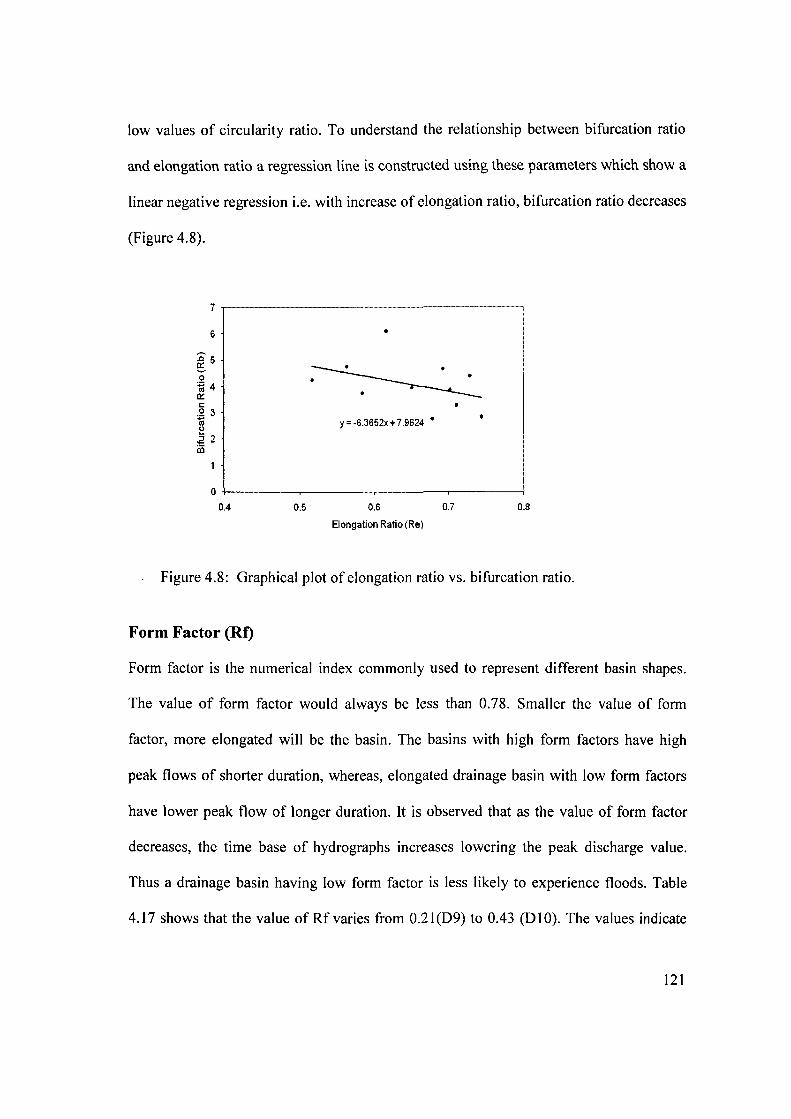
low values of circularity ratio. To understand the relationship between bifurcation ratio
and elongation ratio a regression line is constructed using these parameters which show a
linear negative regression i.e. with increase of elongation ratio, bifurcation ratio decreases
(Figure 4.8).
7
6 •
:a5 ~ 0 ';4 0:: I:
.!:! 3 IV y = -6.3652x + 7.9624 • ()
.2 2 ill
0
0.4 0.5 0.6 0.7 0.8
Elongation Ratio (Re)
Figure 4.8: Graphical plot of elongation ratio vs. bifurcation ratio.
Form Factor (Rt)
Form factor is the numerical index commonly used to represent different basin shapes.
The value of form factor would always be less than 0.78. Smaller the value of form
factor, more elongated will be the basin. The basins with high form factors have high
peak flows of shorter duration, whereas, elongated drainage basin with low form factors
have lower peak flow of longer duration. It is observed that as the value of form factor
decreases, the time base of hydrographs increases lowering the peak discharge value.
Thus a drainage basin having low form factor is less likely to experience floods. Table
4.17 shows that the value of Rf varies from 0.21 (09) to 0.43 (010). The values indicate
121
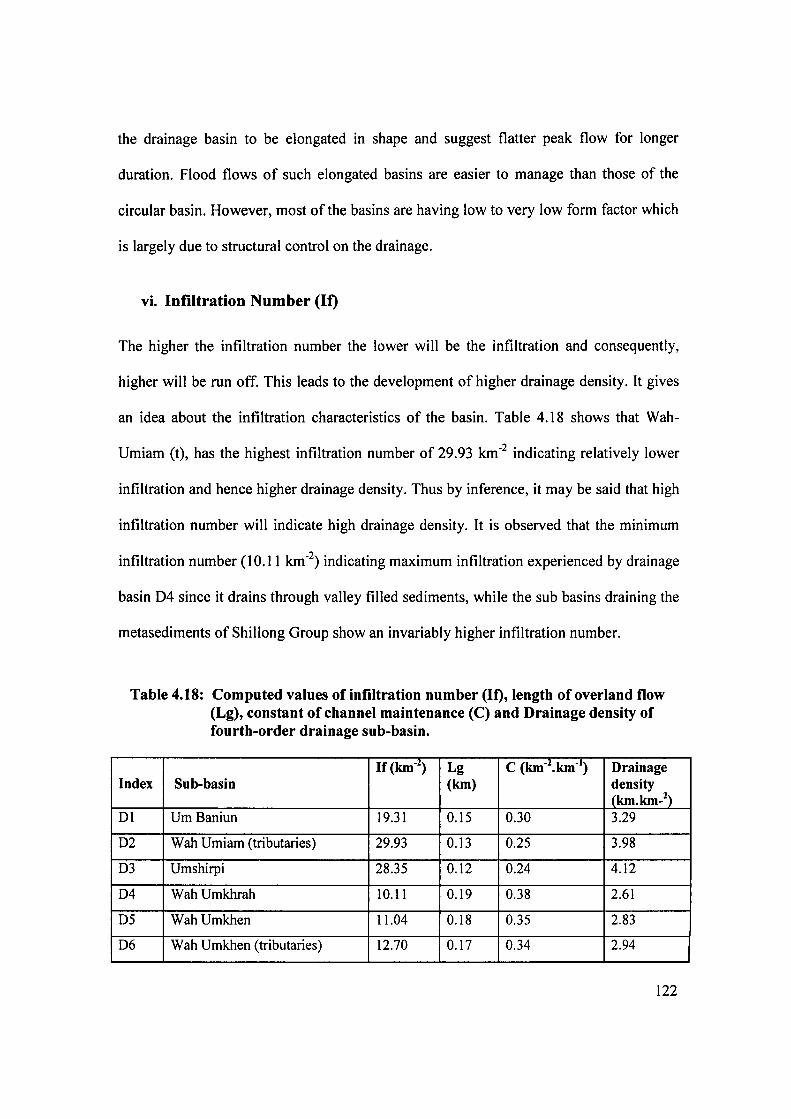
the drainage basin to be elongated in shape and suggest flatter peak flow for longer
duration. Flood flows of such elongated basins are easier to manage than those of the
circular basin. However, most of the basins are having low to very low form factor which
is largely due to structural control on the drainage.
vi. Infiltration Number (It)
The higher the infiltration number the lower will be the infiltration and consequently,
higher will be run off. This leads to the development of higher drainage density. It gives
an idea about the infiltration characteristics of the basin. Table 4.18 shows that Wah-
Umiam (t), has the highest infiltration number of 29.93 km-2 indicating relatively lower
infiltration and hence higher drainage density. Thus by inference, it may be said that high
infiltration number will indicate high drainage density. It is observed that the minimum
infiltration number (l 0.11 km-2) indicating maximum infiltration experienced by drainage
basin D4 since it drains through valley filled sediments, while the sub basins draining the
metasediments of Shillong Group show an invariably higher infiltration number.
Table 4.18: Computed values of infiltration number (It), length of overland flow (Lg), constant of channel maintenance (C) and Drainage density of fourth-order drainage sub-basin.
If (knt"z) Lg C (km-Z.km-I) Drainage Index Sub-basin (km) density
(km.km_z) Dl Urn Baniun 19.31 0.15 0.30 3.29
D2 Wah Urniarn (tributaries) 29.93 0.13 0.25 3.98
D3 Urnshirpi 28.35 0.12 0.24 4.12
D4 Wah Urnkhrah 10.11 0.19 0.38 2.61
D5 WahUrnkhen 11.04 0.18 0.35 2.83
D6 Wah Urnkhen (tributaries) 12.70 0.17 0.34 2.94
122
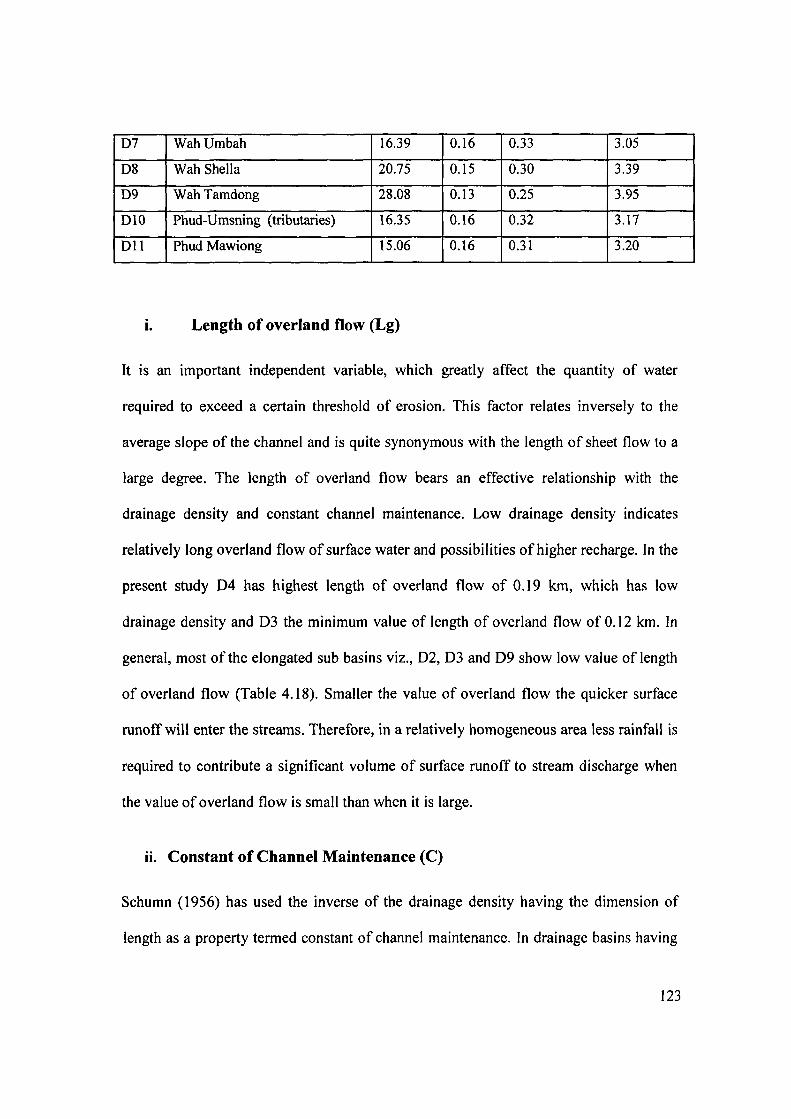
07 WahUmbah 16.39 0.16 0.33 3.05
08 Wah Shell a 20.75 0.15 0.30 3.39
09 Wah Tamdong 28.08 0.13 0.25 3.95
010 Phud-Umsning (tributaries) 16.35 0.16 0.32 3.17
011 Phud Mawiong 15.06 0.16 0.31 3.20
i. Length of overland flow (Lg)
It is an important independent variable, which greatly affect the quantity of water
required to exceed a certain threshold of erosion. This factor relates inversely to the
average slope of the channel and is quite synonymous with the length of sheet flow to a
large degree. The length of overland flow bears an effective relationship with the
drainage density and constant channel maintenance. Low drainage density indicates
relatively long overland flow of surface water and possibilities of higher recharge. In the
present study 04 has highest length of overland flow of 0.19 km, which has low
drainage density and 03 the minimum value of length of overland flow of 0.12 km. In
general, most of the elongated sub basins viz., 02, 03 and 09 show low value of length
of overland flow (Table 4.18). Smaller the value of overland flow the quicker surface
runoff will enter the streams. Therefore, in a relatively homogeneous area less rainfall is
required to contribute a significant volume of surface runoff to stream discharge when
the value of overland flow is small than when it is large.
ii. Constant of Channel Maintenance (C)
Schumn (1956) has used the inverse of the drainage density having the dimension of
length as a property termed constant of channel maintenance. In drainage basins having
123
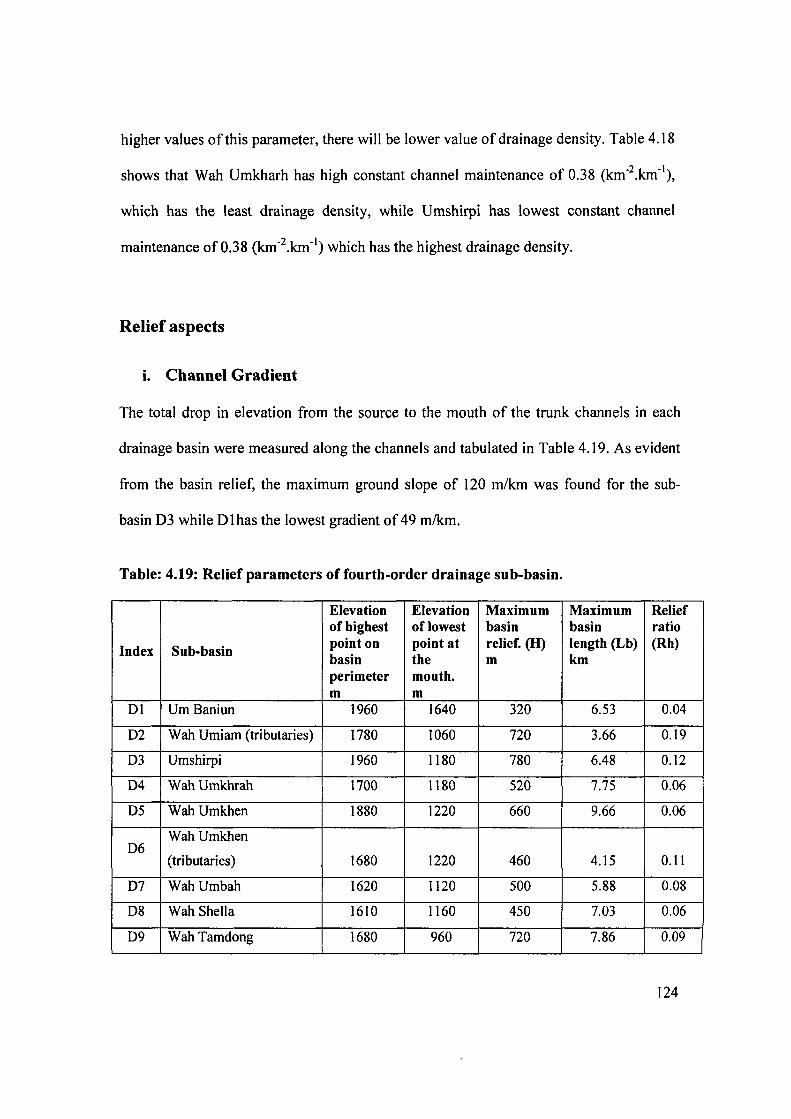
higher values of this parameter, there will be lower value of drainage density. Table 4.18
shows that Wah Umkharh has high constant channel maintenance of 0.38 (km-2.km-I),
which has the least drainage density, while Umshirpi has lowest constant channel
maintenance of 0.38 (km-2.km-l) which has the highest drainage density.
Relief aspects
i. Channel Gradient
The total drop in elevation from the source to the mouth of the trunk channels in each
drainage basin were measured along the channels and tabulated in Table 4.19. As evident
from the basin relief, the maximum ground slope of 120 mlkm was found for the sub-
basin D3 while Dlhas the lowest gradient of 49 mlkm.
Table: 4.19: Relief parameters of fourth-order drainage sub-basin.
Elevation Elevation Maximum Maximum Relief of big best of lowest basin basin ratio
Index Sub-basin point on point at relief. (H) lengtb (Lb) (Rh) basin the m km perimeter mouth. m m
Dl Urn Baniun 1960 1640 320 6.53 0.04
D2 Wah Urniarn (tributaries) 1780 1060 720 3.66 0.19
D3 Urnshirpi 1960 1180 780 6.48 0.12
D4 Wah Urnkhrah 1700 1180 520 7.75 0.06
D5 Wah Urnkhen 1880 1220 660 9.66 0.06
WahUrnkhen D6
(tributaries) 1680 1220 460 4.15 0.11
D7 WahUrnbah 1620 1120 500 5.88 0.08
D8 Wah Shella 1610 1160 450 7.03 0.06
D9 Wah Tarndong 1680 960 720 7.86 0.09
124
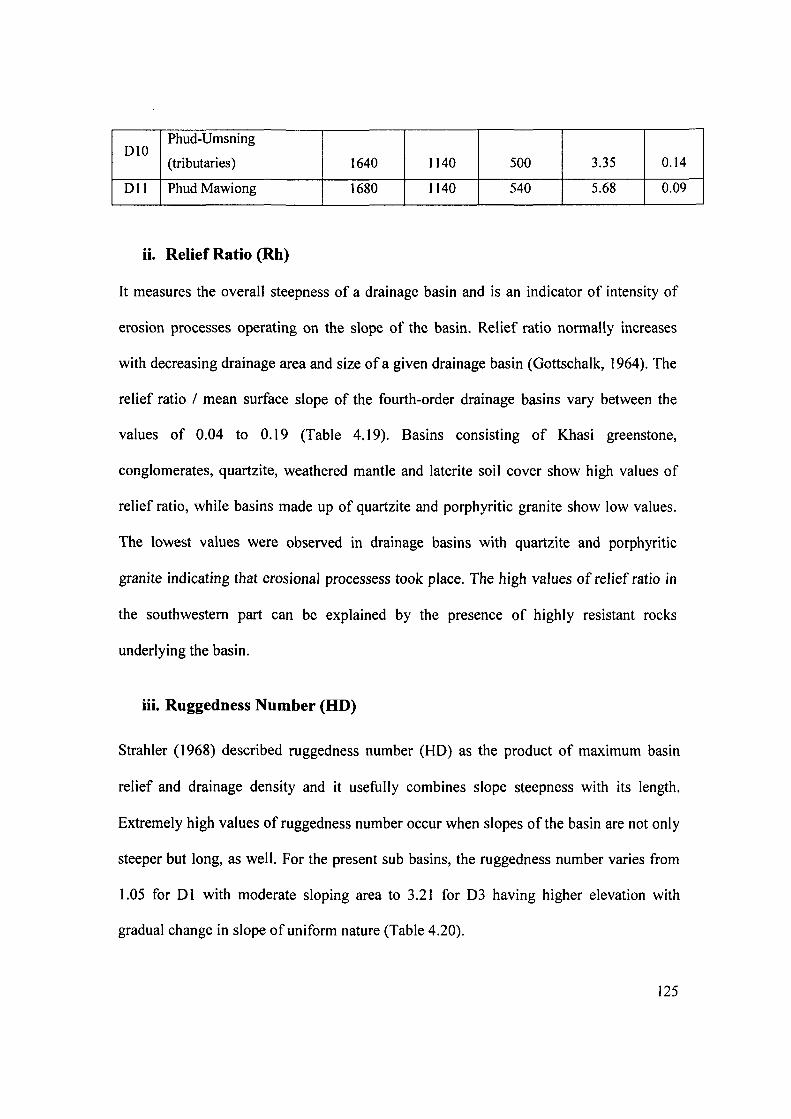
DlO Phud-Umsning
(tributaries) 1640 1140 500 3.35 0.14
Dll Phud Mawiong 1680 1140 540 5.68 0.09
ii. Relief Ratio (Rh)
It measures the overall steepness of a drainage basin and is an indicator of intensity of
erosion processes operating on the slope of the basin. Relief ratio normally increases
with decreasing drainage area and size of a given drainage basin (Gottschalk, 1964). The
relief ratio / mean surface slope of the fourth-order drainage basins vary between the
values of 0.04 to 0.19 (Table 4.19). Basins consisting of Khasi greenstone,
conglomerates, quartzite, weathered mantle and laterite soil cover show high values of
relief ratio, while basins made up of quartzite and porphyritic granite show low values.
The lowest values were observed in drainage basins with quartzite and porphyritic
granite indicating that erosional processess took place. The high values of relief ratio in
the southwestern part can be explained by the presence of highly resistant rocks
underlying the basin.
iii. Ruggedness Number (HD)
Strahler (1968) described ruggedness number (HO) as the product of maximum basin
relief and drainage density and it usefully combines slope steepness with its length.
Extremely high values of ruggedness number occur when slopes of the basin are not only
steeper but long, as well. For the present sub basins, the ruggedness number varies from
1.05 for 01 with moderate sloping area to 3.21 for 03 having higher elevation with
gradual change in slope of uniform nature (Table 4.20).
125
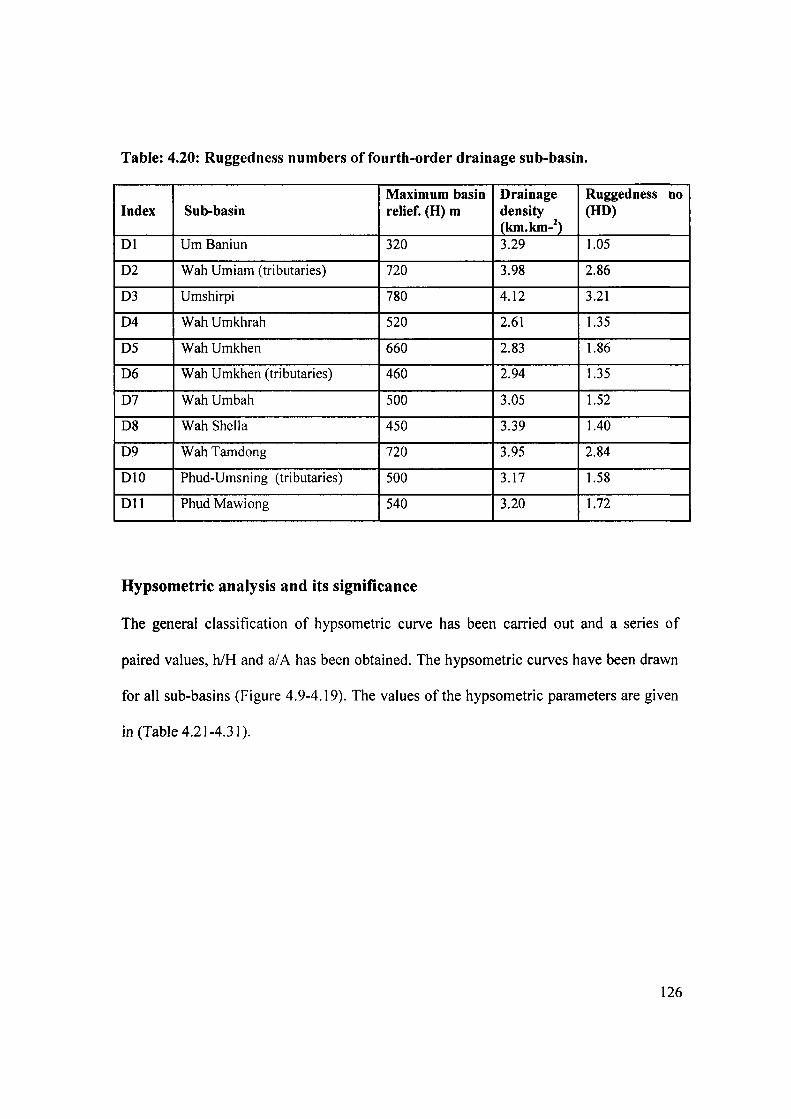
Table: 4.20: Ruggedness numbers of fourth-order drainage sub-basin.
Maximum basin Drainage Ruggedness no Index Sub-basin relief. (H) m density (HD)
(km.km_1)
Dl Urn Baniun 320 3.29 1.05
D2 Wah Urniarn (tributaries) 720 3.98 2.86
D3 Urnshirpi 780 4.12 3.21
D4 Wah Urnkhrah 520 2.61 1.35
D5 Wah Urnkhen 660 2.83 1.86
D6 Wah Umkhen (tributaries) 460 2.94 1.35
D7 Wah Umbah 500 3.05 1.52
D8 Wah Sheila 450 3.39 1.40
D9 Wah Tamdong 720 3.95 2.84
DI0 Phud-Umsning (tributaries) 500 3.17 1.58
Dll Phud Mawiong 540 3.20 1.72
Hypsometric analysis and its significance
The general classification of hypsometric curve has been carried out and a series of
paired values, hlH and alA has been obtained. The hypsometric curves have been drawn
for all sub-basins (Figure 4.9-4.19). The values of the hypsometric parameters are given
in (Table 4.21-4.3 1 ).
126
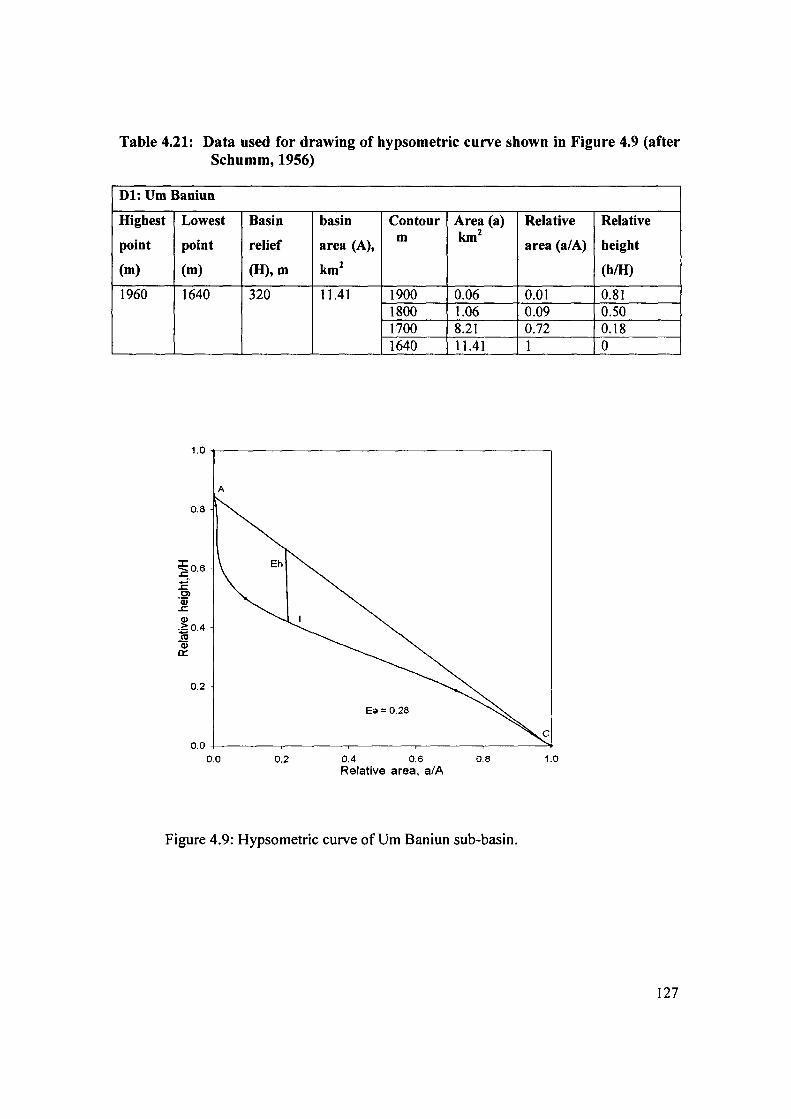
Table 4.21: Data used for drawing of hypsometric curve shown in Figure 4.9 (after Schumm, 1956)
Dl: Um Baniun
Highest Lowest Basin basin Contour Area (a) Relative Relative
point point relief area (A), m km2
area (a/A) height
(m) (m) (H), m kml (hlH)
1960 1640 320 11.41 1900 0.06 0.01 0.81 1800 1.06 0.09 0.50 1700 8.21 0.72 0.18 1640 11.41 1 0
1.0 ~-------------------,
A
0.8
0.2
0.0 +-----.-----r-------.-----r-----"'+ 0.0 0.2 0.4 0.6 0.8 1.0
Relative area, alA
Figure 4.9: Hypsornetric curve of Urn Baniun sub-basin.
127
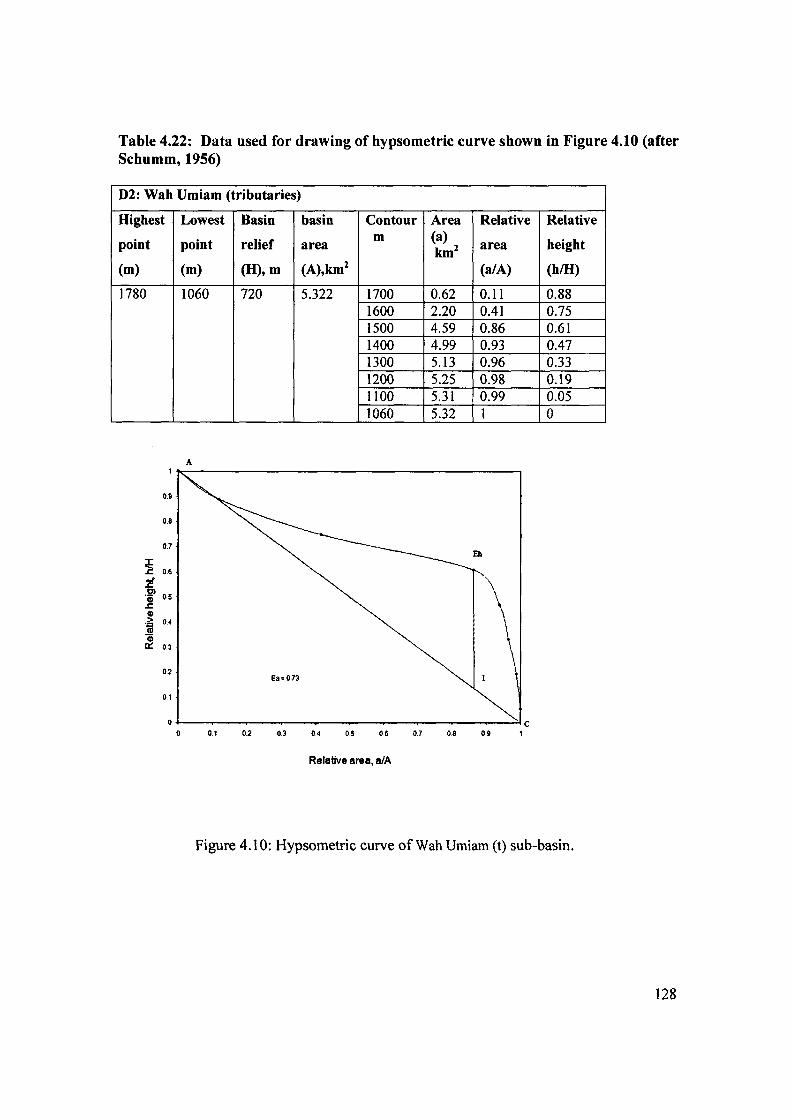
Table 4.22: Data used for drawing of hypsometric curve shown in Figure 4.10 (after Schumm, 1956)
D2: Wah Umiam (tributaries)
Highest Lowest Basin basin Contour Area Relative Relative
point point relief m (a)
height area km2 area
(m) (m) (H), m (A),km2 (a/A) (hlH)
1780 1060 720 5.322 1700 0.62 0.11 0.88 1600 2.20 0.41 0.75 1500 4.59 0.86 0.61 1400 4.99 0.93 0.47 1300 5.13 0.96 0.33 1200 5.25 0.98 0.19 1100 5.31 0.99 0.05 1060 5.32 1 0
A
0.1l
0.8
0.7 Eh
~ 0.6
E CI 'iii 0.5 .s::. Q)
i 0.4
"ii) ct: 0.3
02 Ea=073
0.1
O~--~~------~--~--~--~--~--~~C o 0.1 0.2 0.3 0.4 0.5 06 0.7 0.8 09 1
Relative area, alA
Figure 4.10: Hypsometric curve of Wah Umiam (t) sub-basin.
128
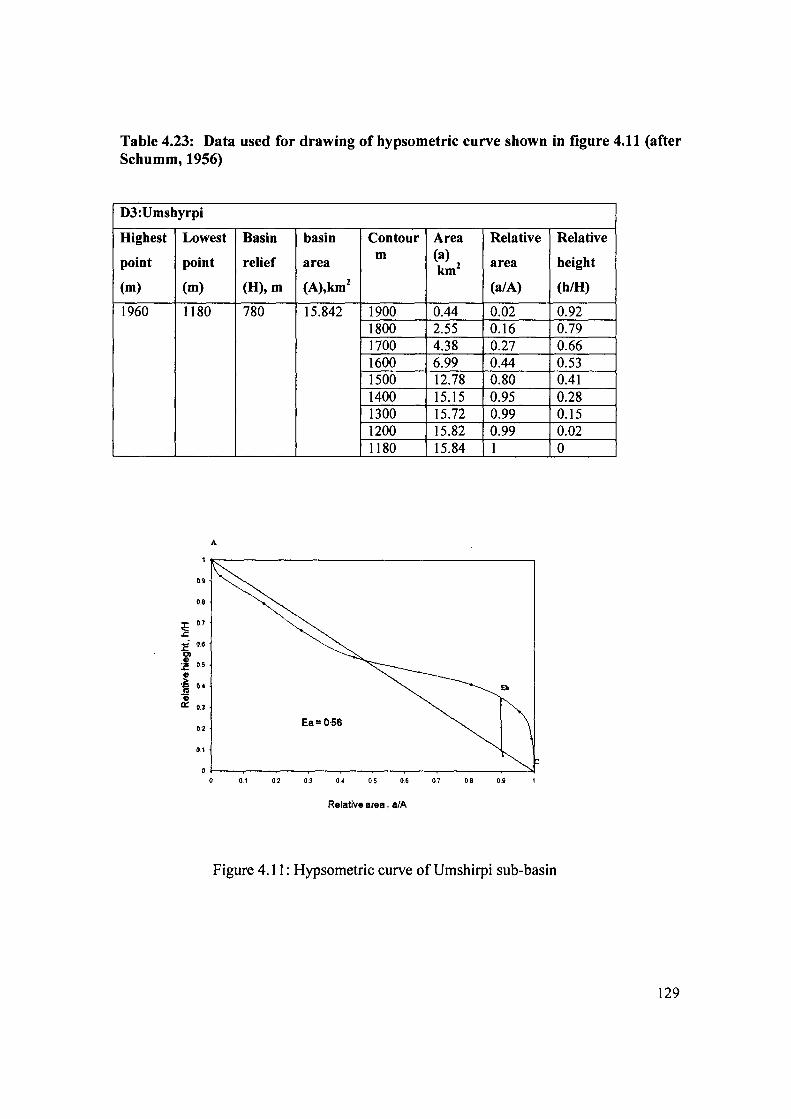
Table 4.23: Data used for drawing of hypsometric curve shown in figure 4.11 (after Schumm, 1956)
D3:Umshyrpi
Highest
point
(m)
1960
Lowest
point
(m)
1180
0.9
0.8
~ 0.7
:i 0.6
1 0.5
GI
.~ u "ii 0:: 0.3
0.2
0.1
A
Basin basin
relief area
(H), m (A),km2
780 15.842
Ea=O-56
Contour Area Relative m (a)
km2 area
(alA)
1900 0.44 0.02 1800 2.55 0.16 1700 4.38 0.27 1600 6.99 0.44 1500 12.78 0.80 1400 15.15 0.95 1300 15.72 0.99 1200 15.82 0.99 1180 15.84 1
O~~--~--~--~--~~--~--__ --~~ o 01 0.2 0.3 O. 05 06 07 08 0.9
Relative area, alA
Figure 4.11: Hypsometric curve of Umshirpi sub-basin
Relative
height
(hlH)
0.92 0.79 0.66 0.53 0.41 0.28 0.15 0.02 0
129
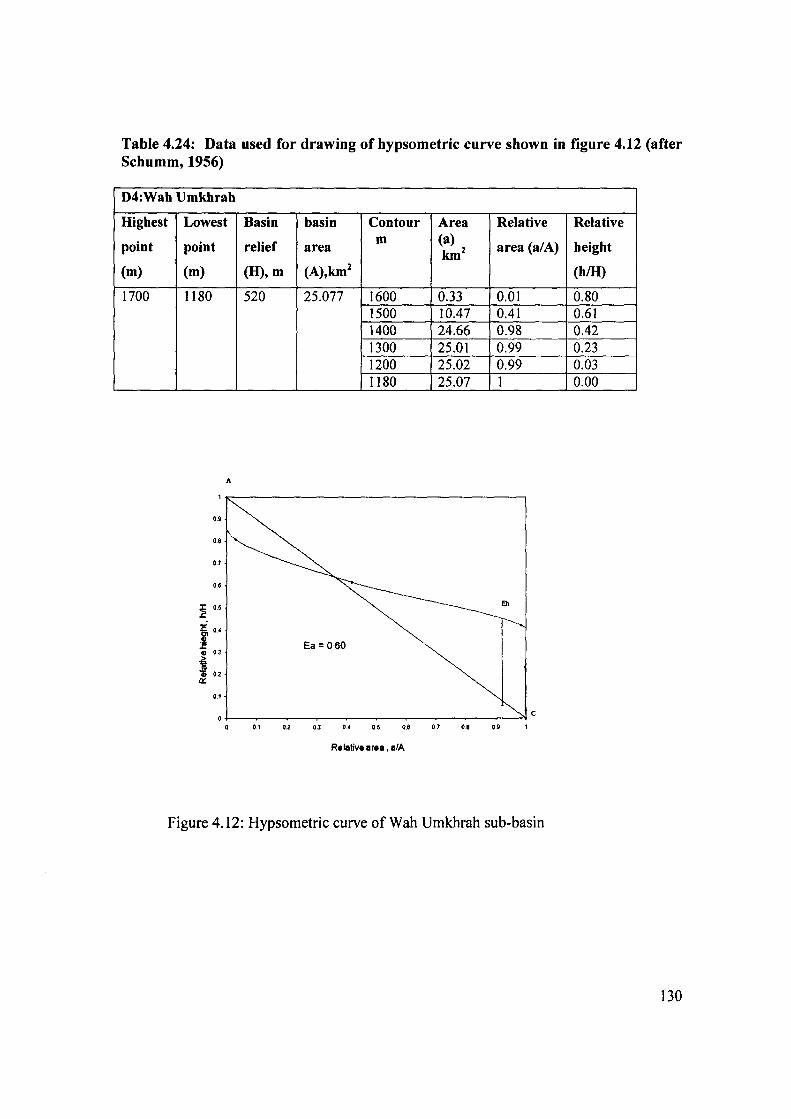
Table 4.24: Data used for drawing of hypsometric curve shown in figure 4.12 (after Schumm, 1956)
D4:Wah Umkhrah
Highest
point
(m)
1700
Lowest
point
(m)
1180
0.9
0.8
0.7
0.6
~ 0.5
~ 0.'
~ Gl 03
~ ~ 02 0::
0.1
A
Basin basin
relief area
(H), m (A),km2
520 25.077
Contour Area Relative m (a)
area (a/A) km2
1600 0.33 0.01 1500 10.47 0.41 1400 24.66 0.98 1300 25.01 0.99 1200 25.02 0.99 1180 25.07 1
o~~ __ ~ __ ~ __ ~~ __ ~ __ ~ __ ~~ __ ~c o ~ ~ U U M U V M U
Relative area. alA
Figure 4.12: Hypsometric curve of Wah Umkhrah sub-basin
Relative
height
(hlH)
0.80 0.61 0.42 0.23 0.03 0.00
130
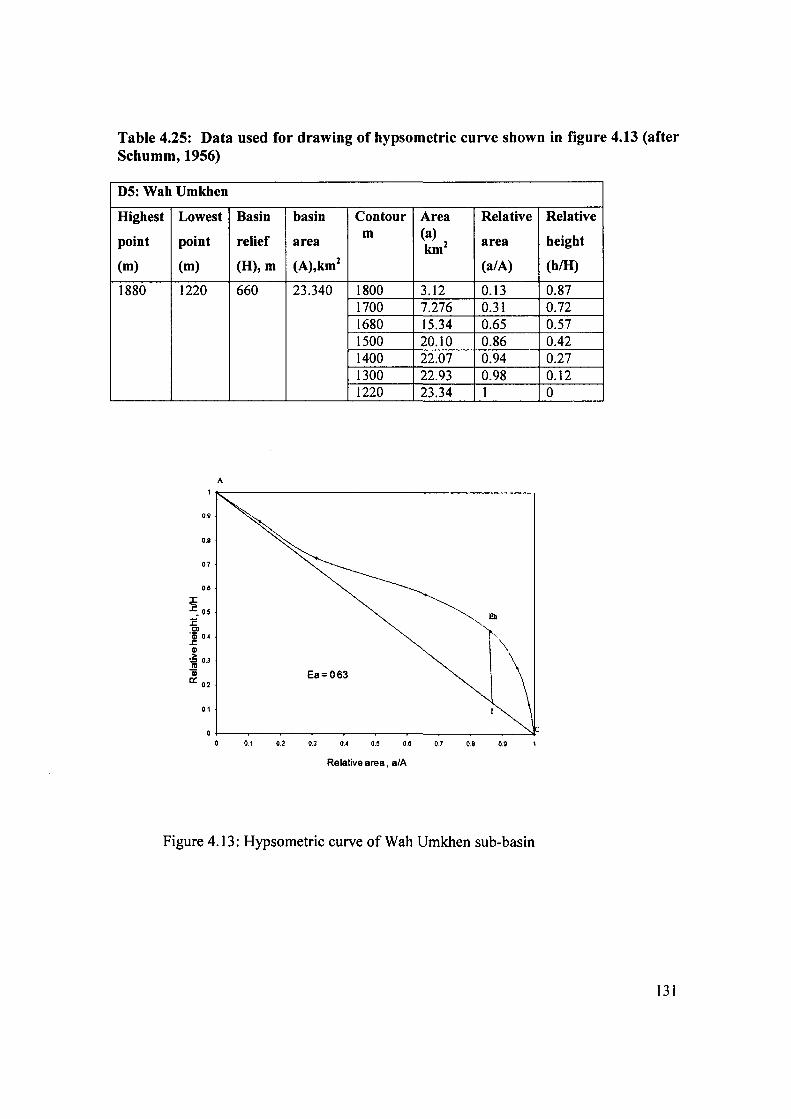
Table 4.25: Data used for drawing of hypsometric curve shown in figure 4.13 (after Schumm, 1956)
D5: Wah Umkhen
Highest
point
(m)
1880
Lowest
point
(m)
1220
0.9
0.8
0.7
0.0
~ 05
1: Cl 'iii 0.' ol:
011
~ 0.3
"iii 0:: 0.2
0.1
A
Basin basin
relief area
(H), m (A),km2
660 23.340
Ea= 063
Contour Area Relative m (a)
km2 area
(a/A)
1800 3.12 0.13 1700 7.276 0.31 1680 15.34 0.65 1500 20.10 0.86 1400 22.07 0.94 1300 22.93 0.98 1220 23.34 1
o~~--~--~--~--~~--~--____ ~~ o 0.1 0.2 0.3 0.' 0.5 0.0 0.7 0.8 0.9
Relative area, alA
Figure 4.13: Hypsometric curve of Wah Umkhen sub-basin
Relative
height
(h/H)
0.87 0.72 0.57 0.42 0.27 0.12 0
131
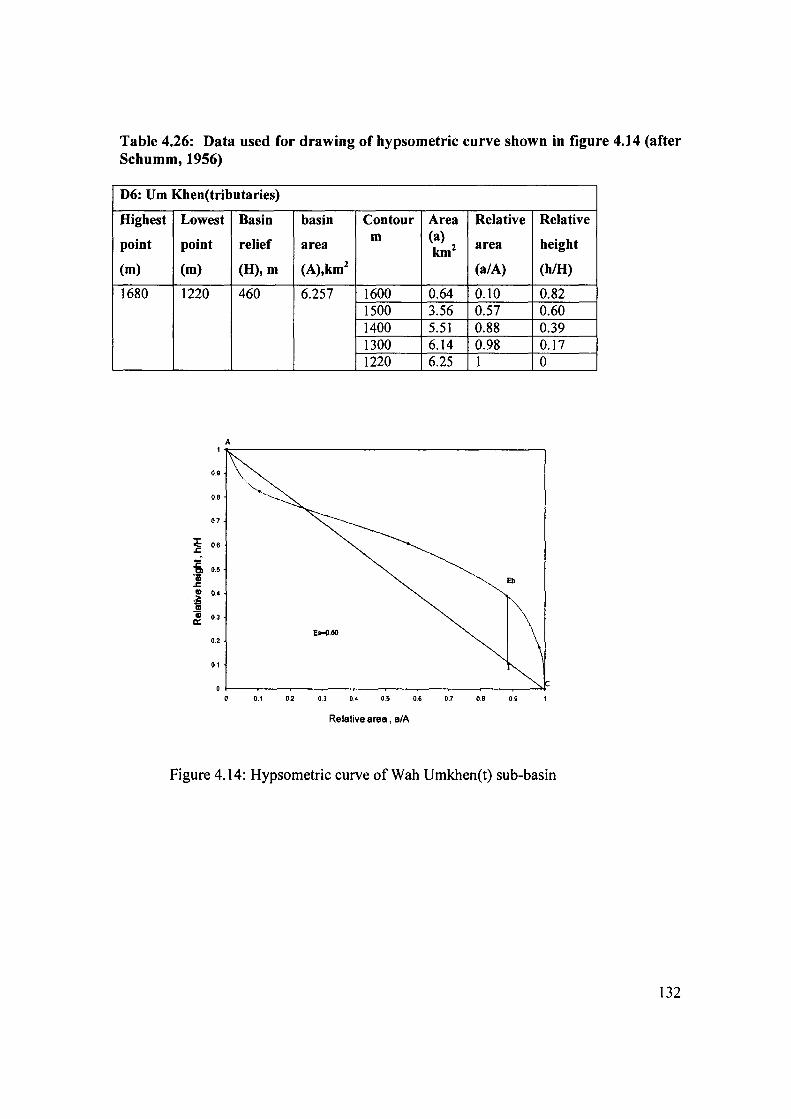
Table 4.26: Data used for drawing of hypsometric curve shown in figure 4.14 (after Schumm, 1956)
D6: Um Khen(tributaries)
Highest Lowest Basin basin Contour Area Relative Relative
point point relief m (a) height area km2 area
(m) (m) (H),m (A),km2 (a/A) (hlH)
1680 1220 460 6.257 1600 0.64 0.10 0.82 1500 3.56 0.57 0.60 1400 5.51 0.88 0.39 1300 6.14 0.98 0.17 1220 6.25 1 0
A
09
0.8
0.7
~ 0.6
1i 0.5 DI
'ij Ell .c ., 0 .•
i 'ii 0.3 c::
E...o.60 0.2
0.1
Relative area, alA
Figure 4.14: Hypsometric curve of Wah Umkhen(t) sub-basin
132
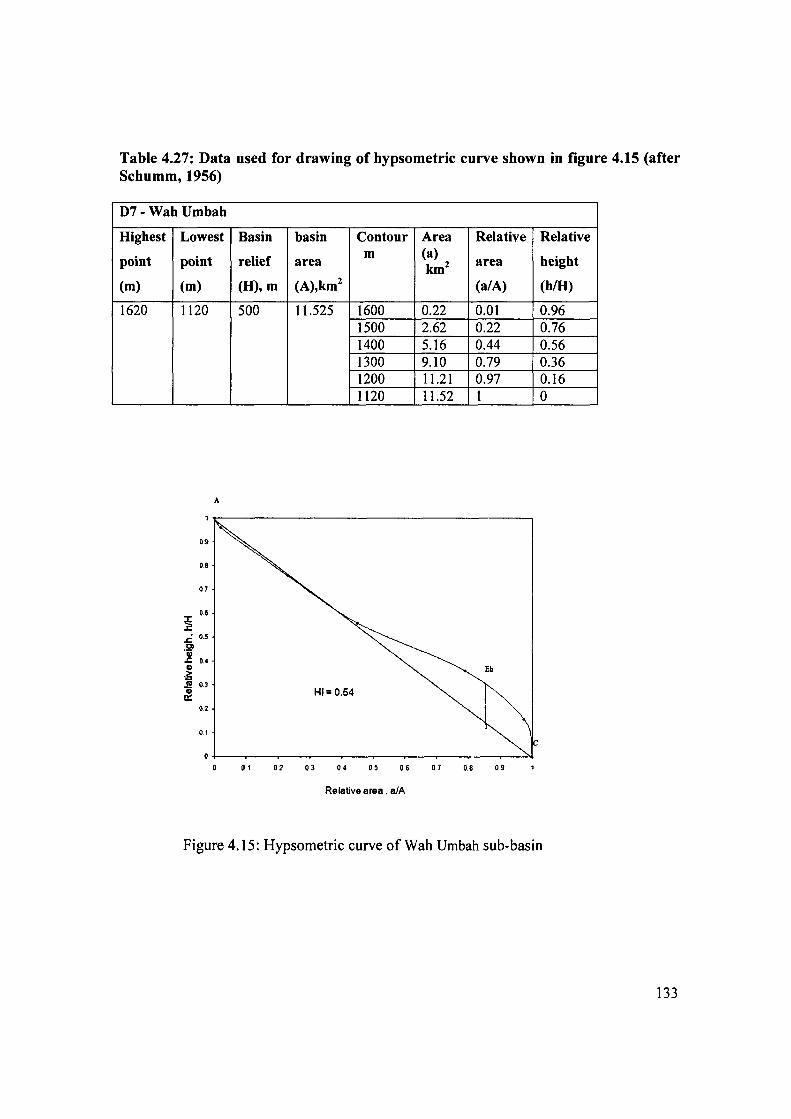
Table 4.27: Data used for drawing of hypsometric curve shown in figure 4.15 (after Schumm, 1956)
D7 - Wah Umbah
Highest
point
(m)
1620
Lowest
point
(m)
1120
0.9
0.8
0.7
0.6
~ .c 0.5 CI
'Qi .J:. 0.4 III
~ .!!! 0.3 III a:
0.2
0.1
A
Basin basin
relief area
(H), m (A),km2
500 11.525
HI= 0.54
Contour Area Relative m (a)
km2 area
(a/A)
1600 0.22 0.01 1500 2.62 0.22 1400 5.16 0.44 1300 9.10 0.79 1200 11.21 0.97 1120 11.52 1
Eh
O~~~~--~--~--~--~--~~--~--~ o 01 02 03 0.4 05 06 07 0.8 09
Relative area. alA
Relative
height
(hlH)
0.96 0.76 0.56 0.36 0.16 0
Figure 4.15: Hypsometric curve of Wah Umbah sub-basin
133
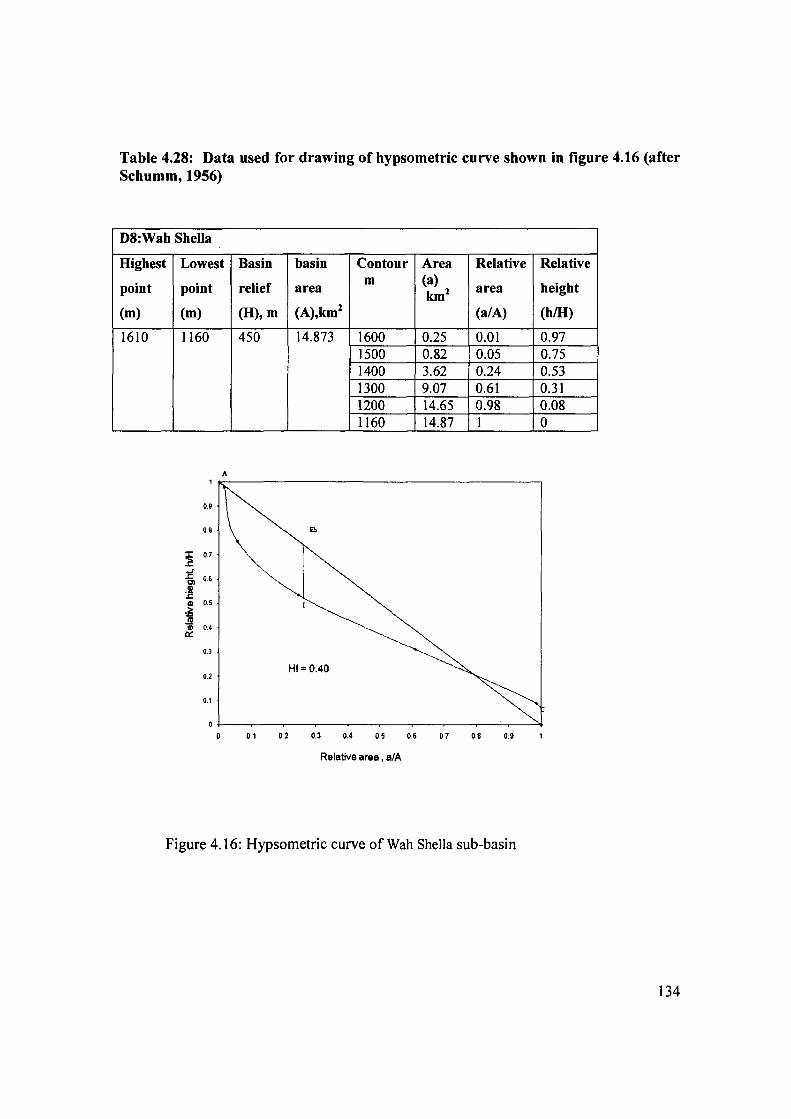
Table 4.28: Data used for drawing of hypsometric curve shown in figure 4.16 (after Schumm, 1956)
D8:Wah Sheila
Highest Lowest Basin basin Contour Area Relative Relative
point point relief m (a) height area km2 area
(m) (m) (H), m (A),km2 (a/A) (hlH)
1610 1160 450 14.873 1600 0.25 0.01 0.97 1500 0.82 0.05 0.75 1400 3.62 0.24 0.53 1300 9.07 0.61 0.31 1200 14.65 0.98 0.08 1160 14.87 1 0
A
0.9
0.8
~ 0.7
:E 0.6 Cl .S! J: GI 0.5
~ !U 1) 0.4 c:::
0.3
HI = 0.40 0.2
0.1
0
0 0.1 02 0.3 0.4 0.5 0.6 0.7 0.8 0.9
Relative area. alA
Figure 4.16: Hypsometric curve of Wah Sheila sub-basin
134
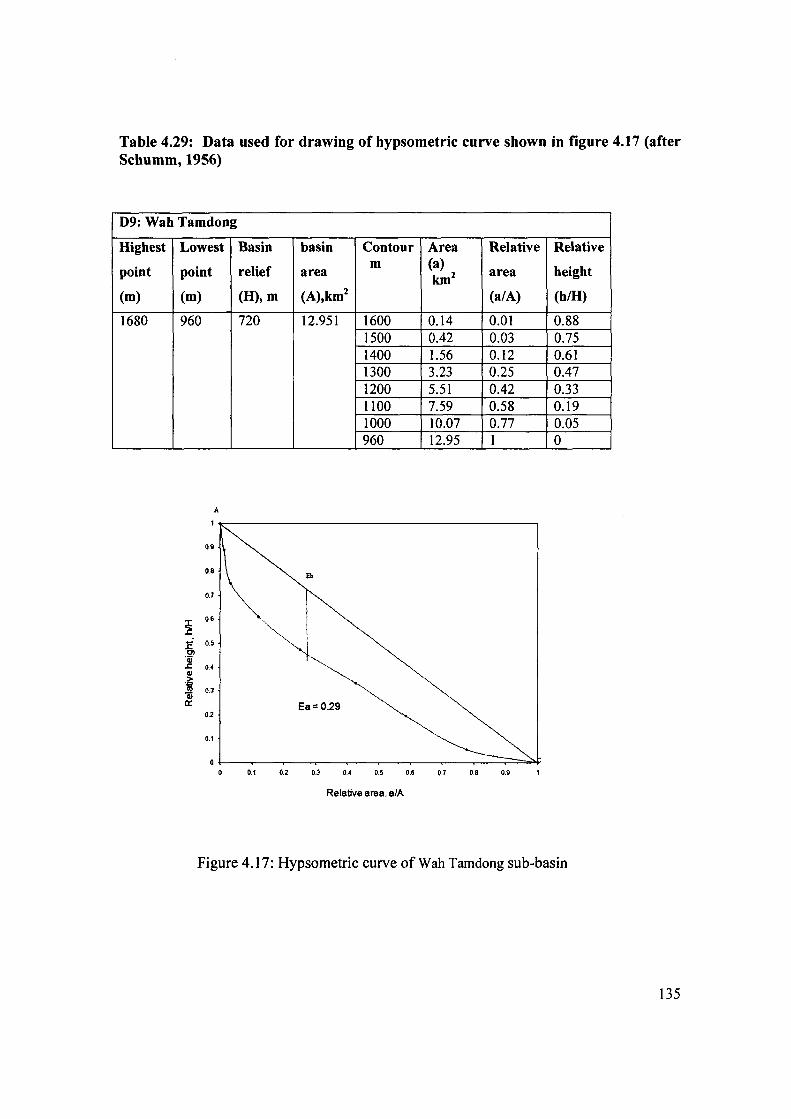
Table 4.29: Data used for drawing of hypsometric curve shown in figure 4.17 (after Schumm, 1956)
D9: Wah Tamdong
Highest
point
(m)
1680
Lowest
point
(m)
960
A
Q.9
0.8
0.7
~ 0.6
Ii 0.5 C>
'Qj .r: 0 .• G)
.1; ~ 0.3
0:: 02
0.1
Basin basin Contour
relief m
area
(H),m (A),kml
720 12.951 1600 1500 1400 1300 1200 1100 1000 960
Relative area, alA
Area Relative Relative (a)
height kInl
area
(alA) (h/H)
0.14 0.01 0.88 0.42 0.03 0.75 1.56 0.12 0.61 3.23 0.25 0.47 5.51 0.42 0.33 7.59 0.58 0.19 10.07 0.77 0.05 12.95 1 0
Figure 4.17: Hypsometric curve of Wah Tamdong sub-basin
135
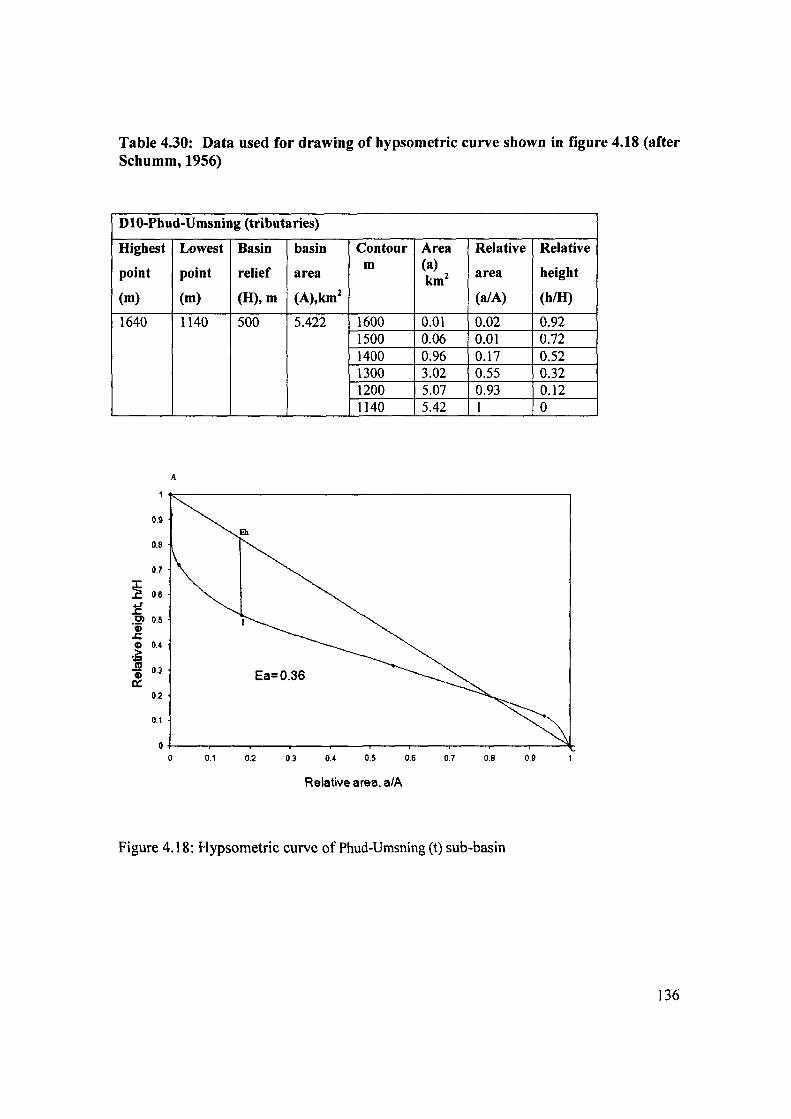
Table 4.30: Data used for drawing of hypsometric curve shown in figure 4.18 (after Schumm, 1956)
DIO-Phud-Umsning (tributaries)
Highest
point
(m)
1640
0.9
0.8
0.7
~ 0.6
:t .2l 0.5 (I) .r. (I) 0.4
~ (0 Q) 0.3
c:: 0.2
0.1
Lowest
point
(m)
1140
A
o 0.1
Basin basin Contour
relief m
area
(H), m (A),km2
500 5.422 1600 1500 1400 1300 1200 1140
Eh
Ea=O.36
0.2 0.3 0.4 0.5 0.6
Relative area, alA
Area Relative (a) km2 area
(a/A)
0.01 0.02 0.06 0.01 0.96 0.17 3.02 0.55 5.07 0.93 5.42 1
0.7 0.8 0.9
Figure 4.18: Hypsometric curve of Phud-Umsning (t) sub-basin
Relative
height
(h/H)
0.92 0.72 0.52 0.32 0.12 0
136
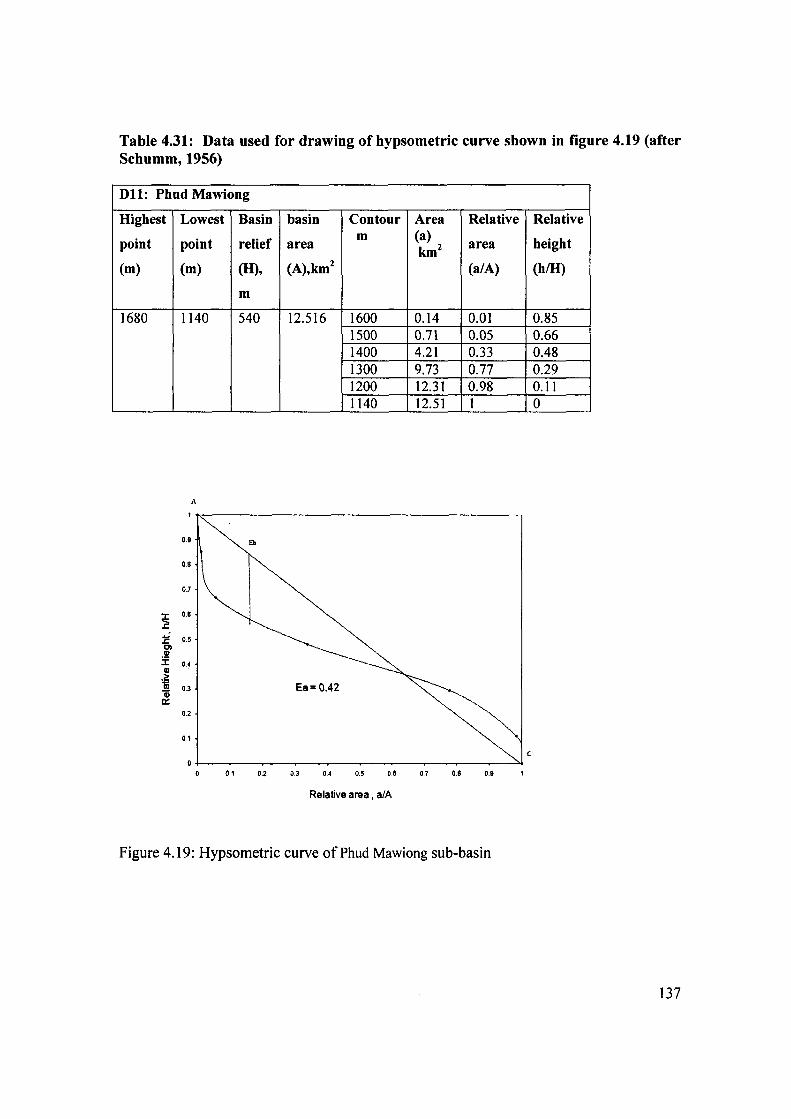
Table 4.31: Data used for drawing of hypsometric curve shown in figure 4.19 (after Schumm, 1956)
Dll: Phud Mawiong
Higbest Lowest Basin basin Contour Area Relative Relative
point point relief m (a)
beight area km2 area
(m) (m) (H), (A),km2 (a/A) (hlH)
m
1680 1140 540 12.516 1600 0.14 0.01 0.85 1500 0.71 0.05 0.66 1400 4.21 0.33 0.48 l300 9.73 0.77 0.29 1200 12.31 0.98 0.11 1140 12.51 1 0
A
0.9
0.8
0]
~ 0.6
1: 0.5 ~ 01 CD :f 0.4
CD
~ Ea=O.42 .!! 0.3
CD Q:
0.2
0.1
c
0.1 0.2 0.3 0.4 0.5 06 0.7 0.8 0.9
Relative area, alA
Figure 4.19: Hypsometric curve ofPhud Mawiong sub-basin
137
Hypsometric parameters and their relation to landform evolution
Schumm (1958) described the stages of geomorphic development on the basis of
hypsometric integral and classified them into three broad categories: youthful stage (60--
100%), mature stage (35-59%), and old stage (below 35%). The hypsometric integral
value is high in the youthful stage, it decreases as the landscape is denuded towards a
stage of maturity and old stage. High values of the hypsometric integral indicate that
most of the topography is high relative to the mean, such as smooth upland surface cut by
deeply incised streams. Intermediate to low values of the integral are associated with
more evenly dissected drainage basins (Keller and Pinter, 1996). The relationship
between the hypsometric integral and the degree of dissection is used as an indicator of a
landscape's stage in the cycle of erosion.
The hypsometric integral calculated for the fourth-order drainage basins varied from
0.28 to 0.73 (Table 4.32). This suggests an unevenly distributed dissection of the
drainage basins. The nature of the hypsometric curves and relation between the
hypsometric integral and degree of dissection indicates that the study area represent a
youthful stage approaching to an early mature stage of evolution. The high hypsometric
integral values of sub basins 02, 04, 05 and 06 represent the deep incised and high
down cutting as well as the younger stage of development. The hypsometric integral is
therefore a numerical description which may be used in the classification, and in the
comparison of different landscapes. The values of hypsometric integrals and the form of
the hypsometric curves taken together help to identify the stage of basin development.
138
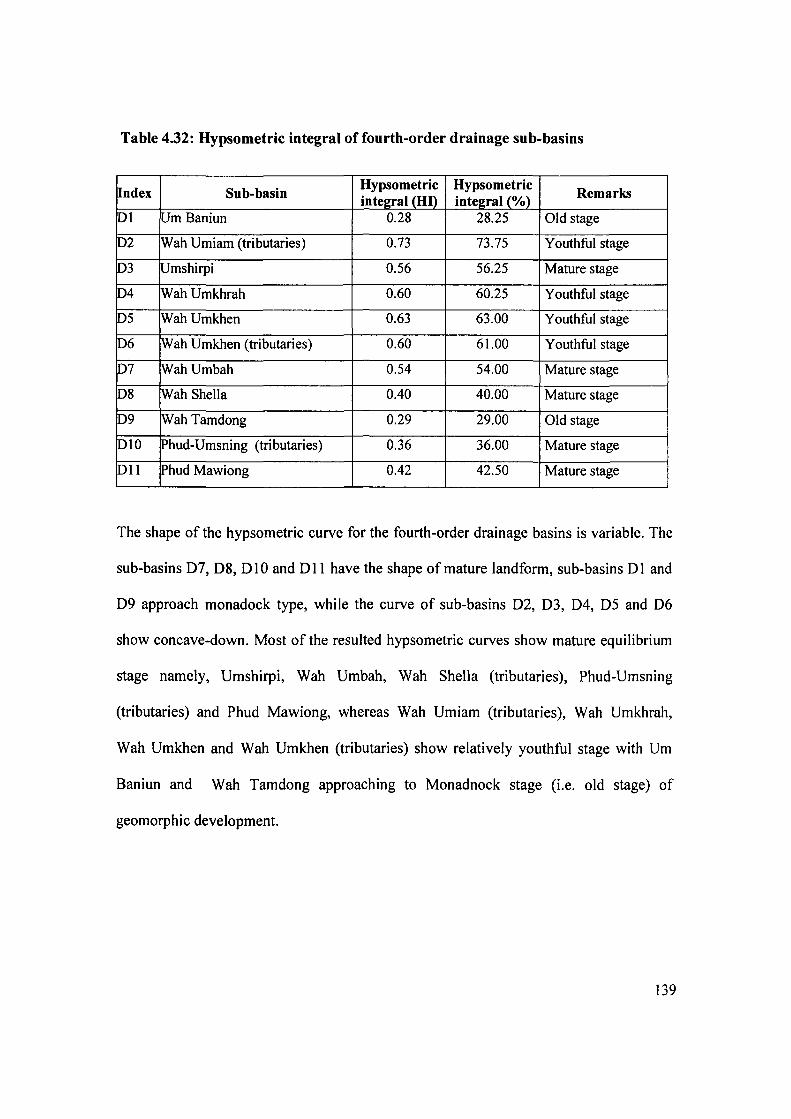
Table 4.32: Hypsometric integral of fourth-order drainage sub-basins
~ndex Sub-basin Hypsometric Hypsometric
Remarks integral (HI) integral(%)
Dl Urn Baniun 0.28 28.25 Old stage
D2 Wah Umiam (tributaries) 0.73 73.75 Youthful stage
D3 Umshirpi 0.56 56.25 Mature stage
D4 Wah Umkhrah 0.60 60.25 Youthful stage
D5 WahUmkhen 0.63 63.00 Youthful stage
b6 Wah Umkhen (tributaries) 0.60 61.00 Youthful stage
107 Wah Umbah 0.54 54.00 Mature stage
p8 Wah She11a 0.40 40.00 Mature stage
iD9 lWah Tamdong 0.29 29.00 Old stage
iD10 IPhud-Umsning (tributaries) 0.36 36.00 Mature stage
1011 IPhud Mawiong 0.42 42.50 Mature stage
The shape of the hypsometric curve for the fourth-order drainage basins is variable. The
sub-basins D7, D8, D 1 0 and D 11 have the shape of mature landform, sub-basins 0 I and
D9 approach monadock type, while the curve of sub-basins 02, 03, 04, 05 and 06
show concave-down. Most of the resulted hypsometric curves show mature equilibrium
stage namely, Umshirpi, Wah Umbah, Wah Sheila (tributaries), Phud-Umsning
(tributaries) and Phud Mawiong, whereas Wah Umiam (tributaries), Wah Umkhrah,
Wah Umkhen and Wah Umkhen (tributaries) show relatively youthful stage with Urn
Baniun and Wah Tamdong approaching to Monadnock stage (i.e. old stage) of
geomorphic development.
139
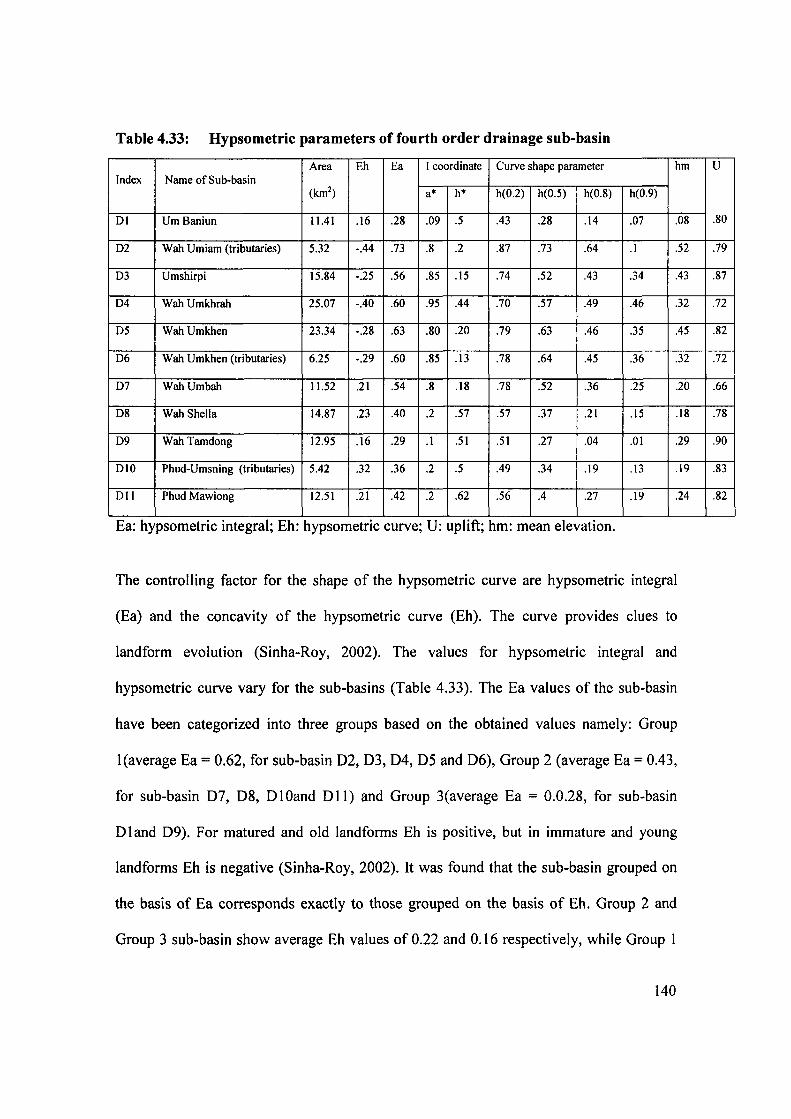
Table 4.33: Hypsometric parameters of fourth order drainage sub-basin
Area Eh Ea I coordinate Curve shape parameter hm Index Name of Sub-basin
(km2) a* h* h(0.2) h(0.5) h(0.8) h(0.9)
01 Urn Baniun 11.41 .16 .28 .09 .5 .43 .28 .14 .07 .08
D2 Wah Umiam (tributaries) 5.32 -.44 .73 .8 .2 .87 .73 .64 .1 .52
D3 Umshirpi 15.84 -.25 .56 .85 .15 .74 .52 .43 .34 .43
04 Wah Umkhrah 25.07 -.40 .60 .95 .44 .70 .57 .49 .46 .32
05 Wah Umkhen 23.34 -.28 .63 .80 .20 .79 .63 .46 .35 .45
06 Wah Umkhen (tributaries) 6.25 -.29 .60 .85 .13 .78 .64 .45 .36 .32
07 WahUmbah 11.52 .21 .54 .8 .18 .78 .52 .36 .25 .20
08 Wah Sheila 14.87 .23 .40 .2 .57 .57 .37 .21 .15 .18
09 Wah Tamdong 12.95 .16 .29 .1 .51 .51 .27 .04 .01 .29
OID Phud-Umsning (tributaries) 5.42 .32 .36 .2 .5 .49 .34 .19 .13 .19
011 Phud Mawiong 12.51 .21 .42 .2 .62 .56 .4 .27 .19 .24
Ea: hypsometric integral; Eh: hypsometric curve; U: uplift; hm: mean elevation.
The controlling factor for the shape of the hypsometric curve are hypsometric integral
(Ea) and the concavity of the hypsometric curve (Eh). The curve provides clues to
landform evolution (Sinha-Roy, 2002). The values for hypsometric integral and
hypsometric curve vary for the sub-basins (Table 4.33). The Ea values of the sub-basin
have been categorized into three groups based on the obtained values namely: Group
I (average Ea = 0.62, for sub-basin 02, 03, 04, 05 and D6), Group 2 (average Ea = 0.43,
for sub-basin 07, D8, OIOand Oil) and Group 3(average Ea = 0.0.28, for sub-basin
Oland 09). For matured and old landforms Eh is positive, but in immature and young
landforms Eh is negative (Sinha-Roy, 2002). It was found that the sub-basin grouped on
the basis of Ea corresponds exactly to those grouped on the basis of Eh. Group 2 and
Group 3 sub-basin show average Eh values of 0.22 and 0.16 respectively, while Group I
140
U
.80
.79
.87
.72
.82
.72
.66
.78
.90
.83
.82
curves are concave - down showing negative Eh values. These values suggest that sub
basins D2, D3, D4, D5 and D6 are least incised, and sub-basin D7, D8, DI0and Dllare
least eroded with most erosion prevails in sub-basins Dland D9.
The position of the slope inflection point (I) for the sub-basins are given by a* and h* on
the hypsometric curves. The hypsometric parameter a* reflects the erosion characteristics
of the catchment such that lower the value of a* greater is the extent of subdued
topography approaching Davisian style peneplain (Sinha-Roy, 2002). Also, lower the
value ofh* higher is the degree ofpeneplanation. The obtained value for a* and h* on the
hypsometric curves shows variation, which indicates a variability in the landform pattern
and their evolution within the sub-basin. Therefore, the sub-basins are grouped on the
basis ofa* values, namely Group 1 (average a* = 0.85, for sub-basins D2, D3, D4, D5, D6
and D7), Group 2 (average a* = 0.2, for sub-basins D8, DIO and Dll) and Group 3
(average Ea = 0.095, for sub-basins Dland D9). The degree of peneplain is highest in
Group3 followed by Group 2 with least in Group 1 sub-basin. Therefore, the value
suggest that sub-basins D 1 and D9 are in a state of declining equilibrium caused by strong
erosion and formation of vast pediplain, hence suggest Daivisian style peneplain of the
sub-basin landscape referring to their lower h* value.
The shape of the hypsometric curve has been analyzed by calculating the values of h
(0.2), h (0.5) and h (0.8) (Table 4.33). Higher the value of h (0.2) i.e., higher hypsometric
head indicates greater influence of diffusive processes at the upper reaches of the sub
catchment. On the other hand, the higher the value of h (0.8) the greater is the mass
accumulation at the subcatchment mouth derived mainly through fluvial (advective)
141
transport (Sinha-Roy, 2002). It is observed that from the derived values for h (0.2), h
(0.5) and h (0.8) Table 3.16, it is found that sub-basins Oland 09 show the least effect
of diffusive process with average value of 0.47 for h (0.2) and fluvial erosion has added
minimum mass at the respective sub-basin with average value of 0.09 for h (0.8).
Conversely for sub-basins D7, 08, 010 and 011 with average value of 0.06 for h (0.2)
show moderate diffusive erosion in the upstream segments and consist large mass
accumulation at the sub-basin mouth with average value of 0.26 for h (0.8).
The calculated empirical relation between uplift (U), mean elevation (hm) and the
hypsometric integral (Ea) gives the value of the relative uplift parameter for the sub-basin
(Table 3.16). The resulted values of U for the sub-basins range from 0.66 to 0.90
suggesting moderate to low uplift of the terrain and a spatial variation in neotectonically
controlled uplift magnitude. Uplift is a parametric measure of the elevation increase in
excess of denudation since the time the present drainage system came into existence and
that it does not indicate the absolute magnitude of tectonic uplift (Sinha-Roy, 2002). The
value of U varied from 0.78 to 0.90 (Table 4.33). Most of the basins fall on the SW and
SE comer of the study area covering a large part of Shillong peak and Laitkor range
suggesting that uplift in the SW and SE comer is the highest. Sub-basins 04, 06 and 07
have low range of U value (0.66 - 0.72) suggesting low uplift or mild subsidence, these
sub-basins are located towards the NE comer of the study and the basins are located in
the valley filled areas. Therefore, it can be concluded that the SW and SE part of the area
is the major uplift block while the NE segment has generally subsided.
142
Longitudinal Profile of the River Channel
Longitudinal profile constructed for each basin under the study area is shown in Figure
4.20. In the present study Urn Baniun shows long profile of low concavity indicating
increase of bed size materials downstream (Hack, 1957). The differences are caused by
the difference in lithology of the tributaries stream as the area is underlain by Shillong
quartzite and Mylliem granite. In the upstream reaches Shillong quartzite makes up only
a small part of the bedload and downstream the major part is constituted by Mylliem
granite. The long profile of Wah Umiam (t) shows an interrupted profile marked by
rapids and waterfall. In the upper reaches the profile is of smooth and uniform nature as
in this part the river flows through an area of Shillong quartzite. But after 3.85 km there
is knickpoint where the channel slope has steepened abruptly marked by a waterfall of
about 37 m and the main stream is intersecting a linear feature at this point. The
knickpoint is developed as a result of accelerated erosion at structurally weak zones.
From this point besides Shillong quartzite, the main stream is also fed by eroded
materials of Khasi greenstone from the tributaries stream. Umshirpi, one of the principal
streams draining Greater Shillong are originates from Shillong peak. The longitudinal
profile of the river reflects accelerated rate of erosion in the upper and middle reaches
and the lower reach is adjusted to the geology of the area. The upper and middle reaches
are underlain by Shillong quartzite. From Shillong Peak it shows gradual change in slope
with uniform nature but near Raid Laban reserve forest it flows through a scarp face
demarcated by a knickpoint and on reaching Shillong town it flows in a gentle slope. The
upper course has been affected by changes in the base level during the geologic history of
the river. This is due to the headward limits of successive period of base leveling in
143
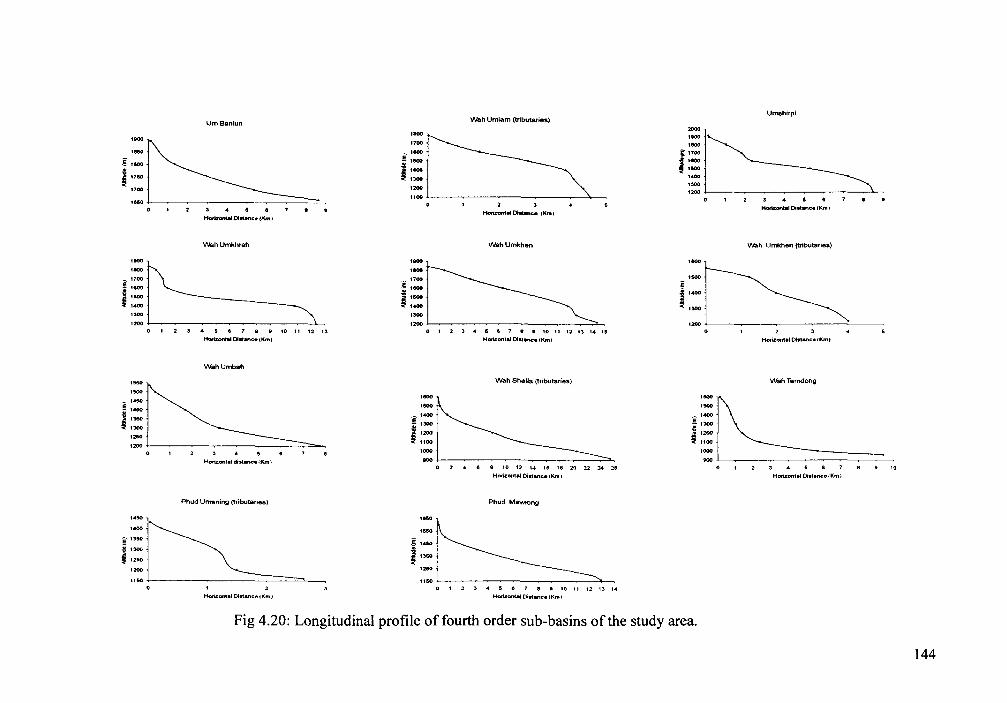
Urn Baniun
,OOO~ '850
f: lelO T··. • .~ __ .~ ____ =-' .
Horizontal a_am:. ~Km)
WahUmkhrah
'-l== '000
~~ ~ '200
it 10 11 12 13
Horizontal Oi"anc.(Km~
WahUmbah
.-~ '500
i§
'400
.§".'l6O -3 1300
j::
Horizontal distaneft~Kml
Phud Umsning (tributaries)
'.50
1 ff50 +-----___ ---..-:==_~
Honzontal Distance (Km)
V\lah Umiam (tributaries)
'800~ -:: f::
'200
ffOO.l---~~_~
Horizont .. ~. (Km)
WahUmkhen
' ... ~ '800
i:: j 1600 :! ,_
'300 '200~~ __________ ~ _______ ~~
o 1 2 3 .. 6 e 7 • " 10 11 12 13 14 16
Horizontal Diatar.c:e (Km)
Wah Sheila (tributaries)
'-~ "'00 ._ 1...00
.! 1300
':: 800 L--...-...~~----::--::-:-:~
8 10 12 14 16 18 2() 22 24 :28
Horizontat DistancelKmI
Phud M~ng
,eoo~ "5O
I:: .2501 ...... ~~ ffooL' ~~_~_~~---.
o 1 2 3 4 5 e 7 • 9 10 11 12 13
Horizontal OistWice tKm I
Ul1l6hirpl
i~l~ Horizontal Oi'-anee (Km)
\Nah Umkhen (trIbutaries)
.-~ '000
':: Horizontal otstance cKm I
\lVah Tamdong
t!~~ j 1100
.000 ... ~~-----:-~===~ .. Horizontal Distance iKm 1
Fig 4.20: Longitudinal profile of fourth order sub-basins of the study area.
144
multi cyclic valleys of homogenous rocks (Thornberry, 1973). In the lower end the
profile steepens abruptly and becomes a series of rapids and falls namely, the Gunner
falls of about 24m and the Bishop falls of 122m, which is an offset fault across the
general strike. In this reach the river passes through the resistance of Khasi greenstone
and conglomerates of the Shillong group of rocks. Major differences in the materials
along the course of a stream commonly cause an abrupt change in the profile as seen
in Wah Umkhrah. In its upper reaches the river is floored by Shillong quartzite, a
knickpoint in the upper end represents the Spread Eagle falls (20 m) near Umpling. At
3.5 km it enters the valley filled sediments area and the profile abruptly changes in
character gradually become flat. In this part the river flows through the Shillong town
up to Mawlai. At 10.85 km at Mawlai the river again enters Shillong quartzite and
again the profile abruptly changes and shows a steep slope. At this point the river is
also offset by a fault. At 12.2 km the river is floored by Khasi greenstone and
conglomerates of the Shillong group where it joins Umshirpi river and meets the main
tributary Phud-Ro Ro river through the Beadon falls.Wah Urn Khen profile is close to
a straight line with gentle slope in the upper and middle reaches and characterized by
knickpoint in the lower reach. Throughout the course, Shillong quartzite is brought in
by the tributaries to make the bed material of the river. In between Laitkor and
Madanriting, Khasi greenstone crops out at few places in the stream and makes up a
small portion of the bed materials. The river flows through an area of hard rock terrain
of Khasi greenstone and Shillong quartzite. The river Urn Khen flows through an axis
of a fold. Throughout this course, cobbles and pebbles of Khasi greenstone and
Shillong quartzite are brought in by tributaries to make up the bed materials. Due to
down cutting of the river course, the scarp faces are developed in the both side of the
145
river. The knickpoint in the lower end of the profile is represented by the Sweet falls
(199m).
In contrast, the profile of Wah Urn Khen (t), shows upconvexity. There is no apparent
change in lithological condition from the neighboring basins. Any significant
structural anomaly is also not recorded. The upconvexity can be explained by increase
in the rate of particle size downstream (Hack, 1957). The river long profile for the
trunk channels of Wah Umbah and Wah Shella shows smooth up-concavity. Due to
the downstream increases in the channel's width and depth and the general tendency
of decrease in of the bed-particles size, the gradient generally flattens (Leopold,
1964). Therefore, the longitudinal profile of Wah Umbah and Wah Shella is concave
to the sky. These rivers are structurally controlled and flow along the main structural
trend and are not subjected to offset in their courses. Besides, the basin is underlain
by uniform lithology throughout the course characterized by Shillong quartzite. The
Wah Tamdong and Phud Mawiong trunk channel show smooth upconcavity profile.
Both rivers flow in a strike valley jointed by tributaries draining Shillong quartzites
area. Along its course the tributaries provide a continuous source of uniform size of
bed materials downstream. The uniformity in size of the bed materials suggests that
the stream has uniform competency along the course because of bed rock geology of
the basin. Phud-Umsning (t) river is characterized by a knickpoint, which represents a
scarp face at a distance of about 1.2 km from the point of origin. From the field
verification it is clear that the scarp face is developed due to the offset faulting across
the strike of the beds. In general the longitudinal profiles of the study area shows
major structural controls. Most of the rivers show knickpoints, waterfalls suggestive
of profile adjustments. This may be attributed to the continuous tectonic activities.
146
Introduction
CHAPTERS
WATER RESOURCES
Water is essential for sustenence of life on earth. Its sustained supply is needed for
socio-economic development and for maintaining healthy ecosystems. The water
resources can be divided into two categories: surface water and sub-surface water.
Surface water encompasses rivers, streams and lakes and sub-surface water includes
spring and ground waters. As population increases and development calls for an
increased allocations of groundwater and surface water for the domestic, agriculture
and industrial sectors. The increasing stress on freshwater resources brought about by
ever rising demand as well as by growing pollution worldwide, is of serious concern.
Water use has been growing at more than twice the rate of population increase in the
last century. Most countries in the Near East and North Africa suffer from acute water
scarcity, as do countries such as Mexico, Pakistan, South Africa, and large parts of
China and India (UN-Water,2006). In order to sustain their needs, these countries
need to focus on the efficient use of all water sources groundwater, surface water and
rainfall. Good city water management is complex and tedious to achieve. It requires
an integrated management of water supplies for domestic and industrial needs, the
control of pollution and the treatment of wastewater, the management of rainfall
runoff (including stormwater) and prevention of flooding, and the sustainable use of
water resources. To maintain the availability of water all needful efforts are being
made in the field of research and development to meet the demand for domestic,
147
agricultural and industrial uses (Bhaisare and Goel, 1992). Remote sensing helps in
management of water resources in view of their availability (qualitative and
quantitative) and its ever-increasing demand for drinking, irrigation and industrial
sectors (Trivedi et.aI. 2005). Earlier studies indicate that remotely sensed data and
GIS techniques are vital tools for delineation and evaluation of surface water and
groundwater potential zones of an area (Chaterjee and Bhattacharya, 1995;
Krishnamurthyand Srinivas, 1995; Krishnamurthy et aI., 1996; Tiwari and Rai, 1996;
Ravindran and Jeyaram, 1997; Saraf and Choudhaury, 1998; Srivastava and
Bhattacharya, 2000; Sarkar et aI., 2001; Khan and Moharana, 2002, and Sankar,
2002).
The present study is an attempt to account the quantity of water supply from ground
water and surface water based on limited secondary data available and also to check
the qualitative aspects of the available water sources for domestic purposes. An
attempt is made to develop a ground water prospect zone map through the
convergence of evidence method by integrating collateral data, satellite image
analysis and field inputs.
Review of Literature
Gupta and Ganesh Raj (1992) have carried out groundwater prospective zone
m8;pping of the entire Pavagada taluk covering 1,350 km2 area in Tumkur district
(Karnataka) on 1 :63,360 scale using Landsat TM and have delineated various
hydromorphogeologic units through visual interpretation and possibilities of
quantification of yield estimates based on borewell data of these zones. Their study
indicated that valley fill zone is the best groundwater potential zone and pediplains in
148
general have poor yield potential in the area. Study on geological, geomorphological
and hydrochemical analysis to understand the hydro geomorphological conditions and
hydrochemistry of Ghoradongri watershed of Betul district of Madhya Pradesh was
carried out by Trivedi et.al. (2005). The occurrence of groundwater in the hard rock
terrain was found confined to secondary permeable structures, i.e. fractures and
weathered zone and in upper unconsolidated materials (Srinivasa Vittala et.al. 2005).
Exploration and utilization of groundwater especially in hard rock terrain, requires
thorough understanding of geology, geomorphology and lineaments of an area, which
directly or indirectly controlls the terrain characteristics (Pradeep, 1998). Delineation
and characterization of groundwater potential zones of nine sub-watersheds of North
Pennar basin, Tamkur district, Karnataka was carried out by Srinivasa Vittala et.al.
(2005) using remote sensing and GIS techniques based on slope, lithology,
hydro geomorphology, lineament and borewell data parameters. They concluded that
nearly level, very gentle and gentle sloping areas are better than the much steeper
hilly areas from the groundwater point of view. Groundwater is dynamic and
replenishable natural resource but in hard rock terrain availability of groundwater is of
limited extent and its occurance is essentially confined to fractured and weathered
zones (Saraf and Choudhury, 1998). Singh et.al. (1997) delineated the aquifer in a
micro-watershed in a granitic terrain through detailed hydrogeological investigations
and found that in the granitic terrain, groundwater occurs in shallow weathered and
fractured zones. Lokesha et. al. (2005) made a quantitative evaluation of groundwater
potential zones in the Cauvery and Kabini rivers valleys in Mysore district, using IRS
data and GIS techniques in relation to field surveys. They concluded that factors such
as geomorphology, lineaments, drainage density, lithology and surface water bodies
directly influence the ground water conditions. Good ground water prospect was
149
found in the valley region compared to the remaining area whose yield was moderate
to poor. Baruah et. al. (1993) conducted a hydrogeomorpholigical study in parts of
Goalpara district, Assam. They discussed the geomorphic forms and their relevance to
groundwater occurrences, and suggested that tea plantation areas and valley fills
should be taken for exploratory drilling. Nag (2005) conducted a study on the
hydrogeomorphology and lineament using remote sensing and GIS technique, for
detecting the most suitable zone for groundwater occurrence in the Baghmundi Block,
Purulia district, West Bengal. From the suitability map excellent groundwater
potential zone was found around Ayodhya village due to presence of planation surface
along valley fill within this area. Ray et.a!' (1993) demonstrated the potential of GIS
techniques in integrating remote sensing and field inputs for hydrological
investigation in a drough prone area of Eastern Singhbhum. They opined that the
methodology can be accepted as a standard for hydrological investigations targeting
prospective zones. Burman (1993) highlighted the contribution of remote sensing
techniques as an integral part of hydrogeological investigation in the greater Guwahati
area for delinating most prospective ground water potential belts as well as surface
water sources for augmentation of urban water supply. Subba (2001) reported that hill
towns in the Darjeeling and Shillong located in the wettest comer of the Indian
subcontinent, face water scarcity all year round. Ravindran and Manchanda (1993)
evaluated groundwater and surface water potentials in JNU campus, New Delhi using
remote sensing technique in conjunction with ground surveys to locate the sites for
ground water exploration and rain water harvesting. The study recommended long
term and short term measures for better management of water within the campus.
Merz et. al. (2004) documented qualitative and quantitative aspects of the public
water supply for domestic purposes in the Jhikhu Khola and Yarsha Khola watersheds
150
and related the issues to other watersheds in the Hindu Kush-Himalayan region. They
found that the water quantity and quality concerns in the two watersheds of Nepal
were not isolated cases but similar problems were reported from other watersheds in
China, India and Pakistan.
In urban areas, most impairment of water resources are the direct results of local
human activities such as water consumption, waste production, construction of
building and traffic system, and the engineering of rivers. Wagner et. al. (2002)
identified the most relevant sustainability deficits and derived general vectors for
more sustainable water management based on the results and observations of
watershed case studies, in Japan, United States, Switzerland and Brazil. They found
that differing historical and cultural backgrounds, extent of development, varying
perception of water management activities, and differing uses of natural ecosystems
have necessitated formulation of different social, political and economic strategies to
handle water issues. Huang and Ferng (1990) studied seventy eight third order
watersheds and grouped them into five watershed zones representing varied
assimilative capacities and relative societal priorities of water quality management. In
order to prioritize potential source of ground water pollution in Idaho, water quality
planners in the state developed a decision analysis technique which numerically
identified the most important pollution sources. The results of this process were
subsequently used as a starting point to develop and implement the goundwater
protection programs of the state (Shook and Grantham, 1993). Srinivasa Rao. et.al,
(1997) used multiple regression analysis to assess the groundwater quality in relation
to agricultural and domestic uses in a part of the Peninsular Archean granite and
gneissic complex of India. They found that the groundwater is suitable for both
agricultural and domestic uses, with high concentration of nitrates observed in some
151
of the wells that are affected by the impact of industrial effluents. Joji et. al. (2001)
worked on geomorphology and terrain characteristics of Vamanapuram river basin,
southern Kerela, India with special reference to ground water potential zones in the
basin. The qualitative studies revealed that ground water in the different geomorphic
units contain chemical constituents that were within the maximum permissible limit
prescribed by the WHO and Bureau of India Standards, and the water was suitable for
drinking purposes. According to Sim and Balamurugan (1991) the urban water
problems in southeast Asian cities are viewed as the consequences of rapid and
uncontrolled urbanization and unsustainable development. In the long term, given the
ever-increasing urbanization and population growth, the urban water problems in
southeast Asia are expected to escalate rather than attenuate unless serious planning
and management are carried out. Land classification, based on integrated land and
water quality, has been found to be a useful tool for land management practices aimed
at enhancing surface water quality. Multi-variate techniques (factor analysis, cluster
analysis, discriminate analysis) have been used for taxonomic land classification
based on watershed units (Wang, 2001).
152
Results and Discussion
Scenario of water supply and production in Greater Shillong Planning Area (GSPA)
Greater Shillong Planning Area (GSPA) is a rapidly growing urban centre. Water
scarcity is common across the urban complex even though it receives a very high rain
fall of the order of 2400mm/ year. GSPA has been exclusively relying on surface
water, but during recent years it has started using groundwater to meet the
requirements of growing population. The total potable water supply quantum is
obtained from numerous springs and a few low discharge streams, formed due to
seepage of inland water. Besides private bore wells or hand pumps are also being
used extensively for water supply in the area. These water sources are controlled and
taken care by several institutions such as the Shillong Municipal Board (SMB),
Public Health Engineering Department (PheD), Shillong Cantonment Board (SCB)
and local Dorbars, who are responsible for providing the water supply service. The
5MB and PheD provide the bulk of the water supply services. In order to meet long-
term projection of water demand, a dam was constructed under Greater Shillong
Water Supply Scheme (GSWSS) in 1978 to divert water from Umiew River located
25 km from the main city.
The Shillong Municipal Board (SMB) obtains water supply from several surface
water sources such as springs and streams which were identified long back probably
when the town was established. These surface water sources include Wahrisa,
Wahjalynoh, Umjasai, Crinoline, Madan Laban, Patta Khanna and Wahdienglieng.
For example the water supply scheme from Umjasai stream was undertaken in the
year 1958 and since then water is being distributed in the municipal area without any
treatment. It was observed that these sources are utilized for water supply either by
153
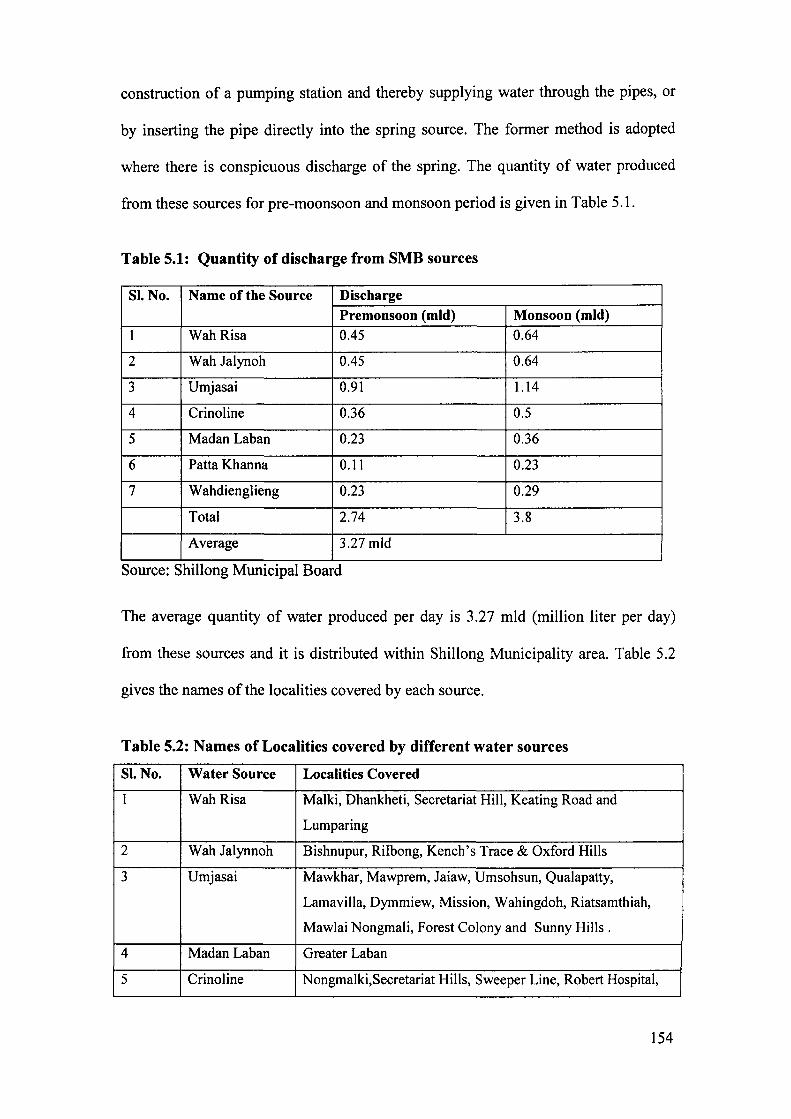
construction of a pumping station and thereby supplying water through the pipes, or
by inserting the pipe directly into the spring source. The former method is adopted
where there is conspicuous discharge of the spring. The quantity of water produced
from these sources for pre-moonsoon and monsoon period is given in Table 5.1.
Table 5.1: Quantity of discharge from 5MB sources
SI. No. Name ofthe Source Discharge
Premonsoon (mid) Monsoon (mid)
1 Wah Risa 0.45 0.64
2 Wah Jalynoh 0.45 0.64
3 Umjasai 0.91 1.14
4 Crinoline 0.36 0.5
5 Madan Laban 0.23 0.36
6 Patta Khanna 0.11 0.23
7 Wahdienglieng 0.23 0.29
Total 2.74 3.8
Average 3.27 mId
Source: Shillong Municipal Board
The average quantity of water produced per day is 3.27 mId (million liter per day)
from these sources and it is distributed within Shillong Municipality area. Table 5.2
gives the names of the localities covered by each source.
Table 5.2: Names of Localities covered by different water sources
SI. No. Water Source Localities Covered
1 Wah Risa Malki, Dhankheti, Secretariat Hill, Keating Road and
Lumparing
2 Wah Jalynnoh Bishnupur, Rilbong, Kench's Trace & Oxford Hills
3 Umjasai Mawkhar, Mawprem, Jaiaw, Umsohsun, Qualapatty,
Lamavilla, Dymmiew, Mission, Wahingdoh, Riatsamthiah,
Mawlai Nongmali, Forest Colony and Sunny Hills.
4 Madan Laban Greater Laban
5 Crinoline Nongmalki,Secretariat Hills, Sweeper Line, Robert Hospital,
154
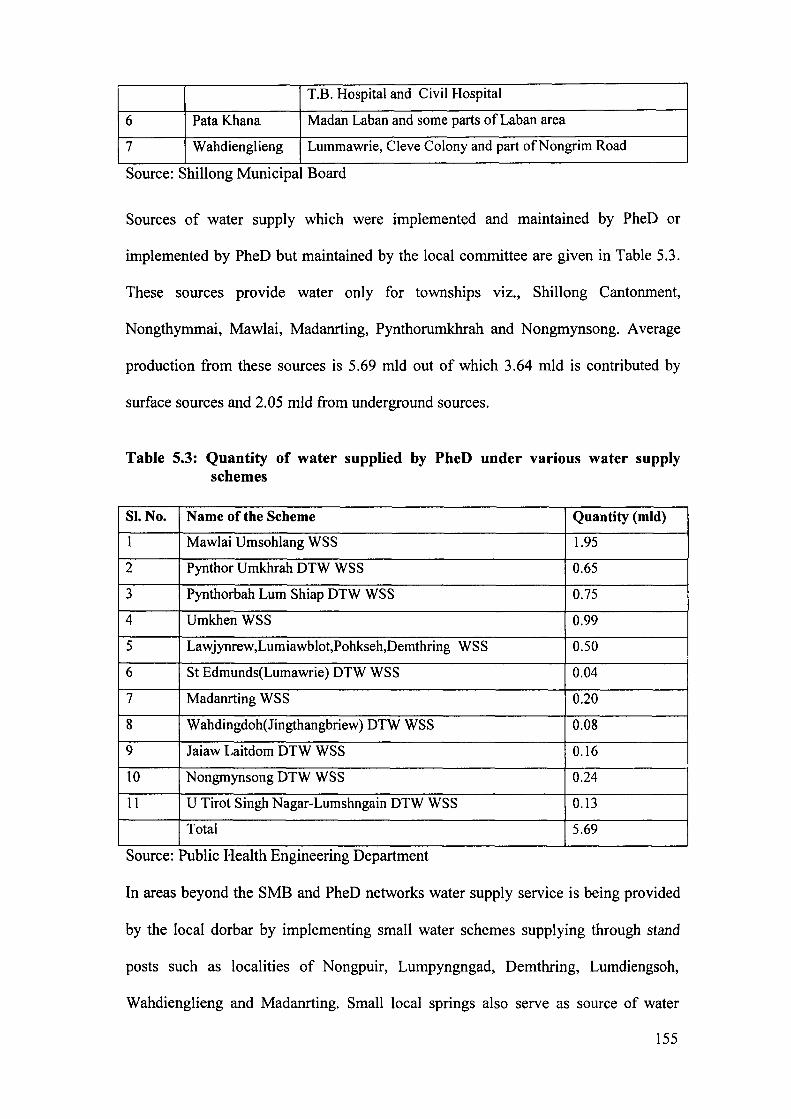
T.B. Hospital and Civil Hospital
6 PataKhana Madan Laban and some parts of Laban area
7 Wahdienglieng Lummawrie, Cleve Colony and part of Non grim Road ..
Source: Shillong Munlclpal Board
Sources of water supply which were implemented and maintained by PheD or
implemented by PheD but maintained by the local committee are given in Table 5.3.
These sources provide water only for townships viz., Shillong Cantonment,
Nongthymmai, Mawlai, Madanrting, Pynthorumkhrah and Nongmynsong. Average
production from these sources is 5.69 mId out of which 3.64 mId is contributed by
surface sources and 2.05 mId from underground sources.
Table 5.3: Quantity of water supplied by PheD under various water supply schemes
SI.No. N arne of the Scheme Quantity (mid)
1 Maw1ai Umsohlang WSS 1.95
2 Pynthor Umkhrah DTW WSS 0.65
3 Pynthorbah Lum Shiap DTW WSS 0.75
4 Umkhen WSS 0.99
5 Lawjynrew,Lumiawblot,Pohkseh,Demthring WSS 0.50
6 St Edmunds(Lumawrie) DTW WSS 0.04
7 Madanrting WSS 0.20
8 Wahdingdoh(Jingthangbriew) DTW WSS 0.08
9 Jaiaw Laitdom DTW WSS 0.16
10 Nongmynsong DTW WSS 0.24
11 U Tirot Singh Nagar-Lumshngain DTW WSS 0.13
Total 5.69
Source: Public Health Engineering Department
In areas beyond the 5MB and PheD networks water supply service is being provided
by the local dorbar by implementing small water schemes supplying through stand
posts such as localities of Nongpuir, Lumpyngngad, Demthring, Lumdiengsoh,
Wahdienglieng and Madanrting. Small local springs also serve as source of water
155
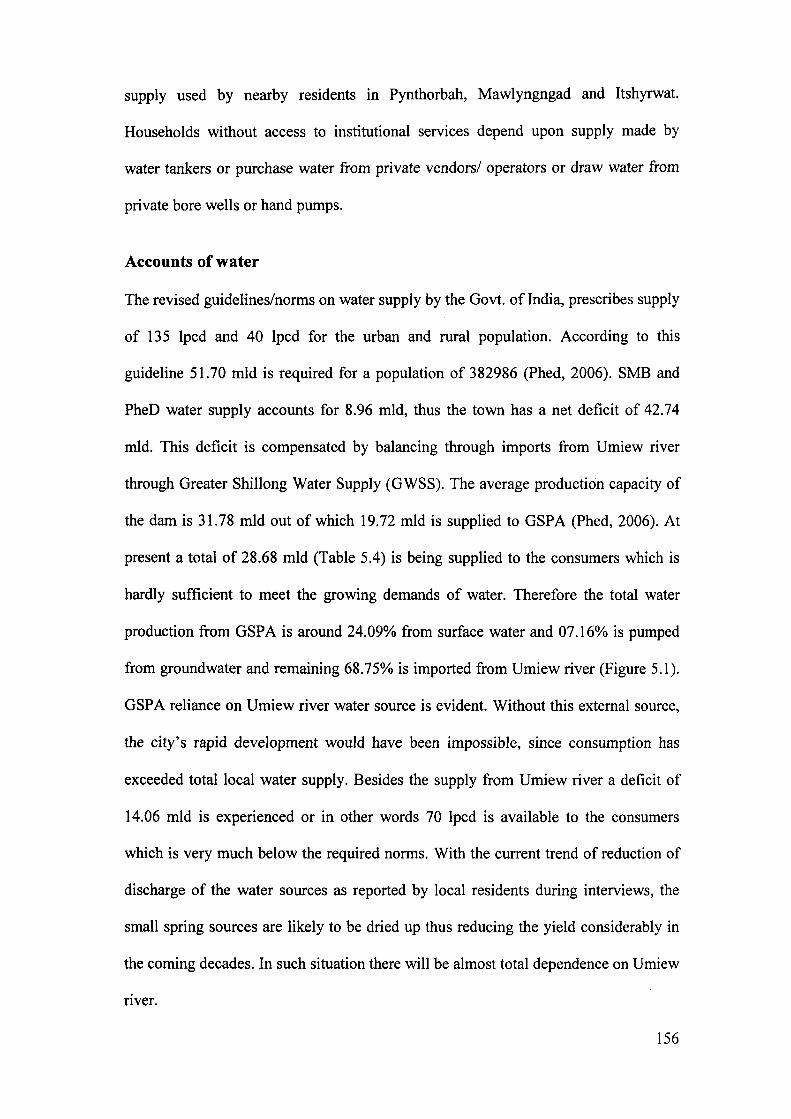
supply used by nearby residents in Pynthorbah, Mawlyngngad and Itshyrwat.
Households without access to institutional services depend upon supply made by
water tankers or purchase water from private vendors/ operators or draw water from
private bore wells or hand pumps.
Accounts of water
The revised guidelines/norms on water supply by the Govt. of India, prescribes supply
of 135 lpcd and 40 lpcd for the urban and rural population. According to this
guideline 51.70 mId is required for a population of 382986 (Phed, 2006). 5MB and
PheD water supply accounts for 8.96 mId, thus the town has a net deficit of 42.74
mId. This deficit is compensated by balancing through imports from Umiew river
through Greater Shillong Water Supply (GWSS). The average production capacity of
the dam is 31.78 mId out of which 19.72 mId is supplied to GSP A (Phed, 2006). At
present a total of 28.68 mId (Table 5.4) is being supplied to the consumers which is
hardly sufficient to meet the growing demands of water. Therefore the total water
production from GSPA is around 24.09% from surface water and 07.16% is pumped
from groundwater and remaining 68.75% is imported from Umiew river (Figure 5.1).
GSPA reliance on Umiew river water source is evident. Without this external source,
the city's rapid development would have been impossible, since consumption has
exceeded total local water supply. Besides the supply from Umiew river a deficit of
14.06 mId is experienced or in other words 70 lpcd is available to the consumers
which is very much below the required norms. With the current trend of reduction of
discharge of the water sources as reported by local residents during interviews, the
small spring sources are likely to be dried up thus reducing the yield considerably in
the coming decades. In such situation there will be almost total dependence on Umiew
river.
156
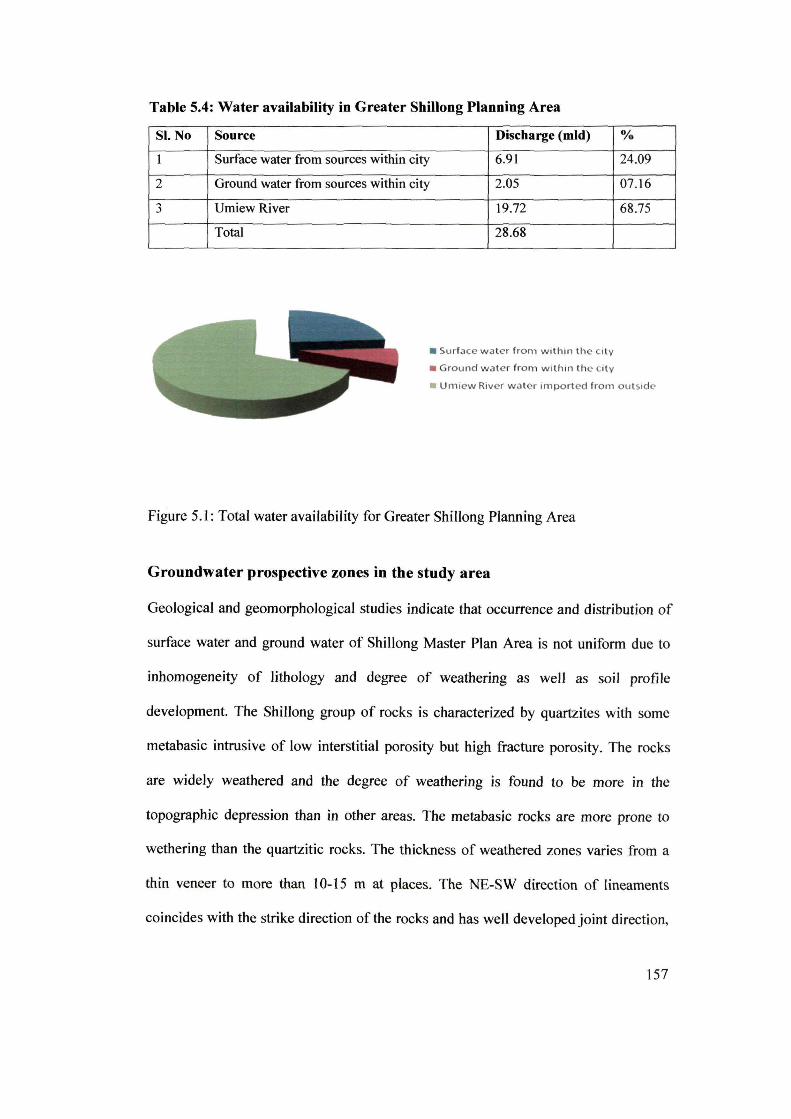
Table 5.4: Water availability in Greater Shillong Planning Area
Sl. No Source Discharge (mId) 0/0
I Surface water from sources within city 6.91 24.09
2 Ground water from sources within city 2.05 07.1 6
3 UmiewRiver 19.72 68.75
Total 28.68
• Surface water from within t he ci ty
• Ground w ater from w ithin the ci t y
• Umiew River water imported from outsid e
Figure 5.1: Total water availability for Greater Shillong Planning Area
Groundwater prospective zones in the study area
Geological and geomorphological studies indicate that occurrence and distribution of
surface water and ground water of Shillong Master Plan Area is not uniform due to
inhomogeneity of lithology and degree of weathering as well as soil profile
development. The Shillong group of rocks is characterized by quartzites with some
metabasic intrusive of low interstitial porosity but high fracture porosity. The rocks
are widely weathered and the degree of weathering is found to be more in the
topographic depression than in other areas. The metabasic rocks are more prone to
wethering than the quartzitic rocks. The thickness of weathered zones varies from a
thin veneer to more than 10-15 m at places. The NE-SW direction of lineaments
coincides with the strike direction of the rocks and has well developed joint direction,
157
and therefore it will be more conducive for ground water storage and circulation.
However, hydrologically, the intersection point of various lineaments in the area are
very important, as they indicate the places where there will be several source of
ground water circulation and the ground water withdrawal, therefore bore well/tube
well located at such places will have a good supply of water. Geomorphologically,
landform varies from highly dissected hills and hills slope with small and narrow
intermontane valleys. The high relief areas of the southern and south-eastern corner
occupied by Laitkor range and Shillong peak with steep topographic slope, and
characteristic geological set-up offer high run-off and little scope for rain water
infiltration. The discharge at this level is meager to very little in several of the streams
which are mostly of low order. The ground water potential therefore in these terrains
is limited to intermontane valleys.
The hydrogeological data indicate that groundwater occur both under artesian as well
as in water table condition (Table 5.5). Occurrence of ground water in Shillong group
of rocks is under water table condition in the weathered zones of underlying hard
rocks, which is unconsolidated and consists of loose porous medium with well
developed secondary porosity composed of cracks, fissures and joints. Ground water
in the consolidated rocks occur under semi-confined condition. Hydrogeological data
shows that depth of water level is shallower in topographic depression than in the
upland areas or slopes. It varies from 4 m to 8 m in topographic depressions whereas
in upland areas it is about 55 meters.
158
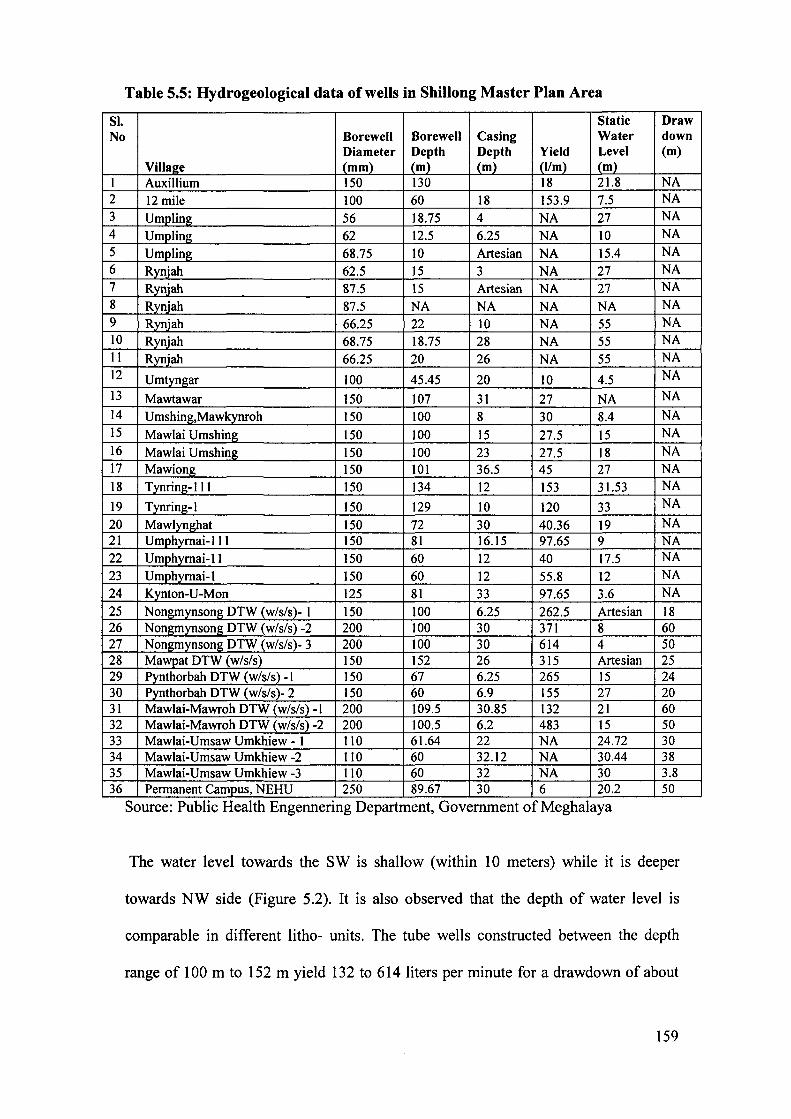
Table 5.5: Hydrogeological data of wells in Shillong Master Plan Area
SI. Static Draw No Borewell Borewell Casing Water down
Diameter Depth Depth Yield Level (m) Village (mm) (m) (m) (11m) (m)
1 Auxillium 150 130 18 21.8 NA 2 12 mile 100 60 18 153.9 7.5 NA
3 Umpling 56 18.75 4 NA 27 NA
4 Umpling 62 12.5 6.25 NA 10 NA
5 Umpling 68.75 10 Artesian NA 15.4 NA
6 Rynjah 62.5 15 3 NA 27 NA
7 Rynjah 87.5 15 Artesian NA 27 NA
8 Rynjah 87.5 NA NA NA NA NA 9 Rynjah 66.25 22 10 NA 55 NA 10 Rynjah 68.75 18.75 28 NA 55 NA
11 Rynjah 66.25 20 26 NA 55 NA 12 Umtyngar 100 45.45 20 10 4.5 NA
13 Mawtawar 150 107 31 27 NA NA
14 Umshing,Maw~oh 150 100 8 30 8.4 NA 15 Mawlai Umshing 150 100 15 27.5 15 NA 16 Mawlai Umshing 150 100 23 27.5 18 NA 17 Mawiong 150 101 36.5 45 27 NA
18 Tynring-lll 150 134 12 153 31.53 NA
19 Tynring-l 150 129 10 120 33 NA
20 Mawlynghat 150 72 30 40.36 19 NA 21 Umphymai-lll 150 81 16.15 97.65 9 NA 22 Umphymai-ll 150 60 12 40 17.5 NA
23 Umphymai-l 150 60 12 55.8 12 NA
24 Kynton-U-Mon 125 81 33 97.65 3.6 NA
25 Nongmynsong DTW (w/s/s)- 1 150 100 6.25 262.5 Artesian 18 26 Nongmynsong DTW (w/s/s) -2 200 100 30 371 8 60 27 Nongmynsong DTW (w/s/s)- 3 200 100 30 614 4 50 28 Mawpat DTW (w/s/s) 150 152 26 315 Artesian 25 29 Pynthorbah DTW (w/s/s)-1 150 67 6.25 265 15 24 30 Pynthorbah DTW (w/s/s)- 2 150 60 6.9 155 27 20 31 Mawlai-Mawroh DTW (w/s/s)-1 200 109.5 30.85 132 21 60 32 Mawlai-Mawroh DTW (w/s/s) -2 200 100.5 6.2 483 15 50 33 Mawlai-Umsaw Umkhiew - 1 110 61.64 22 NA 24.72 30 34 Mawlai-Umsaw Umkhiew -2 110 60 32.12 NA 30.44 38 35 Mawlai-Umsaw Umkhiew -3 110 60 32 NA 30 3.8 36 Permanent Campus, NEHU 250 89.67 30 6 20.2 50
Source: Public Health Engennering Department, Government of Meghalaya
The water level towards the SW is shallow (within 10 meters) while it is deeper
towards NW side (Figure 5.2). It is also observed that the depth of water level is
comparable in different litho- units. The tube wells constructed between the depth
range of 100 m to 152 m yield 132 to 614 liters per minute for a drawdown of about
159
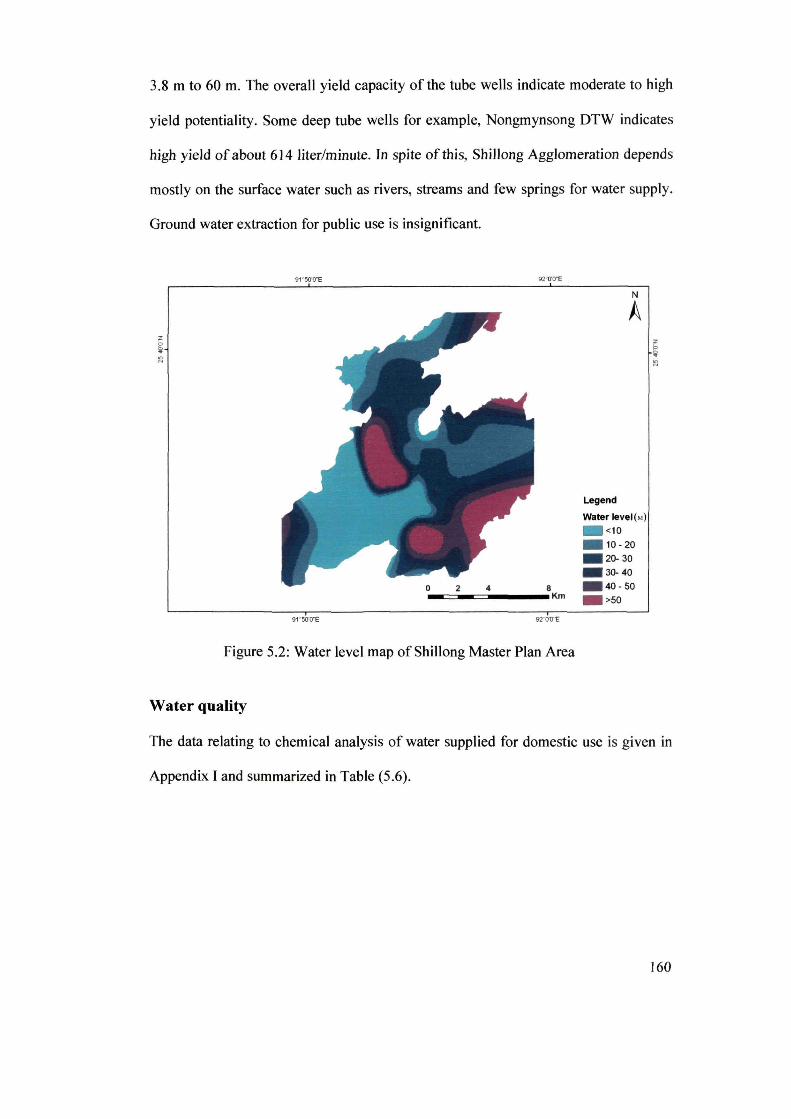
3.8 m to 60 m. The overall yield capacity of the tube wells indicate moderate to high
yield potentiality. Some deep tube wells for example, Nongmynsong DTW indicates
high yield of about 614 liter/minute. In spite of this, Shillong Agglomeration depends
mostly on the surface water such as rivers, streams and few springs for water supply.
Ground water extraction for public use is insignificant.
92' 0'0''E
8 __ =3~=-______ Km
91 ~50'0''E 92'O'O''E
Figure 5.2: Water level map ofShillong Master Plan Area
Water quality
N
A
Legend
Water Ievel (M) _ <10
_ 10-20 _ 20-30
_ 30-40 _ 40-50 _ >50
The data relating to chemical analysis of water supplied for domestic use is given in
Appendix I and summarized in Table (5.6).
160
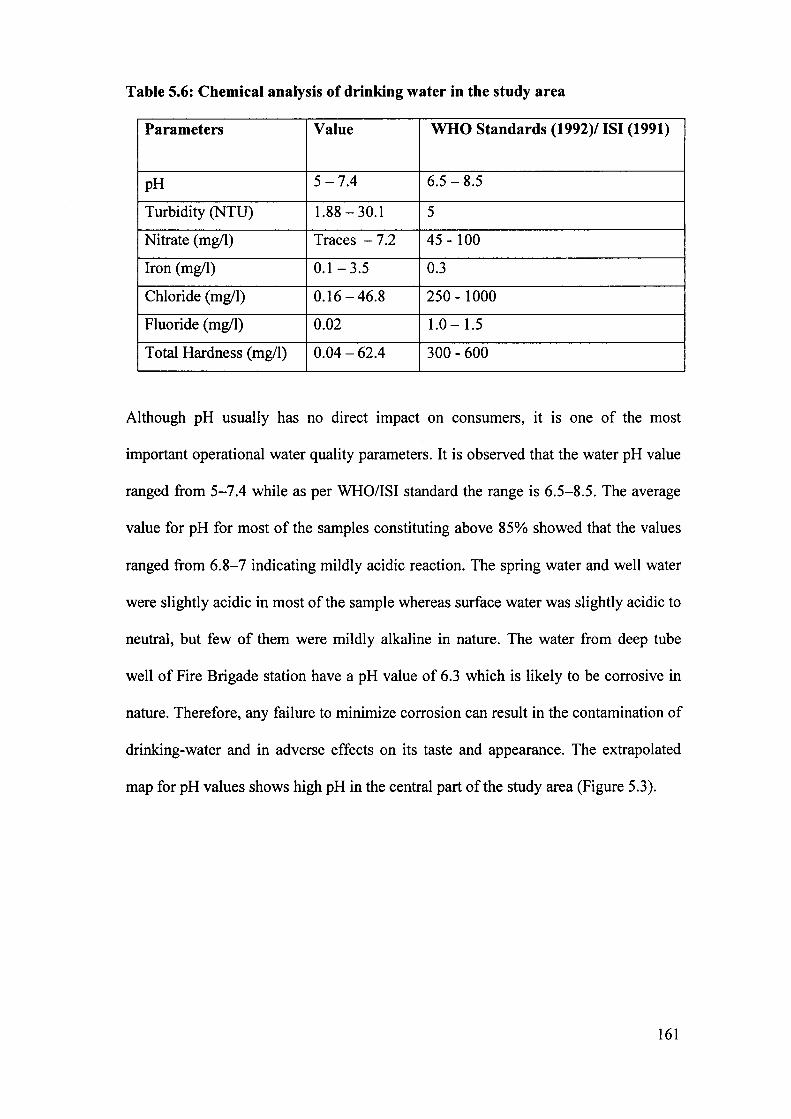
Table 5.6: Chemical analysis of drinking water in the study area
Parameters Value WHO Standards (1992)/ lSI (1991)
pH 5-7.4 6.5 - 8.5
Turbidity (NTU) 1.88 - 30.1 5
Nitrate (mg/l) Traces -7.2 45 - 100
Iron (mg/l) 0.1 - 3.5 0.3
Chloride (mg/l) 0.16 - 46.8 250 - 1000
Fluoride (mg/l) 0.02 1.0 - 1.5
Total Hardness (mg/l) 0.04 - 62.4 300 - 600
Although pH usually has no direct impact on consumers, it is one of the most
important operational water quality parameters. It is observed that the water pH value
ranged from 5-7.4 while as per WHO/lSI standard the range is 6.5-8.5. The average
value for pH for most of the samples constituting above 85% showed that the values
ranged from 6.8-7 indicating mildly acidic reaction. The spring water and well water
were slightly acidic in most of the sample whereas surface water was slightly acidic to
neutral, but few of them were mildly alkaline in nature. The water from deep tube
well of Fire Brigade station have a pH value of 6.3 which is likely to be corrosive in
nature. Therefore, any failure to minimize corrosion can result in the contamination of
drinking-water and in adverse effects on its taste and appearance. The extrapolated
map for pH values shows high pH in the central part of the study area (Figure 5.3).
161
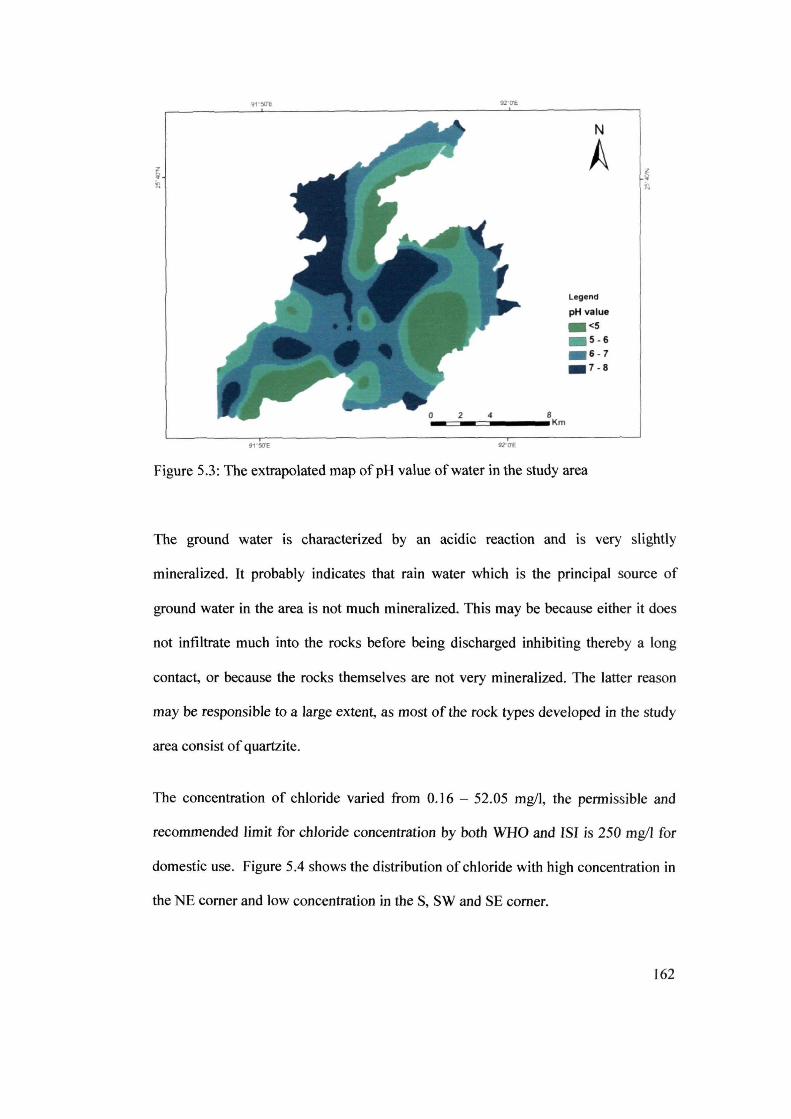
92 O'E
8 _ ==--==-___ Km
91~
N
A
legend
pH value
_ <5 _ 5 - 6 _ 6 - 7 _ 7 - 8
Figure 5.3: The extrapolated map of pH value of water in the study area
The ground water is characterized by an acidic reaction and is very slightly
mineralized. It probably indicates that rain water which is the principal source of
ground water in the area is not much mineralized. This may be because either it does
not infiltrate much into the rocks before being discharged inhibiting thereby a long
contact, or because the rocks themselves are not very mineralized. The latter reason
may be responsible to a large extent, as most of the rock types developed in the study
area consist of quartzite.
The concentration of chloride varied from 0.16 - 52.05 mg/I, the permissible and
recommended limit for chloride concentration by both WHO and lSI is 250 mg/I for
domestic use. Figure 5.4 shows the distribution of chloride with high concentration in
the NE comer and low concentration in the S, SW and SE comer.
162
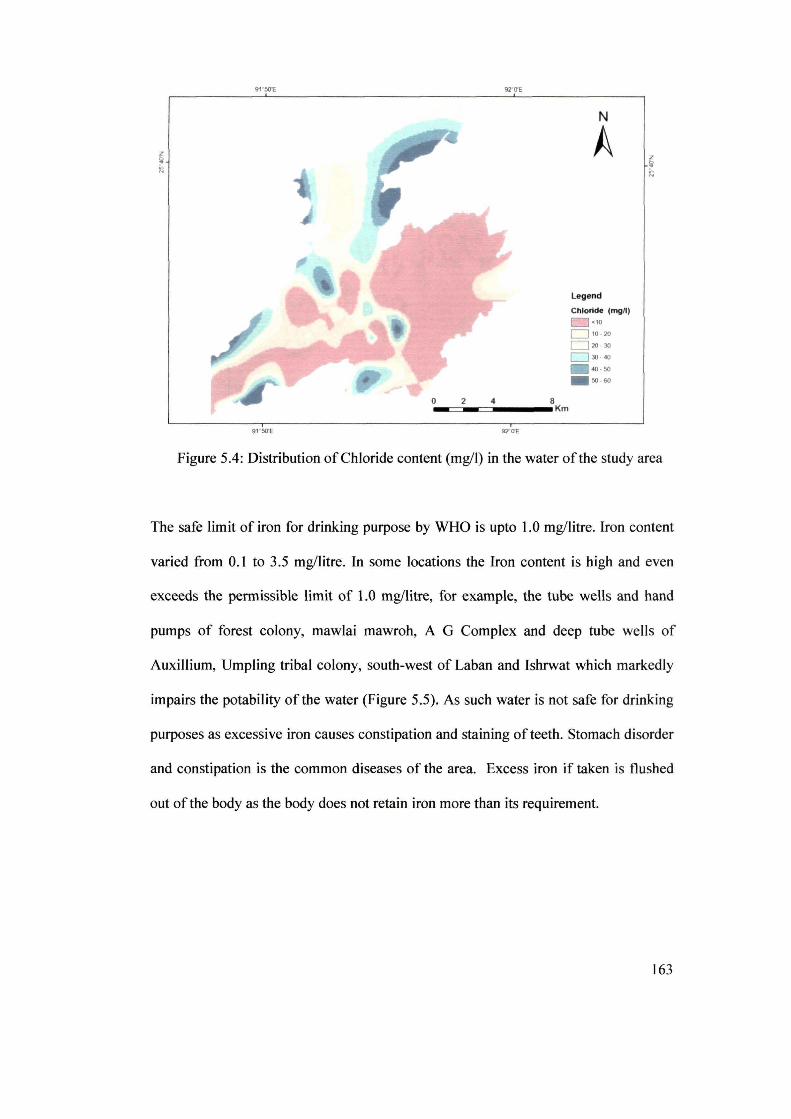
92"O'E
91 "SO'E
N
A
Legend
Chloride (mgn) <10
0 1020
0 20 - 30
O JO -40 _ 40 -SO _SO -60
Figure 5.4: Distribution of Chloride content (mg/I) in the water of the study area
The safe limit of iron for drinking purpose by WHO is upto 1.0 mg/litre. Iron content
varied from 0.1 to 3.5 mg/litre. In some locations the Iron content is high and even
exceeds the permissible limit of 1.0 mg/litre, for example, the tube wells and hand
pumps of forest colony, mawlai mawroh, A G Complex and deep tube wells of
Auxillium, Umpling tribal colony, south-west of Laban and Ishrwat which markedly
impairs the potability of the water (Figure 5.5). As such water is not safe for drinking
purposes as excessive iron causes constipation and staining of teeth. Stomach disorder
and constipation is the common diseases of the area. Excess iron if taken is flushed
out ofthe body as the body does not retain iron more than its requirement.
163
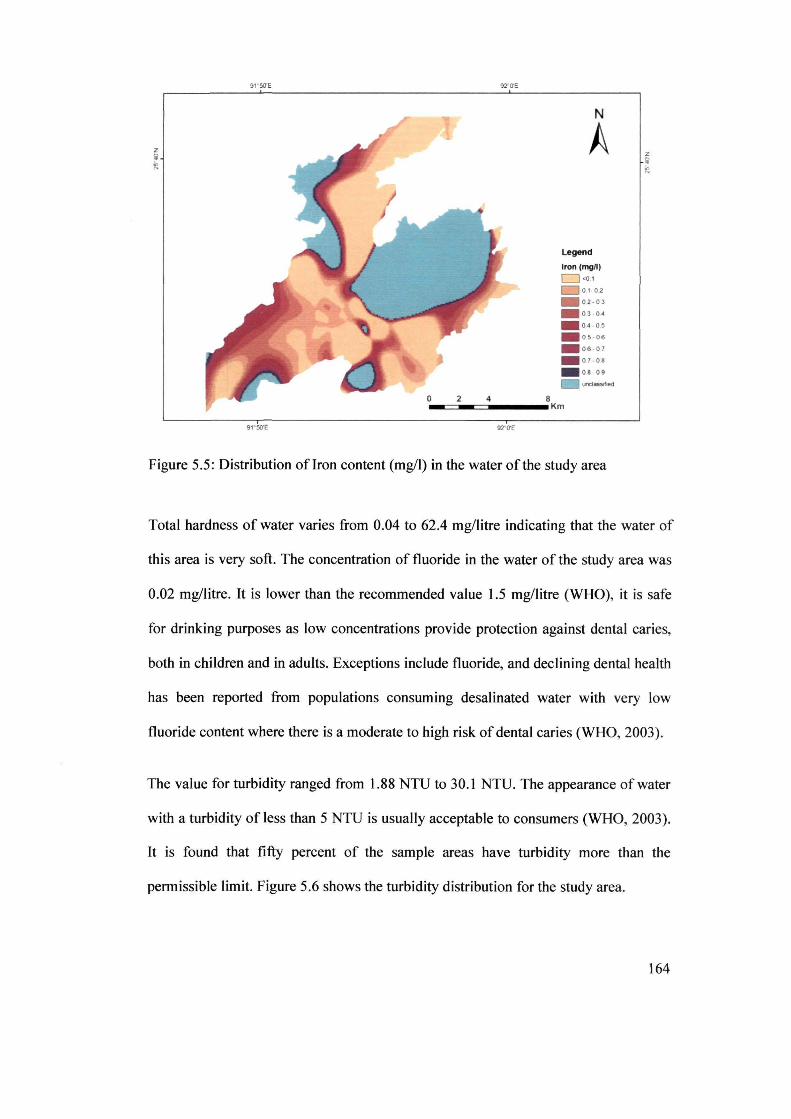
91 ' 50'E
91 D 5(}'E
92"O'E
8
N
A
Legend Iron (mgn)
0 <01
01 - 0.2
. 02-03
. 03 - 0<
. 04 - 05
. 05-06
. 06 - 07
. 07-08
. 08 - 09
• """ ..... ood
__ ~.c=-______ Km
92"O'E
Figure 5.5: Distribution of Iron content (mg/l) in the water of the study area
Total hardness of water varies from 0.04 to 62.4 mg/litre indicating that the water of
this area is very soft. The concentration of fluoride in the water of the study area was
0.02 mg/litre. It is lower than the recommended value 1.5 mg/litre (WHO), it is safe
for drinking purposes as low concentrations provide protection against dental caries,
both in children and in adults. Exceptions include fluoride, and declining dental health
has been reported from populations consuming desalinated water with very low
fluoride content where there is a moderate to high risk of dental caries (WHO, 2003).
The value for turbidity ranged from 1.88 NTU to 30.1 NTU. The appearance of water
with a turbidity of less than 5 NTU is usually acceptable to consumers (WHO, 2003).
It is found that fifty percent of the sample areas have turbidity more than the
permissible limit. Figure 5.6 shows the turbidity distribution for the study area.
164
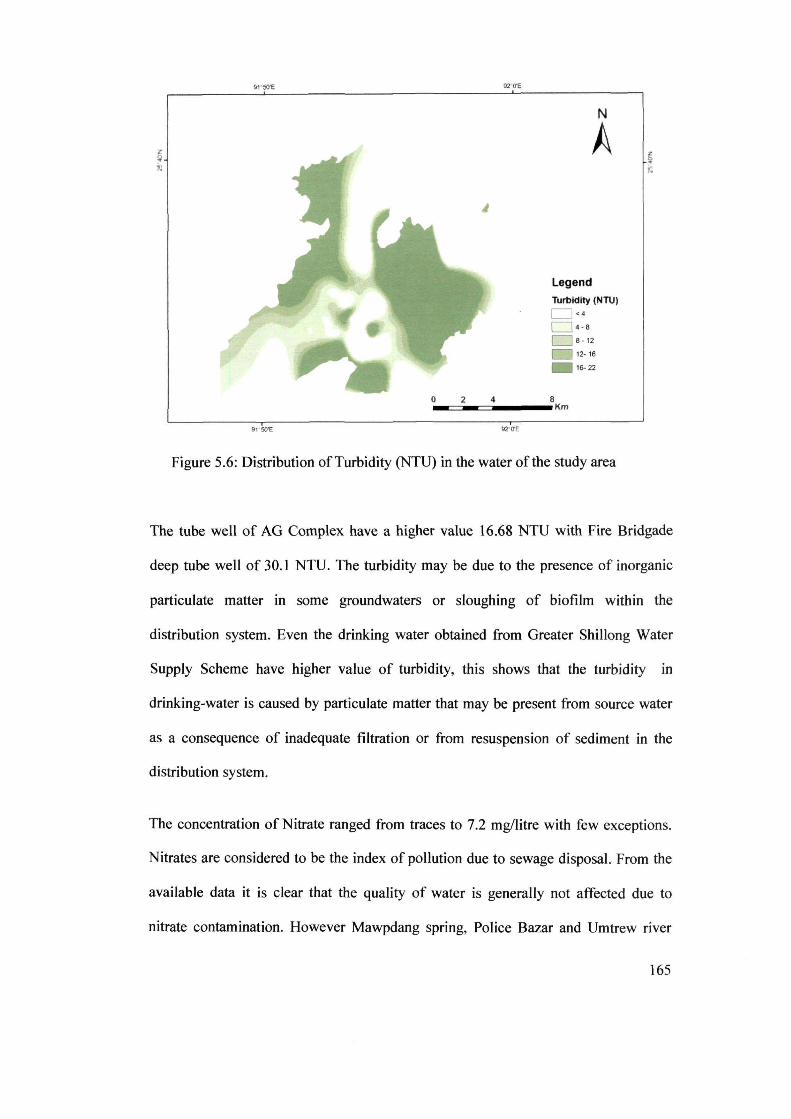
91'50'E
9' "50'E
92"O'E
N
A
Legend
Turbidity (NTU)
0 <4 0 4 - 8
0 8 -' 2
'2· ,6 _ ,5022
o 2 4 8 _ _ Km
92"CYE
Figure 5.6: Distribution of Turbidity (NTU) in the water of the study area
The tube well of AG Complex have a higher value 16.68 NTU with Fire Bridgade
deep tube well of 30.1 NTU. The turbidity may be due to the presence of inorganic
particulate matter in some groundwaters or sloughing of biofilm within the
distribution system. Even the drinking water obtained from Greater Shillong Water
Supply Scheme have higher value of turbidity, this shows that the turbidity in
drinking-water is caused by particulate matter that may be present from source water
as a consequence of inadequate filtration or from resuspension of sediment in the
distribution system.
The concentration of Nitrate ranged from traces to 7.2 mg/litre with few exceptions.
Nitrates are considered to be the index of pollution due to sewage disposal. From the
available data it is clear that the quality of water is generally not affected due to
nitrate contamination. However Mawpdang spring, Police Bazar and Umtrew river
165

shows higher values indicating the beginning of pollution of the water resources.
Presence of Nitrate at Fire Brigade indicates sewage contamination of ground water.
In general, the water is suitable for domestic use and the quality of groundwater and
surface water is affected primarily by anthropogenic activities.
166
Introduction
CHAPTER 6
LAND USE !LAND COVER ANALYSIS
The land use/land cover pattern of a region is an outcome of natural and socio -
economic factors and utilization of land resources by man in time and space. Land is
becoming a scarce resource due to immense agricultural and demographic pressures.
Hence, information on land use / land cover and potentials for their optimal use is
essential for planning and implementation of land use schemes to meet the increasing
demands of land resources for basic human needs and welfare. Land use and land
cover change has become a central component in current strategies for managing
natural resources and monitoring environmental changes. The major procedure in
analysing the temporal variations of land use is through the application of remote
sensing data, which provide a reliable database for planning, evaluation and
monitoring the temporal dynamics in a GIS environment.
In this chapter land use/ land cover change of the study area between 2000 and 2005
has been analysed with a view to detect the changes taking place and to identify the
areas that are experiencing faster rate of change in the land use.
167
Review of literature
Ever since the launch of the first Indian remote sensing satellite (Landsat-I) in 1972,
land use and land cover studies have been carried out on different scales for different
users. For instance, waste land mapping of India was carried out on 1: 1 million scales
by NRSA using 1980 - 82 landsat multi spectral scanner data and it was estimated
that about 16.2% of country's land mass was covered by wastelands. It has been noted
over time through series of studies that Landsat Thematic Mapper is adequate for
general extensive synoptic coverage of large areas. In 1985, the U.S Geological
Survey carried out a research program to produce 1 :250,000 scale land cover maps for
Alaska using Landsat MSS data. Shosheng et. al. (1994) emphasised the advantages
of remote sensing techniques in relation to field surveys in providing a regional
description of vegetation cover. The results of their research were used to produce
four vegetation cover maps that provided new information on spatial and temporal
distributions of vegetation and allowed regional quantitative assessment of the
vegetation cover. Mohanty (1994) analysed the urban land use change of north
Bhubaneswar, Orissa using aerial photographs and satellite data. Singh (1995)
analyzed the land use management and urban planning in Bhilai, an industrial
complex, and suggested land use for the expected population by the year 2001 AD.
An analysis of land use and land cover changes was done using the combination of
MSS Landsat and land use map of Indonesia by Dimyati (1995). Using land use land
cover images of 1972, 1984 and land use maps of 1990, he calculated the index of
change. This was done to analyze the pattern of change in the area, which was rather
difficult with the traditional method of surveying as noted by Olorunfemi (1983)
when he was using aerial photographic approach to monitor urban land use in
developing countries with Ilorin in Nigeria as the case study. Lalianthanga and
168
Goswami (1997) applied IRS-l B (F) Data on I :50,000 scale for studying land use of
Serchip rural development block of Aizawl district.
MENRIS (1997) studied the land use changes in Pranmati watershed Garhwal
Himalayas using IRS- IB and inferred that cultivated land increased significantly at
the expense of forest and pasture land. Uttarwar (1999) studied the usefulness of
aerial photographs at pre-planning stage in urban fringes. The data generated from the
study was made available to the physical planners to monitor and periodically
evaluate the land available with them for urban extension. Ramesh and Goel (1999)
used aerial photographs to make an inventory of land use types and to appraise the
development plan-200! with the existing land-use. Rashid (1999) located and
assessed the suitable vacant land in Bardez along the national highway between Panaji
and Mapusa for urban development using aerial photographs. Bisht and Sokhi (1999)
studied the growth of Saharanpur city and analyzed the functional characteristics and
structural pattern using remote sensing data. Bhargava and Sokhi (1999) identified the
deviations from the master plan proposals of Noida, a new town near Delhi by using
Remote Sensing Technique and GIS software. Singh and Vatsavia (1999) utilized
digital mapping technique using spot data for information generation pertaining to
urban/sub-urban environment of Dehradun.
Vivekanand et.al. (1999) created spatial database of various resources such as land
use/land-cover, drainage, soil, and slope data by using universal soil loss equation
(USLE) to identify erosion prone areas and site suitability analysis for afforestation.
Adeniyi. el. al. (1999) delineated the land use /land cover change evaluation in Sokoto
- Rima Basin of North - Western Nigeria based on Archival Remote Sensing and GIS
techniques, used aerial photographs, Landsat MSS, SPOT XSlPanchromatic image
169
Transparency and Topographic map sheets to study changes in Sokoto and Guronyo
dams between 1962 and 1986. The work revealed that land use land cover of both
areas was unchanged before the construction while settlement alone covered most part
of the area. However, during the post-dam era, land use Iland cover classes changed
with settlement still remaining the largest. Marceau. et.al. (2001) linked temporal and
spatial information into a GIS database structure to investigate the land use changes
in a rural urban region over a thirty-five year period, where information such as rate
of change of land use and zoning regulations and land-use successions were extracted
from the database. They concluded that the approach represents a flexible and
performing tool for scientists and planners who need to efficiently capture essential
spatial-temporal information required for geographical inquiry and decision-making.
Cievo et. al. (2002) in their comparison of land use land cover change detection
methods, made use of 5 methods viz., traditional post-classification cross tabulation,
cross correlation analysis, neural networks, knowledge-based expert systems, and
image segmentation and object-oriented classification. A combination of direct Tl
and T2 change detection as well as post classification analysis was employed. Nine
land use land cover classes were selected for analysis. They observed that there are
merits to each of the five methods examined, and that at the point of their research no
single approach can solve the land use change detection problem.
Chauhan et. al. (2003) used aerial photographs of 1976 and IRS -IC LISS III satellite
data of 1999 to carry out change detection in Sal forest of Deradhun Forest Division
Mahajan and Panwar (2005) carried out a study on land use change in Aswani Khan
Watershed using GIS techniques. They observed that over a span of twenty years, the
agriculture area in the watershed has increased whereas the forest area and waste land
area has decreased. Their topographic analyses indicated that the wastelands in the
170
mid altitudes and mid-slopes suitable for agriculture purpose were brought under
cultivation. On the other hand at relatively higher altitude and moderate slopes, a
decrease in forest area was observed due to encroachment for settlements and
cultivation. Pandey and Nathawat (2006) carried out a study on land use land cover
mapping of Panchkula, Ambala and Yamunangar districts of Haryana, India. They
observed that the heterogeneous climate and physiographic conditions has resulted in
development of varied land use land cover in these districts. An evaluation by digital
analysis of satellite data indicated that majority of areas in these districts are used for
agricultural purpose. The hilly regions exhibit fair development of reserved forests. It
was inferred that land use land cover pattern in the area were generally controlled by
agro-climatic conditions and groundwater potential. Mahajan et.al. (2001) studied the
land use status of Ashwani Khad watershed using IRS-ID satellite data and carried out
topographic analysis using GIS techniques to show that altitude, slope and aspect
affected the land utilization pattern. Thakur and Goswami (1993) prepared urban
sprawl map and land suitability map of Guwahati city using multidate SOl
topographical maps and satellite data and identified areas suitable for construction and
conservation. The study indicated that by analyzing satellite data it was possible to
detect the growth ofthe city over the period of time and also to evaluate the suitability
of land for urban development.
171
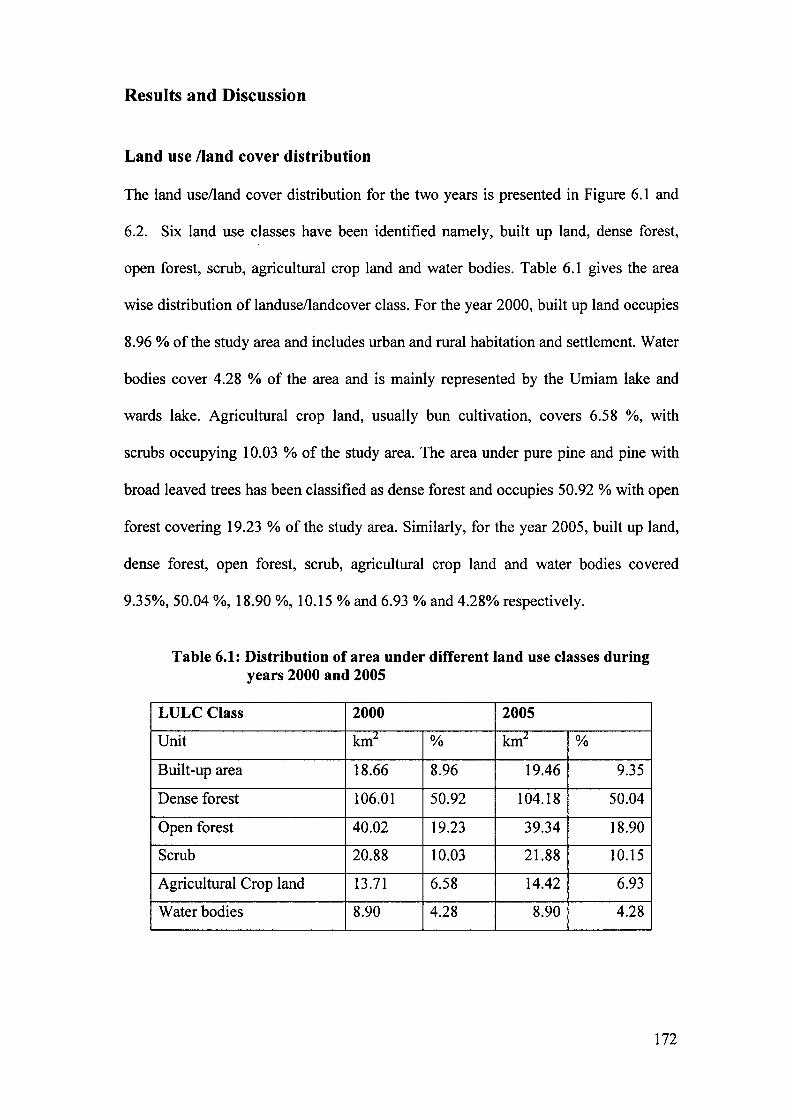
Results and Discussion
Land use !land cover distribution
The land use/land cover distribution for the two years is presented in Figure 6.1 and
6.2. Six land use classes have been identified namely, built up land, dense forest,
open forest, scrub, agricultural crop land and water bodies. Table 6.1 gives the area
wise distribution of landuse/landcover class. For the year 2000, built up land occupies
8.96 % of the study area and includes urban and rural habitation and settlement. Water
bodies cover 4.28 % of the area and is mainly represented by the Umiam lake and
wards lake. Agricultural crop land, usually bun cultivation, covers 6.58 %, with
scrubs occupying 10.03 % of the study area. The area under pure pine and pine with
broad leaved trees has been classified as dense forest and occupies 50.92 % with open
forest covering 19.23 % of the study area. Similarly, for the year 2005, built up land,
dense forest, open forest, scrub, agricultural crop land and water bodies covered
9.35%,50.04 %, 18.90 %, 10.15 % and 6.93 % and 4.28% respectively.
Table 6.1: Distribution of area under different land use classes during years 2000 and 2005
LULC Class 2000 2005
Unit kmL % kmL %
Built-up area 18.66 8.96 19.46 9.35
Dense forest 106.01 50.92 104.18 50.04
Open forest 40.02 19.23 39.34 18.90
Scrub 20.88 10.03 21.88 10.15
Agricultural Crop land 13.71 6.58 14.42 6.93
Water bodies 8.90 4.28 8.90 4.28
172
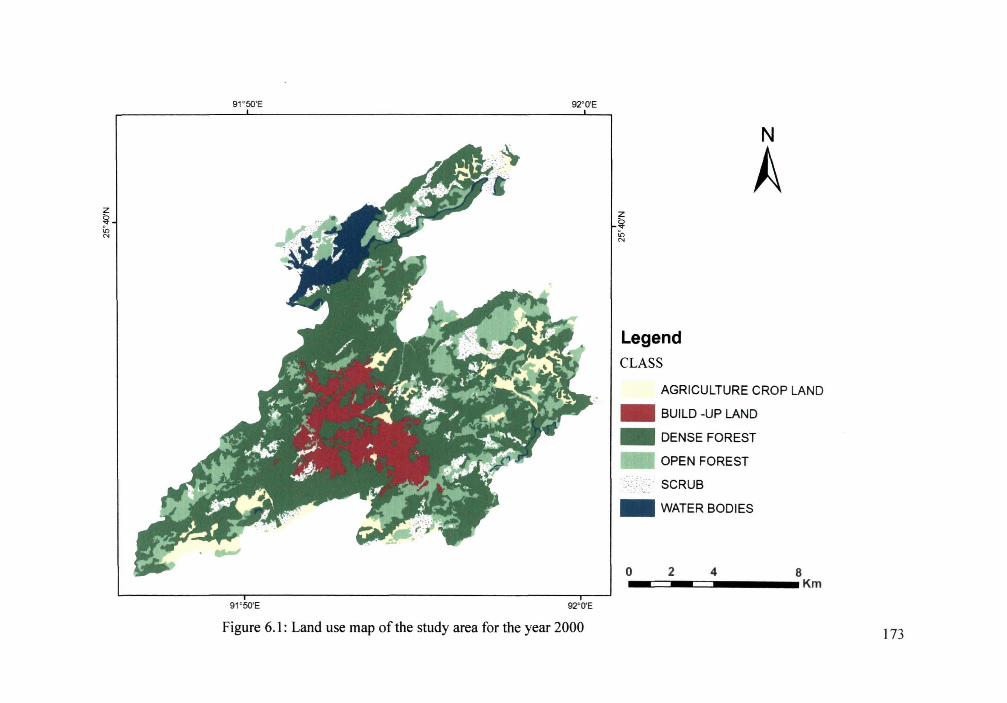
z ~ :0 N
91' 50'E 92'O'E
91' 50'E 92'O'E
Figure 6,1: Land use map of the study area for the year 2000
N
A z ~ :0 N
Legend CLASS
AGRICULTURE CROP LAND
.. BUILD -UP LAND
.. DENSE FOREST
OPEN FOREST
. SCRUB
.. WATER BODIES
o 2 4 8 .. c=~~~ ...... _ Km
173
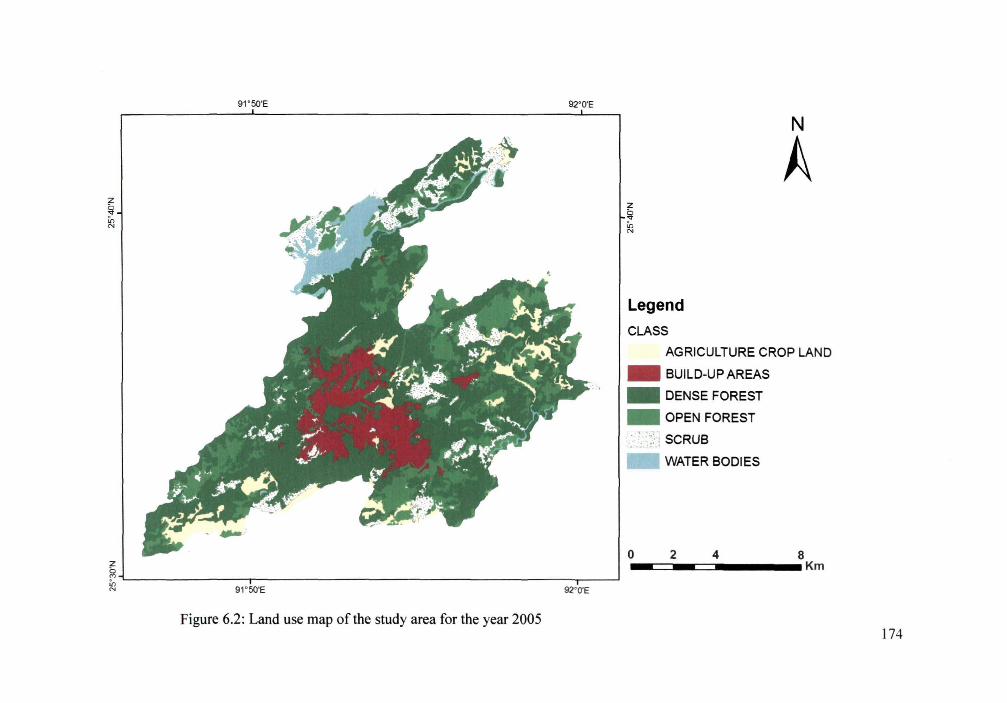
z ~ ~
z
91 ' 5Q'E 92' O'E
g ~'---------------r--------------------------------------'----~ ~ N 91' 5Q'E 92'O'E
Figure 6.2: Land use map of the study area for the year 2005
z ~ ~ N
Legend
CLASS
N
A
AGRICULTURE CROP LAND
.. BUILD-UP AREAS
.. DENSE FOREST
.. OPEN FOREST
i- ~_:~-. SCRUB ~- ~ . -.,,:,-.~
.. WATER BODIES
o 2 4 8 .. ~~-==-........ Km
174
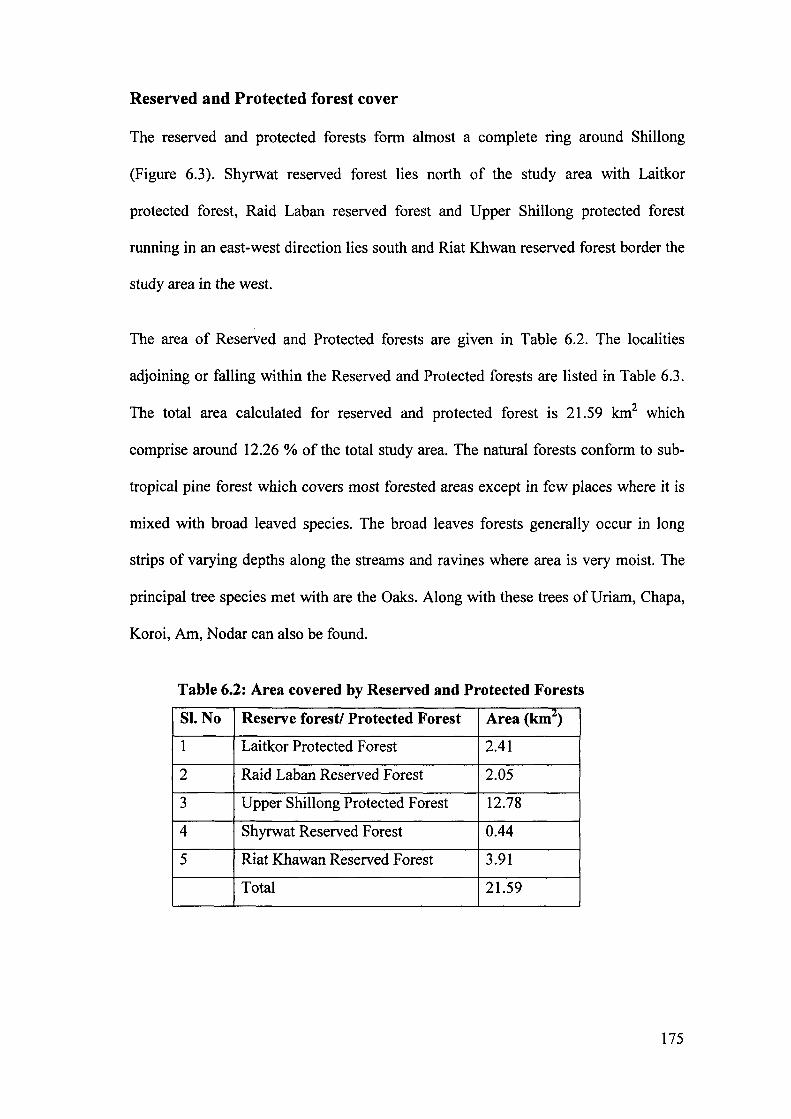
Reserved and Protected forest cover
The reserved and protected forests form almost a complete ring around Shillong
(Figure 6.3). Shyrwat reserved forest lies north of the study area with Laitkor
protected forest, Raid Laban reserved forest and Upper Shillong protected forest
running in an east-west direction lies south and Riat Khwan reserved forest border the
study area in the west.
The area of Reserved and Protected forests are given in Table 6.2. The localities
adjoining or falling within the Reserved and Protected forests are listed in Table 6.3.
The total area calculated for reserved and protected forest is 21.59 km2 which
comprise around 12.26 % of the total study area. The natural forests conform to sub-
tropical pine forest which covers most forested areas except in few places where it is
mixed with broad leaved species. The broad leaves forests generally occur in long
strips of varying depths along the streams and ravines where area is very moist. The
principal tree species met with are the Oaks. Along with these trees of Uriam, Chapa,
Koroi, Am, Nodar can also be found.
Table 6.2: Area covered by Reserved and Protected Forests
SI. No Reserve forest/ Protected Forest Area (km2)
1 Laitkor Protected Forest 2.41
2 Raid Laban Reserved Forest 2.05
3 Upper Shillong Protected Forest 12.78
4 Shyrwat Reserved Forest 0.44
5 Riat Khawan Reserved Forest 3.91
Total 21.59
175
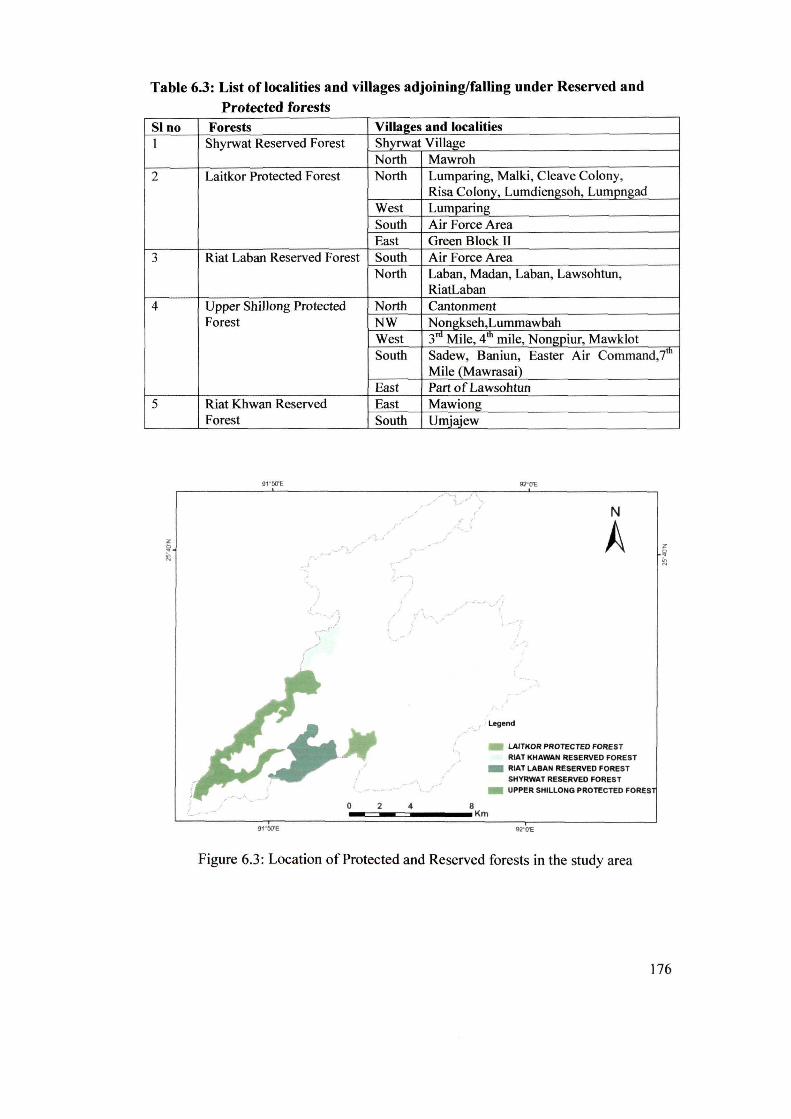
Table 6.3: List of localities and villages adjoining/falling under Reserved and Protected forests
Sino I
2
3
4
5
Forests Shyrwat Reserved Forest
Laitkor Protected Forest
Riat Laban Reserved Forest
Upper Shillong Protected Forest
Riat Khwan Reserved Forest
" , -I
"
- '\
, I
Villages and localities Shyrwat Village North North
West South East South North
North NW West South
East East South
Mawroh Lumparing, Malki, Cleave Colony, Risa Colony, Lumdiengsoh, Lumpngad Lumparing Air Force Area Green Block II Air Force Area Laban, Madan, Laban, Lawsohtun, RiatLaban Cantonment Nongkseh,Lummawbah 3m Mile, 4th mile, Nongpiur, Mawklot Sadew, Baniun, Easter Air Command,7th
Mile (Mawrasai) Part of Lawsohtun Mawiong Umjajew
,; ... , ./ I
")... , ....
92"1TE
N
A
Legend
LAITKOR PROTECTED FOREST
RIAT KHAWAN RESERVED FOREST _ RIAT LABAN RESERVED FOREST
SHYRWAT RESERVED FOREST _ UPPER SHILLONG PROTECTED FORES
02 4 8 _ _ Km
91"SO'E 92"1TE
Figure 6.3: Location of Protected and Reserved forests in the study area
176
It was observed that reserved forests and protected forests are the major catchment
areas of seven municipal sources and other water sources tapped by PHeD for water
supply to the Shillong Municipality, Shillong Cantonement and to the reservoir of
Umiam Hydel Project. Raid Laban reserved forest, Laitkor and Upper Shillong
protected forest forms the catchment areas for water supply to Shillong Municipality
and Cantonement areas. These forests have numerous springs that feed the Umshirpi
river which drains into the Umiam Lake. The forests act as lungs to the Shillong
agglomeration comprising of Shillong Municipality, Shillong Cantonement,
townships as well as other localities around SMP A which are encircled by these
forests. It has been observed that several water sources have dried mainly due to rapid
expansion of the city into these forests which once skirted the town.
Land use change detection
In order to put any change into a proper perspective, it is useful to establish the state
of the environment in the selected base year. The trend of change in land use category
for both the years was then analyzed. From the analysis it has been observed that there
has been a change in vegetation and land cover types within a span of five years
(Figure 6.4). The land use statistics giving percentage of area under different class of
land use for both years are presented in Table 6.4.
Area under dense forest has reduced and it has been replaced by open forest, scrubs,
agriculture and built up areas. In 2000 area under dense forest and open forest was
106.01 and 40.02 km2 (50.92 and 19.23% of the total area) and it decreased to 104.18
and 39.34 km2 (50.04 and 18.90 %) in 2005.
177
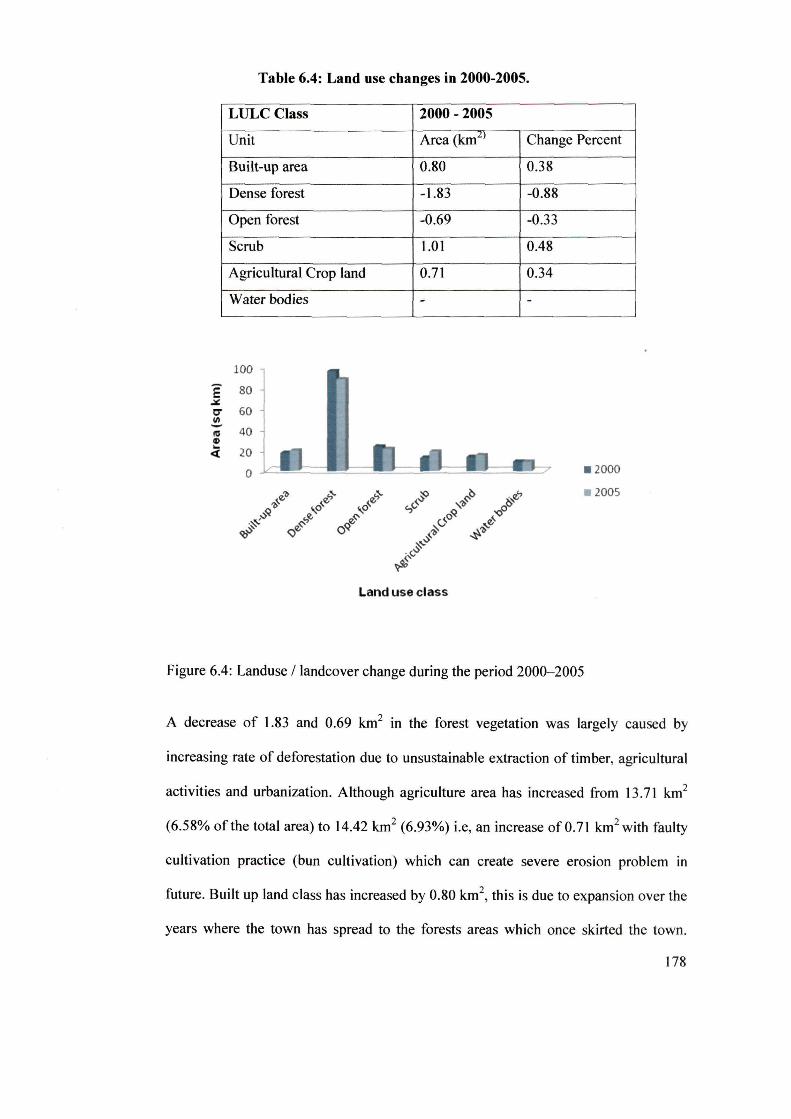
e-~
e-~ «I ~ ~
"'
Table 6.4: Land use changes in 2000-2005.
LULC Class 2000 - 2005
Unit Area (kmL)
Built-up area 0.80
Dense forest -1.83
Open forest -0.69
Scrub 1.01
Agricultural Crop land 0.71
Water bodies -
100
80
60
40
20
0
e7> ~ ~ -§ e e
,§l \0" \0" .~ I?~ e~
,)' e~ oq ~ ~
Land use class
Change Percent
0.38
-0.88
-0.33
0.48
0.34
-
. 2000
. 2005
Figure 6.4: Landuse / landcover change during the period 2000-2005
A decrease of 1.83 and 0.69 km2 in the forest vegetation was largely caused by
increasing rate of deforestation due to unsustainable extraction of timber, agricultural
activities and urbanization. Although agriculture area has increased from 13.71 km2
(6.58% of the total area) to 14.42 km2 (6.93%) i.e, an increase of 0.71 km2 with faulty
cultivation practice (bun cultivation) which can create severe erosion problem in
future. Built up land class has increased by 0.80 km2, this is due to expansion over the
years where the town has spread to the forests areas which once skirted the town.
178

Built up land have expanded especially towards north-eastern part of the study area,
this is a new township located nearly 13 krns from the main city accessible by a
motorable road. The new township includes ten villages viz., Mawdiangdiang,
Umroh, Mawlong, Diengiong, Umsawli, Mawkasiang, Madansaisiej, Mawpdang,
Siejiong and Tynring.
179
Introduction
CHAPTER 7
LANDSLIDE AND FLASHFLOOD
The geoenvironmental hazards in the study area include both natural hazards as well
as man-made hazards. These are: landslide, flashflood, siltation of river due to
quarrying and loss of top soil. Landslide hazard was defined by Vames (1984) as the
probability of occurrence of a potentially damaging landslide phenomenon within a
specified period of time and within a given area. The factors that determine the
landslide hazard of an area may be grouped into two categories: (1) the intrinsic
variables that contribute to landslide susceptibility, such as geology, slope gradient,
slope aspect, elevation, soil geotechnical properties, vegetation cover, and long-term
drainage patterns; and (2) the extrinsic variables that tend to trigger landslides in an
area of given susceptibility, such as heavy rainfall, and earthquakes (Wu and Sidle
1995; Atkinson and Massari 1998). Therefore, the probability of landslide occurrence
depends on both the intrinsic and extrinsic variables. However, the extrinsic variables
may change over a very short time span, and are thus very difficult to estimate. If
extrinsic variables are not taken into account, the term "susceptibility" could be
employed to define the likelihood of occurrence of a landslide event. The spatial
distribution of the intrinsic variables within a given area determines the spatial
distribution of relative landslide susceptibility in that region (Carrara et.al. 1995).
180
A variety of techniques have been developed to assess landslide susceptibility.
Geographical information systems (GIS) have become an important tool for landslide
susceptibility mapping. GIS is a general-purpose computer based technology designed
to capture, store, manipulate, analyze and display diverse sets of spatial or geo
referenced data. The overlay operation commonly applied within the GIS is useful in
both heuristic and statistical approaches (Gupta and Joshi 1989; Carrara et.al. 1991,
1995; Wang and Unwin 1992; Mark and Ellen 1995; Van Westen et.al. 1997;
Fernandez et.al. 1999).
Landslides and flash flood are recurrent problem throughout most of Shillong Master
Plan Area, where they cause extensive damage to property and occasionally result in
loss of life. Landslides and flash flood are triggered by heavy rainfall. Very few
attempts have been made to study the landslides and flashflood in the state of
Meghalaya in general and Shillong in particular (Agarwal, 1994). In view of this
landslide inventory and identification of vulnerable areas with respect to landslides
and flashflood assumes significance. This study utilizes GIS and employs overlay
analysis and statistical analysis to define the physical parameters contributing to the
causal factors of landslides and flash flood for a similar geo-environmental condition.
Such effort will be useful in proper landuse planning, designing civil structures and
urban drainage.
181
Review of Literature
Dai et.al. (2001) presented a method that utilizes GIS and employs statistical analysis
to define the physical parameters contributing to the occurrence of landslides and
classified their study area into five classes of relative landslide susceptibility, namely,
very low, low, moderate, high, and very high. Mckean et.al. (1991) used the remote
sensing and Geographic Information System (GIS) to assess landslide hazards. Prabhu
et. al. (2009) used artificial neutral network approach to estimate areas susceptible to
landslide using a spatial database and also analyzed the socio-economic impact of the
Nilgiris landslide. A susceptibility map was created and it was found that by this
method, landslide occurrence can be assessed, and the method proved to be an
efficient tool for analyzing landslide susceptibility compared to the conventional
methods of landslide mapping. Gupta, et. al. (2009) developed a model to generate a
hazard map for predicting the landslide hazards along NH 31 A between Rangpo and
Singtam using aggregation method. They found that the proposed methodology can be
used in landslide hazards zonation prediction. Narasimha (2001) prepared thematic
maps on slope morphometry, geomorphology and landuse-land cover for Niligiri hills,
and studied their influence over the landslides incidence. He found that slope,
geomorphology and landuse have a conspicuous influence on the occurrence of
landslides. Jagannathan and Kameswar (2001) found that besides others parameters
like slope and landuse, the pattern of rainfall and condition of ground and surface
water regulated the initiation of slides in the Western Ghats. They observed that the
high rainfall causes saturation of soil and poor pressure thereby decreasing the
cohesive strength and angle of internal friction, causing landslide. Vames (1984)
reported that landslides occurred where the maximum daily rainfall exceeded 188.8
mm, with a maximum hourly rainfall of 90 mm. Metrotra et. al. (1993) carried out a
182
terrain evaluation to understand the relationship of lineament with lithology, drainage
pattern and the existing landslide in the parts of Alakanda valley of Garhwal,
Himalaya with the help of remote sensing data and field investigation. They found
that landslides occur, in zones of closely spaced intersecting lineaments, and in the
phyllitic rocks having low drainage density. Krishnaswami (1980) adopted the three
fold geomorphic division of India into Peninsula, the Indo-gangetic Plain and the
Extra-Peninsula as the basis for elevaluating the relative incidences of landslides. He
found that the different geological history, the varying character of the geological
formations and the contrasting physiographic make-up of the three geomorphic
divisions define the pattern and quantum of incidences of landslides. Sharma et. al.
(2009) made a detailed survey of the importance of various soil parameters with
respect to their influence on slope instability and landslide vulnerability. From the
study it was deduced that the soil depth was the most influencing soil parameter
determining the slope instability.
In northeast a number of studies have been conducted. Raju (2001) highlighted the
role of rainfall and seismicity, particularly their combined effect in inducing extensive
landslides in Mizoram. He concluded that the extensive landslides that occurred
within a short span of time in May, 1995 might have been triggered by earthquake
along with a heavy rainfall. He also suggested that the termors during or immediately
after continuous rainfall can possibly cause extensive landslide. Borah et. al. (2001)
found that the landslide in Guwahati are either due to rapid downward movement of
rock mass, soil cum rock mass or sudden spreading of soil. The factors controlling the
stability of slopes include high intensity rainfall, disturbances of natural drainage,
hills cutting, deforestation, structural features of rocks units, lithology, high degree of
rock weathering, building structures on the slope and slope angles. They concluded
183
that the ability to control landslide could be enhanced by adoption of appropriate
landslide management techniques. Chopra and Srivastava (2001) identified the major
geological hazards of Assam viz., landslide, earthquake and floods, besides minor
hazards that include water logging, soil erosion, land subsidence, drainage congestion,
land degradation and groundwater pollution. For proper mitigation of the geological
hazards, they suggested that a disaster management authority with full autonomy at
the state and district levels should be set up under the technical control of experts in
the related field. This authority should be in command at the time of disaster
mitigation and all administrative and logistic support should be binding on the district
authorities. Hiese and Reddy (2001) studied the existing land use pattern of Kohima
area, Nagaland with special reference to the evaluation of landslides and a change in
the land use pattern for two years with the help of remote sensing. They observed
there has been a rapid change in the landuse pattern which has caused serious
consequences on the environment as well as climatic conditions. They suggested that
reasonable geotechnical measures using remote sensing could be used for identifying
large landslides. Awasthy (2001) made a site specific geotechnical appraisal of few
disastrous landslides of Mizoram. He emphasized on the need for development of new
satellite township near Aizawl. On the basis of landslide incidences, physical
characteristics of geological materials and slope characterization a revised landslide
hazard zonation map for Mizoram terrain was prepared.Ghose and Mitra (2001)
prepared a landslide hazard (Macro) zonation (LHZ) map on 1 :25,000 scale following
the landslide hazard evaluation factor (LHEF) rating sheme proposed by the Indian
Bureau of Standards for the area between Singtam and Ranipul sector of East Sikkim
District. They did not observe any definite pattern of distribution of the various zones
in the LHZ map and reported that the maximum area was covered under high hazard
184
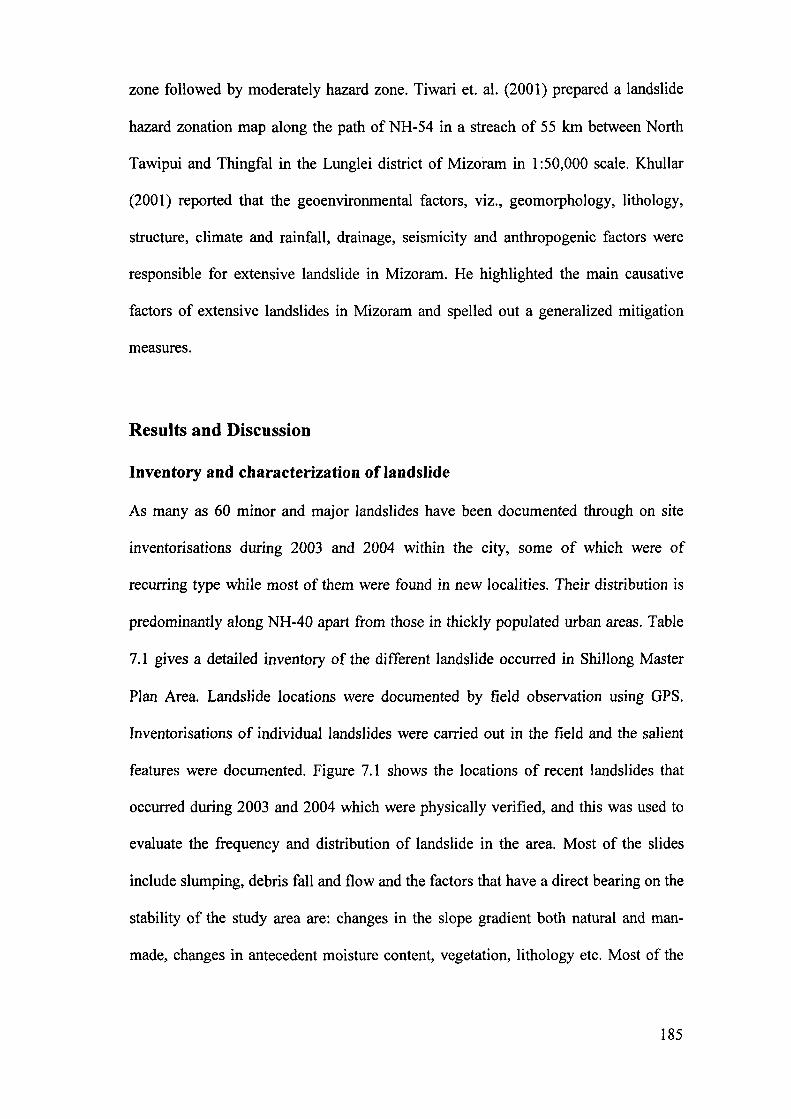
zone followed by moderately hazard zone. Tiwari et. al. (2001) prepared a landslide
hazard zonation map along the path of NH-54 in a streach of 55 km between North
Tawipui and Thingfal in the Lunglei district of Mizoram in 1 :50,000 scale. Khullar
(2001) reported that the geoenvironmental factors, viz., geomorphology, lithology,
structure, climate and rainfall, drainage, seismicity and anthropogenic factors were
responsible for extensive landslide in Mizoram. He highlighted the main causative
factors of extensive landslides in Mizoram and spelled out a generalized mitigation
measures.
Results and Discussion
Inventory and characterization of landslide
As many as 60 minor and major landslides have been documented through on site
inventorisations during 2003 and 2004 within the city, some of which were of
recurring type while most of them were found in new localities. Their distribution is
predominantly along NH-40 apart from those in thickly populated urban areas. Table
7.1 gives a detailed inventory of the different landslide occurred in Shillong Master
Plan Area. Landslide locations were documented by field observation using GPS.
Inventorisations of individual landslides were carried out in the field and the salient
features were documented. Figure 7.1 shows the locations of recent landslides that
occurred during 2003 and 2004 which were physically verified, and this was used to
evaluate the frequency and distribution of landslide in the area. Most of the slides
include slumping, debris fall and flow and the factors that have a direct bearing on the
stability of the study area are: changes in the slope gradient both natural and man
made, changes in antecedent moisture content, vegetation, lithology etc. Most of the
185
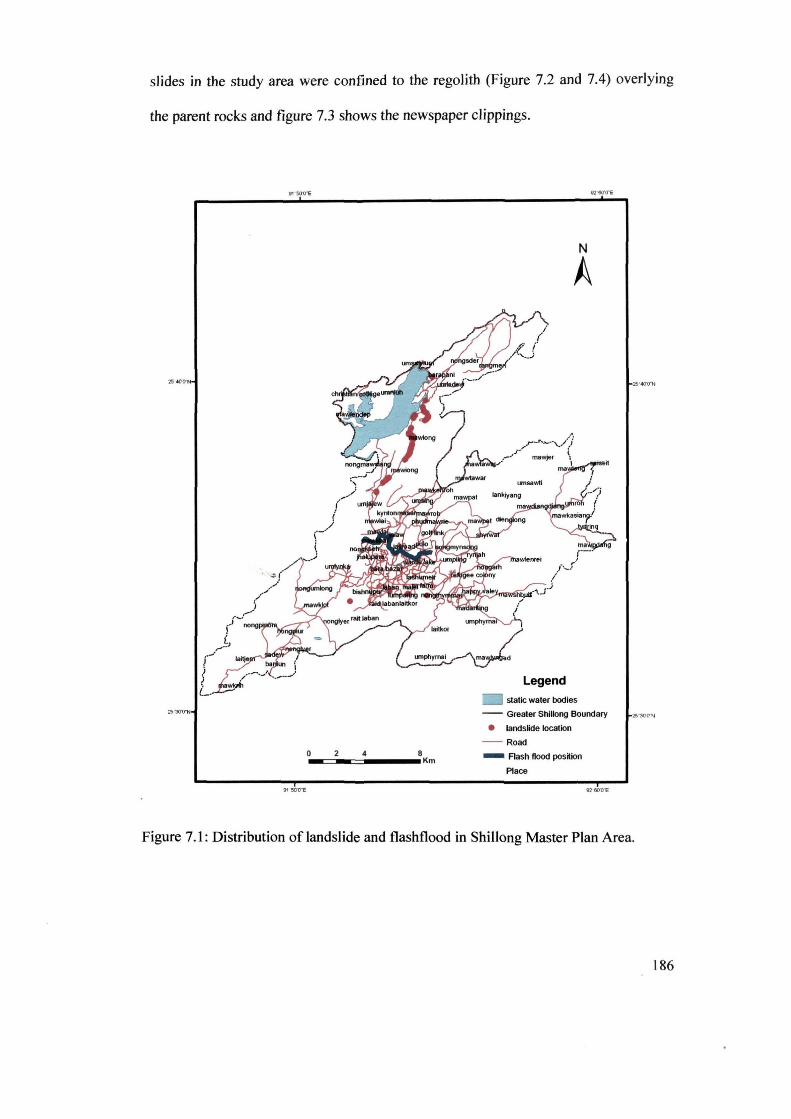
slides in the study area were confmed to the regolith (Figure 7.2 and 7.4) overlying
the parent rocks and figure 7.3 shows the newspaper clippings.
,5<"
o 2 4 8 • __ ~=-~=-...... _Km
N
A
Legend
static water bodies
-- Greater Shillong Boundary
• landstide location
-- Road
- Flash flood posKion
Place
92 eaO"E
Figure 7.1: Distribution of landslide and flashflood in Shillong Master Plan Area.
186
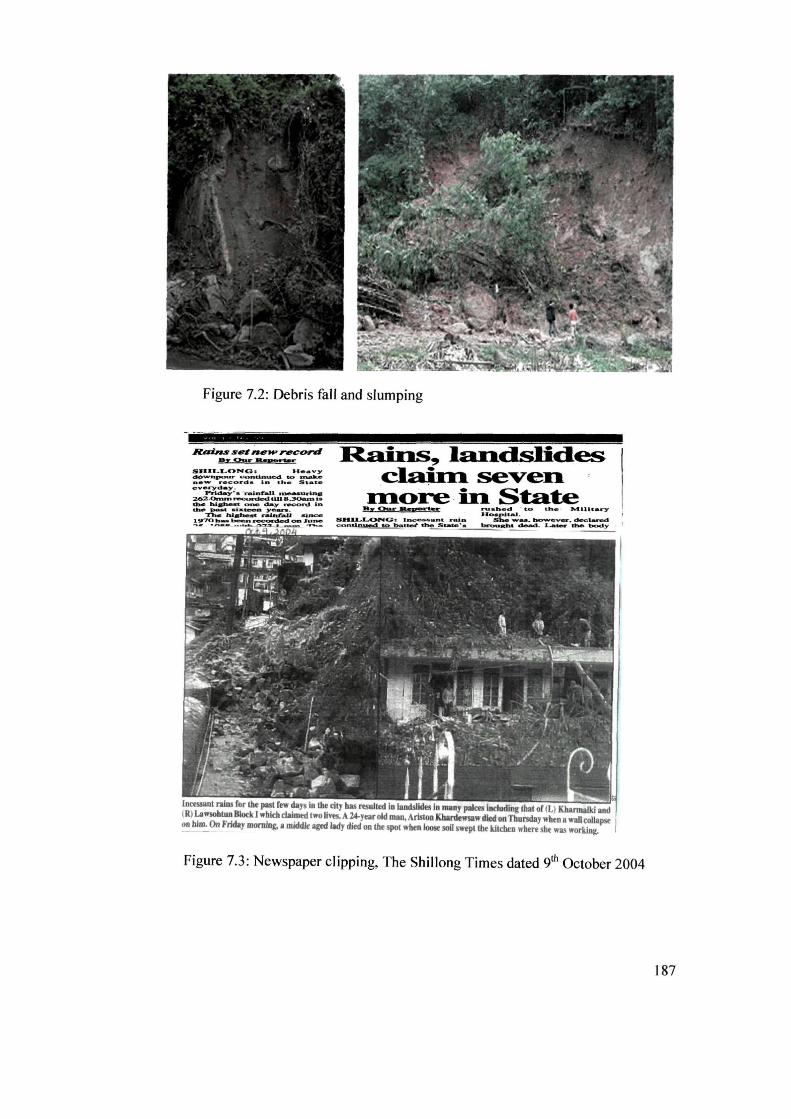
Figure 7.2: Debris fall and slumping
Rains, landslides claiIn seven.
IDore· in. Stat:e By Qyr ............ H:'~-::'J .~ t.o, t..be · '","UU,calf"Y
She __ . ~ev __ • decl ared
~~..:_=~Ah~. Lacer the~
Inc:essant ralns ror !.be past rew days in t.be aty bas rtsulted ID landslides in many paka iDduding that or (L) Khannalki and (It) Lawsobtun BIoclII "hich cIaimtd two Hves. A 24-yearold man, ArlstooKharclnsawdied 011 Thursday when a wall coUapse on him. On Friday morning, I middJe aged lady died on t.be spot when loose soil swept !.be kitchen where she was working.
Figure 7.3 : Newspaper clipping, The Sh illong Times dated 9th October 2004
187
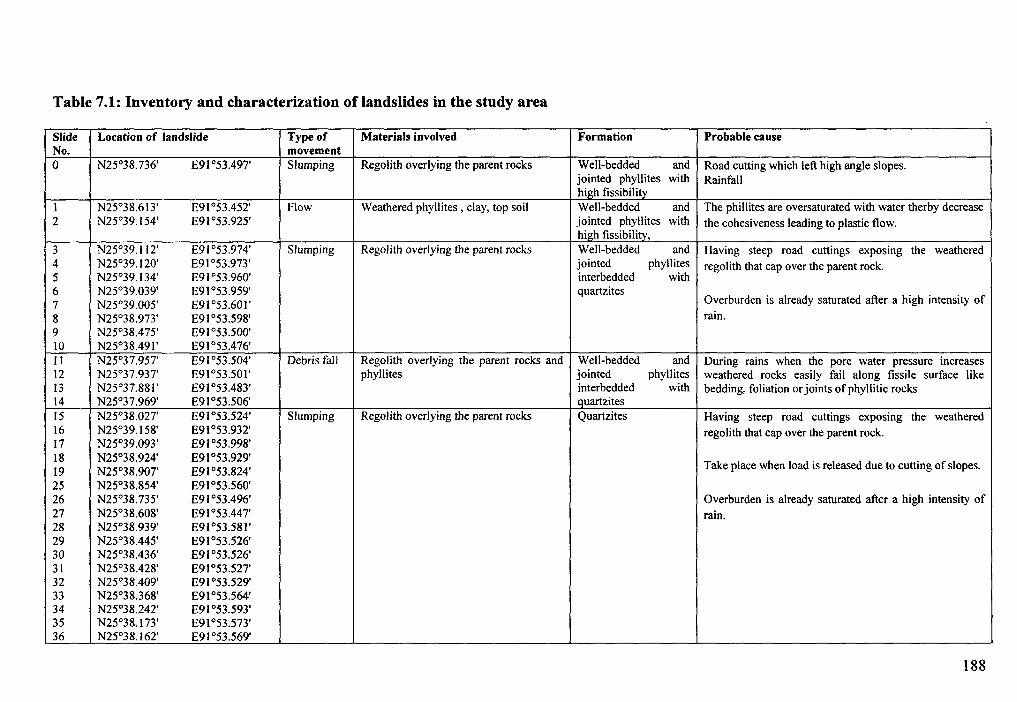
Table 7.1: Inventory and characterization of landslides in the study area
Slide Location of landslide Type of Materials involved Formation Probable cause I No. movement
0 N25°38.736' E91°53.497' Slumping Regolith overlying the parent rocks Well-bedded and Road cutting which left high angle slopes. ,
jointed phyllites with Rainfall I high fissibility
1 N25°3S.613' E91 °53.452' Flow Weathered phyllites, clay, top soil Well-bedded and The ph illites are oversaturated with water therby decrease !
2 N25°39.154' E91 °53.925' jointed phyllites with the cohesiveness leading to plastic flow. high fissibility, I
3 N25°39.112' E91 °53.974' Slumping Regolith overlying the parent rocks Well-bedded and Having steep road cuttings exposing the weathered 4 N25°39.120' E91 °53.973' jointed phyllites regolith that cap over the parent rock. 5 N25°39.134' E91 °53.960' interbedded with 6 N25°39.039' E91 °53.959' quartzites
Overburden is already saturated after a high intensity of 7 N25°39.005' E91°53.60I' S N25°3S.973' E91 °53.598' rain.
9 N25°38.4 75' E91°53.5oo' 10 N25°3S.49I' E91°53.476' II N25°37.95T E91 °53.504' Debris fall Regolith overlying the parent rocks and Well-bedded and During rains when the pore water pressure increases 12 N25°37.93T E91°53.501' phyllites jointed phyllites weathered rocks easily fail along fissile surface like 13 N25°37.88I' E91°53.483' interbedded with bedding, foliation or joints of phyllitic rocks 14 N25°37.969' E91 °53.506' quartzites 15 N25°38.02T E91°53.524' Slumping Regolith overlying the parent rocks Quartzites Having steep road cuttings exposing the weathered 16 N25°39.15S' E91°53.932' regolith that cap over the parent rock. 17 N25°39.093' E91°53.998' IS N25°3S.924' E91 °53.929'
Take place when load is released due to cutting of slopes. 19 N25°38.90T E91°53.824' 25 N25°3S.S54' E91 °53.560' 26 N25°38.735' E91 °53.496' Overburden is already saturated after a high intensity of 27 N25°38.60S' E91 °53.447' rain. 2S N25°38.939' E91°53.581' 29 N25°3S.445' E91 °53.526' 30 N25°38.436' E91°53.526' 31 N25°3S.42S' E91 °53.527' 32 N25°38.409' E91°53.529' 33 N25°3S.368' E91 °53.564' 34 N25°38.242' E91°53.593' 35 N25°3S.173' E91 °53.573' 36 N25°38.162' E91°53.569'
188
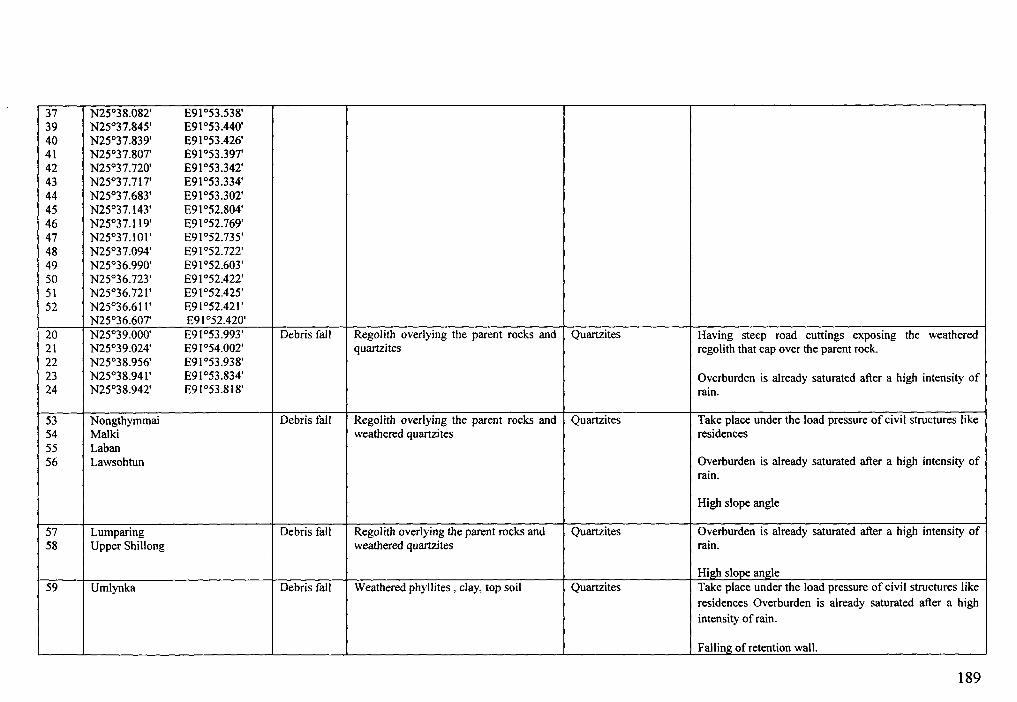
37 N25°38.082' £91 °53.538' 39 N25°37.845' £91 °53.440' 40 N25°37.839' £91 °53.426' 41 N25°37.807' £91 °53.397' 42 N25°37.720' £91 °53.342' 43 N25°37.717' £91°53.334' 44 N25°37.683' £91°53.302' 45 N25°37.143' £91°52.804' 46 N25°37.119' £91°52.769' 47 N25°37.101' £91°52.735' 48 N25°37.094' £91 °52.722' 49 N25°36.990' £91°52.603' 50 N25°36.723' £91 °52.422' 51 N25°36.721' £91 °52.425' 52 N25°36.611' £91 °52.421'
N25°36.607' £91 °52.420' 20 N25°39.000' £91°53.993' Debris fall Regolith overlying the parent rocks and Quartzites Having steep road cuttings exposing the weathered 21 N25°39.024' £91°54.002' quartzites regolith that cap over the parent rock. 22 N25°38.956' £91°53.938' 23 N25°38.94I' £91 °53.834' Overburden is already saturated after a high intensity of 24 N25°38.942' £91°53.818' rain.
53 Nongthymmai Debris fall Regolith overlying the parent rocks and Quartzites Take place under the load pressure of civil structures like 54 Malki weathered quartzites residences 55 Laban 56 Lawsohtun Overburden is already saturated after a high intensity of
rain.
High slope angle
57 Lumparing Debris fall Regolith overlying the parent rocks and Quartzites Overburden is already saturated after a high intensity of 58 Upper Shillong weathered quartzites rain.
High slope angle 59 Umlynka Debris fall Weathered phyllites, clay, top soil Quartzites Take place under the load pressure of civil structures like
residences Overburden is already saturated after a high intensity of rain.
Fallin~ of retention wall.
189
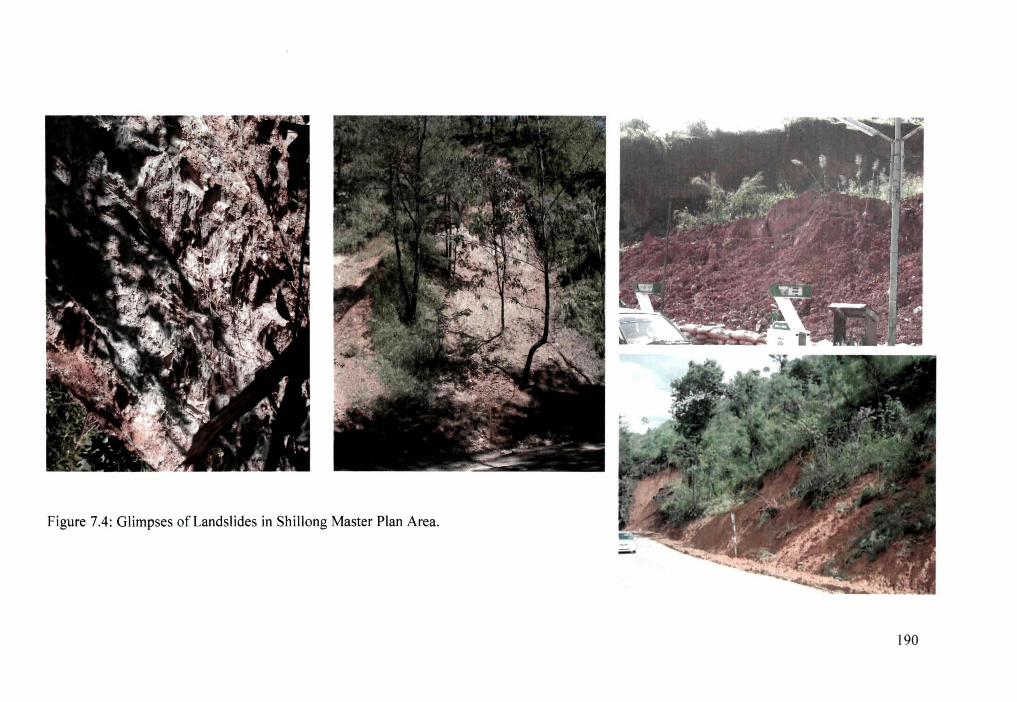
Figure 7.4: Glimpses of Landslides in Shillong Master Plan Area.
190
Casual factors for landslides
In the study area, the landslides were mainly debris flow and slumping that occurred
during 3-4 hours of high intensity rainfall, or shortly after. The landslides occurred
where the maximum daily rainfall exceeded 188.8 mm, with a maximum hourly
rainfall of 90 mm. Damages in 2003 and 2004 was particularly higher and frequently
the Shillong town remained cut off from the rest of the country for several hours when
a series of landslides blocked the NH-40 highway during this time.
Landslides are difficult to predict and their causes vary from place to place. An
integrated study of the causal factors using remote sensing data analysis, GIS and
field investigation in respect of geological, geomorphological and meteorological
parameters suggest that a multiple of factors are responsible for landslide in the study
area. The geoenvironmental factors responsible for landslides in the study area
include geomorphology, lithology, structure, climate and rainfall, drainage, slope and
anthropogenic factors. The influences of these factors in triggering landslides are
discussed below.
i. Landslide and land use pattern
It will be essential to mention that indiscriminate cutting of slopes for construction of
roads and urban settlements have also promoted slope failure. Most of the landslides
are confined in the national highways and urban areas. Landslide prone areas within
urban areas are mostly debris fall (Table 7.2 and Figure 7.5) and are located on steep
hill slopes where the settlements have come up in a haphazard and unplanned manner
and landslides take place under the load pressure of civil structures like residences
(Figure 7.6). Areas affected include Malki-Dhanketi, Upper Shillong, Laithumkhrah
and Lawsohtun, Laban, Nongrim Hills and Umlynka were ravaged by landslides most
191
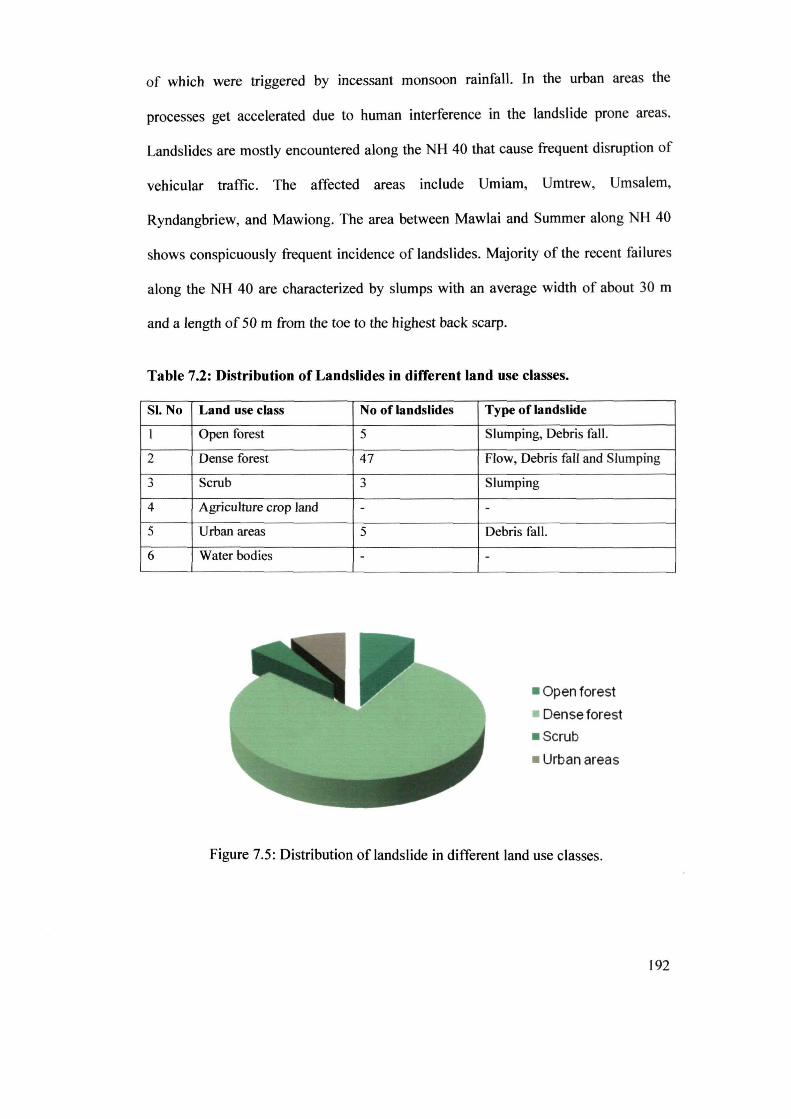
of which were triggered by incessant monsoon rainfall. In the urban areas the
processes get accelerated due to human interference in the landslide prone areas.
Landslides are mostly encountered along the NH 40 that cause frequent disruption of
vehicular traffic. The affected areas include Umiam, Umtrew, Umsalem,
Ryndangbriew, and Mawiong. The area between Mawlai and Summer along NH 40
shows conspicuously frequent incidence of landslides. Majority of the recent failures
along the NH 40 are characterized by slumps with an average width of about 30 m
and a length of 50 m from the toe to the highest back scarp.
Table 7.2: Distribution of Landslides in different land use classes.
SI. No Land use class No of landslides Type of landslide
1 Open forest 5 Slumping, Debris fall.
2 Dense forest 47 Flow, Debris falI and Slumping
3 Scrub 3 Slumping
4 Agriculture crop land - -
5 Urban areas 5 Debris fall.
6 Water bodies - -
• Open forest
• Dense forest
• Scrub
• Urban areas
Figure 7.5: Distribution oflandslide in different land use classes.
192
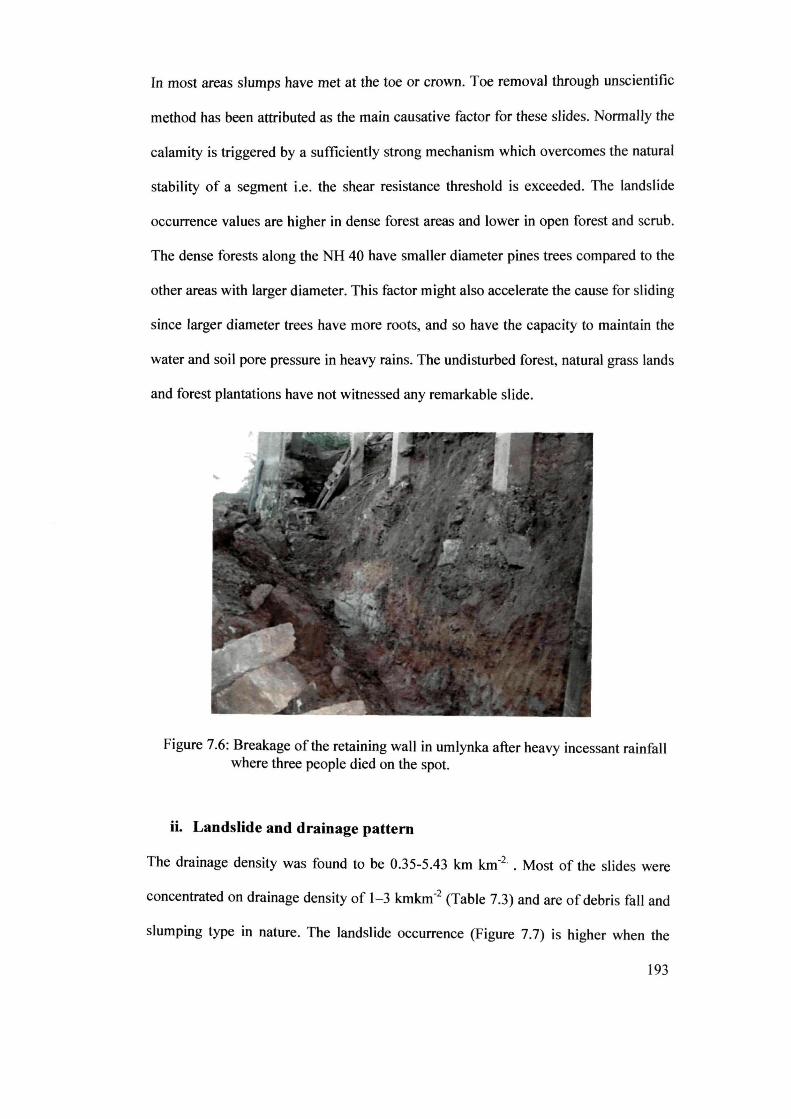
In most areas slumps have met at the toe or crown. Toe removal through unscientific
method has been attributed as the main causative factor for these slides. Normally the
calamity is triggered by a sufficiently strong mechanism which overcomes the natural
stability of a segment i.e. the shear resistance threshold is exceeded. The landslide
occurrence values are higher in dense forest areas and lower in open forest and scrub.
The dense forests along the NH 40 have smaller diameter pines trees compared to the
other areas with larger diameter. This factor might also accelerate the cause for sliding
since larger diameter trees have more roots, and so have the capacity to maintain the
water and soil pore pressure in heavy rains. The undisturbed forest, natural grass lands
and forest plantations have not witnessed any remarkable slide.
Figure 7.6: Breakage of the retaining wall in umlynka after heavy incessant rainfall where three people died on the spot.
ii. Landslide and drainage pattern
The drainage density was found to be 0.35-5.43 km km-2 • Most of the slides were
concentrated on drainage density of 1-3 kmkm-2 (Table 7.3) and are of debris fall and
slumping type in nature. The landslide occurrence (Figure 7.7) is higher when the
193
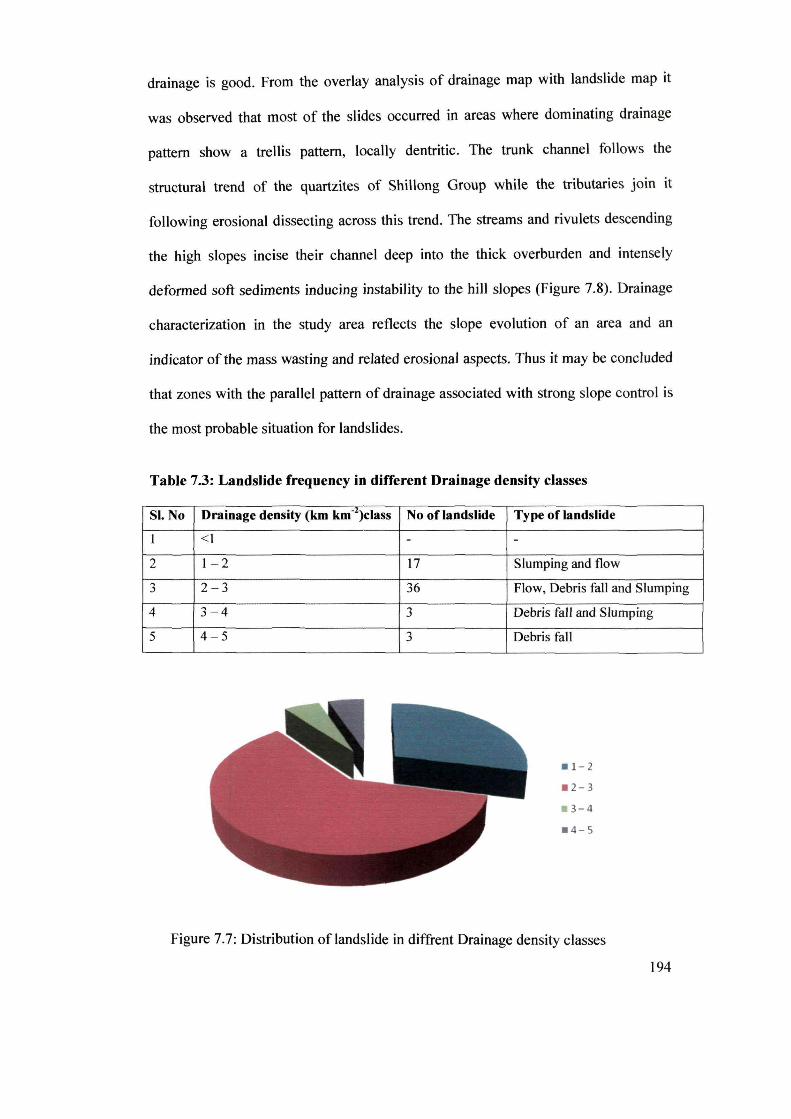
drainage is good. From the overlay analysis of drainage map with landslide map it
was observed that most of the slides occurred in areas where dominating drainage
pattern show a trellis pattern, locally dentritic. The trunk channel follows the
structural trend of the quartzites of Shillong Group while the tributaries join it
following erosional dissecting across this trend. The streams and rivulets descending
the high slopes incise their channel deep into the thick overburden and intensely
deformed soft sediments inducing instability to the hill slopes (Figure 7.8). Drainage
characterization in the study area reflects the slope evolution of an area and an
indicator of the mass wasting and related erosional aspects. Thus it may be concluded
that zones with the parallel pattern of drainage associated with strong slope control is
the most probable situation for landslides.
Table 7.3: Landslide frequency in different Drainage density classes
SI. No Drainage density (km km-2)c1ass
1 < I
2 1-2
3 2-3
4 3 - 4
5 4 - 5
No of landslide
-17
36 ,., .>
3
Type of landslide
-
Slumping and flow
Flow, Debris fall and Slumping
Debris fall and Slumping
Debris fall
.1-2
. 2-3
. 3-4
.4- 5
Figure 7.7: Distribution oflandslide in diffrent Drainage density classes
194
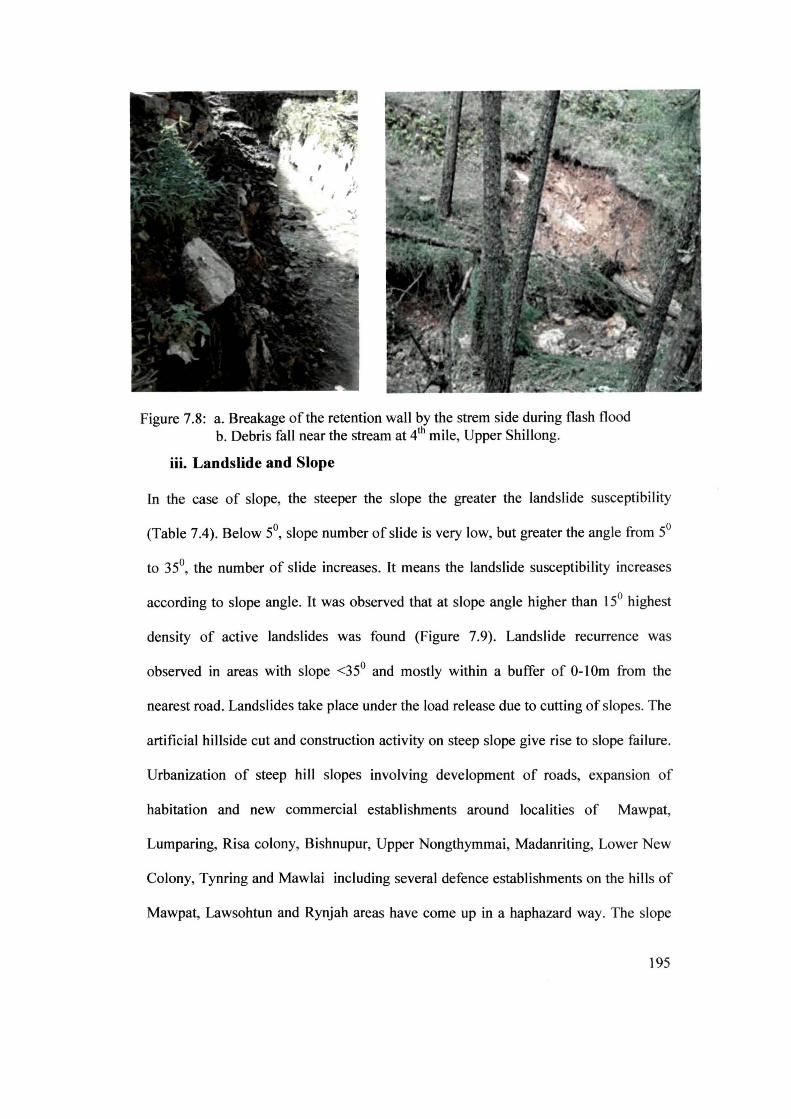
Figure 7.8: a. Breakage of the retention wall by the strem side during flash flood b. Debris fall near the stream at 4th mile, Upper Shillong.
iii. Landslide and Slope
In the case of slope, the steeper the slope the greater the landslide susceptibility
(Table 7.4). Below 5°, slope number of slide is very low, but greater the angle from 5°
to 35°, the number of slide increases. It means the landslide susceptibility increases
according to slope angle. It was observed that at slope angle higher than 15° highest
density of active landslides was found (Figure 7.9). Landslide recurrence was
observed in areas with slope <35° and mostly within a buffer of 0-10m from the
nearest road. Landslides take place under the load release due to cutting of slopes. The
artificial hillside cut and construction activity on steep slope give rise to slope failure.
Urbanization of steep hill slopes involving development of roads, expansion of
habitation and new commercial establishments around localities of Mawpat,
Lumparing, Risa colony, Bishnupur, Upper Nongthymmai, Madanriting, Lower New
Colony, Tynring and Mawlai including several defence establishments on the hills of
Mawpat, Lawsohtun and Rynjah areas have come up in a haphazard way. The slope
195
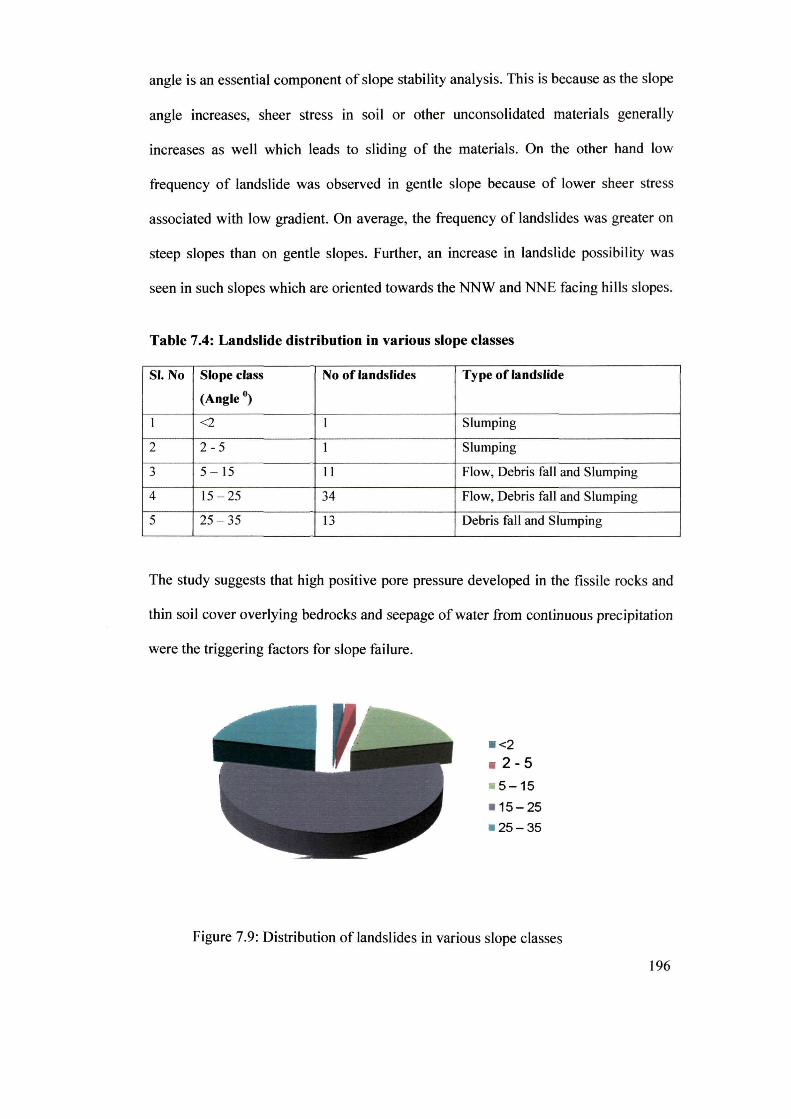
angle is an essential component of slope stability analysis. This is because as the slope
angle increases, sheer stress in soil or other unconsolidated materials generally
increases as well which leads to sliding of the materials. On the other hand low
frequency of landslide was observed in gentle slope because of lower sheer stress
associated with low gradient. On average, the frequency of landslides was greater on
steep slopes than on gentle slopes. Further, an increase in landslide possibility was
seen in such slopes which are oriented towards the NNW and NNE facing hills slopes.
Table 7.4: Landslide distribution in various slope classes
SI. No Slope class No of landslides Type of landslide
(Angle ')
I <2 1 Slumping
2 2-5 I Slumping
3 5 - 15 II Flow, Debris faIl and Slumping
4 15 - 25 34 Flow, Debris faIl and Slumping
5 25 - 35 13 Debris faIl and Slumping
The study suggests that high positive pore pressure developed in the fissile rocks and
thin soil cover overlying bedrocks and seepage of water from continuous precipitation
were the triggering factors for slope failure.
. <2 _ 2 - 5
- 5-15
- 15- 25
- 25-35
Figure 7.9: Distribution of landslides in various slope classes
196
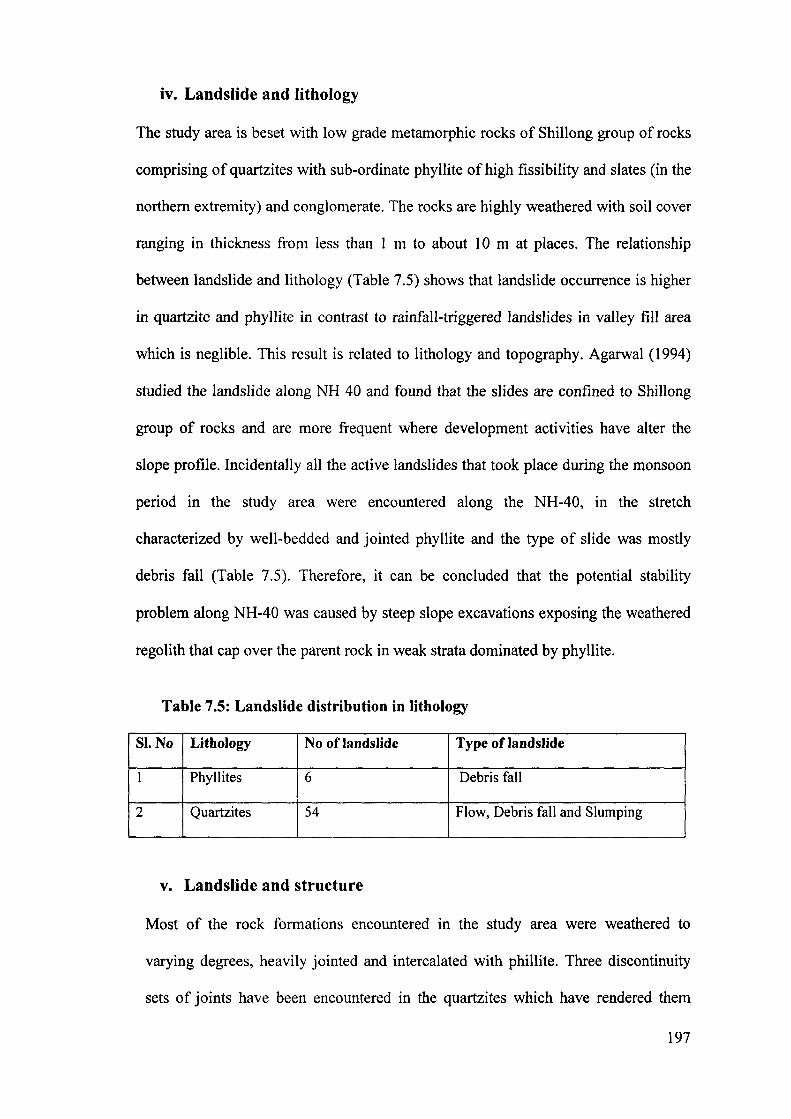
iv. Landslide and lithology
The study area is beset with low grade metamorphic rocks of Shillong group of rocks
comprising of quartzites with sub-ordinate phyllite of high fissibility and slates (in the
northern extremity) and conglomerate. The rocks are highly weathered with soil cover
ranging in thickness from less than 1 m to about 10m at places. The relationship
between landslide and lithology (Table 7.5) shows that landslide occurrence is higher
in quartzite and phyllite in contrast to rainfall-triggered landslides in valley fill area
which is neglible. This result is related to lithology and topography. Agarwal (1994)
studied the landslide along NH 40 and found that the slides are confined to Shillong
group of rocks and are more frequent where development activities have alter the
slope profile. Incidentally all the active landslides that took place during the monsoon
period in the study area were encountered along the NH-40, in the stretch
characterized by well-bedded and jointed phyllite and the type of slide was mostly
debris fall (Table 7.5). Therefore, it can be concluded that the potential stability
problem along NH-40 was caused by steep slope excavations exposing the weathered
regolith that cap over the parent rock in weak strata dominated by phyllite.
Table 7.5: Landslide distribution in lithology
SI.No Lithology No of landslide Type of landslide
1
2
Phyllites 6 Debris fall
Quartzites 54 Flow, Debris fall and Slumping
v. Landslide and structure
Most of the rock formations encountered in the study area were weathered to
varying degrees, heavily jointed and intercalated with phillite. Three discontinuity
sets of joints have been encountered in the quartzites which have rendered them
197
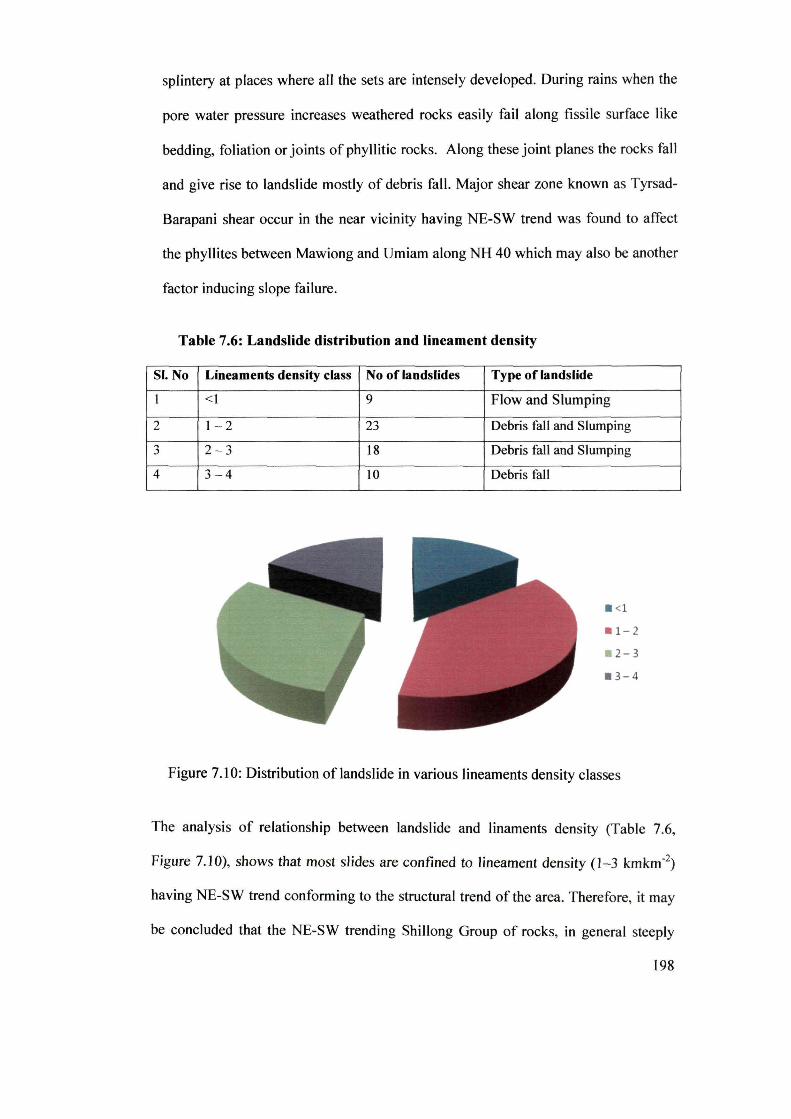
splintery at places where all the sets are intensely developed. During rains when the
pore water pressure increases weathered rocks easily fail along fissile surface like
bedding, foliation or joints of phyllitic rocks. Along these joint planes the rocks fall
and give rise to landslide mostly of debris fall. Major shear zone known as Tyrsad
Barapani shear occur in the near vicinity having NE-SW trend was found to affect
the phyllites between Mawiong and Umiam along NH 40 which may also be another
factor inducing slope failure.
Table 7.6: Landslide distribution and lineament density
SI.No Lineaments density class No of landslides Type of landslide
\ <1 9 Flow and Slumping
2 \ -2 23 Debris fall and Slumping
3 2 - 3 18 Debris fall and Slumping
4 3 - 4 10 Debris fall
Figure 7.10: Distribution of landslide in various lineaments density classes
The analysis of relationship between landslide and linaments density (Table 7.6,
Figure 7.10), shows that most slides are confined to lineament density (1 -3 kmkm-2)
having NE-SW trend conforming to the structural trend of the area. Therefore, it may
be concluded that the NE-SW trending Shillong Group of rocks, in general steeply
198
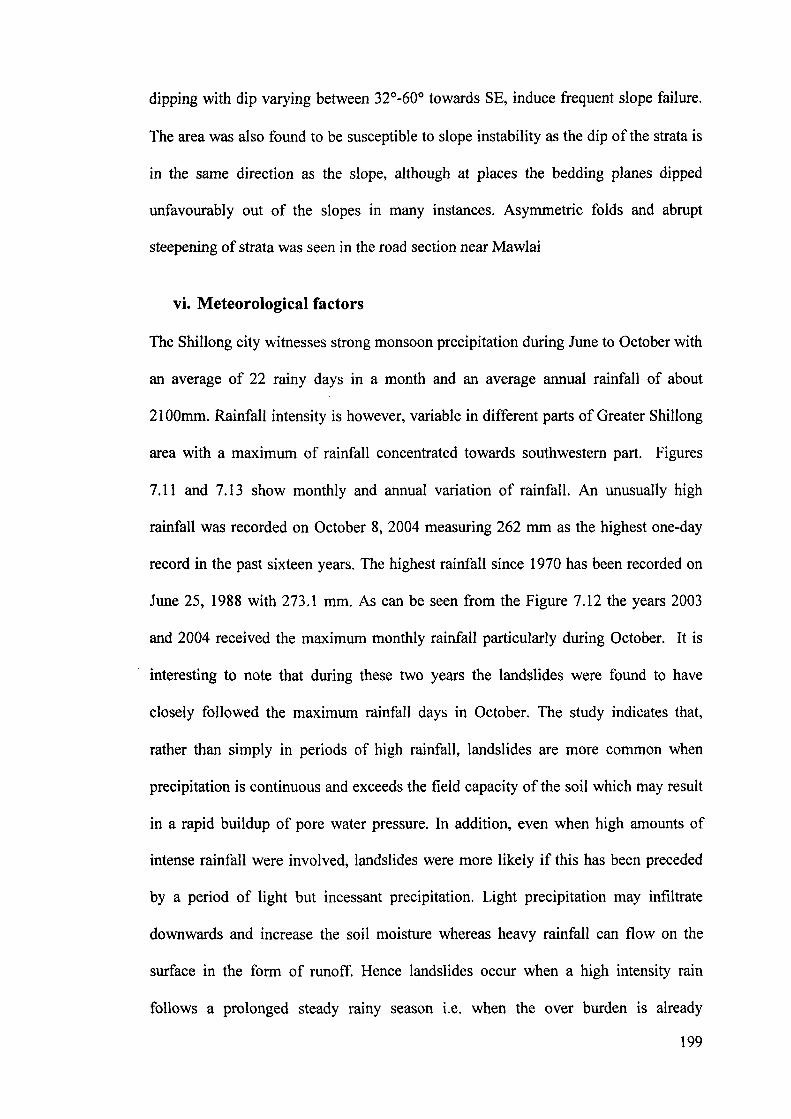
dipping with dip varying between 32°-60° towards SE, induce frequent slope failure.
The area was also found to be susceptible to slope instability as the dip of the strata is
in the same direction as the slope, although at places the bedding planes dipped
unfavourably out of the slopes in many instances. Asymmetric folds and abrupt
steepening of strata was seen in the road section near Mawlai
vi. Meteorological factors
The Shillong city witnesses strong monsoon precipitation during June to October with
an average of 22 rainy days in a month and an average annual rainfall of about
2100mm. Rainfall intensity is however, variable in different parts of Greater Shillong
area with a maximum of rainfall concentrated towards southwestern part. Figures
7.11 and 7.13 show monthly and annual variation of rainfall. An unusually high
rainfall was recorded on October 8, 2004 measuring 262 mm as the highest one-day
record in the past sixteen years. The highest rainfall since 1970 has been recorded on
June 25,1988 with 273.1 mm. As can be seen from the Figure 7.12 the years 2003
and 2004 received the maximum monthly rainfall particularly during October. It is
interesting to note that during these two years the landslides were found to have
closely followed the maximum rainfall days in October. The study indicates that,
rather than simply in periods of high rainfall, landslides are more common when
precipitation is continuous and exceeds the field capacity of the soil which may result
in a rapid buildup of pore water pressure. In addition, even when high amounts of
intense rainfall were involved, landslides were more likely if this has been preceded
by a period of light but incessant precipitation. Light precipitation may infiltrate
downwards and increase the soil moisture whereas heavy rainfall can flow on the
surface in the form of runoff. Hence landslides occur when a high intensity rain
follows a prolonged steady rainy season i.e. when the over burden is already
199
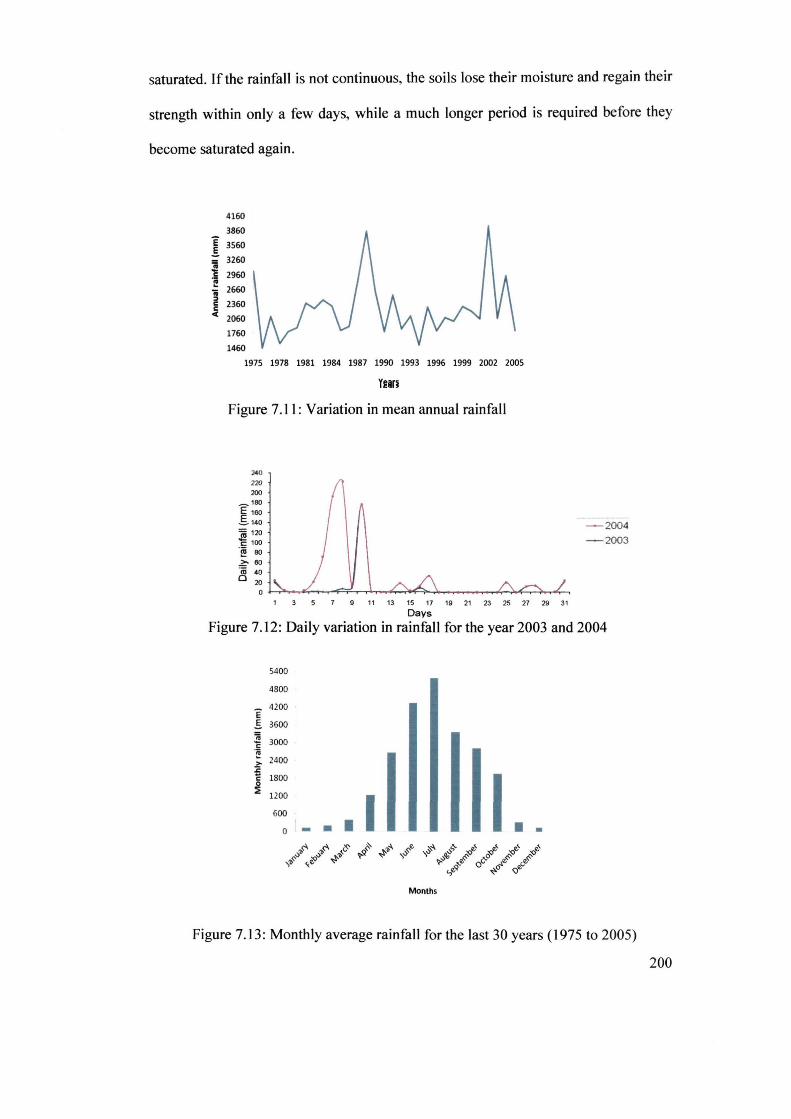
saturated. If the rainfall is not continuous, the soils lose their moisture and regain their
strength within only a few days, while a much longer period is required before they
become saturated again.
4160
3860
E 3560 E ;; 3260
:i 2960 :! 2660 ~ I§ 2360 « 2060
1760
1460
1975 1978 1981 1984 1987 1990 1993 1996 1999 2002 2005
Y~in
Figure 7.11: Variation in mean annual rainfall
~
220 200
~180 E l 80 .§. 140
~ 120 'C 100 .~ 80
~ 80 ·iii 40 o 20
9 11 13 15 17 19 21 23 25 27 29 31
Days
- 2004
-2003
Figure 7.12: Daily variation in rainfall for the year 2003 and 2004
5400
4800
E 4200
~ 3600
is 3000 'E .~
2400
I > ~ C 1800
I ~ 1200
600 I 0 - • • • •
Months
Figure 7.13: Monthly average rainfall for the last 30 years (1975 to 2005)
200
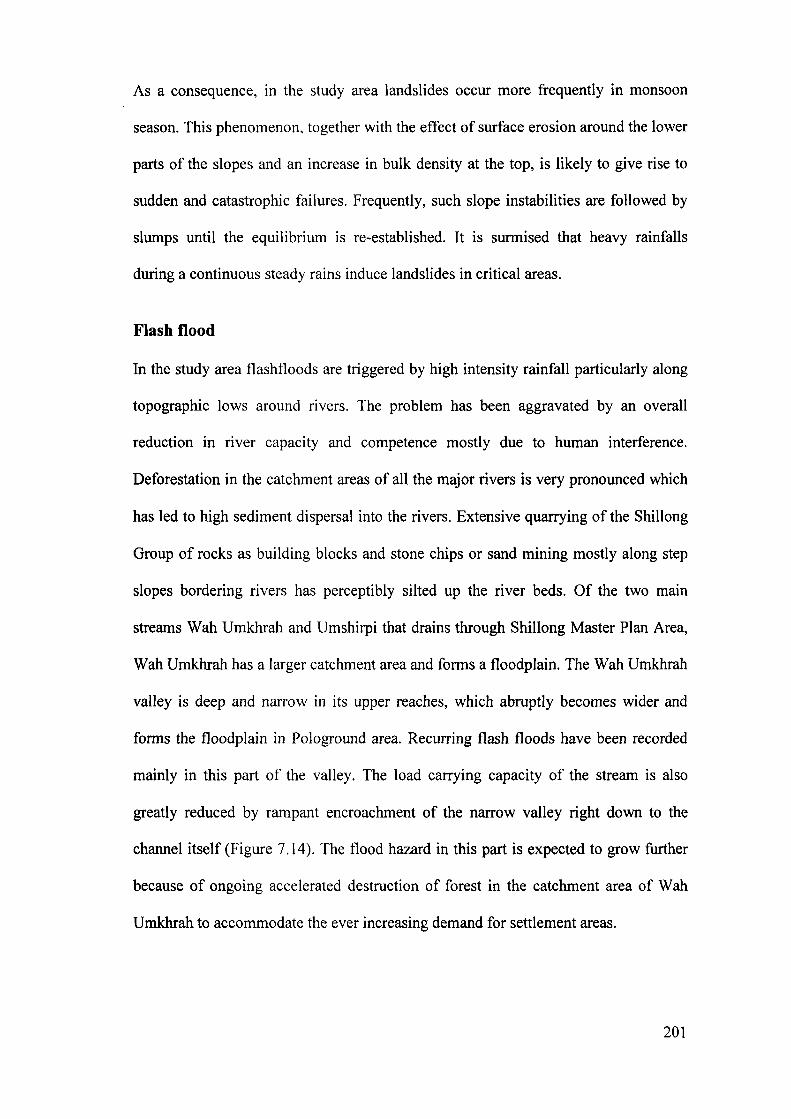
As a consequence, in the study area landslides occur more frequently in monsoon
season. This phenomenon, together with the effect of surface erosion around the lower
parts of the slopes and an increase in bulk density at the top, is likely to give rise to
sudden and catastrophic failures. Frequently, such slope instabilities are followed by
slumps until the equilibrium is re-established. It is surmised that heavy rainfalls
during a continuous steady rains induce landslides in critical areas.
Flash flood
In the study area flashfloods are triggered by high intensity rainfall particularly along
topographic lows around rivers. The problem has been aggravated by an overall
reduction in river capacity and competence mostly due to human interference.
Deforestation in the catchment areas of all the major rivers is very pronounced which
has led to high sediment dispersal into the rivers. Extensive quarrying of the Shillong
Group of rocks as building blocks and stone chips or sand mining mostly along step
slopes bordering rivers has perceptibly silted up the river beds. Of the two main
streams Wah Umkhrah and Umshirpi that drains through Shillong Master Plan Area,
Wah Umkhrah has a larger catchment area and forms a floodplain. The Wah Umkhrah
valley is deep and narrow in its upper reaches, which abruptly becomes wider and
forms the floodplain in Pologround area. Recurring flash floods have been recorded
mainly in this part of the valley. The load carrying capacity of the stream is also
greatly reduced by rampant encroachment of the narrow valley right down to the
channel itself (Figure 7.14). The flood hazard in this part is expected to grow further
because of ongoing accelerated destruction of forest in the catchment area of Wah
Umkhrah to accommodate the ever increasing demand for settlement areas.
201
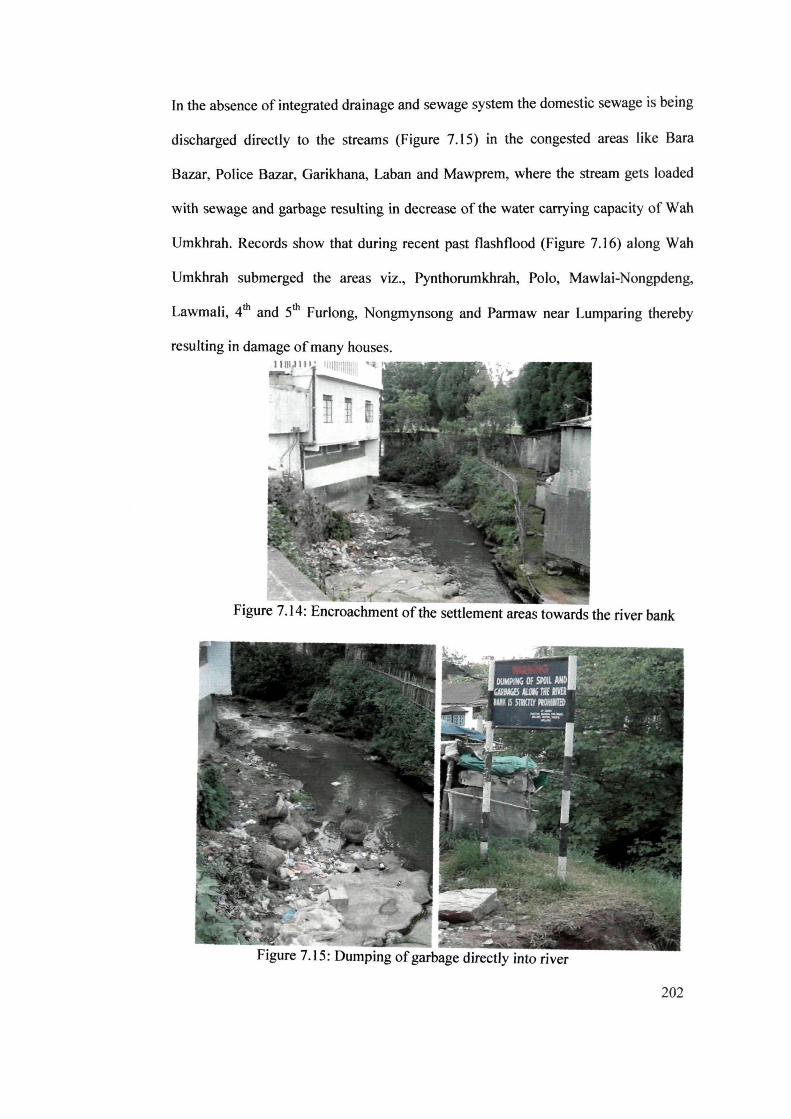
In the absence of integrated drainage and sewage system the domestic sewage is being
discharged directly to the streams (Figure 7.15) in the congested areas like Bara
Bazar, Police Bazar, Garikhana, Laban and Mawprem, where the stream gets loaded
with sewage and garbage resulting in decrease of the water carrying capacity of Wah
Umkhrah. Records show that during recent past flashflood (Figure 7.16) along Wah
Umkhrah submerged the areas viz., Pynthorumkhrah, Polo, Mawlai-Nongpdeng,
Lawmali, 4th and 5th Furlong, Nongmynsong and Pannaw near Lumparing thereby
resulting in damage of many houses.
Figure 7.14: Encroachment of the settlement areas towards the river bank
Figure 7.15: Dumping of garbage directly into river
202
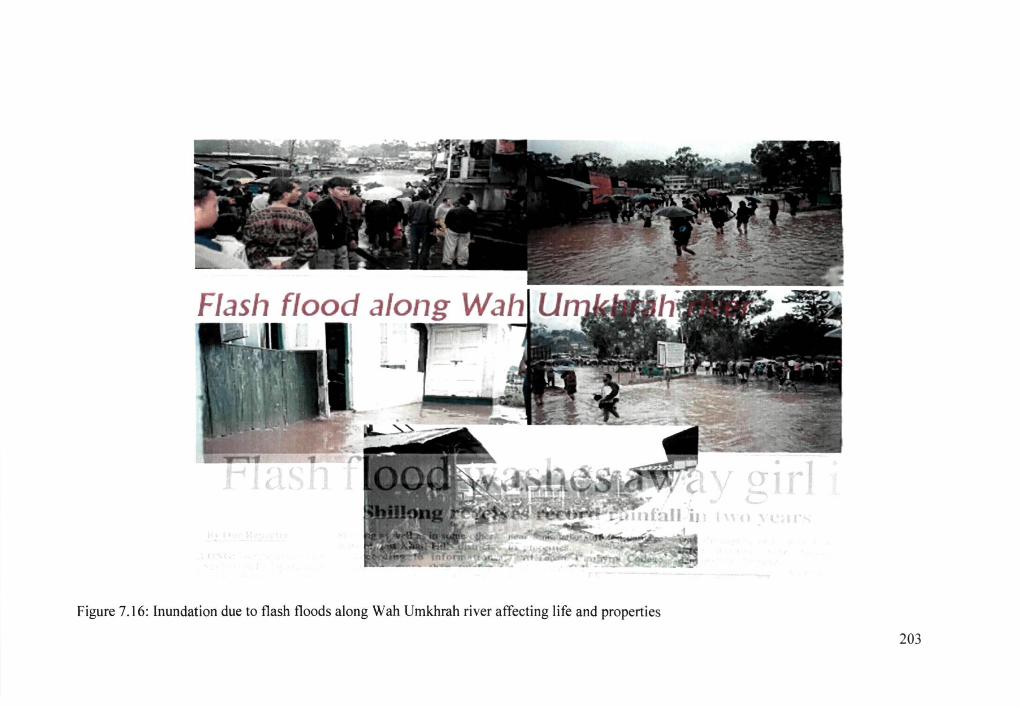
Figure 7.16: Inundation due to flash floods along Wah Umkhrah river affecting life and properties
203
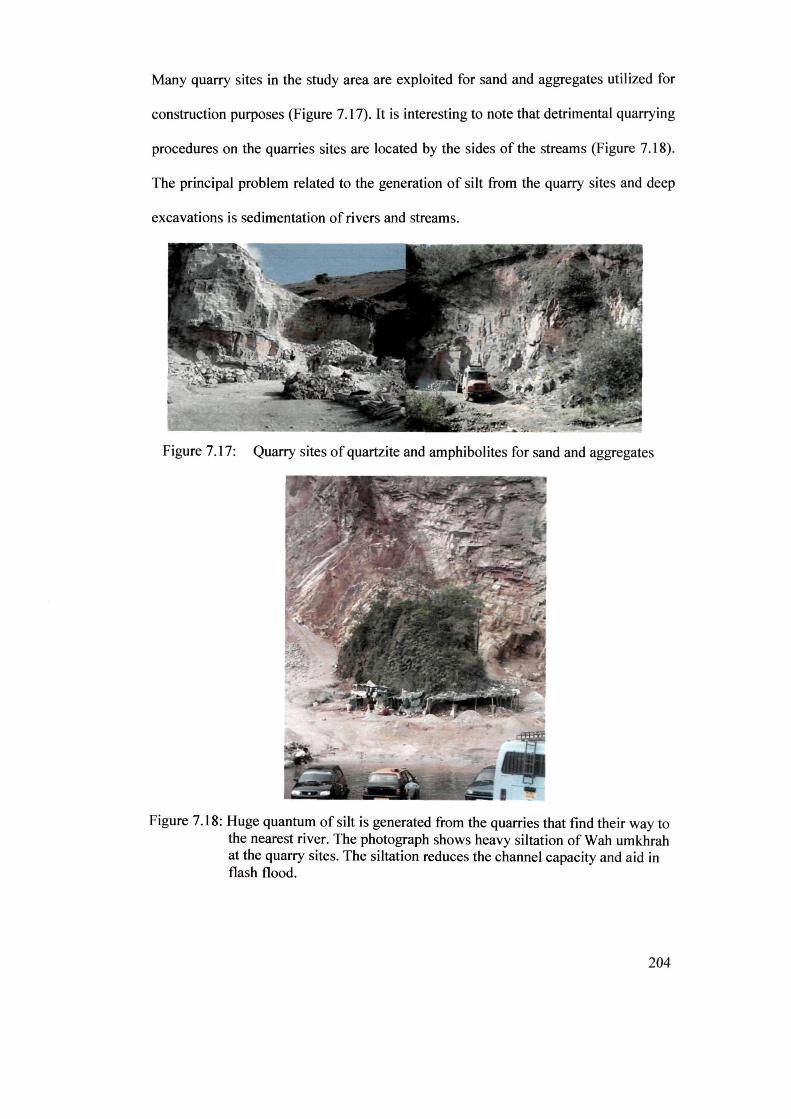
Many quarry sites in the study area are exploited for sand and aggregates utilized for
construction purposes (Figure 7.17). It is interesting to note that detrimental quarrying
procedures on the quarries sites are located by the sides of the streams (Figure 7.18).
The principal problem related to the generation of silt from the quarry sites and deep
excavations is sedimentation ofrivers and streams.
Figure 7.17: Quarry sites of quartzite and amphibolites for sand and aggregates
Figure 7.18: Huge quantum of silt is generated from the quarries that find their way to the nearest river. The photograph shows heavy siltation of Wah umkhrah at the quarry sites. The siltation reduces the channel capacity and aid in flash flood.
204
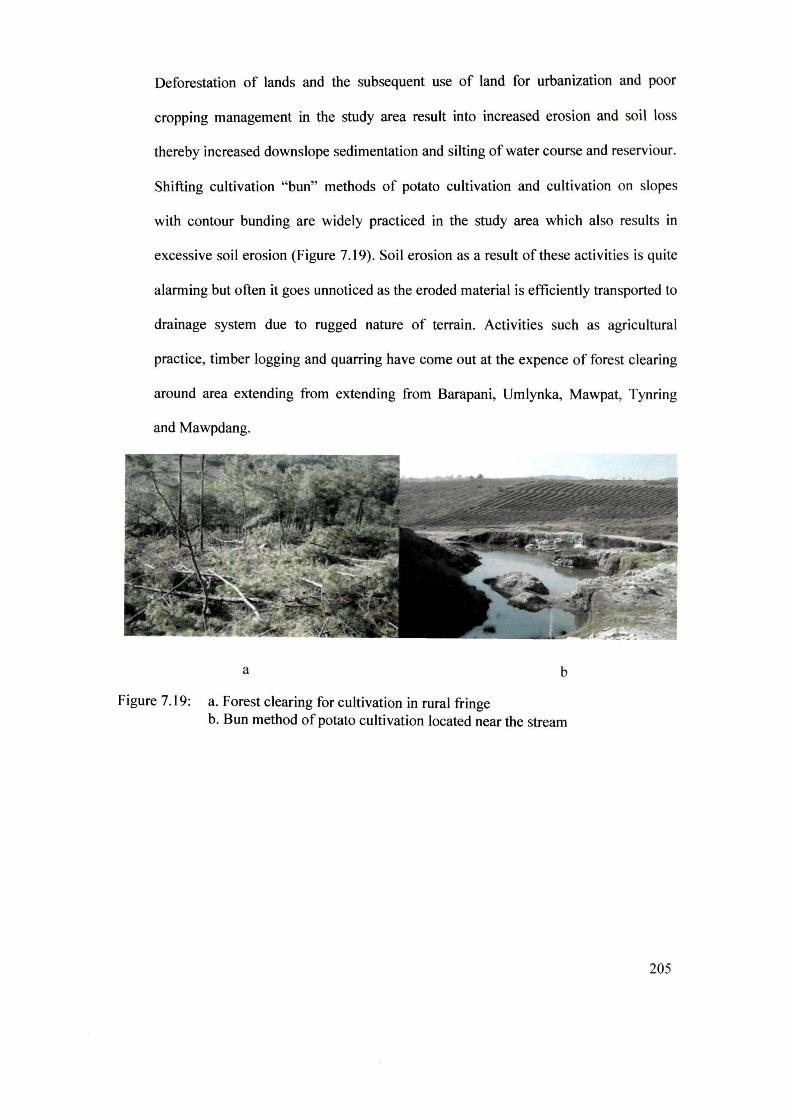
Deforestation of lands and the subsequent use of land for urbanization and poor
cropping management in the study area result into increased erosion and soil loss
thereby increased downslope sedimentation and silting of water course and reserviour.
Shifting cultivation "bun" methods of potato cultivation and cultivation on slopes
with contour bunding are widely practiced in the study area which also results in
excessive soil erosion (Figure 7.19). Soil erosion as a result of these activities is quite
alarming but often it goes unnoticed as the eroded material is efficiently transported to
drainage system due to rugged nature of terrain. Activities such as agricultural
practice, timber logging and quarring have come out at the expence of forest clearing
around area extending from extending from Barapani, Umlynka, Mawpat, Tynring
and Mawpdang.
a b
Figure 7.19: a. Forest clearing for cultivation in rural fringe b. Bun method of potato cultivation located near the stream
205
Introduction
CHAPTER 8
URBAN METABOLISM
The philosophy of modem cities is characterized by their routine use of energy as a
driving force for power production, transportation of goods, construction of building
and infrastructure as well as domestic comforts. In order to sustain themselves the
cities rely on the ecosystems beyond the city limits for more resource and at the same
time accumulate large amounts of materials within themselves. From the point of
view of system ecology, cities are self-regulating system and may be seen as
superorganism created for the benefit of human beings and for sustaining their
livelihood (Huang and Hsu, 2003).
In an innovative thinking, taking the cue of metabolism which signify the chemical
process by which food is built up into living matter or by which living matter is
broken down into simpler substances, in the year 1965, Wolman brought forward the
concept of urban material metabolism. He viewed the operation of urban ecosystem as
a metabolic process. In recent years, ecologists have begun to model hybrid economic
and ecological systems such as cities as if they were "superorganisms", with their own
metabolic processes (Zhang et.al. 2008). Such research on urban metabolism can
contribute to solving of urban ecological and environmental problems by highlighting
the demands placed by the urban metabolic system on various resources and the
pressure of its discharged wastes on the environment (Sahely et al. 2003; Zhang et al.
2006). Urban metabolism has been extensively applied to explore resource
consumption, material flows, asset accumulation and waste emissions in socio-
206
economic systems since the concept was first extended from biological science by
social scientists to analyze human systems (Wolman, 1965). The metabolism of a city
can be seen as the process of transforming all the materials and commodities for
sustaining the city's economic activity. Extending from the concept of urban
metabolism, the requirements to sustain the city include even the construction
materials needed to build the city's structure over a period of time. Lawson and
Douglas (1998) have suggested that deliberate human activity, in terms of excavating
and filling of sectors of the earth's surface has become the most efficient geological
agent on the earth at present.
The major environmental problems and associated social costs of an urban ecosystem
are related to the rapid increase of resource inputs for urban consumption and the
disposal of construction wastes, which are of nuisance to urban dwellers. To make
urbanization sustainable, we must first understand how our cities function in the
context of resource consumption. Like human metabolism, the physical and biological
processes of a city system transform inflows of energy and materials into useful
products, services and wastes. They are based on the laws of thermodynamics and a
balance sheet of inputs and outputs can be analyzed. Material flow analysis can
provide a framework for analyzing the urbanization process and the way cities are
transforming the earth's ecosystems as a consequence of human activities. Rapid
transfer of materials from the natural environment to the urban and industrial
environment will change both geomorphology and urban morphology. Lawson and
Douglas (1998) suggested that the account and quantification of material flow, reuse
and recycling should be important components in the development of indicators that
would help in identifying as to which country or city is becoming more sustainable in
its behaviour.
207
This study is an attempt to understand the metabolism of Shillong Urban
Agglomeration using the data on consumption of construction materials and discharge
of waste and by preparing a flow diagram for the same.
Review of literature
The metabolism of an ecosystem has been defined by ecologists as the production (via
photosynthesis) and consumption (by respiration) of organic matter, typically
expressed in terms of energy (Odum, 1971). Kennedy et.al. (2007) defined urban
metabolism as the sum total of the technical and socioeconomic processes that occur
in cities, resulting in growth, production of energy and elimination of waste. Although
metabolism is purely a biological concept, it can be applied by way of analogy to
cities because the urban metabolic system is also a mechanism for processing
resources and producing waste.
In the wake of rapid urban expansion, Abel Wolman published a pioneering article on
the metabolism of cities (Wolman, 1965). He developed the urban metabolism
concept in response to deteriorating air and water quality in American cities - issues
still recognized today as threatening sustainable urban development. Wolman
analyzed the metabolism of a hypothetical American city, quantifying the overall
fluxes of energy, water, materials, and wastes into and out of an urban region of
1 million people. Since Wolman's work, a handful of urban metabolism studies have
been conducted by a number of scholars based on Wolman's idea by treating city as if
they were organisms and analyzing the processes and mechanisms that formed their
metabolism in urban regions around the globe.
In the year 1995, Tjallingii put forward an opinion that a city, as an ecosystem,
needed the imports of materials and energy for maintaining the function of the
208
ecosystem normally, and at the same time these imports would also bring about
economic cost and environment problems. He held that the eco-efficiency of urban
materials metabolism could be improved through utilizing administrative and
technologic measures to restore the urban metabolic processes. Lyle (1996) reviewed
the ecological researches on cities and emphasized about the importance of cities in
the global ecology and suggested to put aside the classical image of cities and to
consider the ecological functions of cities. Satterthwaite (1997) outlined a framework
for assessing the environmental performance of cities in regard to their meeting of
sustainable development goals and stressed on the importance of taking into account
the environmental costs generated or imposed by city-based activities on people or
ecological resources outside city boundary or displaced into the future. Newman
(1999) expanded the concept of urban metabolism to include aspects oflivability for
demonstrating the practical meaning of sustainability. Mani and Varghese (1999)
discussed the ongoing effort in developing a system to assist planners in taking
decisions conducive to sustainable development and progress, where system design is
generic and can be adopted to other areas such as urban planning, defense, agriculture,
population studies etc.
Newman (1999) proposed that the process of urban materials metabolism, such as a
biological system operation, was about the inputs of resources and the output of
production and waste. Newcombe et.al. (1978) studied the metabolic process in Hong
Kong to determine inflows and outflows of construction materials and finished goods
based on the theory of materials metabolism. Warren-Rhodes and Koenig (2001)
studied the resource consumption, waste generation and its reuse in Hong Kong. Their
results showed that per capita food, water, and materials consumption had increased
by 20%,40%, and 149%, respectively from 1971 to 1997. Sahely et. al. (2003) found
209
that although most inputs to Toronto's metabolism were constant or increasing, some
per capita outputs, notably residential solid waste had decreased between 1987 and
1999. Newman et.al. (1996) studied the material metabolism in Sydney in 1970. Folke
et.al. (1997) reported that Hong Kong relies upon, and appropriates heavily from
natural ecosystem to produce food, water and other resources and to process wastes.
Similar to other cities, it significantly augments and alters material flow and energy
cycling through the environment. Huang (1998) focused on quantifying the embodied
energy in cities by applying thermodynamics methods on urban material metabolism
in Taipei. Louise (1998) focused on the urban metabolism to quantify the inflow and
stock of heavy metals (Cd, Cr, Cu, Pb, Hg, Ni, and Zn) in goods in the anthroposphere
of Stockholm, Sweden. The study showed the importance of stock which will help the
planners to understand and predict future problems that may arise from metal
containing goods and to implement a more sustainable use of metals. Hansen and
Lassen (1998) developed an application of the database for a substance flow analysis
of aluminium at the national level in Denmark, where the database has proven to be
extremely useful in improving the environmental characteristics of different types of
industrial products like copper and nickel. The ESPROMUD project (2008) examined
the ways mining and urbanization change the rates and magnitude of the
transformation of the earth's surface by geologic and geomorphic processes. It sets out
to establish the total quantities of material shifted by extractive industries and in the
building and operation of towns and cities and their supporting infrastructure. The
findings of the project suggest that there is a need of scale-linked feedback from
global climate and biogeochemical cycles to the local deliberate material flow and
land surface modifications that will determine how those global changes impact upon
individual cities and communities. Huang and Hsu (2003) appled material flow and
210
ecological energetic analyses to investigate Taipei area's urban sustainability in the
context of urban construction. The material flows (sand and gravel, cement, asphalt,
and construction waste) for constructing major urban engineering projects such as
roads, bridge, MRT, flood prevention projects, storm drainage and sewerage pipes,
and buildings have been analyzed for Taipei metropolis. It concentrates on the
analysis of materials flows and evaluation of indicators. Lawson and Douglas (1998)
concluded that the demands of cities for earth materials for construction have caused
so much movement of rock and sedimentary matter that its rate is higher by two or
three-orders than magnitude of the rates of erosion and sedimentation.
In India, literature on approaches towards urban metabolism is very rare. Learnmoth
and Simmons (1997) viewed the metropolian area of Greater Calcutta as an ecosystem
where functions of the city and system model of Calcutta has been worked out. They
concluded that there is an overall ecological "envelope" which sets limits to human
endevour and all the adjustments within it have to be made through the medium of
human culture in all its diversity. Chatterjee and De (1999) critically analyzed the
present crisis faced by the society in managing the environmental problems, which are
due to the absence of the systematic analysis and synthesis (system approach) of the
environment. They emphasized that each and every environmental system is to be
examined and understood in terms of its structure and behavior and at the same time
interaction among them are to be determined. This will lead to a fruitful and
sustainable management of environment and resources.
211
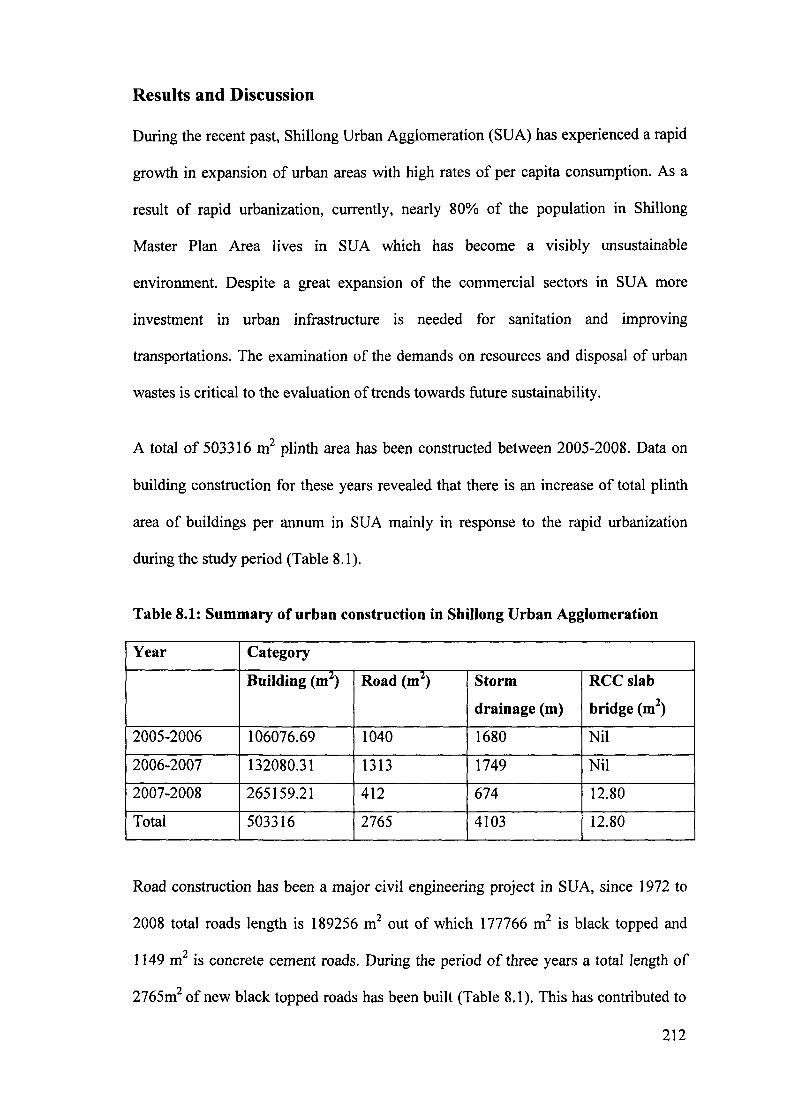
Results and Discussion
During the recent past, Shillong Urban Agglomeration (SUA) has experienced a rapid
growth in expansion of urban areas with high rates of per capita consumption. As a
result of rapid urbanization, currently, nearly 80% of the population in Shillong
Master Plan Area lives in SUA which has become a visibly unsustainable
environment. Despite a great expansion of the commercial sectors in SUA more
investment in urban infrastructure is needed for sanitation and improving
transportations. The examination of the demands on resources and disposal of urban
wastes is critical to the evaluation of trends towards future sustainability.
A total of 503316 m2 plinth area has been constructed between 2005-2008. Data on
building construction for these years revealed that there is an increase of total plinth
area of buildings per annum in SUA mainly in response to the rapid urbanization
during the study period (Table 8.1).
Table 8.1: Summary of urban construction in Shillong Urban Agglomeration
Year Category
Building (ml) Road (ml) Storm RCC slab
drainage (m) bridge (m2)
2005-2006 106076.69 1040 1680 Nil
2006-2007 132080.31 1313 1749 Nil
2007-2008 265159.21 412 674 12.80
Total 503316 2765 4103 12.80
Road construction has been a major civil engineering project in SUA, since 1972 to
2008 total roads length is 189256 m2 out of which 177766 m2 is black topped and
1149 m2 is concrete cement roads. During the period of three years a total length of
2765m2 of new black topped roads has been built (Table 8.1). This has contributed to
212
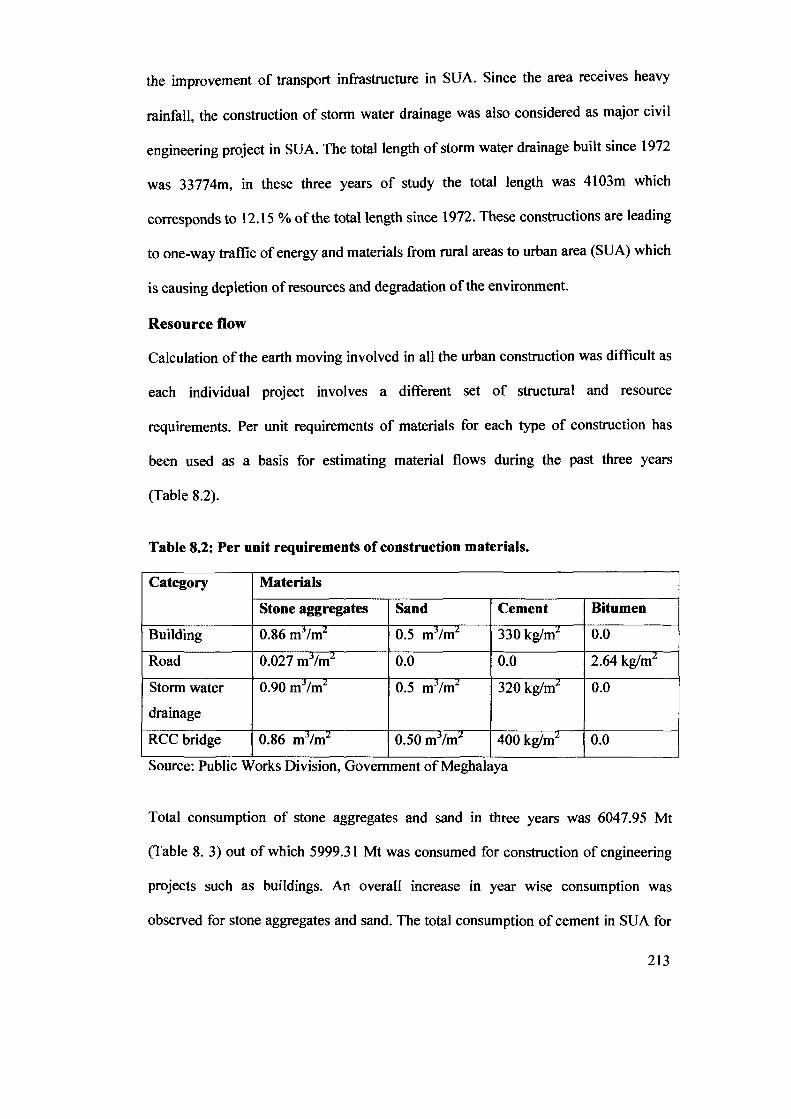
the improvement of transport infrastructure in SUA. Since the area receives heavy
rainfall, the construction of storm water drainage was also considered as major civil
engineering project in SUA. The total length of storm water drainage built since 1972
was 33774m, in these three years of study the total length was 4103m which
corresponds to 12.15 % of the total length since 1972. These constructions are leading
to one-way traffic of energy and materials from rural areas to urban area (SUA) which
is causing depletion of resources and degradation ofthe environment.
Resource flow
Calculation ofthe earth moving involved in all the urban construction was difficult as
each individual project involves a different set of structural and resource
requirements. Per unit requirements of materials for each type of construction has
been used as a basis for estimating material flows during the past three years
(Table 8.2).
Table 8.2: Per unit requirements of construction materials.
Category Materials
Stone aggregates Sand Cement Bitumen
Building 0.86 mj /m1. 0.5 m3/m2 330kglm1. 0.0
Road 0.027mj /mL. 0.0 0.0 2.64 kglm7
Storm water 0.90 mj/mL. 0.5 mJ/mL. 320 kglmL. 0.0
drainage
RCC bridge 0.86 mJ/m2 0.50m~/m--:! 400 kglmL. 0.0 ...
Source: Pubhc Works DIVISion, Government of Meghalaya
Total consumption of stone aggregates and sand in three years was 6047.95 Mt
(Table 8. 3) out of which 5999.31 Mt was consumed for construction of engineering
projects such as buildings. An overall increase in year wise consumption was
observed for stone aggregates and sand. The total consumption of cement in SUA for
213
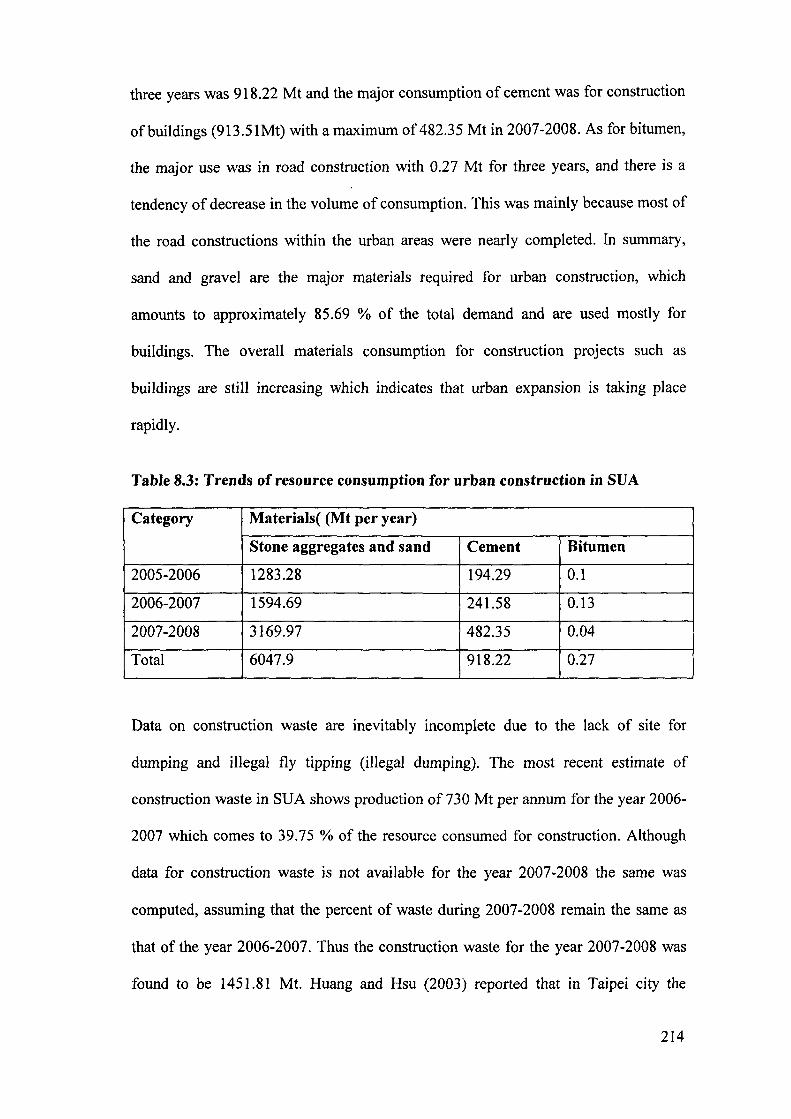
three years was 918.22 Mt and the major consumption of cement was for construction
of buildings (913.51Mt) with a maximum of 482.35 Mt in 2007-2008. As for bitumen,
the major use was in road construction with 0.27 Mt for three years, and there is a
tendency of decrease in the volume of consumption. This was mainly because most of
the road constructions within the urban areas were nearly completed. In summary,
sand and gravel are the major materials required for urban construction, which
amounts to approximately 85.69 % of the total demand and are used mostly for
buildings. The overall materials consumption for construction projects such as
buildings are still increasing which indicates that urban expansion is taking place
rapidly.
Table 8.3: Trends of resource consumption for urban construction in SUA
Category Materials( (Mt per year)
Stone aggregates and sand Cement Bitumen
2005-2006 1283.28 194.29 0.1
2006-2007 1594.69 241.58 0.13
2007-2008 3169.97 482.35 0.04
Total 6047.9 918.22 0.27
Data on construction waste are inevitably incomplete due to the lack of site for
dumping and illegal fly tipping (illegal dumping). The most recent estimate of
construction waste in SUA shows production of 730 Mt per annum for the year 2006-
2007 which comes to 39.75 % of the resource consumed for construction. Although
data for construction waste is not available for the year 2007-2008 the same was
computed, assuming that the percent of waste during 2007-2008 remain the same as
that of the year 2006-2007. Thus the construction waste for the year 2007-2008 was
found to be 1451.81 Mt. Huang and Hsu (2003) reported that in Taipei city the
214
construction waste accounts to about 30 to 40%. This shows that the production of
waste in the case of Shillong is similar to bigger cities situated in economically
developing countries. Figure 8.1 summarised the comparison of materials flows for
the year 2006-2007 and 2007-2008. The total amount of stone aggregates and sands
consumption for these two years was 1594.69 Mt and 3169.97 Mt, out of which
612.93 Mt (39%) and 887.59 Mt (28%) come from supply outside the study area,
972.76 Mt (61 %) and 2282.38 Mt (72%) come from local source supply. For 2006-
2007, the total consumption of construction materials such as stone aggregates, sands,
cement and bitumen amounts to 1836.40 Mt out of which 1574.34 Mt of stone
aggregates and sands is utilized for building and 20.35 Mt for storm water drainage
and roads. Out of241.58 Mt of cement, 239.73 Mt is consumed for buildings and 1.85
Mt for storm water drainage. For road construction O.13Mt of bitumen has been
consumed. Similarly for the year 2007-2008, the total consumption of construction
materials such as stone aggregates, sands, cement and bitumen amounts to 3 169.97
Mt out of which 3160.59 Mt of stone aggregates and sands is utilized for building and
9.31 Mt for storm water drainage, roads and RCC bridges. Out of 482.35 Mt of
cement, 481.26 Mt is consumed for buildings and 1.09 Mt for storm water drainage
and RCC bridges. Road construction consumed 0.04 Mt of bitumen. The total
consumption of stone aggregates and sands in 2007-2008 has increased to 66.53%,
with an increase of production of about 10% from the hinterland, due to increase of
building structures. As for the resource flows for building in 2007-2008, the
consumption of stone aggregates and sands has increased by 66.75 %, and
consumption of cement increased by 33.27 % due to the requirement of RCC
buildings. However, the consumption of bitumen has decrease by 25.53 % as
compared to 2006-2007. In addition to local source, the supply of stone aggregates
215
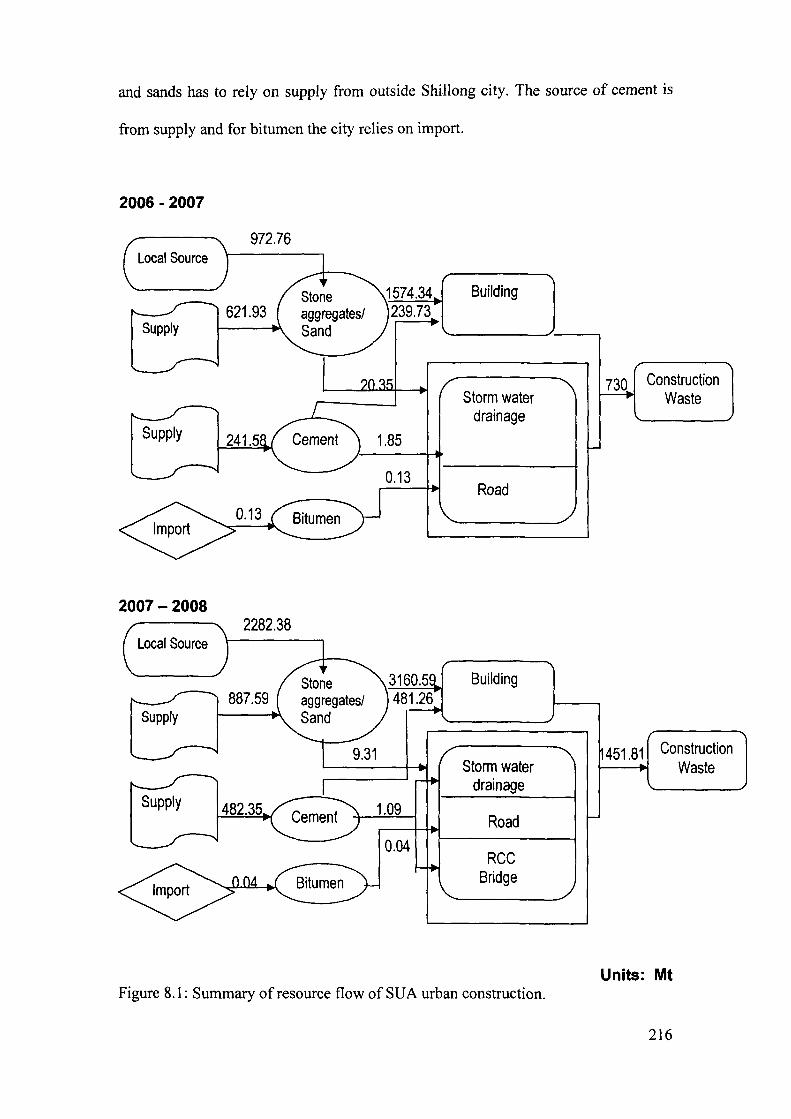
and sands has to rely on supply from outside Shillong city. The source of cement is
from supply and for bitumen the city relies on import.
2006 - 2007
972.76 Local Source
Units: Mt Figure 8.1: Summary of resource flow of SUA urban construction.
216
The extraction of stones aggregates and sand is the most significant human
contribution through material production to the geomorphic change in Shillong city
landscape. From the limited study carried out during last few years it is found that the
production of stone aggregates and sand has increased substantially and has become
the largest source of primary aggregates used in Shillong city. The quarries located
within the study area are worked as small enterprises and produce 61 % and 72% of
stones aggregates and sand consumed respectively for construction projects. This is
because people seeking stone aggregates, sand and gravel tend to procure these
materials that they need from the nearest and most convenient place. Active quarries
or former quarries are not yet reclaimed due to which the scar faces of these extractive
activities are vividly visible in the landscape. Such direct landform reshaping by such
activities IS high m areas of Nongthymmai, Laitkor, Pynthorumkhrah,
Mawdiangdiang, Mawlai, Mawpat, Umroi and Umlynka. Out of 730 Mt of
construction waste produced, a considerable part of this dumping of waste may be
seen as a massive human contribution to changing the geomorphology of Shillong city
through material aggregates extraction in some of the localities.
Increase in local production of stone aggregates and sand for consumption by
different engineering projects in Shillong city, has raised the amount of siltation in the
streams located near the quarry sites viz., Wah Umkhrah, Umshirpi and creating new
levelland which have been landfilled raising the height of the ground surface which is
seen mainly in the area along NH 40. This material transfer is modifying the
landscape at a rapid pace, particularly at the sites of extraction and waste disposal.
With the present pace of urban growth, the waste materials are bound to increase. The
rapid growth of urban areas with relatively weak planning and environmental controls
217
means that the geomorphic changes related to urban ecology are likely to become
more extensive in the near future.
Materials flow accounting and quantification of the urban metabolism has helped in
the development of indicators of the degree to which the Shillong city is becoming
more susceptible in its behaviour vis-a.-vis the geoenvironmental setup. The study
suggests recycling of construction materials to reduce the rate of geomorphic
transformation by construction material use and disposal is the need of the hour. The
examination of geomorphic consequences of urban growth activities confirms the
importance of looking at and encouraging of re-use of materials everywhere. It is
important to identify the key areas of intervention to reduce off-site impacts and cost.
In terms of land consumption, both material extraction and dumping of wastes
continues at present rate, the demand for large areas of land for such activities will
grow. Since these areas have become unsuitable for other productive use and
agriCUlture, the pressure will mount on the fringe areas to feed the city or for housing
and infrastructure development which is bound to be unsustainable in the long run.
The excavations of materials for major developments requiring substantial earth
removal and relocation needs to be examined to find ways and means for more
balanced use of earth resources.
The study, though very preliminary demonstrates that the city is growing at a very
rapid pace and production of the construction waste is very high.There is a scope of
reduction in urban waste through reuse as has been done in developed countries viz.,
(Bell, 1997).
218
CHAPTER 9
GENERAL DISCUSSION
Shillong Master Plan Area is a Precambrian terrain with low grade metamorphic
rocks occupying more than 90% of the total area. The rocks are dominantly quartzites
with sub-ordinate phyllites and slates, quartz-sericite schist and conglomerate. These
rocks are intruded by mafic sills and dykes comprised of epidiorite, dolerite,
amphibolites, pyroxenite rocks known as Khasi greenstones which occur mostly as
sills concordant with the formation and acid intrusive such as Mylliem granite. A part
of the southwestern fringe of the study area is covered by Mylliem granite, which is a
batholithic intrusive body.
The oldest lithounit of the study area is composed of granite gneiss, forming part of
the Basement Gneissic Complex. They are overlain by the Shillong Group of
metasediments following an intervening hiatus marked by a conglomerate horizon.
These sediments were deposited in a Proterozoic intracratonic basin under fluvial
environment. Stratigraphically older horizon within the Shillong Group is mainly
argillaceous, which are well exposed in northern and southern part of the basin, while
the upper horizons are predominantly arenaceous with intermittent argillaceous and
impersistent conglomerate beds. The Shillong Group of rocks are intruded by mafic
sills and dykes which have undergone amphibolite facies metamorphism. They are
now found as discontinuous bodies exposed at places as well as under a thin veneer of
quartzites and locally known as Khasi greenstones. The youngest event of the
219
Precambrian sequence in Shillong Plateau is marked by emplacement of acid
intrusives which form batholiths, stocks and bosses. A small part of a batholithic
porphyritic granite known as Mylliem granite is exposed in the western part of the
study area. The quratzites of Shillong Group of rocks and Khasi greenstones are
affected by numerous cross cutting quartz veins, which mark a post deformational
phenomenon. These quartz veins trend along NNE-SSW, NW-SE and NE-SW and
range in width from less than 1 cm to more than 30 cm.
Colluvial hill wash and a few patches of alluvium constitute the Quaternary sediments
of the area which locally occur along the hill slopes and in intermittent valleys. They
are seen as poorly sorted debris composed of cobble to boulder size sub-angular to
angular pieces of tough massive quartzites and ferruginous quartzite embedded in
semi-consolidated sandy ferruginous matrix and varies in thickness from 1.5 m to 3.0
m. Yellowish to brownish grey alluvium composed of silt and clay form a narrow
alluvial tract in Polo ground and Pynthorumkhrah areas and form a 1.5 to 2.0 m high
bank along Wah Umkhrah river. Minor valley fills of limited extension composed of
grayish brown to yellowish brown coloured sticky clay have also been observed.
Both diastrophic and non-diastrophic structures are recorded in the study area. Non
diastrophic structures include primary sedimentary structures like bedding plane,
current bedding and ripple marks, mostly symmetrical and sharp crested, which are
well preserved in the arenaceous member of the Shillong Group. Well developed
current bedding with foreset laminae dipping 200-300 form internal bedding structures
in quartzites. In conglomerates crude bedding is revealed by presence of intermittent
pebble free layers. In less metamorphosed areas siltstone lenses and channel fills are
seen.
220
Deformation structures are well developed in Shillong Group of rocks which include
at least three phases of folding resulting in both plunging and non-plunging types.
Individual folds are open and mostly non-plunging and asymmetric types. Three sets
of joints trending NNE-SSW (sub-vertical dips), ENE-WSW (300 NW) and NW-SE
(650 -750 SW) have been encountered in the quartzites. Minor local faults and shears
can be deciphered from brecciation within quartzites at some places.
Lineaments trending NE-SW conforming to the structural trend of the area are
commonly found in higher frequency towards north. Average lineament density is 0.4
- 3 km-2 while lineament frequency varies between -3.25 - 0.7 km-I. Major drainage
control in the area is found to be due to the predominant NE-SW trending lineaments.
A major shear zone known as Tyrsad-Barapani shear trending NE-SW occur in the
northern part that affect mainly the Phyllites of Shillong Group near Tyrsad and
between Mawiong and Umiam along the G.S. Road.
The Shillong Master Plan Area is part of the central upland of the greater Shillong
Plateau with elevation varying between 1400-1900m amsl. A gently undulating
plateau top, the Laitkor range trending East-West direction with an average elevation
of 1900 m above msl, is a prominent landmark in the southern extremity of the
Shillong town. The Shillong Peak (1964 m) and Laitkor peak (1960 m) forms the
highest points in the area of mapping. The main urban growth center of Shillong
Master Plan Area is situated on a broad topographic low with several flat topped low
relief hillocks and gently undulating valleys. Polo ground or Umkhrah valley skirts
the northern edge of the town and is situated at a much lesser height.
221
The present day landscape of the study area is the result of a competing interaction of
lithology and structure as well as climatic factors. Mass movements have played a
major role in evolution of the numerous hillslopes while geomorphic work by high
gradient rivers is evidently a controlling factor for the present day landscape
development. Because of effective transfer of eroded debris, both from fluvial erosion
and mass movement, the valleys are deeply incised bordered with cliff faces. Sheet
erosion due to non-channel overland flow is very effective in the study area
particularly during monsoon when precipitation may be as high as > 1 000 mm.
Broadly the geomorphology of Shillong Master Plan Area can be subdivided into two
major geomorphic domains viz., plateau landform and fluvio denudationallandforms.
Almost the entire area comprises erosional landform which can be further subdivided
into three categories viz., highly dissected, moderately dissected and less dissected.
The fluvio-denudational landforms can be further subdivided into sub-domains
namely the narrow infilled valleys and the terraces. Narrow valley fills and recent
terraces have been deposited along the main streams cutting through the erosional
surfaces.
DEM profiles shows that the area is having an undulating topography within the
plateau domain with various degree of erosional dissection imparting the corrugation.
Slopes vary between 2° _35°. The main urban agglomeration of the city is developed
in and around the moderate slope category which form ~28% of the total area. Out of
the eight aspect classes representing direction of slope viz., NNW (18.87%), WNW
(14.66%), NNE (13.66%), ESE (12.19%), ENE (11.68%), SSE (12.18%), SSW
(8.87%) and WSW (7.90%), the maximum of slopes are found to be sloping towards
NNW.
222
Dentritic, sub-dentritic, trellis and rectangular type drainage could be delineated in
the study area. The main drainage of Shillong town is constituted by northwesterly
flowing Wah Umkhrah and Umshirpi streams which are following the general strike
of the area. These two streams join near Beadon and Bishop falls to forms the
westerly flowing Wah Ro-Ro, a joint controlled deep gorge and a tributary to Wah
Umiam. The major trend of rivers synchronizes with the major structural trend of the
region which is NE-SW, while a set of tributaries have developed as a result of
erosional dissection across the structural trend and also following offset faults and
joints across this trend. The lower plateau region in the central part of the area is
characterized by moderately high drainage density with subdendritic to trellis type of
drainage pattern. Rectangular drainage developed at many places is directly
controlled by the two dominant joint patterns viz. NE-SW and NW -SE.
The development of soil cover in the study area is highly irregular and range in
thickness from a thin veneer to more than 10m at places. Inceptisol, and ultisols are
the two major soil types of the study area. Ultisols are found in places dominated by
quartzites and inceptisols occur in places where amphibolites are emplaced. The soils
developed on the hills sides and/or escarpments are moderately shallow to deep,
loamy skeletal to fine, excessively drained and subjected to moderate to very severe
erosion hazards. These soils have well developed B horizon. Ultisols are reddish or
yellow subsurface ferruginous clay mass with very irregular soil profile and formed
due to weathering and chemical leaching of ferruginous quartzites. Towards north of
the study area soil is comparatively better developed than the southern side. Areas
which are characterized by flat topography, thickness of soil cover ranges from 1.0 to
3.0 m. Inceptsols comprising yellowish brown to greyish brown silt and clay occur
mainly on the plateau top with thickness varying from 2.0 to 6.0 m. Oxidation is
223
prevalent in the areas where metabasics are emplaced in the quartzites and they are
overlain by a thick laterite capping. Entisols have also been observed on very recent
geomorphic surface along Wah Umkhrah and its tributary in the Polo ground area and
the minor valley fills in the area. It is brownish grey to dark coloured sandy clay loam.
They are fertile, poorly drained and seasonally flooded. These valley fills are heavy
loams and contain larger amount of organic matter. It is found that this soil, with their
level topography proximity for water for irrigation, and periodic nutrients
replenishment by flood water sediments, supports agricultural activities in the valley
filled areas.
The fourth-order drainage basin is occupied by diverse lithological unit and covers
almost 80% of the area under study. The variation in size of the fourth-order drainage
basins is largely due to physiographic and structural conditions prevailing in these
drainage basins. Higher drainage development giving high mean bifurcation ratio is
found in highly dissected drainage basins with strong structural control while
elongated basins with high value of weighted mean bifurcation ratio shows variation
in lithology dominated by Khasi greenstones, quartzites, weathered mantle and valley
filled sediments, while lower values drain through pure quartzitic area. Higher
drainage development giving high drainage density and stream frequency is
characteristically found in the quartzite dominated terrain while lowest drainage
development is found in the area occupied by the valley filled sediments. Values of
elongation ratio range from 0.5 to 0.7 and circulatory ratios vary from OJ to 0.6.
High values of elongation ratio and circularity values, especially in the south-western
and south-eastern part is due to the combination of lithology and structural control
and suggest an intermediate shape with a tendency to elongation associated with
strong relief and steep slope. In the southeastern part the basins show a fully
224
elongated shape, the central basin show a stronger tendency to circular shape, the
northern basins show a slight tendency to circularity and the southwestern basins
show an intermediate shape with a tendency to elongation. The elongated shape of the
basins indicates a young stage of evolution, while the intermediate shape with a
tendency to circularity suggests an early mature stage. Lower values of the basins in
northern part may be due to strong structural control on the drainage development.
Minimum infiltration number shown by the Wah Umkhrah basin is possibly due to its
lower catchment being in valley fill sediments, while the sub-basins draining the
metasediments of Shillong Group show an invariably higher infiltration number.
The high hypsometric integral values of Wah Umiam (tributaries), Wah Umkhrah,
Wah Umkhen, Wah Umkhen (tributaries) represent younger stage of development
with deep incised and high down cutting with concave-down hypsometric curve,
while Urn Baniun and Wah Tamdong shows lower values with hypsometric curve
approach monadock stage (i.e. old stage) of geomorphic development and Umshirpi,
Wah Umbah, Wah Shella (tributaries), Phud-Umsning (tributaries) and Phud
Mawiong has the shape of mature landform. Concavity of the hypsometric curve (Eh)
shows that sub-basin D2, D3, D4, D5 and D6 are least incised, and sub-basin D7, D8,
DIOand Dllare least eroded while most erosion prevails in sub-basin Dland D9.
From the position of the slope inflection point, a* and h* it is found that degree of
peneplanation caused by strong erosion is highest in D I and D9 followed by D8, D 1 0
and DII with least in D2, D3, D4, D5, D6 and D7DI and D9 sub-basin shows least
effect of diffusive process, while those of D7, D8, DIO and Dll shows moderate
diffusive erosion in the upstream segments and consist large mass accumulation at the
sub-basin mouth.
225
A measure of a relative terrain uplift varying from 0.78 to 0.90 indicates high
upliftment in the SW and SE sides compared to the NE comer. In general the
longitudinal profiles of the trunk channels shows major structural controls.
Differences in the materials along the course of a stream commonly caused an abrupt
change from low concave to flat profile. The longitudinal profiles of most of the trunk
channels shows the presence of one or more knick points which is related to offset
faults in the region and a number of waterfalls dotting the study area are found to have
been formed following these offset faults across the general strike in the Shillong
quartzite, thus suggestive of profile adjustments to the continuous tectonic activities.
The analysis of morphometric parameters of the drainage network shows that
drainage development is largely controlled by structure and lithology.
Shillong Municipal Board (SMB) and Public Health Engineering Department (PHeD)
provide the bulk of the water supply services to Shillong city. In order to meet long
term projection of water demand, a dam was constructed under Greater Shillong
Water Supply Scheme (GSWSS) to divert water from Umiew River located 25 km
from the main city. The Shillong Municipal Board obtains water supply from several
surface water sources such as springs and streams amounting to 3.27 mId per day and
it is distributed within Shillong Municipality area. Whereas water supply by PheD
amounts to 5.69 mId out of which 3.64 mId is contributed by surface sources and 2.05
mId from underground sources and is supplied mainly to township. In areas beyond
the 5MB and PheD networks water supply service is being provided by the local
dorbar by supplying water through stand posts.
5MB and PheD water supply accounts for 8.96 mid. 28.68 mId water is supplied by
GWSS. The total water production from Greater Shillong Plannig Area is around
226
24.09% from surface water and 07.16% is pumped from groundwater and remaining
68.75% is imported from Umiew river. Besides the supply from Umiew river a deficit
of 14.06 mId is experienced. Thus only 70 lpcd water is available to the consumer
which is very much below the Government ofIndia norms (130 lpcd for urban area).
Geological and geomorphological studies indicate that occurrence and distribution of
surface water and ground water of Shillong Master Plan Area is not uniform due to
inhomogeneity of lithology and degree of weathering as well as soil profile
development. Hydrologically, tube wellslbore wells located at the intersection point of
various lineaments in the area will have a good supply of water. Geomorphologically
the ground water potential is limited to intermontane valleys.
Limited hydrological data used in this study indicates that groundwater occur both
under artesian as well as water table condition with moderate to high yield.
Occurrence of ground water in Shillong group of rocks is under water table condition
in the weathered zones of underlying hard rocks where as in consolidated rocks it
occurs under semi-confined condition. In general depth of water level is shallower in
topographic depression than in the upland areas or slopes. The water of the area is
mildly acidic to alkaline, soft and poorly mineralized. The elements present in the
water are far less than the toxic limit excepting Fe which shows concentration more
than 0.3 mg/litre. Average chemical health of the water sources is within safe limits as
per national and WHO certified values. However, a higher degree of mineralization
would have made the water more suitable to public health. The near deficiency of
vital elements is due to non-availability of these elements in the Shillong group of
rocks. Further, due to higher gradient, available elements are also washed away
during heavy precipitation.
227
Six land use classes have been identified namely, built up land, dense forest, open
forest, scrub, agricultural crop land and water bodies. For the year 2000, built up land
occupies 8.96 % of the study area consist of urban and rural habitation and settlement.
Water bodies cover 4.28 % of the area and are mainly represented by the Umiam lake
and Wards lake. Agricultural crop land usually bun cultivation covers 6.58 %, with
scrubs occupying 10.03 % of the study area. The area covered under pure pine and
pine with broad leaf trees has been classed as dense forest which occupies 50.92 %
with open forest consisting 19.23 % of the study area. Similarly, for the year 2005,
built up land, dense forest, open forest, scrub, agricultural crop land and water bodies
cover 9.35 %, 50.04 %, 18.90 %, 10.15 % and 6.93 % and 4.28 % respectively. From
the analysis it has been observed that there has been a change in the landusel
landcover pattern within a span of five years. Area under dense forest has reduced to
7.74 km2 which is replaced either by open forest, scrubs and agriculture and
urbanization. A decrease of 2.28 km2 is observed in open forest mainly due to
deforestation, agricultural activities and urbanization. The reserved and protected
forest forms almost a complete ring around Shillong comprises around 12.26 % of the
total study area. Although agriculture area has increased by 0.71 km2 mainly due to
bun cultivation, this can create severe erosion problem and increase of siltation rate.
Built up land class has an increase of 0.80 km2, this is due to rapid expansion over the
years where the town has spread to the forests areas which once skirted the town.
Built up land have expanded especially towards northeastern part of the study area,
this is a new township located nearly 13 km from the main city.
The twin hazards of landslides and flashfloods are recurrent geoenvironmental
hazards causing loss of life and extensive damage of properties along certain sectors
228
of the city and adjacent areas. With growing anthropogenic activities and urban
development, these twin problems have become more acute over the study years. As
many as 60 minor and major landslides have been documented through on site
inventorisation during the study years within the city, some of which are recurring
type while most of them being found in new localities. Their distribution is
predominantly along NH-40 apart from those in thickly populated urban areas. Most
of the slides include slumping, debris fall and flow and the factors that have a direct
bearing on the stability of the study area are the result from changes in the slope
gradient both natural and man-made, changes in antecedent moisture content,
vegetation and lithology. Most of the slides in the study area are confined to the
regolith overlying the parent rocks. An integrated study of the causal factors using
remote sensing data analysis, GIS and field investigation in respect of geological,
geomorphological and meteorological parameters suggest that a multiple of factors
are responsible for landslide in the study area.
Most of the landslides are confined in the national highways and urban areas.
Landslide prone areas within urban areas are mostly debris fall and are located on
steep hill slopes where the settlements have come up in a haphazard and unplanned
manner and landslides take place under the load pressure of civil structures like
residences. Unnatural load imposed on the rocks by the haphazard civil structures
without slope management is another triggering factor. Landslides are mostly
encountered along the NH 40 that cause frequent disruption of vehicular traffic.
Majority of the recent failures along the NH 40 are characterized by slumps with an
average width of about 30 m and a length of 50 m from the toe to the highest back
scarp. Toe cutting through unscientific method has been attributed as the main
causative factor for these slides. The landslide occurrence values are higher in dense
229
forest areas and lower in open forest and scrub areas. In these dense forests have
smaller diameter pines trees with less roots, and have little capacity to maintain the
water and soil pore pressure during heavy rains. Landslide recurrence is observed in
areas with slope <350 and mostly in areas of toe cutting of slopes. The study suggests
that high positive pore pressure developed in the fissile rocks and thin soil cover
overlying bedrocks due to seepage of water from continuous precipitation is the
triggering factor for slope failure. Landslide occurrence is higher in quartzite and
phyllite. Incidentally all the active landslides that took place during the monsoon
period in the study area are encountered along the NH-40, in the stretch characterized
by well-bedded and jointed phyllite and the type of slide is mostly debris fall.
Correlation of landslide frequency with respect to lineament density shows that most
of the slides are confined to areas with lineament density !-3km-1 having NE-SW
trend conforming to the structural trend of the area. Flashfloods have been recorded in
recent years in few localities particularly the topographic lows around Pologround
areas. The immediate cause of flashfloods is however, constriction of the floodplain
of Wah Umkhrah river by settlement, uncontrolled input of debris from the
surrounding cliffs following high intensity rain and high relief of the terrain.
Siltation, though not a major cause of concern as of now, is slowly showing the sign
of becoming a major problem in near future. Numerous rock and sand quarry sites are
located along streams in and around the Shillong town. These quarries discharge
huge quantum of silt on regular basis to the streams which is beyond the capacity and
competence of the rivers to dissipate downstream. This results in aggradations of
riverbeds and many a times leads artificial damming that becomes a cause of
flashflood during rainy season. Urbanization of steep hill slopes involving
development of roads, expansion of habitation and new commercial establishments
230
have come up in a haphazard way at the expense of forest. This also has contributed
to enormous silt generation in the study area.
Shifting cultivation (bun methods of potato cultivation) and cultivation on the slopes
with contour bunding are widely practiced in the study area which also results in
excessive soil erosion. Soil erosion as a result of these activities is quite alarming but
often it goes unnoticed as eroded material is efficiently transported to drainage system
due to rugged nature of terrain. Deforestation of lands and the subsequent use of land
for urbanization and poor cropping management in the study area result into increased
erosion and soil loss thereby increased downslope sedimentation and silting of water
course and reserviour. Anthropogenic activities such as deforestation and unplanned
urbanization are the two most important factors responsible for environmental
degradation leading to excessive soil erosion, lost of soil fertility, siltation of water
courses, landslide, flood hazards and general desecration of landscape.
The extraction of stones aggregates and sand is the most significant human
contribution through material production to the geomorphic change in Shillong city
landscape. From the limited study carried out during last few years it was found that
the production of stone aggregates and sand has increased substantially and has
become the largest source of primary aggregates used in Shillong city. The quarries
located within the study area are worked as small enterprises and produce 61 % and
72% of stones aggregates and sand consumed respectively for construction projects.
This is because people seeking stone aggregates, sand and gravel tend to procure these
materials that they need from the nearest and most convenient place. Active quarries
or former quarries are not yet reclaimed due to which the scar faces of these extractive
activities are vividly visible in the landscape. Such direct landform reshaping by such
231
activities IS high In areas of Nongthymmai, Laitkor, Pynthorumkhrah,
Mawdiangdiang, Mawlai, Mawpat, Umroi and Umlynka. Out of 730 Mt of
construction waste produced, a considerable part of this dumping of waste may be
seen as a massive human contribution to changing the geomorphology of Shillong city
through material aggregates extraction in some of the localities.
Increase in local production of stone aggregates and sand for consumption by
different engineering projects in Shillong city, has raised the amount of siltation in the
streams located near the quarry sites viz., Wah Umkhrah, Umshirpi and creating new
levelland which have been landfilled raising the height of the ground surface which is
seen mainly in the area along NH 40. This material transfer is modifying the
landscape at a rapid pace, particularly at the sites of extraction and waste disposal.
With the present pace of urban growth, the waste materials are bound to increase. The
rapid growth of urban areas with relatively weak planning and environmental controls
means that the geomorphic changes related to urban ecology are likely to become
more extensive in the near future.
Materials flow accounting and quantification of the urban metabolism has helped in
the development of indicators of the degree to which the Shillong city is becoming
more susceptible in its behaviour vis-a-vis the geoenvironmental setup. The study
suggests recycling of construction materials to reduce the rate of geomorphic
transformation by construction material use and disposal is the need of the hour. The
examination of geomorphic consequences of urban growth activities confirms the
importance of looking at and encouraging of re-use of materials everywhere. It is
important to identify the key areas of intervention to reduce off-site impacts and cost.
232
In terms of land consumption, both material extraction and dumping of wastes
continues at present rate, the demand for large areas of land for such activities will
grow. Since these areas have become unsuitable for other productive use and
agriculture, the pressure will mount on the fringe areas to feed the city or for housing
and infrastructure development which is bound to be unsustainable in the long run.
The excavations of materials for major developments requiring substantial earth
removal and relocation needs to be examined to find ways and means for more
balanced use of earth resources.
The present study takes a holistic look into the geoenvironmental status of the
Shillong urban agglomeration and its adjoining areas. The urban ecosystem has been
analysed with the concept of urban material metabolism and it has been tried to find a
link between the physical and biological parameters vis-a.-vis their spatio-temporal
variability. Lithological units, landforms and prevalent geomorphic setting are
focused as platform to understand the urban ecosystem. This study has brought out a
set of baseline data pertaining to the physical attributes which is expected to fill an
information gap and be useful as future reference to understand and manage their
spatio-temporal variability vis-a.-vis changing status of the urban ecosystem in a
scenario of ever increasing human interference with the natural systems. The study
however, can be treated as the first approximation considering the resolution of
mapping adopted. A further high resolution study, taking advantage of advanced
technology available, both in temporal and spatial contexts and with direct field
measurement of attributes to calibrate the changes imposed, will be the next step in
right direction.
233
SUMMARY
Geoenvironment has been a key area of concern particularly during the last few
decades due to increasing manifestation of adverse impact of anthropogenic forces on
most parts of the earth. The top stratum of the earth's crust with diverse geological
and geomorphic setting as well as under different climate regime, having interface
with the hydrosphere, atmosphere and biosphere has borne the brunt of exploitation of
earth's resources throughout the human civilization, more so in the post industrial era.
The resultant impact on the structure and function of earth ecosystem is now all too
apparent. It is often felt that there is a need for continuous evaluation and appraisal of
the environment in terms of the physical parameters of the earth system vis-a-vis the
man made ecosystems. Geoenvironmental study in combination with metabolism
analysis in spatio-temporal context can be a very effective tool for rational evaluation
of changing status of the environment and overall functioning of the ecosystem.
The geoenvironmental view of resource exploitation takes into account both the mass
of minerals produced and the masses of overburden, wastes and by-products created.
This view lead to a recognition that the material flows driven by human activities can
be seen as part of a broader anthropogenic transformation of the earth's surface which
has implications not only for supplies and environmental costs of materials, but also
for the nature of the lands on which we live and the landscapes surrounding our daily
lives. Materials flow accounting and quantification of the urban metabolism can help
in the development of indicators of the degree to which a city is becoming more
234
sustainable in its behavior. Integrated appraisal of geoenvironment together with
urban metabolism is an emerging field of applied research which has received ample
attention of researchers in recent times. In a number of cities world over, the planners
and researchers are engaged in evolving a holistic model of urban development based
on modem ecological principles.
Shillong, the capital city of Meghalaya, is a growing urban centre with three and half
lakh population, covering about 208 km2 land. The growth has caused an immense
pressure on the available resources and environment resulting into an imbalance in the
city ecosystem. Therefore there is a need of regular monitoring of environment and
inventorisation of the resources for proper planning and management of the city
ecsystem. In doing so the status of geoenvironment has to be known for present and
future development activities. In absence of a comprehensive base line data on the
different geoenvironmental parameters it is difficult to comprehend any change that
has taken place in terms of quantum and rate. Present study aims to fill in this gap in
our knowledge on the dynamics, structure and function of Shillong city ecosystem.
This study also intends to generate the base line data on Geoenvironment and
Metabolism of Shillong city which can be used for monitoring of change and in
planning for sustainable development of the city.
With availability of high resolution satellite data with repetitive coverage of the earth,
development in location based technology viz., Global Positioning System (GPS) and
enhanced capability of value addition to geospatial database in Geographic
Information System (GIS) platform, have proved to be a valuable tool for evaluation
of resources, appraisal of geoenvironmental status of a region as well as for assessing
their spatio-temporal variability. Therefore, for the present study basic spatial data
235
was generated based on satellite data (IRS LISS III, FCC) and Survey of India (Sol)
topomaps in 1 :50000 scale. Preprocessing of topomaps and satellite data was done in
GIS environment using the Orthoengine module of Geomatica 9.1 giving input of
same projection parameters as earth model. Extensive fieldwork was carried out, both
along and across strike for identifying the geological and geomorphological attributes.
Satellite images (IRS LISS III, FCC) and DEM were studied for identifying the
susceptible areas for landslides. On-site investigation and documentation of the
existing landslides were carried out to develop an inventory. Flash flood prone areas
were identified based on their record in news media and the actual events that
happened during the year 2003 and 2004. The prefield maps were edited and finalized
based on the field inputs and a spatial database was generated in GIS environment.
Morphometric analysis was carried out based on the drainage segments and elevation
contours extracted from Survey of India topomaps in 1 :50000 scale. The LULC
thematic mapping was done through standard visual interpretation techniques.
Different thematic layers were prepared after digitizing and their attributes were
entered accordingly. Thematic information gathered from laboratory analysis and
fieldwork has been brought to GIS platform for further processing and analysis.
Published geological maps, soil map, boundary map, municipal ward and township
map, meteorological data, water sources location, water supply and production
pattern, ground water level, water quality and consumption of construction materials
data were used as collateral data. The GIS database generated in the form of raster,
vector and attribute data was integrated for generation of composite data sets and
queries buildings.
Shillong Master Plan Area is a Precambrian terrain with low grade metamorphic rocks
occupying more than 90% of the total area. The oldest lithounit of the study area is
236
composed of granite gneiss, forming part of the Basement Gneissic Complex. They
are overlain by the Shillong Group of metasediments following an intervening hiatus
marked by a conglomerate horizon. These sediments were deposited in a Proterozoic
intracratonic basin under fluvial environment. Stratigraphically older horizon within
the Shillong Group is mainly argillaceous, which are well exposed in northern and
southern part of the basin, while the upper horizons are predominantly arenaceous
with intermittent argillaceous and impersistent conglomerate beds. The Shillong
Group of rocks are intruded by mafic sills and dykes which have undergone
amphibolite facies metamorphism. They are now found as discontinuous bodies
exposed at places as well as under a thin veneer of quartzites and locally known as
Khasi greenstones. The youngest event of the Precambrian sequence in Shillong
Plateau is marked by emplacement of acid intrusives which form batholiths, stocks
and bosses. A small part of a batholithic porphyritic granite known as Mylliem granite
is exposed in the western part of the study area. The quratzites of Shillong Group of
rocks and Khasi greenstones are affected by numerous cross cutting quartz veins,
which mark a post deformational phenomenon. Colluvial hill wash and a few patches
of alluvium constitute the Quaternary sediments of the area which locally occur along
the hill slopes and in intermittent valleys.
Both diastrophic and non-diastrophic structures are recorded in the study area. Non
diastrophic structures include primary sedimentary structures like bedding plane,
current bedding and ripple marks, mostly symmetrical and sharp crested, which are
well preserved in the arenaceous member of the Shillong Group. Deformation
structures are well developed in Shillong Group of rocks which include at least three
phases of folding resulting in both plunging and non-plunging types. Three sets of
joints trending NNE-SSW, ENE-WS and NW-SE have been encountered in the
237
quartzites. Minor local faults and shears can be deciphered from brecciation within
quartzites at some places. Lineaments trending NE-SW conforming to the structural
trend of the area are commonly found in higher frequency towards north. Average
lineament density is 0.4 - 3 km-2 while lineament frequency varies between ~3.25 -
0.7 km-I. Major drainage control in the area is found to be due to the predominant NE
SW trending lineaments. A major shear zone known as Tyrsad-Barapani shear
trending NE-SW occur in the northern part that affect mainly the Phyllites of
Shillong Group near Tyrsad and between Mawiong and Umiam along the GS Road.
The Shillong Master Plan Area is part of the central upland of the greater Shillong
Plateau with elevation varying between 1400-1900m ams!. A gently undulating
plateau top, the Laitkor range trending East-West direction with an average elevation
of 1900 m above msl, is a prominent landmark in the southern extremity of the
Shillong town. The Shillong Peak (1964 m) and Laitkor peak (1960 m) forms the
highest points in the area of mapping. The main urban growth center of Shillong
Master Plan Area is situated on a broad topographic low with several flat topped low
relief hillocks and gently undulating valleys. Polo ground or Umkhrah valley skirts
the northern edge of the town and is situated at a much lesser elevation.
The present day landscape of the study area is the result of a competing interaction of
lithology and structure as well as climatic factors. Mass movements have played a
major role in evolution of the numerous hillslopes while geomorphic work by high
gradient rivers is evidently a controlling factor for the present day landscape
development. Because of effective transfer of eroded debris, both from fluvial erosion
and mass movement, the valleys are deeply incised bordered with cliff faces. Sheet
erosion due to non-channel overland flow is very effective in the study area
particularly during monsoon when precipitation may be as high as > 1000 mm.
238
Broadly the geomorphology of Shillong Master Plan Area can be subdivided into two
major geomorphic domains viz., plateau landform and fluvio denudationallandforms.
The entire area comprises mostly of erosional landform which can be further
subdivided into three categories viz., highly dissected, moderately dissected and less
dissected. The fluvio-denudational landforms can be further subdivided into sub
domains namely, the narrow infilled valleys and the terraces. Narrow valley fills and
recent terraces have been deposited along the main streams cutting through the
erosional surfaces.
DEM profiles shows that the area is having an undulating topography within the
plateau domain with various degree of erosional dissection imparting the corrugation.
Slopes vary between 2° _35°. The main urban agglomeration of the city is developed
in and around the moderate slope category which form -28% of the total area. Out of
the eight aspect classes representing direction of slope viz., NNW (18.87%), WNW
(14.66%), NNE (13.66%), ESE (12.19%), ENE (11.68%), SSE (12.18%), SSW
(8.87%) and WSW (7.90%), the maximum of slopes are found to be sloping towards
NNW.
Dentritic, sub-dentritic, trellis and rectangular type drainage could be delineated in
the study area. The main drainage of Shillong town is constituted by northwesterly
flowing Wah Umkhrah and Umshirpi streams which are following the general strike
of the area. These two streams join near Beadon and Bishop falls to forms the
westerly flowing Wah Ro-Ro, a joint controlled deep gorge and a tributary to Wah
Umiam. The major trend of rivers synchronizes with the major structural trend of the
region which is NE-SW, while a set of tributaries have developed as a result of
erosional dissection across the structural trend and also following offset faults and
239
joints across this trend. The lower plateau region in the central part of the area is
characterized by moderately high drainage density with subdendritic to trellis type of
drainage pattern. Rectangular drainage developed at many places is directly
controlled by the two dominant joint patterns viz. NE-SW and NW -SE.
The development of soil cover in the study area is highly irregular and range in
thickness from a thin veneer to more than 10m at places. Inceptisol, and ultisols are
the two major soil types of the study area. Ultisols are found in places dominated by
quartzites and inceptisols occur in places where amphibolites are emplaced. The soils
developed on the hills sides and/or escarpments are moderately shallow to deep,
loamy skeletal to fine, excessively drained and subjected to moderate to very severe
erosion hazards. These soils have well developed B horizon. Entisols have also been
observed on very recent geomorphic surface along Wah Umkhrah and its tributary in
the Polo ground area and the minor valley fills in the area.
The fourth-order drainage basin is occupied by diverse lithological units and covers
almost 80% of the area under study. The variation in size of the fourth-order drainage
basins is largely due to physiographic and structural conditions prevailing in these
drainage basins. Higher drainage development giving high mean bifurcation ratio is
found in highly dissected drainage basins with strong structural control while
elongated basins with high value of weighted mean bifurcation ratio shows variation
in lithology dominated by Khasi greenstones, quartzites, weathered mantle and valley
filled sediments, while lower values drain through pure quartzitic area. Higher
drainage development giving high drainage density and stream frequency is
characteristically found in the quartzite dominated terrain while lowest drainage
development is found in the area occupied by the valley filled sediments. Values of
240
elongation ratio range from 0.5 to 0.7 and circulatory ratios vary from 0.3 to 0.6.
High values of elongation ratio and circularity values, especially in the south-western
and south-eastern part is due to the combination of lithology and structural control
and suggest an intermediate shape with a tendency to elongation associated with
strong relief and steep slope. In the southeastern part the basins show a fully
elongated shape, the central basin show a stronger tendency to circular shape, the
northern basins show a slight tendency to circularity and the southwestern basins
show an intermediate shape with a tendency to elongation. The elongated shape of the
basins indicates a young stage of evolution, while the intermediate shape with a
tendency to circularity suggests an early mature stage. Lower values of the basins in
northern part may be due to strong structural control on the drainage development.
Minimum infiltration number shown by the Wah Umkhrah basin is possibly due to its
lower catchment being in valley fill sediments, while the sub-basins draining the
metasediments of Shillong Group show an invariably higher infiltration number.
The high hypsometric integral values of Wah Umiam (tributaries), Wah Umkhrah,
Wah Umkhen, Wah Umkhen (tributaries) represents younger stage of development
with deep incised and high down cutting with concave-down hypsometric curve,
while Urn Baniun and Wah Tamdong show lower values with hypsometric curve
approach monadock stage (i.e. old stage) of geomorphic development and Umshirpi,
Wah Umbah, Wah Shella (tributaries), Phud-Umsning (tributaries) and Phud
Mawiong have the shape of mature landform. Concavity of the hypsometric curve
(Eh) shows that sub-basin D2, D3, D4, D5 and D6 are least incised, and sub-basin D7,
D8, D 10 and D 11 are least eroded while most erosion prevails in sub-basin D 1 and
D9. From the position of the slope inflection point, a* and h* it is found that degree of
peneplanation caused by strong erosion is highest in D 1 and D9 followed by D8, D 1 0
241
and Dll with the least in D2, D3, D4, D5, D6. D7, Dl and D9 sub-basin show least
effect of diffusive process, while those of D7, D8, D 10 and D 11 show moderate
diffusive erosion in the upstream segments and consist large mass accumulation at the
sub-basin mouth.
Morphometric studies show differential tectonic upliftment in the study area which is
reflected in the hypsometric parameters. A measure of a relative terrain uplift varying
from 0.78 to 0.90 indicates high upliftment in the SW and SE sides compared to the
NE comer. In general the longitudinal profiles of the trunk channels shows major
structural controls. Differences in the materials along the course of a stream
commonly caused an abrupt change from low concave to flat profile. The longitudinal
profiles of most of the trunk channels show the presence of one or more knick points
which is related to offset faults in the region. A number of waterfalls dotting the study
area are found to have been formed following these offset faults across the general
strike in the Shillong quartzite, suggestive of profile adjustments to the continuous
tectonic activities. The analysis of morphometric parameters of the drainage network
showed that drainage development is largely controlled by structure and lithology.
Limited hydrological data used in this study indicates that groundwater occur both
under artesian as well as water table condition with moderate to high yield.
Occurrence of ground water in Shillong group of rocks is under water table condition
in the weathered zones of underlying hard rocks whereas in consolidated rocks it
occurs under semi-confined condition. In general depth of water level is shallower in
topographic depression than in the upland areas or slopes. The water of the area is
mildly acidic to alkaline, soft and poorly mineralized. The elements present in the
water are far less than the toxic limit excepting Fe which shows concentration more
242
than 0.3 mg/litre. Average chemical quality of the water sources is within safe limits
as per national and WHO certified values. However, a higher degree of mineralization
would have made the water more suitable to public health. The near deficiency of
vital elements is due to non-availability of these elements in the Shillong group of
rocks. Further, due to higher gradient, available elements are also washed away
during heavy precipitation.
Six land use classes have been identified namely, built up land, dense forest, open
forest, scrub, agricultural crop land and water bodies. For the year 2000, built up land
occupies 8.96 % of the study area. Water bodies cover 4.28 % of the area and are
mainly represented by the Umiam lake and Wards lake. Agricultural crop land usually
bun cultivation covers 6.58 %, with scrubs occupying 10.03 % of the study area. The
area covers under pure pine and pine with broad leaf trees has been classed as dense
forest which occupies 50.92 % with open forest consisting 19.2 % of the study area.
Similarly, for the year 2005, built up land, dense forest, open forest, scrub,
agricultural crop land and water bodies cover 9.35 %, 50.04 %, 18.90 %, 10.15 % and
6.93 % and 4.38 % respectively. From the analysis it has been observed that there has
been a change in the landuse/ landcover pattern within a span of five years. Area
under dense forest has reduced to 7.74 km2 which is replaced either by open forest,
scrubs and agriculture and urbanization. A decrease of 2.28 km2 is observed in open
forest mainly due to deforestation, agricultural activities and urbanization. The
reserved and protected forest forms almost a complete ring around Shillong comprises
around 12.26 % of the total study area. Although agriculture area has increased to
0.71 km2 mainly due to bun cultivation, this can create severe erosion problem and
increase of siltation rate. Built up land class has an increase of 0.80 km2, this is due to
rapid expansion over the years where the town has spread to the forests areas which
243
once skirted the town. Built up land have expanded especially towards northeastern
part of the study area.
The twin hazards of landslides and flash floods are recurrent geoenvironmental
hazards causing loss of life and extensive damage of properties along certain sectors
of the city and adjacent areas. With growing anthropogenic activities and urban
development, these twin problems have become more acute over the study years. As
many as 60 minor and major landslides have been documented through on site
inventorisation during the study years within the city, some of which are recurring
type while most of them being found in new localities. Their distribution is
predominantly along NH-40 apart from those in thickly populated urban areas. Most
of the slides include slumping, debris fall and flow. The factors that have a direct
bearing on the stability of the study area are: the changes in the slope gradient both
natural and man-made, changes in antecedent moisture content, vegetation and
lithology. Most of the slides in the study area are confined to the regolith overlying
the parent rocks. An integrated study of the causal factors using remote sensing data
analysis, GIS and field investigation in respect of geological, geomorphological and
meteorological parameters suggest that a multiple of factors are responsible for
landslide in the study area.
Landslide prone areas within urban areas are mostly debris fall and are located on
steep hill slopes where the settlements have come up in a haphazard and unplanned
manner. Unnatural load imposed on the rocks by the haphazard civil structures
without slope management is another triggering factor. Landslides are mostly
encountered along the NH 40 that cause frequent disruption of vehicular traffic.
Majority of the recent failures along the NH 40 are characterized by slumps with an
244
average width of about 30 m and a length of 50 m from the toe to the highest back
scarp. Toe cutting through unscientific method has been attributed as the main
causative factor for these slides. The study suggests that high positive pore pressure
developed in the fissile rocks and thin soil cover overlying bedrocks due to seepage of
water from continuous precipitation is the triggering factor for slope failure. Landslide
occurrence is higher in quartzite and phyllite. Correlation of landslide frequency with
respect to lineament density shows that most of the slides are confined to areas with
lineament density 1-3km-1 having NE-SW trend conforming to the structural trend of
the area. Flash floods have been recorded in recent years in few localities particularly
the topographic lows around Polo ground areas. The immediate cause of flash floods
is however, constriction of the floodplain of Wah Umkhrah river by settlement,
uncontrolled input of debris from the surrounding cliffs following high intensity rain
and high relief of the terrain.
Siltation, though not a major cause of concern as of now, is slowly showing the sign
of becoming a major problem in near future. Numerous rock and sand quarry sites are
located along streams in and around the Shillong town. These quarries discharge
huge quantum of silt on regular basis to the streams which is beyond the capacity and
competence of the rivers to dissipate downstream. This result in aggradations of
riverbeds and many a times leads artificial damming that becomes a cause of
flashflood during rainy season. Urbanization of steep hill slopes involving
development of roads, expansion of habitation and new commercial establishments
have come up in a haphazard way at the expense of forest. This also has contributed
to enormous silt generation in the study area.
245
The extraction of stones aggregates and sand is the most significant human
contribution through material production to the geomorphic change in Shillong city
landscape. From the limited study carried out during last few years it is found that the
production of stone aggregates and sand has increased substantially and has become
the largest source of primary aggregates used in Shillong city. The quarries located
within the study area are worked as small enterprises and produce 61 % and 72% of
stones aggregates and sand consumed respectively for construction projects. This is
because people seeking stone aggregates, sand and gravel tend to procure these
materials that they need from the nearest and most convenient place. Active quarries
or former quarries are not yet reclaimed due to which the scar faces of these extractive
activities are vividly visible in the landscape. Such direct landform reshaping by such
activities IS high III areas of Nongthymmai, Laitkor, Pynthorumkhrah,
Mawdiangdiang, Mawlai, Mawpat, Umroi and Umlynka. Out of 730 Mt of
construction waste produced during the year 2006-2007, a considerable part of this
dumping of waste may be seen as a massive human contribution to changing the
geomorphology of Shillong city through material aggregates extraction in some of the
localities.
Increase in local production of stone aggregates and sand for consumption by
different engineering projects in Shillong city, has raised the amount of siltation in the
streams located near the quarry sites viz., Wah Umkhrah, Umshirpi and creating new
level land which have been landfilled raising the height of the ground surface. This
material transfer is modifying the landscape at a rapid pace, particularly at the sites of
extraction and waste disposal. With the present pace of urban growth, the waste
materials are bound to increase. The rapid growth of urban areas with relatively weak
246
planning and environmental controls means that the geomorphic changes related to
urban ecology are likely to become more extensive in the near future.
Materials flow accounting and quantification of the urban metabolism has helped in
the development of indicators of the degree to which the Shillong Master Plan Area is
becoming more susceptible in its behaviour vis-a-vis the geoenvironmental setup. The
study suggests recycling of construction materials to reduce the rate of geomorphic
transformation by reuse and disposal of construction material. The examination of
geomorphic consequences of urban growth activities confirms the importance of
looking at and encouraging of re-use of materials everywhere. It is important to
identify the key areas of intervention to reduce off-site impacts and cost.
In terms of land consumption, both material extraction and dumping of wastes if
continues at present rate, the demand for large areas of land for such activities will
grow. Since these areas have become unsuitable for other productive use and
agriculture, the pressure will mount on the fringe areas to feed the city or for housing
and infrastructure development which is bound to be unsustainable in the long run.
The excavations of materials for major developments requiring substantial earth
removal and relocation needs to be examined to find ways and means for more
balanced use of earth resources.
The present study takes a holistic look into the geoenvironmental status of the
Shillong urban agglomeration and its adjoining areas. The urban ecosystem has been
analysed with the concept of urban material metabolism and it has been tried to find a
link between the physical and biological parameters vis-a-vis their spatio-temporal
variability. Lithological units, landforms and prevalent geomorphic setting are
focused as platform to understand the urban ecosystem. This study has brought out a
247
set of baseline data pertaining to the physical attributes which is expected to fill an
information gap and be useful as future reference to understand and manage their
spatio-temporal variability vis-a-vis changing status of the urban ecosystem in a
scenario of ever increasing human interference with the natural systems. The study
however, can be treated as the first approximation considering the resolution of
mapping adopted. A further high resolution study, taking advantage of advanced
technology available, both in temporal and spatial contexts and with direct field
measurement of attributes to calibrate the changes imposed, will be the next step in
right direction.
248
REFERENCES
Adriaanse, A., Bringezu, S., Hammond, A., Moriguchi, Y., Rodenburg, E. and Schiltz, H. 1997. Resource flows: the material basis of industrial economies. World Resources Institute, Washington, D.C. pp 66.
Agarwal, A. K. 1993. Environmental Issue in North-East India. In: Environmental Protection Challenges and Issues,Impact of Rapid Development and Policy Measures (Ed: Mahajan, V. S.). Deep and Deep Publication Pvt., Ltd., New Delhi. pp 255-267.
Agarwal, M. 1994. Geomorphology and environmental management of Umiam Basin, East Khasi Hills, Meghalaya. Ph. D. Thesis, North-Eastern Hill University, Shillong.
Adeniyi, P. O. and Omojola, A.1999. Landuse land cover change evaluation: A Preliminary Inquiry. Annals of the Association of American Geographers 4: 55-83.
AI-Sulaimi, J., Khalaf, F. J., and A. Mukhopadhyay.l997. Geomorphological analysis of paleo drainage systems and their environmental implications in the desert of Kuwait. Environmental Geology 29 (1/2):94-110.
Anon. 1974. Geology and mineral resources of the states of India. Geological Survey of India Miscellaneous Publication 30: 1-123.
Atkinson, P.M. and Massari, R. 1998. Generalized linear modelling oflandslide susceptibility in the Central Apennines, Italy. Computers and Geosciences 24:373-385.
Awasthy, R. K. 2001. Slope stability problems in the mountainous terrain of Mizoram, Northeastern Region .National seminar on Geotechniques and Geological Hazards in the Indian Context, Geological Survey ofIndia, North Eastern Region, Shillong. PreSeminar Volume pp 225-226.
Ayres, R.U. and Ayres, L.W. 1996. Industrial Ecology: closing the materials cycle. Edward Elgar, Aldershot.
Barman, R. and Bhattachatjee, N. 2008. Geo-environment scenario in North-East India, In: North-East India Geo-environmental issues (Ed: S. Deka). EBH Publishers Guwahati, India pp. 97-122.
Barooah, B. C. 1971. Tectonic Pattern of the Precambrian Rock around Tyrsad, Assam. Miscellaneous Publication. Geological Survey of India. 23:485-495.
Baruah, U. K., Chouduri, N. K., Ahmed, S. 1993. Application of remote sensing techniques for hydrogeomorphological studies in parts of Goalpara district and prospects of ground water development in the area. In: Proceedings of the national symposium on remote sensing applications for resource management with special emphasis on North Eastern region. Indian Society of Remote Sensing and Assam Remote Sensing Application Centre (A.S.T.E. Council) Guwahati, Assam. pp 155-160.
Bell, A. 1997. Waste statistics 1996-97. (Final draft.) The Environment Agency, North West Regional Office, Warrington.
Bhagabati, A. K. 2008. Environmental problems in North-East India: Some observations. In:
249
North-East India Geo-environmental issues (Ed: S. Deka). EBH Publishers Guwahati, India. pp 123-138.
Bhaisare, A. R. and Goel,D.K. 1992. Ground Water Year Book of Madhya Pradesh. Central Ground Water Board, Bhopal.
Bhargava, A. and Sokhi, B. S. 1999. Application of Remote Sensing to detect incompatible Land Use in Different Physiographic Zones: A Case Study of Nodia, In: Remote Sensing of Urban Environment (Eds: Sokhi, B. S. and Rashid, S.M.). Manak Publication Pvt. Ltd., New Delhi. pp109-122.
Bhattacharjee, C. C. 1968. Structure and Petrology of the Shillong Plateau. Pre-Congress symposium, XXI International Geological Congress India. pp 16-24.
Bhattacharjee, C. C. and Rahman, S. 1985 Structure and lithostratigraphy of the Shillong group of rocks, East Khasi Hills of Meghalaya. Bulletin of Geological Minerological and Metallugical Society of India 53: 90-99.
Biswas, S., Sudhakar, S. and Desai, V. R. 1999. Prioritization of Sub-Watershed Based on Morphometric Analysis of Drainage Basin: A remote sensing and GIS approach. Journal of the Indian Society of Remote Sensing 27:155-166.
Bloom, A. L. 2002. Geomorphology, A systematic Analysis of Late Cenozoic Landforms. 3rd edition. Prentice Hall. pp 482.
Bora, A. K. 2008. Water resources of North-East India: Potentials, Development and Management. In: North-East India Geo-environmental issues (Ed: S. Deka ). EBH Publishers Guwahati, India. pp 173- 198.
Borah, R., Das, P. K. and Bhattacharyya, K. G. 2001. Landslide hazards in Guwahati and its management. National seminar on Geotechniques and Geological Hazards in the Indian Context, Geological Survey of India, North Eastern Region, Shillong. PreSeminar volume pp 196-198.
Bose, P. N. 1901. General report. Geological Survey ofIndia.
Bradshaw. 1925. Records of Geological Survey of India. LVIII
Bringezu, S. and SchUtz, S. 1996. Analyse des stoffverbrauchs der deutschen wirtschaft: status quo, trends und mogliche prioritaten rur maBnahmen zur erhohnung der ressourcenproduktivit:at. In: Neue ansiitze in der weltokonomie (Eds: J. Kohn and M.J. Welfens). Metropolis-Verlag, Marburg. pp 227-251.
Burman, D. K. 1993. Remote Sensing contribution for augmentation of urban water supply in Greater Guwahati area. In: Proceedings of the national symposium on remote sensing applications for resource management with special emphasis on North Eastern region. Indian Society of Remote Sensing and Assam Remote Sensing Application Centre (A.S.T.E. Council) Guwahati, Assam. pp 490-496.
Carrara, A., Cardinali, M., Guzzetti, F. and Reichenbach, P.1995. GIS-based techniques for mapping landslide hazard. In: Geographical information systems in assessing natural hazards (Eds: Carrara, A. and Guzzetti, F.). Kluwer, Dordrecht. pp 135-176.
250
Carrara. A., Cardinali. M., Detti. R., Guzzetti, F., Pasqui, V. and Reichenbach, P. 1991. GIS techniques and statistical models in evaluating landslide hazard. Earth Surface Process Landforms 16: 427-445.
Chatterjee, N. N. 1937. A preliminary account of the Granite near Mylliem, Khasi Hills. Proceedings Indian Science Congress (Abstract), 24th Session.
Chaterjee, R.S and Bhattacharya, A.K .1995. Delineation of the drainage pattern of a coal basin related inference using satellite remote sensing techniques. Journal of Asia Pacific Remote Sensing 1 :107-114.
Chatterjee, S. and De, N. K. 1999. System Approach in Environmental Management: A Conceptual Framework. Indian Journal of Landscape System and &ological Studies 22: 36-43.
Chatterjee, S. P. 1968. Physical geography of India in Gazetter of India, 1968, Govnmentt of India Publication.
Chauhan, P. S., Porwal, M. C., Sharma, L. and Negi, J. D. S. 2003. Change detection in Sal forest in Dehradhun Forest Division using Remote Sensing and Geographical Information System. Journal of Indian Society of Remote Sensing 31: 211-218.
Chen, X. and L. Qiao. 2000. Material flow analysis of Chinese economic-environmental system. Paper presented at the SCOPE Open Executive Committee Meeting, Beijing, April 2000.
Chopra, S. 1984. Geomorphological mapping of parts of northern fringes of Meghalaya. Geological Survey of India. Records 113:4
Chopra, S. and Srivastava, V. C. 2001. Major technical hazards in Assam -A plan outline for management and mitigation. National Seminar on Geo-techniques and Geological Hazards in the Indian Context. Geological Survey of India, North Eastern Region, Shillong. Pre- Seminar Volume. pp 202-204.
Chopra, R., Dhiman. R. D. and Sharma P. K. 2005. Morphometric analysis ofsub-waersheds in Gurdaspur district, Punjab using remote sensing and GIS techniques. Journal of Indian Society of Remote Sensing 33: 530-539.
Chorley, R. J. 1969. The Drainage Basin as the Fundamental Geomorphic Unit. In: Water, Earth and Man (Ed: Choriy, R. J.). Methuen London. pp 77-99.
Choudhury, J. M. 1962. A Petrological Study of Khasi Greenstone Khasi and Jaintia Hills, Assam. Journal ofGauhati University 13: 88-97.
Civco, D.L., Hurd, J.D., Wilson, E.H., Song, M. and Zhang, Z. 2002. A comparison of Landuse and Landcover Change Detection Methods. ASPRS-ACSM Annual Conference and FIG XXII Congress.
Coats, D. R., 1958. Quantitative Geomorphology of small drainage basin of southern Indiana, Project NR 389-042 Techinical Reports 10, Columbia University Department of Geology, ONR, Geography Branch, New York
De Marco, O. L. and E. Pizzoli Mazzacane. 1999. Material flow analysis of the Italian economy: preliminary results. In ConAccount Workshop: Ecologjzjng Societal Metabolism: Designing Scenarios for Sustainable Materials Management, CML Report
251
148, edited by R. Kleijn et at. Leiden: Centre of Environmental Science, Leiden University.
Department of Urban Affairs (DOUA). 1997. Project Report on New Shillong, Department of Urban Affairs: Government of Meghalaya, Shillong.
Department of Urban Affairs (DOUA). 1991. Master Plan of Shillong 1991-20 II, Directorate of Urban Affairs: Government of Meghalaya, Shillong.
Dai, F.C., Lee, C.F., Li, J. and Xu, Z.W. 2001. Assessment oflandslide susceptibility on the natural terrain of Lan tau Island, Hong Kong. Environmental Geology. 40:381-391.
Dasgupta, H. C. 1934. On the Mylliem granites, Khasi Hills. Quarterly Journal of Geological Minerological and Metallugical Society of India 6: 1-4.
De bimalendu. 1981. Final Report on the Assesment of Potentiality for base metal mineralization in Tyrsad - Barapani shear zone, Khasi Hills district, Meghalaya. Progress Report. Geological Survey of India
Dimyati, M., Mizuno, K., Kobayashi, S. and Kitamura, T. 1995. An analysis of land use/land cover change using the combination ofMSS Landsat and land use map: A case study in Yogyakarta, Indonesia. International Journal of Remote Sensing. 17(55): 931-944.
Douglas, I., and Lawson, N. 2001. Problems associated with establishing reliable estimates of materials flows linked to extractive industries. Third Con Account Meeting: Ecologizing Societal Metabolism, Designing Scenarios for Sustainable Materials Management, Amsterdam, The Netherlands .November 21st 1998. pp 127-134
ESPROMUD. 2008. Earth Surface Processes, Materials Use and Urban Development: Understanding the Human Contribution to Global Geomorphological Change. http://www.icsu-scope.orglprojects/cluster2/espromud.htm.
Evans, P. 1932. Tertiary succession in Assam. Transition Mineral Geological Metallurgical Institute of India 27: 168-248.
Evans, P. and Mathur, L. P. 1964. Oil in India - A brochure for 22nd International Geological Congress, India, New Delhi 1964.
Fairbridge,R.W. 1968.The Enclopedia of geomorphology. Encyclopedia of Earth-Science. Reinhold Book Corporation., New York. 5:1295.
Folke, C., Jansson, A., Larsson, J., and Constanza, R. 1997. Ecosystem Appropriation by Cities. Ambio 26(3):167-172.
Fox, C. S. 1949. General Report of the Geological Survey of India for the year 1939. Geological Survey of India 78: 386.
Fernandez, C. I., Castillo, T. F. D., Handouni, R. E. and Montero, J. C. 1999. Verification of landslide susceptibility mapping: a case study. Earth Surface Process Landforms 24: 537-544.
Gannser, A. 1964. Geology of the Himalayas. Inter-Science Publcation. London. 30: 124.
252
Garg, J. K., Narayan, A. and Basu, A. 1988. Monitoring environmental changes over Kudremukh iron ore mining area, India using remote sensing technique. In: Proceedings of the Indo-British workshop on remote Sensing of Environment in Mining field. ISM. Dhanbad. pp 41-47.
Geological Survey ofIndia (GSI). 1974. Geology and mineral resources of the states of India. Miscellaneous Publication. 30: 73.
Ghose, D., and Mitra, A. 2001. Landslide hazard zonation mapping in Singtam - Ranipul sector of East Sikkim District, Sikkim. National seminar on Geotechniques and Geological Hazards in the Indian Context, Geological Survey of India, North Eastern Region, Shillong. Pre-Seminar Volume pp 227-230.
Ghosh, S., Chakraborty, S., Bhalla, J. K., Paul, D. K., Sarkar, A., Bishui, P. K. and Gupta, S.M. 1991. Geochronology and Geochemistry of Granite Plutons from East Khasi Hills, Meghalaya. Journal of Geological Society of India 37: 331-342.
Gilbert, G. K. 1877. Report on the Geology of the Henry Mountains. U.S. Geographical and Geological Survey of the Rocky Mountain Region, Washington, D.C.
Gottschalk, L. C. 1964. Reservoir sedimentation. In: Handbook of Applied Hydrology (Ed: Chow, V.T.). McGraw Hill Book Company, New York, Section 7-1.
Gregory, K. J. 1966. Dry valley and the composition of the drainage net. Journal of Hydrology 4: 327-340.
Gregory, K. J. 1968. The composition of the drainage net: Morphometric analysis of maps. British Geomorphological Research Group Occasional Paper 4: 9-11.
Gregory, K. J. and Welling, D. E. 1973. Drainage Basin form and process: A geomorphological approach. London: John Wiley & Sons, pp 456.
Gupta, R.P and Joshi, B.C.1989. Landslide hazard zoning using the GIS approach - a case study from the Ramganga catchment, Himalayas. Engineering Geology 28: 119-131
Gupta, A. K and Ganesh Raj, K. 1992. Correlation of bore well data with imagery interpreted ground water prospective zone maps. Bhujal News. Quarterly Journal of Central Ground Water Board 2 (1): 10-16.
Gupta, A., Dey, V., and Choudhary, A. 2009. Urban environment quality assessment by Boolean appoarch. Journal ofGeomatics 3: 1-7
Gupta, G. D. 2001 Geological and Anthropogenic hazards of Delhi metropolis - need for adopting sustainable technology. National seminar on Geotechniques and Geological Hazards in the Indian Context, Geological Survey of India, North Eastern Region, Shillong. Pre- Seminar Volume. April 24-26. 162-164.
Hack, J. T. 1957. Studies of longitudinal stream profiles in Virginia and Maryland: U.S. Geoogical Survey Professional Paper 294: 45-97.
Hack, J T., 1960, Interpretation of erosional topography in humid temperate regions. Amercian Jounal of Science 258: 80-97.
Hack, J. T. 1973. Stream profile analysis and stream gradient index: Journal of Research. U.S. Geological Survey 1: 421-429.
253
Hansen, E. and Lassen, C. 1998. A product composition database for material management: Application for priority setting and substance flow analysis of aluminium in Denmark. Third ConAccount Meeting: Ecologizing Societal Metabolism, Designing Scenarios for Sustainable Materials Management, Amsterdam, The Netherlands. November 21st 1998. pp 100-104.
Hedge, V. S. 2002. Geoenvironmental Scenario in the Bangalore Metropolitan Region. An Integrated Study. Ph.D. thesis Bangalore University, India, Bangalore.
Hiese, N., and Reddy, M. A. 2001. Evaluaution of land use/land cover changes of Kohima area, Nagaland, with special reference to landslide using remote sensing techniques. National seminar on Geotechniques and Geological Hazards in the Indian Context , Geological Survey of India, North Eastern Region, Shillong. Pre- Seminar Volume. April 24-26. pp 205-207.
Horton, R. E. 1932. Drainage Basin Characteristic. Transactions - American Geophysical Union 13: 350-361.
Horton, R.E. 1945. Erosional development of streams: and their drainage basins: Hydrophysical approach to quantitative morphology. Geological Society of America Buletin 56: 275-370.
Huang, S. L. 1998 Urban ecosystems, energetic hierarchies and ecological economics of Taipei metropolis. Journal of Environmental Management 52: 31-51.
Huang, S. and Ferng, J. 1990. Applied Land Classification for surface Water Quality Management: 1 Watershed Classification. Journal of Environmental Management 31: 107-126.
Huang, S. L and Hsu, W. L. 2003. Material flow analysis and emergy evaluation of Taipei's urban construction. Landscape Urban Planning 63: 61-74.
Hurterz , J E., Sol, C. and Lucazeau, F. 1999. Effect of drainage area on hypsometry form an analysis of small scale drainage basin in the Siwalik Hills (Central Nepal). Earth Surface Process and Landforms 79: 389.
Hutchinson, M. F. and Dowling, T. I. 1991. A continental hydrologic assessment of a new grid- based digital elevation model of Australia. Hydrologic Processes 5: 45 - 58.
Jagannathan and Kameswar. 2001. Role of rainfall and groundwater in landslide initiation in Wynad area of Wastern Ghats, Kerala. National seminar on Geotechniques and Geological Hazards in the Indian Context, Geological Survey of India, North Eastern Region, Shillong. Pre- Seminar Volume. April 24-26. pp. 168-171.
Joji, V. S., Nair, A. S. K. And Changat, M. 2001. Geomorphology and Terrain Characteristics of Vamanapuram river basin, Southern Kerela, India. Indian Journal of Geology 73(4):263-270.
Keller, E. A. and Pinter, N. 1996. Active Tectonics; Earthquakes, Uplift, and Landscape. Prentice Hall, pp 338.
Kennedy, C., Cuddihy, J. and Engel-Yan, J. 2007. The Changing Metabolism of Cities. Journal of Industrial Ecology 11: 43-59.
254
Khan, M. A and Moharana, P. C .2002. Use of remote sensing and Geographical Information System in the delineation and characterization of ground water prospect zones. Journal of Indian Society of Remote Sensing 31 (3): 131-141.
Khullar, V. K. 2001. Landslide in Mizoram, Northeast India - An opinion. National seminar on Geotechniques and Geological Hazards in the Indian Context, Geological Survey of India, North Eastern Region , Shillong. Pre - Seminar Volume. April 24-26. pp 237-239.
King, L .C. 1962. The Morphology of the Earth, Oliver ara J Boyd, Edinburg.
Krishnaswamy, V. S. 1980. Geological aspects of landslides with particular reference to the Himalayan region. In: Proceedings International Symposium on landslides, India 2:209-211
Krishnamurthy, J and Srinivas, G. 1995. Role of geological and geomorphological features in groundwater exploration: a study using IRS L1SS data. International Journal of Remote Sensing 16(14): 2595-2618.
Krishnamurthy, J., Venkatesa Kumar, N., Jayaraman, V and Manivel, M .1996. An approach to demarcate groundwater potential zones through remote sensing and geographical information system. International Journal of Remote Sensing 17(10): 1867-1884
Kumar, P. 1988. Geoenvironmental Appraisal of Greater Shillong Area Meghalaya. Geological Survey of India 124: 117-120.
Kumar, V. 1993. Remote sensing for geomorphological, lithological and structural in part of Bramaputra valley, Assam. In: Proceedings of the national symposium on remote sensing applications for resource management with special emphasis on North Eastern region organized by Indian Society of Remote Sensing and Assam Remote Sensing Application Centre (A.S.T.E. Council) Guwahati, Assam. November 25-27. pp 108-144 .
Kumar, A. and Pandey, R. N. 1989. Wasteland management in India. Ashis Publishing House, New Delhi. 227.
Lallianthanga, and Goswami, D. C. 1997. Land use Sattelite Mapping ofland cover Pattern in Mizoram, India A case study of Serchhip Rural Development Block, Aizwal District. Indian Journal of Landscape System and &ological Studies 20: 64-69.
Lawson, N. and Douglas, I. 1998. Urban metabolism, materials flows and sustainable development: a geoenvironmentaI perspective. In: Proceedings of the 4th International Symposium on Geoenvironmental Technology and Global Sustainable Development. University of Massachusetts, Lowell.
Learnmonth, A. and Simmons, L. 1997. Man-Environment relationships as Compkex Ecosystems. In: Man and Environment (Ed: Gadsby, R.). Open University Press, Waiton Hall Milton, Keynes. pp 56-95.
Lee, C., Huang, S., and Chan, S. 2009. Synthesis and Spatial dynamics of socio-economic metabolism and land use change of Taipei Metropolitan Region. &ological Modelling 220: 2940-2959.
Leopold, L. B., Wolman, M. G. and Miller, J. P. 1964. Fluvial Processes in Geomorphology: W.H. Freeman and Co. San Francisco. pp 522.
255
LilIes, T. M. and Kiefer, R. W. 1999. Remote sensing and image interpretation. John Wiley & Sons. New York.
Lokesha. N., Gopalakrishna, H., Gowda, H. and Gupta, A. K. 2005. Delineation of ground water potential zones in a hard rock terrain of Mysore district, Karnataka using IRS data and GIS techniques. Journal of Indian SOCiety of Remote Sensing 33: 405-412.
Louise. S. 1998. Inflow and Accumulation of Heavy Metals in Stockholm, Sweden. Third ConAccount Meeting: Ecologizing Societal Metabolism, Designing Scenarios for Sustainable Materials Management, Amsterdam, The Netherlands .November 21st 1998. pp 74-76.
Lyle, J. T. 1996. Urban Ecosystem, InContex, contex Instutue: http/www.contex.orglICLIB IIC351lyle. htm.
Machatchek, F. 1969. Geomorphology (translation of 9th edition, by D. F. Davis) Oliver and Boyd, Edinburgh.
Mackin, J. H. 1948. Concept of the Graded River. Geological Society of America Buletin 59: 463-512.
Mahajan, S. and Panwar, P. 2005. Land use change in Ashwani khad watershed using GIS techniques. Journal of Indian Society of Remote Sensing 33: 227-232.
Mahajan, S., Panwar, P., and Kaundal, D. 2001. GIS application to determine the effect of topography on landuse in Ashwani khad watershed. Journal of Indian Society of Remote Sensing 29: 243-248.
Mani, M. and Varghese, K. 1999. Development of a sustainability Alternative Assessment and Monitoring System for Urban Change/Growth, In: Geo InformatiCS: Beyond 2000, An International Conference on Geo informatics for Natural Resources Assessment, Monitoring and Management, Monitoring and Management. (Eds D.P. Rao., P.S. Roy., A. Zirick., R.V. Zuidam., A. Fabbri., V.K. Jha, and P.K. Champatirai). Indian Institue of Remote Sensing. Debra Dun. pp 102-106.
Marceau, S. J., Lue, G. L., Mirelle, G. and Claude, M. 2001. Building Temporal Topology in a GIS Data base to Study the Land-Use Changes in Rural Urban Environment, The ProfeSSional Geographer 53: 546-556.
Mark, R.K. and Ellen, S. D. 1995. Statistical and simulation models for mapping debris flow hazard. In: Geographical Information Systems in Assessing Natural Hazards (Eds: Carrara, A. and Guzzetti, F.). Kluwer Academic Publisher, Dordrecht. pp 93-106.
Masini, A. and Ayres, R.U. 1996. An application of energy accounting to four basic metal industries. Working Papers Center for the Management of Environmental Resources of INSEAD, 96/65.EPS. pp 51.
Mathur L. P. and Evans, P. 1964. Oil and India, International Geological Congress, 22 nd
Secession New Delhi pp 85.
Mazumdar, S. K. 1971. A summary of the Precambrian Geology of the Khasi Hills, Meghalaya. Miscellaneous Publication Geological Survey of India 23 :311-344.
256
Mazumdar, S. K. 1976. A summary of the Precambrian geology of the Khasi hills, Meghalaya. Miscellaneous Publication Geological Survey of India 23: 311-324.
Mazumdar, S. K. 1978. Morphogenetic evolution of the Khasi Hills, Meghalaya, India. Miscellaneous Publication, Geological Survey of India 30: 208-213.
Mazumdar, S. K. 1986. The Precambrian Framework of part of the Khasi Hills, Meghalaya. Record of Geological Survey of India 117:1-59.
Mckean, J., Buechel. S. and Gagdos, L. 1991. Remote sensing and landslide hazard assessment. Photogrammetric Engineering and Remote Sensing 57: 1185-1193.
Medlicott, H. B. 1869. Geological sketch of the Shillong Plateau in North- East Bengal. Memoirs of Geological Survey of India 7: 151-207.
Meghalaya State Pollution Control Board (MSPCB). 2002. The State of Environment of Shillong City.
MENRIS. 1997. GIS application to Natural Resources Management and Development planning in a rural area - Pranmati watershed, Garhwal Himalayas, India, ICIMOD, Nepal.
Metrotra, G. S., Sarkar, S. and Saxena, P. 1993. Lineament and terrain evaluation studies in a part of Garhwal, Himalaya. In: Proceedings of the national symposium on remote sensing applications for resource management with special emphasis on North Eastern region organized by Indian Society of Remote Sensing and Assam Remote Sensing Application Centre (A.S.T.E. Council) Guwahati, Assam. November 25-27, pp 120- 126.
Merz, J., Nakanni, G., Shrestha, S., Dahal, B. M., Dongol, B. S., Schaffner, M., Shakya, S., Sharma, S. and Weingartner, R. 2004. Public Water Sources in Rural Watersheds of Nepal's Middle Mountains: Issues and Constraints. Environmental Management 34:26-37.
Miller, V. C. 1953. A quantitative geomorphic study of drainage basin characteristics in the Clinch Mountain area, Virginia and Tennessee". Project NR 386-052, Tech. Rept.3 Columbia University., Deptment of Geology, ONR, Geography Branch, New York.
Mitra, S. K. 1998. Structural history of the rocks of the Shillong Group around Sohiong, East Khasi Hills, Meghalaya. Indian Journal of Geology 70: 123 - 131.
Mohanty, R. R. 1994. Analysis of the urban landuse change using sequential aerial photographs and SPOT data: An example of north Bhubaneswar, Orissa. Journal of Indian Society of Remote SenSing 22: 225-235.
More, R. J. 1967. Hydrological models and Geography; In: Models ofGeogaphy (Eds: R Chorly, J. and Hagget, P.) Methuen, London. pp 145 - 185.
Morisawa, M. E. 1957. Accuracy of determination of stream lengths from topographic maps. Transactions - American Geophysical Union 38: 86-88.
Morisawa, M. E. 1958. Measurement of drainage basin outline form. Journal of Geology 66:587-591.
Murthy, M. V. N., Talukdar,S. C., Bhattacharya ,A. C and Chakrabarty, C. 1969. The Dawki
257
Fault of Assam. Bulliten ONGC 6: 57 - 64.
Nag, S. K. 1998. Morphometric analysis using remote sensing techniques in the Chaka subbasin, Purulia district, West Bengal. Journal of the Indian Society of Remote Sensing 26: 69-67.
Nag, S. K. and Chakraborty, S. 2003. Influence of rock types and structure in the development of drainage network in hard rocks area. Journal of Indian Society of Remote Sensing 31: 25-35.
Nandy, D, R. 1980. Tectonic pattern in North-eastern India. Indian Journal of Earth Sciences 7: 103 - 107.
Nautiyal, M. D. 1994. Morphometric analysis of the drainage basin, district Deradhun, Uttar Pradesh. Journal of Indian Society of Remote Sensing 22: 251-261.
Narasimha, S. 2001. Landslide zonation by remote sensing interpretation. National seminar on Geotechniques and Geological Hazards in the Indian Context, Geological Survey of India, North Eastern Region , Shillong. Pre- Seminar Volume. April 24-26. pp 243-244.
Newcombe, K., Kalina, J. D. and Aston, A. R. 1978. The metabolism ofa city: The case of Hong Kong. Ambio 7: 3-15.
Newman, P.W.G., Birrel, R. and Holmes, D. 1996. In: Human settlement in state of the environment Australia. Melbourne: state of the environment Advisory Council (Ed P. W.G Newman). CSIRO publishing. pp 1-57.
Newman, P. W. G. 1999. Sustainable and cities: Extending the metabolism models. Landscape and Urban Planning 44: 219-226.
National Bureau of Soil Survey and Land Use Planning (NBSS) Publ.52. Soils of Meghalaya for optimising Land Use. b. Executive Summary.
Odum, E. P. 1971. Fundamentals of&ology. Philadelphia: Saunders.
Oldham, T. 1858. Geological structure of a portion of the Khasi Hills, Bengal. Memors Geological Survey of India 1: 99-207.
Olorunfemi, J. F. 1983. Monitoring Urban Land - Use in Developed Countries.
Palmer, R. W. 1924. Geology of a part of the Khasi and Jaintia Hills, Assam. Record Geological Survey of India 55: 143-168.
Pandey, A. C. and Nathawat, M. S. 2006. Land Use Land Cover Mapping through Digital Image Processing of Satellite Data: A case study from Panchkula, Ambala and Yamunanagar Districts, Haryana State, India Atlanta, Georgia. pp 628.
Pascoe, E. H. 1950. A manual of Geology of India and Burma, Govt. of India publication.
Prabhu, S., Ramakrishnan, S.S. and Vidhya, R. 2009 Use of remote sensing and GIS technology for landslide hazards mapping using ANN. Journal ofGeomatics 3: 29-36.
258
Pradeep,K.J.l998. Remote sensing techniques to locate groundwater potential zones in upper Urmil river basin District Chatapur, Central India. Journal of Indian Society of Remote Sensing 26(3): 135-147.
Public Health Engineering Department, Government of Meghalaya (PHeD).2006. Information and Data Required by BCEOM India Pvt. Ltd, for Preparation of Vision Statement and City Development Plan under Jawaharlal Nehru National Urban Renewal Mission (Volume: I - water supply).
Rahman, S. 1981. Petrology and Petrochemistry of the Khasi greenstone occurring around Mylliem Granite, Khasi Hills, Meghalaya. Journal of Geological Associations 14: 133-144.
Rahman, S. 1987. Origin and emplacement of the Mylliem granite, Khasi Hills, Meghalaya, India. Revista Brasiteiraa de Geosciosciencias 17: 660-662.
Rahman, S. and Borah, A. K. 1990. The Khasi Greenstones of East Khasi Hills, Meghalaya. Evolution of Precambrian crust of India. (Extended abstract published)
Rahman, S. 1991. Emplacement of some Precambrian granite plutons in the Shillong Plateau, Meghalaya, North-east India. International symposium- Granite and Geodynamics held in Moscow, USSR, Aug 6-9, 1991 (Extended abstract published).
Rahman, S. 1996. Triclinicity of the potassium feldspar and the petrochemistry of the Umroi (Kyrdem) granite, Khasi Hills, Meghalaya. Proceeding Volume: Development of Geological research in North East India, Deptment of Geological Sciences, Gauhati University.
Raj, R., Maurya, D. M. and ChamyaI, L. S. 1999. Evolution ofMahi Drainage Basin during Quaternary: a Morphometric Approach, Gondwana Geological Magazine 4: 131-139.
Raju, M. 2001. Role of seismicity and rainfall as causative factors of extensive landslides in Mizoram. National seminar on Geotechniques and Geological Hazards in the Indian Context, Geological Survey of India, North Eastern Region, Shillong. Pre- Seminar Volume. April 24-26.pp. 165-167.
Ramesh, B. and Goel, A. 1999. Appraisal of Development Plan and the Role of Various Agencies in Plan Implementation Process. In: Remote Sensing of Urban Environment (Eds: Dokhi, S.S. and Rashid, S. M.). Manak Rublication Pvt. Ltd., New Delhi.
Rashid, S. M. 1999. Suitability Analysis of Vacant Lands for Urban Development, A case study of Guirim and Porvorim towns, In: Remote Sensing of Urban Environment (Eds: Sokhi, B. S. and Rashid, S. M.). Manak Publication Pvt., Ltd., New Delhi.
Ratnam, K.N., Shrivasstava, Y.K., Rao, V. V., Amminedu, E. and Murthy, K.S.R. 2005. Check dam positioning by prioritization of micro-watersheds using SYI model and morphometric analysis-Remote sensing and GIS perspective. Journal of the Indian Society of Remote Sensing 33: 26-38.
Ravindran, K. V. and Manchanda, M. L. 1993. Groundwater investigation in JNU Cmpus, New Delhi using Remote Sensing Technique. In: Proceedings of the national symposium on remote sensing applications for resource management with special emphasis on North Eastern region organized by Indian Society of Remote Sensing and Assam Remote Sensing Application Centre (A.S. T.E. Council) Guwahati, Assam. November 25-27, pp 161-166.
259
Ravindran, K. V and Jeyaram, A.1997. Groundwater prospects of Shahbad Tehsil, Baran District, Eastern Rajasthan: A Remote Sensing Approach. Journal of Indian Society of Remote Sensing 25(4): 239-246.
Ray, P. K. C., Dave, V. and Roy, A. K. 1993. Ground water investigation using remote sensing and Geographic Information (GIS) techniques: A case study in Manbazar - II, Purulia 9 (W.B.). In: Proceedings of the national symposium on remote sensing applications for resource management with special emphasis on North Eastern region organized by Indian Society of Remote Sensing and Assam Remote Sensing Application Centre (A.S.T.E. Council) Guwahati, Assam. November 25-27, pp 180-184.
Rees, W.E. 1994. Ecological footprints and appropriated carrying capacity: what urban economics leaves out. Environment and Urbanization 4: 121-130.
Richards, K. 1982. Rivers form and process in Alluvial Channels. Methuen, London & New York. pp 358.
Roy, A., Kumar R. and Baruah. B. 1988. Geological and Geomorphological studies of Greater Shillong Area with special reference to environment aspect. Geological Survey of India Records 123:91-93
Sahely, H. R., Dudding, S. and Kennedy, C.A. 2003. Estimating the urban metabolism of Canada cities: greater Toronto Area case study. Canadian Journal of Civil Engineering 30: 468-483.
Sarkar, S. N. 1968. Precambrian Stratigraphy and Geochronology of Peninsula India. Dhanbad Publ., India
Saraf, A. K. And Choudhury, P. R .1998. Integrated remote sensing and GIS for groundwater exploration and identification of artificial recharge sites. International Journal of Remote Sensing 19(10): 1825-1841.
Sarkar, B. C, Deota, B. S, Raju, P. L. N, and Jugran, D. K .2001. A Geographic Information Systm Approach to Evaluation of Groundwater Potentiality of Sharnri Micro-watershed in the Shimla Taluk, Himachal Pradesh. Journal of Indian Society of Remote Sensing 29(3): 151-164.
Sankar, K.2002. Evaluation of Groundwater Potential Zones using Remote Sensing Data in Upper Vaigai River Basin, Tamil Nadu, India. Journal of Indian Society of Remote Sensing 30(3): 119-129.
Sherlock, R. L. 1922. Man as a geological agent. London: Witherby.
Satterthwaite, D. 1997. Sustainable Cities or Cities that Contribute to Sustainable Development? Urban Cities 34:1667-21691.
Scheidegger, A. E. 1965. The algebra of stream order numbers. US Geol Survey Proffessional Paper 525: 187-189.
Schumm, S.A. 1956. Evolution of Drainage Systems and Slopes in the band lands at Parth Amboy, New Jersey. Bulletin of Geological Society of America 67: 597-646.
260
Seeber, L. and Gornitz, V. 1983. River profile along the Himalayan arc as indicators of active tectonics. Tectonophysics 92: 335-367.
Selby, M. J. 1968. Morphometry of drainage basins in areas ofpumic lithology. Proceedings, Fifth New Zealand Geog Conference. New Zealand Geological Society. pp 169-174.
State Council of Science Technology and Environment, Shillong (SCSTE). 2002. GeoEnvironmental Mapping and Appraisal of Greater Shillong Region, (Unpublished Report)
Sharma, J. N. 1987. Morphometric characteristics of some drainage of Upper Assam, India. Proceedings Volume Seminar on Recent Advances in study of the Cainozoic geology of North Eastern Region ofIndia. pp. 252-268.
Sharma, H. S. and Nathawat, M. S. 1993. Land Transformation and Environmental Degradation in Jaiput Urban Complex. In: Environmental Development, views form the East and the West (Eds: Mukhetjee, A. and Agnihotri, V. K.). Concept Publishing Company, New Delhi. pp 91-105.
Sharma, V. K. 2001. Geotechnique in delination of urban suitability zones around Nanital township, Kumaon Himalaya. National seminar on Geotechniques and Geological Hazards in the Indian Context. Geological Survey of India, North Eastern Region, Shillong. Pre-Seminar Volume. April 24-26. 172-175.
Sharma, L. P., Debnath, P., Patel, N. and Ghose, M. K. 2009. Landslide Vulnerbality. Coordinates 5: 31-34.
Shook, G. and Grantham. C. 1993. A Decision Analysis Technique for Ranking Sources of Ground Water Pollution. Journal of Environmental Management 37: 201-206.
Shreve, R. L. 1967. Infmite topologically random channel networks. Journal of Geology 75:178-186.
Sim, L. K. and Balamurugan, G. 1991. Urbanization and Urban Water Problems in Southeast Asia: a case of Unsustainable Development Journal of Environmental Management 32:195-209.
Singh, R. P. 1968. Geomorphology of the Shillong Plateau, Assam. 21st International Geological Congress. Pre Congress proceedings by Department of Geography, Gauhati University.
Singh, S. and Singh, M. C. 1997. Morphometric analysis of Kanhar river basin. National Geographical Journal of India 43: 31-43.
Singh ,V.S., Krishnan.V., Sarma, M.R.K., Gupta, C.P.and Dhar, R.L. 1997. Hydrogeology of limited aquifer in a granitic terrain. Environmental Geology 37 (1-2):90-95.
Singh, S. B., Gupta, D. P. and Lamichbane, M. 1998. Urban Environmental Problem and Planning: A Case of Garokhpur City. National Geographer 33:28-39.
Singh, R. R. and Vatsavia, R. R. 1999. Digital Mapping of Urban/Sub-Urban Environment of Debra Dun Using Spot Data, In: Remote Sensing of Urban Environment (Eds: Sokhi, B. S. and Rashid, S. M.). Manak Publication Pvt. Ltd., New Delhi. pp 123-136.
261
Singh, and Sangwan, 2001 Urbanization in Haryana: the Emerging Scenario. Geographical Review of India 63: 153-160.
Sinha-Roy., S. 2002. Hypsometry and Landform Evolution: A Case Study in the Banas Drainage Basin , Rajasthan, with Implications for AravaIli Uplift, Journal of Geological Society of India 60: 7-26.
Sinha, S. R. 1981. Alluvial fan model for the Himalayan Piedmont Deposits. Journal of Geological Society of India 22: 164 -174.
Smart, J. S. 1967. A comment on Horton's law of stream numbers. Water Resources Research 3: 773-776.
Smart, J .S. 1969. Topographical properties of channel networks. Geological Society of America Buletin 80: 1757-1774.
Smith, K. G. 1950. Standards for grading texture in Erosional Topography. American Journal of Science 248: 65-668.
Srinivasa, V. S., Govindainah, S. and Gowda, H. 2004. Morphometric analysis of subwatersheds in the pawagada area of tumkur district South India using remote sensing and GIS techniques. Journal of Indian Society of Remote Sensing 32: 351-362.
Srinivasa Rao, Y., Reddy, T. V. K., Nayudu, P. T. (1997) Groundwater quality in the Niva River basin, Chittoor district,Andhra Pradesh, India Environmental Geology 32: 56-63.
Srinivasa Vittala, S. Govindaiah, S and Honne Gowda, H .2004. Morphometric Analysis of Sub-watersheds in the Pavagada area of Tumkur District, South India Using Remote Sensing and GIS techniques. Journal of Indian Society of Remote Sensing 32(4): 351-362.
Srinivasa Vittala, S. Govindaiah, Sand Honne Gowda, H .2005. Evaluation of groundwater potential zones in the sub-watersheds of North Pennar river basin around Pavagada, Karnataka, India using Remote Sensing and GIS techniques. Journal of Indian Society of Remote Sensing 32(4): 483-491.
Srivastava, V. S. 1997. Study of drainage pattern of Jharia Coaldfield (Bihar), India, through Remote Sensing Technology. Journal of Indian Society of Remote sensing 25: 41-46.
Srivastava, P. K and Bhattacharya, A. K .2000. Delineation of Ground Water Potential Zones in a Hard Rock Terrain of Bargarh District, Orissa Using IRS Data. Journal of Indian SOCiety of Remote Sensing 28(2&3): 129-140.
Strahler, A. N. 1950. Equilibrium theory of erosional slopes approached by frequency distribution analysis. American Journal of Science 248: 673-696, 800-814.
Strahler, A. N. 1952. Dynamic Basis of Geomorphology. Geological Society of America Buletin 63: 923-938.
Strahler, A. N. 1954. Physical Geography. New York: Edward Arnold, pp 485.
Strahler, A. N. 1957. Quantitative Analysis of Watershed Geomorphology. Transactions -American Geophysical Union 38: 279-300.
262
Strahler, A. N. 1964. Quantitative Geomorphplogy of Drainage Basin and Channel Net works. In: Handbook of Applied Hydrology (Ed: Chow, V. T.).Hill Book, Company New Delhi. pp 439-476.
Strahler, A. N. 1968.Quantitative Geomorphology. In: The Encyclopedia of Geomorphology (Ed: Fairbridge, R. W.). Rienhold Book Corp, New York, pp 898-912.
Strahler, A. N. 1971. Physical Geography, John Wiley and Sons, New York. pp 487.
Subba, B. 2001. Himalayan waters. Panos Institute, Kathmandu.
Sustainable London Trust. 1996. Creating a sustainable London. London: The Trust.
Sllzen, M.L. and Toprak, V. 1998. Filtering of Satellite Images in Geological Lineament Analyses: An application to a Fault Zone in Central Turkey. International Journal of Remote Sensing 19(19): 1101-1114.
Talukdar, S. C. 1966. Systematic geological mapping of part of Shillong Plateau around Mawsynram in United Khasi and Jaintia Hills District, Assam. Unpublished Progress Report of Geological Survey of India.
Thakur, A. and Goswami, D. C. 1993. Urban sprawl and land suitability analysis: A case study of Guwahati city and its environs. In: Proceedings of the national symposium on remote sensing applications for resource management with special emphasis on North Eastern region. Organized by Indian Society of Remote Sensing and Assam Remote Sensing Application Centre (A.S.T.E. Council) Guwahati, Assam. November 25-27, pp 194-201.
Thornbury, W. D. 1973. Principal of Geomorphology. John Wiley and Sons Inc., New York. pp 171.
Tiwari, R. P., Lalnuntluanga, F. and Kachhara, R. P. 2001. Landslide hazard zonation along North Tawipui-Thingfal road section Lunglei District, Mizoram. National seminar on Geotechniques and Geological Hazards in the Indian Context, Geological Survey of India, North Eastern Region, Shillong. Pre-Seminar Volume. April 24-26. pp. 231-236.
Tiwari, A and Rai, B .1996. Hydrogeomorphological mapping for groundwater prospecting using Landsat MSS image- A case study of part of Dhanbad district. Journal of Indian Society of Remote Sensing 24(4): 281-285.
Tjallingii, S. P. 1995. In: Ecopolis: Stragtegies for ecologically Sound Urban Development (Ed: Tjallingii, S.P), Leiden. Baackhuys Publishers. pp 44-53.
Trivedi ,R.K., Singh, R.M.,and Tiwari, N.K. 2005. Hydrological studies of Ghoradongri watershed of Betul district, Madhya Pradesh. Journal of the Society of Remote sensing 33(3): 421-428.
Uttarwar, P.S. 1999. Aerial Photographs in Planning for Urban Extension. In: Remote Sensing of Urban Environment (Eds: Sokhi, B. S. and Rashid, S.M.). Manak Publication Pvt. Ltd., New Delhi. pp 257-274.
Vaid, J. K., Singh, R. and Sharma, V. K. 1998. History, Heritage and Geo-environment of Jammu district, Jammu and Kashmir. Souvenir, Geological Survey of India, north Eastern Region, On the occasion of sesquicentennial Celebrations and National
263
Symposium on Role of Earth Sciences in integrated Development and related Societal Issues. 2-4 November 2001. pp 47-52.
Van Westen, C.J., Rengers, N., Terlien, M.T.J. and Soeters, R.1997. Prediction of the occurrence of slope instability phenomena through GIS-based hazard zonation. Geological Rundsch 86: 404--414.
Varnes, D. J. 1984, Landslides hazard zonation: a review of principles and practice printed in France.
Vivekanand, T. E., Ashalatha, M. M., Porwal, M. C. and Kumar. S. and Roy, P.S. 1999. Environmental Analysis of Mohand sub-Watershed Through Universal Soil Loss Equation and Ste Suitability Analysis for Afforestation using GIS and Remote Sensing - An Integrated Approach. In: Geo Infor matics: Beyond 2000, An International conference on Geo informatics for Natural Resources Assessment, Monitoring and Management (Eds: Rao, D. P. P., Roy, S., Zirick, A., Zuidam, R. V., Fabbri., A., Jha, V. K. and Champatirai, K.K.). Indian Institute of Remote Sensing, Debra Dun. pp 127-131.
UN-Water. 2006. UN-Water thematic initiatives. Coping with water scarcity. A strategic issue and priority for system-wide action. International Decade for Action Water for Life 2005-2015. http://www .un.org/waterforlifedecade/
Wagner, W., Gawel, J., Furumai, H., DeSouza, M.P., Teixeira, D., Rios, L., Ohgaki, S., Zehnder, A. J. B. and Hermond, H. F. 2002. Sustainable Watershed Management: An international Multi-Watershed Case Study. Ambio 31: 1-13.
Wang, S. Q. and Unwin, D. J. 1992. Modelling landslide distribution on loess soils in China: an investigation. International Journal of Geographic Information Systems 6:391-405.
Wang, X. 2001. Integrating Water-Quality Management and Land-Use Planning in a Watershed Context. Journal of Environmental Management 61: 25 - 36.
Warren-Rhodes, K. and Koenig. A. 2001. Excalating Trends in the Urban Metabolism of Hong Kong: 1971-1997. Ambio 30: 429-438.
World Health Organization (WHO). 2003. The World Health Report: 2003. Shaping the future. WHO Library Cataloguing-in-Publication Data. World Health Organization. 1211 Geneva 27, Switzerland.
Wilburn, D.R. and Goonan, T.G. 1998. Aggregates from natural and recycled sources economic assessments for construction applications: a materials flow analysis. United States Geological Survey. Circular No. 1176. pp 36.
Wiligoose, G. R. and Hancock, G. 1998. Revisiting the hypsometric curve as an indicator form and process in transport-limited· catchment. Earth Surface Processes and Landforms 23: 611-623.
Wood, W. F. and Snell, J.B.1960. A quantitative system for classifying landforms. U. S. Army Quartermaster Research and Engineering Center. Technical report EP-124, NATICK, MA, USA.
Wolman, A. 1965. The metabolism of cities. Scientific American 213: 179-190.
264
Wu, W. and Sidle, R. C. 1995. A distributed slope stability model for steep forested basins. Water Resource Research 31: 2097-2110.
Wyatt, A. R. 1993. Continental size, eustacy, and sediment yield. Geological Rundsch 82: 185-188.
Zhang, Y., Yang, Z. F. and Yu, X. Y. 2006. Measurement and evaluation of interactions in complex urban ecosystem. Ecological Modelling 196: 77-89.
265
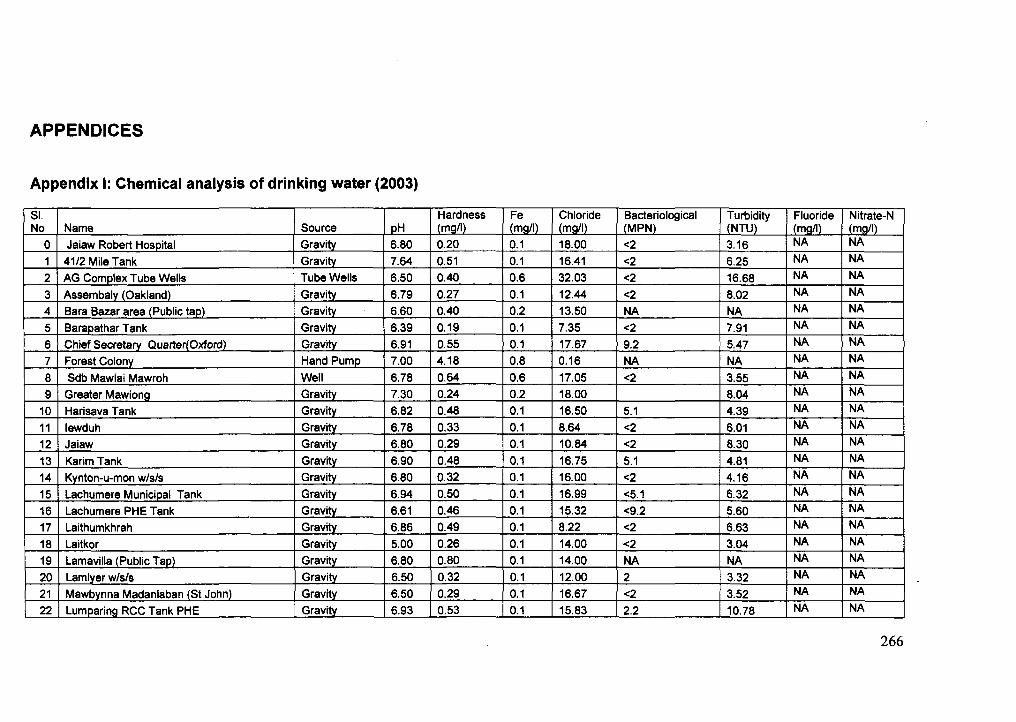
APPENDICES
Appendix I: Chemical analysis of drinking water (2003)
SI. Hardness Fe Chloride Bacteriological Turbidity Fluoride Nitrate-N No Name Source oH (mall) (mall) (mall) (MPN) (NTU) (mg/l) (mgtl)
0 Jaiaw Robert Hospital Gravitv 6.80 0.20 0.1 18.00 <2 3.16 NA NA
1 41/2 Mile Tank Gravitv 7.64 0.51 0.1 16.41 <2 6.25 NA NA
2 AG Complex Tube Wells Tube Wells 6.50 0.40 0.6 32.03 <2 16.68 NA NA
3 Assembaly (Oakland) Gravitv 6.79 0.27 0.1 12.44 <2 8.02 NA NA
4 Bara Bazar area (Public tap) Gravitv 6.60 0.40 0.2 13.50 NA NA NA NA
5 Barapathar Tank Gravity 6.39 0.19 0.1 7.35 <2 7.91 NA NA
6 Chief Secretary Quarter(Oxford) Gravitv 6.91 0.55 0.1 17.67 9.2 5.47 NA NA
7 Forest Colony Hand Pump 7.00 4.18 0.8 0.16 NA NA NA NA
8 Sdb Mawlai Mawroh Well 6.78 0.64 0.6 17.05 <2 3.55 NA NA
9 Greater Mawiong Gravity 7.30 0.24 0.2 18.00 8.04 NA NA
10 Harisava Tank Gravity 6.82 0.48 0.1 16.50 5.1 4.39 NA NA
11 lewduh Gravity 6.78 0.33 0.1 8.64 <2 6.01 NA NA
12 Jaiaw Gravity 6.80 0.29 0.1 10.84 <2 8.30 NA NA
13 Karim Tank Gravity 6.90 0.48 0.1 16.75 5.1 4.81 NA NA
14 Kynton-u-mon w/s/s Gravity 6.80 0.32 0.1 16.00 <2 4.16 NA NA
15 Lachumere Municipal Tank Gravity 6.94 0.50 0.1 16.99 <5.1 6.32 NA NA
16 Lachumere PHE Tank Gravity 6.61 0.46 0.1 15.32 <9.2 5.60 NA NA
17 Laithumkhrah Gravity 6.86 0.49 0.1 8.22 <2 6.63 NA NA
18 Laitkor Gravity 5.00 0.26 0.1 14.00 <2 3.04 NA NA
19 Lamavilla (Public Tap) Gravity 6.80 0.80 0.1 14.00 NA NA NA NA
20 Lamlyer w/s/s Gravity 6.50 0.32 0.1 12.00 2 3.32 NA NA
21 Mawbynna Madanlaban (St John) Gravitv 6.50 0.29 0.1 16.67 <2 3.52 NA NA I 22 Lumparing RCC Tank PHE Gravitv 6.93 0.53 0.1 15.83 2.2 10.78 NA NA J
266
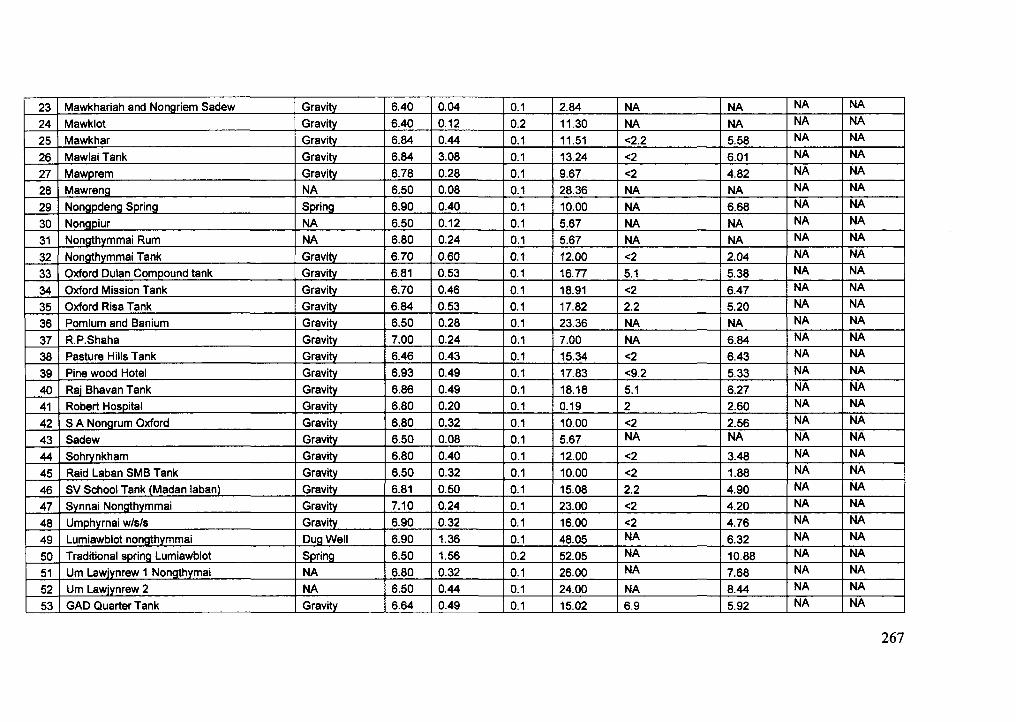
23 Mawkhariah and Nongriem Sadew Gravity 6.40 0.04 0.1 2.84 NA NA NA NA
24 Mawklot Gravity 6.40 0.12 0.2 11.30 NA NA NA NA
25 Mawkhar Gravity 6.84 0.44 0.1 11.51 <2.2 5.58 NA NA
26 Mawlai Tank Gravity 6.84 3.08 0.1 13.24 <2 6.01 NA NA
27 Mawprem Gravity 6.78 0.28 0.1 9.67 <2 4.82 NA NA
28 Mawreng NA 6.50 0.08 0.1 28.36 NA NA NA NA
29 Nongpdeng Spring Spring 6.90 0.40 0.1 10.00 NA 6.68 NA NA
30 Nongpiur NA 6.50 0.12 0.1 5.67 NA NA NA NA
31 Nongthymmai Rum NA 6.80 0.24 0.1 5.67 NA NA NA NA
32 Nongthymmai Tank Gravity 6.70 0.60 0.1 12.00 <2 2.04 NA NA
33 Oxford Dulan Compound tank Gravity 6.81 0.53 0.1 16.77 5.1 5.38 NA NA
34 Oxford Mission Tank Gravity 6.70 0.46 0.1 18.91 <2 6.47 NA NA
35 Oxford Risa Tank Gravity 6.84 0.53 0.1 17.82 2.2 5.20 NA NA
36 Pomlum and Banium Gravity 6.50 0.28 0.1 23.36 NA NA NA NA
37 R.P.Shaha Gravity 7.00 0.24 0.1 7.00 NA 6.84 NA NA
38 Pasture Hills Tank Gravity 6.46 0.43 0.1 15.34 <2 6.43 NA NA
39 Pine wood Hotel Gravity 6.93 0.49 0.1 17.83 <9.2 5.33 NA NA
40 Raj Bhavan Tank Gravity 6.86 0.49 0.1 18.18 5.1 6.27 NA NA
41 Robert Hospital Gravity 6.80 0.20 0.1 0.19 2 2.60 NA NA
42 S A Nonarum Oxford Gravity 6.80 0.32 0.1 10.00 <2 2.56 NA NA
43 Sadew Gravity 6.50 0.08 0.1 5.67 NA NA NA NA
44 Sohrvnkham Gravity 6.80 0.40 0.1 12.00 <2 3.48 NA NA
45 Raid Laban 5MB Tank Gravity 6.50 0.32 0.1 10.00 <2 1.88 NA NA
46 SV School Tank (Madan laban) Gravity 6.81 0.50 0.1 15.08 2.2 4.90 NA NA
47 Synnai NonQthvmmai Gravity 7.10 0.24 0.1 23.00 <2 4.20 NA NA
48 Umphvrnai w/s/s Gravity 6.90 0.32 0.1 16.00 <2 4.76 NA NA
49 Lumiawblot nonathvmmai DuaWell 6.90 1.36 0.1 48.05 NA 6.32 NA NA
50 Traditional sprina Lumiawblot Soring 6.50 1.56 0.2 52.05 NA 10.88 NA NA
51 Um Lawjvnrew 1 Nonathvmai NA 6.80 0.32 0.1 26.00 NA 7.68 NA NA
52 Um Lawjvnrew 2 NA 6.50 0.44 0.1 24.00 NA 8.44 NA NA
53 GAD QUl:irter Tank Gravity 6.64 0.49 0.1 15.02 6.9 5.92 NA NA -
267
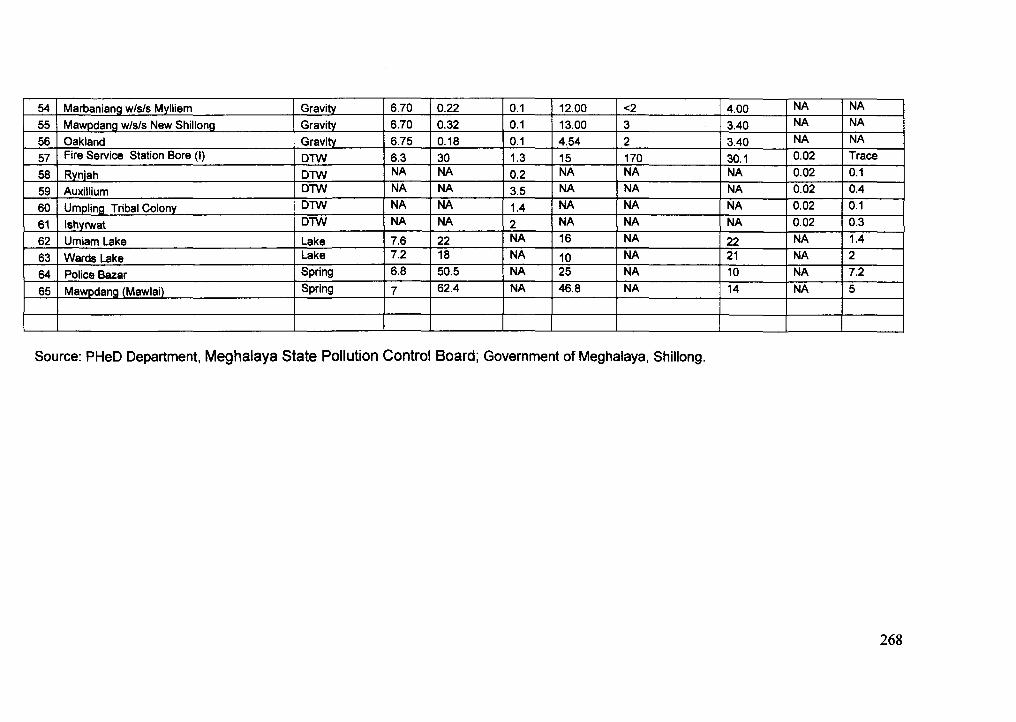
54 Marbaniang w/s/s Mylliem Gravity 6.70 0.22 0.1 12.00 <2 4.00 NA NA
55 Mawpdang w/s/s New Shillong Gravity 6.70 0.32 0.1 13.00 3 3.40 NA NA
56 Oakland Gravity 6.75 0.18 0.1 4.54 2 3.40 NA NA
57 Fire Service Station Bore (I) DTW 6.3 30 1.3 15 170 30.1 0.02 Trace
58 Rynjah DTW NA NA 0.2 NA NA NA 0.02 0.1
59 Auxillium DTW NA NA 3.5 NA NA NA 0.02 0.4
60 Umpling Tribal Colony DTW NA NA 1.4 NA NA NA 0.02 0.1
61 Ishyrwat DTW NA NA 2 NA NA NA 0.02 0.3
62 Umiam Lake Lake 7.6 22 NA 16 NA 22 NA 1.4
63 Wards Lake Lake 7.2 18 NA 10 NA 21 NA 2
64 Police Bazar Spring 6.8 50.5 NA 25 NA 10 NA 7.2
65 Mawpdang (Mawlai) Spring 7 62.4 NA 46.8 NA 14 NA 5 -------
Source: PHeD Department, Meghalaya State Pollution Control Board; Government of Meghalaya, Shillong.
268
CURRICULAM VITAE
1. Name:
2. Father's Name:
3. Date of Birth:
4. Nationality:
5. Sex:
7. Address:
8. Educational qualification:
9. Fellowship:
10. Present Position:
11. Areas of interest:
12. Software Proficiency:
Ms Van Jennifer Joan Wallang
Mr Vankorbar Kharkongor
31-05-1976
Indian
Female
Department of Geology St Anthony's College, Shillong-793001 Tel: 9436102094 (M) Email: [email protected]
B.Sc. (Geology); 1999, St Anthony's College, Shillong. M.Sc. (Geology); 2001, Gauhati University, Guwahati.
JRF, CSIR-UGC (NET); 2002.
Lecturer in Geology Department St Anthony's College, Shillong.
Environmental Geology, Geomorphology.
Remote Sensing, Data analysis and GIS softwares. Use of handheld GPS (Magellan and Garmin) for ground truth and mapping
- :.:. ',' .'~
--Van Jennifer Joan Wallang