geodynz-sud shipboard report: leg hikurangi, 1-18 november 1993, leg puysegur, 21 november-07...
TRANSCRIPT
TFL4VAUXETDOCUMENI’S
MICROFICHES
- .r’ .GEODYNZ-SUD ‘I ..- .&&&)ARD. REPORT
. I
Jean-Yves COLLOT
Leg Htirangi : l-18 November 1993 Leg Puysegur : 21 November - 07 December 1993
‘GEQDYNZ-SUD Shipboard Report
Scientific Team of the Hikurangi Leg Jean-Yves Collot”, Jean Delteil*‘g co-chief scientists, Keith Lewis*** New Zealand representative and Jean-Christophe Audru*:“, Phil Barnes***, Franck Chanier***“:k, Eric Chaumillon*****, Bryan Davy******, Serge Lallemand=, Geoffroy Lamarche*, 33emard Mercier de LtZpinay**, Alan Orpin-*, Bernard Pelletier’“, Marc Sosson*‘fi, Bertrand Toussaint”, Chris Urnski******.
Scientific Team of the Puysegur Leg Jean Delteil**, Jean-Yves Collot* co-chief scientists, Ray Wood ****** New Zealand representa- tive Rick Herzer******, and Sttphane Calmant”, David Christoffel--0, Mike Coffin*--*, Jaciy Ferri?xe ***+, Goeffroy Larnarche”, Jean FredCrique Lebrun*****, Alain Ma&ret*****, Bernard Pontoise*, Michel Popoff*:*, Etienne Ruellan**, Marc Sosson**, Ruppert Sutherland**.
*
**
***
***:g
*****
****ir**
.
. .
. . .
a...
..a..
ORSTOM Villefranche s/Mer, France and Noumta, New Caledonia University of Nice/CNRS, Sophia Antipolis, France MWA Weiiington, New Zealand University of Lillc, France University of Paris/CNRS, Villefranche skier, France IGNS, Wellington, New Zealand CNRS, Montpellier, France University of Otago, New Zealand Victoria University, New Zealand University of Texas, Institute for Geophysics, USA Itiniversity of Paris/ORSTOM Villefranche s/Mer, France
TDM I28 Editions de I’ORSTOM
L'INSTITUTFRANSAIS DE RECHERCHE SCIENTIFIQUE POURLEDiVELOPPEMENTENCOOP~RATION
Collection : Travaux et Documents Microi%liti%
PARIS 1994
ISBN: 2-7099-1230-9
0 ORSTOM
<<La loi du 11 mars 1957 n’autorisant, aux termes des ah&as 2 << et 3 de l’article 41, d’une part, que les <<copies ou reproductions <c strictement r&erwSes 6 I’usage priv6 du copiste et non des- << tinkes 5 une utilisation collective)> et, d’autre part, que les G analyses et les courtes citations dans un but d’exemple et <t d’illustration, cctoute repksentation ou reproduction integrale, << ou partielle, faite saris le consentement de l’auteur ou de ses << ayants droit ou ayants cause, est illicitea> (alineal er de l’article 40).
<< Cette rephentation ou reproduction, par quelque pro&de G que ce soit, constituerait done une contrefaGon sanctionnee par << les articles 425 et suivants du Code p6nal.a)

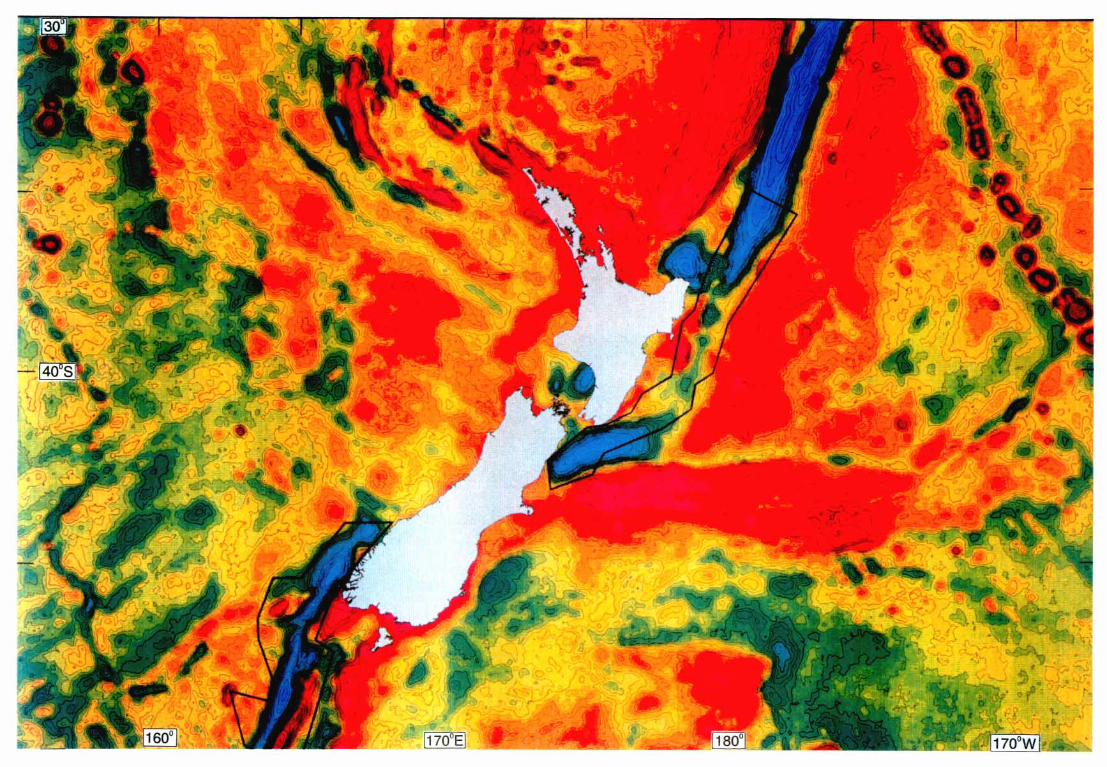
l6gende du frontispice du rapport
Free air gravity anomaly map of the New Zealand region derived from Geosat altimetric dafa (red : positive values, blue : negative values), with the location of areas surveyed during the Ge’odynz-sud geophysical
cruise.
Carte des anomalies gravime’friques de la rhgion de la Nouvelle Zklande, dgduites des don&es altime’triques Geosat (rouge : valeurs positives, bleu : valeurs nkgatives) avec localisation des zones de
lev& ghophysiques effectu& lors de la campagne GBodynz-sud.
SOMMAIRE . . _..
Foreword ___._..._.______.__._f........._._.._.._.-.......---....-......-.-.--.-....................-. P 5
Version Frangaise abrkgCe . ..___..........._._..-....... i . . ..-.-.......-.................... p 7 3 *
PART ONI& Introduction and Geodynamic Setting of NZ ..................................... p 19 Data acquisition and onboard data processing ................................... p 21 R.V. L’ Atalante integrated data collection system .............................. p 21 Real time data availability .................................................................. p 23 Onboard data processina b .................................................................... P 24
PART TWO The Hikurangi leg List of participants .............................................................................. p 27 Geodynamics and objectives of the Hikurangi Leg.. .......................... p 29 The Tonga-Kermadec-Hikurangi subduction system ......................... p 29 The modern Hikurangi accretionary wedge ....................................... p 30 Seabed sediments on the Hikurangi margin ....................................... p 3 I Objectives of the Hikurangi Leo b ........................................................ p 32 Data Analysis Transit between Auckland and the Kermadec box ............................. p 33 The Kerrnadec box .............................................................................. p 37 The Mahia box _ ................................................................................... p 44 Transit between Mahia and Kaikoura boxes ...................................... p 53 The Kaikoura box ............................................................................... p 57
PART THREE The puysegur leg List of participants .............................................................................. p 69 Geodynamics and objectives of the Puysegur Leo b ............................. P 71 The Southern Alpine Fault transpressional system.. ........................... p 7 I The Puysegur Trench and Bank. ......................................................... p 72 The Puysegur Trench-Macquarie Ridge system ................................. p 72 Cruise objectives. ................................................................................ p 73
3
Data Analysis ) _’ i . _.. Transit between Wellington and the Fiordland 30x . .._-.................--....... p 75 The Fiordland Box . . . . . . . . . . . . . .._........~.................. _ . . .._._.....................l......... p 75 The Snares Box . . . . . . . ..e..................e......m....eee..... * ..-......f...._....................... p 85
..The Puysegur. Box -.....--......_ * .-..-...__.’ . .._-..-._............................-......_......... p 92 . .
Bibliography . ..f . ..--._...-.-.........-................---..............*.....--....................... p 103
Figure captions . . . . . . . . . ..--..._.-....I . . . ..-..._....._.....-............-.-.....................-..... p 109 -
Appendix No1 Log 3ook of Geodynz-Sud Cruise
1
Appendix No2 Dual EM12 from SIMRAD
Appendix No3 Seismic reflection
Appendix No4 Gravity Meter
Appendix No5 Magnetometer
Appendix No6 Scientific Office Address List
FOREWORD -.
GEODYNZ is a French-New Zealand research program that was developed by the Institut de Geodynamique de Nice-Sophia Antipolis, the Laboratoire de Geodynamique Sous-Marine of Villefranche s/mer, the Institut Francais de Recherche Scientifique pour le Dtveloppement en Cooperation (ORSTOM), the Institute of Geological and Nuclear Scien- ces (IGNS) and the National Institute of Water and Atmospheric Research (NTWA) to investigate key segments of the modem and ancient plate boundaries around New Zealand. The concept of the program arose from discussions between Dr R. Herzer from IGNS while he was in a sabbatical year in France and various French scientists, including Dr J. Mascle, director of the Laboratoire de Geodynamique Sous-Marine of Villefranche s/mer and Pr. J.-F. Stephan, director of the Institut de Geodynamique de Nice-Sophia Antipolis. We would like to thank Dr R. Herzer, Dr. J. Mascle, Pr. J.F. Stkphan, Dr. J. Rtcy director of the ORSTOM group Marges Actives et Lithospere Octanique as well as Dr. I. Speden and Dr D. Ross of the IGNS and Dr R, Heath and M. Grant of the NIWA for promoting this project at all levels. We also thank INSU, ORSTOM, the Foundation for Research, Sciences & Technology of New Zealand, IGNS, NIWA, the Ministry of French Foreign Affairs and the French Embassy in New Zealand for funding and supporting this collaborative work, IFREMER for providing R/V 1 ‘Atalarzte ship time and equipment, and GENAVIR officers, technicians and crew. Finally we would like to thank Carolyn Hume for greatly improving.the quality of many of the diagrams in this report.
In 1993 the program included a 14-day seismic reflection cruise of the New Zealand- chartered Russian R/V Akademik M.A. Lavr-entyev and the 32-day swath mapping GEODYNZ-SUD cruise ofthe Institut Francais pourl’Exploitation de la Mer’s (IFREMER) R.V. L’Atalarzte .
5

. & :
, . .
I.? . .
I_ . .
- .
.
. . . ,
VERSION FRANSAtSE ABRfGriE DU RAPPORT DE CAMPiGNE GEODYNZ:SUD
*_
1; LE PROGRAMME GEODYNZ . .
GEODYNZ est un programme de recherche franco-ntozelandais developpe en collabo- ration entre 1’Institut de Gtodyndque de Nice-Sol&a Antipolis (IGSA), le Laboratoire de Gtodynamique Sous-Marine de Villefranche sur mer, 1’Institut Franqais de Recherche Scientifique pour le Dtveloppement en Cooperation (ORSTOM), 1’Institute of Geological and Nuclear Sciences (IGNS) et le National Institute of Water and,Atmosphere (NIWA) pour etudier la gtodynamique des marges de la Nouvelle-Zelande.
En 1993, deux campagnes de geophysique marine ont Cte realistes dans le cadre de ce programme : une campagne de 14 jours de sismique reflexion h bord du navire russe Akademik h4. A. Law-entyev affred par la Nouvelle-Zelande et la campagne GEODYNZ- SUD de 32 jours de cartographic multifaisceaux realisee h bord du navire de I’IFREMER L’Atalante .
Le concept de ce programme est nt en 1989 de discussions entre R. Herzer de I’lnstitute of Geological and Nuclear Sciences qui se trouvait en annte sabbatique en France et des scientifiques de 1’Institut de Geodynamique de Nice-Sophia Antipolis et du Laboratoire de Gtodynamique Sous-Marine de Villefranche s/ mer. Nous voulons particuli?rement remer- tier R. Herzer (IGNS), J. Mascle (CNRS), J. RCcy (ORSTOM), J.-F. Stephan (IGSA),ainsi que I. Speeden et D. Ross (IGNS) et R. Heath et M. Grant (NIWA) pour avoir aide h la promotion de ce projet B toutes ses &apes. Nous remercions aussi I’INSU, I’ORSTOM, et la Foundation for Research Sciences & Technology de Nouvelle-Zelande, 1’ IGNS, le NIWA, le Ministere Francais des Affaires krangeres et 1’Ambassade de erarice en Nouvelle-Zklande pour avoir finance ce programme ; I’IFREMER pour avoir fourni le N/O L’Atalante avec ses Cquipements, ainsi que les officiers, les techniciens et l’equipage de GENAVIR.
2 - CONTEXTE GtiODYNAMIQUE DE LA NOUVELLE-Zl?LANDE
La Nouvelle-Zelande est un site gtodynamique exceptionnel, reprkentatif des pheno- menes gtodynamiques actifs associes au passage d’une limite de plaques en convergence intra-odanique orthogonale puis oblique vers une zone de collision transpressive intra- continentale. Les iles Nord et Sud de la Nouvelle-Zelande sont les parties CmergCes d’un vaste domaine continental sous-mar-in recoup6 du Nord vers le Sud par la limite conver- gente entre les plaques Pacifique (PAC) h 1’Est et Australienne (AUS) a I’Ouest (Le Pichon etal., 1968 ; Walcott, 1978) (Fig. 1). Dans l’ile Sud, cette limite lithosphtrique est marquee par un dkcrochement dextre transpressif majeur, la Faille Alpine (Wellman, 1953 ; Berryman et al., 1992) (Fig. 2a) qui relie deux systemes de subduction ti vergence opposee (Johnson et Molnar, 1972 ; Hayes and Talwani, 1972). Au NE de la Nouvelle-Ztlande, la subduction orthogonale de Kermadec fait disparaitre la croiite oceanique cretacte de la plaque Pacifi-
7
. que et une partie du Plateau d’Hikurangi, de nature probablement oceanique, sous l’arc insulaire des Kermadec (Karig, .1970). Dans le prolongement Sud de la fosse de Kerma- dec, le Plateau d’Hikurangi, epais de lo-15 km (Davy, 1992 ; Davy and Wood, 1994), passe en subduction sous la marge continentale neo-zelandaise, le long de la zone de sub- duction d’)-Iikurangi (Cole et Lewis, 1981 ; Katz, 1982 ; Smith et al., 1989 ; Lewis et Pettinga, 1993) (Fig. 2b). Dans la region de Marlborough, le flanc nord de la Ride de Chatham portte par la plaque Pacifique entre en collision continentale avec la marge nord- est de l’i‘le Sud. Au Sud de la Nouvelle-Zelande, la subduction de Puysegur fait dispara&e vers 1’Est la croOte oceanique c&a&e de la mer de Tasman (Weissel et al., 1977) sous la marge continentale du Fiordland (Smith and Davey, 1984) et la create du coin septentrio- nal de 1’OcCan Indien, qui pourmit etre d’$ge Eocene B oligocene, commence B plonger sous le segment Nord de la Ride de Macquarie et le Bane de Puysegur (Christoffel et van der Linden, 1972).
L’originalite du dispositif geodjmamique permettant le passage d’une limite de plaques en convergence oblique depuis un domaine octanique vers un domaine continental puis odanique est renforcee par la connaissance des variations spatiales et temporelles des parametres cintmatiques du mouvement des plaques. Ces pammetres varient du Nord au Sud de la Nouvelle-Zelande (Fig. 1) (De Mets et al., 1990). D’une part, au Nord, la direc- tion de convergence des plaques est sub-orthogonale h la fosse de Kermadec et devient
\ tres oblique aux directions structurales au Sud, vers les latitudes des fosses d’Hikurangi et de Puysegur. D’autre part, le taux de convergence decroft de 6 a 3 cm/an entre les latitudes des fosses de Kermadec et de Puysegur. Les pammetres de la convergence ont aussi varit dans le temps, de facon significative depuis le Miocene (Walcott, 1978), contribuant ainsi au passage d’une hmite dtcrochante vers une limite en subduction. Considerant que I’orien- tation de la faille Alpine n’a pas sensiblement varie depuis 20 Ma, la migration vers le sud- est, puis vers le Sud, du pole de rotation entre plaques Pacifique et Australienne (Fig. 1) a entrain6 une augmentation de la composante convergente du mouvement au detriment de sa composante decrochante. Cette modification temporelle de la direction de convergence est particulierement sensible dans la region de Puysegur oti le mouvement decrochant il y a 20-25 Ma est aujourd’hui convergent oblique.
.
Les variations dans l’espace (zone de Kermadec-Hikurangi) et dans le temps (zone de Fiordland-Puysegur) des parametres de convergence ainsi que l’expression des deforrna- tions qui en resultent font de ces deux zones des exemples demonstratifs et compltmentai- res des processus de transition decrochement-subduction.
3 - LA CAMPAGNE GEODYNZ-SUD
La campagne GEODYNZ-SUD se rattache thematiquement a “l’ttude geodynamique des marges actives” et au sous-theme “frontiere coulissante et convergence oblique : tran- sition dans le temps et dans I’espace”. Cette campagne qui a eu lieu du ler Novembre au 7 Dtcembre 1993 ?I bord du NO L’Atafarzte avait pour objectif la cartographic bathymetrique dttaillte de plusieurs secteurs des marges actives de la Nouvelle-Zelande afin de recon- naitre les structures accompagnant le passage lateral d’une subduction intra-oceanique
8
orthogonale ou oblique a la transpression intra-continentale aux. extr&nit& de la Faille ._ Alpine. Le passage brutal sur 100-200 km, en domaine marin, du fort relief positif de la chame AIpine tdifite dans l”?le Sud, aux reliefs negatifs des fosses d’I!Iikurangi au Nord et de Puysegur au Sud, ainsi que l’importante sedimentation due B la proximite de ces reliefs en tours de surrection (10 mm/an ; 3ishop, 1985) et a l’action des glaciers rendent ces zones de transition decrochement-subduction extremement favorables B la visualisation des deformations par les methodes de la gtophysique marine disponibles sur le NO L’Ata- la&. Le Leg 1 de la campagne GEODYNZ-SLID ou Leg Hikurangi (Fig. 3) a ete consa- crC a l’acquisition de donnees geophysiques sur la zone de subduction de Kermadec- Hikurangi, le long des marges est et nord-est de la Nouvelle-Ztlande, oh la transition entre subduction orthogonale, subduction oblique et dtcrochement transpressif est fonction- nelle. Le Leg 2 ou Leg Puysegur (Fig. 3) a ettc focalise sur une image symetrique du systeme transpression-subduction le long de la marge sud-ouest de l’lle Sud de la Nou- velle-Zelande 06 la transition transpression & subduction oblique est en tours de dtvelop- pement.
4 - MOYENS TECHNIQUES DE LA CAMPAGNE GEODYNZ-SUD
Les moyens mis en oeuvre 5 bord de L’ Atalante comprenaient, deux recepteurs GPS pour la navigation, le sondeur multifaisceaux EMl2D de Simrad (Voir Annexe n”2), la sismique reflexion 6 traces avec deux canons Sodera GI de 75 ci chacun (voir Annexe n”3), un sondeur 3.5 Khz, un gravimetre 3odenseewerk et un magnetometre Barringer. Lors d’un passage du navire, le sondeur EM12D collecte des donnees acoustiques permet- tant d’obtenir simultantment Ia bathymttrie detailICe (Fig. 10a) et I’imagerie sonar (Fig. 1 la) le long d’une bande du fondmarin qui peut atteindre 20 km de large. Laprofon- deur d’eau est determinte avec une precision de 0.2% soit 10 m h 5000 m de fond.
5 - LE LEG HIKURANGI
Au tours du Leg Hikurangi, qui s’est dCroulC du 1 Novembre au 18 Novembre 1993 entre Auckland et Wellington, 3679 miles nautiques de donntes geophysiques ont ttC acquises le long de 55 profils couvrant une surface d’environ 86000 km 2.(Voir Annexe no-l)- Ce Leg a ttt? consacre h l’etude geophysique de la terminaison sud de la subduction de Kermadec et h son passage de plus en plus oblique vers le Sud h la zone transpressive intra-continentale de Marlborough. Entre les latitudes 35” et 42’S, la direc- tion du mouvement relatif de convergence des plaques varie de normal a la fosse de Ker- madec a oblique (20”) h la fosse d’Hikurangi et le taux de convergence diminue de B’cm/ an au Nord 2 3.9 cm/an au Sud. Les variations latitudinales des parametres cindmatiques, des structures de la plaque plongeante ainsi que des apports sedimentaires ont contribue h segmenter la marge d’Hikurangi en trois domaines structuraux et stdimentaires : le do- maine nord (37’45-39’15s) est ttroit (70 km) et en erosion ; le domaine central (39” 15-4 1’45s) est large (130 km) et comprend le prisme d’accrgtion d’ Hikurangi ; et le
9
domaine Sud (41”4542”3OS) qui est Ctroit (60 km) et structuralement peu developpe . . (Fig. 7 ; Lewis et Pettinga, 1993). Deux zones cl&, de transitions structurale entre ces domaines de la marge Hikurangi, les secteurs Kaikoura au Sud et Mahia au Nord, ainsi que le secteur Kermadec plus au Nord ont ete cartographies lors de ce Leg (Fig. 8).
.I ’ ,_ .; :‘. ., -5 . . . L a A Principau objectifs du Leg Hikurangi :
Secteur Kermadec :~reconnaissance des structures associees a la subduction du Plateau d’Hikurangi et a la transition entre la subduction intra-octanique orthbgonale de Kerma- dec et la subduction legerement oblique et sous-continentale de la marge d’Hikurangi.
Secteur Mahia : reconnaissance des structures associees a un secteur etroit et morpho- logiquement raide et complexe de la marge d’Hikumngi et etude du passage de ces struc- tures vers fe prisme d’accretion d’Hikurangi bien developpt au Sud de ce sec’teur.
Secteur Kaikouba : reconnaissance des structures assocites au passage de la subduction sous-continentale oblique en regime d’accretion tectonique & la collision transpression intra-continentale.
b - R&ultats de la campagne Transit entre Auckland et le secteur Kemadec
Lors du transit entre Auckland et le secteur Kermadec un profil a CtC realise par le travers de la Baie de Plenty le long de la zone de transition entre la croiite continentale de Nouvelle-ZClande au sud et la croQte oceanique du fosst du Havre qui s’ouvre au nord perpendiculairement a la direction du profil et parallelement au trace hypothetique de la Zone de Fracture de Veining Meinesz (Fig. 9). Sur lapartie Ouest du profil, un petit volcan a ttC reconnu dans le fosst d’Alderman ; de par sa position, ce volcan pourrait etre simi- laire au volcan arriere-arc de I’?le de Mayor qui perce la marge continentale de l’ile Nord. La par-tie centrale de ce profil montre un edifice volcanique complexe mis en place dans la zone de rift volcanique entre le bassin de Ngatoro et le fosse de White.lsland (Fig. 1Oa). Le long du secteur Est de ce profil, les sediments de la marge neo-zelandaise sont plissts et localement bascults. Cette deformation pourrait resulter des stades initiaux de la subduction du plateau d’Hikurangi. Les donntes de sismique reflexion suggerent l’existence d’un decrochement qui pour-ran rep&enter le prolongement septentrionale d’un des decrochements majeurs connus 5 terre. Sur la par-tie est du profil, les don&es d’imagerie acoustique (Fig. 11 b) indiquent la presence de blocs epars suggerant des ava- lanches sous-marines provenant des pentes fortes de la.marge nord de 1’East Cape. Le secteur Kermadec
Douze profils ont permis de couvrir une surface approximative de 48.000 km2 dans le secteur Kermadec (Fi g. 16 et 17). Ces profils ont permis de reconnaitre les structures :
l- de la plaque plongeante incluant la bordure nord du Plateau d’Hikurangi et la plaine abyssale de 1’OcCan Pacifique,
2- de la fosse de Kermadec et de sa transition vers la fosse d’Hikurangi, 3- du sommet et de la pente avant-arc de la region de la ride d’East Cape et de Kerma-
dec. Les structures geologiques et anomalies geophysiques carttes le long de la terminaison
10
: : sud de l’avant arc de Kermadec indiquent que la subduction du plateau d’Hiknrangi induit . une deformation de l’avant-arc par extension, generalement caracterisee par des failles normales et des glissements sous-marins (Fi,. 0 19). Les don&es d’imagerie (Fig- 20) et de sismique~reflexion montrent que, dans ce secteur, le fond marin est en g&n%l peu reflectif et couvert de sediment. ‘.
-.Dans la partie nord du secteur de Kermadec, l’escarpement de Rapuhia, haut de )’ 1500 m; marque la limite septentrionale du Plateau d’flikurangi (Fig. 18). Cet escarpe-
ment semble se prolonger, sur environ 50 km sous la region avant-arc, con-me en temoi- gne l’anomalie maguttique associee a cet escarpement (Fig. 27). Les pammetres cinema- tiques de la convergence ainsi que la direction de l’escarpement de Rapuhia extrapolee .sous l’avant-arc suggerent que le Plateau d’Hikurangi a balaye la fosse de Kermadec du Nord vers le Sud. Ce balayage produit un effondrement du pied de pente de l’avant-arc qui se traduit par un retrait de la fosse et du front de deformation vers l’arc d’environ 15 km. Au Sud de la jonction entre l’escarpement de Rapuhia et la fosse de Kermadec, la subduc- tion du Plateau d’Hikurangi provoque une surrection de I’avant-arc et de la fosse d’envi- ron 1500 m. La fIexure du plateau induite par la subduction provoque l’apparition, sur sa bordure occidentale, de failles normales dtlimitant des fossts en-&helon, vides de stdi- ment, dont l’alignement constitue la fosse sud de Kermadec (Fig. 19).
La region avant-arc est deformte par un reseau de failles normales h regard oriental et orienttes N10&8”E et N30+5”E selon des directions similaires h celles des failles, a regard occidental, reconnues sur la bordure ouest du Plateau d’Hikurangi. Cette similarite sug- g&e qu’une partie au moins de la dtfo.rmation en extension de l’avant-arc est contr61Ce par la deformation verticale de la partie du plateau d’Hikurangi enfouie sous l’avant-arc. Dans la moitie sud du secteur Kermadec, des lintaments morphologiques et des escarpe- ments orient& N30-45”E, leg&ement oblique ?I lapente, semblent dtfinir un dispositif en queue de cheval divergent vers le Nord. Ce reseau suggere qu’une tectonique d&rochante contribue, ou a contribut, ti la deformation de la pente de I’arc. En has de pente, de petites rides arquees, de faible amplitude, localisees le long de”certains segments du front de deformation, pourraient indiquer la reprise en compression de sediment effondre de la marge.
Dans la region sud du secteur Kermadec, un important rentrant morphologique sub- circulaire entaille profonddment la pente avant-arc (Fig. 18). Ce rentrant, dClimitt par des escarpements assez raides, presente en son sein une strie de monts sous-marin de taille modeste, localement align& N175”E. Les monts sous-mar-ins sont partiellement ennoyts sous une Cpaisse strie stdimentaire turbiditique remplissant le fosst d’Hikurangi. La mor- ,phologie compliqute de la partie occidentale du fond du rentrant suggere des depots avalancheux traduisant un effondrement de la marge. Ce rentrant est interpret6 comme une emprunte laisste sur l’avant-arc par la collision puis la subduction d’un massif volca- nique dont certains tlements, rep&& par leur signature magnttique (Fig. 27), pourraient etre enfouis sous la pente avant-arc non effondree. L.e secteur de Mahia
Onze profils ont permis de couvrir une surface approximative de 15.000 km 2 dans le secteur Mahia (Fi g. 28 et 29). Ces profils ont permis de reconnaTtre quatre domaines struc-
11
- turaux de la zone de subduction (Fig. 30) : l- sur la plaque plongeante, le secteur du .._ . Plateau d’Hikurangi montrant des monts sous-marins volcaniques (Gisborne et Mahia) et
: I une portion du chenal d’Hikurangi, 2- sur la marge, le rentrant morphologique irregulier ‘- de la Poverty Seavalley, 3- la forte pente continentale reguliere au nord de Poverty Seavalley,
4- les forts reliefs et les rides de la marge au sud de la Poverty Seavalley. -. - I ::Sur la plaque plongeante, le Plateau et la fosse d’Hikurangi sont couverts par 1.5 s TD
1 -de sediments turbiditiques per& par des monts sous-mar-ins. Ces monts de forme rhom- , bdide sont lirnites par des directions structurales N15&5”E et N155~!110”E. 11s presentent un toit plat couvert de sediments peu reflectifs en imagerie (Fig. 32) et sont localement surmontes par de petits cones volcaniques (Fig. 31). Le canyon de Poverty qui incise profondtment la marge, a traverse la fosse d’Hikurangi et est passe entre les monts Mahia et Gisborne au cows de son histoire. Aujourd’hui, ce canyon n’est plus actif sur laplaine abyssal ; son lit est comb16 par des sediments transport& et deposes par le chenal d’Hikurangi (Fig. 35).
Les don&es morpho-structurales indiquent que la pente suptrieure de la marge d’Hikurangi est massive et sismiquement opaque B l’exception de la Poverty Seavalley qui forme un rentrant morphologique dans lequel un bassin sedimentaire de pente s’est developpe. La partie mtridionale de cette pente suptrieure est fortement dtformee par un reseau d’accidents lineaires, sub-paralleles entre eux et obliques a la marge, suggtrant des decrochements (Fig. 31). La partie inferieure de la marge est formte par une ceinture Ctroite de rides anticlinales et chevauchements 2 vergence est, separes par des petits bas- sins de pente. Cette ceinture est structuralement similaire au prisme d’accretion d’Hikurangi qui s’etend au sud de la zone Ctudiee. La ceinture qui dispara?t au Nord de 39’S est inter- prede comme une jeune prisme d’accr&ion constitue d’tcailles sedimentaires imbriqutes. La rupture entre pentes superieure et inf&ieure est marquee par une limite tectonique geographique sinueuse. Au nord de la terminaison de la ceinture imbriquee, la pente infe- rieure est affect&e de facon croissante par des glissements et effondrements sous-mar-ins suggerant de l’trosion tectonique frontale. Dans ce secteui, le contact de cette pente avec
I la plaine abyssale est franc et ne presente pas d’indice de deformation compressive ou decrochante (Fig. 33). Le rentrant morphologique de Poverty Seavalley ressemble 5 une cicatrice laissee dans la marge par la subduction d’un mont sous-mar-in. Ce rentrant, dont les flancs sont emousses, contient au moins 1500 m de sediment, suggtrant que la cica- trite est ancienne et qu’elle s’est form&e avant la naissance de la ceinture imbriquee carto- graphite en bas de pente. Transit entre les boites Mahia et Kaikoura
Lors du transit entre les boites Mahia et Kaikoura, un profil multifaisceaux (Fig. 38) transverse ?I la marge et recoupant le prisme d’accretion d’Hikurangi dans sa plus grande Iargeur a permis de determiner les directions structurales des bassins et des axes de plis prealablement reconnus par la sismique reflexion multitrace du S.P. Lee (Davey et al. 1986). Les rides anticlinales sont orientees N22-N40” et montrent localement des termi- naisons periclinales. Le front de deformation a une orientation locale N05” (Fig. 39 et40). Le secteur Kaikoura
Les donnies acquises dans le secteur Kaikoura (Fig. 45) ont permis de reconnaitre la
12
. . . . terminaisofi Sud de la subduction d’ Hikurangi et son passage au systeme transpressif intra- continental de la marge nord-est de l’ile Sud. Dans ce secteur la vitesse de convergence des plaques est d’ention 39 mm/an suivant la direction N79’, tr?s oblique au front de deformation. 28 profils couvrant une surface approximative de 22500 km2 ont et6 effec- tuCs (Fig. 46). Qnatre domaines structuraux de la marge ont 6ttC reconnus (Fig. 47 et 48) : (1) la plaque plongeaite avec le chenal d’Hikurangi et le flanc Nord de la Ride de Cha- tham, (2) la terminaison sud du prisme d’accr&ion d’Hikurangi, (3) la marge continentale de l’ile Nord ; (4) la marge nord-est du plateau continental de l’ile Sud (r&ion de Marlbo- rough).
D&s la n&ion nord-est du secteur Kaikoura, la marge continentale est marquee par une rupture de pente sCparant la pente suptrieure B fort relief de la pente inf&ieure B faible relief et qui constitue le coin sud-ouest du prisme d’accrtition. Ce coin comprends deux Ccailles tectoniques majeures, imbriqu&es, formtes de turbidites initialement dtpostes dans la fosse d’Hikurangi (Fig. 48 et 50). Ces deux Ccailles (I’tcaille frontale et I’Ccaille mediane) sont dispos&es en relais dextre de telle faGon que le front de deformation est discontinu et que la largeur du prisme d’accrktion dtcroit vers le Sud ; ce prisme disparait vers 175” 14’E. Ces deux Ccailles sont constituCes d’anticlinaux dCformCs, disposts en echelon sknestre. Environ 30 km en amont du front de dgformation du prisme, un lin&ment morphologique parall~le B ce front longe la rupture de pente de la marge ; la morphologie associCe A ce linkament sugg&re un accident majeur decrochant dextre qui marque la li- mite entre marge continentale dtformCe A l’ouest et prisme d’accretion recent h l’est .
Dans Ia region sud-ouest du secteur Kaikoura, les donntes de bathym&ie et de sismi- que reflexion indiquent que la marge continentale est dtformCe par des chevauchements, des plis et des dCcrochements. Le dtcrochement dextre majeur ainsi que d’autres lintaments reconnus dans la region nord-est convergent en direction du sud-ouest, recoupant le ca- nyon du Detroit de Cook, pour former un dispositif en queue de cheval qui vient fusionner avec le front de dkformation au pied de la marge de Marlborough (Fig. 48). Le long de la partie supCrieure de cette marge, un linCament morphologique parallHe & cette marge est associC B un bassin de pente et h des anticlinaux allong& para1lGAement j la marge. Cette association suggere l’existence d’un decrochement. La terminaison Sud de cet accident ainsi que celle du front de d$fomlation sont oblittrees par l’empreinte morphologique d’un reseau de canyons Tecoupant la pente dans la rtigion de Kaikoura. ‘,
En conclusion les moitiCs nord-est et sud-ouest du secteur Kaikoura presentent des rkgimes tectoniques diff&ents. Dans la moitit nord-est, les structures CartographiCes sug- g&ent un partitionnement de la dkformation. La composante compressive du mouvement de convergence oblique est absorbCe en bas de pente par les stries imbriquCes du prisme d’accr&ion. La composante dtcrochante de la convergence est accommodte Q mi-pente tt en haut de pente par les roches “continentales” de la marge, le long d’accidents dtcrochants. L’accident dtcrochant situ6 le plus b,as sur lapente marque la limite entre marge continen- tale “ancienne” h I’Ouest et prisme d’accrt%ion “R&ent” h 1’Est. Par opposition, dans la moitie sud-ouest du secteur Kaikoura, le long de la zone de collision intra-continentale, les dkformations compressive et dkcrochante semblent &tre accommodtes le long des m&me failles, suggtrant une deformation transpressive des roches de la marge continentale.
13
6-LELEGPUYSEGUR .
Le second leg de la campagne GCodynz-sud s’est deroule du 21 Novembre au 7 Decembre 1993 avec depart et retour 2 Wellington (Fig. 61), 3442 miles nautiques de
I donnees geophysiques ont ettc recueillis le long de 42 profiles (voir Annexe n”l). Cepen- dant les conditions de navigation n’ont pas permis de collecter la totalite des donnees, en
,; ,particulier.le long des profils de transit entre Wellington et la zone d’etude (profils 56 a 60 lors de l’acces a la zone et profils 90 B 98 lors du retour de zone). Malgre des conditions climatiques parfois dtfavorables l’acquisition de l’ensemble des don&es a cependant pu he r&.lisCe sur la zone.
Ce leg emit dCdiC a l’ttude geophysique de la transition entre le dtbouche en mer de la Faille Alpine a son exir&nitC mtridionale et la zone de subduction t&s oblique de Puysegur vers le Sud (Fig. 56). Dans cette zone, entre la latitude du Milford Sound ou ia Faille Alpine passe en mer a 44’30’s et la latitude 49”4O’S atteinte par le profil le plus mtridio- nal, la front&e entre les plaques australienne et pacifique change de direction (Fig. 1 et 2). L’obliquite du vecteur de convergence qui en resulte, varie en meme temps que le taux de convergence continue de dtcroitre en direction du Sud. Ces modifications des parame- tres cinematiques concement des plaques dont la nature et la structure changent le long de leur front&e. Au Sud-est la plaque pacifique est de nature continentale jusqu’au sud du bane de Puysegur (Fi g. 56) , elle est oceanique plus au Sud. Au Nord-Guest la plaque australienne est representee par l’extremite orientale du bassin octanique cr&acC de la mer de Tasman, qui s’interrompt vers le sud centre le systeme de rides de Resolution a la latitude 45’50’5. Au dela, au sud de ces rides, la plaque australienne est constituee par un coin de croQte oceanique appartenant h l’octan indien plus jeune que la crofite de la mer de Tasman. Ces deux domaines ont des grains structuraux tres differents (Fig. 1). Les changements crustaux et cinkmatiques qui interviennent dans la zone permettent de dis- tinguer trois secteurs structuraux et sediment&e& l/Au nord (44”s - 47,“1O’S), dans le secteur de Fiordland, les trois domaines de la plaque
australienne (Bassin de Tasman, Ride de Resolution et plancher oceanique indien) pas- sent en subduction sous la plaque pacifique homogene et de nature continentale
. 2/ Au centre (47.‘SlO’S, - 48”2O’S), dans le secteur de Snares, la plaque plongeante cons- titute uniquement de croGte oceanique indienne est subductee sous un domaine httero- gene de la plaque pacifique. C’est en effet dans ce secteur que s’effectue, dans la plaque suptrieure, la transition entre croiite continentale au Nord et crorXe oceanique au Sud.
31 Au Sud, dans le secteur de Puysegur, la subduction oblique plus lente et plus recente s’effectue en domaine octanique, sous la ride de Macquarie ;
a- Principaux objectifs du Leg Puysegur Secteur Fiordiand : les modalites morphostructurales du passage du systeme transpressif
de la Faille Alpine a la subduction marginale reconnue sous le bloc continental du Fiordland, l’influence de I’an-ivee dans la zone de subduction du systeme de rides de Resolution portt par la plaque plongeante.
Secteur de Snares : l’identification du type de front&e convergente et de la repartition de la deformation a la transition continent - ocean sur la plaque superieure.
14
. . . Secteur de Puysegur : l’analyse du passage structural de la fosse de Puysegur au sys- ’ teme de Macquarie ou l’inversion de subduction en contexte de convergence tres oblique
est attendue, l’influence du grain structural de la plaque plongeante sur une subduction naissante. .1 ^
b-: Rhdtats de la campagde 1 Le secteur Fiordland I .’
Neuf profils ont ettdrealists dans cette zone (Fig.62), la localisation de’s deux profils les plus occidentaux, loin B 1’Est au dessus de la plaine abyssale de la mer de Tasman, est due a des conditions meteorologiques defavorables. Les sept autres profils ont permis de re- connaitre les structures : I- de la marge continentale de 1’Ile du Sud (Fiordland et bane de Puysegur), 2- du pied de la marge m&-idionale du Plateau de Challenger, 3- de la plaque plongeante represende du Nord au Sud par la ride de &well, le bassin de la mer de Tasman, la ride principale de Resolution, 4- des bassins et fosse qui jalonnent la front&e de plaques, soit du Nord au Sud, un bassin situe 5 44”25’S qui fait par-tie du canyon de Haast, le bassin du Fiordland et l’extremite septentrionale de la fosse de Puysegur (Fig. 63).
Les donnees recueillies montrent que la subduction se manifeste des I’extreme Nord- Est du secteur : a la latitude d’un bassin septentrional, site plus haut, qui fait par-tie du canyon de Haast, c’est a dire au nord du debouche en mer de la Faille Alpine. Le bassin precedent et celui, plus meridional, du Fiordland representent les temoins septentrionaux extremes d’une fosse de subduction qui s’approfondit (de 3600 Z?I 4000 m) et s’tlargit (de 8 a 22 km) vers le Sud. Cette fosse est remplie de sediments r¢s issus de l’erosion des Alpes neo-zelandaises et des rehefs du Fiordland. Le remplissage de la fosse est de- forme au voisinage des latitudes 44’45’s et 415~30 sous forme de deux lobes de sediment recent plisse et imbrique. Ces lobes, seuls temoins d’accretion stdimentaire dans la zone du leg sont responsables de la discontinuite longitudinale de la fosse qu’ils obstruent plus ou moins completement.
Au Nord-Ouest la plaque plongeante Porte la ride de Caswell dont Ie sommet plat ne s’tieve qu’a 700 m au dessus des bassins’qui l’entourent. La couverture sedimentaire de cette ride atteind 1 h 2 s td et pr&ente la m&me signature sismique que celle du’plateau de Challenger au Nord. Le flanc nord-ouest de la ride est entaillt par une strie d’escarpe- ments en feston alors que son flanc sud-est est coupe par des failles normales orientees au Nord et au Nord-Est et faisant face ii 1’Est et au Sud-Est. Ces memes failles se prolongent vers le Sud-Ouest au dela de l’extremite de la ride de Caswell ou elles recoupent les sediments recents du bassin du Fiordland ainsi que Z’extremite septentrionale de la ride de Resolution. Les failles normales accompagnent clairement la flexuration de la plaque aus- tralienne en direction de la zone de subduction- La ride de Resolution, qui ferme le bassin de Fiordland au Sud, est orientte N50”E. Elle comporte une Cpaisseur irreguliere de sedi- ment et n’est marquee par aucune anomalie magnetique, elle se presente comme un relief tlevt (2000 m au dessus des bassins environnants) aux flancs abrupts, ennoyts dans les sediments rtcents. La ride cartographiee au COUTS de la campagne est en fait la plus orien- tale et la plus importante d’un systeme de rides dispodes en echelon droit. Cette ride
15
. presente une surface relativement plane inclinee au Nord-Est et decoupee au Sud-Est par deux escarpements majeurs de failles orient& B N65k3”E. Ces escarpements sont anciens, probablement synchrones de la mise en place du systeme de rides de Resolution, dans la mesure oti ils sont paralleles a l’axe de la ride, ennoyes dans les sediments et recoup& par les failles normales actuelles accompagnant la flexuration de la plaque subductee.
*La marge continentale du Fiordland peut &.re subdivisee du Nord au Sud en trois do- maines morphostructuraux. Au nord de la jonction de la ride de Resolution avec la marge, l’ensemble de la pente continentale est dkoupee obliquement en Ian&es longitudinales par cinq escarpements de faille. Ces escarpements convergent vers le Nord-Est parallele- ment a la direction de la Faille Alpine. Les traces.des failles correspondant aux escarpe- ments sont recouptes ou empruntes par un reseau plus tardif de canyons particulierement dense,au Nord. Les t&es de canyons ne correspondent cependant pas ,aux fjiords qui de- coupent la c&e de l’extreme sud-ouest de 1’Ile du Sud. Au centre du secteur de Fiordland, la pente continentale est caracterisee par un soulevement et une deformation (ride et escar- pement) qui accompagnent I’entree de la ride de Resolution dans la zone de subduction. Faisant suite vers le Sud a cette partie soulevee et deformee de la marge, la partie infe- rieure du mm inteme de la fosse de Puysegur presente une pente faible, essentiellement marquee sur 70 km de long par une large depression. La surface de cette depression pos- s&de une topographie irreguliere et est limitee a 1’Est au dessus de 3000 m de fond par une pente plus forte dessinant un vaste cirque a concavite toumee vers I’Ouest. Ce dispositif semble du a l’effondrement de la marge, qui lui meme, est vraisemblablement consecutif au balayage de la marge par un relief appartenant au systeme de rides de Puysegur. Au sud de la large depression preddente, le domaine meridional de la marge presente B I’inverse une pente plus accentuee dans sa partie inferieure. Le pied de la pente infkieure est de- coupe par une strie de terrasses concaves qui representent probablement les surfaces su- pkieures d’autant de blocs bascules et effondres vers la fosse de Puysegur. Le secteur Snares ?_
Les lignes ont tte orienttes orthogonalement a la frontiere de plaque, de facon a obtenir de meilleures donnees sismiques (Fig. 74). Cependant, en fonction de conditions mttdoro- logiques defavorables (Fig. 75), la couverture du secteur a titt realiste en deux etapes de quatres profils chacune (67 h 70 puis 79 a 82). Dans le secteur Snares qui est situt au Sud du site oti la ride de Resolution est en contact avec la marge meridionale de I’lle du Sud, l’alimentation en sediment en provenance de la c&e ouest de cette ile est en grande pat-tie bloqute. La structure odanique de la croGte Co-oligodne de la plaque plongearite est ainsi de plus en plus apparente au Sud. .
La plaque australienne, qui repose par 4500 m de fond, montre un grain structural souligne par des cretes dominant le fond de 200 a 650 m (Fig.76). Ce grain, orient& N60&2”E, est recoup6 au Nord-Est par un escarpement orient6 N155 - 170”E qui a probablement valeur d’ancienne zone de fracture. Vers l’Est, B proximite de la fosse, les deux directions prectdentes sont reactivees et associees a une troisieme qui est parallele g la fosse, sous forme d’escarpements de failles normales actives a regard est. Ces failles accompagent la courbure de la plaque australienne vers la fosse de subduction qui atteind 5500 m au Nord et s’approfondit jusqu’a 6000 m au Sud.
16
j La fosse dont la largeur se ret&it de 10 km a 3lu-n du Nord vers le Sud ne contient que . moins d’ 1 s td de sediment. Elle subit, suivant la m&me direction nord-sud, une legere modification d’orientation : de N20” a NIO’E. Cette modification se produit precisement a la latitude 05 s’effectue, dans la plaque superieure, le changement entre la crofite conti- nentale du bane de Puysegur et la croQte octanique de la ride de Macquarie. -.
. Le bard de la plaque superieure presente une morphologie accidentee. Au Sud : a 47’42’S, le pied du mur inteme de la fosse est fortement pent6 est decoupt par des blocs effondres. La partie occidentale de la ride de Macquarie est composee d’un plateau irregu- her a 2000 m de profondeur dont la surface est parsemee de cones aux sommets digus ou tronques rappelant fortement des edifices volcaniques. Ce plateau est limit6 a 1’Est par un escarpement convexe vers 1’Est de 1500 m de haut. La partie orientale de la ride de Macquarie est constituee d’une serie de rides et de fesses dont l’orientation g&&ale est.’ N25”E et dont les surfaces sont aplanies alors que les flancs sont t&s pent&. (38”). Au Nord : a 47’24’s la partie inferieure du mur inteme de la fosse est intensement affectee par des effondrements de blocs. Vers I’Est, le reste de la zone limite de plaque pr&ente une morpho-structure complexe d’escarpements, de rides et de bassins qui dessinent en plan un &entail ouvert vers le Nord. La branche occidentale de ce dispositif en &entail comcide avec l’extremid nord de l’escarpement de 1500 m prtcedemment d&-it sur le- quel elle se moule. La branche orientale de l’eventail qui est orientee N20”E semble mar- quer une hmite d&rochante majeure en ptiiculier avec le bassin de Solander, largement pourvu en sediment, situe a 1’Est. L-e secteur Puysegur
Six lignes transversales a la front&e ont tte acquises (71 h 76) auxquelles une ligne longitudinale (77) a permis de completer la couverture du secteur a l’aplomb d’une partie des hauts fonds de la ride de Macquarie. Une ligne (78) ainsi que la partie meridionale d’une autre (70) ont permis de correler Ies structures de ce secteur avec celles du prtce- dent secteur de Snares (Fig. 86). Contrairement a ce qui est indiqut sur la carte bathymetrique au l/l 000 0000 disponible aucune remonde rapide de la fosse de Puysegur vers le sud n’a CtC observte (Fig. 87) ; aucun indice de renversement de subduction n’a ttC decele.
,,
La plaque plongeante australienne montre d’une part de forts reliefs (1250 m)‘aux formes irreguli&es dont la forte reflectivite (Fig.88) suggi?re une origine volcanique, et d’autre part deux ,orains structuraux t&s bien exprimes. L’un est essentiellement repre- sente par une une ride de 800 m de haut et de 100 km de long. Cette ride est orientee N30”E au Sud est change progressivement d’orientation vers le Nord pour atteindre une direction N20”E. L’autre grain structural, soulignt.par une succession reguliere de rides, est globalement orthogonal au premier et oriente N120”E au Sud-Est, il change progressi- vement d’orientation vers le Nord-Ouest du secteur oB il est orient6 N85”E. Les extremi- tes des rides de directions N120”E sont courbees vers le Sud lorsqu’elles rencontrent la ride qui materialise le premier grain structural. Ceci donne a penser qu’il y a eu deforma- tion ductile et association genttique entre les deux grains structuraux.
La fosse de Puysegur presente une gComCtrie reguliere au Nord (profil 78) elle est orientte N 15’E, avec une largeur stable de 6 km et un fond plat h 6200 m de profondeur.’
17
Au Sud, la fosse de Puysegur est orientee N20”, c’est 5 dire parallelement a l’un des ,&ns . . _. strncturanx de la plaque plongeante dans la par-tie laplus meridionale du secteur, et apparait constituee d’une succession de petits fossts de 2 x 10 km disposes en relais gauche dont la
I profondeu diminue en direction du Sud. La subduction de laplaque australienne peut etre suivie vers 1’Est sur 9 km sous la base du mur inteme de la fosse (profi173, Fig. 90).
La ride de Macquarie est depourvue de sediment comme l’atteste les donnees sismi- ques. Sa forte reflectivite en imagerie sonar est en faveur d’un substratum rocheux de type odanique. La caracteristique principale de la ride est d’etre couronnee par une double Crete dont les points les plus hauts affleurent presque (l’un d’eux ne repose que sous 150 m d’eau). Le profil d’ensemble de la ride presente des pentes identiques bien que le flanc ouest, vers la fosse de Puysegur, soit plus long que le flanc est, vers le bassin de Solander. Le sommet de la ride est extremement lineaire et orient6 N25”E. Les cretes et fesses sommitaux sont discontinus, ttroits (2 g 4 km) et tres allonges (26 h 45 km), ensemble ils evoquent nettement la marque d’une vigoureuse tectonique coulis- sante. La pente orientale de la ride qui forme la transition avec le bassin riche en sediment de Solander montre, dans sa par-tie septentrionale, une succesion de marches qui corres- pondent en sismique a des failles compressives h vergence ouest. Celle-ci suggerent une transmission de la deformation au &avers de toute la ride de Macquarie.
18
INTRODUCTION AND GEODYNAMIC SETTING OF NEW ZEALAND . .
The purpose of the GEODYNZ-SUD cruise of the R.V. L’ Atalante was to study the geologic processes that control the temporal and spatial transitions between frontal sub- duction, oblique subduction and continental transpression along a major plate boundary. New Zealand offers a unique opportunity to study such transitions at either end of the transpressional Alpine Fault system that shears New Zealand (Fig. 1 and 2). Leg 1 of the GEODYNZ-SUD cruise (Hikurangi Leg) was devoted to the geophysical survey of the Hikurangi-Kermadec subduction zone off eastern North Island and northeastern South Island. Leg 2 (Puysegur Leg) focussed on a similar, mirror image system in the Puysegur area off southwestern South Island (Fig. 3). During the first leg, we focused on three key zones of structural transitions between segments of the Hikurangi-Kermadec subduction margin that have different kinematic and geologic characteristics. Leg 1 started from Auc- kland, New Zealand 1 November 1993 and ended in Wellington 18 November. During this Leg we collected 3679 nautical miles of geophysical data along 55 profiles that covered an area of approximately 86000 km 2 (See Appendix n”l). The second leg, studied in detail three key zones of structural transitions between segments ofthe Fiordland-Puysegur margin : the offshore extension of the Alpine Fault, the Puysegur subduction ma&, and the connection of this margin with the northern Macquarie Ridge. Leg 2 started from Wellington 21 November 1993 and ended in the same habour 7 December 1993. During this Leg geophysical data were collected along 2171 nautical miles corresponding to 30 profiles (see Appendix n”l).
New Zealand consists of two main islands on a large, mainly submarine continental block located in the SW Pacific Ocean. The block is traversed by the active, convergent boundary between the Pacific plate to the east and Australian plate to the west (Fig. 1). The South Island of New Zealand is cut along its length by the Alpine Fault, (Fig. 2a) a major dextral transpressive fault zone that trends approximately N45”E linking two major systems of subduction with opposing vergences (Ho&z et Ul., 1967 ; Walcott 1978 ; Lewis 1980 ; Ballance et al., 1982 ; Katz, 1982). The Alpine Fault, active since the early or middle Miocene (Wellman 1973, Kamp 1986, Cutten 1979, Uruski and Turbull, 1989), has offset geologic boundaries by more than 500 km (Suggate, 1963 ; Cutten, 1979 ; Norris and Carter, 1982, Sporli, 1987) (Fig. 2a). Motion is thought to have been initiated in a transtensional regime, became almost pure strike-slip in the Late Miocene, and then became increasingly transpressional in the Plio-Pleistocene. A major consequence of this transpressive motion is the uplift of the New Zealand Alps at rates of up to 10 mm/yr (Bishop, 1985 ; Allis, 1986).
North of the Alpine Fault, the east-verging Tonga-Kermadec-Hikurangi subduction system extends N20” E for about 3000 km from the northeastern margin of South Island to east of Tonga islands. At the southern end of the Alpine Fault, the Pacific-Australian plate boundary extends southwards for about 2000 km to the triple junction with the Southeast Indian and Pacific-Antarctic spreading ridges (Fig. 1). l3etween the Alpine Fault and the triple junction the plate boundary, which is close to the pole of rotation between Pacific and Australiaplates, appears to be segmented into linear bathymetric features with differing trends and tectonic styles (strike-slip, east and west verging subduction).
19

DATA ACQUISITION ‘AND ONBOARD DATA PROCESSING . . . r
R.V. L’ATALANTE’S INT.EGRATED DATA COLLECTION SYSTEMS
’ During the GEODYNZ-SUD cruise aboard the R.V. L’ Atalante, we simultaneously obtained swath bathymetry, swath imagery, seismic reflection profiles, 3.5 kHz high resolution profiles, gravity and magnetic data at a mean speed of 10 knots.
Navigation
Navigation was accomplished with Global Positioning System (GPS) equipment supplemented with a cesium / rubidium time standard. The navigational system was out- put into an integrated navigational data logging system, which recorded doppler speed, gyro heading, GPS position and GPS system parameters on magnetic tape.
Multibeam bathymetry and acoustic imagery
In the past, most seafloor data, including bathymetry, were taken as vertical profiles along a single track line under the ship, with no capability to look to the sides of the track. Very closely spaced conventional echosounding tracks are required in areas of complex bathymetry to resolve any but very gross, large scale features. Closely spaced tracks require Iong periods of costly shiptime. Although most data are stiI1 collected along single tracklines, new long-range swath mapping technology now allows very detailed, contoured bathymetric data to be collected rapidly in the deep ocean, with the added advantage of simultaneously obtaining side-scan sonar images of seabed reflectivity over the same area.
The R.V. I’Atalante is equiped with a SIMRAD EM12 Dual multibeam system that enables swath mapping of both bathymetry and side scan imagery over a maximum 20 km-wide strip of seabed in a single pass with (see Appendix N” 2). The side-scan imagery associated with SIMRAD EM12 Dual gives detailed information on the acoustic reflectivity associated with fine bathymetric features and with variations in the nature of the seafloor. Unlike some other systems, EM12 Dual imagery does not require geographic repositioning of pixels with respect to the bathymetry as the same signals are used for both outputs.
The EM12Dual consists oftwo separate multibeam echosounders (one on the port side and one to starboard) each of them generating 8 1 stabilized beams. This system operates at frequencies of 12.6 to 13 kl?Iz and allows simulatneous determination of 162 soundings using both eneiggy and phase measurement of the backscattered signal. Its precision is 0.2 % of water depth, i.e. 10 m at 5000 m.
The following parameters are guaranteed for a speed of 10 knots, which is the nominal speed for data acquisition for precise baathymetry and imagery mapping :
Maximum swath width : 7 times the water depth for depth < 3000 m 20 km for depth > 3000 m
21
Bathymetry horizontal resolution (along-track/across-track) : . . . _.. depthx500m: 30rrJ25m depth < 1000 m : 50 m/ 50m
‘.: :.,., , .. depth < 2000 m : 80 m/ 1OOm depth < 4000 m : 100 n-J 200 m
.‘a: -:,z’;“, : ‘,. depth > 4000 m : 150 m/ 300 m ’ _. * : ._’ . ,“, .
Imagery resolution (along-track*across-track) : shallow mode (depth < 1000 m) : 50 m/ 0.6 m deep mode (1000 m < depth < 10000 m) : 100 m/ 2.4 m
In order to, correct for lateral beam refraction, temperature probes are used to obtain the vertical sound velocity profile in the sea. The Sippican expendable bathythermograph probes transmit the temperature profile to a depth of 2000 m. Using the measured temperature and the salinity provided by the Levitus data base, sound velocity profiles are calculated by TRISMUS software and loaded into the EM12D operating unit. For deeper water, variation in the sound velocity as a function of the time of the year and of position are very small.
Seismic reflection
We used a six-channel seismic system with two 75-cubic inch GI air guns (made by SODERA) at a pressure of 160 bars (see Appendix N” 3). This system allows a penetration of 2 set TWT through unconsolidated sediments at 10 knots. Two45-cubic inch GI airguns were used for lines Pl to P3 ; the 75-cubic inch air guns were used for all the other lines. The 6 channel were continuously recorded on 0.5” magnetic tapes to enable future processing.
The GI guns comprise a pulse generator “G” and an injector or bubble suppressor “I” that fully suppresses the oscillations of each individual bubble when used in GI mode. During the cruise weused the GI guns in harmonic mode to get a signal at 20 Hz instead of 40 Hz in GI mode. The harmonic mode allows less resolution but deeper penetration.
Mud penetrator ’ . .
The Raytheon mud penetrator used during GEODYNZ-SUD cruise enables observa- tions of sediment structures at all water depths with a maximum penetration of 50 m. It includes a 7 transducers base, a correlator/transceiver and a Dowty recorder. Characteristics of the mud penetrator are : 2 kW power, 3.5 Khz frequency and transmis- sion duration of 25,50 or 100 ms.
Gravity data
Gravity data were collected using the marine gravity meter BODENSEEWERK KSS30. This gravimeter consists of a GSS30 gravity sensor mounted on a KT30-two-axis gyro stabilized platform. The gravity sensor includes a non-linearized spring-mass assembly as the basic gravity detector (see Appendix N” 5). In calm seas, during the GEODYNZ-SUD cruise, the effective accuracy of the gravity sensor was to.2 mGa1.
22
The first gravity base station of the cruise was measured in NoumCa, New Caledonia, _ the 22nd of October (G= 978 865.33 mGa1): This absolute value was calculated with respect to the IGSN 71 reference system. The end base station of the GEODYNZ-SUD cruise was done after Leg Puysegur, on the 8th of December at the Queens Wharf in Wellington, New Zealand (G= 980 259.88 mGal).
* During the’cruise gravity data were automatically corrected for spring tension, cross coupling, Eotvos and for latitude according to the IGSN (International Gravity Standardization Net) 1971 ellipsoid; Using the on-line processing system (TRIMEN software), corrected gravity is obtained on board the ship approximately 120 s after the measurement. This system provides values of gravity,’ Eotvos corrections, free air and Bouguer anomalies in mGal. Bouguer anomalies were calculated with a density contrast between the earth’s crust and sea water of 1.64 g/cm3. The free air gravity anomalies were automatically contoured at 10 or 20 mGal using the GMT public software (Wessel and Smith, 199 1) and the TRISMUS software.
PvIagnetic data
Magnetic data were acquired at a 6 second sampling interval using a BARRINGER M- 244 proton magnetometer towed 280 m astern of the ship (see Appendix N” 5). The magnetic anomalies were computed by substracting the IGRF 90 from the measured total field using the TRIMEN software, but were not corrected for diurnal variations. The accuracy of the instrument is about 0.5 nT and cross-over errors (which are less than about 50 nT, with an average equal to about 20 nT) are thus mainly due to diurnal variations. These errors were taken into account in the hand-contouring of the maps, and do not basically affect the results we present. The magnetic anomalies were automatically contoured at 50 or 100 nT using the GMT public software (Wessel and Smith, 1991) and the TRISMUS software.
REAL-TIME DATA AVAILABILITY
During the cruise, real time bathymetric tracks were drawn on a colour, flat-bed plotting table (Benson 1425). This allowed onboard interpretation that guided the survey. In addi- tion, a real time video representation was presented on a Sun computer (Vidosc system). The bathymetric coverage of the seafloor was therefore known in real time so that gaps and overlapping tracks were immediately evident and could be corrected.
The side-scan imagery was plotted in real time on a wide Dowty analoge recorder, in orthogonal co-ordinates and at a chosen scale.
The free air gravity anomalies, total magnetic field and bathymetry of the central beam of the EM12D were recorded in the data base (Thermes) and also represented in real time on a Sun computer (Vidosc system) as vertical profiles.
The third seismic channel was monitored and displayed on two Dowty thermal plotters, one at 5x vertical exaggeration and the other at 26 x. The latter record is interpreted in this report. Digital data were acquired on a HP9000, and were then recorded in SEG-Y format on exabyte tapes.
23
ONBOARD DATA PROCESSING
The data and images were fully processed according to standard procedures and corrected for distortions and artifacts.
Navigation was processed (corrected, interpolated and filtered) using the TRINAV so.ftware. The navigation was then used to process bathymetry, imageryand geophysical data. Processing of.the bathymetric data was carried out on board with the TRISMUS software in order to obtain a Digital Terrain Model (DTM) at a chosen scale for each mapped area. Processing of the side scan imagery with IMAGEM software includes averaging pf the raw pixels for across scaling, mapping of the average pixels on a cartographic grid (mosaic), interpolation of the mosaic pixels in order to fill the unmapped pixels, and contrast enhancement of the mosaic. The result was construction of a mosaic almost in real time. The computed mosaic maps were drawn at the same scale as the bathymetric maps.
Gravity and magnetic data were reduced into free air anomalies and magnetic anoma- lies as described above.
Seismic reflection data were partialy processed onboard the vessel through correction for spherical divergence, trace balancing, filtering, stacking and summing of two adjacent traces using the SU public domain software (Cohen J. K. and Hale D., 1991). Three-fold seismic sections were obtained. Pro.cessing of the seismic data improved the coherency, decreased the diffraction hyperbolas and other incoherent noise and enhanced the signal. We show an example of a seismic section taken along the Hikurangi Plateau. Comparison of this seismic section before (Fig. 4a) and after processing (Fig. 4b) shows an improvment of the seismic signal at all depths, although the improvement is particularly noticeable below the stratified sedimentary sequence. At this depth, no reflections can be interpreted on the non-processed section, whereas there are coherent lowzamplitude and low-frequency reflections on the processed data. These reflections are important because they image deep reflections possibly within the basement of the I-Iikurangi Plateau.
24
TaihoroNuhurangi GEOLOGICAL &NUCLEAR;
s ScIENC,ES Limited
GEObYNZ+iJD thi,H~E ‘I Shi@board Report - Leg Hikurangi’ ‘,
1 - 18 No\iemb&r 1993
Jean-Yves Collot, Jean Delteil, Keith Lewis
and the shipboard scientific party
‘1
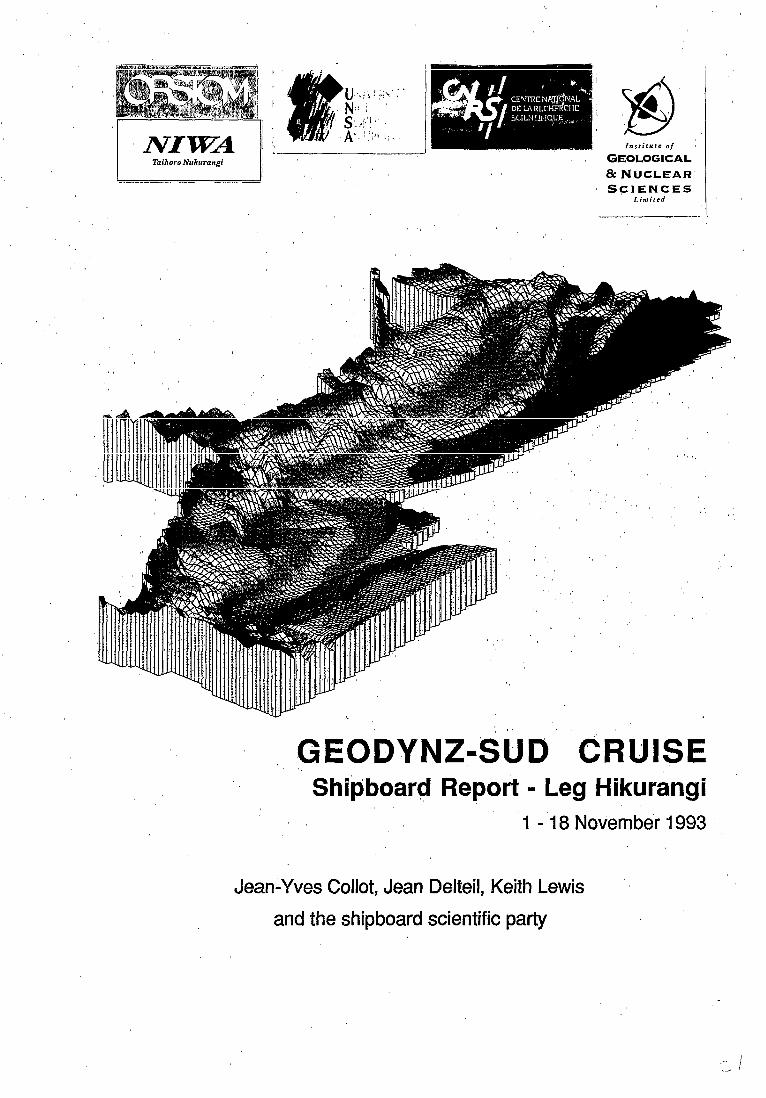
Ggende planche Leg1 Hikurangi
3D multibeam bathymetric diagram of the southern termination of the tiikurangi Trough (Kaikoura Box) ; scale is from 300 m to 3000 m.
Diagramme 3D de la bathym&rie multifaisceaux de la terminaison sud de la fosse d’i-iikurangi (secteur Kaikoura) ; Bchelle de 300 m C?I 3000 m.

LIST OF PARTICIPANTS .
Chief scientists :
J.Y. Collot ORSTOM Villefranche s/mer J. Delteil University of NiceKNRS . .
Watch : O-4 :OOh et 12 :OO-I6 :OOh ’
J.C. Audru CNRS Sophia Antipolis Ph. Barnes NIWA B. Mercier de Ltpinay CNRS Sophia Antipolis c. uruski IGNS
Watch : 4-8 :OOh et 16 :OO-20 :OOh
F. Chanier LilIe University B. Davy IGNS A. Orpin Otago University B. Pelletier ORSTOM Noumea
Watch : 8- I2 :OOh et 20 :OO-24 :OOh
E. Chaumillon S. Lahemand K. Lewis
Drafting :
M. Sosson
Multi&earn EMI2D
acquisition : H. Lossuarne P. Le Scaon EL Serve S. Coquet
bathymetry processing : A Le 3ot
imagerie processing : B. Toussaint %
Seismic reflection
acquisition : G. Le Beuz Ph. Bride
processing : G. Lamarche
CNRS Villefranche s/mer CNRS Montpellier NIWA
CNRS Sophia Antipolis
GENAVIR GENAVIR GENAVIR GENAVTR
GENAVIR
ORSTOM Villefranche s/mer
GENAVIR GENAVIR
ORSTOM Villefranche s/mer
27

. . . . .
GEODYNAMICS AND OBJECTIVES Of THE HIKURANGI LEG . . . . .
TEE TONG-A-KERMADEC-HIHJRANGI SUBDUCTION SYSTEM
. The Tonga-Kermadec arc-trench system represents intra-oceanic orthogonal subduc- tion where Mesozoic Pacific plate is being subducted westward (Karig, 1970). The con- vergence rate decreases from near20 ,cm/yr at the northern tip of the Tonga trench (Bevis et al. 1992) to 6 cm/yr at the southern termination of the Kermadec Trench (Minster and Jordan, 1978 ; de Mets et al., 1990). The direction of convergence remains approximately orthogonal to the plate boundary along the Tonga and Kermadec trenches. Along the Hikurangi Trough, this direction becomes progressively oblique to the structures and the convergence rate decreases to less than 5 cm/yr (Fig. I).
The inner wall of the Tonga-Kermadec trench shows several along-strike transition zones between forearc areas that are characterized by differing structural styles. A struc- tural transition occurs at latitude 26 OS, where the Louisville ridge, a major north-northwest- trending volcanic ridge carried by the Pacific plate, collides and sweeps southward along the Tonga trench. As a result of the sweeping of the ridge, the Tongan forearc has been deformed and shortened by 50 kmnorth of latitude 26’S, with respect to the forearc located south of the coIlision zone (Ballance et al., 1986 ; Pelletier and DuPont, 1990). Another stuctural transition occurs along the Kermadec forearc slope at latitude 32”s. North of latitude 32”S, the inner wall of the trench appears to be dominated by tectonic erosion whereas south of this latitude seismic reflection data suggest that a small accretionary wedge has developed (Pelletier and DuPont, 1990).
In contrast with the Tonga-Kermadec intra-oceanic subduction zone, the Hikurangi Trough is the location where the Hikurangi Plateau (Fig. 2b) under-thrusts eastward beneath the continental margin of the North Island of New ZeaIand (Lewis, 1980 ; Cole and Lewis, 198 I ; Smith at al., 1989 ; Davy 1992 ; Davy and Wood, 1994 ; Lewis and Pettinga, 1993). The Hikurangi Plateau is a triangular shaped, 2500-3500 m deep area that extends more than 1500 km in the N-S direction. This plateau is bounded to the northeast by a steep 500- 1500 m-high scarp, the Raapuhia Scar-p and the abyssal plain of the Southwest Pacific 3asin (Wood and Davy, 1994). On its southern side, the Hikurangi Plateau terminates against the E-W trending, 500 m-deep Chatham Rise. A 1500 km-long canyon-channel, the Hikurangi Channel (Fig. 2b), extends from near where the plate boundary comes ashore in northeastern South Island, northeastward along the deformation front for 800 km before turning sharply eastward out of the trench and across the Hikurangi Plateau to the Southwest Pacific Basin (Lew’is, 1994). The channel deeply incises the thick sediment cover of the plateau and carries abundant sediment into the path of the powerful Deep Western Boundary Current (DWBC), which sweeps northward along the Rapuhia Scar-p into the Pacific. Geophysical and geologic investigations suggest that the plateau has a lo-15 km-thick crust that is pierced by numerous volcanic intrusions (Davy and Wood, 1994). The nature of the crust of the Hikurangi Plateau is not yet well understood. It could have originated as a thick oceanic plateau that once collided with the Chatham Jiise (Davy and Wood, 1994).
29
-. _.. The subduction of the Hikurangi plateau has generated a large imbricate-thrust “accretionary” wedge that developed along the eastern margin of the North Island (Lewis, 1980 ; Davey et al., 1986 ; Lewis and Pettinga, 1993). The emergent part of this wedge may forms part of the eastern Coastal Range of North Island (Fig. 2a) (Van der Lingen and Pettinga, 1980), with the inner part being predominently compressionally deformed pre- subduction material, rather than offscraped trench-fill (Lewis and Pettinga, 1993) (Fig. 5). The positive buoyancy of the subductin, m Mikurangi Plateau and the low dip-angle (3’) of the 3enioff zone were interpreted to cause the partial emergence of the imbricated “accretionary” wedge along the east coast of the North Island (Davy, 1991). Calc-alkaline volcanism, known to have existed in the North Island from 23-22 Ma to Present shows that the Hikurangi subduction has been active since the lower Miocene (23- 25 Ma) (3allance 1976 ; 1988). The deformation of the Coastal Ranges is mainly characterized by compressional and strike-slip tectonics (Pettinga, 1982 ; Delteil er al., submitted) although some normal faulting attributed to recent gravity sliding were reported in some areas ofthe coastal ranges (Cashman and Kelsey, 1990 ; Barnes and Lewis, 199 1).
After the development of the Torlesse accretionary wedge during lower Cretaceous, the first Hikurangi accretionary wedge started to develop between 24 and 18 Ma ago and resulted into the imbrication of the old Torlesse sediment with east-verging thrust-sheets made of Cretaceous to Paleocene sediment. Chanier and Ferriere (1991) gave structural evidence for a major extensional episode that affected the development of the first Ihkurangi accretionary wedge during the Mio-Pliocene time. Because the extensional episode is synchronous with a subsidence of the margin, these authors interpreted this episode as a period of tectonic erosion that occured between 17-18 Ma and 2 Ma along a continuously active subduction margin. The present day I-hkurangi accretionary wedge started to build up against the lower Miocene accretionary wedge sometimes between 2 and 1.5 Ma (Chanier and Fen&e, 199 1) or between 4 and 5 Ma (Lewis and Pettinga, 1993). Therefore, the present day Hikurangi accretionary wedge appears to be restricted to the lower forearc slope, whereas the upper forearc slope and the Coastal Ranges consist of older (Cretaceous to Paleocene) rocks and sediments that suffer compression and strike- slip deformation (Lewis and Pettinga, 1993 ; Cutten and Delteil, submitted) (Fig. 6 and 7). Delteil et nl., (submitted) suggested the Eastern Coastal ranges include nappes emplaced with those of northern North Island during the earliest Miocene when the Vening Meinesz Fracture Zone (VMFZ) was active and subsequently transported southward along major dextral strike-slip faults.
THE MODERN l3SXJRANGX ACCRETXONARY WEDGE
Geophysical data collected by New Zealand and US institutions as well as oil companies indicate that the size and structure of the submarine accretionary wedge vary considerably along the strike ofthe trench. Three segments ofthe accretionary wedge have been identified (Lewis and Pettinga, 1993) (Fig. 7). The central segment of the accretionary wedge is located between latitude 39’15’s and 4 l”45’. In this segment the wedge has an overall
30
. lobate shape and a low relief. It is deformed by thrusts and folds that indicate active com- pression and tectonic accretion of trench sediments along the deformation front. The northern segment of the wedge extends northward from latitude 39O15’S to near 37”‘45’S at the Kermadec Trench. This segment is much narrower than the central segment and show evidences for slope failures and possible tectonic erosion by seamounts. The northern segment shows a .steep forearc slope as well as easkfacing scarps and normal faults suggesting that the structure of the accretionary wedge is controlled by tectonic erosion (Katz and Wood, 1980 ; Lewis and Pettinga, .1993). The northern segment of the wedge appears to terminate northward against the Vening Meinesz Fracture Zone, an old structu- ral lineament that extends northwestward along the northem’margin of the North Island and may cut across the Hikurangi-Kermadec margin. The VMFZ may mark the structural and petrological transition between Kermadec intraoceanic crust to the north and New Zealand continental crust to the South. The southern segment of the wedge extends between latitude 41”45’S and 42’30’s. Along this segment the accretionary wedge is poorly developed and characterized by a steep slope. Oblique subduction and collision of the Chatham Rise prevent the developement of tectonic accretion. The d&collement at the base of the southern segment ofthe wedge may extend southward on land and be connected to branches of the Malborough fault system (Carter and Carter, 1982 ; Herzer and Bradshaw, 1985 ; 3ames, 1993).
SEABED SEDIMENTS ON THEC HIKURANGI MARGIN
The sediments of the Hikurangi magin and trough assist tectonic interpretation rather than mask it. They are generally thick enough to record structural deformation but not thick enough to obliterate its bathymetric expression. There are no large rivers by intema- tional standards anywhere along the coast and the several significant rivers that empty into Hawke I3ay deposit most of their sediment Ioad within the bay. The only large sediment supply is to the Hikurangi Trough via the Hikurangi Channel although some coastal parts of the margin may be dominated by local detrital input, some forearc slope areas by ash from the rhyolitic centres of the Taupo Volcanic Zone, some banks by authigenic or benthic biogenic debris and some parts of the Hikurangi Plateau by pelagic calcareous ooze.
The I-Iikurangi Channel (Fi g. 2b) is the axial conduit for turbidity currents to the Hikurangi Trough and now derives almost all of its sediment supply from the Kaikoura Canyon at its apex (Lewis, 1994). This canyon traps northward drifting sediment from many of the large rivers that drain eastern slopes of the Southern Alps of South Island. Most sediment from the forearc slope is trapped on the shelf or in a baffle of slope basins (Lewis and 3ennett, 1985). The channel is known to meander north for 800 km between flanking levees before turning eastward out of the structural trench off Mahia. It continues eastward for a further 600 km, deeply incising the I-Iikurangi Plateau before disgorging through the Rapuhia Scarp onto the abyssal plain of the Southwest Pacific Basin. There, the channel forms a distal fan that is modified by the massive flow of the Pacific Oceans DW3C. This current circulates nutrient-rich, Antarctic water to all of the Pacific Oceans
31
. _. abyssal plains. The DWI3C sweeps sediment from the Hikurangi Channel northwestwards into a fan-drift elongated parallel with the toe of the Rapuhia Scarp for over 300 km towards the Kermadec Trench (Fig. 2b) (Carter and McCave,1994). It also produces a characteristic “scour moat” along the toe as the flow is contained by the scat-p.
The Hikurangi Channel supplies sediment to a parallel-bedded turbidite plain that fills thestructural trench and an east-west trough in the Hikurangi Plateau (Wood and Davy, in press). North of Mahia, there isno channel and the turbidite plain widens into the Whenuanuipapa Plain, which is pierced by several large seamounts. The turbidite plain ends abruptly off East Cape where the structural trench changes from the Hikurangi Trough to the sediment-starved Kermadec Trench.
Over much of the northern part of the Hikurangi margin and adjacent plateau, the only significant terrigenous input besides turbidites comes from the rhyolitic ash centres in the backarc basin of central North Island. Massive ash eruptions have produced ash horizons several centimetres thick over much of the Kermadec and Mahia study areas on many occasions during the late Quaternary. They tend to evenly drape the topography rather than be concentrated in basins like the turbidites. They can be correlated with dated ash horizons ashore to give rates of sedimentation and frequency of turbidity current input (Lewis and Kahn, 1972). In addition to the ashes, the Hikurangi Plateau and its volcanic cones have been draped by a slow rain of pelagic organisms since their formation. Plateau sediments become more pelagic as they become more remote from the supplies of tenigenous sediment although edge effects of the DWI3C complicate the pattern.
OBJECTIVES OF THE HXURANGI LEG
The major objective of this leg was to study the sedimentary and tectonic processes that control the transition from orthogonal to highly oblique subduction, and continental colli- sion and transpression along the Hikurangi margin. We focused our study on the three major zones of structural transitions that were recognized along the Hikurangi margin (Fig. 8). 1) The structural transition between Kermadec intra-oceanic subduction and the Hikurangi
plateau sub-continental subduction (Kermadec box). 2) The structural transition at latitude 39’15’s between the narrow, high-relief segment of
the Hikurangi accretionary wedge and the wide, low-relief segment of this wedge (Mahia box).
3) The structural transition between the southern segment of the Hikurangi accretionary wedge and onshore dextral transpressive deformation of the Malborough area (Kaikoura box).
32
DATA ANALYSIS -. _._
TRANSIT BETWEEN AUCKL,AND AND TJ3-3 KERMADEC BOX
’ During the transit between Auckland and the Kermadec box (Fig. S), a single multidata traverse was run mainly along the inferred position of the transition between continental crust and ocCani~ ciust’seatiard of the Bay of Plenty (Fig. 9). This transit approximates the supposed position of the Vening Meinesz Fracture Zone in this region (Fig. 2). The line began at 36” 35’S, 176” OS’E off the Coromandel Peninsula and extended to 37” 15’S, 179” 22% on the East Cape Ridge with a slight change of course at 37” 00’S, 177” 3 I’E. The line crossed three distinct segments of seabed : (1) the smooth continental margin east of the Coromandel Peninsula,,(2) the rugged volcanic terrain between the southern limit of the Havre Trough (Ngatoro 3asin) and the nor-them limit of the Taupo Volcanic Zone, and (3) the transition between the smooth slope north of the Raukumara Peninsula and the flat Raukumara Plain (Fig. 9). The three segments represent three distinct plate boundary environments : (1) the sediment-covered Miocene volcanics of the intracontinental Coro- mandel Peninsula and intraoceanic Colville Ridge (Fig, 2), (2) the modem, intraoceanic, rifted-backarc and arc volcanics of the Havre Trough (Ngatoro Basin in Fig. 9), which is sinistrally offset by 50 km from the modem intracontinental arc and backarc of the Taupo Volcanic Zone (Wright 1993), and (3) mountainous forearc of the Raukumara Peninsula and the flat forearc of the Raukumara Plain. On the line of the fraverse, the southern end of the Havre Trough is represented by the Ngatoro Basin, which incises the continental margin at the Mayor Seavalley, and the Taupo Volcanic Zone by the Tauranga Trough and White Island Trough with the White Island - Ngatoro Ridge between them. The new traverse images all of these tectonic environments and helps to understand the relationship between them.
Swath Bathymetry This line, with a swath-width of up to 11 km, cuts eastward across smooth slopes and
rugged volcanic topography. The western part of the line (Fig. Ida) shows that the conti- nental slope of the Coromandel Peninsula is smooth and regular to 1600 m depth, where it connects with the flat seafloor of the Alderman Trough. This seafloor is pierced by a small (100 m) conical seamount that is interpreted as a volcano. Between longitudes 176” 50’E and 177” 38’E, the sea floor is rough and shows a series of irregular highs and both flat- bottomed and irregularly-bottomed troughs trending generally NE. At the western edge of this zone, the steep-sided Mayor Seavalley is shown to enter the western side of the irregular, southern extremity of the Ngatoro Basin. This is separated by irregular slope topography from the flat-floored Tauranga Trough. Further east, a ma.jor high (peak at 1 150 m deep) at the northern limit of the West Ngatoro Ridge is subcircular and bounded by steep scams. The northern end of the White Island Ridge, located at longitude 177” 32’E, has a peak at IS00 m, a triangular shape in plan view and is separated from the White Island Trough by a steep, NE-trending, 900 m-high. scarp.
33
Along the eastern half of the line (Fi g. -. _.. 1 Ob), the seafloor is smoother and dips generally northward away from the land. A 3%-n-long, crescent-shaped dome, trending E-W could be interpreted as an anticiine downslope from the Lottin Ridge. The “Matakoa Seavalley” is a very gentle-sided, shallow depression with an irregular topography, which does not resemble most turbidite slope canyons. At its eastern edge there is a 200 m high scarp trending NE, which separates it from the rounded northwestern slope of the.Awatere Ridge. The eastern end of the Awatere Ridge is rugged, shallow (1350 m deep), and incised by numerous; -small. NE-trending % channels: In. contrast with the .-common NE trending features observed along this line, a north-facing, 400m-high scat-p trends EW near the end of the line.
Side-scan Imagery
On the side-scan imagery, dark facies result from strong acoustic backscatter returned by canyons and steep rocky scarps (Fi g. 1 la and b). Medium grey facies characterize flat sedimentary surfaces. Light grey surfaces correspond either to scarps poorly ‘illuminated’because of their orientation with respect to the shiptrack or to some irregular surfaces that cause low backscattering. One ofthe significant results of the imagery shows numerous dark grey spots on the light grey surface located on the northwestern flank of the Awatere Ridge between longitude 178” 35’E and 178”55’E (Fig. 1 lb). These features were not detected on the bathymetric map and are interpreted as blocks transported in slides and debris flows from the upper continental slope (Fig. 12).
Seismic Reflection
From west to east, single-channel Line PI shows the sediment-blanketed domain of the Coromandel slope and Alderman Trough, a faulted volcanic domain with limited sediment cover between Ngatoro Trough and White Island Trough, and a deep sedimentary basin at the southern edge of the Raukurnara Plain.
On the lower slope off the Coromandel Peninsula, the seismic line shows a structural transition characterized by a series of east-facing nomlal faults bounding tilted blocks. Sedimentation synchronous with the rifting phase is preserved on top of the tilted blocks. Movement along the normal faults continued after the rifting phase because the upward extension of some faults slightly deform the sea floor. Eastward from the toe of the slope, the Alderman Trough is underlain by sediment up to 0.4 set (twt) thick, and within the volcanic zone the Tauranga Trough has 0.7 set (twt) thick sedimentary fill (Fig. 13). Between these two basins the sediment blanket thins and acoustic basement crops out on a structural high. Here, acoustic basement, which may represent the outer edge of the Bay of Plenty continental margin, is acoustically transparent and seems to be intruded by volcanic rocks that include the small seamount located by the bathymetric survey in the Alderman Trough. East of Tauranga Trough is the high relief of the Ngatoro Ridge. This ridge, with its conical peak, lack of sediment cover, and strong magneticanomaly is clearly of volcanic ,origin. The Ngatoro Ridge is flanked by two narrow sedimentary basins containing 0.7 set (twt) of stratified sediment : the Tauranga Trough to the west and a small perched basin to
34
the east. Both are deformed by high-angle normal faultsThe eastern basin is bounded at I.. its eastern margin by a horst (Whitite”Island’Ridgk)~capped with sediment witi’seismic .’ ’ characteristics similar to those of the basin fill. A high-angle fault ‘with a 7OOm-throw separates the horst from the narrow, 2400 m-deep White Island Trough. The normal faulting, horsts and volcanic,intrusions are clear evidence of Recent rifting.
s East of White Island Trough, Line PI shows a thick (2 s twt) fairly well-bedded pile of sediments overlying an acoustic basement that returns some discontinuous reflections, suggesting that the basement consists of sedimentary rocks. The sedimentary cover appears to thin eastward from 2 s twt to 0.5 s twt, where the series dips west, suggesting that the eastern part of the basin, was a structural high at the time of ‘deposition and has been subsequently uplifted. Interestingly, the western margin along the White Island Trough also has evidence of uplift. Within the sedimentary pile, several eastward and wesward onlap surfaces suggest differential or oscillating vertical tectonics. Moreover, in the west the sediments are cut by east-facing normal faults, some of which are still active as they offset the sea floor. To the east, a large anticline may be responsible for general uplift of the area offshore from the Raukumara Peninsula. On the western flank of this large antidine, a slump, 26 km wide and over 100 m thick, was emplaced. The eastern flank of the anticline is sliced by numerous high-angle faults in the vicinity of the East Cape Ridge.
A fault zone 18 km east of the White Island Trough is associated with the buried fold structure. The sediments cut by the uppermost branches of the fault are normally offset. The overall aspect of the structure suggests a strike-slip fault that could be connected to the northernmost branches of the onland Mohaka Fault (Fig. 2a).
Gravity The gravity profile across the l3ay of Plenty (Fi g. 14) traverses a region already
extensively surveyed. The measured data agrees with the published values on the Cook gravity anomaly 1 :lOOOOOO map (Rose 199 1).
The topographic relief (- 700 m) of the Tauranga Trough, Ngatoro Ridge, White Island Ridge and White Island Trough is mirrored in the gravity anomaly signature. These major features are associated with crustal rifting and thinning in a region intermediate between continental backarc to the south and intraoceanic backarc to the north. Gravity models close to the profile (Davy and Wood, perso. corn.) show that the crust beneath the central 150 km of the 3ay of Plenty is 24 km-thick, and thickens to 28 km eastward beneath East Cape Ridge and 33 km beneath the continental rise at the western extreme of the line. It is inferred that the crustal root at the western end of the profile results in the gravity decreasing by only - 40 mGal despite an increase of - 1600 m in the water depth between the conti- nental rise and the-Alderman Trough.
The eastern half of the gravity profile is dominated by the -124 mGal gravity low centred 20 km south of the line at 37” 20’S , 178” 3O’E. This gravity low is modelled as being due to the effects of crustal downwarp forming a deep (> 4 km) sediment filled forearc basin. Part of this sedimentary basin can be seen on the seismic section.
35
Magnetics .n. . . . . The magnetic anomaly signature (Fig. 15) across the sedimentary basin east of the
White Island Trough, and coincident with the gravity low discussed above, has less than 100 nT of variation consistent with deep burial of basement rocks. Anomalies of 20 km
_. wavelength and up to 150 nT of total variation in the East Cape region may be associated with basement uplift (suggested by gravity models) or the possible presence of volcanics similar to the‘obducted oceanic seamounts of the Matakoa volcanics observed onshore at East Cape (Brothersand Delaloye, 1982).
The magnetic signature to the west of White Island Trough is characteristic of shallow magnetic source rocks such as the intrusive volcanics that occur in this region. Magnetic anomaly variations are up to 300 nT and have lo-20 km wavelengths. There is a correlation between the magnetic anomalies and the topography of the ridges and troughs comprising the offshore extension of the Taupo Volcanic Region, which is characterised by extensive Pleistocene-Recent rhyolitic and andesitic volcanism (Cole, 1979). Intrusion along the bounding faults of the offshore grabens has been suggested as a major contributor to the observed magnetic anomaly variations (Wright,1993).
The magnetic anomalies at the western extreme of the profile are probably due either to intrusion within continental basement or to volcanism associated with the Miocene-Pliocene volcanic arc of Coramandel Peninsula (Skinner, 1986).
Conclusions
Line Pl shows the shallow structure.of the continental crust along the E-W trending boundary between the oceanic crust of the Havre trough and continental crust of New Zealand (Fig. 12). Gravity data are consistent with the western part of the line being con- tinental crust and the Alderman Trough being underlain by thinned continental crust. Bathymetr-y, side-scan imagery, seismic reflection profiles and magnetic data indicate that at least one volcano intrudes the Alderman Trough. This volcano may be similar to the Mayor island volcano that pierced the shelf southwestward of the line, and which is characterized by pantellerite.
The central part of the line cuts across a volcanic rift zone located between the Ngatoro Basin and the White Island Trough. A volcanic edifice that is part of the Ngatoro Ridge was emplaced along the axis of the ridge. The western part of the volcanic zone corres- ponds to the southern limit of the intraoceanic backarc I-Iavre Trough whereas the eastern part is the offshore extension of the Taupo Volcanic Zone.
In the eastern part of the line, sediments of the New Zealand margin appear to have been folded, uplifted and tilted. This deformation may result from the active subduction of the Hikurangi Plateau at the junction of the Kermadec Trench and IIikurangi Trough. A strike-slip fault, also interpreted from seismic data, may be the seaward continuation of one of the major strike-slip faults evident onshore. In the eastern region of the line, slumps and debris flow are interpreted from side-scan imagery and seismic data. They appear to derive from the steep northern slope off East Cape and were transported downslope on the eastern side of the broad Matakoa Seavalley.
36
-. _.. THE KERMAD3JC BOX
The Kermadec box was designed to survey the southern termination of the Kermadec subduction zone and its southward transition to the Hikurangi Trough, where the northern edge of the lo-15 km-thick, volcanic Hikurangi Plateau collides and underthrusts the Inca- oceanic Kermadec Island Arc and the continental East Cape Ridge (Fig. 163. Near latitude 37’S, the NUVEL-1 model (de Mets etal., 1990) indicates that the Hikurangi Plateau and Kerrnadec arc converge at 4.9 cm/yr in the N88” E direction.
This box consists of 12 multidata lines (P2 to P13 ) (Fig. 17) that cover an area of approximately 48,000 km 2 in water depths ranging from 650 m to 7800 m. P2 began the 1 November 1993 at 23 :43h GMT at 37” 13’75 S, 179’22.96 E and extended northeastward along the East Cape Ridge. P13 ended on the 8 November 1993 at 10 :07 GMT at 38” 28,80 S, 179’ 45’ 16 Eat the toe of the Ruatoria Knoll on the Whenuanuipapa Plain. These lines were used to survey three structura.lly different domains of the subduction zone : (1) the downgoing plate with the northern edge of the Hikurangi Plateau and abyssal plain of the Pacific ocean, (2) the Kermadec Trench and its southward transition to the Hilcurangi Trough, (3) the rugged and relatively steep forearc slope including the shallow forearc summit along the East Cape Ridge.
Swath Bathymetry
1) The do wngoing plate In the surveyed area, three morphologic domains were recognized on the downgoing
plate : the smooth Pacific abyssal plain to the north, the elevated Hikurangi Plateau in the middle and the rugged Ruatoria Knoll area to the south (Fig. 18 and 19).
The abyssal plain of the Pacific Ocean is characterized by a smooth seafloor dipping northwestward from 6000 m to 7500 m into the Kermadec Trench. The dip of the seafloor slightly increases from 1.3” to 1.9” between 41.5 km and 20 km east of the trench axis. This slope is regular but appears to be offset by two N02- 16” trending scarps in the close vicinity of the trench. Only a single 9 17 m-high conical seamount, which can beinterpreted as a volcano, protrudes from the smooth seafloor 17 km northeast of the Hikurangi Pla- teau. Anarrow (7 km), elongated depression extends northwestward along the steep northern edge of the Hikurangi Plateau and connects with the Kermadec Trench and can be interpreted as a scour moat related to the DW3C.
The northern edge of the Hikurangi Plateau is defined by the linear, 1000 m-high, 30’ dipping Rapuhia Scar-p that trends N 140” (Fig. 18 and 19). Near the junction with the deep Kermadec Trench, this scarp rotates to NllO” and breaks into three smaller, parallel scarps.
The Hikurangi plateau has a smooth NW dipping seafloor varying in depth from 3500 m at 37” 40’S to 6000 m in its northern extremity. Similar to the abyssai plain, the dip of the plateau increases from 1.3 to 1.9” between 39 km and 25 km east of the trench. The bathymetric contours of the undulating plateau seem to show two strikes, one trending roughly NNE and one NE. These strikes could mirror basement structures. The surface of the Plateau is cut by several steep-sided, round topped ridges up to 1000 m high that could be volcanic in origin. The major volcanic ridge in the northern part of the Plateau trends
37
N168” ; . . . .._ others trend N140°f100. Two sets of west-facing scarps cut the 35 km-wide northwestern edge of the Plateau suggesting that this edge is normally faulted when bent into the subduction zone (Fig. 19). The dominant set trends N13” to N20” and consists of scatps that average 25 km in length. The secondary set trends NE and consists of scarps that do not exceed 10 km in length. The two sets of scarps define an en-echelon pattern with an increasing number of scarps toward the trench axis.
The Ruatoria Knoll area incises the forearc slope and displays a series of scattered highs on top of a seafloor bulge 100 km in diameter and 250 m high. The twelve largest highs consist of subcircular to elongated seamounts up to 1250 m in height that are part of a large volcanic massif. The smaller highs within the forearc slope reentrant could be either volcanic intrusions or slump blocks derived from the forearc slope. 2) The trench
The Kermadec geomorphic trench extends from the NNE limit of the surveyed area to latitude 37” 44’S where the Ruatoria knoll volcanic massif abuts the forearc slope. This trench consists of two segments : a deep segment north of the Hikurangi Plateau and the en-echelon and shallower segment where the Hikurangi Plateau is subucting (Fig. 19).
The deep Kermadec Trench trends N15” and lies under 7800 m of water. It is 13 km wide, has a flat bottom and has developed on downgoing Pacific Ocean basin.
The southern part of the Kermadec Trench has developed on the downgoing I-Iikurangi Plateau. The trench trends N28” and shoals southward from 6400 m to 4500 m near lati- tude 37’44’s. This trench consists of a series of seven en-echelon, S-shaped and elongated closed basins that are 35 km-long and 7 km wide. 3) The forearc slope
The morphology of the forearc slope northeast of East Cape Ridge near latitude 36’30’s is more regular than that of the forearc slope south of this latitude.
Northeast of East Cape Ridge the water depth ranges between 2600 m in the upper part of the slope to 7800 m at the toe of the arc slope at the Kermadec Trench. in this northern part of the forearc, the seafloor shows a number of flat terraces and closed lows that are separated by east-facing scarps and round-topped narrow ridges (Fig. 19). A few small sub-circular highs on the terraces suggest either volcanoes or mud diapirs. The overall strike of the slope is approximately north but the scarps show five trends. The &&o major trends are NOO&8” and N30%” and are both well developed along the lower slope. The N00&8” trend meets obliquely with the Kennadec Trench whereas the N30”&5” trend is sub-parallel to it. The other minor trends are oriented N72”t-3” (two scarps), one scarp is oriented NlOO” and another trends N145”(Fig. 19).
West of the deep Kermadec Trench, a major slope break near 6250 m separates the steep (12”) lower slope from the more gentle (1.4”) upper slope. The steep slope exhibits a 8 km wide series of braided scarps bounding small, lense-shaped terraces that are 1.5 to 4.5 km in width. This morphology strongly suggests trenchward slumped blocks (Fig. 19).
South of 36”30’, the water depth ranges between 700 m in the upper part of the slope close to the East Cape of North Island to 5250 m at the toe of the forearc slope near the southern Kermadec Trench. Along the strike of the margin, the forearc slope is cut along strike by a major N30” trending alignment of scams that separates the undulating and
38
. ., northeast-dipping upper slope from the rugged, southeast dipping lower slope (Fig. 19). The upper slope is topped by two massive rounded banks, 12 km in diameter that constitute the East Cape Ridge. 30th N-S and N 30” trends contribute to their morphostructure. Southeast of the the East Cape Ridge, summits the upper slope forms a 8 km wide, 180 km long, gently northeast dippin,, * undulating surface. The lower slope dips 5” toward the SE and shows numerous closed highs and lows that are locally aligned along N40-45” trending scarps. These elongated features form a horse-tail tectonic pattern that appears to merge with the major N30” trending alignment of scarps, perhaps indicating strike-slip deformation. The deformation front has a lobate morphology associated with small-scale flat terraces, highs and lows: These features suggest that block slumping is a major process that controls the development of the lower slope and deformation front. However, a few narrow and small amplitude arcuate ridges at the toe of the slope suggest that thrusting and possibly tectonic accretion is taking place.
The Awanui Seavalley (Fig. 16) forms a morphologic reentrant that incises the forearc slope in front of the volcanic massif of the Ruatoria Knoll. The north and south flanks of the reentrant are outlined by steep (13” to 28”) scarps (Fig. 19). The northern scarps trends EW parallel to the plate convergence direction suggesting that this scarp was created by a subducting seamount. Within the reentrant the seafloor has a hummocky topography probably resulting from slumping and avalanche processes. We interprete this reentrant as a scar left in the forearc by subducting seamounts that could be part of the volcanic massif of the Ruatoria Knoll.
South of the Ruatoria Knoll the steep forearc slope dips eastsoutheast at 7” and shows a much more regular morphology than the forearc slope located immediately north of Ruatoria Knoll.
~~ :./ !’
Side-scan Imagery
The onboard acoustic imagery map from the Kermadec box (Fi g. 20) displays strongly ‘$8; contrasting levels of grey, which correspond to different acoustic and energy responses of 1 h the bottom. Scarps and outcrops of indurated rocks (volcanic or sedimentary rocks) produce : ,! high reflectivity and correspond to dark areas on the maps. In contrast, soft sediments :J. produce low reflectivity and appear as subtle levels of grey on the map. However these levels of grey are not yet well correlated with sediment type as numerous physical characteristics, including sediment grain size, surface texture and water content influence the signal.
. .
Four main facies can be distinguished on the imagery map of the Kermadec box (Fig. 20) : a dark facies mainly corresponding to scarps and volcanic edifices bear of soft sediment, a medium grey facies corresponding to sedimentted slopes of moderate dip, a light grey facies in the smooth, flat sedimented areas, and avery light grey facies in restricted flat soft sedimented areas. Most imagery reflects the bathymetric features, but some features are only observed on the imagery map and have no obvious bathymetric expression. I) The downgoing Pacific PIate
The northeastern part of the survey area is characterised by a strong contrast between
39
. _. the flat plains and the volcanic ridges and the sharp Rapuhia scar-p. The strongly reflective Rapuhia scarp trends NW-SE and divides at its western end (close to the Kermadec trench) into three branches trending WNW-ESE and WSW-ENE. Alignments of dark areas outline the NNW-SSE and NW-SE trending narrow volcanic ridges on the Hikurangi Plateau (Fig. 19 and 20).
. The southwestern part of the surveyed areais mainly characterised by mottled features with high to moderate reflectivity. This particular facies corresponds to an area of numerous small circular bathymetric highs interpreted as volcanic seamounts. The imagery map shows that the slopes of the seamounts’ appear as dark facies and the medium grey corres- ponds to the top and smooth slopes, suggesting that a sedimentary cover is present on the summit of the seamounts (Fig. 20). 2) The trench area and its outer wall ,.
The outer wall of the trench is characterised by dark to medium grey lineations that are scarps. Two directions of strike can be distinguished : the dominant trend ranges from NlO”-20”E and the secondary direction is N35”-40”E. They are interpreted as normal faults that cut the edge of the Hikurangi Plateau just before subduction. In the northermost tip of the study area, the trench is highlighted by very light facies contrasting with the usual mid grey facies observed on the sea bottom east of the trench. This suggests deposition of a different type of sediment. 3) The forearc slope
The toe of the forearc slope is generally imaged by mid grey facies, and is characterised by closely-spaced dark lineations, which mainly trend N30°E, parallel to the mean trench axis orientation. The lineations, which are much more abundant than in the outer wall of the trench, are observed in a zone 20 km wide and are especially well developed between 36’30’5 and 37’45’s. Dark facies indicating very steep slopes and possibly rock outcrops are noted where the forearc slope is steep, in particular at 35’50’s where the Raphuhia scarp of the Hikurangi plateau intersects the trench; and at 37”45’S where the Ruatoria Knoll volcanic massif indents the arc slope.
Dark, circular and isolated spots (2-3 km in diameter) can be observed on the slope margin (e.g. 36’3O’S, 180°) (Fig. 20), The bathymetric map shows that most of these spots coincide with tops of domes. At 36O38’S 179”48’E, a cluster of four spots is located in a N 145”E trending graben. These features with high backscatter indicates the presence of rock outcrops and are interpreted as volcanoes or mud volcanoes.
Seismic Reflection
Twelve 6-channel seismic reflection profiles (P2 to Pl3) (Fig. 17), totalling a distance of 139 1.1 nautical miles, were shot parallel to the trench’axis in the Kermadec box. Four structural and sedimentary seismic domains are distinguished on the single-trace seismic sections (Fig. 19) : 1) The forearc slope
Seismic profiles along the forearc indicate that seismic basement crops out commonly at a series of scarps, which may be fault scarps. The sedimentary cover is everywhere less
40
than 0.1 s TWT thick. Small sedimentary basins appear to be bounded by normal and strike-slip faults, but processing of seismic data is required to confirm the dominant struc- tural style. Due to the orientation of the profiles, lateral seismic reflection (side swipe) is prevalent in areas of high relief. Sediments in the basins are no thicker than 0.5 s TWT and apparently normal faults displacing the basement have a minimum throw of 0.4 s TWT.
In the northern part of profile 5 (Fig. 21), a seismically opaque block overthrusts a small sedimentray basin. A strong reflector 1.2 s TWT beneath the basin rises to the north and meets the steep scarp of the lower arc slope. The reflector may define the surface of a subducting seamount and represent the decollement in this area. 2) The trench
The thickness of the sediment fill in the trench axis is variable. The trench is bordered by steep faults which enclose some lozenge-shaped basins. The sediment thickness increases from 0.35 s in the north to 0.8 s TWT in the south. In the middle part of the survey area, the thickness of sediment in the trench is 1.1 s TWT. 3) The deep oceanic plate.
The oceanic plate surveyed north of the Hikurangi Plateau is overlain by a 0.5 s TWT thick sediment cover. The upper sequences of the sediments bound the scour moat below the Rapuhia scarp and are inferred to represent a fan-drift formed by interaction of the Deep Western Boudary Current with sediment from the Hikurangi channel (Sequences 1, 2 in Fig. 21). Sedimentary units bounded by erosional surfaces can be observed. These sequences unconformably overlie the lower sedimentary sequences (Sequences 3,4 and 5 ; Fig 22 and 23), which are parallel bedded and unrelated to a scour moat, and seem to have been deposited before the fan developed. The oceanic crust and a thin sedimentary sequence (sequence 6) are displaced by normal faults (profile 6 and profiles 7,8 and 9 in Fig. 22 and 23). 4) The Hikurangi Plateau
From north to south the seismic profiles of Hikuraugi Plateau show little variability. In the north, the Rapuhia Scarp, a basement high (volcanic ridge?), marks the northern bor-- der of the Hikurangi Plateau. The sediment cover overlying the basement is well imaged along profiles 11 (Fig. 24) and 12. Six seismic sequences can be distinguished (Fig. 24). From top to bottom they are : (i) Sequence I is characterised by high amplitude and low frequency seismic reflectors,
and is no thicker than 0.25 s TWT. The sequence unconformably overlies sequetzce 2. (ii) Sequence 2 is characterised by weak, low frequency reflectors at about 0.30 s TWT. It
unconformably overlies seqzlence 3. (iii) Sequence 3 has a near-transparent seismic signature and is variable in thickness (maxi-
mum is 0.2 s TWT). The base of this sequence marks a major unconformity over the apparently syntectonic sequences 4 and 5. For example, in areas where the basement rises toward the seafloor, sequence 3 is missing and seqlfence I unconformably overlies both sequences 2 a& 4 (profiles 9, 11 in Fig. 23 and 24 and profile 12).
41
(iv) Sequence 4 is characterised by well-defined, high frequency reflectors, which are commonly disrupted by normal faults. Thickness is variable along the Hikurangi Pla- teau seismic lines (line 11 in Fig. 24 and line 12). Sequence 4 unconformably overlies sequence 5 on a possible erosional surface.
(v) Sequence 5 represents fault bounded infill within a graben, with internal reflectors suggesting syntectonic deposition. Its seismic signature is similar to that of sequence 4, and it has a maximum thickness of 0.15 s TWT (profile 11 in Fig. 24).
(vi) Sequence 6 is marked by strong, high amplitude, low frequency reflectors and is about 0.2 s TWT thick. This reflector represents the lowermost graben infill, and is commonly tilted by normal faults. In the southern part of the survey area, some outcropping basement reflectors appear to
be related to volcanic seamounts and volcanic intrusions, with good examples on profiles 4, 5 (Fig. 25) 6 and 11 (Fig. 24) in the region of the Ruturoa Knoll, from S 37”50’, W 179’50’to S 38”50’, E 179”50’.
Gravity
Figure 26 shows the contoured free-air gravity anomaly for the Kermadec survey box. The gravity is dominated by the deepening bathymetry of the Kermadec Trench with a maximum anomaly of -140 mGa1 corresponding to a maximum water depth of 7800 m at 35” 30’s.
The other major feature of note is the near absence of free-air gravity anomaly associated with the 1 km change in water depth, along the Rapuhia Scarp. There is only a ca. 10 mGal negative gravity ‘anomaly correlated with the scat-p. The small negative anomaly could however be simply due to the topography of the erosional moat at the base of the Rapuhia Scat-p. The lack of a significant gravity anomaly at the Rapuhia Scarp indicates the Hikurangi Plateau is isostatically compensated.
Gravity highs (ca. 50 mGa1) on the southern third of lines 2,3 and 4 and most of line 1 are correlated with high topographic blocks imaged in the bathymetric survey.
A northwest trending, ca. 20 mGa1 high traversing from the southern limit of line 12 (Ruatoria Knolls) to at least 38” 07’S on line 6 correlates with a volcanic ridge imaged in the seismic reflection, magnetic and bathymetric data. The ridge appears to have created an embayment in the inner trench wall bathymetry at 37” 50’S on line 6 and this embayment is correlated with a ca. 25 mGa1 low.
A WNW trending volcanic ridge between 38” S on line 13 and 37” 45’S on line 11 apparent also in seismic reflection, magnetics and imagery data is recorded as a ca. 5-10 mGal high trend.
A large ridge that is apparent in seismic reflection and imagery data trending NW from the southern limit of line 8 to the intersection-of the Rapuhia Scarp and Kermadec Trench at 35” SO’S on line 5 is evident as a ca. 10 mGal ridge.
Magnetics
The magnetic anomaly data shown contoured in Figure 27 are dominated by the effect of the northwest trending volcanic ridges on the subducting Hikurangi Plateau. The
42
northeastern flank of the most prominent ridge forms the Rapuhia Scarp. The high ampli- tude (100-700 nT), broad (70-120 km wide), magnetic signature of this ridge may be reinforced by an edge effect resulting from contrasting susceptibilities between the apparently volcanic basement of the elevated Hikurangi Plateau and that of the oceanic crust to the north. This margin anomaly has a peak value of 680 nT at 36” S on line 7 corresponding to a change in the strike of the margin scarp from 140” in the east to 115” for 50 km immediately east of the trench. The magnetic trend of the high associated with the Rapuhia Scarp maintains an overall strike of 140” over the forearc slope as far west as line 3, indicating subduction of the plateau margin also continues beneath the inner trench wall.
The NW trending Ruatoria Knolls volcanic massif produces an anomaly signature and trend similar to the Rapuhia Scarp described above. The peak anomaly of this southern massif is ‘500 nT at 38” 07’S on line 5. Seismic reflection data reveal elevated (> 1 s TWT) volcanic basement on the subducting Hikurangi PIateau south of 37” 45’S corresponding to a broad (> 100 km wide) base to the Ruatoria Knolls volcanic massif.
A 120-150 nT, NW trending ridge recorded also in the imagery and seismic reflection data is apparent between 38” S on line 13 and 37” 50’S on line 11. This ridge lies at the northern limit of the elevated volcanic basement described above. This broad elevated volcanic basement ridge produces positive magnetic anomalies interpreted as extending as far west beneath the inner trench wall as 37” 45’S on line 5.
In contrast the topographic ridge between 36” 25’S on line 8 and 36” 05’S on line 6, which appears volcanic on both seismics and imagery produces very little magnetic anomaly (< 30 nT).
Over the forearc slopk, the elevated southern half of lines 2 and 3 have high magnetic anomalies (ca. 200 nT) suggesting the area is underlain by a shallow basement volcanic ridge. Positive anomalies (ca. 100 nT at latitude 36” 36’S on lines 4 and 5 may be eastward extensions of this ridge. They lie north and west of a bathymetric embayment and may alternatively correspond to a buried seamount.
While not directly correlated with volcanic structures, the magnetic anomaly contours on the subducting plateau between 36” 35’S and 36” 50’S are orientated NW parallel to the volcanic ridge trend.
Conclusions
The geological structures and geophysical anomalies mapped across the forearc slope east of the East Cape Ridge and at the southern termination of the Kermadec island arc indicate that the subducting, volcano-studded Hikurangi Plateau is deforming the forearc mainly by normal faulting, collapse and slumping. Small-scale slumps and tilted blocks are particularly well-expressed along the lower slope and deformation front both southeast of the East Cape Ridge and at the deep Kermadec Trench. This type of forearc deformation gives a highly irregular morphology that contrasts with the regular and steep forearc slope south of the Ruatoria Knoll.
The Rapuhia Scarp, which bounds the Hikurangi Plateau to the North, appears to extends 50 km beneath the forearc as indicated by magnetic anomalies. The combination of the
43
plate convergence direction with the extrapolated trend of the Rapuhia scarp beneath the Kermadec forearc suggest that the Hikurangi Plateau has swept southwards along the Kermadec Trench. This sweeping sinistrally offsets the forearc slope and produces extensional features in the forearc slope. South of the present junction of the Rapuhia Scarp with the trench, the subducting Hikurangi Plateau has uplifted the forearc slope and forms en echelon, sediment-starved basins along the trench.
The forearc is also deformed by a well-define network of normal faults trending N1&8”E and N30+.5”E in directions similar to those of the faults recognized on the western border of the Hikurangi Plateau. This similarity suggests that part of the extensional deformation of the forearc slope is controled by the vertical deformation of the subducted Hikurangi Plateau. However, the morphologic lineaments and linear scarps that trend N30-45”E seem to define a horse-tail tectonic pattern in the southern half of the survey area, suggesting that strike-slip tectonics may contribute to the deformation of the forearc slope. Moreover, thrusting and imbrication of slope rocks may be locally active near the deformation front.
The extensional deformation that affects the Hikurangi Plateau appears to be concentrated in a narrow band (3.5 km in width) along the Southern Kermadec Trench suggesting that the downgoing plate that carries the Hikurangi Plateau suffers only limited bending prior to being subducted beneath the Kermadec Island Arc and New Zealand.
THE MAHIA BOX
In the Mahia box (Fig. 28) we intended to map the transition zone between the wide and low relief, Hikurangi imbricated accretionary wedge that developed southeast of Hawke Bay and the narrow, high-relief and seismically non-reflective magin located east and northeast of the Mahia Peninsula. The Mahia box is centred on the Poverty Seavalley reentrant and the high steep margin of the Pantin, Caliptogena and Ritchie Banks. It extends southward along the Omakere Ridge. North of the Poverty Seavalley, the box extends over the Tuaheni Bank and connects northward with the Kermadec box along the deformation front. The Mahia Seamount and the Gisborne Knolls, together with a seg- ment of the Hikurangi Channel, were mapped on the downgoing plate.
This box consists of 11 multidata lines from line P14 to P24 (Fig. 29) that cover an area of approximately 15000 km2 in water depths ranging between 500 m and 3500 m. P14 began the 8 November 1993 at 10 : 18 GMT at 38” 29,46’S, 179” 43,22’E on the Hikurangi Plateau and extended across the forearc slope toward the Mahia Peninsula. P24 ended on the 11 November 1993 at 22 :05 GMT at 40” 17’S, 178” 38’E south of the Mahia Seamount on the Hikurangi channel. These lines were used to survey four structurally different domains of the subduction zone (Fig. 30) : (1) the generally flat downgoing Hikurangi Plateau with Hikurangi Channel and seamounts, (2) the rugged, low-angle seafloor of the Poverty Seavalley reentrant, (3) the steep regular forearc slope north of the Poverty Seavalley and (4) the high-reliefs and lower ridges of the margin south of the Poverty Seavalley.
44
Swath Bathymetry
I) The downgoing plate In the survey area (Fig. 30), the subducting Hikurangi Plateau shows two conspicuous
isolated highs that tower above a flat sub-horizontal seafloor locally incised by the winding Hikurangi Channel. The water depth of the abyssal plain increases northward from 3000 m near 40’20 S to 3550 m at 38”40 S, these values correspond to a north-northeast dip of 0.03”. A closed bathymetric contour located at the edge of the Hikurangi trough, in front of the mouth of the Poverty Seavalley, indicates a slight 50-100 m seafloor depression that is part of a gentle undulation of the seafloor 18 km in wavelengh measured transverse to the margin.
Four elongated highs lie on the Hikurangi Plateau in the eastern part of the mapped area ; two minor ones are located at the toe of the forearc margin. The major highs exhibit a rhomboidal shape bounded by two sets of scarps trending N 15f5”E and N155&lO”E. The two northernmost massifs called the Gisborne Knolls have summits located at 38”46’S, 179’26’E and 39”Ol’S, 179’19’E but have coalescent bases. The southern Gisborne Knoll, which is just over 1000 m above the Plateau, is delineated by rectilinear steep scarps and shows a flat summit topped by two 200 m-high cones. The Mahia Seamount with its summit at 39”35’S, 179’15’E and above 1250 m over the Plateau, shows a more complex summit morphology with numerous 100-300 m highs. This seamount is connected by a low ridge of less rugged material, with two deep water summits located near 4O”OO’S, 179”lO’E. A fourth high, reaching over 500 m above the seafloor, was partly mapped ,at the southeastern edge of the survey area. The massive and pyramidal shape of these highs evokes volcanic seamounts emplaced at the intersection between major fractures. Two western highs located at the toe of the margin slope (39”03’S, 178’58’E and 39’3O’S, 178’48’E) are small (150-500 m high), and have a conical shape.
The Hikurangi Channel winds between the southernmost volcano and the deformation front along the western flank of the Mahia Seamount (Fig. 30 and 3 1). There, it is 18&4 km east of the toe of the margin. It is separated from the margin by a 50 m-high rise (levee) as the left bank of channel. Just in front of the Poverty Seavalley, the Hikurangi Channel sharply turns southeastwards between the southern Gisborne Knoll and the Mahia Seamount. In the southern part of the survey area, the channel is 150 m deep and 2 km wide at the rim, whereas where it turns southeast its depth decreases to less than 100 m and its width increases up to 7 km. 2) The margin slope
,
Morphologically three segments can be distinguished from north to south along the margin slope of the Mahia Box (Fig. 31) : I- a steep margin slope north of the latitude 38” 50’S, 2- the massive reentrant and canyons of the Poverty Seavalley, 3- the steep slopes and ridges of the Pantin and Ritchie Banks extending south of the Poverty canyon.
North of latitude 38” 50’S, only the lower slope of the margin was mapped during the survey. This slope trends NIO” and extends in depth from a slope break near 1000 m down to the seafloor of the Hikurangi Plateau at 3500 m. The slope is generally steep (up to 9”) and shows small flat terraces hanging over steep scarps trending between N175”E and
45
Nl5”E. At latitude 38” 43’S a canyon appears to feed into one such flat terrace that could be seen as a slope basin, The toe of the slope shows locally lobate features with convex fronts that we interprete as slumps.
The Poverty Seavalley reentrant includes a 1200 km2 embayment of the upper slope that lies under 1500 m of water and 1800m above the Hikurangi Plateau. The northern part of the embayment represents a slope basin that has a smooth seafloor. Along its northwestern part a fan-shaped morphology suggests a southward direction for sediment transport. The slope basin is bounded eastward by two N35”t-5” trending ridges, 250-450 m high, that mark the limit between the upper and lower slopes. The northern boundary of the basin is formed by a south-facing, gentle slope that is laterally offset by NOO-N22”E trending scarps. South of the canyon network, the basin merges into a 18 km-long basin that trends N30”E. The Poverty Seavalley is separated from the shelf by a 500-600 m high scarp that dips 9” east. This scarp is incised by a series of tributaries parallel to the dip of the slope. These tributaries merge into two major sinuous canyons. These canyons, together with a subsidiary one, cut deeply (750 m) into the margin. The upper sections of the major canyons are V-shaped ; below 2250 m deep, the canyons have a flat bed.
The lower slope north of the mouth of the canyon has a steep morphology characterized by a near-flat terrace that is 4.5 km-wide lying under 2250 m of water. The terrace is fed by a north-trending canyon that sharply incises the upper arc slope. This terrace is separated from the deep seafloor of the Hikurangi trough by a N54” trending, 1100 m-high steep scarp that is cut by a series of small size (3-4 km in diameter) semi-circular calves.
South of the mouth of the Poverty Seavalley reentrant, the slope of the margin shows a slope break that separates the high relief, steep, upper slope from a more gently dipping, stepped lower slope. The width of the lower slope ranges from 18 km near 39’30’s to only 5 km at 39’40’s and it is characterized by widely curved ridges and elongated basins. The ridges appear assymetric with a steeper east flank. Such a morphological pattern evokes an imbricated fold and thrust belt. This belt abuts southward against an elongated, N151”E trending high that is 20 km long and 500 m high. In map view, the slope break between the upper and lower slopes is outlined by a series of sub-orthogonal scarps trending N30”&5 E and N125”45 Esuggesting en echelon structures. The upper slope shows several major banks trending N15”&3”E. The summit of the Ritchie Banks was not mapped during this survey. However, the NZOI map indicates that this bank reaches 300 m deep. The Caliptogena Banks and the Pantin Banks reach respectively 750 m and 900 m deep. In the soutwest region of the survey, a set of narrow ridges and basins together with a dense network of rectilinear scarps trend N30”E. These scams appear to cut obliquely across the N15”E trending banks suggesting that the scarps are sub-active faults that slice an older topography. This region could be deformed by strike-slip faulting.
Side-scan Imagery From the side-scan imagery data (Fig. 32) we can subdivide the Mahia box into
5 regions : - two on the Hikurangi Plateau : (1) the seamounts and (2) the turbidite plain with the
Hikurangi channel and its levees,
46
- three on the margin : (3) the Poverty Seavalley reentrant, (4) the front of the margin north of the Poverty Seavalley reentrant and (5) the margin south of the Poverty Seavalley reentrant.
1) The seamounts on the subducting Plateau We observe similar imagery on three main seamounts (the two Gisborne Knolls and the
Mahia Seamount) and on several minor seamounts outcropping in an elevated area in the southeast of the box. The steep flanks of the seamounts are strongly reflective and we interpret them as outcrops of volcanic rock. However, part of the seamount slopes are weakly reflective suggesting that they are draped with fine/soft sediments. On the summit of the large Gisborne knoll, three pale grey circular patches, less than 1 km in diameter, may represent the craters of volcanoes. South of the Mahia Seamount, small seamounts or rock outcrops are scattered on an elevated area. 2) The tarbidite plain with the Hikurangi Channel and its levees
The turbidite plain is characterised by moderate backscatter compared with the conspicuous channel, which is non-reflective south of 39’30’s. Around 4O”S, two strongly reflective patches, each of them 30 km long and 4 km wide, parallel the deformation front at a distance of 3 to 6 km. These two dark patches are offset along an obliquely trending dark patch. In the absence of bathymetric expression, we suggest that they may be due to a textural contrast with the surounding plain.
South of 4O”S, light and dark bands trending N 110”E are recognized over a 400 km2 area. Their wavelength is about I to 2 km. They are located on the left side of the channel and trend nearly perpendicular to it. They occur in an area where mud waves are evident on 3.5 Khz records and the bands are interpreted as the stoss and lee sides of mudwaves. The strong contrast in reflectivity that marks the path of the channel south of 39”3O’S suggests that its flat floor is filled with non-reflective fine sediment. Its width is nearly constant and equal to 2 km. The steepest flanks of the channel, generally on the outer side of the meanders, are strongly reflective. However, when approaching the northern turn (north of 39”3O’S), the bottom of the channel appears highly reflective suggesting that coarse sediments are deposited there. In its northern part, the trace of the channel widens and is more diffuse, in agreement with bathymetry. Light and dark bands in the inside bend of the chanuel between the seamounts trend N lSO”E, and may reflect northeastward migration of a channel meander. 3) The Poverty Seavalley Reentrant
At the head of the Poverty Seavalley, fifteen NlOO”E trending, strongly reflective patches correspond in bathymetry to the floors of canyon tributaiies. They merge into a strongly reflective sinuous canyon meandering toward the Hikurangi Trough. The bottom segment of the canyon is also reflective. One of its steep flanks in the middle of the reentrant is marked by a black spot attesting either to the steepness ofthe scarp and/or to the outcropping of hard rocks. In the northern comer of the re-entrant, a wide area of speckled backscatter possibly indicates a debris flow. 4) The front of the margin north of the Poverty Seavalley reentrant.
Just north of the canyon’s mouth, the steep flanks of a ridge are dark, perhaps indicating hard rock or a steep slope. To the northeast, in front of the deformation front, a circle of
47
dark patches corresponds to a seamount that is evident in the bathymetry. A semi-circular dark patch marks a very steep section at the back of a margin terrace. Some lineations on the steep slope parallel the deformation front in the northern area and may indicate small scarps. 5) The margin south of the Poverty Seavalley reentrant.
Alternating dark and grey patches outline the bend of the deformation front immediately south of the canyon’s mouth. They correlate well with alternating scarps and flat areas as shown on the bathymetric map. South of S 39”30’, N 20” lineations parallel the deformation front for 25 km. South of S 39”50’, N 40” straight lineations on the upper slope correlate well with bathymetric scarps.
Seismic reflection The seismic tracks (Fig. 29) consist of nine lines oriented approximately parallel to the
coast, heading 016” and 196” on alternative lines, one line running west-southwest from the end of the Kermadec box survey (line 14) and one line (24) running to the southwest from the southern end of line 23. 1) Seismic lines description LINE! 14 This line runs approximately west-southwest and is the nearest to a dip line shot during
this survey in this part of the margin (Fig. 33). The seabed in the Hikurangi Trough is relatively flat, although it is slightly bowed up with its apex at mid-section, Flat-lying sediments overlie a chaotic unit, which is believed to represent a massive debris fan or succession of fans. The chaotic unit includes mounded bodies, which may be shale diapirs (Lewis, pers. comm.).
Below the chaotic unit is a thick transparent unit (0.5 seconds TWT), which appears to be truncated by a major fault near 12 :OOh. The transparent unit does not appear to the east of the fault, possibly because the scattered energy from the chaotic unit cannot image this low reflectivity unit. Another possibility is that some of the material from the trans- parent unit has been mobilised as shale diapirs.
The Hikurangi Plateau below these superficial units is broken by many normal faults and a probable volcanic intrusions at shot time 12 :30h. The Hikurangi Plateau sequences consists of up to four discernable units, which are highly reflective but not all are seen along the whole section covering the Hikurangi Plateau. Basement, as in much of the Hikurangi Plateau, is difficult to pick below these units, which may include older sediments, lava flows and volcaniclastic sediments.
The base of the slope of the margin does not appear to be thrust faulted on this line. On the contrary, the first thrust discernable is more than half-way up the slope. Around 15 :00 a strong, landwards-dipping reflector may be the top of a subducting seamount. This would explain why there is no visible decollement at the base of the slope. A second similar reflector appears between 17 :00 and 17 :30 below Tuaheni Bank and dipping from 1.5 to 2 seconds TWT. This body is fractured by normal faults and over-thrust by sedimentary units. Thrust-faulted sedimentary units are observed below the shallower regions of this line.
48
LINE 15 (not shown) Line 15 crosses the heads of the Poverty Seavalley, an indented and corrugated part of the
shelf edge. The Poverty Seavalley are represented here by a series of tributary canyons, which eventually form a single major canyon to seaward (Fig. 30). This seismic line shows the numerous tributaries, as channel features, which increase in depth to the southeast ; they give rise to much diffraction scattering making it difficult to discern coherent sedimentary reflectors below. However, some reflectors are seen although struc- tures and basement are not observed. Sedimentary reflectors are present below each flank of the Poverty Seavalley region but relationships are not easily seen. Probably all of the reflectors recorded are sedimentary.
LINE 16 (not shown) Line 16 is 15 km further offshore than line 15. Here, the tributaries have coalesced to two
or three major channels and, as a result, sedimentary sequences are better imaged. The deeper sedimentary sequences form a broad syncline along the line and the overlying sediments can be subdivided into low-stand and high-stand systems tracts. At least two phases of canyon fill are observed.
LINE 17 (not shown) This line runs from the Tuaheni Bank in the northeast, across the central part of the Poverty
Seavalley, across Pantin and Ritchie banks to Paoanui Ridge. Three sequences are observed on Tuaheni Bank ; a draped or folded unit at the base, an onlapping unit above that, and a unit draped over the other two. The southwestern boundary between Tuaheni Bank and the Poverty Seavalley low appears to be faulted by a major normal fault and units above it are slumped. Below the Poverty Seavalley, sedimentary units form a broad anticline, in contrast to the previous line where deeper sediments form a syncline. Folding is apparent between 3 and 4 seconds below sea-level, probably as a result of compressional faulting. Intrusive bodies, probably volcanic but possibly shale diapirs, may have enhanced the folding.
The boundary between the Poverty Seavalley depression and Pantin Bank is also probably faulted, perhaps by a thrust fault. This boundary is covered by approximately 1 second of sedimentary rocks. The region between Pantin and Ritchie banks is covered by approximately 2 seconds of sediments. This sequence contains several unconformities and is gently folded, suggesting tectonic control of deposition, while Ritchie Bank and Paoanui Ridge appear to be block faulted basement with only a thin draped sedimentary sequence.
The remaining section to the southwest of Paoanui Ridge also images a thick folded sedimentary sequence, which also shows a prominent Bottom Simulating Reflector (BSR).
LINE 18 (not shown) This line crosses the accretionary prism approximately 20 to 25 km landwards of the
tectonic front. The seabed has great relief from less than 1 to more than 3 seconds TWT and the major feature shown is the Poverty Seavalley canyon, which contains only thin sediments, less than 0.5 seconds TWT at this point. Few continuous reflectors are seen on the section, either because of severe deformation in the accretionary wedge or because
49
this part of the margin contains basement and volcanic rocks. Some steep scarps suggest faulting at the seabed but it is not known whether it is compressional or extensional.
LINE 19 (not shown) The main feature of line 19 is a BSR, which crosses the line near 1 second below the
seabed. This line crosses the Poverty Seavalley where the canyon joins the floor of the subduction trench. Although the BSR obscures underlying data, there is no sign of a basement reflector on this section and some continuity is seen to 2 seconds below the seabed, where folded reflectors are observed. There is some evidence for thrusting to the northeast of the Poverty Canyon. This section gives an overall impression of a thick deformed sedimentary sequence.
LINl$20 This line (Fig. 34) runs approximately along the sinuous deformation front. It crosses the
mouth of the Poverty Canyon and continues north past the limit of the Mahia box to image the deformation front at the southern edge of the Kermadec box. The seabed has 2 seconds of relief (1,500 m), from less than 3 seconds to more than 5 seconds TWT. Between 08 :00 and 09 :15, the mouth of the Poverty Canyon forms a reentrant in the deformation front where sediments are relatively undeformed. To the northeast of this reentrant, the character of the accretionary prism is different from that to the southwest. Although some regions to the northeast are gently folded, other zones show only short, discontinuous reflectors. There is little coherence and consequently little information on facies relationships. To the southwest of the Poverty Seavalley reentrant, reflectors are much better imaged with penetration to 3 seconds below the seabed. There are two bulges in the margin with a small reentrant between. Seismic character changes across this second reentrant. To the northeast, tight, apparently isoclinal folding is imaged, while the remaining part of the section shows a series of asymetric folds, which are interpreted as being caused by eastwards to northeastwards-verging thrusts. It is likely that the folding in both regions is caused by similar thrusting and the different styles result from a different direction of vergence or from slightly different degree of com- pression.
LINE 21 _. Line 21 runs-along the axis of the Hikuraugi Trough, which slopes gently from 4.3.se-
conds in the southwest to 4.8 seconds in the northeast. There is no indication of com- pressive tectonics, so this line lies away from the tectonic front and on the subducting edge of the Hikurangi Plateau (Fig. 35). Sedimentary thickness averages more than 1 second TWT along this line. Basement is difficult to discern. There are many deep reflectors, although most are discontinuous and sedimentary reflectors appear to grade downward without a clerly defined basement. The exception is where the line images the western flank of the Mahia Seamount (Fig. 35). There, deep reflectors dip towards the centre of the mass. This may be a result of flexural loading of the crust by the Mahia Seamount.
Two major features are seen in the sediments (Fig. 35) ; a southwesterly-thinning chaotic wedge thought by Lewis (pers. comm.) to be a major debris flow from slumping of the margin in the Awanui Seavalley reentrant. Secondly, the line images a northwards-
50
migrating, fossil canyon system between 20 :00 and 21 :30 near the point where the Hikurangi Channel is believed to take a sharp turn to the right to pass between Mahia Seamount and the Gisborne Knolls. The modem seabed is undulating above the fossil canyons, probably representing sediment waves. This point also lies along the oceanward projection of the Poverty Canyon and there are several possible explanations : (1) The Poverty Canyon may have fed straight out between the Mahia and Gisborne highs and is now being buried by a sediment fan of the Hikurangi Channel ; (2) The Hikurangi Channel may have cut the original depression including its right-angle bend and was subsequently buried by a fan from the Poverty Canyon ; (3) Something more complex is happening, or has happened, and both systems coalesce to distribute sediment along the channel system to the east.
LINE 22 (not shown) This line passes across Mahia Seamount and the Gisborne Knolls and the intervening
region is occupied by 0.5 to 1.5 seconds of sediments containing the fossil and exposed Hikurangi Channel. In this region, the faulted basement layers of the Hikurangi Plateau are also imaged, as are possible intrusions into the overlying sediments.
LINE 23 (not shown) Line 23 heads southwestwards across Gisborne Knolls and the Mahia Seamount, again
with the Hikurangi Channel between. Both fossil channels and a channel active in recent geological time are well imaged. Sediment thickness on this line reaches 1.5 seconds TWT. These sediments onlap the flanks of the seamounts and appear to be post-extrusive. Wedge-shaped bodies thin away from the bases of the seamounts and these may represent early lava flows.
LINE 24 (not shown) This line runs southwestwards from the flank of the Mahia Seamount along the general
trend of the Hikurangi Channel. Sedimentary units thicken to the southwest as the line obliquely approaches the deformation front. The flanks of the seamount are marked by wedges, which again suggest early lava flows. The deeper sediments may be intercalated in places with volcanic sills. This line crosses the Hikurangi Channel twice and there is no sign of a fossil channel below either crossing.
2) Summary of seismic characteristics In the Mahia Box, the shelf edge in the large embayment of the Poverty Seavalley
shows a number of tributary canyons, which eventually join to form a single canyon, the Poverty Canyon, which once ran across the trench and between the Mahia Seamount and the Gisborne Knolls. This canyon is no longer active and is filled to the level of the trench floor by at least two depositional sequences. Highstand and lowstand systems tracts can be seen on line 16.
Lines 15 to 20 cover the imbricate thrust wedge. Most are unable to image the complex structure of the wedge, but the southwestern sector of Line 20 (Fig. 34) clearly shows thrusting and growing anticlines. Compressional faulting is probably dominant throughout this segment of the margin.
The other lines image various parts of the Hikurangi Plateau. Line 21 runs along the axis of the present-day trench, showing thick sediments, a possible, northerly-derived
51
chaotic debris fan and fossil canyons, probably extensions of the Poverty Canyon, which migrated northwards with time. Lines 21,22 and 23 are dominated by seamounts. Basement, assumed to be old oceanic crust, probably pre-Cretaceous, cannot be identified with con- fidence. The processes, which created the thick Hikurangi Plateau probably included pelagic sedimentation over a long period of time and at least one phase of volcanism in the Late Cretaceous. The thick sediments, volcanic rocks and probably also volcaniclastic sediments effectively mask the basement so that only discontinuous reflectors can be seen. Line 24 shows that there is no fossil Hikurangi Channel beneath its present route in this area and that this part of the Hikurangi Channel may be a modern feature.
Gravity
Figure 36 shows contours of the free-air gravity anomaly derived from data collected along the tracks indicated by the dotted lines. There was a mean cross-over error of 2 mGal. The gravity anomaly contours correlate almost totally with along track bathymetry. Mass excesses or deficits below the seafloor will only become apparent as a result of future modelling.
Magnetics
Figure 37 shows contours of magnetic anomaly measured along the tracks indicated by dotted lines. The cross-over error was 2 nT on both cross-overs.
The major high amplitude (> 200 nT) positive magnetic anomalies generally correlate highly with mapped seamounts. The major exceptions are the 320 nT anomaly at 39” S on line 20 and the ca. 50 km diameter, > 200 nT, positive anomaly beneath Ritchie Bank (39”3O’S-39’45’s) on lines 17-20.
The anomaly at 39”S, line 20, occurs on the flanks of the Paritu Ridge. A nearby small circular feature evident in the swath bathymetry at 39” 02’S, 178” 58’E, has a shape sug- gestive of a volcanic cone. The Paritu Ridge flank appears mainly sedimentary in the line 20 seismic section although low frequency reflectors, ca. 1.5 s TWT below the seafloor at 39” S, which correlate with the magnetic anomaly high may correspond to volcanic rocks.
Reflections returned by the interpreted volcanic rocks are evident on seismic line 20 approximately 1.2 s TWT below the seafloor and coincide with the ca. 200 nT positive magnetic anomaly of Ritchie Bank. These reflections may correspond to a subducted seamont. While almost all of the high (> 200 nT) positive magnetic anomalies can be correlated with volcanic rocks interpreted from seismic reflection records some of the supposed volcanics appear only weakly magnetized. In particular the northern volcanic peak of Gisborne Knolls, evident on both the seismic reflection and bathymetric data along lines 22 and 23, has no obvious anomaly associated with it. Although volcanic rocks of the Mahia Seamount complex outcrop on the seafloor between 39” 25’and 39” 40’S (line 22) the anomaly decreases from ca. 200 nT at the northern margin of the complex to almost zero at the southern limit.
A volcanic seamount evident on the swath bathymetry and seismic reflection data near the southern end of .line 24 produces a 400 nT anomaly at 40” 15’s.
52
Conclusions
In the Mahia box, the active margin comprises two different parts based on morpho- structural and seismic reflection data (Fig. 31). The upper part of the margin that extends all along the survey area has a massive and high topography, and is seismically opaque, except in the Poverty Seavalley embayment, where a slope sedimentary basin developed. The margin to the south is severely sliced by numerous linear faults that are interpreted as strike-slip faults. The lower part of the margin is a belt of seaward verging anticlines and backtilted basins similar to those well-developed south of the Mahia box in the Hikurangi accretionary weddge. The belt narrows northward and terminates near 39”OO’S. We interprete this belt as recently accreted trenchfill sediment deformed by arcuate folds and imbricated thrusts. The slope break between the lower and upper parts of the margin is marked by a major continuous and sinuous tectonic boundary. North of the termination of the fold belt, the toe of the margin is increasingly affected by slumping and collapse features suggesting that tectonic erosion is occuring. The morphologic reentrant of the Poverty Seavalley looks like a large scar left by a subducted seamount in the margin as suggested by Lewis and Pettinga, (1993). This reentrant contains at least 1500 m of sediment infill, which suggests the scar is not a recent feature and probably predates the developement of the deformed belt at the toe of the slope. On the downgoing plate, the Hikurangi Plateau is covered by a sedimentary cover up to 1.5 s TWT thick that is pierced by volcanic seamounts. The Poverty Canyon, which cuts deeply through the margin, once ran across the trench and between the Mahia Seamount and the Gisborne Knolls. This canyon is no longer active on the abyssal plain and is filled to the level of the sea floor by sedimentary deposits from the now active Hikurangi Channel.
TRANSIT BETWEEN MAHIA AND KAIKOURA BOXES
During the transit between the Mahia and Kaikoura boxes, we first followed the meanders of the Hikurangi canyon towards the South (P2.5 oriented N14”) and then made a geophysical” cross section of the accretionary wedge following the multichannel seismic reflection line previously collected by the S.P. Lee (Davey et al. 1986) (P26 oriented N102” E). This line was collected to determine the strikes of deformation across the wedge. Line P27 oriented N208” E was collected just beyond the shelf break to show upper slope structural trends (Fig. 38).
Swath Bathymetry
The swath bathymetry along line P25 is shown in Fig. 39. Along this line the canyon shows 3 segments : a northern segment trending N175”E ; a central segment that trends N45” E and a southern one that is oriented N15” E. The three segments indicate that the canyon is I .5-2.0 km wide and about ‘150 m deep.
Along line P26 (Fig. 39), the overall structures trend NE and the wedge consist of three main flats 18-28 km wide that are separated by four narrow ridges and scarps that vertically offset the flats by 300-400 m (Fig. 39 and 40). We describe the topography from the bottom
53
of the margin to the top. The abyssal plain at the toe of the wedge shows a rounded mound 150 m high above the plain. This mound has been show to be created by a buried seamount (Davey et al., 1986). The mound is separated from the first ridge of the toe of the wedge by an elongated, 150 m-deep, depression. This first ridge trends NOS” and reaches 2850 m below sealevel and is interpreted as the main deformation front (Fig. 40). The second ridge (Akitio ridge) trends N40” and is flanked eastward by a 350 m-high scarp. The flat between the second and third ridges is deformed by two secondary highs that are aligned N22”. The line crosses this alignment in the saddle between the highs. The third ridge (Porangahau ridge) is 8 km long, trends N32” and is bounded eastward by a 350 m-high scarp. The fourth ridge ends where it crosses the line. This segment trends N27” and has an eastfacing, 450 m-high scarp.
Line P27 shows the morphology at the boundary between the continental shelf and the upper accretionary wedge. A 28 km-long, curved and rounded top feature is imaged on this line (Fig. 40). This feature that trends N27” and is 500 m high could be the southern extension of the Madden Ridge.
Side-scan Imagery Sidescan imagery data were collected during the transit (Fig. 41). The transit consists
of a succession of three segments corresponding to three regions : (1) the turbidite plain with the Hikurangi Channel, (2) the accretionary wedge and (3) the upper slope of the margin. 1) The turbidite plain with the Hikurangi Channel and its levees
The turbidite plain is- characterised by moderate backscatter compared with the conspicuous channel, the flanks of which are strongly reflective. The bottom of the meandering channel is increasingly more reflective toward the south suggesting that it is filled by coarser sediment closer to its southern source (Fig. 41). Its bottom is particularly reflective between 40’21 ‘S and 40’32’s. Its width is nearly constant : 2 km between 40’S
I and 41 “S. On the overbank plain, near 40”1O’S, mud waves are located on the left side of the channel and trend N 140” nearly perpendicular to it. Their wavelength is about 2 km. Several small dark patches indicate rock outcrop on a small seamount near41°20’S, which correlates well with bathymetry. 2) The accretionary wedge
Dark patches may indicate outcrops of rock on Bennett Knoll, a seamount located just at the deformation front. The trench axis is characterized by moderate backscatter while the deformation front is expressed as a N 100” trending slightly darker tone at 178” 13’S to the north of the track. The first main anticline is marked by a higher reflectivity along its trenchward slope trending N 30”. The maximum in reflectivity is reached at the level of the second group of 2 to 3 anticlines or ridges (Akitio Ridge) between 177’40’E and 177’50’E. In this case, strong backscatter covers the whole anticlinal structures and low backscatter the adjacent Akitio Basin. West of 177”35’E, wide reflective areas, more or less correlate with steep seaward slopes and low backscatter with basins.
54
3) The upper slope of the margin The strong reflectivity of the steep slope of the Madden ridge, between 41’S and 41” IO’S,
contrasts with the moderate backscatter of the surrounding area. A small dark patch also marks the top of this ridge suggesting some outcrop of hard rock.
Seismic reflection Seismic reflection Line P26 (Fig. 42) extends for about 130 km, from the north of
Bennett Knoll, across the Akitio and Porangahau ridges, to the southern flank of Madden Banks. The line crosses the Hikurangi Trench and the accretionary wedge. 1) General stratigraphy.
Water depth varies from more than 4 set TWT in the east to just over 1 set TWT in the west. Sediment thicknesses do not exceed 4 set TWT. There are 3 main sedimentary seismic facies : 1) continuous high-amplitude reflectors in the upper part of the sequence along most of the line, 2) continuous low-amplitude reflectors at the base of the sequence along the eastern half of the line and 3) relatively chaotic series between Porangahau Ridge and Madden Banks.
Between each ridge, slope basins have formed. Sediments in these basins contain numerous unconformities suggesting tectonic control of deposition by alternating movement on bounding structures. In the east, Bennett Knoll is the only area where volcanic rocks can be observed. All other reflectors appear to be sedimentary. 2) Seismic structures
Within the subducting Hikurangi Plateau, some minor normal faults appear to affect the area between the Hikurangi Channel-and Bennett Knoll. The active channel overlies nested fossil channels. The Trench itself is strongly marked by a decollement on the wes- tern flank of Bennett Knoll and by a growing thrust anticline on its hanging wall. All ridges seem to be formed by complex thrusting, mostly seawards-verging, with subsidiary backthrusting. At depth, below Akitio Ridge, a backthrust is generated by a basal decolle- ment, forming a ramp over which the ridge sediments were thrust seawards. The Porangahau ridge seems to have the same upper structure, but no deep decollement can be seen. Numerous seawards thrusts are also imaged from Porangahau Ridge to Madden Banks. At 09:30, one thrust front is modified by slope failure and formation of slump bodies over its footwall. A Bottom Simulating Reflector (BSR) is observed in many places along the line, about 1 set TWT below the seabed. Deep reflectors are seen through the multiple at 7 set TWT between 06130 to 07:30 and may represent the dtcollement at the top of the Hikurangi Plateau.
Gravity Gravity data were collected during the transit on lines 2.5,26 and 27 (Fig. 43). Lines 36
and 37 together with line 26 trend across the thick accretionary wedge and are thus presented together. The structures in the area surveyed by these lines are dominated by : (1) the bathymetry of the thrust ridges on the accretionary prism, which shallows from 3000 m in the Hikurangi Trough to 800 m at the western end of the lines, and (2) the increasing
55
thickness of sediment in the accretionary prism as the Hikurangi Plateau basement dips to the west beneath the accretionary margin.
Lines 26, 36 and 37 are dip lines across the accretionary structures. The mean cross- over error is 1 mGa1. On line 26 the gravitational effect of the shallowing bathymetry of the accretionary prism is balanced as far west as 177” 30’E by the increasing depth of the subducting plate overlain by the comparatively low density accreted sediments. The main gravitational anomalies are 15 mGa1 anomalies associated with the Akito and Porongahau Ridges. Although buried by sediments the density contrast of Bennett Knoll volcano at 178” 20’E causes an anomaly of ca. 18 mGal. West of 177” 05’E the shallowing bathmetry (1750 m to 750 m at the western end of the line) correlates with a positive anomaly varia- tion of ca. 45 mGal (not shown in figure 43). The sediment above the interpreted plateau basement thickens to the soutwest from 2.5 s TWT east of Bennett Knoll to more than 3 s TWT at the eastern extreme of line 26. The corresponding gravity anomaly decreases from -12 mGa1 to -20 mGal.
On lines 36 and 37 the bathymetry shallows across Aorangi Ridge (see Fig. 45 for names location) from 2800 to 2200 m (longitude 177” IO’E on both lines) with a corresponding 20 mGa1 increase in gravity anomaly. The 1 km decrease in water depth across the Pukeroro Ridge correlates with a further 40 mGal increase in gravity anomaly. To the west of Pukeroro Ridge the gravity decreases by 15 mGa1 accompanying an increase in depth of only 200 m. The magnitude of the anomaly decrease suggests the presence of a basin of comparatively low density sediments west of Pukeroro Ridge This interpretation is supported by the seismic sections which reveal a well-layered sedimentary basin extending to at least 1.3 s TWT below seafloor. The gravity anomaly increases by 15 mGa1 corresponding to the 400 m shallowing of Uriti Ridge at the western extreme (< 176” 10’E) of line 36.
Magnetics Magnetic data collected along lines 25 to 27 indicate a mean cross-over error of 6 nT
(Fig. 44). The magnetic anomaly variations within this area generally correlate poorly with structures imaged on the seismic data or the bathymetry. The 400 nTpositive anomaly variation at the eastern end of line 26 correlates with Bennett Knoll. A nearby 120 nT negative anomaly at 40” 45’S on line 25 appears uncorrelated with any topographic or volcanic features. It may be associated with a buried offline volcanic structure not imaged.
The magnetic anomalies increase on lines 26,36 and 37 by 120 nT over the western ca. 20 km of the lines, possibly associated with basement uplift. A positive 50 nT anomaly variation at 176” 50’E - 177” E on line 36 may be associated with strong low frequency reflectors apparent in the seismic reflection record at 0.4 s TWT below the seafloor. These reflectors may be imaging shallow basement or magnetic intrusive layers.
Conclusions The transit line 25 images the active Hikurangi Channel that overlies nested fossil
channels. Line 26 show a cross section of the Recent accretionary wedge characterized by
56
growing thrust anticlines and back tilted basins. The structure of this wedge is locally complicated by backthrusting. The swath bathymetry indicate that the anticlines shows periclinal terminations and trend N22” to N40°, whereas the deformation front against the subducting Bennett Knoll trends N05”.
THE KAIKOURA BOX
The Kaikoura box (Fig. 45) was designed to survey the southern termination of the Hikurangi accretionary wedge and its southward transition to the transpressive oniand Marlborough fault system, where the northern flank of the continental Chatham Rise collides with the South Island of New Zealand. In this box, near latitude 42”S, the relative plate convergence trends N79’&2’E, obliquely to the deformation front and the convergence rate is 39.5 ,3 mm/yr (DeMets et al., 1990). This box consists of 28 lines, P28 to P55 (Fig. 46) that cover an area of approximately 22500 km 2 in water depth ranging from 200 m to 2900 m. P 28 began 12 November 1993 at 15 :41h at 41” 16.5’S, 176” 35’E and the last line of the cruise ended on 18 November at 01 :50 : h at 41”27.09’S, 174”46.33’E offshore Wellington city. These lines were used to survey four structurally different domains of the oblique, southern Hikurangi subduction zone : (1) the downgoing plate with the Hikurangi Trough and the north flank of the Chatham Rise, (2) the southern termination of the wide, low-relief Hikurangi accretionary wedge, (3) the steep, continental slope offs- hore Honeycomb Canyon and Cook Strait, and (4) the southeastern shelf margin of the South Island between Kaikoura Peninsula and Cape Campbell. .-
Swath Bathymetry
Six morphological domains can be distinguished from the bathymetric map of the Kaikoura box (Fig. 47 and 48). Four of the six domains are on the margin : (1) the wide slope with linear ridges and troughs at the southern end of the modem accretionary prism ; (2) the steep, canyoned southern Wairarapa margin between Honeycomb Canyon and Cook Strait Canyon, (3) the smooth Marlborough steep slope with wide frontal apron between Cook Strait Canyon and 174”11’S, (4) the heavily channelled Kowhai Seavalley and Kaikoura Canyon complex. On the margin, the morphological distinctions are related to variations in style of tectonic deformation and to the intensity of slope erosion. The two other domains are on the downgoing plate : (1) the smooth seafloor of the Hikurangi Trough and (2) the scour-drift textures of the northwestern slope of the Chatharn Rise. 1) The accretionary wedge margin
The southern part of the Hikurangi accretionary wedge is characterized by a series of elongated ridges and associated troughs, trending roughly NE-SW. The southernmost ridge is called Aorangi Ridge (Fig. 45 and 48). We mapped 60 km of its very linear, N.55” trending, western extremity. This ridge is about 10 km wide, has a mean height of 750 m above seafloor and exhibits an asymmetric transverse shape with a steep trenchward wall and a gentle northern slope. Southwestward, the ridge gradually decreases in amplitude and disappears beneath the seafloor of the Hikurangi Trough, near 176’37’E.
57
The Glendhu Ridge, second behind the tectonic front, is S-10 km wide, more than 75 km long and trends N45”E. This ridge is remarkable for its straight southern wall that is more than 1000 m high above seafloor. The Honeycomb Ridge extends west from the Glendhu Ridge and is separated from it by a saddle, 200 m-lower than the axis of the ridges.
Landward of the Glendhu Ridge, the Pukeroro Ridge is a discontinuous ridge divided into 5 to 10 km-long, en-echelon highs that may be interpreted as the surface expression of fault-bounded tectonic lenses rather than en-echelon folding within a strike-slip fault zone.
North of the Pukeroro Ridge, between 176’30’E -41’10 S and 177” E - 41”25’S, a N60”E trending morphologic lineament along a south-facing scarp near 1500 m of water depth could indicate a right-lateral strike-slip fault. At the southwestern tip of the south- facing scar-p a small elongated high appears to be complementary to a small elongated low, suggesting that the high was displaced laterally along the morphologic lineament and created the low in its wake. According to the offset, the apparent displacement could be no less than 5 km (Fig. 48). 2) The southern Wairarapa margin between Honeycomb and Cook Strait
At 174” 55’E, the meandering Cook Strait Canyon extends from 400 m of water depth down to 2550 m where it meets the Hikurangi channel. The Cook Strait canyon has a width of 4 to 5 km and deeply incises the margin, creating steep walls nearly 800 m high above the bottom of the canyon. One meander of the canyon and a tributary canyon appear to be tectonically controlled by a NE trending set of lineaments and fault scarps. Another very large canyon, at 175”45’E, is the Pahua Canyon. This canyon is less than 4 km wide near its rim and about 1 km wide at its bottom, displays very steep walls, 750 m in height above its floor. 3) The smooth Marlborough slope
Between longitudes 174”ll’E and 174”50’E, the margin off the South Island shows a smooth seafloor that contrasts with the highly incised seafloor in Kowhai Seavalley. In the upper part of the margin, a prominent ridge trending N 45”E forms the east flank of a 10 km-wide slope basin. This ridge, which is cut transversally, has a very steep southeastern flank and hangs over an undulating terrace-like feature lying beneath 1750-2250 m of water. The boundary between this terrace-like feature and the Hikurangi channel is a steep slope, (500 m in 5 km) that locally shows evidence of slump scars. A beautiful example of one of these scars is at 42’24’s - 174’30’E. This scar is marked in map view by a morphologic reentrant, 6 km in diameter, bounded upslope by a semi- circular scarp. The fan-shaped bathymetric contours in the Hikurangi Channel adjacent to the scar are inferred to represent the debris cone associate with this slump. The terrace- like feature is also deformed by two faults trending N 95qE to N 100” E. 4) The Kowhai Seavalley and Kaikoura Canyon
At the southern end of the margin, close to Kaikoura Peninsula, the slope margin appears to be highly incised by a network of sub-parallel canyons trending perpendicular to the slope margin. By far the largest (1 to 1.5 km wide) is the Kaikoura Canyon in the south. This canyon has 600 m-high walls, with slope dips greater than 25”. The smaller Kowhai Seavalley to the north independently enter the Hikurangi channel between the toe of the margin and Chatham Rise.
58
5) The Hikurangi Trough The segment of the Hikurangi Plateau that is imaged in the Kaikoura Box is known as
the ‘Hikurangi Trough’. It is the turbidite plain at the toe of the accretionary wedge. The water depth of its subhorizontal seafloor slopes gently from 2600 m at the mouth of the Cook Strait Canyon (175”lO’E) to 2800 m at the eastern edge of the box at 177”OO’E. This corresponds to an eastward dip of 0.03” of the seabed. From 176” E to the eastern edge of the survey, bathymetric contours delineate a 50 m-deep trough that is lo-15 km wide and extends sub-parallel to the margin, which locally trends N65”E. 6) The northwestern slope of the Chatham Rise
On that part of the Chatham Rise, the water depth gradually increases from 1100 m near 42”5O’S, 174’30’E to 2500 m along the Hikurangi Channel. South of latitude 42”2O’S, in the southwestern part of the survey, the northern flank of the Chatham Rise shows a regular smooth slope with two wide and elongated depressions 250 m below the surrounding seafloor and trending N50”E, oblique to the general dip of the slope (Fig. 47 and 48). Along its northern flank, the Chatham Rise is bounded by the 12 km-wide almost flat-bottomed Hikurangi Channel. Several morphologic cones and a small ridge suggest that sedimentary fans and a levee could have developed along the channel. In the western part of the survey, the contact between the smooth slope of the Chatham Rise and the Pegasus canyon system is very sharp and shows a strong erosion pattern with 400 m-high scarps. Between 174’22’E and 174’33’E along the Hikurangi Channel the base of the Chatham Rise slope appears to be cut by small canyons, suggesting the outcrop of basement rocks. East of 174”33’E, the base of the slope appears to be linear and smooth.
Side-scan Imagery
The sidescan imagery of the Kaikoura box (Fig. 49) indicate the same six morphologically distinct areas described above. The imagery is interpreted throughout in close conjunction with the bathymetric results. 1) The accretionary wedge margin
The northeastern comer of the Kaikoura box is characterised by moderate reflectivity with several light and dark bands that trend N50” for at least 60 km. These bands correlate with the flanks of ridges, the main ones being the Aorangi, Glendhu and Pukeroro Ridges, that have been inferred to consist of frontally accreted material. Commonly the seaward flanks are more strongly reflective, presumably because they are steeper and because blanketing soft sediments may be thin or absent. There are variations in reflectivity along strike depending on the direction of illumination of the swath imagery beam. A notable feature is that the long, straight ridges are oblique to the overall trend (N75”) of the deformation front between 175’30’aud 176”30’E. Their representation on the imagery fades as they intersect the trench, presumably reflecting the plunge of the anticlinal ridges. The basins between the ridges are generally moderately reflective and featureless.
One feature of note is a small circular (2 km diameter) dark patch that correlates with a 50 m high knoll in the bathymetry at approximately 41’20’s 176’50’E. The knoll occurs at a low point or reentrant in the Glendhu Ridge. This feature corresponds to the only
59
strong magnetic anomaly in this region and it is interpreted as the projecting summit of a seamount.
Landward of the long, straight ridge morphology, the upper slope consists of much wider, smoother steep slopes. The imagery indicates shorter (G-20 km long) ridges aligned more nearly parallel with the overall deformation front (N75”). 2) The southern Wairarapa margin bewteen Honeycomb and Cook Strait
The imagery clearly shows that the margin off the southern Wairarapa is heavily incised by several large canyons, and by numerous smaller “runnels”, on each steep seaward facing slope. The canyons and runnels are generally darker than the smooth intervening margins, presumably indicating outcrops of rock in the walls and coarse sediment in the canyons axes, but much of the imagery represents sharp changes in bathymetry.
The most northwesterly canyon, the Honeycomb Canyon, is dendritic with two main branches joining on the mid slope. It widens and fades on the lower slope. The large Pahaua Canyon is a single, deeply incised, V-shaped valley with a few small tributary runnels. It bends west, oblique to the margin on the lower slope. Between the Pahaua Canyon and the Opouawe Canyon, there are several banks whose seaward faces are completely covered by runnels. These runnels are generally evenly spaced 1 - 2 km apart and aligned down the dip of the slope. The slopes are reminiscent of steep roadcuts after heavy rain. The Opouawe Canyon off Cape Palliser is a small canyon that also bends west on the mid to lower slope. Finally the massive Cook Strait Canyon coincides with the major change in trend of the margin at 175”E. It also has a sharp right bend on the mid slope. The dextral offset or change in nature of all of the canyons on the mid slope is clear evidence of strike-slip motion along the mid slope in this segment of the margin.
In this segment there is a sharp boundary between the margin and the trough that presumably coincides with the deformation front. 3) The smooth Marlborough slope
Off northeastern Marlborough the seabed is generally weakly reflective, indicating soft sediment cover. The steep mid and upper slopes appear to be terraced with more strongly reflective scarps parallel to the ship’s tracks and the regional trend. There are a few small “runnels” on the midslope scarp.
The lower slope is a smooth frontal apron that decreases in width from about 25 km off Cook Strait to about 15 km in the southwest of this segment. It corresponds to a wide terrace on the bathymetry. At its northern end curved, N95” trending bands are reflections of troughs in the bathymetry. At its outer edge there is a long straight slope that is moderately strongly imaged and incised by widely spaced “runnels”. A sharp, straight line at the base of this slope may represent the deformation front. A strongly reflective circular area, 3 km in diameter, on the terrace above the possible deformation front at 174’30’E is opposite an area of strongly reflective seabed in the adjacent trough. The feature is interpreted as rough seabed associated with a slope failure. A similar but less well defined feature at 174’20’E may be an older slope failure. 4) The Kowhni Seavalley and Kaikoura Canyon
The canyons at the southern end of the Kaikoura margin are essentially similar to those east of Cook Strait. The most northeasterly Seavalley and the Kaikoura canyon show
60
changes of trend that may reflect strike-slip deformation. Four of the five major canyons are strongly reflective in their axes, perhaps indicating recent transport of coarse sediment. 5) The Hikurangi Trough
The flat floor of the Hikurangi Trough is generally moderately reflective. There are subtle textures that may indicate directions of sediment transport. Opposite the troughs between the accretionary ridges there are fans of slightly lighter reflectivity that may indicate some form of flushing of the trough. Faint lineations radiating from the ends of the ca- nyons east of Cook Strait may indicate old fan deposits. The deformation front is well imaged in areas where accretionary ridges obliquely intersect the Hikurangi Trough, but there is no clear deformation front between the accretionary ridges. 6) The northwestern slope of the Chatham Rise
The northwestern Chatham Rise slope is slightly less reflective than the Hikurangi Trough. In the southeastern corner of the box, the Pegasus Canyon system has weakly reflective flanks and an axis indicating blanketing fine sediment and lack of recent activity. The northwestern edge of the rise is the straight, N60”E trending trough between Chatham Rise and the Marlborough slope. It is moderately to strongly reflective and is inferred to be the conduit for sand-laden turbidity currents from the Kaikoura Canyon to the turbidite plain of the Hikurangi Trough. Strongly reflective patches opposite scars in the Marlbo- rough slope are inferred to be debris flow deposits. There is a sharp line marking the deformation front between Chatham Rise and the Marlborough slope.
The slope to the east is marked by bands of strongly reflective and weakly reflective seabed trending N55”E. At some places there is a sharp boundary between the two. In general, the strongly reflective patches coincide with sharp-sided depressions in the seabed and the weakly reflective bands with slight highs. The weakly reflective bands have irregular wave forms on the crests. The overall patten; is reminiscent of the scour and fill in an estuary but on a very much larger scale. It has been inferred that both scour and deposition occur during glacial age lowering of sealevel when north-flowing Antarctic Intermediate Water was concentrated through the Memoo Gap.
Seismic reflection Seismic reflection data are described here from the following three abutting segments
of the Kaikoura box : (1) Southern Wairarapa slope and accretionaary wedge, (2) Marlborough slope and (3) northwestern Chatham Rise slope. All times are in seconds two way travel time (TWT). Stratigraphic depths are given below sea floor and not below sea level. 1) The southern Wairarapa slope and accretionary wedge
Nine seismic reflection lines were obtained on the southern Wairarapa continental slope and between the upper slope and the deformation front in the Hikurangi Trough (Fig. 46). Among those, six lines (27,28,29,30,35 and 38) were parallel to the margin, and line 38 sub-parallel to the western side of the Hikurangi Trough, just beyond the deformation front. Two seismic lines (36 and 37), about 7-18 km apart, were run perpendicular to the margin at the northeastern extremity of the other lines but without crossing them. These latter lines cross the slope in the vicinity of Uruti, Pukeroro and Aorangi ridges.
61
Lines 3.5 and 36 (Fig. 50 and 51) are described in detail. We divided both lines into 4 structural parts, which are from east to west : (1) the Hikurangi Trough, (2) the deformation front at Aorangi Ridge, (3) the Glendhue Basin and the upper part of the margin at Opouawe Bank, and (4) the eastern extremity of the Uruti Bank.
The Hikurangi Trough In the Hikurangi Trough, there is 3.5 s of seismic penetration. The first 1.5 s of lines 35
and 36 is a highly reflective, flat-lying concordant sedimentary unit, which onlaps, a gently north-dipping sedimentary sequence 2 s thick. Seaward of the deformation front is a faint disturbance in the reflection pattern for at least the first 500 ms. This disturbance is interpreted as debris flow from the hanging-wall of the deformation front. Alternatively these reflections may be due to turbidites deposited along the Hikurangi Trough. This disturbance is also clearly seen on the other seismic lines that we collected in the Hikurangi Trough. Small-offset, sub-vertical faults affect the entire sedimentary sequence in the footwall of the deformation front (17:15 h on line 35, and 19:lOh on line 36). The faults are marked at their upper extremity by bright spots. Shallow gas may cause the bright spots, but the structural origin is likely to be a small back-thrust splaying off an inferred blind thrust propagating seaward of the main deformation front. The basement is not imaged on sections 35 and 36 but is well imaged on section 38 at 3 s as a highly diffractive, high- amplitude, unconformable horizon.
The defosmation front, Aorangi Ridge The deformation front is well expressed in the bathymetry at the base of the continental
slope. It is clearly related on seismic sections at depth to a propagating seaward verging thrust beneath the Aorangi Ridge ; an anticline developed above the thrust (16 : 10h on line 35 and 20 :30h on line 36). Diffractions due to the steepness of reflectors and possibly faulting in the overhanging wall of the Aorangi anticline result in a total lack of coherency in this part of the section. Concordant coherent reflections are visible to at least 1.5 s in the west side of the Aorangi Ridge. A small back-tilted, piggy-back basin has developed behind the anticline in response to syn-sedimentary thrusting beneath the ridge (e.g. line 35 14:30 h - 16:00 h. The landward edge of the basin (15:00 h on line 35) is being uplifted and inverted by a branching imbricate thrust in front of Pukeroro Ridge.
The Glendhu Trough and Pukesoro Ridge The Glendhu Trough lies between the southwestern part of the Pukeroro Ridge and the
Opouawe Bank. Reflections are less coherent in the Pukeroro Ridge than on Aorangi Ridge and more deformation is inferred. The major thrust is not imaged on line 35 but can be inferred on line 36, although line 36 only crosses the northeastemmost extremity of the basin. It is inferred that the lower part of the frontal wedge is comprised of complex imbricate structures with two major thrusts at Aorangi and Pukeroro ridges (see inset on Fig. 50).
The crest of the Pukeroro Ridge is irregular, suggesting an erosional surface (line 35 in Fig. 50). The total length of the Glendhu Trough is approxiately 70 km. There is approximately 2 s of sediments in the axis of the basin (12:OO h) ; the sediments thin out and onlap at both extremities. The central part of the basin is marked at depth by a narrow deep syncline, which is buried by approximately 250 ms of onlapping sediments. It is inferred that structural inversion is occuring at both sides of the basin, where fold-
62
propagating faults occur but do not rupture through to the surface. Westward of Pahaua Canyon, the basin is being inverted by a well defined fold-
propagating fault with an apparent vergence to the west (lo:20 h). Two other anticlines (1O:OO h and 11:30 h) are interpreted as related to fold-propagation faulting. Strike-slip faults could also produce such structures.
The Paizaua Canyon The Pahaua Canyon is a 250 ms deep scar in the sea floor. There are complex stratigraphic
structures to the east of the canyon, either rotational slump features or due to channel migration. These structures affect the sequence for about 500 ms .
The Opouawe Bank This structure and the next structural-high to the west are the southeastern extent of
Cape Palliser. They are structurally driven. Seismic character is different from that of the ridges to the east in that there are numerous diffractions and fewer, higher frequency reflections. Numerous small faults are inferred with limited displacements. The Opouawe Bank is interpreted as a fold-propagating structure as shown by the ruptured anticline at 9:00 h (Fig. 50). The deformed sediments are capped by a thin (< 100 ms thick) layer of undeformed sediment.
In summary, the structure within the frontal wedge beneath the Southern Wairarapa Slope is dominated by imbricate thrust faults, growing folds and basin inversion. The deformation front is propagating seaward. The position of the main deformation front is clearly expressed by the morphology except on seismic line 38 (no figure), where a blind thrust is inferred to extend several kilometers seawards. A back thrust of this detachment produces a 1.50 ms bulge in the surface. 2) Marlborough Slope
Nine profiles were recorded on the Marlborough continental slope between Cook Strait Canyon and the Kaikoura canyon. Seismic lines 3 1, 34, 39, 40, 41, 48 and 50 trend NE-SW, subparallel to the margin. Line 49 crosses a short section of the mid-slope normal to the margin, and line 38 extends from the head of Kaikoura Canyon to the seaward side of Conway Ridge.
Because of the obliquity of the lines with respect to the! margin, the major tectonic structures are not well imaged on the seismic data. Up to 2 s seismic penetration is recorded in these seismic lines.
Line 34 (Fig. 52) extends from Cook Strait Canyon, along the middle to upper slope, landward of Kekerengu Bank, and across the Kowhai Seavalley and Kaikoura Canyon. A complex anticline is imaged beneath the Seavalley in the upper 1.6 s of section. This feature is a very oblique transect across the northern end of a SE-verging, NE-SW trending fault-propagation fold. In line 34 the underlying fault is not well imaged. A synclinal basin between two major structural highs is crossed very obliquely between 0 I:30 h and 02:30 h (Fig. 52). Small-scale folds and possible reverse faults occur beneath the western end of the basin. One of the bounding highs is the structure beneath the Kowhai Seavalley and the other is a major NE-SW trending thrust fault that uplifts Kekerengu Bank (northern end of the fold at 04100 h, Fig. 52). A third anticlinale (04 :00 h and 05 :00 h in Fig. 52) lies above a possible thrust that almost reaches the seabed. In this region a bottom simulating
63
reflector occurs at about 0.5 s depth. Erosional morphology dominates profile 34 between ‘O5:OO h and Cook Strait Canyon ; the subsurface penetration is reduced in this area. A normal fault with apparent downthrow to the east occurs beneath the bathymetric high at 0530 h (Fig. 52).
Similar fault propagation folds associated with thrust faults appear to be the dominant structural style in the other seismic profiles from the Marlborough slope. There are a few faults in the profiles with apparent normal displacement, but these appear to be relatively small-scale structures within the upper 1 s. 3) The northwestern slope of Chatham Rise
Five seismic lines (42 to 46) cross the northwestern Chatham Rise continental slope between 1250 m and 2500 m water depth and image up to 2.5 s of section. Four lines (P42 to P45) trend NE-SW, subparallel to the regional bathymetric contours on the slope. The southwestern ends of the profiles cross Pegasus and Pukaki Canyons (Fig. 53). Line 46 crosses the slope normal to the contours, extending from the mid-slope region near 175’E, across the Hikurangi Trough and onto the Marlborough slope.
The interpretation presented here, and the tentative dating presented in Fig. 53, draws on the results of detailed structural and stratigraphic studies recently completed in the region (Barnes, 1993). A major half-graben occurs beneath Pegasus and Pukaki Canyons on line 45. Acoustic basement dips north toward a major, south-dipping, E-W trending normal fault that crosses Pukaki Canyon (0O:OO h ; Fig. 53). A sequence up to 1.5 s thick and inferred to be Late Cretaceous gge (Barnes, 1993), thickens on the hanging wall block towards the fault.
Acoustic basement, previously interpreted as the top of Mesozoic Torlesse terrane (Barnes, 1993), is a very strong reflection characterized by hyperbolic diffractions in all seismic profiles (Fig. 53). The reflection dips northward and ranges from ca. 0.2 s depth beneath Pukaki Canyon to ca. 1.6 s depth at the northeastern ends of lines 42 and 43. In seismic lines 42 to 46 a few discontinous, very weak reflections are imaged beneath this strong reflector. The weak reflections may represent : (1) peg-leg multiples generated by reverberation within the overlying sequence ; (2) reflections within basement ; or (3) sedimentary strata lying on basement rocks.
Four to five sedimentary units can be identified and correlated to the regional geology from Paleogene to Recent. The deepest unit overlaps basement and thickens to the north. The uppermost unit is characterized by complex stratigraphic relationships and subtle unconformities that reflect mid-bathyal sedimentation-bottom current interactions.
Numerous normal faults are imaged in the northern part of profile 45 (Fig. 53). The faults dip to the south (i.e., upslope) and detailed mapping (Barnes, 1993) reveals an E-W structural trend. Two other phases of normal faulting (Paleogene and Late Miocene-Recent) are revealed by the profiles. Each phase is expressed by a discrete episode of syn- sedimentary growth faulting and examples are illustrated in Fig. 53. The profiles show several normal faults displacing the Quatemary sequence and some have ruptured the seabed. This is well expressed on the 3.5 kHzprofiles of the uppermost 50-80 m of sediment.
Seismic lines 42 and 43 also image two possible reverse faults beneath the head of the Hikurangi Trough. These structures define the southernmost expression of crustal shortening
64
within the deformation front above the subducted slab. In contrast, the active normal faults may be accommodating extension of the NW Chatham Rise in response to flexure of the Pacific Plate at the southern end of the subduction zone.
The deformational style contrasts markedly with the compressive structures that characterise the nearby Kaikoura slope, which lies above the subduction decollement. The rise, therefore, constrains the southern termination of the Hikurangi subduction zone.
Gravity
Gravity data collected in the Kaikoura box show a mean cross-over error of 2.5 mGal. Line 36 and 37 have been presented with the transit line between Mahia and Kaikoura boxes. The gravity anomaly map (Fig. 54) is dominated by : (1) the bathymetry of the Hikurangi Trough, the Wairarapa-Kaikoura accretionary wedge/continental shelf and the Chatham Rise, and (2) the increasing depth of sediment (> 3 s TWT) above the subducting plate towards the Kaikoura end of the Hikurangi Trough. The gravity anomaly in the Hikurangi Trough axis decreases from -30 mGa1 at 177” E to -100 mGa1 at 174-175” E. The other gravity anomalies correlate well with the ridge and canyon topography. Analysis of density contrast variations beneath the seafloor require further modelling.
Magnetics
Magnetic data collected in the Kaikoura box show a mean cross-over error of 5 nT. The magnetic anomaly map (Fig. 55) indicates that the Kaikoura Box is magnetically quiet with magnetic anomalies generally’less than 50 nT. This quiet magnetic signature is principally due to sediment thicknss (> 3 s TWT) of the Hikurangi Trough and accretionary prism. The quiet signature is similar to that observed onshore in the Torlesse basement.
The exception to the regional low anomalies is a ca. 20 km diameter, 150 nT positive anomaly observed at 176” 50’E, 41” 25’S, the intersection of the beginning of line 30 with Glendhu Ridge. The seismic reflection line shows only deformed sediments typical of an accretionary thrust wedge. The swath bathymetry, however, shows a nearby indentation in Glendhu Ridge and a circular feature in both bathymetry and imagery consistent with a volcanic cone entrained in the accretionary prism (Fig. 47 and 49).
Conclusions
Geophysical data obtained within the Kaikoura box were collected to clarify the zone of structural transition between the modem Hikurangi accretionary wedge and the active dextral transpressive fault system of the Marlbourough region. These data indicate a slope break between the relatively steep upper continental margin south of Wairarapa and the low-relief, modern accretionary wedge. This wedge, which is well developed NE of the Kaikoura box, consists of tectonically accreted trench-fill sediment that was deposited in the Hikurangi Trough. The wedge decreases regularly in width and amplitude southwestward, toward longitude 175” 14’E, where the wedge dies out with the southernmost anticline developed along the deformation front. The front is discontinuous along-strike of the Hikurangi Trough and consists of a series of right-stepping, anticlinal
65
ridges. In the western part of the survey, the Marlborough margin does not show evidence for recent tectonic accretion, but detailed bathymetric data and seismic reflection profiles suggest that the contintental margin is deformed by thrusting, folding and strike-slip faulting. In the eastern part of the survey, NE to ENE trending morphologic lineaments located about 30 km north of the deformation front, show evidence for lateral offsets indicating that dextral strike-slip deformation is occuring at the back of the two or three most recently accreted thrust sheets. These strike-slip faults converge southward across the Pahaua and Cook strait Canyons forming a horse tail pattern that merges southward with the deformation front along the lower part of the Marlborough margin. Along the upper section of the Marlborough margin, another morphologic lineament, parallel to the margin, is associated with an elongated slope basin and anticlines suggesting strike-slip faulting. However, the southern terminations of this fault and that of the deformation front are difficult to locate because of the strong erosional morphology of the margin between Kowhai Seavalley and Kaikoura Canyon.
In conclusion, the tectonic regime of the southern half of the Kaikoura box contrasts with that of the northern half. In the northern half, the overall deformation pattern suggests strain partitioning with the component of compressive strain being mostly taken up by the 30 km-wide, triangular-shaped, active Hikurangi accretionary wedge, whereas the strike- slip component of the strain is mainly accomodated along faults that developed near the slope break, within rocks of the upper section of the margin. By contrast, in the southern half of the box, both compressive and strike-slip strain appear to be accomodated along the same faults suggesting transpressive deformation of the rocks of the continental margin.
66
GEOLOGIC& &NUCLEAR '_
Limited
,
, ,
, /
‘.
‘I, %EO,DYNZ-SUD CRUISE ,’ ShiPboard Report - Leg Puysegw ” ‘, 21 November - 7 December 1993
Jean Delteil, Jean-Yves Coliot, Rick Herzer, Ray Wood
and the shipboard scientific party
r
! - . -
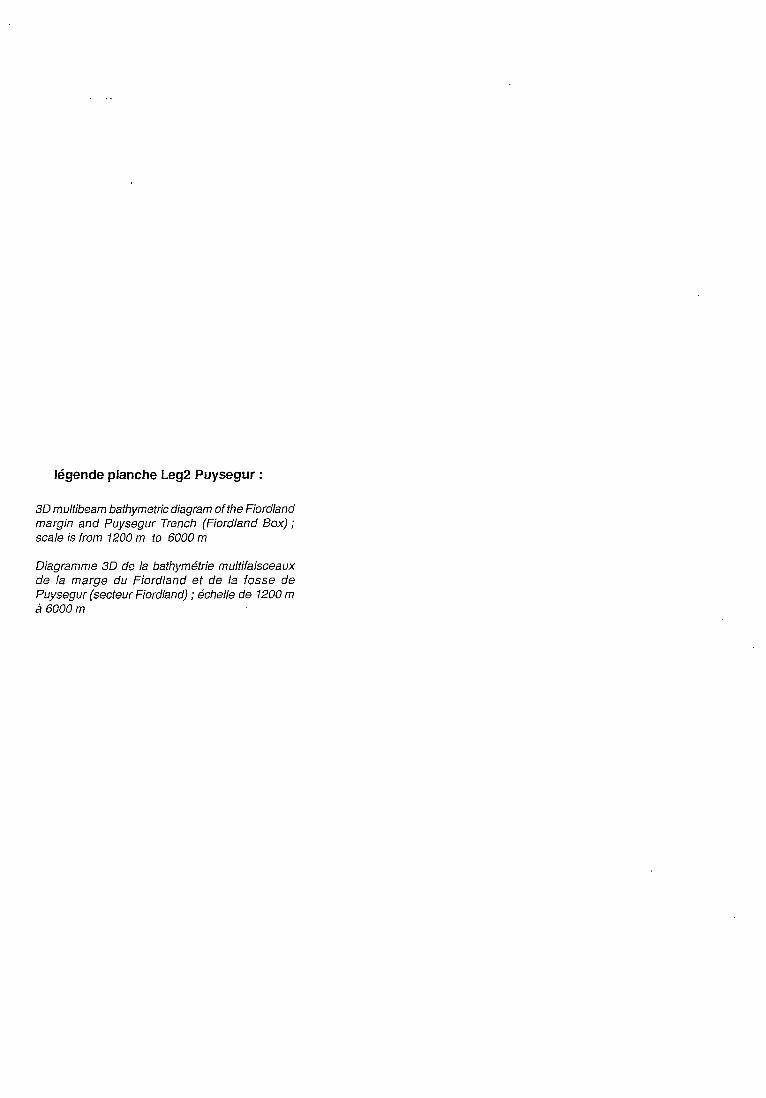
Idgende planche Leg2 Puysegur :
30 multibeam bathymetric diagram of the Fiord/and margin and Puysegur Trench (Fiord/and Box) ; scale is from 1200 m to 6000 m
Diagramme 3D de la bafhym&rie multifaisceaux de la marge du Fiord/and et de la fosse de Puysegur (secteur Fiord/and) ; Bchelle de 1200 m B 6000 m
LIST OF PARTICIPANTS
Chief scientists : J.Y. Collot J. Delteil
Watch : O-4 : S. Calmant J. Ferriere B. Pontoise R. Sutherland
Watch : 4-8 : M. Coffin J. F. Lebrun A. Mauffiet
Watch : 5-12 : D.Christoffel R. Herzer M. Popoff R. Wood
Drafting : M. Sosson
Multibeam EM 12D acquisition :
H. Lossuarne Ph. Le Scaon H. Serve S. Coquet
bathymetry processing A. Le Bot
imagerie processing E. Ruellan
Seismic reflection acquisition :
G. Le Beuz Ph. Bride
processing : G. Lamarche
ORSTOM Villefranche s/mer University of NiceKNRS
ORSTOM NoumCa Lille University ORSTOM Villefranche s/mer University of Otago
University of Texas Paris Univ. / ORSTOM Villefranche s/mer CNRS Paris
University of Wellington IGNS Wellington Nice - Sophia Antipolis University / CNRS IGNS Wellington
CNRS Sophia Antipolis
GENAVIR GENAVIR GENAVIR GENAVIR
GENAVIR
CNRS Sophia Antipolis
GENAVIR GENAVIR
ORSTOM Villefranche s/mer
69

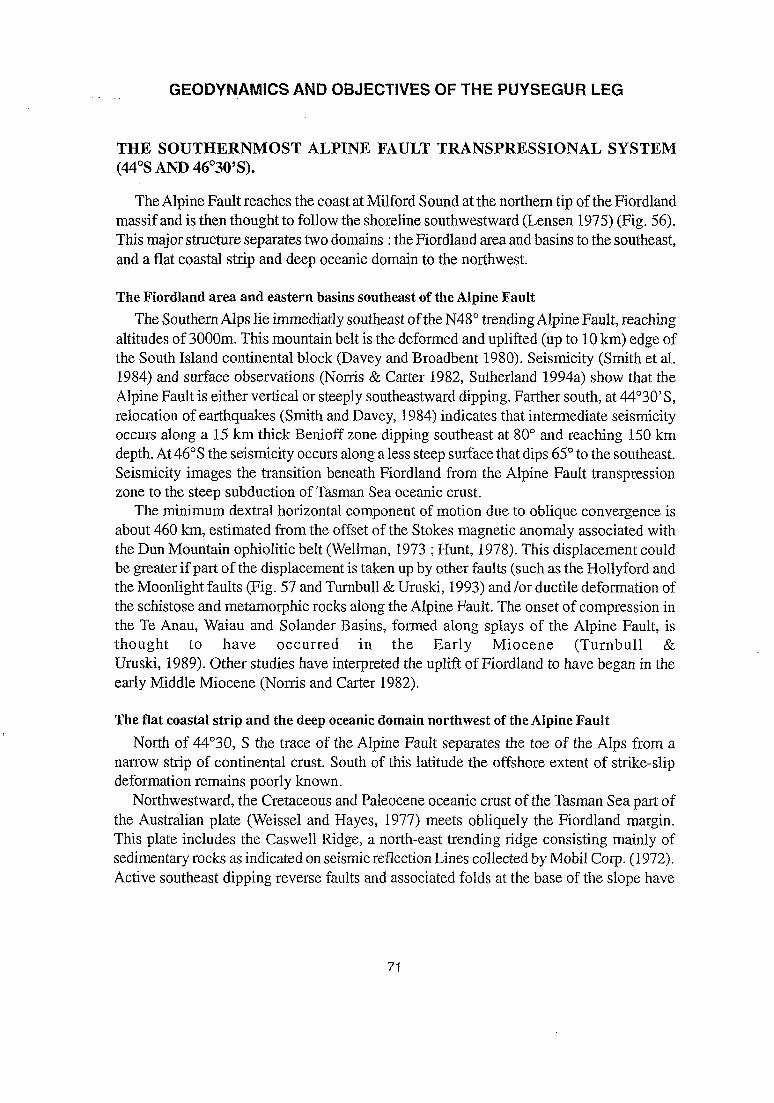
GEODYN,AMlCS AND OBJECTIVES OF THE PUYSEGUR LEG
THE SOUTHERNMOST ALPINE FAULT TRANSPRESSIONAL SYSTEM (44’S AND 46’30%).
The Alpine Fault reaches the coast at Milford Sound at the northern tip of the Fiordland massif and is then thought to follow the shoreline southwestward (Lensen 1975) (Fig. 56). This major structure separates two domains : the Fiordland area and basins to the southeast, and a flat coastal strip and deep oceanic domain to the northwest.
The Fiordland area and eastern basins southeast of the Alpine Fault The Southern Alps lie immediatly southeast of the N48” trending Alpine Fault, reaching
altitudes of 3000m. This mountain belt is the deformed and uplifted (up to 10 km) edge of the South Island continental block (Davey and Broadbent 1980). Seismicity (Smith et al. 1984) and surface observations (Norris & Carter 1982, Sutherland 1994a) show that the Alpine Fault is either vertical or steeply southeastward dipping. Farther south, at 44”3O’S, relocation of earthquakes (Smith and Davey, 1984) indicates that intermediate seismicity occurs along a 15 km thick Benioff zone dipping southeast at 80” and reaching 150 km depth. At 46”s the seismicity occurs along a less steep surface that dips 65” to the southeast. Seismicity images the transition beneath Fiordland from the Alpine Fault transpression zone to the steep subduction of Tasman Sea oceanic crust.
The minimum dextral horizontal component of motion due to oblique convergence is about 460 km, estimated from the offset of the Stokes magnetic anomaly associated with the Dun Mountain ophiolitic belt (Wellman, 1973 ; Hunt, 1978). This displacement could be greater if part of the displacement is taken up by other faults (such as the Hollyford and the Moonlight faults (Fig. 57 and Turnbull & Uruski, 1993) and /or ductile deformation of the schistose and metamorphic rocks along the Alpine Fault. The onset of compression in the Te Anau, Waiau and Solander Basins, formed along splays of the Alpine Fault, is thought to have occurred in the Early Miocene (Turnbull & Uruski, 1989). Other studies have interpreted the uplift of Fiordland to have began in the early Middle Miocene (Norris and Carter 1982).
The flat coastal strip and the deep oceanic domain northwest of the Alpine Fault North of 44”30, S the trace of the Alpine Fault separates the toe of the Alps from a
narrow strip of continental crust. South of this latitude the offshore extent of strike-slip deformation remains poorly known.
Northwestward, the Cretaceous and Paleocene oceanic crust of the Tasman Sea part of the Australian plate (Weissel and Hayes, 1977) meets obliquely the Fiordland margin. This plate includes the Caswell Ridge, a north-east trending ridge consisting mainly of sedimentary rocks as indicated on seismic reflection Lines collected by Mobil Corp. (1972). Active southeast dipping reverse faults and associated folds at the base of the slope have
71
been interpreted on a seismic reflection profile and could represent offscraping of sediment (Davey and Smith, 1983). Compressional stresses are also suggested by the focal mechanism of the 10 August 1993 earthquake, 155 km deep, located at 44”55’S 166’51’E (Ekstrijm and Salganik, 1993).
THE PUYSEGUR TRENCH AND BANK (46’30% TO 48’S)
The continental shelf extends south of Fiordland along the N05” oriented Puysegur Bank (Fig. 3). The Puysegur Bank is separated from the Campbell Plateau to the east by the Solander Trough. Southwest of the bank, the Puysegur Trench, which total length exceeds 500 km, deepens southwards. Quaternary &z-alkaline volcanism occured at Solander Island (Harrington and Wood, 1958), on the northern edge of the Solander basin and about 125 km east of the trench. Seismicity along the north and central portions of the Puysegur Trench appears to be less active and less deep (not more than 35 km) than beneath the Fiordland and the southern extremity of the Puysegur Trench (Ruff et al., 1988). The focal mechanisms associated with the subduction indicate both compression and dextral strike-slip motion (Ruff et al., 1988 ; Anderson, 1990).
To the west, the oceanic crust of the downgoing Australian plate has a complex boundary between two oceanic domains with different ages. This boundary (the “Challenger Fault”as proposed by Calmant et al., submitted in 1993) strikes about N72”E and is marked by a series of N40”E trending en echelon ridges. These ridges separate Cretaceous-Paleocene Tasman Sea oceanic crust from a southern Eocene-Oligocene wedge of the Indian Ocean southernEocene-Oligocene wedge of the Indian Ocean oceanic crust (Weissel et al. 1977). Seismic reflection data collected during the recent New Zealand Puysegur Trough seismic survey across part of this wedge (Fig. 58, Wood pers. comm.) show a lack of trench fill sediments and no clear structures beneath the lower inner.trench slope. These data also show that normal faulting affects both the oceanic crust and the en echelon ridges on the downgoing slab, suggesting that the margin could undergo tectonic erosion.
THE PUYSEGUR TRENCH - MACQUARIE RIDGE SYSTEM (48’S TO 50’S)
The southern part of the Puysegur Trench trends N30”E and ends abruptly at latitude 49’10’s according to the N.Z.O.I. bathymetric Auckland l/l 000 000 sheet. Farther south the plate boundary is not located with accuracy although seismicity in this area is very active and scattered. The earthquakes are shallow (20 km) and show both right-lateral strike-slip and thrust focal mechanisms (Ruff et al. 1988). Whether the apparent sharp southern termination of the Puysegur Trench corresponds to a structural transition from oblique incipient subduction to a transpressional boundary (Fig. 59a) or to the first stages of a subduction-transform-subduction relay (Fig. 59b) is unknown:
The plate tectonic reconstruction of Molnar et al. (1975) indicates that deformation along the Puysegur Trench and Macquarie Ridge system has been active since the Oligocene.
72
,The southward migration of the rotation pole has been rapid since the Miocene (Scholz et al. 1973) and would have caused evolution of motion along the plate boundary from spreading to strike-slip deformation and now to oblique convergence.
OBJECTIVES OF THE PUYSEGUR LEG
The major objective of this leg was to study the tectonic and sedimentary processes of the Fiordland and Puysegur region that control the transition from continental transpression to incipient oblique subduction. We focussed our study on the three major zones of struc- tural transition recognized along the Fiordland - Puysegur oblique convergence plate boundary (Fig. 60 and 61). I- The structural transition between the southern segment of the Alpine strike-slip fault
and sub-continental highly oblique subduction beneath the South Island (Fiordland box). 2 - The structural transition near 46’30’between the highly oblique sub-continental sub-
duction along the margin of the South Island and the oblique subduction along the northern Puysegur Trench (Snares box).
3 - The structural transition between the southern Puysegur Trench - Ridge system and the transpressive Macquarie Ridge system at latitude 49”lO’S (Puysegur box).
73

_..
DATA ANALYSIS
TRANSIT BETWEEN WELLINGTON AND THE FIORDLAND BOX ?
The transit track between Wellington and the Fiordland Box was run through the Cook Strait and along the northwestern coast of South Island. Because of shallow waters, ongoing submarine cable works and rough weather conditions, only gravimetry magnetics and a narrow swath of bathymetry and imagery data were collected.
THE FIORDLAND BOX
The southwestward transition between the offshore extent of the transpressive Alpine Fault and the northernmost part of the Puysegur Trench was investigated in the Fiordland box (Fig. 62). Along this part of the plate boundary the continental margin of the Fiordland massif to the north and the Puysegur bank to the south obliquely converge with the Australian plate. The NUVEL-1 model of plate movements (de Mets et al., 1991) indicates relative convergence of 37 & 3 mm/y at an azimuth of N 60”3 +3”along the plate boundary at latitude 46”s. Several morphological domains are distinguishable on the downgoing Australian plate. From northeast to southwest these domains are : the toe of the Challen- ger Plateau, the Caswell High (striking N40”), the margin-parallel Fiordland Basin, the N53” striking Resolution Ridge and, at the southern edge of the box, the northern extremity of the Puysegur Trench (Fig. 63).
Swath Bathymetry
1) The downgoing plate The northwestern part of the Fiordland box (Fig. 62 and 63) shows the southern toe of
the continental Challenger Plateau cut by the Haast canyon. The latter is characterized by a smooth and flat surface lying under 3800 m of water. The Haast canyon is over 100 km long and up to 6 km wide. It extends southwards across the Challenger Plateau slope, nearly parallel to the margin, and then abruptly turns 90” westwards and deepens gently towards the Tasman basin.
To the south, the &swell High appears as a flat-topped, gently undulated surface elevated 600 m to 800 m above the surounding basins. The high extends from 44’20’s to 45”26’S ; it is 140 km long, 25 km wide and shows an acute triangular southern extremity. Its wes- tern flank has a gentle and sinuous slope that dips 5” west, in contrast with its eastern flank, which is delineated by rectilinear, en echelon NOO’, N33” and N45”E trending southeast-facing scarps. These scarps mark the boundary between the Caswell High and the Fiordland Basin. They are inferred to be normal fault scarps.
Southeast of the Caswell High, the Fiordland Basin, the trench abyssal plain, lies under 4000 to 4500 m of water and has a flat, nearly horizontal surface. The sediments that underly the plain extend westward around the southern tip of Caswell High where they are
75
cut by the southwestern extensions of the eastbounding faultscarps, indicating that these . faults are active.
The Resolution Ridge lies southwest of the Caswell High and the Fiordland Basin. This ridge has an acute isosceles triangle shape in map view. The acute corner of this triangle lies to the southwest. The axis of the ridge is 138 km long and trends N50”E. The maxi- mum width of the ridge is 35 km and it stands 2000 m above the surrounding abyssal plain. The northern side of the ridge is flat, dips NE at 2”-3” and is cut by the southwestern extension of the same Linear N33”E trending normal fault scarps previously mentioned. The vertical offset of the sea floor along the faults is 50 to 250 m. On the southeastern flank of the Ridge there are two conspicuous scarps that trend N62’E and N68”E. These structures offset the seabed by up to 1500 m and cannot be identified northeast beyond the toe of the continental margin. They are inferred to be normal fault scarps. The western flank of the Ridge is outlined by a major rectilinear 35 km long steep scarp that dips 23”NW and trends N43”E. This west-bounding scarp of the Resolution Ridge is also likely to be a major fault carp. The southern end of the Ridge is truncated at latitude 46’26’s against a transverse N120”E trending scarp. Two narrow highs extend southwest of the transverse scarp. The easternmost of these highs was almost completely covered by the survey. It reaches 700 m above the surounding abyssal plain and trends N70°E, which suggests that it is bounded by faults similar to the two faults that cut the southwestern flank of the Resolution Ridge 25 km to the northeast.
South of the Resolution Ridge the seabed shows a gentle east dipping undulating sur- face, affected by scattered fault scarps with several trends : N170”E and N5tilO”E. Three modest conical, 260 to 350 m high, seamounts are located near the trench. Two trend east- west and one N70”E. These seamounts are probably of volcanic origin.
A curved westernmost track was followed during a storm. The southern part of this track shows a strong northeast trending structural grain which will be described in the Snares box. The western part of this track covers part of the 4200 to 4600 m deep flat surface of the abyssal plain of the Tasman Sea. This part of the plain appears to be bounded to the east by a 400 m high west-north-west dipping gentle slope that trends N35”E almost parallel to the west flank of the Resolution Ridge. 2) The Dench
The subduction trench seems to terminate in the north between the lower slope of the Challenger Plateau and the Fiordland margin. The trench may coincide with the Haast Canyon that is 3600 m deep and 8 km wide to the south, 3000 m deep and 3 km wide to the north. The trench shallows rapidly southward between 44”3O’S and 44’46’s where it meets a 46 km large bulge of the inner wall that infringes westward.
East and south of the Caswell High and southwest of the previous spur, the trench is represented ‘by the Fiordland Basin. It extends for 200 km and trends N35”E, is 4000 to 4500 m deep and has a flat seafloor. The width of the trench varies from 10 km to 22 km due to a sinuous eastern margin with the inner wall. The trench disappears where the Resolution Ridge meets the continental margin.
South of the Resolution Ridge (from 46” 1 O’southwards) the trench is very sinuous, has
76
a V-shaped cross-section and deepens regularly to the south from 5000 m to 5750 m. At ‘the southern limit of this box the trench is flat-bottomed and 7 km wide. This southernmost part of the trench consists of two right-stepping en echelon flat-bottomed troughs, 6 km wide. The troughs are bounded to the west by N170” trending en echelon scarps. 3) The continental margin
The continental margin in the Fiordland box displays three morphological domains : (1) a northern domain characterized by alternation of steep slopes incised by canyons and low bulges of folded sediments, (2) a central domain facing the Resolution Ridge, and (3) a southern domain marked by a high and steep scarp at the toe of the margin.
(1) The northern domain of the continental margin The steep parts of the margin slope of the northern domain are deeply incised by ca- nyons. In the north the canyons are 1.5 to 11 km wide and sediment filled, whereas to the south the canyons are narrow (1 km) and sediment starved. Between the canyons detailed morphology of the margin shows a stepped shape in section with alternating flats and very steep portions of slope ( 24” at #‘23’S, 167”35’E ; 19” at 45”S, 166’43’E ). Such a morphology appears to be related to a set of faults (N38”E, N50”E to N56”E) which splay southwestwards from the coastline. Near 45’S canyons follow two ortho- gonal directions, one parallel to the inferred N38”E trending faults and the other parallel to the dip of the slope. Interrupting the steep stepped portions of the margin are two prominent 46 and 65 km long bulges that impinge for 20 km and 18 km on the northern and central parts of the trench, respectively. These bulges of the lower slope show curved elongated highs along their toes which are thought to be folds. In both of these bulges the southernmost curved elongated highs are better developed and are bounded to the southwest by steep scarps. This asymmetric disposition suggests that the deformation is possibly thrust-related, perpendicular to the convergence direction of the plates. The two bulges are comprised of a local prism of accreted trench fill sediments and/or a stack of rocks slumped from margin. The arcuate steep scarps east of the southern bulge might be the scar of such slumps.
(2) The central domain facing the Resolution Ridge This part of the margin can be divided from north to south into two segments. To the north, where the Resolution Ridge collides with the margin, two elongated reliefs stand on the margin along the projection of the Resolution Ridge scarps. One of these is a ridge located at 45’50’s ,165”46’E and the other one is a northwest-facing scarp located at 46’03’s , 165’30’E. The ridge is round-topped in section, 23 km long and trends N48”E. This ridge is in front of the upper scarp of the Resolution Ridge. The northwest- facing curved scarp trends NE to east and deforms the slope of the margin in Line with the lower scarp of the Resolution Ridge. Both of these features probably result from the differential uplift of the margin accompanyin g oblique subduction of the faulted Resolution Ridge. South of the present day zone of contact between the Resolution Ridge and the conti-
77
nental margin there is a slope break at 3000 m depth. Southward for 70 km the upper slope is more than 2000 m high and dips moderately to the west (9”). The shape of the upper slope in map view is of a large curve concave to the west. Below 3000 m of water depth, the lower slope dips more gently westward (2’-3”) with an irregular surface topped by isolated lows and highs. Close to the trench the slope steepens irregularly and shows a succession of lobate and sinuous flats and scarps. The characteristics of this part of the margin are of a large slump, which likely accounts for the lack of flat trench at the toe of the slope. Such a slump could result from the collapse of the inner trench wall behind the ridge as it swept north along the continental margin.
(3) The southern domain marked by a high and steep scarp The upper part of this southern domain has a moderate mean slope (3”-4”). It shows a series of 5 km wide steps separated by N-S to N25”E trending scarps. The lower slope is characterized by a high (3000 m) and steep scarp (19”). The toe of the scarp shows concave terrasses which are thought to be the tops of slump blocks. In detail the steep scarp shows a slope break at 900 m above the flat surface of the trench. This break could correspond to the upper limit between slumped blocks at the base and the hanging wall of the 21” west dipping, unstable margin at the top.
Side-scan Imagery
The Fiordland box can be divided into two main domains : the western subducting Australian plate and the eastern overriding Pacific plate, which includes the continental slope of the South Island. The Resolution ridge separates these domains into three distinct areas : north, south and a transition zone.
Four main facies can be distinguished on the imagery map of the Fiordland box (Fig. 64) : a black facies (high reflectivity : HR) corresponding to scarps, canyon fill (probably coarse) and debris flow ; a dark grey facies (moderate reflectivity : MR) on the moderate slopes and abyssal plain ; a medium grey facies (low reflectivity : LR) on the flat areas (basins) ; a light grey facies (very low reflectivity : VLR) on gentle slopes and plateaux. Most of the bathymetric features are apparent on the imagery map. Some features reflectinvariations in bottom roughness or composition, for example, are only observed on the imagery map. 1) The northern area (1) The downgoing Australian plate
The three facies observed correspond to three distinct levels. From west to east they are : 1) the abyssal plain (MR), 2) the top of the Caswell High (VLR), 3) a flat basin (LR) at the foot of the continental slope. At the northern end of the box, between 44” 00’S and 44” 20’S, a 50 km long and 5 km wide transverse band of very low reflectivity, interpreted as a channel, cuts through the Caswell High to the abyssal plain ; to the east it is connected to the channel system that descends the continental slope. Lineaments trending N 50” to 60” E are connected to the Alpine strike-slip faults system trending N 45” to 50” E, NW of Milford Sound. The shape of the elongate flat basin is controlled by low HR arcuate ridges to the east which separate the MR basin floor from the VLR toe of the slope. To the south the basin
78
abutts the VLR northern slope of the Resolution Ridge. To the north, it narrows and . vanishes in a region of complex Lineaments where the base of the slope of the margin
joins the Caswell High.
(2) The continental slope Two zones are distinguished on the continental slope - an upper slope of more or less EW-trending high and medium reflective areas, and a lower slope of generally medium reflectivity with northerly-trending dark Lineaments. The upper slope is characterised by sinuous flat bottomed submarine canyons up to 8 km wide and 30 km long, separated by spurs. The HR facies coincides with the ca- nyons and is interpreted as coarse glacial fill. The MR facies coincides with the intervening spurs and parts of the valleys. The MR areas are interpreted as rock on the spurs and finer grain size till in some of the larger valleys. Wider canyons tend to be more numerous in the north. The lower slope corresponds to a uniform MR zone consisting of two westward-convex lobes defined by parallel NOO”E and N35”E bands of high reflectivity corresponding to small ridges, backed to the east by a N35”E rectiLinear HR scarp. The HR bands are more pronounced to the south of each lobe. On the tops and fronts of the lobes rare, small, irregular HR spots are interpreted as debris flows or slips. At 45’30’s one is connected to a thin, curved channel.
2) The southem area ( 1) The down-going Australian plate
.- There are four reflectivity facies on the Australian plate side of the box : HR, MR, LR and VLR. The HR facies corresponds to the N65”E trending major scarps on the Resolution Ridge and isolated, small, elongated highs ; the MR facies to the N55”E Lineaments ; the LR facies to the flat sedimentary Puysegur Trench floor ; and the VLR facies to the gently north-sloping backslope of the Resolution Ridge.
(2) The continental slope North of 46’30’s three main facies can be distinguished : MR corresponding to the relatively narrow steep upper slope, cut by few thin HR bands interpreted as approximately EW-trending canyons, and a wide, VLR more or less regular, gently incLined lower slope. The base of this slope is defined by a thin HR sinuous band interpreted as a scarp. On the slope, irregular HR-MR spots are interpreted as debris flows on the upper and middle part and rare slide scars on the lower part. These are most common around 46’20’s where several N70”-8O”E Lineaments cross the slope. South of 46’30’s lies a region of mixed HR-VLR facies. The northern part consists of a H-MR upper slope cut by a set of NNW-trending HR Lineaments, some of which are interpreted as canyons. Another set of grey Lineaments trends NNE and corresponds to an alignment of scarps in the upper and middle parts of the slope. The dominant characteristic facies of this sector comprises crescent-shaped, westward-concave HR scarps, up to 10 km across, on the lower and upper slope. We interpret these features as multiple megaslump scars. A 10 km wide HR belt on the southern part of the lower
79
slope with a festooned upper (eastern) edge, and bordered to the west by a VL-HR mottled facies could be a huge area of slope failure and consequent debris dispersal on the edge of the trench.
3) Transition zone The northern and southern areas are linked by a transition zone of NE trending
Lineaments. The zone extends northeastwards from the N65”E trending Resolution Ridge HR escarpments in the trench, changing strike via relays through the continental slope. It is manifested on the lower slope by a N45”E-trending VLR ridge which is slightly offset towards the north by a N25”E H-MR escarpment which forms the base of the slope. Farther to the NE it is defined by narrow, gently undulating N45-6O”E HR Lineaments, and eventually joins the wider N35”E HR scarps that form the Linear base of the upper slope off Fiordland.
Seismic Reflection
1) The seismic tracks Six seismic Lines were acquired roughly parallel to the Fiordland margin, i.e. roughly
NNE-SSW (Fig. 65). Lines are numbered 60 to 65, with Lines 60 and 61 closest to land, and Line 65 farthest to the west. Comparison of these seismic lines with intersecting Mobil seismic reflection lines (Mobil, 1972 and referenced MO throughout the text) and IGNS lines, which both run roughly perpendicular to the structures, provides .good constraints on the dip and strike of structures and allows lateral correlation from one line to the other. Seismic penetration is better for the Mobil lines than for the data described here. The
- acoustic basement is often imaged on Mobil-lines, whereas it is seldom seen on the GeodyNZ- and IGNS lines. 2) The seismic Lines
Seismic reflection data are described by structural region, with characteristic GeodyNZ seismic lines taken as examples in each region. (1) The Challenger Plateau and the Fiordland upper Margin : Lines 60,61 and 62 :
Line 60 runs over the continental Challenger Plateau and the Fiordland margin of the Tasman-Pacific subduction zone (Fig. 65). The northern half of Line 60 shows well- layered, weakly deformed sediments up to 1.2s TWT thick, typical of sediments elsewhere on the Challenger Plateau (Wood, 1993). There are two major sedimentary units separated by an unconformity (1.7 s TWT at 11OOh). Acoustic basement is imaged at approximately 2.2 s TWT, which correlates with granitic basement identified on other profiles (Wood, 1993). The boundary between the Challenger Plateau, to the north, and the Fiordland Margin, to the south, is characterised by faults with apparent normal displacement (1300h-1400h). They possibly correlate with normal faults bounding the Haast Canyon, visible on Lines 64 (Fig. 66) and 65 (Fig. 67). There are limited reflections on the seismic data from the Fiordland margin. A large canyon located at 11:00 h on Line 62 (Fig. 68) cuts through a well-layered, weakly deformed upper sedimentary sequence. Small normal faults at shallow depths indicate that rocks have collapsed from the edges of the canyon.
80
Correlation with seismic Line Mo93 shows that the canyon is a slope basin (Davey & Smith, 1983). The upper sequence unconformably overlies a deformed sedimentary sequence (4.5 s TWT at 11100 h on Line 62 ; Fig. 68). Fold axes at 0900h on Line 62, (Fig. 68) and a strong angular unconformity (09:15 h-11:00 h ; Fig. 68) indicate a thrust fault apparently verging south. Other folds and/or fault-propagation folds at 1015h, l2OOh and 1300h on Line 63 (Fig. 68) with apparent dip to the south suggest these structures are related to strike-slip. Seismic reflections over the upper part of the Fiordland margin (south part of Lines 60, 61 and 62) show highly-reflective poorly-coherent material. There are few reflectors, none deeper that 0.3 s TWT below sea floor (13100 h-15:00 h Fig. 14). The seabed is dissected by deep erosional features with deep narrow canyons. Diffractions suggest numerous small-scale faults along Puysegur Bank, but dips and displacements are not constrained.
(2) The Deformation Front and Puysegur Bank : Lines 62 and 63 (Fig. 69 and 66) : In the northern part of Line 62 (16:30 h-18:00 h) a sedimentary sequence up to 1.0 s TWT thick dips south and unconformably overlies weak deeper reflectors dipping north (e.g. 6.5 s TWT at 17:00 h). The deeper reflections.are within the basement. Acoustic basement is seen along most of the section and is a characteristic high-amplitude 0.2 s TWT thick ringy reflector (e.g. 6 s TWT at 18:OO h, dipping south). Line 63 (Fig. 68) runs along the deformation front of the Fiordland margin and, because of its obliquity to the structures, the line crosses twice the main thrust (at 22:15 h and 18:30 h). The deformation front lies farther to the west where part of the trench fill sediment seems to be deformed by decollement and reverse faulting (at 03115 h and 02:15 h). An alternative interpretation is that this deformed sediment represents a major slide collapsed off the continental slope. However, the interpretation as thrusts is supported by Line Mo93, on which a decollement is interpreted at approximately 5.5 s TWT, too deep for the base of a slump. Structures at 03:OO h and 01:OO h are correlated with apparent uplift of the deepest reflector. The trench fill appears as a sedimentary sequence over 1.5 s TWT thick. It is well correlated to Lines Mo91, Mo92 and Mo93, where acoustic basement is at 8 s TWT. Strike-slip fault motion is expressed by a flower structure (at 2245h) with a probable reverse component. There are numerous small vertical offsets along the west flank of the Puysegur Bank but no displacements below sea floor can be seen. Some small sedimentary basins along Puysegur Bank are observed along Line 62.
(3) The Caswell High and Resolution Ridge : Lines 64 (Fig. 66) and 65 (Fig. 67) : Although the Caswell High has a relatively thick sedimentary sequence (approx. 1.6 s TWT), somewhat resembling that of the Challenger Plateau (see Line 60 ; Fig. 65), it lies 1200 m lower and is separated from the Challenger Plateau by the 4000 m deep Haast Canyon, which could mark the ocean-continent boundary. Unconformities on the south edge of the canyon are evident at about 5.5, 6 and 6.5 s
81
TWT. The buried structural extension of the Caswell High acoustic basement is visible at depth under the Haast Canyon e.g. at 6.5 s TWT at lo:30 h onLine 64 (Fig. 66). This deep reflector is also interpreted as a north dipping unconformity on Mo94. It is offset by normal faults on both sides of the canyon. The seismic signature of the sedimentary sequence on the Caswell High appears as a succession of high-amplitude and low-amplitude reflectors. The sequence terminates with a high amplitude horizon at depth e.g. at 5.5 s TWT at 05:30 h on Line 64, (Fig. 66) which correlates with the acoustic basement on Line Mo93. The thickness of the overlying unit increases, from about 1 to 2 s TWT along Line 64 from 05:OO h to 08:OO h (Fig. 66), and unconformably overlies acoustic basement. The termination of the Caswell High to the east and southeast, i.e. its contact with the trench fill on Line 64 (Fig. 66), occurs through a series of normal faults and slumps (03:30 h to 05:OO h). However, further to the northeast (as seen on Lines MO 95-94) the normal faulting may progressively change to a flexure of the basement. Along the &well High western margin (Line 65), there is no obvious major structure offsetting the sedimentary sequence from those to the north and south. Between the Caswell High and Resolution Ridge (i.e. between 23:30 h and 04:30 h on Line 64), the line runs over a thick sedimentary sequence (1.8 s TWT). This trench fill sequence is correlated on Line MO 91 and it is thicker (1 s TWT at 04:OO h) than on Line 63 to the west (approx. 0.7 s TWT). Farther to the south the trench fill seems to onlap the Resolution Ridge at shallow depth, but faulting is inferred at depth. The northern side of the Resolution Ridge is cut by a number of minor normal faults. Other than a thin veener of sediments, and a structurally controlled sedimentary basin at the top of the ridge (Fig. 67), no coherent reflections can be seen within the ridge. As a consequence, no displacement estimate can be inferred on the fault between Resolution Ridge and the trench fill. Numerous disjointed reflectors and the lack of a magnetic anomaly suggest the Resolution Ridge may be composed of deformed sediments (Fig. 67). On the south side of Resolution Ridge (Fig. 67) there is a large terrace (approx. 10 km wide) bounded by two major faults trending approx. N45”E. Normal faults which appear
. . _ to drop the ridge into the trench are visible on IGNS Puysegur seismic reflection data but are not clear on this profile as it isparallel to their strike. Strike-slip motion is probably involved. To the south, over 2 s of sediments of trench fill are seen on Lines 64 and 65 (08:OO h on Fig. 67), to be cut by numerous small faults near the base of the trench. Shallowing of basement between 15:OO h and 17:OO h on Line 63 (Fig. 68) appears to be related to another, largely buried, ridge parallel to Resolution Ridge.
3) Summary Seismic reflection data were acquired with the swath bathymetry and imagery data
along the Fiordland margin of the Tasman-Pacific subduction zone. Correlation with other more slope-perpendicular seismic Lines (Mobil, 1972, IGNS 1993) aided the interpretation.
Five major features were identified on the Australian Plate : the continental Challenger Plateau, the Caswell High, the trench fill adjacent to the continental margin (possibly on Cretaceous Tasman sea oceanic crust), the Resolution Ridge, and the Cenozoic oceanic
82
crust at the south end of the box. Those features have distinctive seismic signatures, and .distinctive effects on the subduction zone.
To the north, little deformation is seen on the Challenger Plateau (Line 60, Fig. 65). The ocean-continent boundary between the Challenger Plateau and the Tasman Sea may be marked by the deep trough of the Haast Canyon. The latter appears to be structurally controlled by normal faults, and is thought to be a graben.
In the centre of the section, the subduction zone is marked by a series of imbricate thrusts, apparently verging to the west and forming a small accretionary prism over the oceanic domain. To the north, accretion stops at the Haast Canyon. To the south, accretion stops before the collision of the Resolution Ridge with the margin.
There is apparently no accretion where the Resolution Ridge intersects the Fiordland Margin, nor to the south of the Resolution Ridge. IGNS seismic Lines perpendicular to the margin indicate normal faulting of the downgoing slab and the inner trench wall. The lack of trench fill and accretionnary prism suggest tectonic erosion of the margin along the Puysegur Bank.
The Caswell High is a sedimentary structure bounded to the east by normal faults, suggesting bending of the plate in front of the subduction. There is some indication of strike-slip faults along the Resolution Ridge and in the deformed belt offshore Fiordland. Origin of uplift of the &swell High is unknown.
Gravity
The gravity anomaly map (Fig. 70) in the Fiordland Box is dominated by a pronounced low due to the Puysegur Trench. The minimum value is -190 mGals at 45” 15’S , 166’25’E. A large scale gravity low appears as a succession of separate lows, the whole trending NE- SW from 44’S , 168”E to 47”30’E, 164”45’E. The east side of these gravity lows compri- ses undulations correlated with the bathymetry (Fig. 63). These gravity undulations cor- respond to the sinuous shape of the deformed zone between the Alpine fault to the east and the trench to the west.
A gravity high between 46”s , 165”E and 46’30’s , 164”30’E is not well correlated with the simplified bathymetry ; the Resolution Ridge is located at 46’S , 165” lO’E, slightly northeast of the gravity high. On the Geosat gravity anomaly map (Fig. 71), the gravity anomalies (about 50 mGa1) and the bathymetric high of the Resolution Ridge fit better.
Magnetics
The magnetic anomalies in this region are subdued (Fig. 72). A predominantly negative field extends over the entire region. Its axis runs approximately along the deepest part of the depression, which, in turn, is approximately parallel with the coast.
At the northern end of the box, just south of the Haast Canyon, a continuous, broad positive anomaly extends in a north-westerly direction. The maximum amplitude, near the western end, is just over 200 nT. It is very much less everywhere else. At the south end of the box, three small positive anomalies are also aligned in an approximate northwesterly direction. They are not continuous and a discrete negative anomaly also occurs on this Line. The western end of this Line runs just south of the Resolution Ridge. Near the centre
a3
of the box, two small positive anomalies, each of approximately 100 nT maximum arnpli- &de, also lie on a northwesterly trending Line.
One notable feature is the lack of any magnetic expression arising from the Resolution Ridge.
In summary, the magnetic anomaly field in this region is small and slightly negative. The main trend approximately follows the bathymetry, which in turn parallels the coastline, and runs in a NNE direction. Superimposed on this overall trend are three sets of subdued positive anomalies, which have a roughly north-westerly trend.
Conclusion North of the Resolution Ridge (Fig. 73) the downgoing plate is deformed by Recent
normal faults trending parallel to the trench, suggesting that these faults are related to the bending of the plate. A set of these normal faults trends consistently N33”, deforms the eastern flank of the Caswell High and dies out southwestward into the Resolution Ridge.
The Caswell High and Resolution Ridge appear to have different origins. The Caswell High is flat-topped and shows a sediment cover similar to that of the Challenger Plateau. The high is bounded northward by the distal part of the Haast Canyon that overlies a graben trending N130”E. This direction is very close to the direction of the faults that rifted the Challenger Plateau from Australia during the inception of the Tasman SeaBasin. The &swell High extends along a N40”E strike and may therefore be delimited by transform faults related to opening of the Tasman Sea Basin. In contrast the Resolution Ridge has a sharp morphology, is almost bare of sediment cover (except for a local pocket near the southern margin) and has a non-stratified, reflective basement. These features suggest a volcanic origin, but there is no magnetic anomaly and it may be comprised of highly deformed sediments. South of 46”5O’S the trend of both the trench and the normal faults on the downgoing plate rotate close to N-S. The detailed en echelon pattern of these faults striking N170”E and N5tilO”E suggests that the bending of the plate reactivated pre- existing faults.
On the overriding plate the continental margin widens southwestward and is deformed by a set of steep faults that splay southward away from the onland Alpine Fault. The general pattern of these faults suggests that the submarine faults are dextral transpressive faults. North of 44’30’s it is possible the oblique strain is accommodated by transpressive faults along the toe of the margin, and by perhaps more pure strike-slip motion on faults higher up the slope. South of 44’30’s and along segments of the lower margin accreted sediment together with material slumped from the margin contribute to form two large lobes impinging on the trench. These lobes comprise folded and imbricated rocks.
At 45”45’S the Resolution Ridge meets the continental slope and acts as a sediment barrier to deposition from Fiordland and the West Coast of the South Island, so that h of these features probably result from the differential uplift of the margin accompanying oblique subduction of the faulted Resolution Ridge. They are the tectonic imprint of a lower plate structural feature on the over-thrusting upper plate.
South of where the Resolution Ridge meets the margin the slope of the margin shows a wide morphologic re-entrant at a depth of 3000 m, suggesting slope collapse. This
84
disturbance dominates the structure of the margin and could be due to the sweeping of .the southern continental margin by ridges such as the Resolution Ridge.
Where the margin turns north-south the upper margin still shows evidences of strike- slip movement, whereas the lower margin is characterized by a steep slope and slump features. Both favor tectonic erosion.
THE SNARES BOX
The Snares box survey was planed to map the transition between marginal oblique subduction under the continental Puysegur Bank to the north and the oceanic oblique subduction west of the Macquarie Ridge to the south (Fig. 56). At the southern Snares box, that is at latitude 48’S, the Nuvel-1 model of plate movement (de Mets et al., 1991) predicts relative convergence of 34.1-t27mm/y in an azimuth of N54”4’t-1’5’. In this box the plate boundary trends closer to N-S than in the two other boxes investigated in this leg and the convergence is therefore less oblique.
The downgoing Australian Plate is Eocene to Oligocene in age and appears to have a rather homogeneous morphology. Morpho-structural variety is expected along the edge of the overriding plate where a change from continental to oceanic crust takes place. The tracks were laid out across the plate boundary in order to gather better seismic data in conjunction with bathymetric data in this poorly known area (Fig. 74). Three storms (Fig. 75) interrupted surveying of the Snares box.
Swath Bathymetry -I ._.
The Snares box covers the Australia - Pacific plate boundary at the northern extremity of the Macquarie Ridge south of Puysegur Bank. In the survey area the Australian plate has au oceanic crust and the Pacific plate has a crust that changes from continental at the Puysegur Bank to oceanic at the Macquarie Ridge.
The Australian Plate lies under 4500 m of water (Fig. 76). It has a regular N60&2”E trending structural grain composed of ridges and oceanic troughs that reflect the primary fabric of the Australia oceanic plate. The.highs are 200 - 650 m above the seafloor and vary in shape. The highest appear to be elongated volcanoes and the smalest are flat- topped, bounded by linear steep scarps possibly as oceanic horsts. This structural grain was likely produced by a N60”E trending spreading axis. The northeast extremity of the parallel highs and lows is cut by a rectilinear scarp trending N 155 - 170”E. To the east the seafloor is strongly deformed by faulting where it dips east into the trench. Three sets of fault-scarps cut the bent oceanic crust in a series of losenges. Movement on the scarp- related faults seems to be dip-slip. One of the sets of fault-scarps, the N155 - 170’E trending set,has already be mentioned. A second set of fault-scarps trends N60”E and parallels the structurai fabric of the oceanic Australian Plate. It is not clear whether these two sets of faults were active at the same time. The third set of fault-scarps trends N20”E and parallels the Puysegur Trench. This set of fault-scarps cuts both of the other sets of fault-scarps and is the most recent deformation in this area.
a5
In the northernmost part of the box the morphologic trench is absent. At 46’52’S the . Puysegur Trench has a flat bottom, is 10 km wide and is 5500 m deep. The trench narrows to 3 km in width at latitude 47”43’S, south of which the trench widens and reaches 6200 m deep at latitude 48’20’s. At 47’43’s the trench undergoes a change of direction from N20”E (to the north) to N1O”E (to the south). This change of direction occurs at the same latitude as a major change in the structure of the overriding plate.
The edge of the overriding Pacific plate is characterized by a rugged and varied morphology. Curved ridges, deep elongated basins and conical highs resembling volcanoes are present. These features distinguish three main domains in the inner wall of the trench.
To the south, at 47”42’S, the toe of the inner wall is characterized by a steep west - dipping surface deformed by slumped blocks. The slope extends from 2250 (the Macquarie Ridge) up to 6000 m. The western half of the Macquarie Ridge is an irregular plateau topped by several conical features whose summits are either acute or flat. They are 650 m to 1100 m tall and are probably volcanoes. The plateau is bounded to the northeast by a curved, northeast-convex 1500 m scarp. East of this scarp a 32 km wide zone of alternating ridges and lows forms the eastern half of the Macquarie Ridge. The ridges and lows have flat surfaces and are delimited by very steep (38”) almost rectilinear scarps. The easternmost ridge narrows northwards and separates the Macquarie Ridge to the west from the flat and smooth surface of the Solander Basin to the east.
North of the previous area, at 47’24’5, the inner wall shows evidence of intense block slumping to 2250 m of water depth. To the east, the rest of the plate boundary appears as a highly deformed, 65 km-wide zone of branching highs and lows that splay out northwards. This prominent morphological pattern appears to be fault and fold controlled. It extends between two divergent bounding branches that are, to the west, the northwestern exten- sion of the curved scar-p previously depicted farther south, and to the east a northeast trending scarp. Four flat-surfaced basins and terraces lie between the branching scarps or scar-p-bounded highs of the fan-shaped structural pattern. East of the structure two broad ridges are bounded by N05” - 25”E scarps. These ridges mark the eastern limit of the deformed plate boundary, the undisturbed Solander Basin lies to the east.
North of 47’05’s of the survey area covers only part of the margin between the Puysegur _ . _ _ Trench and the Puysegur Bank. Theslope of the margin-shows a slope-break located at
3500 - 2500 m. The lower slope is steep (19” to the west) and has been the site of extensive block slumping. The upper slope has a rugged surface that dips gently northwestward. On this upper slope discrete extensions of some of the north-south trending branches of the southern fan-shaped structure can be observed.
Side scan Imagery
1) Data The area of the Snares survey area encompasses -50000 km2 (Fig. 77). These data
document basement and sediment distribution, including tectonic fabric, along the northern Resolution Trench - Ridge System from 46’40’s to 48’3O’S, 164”E to 166”E. 2) General interpretation
The Snares survey area is dominated by the Puysegur Trench and the associated
86
The Snares survey area is dominated by the Puysegur Trench and the associated Macquarie Ridge. Important, but less prominent features include presumed oceanic crust of the Australian plate west of the trench, and the Solander Trough east of the ridge, of unknown crustal nature in this vicinity. Below are described and documented from west to east the salient features of the seafloor reflectivity observed in each of the morphotectonic provinces of the survey area.
(1) Australian oceanic crust Acoustic (presumed basaltic) basement of the Australian plate to the west of the trench dips eastward. Sediment, although thin, covers most of the area. General basement fabric displays consistent N60”E Lineations, presumably representing original ridge-parallel seafloor structure. A basement edifice displaying these trends is apparent both on bathymetry and side-scan imagery. On the bathymetry, one Lineament orthogonal to the general grain is observed which may be a fracture zone. Hints of N-S trending basement ridges and scarps, presumably related to deformation of the downgoing plate, appear to the east of the dominant spreading fabric. This probably represents flexure of the Australian plate as it descends into the trench. In some places, normal faults can be correlated with high reflectivity areas.
(2) Macquarie Ridge The western flank of the northern Macquarie Ridge may be divided into three general zones based on reflectivity. Its base commonly shows high reflectivity until a break in slope, approximately 700 m above the trench floor. From there to -3000 m, low reflectivity dominates. Finally, the crest of the western ridge shows high reflectivity. The intermediate zone of low reflectivity is sometimes interrupted by areas of high reflectivity ; these may indicate slumps or landslides. East of the main western flank of the ridge, north of 47”50’N, lies a basin characterized by extremely low reflectivity. Within this basin there are some N170”E trends of high reflectivity which appear to be scarps also visible on bathymetry. Farther east, the twin ridges identified from bathymetry data in the Puysegur box (see below) are highly reflective and are therefore interpreted as basement ridges. These N25”E-trending twin basement ridges are offset in a left- lateral sense at 47’34’s. South of the left-lateral offset, the easternmost ridge appears to plunge to the north.
(3) Solander Trough Seafloor reflectivity is low east of the Macquarie Ridge. Bathymetric and seismic data show that this low reflectivity corresponds to a smooth sedimentary topography.
Seismic Reflection Due to weather conditions, the profiles of the Snares box are not in numerical order
from north to south (see track lines, Fig. 74). The box can be subdivided into five principal regions : the downgoing plate, the trench,
the inner trench wall, the summit region of the Puysegur Bank and Ridge, and the Solander Trough.
a7
1) The downgoingplate (1) Ridges and highs
There are 3 types of ridges and highs : (1) Linear ridges, regularly spaced, striking NE, and composed of acoustic basement, (2) irregular isolated highs also composed of acoustic basement, and (3) occasional small ridges, seen on seismic profiles to be fault blocks cored by sedimentary rocks. The linear basement ridges are interpreted as primary struc-
tures of the volcanic ocean crust (P69 : 07h-07h30) whereas the isolated highs are interpreted as small seamounts (P68 : 05h30, Fig. 78). The sediment-cored ridges, with a relatively low relief, are associated with deformed basins and caused by reverse faults, pop-ups and apparently normal faults (PS2 : 6h to Sh : Fig. 79).
(2) Basins The basins are thin, 2.5 to ca.15 km wide. Basin floors seem to have a uniform depth of 6.2s TWT (P68 : 6h30 Fig. 78 and PS2 : 5h to 6h30 Fig. 79) except above the outer trench wall where the depth is 6s TWT (P68 : 5h Fig. 78 and P69 : Sh). Basin fill varies in thickness between 0.5 and 1s TWT. Sediments are generally poorly deformed (P68 : 06h15’Fig. 78, P69 : OSh and PS2 : 05h15’Fig. 79) and reflectors are more or less rythmically layered (medium to high amplitude, uniform parallel). The seismic character of the infill varies only slightly from basin to basin. When deformed the infill of the basins shows (PS2 : Fig. 79) tilting (6h30), folding at depth (6h30), angular unconformities (7h30-7h45) and compressional faulting (7h15 to ShOO). The flexure of the downgoing plate takes the form of horsts and graben displacing the ocean floor, which are more pronounced in the north (PS6 : 11 hO0 to lJh30 Fig. SO) than in the south (P68 : 04hOO to 05hOO Fig. 78 and P69 : OShOO to 09h30). Adjacent to the trench, the oceanic crust and basin fill are downfaulted by two sets of normal faults trending N170”W and N25’E, both oblique to the trench. The outer trench wall is commonly defined by these normal faults (P68 : 03h15’to 05h00, Fig. 78 and PS6 : llhO0 to 13h30’, Fig. SO), suggesting gravity collapse. Close to the trench these normal faults become very closely spaced.
2) Trench The trench floor is flat and descends gently southwards from 5800 to 6000 m. The
width varies from 6 km (P68) to 1.5 km (P69). It is underlain by undeformed sediments less than 1s TWT thick (Fig. 78). A small axial channel can be distinguished where the trench floor is wide enough (P68 : 03hlO’, Fig. 78). 3) The Inner trench wall
On most seismic profiles (P68, Fig. 78 ; P69, P79 to PSl), the inner trench wall com- prises several inclined steps separated by steeper slopes. The lowest slope is very steep and the upper slope becomes progressively gentler, these slopes are seismically opaque. Slump scars have not been positively identified on the profiles although they are seen in the bathymetry on either side of P68. 4) The summit region
The broad summit, a complex zone of rectilinear and curving ridges and small seamounts (see bathymetry map, Fi g. 76), appears on seismic profiles as a region of opaque acoustic basement highs and nan-row intervening basins, only the widest of which have significant sediment fill (Fig. 78).
88
The structure of the ridges, and their tectonic or volcanic origin is not resolvable on the seismic profiles because there is so little sediment cover. Therefore the ridges on the pro- files have been correlated via the bathymetry and have been assigned alphabetic identifiers.
An uneven western summit area (E), crowned by seamounts, is separated from four major ridges (A-D) to the east by a main axial trough containing deformed sediments up to 1.5 s TWT thick. This trough trends roughly north-south. It is 16 km wide on profiles P67, P68 and P86, and narrows both to the south and to the north with a correlative thinning of the sediments. Other elongate troughs (two to the east, one to the west), running parallel to the main axial trough are smaller and axially discontinous as are the ridges.
Ridge A, the easternmost, is elevated (P69, P68 Fig. 78), plunges to the NNE (P67) and becomes attenuated (P86, Fig. 80) until it is buried (P87 ; P88, Fig. 81). Ridge B likewise disappears southward, ridge C northward. ridge D plunges southwards, then rises again joining with ridge C. Thus these ridges form relays. The sedimentary fill in the troughs shows unconformities (P89 : 07h, Fig. SZ), tiltin g, normal faulting, folding and reverse faulting (P86, Fig. 80 and P89 : Fig. 82). 5) The Solander Trough
Within the Solander basin (Fig. 78, 80, 81) numerous sedimentary sequences can be distinguished dipping away from the basin-bounding ridges which they onlap. The sequences mainly comprise high to low amplitude, continuous, parallel reflectors and less common complex fill and chaotic units. The former are interpreted as terrigenous gravity- flow sediments sourced from the South Island, and the latter are interpreted respectively as channel deposits and massive debris flows. The total sediment thickness is at least 2 s TWT.
On profiles P68 (Fig. 78), P89 (Fig. 82), P88 (Fig. 81) and especially on P86 (Fig. Sl), the western margin of the basin is seen to be slightly deformed. Normal faulting on P68, P86 and P88 (Fig. 81) occurred syndepositionally. These faults cut the present sea-floor and are therefore active (Fig. 81). On P86, a combination of folding, reverse and normal faulting (involving a small basement block) suggests strike-slip motion. 6) Summary
The Snares box straddles two plates which have differing tectono-sedimentary characteristics reflecting different tectonic environments. - The primary features of the oceanic crust on the Australian plate give a rough fabric to
the sea-floor which is only partly subdued by sedimentation. - Normal faulting on the Australian oceanic crust down into the trench, implies that this
plate is being subducted. - The inner trench wall of the Pacific plate shows no sediment accretion and some evidence
of gravity collapse into an almost empty trench indicating tectonic erosion. Faulting of the inner wall is not resolved on these data.
- The combination of folding, reverse and normal faulting (and drag folding ?) in the basins on the summit of Macquarie Ridge, in combination with plunging blocks in relay, demonstrates that strike-slip deformation is taking place within at least the eastern part of the ridge. The survival of apparently undisturbed volcanic peaks in the central area of the box, however, shows that active faulting is not uniformly distributed throughout the ridge.
89
- The Solander Trough, to the east, shows a long history of gravity flow sedimentation in the basin. Its western border is affected by faulting with at least some normal component as well as folding parallel to the eastern ridges of Macquarie Ridge.
Gravity
The gravity map in this area presents three well defined domains (southern part of Fig. 70). These are, from west to east : an domain with low values (close to 0 mGa1) and poorly defined trends, a second domain with NNE-SSW trends, and a third domain defined by gravity values ranging in a wide band, from - 100 mGals to 60 mGals. The first domain corresponds to relatively flat oceanic floor, the second to the su.bduction trench, and the third to a complex morpho-structural unit that extends between the southern end of the continental Puysegur Bank and the northern extremity of the Macquarie Ridge.
The main trends observed on the gravity map are in good agreement with geological structures visible on the bathymetric map. The extreme gravity low of - 120 mGa1 is centered on the trench (6000 m water depth) and trends NNE-SSW. A secondary low east of the main low is centred on 47”25’E, 165’25’E. This secondary low is shorter than the trench- related low. It also corresponds to a basin of complex shape with water depth reaching 3500 m. Between the two lows a value of approximately -50 mGa1 is found in the saddle region.
The largest gravity values (about 80 mGals) are found between 164’45’E and 165’30’E at around 48”s. A major bathymetric feature (centered on 47”45’S , 164”SO’E) lies to the west of a small basin, which corresponds to the secondary gravity low. This small basin is in turn bounded to the east by a Linear bathymetric high, which has a relatively much more pronounced positive gravity signature than the larger feature to the west, North of the Linear bathymetric high a smaller ridge located at 165”45’E, 47’15’s to 47”3O’S has a gravity signature of 40 mGa1. The high and the ridge appear to be aligned but not connected.
On the map of along-track shipbom gravity anomalies, the only usable cross-over in this area presents a difference of 4.9 mGa1 between the two tracks (at 47’40’s , 164”4O’E). The other cross-over occured during a turn for one of the tracks and was discarded. Given the distance between the data locations, this difference is comparable to the local gradients and is not significant.
Magnetics
Unfortunately a day’s record of the Snares box was lost, which means that part of the contour map (Fig. 83), especially over the southern portion of the Puysegur Trench, have to be treated with caution. The magnetic anomalies range between -251 and +829 nT with an average value of 17 nT. Magnetic data have been smoothed to attenuate high frequency noise (averaged to 0,02 “) prior to being contoured. Contouring was performed using GMT free-ware with a tension factor of 0.1. On the map, magnetic anomalies are contoured every 25 nT. Because of the predominently NW - SE track orientation it is clear that NW- SE trending anomalies are difficult to identify, whereas the SW-NE trending anomalies are highlighted. The magnetic anomalies were also plotted along the ship-tracks, using a
90
projection vector oriented NOOlE (Fig. 84). Noise is clearly visible in the area of 47’30’s , 164”45’E. As this noise was not removed from the data file, contouring of this area on Fig. 83 has to be considered carefully. Crossing errors range between 15 and 17 nT. These values can be explained by diurnal variations.
The box can be divided into two distinct regions that are defined by distinct pattern of anomalies (wavelength-amplitude). - The first region, corresponding to the western part of the map (A on Fig. 83) is
characterized by subdued anomalies. Mean level is around -100 nT with an exception in the northwestern part of the area. Here, anomalies recorded over two tracks exhibit a clear coherency. The amplitude of these anomalies ranges from 100 to 300 nT and their characteristic wavelengths are 20 to 25 km. The alternation of positive and negative peaks suggests a sea floor spreading origin. The SW-NE trend of these anomalies (1 on Fig. 84) coincides with the structural fabric of the subducted plate deduced from analysis of bathymetric and imagery data. A detailed analysis of the magnetic data is necessary to identify the anomalies and therefore to estimate the spreading rate and age of the oceanic crust in this area. The axis of the trench between 47”s ,165”E and 48”S- 164’30’E (T on Fig. 83) is a region of very subdued magnetic variations with slightly negative values. It is noticeable that the inner wall of the trench is devoide of significant anomalies.
- The second region is located in the eastern area of this box (B on Fig. 83) and exhibits prominent magnetic features. Two high amplitude positive magnetic Lineaments (400 to 600 nT) start near the southern edge of the box, at 47” 50’S, 165” 10’E and diverge northwards. The eastern Lineament is almost Linear, bearing N25”E ; the western Lineament bears approximately N050E. It curves to the west at 47” 30’S Compared with the bathymetry, these Lineaments closely follow the two peaks of the Macquarie Ridge towards the north. While the eastern magnetic high seems to be continuous, the western one can be divided into two areas of distinct magnetic signature. The northern part of the western branch exhibits high amplitudes and low frequency, in contrast with the southern part. The two areas belong to different structural domains.
Conclusion
In the Snares box the structures of both the Australian Plate and the Pacific Plate are clearly imaged (Fig. 85). The oceanic Australian Plate has a primary fabric that trends N60”E. This fabric as well as orthogonal fractures have been reactivated and cut by trench- parallel normal faults where the plate bends down in the subduction zone. The overthrusting Pacific Plate exibits an original pattern of fan-shapped structure branching out northward. This pattern is in line with the conspicuous southern strike-slip zone described at the apex of the southern Macquarie Ridge in the Puysegur box. Part of the strike-slip structures of the Snares box that trend N20”E can be seen east of the fan-shaped structure. The strike- slip connected pattern of deformation that can be seen in the Snares box may reflect a northward expending distribution of the strike-slip motion across most of the plate boundary. Such a distribution of the deformation is opposite of the localised strike-slip motion at the top of the Macquarie Ridge farther south. The change between localised to distributed
91
deformation occurs at the limit between the southern Macquarie Ridge and the northern Puysegur Bank, where the plate boundary goes from oceanic crust to continental crust. The continental crust of the Puysegur bank seems to have reacted as a rigid core around which branches of the strike-slip faults have split.
THE PUYSEGUR BOX
The aim of the Puysegur box survey was to map a tectonic transition at the southern end of the Puysegur Trench as suggested by the existing bathymetric 1/1000000 Auckland map (49”s , 164”E). In this area the Auckland map indicates the Puysegur Trench axis shallows in less than 30 km to the south from 6000 m to 3750 m. At latitude 49’30’5, 163’30’the Nuvel-1 model of plate movements (de Mets et al., 199 1) indicates relative convergence of 32.2 + 2.5 mm at an azimuth of N49’5’+ l”5’E. An oblique convergence vector together with a rapidly southward shallowing trench suggested reversal of the obli- que subduction system. The present survey showed no southward shallowing of the trench and morphostructures typical of very oblique (29”) intra-oceanic convergence.
The Puysegur box extends from 48”2O’S to 49’42’s. Six multidata lines were obtained across the plate boundary in this box ; it also includes transit Lines 77 and 78 (Fig. 86).
The Puysegur box can be divided into two main domains : the western subducting Australian plate and the eastern overriding Pacific plate. Both plates are thought to be composed of oceanic crust of probable Eocene-?Miocene age (Molnar et al., 1975). The Australian plate has only a thin sedimentary cover and primary sea-floor spreading features are visible. Whereas in the eastern part of the survey area, the Pacific plate underlies the Solander Trough. The latter trough is adjacent to the shallow continental crust of the Cam- pbell Plateau and to the New Zealand landmass and has a much thicker sedimentary cover. The plate boundary is composed of a distinct morphologic trench (trend N20”E) and a double peaked ridge (Macquarie Ridge ; trend N26”E) to the ESE.
Swath bathymetry The N20”E trending Puysegur Trench (6000m) between the Australian and Pacific pla-
tes separates morphologically contrasting areas (Fi,. 0 87). West of the trench, the deep oceanic floor (4000-5000m) of the Australian plate shows strongly oriented structural grains. East of the trench the Pacific plate can be divided into the western Macquarie Ridge that rises to 117m at 49”31’S, 164”12’E and the western flank of the Solander Trough. 1) The downgoing Australian oceanic plate
The sea floor shows a rugged topography. The dip toward the trench increases from 0.07” in the west to 5.5” close to the trench. In the western part of the survey area the seabed is topped by massive reliefs up to 1250 m above the seafloor. These reliefs show various morphologies : a N60” trending ridge at 49”08’S, 163”05’E, a crescent-shaped seamount at 48’55’s , 163’04’E and an elongated, 1200 m-high, N85”E trending ridge at 48’38’S, 163’35’E.
92
These ridges and seamounts sit on seafloor with two strongly-oriented structural grains. One structural grain is characterised by a narrow ridge, 100 km long and up to 800 m high, that comprises two segments with slightly different orientations. The segment south of latitude 49”ll’S trends N30”E ; the northern segment trends N20”E and dies out at 48O46’S. The other structural grain is characterised by two sets of ridges. The first set trends N 120”E, is located between the N20-30”E ridge and the Puysegur Trench and south of latitude 49’11’s. This set consists of five 13 km-long, arcuate ridges concave to the south. The western extremity of each ridge appears to merge obliquely with the southern segment of the N20-30”E ridge, suggesting ductile deformation and a genetic relationship between the N20-30”E ridge and the N120”E set of ridges The second set of ridges, each about 40 km long, trends N85”E to E-W and lies west of the N20-30”E ridge.
Near the trench the down-going plate shows two 200 m-high, east-facing scarps that trend N25-28”E parallel to the trench. These scarps cut southward through the eastern extremity of the N120”E trending arcuate ridges. 2) The Puysegur Trench
From north to south the trench shows two different aspects. The northern segment was surveyed during the 78 transit Line north of the Puysegur box. It is a regular, flat-bottomed, 6 km-wide trough that trends N15”E and lies at a depth of 6200 m. The southern segment, inside the survey area, trends grossly N20”E and is comprised of a succession of left- stepping en echelon troughs. The troughs average 10 km long and 2 km wide and are separated by thresholds. These thresholds are in Line with the subducting (N120”E) ridges transverse to the trench. The southern troughs are shallower than the northern ones (from 5300 to 6200 m). One of these troughs (49”OS’S , 163’56’E) is cut along strike by a small east-facing scarp that is probably the trace of a normal fault. 3) The Macquarie Ridge
The Macquarie Ridge is a twin-peaked ridge that narrows southwards from 46 km to 37 km wide. West of the axis of the ridge the inner wall of the trench has a rugged and steeply west-dipping (12”) slope. A slope break with an irregular trace in map view occurs at 3500 m in the northern part of the survey area and at 4250 m in the southern part. Below the slope break the lower slope shows some N100”E to N150”E Lineaments, an arcuate 9 km wide, gently west-dipping flat at 48”45’S and several narrow lobate terraces suggesting that slumping occurred along the lower slope. The toe of the inner wall of the trench is sinuous ; in its northern part it is marked by a 450 m high steep (20”) scar-p whereas to the south this toe has a similar dip to the overall inner wall. Above the slope break the upper slope of the ridge dips steeper, up to 24” at 49” 16’S , 164”05’E, than the lower slope and is comprised of a succession of spurs that seem to be structurally controlled by two sets of scarps (N40”E and N 165”).
The hinge of the Macquarie Ridge is a prominent morphologic feature that trends N25”E. It is comprised of alternating 26-45 km long and 2-4 km wide ridge and trough segments probably uplifted or downthrown fault-bounded elongated blocks. Both ridges and troughs are discontinuous features that merge or overlap along strike. For instance, two troughs merge at 48”53’S and two ridges overlap at 48’59’s. The size of these narrow ridges and troughs, together with their symmetrical shape in cross-section, favour extensive strike- slip deformation.
93
The steep (11”) eastern flank of the Macquarie Ridge extends to a slope break at 1750 rt 200m. The morphology of this eastern flank was only partly mapped but it shows two directions of east-plunging ridges and scarps : one trends N45’E and a more discrete one is oriented N155”E. 4) The western flank of the Solander Basin
This part of the survey area can be divided from west to east into two zones. To the west is a gentle and irregular east-dipping slope and to the east lies a flat plain. The slope width narrows southward from 26 to 11 km as the dip of the slope steepens from 2.5” to 6.5”. The northern part of the slope shows a stepped morphology with alternating flats and ramps. At latitude 49’15’s the slope comprises three such steps. The shoulders of the steps are 50 to 100 m higher than the flats and trend N25”E to N40”E. They may reflect compressive deformation of the western flank of the Solander Basin close to the Macquarie Ridge. The flat plain at the eastern edge of the survey area is at a depth of 3500 m and appears to overlie undeformed sediment of the central part of the Solander Basin.
Side scan Imagery
1) Introduction Three main facies can be distinguished on the imagery map of the Puysegur box
(Fig. 88) : a black to dark grey facies (high reflectivity ; HR) corresponding to scarps,
canyon fill and volcanic features ; a medium grey facies (moderate reflectivity ; MR) appearing as patches on areas of moderate slope ; and a light grey facies (low reflectivity ; LR) corresponding to a smooth sediment surface. The imagery clearly shows primary features of the Australian plate crust, fault-scarps, depositional and erosional features. Small volcanic centres are visible but are more easily interpreted from the detailed bathymetry and magnetic data. The most prominent features of the Australian plate are illustrated in Fig. 89. 2) Australian plate (1) Primary Fabric
A prominent linear fabric of LR/HR banding, which trends at a high angle to the trench, is clearly visible throughout the box. Regions of HR probably correspond to basement ridges, whereas regions of LR are smooth areas of sediment in linear depressions. The bathymetric profile AA’of Fig. 89 shows that the gradual deepening of the trench to the decrease also corresponds to an increase in sediment cover (LR) and a lowering in the number of exposed basement ridges (HR). Fig. 89 also illustrates the variation in wavelength of the fabric ranging from 5 to 10 km. The orientation of the primary fabric is N120”E within 30 km of the trench, i. e. between a slightly curved, west-concave Ridge trending N20-3O”E here called the Atalante Ridge and the axis of the trench, and swings through an east-west trend to approximately N85’E, 70 km from the trench, west of the N20-30”E trending Ridge (approximately 48’4O’S, 163’20’E). In the vicinity of the Atalante Ridge as well as close to a N 170 E trending Lineament at 48’41’s) 162”47’E, here called the Petit Rouge Lineament, the fabric curves smoothly but sharply to the south, giving a feather-like appearance. The fact that it is symmetrical
94
on either side of the Atalante Ridge implies that this is a primary fabric and not due to shearing of an earlier fabric. The basement ridges are, therefore, interpreted as primary features associated with an ancient spreading centre. The spreading ridge is inferred to have had an orientation parallel to the fabric and, from the curvature of the fabric, to have lain to the south. This also implies that the Atalante Ridge and the Petit Rouge Lineament (subperpendicular to the fabric) were originally transform faults. The gradual deepening to the north would be consistent with an increase in age of the crust in that direction, but is probably an effect of the present subduction regime. In the southern section of the box the fabric curves into the trench on the eastern side as well as toward the Atalante Ridge on the western side. This could be a deformation feature (indicating a dextral sense) or is more likely a primary curvature associated with a transform presently being subducted at this location (49”3O’S). It is interesting to note that where the curvature is more pronounced near the trench it is less pronounced at the Atalante Ridge and vice versa. This reinforces our interpretation that the curvature is a primary feature.
(2) Faults The highly reflective Atalante Ridge (Fig. 89) runs roughly parallel to and approximately 30 km from the trench. It is visible from 48’47’S, 163’50’E to 49”15’S, 163”40’E (trend N20”E), where it curves quite sharply towards 49”36’S, 163’19’E leaving the box on a trend of N30”E. At its northern end, the Atalante Ridge appears to be covered with sediment and have no observable recent offset from bathymetry data. In the northwestern comer ofthe box (at approximately 48’4O’S, 162”50’E), the N 170”E trending the Petit Rouge Lineament is imaged running at a high angle to the primary fabric, similar to the Atalante Ridge. Within 10 km of the trench several highly reflective lineaments associated with small scarps are parallel to the trench. These are almost certainly small fault scarps associated with subduction. In particular, a well developed zone runs parallel to the trench from 48’20’s ,164”25’E to 49”34’S, 164’39’E (trendN24”E). It appears to be better defined in the north and becomes a narrow line of high reflectivity in the south. Fault FI offsets the sediment surface and appears to be propagating to the south but does not appear to offset laterally the distinctive primary fabric of the Australian plate. It is, therefore, almost certainly a recent normal fault associated with flexure of the subducting slab.
3) Puysegur Trench and inner wall The lower part of the slope is of variable reflectivity, although the slope is quite steep.
The patchy of the reflectivity probably indicates that the surface may be largely covered by sediment (LR) but is not smooth. More reflective and rather weakly defined lineaments, roughly perpendicular to the trench, are probably poorly developed gullies. The base of the slope is difficult to pick on the imagery, however small linear features parallel to the trench at the base of the slope are probably small fault scarps.
The upper part of the inner wall of the Macquarie Ridge is a highly reflective, steep, rough surface with only very minor patches of low reflectivity. It is probably an exposed basement surface with small patches of sediment accumulating on flatter areas or in small depressions.
95
The top of the ridge is seen on the bathymetry (Fig. 87) to have a conspicuous elongate depression along its length. It is highly reflective with minor patches of medium reflectivity. This suggests that there is little sediment accumulation on the ridge, but localised scree and sediment accumulation may be occurring in depressions. The linear fault depression clearly seen on the bathymetric data can be identified on the imagery. 4) The east flank of the Macquarie Ridge and the Solander Basin
The upper part of the slope is highly reflective, with HR Linear bands probably corresponding to steep scarps where basement may be exposed. Most of the east flank of the ridge is either characterised by MR or LR, reflecting high or low dip variations on the middle to lower flank of Macquarie Ridge and probably a thin sediment cover. The flat lying LR sediments of the Solander Basin are only slighly lower in reflectivity than the sediment of the lower flank of the ridge, and sometimes the base of the slope is difficult to identify.
To the north (between 49”3O’S, 164’40’E and 48”5O’S, 164”50’E), MR to HR regions with well-defined edges occur as patches on the slope. They are lozenge shaped or elongate parallel to the strike of the slope and have dimensions down-slope of 2-8 km and along- slope of 5-25 km. Thrust faults with a west vergence determined on the mid-flank of the ridge from seismic reflection Lines are not evident on the imagery.
In the southern part of the box, near 49”30’5, 164”30’E, several narrow canyons (HR) of low sinuosity are visible on the mid-lower slope. No obvious fan material or continua- tion can be seen on the imagery beyond the base of the slope. 5) Discussion
The Australian and Pacific plates show distinctive differences in their reflectivity pat- terns. The plate boundary is a morphologic trench with very little sediment fill (LR). This is bounded to the east by a steep inner wall (HR), which probably has basement exposed at its surface and minor sediment accumulating on flatter areas. The apex of the ridge is highly reflective and is inferred to have a continuous fault running in a linear axial depression. The axial depression contains minor sediment or only coarse material. The eastern flank of the ridge (HR to LR) has a thicker sediment cover and discreet patches of high reflectivity which are indicated by seismic data to be bounded by thrust faults. The reason for the variations in reflectivity is unclear but may be due to distubance of overlying sediment by fault activity, exposure of older sediments or basement at the surface, or local topographic effects associated with faulting.
The Australian plate is composed of oceanic crust with a clear primary fabric. Sediment cover is very thin and highlights the primary fabric by filling depressions. The fossil spreading axis that created this oceanic crust is inferred to lie south of the box. If this spreading axis also produced the crust dated late Eocene to Early Oligocene (Weissel and Hayes, 1977) immediately south of the Challenger Fault then the oceanic crust within the survey area is younger, possibly Oligocene to Early Miocene in age. At that time the rate of plate motion in this region was probably close to 20 mm/yr (Sutherland, submitted 1993). At that rate the oceanic crust imaged in the Puysegur box would have recorded about 6 Ma of time and a 35” change of spreading direction obtained from the difference in direction between the two sets of the primary fabric direction (N85”E, N120”E). The
96
Atalante Ridge shows a 10” strike rotation at latitude (49’11’s) whereas the spreading direction changed by 35”, suggesting a complex plate rearrangement.
The distinctive nature of the primary fabric combined with a thin sediment cover allows recent deformation to be assessed. Visible fault traces in recent sediment cover are restricted to a zone within 20 km of the active trench. They appear to have no strike-slip component and are probably dip-slip faults related to flexure of the subducting Australian plate. Farther west, the lack of sediments to record deformation means that reactivation of a pre-existing fracture zone in the downgoing plate cannot be assessed.
Seismic reflection
1) Previous seismic reflection data Existing seismic reflection Lines in the southern Puysegur Trench region are single
channel only, and date from the late 1960’s and early 1970’s. In the region from -48”s to -50”s surveyed by the RN 1’ Atalante, three Eltanin (Hayes and Talwani, 1972 ; Houtz et al. 1972) and two Mobil profiles cross the Macquarie Ridge. 2) New seismic reflection data
A seismic reflection grid of 6 dip Lines (Profiles 71-76) of -60 to -160 km length and spaced at -18.5 km, tied by a -110 km strike Line (Profile 77), were acquired in the Puysegur Box (Fig. 86). Furthermore, a series of four zig-zag trench-ridge profiles (Profi- les 78-81) connect the Puysegur Box with the closely-spaced grid of seismic reflection data to the north in the Snares Box. These lines document basement structure as well as sediment distribution and stratigraphy along the Macquarie Ridge between 48’30’s and 49O4O’S. 3) General interpretation
In the Puysegur Box, the Puysegur Trench and the associated Macquarie Ridge dominate the region. Important, but less prominent features include oceanic crust of the Australian plate to the west of the trench, and crust of unknown nature beneath the Solander Trough to the east of the ridge. Below we describe and document the salient characteristics of each of these morphotectonic provinces, from west to east. (1) Australian oceanic crust Acoustic (presumed basahic) basement of the Australian plate to the west of the trench
dips eastward. Sediment cover is sparse, and thicknesses do not exceed 0.7 s TWT (Line 71). A 1.8 s TWT deep reflector may exist in a basin (3-4h, Line 73, Fig. 90) but it may be a side echo.
General basement fabric changes direction from north to south across the box. In the south the fabric trends east-west, and in the north it trends west-northwest - east-southeast. Line 72 crosses two west-northwest - east-southeast oriented ridges. Some discontinuous flat reflectors can be seen beneath a ridge (12h15, Line 72). A ridge almost parallel to Line 73 is shown in Fig. 90. The apparent flat top of this ridge results from the orienta- tion of the ridge with respect to the line. Some internal reflections can be seen at 1.2 s TWT. A seamount (Line 7 1) of probable volcanic origin is correlated with a prominent magnetic dipole and a rounded high on the bathymetric map. This map shows that other small volcanoes exist in this area.
97
(2) Puysegur Trench The floor of Puysegur Trench lies at depths of 5500-6000 m. The outer wall of the trench is affected by normal faulting (Line 71,3h45 ; 13h40, Line 72 ; Line 73 Fig. 90). These faults are probably related to flexure of the Australian plate into the trench. The outer wall of the trench is sedimented in the northern part of the study area (0.3 s TWT, Line 72 ; 1s TWT Line 71). The flat base of the trench itself is commonly bereft of resolvable sediment. Prominent seismic unconformities in sediment accumulations just west of the trench indicate that submarine erosion was active in the trench region as previously interpreted by Hayes and Talwani (1972) and Houtz et al. (1972). A 1s TWT thick sedimentary basin is affected by a reverse fault (3h and 3h15, Line 71). There is no clear evidence for reverse faulting on Line 72. However, a west-facing reverse fault is evident on Line 73 (2h15) (Fig. 90). Between the Puysegur and Snares survey areas, a well-developed positive flower structure offsets the seafloor as indicated by Mobil Line 72-75. This is strong evidence for strike-slip deformation of the Australian plate west of the trench. In the southern part of the study area (Lines 75 and 74) both the outer wall of the trench and the trench show acoustic characteristics which are different from those of the northern part. The outer wall is not sedimented, in Lines 75 and 76, in contrast with the Line 74 and other northern Lines. Line 75 crosses obliquely a horst of oceanic crust, which may have formed by a seafloor spreading. Line 76 transects the NE flank of a seamount, which may also have formed at a spreading axis. On Lines 75 and 76 acoustic basement is diffractant and rough but some faint reflectors (0.7-0.8 s TWT, real or side-echo) can be seen beneath the basement.
(3) Macquarie Ridge Reflections from the Australian Plate occur beneath the base of the steep western flank of the Macquarie Ridge for 9 km on at least one profile (Line 73, Fig. 90), indicating underthrusting of the Australian plate beneath the ridge. Two flat reflectors are visible beneath the inner wall of the trench (Line 75). No sediment is observed onethe inner wall of the trench except when the slope is interrupted by a bench, where 0.3 s TWT of sediment has accumulated (Line 74). Basement rises steeply from the trench floor to the east and culminates in the twin-peaked crest of the Macquarie Ridge. These peaks are separated by a narrow, straight trough. In places, the eastern peak is flat-topped (Line 71,225 m depth), suggesting wave-base erosion. It is interesting to note that the same flat peak is 825 m deep on a Mobil Line north of the study area. This observation indicates that a large subsidence of the Macquarie Ridge followed its uplift. On the east side of the ridge sediments, apparently normal-faulted down to the east, are visible towards the base of the ridge.
(4) Solander Trough At the base of the Macquarie Ridge, sediment thicknesses increase dramatically in the Solander Trough. Maximum sedimentary cover of the Solander Through is about 1.2 s TWT thick (Line 72) to 2 s TWT (Lines 73 and 74). On Line 75 the Solander Trough has 1.8 s TWT of sediments. This sedimentary cover can be divided into several units from youngest to oldest : 0.7 s TWT thick well stratified layer, 0.4 s TWT thick transpa-
98
rent layer, 0.2 TWT thick well stratified layer, 0.2 s TWT thick transparent layer, 0.2 s TWT thick well stratified layer overlying the basement. Normal, presumably growth faults, are observed in the trough sediment. The contact between the ridge and the Solander Trough is marked along-strike by an east-dipping reverse fault (18h45, Line 75), several dip-slip faults (18h40 to 18h, Line 72), and a thrust fault (21h, Line 73, Fig. 90) or ffexure (19h15, Line 72). On Line 75 the upper sedimentary units are less deformed by the reverse faulting than the lower ones, and the superficial layer onlaps the deformed zone although the sea-floor is affected by the faulting. Therefore, faulting was more pronounced in the past than in the present day. Onlapping of the recent layer onto deformed sediments is also evident on Line 72. In the northernmost Line (71) a scarp limits the Solander Trough. This scarp might be the trace of a reverse fault or flexure (22h, Line 71 ).
4) Summary The Macquarie Ridge in this region is characterised by compressional deformation
such as a morphological trench, west-verging thrust faults deforming the outer-wall of the trench and a well-defined ridge. These features are indicative of high-interplate coupling. The depth of a flat topped peak reveals uplift followed by subsidence, more pronouced in the north than in the south. The upper sedimentary layers of the Solander Trough overlie one or more episodes of compressional deformation. The sedimentary section in the trough can be divided into several sequences ; it may be possible to correlate these with well results from the continental shelf, thereby enabling dating of the deformation.
Gravity
The gravity anomalies collected in this area are displayed in Fig. 91. They are between -150 and +240 mGa1. The extreme values occur in a narrow band trending N30E in the middle of the surveyed area. Five cross-avers occur in this area. The mean of the five cross-over differences is 2.2 mGa1, with smalIest and largest discrepancies of respectiveIy 0.4 mGa1 and 4.6 mGa1. The latter value is much larger than the noise of the gravimeter as would be expected since corrections for sea surface state (which was rough) or gravimeter drift were not performed on the displayed values
The surveyed area is comprised of two distinct domains, whose boundary is marked by a pronounced gravity anomaly undulation with a -150 mGa1 low on the west side and a 240 mGal high on the east side. This boundary trends N30E from 5O”S, 164”E to 48’3O’S, 164’20’E. The gravity low corresponds to the southeast deepening of the Australian plate seafloor towards the trench and the gravity high corresponds to the ridge which bounds the overriding Pacific plate. The large absolute value of this high probably indicates that it reflects a topographic effect and that very little compensation has occured. The gravity low increases in magnitude from southwest to northeast. In the southern part, the mini- mum value is close to -50 mGa1, while in the northern part it reaches -150 mGa1.
In the western domain, the gravity anomalies slowly increase from less than -100 mGa1 in the trench to approximately 40 mGa1 at the northwestern extremity of the survey area. The central part of this domain is an area of rather constant gradient. Short
99
wavelength structures (20 km characteristic width) exist in the westernmost region. These short wavelength anomalies coincide with the negative-positive anomaly transitions. The slightly positive values correspond to bathymetric features of presumed volcanic origin.
In the eastern domain, the gravity anomalies decrease southeastward from the -t200 mGa1 high, associated with the ridge, to values close to 0 in the southeastemmost part of the survey area. The survey does not extend far enough east to identify a reliable trend from the gravity map
The Geosat gravity anomalies in the Puysegur Box area are displayed with a 10 mGal contour interval in Fig. 92. A very good agreement of the shipbom data and the Geosat gravity anomalies can be observed in the area. A bias of - 10 mGal seems to exist between the data sets, the satellite data having slightly lower values. When corrected for this bias, the various signatures show the same characteristic wavelength in both data sets, but with a slightly larger amplitude in the shipbom data. In fact, loss of amplitude at short wavelengths is largely because of the altimetric measurement procedure (averaged over 7 km along track) and because of the gridding which averages the gravity anomalies over 1/50th of a square degree.
The Geosat data can be used to extend interpretation beyond the survey area. For ins- tance, on the Australian Plate, at 48”30’5, 163’E, the gravity high clearly extends towards the southeast with a curved shape and then turns parallel to the trench at its southeastern extremity (48YO’S , 163”18’E). The bathymetry (Fig. 87) mirrors this trend. This trend is also clearly visible on the imagery (Fig. 88) and is inferred to represent a change in orien- tation of the primary fabric (associated with a change in spreading direction).
The gravity highs at the top of the Macquarie Ridge are not continuous (Fig. 57760). On the bathymetric map, three main highs can be distinguished on top of this ridge. On the gravity map the central high appears as an extension of the larger southernmost high.
The gravity low associated with the trench increases and enlarges towards 48’15’s , 164”30’E, whereas the trench depth remains about 5500m. This variation in the gravity low must reflect something other than change in depth.
Magnetics
The magnetic anomalies in the Puysegur box are between -620 and + 600 nT with an average value of -5 nT. Magnetic data have been smoothed to attenuate high frequency noise (averaged on l/50 “) prior to contouring. Contouring was performed using GMT software with a tension factor of 0.1. On the map (Fig. 93), magnetic anomalies are contoured every 25 nT. Because of the predominently NW - SE track orientation it is clear that NW-SE trending anomalies are difficult to identify, and that SW-NE trending anoma- lies are highlighted. The box can be divided into three distinct regions defined by the anomaly characteristics (wavelength-amplitude).
The first region, in the western part of the map, is characterized by low amplitude - low frequency anomalies. Mean level is about -100 nT, but there is no clear magnetic fabric (perhaps N-S) in this area. A large negative anomaly (-200 nT), trending SSW-NNE, marks the general trend of the bathymetric trench. It is not clear why the magnetic anomalies follow the bathymetric trend of the subducted plate. The structural fabric of the subducting
100
frequency anomalies. Mean level is about -100 nT, but there is no clear magnetic fabric (perhaps N-S) in this area. Alarge negative anomaly (-200 nT), trending SSW-NNE, marks the general trend of the bathymetric trench. It is not clear why the magnetic anomalies follow the bathymetric trend of the subducted plate. The structural fabric of the subducting plate, as identified on the bathymetric map, trends WNW-ESE. This fabric does not exhibit magnetic anomalies that could be identified on the magnetic profiles. In the northwestern- most part of this first region the magnetic contours trend N-S suggesting a possible N-S fault in the oceanic plate. In this area a dipole anomaly has a positive peak with a higher amplitude than the negative peak. The positive peak closely corresponds to a seamount located at48”35’S, 163”104E. suggesting that the magnetic anomaly is due to this seamount and that the seamount was emplaced during a normal polarity epoch.
The second region is characterized by a zone of very large magnetic anomalies located over the Macquarie Ridge. Large amplitude-high frequency anomalies suggest that the magnetic sources are shallow. The magnetic anomalies are principally characterised by two closely spaced positive peaks, reflecting the ridge bathymetry. The observed anoma- lies are compatible with an oceanic nature of the overriding plate.
The third area is more complex than the previous ones, with a series of anomalies located over the eastern flank of the northern segment of the Macquarie Ridge. Some edifices (see 48” 54’S, 164” 36’E on the bathymetric map, Fig. 87) are also correlated with magnetic anomalies. The edifices are identified as highly reflective bodies from imagery (Fig. 88) and could be volcanoes. In the southernmost part of the area (49*36’S, 164” 24’E ), a large positive anomaly of 500 nT has an unknown origin. It cannot be correlated with any bathymetric, gravity or imagery feature and therefore could be caused by an intrusive volcanic body.
Conclusions In the Puysegur box, the Australian and Pacific plates are both comprised of oceanic crust but show distinctive differences in their structural and reflectivity patterns (Fig. 94). The downgoing plate, the trench and the Macquarie Ridge are covered by very little or no sediment and seem therefore to be younger than the Solander Basin to the east which has a thick Cretaceous up to Recent sedimentary cover (Uruski and Turnbull, 1989). In this box, the Australian plate underthrusts (as indicated by the seismic reflection data) obliquely (29”, inferred from the Nuvel-1 model of plate movements de Mets et al., 1991) eastward beneath the Macquarie Ridge. The Macquarie Ridge is deformed by a major strike-slip zone that could be a southern extension of the onlshore Alpine Fault.
The primary fabric of the Australian plate indicates a 35” rotation of the spreading direction that could be explained either by differential magmatic production along the spreading axis or by a progressive extinction of the spreading axis from west to east.
Compression occurs not only at the subduction front but also at the back of the Macquarie Ridge and in some areas of the downgoing plate. The distribution of compression favors high interplate-coupling. Strike-slip movement is intense at the apex of the ridge where an 8 km-wide zone of braided faults deLineate narrow ridges and troughs. The acute relief of the ridge together with planation of shallow peaks, now at various water depths, favour
101

recent uplift and subsidence typical of strike-slip zones. Part of the recent uplift could result from the underthrusting of the Australian plate and/or from transpressive deformation along the strike-slip zone. A consequence of uplift would be the eastward tilt of the west verging folds documented along the western flank of the Solander basin.
The distribution of the active deformation along the plate boundary suggests strain partitioning. Strike-slip deformation is mainly taken up along the apex of the ridge whereas compression is localized along the decollement of the subduction zone. The gross struc- ture of the plate boundary evokes half a mega-positive-flower-structure.
102
BIBLIOGRAPHY
ALLIS R.G., 1986 -Mode of crustal shortening adjacent to the Alpine Fault, New Zealand. Tectonics, 5, 1, 15-32.
ANDERSON H.J., 1990 - The 1989 Macquarie Ridge earthquake and its contribution to the regional seismic moment budget. Geophysical Research Letters, 17, 7, 1013-1016.
BALLANCE P.F., 1976 - Evolution of the Upper Cenozoic magmatic arc and plate boundary in northern New Zealand. Earth Planet. Sci. Lett., 28, 356-370.
BALLANCE P. E, 1988 - Late Cenozoic time-lines and talc-alkaline volcanic arcs in northern New Zealand - a discussion. Roy. Sot. N-Z. J. 18, 347-358.
BALLANCE PF., SCHOLL D. W., VALLIERT. L., STEVENSON A.J., RYAN P.F. and HERZER R.H., 1989 - Subduction of a late cretaceous seamount of the Louisville ridge at the Tonga trench : a model of normal and accelerated tectonic erosion,Tectoks,, 8, 953-962.
BALLANCE P.E, PETTINGA J.R., WEBB C., 1982 - A model of the Cenozoic evolution of northern New Zealand and adjacent areas of the southwest Pacific. Tectonophysics, 87, 37-48.
BARNES P. M. 1993 - Structural styles and sedimentation at the southern termination of the Hikurangi subduction zone, offshore north Canterbury, New Zeulmd PhD, University of Can- terbuly.
BARNES P. M. and LEWIS K.B., 1991 - Sheet slides and rotational failures on an accretionary margin : the Kidnappers Slides, New Zealand. Seclimentology. 38 (205-221)
BERRYMAN K.R. BEANLAND S., COOPER A.F., CUTTEN H.N., NORRIS R.J. and WOOD P.R., 1992 - The Alpine Fault, New Zealand : variation in Quaternary structural style and geomorphic expression : Annales Tectonicae, Vi, 126-l 63.
BEVIS and al, 1992 - GPS Experiment across the Tonga trench, EOS.
BISHOP D.G., 1985 - Inferred uplif rates from raised marine surfaces, Southern Fiordland, New Zealand. N. 2. Joum.of Geol. and Geoph., 28, 243-251.
BROTHERS R. N. and DELALOYE M., 1982 - Obducted ophiolites of North Islxtd, New Zealand : origin, age, emplacement and tectonic implications for Tertiary and Quatemary volcanicity, N. Z. J. Geol. Geophys., 25, 257-274
CALDWELL J.G., FROLICH C., 1975 - Microearthquake study of the Alpine Fault near Haast, South Island, New Zealand, Bull. Seism. Sot. Am., 6.5, 1097-1104.
CALMANT S., PELLETIER B. and AUZENDE J.M. 1993 - Tectonics of the southeast indian and Pacific-Antarctic Ridges junction area evidenced by geosat gravity data. Geophysical Research Letters, submitted.
CARTER R. M. and CARTER L., 1982 - The Motunau fault and other structures st the southern edge of the Australian-Pacific plate boundary, offshore Malborough, New Zealand. Tectonophysics. 88 : I33- 1.59.
CARTER L. and MCCAVE I.N., 1994 - Structure of sediment drifts approaching an active plate margin under the SW Pacific Deep Western Boundary Current Paleoceanography, in press
103
CASHMAN S. and KELSEY H., 1990 - Forearc uplift and extension, southern Hawkes Bay, New Zealand : Mid-Pleistocene to present. Tectonics. 9 : 23-24.
CHANIER F. and FERRIERE J.: 1991 - From a passive to an active margin : tectonic and sedimentary processes linked to the birth of an accretionary prism ( Hikurangi margin, New Zealand). &ll. Sot. Geol. France. t.162 (No.4) : 649-660.
CHRISTOFFEL D.A., 1978 - Interpretation of magnetic anomalies across the Campell Plateau, south of New Zealand. Bull Australiafl Sot. Explol: Geoph., 9, 143-145.
CHRISTOFFEL D.A., FALCONER R.F., 1972 - Magnetic measurements in the Macquarie Ridge Region. In : R. Fraser (Compiler), International Symposium on the Oceanography of the South Pacific, Wellington, New Zealand National Commissionfor UNESCO, Wellington, 233-240.
CHRISTOFFEL D.A., FALCONER R.K., 1972 - Marine magnetic measurements in the southwest Pacific Ocean and the identification of new tectonic features. Antarctic Ocanology II? The Australian-New Zealand sector, Hayes D.E. ed., Arttarctic Res. Series, Americarl Geophys. Urdon, 19, 197-209.
CHRISTOFFEL D.A., Van der lingen W.J.M., 1972 - Macquarie Ridge-New Zealand Alpine Fault transition. Antarctic Oceanology II, The Australian-New Zealand sector, Hayes D.E. ed., Antarctic Res. Series, America?1 Geophys. Urlion, 19, 235-242.
COHEN J. K. and HALE D., 1991 - Seismic Unix in the age of the workstation. Centre of Wave Phenomena, Colorado School of Mines, Golden, Colorado
COLE J. W., 1979 - Structure, petrology and genesis of Cenozoic volcanism, Taupo volcanic zone, New Zealand-A review, N. Z. J. Geol. ard Geophys. 22, 631-6.57.
COLE J.W. and LEWIS K. B., 198 1 - Evolution of the Taupo-Hikurangi subduction system, Tectonophysics, 72, 1-21.
CUTTEN H.N.C., 1979 - Rappahannock Group : late Cenozoic sedimentation and tectonics contemporaneous with Alpine Fault movement. N. 2. Jourrl.of Geol. ad Geoph., 22, 5, 53.5: 553.
CUTTEN H. N. C. and DELTEIL J., 1994 - The distribution in time and space of transcurrent faults in an oblique convergent plate boundary. the Hikurangi subduction margin, NorthIsland, New Zealand submitted to Tectonics .
DAVEY F.J., BROADBENTM., 1980 - Seismic refraction measurements in Fiordland, southwest New Zealand. N. Z. Jourxof Geol. ard Geoph. 3, 395-406.
DAVEY EJ., HAMPTON M., CHILDS J., FISHER M.A., LEWIS K.B. and PETTINGA J.R., 1986 - Structure of a growing accretionary prism, Hikurangi margin, New Zealarx! Geology. 14, 663-666.
DAVEY EJ., SMITH E.G.C., 1983 - The tectonic setting of the Fiordland region, southwest New Zealand. Geophys. J. R. Astron. Sot., 72, 23-38.
DAVY, B. and WOOD. R., 1994 - Gravity and magnetic modelling of the Hikurangi Plateau,. Mar. Geology, in press
DAVY B.M., 1992 -The influence of subducting plate buoyancy on subduction of the Hikurangi- Chatham Plateau beneath North Island, New Zealand, A.A. P.G. Memoir 53 : A&awes ilzthe geology and geophysics qf the coritirieiitul margin, Chup. 6, 7.591.
104
DE METS C., GORDON R.G., ARGUS D.F. and STEIN S., 1990 - Current plate motions, Geoplzys. J. Int., 101, 425-478.
EKSTRGM G. and SALGANIK M., 1993 - Detemrination of Centrdid Movement Tensor, Har- vard University, event file name CO8 1093X.
FALCONER R.K.H., 1972 - The Indian-Antarctic-Pacific triple junction, Earth planet. Sci. Lett., 17, 151-158.
FIELD B., URUSKI C., 1991 - Middle Miocene to recent development of the Solander Basin : Structure and sequence stratigraphy. N.Z. Geol. Survey, 43, 117-122.
GRANT A.C., 1985 - Structural evolution of the head of SoIander Trough, south of New Zealand, based on analysis of seismic basement. N. Z. Jounz.of Geol. and Geoph., 28, 1, 5-22.
GRIFFIN B.J., VARNE R., 1980 - The Macquarie Island Opliolite Complex : mid-Tertiary oceanic lithosphere from a major ocean basin. Chem. Geol.,30, 285-308.
GRIFFITHS J.R., VARNE R., 1972 - Evolution of the Tasman Sea. Macquarie Ridge and Alpine Fault. Nature, 235, 83-86.
HARRINGTON H.J., WOOD B.L., 1958 - Quaternary andesitic volcanism at the Solander Is- lands. N. 2. Jounz.of Geol. and Geoph., 1, 419-434.
HAYES D.E., RINGIS J., 1973 - Sea floor spreading in the Tasman Sea. Nature, 243, 54-458.
HAYES D.E., TALWANI M., 1972 - Geophysical investigations of the Macquarie Ridge Complex. In H.D.E.(Eds), Antarctic Oceanology II, The Australian-New Zealand Sector, Antarctic Research Series? Washington DC. :, Americun Geophysical Udon., 211-234.
HERZER R. H. and BRADSHAW J. D., 1985 - The Motunau Fault and other structures at the edge of the Australian-Pacific plate boundary, offshore Marlborough, New Zealand - discus- sion. Tectonophysics. IIS : 161-166.
HOUTZ R.E., EWING J., EWING M. and LEONARD1 A.G, 1967 - Seismic reflection profile of the New Zealand Plateau, J. Geophys. Res., 72,4713-4729.
HUNT T.M., 1978 - Stokes Magnetic Anomaly System. N. Z. Joumof Geol. and Geoph., 21, 5, 59.5-606.
JONES T.D., MCCUE K.F., 1985 - The seismicity and tectonics of the Macquarie Ridge. Papers ad proceedings of the Royul Society of Tqsmania, 122, I, 51-57.
JOHNSON T. MOLNAR P., 1972 - Focal mechanisms and plate tectonics of the South west pacific, Jounia~ of Geophysical Research, 77, 5000-5032.
KAMP P.J.J.? 1986a - The mid-Cenozoic Challenger Rift System of western New Zealand and its implications for age of Alpine fault inception. Geological Society qfAmerica Bulleti& 97, 255- 281.
KAMP P.J.J., 1986b -. Late Cretaceous-Cenozoic tectonic development of the southwest pacific region. Tecto~iopizysics, 121, 225-251.
KARIG D. E., 1970 - Kerrnadec arc - New Zealand tectonic confluence. N.Z. J. Geol. Geophys. I3 : 21-39.
KATZ H.R., 1982 - Plate margin transition from oceanic arc-trench to continental system : the Kermadec-new Zealand example.Tecfo~lophyszysics, 87, 49-64.
105
KATZ H. R. and WOOD R. A., 1980 - Submerged margin east of the North Island New Zealand, and its petroleum potential. in : Luke, I.J. (Eds), Symposium on petroleum potential in island arc, small ocean basin, submerged margin and related arens., 3 : 221-23.5
LE PICHON X., 1968 - Seafloor spreading and continental drift. Journal ofGeophysical Research, 73, 3661-3697.
LEWIS K.B., 1980 - Quaternary sedimentation in the Hikurangi oblique subduction and transform margin, New Zealand. In : Sedimentation in oblique-slip mobile zone, Ballance P.F. & Reading H.G. Eds., Spec. Publ. int. Ass. Sediment., 4, 171-189.
LEWIS K. B. and BENNETT D. J, 1985 - Structural patterns on the Hikurangi margin : an interpretation on new seismic data, in New Seismic Profiles, Core and Dated Rocks from the Hikurangi margin, New Zealand, Comp. K. B. Lewis N. Z. Oceano. Institut., Field report 22, 3-25, Dept. Sci. Id Res., Wellingtoa New Zealand
LEWIS K. B. and KOHN, 1973 - Ashes, turbidites, and rates of sedimentation on the continental slope off Hawkes Bay ; N. Z. Jourtlal of geol. and geophy., 16, 3,439-454
LEWIS K. B. and PETTINGA J. R., 1993 -The emergin, imbricate frontal wedge of the Hikurangi margin. Chap. 13, in : South Pacific Sedimentary basins . Sedimentary basins of the World, 2 ., edited by P.EBallance, 225-250, Elsevier Science Publishers.
LEWIS K. B., 1994 - The 1,500 km long Hikurangi Channel : trench-axis channel that escapes its trench, crosses a plateau and feeds a fan-drift, Geo-Marine Letters, in press.
MARKS K. D.C., 1993 - McAdoo and W. Smith, Mapping the Southwest Indian Ridge with Geosat, EOS trans. AGU, 74, 81-86.
MOLNAR P., ATWATER T., MAMMERICKX J., SMITH S.M., 1975 - Magnetic anomalies, bathymetry and the tectonic evolution of the South Pacific since the Late Cretaceous. Geophys. J. R. ask Sot., 40, 383-420.
MINSTER J. B. and JORDAN T. H., 1978 - Present-day plate motion. J. Geophys. Res. 83 : 5331- 5354.
NORRIS R.J., CARTER R.M., 1980 - Offshore sedimentary basins at the southern end of the Alpine Fault, New Zealand. in Ballance PF. & Reading H.G. eds. Sedimentation of oblique- slip mobile zones. Iutex Ass. Seclime~~tologists Spec. Pub. 4, 237-265.
NORRIS R.J., CARTER R.M., 1982 - Fault-bounded blocks and their role in localising sedimentation and deformation‘adjacent to the Alpine Fault, southern New Zealand. Tectonophysics, 57, U-23.
PELLETIER B. and DUPONT J., 1990 - Effets de la subduction de la ride de Louisville sur l’arc des tonga-kermadec. Ocearrologica Acta. Vol. special, 10.
PETTINGA J. R. 1982 - Upper Cenozoic structural history, coastal southern Hawkes Bay, New Zealand. N.Z. J. Geol. Geophys. 25 : 149-19I.
REYNERS M., GLEDHILL K. and WATERS D., 199 1 -Tearing of the subducted Australian plate during the Te Anau, New Zealand, earthquake of 1988 june 3. Geophys. J. Int. 104, 105-115.
ROSE K.H., 1991- Cook gravity Anomaly Map, 1 : l,OOO,OOO, D. S. I. R., Wellington, New Zealand
RUFF L.J., GIVEN J.W., O.SANDERS C, and SPERBER C.M., 1988 - Large Earthquake in the Macquarie Ridge Complex : Transitional Tectonics and Subduction Initiation. Pageoph. 129, I-2, 71- I29
106
SCHOLZ C.H., RYNN J.M.W., WEED R.W., FROLICH C., 1973 - Detailed seismicity of the Alpine Fault zone and Fiordland region, New Zealand. Geol. Sot. ANY. Bull., 84, 3297-3316.
SKINNER D.N.B., 1986 - Neogene volcanism of the Hauraki volcanic region, in late Cenozoic Volcanism in New Zealand, ed by I. E. M. Smith ; Royal Society ofNew Zealand Bulletin, 23, 21-47
SMITH E.G.C., DAVEY F.J., 1984 - Joint hypocentre determination of intermediate depth earthquakes in Fiordland, New Zealand. Tectonophysics, 104, 127-144.
SP&LI K.B., 1980 - New Zealand and oblique-slip margins : tectonic development up to and during the Cainozoic. Spec. Pub. int. Ass. Sediment. 4, 147-170.
SP&LI K. B., 1987 - Developement of the New Zealand microcontinent, in Circum-Pacific Orogenic Belts and evolution of the Pacific Basin, edited by J.W: H. Monger, J. Francheteau, AGU, 18, 115-132.
STOCK J., MOLNAR P., 1987 - Revised history of early Tertiary plate motion in the southwest Pacific. Nature, 325 (6104), 495-499.
SMITH E.G.C., STERN T.A., REYNERS M., 1989 - Subduction and back-arc activity at the Hikurangi Convergent Margin, New Zealand. Pageoph. 129 (l/2), 203-231.
SUGGATE R.P., 1963 - The Alpine Fault. Transactions of the Royal Society of New Zealand, Geology 2, 105-129.
SUTHERLAND R., 1993a - A critical review of Cenozoic plate motion trough New Zealand. submitted to N. Z. J. G. G.
SUTHERLAND R., 1993b - Displacement, uplift and paleogeography since the Pliocene along the southern section of the Alpine Fault, New Zealand. submitted to Geology.
TURNBULL I.M. and URUSKI C.I., 1993 - Cretaceous and Cenozoic sedimentary basins of western southland, South Island, New Zealand. I.G.N.S. New Zealu&, Monograph 1, 86.
URUSKI C., 1993 - Petroleum potential of Western Southland, South Island, New Zealand. PESA journal, p 55-66.
URUSKI C-I., TURNBULLI.M., 1989 - Stratigraphic and structural evolution of the west southland sedimentary basins. N.Z. Oil Explor: Con$ proc., Min. of Cornerce, Wellington, vol.l, 225-240.
VAN DER LINGEN G.J. and PETTINGA J.R., 1980 -The MakaraBasin : a Miocene slope-basin along the New Zealand sector ot the Australian-Pacific oblique convergent plate boundary. in Ballance, l?F: and Reading, H.G. (Eds), Sedimentation in oblique-slip mobile zones., 4 : I91- 215
WALCOTT R-I., 1978 - Present tectonics and Late Cenozoic evolution of New Zealand. Geophys. J. R. Astron. Sot. 83, 4419-4429
WELLMAN H-W., 1953 - Data for the study of Recent and late Pleistocene faulting in the South Island of New Zealand. New Zealund Journal of Sciences ur2cl Technology, B34, 270-288.
WELLMAN H.W., 1973 - The Stokes Magnetic Anomaly. Geol. Mag.,llO, 419-429. WEISSEL J.K. and HAYES D-E., 1977 - Evolution of the Tasman Sea reappraised, Earth P&et.
SC. Lett., 36, 77-84. WESSEL P., and W. H. SMITH, 1991 - Free software helps map and display data (GMT) EOS,
AGU, 72, 441
107
WEISSEL J.K., HAYES D.E., HERRONE.M., 1977 - Plate tectonic synthesis : the displacements between Australia, New Zealand and Antarctica since the Late Cretaceous. hlnl: geol., 2.5,231- 277.
WILLIAMSON P.E., 1988 - Origin, structural and tectonic history of the Macquarie island region. Papers and Proceedings of the Royul Society of Tasmania, 12.2 (I), 2 7-43.
WILLIAMSON P., HAWKINS L.V. and LONG B., 1981 - An examination of the possible occur- rence of seafloor spreading magnetic anomalies on Macquarie island. Murirze Geophysicul Researches, 5, 139-l 55.
WOOD R. and DAVY B., 1994 - The Hikurangi Plateau. Mar. Geology. , in press WOODWARD D.J., 1972 - Gravity anomalies in Fiordland, south-west, New ZealandJV. Z. Jourxof
Geol. and Geoph., 15 (I), 22-32.
WRIGHT, 1993 - Pre-shaped rifting and heterogeneous volcanism in the southern Havre Through back-arc basin. Mal: Geol. 113 : I79-200.
108

FIGURES
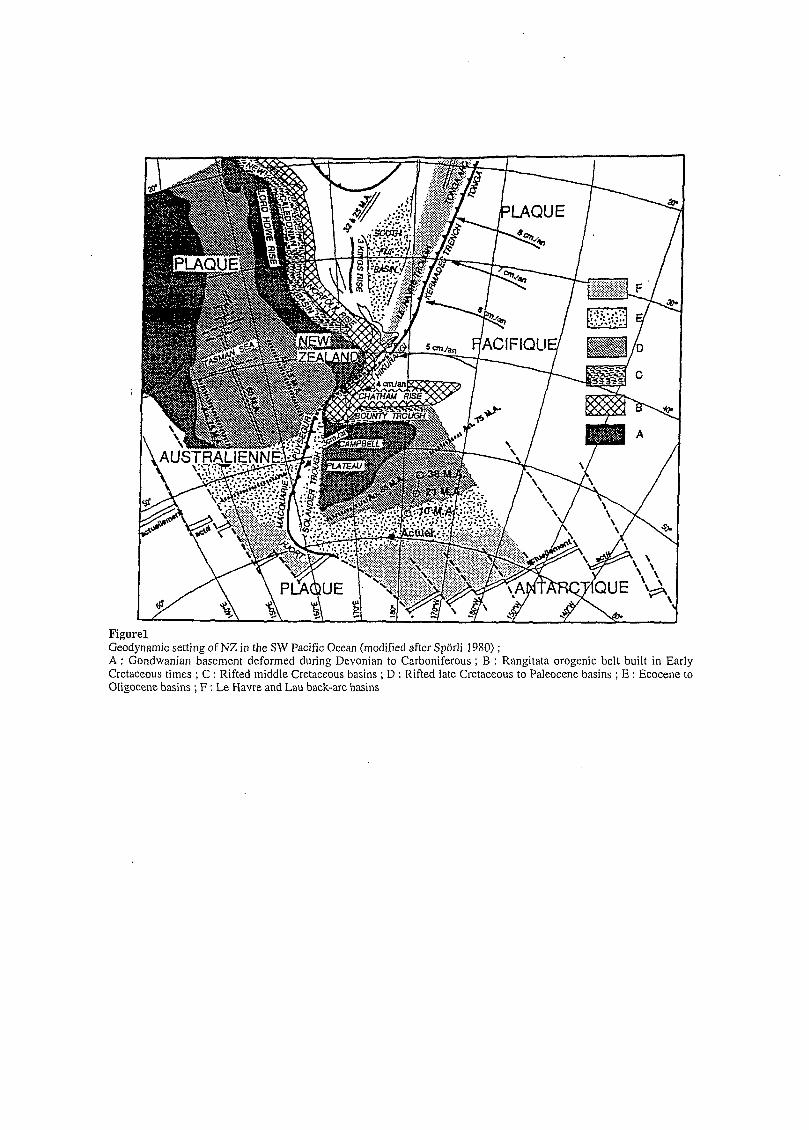
Figure1 Geodynamic setting of NZ in the SW Pacific Ocean (modified after SpGrli 1980) ; A : Gondwanian basement deformed during Devonian to Carboniferous ; B : Rangitata erogenic belt built in Early Cretaceous times ; C : Rifted middle Cretaceous basins ; D : Rifted late Cretaceous to Paleocene basins ; E : Ecocene to Oligocene basins ; F : Le Havre and Lau back-arc basins
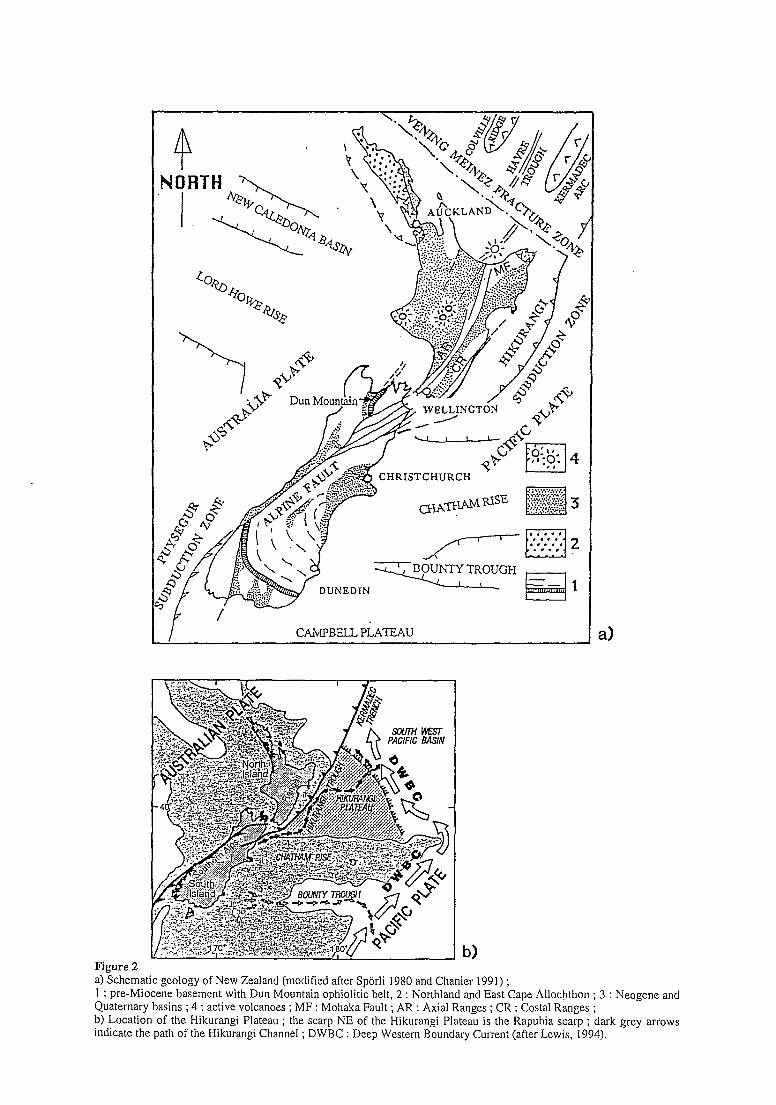
Figure 2
HRISTCHURCH
CAMPBELL PLATEAU a)
a) Schematic geology of New Zealand (modified after Sporli 1980 and Chanier 1991) ; I : pre-Miocene basement with Dun Mountain ophiolitic belt, 2 : Northland and East Cape Ailochthon ; 3 : Neogcne and Quaternary basins ; 4 : active volcanoes ; MF : Mohaka Fault ; AR : Axial Ranges ; CR : Costal Ranges ; b) Location of the Hikurangi Plateau ; the scarp NE of the Hikurangi Plateau is the Rapuhia scarp ; dark grey arrows indicate the path of the Hikurangi Channel ; DWBC : Deep Western Boundary Current (after Lewis, 1994).
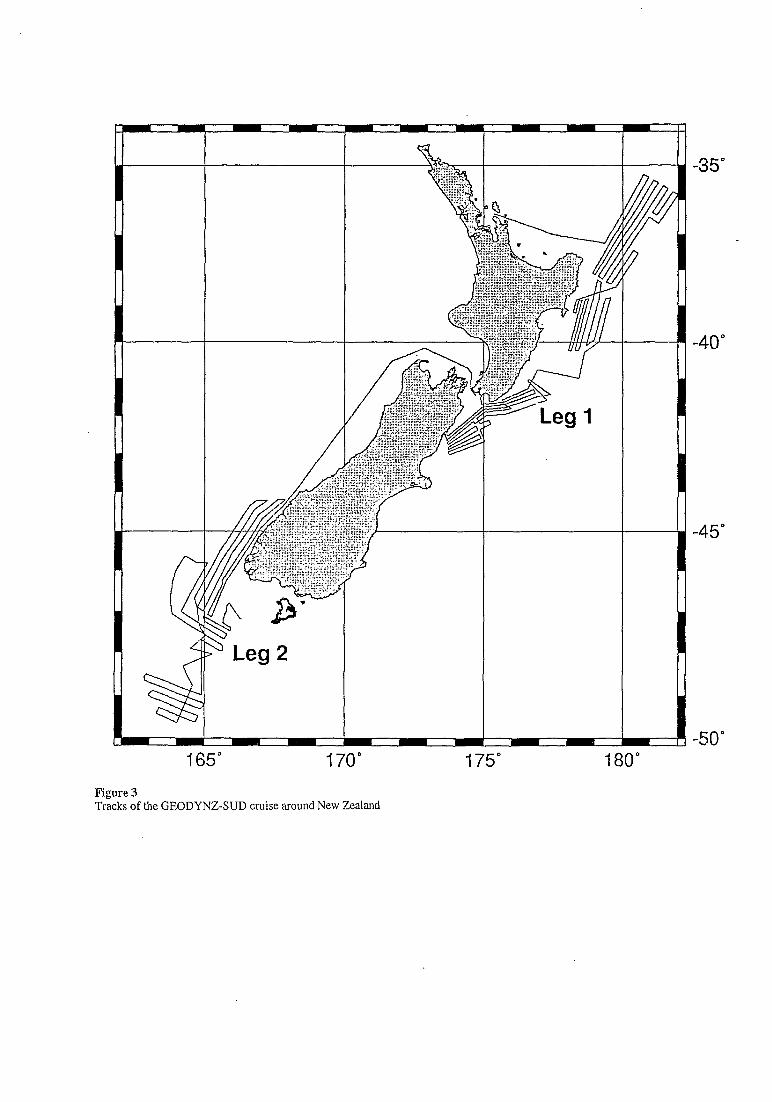
p 3
m - - - 165" 170" 175" 180"
-35"
-40"
-45"
-50"
Figure 3 Tracks of the GEODYNZ-SUD cruise around New Zealand
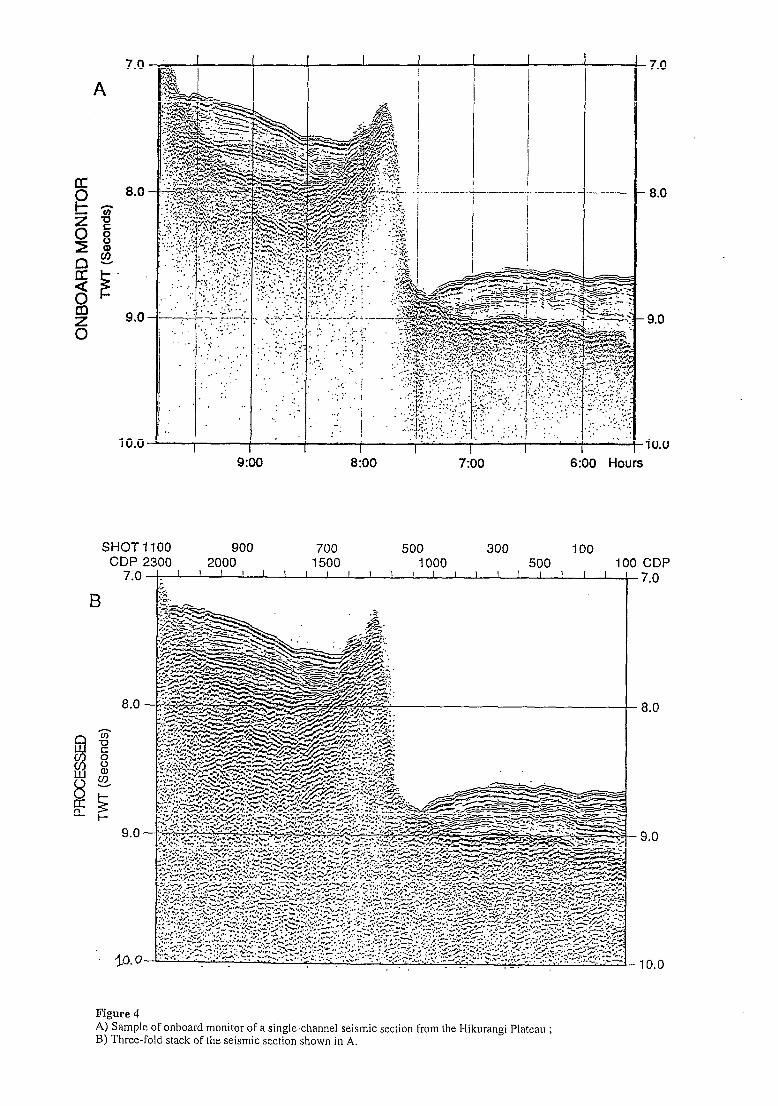
8.0
- 7.0
. 8.0
9.0
10.0 6:00 Hours
SHOT 1100 900 700 500 300 100 CDP 2300 2000 1500 1000 500 100 CDP
8.0
-7.0
- 8.0
Figure4 A) Sample of onboard monitor of a single-channel seismic section from the Hikurangi Plateau ; B) Three-fold stack of the seismic section shown in A.
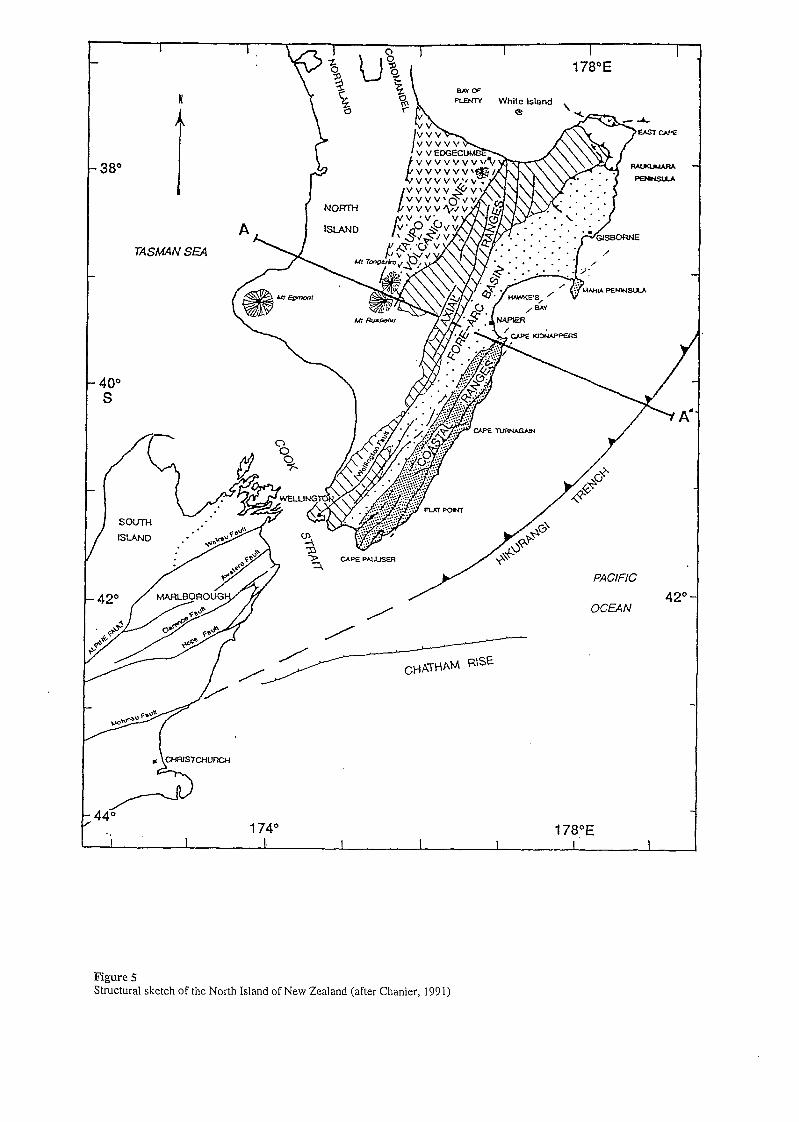
380
White island e \
NORTH
TASMAN SEA . . . .
-. 174” 178;E I I I. I I I I I
Figure 5 Structural sketch of the North Island of New Zealand (after Chanier, 1991)
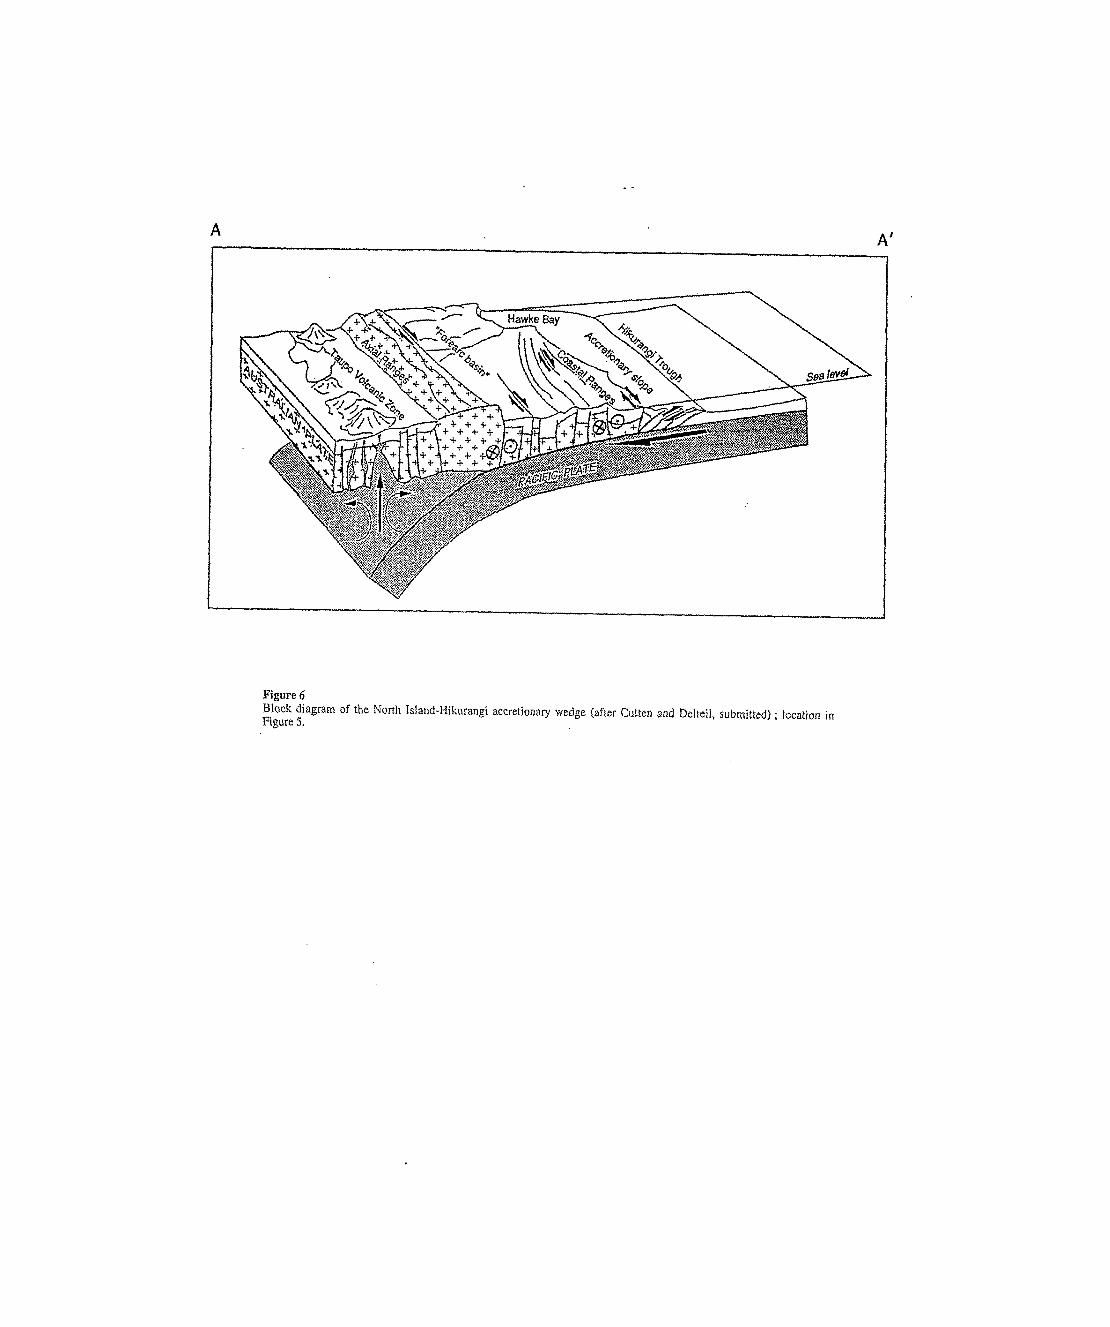
A A’
Figure 6 Block diagram of the North Island-Hikurangi accretjonary wedge (after Cutten and Deiteil, submitted) ; location in Figure 5.
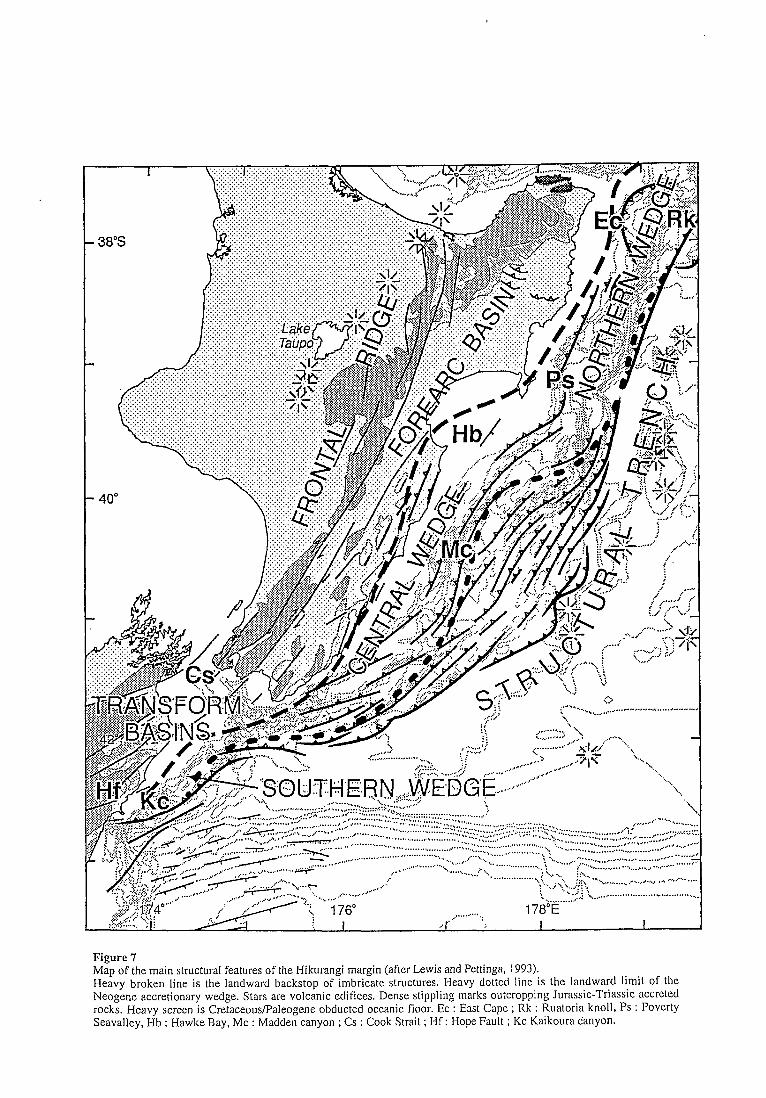
Figure 7 Map of the main structural features of the Hikurangi margin (after Lewis and Pettinga, 1993). Heavy broken line is the landward backstop of imbricate structures. Heavy dottcci line is the landward limit of the Neogene accretionary wedge. Stars are volcanic edifices. Dense stippling marks outcropping Jurassic-Triassic accreted rocks. Heavy screen is CretaceoudPaleogene abducted oceanic floor. EC : East Capt ; Rk : Ruatoria knoll, PS : Poverty Seavalley, Hb : Hawke Bay, MC : Madden canyon ; Cs : Cook Strait ; Hf : Hope Fault ; Kc Kaikoura canyon.
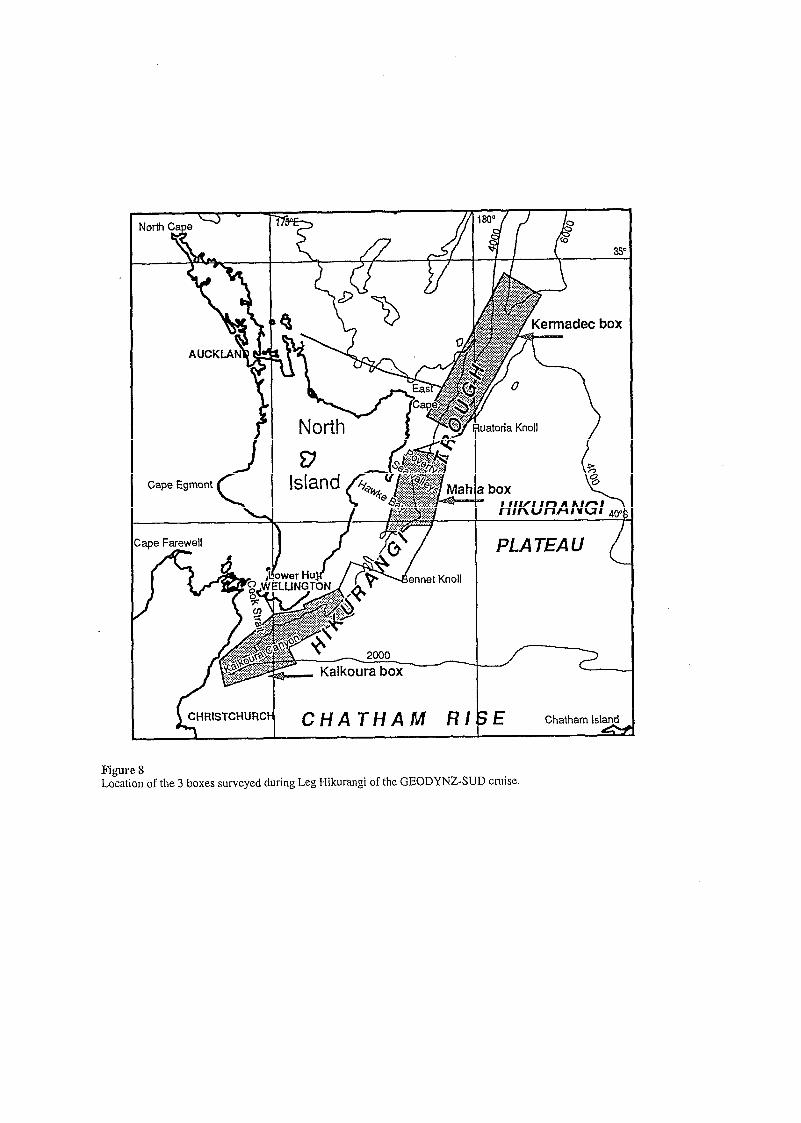
CHRISTCHURC CHATHAM R/FE Chatham Island
Figure 8 Location of the 3 boxes surveyed during Leg Hikurangi of the GEODYNZ-SUD cruise.
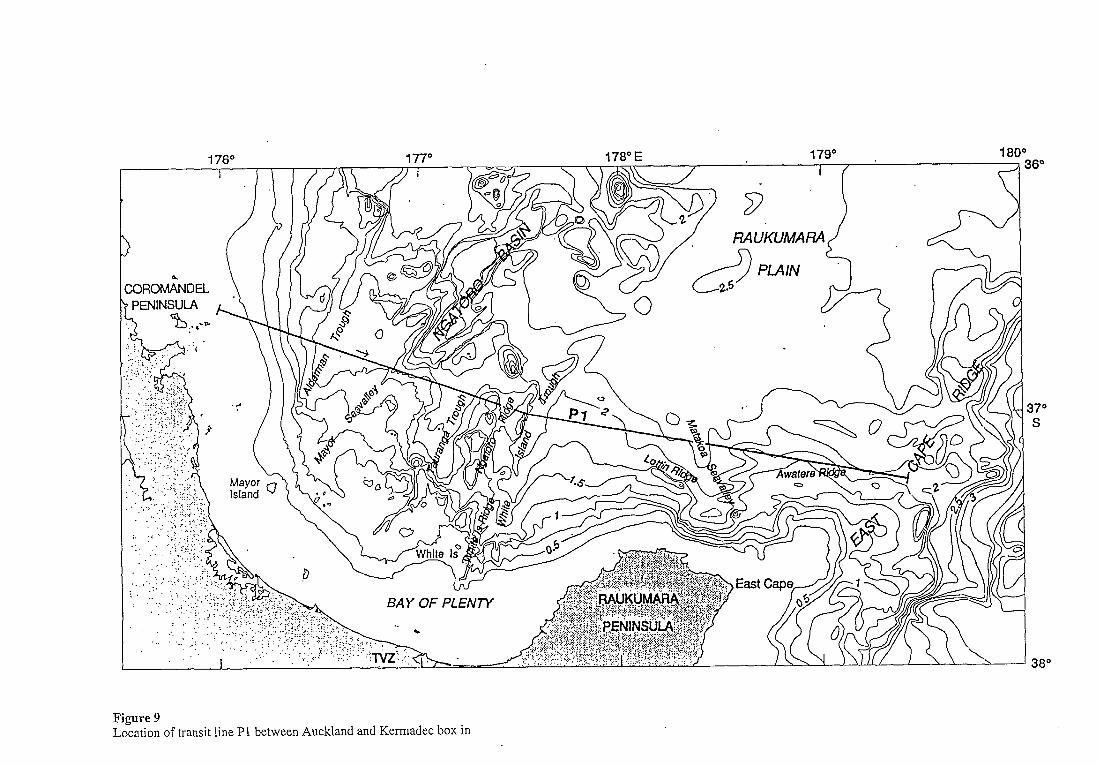
180” 36O
37” S
38“
Figure 9 Location of transit line Pl between Auckland and Kermadec box in
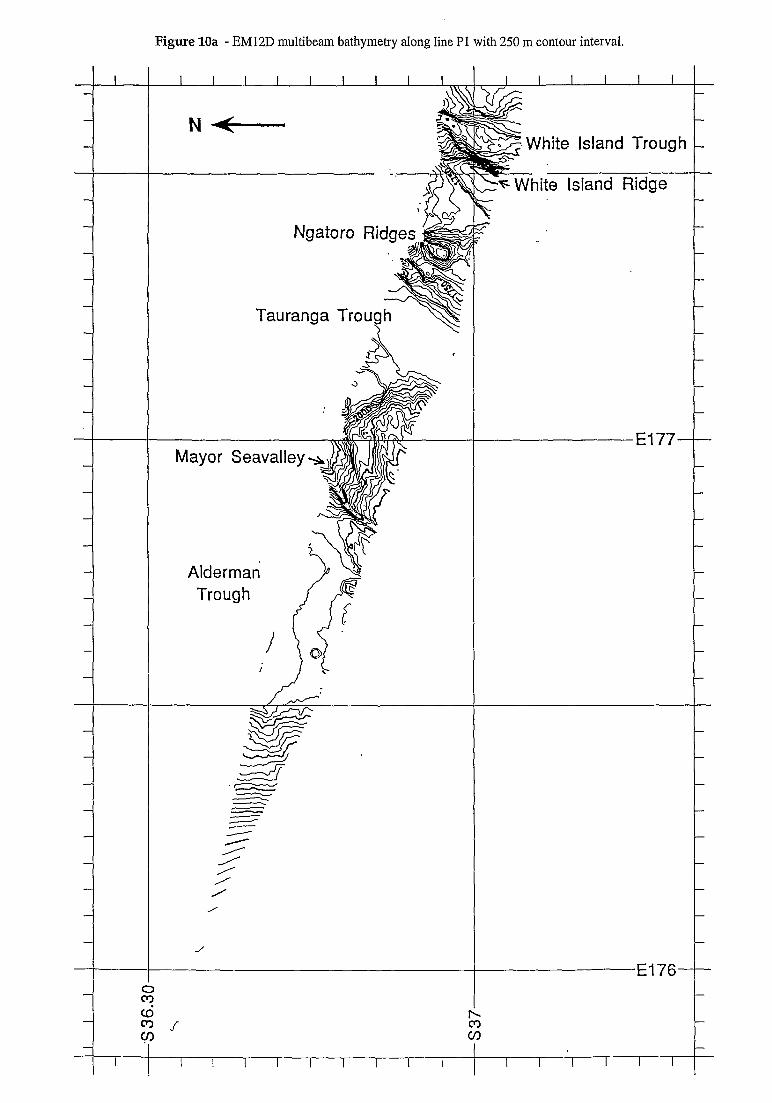
Figure 10a - EM12D multibeam bathymetry along Iine Pl with 250 m contour interval.
I
I ‘
Ngatoro Ridges,,i
Tauranga
: 5- : I
,
J
I I I I I I
El77-
E176-
-
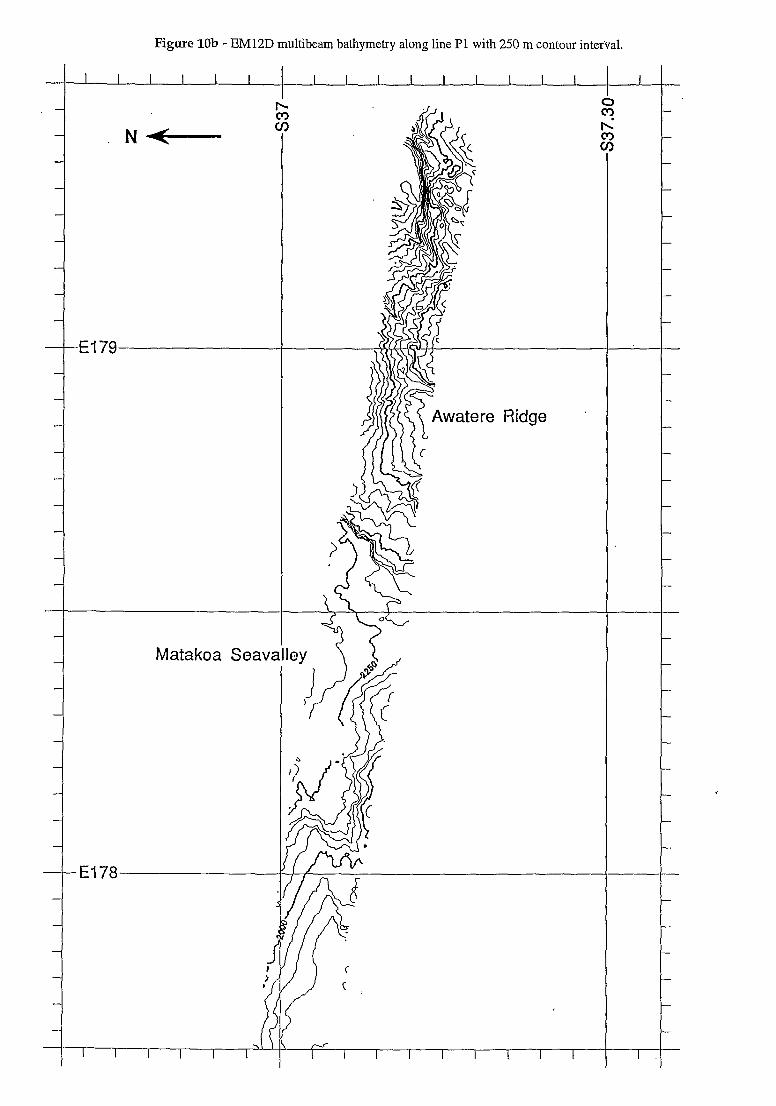
Figure lob - EM12D multibeam bathymetry along line Pl with 250 m contour interval.
I I I I I I
N-
El 79
Matakoa Seav:
- El78 t
watere Ridge
r-J I I I I I I I I
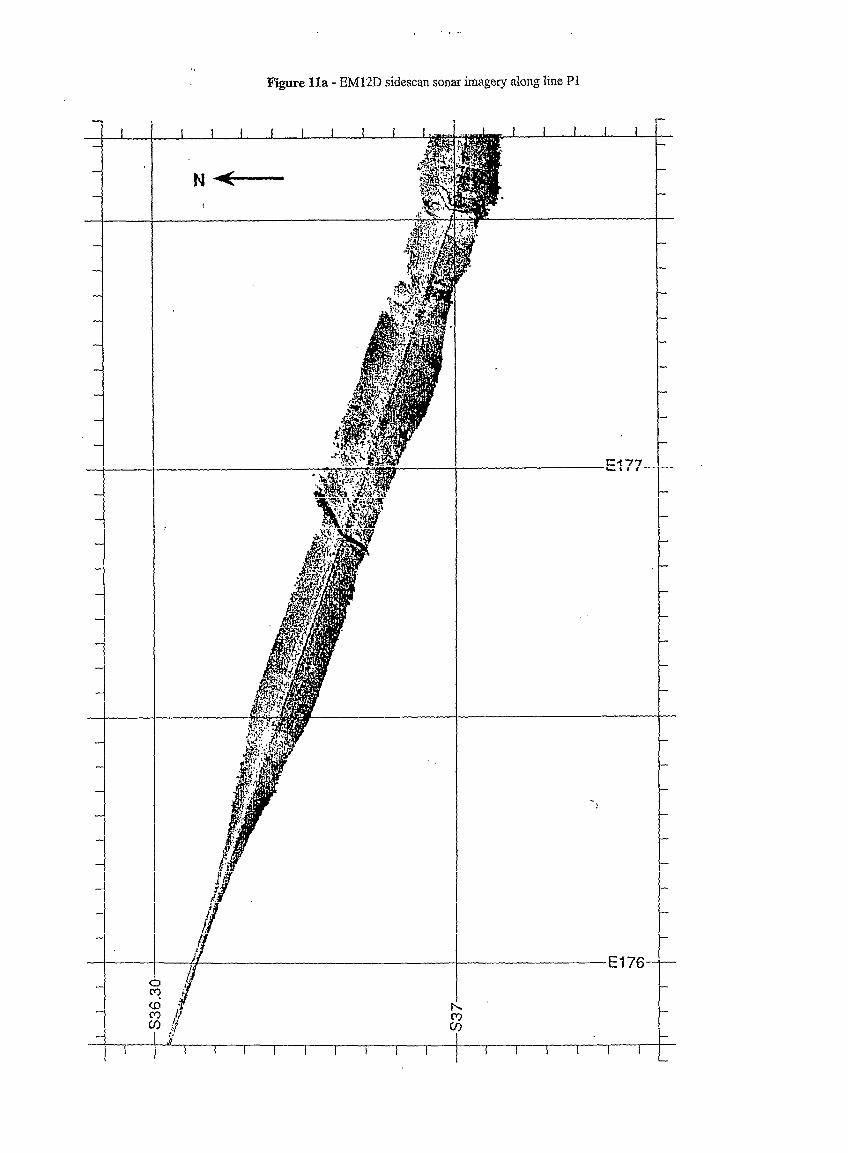
Figure lla - EMI2D sidescan sonar imagery along line Pl
r’ d Q :; 2 I I I I r I I I
El 77-
-!
E176-
I I I I 1 I
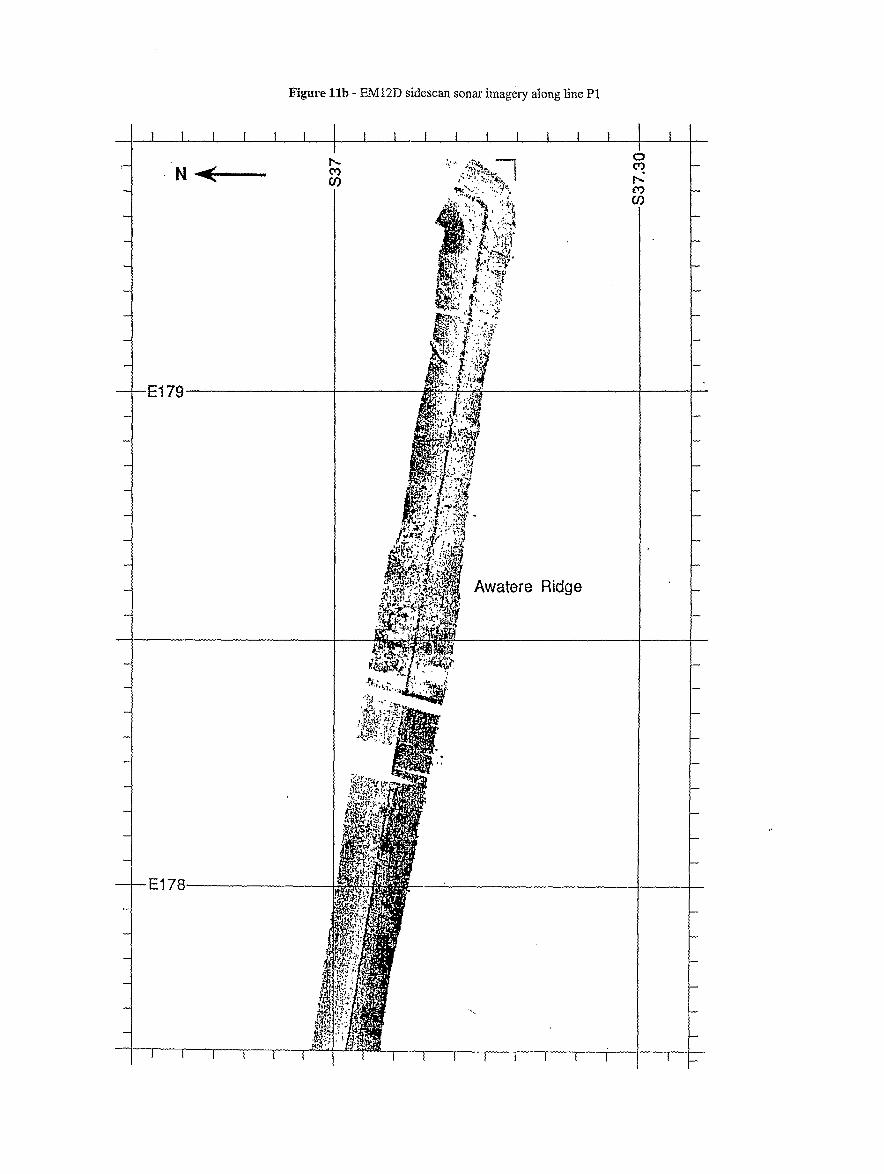
i-
Figure llb - EM12D sidescan sonar imagery along line Pl
-El 79
-El78
I
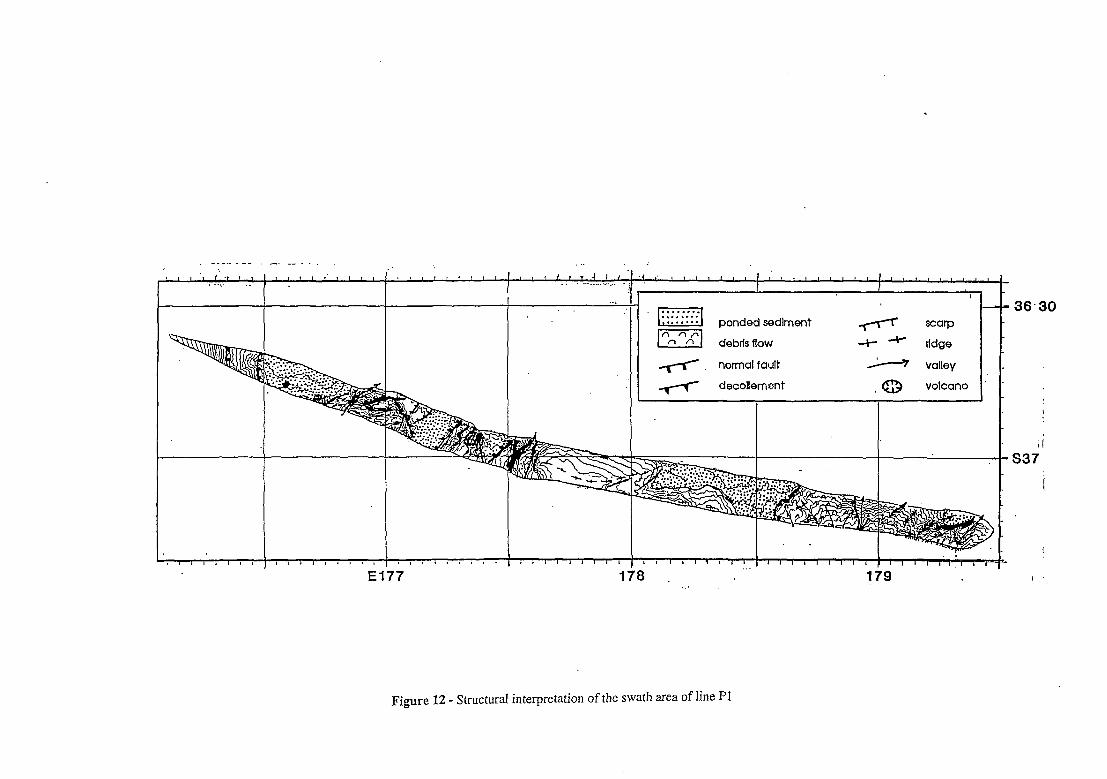
,Wl ponded sediment
Irn] debrfs flow
4 normal fault
fl decollemwt
I
I
y0 =arp
+ a tidge
M valley
x3 volcano
1
El77 178 , 179 .:
Figure 12 - Structural interpretation of the swath area of line PI
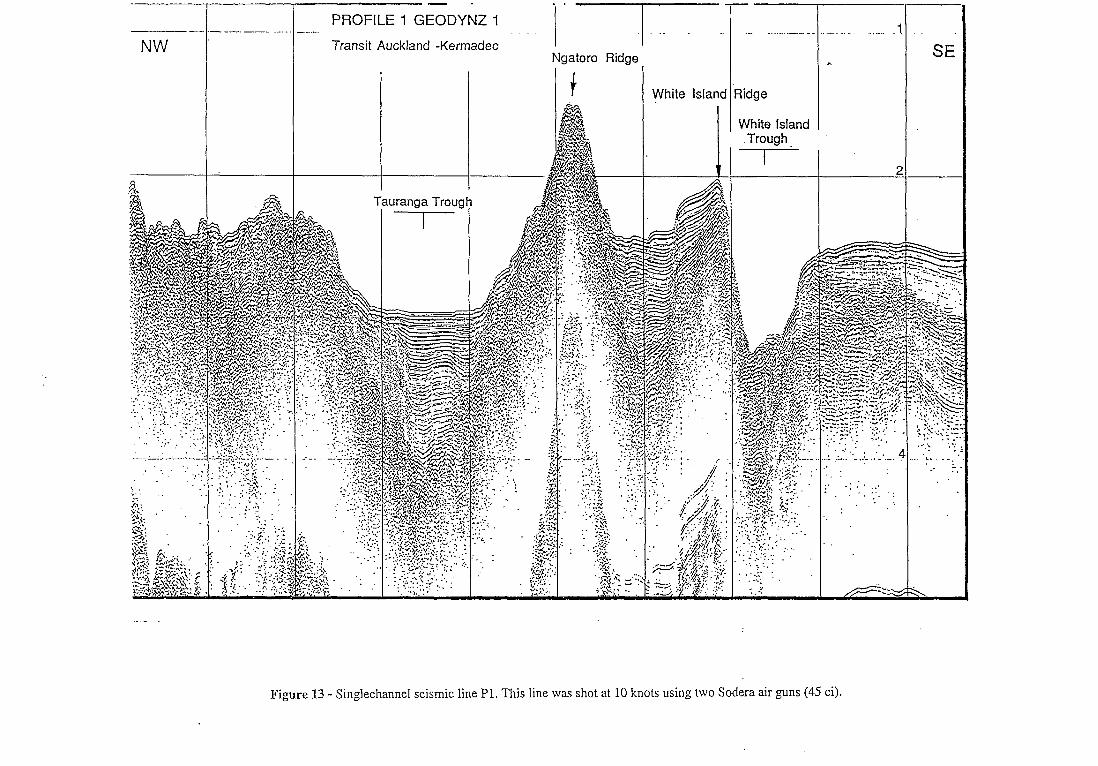
NW
PROFILE 1 GEODYNZ 1 - .-----_ . . . ______ .,.. ._ .- _....... - _._.. .,- .._. .._. . 1 Transit Auckland -Kermadec
Ngatoro Ridge h
White island Ridge
I White Island
SE
Figure 13 - Singlechannel seismic line Pl. This line was shot at 10 knots using two Sodera air guns (45 ci).
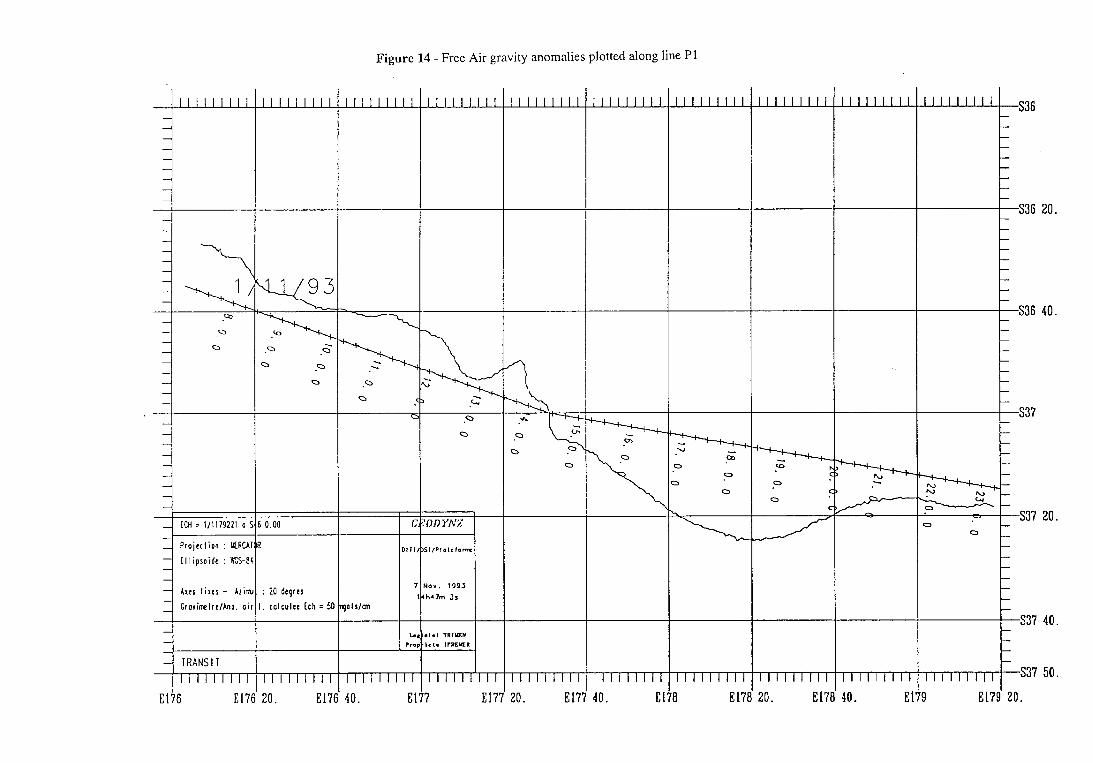
Figure 14 - Free Air gravity anomalies plotted along line Pl
- .Q 0
-
rl Cllipsaidc : ‘KS-1
Ares lixrr - Azir
Grorimlrelbno. a
El76 El;
0.00
: 20 degrcs colcul~e Ich = 50
1 I I I I I I I I
20. El71
1llIlllII
pIs/cm
- 7
I, -
7
-
La Pro -
1 I I I I I I I c
40. El
IIIIIIIIl
1llrllllC
20. E17’
1 I I I I I I I r
40. El
I I I 1 I 1 1 1 1
111111111
3 El7
--+p--& 0 ,
3
111111IIc
20. El7
+--+-p c
1lllllllr
40. E
-I s37
i
s37 40.
s37 50.
I El79 20.
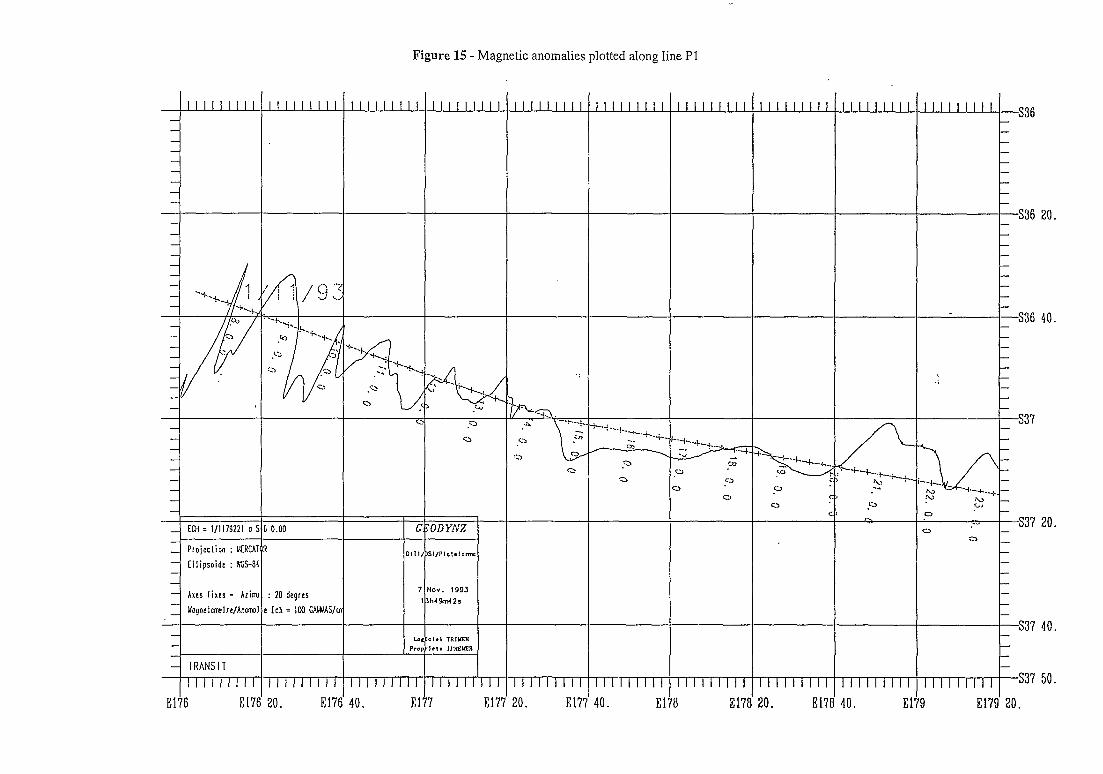
Figure 15 - Magnetic anomalies plotted along line Pl
_ EM = l/l179221 0 5 6 0.00 I - _ Projtclion : WKAll~R
- Cllipsoidt : KS-84 err
- Axes lixts - Azirru : 20 degrts
Uognelcnelrt/Anuml t Ich = 100 IXUAS/m
- TRANSIT 1IIIIIlII 1IIIIIIIl IIIIIIII
El76 El76 20. El76 40. E
LI I I I l I l l
7 El7
I I I I I I I I I
I I I I I I I I I
20. El7 6 El7
IIIIIIIIl
TI I I IIIII
20. El;
1 I I I I l l l l I I I I I I I I l S36
P ---?- p-4. . .
I I I I I I I I I
40. E:
S36 20. -
-S36 40.
s37
s37 40.
I I I I I I I I I s37 50.
3 El79 20.
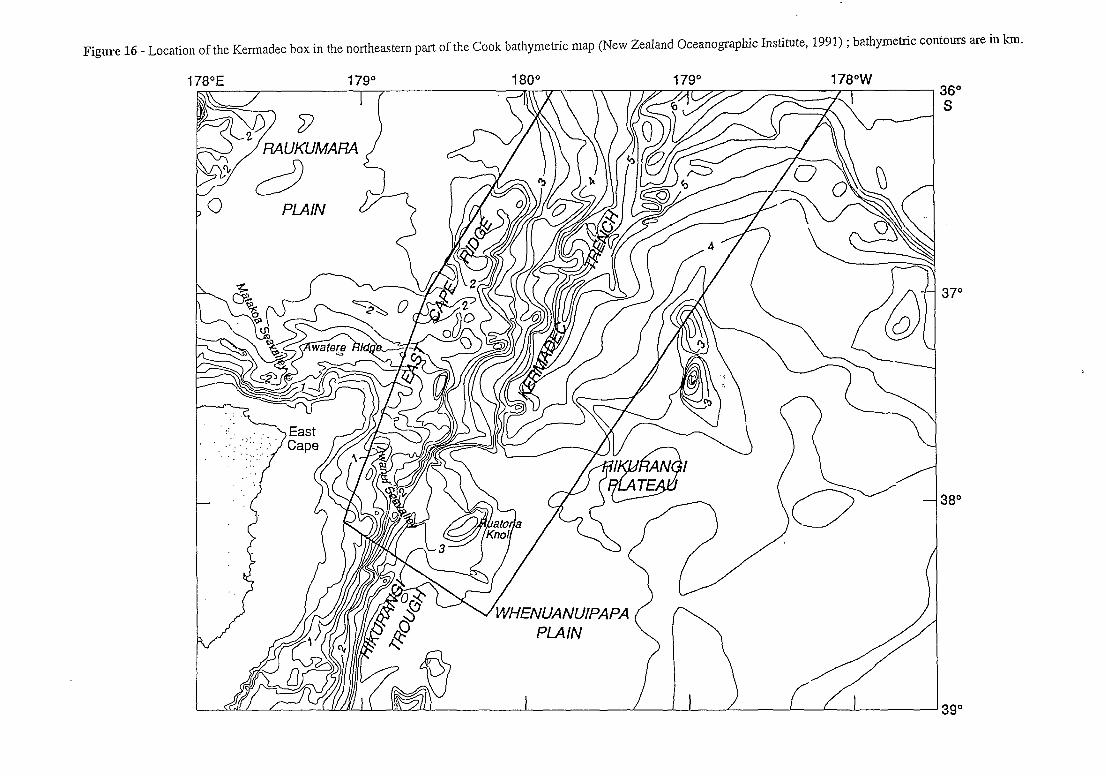
Figure 16 - Location of the Kermadec box in the northeastern part of the Cook bathymetric map (New Zealand Oceanographic Institute, 1991) ; bathymetric contours are in km.
178”E 180” 178”W 36” S
37”
38”
39”
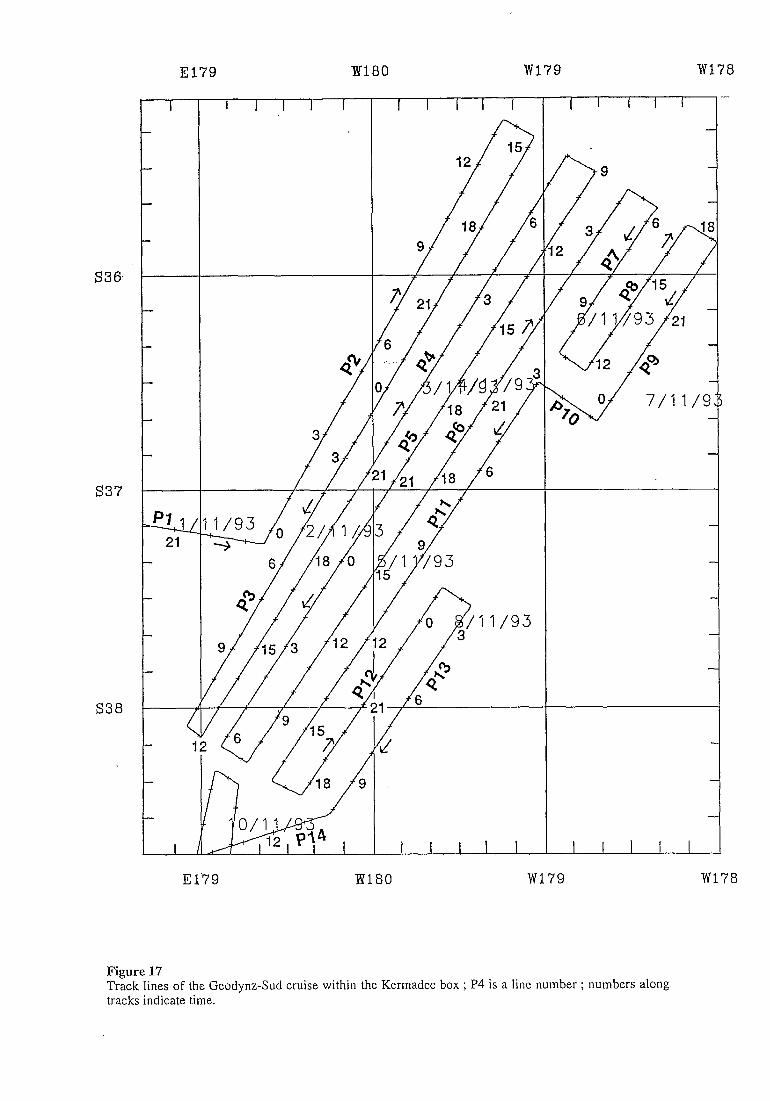
El79 X180 w179 W178
I
S36-'
s37
J&J 21
S38
1
I
E
I I I I I r I I I 1 I I 1 I
I I I I
‘79 19 80 W
--
.78
Figure 17 Track lines of the Geodynz-Sud cruise within the Kermadec box , . P4 is a line number ; numbers along tracks indicate time.
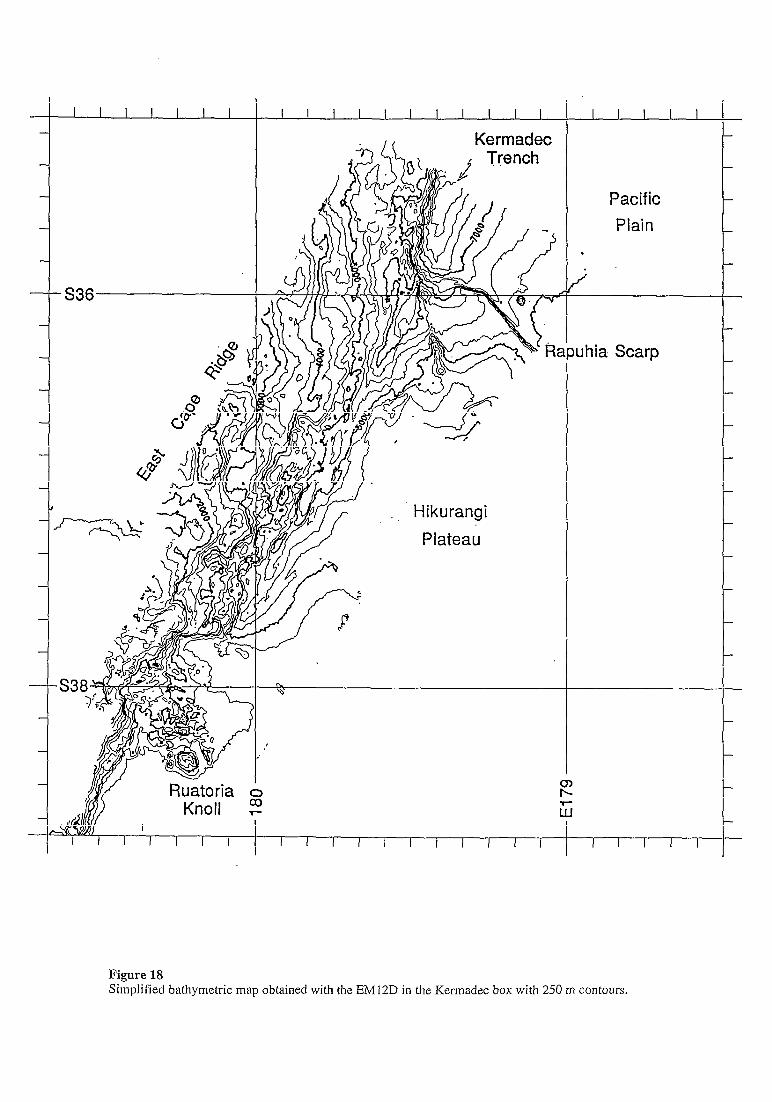
I I I I I I I I I I I I I I I I I I
Kermadec
I I I I I
Pacific
Plain
#u hia Scarp
Figure 18 Simplified bathymetric map obtained with the EM12D in the Kermadec box with 250 m contours.
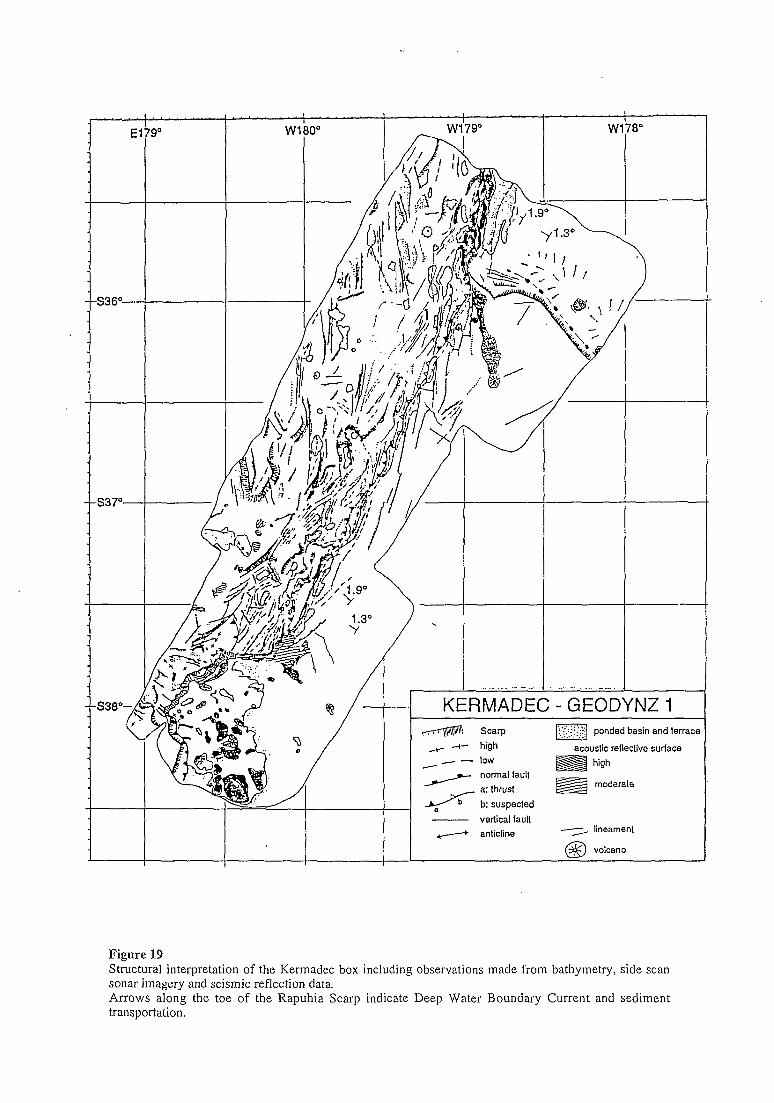
-L-----
KERMADEC - GEODYNZ 1 l-rTqmv Scarp
- -I- high
- -c - low
- vertical fault
+ anlicline
a ponded basin and terrace
acoustic refleclive surlace
m high
5 moderale
--- lineamen!
a3 volcano
Figure 19 Structural interpretation of the Kermadec box including observations made from bathymetry, side scan sonar imagery and seismic reflection data. Arrows along the toe of the Rapuhia Scarp indicate Deep Water Boundary Current and sediment transportation.
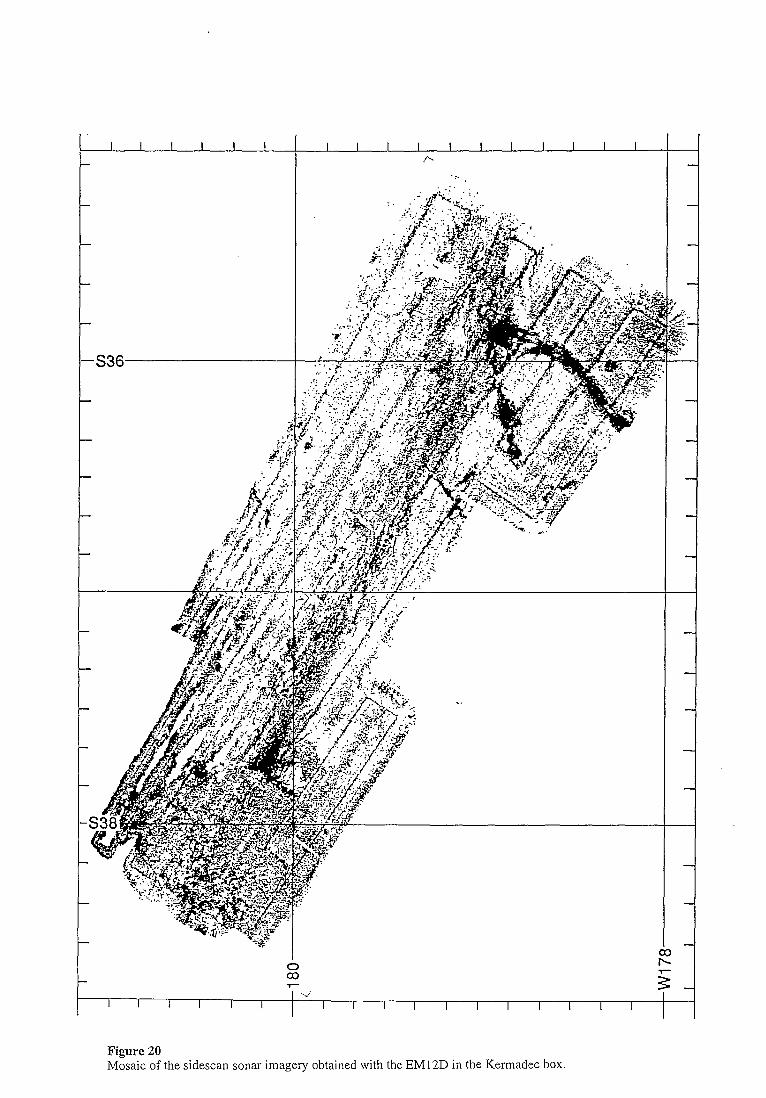
a3
T- ; ..,; I I I I I I I I I I I I I I I I I
1
4 Figure 20 Mosaic of the sidescan sonar imagery obtained with the EM12D in the Kermadec box.
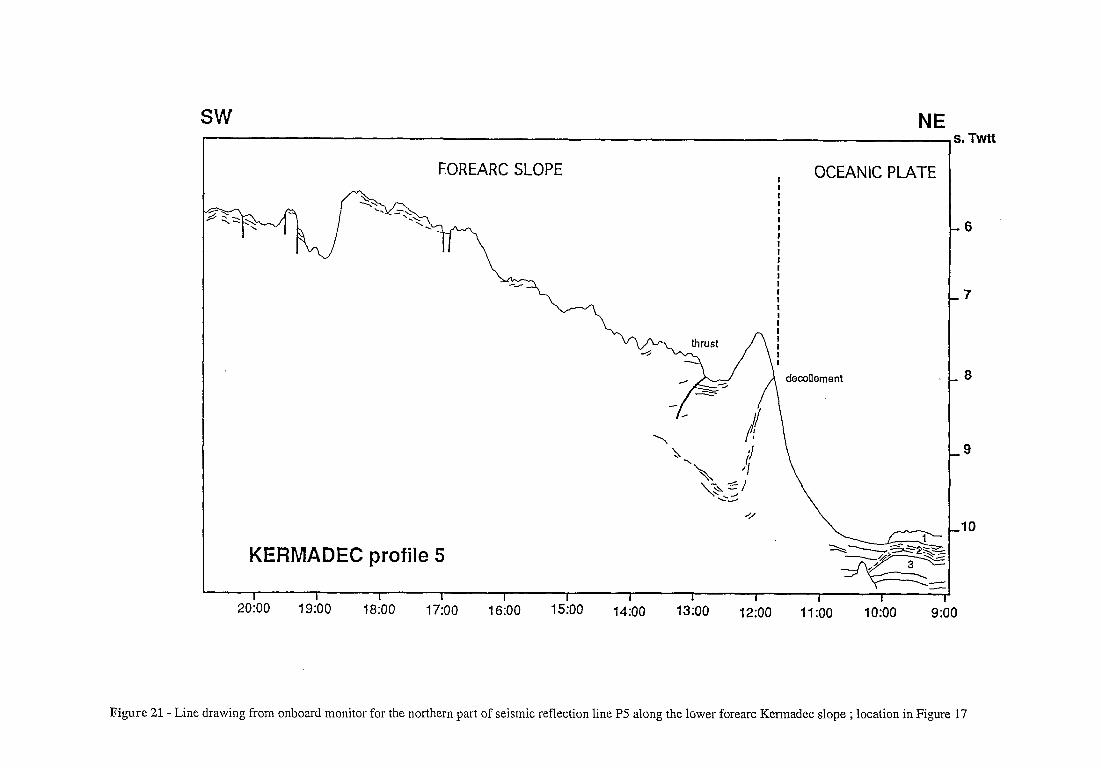
SW NE
EOREARC SLOPE I OCEANIC PLATE I
KERMADEC profile 5
2o:oo 19:oo 18:OO 17:oo 15:oo 14:oo
Figure 21- Line drawing from onboard monitor for the northern part of seismic reflection line P5 along the lower forearc Kermadec slope ; location in Figure 7
s. Twtt
I 6
.7
.a
-9
-10
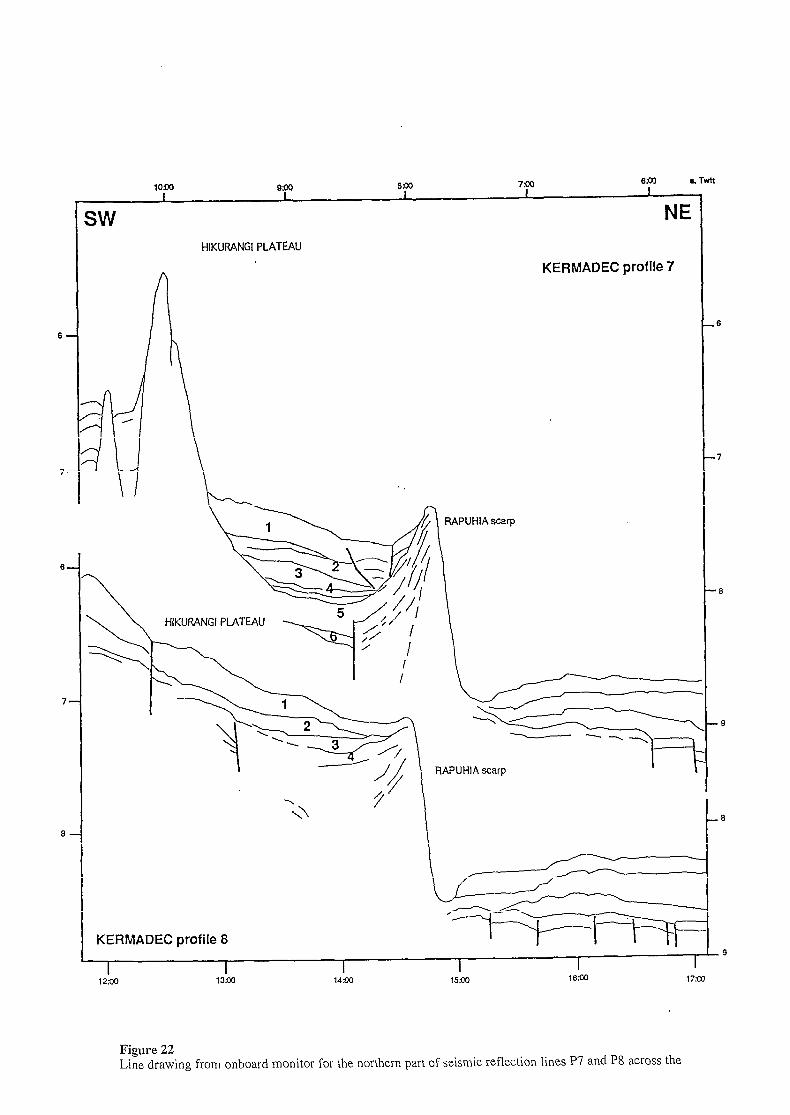
6.(x rTwn
6-
?-
,
,
6- P
.
7-
6-
HIKURANGI PLATEAU
NE
KERMADEC profile 7
HIKURANGI PLATEAU
KERMADEC profile 8
I 12.w
I 14w
.6
-7
-9
-9
Figure 22 Line drawing from onboard monitor for the northern part of seismic reflection lines P7 and P8 across the Rapuhia Scarp.
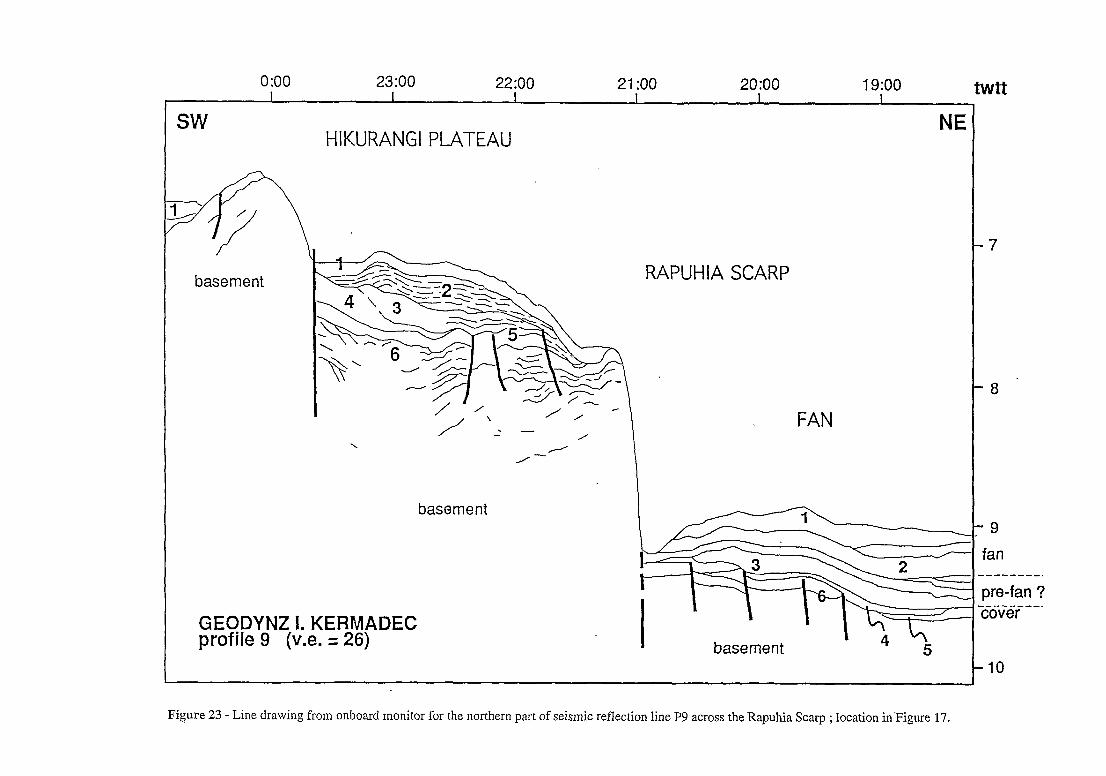
SW
0:oo 23:00 22:oo 21 :oo 20:oo 19:oo I I I I I I twtt
NE HIKURANGI PLATEAU
/ \
basement RAPUHIA SCARP -7
-8
FAN
/-- I
basement -9
fan . pre-fan ? __-----_. cover
-10
Figure 23 - Line drawing from onboard monitor for the northern part of seismic reflection line P9 across the Rapuhia Scarp ; location inPigure 17.
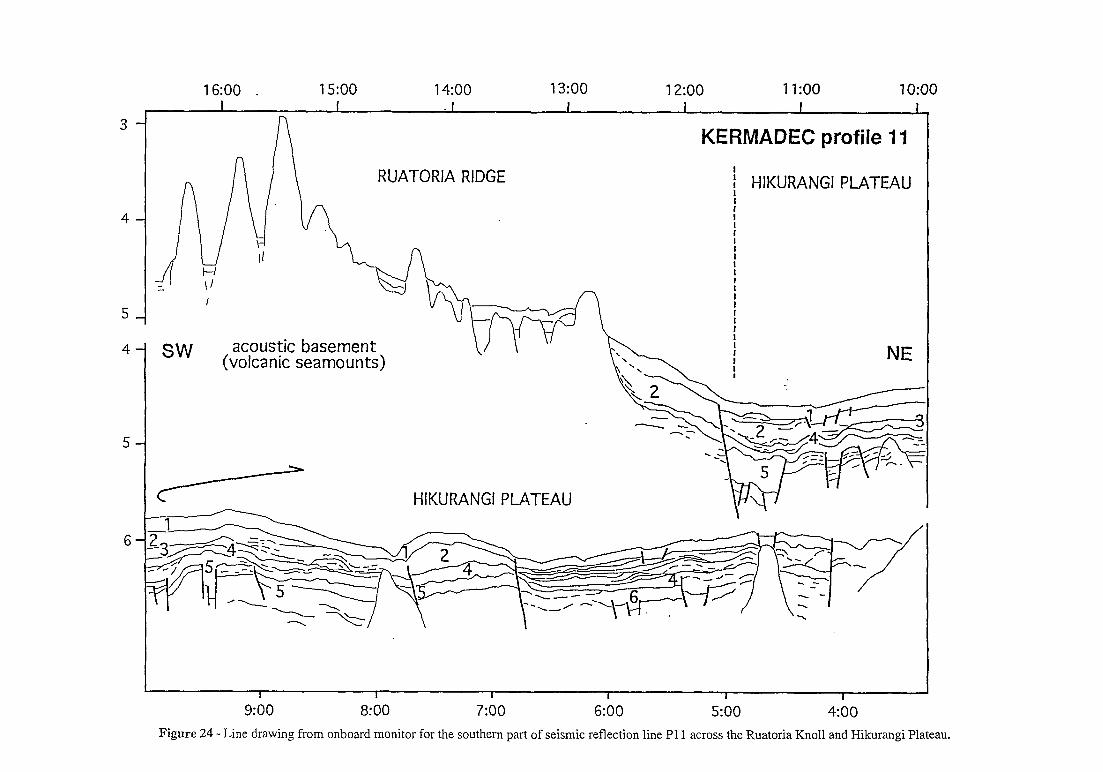
16:00 _ 15:oo 14:oo 13:oo 1200 1 l:oo 1o:oo I I I I I I 1
3-
n KERMADEC profile 11
RUATORIA RIDGE RUATORIA RIDGE i HIKURANGI PLATEAU : I I
i HIKURANGI PLATEAU : I I
I I
acoustic basement acoustic basement sw (volcanic seamounts) sw (volcanic seamounts)
HIKURANGI PLATEAU HIKURANGI PLATEAU
9:bo 8:60 7:ijo 6:bO 5:bo 4:bo Figure 24 - Line drawing from onboard monitor for the southern part of seismic reflection line Pl 1 across the Ruatoria Knoll and Hikurangi Plateau.
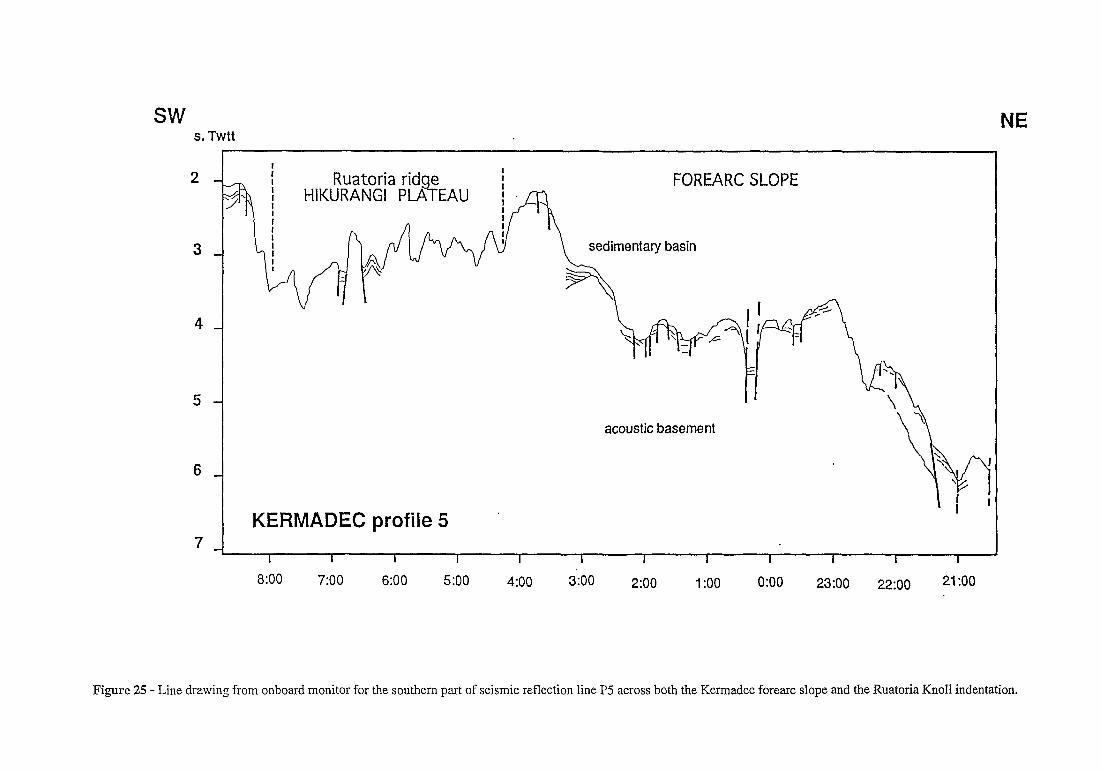
SW s. Twtt
NE
2
3
4
5
6
7
FOREARC SLOPE
sedimentary basin
acoustic basement
KERMADEC profile 5
8:00 7:oo 6:00 5:oo 4:oo 3.:00 2:oo 1 :oo 0:oo 23:00 22:oo 21 :oo
Figure 25 - Line drawing from onboard monitor for the southern part of seismic reflection line P5 across both the Kermadec forearc slope and the Ruatoria Knoll indentation.
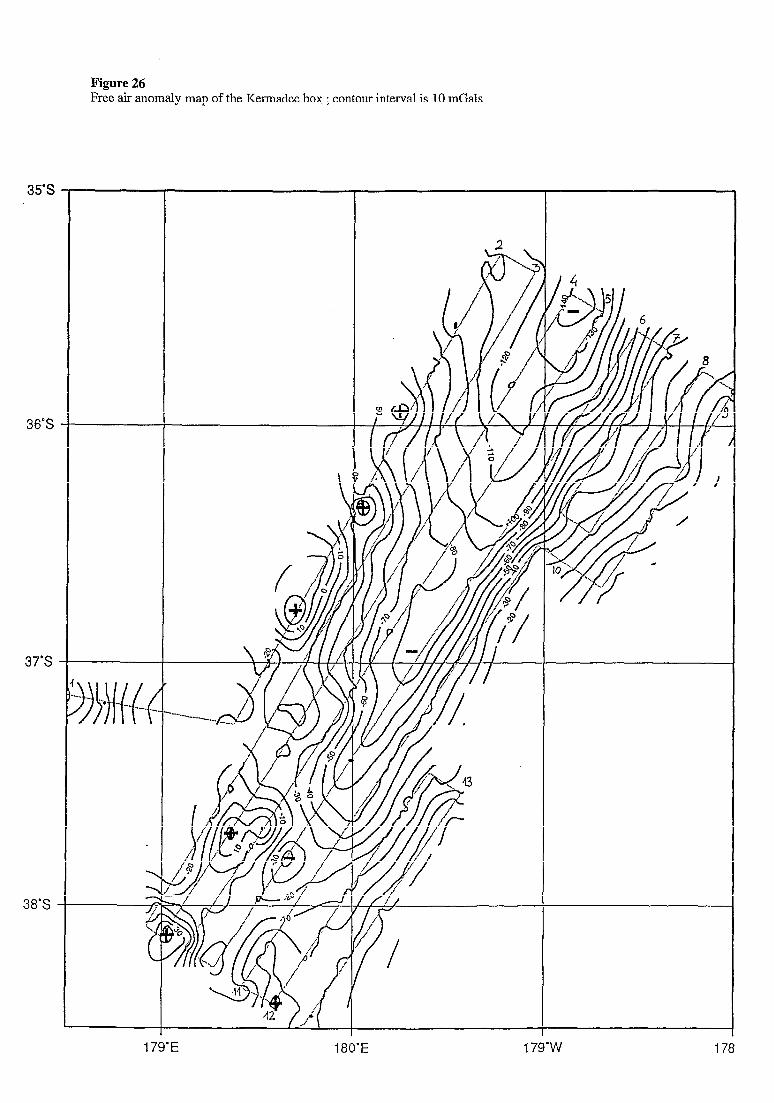
35’S
36-S
37%
38”s
Figure 26 Free air anomaly map of the Kermadec box ; contour interval is 10 mGals
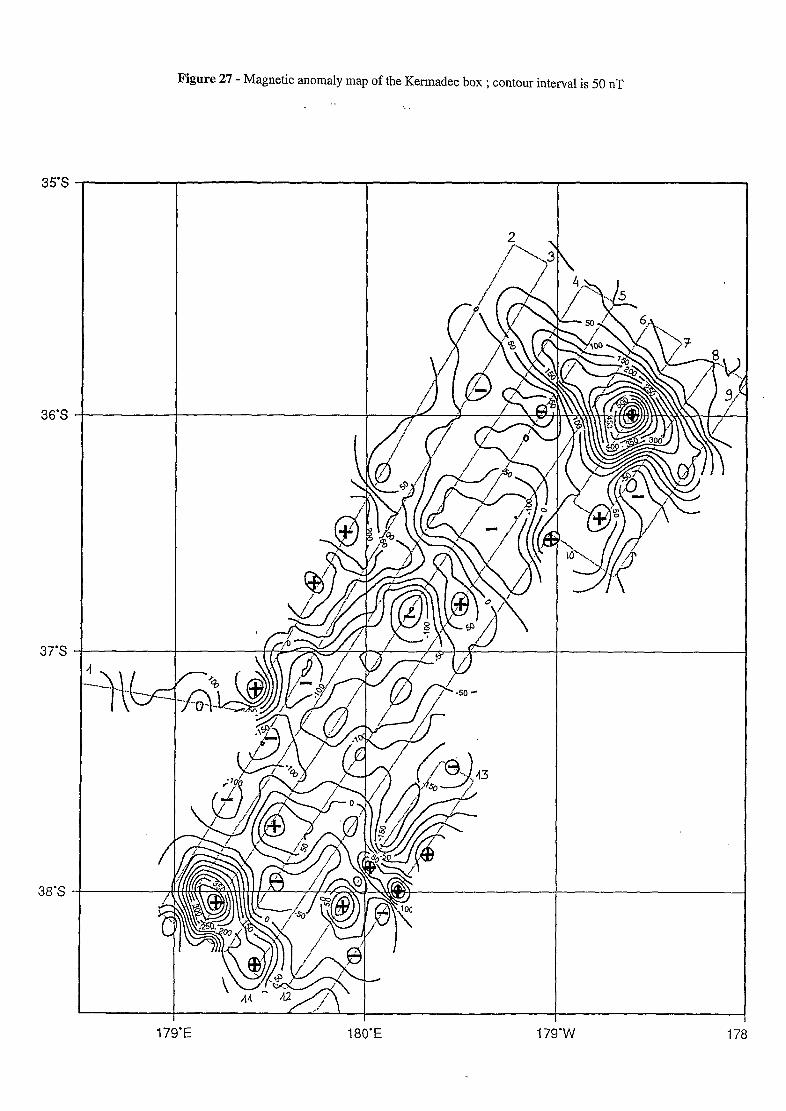
Figure 27 - Magnetic anomaly map of the Kermadec box ; contour interval is 50 nT
‘.
35’S
36-S
179-E
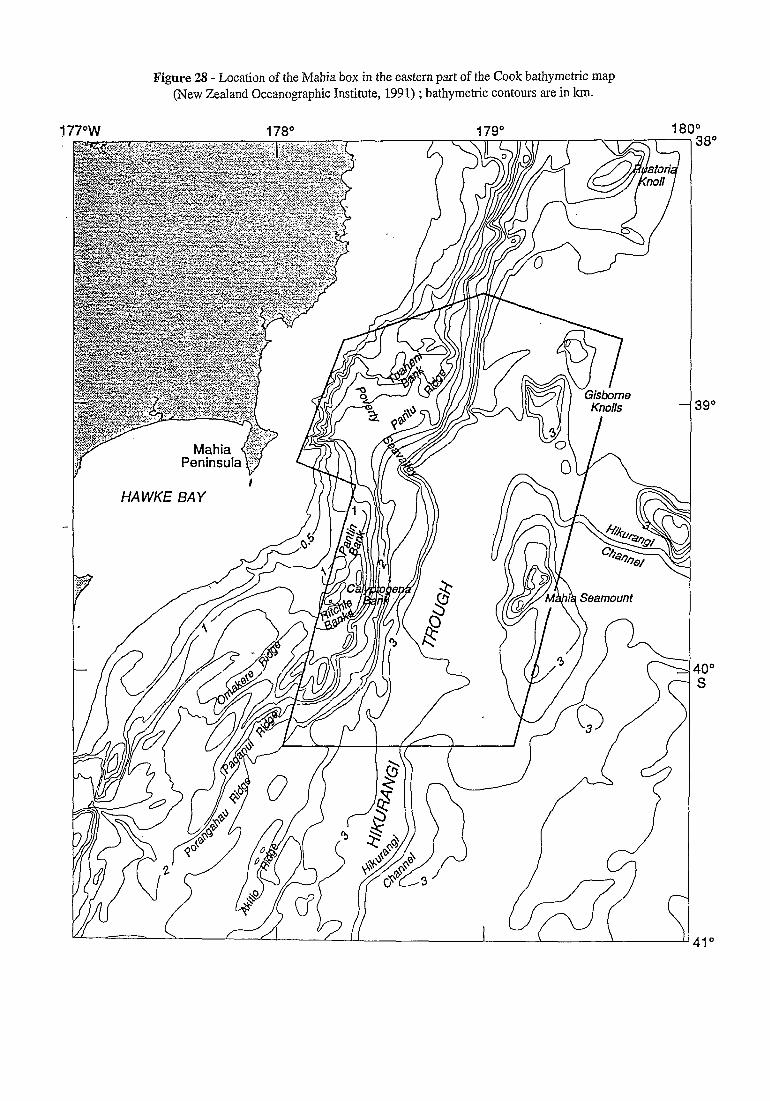
Figure 28 - Location of the Mahia box in the eastern part of the Cook bathymetric map (New Zealand Oceanographic Institute, 1991) ; bathymetric contours are in km.
177ow 178O 1790 180" 38"
39"
40" S
41"
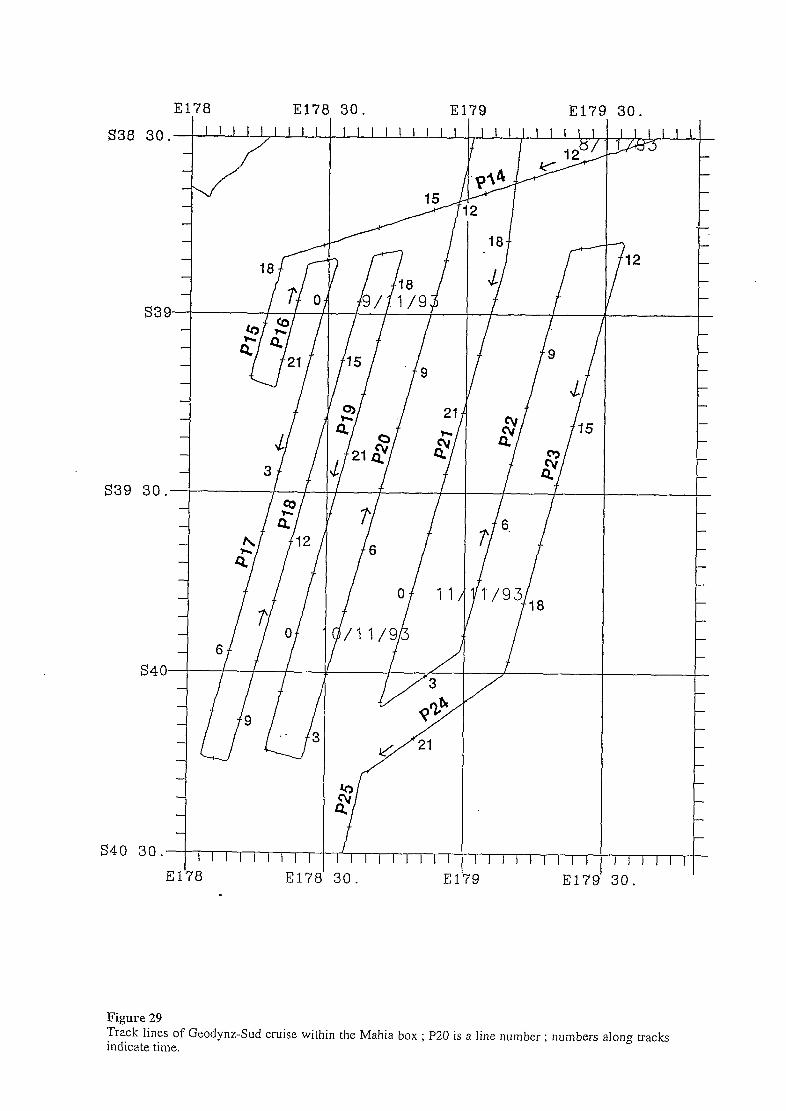
El78 El78 30. El79 -JI^ -- l31’7Y YU.
J I I I I, I I I I I I .ih
30. I I I I I I 1 ) 1 I I I I I I I I I I I I I I l I I I I I I I I I El78 El78 30. El79 El79 30.
Figure 29 Track lines of Geodynz-Sud cruise within the Mahia box ; P20 is a line number ; numbers along tracks indicate time.
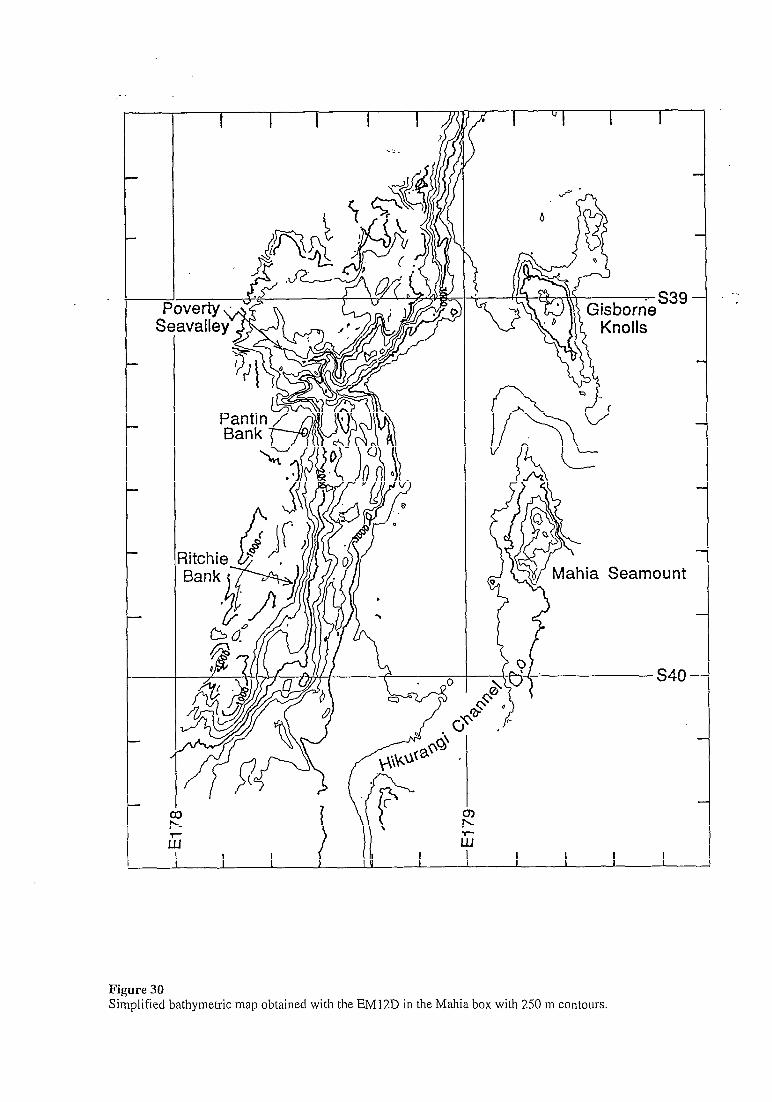
I I I I I . I u
I I
Mahia Seamount
Figure 30 Simplified bathymetric map obtained with the EM12D in the Mahia box with 250 m contours.
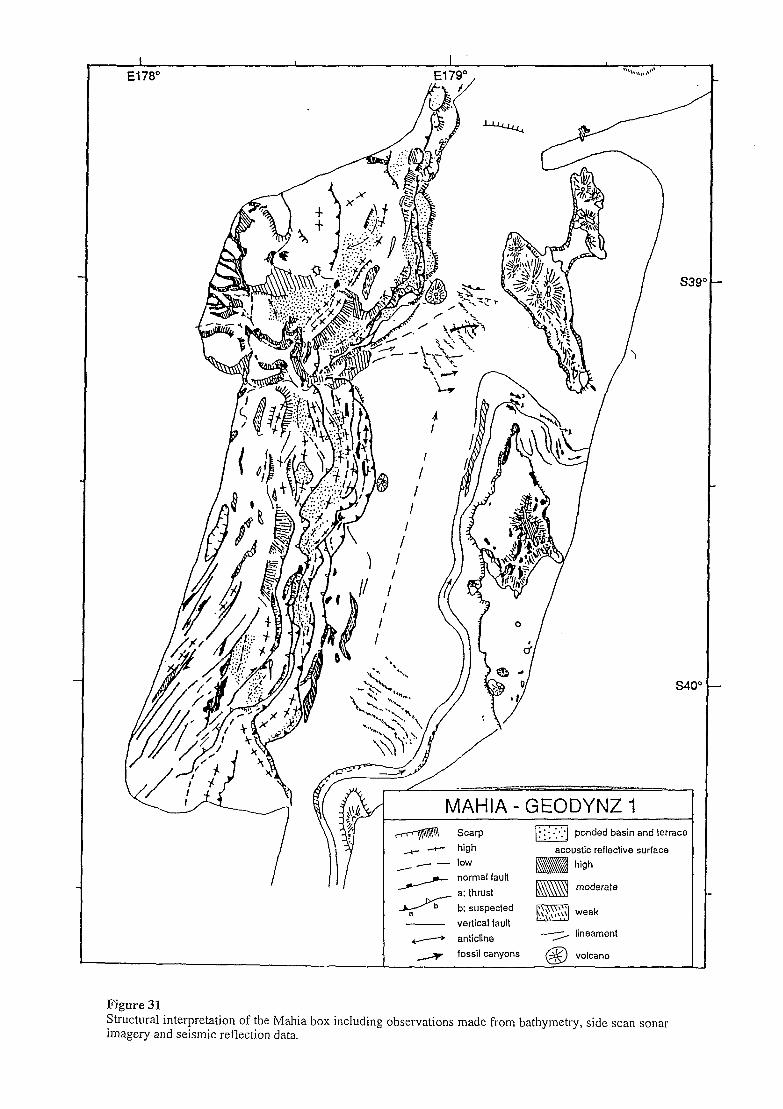
ponded basin and terrace
ustic reflective surface
Figure 31 Structural interpretation of the Mahia box including observations made from bathymetry, side scan sonar imagery and seismic reflection data.
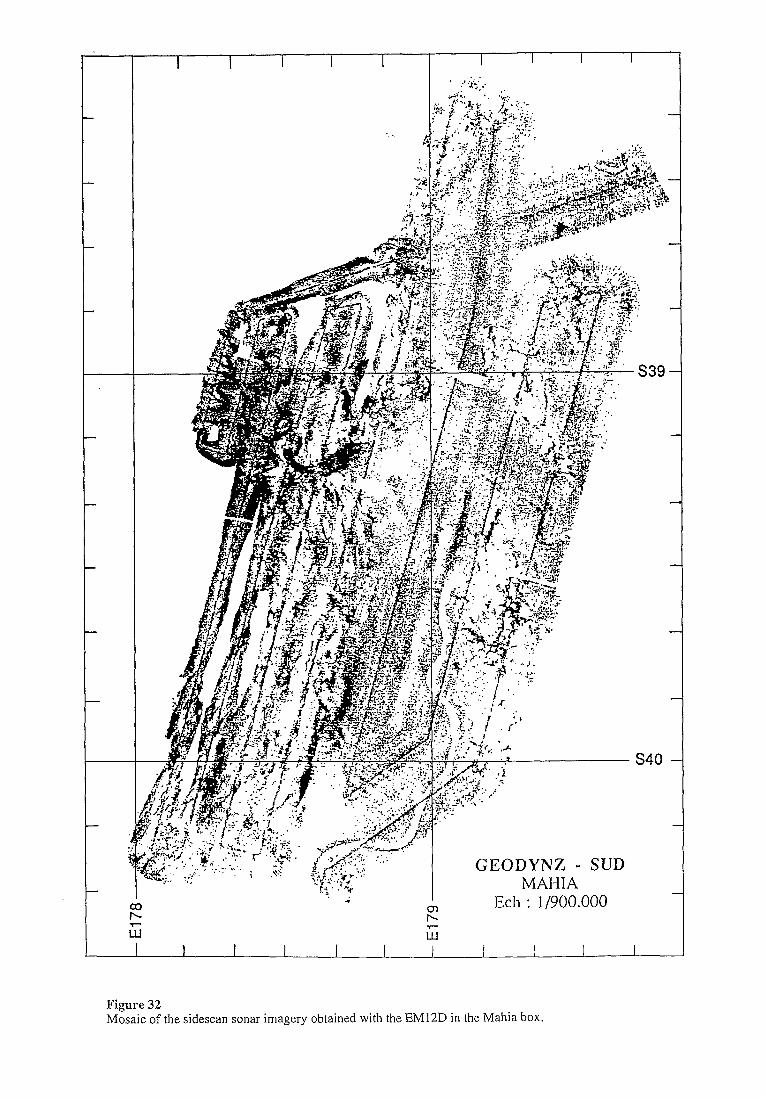
GEODYNZ - SUD MAHIA
cii ;;; 1 I I
Figure 32 Mosaic of the sjdescan sonar imagery obtained with the EM12D in the Mahia box.
-5 4 I
E EC11 : 1/900.000
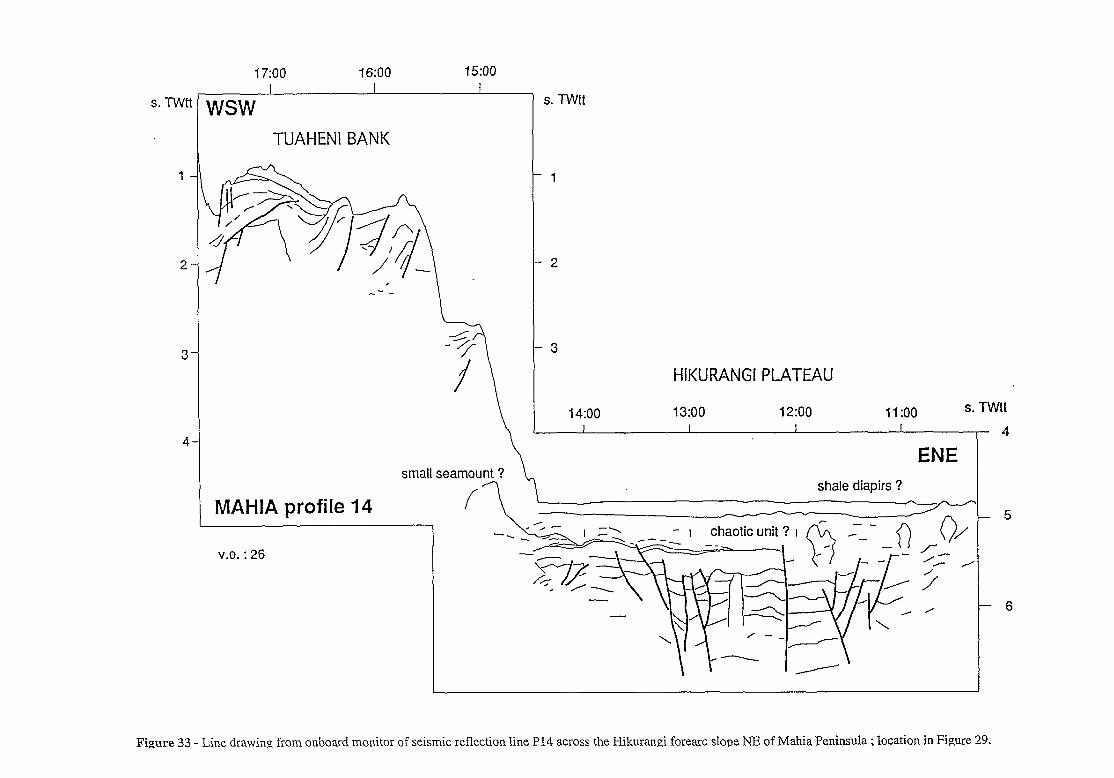
s. Tw
1
2
f
L
i7:oo 16:OO 1500 I I
l/SW
TUAHENI BANK
MAHIA profile 14 /
v.e. : 26
3
HIKURANGI PLATEAU
14:oo 13:oo 12:oo Ii:00 s. TWtt
- 4
ENE
- 5 . -. - I chaotic unit ? I fl> - -
small seamount ? shale diapirs ?
s. Twtt
1
2
i
- 6
Figure 33 - Line drawing from onboard monitor of seismic reflection line P14 across the Hikurangi forearc slope NE of Mahia Peninsula ; location in Figure 29.
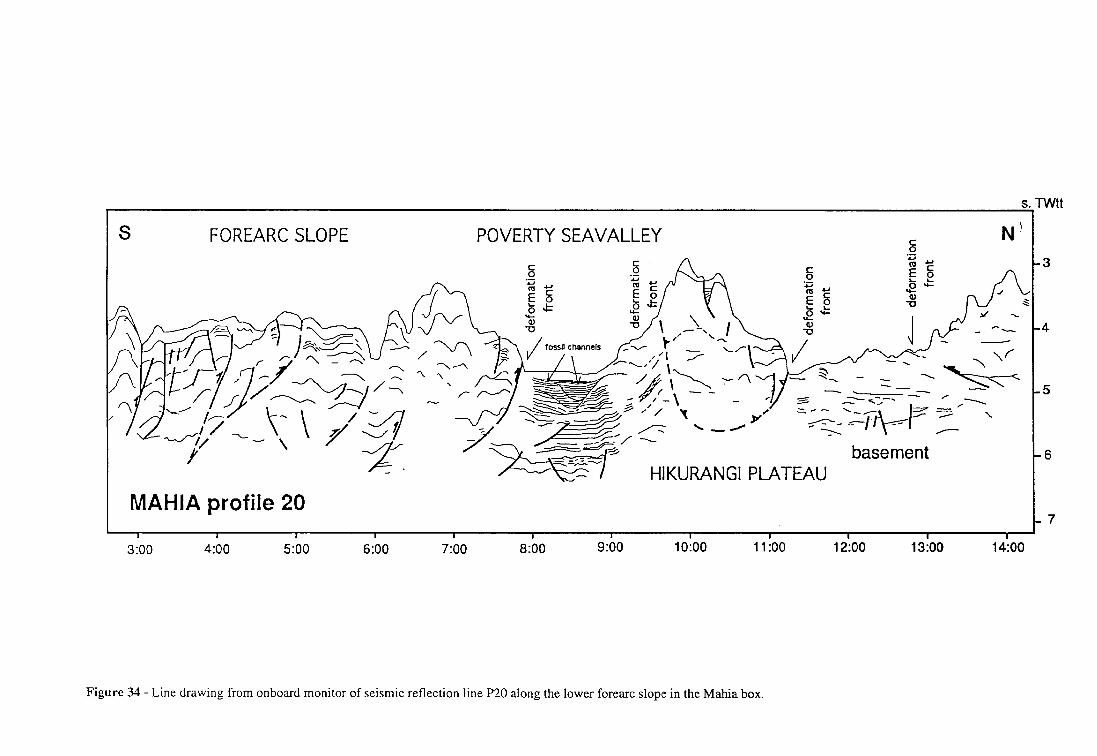
S FOREARC SLOPE
s. Twtt
POVERTY SEAVALLEY N’
basement -6
HIKURANGI PLATEAU
MAHIA profile 20 I 7 I
I I I I I I I 8 I
I I I 1
3:oo 4:oo 5:oo 6:00 7:oo 8:00 9:oo lo:oo 1 l:oo 12:oo 13:oo 14:oo
Figure 34 - Line drawing from onboard monitor of seismic reflection line F20 along the lower forearc slope in the Mahia box.
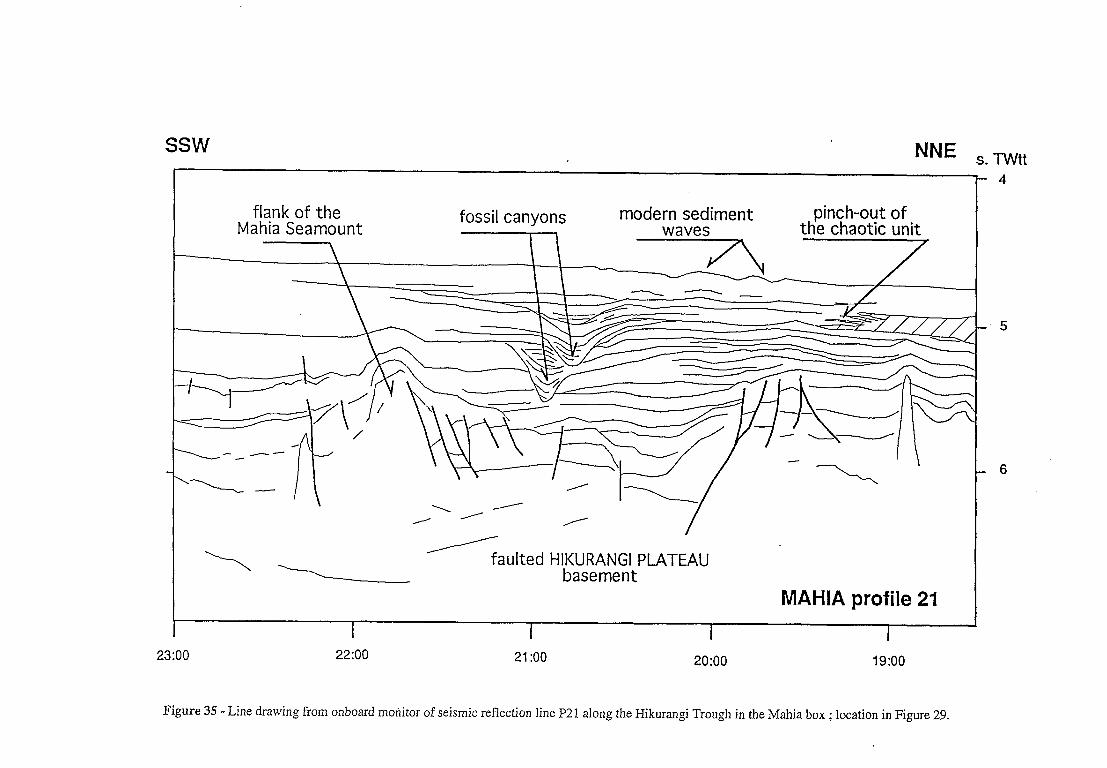
ssw NNE s. Twtt
fossil canyons modern sediment flank of the Mahia Seamount
pint h-out of waves the chaotic unit
\ 7 .A/ \
I \ Y - /
-
\A <aulted HIKURANGI PLATEAU basement
MAHIA profile 21 I I I I I
21 :oo
I
20:oo
I
19:oo 23:00
- 4
Figure 35 -Line drawing from onboard monitor of seismic reflection line P21 along the Hikurangi Trough in the Mahia box ; location in Figure 29.
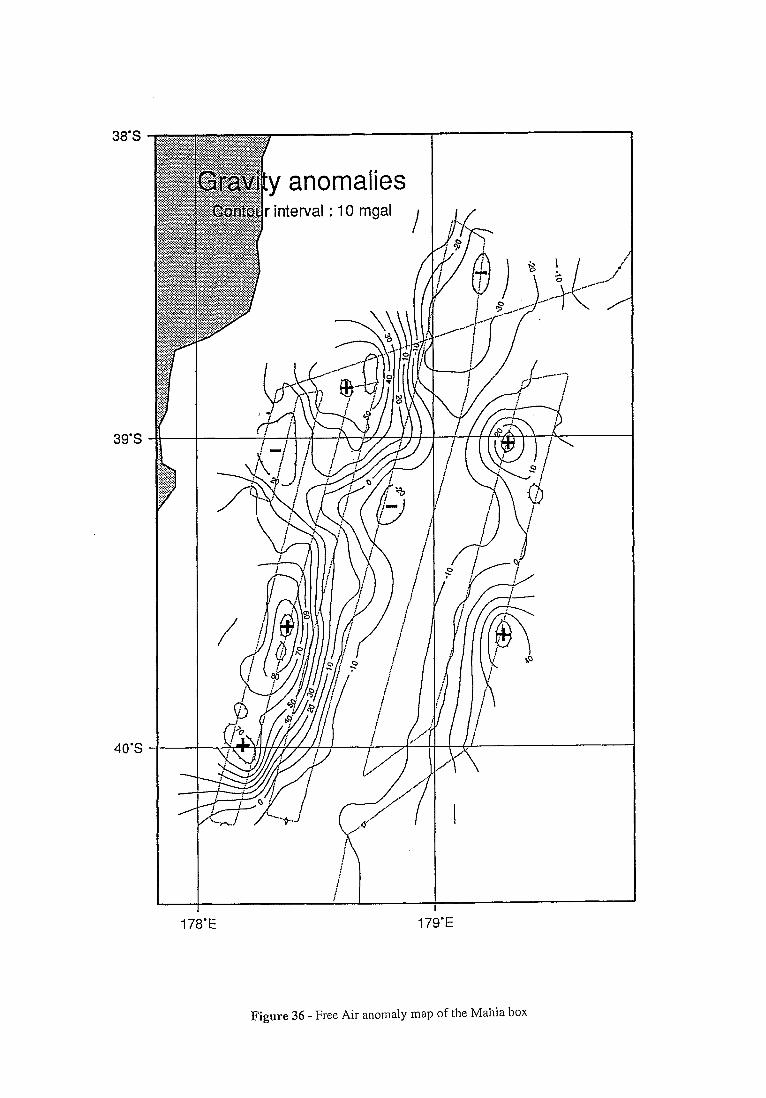
38”s
39’S
40’S
178’E 179’E
Figure 36 - Free Air anomaly map of the Mahia box
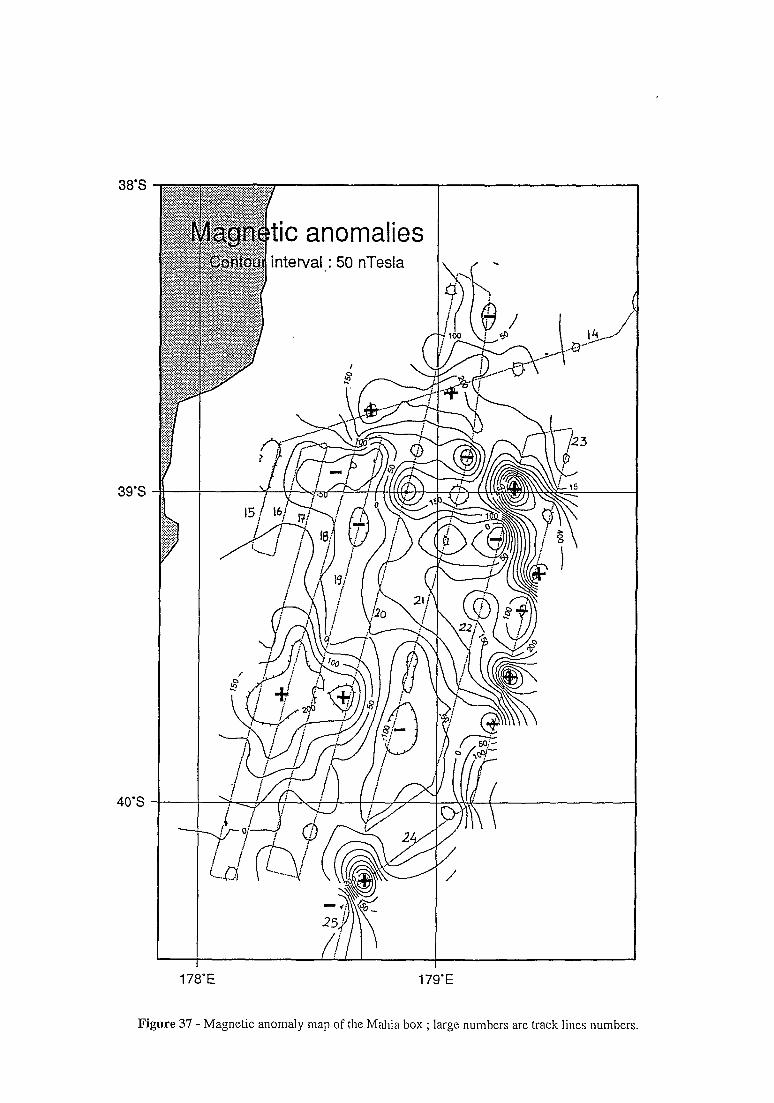
38'S
39%
40'S
178’E 17&E
Figure 37 - Magnetic anomaly map of the Mahia box ; large numbers are track lines numbers.
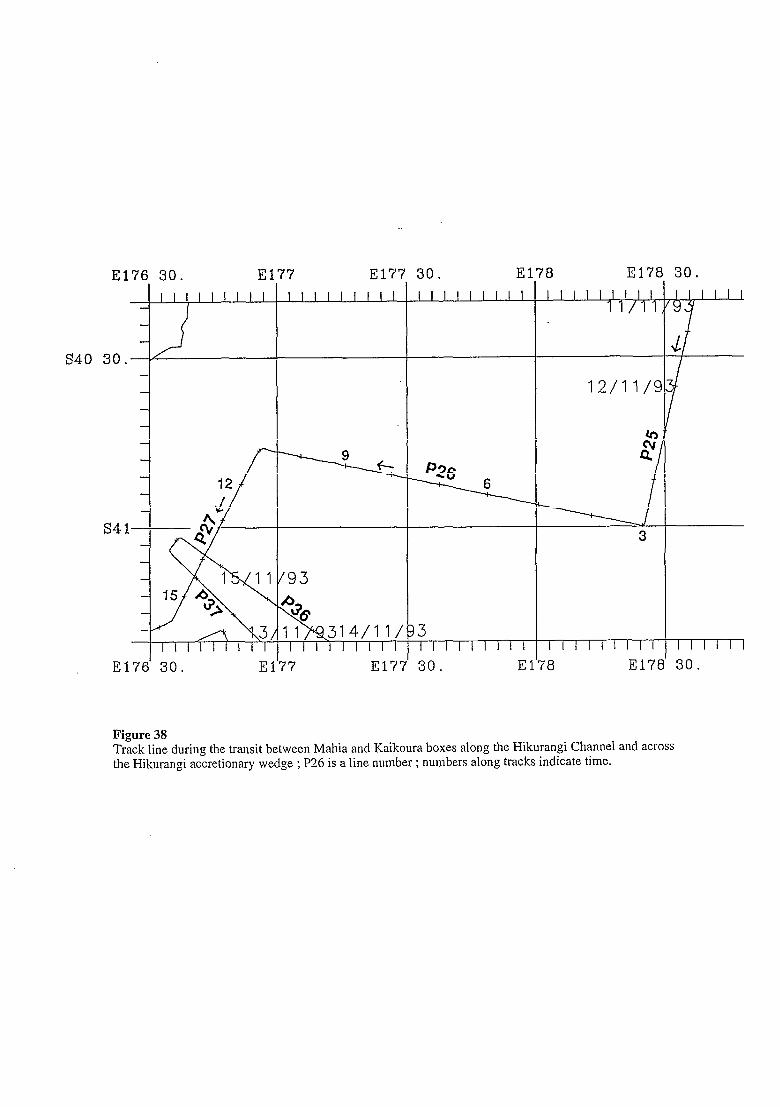
.
El76 30. El77 El77 30, El78 El78 30. I I I I I I I I I I I I I I I I I 1 I I I I I I I I I I I I I I I I I I I I I I 1 I
I I I I I 1 I 1 I I I I I I I
El761 30. El'77 El771 30. El'78 E178' 30.
Figure 38 Track line during the transit between Mahia and Kaikoura boxes along the Hikurangi Channel and across the Hikurangi accretionary wedge ; P26 is a line number ; numbers along tracks indicate time.
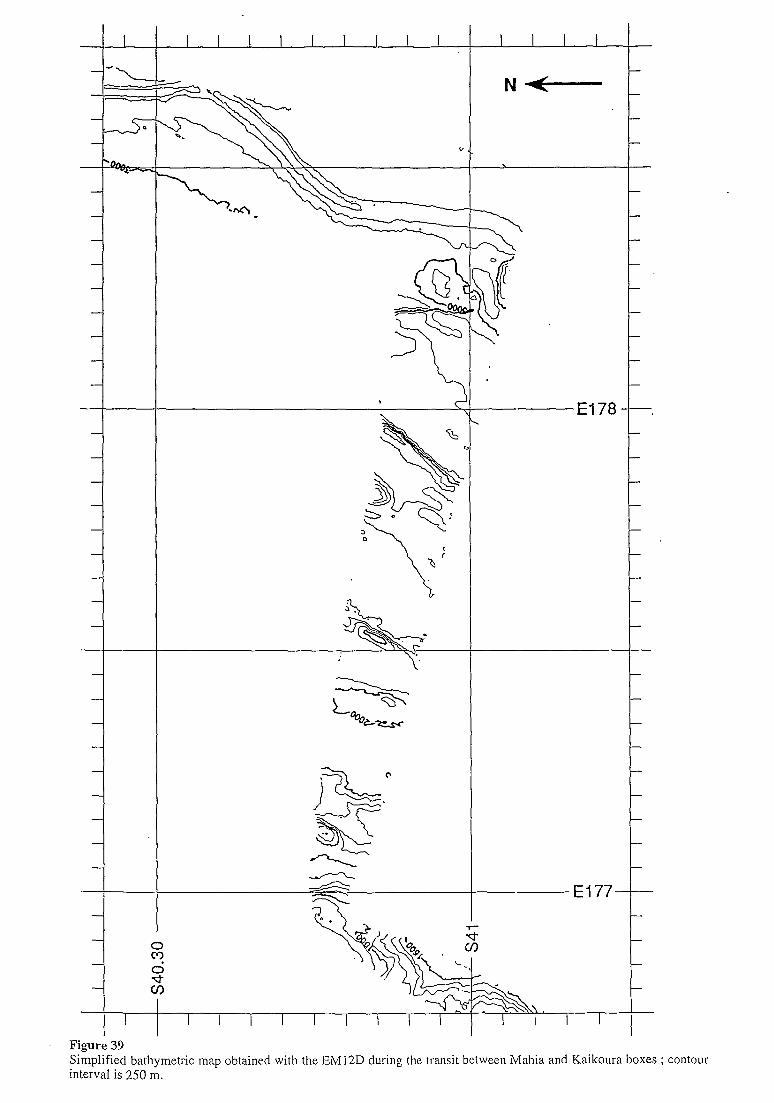
I
=k- - -
I I I I
.
\
I 1
NW
El 78 --.
El77
:
Figure 39 Simplified bathymetric map obtained with the EM12D during the transit between Mahia and Kaikoura boxes interval is 250 m.
; contour
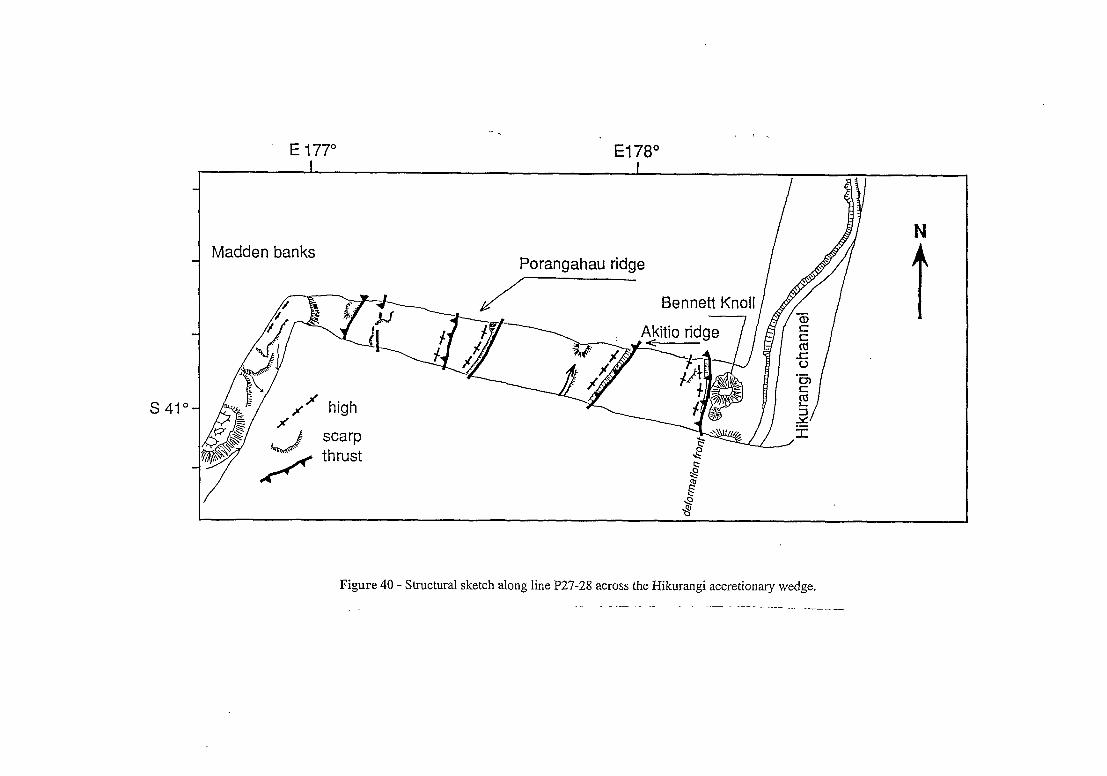
El 78”
Madden banks
Figure 40 - Structural sketch along Iine P27-28 across the Hikurangi accretionary wedge.
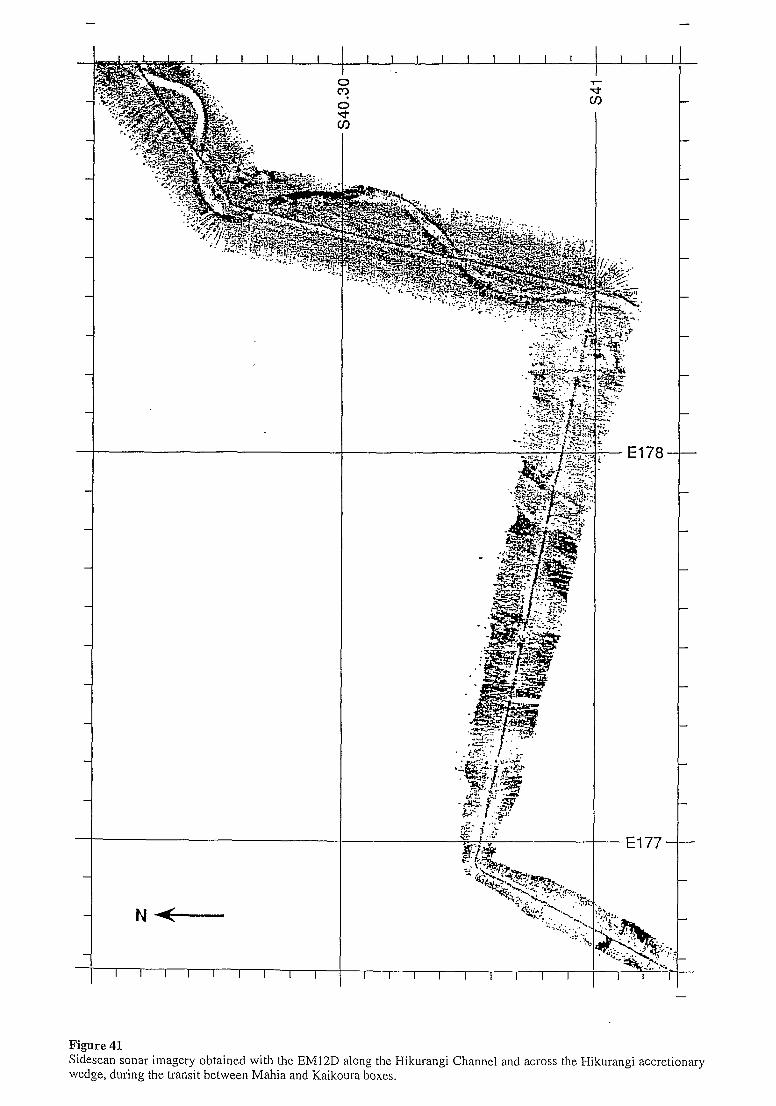
I . . . : ;
5. r
- E178-
E177-
I I I I
Figure 41 Sidescan sonar imagery obtained with the EM12D along the Hikurangi Channel and across the Hikurangi accretionary wedge, during the transit between Mahia and Kaikoura boxes.
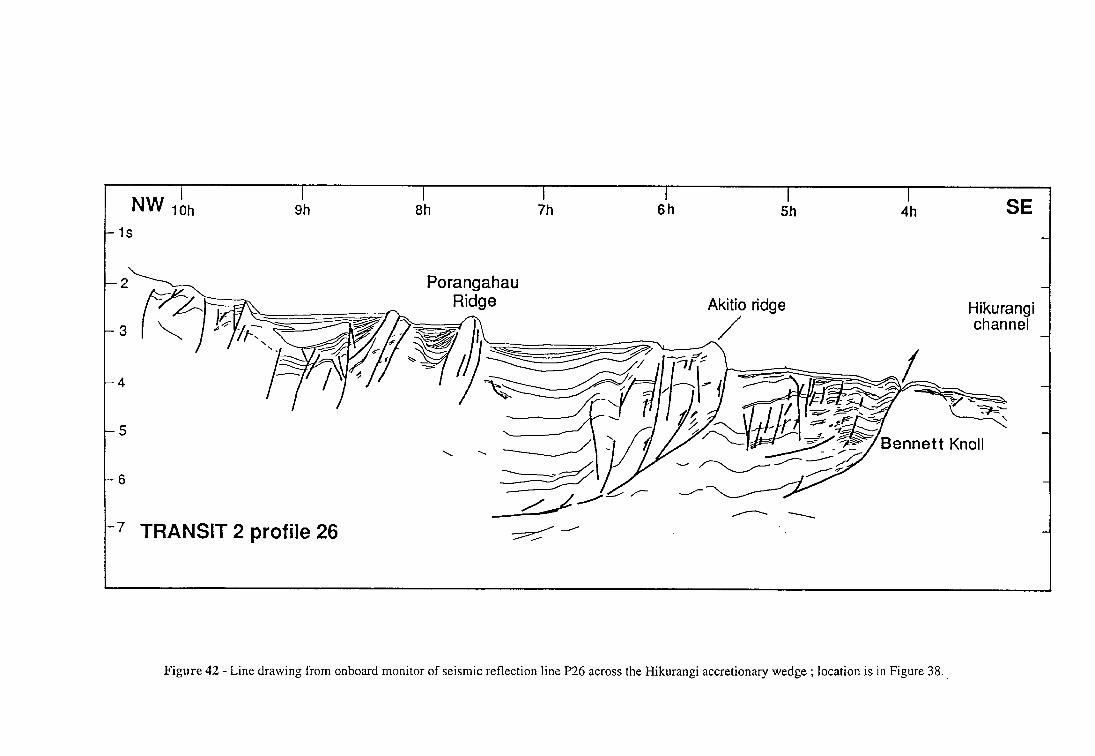
I NW 10h
-1s
\ -2
-3
-4
-5
-7 TRANSIT 2 profile 26
!ih :h 6’h I
4h SE
Porangahau Akitio ridae i-l&l rranni
Bennett Knoll
Figure 42 - Line drawing from onboard monitor of seismic reflection line P26 across the Hikurangi accretionary wedge ; location is in Figure 38..
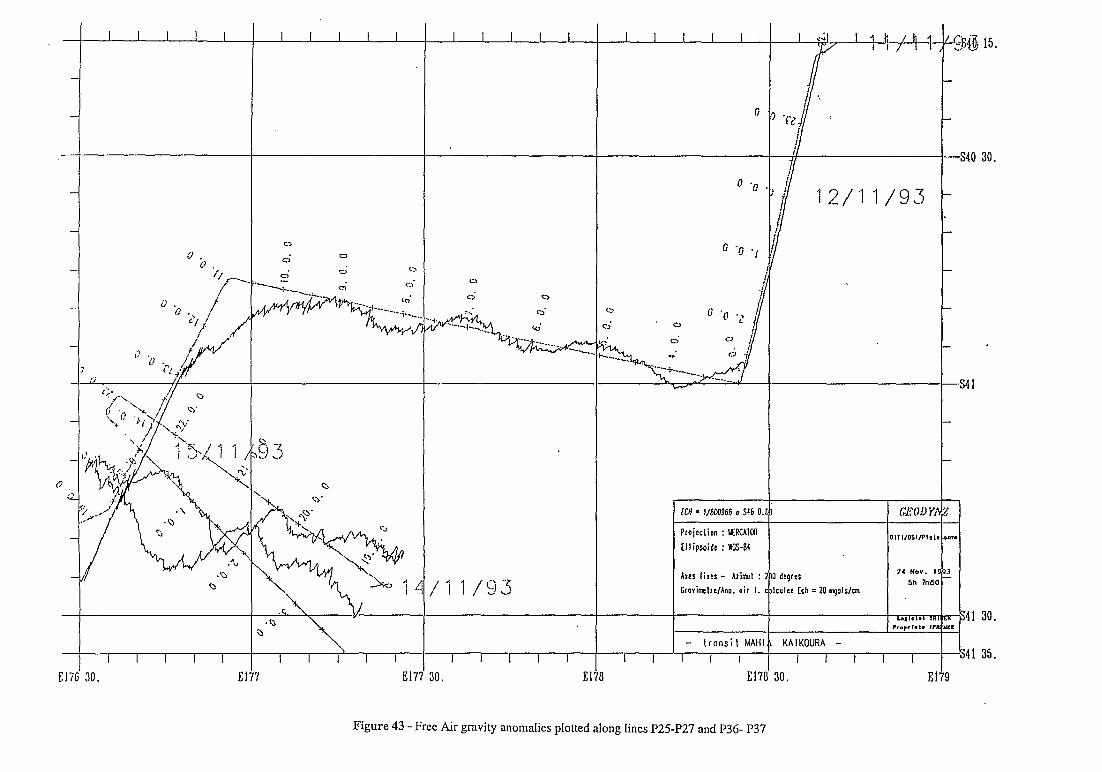
_.
f --
!!
I
:,
c; .-
/
I 176 :
I I I I I I I I I I I I I I I
I I I I I 10. El
WI = l/m3966 0 546 0.
Projcclion : YRCAIW
Ellipsoidr : M&E1
Arcs lixcs - Azirml :
CravimlfeMno. air I.
- tronsil MAH’
I I I
El7
culec Ech = 20 qols/m
KAIKOURA -
10. El
$jT@ 15.
-s40 30.
-341
111
:
41 30. I
41 35.
Figure 43 - Free Air gravity anomalies plotted along lines P25P27 and P36- P37
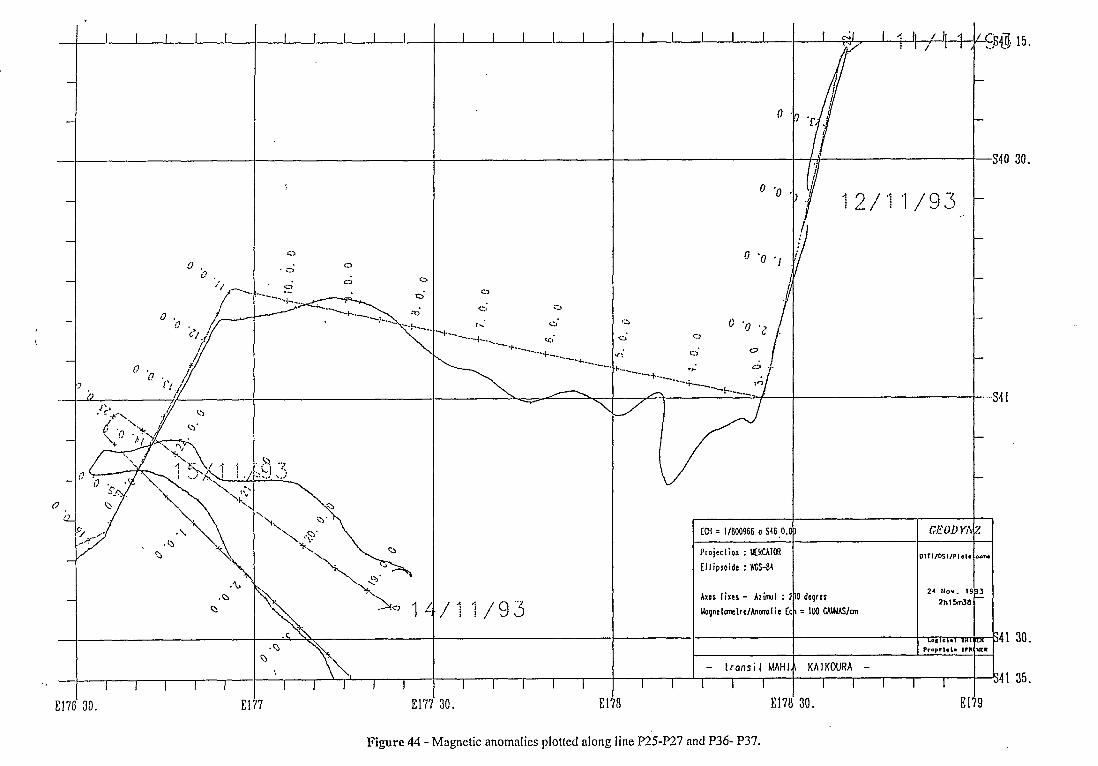
I I I I I I I I I I
-
E17$30. El7
I I I I I
I I I I I
30. El
I I I I I I I I I I 4 4 /h q /h q
EM = 1/800966 a S46~0.01
Projcclion : l&RCAIMl
Ellipsoide : WCs-84
her Iixcs - Aziml : 110 degres
Uognelmlrc/Anamlie ECI = IM) CUlWm
24 NOV. 1 2hl5rJE
La*\e,r, nr Propr1.L. ,,I
- transit MAHI.\ KAlKOURA -
I I I I I I I I I I
El78 30. El
Figure 44 - Magnetic anomalies plotted along line FT?!5P2.7 and P36- P37.
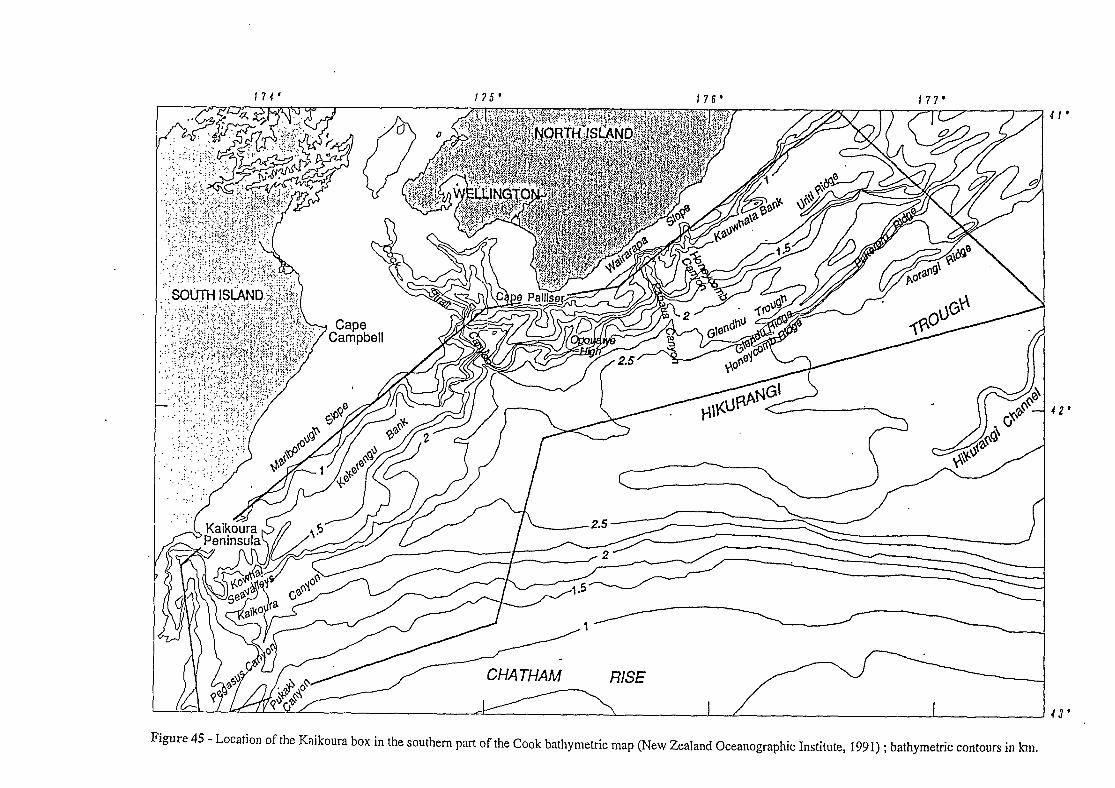
i . ,, . . ., ...;~.,:~‘: ._ :,: ; . /Y//r- f--bit f \ A
s&-c, .5-
CHATHAM RISE
42'
43'
Figure 45 - Location of the Kaikoura box in the southern part of the Cook bathymetric map (New Zealand Oceanographic Institute, 1991) ; bathymetric contours in km.
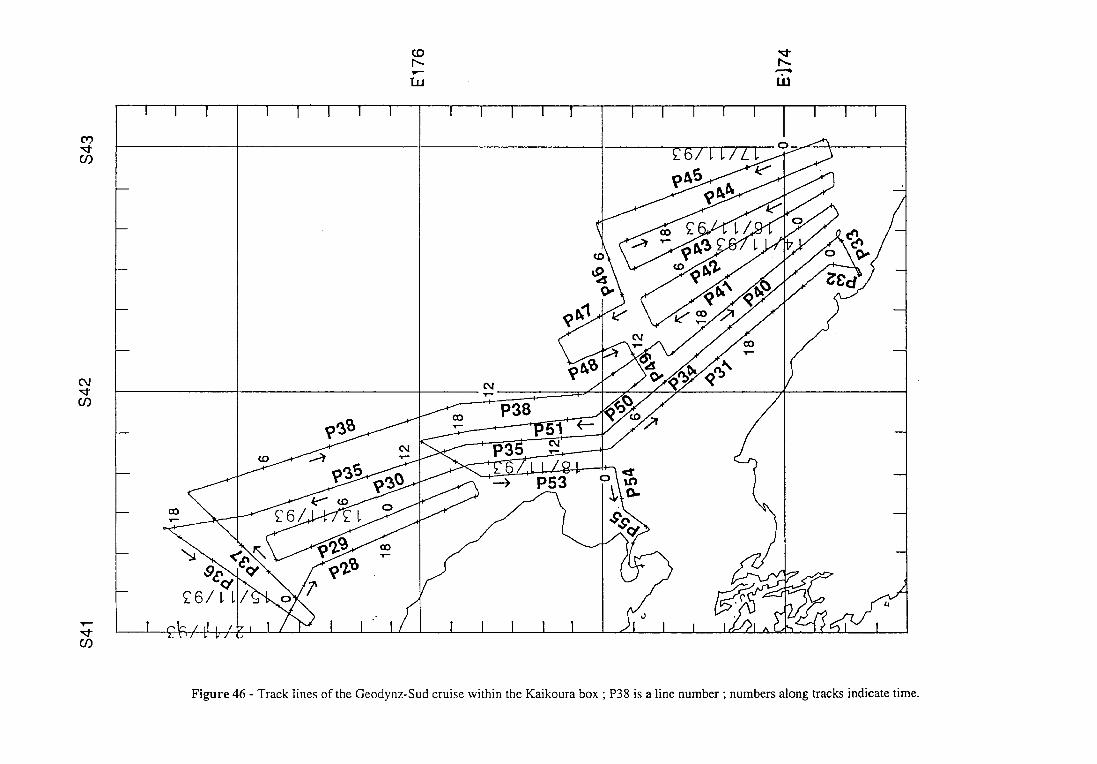
I I 1 I I I I I I I I I I I I I I I
Figure 46 - Track lines of the Geodynz-Sud cruise within the Kaikoura box ; P38 is a line number ; numbers along tracks indicate time.
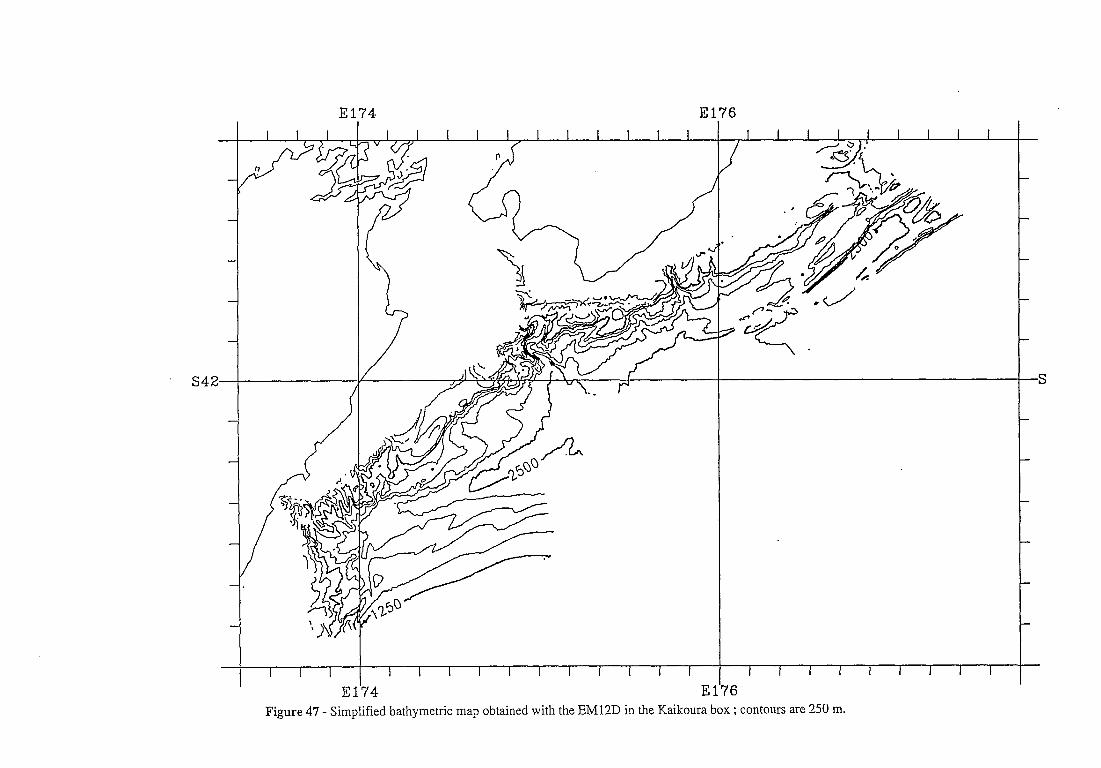
S42-
El74
I I I
E:
El76 I
I I I I I I I I I I I I I
74 E 1’76 I I I I I I I I I
-
Figure 47 - Simplified bathymetric map obtained with the EM12D in the Kaikoura box ; contours are 250 m.
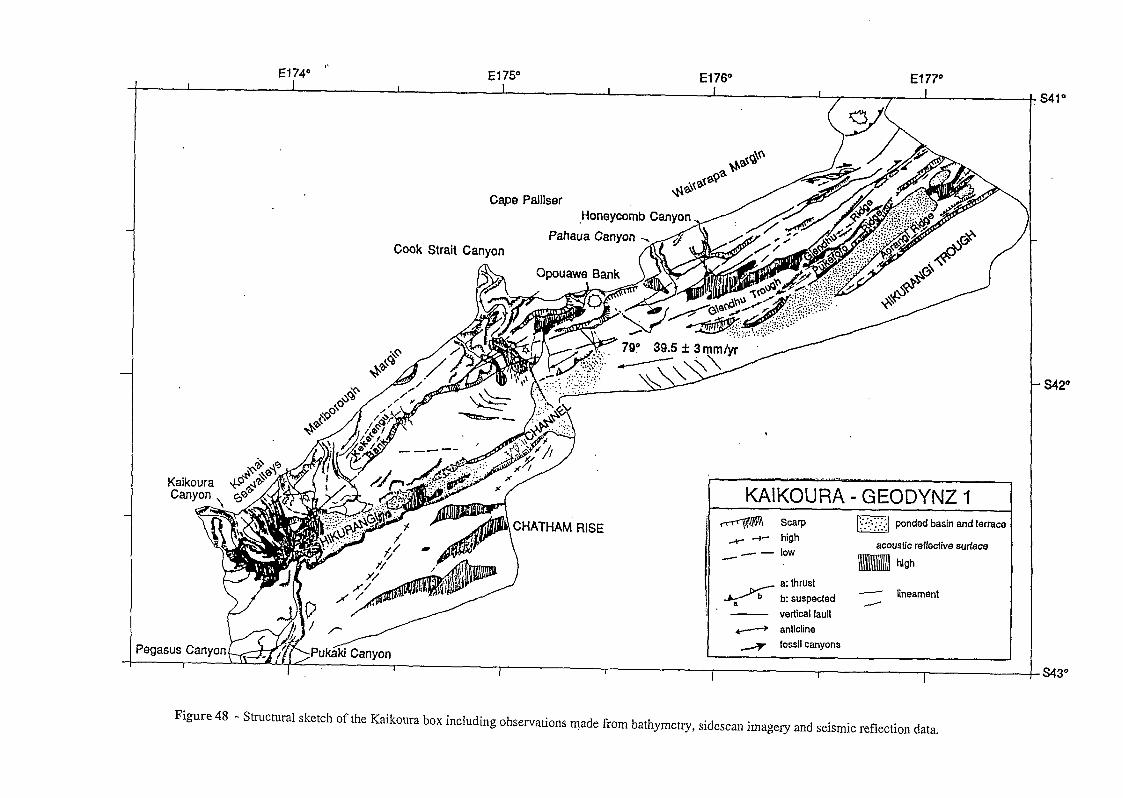
E174” ” I I
E175” E176” I E177” I I I I I I / /
Cape Palliser ,Honeycomb Canyon
fahaua Canyon h ^ .- GooK Strait Canyon
4 CHATHAM’ RISE
vrvirvv
KAIKOURA 1 GEODYNZ I t---qmh s=rp m ponded basin and terrace
- -t- high -- - low acoustic reflective surface
high
4 Ei ~~~~~cted y heament
- vertical fault + anticline
d fossil canyons
I I I
- 5x2”
543”
Figure 48 - Structural sketch of the Kaikoura box including observations made from bathymetry, sidescan imagery and seismic reflection data.
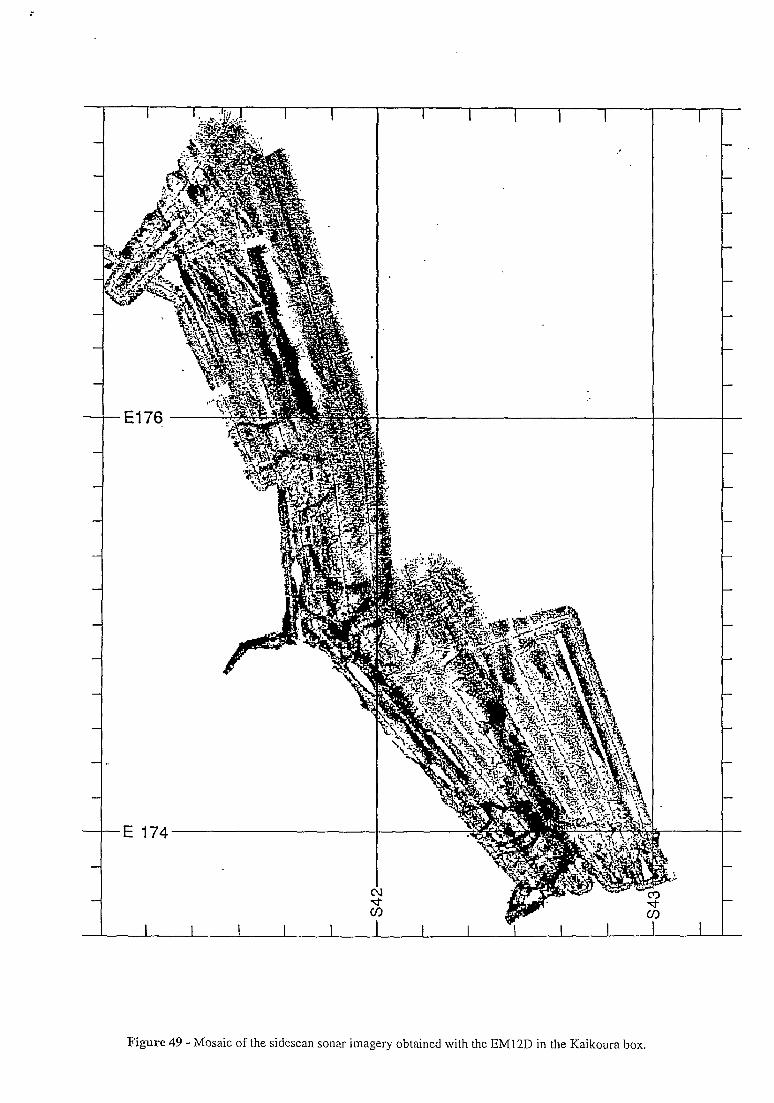
t
E 174
I 1
Figure 49 - Mosaic of the sidescan sonar imagery obtained with the EM12D in the Kaikoura box.
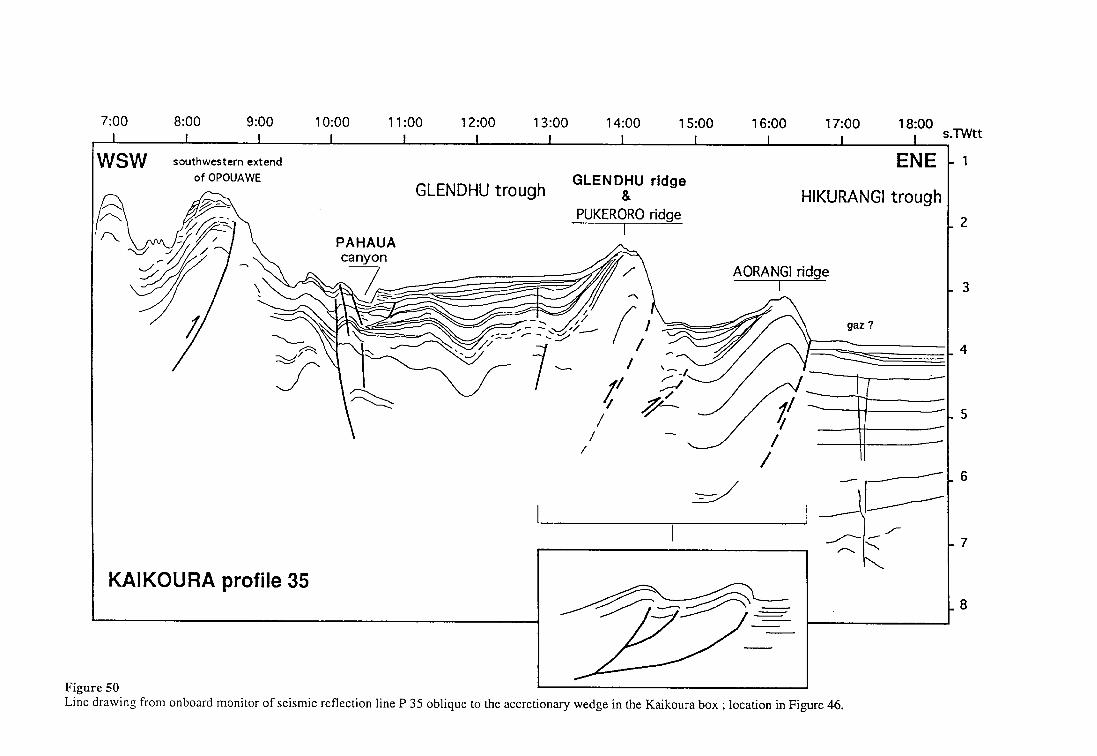
7:oo 8:00 9:oo 1o:oo 11 :oo 12:oo 13:oo 14:oo 15:oo 16:00 17:oo 18:00
I ' I I I I I I I I I I I s.Twtt
I vsw southwestern extend ENE GLENDHU troq Jh
GLENDHU ridge 8
PUKERORO ridge
of OPOUAWE
HIKURANGI trough
AORANGI ridge I
KAIKOURA profile 35
Figure 50 , I Line drawing from onboard monitor of seismic reflection line P 35 oblique to the accretionary wedge in the Kaikoura box ; location in Figure 46.
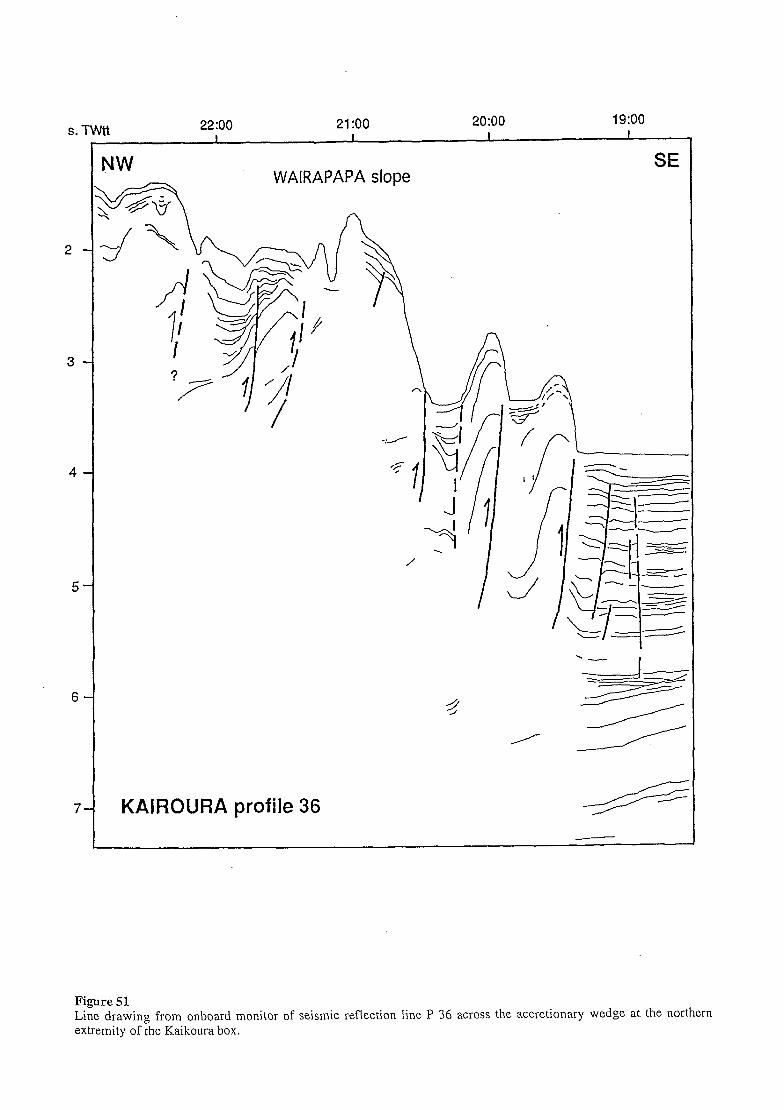
77m-l s. -**.* IWTS w-.-1 I I I I
2
3
6
5 KAIROURA profile 36 -4=
Figure 51 Line drawing from onboard monitor of seismic reflection line P 36 across the accretionary wedge at the northern extremity of the Kaikoura box.
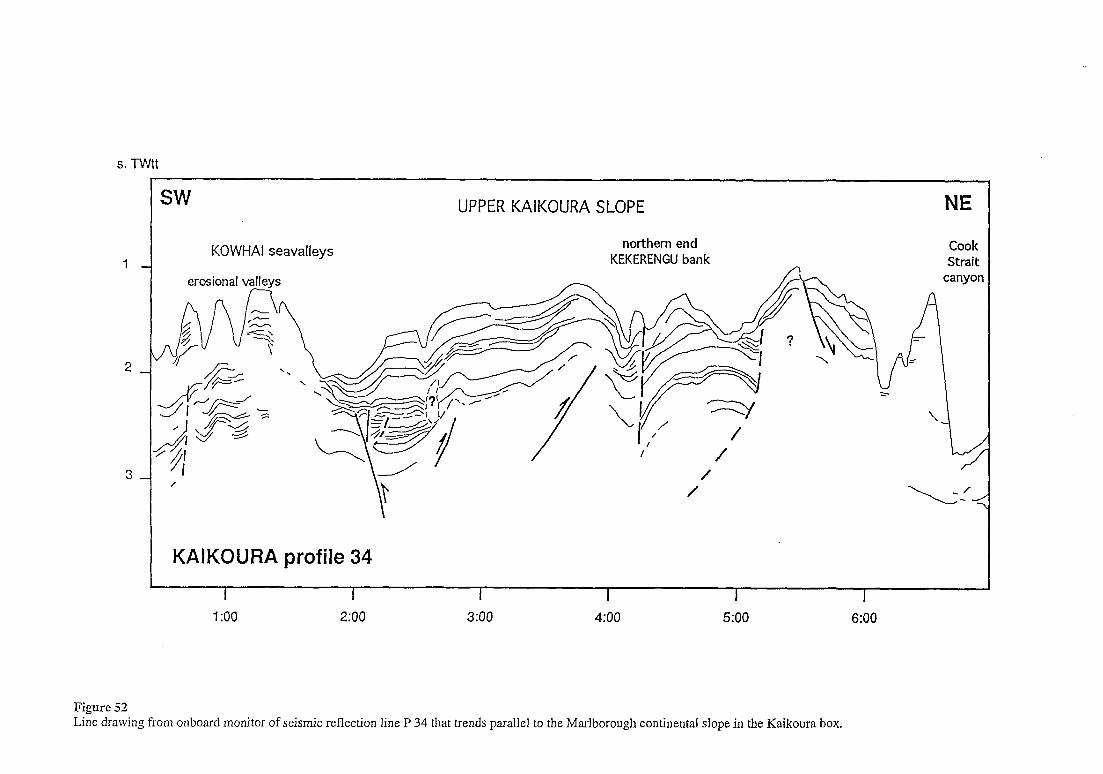
s. TWtt
SW UPPER KAIKOURA SLOPE NE
KOWHAI seavalleys northern end
KEKERENGU bank Cook Strait
canyon
KAIKOURA profile 34
I I I I I I i:oo 200 3:oo 4:oo 5:oo 6:00
Figure 52 Line drawing from onboard monitor of seismic reflection line P 34 that trends parallel to the Marlborough continental slope in the Kaikoura box.
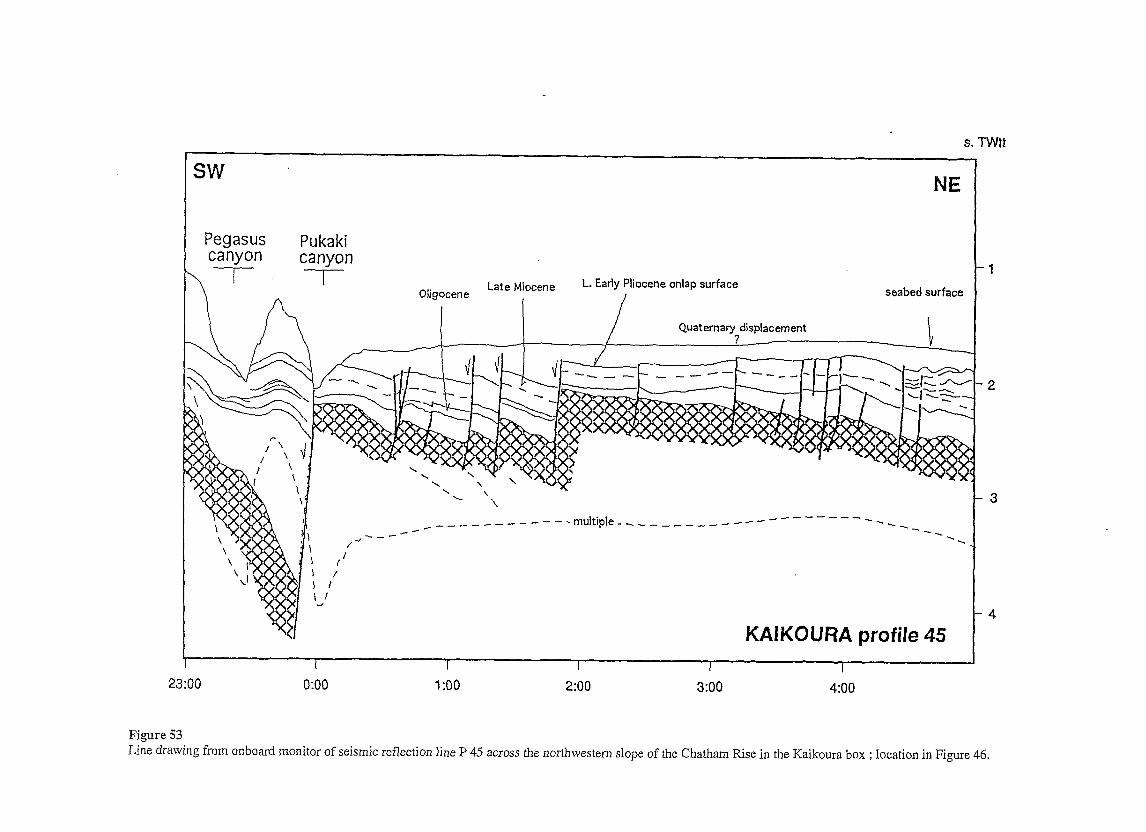
3w NE
Pegasus Pukaki
Oligocene Late Miocene L. Early Pliocene onlap surface seabed surface
Quaternary displacement
----multiple-,,_____,-----‘-----’---,_ \ _*---
\ I &X-L- --
\ / l.
I I
I : I I I 1
KAIKOURA profile 45
2:oo 4:oo
Figure 53 Line drawing from onboard monitor of seismic reflection line P 45 across the northwestern slope of the Chatham Rise in the Kaikoura box ; location in Figure 46.
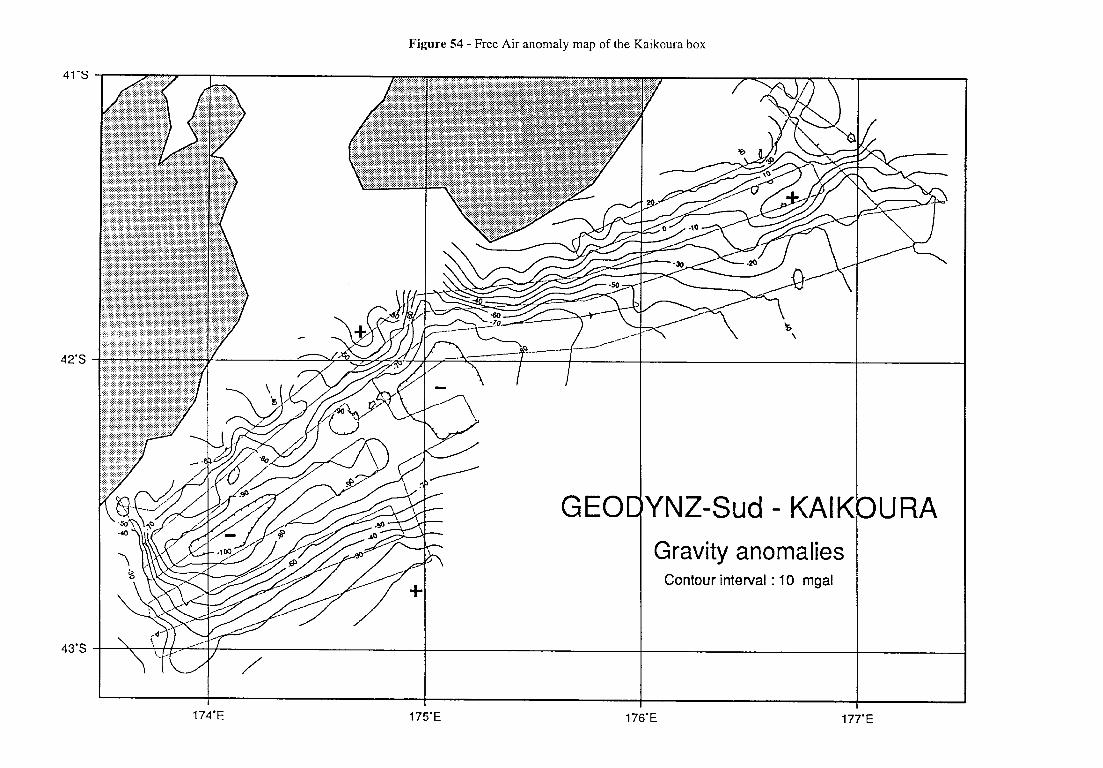
Figure 54 - Free Air anomaly map of the Kaikoura box
42’S
GEOI: YNZ-Sud - KAIK Gravity anomalies
Contour interval : 10 mgal
NRA
174-E 175-E 177-E
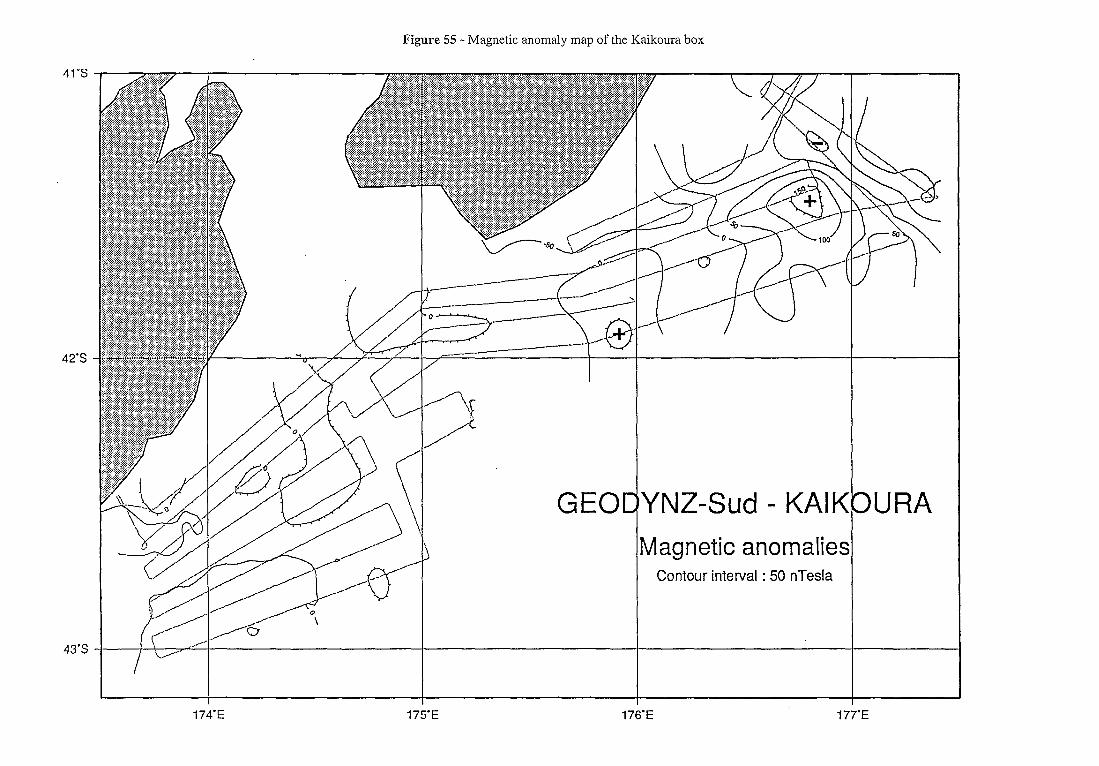
Figure 55 - Magnetic anomaly map of the Kaikoura box
GEOC YNZ-Sud - KAII Wagnetic anomalie
Contour interval : 50 nTesla
NRA
174-E 175-E 176’E -I 77’E
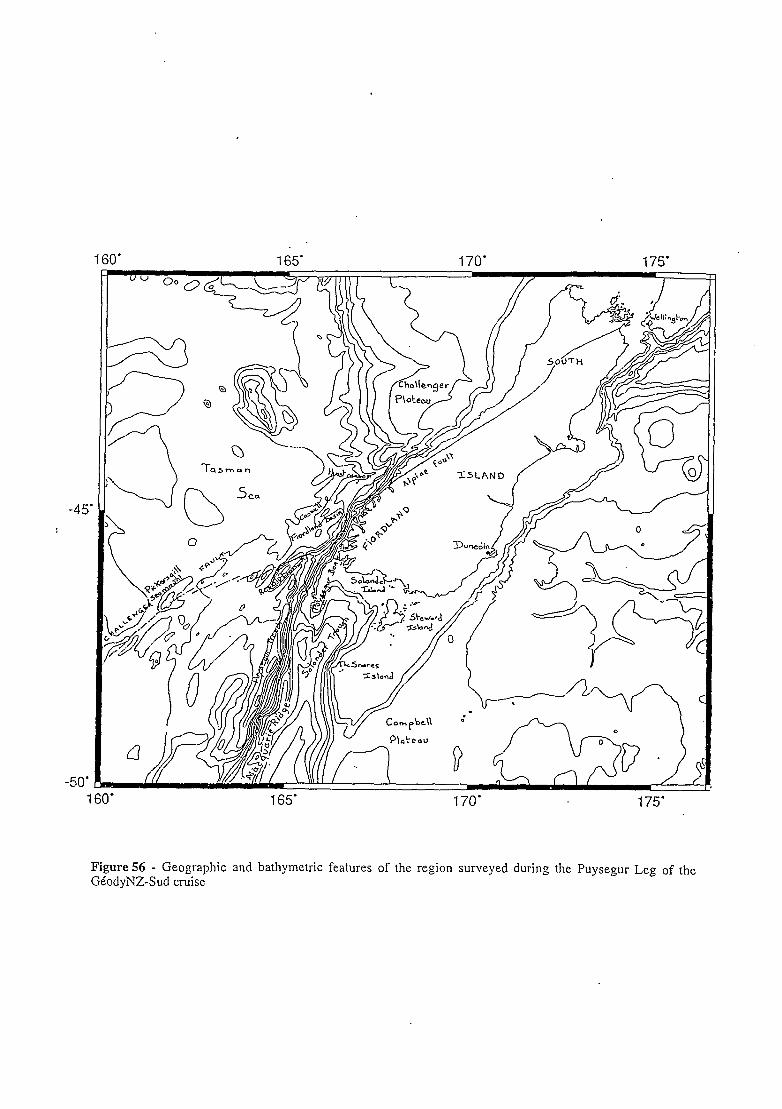
160' 165' 170' 175'
-50' 160' 165' 170' 175'
Figure 56 - Geographic and bathymetric features of the region surveyed during the Puysegur Leg of the GiodyNZ-Sud cruise
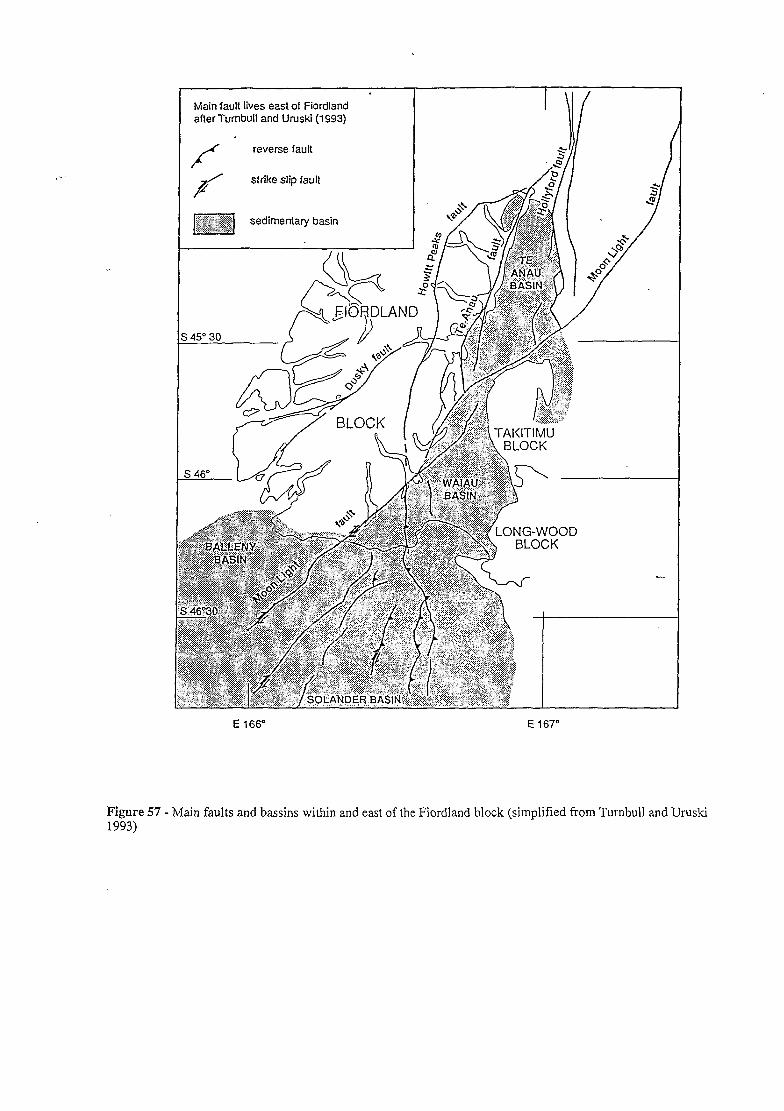
. . .
Main fault lives east of Fiordland after Turnbull and Uruski (1993)
reverse fault
strike slip fault
sedimentary basin
E 166” E 167”
Figure 57 - Main faults and bassins within and east of the Fiordland block (simplified from Turnbull and Uruski 1993)
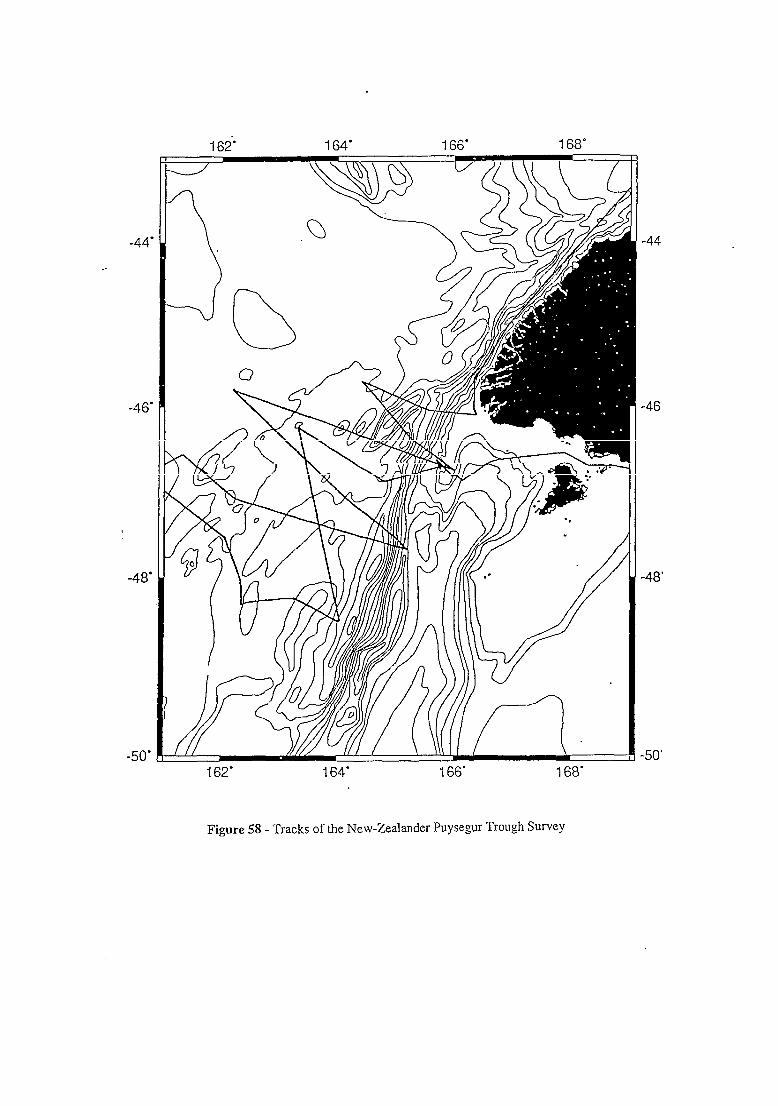
162'. 164' -! 66' 168'
-44
-46
-44'
-46'
-48'
-50' 162' 164’ 166' 168'
Figure 58 - Tracks of the New-Zealander Puysegur Trough Survey
-48'
-50'
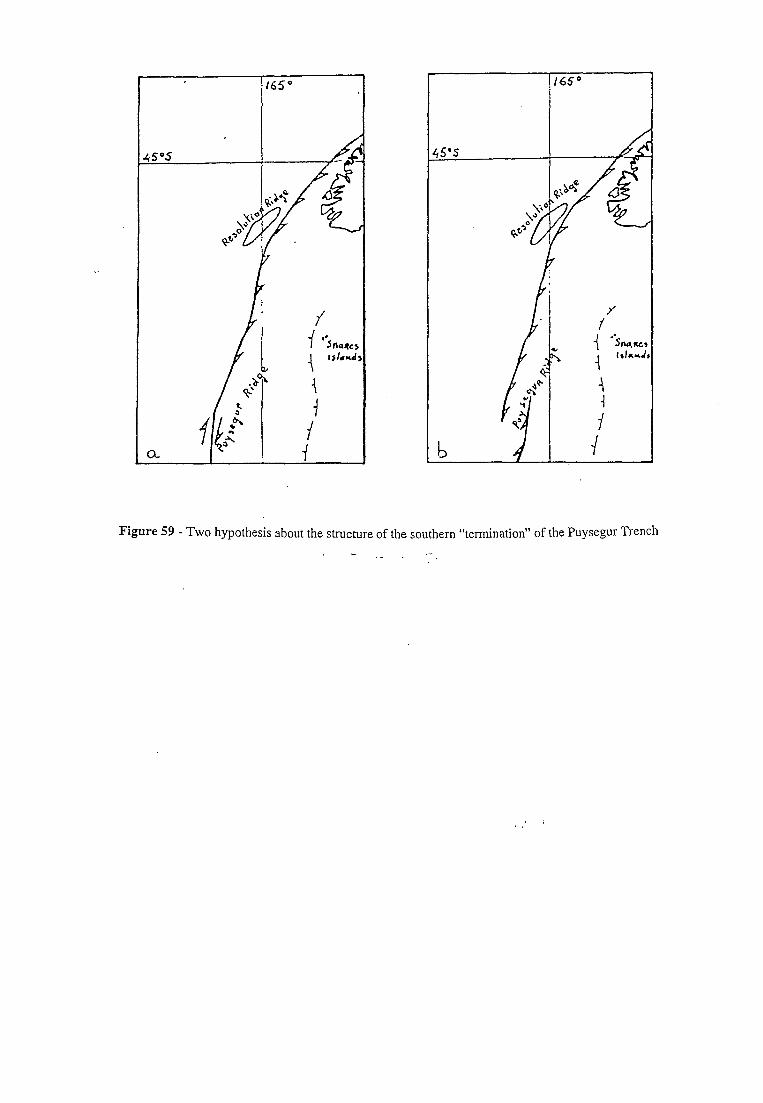
Figure 59 - Two hypothesis about the structure of the southern “termination” of the Puysegur Trench
. - ._ ‘- .
. ! .
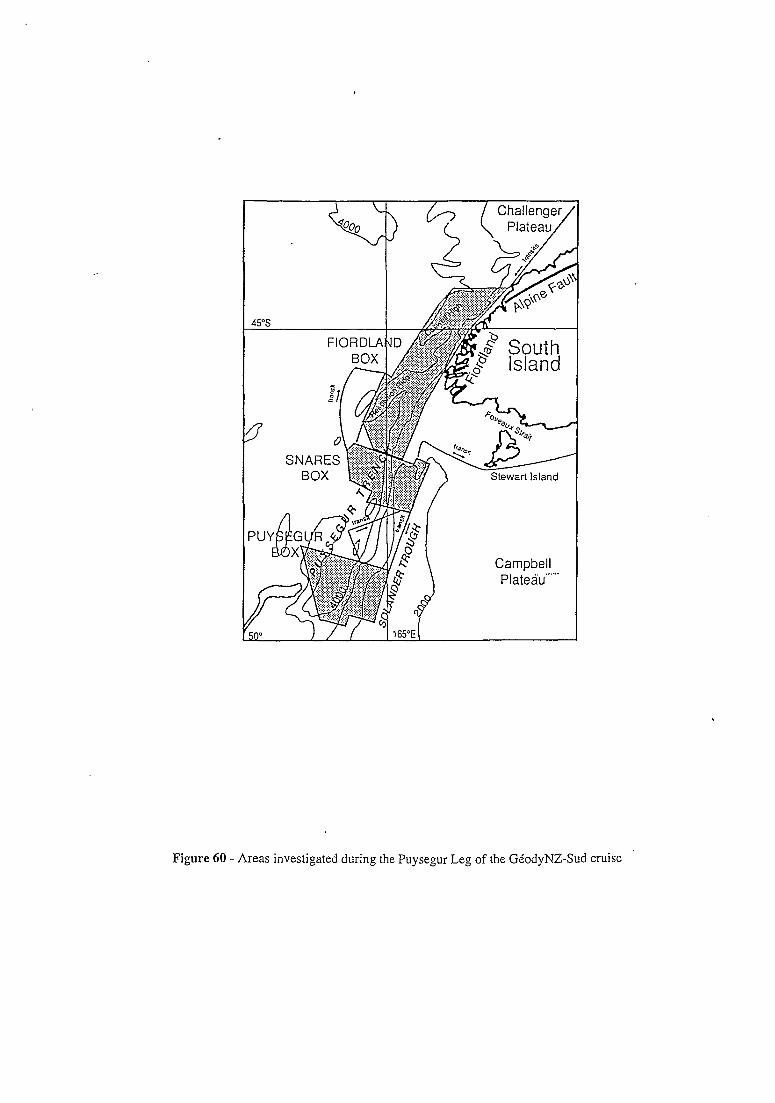
I;$ South 2 Island
Campbell Plateau’*“”
Figure 60 - Areas investigated during the Puysegur Leg of the GCodyNZ-Sud cruise
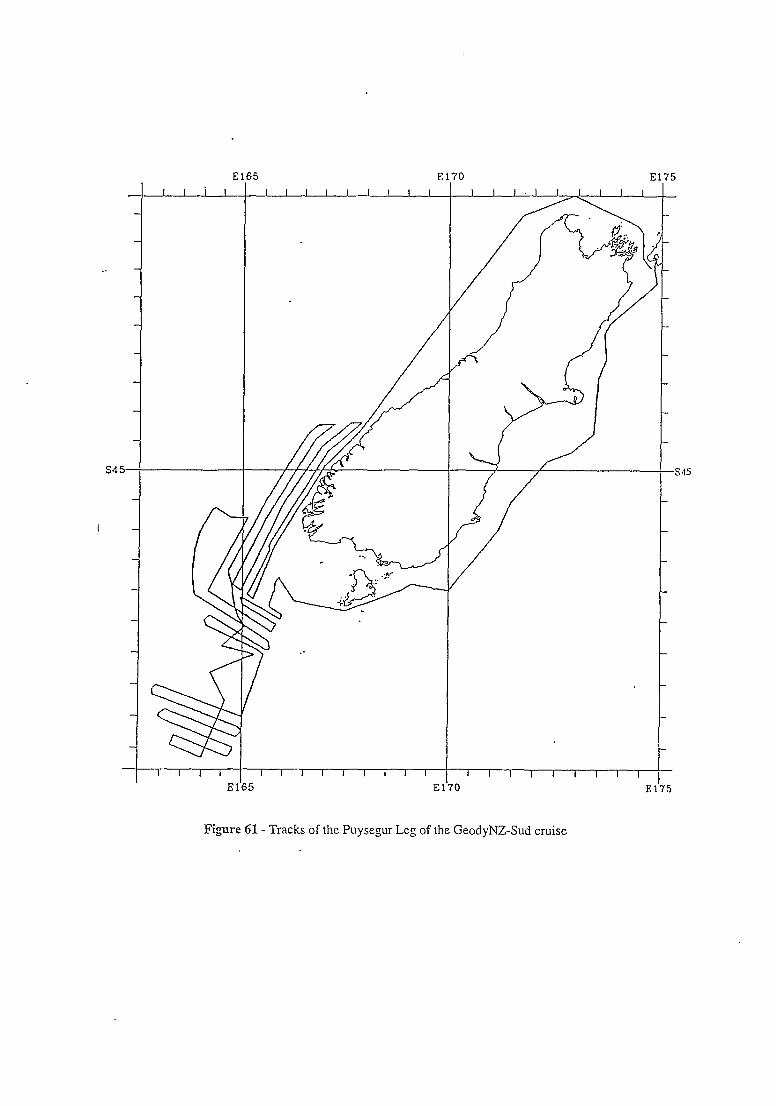
E I I I I
s4
5 I 1 I I I I I I
I I I I I I I I
-: El75
Figure 61- Tracks of the Puysegur Leg of the GeodyNZ-Sud cruise
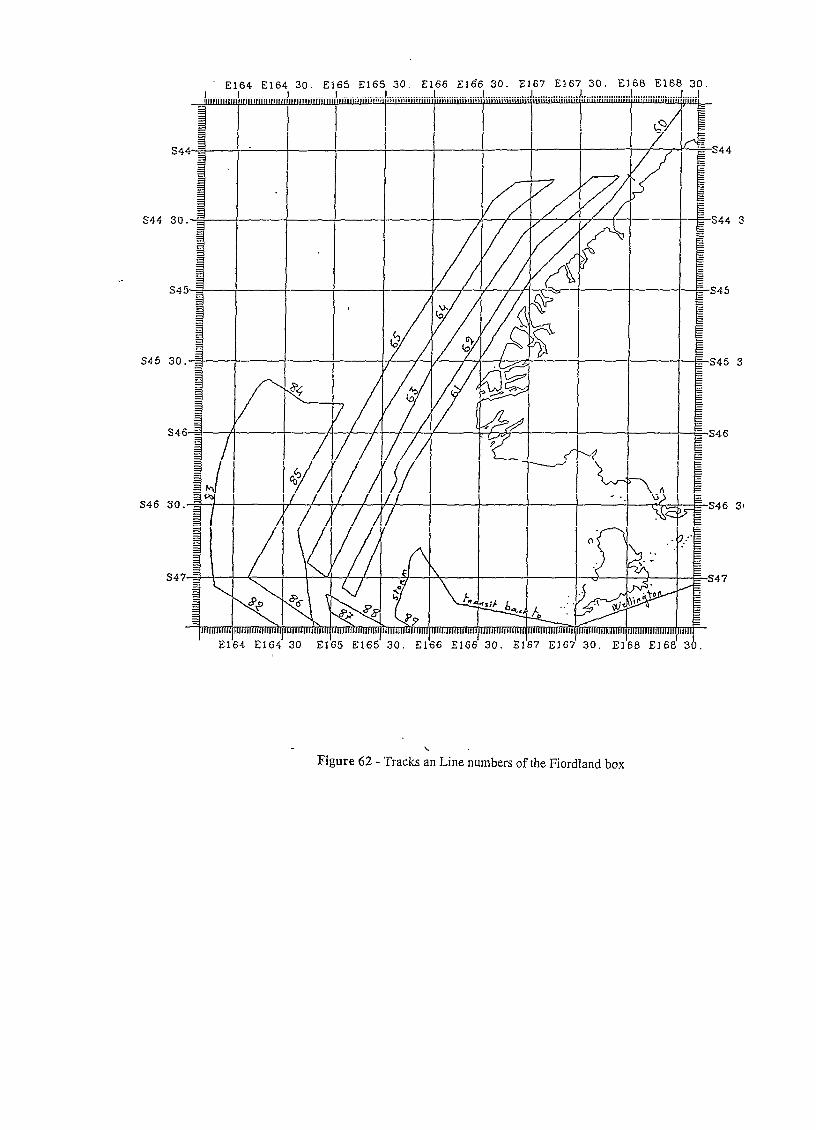
S4
. . s4
S46
S46 30.
El64 El64 30. E mlluijdmm lf 55 El6 me
A-
--
El64 El’64 El64 30. E164’ 30. Elk5 El65 El65 E165’
30. El66 El66 30. :
0. Ei’66 E166’ 30. EI
El 67 El6 7
5?
-- --f-r
I
16:
30. E
7 b )
s44 30
j46
i46 30
i47
Figure 62 - Tracks in Line numbers of the Fiordland box
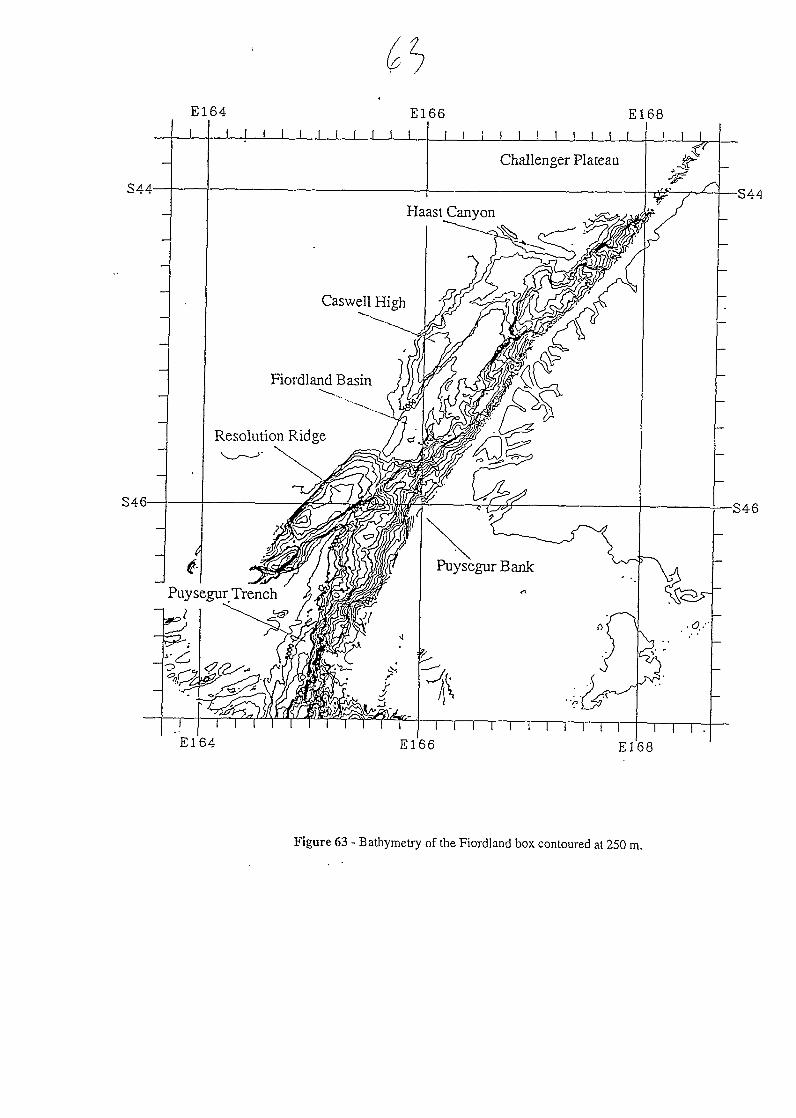
E I
s44
. .
S46
E ;4 El66 E II I I II II 1 II II ; III III I I
Challenger Plateau
Caswell High .--...
----I.
Fiordland Basin ‘.. -..._ -..
Resolution Ridge
’ -El’64 El I I I I I I 1) 11 l
6 El
\ 4 .J 61
s44
S46
Figure 63 - Bathymetry of the Fiordland box contoured at 250 m.
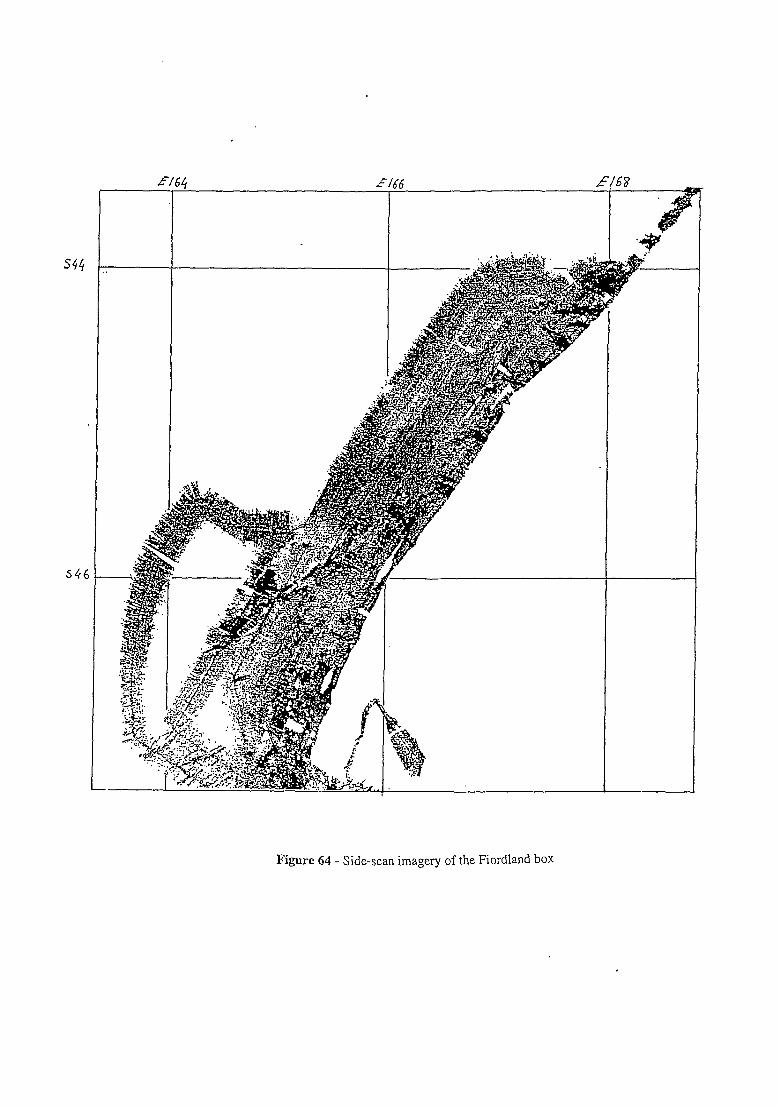
544
Figure 64 - Side-scan imagery of the Fiordland box
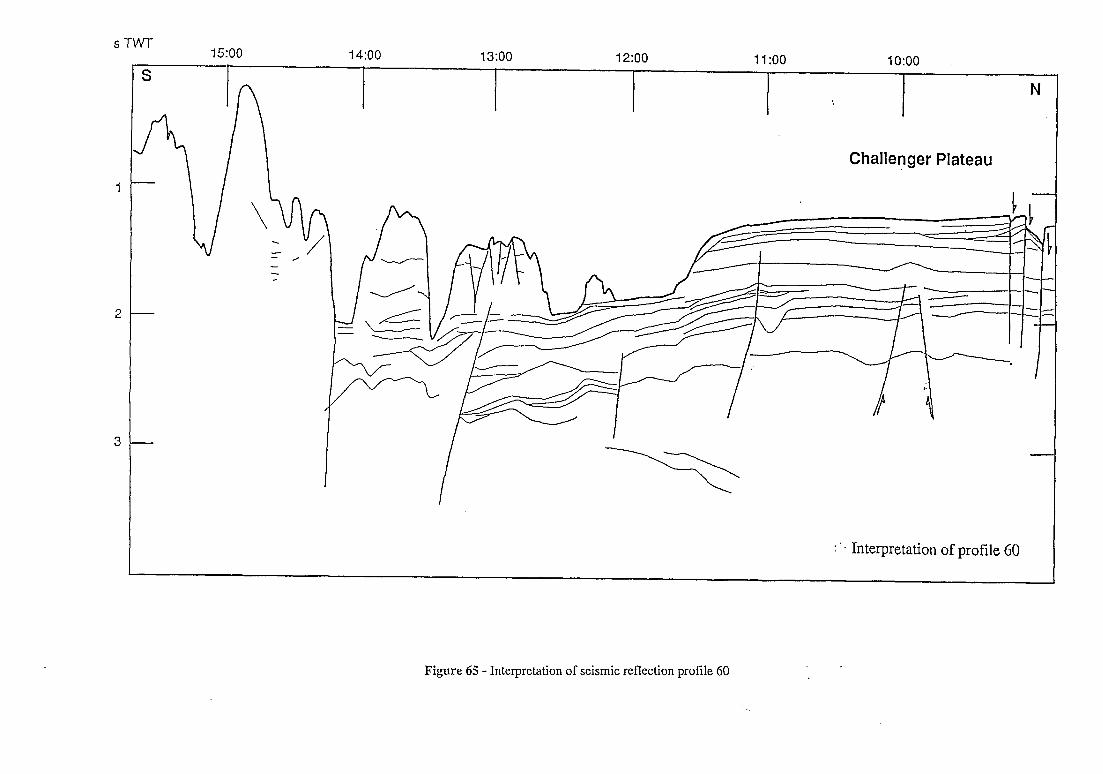
sTWJ l5:OO 14:oo 13:oo 12:oo 11:oo 1o:oo
S
Challenger Plateau
: ‘. Interpretation of profile 60
Figure 65 - Interpretation of seismic reflection profile 60
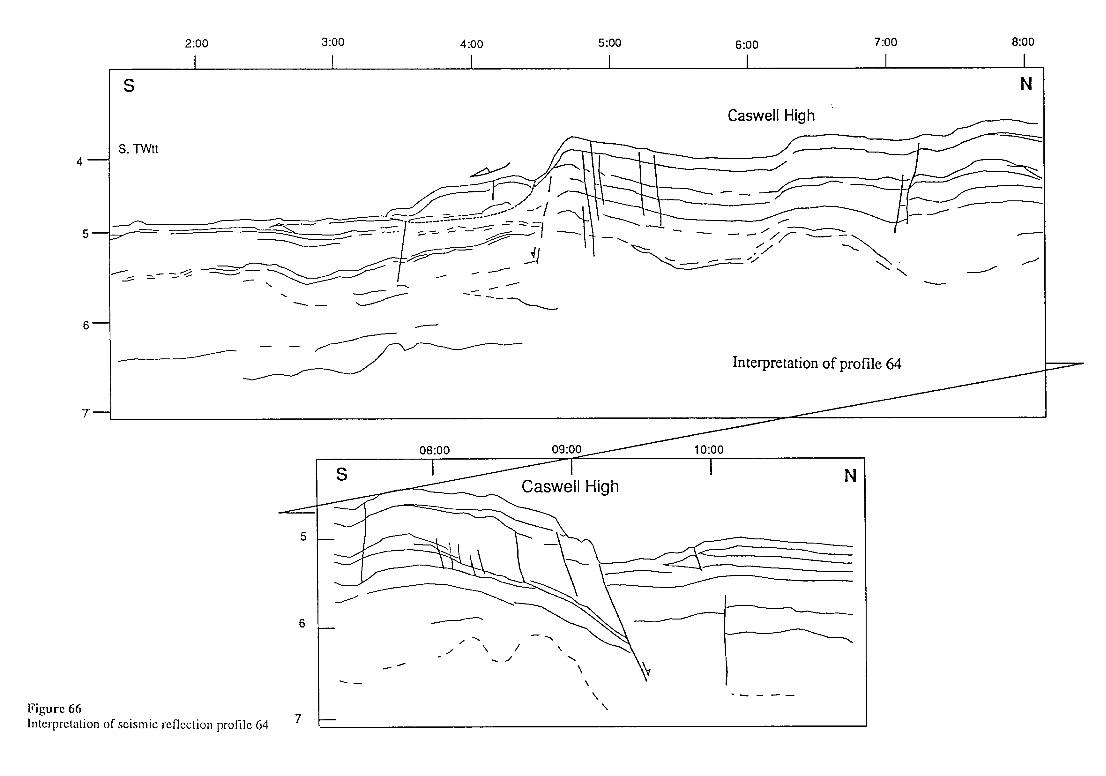
2:oo 3:oo 4:oo 5:oo 6:00 7:oo a:00
S
Caswell High ’
I- 5
----.----
F -----=
I - LG.--+=/ ,I ‘I ‘--. ,‘/ ’ --\ ,‘/ - --- 5 : -- - . - -- .- ------
Interpretation of profile 64
0a:oo
Figure 66 Intcrprchtion of seismic rcllcction profile 64
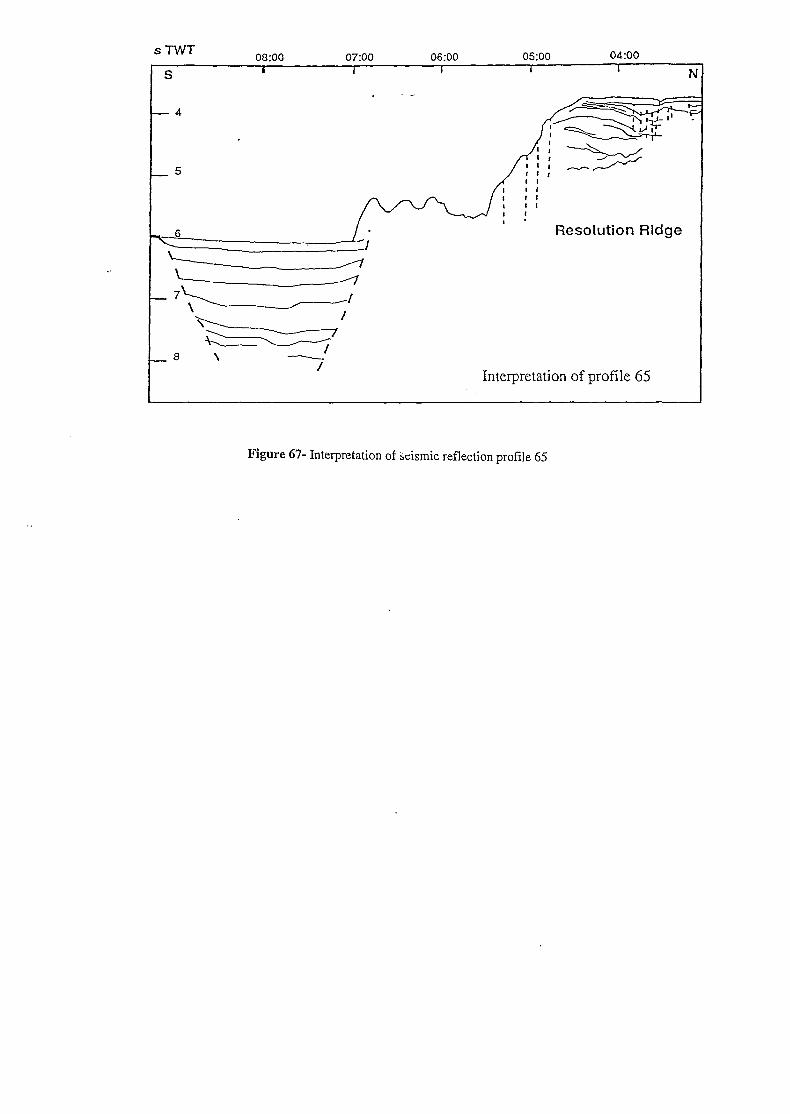
Resolution Ridge
. .
?--l /
c- -
-8 \ - -7 Interpretation of profile 65
Figure 67- Interpretation of hsmic reflection profile 65
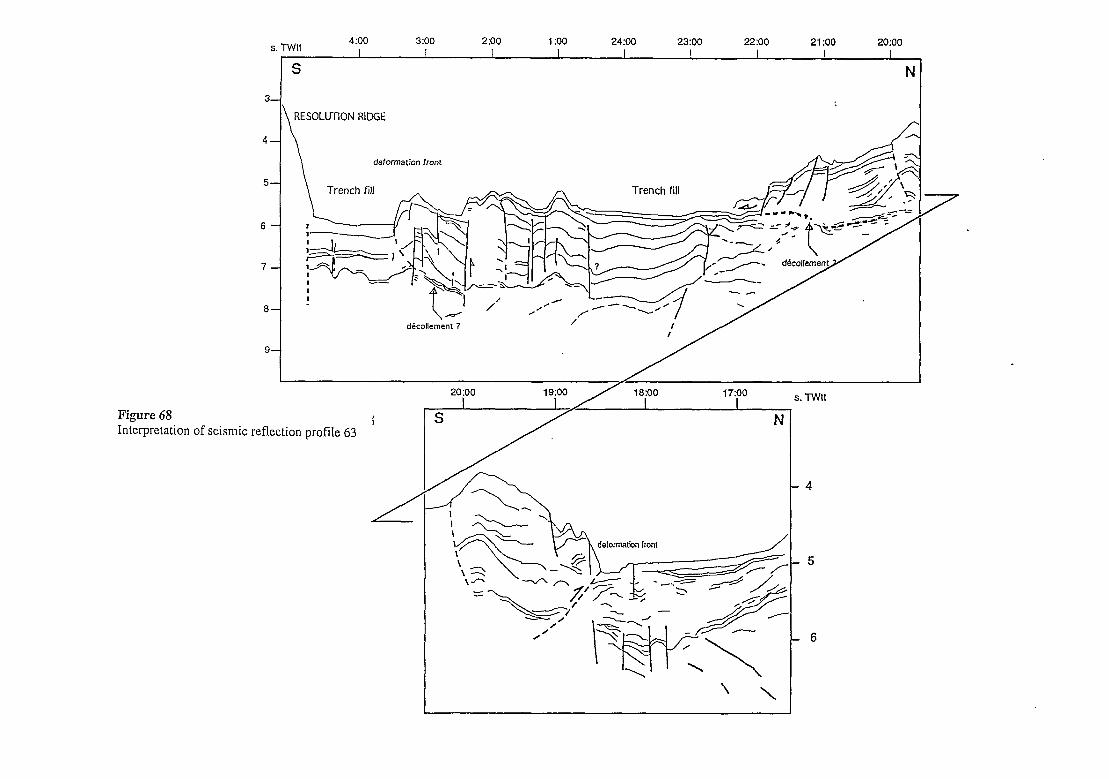
-... . ,.. 490 3:cQ 2:oo 1:oO 2490 23:OO 22:oo 21 :oo 20:oo
E
Figure 68
I-
s. I Wll I I I I I I I I I
S N
ESOLUTION RIDGE
defamation front
,/’ /A---,,
_- ^^
I
Interpretation of seismic reflection profile 63
L”:“” I ‘7” /
1/:uu s. TWll
-4
,
_- 5
- 6
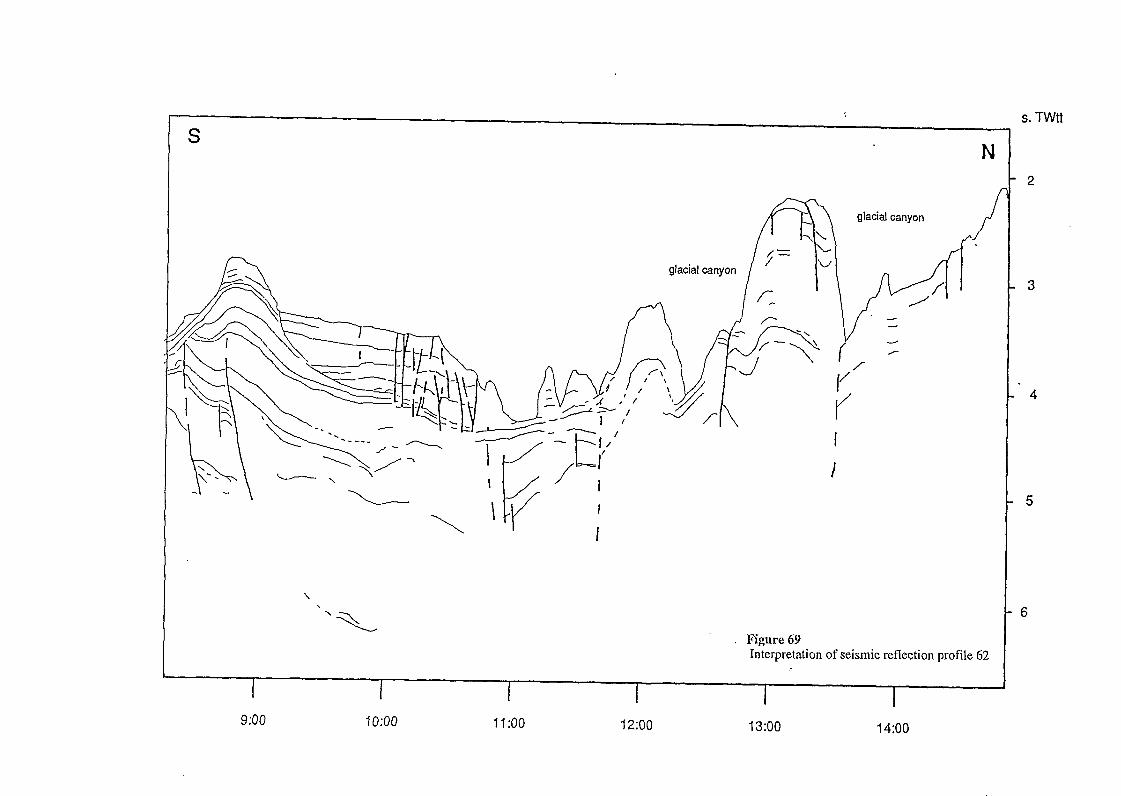
S N
/Qcl glacial canyon
8-A glacial canyon I $’ 17 h /I
Figure 69 Figure 69 Interpretation of seismic reflection profile 62 Interpretation of seismic reflection profile 62
I I I I I I I
1
s. Twtl
2
5
6
9100 1 II:00 Ii:00 12:oo 13:oo 14:oo
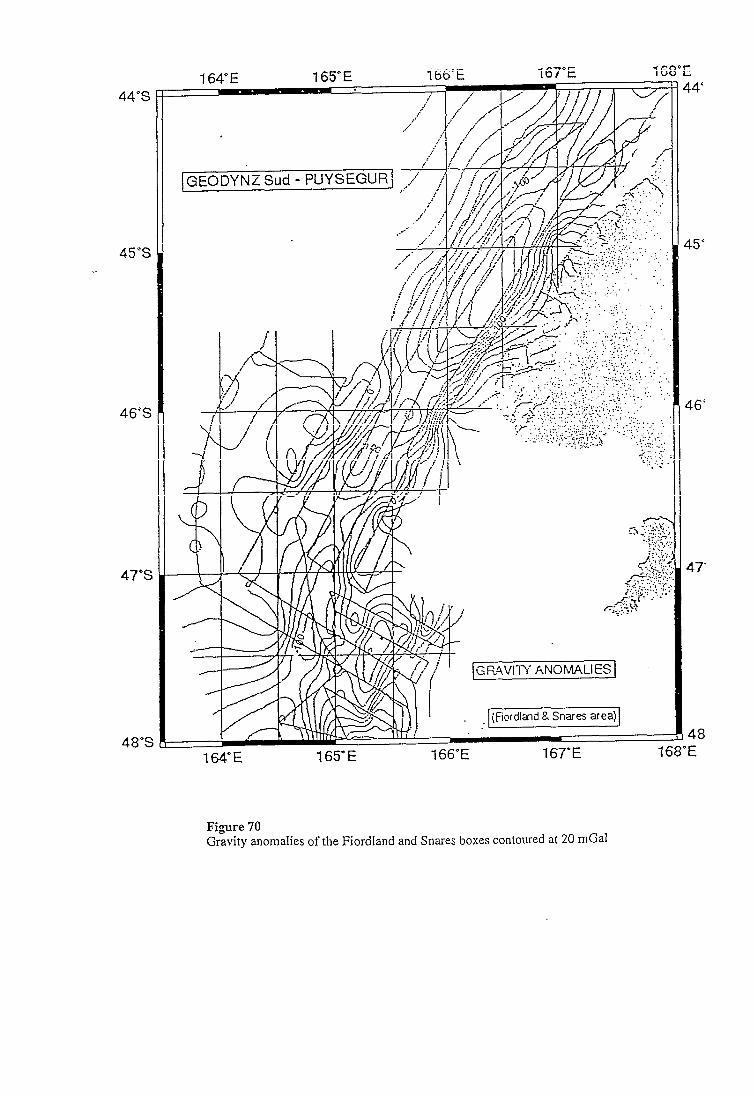
443
45"s . .
46'S
48'5
IGEODYNZSud - PUYSEGUR] ,,r(
46'
48
1WE 165”E 166”E 167-E 168”E
Figure 70 Gravity anomalies of the Fiordland and Snares boxes contoured at 20 mGal
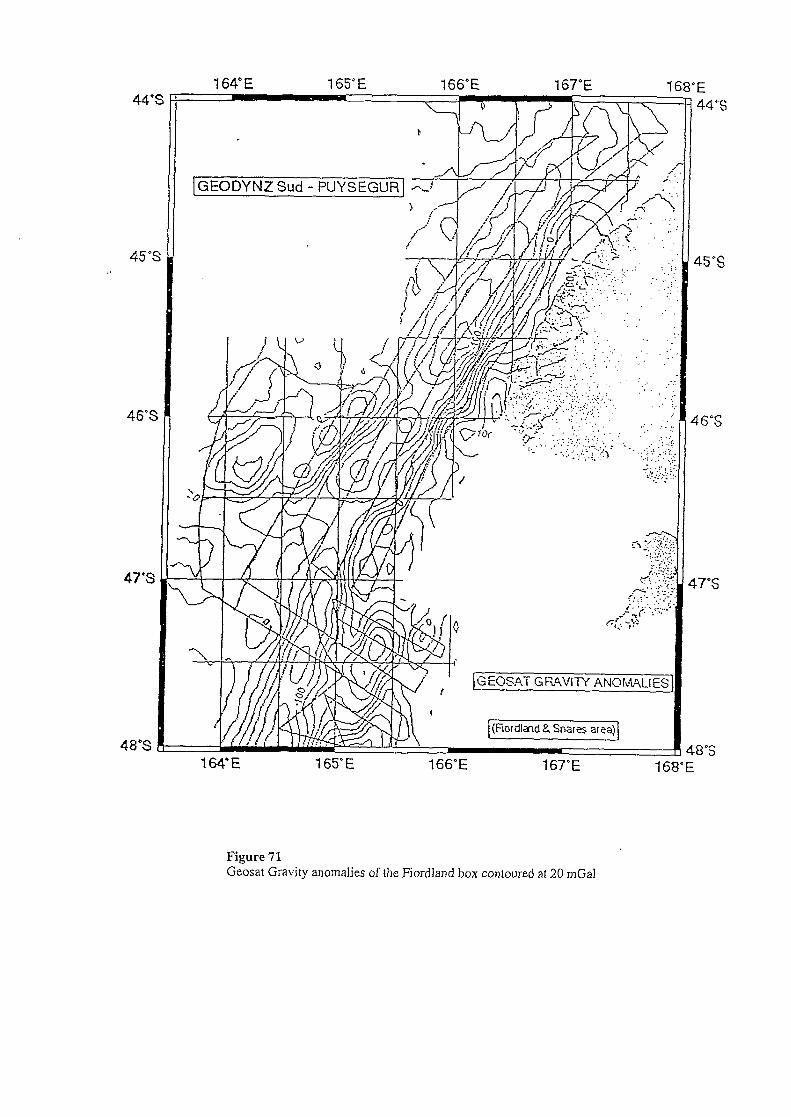
164”E 165”E 166”E 167°F 1 44’
45”.
46’:
48’S 164.E 165”E 166”E 167’E 168”E
>E 44”s
45%
.8’S
Figure 71 Geosat Gravity anomalies of the Fiordland box contoured at 20 mGal
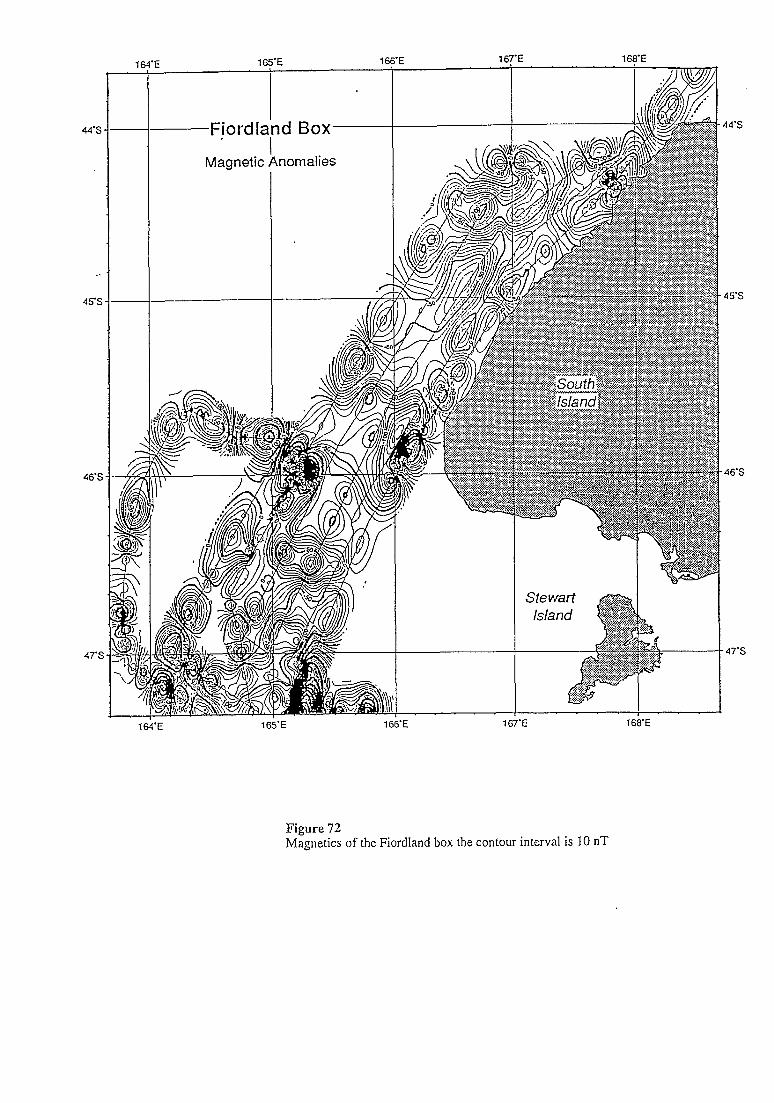
44-I
45:
46-s
47's
Fjordland Box I
Magnetic Anomalies
77-E 166-E
t
E 166'E
$43
45'S
46-s
47's
Figure 72 Magnetics of the Fiordland box the contour interval is 10 nT
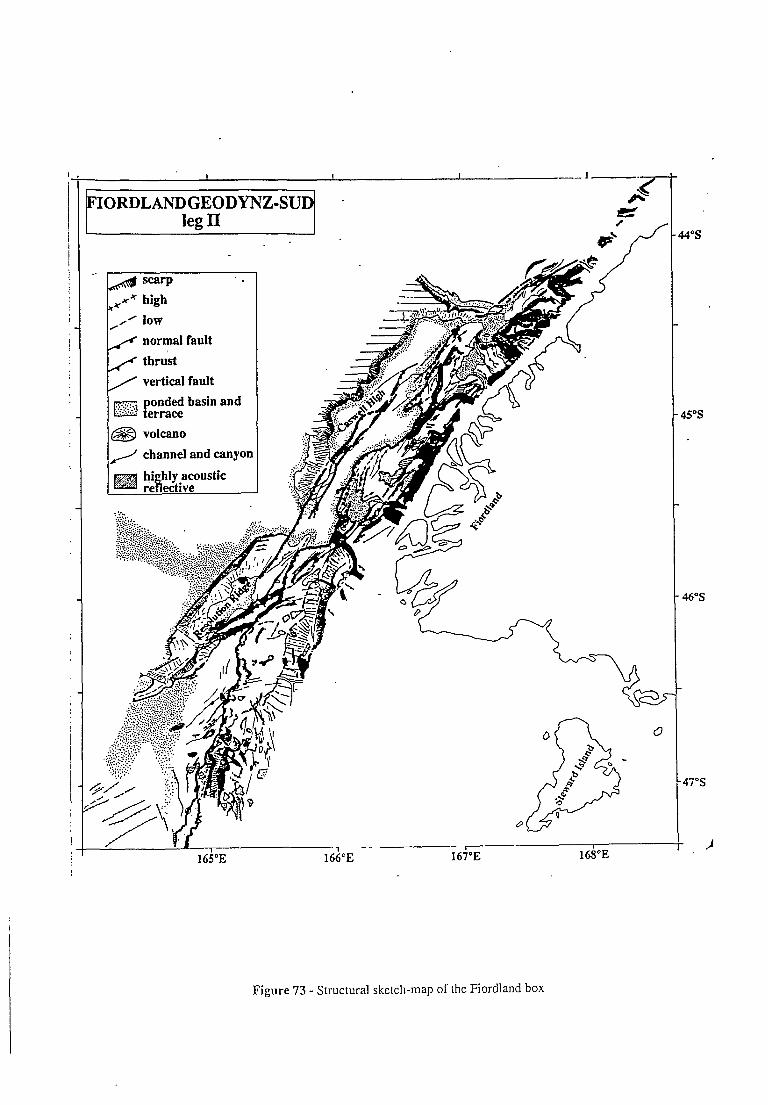
& s=rp .
,.p-* high
/’ low
/ normal fault
/ thrust
/ vertical fault
m r;g bad and
/ -7 -.- 1fX’E
Figure 73 - Structural sketch-map of the Fiordland box
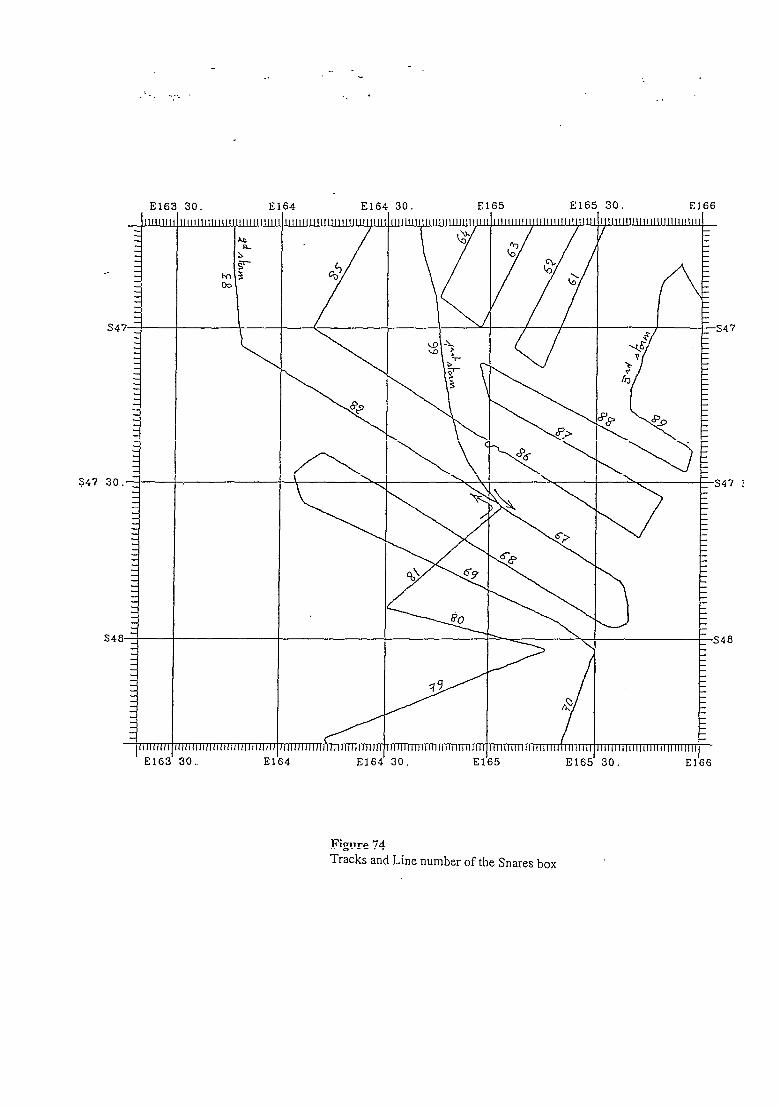
L_ __. ‘, : . : ._
- -
. I
‘_, .
El63 30. El63 30. El64 El64 El64 30. El64 30. El65 El65 El65 30. El65 30. El66 El66
Figure 74 Tracks and Line number of the Snares box
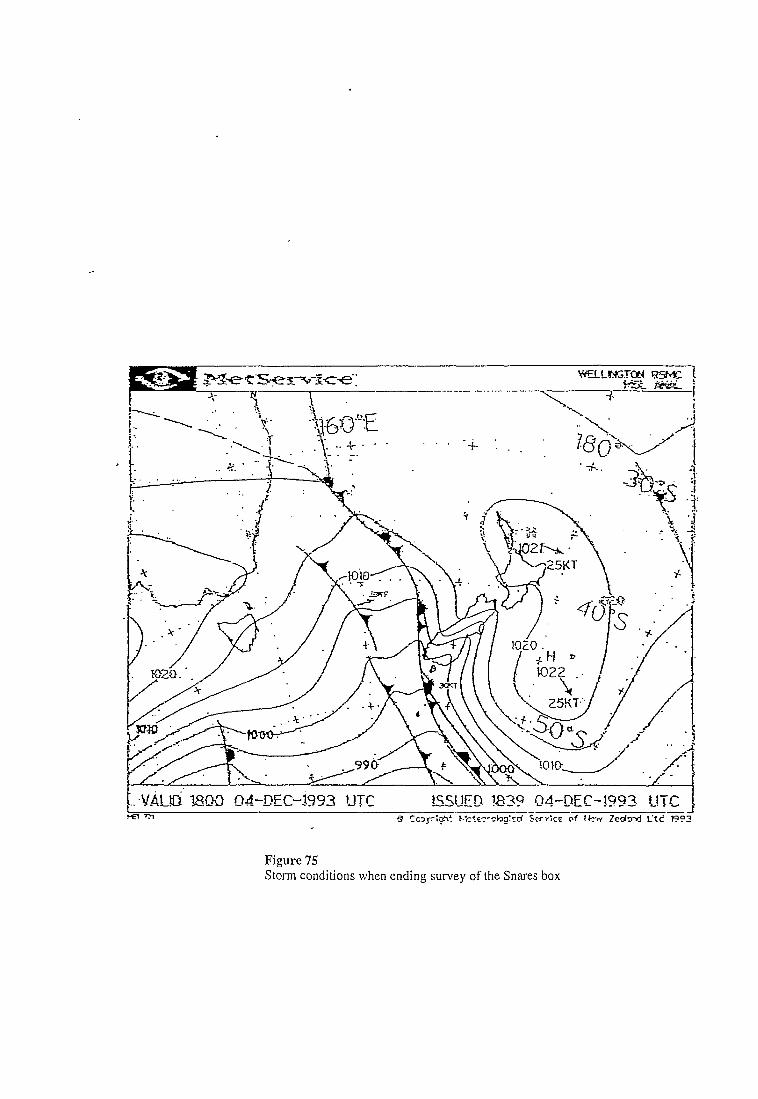
Figure 75 Storm conditions when ending survey of the Snares box
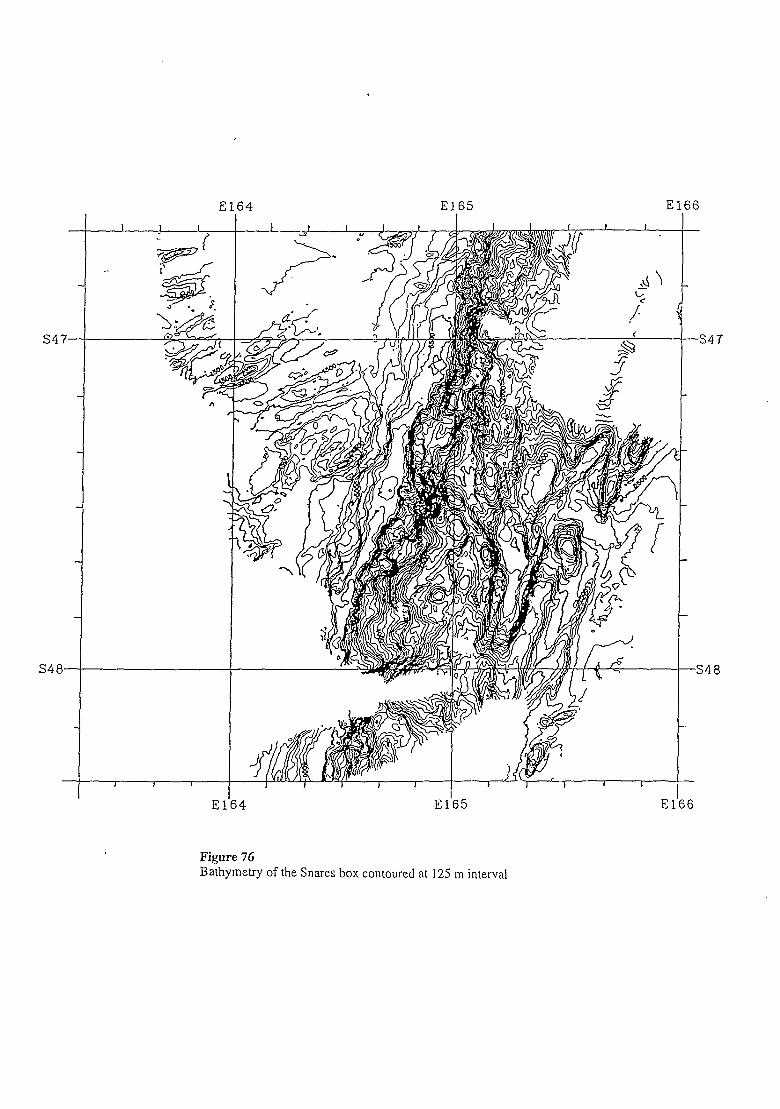
S48-
-
E
I 1 I . . .?
I I I
El
64 El65 E
4 El’65 El
56
-
-s4a
6
Figure 76 Bathymetry of the Snares box contoured at 125 m interval
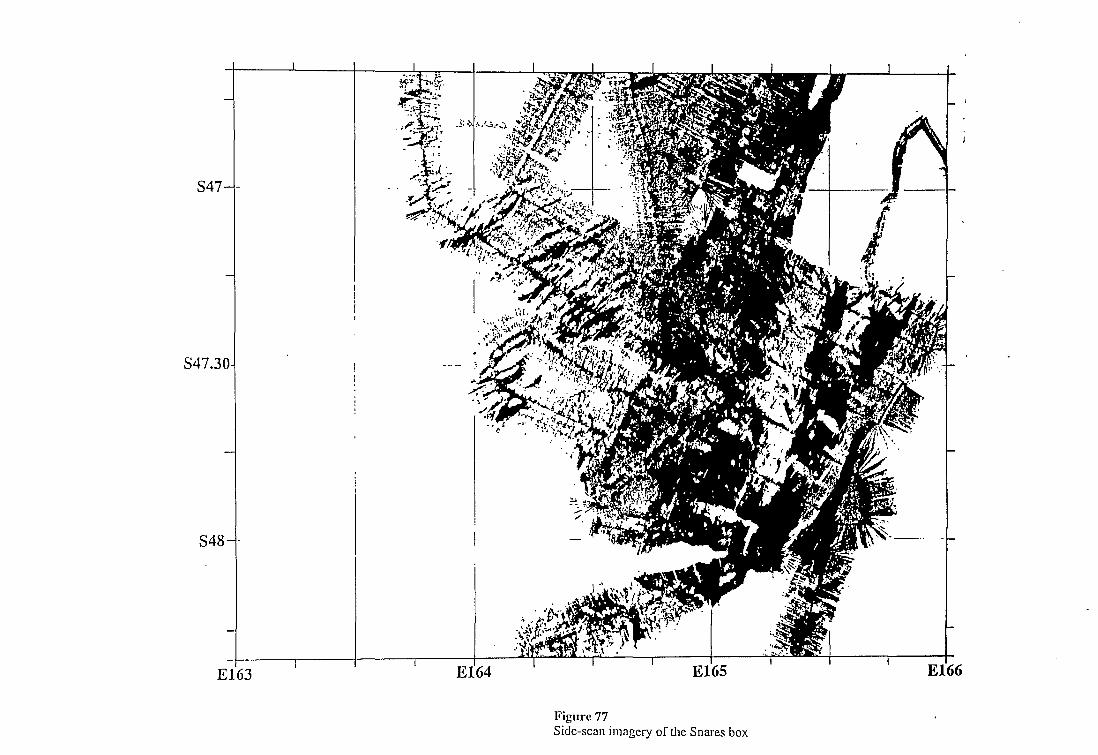
s47
s47.3
S4E
I
I
Figure 77 Side-scan imagery of the Snares box
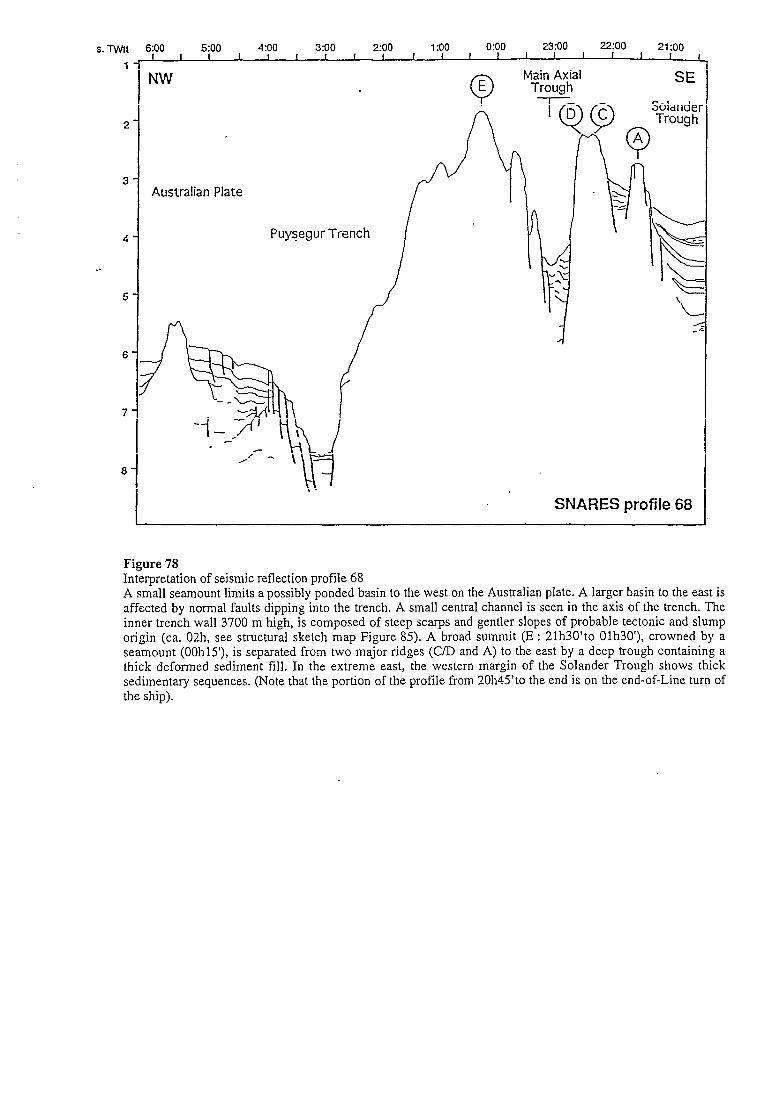
s. Twtr
1
3
4
. .
5
6
7
a
; 6:(
n
I-
rc
30 5:oo 4:oo 3:oo 2:oo l:oo 0:oo 23:00 22:oo 21:oo 1 I I I I I I I I
Q E Main Axial
Trough SE
Solander Trough
Australian Plate
Puy?egur Trench
SNARES profile 68
Figure 78 Interpretation of seismic reflection profile 68 A small seamount limits a possibly ponded basin to the west on the Australian plate. A larger basin to the east is affected by normal faults dipping into the trench. A small central channel is seen in the axis of the trench. The inner trench wall 3700 m high, is composed of steep scarps and gentler slopes of probable tectonic and slump origin (ca. 02h, see structural sketch map Figure 85). A broad summit (E : 21h30’to Olh30’), crowned by a seamount (OOhlS), is separated from two major ridges (C/D and A) to the east by a deep trough containing a thick deformed sediment fill, In the extreme east, the western margin of the Solander Trough shows thick sedimentary sequences. (Note that the portion of the profile from 20h45’to the end is on the end-of-Line turn of the ship).
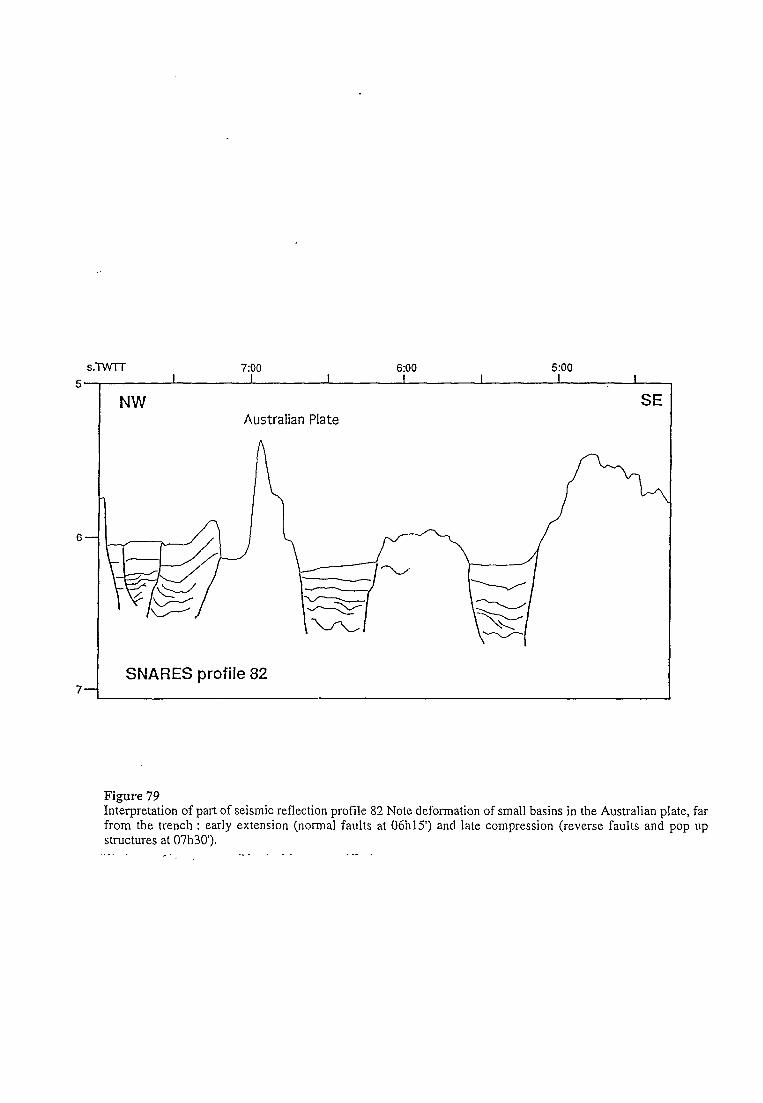
S.-lWFl- 7:oo 6:00 5:oo
5 I I I I I I I
NW SE Australian Plate
6-
7 1 SNARES profile 82
Figure 79 Interpretation of part of seismic reflection profile 82 Note deformation of small basins in the Australian plate, far from the trench : early extension (normal faults at 06h15’) and late compression (reverse faults and pop up structures at 07h30’). ,... - .,. . ..-
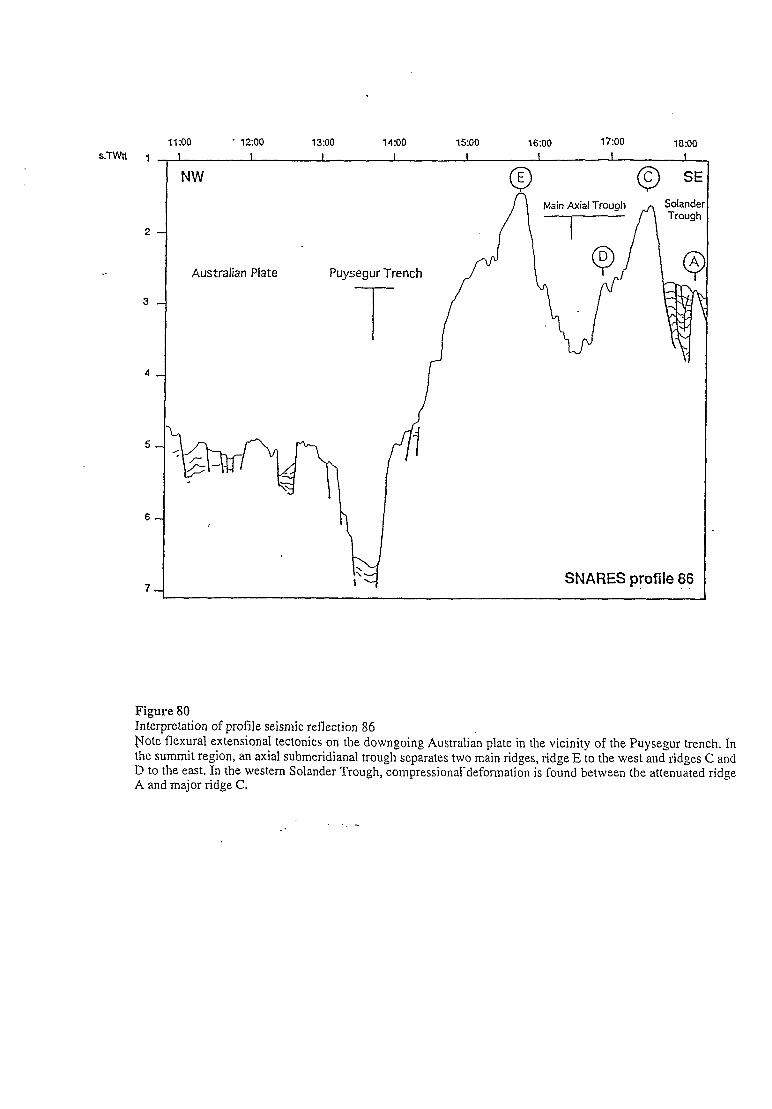
s.lwi 1
2
3
4
6
7
11:oo - 12:oo 13:oo 14:oo 15:oo 16:00 17:oo 1890 I I I I I I I 1
NW SE
Main Axial Trough
Australian Plate Puysegur Trench
T
SNARES profile 86
Figure 80 Interpretation of profile seismic reflection 86 vote flexural extensional tectonics on the downgoing Australian plate in the vicinity of the Puysegur trench. In the summit region, an axial submeridianal trough separates two main ridges, ridge E to the west and ridges C and D to the east. In the western Solander Trough, compressionaldeformation is found between the attenuated ridge A and major ridge C.
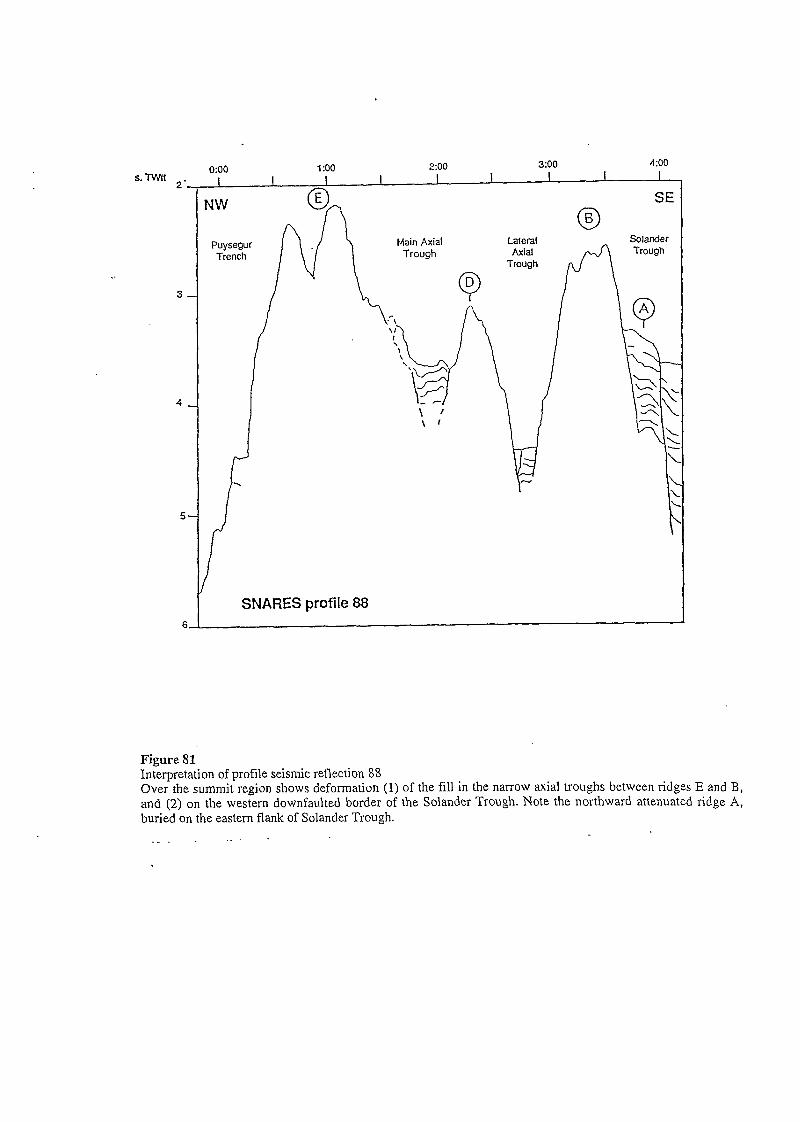
5. Twn 0:oo 1:oO 2:oo 3:oo 4:oo
2’ I I I 1 I I I I I
NW SE
0 I3 Solander
SNARES profile 88 6
Fieure 81 InLpretation of profile seismic reflection X8 Over the summit region shows deformation (1) of the fill in the narrow axial troughs between ridges E and B, and (2) on the western downfaulted border of the Solander Trough. Note the northward attenuated ridge A, buried on the eastern flank of Solander Trough.
.__ . . . . .
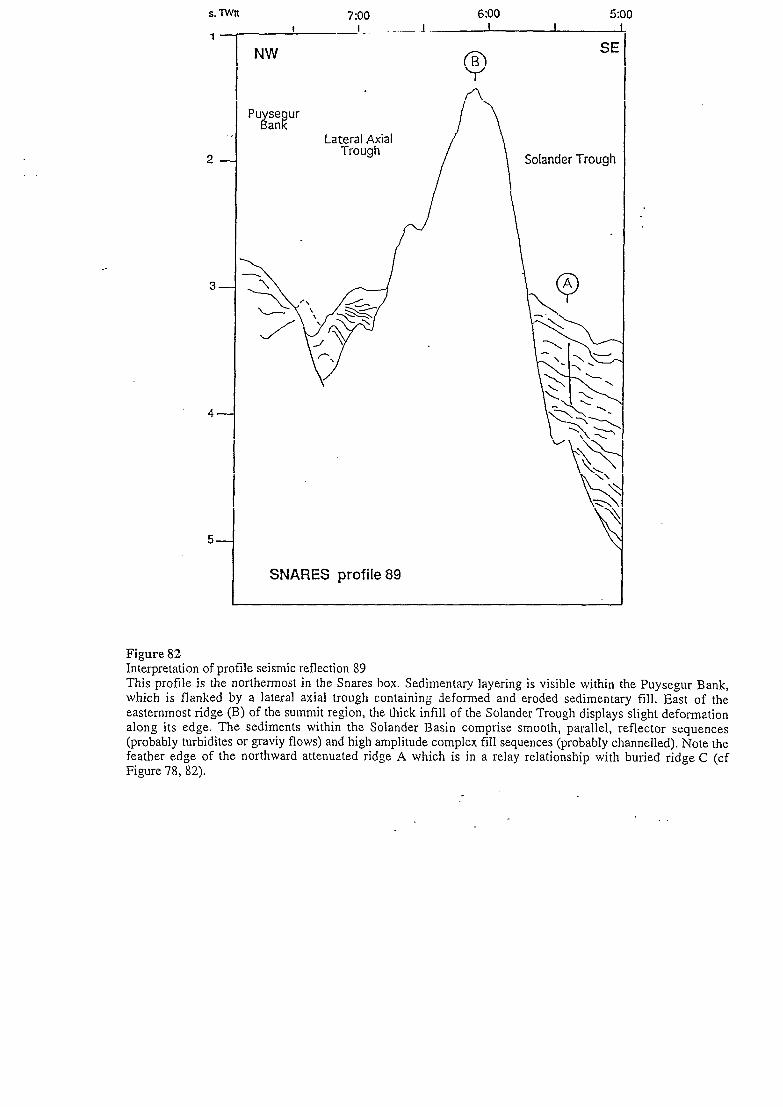
NW SE
5. Tw 7:oo 6:00 5:oo t I I I 1 I-
SNARES profile 89
Figure 82 Interpretation of profile seismic reflection 89 This profile is the northermost in the Snares box. Sedimentary layering is visible within the Puysegur Bank, which is flanked by a lateral axial trough containing deformed and eroded sedimentary fill. East of the easternmost ridge (B) of the summit region, the thick infrll of the Solander Trough displays slight deformation along its edge. The sediments within the Solander Basin comprise smooth, parallel, reflector sequences (probably turbidites or graviy flows) and high amplitude complex fill sequences (probably channelled). Note the feather edge of the northward attenuated ridge A which is in a relay relationship with buried ridge C (cf Figure 78, 82).
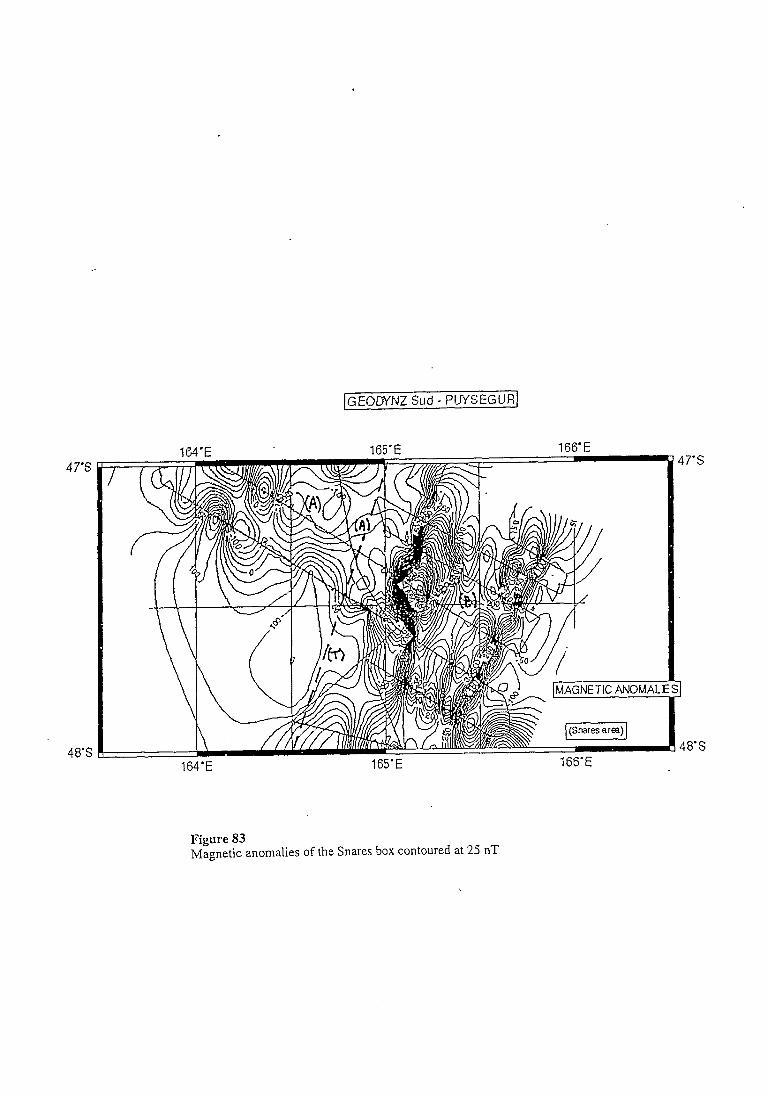
. .
48’S
[~EOmtdz sud - PU~SEGURI
47’S
48’S
Figure 83 Magnetic anomalies of the Snares box contoured at 25 nT
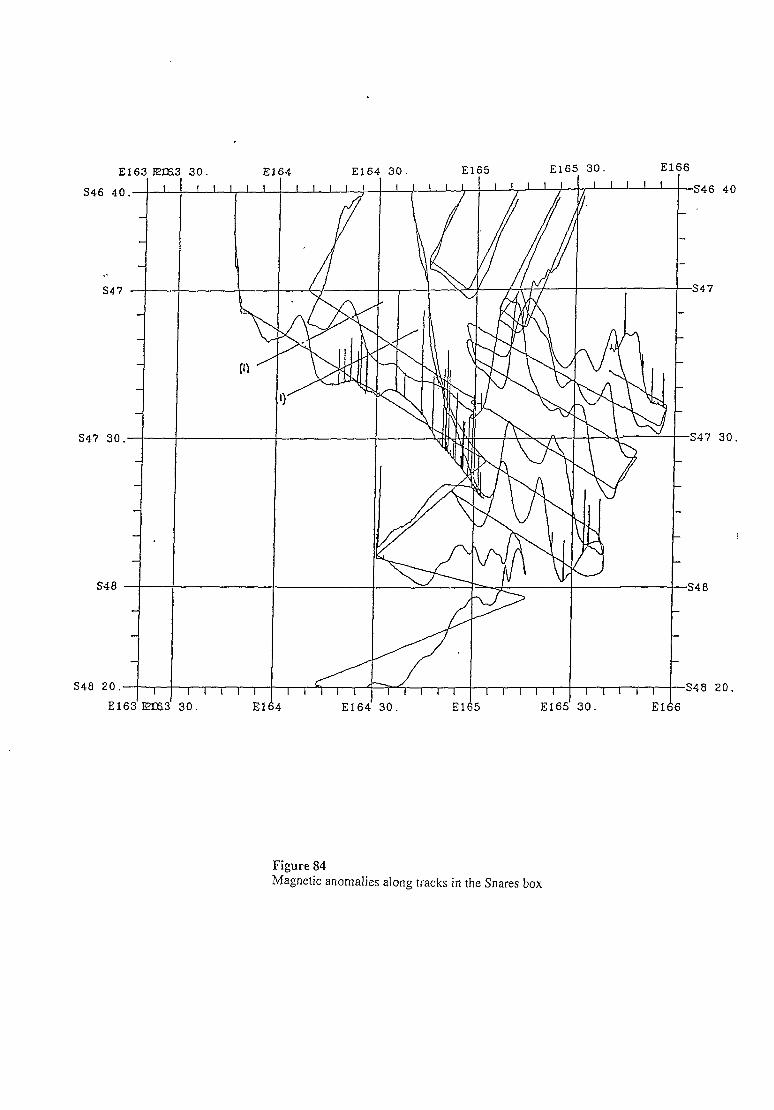
El64 30. El65 E165. 30. El66 El63. ELT53, 30. Elf4
S46 40
s4*20. ’ I ’ I I I I I ’ I ?-Y/l I I I ’ I I I Ii ’
El63 BXfi3 30. El 4 E164’ 30.
I I I I I ’ s4*20-
El 5 E165’ 30. El 6
Figure 84 Magnetic anomalies along tracks in the Snares box
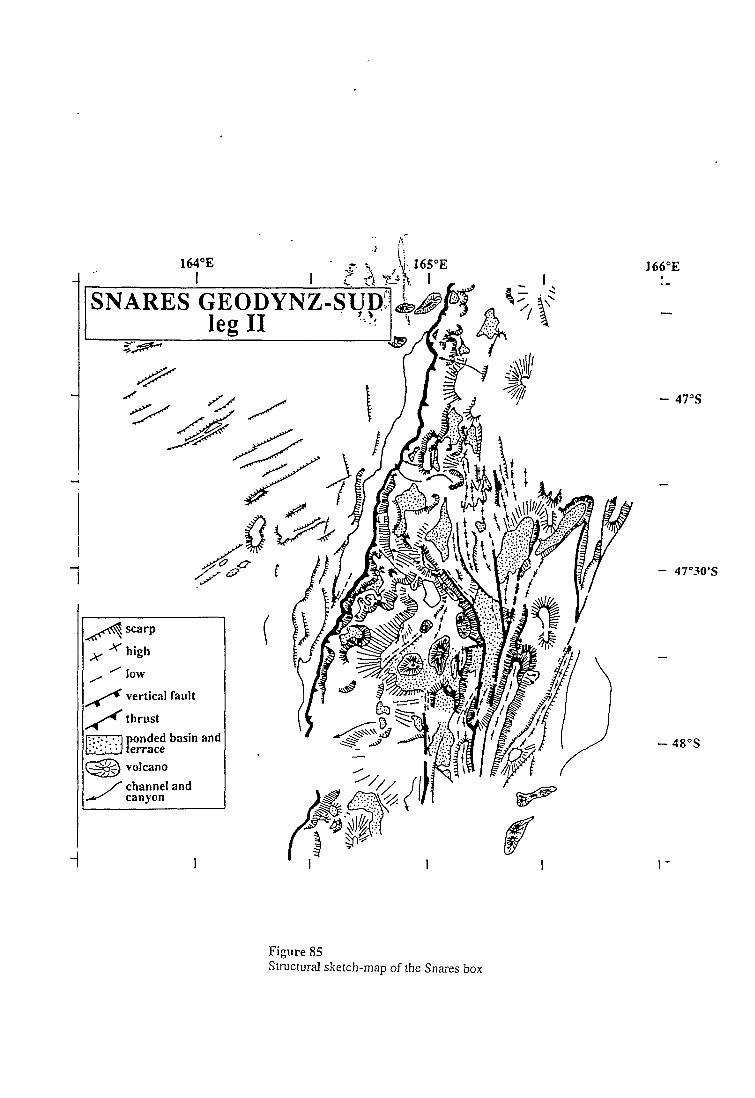
164”E J ii
.‘ $ _ $ 165”E
1
. . I I SNAR
leg II
A? A- :.:.. . . . . . .
_
cl . . . . : * . .
Q s+
l-
vertical fault
.
channel and
- 47”s
I-
Figure 85 Structural sketch-map of the Snares box
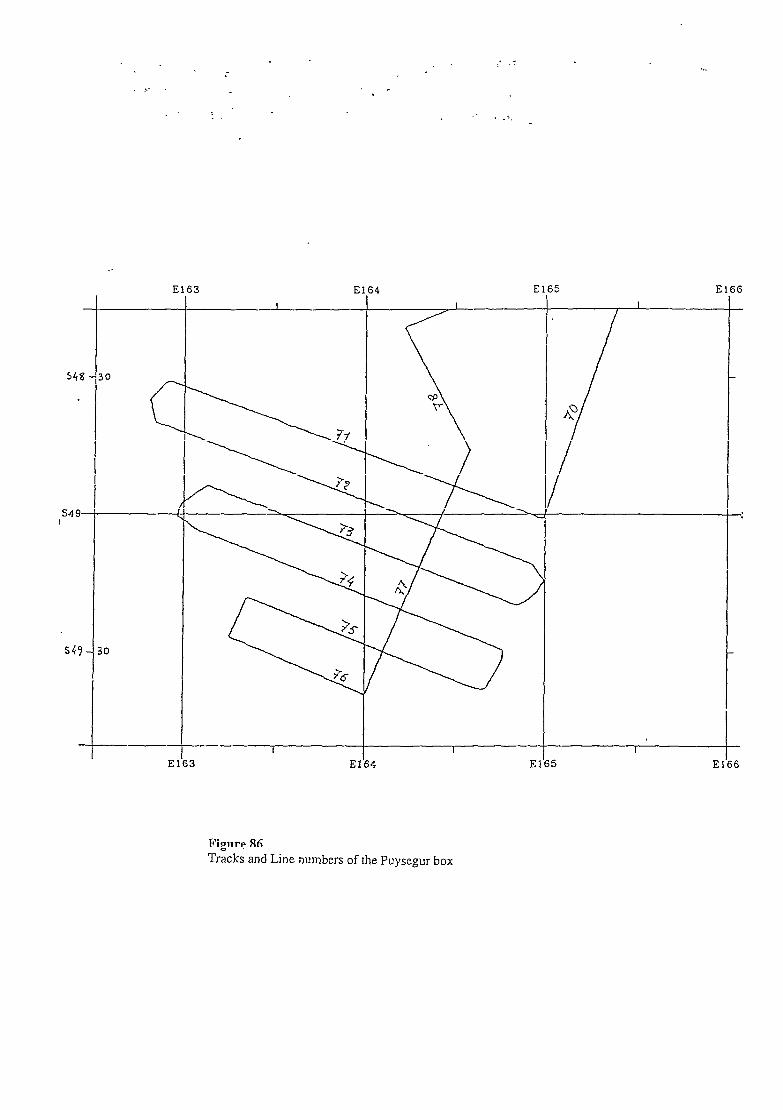
El63 El64 El65 El66 I
s49 U I
s49 - 30
I I El63 El64
Figure 86 Tracks and Line numbers of the Puysegur box
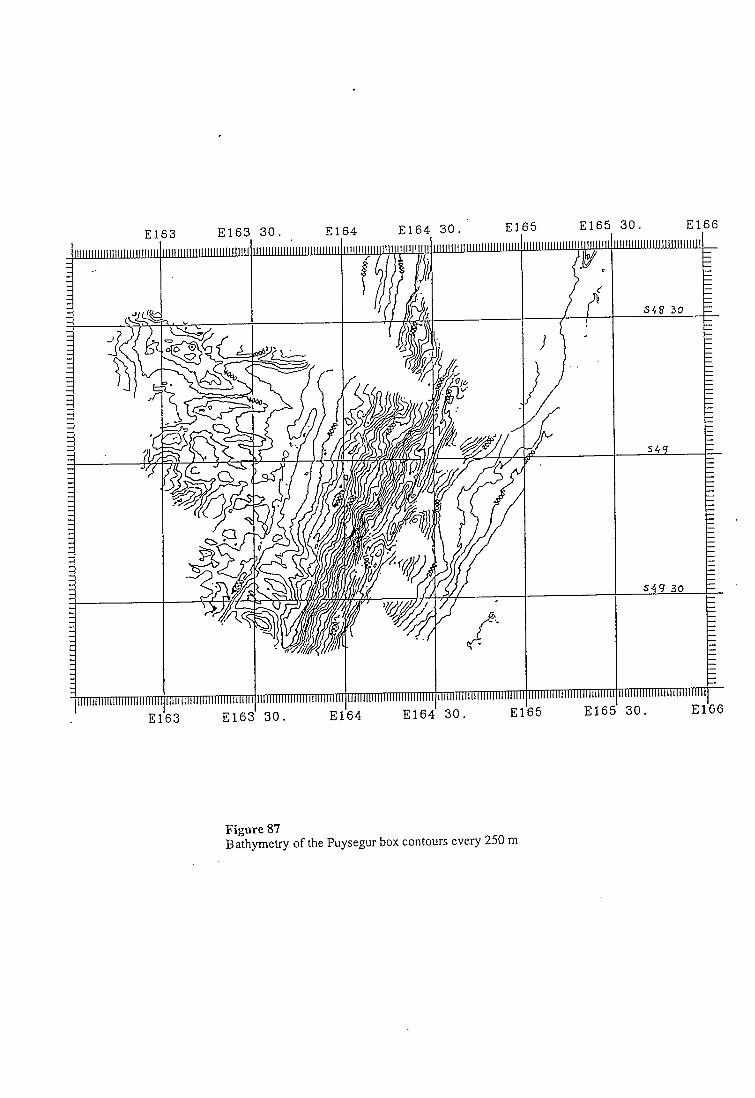
El63 El63 30. El65 30. El66 t
11111111111111111111lllllllll l l l l l l l l l l
I I I I I I
Figure 87 Bathymetry of the Puysegur box contours every 250 m
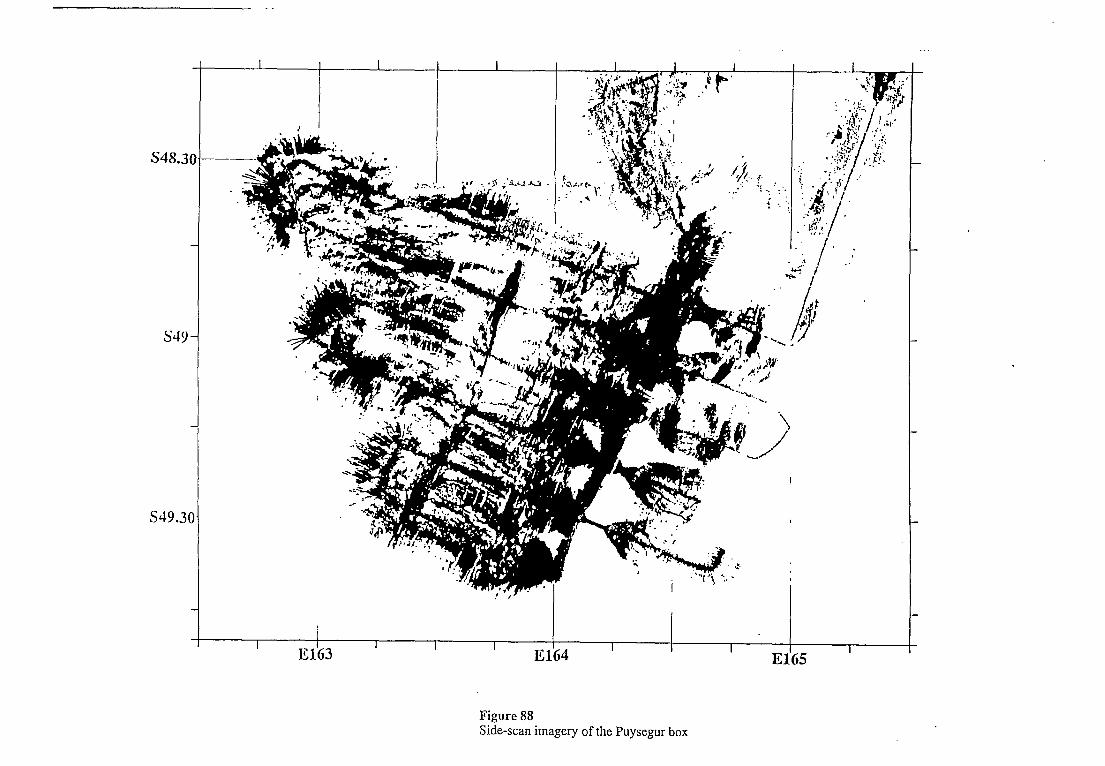
S48.30
s49-
s49.30
I I
El63 I I I
El64 I I
El65 I
Figure 88 Side-scan imagery of the Puysegur box
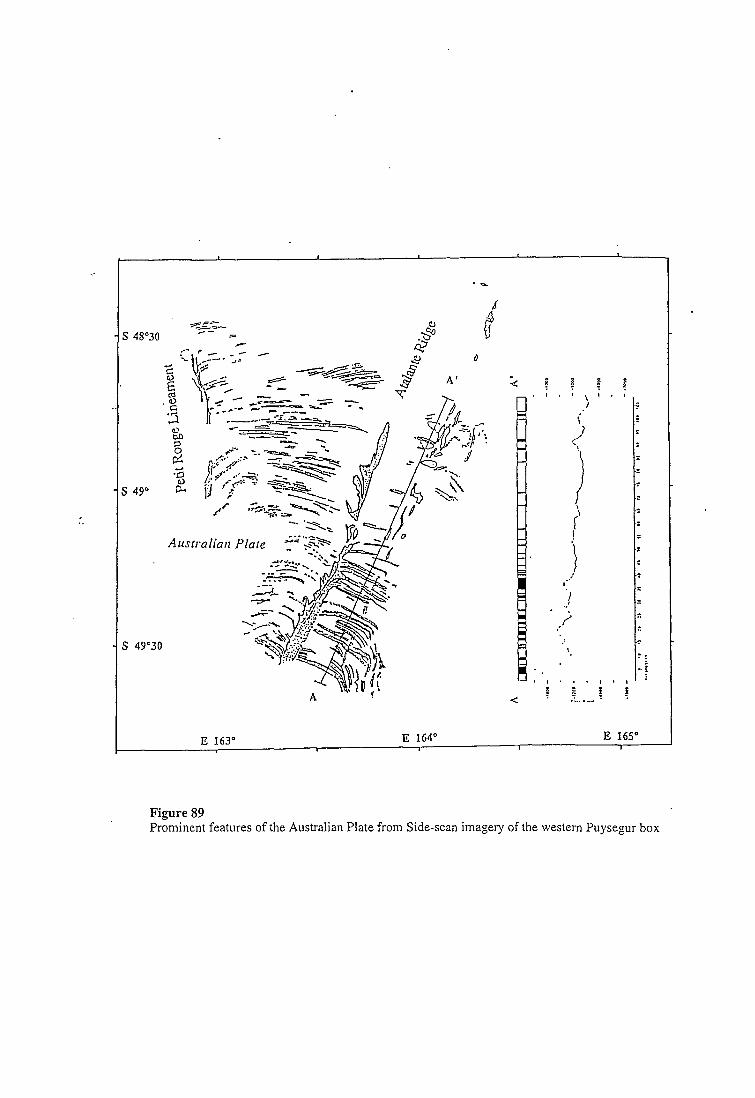
S 48"30 ?g-~z-
E 163" E 1'54" E 165" I ti I
Figure 89 Prominent features of the Australian Plate from Side-scan imagery of the western Puysegur box
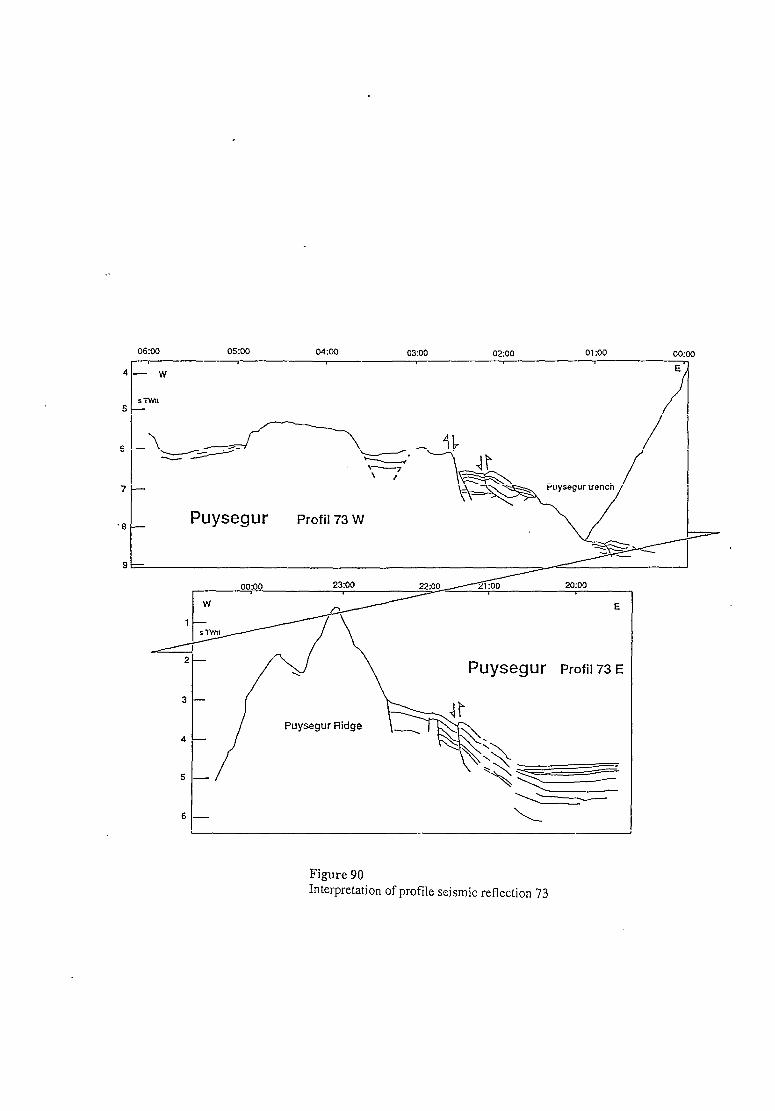
06:ca 05:cm 04:oO 03:oo 02:oo 01 :oo 00
Puysegur Profi173 W
Puysegur Ridge
moo
0
Figure 90 Interpretation of profile seismic reflection 73
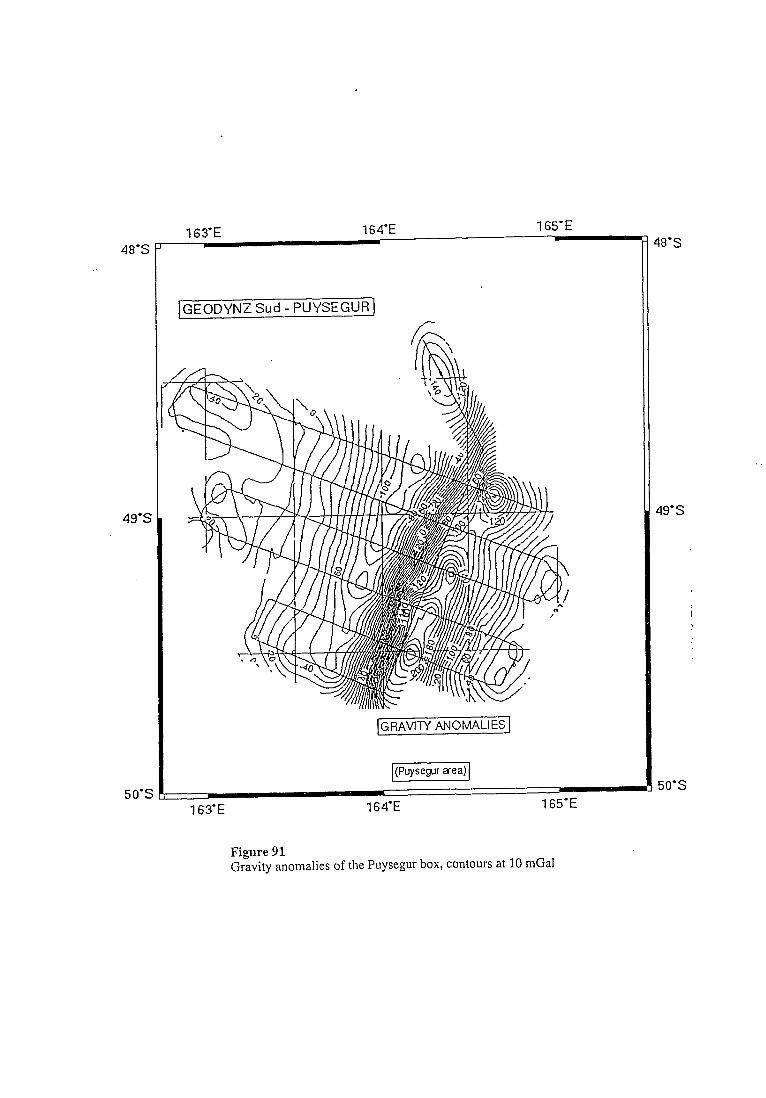
163-E 164”E 165-E ._-- 1 a 43-s
[GEODYNZ ~U~-PUYSEGUR] r
IGRAVITY moht4~IEsI
163-E
Ipyseyr area) (
164-E 50-s
165-E
Figure 91 Gravity anomalies of the Puysegur box, contours at 10 mGal
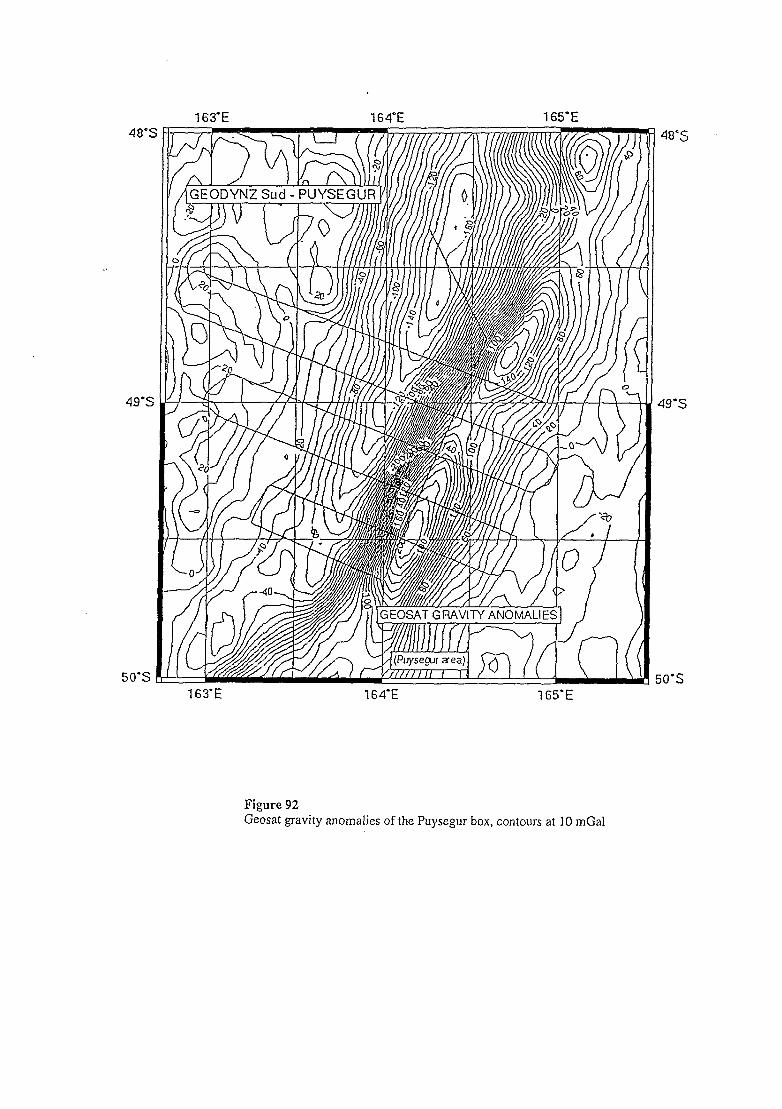
163-E 164-E 165-E
163-E 164-E 165-E
Figure 92 Geosat gravity anomalies of the Puysegur box, contours at 10 mGa1
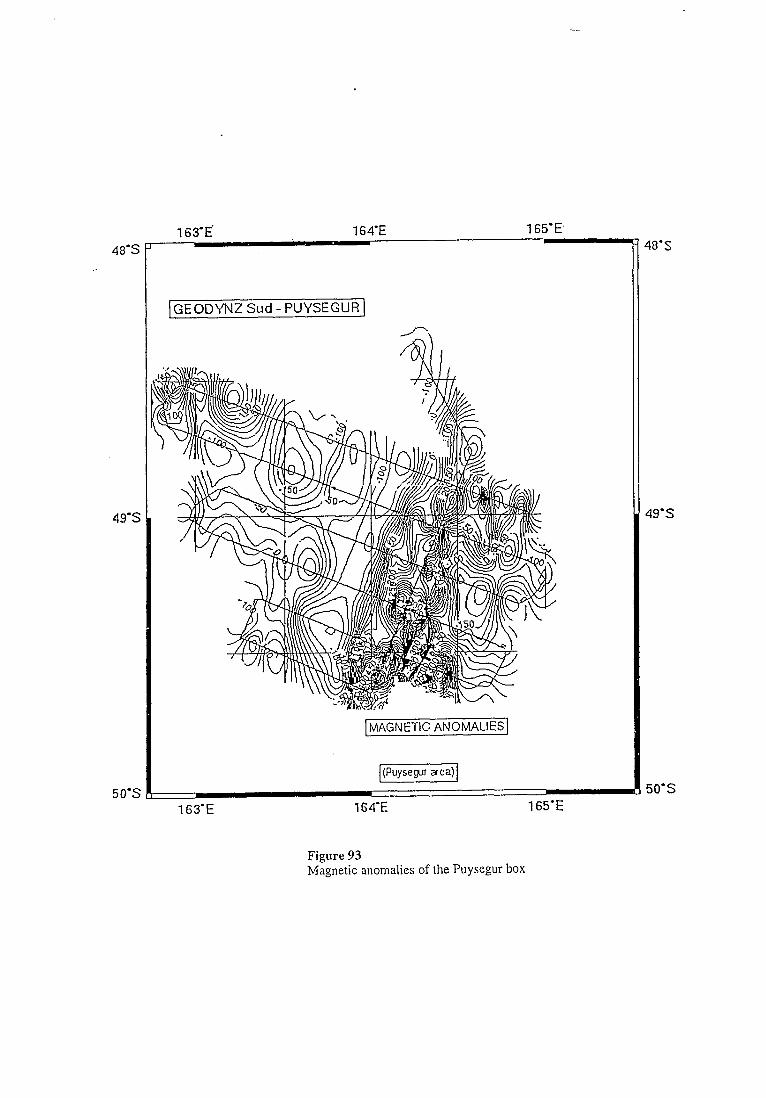
48-S _.
IMAGNETIC ~~obwEs]
(PuyseEprr aea)
163-E 164-E 165-E
48-S
49-s
50-s
Figure 93 Magnetic anomalies of the Puysegur box
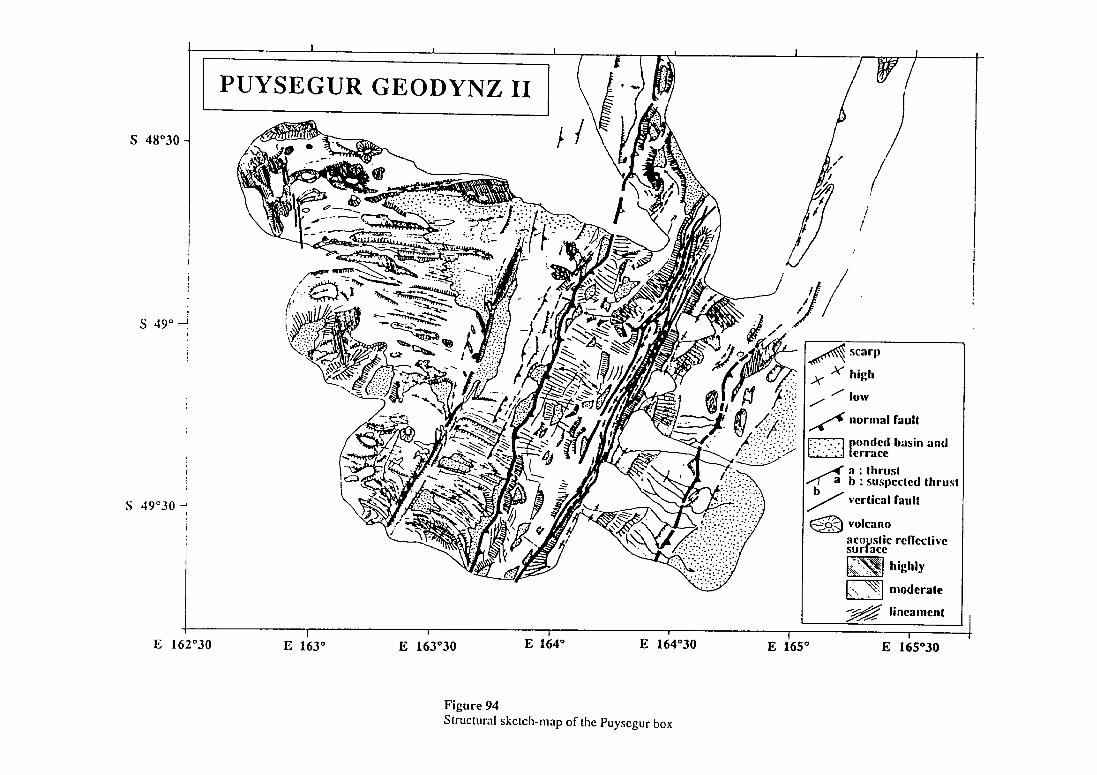
s 48”30 -
PUYSEGURGEODYNZII I
i i
A scarp
x x high
/ ’ low
A? normal fault
mj yr~k,d basin and
volcano ace
r slit reflective
sur ace highly
I . : moderate
-& lineamenl
1 I I I , I I E 164”
t
E 162”30 E 163” E 163”30 E 164”30 E 165” E 165”30
Figure 94 Slructural sketch-map of he Puyscgur box
FIGURE CAPTIONS
Figure1 Geodynamic setting of NZ in the SW Pacific Ocean (modified after Spijrli 1980) ; A : Gondwanian basement deformed during Devonian to Carboniferous ; B : Rangitata erogenic belt built in Early Cretaceous times ; C : Rifted middle Cretaceous basins ; D : Rifted late Cretaceous to Paleocene basins ; E : Ecocene to Oligocene basins ; F : Le Havre and Lau back-arc basins
Figure 2 a) Schematic geology of New Zealand (modified after Sporli 1980 and Chanier 1991) ; 1 : pre-Miocene basement with Dun Mountain ophiolitic belt, 2 : Northland and East Cape Allochthon ; 3 : Neogene and Quaternary basins ; 4 : active volcanoes ; MF : Mohaka Fault ; AR : Axial Ranges ; CR : Costal Ranges ; b) Location of the Hikurangi Plateau ; the scarp NE of the Hikurangi Plateau is the Rapuhia scarp ; dark grey arrows indicate the path of the Hikurangi Channel ; DWBC : Deep Western Boundary Current (after Lewis, 1994).
Figure 3 Tracks of the GEODYNZ-SUD cruise around New Zealand
Figure 4 A) Sample of onboard monitor of a single-channel seismic section from the Hikurangi Plateau ; B) Three-fold stack of the seismic section shown in A.
Figure 5 Structural sketch of the North Island of New Zealand (after Chanier, 1991)
Figure 6 Block diagram of the North Island-Hikurangi accretionary wedge (after Cutten and Delteil, submitted) ; location in Figure 5.
Figure 7 Map of the main structural features of the Hikurangi margin (after Lewis and Pettinga, 1993). Heavy broken line is the landward backstop of imbricate structures. Heavy dotted line is the landward limit of the Neogene accretionary wedge. Stars are volcanic edifices. Dense stippling marks outcropping Jurassic-Triassic accreted rocks. Heavy screen is Cretaceous/Paleogene abducted oceanic floor. EC : East Cape ; Rk : Ruatoria knoll, Ps : Poverty Seavalley, Hb : Hawke Bay, MC : Madden canyon ; Cs : Cook Strait ; Hf : Hope Fault ; Kc Kaikoura canyon.
Figure 8 Location of the 3 boxes surveyed during Leg Hikurangi of the GEODYNZ-SUD cruise.
Figure 9 Location of transit line Pl between Auckland and Kermadec box in the northern part of the Cook bathymetric map (New Zealand Oceanographic Institute, 1991) ; bathymetric contours are in km. TVZ : Taupo Volcanic Zone
Figure 10a and lob EM12D multibeam bathymetry along line PI with 250 m contour interval.
Figure lla and llb EM 12D sidescan sonar imagery along line P 1
109
Figure 12 Structural interpretation of the swath area of line Pl
Figure 13 Singlechannel seismic line Pl. This line was shot at 10 knots using two Sodera air guns (45 ci).
Figure 14 Free Air gravity anomalies plotted along line Pl Figure 15 Magnetic anomalies plotted along line Pl
Figure 16 Location of the Kermadec box in the northeastern part of the Cook bathymetric map (New Zealand Oceanographic Institute, 1991) ; bathymetric contours are in km.
Figure 17 Track lines of the Geodynz-Sud cruise within the Kermadec box ; P4 is a line number ; numbers along tracks indicate time.
Figure 18 Simplified bathymetric map obtained with the EM12D in the Kermadec box with 250 m contours.
Figure 19 Structural interpretation of the Kermadec box including observations made from bathymetry, side scan sonar imagery and seismic reflection data. Arrows along the toe of the Rapuhia Scat-p indicate Deep Water Boundary Current and sediment transportation.
Figure 20 Mosaic of the sidescan sonar imagery obtained with the EM12D in the Kermadec box.
Figure 21 Line drawing from onboard monitor for the northern part of seismic reflection line P5 along the lower forearc Kermadec slope ; location in Figure 17
Figure 22 Line drawing from onboard monitor for the northern part of seismic reflection lines P7 and P8 across the Rapuhia Scar-p.
Figure 23 Line drawing from onboard monitor for the northern part of seismic reflection line P9 across the Rapuhia Scar-p ; location in Figure 17.
Figure 24 Line drawing from onboard monitor for the southern part of seismic reflection line Pl 1 across the Ruatoria Knoll and Hikurangi Plateau.
Figure 25 Line drawing from onboard monitor for the southern part of seismic reflection line P5 across both the Kermadec forearc slope and the Ruatoria Knoll indentation.
Figure 26 Free air anomaly map of the Kermadec box ; contour interval is 10 mGals
Figure 27 Magnetic anomaly map of the Kermadec box ; contour interval is 50 nT
110
Figure 28 Location of the Mahia box in the eastern part of the Cook bathymetric map (New Zealand Oceanographic Institute, 1991) ; bathymetric contours are in km.
Figure 29 Track lines of Geodynz-Sud cruise within the Mahia box ; P20 is a line number ; numbers along tracks indicate time.
Figure 30 Simplified bathymetric map obtained with the EM12D in the Mahia box with 250 m contours.
Figure 31 Structural interpretation of the Mahia box including observations made from bathymetry, side scan sonar imagery and seismic reflection data.
Figure 32 Mosaic of the sidescan sonar imagery obtained with the EM12D in the Mahia box.
Figure 33 Line drawing from onboard monitor of seismic reflection line P14 across the Hikurangi forearc slope NE of Mahia Peninsula ; location in Figure 29.
Figure 34 Line drawing from onboard monitor of seismic reflection line P20 along the lower forearc sl,ope in the Mahia box.
Figure 35 Line drawing from onboard monitor of seismic reflection line P21 along the Hikurangi Trough in the Mahia box ; location in Figure 29.
Figure 36 Free Air anomaly map of the Mahia box
Figure 37 Magnetic anomaly map of the Mahia box ; large numbers are track lines numbers.
Figure 38 Track line during the transit between Mahia and Kaikoura boxes along the Hikurangi Channel and across the Hikurangi accretionary wedge ; P26 is a line number ; numbers along tracks indicate time.
Figure 39 Simplified bathymetric map obtained with the EM12D during the transit between Mahia and Kaikoura boxes ; contour interval is 250 m.
Figure 40 Structural sketch along line P27-28 across the Hikurangi accretionary wedge.
Figure 41 Sidescan sonar imagery obtained with the EM12D along the Hikurangi Channel and across the Hikurangi accretionary wedge, during the transit between Mahia and Kaikoura boxes.
Figure 42 Line drawing from onboard monitor of seismic reflection line P26 across the Hikurangi accretionary wedge ; location is in Figure 35.
111
Figure 43 Free Air gravity anomalies plotted along lines P25-P27 and P36- P37
Figure 44 Magnetic anomalies plotted along line P25-P27 and P36- P37.
Figure 45 Location of the Kaikoura box in the southern part of the Cook bathymetric map (New Zealand Oceanographic Institute, 199 1) ; bathymetric contours in km.
Figure 46 Track lines of the Geodynz-Sud cruise within the Kaikoura box ; P38 is a line number ; numbers along tracks indicate time.
Figure 47 Simplified bathymetric map obtained with the EM12D in the Kaikoura box ; contours are 250 m.
Figure 48 Structural sketch of the Kaikoura box including observations made from bathymetry, sidescan imagery and seismic reflection data.
Figure 49 Mosaic of the sidescan sonar imagery obtained with the EM12D in the Kaikoura box.
Figure 50 Line drawing from onboard monitor of seismic reflection line P 35 oblique to the accretionary wedge in the Kaikoura box ; location in Figure 46.
Figure 51 Line drawing from onboard monitor of seismic reflection line P 36 across the accretionary wedge at the northern extremity of the Kaikoura box.
Figure 52 Line drawing from onboard monitor of seismic reflection ‘line P 34 that trends parallel to the Marlborough continental slope in the Kaikoura box.
Figure 53 Line drawing from onboard monitor of seismic reflection line P 45 across the northwestern slope of the Chatham Rise in the Kaikoura box ; location in Figure 46.
Figure 54 Free Air anomaly map of the Kaikoura box
Figure 55 Magnetic anomaly map of the Kaikoura box
Figure 56 Geographic and bathymetric features of the region surveyed during the Puysegur Leg of the GCodyNZ-Sud cruise
Figure 57 Main faults and bassins within and east of the Fiordland block (simplified from Tumbull and Uruski 1993)
Figure 58 Tracks of the New-Zealander Puysegur Trough Survey
112

Figure 59 Two hypothesis about the structure of the southern “termination” of the Puysegur Trench
Figure 60 Areas investigated during the Puysegur Leg of the GeodyNZ-Sud cruise
Figure 61 Tracks of the Puysegur Leg of the GeodyNZ-Sud cruise
Figure 62 Tracks an Line numbers of the Fiordland box
Figure 63 Bathymetry of the Fiordland box contoured at 250 m.
Figure 64 Side-scan imagery of the Fiordland box
Figure 65 Interpretation of seismic reflection profile 60
Figure 66 Interpretation of seismic reflection profile 64
Figure 67 Interpretation of seismic reflection profile 65
Figure 68 Interpretation of seismic reflection profile 63
Figure 69 Interpretation of seismic reflection profile 62
Figure 70 Gravity anomalies of the Fiordland and Snares boxes contoured at 20 mGal
Figure 71 Geosat Gravity anomalies of the Fiordland box contoured at 20 mGa1
Figure 72 Magnetics of the Fiordland box the contour interval is 10 nT
Figure 73 Structural sketch-map of the Fiordland box
Figure 74 Tracks and Line number of the Snares box
Figure 75 Storm conditions when ending survey of the Snares box
Figure 76 Bathymetry of the Snares box contoured at 12.5 m interval
Figure 77 Side-scan imagery of the Snares box
113
Figure 78 Interpretation of seismic reflection profile 68 A small seamount limits a possibly ponded basin to the west on the Australian plate. A larger basin to the east is affected by normal faults dipping into the trench. A small central channel is seen in the axis of the trench. The inner trench wall 3700 m high, is composed of steep scarps and gentler slopes of probable tectonic and slump origin (ca. 02h, see structural sketch map Figure 85). A broad summit (E : 21h30’to Olh30’), crowned by a seamount (OOh15’), is separated from two major ridges (C/D and A) to the east by a deep trough containing a thick deformed sediment fill. In the extreme east, the western margin of the Solander Trough shows thick sedimentary sequences. (Note that the portion of the profile from 20h45’to the end is on the end-of-Line turn of the ship).
Figure 79 Interpretation of part of seismic reflection profile 82 Note deformation of small basins in the Australian plate, far from the trench : early extension (normal faults at 06h15’) and late compres- sion (reverse faults and pop up structures at 07h30’).
Figure SO Interpretation of profile seismic reflection 86 Note flexural extensional tectonics on the downgoing Australian plate in the vicinity of the Puysegur trench. In the summit region, an axial submeridianal trough separates two main ridges, ridge E to the west and ridges C and D to the east. In the western Solander Trough, compressional deformation is found between the attenuated ridge A and major ridge C.
Figure 81 Interpretation of profile seismic reflection 88 Over the summit region shows deformation (1) of the fill in the narrow axial troughs between ridges E and B, and (2) on the western downfaulted border of the Solander Trough. Note the northward attenuated ridge A, buried on the eastern flank of Solander Trough.
Figure 82 Interpretation of profile seismic reflection 89 This profile is the northermost in the Snares box. Sedimentary layering is visible within the Puysegur Bank, which is flanked by a lateral axial trough containing deformed and eroded sedimentary fill. East of the easternmost ridge (B) of the summit region, the thick infill of the Solander Trough displays slight deformation along its edge. The sediments within the Solander Basin comprise smooth, parallel, reflector sequences (probably turbidites or graviy flows) and high amplitude complex fill sequences (probably channelled). Note the feather edge of the northward attenuated ridge A which is in a relay relationship with buried ridge C (cf Figure 78,82).
Figure 83 Magnetic anomalies of the Snares box contoured at 25 nT
Figure 84 Magnetic anomalies along tracks in the Snares box
Figure 85 Structural sketch-map of the Snares box
Figure 86 Tracks and Line numbers of the Puysegur box
Figure 87 Bathymetry of the Puysegur box contours every 250 m
114

Figure 88 Side-scan imagery of the Puysegur box
Figure 89 Prominent features of the Australian Plate from Side-scan imagery of the western Pnysegur box
Figure 90 Interpretation of profile seismic reflection 73
Figure 91 Gravity anomalies of the Puysegur box, contours at 10 mGal
Figure 92 Geosat gravity anomalies of the Puysegur box, contours at 10 mGal
Figure 93 Magnetic anomalies of the Puysegur box
Figure 94 Structural sketch-map of the Puysegur box
115
APPENDIX No1
LOG BOOK of
GEODYNZ - SUD CRUISE
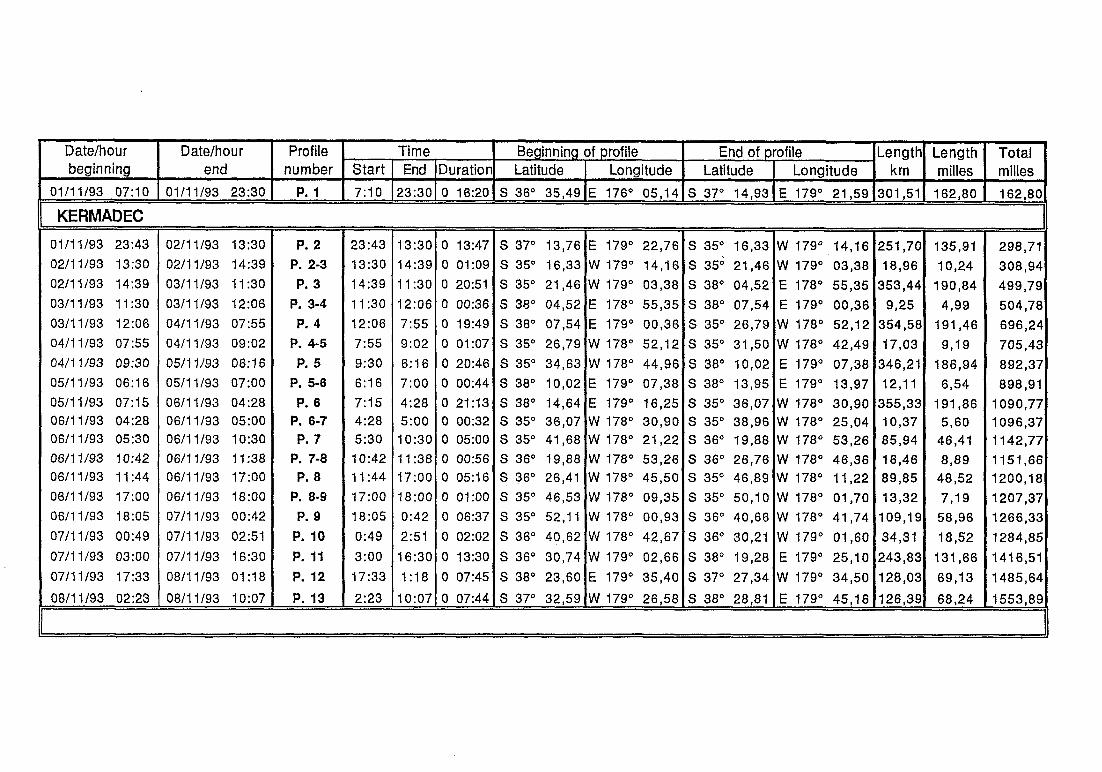
Date/hour Date/hour Profile Time Beginning of profile End of profile Length Length Total beginning end number Start End Duration Latitude Longitude Latitude Longitude km
O-l/11/93 07:lO 01/11/93 23:30 P.l 7:lO 23:30 0 16:20 S 36" 35,49 E 176" 05,14 S 37" 14,93 E 179" 21,59 301,51 162,80
KERMADEC I
01/11/93 23:43 02/11/93 13:30 P. 2 23:43 13:30 0 13:47
02/11/93 13:30 02/11/93 14:39 P. 2-3 13:30 14:39 0 01:09 02/11/93 14:39 03/11/93 II:30 P. 3 14:39 II:30 0 20:51
03/11/93 II:30 03/11/93 12:06 P. 3-4 Ii:30 12:06 0 00:36
03/11/93 12:06 04/11/93 07:55 P. 4 12:06 7:55 0 19:49
04/11/93 0755 04/11/93 09:02 P. 4-5 7:55 9:02 0 01:07
04/11/93 09:30 05/1-l/93 06:16 P. 5 9:30 6:16 0 20:46
05/11/93 06:16 05/11/93 07:oo P. 5-6 6:16 7:oo 0 00:44 05/11/93 07:lS 06/11/93 04:28 P. 6 7:15 4:28 0 21:13 06/11/93 04:28 06/11/93 05:OO P. 6-7 4:28 5:oo 0 00:32 06/11/93 05:30 06/11/93 IO:30 P. 7 5:30 IO:30 0 05:oo 06/11/93 IO:42 06/11/93 II:38 P. 7-8 IO:42 II:36 0 00:56 06/11/93 II:44 06/11/93 17:00 P. 8 II:44 17:oo 0 05:16
06/11/93 17:00 06/11/93 18:00 P. 8-9 17:oo 18:00 0 01:oo 06/11/93 18:OS 07/11/93 00:42 P. 9 18:05 0:42 0 06:37
07/11/93 00:49 07/11/93 02:51 P. IO 0:49 2:51 0 02:02
07/11/93 03:oo 07/11/93 16:30 P. 11 3:oo 16:30 0 13:30
07/11/93 17:33 08/11/93 01:18 P. 12 17:33 I:18 0 07:45
08/11/93 02:23 08/11/93 IO:07 P. 13 2:23 IO:07 0 07:44
S 37" 13,76 E 179" 22,76
S 35O 16,33 W 179" 14,16 S 35" 21,46 W 179" 03,38
S 38" 04,52 E 178" 55,35
S 38" 07,54 E 179" 00,36
S 35' 26,79 W 178" 52,12
S 35" 34,63 W 178" 44,96
S 38" IO,02 E 179" 07,38
S 38' 14,64 E 179" 16,25 S 35" 36,07 W 178" 30,90 s 35" 41,68 W 178" 21,22 S 36" 19,88 W 178" 53,26 S 36" 26,41 W 178" 45,50
S 35" 46,53 W 178" 09,35
s 35" 52,ll W 178" 00,93
S 36" 40,62 W 178" 42,67
S 36" 30,74 Vi' 179" 02,66
S 38" 23,60 E 179" 35,40
s 37" 32,59 W 179" 26,58
S 35" 16,33
s 35; 21,46
S 38' 04,52
S 38' 07,54 S 35" 26,79
s 35" 31,50
S 38" IO,02
S 38" 13,95 S 35" 36,07 S 35" 38,96 S 36" 19,88 S 36" 26,76 S 35" 46,89
s 350 50,lO S 36" 40,66
S 36" 30,21
S 38" 19,28
S 37“ 27,34
S 38" 28,81
W 179" 14,16
W 179' 03,38
E 178" 55,35
E 179" 00‘36 W 178" 52,12
W 178" 42,49
E 179" 07,38
E 179" 13,97 W 178" 30,90 W 178" 25,04 W 178" 53,26 W 178" 46,36 W 178" II,22
W 178" 01,70 W 178" 41,74
W 179" 01,60
E 179" 25,lO
w 179O 34,50
E 179" 45,16
?51,7
18,9f 353,4
9,25
354,5
17,o:
346,2
12,l' 355,3 10,3; 85,9r 16,4t 89,8f
13,3: 109,l
34,3'
243,8
128,O
126,3
-
0
3 4
88
3
1 I
3 7 t 3 5
2 9
1
3
3
9 -
135,91 IO,24
190,84 4,99
191,46
9,19
186,94
6,54 191,86
5,60 46,41 8,89
48,52
7,19 58,96
18,52
131,66
69,13
68,24
298,71
308,94
499,79 504,76
696,24
705,43
892,37 898,91
1090,77 1096,37 1142,77 1151,66 1200,18
1207,37 1266,33
1284,85
1416,51
1485,64
1553,89
-I
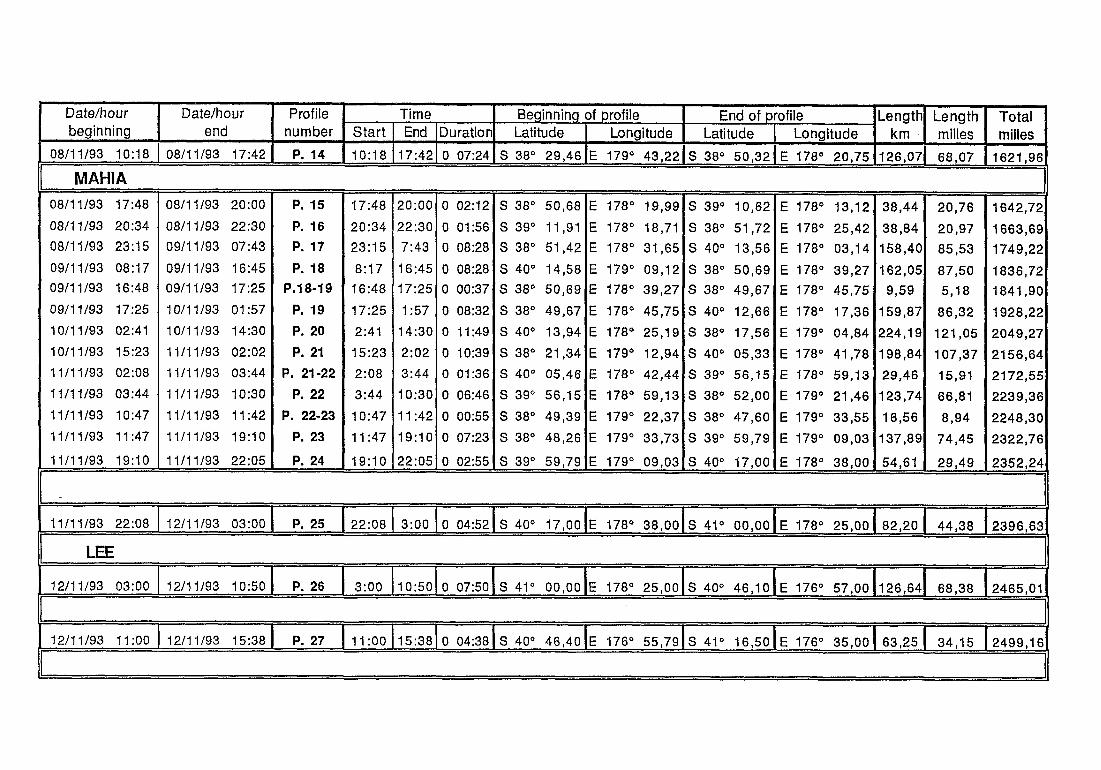
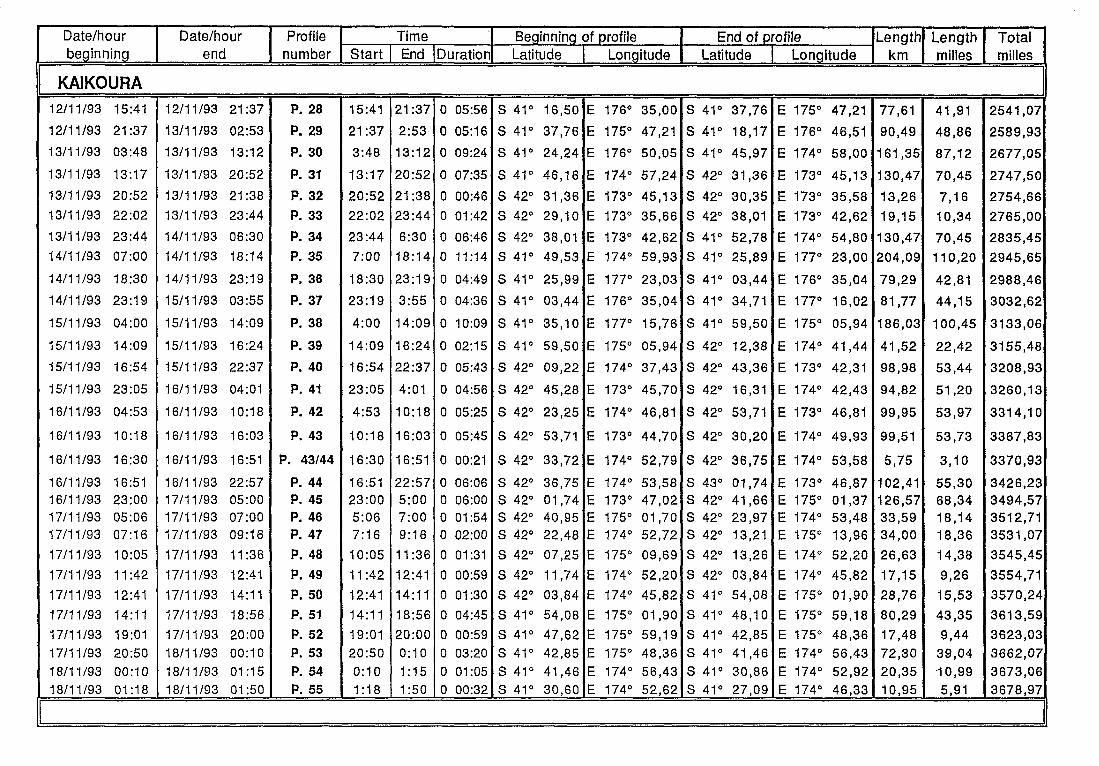
Date/hour Date/hour Profile Time Beginning of profile End of profile Length Length Total beginning end number Start ] End (Duration Latitude 1 Longitude Latitude 1 Longitude km miles milles
KAIKOURA 12/11/93 15:41 12/11/93 21:37 P. 28 15:41 21:37 0 0556 S 41" 16,50 E 176O 35‘00 S 41" 37,76 E 175" 47,21 77,61 41,91 2541,07
12/11/93 21:37 13/11/93 02:53 P. 29 21:37 2:53 0 05:16 S 41" 37,76 E 175" 47,21 S 41" 18,17 E 176" 46,51 90,49 48,86 2589,93
13/11/93 03:48 13/11/93 13:12 P. 30 3:48 13:12 0 09:24 S 41" 24,24 E 176" 50,05 S 41" 45,97 E 174" 58,00 161,35 87,12 2677,05
13/l-i/93 13:17 13/11/93 20:52 P. 31 13:17 20:52 0 07:35 S 41" 46,16 E 174" 57,24 S 42" 31,36 E 173" 45,i3 130,47 70,45 2747,50
13/11/93 20:52 13/11/93 21:38 P. 32 20:52 21:38 0 00:46 S 42" 31,36 E 173" 45,13 S 42" 30,35 E 173" 35,58 13,26 7,16 2754,66
13/11/93 22:02 13/11/93 23:44 P. 33 22:02 23:44 0 01:42 S 42" 29,lO E 173" 35,66 S 42" 38,01 E 173" 42,62 19,15 lo,34 2765,00
13/11/93 23:44 14/11/93 06:30 P. 34 23:44 6:30 0 06:46 S 42" 38,01 E 173" 42,62 S 41" 52,78 E 174" 54,80 130,47 70,45 2835,45
14/11/93 07:OO 14/11/93 18:14 P. 35 7:00 18:14 0 II:14 S 41" 49,53 E 174" 59,93 S 41" 25,89 E 177" 23,00 204,09 110,20 2945,65
14/11/93 18:30 14/11/93 23:19 P. 36 18:30 23:19 0 04:49 S 41" 25,99 E 177" 23,03 S 41" 03,44 E 176O 35,04 79,29 42,81 2988,46
14JliJ93 23:19 15/u/93 03:55 P. 37 23:19 3:55 0 04:36 S 41" 03,44 E 176" 35,04 S 41" 34,71 E 177" 16,02 81,77 44,15 3032,62
15/11/93 04:oo 15/11/93 14:09 P. 38 4:00 14:09 0 IO:09 S 41" 35,lO E 177" 15,76 S 41" 59,50 E 175" 05,94 186,03 100,45 3133,06
15/11/93 14:09 15JllJ93 16:24 P. 39 14:09 16:24 0 02:15 S 41" 59,50 E 175" 05,94 S 42" 12,38 E 174" 41,44 41,52 22,42 3155,48
15JilJ93 16:54 15/i l/93 22:37 P. 40 16:54 22:37 0 05:43 S 42" 09,22 E 174" 37,43 S 42" 43,36 E 173" 42,31 98,98 53,44 3208,93
15/l l/93 23:05 16/l l/93 04:Oi P. 41 23:05 4:Ol 0 04:56 S 42" 45,28 E 173" 45,70 S 42" 16,31 E 174" 42,43 94,82 51,20 3260,13
16/i l/93 04:53 16/11/93 IO:18 P. 42 4:53 IO:18 0 05:25 S 42" 23,25 E 174" 46,81 S 42" 53,71 E 173" 46,81 99,95 53,97 3314,lO
16JllJ93 IO:18 16JliJ93 16:03 P. 43 IO:18 16:03 0 05:45 S 42" 53,71 E 173O 44,70 S 42" 30,20 E 174" 49,93 99,51 53,73 3367,83
16JllJ93 16:30 16JliJ93 16:51 P. 43144 16:30 16:51 0 00:21 S 42" 33,72 E 174" 52,79 S 42" 36,75 E 174" 53,58 5,75 3,lO 3370,93
16JllJ93 16:51 16JllJ93 22:57 P. 44 16:51 22:57 0 06:06 S 42" 36,75 E 174" 53,58 S 43' 01,74 E 173' 46,87 102,41 55,30 3426,23 16/11/93 23:00 17JllJ93 05:OO P. 45 23:00 5:00 0 06:OO S 42" 01,74 E 173" 47,02 S 42" 41,66 E 175" 01,37 126,57 68,34 3494,57 17/l l/93 05:06 17/l l/93 07:OO P. 46 5:06 7:00 0 01:54 S 42" 40,95 E 175" 01,70 S 42" 23,97 E 174" 53,48 33,59 18,14 3512,71 17/11/93 07:16 17/11/93 09:16 P. 47 7:16 9:16 0 02:OO S 42" 22,48 E 174" 52,72 S 42" 13,21 E 175" 13,98 34,00 18,36 3531,07
17/11/93 IO:05 17/11/93 Ii:36 P. 48 IO:05 11:36 0 01:31 S 42" 07,25 E 175" 09,69 S 42" 13,26 E 174" 52,20 26,63 14,38 3545,45
17JliJ93 ii:42 17JllJ93 12:41 P. 49 Ii:42 12:41 0 00:59 S 42" Ii,74 E 174" 52,20 S 42" 03,84 E 174" 45,82 17,15 9,26 3554,71
17/11/93 12:41 17/11/93 14:ll P. 50 12:41 14:ll 0 01:30 S 42" 03,84 E 174" 45,82 S 41" 54,08 E 175" 01,90 28,76 15,53 3570,24
17JllJ93 14:ll 17JliJ93 18:56 P. 51 14~11 18:56 0 04:45 S 41" 54,08 E 175" 01,90 S 41" 48,lO E 175" 59,18 80,29 43,35 3613,59
17JllJ93 19:oi 17JllJ93 20:oo P. 52 19:Ol 20:00 0 00:59 S 41" 47,62 E 175" 59,19 S 41" 42,85 E 175" 48,36 17,48 9,44 3623,03
17/11/93 20:50 18JllJ93 0O:lO P. 53 20:50 0:lO 0 03:20 S 41" 42,85 E 175" 48,36 S 41" 41,46 E 174" 56,43 72,30 39,04 3662,07
18JllJ93 0O:lO 18/11/93 01:15 P. 54 0:lO I:15 0 01:05 S 41" 41,46 E 174" 56,43 S 41" 30,86 E 174" 52,92 20,35 ,10,99 3673,06 18JliJ93 01:18 18JllJ93 01:50 P. 55 I:18 1:50 0 00:32 S 41" 30,60 E 174" 52,62 S 41" 27,09 E 174" 46,33 IO,95 5,91 3678,97
APPENDIX No2
DUAL EM12 from
SIMRAD
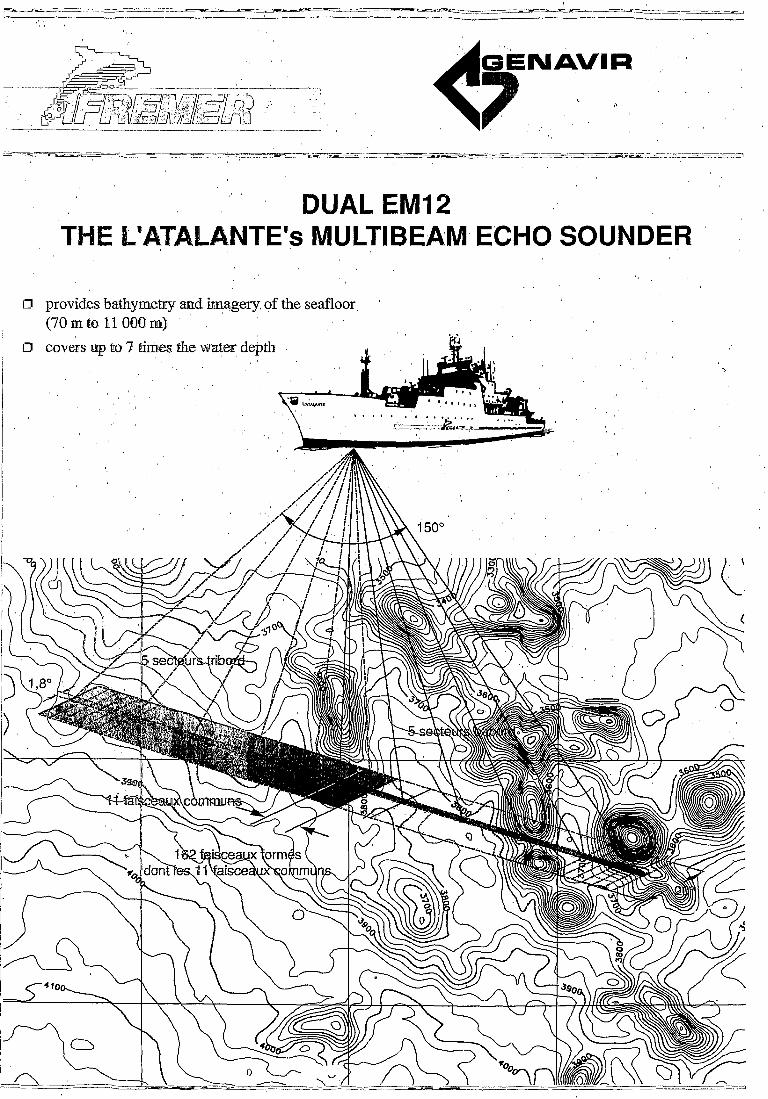
DUAL EM12 ‘, ‘THE L” NTE’s MULTIBEAM ECHO SOUNDER ”
.
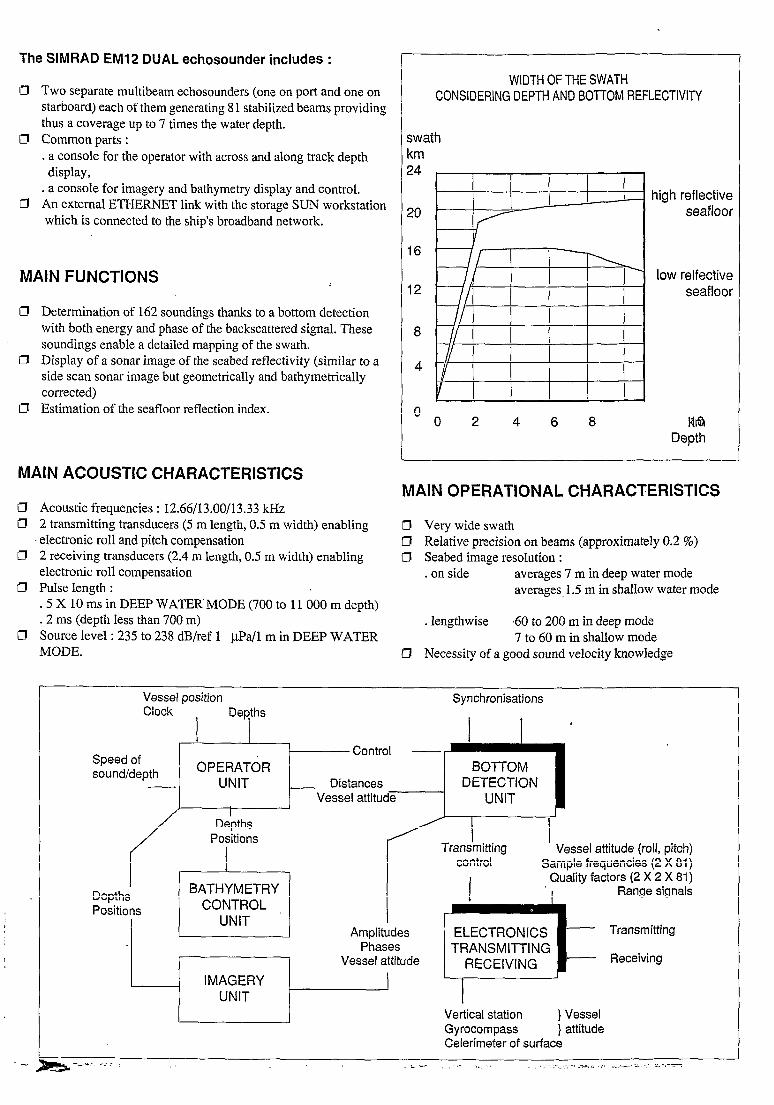
The SIMRAD EM12 DUAL echosounder includes :
13 Two separate multibeam echosounders (one on port and one on starboard) each of them generating 8 1 stabilized beams providing thus a coverage up to 7 times the water depth.
Cl Common parts : . a console for the operator with across and along track depth display,
. a console for imagery and bathymetry display and control. Ct An external ETHERNET link with the storage SUN workstation
which is connected to the ship’s broadband network.
MAIN FUNCTIONS
Cl Determination of 162 soundings thanks to a bottom detection with both energy and phase of the backscattered signal. These soundings enable a detailed mapping of the swath.
IJ Display of a sonar image of the seabed reflectivity (similar to a side scan sonar image but geometrically and bathymetrically corrected)
Cl Estimation of the seafloor reflection index.
MAIN ACOUSTIC CHARACTERISTICS
Cl Acoustic frequencies : 12.66/13.00/13.33 kHz Cl 2 transmitting transducers (5 m length, 0.5 m width) enabling
electronic roll and pitch compensation IJ 2 receiving transducers (2.4 m length, 0.5 m width) enabling
electronic roll compensation Cl Pulse Iength :
.5 X 10 ms in DEEP WATER MODE (700 to 11000 m depth)
.2 ms (depth less than 700 m) Cl Source level : 235 to 238 dB/ref 1 j.tPa/l m in DEEP WATER
MODE.
WIDTH OF THE SWATH CONSIDERING DEPTH AND BO-ITOM REFLECTIVITY
swath tm 24
30
16
12
8
4
l-t-+-t ’ ’ I I
I 1
0 0 2 4 6 8
high reflective seafloor
low relfective seafloor
ldlfa Depth
MAIN OPERATIONAL CHARACTERISTICS
Cl Very wide swath CI Relative precision on beams (approximately 0.2 %) Cl Seabed image resohttion :
. on side averages 7 m in deep water mode averages. 1.5 m in shallow water mode
. lengthwise .60 to 200 m in deep mode 7 to 60 m in shallow mode
Necessity of a good sound velocity knowledge
Vessel position Synchronisations Clock Depths
I I I ,
1 Depths
Positions
Depths Positions
Tranimitting control
I
’ Vessel attitude (roll, pitch) Sample frequencies (2 X 81)
Quality factors (2 X 2 X 81)
‘I Range signals
Phases Vessel attitude
ELECTRONICS - Transmitting TRANSMITTING
RECEIVING - Receiving
I Vertical station } Vessel Gyrocompass } attitude Celerimeter of surface
lNSTlTUTFRAN~AlSDERECHERCHEPOURL'EXPLOITATIONDEiAMER GENAVIH BP71 -2928OPLOUzANi
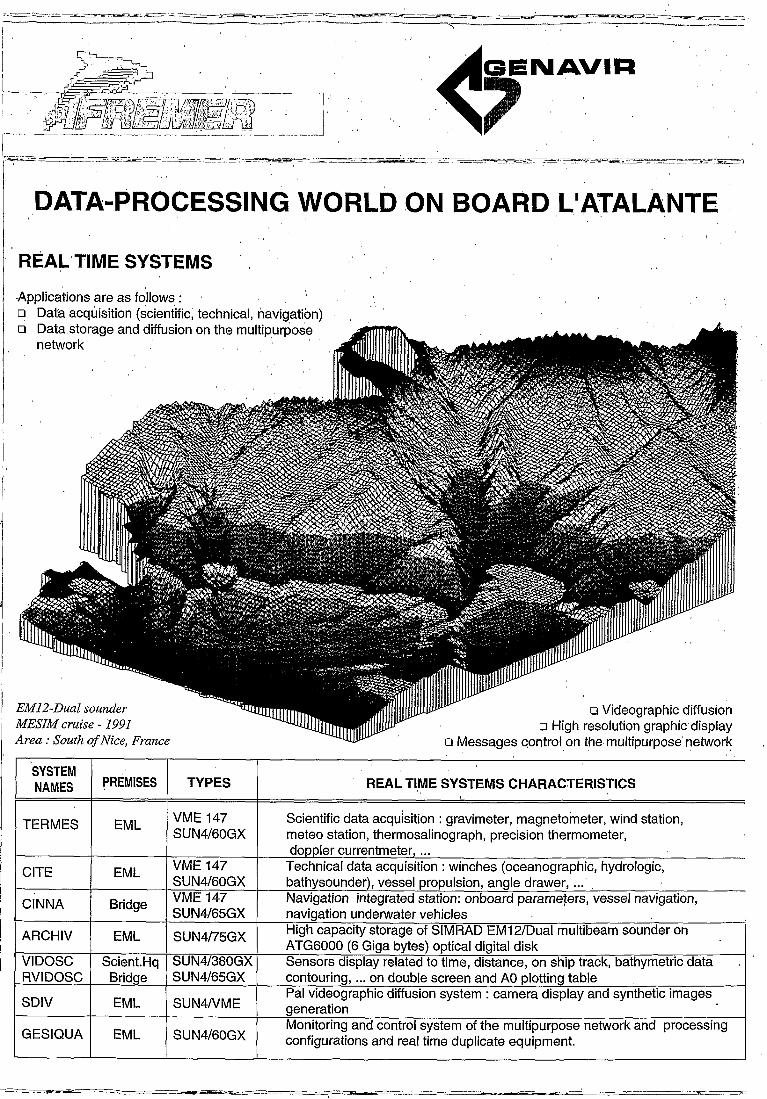
3 DATA-PROCESMG WORLD ON BOARD L~ATALANTE ‘I ‘.
1, REAL’TIME SYSTEMS I’ ‘, _( Applications are as follows: ” ,’ o Data acquisition (scientific, technical, riavig,atibn) o Data.storage and diffusion on the multipurpose
network
EiW2-Dual sounder MESIM cruise - 1991 Area : South of Nice, France o Messages control on the, multipurpose’ net&o&
SYSTEM NAMES PREMISES TYPES REAL Tl,l’ylE SYSTEMS CHARACTERISTICS
TERMES EML VME 147 Scientific data acquisition : gravimeter, magnetometer, wind station, SUN4/60GX meteo station, thermosalinograph, precision thermometer,
doppler currentmeter, . . .
CITE EML VME 147 Technical data acquisition : winches (oceanographic, hydrologic, SUN4/60GX bathysounder), vessel propulsion, angle drawer, . . .
CINNA Bridge VME 147 Navigation integrated station: onboard parameters, vessel navigation, SUN4/65GX navigation underwater vehicles
ARCHIV EML SUN4/75GX High capacity storage of SIMRAD EMI 2/Dual multibeam sounder on ATG6000 (6 Giga bytes) optical digital disk
/ VIDOSC Scient.Hq SUN41380GX Sensors display related to time, distance, on ship track, bathymetric data . RVIDOSC Bridge SUN4/65GX contouring, . . . on double screen and A0 plotting table
SDIV EML SUN4/VME Pal videographic diffusion system : camera display and synthetic images generation
GESIQUA EML SUN4/60GX Monitoring and control system of the multipurpose network and processing configurations and real time duplicate equipment.

: ON ‘BOAFib POST-PROCESSING SYSTEMS
j’ These ,systems enable scientists to undertake high technology cartographic products during the cruise. They can also ; temporarily integrate applications used in at land laboratories. Three computers offer these functions : ‘2 SUN41380GX and i 1 SUN4/75GX which are equipped with numerous devices : 6250BPI tape, magnetic and optical disk (6 Giga bytes), CD ROM / players and cartridges, Hexabyte recorder, . . .
‘TRISMUS
TRINAV Interactive processing of navigation data
TRl,MEN
REGINA
CAPRICA
ARCHIPEL ,J’
CASINO :
ON BOARD APPLICATIONS
Interactive processing of the multibeam echosounders data,
Processing of scientific measurements along navigation
Interactive navigation correction from bathymetric maps
Mapping and,interactive preparation’of cruises I’ ,
Storage and geophysical data,consulting ‘,,
Computerized scientific log book’ ,, :
Available softwares on board L’ATALANTE :
On SUN UNIX, C, FORTRAN, TCP-IP, NFS, VX-WORKS, DATAVIEWS, GKS, PHIGS, NCAR, UNIRAS, NAG, FRAMEMAKER, CARTOLIB
On PC MSDOS, WINDOWS, WORD, EXCEL, LOTUS 123, DESIGNER, STATGRAPHICS, PC/NFS, Screen Machine
On MAC MACWRITE, MACDRAW, Sam Intercept, WORD, EXCEL, NFS, APPLESHARE
Registered trade marks
/ ,@’ Soldeville/RAPHO
MICRO-COlviPUTER SYSTEMS
3 types of micro-computers are available :
o a portable Toshiba 3200 SXC/i 20 17 a Compaq 386/33L equipped with a video card and an
optical magnetic disk of 500 Moctets CI a Macintosh 2 Cl 5/40
INSTlTUTFRAN~AlSDERECHERCHEPOURCEXPLOlTATlONDEIAMER Si~gesodal:Technopolis40,155,rueJ.J.Rousseau.92138Iss~L~Yaulineaux W1.331464821M)-T~ex63~912
GENAVIR BP71 -29280PLOUZANi T~1.99224421-Fax9945T170-Wlex940
APPENDIX No3
SEISMIC REFLECTION
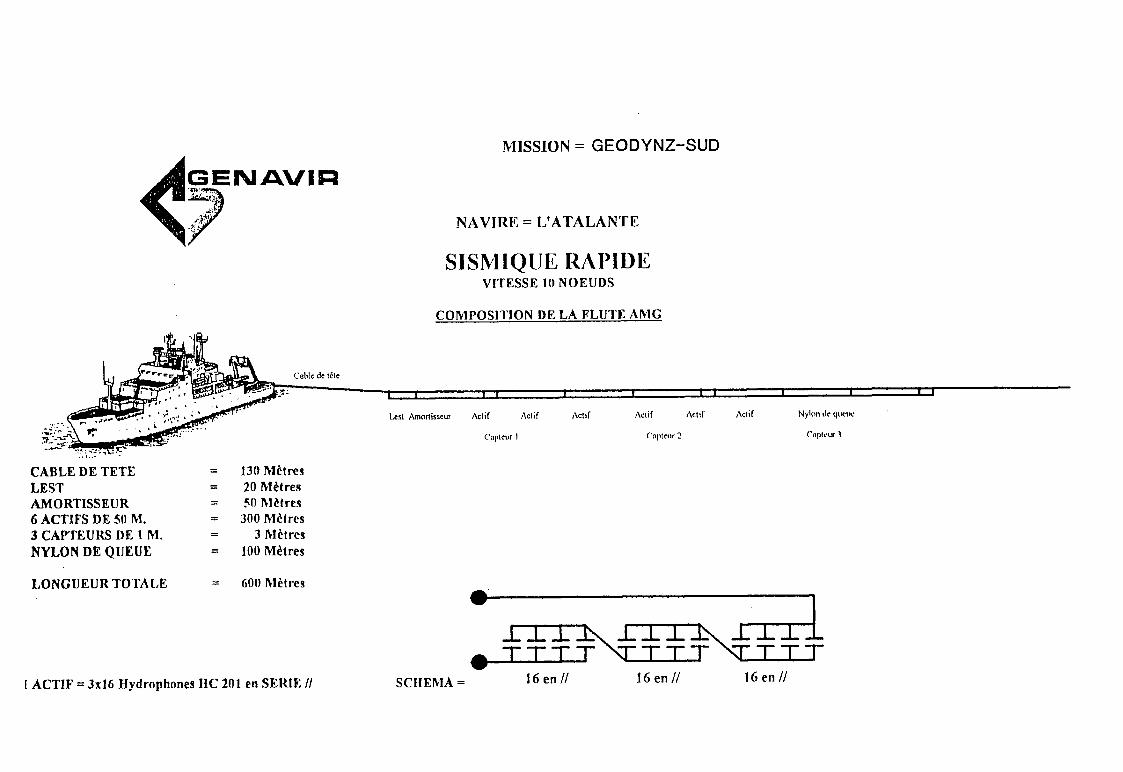
MISSION = GEODYNZ-SUD
NAVIRE = L’ATALANTE
sisn4rQuE Rfu’lDE VITESSE 10 NOEUDS
COMPOSITION DE LA FLUTE AMG
CABLE DE TETE = 130 Métra LEST = 20 hfétres AMORTISSEUR = SO hlétre.9 6 ACTIFS DE 50 M. = 300 MPtres 3 CAPTEURS DE 1 M. = 3 Métres NYLON DE QUEUE = 100 Mètres
LONGUEUR TOTALE = GO0 Mètres
l ACTIF = 3x16 Hydrophones HC 201 en SERIE // SCI1EMA = 16enll 1Genll lGen//
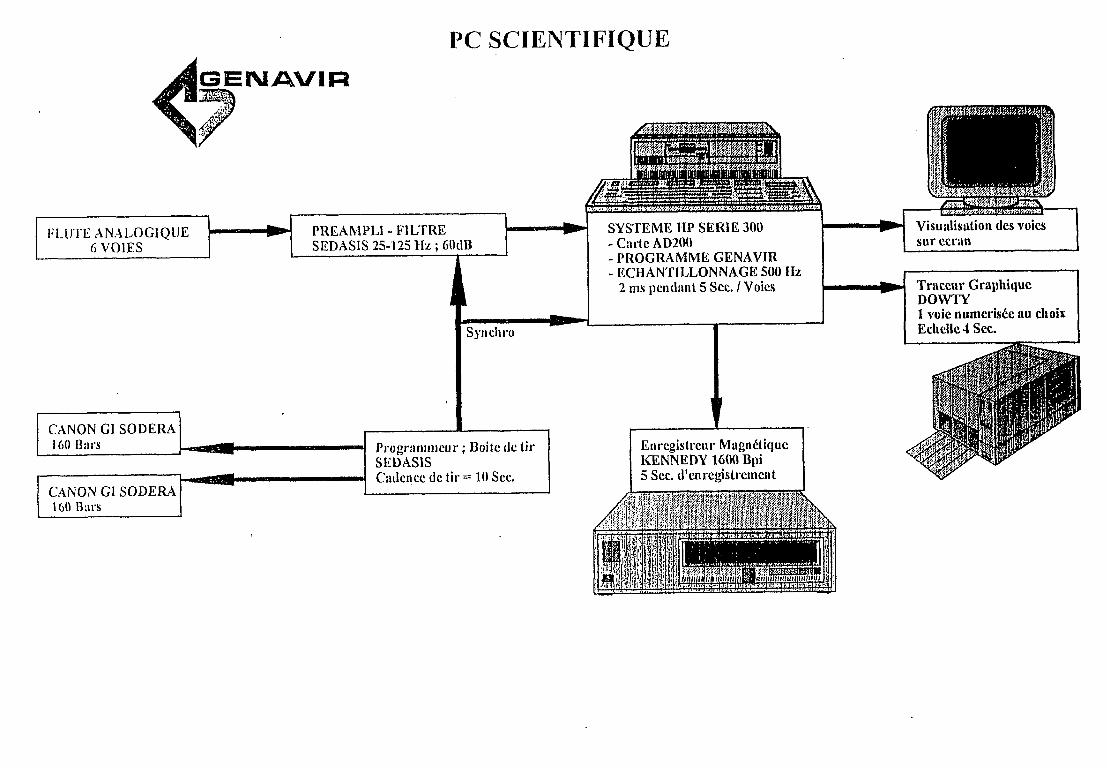
* CANON CI SODERA I
PC SCIENTTFTQUE
Progr:rmncu r ; Doi tc tic til
Catlcncc de tir = 10 Sec.
SYSTEME HP SERIE 3(H) - Carte AD200 - PROGRAMME GENAVIR - ECAANTILLONNAGE S(H) IIz
2 ms pitlant 5 Sec. / Voics
t Eurcgistrcur Magnktiquc KENNEDY lG00 Bpi 5 Sec. d’cn rcgistrerncn t
Trwcur Graphiquc DOWTY 1 voie uumerisCe au choir Echclie J Sec.
APPENDIX No4
GRAVIMETER
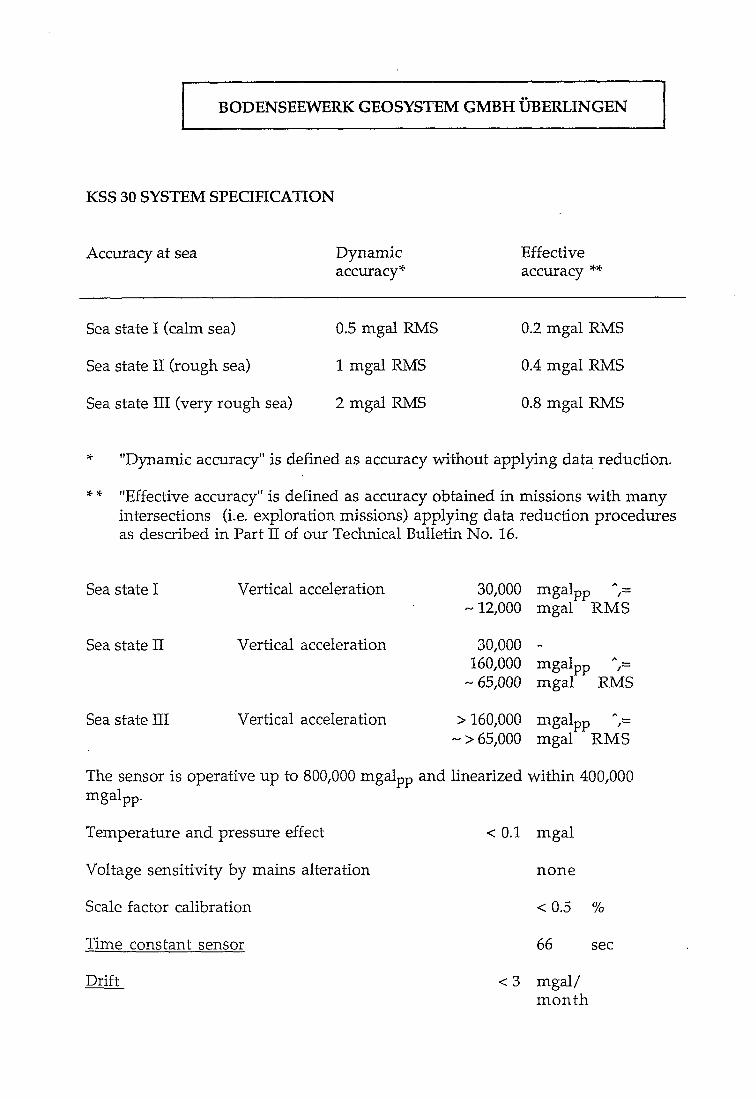
KSS30SYSTEMSPECIFICATION
Accuracy at sea
Sea state I (calm sea)
Dynamic Effective accuracy* accuracy **
0.5 mgal RMS 0.2 mgal RMS
Sea state II (rough sea) 1 mgal RMS 0.4 mgal RMS
Sea state III (very rough sea) 2 mgal RMS 0.8 mgal RMS
* “Dynamic accuracy” is defined as accuracy without applying data reduction.
x-x- “Effective accuracy” is defined as accuracy obtained in missions with many intersections (i.e. exploration missions) applying data reduction procedures as described in Part II of our Technical Bulletin No. 16.
Sea state I Vertical acceleration 30,000 mgalpp ;= - 12,000 mgal RMS
Sea state II Vertical acceleration 30,000 - 160,000 mgal,, ^,=
- 65,000 mgal RMS
Sea state III Vertical acceleration > 160,000 mgal,, n,= - > 65,000 mgal RMS
The sensor is operative up to 800,000 mga$,, and linearized within 400,000 mgalpp*
Temperature and pressure effect < 0.1 mgal
Voltage sensitivity by mains alteration none
Scale factor calibration c 0.5 70
Time constant sensor 66 set
Drift <3 mgal/ month
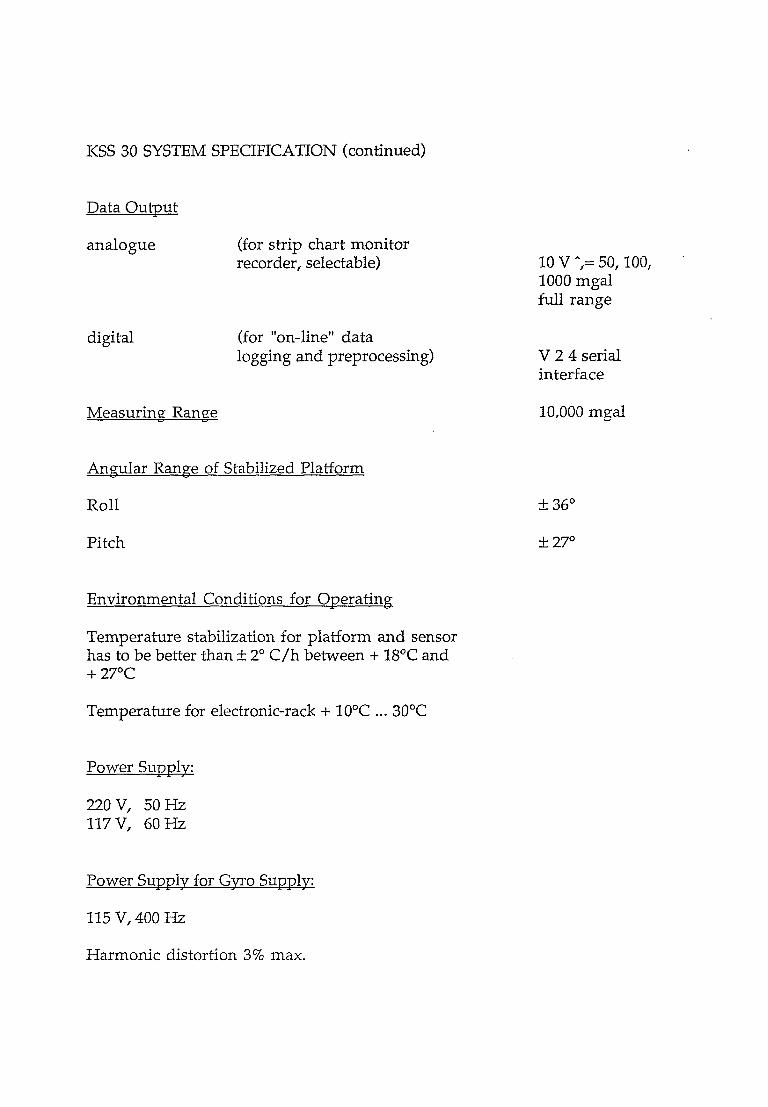
KSS 30 SYSTEM SPECIFICATION (continued)
Data Output
analogue (for strip chart monitor recorder, selectable)
digital (for “on-line” data logging and preprocessing)
Measuring RanPe 10,000 mgal
Angular Range of Stabilized Platform
Roll
Pitch
Environmental Conditions for Operating
Temperature stabilization for platform and sensor has to be better than Z!Z 2” C/h between + 18°C and + 27OC
Temperature for electronic-rack +- 10°C . . . 30°C
Power Supply:
220 v, 50 Hz 117V, 6OHz
1ov ^,= 50,100, 1000 mgal full range
V 2 4 serial interface
4 36”
4 27’
Power Supplv for Gvro Supplv:
115 v, 400 Hz
Harmonic distortion 3% max.
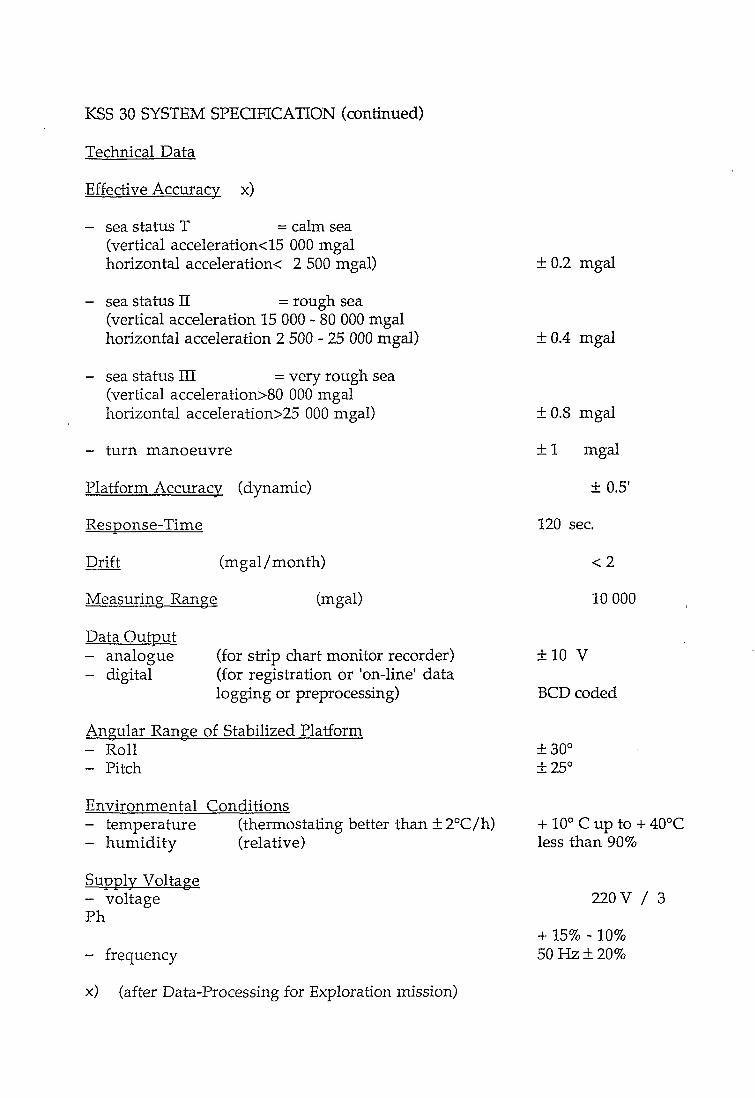
KSS 30 SYSTEM SPECIFICATION (continued)
Technical Data
Effective Accuracv x)
- sea status T = calm sea (vertical acceleration<15 000 mgal horizontal acceleration< 2 500 mgal)
- sea status II = rough sea (vertical acceleration 15 000 - 80 000 mgal horizontal acceleration 2 500 - 25 000 mgal)
- sea status III = very rough sea (vertical acceleration>80 000 mgal horizontal acceleration>25 000 mgal)
- turn manoeuvre
Platform Accuracy (dynamic)
Response-Time
Drift (mgal/month>
Measuring Range (mgal)
Data Output - analogue - digital
(for strip chart monitor recorder) (for registration or ‘on-line’ data logging or preprocessing)
Angular Range of Stabilized Platform - Roll - Pitch
Environmental Conditions - temperature - humidity
Ith;lrFm-;yg better than f 2”C/h) re a .
Supplv Voltage - voltage Ph
- frequency
210.2 mgal
I!Z 0.4 mgal
f: 0.8 mgal
+I mgal
I!l 0.5’
120 sec.
<2
10 000
i-10 v
BCD coded
I!I 30” 2125’
+ 10” c up to + 40°C less than 90%
220v / 3
+ 15% - 10% 5OHz+20%
x> (after Data-Processing for Exploration mission)
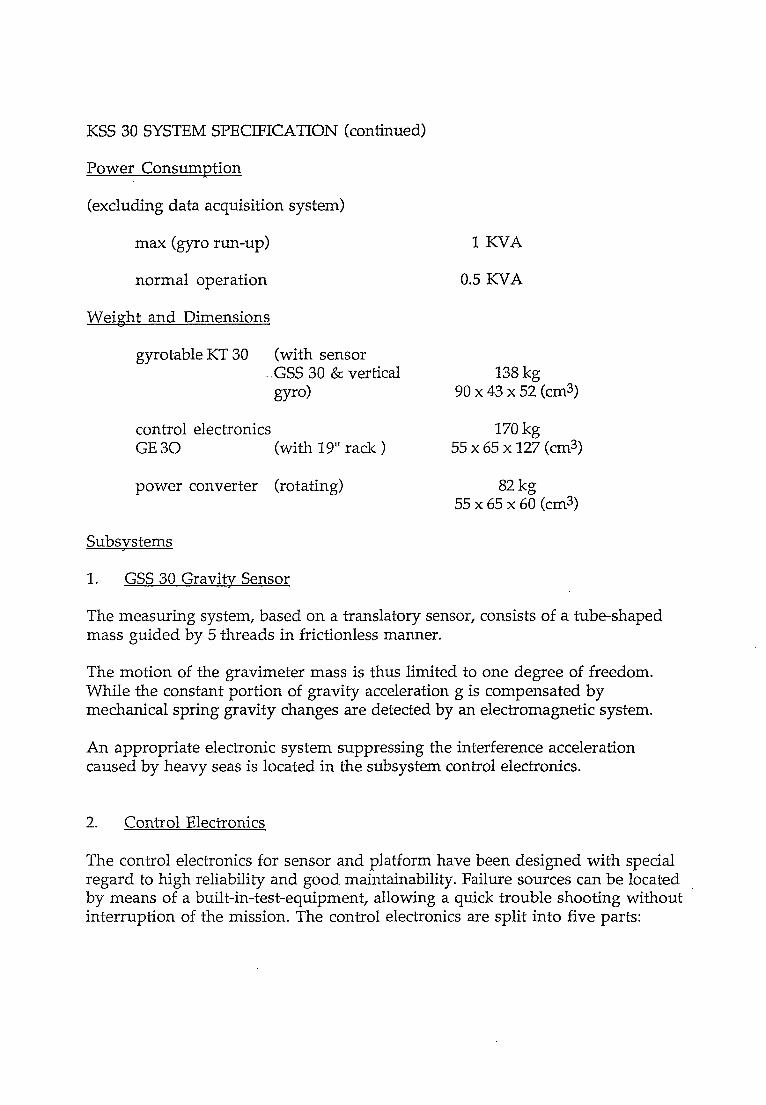
KSS 30 SYSTEM SPECIFICATION (continued)
Power Consumption
(excluding data acquisition system)
max (gyro run-up) 1 KVA
normal operation
Weight and Dimensions
gyrotable KT 30 (with sensor .GSS 30 & vertical WO)
control electronics GE 30 (with 19” rack >
power converter (rotating)
0.5 KVA
138 kg 90 x 43 x 52 (cm3)
170 kg 55 x 65 x 127 (ad)
82 kg 55 x 65 x 60 (cm3)
Subsvstems
1. GSS 30 Gravitv Sensor
The measuring system, based on a translatory sensor, consists of a tube-shaped mass guided by 5 threads in frictionless manner.
The motion of the gravimeter mass is thus limited to one degree of freedom. While the constant portion of gravity acceleration g is compensated by mechanical spring gravity changes are detected by an electromagnetic system.
An appropriate electronic system suppressing the interference acceleration caused by heavy seas is located in the subsystem control electronics.
2. Control Electronics
The control electronics for sensor and platform have been designed with special regard to high reliability and good maintainability. Failure sources can be located by means of a built-in-test-equipment, allowing a quick trouble shooting without interruption of the mission. The control electronics are split into five parts:
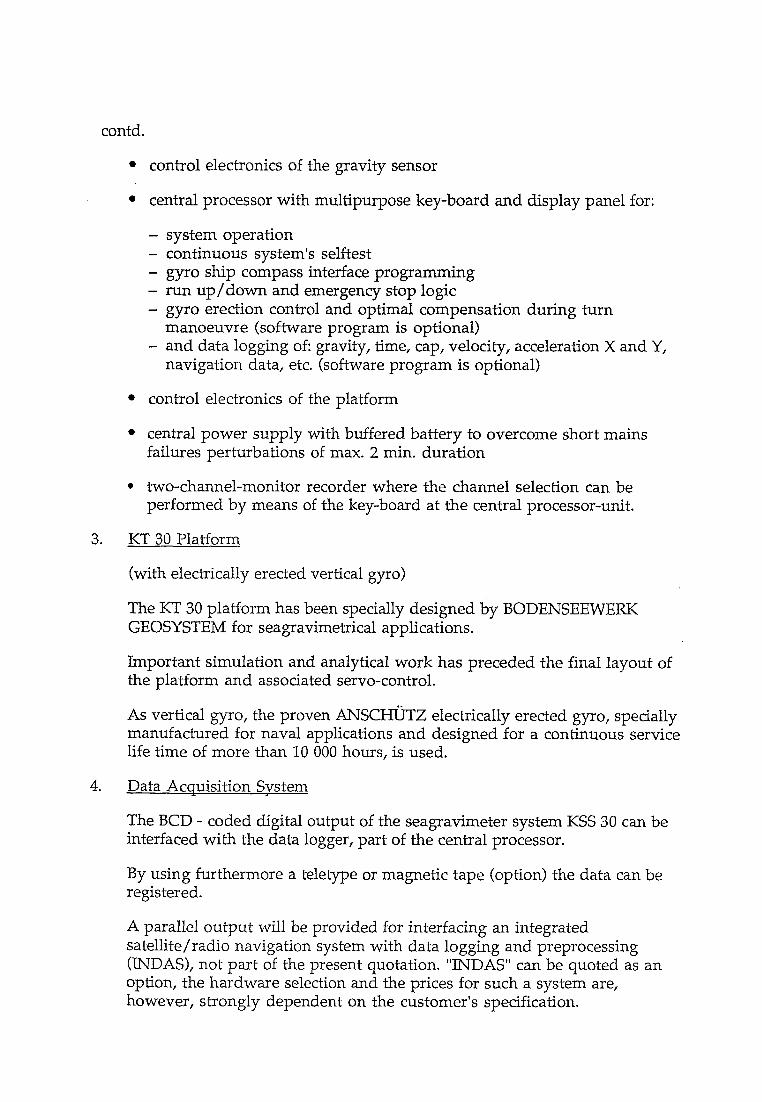
contd.
l control electronics of the gravity sensor
l central processor with multipurpose key-board and display panel for:
-
system operation continuous system’s selftest gyro ship compass interface programming run up/down and emergency stop logic gyro erection control and optimal compensation during turn manoeuvre (software program is optional) and data logging of: gravity, time, cap, velocity, acceleration X and Y, navigation data, etc. (software program is optional)
l control electronics of the platform
l central power supply with buffered battery to overcome short mains failures perturbations of max. 2 min. duration
* two-channel-monitor recorder where the channel selection can be performed by means of the key-board at the central processor-unit.
3. KT 30 Platform
(with electrically erected vertical gyro)
The KT 30 platform has been specially designed by BODENSEEWERK GEOSYSTEM for seagravimetrical applications.
Important simulation and analytical work has preceded the final layout of the platform and associated servo-control.
As vertical gyro, the proven ANSCHI?TZ electrically erected gyro, specially manufactured for naval applications and designed for a continuous service life time of more than 10 000 hours, is used.
4. Data Acquisition Svstem
The BCD - coded digital output of the seagravimeter system KSS 30 can be interfaced with the data logger, part of the central processor.
By using furthermore a teletype or magnetic tape (option) the data can be registered.
A parallel output will be provided for interfacing an integrated satellite/radio navigation system with data logging and preprocessing (INDAS), not part of the present quotation. “INDAS” can be quoted as an option, the hardware selection and the prices for such a system are, however, strongly dependent on the customer’s specification.
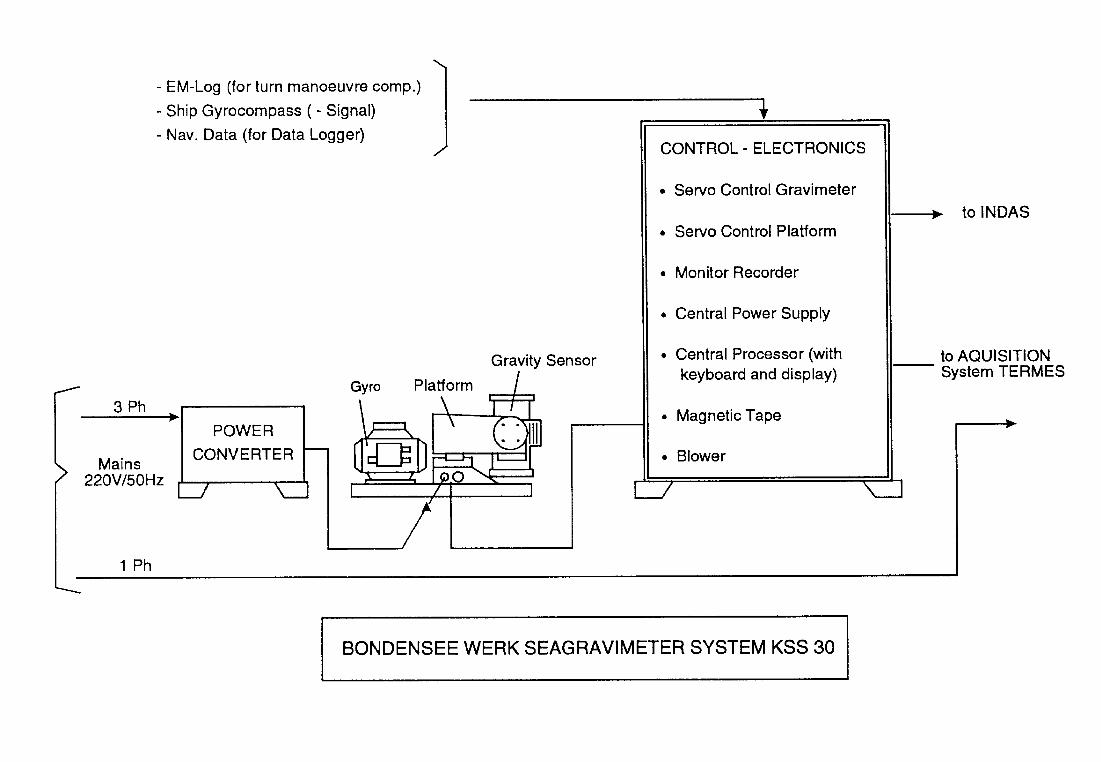
c
- EM-Log (for turn manoeuvre camp.)
- Ship Gyrocompass ( - Signal) - Nav. Data (for Data Logger)
I POWER I
Mains 220V/50Hz
1 Ph
Gravity Sensor
7
CONTROL - ELECTRONICS
l Servo Control Gravimeter
l Servo Control Platform
l Monitor Recorder
4 Central Power Supply
l Central Processor (with keyboard and display)
l Magnetic Tape
l Blower
-+ to INDAS
to AQUISITION System TERMES
BONDENSEE WERK SEAGRAVIMETER SYSTEM KSS 30
APPENDIX No5
IMAGNETOMETER
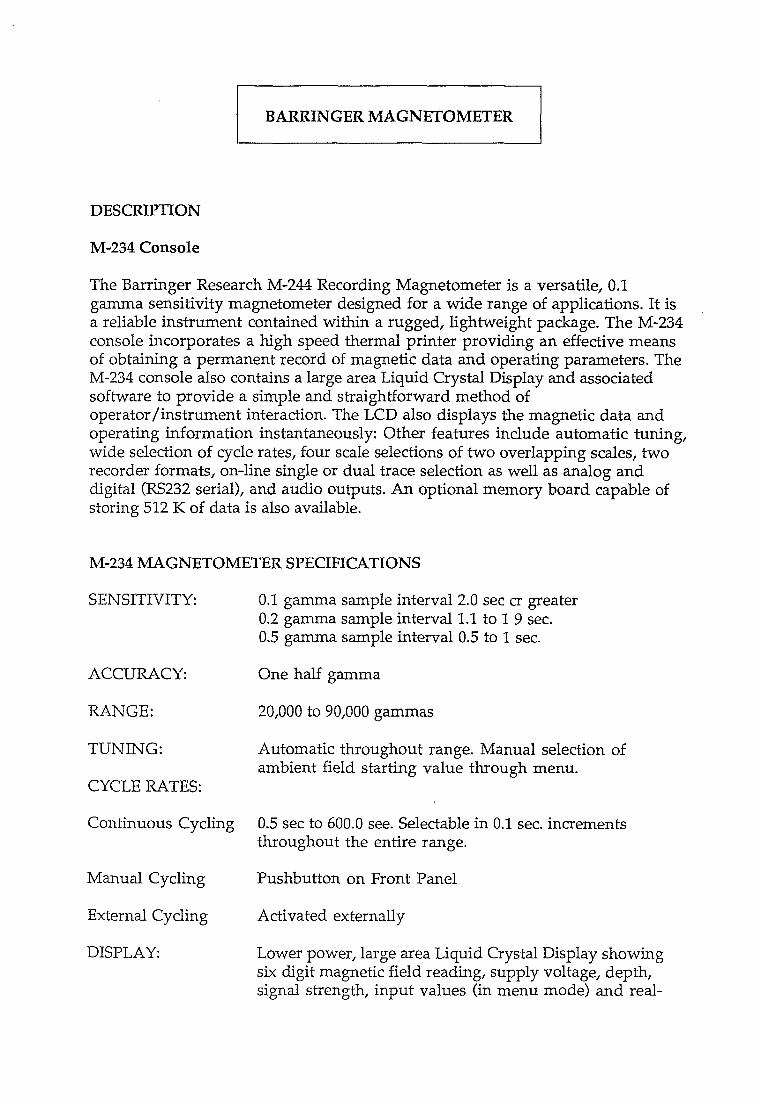
BARRINGER MAGNETOMETER
DESCRIPTION
M-234 Console
The Barringer Research M-244 Recording Magnetometer is a versatile, 0.1 gamma sensitivity magnetometer designed for a wide range of applications. It is a reliable instrument contained within a rugged, lightweight package. The M-234 console incorporates a high speed thermal printer providing an effective means of obtaining a permanent record of magnetic data and operating parameters. The M-234 console also contains a large area Liquid Crystal Display and associated software to provide a simple and straightforward method of operator/instrument interaction. The LCD also displays the magnetic data and operating information instantaneously: Other features include automatic tuning, wide selection of cycle rates, four scale selections of two overlapping scales, two recorder formats, on-line single or dual trace selection as well as analog and digital (RS232 serial), and audio outputs. An optional memory board capable of storing 512 K of data is also available.
M-234 MAGNETOMETER SPECIFICATIONS
SENSITIVITY:
ACCURACY:
RANGE:
TUNING:
CYCLE RATES:
Continuous Cycling
Manual Cycling
External Cycling
DISPLAY:
0.1 gamma sample interval 2.0 set cr greater 0.2 gamma sample interval 1.1 to 1 9 sec. 0.5 gamma sample interval 0.5 to 1 sec.
One half gamma
20,000 to 90,000 gammas
Automatic throughout range. Manual selection of ambient field starting value through menu.
0.5 set to 600.0 see. Selectable in 0.1 sec. increments throughout the entire range.
Pushbutton on Front Panel
Activated externally
Lower power, large area Liquid Crystal Display showing six digit magnetic field reading, supply voltage, depth, signal strength, input values (in menu mode) and real-
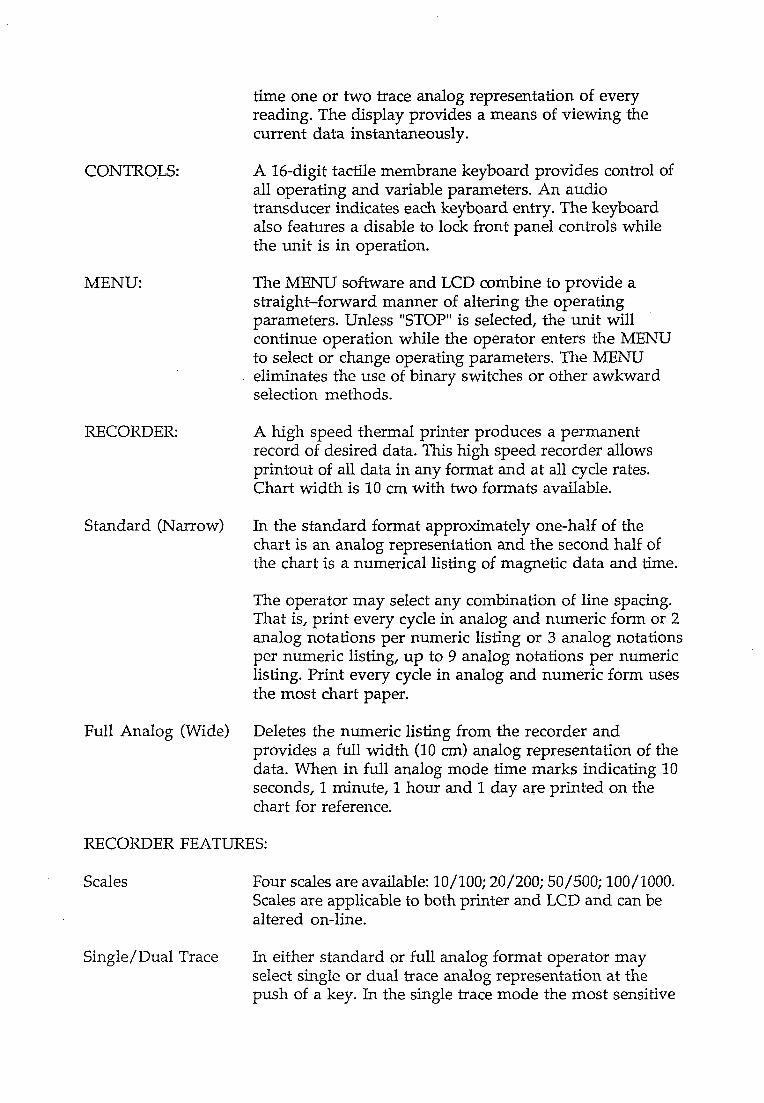
CONTROLS:
MENU:
RECORDER:
Standard (Narrow)
Full Analog (Wide)
time one or two trace analog representation of every reading. The display provides a means of viewing the current data instantaneously.
A 16-digit tactile membrane keyboard provides control of all operating and variable parameters. An audio transducer indicates each keyboard entry. The keyboard also features a disable to lock front panel controls while the unit is in operation.
The MENU software and LCD combine to provide a straight-forward manner of altering the operating parameters. Unless “STOP” is selected, the unit will continue operation while the operator enters the MENU to select or change operating parameters. The MENU eliminates the use of binary switches or other awkward selection methods.
A high speed thermal printer produces a permanent record of desired data. This high speed recorder allows printout of all data in any format and at all cycle rates. Chart width is 10 cm with two formats available.
In the standard format approximately one-half of the chart is an analog representation and the second half of the chart is a numerical listing of magnetic data and time.
The operator may select any combination of line spacing. That is, print every cycle in analog and numeric form or 2 analog notations per numeric listing or 3 analog notations per numeric listing, up to 9 analog notations per numeric listing. Print every cycle in analog and numeric form uses the most chart paper.
Deletes the numeric listing from the recorder and provides a full width (10 cm) analog representation of the data. When in full analog mode time marks indicating 10 seconds, 1 minute, 1 hour and 1 day are printed on the chart for reference.
RECORDER FEATURES:
Scales Four scales are available: lO/lOO; 20/200; 50/500; lOO/lOOO. Scales are applicable to both printer and LCD and can be altered on-line.
Single/Dual Trace In either standard or full analog format operator may select single or dual trace analog representation at the push of a key. In the single trace mode the most sensitive
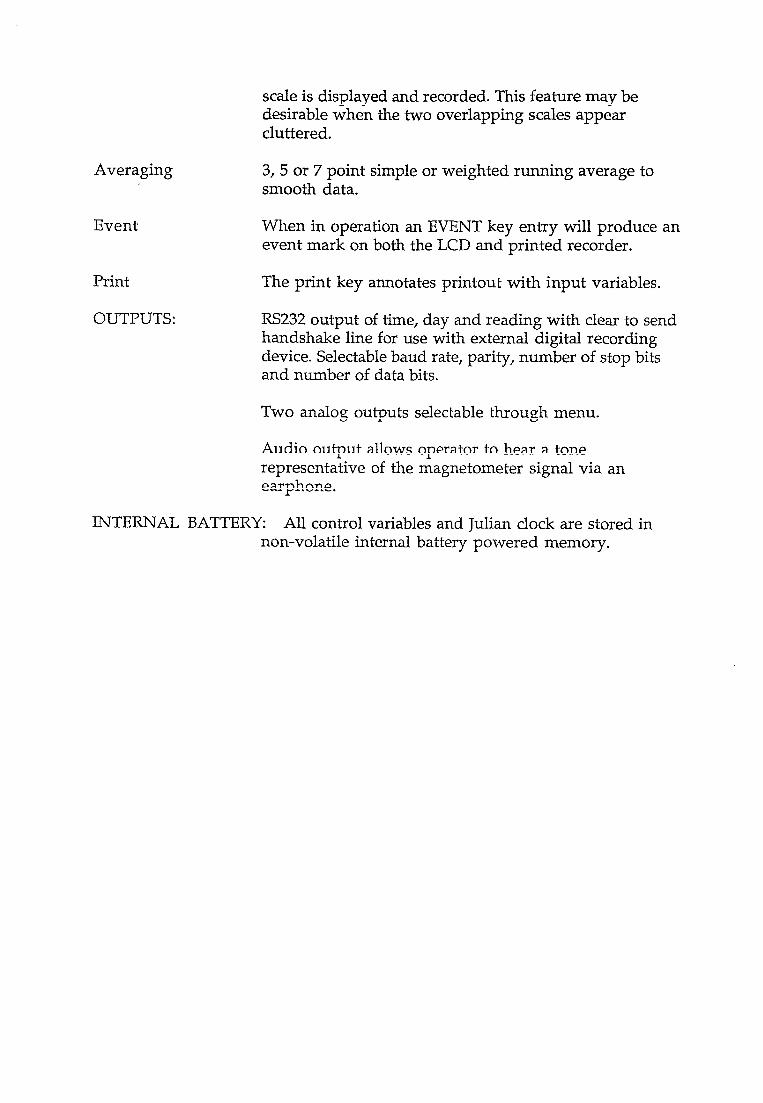
Averaging
Event
OUTPUTS:
scale is displayed and recorded. This feature may be desirable when the two overlapping scales appear cluttered.
3,5 or 7 point simple or weighted running average to smooth data.
When in operation an EVENT key entry will produce an event mark on both the LCD and printed recorder.
The print key annotates printout with input variables.
RS232 output of time, day and reading with clear to send handshake line for use with external digital recording device. Selectable baud rate, parity, number of stop bits and number of data bits.
Two analog outputs selectable through menu.
Audio output allows operator to hear a tone representative of the magnetometer signal via an earphone.
INTERNAL BATTERY: All control variables and Julian clock are stored in non-volatile internal battery powered memory.
APPENDIX No6
§cientific Qffice Address List
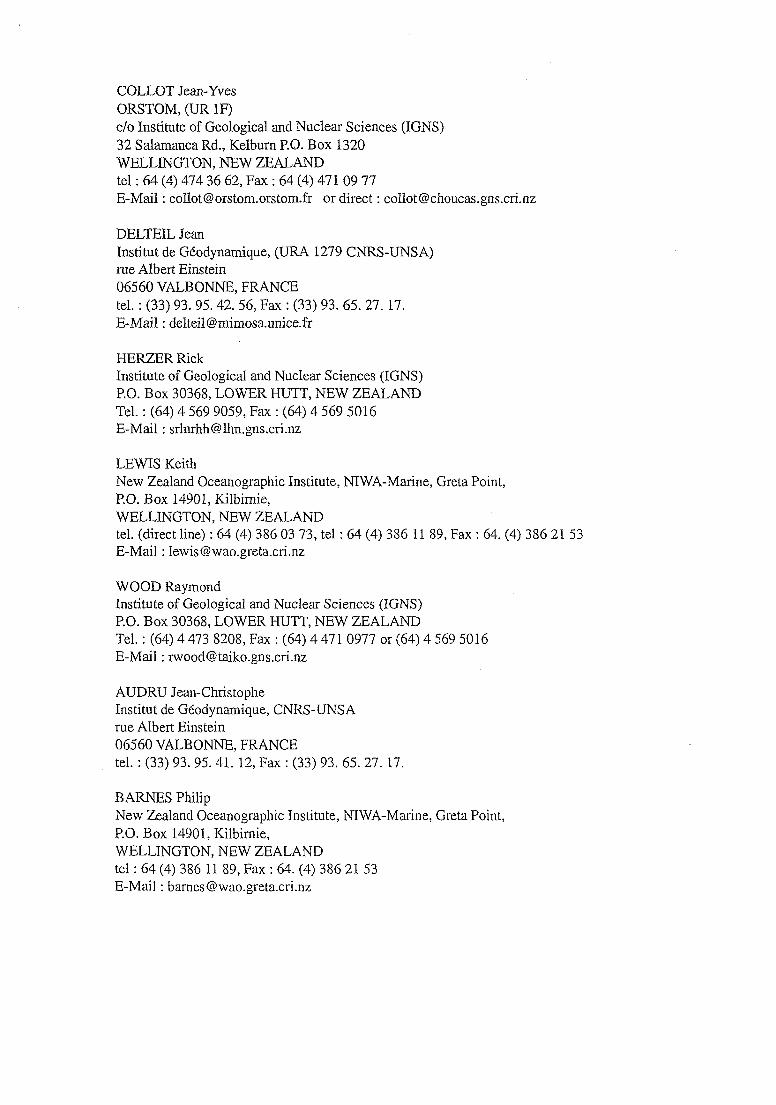
COLLOT Jean-Yves ORSTOM, (UR 1F) c/o Institute of Geological and Nuclear Sciences (IGNS) 32 Salamanca Rd., Kelburn P.O. Box 1320 WELLINGTON, NEW ZEALAND tel : .64 (4) 474 36 62, Fax : 64 (4) 471 09 77 E-Mail : [email protected] or direct : [email protected]
DELTEIL Jean Institut de Geodynamique, (URA 1279 CNRS-UNSA) rue Albert Einstein 06560 VALBONNE, FRANCE tel. : (33) 93. 95.42. 56, Fax : (33) 93. 65. 27. 17. E-Mail : [email protected]
HERZER Rick Institute of Geological and Nuclear Sciences (IGNS) P.O. Box 30368, LOWER HUTT, NEW ZEALAND Tel. : (64) 4 569 9059, Fax : (64) 4 569 5016 E-Mail : [email protected],cri.nz
LEWIS Keith New Zealand Oceanographic Institute, NIWA-Marine, Greta Point, PO. Box 14901, Kilbirnie, WELLINGTON, NEW ZEALAND tel. (direct line) : 64 (4) 386 03 73, tel : 64 (4) 386 11 89, Fax : 64. (4) 356 21 53 E-Mail : [email protected]
WOOD Raymond Institute of Geological and Nuclear Sciences (IGNS) P.O. Box 30368, LOWER HUTT, NEW ZEALAND Tel. : (64) 4 473 8208, Fax : (64) 4 4710977 or (64) 4 569 5016 E-Mail : [email protected]
AUDRU Jean-Christophe Institut de Geodynamique, CNRS-UNSA rue Albert Einstein 06560 VALBONNE, FRANCE tel. : (33) 93. 95.41. 12, Fax : (33) 93. 65. 27. 17.
BARNES Philip New Zealand Oceanographic Institute, NIWA-Marine, Greta Point, P.O. Box 14901, Kilbirnie, WELLINGTON, NEW ZEALAND tel : 64 (4) 386 11 89, Fax : 64. (4) 386 21 53 E-Mail : [email protected]
CALMANT Stephane ORSTOM - Centre de NoumCa GCologie - Geophysique B.P. A5, NOUMEA CEDEX - NOUVELLE CALEDONIE Tel. : (687) 26 10 00, Fax : (687) 26 43 26 E-Mail : [email protected]
CHANIER Frank Laboratoire de GCologie Dynamique, S.N.5 Univ. des Sciences et Technologies de Lille 59655, VILLENEUVE D’ASQ, cedex, FRANCE tel. : (33) 20.43.69. 82, Fax : (33) 20.43.49. 95.
CHAUMILLON Eric Laboratoire de Geodynamique sous-marine B.P. 48,06230 VILLEFRANCHE SUR MER, FRANCE tel. : (33) 93.76.37. 49., Fax : (33) 93.76. 37. 66.
CHRISTOFFEL David Institute of Geophysics, Research School of Earth Sciences Victoria University of Wellington P.O. Box 600, WELLINGTON, NEW ZEALAND Tel. : (64) 4 472 1000, Fax : (64) 4 495 5186
COFFIN MIKE Institute for Geophysics, University of Texas at Austin (UTIG) 8701 N. Mopac Expressway, AUSTIN, TEXAS 78759-8397 Tel. : 512 4710429 (dir.), Fax : 512 471 8844 E-Mail : [email protected]
DAVY Bryan Institute of Geological and Nuclear Sciences (IGNS) 32 Salamanca Rd., Kelbum P.O. Box 1320, WELLINGTON, NEW ZEALAND tel : 64 (4) 474 36 60, Fax : 64 (4) 47109 77 E-Mail : [email protected]
FERRIERE Jacky Universite des Sciences et Technologie de Lille I UFR Sciences de la Terre, Laboratoire de Geologic Dynamique 59655 VILLENEUVE D’ASCQ CEDEX - FRANCE Tel. : (33) 20 43 41 17 (dir.), (33) 20 43 41 25 (sec.), Fax : (33) 20 43 49 95
LALLEMAND Serge Laboratoire de Geologic Structurale, Universite de Montpellier II Case 058, Place Eugene Bataillon 34095 MONTPELLIER cedex 05, FRANCE tel. : (33) 67.14.33.01., Fax : (33) 67.54.73.62, E-Mail : [email protected]
LAMARCHE Geoffroy ORSTOM, (UR 1F) c/o Institute of Geological and Nuclear Sciences (IGNS) 32 Salamanca Rd., Kelbum P.O. Box 1320 WELLINGTON, NEW ZEALAND tel : 64 (4) 473 82 08, Fax : 64 (4) 47109 77 E-Mail : [email protected] or direct [email protected]
LEBRUN Jean-Frederic ORSTOM c/o Laboratoire de Geodynamique sous marine B.P. 48, F-06230 VILLEFRANCHE SUR MER, FRANCE Tel. : (33) 93 76 37 40, Fax : (33) 93 76 37 68. E-Mail : [email protected] from 15/2/l 994 Institut de Geodynamique (URA 1279 CNRS-UNSA) 250 rue Albert Einstein, F-06560 VALBONNE, FRANCE Tel. : (33) 93 95 42 42, Fax : (33) 93 65 27 17. E-Mail : [email protected]
MAUFFRET Alain CNRS / UPMC, Laboratoire,de Geotectonique, case 129 4 Place Jussieu, 75252 PARIS CEDEX 05, FRANCE Tel. : (33) 144 27 51 76, Fax : (33) 144 27 49 50
MERCIER DE LEPINAY Bernard Institut de Geodynamique, (URA 1279 CNRS-UNSA) rue Albert Einstein 06560 VALBONNE, FRANCE tel. : (33) 93. 95.42.43, FAX : (33) 93.65. 27. 17. E-Mail : [email protected]
ORPIN Alan c/- Geology Department, Otago University P.O. Box 56 DUNEDIN, NEW ZEALAND tel. : 64. (3) 479 75 19, Fax : 64 (3) 479 75 27 E-Mail : [email protected] liorne : 9 Kotare Crescertt, A4awu WHANGAREI, NORTHLAND, NEW ZEALAND tel. : (09) 438 88 68 PELLETIER Bernard ORSTOM, (URIF) BP. A5 NOUMEA, Nouvelle-Caledonie, Tel. : (687) 26.10.00, poste 1 I-65, Fax : (687) 26. 37.69 E-Mail : [email protected]

PONTOISE Bernard ORSTOM c/o Laboratoire de Geodynamique B.P. 48, F-06230 VILLEFRANCHE SUR MER, FRANCE Tel. : (33) 93 76 37 54, Fax : (33) 93 76 37 68. E-Mail : [email protected]
POPOFF Michel UNSA - Institut de Geodynamique (URA 1279 CNRS-UNSA) 250 rue Albert Einstein, Sophia Antipolis, F-06560 VALBONNE, FRANCE Tel. : (33) 93 95 42 53, Fax : (33) 93 65 27 17 E-Mail : [email protected]
RUELLAN Etienne CNRS - Institut de Geodynamique (URA 1279 CNRS-UNSA) 250 rue Albert Einstein, Sophia Antipolis F-06560 VALBONNE, FRANCE Tel. : (33) 93 95 42 44, Fax : (33) 93 65 27 17 E-Mail : [email protected], [email protected]
SOSSON Marc Institut de Geodynamique, (URA 1279 CNRS-UNSA) rue Albert Einstein 06560 VALBONNE, FRANCE tel. : (33) 93. 95. 42. 55, Fax : (33) 93. 65. 27. 17. E-Mail : [email protected]
SUTHERLAND Rupert Otago University, Geology Department P.O. Box 56, DUNEDIN, NEW ZEALAND Tel. : (64) 3 479, Fax : (64) 3 479 7527 E-Mail : [email protected]
TOUSSAINT Bertrand ORSTOM, (UR 1F) B.P. 48,06230 VILLEFRANCHE SUR MER, FRANCE tel. : (33) 93.76.37. 52., Fax : (33) 93.76. 37.65. E-Mail : [email protected]
URUSKI Chris Institute of Geological and Nuclear Sciences (IGNS) P.O. Box 30365, LOWER HUTT, NEW ZEALAND tel : 64 (4) 569 90 59, direct dial : 64 (4) 570 48 00, Fax : 64 (4) 569 E-Mail : [email protected]
;o 1

ISBN : 2-7099-I 230-9
editions de I’ORSTOM 72, route d’Aulnay
93143 BONDY Cedex
I _ _ ..: