geochemical analysis of the truncated viking age trading
TRANSCRIPT
Geoarchaeology. 2020;35:748–771.748 | wileyonlinelibrary.com/journal/gea
Received: 19 August 2018 | Revised: 20 March 2020 | Accepted: 25 March 2020
DOI: 10.1002/gea.21795
R E S E A RCH AR T I C L E
Geochemical analysis of the truncated Viking Age tradingsettlement of Heimdalsjordet, Norway
Rebecca J. S. Cannell1,3 | Jan Bill2 | Paul Cheetham1 | Kate Welham1
1Department of Archaeology, Anthropology
and Forensic Sciences, Bournemouth
University, Poole, UK
2Department of Archaeology, Museum of
Cultural History, University of Oslo,
Oslo, Norway
3Department of Archaeology, Conservation
and History, University of Oslo, Oslo, Norway
Correspondence
Rebecca J. S. Cannell, Department of
Archaeology, Conservation and History,
University of Oslo, Oslo, Norway.
Email: [email protected]
Funding information
Arts and Humanities Research Council;
Bournemouth University
Scientific editing by Sarah C. Sherwood.
Abstract
Single and multielement archaeological geochemistry has been applied to research
and rescue projects for many decades to enhance our understanding of the past use
of space. Often applied on one contextual plane, this ignores the complex palimpsest
resulting from past occupation and soil processes. Furthermore, many important
sites are now heavily truncated by plowing, leaving little more than negative fea-
tures below the homogenized topsoil. These challenges require new approaches to
archaeological geochemistry to gather information before these sites are lost to
modern land use. The research presented here applied coring as a sampling method
on a truncated site, the sample locations guided by high‐resolution ground‐penetrating radar data and excavation, before using portable X‐ray fluorescence
directly on the core samples to understand the phase by phase composition of the
deposits and thus past human occupation. The results suggest that even in truncated
and secondary contexts, such as the case study of the Viking Age trade settlement of
Heimdalsjordet, Norway, archaeological geochemistry can give insight into the
chronological and spatial development of the site, and is especially relevant for
detecting nonferrous metalworking activity.
K E YWORD S
coring, geochemistry, geophysics, pXRF, Viking Age
1 | INTRODUCTION
A means of understanding past settlements and the people within
them is to understand how space was organized, utilized, and ex-
perienced over time. The site in focus here, Heimdalsjordet, is one of
only two coastal trading sites from the Viking Period known in
Norway, the other being the nearby site of Kaupang (Skre, 2007).
Understanding the cultural organization of the site and the range of
activities present as the site developed, that is the use of space,
would provide a foundation for comparison between sites in terms of
its role in social and economic networks. While the theoretical per-
spectives on the use of space are not the focus here; they are an
integral part of this project. The use of space, as a social and physical
construct, is fundamental to our understanding of the world around
us. We label space in a culturally specific way, but it is also something
that is created and morphed as it simultaneously mediates social
interactions (Kühtreiber, 2014; Lefebvre, 1991). Space can be viewed
as a manifestation of socially constructed and accepted behaviors
that are environmentally responsive (Løvschal & Holst, 2014)). How
people engage and live within spatial divisions can be seen as the
incremental accumulation of behavioral responses to cultural and
environmental factors. Over time, certain behaviors and responses
become more prominent as they, consciously or unconsciously, are
seen as more acceptable responses; what Løvschal and Holst (2014)- - - - - - - - - - - - - - - - - - - - - - - - - - - - - - - - - - - - - - - - - - - - - - - - - - - - - - - - - - - - - - - - - - - - - - - - - - - - - - - - - - - - - - - - - - - - - - - - - - - - - - - - - - - - - - - - - - - - - - - - - - - - - - - - - - - - - - - - - - - - - - - - - - - - - - - - - - - - - - - - - - - - - - - - - - - - - - - -
This is an open access article under the terms of the Creative Commons Attribution License, which permits use, distribution and reproduction in any medium,
provided the original work is properly cited.
© 2020 The Authors. Geoarchaeology published by Wiley Periodicals LLC
term a “spatial repertoire.” Temporarily and change is added by
shared references and retrospect within the context, which can be
implemented, modified, or ignored by a person or group. This creates
a dynamic between past and present, the individual and society.
Therefore, how space is created and used is a gateway into the cul-
tural past and a means of interpreting sites on many scales.
The site was heavily truncated by plowing, and predominantly
consisted of negative features—that is archaeological features sur-
viving as a backfilled cuts into the subsoil—such as ditches that di-
vided the land into plots and parcels. The ditches at Heimdalsjordet
predominantly divided the area into parcels; that is small ditched
enclosures on the scale of small house sizes, and these parcels are
within the larger plots. Some few of these ditches are more linear
and/or interconnected, and can be associated with plot boundaries.
In many cases, plots may have contained more than one small rec-
tangular parcel, and may also have been additionally defined by, for
example, fencing. In contemporary and broadly comparable sites such
as Dublin, each plot contained one or two buildings, and perhaps
some animals penning, but without space for farming (Wallace,
2016). To understand the use of space at Heimdalsjordet, new
sampling approaches had to be developed to meet the challenges of
the truncated archaeology.
This paper examines the intersection between the application of
archaeological geochemistry, the nature of archaeological deposits in
excavation and prospection contexts, the sampling methods applied
in both methodologies, and their interpretations, as applied to the
site of Heimdalsjordet.
1.1 | Sampling methods in geochemistry
Several reviews of archaeological geochemistry have been published,
considering both the single element methods (e.g., Bethell &
Máte, 1989; Holliday & Gartner, 2007) and multielement approaches
(e.g., Oonk, Slomp, & Huisman, 2009; Walkington, 2010; Wilson,
Davidson, & Cresser, 2008), as well as key papers that have for-
warded knowledge of the relationship between relative elemental
enhancement and depletion in archaeological contexts and how this
can be measured and related to past human activity (e.g., Entwistle &
Abrahams, 1997; Entwistle, Dodgshon, & Abrahams, 2000;
Middleton, 2004; Milek & Roberts, 2013). The method has expanded
in tandem with technological availability. Since the late 1980s, in-
ductively coupled plasma mass spectrometry (ICP‐MS)/optical emis-
sion spectrometry (OES)/atomic emission spectrometry (AES) have
been the most commonly used techniques, exemplified by Bethell
and Smith's (1989) paper and subsequent research (e.g., Entwistle,
Abrahams, & Dodgshon, 1998; Luzzadder‐Beach, Beach, Terry, &
Doctor, 2011; Middleton, 2004; Sylvester, Mann, Rate, &
Wilson, 2017; Wilson, Davidson, & Cresser, 2009). In recent years,
the use of X‐ray fluorescence (XRF) in portable or lab‐based form, has
become increasingly common (Booth et al., 2017; Cook, Clarke,
& Fulford, 2005; Cook et al., 2010; Entwistle, Mccaffrey, &
Abrahams, 2009; Gauss, Bátora, Nowaczinski, Rassmann, &
Schukraft, 2013; Hayes, 2013; Mikołajczyk & Schofield, 2017). In-
strument selection involves additional decisions and restraints which
ultimately dictate the data that can be collected, and this has been
debated in relation to portable XRF (pXRF; Frahm, 2013; Hunt &
Speakman, 2015; Speakman & Shackley, 2013). The concern is that
the utilization of internal calibration and “point and shoot” instru-
ments and methodologies creates inaccurate and imprecise data that,
as uncalibrated to any external standard, is incomparable.
In archaeological geochemistry sampling, there is a strong ten-
dency for methods to fall into one of two categories: sampling spe-
cific features only (Cook et al., 2010; Cook, Kovacevich, Beach, &
Bishop, 2005; Couture, Bhiry, Monette, & Woollett, 2016; Luzzadder‐Beach et al., 2011; Wilson, Davidson, & Cresser, 2007; Wilson
et al., 2009) or areal sampling using a horizontal grid or transects
within an archaeologically defined area (Jones et al., 2010;
Middleton, 2004; Middleton et al., 2010; Oonk, Slomp, Huisman, &
Vriend, 2009; Vyncke, Waelkens, Degryse, & Vassilieva, 2011). The
first approach lays weight on function and activity. It ignores the
significance of motion, reference and relationships in human‐createdspaces, focusing solely on the what. The second achieves more by
way of spatial patterning and social/cultural relations, but often oc-
curs on a single horizontal plane. Time, in effect, ceases to matter,
and it assumes all is chronologically simultaneous, and so comparable,
culturally and pedologically. In addition, the analytical space is not
defined by the past population and society, but by the archaeologist.
There are studies published which include down‐section sampling, for
single or multiple elements, however, these are often limited to one
or two sections and then time becomes the only thing that matters
(Crowther, 1997; Ottaway & Matthews, 1988; Salisbury, 2013).
When sampling occurs on a horizontal plane, a floor is often the
target (if preserved), or a subsoil layer within an excavation, or some
point in the topsoil for prospection. On a multiperiod site, when sam-
pling one stratigraphic layer late in the excavation, the method becomes
reliant on soil processes having paradoxically both leached and retained
elemental enhancements from now removed phases and gathering
them in one horizon. This can have some success, but it is not working
with respect to the mechanisms within the soil the method relies upon.
The present study attempted an alternative approach using coring as a
sampling method to try and capture time and space within the sec-
ondary deposits, measured using pXRF directly on the cores.
Secondary contexts are defined as backfills in archaeological fea-
tures which consist of a heterogeneous mix of locally derived residual
material from the last phases of occupation and earlier activities. The
sediments do not directly represent a sole activity or a deliberate as-
semblage. These compare to primary contexts, whose composition re-
presents a deliberate act, and where the spatial distribution of
enhancements in the sediment reflects the activity or process that
purposively created them (Carver, 1995; Schiffer, 1976, p. 105). From a
geochemical perspective, it is the preservation of spatial patterning
from intentional and unintentional acts that defines whether they can
be considered primary or not. The formation of archaeological deposits
in negative features such as ditches can be a combination of factors,
which can limit their potential interpretations.
CANNELL ET AL. | 749
1.2 | Heimdalsjordet
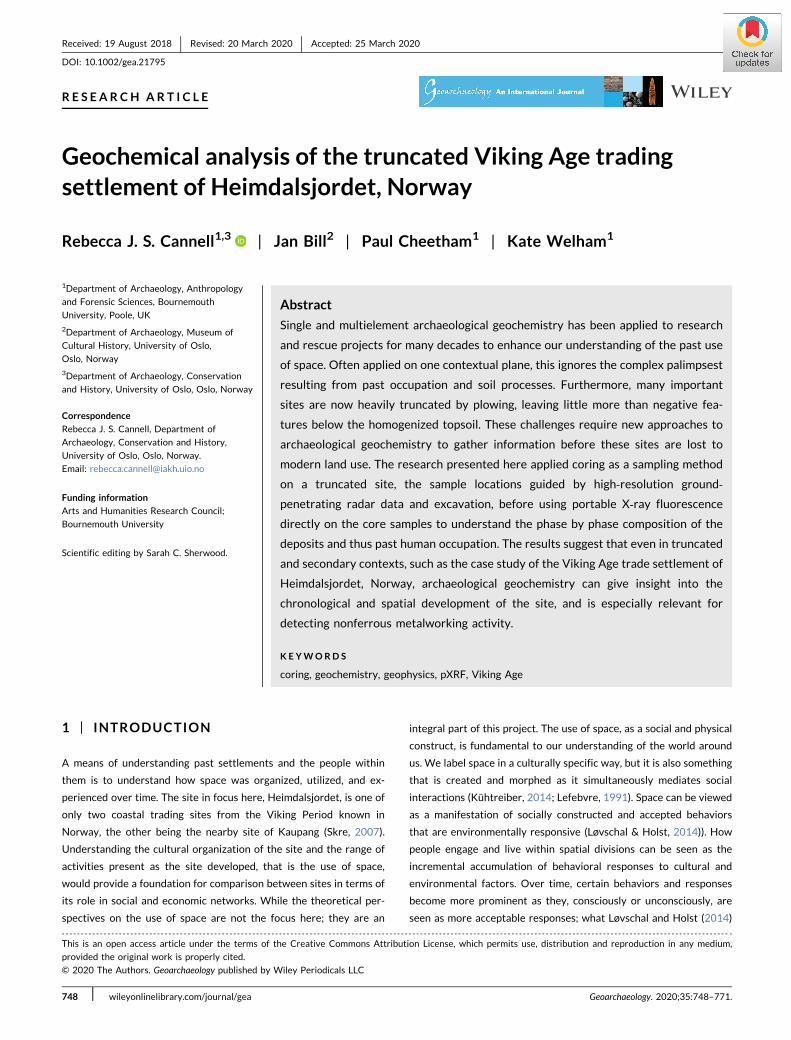
The site of Heimdalsjordet, located in Vestfold County, Norway
(Figure 1), was investigated in 2012–2013 as part of the Gokstad Re-
vitalised Project (GOREV). Heimdalsjordet was occupied in the early to
mid‐Viking Age (800–1050 A.D.), with the main phases of activity in the
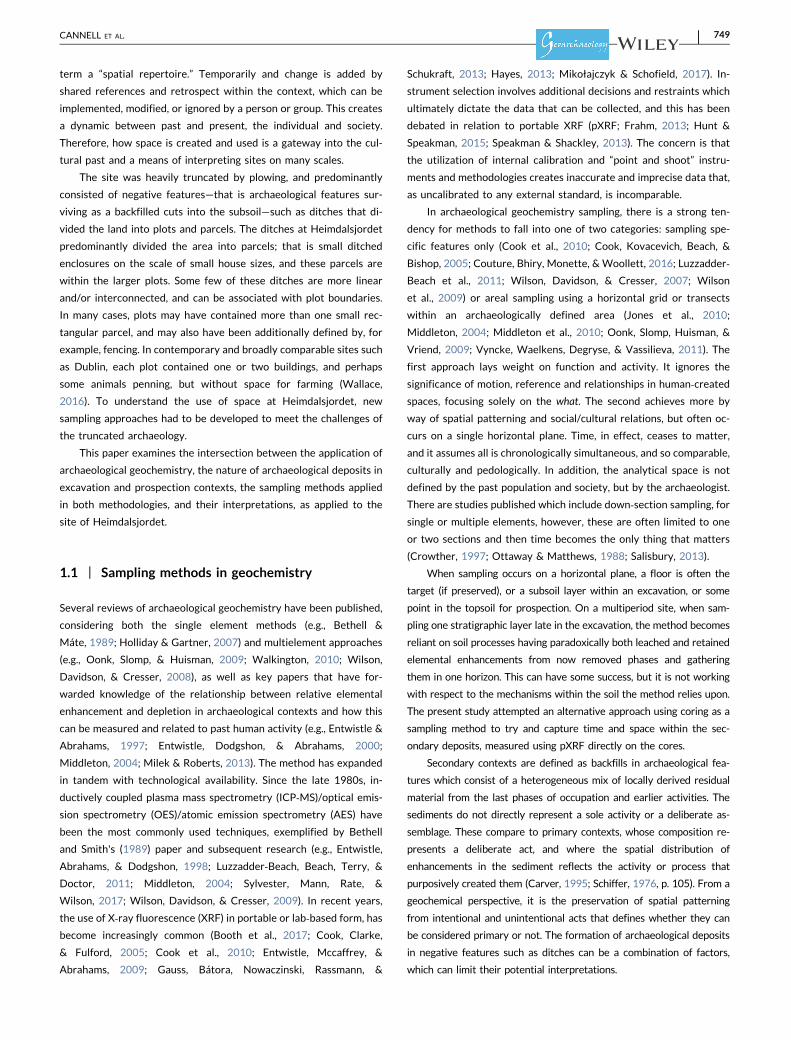
mid‐Viking Age. The site is primarily composed of ditches arranged
along a thoroughfare, comprising parcels of land and the ring ditches
from plowed out burial mounds. The thoroughfare is an E‐W orientated
feature demarcated by the parcel ditches, fading to the east as the
ground rises from around parcel 6 and on toward parcels 9–14 (see
below) (Figure 2). Associated with parcels 9–14 and spreading east, was
an occupation layer that followed the terrain a short distance toward
the former stream course, which is now under modern landscaping
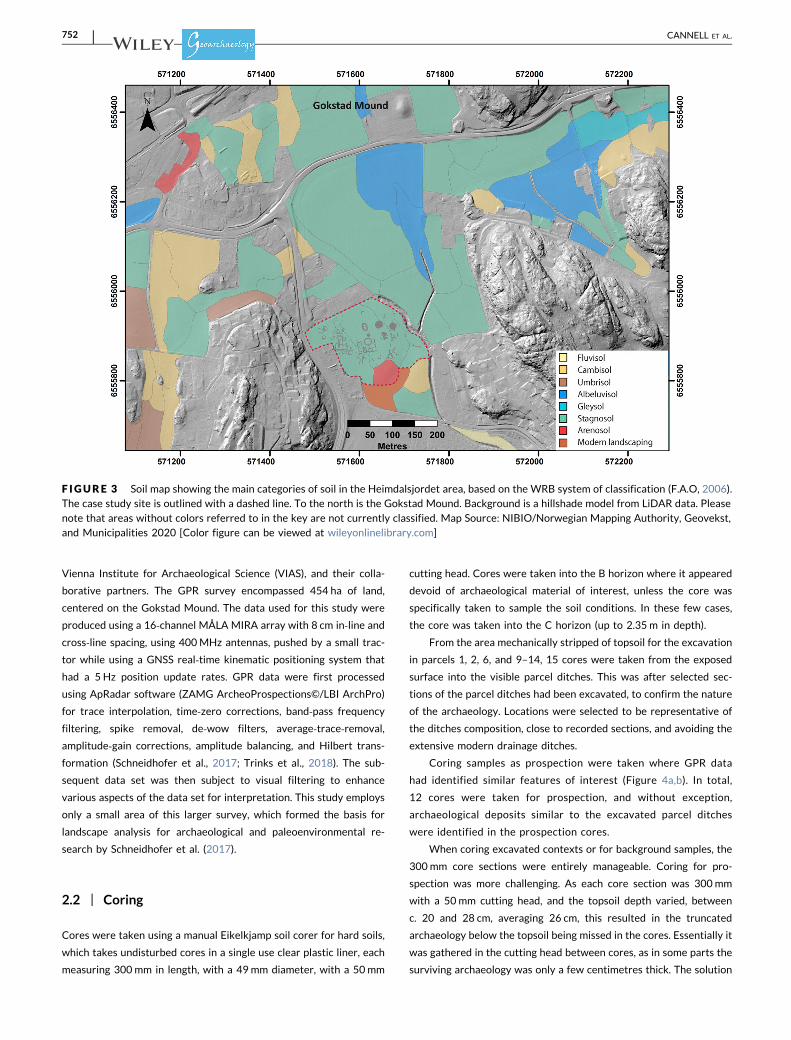
(Figure 3). The areas investigated by excavation were selected from
previous evaluation trenching and ground penetrating radar (GPR) data.
The parcel ditches varied in width and depth, most being rec-
tangular or subrectangular, the largest measuring 14.5 m × 6.7m,
while smaller parcels measure, for example, 10m × 5.5 m. Several are
cut by later ditches, suggesting recutting over several phases of oc-
cupation on the site.
On comparable sites such as Ribe, Denmark, ditches defined
boundaries, although the plots at Ribe were perhaps also separated
by fencing (Feveile, 2008). At Heimdalsjordet, the ditches appear
connected to activities within the parcels, rather than purely defining
the plots themselves (Bill & Rødsrud, 2017). While many are too deep
to be wall ditches, they could define building parcels within a larger
land plot defined by fencing, the traces of which have not survived.
Together with other forms of boundary, parceled land, and ditches
form political, economic, and social boundaries for the occupants
throughout the settlement lifespan.
Finds are predominantly dated to the Viking Age (800–1050
A.D.), including beads, metal fittings, ingots, and metalworking scrap
and waste, Arabic dirhams, whetstones, weights and amber frag-
ments. Based upon radiocarbon dating, the most likely date range for
the early phase of the site is the very late 700s to early 800s, and the
later phases date from the mid‐8th to the mid‐10th centuries. It
appears the settlement fell out of use in the latter half of the 10th
century (Bill & Rødsrud, 2017).
1.3 | The environmental setting
Postglacial eustatic rises caused the inundation of southern Norway
by the sea, forming a marine‐sourced depositional landscape far in-
land. Later isostatic rebound caused relative falls in sea levels, which
have slowed to the current rate of 2–3mm/year, however, in the
Viking Age the rate is estimated to be ca. 3.5 mm/year (Sørensen,
F IGURE 1 Location map of the case study. Map Source: Norwegian Mapping Authority, Geovekst, and Municipalities 2020 [Color figure canbe viewed at wileyonlinelibrary.com]
750 | CANNELL ET AL.
Henningsmoen, Høeg, Stabell, & Bukholm, 2007). The marine sedi-
ments are silty clay, with interspersed layers of sand deposited in a low
energy coastal environment eventually progressing toward estuarine,
intertidal conditions (Macphail, Crowther, & Linderholm, 2014;
Schneidhofer et al., 2017). Located on the seaward side of the nearby
and contemporary Gokstad Mound, the Heimdalsjordet site is currently
at 3–6m a.s.l., dating the emergence from the sea to c. 400–900A.D.
(Sørensen et al., 2007). The sea is now ca. 1 km distant; however, the
site was located on the then coastline in the Viking Age. The land
immediately surrounding the site is today a flat plain between exposed,
steeply graded bedrock hills, the majority under 100m a.s.l. The land
has been levelled significantly by modern land use, from a gently un-
dulating landscape intersected by small, entrenched streams, to a highly
managed and drained agricultural landscape.
The area is composed of hydromorphic soils, predominantly
stagnosols, with albeluvisols concentrated nearer current or former
stream beds, as shown in Figure 3 (NIBIO, 2018). These soils are
characterized by poor surface drainage and redoximorphic properties
in the case of statgnosols, and despite the extensive drainage systems
in the area, standing surface water occurs periodically on the site.
Albeluvisols are also hydromorphic soils, classified by the translocation
of clays down profile. Those located in the research area are Epistagnic
Albeluvisols, indicating they also have impeded surface drainage
(F.A.O, 2006; NIBIO, 2018; Solbakken, Nyborg, Sperstad, Fadnes, &
Klakegg, 2006). The hindered drainage could have reduced the past
productivity of the land for cereal farming in the low lying areas, al-
though it is more than suited to pasture, and sedge‐grassland has been
proposed for the area based upon the micromorphology evidence from
preserved turfs in the nearby Gokstad Mound (Macphail, Bill, Cannell,
Linderholm, & Rødsrud, 2013; Macphail et al., 2014).
Over the eastern part of the site, an area of sandy substrate
overlies the gleyed marine clay silt, on which parcels 9–14 sit. This is
the remains of a sand spit formed during postglacial sea level retreat.
Composed of moderately sorted fine to coarse sands, it thins from
south to north, and is intersected by a later stream bed which is now
drained and infilled (see also Schneidhofer et al., 2017). Soils formed
over this sand spit are classified as Haplic Arenosols, that is free
draining sorted sandy soils, although this classification is generalized;
in areas excavated the sand coverage over the marine silty clay is less
than 1m in depth, frequently less than 50 cm.
2 | METHODS
2.1 | GPR survey
Commissioned by the GOREV project, the wider geophysical land-
scape survey was conducted by ZAMG ArcheoProspections©, the
F IGURE 2 The parcel ditches at Heimdalsjordet as identified via ground penetrating radar (dark grey shades) and excavation (lighter/yellowshades). The thoroughfare was poorly defined, and faded toward the east. The labeled parcel ditches are referred to in the text. Map Source:Norwegian Mapping Authority, Geovekst, and Municipalities 2020 [Color figure can be viewed at wileyonlinelibrary.com]
CANNELL ET AL. | 751
Vienna Institute for Archaeological Science (VIAS), and their colla-
borative partners. The GPR survey encompassed 454 ha of land,
centered on the Gokstad Mound. The data used for this study were
produced using a 16‐channel MÅLA MIRA array with 8 cm in‐line and
cross‐line spacing, using 400MHz antennas, pushed by a small trac-
tor while using a GNSS real‐time kinematic positioning system that
had a 5Hz position update rates. GPR data were first processed
using ApRadar software (ZAMG ArcheoProspections©/LBI ArchPro)
for trace interpolation, time‐zero corrections, band‐pass frequency
filtering, spike removal, de‐wow filters, average‐trace‐removal,
amplitude‐gain corrections, amplitude balancing, and Hilbert trans-
formation (Schneidhofer et al., 2017; Trinks et al., 2018). The sub-
sequent data set was then subject to visual filtering to enhance
various aspects of the data set for interpretation. This study employs
only a small area of this larger survey, which formed the basis for
landscape analysis for archaeological and paleoenvironmental re-
search by Schneidhofer et al. (2017).
2.2 | Coring
Cores were taken using a manual Eikelkjamp soil corer for hard soils,
which takes undisturbed cores in a single use clear plastic liner, each
measuring 300mm in length, with a 49mm diameter, with a 50mm
cutting head. Cores were taken into the B horizon where it appeared
devoid of archaeological material of interest, unless the core was
specifically taken to sample the soil conditions. In these few cases,
the core was taken into the C horizon (up to 2.35m in depth).
From the area mechanically stripped of topsoil for the excavation
in parcels 1, 2, 6, and 9–14, 15 cores were taken from the exposed
surface into the visible parcel ditches. This was after selected sec-
tions of the parcel ditches had been excavated, to confirm the nature
of the archaeology. Locations were selected to be representative of
the ditches composition, close to recorded sections, and avoiding the
extensive modern drainage ditches.
Coring samples as prospection were taken where GPR data
had identified similar features of interest (Figure 4a,b). In total,
12 cores were taken for prospection, and without exception,
archaeological deposits similar to the excavated parcel ditches
were identified in the prospection cores.
When coring excavated contexts or for background samples, the
300mm core sections were entirely manageable. Coring for pro-
spection was more challenging. As each core section was 300mm
with a 50mm cutting head, and the topsoil depth varied, between
c. 20 and 28 cm, averaging 26 cm, this resulted in the truncated
archaeology below the topsoil being missed in the cores. Essentially it
was gathered in the cutting head between cores, as in some parts the
surviving archaeology was only a few centimetres thick. The solution
F IGURE 3 Soil map showing the main categories of soil in the Heimdalsjordet area, based on the WRB system of classification (F.A.O, 2006).The case study site is outlined with a dashed line. To the north is the Gokstad Mound. Background is a hillshade model from LiDAR data. Please
note that areas without colors referred to in the key are not currently classified. Map Source: NIBIO/Norwegian Mapping Authority, Geovekst,and Municipalities 2020 [Color figure can be viewed at wileyonlinelibrary.com]
752 | CANNELL ET AL.
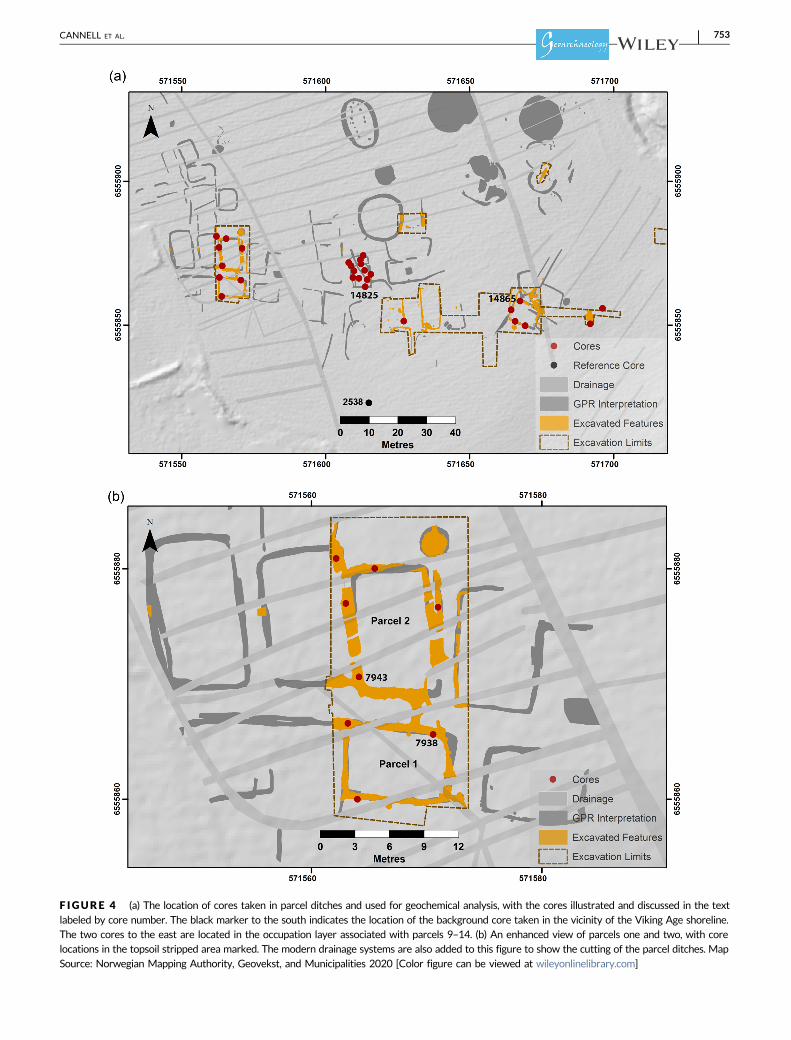
F IGURE 4 (a) The location of cores taken in parcel ditches and used for geochemical analysis, with the cores illustrated and discussed in the text
labeled by core number. The black marker to the south indicates the location of the background core taken in the vicinity of the Viking Age shoreline.The two cores to the east are located in the occupation layer associated with parcels 9–14. (b) An enhanced view of parcels one and two, with corelocations in the topsoil stripped area marked. The modern drainage systems are also added to this figure to show the cutting of the parcel ditches. Map
Source: Norwegian Mapping Authority, Geovekst, and Municipalities 2020 [Color figure can be viewed at wileyonlinelibrary.com]
CANNELL ET AL. | 753
was to core the first 10–15 cm of the topsoil and remove this before
continuing the core. The result was that the uppermost 15 cm of
topsoil was missing, leaving in the region of 10 cm of the lower
topsoil for sampling. The process was applied to parcels 16 and
17–20, although parcels 17–20 proved to be too disturbed and
truncated to be used for analysis.
2.3 | Background sampling
Middleton and Price (1996) suggested that, ideally, an off‐site horizon
should be found that is contemporary to and similar in properties to the
measured archaeological horizon, and free from anthropogenic influ-
ence, which could then be measured for background values. Finding
such an elusive soil while working in intensity cultivated land, is near
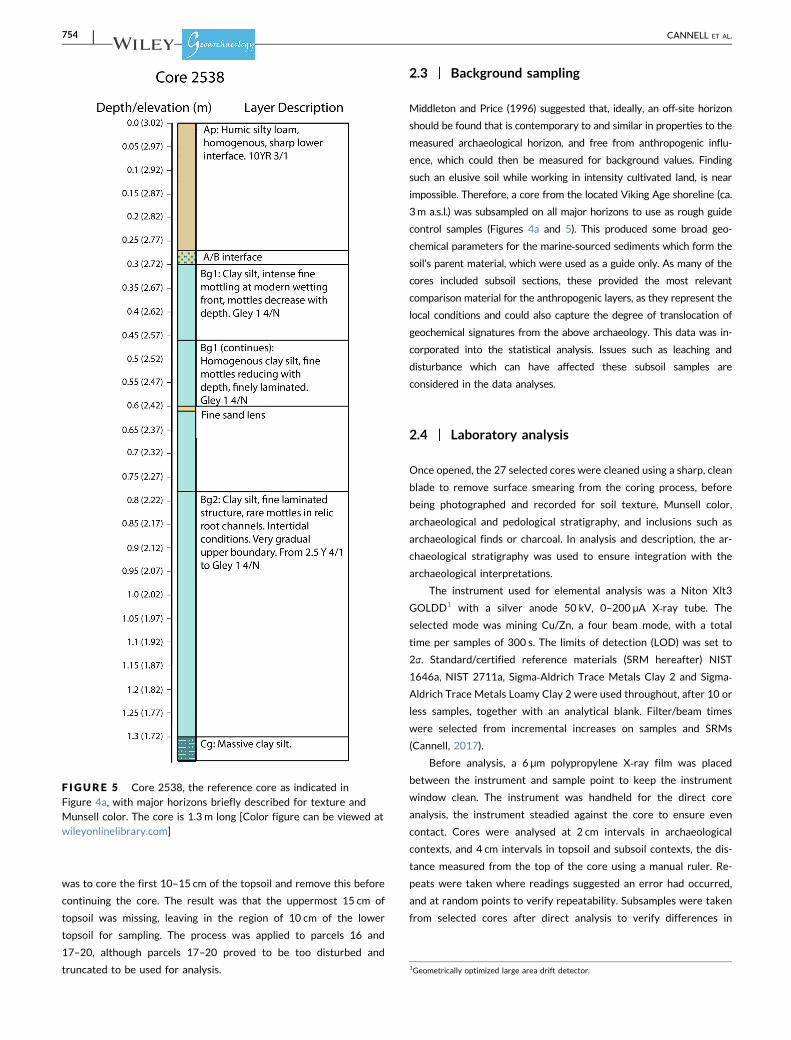
impossible. Therefore, a core from the located Viking Age shoreline (ca.
3m a.s.l.) was subsampled on all major horizons to use as rough guide
control samples (Figures 4a and 5). This produced some broad geo-
chemical parameters for the marine‐sourced sediments which form the
soil's parent material, which were used as a guide only. As many of the
cores included subsoil sections, these provided the most relevant
comparison material for the anthropogenic layers, as they represent the
local conditions and could also capture the degree of translocation of
geochemical signatures from the above archaeology. This data was in-
corporated into the statistical analysis. Issues such as leaching and
disturbance which can have affected these subsoil samples are
considered in the data analyses.
2.4 | Laboratory analysis
Once opened, the 27 selected cores were cleaned using a sharp, clean
blade to remove surface smearing from the coring process, before
being photographed and recorded for soil texture, Munsell color,
archaeological and pedological stratigraphy, and inclusions such as
archaeological finds or charcoal. In analysis and description, the ar-
chaeological stratigraphy was used to ensure integration with the
archaeological interpretations.
The instrument used for elemental analysis was a Niton Xlt3
GOLDD1 with a silver anode 50 kV, 0–200 µA X‐ray tube. The
selected mode was mining Cu/Zn, a four beam mode, with a total
time per samples of 300 s. The limits of detection (LOD) was set to
2σ. Standard/certified reference materials (SRM hereafter) NIST
1646a, NIST 2711a, Sigma‐Aldrich Trace Metals Clay 2 and Sigma‐Aldrich Trace Metals Loamy Clay 2 were used throughout, after 10 or
less samples, together with an analytical blank. Filter/beam times
were selected from incremental increases on samples and SRMs
(Cannell, 2017).
Before analysis, a 6 µm polypropylene X‐ray film was placed
between the instrument and sample point to keep the instrument
window clean. The instrument was handheld for the direct core
analysis, the instrument steadied against the core to ensure even
contact. Cores were analysed at 2 cm intervals in archaeological
contexts, and 4 cm intervals in topsoil and subsoil contexts, the dis-
tance measured from the top of the core using a manual ruler. Re-
peats were taken where readings suggested an error had occurred,
and at random points to verify repeatability. Subsamples were taken
from selected cores after direct analysis to verify differences in
F IGURE 5 Core 2538, the reference core as indicated in
Figure 4a, with major horizons briefly described for texture andMunsell color. The core is 1.3 m long [Color figure can be viewed atwileyonlinelibrary.com]
1Geometrically optimized large area drift detector.
754 | CANNELL ET AL.
values and error as a result of sample processing. All data used for
interpretation was calibrated to the SRM data, although the method
of analysis renders the data semiquantitative at best.
2.5 | Data processing
Data was processed using IBM SPSS 23, Rockworks 15 by Rockware,
and Microsoft Excel. The data set consisted of 374 sample points. These
were classed according to stratigraphic horizon, under three broad ca-
tegories of topsoil (T, n =54), subsoil (S, n = 89) and archaeology/an-
thropogenic (A, n =231). Categories subsoil (S) and topsoil (T) were also
grouped as nonarchaeological (N). In addition, based upon interpreta-
tions from excavation records and observations in cores supplemented
by comprehensive micromorphology data (Macphail et al., 2014), ar-
chaeological horizons were classed into early (E, n = 74) or late (L,
n = 116) phases of occupation. The phasing only included sample points
where micromorphology or stratigraphical observation could support
phasing interpretations, on a parcel by parcel basis (Macphail
et al., 2014; Macphail et al., 2016). The creation of subgroups within the
geochemical data set was to allow parametric testing of groups to va-
lidate interpretations. Eighteen elements were selected for parametric
testing. The initial selection criteria being those elements that could be
calibrated, and produced significant results (over LOD set to 2σ), and
subsequently elements were selected where previous experience and
published research suggested they could be interpreted as potentially
the result of past anthropogenic activity (e.g., Cannell, Cheetham, &
Welham, 2017; Cook et al., 2005; Entwistle et al., 1998, 2000; Knudson,
Frink, Hoffman, & Price, 2004; Middleton, 1996; Oonk et al., 2009;
Wilson et al., 2008). The resulting data sets of 6,732 measured values
(374 sample points for 18 elements) were then subjected to statistical
analysis.
Before proceeding to principal component analysis (PCA), a one‐tailed analysis of variance (ANOVA) test with A/N as a dependant
variable was performed. The result (F 5.187, 0.000 significance value)
confirmed there was significant variation between the archaeological
and nonarchaeological soils. While some elements had a normal dis-
tribution, others, particularly metals such as Cu, Pb, and Ag, were
skewed. Pearson's correlation (two‐tailed) was used; however, this as-
sumes a normal distribution of the data. To compensate, in tandem,
bootstrapping was performed on all data, and separately on the topsoil
only data set. This was done as the lower sample number (n = 54) meant
that there was a degree of uncertainty in whether the PCA results for
this data set were significant (see below). Bootstrapping does not as-
sume normal distribution, and can be used to test the robustness of
correlations identified via other statistical tests.
All data was then standardized (Z score) before covariance PCA
analysis. PCA is sensitive to outliers/extreme values, which are re-
duced via standardization. Varimax rotation was selected as the data
has a few dominant component loadings, such as those connected to
soil structure, and some far smaller, which include zero values (e.g.,
Sn and Ag). A nonrotated data set is also simultaneously produced to
verify interpretations (Abdi, 2003; Abdi & Williams, 2010).
The standardized data set was then tested in classified groups
(topsoil = T, archaeology = A, subsoil = S, see above) To discern
leaching into the subsoil, modern contamination of topsoil, archae-
ological horizons, and how effectively PCA could isolate soil pro-
cesses and past human activity. The number of components
considered significant was determined as four by scree plot (Abdi &
Williams, 2010); although in all cases all eigenvalues over 0.8 were
extracted. Further geostatistical analysis to relate localized en-
hancement of the interpreted factors/principal components was not
done as the data are unsuitable.
To verify that PCA on each of the data sets would produce valid
results for interpretation, a Kaiser–Meyer–Olkin measure of sam-
pling adequacy was performed on both the standardized data set as a
whole, and the topsoil only data set. The results were similar, with
0.726 for the whole data set, and 0.717 for the topsoil only. Results
between 0.6 and 1 are seen as suggesting the variance within the
data set is not random chance, but significant and suitable for PCA.
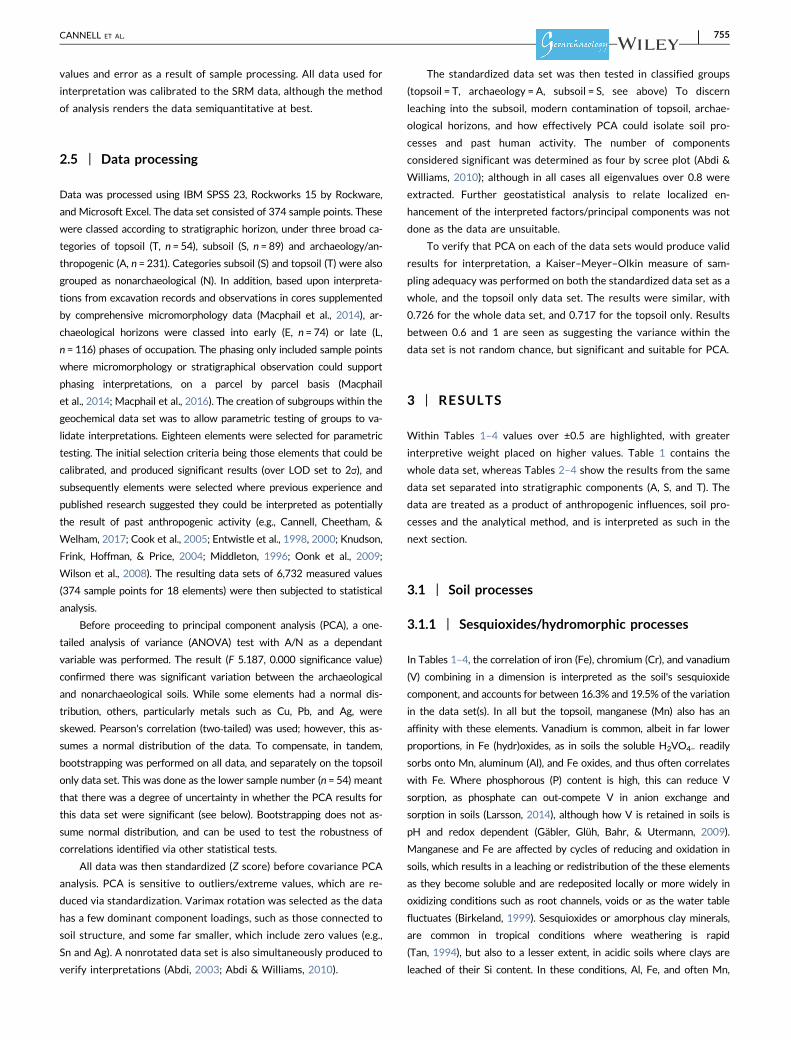
3 | RESULTS
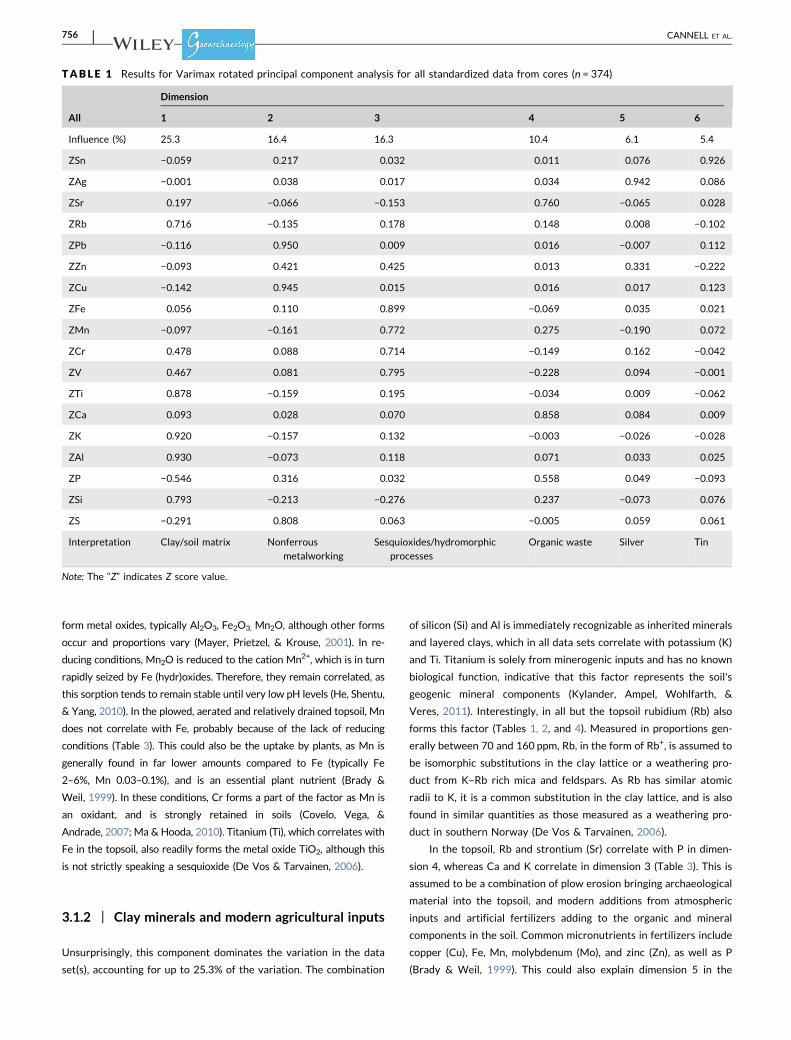
Within Tables 1–4 values over ±0.5 are highlighted, with greater
interpretive weight placed on higher values. Table 1 contains the
whole data set, whereas Tables 2–4 show the results from the same
data set separated into stratigraphic components (A, S, and T). The
data are treated as a product of anthropogenic influences, soil pro-
cesses and the analytical method, and is interpreted as such in the
next section.
3.1 | Soil processes
3.1.1 | Sesquioxides/hydromorphic processes
In Tables 1–4, the correlation of iron (Fe), chromium (Cr), and vanadium
(V) combining in a dimension is interpreted as the soil's sesquioxide
component, and accounts for between 16.3% and 19.5% of the variation
in the data set(s). In all but the topsoil, manganese (Mn) also has an
affinity with these elements. Vanadium is common, albeit in far lower
proportions, in Fe (hydr)oxides, as in soils the soluble H2VO4− readily
sorbs onto Mn, aluminum (Al), and Fe oxides, and thus often correlates
with Fe. Where phosphorous (P) content is high, this can reduce V
sorption, as phosphate can out‐compete V in anion exchange and
sorption in soils (Larsson, 2014), although how V is retained in soils is
pH and redox dependent (Gäbler, Glüh, Bahr, & Utermann, 2009).
Manganese and Fe are affected by cycles of reducing and oxidation in
soils, which results in a leaching or redistribution of the these elements
as they become soluble and are redeposited locally or more widely in
oxidizing conditions such as root channels, voids or as the water table
fluctuates (Birkeland, 1999). Sesquioxides or amorphous clay minerals,
are common in tropical conditions where weathering is rapid
(Tan, 1994), but also to a lesser extent, in acidic soils where clays are
leached of their Si content. In these conditions, Al, Fe, and often Mn,
CANNELL ET AL. | 755
form metal oxides, typically Al2O3, Fe2O3, Mn2O, although other forms
occur and proportions vary (Mayer, Prietzel, & Krouse, 2001). In re-
ducing conditions, Mn2O is reduced to the cation Mn2+, which is in turn
rapidly seized by Fe (hydr)oxides. Therefore, they remain correlated, as
this sorption tends to remain stable until very low pH levels (He, Shentu,
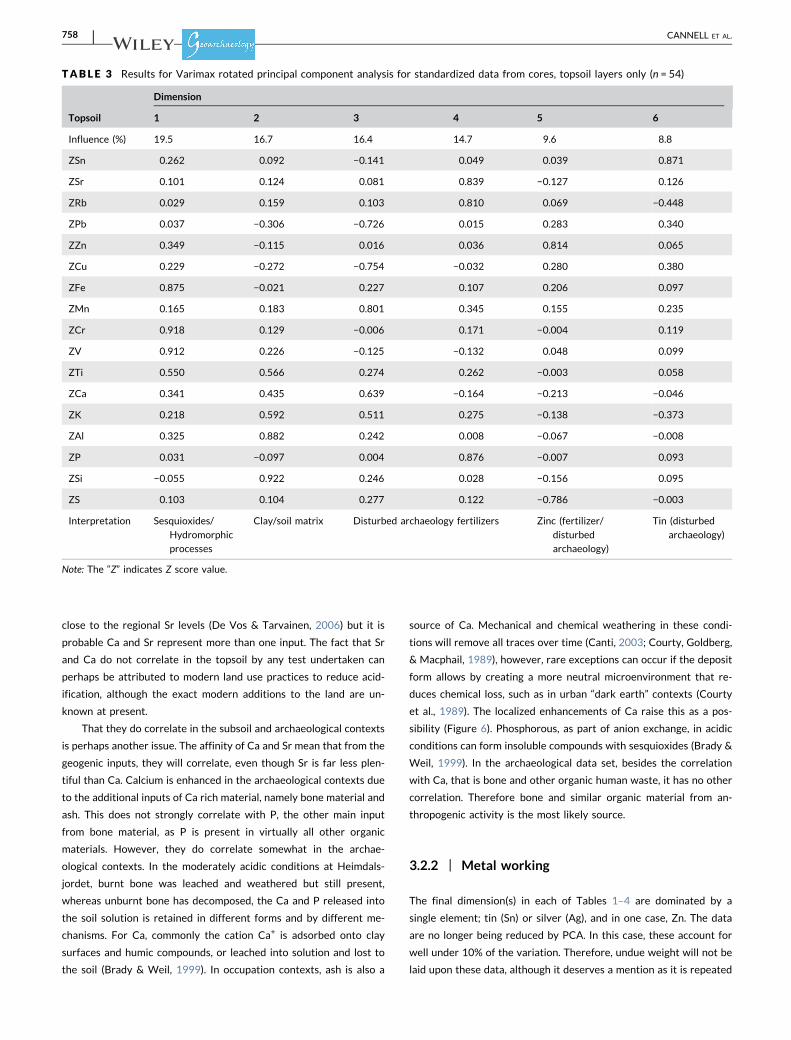
& Yang, 2010). In the plowed, aerated and relatively drained topsoil, Mn
does not correlate with Fe, probably because of the lack of reducing
conditions (Table 3). This could also be the uptake by plants, as Mn is
generally found in far lower amounts compared to Fe (typically Fe
2–6%, Mn 0.03–0.1%), and is an essential plant nutrient (Brady &
Weil, 1999). In these conditions, Cr forms a part of the factor as Mn is
an oxidant, and is strongly retained in soils (Covelo, Vega, &
Andrade, 2007; Ma & Hooda, 2010). Titanium (Ti), which correlates with
Fe in the topsoil, also readily forms the metal oxide TiO2, although this
is not strictly speaking a sesquioxide (De Vos & Tarvainen, 2006).
3.1.2 | Clay minerals and modern agricultural inputs
Unsurprisingly, this component dominates the variation in the data
set(s), accounting for up to 25.3% of the variation. The combination
of silicon (Si) and Al is immediately recognizable as inherited minerals
and layered clays, which in all data sets correlate with potassium (K)
and Ti. Titanium is solely from minerogenic inputs and has no known
biological function, indicative that this factor represents the soil's
geogenic mineral components (Kylander, Ampel, Wohlfarth, &
Veres, 2011). Interestingly, in all but the topsoil rubidium (Rb) also
forms this factor (Tables 1, 2, and 4). Measured in proportions gen-
erally between 70 and 160 ppm, Rb, in the form of Rb+, is assumed to
be isomorphic substitutions in the clay lattice or a weathering pro-
duct from K–Rb rich mica and feldspars. As Rb has similar atomic
radii to K, it is a common substitution in the clay lattice, and is also
found in similar quantities as those measured as a weathering pro-
duct in southern Norway (De Vos & Tarvainen, 2006).
In the topsoil, Rb and strontium (Sr) correlate with P in dimen-
sion 4, whereas Ca and K correlate in dimension 3 (Table 3). This is
assumed to be a combination of plow erosion bringing archaeological
material into the topsoil, and modern additions from atmospheric
inputs and artificial fertilizers adding to the organic and mineral
components in the soil. Common micronutrients in fertilizers include
copper (Cu), Fe, Mn, molybdenum (Mo), and zinc (Zn), as well as P
(Brady & Weil, 1999). This could also explain dimension 5 in the
TABLE 1 Results for Varimax rotated principal component analysis for all standardized data from cores (n = 374)
All
Dimension
1 2 3 4 5 6
Influence (%) 25.3 16.4 16.3 10.4 6.1 5.4
ZSn −0.059 0.217 0.032 0.011 0.076 0.926
ZAg −0.001 0.038 0.017 0.034 0.942 0.086
ZSr 0.197 −0.066 −0.153 0.760 −0.065 0.028
ZRb 0.716 −0.135 0.178 0.148 0.008 −0.102
ZPb −0.116 0.950 0.009 0.016 −0.007 0.112
ZZn −0.093 0.421 0.425 0.013 0.331 −0.222
ZCu −0.142 0.945 0.015 0.016 0.017 0.123
ZFe 0.056 0.110 0.899 −0.069 0.035 0.021
ZMn −0.097 −0.161 0.772 0.275 −0.190 0.072
ZCr 0.478 0.088 0.714 −0.149 0.162 −0.042
ZV 0.467 0.081 0.795 −0.228 0.094 −0.001
ZTi 0.878 −0.159 0.195 −0.034 0.009 −0.062
ZCa 0.093 0.028 0.070 0.858 0.084 0.009
ZK 0.920 −0.157 0.132 −0.003 −0.026 −0.028
ZAl 0.930 −0.073 0.118 0.071 0.033 0.025
ZP −0.546 0.316 0.032 0.558 0.049 −0.093
ZSi 0.793 −0.213 −0.276 0.237 −0.073 0.076
ZS −0.291 0.808 0.063 −0.005 0.059 0.061
Interpretation Clay/soil matrix Nonferrous
metalworking
Sesquioxides/hydromorphic
processes
Organic waste Silver Tin
Note: The “Z” indicates Z score value.
756 | CANNELL ET AL.
topsoil as Zn alone. Unfortunately, the type and use of modern fer-
tilizers on the site is not known, but certain fertilizers are a source of
accumulating Zn, and of course other elements utilized by plants
(Stacey, McLaughlin, & Hettiarachchi, 2010). Zinc can be from several
sources, and it appears in background and subsoil samples where it is
tentatively interpreted as marine‐sourced (Tables 4 and 6; De Vos &
Tarvainen, 2006). From the range of values for Zn, anthropogenic
inputs in the parcel ditch backfills are modestly enhanced over sub-
soil levels of Zn, and are interpreted as human inputs without a clear
source (Table 5). Zinc has been associated with bone material
and general human occupation (Entwistle, et al. 1998; Ottaway &
Matthews, 1988).
3.2 | Anthropogenic
3.2.1 | Organic waste
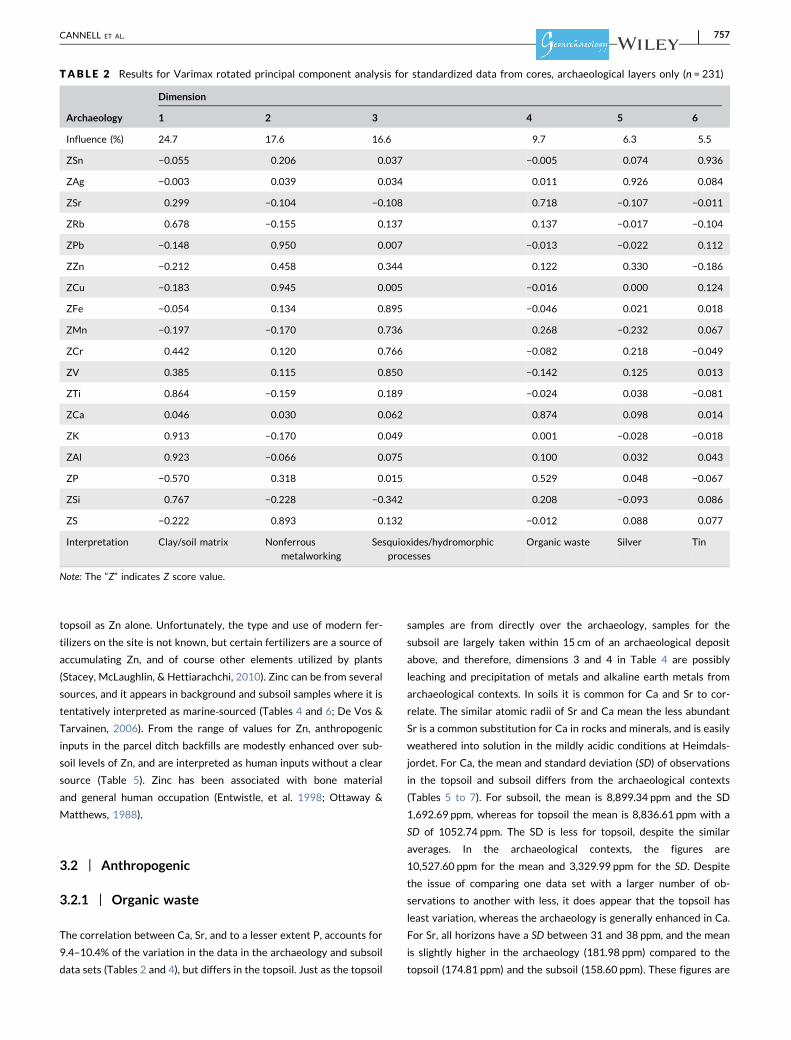
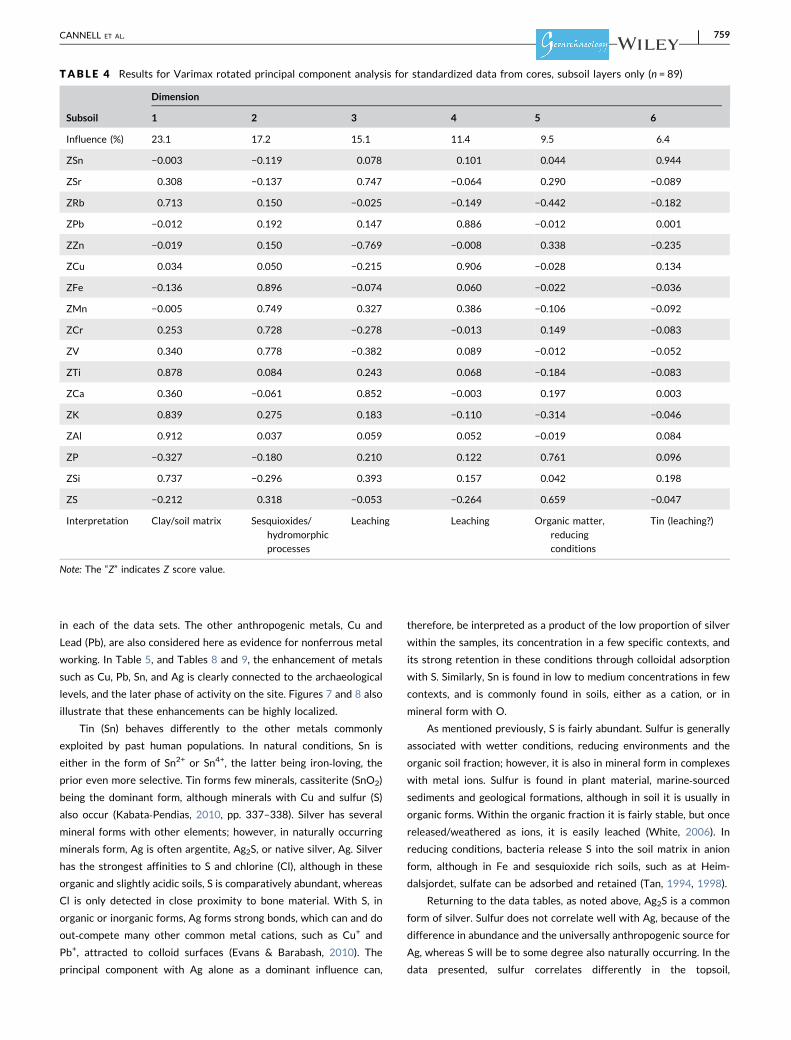
The correlation between Ca, Sr, and to a lesser extent P, accounts for
9.4–10.4% of the variation in the data in the archaeology and subsoil
data sets (Tables 2 and 4), but differs in the topsoil. Just as the topsoil
samples are from directly over the archaeology, samples for the
subsoil are largely taken within 15 cm of an archaeological deposit
above, and therefore, dimensions 3 and 4 in Table 4 are possibly
leaching and precipitation of metals and alkaline earth metals from
archaeological contexts. In soils it is common for Ca and Sr to cor-
relate. The similar atomic radii of Sr and Ca mean the less abundant
Sr is a common substitution for Ca in rocks and minerals, and is easily
weathered into solution in the mildly acidic conditions at Heimdals-
jordet. For Ca, the mean and standard deviation (SD) of observations
in the topsoil and subsoil differs from the archaeological contexts
(Tables 5 to 7). For subsoil, the mean is 8,899.34 ppm and the SD
1,692.69 ppm, whereas for topsoil the mean is 8,836.61 ppm with a
SD of 1052.74 ppm. The SD is less for topsoil, despite the similar
averages. In the archaeological contexts, the figures are
10,527.60 ppm for the mean and 3,329.99 ppm for the SD. Despite
the issue of comparing one data set with a larger number of ob-
servations to another with less, it does appear that the topsoil has
least variation, whereas the archaeology is generally enhanced in Ca.
For Sr, all horizons have a SD between 31 and 38 ppm, and the mean
is slightly higher in the archaeology (181.98 ppm) compared to the
topsoil (174.81 ppm) and the subsoil (158.60 ppm). These figures are
TABLE 2 Results for Varimax rotated principal component analysis for standardized data from cores, archaeological layers only (n = 231)
Archaeology
Dimension
1 2 3 4 5 6
Influence (%) 24.7 17.6 16.6 9.7 6.3 5.5
ZSn −0.055 0.206 0.037 −0.005 0.074 0.936
ZAg −0.003 0.039 0.034 0.011 0.926 0.084
ZSr 0.299 −0.104 −0.108 0.718 −0.107 −0.011
ZRb 0.678 −0.155 0.137 0.137 −0.017 −0.104
ZPb −0.148 0.950 0.007 −0.013 −0.022 0.112
ZZn −0.212 0.458 0.344 0.122 0.330 −0.186
ZCu −0.183 0.945 0.005 −0.016 0.000 0.124
ZFe −0.054 0.134 0.895 −0.046 0.021 0.018
ZMn −0.197 −0.170 0.736 0.268 −0.232 0.067
ZCr 0.442 0.120 0.766 −0.082 0.218 −0.049
ZV 0.385 0.115 0.850 −0.142 0.125 0.013
ZTi 0.864 −0.159 0.189 −0.024 0.038 −0.081
ZCa 0.046 0.030 0.062 0.874 0.098 0.014
ZK 0.913 −0.170 0.049 0.001 −0.028 −0.018
ZAl 0.923 −0.066 0.075 0.100 0.032 0.043
ZP −0.570 0.318 0.015 0.529 0.048 −0.067
ZSi 0.767 −0.228 −0.342 0.208 −0.093 0.086
ZS −0.222 0.893 0.132 −0.012 0.088 0.077
Interpretation Clay/soil matrix Nonferrous
metalworking
Sesquioxides/hydromorphic
processes
Organic waste Silver Tin
Note: The “Z” indicates Z score value.
CANNELL ET AL. | 757
close to the regional Sr levels (De Vos & Tarvainen, 2006) but it is
probable Ca and Sr represent more than one input. The fact that Sr
and Ca do not correlate in the topsoil by any test undertaken can
perhaps be attributed to modern land use practices to reduce acid-
ification, although the exact modern additions to the land are un-
known at present.
That they do correlate in the subsoil and archaeological contexts
is perhaps another issue. The affinity of Ca and Sr mean that from the
geogenic inputs, they will correlate, even though Sr is far less plen-
tiful than Ca. Calcium is enhanced in the archaeological contexts due
to the additional inputs of Ca rich material, namely bone material and
ash. This does not strongly correlate with P, the other main input
from bone material, as P is present in virtually all other organic
materials. However, they do correlate somewhat in the archae-
ological contexts. In the moderately acidic conditions at Heimdals-
jordet, burnt bone was leached and weathered but still present,
whereas unburnt bone has decomposed, the Ca and P released into
the soil solution is retained in different forms and by different me-
chanisms. For Ca, commonly the cation Ca+ is adsorbed onto clay
surfaces and humic compounds, or leached into solution and lost to
the soil (Brady & Weil, 1999). In occupation contexts, ash is also a
source of Ca. Mechanical and chemical weathering in these condi-
tions will remove all traces over time (Canti, 2003; Courty, Goldberg,
& Macphail, 1989), however, rare exceptions can occur if the deposit
form allows by creating a more neutral microenvironment that re-
duces chemical loss, such as in urban “dark earth” contexts (Courty
et al., 1989). The localized enhancements of Ca raise this as a pos-
sibility (Figure 6). Phosphorous, as part of anion exchange, in acidic
conditions can form insoluble compounds with sesquioxides (Brady &
Weil, 1999). In the archaeological data set, besides the correlation
with Ca, that is bone and other organic human waste, it has no other
correlation. Therefore bone and similar organic material from an-
thropogenic activity is the most likely source.
3.2.2 | Metal working
The final dimension(s) in each of Tables 1–4 are dominated by a
single element; tin (Sn) or silver (Ag), and in one case, Zn. The data
are no longer being reduced by PCA. In this case, these account for
well under 10% of the variation. Therefore, undue weight will not be
laid upon these data, although it deserves a mention as it is repeated
TABLE 3 Results for Varimax rotated principal component analysis for standardized data from cores, topsoil layers only (n = 54)
Topsoil
Dimension
1 2 3 4 5 6
Influence (%) 19.5 16.7 16.4 14.7 9.6 8.8
ZSn 0.262 0.092 −0.141 0.049 0.039 0.871
ZSr 0.101 0.124 0.081 0.839 −0.127 0.126
ZRb 0.029 0.159 0.103 0.810 0.069 −0.448
ZPb 0.037 −0.306 −0.726 0.015 0.283 0.340
ZZn 0.349 −0.115 0.016 0.036 0.814 0.065
ZCu 0.229 −0.272 −0.754 −0.032 0.280 0.380
ZFe 0.875 −0.021 0.227 0.107 0.206 0.097
ZMn 0.165 0.183 0.801 0.345 0.155 0.235
ZCr 0.918 0.129 −0.006 0.171 −0.004 0.119
ZV 0.912 0.226 −0.125 −0.132 0.048 0.099
ZTi 0.550 0.566 0.274 0.262 −0.003 0.058
ZCa 0.341 0.435 0.639 −0.164 −0.213 −0.046
ZK 0.218 0.592 0.511 0.275 −0.138 −0.373
ZAl 0.325 0.882 0.242 0.008 −0.067 −0.008
ZP 0.031 −0.097 0.004 0.876 −0.007 0.093
ZSi −0.055 0.922 0.246 0.028 −0.156 0.095
ZS 0.103 0.104 0.277 0.122 −0.786 −0.003
Interpretation Sesquioxides/
Hydromorphic
processes
Clay/soil matrix Disturbed archaeology fertilizers Zinc (fertilizer/
disturbed
archaeology)
Tin (disturbed
archaeology)
Note: The “Z” indicates Z score value.
758 | CANNELL ET AL.
in each of the data sets. The other anthropogenic metals, Cu and
Lead (Pb), are also considered here as evidence for nonferrous metal
working. In Table 5, and Tables 8 and 9, the enhancement of metals
such as Cu, Pb, Sn, and Ag is clearly connected to the archaeological
levels, and the later phase of activity on the site. Figures 7 and 8 also
illustrate that these enhancements can be highly localized.
Tin (Sn) behaves differently to the other metals commonly
exploited by past human populations. In natural conditions, Sn is
either in the form of Sn2+ or Sn4+, the latter being iron‐loving, theprior even more selective. Tin forms few minerals, cassiterite (SnO2)
being the dominant form, although minerals with Cu and sulfur (S)
also occur (Kabata‐Pendias, 2010, pp. 337–338). Silver has several
mineral forms with other elements; however, in naturally occurring
minerals form, Ag is often argentite, Ag2S, or native silver, Ag. Silver
has the strongest affinities to S and chlorine (Cl), although in these
organic and slightly acidic soils, S is comparatively abundant, whereas
Cl is only detected in close proximity to bone material. With S, in
organic or inorganic forms, Ag forms strong bonds, which can and do
out‐compete many other common metal cations, such as Cu+ and
Pb+, attracted to colloid surfaces (Evans & Barabash, 2010). The
principal component with Ag alone as a dominant influence can,
therefore, be interpreted as a product of the low proportion of silver
within the samples, its concentration in a few specific contexts, and
its strong retention in these conditions through colloidal adsorption
with S. Similarly, Sn is found in low to medium concentrations in few
contexts, and is commonly found in soils, either as a cation, or in
mineral form with O.
As mentioned previously, S is fairly abundant. Sulfur is generally
associated with wetter conditions, reducing environments and the
organic soil fraction; however, it is also in mineral form in complexes
with metal ions. Sulfur is found in plant material, marine‐sourcedsediments and geological formations, although in soil it is usually in
organic forms. Within the organic fraction it is fairly stable, but once
released/weathered as ions, it is easily leached (White, 2006). In
reducing conditions, bacteria release S into the soil matrix in anion
form, although in Fe and sesquioxide rich soils, such as at Heim-
dalsjordet, sulfate can be adsorbed and retained (Tan, 1994, 1998).
Returning to the data tables, as noted above, Ag2S is a common
form of silver. Sulfur does not correlate well with Ag, because of the
difference in abundance and the universally anthropogenic source for
Ag, whereas S will be to some degree also naturally occurring. In the
data presented, sulfur correlates differently in the topsoil,
TABLE 4 Results for Varimax rotated principal component analysis for standardized data from cores, subsoil layers only (n = 89)
Subsoil
Dimension
1 2 3 4 5 6
Influence (%) 23.1 17.2 15.1 11.4 9.5 6.4
ZSn −0.003 −0.119 0.078 0.101 0.044 0.944
ZSr 0.308 −0.137 0.747 −0.064 0.290 −0.089
ZRb 0.713 0.150 −0.025 −0.149 −0.442 −0.182
ZPb −0.012 0.192 0.147 0.886 −0.012 0.001
ZZn −0.019 0.150 −0.769 −0.008 0.338 −0.235
ZCu 0.034 0.050 −0.215 0.906 −0.028 0.134
ZFe −0.136 0.896 −0.074 0.060 −0.022 −0.036
ZMn −0.005 0.749 0.327 0.386 −0.106 −0.092
ZCr 0.253 0.728 −0.278 −0.013 0.149 −0.083
ZV 0.340 0.778 −0.382 0.089 −0.012 −0.052
ZTi 0.878 0.084 0.243 0.068 −0.184 −0.083
ZCa 0.360 −0.061 0.852 −0.003 0.197 0.003
ZK 0.839 0.275 0.183 −0.110 −0.314 −0.046
ZAl 0.912 0.037 0.059 0.052 −0.019 0.084
ZP −0.327 −0.180 0.210 0.122 0.761 0.096
ZSi 0.737 −0.296 0.393 0.157 0.042 0.198
ZS −0.212 0.318 −0.053 −0.264 0.659 −0.047
Interpretation Clay/soil matrix Sesquioxides/
hydromorphic
processes
Leaching Leaching Organic matter,
reducing
conditions
Tin (leaching?)
Note: The “Z” indicates Z score value.
CANNELL ET AL. | 759
archaeology and subsoil layers. Indeed in the topsoil, it does not
correlate with much at all, although the bootstrap testing weakly
correlated it with the clay matrix minerals Al, K, Si as well as Mn and
Ca. In the archaeological horizons, S forms a principal component
with Pb and Cu. In the subsoil, it correlates with P. The most common
form of S in soils is the bacterially formed pyrite (FeS2), although
other mineral forms are known, such as the previously mentioned
Ag2S, and other Fe bearing mineral forms (Kabata‐Pendias, 2010;Mees & Stoops, 2010). In the site conditions, S is likely to form stable
sulfides with other metallic ions, such as Cu2+. Lead also has an af-
finity for S, and these forms for both Cu and Pb are fairly insoluble
and unavailable for plant uptake (Hough, 2010). If the soil drains,
some forms of metallic sulfides become oxidized and more soluble
(Kabata‐Pendias, 2010), which explains the presence of Cu and Pb in
the upper subsoil horizons as leached. Together, this implies that the
principal component in the archaeological contexts where Pb, Cu and
S correlate is a result of organic and metal inputs from anthropogenic
activity being subject to intermittent reducing conditions since de-
position. This is highly plausible in hydromorphic soils. Many of the
concentrations of nonferrous metals are in contexts with gleyed
characteristics, including primary and secondary Fe mottles and
coatings.
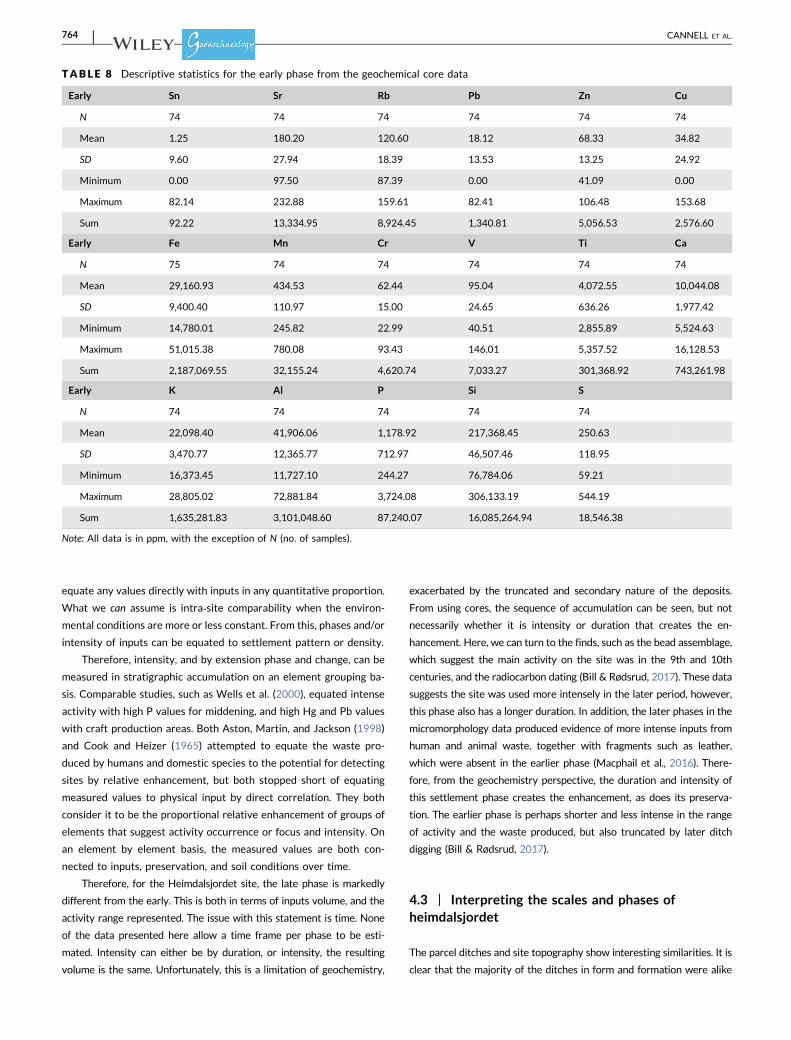
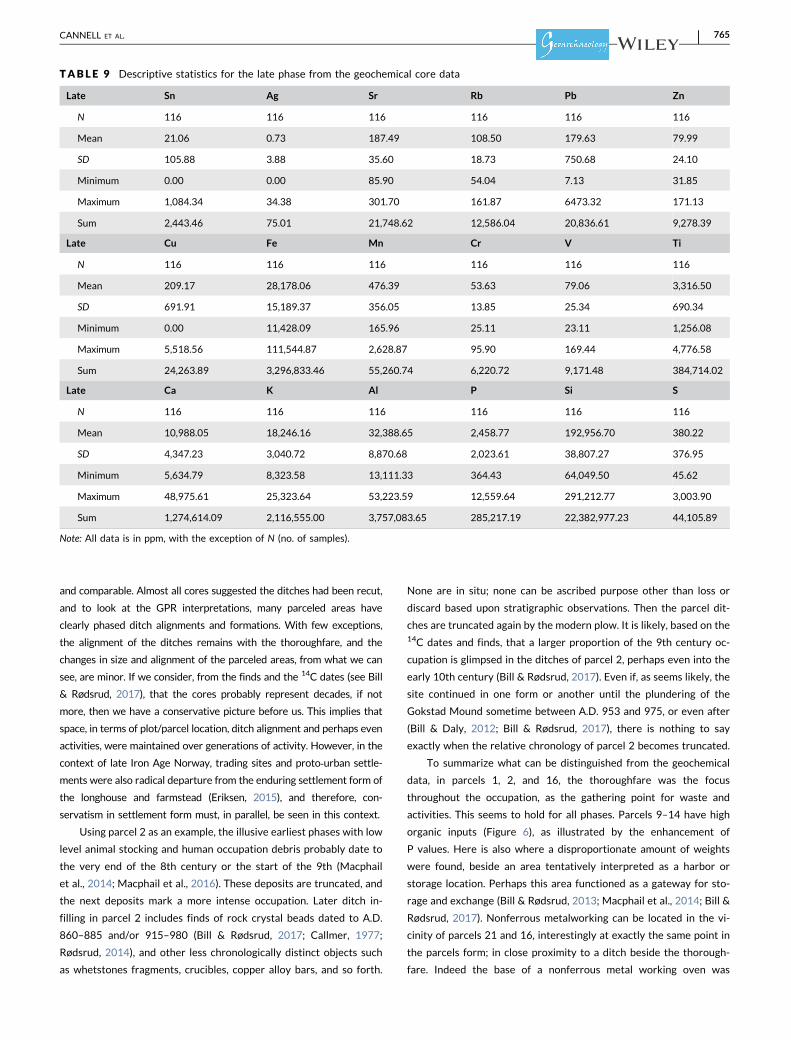
3.3 | Results by phase
The phase results are only considered in terms of descriptive sta-
tistics on the calibrated data (Tables 8 and 9). The cut off between
the early (E) and late (L) phase is based upon elemental values, mi-
cromorphology results, and excavation records, and is imperfect in
that the cores do not necessarily represent the same features and
layers that were recorded during excavation. Visually, the cores
contained more anthropogenic‐sourced inclusions in the later phase,
such as burnt clay, bone, and charcoal, which was also distinguishable
by the geochemical measured values. An early phase with less an-
thropogenic waste and less variation in the waste can therefore be
compared to the later phase, where inputs suggest a wider range of
activities and thus inputs, and considerably more intense.
Of note, when considering the differences between the phases, is
that the mean and SD for the elements extracted as anthropogenic
from PCA analysis are enhanced to varying degrees. For example, Ca
is only slightly enhanced in late phase (Table 9) compared to the early
(Table 5), yet the SD is over twice that of the early phase. In
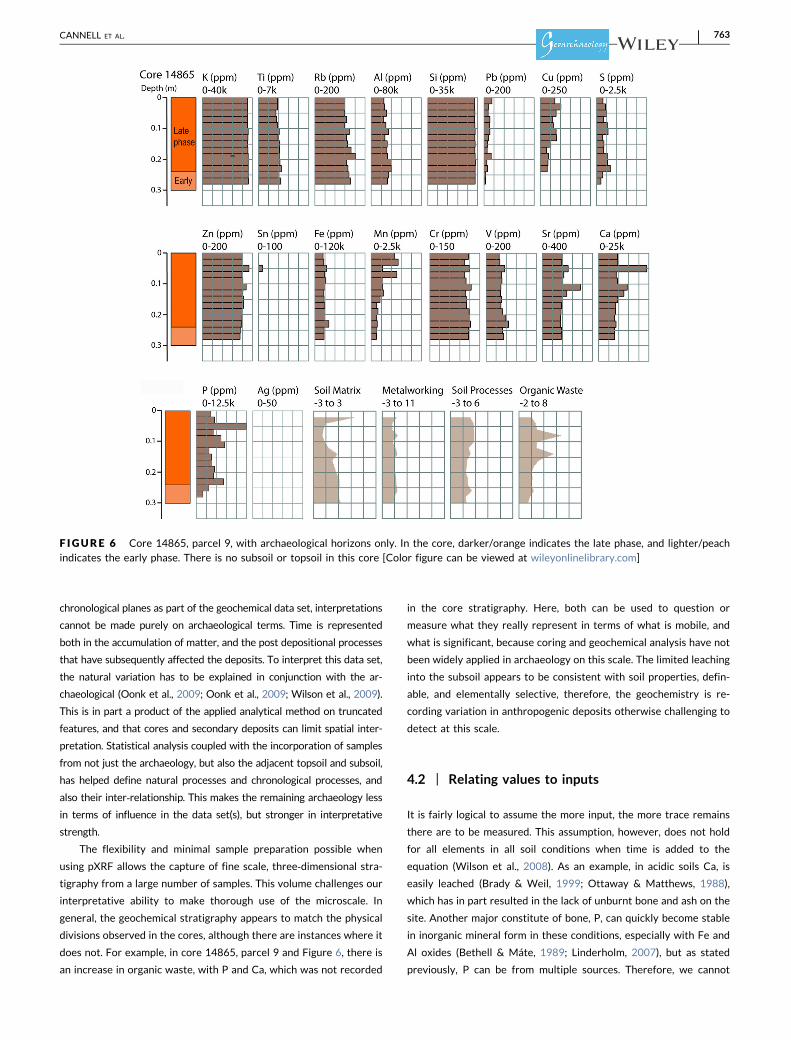
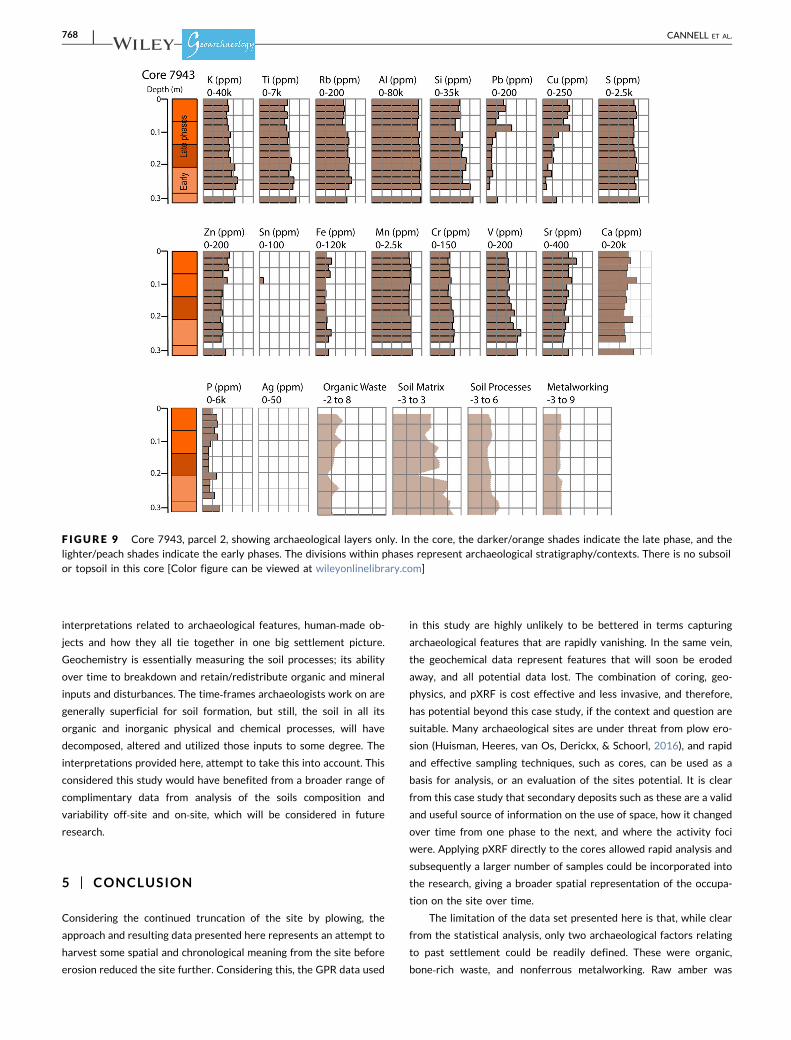
Figures 6–9, the lighter shades define the contexts interpreted as
belonging to the later phase, and corresponds to the peaks in Ca, Sr,
P, Cu, Pb, and S. Conversely, the darker shades relate to contexts
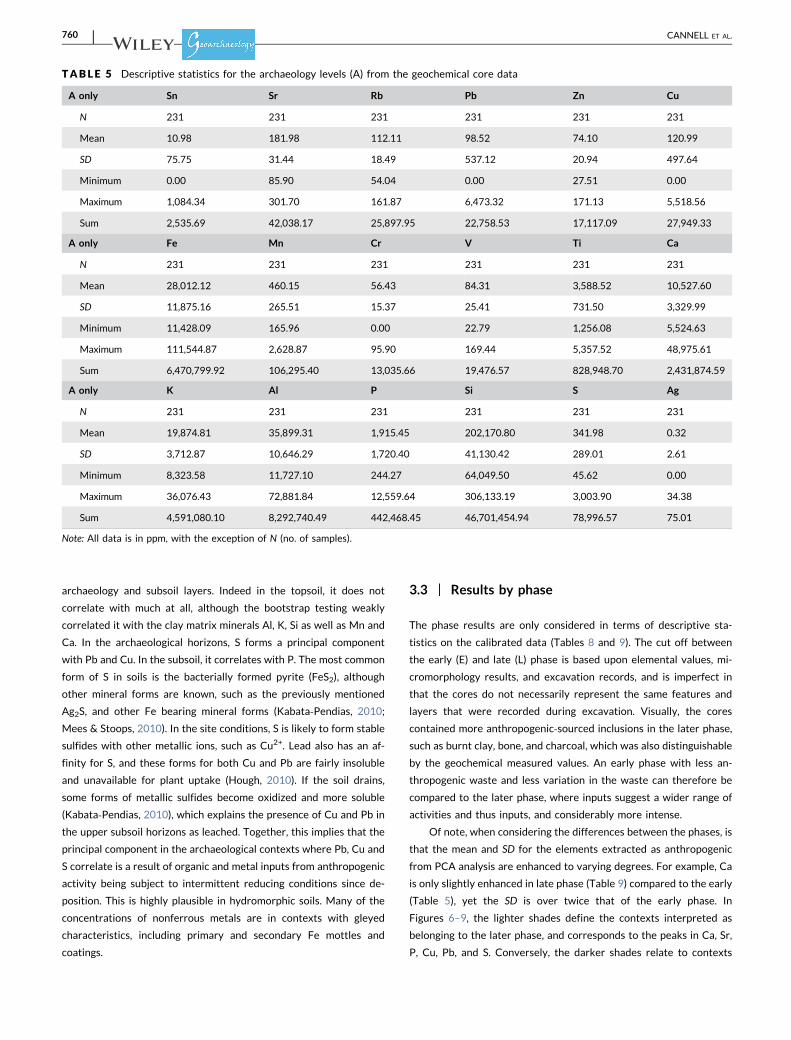
TABLE 5 Descriptive statistics for the archaeology levels (A) from the geochemical core data
A only Sn Sr Rb Pb Zn Cu
N 231 231 231 231 231 231
Mean 10.98 181.98 112.11 98.52 74.10 120.99
SD 75.75 31.44 18.49 537.12 20.94 497.64
Minimum 0.00 85.90 54.04 0.00 27.51 0.00
Maximum 1,084.34 301.70 161.87 6,473.32 171.13 5,518.56
Sum 2,535.69 42,038.17 25,897.95 22,758.53 17,117.09 27,949.33
A only Fe Mn Cr V Ti Ca
N 231 231 231 231 231 231
Mean 28,012.12 460.15 56.43 84.31 3,588.52 10,527.60
SD 11,875.16 265.51 15.37 25.41 731.50 3,329.99
Minimum 11,428.09 165.96 0.00 22.79 1,256.08 5,524.63
Maximum 111,544.87 2,628.87 95.90 169.44 5,357.52 48,975.61
Sum 6,470,799.92 106,295.40 13,035.66 19,476.57 828,948.70 2,431,874.59
A only K Al P Si S Ag
N 231 231 231 231 231 231
Mean 19,874.81 35,899.31 1,915.45 202,170.80 341.98 0.32
SD 3,712.87 10,646.29 1,720.40 41,130.42 289.01 2.61
Minimum 8,323.58 11,727.10 244.27 64,049.50 45.62 0.00
Maximum 36,076.43 72,881.84 12,559.64 306,133.19 3,003.90 34.38
Sum 4,591,080.10 8,292,740.49 442,468.45 46,701,454.94 78,996.57 75.01
Note: All data is in ppm, with the exception of N (no. of samples).
760 | CANNELL ET AL.
belonging to the early phase, where these elements are less en-
hanced. For P, both the mean and SD increase markedly in the later
phase (Tables 8 and 9). From the low sum and mean, it is clear the
nonferrous metals are far rarer in the early phase. As these phase
divisions are using stratigraphic context boundaries, this can be in-
terpreted as that nonferrous metalworking, almost exclusively, is a
later phase phenomenon. Silver can be seen as a minor contribution
to the evidence of nonferrous metalworking in the parcel ditch
backfills. Elements associated with the soil matrix, such as Si and Rb,
decrease slightly in the later phase as proportionately the archae-
ological sediments are more organic and thus marginally less
minerogenic.
3.4 | Cores
On a core‐by‐core basis, a broader, meso‐scale picture can be gath-
ered. Within Figures 6–9 besides the selected cores and elemental
values, are regression scores from the PCA analysis, constructed
from the Z score data using the PCA results. Each regression score is
a standardized score for the data at that sample point, for each di-
mension. The scores are between −3 and +9 in this case. A negative
score means this point/sample has less than average influence on the
principal component, and a positive score means it has a more than
average influence. Thus, the higher the score, the more concentrated
the geochemical causes of each principal component are in that
sample/context. It also follows that principal component regression
scores with the greater value range have more extreme values, and
thus are more influenced by localized concentrations. This is parti-
cularly the case for the anthropogenic factors identified via PCA.
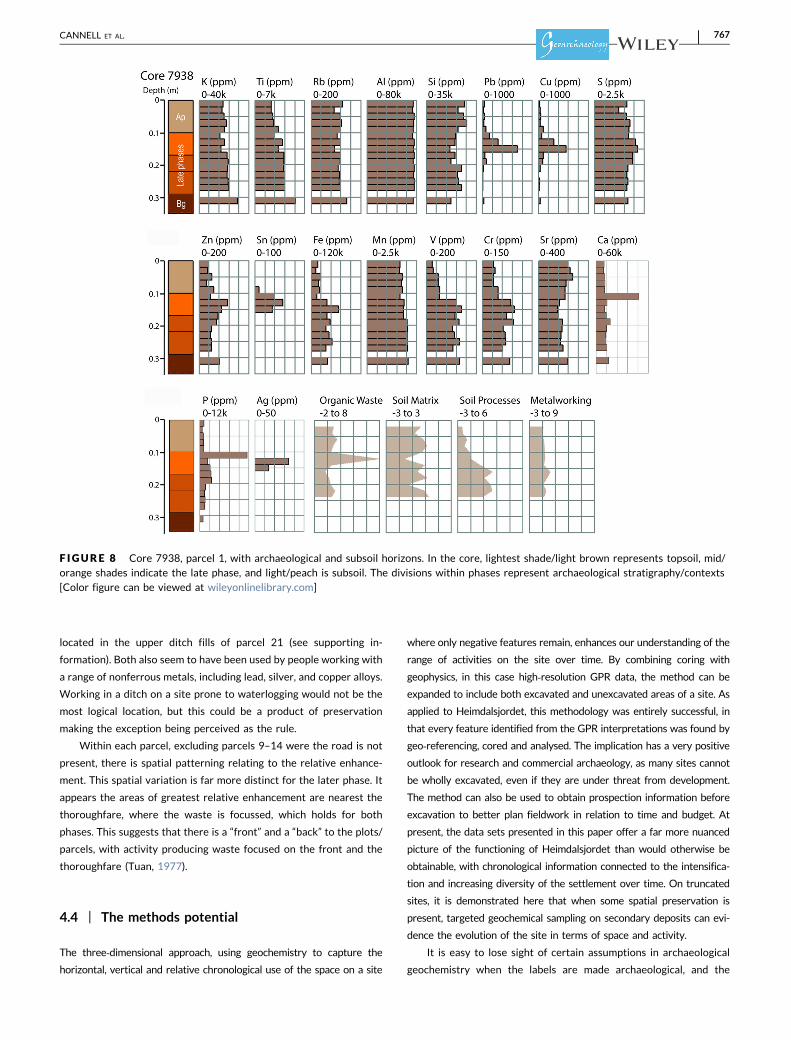
One activity that was clearly localized was nonferrous metal
working. In core 14825 (Figures 4a and 7), there is peak of 6,473 ppm
Pb, and core 7938 (Figures 4b and 8) contains a peak of 11,556 ppm
Pb; the highest values measured in the cores. Covariance between
Pb, Cu, Sn, Zn, and the presence of Ag can be observed in the cores in
Figures 7 and 8, suggesting metal working at or near these locations.
On a core‐by‐core basis, these peaks are also concentrated in cores
taken close to the thoroughfare.
Above the general enhancement of organic material from set-
tlement, as indicated by P and Ca, the episodic nature of the organic
deposits is also apparent in the occasional but marked peaks in the
organic waste dimension. Similarly, the fluctuations in the soil matrix
dimension indicates episodes of in‐washing from precipitation or
flood events, as is evidenced in the micromorphology data (Macphail
et al., 2016). These were also apparent in the cores themselves as
laminated deposits of coarser material with charcoal flecks, often
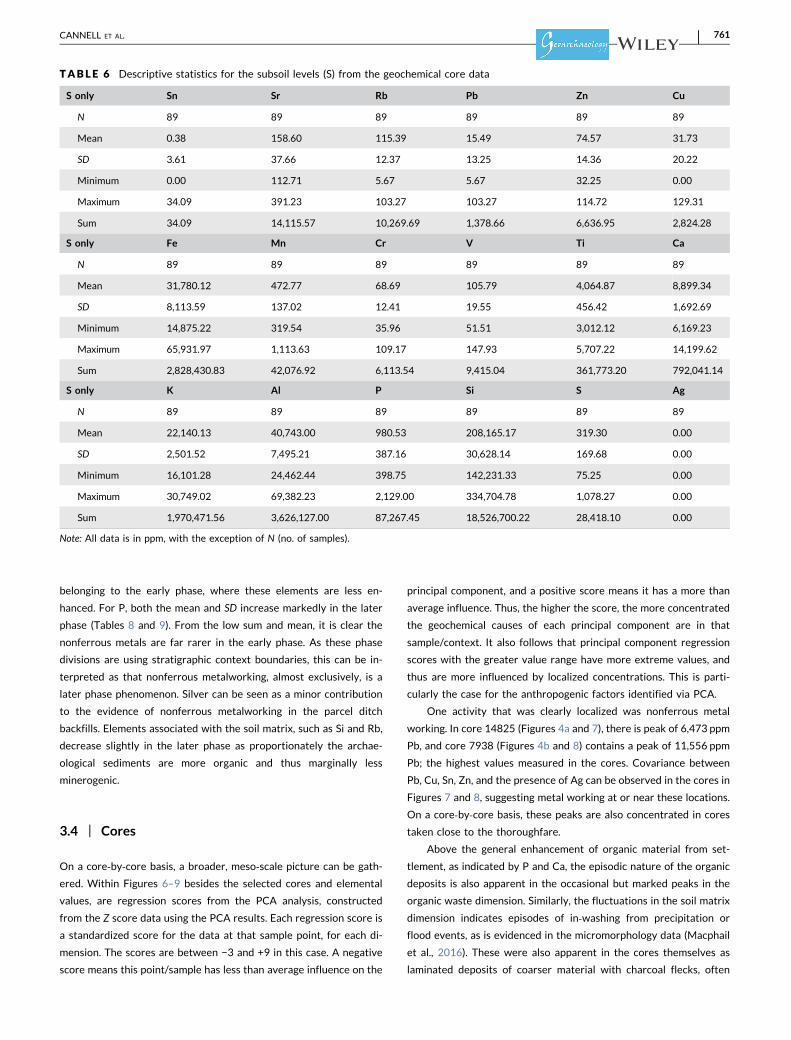
TABLE 6 Descriptive statistics for the subsoil levels (S) from the geochemical core data
S only Sn Sr Rb Pb Zn Cu
N 89 89 89 89 89 89
Mean 0.38 158.60 115.39 15.49 74.57 31.73
SD 3.61 37.66 12.37 13.25 14.36 20.22
Minimum 0.00 112.71 5.67 5.67 32.25 0.00
Maximum 34.09 391.23 103.27 103.27 114.72 129.31
Sum 34.09 14,115.57 10,269.69 1,378.66 6,636.95 2,824.28
S only Fe Mn Cr V Ti Ca
N 89 89 89 89 89 89
Mean 31,780.12 472.77 68.69 105.79 4,064.87 8,899.34
SD 8,113.59 137.02 12.41 19.55 456.42 1,692.69
Minimum 14,875.22 319.54 35.96 51.51 3,012.12 6,169.23
Maximum 65,931.97 1,113.63 109.17 147.93 5,707.22 14,199.62
Sum 2,828,430.83 42,076.92 6,113.54 9,415.04 361,773.20 792,041.14
S only K Al P Si S Ag
N 89 89 89 89 89 89
Mean 22,140.13 40,743.00 980.53 208,165.17 319.30 0.00
SD 2,501.52 7,495.21 387.16 30,628.14 169.68 0.00
Minimum 16,101.28 24,462.44 398.75 142,231.33 75.25 0.00
Maximum 30,749.02 69,382.23 2,129.00 334,704.78 1,078.27 0.00
Sum 1,970,471.56 3,626,127.00 87,267.45 18,526,700.22 28,418.10 0.00
Note: All data is in ppm, with the exception of N (no. of samples).
CANNELL ET AL. | 761
with an erosional lower boundary. The recutting of the parcel ditches
could be seen in sections, and this has removed/disturbed phases.
With the elements associated with organic waste, there is also a
tendency for the highest concentrations to be found in the cores near
the thoroughfare.
3.5 | Summary of interpretations
Clearly soil processes dominate, but here the task is to dis-
criminate the anthropogenic enhancement within and above this.
The combinations of Pb, Cu, and S, probably from sulfide ores,
impurities in refined metals and/or organic inputs, are all mea-
sured at levels far above subsoil levels and background data (De
Vos & Tarvainen, 2006). From the clear connection to the ar-
chaeological levels, and particuarly the later phase of occupation,
these are interpreted as evidence for nonferrous metalworking,
without making the assumption this is the only source of en-
hancement. In the core data, these elements, as well as Ag and Sn,
appear in concentrations on the horizontal and vertical planes
(Figures 6–9). They do not correlate well in the PCA analysis as
they are present in different concentrations, and retained and
mobilized by different soil processes, entered the soil in different
forms, and plural forms probably exist at present; however, they
are all highly likely to represent metalworking.
Human settlement increases organic inputs, which has caused
the enhanced P and S. From the cores these increase in the later
phase of the site, suggesting greater inputs. The enhancement of Ca
and to a lesser extent Sr above the levels from modern land‐use and
geogenic inputs, is also attributed to human activity, including but not
exclusively, ash and bone material.
From the distribution of the enhancement and correlation of the
measured values, it is evident that the deposits contained localized
inputs related to specific activities, such as metal working, and more
generalized inputs from organic refuse from multiple sources. These
accumulated in the ditches by differing acts of deposition, until the
site becomes truncated by the plow.
4 | DISCUSSION
4.1 | Dealing with generalizations in threedimensions
Returning to secondary contexts from cores and in dealing with
samples representing the vertical, horizontal and potentially
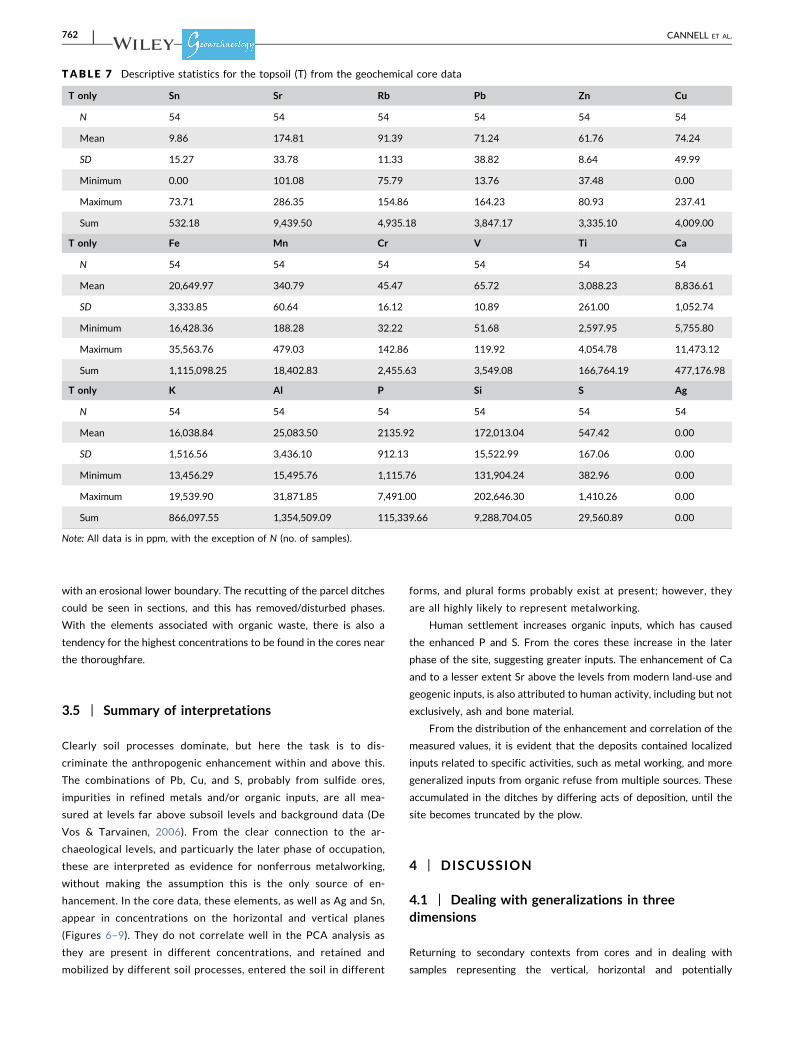
TABLE 7 Descriptive statistics for the topsoil (T) from the geochemical core data
T only Sn Sr Rb Pb Zn Cu
N 54 54 54 54 54 54
Mean 9.86 174.81 91.39 71.24 61.76 74.24
SD 15.27 33.78 11.33 38.82 8.64 49.99
Minimum 0.00 101.08 75.79 13.76 37.48 0.00
Maximum 73.71 286.35 154.86 164.23 80.93 237.41
Sum 532.18 9,439.50 4,935.18 3,847.17 3,335.10 4,009.00
T only Fe Mn Cr V Ti Ca
N 54 54 54 54 54 54
Mean 20,649.97 340.79 45.47 65.72 3,088.23 8,836.61
SD 3,333.85 60.64 16.12 10.89 261.00 1,052.74
Minimum 16,428.36 188.28 32.22 51.68 2,597.95 5,755.80
Maximum 35,563.76 479.03 142.86 119.92 4,054.78 11,473.12
Sum 1,115,098.25 18,402.83 2,455.63 3,549.08 166,764.19 477,176.98
T only K Al P Si S Ag
N 54 54 54 54 54 54
Mean 16,038.84 25,083.50 2135.92 172,013.04 547.42 0.00
SD 1,516.56 3,436.10 912.13 15,522.99 167.06 0.00
Minimum 13,456.29 15,495.76 1,115.76 131,904.24 382.96 0.00
Maximum 19,539.90 31,871.85 7,491.00 202,646.30 1,410.26 0.00
Sum 866,097.55 1,354,509.09 115,339.66 9,288,704.05 29,560.89 0.00
Note: All data is in ppm, with the exception of N (no. of samples).
762 | CANNELL ET AL.
chronological planes as part of the geochemical data set, interpretations
cannot be made purely on archaeological terms. Time is represented
both in the accumulation of matter, and the post depositional processes
that have subsequently affected the deposits. To interpret this data set,
the natural variation has to be explained in conjunction with the ar-
chaeological (Oonk et al., 2009; Oonk et al., 2009; Wilson et al., 2009).
This is in part a product of the applied analytical method on truncated
features, and that cores and secondary deposits can limit spatial inter-
pretation. Statistical analysis coupled with the incorporation of samples
from not just the archaeology, but also the adjacent topsoil and subsoil,
has helped define natural processes and chronological processes, and
also their inter‐relationship. This makes the remaining archaeology less
in terms of influence in the data set(s), but stronger in interpretative
strength.
The flexibility and minimal sample preparation possible when
using pXRF allows the capture of fine scale, three‐dimensional stra-
tigraphy from a large number of samples. This volume challenges our
interpretative ability to make thorough use of the microscale. In
general, the geochemical stratigraphy appears to match the physical
divisions observed in the cores, although there are instances where it
does not. For example, in core 14865, parcel 9 and Figure 6, there is
an increase in organic waste, with P and Ca, which was not recorded
in the core stratigraphy. Here, both can be used to question or
measure what they really represent in terms of what is mobile, and
what is significant, because coring and geochemical analysis have not
been widely applied in archaeology on this scale. The limited leaching
into the subsoil appears to be consistent with soil properties, defin-
able, and elementally selective, therefore, the geochemistry is re-
cording variation in anthropogenic deposits otherwise challenging to
detect at this scale.
4.2 | Relating values to inputs
It is fairly logical to assume the more input, the more trace remains
there are to be measured. This assumption, however, does not hold
for all elements in all soil conditions when time is added to the
equation (Wilson et al., 2008). As an example, in acidic soils Ca, is
easily leached (Brady & Weil, 1999; Ottaway & Matthews, 1988),
which has in part resulted in the lack of unburnt bone and ash on the
site. Another major constitute of bone, P, can quickly become stable
in inorganic mineral form in these conditions, especially with Fe and
Al oxides (Bethell & Máte, 1989; Linderholm, 2007), but as stated
previously, P can be from multiple sources. Therefore, we cannot
F IGURE 6 Core 14865, parcel 9, with archaeological horizons only. In the core, darker/orange indicates the late phase, and lighter/peachindicates the early phase. There is no subsoil or topsoil in this core [Color figure can be viewed at wileyonlinelibrary.com]
CANNELL ET AL. | 763
equate any values directly with inputs in any quantitative proportion.
What we can assume is intra‐site comparability when the environ-
mental conditions are more or less constant. From this, phases and/or
intensity of inputs can be equated to settlement pattern or density.
Therefore, intensity, and by extension phase and change, can be
measured in stratigraphic accumulation on an element grouping ba-
sis. Comparable studies, such as Wells et al. (2000), equated intense
activity with high P values for middening, and high Hg and Pb values
with craft production areas. Both Aston, Martin, and Jackson (1998)
and Cook and Heizer (1965) attempted to equate the waste pro-
duced by humans and domestic species to the potential for detecting
sites by relative enhancement, but both stopped short of equating
measured values to physical input by direct correlation. They both
consider it to be the proportional relative enhancement of groups of
elements that suggest activity occurrence or focus and intensity. On
an element by element basis, the measured values are both con-
nected to inputs, preservation, and soil conditions over time.
Therefore, for the Heimdalsjordet site, the late phase is markedly
different from the early. This is both in terms of inputs volume, and the
activity range represented. The issue with this statement is time. None
of the data presented here allow a time frame per phase to be esti-
mated. Intensity can either be by duration, or intensity, the resulting
volume is the same. Unfortunately, this is a limitation of geochemistry,
exacerbated by the truncated and secondary nature of the deposits.
From using cores, the sequence of accumulation can be seen, but not
necessarily whether it is intensity or duration that creates the en-
hancement. Here, we can turn to the finds, such as the bead assemblage,
which suggest the main activity on the site was in the 9th and 10th
centuries, and the radiocarbon dating (Bill & Rødsrud, 2017). These data
suggests the site was used more intensely in the later period, however,
this phase also has a longer duration. In addition, the later phases in the
micromorphology data produced evidence of more intense inputs from
human and animal waste, together with fragments such as leather,
which were absent in the earlier phase (Macphail et al., 2016). There-
fore, from the geochemistry perspective, the duration and intensity of
this settlement phase creates the enhancement, as does its preserva-
tion. The earlier phase is perhaps shorter and less intense in the range
of activity and the waste produced, but also truncated by later ditch
digging (Bill & Rødsrud, 2017).
4.3 | Interpreting the scales and phases ofheimdalsjordet
The parcel ditches and site topography show interesting similarities. It is
clear that the majority of the ditches in form and formation were alike
TABLE 8 Descriptive statistics for the early phase from the geochemical core data
Early Sn Sr Rb Pb Zn Cu
N 74 74 74 74 74 74
Mean 1.25 180.20 120.60 18.12 68.33 34.82
SD 9.60 27.94 18.39 13.53 13.25 24.92
Minimum 0.00 97.50 87.39 0.00 41.09 0.00
Maximum 82.14 232.88 159.61 82.41 106.48 153.68
Sum 92.22 13,334.95 8,924.45 1,340.81 5,056.53 2,576.60
Early Fe Mn Cr V Ti Ca
N 75 74 74 74 74 74
Mean 29,160.93 434.53 62.44 95.04 4,072.55 10,044.08
SD 9,400.40 110.97 15.00 24.65 636.26 1,977.42
Minimum 14,780.01 245.82 22.99 40.51 2,855.89 5,524.63
Maximum 51,015.38 780.08 93.43 146.01 5,357.52 16,128.53
Sum 2,187,069.55 32,155.24 4,620.74 7,033.27 301,368.92 743,261.98
Early K Al P Si S
N 74 74 74 74 74
Mean 22,098.40 41,906.06 1,178.92 217,368.45 250.63
SD 3,470.77 12,365.77 712.97 46,507.46 118.95
Minimum 16,373.45 11,727.10 244.27 76,784.06 59.21
Maximum 28,805.02 72,881.84 3,724.08 306,133.19 544.19
Sum 1,635,281.83 3,101,048.60 87,240.07 16,085,264.94 18,546.38
Note: All data is in ppm, with the exception of N (no. of samples).
764 | CANNELL ET AL.
and comparable. Almost all cores suggested the ditches had been recut,
and to look at the GPR interpretations, many parceled areas have
clearly phased ditch alignments and formations. With few exceptions,
the alignment of the ditches remains with the thoroughfare, and the
changes in size and alignment of the parceled areas, from what we can
see, are minor. If we consider, from the finds and the 14C dates (see Bill
& Rødsrud, 2017), that the cores probably represent decades, if not
more, then we have a conservative picture before us. This implies that
space, in terms of plot/parcel location, ditch alignment and perhaps even
activities, were maintained over generations of activity. However, in the
context of late Iron Age Norway, trading sites and proto‐urban settle-
ments were also radical departure from the enduring settlement form of
the longhouse and farmstead (Eriksen, 2015), and therefore, con-
servatism in settlement form must, in parallel, be seen in this context.
Using parcel 2 as an example, the illusive earliest phases with low
level animal stocking and human occupation debris probably date to
the very end of the 8th century or the start of the 9th (Macphail
et al., 2014; Macphail et al., 2016). These deposits are truncated, and
the next deposits mark a more intense occupation. Later ditch in-
filling in parcel 2 includes finds of rock crystal beads dated to A.D.
860–885 and/or 915–980 (Bill & Rødsrud, 2017; Callmer, 1977;
Rødsrud, 2014), and other less chronologically distinct objects such
as whetstones fragments, crucibles, copper alloy bars, and so forth.
None are in situ; none can be ascribed purpose other than loss or
discard based upon stratigraphic observations. Then the parcel dit-
ches are truncated again by the modern plow. It is likely, based on the14C dates and finds, that a larger proportion of the 9th century oc-
cupation is glimpsed in the ditches of parcel 2, perhaps even into the
early 10th century (Bill & Rødsrud, 2017). Even if, as seems likely, the
site continued in one form or another until the plundering of the
Gokstad Mound sometime between A.D. 953 and 975, or even after
(Bill & Daly, 2012; Bill & Rødsrud, 2017), there is nothing to say
exactly when the relative chronology of parcel 2 becomes truncated.
To summarize what can be distinguished from the geochemical
data, in parcels 1, 2, and 16, the thoroughfare was the focus
throughout the occupation, as the gathering point for waste and
activities. This seems to hold for all phases. Parcels 9–14 have high
organic inputs (Figure 6), as illustrated by the enhancement of
P values. Here is also where a disproportionate amount of weights
were found, beside an area tentatively interpreted as a harbor or
storage location. Perhaps this area functioned as a gateway for sto-
rage and exchange (Bill & Rødsrud, 2013; Macphail et al., 2014; Bill &
Rødsrud, 2017). Nonferrous metalworking can be located in the vi-
cinity of parcels 21 and 16, interestingly at exactly the same point in
the parcels form; in close proximity to a ditch beside the thorough-
fare. Indeed the base of a nonferrous metal working oven was
TABLE 9 Descriptive statistics for the late phase from the geochemical core data
Late Sn Ag Sr Rb Pb Zn
N 116 116 116 116 116 116
Mean 21.06 0.73 187.49 108.50 179.63 79.99
SD 105.88 3.88 35.60 18.73 750.68 24.10
Minimum 0.00 0.00 85.90 54.04 7.13 31.85
Maximum 1,084.34 34.38 301.70 161.87 6473.32 171.13
Sum 2,443.46 75.01 21,748.62 12,586.04 20,836.61 9,278.39
Late Cu Fe Mn Cr V Ti
N 116 116 116 116 116 116
Mean 209.17 28,178.06 476.39 53.63 79.06 3,316.50
SD 691.91 15,189.37 356.05 13.85 25.34 690.34
Minimum 0.00 11,428.09 165.96 25.11 23.11 1,256.08
Maximum 5,518.56 111,544.87 2,628.87 95.90 169.44 4,776.58
Sum 24,263.89 3,296,833.46 55,260.74 6,220.72 9,171.48 384,714.02
Late Ca K Al P Si S
N 116 116 116 116 116 116
Mean 10,988.05 18,246.16 32,388.65 2,458.77 192,956.70 380.22
SD 4,347.23 3,040.72 8,870.68 2,023.61 38,807.27 376.95
Minimum 5,634.79 8,323.58 13,111.33 364.43 64,049.50 45.62
Maximum 48,975.61 25,323.64 53,223.59 12,559.64 291,212.77 3,003.90
Sum 1,274,614.09 2,116,555.00 3,757,083.65 285,217.19 22,382,977.23 44,105.89
Note: All data is in ppm, with the exception of N (no. of samples).
CANNELL ET AL. | 765
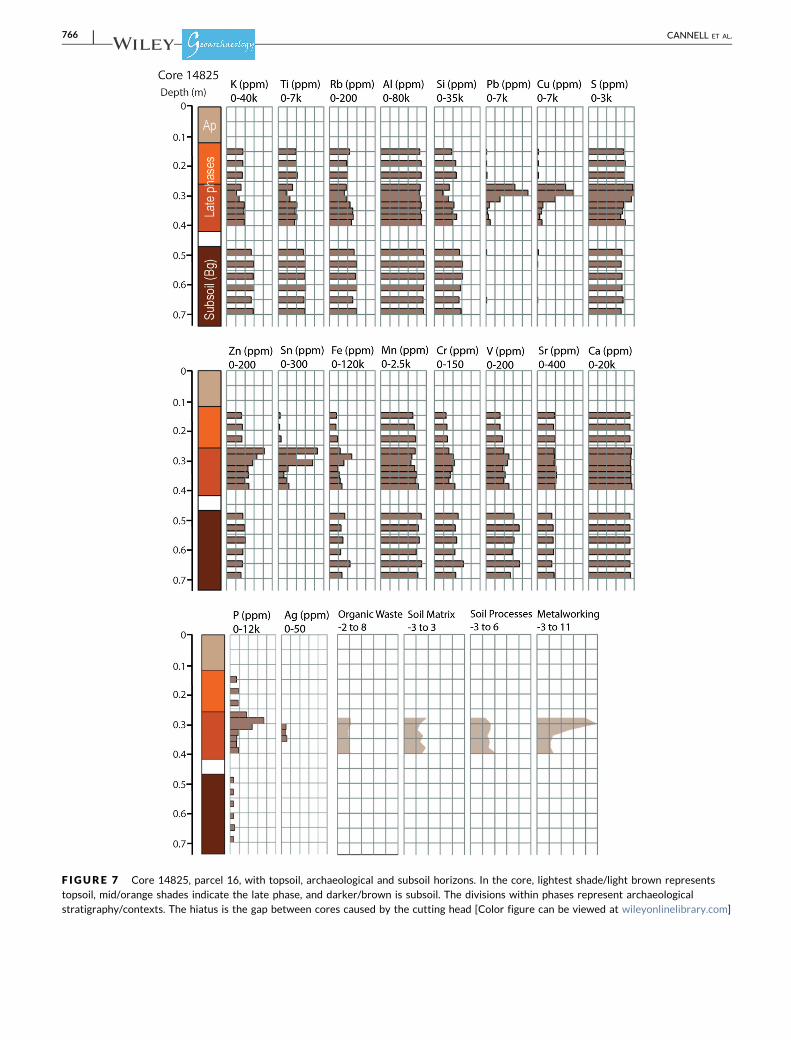
F IGURE 7 Core 14825, parcel 16, with topsoil, archaeological and subsoil horizons. In the core, lightest shade/light brown representstopsoil, mid/orange shades indicate the late phase, and darker/brown is subsoil. The divisions within phases represent archaeologicalstratigraphy/contexts. The hiatus is the gap between cores caused by the cutting head [Color figure can be viewed at wileyonlinelibrary.com]
766 | CANNELL ET AL.
located in the upper ditch fills of parcel 21 (see supporting in-
formation). Both also seem to have been used by people working with
a range of nonferrous metals, including lead, silver, and copper alloys.
Working in a ditch on a site prone to waterlogging would not be the
most logical location, but this could be a product of preservation
making the exception being perceived as the rule.
Within each parcel, excluding parcels 9–14 were the road is not
present, there is spatial patterning relating to the relative enhance-
ment. This spatial variation is far more distinct for the later phase. It
appears the areas of greatest relative enhancement are nearest the
thoroughfare, where the waste is focussed, which holds for both
phases. This suggests that there is a “front” and a “back” to the plots/
parcels, with activity producing waste focused on the front and the
thoroughfare (Tuan, 1977).
4.4 | The methods potential
The three‐dimensional approach, using geochemistry to capture the
horizontal, vertical and relative chronological use of the space on a site
where only negative features remain, enhances our understanding of the
range of activities on the site over time. By combining coring with
geophysics, in this case high‐resolution GPR data, the method can be
expanded to include both excavated and unexcavated areas of a site. As
applied to Heimdalsjordet, this methodology was entirely successful, in
that every feature identified from the GPR interpretations was found by
geo‐referencing, cored and analysed. The implication has a very positive
outlook for research and commercial archaeology, as many sites cannot
be wholly excavated, even if they are under threat from development.
The method can also be used to obtain prospection information before
excavation to better plan fieldwork in relation to time and budget. At
present, the data sets presented in this paper offer a far more nuanced
picture of the functioning of Heimdalsjordet than would otherwise be
obtainable, with chronological information connected to the intensifica-
tion and increasing diversity of the settlement over time. On truncated
sites, it is demonstrated here that when some spatial preservation is
present, targeted geochemical sampling on secondary deposits can evi-
dence the evolution of the site in terms of space and activity.
It is easy to lose sight of certain assumptions in archaeological
geochemistry when the labels are made archaeological, and the
F IGURE 8 Core 7938, parcel 1, with archaeological and subsoil horizons. In the core, lightest shade/light brown represents topsoil, mid/orange shades indicate the late phase, and light/peach is subsoil. The divisions within phases represent archaeological stratigraphy/contexts[Color figure can be viewed at wileyonlinelibrary.com]
CANNELL ET AL. | 767
interpretations related to archaeological features, human‐made ob-
jects and how they all tie together in one big settlement picture.
Geochemistry is essentially measuring the soil processes; its ability
over time to breakdown and retain/redistribute organic and mineral
inputs and disturbances. The time‐frames archaeologists work on are
generally superficial for soil formation, but still, the soil in all its
organic and inorganic physical and chemical processes, will have
decomposed, altered and utilized those inputs to some degree. The
interpretations provided here, attempt to take this into account. This
considered this study would have benefited from a broader range of
complimentary data from analysis of the soils composition and
variability off‐site and on‐site, which will be considered in future
research.
5 | CONCLUSION
Considering the continued truncation of the site by plowing, the
approach and resulting data presented here represents an attempt to
harvest some spatial and chronological meaning from the site before
erosion reduced the site further. Considering this, the GPR data used
in this study are highly unlikely to be bettered in terms capturing
archaeological features that are rapidly vanishing. In the same vein,
the geochemical data represent features that will soon be eroded
away, and all potential data lost. The combination of coring, geo-
physics, and pXRF is cost effective and less invasive, and therefore,
has potential beyond this case study, if the context and question are
suitable. Many archaeological sites are under threat from plow ero-
sion (Huisman, Heeres, van Os, Derickx, & Schoorl, 2016), and rapid
and effective sampling techniques, such as cores, can be used as a
basis for analysis, or an evaluation of the sites potential. It is clear
from this case study that secondary deposits such as these are a valid
and useful source of information on the use of space, how it changed
over time from one phase to the next, and where the activity foci
were. Applying pXRF directly to the cores allowed rapid analysis and
subsequently a larger number of samples could be incorporated into
the research, giving a broader spatial representation of the occupa-
tion on the site over time.
The limitation of the data set presented here is that, while clear
from the statistical analysis, only two archaeological factors relating
to past settlement could be readily defined. These were organic,
bone‐rich waste, and nonferrous metalworking. Raw amber was
F IGURE 9 Core 7943, parcel 2, showing archaeological layers only. In the core, the darker/orange shades indicate the late phase, and thelighter/peach shades indicate the early phases. The divisions within phases represent archaeological stratigraphy/contexts. There is no subsoilor topsoil in this core [Color figure can be viewed at wileyonlinelibrary.com]
768 | CANNELL ET AL.
found on the site, as was a fragment of leather, and these represent
just a fraction of the many potential artisanal activities that occurred
on the site using predominantly organic materials (Macphail
et al., 2014; Rødsrud, 2014). To be able to capture more detail from
the range of potential organic materials, either more directly related
contexts are required for sampling, or a greater sample density and
stratigraphic control is required, if not both. There is potential to
more closely combine fine‐stratigraphic geochemistry and micro-
morphology to help confirm the source of enhancement by micro-
morphology, and gain the distribution and thus use of space via
geochemistry.
The ditches consistently show signs of recutting, and the high
degree of truncation results in uncertainty over what these sec-
ondary deposits represent in both activity and chronological terms.
These deposits are the result of slow accumulation, dumps, silting,
and in‐washing. They are both intentional and unintentional; the
background to generations of settlement, and only a fraction thereof.
It is all we have, and that is not unusual. Our mandate is to use this
scant resource to maximum effect if it divulges a greater contextual
understanding of the human past.
ACKNOWLEDGMENTS
The authors would like to thank all those involved in the Heimdals-
jordet excavations, especially those who helped with the coring over
the two seasons. In particular, Petra Schneidhofer, Johan Linderholm,
Richard Macphail, and Christian L. Rødsrud have engaged in practical
work and discussions over the site and data, all of which contributed
toward this paper. We would also like to thank the two anonymous
reviewers and the journal editors for their helpful and constructive
comments. The GPR survey was carried out in collaboration with the
Ludwig Boltzmann Institute for Archaeological Prospection and Vir-
tual Archaeology (LBI ArchPro), the Norwegian Institute for Cultural
Heritage Research (NIKU), and Vestfold County administration
(VFK). This study was jointly funded by Bournemouth University and
the Arts and Humanities Research Council, England, with contribu-
tions by the Gokstad Revitalised Project.
DATA AVAILABILITY STATEMENT
The data that support the findings of this study are openly available
in the eprints repository at Bournemouth University, available at
http://eprints.bournemouth.ac.uk, reference number 29660.
ORCID
Rebecca J. S. Cannell http://orcid.org/0000-0001-7416-8189
REFERENCES
Abdi, H. (2003). Factor rotations in factor analyses. In M. Lewis‐Beck, A.Bryman & T. Futing (Eds.), The SAGE encyclopedia for social science
research methods (pp. 792–795). Thousand Oaks, CA: Sage.
Abdi, H., & Williams, L. J. (2010). Principal component analysis. Wiley
Interdisciplinary Reviews: Computational Statistics, 2, 433–459.
Aston, M. A., Martin, M. H., & Jackson, A. W. (1998). The potential for
heavy metal soil analysis on low status archaeological sites at
Shapwick, Somerset. Antiquity, 72(278), 838–847.
Bethell, P. H., & Máte, I. (1989). The use of soil phosphate analysis in
archaeology: A critique. In J. Henderson (Ed.), Scientific analysis in
archaeology (pp. 1–29). Oxford: Oxford Univeristy Committee for
Archaeology.
Bethell, P. H., & Smith, J. U. (1989). Trace‐element analysis of an inhumation
from Sutton Hoo, using inductively coupled plasma emission
spectrometry: An evaluation of the technique applied to analysis of
organic residues. Journal of Archaeological Science, 16(1), 47–55.
Bill, J., & Daly, A. (2012). The plundering of the ship graves from Oseberg
and Gokstad: An example of power politics? Antiquity, 86(333),
808–824.
Bill, J., & Rødsrud, C. L. (2013). En ny markeds‐og produksjonsplass ved
Gokstad i Vestfold. Nicolay Arkeologisk tidsskrift, 120, 5–12.
Bill, J., & Rødsrud, C. L. (2017). Heimdalsjordet: Trade, production and
communication. In Z., Glørstad, T. & K. Loftsgarden (Eds.), Viking‐Agetransformations (pp. 212–231). Oxon: Routledge.
Birkeland, P. W. (1999). Soils and geomorphology. New York, NY: Oxford
University Press.
Booth, A. D., Vandeginste, V., Pike, D., Abbey, R., Clark, R. A., Green, C. M.,
& Howland, N. (2017). Geochemical insight during archaeological
geophysical exploration through in situ X‐ray fluorescence
spectrometry. Archaeological Prospection, 24(4), 361–372.
Brady, N. C., & Weil, R. R. (1999). The nature and properties of soils (12th ed.
). New York, NY: Macmillan Publishing Company.
Callmer, J. (1977). Trade beads and bead trade in Scandinavia ca. 800‐1000A.D. Gleerup: Lund.
Cannell, R. J. S. (2017). Prospecting the physicochemical past. Three
dimensional geochemical investigation into the use of space in Viking
Age sites in southern Norway using portable XRF (Unpublished Thesis).
Bournemouth University.
Cannell, R. J. S., Cheetham, P., & Welham, K. (2017). Geochemical analysis
using portable X‐ray fluorescence. In D. Skre (Ed.), Avaldsnes—A sea‐king's manor in first millennium Western Scandinavia (pp. 421–454).
Berlin/Boston, MA: Walter de Gruyter.
Canti, M. (2003). Aspects of the chemical and microscopic characteristics
of plant ashes found in archaeological soils. Catena, 54, 339–361.
Carver, M. (1995). Digging for data: Principles and procedures for
evaluation, excavation and post‐excavation in towns. Dia. In W. S.
Hensel, T. & P. Urbanczyk (Eds.), Theory and practice of archaeological
research 2: Acquisition of field data at multi‐strata sites. Dialogue with the
data: The archaeology of complex societies and its context in the 90's (pp.
45–120). Warsaw: Institute of Archaeology and Ethnology, Polish
Academy of Sciences.
Cook, D. E., Kovacevich, B., Beach, T., & Bishop, R. (2005). Deciphering the
inorganic chemical record of ancient human activity using ICP‐MS: A
reconnaissance study of late Classic soil floors at Cancuen,
Guatemala. Journal of Archaeological Science, 33(2006), 628–640.
Cook, S. F., & Heizer, R. F. (1965). Studies on the chemical analysis of
archaeological sites. Univerisity of Calafornia Publications in
Anthropology, 2, 1–102.
Cook, S. R., Banerjea, R. Y., Marshall, L., Fulford, M., Clarke, A., & van
Zwieten, C. (2010). Concentrations of copper, zinc and lead as
indicators of hearth usage at the Roman town of Calleva Atrebatum
(Silchester, Hampshire, UK). Journal of Archaeological Science, 37(4),
871–879.
Cook, S. R., Clarke, A. S., & Fulford, M. G. (2005). Soil geochemistry and
detection of early Roman precious metal and copper alloy working at
the Roman town of Calleva Atrebatum (Silchester, Hampshire, UK).
Journal of Archaeological Science, 32(5), 805–812.
Courty, M. A., Goldberg, P., & Macphail, R. I. (1989). Soils and
micromorphology in archaeology. Cambridge: Cambridge University
Press.
Couture, A., Bhiry, N., Monette, Y., & Woollett, J. (2016). A geochemical
analysis of 18th‐century Inuit communal house floors in northern
Labrador. Journal of Archaeological Science: Reports, 6, 71–81.
CANNELL ET AL. | 769
Covelo, E. F., Vega, F. A., & Andrade, M. L. (2007). Competitive sorption
and desorption of heavy metals by individual soil components. Journal
of Hazardous Materials, 140(1–2), 308–315.
Crowther, J. (1997). Soil phosphate surveys: Critical approaches to
sampling, analysis and interpretation. Archaeological Prospection, 4,
93–102.
De Vos, W., & Tarvainen, T. (2006). Elements Ag‐Zr. In W. De Vos & T.
Tarvainen (Eds.), Geochemical atlas of Europe Part 2: Interpretations of
geochemical maps, additional tables, figure, maps, and related publications
(Vol. 2). Geological Society of Finalnd.
Entwistle, J. A. (2000). The geoarchaeological significance and spatial
variability of a range of physical and chemical soil properties from a
former habitation site, Isle of Skye. Journal of Archaeological Sciences,
27, 287–303.
Entwistle, J. A., & Abrahams, P. W. (1997). Multi‐elemental analysis of
soils and sediments from Scottish historical sites. The potential of
inductively coupled plasma‐mass spectrometry for rapid site
investigation. Journal of Archaeological Sciences, 24, 407–416.
Entwistle, J. A., Abrahams, P. W., & Dodgshon, R. A. (1998). Multi‐element
analysis of soils from Scottish historical sites. interpreting land‐usehistory through the physical and geochemical analysis of soil. Journal
of Archaeological Sciences, 25(1), 53–68.
Entwistle, J. A., Dodgshon, R. A., & Abrahams, P. W. (2000). An
investigation of former land‐use activity through the physical and
chemical analysis of soils from the Isle of Lewis, Outer Hebrides.
Archaeological Prospection, 7, 171–188.
Entwistle, J. A., Mccaffrey, K., & Abrahams, P. (2009). Three‐dimensional
(3D) visualisation: The application of terrestrial laser scanning in the
investigation of historical Scottish farming townships. Journal of
Archaeological Sciences, 36, 860–866.
Eriksen, M. H. (2015). Portals to the Past: An archaeology of doorways,
dwellings, and ritual practice in Late Iron Age Scandinavia. Department of
Archaeology, Conservation and History (Unpublished Ph.D thesis).
University of Oslo.
Evans, L. J., & Barabash, S. J. (2010). Molybdenum, silver, thallium and
vanadium. In P. S. Hooda (Ed.), Trace elements in soils (pp. 515–551).
Chichester: John Wiley & Sons/Blackwell Publishing.
F.A.O. (2006). World reference base for soil resources. In F.A.O (Ed.), A
framework for international classification, correlation and communication
(Vol. 103). Rome, Italy: United Nations.
Feveile, C. (2008). Ribe. In S. Brink & N. Price (Eds.), The Viking World (pp.
126–130). Oxon, UK/New York: Routledge.
Frahm, E. (2013a). Commentary: Is obsidian sourcing about geochemistry
or archaeology? A reply to Speakman and Shackley. Journal of
Archaeological Sciences, 40, 1444–1448.
Gauss, R. K., Bátora, J., Nowaczinski, E., Rassmann, K., & Schukraft, G.
(2013). The Early Bronze Age settlement of Fidvár, Vráble (Slovakia):
Reconstructing prehistoric settlement patterns using portable XRF.
Journal of Archaeological Sciences, 40(7), 2942–2960.
Gäbler, H. E., Glüh, K., Bahr, A., & Utermann, J. (2009). Quantification of
vanadium adsorption by German soils. Journal of Geochemical
Exploration, 103(1), 37–44.
Hayes, K. (2013). Parameters in the use of pXRF for archaeological site
prospection: A case study at the Reaume Fort Site, Central
Minnesota. Journal of Archaeological Sciences, 40(8), 3193–3211.
He, Z. L., Shentu, J., & Yang, X. E. (2010). Mangenese and selinium. In P. S.
Hooda (Ed.), Trace elements in soils (pp. 481–495). Chichester: John
Wiley & Sons.
Holliday, V. T., & Gartner, W. G. (2007). Methods of soil P analysis in
archaeology. Journal of Archaeological Sciences, 34(2), 301–333.
Hough, R. L. (2010). Copper and lead. In P. S. Hooda (Ed.), Trace elements in
soils. Chichester: John WIley & Sons/Blackwell Publishing.
Huisman, H., Heeres, G., van Os, B., Derickx, W., & Schoorl, J. (2016).
Erosion and errors: Testing the use of repeated LIDAR analyses and
erosion modelling for the assessment and prediction of erosion of
archaeological sites? Conservation and Management of Archaeological
Sites, 18(1–3), 205–216.
Hunt, A., & Speakman, R. (2015). Portable XRF analysis of archaeological
sediments and ceramics. Journal of Archaeological Sciences, 53,
626–638.
Jones, R., Challands, A., French, C., Card, N., Downes, J., & Richards, C.
(2010). Exploring the location and function of a Late Neolithic house
at Crossiecrown, Orkney by geophysical, geochemical and soil
micromorphological methods. Archaeological Prospection, 17, 29–47.
Kabata‐Pendias, A. (2010). Trace elements in soils and plants (4th ed.). Boca
Raton, FL: CRC Press.
Knudson, K. J., Frink, L., Hoffman, B. W., & Price, T. D. (2004). Chemical
characterization of Arctic soils: Activity area analysis in contemporary
Yup'ik fish camps using ICP‐AES. Journal of Archaeological Sciences,
31(4), 443–456.
Kylander, M. E., Ampel, L., Wohlfarth, B., & Veres, D. (2011). High‐resolution X‐ray fluorescence core scanning analysis of Les Echets
(France) sedimentary sequence: New insights from chemical proxies.
Journal of Quaternary Science, 26(1), 109–117.
Kühtreiber, T. (2014). The investigation of domestricated space in
archaeology‐ architecture and human beings. In S. M. Kristiansen &
K. Giles (Eds.), Dwellings, identities and homes: European housing culture
from the Viking Age to the renaissance (Vol. 84) Denmark: Jutland
Archaeological Society.
Larsson, M. A. (2014). Vanadium in soils: Chemistry and ecotoxicity.
Unpublished Doctoral Thesis. Swedish University of Agricultural
Sciences, Uppsala.
Lefebvre, H. (1991). The production of space. Oxford: Blackwell Publishing.
Linderholm, J. (2007). Soil chemical surveying: A path to a deeper
understanding of prehistoric sites and societies in Sweden.
Geoarchaeology, 22, 417–438.
Løvschal, M. and Holst, M. K. (2014). Repeating boundaries‐repertoires oflandscape regulations in southern Scandinavia in the Late Bronze Age
and Pre‐Roman Iron Age. Danish Journal of Archaeology, 3(2), 95–118.
Luzzadder‐Beach, S., Beach, T., Terry, R. E., & Doctor, K. Z. (2011).
Elemental prospecting and geoarchaeology in Turkey and Mexico.
Catena, 85(2), 119–129.
Ma, Y., & Hooda, P. S. (2010). Chromium, nickel and cobalt. In P. S. Hooda
(Ed.), Trace elements in soils (pp. 461–479). Chichester: John Wiley
& Sons.
Macphail, R., Bill, J., Cannell, R., Linderholm, J., & Rødsrud, C. L. (2013).
Integrated microstratigraphic investigations of coastal archaeological
soils and sediments in Norway: The Gokstad ship burial mound and its
environs including the Viking harbour settlement of Heimdaljordet,
Vestfold. Quaternary International, 315, 131–146.
Macphail, R., Crowther, J., & Linderholm, J. (2014). Heimdaljordet, Vestfold,
Norway: soil micromorphology, chemistry and magnetic susceptibility.
Unpublished archive report: UCL.
Macphail, R. I., Bill, J., Crowther, J., Haită, C., Linderholm, J., Popovici, D., &
Rødsrud, C. L. (2016). European ancient settlements—A guide to their
composition and morphology based on soil micromorphology and
associated geoarchaeological techniques; introducing the contrasting
sites of Chalcolithic Borduşani‐Popină, Borcea River, Romania and
Viking Age Heimdaljordet, Vestfold, Norway. Quaternary International,
460, 30–47.
Mayer, B., Prietzel, J., & Krouse, H. R. (2001). The influence of sulfur
deposition rates on sulfate retention patterns and mechanisms in
aerated forest soils. Applied Geochemistry, 16(9–10), 1003–1019.
Mees, F., & Stoops, G. (2010). Sulphidic and sulphuric materials. In G.
Stoops (Ed.), Interpretation of micormorphological of soils and regoliths
(pp. 543–568). Amsterdam: Elsevier.
Middleton, W. D., & Price, D. T. (1996). Identification of activity areas by
multi‐element characterization of sediments from modern and
archaeological house floors using inductively coupled plasma‐atomic
emission spectroscopy. Journal of Archaeological Sciences, 23, 673–687.
770 | CANNELL ET AL.
Middleton, W. D. (2004). Identifying chemical activity residues on
prehistoric house floors: A methodology and rationale for multi‐elemental characterization of a mild acid extract of anthropogenic
sediments. Archaeometry, 46(1), 47–65.
Middleton, W. D., Barba, L., Pecci, A., Burton, J. H., Ortiz, A., Salvini, L., &
Suárez, R. R. (2010). The study of archaeological floors:
Methodological proposal for the analysis of anthropogenic residues
by spot tests, ICP‐OES, and GC‐MS. Journal of Archaeological Method
and Theory, 17(3), 183–208.
Mikołajczyk, Ł., & Schofield, J. E. (2017). A geochemical signal from a
Mesolithic Intertidal Archaeological Site: A proof‐of‐concept study
from Clachan Harbor, Scotland. Geoarchaeology, 32(3), 400–413.
Milek, K. B., & Roberts, H. M. (2013). Integrated geoarchaeological
methods for the determination of site activity areas: A study of a
Viking Age house in Reykjavik, Iceland. Journal of Archaeological
Sciences, 40(4), 1845–1865.
NIBIO. (2018). Kilden. Aas: NIBIO (Norwegian Institute for Bioeconomy
Research) Online database. Retrieved from https://kilden.nibio.no/
Oonk, S., Slomp, C., & Huisman, D. (2009). Geochemistry as an aid in
archaeological prospection and site interpretation: Current issues and
research directions. Archaeological Prospection, 16, 35–51.
Oonk, S., Slomp, C. P., Huisman, D. J., & Vriend, S. P. (2009). Effects of site
lithology on geochemical signatures of human occupation in
archaeological house plans in the Netherlands. Journal of
Archaeological Sciences, 36(6), 1215–1228.
Ottaway, J. H., & Matthews, M. R. (1988). Trace element analysis of soil
samples from a stratified archaeological site. Environmental
Geochemistry and Health, 10(3), 105–112.
Rødsrud, C. L. (2014). Markeds/Produksjonplass og Gravfelt. Gokstad Nedre
48/2, 46/4, Sandefjord, Vestfold. Unpublished archive report,
Museum of Cultural History: University of Oslo.
Salisbury, R. B. (2013). Interpolating geochemical patterning of activity
zones at Late Neolithic and Early Copper Age settlements in eastern
Hungary. Journal of Archaeological Sciences, 40(2), 926–934.
Schiffer, M. B. (1976). Behavioral archeology. New York, NY: Academic Press.
Schneidhofer, P., Nau, E., Hinterleitner, A., Lugmayr, A., Bill, J., Gansum, T.,
… Trinks, I. (2017). Palaeoenvironmental analysis of large‐scale, high‐resolution GPR and magnetometry data sets: The Viking Age site of
Gokstad in Norway. Archaeological and Anthropological Sciences, 9(6),
1187–1213.
Skre, D. (2007). Introduction. In D. Skre (Ed.), Kaupang in Skiringssal (Vol. 1,
pp. 13–24). Aarhus: Aahus University Press.
Solbakken, E., Nyborg, Å., Sperstad, R., Fadnes, K., & Klakegg, O. (2006).
Viten fra Skog og Landskap. Jordmonnsatlas for Norge: Beskrivelse av
jordsmonn på dyrkamark i Vestfold Ås: Norsk Institutt for Skog og
Landskap.
Speakman, R. J., & Shackley, S. M. (2013). Silo science and portable XRF in
archaeology: A response to Frahm. Journal of Archaeological Sciences,
40(2), 1435–1443.
Stacey, S. P., McLaughlin, M. J., & Hettiarachchi, G. M. (2010). Fertilizer‐borne trace element contaminats in soils. In P. S. Hooda (Ed.), Trace
elements in soils (pp. 134–154). Chichester: John Wiley & Sons.
Sylvester, G. C., Mann, A. W., Rate, A. W., & Wilson, C. A. (2017).
Application of high‐resolution Mobile Metal Ion (MMI) soil
geochemistry to archaeological investigations: An example from a
Roman metal working site, Somerset, United Kingdom. Geoarchaeology,
32(5), 563–574.
Sørensen, R., Henningsmoen, K. E., Høeg, H., Stabell, B., & Bukholm, K. M.
(2007). Geology, soils, vegetation and sea‐levels in the Kaupang Area.
In D. Skre (Ed.), Kaupang in Skiringssal (Vol. 1, pp. 251–272). Aarhus:
Aarhus University Press.
Tan, K. H. (1994). Environmental soil science. New York, NY: Marcel
Dekker Inc.
Tan, K. H. (1998). Principles of soil chemistry (3rd ed.). New York, NY:
Marcel Dekker, Inc.
Trinks, I., Hinterleitner, A., Neubauer, W., Nau, E., Löcker, K., Wallner, M.,
… Seren, S. (2018). Large‐area high‐resolution ground‐penetratingradar measurements for archaeological prospection. Archaeological
Prospection, 25(3), 171–195.
Tuan, Y.‐F. (1977). Space and place, the perspective of experience. London:
Edward Arnold.
Vyncke, K., Waelkens, M., Degryse, P., & Vassilieva, E. (2011). Identifying
domestic functional areas. Chemical analysis of floor sediments at the
Classical‐Hellenistic settlement at Düzen Tepe (SW Turkey). Journal of
Archaeological Sciences, 38(9), 2274–2292.
Walkington, H. (2010). Soil science applications in archaeological contexts:
A review of key challenges. Earth Science Reviews, 103, 122–134.
Wallace, P. F. (2016). Viking Dublin: The Wood Quay excavations. Sallins, Co.
Kildare: Irish Academic Press
Wells, E. C., Terry, R. E., Parnell, J. J., Hardin, P. J., Jackson, M. W., &
Houston, S. D. (2000). Chemical analyses of ancient anthrosols in
residential areas at Piedras Negras, Guatemala. Journal of
Archaeological Sciences, 27(5), 449–462.
White, R. E. (2006). Principles and practice of soil science: The soil as a natural
resource (4th ed.). Oxford: Blackwell Science Ltd.
Wilson, C. A., Davidson, D. A., & Cresser, M. S. (2007). Evaluating the use
of multi‐element soil analysis in archaeology: A study of a
postmedieval croft (Olligarth) in Shetland. Atti della Società Toscana,
112, 69–78.
Wilson, C. A., Davidson, D. A., & Cresser, M. S. (2008). Multi‐element soil
analysis: An assessment of its potential as an aid to archaeological
interpretation. Journal of Archaeological Sciences, 35(2), 412–424.
Wilson, C. A., Davidson, D. A., & Cresser, M. S. (2009). An evaluation of the
site specificity of soil elemental signatures for identifying and
interpreting former functional areas. Journal of Archaeological
Sciences, 36(10), 2327–2334.
SUPPORTING INFORMATION
Additional supporting information may be found online in the
Supporting Information section.
How to cite this article: Cannell RJS, Bill J, Cheetham P,
Welham K. Geochemical analysis of the truncated Viking Age
trading settlement of Heimdalsjordet, Norway. Geoarchaeology.
2020;35:748–771. https://doi.org/10.1002/gea.21795
CANNELL ET AL. | 771