genetic restoration of the florida panther
TRANSCRIPT

DOI: 10.1126/science.1192891 , 1641 (2010); 329Science
et al.Warren E. Johnson,Genetic Restoration of the Florida Panther
This copy is for your personal, non-commercial use only.
. clicking herecolleagues, clients, or customers by , you can order high-quality copies for yourIf you wish to distribute this article to others
. herefollowing the guidelines can be obtained byPermission to republish or repurpose articles or portions of articles
(this information is current as of September 23, 2010 ):The following resources related to this article are available online at www.sciencemag.org
http://www.sciencemag.org/cgi/content/full/329/5999/1641version of this article at:
including high-resolution figures, can be found in the onlineUpdated information and services,
http://www.sciencemag.org/cgi/content/full/329/5999/1641/DC1 can be found at: Supporting Online Material
http://www.sciencemag.org/cgi/content/full/329/5999/1641#otherarticles, 6 of which can be accessed for free: cites 20 articlesThis article
http://www.sciencemag.org/cgi/content/full/329/5999/1641#otherarticles 1 articles hosted by HighWire Press; see: cited byThis article has been
http://www.sciencemag.org/cgi/collection/ecologyEcology
: subject collectionsThis article appears in the following
registered trademark of AAAS. is aScience2010 by the American Association for the Advancement of Science; all rights reserved. The title
CopyrightAmerican Association for the Advancement of Science, 1200 New York Avenue NW, Washington, DC 20005. (print ISSN 0036-8075; online ISSN 1095-9203) is published weekly, except the last week in December, by theScience
on
Sep
tem
ber
23, 2
010
ww
w.s
cien
cem
ag.o
rgD
ownl
oade
d fr
om
deformation. Deformation of pPv has been ex-tensively modeled using the viscoplastic self-consistent polycrystal plasticity code [VPSC; (31)](16, 17, 23). A comparison of the IPFs obtainedin this study with results of VPSC models showsthat the 001 texture observed here is compatiblewith dominant slip on (001) lattice planes and40% compressive strain (Fig. 2D). For this mod-el, the transformation texture obtained after con-version to pPv was used as the starting texture forthe deformation simulation (Fig. 2A).
Admittedly, there are limitations to our ex-periments because the time scale of deformation,grain size, composition, temperature, and devia-toric stress are quite different from those expectedin theD′′. However, if we assume that slip is activeon (001) planes in MgSiO3 pPv at D′′ conditionsand combine this information with geodynamicmodeling of deformation along theD′′, we can pre-dict texture development in the lowermost mantle.This can, in turn, be combined with single crystalelastic constants to assess associated seismic anisot-ropy. For these calculations,weneglect any contribu-tion from the second most abundant mineral inthe mantle, ferropericlase, which may also playan important role in generatingD′′ anisotropy (32).
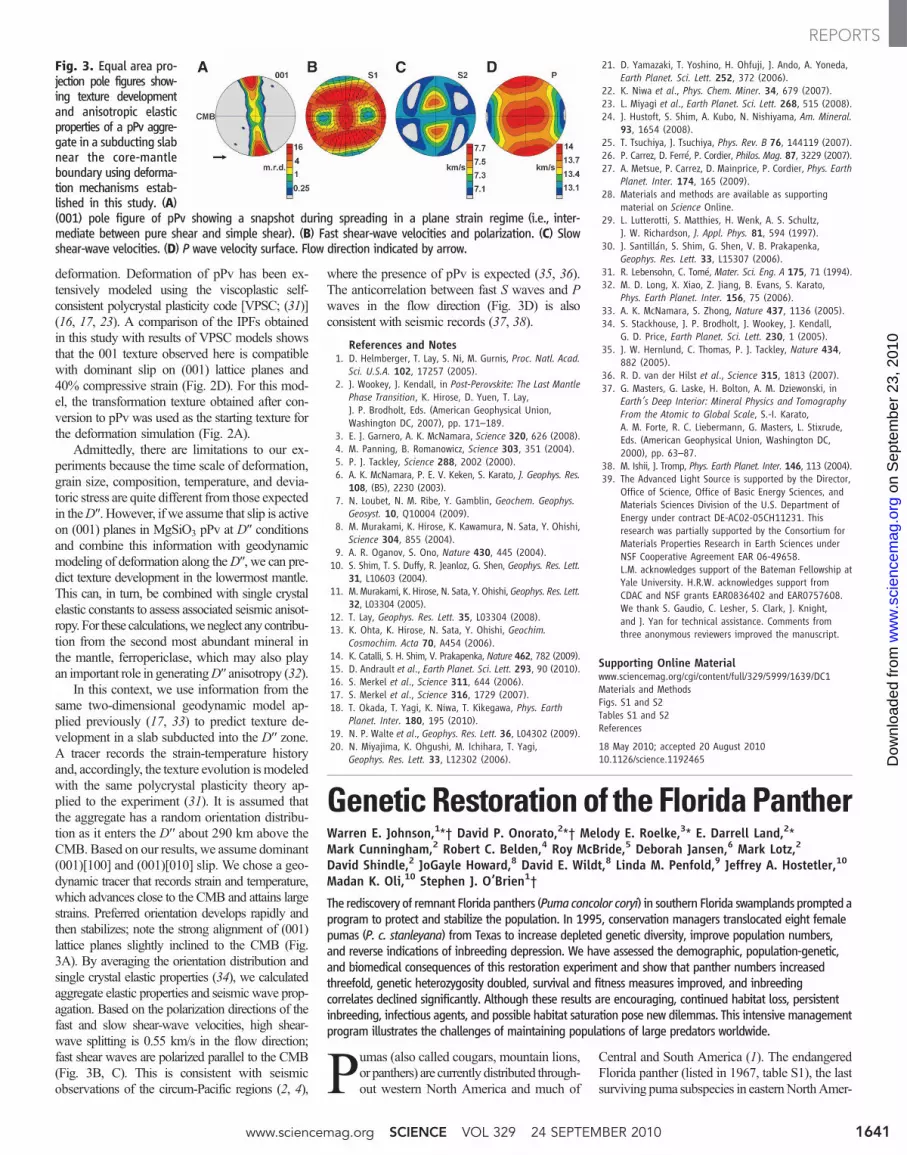
In this context, we use information from thesame two-dimensional geodynamic model ap-plied previously (17, 33) to predict texture de-velopment in a slab subducted into the D′′ zone.A tracer records the strain-temperature historyand, accordingly, the texture evolution ismodeledwith the same polycrystal plasticity theory ap-plied to the experiment (31). It is assumed thatthe aggregate has a random orientation distribu-tion as it enters the D′′ about 290 km above theCMB. Based on our results, we assume dominant(001)[100] and (001)[010] slip. We chose a geo-dynamic tracer that records strain and temperature,which advances close to the CMB and attains largestrains. Preferred orientation develops rapidly andthen stabilizes; note the strong alignment of (001)lattice planes slightly inclined to the CMB (Fig.3A). By averaging the orientation distribution andsingle crystal elastic properties (34), we calculatedaggregate elastic properties and seismic wave prop-agation. Based on the polarization directions of thefast and slow shear-wave velocities, high shear-wave splitting is 0.55 km/s in the flow direction;fast shear waves are polarized parallel to the CMB(Fig. 3B, C). This is consistent with seismicobservations of the circum-Pacific regions (2, 4),
where the presence of pPv is expected (35, 36).The anticorrelation between fast S waves and Pwaves in the flow direction (Fig. 3D) is alsoconsistent with seismic records (37, 38).
References and Notes1. D. Helmberger, T. Lay, S. Ni, M. Gurnis, Proc. Natl. Acad.
Sci. U.S.A. 102, 17257 (2005).2. J. Wookey, J. Kendall, in Post-Perovskite: The Last Mantle
Phase Transition, K. Hirose, D. Yuen, T. Lay,J. P. Brodholt, Eds. (American Geophysical Union,Washington DC, 2007), pp. 171–189.
3. E. J. Garnero, A. K. McNamara, Science 320, 626 (2008).4. M. Panning, B. Romanowicz, Science 303, 351 (2004).5. P. J. Tackley, Science 288, 2002 (2000).6. A. K. McNamara, P. E. V. Keken, S. Karato, J. Geophys. Res.
108, (B5), 2230 (2003).7. N. Loubet, N. M. Ribe, Y. Gamblin, Geochem. Geophys.
Geosyst. 10, Q10004 (2009).8. M. Murakami, K. Hirose, K. Kawamura, N. Sata, Y. Ohishi,
Science 304, 855 (2004).9. A. R. Oganov, S. Ono, Nature 430, 445 (2004).10. S. Shim, T. S. Duffy, R. Jeanloz, G. Shen, Geophys. Res. Lett.
31, L10603 (2004).11. M. Murakami, K. Hirose, N. Sata, Y. Ohishi, Geophys. Res. Lett.
32, L03304 (2005).12. T. Lay, Geophys. Res. Lett. 35, L03304 (2008).13. K. Ohta, K. Hirose, N. Sata, Y. Ohishi, Geochim.
Cosmochim. Acta 70, A454 (2006).14. K. Catalli, S. H. Shim, V. Prakapenka, Nature 462, 782 (2009).15. D. Andrault et al., Earth Planet. Sci. Lett. 293, 90 (2010).16. S. Merkel et al., Science 311, 644 (2006).17. S. Merkel et al., Science 316, 1729 (2007).18. T. Okada, T. Yagi, K. Niwa, T. Kikegawa, Phys. Earth
Planet. Inter. 180, 195 (2010).19. N. P. Walte et al., Geophys. Res. Lett. 36, L04302 (2009).20. N. Miyajima, K. Ohgushi, M. Ichihara, T. Yagi,
Geophys. Res. Lett. 33, L12302 (2006).
21. D. Yamazaki, T. Yoshino, H. Ohfuji, J. Ando, A. Yoneda,Earth Planet. Sci. Lett. 252, 372 (2006).
22. K. Niwa et al., Phys. Chem. Miner. 34, 679 (2007).23. L. Miyagi et al., Earth Planet. Sci. Lett. 268, 515 (2008).24. J. Hustoft, S. Shim, A. Kubo, N. Nishiyama, Am. Mineral.
93, 1654 (2008).25. T. Tsuchiya, J. Tsuchiya, Phys. Rev. B 76, 144119 (2007).26. P. Carrez, D. Ferré, P. Cordier, Philos. Mag. 87, 3229 (2007).27. A. Metsue, P. Carrez, D. Mainprice, P. Cordier, Phys. Earth
Planet. Inter. 174, 165 (2009).28. Materials and methods are available as supporting
material on Science Online.29. L. Lutterotti, S. Matthies, H. Wenk, A. S. Schultz,
J. W. Richardson, J. Appl. Phys. 81, 594 (1997).30. J. Santillán, S. Shim, G. Shen, V. B. Prakapenka,
Geophys. Res. Lett. 33, L15307 (2006).31. R. Lebensohn, C. Tomé, Mater. Sci. Eng. A 175, 71 (1994).32. M. D. Long, X. Xiao, Z. Jiang, B. Evans, S. Karato,
Phys. Earth Planet. Inter. 156, 75 (2006).33. A. K. McNamara, S. Zhong, Nature 437, 1136 (2005).34. S. Stackhouse, J. P. Brodholt, J. Wookey, J. Kendall,
G. D. Price, Earth Planet. Sci. Lett. 230, 1 (2005).35. J. W. Hernlund, C. Thomas, P. J. Tackley, Nature 434,
882 (2005).36. R. D. van der Hilst et al., Science 315, 1813 (2007).37. G. Masters, G. Laske, H. Bolton, A. M. Dziewonski, in
Earth’s Deep Interior: Mineral Physics and TomographyFrom the Atomic to Global Scale, S.-I. Karato,A. M. Forte, R. C. Liebermann, G. Masters, L. Stixrude,Eds. (American Geophysical Union, Washington DC,2000), pp. 63–87.
38. M. Ishii, J. Tromp, Phys. Earth Planet. Inter. 146, 113 (2004).39. The Advanced Light Source is supported by the Director,
Office of Science, Office of Basic Energy Sciences, andMaterials Sciences Division of the U.S. Department ofEnergy under contract DE-AC02-05CH11231. Thisresearch was partially supported by the Consortium forMaterials Properties Research in Earth Sciences underNSF Cooperative Agreement EAR 06-49658.L.M. acknowledges support of the Bateman Fellowship atYale University. H.R.W. acknowledges support fromCDAC and NSF grants EAR0836402 and EAR0757608.We thank S. Gaudio, C. Lesher, S. Clark, J. Knight,and J. Yan for technical assistance. Comments fromthree anonymous reviewers improved the manuscript.
Supporting Online Materialwww.sciencemag.org/cgi/content/full/329/5999/1639/DC1Materials and MethodsFigs. S1 and S2Tables S1 and S2References
18 May 2010; accepted 20 August 201010.1126/science.1192465
Genetic Restoration of the FloridaPantherWarren E. Johnson,1*† David P. Onorato,2*† Melody E. Roelke,3* E. Darrell Land,2*Mark Cunningham,2 Robert C. Belden,4 Roy McBride,5 Deborah Jansen,6 Mark Lotz,2David Shindle,2 JoGayle Howard,8 David E. Wildt,8 Linda M. Penfold,9 Jeffrey A. Hostetler,10Madan K. Oli,10 Stephen J. O’Brien1†The rediscovery of remnant Florida panthers (Puma concolor coryi) in southern Florida swamplands prompted aprogram to protect and stabilize the population. In 1995, conservation managers translocated eight femalepumas (P. c. stanleyana) from Texas to increase depleted genetic diversity, improve population numbers,and reverse indications of inbreeding depression. We have assessed the demographic, population-genetic,and biomedical consequences of this restoration experiment and show that panther numbers increasedthreefold, genetic heterozygosity doubled, survival and fitness measures improved, and inbreedingcorrelates declined significantly. Although these results are encouraging, continued habitat loss, persistentinbreeding, infectious agents, and possible habitat saturation pose new dilemmas. This intensive managementprogram illustrates the challenges of maintaining populations of large predators worldwide.
Pumas (also called cougars, mountain lions,or panthers) are currently distributed through-out western North America and much of
Central and South America (1). The endangeredFlorida panther (listed in 1967, table S1), the lastsurviving puma subspecies in easternNorthAmer-
Fig. 3. Equal area pro-jection pole figures show-ing texture developmentand anisotropic elasticproperties of a pPv aggre-gate in a subducting slabnear the core-mantleboundary using deforma-tion mechanisms estab-lished in this study. (A)(001) pole figure of pPv showing a snapshot during spreading in a plane strain regime (i.e., inter-mediate between pure shear and simple shear). (B) Fast shear-wave velocities and polarization. (C) Slowshear-wave velocities. (D) P wave velocity surface. Flow direction indicated by arrow.
www.sciencemag.org SCIENCE VOL 329 24 SEPTEMBER 2010 1641
REPORTS
on
Sep
tem
ber
23, 2
010
ww
w.s
cien
cem
ag.o
rgD
ownl
oade
d fr
om

ica, is restricted to shrinking habitat between theurban centers of Miami and Naples (Fig. 1). Bythe early 1990s, the population of ~20 to 25adults (2) showed reduced levels of moleculargenetic variation relative to other puma populations(3–5), which is indicative of inbreeding (4, 6). Thismay have led to defects, including poor spermquality and low testosterone levels (4, 7), poorfecundity and recruitment (4, 7), cryptorchidism[where >80% of males born from 1990 to 1992had one or no descended testes (4)], a highincidence of thoracic cowlicks and kinked tails(4), numerous atrial septal defects (4, 8), and ahigh load of parasites and infectious diseasepathogens (4, 8–10).
In 1995, these cumulative observations, coupledwith demographic models predicting a 95% like-lihood of extinction within two decades, moti-vated the translocation of 8 wild-caught Texas(TX) female pumas into habitat occupied by atleast 22 adult canonical (last-remaining, authen-tic) Florida panthers (CFPs) and 4 EvergladesFlorida panthers (EVGs) (Fig. 1A), because his-torically, gene flow occurred between Texas andFlorida puma populations (11, 12).
We compared data from 591 individuals sam-pled from 1978 to 2009 (table S2). Twenty-threeinformative (minimumallele frequency > 0.1) shorttandem repeat (STR) loci were examined to re-construct genetic heritage and parentage relation-ships; assess spatial and demographic patterns;distinguish CFP from other puma lineages; trackmorphological, biomedical, and life history traitsas indices of fitness; and associate genetic heritageand heterozygosity with panther survival (13).
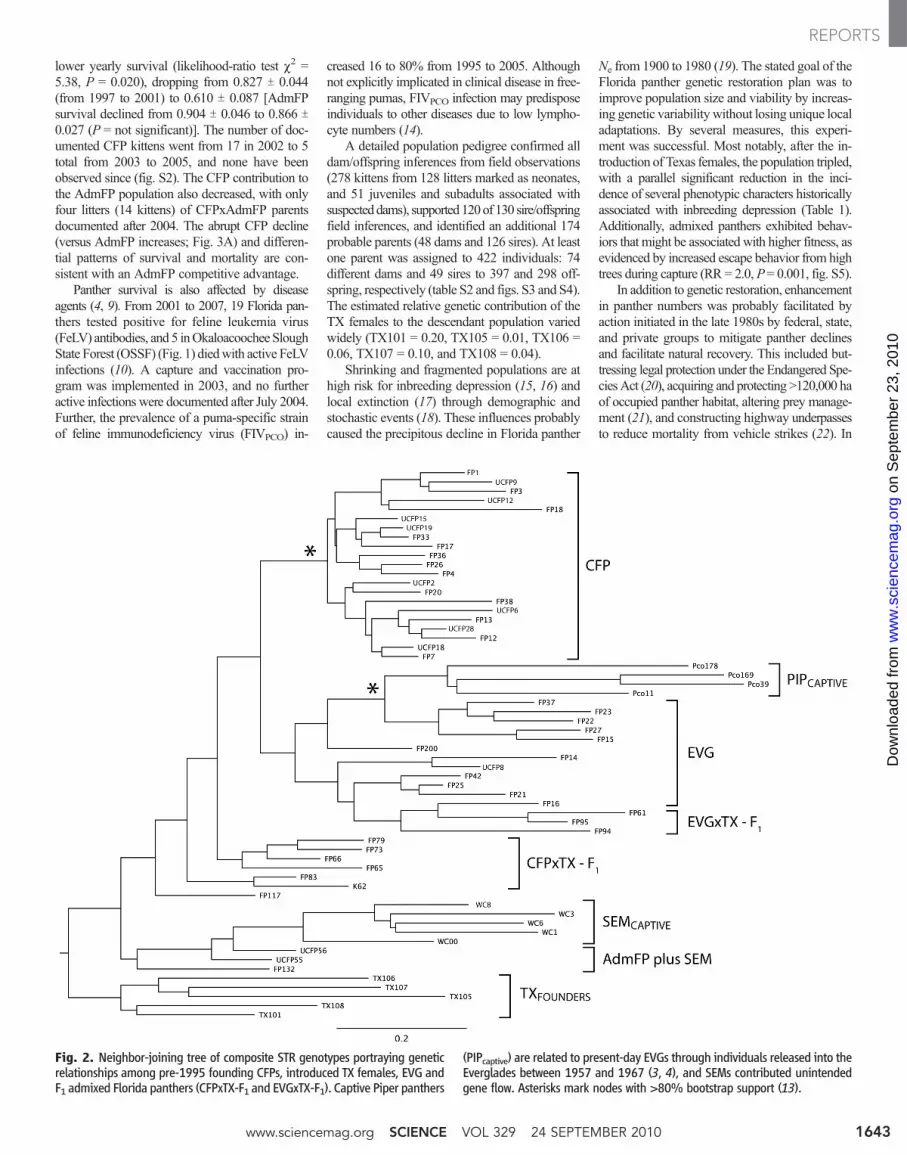
Pumas of diverse ancestry, time periods, andgeographic origins, including wild-caught andcaptive animals in Florida, clustered into phylo-genetic groups (Fig. 2). This analysis, combinedwith Bayesian population genetic results fromSTR genotypes that revealed nine distinct groups(fig. S1 and table S2), allowed us to explicitlyinfer the genetic heritage of each Florida panther(table S2, column 2; Figs. 1 and 2; and fig. S2)and to distinguish the two pre-1995 groups (CFPand EVG). Further, admixed Florida panthers(AdmFPs) were clearly identifiable, including first-generation (F1) offspring of TX females bred byCFP or EVGmales (CFPxTX-F1 or EVGxTX-F1)and panthers that were related to captive pumas ofwestern U.S. origin who had escaped from enclo-sures on the Big Cypress Seminole Indian Res-ervation (SEM) from 1997 to 1999 (Figs. 1 and 2).
From 1986 to 1995, the minimum number ofadult (>1.5 years old) panthers fluctuated from 24to 32 (Fig. 3A), and genetic heritage remainedrelatively stable (85% CFP and 15% EVG; Fig.1 and figs. S1 and S3). After their introduc-tion, five of eight TX females bred (Fig. 1a) andproduced 15 F1 kittens with CFP, EVG, and atleast five TX-backcross (TX-BC) offspring (figs.S3 and S4 and table S2). Twelve F1 panthersproduced offspring. From 1995 to 2008, 424panther births were documented (81 CFP, 319AdmFP, and 24 undetermined; 272were observed
only as neonatal kittens). These largely AdmFPwere responsible for colonizing former pantherrange and densities increased. For example,between 1995 and 2007, the number and densityof panthers in the southern Big Cypress NationalPreserve (BCNP) (2174 km2) increased eightfoldfrom3 (0.14/100 km2) to 25 (1.15/100 km2) (Fig. 1).
From 1996 to 2003, numbers (N) increasedby 14%/year to at least 95 adults (Fig. 3A), 26.6kittens were produced annually (fig. S2). The ef-fective population size (Ne) rose from 16.4 in1995 to 32.1 by 2007, andNe/Nwas 0.314 (Fig. 1)(13). This paralleled an increase in average indi-vidual STR heterozygosity (to 25% from 18.4% in1993; Fig. 3B) and a decrease in the averageestimated age of adults from 6.6 to 4.2 years from1997 to 2004. Population growth slowed andaverage age increased gradually after 2004 (Fig. 3C).
Admixed genetic ancestrywas associatedwithincreased survival of F1, EVG-BC, and TX-BCkittens (<1 year old) relative to purebred CFP andCFP-backcross (CFP-BC) kittens (0.518 T 0.130versus 0.243 T 0.074,P=0.020) (Fig. 3D). F1 adultshad significantly higher survival (P= 0.002) thanother admixed or CFP groups (table S4), with arisk ratio (RR: relative instantaneous probabilityof mortality) of 0.118 (13). The survival of sub-adults and adults increased significantlywith hetero-zygosity (RR for an increase of 0.1 = 0.643, P =0.011). Interestingly, CFPs also experienced signif-icantly higher mortality rates from intraspecific ag-gression than didAdmFPs (RR=3.077,P=0.014),and mortality rates from intraspecific aggressiondeclined as heterozygosity increased (RR = 0.480,P = 0.005) (13).
Demographic differences among >1-year-oldpanthers from 2002 to 2004 (Fig. 3A) wereevident when 23 out of 29 (23/29) (79%) CFPsalive in 2002 were lost versus 22/47 (47%)AdmFPs and when CFPs had a significantly
1Laboratory of Genomic Diversity, National Cancer Institute,Frederick, MD 21702, USA. 2Florida Fish and Wildlife Conser-vation Commission, Naples, FL 34114, USA. 3SAIC-Frederick,Laboratory of Genomic Diversity, National Cancer Institute,Frederick, MD 21702, USA. 4U.S. Fish and Wildlife Service, VeroBeach, FL 32960, USA. 5Livestock Protection Company, Alpine,TX 79832, USA. 6Big Cypress National Preserve, Ochopee, FL34141, USA. 8Smithsonian Conservation Biology Institute, FrontRoyal, VA 22630, USA. 9White Oak Conservation Center, Yulee,FL 32046, USA. 10Department of Wildlife Ecology and Con-servation, University of Florida, Gainesville, FL 32611, USA.
*These authors contributed equally to this work.†To whom correspondence should be addressed. E-mail:[email protected] (S.J.O.); [email protected](W.E.J.); [email protected] (D.P.O.)
Fig. 1. (A and B) Southern Florida (1995, left; 2007, right) with locations ofbreeding-age Florida panthers (>1.5 years old), geographic features, number(N) alive, and effective population size (Ne). Labeled colored areas in (A) de-marcate public land (23): Fakahatchee Strand Preserve State Park (FSPSP),Picayune Strand State Forest (PSSF), Florida Panther National Wildlife Refuge
(FPNWR), BCNP, Big Cypress Seminole Indian Reservation (SEM), OkaloacoocheeSlough State Forest (OSSF), and Everglades National Park (EVER) and in (B) showpanther habitat. Circles are coded by ancestry: CFP, TX females (with a B if asuccessful breeder), EVG, AdmFP, and SEM. Pie charts illustrate the geneticheritage of the population (fig. S1 and table S2) (13).
24 SEPTEMBER 2010 VOL 329 SCIENCE www.sciencemag.org1642
REPORTS
on
Sep
tem
ber
23, 2
010
ww
w.s
cien
cem
ag.o
rgD
ownl
oade
d fr
om
lower yearly survival (likelihood-ratio test c2 =5.38, P = 0.020), dropping from 0.827 T 0.044(from 1997 to 2001) to 0.610 T 0.087 [AdmFPsurvival declined from 0.904 T 0.046 to 0.866 T0.027 (P = not significant)]. The number of doc-umented CFP kittens went from 17 in 2002 to 5total from 2003 to 2005, and none have beenobserved since (fig. S2). The CFP contribution tothe AdmFP population also decreased, with onlyfour litters (14 kittens) of CFPxAdmFP parentsdocumented after 2004. The abrupt CFP decline(versus AdmFP increases; Fig. 3A) and differen-tial patterns of survival and mortality are con-sistent with an AdmFP competitive advantage.
Panther survival is also affected by diseaseagents (4, 9). From 2001 to 2007, 19 Florida pan-thers tested positive for feline leukemia virus(FeLV) antibodies, and 5 inOkaloacoochee SloughState Forest (OSSF) (Fig. 1) diedwith active FeLVinfections (10). A capture and vaccination pro-gram was implemented in 2003, and no furtheractive infections were documented after July 2004.Further, the prevalence of a puma-specific strainof feline immunodeficiency virus (FIVPCO) in-
creased 16 to 80% from 1995 to 2005. Althoughnot explicitly implicated in clinical disease in free-ranging pumas, FIVPCO infection may predisposeindividuals to other diseases due to low lympho-cyte numbers (14).
A detailed population pedigree confirmed alldam/offspring inferences from field observations(278 kittens from 128 litters marked as neonates,and 51 juveniles and subadults associated withsuspecteddams), supported120of 130 sire/offspringfield inferences, and identified an additional 174probable parents (48 dams and 126 sires). At leastone parent was assigned to 422 individuals: 74different dams and 49 sires to 397 and 298 off-spring, respectively (table S2 and figs. S3 and S4).The estimated relative genetic contribution of theTX females to the descendant population variedwidely (TX101 = 0.20, TX105 = 0.01, TX106 =0.06, TX107 = 0.10, and TX108 = 0.04).
Shrinking and fragmented populations are athigh risk for inbreeding depression (15, 16) andlocal extinction (17) through demographic andstochastic events (18). These influences probablycaused the precipitous decline in Florida panther
Ne from 1900 to 1980 (19). The stated goal of theFlorida panther genetic restoration plan was toimprove population size and viability by increas-ing genetic variability without losing unique localadaptations. By several measures, this experi-ment was successful. Most notably, after the in-troduction of Texas females, the population tripled,with a parallel significant reduction in the inci-dence of several phenotypic characters historicallyassociated with inbreeding depression (Table 1).Additionally, admixed panthers exhibited behav-iors that might be associated with higher fitness, asevidenced by increased escape behavior from hightrees during capture (RR = 2.0, P= 0.001, fig. S5).
In addition to genetic restoration, enhancementin panther numbers was probably facilitated byaction initiated in the late 1980s by federal, state,and private groups to mitigate panther declinesand facilitate natural recovery. This included but-tressing legal protection under the Endangered Spe-ciesAct (20), acquiring and protecting >120,000 haof occupied panther habitat, altering prey manage-ment (21), and constructing highway underpassesto reduce mortality from vehicle strikes (22). In
Fig. 2. Neighbor-joining tree of composite STR genotypes portraying geneticrelationships among pre-1995 founding CFPs, introduced TX females, EVG andF1 admixed Florida panthers (CFPxTX-F1 and EVGxTX-F1). Captive Piper panthers
(PIPcaptive) are related to present-day EVGs through individuals released into theEverglades between 1957 and 1967 (3, 4), and SEMs contributed unintendedgene flow. Asterisks mark nodes with >80% bootstrap support (13).
www.sciencemag.org SCIENCE VOL 329 24 SEPTEMBER 2010 1643
REPORTS
on
Sep
tem
ber
23, 2
010
ww
w.s
cien
cem
ag.o
rgD
ownl
oade
d fr
om
spite of improvements, ongoing density-dependentfactors (related to limited and decreasing habitatavailability) and stochastic events will continueto regulate population growth, requiring con-tinued commitments to identify and maintainadditional quality habitat to preserve Floridapanther evolutionary potential for the long term.
References and Notes1. M. J. Currier, Mamm. Species 200, 1 (1983).2. R. T. McBride, R. T. McBride, R. M. McBride,
C. E. McBride, Southeast. Nat. 7, 381 (2008).
3. S. J. O’Brien et al., Natl. Geogr. Res. 6, 485 (1990).4. M. E. Roelke, J. S. Martenson, S. J. O’Brien, Curr. Biol. 3,
340 (1993).5. M. Culver, W. E. Johnson, J. Pecon-Slattery, S. J. O’Brien,
J. Hered. 91, 186 (2000).6. P. W. Hedrick, R. Fredrickson, Conserv. Genet. 11, 615
(2010).7. M. A. Barone et al., J. Mammal. 75, 150 (1994).8. M. W. Cunningham et al., J. Wildl. Dis. 35, 519 (1999).9. M. E. Roelke et al., J. Wildl. Dis. 29, 36 (1993).10. M. W. Cunningham et al., J. Wildl. Dis. 44, 537
(2009).11. U. S. Seal, R. C. Lacy, Eds., A Plan for Genetic Restoration
and Management of the Florida Panther (Felis concolor
coryi) (Report to the Florida Game and Fresh WaterFish Commission, Conservation Breeding SpecialistGroup, Apple Valley, MN, 1994).
12. S. J. O’Brien, Tears of the Cheetah and Other Talesfrom the Genetic Frontier (St. Martin’s Press, New York,2003).
13. Materials, methods, and additional figures andtables are available as supporting material on ScienceOnline.
14. M. E. Roelke et al., J. Wildl. Dis. 42, 234 (2006).15. R. C. Lacy, J. Mammal. 78, 320 (1997).16. P. W. Hedrick, S. T. Kalinowski, Annu. Rev. Ecol. Syst. 31,
139 (2000).17. R. Frankham, K. Ralls, Nature 392, 441 (1998).
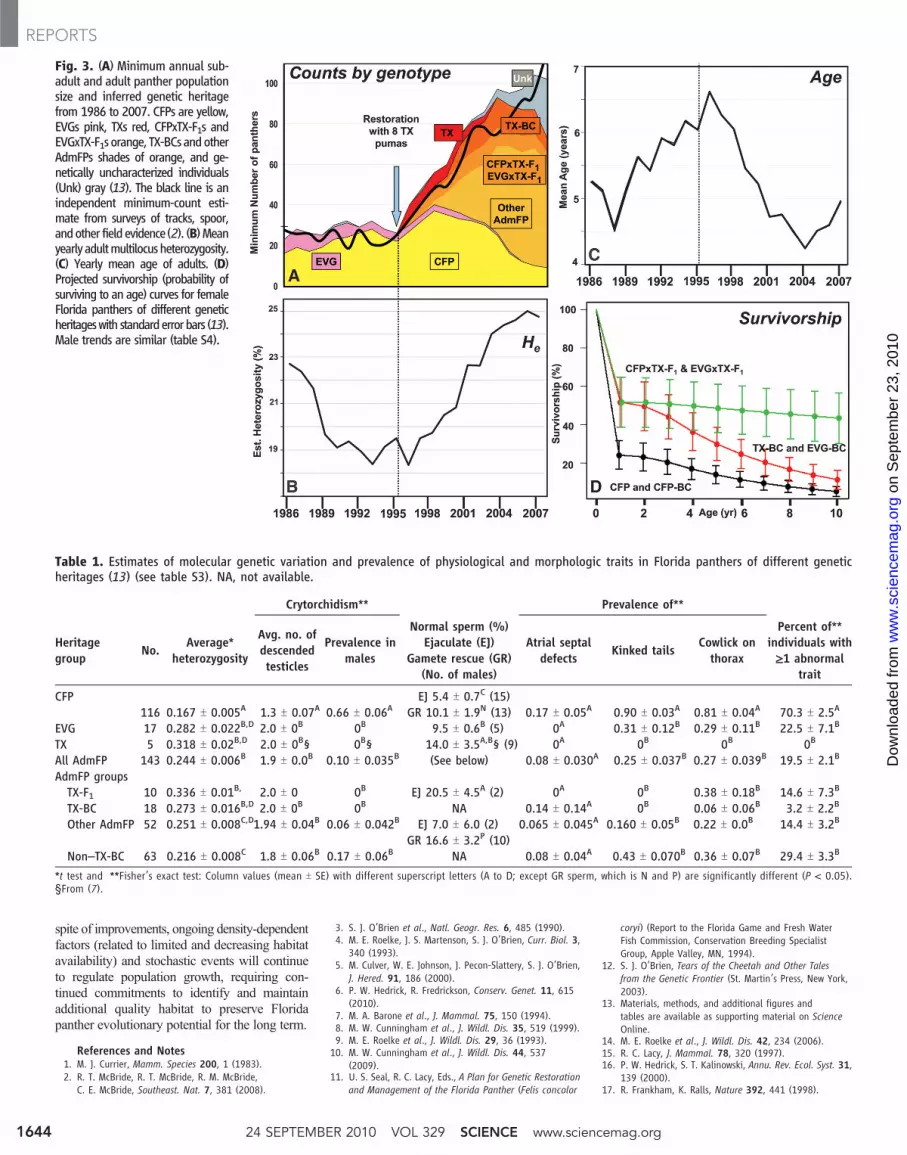
Fig. 3. (A) Minimum annual sub-adult and adult panther populationsize and inferred genetic heritagefrom 1986 to 2007. CFPs are yellow,EVGs pink, TXs red, CFPxTX-F1s andEVGxTX-F1s orange, TX-BCs andotherAdmFPs shades of orange, and ge-netically uncharacterized individuals(Unk) gray (13). The black line is anindependent minimum-count esti-mate from surveys of tracks, spoor,andother field evidence(2). (B)Meanyearly adultmultilocusheterozygosity.(C) Yearly mean age of adults. (D)Projected survivorship (probability ofsurviving to an age) curves for femaleFlorida panthers of different geneticheritageswith standarderrorbars (13).Male trends are similar (table S4).
Table 1. Estimates of molecular genetic variation and prevalence of physiological and morphologic traits in Florida panthers of different geneticheritages (13) (see table S3). NA, not available.
Crytorchidism** Prevalence of**
Heritagegroup No. Average*
heterozygosityAvg. no. ofdescendedtesticles
Prevalence inmales
Normal sperm (%)Ejaculate (EJ)
Gamete rescue (GR)(No. of males)
Atrial septaldefects Kinked tails Cowlick on
thorax
Percent of**individuals with≥1 abnormal
traitCFP EJ 5.4 T 0.7C (15)
116 0.167 T 0.005A 1.3 T 0.07A 0.66 T 0.06A GR 10.1 T 1.9N (13) 0.17 T 0.05A 0.90 T 0.03A 0.81 T 0.04A 70.3 T 2.5A
EVG 17 0.282 T 0.022B,D 2.0 T 0B 0B 9.5 T 0.6B (5) 0A 0.31 T 0.12B 0.29 T 0.11B 22.5 T 7.1B
TX 5 0.318 T 0.02B,D 2.0 T 0B§ 0B§ 14.0 T 3.5A,B§ (9) 0A 0B 0B 0B
All AdmFP 143 0.244 T 0.006B 1.9 T 0.0B 0.10 T 0.035B (See below) 0.08 T 0.030A 0.25 T 0.037B 0.27 T 0.039B 19.5 T 2.1B
AdmFP groupsTX-F1 10 0.336 T 0.01B, 2.0 T 0 0B EJ 20.5 T 4.5A (2) 0A 0B 0.38 T 0.18B 14.6 T 7.3B
TX-BC 18 0.273 T 0.016B,D 2.0 T 0B 0B NA 0.14 T 0.14A 0B 0.06 T 0.06B 3.2 T 2.2B
Other AdmFP 52 0.251 T 0.008C,D1.94 T 0.04B 0.06 T 0.042B EJ 7.0 T 6.0 (2) 0.065 T 0.045A 0.160 T 0.05B 0.22 T 0.0B 14.4 T 3.2B
GR 16.6 T 3.2P (10)Non–TX-BC 63 0.216 T 0.008C 1.8 T 0.06B 0.17 T 0.06B NA 0.08 T 0.04A 0.43 T 0.070B 0.36 T 0.07B 29.4 T 3.3B
*t test and **Fisher’s exact test: Column values (mean T SE) with different superscript letters (A to D; except GR sperm, which is N and P) are significantly different (P < 0.05).§From (7).
24 SEPTEMBER 2010 VOL 329 SCIENCE www.sciencemag.org1644
REPORTS
on
Sep
tem
ber
23, 2
010
ww
w.s
cien
cem
ag.o
rgD
ownl
oade
d fr
om
18. R. Lande, Science 241, 1455 (1988).19. M. Culver, P. W. Hedrick, K. Murphy, S. O’Brien,
M. G. Hornocker, Anim. Conserv. 11, 104 (2008).20. S. J. O’Brien, E. Mayr, Science 251, 1187 (1991).21. M. W. Janis, J. D. Clark, J. Wildl. Manage. 66, 839 (2002).22. M. L. Foster, S. R. Humphrey, Wildl. Soc. Bull. 23, 95 (1995).23. R. Kautz et al., Biol. Conserv. 130, 118 (2006).24. We dedicate this study to the memory of Ulysses Seal and
Ernst Mayr, important heroes in the conservation struggleof the Florida panther. Funded by the Florida Fish andWildlife Conservation Commission (FWC) via purchases ofFlorida panther license plates. Other major funding for
the field work was provided by Everglades NationalPark (EVER), the BCNP, and federal funds from theU.S. Fish and Wildlife Service (especially in the earlyyears) as well as from the National Cancer Institute,National Institutes of Health (NIH), under contractnumber N01-CO-12400. This research was supported inpart by the Intramural Research Program of NIH,National Cancer Institute, Center for Cancer Research,and the Florida Panther Research and ManagementTrust Fund. All panther captures, sampling, and radiocollaring were authorized by U.S. Fish and WildlifeService Endangered Species Permits TE01553-3 (FWC)
and TE146761-1 (BCNP). We thank many individualsfor their help in this project, who are named in SOMreference S25.
Supporting Online Materialwww.sciencemag.org/cgi/content/full/329/5999/1641/DC1Materials and MethodsFigs. S1 to S5Tables S1 to S6References
27 May 2010; accepted 11 August 201010.1126/science.1192891
Parasympathetic Innervation MaintainsEpithelial Progenitor Cells DuringSalivary OrganogenesisS. M. Knox,1 I. M. A. Lombaert,1 X. Reed,1 L. Vitale-Cross,2 J. S. Gutkind,2 M. P. Hoffman1*The maintenance of a progenitor cell population as a reservoir of undifferentiated cells isrequired for organ development and regeneration. However, the mechanisms by which epithelialprogenitor cells are maintained during organogenesis are poorly understood. We report that removalof the parasympathetic ganglion in mouse explant organ culture decreased the number andmorphogenesis of keratin 5–positive epithelial progenitor cells. These effects were rescued with anacetylcholine analog. We demonstrate that acetylcholine signaling, via the muscarinic M1 receptor andepidermal growth factor receptor, increased epithelial morphogenesis and proliferation of the keratin5–positive progenitor cells. Parasympathetic innervation maintained the epithelial progenitor cellpopulation in an undifferentiated state, which was required for organogenesis. This mechanism forepithelial progenitor cell maintenance may be targeted for organ repair or regeneration.
Organogenesis involves the coordinatedgrowth of epithelium,mesenchyme, nerves,and blood vessels, which use common
sets of genes, guidance cues, and growth factor–signaling pathways (1–5). Research on epithelial or-ganogenesis has focused on epithelial-mesenchymaland endothelial-epithelial cell interactions. How-ever, the function of the peripheral nervous sys-tem during epithelial organogenesis is less clear.
Pavlov’s seminal experiments on dogs demon-strated that neuronal input controls salivary glandfunction (6), and more recent work showed thatparasympathetic innervation of salivary glands is es-sential for regeneration after injury (7). Becauseparasympathetic innervation occurs in parallel withsalivary gland development (8), we hypothesizedthat parasympathetic innervation is required for ep-ithelial progenitor cell function during organogenesis.
To test this hypothesis, we used mouse em-bryonic submandibular gland (SMG) explantculture and mechanically removed the parasym-pathetic submandibular ganglion (PSG) beforethe gland developed (9). SMG development be-gins at embryonic day 11 (E11), when the oralepithelium invaginates into neural crest–derived
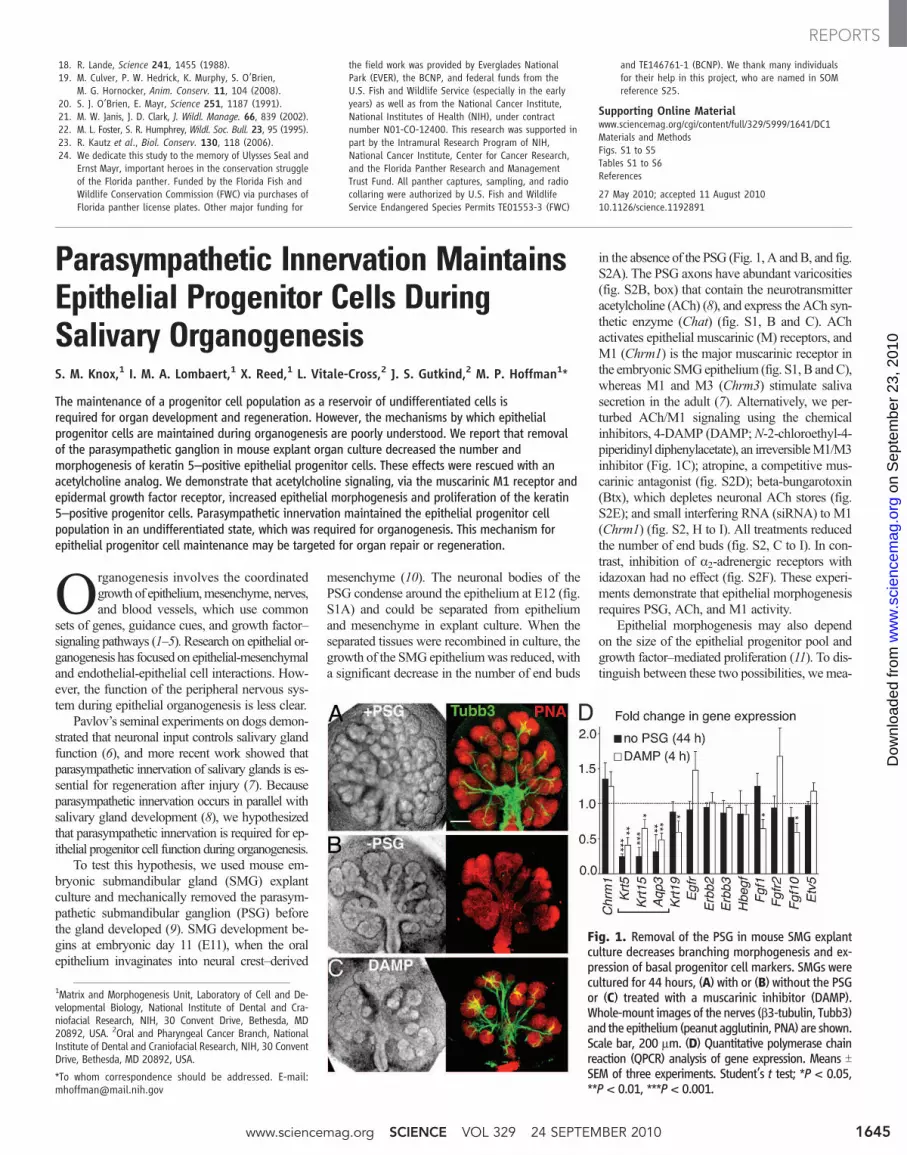
mesenchyme (10). The neuronal bodies of thePSG condense around the epithelium at E12 (fig.S1A) and could be separated from epitheliumand mesenchyme in explant culture. When theseparated tissues were recombined in culture, thegrowth of the SMG epitheliumwas reduced, witha significant decrease in the number of end buds
in the absence of the PSG (Fig. 1, A andB, and fig.S2A). The PSG axons have abundant varicosities(fig. S2B, box) that contain the neurotransmitteracetylcholine (ACh) (8), and express the ACh syn-thetic enzyme (Chat) (fig. S1, B and C). AChactivates epithelial muscarinic (M) receptors, andM1 (Chrm1) is the major muscarinic receptor inthe embryonic SMGepithelium (fig. S1, B andC),whereas M1 and M3 (Chrm3) stimulate salivasecretion in the adult (7). Alternatively, we per-turbed ACh/M1 signaling using the chemicalinhibitors, 4-DAMP (DAMP;N-2-chloroethyl-4-piperidinyl diphenylacetate), an irreversibleM1/M3inhibitor (Fig. 1C); atropine, a competitive mus-carinic antagonist (fig. S2D); beta-bungarotoxin(Btx), which depletes neuronal ACh stores (fig.S2E); and small interfering RNA (siRNA) to M1(Chrm1) (fig. S2, H to I). All treatments reducedthe number of end buds (fig. S2, C to I). In con-trast, inhibition of a2-adrenergic receptors withidazoxan had no effect (fig. S2F). These experi-ments demonstrate that epithelial morphogenesisrequires PSG, ACh, and M1 activity.
Epithelial morphogenesis may also dependon the size of the epithelial progenitor pool andgrowth factor–mediated proliferation (11). To dis-tinguish between these two possibilities, we mea-
1Matrix and Morphogenesis Unit, Laboratory of Cell and De-velopmental Biology, National Institute of Dental and Cra-niofacial Research, NIH, 30 Convent Drive, Bethesda, MD20892, USA. 2Oral and Pharyngeal Cancer Branch, NationalInstitute of Dental and Craniofacial Research, NIH, 30 ConventDrive, Bethesda, MD 20892, USA.
*To whom correspondence should be addressed. E-mail:[email protected]
Fig. 1. Removal of the PSG in mouse SMG explantculture decreases branching morphogenesis and ex-pression of basal progenitor cell markers. SMGs werecultured for 44 hours, (A) with or (B) without the PSGor (C) treated with a muscarinic inhibitor (DAMP).Whole-mount images of the nerves (b3-tubulin, Tubb3)and the epithelium (peanut agglutinin, PNA) are shown.Scale bar, 200 mm. (D) Quantitative polymerase chainreaction (QPCR) analysis of gene expression. Means TSEM of three experiments. Student’s t test; *P < 0.05,**P < 0.01, ***P < 0.001.
www.sciencemag.org SCIENCE VOL 329 24 SEPTEMBER 2010 1645
REPORTS
on
Sep
tem
ber
23, 2
010
ww
w.s
cien
cem
ag.o
rgD
ownl
oade
d fr
om
24 SEPTEMBER 2010 VOL 329 SCIENCE www.sciencemag.org 1606
PERSPECTIVES
Researchers have had more success in
developing hypotheses about Compositae’s
evolutionary sequence (phylogeny) by using
molecular techniques to study genetic simi-
larities among existing species. These studies
initially identifi ed two related families: Good-
eniaceae, centered in Australia; and Calycer-
aceae, which are in southern South America
and are closer to Compositae ( 6, 7). Caly-
ceraceae, a small family of just four genera
and about 60 species ( 8), stands in contrast to
the huge sunfl ower assemblage of 1500 gen-
era. The phylogenetic approach has helped
researchers identify what appears to be the
oldest known familial relative: Barnadesii-
nae, a little known subtribe of Mutisieae; it
consists of nine genera and 91 species from
southern and Andean South America ( 9, 10).
All data suggested that the common
ancestor of Goodeniaceae, Calyceraceae, and
Compositae developed in Antarctica, when it
had mixed temperate and tropical forests ( 11,
12). As Antarctica cooled during Eocene-
Oligocene (~56 million to 23 million years
ago) ( 13), the ancestral form dispersed and
migrated eastward into Australia, resulting
eventually in Goodeniaceae, and westward
into southern South America, leading to the
progenitor of Calyceraceae and Composi-
tae. The splitting of Calyceraceae and Com-
positae, therefore, would have occurred in
southern South America during the Eocene
(~56 million to 34 million years ago). These
hypotheses have been buttressed by “molecu-
lar clock” studies, which suggest that Com-
positae diverged in the Eocene, approxi-
mately 50 million years ago ( 14).
Given this background, Barreda et al.’s
report of an Eocene fossil from southern
South America showing clear fl owering heads
with phyllaries and pappus is important. At
long last, there is clear macrofossil evidence
of the sunfl ower family at an early stage of its
diversifi cation, just where it had been hypoth-
esized to originate. The fossil does not allow
unequivocal assignment, but the authors sug-
gest that its large, conical heads and types of
pappus and phyllaries are broadly compatible
with Mutisieae. There is also dispersed pol-
len found in the matrix with the fossil, and
its features are also suggestive of Mutisieae
(or possibly Carduoideae). Detailed scanning
and transmission electron microscopic stud-
ies on the pollen would be helpful for deeper
understanding of relationships, as would fi nd-
ing pollen in situ in anther sacs of a better pre-
served fossil.
Much remains to be learned about the evo-
lution and biogeography of the sunfl ower fam-
ily. A new book ( 15) has synthesized molecu-
lar phylogenetic studies and, in consort with
the new fossil reported here, provides strong
stimuli for further research. Even if research-
ers accept the sunflower’s origin in south-
ern South America, it is still unclear how the
family quickly colonized the entire planet and
became so incredibly diverse.
References
1. V. D. Barreda et al., Science 329, 1621 (2010). 2. A. Graham, in Compositae: Systematics; Proc. Intern.
Compositae Conf., D. J. N. Hind, H. J. Beentje, Eds. (Royal Botanic Gardens, Kew, 1996), pp. 123–140.
3. V. Barreda, L. Palazzesi, M. C. Tellería, L. Katinas, J. V. Crisci, Rev. Palaeobot. Palynol. 160, 102 (2010).
4. H. F. Becker, Palaeontographica 127, 1 (1969). 5. W. L. Crepet, T. F. Stuessy, Brittonia 30, 483 (1978). 6. R. G. Olmstead, K. J. Kim, R. K. Jansen, S. J. Wagstaff,
Mol. Phylogenet. Evol. 16, 96 (2000). 7. K. Bremer et al., Plant Syst. Evol. 229, 137 (2001). 8. F. H. Hellwig, in Flowering Plants. Eudicots: Asterales, J.
W. Kadereit, C. Jeffrey, Eds. [K. Kubitzki, Gen. Ed., The
Families and Genera of Vascular Plants, vol. 8] (Springer, Berlin, 2007), pp. 19–25.
9. R. K. Jansen, J. D. Palmer, Proc. Natl. Acad. Sci. U.S.A. 84, 5818 (1987).
10. T. F. Stuessy, E. Urtubey, M. Gruenstaeudl, in Systematics,
Evolution, and Biogeography of Compositae, V. A. Funk, A. Susanna, T. F. Stuessy, R. J. Bayer, Eds. (IAPT Press, Vienna, 2009), pp. 215–228.
11. G. T. Torres, Bol. Antart. Chil. 5, 17 (1985). 12. A. N. Drinnen, P. R. Crane, in Antarctic Paleobotany, T.
N. Taylor, E. L. Taylor, Eds. (Springer-Verlag, New York, 1990), pp. 192–219.
13. P. N. Pearson et al., Nature 461, 1110 (2009). 14. V. A. Funk et al., Biol. Skrif. 55, 343 (2005). 15. V. A. Funk, A. Susanna, T. F. Stuessy, R. J. Bayer, Eds.,
Systematics, Evolution, and Biogeography of Compositae (IAPT Press, Vienna, 2009).
10.1126/science.1195336
A Bit of Texas in Florida
GENETICS
Craig Packer
Florida’s inbred panthers benefi ted from the import of Texas pumas.
Harassed, hunted, and restricted to
ever smaller areas, most populations
of large carnivores are fragmented
into archipelagoes of parks and reserves.
Biologists have long warned of the nega-
tive genetic consequences of inbreeding in
such small populations. To restore genetic
health, they have prescribed “active man-
agement,” including moving, or translocat-
ing, individuals into inbred populations. In a
time of budget cuts and inadequate funding
for effective conservation, however, is trans-
location worth the costs? Moving a lion from
Namibia to South Africa is not a trivial exer-
cise, nor is the translocation of cougars from
one part of the United States to another. But
it may be worth the trouble, Johnson et al. ( 1)
report on page 1641 of this issue. In the most
comprehensive study ever conducted on the
effects of inbreeding in wild carnivores, they
fi nd convincing evidence that the “quality”
of a population of Florida panthers was suc-
cessfully improved by the addition of pan-
thers from Texas.
Florida panthers (also called cougars,
pumas, or mountain lions) have been stud-
ied in considerable detail since the 1970s and
provide an exceptionally clear example of the
genetic consequences of prolonged inbreed-
ing. By the early 1990s, Florida’s population
of 20 to 25 adult panthers was showing lower
genetic variation than other puma popula-
tions. Biologists observed a range of prob-
lems—including heart defects, poor sperm
quality, poor fecundity, and many adult males
with one or no descended testes—that led
to predictions that the population could go
extinct within decades. In a bid to stem the
tide, managers introduced eight female Texas
cougars to Florida in 1995.
By comparing genetic data collected from
591 Florida panthers between 1978 and 2009,
Johnson et al. show that Texas-Florida hybrid
offspring have replaced the original inbred
stock. The researchers documented increased
levels of genetic heterozygosity (having dif-
ferent versions of the same gene), and the
hybrid offspring enjoyed greater viability
and fewer genetic abnormalities. The adult
hybrids were also superior competitors: The
pure-bred Florida panthers suffered greater
mortality from fi ghts with outbred cougars,
and hybrids were better able to climb trees
when pursued by scientists.
The size of the panther population has
also increased since the translocation, but
this result is more diffi cult to interpret. The
amount of land available to the Florida pan-
ther has increased in the past few decades due
Department of Ecology, Evolution, and Behavior, University of Minnesota, St. Paul, MN 55108, USA. E-mail: [email protected]
Published by AAAS
on
Sep
tem
ber
23, 2
010
ww
w.s
cien
cem
ag.o
rgD
ownl
oade
d fr
om
www.sciencemag.org SCIENCE VOL 329 24 SEPTEMBER 2010 1607
PERSPECTIVES
to a variety of conservation measures. More
land supports more cougars, so it is hard to
estimate how much of the population growth
resulted from the infl ux of “fresh blood” as
opposed to range expansion. A similar trans-
location of 16 lions into a highly inbred pop-
ulation in Hluhluwe iMfolozi Park, a fenced
reserve in South Africa, also improved the
reproductive performance of the lions in the
park, but population size did not increase in
the short term ( 2).
Although translocation looks to be an effec-
tive technique for ameliorating the genetic
consequences of small population size, the
larger problem still remains. Big cats may be
popular in places where they’ve become scarce
and most people live in cities, but the rest of
the world still struggles to deal with the dan-
gers that man-eaters and cattle-killers pose to
rural residents. Lions attacked more than 100
Tanzanians every year for the fi rst few years
of this millennium ( 3), and thousands of live-
stock are killed by lions, leopards, and jaguars
throughout the world each year.
Retaliatory poisoning is increasingly
common in Africa, greatly reducing the
number of large carnivores outside national
parks, and trophy hunting is excessive and
poorly regulated, resulting in rapid popula-
tion declines in many jurisdictions ( 4). Even
in the United States, attitudes toward cou-
gars vary from state to state. Montana paid
bounties for dead cougars between 1908 and
1911; the take averaged about 140 animals
per year. In contrast, between 1997 and 1999,
trophy hunters in Montana killed an average
of 800 cougars per year—virtually at the
same time as the translocation from Texas to
Florida. In 2006, Oregon announced plans to
increase trophy hunting in order to decrease
the state’s cougar population by 40% and
thereby reduce livestock depredation.
Although 21st-century Floridians may be
willing to enlarge panther habitat, the story
is still quite different in the rest of the world.
We can perhaps take some consolation from
Johnson et al.’s study: Once the entire planet
reaches the same state of economic develop-
ment and urbanization as the United States,
wildlife managers all over the world can look
forward to carting rare species from one park
to another until the end of time.
References
1. W. E. Johnson et al., Science 329, 1641 (2010).
2. M. Trinkel et al., Anim. Conserv. 11, 138 (2008).
3. C. Packer, D. Ikanda, B. Kissui, H. Kushnir, Nature 436,
927 (2005).
4. C. Packer et al., PLoS ONE 4, e5941 (2009).
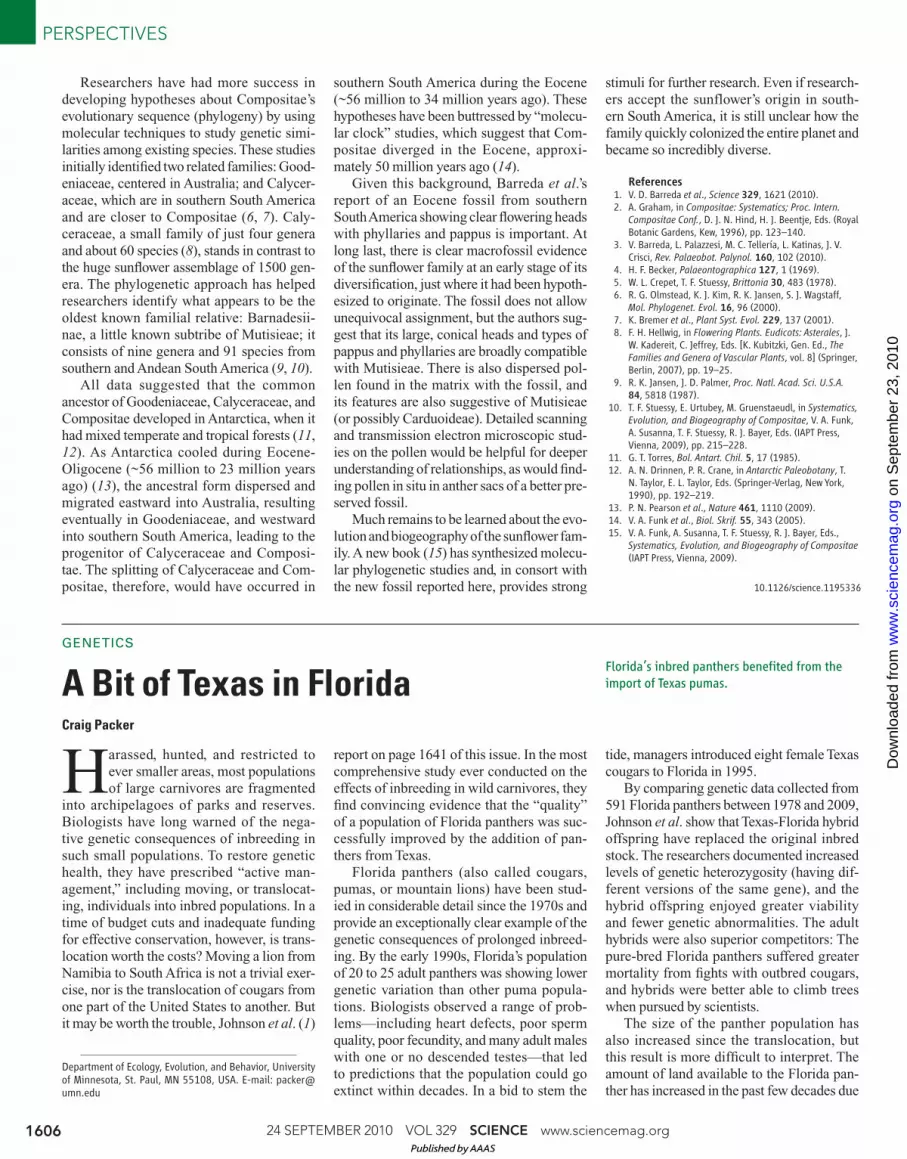
Gene fl ow. The Florida panther got a genetic boost from introductions of pumas from Texas, but other big cats still face serious problems around the world.
10.1126/science.1196738
CR
ED
IT: D
EN
GU
Y/I
ST
OC
KP
HO
TO
.CO
M
Exposing a DUX Tale
GENETICS
Mani S. Mahadevan
A DNA sequence stabilizes the expression of
a gene that may affect muscle development
and lead to muscular dystrophy.
Facioscapulohumeral muscular dystro-
phy (FSHD), the third most common
muscular dystrophy, is characterized
by progressive weakness that starts in the
facial muscles, proceeds to the upper back
(scapula) and shoulder-upper arm regions
(humeral), and eventually affects the trunk
and lower extremities. Since 1992, this dis-
order has been associated with an array of
repeated DNA sequences (called D4Z4) on
chromosome 4 ( 1). An unaffected chromo-
some 4 has between 11 and more than 100
repeat units within D4Z4, but when this is
shortened to 1 to 10 units, disease develops
(see the fi gure). How this contraction leads
to disease has been a mystery. Over the past
3 years, analyses of chromosome 4q35 have
identifi ed a combination of DNA sequences
(haplotype 4A161) associated with suscep-
tibility to FSHD, suggesting that specific
sequence variations are coupled to disease
pathogenesis in conjunction with D4Z4
contraction ( 2). On page 1650 of this issue,
Lemmers et al. ( 3) provide an intriguing uni-
fying model for FSHD pathogenesis based
on very high resolution haplotype mapping
and sequence analyses and careful study of
exceptional pedigrees.
FSHD pathogenesis has been one of the
most puzzling enigmas in human genetics for
the past two decades, but there was always a
consensus that the disease was caused by a
gain-of-function mutation ( 1). Each D4Z4
repeat unit has a sequence called DUX4 that
potentially encodes a double homeobox gene
putatively involved in developmental regu-Department of Pathology, University of Virginia, Charlottes-ville, VA 22908, USA. E-mail: [email protected]
Published by AAAS
on
Sep
tem
ber
23, 2
010
ww
w.s
cien
cem
ag.o
rgD
ownl
oade
d fr
om