genetic and 'cultural' similarity in wild chimpanzees
TRANSCRIPT

doi: 10.1098/rspb.2010.1112 published online 18 August 2010Proc. R. Soc. B
Wroblewski and Linda VigilantToshisada Nishida, Anne Pusey, Vernon Reynolds, Grit Schubert, Richard W. Wrangham, Emily Kevin E. Langergraber, Christophe Boesch, Eiji Inoue, Miho Inoue-Murayama, John C. Mitani, Genetic and 'cultural' similarity in wild chimpanzees
Supplementary data
tmlhttp://rspb.royalsocietypublishing.org/content/suppl/2010/08/10/rspb.2010.1112.DC1.h
"Data Supplement"
Referencesml#ref-list-1http://rspb.royalsocietypublishing.org/content/early/2010/08/10/rspb.2010.1112.full.ht
This article cites 47 articles, 12 of which can be accessed free
P<P Published online 18 August 2010 in advance of the print journal.
Subject collections
(2258 articles)evolution � (1996 articles)ecology �
(1656 articles)behaviour � Articles on similar topics can be found in the following collections
Email alerting service hereright-hand corner of the article or click Receive free email alerts when new articles cite this article - sign up in the box at the top
publication. Citations to Advance online articles must include the digital object identifier (DOIs) and date of initial online articles are citable and establish publication priority; they are indexed by PubMed from initial publication.the paper journal (edited, typeset versions may be posted when available prior to final publication). Advance Advance online articles have been peer reviewed and accepted for publication but have not yet appeared in
http://rspb.royalsocietypublishing.org/subscriptions go to: Proc. R. Soc. BTo subscribe to
This journal is © 2010 The Royal Society
on December 9, 2010rspb.royalsocietypublishing.orgDownloaded from
Proc. R. Soc. B
on December 9, 2010rspb.royalsocietypublishing.orgDownloaded from
* Autho
Electron10.1098
doi:10.1098/rspb.2010.1112
Published online
ReceivedAccepted
Genetic and ‘cultural’ similarity inwild chimpanzees
Kevin E. Langergraber1,*, Christophe Boesch1, Eiji Inoue2,
Miho Inoue-Murayama3, John C. Mitani4, Toshisada Nishida5,
Anne Pusey6, Vernon Reynolds7, Grit Schubert1, Richard
W. Wrangham8, Emily Wroblewski9 and Linda Vigilant1
1Primatology Department, Max Planck Institute for Evolutionary Anthropology, Deutscher Platz 6,
Leipzig 04103, Germany2Graduate School of Science, Kyoto University, Kyoto 606-8502, Japan
3Wildlife Research Center, Kyoto University, Kyoto 606-8203, Japan4Department of Anthropology, University of Michigan, 101 West Hall, 1085 South University Avenue,
Ann Arbor, MI 48109-1107, USA5Japan Monkey Center, 26 Kanrin, Inuyama 484-0081, Japan
6Department of Evolutionary Anthropology, Duke University, Durham, NC 27708-0680, USA7School of Anthropology, Oxford University, 51 Banbury Road, Oxford OX2 6PE, UK
8Department of Human Evolutionary Biology, Harvard University, Peabody Museum, 11 Divinity Avenue,
Cambridge, MA 02138, USA9Department of Ecology, Evolution, and Behavior, University of Minnesota, St Paul, MN 55108, USA
The question of whether animals possess ‘cultures’ or ‘traditions’ continues to generate widespread
theoretical and empirical interest. Studies of wild chimpanzees have featured prominently in this discus-
sion, as the dominant approach used to identify culture in wild animals was first applied to them. This
procedure, the ‘method of exclusion,’ begins by documenting behavioural differences between groups
and then infers the existence of culture by eliminating ecological explanations for their occurrence.
The validity of this approach has been questioned because genetic differences between groups have not
explicitly been ruled out as a factor contributing to between-group differences in behaviour. Here we
investigate this issue directly by analysing genetic and behavioural data from nine groups of wild chimpan-
zees. We find that the overall levels of genetic and behavioural dissimilarity between groups are highly and
statistically significantly correlated. Additional analyses show that only a very small number of behaviours
vary between genetically similar groups, and that there is no obvious pattern as to which classes of
behaviours (e.g. tool-use versus communicative) have a distribution that matches patterns of between-
group genetic dissimilarity. These results indicate that genetic dissimilarity cannot be eliminated as
playing a major role in generating group differences in chimpanzee behaviour.
Keywords: culture; social learning; genetics; chimpanzees; Pan troglodytes
1. INTRODUCTIONThe importance of group-specific, socially transmitted
behaviour to the lives of non-human animals, and its rele-
vance to the evolution of human culture, is a matter of
considerable controversy [1–4]. As our closest living
relatives and the most intensively studied non-human
primate in the wild, chimpanzees have played a particularly
important role in the study of culture in non-human ani-
mals [5–8]. A landmark survey of geographical variation
in chimpanzee behaviour found 39 behaviours, including
various forms of tool use, grooming, and courtship behav-
iour, that were common in at least one chimpanzee group
but absent in at least one other, and for which an ecologi-
cal explanation for this absence was judged to be unlikely,
e.g. a lack of ‘termite fishing’ even though the appropriate
r for correspondence ([email protected]).
ic supplementary material is available at http://dx.doi.org//rspb.2010.1112 or via http://rspb.royalsocietypublishing.org.
27 May 201027 July 2010 1
termite species was present [9,10]. This so-called ‘method
of exclusion’, which infers the existence of culture by elim-
inating ecological explanations for the patterning of
between-group behavioural variation, has since been
applied to several other primate and non-primate species,
and has until recently been the dominant approach used
to identify animal culture in the wild [11–14].
In a pattern reminiscent of between-group variation in
human behaviour, each chimpanzee group had its own
unique combination of putative cultural variants. This com-
plex, mosaic pattern of between-group variation in
behaviour was different than that observed in prior studies
of animal culture, where in most cases only one type of
behaviour varied among groups (although this may be a
result of the fact that usually only one type of behaviour
was being investigated, e.g. bird song dialects; [15]).
Although other species have now been discovered to show
patterns of behavioural diversity that approach levels
displayed by chimpanzees [14], for many, chimpanzees
remain the prime exemplar of animal culture [1,16,17].
This journal is q 2010 The Royal Society
2 K. E. Langergraber et al. Chimp genetic and cultural similarity
on December 9, 2010rspb.royalsocietypublishing.orgDownloaded from
Support for the hypothesis that some of the geographi-
cal variation in the behaviour of chimpanzees and other
animals may represent socially learned cultural variation
comes from three main areas. First, research conducted
in captivity suggests that chimpanzees and other animals
have the requisite social-learning abilities to produce
stable differences in group-specific behaviour [18–25].
In one representative experiment [18], two chimpanzees
were isolated from their respective groups and trained in
different tool using techniques to gain access to food in
an experimental apparatus. These two ‘demonstrators’
were then re-introduced into their original groups. The
behaviour of individuals in each group was then com-
pared with each other and with the behaviour of
chimpanzees in a no-demonstrator control group. The
majority of chimpanzees in the two experimental groups
employed the technique of their demonstrator, while
chimpanzees in the control group did not typically
obtain access to the food. Second, longitudinal naturalis-
tic observations of wild chimpanzees [26] and capuchin
monkeys [27,28] show that individuals which spend
more time together develop similar techniques for par-
ticular extractive foraging tasks, suggesting that social
learning plays a role in skill development. And third, as
would be predicted if more exposure to models results
in more opportunities for social learning, between-site
comparisons in wild chimpanzees and orangutans
indicate that the number of behavioural variants found
at a site is positively correlated with the amount of time
individuals spend associating with conspecifics [14,29].
While results such as these indicate that the social learn-
ing abilities of chimpanzees and other primates may be
sufficient to produce differences in the behaviour of indi-
viduals within and between groups, they do
not necessarily indicate that all or even most of the
behavioural variants observed in the wild arise as a result
of social learning, and thus represent true cultural variants
[3,7,17,30,31]. In addition to the difficulty of determining
whether ecological explanations can ever be definitively
excluded as a source of behavioural variation, some
critics argue that insufficient attention has been paid to
the possibility that genetic differences are responsible for
behavioural variation between groups of chimpanzees
and other animals [2,4,30,32,33]. Recent research shows
that individuals raised with no opportunity to acquire a
suspected socially learnt behaviour exhibit sophisticated
abilities to use tools (finches and crows; [34,35]) and
process foods (gorillas; [36]). Similarly, two naive
captive-born chimpanzees presented with rough bristly
leaves spontaneously folded and swallowed them in the
same way that sick chimpanzees do in the wild (probably
in order to expel intestinal parasites; [37]). Together,
these results suggest that complex behaviours can be at
least partly under genetic control and that group differ-
ences in underlying genetic predispositions and abilities
could plausibly contribute to group differences in behav-
iour. Indeed, almost one-third of the putative cultural
variants in the original report [9] of geographical variation
in chimpanzee behaviour are found only in Pan troglodytes
verus, the most genetically divergent of the four
chimpanzee subspecies and considered by some to
represent a different species [38,39]. Genetic dissimilarity
within subspecies may even play a role in generating
between-group variation in chimpanzee behaviour. The
Proc. R. Soc. B
east African subspecies Pan troglodytes schweinfurthii, for
example, shows as much geographical structuring of
genetic variation as does the entire human species [40],
and genetically influenced variation in body size has been
hypothesized to contribute to differences between the
calls produced by chimpanzees in two groups belonging
to the same east African subspecies [41].
In an indirect investigation of this issue, Lycett et al.
[42,43] reasoned that if the patterning of intergroup
variation in behaviour is primarily the product of genetic
differences between groups, then a tree of the relation-
ships between chimpanzee groups generated from a
cladistic analysis of the 39 putative cultural variants
should display more phylogenetic structure when two
subspecies are considered together than a tree generated
from the east African subspecies alone. They failed to
find more phylogenetic structure in the two-subspecies
than the single-subspecies tree, and thus concluded that
the patterning of between-group variation in chimpanzee
behaviour fit a cultural explanation better than a genetic
one. This study, however, has at least three major
limitations. First, as acknowledged by Lycett et al. [43],
at present there is no well-accepted methodology for
determining whether the difference in the extent of
phylogenetic structure in two different trees is statistically
significant. Second, a recent simulation study on trees
generated with varying levels of horizontal versus vertical
transmission has shown that measures of phylogenetic
structure are very sensitive to rates of evolution [44]. If
the rate of evolution is sufficiently high, then phylogenetic
structure measured for a subset of the branches of a tree
can be higher than when measured for the entire tree,
even when transmission is completely vertical (i.e. as in
genetic transmission), calling the central assumption of
the analysis by Lycett et al. [42,43] into question. Finally,
the method employed by Lycett et al. [42,43] purports to
test only whether genetics can be excluded as a cause for
overall levels of similarity in the behavioural repertoires of
chimpanzee groups; it furnishes no insight into how
strongly the distribution of each of the individual
behavioural variants follows or fails to follow patterns of
between-group genetic dissimilarity. For example, some
authors have suggested that differences in non-vocal
communicative behaviours are unlikely to result from
differences in underlying genetic predispositions, as
these will not be influenced as much as other classes
of behaviour that vary according to local ecological
conditions and are affected by the operation of natural
selection, e.g. tool-use in a foraging context [7,45].
Here, we take a more direct approach to the question of
whether genetics plays a role in generating intergroup vari-
ation in the behaviour of wild chimpanzees by measuring
levels of genetic dissimilarity among nine groups of wild
chimpanzees and comparing these with patterns of
between-group behavioural variation. We examine the
relationship between genetic dissimilarity and both pat-
terns of overall behavioural dissimilarity between groups
and the distribution of individual behavioural variants.
2. MATERIAL AND METHODS(a) Study groups and genetic analyses
Of the nine chimpanzee groups we studied, three belonged to
the west African P. t. verus and six belonged to the east

Chimp genetic and cultural similarity K. E. Langergraber et al. 3
on December 9, 2010rspb.royalsocietypublishing.orgDownloaded from
African P. t. schweinfurthii subspecies. We sequenced most of
the members of each of the nine groups at the first hyper-
variable region of the maternally inherited mitochondrial
(mt)DNA (354 bases; numbers of adolescent and adult indi-
viduals sequenced/number of adolescent and adult group
members present at time of sampling in brackets): the
Bossou group (12/12) of Guinea, the North (8/11) and
South (16/26) groups of Taı̈ National Park, Cote d’Ivoire,
the Sonso group (28/28) of Budongo Forest Reserve,
Uganda, the Ngogo (89/89) and Kanyawara (20/20) groups
of Kibale National Park, Uganda, the M (32/32) and K (3/
Unknown) groups of Mahale Mountains National Park, Tan-
zania and the Kasekela (38/38) group of Gombe Stream
National Park, Tanzania. MtDNA sequences for five of the
groups were previously published: Bossou [46], Sonso
[47,48], Gombe [49], Ngogo [47,48] and Kanyawara
[47,48]. We generated new mtDNA sequences for the Taı̈
North and South groups and the Mahale M and K groups,
following previously described procedures [47,48]. Although
mtDNA is unlikely to directly code for any of the behavioural
variants considered here, it is an excellent marker for deter-
mining overall levels of genetic similarity among groups,
particularly in species such as chimpanzees where females
rather than males move between groups. This is supported
by the strong correlation between mtDNA genetic distance
and geographical distance among the nine chimpanzee
groups included in this study (Pearson’s r ¼ 0.96, p ¼
0.00005, n ¼ 36 pairs of groups).
We calculated AMOVA and pairwise FST values between
each of the nine groups (i.e. 36 pairwise comparisons)
using ARLEQUIN 3.1 [50], with genetic distances between
haplotypes measured using the number of nucleotide differ-
ences, and statistical significance assessed by comparison
with genetic dissimilarity calculated on random datasets
where mtDNA haplotypes were permuted among groups.
We set the FST values of two pairs of groups which showed
negative values (Mahale M and K ¼ 20.18, Taı̈ North
and South ¼2 0.06) to zero, as is common practice when
negative values are suspected to result from sampling error
rather than indicating more genetic dissimilarity among
individuals of the same group than of individuals between
groups [50]. We found only minor quantitative changes in
our results depending on whether we set FST as 0 or used
the original negative values for these two pairs.
(b) Behavioural analyses
We converted the behavioural data from the original study of
geographical variation in chimpanzee behaviour [9], as well
as similar data from the two chimpanzee groups newly
coded for this study (i.e. the South group at Taı̈ and the
Ngogo group at Kibale), into numerical codes in order to
assess how frequently the 39 behaviours occurred in each
chimpanzee group. For six of the chimpanzee groups in
this study (Bossou, Sonso, Kanyawara, Mahale M and K,
Kasekela), we used the behavioural codes as described in
the original paper on geographical variation in chimpanzee
behaviour [9,10]. For Taı̈ North, we changed three codes
from the original paper, as one of us (C.B., the director of
this field site) decided that these new codes were more accu-
rate: ‘hand-clasp’ was changed from habitual to present,
‘knuckle-knock’ was changed from customary to habitual
and ‘branch-slap’ was changed from customary to absent.
We repeated all analyses using the original Taı̈ North codes
and found only minor quantitative changes in the results.
Proc. R. Soc. B
The Taı̈ South group, newly coded for this study by C.B.,
had the same codes as Taı̈ North, with the following two
exceptions: ‘bee-probe’ was coded as present and ‘marrow-
pick’ as habitual. Ngogo, newly coded by J.M. and K.L.
for this study, had the same codes as Kanyawara, with the fol-
lowing two exceptions: ‘seat-vegetation’ was coded as
habitual, and ‘leaf-clip, mouth’ was coded as customary.
The behavioural variant ‘branch-din’ was excluded from all
analyses because it was absent in all nine of the chimpanzee
groups included in this study. Thus, our study examined only
38 of the 39 putative cultural variants described in the orig-
inal study on geographical variation in chimpanzee behaviour
[9,10]. We made no attempt to include behaviours now
known or suspected to vary between chimpanzee groups
that were not included in this original study, e.g. [51].
We converted the behavioural codes into numbers as fol-
lows: (3) ‘customary’, the behaviour occurs in all or most
able-bodied members of at least one age–sex class (such as
adult males); (2) ‘habitual’, the behaviour is not customary
but has occurred repeatedly in several individuals, consistent
with some degree of social transmission; (1) ‘present’, the
behaviour is neither customary nor habitual but is clearly
identified; (0) ‘absent’, the behaviour has not been recorded
and no ecological explanation is apparent; (?) ‘ecological
explanation’, absence is explicable because of a local ecologi-
cal feature; and (?) ‘unknown’, the behaviour has not been
recorded, but this may be owing to inadequacy of relevant
observational opportunities. Both of the (?) codes were
treated as missing values in our quantitative analyses. Our
numerical coding system differs from that used in the study
of Lycett et al. [42,43], in that these authors did not
distinguish between behavioural variants that were absent
and those that were absent owing to an ecological reason.
(c) Comparing overall behavioural dissimilarity
and genetic dissimilarity
We used these 38 numerical codes to calculate overall behav-
ioural dissimilarity among each of the 36 pairs of groups
using two different distance measures: (i) normalized Ham-
ming distance, the number of behavioural variants with a
different code, divided by the number of behavioural variants
for which the pair of groups was compared, and (ii) Manhat-
tan distance, the sum of the absolute values of the distances
between the behavioural variants for a pair of groups. When
calculating overall behavioural dissimilarity, behavioural var-
iants with missing values were excluded pairwise rather than
listwise (e.g. if for behavioural variant 1 group A had a code
of ‘customary’, group B ‘habitual’, and group C ‘unknown’,
then behavioural variant 1 would be excluded from the calcu-
lations of overall behavioural dissimilarity between groups A
and B with C, but not from group A with B). We compared
overall behavioural dissimilarity with genetic dissimilarity
(FST) using Pearson correlation coefficients. To account for
the fact that each of the nine groups appeared multiple
times among the 36 pairs of groups, which thus do not rep-
resent independent data points, we assessed the statistical
significance of the Pearson-test statistic through Mantel
matrix permutation [52]. To account for the possibility that
outliers might have an undue influence on the result, we
also performed Spearman rank correlations with Mantel
matrix permutation.
Given that the behavioural codes for each chimpanzee
group were determined retrospectively based on the opinions
of researchers rather than through a prospective, systematic
4 K. E. Langergraber et al. Chimp genetic and cultural similarity
on December 9, 2010rspb.royalsocietypublishing.orgDownloaded from
study of how many individuals performed each of the behav-
ioural variants, the reliability and validity of the coding
system used in the original chimpanzee culture study is
unclear. We thus performed two additional analyses to
assess the robustness of our main analysis of the relationship
between overall behavioural dissimilarity and genetic
dissimilarity. In the first, we systematically introduced vary-
ing amounts of error into the behavioural codes and then
re-examined the size and statistical significance of the
correlation between overall behavioural dissimilarity and gen-
etic dissimilarity. In the second, we recoded the behavioural
data binarily such that the measure of overall behavioural
dissimilarity measure was insensitive to the specific levels
chosen for the behavioural traits, then re-examined the size
and statistical significance of the correlation between overall
behavioural dissimilarity and genetic dissimilarity. See the
electronic supplementary material for further details.
While a strong correlation between genetic and overall
behavioural dissimilarity would indicate that genetic dissim-
ilarity cannot be excluded as playing a major role in the
patterning of behavioural variation among chimpanzee
groups, it would not necessarily exclude social learning. If
emigrating females carry the behavioural variants of their
natal group to their new group [53,54], then groups that
share many migrants are likely to be behaviourally similar.
High migration rates between groups could thus result in a
positive correlation between genetic and behavioural dissim-
ilarity, even if behavioural variants were entirely socially
learned. Thus, it is only when patterns of behavioural
and genetic dissimilarity are discordant that inferences can
be made about the role of social learning in generating
geographical variation in behaviour.
(d) Behavioural variation between pairs of genetically
similar groups
One way to approach this issue is to examine behavioural
variation between groups that are genetically similar. In
other words, to compare groups in which genetic dissimilar-
ity is so low that it is unlikely to generate differences in their
behaviour. Given our lack of knowledge of the specific gen-
etic loci that influence the behaviours considered here, it is
impossible to determine definitively what this level of genetic
dissimilarity would be. Therefore, we conducted two
additional analyses to address this issue, using different cri-
teria for classifying pairs of groups as genetically similar.
We started with the method of Whiten et al. [9,10] and ident-
ified potential cultural variants as behaviours that were
common (i.e. ‘customary’ or ‘habitual’) in one community
but absent in another. In the first analysis, we limited our
comparisons to groups for which we had strong statistical
evidence that genetic dissimilarity between them was not
significant. Here we classified the following pairs of
groups as genetically similar: Mahale K–Mahale M,
Ngogo–Kanyawara, Taı̈ North–Taı̈ South, Bossou–Tai
North, Bossou–Taı̈ South. Although the permutation tests
conducted in ARLEQUIN indicated that the Mahale K group
was not significantly dissimilar from several other non-
neighbouring groups within East Africa, i.e. Ngogo,
Kanyawara and Kasekela, we excluded these three pairs of
groups from this analysis given the poor genetic sampling
of the Mahale K group and the other results showing that
the well-sampled Mahale M group, which is the direct neigh-
bour of the Mahale K group and has the same set of mtDNA
haplotypes, was significantly genetically dissimilar from these
Proc. R. Soc. B
other three groups. We interpret results of this analysis
cautiously because statistical measures of genetic dissimilar-
ity depend not only on the amount of genetic dissimilarity
between communities, but also on the number of individuals
sampled and the number and type of loci examined.
In the second, more conservative analysis, we took
advantage of the behavioural data we compiled from two
new chimpanzee communities. Adding this information to
published data from the seven communities in the original
study [9] allowed us to make comparisons between pairs
of groups located in the same block of continuous forest.
Behavioural differences that emerge from this analysis are
especially informative because the amount of genetic
dissimilarity between groups exhibiting extensive contem-
porary gene flow is almost certainly insufficient to
generate differences in behaviour. Here we included the
same pairs of groups as above, minus Bossou–Tai North
and Bossou–Tai South.
(e) Genetic dissimilarity and the distribution of the
individual behavioural variants
In our final analysis we generated a measure of between-
group dissimilarity for each of the individual behavioural
variants and investigated the relationships between these
and the measure of between-group genetic dissimilarity.
Here we created a matrix consisting of the absolute value
of the difference in the numerical code between each of the
communities, such that communities which were similar for
the behavioural variant had a score of 0 (i.e. both had the
same code), and communities that were very different for
the behavioural variant had a score of 3 (i.e. ‘habitual’ in
one group and ‘absent’ in the other). Behavioural variants
with missing values were excluded pairwise rather than list-
wise. We then calculated a Spearman rank correlation
matrix permutation test between each of these 38 matrices
and a matrix of genetic dissimilarity (FST). The combination
of a relatively modest sample size (n ¼ 6 – 36 pairs of groups,
depending on the number of groups that had missing values
for that particular behavioural variant) and the stringent
alpha level (e.g. in this case, a Bonferroni correction of
0.05/38 ¼ 0.001) that is required to correct for multiple
comparisons means that there is very low power to reject
the null hypothesis that the distribution of each behavioural
variant is not predicted by genetic dissimilarity. Thus, we
use this analysis only to explore whether there are any general
patterns as to which types of behavioural variants are more or
less strongly predicted by patterns of genetic dissimilarity.
We used 10 000 Mantel permutations in all of our
statistical tests.
3. RESULTS(a) Comparing overall behavioural dissimilarity
and genetic dissimilarity
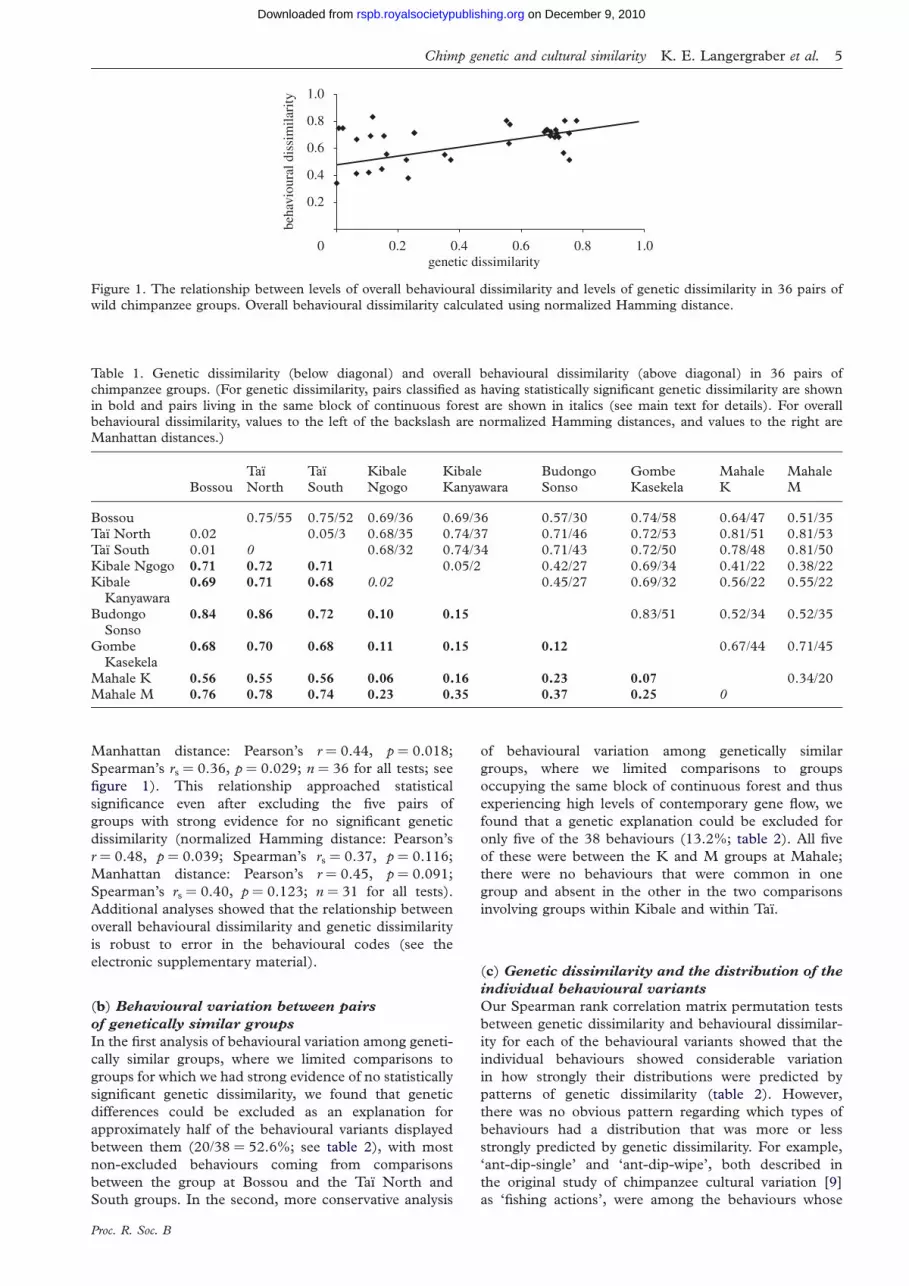
We found that the overall level of genetic dissimilarity
among the nine groups was substantial (AMOVA
value ¼ 0.49, p ¼ 0.00001), and most pairs of groups
were significantly genetically dissimilar from one another
(table 1). Levels of genetic dissimilarity and overall behav-
ioural dissimilarity between chimpanzee groups were
strongly and significantly correlated, regardless of the
method used to calculate overall behavioural
dissimilarity (normalized Hamming distance: Pearson’s
r ¼ 0.52, p ¼ 0.015; Spearman’s rs ¼ 0.37, p ¼ 0.031;
genetic dissimilarity0.2 0.4 0.6 0.8 1.00
0.2
beha
viou
ral d
issi
mila
rity
0.4
0.6
0.8
1.0
Figure 1. The relationship between levels of overall behavioural dissimilarity and levels of genetic dissimilarity in 36 pairs ofwild chimpanzee groups. Overall behavioural dissimilarity calculated using normalized Hamming distance.
Table 1. Genetic dissimilarity (below diagonal) and overall behavioural dissimilarity (above diagonal) in 36 pairs ofchimpanzee groups. (For genetic dissimilarity, pairs classified as having statistically significant genetic dissimilarity are shown
in bold and pairs living in the same block of continuous forest are shown in italics (see main text for details). For overallbehavioural dissimilarity, values to the left of the backslash are normalized Hamming distances, and values to the right areManhattan distances.)
BossouTaı̈North
Taı̈South
KibaleNgogo
KibaleKanyawara
BudongoSonso
GombeKasekela
MahaleK
MahaleM
Bossou 0.75/55 0.75/52 0.69/36 0.69/36 0.57/30 0.74/58 0.64/47 0.51/35Taı̈ North 0.02 0.05/3 0.68/35 0.74/37 0.71/46 0.72/53 0.81/51 0.81/53Taı̈ South 0.01 0 0.68/32 0.74/34 0.71/43 0.72/50 0.78/48 0.81/50
Kibale Ngogo 0.71 0.72 0.71 0.05/2 0.42/27 0.69/34 0.41/22 0.38/22Kibale
Kanyawara0.69 0.71 0.68 0.02 0.45/27 0.69/32 0.56/22 0.55/22
BudongoSonso
0.84 0.86 0.72 0.10 0.15 0.83/51 0.52/34 0.52/35
GombeKasekela
0.68 0.70 0.68 0.11 0.15 0.12 0.67/44 0.71/45
Mahale K 0.56 0.55 0.56 0.06 0.16 0.23 0.07 0.34/20Mahale M 0.76 0.78 0.74 0.23 0.35 0.37 0.25 0
Chimp genetic and cultural similarity K. E. Langergraber et al. 5
on December 9, 2010rspb.royalsocietypublishing.orgDownloaded from
Manhattan distance: Pearson’s r ¼ 0.44, p ¼ 0.018;
Spearman’s rs ¼ 0.36, p ¼ 0.029; n ¼ 36 for all tests; see
figure 1). This relationship approached statistical
significance even after excluding the five pairs of
groups with strong evidence for no significant genetic
dissimilarity (normalized Hamming distance: Pearson’s
r ¼ 0.48, p ¼ 0.039; Spearman’s rs ¼ 0.37, p ¼ 0.116;
Manhattan distance: Pearson’s r ¼ 0.45, p ¼ 0.091;
Spearman’s rs ¼ 0.40, p ¼ 0.123; n ¼ 31 for all tests).
Additional analyses showed that the relationship between
overall behavioural dissimilarity and genetic dissimilarity
is robust to error in the behavioural codes (see the
electronic supplementary material).
(b) Behavioural variation between pairs
of genetically similar groups
In the first analysis of behavioural variation among geneti-
cally similar groups, where we limited comparisons to
groups for which we had strong evidence of no statistically
significant genetic dissimilarity, we found that genetic
differences could be excluded as an explanation for
approximately half of the behavioural variants displayed
between them (20/38 ¼ 52.6%; see table 2), with most
non-excluded behaviours coming from comparisons
between the group at Bossou and the Taı̈ North and
South groups. In the second, more conservative analysis
Proc. R. Soc. B
of behavioural variation among genetically similar
groups, where we limited comparisons to groups
occupying the same block of continuous forest and thus
experiencing high levels of contemporary gene flow, we
found that a genetic explanation could be excluded for
only five of the 38 behaviours (13.2%; table 2). All five
of these were between the K and M groups at Mahale;
there were no behaviours that were common in one
group and absent in the other in the two comparisons
involving groups within Kibale and within Taı̈.
(c) Genetic dissimilarity and the distribution of the
individual behavioural variants
Our Spearman rank correlation matrix permutation tests
between genetic dissimilarity and behavioural dissimilar-
ity for each of the behavioural variants showed that the
individual behaviours showed considerable variation
in how strongly their distributions were predicted by
patterns of genetic dissimilarity (table 2). However,
there was no obvious pattern regarding which types of
behaviours had a distribution that was more or less
strongly predicted by genetic dissimilarity. For example,
‘ant-dip-single’ and ‘ant-dip-wipe’, both described in
the original study of chimpanzee cultural variation [9]
as ‘fishing actions’, were among the behaviours whose

Tab
le2.
Gen
etic
dis
sim
ilari
tyan
dth
ed
istr
ibu
tion
sof
the
ind
ivid
ual
beh
avio
ura
lva
rian
ts.
(Sh
ow
nfo
rea
chof
the
ind
ivid
ual
beh
avio
ura
lva
rian
tsare
thei
rcl
ass
ifica
tion
sas
giv
enin
the
ori
gin
al
stu
dy
of
geo
gra
phic
al
vari
atio
nin
chim
pan
zee
beh
avio
ur
[9],
the
nu
mb
erof
gro
up
sco
mp
are
din
the
corr
elat
ion
bet
wee
ngen
etic
an
dbeh
avio
ura
ld
issi
milari
ty,
the
Spea
rman
’sr s
an
dp-v
alu
esfo
rth
isco
rrel
atio
n,
an
dw
het
her
itva
ries
bet
wee
ngen
etic
ally
sim
ilar
gro
up
s:cr
iter
ion
1:
gro
up
scl
ass
ified
as
hav
ing
no
stat
isti
cally
sign
ifica
nt
gen
etic
dis
sim
ilari
ty;
crit
erio
n2:
gro
ups
occ
upyin
gth
esa
me
blo
ckof
con
tin
uou
sfo
rest
.B
ehav
iou
ral
vari
an
tsare
list
edin
asc
end
ing
ord
erof
stre
ngth
of
posi
tive
corr
elat
ion
wit
hgen
etic
dis
sim
ilari
ty.
See
[10]
for
more
det
ailed
des
crip
tion
sof
the
beh
avio
ura
lva
rian
ts.)
beh
avio
ura
lva
rian
tcl
ass
ifica
tion
nS
pea
rman
’sr s
p
vari
esam
on
gn
on
-gen
etic
ally
dif
fere
nti
ated
gro
ups?
crit
erio
n1
crit
erio
n2
term
ite-
fish
usi
ng
leaf
mid
rib
fish
ing
acti
on
s6
20.6
20.2
6ye
sye
sle
af-s
qu
ash
(squ
ash
ecto
-para
site
on
leaf
)ex
plo
itat
ion
of
leaf
pro
per
ties
/gro
om
ing
28
20.2
10.2
6n
on
o
term
ite-
fish
usi
ng
non
-lea
fm
ater
ials
fish
ing
acti
on
s6
20.2
10.7
7ye
sye
sse
lf-t
ickle
(tic
kle
self
usi
ng
obje
cts)
mis
c.ex
plo
itat
ion
of
veget
atio
np
rop
erti
es36
20.1
40.5
6n
on
ole
af-c
lip,
fin
ger
s(r
ipsi
ngle
leaf
wit
hfi
nger
s)ex
plo
itat
ion
of
leaf
pro
per
ties
36
20.1
10.4
9ye
sn
opes
tle-
pou
nd
(mash
palm
crow
nw
ith
pet
iole
)pou
nd
ing
acti
on
s6
20.1
01.0
0ye
sn
ole
af-c
lip,
mou
th(r
ippart
soff
leaf
,w
ith
mou
th)
explo
itat
ion
of
leaf
pro
per
ties
36
20.0
90.6
1n
on
o
an
t-d
ip-w
ipe
(man
ually
wip
ean
tsoff
wan
d)
fish
ing
acti
on
s36
20.0
70.6
4n
on
ole
af-i
nsp
ect
(in
spec
tec
to-p
ara
site
on
han
d)
explo
itat
ion
of
leaf
pro
per
ties
/gro
om
ing
28
20.0
30.8
9n
on
ole
af-d
ab
(lea
fd
abbed
on
wou
nd
,ex
am
ined
)ex
plo
itat
ion
of
leaf
pro
per
ties
36
20.0
30.8
2n
on
ole
af-s
trip
(rip
leav
esoff
stem
,as
thre
at)
exp
loit
atio
nof
leaf
pro
per
ties
36
20.0
20.8
9n
on
ofl
y-w
his
k(l
eafy
stic
ku
sed
tofa
nfl
ies)
com
fort
beh
avio
ur
21
00.9
8ye
sn
o
food
-pou
nd
on
tooth
er(e
.g.
ston
e)p
ou
nd
ing
acti
on
s21
00.9
9ye
sn
ost
empu
ll-t
hro
ugh
(pu
llst
ems
nois
ily)
atte
nti
on
-get
tin
g36
00.9
7ye
sye
sex
pel
/sti
rst
ick
expel
sor
stir
sin
sect
s)fo
rcin
gac
tion
s21
0.0
20.9
3ye
sn
oan
t-fi
sh(p
robe
use
dto
extr
act
an
ts)
fish
ing
acti
on
s36
0.0
30.7
8n
on
obra
nch
-sla
p(s
lap
bra
nch
,fo
rat
ten
tion
)at
ten
tion
-get
tin
g36
0.0
30.8
2ye
sn
o
aim
ed-t
hro
w(t
hro
wobje
ctd
irec
tion
ally)
mis
c.ex
plo
itat
ion
of
veget
atio
np
rop
erti
es36
0.0
60.5
8ye
sye
ssh
rub-b
end
(squ
ash
stem
su
nd
erfo
ot)
atte
nti
on
-get
tin
g36
0.0
70.6
2ye
sye
sle
ver
open
(sti
cku
sed
toen
larg
een
tran
ce)
forc
ing
acti
on
s36
0.1
00.5
9ye
sn
ofl
uid
-dip
(use
of
pro
be
toex
trac
tfl
uid
s)p
rob
ing
acti
on
s36
0.1
40.3
1ye
sn
o
bee
-pro
be
(dis
able
bee
s,fl
ick
wit
hpro
be)
pro
bin
gac
tion
s36
0.1
50.3
6ye
sn
okn
uck
le-k
nock
(kn
ock
toat
trac
tat
ten
tion
)at
ten
tion
-get
tin
g36
0.1
60.2
8n
on
ohan
d-c
lasp
(cla
sparm
sove
rhea
d,
gro
om
)gro
om
ing
36
0.1
80.2
0n
on
on
ut-
ham
mer
,w
ood
ham
mer
on
wood
anvil
pou
nd
ing
acti
on
s6
0.2
10.7
7ye
sn
ocl
ub
(str
ike
forc
efu
lly
wit
hst
ick)
pou
nd
ing
acti
on
s36
0.2
50.1
0n
on
o
leaf
-napkin
(lea
ves
use
dto
clea
nbod
y)
exp
loit
atio
nof
leaf
pro
per
ties
36
0.2
50.1
0n
on
on
ut-
ham
mer
,oth
er(e
.g.
on
gro
un
d)
pou
nd
ing
acti
on
s15
0.2
80.2
1ye
sn
on
ut-
ham
mer
,w
ood
ham
mer
on
ston
eanvil
pou
nd
ing
acti
on
s15
0.2
80.2
1ye
sn
o
6 K. E. Langergraber et al. Chimp genetic and cultural similarity
Proc. R. Soc. B
on December 9, 2010rspb.royalsocietypublishing.orgDownloaded from

food
-pou
nd
on
tow
ood
(sm
ash
food
)pou
nd
ing
acti
on
s21
0.3
50.0
7n
on
oin
dex
-hit
(squ
ash
ecto
-para
site
on
arm
)gro
om
ing
36
0.3
50.0
5ye
sn
om
arr
ow
-pic
k(p
ick
bon
em
arr
ow
ou
t)p
rob
ing
acti
on
s36
0.3
80.0
4ye
sn
ora
ind
an
ce(s
low
dis
pla
yat
start
of
rain
)n
oco
de
36
0.3
90.0
3ye
sn
ose
at-v
eget
atio
n(l
arg
ele
aves
as
set)
com
fort
beh
avio
ur
36
0.4
90.0
2n
on
o
nu
t-ham
mer
,st
on
eham
mer
on
wood
anvil
pou
nd
ing
acti
on
s6
0.5
90.1
7n
on
ole
af-g
room
(in
ten
se’g
room
ing’
of
leav
es)
explo
itat
ion
of
leaf
pro
per
ties
36
0.7
20.0
1n
on
oan
t-d
ip-s
ingle
(on
ehan
ded
dip
stic
kon
an
ts)
fish
ing
acti
on
s36
0.8
40
no
no
nu
t-ham
mer
,st
on
eham
mer
on
ston
ean
vil
pou
nd
ing
acti
on
s15
0.8
50
no
no
Chimp genetic and cultural similarity K. E. Langergraber et al. 7
Proc. R. Soc. B
on December 9, 2010rspb.royalsocietypublishing.orgDownloaded from
distributions are the most and least strongly predicted,
respectively, by genetic dissimilarity.
4. DISCUSSIONWe found that levels of overall behavioural dissimilarity
and genetic dissimilarity between nine chimpanzee
groups were strongly correlated, that few behaviours
varied between groups classified as genetically similar
according to our most conservative criteria, and that
there was no obvious pattern as to which types of beha-
viours had a distribution that was more or less strongly
predicted by patterns of between-group genetic dissimi-
larity. Together, these results indicate that genetic
differences cannot be excluded as playing a major role
in structuring patterns of behavioural variation among
chimpanzee groups. These results do not, however,
necessarily indicate that a substantial proportion of the
behavioural variation between chimpanzees groups is
not cultural in nature, but rather testify to the difficulty
inherent in using the method of exclusion to identify the
processes responsible for between-group behavioural vari-
ation. As others have noted, a strict application of the
method of exclusion may lead to an underestimation of
the true number of cultural variants that exist in the
wild [2,7,17]. Indeed, if the method of exclusion were
applied to humans, the strong correlations between
behavioural and both genetic [55] and ecological [56]
similarity would indicate that a considerable amount of
human between-group diversity is not necessarily cultural
in nature.
Mathematical methods to identify a statistical ‘signa-
ture’ of transmission of a behavioural variant through
social learning represent a promising alternative to the
method of exclusion for investigating culture in the wild
for animals [57–59]. Such methods are especially apt
for animals like chimpanzees, for whom definitive translo-
cation experiments [60] are impossible for logistic and
ethical reasons. Unfortunately, while we often have a
good understanding of the distribution of a behaviour
among the individuals within a group, the diffusion pro-
cesses that led to that distribution are rarely observed
[13]. Comparing patterns of behavioural variation with
patterns of kinship among individuals within the same
social group may be a more tractable way to investigate
animal culture in the wild [61], particularly in species
like chimpanzees where the relatively weak influence of
kinship on patterns of affiliation [47,48,62] means that
evidence for social learning (i.e. animals that interact
with each other more frequently are more likely to share
the behavioural variant) is not confounded with evidence
for genetic inheritance (i.e. close relatives are more likely
to share the behavioural variant). In summary, diverse
methodologies will be essential to resolving the long-stand-
ing debate of the relative contributions of genetics, social
learning and other factors in generating geographical
variation in animal behaviour.
This research was approved by the Max Planck Institute forEvolutionary Anthropology.
Thanks to T. Deschner, M. Franz, S. Geidel, C. Rowney,M. Surbeck, C. Tennie and R. Kendal and the anonymousreviewers for discussions and comments on the manuscript,and to R. Mundry for statistical assistance. This research
8 K. E. Langergraber et al. Chimp genetic and cultural similarity
on December 9, 2010rspb.royalsocietypublishing.orgDownloaded from
was supported by the Alexander von Humboldt Foundation,the Max Planck Society, the National Science Foundation(USA), the Leakey Foundation and the Wenner-GrenFoundation.
REFERENCES1 Boesch, C. 2003 Is culture a golden barrier between
human and chimpanzee? Evol. Anthropol. 12, 82–91.(doi:10.1002/evan.10106)
2 Laland, K. N. & Janik, V. M. 2006 The animal culturesdebate. Trends Ecol. Evol. 21, 542–547. (doi:10.1016/j.tree.2006.06.005)
3 Galef, B. G. 2009 Culture in animals? In The question ofanimal culture (eds K. N. Lalande & B. G. Galef ),pp. 222–246. Cambridge, MA: Harvard University Press.
4 Heyes, C. M. & Galef, B. G. 1996 Social learning and imi-tation: the roots of culture. New York, NY: Academic Press.
5 Goodall, J. 1973 Cultural elements in a chimpanzee com-munity. In Precultural primate behaviour (ed. E. W.Menzel), pp. 195–249. Basel, Switzerland: Karger.
6 McGrew, W. C. 1992 Chimpanzee material culture: impli-cations for human evolution. Cambridge, UK: CambridgeUniversity Press.
7 Boesch, C. B. 1996 The emergence of culture amongwild chimpanzees. In Evolution of social behaviour patternsin primates and man (eds W. G. Runciman, J. Maynard
Smith & R. I. M. Dunbar), pp. 251–268. Oxford, UK:Oxford University Press.
8 Boesch, C. & Tomasello, M. 1998 Chimpanzee andhuman cultures. Curr. Anthropol. 39, 591–614. (doi:10.1086/204785)
9 Whiten, A., Goodall, J., McGrew, W. C., Nishida, T.,Reynolds, V., Sugiyama, Y., Tutin, C. E. G., Wrangham,R. W. & Boesch, C. 1999 Cultures in chimpanzees.Nature 399, 682–685. (doi:10.1038/21415)
10 Whiten, A., Goodall, J., McGrew, W. C., Nishida, T.,Reynolds, V., Sugiyama, Y., Tutin, C. E. G., Wrangham,R. W. & Boesch, C. 2001 Charting cultural variation inchimpanzees. Behaviour 138, 1481–1516. (doi:10.1163/156853901317367717)
11 Rendell, L. & Whitehead, H. 2001 Culture in whales anddolphins. Behav. Brain Sci. 24, 309–382.
12 Hohmann, G. & Fruth, B. 2003 Culture in bonobos?Between-species and within-species variation in behavior.Curr. Anthropol. 44, 563–571. (doi:10.1086/377649)
13 Perry, S. et al. 2003 Social conventions in wildwhite-faced capuchin monkeys: evidence for traditionsin a neotropical primate. Curr. Anthropol. 44, 241–268.(doi:10.1086/345825)
14 Van Schaik, C. P., Ancrenaz, M., Borgen, G., Galdikas,
B. M. F., Knott, C. D., Singleton, I., Suzuki, A.,Utami, S. S. & Merrill, M. 2003 Orangutan culturesand the evolution of material culture. Science 299,102–105. (doi:10.1126/science.1078004)
15 Marler, P. & Tamura, M. 1964 Culturally transmitted
patterns of vocal behavior in sparrows. Science 146,1483–1486. (doi:10.1126/science.146.3650.1483)
16 McGrew, W. C. 2004 The cultured chimpanzee: reflectionson cultural primatology. Cambridge, UK: Cambridge
University Press.17 Laland, K. N., Kendal, J. R. & Kendal, R. L. 2009 Animal
culture: problems and solutions. In The question of animalculture (eds K. N. Lalande & B. G. Galef ), pp. 174–197. Cambridge, MA: Harvard University Press.
18 Whiten, A., Horner, V. & de Waal, F. B. M. 2005 Confor-mity to cultural norms of tool use in chimpanzees. Nature437, 737–740. (doi:10.1038/nature04047)
19 Horner, V., Whiten, A., Flynn, E. & de Waal, F. B. M.2006 Faithful replication of foraging techniques along
Proc. R. Soc. B
cultural transmission chains by chimpanzees and chil-dren. Proc. Natl Acad. Sci. USA 103, 13 878–13 883.(doi:10.1073/pnas.0606015103)
20 Bonnie, K. E. & de Waal, F. B. M. 2007 Copying withoutrewards: socially influenced foraging decisions amongbrown capuchin monkeys. Anim. Cogn. 10, 283–292.(doi:10.1007/s.10071-006-0069-9)
21 Bonnie, K. E., Horner, V., Whiten, A. & de Waal,
F. B. M. 2007 Spread of arbitrary conventions amongchimpanzees: a controlled experiment. Proc. R. Soc. B274, 367–372. (doi:10.1098/rspb.2006.3733)
22 Whiten, A., Spiteri, A., Horner, V., Bonnie, K. E.,
Lambeth, S. P., Schapiro, S. J. & de Waal, F. B. M.2007 Transmission of multiple traditions within andbetween chimpanzee groups. Curr. Biol. 17, 1038–1043.(doi:10.1016/j.cub.2007.05.031)
23 Dindo, M., Thierry, B. & Whiten, A. 2008 Social diffu-
sion of novel foraging methods in brown capuchinmonkeys (Cebus apella). Proc. R. Soc. B 275, 187–193.(doi:10.1098/rspb.2007.1318)
24 Fredman, T. & Whiten, A. 2008 Observational learningfrom tool using models by human-reared and mother-
reared capuchin monkeys (Cebus apella). Anim. Cogn.11, 295–309. (doi:10.1007/s10071-007-0117-0)
25 Price, E. E., Lambeth, S. P., Schapiro, S. J. & Whiten, A.2009 A potent effect of observational learning onchimpanzee tool construction. Proc. R. Soc. B 276,
3377–3383. (doi:10.1098/rspb.2009.0640)26 Lonsdorf, E. V. 2005 Sex differences in the development
of termite-fishing skills in the wild chimpanzees, Pantroglodytes schweinfurthii, of Gombe National Park,
Tanzania. Anim. Behav. 70, 673–683. (doi:10.1016/j.anbehav.2004.12.014)
27 Matthews, L. J. 2009 Intragroup behavioral variation inwhite-fronted capuchin monkeys (Cebus albifrons):mixed evidence for social learning inferred from new
and established analytical methods. Behaviour 146,295–324. (doi:10.1163/156853909x410937)
28 Perry, S. 2009 Conformism in the food processing tech-niques of white-faced capuchin monkeys (Cebuscapucinus). Anim. Cogn. 12, 705–716. (doi:10.1007/
s10071-009-0230-3)29 Van Schaik, C. P. 2003 Local traditions in orangutans
and chimpanzees: social learning and social tolerance.In The biology of traditions: models and evidence (eds D.Fragaszy & S. Perry), pp. 297–328. Cambridge, UK:
Cambridge University Press.30 Galef, B. G. 1990 Tradition in animals: field observations
and laboratory analyses. In Interpretation and explanation inthe study of behavior: comparative perspectives (eds M. Bekoff
& D. Jamieson), pp. 74–95. Boulder, CO: Westview Press.31 Tomasello, M. 1990 Cultural transmission in the tool
use and communicatory signalling of chimpanzees?In ‘Language’ and intelligence in monkeys and apes:comparative developmental perspectives (eds S. Parker &
K. Gibson), pp. 274–311. Cambridge, UK: CambridgeUniversity Press.
32 Heyes, C. M. 1994 Social-learning in animals: categoriesand mechanisms. Biol. Rev. Camb. Phil. Soc. 69, 207–231.
33 Tennie, C., Call, J. & Tomasello, M. 2009 Ratcheting
up the ratchet: on the evolution of cumulative culture.Phil. Trans. R. Soc. B 364, 2405–2415. (doi:10.1098/rstb.2009.0052)
34 Tebbich, S., Taborsky, M., Fessl, B. & Blomqvist, D.2001 Do woodpecker finches acquire tool-use by social
learning? Proc. R. Soc. Lond. B 268, 2189–2193.(doi:10.1098/rspb.2001.1738)
35 Kenward, B., Weir, A. A. S., Rutz, C. & Kacelnik, A.2005 Tool manufacture by naı̈ve juvenile crows. Nature433, 121–121. (doi:10.1038/433121a)
Chimp genetic and cultural similarity K. E. Langergraber et al. 9
on December 9, 2010rspb.royalsocietypublishing.orgDownloaded from
36 Tennie, C., Hedwig, D., Call, J. & Tomasello, M. 2008An experimental study of nettle feeding in captivegorillas. Am. J. Primatol. 70, 584–593. (doi:10.1002/
ajp.20532)37 Huffman, M. A. & Hirata, S. 2004 An experimental
study of leaf swallowing in captive chimpanzees: insightsinto the origin of a self-medicative behavior and the roleof social learning. Primates 45, 113–118. (doi:10.1007/
s10329-003-0065-5)38 Morin, P. A., Moore, J. J., Chakraborty, R., Jin, L.,
Goodall, J. & Woodruff, D. S. 1994 Kin selection,social-structure, gene flow, and the evolution of
chimpanzees. Science 265, 1193–1201. (doi:10.1126/science.7915048)
39 Gagneux, P. et al. 1999 Mitochondrial sequences showdiverse evolutionary histories of African hominoids.Proc. Natl Acad. Sci. USA 96, 5077–5082. (doi:10.
1073/pnas.96.9.5077)40 Goldberg, T. L. & Ruvolo, M. 1997 The geographic
apportionment of mitochondrial genetic diversity inEast African chimpanzees Pan troglodytes schweinfurthii.Mol. Biol. Evol. 14, 976–984.
41 Mitani, J. C., Hunley, K. L. & Murdoch, M. E. 1999Geographic variation in the calls of wild chimpanzees: areassessment. Am. J. Primatol. 47, 133–151. (doi:10.1002/(SICI)1098-2345(1999)47:2,133::AID-AJP4.3.0.CO;2-I)
42 Lycett, S. J., Collard, M. & McGrew, W. C. 2007 Phylo-genetic analyses of behavior support existence of cultureamong wild chimpanzees. Proc. Natl Acad. Sci. USA104, 17 588–17 592. (doi:10.1073/pnas.0707930104)
43 Lycett, S. J., Collard, M. & McGrew, W. C. 2009Cladistic analyses of behavioural variation in wildPan troglodytes: exploring the chimpanzee culture hypoth-esis. J. Hum. Evol. 57, 337–349. (doi:10.1016/j.jhevol.2009.05.015)
44 Nunn, C. L., Arnold, C., Matthews, L. & BorgerhoffMulder, M. In press. Simulating trait evolution forcross-cultural comparison. Phil. Trans. R. Soc. B.
45 Van Schaik, C. P. 2009 Geographic variation in thebehavior of wild great apes: is it really cultural? In
The question of animal culture (eds K. N. Lalande &B. G. Galef ), pp. 70–98. Cambridge, MA: HarvardUniversity Press.
46 Shimada, M. K., Hayakawa, S., Fujita, S., Sugiyama, Y. &Saitou, N. 2009 Skewed matrilineal genetic composition
in a small wild chimpanzee community. Folia Primatol.80, 19–32. (doi:10.1159/000181187)
47 Langergraber, K. E., Mitani, J. C. & Vigilant, L. 2007The limited impact of kinship on cooperation in
wild chimpanzees. Proc. Natl Acad. Sci. USA 104,7786–7790. (doi:10.1073/pnas.0611449104)
48 Langergraber, K. E., Siedel, H., Mitani, J. C.,Wrangham, R. W., Reynolds, V., Hunt, K. D. & Vigilant,
Proc. R. Soc. B
L. 2007 The genetic signature of sex-biased migration inpatrilocal chimpanzees and humans. PLoS ONE 10,e973. (doi:10.1371/journal.pone.0000973)
49 Liu, W. M. et al. 2008 Molecular ecology and naturalhistory of simian foamy virus infection in wild-living chimpanzees. PLoS Pathog. 4, e1000097.(doi:e100009732.10.1371/journal.ppat.1000097)
50 Excoffier, L., Laval, G. & Schneider, S. 2005 ARLEQUIN
(version 3.0): an integrated software package for popu-lation genetics data analysis. Evol. Bioinform. 1, 47–50.
51 Nishida, T., Mitani, J. C. & Watts, D. P. 2004 Variablegrooming behaviours in wild chimpanzees. Folia Primatol.75, 31–36. (doi:10.1159/000073429)
52 Sokal, R. R. & Rohlf, F. J. 1995 Biometry. New York, NY:W. H. Freeman and Co.
53 Matsuzawa, T. 1994 Field experiments on the useof stone tools in the wild. In Chimpanzee cultures(eds R. W. Wrangham, W. C. McGrew & F. B. M.de Waal), pp. 351–370. Cambridge, MA: HarvardUniversity Press.
54 Lind, J. & Lindenfors, P. 2010 The number of culturaltraits is correlated with female group size but not with
male group size in chimpanzee communities. PLoS ONE5, e9241. (doi:e924110.1371/journal.pone.0009241)
55 Cavalli-Sforza, L. L. 2000 Genes, people, and languages.San Francisco, CA: North Point Press.
56 Nettle, D. 2009 Ecological influences on human behav-
ioural diversity: a review of recent findings. Trends Ecol.Evol. 24, 618–624. (doi:10.1016/j.tree.2009.05.013)
57 Lefebvre, L. 1995 The opening of milk bottles by birds:evidence for accelerating learning rates, but against
the wave-of-advance model of cultural transmission.Behav. Process. 34, 43–53. (doi:10.1016/0376-6357(94)00051-H)
58 Franz, M. & Nunn, C. L. 2009 Network-based diffusionanalysis: a new method for detecting social learning.
Proc. R. Soc. B 276, 1829–1836. (doi:10.1098/rspb.2008.1824)
59 Kendal, R. L., Kendal, J. R., Hoppitt, W. & Laland,K. N. 2009 Identifying social learning in animal popu-lations: a new ‘option-bias’ method. PLoS ONE 4,
e6541. (doi:10.1371/journal.pone.0006541)60 Helfman, G. S. & Schultz, E. T. 1984 Social transmission
of behavioral traditions in a coral-reef fish. Anim. Behav.32, 379–384. (doi:10.1016/S0003-3472(84)80272-9)
61 Krutzen, M., Mann, J., Heithaus, M. R., Connor, R. C.,
Bejder, L. & Sherwin, W. B. 2005 Culturaltransmission of tool use in bottlenose dolphins. Proc.Natl Acad. Sci. USA 102, 8939–8943. (doi:10.1073/pnas.0500232102)
62 Langergraber, K., Mitani, J. & Vigilant, L. 2009Kinship and social bonds in female chimpanzees (Pan tro-glodytes). Am. J. Primatol. 71, 840–851. (doi:10.1002/ajp.20711)