genetic activation, inactivation and deletion reveal a limited
TRANSCRIPT
Accepted manuscripts are peer-reviewed but have not been through the copyediting, formatting, or proofreadingprocess.
Copyright © 2018 the authors
This Accepted Manuscript has not been copyedited and formatted. The final version may differ from this version.
Research Articles: Systems/Circuits
Genetic activation, inactivation and deletion reveal a limited and nuancedrole for somatostatin-containing basal forebrain neurons in behavioralstate control
Christelle Anaclet1,2, Roberto De Luca1, Anne Venner1, Olga Malyshevskaya3, Michael Lazarus3, Elda
Arrigoni1 and Patrick M. Fuller1
1Department of Neurology, Beth Israel Deaconess Medical Center, Division of Sleep Medicine, Harvard MedicalSchool, Boston, MA 021152Department of Neurobiology, University of Massachusetts Medical School, Worcester, MA 016053International Institute for Integrative Sleep Medicine (WPI-IIIS), University of Tsukuba, 1-1-1 Tennodai,Tsukuba, Ibaraki 305-8575, Japan
DOI: 10.1523/JNEUROSCI.2955-17.2018
Received: 13 October 2017
Revised: 26 March 2018
Accepted: 24 April 2018
Published: 7 May 2018
Author contributions: C.A., R.D.L., A.V., E.A., and P.M.F. designed research; C.A., R.D.L., and A.V.performed research; O.M., M.L., E.A., and P.M.F. contributed unpublished reagents/analytic tools; C.A., R.D.L.,A.V., E.A., and P.M.F. analyzed data; C.A., R.D.L., A.V., E.A., and P.M.F. wrote the paper.
Conflict of Interest: The authors declare no competing financial interests.
Correspondence should be addressed to Elda Arrigoni, Department of Neurology, Beth Israel DeaconessMedical Center, 330 Brookline Avenue, E/CLS 705, Boston, MA, 02215, United States of America, Phone:+1 (617) 735-XXX, Fax: +1 (617) 735-2910, Email: [email protected]; Patrick M. Fuller,Department of Neurology, Beth Israel Deaconess Medical Center, 330 Brookline Avenue, E/CLS 707,Boston, MA, 02215, United States of America, Phone: +1 (617) 735-2811, Fax: +1 (617) 735-2910, Email:[email protected]
Cite as: J. Neurosci ; 10.1523/JNEUROSCI.2955-17.2018
Alerts: Sign up at www.jneurosci.org/cgi/alerts to receive customized email alerts when the fully formattedversion of this article is published.
1
Genetic activation, inactivation and deletion reveal a limited and nuanced role for somatostatin-1 containing basal forebrain neurons in behavioral state control 2
3
4
Christelle Anaclet1,2, Roberto De Luca1, Anne Venner1, Olga Malyshevskaya3 5
Michael Lazarus3, Elda Arrigoni1* and Patrick M. Fuller1* 6
7 1 Department of Neurology, Beth Israel Deaconess Medical Center, Division of Sleep Medicine, Harvard 8
Medical School, Boston, MA 02115 9 2 Department of Neurobiology, University of Massachusetts Medical School, Worcester, MA 01605 10
3 International Institute for Integrative Sleep Medicine (WPI-IIIS), University of Tsukuba, 1-1-1 Tennodai, 11
Tsukuba, Ibaraki 305-8575, Japan 12
13
14
15
16
17
18
19
20
21
* co-senior authors 22
23 Elda Arrigoni 24 Department of Neurology, 25 Beth Israel Deaconess Medical Center 26 330 Brookline Avenue, E/CLS 705 27 Boston, MA, 02215 28 United States of America 29 Phone: +1 (617) 735-XXX 30 Fax: +1 (617) 735-2910 31 Email: [email protected] 32 33 34 Patrick M. Fuller 35 Department of Neurology, 36 Beth Israel Deaconess Medical Center 37 330 Brookline Avenue, E/CLS 707 38 Boston, MA, 02215 39 United States of America 40 Phone: +1 (617) 735-2811 41 Fax: +1 (617) 735-2910 42 Email: [email protected] 43

2
44
3
ABSTRACT 45
46
Recent studies have identified an especially important role for basal forebrain GABAergic (BFVGAT) neurons in 47
the regulation of behavioral waking and fast cortical rhythms associated with cognition. However, BFVGAT 48
neurons comprise several neurochemically and anatomically distinct sub-populations, including parvalbumin- 49
and somatostatin-containing BFVGAT neurons (BFParv and BFSOM), and it was recently reported that optogenetic 50
activation of BFSOM neurons increases the probability of a wakefulness to non-rapid-eye movement (NREM) 51
sleep transition when stimulated during the animal’s rest period. This finding was unexpected given that most 52
BFSOM neurons are not NREM sleep active and that central administration of the synthetic SOM analog, 53
octreotide, suppresses NREM sleep or increases REM sleep. Here we employed a combination of genetically-54
driven chemogenetic and optogenetic activation, chemogenetic inhibition and ablation approaches to further 55
explore the in vivo role of BFSOM neurons in arousal control. Our findings indicate that acute activation or 56
inhibition of BFSOM neurons is neither wakefulness- nor NREM sleep-promoting, is without significant effect on 57
the EEG, and that chronic loss of these neurons is without effect on total 24h sleep amounts, although a small 58
but significant increase in waking was observed in the lesioned mice during the early active period. Our in vitro 59
cell recordings further reveal electrophysiological heterogeneity in BFSOM neurons, specifically suggesting at 60
least two distinct sub-populations. Taken together our data support the more nuanced view that BFSOM are 61
electrically heterogeneous and are not NREM sleep- or wake-promoting per se, but may exert, in particular 62
during the early active period, a modest inhibitory influence on arousal circuitry. 63
64
65
Significance Statement 66
67
The cellular basal forebrain (BF) is a highly complex area of the brain that is implicated in a wide-range of 68
higher-level neurobiological processes, including regulating and maintaining normal levels of electrocortical 69
and behavioral arousal. The respective in vivo roles of BF cell populations and their neurotransmitter systems 70
in the regulation of electrocortical and behavioral arousal remains incompletely understood. Here we seek to 71
define the neurobiological contribution of GABAergic somatostanin-containing BF neurons to arousal control. 72
Understanding the respective contribution of BF cell populations to arousal control may provide critical insight 73
into the pathogenesis of a host of neuropsychiatric and neurodegenerative disorders, including Alzheimer's 74
disease, Parkinson's disease, schizophrenia and the cognitive impairments of normal aging. 75
4
INTRODUCTION 76
77
An important, if indispensable, role for the cellular basal forebrain (BF) in behavioral and electrocortical arousal 78
has been previously established, in particular for GABAergic (BFVGAT) neurons (Buzsaki et al., 1988; Fuller et 79
al., 2011; Anaclet et al., 2015; Kim et al., 2015; Xu et al., 2015). For example, acute chemo- and opto-genetic 80
activation of BFVGAT neurons, including those containing the calcium binding protein parvalbumin (Parv+), 81
rapidly induces behavioral waking and fast cortical rhythms associated with cognition (Anaclet et al., 2015; Kim 82
et al., 2015; Xu et al., 2015). By contrast, acute chemogenetic inhibition of BFVGAT neurons during the early 83
subjective night (active period) increases non-rapid-eye movement (NREM) sleep and cortical slow wave 84
activity (Anaclet et al., 2015). Hence BFVGAT neurons appear to be both sufficient and necessary for normal 85
behavioral and EEG wake. However, the BF contains several neurochemically and anatomically distinct sub-86
populations of BFVGAT neurons beyond Parv+, including a population of BFVGAT neurons that contain the 87
neuropeptide somatostatin [BFSOM (Yang et al., 2017)]. Interestingly, BFSOM and BFParv neurons derive from the 88
same embryonic progenitors, raising the possibility that BFSOM neurons may contribute to the wake-promoting 89
and EEG activating responses seen following activation of BFParv neurons (Hu et al., 2013). This possibility 90
however seems unlikely given findings from a recent study that showed that optogenetic stimulation of BFSOM 91
neurons increased the probability of a wakefulness to NREM sleep, and not NREM to wakefulness, transition, 92
during the animal’s normal rest period (Xu et al., 2015). Yet it remains a challenge to reconcile a NREM sleep-93
promoting role for BFSOM neurons given that the majority of BFSOM neurons are not NREM sleep active (Xu et 94
al., 2015) and that administration of octreotide, a synthetic SOM analog, was found to either suppress NREM 95
sleep or increase rapid-eye movement (REM) sleep in rats (Hajdu et al., 2003; Ziegenbein et al., 2004) and 96
impairs deep sleep in humans (Ziegenbein et al., 2004). Moreover, a role for BFSOM neurons in feeding and 97
anxiety, both waking-related behaviors, has been recently described (Zhu et al., 2017). Perhaps most 98
importantly, key evidence for a sleep- or wake-promoting role for BFSOM neurons, taking the form of a loss of 99
function (acute inhibition or chronic loss) experiments, is lacking. 100
101
Hence, and building upon on prior experimental work that established a key regulatory role for BFVGAT neurons 102
in neurobehavioral and electrocortical arousal (Anaclet et al., 2015), we employed a combination of genetically-103
driven chemogenetic and optogenetic activation, chemogenetic inhibition and ablation approaches to more 104
definitively assess the in vivo role of BFSOM neurons, as a genetically-defined subgroup of BFVGAT neurons 105
(Yang et al., 2017), in sleep-wake regulation. 106
107
METHODS 108
109
Animals 110
5
Adult male SOM-ires-Cre mice [8-12 weeks, 20-25g; n = 42 in vivo and n = 11 in vitro], obtained from Jackson 111
Laboratory, were used in this study. The SOM-ires-Cre (or Sst-IRES-Cre knock-in allele) has an internal 112
ribosome entry site and Cre recombinase in the 3' UTR of the somatostatin locus (Sst). These mice have been 113
used and histologically validated in a previous study (Xu et al., 2015). All mice were bred at our animal facility 114
and underwent genotyping both before and after experiments and all procedures were approved by the 115
Institutional Animal Care and Use Committee of Beth Israel Deaconess Medical Center. 116
117
Surgery 118
Mice were anesthetized with ketamine/xylazine [100 and 10 mg/kg respectively, intraperitoneal (IP)] and then 119
placed in a stereotaxic apparatus. To selectively express the hM3Dq receptors in GABAergic somatostatin-120
expressing (SOM+) neurons of the BF (diagonal band, magnocellular preoptic nucleus and ventral regions of 121
the substantia innominata and ventral pallidum), we placed bilateral injections of an adeno-associated viral 122
(AAV; serotype 10) vector expressing the hM3Dq receptor in a cre-dependent configuration (hSyn-DIO-123
hM3Dq-mCherry-AAV; hM3Dq-AAV) into the BF [coordinates: AP = - 0.2 mm, L = ± 0.1 mm, DV = - 4.6 mm, as 124
per the mouse atlas of Paxinos and Franklin (Paxinos and Franklin, 2001)] of homozygous SOM-ires-Cre 125
(BFSOM-hM3Dq, n = 8). To selectively express the hM4Di receptors in SOM+ neurons of the magnocellular BF, 126
we placed bilateral injections of an adeno-associated viral (AAV; serotype 10) vector expressing the hM4Di 127
receptor in a cre-dependent configuration (hSyn-DIO-hM4Di-mCherry-AAV; hM4Di-AAV) into the BF of 128
heterozygous SOM-ires-Cre, lox-L10GFP (BFSOM-hM4Di, n = 5) mice. To selectively kill SOM+ neurons of the 129
magnocellular BF, we placed bilateral injections of an adeno-associated viral (AAV; serotype 10) vector 130
expressing the Diphtheria Toxin subunit A in a cre-dependent configuration (hSyn-DIO-DTA-mCherry-AAV; 131
DTA-AAV) into the BF of heterozygous SOM-ires-Cre, lox-L10GFP (BFSOM-DTA, n = 11) mice. A vector injection 132
control (hSyn-DIO-mCherry-AAV; mCherry-AAV) was placed into the BF of littermate heterozygous SOM-ires-133
Cre, lox-L10GFP mice (BFSOM-mCherry, n = 5). Injections of hM3Dq-AAV, hM4Di-AAV or DTA-AAV (60 nl) into 134
the BF of these mice were performed using a compressed air delivery system as previously described (Fuller 135
et al., 2011). The scalp wound was closed with surgical sutures and the mouse was kept in a warm 136
environment until resuming normal activity as previously described. In a separate surgery taking place at least 137
two weeks after brain injection, mice were implanted with four EEG screw electrodes (two frontal and two 138
parietal electrodes; Pinnacle Technology Inc. #8403) and two flexible electromyogram (EMG) wire electrodes 139
(Plastics One #E363/76/SPC) previously soldered to a 6-pin connector (Heilind Electronics, Inc. #853-43-006-140
10-001000) and the assembly was secured with dental cement (Anaclet et al., 2014). The frontal electrodes 141
were positioned 1 mm frontal and 1 mm lateral of bregma whereas the parietal electrodes were positioned 142
1mm lateral from bregma and midway between bregma and lambda. For the in vivo optogenetic experiments, 143
SOM-ires-Cre (BFSOM-ChR2, n = 11) and VGAT-IRES-Cre (BFVgat-ChR2, n = 2) mice were stereotaxically injected 144
with 60 nl AAV8-FLEX-EF1α-ChR2-mCherry [bilateral: AP = - 0.2 mm, ML = ± 0.1 mm, DV = - 4.6 mm as per 145
the mouse atlas of Paxinos and Franklin (Paxinos and Franklin, 2001)] and optical fibers (200 μm, 0.39 NA) 146
6
were implanted so that the fiber tip targeted a region 0.2 mm dorsal to the injection site: [bilateral: AP = - 0.2 147
mm, ML = ± 0.1 mm, DV = - 4.4 mm]. Of the 11 BFSOM-ChR2 mice, we excluded 4 mice based upon histology 148
that showed caudal placement of fiber/injection. Our final analysis therefore includes 7 BFSOM-ChR2 mice that 149
had good bilateral placement of the optical fibers and ChR2 expression within the BF. All mice were equipped 150
with a headset for recording EEG/EMG, as previously described for chemogenetic experiments. Optical fibers 151
and headset were secured in place firstly with a mixture of dental cement and cyanoacrylate glue to affix the 152
hardware to the skull and secondly with dental cement alone to build a stable headcap and provide electrical 153
insulation for the EEG/EMG headset. 154
155
Sleep-wake monitoring - chemogenetics 156
Two weeks after EEG/EMG implantation, the mice were housed individually in transparent barrels in an 157
insulated sound-proofed recording chamber maintained at an ambient temperature of 22 ± 1°C and on a 12 hrs 158
light/dark cycle (lights-on at 7 A.M., Zeitgeber time: ZT0) with food and water available ad libitum. Mice were 159
habituated to the recording cable for 5-7 days before starting polygraphic recording. Cortical EEG (ipsilateral 160
frontoparietal leads) and EMG signals were amplified and digitalized with a resolution of 500 Hz using 161
VitalRecorder software (Kissei, Japan). BFSOM-DTA and BFSOM-mCherry control mice were subjected to 48h 162
baseline recording. BFSOM-M3 and BFSOM-M4 mice were recorded for 24h baseline period followed by injections of 163
Clozapine-N-oxide (CNO, Sigma-Aldrich; 0.3 and 0.9 mg/kg in saline, IP) injections at 10 A.M. (ZT3, light 164
period, time of high sleeping drive) and 7 P.M. (ZT12, lights-off, time of high activity). As control injections, 165
mice were injected with saline at 10 A.M. and 7 P.M. CNO and saline injections were performed in a random 166
sequence and separated by 3-5 days washout period. The injections were performed using a cross-over 167
design. Data were scored offline using SleepSign for Animals software (Kissei, Japan). 168
169
Sleep-wake monitoring – optogenetics 170
At least 2 weeks following optical fiber/EEG implant surgeries, mice were habituated to the recording chamber 171
and recording equipment (electrical cables plus bilateral optical patch cables (200 μm, 0.39 NA)) for 5 days 172
prior to commencing the experiment. 473 nm blue light (LaserGlow lasers) was used to activate ChR2 in BF 173
neurons with an estimated power output at the tip of the optical fiber of 12-15 mW. The stimulation paradigm 174
consisted of 10 ms light pulses, delivered at a frequency of 2.5 Hz or 10 Hz continuously, for 1 minute every 10 175
minutes for a 3 hour window during the light period (between 9am-3pm). Stimulations were controlled using the 176
digital output of a Micro 1401-3 and Spike 2.08 software (Cambridge Electronic Design). Mice were given one 177
day recovery between each stimulation frequency. The electrical signal from the EEG/EMG headset was 178
amplified by 20,000 using an AM Systems Model 3500 amplifier and digitized at 500 Hz using the Micro 1401-179
3. Data were scored offline using Spike 2.08 software. 180
181
182
7
hM3Dq/hM4Di-AAV and Clozapine-N-oxide 183
For the in vivo and in vitro studies, we employed evolved G protein-coupled muscarinic receptors (hM3Dq and 184
hM4Di) that are selectively activated by the pharmacologically inert drug clozapine-N-oxide (CNO). This 185
system was first developed and described by the Roth laboratory (Alexander et al., 2009). In our studies, cre-186
dependent versions of the hM3Dq and hM4Di receptors were packaged into an AAV to facilitate the 187
stereotaxic-based delivery and regionally restricted expression of hM3Dq and hM4Di. As demonstrated 188
previously by our lab (Anaclet et al., 2014; Anaclet et al., 2015; Venner et al., 2016; Anaclet et al., 2018; 189
Pedersen et al., 2017) and others, both the hM3Dq/hM4Di receptor and ligand are biologically inert in the 190
absence of ligand. Moreover, at the administered dose of 0.3 mg/kg, CNO injection 1) does not affect sleep-191
wake quantity or quality in wild-type (WT) control mice and 2) induces a maximum effect during the 1-3 hr post-192
injection period (Anaclet et al., 2014; Anaclet et al., 2017). We are therefore confident that the sleep-wake 193
effects described in our studies result from specific activation or inhibition of the targeted neuronal population 194
and not from a non-specific effect of CNO or its metabolite clozapine (Gomez et al., 2017). 195
196
Sleep scoring and analysis 197
Using SleepSign for Animal (Kissei, Japan) and with assistance of spectral analysis using fast Fourier 198
transform, polygraphic records were visually scored by 10 s epochs for wakefulness, NREM sleep, and REM 199
sleep. The percentage of time spent in W, NREM sleep and REM sleep, as well as the number and the 200
average durations of the episode were summarized for each group and each condition. The latency to NREM 201
sleep and REM sleep are defined as the time between the end of the injection and the onset of the first NREM 202
sleep episode lasting > 20 s and the first REM sleep episode lasting > 10 s. 203
Recordings were scored again in 5 s epochs to allow for performance of an EEG power spectrum analysis, 204
during the 3 hr post-injection, when CNO effect is at its maximum (Anaclet et al., 2014; Anaclet et al., 2015). 205
On the basis of visual and spectral analysis, epochs containing artifacts occurring during active wakefulness 206
(with large movements) or containing two vigilance states were visually identified and omitted from the spectral 207
analysis. Recordings containing wake artifact during more than 20% of the time were removed from the 208
spectral analysis. EEG power spectra were computed for consecutive 5 s epochs within the frequency range of 209
0.5–120 Hz using a fast Fourier transform routine (FFT). The data were collapsed into 0.5 Hz bins. The data 210
were standardized by either expressing each frequency bin as a percentage relative to the total power (e.g., 211
bin power/0.5-120 Hz total power) of the same epochs; or expressing each frequency bin as a percentage 212
relative to the same bin in baseline condition from the same mouse and from the same time of the day (same 213
Zeitgeber time). To analyze the EEG frequency bands, relative power bins were summed in delta, δ: 0.5-5 Hz; 214
theta, θ: 5-9 Hz; sigma, : 9-15 Hz; beta, β: 15-30 Hz, low gamma, lγ: 30-60 Hz and high gamma, hγ: 60-120 215
Hz. 216
The individuals performing the saline/CNO injections and sleep-wake analysis were blinded to the initial 217
immunohistochemical assessment of the injection sites. 218
8
219
Statistical analysis 220
Statistical analysis was performed using Prism v6 (GraphPad Software, San Diego, CA, USA). Following 221
confirmation that the data met the assumptions of the ANOVA model, a two-way ANOVA followed by a post 222
hoc Bonferroni test were used to compare the effects of the genotype or the drug injection on sleep-wake 223
parameters. One-way ANOVA was used to analyze the latency to NREM sleep or REM sleep. Sample size 224
and power calculations were performed post-hoc at http://www.biomath.info, using means and standard 225
deviations derived from our analysis. The present study was sufficiently powered to detect effect sizes. 226
227
Immunohistochemistry 228
Animals received CNO (0.3 mg/kg, IP 10 A.M.) and were killed two hours later by deep anesthesia with 200 229
mg/kg of chloral hydrate, followed by transcardial perfusion with 20 ml saline, followed by 100 ml of neutral 230
phosphate buffered formalin (4%, Fischer Scientific Co.). Brains were removed, incubated in 20% sucrose at 231
4°C until they sank, and then sectioned at 40 μm on a freezing microtome in three series. For all c-Fos and 232
DsRed immunohistochemical staining that involved visualization using a diaminobenzidine (DAB) reaction, the 233
sections incubated overnight with primary antiserum (1:20K, c-Fos; 1:10K DsRed) and then incubated in the 234
respective secondary antibodies for 2 h, followed by incubation in ABC reagents (1:1000; Vector Laboratories) 235
for 90 min, then washed again and incubated in a 0.06% solution of 3,3-diaminobenzidine tetrahydrochloride 236
(Sigma-Aldrich) or 0.06% solution of 3,3-diaminobenzidine tetrahydrochloride and 0.05% CoCl2 and 0.01% 237
NiSO4 (NH4) in PBS plus 0.02% H2O2 for 5 min. Finally, the sections were mounted on slides, dehydrated, 238
cleared, and coverslipped. Sections for immunofluorescence staining were incubated in fluorescent-labeled 239
secondary antibody for 2 h and coverslipped with DAPI-infused fluorescence mounting media. 240
241
Antibody characterization 242
The rabbit polyclonal Fos antibody was raised against a synthetic peptide including residues 4-17 from human 243
c-Fos (Oncogene Sciences, rabbit polyclonal cat # Ab5; note that this Ab is no longer commercially available). 244
This antibody stained a single band of 55 kD m.w. on Western blots from rat brain (manufacturer's technical 245
information). c-Fos staining with the Ab5 antiserum is found in many CNS structures only when neurons within 246
these structures have recently been physiologically stimulated. 247
248
The rabbit polyclonal antibody against mCherry was raised against DsRed (Clontech cat#632496) and the 249
specificity of immunostaining for DsRed was indicated by the lack of detectable immunostaining in uninjected 250
mice. 251
252
9
For all secondary antibody immunohistochemical controls, the primary antibodies were omitted and the tissue 253
showed no immunoreactivity above background. Secondary antibodies included: Donkey anti-rabbit Alexa 254
Fluor® 546 (Invitrogen; 1:500) and Donkey anti-rabbit biotinylated (Invitrogen; 1:500). 255
256
Packaging of DIO-hM3Dq and DIO-hM4D AAVs 257
We used the pAAV-hSyn-DIO-hM3D-mCherry and pAAV-hSyn-DIO-hM4D-mCherry plasmids (gift from B. 258
Roth) to provide the Cre-dependent hM3D transgene for packaging into AAV2/10. Packaging was carried out 259
using a standard triple transfection protocol to generate helper virus-free pseudotyped AAV2/10 virus (Anaclet 260
et al., 2015). An AAV 2/10 rep/cap plasmid provided AAV2 replicase and AAV10 capsid functions (Gao et al., 261
2002; De et al., 2006) while adenoviral helper functions were supplied by the pHelper plasmid (Stratagene, La 262
Jolla, CA). Briefly, AAV-293 cells were transfected via calcium phosphate precipitation with 1.33 pmol of 263
pHelper, and 1.15 pmol each of AAV2/10 and an AAV vector plasmid (double-floxed). The cells were 264
harvested 72 hrs later and the pellets resuspended in DMEM, freeze-thawed three times and centrifuged to 265
produce a clarified viral lysate. The vector stocks were titered by real-time PCR using an Eppendorf Realplex 266
machine as previously described (Gao et al., 2002). The titer of the preparations ranged from approximately 1 267
x 1012 to 1 x 10¹³ vector genomes copies/ml. Prior to initiating the in vivo experiments, an absolute 268
requirement for Cre-enabled expression of hM3Dq and hM4Di was confirmed in vitro using 293 cre cells. 269
270
Packaging of DTA-AAV 271
Drs. P. Fuller and M. Lazarus developed a new and enhanced version of our previously published Diphtheria 272
Subunit A-based toxin [DTA; (Kaur et al., 2013)], which was employed in the current study. For the pAAV-273
FLEX-DTA plasmid, a FLEX-DTA cassette that consists of (5’ to 3’) a lox2272 site, a mCherry coding 274
sequence, a human growth hormone polyadenylation signal sequence, a loxP site, an inverted diphtheria toxin 275
fragment A (DTA) sequence, and inverted lox2272 and loxP sites was synthesized by Eurofins Genomics K.K. 276
(Japan) and inserted between the Cla I and BamH I restriction sites in a pAAV-MCS vector (Stratagene, La 277
Jolla, CA). In this design, mCherry was expressed in all non-cre-recombinase cells within the injection field, 278
thereby allowing us to ascertain 1) the anatomic extent of the injection, and 2) “survival” of the non-cre-279
recombinase cells intermingled with the cre-recombinase cells targeted by DTA. See panel B in Figure 5 for 280
construct (CMV-β-globin-DIO-mCherry-DTA-hGH pA) details. 281
282
AAV of serotype rh10 for AAV-FLEX-DTA were generated by tripartite transfection (AAV-rep2/caprh10 283
expression plasmid, adenovirus helper plasmid, and pAAV plasmid) into 293A cells. After 3 d, the 293A cells 284
were resuspended in artificial CSF, freeze-thawed four times, and treated with benzonase nuclease (Millipore, 285
Billerica, MA) to degrade all forms of non-viral DNA and RNA. Subsequently, the cell debris were removed by 286
centrifugation and the virus titer in the supernatant was determined with an AAVpro Titration Kit for Real Time 287
PCR (Takara, Japan). 288
10
289
Whole Cell in vitro experiments 290
Bilateral injections (120 nl) of DIO-hM3Dq-mCherry-AAV, DIO-hM4Di-mCherry-AAV or DIO-mCherry-AAV 291
were placed into the BF of SOM-Cre mice (n = 11 mice). Five to six weeks after AAV injections the mice were 292
used for in vitro electrophysiological recordings. Mice were deeply anaesthetized with isoflurane (inhalation; 293
5% in oxygen), and transcardially perfused with ice-cold cutting ACSF (N-methyl-D-glucamine, NMDG-based 294
solution) containing (in mM): 100 NMDG, 2.5 KCl, 1.24 NaH2PO4, 30 NaHCO3, 25 glucose, 20 HEPES, 2 295
thiourea, 5 Na-L-ascorbate, 3 Na-pyruvate, 0.5 CaCl2, 10 MgSO4 (pH 7.3 with HCl when carbogenated with 296
95% O2 and 5% CO2; 310-320 mOsm). Coronal slices (250 μm-thickness) were cut in ice-cold cutting ACSF 297
using a vibrating microtome (VT1200S, Leica, Bannockburn, IL, USA). Slices were first kept in cutting ACSF at 298
37°C for 5 minutes and then transferred in normal ACSF at 37°C. Slices were then let gradually return to room 299
temperature for an hour. Normal ACSF contained (in mM): 120 NaCl, 2.5 KCl, 1.3 MgCl2, 10 glucose, 26 300
NaHCO3, 1.24 NaH2PO4, 4 CaCl2, 2 thiourea, 1 Na-L-ascorbate, 3 Na-pyruvate (pH 7.4 when carbogenated 301
with 95% O2 and 5% CO2; 310-320 mOsm). 302
Slices containing the BF were recorded in oxygenated (95% O2, 5% CO2) normal ACSF at room temperature. 303
Recordings were conducted in whole-cell configuration and in current-clamp mode using a K-gluconate-based 304
pipette solution containing (in mM): 120 K-Gluconate, 10 KCl, 3 MgCl2, 10 HEPES, 2.5 K-ATP, 0.5 Na-GTP 305
(pH 7.2 adjusted with KOH; 280 mOsm). Biocytin (0.5%) was added to the pipette solution to fill and mark the 306
recorded neurons. Recordings were conducted using a MultiClamp 700B amplifier, Digidata 1440A digitizer 307
interface and pClamp 10 software (Molecular Devices, Foster City, CA, USA). Neurons showing changes in 308
input resistance more than 10% over time were excluded from the analysis. BF mCherry-labeled somatostatin 309
neurons were visualized through a combination of fluorescence and infrared differential interference contrast 310
(IR-DIC) video microscopy using a fixed stage upright microscope (BX51WI, Olympus America Inc.) equipped 311
with a Nomarski water immersion lens (Olympus 40X / 0.8 NAW) and IR-sensitive CCD camera (ORCA-ER, 312
Hamamatsu, Bridgewater, NJ, USA). Images were acquired in real time using a Matlab (MathWorks) script. 313
Recording data were analyzed using Clampfit 10 (Molecular Devices). Firing frequencies and membrane 314
potentials were analyzed using MiniAnalysis (Synaptosoft) and Matlab (MathWorks). Data were represented as 315
mean ± s.e.m.; n indicates number of cells per group. Group means were compared using paired t-tests. 316
Effects of CNO on firing frequency and membrane potential were analyzed by comparing 5 minutes of 317
recordings just before CNO applications (control group) and during the last 5 minutes of 10-min CNO 318
application. Figures were generated using Photoshop (Adobe), Igor Pro version 6 (WaveMetrics) and Prism 7 319
(GraphPad). 320
Immediately following the in vitro recordings, recorded slices were fixed in 10% buffered formalin (overnight), 321
then washed and incubated in streptavidin-conjugated Alexa Fluor®405 (1:500, 24h; Invitrogen). Images were 322
acquired using a confocal microscope (Zeiss LSM 5 Pascal) and a slide scanner (Olympus VS120). 323
324
11
325
RESULTS 326
327
In vitro BFSOM activation and inhibition: 328
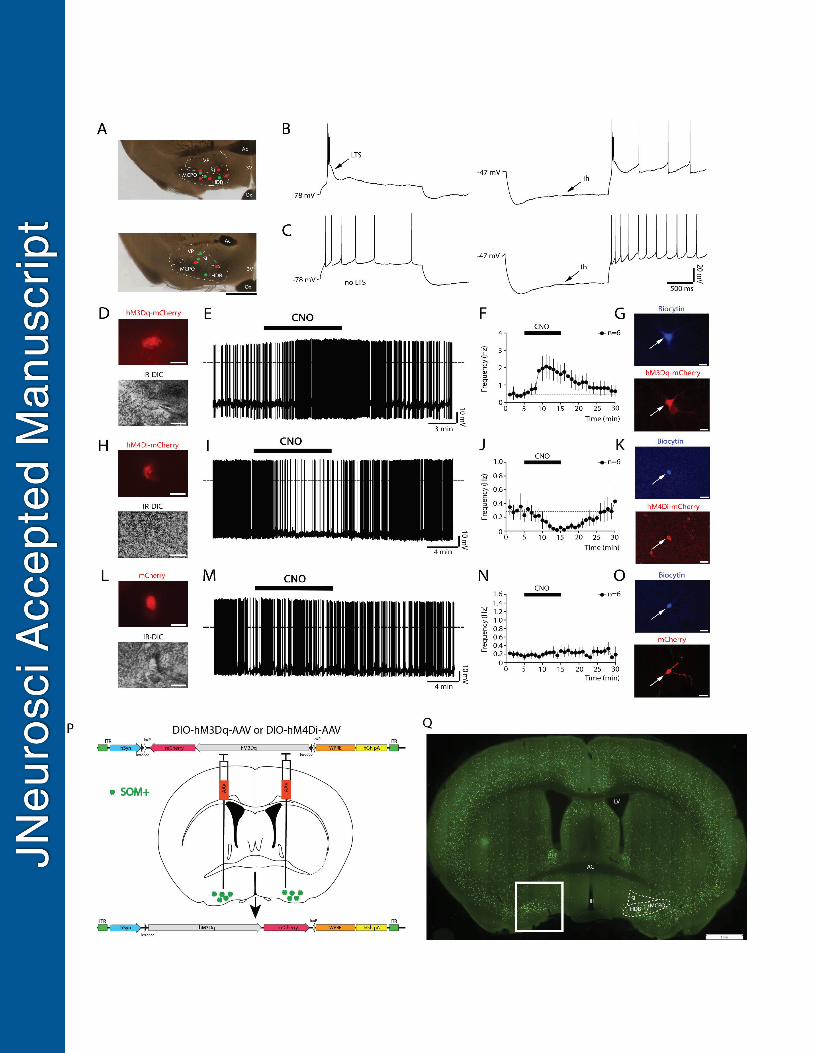
Whole-cell current clamp recordings in the BF revealed two populations of somatostatin expressing (BFSOM) 329
neurons with distinct firing properties (Fig 1A-C). One population had a large low threshold spikes (LTS) that 330
supported burst firing when neurons were depolarized from hyperpolarized potentials (17 out of 29 recorded 331
neurons; Fig.1B). The second population showed tonic firing and no LTS (12 out of 29 recorded neurons; 332
Fig.1C), and the hyperpolarization-activated cation current (Ih) was present in the majority of BFSOM neurons 333
(25 out of 29). Both subtypes of BFSOM neurons were capable of expressing hM3Dq (BFSOM-hM3Dq-mCherry) or 334
hM4Di (BFSOM-hM4Di-mCherry) receptors following injections of DIO-hM3Dq-mCherry-AAV and DIO-hM4Di-335
mCherry-AAV in SOM-Cre mice and responded to bath application of clozapine-N-oxide (CNO, 0.5-1 μM). We 336
tested the response to CNO in 18 BFSOM neurons. CNO increased the firing frequency of BFSOM-hM3Dq-mCherry 337
neurons (control: 0.47 ± 0.25 Hz; CNO: 1.81 ± 0.66 Hz; n = 6; p = 0.0284, paired t-test; Fig. 1D-G) and this 338
effect was accompanied by a membrane depolarization (control: -44.31 ± 2.02 mV; CNO: -39.26 ± 1.10 mV; n 339
= 6; p = 0.0018, paired t-test). Both firing frequency and membrane potential returned to control levels after 15 340
min of CNO washout. CNO decreased the firing frequency of BFSOM-hM4Di-mCherry (control: 0.31 ± 0.12 Hz; CNO: 341
0.04 ± 0.02 Hz; n = 6; p = 0.0199, paired t-test; Fig.1H-K) and hyperpolarized their membrane potential 342
(control: -45.52 ± 1.00 mV; CNO: -49.61 ± 0.90 mV; n = 6; p = 0.0001, paired t-test). Both effects were 343
reversed after 15-min washout. CNO had no effect on BFSOM-mCherry neurons that lacked hM3Dq or hM4Di 344
receptors and only expressed mCherry following injections of DIO-mCherry-AAV (control injections; Fig.1L-O). 345
No changes of firing frequency (control: 0.19 ± 0.08 Hz; CNO 0.21 ± 0.10 Hz; n = 6; p = 0.1873, paired t-test) 346
and in membrane potential (control: -40.94 ± 1.97 mV; CNO: -40.90 ± 2.14 mV; n = 6; p = 0.4645, paired t-test) 347
in response to CNO (1 μM) was observed in BFSOM-mCherry neurons confirming that CNO-mediated activation or 348
inhibition of BFSOM neurons occurs only in neurons expressing hM3Dq and hM4Di receptors. 349
350
351
In vivo BFSOM chemogenetic activation: 352
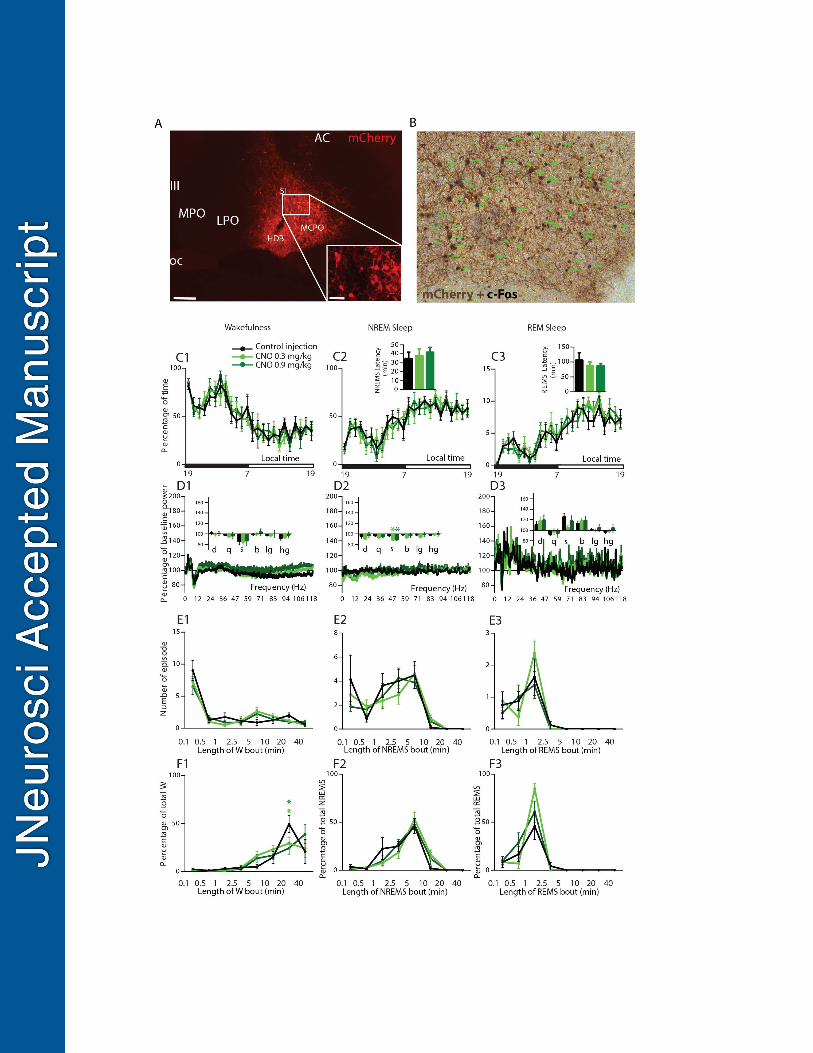
Following bilateral injections of hM3Dq-AAV, transduced somata (hM3Dq+) were consistently observed in the 353
horizontal limb of the diagonal band, magnocellular preoptic area, and substantia innominata and spanned, 354
rostrally-caudally, from Bregma +0.26 to -0.82 (Figure 1P-Q; Figure 2A). As we have shown previously 355
(Anaclet et al., 2014), administration of clozapine-N-oxide [CNO, the hM3Dq ligand; i.p., 0.3 mg/kg) 356
consistently produced robust c-Fos expression in hM3Dq+ neurons (Figure 2B). To test the putative sleep-357
promoting action of BFSOM neurons in vivo, BFSOM-hM3Dq mice (n =8 ) received injection of CNO (0.3 or 0.9 358
mg/kg) at the beginning of the dark period, a time of high waking drive in mouse (Figure 2C). CNO dosage had 359
no effect on NREM sleep [one-way ANOVA, F(1.89,13.22)= 0.32, p= 0.72] or REM sleep [one-way ANOVA, 360
12
F(1.26,8.84)= 0.45, p= 0.56] latency, suggesting that activation of BFSOM neurons does not affect sleep onset. 361
CNO dosage had no effect on hourly amount of NREM sleep [two-way ANOVA, F(2,14)= 0.83, p= 0.45] or 362
REM sleep [two-way ANOVA, F(2,14)= 1.43, p= 0.27] amount, suggesting that activation of BFSOM neurons 363
does not affect sleep behavior. Cortical EEG power spectral analysis during the 3 hr post-injection confirmed 364
that CNO dosage did not affect frequency distribution during the three vigilance stages (Fig 2D), indicating no 365
major influence of BFSOM neurons on cortical activity. Sigma power was however reduced during NREM sleep 366
following CNO administration (low CNO dose: 88.5 ± 1.8 and high dose: 89.2 ± 2.2 vs 97.0 ± 2.3 % of baseline 367
sigma power during NREM sleep, p = 0.0008 and 0.002, respectively, Bonferroni’s multiple comparisons test), 368
suggesting a possible decrease in spindle activity during NREM sleep. Sleep architecture during the 3 hr post-369
injection, bout number and duration, was not affected by CNO dosage (Fig2E-F) and CNO (0.3 mg/kg, IP) 370
administration during the light period did not affect NREM sleep [F(23,161)=1.36, p=0.14] or REM sleep 371
[F(23,161)=1.10, p=0.35] hourly distribution, indicating a very modest influence of BFSOM neurons on sleep-372
wake regulation. Our findings therefore fail to confirm a wake- or sleep-promoting role for BFSOM neurons in 373
vivo and, moreover, are inconsistent with those from a prior optogenetic study suggesting that BFSOM neurons 374
are acutely sleep-promoting in vivo (Xu et al., 2015). 375
376
377
In vivo BFSOM chemogenetic inhibition: 378
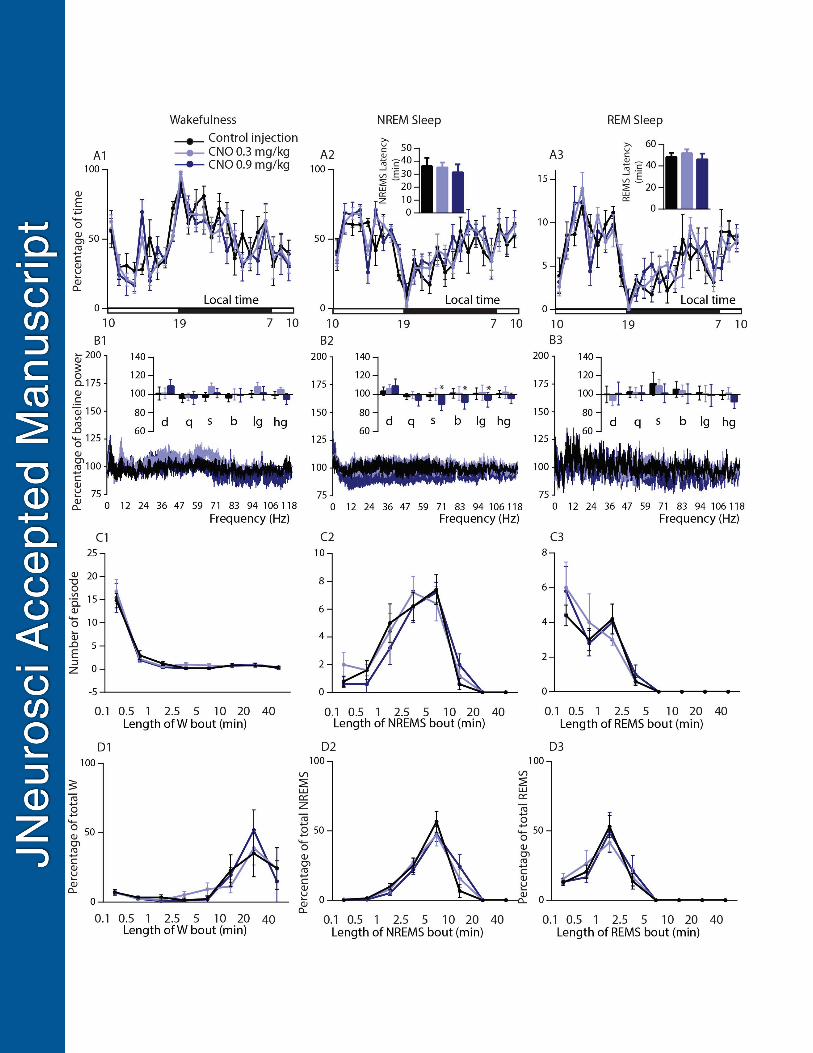
Similar to the activation experiments, acute inhibition of BFSOM neurons had limited effects on sleep-wake 379
quantity or quality in BFSOM-hM4Di mice (n=5; Figure 3). Specifically, administration of CNO (0.3 or 0.9 mg/kg, 380
IP) was without effect on NREM sleep [one-way ANOVA, F(1.32,5.28)= 0.27, p= 0.69] or REM sleep [one-way 381
ANOVA, F(1.06,4.23)= 0.39, p= 0.58] latency (Figure 3A1-3), suggesting that inhibition of BFSOM neurons does 382
not affect sleep onset. CNO dosage was also without effect on hourly amount of wakefulness [two-way 383
ANOVA, F(2,8)= 3.76, p= 0.07], suggesting that inhibition of BFSOM neurons did not affect waking behavior (Fig 384
3A1). Cortical EEG power spectral analysis during the 3 hr post-injection confirmed that CNO dosage did not 385
affect frequency bands during wakefulness [two-way ANOVA, F(10,30)= 1.60, p= 0.15, (Fig 3B1)], indicating 386
that BFSOM neurons are not necessary for cortical activation. The higher dose of CNO (0.9 mg/kg) did however 387
decrease sigma, beta and low gamma power band as compared with both control and low CNO (0.3mg/kg) 388
injections during NREM sleep (Figure 3B2), indicative of a decrease of spindle and fast activity during NREM 389
sleep. Sleep architecture during the 3 hr post-injection, bout number and duration, was not affected by CNO 390
dosage (Fig 3C-D) confirming no major influence of BFSOM neurons sleep-wake phenotype. These results 391
suggest that BFSOM neurons are not necessary for sleep onset and maintenance, although the spectral results 392
suggest that BFSOM neurons may facilitate the ‘dampening down’ of cortical activity during sleep. 393
394
In vivo BFSOM optogenetic activation: 395
13
As chemogenetic activation of BFSOM neurons was ineffective at inducing changes in wakefulness or sleep, we 396
next sought to determine whether activation of this population using an optogenetic strategy could induce a 397
behavioral state transition. BFSOM-ChR2 mice (n = 7; Figure 4A-B) received blue light pulses delivered through 398
the optical fiber at frequencies close to the native firing frequency of these neurons in vivo [based upon (Xu et 399
al., 2015), 10ms pulses delivered at 2.5 Hz for 1 minute, Figure 4C1] and at a previously investigated stimulus 400
frequency [(Xu et al., 2015) of 10 ms pulses delivered at 10 Hz for 1 minute, Figure 4C2], once every 10 401
minutes for 3 hours during the light period (between and 9am and 3pm). Consistent with our chemogenetic 402
findings, we did not observe an increased probability of the mice experiencing NREM (or REM) sleep during 403
light stimulations at either frequency tested. As a positive control for this stimulation, we similarly bilaterally 404
stimulated BFVGAT-ChR2 neurons (n = 2 mice, Figure 4D), which induced a robust increase in wakefulness at 405
both 2.5 Hz and 10 Hz. We therefore conclude that activation of SOM-containing neurons within the BF 406
(confirmed using two complementary yet distinct approaches) does not acutely drive sleep or wakefulness in 407
mice. 408
409
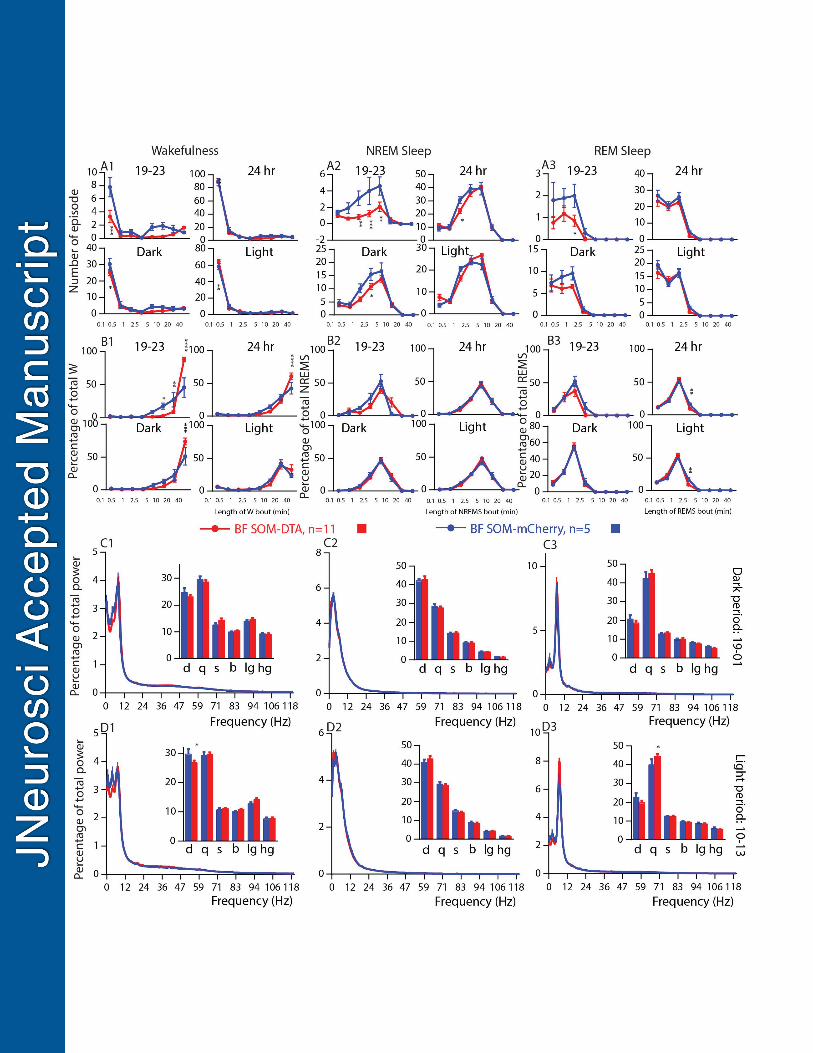
BFSOM genetically-targeted chronic ablation: 410
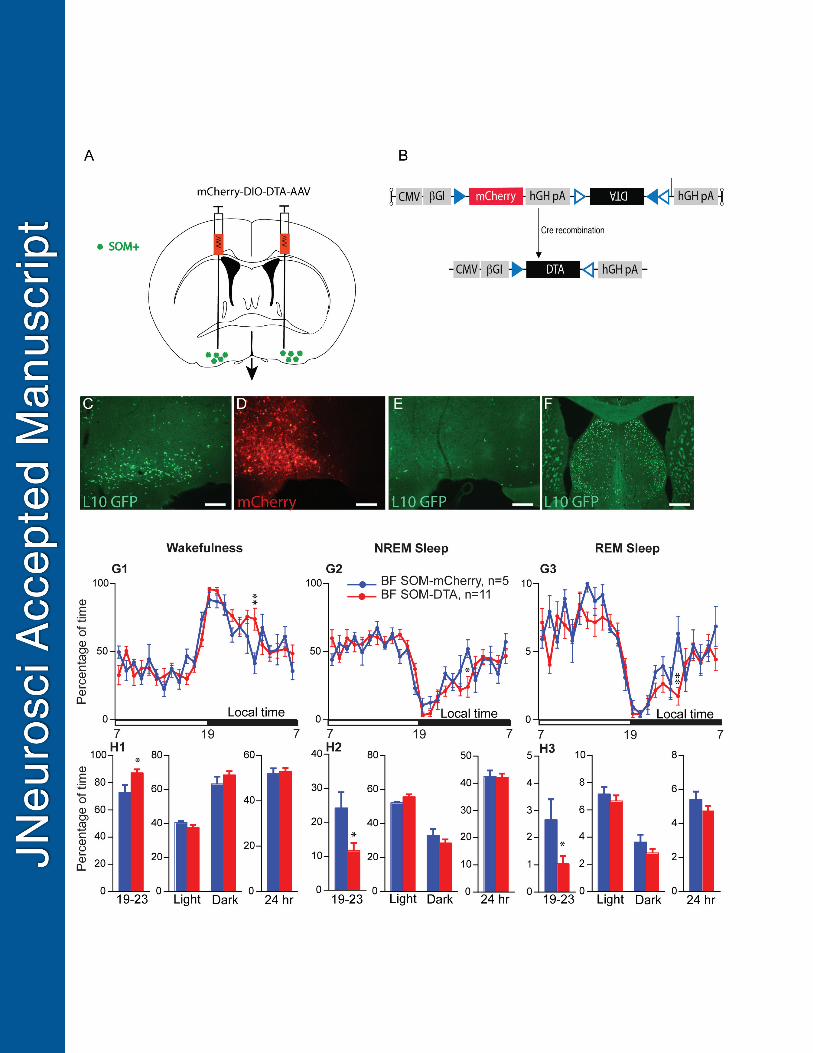
To test the sleep-wake effect of chronic loss of BFSOM neurons, we placed bilateral injections of AAV-DTA into 411
the BF of SOM-ires-cre,lox-L10GFP mice (BFSOM-DTA, n = 11) to selectively and chronically ablate BFSOM 412
neurons (Figure 5A-B). Histological analysis of the tissue revealed a >90% bilateral reduction in BFSOM cells 413
(GFP+) across the anatomic BF (Figure 5C-F). With respect to the physiology of these mice, chronic loss of 414
BFSOM neurons (BFSOM-DTA) resulted in cycles of sleep and wakefulness that were comparable to control mice 415
(BFSOM-mCherry, n = 5, same genotype as BFSOM-DTA mice, bilateral injection of AAV-mCherry for viral vector 416
injection control), in baseline condition, with minor exceptions. 24 hour wakefulness distribution was not 417
affected by the loss of BFSOM neurons [two-way ANOVA, F(1,14)= 1.16, p= 0.69, Figure 5G1], and similar to 418
control mice, BFSOM-DTA mice were more awake during the dark period as compared with the light period [light-419
dark interaction: two-way ANOVA, F(1,14)=153.3, p< 0.0001, Figure 5H1]. NREM sleep and REM sleep 420
displayed opposite variations (Figure 5G2-3, H2-3). However, wakefulness was significantly increased during 421
the first 4 hr of the dark period, a time of high waking drive in the mouse [87.3±2.6 vs 73.1±5.2 % of 422
wakefulness in control mice, p=0.015, Unpaired t test, t= 2.76, df= 14; Figure 5H1). The wakefulness amount 423
increases during the first 4 hr of the dark period was at the expense of both NREM sleep (Figure 5H2) and 424
REM sleep (Figure 5H3). The increased wakefulness during the early active period in BFSOM-DTA mice resulted 425
from a significant decrease of short wakefulness epoch (< 30 sec: 3.3±0.9 vs 7.8 ± 1.5 episodes in control 426
mice, p<0.0001, Bonferroni’s adjustment for multiple comparisons; Figure 6A1) and a significant increase of 427
the percentage of wakefulness from long wakefulness epochs (> 40 min: 88.0 ± 3.2 vs 45.3 ± 14.7 % of 428
wakefulness in control mice, p<0.0001, Bonferroni’s adjustment for multiple comparisons; Figure 6B1). At the 429
same time, the number of medium length NREM sleep episodes (1min < NREM sleep epoch < 10 min, Figure 430
6A2) was significantly decreased in BFSOM-DTA mice. REM sleep epoch number was also affected (two-way 431
14
ANOVA, F(1,112)=9.25, p=0.0029) and REM sleep episode number lasting 1-2.5 min were significantly 432
decreased (0.9±0.3 vs 2.0±0.5 episode in control mice, p<0.05, Bonferroni’s adjustment for multiple 433
comparisons; Figure 6A3). 434
Power spectral analysis revealed a similar power distribution in BFSOM-DTA mice as compared with control mice, 435
during the beginning of the dark period, indicating that the increase in wakefulness amount was not associated 436
with EEG power change. During the light period, delta band power was decreased during the waking state 437
(26.7±0.8 vs 28.5±1.0 % of total power in control mice, p<0.05, Bonferroni’s adjustment for multiple 438
comparisons). At the same time, REM sleep theta power was significantly increased (44.5 ± 1.3 vs 42.5 ± 1.6 439
% of total power in control mice, p<0.05, Bonferroni’s adjustment for multiple comparisons). 440
Thus, beyond a decrease in cortical delta power during wakefulness and an increase in theta power during 441
REM sleep, cortical EEG delta power was not significantly changed during NREM sleep in BFSOM-DTA mice, 442
indicating that these neurons are not involved in NREM sleep homeostatic control. 443
444
445
Genotype comparisons: 446
As previous studies using this same SOM-ires-Cre mouse line have not, to our knowledge, evaluated potential 447
sleep-wake phenotypic differences between heterozygous and homozygous SOM-ires-cre mice, we decided to 448
compare baseline sleep-wake and EEG between homozygous SOM-ires-Cre and heterozygous SOM-ires-Cre 449
(i.e., SOM-ires-Cre,lox-L10GFP) mice. To enable a more direct comparison with our chemogenetic and 450
optogenetic work, we used homozygous and heterozygous SOM-ires-Cre mice with bilateral injections of AAVs 451
targeting BFSOM neurons (hM3Dq-AAV and hM4Di-AAV or mCherry-AAV, respectively). Baseline recordings 452
(i.e., in the absence of CNO) revealed that homozygous SOM-ires-Cre mice exhibited significantly more NREM 453
sleep, at the expense of wakefulness (Figure 7B2), during the light period than heterozygous SOM-ires-Cre 454
mice (62.2 ± 1.6 vs 54.5 ± 1.2% of the light period, p<0.01) and was associated with an increase in NREM 455
sleep delta power (42.9 ± 0.7 vs 40.7 ± 1.3 % of total power, p<0.05; Figure 7E2), suggesting elevated sleep 456
pressure in the homozygous condition. Interestingly, REM sleep amount was significantly decreased during the 457
dark period (3.0±0.3 vs 4.5±0.3% of the dark period, p<0.05; Figure 7D1) in homozygous SOM-ires-Cre mice. 458
Given that SOM-ires-Cre mice were obtained as homozygous breeders, the introduction of another strain (lox-459
L10GFP) was necessary to generate the heterozygous condition, and this could account in part or fully for the 460
noted differences. Regardless, the possibility of a hypomorphic allele cannot be definitively ruled out in the 461
homozygous condition and hence interpretative caution using this mouse line in the homozygous state is 462
warranted. 463
464
465
DISCUSSION 466
467
15
Results from our targeted activation (chemogenetic and optogenetic) and inhibition (chemogenetic) studies 468
reveal that BFSOM neurons, presumably comprising both electrophysiologically-identified subpopulations 469
(Figure 1), are neither sufficient nor necessary to appreciably and acutely alter the levels of behavioral or EEG 470
wake or sleep. By contrast, our genetically-driven deletion studies suggest that BFSOM neurons may influence 471
the magnitude of waking as well as total REM sleep time during the early active period. Our data also suggest, 472
but does not confirm, that the SOM-ires-Cre allele may be hypomorphic, biasing increased sleep in the 473
homozygous condition. Taken together with previous work showing that optogenetic activation of BFSOM 474
neurons during the inactive period (ZT4-8) increased the probability of a wake-NREM sleep transition, and that 475
only a minority of BFSOM neurons (~22% of those recorded) were NREM active (Xu et al., 2015), we would 476
propose a more nuanced and time-of-day dependent role for BFSOM neurons in behavioral state control. 477
Specifically, our data suggest that BFSOM are not NREM sleep-, REM sleep- or wake-promoting per se, but may 478
exert, in particular during the early active period, a modest inhibitory influence on arousal circuitry, including 479
possibly on local wake-promoting cells within the BF. While it is unclear what the functional significance of this 480
“dampening” effect of BFSOM neurons on active period waking levels might be, one possibility is that they may 481
help fine tune the level of behavioral arousal, likely via modulation of neighboring BF cholinergic and 482
GABAergic neurons, in accordance with situational-specific cognitive demands. To this end, BFSOM neurons 483
directly inhibit, via release of GABA, BF wake-promoting cells, including cholinergic cells (Xu et al., 2015), the 484
activity of which is strongly linked to many cognitive processes (Gielow and Zaborszky, 2017). The time of day 485
of this influence on wakefulness levels observed in our study would also suggest that the operative population 486
of BFSOM neurons is wake-, and not sleep-, active. 487
488
The cellular BF and wakefulness 489
Pharmacologic, lesion, stimulation, chemogenetic and optogenetic studies have established a key role for the 490
BF in electrocortical and behavioral arousal. For example, direct stimulation of the BF has pronounced 491
activating effects on the cortical EEG (Berridge and Foote, 1996; Cape and Jones, 2000), whereas lesions of 492
the BF increase EEG delta activity, reduce wakefulness or result in low amplitude EEG and behavioral 493
unresponsiveness (Buzsaki et al., 1988; Fuller et al., 2011; Kaur et al., 2013). Recent studies, including from 494
our laboratory, have attempted to genetically parse the contribution of individual BF cell populations, including 495
cholinergic, glutamatergic and GABAergic cell groups, in these processes (Anaclet et al., 2015; Kim et al., 496
2015; Xu et al., 2015; Yang et al., 2017). For example, optogenetic studies of the cholinergic BF cell group 497
have indicated these cell groups 1) promotes both wakefulness and REM sleep or 2) just wakefulness. In 498
some contrast, two chemogenetic-based studies showed that acute activation of BF cholinergic neurons led to 499
fragmentation of the sleep state and suppressed lower frequency EEG components during NREM sleep, but 500
was not wake-promoting per se (Anaclet et al., 2015; Chen et al., 2016). With respect to the glutamatergic BF 501
cell group, it was recently reported that optogenetic stimulation of glutamatergic BF neurons potently drove 502
wakefulness from NREM sleep (Xu et al., 2015). Once again in some contrast, chemogenetic activation of this 503
16
same cell group had no effect on sleep latency or consolidation and produced no changes in the EMG or EEG 504
fast frequencies, but did result in a small decrease in EEG delta power during NREM sleep, indicating a 505
contribution to cortical desynchronization (Anaclet et al., 2015). Finally, investigations of the GABAergic BF 506
cell population have revealed, consistently, strong high frequency EEG- and wake-promoting responses 507
(Anaclet et al., 2015; Kim et al., 2015). In the first of the optogenetic-based studies, the authors found that 508
stimulation of parvalbumin-containing GABAergic BF (BFParv) neurons elicited cortical gamma band oscillations 509
(GBO, ~ 40Hz activity), linking their activation to higher cognitive function (Kim et al., 2015). In a second 510
published optogenetic study, the author found that optogenetic stimulation of BFParv neurons elicits waking, but 511
not GBO (Xu et al., 2015). Finally, in a contemporaneous chemogenetic study we found that acute activation 512
of GABAergic BF neurons (BFVGAT) neurons potently drove wakefulness as well as EEG high gamma (60–513
120 Hz) activity (Anaclet et al., 2015). We further showed that acute inhibition of BFVGAT neurons during the 514
early dark period, a typical time of maximal wakefulness in the mouse, resulted in a significant decrease in 515
behavioral wakefulness, establishing necessity of BFVGAT neurons for wakefulness maintenance (Anaclet et al., 516
2015). These rather monolithic waking/EEG activating responses seen following activation of BFVGAT neurons 517
belie the functional and anatomic complexity of the GABAergic BF cell population, namely the existence of 518
wake-, REM- and NREM sleep-active subgroups as well as subgroups that contain different calcium binding 519
proteins, such as parvalbumin, calbindin-D28k and calretinin, or other markers, including the SOM cell group 520
investigated in the present study (Yang et al., 2017). 521
522
The cellular BF and sleep 523
Older literature has suggested that the BF may contain, in addition to wake-promoting cell populations, NREM 524
sleep-promoting circuitry. For example, the BF contains sleep-active cells (Hassani et al., 2009; Sakai, 2011; 525
Xu et al., 2015) and lesions placed into the BF of the cat have been reported to increase EEG and behavioral 526
waking, presumably secondary to loss of NREM sleep-promoting neurons (McGinty and Sterman, 1968; 527
Szymusiak and McGinty, 1986). As indicated, a recent optogenetic study revealed a NREM sleep-promoting 528
role for BFSOM neurons (Xu et al., 2015), suggesting the cellular basis for these wake-promoting lesions. This 529
finding is however difficult to reconcile with outcomes from our activation, inhibition and lesion experiments, 530
which were inconsistent with BFSOM neurons promoting NREM sleep per se. In fact, the results of our 531
chemogenetic studies, which employed the same vector system and construct as used in our previous studies 532
to activate BFVGAT (Anaclet et al., 2015), lateral hypothalamic VGAT+ (Venner et al., 2016) and 533
supramammillary (Pedersen et al., 2017) or parafacial VGAT+ (Anaclet et al., 2014; Anaclet et al., 2017) 534
neurons (potently driving wakefulness or sleep), were acutely underwhelming in this regard. While these 535
disparate outcomes could link to some unrecognized technical difference, we feel that a critical reassessment 536
of the lesion papers cited in support of the concept that the BF contains NREM sleep-promoting circuitry may 537
be particular revealing. Specifically, a review of the lesion maps shown in the lesion papers suggests that the 538
lesions themselves may have included, in part or entirety, the ventrolateral preoptic nucleus (VLPO). The 539
17
VLPO comprises a major NREM sleep-promoting cell population within the preoptic forebrain (Sherin et al., 540
1996; Lu et al., 2000), and in the cat the VLPO is located laterally adjacent to the BF (Gaus et al., 2002), and 541
hence far more lateral from the midline than in the rodent. At the time that these lesions studies were 542
published the VLPO had not yet been identified, and as such the authors of the papers had no a priori reason 543
to assume that the lesions might have encroached upon this NREM sleep-promoting cell group. Hence, and 544
until shown otherwise, we feel that a more parsimonious explanation for the increased wakefulness observed 545
in the BF lesioned cats is unintended ablation of the NREM sleep-promoting VLPO, and not disruption/ablation 546
of a resident NREM sleep-promoting cell group (but see limitations below). 547
548
Limitations 549
Two technical points must be considered when interpreting our data. First, in light of the revealed 550
electrophysiological heterogeneity in the present study, and the variable state-dependent activity of BFSOM 551
neurons demonstrated by another group (Xu et al., 2015), it is possible, if not likely, that different sub-552
populations of BFSOM neurons subserve different aspects of behavioral state control. As these putative subsets 553
of BFSOM neurons have not, to our knowledge, been molecularly defined, the ability to selective target BFSOM 554
subpopulations is constrained. Hence the changes observed in our measured response variables reflect 555
presumptive concurrent manipulation of all BFSOM sub-populations, and we therefore cannot rule out the 556
possibility that, for example, manipulation of one sub-population may antagonize the activity of the other sub-557
population(s). What is clear from our experimental work is that the influence of BFSOM on wake, NREM sleep 558
and REM sleep, both in the acute and chronic conditions, are modest across interrogations and likely time of 559
day dependent. 560
561
The second consideration is that while the SOM-ires-Cre was designed as a 3' knock-in, our comparison of the 562
heterozygous versus homozygous condition suggests that it may be a hypomorphic allele. While we could not 563
definitely conclude this on the basis of our comparison, which included the introduction of a different strain of 564
mouse, we did find that homozygous SOM-cre mice exhibited slightly more NREM sleep during the light period 565
and across the 24 hour day than heterozygous SOM-cre mice. The increase in NREM sleep in the 566
homozygous condition was largely attributable to an increase in the number of 2.5-5 min NREM sleep 567
episodes. Thus, on the one hand, the increases in total NREM sleep and 2.5-5 min NREM sleep episodes 568
would actually suggest, in the context of a hypomorphic allele, that SOM-cre neurons are modestly 569
wakefulness-, and not sleep-, promoting. On the other hand, our acute activation and inhibition studies would 570
suggest that modulation of BFSOM neurons is not sufficient to appreciably or acutely alter sleep or wakefulness, 571
whereas our ablation studies suggest that BFSOM neurons may exert a modest inhibitory influence on waking 572
during the early active period, an effect that is likely mediated by GABA release since this effect on waking was 573
not observed in the non-ablated, homozygous mice in which GABA production and release is unlikely affected. 574
Additionally, our in vitro data, taken together with previous optrode data (Xu et al., 2015), suggest considerable 575
18
heterogeneity in the BFSOM population, which would be consistent with the diversity of modest influences that 576
these neurons appear to exert on behavioral state. 577
578
Conclusions 579
580
Our experimental outcomes suggest a modest and time-of-day dependent influence of BFSOM neurons on 581
behavioral state and are generally inconsistent with the idea that this cell population is NREM sleep-promoting, 582
as was previously proposed. Taken together with previous work on the cellular BF, the findings from the 583
present study not only emphasize strong functional heterogenetity across BFVGAT subgroups, but also point to 584
BFParv neurons as being uniquely wake-promoting among the subgroups of BFVGAT cell populations thus far 585
tested. Also, our lesion findings in particular suggest the interesting possibility that impairment of BFSOM 586
neurons may contribute, at least in part, to hyperarousal phenotypes, e.g., hyperarousal of posttraumatic stress 587
disorder. Future studies interrogating other BFVGAT subgroups as well as defining the circuit basis by which 588
they regulate behavioral state are eagerly awaited. 589
590
Acknowledgments 591
We are grateful for the technical assistance of Tilar Martin, Rebecca Broadhurst, Lauren Sohn, Minh Ha and 592
Quan Hue Ha. This work was supported by National Institutes of Health grants K99MH103399 and 593
R00MH103399 (C.A.); NS073613, NS092652 and NS103161 (P.M.F.); NS091126 (E.A.). 594
595
REFERENCES 596
597
Alexander GM, Rogan SC, Abbas AI, Armbruster BN, Pei Y, Allen JA, Nonneman RJ, Hartmann J, Moy SS, 598 Nicolelis MA, McNamara JO, Roth BL (2009) Remote control of neuronal activity in transgenic mice 599 expressing evolved G protein-coupled receptors. Neuron 63:27-39. 600
Anaclet C, Griffith K, Fuller PM (2018) Activation of the GABAergic Parafacial Zone Maintains Sleep and 601 Counteracts the Wake-Promoting Action of the Psychostimulants Armodafinil and Caffeine. 602 Neuropsychopharmacology. 43(2):415-425 603
Anaclet C, Ferrari L, Arrigoni E, Bass CE, Saper CB, Lu J, Fuller PM (2014) The GABAergic parafacial zone is 604 a medullary slow wave sleep-promoting center. Nat Neurosci 17:1217-1224. 605
Anaclet C, Pedersen NP, Ferrari LL, Venner A, Bass CE, Arrigoni E, Fuller PM (2015) Basal forebrain control 606 of wakefulness and cortical rhythms. Nat Commun 6:8744. 607
Berridge CW, Foote SL (1996) Enhancement of behavioral and electroencephalographic indices of waking 608 following stimulation of noradrenergic beta-receptors within the medial septal region of the basal 609 forebrain. J Neurosci 16:6999-7009. 610
Buzsaki G, Bickford RG, Ponomareff G, Thal LJ, Mandel R, Gage FH (1988) Nucleus basalis and thalamic 611 control of neocortical activity in the freely moving rat. J Neurosci 8:4007-4026. 612
Cape EG, Jones BE (2000) Effects of glutamate agonist versus procaine microinjections into the basal 613 forebrain cholinergic cell area upon gamma and theta EEG activity and sleep-wake state. Eur J 614 Neurosci 12:2166-2184. 615
Chen L, Yin D, Wang TX, Guo W, Dong H, Xu Q, Luo YJ, Cherasse Y, Lazarus M, Qiu ZL, Lu J, Qu WM, 616 Huang ZL (2016) Basal Forebrain Cholinergic Neurons Primarily Contribute to Inhibition of 617
19
Electroencephalogram Delta Activity, Rather Than Inducing Behavioral Wakefulness in Mice. 618 Neuropsychopharmacology 41:2133-2146. 619
De BP, Heguy A, Hackett NR, Ferris B, Leopold PL, Lee J, Pierre L, Gao G, Wilson JM, Crystal RG (2006) 620 High levels of persistent expression of alpha1-antitrypsin mediated by the nonhuman primate serotype 621 rh.10 adeno-associated virus despite preexisting immunity to common human adeno-associated 622 viruses. Mol Ther 13:67-76. 623
Fuller P, Sherman D, Pedersen NP, Saper CB, Lu J (2011) Reassessment of the structural basis of the 624 ascending arousal system. J Comp Neurol 519:933-956. 625
Gao GP, Alvira MR, Wang L, Calcedo R, Johnston J, Wilson JM (2002) Novel adeno-associated viruses from 626 rhesus monkeys as vectors for human gene therapy. Proc Natl Acad Sci U S A 99:11854-11859. 627
Gaus SE, Strecker RE, Tate BA, Parker RA, Saper CB (2002) Ventrolateral preoptic nucleus contains sleep-628 active, galaninergic neurons in multiple mammalian species. Neuroscience 115:285-294. 629
Gielow MR, Zaborszky L (2017) The Input-Output Relationship of the Cholinergic Basal Forebrain. Cell Rep 630 18:1817-1830. 631
Gomez JL, Bonaventura J, Lesniak W, Mathews WB, Sysa-Shah P, Rodriguez LA, Ellis RJ, Richie CT, Harvey 632 BK, Dannals RF, Pomper MG, Bonci A, Michaelides M (2017) Chemogenetics revealed: DREADD 633 occupancy and activation via converted clozapine. Science 357:503-507. 634
Hajdu I, Szentirmai E, Obal F, Jr., Krueger JM (2003) Different brain structures mediate drinking and sleep 635 suppression elicited by the somatostatin analog, octreotide, in rats. Brain Res 994:115-123. 636
Hassani OK, Lee MG, Henny P, Jones BE (2009) Discharge profiles of identified GABAergic in comparison to 637 cholinergic and putative glutamatergic basal forebrain neurons across the sleep-wake cycle. J Neurosci 638 29:11828-11840. 639
Hu H, Cavendish JZ, Agmon A (2013) Not all that glitters is gold: off-target recombination in the somatostatin-640 IRES-Cre mouse line labels a subset of fast-spiking interneurons. Front Neural Circuits 7:195. 641
Kaur S, Pedersen NP, Yokota S, Hur EE, Fuller PM, Lazarus M, Chamberlin NL, Saper CB (2013) 642 Glutamatergic signaling from the parabrachial nucleus plays a critical role in hypercapnic arousal. J 643 Neurosci 33:7627-7640. 644
Kim T, Thankachan S, McKenna JT, McNally JM, Yang C, Choi JH, Chen L, Kocsis B, Deisseroth K, Strecker 645 RE, Basheer R, Brown RE, McCarley RW (2015) Cortically projecting basal forebrain parvalbumin 646 neurons regulate cortical gamma band oscillations. Proc Natl Acad Sci U S A 112:3535-3540. 647
Lu J, Greco MA, Shiromani P, Saper CB (2000) Effect of lesions of the ventrolateral preoptic nucleus on NREM 648 and REM sleep. J Neurosci 20:3830-3842. 649
McGinty DJ, Sterman MB (1968) Sleep suppression after basal forebrain lesions in the cat. Science 160:1253-650 1255. 651
Paxinos GT, Franklin K (2001) The mouse brain in stereotaxic coordinates, 2 Edition. San Diego: Academic. 652 Pedersen NP, Ferrari L, Venner A, Wang JL, Abbott SBG, Vujovic N, Arrigoni E, Saper CB, Fuller PM (2017) 653
Supramammillary glutamate neurons are a key node of the arousal system. Nat Commun 8:1405. 654 Sakai K (2011) Sleep-waking discharge profiles of median preoptic and surrounding neurons in mice. 655
Neuroscience 182:144-161. 656 Sherin JE, Shiromani PJ, McCarley RW, Saper CB (1996) Activation of ventrolateral preoptic neurons during 657
sleep. Science 271:216-219. 658 Szymusiak R, McGinty D (1986) Sleep suppression following kainic acid-induced lesions of the basal forebrain. 659
Exp Neurol 94:598-614. 660 Venner A, Anaclet C, Broadhurst RY, Saper CB, Fuller PM (2016) A Novel Population of Wake-Promoting 661
GABAergic Neurons in the Ventral Lateral Hypothalamus. Curr Biol 26:2137-2143. 662 Xu M, Chung S, Zhang S, Zhong P, Ma C, Chang WC, Weissbourd B, Sakai N, Luo L, Nishino S, Dan Y (2015) 663
Basal forebrain circuit for sleep-wake control. Nat Neurosci 18:1641-1647. 664 Yang C, Thankachan S, McCarley RW, Brown RE (2017) The menagerie of the basal forebrain: how many 665
(neural) species are there, what do they look like, how do they behave and who talks to whom? Curr 666 Opin Neurobiol 44:159-166. 667
Zhu C, Yao Y, Xiong Y, Cheng M, Chen J, Zhao R, Liao F, Shi R, Song S (2017) Somatostatin Neurons in the 668 Basal Forebrain Promote High-Calorie Food Intake. Cell Rep 20:112-123. 669
20
Ziegenbein M, Held K, Kuenzel HE, Murck H, Antonijevic IA, Steiger A (2004) The somatostatin analogue 670 octreotide impairs sleep and decreases EEG sigma power in young male subjects. 671 Neuropsychopharmacology 29:146-151. 672
673
21
FIGURE LEGENDS 674
675
Figure 1: Evidence that BF somatostatin (BFSOM) hM3Dq+ and hM4Di+ neurons are excited and 676
inhibited, respectively, by CNO in in vitro brain slices, experimental design, and BFSOM cell distribution. 677
Injections of DIO-hM3Dq-mCherry-AAV, DIO-hM4Di-mCherry-AAV or DIO-mCherry-AAV were placed into the 678
BF of SOM-Cre mice, resulting respectively in the expression of hM3Dq-mCherry, hM4Di-mCherry or mCherry 679
in BFSOM neurons. Whole-cell recordings in brain slices were conducted 5 to 6 weeks after the AAV injections. 680
(A) Microphotographs showing the distribution of the recorded neurons labeled with biocytin. After incubation in 681
fluorescent-streptavidin 13 out 29 recorded neurons were recovered, they were mapped and represented (red 682
dots, indicating BF somatostatin neurons with LTS n = 7 and green dots representing non-LTS BF 683
somatostatin neurons, n = 6) over the images of two recorded slices (rostral level: top image and caudal level: 684
lower image; scale bar: 1mm; Ac, Anterior commissure; 3V, Third ventricle; Ox, Optical chiasm; VP, Ventral 685
pallidum; SI, Substantia innominata; MCPO, magnocellular preoptic nucleus; HDB, horizontal diagonal band). 686
(B-C) Firing properties of two distinct types of BFSOM neurons: one group of BFSOM neurons responds to 687
depolarizing (left) and hyperpolarizing (right) current pulse protocols with LTS (B), the other group has no LTS 688
(C). The vast majority of BFSOM neurons have a hyperpolarization-activated current (Ih). (D-E) hM3Dq-689
mCherry-expressing BFSOM neurons (top) visualized under IR-DIC during whole-cell recordings (bottom; scale 690
bars: 20 μm) showed increase in firing frequency in response to bath application of CNO (1 μM; dotted lines: 0 691
mV). (F) Averaged response on the firing frequency of hM3Dq-expressing BFSOM neurons (n = 6) to 10-min 692
application of CNO (0.5 - 1 μM). (G) Confocal images of a recorded BFSOM neuron (filled with biocytin and 693
labeled in blue; top) that expresses hM3Dq-mCherry (native fluorescence; bottom; scale bars: 20 μm). (H-I) 694
hM4Di-mCherry expressing BFSOM neurons (top) visualized under IR-DIC (bottom; scale bars: 20 μm) reduced 695
their firing frequency in response to CNO (1 μM; dotted lines: 0 mV). (J) Averaged response of hM4Di-696
expressing BFSOM neurons to CNO (0.5 - 1μM; n = 6). (K) Confocal image of a recorded BFSOM neuron (top: 697
biocytin labeled in blue; bottom: mCherry native fluorescence; scale bars: 20 μm). (L-N) Non-hM3Dq-698
expressing BFSOM neurons, recorded from SOM-Cre mice injected with DIO-mCherry-AAV, control injections 699
(top: mCherry; bottom: IR-DIC; scale bars: 20 μm) did not respond to CNO (1 μM; dotted lines: 0 mV; n = 6). 700
(O) Confocal images of a recorded BFSOM neuron (top: biocytin labeled in blue; bottom: mCherry native 701
fluorescence; scale bars: 20 μm). (P) Experimental design for the chemogenetic-based in vivo experiments. 702
(Q) Coronal section from a Som-ires-cre, lox-GFPL10 reporter cross (box shows targeted region of BF; scale 703
bar = 1 mm). 704
705
Figure 2: Absence of sleep-wake changes following chemogenetic activation of BFSOM neurons 706
(A) Photomicrographs showing transfection of BFSOM neurons and (B) their robust activation following CNO in 707
vivo (green arrows indicate hM3Dq+ cells expressing c-Fos). (C1-F3) Sleep-wake phenotypes following 708
injection of vehicle and CNO (0.3 mg/kg and 0.9 mg/kg) in BFSOM-hM3Dq mice. (C) Hourly amount (±s.e.m.) of the 709
22
vigilance stages and sleep latencies in BFSOM-hM3Dq mouse group, n=8 mice. (D) Power spectrum changes 710
(±s.e.m.) over baseline during the 3-h post-injection period for vehicle injection as compared with the 3-h post-711
injection period for CNO (0.3 and 0.9 mg/kg) administration and the quantitative changes (±s.e.m.) in power for 712
the delta ( : 0.5–5Hz), theta ( :5–9Hz), sigma ( : 9–15Hz), beta ( : 15–30Hz), low gamma (l : 30–60Hz) and 713
high gamma (h : 60–120Hz) frequency bands, n=8 mice. (E) Number of episode (±s.e.m.) of wakefulness, 714
NREM or REM sleep in each bout length and (F) Time-weighted frequency histograms showing the proportion 715
(±s.e.m.) of wakefulness, NREM or REM sleep amounts in each bout length to the total amount of 716
wakefulness, NREM or REM sleep during the 3-h post-injection period for vehicle injection as compared with 717
the 3-h post-injection period for CNO (0.3 and 0.9 mg/kg) administration (n=8). No significant changes per two-718
way ANOVA followed by a post hoc Bonferroni test or paired t test were uncovered. Scale bars: 1A, 400um; 719
1A inset, 100um; 1B, 70um. 720
721
Figure 3: Absence of sleep-wake changes following chemogenetic inhibition of BFSOM neurons 722
Sleep-wake phenotypes following injection of vehicle and CNO (0.3 mg/kg and 0.9 mg/kg) in BFSOM-hM4Di mice. 723
(A) Hourly amount of the vigilance stages and sleep latencies in BFSOM-hM4Di mouse group (n=5 mice). (B) 724
Power spectrum changes (±s.e.m.) over baseline during the 3-h post-injection period for vehicle injection as 725
compared with the 3-h post-injection period for CNO (0.3 and 0.9 mg/kg) administration and the quantitative 726
changes (±s.e.m.) in power for the delta ( : 0.5–5Hz), theta ( :5–9Hz), sigma ( : 9–15Hz), beta ( : 15–30Hz), 727
low gamma (l : 30–60Hz) and high gamma (h : 60–120Hz) frequency bands (n=4 mice). (C) Number of 728
episode (±s.e.m.) of wakefulness (W), NREM sleep (NREMS) or REM sleep (REMS) in each bout length and 729
(D) Time-weighted frequency histograms showing the proportion (±s.e.m.) of W, NREMS, or REMS amounts in 730
each bout length to the total amount of wakefulness, NREM or REM sleep during the 3-h post-injection period 731
for vehicle injection as compared with the 3-h post-injection period for CNO (0.3 and 0.9 mg/kg) administration 732
(n=5). No significant changes per two-way ANOVA followed by a post hoc Bonferroni test or paired t test were 733
uncovered. 734
735
Figure 4: Absence of sleep-wake changes following optogenetic activation of BFSOM neurons 736
(A) Schematic showing experimental setup. (B) Histological verification of ChR2-mCherry expressing neurons 737
within the BF (red), together with optical fiber placement (*) in both a BFSOM-ChR2 (B1) and BFVGAT-ChR2 (B2) 738
mouse (scale bar: 200um). (C) Arousal state probability plots from BFSOM-ChR2 mice showing wakefulness 739
(blue), NREM sleep (purple) and REM sleep (red) over time as a percentage of the total number of trials over 740
all mice (n = 7) before, during and after blue light stimulation (light blue box) at either 2.5 Hz (C1) or 10 Hz 741
(C2). (D) Arousal state probability plots from BFVGAT-ChR2 mice showing wakefulness (blue), NREM sleep 742
(purple) and REM sleep (red) over time as a percentage of the total number of trials over all mice (n = 2) 743
before, during and after blue light stimulation (light blue box) at either 2.5 Hz (D1) or 10 Hz (D2). 744
745
23
746
Figure 5: Sleep-wake quantitative changes following selective ablation of BFSOM neurons. (A) Schematic 747
showing experimental design. (B) Cartoon of construct expressing the cellular toxin Diptheria Toxin Subunit A 748
(DTA) in a cre-dependent configuration (NB mCherry is expressed in transduced cre-negative cells). (C) SOM+ 749
neurons of the BF the SOM-ires-cre,lox-L10GFP mouse; (D) injection of DTA-AAV into BF of SOM-ires-cre, 750
lox-L10GFP mouse; red neurons show extent cellular transduction and label surviving cells; (E) a 751
corresponding section from the same mouse shown in D showing near complete loss of SOM (green) cells 752
following DTA-AAV; (F) the dorsally-situated lateral septum, which contains a large number of SOM+ cells, 753
was unaffected by the DTA-AAV targeting the BF (same mouse as E). (G) Hourly amount (±s.e.m.) of the 754
vigilance stages in BFSOM-DTA and control mouse groups, n=11 and 5 mice, respectively. (H) Amount (±s.e.m.) 755
of the vigilance stages during the first 4 hr of the dark period (19-23), during the light, dark and 24 hr periods in 756
BFSOM-DTA and control mouse groups, n=11 and 5 mice, respectively. * p < 0.05, ** p < 0.01, two-way ANOVA 757
followed by a post hoc Bonferroni test (hourly amounts and light/dark analysis) or paired t test (19-23 and 24 758
hr). 759
760
Figure 6: Sleep-wake qualitative changes following selective ablation of BFSOM neurons. (A) Number of 761
episode (±s.e.m.) of wakefulness (W), NREM sleep (NREMS) or REM sleep (REMS) in each bout length and 762
(B) Time-weighted frequency histograms showing the proportion (±s.e.m.) of W, NREMS or REMS amounts in 763
each bout length to the total amount of W, NREMS or REMS sleep during the first 4 hr of the dark period (19-764
23), during the light, dark and 24 hr periods in BFSOM-DTA and control mouse groups, n=11 and 5 mice, 765
respectively. * p < 0.05, ** p < 0.01, *** p < 0.001, **** p < 0.0001, two-way ANOVA followed by a post hoc 766
Bonferroni test. (C-D) Power spectrum (±s.e.m.) over total power during the dark period (19-01, C) and the 767
light period (10-13, D) and the and power band (±s.e.m.) for the delta ( : 0.5–5Hz), theta ( :5–9Hz), sigma ( : 768
9–15Hz), beta ( : 15–30Hz), low gamma (l : 30–60Hz) and high gamma (h : 60–120Hz) frequency bands, in 769
BFSOM-DTA and control mouse groups, n=8 and 5 mice, respectively. ** p < 0.01, two-way ANOVA followed by a 770
post hoc Bonferroni test. 771
772
Figure 7: SOM-IRES-cre: a hypomorphic allele? (A) Comparison of hourly amounts (±s.e.m.) of baseline 773
vigilance stages in BFSOMcre/cre (homozygous for the Cre allele, n=11 mice) and BFSOMcre/wt (heterozygous for the 774
Cre allele, n=10 mice) mouse groups. (B1, C1, D1) Amount (±s.e.m.) of the vigilance stages during the light, 775
dark and 24 hr baseline periods in BFSOMcre/cre as compared BFSOMcre/wt mouse groups, n=11 and 10 mice, 776
respectively. * p < 0.05, ** p < 0.01, two-way ANOVA followed by a post hoc Bonferroni test (hourly amounts 777
and light/dark analysis) or paired t test (24 hr). (B2, C2, D2) Number of episode (±s.e.m.) of wakefulness (W), 778
NREM sleep (NREMS) or REM sleep (REMS) in each bout length during the light and 24 hr periods in 779
BFSOMcre/cre as compared BFSOMcre/wt mouse groups, n=11 and 10 mice, respectively. ** p < 0.01, ****p<0.0001, 780
two-way ANOVA followed by a post hoc Bonferroni test. (E) Power spectrum (±s.e.m.) over total power during 781

24
the dark period (19-01) and power band (±s.e.m.) for the delta ( : 0.5–5Hz), theta ( :5–9Hz), sigma ( : 9–782
15Hz), beta ( : 15–30Hz), low gamma (l : 30–60Hz) and high gamma (h : 60–120Hz) frequency bands, in 783
BFSOMcre/cre as compared BFSOMcre/wt mouse groups, n=8 and 9 mice, respectively. * p < 0.05, two-way ANOVA 784
followed by a post hoc Bonferroni test. 785
786