gene regulation by sphingosine kinase
TRANSCRIPT

i
Gene Regulation by Sphingosine kinase
Duyen H. Pham
Centre for Cancer Biology, SA Pathology and
Discipline of Biochemistry, School of Molecular and Biomedical Science
University of Adelaide
Presented for the degree of Doctor of Philosophy
October, 2012

ii
TABLE OF CONTENTS
Title Page…………………………………………………………………………….. i
Table of Contents…………………………………………………………………….. ii
Table of Figures……………………………………………………………………… vii
Abbreviations ………………………………………………………………………... xi
Abstract………………………………………………………………………………. xv
Declaration………………………………………………………………………….... xvii
Acknowledgements………………………………………………………………….. xviii
Chapter 1: Introduction……………………………………………………………. 1
1.1 S1P as a signalling molecule………………………………………………..3
1.2 Sphingolipids……………………………………………………….……… 7
1.3 Control of S1P levels……………………………………………………… 10
1.4 Sphingosine kinases (SKs) ……………………………………………… 11
1.5 S1P signalling……………………………………………………………… 17
1.5.1 Extracellular actions of S1P ………………………………………… 17
1.5.1.1 S1P1………………………………………………………………… 20
1.5.1.2 S1P2……………………………………………………………… 20
1.5.1.3 S1P3………………………………………………………………… 21
1.5.1.2 S1P4 and S1P5……………………………………………………… 22
1.5.2 S1P as an intracellular second messenger…………………………… 23
1.6 SK/S1P in diseases……………………………………………………….… 25
1.6.1 Cancer ………………………………………………………………… 25
1.6.2 Inflammation and immunity…………………………………………… 26
1.6.3 Asthma………………………………………………………………… 28
1.6.4 Atherosclerosis………………………………………………………… 29
1.6.5 Neurodegenerative diseases…………………………………………… 31
1.7 SK regulation………………………………………………………………. 32
1.7.1 Activation of SK1……………………………………………………… 32
1.7.1.1 Activation of SK1 by phosphorylation……………………………… 32

iii
1.7.1.2 Activation of SK1 by translocation to the plasma membrane……… 33
1.7.1.3 Activation of SK1 by protein-protein interactions………………… 34
1.7.2 Activation of SK2……………………………………………………… 35
1.7.1.1 Activation of SK2 by phosphorylation-induced translocation……… 35
1.7.1.2 Activation of SK2 by protein-protein interactions………………… 36
1.8 Transcriptional regulation of SKs……………………………………….… 36
1.8.1 Transcriptional regulation of SK1…………………………………… 36
1.8.2 Transcriptional regulation of SK2…………………………………… 37
1.9 Transcriptional regulation by SK/S1P…………………………………… 38
1.10 Hypothesis………………………………………………………………… 39
1.11 Aims ……………………………………………………………………… 39
Chapter 2: Generation and Characterisation of Cell Lines with Tightly Regulated
Inducible Expression of Sphingosine Kinase 1 and 2……………………………...40
2.1 Abstract…………………………………………………………………… 41
2.2 Introduction…………………………………………………………….… 42
2.3 Materials and Methods……………………………………………………. 43
2.3.1 Materials……………………………………………………………… 43
2.3.2 Construction of expression plasmids………………………………… 44
2.3.3 Cell culture and generation of stably transfected HEK293 cell lines… 44
2.3.4 Generation and affinity purification of anti-SK1/anti-SK2 antibodies… 45
2.3.5 Generation and affinity purification of anti-phospho-SK1 antibodies… 45
2.3.6 Western blotting……………………………………………………… 46
2.3.7 SK activity assays……………………………………………………… 47
2.3.8 Northern blotting……………………………………………………… 47
2.3.9 Cell proliferation and apoptosis assays……………………………… 48
2.3.10 Immunofluorescence microscopy……………………………………… 48
2.4 Results ……………………………………………………………….…… 49
2.4.1 Examination of cell lines with inducible expression of SK1 and SK2
using the Clontech Tet-On system…………………………………… 49
2.4.2 Generation of cell lines with tightly regulated inducible expression of

iv
SK1 and SK2 using the Invitrogen Flp-In T-Rex system……………… 53
2.4.2.1 Inducible SK expression using the Invitrogen Flp-In T-Rex system… 53
2.4.2.2 Effect of tetracycline-free foetal bovine serum on SK
expression using the Invitrogen Flp-In T-Rex system……………… 56
2.4.2.3 Design and construction of doxycycline-inducible expression system
containing 3’ AU-rich elements…………………………………… 59
2.4.2.4 Incorporation of AREs effectively reduce leakiness in doxycycline-
inducible expression via mRNA destabilization…………………… 60
2.4.2.5 Universality of the approach……………………………………… 63
2.4.3 Characterisation the cellular effects of inducible SK expression……… 65
2.4.3.1 Titration of SK induction levels…………………………………………………… 65
2.4.3.2 Proliferation and survival of the SK1 inducible cell line……………… 68
2.4.3.3 Phosphorylation of SK1 inducible cell lines………………………… 68
2.4.3.4 Proliferation and Survival of the SK2 inducible cell line……………… 72
2.4.3.5 Localisation of SK2 in the inducible cell line………………………… 72
2.5 Discussion.………………………………………………………………… 77
2.5.1 Generation of cell lines with tight inducible SK expression………… 77
2.5.2 Characterisation the cellular effects of SK inducible cell lines……… 79
2.5.2.1 Low level SK1 overexpression enhances cell survival
and proliferation…………………………………………………… 79
2.5.2.2 Effect of different levels of SK2 overexpression on cell survival
and proliferation…………………………………………………… 79
2.5.2.3 Regulation of cell survival and proliferation by SK2……………… 80
2.5.2.4 Likely importance of SK2 in its function…………………………… 81
Chapter 3: Gene and microRNA Regulation by Sphingosine Kinases …….…… 83
3.1 Abstract……………………………………………………………………. 83
3.2 Introduction……………………………………………………………… 84
3.3 Materials and Methods………………………………….……………..… 86
3.3.1 Construction of expression plasmids………………………………… 86
3.3.2 RNA preparation, and DNA microarray and microRNA

v
array analysis………………………………………………………… 86
3.3.3 Data analysis………………………………………………………… 88
3.3.4 Quantitative real-time PCR (qPCR) ………………………………… 88
3.4 Results and Discussion…………………………………………………..... 91
3.4.1 Expression profiling of gene regulation by SK1……………………… 91
3.4.2 Expression profiling of gene regulation by SK2……………………… 111
3.4.3 Analysis of differential gene regulation by SK1 and SK2…………… 115
3.4.4 MiRNA regulation by SK1…………………………………………… 123
3.5 Conclusions……………………………………………………………… 124
Chapter 4: Activated Sphingosine Kinase 1 Induces Transferrin Receptor 1
Expression to Promote Cell Proliferation, Survival and Neoplastic
Transformation…………………………………………………………………… 125
4.1 Abstract………………………………………………………………….… 125
4.2 Introduction…………………………………………………………….... 126
4.3 Materials and Methods…………………………………………………… 127
4.3.1 Materials……………………………………………………………… 127
4.3.2 Generation of expression constructs………………………………… 128
4.3.3 Cell culture and generation of stably transfected inducible
HEK293 cell lines…………………………………………………… 128
4.3.4 SK enzyme activity…………………………………………………… 128
4.3.5 Western blot analysis………………………………………………… 128
4.3.6 siRNA knock-down of S1P2…………………………………………… 129
4.3.7 Quantitative real-time PCR (qPCR)………………………………… 129
4.3.8 Immunofluorescence………………………………………………… 129
4.3.9 Transferrin (Tf) alexa 568 uptake assay……………………………… 130
4.3.10 Cell proliferation and apoptosis assays……………………………… 130
4.3.11 Focus formation assays……………………………………………… 130
4.4 Results…………………………………………………………………… 131
4.4.1 SK1-mediated changes in TFR1 mRNA and protein………………… 131
4.4.2 SK1 induces cell-membrane TFR1 expression

vi
and mediates Tf uptake……………………………………………… 136
4.4.3 SK1 phosphorylation and localisation to the plasma membrane
is critical for its effects on TFR1 regulation………………………… 136
4.4.4 Addition of exogenous S1P regulates TFR1 expression ……………… 145
4.4.5 SK1 regulates TFR1 expression via S1P2…………………………… 145
4.4.6 Inhibition of cell-surface TFR1 ablates SK1-induced
cell proliferation, survival and neoplastic transformation…………… 151
4.5 Discussion………………………………………………………………… 156
4.5.1 SK1 enhances TFR1 expression and subsequent Tf uptake into cells… 156
4.5.2 SK1 activation and plasma membrane localisation are necessary
for enhanced TFR1 expression……………………………………… 160
4.5.3 S1P2 is necessary for TFR1-mediated SK1 oncogenesis……………… 160
4.5.4 Conclusions and implications to this study…………………………… 163
Chapter 5: General Discussion………………………………….………………… 164
5.1 Advantages of using tight-inducible system to study SK
cellular functions………………………………………………………… 164
5.2 Array studies…………………………………………………….………… 166
5.3 Transferrin receptor 1 (TFR1)…………………………………………… 170
5.4 Conclusions & future work……………………………………………… 173
References……………………………………………………………………. 175
Appendix 1…………………………………………….……………………… 215
Appendix 2…………………………………………….……………………… 216

vii
List of Figures
Chapter 1: Introduction
Figure 1.1 SK phosphorylates sphingosine to form S1P……………………… 2
Figure 1.2 Tissue distribution of human S1P1-5 based on Affymetrix
gene expression analysis…………………………………………… 5
Figure 1.3 The sphingomyelin cycle showing the pathway involved in the
regulation of S1P………………………………………………… 8
Figure 1.4 Human sphingosine kinases……………………………………… 12
Figure 1.5 Tissue distribution of human SK1 and SK2 based on
Affymetrix gene expression analysis……………………………… 15
Figure 1.6 Major downstream biological processes regulated by S1P via the
five S1P receptors………………………………………………… 19
Chapter 2: Generation and Characterisation of Cell Lines with Tightly
Regulated Inducible Expression of Sphingosine Kinase 1 and 2
Figure 2.1 SK1 expression in the Clontech TetOn system………………… 51
Figure 2.2 SK2 expression in the Clontech TetOn system………………… 52
Figure 2.3 Leakiness in SK1 expression in the doxycycline-inducible system 54
Figure 2.4 Leakiness in SK2 expression in the doxycycline-inducible system 55
Figure 2.5 Attempts to attenuate leakiness in the doxycycline-inducible SK1
expression system using Tet-free-FBS…………………………… 57
Figure 2.6 Attempts to attenuate leakiness in the doxycycline-inducible SK2
expression system using Tet-free-FBS…………………………… 58
Figure 2.7 Schematic representation of ARE incorporation into the 3’ UTR
of the Tet-inducible Flp-In T-Rex vector system………………… 59
Figure 2.8 AREs strongly attenuate leakiness in SK1 expression in the
doxycycline-inducible system…………………………………… 61
Figure 2.9 Degradation of SK1 mRNA is enhanced by insertion of AREs
in the 3’ UTR……………………………………………………… 62
Figure 2.10 AREs also strongly attenuate leakiness in SK2 expression in the
doxycycline-inducible system…………………………………… 64

viii
Figure 2.11 Dose-dependent induction of SK1 in the doxycycline-inducible
system…………………………………………………………… 66
Figure 2.12 Dose-dependent induction of SK2 in the doxycycline-inducible
system…………………………………………………………… 67
Figure 2.13 Low and high induction of SK1 enhances cell proliferation and
survival…………………………………………………………… 69
Figure 2.14 SK1 is phosphorylated when overexpressed at high and low levels 71
Figure 2.15 Low and high induction of SK2 mediates differential cellular
functions………………………………………………………… 74
Figure 2.16 Low and high induction of SK2 mediates differential subcellular
localisation………………………………………………………… 76
Chapter 3: Gene and microRNA Regulation by Sphingosine Kinases
Figure 3.1 Differential genes expression mediated by cellular SK1………… 93
Figure 3.2 Heat plot of differentially expressed genes altered by inducible
expression of SK1………………………………………………… 94
Figure 3.3 Low SK1 & SK1G82D expression level used in arrays…………… 96
Figure 3.4 Heat plot comparing differentially expressed genes by SK1 versus
SK1G82D………………………………………………………… 97
Figure 3.5 Validation of FUS, SFPQ & PCGF2 mRNA expression by SK1
versus SK1G82D…………………………………………………… 102
Figure 3.6 Validation of RASD1 & TFR1 mRNA expression in SK1 versus
SK1G82D…………………………………………………………… 104
Figure 3.7 Validation of HSPA5, CLK1, IRS4, HSPA8 and MANF mRNA
expression in SK1 versus SK1G82D ……………………………… 108
Figure 3.8 Validation of ZNF711 and TSC23D3 mRNA expression in SK1
versus SK1G82D ………………………………………………… 109
Figure 3.9 Validation of TNFRSF10D, PPP1R10, PCTK3 and
EIF4B mRNA expression in SK1 versus SK1G82D ……………… 110
Figure 3.10 Differential expression of genes modulated by increased cellular
SK2………………………………………………………………… 112

ix
Figure 3.11 Heat plot of differentially expressed genes by increased cellular
SK2 versus SK2G212D…………………………………………… 113
Figure 3.12 Heat plot of differentially expressed genes by cellular SK2 versus
SK1, SK2G212D and SK1G82D……………………………………… 116
Figure 3.13 Heat plot of differentially expressed genes by SK1 versus SK2,
SK1G82D and SK2G212D…………………………………………… 118
Figure 3.14 Validation of RASD1, FUS & SFPQ mRNA expression in SK2
versus SK2G212D…………………………………………………… 120
Figure 3.15 Validation of CLK1 & HSPA8 mRNA expression in SK2 versus
SK1G212D………………………………………………………… 122
Chapter 4: Activated Sphingosine Kinase 1 Induces Transferrin Receptor 1
Expression to Promote Cell Proliferation, Survival and Neoplastic
Transformation
Figure 4.1 SK1 increases TFR1 mRNA in a dose-responsive manner…………133
Figure 4.2 SK1 mediates increase TFR mRNA and protein expression……… 135
Figure 4.3 SK1 mediates enhance cell-surface TFR1 expression…………… 138
Figure 4.4 SK1 mediates increase Tf uptake into cells……………………… 139
Figure 4.5 Characterisation of non-phosphorylatable SK1 (SK1S225A) in
doxycycline-inducible system…………………………………… 141
Figure 4.6 Characterisation of non-phosphorylatable SK1 mutant that
constitutively localized to plasma membrane (SK1pm-S225A) in
doxycycline-inducible system…………………………………… 142
Figure 4.7 SK1pm-S225A but not SK1S225A mediates increase TFR1 mRNA and
protein expression………………………………………………… 143
Figure 4.8 S1P increases TFR1 protein expression in a dose-responsive
manner way……………………………………………………… 147
Figure 4.9 SK1 does not mediate increase TFR1 expression via S1P1 or S1P3
receptors…………………………………………………………… 148
Figure 4.10 SK1 mediates increase TFR1 expression via S1P2 receptor……… 149
Figure 4.11 S1P2 receptor knocked-down inhibits SK1-enhanced TFR1

x
expression………………………………………………………… 150
Figure 4.12 TFR1 neutralizing antibodies ablate SK1-induced cell proliferation
and survival……………………………………………………… 153
Figure 4.13 Inhibition of TFR1 expression reduces SK1-induced neoplastic
transformation…………………………………………………… 155
Figure 4.14 Regulation of TFR1 expression in response to cellular iron levels 158
Figure 4.15 Proposed pathways for the regulation of TFR1 by SK1………… 162

xi
ABBREVIATIONS
ABC; ATP binding cassette
AC; Adenylate cyclase
AD; Alzheimer disease
ADP; Adenosine-5'-diphosphate
ApoE; Apolipoprotein E
ApoM; Apolipoprotien M
AREs; AU-rich mRNA destabilizing elements
ATP; Adenosine-5'-triphosphate
AML; Acute myeloid leukaemia
BAL; Bronchoalveolar lavage
BH3; Bcl-2 homology 3
BrdU; 5-bromo-2-deoxyuridine
BSA; Bovine serum albumin
Cdc42; Cell division cycle 42
CerS; Ceramide synthase
CIB1; Calcium and integrin binding protein 1
C1P; Ceramide-1-phosphate
CML; Chronic myeloid leukaemia
CNS; Central nervous system
COX-2; Cyclooxygenase 2
DAPI; 4',6-diamidino-2-phenylindole
DEPC; Diethylpyrocarbonate
DMS; Ν,Ν-dimethylsphingosine
Dox; Doxycycline
DTT; Dithiothreitol
EAE; Encephalomyelitis
EC; Endothelial cell
eEF1A; Eukaryotic elongation factor 1A
EGF; Epidermall growth factor
EGFP; Enhanced green fluorescent protein
xii
eNOS; Endothelial nitric oxide synthase
ER; Endoplasmic reticulum
ERK1/2; Extracellular signal regulated kinase 1/ 2
eYFP; Enhanced yellow fluorescent protein
FACS; Fluorescence associated cell sorter
FBS; Foetal bovine serum
FcєRI; High-affinity receptor for IgE
FDR; False discovery rate
FHL-2; Four and a half LIM domains protein 2
FLNa; Filamin A
GAP43; Growth associated protein 43
GC; Germinal centre
GDNF; Glial cell line-derived neurotrophic factor
HDAC; Histone deactetylases
HDL; High density lipoproteins
HEK293; Human embryonic kidney 293 cells
HRP; Horseradish peroxidase
HSPs; Heat shock proteins
IRES; Internal ribosome entry site
IRPs; Iron regulatory proteins
LDL; Low density lipoproteins
LPA; Lysophosphatidic acid
LPP; Lipid phosphate phosphatase
LPS; Lipopolysaccharide
MAPK; Mitogen-activated protein kinase
MiRNA; microRNA
MMP; Matrix metalloproteinase
MS; Multiple sclerosis
MTs; Metallothioneins
NES; Nuclear export signal
NGF; Nerve growth factor

xiii
NO; Nitric oxide
OVA; Ovalbumin
Ox-LDL; Oxidised LDL
PA; Phosphatidic acid
PBS; Phosphate buffered saline
PCR; Polymerase chain reaction
PDGF; Platelet-derived growth factor
PECAM-1; Platelet endothelial cell adhesion molecule
PGE2; prostaglandin E2
PHB2; Prohibitin 2
PI3K; Phosphatidylinositol 3-kinase
PLC; Phospholipase C
PMA; Phorbol 12-myristate 13-acetate
PS; Phosphatidylserine
PS2; Presenilin 2
qPCR; Quantitative real-time PCR
rtTA; Reverse tetracycline-responsive transcriptional activator
siRNA; Small interfering RNA
SDS; Sodium dodecyl sulfate
SDS-PAGE; Sodium dodecyl sulfate polyacrylamide gel electrophoresis
SKs; Sphingosine kinases
SKIP; SK1-interacting protein
SMP; Skim milk powder
S1P; Sphingosine 1-phosphate
S1PR1–5; Sphingosine 1-phosphate receptors 1-5
SPP1/2; S1P phosphatases 1/ 2
SPT; Serine palmitoyltransferase
SREBP; Sterol regulatory element binding protein
SSC; Saline-sodium citrate
Tet; Tetracycline
TetR; Tet-repressor

xiv
Tf; Transferrin
TFR1; Transferrin receptor 1
TGFβ; Transforming growth factor-β
TIMP; Tissue inhibitor of metalloproteinase
TNF-α; Tumour necrosis factor-α
TRAF2; TNF receptor-associated factor 2
TRE; Tet-responsive element
VEGF; Vascular endothelial growth factor
VCAM; Vascular cell adhesion molecule
VSMC; Vascular smooth muscle cells

xv
ABSTRACT
Sphingosine kinases (SKs) are lipid kinases that catalyse the phosphorylation of
sphingosine to form sphingosine-1-phosphate (S1P), a bioactive phospholipid that plays
important roles in a wide variety of cellular processes, including calcium mobilisation,
proliferation, apoptosis, angiogenesis, inflammatory responses and cytoskeletal rearrangement.
Two SK isoforms exist in mammals, termed SK1 and SK2, which originate from different
genes, but possess a high degree of sequence similarity. Although the two enzymes utilise the
same substrate, sphingosine, to generate S1P, surprisingly, studies have suggested that SK1 and
SK2 may have opposing cellular functions, with SK1 inducing cell survival and SK2 appearing
to promote apoptosis. However, the molecular mechanisms mediating these apparently
divergent roles for the two SKs have not been extensively examined at present. Furthermore,
mouse knockout studies have suggested the two enzymes may have at least some overlapping
functions.
There is strong evidence implicating SK1 in crucial role(s) in the development and
progression of tumourigenesis. However, the mechanism whereby this enzyme induces
tumourigenic processes is less clear and remains an important question to be answered in the
field. Although high levels of intracellular S1P appears to have a role in regulation of cell
proliferation and survival, various observations also suggest a role for extracellular S1P in cell
surface G protein-coupled receptor-mediated cell proliferation and survival. However, the
specific downstream pathways mediating this oncogenic signalling by SK1 are still poorly
defined.
In attempts to answer these questions, studies to date have mainly focused on elucidating
the cellular signalling pathways that are transiently modulated following SK1 activation.
Considerable evidence suggests that SK1 is transcriptionally upregulated in many human
cancers and also that its product, S1P, can induce activation of various transcription factors to
regulate transcription of other genes. While this type of cellular regulation by SK1 is likely to
play an important role in tumourigenesis, no studies have yet been published that systematically
examined the molecular mechanisms whereby enhanced SK1 levels lead to oncogenesis. Thus,
the main aim of the studies outlined in this thesis was to elucidate the genes regulated by
increased cellular SK activity that may be important for normal and pathological cellular
regulation.

xvi
In order to do this, we generated cell lines with tight doxycycline-inducible expression of
SK1 and SK2 via a novel approach that involves the incorporation of AU-rich mRNA
destabilizing elements (AREs) into the 3’ untranslated regions of the tetracycline-inducible
constructs. Use of these tightly controlled SK inducible systems allowed us to perform DNA
microarrays and microRNA arrays to elucidate genes and microRNAs regulated soon after a
moderate increase in cellular SK levels (approximately 10- and 6-fold overexpression of SK1
and SK2, respectively). This was done to maximise the likelihood of observing direct
downstream effects of physiologically relevant increased SK expression that may have been
missed by very high constitutive SK expression. While no microRNA regulation was observed
following SK1 expression, screening of the Compugen human 19,000-oligonucleotide library,
lead to the identification of various genes that were regulated by either SK1 or SK2 or by both
enzymes. Of the various SK-regulated genes identified, transferrin receptor 1 (TFR1) was
examined in greater detail in this study since its upregulation has been reported in various
human cancers, and implicated in tumourigenic progression.
Here, we demonstrate a novel mechanism whereby SK1 regulates cell survival,
proliferation and neoplastic transformation through upregulation of TFR1 expression. We
show that elevated levels of SK1 enhanced total as well as cell-surface TFR1 expression
resulting in increased transferrin (Tf) uptake into the cells. We also found that SK1
phosphorylation and/or translocation to the plasma membrane, which have been shown
previously to be critical for SK1-mediated oncogenic effects, are necessary for regulation of
TFR1 expression. Furthermore, we also demonstrated that S1P receptor 2 (S1P2) is essential
for SK1-induced TFR1 expression through the use of a S1P2-specific inhibitor and siRNA
knock-down of S1P2. Finally, we show that blocking TFR1 function with a neutralizing
antibody attenuated SK1-induced cell proliferation, survival and transformation. Together,
these findings suggest that TFR1 plays an important role in oncogenesis mediated by SK1.

xvii
DECLARATION
This work contains no material which has been accepted for the award of any other
degree or diploma in any university or other tertiary institution to Duyen Hong Pham and, to
the best of my knowledge and belief, contains no material previously published or written by
another person, except where due reference has been made in the text.
I give consent to this copy of my thesis when deposited in the University Library, being
made available for loan and photocopying, subject to the provisions of the Copyright Act 1968.
The author acknowledges that copyright of published works contained within this thesis
(as listed below*) resides with the copyright holder(s) of those works.
I also give permission for the digital version of my thesis to be made available on the
web, via the University’s digital research repository, the Library catalogue, the Australasian
Digital Theses Program (ADTP) and also through web search engines unless permission has
been granted by the University to restrict access for a period of time.
* Pham, D. H., Moretti, P. A., Goodall, G. J. & Pitson, S. M. (2008) Attenuation of leakiness in
doxycycline-inducible expression via incorporation of 3' AU-rich mRNA destabilizing
elements. Biotechniques, 45, 155-160.
* Pitman MR, Jarman KE, Leclerq TM, Pham DH and Pitson SM (2011) Sphingosine kinases:
biochemistry, regulation and role. In: Lysophospholipid Receptors: Signaling and Biochemistry.
Chun J, Hla T, Spiegel S and Moolenaar W (Eds). John Wiley & Sons, Hoboken, New Jersey,
USA. in press
Duyen Hong Pham

xviii
ACKNOWLEDGEMENTS
My sincerest thanks go to my supervisor Assoc. Prof. Stuart Pitson for his unlimited
patience and assistance throughout the years, especially during the preparation of this thesis. I
am eternally grateful that he has given me the opportunity to work on this project and
everything else he taught me, giving me an insight through the eyes of a great scientist. Thank
you to Greg Goodall for his valuable input and encouragements throughout my PhD. I would
also like to thank Jo Woodcock and Claudine Bonder for many wonderful suggestions and
comments during our combined lab meetings, throughout my candidature.
A big thank you goes to all the staff members within the Pitson group, especially Paul
Moretti, Melissa Pitman and Julia Dobblins; ‘Your kind and caring words filled my heart and
will always be remembered’.
I would also like to acknowledge Roslyn Kenyon and Mark Van der Hoek at the Adelaide
microarray facility for their help in performing the arrays and the data analysis.
To my parents and my family, especially my partner and my little boy, your love, help,
unlimited support, time and encouragement are my motivation and strength. I love you all very
much and I could not have completed this project without you.

1
Gene regulation by sphingosine kinase Duyen Pham
Chapter 1 Introduction
Aspects of this literature review have been published as:
Pitman MR, Jarman KE, Leclercq TM, Pham DH and Pitson SM (2012) Sphingosine kinases:
biochemistry, regulation and role. In: Lysophospholipid Receptors: Signaling and Biochemistry.
Chun J, Hla T, Spiegel S and Moolenaar W (Eds). John Wiley & Sons, Hoboken, New Jersey,
USA. in press
See Appendix 1 for author contributions

2
1 CHAPTER 1: INTRODUCTION Sphingosine kinases (SKs) are enzymes that catalyse the formation of sphingosine 1-
phosphate (S1P) (Figure 1.1), a bioactive lipid that regulates many cellular processes, including
cell proliferation, survival, differentiation, motility, and cytoskeletal rearrangement [reviewed
in (Takabe et al., 2008)].
Figure 1.1 SK phosphorylates sphingosine to form S1P. SK uses ATP as a phosphate
donor to catalyse the phosphorylation of the lipid sphingosine to produce S1P.
Sphingosine Sphingosine 1-phosphateATP ADP
Sphingosinekinase
NH
OHOH OPO3H2
NH
OH
Sphingosine Sphingosine 1-phosphateATP ADP
Sphingosinekinase
NH
OHOH OPO3H2
NH
OH
3
There is now considerable evidence implicating elevated levels of SK/S1P in the
development and progression of tumourigenesis (Leong & Saba, 2010; Pyne & Pyne, 2010).
Although high levels of intracellular S1P appears to have a role in regulation of cell
proliferation and survival (Olivera et al., 1999a; Olivera et al., 2003; Spiegel et al., 1994;
Alvarez et al., 2010), various observations also suggest a role for extracellular S1P in the pro-
proliferative and pro-survival effects of this phospholipid (Bonnaud et al., 2010; Schuppel et
al., 2008; Harada et al., 2004). However, the specific downstream pathways mediating this
oncogenic signalling by SK are still not fully determined. A number of studies have reported
that at least one of the SK isoforms, SK1, is transcriptionally upregulated in human cancers and
that SK1/S1P can regulate gene transcription (Alvarez et al., 2010; Yamanaka et al., 2004; Xia
et al., 2002; Takeshita et al., 2000). Therefore, this thesis examines the molecular mechanisms
whereby increased cellular levels of SK lead to pathological conditions, particularly cancer.
1.1 S1P as a signalling molecule
Sphingolipids are a class of lipids characterized by a serine head group with one or two
fatty acyl tails [reviewed in (Fyrst & Saba, 2010)]. These molecules which are present in all
eukaryotic cells are enriched in lipid rafts where they contribute to membrane biology and
signalling events that control cellular behaviour and function (Furuya et al., 2011). For a long
time sphingolipids, including sphingomyelin and its metabolites were considered mainly as
structural components of cell membranes or as metabolic intermediates. However, sphingolipid
metabolites including ceramide, sphingosine, ceramide 1-phosphate (C1P) and S1P have
emerged as bioactive signalling molecules that regulate a diverse range of cellular processes. Of
these, S1P is of particular interest. In the last two decades, it has become increasing clear that
S1P is an important signalling molecule that has the ability to function through either a family
of specific G-protein coupled membrane receptors or via intracellular targets to regulate a
diverse range of cellular processes including cell growth and proliferation, angiogenesis, cell
motility and migration, and lymphocyte trafficking [reviewed in (Strub et al., 2010)].
Although the intracellular functions of S1P are only beginning to emerge, its extracellular
functions as a ligand for five S1P receptors (S1PR), named S1P1–5 are well established

4
[reviewed in (Strub et al., 2010)]. These receptors display tissue-specific expression patterns
(Figure 1.2) and are coupled to various G proteins, enabling them to regulate a range of
downstream signalling pathways, leading to the regulation of numerous physiological processes
[reviewed in (Maceyka et al., 2012)]. Dysregulation of S1P and its receptors have been
implicated in numerous human pathophysiological processes such as cancer, asthma,
inflammation, atherosclerosis and neurodegenerative diseases [reviewed in (Strub et al., 2010;
Aarthi et al., 2011; Strub et al., 2011)]. Therefore, targeting of the S1P/S1PR system by either
genetic or pharmacologic means may have therapeutic potential for a range of diseases.

5
Figure 1.2 Tissue distribution of human S1P1, S1P2, S1P4 and S1P5 (A-D) based on
Affymetrix gene expression analysis. The bar graph shows the average microarray
intensity across the selected probe set (y-axis), representing the relative gene expression
level in each cell line or tissue analysed (x-axis) [from (Aarthi et al., 2011)].

6

7
1.2 Sphingolipids
Sphingolipids are ubiquitous components of the lipid bilayer of eukaryotic cells
[reviewed in (Fyrst & Saba, 2010)]. Numerous agonists regulate sphingolipid metabolism to
generate signalling molecules including ceramide (N-acyl sphingosine), sphingosine and S1P.
S1P is an important cellular metabolite that is synthesized as part of the sphingomyelin cycle
[reviewed in (Gault et al., 2010; Fyrst & Saba, 2010)] (Figure 1.3). In this pathway membrane
associated sphingomyelin is converted to ceramide. Ceramide is deacylated to remove one acyl
chain via the activity of ceramidase to generate sphingosine which is phosphorylated by the
SKs to yield S1P. S1P can then be irreversibly broken down into phosphoethanolamine and
hexadecenal via S1P lyase or recycled back to sphingosine via phosphatases including two
S1P-specific phosphatases, termed SPP1 and SPP2, as well as by a family of three broad-
specificity lipid phosphatases, known as LPP1, LPP2 and LPP3. Ceramide can be produced by
both de novo synthesis or from complex glycosphingolipids by sphingomyelinases which can
be enhanced in response to many inducers of stress such as heat, UV radiation,
hypoxia/reperfusion, cytokines or chemotherapeutic agents.

8
Figure 1.3 The sphingomyelin cycle showing the pathway involved in the
regulation of S1P. Degradation of S1P can occur via two pathways; S1P phosphatases
convert S1P back to sphingosine, while S1P lyases cleave S1P into hexadecenal and
phosphoethanolamine which are reused for biosynthesis of phosphatidylethanolamine
[from (Pitson, 2011)].

9
LPPs are integral membrane proteins that are localized at the plasma membrane as well
as internal membranes with their catalytic centres facing the extracellular space and the luminal
side of organelles, respectively. As a consequence they can regulate extracellular as well as
intracellular levels of lipid phosphates including S1P (Fyrst & Saba, 2010). The two known
SPPs and S1P lyase are also integral membrane proteins and are localized at the endoplasmic
reticulum (ER). The catalytic centre of SPPs has been predicted to face the luminal side (Sigal
et al., 2005) whereas that of S1P lyase is directed toward the cytoplasm (Ikeda et al., 2004).
Both the SPPs and S1P lyase are proposed to regulate intracellular levels of S1P and contribute
to the cellular balance of relative levels of S1P, sphingosine and ceramide (Fyrst & Saba,
2010).
Ceramide can also be generated de novo by condensation of serine and palmitoyl-CoA at
the ER (Figure 1.3) (Gault et al., 2010). This rate-limiting first step and is catalysed by serine
palmitoyltransferase (SPT) to form 2-ketosphinganine. The 2-ketosphinganine formed is then
reduced to dihydrosphingosine which is subsequently N-acylated by one of a family of six
(dihydro) ceramide synthase (CerS) to form dihydroceramide, with the CerSs having differing
but overlapping preferences for acyl chains from 16 to 26 carbons long. Finally, a 4-5 trans-
double bound is introduced into the sphingoid base to produce ceramide. For sphingomyelin
synthesis, ceramide is then trafficked from the ER to the Golgi via a ceramide transport protein
known as CERT. Once in the Golgi apparatus, ceramide can be further metabolized to other
sphingolipids, such as sphingomyelin and the complex glycosphingolipids. For example,
ceramide may be subsequently phosphorylated by ceramide kinase to form ceramide-1-
phosphate, or glycosylated by glucosylceramide synthase or galactosylceramide synthase.
Additionally, it can be converted to sphingomyelin by the addition of a phosphorylcholine
headgroup by sphingomyelin synthase. Finally, ceramide may be broken down by a ceramidase
to form sphingosine. Sphingosine can then be re-utilised for complex sphingolipid biosynthesis
or phosphorylated by SKs to form S1P.

10
1.3 Control of S1P levels
The sphingomyelin pathway was once considered purely a sphingolipid degradative
pathway for relieving the cell of excess sphingomyelin. However, over the past 20 years, this
pathway has been recognized as much more than a degradative pathway since various
sphingolipid metabolites including ceramide, sphingosine and S1P have been identified as
important bioactive mediators regulating an array of cellular processes [reviewed in (Oskouian
& Saba, 2010)]. While elevated levels of S1P promotes cell survival and proliferation (Hengst
et al., 2009; Pitson et al., 2005; Sarkar et al., 2005; Safadi-Chamberlain et al., 2005; Jarman et
al., 2010), its precursors, ceramide and sphingosine induce cell growth arrest and apoptosis
(Woodcock et al., 2010; Xu et al., 2006; Taha et al., 2006; Dagan et al., 2003; Connor et al.,
2001). The cellular levels of S1P are primarily controlled by the activity of SK and to a lesser
extent by its degradation by S1P lyase and S1P phosphatase activities (Fyrst & Saba, 2010)
(Figure 1.3). Thus, this places SK at a critical step in maintaining a tight balance between the
levels of these metabolites for normal cellular function. In the basal state this balance between
S1P generation and degradation results in low levels of S1P in the cell (Aarthi et al., 2011).
However, when cells are exposed to specific growth factors and other agonists, S1P levels
increase rapidly and transiently as a direct consequence of a rapid increase in SK1 activity in
the cell. This agonist-induced increase in cellular S1P and its downstream consequences can be
blocked by the addition of SK1 inhibitors or expression of a dominant-negative SK1 (Pitson et
al., 2000b), suggesting that SK1 plays an important role in these agonist-induced downstream
effects. Notably, many of these external stimuli activate SK1 in a biphasic manner consisting of
an ‘acute’ rapid and transient first phase of activation which is most likely via post-translational
modifications that increase SK1 enzymatic activity and its translocation to the plasma
membrane where its substrate resides (Hengst et al., 2009; Pitson et al., 2005; Sarkar et al.,
2005; Safadi-Chamberlain et al., 2005; Jarman et al., 2010), followed by a ‘chronic’ delayed
activation that involves upregulation of transcription (Nakade et al., 2003; Doll et al., 2005;
Doll et al., 2007; Sobue et al., 2005; Huwiler et al., 2006) which will be discussed later.

11
1.4 Sphingosine kinases (SKs)
SKs are members of a highly conserved gene family that are expressed in many
eukaryotic organisms ranging from yeasts to humans, with orthologues also expressed in
worms and flies [reviewed in (Alemany et al., 2007; Pitson, 2011; Leclercq & Pitson, 2006)].
All these SKs have five conserved regions in their amino acid sequences, designated C1-C5,
which distinguishes them from all other known proteins (Wattenberg et al., 2006; Pitson, 2011;
Leclercq & Pitson, 2006). Following the purification of a rat SK (Olivera et al., 1998), Spiegel
and colleagues were successful in cloning the first two mammalian SK1 isoforms from mouse
(Kohama et al., 1998). The two isoforms found probably arose from alternate splicing and were
termed mSK1a and mSK1b. Soon after, the human SK1 was cloned by multiple groups (Pitson
et al., 2000a; Melendez et al., 2000; Nava et al., 2000). Subsequently, a second human (and
mouse) SK was cloned, SK2 (Liu et al., 2000a).
In humans, at least three splice variants of SK1 [named SK1a, SK1b and SK1c]
(Venkataraman et al., 2006) and two variants of SK2 [named SK2-S and SK2-L or SK2a and
SK2b] (Liu et al., 2000a; Okada et al., 2005) have been described that differ at their N termini
(Figure 1.4). SK1a appears to be the major form of SK1 and is the most studied compared to
the other two isoforms (SK1b and SK1c). The three SK1 isoforms appear to have similar
enzymatic properties and are predominantly cytosolic, but have slightly different subcellular
distributions, with SK1b and SK1c having greater plasma membrane localisation. Compared to
SK1, much less is known about SK2 and its isoforms. The smaller, SK2-S, was the original
cloned variant from mammalian cells based on its homology to SK1 (Liu et al., 2000a).
However the N-terminally extended SK2-L is believed to be the predominant SK2 mRNA in a
range of human tissues and cell lines but not in mice (Okada et al., 2005). While SK1 and SK2
are the only two SK isoforms cloned from mammalian cells, it should be noted that the
existence of a third potential SK isoform has been proposed, which exhibits a different substrate
specificity and subcellular localisation in some tissues (Fukuda et al., 2003). The validity of
this third SK isoform, however, awaits further experimentation.
12
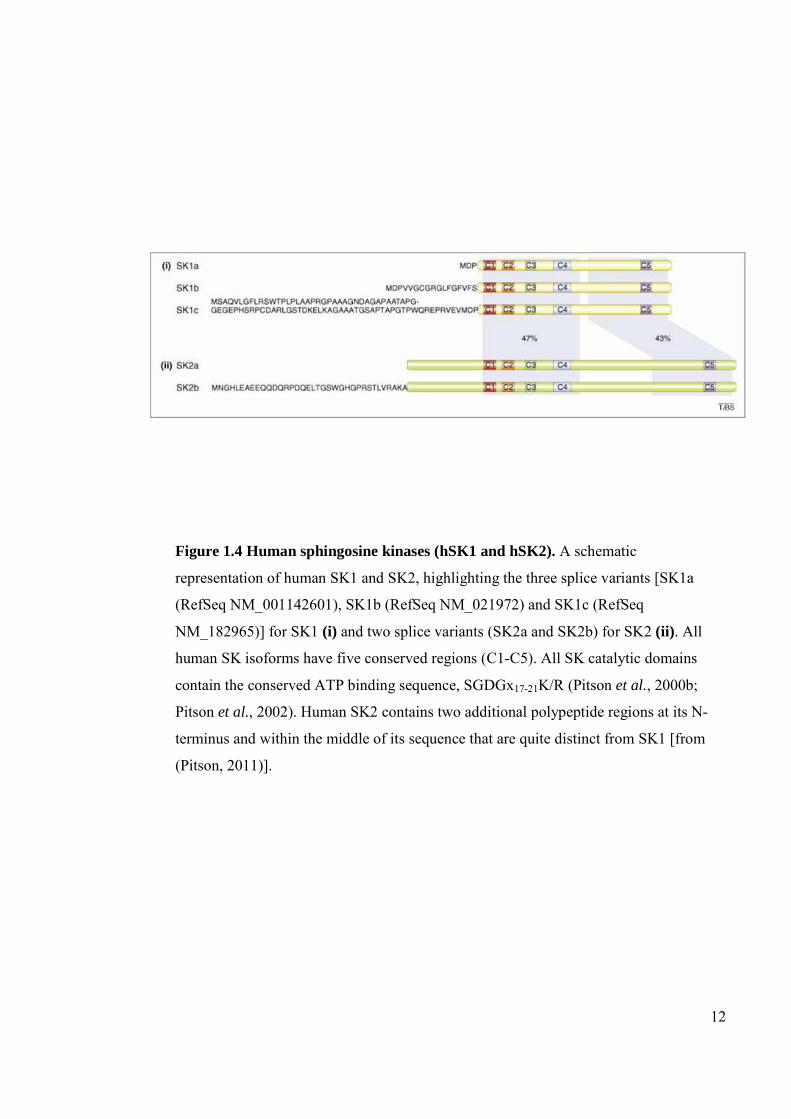
Figure 1.4 Human sphingosine kinases (hSK1 and hSK2). A schematic
representation of human SK1 and SK2, highlighting the three splice variants [SK1a
(RefSeq NM_001142601), SK1b (RefSeq NM_021972) and SK1c (RefSeq
NM_182965)] for SK1 (i) and two splice variants (SK2a and SK2b) for SK2 (ii) . All
human SK isoforms have five conserved regions (C1-C5). All SK catalytic domains
contain the conserved ATP binding sequence, SGDGx17-21K/R (Pitson et al., 2000b;
Pitson et al., 2002). Human SK2 contains two additional polypeptide regions at its N-
terminus and within the middle of its sequence that are quite distinct from SK1 [from
(Pitson, 2011)].

13
Although mammalian SK1 and SK2 have regions of very similar amino acid sequence
(80% amino acid sequence similarity), they originate from different genes [the SPHK1 gene is
located on chromosome 17 (17q25.2) while the SPHK2 gene on chromosome 19 (19q13.2)]. In
addition, SK2 is considerably larger than SK1 due to the presence of two additional polypeptide
regions at its N-terminus and within the middle of its sequence that are quite distinct from SK1
(Alemany et al., 2007; Pitson, 2011) (Figure 1.4). However, SK2 still contains all five of the
regions (C1-C5) that are highly conserved between this family of enzymes, including a
conserved catalytic domain and C-termini, which are related to the diacylglycerol kinase family
(Pitson, 2011). At least part of the ATP-binding site in SK was shown to reside in the C2
domain of the enzyme within the consensus sequence SGDGX17-21K (Pitson et al., 2002) and
mutation of the glycine downstream of aspartic acid produces a catalytically inactive SK
protein (Pitson et al., 2000b).
In addition to these sequence differences, SK2 has lower specific activity than SK1
(Roberts et al., 2004), and appears to be considerably less selective than SK1 in the substrates it
can utilize (Liu et al., 2000a; Pitson et al., 2000a; Roberts et al., 2004). Both SK1 and SK2 can
efficiently use D-erythro-sphingosine and D-erythro-dihydrosphingosine. SK2, however, has
much greater affinity towards phytosphingosine and an artificial substrate ω-biotinyl D-erythro-
sphingosine compared to SK1 (Roberts et al., 2004). Furthermore, L-threo-dihydrosphingosine,
an inhibitor of SK1, is phosphorylated by SK2 (Kohama et al., 1998; Liu et al., 2000a). SK2
has also been reported to be the main enzyme responsible for phosphorylation and activation of
the immunosuppressive pro-drug FTY720, with SK1 appearing to show little activity toward
this agent and related analogs (Billich et al., 2003; Paugh et al., 2003; Don et al., 2007). The
physiological significance of these differences in substrate specificity between the two SKs still
remains to be clarified.
SK1 and SK2 have differential tissue distribution and developmental expression. While
SK1 is abundantly expressed in adult mouse heart, spleen, lung and brain (Melendez et al.,
2000), SK2 expression is highest in brain, kidney and liver (Liu et al., 2000a). The expression
pattern of the two SKs in humans are quite different from mice, with SK1 expression its highest
in the bronchial epithelial cells and smooth muscles, whereas SK2 expression is similar across
all the tissues analysed (Figure 1.5), suggesting that the two enzymes are involved in distinct
cellular functions. This notion is further supported by the fact that SK1 and SK2 can play

14
contrasting roles in a number of disease conditions including murine collagen-induced arthritis
(Lai et al., 2009), LPS-induced lung injury (Wadgaonkar et al., 2009) renal ischemia-
reperfusion injury (Park et al., 2011) and immune cell functions (Schroder et al., 2011). A
number of in vitro studies have also reported that SK1 and SK2 appear to play quite contrasting
roles in the cell under different conditions. While SK1 promotes cellular survival and
proliferation (Olivera et al., 1999a; Xia et al., 2000; Le Scolan et al., 2005; Kohno et al., 2006),
overexpressed SK2 appears to have a pro-apoptotic effect in cells (Liu et al., 2003; Igarashi et
al., 2003b; Maceyka et al., 2005a; Okada et al., 2005). Although the reason for these opposing
functions remains to be investigated, the distinct cellular localisation of the two isoforms
appears to be important in determining their function. SK1 is mainly cytoplasmic and upon
activation, it translocates to the plasma membrane which appears to be integral for enhancing
cell proliferation and survival (Pitson et al., 2005). Whereas, SK2 localises predominantly to
internal membranes, and the levels of SK2 at the ER are enhanced during serum starvation and
this localisation of SK2 appears critical for its pro-apoptotic function (Igarashi et al., 2003b;
Maceyka et al., 2005a).

15
Figure 1.5 Tissue distribution of human SK1 (A) and SK2 (B) based on Affymetrix
gene expression analysis. The bar graph shows the average microarray intensity across
the selected probe set (y-axis), representing the relative gene expression level in each
cell or tissue analysed (x-axis) [from (Aarthi et al., 2011)].

16
Despite these divergent roles of SK1 and SK2, SK knockout mice have added further
complexity to this area. Mice lacking either SK1 or SK2 are viable, fertile and lack any obvious
abnormalities (Allende et al., 2004; Mizugishi et al., 2005). Simultaneous deletion of both
enzymes, however, produces mice that die in utero due to severe defects in neurogenesis and
angiogenesis (Mizugishi et al., 2005). Although the single knockout mice have not been
extensively examined, these findings suggest that despite SK1 and SK2 having some different
cellular effects, these enzymes also have some functional redundancy in mice that enables each
to compensate for the loss of the other (Mizugishi et al., 2005).
Although SK1 is mainly in the cytoplasm, it is also seen to some extent in the plasma
membrane and the nucleus (Inagaki et al., 2003; Pitson et al., 2003). SK1 activation-induced
translocation from the cytosol to the plasma membrane appears to be crucial for its oncogenic
effects (Pitson et al., 2003; Pitson et al., 2005; Jarman et al., 2010). In addition, SK1 was
shown to translocate from the cytosol to the nucleus upon platelet derived growth factor
(PDGF) stimulation (Kleuser et al., 2001). Subsequent to this, SK1 was reported to shuttle
between the cytosol and the nucleus due to its nuclear export sequences since deletion or
inhibition of these sequences caused accumulation of the enzyme in the nucleus (Inagaki et al.,
2003).
The localisation of SK2 appears more complex, the enzyme has been reported to localise
to the cytosol, nucleus, plasma membrane and predominantly to internal membranes, dependent
on cell type and also cell density (Igarashi et al., 2003b; Maceyka et al., 2005a). In particular,
the localisation of SK2 is enhanced at the ER during serum starvation and this localisation
appears critical for the enzyme’s pro-apoptotic function (Maceyka et al., 2005a). Localisation
of SK2 in the nucleus appears to be due to the presence of a novel nuclear localisation signal
sequence (Ding et al., 2007). Consistent with this notion, more recently, SK2/S1P was shown
to interact directly with histone deactetylases (HDAC1 and HDAC2) in the nucleus to influence
gene expression (Hait et al., 2009). Interestingly, a recent report has shown that SK1 and SK2
are localized in the centromere along with S1P5 where it is proposed to participate in the
regulation of mitosis (Gillies et al., 2009). Taken together, these results indicate that SK1 and
SK2 can be present in the nucleus, suggesting the possibility that they may regulate
transcriptional processes.

17
1.5 S1P Signalling
All cells appear to be able to generate S1P during the normal physiologic metabolism of
sphingomyelin. S1P is present at high concentrations in human serum ranging from 0.4 µM to 1
µM, mainly bound by albumin and other plasma proteins (Murata et al., 2000a; Okajima,
2002). The high levels of S1P found in serum have long been thought to be derived from
platelets (Yatomi et al., 1997). Indeed, platelets store a considerable amount of S1P, and release
it during platelet activation (Dindo et al., 2006). More recently, however erythrocytes, have
emerged as the major source of S1P in plasma under normal homeostatic conditions, (Hanel et
al., 2007; Bode et al., 2010; Pappu et al., 2007) whereas platelets and mast cells appear to
contribute to the local synthesis of S1P during platelet activation and inflammation reactions,
respectively (Ulrych et al., 2011; Dahm et al., 2006; Oskeritzian et al., 2010). Other cells, such
as vascular endothelium have also been shown to release a significant amount of S1P following
SK1 activation (Venkataraman et al., 2008).
Members of the ATP binding cassette (ABC) transporters have been implicated in cellular
export of S1P in a range of different cell types including mast cells, platelets, endothelial cells,
astrocytes and erythrocytes [reviewed in (Kim et al., 2009)]. For example, the release of S1P
from astrocytes and platelets appear to be dependent on ABCA1 transporter (Kobayashi et al.,
2006), while ABCC1 was important for the export of S1P from both human and rodent mast
cells (Mitra et al., 2006). More recently, however, ABCC1 and ABCG2 have been reported to
be involved in estradiol-mediated transport of S1P out of MCF-7 cells (Takabe et al., 2010).
Interestingly, recent studies in zebrafish and human cells have also identified spinster
homologue 2 (two of hearts) as a putative S1P transmembrane transporter (Osborne et al.,
2008; Kawahara et al., 2009).
1.5.1 Extracellular actions of S1P
As mentioned above, it is well established that cellular S1P, produced by SK, can be
secreted from cells to act in an autocrine or paracrine fashion, a process called inside-out
signalling, to activate a family of specific cell surface G-protein coupled receptors [reviewed in
(Kim et al., 2009)]. To date, five S1P receptors have been identified: S1P1, S1P2, S1P3, S1P4
and S1P5, which can specifically bind and be activated by only S1P and dihydro-S1P (Taha et

18
al., 2004; Aarthi et al., 2011). These S1P receptors are coupled to a variety of distinct
heterotrimeric G proteins, which are linked to different effector molecules with varying
affinities, allowing them to trigger a wide range of cellular responses in a highly cell-specific
manner (Taha et al., 2004) (Figure 1.6).

19
Figure 1.6 Major downstream biological processes regulated by S1P via the five
S1P receptors. S1P binds S1P receptors and activates partially overlapping downstream
via coupling to different G proteins to regulate numerous cellular and biological
processes. Coupling of S1P1 to Gi activates ERK, PI3K, AC and Rac to promote cell
proliferation, migration and angiogenesis, respectively. S1P2 couples to G12/13 and
activates Rho to inhibit cell migration, while, S1P3 enhances cell migration and
angiogenesis via Rac and PLC singalling through Gi and Gq, respectively [Adapted from
(Aarthi et al., 2011)].
S1P2 S1P3 S1P4 S1P5S1P1
Gq G12/13GiGi GiG12/13
Rac RhoPI3K
Inhibition of Inhibition of ApoptosisApoptosis
AngiogenesisAngiogenesisMigration Migration of Cellsof Cells
SurvivalSurvival
PLC ERKAC PLC
S1P2 S1P3 S1P4 S1P5S1P1
Gq G12/13GiGi GiG12/13
Rac RhoPI3K
Inhibition of Inhibition of ApoptosisApoptosis
AngiogenesisAngiogenesisMigration Migration of Cellsof Cells
SurvivalSurvival
PLC ERKAC PLC

20
1.5.1.1 S1P1
S1P1 was the first S1P receptor to be functionally identified as being coupled
exclusively to Gi (Windh et al., 1999; Okamoto et al., 1998). This receptor subtype localises
widely within the cell including the plasma membrane, caveolae, cytoplasmic vesicles and the
nucleus [reviewed in (Aarthi et al., 2011)]. Binding of S1P to S1P1 leads to the inhibiton of
adenylate cyclase (AC) and activation of phospholipase C (PLC), the Ras/ERK pathway, Rac,
and the phosphatidylinositol 3-kinase (PI3K)/Akt pathway (Kihara et al., 2007b). In particular,
activation of ERK1/2 and PI3K signalling, stimulates cell proliferation and angiogenesis
respectively (Kimura et al., 2000; Wang et al., 2010c). Activation of the small GTPase Rac by
S1P1 stimulates cell migration, actin cytoskeletal rearrangement and adherens junction
assembly (Li et al., 2009b). In addition, S1P1 has been reported to play crucial role in
neurogenesis, immune cell trafficking, endothelial barrier and vascular tone. Knockout of S1P1
has been shown to be embryonic lethal mainly due to defects in the development of the vascular
and central nervous system (Liu et al., 2000b; Kono et al., 2004).
1.5.1.2 S1P2
Unlike S1P1, S1P2 receptor can be coupled to multiple G-proteins, including Gi, Gq, and
G12/13, but it couples most efficiently to G12/13 protein (Windh et al., 1999; Ancellin & Hla,
1999). Engagement of this receptor participates in cell proliferation, motility and
transcriptional activation, generally acting in the opposite way to S1P1 [reviewed in (Skoura &
Hla, 2009)]. Coupling of S1P2 to G12/13 is known to activate the small GTPase, Rho that inhibits
cell migration through inhibition of Rac (Lepley et al., 2005; Malchinkhuu et al., 2008). S1P2
has also been reported to activate PLC leading to the release of Ca2+ in response to coupling to
Gq protein. Although the S1P2 receptor has not been shown to couple to Gs protein, it can
activate AC and increase intracellular levels of cAMP, possibly through coupling to G13 protein
(Jiang et al., 2007).
S1P2 is also able to activate ERK and mediate cell proliferation and survival through Gi
(An et al., 2000; Blom et al., 2010). Indeed, expression of S1P2 in various cancer cell lines has
been shown to promote ERK phosphorylation and induction of c-Jun and c-Fos oncogenes (An

21
et al., 2000). Apart from ERK, S1P2 has been reported to activate other members of the MAPK
family, such as JNK and p38 MAPK and play a role in cell stress, inflammation and apoptosis
(Goparaju et al., 2005; Donati et al., 2005; Michaud et al., 2010). In addition to its pro-
proliferative and pro-survival effects, S1P2 has also been reported to inhibit cell proliferation in
a different aspect of cellular physiology. Previously, S1P2 was shown to inhibit hepatocyte
proliferation through coupling to G12/13 protein and activation of the small Rho GTPase (Ikeda
et al., 2003). This was consistent with a recent study which proposed that S1P/S1P2 act through
the RhoA/ROCK and JNK pathways to enhance connective tissue growth factor expression and
appears to act as a tumor suppressor in Wilms tumor (Li et al., 2008b). Recently, it was also
reported that knock out of S1P2 leads to a high incidence of clonal B-cell lymphoma formation
in mice (Cattoretti et al., 2009). These tumours displayed a uniform phenotype with
characteristics of germinal centre (GC)-derived diffuse large B-cell lymphoma due to an
increase in GC B-cells and CD69+ T-cells as well as an increased proliferation of spontaneous
GCs, suggesting a role of S1P2 in maintaining B-cell homeostasis. Notably, more recent studies
suggest that the anti-tumour effect of S1P2 appears to be due to inhibition of Akt signalling
through G12/13 and RhoA/ROCK, which prevent GC B-cell survival and migration towards the
follicle center necessary for GC cell growth control. Thus, loss of this receptor in part could
potentially disrupt this balance leading to the development of tumours (Green et al., 2011).
S1P2 knockout mice do not demonstrate any striking abnormalities, but do appear to
develop epileptic seizures and deafness, indicating an important role of S1P2 in the development
of the auditory and vestibular systems (Herr et al., 2007).
1.5.1.3 S1P3
S1P3 is localized mainly in the cell surface on the plasma membrane (Dolezalova et al.,
2003). Similarly to S1P2, S1P3 can also be coupled to Gi, Gq, and G12/13 [reviewed in (Aarthi et
al., 2011)]. However, this receptor seems to couple most efficiently to Gq to stimulate PLC
leading to the production of inositol 1,4,5-trisphosphate and subsequent release of Ca2+ from
internal stores and activation of protein kinase C. In contrast to S1P2, S1P3 appears to activate
Rac and enhance cell migration through Gi (Arikawa et al., 2003; Becker et al., 2011).
Knockout of S1P3 alone does not result in any obvious phenotype, but deletion of S1P1-3 shows

22
vascular defects earlier than those of S1P1 alone, suggesting that these three S1P receptors have
redundant or cooperative functions for regular and mature vascular development during
embryogenesis (Kono et al., 2004).
1.5.1.4 S1P4 and S1P5
Unlike the other three S1P receptor subtypes, S1P4 and S1P5 have narrower patterns of
expression, with S1P4 expressed primary in lymphoid tissues and S1P5 mainly distributed in the
brain and the skin [reviewed in (Aarthi et al., 2011)]. Although the G proteins coupled to S1P4
and S1P5 remain largely unclear at present, various studies have suggested that S1P4 couples to
Gi, and G12/13 proteins (Van Brocklyn et al., 2000; Yamazaki et al., 2000), whereas the S1P5
receptor couples to Gi, and G12 proteins (Malek et al., 2001). Ligation of S1P4 appears to
activate PLC, ERK and the Rho-family GTPase Cdc42 through Gi [reviewed in (Kihara et al.,
2007a)]. In addition, activation of Rho by engagement of this receptor subtype has also been
reported to induce cytoskeletal rearrangements and cell rounding (Anliker & Chun, 2004).
Unlike the other S1PRs, ligation of S1P5 decreases oligodendrocyte cell migration via the
Rho/ROCK pathway and inhibits ERK activation leading to anti-proliferative effects
(Novgorodov et al., 2007). Consistent with this, recent studies also showed that binding of S1P
to S1P5 inhibits the proliferation and migration of esophageal cancer cells (Hu et al., 2010).
In summary, the coupling of S1P receptors to diverse G proteins results in the activation
of numerous downstream signalling pathways including AC, PLC, Ras/ERK1/2, PI3K/Akt,
Rho, and several protein kinases, such as, JNK and p38 MAPK, enabling them to regulate a
range of downstream signalling pathways, leading to regulation of numerous physiological
processes. Many of these well known roles of extracellular S1P are associated with
angiogenesis, differentiation, motility and cytoskeletal organization [reviewed in (Schuchardt et
al., 2011)]. However, S1P receptor engagement can also activate multiple pathways involved in
enhancing cell proliferation and survival. The true importance of S1P receptors in S1P-
mediated enhanced survival and proliferation, however, has been difficult to determine due to
the apparent role of intracellular S1P in these similar processes (Van Brocklyn et al., 1998;
Olivera et al., 2003; Kohno et al., 2006).

23
1.5.2 S1P as an intracellular second messenger
In addition to its extracellular action, intracellular signalling of S1P also exists to
mediate several cellular functions, such as proliferation, cell survival, and autophagy [reviewed
in (Strub et al., 2010)]. Various studies performed in systems lacking identifiable S1P receptors
have shown that disrupting S1P metabolism can result in marked changes in calcium
mobilisation, cell growth and survival, stress responses, endocytosis, tissue homeostasis,
infectivity, viability and reproduction. These effects could be explained by the direct interaction
of S1P with intracellular targets.
First of all, yeast do not posses S1P receptors, yet intracellular S1P regulates
environmental stress responses and survival (Mandala et al., 1998), in a manner reminiscent of
the function of S1P in mammalian cells. This was further supported by later studies which
showed plants lacking identifiable S1P receptors are able to regulate stomata closure and
prevent water loss in drought conditions by increasing their S1P levels (Ng et al., 2001).
Consistent with this notion, the intracellular signalling of S1P has been proposed to be
responsible for the enhanced cell proliferation and suppression of apoptosis following SK1
activation. For example, overexpression of SK1 promotes cell survival and protects the cell
from apoptosis through inhibition of NF- B and activation of Akt, an effect which cannot be
reproduced by either exogenous S1P or dihydro-S1P (Suomalainen et al., 2005; Limaye et al.,
2005). In addition, overexpression of SK1 in cells lacking functional S1P receptors was still
able to promote cell growth and survival (Olivera et al., 2003). Deletion of SK1 in mice reduces
spontaneous tumour formation, whereas deletion of the S1P receptors does not, which further
suggests an intracellular effect of S1P and/or sphingosine on the regulation of adenoma growth
(Kohno et al., 2006). Recently, a study has demonstrated that intracellularly generated S1P
offers protection against LPS-induced lung injury and inflammation in a murine model of acute
lung injury (Lin et al., 2011). In addition, endothelial cell motility mediated by extracellular
S1P was dependent on intracellular S1P production which was regulated by SK1 and S1P lyase
(Berdyshev et al., 2011). Furthermore, elevation of intracellular S1P either by depleting S1P
phosphatase (S1PP) or overexpressing SK1 causes autophagy in MCF7 cells (Lepine et al.,
2011).
Further evidence for a second-messenger action of S1P is through activation of calcium
channels (Young et al., 2000; Hong et al., 2008). There is strong evidence which implies that

24
S1P can activate thapsigargin-sensitive calcium channels in the ER, although the direct target
for S1P in the ER is yet been identified (Mattie et al., 1994). Indeed, intracellular S1P released
through either direct micro-injection of S1P or by photolysis of caged S1P, which circumvents
surface S1P receptors, results in mobilization of calcium (Blom et al., 2005) and enhanced cell
proliferation and survival (Van Brocklyn et al., 1998; Morita et al., 2000) independent of
inositol trisphosphate formation and of S1P-receptor activation. This intracellular action of S1P
seems to be cell-type specific, since microinjection of S1P had no effect on neuronal cells
(Postma et al., 1996) and it in fact reduced cell proliferation in keratinocytes (Kim et al., 2004).
Furthermore, chemical inhibition of SK demonstrated that endogenously generated S1P
functions as a positive modulator of calcium entry via store operated channels, whereas
exogenously administrated S1P initiated calcium release from the ER (similarly to histamine)
and decreased endothelial cell (EC) permeability (Itagaki et al., 2007). These results suggest
that S1P targeting ECs from the extracellular space exerts it effects through different receptor
and signalling mechanisms than those of S1P generated intracellularly (Zhi et al., 2006).
However, these studies could not completely exclude the fact that S1P generated intracellularly
could be released from the cell, activating S1P receptors (or altering membrane function) and
have other nonspecific effects on sphingolipids. Thus, the intracellular signalling function of
S1P has remained a controversial issue.
Recently, some clarity has begun to emerge with the identification of several direct
intracellular targets of S1P. This includes studies which show that S1P in the nucleus can
directly interact with histone deacetylases (HDAC) to play a role in epigenetic gene regulation
(Hait et al., 2009). Nuclear S1P was shown to form complexes with HDAC and prevent
deacylation of lysine residues within the histone tail, thereby affecting its DNA binding and
resulting in upregulation of p21 and c-fos. S1P has also been identified to be a cofactor for the
ubiquitin ligase activity of TNF receptor-associated factor 2 (TRAF2) (Alvarez et al., 2010).
Binding of TRAF2 to S1P increases its activity and leads to subsequent activation of the NF- B
transcription factor to mediate pro-survival signalling. Moreover, prohibitin 2 (PHB2), a highly
conserved protein that regulates mitochondrial assembly and function, has just recently been
reported to bind to S1P both in vitro and in vivo (Strub et al., 2011). This interaction between
S1P and PHB2 appears to play an important role in cytochrome-c oxidase assembly and
mitochondrial respiration.

25
1.6 SK/S1P in diseases
Elevated levels of SK1/S1P have been implicated in a number of disease pathologies,
including asthma, inflammation and autoimmune diseases, atherosclerosis, hypertension, and
neurodegenerative diseases [reviewed in (Pyne et al., 2009; Takabe et al., 2008)]. However, the
most studied patho-physiological role of SK1 is in cancer.
1.6.1 Cancer
There is considerable evidence implicating SK and S1P in tumourigenesis [reviewed in
(Pyne & Pyne, 2010; Pyne et al., 2012)]. One of the initial studies examining the oncogenic
potential role of SK1 showed that its overexpression in NIH 3T3 fibroblasts enhanced cell
survival and proliferation, and induced neoplastic cell transformation and the formation of
tumours in NOD/SCID mice (Xia et al., 2000). These initial observations have been supported
by other studies that have shown that SK1 activation is important in the promotion of estrogen-
dependent tumour cell growth in breast cancer cells (Nava et al., 2002; Sukocheva et al., 2003).
More recently, various studies have provided further and more specific evidence in support of a
role for SK1 deregulation in naturally occurring solid tumours (French et al., 2003b; French et
al., 2006). Indeed, there is now considerable evidence linking SK1 up-regulation to the
development and progression of several types of human cancers, including glioblastoma (Van
Brocklyn et al., 2005), intestinal adenoma (Kohno et al., 2006), colon cancer (Kawamori et al.,
2006; Kawamori et al., 2009), prostate (Malavaud et al., 2010), head and neck (Shirai et al.,
2011), oral (Liu et al., 2010), thyroid (Guan et al., 2011a) and non-small cell lung cancers
(Song et al., 2011). This increased SK1 expression has been associated with a poor survival of
patients with brain tumours (Van Brocklyn et al., 2005), gastric (Li et al., 2009c), oral (Liu et
al., 2010), breast (Watson et al., 2010) and non-small cell lung cancers (Song et al., 2011).
Overexpression of SK1 also correlates with resistance of cancer cells to chemotherapeutic
agents (Illuzzi et al., 2010; Akao et al., 2006; Watson et al., 2010; Guillermet-Guibert et al.,
2009). However, the most compelling evidence supporting the role of SK1 in cancer comes
from studies showing that down-regulation of SK1 either by genetic or pharmacological
approaches significantly reduces tumour growth in vivo in mice (Kohno et al., 2006; French et
al., 2006; Kawamori et al., 2009; Fuereder et al., 2011; Shirai et al., 2011), induces apoptosis

26
in cancer cells (Bektas et al., 2009; Taha et al., 2006; Paugh et al., 2008) and also sensitizes
tumor cells to other chemotherapeutics (Bonhoure et al., 2008; Pchejetski et al., 2008; Sauer et
al., 2009) and radiation therapy (Pchejetski et al., 2010; Sinha et al., 2011). Notably, specific
monoclonal antibodies against S1P have also been produced which reduced tumour progression
in murine xenograft and allograft models and are in clinical trials in cancer (Visentin et al.,
2006; O'Brien et al., 2009).
In addition to the solid tumours, deregulation of SK1 has also been found in both acute
and chronic myeloid leukemia [reviewed in (Pitson et al., 2011; Ekiz & Baran, 2011)]. This
includes findings that elevated levels of SK1 occur in a variety of leukemic cell lines which
correlates with resistance of these lines to chemotherapeutic agents (Paugh et al., 2008;
Bonhoure et al., 2008; Marfe et al., 2011), while high SK1 expression appears to be integral for
erythroleukemic progression (Le Scolan et al., 2005). In addition, SK1 expression is involved
in BCR/ABL-induced upregulation of Mcl-1 expression which appears to be important for
survival and chemotherapy resistance of chronic myeloid leukemia (CML) cells (Li et al., 2007;
Li et al., 2011a). Notably, a recent report has shown that SK1/S1P enhances BCR/ABL protein
stability, which appears to be signalled through the S1P2 pathway via inhibition of PP2A (Salas
et al., 2011). Inhibition of the SK1/ S1P pathway via either genetic manipulation or
pharmacogenic methods inhibits growth of acute myeloid leukemia xenografts in mice (Paugh
et al., 2008), and also reduces chemotherapeutic resistance in both AML (Bonhoure et al.,
2006; Cakir et al., 2011; Park et al., 2010) and CML cells (Li et al., 2011a). Furthermore, due
to the opposing effects of S1P and ceramide/sphingosine, which can be inter-convertible within
cells, chemotherapeutic agents which enhance the generation/accumulation of ceramides have
been shown to induce apoptosis in CML cells (Cakir et al., 2011; Kartal et al., 2011; Camgoz et
al., 2011).
1.6.2 Inflammation and immunity
There is considerable evidence linking SK and S1P with inflammation and immunity
[reviewed in (Spiegel & Milstien, 2011)]. S1P and S1P1 play important functions in lymphocyte
homeostasis by regulating the trafficking of these cells between the blood and lymphoid tissues
(Chiba et al., 2006). Furthermore, S1P is released from platelets and contributes to the invasion
27
of tissues by inflammatory cells, including mast cells and eosinophils (Rivera et al., 2008).
Notably, SK1 is required for TNFα-induced adhesion molecule expression in vascular
endothelial cells which is necessary for leukocyte recruitment during inflammatory responses
(Xia et al., 1998; Xia et al., 1999a). SK1 mRNA levels have also been reported to increase in
RAW macrophages during inflammatory responses (Hammad et al., 2008), supporting the
importance of the SK1/S1P pathway in the inflammatory response. This is consistent with
findings that chronic overexpression of SK1 promotes a pro-inflammatory phenotype in
endothelial cells (Limaye et al., 2009). In addition, other studies have shown that SK1
activation contributes to induction of pro-inflammatory cyclooxygenase 2 (COX-2) and
prostaglandin E2 (PGE2) release, and this could be further increased by knockdown of S1P-
degrading enzymes (Pettus et al., 2003).
In addition to its pro-inflammatory role, however, S1P has also been shown to inhibit
the expression of adhesion molecules in endothelial cells and suppress the production of pro-
inflammatory cytokines via activation of phosphatidylinositol 3-kinase (PI3-K) and endothelial
nitric oxide synthase (eNOS) (Kimura et al., 2006). Furthermore, negative cross-talk between
S1P receptors and toll-like receptor 2 has been reported in murine macrophages, thus
preventing inflammation (Duenas et al., 2008). Moreover oxidized LDL immune complexes
induced release of SK1 from monocytes and promoted monocyte survival which could
contribute to anti-inflammatory receptor engagement (Smith et al., 2010). The anti-
inflammatory property of S1P on macrophages was further highlighted in a model of acute
necrotising pancreatitis in rats (Liu et al., 2008). In this model, S1P as well as the S1PR agonist
FTY720, decreased acute pulmonary inflammation and injury by suppression of NF-κB activity
in alveolar macrophages and thereby production of IL1β, IL6 and TNF. Recently, S1P2
signalling has been shown to play an important role during inflammation by showing that S1P2
knockout mice enhanced macrophage recruitment during peritonitis (Michaud et al., 2010).
The proposed role(s) of SK1 in inflammation, however, has become more contentious
with SK1 knockout mice and specific knockdown of SK1 in a collagen-induced arthritis model,
producing contrasting results. While SK1 knockout mice showed normal responses in collagen-
induced arthritis, thioglycolate-triggered acute inflammation and efficient clearing of bacterial
infection (Michaud et al., 2006), specific targeting of SK1 by siRNA reduced the incidence and
severity of disease in a murine collagen-induced arthritis model (Lai et al., 2009). Factors

28
which possibly lead to these conflicting results could be due to different strains of mice and the
mode of knockdown of the SK1 enzyme used in these two studies. Furthermore, the different
dose of collagen used to induce arthritis in the two studies (Michchaud et al. used 100ug
collagen whereas, Lai et al. used 200ug to induce the disease), may have contributed to the
different outcome of these studies. Further studies are needed to clarify the underlining
mechanisms of the effects of SK1/S1P on inflammation.
1.6.3 Asthma
A considerable number of studies have implicated SK/S1P in the progression of
allergic responses including asthma, which is characterised by constriction of the smooth
muscle cells in the airway and influx of inflammatory cells into the lungs [reviewed in (Lai et
al., 2011)]. Activation of S1P receptors and downstream signalling is also crucial for the
migration of mast cells toward antigen (Jolly et al., 2004). This is demonstrated by crosslinking
of the high-affinity receptor for IgE (FcєRI) with antigen on mast cells then activating SK. This
leads to the generation and secretion of S1P which activates receptors (S1P1 and S1P2) in mast
cells to promote degranulation and release of histamine, cytokines and chemokines to mediate
inflammatory allergic reactions (Jolly et al., 2004). Inhibition of SK blocks FcєRI-mediated
internalization of these receptors and reduces degranulation and chemotaxis. Although SK
activation and S1P production are clearly required for FcǫRI-dependent allergic responses in
mast cells, results from various studies have suggest that differential formation of S1P by SK1
and SK2 has quite distinct and conflicting roles in mast cell functions. For example, in one
study SK2 has been demonstrated to be required for FcǫRI-mediated mast cell function
(Olivera et al., 2007), while, in another study it was found that both Sphk1–/– and Sphk2–/– mice
have normal mast cell responses (Pushparaj et al., 2009). In contrast, results from specific
targeting of SK1 have shown that this enzyme seems to have a dominant role in the generation
of S1P in mast cells (Pushparaj et al., 2009; Oskeritzian et al., 2008). Clearly, more studies are
needed to clarify the importance of the selective role of the SK isoenzyme in inflammatory
allergic reactions mediated by mast cell functions.
SK1 expression is elevated around bronchial epithelial walls and inflammatory areas in
an asthmatic mouse model and S1P induces airways smooth muscle contraction and can

29
influence the migration of inflammatory cells, such as eosinophils towards the site of
inflammation (Lai et al., 2008a; Rosenfeldt et al., 2003; Nishiuma et al., 2008). Elevated levels
of S1P are detected in bronchoalveolar lavage (BAL) fluid from allergic patients challenged
with allergen, compared to normal non-allergic patients (Nishiuma et al., 2008). S1P sustains
inflammation in systemic inflammatory responses and is elevated in BAL fluid from
asthmatics. Strikingly, inhalation of SK inhibitors in an ovalbumin (OVA) asthma mouse model
improved the disease severity by decreasing the S1P levels in BAL as well as reducing
peroxidase activity and eosinophil migration (Nishiuma et al., 2008; Lai et al., 2008b; Chiba et
al., 2010). Similarly, treatment with the S1P receptor modulator FTY720 in a murine asthma
model prior to allergen challenge, appears to reduce airways inflammation and bronchial
hyperresponsiveness (Idzko et al., 2006). Interestingly, a functional variant of the S1PR1 gene
has recently been associated with asthma susceptibility and severity (Sun et al., 2010c).
Together these data support a significant role of SK/S1P in allergic asthma.
1.6.4 Atherosclerosis
SK and S1P are also implicated in the pathogenesis of atherosclerosis which is a result
of a complex interaction of inflammatory signals in the vessel wall [reviewed in (Ipatova et al.,
2006; Weber et al., 2008)]. Their involvement arises from studies showing that S1P in plasma
is tightly associated with lipoproteins, HDL and LDL [reviewed in (Sato & Okajima, 2010;
Nofer, 2008)]. LDL that accumulates in atherosclerotic lesions contains S1P at it is possibly
produced locally in the atherosclerotic lesions by vascular smooth muscle cells (VSMC)
activated by growth factors. Oxidised LDL (Ox-LDL) is a major risk factor for atherosclerosis
as it can induce sphingomyelinase, ceramidase and SK in smooth muscle cells, resulting in S1P
production and enhanced mitogenesis of these cells. The interaction between S1P and
lipoproteins seems to reduce its bioactivity which may prevent full activation of S1P receptors
in the vascular wall (Murata et al., 2000b). In endothelial cells, SK activation is involved in
TNFα induced ERK and NF-κB activities, as well as E-selectin and VCAM expression (Kimura
et al., 2006). HDL inhibits all these effects by preventing SK activation by TNFα, supporting
an anti-atherogenic role of HDL via inhibition of intracellular SK activation and S1P
production by pro-inflammatory cytokines (Xia et al., 1999a). In fact, HDL-induced

30
vasorelaxation may be due to S1P which requires the S1P1 receptor for its downstream Akt
induction, eNOS activation and vasorelaxation (Keul et al., 2007). These data implicate S1P as
an anti-atherogenic, hypotensive and vasoprotective molecule. Nevertheless, the anti-
atherogenic action of HDL is also suggested to be mediated by HDL-associated S1P bound
solely to apolipoprotein M (ApoM), which is known to have anti-atherogeic effects
(Christoffersen et al., 2011).
In addition to the proposed anti-atherosclerotic role of S1P, a clinical trail has shown
that S1P levels correlated with the severity of obstructive coronary artery disease (Sattler et al.,
2010). Treatment of endothelial cells with reconstituted HDL and N,N-dimethylsphingosine
(DMS) suppressed TNFα-induced expression of adhesion molecules and apoptosis via
inhibition of SK activity (Xia et al., 1999a). In mouse models, it could be shown that treatment
with FTY720, a pro-drug that forms an analogue of S1P, significantly reduced atherosclerotic
plagues (Keul et al., 2007). These data, again propose an active role of S1P in the
atherosclerotic process. During vascular repair and thombosis after injury to an artery, thrombin
activates platelets to release S1P that may promote vascular cell proliferation and platelet
aggregation (Son et al., 2008). This may benefit the repair process but can also contribute to the
pathogenesis of atherosclerosis. Together, these studies point to an active but controversial role
for SK and S1P in atherogenesis, with some studies implicating the lipid as a protector and
other as a mediator of atherosclerosis.
Interestingly, S1P2 signalling has been recently shown to be involved in atherosclerotic
inflammation processes and hence inhibition of S1P2 signalling by either genetic or
pharmacological approaches attenuated atherosclerotic lesion formation in apolipoprotein E
(ApoE) mice (Wang et al., 2010a; Skoura et al., 2011). S1P2 seems to retain macrophages in
atherosclerotic plaques and these macrophages from ApoE-/- /S1P2-/- mice displayed reduced
cytokine expression, ablated MCP-1 expression and elevated eNOS phosphorylation.
Pharmacological inhibition of S1P2 in wild type ApoE-/- /S1P2+/+ mice also reduced cytokine
levels in plasma and decreased plaque size (Skoura et al., 2011). Similarly, S1P3 has been
shown to mediate the chemotactic effect of S1P in macrophages both in vitro and in vivo (Keul
et al., 2011). Although there are no major differences in atherosclerotic lesions and lipid
volume in the aorta of ApoE-/- /S1P3-/- mice, these mice appear to have decreased monocyte and

31
macrophage recruitment to the atherosclerotic lesions, further suggesting a role of S1P and its
receptors in the progression of atherosclerosis (Keul et al., 2011).
1.6.5 Neurodegenerative diseases
In the central nervous system (CNS), S1PRs are expressed on neurons, astrocytes,
oligodendrocytes and microglial cells [reviewed in (Pitson & Pebay, 2009; Soliven et al.,
2011)]. Both in vivo and in vitro studies suggest that S1P is important in a number of normal
physiological functions in the CNS, such as maintenance of the integrity of the blood–brain
barrier; migration of neuronal progenitor cells and astrocytes toward areas of damage;
regulation of oligodendrocyte survival, function, and myelination following injury, and;
regulation of microglial number and activation (Nayak et al., 2010). Although the functions of
SIP and its role in pathological processes involved in the CNS are still being unraveled, a
number of studies have suggested an important role of the S1P receptor signalling pathway in
neurodegenerative diseases including multiple sclerosis (MS) (Van Doorn et al., 2010; Fischer
et al., 2011; Choi et al., 2011) and alzheimer disease (AD) (He et al., 2010b; Takasugi et al.,
2011). S1P is present in high levels in the blood and can enter the brain during CNS injury. In
injured spinal cords, reactive astrocytes and microglia around the injury sites co-localise to
regions with high levels of S1P, suggesting that the accumulation of reactive astrocytes and
microglia is mediated through S1P receptors. In addition, stimulation of microglia with S1P
induced the release of TNFα suggesting the potential involvement of S1P in CNS inflammation.
Indeed, recent studies had demonstrated that S1P receptor levels were increased in
encephalomyelitis (EAE), a mouse model for multiple sclerosis, and FTY720 appears to have
protective function toward the disease (Chiba et al., 2011; Choi et al., 2011). Consistent with
this, the level of S1P in cerebrospinal fluid correlates with increasing severity in patients with
MS (Lee et al., 2010; Wu et al., 2008b; Nayak et al., 2010).
Interestingly, SK2 activity appears upregulated in neuronal stress, such as ischemia.
Furthermore, SK2 activity was increased in cells following exposure to β-amyloid fibrils, and
was also found to be increased in the postmortem cerebral cortices of AD patients. This,
together with the findings that chemical inhibitors of SK decreased β-amyloid levels in APP

32
transgenic mice (Takasugi et al., 2011) suggest that SK2 and S1P are involved in the etiology
of AD and are potential therapeutic targets for this disease.
1.7 SK regulation
1.7.1 Activation of SK1
SK1 has high intrinsic catalytic activity that is independent of post-translational
modifications of the protein (Pitson et al., 2000a) but is further activated by a number of
external stimuli mentioned previously, such as various growth factors [platelet-derived growth
factors (PDGF) (Olivera & Spiegel, 1993), epidermal growth factor (EGF) (Meyer zu
Heringdorf et al., 1999), hepatocyte growth factor (Duan et al., 2004), vascular endothelial
growth factor (VEGF) (Shu et al., 2002), nerve growth factor (NGF) (Edsall et al., 1997), and
transforming growth factor beta (TGFβ) (Yamanaka et al., 2004)], cytokines [tumour necrosis
factor α (TNFα) (Xia et al., 1999b) and interleukins (Mastrandrea et al., 2005)], hormones
[estradiol (Takabe et al., 2010) and prolactin (Doll et al., 2007)], and GPCR ligands
[acetylcholine (van Koppen et al., 2001), lysophosphatidic acid (Delon et al., 2004) and S1P
itself (Meyer zu Heringdorf et al., 2001)]. While activation of SK1 by these agonists generally
results in a modest enhancement of SK activity (approximately 2- to 3-fold) over basal levels,
this is sufficient to increase cellular S1P levels to trigger downstream effects (Pitson et al.,
2000b; Pitson et al., 2003).
1.7.1.1 Activation of SK1 by phosphorylation
A number of studies have examined the molecular mechanisms whereby SK1 is
activated. Most studies to date have mainly focused on the post-translational regulation of SK1,
in particular the cellular signalling pathways that are transiently modulated following SK1
activation (Pitson et al., 2000b; Pitson et al., 2003). This activation can occur through
phosphorylation of SK1 at serine 225 by ERK1/2 (Pitson et al., 2003). This results directly in
enhanced catalytic activity of the enzyme (approximately 14-fold increase in Vmax), but also its
translocation to the plasma membrane (Pitson et al., 2003) which is critical for agonist-induced
33
S1P generation and the pro-proliferative, pro-survival and oncogenic effects of SK1 (Pitson et
al., 2005). Mutation of this phosphorylation site (serine 225 to alanine) in human SK1
(SK1S225A) ablates the ability for agonists to stimulate SK1 and abolishes the stimulatory effects
of this enzyme on cell growth, resulting in attenuated survival and reduced colony growth in
soft agar, demonstrating the necessity of this phosphorylation for the pro-survival, pro-
proliferative and oncogenic signalling of SK1 (Pitson et al., 2005). Interestingly,
overexpression of SK1S225A inhibits Ras-dependent transformation of NIH3T3 fibroblasts
despite exhibiting full basal SK1 activity (Pitson et al., 2005). Moreover, artificial targeting of
the SK1S225A mutant to the plasma membrane (by attaching a myristoylation and palmitoylation
motif of Lck tyrosine kinase) rescued the ability of this SK1 variant to promote cellular
transformation (Pitson et al., 2005). Taken together, these data suggest that phosphorylation-
induced localisation of SK1 to the plasma membrane and the localized production of S1P at the
plasma membrane rather than the overall enhancement in SK1 activity is critical for agonist-
induced S1P generation and the pro-proliferative, pro-survival and oncogenic effects of SK1.
1.7.1.2 Activation of SK1 by translocation to the plasma membrane
SK1 resides mainly in the cytoplasm, but translocates to the plasma membrane once
activated by various stimuli including PDGF (Rosenfeldt et al., 2001), NGF (Toman et al.,
2004), EGF (Sarkar et al., 2005), TNFα (Pitson et al., 2005), phorbol 12-myristate 13-acetate
(PMA) (Johnson et al., 2002), lipopolysaccharides (LPS) (Wu et al., 2004), lysophosphatidic
acid (Delon et al., 2004) and calcium (Young et al., 2003). As noted above this relocalisation of
SK1 appears critical for the oncogenic effect of SK1. The mechanism of how SK1 is targeted to
this location has only recently been determined. Early studies have suggested a mechanism for
membrane targeting of SK1 which involves interaction with plasma membrane-associated
phosphatidic acid (Delon et al., 2004) or phosphatidylserine (Stahelin et al., 2005). In
particular, the phosphorylated state of SK1 appears to be essential for its interaction with
phosphatidylserine at the membrane (Stahelin et al., 2005). Indeed, phosphorylation of SK1 at
Ser225 by ERK2 was proposed to expose threonine-54 and asparagine-89 and/or other
phosphatidylserine-binding residues which are crucial for enhancing plasma membrane
selectivity of SK1 (Stahelin et al., 2005). Not all SK1 translocation depends on phosphorylation
34
of SK1 at Ser225, however, as SK1 robustly translocates to the phagosome membrane in
macrophages in response to uptake of killed mycobacterium or latex beads (Thompson et al.,
2005). Clearly, the translocation mechanism of SK1 still required further clarification.
Recently, the role of calcium and integrin binding protein 1 (CIB1) in SK1 translocation has
been established (Jarman et al., 2010). CIB1 has been shown to interact with SK1 as a calcium-
myristoyl switch protein enabling SK1 translocation to the plasma membrane and hence siRNA
knockdown of C1B1 inhibits SK1 translocation.
1.7.1.3 Activation of SK1 by protein-protein interactions
To date, several other SK1-interacting proteins have been shown to modulate the
function of SK1 in cells. The first interaction with SK1 identified was with the adaptor
molecule TNF receptor-associated factor 2 (TRAF2) (Xia et al., 2002). Activation of SK1 by
TNFα requires its interaction with TRAF2 which also mediates S1P-induced activation of NF-
κB and subsequent anti-apoptotic effects. A number of other proteins have since been identified
to interact with SK1 and modulate its activity. These include: SK1-interacting protein (SKIP)
(Lacana et al., 2002), δ-catenin (Fujita et al., 2004), aminoacylase 1 (Maceyka et al., 2004),
four and a half LIM domains protein 2 (FHL-2) (Sun et al., 2006) and platelet endothelial cell
adhesion molecule (PECAM-1) (Fukuda et al., 2004). While δ-catenin has been shown interact
with SK1 and directly enhance its activity, SKIP, PECAM-1, FHL-2, and aminoacylase 1 have
been shown to reduce the activity of SK1 in vitro. SK1-protein interactions also occur at the
membrane level. Activation of mast cells induces interaction of SK1 with Lyn kinase, which
brings the lipid kinase into close proximity with FcRI receptor within lipid raft domains (Urtz
et al., 2004). This interaction enhanced the enzymatic activities of both SK1 and Lyn kinase,
although SK1 was not phosphorylated by Lyn. In addition Fyn, another Src-family protein
tyrosine kinase, is also essential for SK1 and SK2 activation, since mast cells from Fyn
deficient mice exhibit impaired SK1 and SK2 enzyme activity and S1P production (Olivera et
al., 2006). Recently, protein elongation factor 1A (eEF1A) was also shown to directly interact
with both SK1 and SK2 and enhance their catalytic activity (Leclercq et al., 2008).

35
1.7.2 Activation of SK2
Very few studies have examined the mechanism of regulation of SK2. Similar to SK1,
the activity of SK2 can also be rapidly increased following cell exposure to TNFα (Mastrandrea
et al., 2005), IL-1β (Yoshimoto et al., 2003), EGF (Hait et al., 2007), and crosslinking of the
IgE receptor FсεRI (Olivera et al., 2006). In addition, SK2 can also be activated through
phosphorylation by ERK1/2 (Hait et al., 2007). Although the exact phosphorylation sites of
SK2 still require further clarification, recent studies have demonstrated that activation of SK2
by EGF results in ERK1-mediated phosphorylation of SK2 at Ser351 and Thr578 thereby
increasing its enzymatic activity which is crucial for EGF-induced cell migration of MDA-MB-
453cells (Hait et al., 2005; Hait et al., 2007).
1.7.2.1 Regulation of SK2 localisation by phosphorylation
As mentioned earlier, SK2 is predominantly localised in the nucleus and the ER
(Igarashi et al., 2003b; Maceyka et al., 2005a). Overexpression of SK2 has been reported to
suppress cell growth and induce cell cycle arrest, with these effects correlating with its nuclear
localisation (Igarashi et al., 2003b). However, phosphorylation of SK2 by protein kinase D
(PKD) at either Ser383 or Ser385 within the nuclear export signal (NES) results in its export
from the nucleus to the cytoplasm (Ding et al., 2007), suggesting that phosphorylation-induced
cytoplasmic localisation of SK2 by this agonist may modulate its pro-apoptotic effects. In
addition, it was also shown that upon phorbol ester stimulation of cells, Ser419 and Ser421 in
the NES of SK2 were phosphorylated and stimulated the export of the enzyme from the nucleus
to the cytosol (Ding et al., 2007). Mutation of these two serine residues within this NES
abolished SK2 export. Again, these findings suggest that phosphorylation of SK2 not only has a
direct effect on the enzyme catalytic activity but may also alter its cellular localisation, which
appears to play a critical role in its cellular function. This is consistent with a recent report
which proposed the function of nuclear SK2 in epigenetic gene regulation since at this location
it can associate with HDACs, inhibit histone deacetylation and enhance transcription of p21 and
c-fos (Hait et al., 2009).

36
1.7.2.2 Regulation of SK2 by protein-protein interactions
Interaction of SK2 with other proteins has also been described. This includes studies
suggesting that the pro-apoptotic effect of SK2 is due to its ability to behave like a BH3-only
protein and associate with Bcl-XL to block pro-survival singalling by this protein (Liu et al.,
2003). Since these findings were only shown with overexpressed SK2, the physiological
significance is still unclear. SK2 also directly interacts with the cytoplasmic region of the IL-12
receptor subunit, IL-12B1, and expression of a dominant negative SK2 suppressed IL-2 induced
production of interferon-γ (Yoshimoto et al., 2003). In addition, like SK1, SK2 can directly
interact with Fyn kinase which is required for SK2 activation by FсεRI crosslinking, since mast
cells from Fyn deficient mice exhibit impaired SK1 and SK2 enzyme activity and S1P
production (Olivera et al., 2006). Similarly, as mentioned earlier in section 1.7.1.3 SK2 has also
been shown to interact with eEF1A to enhance its catalytic activity in vitro (Leclercq et al.,
2008).
1.8 Transcriptional Regulation of SKs
1.8.1 Transcriptional regulation of SK1
While some detail of the post-translational regulation of SK1 has been elucidated,
comparatively little is known of its transcription regulation despite the fact that SK1 is
upregulated in many human cancers (Facchinetti et al., 2010; Li et al., 2009c; Shida et al.,
2008; Bayerl et al., 2008; French et al., 2003b; Kawamori et al., 2006).
A number of agonists, including PDGF (Kleuser et al., 2001), estrogen (Sukocheva et
al., 2003), phorbol esters (Nakade et al., 2003), NGF (Sobue et al., 2005), EGF (Doll et al.,
2005), histamine (Huwiler et al., 2006), prolactin (Doll et al., 2007), extracellular nucleotides
(Klawitter et al., 2007) and IL-1 (Paugh et al., 2009) induce biphasic increases in cellular SK1
activity; an initial and transient activation that occurs within minutes, followed by a delayed but
more sustained elevation in SK1 activity that appears due to increased SK1 transcription. While
some information is now known of the signalling pathways linking these agonists to
transcriptional regulation of SK1, which appear to differ between agonists, the direct

37
transcription factors involved remain unclear. A range of transcription factor binding sites have
been identified in the SPHK1 promoter, including those for Sp1, AP-1 and AP-2, all of which,
depending on the agonist, appear to be involved in SPHK1 transcription. For example, the Sp1-
binding site appears to be important in expression of SK1 in rat pheochromocytoma PC12 cells
in response to NGF (Sobue et al., 2005), as well as in the human leukaemia MEG-01 cell line
following exposure to phorbol esters (Nakade et al., 2003), and in human neuroblastoma cells
stimulated with glial cell line-derived neurotrophic factor (GDNF) (Murakami et al., 2007).
The latter two studies, however, suggest that Ap-2 binding motifs are also necessary to mediate
SPHK1 transcription induced by these agents. In contrast, other studies have implicated an AP-
1 binding element in enhancing SPHK1 transcription in glioblastoma cells in response to IL-1
(Paugh et al., 2009). Upregulation of SPHK1 transcription was required for SK1-mediated cell
survival and invasiveness (Paugh et al., 2009), suggesting SK1 transcriptional regulation may
play important role(s) in tumourigenesis.
In addition to growth factors and other cell agonists, hypoxia has also been shown to
induce SK1 expression in a range of cell types in a process dependent on HIF2α and hypoxia
response elements in the SPHK1 promoter (Ahmad et al., 2006; Schwalm et al., 2008; Anelli et
al., 2008).
Interestingly, recent studies suggest that in addition to transcriptional regulation, SK1
expression can also be regulated via its mRNA stability (Sobue et al., 2008a). It was reported
that the stability of the SK1 mRNA is regulated by the AU-rich element-binding proteins AUF1
and HuR, and that v-Src oncogene induces SK1 expression via modulation of these proteins
and subsequent enhancement of SK1 mRNA stability, rather than by increasing SPHK1
transcription (Sobue et al., 2008a).
1.8.2 Transcriptional regulation of SK2
Unlike SK1, there is very little published data on the transcriptional regulation of SK2.
Despite this, however, there are observation(s) suggesting that SK2 is also elevated in various
solid tumours (French et al., 2010; Beljanski et al., 2010) and under hypoxic conditions
(Schnitzer et al., 2009).

38
1.9 Transcriptional regulation by SK/S1P
A number of studies have suggested the involvement of SK1 and S1P in regulating
transcription of other genes. Studies showing SK1 is essential for TNFα-induced activation of
the pro-survival transcription factor NF- B provided some of the first evidence in this area (Xia
et al., 2002; Alvarez et al., 2010). This was further confirmed by Bu et al. (2005) where they
found that overexpression of SK1 up-regulated MMP1 protein, mRNA and its promoter activity
via activation of the ERK1/2-Ets1 and NF- B pathways (Bu et al., 2006). SK1 has also been
suggested to play a crucial role in the regulation of inflammatory genes such as MCP-1,
VCAM-1 and E-selectin in response to inflammatory cytokines in endothelial cells (Chen et al.,
2004). Overexpression of SK1 induced tissue inhibitor of metalloproteinase 1 (TIMP-1)
upregulation through the Ap-1 response element of the TIMP-1 promoter (Yamanaka et al.,
2004). Moreover, overexpression of SK1 increased growth associated protein 43 (GAP43)
expression (Murakami et al., 2011). It appears that SK1/S1P stimulates GAP43 transcription
may be due to increased binding of C/EBPβ transcription factor to the C/EBP binding site
located at the 5'-promoter of GAP43 (Murakami et al., 2011). Besides the observations
suggesting a role for SK1 in gene regulation, several studies have also acknowledged that S1P
can activate gene transcription. This includes the role of S1P in induction of CYP17
transcription by stimulating the binding of sterol regulatory element binding protein (SREBP) 1
to its promoter following dibutyryl cyclic AMP stimulation (Ozbay et al., 2006). Recently, S1P
has also been shown to upregulate MMP2 and VEGF expression via activation of the
transcription factor, ZNF580, which appears to be important for human endothelial cell
migration and proliferation (Sun et al., 2010a). Together, these studies show that some
transcription factors are regulated by SK and S1P. Thus, in addition to the activation of
numerous cell signalling pathways that can enhance cell survival and proliferation through
post-translational mechanisms, evidence of transcriptional regulation by SK and S1P is also
emerging. The transcriptional profile induced by the SKs, however, has not been defined.

39
1.10 Hypothesis:
Although transcriptional regulation by SK and S1P appears to play an important role in a
number of pathophysiological processes, no studies have yet been published that systematically
examined gene regulation by SK. Thus, we hypothesize that gene regulation induced by
increased cellular SK activity and activation is important for normal and pathological cellular
regulation.
1.11 Aims
1) To characterize gene and miRNA regulation induced in response to low,
physiologically relevant overexpression of SK1 and SK2
2) To determine gene regulation induced specifically in response to SK activity and
or SK1 activation
3) To determine the role of SK-responsive gene products in oncogenic and other
signalling by the SKs

40
Gene regulation by sphingosine kinase Duyen Pham
Chapter 2
Generation and characterisation of cell lines
with tightly regulated inducible expression
of sphingosine kinase 1 and 2
The majority of this Chapter has been published as:
Duyen H. Pham, Paul A.B. Moretti, Gregory J. Goodall, and Stuart M. Pitson (2008) Attenuation of leakiness in doxycycline-inducible expression via incorporation of 3' AU-rich
mRNA destabilizing elements. Biotechniques 45, 155-160.
See Appendix 2 for author contributions and reprint

41
A Pham, D.H., Moretti, P.A.B., Goodall, G.J. & Pitson, S.M. (2008) Attenuation of leakiness in doxycycline- inducible expression via incorporation of 3' AU-rich mRNA destabilizing elements.Biotechniques, v. 45(2), pp. 155-160
NOTE:
This publication is included on pages 41-82 in the print copy of the thesis held in the University of Adelaide Library.
It is also available online to authorised users at:
http://doi.org/10.2144/000112896

83
3. CHAPTER 3: GENE AND MICRORNA REGULATION BY
SPHINGOSINE KINASES
3.1 ABSTRACT
Sphingosine kinases (SKs) are highly conserved signalling enzymes that phosphorylate
sphingosine to form sphingosine-1-phosphate (S1P). S1P plays important roles in a wide
variety of cellular processes, including calcium mobilisation, mitogenesis, apoptosis,
atherosclerosis, inflammatory responses and cytoskeletal rearrangement. Two SK isoforms
exist (SK1 and SK2), which originate from different genes, termed SPHK1 and SPHK2.
Although the two enzymes show high sequence similarity, and generate the same product, S1P,
some studies have suggested that SK1 and SK2 can have opposing cellular functions. Indeed,
while SK1 appears to almost universally enhance cell survival, in at least some situations SK2
promotes apoptosis. Despite this, recent mouse knockout studies have suggested the two
enzymes may have overlapping functions in vascular development and neurogenesis. The
molecular mechanism(s) mediating the roles of the SKs and their product S1P have been
extensively examined, but much is still unknown. Several observations suggest that
transcriptional regulation by the SKs may play important role(s) in their cellular functions.
Thus, using tightly controlled inducible expression of the SKs we have performed microarray
analyses to elucidate genes and microRNAs regulated by the enhanced expression of the SKs.
Notably, from these studies, we have identified a number of genes that were regulated by both
SK1 and SK2 as well as genes that are differentially regulated by these two enzymes. We also
found that catalytically dead SK1 and SK2 could regulate gene expression suggesting that these
enzymes might have regulatory properties that are independent of catalytic activity. These
findings may lead to new insights into the mechanism(s) whereby SK1 and SK2 mediate their
cellular effects.

84
3.2 INTRODUCTION
There is considerable evidence indicating that elevated levels of sphingosine kinase 1
(SK1) and sphingosine 1-phosphate (S1P) in cells play an important role in generating many
pathological processes through control of cell survival, proliferation, differentiation, migration
and immune responses (Pitson, 2011; Pyne & Pyne, 2010; Leong & Saba, 2010). In particular,
SK1-induced enhancement of cell survival and proliferation and promotion of neoplastic
transformation (Xia et al., 2000; Pitson et al., 2005) has lead to SK1 receiving considerable
attention as a target for cancer therapy (Pitman & Pitson, 2010; Gangoiti et al., 2010). Indeed,
numerous studies have shown that SK1 expression is elevated in a number of solid tumours
(French et al., 2003a; Kawamori et al., 2006; Johnson et al., 2005b; Kawamori et al., 2009;
Bayerl et al., 2008) and leukaemias (Sobue et al., 2008b; Paugh et al., 2008; Bonhoure et al.,
2008; Li et al., 2007; Bonhoure et al., 2006; Le Scolan et al., 2005). High SK1 expression has
been correlated with poor survival of brain, gastric and breast cancer patients and others (Li et
al., 2009c; Ruckhaberle et al., 2008; Van Brocklyn et al., 2005). However, the most striking
evidence for a role of SK1 in cancer includes findings that targeting SK by chemical or genetic
means reduced tumour growth in mice and sensitized tumour cells to other chemotherapeutics
(Guillermet-Guibert et al., 2009; Pchejetski et al., 2005a; Baran et al., 2007; Bonhoure et al.,
2006; Bonhoure et al., 2008; Sauer et al., 2009).
Although it is becoming increasingly clear that SK1 can play a role in cancer
development and progression, the molecular mechanisms whereby SK1 promotes
tumourigenesis have not been clarified. Most studies to date have focused mainly on the
cellular signalling pathways that are transiently modulated following SK1 activation, such as,
Ras/ERK and PI3K/Akt pathways that appear to be mediated through the S1P G protein-
coupled receptors (El-Shewy et al., 2006; Radeff-Huang et al., 2007; Kim et al., 2010). While
activation of these signalling pathways may directly contribute to the oncogenic effects of SK1,
several lines of evidence suggest that SK1 and/or S1P can also activate various transcription
factors to regulate gene transcription via these and other pathways. This includes findings that
SK1 can mediate TNF-α induced activation of the NF- B transcription factor (Xia et al., 2002;
Alvarez et al., 2010), and enhance the expression of various inflammatory genes in endothelial
cells (Chen et al., 2004). SK1 overexpression has also been shown to result in the up-regulation
of the matrix metalloproteinase (MMP) 1 via activation of the ERK1/2-Ets1 and NF- B

85
pathways (Bu et al., 2006). Moreover, overexpression of SK1 induced tissue inhibitor of
metalloproteinase (TIMP) 1 upregulation via an Ap-1 response element in the TIMP1 promoter
(Yamanaka et al., 2004). Other evidence has indicated a role for S1P in gene regulation. For
example, S1P stimulates the transcriptional activity of AP-1 (Takeshita et al., 2000),
upregulates MMP2 production via activation of ZNF580 transcription factor (Sun et al.,
2010a), and induces CYP17 transcription by stimulating the binding of sterol regulatory
element binding protein (SREBP) 1 to its promoter following dibutyryl cyclic AMP stimulation
(Ozbay et al., 2006).
In contrast to SK1, the role and regulation of SK2 is less well defined. While a number of
in vitro studies have suggested that under certain conditions SK2 can promote apoptosis
(Igarashi et al., 2003a; Liu et al., 2003; Maceyka et al., 2005b; Okada et al., 2005; Hofmann et
al., 2008), the mechanism for these pro-apoptotic effects of SK2 remains to be determined.
Knockdown of SK2 in various cancer cell lines, however, induced apoptosis and enhanced the
sensitivity of these cancer cells to chemotherapeutics (Van Brocklyn et al., 2005; Sankala et al.,
2007; Nemoto et al., 2009; Schnitzer et al., 2009) and SK2 inhibitors blocked tumour growth
(French et al., 2010; Beljanski et al., 2011), suggesting a pro-survival role for this enzyme.
Recent studies have shown that SK2 and S1P in the nucleus interact with histones
deacetylases (HDACs) and inhibit HDAC activity and appear to be involved in epigenetic
changes in breast cancer cells (Hait et al., 2009). Furthermore, SK1 translocates to the plasma
membrane upon activation by various agonists and this activation-induced translocation appears
to be integral for the oncogenic effects of this enzyme (Pitson et al., 2005). Taken together,
these data demonstrate the importance of subcellular localised SK/S1P in the regulation of
cancer cell growth and/or apoptosis. The exact mechanism(s) whereby the SKs elicit these
effects, however, awaits further examination.
Systematic studies to investigate gene regulation by the SKs have not yet been reported.
Here, using microarray and microRNA array technology, together with human cell lines with
inducible expression of SK1 and SK2, we have begun to elucidate the SK/S1P-regulated gene
transcription profile to assist in correlating this with normal and pathological cellular function.

86
3.3 MATERIALS AND METHODS
3.3.1 Construction of expression plasmids
The catalytically inactive human SK1 (SK1G82D) (Pitson et al., 2000b) was sub-cloned
into pcDNA5/FRT/TO-SK1(FLAG)-AU following digestion with BamHI and NotI. The
construct for expression of catalytically inactive human SK2 (SK2G212D) was produced by sub-
cloning SK2G212D cDNA containing a C-terminal FLAG epitope tag (Moretti & Pitson,
unpublished) into pcDNA5/FRT/TO-AU vector following digestion with BamHI and NotI by
replacing the wild-type SK1 with the mutant BamHI/NotI SK2G212D cassettes/fragments.
3.3.2 RNA preparation, and DNA microarray and microRNA array analysis
Microarray studies were performed on cells that were either induced to express
recombinant SK1 proteins with 0.5 ng/ml doxycycline or the same cells not exposed to the
inducing agent. For mRNA arrays, RNA was extracted at various time points (t=6, 12 and 24 h)
after induction of SK expression by part TRIzol extraction (Invitrogen) followed by Qiagen
RNAeasy column prep (Qiagen, Valencia, CA) according to the manufacturers specifications.
RNA samples were run on Bioanalyser (Agilent) before committing to arrays to ensure high-
quality RNA integrity.
Compugen human 19,000-oligonucleotide library microarrays were performed at the
Adelaide Microarray Facility. Briefly, cDNA probes were prepared by incubating 20 µg of
RNA with 4 µg of anchored polyT(V)N at 70 °C for 10 min followed by incubation on ice.
Samples were mixed with 400 U/µl Superscript II and and aminoallyl (aa) dNTP mix (25 mM
dATP, 25 mM dGTP, 25 mM dCTP, 10mM dTTP and 15 mM aa dUTP) in 5X Superscript II
buffer containing 0.1 M dithiothreitol and incubated at 42 °C for 2.5 hours. RNAs were then
hydrolysed by incubating with 0.25 M NaOH and 0.5 M EDTA (pH 7.5) at 65 °C for 15 min
with immediate neutralization into 0.2 M acetic acid to terminate the reaction. cDNAs were
purified using QIAquick PCR purification kit according to the manufacture’s protocol, dried
under reduced pressure, dissolved in 0.1 M NaHCO3 (pH 9.0) and incubated with Cy3 or Cy5
dyes (Amersham) at room temperature (in the dark) for 60 min. The labeled cDNAs were
diluted in Milli Q water and again purified using a QIAquick PCR purification kit. Purified
cDNAs were mixed with hybridization buffer (16 µg yeast tRNA, 8 µg poly A and 20 µg Cot-1

87
DNA), dried, dissolved in 6.25X saline-sodium citrate (SSC) containing formamide, heated at
100 °C for 3 min followed by immediate incubation on ice with addition of 10 % sodium
dodecyl sulfate (SDS) and then hybridized to arrays at 42 °C in a humidified chamber
overnight. The following day, arrays were washed with 0.5X SSC containing 0.01 % SDS for 5
min followed by another 5 min wash with 0.5 X SSC and then 3 min with 0.2 X SSC. Slides
were dried by centrifugation at 750 rpm for 5 min and scanned with a Genepix 4000B Scanner
(Axon). Gene expression patterns in these cells were examined at various time points following
induction of SK1 or SK2 expression and compared to zero time point just prior to induction.
All arrays were performed in dual colour mode using two biological replicates for each time
point, analysed by microarray in duplicate, with dye-swap replicates also performed for each
comparison. The zero time (T0) point was used as a reference to obtain relative expression
levels following SK induction.
For miRNA arrays, total RNA was extracted using the complete Invitrogen TRIzol
procedure with isopropanol precipitation to preserve the small RNA fraction. miRNAs were
labeled by incubating 5 µg of RNAs with labelling mix containing 500 ng Cy3 or Cy5
dinucleotide (Dharmacon), 10 X Igloi buffer (1 mM ATP, 500 mM HEPES pH 7.8, 35 mM
DTT, 200 mM MgCl2 and 100 mg/ml BSA), DMSO, 20 (U) RNA ligase (NEB) and DEPC
water in a total volume of 10 µl on ice in the dark for 2 h. Reactions were terminated by
addition of Diethylpyrocarbonate (DEPC) water containing 3 M sodium acetate (pH 5.2) and 20
µg glycogen followed by precipitation with 100 % ethanol. Pellets were dried, resuspended in
Exiqon hybridization buffer and incubated at 95°C for 3 min. Labelled miRNAs were
hybridized to spotted microarrays printed using the Exiqon library, v8.1 in the dark at 56°C
overnight. Following hybridization, slides were washed for 2 min in DEPC water containing 2
X Exiqon salt buffer and 0.2 % Exiqon detergent solution, followed by another 2 min in DEPC
water containing 1 X Exiqon salt buffer and then 2 min with DEPC containing 0.2 X Exiqon
salt buffer. Slides were dried and scanned with a Genepix 4000B Scanner (Axon). MiRNA
expression patterns in these cells were examined at t=6 h following induction of SK1
expression and compared to T0. All arrays were performed in dual colour mode using two
biological replicates, with dye-swap performed for each array comparison.

88
3.3.3 Data analysis
For each channel (Cy3, Cy5), the foreground and background median pixel intensity
values were extracted from the scanned images using the Spot v3 plugin (CSIRO, Australia) for
R (www.r-project.org). After background subtraction, the foreground intensities were log2
transformed and a single ratio (Cy5/Cy3) value was obtained for each probe. For each array
the probe ratio values were normalized with the Limma plugin for R, using the printtip-loess
normalization option (Smyth & Speed, 2003). The five replicate arrays were normalized to each
other to give similar ranges of mRNA expression values. For each probe across the arrays, a
linear model was fitted to determine the final expression value for each mRNA and associated
statistics (Smyth, 2004). An empirical Bayes method was used to generate statistics which
enabled the ranking of mRNA expression, from the most likely to be differentially expressed to
the least between the 2 populations. For miRNA arrays, similar approaches were used to
analyze the data, except, global loess normalization method was used to identify differentially
expressed miRNAs (Smyth & Speed, 2003).
To examine the distribution of differentially expressed genes/miRNAs for a given
comparison of interest, a volcano plot was constructed, where the log2 (fold change) was on the
x-axis and –log10 [false discovery rate (FDR)-adjusted P value] on the y-axis. This generates a
volcano shaped chart, which is useful as it takes into account both the fold-change of the
genes/miRNAs as well as the reproducibility of the results. Genes identified from this analysis
were categorised into groups according to their functions (i.e. unknown function versus various
cellular functions). In particular, we focused on genes that are known to be involved in cellular
proliferation and survival. Genes that are differentially regulated by SK expression at early
times were preferred to enhance the chances of identifying primary effects of SK
overexpression.
3.3.4 Quantitative real-time PCR (qPCR)
QPCR analyses were performed using RNA preparations from the samples used in the
microarray experiments or RNA samples prepared from subsequent independent experiments.
Briefly, cDNA was synthesized from 2µg of total RNA in a 20µl reaction volume by using
Omniscript RT kit (Qiagen, Valencia, CA) and oligo(dT)17-adaptor primers (Frohman et al.,

89
1988) for amplification. QPCR analyses were performed using 2x Quantitect SYBR Green
PCR Master mix reagent (Qiagen, Valencia, CA) with various primers designed for each gene
candidates (Table 1) (Geneworks, Adelaide, Australia) using the following profiles: 50 °C for 2
min, 95 °C for 15 min, 45 cycles at 95 °C for 15 s and 55 °C for 20 s to give rise to 100 bp
products. Data were acquired using the Rotor-GeneTM 6000 software 1.7 (Corbett Research)
and expression of mRNA was normalized against the housekeeping gene, glyceraldehyde 3-
phosphate dehydrogenase (GAPDH).

90
Gene Forward sequence (5' → 3') Reverse sequence (5' → 3') Product
size (bp)
RASD1 SFPQ TFR1 HSPA5 FUS PPP1R10P CLK1 EIF4B PCGF2 PCTK3 ZNF6 ARMET HSPA8 IRS4 TNFRSF10D TSC23D3
AGGGTGACCGCGACTTCTA GCAGGTCTGGGCTCATCTC GTTACAGCCGAATGGGCTACA TTCTGGCCTCCTGAACCATAG ACCCATTCGTGGTGATCAAT CGTTTCCAACTGCCCTATGA TGGATCCCAACACCAAACTC GTATTGGGCTTGGCCTGAG ACAAACAAGAAAACGGGACAGC GTGGGTCATCAAAAGAGACCG TTCACCCTGTCAACCACCTC CTGCACAAAACCCAACCAAT CCAACCATGTGATGTCTGGA TCCATCATTGCTAAATGCTCCT GCCACCCTACACTGCTTTTCT TCTCTGGATTGCTGGGTTCAC CTATGCAGCGTACCCCCTG TCCCTGGCACCTTCGTAGAA TATGAATCCAAGAGTCGCATGTC GAAGGCCAAGCCTCGGTAG ATGTGAGCATTGTCCCCAAG GCCGCTTAAGGTCACTTGAAT CGGACCGATTTGTAGTCTGC AGGAAAGCTCCAGGCTTCAC CCCCGAGGTGTTCCTCAGAT CAAACGGCCCTTGTCATTAGT GTGAGAATGGATTTTGCCAGAC TAGACTGTAGCGCATCGAATCA TCAGAGGCCTTCCTTGAAGA GCCCGGGTATAAAGCAAAAC CTCCCCAAGCATCATCTCAC CTCTTGTCAGGGGTCTGTCG
180 103 127 119 97 121 119 125 138 159 111 149 129 123 147 114
Table 1: Primer sequences used in qPCR

91
3.4 RESULTS AND DISCUSSION
3.4.1 Expression profiling of gene regulation by SK1
In an attempt to identify gene regulation in response to cellular SK1 expression, we
conducted a large-scale gene expression profile using microarray technology. For the purpose
of SK1 gene regulation studies, tightly controlled SK1 inducible cell lines were generated using
a novel approach by incorporating the AREs into the 3’ UTR of the Tet-inducible constructs
(Pham et al., 2008).
The major advantage of using inducible expression of SK1 over cells with constitutive
overexpression of SK1 is the stringent control of the level and timing of SK1 overexpression.
Thus, using this system, we were able to examine immediate early genes regulated in response
to a subtle increased cellular SK1 overexpression which would be more likely to resemble the
in vivo level of SK1 previously detected in human cancers. We reasoned this approach would
enhance the likelihood of identifying direct and physiologically relevant target genes by SK1
and reduce the possibility of non-specific secondary effects due to high and long term
overexpression.
SK1 overexpression was induced in Flp-In T-Rex HEK293 cells to around 10-fold
higher than endogenous levels, RNA was isolated and then a number of arrays were performed
using a Compugen human 19,000-oligonucleotide library (Adelaide Microarray Centre)
comparing the gene expression pattern in cells induced to express SK1 for 6 h, 12 h and 24 h, to
cells that were untreated. Results from volcano plots (Figures 3.1A, B and C) showed genes
differentially regulated by SK1 overexpression following 6 h, 12 h and 24 h, respectively and
the top 50 genes that were differentially regulated over time following induction of SK1
overexpression are shown in Figure 3.2. Remarkably, even though SK1 overexpression was
only moderately higher than endogenous levels, this was sufficient to generate a considerable
number of genes that showed statistically significant regulation. Since robust gene regulation
was observed after 6 h, this early time point was selected for further studies to optimize the
likelihood of identifying direct effects of gene regulation by SK1. To eliminate SK1 protein
effects that were not dependent on its catalytic activity, we performed additional microarrays
using cells induced to overexpress the catalytically inactive variant of SK1, SK1G82D.
Somewhat surprisingly, low overexpression of SK1G82D to a similar level to that of wild-type

92
SK1 (Figure 3.3) also resulted in the regulation of a number of genes at 6 h, suggesting at least
some non-catalytic effects of the SK1 protein on gene regulation in this system. Gene
expression profiles were then compared between arrays to identify genes differentially
expressed in response to low regulated overexpression of wild-type SK1, but not SK1G82D
(Figure 3.4).

93
Figure 3.1 Differential genes expression mediated by cellular SK1. Volcano plots
showing gene modulation following induction of SK1 at 6 h (A), 12 h (B) and 24 h (C).
A
B
C
A
B
C

94
Figure 3.2 Heat plot of differentially expressed genes altered by inducible
expression of SK1. Heat plot of genes that showed differential regulation by cellular
expression of SK1 following 6 h, 12 h and 24 h post induction. Genes shown in green
were up-regulated, and those in red were down-regulated, while those that did not show
any change with respect to a normalized matched control are shown in black (see color
scale).
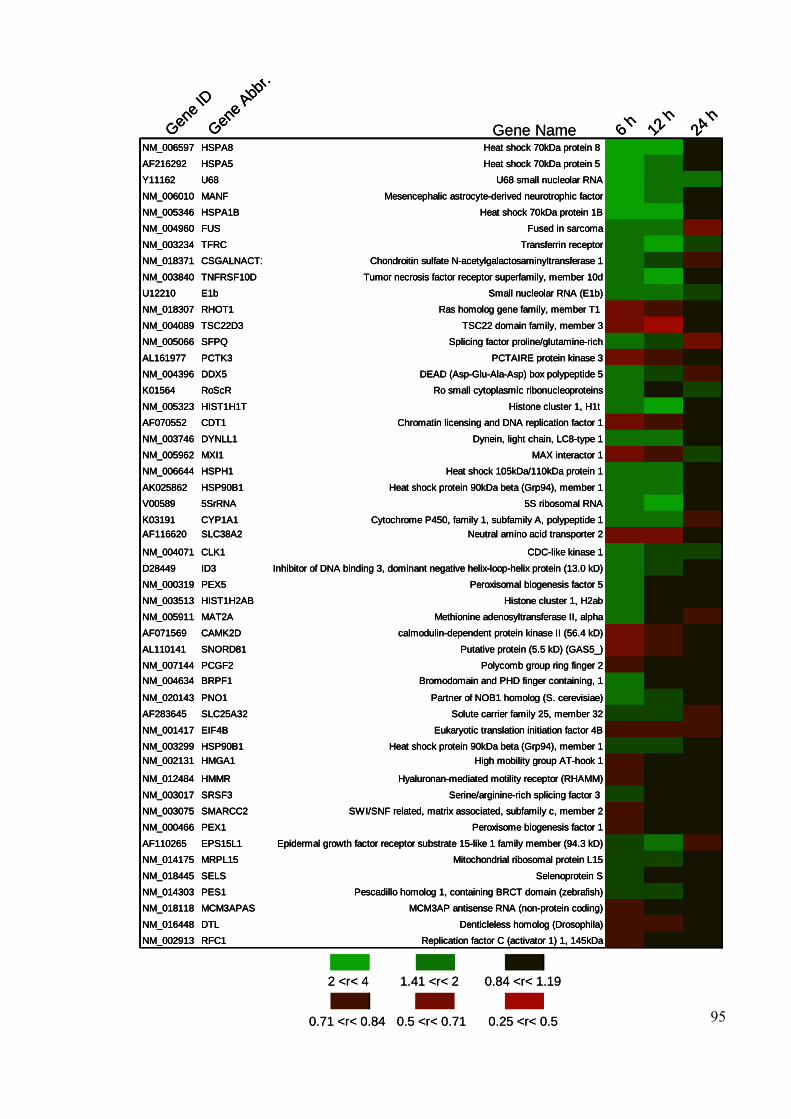
95
24 h
12 h
6 h
NM_006597 HSPA8 Heat shock 70kDa protein 8
AF216292 HSPA5 Heat shock 70kDa protein 5
Y11162 U68 U68 small nucleolar RNA
NM_006010 MANF Mesencephalic astrocyte-derived neurotrophic factor
NM_005346 HSPA1B Heat shock 70kDa protein 1B
NM_004960 FUS Fused in sarcoma
NM_003234 TFRC Transferrin receptor
NM_018371 CSGALNACT1 Chondroitin sulfate N-acetylgalactosaminyltransferase 1
NM_003840 TNFRSF10D Tumor necrosis factor receptor superfamily, member 10d
U12210 E1b Small nucleolar RNA (E1b)
NM_018307 RHOT1 Ras homolog gene family, member T1
NM_004089 TSC22D3 TSC22 domain family, member 3
NM_005066 SFPQ Splicing factor proline/glutamine-rich
AL161977 PCTK3 PCTAIRE protein kinase 3
NM_004396 DDX5 DEAD (Asp-Glu-Ala-Asp) box polypeptide 5
K01564 RoScR Ro small cytoplasmic ribonucleoproteins
NM_005323 HIST1H1T Histone cluster 1, H1t
AF070552 CDT1 Chromatin licensing and DNA replication factor 1
NM_003746 DYNLL1 Dynein, light chain, LC8-type 1
NM_005962 MXI1 MAX interactor 1
NM_006644 HSPH1 Heat shock 105kDa/110kDa protein 1
AK025862 HSP90B1 Heat shock protein 90kDa beta (Grp94), member 1
V00589 5SrRNA 5S ribosomal RNA
K03191 CYP1A1 Cytochrome P450, family 1, subfamily A, polypeptide 1
AF116620 SLC38A2 Neutral amino acid transporter 2
NM_004071 CLK1 CDC-like kinase 1
D28449 ID3 Inhibitor of DNA binding 3, dominant negative helix-loop-helix protein (13.0 kD)
NM_000319 PEX5 Peroxisomal biogenesis factor 5
NM_003513 HIST1H2AB Histone cluster 1, H2ab
NM_005911 MAT2A Methionine adenosyltransferase II, alpha
AF071569 CAMK2D calmodulin-dependent protein kinase II (56.4 kD)
AL110141 SNORD81 Putative protein (5.5 kD) (GAS5_)
NM_007144 PCGF2 Polycomb group ring finger 2
NM_004634 BRPF1 Bromodomain and PHD finger containing, 1
NM_020143 PNO1 Partner of NOB1 homolog (S. cerevisiae)
AF283645 SLC25A32 Solute carrier family 25, member 32
NM_001417 EIF4B Eukaryotic translation initiation factor 4B
NM_003299 HSP90B1 Heat shock protein 90kDa beta (Grp94), member 1
NM_002131 HMGA1 High mobility group AT-hook 1
NM_012484 HMMR Hyaluronan-mediated motility receptor (RHAMM)
NM_003017 SRSF3 Serine/arginine-rich splicing factor 3
NM_003075 SMARCC2 SWI/SNF related, matrix associated, subfamily c, member 2
NM_000466 PEX1 Peroxisome biogenesis factor 1
AF110265 EPS15L1 Epidermal growth factor receptor substrate 15-like 1 family member (94.3 kD)
NM_014175 MRPL15 Mitochondrial ribosomal protein L15
NM_018445 SELS Selenoprotein S
NM_014303 PES1 Pescadillo homolog 1, containing BRCT domain (zebrafish)
NM_018118 MCM3APAS MCM3AP antisense RNA (non-protein coding)
NM_016448 DTL Denticleless homolog (Drosophila)
NM_002913 RFC1 Replication factor C (activator 1) 1, 145kDa
Gene
ID
Gene A
bbr.
Gene Name 24 h
12 h
6 h
NM_006597 HSPA8 Heat shock 70kDa protein 8
AF216292 HSPA5 Heat shock 70kDa protein 5
Y11162 U68 U68 small nucleolar RNA
NM_006010 MANF Mesencephalic astrocyte-derived neurotrophic factor
NM_005346 HSPA1B Heat shock 70kDa protein 1B
NM_004960 FUS Fused in sarcoma
NM_003234 TFRC Transferrin receptor
NM_018371 CSGALNACT1 Chondroitin sulfate N-acetylgalactosaminyltransferase 1
NM_003840 TNFRSF10D Tumor necrosis factor receptor superfamily, member 10d
U12210 E1b Small nucleolar RNA (E1b)
NM_018307 RHOT1 Ras homolog gene family, member T1
NM_004089 TSC22D3 TSC22 domain family, member 3
NM_005066 SFPQ Splicing factor proline/glutamine-rich
AL161977 PCTK3 PCTAIRE protein kinase 3
NM_004396 DDX5 DEAD (Asp-Glu-Ala-Asp) box polypeptide 5
K01564 RoScR Ro small cytoplasmic ribonucleoproteins
NM_005323 HIST1H1T Histone cluster 1, H1t
AF070552 CDT1 Chromatin licensing and DNA replication factor 1
NM_003746 DYNLL1 Dynein, light chain, LC8-type 1
NM_005962 MXI1 MAX interactor 1
NM_006644 HSPH1 Heat shock 105kDa/110kDa protein 1
AK025862 HSP90B1 Heat shock protein 90kDa beta (Grp94), member 1
V00589 5SrRNA 5S ribosomal RNA
K03191 CYP1A1 Cytochrome P450, family 1, subfamily A, polypeptide 1
AF116620 SLC38A2 Neutral amino acid transporter 2
NM_004071 CLK1 CDC-like kinase 1
D28449 ID3 Inhibitor of DNA binding 3, dominant negative helix-loop-helix protein (13.0 kD)
NM_000319 PEX5 Peroxisomal biogenesis factor 5
NM_003513 HIST1H2AB Histone cluster 1, H2ab
NM_005911 MAT2A Methionine adenosyltransferase II, alpha
AF071569 CAMK2D calmodulin-dependent protein kinase II (56.4 kD)
AL110141 SNORD81 Putative protein (5.5 kD) (GAS5_)
NM_007144 PCGF2 Polycomb group ring finger 2
NM_004634 BRPF1 Bromodomain and PHD finger containing, 1
NM_020143 PNO1 Partner of NOB1 homolog (S. cerevisiae)
AF283645 SLC25A32 Solute carrier family 25, member 32
NM_001417 EIF4B Eukaryotic translation initiation factor 4B
NM_003299 HSP90B1 Heat shock protein 90kDa beta (Grp94), member 1
NM_002131 HMGA1 High mobility group AT-hook 1
NM_012484 HMMR Hyaluronan-mediated motility receptor (RHAMM)
NM_003017 SRSF3 Serine/arginine-rich splicing factor 3
NM_003075 SMARCC2 SWI/SNF related, matrix associated, subfamily c, member 2
NM_000466 PEX1 Peroxisome biogenesis factor 1
AF110265 EPS15L1 Epidermal growth factor receptor substrate 15-like 1 family member (94.3 kD)
NM_014175 MRPL15 Mitochondrial ribosomal protein L15
NM_018445 SELS Selenoprotein S
NM_014303 PES1 Pescadillo homolog 1, containing BRCT domain (zebrafish)
NM_018118 MCM3APAS MCM3AP antisense RNA (non-protein coding)
NM_016448 DTL Denticleless homolog (Drosophila)
NM_002913 RFC1 Replication factor C (activator 1) 1, 145kDa
Gene
ID
Gene A
bbr.
24 h
12 h
6 h
NM_006597 HSPA8 Heat shock 70kDa protein 8
AF216292 HSPA5 Heat shock 70kDa protein 5
Y11162 U68 U68 small nucleolar RNA
NM_006010 MANF Mesencephalic astrocyte-derived neurotrophic factor
NM_005346 HSPA1B Heat shock 70kDa protein 1B
NM_004960 FUS Fused in sarcoma
NM_003234 TFRC Transferrin receptor
NM_018371 CSGALNACT1 Chondroitin sulfate N-acetylgalactosaminyltransferase 1
NM_003840 TNFRSF10D Tumor necrosis factor receptor superfamily, member 10d
U12210 E1b Small nucleolar RNA (E1b)
NM_018307 RHOT1 Ras homolog gene family, member T1
NM_004089 TSC22D3 TSC22 domain family, member 3
NM_005066 SFPQ Splicing factor proline/glutamine-rich
AL161977 PCTK3 PCTAIRE protein kinase 3
NM_004396 DDX5 DEAD (Asp-Glu-Ala-Asp) box polypeptide 5
K01564 RoScR Ro small cytoplasmic ribonucleoproteins
NM_005323 HIST1H1T Histone cluster 1, H1t
AF070552 CDT1 Chromatin licensing and DNA replication factor 1
NM_003746 DYNLL1 Dynein, light chain, LC8-type 1
NM_005962 MXI1 MAX interactor 1
NM_006644 HSPH1 Heat shock 105kDa/110kDa protein 1
AK025862 HSP90B1 Heat shock protein 90kDa beta (Grp94), member 1
V00589 5SrRNA 5S ribosomal RNA
K03191 CYP1A1 Cytochrome P450, family 1, subfamily A, polypeptide 1
AF116620 SLC38A2 Neutral amino acid transporter 2
NM_004071 CLK1 CDC-like kinase 1
D28449 ID3 Inhibitor of DNA binding 3, dominant negative helix-loop-helix protein (13.0 kD)
NM_000319 PEX5 Peroxisomal biogenesis factor 5
NM_003513 HIST1H2AB Histone cluster 1, H2ab
NM_005911 MAT2A Methionine adenosyltransferase II, alpha
AF071569 CAMK2D calmodulin-dependent protein kinase II (56.4 kD)
AL110141 SNORD81 Putative protein (5.5 kD) (GAS5_)
NM_007144 PCGF2 Polycomb group ring finger 2
NM_004634 BRPF1 Bromodomain and PHD finger containing, 1
NM_020143 PNO1 Partner of NOB1 homolog (S. cerevisiae)
AF283645 SLC25A32 Solute carrier family 25, member 32
NM_001417 EIF4B Eukaryotic translation initiation factor 4B
NM_003299 HSP90B1 Heat shock protein 90kDa beta (Grp94), member 1
NM_002131 HMGA1 High mobility group AT-hook 1
NM_012484 HMMR Hyaluronan-mediated motility receptor (RHAMM)
NM_003017 SRSF3 Serine/arginine-rich splicing factor 3
NM_003075 SMARCC2 SWI/SNF related, matrix associated, subfamily c, member 2
NM_000466 PEX1 Peroxisome biogenesis factor 1
AF110265 EPS15L1 Epidermal growth factor receptor substrate 15-like 1 family member (94.3 kD)
NM_014175 MRPL15 Mitochondrial ribosomal protein L15
NM_018445 SELS Selenoprotein S
NM_014303 PES1 Pescadillo homolog 1, containing BRCT domain (zebrafish)
NM_018118 MCM3APAS MCM3AP antisense RNA (non-protein coding)
NM_016448 DTL Denticleless homolog (Drosophila)
NM_002913 RFC1 Replication factor C (activator 1) 1, 145kDa
Gene
ID
Gene A
bbr.
Gene Name
2 <r< 4
0.71 <r< 0.84
0.84 <r< 1.191.41 <r< 2
0.5 <r< 0.71 0.25 <r< 0.5
2 <r< 4
0.71 <r< 0.84
0.84 <r< 1.191.41 <r< 2
0.5 <r< 0.71 0.25 <r< 0.5

96
Figure 3.3 Low SK1 and SK1G82D expression level used in arrays. SK1 or SK1G82D
Flp-In T-Rex HEK293 cells were cultured in medium for 6 h either in the absence or the
presence of 0.5 ng/ml doxycycline. The expression of SK1 and SK1G82D was then
examined in cell lysates by immunoblot analysis using an anti-FLAG antibody (A) and
SK activity assays (B).
Dox
SK1G82D
++–
anti-FLAG
–
SK1A
SK
1ac
tivity
(%
of C
tl)
0
200
400
600
800
1000
Dox
SK1G82D
++–
SK1
–
B
Dox
SK1G82D
++–
anti-FLAG
–
SK1
Dox
SK1G82D
++–
anti-FLAG
–
SK1A
SK
1ac
tivity
(%
of C
tl)
0
200
400
600
800
1000
Dox
SK1G82D
++–
SK1
–
B
97
Figure 3.4 Heat plot comparing differentially expressed genes by SK1 versus
SK1G82D. Hierarchical clustering of the genes that were differentially regulated by
changes in cellular level of SK1 versus SK1G82D following 6 h induction. Genes shown
in green were up-regulated, and those in red were down-regulated, while those that did
not show any change with respect to a normalized matched control are shown in black
(see color scale).

98
SK1G82
D
SK1
NM_006597 HSPA8 Heat shock 70kDa protein 8
AF216292 HSPA5 Heat shock 70kDa protein 5
Y11162 U68 U68 small nucleolar RNA
NM_006010 MANF Mesencephalic astrocyte-derived neurotrophic factor
NM_005346 HSPA1B Heat shock 70kDa protein 1B
NM_004960 FUS Fused in sarcoma
NM_003234 TFRC Transferrin receptor
NM_018371 CSGALNACT1 Chondroitin sulfate N-acetylgalactosaminyltransferase 1
NM_003840 TNFRSF10D Tumor necrosis factor receptor superfamily, member 10d
U12210 E1b Small nucleolar RNA (E1b)
NM_018307 RHOT1 Ras homolog gene family, member T1
NM_004089 TSC22D3 TSC22 domain family, member 3
NM_005066 SFPQ Splicing factor proline/glutamine-rich
AL161977 PCTK3 PCTAIRE protein kinase 3
NM_004396 DDX5 DEAD (Asp-Glu-Ala-Asp) box polypeptide 5
K01564 RoScR Ro small cytoplasmic ribonucleoproteins
NM_005323 HIST1H1T Histone cluster 1, H1t
AF070552 CDT1 Chromatin licensing and DNA replication factor 1
NM_003746 DYNLL1 Dynein, light chain, LC8-type 1
NM_005962 MXI1 MAX interactor 1
NM_006644 HSPH1 Heat shock 105kDa/110kDa protein 1
AK025862 HSP90B1 Heat shock protein 90kDa beta (Grp94), member 1
V00589 5SrRNA 5S ribosomal RNA
K03191 CYP1A1 Cytochrome P450, family 1, subfamily A, polypeptide 1
AF116620 SLC38A2 Neutral amino acid transporter 2
NM_004071 CLK1 CDC-like kinase 1
D28449 ID3 Inhibitor of DNA binding 3, dominant negative helix-loop-helix protein (13.0 kD)
NM_000319 PEX5 Peroxisomal biogenesis factor 5
NM_003513 HIST1H2AB Histone cluster 1, H2ab
NM_005911 MAT2A Methionine adenosyltransferase II, alpha
AF071569 CAMK2D calmodulin-dependent protein kinase II (56.4 kD)
AL110141 SNORD81 Putative protein (5.5 kD) (GAS5_)
NM_007144 PCGF2 Polycomb group ring finger 2
NM_004634 BRPF1 Bromodomain and PHD finger containing, 1
NM_020143 PNO1 Partner of NOB1 homolog (S. cerevisiae)
AF283645 SLC25A32 Solute carrier family 25, member 32
NM_001417 EIF4B Eukaryotic translation initiation factor 4B
NM_003299 HSP90B1 Heat shock protein 90kDa beta (Grp94), member 1
NM_002131 HMGA1 High mobility group AT-hook 1
NM_012484 HMMR Hyaluronan-mediated motility receptor (RHAMM)
NM_003017 SRSF3 Serine/arginine-rich splicing factor 3
NM_003075 SMARCC2 SWI/SNF related, matrix associated, subfamily c, member 2
NM_000466 PEX1 Peroxisome biogenesis factor 1
AF110265 EPS15L1 Epidermal growth factor receptor substrate 15-like 1 family member (94.3 kD)
NM_014175 MRPL15 Mitochondrial ribosomal protein L15
NM_018445 SELS Selenoprotein S
NM_014303 PES1 Pescadillo homolog 1, containing BRCT domain (zebrafish)
NM_018118 MCM3APAS MCM3AP antisense RNA (non-protein coding)
NM_016448 DTL Denticleless homolog (Drosophila)
NM_002913 RFC1 Replication factor C (activator 1) 1, 145kDa
Gene
ID
Gene
Abbr.
Gene Name SK1G82
D
SK1
NM_006597 HSPA8 Heat shock 70kDa protein 8
AF216292 HSPA5 Heat shock 70kDa protein 5
Y11162 U68 U68 small nucleolar RNA
NM_006010 MANF Mesencephalic astrocyte-derived neurotrophic factor
NM_005346 HSPA1B Heat shock 70kDa protein 1B
NM_004960 FUS Fused in sarcoma
NM_003234 TFRC Transferrin receptor
NM_018371 CSGALNACT1 Chondroitin sulfate N-acetylgalactosaminyltransferase 1
NM_003840 TNFRSF10D Tumor necrosis factor receptor superfamily, member 10d
U12210 E1b Small nucleolar RNA (E1b)
NM_018307 RHOT1 Ras homolog gene family, member T1
NM_004089 TSC22D3 TSC22 domain family, member 3
NM_005066 SFPQ Splicing factor proline/glutamine-rich
AL161977 PCTK3 PCTAIRE protein kinase 3
NM_004396 DDX5 DEAD (Asp-Glu-Ala-Asp) box polypeptide 5
K01564 RoScR Ro small cytoplasmic ribonucleoproteins
NM_005323 HIST1H1T Histone cluster 1, H1t
AF070552 CDT1 Chromatin licensing and DNA replication factor 1
NM_003746 DYNLL1 Dynein, light chain, LC8-type 1
NM_005962 MXI1 MAX interactor 1
NM_006644 HSPH1 Heat shock 105kDa/110kDa protein 1
AK025862 HSP90B1 Heat shock protein 90kDa beta (Grp94), member 1
V00589 5SrRNA 5S ribosomal RNA
K03191 CYP1A1 Cytochrome P450, family 1, subfamily A, polypeptide 1
AF116620 SLC38A2 Neutral amino acid transporter 2
NM_004071 CLK1 CDC-like kinase 1
D28449 ID3 Inhibitor of DNA binding 3, dominant negative helix-loop-helix protein (13.0 kD)
NM_000319 PEX5 Peroxisomal biogenesis factor 5
NM_003513 HIST1H2AB Histone cluster 1, H2ab
NM_005911 MAT2A Methionine adenosyltransferase II, alpha
AF071569 CAMK2D calmodulin-dependent protein kinase II (56.4 kD)
AL110141 SNORD81 Putative protein (5.5 kD) (GAS5_)
NM_007144 PCGF2 Polycomb group ring finger 2
NM_004634 BRPF1 Bromodomain and PHD finger containing, 1
NM_020143 PNO1 Partner of NOB1 homolog (S. cerevisiae)
AF283645 SLC25A32 Solute carrier family 25, member 32
NM_001417 EIF4B Eukaryotic translation initiation factor 4B
NM_003299 HSP90B1 Heat shock protein 90kDa beta (Grp94), member 1
NM_002131 HMGA1 High mobility group AT-hook 1
NM_012484 HMMR Hyaluronan-mediated motility receptor (RHAMM)
NM_003017 SRSF3 Serine/arginine-rich splicing factor 3
NM_003075 SMARCC2 SWI/SNF related, matrix associated, subfamily c, member 2
NM_000466 PEX1 Peroxisome biogenesis factor 1
AF110265 EPS15L1 Epidermal growth factor receptor substrate 15-like 1 family member (94.3 kD)
NM_014175 MRPL15 Mitochondrial ribosomal protein L15
NM_018445 SELS Selenoprotein S
NM_014303 PES1 Pescadillo homolog 1, containing BRCT domain (zebrafish)
NM_018118 MCM3APAS MCM3AP antisense RNA (non-protein coding)
NM_016448 DTL Denticleless homolog (Drosophila)
NM_002913 RFC1 Replication factor C (activator 1) 1, 145kDa
Gene
ID
Gene
Abbr.
Gene Name
2 <r< 4
0.71 <r< 0.84
0.84 <r< 1.191.41 <r< 2
0.5 <r< 0.71
2 <r< 4
0.71 <r< 0.84
0.84 <r< 1.191.41 <r< 2
0.5 <r< 0.71

99
From the expression profiles, 22 genes were shown to be modulated by wild-type SK1
but had either no major change or opposite changes in their mRNA expression by SK1G82D,
suggesting that these genes that were specifically regulated by SK1 activity. Among these
genes, 13 genes were upregulated and 9 genes were downregulated specifically by SK1. The
genes that were upregulated were involved in cell proliferation and survival [TFRC (also known
as p90 and CD71) (O'Donnell et al., 2006; Habashy et al., 2010), DDX5 (Wortham et al.,
2009), MAT2A (Lu & Mato, 2008)], cell cycle and transcriptional regulation [FUS, (Buratti &
Baralle, 2010), SFPQ (also known as polypyrimidine tract binding protein associated splicing
factor) (Tapia-Paez et al., 2008), HIST1H1T (Grimes et al., 2003), BRPF1 (Ullah et al., 2008)],
transportation and biochemical pathways [B4GALNT1 (Dobrovic et al., 2011), CYP1A1
(Sergentanis & Economopoulos, 2010), SLC25A32 (Haitina et al., 2006), SELS (Olsson et al.,
2011)] and other, had unknown functions [U68, E1b (is also known as SNORA73A), RoScR].
On the other hand, genes associated with tumor-suppressor functions [MXI1 (Manni et al.,
2002), PCGF2 (is also known as MEL18) (Guo et al., 2007; Zhang et al., 2010)], cell cycle and
DNA replication [CDT1 (Nishitani & Lygerou, 2002), DTL (Sansam et al., 2006), RFC1 (Ryu
et al., 2006)], and transportation/lipid biosynthesis [RHOT1 (Fransson et al., 2006), SLC38A2
(Zhang et al., 2011), PEX1 (Wanders, 2004)] were significantly down-regulated.
Notably, it appears that the mRNA expression of U68 and TFRC were enhanced by
wild-type SK1, but repressed by SK1G82D, suggesting that these two genes were regulated by
SK1 activation. TFRC encodes for transferrin receptor 1 (TFR1) and is a cell membrane-
associated glycoprotein involved in regulation of cell growth (Daniels et al., 2006). U68
encodes for SNORA68, an H/ACA box class of small nucleolar RNAs (snoRNAs), and is
involved in cellular processes, such as protein synthesis, mRNA splicing and telomerase
function (Mallardo et al., 2008). Interestingly, both genes have been implicated in cancers. For
example, increased expression of TFR1 was detected in various human cancers (Helpman et al.,
2009; Wirth et al., 2006; Ha et al., 2009) and overexpression of TFR1 correlated with enhanced
resistance of breast cancer to tamoxifen (Habashy et al., 2010). Although snoRNAs have not
been widely studied like TFR1, dysregulation of various snoRNAs has also recently been
proposed to contribute to carcinogenesis (Liao et al., 2010). Thus, it is likely that these two
genes will have potential functional significance in SK1-mediated oncogenesis. SK1-induced
expression of TFR1 is examined in more detail in Chapter 4 of this thesis.

100
In addition to the potential genes regulated by SK1 activity, surprisingly, a considerable
number of genes encoding for heat shock proteins (HSPs), such as, HSPA8, HSPA5 (also
known as GRP78), HSPA1B, HSPH1, and HSP90B1 were elevated by both wild-type SK1 and
SK1G82D, suggesting that these genes could be regulated by SK1 protein independent of its
catalytic activity. HSPs are known to function as chaperones to assist in protein folding,
assembly, degradation and translocation (Li & Srivastava, 2004; Zhao & Houry, 2005; Jose-
Eneriz et al., 2008; Mellati, 2006). Interestingly, SK1 has been shown to be inherently unstable
(Pitson et al., 2000a), which may contribute to the large numbers of HSPs upregulated in the
SK1 arrays. However, recent studies have indicated that various high molecular weight HSPs,
for example, HSP70, HSP90 and HSP105, which were also identified in our arrays, are
overexpressed in a wide variety of human tumours (Onda et al., 2004; Park et al., 2009; Jose-
Eneriz et al., 2008; Muchemwa et al., 2008). Furthermore, high expression of several HSPs has
been shown to promote cancer cell proliferation and survival (Muchemwa et al., 2006; Huang
et al., 2009) and inhibition of HSPs by either genetic or chemotherapeutic approaches has been
shown to induce apoptosis in various cancer cells and reduce tumour growth in various
xenograft mouse models (Breinig et al., 2009; Tran et al., 2010; Sun et al., 2010b; Hosaka et
al., 2006; Ohba et al., 2010; Schwock et al., 2008; Cheung et al., 2010). Thus, it is possible that
enhanced HSPs induced by SK1 may be a true biological response of SK1 and not simply a
result of the presence of unfolded SK1 protein.
Since some of the main biological effects of elevated cellular SK1 levels are enhanced
cell survival and proliferation and induction of neoplastic transformation, various genes which
are known to be involved in cellular proliferation, survival and/or tumourigenesis were selected
for further confirmation studies. From this validation we identified five genes that were
differentially regulated by SK1, and not SK1G82D, suggesting that they are regulated by elevated
cellular SK1 activity. These were TFRC, RASD1, SFPQ, FUS and PCGF2. In agreement with
our microarray data, results from qPCR showed that FUS (Figure 3.5A) and SFPQ (Figure
3.5B) mRNA were significantly up-regulated, and PCGF2 (Figure 3.5C) mRNA was
significantly down-regulated at 6h following overexpression of SK1, but not SK1G82D. RASD1
mRNA was shown to be upregulated in SK2 arrays (see below), was also enhanced by SK1
(Figure 3.6A) although it was not one of the top 50 genes identified from the arrays. Notably,

101
we also demonstrated that TFR1 mRNA expression (Figure 3.6B) was up-regulated by wild-
type SK1 and down-regulated by SK1G82D consistent with the results from the microarray.

102
Figure 3.5 Validation of FUS, SFPQ and PCGF2 mRNA expression by SK1 versus
SK1G82D. QPCR analysis of (A) FUS [Fusion (involved in t(12;16) in malignant
liposarcoma)], (B) SFPQ [splicing factor proline/glutamine-rich (polypyrimidine tract
binding protein associated)] and (C) PCGF2 (polycomb group ring finger 2) in SK1 (●)
and SK1G82D (○) inducible cell lines at various time points following induction. The
expression of mRNA was normalized against the housekeeping gene glyceraldehyde
phosphate dehydrogenase (GAPDH). Data represent the mean (± range) from two
independent experiments, each analysed in triplicate (*P < 0.05 compared with
SK1G82D). Statistical significance was calculated by using an unpaired t test.

103
FU
S m
RN
A (
rela
tive
to
0h)
0 6 12 24
FU
S m
RN
A (
rela
tive
to 0
h)
0.0
0.5
1.0
1.5
2.0 *
A
Time after induction (h)
PC
GF
2 m
RN
A (
rela
tive
to
0h)
0 6 12 240.0
0.5
1.0
*
C
SF
PQ
mR
NA
(re
lati
ve t
o 0h
)
0 6 12 240.0
0.5
1.0
1.5
2.0
B
*
FU
S m
RN
A (
rela
tive
to
0h)
0 6 12 24
FU
S m
RN
A (
rela
tive
to 0
h)
0.0
0.5
1.0
1.5
2.0 *
A
FU
S m
RN
A (
rela
tive
to
0h)
0 6 12 24
FU
S m
RN
A (
rela
tive
to 0
h)
0.0
0.5
1.0
1.5
2.0 *
FU
S m
RN
A (
rela
tive
to
0h)
0 6 12 24
FU
S m
RN
A (
rela
tive
to 0
h)
0.0
0.5
1.0
1.5
2.0 *
0 6 12 24
FU
S m
RN
A (
rela
tive
to 0
h)
0.0
0.5
1.0
1.5
2.0 *
A
Time after induction (h)
PC
GF
2 m
RN
A (
rela
tive
to
0h)
0 6 12 240.0
0.5
1.0
*
C
Time after induction (h)
PC
GF
2 m
RN
A (
rela
tive
to
0h)
0 6 12 240.0
0.5
1.0
*
Time after induction (h)
PC
GF
2 m
RN
A (
rela
tive
to
0h)
0 6 12 240.0
0.5
1.0
*
0 6 12 240.0
0.5
1.0
*
C
SF
PQ
mR
NA
(re
lati
ve t
o 0h
)
0 6 12 240.0
0.5
1.0
1.5
2.0
B
*
SF
PQ
mR
NA
(re
lati
ve t
o 0h
)
0 6 12 240.0
0.5
1.0
1.5
2.0
B
*

104
Figure 3.6 Validation of RASD1 and TFR1 mRNA expression in SK1 versus
SK1G82D. QPCR analysis of (A) RASD1 (RAS, dexamethasone-induced 1) and (B)
TFR1 (transferrin receptor 1) in SK1 (●) and SK1G82D (○) inducible cell lines at various
times following induction. The expression of mRNA was normalized against the
housekeeping gene, GAPDH. Data represent the mean (± range) from two independent
experiments, each analysed in triplicate (*P < 0.05 compared with SK1G82D, **P < 0.01
compared with SK1G82D and ****P < 0.001 compared with SK1G82D). Statistical
significance was calculated by using an unpaired t test.
RA
SD
1 m
RN
A (
rela
tive
to
0h)
Time (h)
0 6 12 24
RA
DS
1 m
RN
A (
rela
tive
to 0
h)
0.0
0.5
1.0
1.5
2.0
A
******
Time after induction (h)
TFR
1 m
RN
A (
rela
tive
to
0h)
0 6 12 240.0
0.5
1.0
1.5
2.0
2.5 * *
B
RA
SD
1 m
RN
A (
rela
tive
to
0h)
Time (h)
0 6 12 24
RA
DS
1 m
RN
A (
rela
tive
to 0
h)
0.0
0.5
1.0
1.5
2.0
A
******
RA
SD
1 m
RN
A (
rela
tive
to
0h)
Time (h)
0 6 12 24
RA
DS
1 m
RN
A (
rela
tive
to 0
h)
0.0
0.5
1.0
1.5
2.0
A
******
Time after induction (h)
TFR
1 m
RN
A (
rela
tive
to
0h)
0 6 12 240.0
0.5
1.0
1.5
2.0
2.5 * *
B
Time after induction (h)
TFR
1 m
RN
A (
rela
tive
to
0h)
0 6 12 240.0
0.5
1.0
1.5
2.0
2.5 * *
TFR
1 m
RN
A (
rela
tive
to
0h)
0 6 12 240.0
0.5
1.0
1.5
2.0
2.5 * *
0 6 12 240.0
0.5
1.0
1.5
2.0
2.5 * *
B

105
SFPQ encodes for PSF (polypyrimidine tract-binding protein-associated splicing
factor), a nuclear protein implicated in transcription, DNA binding, unwinding, repair and pre-
mRNA splicing and RNA editing (Shav-Tal & Zipori, 2002). Similarly, the gene product of
FUS is also mainly a nuclear protein which was initially identified as a component of a fusion
pro-oncogene resulting from a chromosomal translocation seen in liposarcoma (Crozat et al.,
1993; Kanoe et al., 1999; Spitzer et al., 2011). Like SFPQ, FUS is involved in pre-mRNA
splicing and mRNA transport from nucleus to the cytoplasm (Buratti & Baralle, 2010; Yang et
al., 2010). Interestingly, both of these genes (FUS and SFPQ) have been reported to be
involved in several chromosomal translocation-mediated cancers (Tanaka et al., 2009; Hidalgo-
Curtis et al., 2008; Berg et al., 2009). TFR1 (encoded by TFRC) is overexpressed in a number
of solid tumours and leukemias (Habashy et al., 2010; Kukulj et al., 2010; Takahashi et al.,
2008; Boult et al., 2008; Singh et al., 2007; Brookes et al., 2006; Hogemann-Savellano et al.,
2003; Whitney et al., 1995; Ryschich et al., 2004), and PCGF2 has been shown to act as a
tumour suppressor gene (Guo et al., 2007). Thus, it is possible that up-regulation of FUS, SFPQ
or TFRC and down-regulation of PCGF2 by elevated SK1 expression may have functional
importance in SK1-induced tumourigenesis. The role of TFR1 in SK1-induced oncogenesis will
be further explored in Chapter 4 of this thesis. RASD1 encodes for a Ras family member and
was originally identified as a dexamethasone-inducible gene. Interestingly, although not
involved in chromosomal rearrangements, loss of RASD1 hetorozygosity is frequently detected
in human tumours (Vaidyanathan et al., 2004; Furuta et al., 2006; de Souza Rocha Simonini et
al., 2010), and epigenetic inactivation of RASD1 has been reported to promote tumour cell
growth and resistance of multiple melanoma cells to dexamethasone (Nojima et al., 2009).
Future studies may be to investigate whether SFPQ, FUS, PCGF2 and RASD1 play a role in
SK/S1P-mediated tumourigenesis.
Several lines of evidence also suggest a role of FUS in neurodegenerative diseases
(Lagier-Tourenne & Cleveland, 2009). Mutations of FUS have been found in amyotrophic
lateral sclerosis (ALS) which is a progressive neurodegenerative disease that affects nerve cells
in the brain and the spinal cord (Vance et al., 2009; Kwiatkowski et al., 2009; Ling et al.,
2010). FUS mainly localised to the nucleus due to its nuclear localisation signal (Dormann et
al., 2010), however abnormal FUS cytoplasmic redistribution forming inclusions consisting of
FUS, GRP78/BiP, p62 and ubiquitin in neurons and glial cells were normally observed in

106
patients with FUS mutations (Dormann et al., 2010). Interestingly, SK1/S1P appear to promote
glial cell proliferation, astrogliosis and the development of neurodegenerative diseases (Wu et
al., 2008a; Nayak et al., 2010; Lee et al., 2010). As SK1 is mainly cytoplasmic (Kohama et al.,
1998; Pitson et al., 2005), it is tempting to speculate that SK1/S1P could play a role in the
accumulation of FUS in the cytoplasm resulting in the formation of cytosolic aggregates in
neurons contributing to the pathological processes of neurodegenerative diseases. Therefore, it
would be interesting to examine any potential role of SK1/S1P in FUS-mediated
neurodegenerative diseases.
Recently, an involvement of SK/S1P in the pathogenesis of asthma has also been
suggested (Oskeritzian et al., 2007; Lai et al., 2011). For example, S1P levels are elevated in
the airways of asthma patients after allergen challenge and SK1 plays important roles in the
regulation of IL-13 induced MUC5A production via ERK1/2 signalling pathway, independent
of STAT6 phosphorylation (Kono et al., 2010). Asthma is characterized by increased STAT6
activity and IgE gene expression that are associated with an increase in histone
acetyltransferase and reduction in HDAC activities in the bronchi and alveolar macrophages
(Barnes et al., 2005). Intriguingly, a recent study suggest that SFPQ may have a protective role
in allergic diseases based on the fact that this protein can function as a repressor of STAT6-
mediated transcription through recruitment of HDAC complex, which resulted in reduction of
H3 acetylation at the promoter regions of IgE and inhibition of STAT6-mediated transcription
(Dong et al., 2011). Thus, future studies should examine the biological function of SFPQ in
SK/S1P mediated allergic diseases and whether this protein has any potential therapeutic
implications for SK-mediated allergic diseases.
Furthermore, expression of genes such as, HSPA5 (Figure 3.7A), CLK1 (Figure 3.7B),
IRS4 (Figure 3.7C), HSPA8 (Figure 3.7D), MANF (Figure 3.7E) and TNFRSF10D (Figure
3.7F) were enhanced while, genes like ZNF711 (Figure 3.8A) and TSC23D3 (Figure 3.8B)
were repressed by both wild-type SK1 and SK1G82D, demonstrating that these genes may be
regulated by SK1 independently of its catalytic activity. These observations may be due to non-
specific effects of protein overexpression, despite the use of low level overexpression. Previous
studies using similar inducible systems have shown that doxycycline (at 1 µg/ml) had no
appreciable effect on gene expression (Grigo et al., 2008; Tian et al., 2002; Thomas et al.,
2004; Darby et al., 2008). So, coupled with the fact that a very low concentration of

107
doxycycline (0.5ng/ml) was used to induce SK1 in the array experiments, this suggests that the
results are more likely to arise from non-catalytic effects of SK1 protein rather than non-
specific effects due to doxycycline. Other genes like PPP1R10 (Figure 3.9A), PCTK3 (Figure
3.9B) and EIF4B (Figure 3.9C) only had either modest changes or no major change by both
SK1 and SK1G82D.

108
Figure 3.7 Validation of HSPA5, CLK1, IRS4, HSPA8, MANF and TNFRSF10D
mRNA expression in SK1 versus SK1G82D. QPCR analysis of (A) HSPA5 [Heat shock
70kDa protein 5 (glucose-regulated protein, 78kDa)], (B) CLK1 (CDC-like kinase 1),
(C) IRS4 (insulin receptor substrate 4), (D) HSPA8 (heat shock 70kDa protein 8), (E)
MANF (mesencephalic astrocyte-derived neurotrophic factor) and (F) TNFRSF10D
(tumor necrosis factor receptor superfamily, member 10d, decoy with truncated death
domain) in SK1 (●) and SK1G82D (○) inducible cell lines at various time points
following. The expression of mRNA was normalized against the housekeeping gene,
GAPDH. Data represent the mean (± range) from two independent experiments, each
analysed in triplicate (*P < 0.05 compared with SK1G82D and **P < 0.01 compared with
SK1G82D). Statistical significance was calculated by using an unpaired t test.
IRS
4 m
RN
A (
rela
tive
to 0
h)
Time (h)
0 6 12 240.0
0.5
1.0
1.5
2.0
2.5
Time after induction (h)
HS
PA
8 m
RN
A (
rela
tive
to 0
h) 0 6 12 24
HS
PA
8 m
RN
A (
rela
tive
to 0
h)
0.0
0.5
1.0
1.5
2.0
2.5
3.0
3.5
4.0
A
C
E
B
D
HS
PA
5 m
RN
A (
rela
tive
to 0
h)
0 6 12 240.0
0.5
1.0
1.5
2.0
2.5
3.0 **
*
CLK
1 m
RN
A (
rela
tive
to 0
h)
Time (h)
0 6 12 240.0
0.5
1.0
1.5
2.0
MA
NF
mR
NA
(re
lativ
e to
0h)
Time (h)
0 6 12 24
AR
ME
T m
RN
A (
rela
tive
to 0
h)
0.0
0.5
1.0
1.5
2.0
2.5
3.0
TN
FR
SF
10D
mR
NA
(re
lativ
e to
0h)
0 6 12 24
TN
FR
SF
10D
mR
NA
(re
lativ
e to
0h)
0.0
0.5
1.0
1.5
2.0
2.5
3.0
3.5
F
Time after induction (h)
IRS
4 m
RN
A (
rela
tive
to 0
h)
Time (h)
0 6 12 240.0
0.5
1.0
1.5
2.0
2.5
Time after induction (h)
HS
PA
8 m
RN
A (
rela
tive
to 0
h) 0 6 12 24
HS
PA
8 m
RN
A (
rela
tive
to 0
h)
0.0
0.5
1.0
1.5
2.0
2.5
3.0
3.5
4.0
A
C
E
B
D
HS
PA
5 m
RN
A (
rela
tive
to 0
h)
0 6 12 240.0
0.5
1.0
1.5
2.0
2.5
3.0 **
*
CLK
1 m
RN
A (
rela
tive
to 0
h)
Time (h)
0 6 12 240.0
0.5
1.0
1.5
2.0
CLK
1 m
RN
A (
rela
tive
to 0
h)
Time (h)
0 6 12 240.0
0.5
1.0
1.5
2.0
MA
NF
mR
NA
(re
lativ
e to
0h)
Time (h)
0 6 12 24
AR
ME
T m
RN
A (
rela
tive
to 0
h)
0.0
0.5
1.0
1.5
2.0
2.5
3.0
TN
FR
SF
10D
mR
NA
(re
lativ
e to
0h)
0 6 12 24
TN
FR
SF
10D
mR
NA
(re
lativ
e to
0h)
0.0
0.5
1.0
1.5
2.0
2.5
3.0
3.5
F
Time after induction (h)

109
Figure 3.8 Validation of ZNF711 and TSC23D3 mRNA expression in SK1 versus
SK1G82D. QPCR analysis of (A) ZNF711 (Finger protein 711) and (B) TSC23D3
(TSC22 domain family, member 3) in SK1 (●) and SK1G82D (○) inducible cell lines at
various time points following induction. The expression of mRNA was normalized
against the housekeeping gene, GAPDH. Data represent the mean (± range) from two
independent experiments, each analysed in triplicate.
Time after induction (h)
TS
C22
D3
mR
NA
(re
lativ
e to
0h)
0 6 12 240.0
0.5
1.0
A
B
ZN
F71
1 m
RN
A (
rela
tive
to 0
h)
Time (h)
0 6 12 240.0
0.5
1.0
Time after induction (h)
TS
C22
D3
mR
NA
(re
lativ
e to
0h)
0 6 12 240.0
0.5
1.0
A
B
ZN
F71
1 m
RN
A (
rela
tive
to 0
h)
Time (h)
0 6 12 240.0
0.5
1.0

110
Figure 3.9 Validation of PPP1R10, PCTK3 and EIF4B mRNA expression in SK1
versus SK1G82D. QPCR analysis of (A) PPP1R10 (protein phosphatase 1 regulatory
(inhibitor) subunit 10), (B) PCTK3 (PCTAIRE protein kinase 3) and (C) EIF4B
(eukaryotic translation initiation factor 4B) in SK1 (●) and SK1G82D (○) inducible cell
lines at various time points following induction. The expression of mRNA was
normalized against the housekeeping gene, GAPDH. Data represent the mean (± range)
from two independent experiments, each analysed in triplicate.
PP
P1R
10 m
RN
A (
rela
tive
to 0
h)
0 6 12 240.0
0.5
1.0
1.5
A
C
B
Time after induction (h)
PC
TK
3 m
RN
A (
rela
tive
to 0
h)
Time (h)
0 6 12 24
PC
TK
3 m
RN
A (
rela
tive
to 0
h)
0.0
0.5
1.0
1.5
Time after induction (h)
EIF
4B m
RN
A (
rela
tive
to 0
h)
Time (h)
0 6 12 24
EIF
4B m
RN
A (
rela
tive
to 0
h)
0.0
0.5
1.0
1.5
PP
P1R
10 m
RN
A (
rela
tive
to 0
h)
0 6 12 240.0
0.5
1.0
1.5
PP
P1R
10 m
RN
A (
rela
tive
to 0
h)
0 6 12 240.0
0.5
1.0
1.5
A
C
B
Time after induction (h)
PC
TK
3 m
RN
A (
rela
tive
to 0
h)
Time (h)
0 6 12 24
PC
TK
3 m
RN
A (
rela
tive
to 0
h)
0.0
0.5
1.0
1.5
Time after induction (h)
PC
TK
3 m
RN
A (
rela
tive
to 0
h)
Time (h)
0 6 12 24
PC
TK
3 m
RN
A (
rela
tive
to 0
h)
0.0
0.5
1.0
1.5
Time after induction (h)
EIF
4B m
RN
A (
rela
tive
to 0
h)
Time (h)
0 6 12 24
EIF
4B m
RN
A (
rela
tive
to 0
h)
0.0
0.5
1.0
1.5
Time after induction (h)
EIF
4B m
RN
A (
rela
tive
to 0
h)
Time (h)
0 6 12 24
EIF
4B m
RN
A (
rela
tive
to 0
h)
0.0
0.5
1.0
1.5

111
3.4.2 Expression profiling of gene regulation by SK2
DNA microarrays using cells overexpressing SK2 were also performed to assess the
gene transcription profile regulated by this enzyme. Flp-In T-Rex HEK293 with
doxycyclin-inducible expression of SK2 were treated to induce approximately 6-fold higher
SK2 activity over endogenous levels. The cells were then harvested 6 h later, RNA extracted
and the gene expression profile compared to uninduced cells by DNA microarray. Figure 3.10
shows the volcano plot of genes that were differentially regulated following SK2 induction.
Somewhat surprisingly, the level of gene regulation identified in the SK2 array appears to be
generally higher than those observed in SK1 array. Like for SK1 analysis, additional microarray
experiments were performed using cells expressing comparable levels of a catalytically inactive
version of SK2, SK2G212D (Figure 3.11), in an attempt to eliminate non-specific (or specific)
protein effects of SK2 and identify gene regulation specifically induced by elevated cellular
SK2 activity. It appears that only a small number of genes were predominantly regulated by
active SK2 compared to the SK2G212D. These include UBE2D4 (encodes for a ubiquitin-
conjugating enzyme), RASD1, and genes involved in transport and metabolism [SLC16A9 (Illig
et al., 2010), CYP1A1 (Sergentanis & Economopoulos, 2010)], and transcriptional regulation
[WDR7 (Gu et al., 2011) and BRPF3 (Mishima et al., 2011)]. These genes were all upregulated
by wild-type SK2 but largely unaltered by expression of SK2G212D, suggesting that they were
regulated predominantly by SK2 activity. Interestingly, many of these genes appear to be
involved in nuclear processes (Mishima et al., 2011; Gu et al., 2011) which would be expected
as SK2 has been reported to localise in the nucleus and so this data further supports it potential
role(s) in the nucleus.

112
Figure 3.10 Differential expression of genes modulated by increased cellular SK2.
Volcano plot showing genes regulation by SK2 expression at 6 h subsequent to
induction.

113
Figure 3.11 Heat plot of differentially expressed genes by increased cellular SK2
versus SK2G212D. Heat plot of genes that showed differential regulation by cellular
expression of SK2 versus SK2G212D following 6 h induction. Genes shown in green
showed up-regulation, and those in red were down-regulated, while those that did not
show any change with respect to a normalized matched control are shown in black (see
color scale).

114
SK2G21
2D
SK2Gen
e ID
Gene
Abbr.
Gene NameS68954 MT1G Metallothionein 1G
X97261 MT1R Metallothionein 1R
NM_005953 MT2A Metallothionein 2A
NM_002450 MT1L Metallothionein 1L (gene/pseudogene)
NM_003746 DYNLL1 Dynein, light chain, LC8-type 1
AB033091 SLC39A10 Solute carrier family 39 (zinc transporter), member 10
NM_012068 ATF5 Activating transcription factor 5
NM_006597 HSPA8 Heat shock 70kDa protein 8
NM_004071 CLK1 CDC-like kinase 1
NM_005066 SFPQ Splicing factor proline/glutamine-rich
NM_006441 MTHFS 5,10-methenyltetrahydrofolate synthetase
AK022581 WDR75 WD repeat domain 75 family member
U69645 ZNF32 Zinc finger protein 32
X56465 ZNF711 Finger protein 711
AK001102 HEMBB CDNA FLJ10240 fis, clone HEMBB1000591
NM_016539 SIRT6 Sirtuin 6
NM_015983 UBE2D4 Ubiquitin-conjugating enzyme E2D 4
NM_005762 TRIM28 Tripartite motif-containing 28
AB046857 NCOA5 Nuclear receptor coactivator 5
NM_016084 RASD1 RAS, dexamethasone-induced 1
AL122071 SLC16A9 solute carrier family 16, member 9
AF216292 HSPA5 heat shock 70kDa protein 5 (glucose-regulated protein, 78kDa)
NM_001539 DNAJA1 DnaJ (Hsp40) homolog, subfamily A, member 1
NM_003544 HIST1H4B Histone cluster 1, H4bm
NM_003529 HIST1H3A Histone cluster 1, H3a
AB046781 UACA Uveal autoantigen like family member
NM_012437 SNAPIN SNAP-associated protein
NM_003418 CNBP CCHC-type zinc finger, nucleic acid binding protein
NM_014175 MRPL15 Mitochondrial ribosomal protein L15
AK026208 C2orf47 Chromosome 2 open reading frame 47
AB033118 ZDHHC8 Zinc finger, DHHC-type containing 8
K03191 CYP1A1 Cytochrome P450, family 1, subfamily A, polypeptide 1
AK022860 WDR77 cDNA FLJ12798 fis, clone NT2RP2002076
NM_001983 ERCC1 Excision repair cross-complementing, group 1
D31885 RPS15A ADP-ribosylation factor-like protein 1
NM_016274 PLEKHO1 Pleckstrin homology domain containing, family O member 1
NM_017503 SURF2 Surfeit 2
AF113007 METTL7A Methyltransferase like 7A
NM_013293 TRA2A Transformer-2 alpha (TRA2A)
AB033112 BRPF3 Bromodomain and PHD finger containing, 3
AK026783 N/A CDNA: FLJ23130 fis, clone LNG08419
AB011099 SUSD5 Sushi domain containing 5
NM_006325 RAN RAN, member RAS oncogene family
NM_001383 DPH1 DPH1 homolog (S. cerevisiae)
D63487 TTLL12 Tubulin tyrosine ligase-like family, member 12
NM_032727 LNG08419 Internexin neuronal intermediate filament protein, alpha
NM_006601 PTGES3 Prostaglandin E synthase 3
NM_002266 KPNA2 Karyopherin alpha 2 (RAG cohort 1, importin alpha 1)
NM_005903 SMAD5 SMAD family member 5
AB040887 SCAPER Zinc finger protein 291 CRA c family member
2 <r< 4
0.71 <r< 0.84
0.84 <r< 1.191.41 <r< 2
0.5 <r< 0.71
4 <r< 10
0.25 <r< 0.5
2 <r< 4
0.71 <r< 0.84
0.84 <r< 1.191.41 <r< 2
0.5 <r< 0.71
4 <r< 10
0.25 <r< 0.5

115
3.4.3 Analysis of differential gene regulation by SK1 and SK2
When comparing of genes differentially regulated by SK2 versus SK1 (Figure 3.12),
various genes particularly those encoded for metallothioneins (MTs) [MT1G, MT1R, MT2A and
MT1L] were upregulated specifically by both active and inactive SK2. MTs are low-molecular
weight metal-binding proteins that bind excess heavy metal ions (in particular copper and zinc)
and thus play an important role in protection against toxic heavy metals and to maintain
homeostasis of essential trace metals (Cherian et al., 2003; Thirumoorthy et al., 2007; Nielsen
et al., 2007). Interestingly, like SK2, MT appears to have two faces in tumourigenesis which
will be further discussed in Chapter 5.2. Interestingly, when SK1 was compared against SK2
(Figure 3.13), genes encoding for SNORA68, TFR1, SNORA73A, 5S ribosomal RNA, and Ro
small cytoplasmic ribonucleoproteins appeared to be upregulated exclusively by active SK1.
Furthermore, gene candidates like HSPA8, CLK1, SFPQ, RASD1, HSPA5, FUS, ZNF711,
TSC23D3, and HIST1H2AB, previously shown to be differentially regulated by SK1, were also
regulated in the SK2 arrays. From the microarray validation using qPCR, two of the identified
gene candidates appear to be moderately up-regulated mainly by SK2 activity. These genes
were RASD1 (Figure 3.14A) and FUS (Figure 3.14B). Other genes including SFPQ (Figure
3.14.C), CLK1 (Figure 3.15A) and HSPA8 (Figure 3.15B), which were up-regulated by
overexpression of both active and in-active SK1 were also up-regulated by both active and
inactive SK2. Although it appears that the two SK isoforms have different subcellular
localisations (Pitson et al., 2005; Igarashi et al., 2003a; Maceyka et al., 2005b; Ding et al.,
2007), they generate the same product. Therefore, it is not surprising that various genes appear
to be regulated specifically by either SK1 or SK2 or by both enzymes. Future studies aim to
examine the potential role(s) of these regulated genes in mediating the biological functions of
these two SK isoforms.

116
Figure 3.12 Heat plot of differentially expressed genes by cellular SK2 versus SK1,
SK2G212D and SK1G82D. Heat plot of genes that showed differential expression by SK2
versus SK1, SK2G212D and SK1G82D following 6 h induction. Genes shown in green
showed up-regulation, and those in red were down-regulated, while those that did not
show any change with respect to a normalized matched control are shown in black (see
color scale).

117
SK2SK1
Gene
ID
Gene
Abbr.
Gene Name SK2G21
2D
SK1G82
D
S68954 MT1G Metallothionein MT-1g isoform
X97261 MT1R Metallothionein 1R
NM_005953 MT2A Metallothionein 2A (MT2A)
NM_002450 MT1L Metallothionein 1L (MT1L)
NM_003746 DYNLL1 Dynein, light chain, LC8-type 1 (DYNLL1)
AB033091 SLC39A10 Solute carrier family 39 (zinc transporter), member 10 (SLC39A10)
NM_012068 ATF5 Activating transcription factor 5
NM_006597 HSPA8 Heat shock 70kDa protein 8 (HSPA8)
NM_004071 CLK1 CDC-like kinase 1
NM_005066 SFPQ Splicing factor proline/glutamine-rich (SFPQ)
NM_006441 MTHFS MTHFS
AK022581 WDR75 WD repeat domain 75
U69645 ZNF32 Zinc finger protein 32 (ZNF32 )
X56465 ZNF711 Zinc finger transcription factor (Znf6)
AK001102 HEMBB CDNA FLJ10240 fis, clone HEMBB1000591
NM_016539 SIRT6 Sirtuin 6 (SIRT6)
NM_015983 UBE2D4 Ubiquitin-conjugating enzyme E2D 4 (UBE2D4)
NM_005762 TRIM28 Tripartite motif-containing 28 (TRIM28)
AB046857 NCOA5 Nuclear receptor coactivator 5 (NCOA5)
NM_016084 RASD1 RAS, dexamethasone-induced 1(RASD1)
AL122071 SLC16A9 Solute carrier family 16, member 9 (SLC16A9)
AF216292 HSPA5 Heat shock 70kDa protein 5 (HSPA5)
NM_001539 DNAJA1 DnaJ (Hsp40) homolog, subfamily A, member 1 (DNAJA1)
NM_003544 HIST1H4B Histone cluster 1, H4bm (HIST1H4B)
NM_003529 HIST1H3A Histone cluster 1, H3a (HIST1H3A)
AB046781 UACA UACA
NM_012437 SNAPIN SNAP-associated protein (SNAPIN)
NM_003418 CNBP CCHC-type zinc finger, nucleic acid binding protein (CNBP)
NM_014175 MRPL15 Mitochondrial ribosomal protein L15 (MRPL15)
AK026208 C2orf47 Chromosome 2 open reading frame 47 (C2orf47)
AB033118 ZDHHC8 Zinc finger, DHHC-type containing 8 (ZDHHC8)
K03191 CYP1A1 Cytochrome P450, family 1, subfamily A, polypeptide 1 (CYP1A1 )
AK022860 WDR77 WD repeat domain 77 (WDR77)
NM_001983 ERCC1 ERCC1
D31885 RPS15A ADP-ribosylation factor-like 6 interacting protein 1 (ARL6IP1)
NM_016274 PLEKHO1 PLEKHO1
NM_017503 SURF2 Surfeit 2 (SURF2)
AF113007 METTL7A Methyltransferase like 7A (METTL7A)
NM_013293 TRA2A Transformer-2 alpha (TRA2A)
AB033112 BRPF3 Bromodomain and PHD finger containing, 3 (BRPF3)
AK026783 LNG08419 CDNA: FLJ23130 fis, clone LNG08419
AB011099 SUSD5 Sushi domain containing 5 (SUSD5)
NM_006325 RAN RAN, member RAS oncogene family (RAN)
NM_001383 DPH1 DPH1 homolog (DPH1)
D63487 TTLL12 Tubulin tyrosine ligase-like family, member 12 (TTLL12)
NM_004692 INA Internexin neuronal intermediate filament protein, alpha (INA)
NM_006601 PTGES3 Prostaglandin E synthase 3 (PTGES3)
NM_002266 KPNA2 Karyopherin alpha 2 (KPNA2)
NM_005903 SMAD5 SMAD family member 5 (SMAD5)
AB040887 SCAPER S phase cyclin A-associated protein in the ER (SCAPER)
SK1Gen
e ID
Gene
Abbr.
Gene Name SK2G21
2D
SK1G82
D
S68954 MT1G Metallothionein MT-1g isoform
X97261 MT1R Metallothionein 1R
NM_005953 MT2A Metallothionein 2A (MT2A)
NM_002450 MT1L Metallothionein 1L (MT1L)
NM_003746 DYNLL1 Dynein, light chain, LC8-type 1 (DYNLL1)
AB033091 SLC39A10 Solute carrier family 39 (zinc transporter), member 10 (SLC39A10)
NM_012068 ATF5 Activating transcription factor 5
NM_006597 HSPA8 Heat shock 70kDa protein 8 (HSPA8)
NM_004071 CLK1 CDC-like kinase 1
NM_005066 SFPQ Splicing factor proline/glutamine-rich (SFPQ)
NM_006441 MTHFS MTHFS
AK022581 WDR75 WD repeat domain 75
U69645 ZNF32 Zinc finger protein 32 (ZNF32 )
X56465 ZNF711 Zinc finger transcription factor (Znf6)
AK001102 HEMBB CDNA FLJ10240 fis, clone HEMBB1000591
NM_016539 SIRT6 Sirtuin 6 (SIRT6)
NM_015983 UBE2D4 Ubiquitin-conjugating enzyme E2D 4 (UBE2D4)
NM_005762 TRIM28 Tripartite motif-containing 28 (TRIM28)
AB046857 NCOA5 Nuclear receptor coactivator 5 (NCOA5)
NM_016084 RASD1 RAS, dexamethasone-induced 1(RASD1)
AL122071 SLC16A9 Solute carrier family 16, member 9 (SLC16A9)
AF216292 HSPA5 Heat shock 70kDa protein 5 (HSPA5)
NM_001539 DNAJA1 DnaJ (Hsp40) homolog, subfamily A, member 1 (DNAJA1)
NM_003544 HIST1H4B Histone cluster 1, H4bm (HIST1H4B)
NM_003529 HIST1H3A Histone cluster 1, H3a (HIST1H3A)
AB046781 UACA UACA
NM_012437 SNAPIN SNAP-associated protein (SNAPIN)
NM_003418 CNBP CCHC-type zinc finger, nucleic acid binding protein (CNBP)
NM_014175 MRPL15 Mitochondrial ribosomal protein L15 (MRPL15)
AK026208 C2orf47 Chromosome 2 open reading frame 47 (C2orf47)
AB033118 ZDHHC8 Zinc finger, DHHC-type containing 8 (ZDHHC8)
K03191 CYP1A1 Cytochrome P450, family 1, subfamily A, polypeptide 1 (CYP1A1 )
AK022860 WDR77 WD repeat domain 77 (WDR77)
NM_001983 ERCC1 ERCC1
D31885 RPS15A ADP-ribosylation factor-like 6 interacting protein 1 (ARL6IP1)
NM_016274 PLEKHO1 PLEKHO1
NM_017503 SURF2 Surfeit 2 (SURF2)
AF113007 METTL7A Methyltransferase like 7A (METTL7A)
NM_013293 TRA2A Transformer-2 alpha (TRA2A)
AB033112 BRPF3 Bromodomain and PHD finger containing, 3 (BRPF3)
AK026783 LNG08419 CDNA: FLJ23130 fis, clone LNG08419
AB011099 SUSD5 Sushi domain containing 5 (SUSD5)
NM_006325 RAN RAN, member RAS oncogene family (RAN)
NM_001383 DPH1 DPH1 homolog (DPH1)
D63487 TTLL12 Tubulin tyrosine ligase-like family, member 12 (TTLL12)
NM_004692 INA Internexin neuronal intermediate filament protein, alpha (INA)
NM_006601 PTGES3 Prostaglandin E synthase 3 (PTGES3)
NM_002266 KPNA2 Karyopherin alpha 2 (KPNA2)
NM_005903 SMAD5 SMAD family member 5 (SMAD5)
AB040887 SCAPER S phase cyclin A-associated protein in the ER (SCAPER)
2 <r< 4
0.71 <r< 0.84
0.84 <r< 1.191.41 <r< 2
0.5 <r< 0.71
4 <r< 10
0.25 <r< 0.5
2 <r< 4
0.71 <r< 0.84
0.84 <r< 1.191.41 <r< 2
0.5 <r< 0.71
4 <r< 10
0.25 <r< 0.5

118
Figure 3.13 Heat plot of differentially expressed genes by SK1 versus SK2, SK1G82D
and SK2G212D. Heat plot of differentially expressed genes by cellular SK1 versus SK2,
SK1G82D and SK2G212D following 6 h induction. Genes shown in green showed up-
regulation, and those in red were down-regulated, while those that did not show any
change with respect to a normalized matched control are shown in black (see color
scale).

119
Gene
ID
Gene A
bbr.
Gene Name SK1SK2
SK2G21
2D
SK1G82
D
NM_006597 HSPA8 Heat shock 70kDa protein 8
AF216292 HSPA5 Heat shock 70kDa protein 5
Y11162 U68 U68 small nucleolar RNA
NM_006010 MANF Mesencephalic astrocyte-derived neurotrophic factor
NM_005346 HSPA1B Heat shock 70kDa protein 1B
NM_004960 FUS Fused in sarcoma
NM_003234 TFRC Transferrin receptor
NM_018371 CSGALNACT1 Chondroitin sulfate N-acetylgalactosaminyltransferase 1
NM_003840 TNFRSF10D Tumor necrosis factor receptor superfamily, member 10d
U12210 E1b Small nucleolar RNA (E1b)
NM_018307 RHOT1 Ras homolog gene family, member T1
NM_004089 TSC22D3 TSC22 domain family, member 3
NM_005066 SFPQ Splicing factor proline/glutamine-rich
AL161977 PCTK3 PCTAIRE protein kinase 3
NM_004396 DDX5 DEAD (Asp-Glu-Ala-Asp) box polypeptide 5
K01564 RoScR Ro small cytoplasmic ribonucleoproteins
NM_005323 HIST1H1T Histone cluster 1, H1t
AF070552 CDT1 Chromatin licensing and DNA replication factor 1
NM_003746 DYNLL1 Dynein, light chain, LC8-type 1
NM_005962 MXI1 MAX interactor 1
NM_006644 HSPH1 Heat shock 105kDa/110kDa protein 1
AK025862 HSP90B1 Heat shock protein 90kDa beta (Grp94), member 1
V00589 5SrRNA 5S ribosomal RNA
K03191 CYP1A1 Cytochrome P450, family 1, subfamily A, polypeptide 1
AF116620 SLC38A2 Neutral amino acid transporter 2
NM_004071 CLK1 CDC-like kinase 1
D28449 ID3 Inhibitor of DNA binding 3, dominant negative helix-loop-helix protein (13.0 kD)
NM_000319 PEX5 Peroxisomal biogenesis factor 5
NM_003513 HIST1H2AB Histone cluster 1, H2ab
NM_005911 MAT2A Methionine adenosyltransferase II, alpha
AF071569 CAMK2D calmodulin-dependent protein kinase II (56.4 kD)
AL110141 SNORD81 Putative protein (5.5 kD) (GAS5_)
NM_007144 PCGF2 Polycomb group ring finger 2
NM_004634 BRPF1 Bromodomain and PHD finger containing, 1
NM_020143 PNO1 Partner of NOB1 homolog (S. cerevisiae)
AF283645 SLC25A32 Solute carrier family 25, member 32
NM_001417 EIF4B Eukaryotic translation initiation factor 4B
NM_003299 HSP90B1 Heat shock protein 90kDa beta (Grp94), member 1
NM_002131 HMGA1 High mobility group AT-hook 1
NM_012484 HMMR Hyaluronan-mediated motility receptor (RHAMM)
NM_003017 SRSF3 Serine/arginine-rich splicing factor 3
NM_003075 SMARCC2 SWI/SNF related, matrix associated, subfamily c, member 2
NM_000466 PEX1 Peroxisome biogenesis factor 1
AF110265 EPS15L1 Epidermal growth factor receptor substrate 15-like 1 family member (94.3 kD)
NM_014175 MRPL15 Mitochondrial ribosomal protein L15
NM_018445 SELS Selenoprotein S
NM_014303 PES1 Pescadillo homolog 1, containing BRCT domain (zebrafish)
NM_018118 MCM3APAS MCM3AP antisense RNA (non-protein coding)
NM_016448 DTL Denticleless homolog (Drosophila)
NM_002913 RFC1 Replication factor C (activator 1) 1, 145kDa
Gene
ID
Gene A
bbr.
Gene Name SK1SK2
SK2G21
2D
SK1G82
D
NM_006597 HSPA8 Heat shock 70kDa protein 8
AF216292 HSPA5 Heat shock 70kDa protein 5
Y11162 U68 U68 small nucleolar RNA
NM_006010 MANF Mesencephalic astrocyte-derived neurotrophic factor
NM_005346 HSPA1B Heat shock 70kDa protein 1B
NM_004960 FUS Fused in sarcoma
NM_003234 TFRC Transferrin receptor
NM_018371 CSGALNACT1 Chondroitin sulfate N-acetylgalactosaminyltransferase 1
NM_003840 TNFRSF10D Tumor necrosis factor receptor superfamily, member 10d
U12210 E1b Small nucleolar RNA (E1b)
NM_018307 RHOT1 Ras homolog gene family, member T1
NM_004089 TSC22D3 TSC22 domain family, member 3
NM_005066 SFPQ Splicing factor proline/glutamine-rich
AL161977 PCTK3 PCTAIRE protein kinase 3
NM_004396 DDX5 DEAD (Asp-Glu-Ala-Asp) box polypeptide 5
K01564 RoScR Ro small cytoplasmic ribonucleoproteins
NM_005323 HIST1H1T Histone cluster 1, H1t
AF070552 CDT1 Chromatin licensing and DNA replication factor 1
NM_003746 DYNLL1 Dynein, light chain, LC8-type 1
NM_005962 MXI1 MAX interactor 1
NM_006644 HSPH1 Heat shock 105kDa/110kDa protein 1
AK025862 HSP90B1 Heat shock protein 90kDa beta (Grp94), member 1
V00589 5SrRNA 5S ribosomal RNA
K03191 CYP1A1 Cytochrome P450, family 1, subfamily A, polypeptide 1
AF116620 SLC38A2 Neutral amino acid transporter 2
NM_004071 CLK1 CDC-like kinase 1
D28449 ID3 Inhibitor of DNA binding 3, dominant negative helix-loop-helix protein (13.0 kD)
NM_000319 PEX5 Peroxisomal biogenesis factor 5
NM_003513 HIST1H2AB Histone cluster 1, H2ab
NM_005911 MAT2A Methionine adenosyltransferase II, alpha
AF071569 CAMK2D calmodulin-dependent protein kinase II (56.4 kD)
AL110141 SNORD81 Putative protein (5.5 kD) (GAS5_)
NM_007144 PCGF2 Polycomb group ring finger 2
NM_004634 BRPF1 Bromodomain and PHD finger containing, 1
NM_020143 PNO1 Partner of NOB1 homolog (S. cerevisiae)
AF283645 SLC25A32 Solute carrier family 25, member 32
NM_001417 EIF4B Eukaryotic translation initiation factor 4B
NM_003299 HSP90B1 Heat shock protein 90kDa beta (Grp94), member 1
NM_002131 HMGA1 High mobility group AT-hook 1
NM_012484 HMMR Hyaluronan-mediated motility receptor (RHAMM)
NM_003017 SRSF3 Serine/arginine-rich splicing factor 3
NM_003075 SMARCC2 SWI/SNF related, matrix associated, subfamily c, member 2
NM_000466 PEX1 Peroxisome biogenesis factor 1
AF110265 EPS15L1 Epidermal growth factor receptor substrate 15-like 1 family member (94.3 kD)
NM_014175 MRPL15 Mitochondrial ribosomal protein L15
NM_018445 SELS Selenoprotein S
NM_014303 PES1 Pescadillo homolog 1, containing BRCT domain (zebrafish)
NM_018118 MCM3APAS MCM3AP antisense RNA (non-protein coding)
NM_016448 DTL Denticleless homolog (Drosophila)
NM_002913 RFC1 Replication factor C (activator 1) 1, 145kDa
2 <r< 4
0.71 <r< 0.84
0.84 <r< 1.191.41 <r< 2
0.5 <r< 0.71
4 <r< 10
0.25 <r< 0.5
2 <r< 4
0.71 <r< 0.84
0.84 <r< 1.191.41 <r< 2
0.5 <r< 0.71
4 <r< 10
0.25 <r< 0.5

120
Figure 3.14 Validation of RASD1, FUS and SFPQ mRNA expression in SK2 versus
SK2G212D. QPCR analysis of (A) RASD1, (B) FUS and (C) SFPQ in cells induced to
express SK2 and SK2G212D inducible cell lines at various time points following
induction. The expression of mRNA was normalized against the housekeeping gene,
GAPDH. Data represent the mean (± range) from two independent experiments, each
analysed in triplicate (*P < 0.05 compared with SK1G82D). Statistical significance was
calculated by using an unpaired t test.

121
Time after induction (h)
SF
PQ
mR
NA
(re
lativ
e to
0h)
Time (h)
0 6 12 240.0
0.5
1.0
1.5
2.0
A
B
C
RA
SD
1 m
RN
A (
rela
tive
to 0
h)
0 6 12 240.0
0.5
1.0
1.5
2.0
FU
S m
RN
A (
rela
tive
to 0
h)
0 6 12 240.0
0.5
1.0
1.5 *
Time after induction (h)
SF
PQ
mR
NA
(re
lativ
e to
0h)
Time (h)
0 6 12 240.0
0.5
1.0
1.5
2.0
Time after induction (h)
SF
PQ
mR
NA
(re
lativ
e to
0h)
Time (h)
0 6 12 240.0
0.5
1.0
1.5
2.0
A
B
C
RA
SD
1 m
RN
A (
rela
tive
to 0
h)
0 6 12 240.0
0.5
1.0
1.5
2.0
RA
SD
1 m
RN
A (
rela
tive
to 0
h)
0 6 12 240.0
0.5
1.0
1.5
2.0
FU
S m
RN
A (
rela
tive
to 0
h)
0 6 12 240.0
0.5
1.0
1.5 *

122
Figure 3.15 Validation of CLK1 and HSPA8 mRNA expression in SK2 versus
SK1G212D. QPCR analysis of (A) CLK1 and (B) HSPA8 in SK2 and SK2G212D inducible
cell lines at various times following induction. The expression of mRNA was
normalized against the housekeeping gene, GAPDH. Data represent the mean (± range)
from two independent experiments, each analysed in triplicate.
CLK
1 m
RN
A (
rela
tive
to
0h)
0 6 12 24
CLK
1 m
RN
A (
rela
tive
to 0
h)
0.0
0.5
1.0
1.5
2.0
Time after induction (h)
HS
PA
8 m
RN
A (
rela
tive
to
0h)
Time (h)
0 6 12 240.0
0.5
1.0
1.5
2.0
A
B
CLK
1 m
RN
A (
rela
tive
to
0h)
0 6 12 24
CLK
1 m
RN
A (
rela
tive
to 0
h)
0.0
0.5
1.0
1.5
2.0
CLK
1 m
RN
A (
rela
tive
to
0h)
0 6 12 24
CLK
1 m
RN
A (
rela
tive
to 0
h)
0.0
0.5
1.0
1.5
2.0
Time after induction (h)
HS
PA
8 m
RN
A (
rela
tive
to
0h)
Time (h)
0 6 12 240.0
0.5
1.0
1.5
2.0
Time after induction (h)
HS
PA
8 m
RN
A (
rela
tive
to
0h)
Time (h)
0 6 12 240.0
0.5
1.0
1.5
2.0
A
B

123
3.4.4 MiRNA regulation by SK1
MicroRNAs are small, non-coding, regulatory RNAs of about 21-25 nucleotides in
length that are expressed in animals, plants and viruses (Huang et al., 2011; Zhang et al., 2007;
Meltzer, 2005; Pfeffer & Voinnet, 2006; Anglicheau et al., 2010). MiRNAs are expressed as
long precursor RNAs that are processed by a cellular nuclease, Drosha, before being
transported by an Exportin-5-dependent mechanism into the cytoplasm. Once in the cytoplasm,
miRNAs are cleaved further by the enzyme DICER and the resulting 21-25 nucleotide miRNA
can post-transcriptionally regulate gene expression by either inhibiting mRNA translation or
inducing mRNA degradation, and participate in a wide variety of physiological and
pathological cellular processes, such as, cell differentiation, development, proliferation and
progression of human diseases (Zeng, 2006; O'Connell et al., 2010; Pauley et al., 2009;
Carissimi et al., 2009). While altered expression of miRNAs has been implicated in a number
of different diseases including cardiovascular diseases (Chen et al., 2011; Fukushima et al.,
2011; Huang et al., 2010), diabetes (Zampetaki et al., 2010; Donnem et al., 2011),
neurodegenerative diseases (Haramati et al., 2010; Wang et al., 2010b), autoimmune diseases
(Ha, 2011; Thamilarasan et al., 2012; Leng et al., 2011) and viral infection (Roberts et al.,
2011; Lu et al., 2010; Carpio et al., 2010), the most studied role of miRNA is in
tumourigenesis. Considerable evidence now exists, supporting a role for dysregulation of
miRNAs in the initiation and progression of a wide range of human cancers (Wu et al., 2011;
Tsuchiya et al., 2011; Ueda et al., 2010; Sarver et al., 2010; Li et al., 2011b; Gregory et al.,
2008). Thus, in addition to gene regulation, it was also of interest to examine if SK1 was
involved in regulating miRNA expression.
Analysis of miRNA regulation in response to cellular SK1 expression was performed
using miRNA array technology. Again, SK1 expression was induced for 6 h in Flp-In T-
Rex HEK293 cells to achieve around 10-fold higher SK1 activity than endogenous levels,
RNA isolated, and then miRNA arrays were performed and compared to the miRNA expression
pattern of uninduced cells. Unfortunately, from the studies we were unable to identify any
miRNA which was significantly regulated by SK1 expression. While this may suggest that SK1
does not play a role in miRNA regulation, it should be noted that these initial miRNA arrays
were performed using only one condition, where SK1 was overexpressed at a moderate level
slightly higher than that of endogenous levels for 6 h. Notably, recent findings from other

124
miRNA array studies using similar doxycycline-inducible expression systems showed that high
overexpression of the transcription factor, E2F1, for 24h post induction led to consistent up-
regulation of miR-449a and miR-449b in both Saos2 and U2OS cells (Lize et al., 2010; He et
al., 2010a; Yang et al., 2009). Based on our array data and other miRNA array studies (Lize et
al., 2010; He et al., 2010a; Yang et al., 2009), it appears that higher and longer overexpression
of SK1 may be necessary to observe any potential miRNA regulation. Thus, future miRNA
array studies should be performed using inducible cell lines with higher and longer
overexpression of SK1 in order to thoroughly identify potential miRNA(s) involved in SK1-
mediated oncogenic effects.
3.5 CONCLUSIONS
In summary, we have elucidated a number of genes that were differentially regulated by
moderately increased SK expression via DNA microarray-based approaches. The fact that
several of the genes identified from the arrays have previously been shown to be dysregulated
in cell growth and survival further substantiates the success of our approach in identifying
down-stream targets mediated by SK-induced oncogenesis. As expected, we have identified
various genes that were regulated by either SK1 or SK2 or both enzymes. However, the most
significant finding was the identification of a number of gene candidates (TFR1, SFPQ, FUS,
PCGF2, and RASD1), which were regulated specifically by SK1 or SK2 activity. It is unclear
whether the molecular mechanism(s) driving the oncogenic pathways from each SK are the
same or different. From our initial data analysis, it appears that the expression levels of genes,
such as, RASD1 and FUS were up-regulated by both active SK enzymes suggesting that these
two enzymes could activate similar down-stream pathway(s) leading to oncogenesis. Future
experiments should include functional studies to further clarify the molecular mechanisms of
these gene candidates in oncogenic signalling by the two enzymes. Although no significant
miRNA regulation was observed from our arrays, it is still inconclusive whether miRNAs could
be regulated by SK since we only performed miRNA arrays with SK1 expression under one
condition. Thus, additional miRNA arrays should be performed in the future using optimized
conditions to gain a more accurate picture of miRNA regulation by SK.

125
4. CHAPTER 4: ACTIVATED SPHINGOSINE KINASE 1 INDUCES
TRANSFERRIN RECEPTOR 1 EXPRESSION TO PROMOTE CELL
PROLIFERATION, SURVIVAL AND NEOPLASTIC
TRANSFORMATION
4.1 ABSTRACT
Sphingosine kinase 1 (SK1) is a lipid kinase that catalyses the formation of sphingosine
1-phosphate (S1P). There is convincing evidence implicating elevated cellular SK1 in tumour
development and progression; notably the enhancement of cellular proliferation and survival,
induction of neoplastic transformation, and stimulation of angiogenesis. However, the specific
downstream pathways mediating this oncogenic signalling by SK1 are still poorly defined.
Here, we have demonstrated a novel mechanism whereby SK1 regulates cell survival and
proliferation through enhancing expression of transferrin receptor 1 (TFR1). We show that
elevated levels of SK1 enhanced total as well as cell-surface TFR1 expression resulting in
increased transferrin uptake into the cells. Notably, we also found that SK1 activation and
relocalisation to the plasma membrane, which are critical for its oncogenic effects, are
necessary for regulation of TFR1 expression specifically through engagement of the S1P G-
protein coupled receptor, S1P2. Furthermore, we show that blocking TFR1 function with a
neutralizing antibody inhibits SK1-induced cell proliferation, survival and neoplastic
transformation of NIH3T3 fibroblasts, suggesting that TFR1 plays an important role in SK1-
mediated oncogenesis.

126
4.2 INTRODUCTION
Sphingosine kinase 1 (SK1) catalyses the phosphorylation of sphingosine to sphingosine-
1-phosphate (S1P), a bioactive phospholipid that plays important roles in a wide variety of
cellular processes, including calcium mobilisation, cell proliferation, apoptosis, angiogenesis,
inflammatory responses and cytoskeletal rearrangement (Takabe et al., 2008). Elevated levels
of SK1/S1P have been shown to enhance cell survival and proliferation, and there is now
substantial evidence implicating an important role of SK1 in tumour development and
progression. This includes findings that SK1 expression is elevated in a variety of human
tumours (French et al., 2003b; Kawamori et al., 2006; Kawamori et al., 2009; Johnson et al.,
2005a; Bayerl et al., 2008; Facchinetti et al., 2010), high SK1 expression correlates with poor
survival of patients with a range of solid tumours (Van Brocklyn et al., 2005; Li et al., 2008a;
Ruckhaberle et al., 2008; Malavaud et al., 2010; Shirai et al., 2011; Liu et al., 2010),
dysregulation of SK1 plays a important role in both acute and chronic myeloid leukemia(Sobue
et al., 2008b; Ricci et al., 2009; Paugh et al., 2008; Bonhoure et al., 2008; Bonhoure et al.,
2006; Li et al., 2007; Le Scolan et al., 2005; Pitson et al., 2011), and overexpression of SK1 in
NIH 3T3 fibroblasts induces full neoplastic cell transformation (Xia et al., 2000). Furthermore,
targeting SK1 by genetic or pharmacological approaches has been shown to significantly
reduce tumour growth in mice (Kohno et al., 2006; Kawamori et al., 2009; Sinha et al., 2011)
and also sensitize tumour cells to radiation (Pchejetski et al., 2010; Sinha et al., 2011) and other
chemotherapeutics (Guillermet-Guibert et al., 2009; Pchejetski et al., 2005b; Baran et al., 2007;
Bonhoure et al., 2006; Bonhoure et al., 2008; Sauer et al., 2009).
Oncogenic signalling by SK1 has been previously shown to be dependent on both its
activation and translocation from the cytosol to the plasma membrane (Pitson et al., 2003;
Pitson et al., 2005). This localisation of SK1 to the plasma membrane appears to place the
enzyme into close proximity with its substrate and also enables localised production of S1P to
be either released from the cell to act on cell surface S1P receptors (S1PRs) (Johnson et al.,
2002; Pitson et al., 2005) or to regulate intracellular signalling targets (Strub et al., 2010; Hait
et al., 2009; Alvarez et al., 2010). However, the molecular mechanism(s) by which SK1 exerts
its oncogenic effects are yet to be elucidated. While early evidence suggested SK1 may
enhance cell survival and proliferation via mechanisms independent of S1PRs (Olivera et al.,
2003), considerable evidence now supports the notion of pro-survival and pro-proliferative

127
signalling by S1PRs (Leong & Saba, 2010; Radeff-Huang et al., 2004; Saddoughi et al., 2008).
These effects appear to be mediated primarily through Gi-mediated PI3K/Akt and ERK1/2
(Bonnaud et al., 2010; Kim et al., 2010; Schuppel et al., 2008; Harada et al., 2004; Yamada et
al., 2004) , although the specific downstream pathways which lead to SK1-mediated oncogenic
signalling are still poorly defined.
In this study, we have elucidated a novel mechanism whereby SK1 regulates cell survival
and proliferation through control of transferrin receptor 1 (TFR1) expression and function. We
show that elevated levels of SK1 enhanced both total and functional TFR1 expression resulting
in enhanced rates of transferrin (Tf) uptake into the cells. We also demonstrate that it is
specifically the phosphorylated, plasma membrane-localised, oncogenic form of SK1 that
mediates these effects on TFR1 expression via engagement of the S1P2 receptor. Furthermore,
we show that blocking TFR1 function with a neutralizing antibody inhibits SK1-induced cell
proliferation, survival and neoplastic transformation, suggesting that TFR1 plays an important
role in SK1-induced oncogenesis.
4.3 MATERIALS AND METHODS
4.3.1 Materials
Anti-human TFR1 antibodies for immunoblot analysis were from ZYMED®
Laboratories, neutralizing anti-human TFR1 [RVS10] and control antibodies were from Abcam
(Cambridge, MA), while LEAFTM purified anti-mouse TFR1 and isotype control antibodies
were purchased from Biolegend (San Diego, CA). Monoclonal α-tubulin [DM1A] and M2
anti-FLAG antibodies were from Abcam (Cambridge, UK) and Sigma, respectively. Alexa-488
conjugated anti-mouse IgG, alexa-594 conjugated anti-rabbit IgG and HRP-conjugated anti-
mouse IgG were purchased from Thermo Scientific (Rockford, CA). RNeasy columns,
Omniscript RT kit, and 2x Quantitect SYBR Green PCR Master Mix reagent were from Qiagen
(Valencia, CA). S1P, VPC-23019 and JTE-013 were purchased from Cayman Chemical (Ann
Arbor, MI). Tf-alexa 568 was from Molecular Probes (Eugene, OR). Poly-L-lysine was from
Sigma (St. Louis, MO).

128
4.3.2 Generation of expression constructs
Cell lines with tight doxycycline-inducible expression of SK1, SK2, SK1G82D and
SK1G212D were generated as previously described in Section 2.3.2 and 3.2.1. To generate
inducible cell lines for the non phosphorylatable human SK1 (SK1S225A), the cDNA of SK1S225A
with C-terminal FLAG epitope tag (Pitson et al., 2000a; Pitson et al., 2003) was cloned into
pcDNA5/FRT/TO-SK1-AU (Pham et al., 2008) by digestion with BamHI and NotI. The
expression construct for the constitutively plasma membrane-localised, non-phosphorylatable
SK1 (SK1pm-S225A; containing the N-terminal ten amino acids of the Lck tyrosine kinase that
results in myristoylation and dual palmitoylation) was produced by digesting human SK1pm-
S225A in pcDNA3 (Pitson et al., 2005) with HindIII and NotI, blunted with Pfu, and then cloned
into pcDNA5/FRT/TO-AU plasmid following digestion with EcoRV and NotI. Restriction
analyses were performed to verify the integrity of all cDNAs.
4.3.3 Cell culture and generation of stably transfected inducible HEK293 cell lines
Flp-In T-Rex HEK293 cells (Invitrogen) were cultured, transfected, selected to generate
stable cell lines, induced with doxycycline, and harvested as previously described in Section
2.3.3.
4.3.4 SK enzyme activity
SK activity specific for the two SK enzymes was measured as described previously in
Section 2.3.7. Assays were performed using sphingosine-solublised with Triton X-100 under
conditions that are largely selective for SK1, while assays for SK2 were performed with
sphingosine-solublised with fatty acid free BSA in assay buffer containing 1 M KCl specific for
SK2 activity (Pitman et al., 2012). One unit (U) of activity is defined as 1 pmol of S1P formed
per minute per mg of protein.
4.3.5 Western blot analysis
Samples containing equal protein concentrations were separated by SDS-PAGE using
12% acrylamide gels and transferred onto nitrocellulose membranes. Membranes were
generally blocked with PBS containing 5% (w/v) skim milk powder (SMP) and 0.1% (v/v)
Triton X-100. SK1, SK1S225A, SK1pm-S225A were detected via their FLAG-epitope tags with the

129
monoclonal M2 anti-FLAG antibody as described in Section 2.3.6. To detect TFR1, membranes
were blocked with PBS containing 5% (w/v) SMP and 0.2% (v/v) Tween-20 then incubated
with monoclonal anti-TFR1 antibody at 1:2500 in the same buffer for 1 hr at room temperature.
In most cases blots were washed and then re-probed with monoclonal anti-tubulin antibody at
1:5000 in PBS containing 0.1 % Tween-20 for 1 hr at room temperature for loading controls.
The immunocomplexes were detected with HRP-conjugated anti-mouse IgG using an enhanced
chemiluminescence kit (ECL, GE Healthcare) and LAS 4000 imager.
4.3.6 siRNA knock-down of S1P2
Cells were transfected with a pool of siRNA duplexes targeting human S1P2
(siGENOME SMARTpool siRNA D-003952-05; Dharmacon, Lafayette, CO) or control siRNA
(Dharmacon) using LipofectamineTM RNAiMAX reagent (Invitrogen) according to the
manufacturer’s protocol. The cells were incubated for 48 h to achieve maximum silencing
effects then subjected to 16 h induction of SK1 prior to harvesting for total RNA and protein.
The levels of SK1 activity were then determined by SK1 activity assays, TFR1 protein was
examined by Western blotting, and the expression of S1P2 was analysed by qPCR (see below).
4.3.7 Quantitative real-time PCR (qPCR)
QPCR analysis of human TFR1 was performed using RNA preparations from either
samples used in the microarray experiments or RNA samples prepared from subsequent
independent experiments using the same RNA extraction and qPCR procedure as detailed
earlier (Section 3.3.4). QPCR of S1P2 was performed under the same conditions using the
primers 5'-ACCATCGTGCTAGGCGTCT-3' and 5'-GTGGGCTTTGTAGAGGATCGG-3'
(Geneworks, Adelaide, Australia).
4.3.8 Immunofluorescence
For immunofluorescence analysis of cell surface TFR1 and total SK1 expression, cells
were plated onto poly-L-lysine coated cover slips, incubated for 24 h and then induced with
doxycycline for a further 16 h. The cells were then fixed for 15 min with 4% paraformaldehyde,
incubated in PBS with 2% BSA for 10 min to block any non-specific binding of antibodies in
later steps and then incubated with 2 ng/ml anti-TFR1 antibody [RVS10] in PBS with 2% BSA

130
for 1 h at room temperature. The cells were then washed thoroughly to remove any residual
TFR1 antibody, permeabilised with 0.1% TritonX-100 in PBS for 15 min, and then incubated
with affinity purified polyclonal anti-SK1 antibodies (from Section 2.3.4) at 1:1000 in PBS
containing 2% BSA and 0.1% Triton X-100 for 1 h at room temperature. The
immunocomplexes were detected with alexa-488 conjugated anti-mouse IgG (for TFR1) or
alexa-594 conjugated anti-rabbit IgG (for SK1). Cover slips were mounted with Dako
Fluorescent Mounting Medium. Membrane TFR1 and total SK1 were visualized using a 60X
water-immersion objective on an Olympus IX81 inverted microscope (Solent Scientific,
Segensworth, UK). Fluorescence intensity was quantified using AnalySIS Five Life Sciences
software (Olympus).
4.3.9 Transferrin (Tf) alexa 568 uptake assay
Tf uptake was determined with cells plated onto poly-L-lysine coated cover slips and
incubated for 24 h and then induced with doxycycline for a further 16 h. After induction, cells
were serum starved for 1 h, then incubated at 4 °C for 5 min to block any non-specific
internalization of Tf, and then incubated with 50 ng/ml of Tf alexa-568 for 30 min at 4 °C.
Unbound Tf was then removed by washing with cold serum free media and then cells at 0 min
point were immediately fixed for 15 min with 4% paraformaldehyde. The remaining cells were
chased in serum free media at 37 oC for 10 min, washed with cold serum free media and then
fixed in paraformaldehyde. Cover slips were mounted with Dako Fluorescent Mounting
Medium. Tf uptake was visualized via Fluorescence microscopy as described above (section
4.3.9).
4.3.10 Cell proliferation and apoptosis assays
Cell proliferation was determined with BrdU incorporation and cell death was measured
with DAPI staining as detailed earlier (Section 2.3.9).
4.3.11 Focus formation assays
NIH3T3 fibroblasts were cultured in DMEM with 10% FBS, 2 mM glutamine, 0.2%
(w/v) sodium bicarbonate, 1.2 mg/ml penicillin and 1.6 mg/ml streptomycin. For generation of
pooled stable cell lines, the cells were made with pcDNA3/IRES/EGFP or

131
pcDNA3/IRES/SK1(FLAG)/EGFP constructs which express EGFP alone or SK1 from the
CMV promoter and EGFP via an IRES, respectively. These constructs were previously
generated (Moretti & Pitson, unpublished) and transfected into cells using Lipofectamine
2000 reagent (Invitrogen) as described by the manufacturer. One day after transfection, the cells
were passaged and the medium was replaced with a selective medium containing 0.8 mg/ml
neomycin (G418) (Invitrogen) for 7 days with media and selection changed every 2-3 days.
Given that both of our constructs contained the enhanced green fluorescence protein (EGFP)
cDNA, cells expressing EGFP should, in theory, also express SK1. Thus, after a week of
selection the cells were sorted for EGFP expression using fluorescence associated cell sorter
(FACS), in an attempt to increase the likelihood of having pools of stable cells that would all
express SK1. For focus formation assays, selection was removed, and cells were seeded into
12-well plates, and then remaining cells were harvested for Western analysis to confirm the
expression of SK1. Cells were cultured for 3 weeks, with media replaced every 3-4 days in the
presence or either 10 µg/ml TFR1 neutralizing antibody or the corresponding isotype control
antibody. Foci were visualized after fixing with methanol and staining with 0.01% methyl
violet.
4.4 RESULTS
4.4.1 SK1-mediated changes in TFR1 mRNA and protein
Our initial microarray and subsequent validation studies demonstrated that low level
SK1 overexpression up-regulates TFR1 mRNA expression (Figure 3.6). We next investigated
whether SK1 regulates TFR1 expression in a dose-dependent manner. Cells were induced to
overexpress various levels of SK1 (Figure 4.1A) and then TFR1 mRNA expression was
measured 12 h later by qPCR. Interestingly, the results show that TFR1 expression varied
depending on the level of SK1 overexpression (Figure 4.1B). Increases in cellular SK1 activity
of around 12 to 20-fold over endogenous levels resulted in robust increases of TFR1 mRNA
expression. In contrast, however, TFR1 mRNA levels appeared unchanged at 35-fold
overexpression of SK1 and higher.

132
To further confirm that SK1 regulates TFR1 expression, we induced cells to express
around 20-fold higher SK1 activity over endogenous levels (Figure 4.2A), and then assessed
total cellular TFR1 protein levels by Western blotting, along with TFR1 mRNA by qPCR. The
results showed that enhanced SK1 activity resulted in a 2-fold increase in both TFR1 mRNA
(Figure 4.2B) and protein (Figure 4.2C) compared to the uninduced control cells.

133
Figure 4.1 SK1 increases TFR1 mRNA in a dose-responsive manner. SK1-AU
(SK1) inducible cells were cultured for 12 h in various concentrations of doxycycline.
Following induction, cells were harvested to isolate both (A) cell lysates for SK1
activity assays and total RNA for TFR1 qPCR analysis (B). Data are mean (± range) of
duplicate determinations from a single experiment, and are representative of results
obtained from two independent experiments.

134
B
TFR
1 m
RN
A (
rela
tive
to C
tl)
SK1 activity (fold change relative to Ctl)Ctl
6 352012 53 73 93 1021
0.5
1.0
1.5
0
SK1-AU EtOH
SK1-AU 2ng/mL
SK1-AU 3ng/mL
SK1-AU 4ng/mL
SK1-AU 4.5ng/mL
SK1-AU 5ng/mL
SK1-AU 6ng/mL
SK1-AU 7ng/mL
SK1-AU 8.5ng/mL
B
TFR
1 m
RN
A (
rela
tive
to C
tl)
SK1 activity (fold change relative to Ctl)Ctl
6 352012 53 73 93 1021
0.5
1.0
1.5
0
SK1-AU EtOH
SK1-AU 2ng/mL
SK1-AU 3ng/mL
SK1-AU 4ng/mL
SK1-AU 4.5ng/mL
SK1-AU 5ng/mL
SK1-AU 6ng/mL
SK1-AU 7ng/mL
SK1-AU 8.5ng/mL
TFR
1 m
RN
A (
rela
tive
to C
tl)
SK1 activity (fold change relative to Ctl)Ctl
6 352012 53 73 93 1021
0.5
1.0
1.5
0
SK1-AU EtOH
SK1-AU 2ng/mL
SK1-AU 3ng/mL
SK1-AU 4ng/mL
SK1-AU 4.5ng/mL
SK1-AU 5ng/mL
SK1-AU 6ng/mL
SK1-AU 7ng/mL
SK1-AU 8.5ng/mL
A
2000
4000
6000
8000
SK
1 ac
tivity
(% o
f Ctl)
SK1Ctl
00 1 2 3 4 5 6 7 8 9 10
6
35
2012
53
73
93102
1
10000
A
2000
4000
6000
8000
SK
1 ac
tivity
(% o
f Ctl)
SK1Ctl
00 1 2 3 4 5 6 7 8 9 10
6
35
2012
53
73
93102
1
10000
2000
4000
6000
8000
SK
1 ac
tivity
(% o
f Ctl)
SK1Ctl
00 1 2 3 4 5 6 7 8 9 10
6
35
2012
53
73
93102
1
10000

135
Figure 4.2 SK1 mediates increased TFR mRNA and protein expression. SK1
inducible cells were cultured for 16 h either in the absence or the presence of
doxycycline to induce to approximately 20-fold SK1 activity over endogenous levels.
After induction, the cells were harvested, and then cell lysates were prepared for SK1
activity assays (A), total RNA isolated for TFR1 qPCR analysis (B) and Western
analysis with anti-TFR1 antibody (C). Data represent the mean ± SEM from six
experiments. Statistical significance was calculated by an unpaired t-test, (##P < 0.0001
compared with Ctl cells and ****P < 0.001 compared with Ctl cells).
A
Ctl SK1
SK
1ac
tivity
(%
of C
tl)
0
500
1000
1500
2000
Ctl SK1
A
Ctl SK1
SK
1ac
tivity
(%
of C
tl)
0
500
1000
1500
2000
Ctl SK1Ctl SK1
SK
1ac
tivity
(%
of C
tl)
0
500
1000
1500
2000
Ctl SK1
B
TF
R1
mR
NA
(re
lativ
e to
Ctl)
0.0
0.5
1.0
1.5
2.0
Ctl SK1Ctl SK1
##
B
TF
R1
mR
NA
(re
lativ
e to
Ctl)
0.0
0.5
1.0
1.5
2.0
Ctl SK1Ctl SK1
##
C
anti-Tubulin
Ctl SK1
anti-TFR1
C
anti-Tubulinanti-Tubulin
Ctl SK1
anti-TFR1
Ctl SK1
anti-TFR1
TF
R p
rote
in (
% o
f Ctl)
0
50
100
150
200
250
Ctl SK1Ctl SK1
****T
FR
pro
tein
(%
of C
tl)
0
50
100
150
200
250
Ctl SK1Ctl SK1
****

136
4.4.2 SK1 induces cell-membrane TFR1 expression and mediates Tf uptake
TFR1 is a type II membrane protein that mediates iron uptake into cells (Wang &
Pantopoulos, 2011; Macedo & de Sousa, 2008; Daniels et al., 2006; Kuhn, 1989). Although, we
showed that SK1 enhanced total cellular levels of TFR1 expression, the presentation of this
receptor at the cell surface is necessary for its binding and uptake of iron bound-Tf into cells
(Wang & Pantopoulos, 2011; Klausner et al., 1984; Cavanaugh et al., 1999; Trowbridge &
Shackelford, 1986). Therefore, we next examined the functional effects of SK1 on cell surface
presentation of TFR1 via fluorescence microscopy. Control (uninduced) cells showed very low
cell surface presentation of endogenous TFR1. Following induction of SK1 expression,
however, a clear increase in the levels of TFR1 at the cell surface was observed (Figure 4.3).
This effect was further confirmed by examining the level of Tf uptake in these cells as a direct
measure of functional TFR1. Consistent with an increase in total and cell surface TFR1
expression, there was also an approximate 2-fold increase in Tf uptake into the cells expressing
SK1 compared to control cells (Figure 4.4). Together these results firmly indicate that SK1
overexpression enhances total TFR1 expression which results in subsequent functional TFR1
presentation on the cell surface.
4.4.3 SK1 phosphorylation and localisation to the plasma membrane is critical for its
effects on TFR1 regulation
Since SK1 phosphorylation at Ser225 and its subsequent translocation to the plasma
membrane is crucial for oncogenic signalling by this enzyme (Pitson et al., 2005), and we had
already shown SK1 becomes phosphorylated following low overexpression (Figure 2.14), we
further examined if TFR1 expression is dependent on this type of SK1 regulation. To do this
we first generated HEK293 cell lines with inducible expression of SK1S225A (the non
phosphorylatable human SK1) (Figure 4.5) and SK1pm-S225A (the constitutively plasma
membrane-localised, non-phosphorylatable SK1) (Figure 4.6). Following establishment of
these cell lines, we induced expression of SK1S225A and SK1pm-S225A to approximately 20-fold
higher levels than endogenous SK1, as determined by cellular SK1 activity (Figure 4.7A), and
then performed TFR1 qPCR and Western blot analysis to assess the effect on TFR1 expression
(Figure 4.7B & C) . In contrast to the effects of wild-type SK1, TFR1 mRNA and protein
expression were unaltered following induction of SK1S225A expression. However, we found that

137
expression of the plasma membrane version of this SK1 variant, SK1pm-S225A, resulted in a 2-
fold increase in TFR1 mRNA as well as protein expression to a similar extent to that seen with
wild-type SK1. This data suggests that the phosphorylation and subsequent plasma membrane
localisation of SK1 are critical for SK1-induced regulation of TFR1 expression.

138
Figure 4.3 SK1 mediates enhanced cell-surface TFR1 expression. SK1 inducible
cells were either uninduced or induced with 4 ng/ml doxycycline for 16 h to
approximately 20-fold over endogenous level. Cell-surface TFR1 expression was
detected in unpermeabilised cells using anti-TFR1 antibody and then cells were
subsequently permeabilised and expression of total SK1 in cells was confirmed using
anti-SK1 antibodies. Cells were visualized with a 60X water-immersion objective on an
Olympus IX81 inverted microscope. Images are representative of more than 300 cells
examined.
Anti-SK1
Anti-TFR1
Ctl SK1
Anti-SK1
Anti-TFR1
Ctl SK1

139
Figure 4.4 SK1 mediates increase Tf uptake into cells. SK1 inducible cells were
either uninduced or induced with doxycycline for 16 h. Cells were incubated with alexa
568-labelled Tf for 30 min at 4 oC. Following that, unbound Tf was removed and cells
were incubated at 37 oC for 10 min and the internalization of Tf (red) was observed by a
60X water-immersion objective on an Olympus IX81 inverted microscope (A). Cell
nuclei were visualized by staining with DAPI (blue). Tf uptake into cells at 10 min was
quantitated using Image Quant (B). Data represent the mean ± SEM from four
independent experiments, with statistical significance calculated by an unpaired t-test,
(***P < 0.005 compared with Ctl cells).

140
SK1
Ctl
0min 10min
A
B
Ctl SK1
Tfup
take
(%
of C
tl)
0
50
100
150
200
Ctl SK1
***
SK1
Ctl
0min 10min
A
SK1
Ctl
0min 10min
SK1
Ctl
0min 10min
A
B
Ctl SK1
Tfup
take
(%
of C
tl)
0
50
100
150
200
Ctl SK1
***
B
Ctl SK1
Tfup
take
(%
of C
tl)
0
50
100
150
200
Ctl SK1
***
Ctl SK1
Tfup
take
(%
of C
tl)
0
50
100
150
200
Ctl SK1
***

141
Figure 4.5 Characterisation of non-phosphorylatable SK1 (SK1S225A) in
doxycycline-inducible system. Flp-In T-Rex HEK293 cells containing inducible SK1,
or FLAG-epitope tagged SK1S225A-AU (SK1S225A) or vector cells were cultured for 24 h
either in the absence or the presence of 50 ng/ml doxycycline. The expression of SK1
and SK1S225A were examined in cell lysates by immunoblot analysis with M2 anti-
FLAG (A) and SK1 activity assays (B). Data represent the mean ± SEM from three
independent experiments.
A
anti-FLAG
500 0
SK1
[Dox] (ng/ml)500
Vector
50
SK1S225A
B
[Dox] (ng/ml)
S225A-AU & SK1-AU
0 1 2 3 4 5 6 70
200400
5000
10000
15000
20000
25000
30000
SK
1 ac
tivity
(% o
f Ctl)
SK1
500
Vector
500 500
SK1S225A
A
anti-FLAG
500 0
SK1
[Dox] (ng/ml)500
Vector
50
SK1S225A
A
anti-FLAG
500 0
SK1
[Dox] (ng/ml)500
Vector
50
SK1S225A
anti-FLAG
500 0
SK1
[Dox] (ng/ml)500
Vector
50
SK1S225A
B
[Dox] (ng/ml)
S225A-AU & SK1-AU
0 1 2 3 4 5 6 70
200400
5000
10000
15000
20000
25000
30000
SK
1 ac
tivity
(% o
f Ctl)
SK1
500
Vector
500 500
SK1S225A
B
[Dox] (ng/ml)
S225A-AU & SK1-AU
0 1 2 3 4 5 6 70
200400
5000
10000
15000
20000
25000
30000
SK
1 ac
tivity
(% o
f Ctl)
SK1
500
Vector
500 500
SK1S225A

142
Figure 4.6 Characterisation of a non-phosphorylatable SK1 mutant that
constitutively localises to the plasma membrane (SK1pm-S225A) in a doxycycline-
inducible system. Flp-In T-Rex HEK293 cells containing inducible SK1, or FLAG-
epitope tagged SK1pm-S225A-AU (SK1pm-S225A) or vector cells were cultured for 24 h
either in the absence or the presence of 50 ng/ml doxycycline. The expression of SK1
and SK1pm-S225A were examined in cell lysates by immunoblot analysis with M2 anti-
FLAG (A) and SK1 activity assays (B). Data represent the mean ± SEM from three
independent experiments.
A
anti-FLAG
500 0
SK1
[Dox] (ng/ml)500
Vector
50
SK1pm-S225A
BLCK-S225A-AU & SK1-AU
0 1 2 3 4 5 6 70
200400
5000
10000
15000
20000
25000
30000
SK
1 ac
tivity
(%
of C
tl)
SK1
500
Vector
500 500
SK1pm-S225A
A
anti-FLAG
500 0
SK1
[Dox] (ng/ml)500
Vector
50
SK1pm-S225A
A
anti-FLAG
500 0
SK1
[Dox] (ng/ml)500
Vector
50
SK1pm-S225A
anti-FLAG
500 0
SK1
[Dox] (ng/ml)500
Vector
50
SK1pm-S225A
BLCK-S225A-AU & SK1-AU
0 1 2 3 4 5 6 70
200400
5000
10000
15000
20000
25000
30000
SK
1 ac
tivity
(%
of C
tl)
SK1
500
Vector
500 500
SK1pm-S225A
BLCK-S225A-AU & SK1-AU
0 1 2 3 4 5 6 70
200400
5000
10000
15000
20000
25000
30000
SK
1 ac
tivity
(%
of C
tl)
SK1
500
Vector
500 500
SK1pm-S225A
LCK-S225A-AU & SK1-AU
0 1 2 3 4 5 6 70
200400
5000
10000
15000
20000
25000
30000
SK
1 ac
tivity
(%
of C
tl)
SK1
500
Vector
500 500
SK1pm-S225A

143
Figure 4.7 SK1pm-S225A but not SK1S225A mediates increased TFR1 mRNA and
protein expression. SK1pm-S225A and SK1S225A inducible cells were cultured for 16 h
either in the absence or the presence of 5 ng/ml doxycycline to induce approximately
20-fold SK1 activity over endogenous levels. Cells were harvested, and lysates were
prepared for SK1 activity assays (A), total RNA isolated for TFR1 qPCR assays (B),
and Western analysis performed with anti-TFR1 antibody (C). Data represent the mean
± SEM from three independent experiments, with statistical significance calculated by
an unpaired t-test, (##P < 0.0001 compared with Ctl cells and ****P < 0.001 compared
with Ctl cells). The dividing lines indicate where lanes from the same immunoblot have
been spliced to simplify viewing. Data from Figure 4.2 has been shown again in Figure
4.7 to enable easy direct comparison of TFR1 expression level between SK1, SK1S225A
and SK1LCK-S225A.

144
anti-Tubulin
Ctl SK1
anti-TFR1
SK
1 ac
tivity
(%
of C
tl)
Ctl SK10
500
1000
1500
2000
TF
R1
mR
NA
(re
lativ
e to
Ctl)
0.0
0.5
1.0
1.5
2.0
Ctl SK1
##
TF
R p
rote
in (
% o
f Ctl)
Ctl SK1
0
50
100
150
200
250
Ctl SK1
****
A
B
C
anti-Tubulin
Ctl SK1
anti-TFR1
anti-Tubulin
Ctl SK1
anti-TFR1
anti-Tubulin
Ctl SK1
anti-TFR1
SK
1 ac
tivity
(%
of C
tl)
Ctl SK10
500
1000
1500
2000
TF
R1
mR
NA
(re
lativ
e to
Ctl)
0.0
0.5
1.0
1.5
2.0
Ctl SK1
##
TF
R p
rote
in (
% o
f Ctl)
Ctl SK1
0
50
100
150
200
250
Ctl SK1
****
A
B
C
SK
1 ac
tivity
(%
of C
tl)
Ctl SK10
500
1000
1500
2000
Ctl SK10
500
1000
1500
2000
TF
R1
mR
NA
(re
lativ
e to
Ctl)
0.0
0.5
1.0
1.5
2.0
Ctl SK1
##
TF
R p
rote
in (
% o
f Ctl)
Ctl SK1
0
50
100
150
200
250
Ctl SK1
****
Ctl SK1
0
50
100
150
200
250
Ctl SK1
****
A
B
C
Ctl
SK1
S225
A
anti-TFR1
anti-Tubulin
0
500
1000
1500
2000
2500
Ctl S225A0.0
0.5
1.0
1.5
2.0
Ctl SK1S225A
0
50
100
150
200
250
Ctl S225A0
100
150
200
250
300
Ctl
SK1
S225
A
anti-TFR1
anti-Tubulin
Ctl
SK1
S225
A
anti-TFR1
anti-Tubulin
0
500
1000
1500
2000
2500
Ctl S225A0.0
0.5
1.0
1.5
2.0
Ctl SK1S225A
0
50
100
150
200
250
Ctl S225A0
100
150
200
250
300
0
500
1000
1500
2000
2500
0
500
1000
1500
2000
2500
Ctl S225A0.0
0.5
1.0
1.5
2.0
Ctl S225A0.0
0.5
1.0
1.5
2.0
Ctl SK1S225A
0
50
100
150
200
250
Ctl S225A0
100
150
200
250
300
Ctl SK1S225A
0
50
100
150
200
250
Ctl S225A0
100
150
200
250
300
0
500
1000
1500
2000
Ctl LCK-S225A0.0
0.5
1.0
1.5
2.0
2.5
0.0
0.5
1.0
1.5
2.0****
Ctl SK1pm-S225A
100
150
200
50
0Ctl LCK-S225A
0
100
150
200
250
300
****
SK1
pm-S
225A
anti-Tubulin
Ctl
anti-TFR1
0
500
1000
1500
2000
Ctl LCK-S225A0.0
0.5
1.0
1.5
2.0
2.5
0.0
0.5
1.0
1.5
2.0****
Ctl SK1pm-S225A
100
150
200
50
0Ctl LCK-S225A
0
100
150
200
250
300
****
0
500
1000
1500
2000
0
500
1000
1500
2000
Ctl LCK-S225A0.0
0.5
1.0
1.5
2.0
2.5
0.0
0.5
1.0
1.5
2.0****
Ctl LCK-S225A0.0
0.5
1.0
1.5
2.0
2.5
0.0
0.5
1.0
1.5
2.0****
Ctl SK1pm-S225A
100
150
200
50
0Ctl LCK-S225A
0
100
150
200
250
300
****
Ctl SK1pm-S225A
100
150
200
50
0Ctl LCK-S225A
0
100
150
200
250
300
****
SK1
pm-S
225A
anti-Tubulin
Ctl
anti-TFR1
SK1
pm-S
225A
anti-Tubulin
Ctl
anti-TFR1
145
4.4.4 Addition of exogenous S1P regulates TFR1 expression
We previously showed that activation and subsequent translocation of human SK1 to
the plasma membrane results in both increases in intracellular S1P and enhanced release of S1P
into the extracellular environment (Pitson et al., 2003; Pitson et al., 2005). Therefore, to assess
the roles of intra- and extracellular S1P we next examined the effect on TFR1 expression
following addition of exogenous S1P to cells. The results (Figure 4.8) show a dose-dependent
increase in TFR1 protein expression in cells treated with S1P. Notably, this increase in TFR1
protein expression was detectable at very low concentrations of S1P; as low as 10 nM (Figure
4.8), suggesting the involvement of S1P cell surface receptor(s) in this process. Interestingly,
Figure 4.1 and Figure 4.8 show quite different dose-response curves with high levels of SK1
not inducing TFR1 expression while high levels of exogenous S1P did. While the reason(s) for
this difference remains unclear it may be a result of the different nature of the two experiments.
The studies shown in Figure 4.1 examined the effect of SK1 activity on TFR1 expression at the
mRNA level, while those described in Figure 4.8 examined the effect of exogenous S1P on
TFR1 expression at the protein level. Alternatively, SK1 regulation of TFR1 expression occurs
through the cell surface S1P receptor(s). Thus, S1P produced by SK1 intracellularly must be
released from the cells to enhance TFR1 expression. Since high levels of SK1 activity result in
high levels of S1P within the cells, it could be possible that this might trigger other, as yet
unknown signaling pathways that suppress TFR1 expression under these conditions.
4.4.5 SK1 regulates TFR1 expression via S1P2
To directly examine whether SK1 regulates TFR1 by acting through the S1P cell-
surface receptor(s), we next employed isoform-selective S1P receptor inhibitors. Cells were
induced to express SK1 and treated with various S1P receptor inhibitors and the effects on
TFR1 expression examined. The results showed that VPC-23019, an inhibitor of S1P1 and
S1P3 [reviewed in (Im, 2010)], had no effect on SK1-induced TFR1 protein expression (Figure
4.9). In contrast, however, treatment of cells with JTE-013, an inhibitor of S1P2 (Pyne & Pyne,
2011), effectively blocked TFR1 expression induced by SK1 (Figure 4.10A). As expected, JTE-
013 had no effect on SK1 activity (Figure 4.10B). Since JTE-013 has been suggested to also be
an antagonist of S1P4 (Long et al., 2010) and possibly have other off-target effects (Salomone
& Waeber, 2011), we further examined the involvement of S1P2 by utilising siRNA knock-

146
down of S1P2 in cells expressing SK1 and then examined its effect on TFR1 mRNA and protein
expression. The results again, show that TFR1 expression induced by SK1 was blocked in cells
following knock-down of S1P2 (Figure 4.11B & C). Taken together, these results indicate that
SK1 regulates TFR1 expression via the S1P2 receptor.

147
Figure 4.8 S1P increases TFR1 protein expression in a dose-responsive manner.
Vector cells were cultured in the absence or the presence of increasing concentrations of
S1P for 16 h. TFR1 protein expression was examined in cell lysates by immunoblot
analysis with anti-TFR1 antibody. Data represent the mean ± SEM from three
independent experiments, with statistical significance calculated by an unpaired t-test,
(*P < 0.05, **P < 0.01, and ***P < 0.005, compared with Ctl cells).
anti-Tubulin
100010010 5000 50
[S1P] (nM)
anti-TFR1
[S1P] (nM)
TF
R1
prot
ein
(% o
f Ctl)
0 10 50 100 500 10000
50
100
150
200
250
300
*
** **** *
anti-Tubulin
100010010 5000 50
[S1P] (nM)
anti-TFR1
anti-Tubulinanti-Tubulin
100010010 5000 50
[S1P] (nM)
anti-TFR1
[S1P] (nM)
TF
R1
prot
ein
(% o
f Ctl)
0 10 50 100 500 10000
50
100
150
200
250
300
*
** **** *
[S1P] (nM)
TF
R1
prot
ein
(% o
f Ctl)
0 10 50 100 500 10000
50
100
150
200
250
300
*
** **** *

148
Figure 4.9 SK1 does not mediate increased TFR1 expression via S1P1 or S1P3
receptors. SK1 inducible cells were cultured for 16 h either in the absence or the
presence of doxycycline and untreated or treated with 10µM VPC-23019 (antagonist of
S1P1/S1P3). Western blot using anti-TFR1 antibody shows that treatment of cells with
VPC-23019 had no effect on TFR1 expression (A). As expected, VPC-23019 had no
effect on SK1 activity (B). Data represent the mean ± SEM from three independent
experiments, with statistical significance calculated by an unpaired t-test, (***P < 0.005
and ****P < 0.001, compared with Ctl cells).
A
Ctl
anti-TFR1
SK1SK1 + V
PC-23109
anti-Tubulin
Ctl SK1 SK1 + VPC
TF
R1
prot
ein
(% o
f Ctl)
0
50
100
150
200
Ctl SK1 + VPC-23109
SK1
*******
B
SK
1 ac
tivity
(%
of C
tl)
0
500
1000
1500
2000
2500
SK1 SK1 + VPC-23109
SK1-AUSK1-AU Dox
SK1-AU Dox + VPC
A
Ctl
anti-TFR1
SK1SK1 + V
PC-23109
anti-Tubulin
Ctl SK1 SK1 + VPC
TF
R1
prot
ein
(% o
f Ctl)
0
50
100
150
200
Ctl SK1 + VPC-23109
SK1
*******
A
Ctl
anti-TFR1
SK1SK1 + V
PC-23109
anti-Tubulin
Ctl
anti-TFR1
SK1SK1 + V
PC-23109
anti-Tubulinanti-Tubulin
Ctl SK1 SK1 + VPC
TF
R1
prot
ein
(% o
f Ctl)
0
50
100
150
200
Ctl SK1 + VPC-23109
SK1
*******
Ctl SK1 SK1 + VPC
TF
R1
prot
ein
(% o
f Ctl)
0
50
100
150
200
Ctl SK1 + VPC-23109
SK1
*******
B
SK
1 ac
tivity
(%
of C
tl)
0
500
1000
1500
2000
2500
SK1 SK1 + VPC-23109
SK1-AUSK1-AU Dox
SK1-AU Dox + VPC
B
SK
1 ac
tivity
(%
of C
tl)
0
500
1000
1500
2000
2500
SK1 SK1 + VPC-23109
SK1-AUSK1-AU Dox
SK1-AU Dox + VPC
SK
1 ac
tivity
(%
of C
tl)
0
500
1000
1500
2000
2500
SK1 SK1 + VPC-23109
SK1-AUSK1-AU Dox
SK1-AU Dox + VPC

149
Figure 4.10 SK1 mediates increased TFR1 expression via S1P2 receptor. SK1
inducible cells were cultured for 16 h either in the absence or the presence of
doxycycline and untreated or treated with JTE-013 (antagonist of S1P2). Western blots
using anti-TFR1 antibody showed that treatment of cells with JTE-013 significantly
prevented the SK1-mediated enhanced TFR1 protein expression (A). As expected, JTE-
013 had no effect on SK1 activity (B). Data represent the mean ± SEM from four
independent experiments, with statistical significance calculated by an unpaired t-test,
(**P < 0.01 and ***P < 0.005, compared with Ctl cells).
B
SK
1 ac
tivity
(%
of C
tl)
0
500
1000
1500
2000
Ctl
2500
SK1-AUSK1-AU Dox
SK1-AU Dox + JTE
SK1 SK1 + JTE-013
A
TF
R1
prot
ein
(% o
f Ctl)
0
50
100
150
Ctl SK1 SK1 + JTE0
50
100
150
200
Ctl SK1 SK1 + JTE-013
*****
anti-Tubulin
anti-TFR1
Ctl SK1SK1 + JT
E-013
B
SK
1 ac
tivity
(%
of C
tl)
0
500
1000
1500
2000
Ctl
2500
SK1-AUSK1-AU Dox
SK1-AU Dox + JTE
SK1 SK1 + JTE-013
B
SK
1 ac
tivity
(%
of C
tl)
0
500
1000
1500
2000
Ctl
2500
SK1-AUSK1-AU Dox
SK1-AU Dox + JTE
SK1 SK1 + JTE-013
SK
1 ac
tivity
(%
of C
tl)
0
500
1000
1500
2000
Ctl
2500
SK1-AUSK1-AU Dox
SK1-AU Dox + JTE
SK1 SK1 + JTE-013
A
TF
R1
prot
ein
(% o
f Ctl)
0
50
100
150
Ctl SK1 SK1 + JTE0
50
100
150
200
Ctl SK1 SK1 + JTE-013
*****
anti-Tubulin
anti-TFR1
Ctl SK1SK1 + JT
E-013A
TF
R1
prot
ein
(% o
f Ctl)
0
50
100
150
Ctl SK1 SK1 + JTE0
50
100
150
200
Ctl SK1 SK1 + JTE-013
*****
TF
R1
prot
ein
(% o
f Ctl)
0
50
100
150
Ctl SK1 SK1 + JTE0
50
100
150
200
Ctl SK1 SK1 + JTE-013
*****
anti-Tubulin
anti-TFR1
Ctl SK1SK1 + JT
E-013
anti-Tubulin
anti-TFR1
Ctl SK1SK1 + JT
E-013

150
Figure 4.11 S1P2 receptor knock-down inhibits SK1-enhanced TFR1 expression.
SK1 inducible cells were transfected with either control or S1P2 siRNA for 48h and then
subsequently uninduced or induced with doxycycline for 16 h. After induction, the cells
were harvested, cell lysates were generated for SK1 activity assays (A), total RNA
isolated for qPCR assays of S1P2 expression (B), and Western analysis with anti-TFR1
antibody (C). Data represent the mean ± SEM from quantitations of six independent
experiments, with statistical significance was calculated by an unpaired t-test, (*P <
0.05, ***P < 0.005, and ****P < 0.001, compared with Ctl cells).
SK
1 ac
tivity
(%
of C
tl)
0
500
1000
1500
2000
2500
Ctl siRNA Nil
Ctl siRNA Dox
EDG5 siRNA Nil
EDG5 siRNA Dox
S1P2 siRNACtl siRNA
Dox++– –
anti-Tubulin
anti-FLAG
anti-TFR1
Ctl siRNA S1P2 siRNA
Dox++– –
SK
1 ac
tivity
(%
of C
tl)
0
500
1000
1500
2000
2500
Ctl siRNA Nil
Ctl siRNA Dox
EDG5 siRNA Nil
EDG5 siRNA Dox
S1P2 siRNACtl siRNA
Dox++– –
SK
1 ac
tivity
(%
of C
tl)
0
500
1000
1500
2000
2500
Ctl siRNA Nil
Ctl siRNA Dox
EDG5 siRNA Nil
EDG5 siRNA Dox
S1P2 siRNACtl siRNA
Dox++– –
anti-Tubulin
anti-FLAG
anti-TFR1
Ctl siRNA S1P2 siRNA
Dox++– –
anti-Tubulin
anti-FLAG
anti-TFR1
Ctl siRNA S1P2 siRNA
Dox++– –
S1P
2m
RN
A (
rela
tive
to C
tl)
0.6
0.8
1.0
1.2
Ctl siRNA Nil
Ctl siRNA Dox
EDG5 siRNA Nil
EDG5 siRNA Dox Dox++– –
****
S1P2 siRNACtl siRNA
S1P
2m
RN
A (
rela
tive
to C
tl)
0.6
0.8
1.0
1.2
Ctl siRNA Nil
Ctl siRNA Dox
EDG5 siRNA Nil
EDG5 siRNA Dox Dox++– –
****
S1P2 siRNACtl siRNA
A B
C
S1P2 siRNACtl siRNA
TF
R1
prot
ein
(% o
f Ctl)
Dox++– –0
50
100
150
Ctl siRNA Nil
Ctl siRNA Dox
EDG5 siRNA Nil
EDG5 siRNA Dox
*** ****
S1P2 siRNACtl siRNA
TF
R1
prot
ein
(% o
f Ctl)
Dox++– –0
50
100
150
Ctl siRNA Nil
Ctl siRNA Dox
EDG5 siRNA Nil
EDG5 siRNA Dox
*** ****
TF
R1
prot
ein
(% o
f Ctl)
Dox++– –0
50
100
150
Ctl siRNA Nil
Ctl siRNA Dox
EDG5 siRNA Nil
EDG5 siRNA Dox
*** ****

151
4.4.6 Inhibition of cell-surface TFR1 ablates SK1-induced cell proliferation, survival
and neoplastic transformation.
Overexpression of SK1 has been shown to enhance cell proliferation and survival, and
induce neoplastic transformation (Olivera et al., 1999a; Olivera et al., 2003; Xia et al., 2000;
Pitson et al., 2005). Notably, TFR1 is also associated with cancer. For example, increased
expression of TFR1 promoted cell growth, and enhanced c-myc-mediated tumour formation in
mice (O'Donnell et al., 2006; Habashy et al., 2010). Therefore, we investigated if TFR1 plays a
role in oncogenic signalling by SK1 through the use of a TFR1 neutralizing antibody. This
antibody is commercially available and has been utilised in various studies to block the
biological functions of TFR1, both in cultured cells and in vivo (Efferth et al., 2004; Lee et al.,
2004; Trowbridge & Lopez, 1982; Trowbridge et al., 1982; Grisendi et al., 2005). Our results
showed that SK1 overexpression enhanced cell proliferation (Figure 4.12A) and protected cells
from serum-deprivation-induced apoptosis (Figure 4.12B), consistent with previous studies
(Pitson et al., 2005; Le Scolan et al., 2005; Xia et al., 2000). However, strikingly, this SK1-
induced cell proliferation and survival was blocked in the presence of TFR1 neutralising
antibody. Notably, the TFR1 antibody showed little effect on cell proliferation and survival in
the absence of SK1 overexpression, suggesting its effects were specific for SK1-mediated
signalling.
We next examined the role of TFR1 in SK1-induced neoplastic transformation by
performing focus formation assays using NIH3T3 cells ectopically expressing SK1 in the
presence of either TFR1 neutralising antibody or isotype control antibody (Figure 4.13A).
Consistent with previous studies, our results showed that SK1 overexpression in NIH3T3 cells
induced the formation of numerous foci. Remarkably, however, the number of SK1-induced
foci was significantly reduced in the presence of the TFR1 neutralising antibody (Figure
4.13B). Interestingly, neoplastic transformation of NIH3T3 cells has been previously shown to
be induced by high SK1 overexpression (approximately 200-fold over endogenous level)
(Pitson et al., 2005). In contrast, our current data show that only moderate and not high levels
of SK1 activity in HEK293 cells appear to regulate TFR1 expression. A possible explanation
for this might be due to the differences in the two cell types and expression systems used.
Previously, neoplastic transformation was observed in pools of NIH3T3 stables consisting of
cells with different levels (moderate to very high) of SK1 activity, which when assayed together

152
gave ‘high’ level overexpression. In contrast, our current results were generated from
doxycycline-inducible HEK293 system which produces a clonal population of cells with a
similar level of SK1 activity. Therefore, it is possible that the previously observed neoplastic
transformation were selectively formed only from a sub-population of cells from the pool with
moderate SK1 activity. Alternatively, there may simply be differences in the response to SK1
expression between human and mouse cells.

153
Figure 4.12 TFR1 neutralizing antibodies ablate SK1-induced cell proliferation
and survival. SK1 inducible cells were grown on coverslips overnight. After 24h, cells
were cultured in serum-free medium for 24 h either in the absence or the presence of
doxycycline and untreated or treated with anti-TFR1 neutralizing antibody. (A) Cell
proliferation of these cells as measured by BrdU incorporation into nacent DNA. (B)
Serum deprivation-induced apoptosis of these cells as measured by nuclear
condensation and fragmentation. Data represent the mean ± SEM from four independent
experiments, with statistical significance calculated by an unpaired t-test, (***P <
0.005, ****P < 0.001, and #P < 0.0005, compared with Ctl cells).

154
A
B
Ctl Ab
Cel
l apo
ptos
is (
% o
f Cel
ls)
0
10
20
30
40
Uninduced ctl Ab
Induced ctl Ab
Uninduced TFR Ab
Induced TFR AbSK1– – SK1
TFR1 Ab
*******
Ctl Ab
Cel
l pro
lifer
atio
n (%
of C
ells
)
SK1
0
20
40
60
80
Uninduced ctl Ab
Induced ctl Ab
Uninduced TFR Ab
Induced TFR Ab– – SK1
TFR1 Ab
****#
A
B
Ctl Ab
Cel
l apo
ptos
is (
% o
f Cel
ls)
0
10
20
30
40
Uninduced ctl Ab
Induced ctl Ab
Uninduced TFR Ab
Induced TFR AbSK1– – SK1
TFR1 Ab
*******
Ctl Ab
Cel
l apo
ptos
is (
% o
f Cel
ls)
0
10
20
30
40
Uninduced ctl Ab
Induced ctl Ab
Uninduced TFR Ab
Induced TFR Ab0
10
20
30
40
Uninduced ctl Ab
Induced ctl Ab
Uninduced TFR Ab
Induced TFR AbSK1– – SK1
TFR1 Ab
*******
Ctl Ab
Cel
l pro
lifer
atio
n (%
of C
ells
)
SK1
0
20
40
60
80
Uninduced ctl Ab
Induced ctl Ab
Uninduced TFR Ab
Induced TFR Ab– – SK1
TFR1 Ab
****#
Ctl Ab
Cel
l pro
lifer
atio
n (%
of C
ells
)
SK1
0
20
40
60
80
Uninduced ctl Ab
Induced ctl Ab
Uninduced TFR Ab
Induced TFR Ab– – SK1SK1
0
20
40
60
80
Uninduced ctl Ab
Induced ctl Ab
Uninduced TFR Ab
Induced TFR Ab0
20
40
60
80
Uninduced ctl Ab
Induced ctl Ab
Uninduced TFR Ab
Induced TFR Ab– – SK1
TFR1 Ab
****#

155
Figure 4.13 Inhibition of TFR1 expression reduces SK1-induced neoplastic
transformation. NIH3T3 cells stably expressing the empty pcDNA3/IRES/EGFP vector
(vector) or pcDNA3/IRES/SK1/EGFP (SK1) (Moretti & Pitson, unpublished data) were
sorted for SK1-posittive cells according to their high GFP expression using FACS. GFP-
positive cells were cultured in 3 wells, with media replaced every 3-4 days in the
presence or absence of 10 µg anti-TFR1 neutralizing antibody. Foci were scored after
fixing with methanol and staining with methyl violent. Data are the mean ± SEM from
three independent experiments, with statistical significance calculated by an unpaired t-
test, (*P < 0.05 and ****P < 0.001 compared with Ctl cells).
A
B
vect
or
anti-FLAG
SK1
anti-Tubulin
Vector SK1
Ctl Ab TFR1 Ab Ctl Ab TFR1 AbUninduced ctl Ab
Uninduced TFR Ab
Induced ctl Ab
Induced TFR Ab
**** *
No
of fo
ci
0
10
20
30
40
SK1Non-specific
A
B
vect
or
anti-FLAG
SK1
anti-Tubulin
Vector SK1
Ctl Ab TFR1 Ab Ctl Ab TFR1 AbUninduced ctl Ab
Uninduced TFR Ab
Induced ctl Ab
Induced TFR Ab
**** *
No
of fo
ci
0
10
20
30
40
A
B
vect
or
anti-FLAG
SK1
vect
or
anti-FLAG
SK1
anti-Tubulinanti-Tubulin
Vector SK1
Ctl Ab TFR1 Ab Ctl Ab TFR1 AbUninduced ctl Ab
Uninduced TFR Ab
Induced ctl Ab
Induced TFR Ab
**** *
No
of fo
ci
0
10
20
30
40
Vector SK1
Ctl Ab TFR1 Ab Ctl Ab TFR1 AbUninduced ctl Ab
Uninduced TFR Ab
Induced ctl Ab
Induced TFR Ab
**** *
No
of fo
ci
0
10
20
30
40
SK1Non-specific

156
4.5 DISCUSSION
Significant steps towards understanding the molecular mechanisms of cellular regulation
by SK1 have been made in the past few years through the identification that SK1 activation and
translocation from the cytosol to the plasma membrane is crucial for oncogenesis mediated by
this enzyme (Pitson et al., 2003; Pitson et al., 2005; Jarman et al., 2010). Indeed, localisation of
SK1 to the plasma membrane where its substrate, sphingosine, is enriched, appears critical for
agonist-induced S1P generation and the pro-proliferative, pro-survival and oncogenic effects of
SK1 (Hengst et al., 2009; Pitson et al., 2005; Sarkar et al., 2005; Safadi-Chamberlain et al.,
2005; Jarman et al., 2010). The downstream mechanisms whereby SK1 leads to
tumourigenesis, however, are still being elucidated. In attempts to understand these downstream
targets of SK1, we have examined genes that are differentially regulated by SK1 using DNA
microarray technology. One of the genes identified in this study that was up-regulated by SK1
expression was TFRC. Notably, elevated TFR1 (the protein product of TFRC) has been widely
reported in a variety of human tumours (Habashy et al., 2010; Kukulj et al., 2010; Takahashi et
al., 2008; Boult et al., 2008; Singh et al., 2007; Brookes et al., 2006; Hogemann-Savellano et
al., 2003; Whitney et al., 1995; Ryschich et al., 2004), high TFR1 expression enhances cell
growth and tumour formation in mice (O'Donnell et al., 2006; Habashy et al., 2010), and
inhibition of TFR1 by either genetic, pharmacological or antibody-neutralization approaches
has been shown to reduce cancer cell proliferation, tumour growth and metastases in mice
(Yang et al., 2001; Zhou et al., 2008; Schaar et al., 2009; Peng et al., 2007; Shen et al., 2008;
Callens et al., 2008; Jiang et al., 2010). Together, these findings raised the possibility that
TFR1 may play a role in SK1-mediated oncogenesis.
4.5.1 SK1 enhances TFR1 expression and subsequent Tf uptake into cells
Previous studies have used constitutive overexpression systems to investigate gene
regulation by SK1 (Bu et al., 2006; Yamanaka et al., 2004). These have limitations because
high and long-term overexpression of proteins could potentially lead to non-physiologic effects.
Here, we have for the first time, examined the immediate effects of moderate (close to
physiological) inducible expression of SK1 on gene regulation. One of a number of apparent

157
SK1-regulated genes identified by this approach was TFRC, which we examined in more detail
here.
We demonstrated that SK1 expression could upregulate TFR1 mRNA and protein levels
via S1P2. The mechanism(s) mediating this upregulation of TFR1 by SK1 and S1P2, however,
awaits further examination. Numerous studies have examined the regulation of TFR1
transcription. In most tissues, TFR1 expression is also controlled by iron availability at the
post-transcriptional level in a manner resembling feedback inhibition: fewer receptors are
expressed when iron is abundant and more receptors are expressed when iron is scarce (Daniels
et al., 2006). The regulation of TFR1 expression is post-transcriptionally controlled by means
of the well characterized interaction between iron regulatory proteins (IRPs) and the iron-
responsive elements in the 3' untranslated regions of iron-related TFR1 mRNAs (Figure 4.14).
Interestingly, TFR1 expression is known to be also regulated by the transcription factor AP-1,
which appears to be activated by S1P (Takeshita et al., 2000). C-Myc has also been reported to
activate TFR1 transcription during tumourigenesis (O'Donnell et al., 2006; Okazaki et al.,
2009), and notably, c-Myc has been shown to be downregulated at both the mRNA and protein
levels in the mice that lack the Sphk1 gene (Kohno et al., 2006). Therefore, it is tempting to
speculate that SK1/S1P could enhance TFR1 transcription through the activation of one of
these transcription factors. TFR1 expression, however, also is up-regulated by other
mechanisms, including the hypoxia-inducible factor 1α (HIF1α) (Bianchi et al., 1999), which is
typically activated under hypoxic conditions but can also respond to a number of non-hypoxic
stimuli, including inflammatory signals such as nitric oxide (NO) and lipopolysaccharide (LPS)
(Pantopoulos & Hentze, 1995; Tacchini et al., 2008). Interestingly, SK1 was recently show to
enhance HIF1α stability and hence increase its function (Ader et al., 2008; Ader et al., 2009).
Notably, this is consistent with another study which demonstrated that S1P increases HIF-1α
protein stability through activation of the S1P2 receptor (Michaud et al., 2009). Therefore, it is
possible that SK1/S1P increases TFR1 transcription through the accumulation of HIF-1α and its
transcriptional activity. To test this hypothesis, it would be interesting to knockdown HIF-1α by
RNA interference in cells expressing SK1 and then examine the effect of SK1 on TFR1
regulation via HIF-1α.

158
Figure 4.14 Regulation of TFR1 expression in response to cellular iron levels. (A)
Expression of TFR1 is post-transcriptionally regulated by the binding of iron regulatory
Figure 4.14. Regulation of TFR1 (TfR) expression in response to cellular iron
levels. (A) Expression of TFR1 is post-transcriptionally regulated by the binding of iron
regulatory proteins (IRP) to iron response elements (IRE) in 3′ untranslated regions (3′
UTR) of the TFR1 mRNA. (B) Low iron conditions cause the dissociation of 4Fe-4S
clusters from IRP1 as well as the de novo synthesis of IRP2. This allows binding of
both IRP1 and IRP2 to the multiple IREs in the 3′ UTR of the TFR1 mRNA. Binding of
IRPs to IRE sites in the 3′ UTR of TFR1 stabilizes its mRNA and promotes its
translation. (C) High iron conditions allow the association of 4Fe-4S clusters to cysteine
residues within the IRE-binding site of IRP1 as well as the ubiquitination and
proteosomal degradation of IRP2. High iron conditions prevent IRP binding to TFR1
mRNA promoting degradation of TfR1 mRNA through endonucleosis of its 3′ UTR
[Adapted from (Daniels et al., 2006)].

159
TFR1 is expressed on the cell surface and is involved in the uptake of iron into cells
through the binding and internalization of Tf (Daniels et al., 2006). TFR1 binds Tf, which binds
to two ferric ions, and is endocytosed in clathrin-coated pits. It then moves to the sorting
endosomes, where the ferric ions are released due to the lower pH of the endosomes, to the
endocytic recycling compartment and back to the plasma membrane (Maxfield & McGraw,
2004). Cancer cells are known to express higher TFR1 levels than normal cells (Daniels et al.,
2006). Generally, low amounts of TFR1 are detectable on the surface of resting cells, but this
level is markedly increased upon antigen (Baumgartner et al., 2005) or mitogen (Davis et al.,
1986) stimulation, presumably to support the iron needs of rapidly proliferating cells.
Our findings demonstrate that SK1 not only enhances TFR1 expression, but that this
also results in enhanced cell surface presentation of TFR1 and subsequent Tf uptake. At present
it is unclear, however, if this enhanced cell surface presentation of TFR1 is simply a result of
the overall increase in TFR1 expression levels, or whether it is a result of another level of SK1-
mediated signalling through altering TFR1 trafficking. Since TFR1 has to pass sequentially
through early endosomes and recycling endosomes before returning to the cell surface
(Maxfield & McGraw, 2004), an additional layer of regulation of TFR1 cell surface expression
and iron uptake is controlled by components of the vesicular trafficking machinery which
appear to be regulated by clathrin/dynamin-coated vesicles and phosphatidylinositol-3 kinase
(PI3K) (van Dam et al., 2002). Interestingly, treatment of adipocytes with either insulin or
rosiglitazone (a widely prescribed anti-diabetic drug) increases cell surface levels of TFR1
(Davis et al., 1986; Martinez et al., 2010). Intracellular TFR1 is present exclusively in
endosomes and is constitutively recycled towards the plasma membrane. Its recycling kinetics,
however, are increased upon acute insulin stimulation, which appears to be through activation
of class I PI3K activity (Millar et al., 2000). Notably, SK1 has been shown to activate
PI3K/Akt pathway (Song et al., 2011; Guan et al., 2011b), and the PI3K activity seems to
regulate both the overall amount of observed TFR1 and presentation of the receptor at the cell
surface (Kanayasu-Toyoda et al., 2002; Barata et al., 2004; Habashy et al., 2010). Thus, it is
possible that the SK1-induced effects on TFR1 may be mediated via PI3K activation which will
be further discussed in chapter 5.3.

160
4.5.2 SK1 activation and plasma membrane localisation are necessary for enhanced
TFR1 expression
While the catalytically inactive SK1 (SK1G82D) resulted in downregulation of TFR1
expression, SK1 enhanced TFR1 expression. This is important, since firstly it demonstrates that
elevated TFR1 expression is a specific result of increased SK1 catalytic activity in the cell,
rather than other potential non-catalytic effects of this protein. Secondly, this finding also
suggested that SK1 activation may be important in the process of TFR1 expression since
SK1G82D has been previously shown to act like a dominant negative to block activation of
endogenous SK1 (Pitson et al., 2000b).
We have previously shown that activation of SK1 through phosphorylation and
subsequent translocation from the cytoplasm to the plasma membrane is required for oncogenic
signalling of this enzyme (Pitson et al., 2003; Pitson et al., 2005). Notably, here we showed that
the non-phosphorylatable SK1 (SK1S225A) which does not induce neoplastic cell transformation
(Pitson et al., 2005) does not upregulate TFR1. In contrast, the oncogenic plasma membrane
localised non-phosphorylatable SK1 (SK1pm-S225A) did enhance TFR1 expression. This is a clear
demonstration that plasma membrane localisation of SK1, which normally occurs after
phosphorylation-mediated activation (Pitson et al., 2005), is necessary to regulate TFR1
expression.
4.5.3 S1P2 is necessary for TFR1-mediated SK1 oncogenesis
Upon activation and translocation of SK1 to the plasma membrane, cellular S1P levels
increase (Pitson et al., 2003; Pitson et al., 2005; Jarman et al., 2010). This elevated level of
cellular S1P regulates a wide range of biological processes mediated through either intracellular
targets (Hait et al., 2009; Alvarez et al., 2010) or the S1P G-protein coupled receptors present
on the cell surface (Young & Van Brocklyn, 2006; Rosen et al., 2009). Although intracellular
S1P has been shown to enhance cell proliferation and survival (Olivera et al., 2003; Illuzzi et
al., 2010), there is growing evidence which suggests that extracellular S1P mediated signalling
via the S1P-receptors also promotes cell survival and proliferation (Harada et al., 2004;
Yoshida et al., 2010b; Yoshida et al., 2010a).
Indeed, we found that SK1-induced TFR1 expression is mediated via the cell surface
receptor S1P2. This finding was somewhat surprising since, in contrast to the positive effects of

161
S1P1 and S1P3 receptors on cell survival and proliferation (Yamada et al., 2004; Kimura et al.,
2000; Harada et al., 2004; Osawa et al., 2001; Wang et al., 2010c; Bonnaud et al., 2010;
Ushitora et al., 2009), S1P2 has been implicated in decreased cell proliferation and migration in
a number of cell types (Ikeda et al., 2003; Goparaju et al., 2005; Lepley et al., 2005; Du et al.,
2010; Takashima et al., 2008). Furthermore, approximately half of S1P2 knock-out mice
develop B-cell lymphomas at old age (1.5 to 2 years) (Cattoretti et al., 2009), which would
point away from the oncogenic role for this receptor. These mice, however, do not develop any
other neoplasms. The anti-tumour effect of S1P2 in B-cell lymphomas appears to be due to
inhibition of Akt signalling through G12/13 and RhoA/ROCK, which prevent germinal centre
(GC) B-cell survival and migration towards the follicle centre, necessary for GC cell growth
control (Green et al., 2011). In contrast to the above findings, the contribution of S1P2 to cancer
is not new. S1P2 mRNA was found to be elevated in Wilms tumour, and furthermore, S1P
induced cyclooxygenase-2 (Cox-2) expression in Wilms tumour via S1P2 (Li et al., 2009a).
Since Cox-2 has been implicated in regulation of cell growth, apoptosis and the development of
several human neoplasms, particularly Wilms tumour (Fridman et al., 2006; Giordano et al.,
2008), S1P2 appears to play an oncogenic role in this neoplasm. More recently SK1/S1P was
shown to enhance Bcr-Abl1 protein stability via S1P2-mediated increases in Bcr-Abl
phosphorylation (Salas et al., 2011). This contributed to resistance to the Abl kinase inhibitor
imatinib, in chronic myeloid leukemia (CML). Inhibition of the SK1/S1P2 pathway however,
restored PP2A-induced Bcr-Abl1 dephosphorylation leading to enhanced imatinib-induced
apoptosis in drug resistant CML cells.
Interestingly, the downstream signalling effects of S1P have been proposed to be largely
influenced by differential expression of the S1P receptor subtypes and the downstream effector
proteins in specific cell types(Young & Van Brocklyn, 2006) (Young & Van Brocklyn, 2006;
Rosen et al., 2009). HEK293 cells used in this study have been reported to express three of the
S1P receptor subtypes S1P1, S1P2, and S1P3 (El-Shewy et al., 2006; Meyer zu Heringdorf et al.,
2001). The pro-proliferative, pro-survival effects of S1P1 and S1P3 have been shown to be
predominantly mediated through Gi proteins (Osinde et al., 2007; Tao et al., 2009). However,
S1P2 appears to act primarily through G12/13 to inhibit cell proliferation and migration, but can
also signal via Gi or Gq pathways [reviewed in (Skoura & Hla, 2009)]. Since signalling through
Gi can promote cell proliferation and survival (Bonnaud et al., 2010; Kim et al., 2010; Schuppel

162
et al., 2008; Harada et al., 2004; Yamada et al., 2004), it is tempting to speculate that elevated
SK1 expression in these cells may preferentially enable S1P2 to act predominantly via Gi to
elicit TFR1 expression and its subsequent oncogenic effects (Figure 4.15).
Figure 4.15 Proposed pathways for the regulation of TFR1 by SK1. Elevated
cellular levels of SK1, following agonist stimulation, induce phosphorylation-mediated
activation/translocation of SK1 to the plasma membrane and the generation of S1P at
this location appears to regulate TFR1 expression. SK1/S1P enhanced TFR1 expression
and uptake appears to be through engagement of the S1P2 receptor which may be
mediated through Gi via activation of PI3K by increasing TFR1 recycling pathways. In
addition to this, it is possible that SK1/S1P enhances TFR1 expression by promoting its
transcription through activation of transcription factors, such as AP-1, c-Myc and
HIF1α.

163
4.5.4 Conclusions and implications to this study
In summary, we have identified TFR1 as a novel downstream target which appears to be
important in oncogenic signalling by SK1. The observation that blocking TFR1 function
prevented SK1-mediated cellular proliferation, survival and neoplastic transformation suggests
that TFR1 may represent a downstream target for SK1-mediated tumourigenesis. Our results
provide new insight into the mechanisms of regulation by which SK1/S1P exerts its oncogenic
effects by enhancing TFR1 expression via signalling through the S1P2 receptor.

164
5. CHAPTER 5: GENERAL DISCUSSION
Elevated levels of SK/S1P have been implicated in a number of different diseases
including asthma (Nishiuma et al., 2008; Kono et al., 2010), inflammation (Baker et al., 2010;
Lai et al., 2008b), atherosclerosis (Pacheco et al., 2003; Keul et al., 2011), neurodegenerative
diseases (Wu et al., 2008a; Nayak et al., 2010) and infection (Puneet et al., 2010). By far the
most studied pathological role for SK, however, is in cancer (Pitman & Pitson, 2010; Pyne &
Pyne, 2010; Fuereder et al., 2011). Cancer in humans is a multi-step process which is derived
from the accumulation of clonal cells that have lost their ability to control normal cell
proliferation, survival and homeostasis (Hanahan & Weinberg, 2011). This is in concurrence to
the theory of ‘acquired capabilities of cancer’, which have proposed that; the majority of human
cancer is a manifestation of six essential alterations in cell physiology that collectively results
in uncontrollable growth (Hanahan & Weinberg, 2011; Hanahan & Weinberg, 2000). Thus, we
hypothesize that pathological conditions in particular cancers mediated by SK/S1P are not
mediated through a single mechanism but may be via a coordinated number of mechanisms.
5.1 Advantages of using tight-inducible system to study SK cellular functions
Two human SK isoforms exist which appear to have both conserved and divergent
cellular functions (Allende et al., 2004; Kharel et al., 2005; Lai et al., 2009; Wadgaonkar et al.,
2009; Jo et al., 2009). SK1 appears to almost universally enhance cell proliferation and survival
(Pyne & Pyne, 2010; Pitson, 2011). However, the cellular effects of SK2 are more controversial
with some studies proposing that SK2 promotes cell apoptosis (Liu et al., 2003; Igarashi et al.,
2003a; Maceyka et al., 2005b), and various other studies suggesting that SK2 has pro-survival
and pro-proliferative roles (Weigert et al., 2009; French et al., 2010). However, the exact
mechanism(s) mediating these distinct and overlapping roles have yet to be fully elucidated and
still remains an important question to be answered in the area. Unlike the majority of in vitro
studies which use constitutive overexpression systems (Liu et al., 2003; Igarashi et al., 2003a;
Maceyka et al., 2005b; Pitson et al., 2005), we used tight doxycycline-inducible SK1 and SK2
cell lines in attempts to examine the cellular effects mediated by these two enzymes in a more
physiological manner.

165
Consistent with previous studies, ‘high’ SK1 overexpression promotes cellular
proliferation and survival (Olivera et al., 1999b; Xia et al., 2000; Kohno et al., 2006; Le Scolan
et al., 2005; Pitson et al., 2005), but more remarkably is the identification that ‘low’ levels in
SK1 expression could also induce the same cellular effects. Whether these two overexpression
levels of SK1 mediated cellular survival and proliferation effects are through the same or
distinct mechanism(s), however, still needed to be clarified. Interestingly, we showed that
although both ‘low’ and ‘high’ levels of SK1 overexpression promote cell survival and
proliferation, surprisingly, only ‘moderately’ enhanced cellular levels of SK1 (but not ‘high’
overexpression levels) appear to regulate TFR1 expression which is necessary for the observed
SK1-induced cellular proliferation, survival and neoplastic transformation. These findings
suggest that although different overexpression levels of SK1 in cells result in overlapping
cellular effects, its cellular overexpression levels appear to direct SK1 to activate differential
downstream signalling pathways. This will be further discussed below in section 5.3.
In contrast to SK1, enhanced expression of SK2 at ‘low’ and ‘high’ levels results in
differential cellular functions, with ‘high’ SK2 inducing apoptosis, while ‘low’ SK2 promotes
cell proliferation and survival. Again, clearly, this further supports the idea that the expression
levels of the enzyme in the cell appears to be crucial in determining its downstream pathways
and potentially different cellular functions. This therefore raises important issue(s) with the use
of strong constitutive overexpression systems to study the biological functions of SK2 and
further indicates that inducible expression system(s) may be a more appropriate approach to
accurately study the cellular effects of this protein.
The localisation of the two SKs appears to be crucial for determining their downstream
cellular effects (Pitson et al., 2005; Maceyka et al., 2005b). Since SK1 is present mainly in the
cytosol (Kohama et al., 1998; Pitson et al., 2005), it is tempting to speculate that SK1 remains
predominantly cytoplasmic whether it is overexpressed at either ‘low’ or ‘high’ levels. Here it
can bind to the calcium and integrin-binding protein 1 (CIB1) which normally resides in the
cytoplasm (Jarman et al., 2010) and thereby facilities active translocation of SK1 to the plasma
membrane bringing it in to close proximity to its substrate to generate S1P necessary for the
above SK1-mediated pro-proliferative and pro-survival effects. In contrast, SK2 appears to
localise to the ER and the nucleus (Igarashi et al., 2003a; Maceyka et al., 2005b; Ding et al.,
2007), where it is thought to elicit its pro-apoptotic effects (Liu et al., 2003; Igarashi et al.,

166
2003a; Maceyka et al., 2005b). Therefore, the different overexpression levels of the enzyme in
the cells could preferentially direct SK2 to localise to a particular subcellular site to innovate
distinct downstream target(s) triggering different cellular effects. The physiological
significance of ‘low’ and ‘high’ overexpression of the two SK enzymes still requires further
clarification. Considerable evidence has suggested that the balance between pro-apoptotic
sphingosine, and ceramide, and pro-proliferative, pro-survival S1P is crucial in determining
cellular effects (Pyne & Pyne, 2010; Leong & Saba, 2010; Hait et al., 2006). Therefore, future
studies should focus on determining the level of these different sphingolipid species in cells
produced by ‘low’ or ‘high’ expression levels of SK1 and SK2, to tease out how the different
expression levels of SK result in similar and differential cellular functions.
5.2 Array studies
In recent years increasing effort has focused on elucidating the oncogenic mechanisms
induced by SK1 using different approaches (Pitson, 2011; Pyne & Pyne, 2010). Prior to my
studies there was no global gene expression analysis available in the field examining genes
regulated by enhanced cellular SK1 expression and in particular its activation/translocation to
the plasma membrane which appears to be essential for SK1-mediated oncogenesis. As
discussed earlier in the thesis, we found a considerable number of genes that were differentially
regulated by enhanced cellular expression of SK1 and SK2. As expected, these genes are
involved in a diverse range of cellular functions including, nuclear processes, cell proliferation
and survival, cell signalling, cytoskeleton and extracellular matrix and cell metabolism
pathways.
Using a tightly inducible expression system allowed us to directly examine genes
regulated by subtle increases in SK expression. Surprisingly, however, a large number of these
genes appear to be regulated by the SKs independent of their catalytic activity, despite the fact
that the SK protein levels were only slightly enhanced over endogenous levels. Interestingly,
when we compared our study with previous approaches using constitutive overexpression
systems to identify genes regulated by SK1 and or S1P (Xia et al., 2002; Yamanaka et al.,
2004; Takeshita et al., 2000; Ozbay et al., 2006; Sun et al., 2010a), our system appears more

167
physiologically relevant as the system allowed us to examine immediate early genes regulated
by ‘low’ SK close to physiological levels. The genes which have been previously reported to be
regulated by SK1 and or S1P were mainly identified through high and/or long-term
overexpression (Xia et al., 2002; Yamanaka et al., 2004). In light of our findings it is possible
some of these may be due to non-catalytic effects resulting from other downstream targets
independent of the S1P pathway.
As illustrated earlier in chapter 3, genes encoded for HSPs, particularly the Hsp70 and
Hsp90 were most noticeable among the genes which appear to be upregulated by the SK
proteins. Hsp70 and Hsp90 are molecular chaperones that can interact with newly synthesized
unfolded protein polypeptides preventing premature self-associations in the nascent chain, or
retain already matured proteins in an inactive state, respectively, which participate in multi-
protein complexes known as ‘chaperosomes’ (Li & Srivastava, 2004; Zhao & Houry, 2005;
Lanneau et al., 2010). Notably, Hsp70 has been shown to form a complex with other proteins
and can also bind to intracellular lipids (Harada et al., 2007; Smith et al., 2010). The initial
clues for a potential role of HSPs in the regulation of sphingolipids came from studies whereby
overexpression of Hsp70 appeared to inhibit ceramide-induced apoptosis (Mosser et al., 1997;
Ahn et al., 1999; Kondo et al., 2000; Niimura et al., 2010). Consistent with this, our group has
recently showed that the chaperonin CCT/TRiC interacts with newly synthesized SK1 and
appear to be essential for folding and maturation of the SK1 protein (Zebol et al., 2009).
Notably, CCT/TRiC cooperates with numerous other chaperones, including Hsp70 and Hsp90
in its role in folding and re-folding proteins (Siegers et al., 2003; Melville et al., 2003; Cuellar
et al., 2008; Gong et al., 2009). Therefore, we hypothesize that at least one or more of these
HSPs identified from the arrays is involved in the regulation of SK or the sphingolipid rheostat.
Further studies will include examining whether these HSPs interact directly with SK or
associate with SK in a complex, using immunoprecipitation assays both in vitro and in cells. In
addition to this, it may also be useful to examine whether these HSPs are involved in the
maturation or stability of SK.
Recently, however, the HSPs, in particular the Hsp90, have emerged as a potential
therapeutic target for cancer therapy since it has been implicated to play a crucial role in the
folding, maturation and maintenance of a number of oncogenic proteins including Bcr-Abl,
mutated p53, ErbB2, Akt, B-Raf and Wilms tumor 1 (Porter et al., 2010; Trepel et al., 2010;

168
Gimenez Ortiz & Montalar Salcedo, 2010; Banerji, 2009). More strikingly is that inhibition of
Hsp90 resulted in ubiquitination and subsequent proteasome-dependent degradation of these
oncogenes and its downstream targets significantly reduced cancer cell growth and tumour
formation in mice (Cheung et al., 2010; Jang et al., 2010; Karkoulis et al., 2010; Tran et al.,
2010; Sun et al., 2010b). Interestingly, it has been reported Hsp90 can be secreted into the
extracellular environment by cancer cells and associates with proteins on the plasma membrane
(Whitesell & Lindquist, 2005; Lagarrigue et al., 2010), but the mechanism of its recruitment is
not understood. Therefore, it is tempting to speculate that Hsp90 might play a role in the
folding and stabilization of SK1 to facilitate the interaction of SK1 with other proteins which
could be crucial for active translocation and or retention of SK1 to the plasma membrane where
it can generate S1P at this location necessary for its oncogenic signalling. Thus, future studies
will look at co-localisation of SK1 and Hsp90 at the plasma membrane via immunofluoresence
studies. Furthermore, we will also examine the effect of the HSPs on SK-mediated cell
proliferation, survival and neoplastic transformation by performing cell proliferation, apoptosis
and focus formation assays in cells ectopically expressing SK1 or SK2 in the presence of either
Hsp90 inhibitors or siRNA knock-down of Hsp90.
Potentially adding further prospects to our array work is the identification of various
genes including, SFPQ, FUS, PCGF2, RASD1 and TFRC that appear to be differentially
regulated by SK catalytic activity. Remarkably, however, as discussed earlier in section 3.4.1,
we found that like SK, these genes have been implicated in a number of different pathological
conditions, such as, asthma, cardiovascular dieases, neurodegenerative diseases and cancers.
Taken together, these data suggests that at least one of these gene candidates could possibly
play important role(s) in mediating the involvement of the SKs in various disease conditions
and future studies will investigate if there are any potential role(s) of some of these genes in
SK-mediated diseases.
As noted earlier in chapter 3, it appears that genes encoding for SNORA68, SNORA73A,
5S ribosomal RNA, and Ro small cytoplasmic ribonucleoproteins were upregulated
predominantly by active SK1. Interestingly, these genes were mainly associated with either the
nucleolus or ribosomes (Boisvert et al., 2007; Montanaro et al., 2008). The nucleolus is the
organelle of the interphase cell nucleus where the biogenesis of ribosomes takes place
(Hernandez-Verdun, 2006; Montanaro et al., 2008). Increasing evidence has suggested that the

169
morphological and functional changes in the nucleolus that have been widely observed in
cancer tissues are a consequence of both the increased demand for ribosome biosynthesis which
is characterized by proliferating cells and the changes in the mechanisms controlling cell
proliferation (Boisvert et al., 2007; Montanaro et al., 2008). For example, the c-Myc
oncoprotein promotes cell growth and tumourigenesis through controlling the transcription of
several nucleolar proteins necessary for ribosome biosynthesis (Schlosser et al., 2003; van
Riggelen et al., 2010). Therefore, taken together, it is tempting to hypothesize that
overexpression of SK1 upregulates various nucleolar and ribosomal proteins due to the increase
in nucleolar function and ribosome biosynthesis necessary for SK1-mediated tumourigenic
processes. Although it is thought that changes in the morphology of the nucleolus and
ribosomes is a consequence of neoplastic transformation, various evidence exists suggesting
that it is changes in the organelles, both quantitatively and qualitatively, that may promote
tumourigenesis (Montanaro et al., 2008). Therefore, to clarify this future studies should
examine the effect of overexpression of SK1 on the morphology of both the nucleolus and the
ribosomes using contrast-phase light microscopy.
Unlike the SK1 arrays, only a few genes appeared to be specifically upregulated by SK2
activity. Interestingly, some of these genes, including WDR77 and BRPF3 have been reported
to be involved in nuclear functions including transcriptional regulation and histone
modifications (Furuno et al., 2006; Slama & Geman, 2010; Ullah et al., 2008). Notably, a
recent report showed that SK2 and its product, S1P, are found in association with HDACs and
inhibit their activity (Hait et al., 2009). These findings further support the notion that SK2 and
or S1P appear to play a role in epigenetic regulation, possibly through upregulation of various
nuclear proteins which may form part of a large multiprotein complex important for initiation
of transcription, DNA replication and DNA repair. Therefore, alteration in the expression of
various nuclear proteins by SK2 and or S1P could involve methylation of specific genes which
could contribute to pathological conditions such as cancer and neurodegenerative diseases.
Although we failed to identify any miRNA with significant differential regulation by SK1
expression, it is worth noting that from the DNA microarrays we have identified various small
nucleolar RNAs, including the SNORA68, SNORA73A that appear to be upregulated by active
SK1. Small nucleolar RNAs and miRNAs are two classes of small non-coding regulatory
RNAs (Brameier et al., 2011). Interestingly, recent studies have suggested that various

170
miRNAs are evolved from snoRNAs, and thus it is believed that they may share the same
biogenesis and processing machinery (Brameier et al., 2011). Although they have different
cellular functions, members from these two types of small RNAs display numerous genomic
similarities and a small number of snoRNAs have been shown to encode miRNAs in several
organisms (Scott et al., 2009; Ono et al., 2011). Notably, FUS and RASD1 discussed earlier
appear to play a role in miRNA synthesis and/or regulation (de Souza Rocha Simonini et al.,
2010; Buratti & Baralle, 2010). This includes miR-375, that appears to have a pro-proliferative
role in ERα-positive breast cancer cells by targeting RASD1 (de Souza Rocha Simonini et al.,
2010) and FUS was recently found in the large Drosha microprocessor complex and hence has
been proposed to play a role the primary processing of miRNA (Buratti & Baralle, 2010).
Taken together, we postulate that miRNA(s) may be likely to be differentially regulated by SK1
and possibly by SK2. As discussed earlier, there were various factors which may have
contributed to our unsuccessful attempt to examine miRNAs regulation by SK1, such as not
performing arrays with optimized conditions and/or the limited 400-miRNA library used which
could possibly result in potential regulated miRNAs being missed. Thus, future experiments
will be to examine miRNA(s) regulated by both SK1 and SK2 using optimized conditions
together with the most current miRNA library available.
5.3 Transferrin receptor 1 (TFR1)
There is clear evidence supporting a role of SK1 in tumourigenesis (Paugh et al., 2008;
Kawamori et al., 2009; Facchinetti et al., 2010; Malavaud et al., 2010; Liu et al., 2010; Sinha et
al., 2011), however, the mechanism through which SK1 drives tumourigenesis is still not fully
understood. In agreement with the literature (Xia et al., 2000; Sukocheva et al., 2003; Pitson et
al., 2005), our study showed that SK1 appears to be universally mitogenic since both
‘moderate’ or ‘high’ overexpression levels of SK1 promote cell proliferation and survival. As
discussed earlier in the thesis (section 1.5.1), it has been difficult to differentiate between the
pro-survival, pro-proliferative cellular effects mediated by either engagement of S1P receptors
or intracellular signalling since both pathways appear to elicit similar effects. Strikingly, our
results demonstrated that only ‘moderate’ levels of SK1 overexpression appear to upregulate

171
TFR1 expression. Therefore, it is possible that the different overexpression levels of SK1 in the
cell are what determines whether it activates pathways involving either intracellular or
extracellular signalling to enhance cell survival and proliferation. Presumably, the pro-
proliferative and pro-survival effect induced by ‘moderate’ levels of SK1 expression is
mediated through S1P cell-surface receptors since only ‘moderately’ enhanced cellular levels of
SK1 (but not ‘high’ overexpression levels) appear to regulate TFR1 expression through the
S1P2 receptor. ‘High’ level overexpression of SK1 therefore appears to enhance cell
proliferation and survival through a distinct mechanism(s), possibly via intracellular targets.
As noted above, TFR1 is a membrane protein that mediates iron uptake through
endocytosis (Daniels et al., 2006; Macedo & de Sousa, 2008; Wang & Pantopoulos, 2011).
However, receptor-induced endocytosis is mediated by two different mechanisms; clathrin-
dependent and clathrin-independent (Le Roy & Wrana, 2005). TFR1 is internalised by clathrin-
dependent endocytosis which is dependent on the formation of clathrin-coated pits, whereas,
clathrin-independent endocytosis mainly involves lipid rafts (Le Roy & Wrana, 2005).
Interestingly, recent findings have shown that phosphorylated SK1 translocates to lipid rafts
and this appears to be essential for the enzyme induced mitogenic effects (Hengst et al., 2009).
In line with this, studies have suggested that SK1pm-S225A; containing the N-terminal ten amino
acids of the Lck tyrosine kinase that results in myristoylation and dual palmitoylation drives the
protein to lipid rafts, facilitating pro-survival, pro-proliferative and oncogenic signalling, while
SK1c-Src; containing a single myristoylation site that would likely drive SK1 to a membrane
microdomain distinct from lipid rafts, inhibits cell proliferation but can still protect the cell
against serum deprivation-induced apoptosis (Pitson et al., 2005; Brown, 2006; Safadi-
Chamberlain et al., 2005). Together, these findings suggest that targeting SK1 to different
compartments of the plasma membrane may result in different cellular effects. However, since
clathrin-coated pits and lipid-rafts are localised in proximity (Frankel et al., 2006), it is not
clear whether these effects involve clathrin or lipid rafts due to the lack of tools to clearly
separate these two membrane microdomains. Therefore, to further clarify this, future
experiments will be to examine whether SK1c-Src (SK1 with Src N-terminal attached) could
enhance TFR1 expression.
Ser225 phosphorylation-induced translocation of SK1 to the plasma membrane is
essential for the enzyme to mediate oncogenic signalling (Pitson et al., 2005). As

172
phosphorylated SK1 appears to be retained at the plasma membrane by binding to
phosphatidylserine and other plasma membrane-associated lipids (Delon et al., 2004; Stahelin
et al., 2005), it could be postulated that different levels of overexpression of SK1 in cells
produces different amounts of phosphorylated SK1 that could target the enzyme to different
locations on the plasma membrane. Therefore, although both ‘moderate’ and ‘high’
overexpression levels of SK1 lead to mitogenic effects, they could activate distinct downstream
pathways. Future studies will be to examine the localisation of ‘moderate’ and ‘high’
overexpression of SK1, SK1S225A and SK1pm-S225A in membrane microdomains by using
electron microscopy and fluorescence resonance energy transfer (FRET) (Loura et al., 2009;
Loura et al., 2010). Interestingly, like wild-type SK1, ‘moderate’ overexpression of SK1pm-S225A
also appeared to upregulate TFR1 which again supports the notion that plasma membrane-
localised SK1 is essential for the oncogenic effect mediated through enhanced TFR1 expression
(Pitson et al., 2005). Thus, future studies will be to tease out whether SK1 activation-induced-
generation of S1P at the plasma membrane or localized production of S1P at the plasma
membrane site alone is required for enhanced TFR1 expression. This will be carried out by
looking at the localisation of phosphorylated SK1 and SK1pm-S225A to examine whether the two
co-localise to similar or distinct membrane microdomains.
The exact mechanism(s) regulating TFR1 expression by SK1/ S1P2 still remain to be
clarified, we proposed earlier in Chapter 4 that SK1 enhanced TFR1 expression may not be due
to a single mechanism, but possibly through various mechanisms involving both transcription
and the endosomal recycling pathways. Therefore, future studies should examine whether
SK1/S1P increases TFR1 transcription through activation of transcription factors, such as AP-1,
c-Myc and HIF1α, employing genetic or pharmacological approaches to inhibit the above
transcription factors in cells expressing SK1.
As discussed earlier, intracellular TFR1 is present in endosomes and is recycled back to
the plasma membrane through recycling endosomes (Maxfield & McGraw, 2004). The
molecular mechanism of the TFR1 recycling pathway has already been widely investigated, and
several members of the small GTPase Rab proteins have been shown to regulate distinct steps
in the TFR1 recycling pathway (Vanlandingham & Ceresa, 2009; Hirota et al., 2007;
McCaffrey et al., 2001; Mohrmann & van der Sluijs, 1999; Matsui et al., 2011). Thus, it will be
of interest to examine whether members of Rab-type GTPases are involved in SK1 enhanced

173
TFR1 expression, and if so, which specific Rab is involved. Furthermore, the recycling of
TFR1 appears to be dependent on PI3K activation (Millar et al., 2000). Therefore, in future
studies, to examine whether SK1 regulates TFR1 by acting through the PI3K pathway, cells
induced to express SK1 will be treated with LY294002 (a specific PI3K inhibitor) and the
subsequent effects of SK1 on TFR1 expression examined.
Because coupling of S1P2 to Gi proteins appears to enhance cell proliferation and survival
(Bonnaud et al., 2010; Kim et al., 2010; Schuppel et al., 2008; Harada et al., 2004; Yamada et
al., 2004), it would be necessary to determine whether S1P2-induced TFR1 expression is
mediated through Gi proteins. This will be preformed by examining the effect of TFR1 on cells
that have been simultaneously induced with SK1 and treated with pertussis toxin (PTx) to block
Gi activation (Sunyer et al., 1989).
5.4 Conclusions & future work
Overall, we have established a tight and reliable inducible system which allows us to
examine the cellular functions of SK under more ‘physiological’ conditions than many other
constitutive overexpression systems previously used in the past. Using this system enabled us to
perform DNA microarray-based approaches to identify: (i) genes regulated by active SK1
and/or SK2; (ii) genes regulated specifically by SK1 activation/translocation important in SK1-
mediated oncogenesis under more controlled conditions. From the microarrays, we identified
various gene candidates that were either differentially regulated by SK1 or SK2 or both,
suggesting that these two enzymes could target similar and/or distinct downstream target(s).
Since some of these genes have been reported to be involved in various disease conditions, such
as cancers, asthma and neurodegenerative diseases, we hypothesize that under ‘physiological’
conditions, SKs could play important role(s) in various pathological conditions through
regulating at least some of these downstream target(s). Thus, functional studies to investigate
the potential mechanism of potential gene candidates in these SK-mediated pathological
conditions should be performed in the future.
Overexpression of SK1 at either ‘moderate’ or ‘high’ levels promotes cell proliferation
and survival. Notably, only ‘moderate’ SK1 levels appear to regulate TFR1 expression, despite

174
the fact that both ‘moderate’ and ‘high’ overexpression levels mediate similar cellular effects.
This suggests that there are at least two distinct mechanisms responsible for mediating SK1-
enhanced cell proliferation, survival and tumourigenesis which is consistent with the literature
that cancer is a disease of multiple processes and SK1 appears to play crucial roles in more than
one of these tumourigenic processes. Future studies will focus on further clarifying these
pathways involved in SK1-induced tumourigenesis.
Although significant progress has been made in the past few years towards understanding
the molecular mechanisms controlling the two SK isoforms activation and subcellular
localisation, our current studies have added further insights into the molecular mechanisms
whereby SK is involved in gene transcription. Investigation into these genes regulated by SK
appears to be important in order to gain a better understanding of the regulation of diseases
mediated by SK. These insights will contribute to the identification and development of better
and more specific therapeutics which are necessary for the diagnosis and treatment of SK-
mediated diseases, such as cancers.

175
REFERENCES
Aarthi, J. J., Darendeliler, M. A. & Pushparaj, P. N. (2011) Dissecting the Role of the S1P/S1PR Axis in Health and Disease. J Dent Res, 90, 841-854.
Ader, I., Brizuela, L., Bouquerel, P., Malavaud, B. & Cuvillier, O. (2008) Sphingosine kinase 1: a new modulator of hypoxia inducible factor 1alpha during hypoxia in human cancer cells. Cancer Res, 68, 8635-8642.
Ader, I., Malavaud, B. & Cuvillier, O. (2009) When the sphingosine kinase 1/sphingosine 1-phosphate pathway meets hypoxia signaling: new targets for cancer therapy. Cancer Res, 69, 3723-3726.
Ahmad, M., Long, J. S., Pyne, N. J. & Pyne, S. (2006) The effect of hypoxia on lipid phosphate receptor and sphingosine kinase expression and mitogen-activated protein kinase signaling in human pulmonary smooth muscle cells. Prostaglandins Other Lipid Mediat, 79, 278-286.
Ahn, J. H., Ko, Y. G., Park, W. Y., Kang, Y. S., Chung, H. Y. & Seo, J. S. (1999) Suppression of ceramide-mediated apoptosis by HSP70. Mol Cells, 9, 200-206.
Akao, Y., Banno, Y., Nakagawa, Y., Hasegawa, N., Kim, T. J., Murate, T., Igarashi, Y. & Nozawa, Y. (2006) High expression of sphingosine kinase 1 and S1P receptors in chemotherapy-resistant prostate cancer PC3 cells and their camptothecin-induced up-regulation. Biochem Biophys Res Commun, 342, 1284-1290.
Akashi, M., Shaw, G., Gross, M., Saito, M. & Koeffler, H. P. (1991) Role of AUUU sequences in stabilization of granulocyte-macrophage colony-stimulating factor RNA in stimulated cells. Blood, 78, 2005-2012.
Alemany, R., Van Koppen, C. J., Danneberg, K., Ter Braak, M. & Meyer Zu Heringdorf, D. (2007) Regulation and functional roles of sphingosine kinases. Naunyn Schmiedebergs Arch Pharmacol, 374, 413-428.
Allende, M. L., Sasaki, T., Kawai, H., Olivera, A., Mi, Y., Van Echten-Deckert, G., Hajdu, R., Rosenbach, M., Keohane, C. A., Mandala, S., Spiegel, S. & Proia, R. L. (2004) Mice deficient in sphingosine kinase 1 are rendered lymphopenic by FTY720. J Biol Chem, 279, 52487-52492.
Alvarez, S. E., Harikumar, K. B., Hait, N. C., Allegood, J., Strub, G. M., Kim, E. Y., Maceyka, M., Jiang, H., Luo, C., Kordula, T., Milstien, S. & Spiegel, S. (2010) Sphingosine-1-phosphate is a missing cofactor for the E3 ubiquitin ligase TRAF2. Nature, 465, 1084-1088.
An, S., Zheng, Y. & Bleu, T. (2000) Sphingosine 1-phosphate-induced cell proliferation, survival, and related signaling events mediated by G protein-coupled receptors Edg3 and Edg5. J Biol Chem, 275, 288-296.
Ancellin, N. & Hla, T. (1999) Differential pharmacological properties and signal transduction of the sphingosine 1-phosphate receptors EDG-1, EDG-3, and EDG-5. J Biol Chem, 274, 18997-19002.
Anelli, V., Gault, C. R., Cheng, A. B. & Obeid, L. M. (2008) Sphingosine kinase 1 is up-regulated during hypoxia in U87MG glioma cells. Role of hypoxia-inducible factors 1 and 2. J Biol Chem, 283, 3365-3375.
Anglicheau, D., Muthukumar, T. & Suthanthiran, M. (2010) MicroRNAs: small RNAs with big effects. Transplantation, 90, 105-112.
176
Anliker, B. & Chun, J. (2004) Cell surface receptors in lysophospholipid signaling. Semin Cell Dev Biol, 15, 457-465.
Arikawa, K., Takuwa, N., Yamaguchi, H., Sugimoto, N., Kitayama, J., Nagawa, H., Takehara, K. & Takuwa, Y. (2003) Ligand-dependent inhibition of B16 melanoma cell migration and invasion via endogenous S1P2 G protein-coupled receptor. Requirement of inhibition of cellular RAC activity. J Biol Chem, 278, 32841-32851.
Baker, D. A., Barth, J., Chang, R., Obeid, L. M. & Gilkeson, G. S. (2010) Genetic sphingosine kinase 1 deficiency significantly decreases synovial inflammation and joint erosions in murine TNF-alpha-induced arthritis. J Immunol, 185, 2570-2579.
Banerji, U. (2009) Heat shock protein 90 as a drug target: some like it hot. Clin Cancer Res, 15, 9-14.
Baran, Y., Salas, A., Senkal, C. E., Gunduz, U., Bielawski, J., Obeid, L. M. & Ogretmen, B. (2007) Alterations of ceramide/sphingosine 1-phosphate rheostat involved in the regulation of resistance to imatinib-induced apoptosis in K562 human chronic myeloid leukemia cells. J Biol Chem, 282, 10922-10934.
Barata, J. T., Silva, A., Brandao, J. G., Nadler, L. M., Cardoso, A. A. & Boussiotis, V. A. (2004) Activation of PI3K is indispensable for interleukin 7-mediated viability, proliferation, glucose use, and growth of T cell acute lymphoblastic leukemia cells. J Exp Med, 200, 659-669.
Barnes, P. J., Adcock, I. M. & Ito, K. (2005) Histone acetylation and deacetylation: importance in inflammatory lung diseases. Eur Respir J, 25, 552-563.
Baumgartner, M., Chaussepied, M., Raposo, G., Goud, B. & Langsley, G. (2005) Accelerated recycling of transferrin receptor in Theileria-transformed B cells. Cell Microbiol, 7, 637-644.
Bayerl, M. G., Bruggeman, R. D., Conroy, E. J., Hengst, J. A., King, T. S., Jimenez, M., Claxton, D. F. & Yun, J. K. (2008) Sphingosine kinase 1 protein and mRNA are overexpressed in non-Hodgkin lymphomas and are attractive targets for novel pharmacological interventions. Leuk Lymphoma, 49, 948-954.
Becker, S., Von Otte, S., Robenek, H., Diedrich, K. & Nofer, J. R. (2011) Follicular fluid high-density lipoprotein-associated sphingosine 1-phosphate (S1P) promotes human granulosa lutein cell migration via S1P receptor type 3 and small G-protein RAC1. Biol Reprod, 84, 604-612.
Bektas, M., Johnson, S. P., Poe, W. E., Bigner, D. D. & Friedman, H. S. (2009) A sphingosine kinase inhibitor induces cell death in temozolomide resistant glioblastoma cells. Cancer Chemother Pharmacol, 64, 1053-1058.
Beljanski, V., Knaak, C. & Smith, C. D. (2010) A novel sphingosine kinase inhibitor induces autophagy in tumor cells. J Pharmacol Exp Ther, 333, 454-464.
Beljanski, V., Lewis, C. S. & Smith, C. D. (2011) Antitumor activity of sphingosine kinase 2 inhibitor ABC294640 and sorafenib in hepatocellular carcinoma xenografts. Cancer Biol Ther, 11, 524-534.
Berdyshev, E. V., Gorshkova, I., Usatyuk, P., Kalari, S., Zhao, Y., Pyne, N. J., Pyne, S., Sabbadini, R. A., Garcia, J. G. & Natarajan, V. (2011) Intracellular S1P generation is essential for S1P-induced motility of human lung endothelial cells: role of sphingosine kinase 1 and S1P lyase. PLoS One, 6, e16571.

177
Berg, T., Kalsaas, A. H., Buechner, J. & Busund, L. T. (2009) Ewing sarcoma-peripheral neuroectodermal tumor of the kidney with a FUS-ERG fusion transcript. Cancer Genet Cytogenet, 194, 53-57.
Bianchi, L., Tacchini, L. & Cairo, G. (1999) HIF-1-mediated activation of transferrin receptor gene transcription by iron chelation. Nucleic Acids Res, 27, 4223-4227.
Billich, A., Bornancin, F., Devay, P., Mechtcheriakova, D., Urtz, N. & Baumruker, T. (2003) Phosphorylation of the immunomodulatory drug FTY720 by sphingosine kinases. J Biol Chem, 278, 47408-47415.
Blom, T., Bergelin, N., Meinander, A., Lof, C., Slotte, J. P., Eriksson, J. E. & Tornquist, K. (2010) An autocrine sphingosine-1-phosphate signaling loop enhances NF-kappaB-activation and survival. BMC Cell Biol, 11, 45.
Blom, T., Slotte, J. P., Pitson, S. M. & Tornquist, K. (2005) Enhancement of intracellular sphingosine-1-phosphate production by inositol 1,4,5-trisphosphate-evoked calcium mobilisation in HEK-293 cells: endogenous sphingosine-1-phosphate as a modulator of the calcium response. Cell Signal, 17, 827-836.
Bode, C., Sensken, S. C., Peest, U., Beutel, G., Thol, F., Levkau, B., Li, Z., Bittman, R., Huang, T., Tolle, M., Van Der Giet, M. & Graler, M. H. (2010) Erythrocytes serve as a reservoir for cellular and extracellular sphingosine 1-phosphate. J Cell Biochem, 109, 1232-1243.
Boisvert, F. M., Van Koningsbruggen, S., Navascues, J. & Lamond, A. I. (2007) The multifunctional nucleolus. Nat Rev Mol Cell Biol, 8, 574-585.
Bonhoure, E., Lauret, A., Barnes, D. J., Martin, C., Malavaud, B., Kohama, T., Melo, J. V. & Cuvillier, O. (2008) Sphingosine kinase-1 is a downstream regulator of imatinib-induced apoptosis in chronic myeloid leukemia cells. Leukemia, 22, 971-979.
Bonhoure, E., Pchejetski, D., Aouali, N., Morjani, H., Levade, T., Kohama, T. & Cuvillier, O. (2006) Overcoming MDR-associated chemoresistance in HL-60 acute myeloid leukemia cells by targeting sphingosine kinase-1. Leukemia, 20, 95-102.
Bonnaud, S., Niaudet, C., Legoux, F., Corre, I., Delpon, G., Saulquin, X., Fuks, Z., Gaugler, M. H., Kolesnick, R. & Paris, F. (2010) Sphingosine-1-phosphate activates the AKT pathway to protect small intestines from radiation-induced endothelial apoptosis. Cancer Res, 70, 9905-9915.
Bornkamm, G. W., Berens, C., Kuklik-Roos, C., Bechet, J. M., Laux, G., Bachl, J., Korndoerfer, M., Schlee, M., Holzel, M., Malamoussi, A., Chapman, R. D., Nimmerjahn, F., Mautner, J., Hillen, W., Bujard, H. & Feuillard, J. (2005) Stringent doxycycline-dependent control of gene activities using an episomal one-vector system. Nucleic Acids Res, 33, e137.
Boult, J., Roberts, K., Brookes, M. J., Hughes, S., Bury, J. P., Cross, S. S., Anderson, G. J., Spychal, R., Iqbal, T. & Tselepis, C. (2008) Overexpression of cellular iron import proteins is associated with malignant progression of esophageal adenocarcinoma. Clin Cancer Res, 14, 379-387.
Brameier, M., Herwig, A., Reinhardt, R., Walter, L. & Gruber, J. (2011) Human box C/D snoRNAs with miRNA like functions: expanding the range of regulatory RNAs. Nucleic Acids Res, 39, 675-686.
Breinig, M., Caldas-Lopes, E., Goeppert, B., Malz, M., Rieker, R., Bergmann, F., Schirmacher, P., Mayer, M., Chiosis, G. & Kern, M. A. (2009) Targeting heat shock protein 90 with
178
non-quinone inhibitors: a novel chemotherapeutic approach in human hepatocellular carcinoma. Hepatology, 50, 102-112.
Brookes, M. J., Hughes, S., Turner, F. E., Reynolds, G., Sharma, N., Ismail, T., Berx, G., Mckie, A. T., Hotchin, N., Anderson, G. J., Iqbal, T. & Tselepis, C. (2006) Modulation of iron transport proteins in human colorectal carcinogenesis. Gut, 55, 1449-1460.
Brown, C. Y., Lagnado, C. A. & Goodall, G. J. (1996) A cytokine mRNA-destabilizing element that is structurally and functionally distinct from A+U-rich elements. Proc Natl Acad Sci U S A, 93, 13721-13725.
Brown, D. A. (2006) Lipid rafts, detergent-resistant membranes, and raft targeting signals. Physiology (Bethesda), 21, 430-439.
Bu, S., Yamanaka, M., Pei, H., Bielawska, A., Bielawski, J., Hannun, Y. A., Obeid, L. & Trojanowska, M. (2006) Dihydrosphingosine 1-phosphate stimulates MMP1 gene expression via activation of ERK1/2-Ets1 pathway in human fibroblasts. Faseb J, 20, 184-186.
Buratti, E. & Baralle, F. E. (2010) The multiple roles of TDP-43 in pre-mRNA processing and gene expression regulation. RNA Biol, 7, 420-429.
Cakir, Z., Saydam, G., Sahin, F. & Baran, Y. (2011) The roles of bioactive sphingolipids in resveratrol-induced apoptosis in HL60: acute myeloid leukemia cells. J Cancer Res Clin Oncol, 137, 279-286.
Callens, C., Moura, I. C., Lepelletier, Y., Coulon, S., Renand, A., Dussiot, M., Ghez, D., Benhamou, M., Monteiro, R. C., Bazarbachi, A. & Hermine, O. (2008) Recent advances in adult T-cell leukemia therapy: focus on a new anti-transferrin receptor monoclonal antibody. Leukemia, 22, 42-48.
Camgoz, A., Gencer, E. B., Ural, A. U., Avcu, F. & Baran, Y. (2011) Roles of ceramide synthase and ceramide clearence genes in nilotinib-induced cell death in chronic myeloidleukemia cells. Leuk Lymphoma, 52, 1574-1584.
Caput, D., Beutler, B., Hartog, K., Thayer, R., Brown-Shimer, S. & Cerami, A. (1986) Identification of a common nucleotide sequence in the 3'-untranslated region of mRNA molecules specifying inflammatory mediators. Proc Natl Acad Sci U S A, 83, 1670-1674.
Carissimi, C., Fulci, V. & Macino, G. (2009) MicroRNAs: novel regulators of immunity. Autoimmun Rev, 8, 520-524.
Carpio, L., Klase, Z., Coley, W., Guendel, I., Choi, S., Van Duyne, R., Narayanan, A., Kehn-Hall, K., Meijer, L. & Kashanchi, F. (2010) microRNA machinery is an integral component of drug-induced transcription inhibition in HIV-1 infection. J RNAi Gene Silencing, 6, 386-400.
Cattoretti, G., Mandelbaum, J., Lee, N., Chaves, A. H., Mahler, A. M., Chadburn, A., Dalla-Favera, R., Pasqualucci, L. & Maclennan, A. J. (2009) Targeted disruption of the S1P2 sphingosine 1-phosphate receptor gene leads to diffuse large B-cell lymphoma formation. Cancer Res, 69, 8686-8692.
Cavanaugh, P. G., Jia, L., Zou, Y. & Nicolson, G. L. (1999) Transferrin receptor overexpression enhances transferrin responsiveness and the metastatic growth of a rat mammary adenocarcinoma cell line. Breast Cancer Res Treat, 56, 203-217.
Chen, C. Y., Gherzi, R., Ong, S. E., Chan, E. L., Raijmakers, R., Pruijn, G. J., Stoecklin, G., Moroni, C., Mann, M. & Karin, M. (2001) AU binding proteins recruit the exosome to degrade ARE-containing mRNAs. Cell, 107, 451-464.

179
Chen, K. C., Wang, Y. S., Hu, C. Y., Chang, W. C., Liao, Y. C., Dai, C. Y. & Juo, S. H. (2011) OxLDL up-regulates microRNA-29b, leading to epigenetic modifications of MMP-2/MMP-9 genes: a novel mechanism for cardiovascular diseases. Faseb J, 25, 1718-1728.
Chen, X. L., Grey, J. Y., Thomas, S., Qiu, F. H., Medford, R. M., Wasserman, M. A. & Kunsch, C. (2004) Sphingosine kinase-1 mediates TNF-alpha-induced MCP-1 gene expression in endothelial cells: upregulation by oscillatory flow. Am J Physiol Heart Circ Physiol, 287, H1452-H1458.
Cherian, M. G., Jayasurya, A. & Bay, B. H. (2003) Metallothioneins in human tumors and potential roles in carcinogenesis. Mutat Res, 533, 201-209.
Cheung, C. H., Chen, H. H., Cheng, L. T., Lyu, K. W., Kanwar, J. R. & Chang, J. Y. (2010) Targeting Hsp90 with small molecule inhibitors induces the over-expression of the anti-apoptotic molecule, survivin, in human A549, HONE-1 and HT-29 cancer cells. Mol Cancer, 9, 77.
Chiba, K., Kataoka, H., Seki, N., Shimano, K., Koyama, M., Fukunari, A., Sugahara, K. & Sugita, T. (2011) Fingolimod (FTY720), sphingosine 1-phosphate receptor modulator, shows superior efficacy as compared with interferon-beta in mouse experimental autoimmune encephalomyelitis. Int Immunopharmacol, 11, 366-372.
Chiba, K., Matsuyuki, H., Maeda, Y. & Sugahara, K. (2006) Role of sphingosine 1-phosphate receptor type 1 in lymphocyte egress from secondary lymphoid tissues and thymus. Cell Mol Immunol, 3, 11-19.
Chiba, Y., Takeuchi, H., Sakai, H. & Misawa, M. (2010) SKI-II, an inhibitor of sphingosine kinase, ameliorates antigen-induced bronchial smooth muscle hyperresponsiveness, but not airway inflammation, in mice. J Pharmacol Sci, 114, 304-310.
Choi, J. W., Gardell, S. E., Herr, D. R., Rivera, R., Lee, C. W., Noguchi, K., Teo, S. T., Yung, Y. C., Lu, M., Kennedy, G. & Chun, J. (2011) FTY720 (fingolimod) efficacy in an animal model of multiple sclerosis requires astrocyte sphingosine 1-phosphate receptor 1 (S1P1) modulation. Proc Natl Acad Sci U S A, 108, 751-756.
Christoffersen, C., Obinata, H., Kumaraswamy, S. B., Galvani, S., Ahnstrom, J., Sevvana, M., Egerer-Sieber, C., Muller, Y. A., Hla, T., Nielsen, L. B. & Dahlback, B. (2011) Endothelium-protective sphingosine-1-phosphate provided by HDL-associated apolipoprotein M. Proc Natl Acad Sci U S A, 108, 9613-9618.
Connor, C. E., Burrows, J., Hearps, A. C., Woods, G. M., Lowenthal, R. M. & Ragg, S. J. (2001) Cell cycle arrest of hematopoietic cell lines after treatment with ceramide is commonly associated with retinoblastoma activation. Cytometry, 43, 164-169.
Crozat, A., Aman, P., Mandahl, N. & Ron, D. (1993) Fusion of CHOP to a novel RNA-binding protein in human myxoid liposarcoma. Nature, 363, 640-644.
Cuellar, J., Martin-Benito, J., Scheres, S. H., Sousa, R., Moro, F., Lopez-Vinas, E., Gomez-Puertas, P., Muga, A., Carrascosa, J. L. & Valpuesta, J. M. (2008) The structure of CCT-Hsc70 NBD suggests a mechanism for Hsp70 delivery of substrates to the chaperonin. Nat Struct Mol Biol, 15, 858-864.
Dagan, A., Wang, C., Fibach, E. & Gatt, S. (2003) Synthetic, non-natural sphingolipid analogs inhibit the biosynthesis of cellular sphingolipids, elevate ceramide and induce apoptotic cell death. Biochim Biophys Acta, 1633, 161-169.
Dahm, F., Nocito, A., Bielawska, A., Lang, K. S., Georgiev, P., Asmis, L. M., Bielawski, J., Madon, J., Hannun, Y. A. & Clavien, P. A. (2006) Distribution and dynamic changes of

180
sphingolipids in blood in response to platelet activation. J Thromb Haemost, 4, 2704-2709.
Daniels, T. R., Delgado, T., Rodriguez, J. A., Helguera, G. & Penichet, M. L. (2006) The transferrin receptor part I: Biology and targeting with cytotoxic antibodies for the treatment of cancer. Clin Immunol, 121, 144-158.
Darby, S., Cross, S. S., Brown, N. J., Hamdy, F. C. & Robson, C. N. (2008) BMP-6 over-expression in prostate cancer is associated with increased Id-1 protein and a more invasive phenotype. J Pathol, 214, 394-404.
Davis, R. J., Corvera, S. & Czech, M. P. (1986) Insulin stimulates cellular iron uptake and causes the redistribution of intracellular transferrin receptors to the plasma membrane. J Biol Chem, 261, 8708-8711.
De Souza Rocha Simonini, P., Breiling, A., Gupta, N., Malekpour, M., Youns, M., Omranipour, R., Malekpour, F., Volinia, S., Croce, C. M., Najmabadi, H., Diederichs, S., Sahin, O., Mayer, D., Lyko, F., Hoheisel, J. D. & Riazalhosseini, Y. (2010) Epigenetically Deregulated microRNA-375 Is Involved in a Positive Feedback Loop with Estrogen Receptor {alpha} in Breast Cancer Cells. Cancer Res, 70, 9175-9184.
Delon, C., Manifava, M., Wood, E., Thompson, D., Krugmann, S., Pyne, S. & Ktistakis, N. T. (2004) Sphingosine kinase 1 is an intracellular effector of phosphatidic acid. J Biol Chem, 279, 44763-44774.
Deuschle, U., Meyer, W. K. & Thiesen, H. J. (1995) Tetracycline-reversible silencing of eukaryotic promoters. Mol Cell Biol, 15, 1907-1914.
Dindo, D., Dahm, F., Szulc, Z., Bielawska, A., Obeid, L. M., Hannun, Y. A., Graf, R. & Clavien, P. A. (2006) Cationic long-chain ceramide LCL-30 induces cell death by mitochondrial targeting in SW403 cells. Molecular Cancer Therapeutics, 5, 1520-1529.
Ding, G., Sonoda, H., Yu, H., Kajimoto, T., Goparaju, S. K., Jahangeer, S., Okada, T. & Nakamura, S. (2007) Protein kinase D-mediated phosphorylation and nuclear export of sphingosine kinase 2. J Biol Chem, 282, 27493-27502.
Dobrovic, B., Curic, G., Petanjek, Z. & Heffer, M. (2011) Dendritic morphology and spine density is not altered in motor cortex and dentate granular cells in mice lacking the ganglioside biosynthetic gene B4galnt1 - A quantitative Golgi cox study. Coll Antropol, 35 Suppl 1, 25-30.
Dolezalova, H., Shankar, G., Huang, M. C., Bikle, D. D. & Goetzl, E. J. (2003) Biochemical regulation of breast cancer cell expression of S1P2 (Edg-5) and S1P3 (Edg-3) G protein-coupled receptors for sphingosine 1-phosphate. J Cell Biochem, 88, 732-743.
Doll, F., Pfeilschifter, J. & Huwiler, A. (2005) The epidermal growth factor stimulates sphingosine kinase-1 expression and activity in the human mammary carcinoma cell line MCF7. Biochim Biophys Acta, 1738, 72-81.
Doll, F., Pfeilschifter, J. & Huwiler, A. (2007) Prolactin upregulates sphingosine kinase-1 expression and activity in the human breast cancer cell line MCF7 and triggers enhanced proliferation and migration. Endocr Relat Cancer, 14, 325-335.
Don, A. S., Martinez-Lamenca, C., Webb, W. R., Proia, R. L., Roberts, E. & Rosen, H. (2007) Essential requirement for sphingosine kinase 2 in a sphingolipid apoptosis pathway activated by FTY720 analogues. J Biol Chem, 282, 15833-15842.
Donati, C., Meacci, E., Nuti, F., Becciolini, L., Farnararo, M. & Bruni, P. (2005) Sphingosine 1-phosphate regulates myogenic differentiation: a major role for S1P2 receptor. Faseb J, 19, 449-451.

181
Dong, L., Zhang, X., Fu, X., Zhang, X., Gao, X., Zhu, M., Wang, X., Yang, Z., Jensen, O. N., Saarikettu, J., Yao, Z., Silvennoinen, O. & Yang, J. (2011) PTB-associated splicing factor (PSF) functions as a repressor of STAT6-mediated Ig epsilon gene transcription by recruitment of HDAC1. J Biol Chem, 286, 3451-3459.
Donnem, T., Lonvik, K., Eklo, K., Berg, T., Sorbye, S. W., Al-Shibli, K., Al-Saad, S., Andersen, S., Stenvold, H., Bremnes, R. M. & Busund, L. T. (2011) Independent and tissue-specific prognostic impact of miR-126 in nonsmall cell lung cancer: coexpression with vascular endothelial growth factor-A predicts poor survival. Cancer, 117, 3193-3200.
Dormann, D., Rodde, R., Edbauer, D., Bentmann, E., Fischer, I., Hruscha, A., Than, M. E., Mackenzie, I. R., Capell, A., Schmid, B., Neumann, M. & Haass, C. (2010) ALS-associated fused in sarcoma (FUS) mutations disrupt Transportin-mediated nuclear import. Embo J, 29, 2841-2857.
Du, W., Takuwa, N., Yoshioka, K., Okamoto, Y., Gonda, K., Sugihara, K., Fukamizu, A., Asano, M. & Takuwa, Y. (2010) S1P(2), the G protein-coupled receptor for sphingosine-1-phosphate, negatively regulates tumor angiogenesis and tumor growth in vivo in mice. Cancer Res, 70, 772-781.
Duan, H. F., Wu, C. T., Lu, Y., Wang, H., Liu, H. J., Zhang, Q. W., Jia, X. X., Lu, Z. Z. & Wang, L. S. (2004) Sphingosine kinase activation regulates hepatocyte growth factor induced migration of endothelial cells. Exp Cell Res, 298, 593-601.
Duenas, A. I., Aceves, M., Fernandez-Pisonero, I., Gomez, C., Orduna, A., Crespo, M. S. & Garcia-Rodriguez, C. (2008) Selective attenuation of Toll-like receptor 2 signalling may explain the atheroprotective effect of sphingosine 1-phosphate. Cardiovasc Res, 79, 537-544.
Edsall, L. C., Pirianov, G. G. & Spiegel, S. (1997) Involvement of sphingosine 1-phosphate in nerve growth factor-mediated neuronal survival and differentiation. J Neurosci, 17, 6952-6960.
Efferth, T., Benakis, A., Romero, M. R., Tomicic, M., Rauh, R., Steinbach, D., Hafer, R., Stamminger, T., Oesch, F., Kaina, B. & Marschall, M. (2004) Enhancement of cytotoxicity of artemisinins toward cancer cells by ferrous iron. Free Radic Biol Med, 37, 998-1009.
Ekiz, H. A. & Baran, Y. (2011) Bioactive sphingolipids in response to chemotherapy: a scope on leukemias. Anticancer Agents Med Chem, 11, 385-397.
El-Shewy, H. M., Johnson, K. R., Lee, M. H., Jaffa, A. A., Obeid, L. M. & Luttrell, L. M. (2006) Insulin-like growth factors mediate heterotrimeric G protein-dependent ERK1/2 activation by transactivating sphingosine 1-phosphate receptors. J Biol Chem, 281, 31399-31407.
Elad-Sfadia, G., Haklai, R., Balan, E. & Kloog, Y. (2004) Galectin-3 augments K-Ras activation and triggers a Ras signal that attenuates ERK but not phosphoinositide 3-kinase activity. J Biol Chem, 279, 34922-34930.
Facchinetti, M. M., Gandini, N. A., Fermento, M. E., Sterin-Speziale, N. B., Ji, Y., Patel, V., Gutkind, J. S., Rivadulla, M. G. & Curino, A. C. (2010) The expression of sphingosine kinase-1 in head and neck carcinoma. Cells Tissues Organs, 192, 314-324.
Fischer, I., Alliod, C., Martinier, N., Newcombe, J., Brana, C. & Pouly, S. (2011) Sphingosine Kinase 1 and Sphingosine 1-Phosphate Receptor 3 Are Functionally Upregulated on Astrocytes under Pro-Inflammatory Conditions. PLoS One, 6, e23905.

182
Forster, K., Helbl, V., Lederer, T., Urlinger, S., Wittenburg, N. & Hillen, W. (1999) Tetracycline-inducible expression systems with reduced basal activity in mammalian cells. Nucleic Acids Res, 27, 708-710.
Frankel, D. J., Pfeiffer, J. R., Surviladze, Z., Johnson, A. E., Oliver, J. M., Wilson, B. S. & Burns, A. R. (2006) Revealing the topography of cellular membrane domains by combined atomic force microscopy/fluorescence imaging. Biophys J, 90, 2404-2413.
Fransson, S., Ruusala, A. & Aspenstrom, P. (2006) The atypical Rho GTPases Miro-1 and Miro-2 have essential roles in mitochondrial trafficking. Biochem Biophys Res Commun, 344, 500-510.
French, K. J., Schrecengost, R. S., Lee, B. D., Zhuang, Y., Smith, S. N., Eberly, J. L., Yun, J. K. & Smith, C. D. (2003a) Discovery and evaluation of inhibitors of human sphingosine kinase. Cancer Research, 63, 5962-5969.
French, K. J., Schrecengost, R. S., Lee, B. D., Zhuang, Y., Smith, S. N., Eberly, J. L., Yun, J. K. & Smith, C. D. (2003b) Discovery and evaluation of inhibitors of human sphingosine kinase. Cancer Res, 63, 5962-5969.
French, K. J., Upson, J. J., Keller, S. N., Zhuang, Y., Yun, J. K. & Smith, C. D. (2006) Antitumor activity of sphingosine kinase inhibitors. J Pharmacol Exp Ther, 318, 596-603.
French, K. J., Zhuang, Y., Maines, L. W., Gao, P., Wang, W., Beljanski, V., Upson, J. J., Green, C. L., Keller, S. N. & Smith, C. D. (2010) Pharmacology and antitumor activity of ABC294640, a selective inhibitor of sphingosine kinase-2. J Pharmacol Exp Ther, 333, 129-139.
Freundlieb, S., Schirra-Muller, C. & Bujard, H. (1999) A tetracycline controlled activation/repression system with increased potential for gene transfer into mammalian cells. J Gene Med, 1, 4-12.
Fridman, E., Pinthus, J. H., Kopolovic, J., Ramon, J., Mor, O. & Mor, Y. (2006) Expression of cyclooxygenase-2 in Wilms tumor: immunohistochemical study using tissue microarray methodology. J Urol, 176, 1747-1750.
Frohman, M. A., Dush, M. K. & Martin, G. R. (1988) Rapid production of full-length cDNAs from rare transcripts: amplification using a single gene-specific oligonucleotide primer. Proc Natl Acad Sci U S A, 85, 8998-9002.
Fuereder, T., Hoeflmayer, D., Jaeger-Lansky, A., Rasin-Streden, D., Strommer, S., Fisker, N., Hansen, B. J., Crevenna, R. & Wacheck, V. (2011) Sphingosine kinase 1 is a relevant molecular target in gastric cancer. Anticancer Drugs, 22, 245-252.
Fujita, T., Okada, T., Hayashi, S., Jahangeer, S., Miwa, N. & Nakamura, S. (2004) Delta-catenin/NPRAP (neural plakophilin-related armadillo repeat protein) interacts with and activates sphingosine kinase 1. Biochem J, 382, 717-723.
Fukuda, Y., Kihara, A. & Igarashi, Y. (2003) Distribution of sphingosine kinase activity in mouse tissues: contribution of SPHK1. Biochem Biophys Res Commun, 309, 155-160.
Fukushima, Y., Nakanishi, M., Nonogi, H., Goto, Y. & Iwai, N. (2011) Assessment of plasma miRNAs in congestive heart failure. Circ J, 75, 336-340.
Furuno, K., Masatsugu, T., Sonoda, M., Sasazuki, T. & Yamamoto, K. (2006) Association of Polycomb group SUZ12 with WD-repeat protein MEP50 that binds to histone H2A selectively in vitro. Biochem Biophys Res Commun, 345, 1051-1058.

183
Furuta, J., Nobeyama, Y., Umebayashi, Y., Otsuka, F., Kikuchi, K. & Ushijima, T. (2006) Silencing of Peroxiredoxin 2 and aberrant methylation of 33 CpG islands in putative promoter regions in human malignant melanomas. Cancer Res, 66, 6080-6086.
Furuya, H., Shimizu, Y. & Kawamori, T. (2011) Sphingolipids in cancer. Cancer Metastasis Rev, 30, 567-576.
Fyrst, H. & Saba, J. D. (2010) An update on sphingosine-1-phosphate and other sphingolipid mediators. Nat Chem Biol, 6, 489-497.
Gangoiti, P., Camacho, L., Arana, L., Ouro, A., Granado, M. H., Brizuela, L., Casas, J., Fabrias, G., Abad, J. L., Delgado, A. & Gomez-Munoz, A. (2010) Control of metabolism and signaling of simple bioactive sphingolipids: Implications in disease. Prog Lipid Res, 49, 316-334.
Garrick, D., Fiering, S., Martin, D. I. & Whitelaw, E. (1998) Repeat-induced gene silencing in mammals. Nat Genet, 18, 56-59.
Gault, C. R., Obeid, L. M. & Hannun, Y. A. (2010) An overview of sphingolipid metabolism: from synthesis to breakdown. Adv Exp Med Biol, 688, 1-23.
Gherzi, R., Lee, K. Y., Briata, P., Wegmuller, D., Moroni, C., Karin, M. & Chen, C. Y. (2004) A KH domain RNA binding protein, KSRP, promotes ARE-directed mRNA turnover by recruiting the degradation machinery. Mol Cell, 14, 571-583.
Gillies, L., Lee, S. C., Long, J. S., Ktistakis, N., Pyne, N. J. & Pyne, S. (2009) The sphingosine 1-phosphate receptor 5 and sphingosine kinases 1 and 2 are localised in centrosomes: possible role in regulating cell division. Cell Signal, 21, 675-684.
Gimenez Ortiz, A. & Montalar Salcedo, J. (2010) Heat shock proteins as targets in oncology. Clin Transl Oncol, 12, 166-173.
Giordano, G., Campanini, N., Donofrio, V., Bertolini, P., Falleti, J., Grassani, C. & Pettinato, G. (2008) Analysis of Cox-2 expression in Wilms' tumor. Pathol Res Pract, 204, 875-882.
Gong, Y., Kakihara, Y., Krogan, N., Greenblatt, J., Emili, A., Zhang, Z. & Houry, W. A. (2009) An atlas of chaperone-protein interactions in Saccharomyces cerevisiae: implications to protein folding pathways in the cell. Mol Syst Biol, 5, 275.
Goparaju, S. K., Jolly, P. S., Watterson, K. R., Bektas, M., Alvarez, S., Sarkar, S., Mel, L., Ishii, I., Chun, J., Milstien, S. & Spiegel, S. (2005) The S1P2 receptor negatively regulates platelet-derived growth factor-induced motility and proliferation. Mol Cell Biol, 25, 4237-4249.
Gossen, M. & Bujard, H. (1992) Tight control of gene expression in mammalian cells by tetracycline-responsive promoters. Proc Natl Acad Sci U S A, 89, 5547-5551.
Gossen, M., Freundlieb, S., Bender, G., Muller, G., Hillen, W. & Bujard, H. (1995) Transcriptional activation by tetracyclines in mammalian cells. Science, 268, 1766-1769.
Green, J. A., Suzuki, K., Cho, B., Willison, L. D., Palmer, D., Allen, C. D., Schmidt, T. H., Xu, Y., Proia, R. L., Coughlin, S. R. & Cyster, J. G. (2011) The sphingosine 1-phosphate receptor S1P maintains the homeostasis of germinal center B cells and promotes niche confinement. Nat Immunol, 12, 672-680.
Gregory, P. A., Bert, A. G., Paterson, E. L., Barry, S. C., Tsykin, A., Farshid, G., Vadas, M. A., Khew-Goodall, Y. & Goodall, G. J. (2008) The miR-200 family and miR-205 regulate epithelial to mesenchymal transition by targeting ZEB1 and SIP1. Nat Cell Biol, 10, 593-601.

184
Grigo, K., Wirsing, A., Lucas, B., Klein-Hitpass, L. & Ryffel, G. U. (2008) HNF4 alpha orchestrates a set of 14 genes to down-regulate cell proliferation in kidney cells. Biol Chem, 389, 179-187.
Grimes, S. R., Wilkerson, D. C., Noss, K. R. & Wolfe, S. A. (2003) Transcriptional control of the testis-specific histone H1t gene. Gene, 304, 13-21.
Grisendi, S., Bernardi, R., Rossi, M., Cheng, K., Khandker, L., Manova, K. & Pandolfi, P. P. (2005) Role of nucleophosmin in embryonic development and tumorigenesis. Nature, 437, 147-153.
Gu, Z., Zhou, L., Gao, S. & Wang, Z. (2011) Nuclear Transport Signals Control Cellular Localization and Function of Androgen Receptor Cofactor p44/WDR77. PLoS One, 6, e22395.
Guan, H., Liu, L., Cai, J., Liu, J., Ye, C., Li, M. & Li, Y. (2011a) Sphingosine kinase 1 is overexpressed and promotes proliferation in human thyroid cancer. Mol Endocrinol, 25, 1858-1866.
Guan, H., Song, L., Cai, J., Huang, Y., Wu, J., Yuan, J., Li, J. & Li, M. (2011b) Sphingosine kinase 1 regulates the Akt/FOXO3a/Bim pathway and contributes to apoptosis resistance in glioma cells. PLoS One, 6, e19946.
Guillermet-Guibert, J., Davenne, L., Pchejetski, D., Saint-Laurent, N., Brizuela, L., Guilbeau-Frugier, C., Delisle, M. B., Cuvillier, O., Susini, C. & Bousquet, C. (2009) Targeting the sphingolipid metabolism to defeat pancreatic cancer cell resistance to the chemotherapeutic gemcitabine drug. Mol Cancer Ther, 8, 809-820.
Guo, W. J., Zeng, M. S., Yadav, A., Song, L. B., Guo, B. H., Band, V. & Dimri, G. P. (2007) Mel-18 acts as a tumor suppressor by repressing Bmi-1 expression and down-regulating Akt activity in breast cancer cells. Cancer Res, 67, 5083-5089.
Ha, T. Y. (2011) MicroRNAs in Human Diseases: From Autoimmune Diseases to Skin, Psychiatric and Neurodegenerative Diseases. Immune Netw, 11, 227-244.
Ha, Y. M., Park, M. K., Kim, H. J., Seo, H. G., Lee, J. H. & Chang, K. C. (2009) High concentrations of ascorbic acid induces apoptosis of human gastric cancer cell by p38-MAP kinase-dependent up-regulation of transferrin receptor. Cancer Lett, 277, 48-54.
Habashy, H. O., Powe, D. G., Staka, C. M., Rakha, E. A., Ball, G., Green, A. R., Aleskandarany, M., Paish, E. C., Douglas Macmillan, R., Nicholson, R. I., Ellis, I. O. & Gee, J. M. (2010) Transferrin receptor (CD71) is a marker of poor prognosis in breast cancer and can predict response to tamoxifen. Breast Cancer Res Treat, 119, 283-293.
Hait, N. C., Allegood, J., Maceyka, M., Strub, G. M., Harikumar, K. B., Singh, S. K., Luo, C., Marmorstein, R., Kordula, T., Milstien, S. & Spiegel, S. (2009) Regulation of histone acetylation in the nucleus by sphingosine-1-phosphate. Science, 325, 1254-1257.
Hait, N. C., Bellamy, A., Milstien, S., Kordula, T. & Spiegel, S. (2007) Sphingosine kinase type 2 activation by ERK-mediated phosphorylation. J Biol Chem, 282, 12058-12065.
Hait, N. C., Oskeritzian, C. A., Paugh, S. W., Milstien, S. & Spiegel, S. (2006) Sphingosine kinases, sphingosine 1-phosphate, apoptosis and diseases. Biochim Biophys Acta, 1758, 2016-2026.
Hait, N. C., Sarkar, S., Le Stunff, H., Mikami, A., Maceyka, M., Milstien, S. & Spiegel, S. (2005) Role of sphingosine kinase 2 in cell migration toward epidermal growth factor. J Biol Chem, 280, 29462-29469.

185
Haitina, T., Lindblom, J., Renstrom, T. & Fredriksson, R. (2006) Fourteen novel human members of mitochondrial solute carrier family 25 (SLC25) widely expressed in the central nervous system. Genomics, 88, 779-790.
Hammad, S. M., Crellin, H. G., Wu, B. X., Melton, J., Anelli, V. & Obeid, L. M. (2008) Dual and distinct roles for sphingosine kinase 1 and sphingosine 1 phosphate in the response to inflammatory stimuli in RAW macrophages. Prostaglandins Other Lipid Mediat, 85, 107-114.
Hanahan, D. & Weinberg, R. A. (2000) The hallmarks of cancer. Cell, 100, 57-70. Hanahan, D. & Weinberg, R. A. (2011) Hallmarks of cancer: the next generation. Cell, 144,
646-674. Hanel, P., Andreani, P. & Graler, M. H. (2007) Erythrocytes store and release sphingosine 1-
phosphate in blood. Faseb J, 21, 1202-1209. Harada, J., Foley, M., Moskowitz, M. A. & Waeber, C. (2004) Sphingosine-1-phosphate
induces proliferation and morphological changes of neural progenitor cells. J Neurochem, 88, 1026-1039.
Harada, Y., Sato, C. & Kitajima, K. (2007) Complex formation of 70-kDa heat shock protein with acidic glycolipids and phospholipids. Biochem Biophys Res Commun, 353, 655-660.
Haramati, S., Chapnik, E., Sztainberg, Y., Eilam, R., Zwang, R., Gershoni, N., Mcglinn, E., Heiser, P. W., Wills, A. M., Wirguin, I., Rubin, L. L., Misawa, H., Tabin, C. J., Brown, R., Jr., Chen, A. & Hornstein, E. (2010) miRNA malfunction causes spinal motor neuron disease. Proc Natl Acad Sci U S A, 107, 13111-13116.
He, S., Yang, S., Deng, G., Liu, M., Zhu, H., Zhang, W., Yan, S., Quan, L., Bai, J. & Xu, N. (2010a) Aurora kinase A induces miR-17-92 cluster through regulation of E2F1 transcription factor. Cell Mol Life Sci, 67, 2069-2076.
He, X., Huang, Y., Li, B., Gong, C. X. & Schuchman, E. H. (2010b) Deregulation of sphingolipid metabolism in Alzheimer's disease. Neurobiol Aging, 31, 398-408.
Helpman, L., Katz, B. Z., Safra, T., Schreiber, L., Levine, Z., Nemzer, S., Kinar, Y. & Grisaru, D. (2009) Systematic antigenic profiling of hematopoietic antigens on ovarian carcinoma cells identifies membrane proteins for targeted therapy development. Am J Obstet Gynecol, 201, 196 e1-e7.
Hengst, J. A., Guilford, J. M., Fox, T. E., Wang, X., Conroy, E. J. & Yun, J. K. (2009) Sphingosine kinase 1 localized to the plasma membrane lipid raft microdomain overcomes serum deprivation induced growth inhibition. Arch Biochem Biophys, 492, 62-73.
Hernandez-Verdun, D. (2006) The nucleolus: a model for the organization of nuclear functions. Histochem Cell Biol, 126, 135-148.
Herr, D. R., Grillet, N., Schwander, M., Rivera, R., Muller, U. & Chun, J. (2007) Sphingosine 1-phosphate (S1P) signaling is required for maintenance of hair cells mainly via activation of S1P2. J Neurosci, 27, 1474-1478.
Hidalgo-Curtis, C., Chase, A., Drachenberg, M., Roberts, M. W., Finkelstein, J. Z., Mould, S., Oscier, D., Cross, N. C. & Grand, F. H. (2008) The t(1;9)(p34;q34) and t(8;12)(p11;q15) fuse pre-mRNA processing proteins SFPQ (PSF) and CPSF6 to ABL and FGFR1. Genes Chromosomes Cancer, 47, 379-385.

186
Hirota, Y., Kuronita, T., Fujita, H. & Tanaka, Y. (2007) A role for Rab5 activity in the biogenesis of endosomal and lysosomal compartments. Biochem Biophys Res Commun, 364, 40-47.
Hofmann, L. P., Ren, S., Schwalm, S., Pfeilschifter, J. & Huwiler, A. (2008) Sphingosine kinase 1 and 2 regulate the capacity of mesangial cells to resist apoptotic stimuli in an opposing manner. Biol Chem, 389, 1399-1407.
Hogemann-Savellano, D., Bos, E., Blondet, C., Sato, F., Abe, T., Josephson, L., Weissleder, R., Gaudet, J., Sgroi, D., Peters, P. J. & Basilion, J. P. (2003) The transferrin receptor: a potential molecular imaging marker for human cancer. Neoplasia, 5, 495-506.
Hong, J. H., Youm, J. K., Kwon, M. J., Park, B. D., Lee, Y. M., Lee, S. I., Shin, D. M. & Lee, S. H. (2008) K6PC-5, a direct activator of sphingosine kinase 1, promotes epidermal differentiation through intracellular Ca2+ signaling. J Invest Dermatol, 128, 2166-2178.
Hosaka, S., Nakatsura, T., Tsukamoto, H., Hatayama, T., Baba, H. & Nishimura, Y. (2006) Synthetic small interfering RNA targeting heat shock protein 105 induces apoptosis of various cancer cells both in vitro and in vivo. Cancer Sci, 97, 623-632.
Hu, M. C. & Davidson, N. (1990) A combination of derepression of the lac operator-repressor system with positive induction by glucocorticoid and metal ions provides a high-level-inducible gene expression system based on the human metallothionein-IIA promoter. Mol Cell Biol, 10, 6141-6151.
Hu, W. M., Li, L., Jing, B. Q., Zhao, Y. S., Wang, C. L., Feng, L. & Xie, Y. E. (2010) Effect of S1P5 on proliferation and migration of human esophageal cancer cells. World J Gastroenterol, 16, 1859-1866.
Huang, W. J., Xia, L. M., Zhu, F., Huang, B., Zhou, C., Zhu, H. F., Wang, B., Chen, B., Lei, P. & Shen, G. X. (2009) Transcriptional upregulation of HSP70-2 by HIF-1 in cancer cells in response to hypoxia. Int J Cancer, 124, 298-305.
Huang, Y., Shen, X. J., Zou, Q., Wang, S. P., Tang, S. M. & Zhang, G. Z. (2011) Biological functions of microRNAs: a review. J Physiol Biochem, 67, 129-139.
Huang, Z. P., Chen, J. F., Regan, J. N., Maguire, C. T., Tang, R. H., Dong, X. R., Majesky, M. W. & Wang, D. Z. (2010) Loss of microRNAs in neural crest leads to cardiovascular syndromes resembling human congenital heart defects. Arterioscler Thromb Vasc Biol, 30, 2575-2586.
Huwiler, A., Doll, F., Ren, S., Klawitter, S., Greening, A., Romer, I., Bubnova, S., Reinsberg, L. & Pfeilschifter, J. (2006) Histamine increases sphingosine kinase-1 expression and activity in the human arterial endothelial cell line EA.hy 926 by a PKC-alpha-dependent mechanism. Biochim Biophys Acta, 1761, 367-376.
Idzko, M., Hammad, H., Van Nimwegen, M., Kool, M., Muller, T., Soullie, T., Willart, M. A., Hijdra, D., Hoogsteden, H. C. & Lambrecht, B. N. (2006) Local application of FTY720 to the lung abrogates experimental asthma by altering dendritic cell function. J Clin Invest, 116, 2935-2944.
Igarashi, N., Okada, T., Hayashi, S., Fujita, T., Jahangeer, S. & Nakamura, S. (2003a) Sphingosine kinase 2 is a nuclear protein and inhibits DNA synthesis. Journal of Biological Chemistry, 278, 46832-46839.
Igarashi, N., Okada, T., Hayashi, S., Fujita, T., Jahangeer, S. & Nakamura, S. (2003b) Sphingosine kinase 2 is a nuclear protein and inhibits DNA synthesis. J Biol Chem, 278, 46832-46839.

187
Ikeda, H., Satoh, H., Yanase, M., Inoue, Y., Tomiya, T., Arai, M., Tejima, K., Nagashima, K., Maekawa, H., Yahagi, N., Yatomi, Y., Sakurada, S., Takuwa, Y., Ogata, I., Kimura, S. & Fujiwara, K. (2003) Antiproliferative property of sphingosine 1-phosphate in rat hepatocytes involves activation of Rho via Edg-5. Gastroenterology, 124, 459-469.
Ikeda, M., Kihara, A. & Igarashi, Y. (2004) Sphingosine-1-phosphate lyase SPL is an endoplasmic reticulum-resident, integral membrane protein with the pyridoxal 5'-phosphate binding domain exposed to the cytosol. Biochem Biophys Res Commun, 325, 338-343.
Illig, T., Gieger, C., Zhai, G., Romisch-Margl, W., Wang-Sattler, R., Prehn, C., Altmaier, E., Kastenmuller, G., Kato, B. S., Mewes, H. W., Meitinger, T., De Angelis, M. H., Kronenberg, F., Soranzo, N., Wichmann, H. E., Spector, T. D., Adamski, J. & Suhre, K. (2010) A genome-wide perspective of genetic variation in human metabolism. Nat Genet, 42, 137-141.
Illuzzi, G., Bernacchioni, C., Aureli, M., Prioni, S., Frera, G., Donati, C., Valsecchi, M., Chigorno, V., Bruni, P., Sonnino, S. & Prinetti, A. (2010) Sphingosine kinase mediates resistance to the synthetic retinoid N-(4-hydroxyphenyl)retinamide in human ovarian cancer cells. J Biol Chem, 285, 18594-18602.
Im, D. S. (2010) Pharmacological tools for lysophospholipid GPCRs: development of agonists and antagonists for LPA and S1P receptors. Acta Pharmacol Sin, 31, 1213-1222.
Inagaki, Y., Li, P. Y., Wada, A., Mitsutake, S. & Igarashi, Y. (2003) Identification of functional nuclear export sequences in human sphingosine kinase 1. Biochem Biophys Res Commun, 311, 168-173.
Ipatova, O. M., Torkhovskaya, T. I., Zakharova, T. S. & Khalilov, E. M. (2006) Sphingolipids and cell signaling: involvement in apoptosis and atherogenesis. Biochemistry (Mosc), 71, 713-722.
Itagaki, K., Yun, J. K., Hengst, J. A., Yatani, A., Hauser, C. J., Spolarics, Z. & Deitch, E. A. (2007) Sphingosine 1-phosphate has dual functions in the regulation of endothelial cell permeability and Ca2+ metabolism. J Pharmacol Exp Ther, 323, 186-191.
Jang, J. Y., Jeon, Y. K. & Kim, C. W. (2010) Degradation of HER2/neu by ANT2 shRNA suppresses migration and invasiveness of breast cancer cells. BMC Cancer, 10, 391.
Jarman, K. E., Moretti, P. A., Zebol, J. R. & Pitson, S. M. (2010) Translocation of sphingosine kinase 1 to the plasma membrane is mediated by calcium- and integrin-binding protein 1. J Biol Chem, 285, 483-492.
Jiang, L. I., Collins, J., Davis, R., Lin, K. M., Decamp, D., Roach, T., Hsueh, R., Rebres, R. A., Ross, E. M., Taussig, R., Fraser, I. & Sternweis, P. C. (2007) Use of a cAMP BRET sensor to characterize a novel regulation of cAMP by the sphingosine 1-phosphate/G13 pathway. J Biol Chem, 282, 10576-10584.
Jiang, X. P., Elliott, R. L. & Head, J. F. (2010) Manipulation of iron transporter genes results in the suppression of human and mouse mammary adenocarcinomas. Anticancer Res, 30, 759-765.
Jo, S. K., Bajwa, A., Ye, H., Vergis, A. L., Awad, A. S., Kharel, Y., Lynch, K. R. & Okusa, M. D. (2009) Divergent roles of sphingosine kinases in kidney ischemia-reperfusion injury. Kidney Int, 75, 167-175.
Johansen, J., Rosenblad, C., Andsberg, K., Moller, A., Lundberg, C., Bjorlund, A. & Johansen, T. E. (2002) Evaluation of Tet-on system to avoid transgene down-regulation in ex vivo gene transfer to the CNS. Gene Ther, 9, 1291-1301.

188
Johnson, K. R., Becker, K. P., Facchinetti, M. M., Hannun, Y. A. & Obeid, L. M. (2002) PKC-dependent activation of sphingosine kinase 1 and translocation to the plasma membrane. Extracellular release of sphingosine-1-phosphate induced by phorbol 12-myristate 13-acetate (PMA). J Biol Chem, 277, 35257-35262.
Johnson, K. R., Johnson, K. Y., Crellin, H. G., Ogretmen, B., Boylan, A. M., Harley, R. A. & Obeid, L. M. (2005a) Immunohistochemical distribution of sphingosine kinase 1 in normal and tumor lung tissue. J Histochem Cytochem, 53, 1159-1166.
Johnson, K. R., Johnson, K. Y., Crellin, H. G., Ogretmen, B., Boylan, A. M., Harley, R. A. & Obeid, L. M. (2005b) Immunohistochemical distribution of sphingosine kinase 1 in normal and tumor lung tissue. Journal of Histochemistry & Cytochemistry, 53, 1159-1166.
Jolly, P. S., Bektas, M., Olivera, A., Gonzalez-Espinosa, C., Proia, R. L., Rivera, J., Milstien, S. & Spiegel, S. (2004) Transactivation of sphingosine-1-phosphate receptors by FcepsilonRI triggering is required for normal mast cell degranulation and chemotaxis. J Exp Med, 199, 959-970.
Jose-Eneriz, E. S., Roman-Gomez, J., Cordeu, L., Ballestar, E., Garate, L., Andreu, E. J., Isidro, I., Guruceaga, E., Jimenez-Velasco, A., Heiniger, A., Torres, A., Calasanz, M. J., Esteller, M., Gutierrez, N. C., Rubio, A., Perez-Roger, I., Agirre, X. & Prosper, F. (2008) BCR-ABL1-induced expression of HSPA8 promotes cell survival in chronic myeloid leukaemia. Br J Haematol, 142, 571-582.
Kanayasu-Toyoda, T., Yamaguchi, T., Oshizawa, T., Kogi, M., Uchida, E. & Hayakawa, T. (2002) Role of the p70 S6 kinase cascade in neutrophilic differentiation and proliferation of HL-60 cells-a study of transferrin receptor-positive and -negative cells obtained from dimethyl sulfoxide- or retinoic acid-treated HL-60 cells. Arch Biochem Biophys, 405, 21-31.
Kanoe, H., Nakayama, T., Hosaka, T., Murakami, H., Yamamoto, H., Nakashima, Y., Tsuboyama, T., Nakamura, T., Ron, D., Sasaki, M. S. & Toguchida, J. (1999) Characteristics of genomic breakpoints in TLS-CHOP translocations in liposarcomas suggest the involvement of Translin and topoisomerase II in the process of translocation. Oncogene, 18, 721-729.
Karkoulis, P. K., Stravopodis, D. J., Margaritis, L. H. & Voutsinas, G. E. (2010) 17-Allylamino-17-demethoxygeldanamycin induces downregulation of critical Hsp90 protein clients and results in cell cycle arrest and apoptosis of human urinary bladder cancer cells. BMC Cancer, 10, 481.
Kartal, M., Saydam, G., Sahin, F. & Baran, Y. (2011) Resveratrol triggers apoptosis through regulating ceramide metabolizing genes in human K562 chronic myeloid leukemia cells. Nutr Cancer, 63, 637-644.
Kawahara, A., Nishi, T., Hisano, Y., Fukui, H., Yamaguchi, A. & Mochizuki, N. (2009) The sphingolipid transporter spns2 functions in migration of zebrafish myocardial precursors. Science, 323, 524-527.
Kawamori, T., Kaneshiro, T., Okumura, M., Maalouf, S., Uflacker, A., Bielawski, J., Hannun, Y. A. & Obeid, L. M. (2009) Role for sphingosine kinase 1 in colon carcinogenesis. Faseb J, 23, 405-414.
Kawamori, T., Osta, W., Johnson, K. R., Pettus, B. J., Bielawski, J., Tanaka, T., Wargovich, M. J., Reddy, B. S., Hannun, Y. A., Obeid, L. M. & Zhou, D. (2006) Sphingosine kinase 1 is up-regulated in colon carcinogenesis. Faseb J, 20, 386-388.
189
Kessler, B., De Lorenzo, V. & Timmis, K. N. (1993) Identification of a cis-acting sequence within the Pm promoter of the TOL plasmid which confers XylS-mediated responsiveness to substituted benzoates. J Mol Biol, 230, 699-703.
Keul, P., Lucke, S., Von Wnuck Lipinski, K., Bode, C., Graler, M., Heusch, G. & Levkau, B. (2011) Sphingosine-1-phosphate receptor 3 promotes recruitment of monocyte/macrophages in inflammation and atherosclerosis. Circ Res, 108, 314-323.
Keul, P., Tolle, M., Lucke, S., Von Wnuck Lipinski, K., Heusch, G., Schuchardt, M., Van Der Giet, M. & Levkau, B. (2007) The sphingosine-1-phosphate analogue FTY720 reduces atherosclerosis in apolipoprotein E-deficient mice. Arterioscler Thromb Vasc Biol, 27, 607-613.
Kharel, Y., Lee, S., Snyder, A. H., Sheasley-O'neill S, L., Morris, M. A., Setiady, Y., Zhu, R., Zigler, M. A., Burcin, T. L., Ley, K., Tung, K. S., Engelhard, V. H., Macdonald, T. L., Pearson-White, S. & Lynch, K. R. (2005) Sphingosine kinase 2 is required for modulation of lymphocyte traffic by FTY720. J Biol Chem, 280, 36865-36872.
Kihara, A., Mitsutake, S., Mizutani, Y. & Igarashi, Y. (2007a) Metabolism and biological functions of two phosphorylated sphingolipids, sphingosine 1-phosphate and ceramide 1-phosphate. Prog Lipid Res, 46, 126-144.
Kihara, A., Mitsutake, S., Mizutani, Y. & Igarashi, Y. (2007b) Metabolism and biological functions of two phosphorylated sphingolipids, sphingosine 1-phosphate and ceramide 1-phosphate. Progress in Lipid Research, 46, 126-144.
Kim, D. S., Kim, S. Y., Kleuser, B., Schafer-Korting, M., Kim, K. H. & Park, K. C. (2004) Sphingosine-1-phosphate inhibits human keratinocyte proliferation via Akt/protein kinase B inactivation. Cell Signal, 16, 89-95.
Kim, M., Kim, M., Park, S. W., Pitson, S. M. & Lee, H. T. (2010) Isoflurane protects human kidney proximal tubule cells against necrosis via sphingosine kinase and sphingosine-1-phosphate generation. Am J Nephrol, 31, 353-362.
Kim, R. H., Takabe, K., Milstien, S. & Spiegel, S. (2009) Export and functions of sphingosine-1-phosphate. Biochim Biophys Acta, 1791, 692-696.
Kimura, T., Tomura, H., Mogi, C., Kuwabara, A., Ishiwara, M., Shibasawa, K., Sato, K., Ohwada, S., Im, D. S., Kurose, H., Ishizuka, T., Murakami, M. & Okajima, F. (2006) Sphingosine 1-phosphate receptors mediate stimulatory and inhibitory signalings for expression of adhesion molecules in endothelial cells. Cell Signal, 18, 841-850.
Kimura, T., Watanabe, T., Sato, K., Kon, J., Tomura, H., Tamama, K., Kuwabara, A., Kanda, T., Kobayashi, I., Ohta, H., Ui, M. & Okajima, F. (2000) Sphingosine 1-phosphate stimulates proliferation and migration of human endothelial cells possibly through the lipid receptors, Edg-1 and Edg-3. Biochem J, 348 Pt 1, 71-76.
Klausner, R. D., Harford, J. & Van Renswoude, J. (1984) Rapid internalization of the transferrin receptor in K562 cells is triggered by ligand binding or treatment with a phorbol ester. Proc Natl Acad Sci U S A, 81, 3005-3009.
Klawitter, S., Hofmann, L. P., Pfeilschifter, J. & Huwiler, A. (2007) Extracellular nucleotides induce migration of renal mesangial cells by upregulating sphingosine kinase-1 expression and activity. Br J Pharmacol, 150, 271-280.
Kleuser, B., Maceyka, M., Milstien, S. & Spiegel, S. (2001) Stimulation of nuclear sphingosine kinase activity by platelet-derived growth factor. FEBS Lett, 503, 85-90.

190
Ko, M. S., Takahashi, N., Sugiyama, N. & Takano, T. (1989) An auto-inducible vector conferring high glucocorticoid inducibility upon stable transformant cells. Gene, 84, 383-389.
Kobayashi, N., Nishi, T., Hirata, T., Kihara, A., Sano, T., Igarashi, Y. & Yamaguchi, A. (2006) Sphingosine 1-phosphate is released from the cytosol of rat platelets in a carrier-mediated manner. J Lipid Res, 47, 614-621.
Kohama, T., Olivera, A., Edsall, L., Nagiec, M. M., Dickson, R. & Spiegel, S. (1998) Molecular cloning and functional characterization of murine sphingosine kinase. J Biol Chem, 273, 23722-23728.
Kohno, M., Momoi, M., Oo, M. L., Paik, J. H., Lee, Y. M., Venkataraman, K., Ai, Y., Ristimaki, A. P., Fyrst, H., Sano, H., Rosenberg, D., Saba, J. D., Proia, R. L. & Hla, T. (2006) Intracellular role for sphingosine kinase 1 in intestinal adenoma cell proliferation. Mol Cell Biol, 26, 7211-7223.
Kondo, T., Matsuda, T., Tashima, M., Umehara, H., Domae, N., Yokoyama, K., Uchiyama, T. & Okazaki, T. (2000) Suppression of heat shock protein-70 by ceramide in heat shock-induced HL-60 cell apoptosis. J Biol Chem, 275, 8872-8879.
Kono, M., Mi, Y., Liu, Y., Sasaki, T., Allende, M. L., Wu, Y. P., Yamashita, T. & Proia, R. L. (2004) The sphingosine-1-phosphate receptors S1P1, S1P2, and S1P3 function coordinately during embryonic angiogenesis. J Biol Chem, 279, 29367-29373.
Kono, Y., Nishiuma, T., Okada, T., Kobayashi, K., Funada, Y., Kotani, Y., Jahangeer, S., Nakamura, S. & Nishimura, Y. (2010) Sphingosine kinase 1 regulates mucin production via ERK phosphorylation. Pulm Pharmacol Ther, 23, 36-42.
Kuhn, L. C. (1989) The transferrin receptor: a key function in iron metabolism. Schweiz Med Wochenschr, 119, 1319-1326.
Kukulj, S., Jaganjac, M., Boranic, M., Krizanac, S., Santic, Z. & Poljak-Blazi, M. (2010) Altered iron metabolism, inflammation, transferrin receptors, and ferritin expression in non-small-cell lung cancer. Med Oncol, 27, 268-277.
Kwiatkowski, T. J., Jr., Bosco, D. A., Leclerc, A. L., Tamrazian, E., Vanderburg, C. R., Russ, C., Davis, A., Gilchrist, J., Kasarskis, E. J., Munsat, T., Valdmanis, P., Rouleau, G. A., Hosler, B. A., Cortelli, P., De Jong, P. J., Yoshinaga, Y., Haines, J. L., Pericak-Vance, M. A., Yan, J., Ticozzi, N., Siddique, T., Mckenna-Yasek, D., Sapp, P. C., Horvitz, H. R., Landers, J. E. & Brown, R. H., Jr. (2009) Mutations in the FUS/TLS gene on chromosome 16 cause familial amyotrophic lateral sclerosis. Science, 323, 1205-1208.
Lacana, E., Maceyka, M., Milstien, S. & Spiegel, S. (2002) Cloning and characterization of a protein kinase A anchoring protein (AKAP)-related protein that interacts with and regulates sphingosine kinase 1 activity. J Biol Chem, 277, 32947-32953.
Lagarrigue, F., Dupuis-Coronas, S., Ramel, D., Delsol, G., Tronchere, H., Payrastre, B. & Gaits-Iacovoni, F. (2010) Matrix metalloproteinase-9 is upregulated in nucleophosmin-anaplastic lymphoma kinase-positive anaplastic lymphomas and activated at the cell surface by the chaperone heat shock protein 90 to promote cell invasion. Cancer Res, 70, 6978-6987.
Lagier-Tourenne, C. & Cleveland, D. W. (2009) Rethinking ALS: the FUS about TDP-43. Cell, 136, 1001-1004.
Lagnado, C. A., Brown, C. Y. & Goodall, G. J. (1994) AUUUA is not sufficient to promote poly(A) shortening and degradation of an mRNA: the functional sequence within AU-rich elements may be UUAUUUA(U/A)(U/A). Mol Cell Biol, 14, 7984-7995.

191
Lai, W. Q., Goh, H. H., Bao, Z., Wong, W. S., Melendez, A. J. & Leung, B. P. (2008a) The role of sphingosine kinase in a murine model of allergic asthma. J Immunol, 180, 4323-4329.
Lai, W. Q., Irwan, A. W., Goh, H. H., Howe, H. S., Yu, D. T., Valle-Onate, R., Mcinnes, I. B., Melendez, A. J. & Leung, B. P. (2008b) Anti-inflammatory effects of sphingosine kinase modulation in inflammatory arthritis. J Immunol, 181, 8010-8117.
Lai, W. Q., Irwan, A. W., Goh, H. H., Melendez, A. J., Mcinnes, I. B. & Leung, B. P. (2009) Distinct roles of sphingosine kinase 1 and 2 in murine collagen-induced arthritis. J Immunol, 183, 2097-2103.
Lai, W. Q., Wong, W. S. & Leung, B. P. (2011) Sphingosine kinase and sphingosine 1-phosphate in asthma. Biosci Rep, 31, 145-150.
Lai, W. S., Carballo, E., Strum, J. R., Kennington, E. A., Phillips, R. S. & Blackshear, P. J. (1999) Evidence that tristetraprolin binds to AU-rich elements and promotes the deadenylation and destabilization of tumor necrosis factor alpha mRNA. Mol Cell Biol, 19, 4311-4323.
Lamartina, S., Roscilli, G., Rinaudo, C. D., Sporeno, E., Silvi, L., Hillen, W., Bujard, H., Cortese, R., Ciliberto, G. & Toniatti, C. (2002) Stringent control of gene expression in vivo by using novel doxycycline-dependent trans-activators. Hum Gene Ther, 13, 199-210.
Lanneau, D., Wettstein, G., Bonniaud, P. & Garrido, C. (2010) Heat shock proteins: cell protection through protein triage. ScientificWorldJournal, 10, 1543-1552.
Le Roy, C. & Wrana, J. L. (2005) Clathrin- and non-clathrin-mediated endocytic regulation of cell signalling. Nat Rev Mol Cell Biol, 6, 112-126.
Le Scolan, E., Pchejetski, D., Banno, Y., Denis, N., Mayeux, P., Vainchenker, W., Levade, T. & Moreau-Gachelin, F. (2005) Overexpression of sphingosine kinase 1 is an oncogenic event in erythroleukemic progression. Blood, 106, 1808-1816.
Leclercq, T. M., Moretti, P. A., Vadas, M. A. & Pitson, S. M. (2008) Eukaryotic elongation factor 1A interacts with sphingosine kinase and directly enhances its catalytic activity. J Biol Chem, 283, 9606-9614.
Leclercq, T. M. & Pitson, S. M. (2006) Cellular signalling by sphingosine kinase and sphingosine 1-phosphate. IUBMB Life, 58, 467-472.
Lee, D. H., Jeon, B. T., Jeong, E. A., Kim, J. S., Cho, Y. W., Kim, H. J., Kang, S. S., Cho, G. J., Choi, W. S. & Roh, G. S. (2010) Altered expression of sphingosine kinase 1 and sphingosine-1-phosphate receptor 1 in mouse hippocampus after kainic acid treatment. Biochem Biophys Res Commun, 393, 476-480.
Lee, K. W., Liu, B., Ma, L., Li, H., Bang, P., Koeffler, H. P. & Cohen, P. (2004) Cellular internalization of insulin-like growth factor binding protein-3: distinct endocytic pathways facilitate re-uptake and nuclear localization. J Biol Chem, 279, 469-476.
Leng, R. X., Pan, H. F., Qin, W. Z., Chen, G. M. & Ye, D. Q. (2011) Role of microRNA-155 in autoimmunity. Cytokine Growth Factor Rev, 22, 141-147.
Leong, W. I. & Saba, J. D. (2010) S1P metabolism in cancer and other pathological conditions. Biochimie, 92, 716-723.
Lepine, S., Allegood, J. C., Park, M., Dent, P., Milstien, S. & Spiegel, S. (2011) Sphingosine-1-phosphate phosphohydrolase-1 regulates ER stress-induced autophagy. Cell Death Differ, 18, 350-361.

192
Lepley, D., Paik, J. H., Hla, T. & Ferrer, F. (2005) The G protein-coupled receptor S1P2 regulates Rho/Rho kinase pathway to inhibit tumor cell migration. Cancer Res, 65, 3788-3795.
Li, J., Guan, H. Y., Gong, L. Y., Song, L. B., Zhang, N., Wu, J., Yuan, J., Zheng, Y. J., Huang, Z. S. & Li, M. (2008a) Clinical significance of sphingosine kinase-1 expression in human astrocytomas progression and overall patient survival. Clin Cancer Res, 14, 6996-7003.
Li, M. H., Sanchez, T., Milne, G. L., Morrow, J. D., Hla, T. & Ferrer, F. (2009a) S1P/S1P2 signaling induces cyclooxygenase-2 expression in Wilms tumor. J Urol, 181, 1347-1352.
Li, M. H., Sanchez, T., Pappalardo, A., Lynch, K. R., Hla, T. & Ferrer, F. (2008b) Induction of antiproliferative connective tissue growth factor expression in Wilms' tumor cells by sphingosine-1-phosphate receptor 2. Mol Cancer Res, 6, 1649-1656.
Li, M. H., Sanchez, T., Yamase, H., Hla, T., Oo, M. L., Pappalardo, A., Lynch, K. R., Lin, C. Y. & Ferrer, F. (2009b) S1P/S1P1 signaling stimulates cell migration and invasion in Wilms tumor. Cancer Lett, 276, 171-179.
Li, Q. F., Huang, W. R., Duan, H. F., Wang, H., Wu, C. T. & Wang, L. S. (2007) Sphingosine kinase-1 mediates BCR/ABL-induced upregulation of Mcl-1 in chronic myeloid leukemia cells. Oncogene, 26, 7904-7908.
Li, Q. F., Yan, J., Zhang, K., Yang, Y. F., Xiao, F. J., Wu, C. T., Wang, H. & Wang, L. S. (2011a) Bortezomib and sphingosine kinase inhibitor interact synergistically to induces apoptosis in BCR/ABl+ cells sensitive and resistant to STI571 through down-regulation Mcl-1. Biochem Biophys Res Commun, 405, 31-36.
Li, W., Yu, C. P., Xia, J. T., Zhang, L., Weng, G. X., Zheng, H. Q., Kong, Q. L., Hu, L. J., Zeng, M. S., Zeng, Y. X., Li, M., Li, J. & Song, L. B. (2009c) Sphingosine kinase 1 is associated with gastric cancer progression and poor survival of patients. Clin Cancer Res, 15, 1393-1399.
Li, X. M., Wang, A. M., Zhang, J. & Yi, H. (2011b) Down-regulation of miR-126 expression in colorectal cancer and its clinical significance. Med Oncol, 28, 1054-1057.
Li, Z. & Srivastava, P. (2004) Heat-shock proteins. Curr Protoc Immunol, Appendix 1, Appendix 1T.
Liao, J., Yu, L., Mei, Y., Guarnera, M., Shen, J., Li, R., Liu, Z. & Jiang, F. (2010) Small nucleolar RNA signatures as biomarkers for non-small-cell lung cancer. Mol Cancer, 9, 198.
Limaye, V., Li, X., Hahn, C., Xia, P., Berndt, M. C., Vadas, M. A. & Gamble, J. R. (2005) Sphingosine kinase-1 enhances endothelial cell survival through a PECAM-1-dependent activation of PI-3K/Akt and regulation of Bcl-2 family members. Blood, 105, 3169-3177.
Limaye, V., Xia, P., Hahn, C., Smith, M., Vadas, M. A., Pitson, S. M. & Gamble, J. R. (2009) Chronic increases in sphingosine kinase-1 activity induce a pro-inflammatory, pro-angiogenic phenotype in endothelial cells. Cell Mol Biol Lett, 14, 424-441.
Lin, W. C., Lin, C. F., Chen, C. L., Chen, C. W. & Lin, Y. S. (2011) Inhibition of Neutrophil Apoptosis via Sphingolipid Signaling in Acute Lung Injury. J Pharmacol Exp Ther, 339, 45-53.
Ling, S. C., Albuquerque, C. P., Han, J. S., Lagier-Tourenne, C., Tokunaga, S., Zhou, H. & Cleveland, D. W. (2010) ALS-associated mutations in TDP-43 increase its stability and

193
promote TDP-43 complexes with FUS/TLS. Proc Natl Acad Sci U S A, 107, 13318-13323.
Liu, G., Zheng, H., Zhang, Z., Wu, Z., Xiong, H., Li, J. & Song, L. (2010) Overexpression of sphingosine kinase 1 is associated with salivary gland carcinoma progression and might be a novel predictive marker for adjuvant therapy. BMC Cancer, 10, 495.
Liu, H., Sugiura, M., Nava, V. E., Edsall, L. C., Kono, K., Poulton, S., Milstien, S., Kohama, T. & Spiegel, S. (2000a) Molecular cloning and functional characterization of a novel mammalian sphingosine kinase type 2 isoform. J Biol Chem, 275, 19513-19520.
Liu, H., Toman, R. E., Goparaju, S. K., Maceyka, M., Nava, V. E., Sankala, H., Payne, S. G., Bektas, M., Ishii, I., Chun, J., Milstien, S. & Spiegel, S. (2003) Sphingosine kinase type 2 is a putative BH3-only protein that induces apoptosis. J Biol Chem, 278, 40330-40336.
Liu, H. B., Cui, N. Q., Wang, Q., Li, D. H. & Xue, X. P. (2008) Sphingosine-1-phosphate and its analogue FTY720 diminish acute pulmonary injury in rats with acute necrotizing pancreatitis. Pancreas, 36, e10-e5.
Liu, Y., Wada, R., Yamashita, T., Mi, Y., Deng, C. X., Hobson, J. P., Rosenfeldt, H. M., Nava, V. E., Chae, S. S., Lee, M. J., Liu, C. H., Hla, T., Spiegel, S. & Proia, R. L. (2000b) Edg-1, the G protein-coupled receptor for sphingosine-1-phosphate, is essential for vascular maturation. J Clin Invest, 106, 951-961.
Lize, M., Pilarski, S. & Dobbelstein, M. (2010) E2F1-inducible microRNA 449a/b suppresses cell proliferation and promotes apoptosis. Cell Death Differ, 17, 452-458.
Long, J. S., Fujiwara, Y., Edwards, J., Tannahill, C. L., Tigyi, G., Pyne, S. & Pyne, N. J. (2010) Sphingosine 1-phosphate receptor 4 uses HER2 (ERBB2) to regulate extracellular signal regulated kinase-1/2 in MDA-MB-453 breast cancer cells. J Biol Chem, 285, 35957-35966.
Loura, L. M., De Almeida, R. F., Silva, L. C. & Prieto, M. (2009) FRET analysis of domain formation and properties in complex membrane systems. Biochim Biophys Acta, 1788, 209-224.
Loura, L. M., Fernandes, F. & Prieto, M. (2010) Membrane microheterogeneity: Forster resonance energy transfer characterization of lateral membrane domains. Eur Biophys J, 39, 589-607.
Lu, C. C., Li, Z., Chu, C. Y., Feng, J., Feng, J., Sun, R. & Rana, T. M. (2010) MicroRNAs encoded by Kaposi's sarcoma-associated herpesvirus regulate viral life cycle. EMBO Rep, 11, 784-790.
Lu, S. C. & Mato, J. M. (2008) S-Adenosylmethionine in cell growth, apoptosis and liver cancer. J Gastroenterol Hepatol, 23 Suppl 1, S73-S77.
Macedo, M. F. & De Sousa, M. (2008) Transferrin and the transferrin receptor: of magic bullets and other concerns. Inflamm Allergy Drug Targets, 7, 41-52.
Maceyka, M., Harikumar, K. B., Milstien, S. & Spiegel, S. (2012) Sphingosine-1-phosphate signaling and its role in disease. Trends Cell Biol, 22, 50-60.
Maceyka, M., Nava, V. E., Milstien, S. & Spiegel, S. (2004) Aminoacylase 1 is a sphingosine kinase 1-interacting protein. FEBS Lett, 568, 30-34.
Maceyka, M., Sankala, H., Hait, N. C., Le Stunff, H., Liu, H., Toman, R., Collier, C., Zhang, M., Satin, L. S., Merrill, A. H., Jr., Milstien, S. & Spiegel, S. (2005a) SphK1 and SphK2, sphingosine kinase isoenzymes with opposing functions in sphingolipid metabolism. J Biol Chem, 280, 37118-37129.

194
Maceyka, M., Sankala, H., Hait, N. C., Le Stunff, H., Liu, H., Toman, R., Collier, C., Zhang, M., Satin, L. S., Merrill, A. H., Milstien, S. & Spiegel, S. (2005b) SphK1 and SphK2, sphingosine kinase isoenzymes with opposing functions in sphingolipid metabolism. Journal of Biological Chemistry, 280, 37118-37129.
Malavaud, B., Pchejetski, D., Mazerolles, C., De Paiva, G. R., Calvet, C., Doumerc, N., Pitson, S., Rischmann, P. & Cuvillier, O. (2010) Sphingosine kinase-1 activity and expression in human prostate cancer resection specimens. Eur J Cancer, 46, 3417-3424.
Malchinkhuu, E., Sato, K., Maehama, T., Mogi, C., Tomura, H., Ishiuchi, S., Yoshimoto, Y., Kurose, H. & Okajima, F. (2008) S1P(2) receptors mediate inhibition of glioma cell migration through Rho signaling pathways independent of PTEN. Biochem Biophys Res Commun, 366, 963-968.
Malek, R. L., Toman, R. E., Edsall, L. C., Wong, S., Chiu, J., Letterle, C. A., Van Brocklyn, J. R., Milstien, S., Spiegel, S. & Lee, N. H. (2001) Nrg-1 belongs to the endothelial differentiation gene family of G protein-coupled sphingosine-1-phosphate receptors. J Biol Chem, 276, 5692-5699.
Mallardo, M., Poltronieri, P. & D'urso, O. F. (2008) Non-protein coding RNA biomarkers and differential expression in cancers: a review. J Exp Clin Cancer Res, 27, 19.
Mandala, S. M., Thornton, R., Tu, Z., Kurtz, M. B., Nickels, J., Broach, J., Menzeleev, R. & Spiegel, S. (1998) Sphingoid base 1-phosphate phosphatase: a key regulator of sphingolipid metabolism and stress response. Proc Natl Acad Sci U S A, 95, 150-155.
Manni, I., Tunici, P., Cirenei, N., Albarosa, R., Colombo, B. M., Roz, L., Sacchi, A., Piaggio, G. & Finocchiaro, G. (2002) Mxi1 inhibits the proliferation of U87 glioma cells through down-regulation of cyclin B1 gene expression. Br J Cancer, 86, 477-484.
Marfe, G., Di Stefano, C., Gambacurta, A., Ottone, T., Martini, V., Abruzzese, E., Mologni, L., Sinibaldi-Salimei, P., De Fabritis, P., Gambacorti-Passerini, C., Amadori, S. & Birge, R. B. (2011) Sphingosine kinase 1 overexpression is regulated by signaling through PI3K, AKT2, and mTOR in imatinib-resistant chronic myeloid leukemia cells. Exp Hematol, 39, 653-665 e6.
Martinez, L., Berenguer, M., Bruce, M. C., Le Marchand-Brustel, Y. & Govers, R. (2010) Rosiglitazone increases cell surface GLUT4 levels in 3T3-L1 adipocytes through an enhancement of endosomal recycling. Biochem Pharmacol, 79, 1300-1309.
Mastrandrea, L. D., Sessanna, S. M. & Laychock, S. G. (2005) Sphingosine kinase activity and sphingosine-1 phosphate production in rat pancreatic islets and INS-1 cells: response to cytokines. Diabetes, 54, 1429-1436.
Matsui, T., Itoh, T. & Fukuda, M. (2011) Small GTPase Rab12 regulates constitutive degradation of transferrin receptor. Traffic, 12, 1432-1443.
Mattie, M., Brooker, G. & Spiegel, S. (1994) Sphingosine-1-phosphate, a putative second messenger, mobilizes calcium from internal stores via an inositol trisphosphate-independent pathway. J Biol Chem, 269, 3181-3188.
Maxfield, F. R. & Mcgraw, T. E. (2004) Endocytic recycling. Nat Rev Mol Cell Biol, 5, 121-132.
Mccaffrey, M. W., Bielli, A., Cantalupo, G., Mora, S., Roberti, V., Santillo, M., Drummond, F. & Bucci, C. (2001) Rab4 affects both recycling and degradative endosomal trafficking. FEBS Lett, 495, 21-30.
195
Melendez, A. J., Carlos-Dias, E., Gosink, M., Allen, J. M. & Takacs, L. (2000) Human sphingosine kinase: molecular cloning, functional characterization and tissue distribution. Gene, 251, 19-26.
Mellati, A. A. (2006) The role of heat shock proteins as chaperones on several human diseases. Saudi Med J, 27, 1302-1305.
Meltzer, P. S. (2005) Cancer genomics: small RNAs with big impacts. Nature, 435, 745-746. Melville, M. W., Mcclellan, A. J., Meyer, A. S., Darveau, A. & Frydman, J. (2003) The Hsp70
and TRiC/CCT chaperone systems cooperate in vivo to assemble the von Hippel-Lindau tumor suppressor complex. Mol Cell Biol, 23, 3141-3151.
Meyer-Ficca, M. L., Meyer, R. G., Kaiser, H., Brack, A. R., Kandolf, R. & Kupper, J. H. (2004) Comparative analysis of inducible expression systems in transient transfection studies. Anal Biochem, 334, 9-19.
Meyer Zu Heringdorf, D., Lass, H., Kuchar, I., Alemany, R., Guo, Y., Schmidt, M. & Jakobs, K. H. (1999) Role of sphingosine kinase in Ca(2+) signalling by epidermal growth factor receptor. FEBS Lett, 461, 217-222.
Meyer Zu Heringdorf, D., Lass, H., Kuchar, I., Lipinski, M., Alemany, R., Rumenapp, U. & Jakobs, K. H. (2001) Stimulation of intracellular sphingosine-1-phosphate production by G-protein-coupled sphingosine-1-phosphate receptors. Eur J Pharmacol, 414, 145-154.
Michaud, J., Im, D. S. & Hla, T. (2010) Inhibitory role of sphingosine 1-phosphate receptor 2 in macrophage recruitment during inflammation. J Immunol, 184, 1475-1483.
Michaud, J., Kohno, M., Proia, R. L. & Hla, T. (2006) Normal acute and chronic inflammatory responses in sphingosine kinase 1 knockout mice. FEBS Lett, 580, 4607-4512.
Michaud, M. D., Robitaille, G. A., Gratton, J. P. & Richard, D. E. (2009) Sphingosine-1-phosphate: a novel nonhypoxic activator of hypoxia-inducible factor-1 in vascular cells. Arterioscler Thromb Vasc Biol, 29, 902-908.
Millar, C. A., Meerloo, T., Martin, S., Hickson, G. R., Shimwell, N. J., Wakelam, M. J., James, D. E. & Gould, G. W. (2000) Adipsin and the glucose transporter GLUT4 traffic to the cell surface via independent pathways in adipocytes. Traffic, 1, 141-151.
Mishima, Y., Miyagi, S., Saraya, A., Negishi, M., Endoh, M., Endo, T. A., Toyoda, T., Shinga, J., Katsumoto, T., Chiba, T., Yamaguchi, N., Kitabayashi, I., Koseki, H. & Iwama, A. (2011) The Hbo1-Brd1/Brpf2 complex is responsible for global acetylation of H3K14 and required for fetal liver erythropoiesis. Blood, 118, 2443-2453.
Misquitta, C. M., Chen, T. & Grover, A. K. (2006) Control of protein expression through mRNA stability in calcium signalling. Cell Calcium, 40, 329-346.
Mitra, P., Oskeritzian, C. A., Payne, S. G., Beaven, M. A., Milstien, S. & Spiegel, S. (2006) Role of ABCC1 in export of sphingosine-1-phosphate from mast cells. Proc Natl Acad Sci U S A, 103, 16394-16399.
Mizugishi, K., Yamashita, T., Olivera, A., Miller, G. F., Spiegel, S. & Proia, R. L. (2005) Essential role for sphingosine kinases in neural and vascular development. Mol Cell Biol, 25, 11113-11121.
Mizuguchi, H. & Hayakawa, T. (2001) Characteristics of adenovirus-mediated tetracycline-controllable expression system. Biochim Biophys Acta, 1568, 21-29.
Mohrmann, K. & Van Der Sluijs, P. (1999) Regulation of membrane transport through the endocytic pathway by rabGTPases. Mol Membr Biol, 16, 81-87.

196
Molin, M., Shoshan, M. C., Ohman-Forslund, K., Linder, S. & Akusjarvi, G. (1998) Two novel adenovirus vector systems permitting regulated protein expression in gene transfer experiments. J Virol, 72, 8358-8361.
Montanaro, L., Trere, D. & Derenzini, M. (2008) Nucleolus, ribosomes, and cancer. Am J Pathol, 173, 301-310.
Morita, Y., Perez, G. I., Paris, F., Miranda, S. R., Ehleiter, D., Haimovitz-Friedman, A., Fuks, Z., Xie, Z., Reed, J. C., Schuchman, E. H., Kolesnick, R. N. & Tilly, J. L. (2000) Oocyte apoptosis is suppressed by disruption of the acid sphingomyelinase gene or by sphingosine-1-phosphate therapy. Nat Med, 6, 1109-1114.
Mosser, D. D., Caron, A. W., Bourget, L., Denis-Larose, C. & Massie, B. (1997) Role of the human heat shock protein hsp70 in protection against stress-induced apoptosis. Mol Cell Biol, 17, 5317-5327.
Muchemwa, F. C., Nakatsura, T., Fukushima, S., Nishimura, Y., Kageshita, T. & Ihn, H. (2008) Differential expression of heat shock protein 105 in melanoma and melanocytic naevi. Melanoma Res, 18, 166-171.
Muchemwa, F. C., Nakatsura, T., Ihn, H. & Kageshita, T. (2006) Heat shock protein 105 is overexpressed in squamous cell carcinoma and extramammary Paget disease but not in basal cell carcinoma. Br J Dermatol, 155, 582-585.
Murakami, M., Ichihara, M., Sobue, S., Kikuchi, R., Ito, H., Kimura, A., Iwasaki, T., Takagi, A., Kojima, T., Takahashi, M., Suzuki, M., Banno, Y., Nozawa, Y. & Murate, T. (2007) RET signaling-induced SPHK1 gene expression plays a role in both GDNF-induced differentiation and MEN2-type oncogenesis. J Neurochem, 102, 1585-1594.
Murakami, M., Ito, H., Hagiwara, K., Kobayashi, M., Hoshikawa, A., Takagi, A., Kojima, T., Tamiya-Koizumi, K., Sobue, S., Ichihara, M., Suzuki, M., Banno, Y., Nozawa, Y. & Murate, T. (2011) Sphingosine kinase 1/S1P pathway involvement in the GDNF-induced GAP43 transcription. J Cell Biochem, 112, 3449-3458.
Murata, N., Sato, K., Kon, J., Tomura, H. & Okajima, F. (2000a) Quantitative measurement of sphingosine 1-phosphate by radioreceptor-binding assay. Anal Biochem, 282, 115-120.
Murata, N., Sato, K., Kon, J., Tomura, H., Yanagita, M., Kuwabara, A., Ui, M. & Okajima, F. (2000b) Interaction of sphingosine 1-phosphate with plasma components, including lipoproteins, regulates the lipid receptor-mediated actions. Biochem J, 352 Pt 3, 809-815.
Nakade, Y., Banno, Y., K, T. K., Hagiwara, K., Sobue, S., Koda, M., Suzuki, M., Kojima, T., Takagi, A., Asano, H., Nozawa, Y. & Murate, T. (2003) Regulation of sphingosine kinase 1 gene expression by protein kinase C in a human leukemia cell line, MEG-O1. Biochim Biophys Acta, 1635, 104-116.
Nava, V. E., Hobson, J. P., Murthy, S., Milstien, S. & Spiegel, S. (2002) Sphingosine kinase type 1 promotes estrogen-dependent tumorigenesis of breast cancer MCF-7 cells. Exp Cell Res, 281, 115-127.
Nava, V. E., Lacana, E., Poulton, S., Liu, H., Sugiura, M., Kono, K., Milstien, S., Kohama, T. & Spiegel, S. (2000) Functional characterization of human sphingosine kinase-1. FEBS Lett, 473, 81-84.
Nayak, D., Huo, Y., Kwang, W. X., Pushparaj, P. N., Kumar, S. D., Ling, E. A. & Dheen, S. T. (2010) Sphingosine kinase 1 regulates the expression of proinflammatory cytokines and nitric oxide in activated microglia. Neuroscience, 166, 132-144.

197
Nemoto, S., Nakamura, M., Osawa, Y., Kono, S., Itoh, Y., Okano, Y., Murate, T., Hara, A., Ueda, H., Nozawa, Y. & Banno, Y. (2009) Sphingosine kinase isoforms regulate oxaliplatin sensitivity of human colon cancer cells through ceramide accumulation and Akt activation. J Biol Chem, 284, 10422-10432.
Ng, C. K., Carr, K., Mcainsh, M. R., Powell, B. & Hetherington, A. M. (2001) Drought-induced guard cell signal transduction involves sphingosine-1-phosphate. Nature, 410, 596-599.
Nielsen, A. E., Bohr, A. & Penkowa, M. (2007) The Balance between Life and Death of Cells: Roles of Metallothioneins. Biomark Insights, 1, 99-111.
Niimura, Y., Moue, T., Takahashi, N. & Nagai, K. (2010) Modification of sphingoglycolipids and sulfolipids in kidney cell lines under heat stress: activation of monohexosylceramide synthesis as a ceramide scavenger. Glycobiology, 20, 710-717.
Nishitani, H. & Lygerou, Z. (2002) Control of DNA replication licensing in a cell cycle. Genes Cells, 7, 523-534.
Nishiuma, T., Nishimura, Y., Okada, T., Kuramoto, E., Kotani, Y., Jahangeer, S. & Nakamura, S. (2008) Inhalation of sphingosine kinase inhibitor attenuates airway inflammation in asthmatic mouse model. Am J Physiol Lung Cell Mol Physiol, 294, L1085-L1093.
No, D., Yao, T. P. & Evans, R. M. (1996) Ecdysone-inducible gene expression in mammalian cells and transgenic mice. Proc Natl Acad Sci U S A, 93, 3346-3351.
Nofer, J. R. (2008) High-density lipoprotein, sphingosine 1-phosphate, and atherosclerosis. J Clin Lipidol, 2, 4-11.
Nojima, M., Maruyama, R., Yasui, H., Suzuki, H., Maruyama, Y., Tarasawa, I., Sasaki, Y., Asaoku, H., Sakai, H., Hayashi, T., Mori, M., Imai, K., Tokino, T., Ishida, T., Toyota, M. & Shinomura, Y. (2009) Genomic screening for genes silenced by DNA methylation revealed an association between RASD1 inactivation and dexamethasone resistance in multiple myeloma. Clin Cancer Res, 15, 4356-4364.
Novgorodov, A. S., El-Alwani, M., Bielawski, J., Obeid, L. M. & Gudz, T. I. (2007) Activation of sphingosine-1-phosphate receptor S1P5 inhibits oligodendrocyte progenitor migration. Faseb Journal, 21, 1503-1514.
O'brien, N., Jones, S. T., Williams, D. G., Cunningham, H. B., Moreno, K., Visentin, B., Gentile, A., Vekich, J., Shestowsky, W., Hiraiwa, M., Matteo, R., Cavalli, A., Grotjahn, D., Grant, M., Hansen, G., Campbell, M. A. & Sabbadini, R. (2009) Production and characterization of monoclonal anti-sphingosine-1-phosphate antibodies. J Lipid Res, 50, 2245-2257.
O'connell, R. M., Rao, D. S., Chaudhuri, A. A. & Baltimore, D. (2010) Physiological and pathological roles for microRNAs in the immune system. Nat Rev Immunol, 10, 111-122.
O'donnell, K. A., Yu, D., Zeller, K. I., Kim, J. W., Racke, F., Thomas-Tikhonenko, A. & Dang, C. V. (2006) Activation of transferrin receptor 1 by c-Myc enhances cellular proliferation and tumorigenesis. Mol Cell Biol, 26, 2373-2386.
O'gorman, S., Fox, D. T. & Wahl, G. M. (1991) Recombinase-mediated gene activation and site-specific integration in mammalian cells. Science, 251, 1351-1355.
Ohba, S., Hirose, Y., Yoshida, K., Yazaki, T. & Kawase, T. (2010) Inhibition of 90-kD heat shock protein potentiates the cytotoxicity of chemotherapeutic agents in human glioma cells. J Neurosurg, 112, 33-42.

198
Okada, T., Ding, G., Sonoda, H., Kajimoto, T., Haga, Y., Khosrowbeygi, A., Gao, S., Miwa, N., Jahangeer, S. & Nakamura, S. (2005) Involvement of N-terminal-extended form of sphingosine kinase 2 in serum-dependent regulation of cell proliferation and apoptosis. J Biol Chem, 280, 36318-36325.
Okajima, F. (2002) Plasma lipoproteins behave as carriers of extracellular sphingosine 1-phosphate: is this an atherogenic mediator or an anti-atherogenic mediator? Biochim Biophys Acta, 1582, 132-137.
Okamoto, H., Takuwa, N., Gonda, K., Okazaki, H., Chang, K., Yatomi, Y., Shigematsu, H. & Takuwa, Y. (1998) EDG1 is a functional sphingosine-1-phosphate receptor that is linked via a Gi/o to multiple signaling pathways, including phospholipase C activation, Ca2+ mobilization, Ras-mitogen-activated protein kinase activation, and adenylate cyclase inhibition. J Biol Chem, 273, 27104-27110.
Okazaki, F., Matsunaga, N., Okazaki, H., Utoguchi, N., Suzuki, R., Maruyama, K., Koyanagi, S. & Ohdo, S. (2009) Circadian rhythm of transferrin receptor 1 gene expression controlled by c-Myc in colon cancer-bearing mice. Cancer Res, 70, 6238-6246.
Olivera, A., Kohama, T., Edsall, L., Nava, V., Cuvillier, O., Poulton, S. & Spiegel, S. (1999a) Sphingosine kinase expression increases intracellular sphingosine-1-phosphate and promotes cell growth and survival. J Cell Biol, 147, 545-558.
Olivera, A., Kohama, T., Edsall, L., Nava, V., Cuvillier, O., Poulton, S. & Spiegel, S. (1999b) Sphingosine kinase expression increases intracellular sphingosine-1-phosphate and promotes cell growth and survival. Journal of Cell Biology, 147, 545-557.
Olivera, A., Kohama, T., Tu, Z., Milstien, S. & Spiegel, S. (1998) Purification and characterization of rat kidney sphingosine kinase. J Biol Chem, 273, 12576-12583.
Olivera, A., Mizugishi, K., Tikhonova, A., Ciaccia, L., Odom, S., Proia, R. L. & Rivera, J. (2007) The sphingosine kinase-sphingosine-1-phosphate axis is a determinant of mast cell function and anaphylaxis. Immunity, 26, 287-297.
Olivera, A., Rosenfeldt, H. M., Bektas, M., Wang, F., Ishii, I., Chun, J., Milstien, S. & Spiegel, S. (2003) Sphingosine kinase type 1 induces G12/13-mediated stress fiber formation, yet promotes growth and survival independent of G protein-coupled receptors. J Biol Chem, 278, 46452-46460.
Olivera, A. & Spiegel, S. (1993) Sphingosine-1-phosphate as second messenger in cell proliferation induced by PDGF and FCS mitogens. Nature, 365, 557-560.
Olivera, A., Urtz, N., Mizugishi, K., Yamashita, Y., Gilfillan, A. M., Furumoto, Y., Gu, H., Proia, R. L., Baumruker, T. & Rivera, J. (2006) IgE-dependent activation of sphingosine kinases 1 and 2 and secretion of sphingosine 1-phosphate requires Fyn kinase and contributes to mast cell responses. J Biol Chem, 281, 2515-2525.
Olsson, M., Olsson, B., Jacobson, P., Thelle, D. S., Bjorkegren, J., Walley, A., Froguel, P., Carlsson, L. M. & Sjoholm, K. (2011) Expression of the selenoprotein S (SELS) gene in subcutaneous adipose tissue and SELS genotype are associated with metabolic risk factors. Metabolism, 60, 114-120.
Onda, M., Emi, M., Yoshida, A., Miyamoto, S., Akaishi, J., Asaka, S., Mizutani, K., Shimizu, K., Nagahama, M., Ito, K., Tanaka, T. & Tsunoda, T. (2004) Comprehensive gene expression profiling of anaplastic thyroid cancers with cDNA microarray of 25 344 genes. Endocr Relat Cancer, 11, 843-854.

199
Ono, M., Scott, M. S., Yamada, K., Avolio, F., Barton, G. J. & Lamond, A. I. (2011) Identification of human miRNA precursors that resemble box C/D snoRNAs. Nucleic Acids Res, 39, 3879-3891.
Osawa, Y., Banno, Y., Nagaki, M., Brenner, D. A., Naiki, T., Nozawa, Y., Nakashima, S. & Moriwaki, H. (2001) TNF-alpha-induced sphingosine 1-phosphate inhibits apoptosis through a phosphatidylinositol 3-kinase/Akt pathway in human hepatocytes. J Immunol, 167, 173-180.
Osborne, N., Brand-Arzamendi, K., Ober, E. A., Jin, S. W., Verkade, H., Holtzman, N. G., Yelon, D. & Stainier, D. Y. (2008) The spinster homolog, two of hearts, is required for sphingosine 1-phosphate signaling in zebrafish. Curr Biol, 18, 1882-1888.
Osinde, M., Mullershausen, F. & Dev, K. K. (2007) Phosphorylated FTY720 stimulates ERK phosphorylation in astrocytes via S1P receptors. Neuropharmacology, 52, 1210-1218.
Oskeritzian, C. A., Alvarez, S. E., Hait, N. C., Price, M. M., Milstien, S. & Spiegel, S. (2008) Distinct roles of sphingosine kinases 1 and 2 in human mast-cell functions. Blood, 111, 4193-4200.
Oskeritzian, C. A., Milstien, S. & Spiegel, S. (2007) Sphingosine-1-phosphate in allergic responses, asthma and anaphylaxis. Pharmacol Ther, 115, 390-399.
Oskeritzian, C. A., Price, M. M., Hait, N. C., Kapitonov, D., Falanga, Y. T., Morales, J. K., Ryan, J. J., Milstien, S. & Spiegel, S. (2010) Essential roles of sphingosine-1-phosphate receptor 2 in human mast cell activation, anaphylaxis, and pulmonary edema. J Exp Med, 207, 465-474.
Oskouian, B. & Saba, J. D. (2010) Cancer treatment strategies targeting sphingolipid metabolism. Adv Exp Med Biol, 688, 185-205.
Otsuka, T., Miyajima, A., Brown, N., Otsu, K., Abrams, J., Saeland, S., Caux, C., De Waal Malefijt, R., De Vries, J., Meyerson, P. & Et Al. (1988) Isolation and characterization of an expressible cDNA encoding human IL-3. Induction of IL-3 mRNA in human T cell clones. J Immunol, 140, 2288-2295.
Ozbay, T., Rowan, A., Leon, A., Patel, P. & Sewer, M. B. (2006) Cyclic adenosine 5'-monophosphate-dependent sphingosine-1-phosphate biosynthesis induces human CYP17 gene transcription by activating cleavage of sterol regulatory element binding protein 1. Endocrinology, 147, 1427-1437.
Pacheco, Y. M., Abia, R., Olivera, A., Spiegel, S., Ruiz-Gutierrez, V. & Muriana, F. J. (2003) Sphingosine 1-phosphate signal survival and mitogenesis are mediated by lipid-stereospecific binding of triacylglycerol-rich lipoproteins. Cell Mol Life Sci, 60, 2757-2766.
Pantopoulos, K. & Hentze, M. W. (1995) Nitric oxide signaling to iron-regulatory protein: direct control of ferritin mRNA translation and transferrin receptor mRNA stability in transfected fibroblasts. Proc Natl Acad Sci U S A, 92, 1267-1271.
Pappu, R., Schwab, S. R., Cornelissen, I., Pereira, J. P., Regard, J. B., Xu, Y., Camerer, E., Zheng, Y. W., Huang, Y., Cyster, J. G. & Coughlin, S. R. (2007) Promotion of lymphocyte egress into blood and lymph by distinct sources of sphingosine-1-phosphate. Science, 316, 295-298.
Park, H. S., Park, C. H., Choi, B. R., Lim, M. S., Heo, S. H., Kim, C. H., Kang, S. G., Whang, K. U. & Cho, M. K. (2009) Expression of heat shock protein 105 and 70 in malignant melanoma and benign melanocytic nevi. J Cutan Pathol, 36, 511-516.

200
Park, S. R., Cho, H. J., Moon, K. J., Chun, K. H., Kong, S. Y., Yoon, S. S., Lee, J. S. & Park, S. (2010) Cytotoxic effects of novel phytosphingosine derivatives, including N,N-dimethylphytosphingosine and N-monomethylphytosphingosine, in human leukemia cell line HL60. Leuk Lymphoma, 51, 132-145.
Park, S. W., Kim, M., Kim, M., D'agati, V. D. & Lee, H. T. (2011) Sphingosine kinase 1 protects against renal ischemia-reperfusion injury in mice by sphingosine-1-phosphate1 receptor activation. Kidney Int, 80, 1315-1327.
Paugh, B. S., Bryan, L., Paugh, S. W., Wilczynska, K. M., Alvarez, S. M., Singh, S. K., Kapitonov, D., Rokita, H., Wright, S., Griswold-Prenner, I., Milstien, S., Spiegel, S. & Kordula, T. (2009) Interleukin-1 regulates the expression of sphingosine kinase 1 in glioblastoma cells. J Biol Chem, 284, 3408-3417.
Paugh, S. W., Paugh, B. S., Rahmani, M., Kapitonov, D., Almenara, J. A., Kordula, T., Milstien, S., Adams, J. K., Zipkin, R. E., Grant, S. & Spiegel, S. (2008) A selective sphingosine kinase 1 inhibitor integrates multiple molecular therapeutic targets in human leukemia. Blood, 112, 1382-1391.
Paugh, S. W., Payne, S. G., Barbour, S. E., Milstien, S. & Spiegel, S. (2003) The immunosuppressant FTY720 is phosphorylated by sphingosine kinase type 2. FEBS Lett, 554, 189-193.
Pauley, K. M., Cha, S. & Chan, E. K. (2009) MicroRNA in autoimmunity and autoimmune diseases. J Autoimmun, 32, 189-194.
Pchejetski, D., Bohler, T., Brizuela, L., Sauer, L., Doumerc, N., Golzio, M., Salunkhe, V., Teissie, J., Malavaud, B., Waxman, J. & Cuvillier, O. (2010) FTY720 (fingolimod) sensitizes prostate cancer cells to radiotherapy by inhibition of sphingosine kinase-1. Cancer Res, 70, 8651-8661.
Pchejetski, D., Doumerc, N., Golzio, M., Naymark, M., Teissie, J., Kohama, T., Waxman, J., Malavaud, B. & Cuvillier, O. (2008) Chemosensitizing effects of sphingosine kinase-1 inhibition in prostate cancer cell and animal models. Mol Cancer Ther, 7, 1836-1845.
Pchejetski, D., Golzio, M., Bonhoure, E., Calvet, C., Doumerc, N., Garcia, V., Mazerolles, C., Rischmann, P., Teissie, J., Malavaud, B. & Cuvillier, O. (2005a) Sphingosine kinase-1 as a chemotherapy sensor in prostate adenocarcinoma cell and mouse models. Cancer Research, 65, 11667-11675.
Pchejetski, D., Golzio, M., Bonhoure, E., Calvet, C., Doumerc, N., Garcia, V., Mazerolles, C., Rischmann, P., Teissie, J., Malavaud, B. & Cuvillier, O. (2005b) Sphingosine kinase-1 as a chemotherapy sensor in prostate adenocarcinoma cell and mouse models. Cancer Res, 65, 11667-11675.
Peng, J. L., Wu, S., Zhao, X. P., Wang, M., Li, W. H., Shen, X., Liu, J., Lei, P., Zhu, H. F. & Shen, G. X. (2007) Downregulation of transferrin receptor surface expression by intracellular antibody. Biochem Biophys Res Commun, 354, 864-871.
Pettus, B. J., Bielawski, J., Porcelli, A. M., Reames, D. L., Johnson, K. R., Morrow, J., Chalfant, C. E., Obeid, L. M. & Hannun, Y. A. (2003) The sphingosine kinase 1/sphingosine-1-phosphate pathway mediates COX-2 induction and PGE2 production in response to TNF-alpha. Faseb J, 17, 1411-1421.
Pfeffer, S. & Voinnet, O. (2006) Viruses, microRNAs and cancer. Oncogene, 25, 6211-6219. Pham, D. H., Moretti, P. A., Goodall, G. J. & Pitson, S. M. (2008) Attenuation of leakiness in
doxycycline-inducible expression via incorporation of 3' AU-rich mRNA destabilizing elements. Biotechniques, 45, 155-160.

201
Pitman, M. R., Pham, D. H. & Pitson, S. M. (2012) Isoform-selective assays for sphingosine kinase activity. Methods Mol Biol, 874, 21-31.
Pitman, M. R. & Pitson, S. M. (2010) Inhibitors of the sphingosine kinase pathway as potential therapeutics. Curr Cancer Drug Targets, 10, 354-367.
Pitson, S. M. (2011) Regulation of sphingosine kinase and sphingolipid signaling. Trends Biochem Sci, 36, 97-107.
Pitson, S. M., D'andrea R, J., Vandeleur, L., Moretti, P. A., Xia, P., Gamble, J. R., Vadas, M. A. & Wattenberg, B. W. (2000a) Human sphingosine kinase: purification, molecular cloning and characterization of the native and recombinant enzymes. Biochem J, 350 Pt 2, 429-441.
Pitson, S. M., Moretti, P. A., Zebol, J. R., Lynn, H. E., Xia, P., Vadas, M. A. & Wattenberg, B. W. (2003) Activation of sphingosine kinase 1 by ERK1/2-mediated phosphorylation. Embo J, 22, 5491-5500.
Pitson, S. M., Moretti, P. A., Zebol, J. R., Xia, P., Gamble, J. R., Vadas, M. A., D'andrea, R. J. & Wattenberg, B. W. (2000b) Expression of a catalytically inactive sphingosine kinase mutant blocks agonist-induced sphingosine kinase activation. A dominant-negative sphingosine kinase. J Biol Chem, 275, 33945-33950.
Pitson, S. M., Moretti, P. A., Zebol, J. R., Zareie, R., Derian, C. K., Darrow, A. L., Qi, J., D'andrea, R. J., Bagley, C. J., Vadas, M. A. & Wattenberg, B. W. (2002) The nucleotide-binding site of human sphingosine kinase 1. J Biol Chem, 277, 49545-49553.
Pitson, S. M. & Pebay, A. (2009) Regulation of stem cell pluripotency and neural differentiation by lysophospholipids. Neurosignals, 17, 242-254.
Pitson, S. M., Powell, J. A. & Bonder, C. S. (2011) Regulation of sphingosine kinase in hematological malignancies and other cancers. Anticancer Agents Med Chem, 11, 799-809.
Pitson, S. M., Xia, P., Leclercq, T. M., Moretti, P. A., Zebol, J. R., Lynn, H. E., Wattenberg, B. W. & Vadas, M. A. (2005) Phosphorylation-dependent translocation of sphingosine kinase to the plasma membrane drives its oncogenic signalling. J Exp Med, 201, 49-54.
Pluta, K., Luce, M. J., Bao, L., Agha-Mohammadi, S. & Reiser, J. (2005) Tight control of transgene expression by lentivirus vectors containing second-generation tetracycline-responsive promoters. J Gene Med, 7, 803-817.
Porter, J. R., Fritz, C. C. & Depew, K. M. (2010) Discovery and development of Hsp90 inhibitors: a promising pathway for cancer therapy. Curr Opin Chem Biol, 14, 412-420.
Postma, F. R., Jalink, K., Hengeveld, T. & Moolenaar, W. H. (1996) Sphingosine-1-phosphate rapidly induces Rho-dependent neurite retraction: action through a specific cell surface receptor. Embo J, 15, 2388-2392.
Protopopov, A. I., Li, J., Winberg, G., Gizatullin, R. Z., Kashuba, V. I., Klein, G. & Zabarovsky, E. R. (2002) Human cell lines engineered for tetracycline-regulated expression of tumor suppressor candidate genes from a frequently affected chromosomal region, 3p21. J Gene Med, 4, 397-406.
Puneet, P., Yap, C. T., Wong, L., Lam, Y., Koh, D. R., Moochhala, S., Pfeilschifter, J., Huwiler, A. & Melendez, A. J. (2010) SphK1 regulates proinflammatory responses associated with endotoxin and polymicrobial sepsis. Science, 328, 1290-1294.
Pushparaj, P. N., Manikandan, J., Tay, H. K., H'ng S, C., Kumar, S. D., Pfeilschifter, J., Huwiler, A. & Melendez, A. J. (2009) Sphingosine kinase 1 is pivotal for Fc epsilon RI-
202
mediated mast cell signaling and functional responses in vitro and in vivo. J Immunol, 183, 221-227.
Pyne, N. J. & Pyne, S. (2010) Sphingosine 1-phosphate and cancer. Nat Rev Cancer, 10, 489-503.
Pyne, N. J., Tonelli, F., Lim, K. G., Long, J. S., Edwards, J. & Pyne, S. (2012) Sphingosine 1-phosphate signalling in cancer. Biochem Soc Trans, 40, 94-100.
Pyne, S., Lee, S. C., Long, J. & Pyne, N. J. (2009) Role of sphingosine kinases and lipid phosphate phosphatases in regulating spatial sphingosine 1-phosphate signalling in health and disease. Cell Signal, 21, 14-21.
Pyne, S. & Pyne, N. J. (2011) Translational aspects of sphingosine 1-phosphate biology. Trends Mol Med, 17, 463-472.
Radeff-Huang, J., Seasholtz, T. M., Chang, J. W., Smith, J. M., Walsh, C. T. & Brown, J. H. (2007) Tumor necrosis factor-alpha-stimulated cell proliferation is mediated through sphingosine kinase-dependent Akt activation and cyclin D expression. J Biol Chem, 282, 863-870.
Radeff-Huang, J., Seasholtz, T. M., Matteo, R. G. & Brown, J. H. (2004) G protein mediated signaling pathways in lysophospholipid induced cell proliferation and survival. J Cell Biochem, 92, 949-966.
Ricci, C., Onida, F., Servida, F., Radaelli, F., Saporiti, G., Todoerti, K., Deliliers, G. L. & Ghidoni, R. (2009) In vitro anti-leukaemia activity of sphingosine kinase inhibitor. Br J Haematol, 144, 350-357.
Rivera, J., Proia, R. L. & Olivera, A. (2008) The alliance of sphingosine-1-phosphate and its receptors in immunity. Nat Rev Immunol, 8, 753-763.
Rivera, V. M., Ye, X., Courage, N. L., Sachar, J., Cerasoli, F., Jr., Wilson, J. M. & Gilman, M. (1999) Long-term regulated expression of growth hormone in mice after intramuscular gene transfer. Proc Natl Acad Sci U S A, 96, 8657-8662.
Robbins, D. J., Zhen, E., Owaki, H., Vanderbilt, C. A., Ebert, D., Geppert, T. D. & Cobb, M. H. (1993) Regulation and properties of extracellular signal-regulated protein kinases 1 and 2 in vitro. J Biol Chem, 268, 5097-5106.
Roberts, A. P., Lewis, A. P. & Jopling, C. L. (2011) The role of microRNAs in viral infection. Prog Mol Biol Transl Sci, 102, 101-139.
Roberts, J. L., Moretti, P. A., Darrow, A. L., Derian, C. K., Vadas, M. A. & Pitson, S. M. (2004) An assay for sphingosine kinase activity using biotinylated sphingosine and streptavidin-coated membranes. Anal Biochem, 331, 122-129.
Rosen, H., Gonzalez-Cabrera, P. J., Sanna, M. G. & Brown, S. (2009) Sphingosine 1-phosphate receptor signaling. Annu Rev Biochem, 78, 743-768.
Rosenfeldt, H. M., Amrani, Y., Watterson, K. R., Murthy, K. S., Panettieri, R. A., Jr. & Spiegel, S. (2003) Sphingosine-1-phosphate stimulates contraction of human airway smooth muscle cells. Faseb J, 17, 1789-1799.
Rosenfeldt, H. M., Hobson, J. P., Maceyka, M., Olivera, A., Nava, V. E., Milstien, S. & Spiegel, S. (2001) EDG-1 links the PDGF receptor to Src and focal adhesion kinase activation leading to lamellipodia formation and cell migration. Faseb J, 15, 2649-2659.
Rossi, F. M., Guicherit, O. M., Spicher, A., Kringstein, A. M., Fatyol, K., Blakely, B. T. & Blau, H. M. (1998) Tetracycline-regulatable factors with distinct dimerization domains allow reversible growth inhibition by p16. Nat Genet, 20, 389-393.

203
Ruckhaberle, E., Rody, A., Engels, K., Gaetje, R., Von Minckwitz, G., Schiffmann, S., Grosch, S., Geisslinger, G., Holtrich, U., Karn, T. & Kaufmann, M. (2008) Microarray analysis of altered sphingolipid metabolism reveals prognostic significance of sphingosine kinase 1 in breast cancer. Breast Cancer Res Treat, 112, 41-52.
Ryschich, E., Huszty, G., Knaebel, H. P., Hartel, M., Buchler, M. W. & Schmidt, J. (2004) Transferrin receptor is a marker of malignant phenotype in human pancreatic cancer and in neuroendocrine carcinoma of the pancreas. Eur J Cancer, 40, 1418-1422.
Ryu, M. J., Kim, B. J., Lee, J. W., Lee, M. W., Choi, H. K. & Kim, S. T. (2006) Direct interaction between cohesin complex and DNA replication machinery. Biochem Biophys Res Commun, 341, 770-775.
Saddoughi, S. A., Song, P. & Ogretmen, B. (2008) Roles of bioactive sphingolipids in cancer biology and therapeutics. Subcell Biochem, 49, 413-440.
Safadi-Chamberlain, F., Wang, L. P., Payne, S. G., Lim, C. U., Stratford, S., Chavez, J. A., Fox, M. H., Spiegel, S. & Summers, S. A. (2005) Effect of a membrane-targeted sphingosine kinase 1 on cell proliferation and survival. Biochem J, 388, 827-834.
Salas, A., Ponnusamy, S., Senkal, C. E., Meyers-Needham, M., Selvam, S. P., Saddoughi, S. A., Apohan, E., Sentelle, R. D., Smith, C., Gault, C. R., Obeid, L. M., El-Shewy, H. M., Oaks, J., Santhanam, R., Marcucci, G., Baran, Y., Mahajan, S., Fernandes, D., Stuart, R., Perrotti, D. & Ogretmen, B. (2011) Sphingosine kinase-1 and sphingosine 1-phosphate receptor 2 mediate Bcr-Abl1 stability and drug resistance by modulation of protein phosphatase 2A. Blood, 117, 5941-5952.
Salomone, S. & Waeber, C. (2011) Selectivity and specificity of sphingosine-1-phosphate receptor ligands: caveats and critical thinking in characterizing receptor-mediated effects. Front Pharmacol, 2, 9.
Sankala, H. M., Hait, N. C., Paugh, S. W., Shida, D., Lepine, S., Elmore, L. W., Dent, P., Milstien, S. & Spiegel, S. (2007) Involvement of sphingosine kinase 2 in p53-independent induction of p21 by the chemotherapeutic drug doxorubicin. Cancer Res, 67, 10466-10474.
Sansam, C. L., Shepard, J. L., Lai, K., Ianari, A., Danielian, P. S., Amsterdam, A., Hopkins, N. & Lees, J. A. (2006) DTL/CDT2 is essential for both CDT1 regulation and the early G2/M checkpoint. Genes Dev, 20, 3117-3129.
Sarkar, S., Maceyka, M., Hait, N. C., Paugh, S. W., Sankala, H., Milstien, S. & Spiegel, S. (2005) Sphingosine kinase 1 is required for migration, proliferation and survival of MCF-7 human breast cancer cells. FEBS Lett, 579, 5313-5317.
Sarver, A. L., Li, L. & Subramanian, S. (2010) MicroRNA miR-183 functions as an oncogene by targeting the transcription factor EGR1 and promoting tumor cell migration. Cancer Res, 70, 9570-9580.
Sato, K. & Okajima, F. (2010) Role of sphingosine 1-phosphate in anti-atherogenic actions of high-density lipoprotein. World J Biol Chem, 1, 327-337.
Sattler, K. J., Elbasan, S., Keul, P., Elter-Schulz, M., Bode, C., Graler, M. H., Brocker-Preuss, M., Budde, T., Erbel, R., Heusch, G. & Levkau, B. (2010) Sphingosine 1-phosphate levels in plasma and HDL are altered in coronary artery disease. Basic Res Cardiol, 105, 821-832.
Sauer, B. (1994) Site-specific recombination: developments and applications. Curr Opin Biotechnol, 5, 521-527.

204
Sauer, L., Nunes, J., Salunkhe, V., Skalska, L., Kohama, T., Cuvillier, O., Waxman, J. & Pchejetski, D. (2009) Sphingosine kinase 1 inhibition sensitizes hormone-resistant prostate cancer to docetaxel. Int J Cancer, 125, 2728-2736.
Schaar, D. G., Medina, D. J., Moore, D. F., Strair, R. K. & Ting, Y. (2009) miR-320 targets transferrin receptor 1 (CD71) and inhibits cell proliferation. Exp Hematol, 37, 245-255.
Schlosser, I., Holzel, M., Murnseer, M., Burtscher, H., Weidle, U. H. & Eick, D. (2003) A role for c-Myc in the regulation of ribosomal RNA processing. Nucleic Acids Res, 31, 6148-6156.
Schmidt, J., Krump-Konvalinkova, V., Luz, A., Goralczyk, R., Snell, G., Wendel, S., Dorn, S., Pedersen, L., Strauss, P. G. & Erfle, V. (1995) Akv murine leukemia virus enhances bone tumorigenesis in hMT-c-fos-LTR transgenic mice. Virology, 206, 85-92.
Schnitzer, S. E., Weigert, A., Zhou, J. & Brune, B. (2009) Hypoxia enhances sphingosine kinase 2 activity and provokes sphingosine-1-phosphate-mediated chemoresistance in A549 lung cancer cells. Mol Cancer Res, 7, 393-401.
Schroder, M., Richter, C., Juan, M. H., Maltusch, K., Giegold, O., Quintini, G., Pfeilschifter, J. M., Huwiler, A. & Radeke, H. H. (2011) The sphingosine kinase 1 and S1P1 axis specifically counteracts LPS-induced IL-12p70 production in immune cells of the spleen. Mol Immunol, 48, 1139-1148.
Schuchardt, M., Tolle, M., Prufer, J. & Van Der Giet, M. (2011) Pharmacological relevance and potential of sphingosine 1-phosphate in the vascular system. Br J Pharmacol, 163, 1140-1162.
Schuppel, M., Kurschner, U., Kleuser, U., Schafer-Korting, M. & Kleuser, B. (2008) Sphingosine 1-phosphate restrains insulin-mediated keratinocyte proliferation via inhibition of Akt through the S1P2 receptor subtype. J Invest Dermatol, 128, 1747-1756.
Schwalm, S., Doll, F., Romer, I., Bubnova, S., Pfeilschifter, J. & Huwiler, A. (2008) Sphingosine kinase-1 is a hypoxia-regulated gene that stimulates migration of human endothelial cells. Biochem Biophys Res Commun, 368, 1020-1025.
Schweinfest, C. W., Graber, M. W., Henderson, K. W., Papas, T. S., Baron, P. L. & Watson, D. K. (1998) Cloning and sequence analysis of Hsp89alpha DeltaN, a new member of theHsp90 gene family. Biochim Biophys Acta, 1398, 18-24.
Schwock, J., Pham, N. A., Cao, M. P. & Hedley, D. W. (2008) Efficacy of Hsp90 inhibition for induction of apoptosis and inhibition of growth in cervical carcinoma cells in vitro and in vivo. Cancer Chemother Pharmacol, 61, 669-681.
Scott, M. S., Avolio, F., Ono, M., Lamond, A. I. & Barton, G. J. (2009) Human miRNA precursors with box H/ACA snoRNA features. PLoS Comput Biol, 5, e1000507.
Sergentanis, T. N. & Economopoulos, K. P. (2010) Four polymorphisms in cytochrome P450 1A1 (CYP1A1) gene and breast cancer risk: a meta-analysis. Breast Cancer Res Treat, 122, 459-469.
Shav-Tal, Y. & Zipori, D. (2002) PSF and p54(nrb)/NonO--multi-functional nuclear proteins. FEBS Lett, 531, 109-114.
Shaw, G. & Kamen, R. (1986) A conserved AU sequence from the 3' untranslated region of GM-CSF mRNA mediates selective mRNA degradation. Cell, 46, 659-667.
Shen, X., Zhu, H. F., He, F. R., Xing, W., Li, L., Liu, J., Yang, J., Pan, X. F., Lei, P., Wang, Z. H. & Shen, G. X. (2008) An anti-transferrin receptor antibody enhanced the growth

205
inhibitory effects of chemotherapeutic drugs on human non-hematopoietic tumor cells. Int Immunopharmacol, 8, 1813-1820.
Shida, D., Fang, X., Kordula, T., Takabe, K., Lepine, S., Alvarez, S. E., Milstien, S. & Spiegel, S. (2008) Cross-talk between LPA1 and epidermal growth factor receptors mediates up-regulation of sphingosine kinase 1 to promote gastric cancer cell motility and invasion. Cancer Res, 68, 6569-6577.
Shirai, K., Kaneshiro, T., Wada, M., Furuya, H., Bielawski, J., Hannun, Y. A., Obeid, L. M., Ogretmen, B. & Kawamori, T. (2011) A role of sphingosine kinase 1 in head and neck carcinogenesis. Cancer Prev Res (Phila), 4, 454-462.
Shu, X., Wu, W., Mosteller, R. D. & Broek, D. (2002) Sphingosine kinase mediates vascular endothelial growth factor-induced activation of ras and mitogen-activated protein kinases. Mol Cell Biol, 22, 7758-7768.
Siegers, K., Bolter, B., Schwarz, J. P., Bottcher, U. M., Guha, S. & Hartl, F. U. (2003) TRiC/CCT cooperates with different upstream chaperones in the folding of distinct protein classes. Embo J, 22, 5230-5240.
Sigal, Y. J., Mcdermott, M. I. & Morris, A. J. (2005) Integral membrane lipid phosphatases/phosphotransferases: common structure and diverse functions. Biochem J, 387, 281-293.
Singh, S., Singh, M., Kalra, R., Marwah, N., Chhabra, S. & Arora, B. (2007) Transferrin receptor expression in reactive and neoplastic lesions of lymphnodes. Indian J Pathol Microbiol, 50, 433-436.
Sinha, U. K., Schorn, V. J., Hochstim, C., Chinn, S. B., Zhu, S. & Masood, R. (2011) Increased radiation sensitivity of head and neck squamous cell carcinoma with sphingosine kinase 1 inhibition. Head Neck, 33, 178-188.
Siow, D. & Wattenberg, B. (2011) The compartmentalization and translocation of the sphingosine kinases: mechanisms and functions in cell signaling and sphingolipid metabolism. Crit Rev Biochem Mol Biol, 46, 365-375.
Skoura, A. & Hla, T. (2009) Regulation of vascular physiology and pathology by the S1P2 receptor subtype. Cardiovasc Res, 82, 221-228.
Skoura, A., Michaud, J., Im, D. S., Thangada, S., Xiong, Y., Smith, J. D. & Hla, T. (2011) Sphingosine-1-phosphate receptor-2 function in myeloid cells regulates vascular inflammation and atherosclerosis. Arterioscler Thromb Vasc Biol, 31, 81-85.
Slama, P. & Geman, D. (2010) Identification of family-determining residues in PHD fingers. Nucleic Acids Res, 39, 1666-1679.
Smith, K. J., Twal, W. O., Soodavar, F., Virella, G., Lopes-Virella, M. F. & Hammad, S. M. (2010) Heat shock protein 70B' (HSP70B') expression and release in response to human oxidized low density lipoprotein immune complexes in macrophages. J Biol Chem, 285, 15985-15993.
Smyth, G. K. (2004) Linear models and empirical bayes methods for assessing differential expression in microarray experiments. Stat Appl Genet Mol Biol, 3, Article3.
Smyth, G. K. & Speed, T. (2003) Normalization of cDNA microarray data. Methods, 31, 265-273.
Sobue, S., Hagiwara, K., Banno, Y., Tamiya-Koizumi, K., Suzuki, M., Takagi, A., Kojima, T., Asano, H., Nozawa, Y. & Murate, T. (2005) Transcription factor specificity protein 1 (Sp1) is the main regulator of nerve growth factor-induced sphingosine kinase 1 gene expression of the rat pheochromocytoma cell line, PC12. J Neurochem, 95, 940-949.

206
Sobue, S., Murakami, M., Banno, Y., Ito, H., Kimura, A., Gao, S., Furuhata, A., Takagi, A., Kojima, T., Suzuki, M., Nozawa, Y. & Murate, T. (2008a) v-Src oncogene product increases sphingosine kinase 1 expression through mRNA stabilization: alteration of AU-rich element-binding proteins. Oncogene, 27, 6023-6033.
Sobue, S., Nemoto, S., Murakami, M., Ito, H., Kimura, A., Gao, S., Furuhata, A., Takagi, A., Kojima, T., Nakamura, M., Ito, Y., Suzuki, M., Banno, Y., Nozawa, Y. & Murate, T. (2008b) Implications of sphingosine kinase 1 expression level for the cellular sphingolipid rheostat: relevance as a marker for daunorubicin sensitivity of leukemia cells. Int J Hematol, 87, 266-275.
Soliven, B., Miron, V. & Chun, J. (2011) The neurobiology of sphingosine 1-phosphate signaling and sphingosine 1-phosphate receptor modulators. Neurology, 76, S9-S14.
Son, D. J., Lee, H. W., Shin, H. W., Lee, J. J., Yoo, H. S., Kim, T. J., Yun, Y. P. & Hong, J. T. (2008) Enhanced release of sphingosine-1-phosphate from hypercholesterolemic platelets: role in development of hypercholesterolemic atherosclerosis. Prostaglandins Leukot Essent Fatty Acids, 78, 383-390.
Song, L., Xiong, H., Li, J., Liao, W., Wang, L., Wu, J. & Li, M. (2011) Sphingosine kinase-1 enhances resistance to apoptosis through activation of PI3K/Akt/NF-kappaB pathway in human non-small cell lung cancer. Clin Cancer Res, 17, 1839-1849.
Spiegel, S. & Milstien, S. (2011) The outs and the ins of sphingosine-1-phosphate in immunity. Nat Rev Immunol, 11, 403-415.
Spiegel, S., Olivera, A., Zhang, H., Thompson, E. W., Su, Y. & Berger, A. (1994) Sphingosine-1-phosphate, a novel second messenger involved in cell growth regulation and signal transduction, affects growth and invasiveness of human breast cancer cells. Breast Cancer Res Treat, 31, 337-348.
Spitzer, J. I., Ugras, S., Runge, S., Decarolis, P., Antonescu, C., Tuschl, T. & Singer, S. (2011) mRNA and protein levels of FUS, EWSR1, and TAF15 are upregulated in liposarcoma. Genes Chromosomes Cancer, 50, 338-347.
Stahelin, R. V., Hwang, J. H., Kim, J. H., Park, Z. Y., Johnson, K. R., Obeid, L. M. & Cho, W. (2005) The mechanism of membrane targeting of human sphingosine kinase 1. J Biol Chem, 280, 43030-43038.
Stoecklin, G., Hahn, S. & Moroni, C. (1994) Functional hierarchy of AUUUA motifs in mediating rapid interleukin-3 mRNA decay. J Biol Chem, 269, 28591-28597.
Strub, G. M., Maceyka, M., Hait, N. C., Milstien, S. & Spiegel, S. (2010) Extracellular and intracellular actions of sphingosine-1-phosphate. Adv Exp Med Biol, 688, 141-155.
Strub, G. M., Paillard, M., Liang, J., Gomez, L., Allegood, J. C., Hait, N. C., Maceyka, M., Price, M. M., Chen, Q., Simpson, D. C., Kordula, T., Milstien, S., Lesnefsky, E. J. & Spiegel, S. (2011) Sphingosine-1-phosphate produced by sphingosine kinase 2 in mitochondria interacts with prohibitin 2 to regulate complex IV assembly and respiration. Faseb J, 25, 600-612.
Sukocheva, O. A., Wang, L., Albanese, N., Pitson, S. M., Vadas, M. A. & Xia, P. (2003) Sphingosine kinase transmits estrogen signaling in human breast cancer cells. Mol Endocrinol, 17, 2002-2012.
Sun, H. Y., Wei, S. P., Xu, R. C., Xu, P. X. & Zhang, W. C. (2010a) Sphingosine-1-phosphate induces human endothelial VEGF and MMP-2 production via transcription factor ZNF580: novel insights into angiogenesis. Biochem Biophys Res Commun, 395, 361-366.

207
Sun, J., Liu, L., Jiang, X., Chen, D. & Huang, Y. (2010b) Therapeutic effects of radiolabeled 17-allylamino-17-demethoxygeldanamycin on human H460 nonsmall-cell lung carcinoma xenografts in mice. Cancer Biother Radiopharm, 25, 155-164.
Sun, J., Yan, G., Ren, A., You, B. & Liao, J. K. (2006) FHL2/SLIM3 decreases cardiomyocyte survival by inhibitory interaction with sphingosine kinase-1. Circ Res, 99, 468-476.
Sun, X., Ma, S. F., Wade, M. S., Flores, C., Pino-Yanes, M., Moitra, J., Ober, C., Kittles, R., Husain, A. N., Ford, J. G. & Garcia, J. G. (2010c) Functional variants of the sphingosine-1-phosphate receptor 1 gene associate with asthma susceptibility. J Allergy Clin Immunol, 126, 241-249.
Sunyer, T., Monastirsky, B., Codina, J. & Birnbaumer, L. (1989) Studies on nucleotide and receptor regulation of Gi proteins: effects of pertussis toxin. Mol Endocrinol, 3, 1115-1124.
Suomalainen, L., Pentikainen, V. & Dunkel, L. (2005) Sphingosine-1-phosphate inhibits nuclear factor kappaB activation and germ cell apoptosis in the human testis independently of its receptors. Am J Pathol, 166, 773-781.
Tacchini, L., Gammella, E., De Ponti, C., Recalcati, S. & Cairo, G. (2008) Role of HIF-1 and NF-kappaB transcription factors in the modulation of transferrin receptor by inflammatory and anti-inflammatory signals. J Biol Chem, 283, 20674-20686.
Taha, T. A., Argraves, K. M. & Obeid, L. M. (2004) Sphingosine-1-phosphate receptors: receptor specificity versus functional redundancy. Biochim Biophys Acta, 1682, 48-55.
Taha, T. A., Kitatani, K., El-Alwani, M., Bielawski, J., Hannun, Y. A. & Obeid, L. M. (2006) Loss of sphingosine kinase-1 activates the intrinsic pathway of programmed cell death: modulation of sphingolipid levels and the induction of apoptosis. Faseb J, 20, 482-484.
Takabe, K., Kim, R. H., Allegood, J. C., Mitra, P., Ramachandran, S., Nagahashi, M., Harikumar, K. B., Hait, N. C., Milstien, S. & Spiegel, S. (2010) Estradiol induces export of sphingosine 1-phosphate from breast cancer cells via ABCC1 and ABCG2. J Biol Chem, 285, 10477-10486.
Takabe, K., Paugh, S. W., Milstien, S. & Spiegel, S. (2008) "Inside-out" signaling of sphingosine-1-phosphate: therapeutic targets. Pharmacol Rev, 60, 181-195.
Takahashi, M., Shibutani, M., Woo, G. H., Inoue, K., Fujimoto, H., Igarashi, K., Kanno, J., Hirose, M. & Nishikawa, A. (2008) Cellular distributions of molecules with altered expression specific to the tumor promotion process from the early stage in a rat two-stage hepatocarcinogenesis model. Carcinogenesis, 29, 2218-2226.
Takashima, S., Sugimoto, N., Takuwa, N., Okamoto, Y., Yoshioka, K., Takamura, M., Takata, S., Kaneko, S. & Takuwa, Y. (2008) G12/13 and Gq mediate S1P2-induced inhibition of Rac and migration in vascular smooth muscle in a manner dependent on Rho but not Rho kinase. Cardiovasc Res, 79, 689-697.
Takasugi, N., Sasaki, T., Suzuki, K., Osawa, S., Isshiki, H., Hori, Y., Shimada, N., Higo, T., Yokoshima, S., Fukuyama, T., Lee, V. M., Trojanowski, J. Q., Tomita, T. & Iwatsubo, T. (2011) BACE1 activity is modulated by cell-associated sphingosine-1-phosphate. J Neurosci, 31, 6850-6857.
Takeshita, A., Watanabe, A., Takada, Y. & Hanazawa, S. (2000) Selective stimulation by ceramide of the expression of the alpha isoform of retinoic acid and retinoid X receptors in osteoblastic cells. A role of sphingosine 1-phosphate-mediated AP-1 in the ligand-dependent transcriptional activity of these receptors. J Biol Chem, 275, 32220-32226.

208
Tanaka, M., Kato, K., Gomi, K., Matsumoto, M., Kudo, H., Shinkai, M., Ohama, Y., Kigasawa, H. & Tanaka, Y. (2009) Perivascular epithelioid cell tumor with SFPQ/PSF-TFE3 gene fusion in a patient with advanced neuroblastoma. Am J Surg Pathol, 33, 1416-1420.
Tao, R., Hoover, H. E., Zhang, J., Honbo, N., Alano, C. C. & Karliner, J. S. (2009) Cardiomyocyte S1P1 receptor-mediated extracellular signal-related kinase signaling and desensitization. J Cardiovasc Pharmacol, 53, 486-494.
Tapia-Paez, I., Tammimies, K., Massinen, S., Roy, A. L. & Kere, J. (2008) The complex of TFII-I, PARP1, and SFPQ proteins regulates the DYX1C1 gene implicated in neuronal migration and dyslexia. Faseb J, 22, 3001-3009.
Thamilarasan, M., Koczan, D., Hecker, M., Paap, B. & Zettl, U. K. (2012) MicroRNAs in multiple sclerosis and experimental autoimmune encephalomyelitis. Autoimmun Rev, 11, 174-179.
Thirumoorthy, N., Manisenthil Kumar, K. T., Shyam Sundar, A., Panayappan, L. & Chatterjee, M. (2007) Metallothionein: an overview. World J Gastroenterol, 13, 993-996.
Thomas, H., Senkel, S., Erdmann, S., Arndt, T., Turan, G., Klein-Hitpass, L. & Ryffel, G. U. (2004) Pattern of genes influenced by conditional expression of the transcription factors HNF6, HNF4alpha and HNF1beta in a pancreatic beta-cell line. Nucleic Acids Res, 32, e150.
Thompson, C. R., Iyer, S. S., Melrose, N., Vanoosten, R., Johnson, K., Pitson, S. M., Obeid, L. M. & Kusner, D. J. (2005) Sphingosine kinase 1 (SK1) is recruited to nascent phagosomes in human macrophages: inhibition of SK1 translocation by Mycobacterium tuberculosis. J Immunol, 174, 3551-3561.
Tian, B., Zhang, Y., Luxon, B. A., Garofalo, R. P., Casola, A., Sinha, M. & Brasier, A. R. (2002) Identification of NF-kappaB-dependent gene networks in respiratory syncytial virus-infected cells. J Virol, 76, 6800-6814.
Toman, R. E., Payne, S. G., Watterson, K. R., Maceyka, M., Lee, N. H., Milstien, S., Bigbee, J. W. & Spiegel, S. (2004) Differential transactivation of sphingosine-1-phosphate receptors modulates NGF-induced neurite extension. J Cell Biol, 166, 381-392.
Tran, P. L., Kim, S. A., Choi, H. S., Yoon, J. H. & Ahn, S. G. (2010) Epigallocatechin-3-gallate suppresses the expression of HSP70 and HSP90 and exhibits anti-tumor activity in vitro and in vivo. BMC Cancer, 10, 276.
Trepel, J., Mollapour, M., Giaccone, G. & Neckers, L. (2010) Targeting the dynamic HSP90 complex in cancer. Nat Rev Cancer, 10, 537-549.
Trowbridge, I. S., Lesley, J. & Schulte, R. (1982) Murine cell surface transferrin receptor: studies with an anti-receptor monoclonal antibody. J Cell Physiol, 112, 403-410.
Trowbridge, I. S. & Lopez, F. (1982) Monoclonal antibody to transferrin receptor blocks transferrin binding and inhibits human tumor cell growth in vitro. Proc Natl Acad Sci U S A, 79, 1175-1179.
Trowbridge, I. S. & Shackelford, D. A. (1986) Structure and function of transferrin receptors and their relationship to cell growth. Biochem Soc Symp, 51, 117-129.
Tsuchiya, S., Fujiwara, T., Sato, F., Shimada, Y., Tanaka, E., Sakai, Y., Shimizu, K. & Tsujimoto, G. (2011) MicroRNA-210 regulates cancer cell proliferation through targeting fibroblast growth factor receptor-like 1 (FGFRL1). J Biol Chem, 286, 420-428.
Ueda, T., Volinia, S., Okumura, H., Shimizu, M., Taccioli, C., Rossi, S., Alder, H., Liu, C. G., Oue, N., Yasui, W., Yoshida, K., Sasaki, H., Nomura, S., Seto, Y., Kaminishi, M.,

209
Calin, G. A. & Croce, C. M. (2010) Relation between microRNA expression and progression and prognosis of gastric cancer: a microRNA expression analysis. Lancet Oncol, 11, 136-146.
Ullah, M., Pelletier, N., Xiao, L., Zhao, S. P., Wang, K., Degerny, C., Tahmasebi, S., Cayrou, C., Doyon, Y., Goh, S. L., Champagne, N., Cote, J. & Yang, X. J. (2008) Molecular architecture of quartet MOZ/MORF histone acetyltransferase complexes. Mol Cell Biol, 28, 6828-6843.
Ulrych, T., Bohm, A., Polzin, A., Daum, G., Nusing, R. M., Geisslinger, G., Hohlfeld, T., Schror, K. & Rauch, B. H. (2011) Release of sphingosine-1-phosphate from human platelets is dependent on thromboxane formation. J Thromb Haemost, 9, 790-798.
Urtz, N., Olivera, A., Bofill-Cardona, E., Csonga, R., Billich, A., Mechtcheriakova, D., Bornancin, F., Woisetschlager, M., Rivera, J. & Baumruker, T. (2004) Early activation of sphingosine kinase in mast cells and recruitment to FcepsilonRI are mediated by its interaction with Lyn kinase. Mol Cell Biol, 24, 8765-8777.
Ushitora, Y., Tashiro, H., Ogawa, T., Tanimoto, Y., Kuroda, S., Kobayashi, T., Miyata, Y., Itamoto, T., Asahara, T. & Ohdan, H. (2009) Suppression of hepatocellular carcinoma recurrence after rat liver transplantation by FTY720, a sphingosine-1-phosphate analog. Transplantation, 88, 980-986.
Vaidyanathan, G., Cismowski, M. J., Wang, G., Vincent, T. S., Brown, K. D. & Lanier, S. M. (2004) The Ras-related protein AGS1/RASD1 suppresses cell growth. Oncogene, 23, 5858-5863.
Van Brocklyn, J. R., Graler, M. H., Bernhardt, G., Hobson, J. P., Lipp, M. & Spiegel, S. (2000) Sphingosine-1-phosphate is a ligand for the G protein-coupled receptor EDG-6. Blood, 95, 2624-2629.
Van Brocklyn, J. R., Jackson, C. A., Pearl, D. K., Kotur, M. S., Snyder, P. J. & Prior, T. W. (2005) Sphingosine kinase-1 expression correlates with poor survival of patients with glioblastoma multiforme: roles of sphingosine kinase isoforms in growth of glioblastoma cell lines. J Neuropathol Exp Neurol, 64, 695-705.
Van Brocklyn, J. R., Lee, M. J., Menzeleev, R., Olivera, A., Edsall, L., Cuvillier, O., Thomas, D. M., Coopman, P. J., Thangada, S., Liu, C. H., Hla, T. & Spiegel, S. (1998) Dual actions of sphingosine-1-phosphate: extracellular through the Gi-coupled receptor Edg-1 and intracellular to regulate proliferation and survival. J Cell Biol, 142, 229-240.
Van Dam, E. M., Ten Broeke, T., Jansen, K., Spijkers, P. & Stoorvogel, W. (2002) Endocytosed transferrin receptors recycle via distinct dynamin and phosphatidylinositol 3-kinase-dependent pathways. J Biol Chem, 277, 48876-48883.
Van Doorn, R., Van Horssen, J., Verzijl, D., Witte, M., Ronken, E., Van Het Hof, B., Lakeman, K., Dijkstra, C. D., Van Der Valk, P., Reijerkerk, A., Alewijnse, A. E., Peters, S. L. & De Vries, H. E. (2010) Sphingosine 1-phosphate receptor 1 and 3 are upregulated in multiple sclerosis lesions. Glia, 58, 1465-1476.
Van Koppen, C. J., Meyer Zu Heringdorf, D., Alemany, R. & Jakobs, K. H. (2001) Sphingosine kinase-mediated calcium signaling by muscarinic acetylcholine receptors. Life Sci, 68, 2535-2540.
Van Riggelen, J., Yetil, A. & Felsher, D. W. (2010) MYC as a regulator of ribosome biogenesis and protein synthesis. Nat Rev Cancer, 10, 301-309.
Vance, C., Rogelj, B., Hortobagyi, T., De Vos, K. J., Nishimura, A. L., Sreedharan, J., Hu, X., Smith, B., Ruddy, D., Wright, P., Ganesalingam, J., Williams, K. L., Tripathi, V., Al-

210
Saraj, S., Al-Chalabi, A., Leigh, P. N., Blair, I. P., Nicholson, G., De Belleroche, J., Gallo, J. M., Miller, C. C. & Shaw, C. E. (2009) Mutations in FUS, an RNA processing protein, cause familial amyotrophic lateral sclerosis type 6. Science, 323, 1208-1211.
Vanlandingham, P. A. & Ceresa, B. P. (2009) Rab7 regulates late endocytic trafficking downstream of multivesicular body biogenesis and cargo sequestration. J Biol Chem, 284, 12110-12124.
Venkataraman, K., Lee, Y. M., Michaud, J., Thangada, S., Ai, Y., Bonkovsky, H. L., Parikh, N. S., Habrukowich, C. & Hla, T. (2008) Vascular endothelium as a contributor of plasma sphingosine 1-phosphate. Circ Res, 102, 669-676.
Venkataraman, K., Thangada, S., Michaud, J., Oo, M. L., Ai, Y. X., Lee, Y. M., Wu, M. T., Parikh, N. S., Khan, F., Proia, R. L. & Hla, T. (2006) Extracellular export of sphingosine kinase-1a contributes to the vascular S1P gradient. Biochemical Journal, 397, 461-471.
Visentin, B., Vekich, J. A., Sibbald, B. J., Cavalli, A. L., Moreno, K. M., Matteo, R. G., Garland, W. A., Lu, Y., Yu, S., Hall, H. S., Kundra, V., Mills, G. B. & Sabbadini, R. A. (2006) Validation of an anti-sphingosine-1-phosphate antibody as a potential therapeutic in reducing growth, invasion, and angiogenesis in multiple tumor lineages. Cancer Cell, 9, 225-238.
Wadgaonkar, R., Patel, V., Grinkina, N., Romano, C., Liu, J., Zhao, Y., Sammani, S., Proia, R., Garcia, J. G. & Natarajan, V. (2009) Differential Regulation of Sphingosine Kinases 1 and 2 in Lung injury. Am J Physiol Lung Cell Mol Physiol, 296, L603-L613.
Wanders, R. J. (2004) Metabolic and molecular basis of peroxisomal disorders: a review. Am J Med Genet A, 126A, 355-375.
Wang, E., Ma, W. J., Aghajanian, C. & Spriggs, D. R. (1997) Posttranscriptional regulation of protein expression in human epithelial carcinoma cells by adenine-uridine-rich elements in the 3'-untranslated region of tumor necrosis factor-alpha messenger RNA. Cancer Res, 57, 5426-5433.
Wang, F., Okamoto, Y., Inoki, I., Yoshioka, K., Du, W., Qi, X., Takuwa, N., Gonda, K., Yamamoto, Y., Ohkawa, R., Nishiuchi, T., Sugimoto, N., Yatomi, Y., Mitsumori, K., Asano, M., Kinoshita, M. & Takuwa, Y. (2010a) Sphingosine-1-phosphate receptor-2 deficiency leads to inhibition of macrophage proinflammatory activities and atherosclerosis in apoE-deficient mice. J Clin Invest, 120, 3979-3995.
Wang, H., Liu, J., Zong, Y., Xu, Y., Deng, W., Zhu, H., Liu, Y., Ma, C., Huang, L., Zhang, L. & Qin, C. (2010b) miR-106b aberrantly expressed in a double transgenic mouse model for Alzheimer's disease targets TGF-beta type II receptor. Brain Res, 1357, 166-174.
Wang, J. & Pantopoulos, K. (2011) Regulation of cellular iron metabolism. Biochem J, 434, 365-381.
Wang, S., Zhang, Z., Lin, X., Xu, D. S., Feng, Y. & Ding, K. (2010c) A polysaccharide, MDG-1, induces S1P1 and bFGF expression and augments survival and angiogenesis in the ischemic heart. Glycobiology, 20, 473-484.
Wang, Y., O'malley, B. W., Jr., Tsai, S. Y. & O'malley, B. W. (1994) A regulatory system for use in gene transfer. Proc Natl Acad Sci U S A, 91, 8180-8184.
Watson, C., Long, J. S., Orange, C., Tannahill, C. L., Mallon, E., Mcglynn, L. M., Pyne, S., Pyne, N. J. & Edwards, J. (2010) High expression of sphingosine 1-phosphate receptors, S1P1 and S1P3, sphingosine kinase 1, and extracellular signal-regulated kinase-1/2 is

211
associated with development of tamoxifen resistance in estrogen receptor-positive breast cancer patients. Am J Pathol, 177, 2205-2215.
Wattenberg, B. W., Pitson, S. M. & Raben, D. M. (2006) The sphingosine and diacylglycerol kinase superfamily of signaling kinases: localization as a key to signaling function. J Lipid Res, 47, 1128-1139.
Weber, C., Zernecke, A. & Libby, P. (2008) The multifaceted contributions of leukocyte subsets to atherosclerosis: lessons from mouse models. Nat Rev Immunol, 8, 802-815.
Weigert, A., Schiffmann, S., Sekar, D., Ley, S., Menrad, H., Werno, C., Grosch, S., Geisslinger, G. & Brune, B. (2009) Sphingosine kinase 2 deficient tumor xenografts show impaired growth and fail to polarize macrophages towards an anti-inflammatory phenotype. Int J Cancer, 125, 2114-2121.
Whitesell, L. & Lindquist, S. L. (2005) HSP90 and the chaperoning of cancer. Nat Rev Cancer, 5, 761-772.
Whitney, J. F., Clark, J. M., Griffin, T. W., Gautam, S. & Leslie, K. O. (1995) Transferrin receptor expression in nonsmall cell lung cancer. Histopathologic and clinical correlates. Cancer, 76, 20-25.
Windh, R. T., Lee, M. J., Hla, T., An, S., Barr, A. J. & Manning, D. R. (1999) Differential coupling of the sphingosine 1-phosphate receptors Edg-1, Edg-3, and H218/Edg-5 to the G(i), G(q), and G(12) families of heterotrimeric G proteins. J Biol Chem, 274, 27351-27358.
Winther-Larsen, H. C., Blatny, J. M., Valand, B., Brautaset, T. & Valla, S. (2000) Pm promoter expression mutants and their use in broad-host-range RK2 plasmid vectors. Metab Eng, 2, 92-103.
Wirth, G. J., Schandelmaier, K., Smith, V., Burger, A. M. & Fiebig, H. H. (2006) Microarrays of 41 human tumor cell lines for the characterization of new molecular targets: expression patterns of cathepsin B and the transferrin receptor. Oncology, 71, 86-94.
Woodcock, J. M., Ma, Y., Coolen, C., Pham, D., Jones, C., Lopez, A. F. & Pitson, S. M. (2010) Sphingosine and FTY720 directly bind pro-survival 14-3-3 proteins to regulate their function. Cell Signal, 22, 1291-1299.
Wortham, N. C., Ahamed, E., Nicol, S. M., Thomas, R. S., Periyasamy, M., Jiang, J., Ochocka, A. M., Shousha, S., Huson, L., Bray, S. E., Coombes, R. C., Ali, S. & Fuller-Pace, F. V. (2009) The DEAD-box protein p72 regulates ERalpha-/oestrogen-dependent transcription and cell growth, and is associated with improved survival in ERalpha-positive breast cancer. Oncogene, 28, 4053-4064.
Wu, W., Mosteller, R. D. & Broek, D. (2004) Sphingosine kinase protects lipopolysaccharide-activated macrophages from apoptosis. Mol Cell Biol, 24, 7359-7369.
Wu, Y. P., Mizugishi, K., Bektas, M., Sandhoff, R. & Proia, R. L. (2008a) Sphingosine kinase 1/S1P receptor signaling axis controls glial proliferation in mice with Sandhoff disease. Human Molecular Genetics, 17, 2257-2264.
Wu, Y. P., Mizugishi, K., Bektas, M., Sandhoff, R. & Proia, R. L. (2008b) Sphingosine kinase 1/S1P receptor signaling axis controls glial proliferation in mice with Sandhoff disease. Hum Mol Genet, 17, 2257-2264.
Wu, Z. S., Wu, Q., Wang, C. Q., Wang, X. N., Huang, J., Zhao, J. J., Mao, S. S., Zhang, G. H., Xu, X. C. & Zhang, N. (2011) miR-340 inhibition of breast cancer cell migration and invasion through targeting of oncoprotein c-Met. Cancer, 117, 2842-2852.

212
Xia, P., Gamble, J. R., Rye, K. A., Wang, L., Hii, C. S., Cockerill, P., Khew-Goodall, Y., Bert, A. G., Barter, P. J. & Vadas, M. A. (1998) Tumor necrosis factor-alpha induces adhesion molecule expression through the sphingosine kinase pathway. Proc Natl Acad Sci U S A, 95, 14196-141201.
Xia, P., Gamble, J. R., Wang, L., Pitson, S. M., Moretti, P. A., Wattenberg, B. W., D'andrea, R. J. & Vadas, M. A. (2000) An oncogenic role of sphingosine kinase. Curr Biol, 10, 1527-1530.
Xia, P., Vadas, M. A., Rye, K. A., Barter, P. J. & Gamble, J. R. (1999a) High density lipoproteins (HDL) interrupt the sphingosine kinase signaling pathway. A possible mechanism for protection against atherosclerosis by HDL. J Biol Chem, 274, 33143-33147.
Xia, P., Wang, L., Gamble, J. R. & Vadas, M. A. (1999b) Activation of sphingosine kinase by tumor necrosis factor-alpha inhibits apoptosis in human endothelial cells. J Biol Chem, 274, 34499-34505.
Xia, P., Wang, L., Moretti, P. A., Albanese, N., Chai, F., Pitson, S. M., D'andrea, R. J., Gamble, J. R. & Vadas, M. A. (2002) Sphingosine kinase interacts with TRAF2 and dissects tumor necrosis factor-alpha signaling. J Biol Chem, 277, 7996-8003.
Xu, R., Jin, J., Hu, W., Sun, W., Bielawski, J., Szulc, Z., Taha, T., Obeid, L. M. & Mao, C. (2006) Golgi alkaline ceramidase regulates cell proliferation and survival by controlling levels of sphingosine and S1P. Faseb J, 20, 1813-1825.
Yamada, M., Banno, Y., Takuwa, Y., Koda, M., Hara, A. & Nozawa, Y. (2004) Overexpression of phospholipase D prevents actinomycin D-induced apoptosis through potentiation of phosphoinositide 3-kinase signalling pathways in Chinese-hamster ovary cells. Biochem J, 378, 649-656.
Yamanaka, M., Shegogue, D., Pei, H., Bu, S., Bielawska, A., Bielawski, J., Pettus, B., Hannun, Y. A., Obeid, L. & Trojanowska, M. (2004) Sphingosine kinase 1 (SPHK1) is induced by transforming growth factor-beta and mediates TIMP-1 up-regulation. J Biol Chem, 279, 53994-54001.
Yamazaki, Y., Kon, J., Sato, K., Tomura, H., Sato, M., Yoneya, T., Okazaki, H., Okajima, F. & Ohta, H. (2000) Edg-6 as a putative sphingosine 1-phosphate receptor coupling to Ca(2+) signaling pathway. Biochem Biophys Res Commun, 268, 583-589.
Yang, D. C., Jiang, X. P., Elliott, R. L. & Head, J. F. (2001) Inhibition of growth of human breast carcinoma cells by an antisense oligonucleotide targeted to the transferrin receptor gene. Anticancer Res, 21, 1777-1787.
Yang, S., Warraich, S. T., Nicholson, G. A. & Blair, I. P. (2010) Fused in sarcoma/translocated in liposarcoma: a multifunctional DNA/RNA binding protein. Int J Biochem Cell Biol, 42, 1408-1411.
Yang, X., Feng, M., Jiang, X., Wu, Z., Li, Z., Aau, M. & Yu, Q. (2009) miR-449a and miR-449b are direct transcriptional targets of E2F1 and negatively regulate pRb-E2F1 activity through a feedback loop by targeting CDK6 and CDC25A. Genes Dev, 23, 2388-2393.
Yao, F., Svensjo, T., Winkler, T., Lu, M., Eriksson, C. & Eriksson, E. (1998) Tetracycline repressor, tetR, rather than the tetR-mammalian cell transcription factor fusion derivatives, regulates inducible gene expression in mammalian cells. Hum Gene Ther, 9, 1939-1950.

213
Yarranton, G. T. (1992) Inducible vectors for expression in mammalian cells. Curr Opin Biotechnol, 3, 506-511.
Yatomi, Y., Yamamura, S., Ruan, F. & Igarashi, Y. (1997) Sphingosine 1-phosphate induces platelet activation through an extracellular action and shares a platelet surface receptor with lysophosphatidic acid. J Biol Chem, 272, 5291-5297.
Yoshida, Y., Nakada, M., Harada, T., Tanaka, S., Furuta, T., Hayashi, Y., Kita, D., Uchiyama, N., Hayashi, Y. & Hamada, J. (2010a) The expression level of sphingosine-1-phosphate receptor type 1 is related to MIB-1 labeling index and predicts survival of glioblastoma patients. J Neurooncol, 98, 41-47.
Yoshida, Y., Nakada, M., Sugimoto, N., Harada, T., Hayashi, Y., Kita, D., Uchiyama, N., Hayashi, Y., Yachie, A., Takuwa, Y. & Hamada, J. (2010b) Sphingosine-1-phosphate receptor type 1 regulates glioma cell proliferation and correlates with patient survival. Int J Cancer, 126, 2341-2352.
Yoshimoto, T., Furuhata, M., Kamiya, S., Hisada, M., Miyaji, H., Magami, Y., Yamamoto, K., Fujiwara, H. & Mizuguchi, J. (2003) Positive modulation of IL-12 signaling by sphingosine kinase 2 associating with the IL-12 receptor beta 1 cytoplasmic region. J Immunol, 171, 1352-1359.
Young, K. W., Bootman, M. D., Channing, D. R., Lipp, P., Maycox, P. R., Meakin, J., Challiss, R. A. & Nahorski, S. R. (2000) Lysophosphatidic acid-induced Ca2+ mobilization requires intracellular sphingosine 1-phosphate production. Potential involvement of endogenous EDG-4 receptors. J Biol Chem, 275, 38532-38539.
Young, K. W., Willets, J. M., Parkinson, M. J., Bartlett, P., Spiegel, S., Nahorski, S. R. & Challiss, R. A. (2003) Ca2+/calmodulin-dependent translocation of sphingosine kinase: role in plasma membrane relocation but not activation. Cell Calcium, 33, 119-128.
Young, N. & Van Brocklyn, J. R. (2006) Signal transduction of sphingosine-1-phosphate G protein-coupled receptors. ScientificWorldJournal, 6, 946-966.
Zampetaki, A., Kiechl, S., Drozdov, I., Willeit, P., Mayr, U., Prokopi, M., Mayr, A., Weger, S., Oberhollenzer, F., Bonora, E., Shah, A., Willeit, J. & Mayr, M. (2010) Plasma microRNA profiling reveals loss of endothelial miR-126 and other microRNAs in type 2 diabetes. Circ Res, 107, 810-817.
Zebol, J. R., Hewitt, N. M., Moretti, P. A., Lynn, H. E., Lake, J. A., Li, P., Vadas, M. A., Wattenberg, B. W. & Pitson, S. M. (2009) The CCT/TRiC chaperonin is required for maturation of sphingosine kinase 1. Int J Biochem Cell Biol, 41, 822-827.
Zeng, Y. (2006) Principles of micro-RNA production and maturation. Oncogene, 25, 6156-6162.
Zhang, B., Wang, Q. & Pan, X. (2007) MicroRNAs and their regulatory roles in animals and plants. J Cell Physiol, 210, 279-289.
Zhang, X. W., Sheng, Y. P., Li, Q., Qin, W., Lu, Y. W., Cheng, Y. F., Liu, B. Y., Zhang, F. C., Li, J., Dimri, G. P. & Guo, W. J. (2010) BMI1 and Mel-18 oppositely regulate carcinogenesis and progression of gastric cancer. Mol Cancer, 9, 40.
Zhang, Z., Zander, C. B. & Grewer, C. (2011) The C-terminal domain of the neutral amino acid transporter SNAT2 regulates transport activity through voltage-dependent processes. Biochem J, 434, 287-296.
Zhao, R. & Houry, W. A. (2005) Hsp90: a chaperone for protein folding and gene regulation. Biochem Cell Biol, 83, 703-710.

214
Zhi, L., Leung, B. P. & Melendez, A. J. (2006) Sphingosine kinase 1 regulates pro-inflammatory responses triggered by TNFalpha in primary human monocytes. J Cell Physiol, 208, 109-115.
Zhou, H. J., Wang, Z. & Li, A. (2008) Dihydroartemisinin induces apoptosis in human leukemia cells HL60 via downregulation of transferrin receptor expression. Anticancer Drugs, 19, 247-255.

215
Gene regulation by sphingosine kinase Duyen Pham
APPENDIX 1
Sphingosine kinases: biochemistry, regulation and role
Melissa R. Pitman1, Kate E. Jarman1, Tamara M. Leclercq1, Duyen H. Pham1,2 and Stuart M. Pitson1,2
1Centre for Cancer Biology, Division of Human Immunology, SA Pathology, Frome Road, Adelaide, South Australia 5000, Australia
2School of Molecular and Biomedical Science, University of Adelaide, Adelaide, South Australia 5005, Australia
Lysophospholipid Receptors: Signaling and Biochemistry. Chun J, Hla T, Spiegel S and Moolenaar W (Eds). John Wiley & Sons, Hoboken, New Jersey, USA.


216
Gene regulation by sphingosine kinase Duyen Pham
APPENDIX 2
Attenuation of leakiness in doxycycline-inducible expression via incorporation of 3' AU-rich mRNA destabilizing elements
Duyen H. Pham1,2, Paul A.B. Moretti1, Gregory J. Goodall1,3, and Stuart M. Pitson1,2
1Centre for Cancer Biology, Division of Human Immunology, SA Pathology, Frome Road, Adelaide, South Australia 5000, Australia
2 School of Molecular and Biomedical Science 3Department of Medicine, University of Adelaide, Adelaide, South Australia 5005, Australia
Biotechniques (2008) 45, 155-160


A Pham, D.H., Moretti, P.A.B., Goodall, G.J. & Pitson, S.M. (2008) Attenuation of leakiness in doxycycline- inducible expression via incorporation of 3' AU-rich mRNA destabilizing elements.Biotechniques, v. 45(2), pp. 155-160
NOTE:
This publication is included after page 216 in the print copy of the thesis held in the University of Adelaide Library.
It is also available online to authorised users at:
http://doi.org/10.2144/000112896