gene pools in wild lima bean ( phaseolus lunatus l.) from the americas: evidences for an andean...
TRANSCRIPT
This article appeared in a journal published by Elsevier. The attachedcopy is furnished to the author for internal non-commercial researchand education use, including for instruction at the authors institution
and sharing with colleagues.
Other uses, including reproduction and distribution, or selling orlicensing copies, or posting to personal, institutional or third party
websites are prohibited.
In most cases authors are permitted to post their version of thearticle (e.g. in Word or Tex form) to their personal website orinstitutional repository. Authors requiring further information
regarding Elsevier’s archiving and manuscript policies areencouraged to visit:
http://www.elsevier.com/copyright
Author's personal copy
Gene pools in wild Lima bean (Phaseolus lunatus L.) from the Americas: Evidencesfor an Andean origin and past migrations
Martha L. Serrano-Serrano a, Jorge Hernández-Torres a, Genis Castillo-Villamizar a, Daniel G. Debouck b,María I. Chacón Sánchez c,*
a Escuela de Biología, Facultad de Ciencias, Universidad Industrial de Santander-UIS, Cl27 Cra9, Bucaramanga, Colombiab Genetic Resources Unit, International Center for Tropical Agriculture (CIAT), Km17 via Cali-Palmira, Colombiac Facultad de Agronomía, Universidad Nacional de Colombia, Cra30 Cl45, Bogotá, Colombia
a r t i c l e i n f o
Article history:Received 3 March 2009Revised 19 August 2009Accepted 25 August 2009Available online 1 September 2009
Keywords:NeotropicsFloristic migrationsPaleobotanyITSChloroplast DNAPhylogeography
a b s t r a c t
The aims of this research were to assess the genetic structure of wild Phaseolus lunatus L. in the Americasand the hypothesis of a relatively recent Andean origin of the species. For this purpose, nuclear and non-coding chloroplast DNA markers were analyzed in a collection of 59 wild Lima bean accessions and sixallied species. Twenty-three chloroplast and 28 nuclear DNA haplotypes were identified and shown tobe geographically structured. Three highly divergent wild Lima bean gene pools, AI, MI, and MII, withmostly non-overlapping geographic ranges, are proposed. The results support an Andean origin of wildLima beans during Pleistocene times and an early divergence of the three gene pools at an age that is pos-terior to completion of the Isthmus of Panama and major Andean orogeny. Gene pools would haveevolved and reached their current geographic distribution mainly in isolation and therefore are of highpriority for conservation and breeding programs.
� 2009 Elsevier Inc. All rights reserved.
1. Introduction
In the Neotropics, the current patterns of distribution of theflora have been shaped by relatively recent events such as the clo-sure of the Isthmus of Panama and the final uplift of the Andes dur-ing the Quaternary (Burnham and Graham, 1999; Coates et al.,2004; Gentry, 1982; Gregory-Wodzicki, 2000; Pennington et al.,2004). The closure of the Isthmus of Panama has been of great sig-nificance since it has allowed the interchange of North Americanfauna and flora of Laurasian origin and South American faunaand flora of Gondwanan origin, an event that is known as the GreatAmerican Biotic Interchange (Webb, 1997). Apparently, the inter-change could have started about 8 million years before present(mybp) by island-hopping (Webb, 1997), a time when, presumably,the basin became more shallow during the collision of the CentralAmerican arc with northwestern South America (�12.8–7.1 mybp),followed by a rapid and extensive emergence of the Panama bridgeduring the latest Miocene (Coates et al., 2004). On the other hand,the complex orogeny of the Andes has also been a factor influenc-ing the patterns of distribution and speciation of taxa of Gondwa-nan origin and taxa of Laurasian origin that migrated into SouthAmerica (Gregory-Wodzicki, 2000; Young et al., 2002). The uplift
of the Andes started at about 85 mybp or earlier, for the CentralAndes and the Eastern Cordillera only half their modern elevationwas attained by 10.7 and 10 mybp, respectively, while in theColombian Andes a rapid uplift occurred between 2 and 5 mybp.As Young et al. (2002) noted, the relatively old age of the Andesand the dramatic differences in timing and type of uplift for differ-ent regions (northern, central and southern Andes) have offered aheterogeneous and dynamic environment where habitats of plantshave changed their distribution and extent.
The influence of these two relatively recent geological events onpatterns of flora distribution may be assessed by means of phylo-genetic and population genetic studies of taxa naturally distributedin both Mesoamerica and the Andes. In this context, the genusPhaseolus, of Mesoamerican origin, is of great interest due to itswide distribution across these two regions. Recently, Delgado-Sali-nas et al. (2006) analyzed the Internal Transcribed Spacers of theribosomal DNA (ITS) and estimated the age for the Phaseolus stemclade at about 6–8 mybp and the age for the Phaseolus crown cladeat about 1–2 mybp, an age that is posterior to the completion oftectonic activity in Mexico (Ferrari et al., 1999). Most species with-in the genus have relatively restricted ranges in North America,Mesoamerica or South America (Freytag and Debouck, 2002), butwild populations of two species, namely P. vulgaris L. (the commonbean) and P. lunatus L. (the Lima bean), are widely distributedacross Mesoamerica and South America. The common bean has
1055-7903/$ - see front matter � 2009 Elsevier Inc. All rights reserved.doi:10.1016/j.ympev.2009.08.028
* Corresponding author. Fax: +57 1 3165176.E-mail address: [email protected] (M.I. Chacón Sánchez).
Molecular Phylogenetics and Evolution 54 (2010) 76–87
Contents lists available at ScienceDirect
Molecular Phylogenetics and Evolution
journal homepage: www.elsevier .com/locate /ympev
Author's personal copy
been the subject of recent studies on phylogeography and domes-tication (Chacón et al., 2005, 2007). These studies suggest a diver-gence of P. vulgaris from its sister species in Mesoamerica at orbefore 1.3 mybp, and an influence of geological events such asthe closure of the Isthmus of Panama and the uplift of the Andeson its current distribution (Chacón et al., 2007).
Phaseolus lunatus is a pluriannual species, predominantly autog-amous with about 10% outcrossing (Hardy et al., 1997), and dis-persal of seed and pollen over short-distance (<1 m) (Zoro Biet al., 2003, 2005). Within P. lunatus, the existence of two genepools in the wild, the Mesoamerican and the Andean, has beenshown on the bases of seed characteristics (Debouck et al., 1987),biochemical patterns of seed proteins (Gutiérrez Salgado et al.,1995; Maquet et al., 1999) and nuclear and chloroplast DNA poly-morphisms (Caicedo et al., 1999; Fofana et al., 1999). The Meso-american gene pool contains only small-seeded beans. It iswidely distributed from northern Mexico (state of Sinaloa) to Saltain Argentina and the Caribbean, mainly at elevations below 1600 mabove sea level (masl). Current germplasm and herbarium collec-tions (Debouck, 2008) indicate that in Mesoamerica it occurs inMexico, Guatemala, Belize, El Salvador, Honduras, Nicaragua, CostaRica and Panama. In the Caribbean it occurs in Cuba, the DominicanRepublic, Puerto Rico and Trinidad-and-Tobago. In South Americaits range is discontinuous, starting in the lowlands of the Caribbeancoast of Venezuela and Colombia, entering the inter-Andean Val-leys of central Colombia, central Peru, Bolivia, and ending in north-ern Argentina and Paraguay, invariably on the eastern slope of theAndes. According to herbarium records, the presence of wild formsof the Mesoamerican type in the state of Pará in Brazil (Debouck,2008), opens up the possibility that the range in South America ex-tends further to the east. The Andean gene pool consists of large-seeded beans. It is geographically restricted to Ecuador andnorthern Peru, in the inter-Andean valleys on the western slopeof the Andes, at elevations in the range of 400–2000 masl (Baudoinet al., 2004; Debouck, 1996, 2008).
Phaseolus lunatus is one of the five species domesticated withinPhaseolus and belongs to the Lunatus clade together with P. augustiHarms, P. bolivianus Piper, P. pachyrrhizoides Harms (all endemic tothe central-southern Andes), P. mollis Hooker (from the GalapagosIslands) and P. lignosus Britton (from Bermuda) (Delgado-Salinas,2000; Delgado-Salinas et al., 1999). Caicedo et al. (1999), Fofanaet al. (1999) and Sparvoli et al. (2001) have found P. lunatus to bephylogenetically and genetically more related to Andean than toMesoamerican species of Phaseolus, thus supporting an Andean ori-gin for this species. Recently, Delgado-Salinas et al. (2006) esti-mated the age for the Lunatus clade at about 1.1–1.9 mybp,which would indicate that P. lunatus is a relatively young species.The main goals of this research were to evaluate the genetic struc-ture of wild Lima beans and to further assess the hypothesis of arelatively recent Andean origin of the species by applying a com-bined phylogeographical and phylogenetic approach.
2. Materials and methods
2.1. Plant material
All plant material used in this study was obtained from CIAT(Appendix 1). A total of 59 wild Lima bean accessions were se-lected on the basis of their geographic distribution, seed availabil-ity and complete passport data. According to current evidence, thegenus Phaseolus probably had its origin in south-western Laurasia(what is currently known as Mesoamerica). The tertiary gene poolof P. lunatus is distributed in Mesoamerica; however, the secondarygene pool is located in South America. A group of species from thetertiary and secondary gene pools were, therefore, included in this
study. A total of 12 accessions that includes Andean wild alliedspecies (P. augusti, P. pachyrrhyzoides and P. bolivianus) and Meso-american related species (P. leptostachyus Bentham, P. marechaliiDelgado and P. novoleonensis Debouck), was selected. P. lep-tostachyus is a member of section Falcati where 2n = 2x = 20 (in-stead of 2n = 2x = 22). P. marechalii is a Mexican member ofsection Paniculati, the section that contains P. lunatus, P. augustiand P. pachyrrhizoides, which makes it very useful for the purposesof the study. P. novoleonensis is a Mexican member of section Cori-acei, a section that is closely related to section Paniculati (Delgado-Salinas et al., 2006; Freytag and Debouck, 2002).
2.2. Molecular analyses of chloroplast and nuclear DNA
Two intergenic spacers in the chloroplast genome, namelyatpB-rbcL and trnL-trnF, and the nuclear ITS region were shownto contain useful information for population genetic and phyloge-ographic studies (Serrano-Serrano et al., 2008, unpublished data).Primers for PCR amplification of these three regions have beenpublished elsewhere (Chiang et al., 1998; Taberlet et al., 1991;White et al., 1990). DNA was extracted from young leaves of eachof five seedlings per accession by applying a standard CTAB meth-od (Doyle and Doyle, 1987). A standard PCR protocol was used andPCR products were purified using the Kit Wizard SV Gel and thePCR Clean-up System from Promega Corporation (Madison, WI,USA), and sequenced in an ABI 3700 at Macrogen (http://www.macrogen.com). Duplicate samples were sequenced for qual-ity control. Sequences were edited with Bioedit, Version 5.0.6 (Hall,1999). In order to justify the use of five seedlings per accession, in-tra-accession polymorphism was tested by sequencing the ITS re-gion in each of 20 individuals for each of two accessions (G25704from Mexico and G26606 from Ecuador) and no sequence poly-morphism was observed.
2.3. Genetic structure
Sequences from the cpDNA and ITS data sets were analyzedindependently and alignment was performed in Muscle version3.6 (Edgar, 2004). Gaps were coded according to the method pro-posed by Simmons and Ochoterena (2000). Genetic distance matri-ces were obtained under the Jukes–Cantor (JC) model and used tobuild Neighbor-joining (NJ) topologies as implemented in PAUP(Swofford, 1998). Cluster confidence limit was assessed by meansof 1000 bootstrap replicates (Giribert, 2003). The clusters observedwere consistent when different models of nucleotide substitutionand different clustering algorithms were applied. Genetic diver-gence among NJ clusters was estimated by means of AMOVA tests(Excoffier et al., 1992) as implemented in the software Arlequin(Schneider et al., 2000), and by the statistics GST (Nei, 1973) andNST (Lynch and Crease, 1990) by using the DNAsp software (Rozaset al., 2003). For the AMOVA tests, different group configurationswere tested based on NJ clusters and the previously reported Mes-oamerican and Andean gene pools, and significance was tested bymeans of 10,000 permutations. Gene pools were defined as NJ clus-ters with a defined geographic distribution and high genetic differ-entiation among each other. Genetic diversity within gene poolswas described as the number of segregating sites (S), and quanti-fied as the nucleotide diversity (p) (Nei, 1987; Nei and Miller,1990) and haplotype diversity (Hd) (Nei, 1987) by using the soft-ware DNAsp (Rozas et al., 2003).
2.4. Phylogeographic analyses
Haplotype networks, contingency analyses and other statisticaltests were applied to assess the geographical association of haplo-types and the demographic history of gene pools. First, the statistic
M.L. Serrano-Serrano et al. / Molecular Phylogenetics and Evolution 54 (2010) 76–87 77
Author's personal copy
U was used to assess the phylogeographical structure of data byusing the software PERMUT (Pons and Petit, 1996). Second, cpDNAand ITS haplotype networks were built under the parsimony crite-rion (95% connection limit) (Templeton et al., 1987) using the TCSsoftware (Clement et al., 2000). Haplotypes within the networkwere grouped into nested clades following the algorithm of Tem-pleton et al. (1992). The nested design was then used to carryout association tests to evaluate the null hypothesis of absence ofgeographical association between haplotypes within a nestingclade. These tests were performed with the software GeoDis(Posada et al., 2000) and significance was assessed by means ofpermutations (n = 1000). Third, in order to assess isolation by dis-tance, nine populations were defined according to geographic ori-gin and NJ clusters (Mexico to the west and to the east of theIsthmus of Tehuantepec, Guatemala, Honduras, Costa Rica, Colom-bia, Ecuador, Peru and Argentina). A Mantel test was applied to thematrices of pairwise FST values and geographic distances (loga-rithms of geographic distances) as implemented in the programIBD (Bohonak, 2002). Fourth, as demographic processes such asrange expansions could have influenced the current distributionof gene pools, two additional tests were applied. Thus, the demo-graphic history of gene pools was investigated by means of Taj-ima’s D test (Tajima, 1989) and the R2 test (Ramos-Onsins andRozas, 2002), and significance was assessed by means of coalescentsimulations (5000 replicates) using the software DNAsp (Rozaset al., 2003).
2.5. Phylogenetic analyses and divergence times
Phylogenetic analyses were performed to validate the hypothe-sis of a recent diversification of wild Lima bean in the Andes. Diver-gence times were calculated for the most recent common ancestor(MRCA) between wild Lima bean and its sister taxa, and betweengene pools within wild Lima bean. For phylogenetic reconstruc-tions, 97 ITS sequences were used: 22 sequences generated in thisstudy and 75 sequences from species of the Millettioid clade (seeFig. 3 in Lavin et al., 2005) obtained from GenBank (Appendix 2).In order to avoid bias by over-representing a single species, wedid not use all the P. lunatus ITS sequences obtained in this studybut selected a small group of 13 accessions based on the numberof ITS haplotypes observed, their phylogenetic relationships basedon the haplotype network and their geographic distribution. Se-quence alignment was performed in Muscle version 3.6 (Edgar,2004). Gap costs were explored using values from �20 to 0. Foreach alignment, rapid heuristic searches were performed withbranch swapping using the Tree Bisection Reconnection algorithm(TBR) under the parsimony criterion in Winclada version 1.00.08(Nixon, 2002). The clusters recovered for each topology were com-pared among each other. The best-fit model of nucleotide substitu-tion was selected (Posada and Crandall, 2001) using the programMr ModelTest (Nylander, 2004) under the Akaike Information Cri-terion (AIC) and Hierarchical Likelihood Ratio Tests (HLRTs). Sincecoding and non-coding regions may evolve independently (Pageand Holmes, 1998), separate analyses were performed for the cod-ing region (the 5.8S gene) and the intergenic spacers (ITS1 andITS2). A Bayesian approach was applied with MrBayes(Huelsenbeck and Ronquist, 2001) using two independent runs,each one with four chains and 3,000,000 generations with sam-pling performed every 10,000 generations. Parameters reachedan asymptote within the 500,000 generations and topologiesresulting from the first 1,000,000 generations (100 trees) were dis-carded. From a sampling of 200 topologies obtained from MrBayes,branch lengths were estimated by using PAUP (Swofford, 1998).Estimating dates of divergence have a variety of potential pitfallswhich are difficult to overcome even by applying methods thatconsider complex models of nucleotide substitution, among-line-
age rate heterogeneity and population genetic processes (Arbogastet al., 2002). Two characteristics of the sequences were explored inthe present study: saturation and clock-like behavior. Saturationwas assessed by the method proposed by Xia et al. (2003) as imple-mented in the DAMBE software (Xia and Xie, 2001). The hypothesisof a molecular clock was tested by means of a Likelihood Ratio Test(LRT) (Muse and Weir, 1992). To provide estimates of minimumdivergence times, a Penalized Likelihood test (PL) (Sanderson,2002) was applied using the software R8S (Sanderson, 2004), fol-lowing the strategy reported by Chacón et al. (2007). A constrictionfor the age of the MRCA between Xeroderris stuhlmannii–Phaseoluslunatus, Wajira albescens–Phaseolus lunatus and Vigna unguiculata–Phaseolus lunatus was performed by using the minimum and max-imum crown node ages calculated by Lavin et al. (2005). Lavin et al.(2005) used the fossil record of Barnebyanthus buchananensis witha minimum age of 55 mybp (Crepet and Herendeen, 1992); there-fore, our age estimations should not be considered as absolute agesbut as minimum ages.
All sequences generated in this study were deposited in Gen-Bank under Accession Nos. EU908862–EU909131.
3. Results
3.1. Haplotypes and their geographic distribution
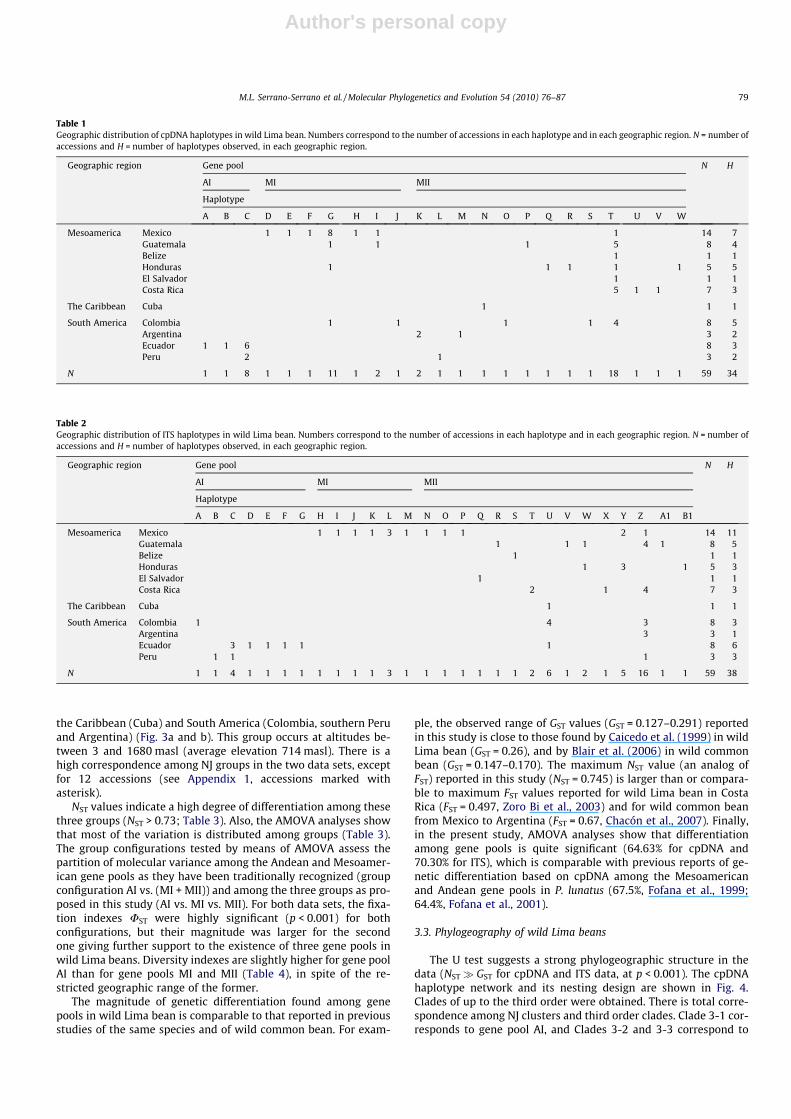
The two cpDNA regions provided 1324 base pairs (bp) for anal-ysis, of which 33 sites were polymorphic and 16 sites were parsi-mony informative. Haplotype and nucleotide diversities wereestimated as 0.861 ± 0.032 and 0.00347 ± 0.00031, respectively. Atotal of 23 cpDNA haplotypes was identified, 21 of which were geo-graphically restricted and only one of which (haplotype T) waswidely distributed in Mesoamerica and South America (Table 1).For the ITS region, a total of 673 bp were sequenced and a totalof 28 polymorphic sites were observed, ten of which were parsi-mony informative. Haplotype and nucleotide diversities were esti-mated as 0.870 ± 0.039 and 0.00498 ± 0.00066, respectively. A totalof 28 haplotypes was identified, 26 of which were geographicallyrestricted and only one of which (haplotype Z) was widely distrib-uted (Table 2). These results suggest that the observed cpDNA andITS polymorphisms are geographically structured and might beuseful for phylogeographic and domestication studies within thisspecies. For the allied species, diversity indices could be calculatedonly for the two cpDNA regions in P. augusti because for the otherspecies fewer than five accessions were analyzed. For P. augusti, 12cpDNA sites were polymorphic, five cpDNA haplotypes were ob-served, and cpDNA haplotype and nucleotide diversities were esti-mated as 1.000 ± 0.126 and 0.00530 ± 0.00116, respectively.
3.2. Gene pools in wild Lima beans
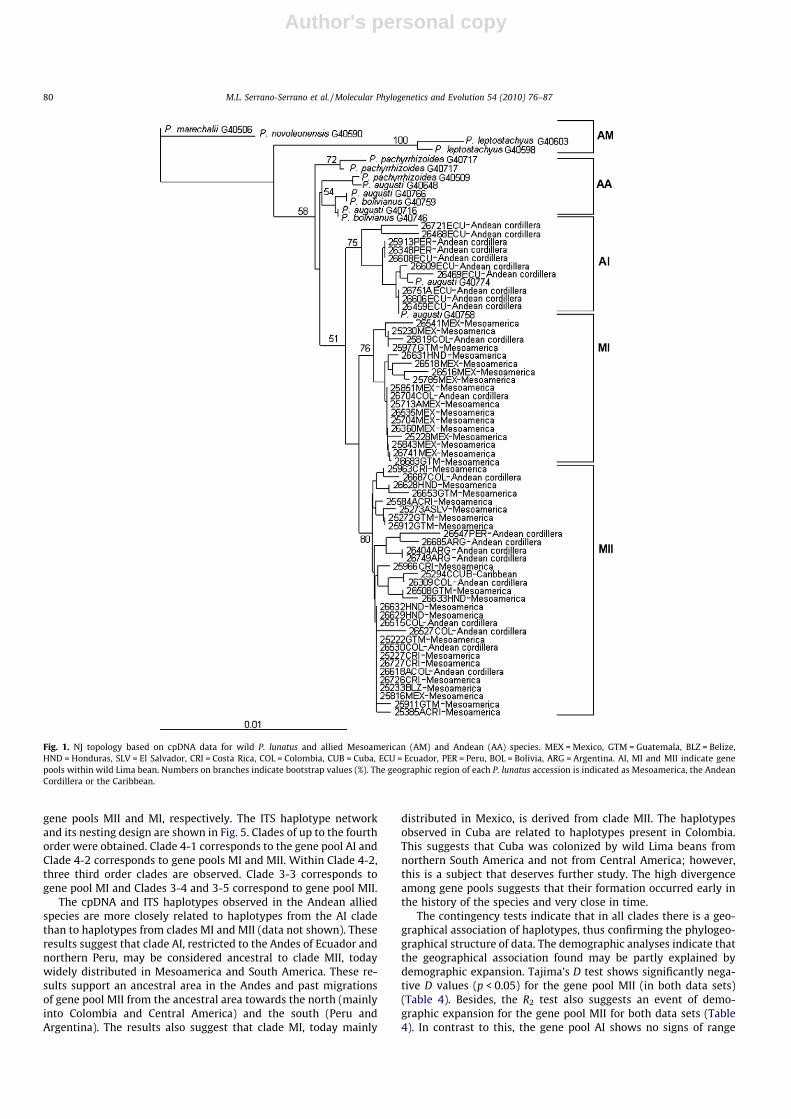
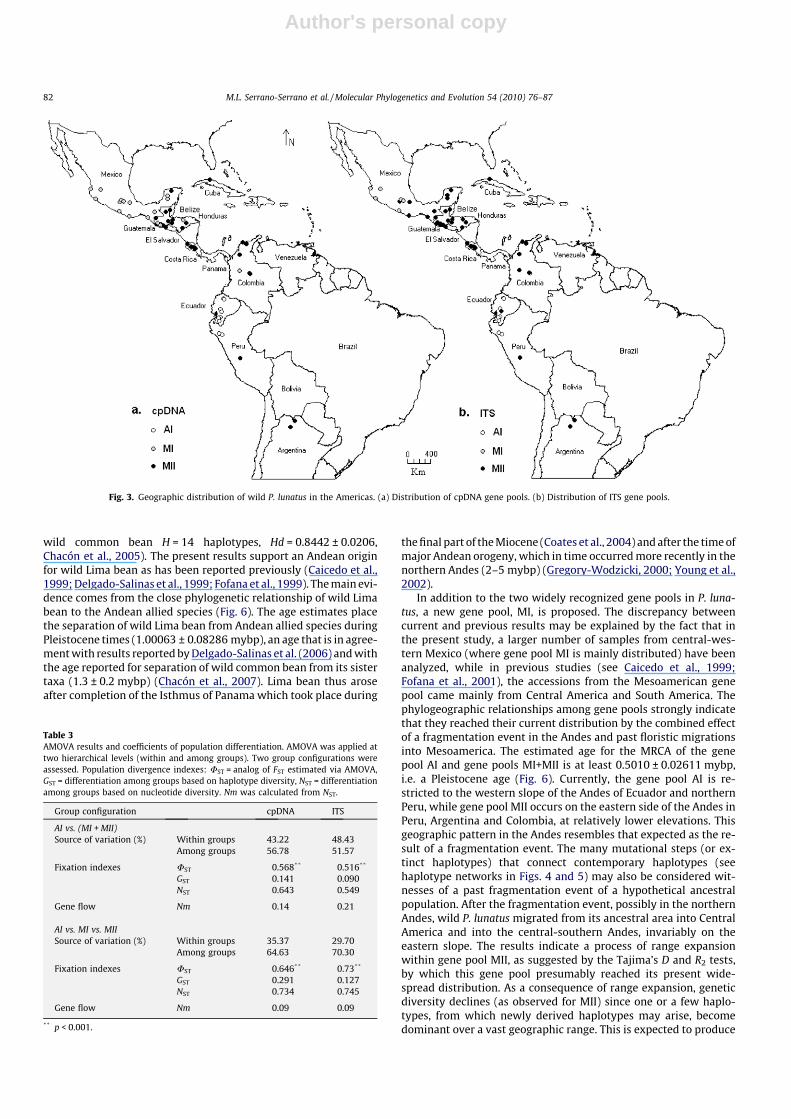
The NJ topologies obtained from both data sets are shown inFigs. 1 and 2. Three major groups with bootstrap values higherthan 60% and with mainly non-overlapping geographic rangesare identifiable in each of these two topologies. These groups werenamed as AI, MI and MII. AI corresponds to the previously reportedAndean gene pool, and the other two groups correspond to the pre-viously reported Mesoamerican gene pool (Caicedo et al., 1999;Fofana et al., 1999). AI is restricted to Ecuador and northern Peru(Fig. 3a and b) at altitudes between 470 and 1810 masl (averageelevation 1288 masl). MI comprises accessions present in Mexico,mainly in the area to the west and northwest of the Isthmus ofTehuantepec. Accessions in this group occur at elevations between20 and 1750 masl (average elevation 710 masl). MII is more widelydistributed and occurs in Mexico (mainly in the area to the eastand south east of the Isthmus of Tehuantepec), Central America,
78 M.L. Serrano-Serrano et al. / Molecular Phylogenetics and Evolution 54 (2010) 76–87
Author's personal copy
the Caribbean (Cuba) and South America (Colombia, southern Peruand Argentina) (Fig. 3a and b). This group occurs at altitudes be-tween 3 and 1680 masl (average elevation 714 masl). There is ahigh correspondence among NJ groups in the two data sets, exceptfor 12 accessions (see Appendix 1, accessions marked withasterisk).
NST values indicate a high degree of differentiation among thesethree groups (NST > 0.73; Table 3). Also, the AMOVA analyses showthat most of the variation is distributed among groups (Table 3).The group configurations tested by means of AMOVA assess thepartition of molecular variance among the Andean and Mesoamer-ican gene pools as they have been traditionally recognized (groupconfiguration AI vs. (MI + MII)) and among the three groups as pro-posed in this study (AI vs. MI vs. MII). For both data sets, the fixa-tion indexes UST were highly significant (p < 0.001) for bothconfigurations, but their magnitude was larger for the secondone giving further support to the existence of three gene pools inwild Lima beans. Diversity indexes are slightly higher for gene poolAI than for gene pools MI and MII (Table 4), in spite of the re-stricted geographic range of the former.
The magnitude of genetic differentiation found among genepools in wild Lima bean is comparable to that reported in previousstudies of the same species and of wild common bean. For exam-
ple, the observed range of GST values (GST = 0.127–0.291) reportedin this study is close to those found by Caicedo et al. (1999) in wildLima bean (GST = 0.26), and by Blair et al. (2006) in wild commonbean (GST = 0.147–0.170). The maximum NST value (an analog ofFST) reported in this study (NST = 0.745) is larger than or compara-ble to maximum FST values reported for wild Lima bean in CostaRica (FST = 0.497, Zoro Bi et al., 2003) and for wild common beanfrom Mexico to Argentina (FST = 0.67, Chacón et al., 2007). Finally,in the present study, AMOVA analyses show that differentiationamong gene pools is quite significant (64.63% for cpDNA and70.30% for ITS), which is comparable with previous reports of ge-netic differentiation based on cpDNA among the Mesoamericanand Andean gene pools in P. lunatus (67.5%, Fofana et al., 1999;64.4%, Fofana et al., 2001).
3.3. Phylogeography of wild Lima beans
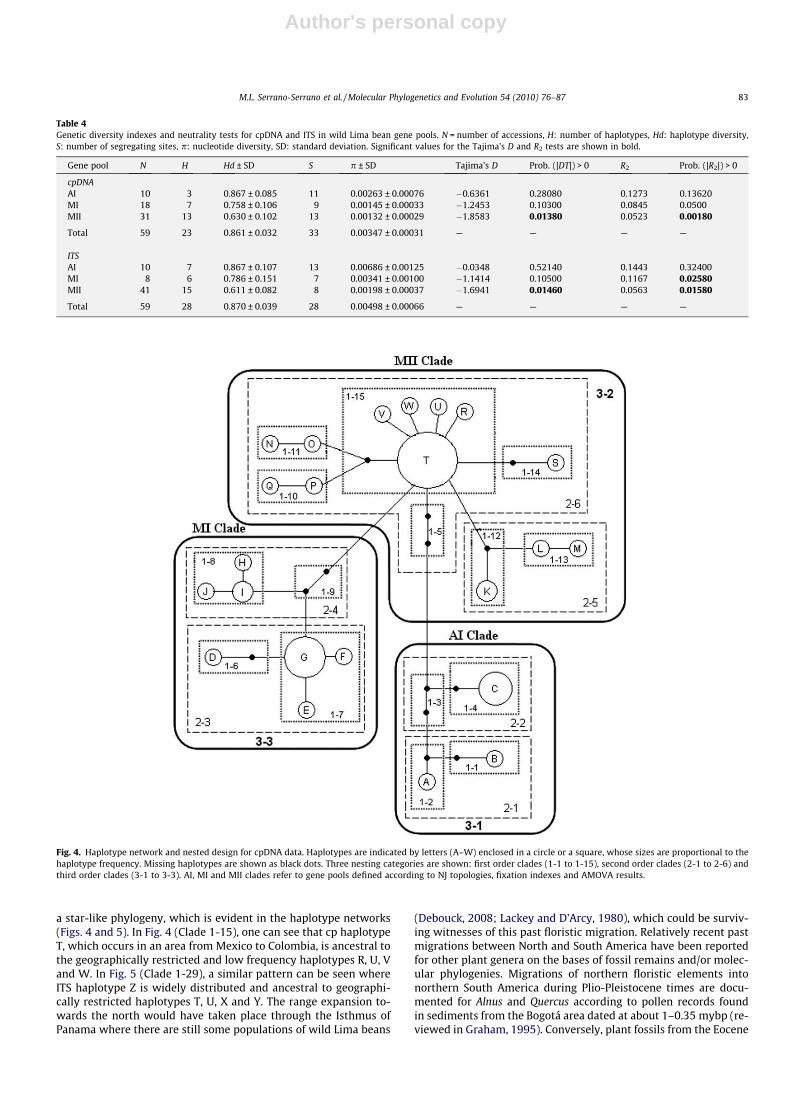
The U test suggests a strong phylogeographic structure in thedata (NST� GST for cpDNA and ITS data, at p < 0.001). The cpDNAhaplotype network and its nesting design are shown in Fig. 4.Clades of up to the third order were obtained. There is total corre-spondence among NJ clusters and third order clades. Clade 3-1 cor-responds to gene pool AI, and Clades 3-2 and 3-3 correspond to
Table 1Geographic distribution of cpDNA haplotypes in wild Lima bean. Numbers correspond to the number of accessions in each haplotype and in each geographic region. N = number ofaccessions and H = number of haplotypes observed, in each geographic region.
Geographic region Gene pool N H
AI MI MII
Haplotype
A B C D E F G H I J K L M N O P Q R S T U V W
Mesoamerica Mexico 1 1 1 8 1 1 1 14 7Guatemala 1 1 1 5 8 4Belize 1 1 1Honduras 1 1 1 1 1 5 5El Salvador 1 1 1Costa Rica 5 1 1 7 3
The Caribbean Cuba 1 1 1
South America Colombia 1 1 1 1 4 8 5Argentina 2 1 3 2Ecuador 1 1 6 8 3Peru 2 1 3 2
N 1 1 8 1 1 1 11 1 2 1 2 1 1 1 1 1 1 1 1 18 1 1 1 59 34
Table 2Geographic distribution of ITS haplotypes in wild Lima bean. Numbers correspond to the number of accessions in each haplotype and in each geographic region. N = number ofaccessions and H = number of haplotypes observed, in each geographic region.
Geographic region Gene pool N H
AI MI MII
Haplotype
A B C D E F G H I J K L M N O P Q R S T U V W X Y Z A1 B1
Mesoamerica Mexico 1 1 1 1 3 1 1 1 1 2 1 14 11Guatemala 1 1 1 4 1 8 5Belize 1 1 1Honduras 1 3 1 5 3El Salvador 1 1 1Costa Rica 2 1 4 7 3
The Caribbean Cuba 1 1 1
South America Colombia 1 4 3 8 3Argentina 3 3 1Ecuador 3 1 1 1 1 1 8 6Peru 1 1 1 3 3
N 1 1 4 1 1 1 1 1 1 1 1 3 1 1 1 1 1 1 1 2 6 1 2 1 5 16 1 1 59 38
M.L. Serrano-Serrano et al. / Molecular Phylogenetics and Evolution 54 (2010) 76–87 79
Author's personal copy
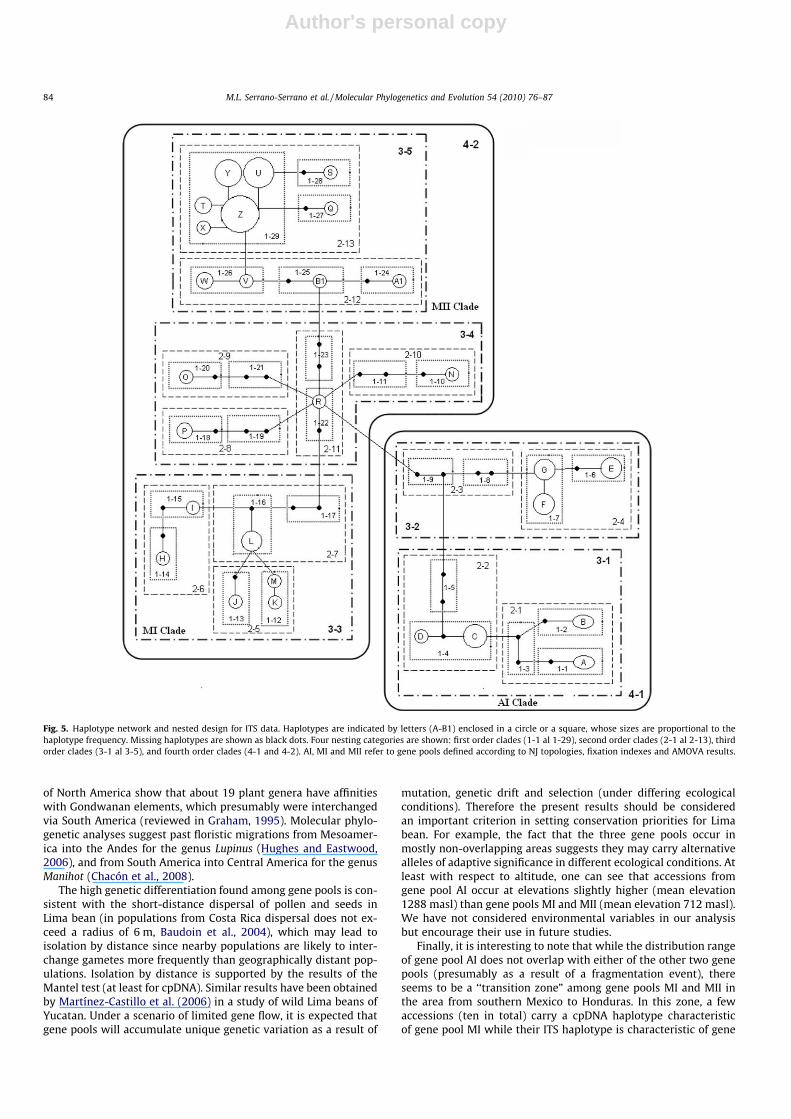
gene pools MII and MI, respectively. The ITS haplotype networkand its nesting design are shown in Fig. 5. Clades of up to the fourthorder were obtained. Clade 4-1 corresponds to the gene pool AI andClade 4-2 corresponds to gene pools MI and MII. Within Clade 4-2,three third order clades are observed. Clade 3-3 corresponds togene pool MI and Clades 3-4 and 3-5 correspond to gene pool MII.
The cpDNA and ITS haplotypes observed in the Andean alliedspecies are more closely related to haplotypes from the AI cladethan to haplotypes from clades MI and MII (data not shown). Theseresults suggest that clade AI, restricted to the Andes of Ecuador andnorthern Peru, may be considered ancestral to clade MII, todaywidely distributed in Mesoamerica and South America. These re-sults support an ancestral area in the Andes and past migrationsof gene pool MII from the ancestral area towards the north (mainlyinto Colombia and Central America) and the south (Peru andArgentina). The results also suggest that clade MI, today mainly
distributed in Mexico, is derived from clade MII. The haplotypesobserved in Cuba are related to haplotypes present in Colombia.This suggests that Cuba was colonized by wild Lima beans fromnorthern South America and not from Central America; however,this is a subject that deserves further study. The high divergenceamong gene pools suggests that their formation occurred early inthe history of the species and very close in time.
The contingency tests indicate that in all clades there is a geo-graphical association of haplotypes, thus confirming the phylogeo-graphical structure of data. The demographic analyses indicate thatthe geographical association found may be partly explained bydemographic expansion. Tajima’s D test shows significantly nega-tive D values (p < 0.05) for the gene pool MII (in both data sets)(Table 4). Besides, the R2 test also suggests an event of demo-graphic expansion for the gene pool MII for both data sets (Table4). In contrast to this, the gene pool AI shows no signs of range
Fig. 1. NJ topology based on cpDNA data for wild P. lunatus and allied Mesoamerican (AM) and Andean (AA) species. MEX = Mexico, GTM = Guatemala, BLZ = Belize,HND = Honduras, SLV = El Salvador, CRI = Costa Rica, COL = Colombia, CUB = Cuba, ECU = Ecuador, PER = Peru, BOL = Bolivia, ARG = Argentina. AI, MI and MII indicate genepools within wild Lima bean. Numbers on branches indicate bootstrap values (%). The geographic region of each P. lunatus accession is indicated as Mesoamerica, the AndeanCordillera or the Caribbean.
80 M.L. Serrano-Serrano et al. / Molecular Phylogenetics and Evolution 54 (2010) 76–87

Author's personal copy
expansions or demographic growth with either test. In addition,the geographical association of cpDNA haplotypes may also bepartly explained by a process of isolation by distance as suggestedby the Mantel test (r = 0.5467, p = 0.0084), while for ITS the corre-lation was high but not significant (r = 0.3161, p = 0.0998).
3.4. Phylogenetic analyses and divergence times
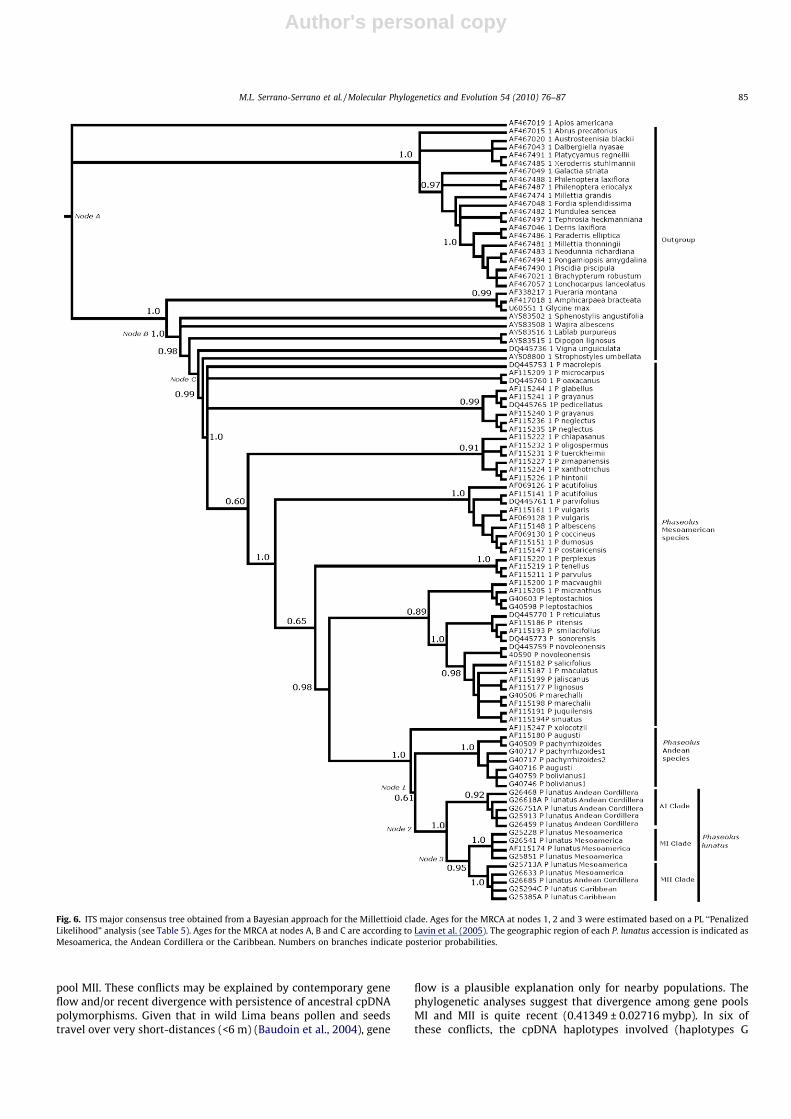
The molecular evolution model that best fitted the entire ITS re-gion and the spacers (ITS1 and ITS2) was the General Time Revers-ible model with gamma distribution and invariable sites (GTR +G + I), while for the 5.8S gene the best model was the SymmetricalModel (SYM + G + I); therefore, all analyses were performed underthe GTR + G + I model. The null hypothesis of a molecular clockwas rejected for the 200 trees tested (v2 = 431.2–632.5, p < 0.001).Fig. 6 shows the major consensus tree obtained by the Bayesian anal-ysis. The ages estimated by applying the PL test can be seen in Table
5. The results further support an Andean origin for P. lunatus since itgroups within a clade containing the Andean allied species. Theresults indicate an age for the MRCA of P. lunatus and the Andeanspecies allied to P. lunatus of at least 1.00063 ± 0.08286 mybp, anage for the MRCA of the Andean (AI) and Mesoamerican (MI, MII)gene pools of P. lunatus of at least 0.5010 ± 0.02611 mybp, and anage for the MRCA of the MI and MII gene pools of P. lunatus of at least0.41349 ± 0.02716 mybp.
4. Discussion
The cpDNA and the ITS regions proved to be useful and comple-mentary for phylogeographic and population genetic studies inwild Lima bean. In terms of chloroplast DNA diversity, wild Limabean displays diversity values similar to or within the range ofthose reported for wild common bean (P. vulgaris), a congenericspecies with similar mating system and distribution range (for
Fig. 2. NJ topology based on ITS data for wild P. lunatus and allied Mesoamerican (AM) and Andean (AA) species. MEX = Mexico, GTM = Guatemala, BLZ = Belize,HND = Honduras, SLV = El Salvador, CRI = Costa Rica, COL = Colombia, CUB = Cuba, ECU = Ecuador, PER = Peru, BOL = Bolivia, ARG = Argentina. AI, MI and MII indicate genepools within wild Lima bean. Numbers on branches indicate bootstrap values (%). The geographic region of each P. lunatus accession is indicated as Mesoamerica, the AndeanCordillera or the Caribbean.
M.L. Serrano-Serrano et al. / Molecular Phylogenetics and Evolution 54 (2010) 76–87 81
Author's personal copy
wild common bean H = 14 haplotypes, Hd = 0.8442 ± 0.0206,Chacón et al., 2005). The present results support an Andean originfor wild Lima bean as has been reported previously (Caicedo et al.,1999; Delgado-Salinas et al., 1999; Fofana et al., 1999). The main evi-dence comes from the close phylogenetic relationship of wild Limabean to the Andean allied species (Fig. 6). The age estimates placethe separation of wild Lima bean from Andean allied species duringPleistocene times (1.00063 ± 0.08286 mybp), an age that is in agree-ment with results reported by Delgado-Salinas et al. (2006) and withthe age reported for separation of wild common bean from its sistertaxa (1.3 ± 0.2 mybp) (Chacón et al., 2007). Lima bean thus aroseafter completion of the Isthmus of Panama which took place during
the final part of the Miocene (Coates et al., 2004) and after the time ofmajor Andean orogeny, which in time occurred more recently in thenorthern Andes (2–5 mybp) (Gregory-Wodzicki, 2000; Young et al.,2002).
In addition to the two widely recognized gene pools in P. luna-tus, a new gene pool, MI, is proposed. The discrepancy betweencurrent and previous results may be explained by the fact that inthe present study, a larger number of samples from central-wes-tern Mexico (where gene pool MI is mainly distributed) have beenanalyzed, while in previous studies (see Caicedo et al., 1999;Fofana et al., 2001), the accessions from the Mesoamerican genepool came mainly from Central America and South America. Thephylogeographic relationships among gene pools strongly indicatethat they reached their current distribution by the combined effectof a fragmentation event in the Andes and past floristic migrationsinto Mesoamerica. The estimated age for the MRCA of the genepool AI and gene pools MI+MII is at least 0.5010 ± 0.02611 mybp,i.e. a Pleistocene age (Fig. 6). Currently, the gene pool AI is re-stricted to the western slope of the Andes of Ecuador and northernPeru, while gene pool MII occurs on the eastern side of the Andes inPeru, Argentina and Colombia, at relatively lower elevations. Thisgeographic pattern in the Andes resembles that expected as the re-sult of a fragmentation event. The many mutational steps (or ex-tinct haplotypes) that connect contemporary haplotypes (seehaplotype networks in Figs. 4 and 5) may also be considered wit-nesses of a past fragmentation event of a hypothetical ancestralpopulation. After the fragmentation event, possibly in the northernAndes, wild P. lunatus migrated from its ancestral area into CentralAmerica and into the central-southern Andes, invariably on theeastern slope. The results indicate a process of range expansionwithin gene pool MII, as suggested by the Tajima’s D and R2 tests,by which this gene pool presumably reached its present wide-spread distribution. As a consequence of range expansion, geneticdiversity declines (as observed for MII) since one or a few haplo-types, from which newly derived haplotypes may arise, becomedominant over a vast geographic range. This is expected to produce
Fig. 3. Geographic distribution of wild P. lunatus in the Americas. (a) Distribution of cpDNA gene pools. (b) Distribution of ITS gene pools.
Table 3AMOVA results and coefficients of population differentiation. AMOVA was applied attwo hierarchical levels (within and among groups). Two group configurations wereassessed. Population divergence indexes: UST = analog of FST estimated via AMOVA,GST = differentiation among groups based on haplotype diversity, NST = differentiationamong groups based on nucleotide diversity. Nm was calculated from NST.
Group configuration cpDNA ITS
AI vs. (MI + MII)Source of variation (%) Within groups 43.22 48.43
Among groups 56.78 51.57
Fixation indexes UST 0.568** 0.516**
GST 0.141 0.090NST 0.643 0.549
Gene flow Nm 0.14 0.21
AI vs. MI vs. MIISource of variation (%) Within groups 35.37 29.70
Among groups 64.63 70.30
Fixation indexes UST 0.646** 0.73**
GST 0.291 0.127NST 0.734 0.745
Gene flow Nm 0.09 0.09
** p < 0.001.
82 M.L. Serrano-Serrano et al. / Molecular Phylogenetics and Evolution 54 (2010) 76–87
Author's personal copy
a star-like phylogeny, which is evident in the haplotype networks(Figs. 4 and 5). In Fig. 4 (Clade 1-15), one can see that cp haplotypeT, which occurs in an area from Mexico to Colombia, is ancestral tothe geographically restricted and low frequency haplotypes R, U, Vand W. In Fig. 5 (Clade 1-29), a similar pattern can be seen whereITS haplotype Z is widely distributed and ancestral to geographi-cally restricted haplotypes T, U, X and Y. The range expansion to-wards the north would have taken place through the Isthmus ofPanama where there are still some populations of wild Lima beans
(Debouck, 2008; Lackey and D’Arcy, 1980), which could be surviv-ing witnesses of this past floristic migration. Relatively recent pastmigrations between North and South America have been reportedfor other plant genera on the bases of fossil remains and/or molec-ular phylogenies. Migrations of northern floristic elements intonorthern South America during Plio-Pleistocene times are docu-mented for Alnus and Quercus according to pollen records foundin sediments from the Bogotá area dated at about 1–0.35 mybp (re-viewed in Graham, 1995). Conversely, plant fossils from the Eocene
Table 4Genetic diversity indexes and neutrality tests for cpDNA and ITS in wild Lima bean gene pools. N = number of accessions, H: number of haplotypes, Hd: haplotype diversity,S: number of segregating sites, p: nucleotide diversity, SD: standard deviation. Significant values for the Tajima’s D and R2 tests are shown in bold.
Gene pool N H Hd ± SD S p ± SD Tajima’s D Prob. (|DT|) > 0 R2 Prob. (|R2|) > 0
cpDNAAI 10 3 0.867 ± 0.085 11 0.00263 ± 0.00076 �0.6361 0.28080 0.1273 0.13620MI 18 7 0.758 ± 0.106 9 0.00145 ± 0.00033 �1.2453 0.10300 0.0845 0.0500MII 31 13 0.630 ± 0.102 13 0.00132 ± 0.00029 �1.8583 0.01380 0.0523 0.00180
Total 59 23 0.861 ± 0.032 33 0.00347 ± 0.00031 — — — —
ITSAI 10 7 0.867 ± 0.107 13 0.00686 ± 0.00125 �0.0348 0.52140 0.1443 0.32400MI 8 6 0.786 ± 0.151 7 0.00341 ± 0.00100 �1.1414 0.10500 0.1167 0.02580MII 41 15 0.611 ± 0.082 8 0.00198 ± 0.00037 �1.6941 0.01460 0.0563 0.01580
Total 59 28 0.870 ± 0.039 28 0.00498 ± 0.00066 — — — —
Fig. 4. Haplotype network and nested design for cpDNA data. Haplotypes are indicated by letters (A–W) enclosed in a circle or a square, whose sizes are proportional to thehaplotype frequency. Missing haplotypes are shown as black dots. Three nesting categories are shown: first order clades (1-1 to 1-15), second order clades (2-1 to 2-6) andthird order clades (3-1 to 3-3). AI, MI and MII clades refer to gene pools defined according to NJ topologies, fixation indexes and AMOVA results.
M.L. Serrano-Serrano et al. / Molecular Phylogenetics and Evolution 54 (2010) 76–87 83
Author's personal copy
of North America show that about 19 plant genera have affinitieswith Gondwanan elements, which presumably were interchangedvia South America (reviewed in Graham, 1995). Molecular phylo-genetic analyses suggest past floristic migrations from Mesoamer-ica into the Andes for the genus Lupinus (Hughes and Eastwood,2006), and from South America into Central America for the genusManihot (Chacón et al., 2008).
The high genetic differentiation found among gene pools is con-sistent with the short-distance dispersal of pollen and seeds inLima bean (in populations from Costa Rica dispersal does not ex-ceed a radius of 6 m, Baudoin et al., 2004), which may lead toisolation by distance since nearby populations are likely to inter-change gametes more frequently than geographically distant pop-ulations. Isolation by distance is supported by the results of theMantel test (at least for cpDNA). Similar results have been obtainedby Martínez-Castillo et al. (2006) in a study of wild Lima beans ofYucatan. Under a scenario of limited gene flow, it is expected thatgene pools will accumulate unique genetic variation as a result of
mutation, genetic drift and selection (under differing ecologicalconditions). Therefore the present results should be consideredan important criterion in setting conservation priorities for Limabean. For example, the fact that the three gene pools occur inmostly non-overlapping areas suggests they may carry alternativealleles of adaptive significance in different ecological conditions. Atleast with respect to altitude, one can see that accessions fromgene pool AI occur at elevations slightly higher (mean elevation1288 masl) than gene pools MI and MII (mean elevation 712 masl).We have not considered environmental variables in our analysisbut encourage their use in future studies.
Finally, it is interesting to note that while the distribution rangeof gene pool AI does not overlap with either of the other two genepools (presumably as a result of a fragmentation event), thereseems to be a ‘‘transition zone” among gene pools MI and MII inthe area from southern Mexico to Honduras. In this zone, a fewaccessions (ten in total) carry a cpDNA haplotype characteristicof gene pool MI while their ITS haplotype is characteristic of gene
Fig. 5. Haplotype network and nested design for ITS data. Haplotypes are indicated by letters (A-B1) enclosed in a circle or a square, whose sizes are proportional to thehaplotype frequency. Missing haplotypes are shown as black dots. Four nesting categories are shown: first order clades (1-1 al 1-29), second order clades (2-1 al 2-13), thirdorder clades (3-1 al 3-5), and fourth order clades (4-1 and 4-2). AI, MI and MII refer to gene pools defined according to NJ topologies, fixation indexes and AMOVA results.
84 M.L. Serrano-Serrano et al. / Molecular Phylogenetics and Evolution 54 (2010) 76–87
Author's personal copy
pool MII. These conflicts may be explained by contemporary geneflow and/or recent divergence with persistence of ancestral cpDNApolymorphisms. Given that in wild Lima beans pollen and seedstravel over very short-distances (<6 m) (Baudoin et al., 2004), gene
flow is a plausible explanation only for nearby populations. Thephylogenetic analyses suggest that divergence among gene poolsMI and MII is quite recent (0.41349 ± 0.02716 mybp). In six ofthese conflicts, the cpDNA haplotypes involved (haplotypes G
Fig. 6. ITS major consensus tree obtained from a Bayesian approach for the Millettioid clade. Ages for the MRCA at nodes 1, 2 and 3 were estimated based on a PL ‘‘PenalizedLikelihood” analysis (see Table 5). Ages for the MRCA at nodes A, B and C are according to Lavin et al. (2005). The geographic region of each P. lunatus accession is indicated asMesoamerica, the Andean Cordillera or the Caribbean. Numbers on branches indicate posterior probabilities.
M.L. Serrano-Serrano et al. / Molecular Phylogenetics and Evolution 54 (2010) 76–87 85
Author's personal copy
and T) may be considered ancestral according to their position inthe haplotype network, high frequency in the sample and wide-spread distribution (Appendix 1, Table 1, Fig. 4), while the ITS hap-lotypes involved (haplotypes A, A1, N, O and Y) are all derivedhaplotypes in the network, occur at low frequency and are geo-graphically restricted (Appendix 1, Table 2, Fig. 5). All these resultsgive support to the second hypothesis of a recent diversification ofgene pools MI and MII and persistence of ancestral polymorphisms(old cpDNA haplotypes in accessions with recently derived ITShaplotypes), mostly in the absence of contemporary gene flow.
In summary, the present results strongly support an Andeanorigin for wild Lima beans and an early separation into three genepools, which evolved mainly in isolation. The current geographicrange of wild Lima beans was probably affected by a fragmentationevent in the northern Andes and by migration into Central Amer-ica, after the formation of the Isthmus of Panama. In this study, anew gene pool (MI) is proposed in the area to the west and north-west of the Isthmus of Tehuantepec, which has been under-repre-sented in previous studies. The present results encourage furtherresearch in this poorly known species, which may contribute toour understanding of the processes that influence the distributionof species with wide geographic ranges and the dynamics of pastfloristic migrations in the Neotropics.
Acknowledgments
The authors are grateful to the Fundación para la Promoción dela Investigación y la Tecnología, Banco de la República, Colombia(Grant No. 1941), and to Dirección de Investigaciones, UniversidadIndustrial de Santander-UIS, Colombia, for providing funding tocarry out this research. We are also grateful to CIAT for providinggermplasm material. Thanks are also due to Jenny R. Motta Aldanafor her valuable help in molecular analyses and to Dr. BarbaraPickersgill for her useful comments on the manuscript.
Appendices 1 and 2. Supplementary data
Supplementary data associated with this article can be found, inthe online version, at doi:10.1016/j.ympev.2009.08.028.
References
Arbogast, B.S., Edwards, S.V., Wakeley, J., Beerli, P., Slowinski, J.B., 2002. Estimatingdivergence times from molecular data on phylogenetic and population genetictimescales. Annu. Rev. Ecol. Syst. 33, 707–740.
Baudoin, J., Rocha, J., Degreef, A., Maquet, A., Guarino, L., 2004. Ecogeography,Demography, Diversity and Conservation of Phaseolus lunatus L. in the CentralValley of Costa Rica. International Plant Genetic Resources Institute, Rome, Italy.
Blair, M.W., Giraldo, M.C., Buendía, H.F., Tovar, E., Duque, M.C., Beebe, S.E., 2006.Microsatellite marker diversity in common bean (Phaseolus vulgaris L.). Theor.Appl. Genet. 113, 100–109.
Bohonak, A.J., 2002. IBD (Isolation By Distance): a program for analyses of isolationby distance. J. Hered. 93, 153–154.
Burnham, R., Graham, A., 1999. The history of neotropical vegetation: newdevelopments and status. Ann. Mo. Bot. Gard. 86, 546–589.
Caicedo, A.L., Gaitán, E., Duque, M.C., Toro, C.O., Debouck, D.G., Tohme, M.J., 1999.AFLP fingerprinting of Phaseolus lunatus L. and related wild species from SouthAmerica. Crop Sci. 39, 1497–1507.
Chacón, J., Madriñán, S., Debouck, D.G., Rodríguez, F., Tohme, J., 2008. Phylogeneticpatterns in the genus Manihot (Euphorbiaceae) inferred from analyses ofnuclear and chloroplast DNA regions. Mol. Phylogen. Evol. 49, 260–267.
Chacón, M.I., Pickersgill, B., Debouck, D.G., 2005. Domestication patterns in commonbean (Phaseolus vulgaris L.) and the origin of the Mesoamerican and Andeancultivated races. Theor. Appl. Genet. 110, 432–444.
Chacón, M.I., Pickersgill, B., Debouck, D.G., 2007. Phylogeographic analysis of thechloroplast DNA variation in wild common bean (Phaseolus vulgaris L.) in theAmericas. Plant Syst. Evol. 266, 175–195.
Chiang, T.Y., Schaal, B.A., Peng, C.I., 1998. Universal primers for amplification andsequencing a non-coding spacer between the atpB and rbcL genes of chloroplastDNA. Bot. Bull. Acad. Sin. 39, 245–250.
Clement, M., Posada, D., Crandall, K., 2000. TCS: a computer program to estimategene genealogies. Mol. Ecol. 9, 1657–1660.
Coates, A.G., Collins, L.S., Aubry, M., Berggren, W.A., 2004. The geology of the Darien,Panama, and the late Miocene–Pliocene collision of the Panama arc withnorthwestern South America. Bull. Geol. Soc. Am. 116, 1327–1344.
Crepet, W.L., Herendeen, P.S., 1992. Papilionoid flowers from the early Eocene ofsoutheastern North America. In: Herendeen, P.S., Dilcher, D.L. (Eds.), The FossilRecord. Advances in Legume Systematics, Part 4. Royal Botanic Garden, Kew,England, pp. 43–55.
Debouck, D.G., 1996. Colombian common and Lima beans: views on their originsand evolutionary significance. Rev. Corpoica 1, 7–15.
Debouck, D.G., 2008. Notes sur les différents taxons de Phaseolus à partir desHerbiers — Section Paniculati, vol. 2008, pp. 233. Available from: <http://www.ciat.cgiar.org/urg>.
Debouck, D.G., Liñan, J., Campana, S.A., De La Cruz Rojas, J.H., 1987. Observations onthe domestication of Phaseolus lunatus L.. Plant Genet. Resourc. Newsl. 70, 26–32.
Delgado-Salinas, A., 2000. New species of Mexican Phaseolus (Fabaceae). Syst. Bot.25, 414–436.
Delgado-Salinas, A., Bibler, R., Lavin, M., 2006. Phylogeny of the genus Phaseolus(Leguminosae): a recent diversification in an ancient landscape. Syst. Bot. 31,779–791.
Delgado-Salinas, A., Turley, T., Richman, A., Lavin, M., 1999. Phylogenetic analysis ofthe cultivated and wild species of Phaseolus (Fabaceae). Syst. Bot. 24, 438–460.
Doyle, J.J., Doyle, J.L., 1987. A rapid DNA isolation procedure for small quantities offresh leaf tissue. Phytochem. Bull. 19, 11–15.
Edgar, R.C., 2004. MUSCLE: multiple sequence alignment with high accuracy andhigh throughput. Nucleic Acids Res. 32, 1792–1797.
Excoffier, L., Smouse, P.E., Quattro, J.M., 1992. Analysis of molecular varianceinferred from metric distances among DNA haplotypes: application to humanmitochondrial DNA restriction data. Genetics 131, 479–491.
Ferrari, L., Pasquarè, G., Venegas-Salgado, S., Romero-Rios, F., 1999. Geology of thewestern Mexican Volcanic Belt and adjacent Sierra Madre Occidental and Jaliscoblock. In: Delgado-Granados, H., Aguirre-Díaz, G., Stock, J.M. (Eds.), CenozoicTectonics and Volcanism of Mexico. Geological Society of America, Boulder, CO.
Fofana, B., Baudoin, J.P., Vekemans, X., Debouck, D.G., du Jardin, P., 1999. Molecularevidence for an Andean origin and a secondary gene pool for the Lima bean(Phaseolus lunatus L.) using chloroplast DNA. Theor. Appl. Genet. 98, 202–212.
Fofana, B., du Jardin, P., Baudoin, J.P., 2001. Genetic diversity in the Lima bean(Phaseolus lunatus L.) as revealed by chloroplast DNA (cpDNA) variations. Genet.Resour. Crop Evol. 48, 437–445.
Freytag, G.F., Debouck, D.G., 2002. Taxonomy, Distribution, and Ecology of theGenus Phaseolus (Leguminosae-papilionoideae) in North America, Mexico andCentral America. Botanical Research Institute of Texas (BRIT), Forth Worth, TX,USA. pp. 298.
Gentry, A.H., 1982. Neotropical floristic diversity: phytogeographical connectionsbetween Central and South America, Pleistocene climatic fluctuations, or anaccident of the Andean orogeny? Ann. Mo. Bot. Gard. 69, 557–593.
Giribert, G., 2003. Stability in phylogenetic formulations and its relationship tonodal support. Syst. Biol. 52, 554–564.
Graham, A., 1995. Development of affinities between Mexican/Central Americanand northern South America lowland and lower montane vegetation during theTertiary. In: Churchill, S.P., Balslev, H., Forero, E., Luteyn, J.L. (Eds.), Biodiversityand Conservation of Neotropical Montane Forests. The New York BotanicalGarden, pp. 11–12.
Gregory-Wodzicki, K.M., 2000. Uplift history of the central and northern Andes: areview. Bull. Geol. Soc. Am. 112, 1091–1105.
Gutiérrez Salgado, A., Gepts, P., Debouck, D.G., 1995. Evidence for two gene pools ofthe lima bean, Phaseolus lunatus L., in the Americas. Genet. Resour. Crop Evol.42, 15–28.
Table 5Estimation of divergence times based on 200 ITS trees obtained from a Bayesian approach. mybp = million years before present. SD: standard deviation. Ages for the MRCA atnodes A, B and C are according to Lavin et al. (2005).
Node MRCA Average age (mybp) SD (mybp) Minimum age (mybp) Maximum age (mybp)
A Xeroderris — Phaseolus 40.000 0.0000 40.000 40.000B Wajira — Phaseolus 12.2808 ±0.2683 11.840 13.000C Vigna — Phaseolus 9.9956 ±0.0440 9.550 10.0001 P. lunatus — Andean allied species 1.00063 ±0.08286 0.870 1.2102 P. lunatus Andean — P. lunatus Mesoamerican gene pools 0.5010 ±0.02611 0.440 0.5603 P. lunatus gene pool MI — P. lunatus gene pool MII 0.41349 ±0.02716 0.350 0.530
86 M.L. Serrano-Serrano et al. / Molecular Phylogenetics and Evolution 54 (2010) 76–87
Author's personal copy
Hall, T., 1999. BioEdit: a user friendly biological sequence alignment editor andanalysis program. Nucleic Acids Symp. Ser. 41, 95–98.
Hardy, O.S., Dubois, I., Zoro, B., Baudoin, J.P., 1997. Gene dispersal and itsconsequences on the genetic structure of wild populations of Lima bean(Phaseolus lunatus) in Costa Rica. Plant Genet. Resour. Newsl. 109, 1–6.
Huelsenbeck, J.P., Ronquist, F., 2001. MRBAYES: Bayesian inference of phylogeny.Bioinformatics 17, 754–755.
Hughes, C., Eastwood, R., 2006. Island radiation on a continental scale: exceptionalrates of plant diversification after uplift of the Andes. Proc. Natl. Acad. Sci. USA103, 10334–10339.
Lackey, J., D’Arcy, W.G., 1980. Phaseolus. Family 83. Leguminosae. Flora of Panama.Ann. Mo. Bot. Gard. 67, 746–751.
Lavin, M., Herendeen, P., Wojciechowski, M.F., 2005. Evolutionary rates analysis ofLeguminosae implicates a rapid diversification of lineages during the Tertiary.Syst. Biol. 54, 530–549.
Lynch, M., Crease, T., 1990. The analysis of population survey data on DNA sequencevariation. Mol. Biol. Evol. 7, 377–394.
Maquet, A., Vekemans, X., Baudoin, J.P., 1999. Phylogenetic study on wild allies ofLima bean, Phaseolus lunatus L. (Fabaceae), and implications on its origin. PlantSyst. Evol. 218, 43–54.
Martínez-Castillo, J., Zizumbo-Villareal, D., Gepts, P., Delgado-Valerio, P., Colunga-GarcíaMarín, P., 2006. Structure and genetic diversity of wild populations ofLima bean (Phaseolus lunatus L.) from the Yucatan Peninsula, Mexico. Crop Sci.46, 1071–1080.
Muse, S.V., Weir, B.S., 1992. Testing for equality of evolutionary rates. Genetics 132,269–276.
Nei, M., 1973. Analysis of gene diversity in subdivided populations. Proc. Natl. Acad.Sci. USA 70, 3321–3323.
Nei, M., 1987. Molecular Evolutionary Genetics. Columbia University Press, New York.Nei, M., Miller, J.C., 1990. A simple method for estimating average number of
nucleotide substitutions within and between populations from restriction data.Genetics 125, 873–879.
Nixon, K.C., 2002. WinClada ver. 1.00.08. Published by the author. Ithaca, NY.Nylander, J.A., 2004. MrModeltest v2. Program distributed by the author.
Evolutionary Biology Centre, Uppsala University.Page, R.D., Holmes, E.C., 1998. Molecular Evolution: A Phylogenetic Approach.
Blackwell Science, Oxford. pp. 346.Pennington, R.T., Lavin, M., Prado, D.E., Pendry, C.A., Pell, S.K., Butterworth, C.A.,
2004. Historical climate change and speciation: neotropical seasonally dryforest plants show patterns of both Tertiary and Quaternary diversification.Philos. Trans. R. Soc. Lond. Ser. B Biol. Sci. 359, 515–537.
Pons, O., Petit, R.J., 1996. Measuring and testing genetic differentiation with orderedversus unordered alleles. Genetics 144, 1237–1245.
Posada, D., Crandall, K.A., Templeton, A.R., 2000. GeoDis: a program for the cladisticnested analysis of the geographical distribution of genetic haplotypes. Mol. Ecol.9, 487–488.
Posada, D., Crandall, K.A., 2001. Selecting the best-fit model of nucleotidesubstitution. Syst. Biol. 50, 580–601.
Ramos-Onsins, S.E., Rozas, J., 2002. Statistical properties of new neutrality testsagainst population growth. Mol. Biol. Evol. 19, 2092–2100.
Rozas, J., Sánchez-DelBarrio, J.C., Messeguer, X., Rozas, R., 2003. DnaSP, DNApolymorphism analyses by the coalescent and other methods. Bioinformatics19, 2496–2497.
Sanderson, M.J., 2002. Estimating absolute rates of molecular evolution anddivergence times: a penalized likelihood approach. Mol. Biol. Evol. 19,101–109.
Sanderson, M.J., 2004. r8s ver.1.70. Analysis of Rates of Evolution. Available from:<http://loco.biosci.arizona.edu/r8s/>.
Schneider, S., Roessli, D., Excoffier, L., 2000. Arlequin ver. 2000: A Software forPopulation Genetic Data Analysis. Genetics and Biometry Laboratory, Universityof Geneva, Switzerland.
Simmons, M., Ochoterena, H., 2000. Gaps as characters in sequence-basedphylogenetic analysis. Syst. Biol. 49, 369–381.
Sparvoli, F., Lanave, C., Santucci, A., Bollini, R., Lioi, L., 2001. Lectin and lectin-relatedproteins in Lima bean (Phaseolus lunatus L.) seeds: biochemical andevolutionary studies. Plant Mol. Biol. 45, 587–597.
Swofford, D.L., 1998. PAUP*. Phylogenetic Analysis Using Parsimony (� and OtherMethods). vs. 4. Sinauer Associates, Sunderland, MA.
Taberlet, P., Gielly, L., Pautou, G., Bouvet, J., 1991. Universal primers foramplification of three non-coding regions of chloroplast DNA. Plant Mol. Biol.17, 1105–1109.
Tajima, F., 1989. Statistical method for testing the neutral mutation hypothesis byDNA polymorphism. Genetics 123, 585–595.
Templeton, A.R., Boerwinkle, E., Sing, C.F., 1987. A cladistic analysis of phenotypicassociations with haplotypes inferred from restriction endonuclease mapping. I.Basic theory and an analysis of alcohol dehydrogenase activity in Drosophila.Genetics 117, 343–351.
Templeton, A.R., Crandall, K.A., Sing, C.F., 1992. A cladistic analysis of phenotypicassociations with haplotypes inferred from restriction endonucleasemapping and DNA sequence data. III. Cladogram estimation. Genetics 132,619–633.
Webb, S.D., 1997. The great American faunal interchange. In: Coates, A.G. (Ed.),Central America: A Natural and Cultural History. Yale University Press,Michigan, pp. 97–122.
White, T.J., Bruns, T., Lee, S., Taylor, W., 1990. Amplifications and direct sequencingof fungal ribosomal RNA genes for phylogenetics. In: Innis, M.A., Gelfand, D.H.,Sninsky, J.J., White, T.J. (Eds.), PCR Protocols: A Guide to Methods andApplications. Academic Press Inc., New York, pp. 315–322.
Xia, X., Xie, Z., 2001. DAMBE: data analysis in molecular biology and evolution. J.Hered. 92, 371–373.
Xia, X., Xie, Z., Salemi, M., Chen, L., Wang, Y., 2003. An index of substitutionsaturation and its application. Mol. Phylogen. Evol. 26, 1–7.
Young, K.R., Ulloa Ulloa, C., Luteyn, J.L., 2002. Plant evolution and endemism inAndean South America: an introduction. Bot. Rev. 68, 4–21.
Zoro Bi, I., Maquet, A., Baudoin, J.P., 2003. Population genetic structure of wildPhaseolus lunatus (Fabaceae), with special reference to population size. Am. J.Bot. 90, 897–904.
Zoro Bi, I., Maquet, A., Baudoin, J.P., 2005. Mating system of wild Phaseolus lunatus L.and its relationship to population size. Heredity 94, 153–158.
M.L. Serrano-Serrano et al. / Molecular Phylogenetics and Evolution 54 (2010) 76–87 87