gene finding in the chicken genome
TRANSCRIPT

BioMed CentralBMC Bioinformatics
ss
Open AcceResearch articleGene finding in the chicken genomeEduardo Eyras*1, Alexandre Reymond2,3, Robert Castelo1, Jacqueline M Bye4, Francisco Camara1, Paul Flicek5, Elizabeth J Huckle4, Genis Parra1, David D Shteynberg5, Carine Wyss2, Jane Rogers4, Stylianos E Antonarakis2, Ewan Birney6, Roderic Guigo1 and Michael R Brent5Address: 1Research Group in Biomedical Informatics, Institut Municipal d'Investigacio Medica/Universitat Pompeu Fabra/Centre de Regulacio Genomica, E08003 Barcelona, Catalonia, Spain, 2Department of Genetic Medicine and Development, University of Geneva, Medical School and University Hospital of Geneva, CMU, 1, rue Michel Servet, 1211 Geneva, Switzerland, 3Center for Integrative Genomics, University of Lausanne, 1015 Lausanne, Switzerland, 4The Wellcome Trust Sanger Institute, Wellcome Trust Genome Campus, Hinxton, Cambridge CB10 1SA, UK, 5Laboratory for Computational Genomics and Department of Computer Science, Campus Box 1045, Washington University, One Brookings Drive, St Louis, Missouri 63130, USA and 6EBI, Wellcome Trust Genome Campus, Hinxton, Cambridge CB10 1SD, UK
Email: Eduardo Eyras* - [email protected]; Alexandre Reymond - [email protected]; Robert Castelo - [email protected]; Jacqueline M Bye - [email protected]; Francisco Camara - [email protected]; Paul Flicek - [email protected]; Elizabeth J Huckle - [email protected]; Genis Parra - [email protected]; David D Shteynberg - [email protected]; Carine Wyss - [email protected]; Jane Rogers - [email protected]; Stylianos E Antonarakis - [email protected]; Ewan Birney - [email protected]; Roderic Guigo - [email protected]; Michael R Brent - [email protected]
* Corresponding author
AbstractBackground: Despite the continuous production of genome sequence for a number of organisms,reliable, comprehensive, and cost effective gene prediction remains problematic. This is particularlytrue for genomes for which there is not a large collection of known gene sequences, such as therecently published chicken genome. We used the chicken sequence to test comparative andhomology-based gene-finding methods followed by experimental validation as an effective genomeannotation method.
Results: We performed experimental evaluation by RT-PCR of three different computational genefinders, Ensembl, SGP2 and TWINSCAN, applied to the chicken genome. A Venn diagram wascomputed and each component of it was evaluated. The results showed that de novo comparativemethods can identify up to about 700 chicken genes with no previous evidence of expression, andcan correctly extend about 40% of homology-based predictions at the 5' end.
Conclusions: De novo comparative gene prediction followed by experimental verification iseffective at enhancing the annotation of the newly sequenced genomes provided by standardhomology-based methods.
BackgroundThe draft sequence of the chicken (Gallus gallus) genome
has been recently obtained and an initial analysis com-pleted [1]. This genome sequence will be extremely
Published: 30 May 2005
BMC Bioinformatics 2005, 6:131 doi:10.1186/1471-2105-6-131
Received: 26 October 2004Accepted: 30 May 2005
This article is available from: http://www.biomedcentral.com/1471-2105/6/131
© 2005 Eyras et al; licensee BioMed Central Ltd. This is an Open Access article distributed under the terms of the Creative Commons Attribution License (http://creativecommons.org/licenses/by/2.0), which permits unrestricted use, distribution, and reproduction in any medium, provided the original work is properly cited.
Page 1 of 12(page number not for citation purposes)

BMC Bioinformatics 2005, 6:131 http://www.biomedcentral.com/1471-2105/6/131
valuable for vertebrate development, avian biology, andagriculture. To reap these benefits, however, we must beable to determine with reasonable accuracy the aminoacid sequences of the proteins encoded by this genome.We therefore set out to adapt three leading gene predic-tion systems to the chicken genome sequence and to eval-uate their predictions experimentally. Some features ofthe chicken genome facilitate gene prediction while othershinder it. Generally, gene prediction tends to be moreaccurate in more compact genomes than in the largemammalian genomes [2-6]. The chicken genome is about40% the size of the human genome, but about three timesthe size of the Takifugu genome [7-11]. This translatesinto a substantial reduction in repeats and pseudogenes.Interspersed repeats cover about 9% of the genome, farless than the 40–50% found in mammals [1]. The smallnumber of processed pseudogenes is beneficial to auto-mated annotation, as this technology often misclassifiespseudogenes as functional. De novo prediction methodsneed full open reading frame (ORF) mRNAs to train theirstatistical models and homology-based methods rely onthese sequences in order to predict a core set of high qual-ity genes. However, an abundant set of chicken full-lengthcDNAs was not available at the start of this project, as onlyabout 1,800 putatively full-length cDNAs and 340,000ESTs were deposited in GenBank [12].
We set out to determine how well the computationalmethods used for annotating protein-coding genes in themouse and rat genomes [9,10] would perform in thisavian context, where transcriptome sequencing was muchless advanced and where sequence divergence may bebeyond the optimal distance. An assessment of the com-putational methods was carried out by a large-scale exper-imental verification by RT-PCR. The gene prediction toolstested were Ensembl, SGP2 and TWINSCAN. Ensembl is ahomology-based method, which builds gene-modelsusing species-specific known sequences and proteins fromother species aligned to the genome [13]. SGP2 andTWINSCAN are de novo comparative gene predictorswhose only inputs are the genome to be annotated and asecond informant genome [3,4,14-16]. In this case, theinformant genome selected for comparison was human.Since Ensembl relies on mapping known genes fromchicken and other organisms to the chicken genome, wesurmised that its prediction set would contain fewer falsepositives (predicted genes that are not real) and moreaccurate gene structures, as well as more false negatives(real genes that are not predicted) than the de novo meth-ods. Conversely, SGP2 and TWINSCAN should be effec-tive in detecting bona fide genes missed by the Ensemblpipeline. In particular, we were able to verify gene struc-tures simultaneously predicted by both de novo methodsabout 50% of the time. In this respect, de novo compara-tive methods complement homology-based methods,
which in general miss genes for which there is no pre-existing evidence of transcription.
To test and compare the performance of these predictionsystems under the new conditions presented by thechicken genome, we tested a large number of predictedgenes by RT-PCR and direct sequencing. We sampled indi-vidually from the predictions for which either one or twoof the three methods agreed, and the remainder did not.We thus focused our tests on the most difficult genes topredict and on the differences between the various predic-tion systems. We present here the largest experimentalcomparison of multiple gene-prediction programs to dateas well as the first to use this kind of differential design.We aimed to evaluate how de novo and homology-basedgene finding methods perform in a newly sequencedgenome for which a small number of gene sequences areknown. In particular we have (1) evaluated the three pre-diction methods, (2) investigated TWINSCAN and SGP2as possible effective methods to complement the Ensemblprediction pipeline and (3) tested the overall specificity ofthe Ensembl prediction set.
Results and discussionExperimental evaluation of gene finding in chickenWe aimed to estimate the accuracy of each of the gene pre-diction sets, which consisted of 29,430 SGP2 (S) and29,052 TWINSCAN (T) gene predictions, with one tran-script per gene, and 17,709 Ensembl (E) genes containing28,416 transcripts. We classified the predictions accordingto the Venn diagram defined by the three-way intersec-tions of the sets and their complements (Figure 1A, Table1). The subsets were populated with intron assemblies(IAs), defined as a list of exons and introns contiguous ina predicted transcript (see Figure 2 and Methods fordetails), and can be classified into three types: (1) theorphan subsets, containing those elements that are in oneset but not in any of the other two, (2) the two-way inter-section subsets, containing those elements that are in twosets and not in the third, and (3) the triple intersection,containing those elements that are in all three sets. Subse-quently we tested pairs of adjacent exons from each of thesubsets.
Complementing homology-based gene prediction with de novo methodsSelected IAs belonging to the three possible two-way inter-sections were experimentally tested. The results are sum-marized in Figure 1 and detailed in Table 2. After RT-PCR,gel purification, and direct sequencing, about 50% of thetested transcripts predicted by both SGP2 and TWINS-CAN, but not by Ensembl yielded spliced alignments tothe gene targeted (Figure 1C). This rate is higher than thatreported for human using a combination of homology-based and single-genome predictors [16,17] in spite of the
Page 2 of 12(page number not for citation purposes)

BMC Bioinformatics 2005, 6:131 http://www.biomedcentral.com/1471-2105/6/131
lack of available known gene sequences for the chickengenome. There is a total of 4,769 IAs in the '(S and T) notE' subset, corresponding to a total of 13,470 exons. Pro-jecting these results onto genes and using an average dis-tribution of coding exons per gene from other vertebrates(Human, Mouse and Rat), we estimate that approximately740 to 840 bona fide chicken genes that are not in the cur-rently predicted Ensembl set can be found by the de novo
comparative methods followed by direct amplificationand sequencing.
Considering the set of IAs unique to one prediction set(orphans), 39% of these have one single intron and 80%have 1 or 2 introns. On the other hand, after testing exper-imentally 96 orphans from TWINSCAN, 88 orphans fromSGP2 and 30 orphans from Ensembl, we found that about
Venn diagram of the prediction setsFigure 1Venn diagram of the prediction sets. Venn diagram obtained from the comparison of the three prediction sets: Ensembl (E), SGP2 (S) and TWINSCAN (T). (A) Description of each subset in the Venn diagram. (B) Total number of intron assemblies (IAs) populating each subset. (C) Percentage of experimentally verified IAs for each subset (top) and number of assayed IAs (bottom). (D) Percentage of correctly predicted splice junctions (top) from the experimentally verified IAs (bottom).
Page 3 of 12(page number not for citation purposes)

BMC Bioinformatics 2005, 6:131 http://www.biomedcentral.com/1471-2105/6/131
77% of the Ensembl orphans are real genes, compared toan average 18% for TWINSCAN and SGP2 (see Figure 1,see Table 2). Thus while Ensembl orphans are more likelyto be real genes not predicted by the other methods,orphan de novo predictions are more likely to be falsepositives.
Extending homology-based gene predictions with de novo methodsAs Ensembl predictions often fail to correctly predict oneor both ends of a gene [13], we reasoned that de novo pre-
diction methods could help in extending the homology-based predicted transcripts. To test this hypothesis, weidentified candidate 5' extensions: exons predicted byTWINSCAN, SGP2 or both to the 5' side of Ensembl geneson the same strand. We found that 8,368 (47%) Ensemblgenes have such candidate extensions. However, not allthese extensions were as likely to correspond to real exons.From this total, 7,630 genes had extensions suggested byde novo predictions that overlap the Ensembl gene (linked,see Figure 3A), and 738 (4%) had extra exons from de novopredictions that did not overlap the Ensembl gene
Comparison of two predictionsFigure 2Comparison of two predictions. From the comparison of two predictions (a) we obtain three differentiated sets of intron assemblies (IAs): the set of IAs that are identical in both transcripts ('A and B'), and two set of the IAs that are in one predic-tion but not in the other ('A not B' and 'B not A'). When two sets have the same intron with different outside boundaries for the flanking exons these boundaries are taken from the intersection of the exons. Ensembl predictions (b) have in general more than one transcript per gene (two top yellow tracks). The intersecting intron assemblies (IAs) are therefore defined as the longest non-redundant IAs common between the transcripts from either prediction. For the novel IAs we take the longest non-redundant IAs in one that are not present in the other set.
Page 4 of 12(page number not for citation purposes)

BMC Bioinformatics 2005, 6:131 http://www.biomedcentral.com/1471-2105/6/131
(unlinked, see Figure 3B). As 99% of Ensembl intronswere no longer than 100 kb, we considered only exonextensions that were no further than 100 kb from the 5'-most Ensembl exon. Interestingly, we found that 93% ofthe linked extensions were to multiexonic Ensembl tran-scripts, the remainder being extensions to single-exonEnsembl transcripts; however, for unlinked extensions,only 58% were to multiexonic Ensembl transcripts.
We investigated experimentally 60 linked and 29unlinked extensions by designing one primer in the 5'-most exon of the Ensembl prediction and the secondprimer within one of the upstream exon suggested byTWINSCAN and/or SGP2 to the 5' side. The RT-PCRresults (see Table 3) show that de novo methods-suggestedlinked extensions were correct in about 40% of the cases.This rate dropped to a mere 7% for the unlinkedextensions.
Separating the extensions according to whether the extraexon was predicted either by SGP2 or by TWINSCANshowed that both methods had a comparable contribu-tion. From the 60 linked tested extensions, 46 were pre-
dicted by SGP2 with 21 (46%) RT-PCR positives, 36 werepredicted by TWINSCAN with 15 (42%) positives, and 22were predicted by both programs with 12 (54%) positives.On the other hand, from the 29 tested unlinked exten-sions 15 were predicted by SGP2, with 2 positives, and 17were predicted by TWINSCAN, with 1 positive. Finally,there were 3 cases where both, SGP2 and TWINSCAN, pre-dicted the unlinked extra exon of which one was positive.
Testing Ensembl specificityA randomly selected set of Ensembl predictions wasassayed to evaluate Ensembl's specificity. This test meas-ured a false positive rate of 4% (see Table S5 of the supple-mentary material for more details). On the other hand,the tested exon-pairs for the two-way intersection sets thatincluded Ensembl ('(E and S) not T' and '(T and E) not S')had an average false positive rate of 19% and 35%, respec-tively (see Figure 1). The disparity is greater with the two-way intersection set that excludes Ensembl ('(S and T) notE'), which shows a false positive rate of 53%. One expla-nation for this difference is the observation that most ofthe Ensembl predictions have exons predicted by bothSGP2 and TWINSCAN. Indeed, 25,222 (89%) of the
Table 1: distribution of intron assemblies (IAs) for each of the 7 subsets of the Venn diagram of the three prediction sets: Ensembl (E), SGP2 (S) and TWINSCAN (T) (see also Figure 1). The number of transcripts from each prediction set participating in the intron assemblies is indicated on the right.
Distribution of intron assembliesSubsets Number of IAs Transcripts involved
E S T
E and S and T 10650 10282 8974 9888(S and T) not E 4769 0 3930 3924(E and S) not T 4757 3636 3273 0(T and E) not S 1748 1592 0 1507S not (E+T) 25119 0 20740 0T not (S+E) 27592 0 0 22239E not (T+S) 13514 11014 0 0
Table 2: Experimentally verified of intron assemblies (see also Figure 1)
Experimentally verified intron assembliesTotal tested No amplimer Amplimer correctly
predictedAmplimer but junction not
correctly predicted
S and T and E 20 3 (15%) 16 (80%) 1 (5%)(S and T) not E 76 40 (53%) 27 (35%) 9 (12%)(E and S) not T 64 12 (19%) 44 (69%) 8 (12%)(T and E) not S 40 14 (35%) 22 (55%) 4 (10%)S not (T + E) 88 67 (76%) 6 (7%) 15 (17%)T not (S + E) 96 83 (86%) 9 (9%) 4 (5%)E not (T + S) 30 7 (23.3%) 16 (53.3%) 7 (23.3%)
Page 5 of 12(page number not for citation purposes)

BMC Bioinformatics 2005, 6:131 http://www.biomedcentral.com/1471-2105/6/131
28,416 Ensembl transcripts have at least one exon, whichis also in the SGP2 and TWINSCAN sets, and 82% of thesetranscripts have 2 or more exons in common with both denovo methods. Thus, Ensembl predictions are most likelyto fall within a triple intersection, resulting in an increasedrate of true positives. Based on previous experiments [16],we expected the triple intersection to give a yield close to100% positive rate. We tested 20 cases of triple intersec-tion and found 85% positive rate (see Figure 1C). Moreo-ver, 94% of these positive cases had the exon-intronboundaries correctly predicted (see Figure 1D).
We compared the accuracy of the human-based predic-tions with the accuracy of a fish-based set of predictions.We predicted genes in chicken with SGP2 and TWINSCANusing Tetraodon nigroviridis as informant genome, andfound that they are less accurate than the human-basedones (see Table S7 of the supplementary material). Addi-tionally, we found that 85% and 98% of the Tetraodon-based predictions from TWINSCAN and SGP2, respec-tively, overlap the corresponding human-based ones.Interestingly, 85% of the TWINSCAN orphans overlapTWINSCAN Tetraodon-based predictions, and 80% of the
Ensembl extensionsFigure 3Ensembl extensions. Exon extensions to Ensembl predictions can be obtained from exons predicted by TWINSCAN and/or SGP2. These exons can either (a) be part of a transcript with exons in common with the Ensembl transcript (linked) or (b) be part of a close but non-overlapping transcript (unlinked).
Table 3: Experimental verification of IAs corresponding to Ensembl 5' extensions. The extensions are separated according to whether the 5'-most Ensembl exon also existed in TWINSCAN and/or SGP2 (linked) or not (unlinked) (see Figure 3).
Experimentally verified Ensembl extensionsEnsembl extensions Total tested No amplimer Amplimer correctly
predictedAmplimer but junction not
correctly predicted
linked 60 36 (60%) 11 (18%) 13(22%)unlinked 29 27 (93%) 2 (7%) 0
Page 6 of 12(page number not for citation purposes)

BMC Bioinformatics 2005, 6:131 http://www.biomedcentral.com/1471-2105/6/131
SGP2 orphans overlap SGP2 Tetraodon-basedpredictions. On the other hand, 99% of the IAs commonto TWINSCAN and SGP2 but not in Ensembl, overlapTWINSCAN or SGP2 Tetraodon-based predictions.
ConclusionsIn this paper we have evaluated how effective purely com-putational approaches for genome annotation can be,even in the absence of a large collection of previouslyknown genes, by means of the largest attempt so far toexperimentally compare several gene finders. After testingthe accuracy of Ensembl, SGP2 and TWINSCAN on thechicken genome we have shown that de novo comparativemethods followed by experimental verification remain asuccessful approach in the annotation of newly sequencedgenomes from which little is known.
We found that approximately 50% of predictions thatwere in TWINSCAN and SGP2 but not in Ensembl couldbe experimentally verified (Figure 1). These experimentsdemonstrate that de novo comparative prediction methodsare effective at complementing homology-based methodsand confirm that a combination of methods can improvethe prediction accuracy [18-22]. Moreover, in spite of thelimited gene sequence data available for chicken, the com-bination of TWINSCAN and SGP2 achieves better accu-racy than previous attempts to verify by RT-PCRcomputational predictions that fall outside a set of anno-tations [17,23]. On the other hand, looking at the intronassemblies unique to one prediction set, the proportion ofpositives is largely reduced for predictions not inEnsembl. The predictions unique to one of the de novomethods show an abundance of gene models with 2 and3 exons, which may be artefacts due to genome misassem-blies. These results are in contrast with the high successrate (77%) of the predictions unique to Ensembl. This is areasonable observation considering that the Ensemblprediction pipeline has access to genes that do not followa 'standard' gene-grammar (e.g., unusual codon usage),but which may nevertheless be represented in the cDNA/protein databases used.
The Ensembl chicken gene set has been found to have a96% positive rate, whereas the IAs from the two-way inter-sections that include Ensembl, '(E and S) not T' and '(Tand E) not S', and the Ensembl orphans, have a lower pos-itive rate, 81%, 65% and 77%, respectively, which stemsfrom the fact that most exons predicted by Ensembl arealso predicted by both SGP2 and TWINSCAN. Addition-ally, de novo comparative methods are useful for extendingpartial predictions from homology-based methods.Ensembl may generate predictions based on protein frag-ments or on partial homology from other species, andTWINSCAN and SGP2 predictions can add bona fide exonsto the Ensembl predictions they overlap with. For the 5'
end we show that 40% of the tested cases, where eitherTWINSCAN or SGP2 predicted at least one additionalexon, were verified (Table 3). To our knowledge, this isthe first time that experimental evidence is provided forextensions to homology-based models produced by denovo methods.
We observed that the subsets containing SGP2 IAs (e.g.,'(S and E) not T)') have in general a higher proportion ofRT-PCR positives than those containing TWINSCAN IAs(e.g., '(T and E) not S)') (Figure 1C, Table 2). There are twofactors that may contribute to this difference. The first isan intrinsic difference between TWINSCAN and SGP2 –SGP2 uses TBLASTX (translated) alignments betweenhuman and chicken to reward exons overlapping alignedregions, whereas TWINSCAN uses BLASTN (nucleotide)alignments to influence the scores of exons, splice sites,and translation initiation and termination sites. Humanand chicken are sufficiently diverged that translated align-ments may be more sensitive, whereas nucleotide align-ments fail to cover many known exons. The other factor isincidental to the way TWINSCAN was trained and run toproduce the predictions tested. TWINSCAN used 525chicken RefSeqs to estimate parameters for its probabilitymodel. This training set was probably too small to pro-duce optimal parameter values. SGP2, on the other hand,was run with a combination of parameters estimated fromthe much larger set of known human genes (for its modelof chicken DNA sequence) and parameters were handtuned using the same 525 chicken genes (for its scoring ofhuman-chicken alignments). Although a larger fraction ofSGP2 predictions yielded positive experimental results,we found that TWINSCAN tends to be more accurate thanSGP2 in the prediction of the intron boundaries (Figure1D, Table 2). This difference stems from the intron modelused by TWINSCAN, as opposed to SGP2, which does notmodel introns explicitly. TWINSCAN was re-run aftercompletion of the experiments with an improved intron-length model, yielding a prediction set that was substan-tially smaller and more accurate (see Table S6) than theset tested. In spite these differences, comparing the genepredictions with a set of coding cDNAs released after thecompletion of these analyses, we found that all threemethods have similar sensitivity (79%) (see Methods fordetails), hence the de novo comparative methods cover afraction of the transcriptome similar to homology-basedmethods with a minimal initial amount of genome-spe-cific expression data.
The experimentally verified IAs represent a fraction of theactual number of chicken genes that can be eventuallyfound using our methods. If we extrapolate the propor-tions of experimentally verified IAs (Figure 1C) to all thegenerated IAs in the Venn diagram (Figure 1B) and usingan average distribution of coding exons per gene from
Page 7 of 12(page number not for citation purposes)

BMC Bioinformatics 2005, 6:131 http://www.biomedcentral.com/1471-2105/6/131
other vertebrates (Human, Mouse and Rat), we estimate arange of 14,600 to 17,500 experimentally verifiablechicken genes from our computational predictions. In thispaper we only analysed intron assemblies and deliber-ately left out a number of chicken protein-coding intron-less predictions (3,049 from SGP2, 2,727 fromTWINSCAN and 1,855 from Ensembl). The triple intersec-tion of these intronless genes contains 148 genes, whichare worth investigating and for which techniques differentfrom the ones applied here will be required.
Considering all 2-way IAs (see Table 1), one would need11,274 RT-PCR reactions to experimentally confirm about7,232 (64%) genes. This number of experiments com-pares favourably to large-scale EST projects with the addedbenefit of having almost no redundancy (only genefissions and misassemblies will contribute to redun-dancy). The biggest drawback to EST sequencing is itslarge redundancy and extensive overlap. The falling cost ofprimers and the increased flexibility of large-scale molec-ular biology centers make this approach of computationalprediction followed by experimental verification costeffective and scalable [5,6]. As RT-PCR primers can bedesigned with appropriate linker sites such an approachcould also provide a physical resource of clonable frag-ments. We conclude that de novo comparative gene predic-tions followed by experimental verification is an effectiveway to carry out the annotation of a newly sequencedgenome for which little gene sequence information isknown. In particular, as our results show, performing RT-PCR and sequencing for all the predicted novel genes,starting with those predicted by multiple de novo methods,should enhance the quality of the annotation in forth-coming eukaryote genome sequencing projects.
MethodsGeneration of predictionsThe initial lack of an abundant set of known chicken genesequences forced us to adapt the methodology for trainingof the de novo methods and running the Ensembl genebuild. The Ensembl prediction pipeline [13] builds genemodels from known vertebrate proteins and cDNAsequences, whereas gene models based solely on ESTs areusually kept separated as ESTGenes [24]. For the chickengenome, ESTs were combined with the standard genebuild to include additional genes and transcripts. Thealignments from approximately 400,000 ESTs and 24,000full-length cDNAs [12,25] from multiple tissues were con-ciliated into non-redundant transcript structures [24].Those predicted models that fell on non-annotated lociand those that contributed with at least two new exons inpreviously annotated loci were added to the protein-basedgene set. Single-exons transcripts produced by the EST/cDNA-based models were rejected, as they could not bedistinguished from cloning artefacts without protein evi-
dence. For our analyses we did not include the untrans-lated regions that Ensembl annotates combining thecDNA/EST and protein evidence [13]. Ensembl also anno-tates processed pseudogenes [13], which we did not con-sider either.
TWINSCAN was trained on 525 chicken RefSeq sequences[26] aligned to the chicken genomic sequence. This set isbased on a set of 1266 provisional RefSeq mRNAs fromGenBank (27 March 2004) March 27 filtered in the fol-lowing way: The Refseq mRNA sequences were matchedwith the corresponding mRNAs placed on the Chickengenome assembly at UCSC. Any mRNA not placed wasnot considered. Additionally, sequences without anungapped alignment between the entire CDS portion ofthe Refseq mRNA and the extracted unmasked genomicsequence were removed. Additionally, cases with in-framestop codons and/or non-canonical splice sites were alsoremoved. TWINSCAN uses nucleotide alignments and hasspecific models for how the alignments modify the scoresof the gene signals. The BLASTN [27] alignments used byTWINSCAN covered 3.8% of the chicken assembly.
SGP2 training followed a hybrid approach. SGP2 was runwith human parameters for the coding statistics and splicesites, whereas the score weights that reward the human-chicken homologies and penalize the lack of them wereoptimised using the same set of 525 Chicken RefSeqs usedfor the TWINSCAN training. SGP2 was then run on unseg-mented chicken chromosomes using the TBLASTX [27]alignments with the human genomic sequence (assemblyNCBI34). These alignments, which covered approxi-mately 3% of the Chicken genome, were enriched with391,610 extra HSPs obtained from the ungapped Exoner-ate [28] alignments of human proteins from the Ensemblpredictions (release NCBI34c), the GeneId prediction setfor the same human assembly and the set of vertebrateRefSeq proteins (version of April 2004). The extra align-ments covered 43% of the nucleotides in TBLASTX HSPsand 5% of their sequence represented 5,840 non-redun-dant homology regions that had no overlap with theTBLASTX hits. These extra alignments produced a consid-erable improvement of the sensitivity and specificity at thegene level with respect to SGP2 predictions using onlyTBLASTX HSPs when tested against the Ensembl set andthe aforementioned 525 RefSeqs. It also achieved a slightimprovement of the sensitivity at the exon and nucleotidelevel.
Classification of predictionsWe classified the predictions according to the Venn dia-gram defined by the intersections of the three sets:Ensembl (E), TWINSCAN (T) and SGP2 (S). Using theexact identity between transcripts is problematic becausethe exon-structures from each prediction are in general
Page 8 of 12(page number not for citation purposes)

BMC Bioinformatics 2005, 6:131 http://www.biomedcentral.com/1471-2105/6/131
not identical. Thus we defined the intron assembly (IA) asthe element of comparison. An IA is a list of exons andintrons that are contiguous in a given predicted transcript.When comparing two predictions three differentiated setsare produced: the set of IAs that are identical in both tran-scripts, and the two sets of IAs that are present in one pre-diction and not in the other (see Figure 2). If theboundaries of the exons do not agree between two predic-tions the produced IA contains only the exonic sequencethat is common to both predictions, i.e., an intersecting IAcontains the sequence and exon-structure on which bothpredictors agree (see Figure 2). An intron assembly repre-sents naturally the entities to be tested by RT-PCR, wherean exon-pair, separated by one or more introns and by notmore than about 1 Kb, is tested for amplification in cDNAtissue libraries. As each IA contains the maximal set ofintrons in a given genomic locus that fall in one of the dif-ferent categories of the Venn diagram, we picked up oneexon-pair from each IA, making sure to test different genesin each Venn diagram.
Combining the operations of set-difference 'not', set-intersection 'and', and set-union '+', we populated theVenn diagram. For instance: the subset 'E not (T+S)' wasgenerated by first obtaining the union of T and S predic-tions (T+S) and then comparing the Ensembl predictionswith this latter set, hence 'E not (T+S)' contains EnsemblIAs that are not in TWINSCAN or SGP2. Similarly, weobtained the subset '(S and T) not E' by first calculatingthe intersection of S and T, and then calculating the set-difference against E. Note that the set-difference is non-commutative, as we keep elements from one set and usethe other for comparison, hence S not T ? T not S. Theseoperations divide the subsets into three types: (1) orphansubsets, formed by those elements that are in one set butnot in any of the other two, (2) the two-way intersectionsubsets, formed by those elements that are in two sets andnot in the third one, and (3) the triple intersection,formed by those elements that are in the three sets. Figure1B shows the number of IAs in each of the subsets (seealso Table 1).
When considering the Ensembl predictions we introduceda slight modification of the operations, as one Ensemblgene may have more than one transcript (see Figure 2b).We defined the intersecting IAs as the longest non-redun-dant common IA between the transcripts from either pre-diction. That is, from all the redundant intron assembliesin an Ensembl gene that are also in a prediction fromSGP2 or TWINSCAN, we took the longest one. By the con-cept of redundancy of two intron assemblies we mean thatthey have the same splicing structure or one is included inthe structure of the other, allowing for mismatches in theexon edges. Likewise, for the set difference involvingEnsembl predictions we took the longest IA from all the
ones in an Ensembl gene that were novel with respect tothe de novo prediction. The inverse case works similarly: anIA in TWINSCAN or SGP2 which is not in an Ensemblgene is the longest IA that is novel with respect to all theEnsembl transcripts in that gene.
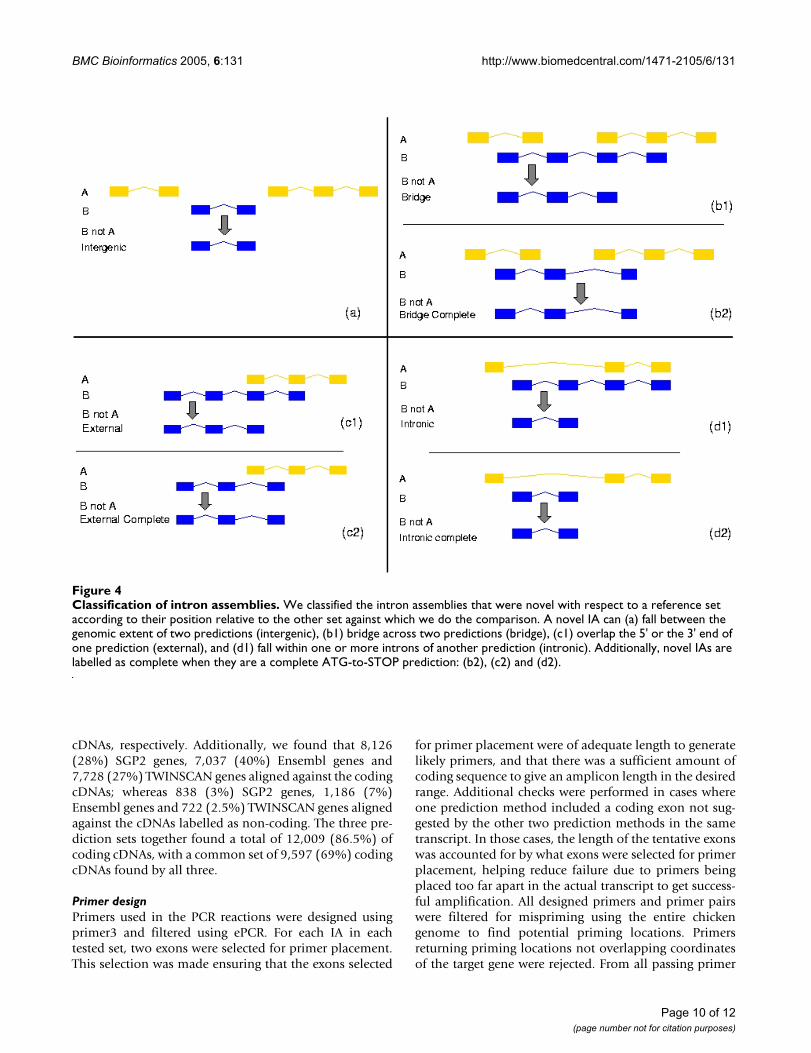
We classified IAs according to their position relative to thepredictions from the other set against which they are com-pared. We considered an IA to be:
• Intergenic: if it falls outside the genomic extension ofany of the predictions from the other set.
• Bridge: if it bridges between two different predictions inthe other set.
• Intronic: if it extends one or more introns of theexcluded prediction, i.e., the exons of the IA fall in theintrons of the other prediction.
• External: if it extends the 5' or 3' of the other prediction.
In Table S1 we give the distribution of the IAs accordingto their relative position (see Figure 4). We observe thatwhile SGP2 produces approximately the same proportionof external and intronic orphan IAs, TWINSCAN producesmany more intronic ones.
Finally, IAs were further classified according to whetherthey are complete, i.e., they represent a complete ATG-to-STOP prediction in at least one set (Figure 4). Table S2presents the number of complete IAs from each set.TWINSCAN predictions produced more complete novelgenes within introns than SGP2, whereas SGP2 predictsmore complete novel genes that extend the genomic spanof other genes. Furthermore, more than 70% of the com-plete intergenic orphan IAs from all programs have eithertwo or three exons. Finally, analysing the triple intersec-tion of the prediction sets we find 10,650 IAs that arecommon to the three sets from which 8,837 (83%) arecomplete. In contrast to the complete IAs predicted byonly one program, 55% of those predicted by all pro-grams have more than 3 exons.
Comparison to chicken expression dataWe compared the prediction sets against 13,880 chickencDNAs annotated as coding for protein and 4,154 cDNAsannotated as non-coding [12,25]. We used Exonerate inungapped mode to directly compare the nucleotidesequence of the gene predictions against the cDNA set. Weconsidered a cDNA to be 'found' if there was an alignmentwith more than 90% identity over more than 60 bp. Theresults showed that Ensembl and SGP2 included 79% andTWINSCAN included 77% of the coding cDNAs, whereasthey included a 17%, 20% and 30% of non-coding
Page 9 of 12(page number not for citation purposes)
BMC Bioinformatics 2005, 6:131 http://www.biomedcentral.com/1471-2105/6/131
cDNAs, respectively. Additionally, we found that 8,126(28%) SGP2 genes, 7,037 (40%) Ensembl genes and7,728 (27%) TWINSCAN genes aligned against the codingcDNAs; whereas 838 (3%) SGP2 genes, 1,186 (7%)Ensembl genes and 722 (2.5%) TWINSCAN genes alignedagainst the cDNAs labelled as non-coding. The three pre-diction sets together found a total of 12,009 (86.5%) ofcoding cDNAs, with a common set of 9,597 (69%) codingcDNAs found by all three.
Primer designPrimers used in the PCR reactions were designed usingprimer3 and filtered using ePCR. For each IA in eachtested set, two exons were selected for primer placement.This selection was made ensuring that the exons selected
for primer placement were of adequate length to generatelikely primers, and that there was a sufficient amount ofcoding sequence to give an amplicon length in the desiredrange. Additional checks were performed in cases whereone prediction method included a coding exon not sug-gested by the other two prediction methods in the sametranscript. In those cases, the length of the tentative exonswas accounted for by what exons were selected for primerplacement, helping reduce failure due to primers beingplaced too far apart in the actual transcript to get success-ful amplification. All designed primers and primer pairswere filtered for mispriming using the entire chickengenome to find potential priming locations. Primersreturning priming locations not overlapping coordinatesof the target gene were rejected. From all passing primer
Classification of intron assembliesFigure 4Classification of intron assemblies. We classified the intron assemblies that were novel with respect to a reference set according to their position relative to the other set against which we do the comparison. A novel IA can (a) fall between the genomic extent of two predictions (intergenic), (b1) bridge across two predictions (bridge), (c1) overlap the 5' or the 3' end of one prediction (external), and (d1) fall within one or more introns of another prediction (intronic). Additionally, novel IAs are labelled as complete when they are a complete ATG-to-STOP prediction: (b2), (c2) and (d2).
Page 10 of 12(page number not for citation purposes)

BMC Bioinformatics 2005, 6:131 http://www.biomedcentral.com/1471-2105/6/131
pairs for a given IA, the pair giving the longest expectedproduct in the requested range was selected foramplification. The selection of targets appearing on eachplate was done completely randomly among all targetsreturning at least one designed primer pair passing all cri-teria. The primer selection parameters used for the designof Plate 1 were consistent with primer3 defaults, except:Tm range was set to (63, 65), product length range was setto (300, 600), and primer length range was set to (23, 28)with 24 being optimal. The primer selection parametersused for the design of Plates 2–5 were also consistent withprimer3 defaults, except: GC content range was set to (30,70) with 50 being optimal, Tm range was set to (59, 62),product length range was set to (150, 500), and primerlength range was set to (17, 27) with 20 being optimal.
Experimental verification of predictions by RT-PCRcDNA preparationMultiple organs (brain, liver, heart, spleen, lung, kidney,muscle, tongue, trachea, crop, proventriculus, gizzard, gallbladder, small-intestine, pancreas, caeca, mesentery,ovary, oviduct and testis) of an adult male and two egg-laying females of the "Bleue de Hollande" strain were col-lected soon after sacrifice. Total RNA was prepared fromfrozen tissues using TRIzol Reagent (Invitrogen) accord-ing to manufacturers' instructions. The quality of all RNAsamples was checked using an Agilent 2100 Bioanalyzer(Agilent Technologies) and by PCR using pairs of oligosdesigned in four CNGs (Conserved Non-GenicSequences) conserved between GGA1 and HSA21 [29,30],as indicators of possible genomic DNA contamination.Total RNA was converted to cDNA using Superscript II(Invitrogen) primed with random primers. For each tissuein the study, 5 µg of total RNA was converted to cDNA.
Experimental verificationPredictions of chicken genes were assayed experimentallyby RT-PCR as previously described and modified[9,16,31]. Similar amounts of 12 Gallus gallus cDNAs(brain, liver, heart, spleen, lung, kidney, muscle, proven-triculus, small intestine, caeca, ovary and testis, final dilu-tion 1000x) were mixed with JumpStart REDTaqReadyMix (Sigma) and 4 ng/ul primers (Sigma-Genosys)with a BioMek 2000 robot (Beckman). The ten first cyclesof PCR amplification were performed with a touchdownannealing temperatures decreasing from 60 to 50°C;annealing temperature of the next 30 cycles was carriedout at 50°C. Amplimers were separated on "Ready toRun" precast gels (Pharmacia) and sequenced. This proce-dure was used to experimentally assay 456 exon-exonjunctions of chicken predictions. The later are representa-tive of each subsets of predictions found in the Venn dia-gram of the three sets of predictions studied, i.e., theEnsembl, TWINSCAN and SGP2 set (see Table S3, and
Table S4 for the transcripts used as internal controls). Thesequences of the amplified exon-exon junctions can beobtained from the web site http://genome.imim.es/~eeyras/Chicken/GeneFinding/.
Authors' contributionsEE with help from AR and MRB led the writing and prep-aration of the manuscript. RC, EB, SEA, PF, DDS and RGcontributed to the text and overall layout. MRB conceivedthe Venn diagram approach for the experiments inchicken and chose the target sets, with input from DDSand EE. EE generated the chicken intron assemblies andanalysed the experimental results. RC, PF, EE, GP, FC gen-erated the gene predictions and performed several analy-ses on them. The generation of primers was carried out byDDS, MRB and EB for chicken. AR and CW collected thetissues and prepared the RNAs/cDNAs. EJH, JMB, CW car-ried out the RT-PCR experiments with supervision fromAR, JR, EB and SEA. The analysis of the chicken predic-tions was coordinated by RG, MRB and EB.
Additional material
AcknowledgementsWe thank J.F. Abril, O. Gonzalez, C. Rossier, M. Ruedi and C. Ucla for assistance. This work was supported by grants from the Jérôme Lejeune, Childcare and Désirée and Niels Yde Foundations, the European Union, the Swiss National Science Foundation and the NCCR Frontiers in Genetics. E Eyras is funded by the Institució Catalana de Recerca I Estudis Avançats (ICREA). R Guigo's lab acknowledges support from grants from the National Plan for R&D (Spain), QLK3-CT-2002-02062 from the European Community and HG003150-01 from the National Institutes of Health. Research on gene prediction by vertebrate genome comparison in the Brent lab is supported by grant R01 HG02278 from the National Institutes of Health. This work was also supported by EMBL and the Wellcome Trust.
References1. International Chicken Genome Sequencing Consortium: Sequence
and Comparative Analysis of the Chicken Genome provideunique perspectives on vertebrate evolution. Nature 2004,432(7018):695-716. Erratum in: Nature 433(7027):777
2. Alexandersson MS, Cawley , Pachter L: SLAM: cross-species genefinding and alignment with a generalized pair hidden Markovmodel. Genome Res 2003, 13:496-502.
3. Flicek PE, Keibler P, Hu I, Korf , Brent MR: Leveraging the mousegenome for gene prediction in human: From whole-genomeshotgun reads to a global synteny map. Genome Res 2003,13:46-54.
Additional File 1Supplementary information: distribution of intron-assemblies according to relative positions; details on the RT-PCR test and control sets; accuracy evaluation of the human-based and tetraodon-based chicken gene predictions.Click here for file[http://www.biomedcentral.com/content/supplementary/1471-2105-6-131-S1.doc]
Page 11 of 12(page number not for citation purposes)

BMC Bioinformatics 2005, 6:131 http://www.biomedcentral.com/1471-2105/6/131
4. Parra G, Agarwal P, Abril JF, Wiehe T, Fickett JW, Guigo R: Com-parative Gene Prediction in Human and Mouse. Genome Res2003, 13:108-117.
5. Tenney A, Brown RH, Vaske C, Lodge JK, Doering TL, Brent MR:Gene prediction and verification in a compact genome withnumerous small introns. Genome Res 2004, 14:2330-2335.
6. Wei C, Lamesch P, Arumugam M, Rosenberg J, Hu P, Brent MR, VidalM: Closing in on the C. elegans ORFeome by CloningTWINSCAN. Genome Res 2005, 15(4):577-82.
7. International Human Genome Sequencing Consortium: InitialSequencing and Analysis of the Human Genome. Nature 2001,409(6822):860-921.
8. Venter JC, Adams MD, Myers EW, Li PW, Mural RJ, Sutton GG, SmithHO, Yandell M, Evans CA, Holt RA, Gocayne JD, Amanatides P,Ballew RM, Huson DH, Wortman JR, Zhang Q, Kodira CD, ZhengXH, Chen L, Skupski M, Subramanian G, Thomas PD, Zhang J, GaborMiklos GL, Nelson C, Broder S, Clark AG, Nadeau J, McKusick VA,Zinder N, Levine AJ, Roberts RJ, Simon M, Slayman C, Hunkapiller M,Bolanos R, Delcher A, Dew I, Fasulo D, Flanigan M, Florea L, HalpernA, Hannenhalli S, Kravitz S, Levy S, Mobarry C, Reinert K, RemingtonK, Abu-Threideh J, Beasley E, Biddick K, Bonazzi V, Brandon R, CargillM, Chandramouliswaran I, Charlab R, Chaturvedi K, Deng Z, DiFrancesco V, Dunn P, Eilbeck K, Evangelista C, Gabrielian AE, Gan W,Ge W, Gong F, Gu Z, Guan P, Heiman TJ, Higgins ME, Ji RR, Ke Z,Ketchum KA, Lai Z, Lei Y, Li Z, Li J, Liang Y, Lin X, Lu F, MerkulovGV, Milshina N, Moore HM, Naik AK, Narayan VA, Neelam B, Nussk-ern D, Rusch DB, Salzberg S, Shao W, Shue B, Sun J, Wang Z, WangA, Wang X, Wang J, Wei M, Wides R, Xiao C, Yan C, Yao A, Ye J,Zhan M, Zhang W, Zhang H, Zhao Q, Zheng L, Zhong F, Zhong W,Zhu S, Zhao S, Gilbert D, Baumhueter S, Spier G, Carter C, CravchikA, Woodage T, Ali F, An H, Awe A, Baldwin D, Baden H, BarnsteadM, Barrow I, Beeson K, Busam D, Carver A, Center A, Cheng ML,Curry L, Danaher S, Davenport L, Desilets R, Dietz S, Dodson K,Doup L, Ferriera S, Garg N, Gluecksmann A, Hart B, Haynes J, HaynesC, Heiner C, Hladun S, Hostin D, Houck J, Howland T, Ibegwam C,Johnson J, Kalush F, Kline L, Koduru S, Love A, Mann F, May D,McCawley S, McIntosh T, McMullen I, Moy M, Moy L, Murphy B, Nel-son K, Pfannkoch C, Pratts E, Puri V, Qureshi H, Reardon M, Rod-riguez R, Rogers YH, Romblad D, Ruhfel B, Scott R, Sitter C,Smallwood M, Stewart E, Strong R, Suh E, Thomas R, Tint NN, Tse S,Vech C, Wang G, Wetter J, Williams S, Williams M, Windsor S, Winn-Deen E, Wolfe K, Zaveri J, Zaveri K, Abril JF, Guigo R, Campbell MJ,Sjolander KV, Karlak B, Kejariwal A, Mi H, Lazareva B, Hatton T,Narechania A, Diemer K, Muruganujan A, Guo N, Sato S, Bafna V,Istrail S, Lippert R, Schwartz R, Walenz B, Yooseph S, Allen D, BasuA, Baxendale J, Blick L, Caminha M, Carnes-Stine J, Caulk P, ChiangYH, Coyne M, Dahlke C, Mays A, Dombroski M, Donnelly M, Ely D,Esparham S, Fosler C, Gire H, Glanowski S, Glasser K, Glodek A,Gorokhov M, Graham K, Gropman B, Harris M, Heil J, Henderson S,Hoover J, Jennings D, Jordan C, Jordan J, Kasha J, Kagan L, Kraft C,Levitsky A, Lewis M, Liu X, Lopez J, Ma D, Majoros W, McDaniel J,Murphy S, Newman M, Nguyen T, Nguyen N, Nodell M, Pan S, PeckJ, Peterson M, Rowe W, Sanders R, Scott J, Simpson M, Smith T,Sprague A, Stockwell T, Turner R, Venter E, Wang M, Wen M, WuD, Wu M, Xia A, Zandieh A, Zhu X: The sequence of the humangenome. Science 2001, 291(5507):1304-51. Erratum in: Science2001, 292(5523):1838
9. Mouse Genome Sequence Consortium: Initial sequencing andcomparative analysis of the mouse genome. Nature 2002,420(6915):520.
10. Rat Genome Sequencing Project Consortium: Genome sequenceof the Brown Norway rat yields insights into mammalianevolution. Nature 2004, 428(6982):493.
11. Aparicio S, Chapman J, Stupka E, Putnam N, Chia JM, Dehal P, Christ-offels A, Rash S, Hoon S, Smit A, Gelpke MD, Roach J, Oh T, Ho IY,Wong M, Detter C, Verhoef F, Predki P, Tay A, Lucas S, RichardsonP, Smith SF, Clark MS, Edwards YJ, Doggett N, Zharkikh A, TavtigianSV, Pruss D, Barnstead M, Evans C, Baden H, Powell J, Glusman G,Rowen L, Hood L, Tan YH, Elgar G, Hawkins T, Venkatesh B, RokhsarD, Brenner S: Whole-genome shotgun assembly and analysisof the genome of Fugu rubripes. Science 2002,297(5585):1301-10.
12. Boardman PE, Sanz-Esquerro J, Overton IM, Burt DW, Bosch E, FongWT, Tickle C, Brown WRA, Wilson SA, Hubbart SJ: A comprehen-sive collection of chicken cDNAs. Curr Biol 2002, 12:1965-1969.
13. Curwen V, Eyras E, Andrews DT, Clarke L, Mongin E, Searle S, ClampM: The Ensembl Automatic Gene Annotation System.Genome Res 2001, 14(5):942.
14. Korf I, Flicek P, Duan D, Brent MR: Integrating Genomic Homol-ogy into Gene Structure Prediction. Bioinformatics 2001,17(Suppl 1):140-148.
15. Wu JQ, Shteynberg D, Arumugam M, Gibbs RA, Brent MR: Identifi-cation of rat genes by TWINSCAN gene prediction, RT-PCRand direct sequencing. Genome Res 2004, 14:665-671.
16. Guigo R, Dermitzakis ET, Agarwal P, Ponting CP, Parra G, ReymondA, Abril JF, Keibler E, Lyle R, Ucla C, Antonarakis SE, Brent MR:Comparison of mouse and human genomes followed byexperimental verification yields an estimated 1,019 addi-tional genes. PNAS 2003, 100(3):1140-1145.
17. Makalowska I, Sood R, Faruque MU, Hu P, Robbins CM, Eddings EM,Mestre JD, Baxevanis AD, Carpten JD: Identification of six novelgenes by experimental validation of GeneMachine predictedgenes. Gene 2002, 284(1–2):203-13.
18. Rogic S, Ouellette BF, Mackworth AK: Improving gene recogni-tion accuracy by combining predictions from two gene-find-ing programs. Bioinformatics 2002, 18(8):1034-45.
19. Howe KL, Chothia T, Durbin R: GAZE: a generic framework forthe integration of gene-prediction data by dynamicprogramming. Genome Res 2002, 12(9):1418-27.
20. Zhang L, Pavlovic V, Cantor CR, Kasif S: Human-Mouse GeneIdentification by Comparative Evidence Integration andEvolutionary Analysis. Genome Res 2003, 13(6):1190-1202.
21. Yada T, Totoki Y, Takaeda Y, Sakaki Y, Takagi T: DIGIT: A NovelGene Finding Program by Combining Gene-Finders. Proceed-ings of the 8th Pacific Symposium on Biocomputing (PSB 2003), Lihue,Hawaii, USA :375-387. January 3–7, 2003
22. Allen JE, Pertea M, Salzberg SL: Computational gene predictionusing multiple sources of evidence. Genome Res 2004,14(1):142-8.
23. Das M, Burge CB, Park E, Colinas J, Pelletier J: Assessment of thetotal number of human transcription units. Genomics 2001,77(1–2):71-8.
24. Eyras E, Caccamo M, Curwen V, Clamp M: ESTgenes: Alternativesplicing from ESTs in Ensembl. Genome Res 2004, 14(5):976.
25. Hubbard SJ, Graham DV, Beattie KJ, Overton IA, McLaren SR, Cron-ing MDR, Boardman PE, Bonfield JK, Burnside J, Davies RM, Farrel ER,Francis MD, Griffiths-Jones S, Humphray SJ, Hyland C, Scott CE, TangH, Taylor RG, Tickle C, Brown WRA, Birney E, Rogers J, Wilson SA:Transcriptome Analysis for the Chicken Based on 19,626Finished cDNA Sequences and 485,337 Expressed SequenceTags. Genome Res 2005, 15(1):174-83.
26. Pruitt KD, Maglott DR: RefSeq and LocusLink: NCBI gene-cen-tered resources. Nucleic Acids Res 2001, 29(1):137-140.
27. Altschul SF, Gish W, Miller W, Myers EW, Lipman DJ: Basic localalignment search tool. J Mol Biol 1990, 215:403-410.
28. Slater GS, Birney E: Automated generation of heuristics for bio-logical sequence comparison. BMC Bioinformatics 2005, 6(1):31.
29. Dermitzakis ET, Reymond A, Lyle R, Scamuffa N, Ucla C, Deutsch S,Stevenson BJ, Flegel V, Bucher P, Jongeneel CV, Antonarakis SE:Numerous potentially functional but non-genic conservedsequences on human chromosome 21. Nature 2002,420(6915):578-82.
30. Dermitzakis ET, Reymond A, Scamuffa N, Ucla C, Kirkness E, RossierC, Antonarakis SE: Evolutionary discrimination of mammalianconserved non-genic sequences (CNGs). Science 2003,302(5647):1033-5.
31. Reymond A, Camargo AA, Deutsch S, Stevenson BJ, Parmigiani RB,Ucla C, Bettoni F, Rossier C, Lyle R, Guipponi M, de Souza S, Iseli C,Jongeneel CV, Bucher P, Simpson AJ, Antonarakis SE: Nineteenadditional unpredicted transcripts from human chromo-some 21. Genomics 2002, 79(6):824-32.
32. Scripts to generate intron assemblies from prediction sets:[http://genome.imim.es/~eeyras/]
33. Download page for SGP2 software and predictions: [http://genome.imim.es/software/]
34. Download page for TWINSCAN software and predictions:[http://genes.cs.wustl.edu/]
35. Website for Ensembl predictions in chicken: [http://www.ensembl.org/Gallus_gallus/]
36. Website with supplementary data: [http://genome.imim.es/~eeyras/Chicken/GeneFinding/]
Page 12 of 12(page number not for citation purposes)