gene expression profiles of bone marrow cells from mice phenotype-selected for maximal or minimal...
TRANSCRIPT

Gene expression profiles of bone marrow cells from micephenotype-selected for maximal or minimal acute inflammations:
searching for genes in acute inflammation modifier loci
Introduction
Mouse lines phenotype-selected for the maximum (AIR-
max) or minimum (AIRmin) acute inflammatory reac-
tivity (AIR) were used to study the impact of the
genetic control of non-specific immunity on susceptibil-
ity to autoimmune,1 neoplasic2 and infectious diseases.3
AIRmax and AIRmin mice were developed through
bidirectional selection, starting from a highly poly-
morphic population (F0) derived from the intercrossing
of eight inbred mouse strains (A, DBA2, P, SWR, CBA,
SJL, BALB/c and C57BL/6). The selection phenotypes
chosen were localized leucocyte influx and exudated
plasma proteins 24 hr after the subcutaneous injection
of polyacrylamide beads (Biogel; Bio-Rad, Hercules,
CA), a non-antigenic, insoluble, and chemically inert
substance.4 The progressive divergence of the AIRmax
and AIRmin lines during successive generations of selec-
tive breeding reached 20- and 2�5-fold differences in
leucocyte infiltration and exudated protein concentra-
tions, respectively. These differences resulted from the
accumulation of alleles endowed with opposite and
additive effects on the inflammatory response. We can
consider AIRmax and AIRmin as outbred stock mice
developed from eight inbred lines for strong and weak
acute inflammation phenotypes after extensive selective
processes, while avoiding inbreeding. As such, they
maintain a heterogeneous genetic background yet have
homozygosis in acute inflammation modifier loci in
each line. Analysis of the selective processes indicated
Patrıcia dos S. Carneiro, Luciana
C. Peters, Francisca Vorraro,
Andrea Borrego, Orlando
G. Ribeiro, Nancy Starobinas, Jose
R. Jensen, Wafa H. K. Cabrera,
Olga M. Ibanez and Marcelo De
Franco
Laboratorio de Imunogenetica, Instituto
Butantan, Sao Paulo, Brazil
doi:10.1111/j.1365-2567.2008.03032.x
Received 9 October 2008; revised 21
November 2008; accepted 1 December 2008.
Correspondence: M. De Franco, Laboratorio
de Imunogenetica, Instituto Butantan. Av.
Vital Brasil, 1500 – Sao Paulo, Brazil
05503900.
Email: [email protected]
Senior author: Marcelo De Franco
Summary
Two mouse lines were phenotype-selected for maximum (AIRmax) or
minimum (AIRmin) acute inflammation responses to polyacrylamide bead
(Biogel) injection. These lines differ in terms of bone marrow granulo-
poiesis, neutrophil resistance to apoptosis, and inflammatory cytokine
production during acute inflammation responses. We compared gene
expression profiles in bone marrow cells (BMC) of AIRmax and AIRmin
mice during acute inflammatory reactions. The BMC from femurs were
recovered 24 hr after subcutaneous injections of Biogel. Global gene
expression analysis was performed on CodeLink Bioarrays (36K genes)
using RNA pools of BMC from both control and treated AIRmax and
AIRmin mice. Differentially expressed genes were statistically established
and the over-represented gene ontology biological process categories were
identified. Upregulations of about 136 and 198 genes were observed in
the BMC of Biogel-treated AIRmax and AIRmin mice, respectively, but
740 genes were found to be downregulated in AIRmin mice compared
with 94 genes in AIRmax mice. The over-represented biological themes of
the differently expressed genes among AIRmax and AIRmin mice repre-
sent inflammatory response, signal transduction, cell proliferation and
immune cell chemotaxis. We were able to demonstrate a broad down-
modulation of gene transcripts in BMC from AIRmin mice during acute
inflammation, and significant differentially expressed genes colocalized
with previously mapped regions for inflammation-related phenotypes in
chromosomes 1, 3, 6 and 11.
Keywords: immunogenetics; inflammation; microarray; neutrophils;
selected mouse lines
Please cite this article in press as: Carneiro P. S. et al. Gene expression profiles of bone marrow cells from mice phenotype-selected for maximal or
minimal acute inflammations: searching for genes in acute inflammation modifier loci, Immunology (2009) doi: 10.1111/j.1365-2567.2008.03032.x
e562 � 2009 Blackwell Publishing Ltd, Immunology, 128, e562–e571
I M M U N O L O G Y O R I G I N A L A R T I C L E
that the AIR phenotype involves at least 11 quantitative
trait loci (QTL).2
The acute inflammation response to Biogel, as well as
susceptibilities to pristine-induced arthritis,5 to Salmo-
nella enterica serotype typhimurium infection, and to
the lipopolysaccharide of the bacteria were all modified
in these mice; and the genotyping of microsatellite
markers suggests the presence of QTL in chromosomes
1, 6 and 11, which are relevant to these phenotypes.6
Susceptibility to lung, colon and skin carcinogenesis was
also distinct in these two mouse lines. In previous stud-
ies we demonstrated that the pulmonary adenoma sus-
ceptibility 1 (Pas1) locus (which plays a major role in
predisposition to this tumour in mice) is involved in
AIR control.7 This relationship was indicated by the
lung–tumour response and by the segregation of the
resistant and susceptible haplotypes in AIRmax and
AIRmin mice, respectively, at genetic markers inside a
452-kilobase region in the Pas1 locus on chromosome
6. Interestingly, an inverse genetic predisposition to
colon carcinogenesis was observed in these mice, with
the AIRmax line being more susceptible to chemically-
induced colon cancer.8
Tissue repair was also investigated in these two lines,
revealing that AIRmax mice present a high capacity for
wound healing in comparison to AIRmin mice. Inflam-
matory QTL on chromosomes 1 (Slc11a1 gene region)
and 14 were found to be involved in the wound healing
phenotype in this model.9 Additionally, the same chro-
mosome 1 QTL seems to regulate leucocyte and protein
influx during acute inflammation, as well as arthritis inci-
dence and severity.5
Alterations in bone marrow granulopoiesis in response
to haematopoietic factors and the production of chemo-
tactic factors by infiltrated or local resident cells both
contribute to phenotypic differences between the two
lines. Convergent phenotypes in AIRmax mice were
observed that were characterized by high neutrophil
production in bone marrow, a high number of neu-
trophils in the blood, high concentrations of chemotac-
tic agents, and increased resistance to spontaneous
apoptosis.10
In the present study, we compared the gene expression
profiles of bone marrow cells (BMC) from control and
Biogel-treated AIRmax and AIRmin mice to identify dif-
ferentially expressed genes correlating with previously
mapped QTL involved in inflammation-related pheno-
types.
Materials and methods
Mouse lines
AIRmax and AIRmin mice from generation 47 were used.
Two experiments were carried out with equivalent
numbers of 2- to 3-month-old male and female mice
maintained under standard conditions in our animal
facilities. All procedures involving animals were approved
by the Committee for Ethics in Animal Experimentation
of the Instituto Butantan.
Biogel treatment and RNA preparation
The animals were shaved and 750 ll of a sterile 67% sus-
pension (53 mg dry weight/ml) of Biogel P100 (Biorad)
in phosphate-buffered saline was injected subcutaneously
into their backs. After 24 hr, BMC were obtained from
the femurs of six treated and six untreated animals of
each line, and total RNA was individually isolated using
the RNeasy mini kit (Qiagen, Valencia, CA). RNA pools
were prepared (from Biogel-treated and untreated AIR-
max, and from Biogel-treated and untreated AIRmin) by
mixing equal amounts of their RNAs. Identical aliquots
of each pool were used for microarray analysis after treat-
ment with DNaseI Amplification Grade (Invitrogen,
Carlsbad, CA), purified with RNeasy kit (Qiagen). Other
aliquots of these same pools were reverse-transcribed
using the Superscript III kit (Invitrogen) and used to vali-
date the microarray data by quantitative polymerase chain
reaction (qPCR).
Microarray expression analysis
Whole genome expression analysis was performed on
CodeLink mouse Bioarrays 36K genes obtained from GE
Healthcare (formerly Amersham Bioscience, Piscataway,
NJ) according to the manufacturer’s protocols. Briefly,
1 lg high-quality total RNA was reverse transcribed using
T7-oligo-dT primer and double-stranded complementary
DNA (cDNA), in vitro transcription and biotin labelling
of cRNA were carried out using the CodeLink mouse Bio-
array reagents. The samples of fragmented biotinylated
cRNA (10 lg cRNA each) were prepared for hybridiza-
tion to the bioarrays using the expression assay reagent
kit (GE Healthcare). Slides were incubated for 18 hr at
37� while shaking at 250 g (Innova 4080, New Brunswick
Scientific, Edison, NJ). After hybridization, each slide was
incubated in TNT buffer (Tris–HCl, NaCl, Tween-20) at
42� for 60 min and then washed. The signal was devel-
oped using streptavidin-Cy5 (GE Healthcare) for 30 min
at room temperature. Excess dye was removed by washing
four times with TNT buffer and slides were then dried
under centrifugation. The processed slides were scanned
on an Axon GenePix Scanner (Axon, Molecular Devices,
Union City, CA) at 635 nm with the photomultiplier tube
at 600 V, and using a scan resolution of 5 nm. CODELINK
expression analysis software (version 4.1, Amersham Bio-
science) was used to analyse the images of each slide. Sig-
nal intensities of the spots were normalized and their
quality was evaluated using data flagging from CODELINK
� 2009 Blackwell Publishing Ltd, Immunology, 128, e562–e571 e563
Gene expression profiles of bone marrow cells from AIRmax and AIRmin mice

expression analysis software. Spots with intensities below
that of the negative control (absence of an
oligonucleotide probe) were excluded, as were those spots
with irregular shapes or near-background intensities.
Biological replicates of the four groups were performed
for statistical analysis.
Real-time quantitative reverse transcription–PCR
Microarray data were validated by quantitative real-time
PCR using gene-specific primers. Real-time PCR amplifica-
tion mixtures contained 0�5 ll template cDNA, 12�5 ll
SYBRGreen PCR master mix (Invitrogen), and 0�3 lM
specific PCR primers were run through a Chromo 4
(Biorad, Hercules, CA) sequence detection system. The
mouse hydroxymethylbilane synthase (Hmbs) gene was
amplified with primers 50-aaagtgccgtgggaaccag-30 and 50-
gaggcgggtgttgaggtttc-30 and used as a housekeeping control
for possible differences in cDNA amounts. Target genes
were amplified with primers Il1b 50-ttgacggaccccaaaagatg-30
and 50-agaaggtgctcatgtcctca-30, Il6 50-gttctctgggaaatcgtgga-
30 and 50-tgtactccaggtagctatgg-30, Il10 50-atgcaggactttaaggg-
ttacttg-30 and 50-tagacaccttggtcttggagctta-30, Il8rb 50-gac-
tgttcacctaaacggtg-30 and 50-cataccaagatggaagggagc-30.
Relative differences were calculated according to the
delta–delta Ct method.11 Microarray data were correlated
with qPCR results using the Pearson analysis.
Statistical analysis
The gene expression observed in each array was log-trans-
formed to approximate Gaussian distribution and then
standardized over the array to adjust for systematic differ-
ences in their expressions. Differentially expressed genes
were detected using significance of analysis of microarray
software (two class unpaired, false discovery rate � 5%)
that analysed both biological replicate data.12 To increase
the statistical power of microarray analysis, we have con-
sidered fourfold (or higher) differentially expressed genes.
We analysed all of the significant differentially expressed
genes for the over-represented biological themes using
EXPRESSION ANALYSIS SYSTEMATIC EXPLORER (EASE) software.13
This program automates the process of biological theme
determination using gene ontology (GO) classification.
EASE calculates over-representation with respect to the
total number of genes assayed and annotated within each
system, allowing for side-by-side comparisons of catego-
ries from categorization systems with varying levels of
annotation. In this way, EASE rapidly converts a list of
genes in an ordered table of robust biological themes.
Calculating statistics on thousands of gene categories,
however, can lead to a few seemingly significant probabil-
ities simply by chance. To address this multiple compari-
son issue, we used the Bonferroni-type probability
correction.
Results
Overview of differentially expressed genes in AIRmaxand AIRmin BMC
Significance of analysis of microarray (SAM) analysis
using fourfold change minimal differences revealed dis-
tinct gene expression profiles of BMC from AIRmax and
AIRmin mice. Twenty-four hours after Biogel treatment,
upregulations of 136 and 198 genes were observed in
AIRmax and AIRmin BMC, respectively, while 740 genes
were downmodulated in AIRmin and 94 in AIRmax as
compared with control mice (Fig. 1a). Comparisons of
AIRmax/AIRmin gene expression ratios indicated similar
numbers of differentially expressed genes in control
groups, whereas greater numbers of genes with higher
expression in AIRmax than in AIRmin were observed in
Control
AIRmax AIRmin
Num
ber
of g
enes
4-f
old
diffe
rent
ially
expr
esse
d / 3
6 k
gene
s
0
100
200
300
400
500
600
700
Num
ber
of g
enes
4-f
old
diffe
rent
ially
expr
esse
d / 3
6 k
gene
s
0
100
200
300
400
500
600
700
AIRmax/AIRmin ratio > 4
AIRmax/AIRmin ratio < 0·25
Biogel/control ratio > 4(a)
(b)
Biogel/control ratio < 0·25
Biogel
Figure 1. Numbers of differentially-expressed genes in mice with
maximum and minimum acute inflammation responses (AIRmax
and AIRmin mice, respectively). Significance of analysis of micro-
array method using fourfold change minimal difference and false dis-
covery rate < 5% revealed distinct gene expression profile of bone
marrow cells from AIRmax and AIRmin mice, comparing Biogel/
control (a) or AIRmax/AIRmin (b) groups.
e564 � 2009 Blackwell Publishing Ltd, Immunology, 128, e562–e571
P. S. Carneiro et al.
Biogel-treated mice (Fig. 1b). Downmodulated genes in
AIRmin (Fig. 1a) are mostly responsible (75%) for the
higher expressed genes observed in Biogel treated AIRmax
mice (Fig. 1b).
Gene expression and chromosome gene clusters
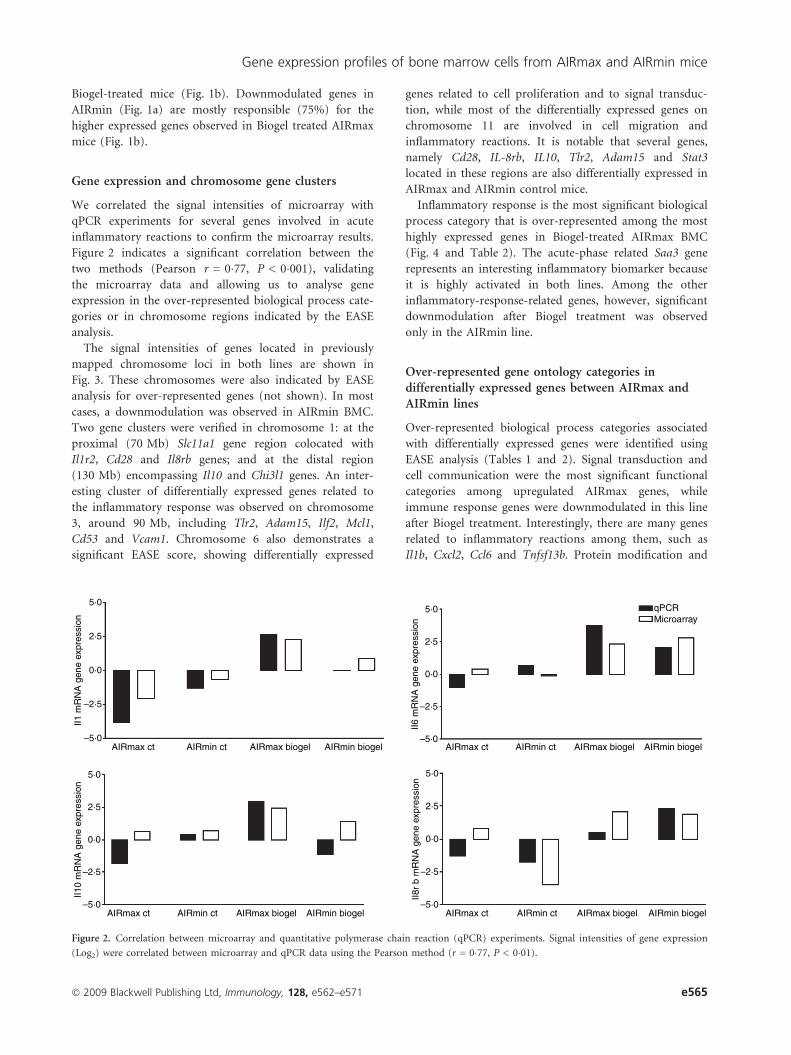
We correlated the signal intensities of microarray with
qPCR experiments for several genes involved in acute
inflammatory reactions to confirm the microarray results.
Figure 2 indicates a significant correlation between the
two methods (Pearson r = 0�77, P < 0�001), validating
the microarray data and allowing us to analyse gene
expression in the over-represented biological process cate-
gories or in chromosome regions indicated by the EASE
analysis.
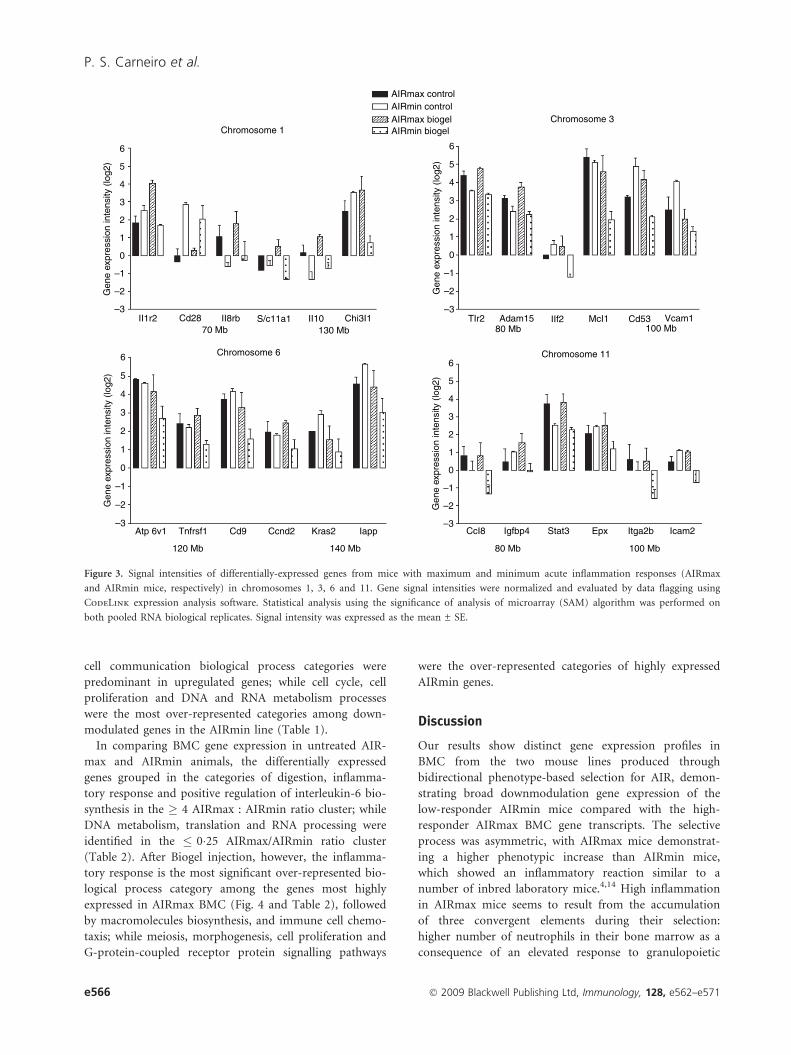
The signal intensities of genes located in previously
mapped chromosome loci in both lines are shown in
Fig. 3. These chromosomes were also indicated by EASE
analysis for over-represented genes (not shown). In most
cases, a downmodulation was observed in AIRmin BMC.
Two gene clusters were verified in chromosome 1: at the
proximal (70 Mb) Slc11a1 gene region colocated with
Il1r2, Cd28 and Il8rb genes; and at the distal region
(130 Mb) encompassing Il10 and Chi3l1 genes. An inter-
esting cluster of differentially expressed genes related to
the inflammatory response was observed on chromosome
3, around 90 Mb, including Tlr2, Adam15, Ilf2, Mcl1,
Cd53 and Vcam1. Chromosome 6 also demonstrates a
significant EASE score, showing differentially expressed
genes related to cell proliferation and to signal transduc-
tion, while most of the differentially expressed genes on
chromosome 11 are involved in cell migration and
inflammatory reactions. It is notable that several genes,
namely Cd28, IL-8rb, IL10, Tlr2, Adam15 and Stat3
located in these regions are also differentially expressed in
AIRmax and AIRmin control mice.
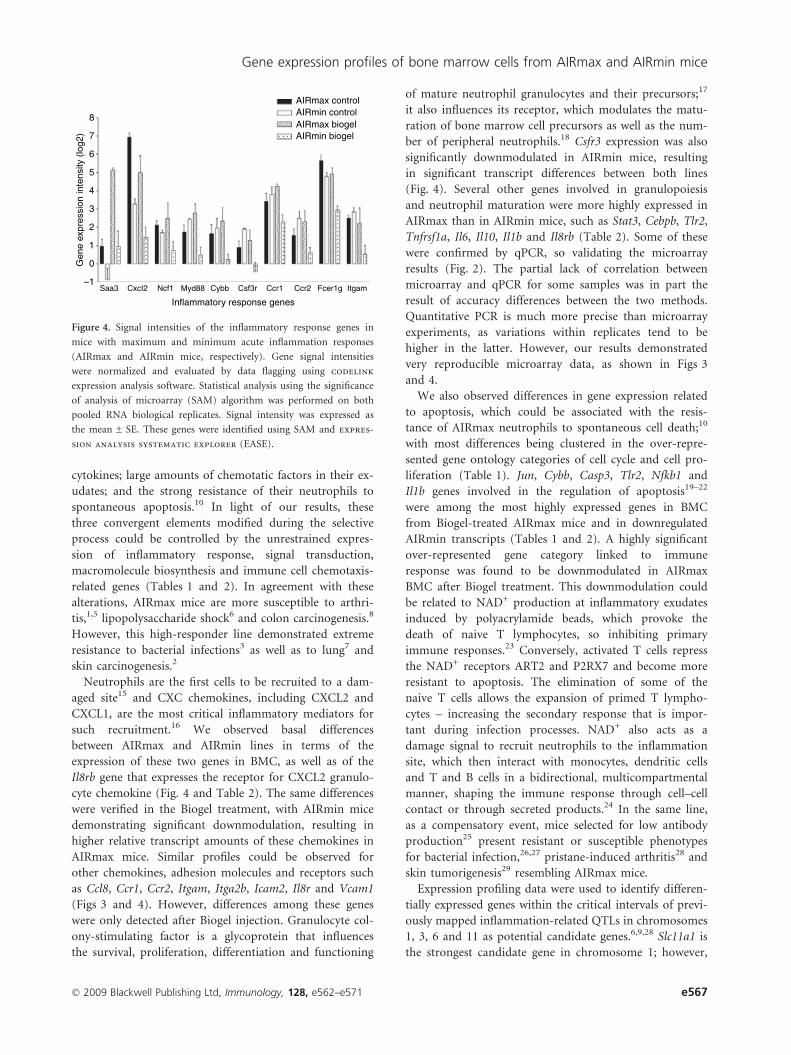
Inflammatory response is the most significant biological
process category that is over-represented among the most
highly expressed genes in Biogel-treated AIRmax BMC
(Fig. 4 and Table 2). The acute-phase related Saa3 gene
represents an interesting inflammatory biomarker because
it is highly activated in both lines. Among the other
inflammatory-response-related genes, however, significant
downmodulation after Biogel treatment was observed
only in the AIRmin line.
Over-represented gene ontology categories indifferentially expressed genes between AIRmax andAIRmin lines
Over-represented biological process categories associated
with differentially expressed genes were identified using
EASE analysis (Tables 1 and 2). Signal transduction and
cell communication were the most significant functional
categories among upregulated AIRmax genes, while
immune response genes were downmodulated in this line
after Biogel treatment. Interestingly, there are many genes
related to inflammatory reactions among them, such as
Il1b, Cxcl2, Ccl6 and Tnfsf13b. Protein modification and
5·0
–5·0AIRmax ct AIRmin ct AIRmin biogelAIRmax biogel AIRmax ct AIRmin ct AIRmin biogelAIRmax biogel
AIRmax ct AIRmin ct AIRmin biogelAIRmax biogelAIRmax ct AIRmin ct AIRmin biogelAIRmax biogel
2·5
–2·5
0·0
5·0 qPCRMicroarray
–5·0
2·5
–2·5
0·0
5·0
–5·0
2·5
–2·5
0·0
5·0
–5·0
2·5
–2·5
II10
mR
NA
gen
e ex
pres
sion
II8r
b m
RN
A g
ene
expr
essi
onII6
mR
NA
gen
e ex
pres
sion
II1 m
RN
A g
ene
expr
essi
on
0·0
Figure 2. Correlation between microarray and quantitative polymerase chain reaction (qPCR) experiments. Signal intensities of gene expression
(Log2) were correlated between microarray and qPCR data using the Pearson method (r = 0�77, P < 0�01).
� 2009 Blackwell Publishing Ltd, Immunology, 128, e562–e571 e565
Gene expression profiles of bone marrow cells from AIRmax and AIRmin mice
cell communication biological process categories were
predominant in upregulated genes; while cell cycle, cell
proliferation and DNA and RNA metabolism processes
were the most over-represented categories among down-
modulated genes in the AIRmin line (Table 1).
In comparing BMC gene expression in untreated AIR-
max and AIRmin animals, the differentially expressed
genes grouped in the categories of digestion, inflamma-
tory response and positive regulation of interleukin-6 bio-
synthesis in the � 4 AIRmax : AIRmin ratio cluster; while
DNA metabolism, translation and RNA processing were
identified in the � 0�25 AIRmax/AIRmin ratio cluster
(Table 2). After Biogel injection, however, the inflamma-
tory response is the most significant over-represented bio-
logical process category among the genes most highly
expressed in AIRmax BMC (Fig. 4 and Table 2), followed
by macromolecules biosynthesis, and immune cell chemo-
taxis; while meiosis, morphogenesis, cell proliferation and
G-protein-coupled receptor protein signalling pathways
were the over-represented categories of highly expressed
AIRmin genes.
Discussion
Our results show distinct gene expression profiles in
BMC from the two mouse lines produced through
bidirectional phenotype-based selection for AIR, demon-
strating broad downmodulation gene expression of the
low-responder AIRmin mice compared with the high-
responder AIRmax BMC gene transcripts. The selective
process was asymmetric, with AIRmax mice demonstrat-
ing a higher phenotypic increase than AIRmin mice,
which showed an inflammatory reaction similar to a
number of inbred laboratory mice.4,14 High inflammation
in AIRmax mice seems to result from the accumulation
of three convergent elements during their selection:
higher number of neutrophils in their bone marrow as a
consequence of an elevated response to granulopoietic
6
5
4
3
2
1
0
–1
–2
–3
70 MbII1r2 II8rb II10S/c11a1 Chi3I1 TIr2 McI1IIf2Adam15 Vcam1Cd53
130 Mb 80 Mb 100 Mb
80 Mb120 Mb 140 Mb
Cd9 Ccnd2 IappKras2Tnfrsf1Atp 6v1
100 Mb
Chromosome 6
Chromosome 1
Gen
e ex
pres
sion
inte
nsity
(lo
g2)
6
5
4
3
2
1
0
–1
–2
–3Icam2Itga2bEpxStat3Igfbp4CcI8
Gen
e ex
pres
sion
inte
nsity
(lo
g2)
6
5
4
3
2
1
0
–1
–2
–3
Gen
e ex
pres
sion
inte
nsity
(lo
g2)
6
5
4
3
2
1
0
–1
–2
–3
Gen
e ex
pres
sion
inte
nsity
(lo
g2)
Chromosome 3
AIRmax controlAIRmin control
AIRmin biogelAIRmax biogel
Chromosome 11
Cd28
Figure 3. Signal intensities of differentially-expressed genes from mice with maximum and minimum acute inflammation responses (AIRmax
and AIRmin mice, respectively) in chromosomes 1, 3, 6 and 11. Gene signal intensities were normalized and evaluated by data flagging using
CodeLink expression analysis software. Statistical analysis using the significance of analysis of microarray (SAM) algorithm was performed on
both pooled RNA biological replicates. Signal intensity was expressed as the mean ± SE.
e566 � 2009 Blackwell Publishing Ltd, Immunology, 128, e562–e571
P. S. Carneiro et al.
cytokines; large amounts of chemotatic factors in their ex-
udates; and the strong resistance of their neutrophils to
spontaneous apoptosis.10 In light of our results, these
three convergent elements modified during the selective
process could be controlled by the unrestrained expres-
sion of inflammatory response, signal transduction,
macromolecule biosynthesis and immune cell chemotaxis-
related genes (Tables 1 and 2). In agreement with these
alterations, AIRmax mice are more susceptible to arthri-
tis,1,5 lipopolysaccharide shock6 and colon carcinogenesis.8
However, this high-responder line demonstrated extreme
resistance to bacterial infections3 as well as to lung7 and
skin carcinogenesis.2
Neutrophils are the first cells to be recruited to a dam-
aged site15 and CXC chemokines, including CXCL2 and
CXCL1, are the most critical inflammatory mediators for
such recruitment.16 We observed basal differences
between AIRmax and AIRmin lines in terms of the
expression of these two genes in BMC, as well as of the
Il8rb gene that expresses the receptor for CXCL2 granulo-
cyte chemokine (Fig. 4 and Table 2). The same differences
were verified in the Biogel treatment, with AIRmin mice
demonstrating significant downmodulation, resulting in
higher relative transcript amounts of these chemokines in
AIRmax mice. Similar profiles could be observed for
other chemokines, adhesion molecules and receptors such
as Ccl8, Ccr1, Ccr2, Itgam, Itga2b, Icam2, Il8r and Vcam1
(Figs 3 and 4). However, differences among these genes
were only detected after Biogel injection. Granulocyte col-
ony-stimulating factor is a glycoprotein that influences
the survival, proliferation, differentiation and functioning
of mature neutrophil granulocytes and their precursors;17
it also influences its receptor, which modulates the matu-
ration of bone marrow cell precursors as well as the num-
ber of peripheral neutrophils.18 Csfr3 expression was also
significantly downmodulated in AIRmin mice, resulting
in significant transcript differences between both lines
(Fig. 4). Several other genes involved in granulopoiesis
and neutrophil maturation were more highly expressed in
AIRmax than in AIRmin mice, such as Stat3, Cebpb, Tlr2,
Tnfrsf1a, Il6, Il10, Il1b and Il8rb (Table 2). Some of these
were confirmed by qPCR, so validating the microarray
results (Fig. 2). The partial lack of correlation between
microarray and qPCR for some samples was in part the
result of accuracy differences between the two methods.
Quantitative PCR is much more precise than microarray
experiments, as variations within replicates tend to be
higher in the latter. However, our results demonstrated
very reproducible microarray data, as shown in Figs 3
and 4.
We also observed differences in gene expression related
to apoptosis, which could be associated with the resis-
tance of AIRmax neutrophils to spontaneous cell death;10
with most differences being clustered in the over-repre-
sented gene ontology categories of cell cycle and cell pro-
liferation (Table 1). Jun, Cybb, Casp3, Tlr2, Nfkb1 and
Il1b genes involved in the regulation of apoptosis19–22
were among the most highly expressed genes in BMC
from Biogel-treated AIRmax mice and in downregulated
AIRmin transcripts (Tables 1 and 2). A highly significant
over-represented gene category linked to immune
response was found to be downmodulated in AIRmax
BMC after Biogel treatment. This downmodulation could
be related to NAD+ production at inflammatory exudates
induced by polyacrylamide beads, which provoke the
death of naive T lymphocytes, so inhibiting primary
immune responses.23 Conversely, activated T cells repress
the NAD+ receptors ART2 and P2RX7 and become more
resistant to apoptosis. The elimination of some of the
naive T cells allows the expansion of primed T lympho-
cytes – increasing the secondary response that is impor-
tant during infection processes. NAD+ also acts as a
damage signal to recruit neutrophils to the inflammation
site, which then interact with monocytes, dendritic cells
and T and B cells in a bidirectional, multicompartmental
manner, shaping the immune response through cell–cell
contact or through secreted products.24 In the same line,
as a compensatory event, mice selected for low antibody
production25 present resistant or susceptible phenotypes
for bacterial infection,26,27 pristane-induced arthritis28 and
skin tumorigenesis29 resembling AIRmax mice.
Expression profiling data were used to identify differen-
tially expressed genes within the critical intervals of previ-
ously mapped inflammation-related QTLs in chromosomes
1, 3, 6 and 11 as potential candidate genes.6,9,28 Slc11a1 is
the strongest candidate gene in chromosome 1; however,
AIRmax controlAIRmin control
AIRmin biogelAIRmax biogel
6
5
4
3
2
1
0
–1
8
7
Saa3 CxcI2 Ncf1 Csf3r ItgamFcer1gCcr1 Ccr2CybbMyd88
Inflammatory response genes
Gen
e ex
pres
sion
inte
nsity
(lo
g2)
Figure 4. Signal intensities of the inflammatory response genes in
mice with maximum and minimum acute inflammation responses
(AIRmax and AIRmin mice, respectively). Gene signal intensities
were normalized and evaluated by data flagging using codelink
expression analysis software. Statistical analysis using the significance
of analysis of microarray (SAM) algorithm was performed on both
pooled RNA biological replicates. Signal intensity was expressed as
the mean ± SE. These genes were identified using SAM and expres-
sion analysis systematic explorer (EASE).
� 2009 Blackwell Publishing Ltd, Immunology, 128, e562–e571 e567
Gene expression profiles of bone marrow cells from AIRmax and AIRmin mice

some other linked genes were differentially expressed in the
two lines (Fig. 3). The Slc11a1 gene mutation correspond-
ing to a non-functional protein is determined by a
gly169asp substitution.30 This lack of functionality results
in the accumulation of ions inside the phagosome, favour-
ing replication of the pathogens.31 Homozygous AIRmax
Table 1. Over-represented gene ontology categories of up- and down-regulated genes in AIRmax and AIRmin mice after Biogel treatment
Groups
Biogel/
control
ratio
Gene category GO
biological process
Gene
number
EASE
score Gene symbol
AIRmax
upregulated
> 4 Signal transduction 32 1�43e-002 Fyn, Ctnnbip1, Grit, Fgf13, Agtr1b, Olfr983, Trim23, Per3,
Gpr124, Pde9a, Il1r2, Il17ra, Il10ra, Il4ra, Adam28, Sipa1,
V1rg12, V1rh1, V1rh9,Ccr7, Cd3e, Gtpbp1, Smad3, Glra1,
Gnas, Ghrh, Gnal, Axin1, Map3k7, Lck, Gabrb1, Rbm9
Cell communication 37 1�82e-002 Fyn, Ctnnbip1, Grit, Fgf13, Agtr1b, Olfr983, Chrne,
Trim23, Per3, Gpr124, Pde9a, Il1r2, Il11, Il17ra, Il10ra,
Il4ra, Adam28, Fgf21, Sipa1, Vcan, V1rg12, V1rh1, V1rh9,
Ccr7, Cd3e, Gtpbp1, Gpld1, Smad3, Glra1, Gnas, Ghrh,
Gnal, Axin1, Map3k7, Lck, Gabrb1, Rbm9
AIRmax
downregulated
< 0�25 Immune response 20 3�87e-006 Ppbp, Irf2, Igll1, Igk-V33, Igk-V38, Il1b, Ighg1, Igj, Igk-V,
Serpina1e, Pf4, Cxcl2, Ccl6, Tcrb-V13, Vpreb1, H2-Q10,
Tyrobp, Cd3d, Ly96, Tnfsf13b
AIRmin
upregulated
> 4 Protein modification 10 9�00e-003 Stk40, Prkaca, Lrrk2, Pdgfra, Ppt2, Pias4, Havcr2, Rps6kl1,
Cdc25a, Gria1
Cell communication 21 1�38e-002 Lama4, Glra3, Olfr170, Clec14a, Prkaca, Olfr507, Hapln2,
Trim23, Pdgfra, Olfr1269, Olfr493, Pias4, Drd3, Scg5,
V1rc5, Foxa3, Mapk8ip2, Gria1, Pcdhb21, Chrnb4, Tac4
Protein metabolism 16 2�68e-002 Stk40, Prkaca, Lrrk2, 4930432H15Rik, Pdgfra, Erap1, Ppt2,
Pias4, Barhl2, BarH, Havcr2, Rps6kl1, Rps3, Cdc25a,
Tpp2, Gria1, Nr5a2
AIRmin
downregulated
< 0�25 Cell cycle 50 3�96e-007 Cct2, Cetn2, Smchd1, Gadd45g, Prim1, Ppp1ca, Kras2,
Ccnb1, Ppm1g, Mobkl3, Pttg1, Nuf2, Kit, Jun, Itgb1,
Ebna1bp2, Aurka, Stag2, Aurkb, Mapre1, Psmg2, Cdkl1,
Sept6, Nf2, Siah1a, Nek2, Nek1, Cul4a, Csf1r, Sfn, Uba1,
Rnf2, Cul1, Cdc25b, Cdkn2c, Ccnd3, Cct7, Mcm2, Mcm6,
Gspt1, Smc4, Ccne2, Rbl1, Casp3, Calm2, Bub3, Rad9,
Rad21, Wdr20a, Orc4l
Cell proliferation 62 5�79e-007 Cct2, Cetn2, Smchd1, Gadd45g, Prim1, Ppp1ca, Kras2, Ccnb1,
Ppm1g, Mobkl3, Fancl, Pttg1, Nuf2, Kit, Jun, Itgb1, Ebna1bp2,
Aurka, Stag2, Aurkb, Mapre1, Psmg2, Cdkl1, Pbef1,
Sept6, Nf2, Slfn3, Gtpbp8, Siah1a, Nek2, Nek1, Nfkb1, Mxi1,
Cul4a, Csf1r, Hdgf, Sfn, Uba1, Rnf2, Cul1, Cdc25b, Dock2,
Cdc42, Cdkn2c, Ccnd3, Cct7, Mcm2, Mcm6, Gspt1, Smc4,
Ccne2, Rbl1, Casp3, Ctnnb1, Calm2, Cd40lg, Tgfbi, Btg2,
Bub3, Rad9, Rad21, Wdr20a, Orc4l
DNA metabolism 38 4�30e-006 Gadd45g, Prim1, Fancl, Pttg1, Smarcd2, Asf1b, Parp1, Hat1,
Supt4h1, Aurkb, Dnmt3a, Ruvbl1, Actl6a, Csnk1d, Hp1bp3,
Zc3h11a, Hist1h2bc, Mylc2b, Hdac2, Mll3, Uba1, H2afy,
Polr2g, Recql, Mcm2, Mcm6, Cbx1, Mela, Ccne2, Cbx3,
Mbd3, Btg2, Xab2, Rad21, Smarca5, Rad51ap1, Morf4l1,
Orc4l
RNA metabolism 32 5�01e-006 Cct2, Cpsf3l, Pcbp1, Auh, Farsb, Sfrs4, Papola, Cstf2t,
Ebna1bp2, Sip1, Pcbp2, Vars2, Spop, Hnrnpu, Pabpn1, Dhx15,
Rpgrip1, Prmt1, Cugbp1, Hnrnpa1, Ddx24, Dnajb11, Papolg,
Hnrnpa2b1, Exosc9, Rbm6, Trnt1, Sfrs1, Rbm39, Xab2, Csdc2,
Skiv2l2
Genes are listed from the most to the least differently expressed. Biological process categories over-represented from differentially expressed genes
were identified by EASE analysis at P < 0�05 significance level (after Bonferroni correction).
GO, gene ontology; EASE, expression analysis systematic Explorer.
e568 � 2009 Blackwell Publishing Ltd, Immunology, 128, e562–e571
P. S. Carneiro et al.

and AIRmin sub-lines for wild-type and non-functional
Slc11a1 alleles were produced to study the interaction of
this gene with the acute inflammatory loci and significant
cell infiltration differences were observed between AIRmax
sub-lines bearing distinct alleles.5,6 The Slc11a1 gene is
pleiotropic and interferes with macrophage activation, oxi-
dative and nitrosamine bursts,32 tumour necrosis factor-aand interleukin-1b production,33 as well as with the expres-
sion of major histocompatibility complex class II mole-
cules.34 We observed interline differences in the transcripts
of these molecules in the present work.
The rat collagen-induced arthritis (Cia7) locus is syn-
tenic to the mouse chromosome 3 region (80–100 Mb). It
has been linked to experimental arthritis and neutrophil
influx28,35 and colocalizes with QTL described for mouse
models of rheumatoid arthritis, namely Cia5,36 Pgia2637
and Prtia.28 Several interesting genes are strong candidates
in this region, but the combined effects of multiple genes
must be taken into account, for it seems to occur at the
Cia5 region where a cluster of close-linked genes has been
reported to be differentially expressed during arthritis
progression.38
Table 2. Over-represented gene ontology categories of fourfold differentially expressed genes comparing AIRmax versus AIRmin mice
Groups
AIRmax/
AIRmin
ratio
Gene category GO
biological process
Gene
number
EASE
score Gene symbol
Control > 4 Digestion 3 7�48e-003 Npy, Tac4, Csn1s1
Inflammatory response 4 3�16e-002 Cxcl2, Cxcl1, Il1b, Tlr6
Positive regulation of
interleukin-6
biosynthesis
2 3�37e-002 Il1b, Tlr6
Control < 0�25 DNA metabolism 19 5�45e-008 Prim1, Prim2, Asf1b, Parp1, Hells, Hat1,
4933411G06Rik, Ruvbl1, Actl6a, Ctcf, Mre11a,
Ahcy, Mela, Gtf2h1, Ccne2, Rad23a,
Gcn5l2, Rad21, Usp8
Translation 9 6�52e-004 Farsb, Prim2, Gfm1, Eif4g2, Eif4a2, Spnb2,
Cct2, Lgtn, Rpgrip1
RNA processing 10 2�00e-003 Farsb, Prim2, Ppp1r8, Spnb2, Cct2,
Hnrnpu, Rpgrip1, Nol5, Rbm6, Sfrs1
Biogel > 4 Inflammatory response 17 2�97e-008 Saa3, Cxcl2, Fos, Itgb2, Fcer1g, Ccl8, Itgam, Il10,
Ncf1, Myd88, Cybb, Csf3r, Ccr2, Ccr1,
Dock2, Cd14, Tnfrsf1a, Tlr1
Macromolecule
biosynthesis
41 1�12e-005 Atp6v1b2, Atp6v1a, Impdh1, Atp5b, Rpl14, Eef1g,
Atp6v0d1, Gadd45g, Farsb, Ireb2, Paics, Prkag1,
Isyna1, Eif4e3, Eif3e, Adsl, Il6, Vars2, Il10, Eef1a1,
Ampd2, Mterfd1, Eif4g2, Nmt1, St8sia1, Gadd45b,
Acly, Gyg, Eif4h, Cebpb, Edem2, Gys1, Cct2, Cd37,
Agpat2, Tlr1, Atic, B3gnt5, Rad21, Chst14,
Mapk13
Purine nucleotide
biosynthesis
9 1�91e-005 Atp6v1b2, Atp6v1a, Impdh1, Atp5b, Atp6v0d1,
Paics, Adsl, Ampd2, Atic
Coenzyme and prosthetic
group metabolism
13 6�22e-005 Atp6v1b2, Atp6v1a, Atp5b, Atp6v0d1, Ubiad1,
Idh1, Ncf1, Acly, Cpox, Gcat, Rsad2, Gsr, Cyb5r4
Immune cell chemotaxis 5 1�95e-004 Itgb2, Itgam, Csf3r, Ccr1, Dock2
Biogel < 0�25 Meiosis 4 5�18e-003 Sycp1, Rec8, Clgn, Wdr20a
Morphogenesis 16 6�30e-003 Plce1, Pitx1, Pdgfra, Elf3, Prelp, Dmd, Myom2,
Hoxd3, Myl4, Hoxd13, Tlx3, Dpysl3, Cdkn2a,
Lhx8, Ptprz1, Bglap1
Cell proliferation 14 6�57e-003 Ets1, Pdgfra, Sycp1, Elk1, Rec8, Hoxd13, Clgn, Ccnj,
Cdkn2a, Rab8a, Cd28, Nr6a1, Wdr20a, Cdk8
G-protein coupled receptor
protein signaling pathway
16 3�16e-002 Mrgprb2, Olfr570, Olfr1125, Olfr1377, Olfr170,
Olfr1378, Plce1, Gpr85, Olfr507, Olfr771, Olfr1356,
Olfr498, Olfr642, Olfr114, V1rh5, Tac4
Genes are listed from the most to the least differently-expressed. Biological process categories over-represented from differentially expressed genes
were identified by EASE analysis at P < 0�05 significance level (after Bonferroni correction).
GO, gene ontology; EASE, expression analysis systematic Explorer.
� 2009 Blackwell Publishing Ltd, Immunology, 128, e562–e571 e569
Gene expression profiles of bone marrow cells from AIRmax and AIRmin mice

A highly significant linkage disequilibrium pattern was
observed in AIRmax and AIRmin mice among marker
alleles located within a 452-kilobase pulmonary adenoma
susceptibility 1 (Pas1) locus on chromosome 6, so defin-
ing the location of gene candidacy for inflammatory
response and for lung cancer susceptibility.7 Kras2 is the
candidate gene in this region and it was downregulated
in AIRmin BMC after Biogel injection (Fig. 3), together
with the other differentially expressed linked genes. This
same profile was observed with the genes on chromo-
some 11 that were previously determined to be involved
in acute inflammation and bacterial infection resis-
tance.6,39 This region is syntenic to human chromosome
5q31–q33, which is also related to resistance to several
diseases.40 Stat3 is the major candidate gene for this
QTL, as it has been implicated in neutrophil migration,41
carcinogenesis,42 resistance to apoptosis43 and endotoxic
shock.44 However, we cannot exclude its interaction with
other differentially expressed genes close to this region in
modulating inflammation, as observed in another
study.45
Cytokine signalling via the STAT–SOCS (signal trans-
ducer and activator of transcription/suppressor of cyto-
kine signalling) pathways regulate several cell types
involved in the initiation and resolution of inflamma-
tion.46 Resolution of inflammation is a tightly regulated
process that is controlled by distinct mediators, including
cytokines, chemokines, their receptors, as well as resolvins
and lipoxins.47 The higher number of downmodulated
genes in AIRmin mice could represent an impaired mech-
anism of inflammatory resolution in this strain. In fact,
several genes known to be involved in the dampening of
inflammation are repressed in this line (Table 2). The
high susceptibility of AIRmin mice to lung and skin
tumorigenesis was in agreement with these results, in
which a persistent chronic inflammation was detected
only in the AIRmin line.2,7
Taken together, our results demonstrated distinct gene
expression profiles of the BMC from high and low
inflammatory responder mice, pointing to gene clusters
in QTL related to several inflammatory phenotypes.
These differences increase during Biogel-induced acute
inflammation, as a result of the downmodulation of
gene transcripts in AIRmin mice. The main pathways
closely associated with these gene expression profiles are
linked to inflammatory response, signal transduction
and cell proliferation, with several of the differently
expressed genes mapped in QTL implicated in the regu-
lation of inflammatory phenotypes. A finer resolution of
each of these loci will still be necessary to identify single
gene effects. Our approach represents an alternative to
models of knockout or transgenic mice and allows the
evaluation of allelic gene combinations instead of gene
mutations, and might be satisfactorily applicable to
humans.
Acknowledgements
This work was supported by grants from the Fundacao de
Amparo a Pesquisa do Estado de Sao Paulo (FAPESP)
and the Conselho Nacional de Desenvolvimento Cientıfi-
co e Tecnologico (CNPq). We would like to thank Mr
Roy Funch for the English revision and Dr Carlos Alberto
Moreira Filho and Dr Osvaldo Keith Okamoto for their
permission to use the Microarray facility at the Albert
Einstein Hospital.
Disclosures
None.
References
1 Vigar ND, Cabrera WH, Araujo LM, Ribeiro OG, Ogata TR,
Siqueira M, Ibanez OM, De Franco M. Pristane-induced arthritis
in mice selected for maximal or minimal acute inflammatory
reaction. Eur J Immunol 2000; 30:431–7.
2 Biozzi G, Ribeiro OG, Saran A et al. Effect of genetic modifica-
tion of acute inflammatory responsiveness on tumorigenesis in
the mouse. Carcinogenesis 1998; 19:337–46.
3 Araujo LM, Ribeiro OG, Siqueira M et al. Innate resistance to
infection by intracellular bacterial pathogens differs in mice
selected for maximal or minimal acute inflammatory response.
Eur J Immunol 1998; 28:2913–20.
4 Ibanez OM, Stiffel C, Ribeiro OG et al. Genetics of nonspecific
immunity: I. Bidirectional selective breeding of lines of mice
endowed with maximal or minimal inflammatory responsive-
ness. Eur J Immunol 1992; 22:2555–63.
5 Peters LC, Jensen JR, Borrego A et al. Slc11a1 (formerly
NRAMP1) gene modulates both acute inflammatory reactions and
pristane-induced arthritis in mice. Genes Immun 2007; 8:51–6.
6 Borrego A, Peters LC, Jensen JR et al. Genetic determinants of
acute inflammation regulate Salmonella infection and modulate
Slc11a1 gene (formerly Nramp1) effects in selected mouse lines.
Microbes Infect 2006; 8:2766–71.
7 Maria DA, Manenti G, Galbiati F et al. Pulmonary adenoma
susceptibility 1 (Pas1) locus affects inflammatory response.
Oncogene 2003; 22:426–32.
8 Di Pace RF, Massa S, Ribeiro OG, Cabrera WH, De Franco M,
Starobinas N, Seman M, Ibanez OC. Inverse genetic predisposi-
tion to colon versus lung carcinogenesis in mouse lines selected
based on acute inflammatory responsiveness. Carcinogenesis
2006; 27:1517–25.
9 De Franco M, Carneiro PS, Peters LC et al. Slc11a1 (Nramp1)
alleles interact with acute inflammation loci to modulate
wound-healing traits in mice. Mamm Genome 2007; 18:263–9.
10 Ribeiro OG, Maria DA, Adriouch S, Pechberty S, Cabrera WH,
Morisset J, Ibanez OM, Seman M. Convergent alteration of
granulopoiesis, chemotactic activity, and neutrophil apoptosis
during mouse selection for high acute inflammatory response.
J Leukoc Biol 2003; 74:497–506.
11 Livak KJ, Schmittgen TD. Analysis of relative gene expression
data using real-time quantitative PCR and the 2(-Delta Delta
C(T)) method. Methods 2001; 25:402–8.
e570 � 2009 Blackwell Publishing Ltd, Immunology, 128, e562–e571
P. S. Carneiro et al.

12 Tusher VG, Tibshirani R, Chu G. Significance analysis of micro-
arrays applied to the ionizing radiation response. Proc Natl Acad
Sci USA 2001; 98:5116–21.
13 Hosack DA, Dennis G Jr, Sherman BT, Lane HC, Lempicki RA.
Identifying biological themes within lists of genes with EASE.
Genome Biol 2003; 4:R70.
14 Stiffel C, Ibanez OM, Ribeiro OG, Decreusefond C, Mouton D,
Siqueira M, Biozzi G. Genetics of acute inflammation: inflam-
matory reactions in inbred lines of mice and in their interline
crosses. Exp Clin Immunogenet 1990; 7:221–33.
15 Kobayashi Y. Neutrophil infiltration and chemokines. Crit Rev
Immunol 2006; 26:307–16.
16 Kobayashi Y. The role of chemokines in neutrophil biology.
Front Biosci 2008; 13:2400–7.
17 Demetri GD, Griffin JD. Granulocyte colony-stimulating factor
and its receptor. Blood 1991; 78:2791–808.
18 Mitsui T, Watanabe S, Taniguchi Y et al. Impaired neutrophil
maturation in truncated murine G-CSF receptor-transgenic
mice. Blood 2003; 101:2990–5.
19 Sabroe I, Dower SK, Whyte MK. The role of Toll-like receptors
in the regulation of neutrophil migration, activation, and apop-
tosis. Clin Infect Dis 2005; 41(Suppl. 7):S421–6.
20 Wilkie RP, Vissers MC, Dragunow M, Hampton MB. A functional
NADPH oxidase prevents caspase involvement in the clearance
of phagocytic neutrophils. Infect Immun 2007; 75:3256–63.
21 Li LF, Liao SK, Lee CH, Tsai YH, Huang CC, Quinn DA. Venti-
lation-induced neutrophil infiltration and apoptosis depend on
apoptosis signal-regulated kinase 1 pathway. Crit Care Med
2005; 33:1913–21.
22 Lamb JA, Ventura JJ, Hess P, Flavell RA, Davis RJ. JunD medi-
ates survival signaling by the JNK signal transduction pathway.
Mol Cell 2003; 11:1479–89.
23 Adriouch S, Hubert S, Pechberty S, Koch-Nolte F, Haag F,
Seman M. NAD+ released during inflammation participates in T
cell homeostasis by inducing ART2-mediated death of naive T
cells in vivo. J Immunol 2007; 179:186–94.
24 Nathan C. Neutrophils and immunity: challenges and opportu-
nities. Nat Rev Immunol 2006; 6:173–82.
25 Sant’Anna OA, Bouthillier Y, Mevel JC, De Franco M, Mouton
D. Isotypic distribution of antibody responses in lines of mice
selected for high or low immunoresponsiveness. Braz J Med Biol
Res 1991; 24:407–16.
26 Sant’Anna OA, Massa S, Mouton D et al. Salmonella typhimuri-
um infection in high and low antibody responder mice: inverse
correlation between antibody responsiveness and resistance to
infection. FEMS Microbiol Immunol 1989; 1:465–71.
27 Trezena AG, Souza CM, Borrego A, Massa S, Siqueira M, De
Franco M, Sant’Anna OA. Co-localization of quantitative trait
loci regulating resistance to Salmonella typhimurium infection
and specific antibody production phenotypes. Microbes Infect
2002; 4:1409–15.
28 Jensen JR, Peters LC, Borrego A et al. Involvement of antibody
production quantitative trait loci in the susceptibility to pristane-
induced arthritis in the mouse. Genes Immun 2006; 7:44–50.
29 Ibanez OM, Mouton D, Ribeiro OG, Bouthillier Y, De Franco M,
Cabrera WH, Siqueira M, Biozzi G. Low antibody responsiveness
is found to be associated with resistance to chemical skin tumori-
genesis in several lines of Biozzi mice. Cancer Lett 1999; 136:153–8.
30 Mulero V, Searle S, Blackwell JM, Brock JH. Solute carrier 11a1
(Slc11a1; formerly Nramp1) regulates metabolism and release of
iron acquired by phagocytic, but not transferrin-receptor-medi-
ated, iron uptake. Biochem J 2002; 363:89–94.
31 Hackam DJ, Rotstein OD, Zhang W, Gruenheid S, Gros P, Grin-
stein S. Host resistance to intracellular infection: mutation of
natural resistance-associated macrophage protein 1 (Nramp1)
impairs phagosomal acidification. J Exp Med 1998; 188:351–64.
32 Barton CH, Whitehead SH, Blackwell JM. Nramp transfection
transfers Ity/Lsh/Bcg-related pleiotropic effects on macrophage
activation: influence on oxidative burst and nitric oxide path-
ways. Mol Med 1995; 1:267–79.
33 Kita E, Emoto M, Oku D, Nishikawa F, Hamuro A, Kamikaidou
N, Kashiba S. Contribution of interferon gamma and mem-
brane-associated interleukin 1 to the resistance to murine
typhoid of Ityr mice. J Leukoc Biol 1992; 51:244–50.
34 Wojciechowski W, DeSanctis J, Skamene E, Radzioch D. Attenu-
ation of MHC class II expression in macrophages infected with
Mycobacterium bovis bacillus Calmette–Guerin involves class II
transactivator and depends on the Nramp1 gene. J Immunol
1999; 163:2688–96.
35 Laragione T, Brenner M, Yarlett NC, Mello A, Miller EJ, Metz
CN, Sherry B, Gulko PS. The arthritis severity quantitative trait
locus Cia7 regulates neutrophil migration into inflammatory
sites. Genes Immun 2007; 8:147–53.
36 Jirholt J, Cook A, Emahazion T, Sundvall M, Jansson L, Nord-
quist N, Pettersson U, Holmdahl R. Genetic linkage analysis of
collagen-induced arthritis in the mouse. Eur J Immunol 1998;
28:3321–8.
37 Adarichev VA, Nesterovitch AB, Bardos T et al. Sex effect on clini-
cal and immunologic quantitative trait loci in a murine model of
rheumatoid arthritis. Arthritis Rheum 2003; 48:1708–20.
38 Johannesson M, Olsson LM, Lindqvist AK et al. Gene expression
profiling of arthritis using a QTL chip reveals a complex gene
regulation of the Cia5 region in mice. Genes Immun 2005;
6:575–83.
39 Wells CA, Ravasi T, Faulkner GJ et al. Genetic control of the
innate immune response. BMC Immunol 2003; 4:5.
40 Dessein AJ, Marquet S, Henri S et al. Infection and disease in
human schistosomiasis mansoni are under distinct major gene
control. Microbes Infect 1999; 1:5–61.
41 Hurst SM, McLoughlin RM, Monslow J, Owens S, Morgan L,
Fuller GM, Topley N, Jones SA. Secretion of oncostatin M by
infiltrating neutrophils: regulation of IL-6 and chemokine expres-
sion in human mesothelial cells. J Immunol 2002; 169:5244–51.
42 Hodge DR, Hurt EM, Farrar WL. The role of IL-6 and STAT3
in inflammation and cancer. Eur J Cancer 2005; 41:2502–12.
43 Wang J, Ouyang C, Chen X, Fu B, Lu Y, Hong Q. STAT3
inhibits apoptosis of human renal tubular epithelial cells induced
by ATP depletion/recovery. Nephron Exp Nephrol 2008; 108:e11–
8.
44 Carrithers M, Tandon S, Canosa S, Michaud M, Graesser D,
Madri JA. Enhanced susceptibility to endotoxic shock and
impaired STAT3 signaling in CD31-deficient mice. Am J Pathol
2005; 166:185–96.
45 Yoshimura A. Signal transduction of inflammatory cytokines
and tumor development. Cancer Sci 2006; 97:439–47.
46 O’Shea JJ, Murray PJ. Cytokine signaling modules in inflamma-
tory responses. Immunity 2008; 28:477–87.
47 Ariel A, Serhan CN. Resolvins and protectins in the termination
program of acute inflammation. Trends Immunol 2007; 28:176–
83.
� 2009 Blackwell Publishing Ltd, Immunology, 128, e562–e571 e571
Gene expression profiles of bone marrow cells from AIRmax and AIRmin mice