gearing national s & t capability for ... - nast philippines
TRANSCRIPT
Trans. Nail. Acad. Sci. & Tech., Philippines (2001) 23: 247-265
GEARING NATIONAL S & T CAPABILITY FOR GLOBAL COMPETITIVENESS IN THE 21ST CENTURY:
THEORETICAL AND EMPIRICAL CONSIDERATIONS
CAMARA. UMPA President, Mindanao State University
Marawi City
ABSTRACT
Although many explanations have been offered about why some nations, but not others, are able to industrialize and attain rapid and sustained economic growth, the role of the development of technological capability appears to be the most compelling. This paper initially presents some historical and theoretical arguments about the vital role of the adoption of new technologies in the industTialization and economic success of the rich nations of the world. It then examines the technological capability appears to be the most compelling. This paper initially presents some historical and theoretical arguments about the vital role of the adoption of new technologies in the industrialization and economic success of the rich nations of the world. It then examines the empirical relationship between (I) economic success, measured by per capita GNP of nations, and (2) technological capability, measured by: (a) size of R&D manpower, and (b) level of expenditure on R&D activities. Results of the analysis of both worldwide (70 nations, World Bank and UNESCO) and time series (Japan, South Korea and Taiwan) data support the contention that indeed economic success is a function of technological capability. On the basis of consistent hi storical, theoretical and empirical evidence, it is proposed that the Philippines, or any country for that matter, may only attain global competi ti veness in the 21st century for the maller, may only attain global competitiveness in the 21st century by adequately improving its national technological capability. This can be done by increasing its number and quality of R&D personnel and spending a bigger proportion of GNP and R&D activities.
Statement of Purpose
Although many explanations have been offered about why some nations, but not others, are able to industrialize and attain sustained economic growth, the role of science and technology (S & T) seems to be the most compelling. Evidence
247
248 Camar A. Umpa
from various sources point to the adoption by rich and industrialized nations of modem technology in the production of goods and services as they improve their scientific and technological capability and enhance their research and development (R & D) activities . This paper therefore: (a) presents evidence that science and technology capability (STC) is the major engine of economic growth among rich and industrialized nations; (b) offers to explain the apparent inability of Philippine education to contribute to the nation 's economic growth; and (c) recommends a strategy to make the Philippines join the ranks of the rich and uldustrialized nations by strengthening its science and technology capability (STC) and enhancing its research and development effort (RDE).
AJthough most of the recommendations made in this study are specific to the Philippines, they may also apply to other countries whose levels of science and technology capability and economic success are similar to that of the Philippines. Among good models of economic success through strengthened national science and technology capability are the Asian Pacific nations of Japan, South Korea, Taiwan, Singapore and Hong Kong.
The Role of Technology in Economic Growth
80th historical and theoretical evidence exist to support the vital role of the adoption of modem technologies in the industrialization and economic success of the rich nations of the world:
Historical Evidence. The success of the industrial revolution in transforming the economies of European countries beginning with England in the middle of the eighteenth century established the role of technology in industrialization and economic success. The rapid industrialization of the USA, which eventually became the world's largest economy, and later on that of Japan, following its defeat in World War II, bolstered further the crucial role of technology in economic growth. The more recent experience of Asia's four "newly industrializing economies" (NIE's), namely, Singapore, Taiwan, South Korea and Hong Kong, is truly phenomenal in that they achieved in some thirty years what it took European countries more than 200 years, the USA over 100 years and Japan over 60 years to accomplish. Common among the strategies of these four Asian ''NIE's'' is the adoption of modem technology in the production of big volumes of high quality products aimed primarily at the export market.
Theoretical Evidence. The Nobel laureate, Robert M. Solow (1957), theorized that more than the billions in dollars of capital investment, it was technological progress or the application of modem technology, which accounted for over 80 per cent of the growth in output per labor hour in the USA from 1909 to 1949. Denison (1974, 1980), likewise, theorized that over 76 per cent in the growth in output per labor hour also in the USA from 1929 to 1969 was also the result of technological progress or the adoption of new technologies. Finally, Dumbusch
Transactions o/the National Academy o/Science & Technology Philippines 249
and Fisher (1985) attributed Japan's ability to almost triple its output per labor hour from 1960 to 1973 to the adoption of new technologies.
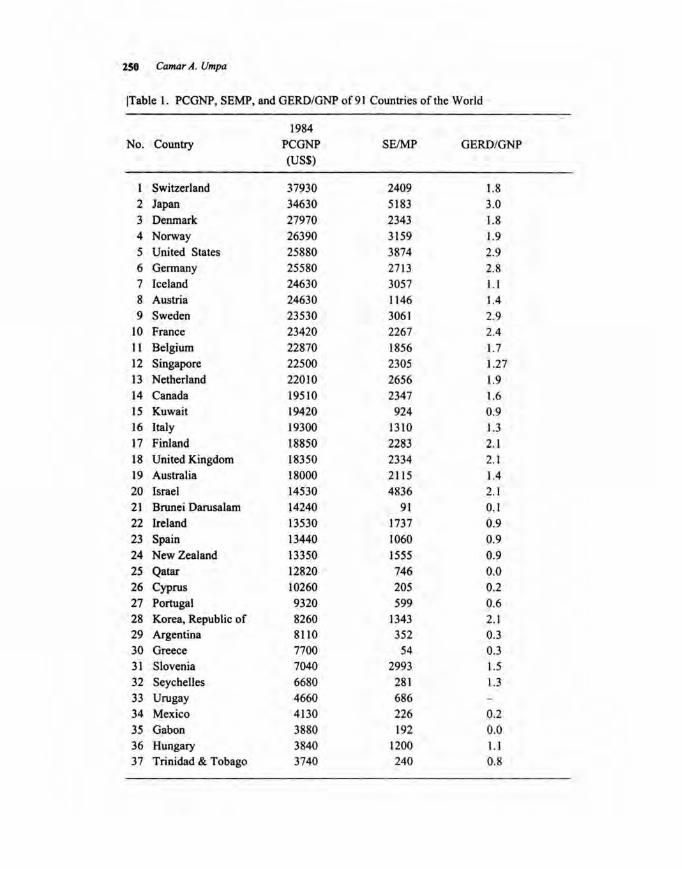
Empirical Evidence. In a study of 70 nations of the world, this investigator (Umpa, 1997) finds that indeed science and technology capability (STC), as embodied in the level of research and development effort (RDE), is a very effective predictor of economic success (ES), as measured by per capita gross national product (PCGNP) in 1994 US dollars (Table I, Figures I & 2). Furthermore, analysis of three sets of time-series data from Japan, South Korea and Taiwan bolsters the worldwide finding about the role of science and technology capability and research and development effort in the economic success of the three nations (Tables 2,3 & 4; Figures 3,4 & 5).
Theoretical Framework
A Model of Economic Success. Classical economic theory emphasizes the role of the traditional factors of production (e.g. land, labor and capital) in the expansion of the economy as a nation attains economic growth and development. However, the role of technological progress has been found to account for a big portion of economic growth (Solow, 1957; Denison, 1974 & 1980; Dumbusch & Fisher, 1985). The adoption of modem technology is therefore crucial to the growth and development of a nation's economy since it provides increasingly newer and more efficient methods of production of goods and services.
In order therefore for a country to develop economically and remain competitive, it must adopt modern technology. But the adoption of modern technology cannot be done simply through the purchase of imported machinery because imported machinery is usually expensive, exporting countries do not sell their advance machinery to prevent competition and that imported machinery often requires parts, services, repairs, modifications and technicians not readily available in importing countries.
The successful adoption of modem technology requires that a country ultimately develops its · own technology capability by monitoring worldwide technological discoveries and application, studying and innovating them and eventually inventing creating and designing its own new products and services. Such technological capability requires that a large sector of the population becomes familiar with not only modem technology itself but also with the whole gamut of the fundamental sciences that feed technology with increasing understanding of underlying relationships among various natural phenomena.
But scientific and technological capability (STC) itself does not necessarily translate into economic growth and development unless it is mobilized through the conduct of research and development (R & D) activities, whereby a nation's scientists and engineers are tasked to invent, create, innovate and design new high quality goods and services.
250 Camar A. Umpa
JTable I. PCGNP, SEMP, and GERO/GNP of91 Countries of the World
1984 No. Country PCGNP SEIMP GERD/ONP
(US$)
Switzerland 37930 2409 1.8 2 Japan 34630 5183 3.0 3 Denmark 27970 2343 1.8 4 Norway 26390 3159 1.9 5 United States 25880 3874 2.9 6 Germany 25580 2713 2.8 7 Iceland 24630 3057 1.1 8 Austria 24630 1146 1.4 9 Sweden 23530 3061 2.9
10 France 23420 2267 2.4 II Belgium 22870 1856 1.7 12 Singapore 22500 2305 1.27 13 Netherland 22010 2656 1.9 14 Canada 19510 2347 1.6 15 Kuwait 19420 924 0.9 16 Italy 19300 1310 1.3 17 Finland 18850 2283 2.1 18 United Kingdom 18350 2334 2.1 19 Australia 18000 2115 1.4 20 Israel 14530 4836 2.1 21 Brunei Darusalam 14240 91 0.1 22 Ireland 13530 1737 0.9 23 Spain 13440 \060 0.9 24 New Zealand 13350 1555 0.9 25 Qatar 12820 746 0.0 26 Cyprus 10260 205 0.2 27 Portugal 9320 599 0.6 28 Korea, Republic of 8260 1343 2.1 29 Argentina 8110 352 0.3 30 Greece 7700 54 0.3 31 Slovenia 7040 2993 1.5
32 Seychelles 6680 281 1.3 33 Urugay 4660 686 34 Mexico 4130 226 0.2 35 Gabon 3880 192 0.0 36 Hungary 3840 1200 1.1 37 Trinidad & Tobago 3740 240 0.8
Transactions of the National Academy of Science & Technology Philippines 251
ITable I (continued)
1984 No. Country PCGNP SEIMP GERD/GNP
(US$)
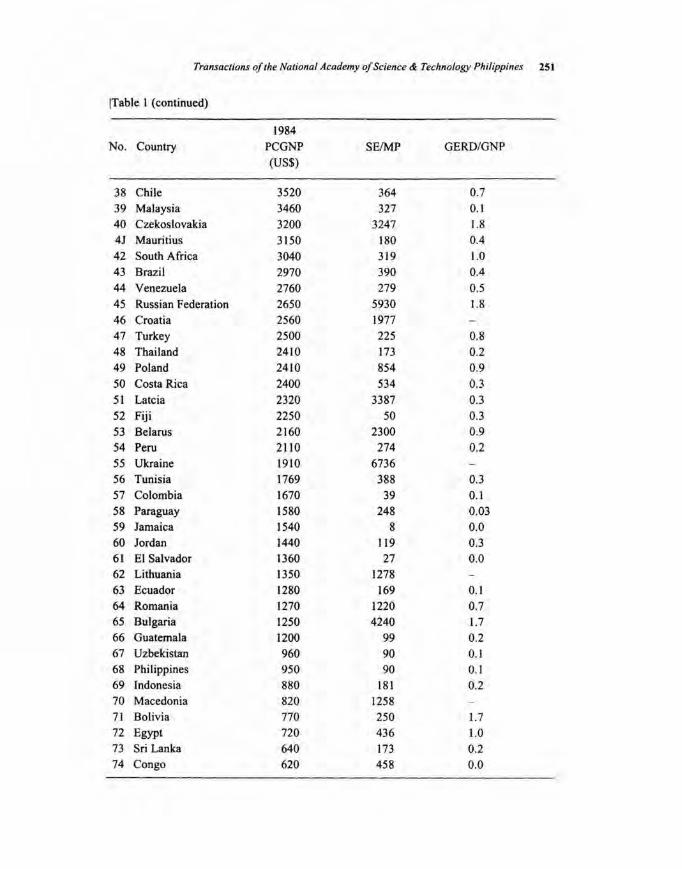
38 Chile 3520 364 0.7 39 Malaysia 3460 327 0.1 40 Czekoslovakia 3200 3247 1.8 4J Mauritius 3150 180 0.4 42 South Africa 3040 319 1.0 43 Brazil 2970 390 0.4 44 Venezuela 2760 279 0.5 45 Russian Federation 2650 5930 1.8 46 Croatia 2560 1977 47 Turkey 2500 225 0.8 48 Thailand 2410 173 0.2 49 Poland 2410 854 0.9 50 Costa Rica 2400 534 0.3 51 Latcia 2320 3387 0.3 52 Fiji 2250 50 0.3 53 Belarus 2160 2300 0.9 54 Peru 21 IO 274 0.2 55 Ukraine 19IO 6736 56 Tunisia 1769 388 0.3 57 Colombia 1670 39 0.1 58 Paraguay 1580 248 0.Q3 59 Jamaica 1540 8 0.0 60 Jordan 1440 119 0.3 61 EI Salvador 1360 27 0.0 62 Lithuania 1350 1278 63 Ecuador 1280 169 0.1 64 Romania 1270 1220 0.7 65 Bulgaria 1250 4240 1.7 66 Guatemala 1200 99 0.2 67 Uzbekistan 960 90 0.1 68 Philippines 950 90 0.1 69 Indonesia 880 181 0.2 70 Macedonia 820 1258 71 Bolivia 770 250 1.7 72 Egypt 720 436 1.0 73 Sri Lanka 640 173 0.2 74 Congo 620 458 0.0
252 Camar A. Umpa
Table 1 (continued)
1984 No. Country PCGNP SEIMP
(US$)
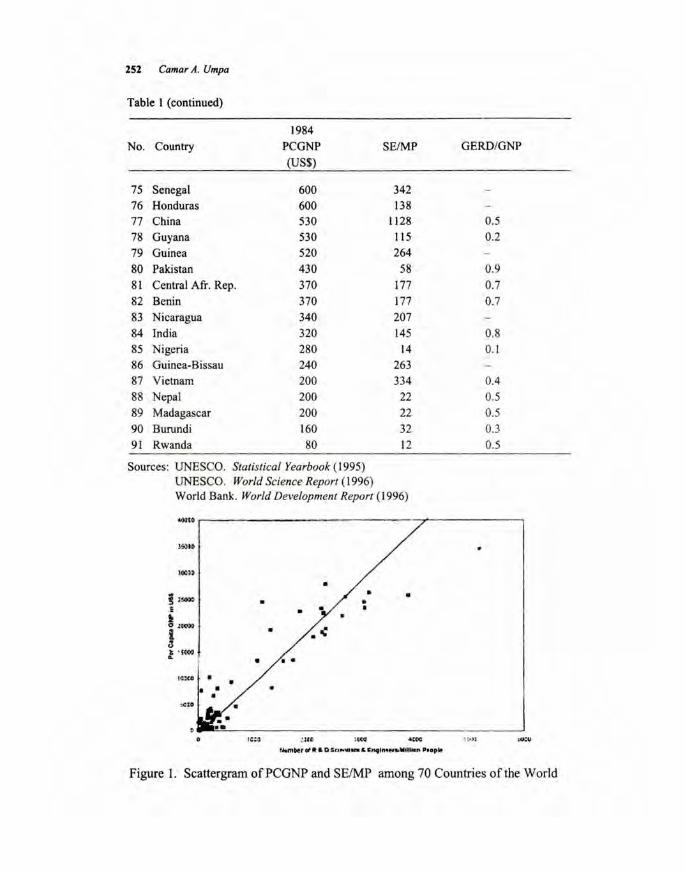
75 Senegal 600 342 76 Honduras 600 138 77 China 530 1128 78 Guyana 530 115 79 Guinea 520 264 80 Pakistan 430 58 81 Central Afr. Rep. 370 177 82 Benin 370 177 83 Nicaragua 340 207 84 India 320 145 85 Nigeria 280 14 86 Guinea-Bissau 240 263 87 Vietnam 200 334 88 Nepal 200 22 89 Madagascar 200 22 90 Burundi 160 32 91 Rwanda 80 12
Sources: UNESCO. Statistical Yearbook ( 1995) UNESCO. World Science Report (1996 ) World Bank. World Development Reporl ( 1996)
"'''0
),,)10
100l)
• ~ ;!.OOO • • • . . Ii • t "'lCO» • .( i
" t ISC«I .. • • • IQ:(O • •
,:~ro
!c:o. ': lCD ' WI .. :C'C t4m~r "' ... & D S(.JfIo;"'UW &. '""I,"e-.. "U~" ".op"
GERD/GNP
~ ::"-) l
0.5 0.2
0.9 0.7 0.7
0.8 0.1
04 0.5 0.5 0.3 0.5
~u
Figure 1. Scattergram of PC GNP and SE/MP among 70 Countries of the World
Transactions of the National Academy of Science & Technology Philippines 253
4~OOr-----------------------------------------~
:: __ ': .000 :J L Z Ci :! :!OOIXJ .. .. v .f 1:.000
IUQOO
~ooo
O~~~4-~LS~----~~--------------------~ 05(1 IDa 2 .00 :I.SO 'JOO
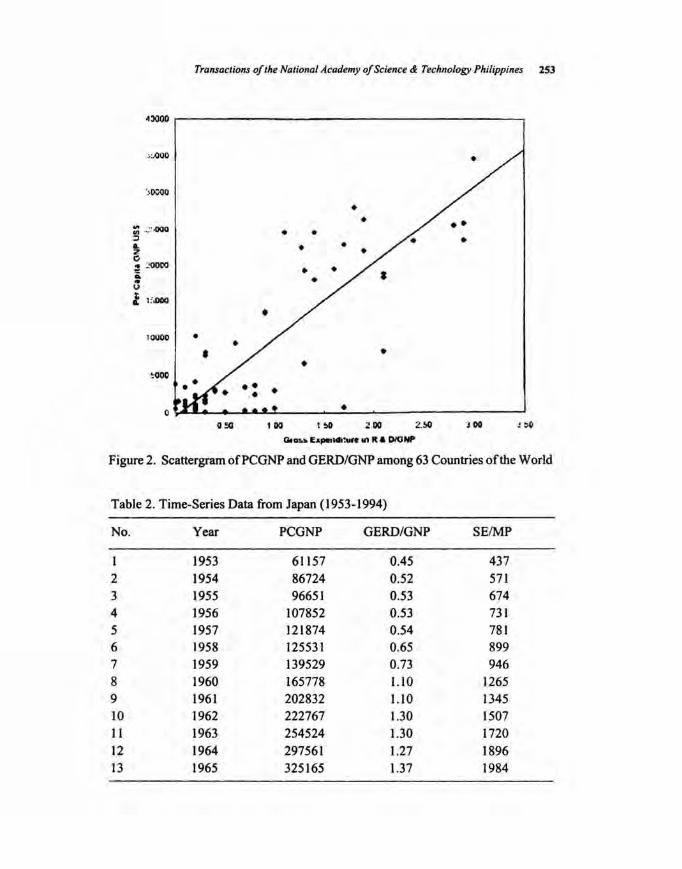
Figure 2. Scattergram of PC GNP and GERD/GNP among 63 Countries of the World
Table 2. Time-Series Data from Japan (1953-1994)
No. Year PCGNP GERD/GNP SEIMP
1953 61157 0.45 437 2 1954 86724 0.52 571 3 1955 96651 0.53 674 4 1956 107852 0.53 731 5 1957 121874 0.54 781 6 1958 125531 0.65 899 7 1959 139529 0.73 946 8 1960 165778 1.10 1265 9 1961 202832 1.10 1345 10 1962 222767 1.30 1507 11 1963 254524 1.30 1720 12 1964 297561 1.27 1896 13 1965 325165 1.37 1984
254 Camar A. Umpa
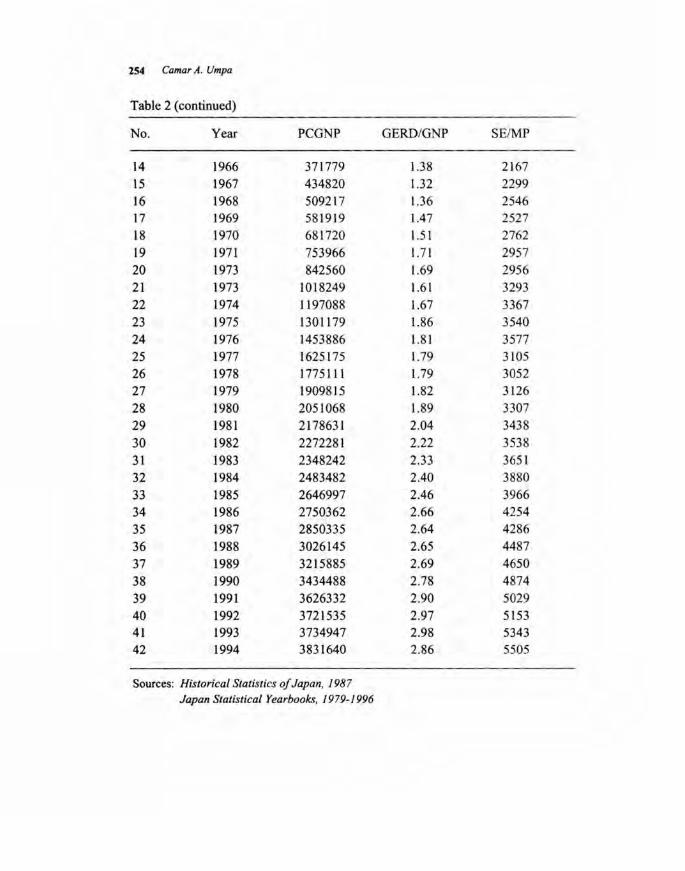
Table 2 (continued)
No. Year PCGNP GERDIGNP SE/MP
.14 1966 371779 1.38 2167 15 1967 434820 1.32 2299 16 1968 509217 1.36 2546 17 1969 581919 1.47 2527 18 1970 681720 1.51 2762 19 1971 753966 1.71 2957 20 1973 842560 1.69 2956 21 1973 1018249 1.61 3293 22 1974 1197088 1.67 3367 23 1975 1301179 1.86 3540 24 1976 1453886 1.81 3577 25 1977 1625175 1.79 3105 26 1978 1775111 1.79 3052 27 1979 1909815 1.82 3126 28 1980 2051068 1.89 3307 29 1981 2178631 2.04 3438 30 1982 2272281 2.22 3538 31 1983 2348242 2.33 3651 32 1984 2483482 2.40 3880 33 1985 2646997 2.46 3966 34 1986 2750362 2.66 4254 35 1987 2850335 2.64 4286 36 1988 3026145 2.65 4487 37 1989 3215885 2.69 4650 38 1990 3434488 2.78 4874 39 1991 3626332 2.90 5029 40 1992 3721535 2.97 5153 41 1993 3734947 2.98 5343 42 1994 3831640 2.86 5505
Sources: Historical Statistics of Japan, 1987 Japan Statistical Yearbooks, 1979-1996
Transactions a/the National Academy a/Science & Technology Philippines 255
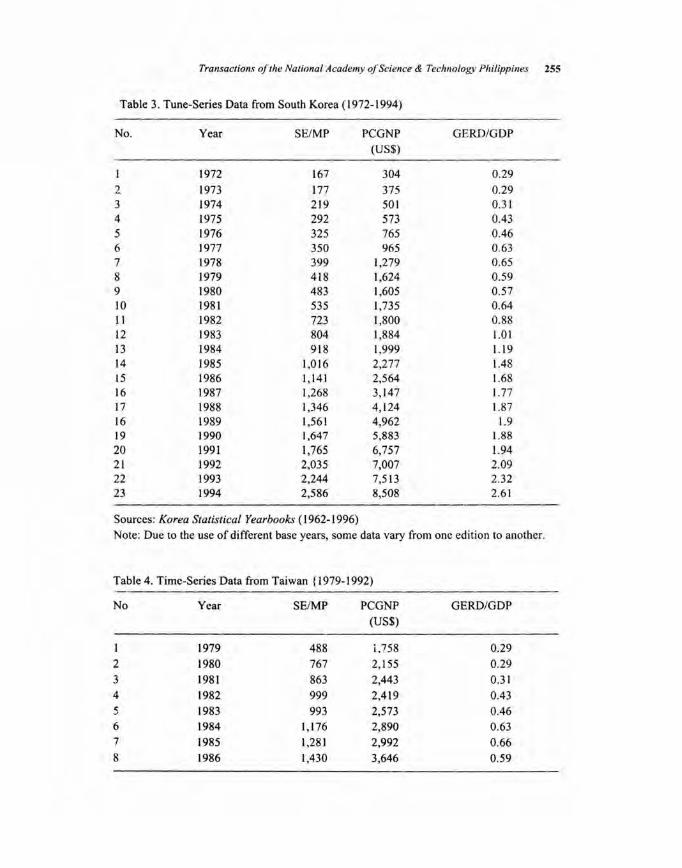
Table 3. Tune-Series Data from South Korea (1972-1994)
No. Year SE/MP PCGNP GERD/GOP (US$)
1 1972 167 304 0.29
2 1973 177 375 0.29 3 1974 219 501 0.31 4 1975 292 573 0.43 5 1976 325 765 0.46 6 1977 350 965 0.63 7 1978 399 1,279 0.65 8 1979 418 1,624 0.59 9 1.980 483 1,605 0.57 1O 1981 535 1,735 0.64 II 1982 723 1,800 0.88 12 1983 804 1,884 1.01 13 1984 918 1,999 1.19 14 1985 1,016 2,277 1.48 15 1986 1, 141 2,564 1.68 16 1987 1,268 3,147 1.77 17 1988 1,346 4,124 1.87 16 1989 1,561 4,962 1.9 19 1990 1,647 5,883 1.88 20 1991 1,765 6,757 1.94 21 1992 2,035 7,007 2.09 22 1993 2,244 7,513 2.32 23 1994 2,586 8,508 2.61
Sources: Korea Statistical Yearbooks (1962-1996)
Note: Due to the use of different base years, some data vary from one edition to another.
Table 4. Time-Series Data from Taiwan (1979-1992)
No Year SE/MP PCGNP GERD/GOP (US$)
I 1979 488 i,758 0.29
2 1980 767 2,155 0.29 3 1981 863 2,443 0.31 4 1.982 999 2,419 0.43 5 1983 993 2,573 0.46 6 1984 1,176 2,890 0.63 7 1985 1,281 2,992 0 .66 8 1986 1,430 3,646 0.59
256 Camar A. Umpa
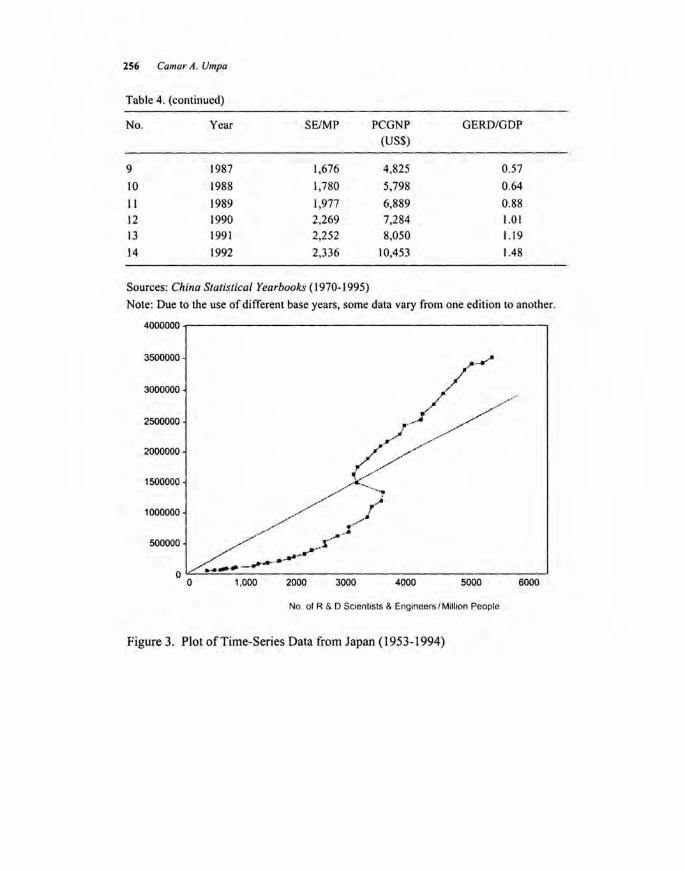
Table 4. (continued)
No. Year SE/MP PCGNP GERD/GDP (US$)
9 1987 1,676 4,825 0.57
10 1988 1,780 5,798 0.64
II 1989 1,977 6,889 0.88
12 1990 2,269 7,284 1.01 13 1991 2,252 8,050 1.19
14 1992 2,336 10,453 1.48
Sources: China Statistical Yearbooks (1970-1995)
Note: Due to the use of different base years, some data vary from one edition to another.
4000000 -r---------------------------,
3500000
3000000
2500000
2000000
1500000
1000000
500000
3000 4000 5000 6000
No. of R & D Scientists & Engineers / Million People
Figure 3. Plot of Time-Series Data from Japan (1953-1994)
Transactions o/the National Academy o/Science & Technology Philippines 257
9,000.----------------------------,
8,000
7,000
... ~ 6,000 Il. ~ 5,000
J9 .~ 4,000 l)
tf 3,000
2,000
1,000
1,000 1,500 2,000 2,500
No. of R&D Scientists & Engineers/Million People
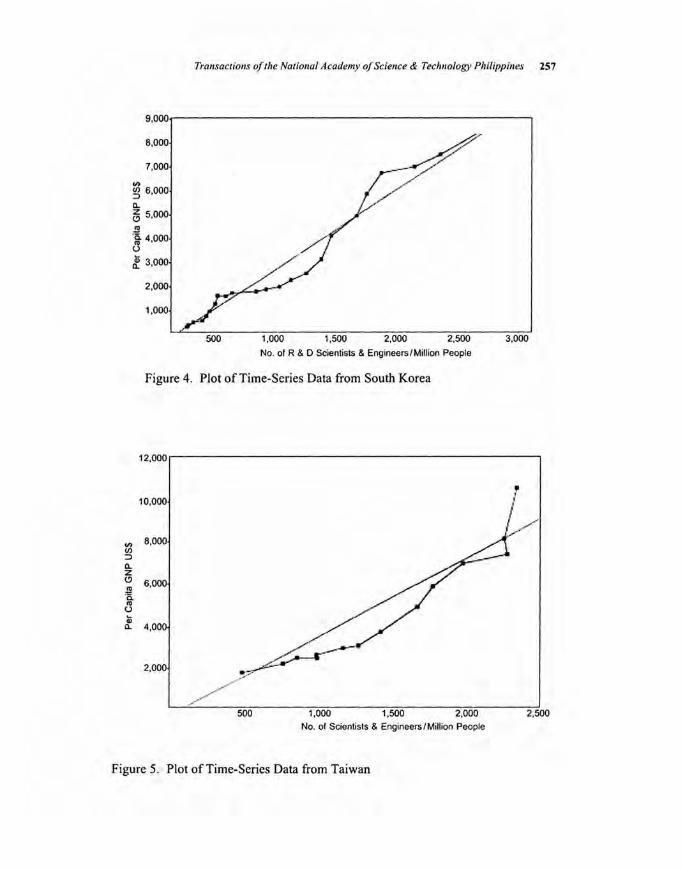
Figure 4, Plot of Time-Series Data from South Korea
3,000
12,000,.--- ------------------------.
10,000
... 8,000 If)
::> Il. z C> 6,000 J9 '5..
8 ~ Il. 4,000
2,000
500 1,000 1,500 2,000 No. of Scientists & Engineers/Million People
Figure 5. Plot of Time-Series Data from Taiwan
2,500
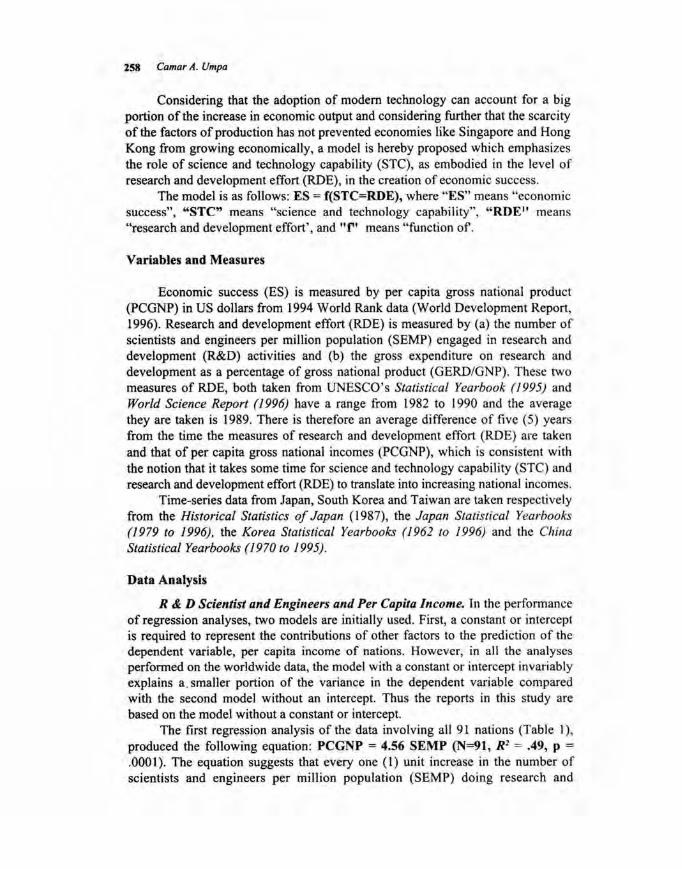
258 Camar A. Umpa
Considering that the adoption of modem technology can account for a big portion of the increase in economic output and considering further that the scarcity of the factors of production has not prevented economies like Singapore and Hong Kong from growing economically, a model is hereby proposed which emphasizes the role of science and technology capability (STC), as embodied in the level of research and development effort (RDE), in the creation of economic success.
The model is as follows: ES = f(STC=RDE), where "ES" means "economic success", "STC" means "science and technology capability", "RDEII means "research and development effort', and "r' means "function of.
Variables and Measures
Economic success (ES) is measured by per capita gross national product (PCGNP) in US dollars from 1994 World Rank data (World Development Report, 1996). Research and development effort (RDE) is measured by (a) the number of scientists and engineers per million population (SEMP) engaged in research and development (R&D) activities and (b) the gross expenditure on research and development as a percentage of gross national product (GERD/GNP). These two measures of RDE, both taken from UNESCO's StatisticaL Yearbook (1995) and World Science Report (J 996) have a range from 1982 to 1990 and the average they are taken is 1989. There is therefore an average difference of five (5) years from the time the measures of research and development effort (RDE) are taken and that of per capita gross national incomes (PCGNP), which is consistent with the notion that it takes some time for science and technology capability (STC) and research and development effort (RDE) to translate into increasing national incomes.
Time-series data from Japan, South Korea and Taiwan are taken respectively from the Historical Statistics of Japan (1987), the Japan Statistical Yearbooks (J 979 to J 996), the Korea Statistical Yearbooks (J 962 to 1996) and the China Statistical Yearbooks (1970 to 1995).
Data Analysis
R&D Scientist and Engi"eers and Per Capita ["come. In the performance of regression analyses, two models are initially used. First, a constant or intercept is required to represent the contributions of other factors to the prediction of the dependent variable, per capita income of nations. However, in all the analyses performed on the worldwide data, the model with a constant or intercept invariably explains a . smaller portion of the variance in the dependent variable compared with the second model without an intercept. Thus the reports in this study are based on the model without a constant or intercept.
The first regression analysis of the data involving all 91 nations (Table I), produced the following equation: PCGNP = 4.56 SEMP (N=91, Rl = .49, P =
.0001). The equation suggests that every one (I) unit increase in the number of scientists and engineers per million population (SEMP) doing research and
Transactions of the National Academy of Science & Technology Philippines 259
development. work produces an increase of $4.56 in per capita gross national product (PCGNP) among the nations. However, only 49 percent of the variance in PCGNP is accounted for by SEMP, which suggests that the latter is able to account for less than half of the total variance in the dependent variable which suggests a rather weak relationship. The findings however is significant considering the probability that the configuration in the data would occur if in reality the two variables are unrelated is less than one in ten thousand.
Upon further examination of Table I, it becomes clear that 21 of the nations must be excluded from analysis for various reasons. Sixteen (16) present or former Communist countries are expected to use their scientists and engineers to produce weapons and not incomes during the Cold War (Slovenia, Hungary, Czechoslovakia, Russia, Croatia, Poland, Latvia, Belarus, Ukraine, Lithuania, Romania, Bulgaria, Uzbekistan, Macedonia, China and Vietnam). Three (3) oil-producing countries do not need scientists and engineers to pump oil to produce huge incomes. Switzerland is a small country with a very mature economy, which focuses on high-value products and has rich financial centers that allow it to obtain a highcr income compared with other nations. Finally, Israel is a small country faced with hostile Arab neighbors and although it has many scientists, it cannot receive their full economic benefits due to unstable investments by foreign business concerns due to the war situation
With only seventy (70) nations, after removing the 21 nations where the relationship between STCIRDE and ES is believed to be distorted, the regression equation is: PCGNP = 8.44 X SEMP (N = 70, Rl = .91, p. = .0001). The equation suggests that every SEMP contributes $8.44 to a country's PCGNP. The amount of variance, 91 percent, in the dependent variable explained by the independent variable is extremely high. Furthermore, the result is very significant because the probability that the same configuration in the data can occur if in reality the variables are unrelated is one in ten thousand. The strong relationship of the variables may be visually observed in Figure I.
R &D Expenditure and Per Capita Income. Considering that in the previous analysis, 21 nations are excluded because it is presumed that the relationship between scientists and engineers, on thc one hand, and per capita income, on the other hand, is distorted, the same nations are also excluded in the present analysis. With only sixty-three (63) nations, the regression equation is: PCGNP= 9,866.82 X GERD/GNP (N = 63, Rl = .82, P = .0001). The equation suggests that every one percent of GNP spent on R&D produces for a country $9,866.82 in PCGNP, with the independent variable predicting 82 percent of the variance in the dependent variable. The fmding is significant a the .0001 leve\.
Time Series Data. Time-series data from Japan (Table 2, Figure 3) cover the period 1953 to 1994 or 42 years. PCGNP is measured in Yen and not US dollars. An examination of Table 2 shows that SEMP rose from 437 to 5,505, GERD/GNP from 0.45 percent to 2.86 percent, and PCGNP from Y81.157 to Y3,83 1,640 for the period. Under regression analysis, SEMP and GERD/GNP account for 90
260 Coma,. A. Umpa
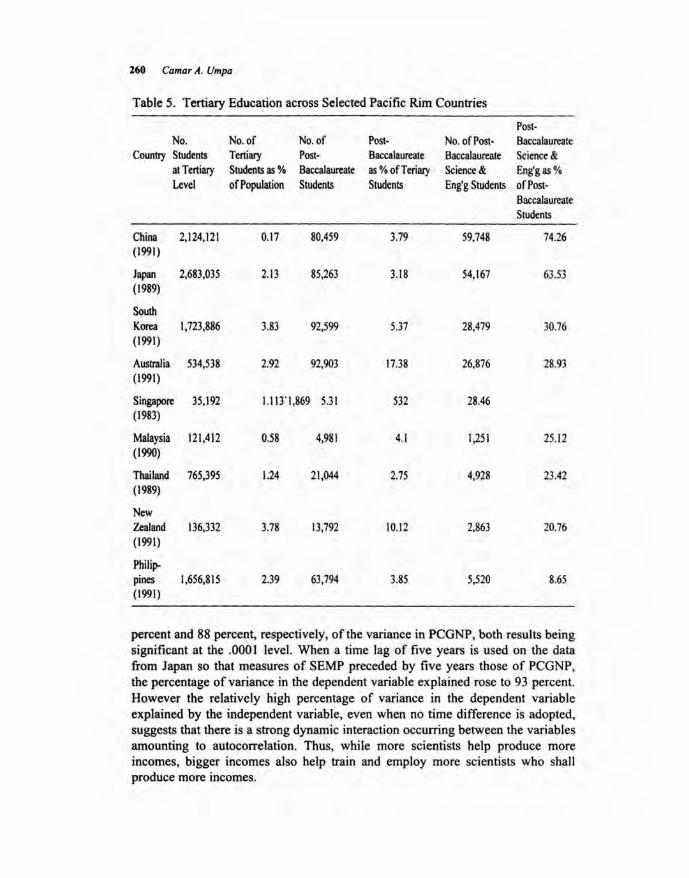
Table 5. Tertiary Education across Selected Pacific Rim Countries
Post-No. No.of No. of Post- No. of Post- Baccalaureate
Country Students Tertiary Post- Baccalaureate Baccalaureate Science & at Tertiary Students as % Baccalaureate as % ofTeriary Science & Eng'g as % Level of Population Students Students Eng'g Students of Post-
Baccalaureate Students
China 2,124,121 0.17 80,459 3.79 59,748 74.26 (1991)
Japan 2,683,035 2.\3 85,263 3.18 54,167 63.53 (1989)
South Korea 1,723,886 3.83 92,599 5.37 28,479 30.76 (1991)
Australia 534,538 2.92 92,903 17.38 26,876 28.93 (1991)
Singapore 35,192 1.113'1,869 5.31 532 28.46 (1983)
Malaysia 121,412 0.58 4,981 4.1 1,251 25.12 (1990)
Thailand 765,395 1.24 21,044 2.75 4,928 23.42 (1989)
New Zealand 136,332 3.78 13,792 10.12 2,863 20.76 (1991)
Philip-pines 1,656,815 2.39 63,794 3.85 5,520 8.65 (1991)
percent and 88 percent, respectively, of the variance in PC GNP, both results being significant at the .0001 level. When a time lag of five years is used on the data from Japan so that measures of SEMP preceded by five years those of PCGNP, the percentage of variance in the dependent variable explained rose to 93 percent. However the relatively high percentage of variance in the dependent variable explained by the independent variable, even when no time difference is adopted, suggests that there is a strong dynamic interaction occurring between the variables amounting to autocorrelation. Thus, while more scientists help produce more incomes, bigger incomes also help train and employ more scientists who shall produce more incomes.
Transactions of the National Academy of Science & Technology Philippines 261
The presence of autocorrelation is confirmed when a predictive mathematical model was created that allowed the fullest extent of autocorrelation. The full Yule-Walker estimate of variance explained, including autocorrelation, is near perfect at over 99 percent. However, under the same estimates, at least 61 percent of the variance explained is not due to autocorrelation.
Time series data from South Korea cover the period 1972 to 1994 (Table 3, Figures 4) or '23 years. An examination of the data show that PCONP rose from $304 to $8,508, SEMP from 167 to 2,586 and OERD/ONP from. 0.29 percent to 2.61 percent for the period. SEMP accounts for 97 percent, while OERD/ONP accounts for 92 percent, respectively, of the variance in PCONP, both results are significant at .0001 level. Under the Yule-Walker estimates of autocorrelations, over 99 percent of the variance in PCONP is accounted for by SEMP, of which at least 93 percent is not due to autocorrelation.
Time series data from Taiwan cover the period 1979 to 1992 or 14 years. Table 5 shows that PCONP increased from $1,758 to $10,453, SEMP from 488 to 2,336 and OERD/ONP from 0.71 percent to 1.79 percent for the period. SEMP explains 96 percent, while OERD/ONP explains 94 percent, respectively, in the variance of PCONP, both result are significant at .0001 level. Under the YuleWalker estimates which includes autocorrelation, up to 97 percent in the variance ofPCONP is accounted for by SEMP, but at least 93 percent of the same variance is not due to autocorrelation
Under statistical inference three conditions must be satisfied before one can establish causality between two variables, (a) that the two variables are strongly related, (b) that the independent variable precedes the dependent variable, and (c) that the joint association of the two variables are not due to other causes.
First, the association between the measures of economic success (PCONP) and science and technology capability (STC), as embodied in research and development effort (SEMP and OERD/ONP) is indeed very strong because more than 90 percent of the variance in the former is accounted for by the latter, and that the probability of the occurrence of the findings, if in reality the variables are unrelated, is less that one chance in ten thousand. Second, the measures of RDE ferr the worldwide data are taken an average of five years preceding the measure of PCONP. Finally, the results of the time-series analysis of data from Japan , South Korea and Taiwan removes any doubt that the observed relationship between the variables is due to other causes.
The results of the analyses of both the worldwide data on 70 nations and the time-series data on Japan, South Korea and Taiwan provide a strong evidence that indeed economic success (ES), as measured by PCONP, is almost accurately predicted by science and technology capability (STC), as embodied in research and deve.lopment effort (ROE), which is measured by the number of R&D scientists and engineers per million population (SEMP) and by the gross expenditure on R&D as percentage of ONP (OERD/ONP).
262 Camar A. Umpa
These findings are consistent with the historical evidence of the industrialization process that occurred in Europe on the occasion of the Industrial Revolution, that of the USA, Japan and the four Asian "NIEs" of Singapore, South Korea, Taiwan and Hong Kong. The findings are further consistent with the theoretical conclusions of Solow (1957), Denison (1974) and Durnbusch and Fisher (1980) that attribute much of the growth in the American and Japanese economies for some specific periods to technological progress or the adoption of new technologies.
On the basis of the strong relationship between economic success (ES) and science and technology capability (STC), as manifested by research and development effort (RDE), it is suggested tbat a country, like the Philippines, must strengthen its STC and enhance its RDE in the 21 5t century. The beta coefficients of the equation provide estimates of the needed SEMP and GERDI GNP for a country to earn a given level of PC GNP.
Why Did Philippine Education Not Contribute to Economic Growth?
Some studies in the 1970's suggest that while expanding education, as indicated by increasing enrolment and graduation in all levels of education, was positively correlated with economic growth among other nations of the world, this was not true to the Philippines. Until recently, this paradox could not be adequately explained.
A comparison or enrolment data among key Pacific Rim nations show that while the Philippines does not lag behind in the proportion of its population enrolled in both tertiary and graduate education, the country had the lowest concentration of its graduate students enrolled in science and engineering (Table 5), which explains its small size of SEMP (Table I). It is obvious that the Philippines with SEMP of 90 in 1984 (which increased to 155 in 1997) cannot match that of its neighbors in Asia like Japan, South Korea, Singapore and Taiwan.
The results of the Third International Mathematics and Science Study (TIMSS) showed a poor performance of Filipino elementary and secondary students who landed 37th and 38th among 39 nations in mathematics and science, respectively, which cast doubt on the quality of basic education.
While most other countries have twelve to thirteen years of basic education, the Philippines has only ten years, which further casts doubt on the adequacy of its basic education.
Official data from Philippine government education agencies, including the Department Education, Culture and Sports (DECS) and the Commission on Higher Education (CRED) reveal that many primary, el(fmentary, secondary and tertiary teachers are not qualified to teach the subjects assigned to them because they are either not majors in the said disciplines or they lack the necessary graduate degrees for their level.
Transactions of the National Academy of Science & Technology Philippines 263
Tertiary and advance education in the Philippines are not geared toward research undertaking. Instead, they emphasize the accumulation of credit hours or units mostly through classroom instruction. Institutions of higher learning also rarely base their academic programs and researches on the needs of business and industry.
Making the Philippines Join the Ranks of the Richest Nations of the World.
Under the regression equation, PCGNP = 0 + 8.44 x SEMP, a country 's leaders can determine how rich they want their country to be. By dividing the desired PCGNP by the beta coefficient (8.44), one can determine the number of SEMP needed to conduct R&D work to obtain the desired PCGNP. Thus a PCGNP of $1 0,000 requires the employment of at least 1,185 SEMP.
Furthermore, under the regression equation, PCGNP = 0 + 9,866.82 x GERDI GNP, a PCGNP of $ 10,000.00 requires that the country spends at least 1.02% of its GNP in R&D activities.
Strengthening R&D in S&T Among Institutions of Higher Learning
In order for the Philippines to strengthen its S & T capability and enhance its R&D activities, it should lengthen its basic education to thirteen years to make it comparable and competitive with those of other countries, while emphasizing science, mathematics and language. Such concepts as the. "scientific method" and learning by self-discovery" should be introduced early to pupils and students.
At least 75 percent of all secondary schools in the country should be converted to science and technology high school in order to provide adequate input to science engineering programs at the tertiary level. Simple applications of the "scientific method of research" should be introduced to students at the secondary level.
At least 75 percent of all enrollees in tertiary and advance education should eventually be in science, engineering and technology fields . The grant of degrees, particularly at the graduate level. Should be more knowledge-and research-based, rather than being very dependent on the number of lecture hours or units obtained.
In all levels of education, particular attention should be given to quality with a view to making the country land in the top places of future international science and mathematics studies and making. its researchers, scientists and engineers world-class.
All institutions of higher learning should encourage the conduct of high quality researches among its faculty members, preferably in coordination with business and industry people, while addressing the latter's real needs or problems. These institutions should adopt research agenda which are geared toward the production of good and services that the nation can sell in the export markets.
264 Camar A. Umpa
CONCLUSIONS
Three types of evidence, namely, historical, theoretical and empirical , exist to support the contention that the adoption of modem technology is indeed the precursor of industrialization and economic success among the rich nations of the world. There is also evidence that the successful adoption of modem technology can be made through the strengthening a nation's science and technology capability as demonstrated by the regression analyses of data from 70 nations and the three sets of time-series data from Japan, South Korea and Taiwan.
A comparison of the Philippines and other countries reveals that the fonner lags behind in S & T capability as indicated by its low SEMP and GERD/GNP. This situation helps explain the findings of some studies that while expanding educational opportunities in other nations contribute to their economic success, this same did not happen to the Philippines.
Given the strong degree of relationship found in the regression analyses of the worldwide data, and the high level of its statistical significance the beta coefficients provide a formula for a country to achieve industrialization and economic success. By dividing the desired PCGNP by the appropriate beta coefficient. one arrives at the needed SEMP or GERD/GNP to achieve the target PCGNP. Thus it may be possible for the Philippines (or any country in Asia and the Pacifi.c) to achieve a PCGNP of$ 10,000.00, $20,000.00 at 1994 prices in 15 to 30 years from now.
In order to achieve that goal, the Philippines should strengthen its science and technology capability in the 21 st century. In doing so, the country should also rectify some inadequacies in its educational system. first , the length of basic education should be increased to 12-13 years to make it at par with those of other countries. Second, tertiary and advanced education should be re-focused so that three-fourths of all enrollees and graduates in both educational levels shall be in S & T fields . Third, three-fourths of all secondary schools should be converted to S & T high schools. Fourth, there should be an improvement in the quality of education at all levels of the educational ladder. fifth, there should be a program to encourage and stimulate the conduct of fundamental research and R&D in all institutions of higher learning. Sixth, adequate compensation and incentive packages should be adopted to attract the best and the brightest persons in the conduct of R & D in S & T fields. Finally, private firms should be persuaded to invest in and conduct world-class R&D work in collaboration with universities and research and development (R & . D) institutes.
Transactions of the National Academy of Science & Technology Philippines 265
BIBLIOGRAPHY
Denison, E.F. 1974. Accounting for the United States Economic Growth 1929-1969. Washington, D.C.: Brookings.
Denison, E.F. and W.K. Chung. 1976. How Japan's Economy Grew So Fast? Washington D.C. : Brookings.
Durnbusch, R. and S. Fisher. 1985. Macroeconomics. 3rd International Student Edition. Singapore: McGraw:Hill-International Book Company.
Government of Japan. 1979- 1996. Historical Statistics of Japan. Office of the Prime Minister, Statistics Bureau.
Kim, Hoagy. 1988. The Role of Science and Technology in the Industrialization of Korea. Seoul : Ministry of Science and Technology, (July 14, 1988).
Psacharopo1ous, G. and M. Woodhall. 1986. Education for Development: An AnalysiS of Investments. Washington D.C.: World Bank.
Republic of China. 1970-1995 Editions. China Slatistical Yearbooks. Republic of Korea. 1962-1996 Editions. Korea Statistical Yearbooks. National Statistics Office. Solow, R.M. 1957. Technical Change and Aggregate Production, Review of Economics and Statistics.
August. Todaro, M.P. 1989. Economic Develomenl in the Third World. New York and London: Longman. Umpa, C.A. 1997. Science, Technology and Economic Growth: Toward a Theory, Lectern, Vol . 3,
No. 7. MSU-IIT, I1igan City: Philippines, July, 1997. Umpa, C.A. 1998. Science, Technology and Philippine Economics Success in the 2JSt Century. Paper
presented at the National Centennial Congress on Higher Education, Commission on Higher Education, Manila Midtown Hotel, (28-29 May 1998).
UNESCO. 1995. Statistical Yearbook 1995. Paris: UNESCO Publishing. UNESCO. 1996. World Science Report 1996. Paris: UNESCO Publishing. Wade, R. 1972. Manpower Development and Economic Development. Bangkok: Friedrick-Ebert
Stiftung. World Bank. 1996. World Development Report. New York Press.
• ! !
f