gamma‐ray blazars: an overview
TRANSCRIPT

Gamma-ray Blazars: an overview
Laura Maraschi and Fabrizio Tavecchio
Osservatorio Astronomico di Brera, via Brera 28, 20121 Milano Italy
Abstract. A synthesis of the present knowledge on Gamma-ray blazars is presented, focusingon the best studied "protoypical" objects. Basic results and concepts are introduced following ahistorical path. Multifrequency correlations and spectral variability are discussed as probes of ourunderstanding of physical processes in the emission regions of relativistic jets. Finally an overallscheme for unification of GeV and TeV blazars is described.
INTRODUCTION
The violent “activity” observed in some galactic nuclei (AGN) in the form of veryluminous and compact emission is generally thought to be associated with accretion ontosupermassive black holes (107 � 10 M � ). However in a subset of AGN a large fraction ofthe total power is channelled into outflowing collimated relativistic jets which radiate -dissipate - deposit their power at large distances from the nucleus . How the interactionof the inflowing accreting matter with the (presumably) spinning black hole can originatethese jets is one of the most interesting open problems in astrophysics.
Due to relativistic amplification the radiation emitted by jets is strongly beamed in theforward direction and therefore best studied for jets pointing at small angles to the lineof sight, i.e. for blazars. Then, the radiation from the jet outshines the nucleus in mostwavelength bands.
In the following we highlight the main observational breakthroughs and the theoreticalimplications that led to the present level of understanding of blazars relying on protypicalblazars, 3C 279 which was the first discovered to emit GeV gamma-rays [25] (Section2) and Mkn 421 and Mkn 501 the first discovered to emit TeV gamma-rays [39][40](Section 3). We treat in some more detail the problems associated with TeV blazars, asthe extraordinary improvement in sensitivity occurred in the last few years and forseenin the near future drives substantial progress in the quality of observations and motivatesthe need of improved theoretical understanding (Section 4). We conclude discussing aunification scheme for the properties of blazars based on the fundamantal parameters forthe AGN engine, the black hole mass, spin and accretion rate.
3C 279: A PROTOTYPE FOR GEV BLAZARS
The discovery of high energy gamma-rays was critical in enlightening the spectralenergy distributions (SED) of blazars. It showed for the first time (Fig. 1a) that thebolometric output was dominated by the high energy emission. Moreover the gamma-
129
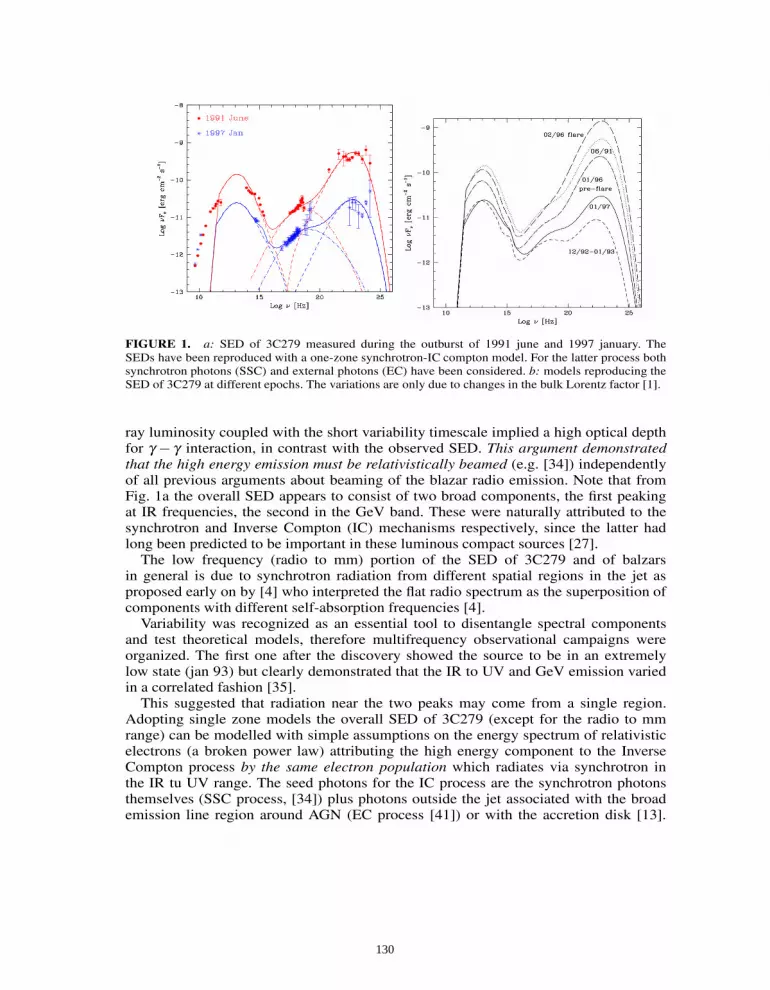
FIGURE 1. a: SED of 3C279 measured during the outburst of 1991 june and 1997 january. TheSEDs have been reproduced with a one-zone synchrotron-IC compton model. For the latter process bothsynchrotron photons (SSC) and external photons (EC) have been considered. b: models reproducing theSED of 3C279 at different epochs. The variations are only due to changes in the bulk Lorentz factor [1].
ray luminosity coupled with the short variability timescale implied a high optical depthfor γ � γ interaction, in contrast with the observed SED. This argument demonstratedthat the high energy emission must be relativistically beamed (e.g. [34]) independentlyof all previous arguments about beaming of the blazar radio emission. Note that fromFig. 1a the overall SED appears to consist of two broad components, the first peakingat IR frequencies, the second in the GeV band. These were naturally attributed to thesynchrotron and Inverse Compton (IC) mechanisms respectively, since the latter hadlong been predicted to be important in these luminous compact sources [27].
The low frequency (radio to mm) portion of the SED of 3C279 and of balzarsin general is due to synchrotron radiation from different spatial regions in the jet asproposed early on by [4] who interpreted the flat radio spectrum as the superposition ofcomponents with different self-absorption frequencies [4].
Variability was recognized as an essential tool to disentangle spectral componentsand test theoretical models, therefore multifrequency observational campaigns wereorganized. The first one after the discovery showed the source to be in an extremelylow state (jan 93) but clearly demonstrated that the IR to UV and GeV emission variedin a correlated fashion [35].
This suggested that radiation near the two peaks may come from a single region.Adopting single zone models the overall SED of 3C279 (except for the radio to mmrange) can be modelled with simple assumptions on the energy spectrum of relativisticelectrons (a broken power law) attributing the high energy component to the InverseCompton process by the same electron population which radiates via synchrotron inthe IR tu UV range. The seed photons for the IC process are the synchrotron photonsthemselves (SSC process, [34]) plus photons outside the jet associated with the broademission line region around AGN (EC process [41]) or with the accretion disk [13].
130

In the simplest model these two processes predict different variability amplitudes, alsodepending on the actual physical quantity causing the variability, e.g. radiating particles,the magnetic field or the bulk Lorentz factor [19].
A number of multifrequency campaigns [26] on 3C279 over the EGRET lifetimeshowed that both the SED and the variability of 3C279 are complex. In this sourcethe X-rays are probably due to the SSC process, while the GeV gamma-rays are dueto the EC process. Two SEDs obtained from simultaneous observations at differentepochs are shown in Fi. 1a together with models in which the synchrotron, SSC andEC components are evidenced. While the SSC component varied with amplitude similarto the synchrotron component the EC component varied with much larger amplitude.
This result yields insight into the origin of the variability. In fact an increase of theelectron population should cause the SSC component to vary more than the synchrotronone, while the EC component should vary with the same amplitude as the synchrotronone contrary to what is observed. An interesting alternative is that the variability isdue to a change in the bulk Lorentz factor of the flow. In that case, as shown in Fig.1a, the relative amplitudes of the three components can be reproduced. This model canreproduce all the measured "states" of 3C 279 (see Fig. 1b) The derived conclusionagrees with the internal shock scenario developed for Gamma-Ray Bursts and laterdiscussed in the blazar context [22] [42].
3C 279 represents a milestone in the understanding of blazars. However it is neces-sary to stress that in the quoted models the energy distribution of the radiating electronsis determined phenomenologically from the observed spectra, while a theoretical frame-work is still lacking (see section 3). Moreover, no comparable set of data exists for anyother GeV blazar. Though a number of simultaneous multifrequency observations (e.g.[45][46][20]) exist for other objects, their gamma ray flux is much fainter and the obser-vations more sporadic. In general they are consistent with the same picture, but to reallytest models on different objects the sensitivity of GLAST will be required.
MKN 421, MKN 501: PROTOTYPES OF TEV BLAZARS
Spectral Energy Distributions
The discovery by the Whipple observatory of TeV emission from Mkn 421 [39] andMkn 501 [40] represented a surprise even for blazar specialists, particularly becausethese were not bright GeV sources. However, once the overall SEDs were put together(e.g. Fig. 2a and 2b, where the X-ray and TeV data derive from simultaneous obser-vations) it appeared that in a broad sense these SEDs were analogous to those of GeVblazars, exhibiting two broad peaks, the main difference being that the first componentpeaked in the X-rays rather than in the IR and the second in the TeV rather than in theGeV band, a shift of three decades in frequency for both peaks!
The usual Synchrotron plus Inverse Compton models can be applied in interpretingthe SEDs of TeV blazars. In the latter objects the optical emission is dominated by thegalactic starlight with no evidence for the presence of an optically thick accretion diskand associated emission lines. It seems then reasonable to adopt the SSC mechanism
131

FIGURE 2. a: SED of Mkn 421 assembled with X-ray (BeppoSAX and TeV (WHIPPLE) data takensimultaneously during the 1998 campaign [36]. We also report the contribution to the synchrotron andSSC emission by electrons in different energy ranges. b: SED of Mkn 501 at the beginning and peak ofthe giant outburst in April 1997 [44].
neglecting external photons as seed photons for the IC component. The latter mayhowever become important if the bulk Lorentz factor of the flow reached extremelyhigh values, Γ � 50 [11].
Two further effects need to be considered. First The IC process likely occurs in theKlein Nishina regime [43] secondly the TeV photons can interact with IR photons alongthe line of sight to produce e � e � pairs with the Thomson cross section.
The first effect is essentially a technical problem in the computations, but affects the"intuitive" notion of a constant ratio between the frequencies of synchrotron and ICphotons emitted by electrons of given energies and therefore of the spectral similaritiesand correlations expected in the Thmson case. In the lower part of Fig. 2a we show adecomposition of the synchrotron and IC components of the model computed fro Mkn421 in which each subcomponent refers to electrons in fixed energy ranges: due to thedecline of the KN cross section the IC photons deriving from higher energy electronsare depressed with respect to what expected in the Thomson regime.
The importance of intergalactic absorption clearly depends on the intensity of thestill uncertain IR background, and may significantly affect the observed TeV spectraeven for sources as close as Mkn 421/501, introducing deviations from an "intrinsic"power law spectrum. We refer to the review of Joel Primack at this meeting for acomplete discussion of these issues. Here we wish to stress two general aspects: i)Since absorption depresses the observed radiaton at high energies, the intrinsic spectrashould be harder than observed, leading to increase the required bulk Lorentz factor. ii)If the X-ray and TeV spectra are measured simultaneously one can in principle derivethe intrinsic electron spectrum from the synchrotron (X-ray) emission and predict theintrinsic IC (TeV) spectrum . Comparison with observations will then yield constraints
132
on the optical depth of the absorbing IR background [12] [29].
Variability and correlations
Variability provides one of the best tools to investigate the emission regions in Blazars.For the particular case of TeV sources, studies conducted simultaneosly in the X-raysand TeV are of particular importance, since in the simple SSC framework one expectsthat variations in X-rays and TeV should be closely correlated, being produced byelectrons with similar energies. Indeed, assuming a typical magnetic field B � 0 � 1 Gand δ � 10, photons with energy E � 1 keV are emitted by electrons with Lorentz factorγ � 106. The same electrons will upscatter photons at energy E � γmc2 � 1 TeV.
The first observations at X-ray and TeV energies [9][7] already yielded significant ev-idence of correlation between TeV and X-ray emissions. An extreme case of variabilitywas the dramatic flare exhibited by Mkn 501 in 1997 (see Fig. 2b). Observations with theBeppoSAX satellite revealed not only a large variation in X-ray flux but also a correlatedhardening of the spectrum which caused the peak energy of the SED to increase fromthe keV to the 100 keV range. Correspondingly also the TeV spectrum hardened. Thisexceptional event clearly demonstrated that the critical energy of the radiating particlesincreased with increasing intensity, a behaviour also exhibited by Mkn421 [32].
The observations mentioned above supported the general picture on relatively longtimescales (days) but were not suitable to probe short timescales (hours or less) due toinsufficient sampling.
The first clear evidence of a correlation on short timescales was obtained duringthe intensive multifrequency campaign on Mkn 421 in 1998 [36]. A well-defined flarewas detected simultaneously both at X-ray and TeV energies and the maxima weresimultaneous within 1 hour, confirming that variations in these two bands are closelyrelated as expected in the one-zone SSC model. A detailed analysis [17] showed alsothat the frequency of the synchrotron peak correlates with the synchrotron flux (Fig.3), as already suggested by previous observations. Subsequent more extensive analyisisevidenced a similar behaviour also in other sources.
Important hints on the machanisms producing the variability can be obtained compar-ing the relative variations observed for the synchrotron and IC emissions. Observationsof Mkn 501 during the giant 1997 outburst already suggested that there is a strong cor-relation between the two components, and that the shape of the correlation depends onthe selected band (Fig. 4). Note that for Mkn 501 the OSSE and XTE-ASM bands fallabove and below the peak of the synchrotron component respectively.
Recently the quality of the data has improved enough to allow the comparison of theevolution of the X-ray and TeV emissions within a single flare. Preliminary results onMkn 421 observed with Whipple and RXTE during 2001 March [18] are stimulating.Indeed the fluxes in the two bands appear strongly correlated and, perhaps more impor-tantly, the TeV emission appears to vary more than linearly (quadratic in same cases)with respect to the X-rays, both during the rise and the decay phases of the flares. Asdiscussed in [28] this evidence (already present in the data for Mkn 501 shown in Fig 4)represents a challenge to the simple one-zone SSC model. In fact, a faster increase in the
133

FIGURE 3. Synchrotron peak energy plotted vs. the deabsorbed 0.1-10 keV flux, for X-ray data of Mkn421 taken during 1997 and 1998. The dashed line across diagram represents the best-fitting power law,with a slope 0.55 [17].
TeV than in the X-ray band can be easily obtained through the injection of new particlesin the emitting region, a quadratic relation in the decaying phase can be explained onlyassuming very specific values of the physical parameters and selecting rather specificobserving bands. If a "more than linear" correlation during the decay will be found to becommon the one zone SSC modeling will face a severe problem.
An extreme case of such kind of behavior is the “orphan” TeV flare (i.e. not accom-panied by a correspondent X-ray flare) observed in the BLLac 1ES 1959+650 [30]. Asdiscussed by [30] this event has virtually no explanation within the framework of theone-zone SSC model. A possible way out to the problem retaining the SSC model is toadmit a multi-component emission region, with a very dense subregion responsible forthe IC flare. Other alternatives include a contribution from external Compton or particu-lar geometries for the magnetic field.
THE BLAZAR SEQUENCE AND THE JET - ACCRETION DISCCONNECTION
The observations of high energy emission from blazars allowed to connect the highenergy spectra to the previously known X-ray spectra revealing systematic propertiesin the blazar SEDs. In general all the SEDs show two broad non thermal componentspeaking respectively in the FIR to X-ray range and in the soft gamma-ray to TeVrange. Most importantly there appears to be a "coherence" in the overall SEDs, inthe sense that if the first component peaks at the lower/higher end of the frequencyrange indicated above, the peak of the second component shifts accordingly, i.e. theratio between the peak frequencies of the two components is approximately constant.Moreover within the available complete samples, objects of high luminosity tend to havelow peak frequencies while objects with lower luminosity have higher peak frequencies[16] (Fig. 5a). Though admittedly the correlation may suffer from the paucity and
134

FIGURE 4. Correlations made between the X–ray (fromby ASM and OSS) and the TeV gamma–rayfluxes (from Whipple) measured in Mkn 501 during the high-state activity of 1997. The dashed lines onthis panel show a template for the linear and the quadratic correlation [28].
selection biases of the present samples, the systematic shift to higher energies of thepeak frequencies with decreasing (isotropic) luminosity is truely remarkable and leadsto the idea of a "spectral sequence", i.e. a one parameter family of SEDs.
An important question is the physical understanding of the spectral sequence. In asystematic modelling of the objects along the sequence [21][23] it is found that in higherluminosity objects the energy density of external photons is increasingly dominant,leading the EC process to overtake the SSC. No systematic trend is apparent in thederived Doppler factors along the sequence. Thus the sequence does not appear to be dueto a varying degree of relativistic beaming. The lower peak frequency of high luminositysources appears to be due to lower particle energies while the magnetic field is largerthan in lower luminosity objects (Fig. 5b).
These results led to propose that the energy of electrons emitting at the peak is due toa balance between losses and acceleration [21]. In the powerful sources losses are largerand thus the resulting energy of the electrons is lower. If this phenomenological schemecan account for the general trend observed in the peak energies of the SED, the detailedshapes of the spectra are not well understood. In particular is not clear how to producean electron distribution formed by two power-laws with a difference in slope larger than1, as inferred from the observed spectral breaks.
Moreover there is no “theoretical” reason at this stage as to why high luminositysources should have larger radiation energy densities. In fact for objects accreting ata fixed fraction of the Eddington rate, the luminosity scales with the mass, but lengthscales also scale with the mass so that "densities" are usually larger in lower mass/lowerluminosity objects.
An important related question is the connection between the jet and the accretion disk.In the blazar sequence the signatures of a bright accretion disk (emission lines and theblue bump) are clearly present at the high luminosity end (FSRQ) and tend to disappearat lower luminosities (BL Lac objects). Originally this was attributed to a higher degree
135

421
501
2155
2344
2344
1426
FIGURE 5. a: The blazar sequence [16][14].b: The correlation [23] between the Lorentz factor ofparticles emitting at the peak (γb) and the energy density in radiation and magnetic field. See text for adiscussion.
of relativistic beaming in BL Lac objects enhancing the non thermal continuum withrespect to the more isotropic components of the nuclear emission. The latter explanationis not tenable in the new scheme. We are rather lead to infer that the brightest disks areassociated with the brightest jets.
From a theoretical point of view a jet may be produced via magnetohydrodynamicprocesses directly from the accretion flow [5] or involve a substantial role of the blackhole spin. We simply recall that even in the latter case, first discussed by Blandford andZnajek (BZ [3]], the production of the jet is related to the accretion flow which shouldprovide the magnetic field necessary for the BZ process.
A simple estimate through the BZ formula in the case of a purely spherical accretionmodel in equipartition gives the following relation
PBZ � gMc2a2 (1)
where PBZ is the extracted (jet) power, Pacc � Mc2 is the accretion power, a is theadimensional hole angular momentum. The coefficient g is of order 1/64 in the sphericalcase, but in fact is a highly uncertain number since it depends strongly on the fieldconfiguration. Eq. 1 shows that the extracted jet power depends on the accretion rate, inthe simplest approximation the two are proportional.
Following an empirical approach, one can work backwards estimating the jet powerfrom the SEDs of the blazar region (inner jet) and the accretion power from the tra-ditional signatures of the accretion disk (the blue bump and or the emission lines) inthe SEDs of the nuclei, and compare the two. This was done for a small “sample” ofFSRQ with a good measure of the non thermal (blazar) SEDs up to at least hard X-raysobtained with BeppoSAX [38]. For BL Lac sources (again selected to have adequateobservational coverage of their SEDs) upper limits on the disk luminosity were inferred,except for BL Lac itself, which showed a measurable Hα line. The results are summa-
136

FIGURE 6. Luminosities of blazar jets are plotted vs. luminosities of the associated accretion disks(filled simbols). For open simbols see text
rized in Fig. 6, where the (rest frame) luminosity of the jet, Ljet, is compared with theluminosity of the disk, Ldisk. The figure shows that at high luminosities the two valuesare of the same order.
At such high lumniosities the estimated radiative efficiencies of the jet ([38]) areof order 10% as is the efficiency of a "standard" optically thick disk, thus the powertransported by the jet, Pjet , is of the same order as the accretion power, Pacc. Thisalready poses a stringent requirement as to how to supply a strong enough field forthe BZ process even for maximal rotation (a � 1, (e.g. [24], [31]).
On the other hand, the dominance of the jet luminosity for lower power objects canonly be understood if the disk is radiatively inefficient, as expected for low accretionrates (in Eddington units). On the equality line drawn for reference in the figure wemark (empty circles) the jet and disk luminosities corresponding to an accretion rate of10 � 2 mEdd for 109 and 108 M � respectively (with the assumption Pjet � Pacc and 10%radiative efficiency for both). Similarly we show jet and disk luminosities for 10 � 3 mEddfor the same masses computed assuming the disc radiative efficiency predicted by theADAF model [33] . Note that the points corresponding to the lower accretion rates arebroadly consistent with the BL Lac region.
In summary the luminosity range spanned by the objects in Fig. 6 can be interpretedas a sequence of decreasing accretion rates, for objects of essentially similar (large)mass [37]. Mass measurements of a number of nearby BL Lacs directly support thishypothesis [2],[15]. It would be interesting to provide reliable mass estimates for all theobjects so that the diagram could be best drawn in normalised luminosities.
The larger photon energy density around the most powerful jets, a result derived fromradiative modeling of the “blazar sequence”, i.e. the systematic trend of the blazar SEDsto peak at higher energies with decreasing luminosities, [21], [8], can then be accountedfor in terms of a larger radiative efficiency of more powerful disks. Finally also theevolutionary properties if the blazar population may find an astrophysical interpretation
137
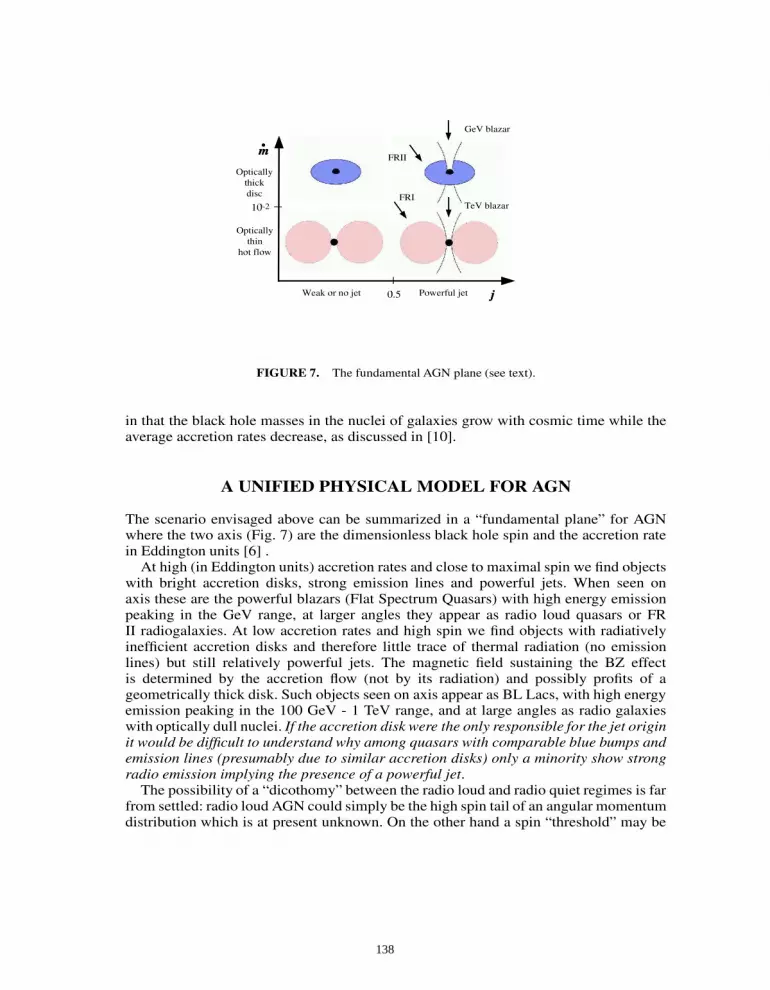
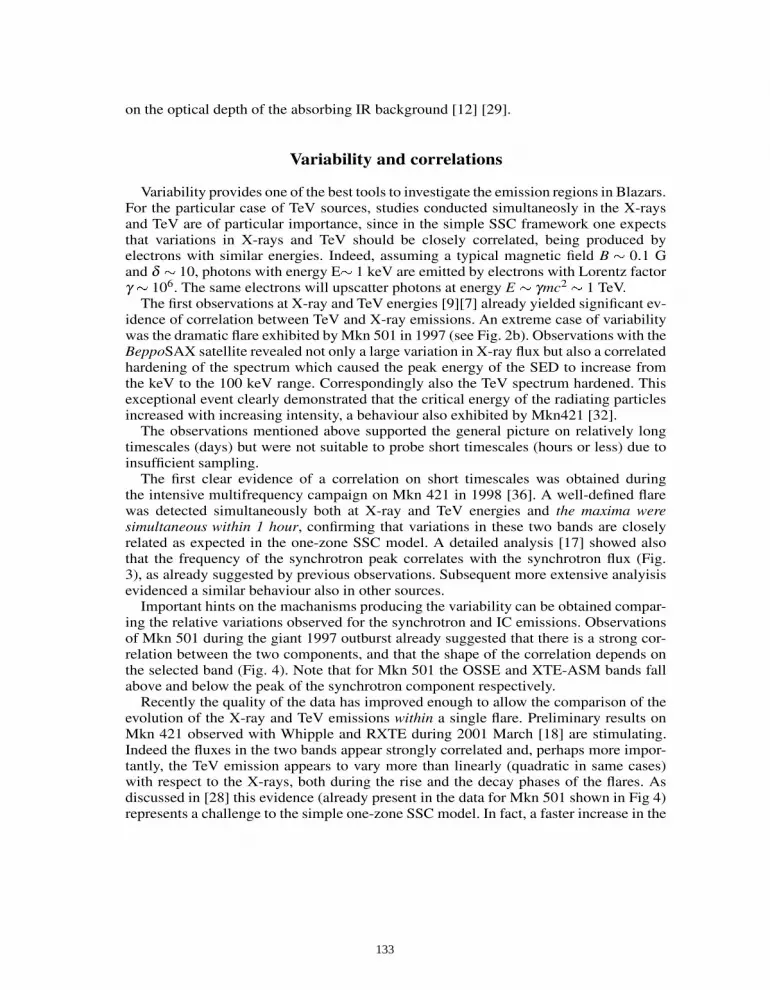
FIGURE 7. The fundamental AGN plane (see text).
in that the black hole masses in the nuclei of galaxies grow with cosmic time while theaverage accretion rates decrease, as discussed in [10].
A UNIFIED PHYSICAL MODEL FOR AGN
The scenario envisaged above can be summarized in a “fundamental plane” for AGNwhere the two axis (Fig. 7) are the dimensionless black hole spin and the accretion ratein Eddington units [6] .
At high (in Eddington units) accretion rates and close to maximal spin we find objectswith bright accretion disks, strong emission lines and powerful jets. When seen onaxis these are the powerful blazars (Flat Spectrum Quasars) with high energy emissionpeaking in the GeV range, at larger angles they appear as radio loud quasars or FRII radiogalaxies. At low accretion rates and high spin we find objects with radiativelyinefficient accretion disks and therefore little trace of thermal radiation (no emissionlines) but still relatively powerful jets. The magnetic field sustaining the BZ effectis determined by the accretion flow (not by its radiation) and possibly profits of ageometrically thick disk. Such objects seen on axis appear as BL Lacs, with high energyemission peaking in the 100 GeV - 1 TeV range, and at large angles as radio galaxieswith optically dull nuclei. If the accretion disk were the only responsible for the jet originit would be difficult to understand why among quasars with comparable blue bumps andemission lines (presumably due to similar accretion disks) only a minority show strongradio emission implying the presence of a powerful jet.
The possibility of a “dicothomy” between the radio loud and radio quiet regimes is farfrom settled: radio loud AGN could simply be the high spin tail of an angular momentumdistribution which is at present unknown. On the other hand a spin “threshold” may be
138

required to launch a relativistic jet. The value of this threshold would probably dependon the accretion rate, magnetic structure and angular momentum in the inner disk andcould be lower for largely subEddington radiatively inefficient disks.
REFERENCES
1. Ballo, L., et al. 2002, ApJ, 567, 502. Barth, A. J. et al. 2002, ApJ, 566, L133. Blandford, R. D. & Znajek, R. L. 1977, MNRAS, 179, 4334. Blandford, R. D. & Königl, A. 1979, ApJ, 232, 345. Blandford, R. D. & Payne, D. G. 1982, MNRAS, 199, 8836. Blandford, R. D. 1990, Saas-Fee Advanced Course 20. Lecture Notes 1990, XII, 280 pp. 97,
Springer-Verlag.7. Buckley, J. H. et al. 1996, ApJ, 472, L98. Böttcher, M. & Dermer, C. D. 2002, ApJ, 564, 869. Catanese, M. et al. 1997, ApJ, 487, L14310. Cavaliere, A. & D’Elia, V. 2002, ApJ, 571, 22611. Celotti, A., Fabian, A. C., & Rees, M. J. 1998, MNRAS, 293, 23912. Costamante, L., Aharonian, F., Horns, D., & Ghisellini, G. 2004, New Astr, Rev. 48, 46913. Dermer, C. D. & Schlickeiser, R. 1993, ApJ, 416, 45814. Donato, D., Ghisellini, G., Tagliaferri, G., & Fossati, G. 2001, A&A, 375, 73915. Falomo, R. et al. 2003, MNRAS, 343, 50516. Fossati, G., et al. 1998, MNRAS, 299, 43317. Fossati, G., et al. 2000, ApJ, 541, 16618. Fossati, G., Buckley, J., Edelson, R., A., et al., 2004, NewAR, 48, 419F19. Ghisellini, G. & Maraschi, L. 1996, AIP Conf. Proc. 100, 43620. Ghisellini, G., et al. 1997, A&A, 327, 6121. Ghisellini, G., et al. 1998, MNRAS, 301, 45122. Ghisellini, G. 1999, Astronomische Nachrichten, 320, 23223. Ghisellini, G., Celotti, A., & Costamante, L. 2002, A&A, 386, 83324. Ghosh, P. & Abramowicz, M. A. 1997, MNRAS, 292, 88725. Hartman, R. C. et al. 1992, ApJ, 385, L126. Hartman, R. C., et al. 2001, ApJ, 553, 68327. Hoyle, F. et al. 1966, Nature, 209, 75128. Katarzynski, K. et al. 2004, A&A submitted29. Konopelko, A. et al. 2003, ApJ, 597, 85130. Krawczynski, et al., 2004, ApJ, 601, 15131. Livio, M., Ogilvie, G. I., & Pringle, J. E. 1999, ApJ, 512, 10032. Macomb, D. J., et al. 1995, ApJ, 449, L9933. Mahadevan, R. 1997, ApJ, 477, 58534. Maraschi, L. et al. 1992, ApJ, 397, L535. Maraschi, L., et al. 1994, ApJ, 435, L9136. Maraschi, L. et al. 1999, ApJ, 526, L8137. Maraschi, L. 2001, AIP Conf. Proc. 586, 40938. Maraschi, L. & Tavecchio, F. 2003, ApJ, 593, 66739. Punch, M. et al. 1992, Nature, 358, 47740. Quinn, J. et al. 1996, ApJ, 456, L8341. Sikora, M., Begelman, M. C., & Rees, M. J. 1994, ApJ, 421, 15342. Spada, M., et al. 2001, MNRAS,325, 155943. Tavecchio, F., Maraschi, L., & Ghisellini, G. 1998, ApJ, 509, 60844. Tavecchio, F., et al. 2001, ApJ, 554, 72545. Wagner, S.J. et al. 1995, ApJ, 454, L9746. Wagner, S.J. et al. 1995, A&A, 298, 688
139