gadolinium-conjugated tio2-dna oligonucleotide nanoconjugates show prolonged intracellular retention...
TRANSCRIPT

Gadolinium conjugated TiO2-DNA oligonucleotidenanoconjugates show prolonged intracellular retention periodand T1-weighted contrast enhancement in Magnetic Resonanceimages
Tatjana Paunesku, PhD1,2,3, Tianyi Ke, PhD4, Rohan Dharmakumar, PhD3, Nicole Mascheri,MS3, Aiguo Wu, PhD1, Barry Lai, PhD5, Stefan Vogt, PhD5, Jörg Maser, PhD5, Kenneth Thurn,BS1, Barbara Szolc-Kowalska, MD1, Andrew Larson, PhD3, Raymond C Bergan, PhD2,6,Reed Omary, MD2,3, Debiao Li, PhD3, Zheng-Rong Lu, PhD4, and Gayle E. Woloschak,PhD1,2,3,7,*
1 Department of Radiation Oncology, Feinberg School of Medicine, Northwestern University, Chicago, IL60611
2 Robert H. Lurie Comprehensive Cancer Center, Northwestern University, Chicago, IL 60611
3 Department of Radiology, Feinberg School of Medicine, Northwestern University, Chicago, IL 60611
4 Department of Pharmaceutics & Pharmaceutical Chemistry, University of Utah, Salt Lake City, Utah 84108
5 X-ray Science Division, Advanced Photon Source, Argonne National Laboratory, Argonne, IL 60439
6 Department of Medicine, Northwestern University, Chicago, IL 60611
7 Department of Cell and Molecular Biology, Northwestern University, Chicago, IL 60611
AbstractNanoconjugates composed of TiO2 nanoparticles, DNA oligonucleotides and a gadolinium contrastagent were synthesized for use in magnetic resonance imaging. Transfection of cultured cancer cellswith these nanoconjugates showed them to be superior to the free contrast agent of same formulationwith regard to 1) intracellular accumulation, 2) retention and 3) subcellular localization. Our resultshave shown that 48 hours after treatment, the concentration of gadolinium in nanoconjugate treatedcells was 1000 fold higher compared to cells treated with contrast agent alone. Consequently, T1-weighted contrast enhancements were observed in cells treated with nanoconjugates but not in cellstreated by the contrast agent alone. This type of nanoconjugate with increased retention time, Gdaccumulation and intracellular delivery may find its use in gadolinium neutron-capture cancertherapy.
Keywordsnanoconjugates; magnetic resonance imaging; subcellular targeting
*to whom reprint requests should be addressed: [email protected].
NIH Public AccessAuthor ManuscriptNanomedicine. Author manuscript; available in PMC 2009 September 1.
Published in final edited form as:Nanomedicine. 2008 September ; 4(3): 201–207. doi:10.1016/j.nano.2008.04.004.
NIH
-PA Author Manuscript
NIH
-PA Author Manuscript
NIH
-PA Author Manuscript

IntroductionMagnetic resonance imaging (MRI) is a non- or minimally- invasive method for in vivo imagingthat permits down to a micrometer spatial resolution (1). Imaging using gadolinium (Gd) basedMR contrast agents requires, under most circumstances, administration of a contrast agenteither simultaneously with or shortly followed by imaging. Some of the recently developedGd containing contrast agents (CA) have increased molecular weight and retention times. Forexample: gadolinium oxide nanoparticles (2,3) and nanoparticle filled carbon nanohorns (3),GdPO4 dextran coated nanorods (4), Gd loaded nanoparticles (5,6), micelles (7), liposomes(8), dendrimers (9), antibody-functionalized vesicles (10), and protein shells such as viralcapsids (11) or apoferritin (12) have in some cases peak signal at 5 hours post injection (12).Imaging at time periods in excess of 24 hours post delivery is generally not possible forgadolinium-based contrast agents due to their rapid clearance (13). Prolonged retention ofcontrast agents in a tissue may be desirable since this would decrease the dependence of MRsignals on blood-flow and tissue-perfusion factors, and comparisons of MR imagesimmediately post delivery with the signal achieved at 24 hours or later post-delivery may bringa wealth of new approaches to MRI diagnostics.
In the work described here we used TiO2 nanoparticles to achieve intracellular and intranuclear,locally high Gd concentration, reaching a 1000-fold increase in Gd quantity on a per cell basisat 48 hours post-delivery when compared to the un-conjugated CA compound. The use ofTiO2 nanoparticles as scaffolding provided us with chemistry solutions to functionalize thenanoconjugates and make them specific for selected subcellular compartments (14–18) whichallows retention of nanoconjugates in subcellular compartments of up to several days. In theexperiments presented here, cells treated with nanoconjugates of TiO2-DNA oligonucleotide-Gd contrast agent (TiO2-DNA-Gd) were imaged in cells by MRI 24 or 48 hours post-treatment.
Materials and MethodsSynthesis of contrast agent
The first step of synthesis process was synthesis of poly (L-glutamic acid) (PGA, Mn = 69.1KDa, Mw = 80.8KDa,) using the procedure described by Idelson (19). Poly(L-glutamic acid)N-hydroxysuccinimide esters (PGA-OSu) (1) and 1,4,7,10-tetraazacyclododecane-1,4,7-tris(acetic acid)-10-(acetic acid-1,6-hexanediamine monoamide (2) were prepared according tothe literature (20). The other reagents were purchased from Sigma-Aldrich (St. Louis, MO).Spectra/Por® 6 membrane (MWCO: 25,000) was purchased from Spectrum Laboratory, Inc.(Rancho Dominguez, CA).
The molecular weights of the polymers were determined by size exclusion chromatography(SEC) with poly((N-2-hydroxypropyl)methacrylamide) calibration on an AKTA FPLC systemwith a Superose 6 column, UV and refractive index detectors. The Gd wt % content in thecopolymers was determined by inductively coupled plasma-optical emission spectroscopy(ICP-OES) (Perkin-Elmer, Norwalk, CT, Optima 3100XL). The content of dopamine in theconjugate was determined by UV spectroscopy.
PGA-1,6-hexanediamine-(Gd-DOTA)/Dopamine conjugate (5) was prepared according toFigure 1. Briefly, PGA-OSu (1, 80 mg), 1,4,7,10-tetraazacyclododecane-1,4,7-tris(aceticacid)-10-(acetic acid-1,6-hexanediamine monoamide) (2, 373 mg, 0.34 mmol), dopamine (3,5.0 mg, 0.036 mmol), p-(dimethylamino)pyridine (55 mg, 0.45 mmol) and 2.0 mLtriethylamine were added sequentially into 15 ml anhydrous DMF with stirring. The mixturewas stirred overnight at room temperature and the solvent was then evaporated under vacuum.The product was precipitated from acetone. The precipitate was then dissolved in deionizedwater and the pH of the solution was adjusted to 5~6. An excess of Gd(OAc)3 (200 mg) was
Paunesku et al. Page 2
Nanomedicine. Author manuscript; available in PMC 2009 September 1.
NIH
-PA Author Manuscript
NIH
-PA Author Manuscript
NIH
-PA Author Manuscript

added to the solution and the mixture was stirred overnight at room temperature. XylenolOrange indicator was added into the solution and EDTA was then added until the pink colordisappeared. The polymer conjugate was purified by dialysis with Spectra/Por® 6 membrane(MWCO: 25,000). The solution was lyophilized to a pink product, which was dissolved indistilled water again and treated with sodium dithionite. After dialysis and lyophilization, acolorless final product was obtained. The yield was 67 mg. The molecular weight of theconjugate is 50.9 kDa (PDI = 1.17). Based on weight content (9% for Gd, 2.7% for dopamine),each molecule of contrast agent contains 28 molecules of gadolinium and 10 molecules ofdopamine. Due to the rigidity and bulk of the contrast agent molecule, we anticipate that sterichindrance will make it unlikely that more than one dopamine per molecule of contrast agentestablishes interactions with the TiO2 nanoparticle surface.
Synthesis of nanoparticles and nanoconjugatesTiO2 nanoparticles were prepared by a modification of a procedure published by Rajh andothers (14,16,21). For the experiments described here 0.8 μM (TiO2) 6 nm nanoparticles wereused. The concentration of the nanoparticles was determined by ICP-MS. The size, dispersaland uniformity of nanoparticles were examined by atomic force microscopy and transmissionelectron microscopy.
Uncoated TiO2 nanoparticles were mixed with DNA oligonucleotides (synthesized withglycerol on 3′ end of the molecule) in the ratio (TiO2):oligonucleotide=1:7 (corresponding toapproximately 1:0.01 ratio if number of active nanoparticle surface sites is considered). Theoligonucleotide sequence was matching the sense stand of the R18S ribosomal RNA gene: 5′ttccttggatgtggt-glycerol 3′ (R18Ss) universally present in mammalian cells (16). OH groups ofglycerol bound loosely to the surface of the nanoparticles, similarly to the OH groups ofphosphates (22). Such nanoconjugates were mixed with Gd CA in 1:69 molar ratio (for activesurface sites ratio of 1:0.1). Because each CA molecule contained more than one Gd atom,with this stoichiometry we expected that the final molar ratio of (TiO2):Gd could be up to1932:1. Using Inductively Coupled Plasma Mass Spectrometry (ICP-MS), however, we foundthe actual ratio to be maximally 630:1. This may be a result of steric hindrance between CAmolecules as they compete for binding sites on the TiO2 nanoparticle surface. Conjugationbetween the dopamine-Gd CA molecule and TiO2 was immediate and the color ofnanoparticonjugates upon binding changed from transparent-whitish to ochre; this wasexpected because binding all active surface sites of TiO2 with dopamine causes a color changeto deep brown (21). Completed nanoconjugates were dialyzed in 10 mM sodium phosphate,purified and concentrated by centrifugation to 4 μM (TiO2-DNA-Gd) and stored at 4 °C.
Cell culture and nanoconjugate transfectionsFor transfection experiments MCF-7/W8/WS8 breast cancer cells (American Type CultureCollection ATCC) and PC3-M prostate cancer cells (ATCC) were grown in a 5% CO2humidified atmosphere in RPMI1640 cell culture medium (this and all other standard cellculture supplements were Invitrogen/Gibco) supplemented with 10% fetal bovine serum andantibiotic-antimycotic. MCF-7/W8 media also contained insulin at a concentration of 10 μg/ml (Sigma), 200 mM L-glutamine and 10 mM Non-essential Amino Acids; while PC3-M mediaalso contained 25 μg/ml G418 and 2.4 mg/ml HEPES. Nearly confluent cells were serumstarved for 16 to 20 hours before transfection or treatment.
For SuperFect transfection, 60 μL of SuperFect reagent (Qiagen) and 300 μL of any one of thefollowing: (1) Gd CA, (2) TiO2 nanoparticles, or (3) TiO2-DNA-Gd nanoconjugates; thesemixtures were applied onto 16 million cells each. Final concentrations of these agents in themedia were (1) 144 μM Gd; (2) 0.12 μM TiO2 nanoparticles, or (3) TiO2-DNA-Gdnanoconjugates wherein TiO2 nanoparticles were 0.12 μM and Gd was 75.6 μM in
Paunesku et al. Page 3
Nanomedicine. Author manuscript; available in PMC 2009 September 1.
NIH
-PA Author Manuscript
NIH
-PA Author Manuscript
NIH
-PA Author Manuscript

concentration. Media were exchanged for fresh complete cell media 24 hours later and,following an additional 24 hour incubation, cells were harvested for imaging.
For transfection by electroporation, cells were collected by trypsinization (0.05% trypsin,Invitrogen/Gibco) and resuspended in MZB solution (Tritech, Carlsbad, CA). For eachelectroporation: mix of 106 cells and 5 μl of nanoconjugate each was electroporated using theMammozapper™ apparatus (Tritech, Carlsbad, CA) following the manufacturer’s instructions.The cells were placed in complete medium and allowed to grow for 24 hours before harvesting.
In all cases, cells harvested for MRI were embedded in 300 μL agarose phantoms. Once theMR imaging was completed, these phantoms were used for ICP-MS and/or preparation ofparaffin embedded samples for sectioning and imaging by X-ray fluorescence imaging.
Magnetic Resonance ImagingIn order to prepare samples for MRI, 150 μl of Hank’s balanced buffered salt solution (HBBS;Invitrogen/Gibco) containing cells were mixed with 2% agarose melted in 150 μl of HBBS.Cells in agarose solidified as a plug and were transferred into tubes, placed in a water bath andimaged using a 1.5 T Siemens Sonata system (Erlangen, Germany) with a four channel headcoil for signal reception and body coil for excitation. T1 of each sample was measured usingan inversion recovery sequence with repetition time (TR) = 4000 ms and inversion times of 50,200, 500, 800, 1000, 1200, 1500, and 2000 ms. Other scan parameters were: field of view =125 × 200 mm2; acquisition matrix = 115 × 192; readout bandwidth = 965 Hz/pixel; slicethickness = 5 mm; all images were acquired in the coronal orientation.
For data analysis the raw data of signal intensity versus TI were fit to the equation:
Variables “A” and “C” are free parameters of the model. The confidence interval wasdetermined statistically; R2 indicates goodness of fit. The TI corresponding to the lowest signalintensity (TInull) is an indication of the T1 value; a relationship estimated by the equation: T1= TInull / ln(2). T1 values determined using the results of the equation fit and the null pointrelationship are listed in Table 1. Signal intensity, a quantitative metric of relative brightness,was measured with a circular region-of-interest within each sample.
X-ray fluorescence imagingAgarose phantoms with cells used for MRI were embedded in paraffin and sectioned. Fivemicron thick sections were placed on silicon nitride (Si3N4) windows (Silson, UK). K alphacharacteristic X-ray fluorescence of elements between P and Zn and L alpha shell characteristicX-ray fluorescence of Gd were mapped simultaneously in 2D using an ultra-LEGe energydispersive detector (Canberra, Meriden, CT) (14,16,17). The XFM facility at the 2-ID-Dbeamline at the Advanced Photon Source at Argonne National Laboratory was used to producehard X-rays with 10 keV energy were monochromatized and focused to a beam spot ~0.3×0.2μm. The fluorescence spectra were acquired at every pixel and fitted with modified Gaussianscorresponding to X-ray fluorescence lines. Elemental quantification against NBS thin filmstandards 1832 and 1833 (NIST, Gaithersburg, MD) and co-localization of elemental signalswere investigated using MAPS program (23).
ResultsMRI measurements were performed with PC3-M or MCF7 cells, 24 or 48 hours post-treatment,respectively. These two different types of cells were either transfected by electroporation or
Paunesku et al. Page 4
Nanomedicine. Author manuscript; available in PMC 2009 September 1.
NIH
-PA Author Manuscript
NIH
-PA Author Manuscript
NIH
-PA Author Manuscript
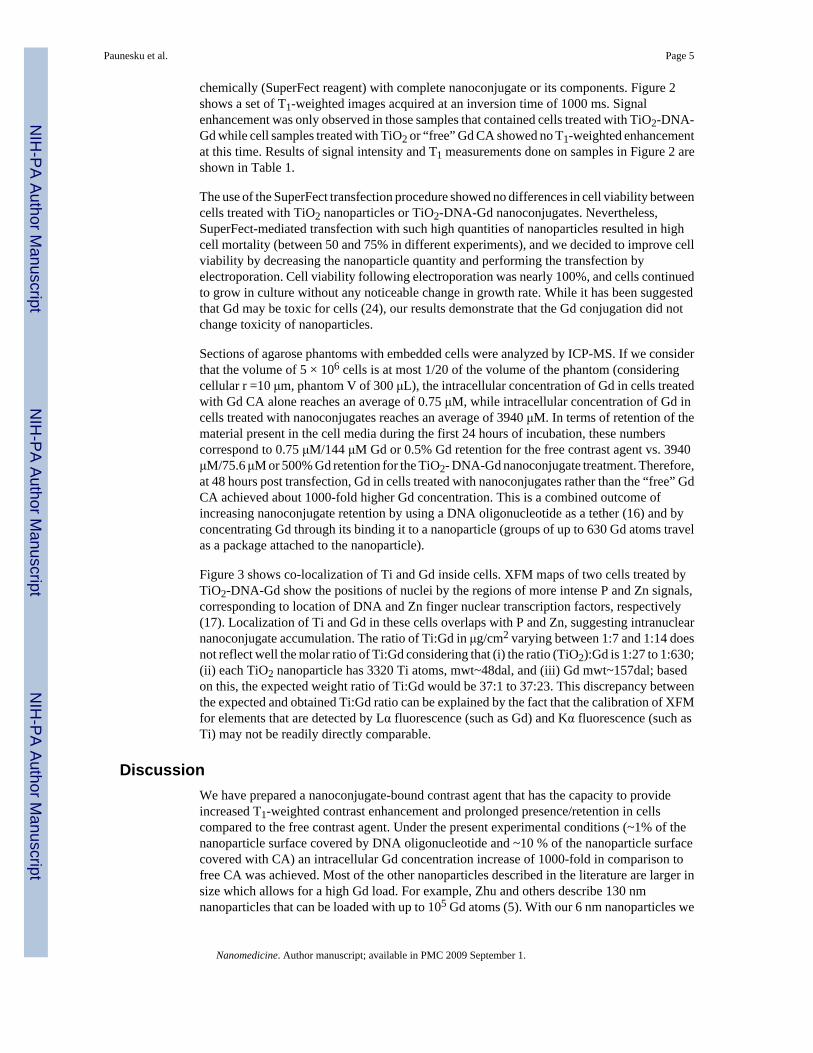
chemically (SuperFect reagent) with complete nanoconjugate or its components. Figure 2shows a set of T1-weighted images acquired at an inversion time of 1000 ms. Signalenhancement was only observed in those samples that contained cells treated with TiO2-DNA-Gd while cell samples treated with TiO2 or “free” Gd CA showed no T1-weighted enhancementat this time. Results of signal intensity and T1 measurements done on samples in Figure 2 areshown in Table 1.
The use of the SuperFect transfection procedure showed no differences in cell viability betweencells treated with TiO2 nanoparticles or TiO2-DNA-Gd nanoconjugates. Nevertheless,SuperFect-mediated transfection with such high quantities of nanoparticles resulted in highcell mortality (between 50 and 75% in different experiments), and we decided to improve cellviability by decreasing the nanoparticle quantity and performing the transfection byelectroporation. Cell viability following electroporation was nearly 100%, and cells continuedto grow in culture without any noticeable change in growth rate. While it has been suggestedthat Gd may be toxic for cells (24), our results demonstrate that the Gd conjugation did notchange toxicity of nanoparticles.
Sections of agarose phantoms with embedded cells were analyzed by ICP-MS. If we considerthat the volume of 5 × 10⁶ cells is at most 1/20 of the volume of the phantom (consideringcellular r =10 μm, phantom V of 300 μL), the intracellular concentration of Gd in cells treatedwith Gd CA alone reaches an average of 0.75 μM, while intracellular concentration of Gd incells treated with nanoconjugates reaches an average of 3940 μM. In terms of retention of thematerial present in the cell media during the first 24 hours of incubation, these numberscorrespond to 0.75 μM/144 μM Gd or 0.5% Gd retention for the free contrast agent vs. 3940μM/75.6 μM or 500% Gd retention for the TiO2- DNA-Gd nanoconjugate treatment. Therefore,at 48 hours post transfection, Gd in cells treated with nanoconjugates rather than the “free” GdCA achieved about 1000-fold higher Gd concentration. This is a combined outcome ofincreasing nanoconjugate retention by using a DNA oligonucleotide as a tether (16) and byconcentrating Gd through its binding it to a nanoparticle (groups of up to 630 Gd atoms travelas a package attached to the nanoparticle).
Figure 3 shows co-localization of Ti and Gd inside cells. XFM maps of two cells treated byTiO2-DNA-Gd show the positions of nuclei by the regions of more intense P and Zn signals,corresponding to location of DNA and Zn finger nuclear transcription factors, respectively(17). Localization of Ti and Gd in these cells overlaps with P and Zn, suggesting intranuclearnanoconjugate accumulation. The ratio of Ti:Gd in μg/cm2 varying between 1:7 and 1:14 doesnot reflect well the molar ratio of Ti:Gd considering that (i) the ratio (TiO2):Gd is 1:27 to 1:630;(ii) each TiO2 nanoparticle has 3320 Ti atoms, mwt~48dal, and (iii) Gd mwt~157dal; basedon this, the expected weight ratio of Ti:Gd would be 37:1 to 37:23. This discrepancy betweenthe expected and obtained Ti:Gd ratio can be explained by the fact that the calibration of XFMfor elements that are detected by Lα fluorescence (such as Gd) and Kα fluorescence (such asTi) may not be readily directly comparable.
DiscussionWe have prepared a nanoconjugate-bound contrast agent that has the capacity to provideincreased T1-weighted contrast enhancement and prolonged presence/retention in cellscompared to the free contrast agent. Under the present experimental conditions (~1% of thenanoparticle surface covered by DNA oligonucleotide and ~10 % of the nanoparticle surfacecovered with CA) an intracellular Gd concentration increase of 1000-fold in comparison tofree CA was achieved. Most of the other nanoparticles described in the literature are larger insize which allows for a high Gd load. For example, Zhu and others describe 130 nmnanoparticles that can be loaded with up to 105 Gd atoms (5). With our 6 nm nanoparticles we
Paunesku et al. Page 5
Nanomedicine. Author manuscript; available in PMC 2009 September 1.
NIH
-PA Author Manuscript
NIH
-PA Author Manuscript
NIH
-PA Author Manuscript

found loading of up to 630 Gd atoms per nanoparticle. Unlike larger nanoparticles, however(18), nanoconjugates used in this study are sufficiently small to be easily taken up by the cells,as shown. Nanoparticles in excess of 20 nm experience difficulties in cellular uptake (18), andthe 130 nm nanoparticles coated with Gd may be expected to remain in the space between cells.Furthermore, due to an oligonucleotide that recognized intracellular target, nanoconjugatesdescribed here are endowed with long intracellular retention times (16); while the CA agentused on its own shows minimal long-term tissue retention (20). In addition, nanoparticlesdescribed here still have a large number of potential binding sites for other molecules that canfunctionalize them for additional boost to tumor uptake and retention. For example, coatingwith folic acid facilitates tumor cell internalization and retention of other types of Gd-nanoparticles tested in vivo (6). In the future, we too may attempt to use folic acid or glucoseto target these nanoconjugates to tumor tissues in vivo. Both molecules possess free OH groupsthat could be used to functionalize TiO2 nanoparticles. Glucose in particular may be aninteresting molecule, since it has been used successfully for tumor-specific imaging by positronemission tomography. It is possible that the ability to use CA with long tumor retention willenable development of new procedures for MR imaging, the benefits of which we may not beaware of at this time.
The nanoconjugate with Gd contrast agent may provide us with a future opportunity to compareimmediate MRI signal gain (dependent upon vascular permeability and tissue perfusion) withdelayed MRI signal (>24 hours post treatment; dependent on cellular uptake of thenanoconjugate). If retention of nanoconjugates for prolonged periods of time is associated withtarget specific interaction between nanoconjugate and cells, we can achieve both signalamplification (T1-weighted enhancements) and cell specific delivery. Moreover, if sufficientconcentration of 157Gd can be achieved (157Gd makes about 16% of natural Gd(III)), especiallyin close proximity to its primary target—nuclear DNA, this type of treatment could be used asa preparatory step for neutron capture therapy. Neutron capture therapy leads to localproduction of high linear energy transfer radiation, with subsequent production of Augerelectrons (8,25,26). Due to target dependent retention of nanoconjugate associated Gd, ifneutron capture therapy is to be attempted, target cells would be by the most affected by thistreatment, while normal tissues would suffer very limited radiation damage. By altering thecoating of the nanoconjugates we can change the intensity of the MR signal (more or less Gdcontrast agent can be attached per nanoparticle); and/or change the specificity of thenanoconjugate for homing into different cell types or subcellular localities (by changing theoligonucleotide sequence or adding other conjugates onto the nanoparticle surface). Thesetypes of nanoconjugate modulations could further increase usefulness of Gd containingnanoconjugates in imaging and therapy.
Supplementary MaterialRefer to Web version on PubMed Central for supplementary material.
AcknowledgementsThis work was supported in part by the following NIH grants: CA107467, EB002100, P50 CA89018, U54CA119341,by DOE FG02-04 ER 63920 and Siemens Medical Solutions. Use of the Advanced Photon Source was supported bythe U. S. Department of Energy, Office of Science, Office of Basic Energy Sciences, under Contract No. W-31-109-Eng-38.
References1. Fuster V, Kim RJ. Frontiers in cardiovascular magnetic resonance. Circulation 2005;112(1):135–144.
[PubMed: 15998698]
Paunesku et al. Page 6
Nanomedicine. Author manuscript; available in PMC 2009 September 1.
NIH
-PA Author Manuscript
NIH
-PA Author Manuscript
NIH
-PA Author Manuscript

2. McDonald MA, Watkin KL. Investigations into the physicochemical properties of dextran smallparticulate gadolinium oxide nanoparticles. Acad Radiol 2006;13(4):421–427. [PubMed: 16554221]
3. Miyawaki J, Yudasaka M, Imai H, Yorimitsu H, Isobe H, Nakamura E, et al. Synthesis of ultrafineGd2O3 nanoparticles inside single-wall carbon nanohorns. J Phys Chem B 2006;110(11):5179–5181.[PubMed: 16539444]
4. Hifumi H, Yamaoka S, Tanimoto A, Citterio D, Suzuki K. Gadolinium-based hybrid nanoparticles asa positive MR contrast agent. J Amer Chem Soc 2006;128(47):15090–15091. [PubMed: 17117851]
5. Zhu DH, White RD, Hardy PA, Weerapreeyakul N, Sutthanut K, Jay M. Biocompatible nanotemplate-engineered nanoparticles containing gadolinium: Stability and relaxivity of a potential MRI contrastagent. J Nanosci Nanotech 2006;6(4):996–1003.
6. Oyewumi MO, Yokel RA, Jay M, Coakley T, Mumper RJ. Comparison of cell uptake, biodistributionand tumor retention of folate-coated and PEG-coated gadolinium nanoparticles in tumor-bearing mice.J Controlled Release 2004;95(3):613–626.
7. Briley-Saebo KC, Amirbekian V, Mani V, Aguinaldo JGS, Vucic E, Carpenter D, et al. Gadoliniummixed-micelles: Effect of the amphiphile on in vitro and in vivo efficacy in apolipoprotein E knockoutmouse models of atherosclerosis. Mag Reson Med 2006;56(6):1336–1346.
8. Le UM, Cui ZG. Biodistribution and tumor-accumulation of gadolinium (Gd) encapsulated in long-circulating liposomes in tumor-bearing mice for potential neutron capture therapy. International JPharmaceut 2006;320(1–2):96–103.
9. Kobayashi H, Brechbiel MW. Nano-sized MRI contrast agents with dendrimer cores. Advanced DrugDel Rev 2005;57(15):2271–2286.
10. Sipkins DA, Cheresh DA, Kazemi MR, Nevin LM, Bednarski MD, Li KCP. Detection of tumorangiogenesis in vivo by alpha(v)beta(3)-targeted magnetic resonance imaging. Nat Med 1998;4(5):623–626. [PubMed: 9585240]
11. Anderson EA, Isaacman S, Peabody DS, Wang EY, Canary JW, Kirshenbaum K. Viral nanoparticlesdonning a paramagnetic coat: Conjugation of MRI contrast agents to the MS2 capsid. Nano Lett2006;6(6):1160–1164. [PubMed: 16771573]
12. Crich SG, Bussolati B, Tei L, Grange C, Esposito G, Lanzardo S, et al. Magnetic resonancevisualization of tumor angiogenesis by targeting neural cell adhesion molecules with the highlysensitive gadolinium-loaded apoferritin probe. Cancer Res 2006;66(18):9196–9201. [PubMed:16982763]
13. Merbach, A.; Toth, E. The chemistry of contrast agents in magnetic resonance imaging. Chichester,UK: Willey; 2001.
14. Paunesku T, Rajh T, Wiederrecht G, Maser J, Vogt S, Stojicevic N, et al. Biology of TiO2-oligonucleotide nanocomposites. Nat Mater 2003;2(5):343–6. [PubMed: 12692534]
15. Paunesku T, Stojicevic N, Vogt S, Maser J, Lai B, Rajh T, et al. Intracellular localization of titaniumdioxide-biomolecule nanocomposites. J Physique Iv 2003;104:317–319.
16. Paunesku T, Vogt S, Lai B, Maser J, Stojicevic N, Thurn KT, et al. Intracellular Distribution of TiO(2)-DNA Oligonucleotide Nanoconjugates Directed to Nucleolus and Mitochondria IndicatesSequence Specificity. Nano Lett 2007;7(3):596–601. [PubMed: 17274661]
17. Paunesku T, Vogt S, Maser J, Lai B, Woloschak G. X-ray fluorescence microprobe imaging in biologyand medicine. J Cell Biochem 2006;99(6):1489–1502. [PubMed: 17006954]
18. Thurn KT, Brown EMB, Wu A, Vogt S, Lai B, Maser J, et al. Nanoparticles for Applications inCellular Imaging. Nanoscale Res Lett 2007;2(9):430–441.
19. Idelson M, Blout ER. Polypeptides. 18 A Kinetic Study of the Polymerization of Amino Acid N-Carboxyanhydrides Initiated by Strong Bases. J Amer Chem Soc 1958;80(10):2387–2393.
20. Ke TY, Feng Y, Guo JY, Parker DL, Lu ZR. Biodegradable cystamine spacer facilitates the clearanceof Gd(III) chelates in poly(glutamic acid) Gd-DO3A conjugates for contrast-enhanced MR imaging.Mag Reson Imaging 2006;24(7):931–940.
21. Rajh T, Chen LX, Lukas K, Liu T, Thurnauer MC, Tiede DM. Surface restructuring of nanoparticles:An efficient route for ligand-metal oxide crosstalk. J Phys Chem B 2002;106(41):10543–10552.
22. Michelmore A, Gong WQ, Jenkins P, Ralston J. The interaction of linear polyphosphates with titaniumdioxide surfaces. Phys Chem Chem Phys 2000;2(13):2985–2992.
Paunesku et al. Page 7
Nanomedicine. Author manuscript; available in PMC 2009 September 1.
NIH
-PA Author Manuscript
NIH
-PA Author Manuscript
NIH
-PA Author Manuscript

23. Vogt S, Maser J, Jacobsen C. Data analysis for X-ray fluorescence imaging. J Physique Iv2003;104:617–622.
24. Cacheris WP, Quay SC, Rocklage SM. The relationship between thermodynamics and the toxicityof gadolinium complexes. Magn Reson Imaging 1990;8(4):467–81. [PubMed: 2118207]
25. Hofmann B, Fischer CO, Lawaczeck R, Platzek J, Semmler W. Gadolinium neutron capture therapy(GdNCT) of melanoma cells and solid tumors with the magnetic resonance imaging contrast agentGadobutrol. Invest Radiol 1999;34(2):126–33. [PubMed: 9951792]
26. De Stasio G, Casalbore P, Pallini R, Gilbert B, Sanita F, Ciotti MT, et al. Gadolinium in humanglioblastoma cells for gadolinium neutron capture therapy. Cancer Res 2001;61(10):4272–7.[PubMed: 11358855]
Paunesku et al. Page 8
Nanomedicine. Author manuscript; available in PMC 2009 September 1.
NIH
-PA Author Manuscript
NIH
-PA Author Manuscript
NIH
-PA Author Manuscript

Figure 1.i) DMAP, DMF, rt, overnight, NaOH; ii) Gd(OAc)3, pH 5.0–5.5, rt, 24 h; iii) Na2-EDTA. (x= 0.03, y = 0.12 and z = 0.85).
Paunesku et al. Page 9
Nanomedicine. Author manuscript; available in PMC 2009 September 1.
NIH
-PA Author Manuscript
NIH
-PA Author Manuscript
NIH
-PA Author Manuscript
Figure 2.A T1-weighted image of samples containing PC3-M (transfected by electroporation) andMCF7 cells (transfected by SuperFect reagent) treated with TiO2-DNA-Gd, TiO2, Gd CA ornothing (Control). Differential T1-weighted signal enhancements from the samples labeledwith TiO2-DNA-Gd CA with respect to other samples are apparent; T1 values for each of thesesamples are given in Table 1. These samples were prepared by embedding in agarose differentnumbers of cells from each treatment.
Paunesku et al. Page 10
Nanomedicine. Author manuscript; available in PMC 2009 September 1.
NIH
-PA Author Manuscript
NIH
-PA Author Manuscript
NIH
-PA Author Manuscript

Figure 3.X-ray fluorescence maps of 2 whole MCF-7/W8 cells transfected with TiO2-DNAoligonucleotide-Gd CA nanoconjugates. Elemental maps of P, S, K, Ca, Ti, Mn, Cu, Zn andGd in two cells treated with nanoconjugates for 24 hours and then “washed” for 24 hours innanoconjugate-free medium. Elemental maps show the range of concentrations in the samplein a rainbow color scale from highest (red) to lowest signal (black). Elemental concentrationsare given in micrograms per cm2.
Paunesku et al. Page 11
Nanomedicine. Author manuscript; available in PMC 2009 September 1.
NIH
-PA Author Manuscript
NIH
-PA Author Manuscript
NIH
-PA Author Manuscript

NIH
-PA Author Manuscript
NIH
-PA Author Manuscript
NIH
-PA Author Manuscript
Paunesku et al. Page 12Ta
ble
1T1
val
ues o
f sam
ples
from
Fig
ure
1, c
alcu
late
d us
ing
two
diff
eren
t app
roac
hes.
cell
num
ber
Tre
atm
ent
(Tra
nsfe
ctio
n)N
ull P
oint
Met
hod
Equ
atio
n M
etho
d95
% C
I(E
qn.M
th.)
R2
(Eqn
.Mth
.)*Si
gnal
Inte
nsity
7×10
6
TiO
2 –D
NA
– G
d(E
lect
ropo
ratio
n)
813
621
± 50
0.98
4142
8
15×1
0675
961
5±
430.
9887
405
5×10
5
TiO
2 –D
NA
– G
d(S
uper
Fect
)
446
626
± 84
0.96
6234
8
5×10
620
535
1±
680.
9973
766
5×10
5
Gd
(Sup
erFe
ct)
1436
1799
± 28
0.99
5833
5×10
612
3516
25±
270.
9938
71
5×10
5
TiO
2(S
uper
Fect
)
1459
*22
10±
200.
9977
30
5×10
613
0917
83±
400.
9868
48
5×10
5C
ontro
l13
26*
1608
± 36
0.99
2449
5×10
6C
ontro
l12
4516
55±
400.
986
46* R
2 in
dica
tes g
oodn
ess o
f fit
Nanomedicine. Author manuscript; available in PMC 2009 September 1.