fuzzy inference systems applied to the daily ultraviolet radiation evaluation (295–385 nm) from...
TRANSCRIPT
Solar Energy 75 (2003) 447–454
www.elsevier.com/locate/solener
Fuzzy inference systems applied to the dailyultraviolet radiation evaluation (295–385 nm) from daily
global radiation
Lourdes Ramirez Santigosa a, Jesus Polo Martinez a,*, Llanos Mora Lopez b,Mariano Sidrach de Cardona Ortin c, Julian Blanco Galvez a
a Dpto. de Energ�ııas Renovables, CIEMAT, Av. Complutense, 22 28040 Madrid, Spainb Dpto. de lenguajes y CC de la Computaci�oon, Universidad de M�aalaga, Spain
c Dpto. de F�ıısica Aplicada II, Universidad de M�aalaga, Spain
Received 26 March 2003; received in revised form 19 September 2003; accepted 19 September 2003
Abstract
This work presents the results of applying different automatic learning techniques to the calculation of daily ul-
traviolet radiation from daily global radiation on a horizontal surface. Using the data from three Spanish locations, a
zonal study was made, which was finally combined in models for general application. Using the corresponding at-
mospheric transparency index, three models based on multivariate linear regression, non-linear regression and gener-
ation of fuzzy inference systems, respectively, were designed. The results obtained verify the good behavior of the fuzzy
inference system calculated.
� 2003 Elsevier Ltd. All rights reserved.
1. Introduction
One of the limitations of using solar technologies for
photochemical decomposition of organic compounds is
the lack of information on the availability of ultraviolet
radiation (295–385 nm) at different sites (Riordan,
1990). This article reports the results of a study on the
possibility of determining daily ultraviolet radiation
from daily horizontal global radiation sets, which al-
though scant, are more frequent than the ultraviolet
radiation measurement sets. In related work, such as
that of (Baker-Blocker et al., 1984), with data measured
at the South Pole, that of (Al-Aruri et al., 1988) in
Kuwait or that of (Elhadidy et al., 1990) in Saudi Ara-
bia, the ratio of daily ultraviolet to the corresponding
* Corresponding author. Tel.: +34-91-3466043; fax: +34-91-
3466037.
E-mail addresses: [email protected] (L. Ramirez
Santigosa), [email protected] (J. Polo Martinez).
0038-092X/$ - see front matter � 2003 Elsevier Ltd. All rights reserv
doi:10.1016/j.solener.2003.09.014
global radiation has been found to vary over a range
between 2.7% and 6%. Later, (Ambach et al., 1991),
demonstrated that this ratio increases when global ra-
diation decreases, that is, with overcast skies. It is pos-
sible to attempt to diminish the strong dependence of
these ratios on place of measurement by studying a
transformed variable instead of measured variables. For
this purpose, the index of atmospheric transparency
were calculated for the two variables and their ratios
were studied. The results of the ratios found in the
bibliography do not allow a clear conclusion to be ar-
rived at, since, although in (Pedr�oos et al., 1997) good fits
for a third order polynomial function are found, in
(Mart�ıınez-Lozano et al., 1994) the results of this fit are
not satisfactory for daily values. Using data from three
Spanish locations, in this work, the possibility of
studying new general models is proposed. Different au-
tomatic learning techniques were applied for this: mul-
tivariate linear regression, non-linear models and fuzzy
inference systems. Finally, the results of the different
models are analyzed and compared.
ed.
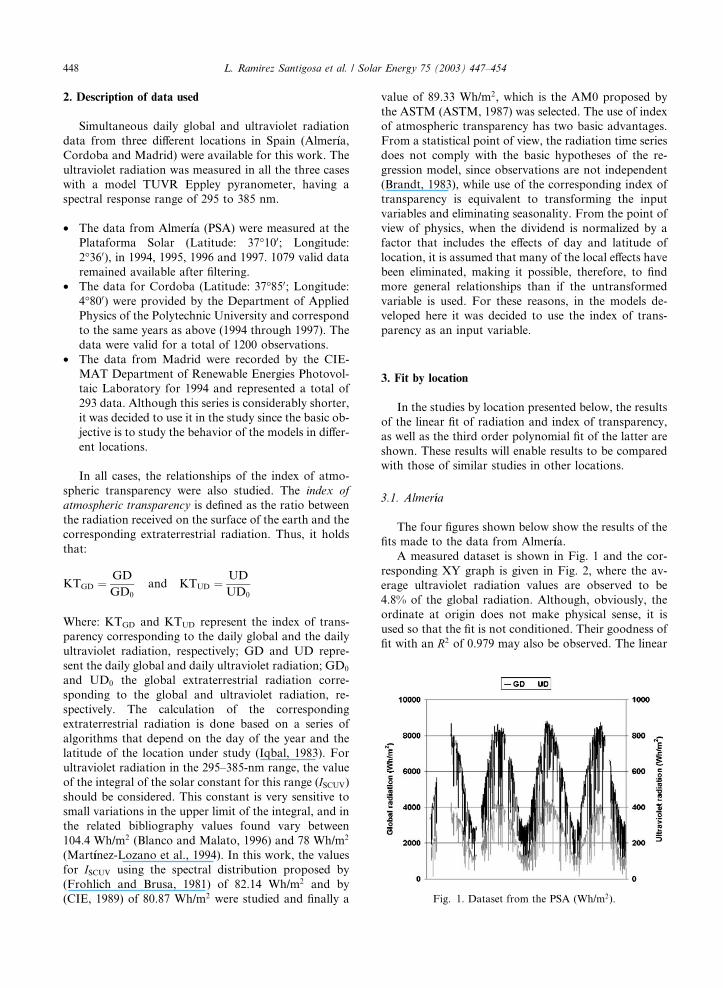
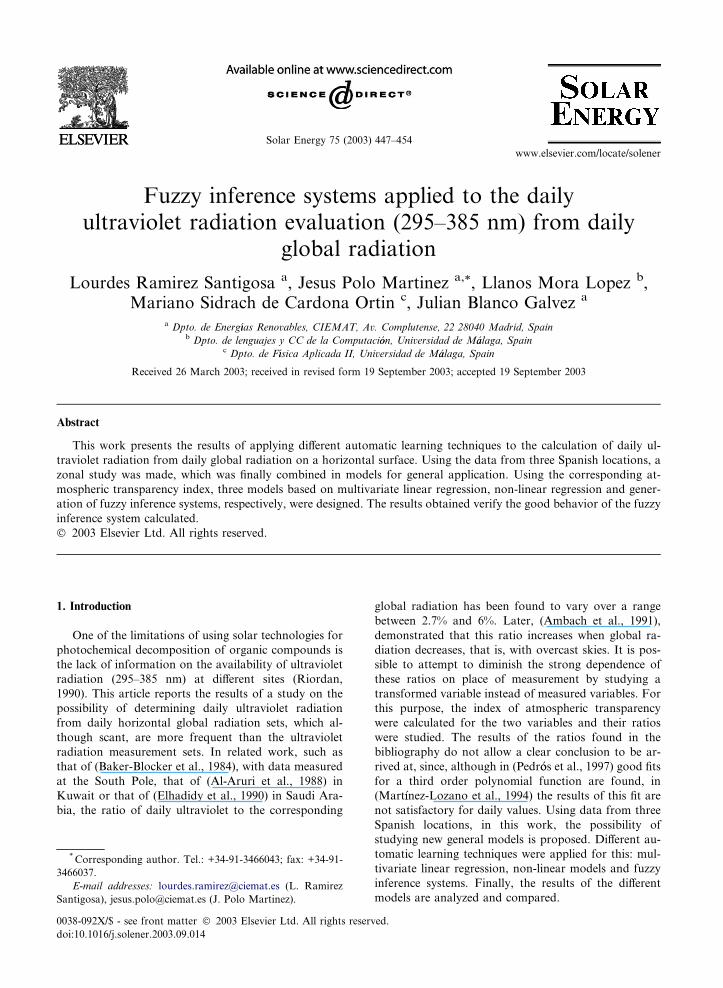
Fig. 1. Dataset from the PSA (Wh/m2).
448 L. Ramirez Santigosa et al. / Solar Energy 75 (2003) 447–454
2. Description of data used
Simultaneous daily global and ultraviolet radiation
data from three different locations in Spain (Almer�ııa,Cordoba and Madrid) were available for this work. The
ultraviolet radiation was measured in all the three cases
with a model TUVR Eppley pyranometer, having a
spectral response range of 295 to 385 nm.
• The data from Almer�ııa (PSA) were measured at the
Plataforma Solar (Latitude: 37�100; Longitude:
2�360), in 1994, 1995, 1996 and 1997. 1079 valid data
remained available after filtering.
• The data for Cordoba (Latitude: 37�850; Longitude:4�800) were provided by the Department of Applied
Physics of the Polytechnic University and correspond
to the same years as above (1994 through 1997). The
data were valid for a total of 1200 observations.
• The data from Madrid were recorded by the CIE-
MAT Department of Renewable Energies Photovol-
taic Laboratory for 1994 and represented a total of
293 data. Although this series is considerably shorter,
it was decided to use it in the study since the basic ob-
jective is to study the behavior of the models in differ-
ent locations.
In all cases, the relationships of the index of atmo-
spheric transparency were also studied. The index of
atmospheric transparency is defined as the ratio between
the radiation received on the surface of the earth and the
corresponding extraterrestrial radiation. Thus, it holds
that:
KTGD ¼ GD
GD0
and KTUD ¼ UD
UD0
Where: KTGD and KTUD represent the index of trans-
parency corresponding to the daily global and the daily
ultraviolet radiation, respectively; GD and UD repre-
sent the daily global and daily ultraviolet radiation; GD0
and UD0 the global extraterrestrial radiation corre-
sponding to the global and ultraviolet radiation, re-
spectively. The calculation of the corresponding
extraterrestrial radiation is done based on a series of
algorithms that depend on the day of the year and the
latitude of the location under study (Iqbal, 1983). For
ultraviolet radiation in the 295–385-nm range, the value
of the integral of the solar constant for this range (ISCUV)
should be considered. This constant is very sensitive to
small variations in the upper limit of the integral, and in
the related bibliography values found vary between
104.4 Wh/m2 (Blanco and Malato, 1996) and 78 Wh/m2
(Mart�ıınez-Lozano et al., 1994). In this work, the values
for ISCUV using the spectral distribution proposed by
(Frohlich and Brusa, 1981) of 82.14 Wh/m2 and by
(CIE, 1989) of 80.87 Wh/m2 were studied and finally a
value of 89.33 Wh/m2, which is the AM0 proposed by
the ASTM (ASTM, 1987) was selected. The use of index
of atmospheric transparency has two basic advantages.
From a statistical point of view, the radiation time series
does not comply with the basic hypotheses of the re-
gression model, since observations are not independent
(Brandt, 1983), while use of the corresponding index of
transparency is equivalent to transforming the input
variables and eliminating seasonality. From the point of
view of physics, when the dividend is normalized by a
factor that includes the effects of day and latitude of
location, it is assumed that many of the local effects have
been eliminated, making it possible, therefore, to find
more general relationships than if the untransformed
variable is used. For these reasons, in the models de-
veloped here it was decided to use the index of trans-
parency as an input variable.
3. Fit by location
In the studies by location presented below, the results
of the linear fit of radiation and index of transparency,
as well as the third order polynomial fit of the latter are
shown. These results will enable results to be compared
with those of similar studies in other locations.
3.1. Almer�ııa
The four figures shown below show the results of the
fits made to the data from Almer�ııa.A measured dataset is shown in Fig. 1 and the cor-
responding XY graph is given in Fig. 2, where the av-
erage ultraviolet radiation values are observed to be
4.8% of the global radiation. Although, obviously, the
ordinate at origin does not make physical sense, it is
used so that the fit is not conditioned. Their goodness of
fit with an R2 of 0.979 may also be observed. The linear
L. Ramirez Santigosa et al. / Solar Energy 75 (2003) 447–454 449
fit of the index of transparency for the two variables
studied are shown in Figs. 3 and 4 for a third order
polynomial fit (Pedr�oos et al., 1997). It may be seen how
the function resulting from the polynomial fit is better in
all the ranges of KT, but R2 only goes from 0.914 to
0.915.
Fig. 3. Linear fit of index of transparency (PSA).
Fig. 4. Polynomial fit of index of transparency (PSA).
Fig. 2. Linear fit of the PSA data (Wh/m2).
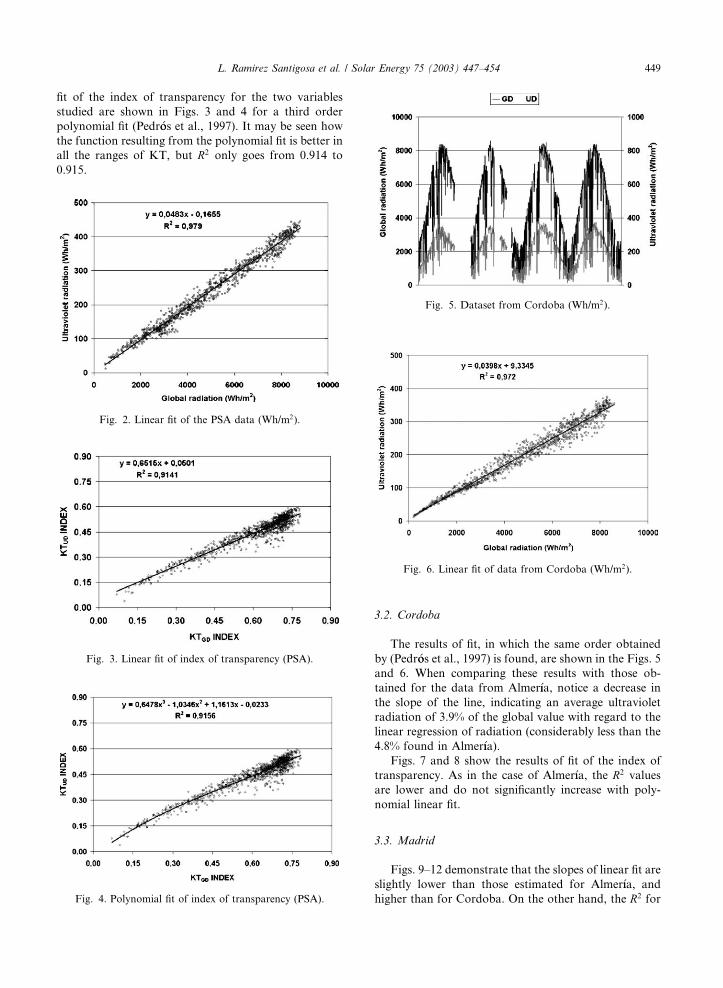
Fig. 5. Dataset from Cordoba (Wh/m2).
Fig. 6. Linear fit of data from Cordoba (Wh/m2).
3.2. Cordoba
The results of fit, in which the same order obtained
by (Pedr�oos et al., 1997) is found, are shown in the Figs. 5
and 6. When comparing these results with those ob-
tained for the data from Almer�ııa, notice a decrease in
the slope of the line, indicating an average ultraviolet
radiation of 3.9% of the global value with regard to the
linear regression of radiation (considerably less than the
4.8% found in Almer�ııa).Figs. 7 and 8 show the results of fit of the index of
transparency. As in the case of Almer�ııa, the R2 values
are lower and do not significantly increase with poly-
nomial linear fit.
3.3. Madrid
Figs. 9–12 demonstrate that the slopes of linear fit are
slightly lower than those estimated for Almer�ııa, and
higher than for Cordoba. On the other hand, the R2 for
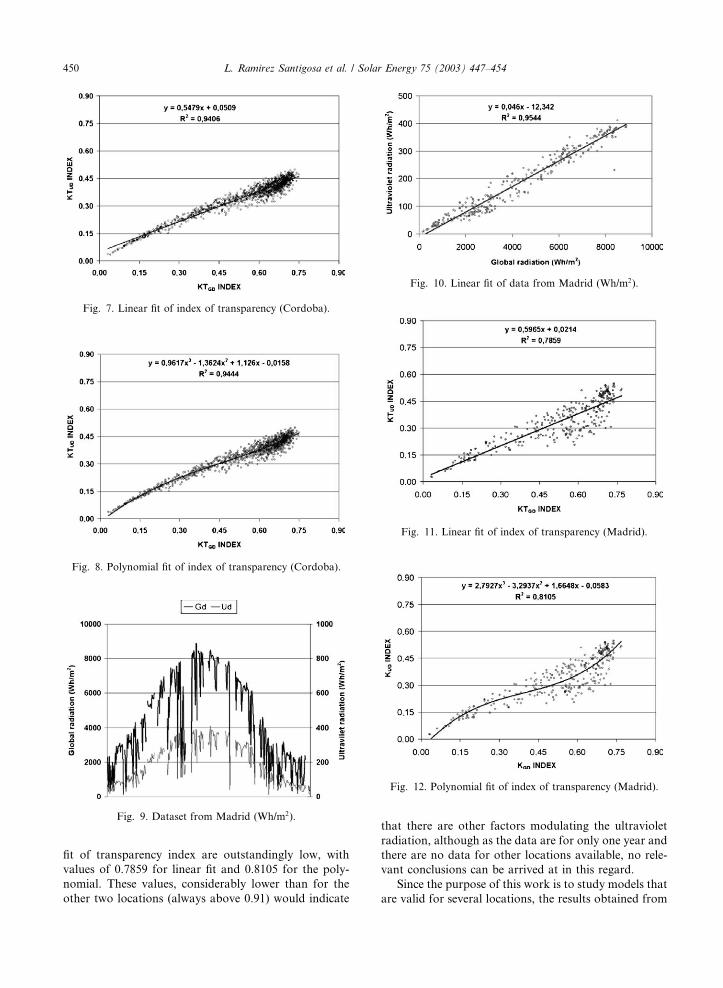
Fig. 7. Linear fit of index of transparency (Cordoba).
Fig. 9. Dataset from Madrid (Wh/m2).
Fig. 8. Polynomial fit of index of transparency (Cordoba).
Fig. 10. Linear fit of data from Madrid (Wh/m2).
Fig. 11. Linear fit of index of transparency (Madrid).
Fig. 12. Polynomial fit of index of transparency (Madrid).
450 L. Ramirez Santigosa et al. / Solar Energy 75 (2003) 447–454
fit of transparency index are outstandingly low, with
values of 0.7859 for linear fit and 0.8105 for the poly-
nomial. These values, considerably lower than for the
other two locations (always above 0.91) would indicate
that there are other factors modulating the ultraviolet
radiation, although as the data are for only one year and
there are no data for other locations available, no rele-
vant conclusions can be arrived at in this regard.
Since the purpose of this work is to study models that
are valid for several locations, the results obtained from
L. Ramirez Santigosa et al. / Solar Energy 75 (2003) 447–454 451
the above fit with linear functions for the index of
transparency are summarized in the Table 1.
From the above expressions it may be deduced that
the coefficients of fit, while different, are of the same
order in the three locations. This enables more general
models, such as those below, to be proposed.
4. Design of general models
The purpose of this work is to obtain a general model
for the Iberian Peninsula. It is obvious that for this
purpose it would be advisable to have measurements
from some location at a high latitude or at around 42�,but at present, none with simultaneous global and ul-
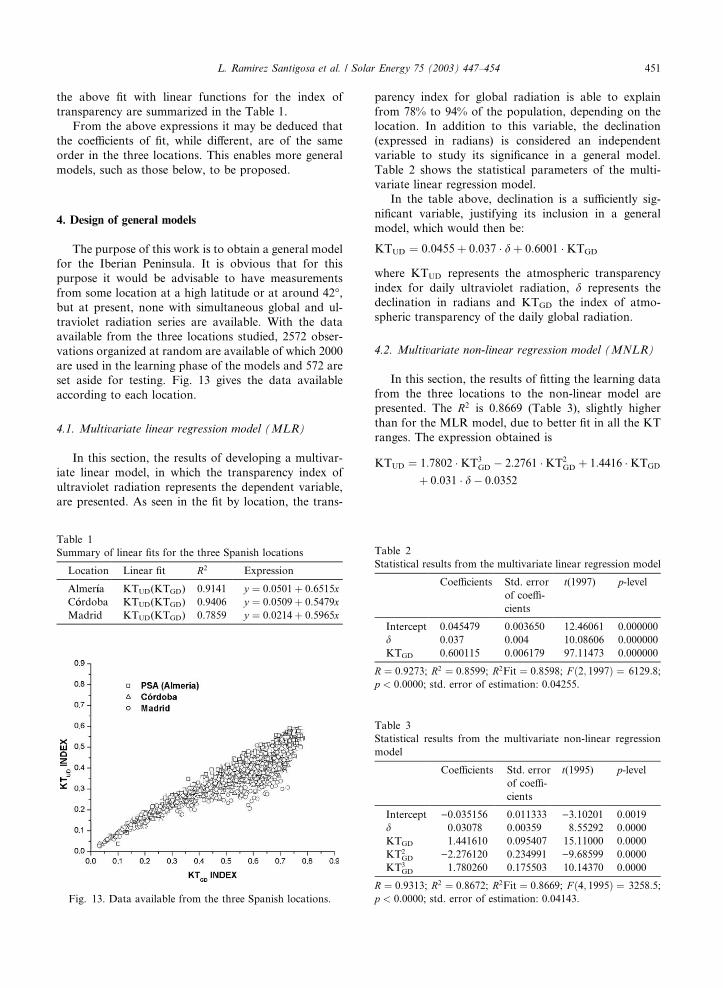
traviolet radiation series are available. With the data
available from the three locations studied, 2572 obser-
vations organized at random are available of which 2000
are used in the learning phase of the models and 572 are
set aside for testing. Fig. 13 gives the data available
according to each location.
4.1. Multivariate linear regression model (MLR)
In this section, the results of developing a multivar-
iate linear model, in which the transparency index of
ultraviolet radiation represents the dependent variable,
are presented. As seen in the fit by location, the trans-
Table 1
Summary of linear fits for the three Spanish locations
Location Linear fit R2 Expression
Almer�ııa KTUD(KTGD) 0.9141 y ¼ 0:0501þ 0:6515xC�oordoba KTUD(KTGD) 0.9406 y ¼ 0:0509þ 0:5479xMadrid KTUD(KTGD) 0.7859 y ¼ 0:0214þ 0:5965x
Fig. 13. Data available from the three Spanish locations.
parency index for global radiation is able to explain
from 78% to 94% of the population, depending on the
location. In addition to this variable, the declination
(expressed in radians) is considered an independent
variable to study its significance in a general model.
Table 2 shows the statistical parameters of the multi-
variate linear regression model.
In the table above, declination is a sufficiently sig-
nificant variable, justifying its inclusion in a general
model, which would then be:
KTUD ¼ 0:0455þ 0:037 � dþ 0:6001 �KTGD
where KTUD represents the atmospheric transparency
index for daily ultraviolet radiation, d represents the
declination in radians and KTGD the index of atmo-
spheric transparency of the daily global radiation.
4.2. Multivariate non-linear regression model (MNLR)
In this section, the results of fitting the learning data
from the three locations to the non-linear model are
presented. The R2 is 0.8669 (Table 3), slightly higher
than for the MLR model, due to better fit in all the KT
ranges. The expression obtained is
KTUD ¼ 1:7802 �KT3GD � 2:2761 �KT2
GD þ 1:4416 �KTGD
þ 0:031 � d� 0:0352
Table 2
Statistical results from the multivariate linear regression model
Coefficients Std. error
of coeffi-
cients
t(1997) p-level
Intercept 0.045479 0.003650 12.46061 0.000000
d 0.037 0.004 10.08606 0.000000
KTGD 0.600115 0.006179 97.11473 0.000000
R ¼ 0:9273; R2 ¼ 0:8599; R2Fit ¼ 0:8598; F ð2; 1997Þ ¼ 6129:8;
p < 0:0000; std. error of estimation: 0.04255.
Table 3
Statistical results from the multivariate non-linear regression
model
Coefficients Std. error
of coeffi-
cients
t(1995) p-level
Intercept )0.035156 0.011333 )3.10201 0.0019
d 0.03078 0.00359 8.55292 0.0000
KTGD 1.441610 0.095407 15.11000 0.0000
KT2GD )2.276120 0.234991 )9.68599 0.0000
KT3GD 1.780260 0.175503 10.14370 0.0000
R ¼ 0:9313; R2 ¼ 0:8672; R2Fit ¼ 0:8669; F ð4; 1995Þ ¼ 3258:5;
p < 0:0000; std. error of estimation: 0.04143.
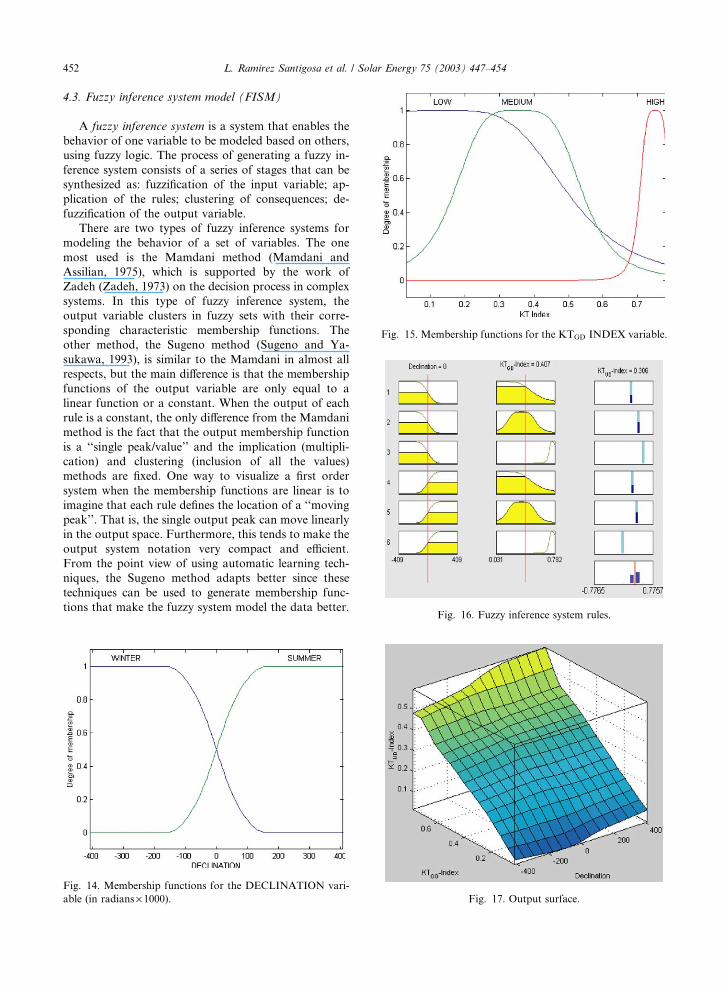
Fig. 15. Membership functions for the KTGD INDEX variable.
Fig. 16. Fuzzy inference system rules.
452 L. Ramirez Santigosa et al. / Solar Energy 75 (2003) 447–454
4.3. Fuzzy inference system model (FISM)
A fuzzy inference system is a system that enables the
behavior of one variable to be modeled based on others,
using fuzzy logic. The process of generating a fuzzy in-
ference system consists of a series of stages that can be
synthesized as: fuzzification of the input variable; ap-
plication of the rules; clustering of consequences; de-
fuzzification of the output variable.
There are two types of fuzzy inference systems for
modeling the behavior of a set of variables. The one
most used is the Mamdani method (Mamdani and
Assilian, 1975), which is supported by the work of
Zadeh (Zadeh, 1973) on the decision process in complex
systems. In this type of fuzzy inference system, the
output variable clusters in fuzzy sets with their corre-
sponding characteristic membership functions. The
other method, the Sugeno method (Sugeno and Ya-
sukawa, 1993), is similar to the Mamdani in almost all
respects, but the main difference is that the membership
functions of the output variable are only equal to a
linear function or a constant. When the output of each
rule is a constant, the only difference from the Mamdani
method is the fact that the output membership function
is a ‘‘single peak/value’’ and the implication (multipli-
cation) and clustering (inclusion of all the values)
methods are fixed. One way to visualize a first order
system when the membership functions are linear is to
imagine that each rule defines the location of a ‘‘moving
peak’’. That is, the single output peak can move linearly
in the output space. Furthermore, this tends to make the
output system notation very compact and efficient.
From the point view of using automatic learning tech-
niques, the Sugeno method adapts better since these
techniques can be used to generate membership func-
tions that make the fuzzy system model the data better.
Fig. 14. Membership functions for the DECLINATION vari-
able (in radians· 1000). Fig. 17. Output surface.
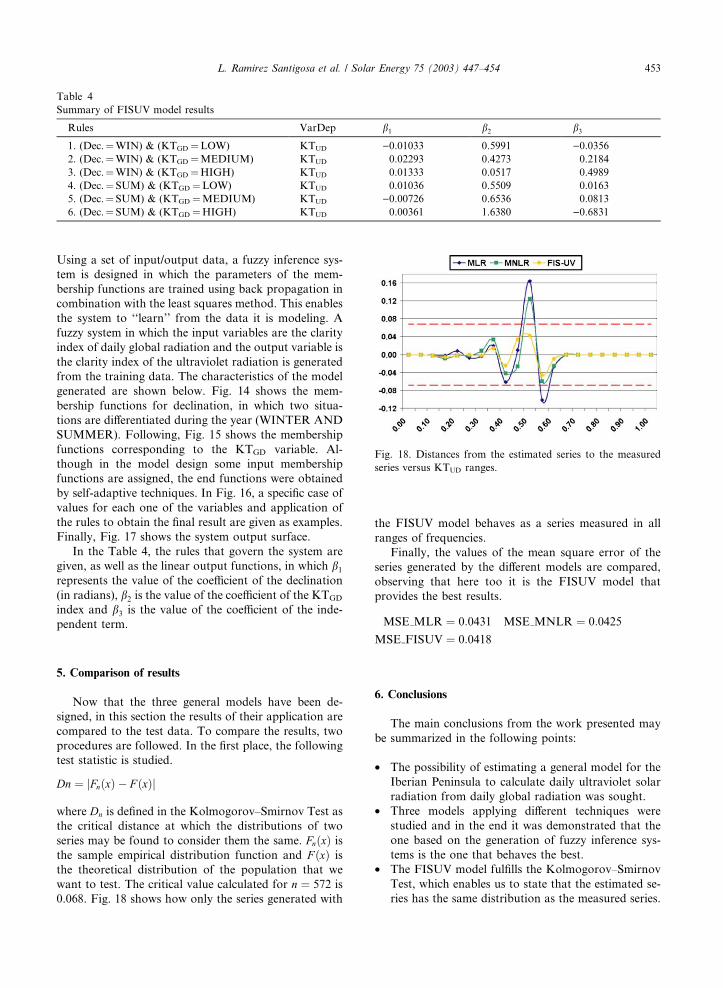
Table 4
Summary of FISUV model results
Rules VarDep b1 b2 b3
1. (Dec.¼WIN) & (KTGD ¼LOW) KTUD )0.01033 0.5991 )0.03562. (Dec.¼WIN) & (KTGD ¼MEDIUM) KTUD 0.02293 0.4273 0.2184
3. (Dec.¼WIN) & (KTGD ¼HIGH) KTUD 0.01333 0.0517 0.4989
4. (Dec.¼ SUM) & (KTGD ¼LOW) KTUD 0.01036 0.5509 0.0163
5. (Dec.¼ SUM) & (KTGD ¼MEDIUM) KTUD )0.00726 0.6536 0.0813
6. (Dec.¼ SUM) & (KTGD ¼HIGH) KTUD 0.00361 1.6380 )0.6831
Fig. 18. Distances from the estimated series to the measured
series versus KTUD ranges.
L. Ramirez Santigosa et al. / Solar Energy 75 (2003) 447–454 453
Using a set of input/output data, a fuzzy inference sys-
tem is designed in which the parameters of the mem-
bership functions are trained using back propagation in
combination with the least squares method. This enables
the system to ‘‘learn’’ from the data it is modeling. A
fuzzy system in which the input variables are the clarity
index of daily global radiation and the output variable is
the clarity index of the ultraviolet radiation is generated
from the training data. The characteristics of the model
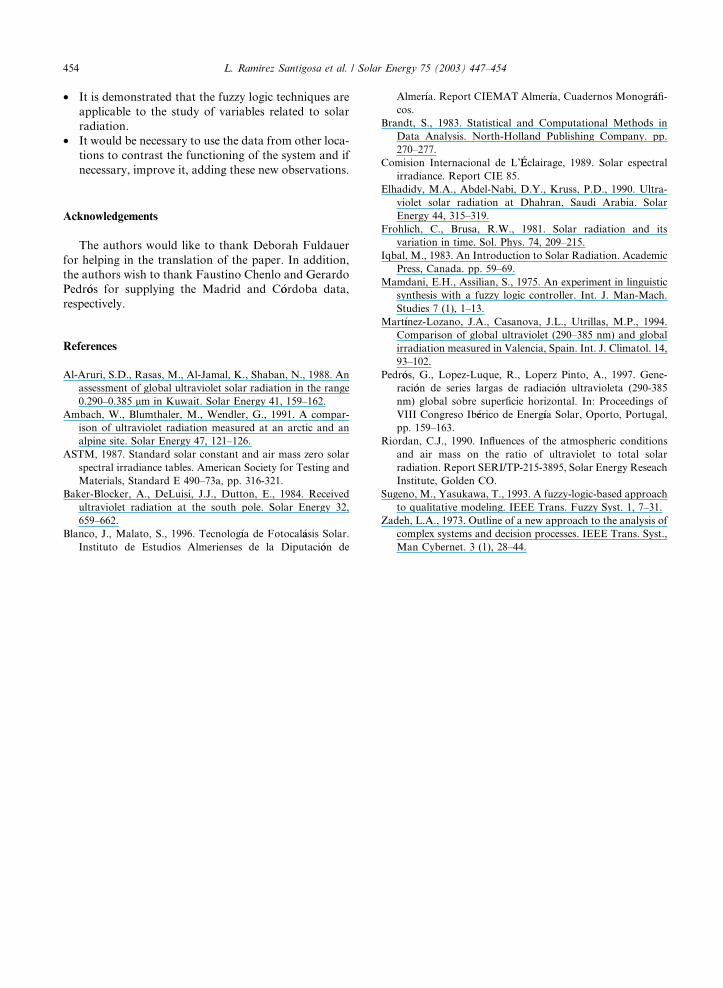
generated are shown below. Fig. 14 shows the mem-
bership functions for declination, in which two situa-
tions are differentiated during the year (WINTER AND
SUMMER). Following, Fig. 15 shows the membership
functions corresponding to the KTGD variable. Al-
though in the model design some input membership
functions are assigned, the end functions were obtained
by self-adaptive techniques. In Fig. 16, a specific case of
values for each one of the variables and application of
the rules to obtain the final result are given as examples.
Finally, Fig. 17 shows the system output surface.
In the Table 4, the rules that govern the system are
given, as well as the linear output functions, in which b1
represents the value of the coefficient of the declination
(in radians), b2 is the value of the coefficient of the KTGD
index and b3 is the value of the coefficient of the inde-
pendent term.
5. Comparison of results
Now that the three general models have been de-
signed, in this section the results of their application are
compared to the test data. To compare the results, two
procedures are followed. In the first place, the following
test statistic is studied.
Dn ¼ jFnðxÞ � F ðxÞj
where Dn is defined in the Kolmogorov–Smirnov Test as
the critical distance at which the distributions of two
series may be found to consider them the same. FnðxÞ isthe sample empirical distribution function and F ðxÞ is
the theoretical distribution of the population that we
want to test. The critical value calculated for n ¼ 572 is
0.068. Fig. 18 shows how only the series generated with
the FISUV model behaves as a series measured in all
ranges of frequencies.
Finally, the values of the mean square error of the
series generated by the different models are compared,
observing that here too it is the FISUV model that
provides the best results.
MSE MLR ¼ 0:0431 MSE MNLR ¼ 0:0425
MSE FISUV ¼ 0:0418
6. Conclusions
The main conclusions from the work presented may
be summarized in the following points:
• The possibility of estimating a general model for the
Iberian Peninsula to calculate daily ultraviolet solar
radiation from daily global radiation was sought.
• Three models applying different techniques were
studied and in the end it was demonstrated that the
one based on the generation of fuzzy inference sys-
tems is the one that behaves the best.
• The FISUV model fulfills the Kolmogorov–Smirnov
Test, which enables us to state that the estimated se-
ries has the same distribution as the measured series.
454 L. Ramirez Santigosa et al. / Solar Energy 75 (2003) 447–454
• It is demonstrated that the fuzzy logic techniques are
applicable to the study of variables related to solar
radiation.
• It would be necessary to use the data from other loca-
tions to contrast the functioning of the system and if
necessary, improve it, adding these new observations.
Acknowledgements
The authors would like to thank Deborah Fuldauer
for helping in the translation of the paper. In addition,
the authors wish to thank Faustino Chenlo and Gerardo
Pedr�oos for supplying the Madrid and C�oordoba data,
respectively.
References
Al-Aruri, S.D., Rasas, M., Al-Jamal, K., Shaban, N., 1988. An
assessment of global ultraviolet solar radiation in the range
0.290–0.385 lm in Kuwait. Solar Energy 41, 159–162.
Ambach, W., Blumthaler, M., Wendler, G., 1991. A compar-
ison of ultraviolet radiation measured at an arctic and an
alpine site. Solar Energy 47, 121–126.
ASTM, 1987. Standard solar constant and air mass zero solar
spectral irradiance tables. American Society for Testing and
Materials, Standard E 490–73a, pp. 316-321.
Baker-Blocker, A., DeLuisi, J.J., Dutton, E., 1984. Received
ultraviolet radiation at the south pole. Solar Energy 32,
659–662.
Blanco, J., Malato, S., 1996. Tecnolog�ııa de Fotocal�aasis Solar.
Instituto de Estudios Almerienses de la Diputaci�oon de
Almer�ııa. Report CIEMAT Almer�ııa, Cuadernos Monogr�aafi-
cos.
Brandt, S., 1983. Statistical and Computational Methods in
Data Analysis. North-Holland Publishing Company. pp.
270–277.
Comision Internacional de L’�EEclairage, 1989. Solar espectral
irradiance. Report CIE 85.
Elhadidy, M.A., Abdel-Nabi, D.Y., Kruss, P.D., 1990. Ultra-
violet solar radiation at Dhahran, Saudi Arabia. Solar
Energy 44, 315–319.
Frohlich, C., Brusa, R.W., 1981. Solar radiation and its
variation in time. Sol. Phys. 74, 209–215.
Iqbal, M., 1983. An Introduction to Solar Radiation. Academic
Press, Canada. pp. 59–69.
Mamdani, E.H., Assilian, S., 1975. An experiment in linguistic
synthesis with a fuzzy logic controller. Int. J. Man-Mach.
Studies 7 (1), 1–13.
Mart�ıınez-Lozano, J.A., Casanova, J.L., Utrillas, M.P., 1994.
Comparison of global ultraviolet (290–385 nm) and global
irradiation measured in Valencia, Spain. Int. J. Climatol. 14,
93–102.
Pedr�oos, G., Lopez-Luque, R., Loperz Pinto, A., 1997. Gene-
raci�oon de series largas de radiaci�oon ultravioleta (290-385
nm) global sobre superficie horizontal. In: Proceedings of
VIII Congreso Ib�eerico de Energ�ııa Solar, Oporto, Portugal,
pp. 159–163.
Riordan, C.J., 1990. Influences of the atmospheric conditions
and air mass on the ratio of ultraviolet to total solar
radiation. Report SERI/TP-215-3895, Solar Energy Reseach
Institute, Golden CO.
Sugeno, M., Yasukawa, T., 1993. A fuzzy-logic-based approach
to qualitative modeling. IEEE Trans. Fuzzy Syst. 1, 7–31.
Zadeh, L.A., 1973. Outline of a new approach to the analysis of
complex systems and decision processes. IEEE Trans. Syst.,
Man Cybernet. 3 (1), 28–44.