functional imaging of visuospatial processing in alzheimer's disease
TRANSCRIPT
NeuroImage 17, 1403–1414 (2002)doi:10.1006/nimg.2002.1271
Functional Imaging of Visuospatial Processing in Alzheimer’s DiseaseD. Prvulovic,* D. Hubl,† A. T. Sack,* L. Melillo,*,‡ K. Maurer,* L. Frolich,* H. Lanfermann,§ F. E. Zanella,§
R. Goebel,¶ D. E. J. Linden,*,� ,1 and T. Dierks†*Department of Psychiatry and §Department of Neuroradiology, University of Frankfurt, Frankfurt, Germany; †Department of Psychiatric
Neurophysiology, University Hospital for Clinical Psychiatry, Bern, Switzerland; ‡Department of Electronic Engineering andTelecommunications, Federico II University, Naples, Italy; ¶Department of Psychology, Neurocognition, Maastricht University,
Maastricht, The Netherlands; and �Max-Planck-Institut fur Hirnforschung, Frankfurt, Germany
Alzheimer’s disease (AD) is known to cause a variety ofdisturbances of higher visual functions that are closelyrelated to the neuropathological changes. Visual associ-ation areas are more affected than primary visual cor-tex. Additionally, there is evidence from neuropsycho-logical and imaging studies during rest or passive visualstimulation that the occipitotemporal pathway is lessaffected than the parietal pathway. Our goal was to in-vestigate functional activation patterns during activevisuospatial processing in AD patients and the impact oflocal cerebral atrophy on the strength of functional ac-tivation. Fourteen AD patients and fourteen age-matched controls were measured with functional mag-netic resonance imaging (fMRI) while they performedan angle discrimination task. Both groups revealedoverlapping networks engaged in angle discriminationincluding the superior parietal lobule (SPL), frontal andoccipitotemporal (OTC) cortical regions, primary visualcortex, basal ganglia, and thalamus. The most pro-nounced differences between the two groups were foundin the SPL (more activity in controls) and OTC (moreactivity in patients). The differences in functional acti-vation between the AD patients and controls were partlyexplained by the differences in individual SPL atrophy.These results indicate that parietal dysfunction in mildto moderate AD is compensated by recruitment of theventral visual pathway. We furthermore suggest thatlocal cerebral atrophy should be considered as a covari-ate in functional imaging studies of neurodegenerativedisorders. © 2002 Elsevier Science (USA)
INTRODUCTION
The impairment of higher visual functions is one ofthe neuropsychological hallmarks of Alzheimer’s dis-
1 To whom correspondence should be addressed at Laboratory forNeurophysiology and Neuroimaging, Department of Psychiatry,Johann Wolfgang Goethe-Universitat, Heinrich-Hoffmann-Strasse10, D-60528 Frankfurt, Germany. Fax: �49 69 6301 3833. E-mail:
ease (AD) (Mendez et al., 1990). Visual attention andvisuospatial processing, two functions related to thesuperior parietal lobule (SPL) (Vandenberghe et al.,2001; Linden et al., 1998; Alivisatos and Petrides,1997), are impaired in AD (Meguro et al., 2001; Rizzo etal., 2000; Parasuraman et al., 1992; Ska et al., 1990),and affect greatly the patients’ activities of daily living.
By inducing temporary functional lesions in the SPLusing repetitive transcranial magnetic stimulation(rTMS), we recently demonstrated that the activationof the SPL during an angle discrimination task is notonly sufficient but also essential for successful visuo-spatial processing (Sack et al., 2002a). These findingsare in line with the well-known reductions in restingregional glucose metabolism (Duara et al., 1986) andregional cerebral blood flow (Perani et al., 1988) in theparietal cortex of AD patients, reflecting severe func-tional damage to this region, that might explain thevisuospatial impairments of these patients (Fujimori etal., 2000; Buck et al., 1997). This damage is also evi-dent through a marked atrophy of the parietal grayand white matter (Baron et al., 2001; Thompson et al.,2001; Fox et al., 1996; Foundas et al., 1997; de laMonte, 1989), indicating an irreversible structuraldamage due to the death of neurons and degradation ofdendrites and axons caused by accumulation of amy-loid plaques and neurofibrillary tangles (NFTs) (Braakand Braak, 1991; DeKosky et al., 1996). These consid-erations lead to two important questions: (1) What isthe relationship between the amount of structuraldamage of SPL and its functional activation duringvisuospatial processing in AD? (2) Are there mecha-nisms of functional reorganization by which the ADbrain attempts to compensate for the impaired process-ing capacity in regions essential for visuospatial pro-cessing?
Cortical atrophy may cause some artificial decreasesin measured functional signals, especially with imag-ing techniques with low spatial resolution, such as PET
Received M
ch 5, 2002
and SPECT, which are particularly vulnerable to the
ar
1403 1053-8119/02 $35.00© 2002 Elsevier Science (USA)
All rights reserved.

partial volume effect. While many articles have ad-dressed the influence of the partial volume effect onmeasures of the atrophic brain (Bokde et al., 2001;Chawluk et al., 1990; Tanna et al., 1991), the neurobi-ological relationship between brain atrophy in AD andfunctional activation has so far been formally ad-dressed only in the study by Johnson et al. (2000).These authors found a positive correlation betweenatrophy and the amount of blood oxygenation level-dependent (BOLD) signal change in the inferior frontalgyrus (IFG) during a semantic task. This correlationwas noted only in AD patients but not in age-matchedhealthy controls. Furthermore, they found this corre-lation only in the IFG but not in other regions activatedby the task. This result implies that local atrophy mayinfluence the amount of functional activation, and thatthis impact is not equal across different brain regions.In the present study we aimed to investigate the im-pact of local atrophy in SPL on the amount of BOLDsignal change during visuospatial processing.
A large body of studies have proved the capability ofthe adult (non-AD) brain for intra-and cross-modalfunctional reorganization as a response to peripheralor central lesions (see Chen et al., 2002). In AD, thereis evidence from immunhistochemical (Arendt et al.,1998; Mikkonen et al., 1999) and imaging (Kondo et al.,1999) studies of the presence of mechanisms involvedin plastic neuronal and synaptic remodeling, particu-larly across limbic and higher-order neocortical associ-ation areas. Recent functional activation studies indi-cate that the AD brain attempts to compensate forthe damage to multiple functional systems by reorga-nizing the spatial and temporal patterns of functionalcircuits (Grady et al., 1993; Woodard et al., 1998;Becker et al., 1996a,b; Bookheimer et al., 2000; Smithet al., 2002).
It has been shown that not all higher visual areasare equally damaged in AD. Functions related to thedorsal visual pathway (Haxby et al., 1991) (occipitaland parietal cortex) such as motion detection andvisuospatial processing seem to be more impaired inAD than functions related to the ventral visual path-way (occipitotemporal cortex), such as color recognition(Mendez et al., 1990). The first functional imagingstudy, which measured in vivo the differential func-tional impairment of the dorsal visual stream in AD,was performed by Mentis et al. (1996). In their PETstudy, they demonstrated hypoactivation of extrastri-ate visual areas during passive visual stimulation onlyat frequencies involving the dorsal but not the ventralvisual stream. However, it remained open what effectthis differential damage would have on the distributionof activation across the ventral and dorsal stream dur-ing the performance of active visual tasks.
The goal of our study was to detect a functionalcounterpart of the unequal distribution of AD-relatedpathological changes across the visual system. A recent
study by Pfefferbaum et al. (2001) found marked signsof functional reorganization in (non-AD) alcoholics re-lated to visuospatial processing. In a visuospatialmemory task, the patients revealed less activation inthe parietal cortex, but more activation in areas of theventral visual stream compared with healthy controls.
On the basis of these findings, we hypothesized thattask-related functional activation changes in the pari-etal lobe would be smaller in AD patients than incontrols and that this hypoactivation could be compen-sated for by a recruitment of ventral visual areas. Toour knowledge this is the first fMRI study of corticalactivation changes during active visuospatial process-ing in AD. It is also the first study to evaluate theimpact of atrophy of visual cortical areas on the result-ing fMRI signal.
METHODS
Subjects and Clinical Assessment
Fourteen patients (mean age, 69.2 � 9.9; 6 women, 8men) suffering from mild to moderate AD were re-cruited from our outpatient memory unit (diagnosedaccording to NINCDS-ADRDA (McKhann et al., 1984)and ICD-10 criteria (Bramer, 1988)). The clinical diag-nosis of probable AD was established by a clinicalworkup with special attention to insidious onset of thecognitive impairment and progression over time. Rele-vant medical disorders (aside from AD) were excludedon the basis of the medical history, by medical andneurological examination, laboratory tests (includingVDRL, vitamin B12, folate, and thyroid hormones), andcerebral MRI showing only cerebral atrophy if abnor-mal. Patients were included only if they were able tounderstand the tasks sufficiently and were not treatedwith any kind of psychotropic drugs.
The severity of cognitive impairment was assessedusing the Mini Mental State Examination (MMSE)(Folstein et al., 1975) (group mean score, 21.5 � 5.6).The control group consisted of 14 healthy subjects,similar to the patient group in age (mean age 63.7 �4.8) and gender (7 women, 7 men). All control subjectshad a score � 27 points in the MMSE and no patho-logical changes in T1 and T2 structural cranial MRimages. They had no psychiatric, neurological, or car-diovascular history and did not use psychotropic drugs.One year after the fMRI experiment, the cognitive sta-tus of the control subjects was investigated by a tele-phone interview. It was found that the control subjectshad not developed subjective memory decline or im-pairments of daily living during the year following theinvestigation. All patients and controls were right-handed as assessed by the Edinburgh handedness in-ventory. The study was conducted according to theDeclaration of Helsinki and approved by the EthicsCommittee of the University of Frankfurt, and all sub-
1404 PRVULOVIC ET AL.
jects provided written informed consent prior to par-ticipation.
MR Imaging
The fMRI examination was carried out using a 1.5-Twhole-body superconducting MR system (MagnetomVision, Siemens Medical Systems, Erlangen, Ger-many) equipped with a standard head coil, an activeshielded gradient coil (25 mT/m), and Echo Planar(EPI) sequences for ultrafast MR imaging.
For functional imaging, 15 slices (slice thickness � 5mm, interslice distance � 1 mm), parallel to the ante-rior–posterior commissure line, were acquired using aBOLD signal-sensitive single-shot EPI sequence [echotime (TE) � 66 ms; repetition time (TR) � 4000 ms; flipangle (FA) � 90°; matrix size � 128 � 128; field of view(FOV) � 210 mm2]. Each functional time series con-sisted of 64 volumes and lasted 256 s. Additionally, ahigh-resolution three-dimensional data set coveringthe whole brain was collected for each subject with amagnetization-prepared rapid acquisition gradientecho (MP-RAGE) sequence (TE � 4 ms; TR � 9.7 ms;FA � 12°; matrix � 256 � 256; thickness � 1 mm;voxel dimensions � 1 (�) 1 (�) 1 mm).
Experimental Paradigm
The visual stimuli were generated on a personalcomputer using the STIM software package (Neuro-scan, Inc., El Paso, TX, USA) and delivered to a high-luminance LCD projector (EIKI LC-6000), which pro-jected the stimuli onto a frosted screen in front of theMR scanner. Subjects were positioned in the center ofthe head coil and stabilized against bulk head move-ments using custom-made foam pads. They viewed thestimuli through a mirror mounted on the head coil. Allcontrol subjects and patients performed two tasks: Inthe first task, analogue clocks were presented for 800ms every 2 s with the two clock hands configured indifferent angles. Subjects were asked to press a buttonwhenever they detected a small angle (60°) in trains oflarge angles (�90°). In the control condition, clockswithout hands were presented with the same durationand frequency as in the previous task. Subjects had topress a button every time they observed a stimulus.This control task was intended to account for the con-tribution of primary visual cortex stimulation, generalvisual attention, visuomotor integration, and motorperformance to the activation observed during the ex-ecution of the clock task. The functional scan followeda classic block design where the angle and controlstimuli were presented in four blocks (of 32 each),alternating with fixation periods of 32 s. Two scans of64 volumes were performed for each subject within onescanning session.
Data Analysis
Data analysis, registration, and visualization wereperformed with the fMRI software package BrainVoy-ager 2000 (www.brainvoyager.com). The completefunctional data for each subject were transformed intoTalairach space, yielding a 4D data representation(volume time course: 3 � space, 1 � time). The spatialnormalization into Talairach space as implemented inthe BrainVoyager software is based on the followingsteps: (1) The 3D MR volume is rotated into the AC–PCplane anterior commissure (AC)–posterior commissure(PC) plane. (2) The AC and PC and the anterior andposterior, upper and lower, and right and left outer-most points of the cerebrum are determined. (3) On thebasis of these points, 12 subvolumes of the cerebrumare determined [(left and right of the midsagittalplane) � (above and below the AC–PC line) � (anteriorto AC, between AC and PC, posterior to PC)]. (4) Theindividual brain coordinates are transformed into thecoordinates of the Talairach brain (Talairach and Tour-noux, 1998) for each of these 12 subvolumes separately.Prior to statistical analysis, the time series of func-tional images were aligned to minimize the effects ofhead movements. Preprocessing furthermore includedgaussian spatial (FWHM � 4 mm) and temporal(FWHM � 3 volumes) smoothing of the functionaldata.
Atrophy Index Measurements
We calculated the cerebral atrophy in the SPL of ADpatients and control subjects based on the MP-RAGEdata sets obtained from each subject. We used a semi-automatic approach provided by the BrainVoyagersoftware package. We used 3D data sets, which wereonly rotated in the AC–PC plane, but were not scaledinto the Talairach-based coordinate system, becausewe considered that the scaling of 3D data sets intoTalairach space might lead to undesired distortions ofthe cerebrospinal fluid (CSF)/brain tissue ratio. To ob-tain a representative part of the SPL that would beconsistent across all subjects, a region was markedposterior to the corpus callosum (CC), extending 20% ofthe longitudinal distance between the anterior andposterior border of the CC in the mediosagittal plane(Figs 1a, 1d). Its lower border was defined by the planeof the subparietal sulcus. In the next step the intracra-nial space was outlined along the dura mater on eachcoronal slice within the SPL region (Fig. 1b) (Johnsonet al., 2000; Andreasen et al., 1993). Based on visualinspection, an appropriate intensity threshold was setto mark brain tissue and CSF space (Fig. 1c). Finally,the atrophy index was calculated by division of thenumber of voxels of brain tissue by the total number ofvoxels in the intracranial space within the SPL region(brain tissue � CSF space). This individually calcu-lated atrophy index has a range between 0 and 1. It
1405FMRI OF VISUOSPATIAL PROCESSING IN AD

was computed for the right and left SPL separately.Higher values of the atrophy index indicate smalleramounts of atrophy. To estimate the objectivity of thisapproach, 11 independent observers performed theprocedure on the same data set. Additionally, 7 observ-ers repeated the same procedure after 1 week to testthe intraobserver reliability of this method. This pro-cedure revealed high interobserver reproducibility(SD � 0.01, range � 3%) and intraobserver reliability(r � 0.918, P � 0.004).
FMRI Data Analysis
Because of theoretical considerations we used a dou-ble statistical approach to analyze the fMRI data: Re-gardless of the scaling into Talairach space, differentlevels and locations of cerebral atrophy in the ADgroup would lead to some spatial misalignment of func-tional data sets and thus to reduced averaged local
levels of BOLD signal change. We therefore calculatednot only group-based but also individual-based generallinear model (GLM) maps to reveal focal maxima ofactivation. We additionally counted the number of ac-tivated voxels at different thresholds revealed by lin-ear correlation analysis inside the total volume of adefined region of interest [SPL and fusiform gyrus(GF)]. This dual approach should benefit not only fromthe high specificity of focal maxima of BOLD signalchange to detect activation, but also from the highsensitivity of the total count of activated voxels atdifferent thresholds within a region of interest (Klein-schmidt et al., 1995).
BOLD signal change analysis. The statistical anal-ysis of the variance of the BOLD signal was based onthe application of multiple regression analysis to timeseries of task-related functional activation (Friston etal., 1995). The GLM of the experiment was computed
FIG. 1. Calculation of the atrophy index. (a) In each subject a region extending posteriorly from the corpus callosum is defined. Theextension of this volume in the anterior–posterior (a-p) direction is 20% of the a-p extension of the corpus callosum. (b, c) On each coronalslice (thickness: 1 mm) from the above defined volume, the outer border of the CSF space is outlined and the brain tissue (green: SPL) ismarked. (d) The covered area is projected onto the cortical surface of one patient.
1406 PRVULOVIC ET AL.
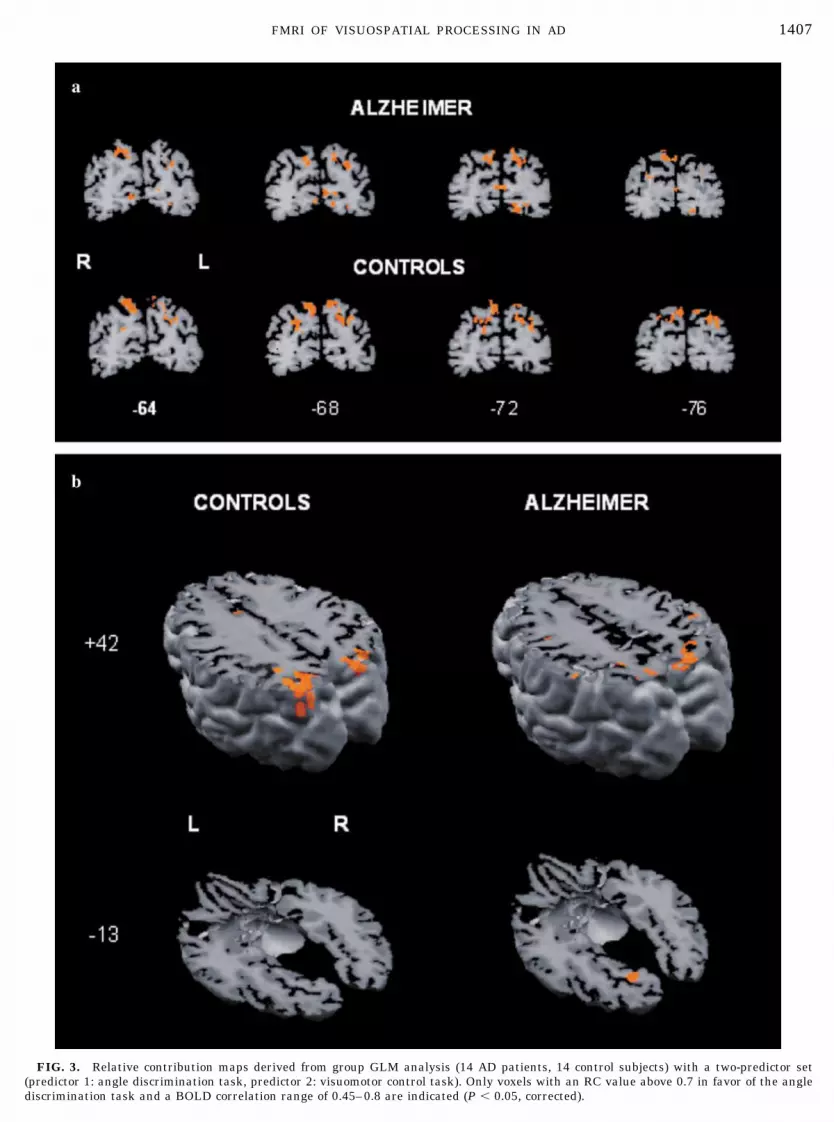
FIG. 3. Relative contribution maps derived from group GLM analysis (14 AD patients, 14 control subjects) with a two-predictor set(predictor 1: angle discrimination task, predictor 2: visuomotor control task). Only voxels with an RC value above 0.7 in favor of the anglediscrimination task and a BOLD correlation range of 0.45–0.8 are indicated (P � 0.05, corrected).
1407FMRI OF VISUOSPATIAL PROCESSING IN AD

for each group from the individual Z-normalized vol-ume time courses. The signal values during the angledetection and control tasks were considered the effectsof interest. The corresponding predictors, obtained byconvolution of an ideal boxcar response (assuming thevalue 1 for the time points of task presentation and thevalue 0 for the control task) with a linear model of thehemodynamic response (Boynton et al., 1996), wereused to build the design matrix of the experiment.Three-dimensional statistical maps were generated byassociating each voxel with the F value correspondingto the specified set of predictors and calculated on thebasis of the least-mean-square solution of the GLM.Voxels were accepted as activated only when the cor-responding regression coefficient was greater than 0.45(P � 0.05, corrected for multiple comparisons). Forsignificantly activated voxels, the relative contribution(RC) between two selected sets of conditions in explain-ing the variance of a voxel signal time course werecomputed (Trojano et al., 2000; Goebel et al., 2001). AnRC value of 1 (green) indicates that the variance of avoxel time course is solely explained with predictor 1(control condition), whereas an RC value of �1 (red)indicates that the variance of a voxel time course isexplained solely with predictor 2 (angle discriminationtask). In the contrast maps, only �RC� values greaterthan 0.7 were visualized. The peak BOLD signalchange in the significantly activated areas zduringtask condition in comparison to the control task wascomputed for every single subject. These values wereexported to the statistical software package SPSS forWindows, Release 10.0 (SPSS Inc., Chicago, IL).
Statistical analysis of the BOLD signal change. Wecomputed a one-factorial analysis of variance (ANOVA)of the peak values of BOLD signal change betweenboth groups. We additionally computed a two-factorialANOVA for repeated measurements to reveal a possi-ble interaction between the groups (AD and controlgroup) and BOLD signal changes within areas of thedorsal (SPL) and ventral (GF) visual stream. On thebasis of previous studies and theoretical considerations(Linden et al., 1998; Sack et al., 2002a,b) we focused theanalysis of BOLD signal change on bilateral SPL, PVC,and GF. Because we expected a significant contributionof individual atrophy levels to the interindividual vari-ance of BOLD signal changes, we additionally com-puted two ANCOVAs with the local atrophy index forSPL left and SPL right as covariates. The ANCOVA asa statistical combination of regression analysis andANOVA enables adjustment of the variance of the de-pendent variable to the influence of a parametric co-variate. Applied to the present study, the ANCOVAprovides the opportunity to investigate the differencein functional neuronal activation between patients andsubjects after statistically controlling for the individualatrophy index.
Voxel-based analysis. Cubic volumes were definedfor the anatomical regions superior parietal lobule(SPL), primary visual cortex (PVC), and fusiform gyrus(GF) on the basis of Talairach coordinates: SPL [x �8 � 35 (�8 � �35); y � �75 � �45; z � 25 � 70]; GF[x � 12 � 50 (�50 � �12); y � �75 � �40; z � �20 ��7]; PVC [x � 0 � 12 (�12 � �0); y � �100 � �60; z ��7 � �10]. Linear correlation maps were then calcu-lated for each task condition using a boxcar referencefunction shifted by the hemodynamic delay. The totalnumber of activated voxels within the defined volumewas counted at three different correlation coefficients(r � 0.3, 0.4, and 0.5). We computed the number oftask-related activated voxels by subtracting the num-ber of activated voxels during the control task from thenumber of activated voxels during the task condition.These values were exported to the statistical softwarepackage SPSS for Windows, Release 10.0.
Statistical analysis of the number of voxels. Toquantify total and not only peak activation differenceswithin a defined anatomical region between controland patient groups, we computed a one-factorialANOVA of the difference in the absolute numbers ofactivated voxels during task and control conditionsbetween groups. The number of activated voxels wasanalyzed for SPL bilaterally at the different correlationthresholds. Similar to the statistical analysis of theBOLD signal change we additionally computed twoANCOVAs with the left and right SPL atrophy index ascovariates to compare the number of activated voxelsbetween groups after statistically controlling for theinfluence of the individual atrophy level.
RESULTS
Behavioral Data
The AD patients performed significantly worse thanthe controls in the MMSE (Mann–Whitney U test: P �0.01). The performance of the patients in the visuospa-tial task (reaction time: 721 � 153 ms; error rate:10.6 � 9.7%) did not differ significantly from the per-formance of the control group (reaction time: 677 � 106ms; error rate: 6.7 � 3.6%). However, although thestatistical comparison of centrality differences in thevisuospatial task between patients and controls wasnonsignificant for both measurements (Mann–WhitneyU test: reaction time: P � 0.56; error rate: P � 0.64),the variance of the patients’ error rate was signifi-cantly higher in comparison to that of the control group(F(13,13) � 6.99, P � 0.01). This significantly highervariability of the error rate in AD patients reflects thehigher heterogeneity of this group in comparison to thehealthy subjects and indicates that some patients per-formed much worse than the control subjects.
1408 PRVULOVIC ET AL.

Structural Imaging: Volumetry
The local cerebral volume loss in SPL was signifi-cantly higher in patients than in controls (left SPL: t �4.58, P � 0.01; right SPL: t � 4.44, P � 0.01) (Fig. 2).In the AD group there was a significant positive corre-lation between the atrophy index and MMSE score [r �0.725, P � 0.003 (left SPL volume index); r � 0.650,p � 0.012 (right SPL volume index)]. There were nosignificant correlations between the atrophy index andthe variables age, latency, and errors in the AD groupor the control group.
BOLD Signal Change
The analysis of group RC maps for AD and controlsrevealed a corticosubcortical network consisting of re-gions located in the frontal lobe, the occipital lobe,occipitotemporal cortex, basal ganglia, thalamus, and,most pronounced, superior parietal lobule (Table 1,Fig. 3). The one-factorial ANOVA of the BOLD signalchange revealed a significantly higher BOLD signalchange in the control group in comparison to the pa-tients in the SPL, bilaterally [SPL left: F(1,26) � 9.778,P � 0.004; SPL right: F(1,26) � 5.237, P � 0.03], and asignificantly higher BOLD signal change in the patientgroup in the left GF [F(1,26) � 7.914, P � 0.009), whilethe PVC did not show any significant difference be-tween the groups (Table 2, left). The difference be-tween the groups in the SPL and GF remained signif-icant after controlling for task performance (latencyand accuracy), age, and MMSE as covariates within anANCOVA. The double dissociation between AD pa-tients and controls with respect to dorsal (SPL) versusventral (GF) stream activation was confirmed by asignificant interaction between the group factor andthe factor of repeated measurements (BOLD signalchange in GF and SPL) for the left side (SPL left: P �0.0001, F � 19.875) and for the right side (SPL right:
P � 0.0001, F � 21.276), as computed by a two-factorialANOVA (see Methods).
The ANCOVA with the left and right SPL atrophyindices as covariates revealed that the significant dif-ferences between both groups in the SPL and GF canpartly be explained by the individual atrophy index(Table 2, middle and right), thus resulting in a nonsig-nificant difference after statistically controlling for theinfluence of the atrophy index. However, the differencein the right SPL, after controlling for the left atrophyindex, remained as a strong statistical trend (0.07),indicating the specificity of the calculated atrophy in-dex for the respective hemisphere. This is further sup-ported by the observation that the significant differ-ence between the groups in the GF (Table 2, left) canstatistically be explained by the left atrophy index(Table 2, middle), but not by the right atrophy index(Table 2, right).
Number of Voxels
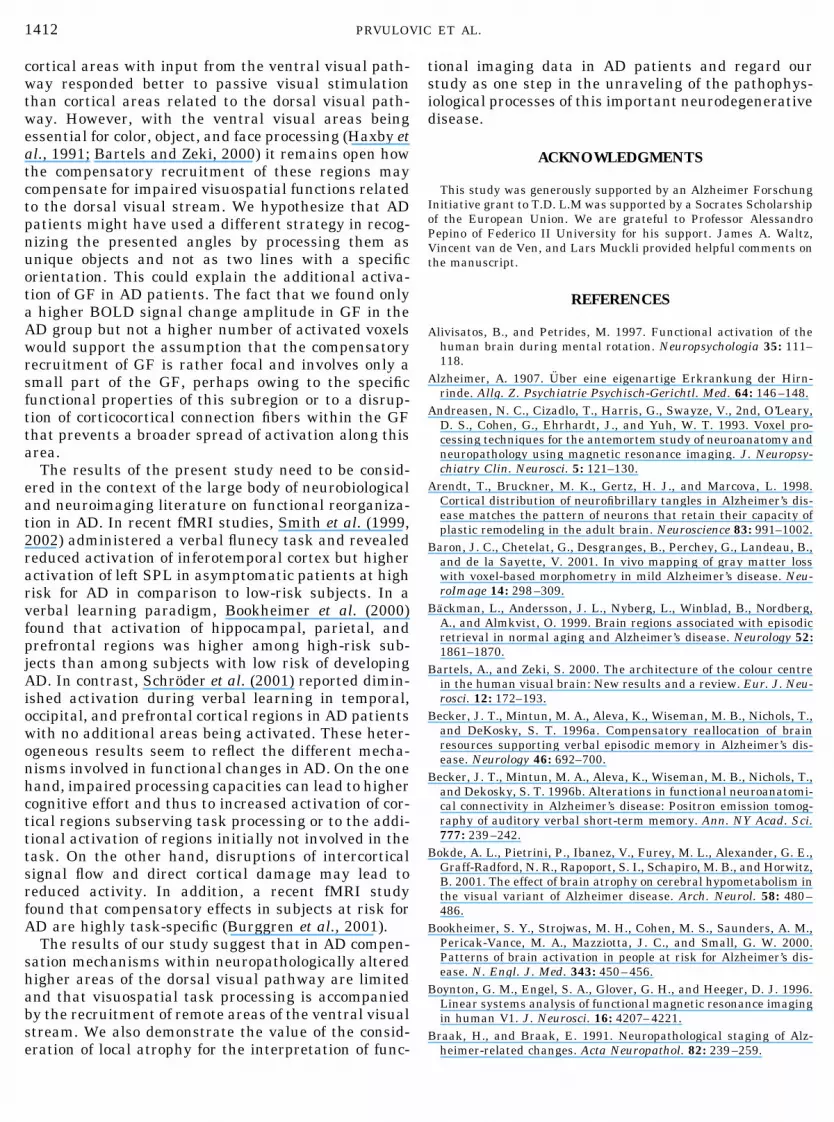
The one-factorial ANOVA of the number of activatedvoxels revealed a significantly larger number of acti-vated voxels in the control group in comparison to thepatients in the left SPL at correlation thresholds 0.3,0.4, and 0.5, as well as the right SPL at correlationthreshold 0.3 (Table 3, left). This difference betweenthe groups in the number of task-related voxels in SPLremained significant after controlling for task perfor-mance (latency and accuracy), age, and MMSE as co-variates within an ANCOVA. The number of activatedvoxels in PVC and GF did not differ significantly be-tween groups. As in the ANCOVA of the amplitude ofBOLD signal change, consideration of the individualatrophy index as a covariate revealed that the signifi-cant difference between groups in the left and rightSPL is statistically explained by the individual atrophyindex (Table 3, middle and right). The ANCOVA withthe right SPL atrophy index as a covariate resulted ina nonsignificant difference in the number of activatedvoxels between groups for the right SPL, while thedifference in the left SPL remained significant betweengroups (Table 3, right), indicating the specificity of thevolume index to the ipsilateral regions of task-relatedactivation.
DISCUSSION
We demonstrate a network related to visuospatialprocessing whose outline is very similar in AD patientsand controls, with circumscribed frontal, parietal, oc-cipital, occipitotemporal, and subcortical contributions.The relative contribution of the components of thisnetwork differed between the two groups in that theAD patients showed less activation in the frontal re-gions, basal ganglia, thalamus, and left and right su-perior parietal cortex (Table 1) while they revealed
FIG. 2. Means and standard deviations of the atrophy index inright and left SPL for AD and control groups. A higher index scoreindicates a smaller amount of atrophy.
1409FMRI OF VISUOSPATIAL PROCESSING IN AD
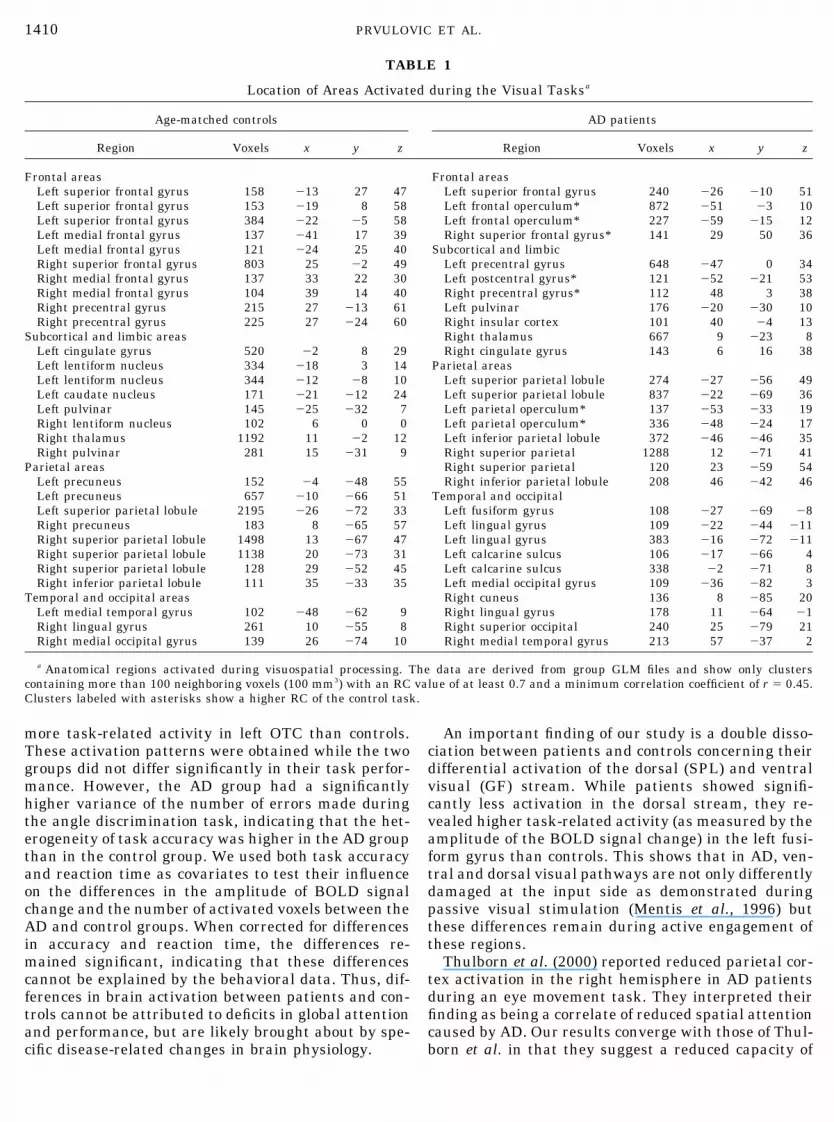
more task-related activity in left OTC than controls.These activation patterns were obtained while the twogroups did not differ significantly in their task perfor-mance. However, the AD group had a significantlyhigher variance of the number of errors made duringthe angle discrimination task, indicating that the het-erogeneity of task accuracy was higher in the AD groupthan in the control group. We used both task accuracyand reaction time as covariates to test their influenceon the differences in the amplitude of BOLD signalchange and the number of activated voxels between theAD and control groups. When corrected for differencesin accuracy and reaction time, the differences re-mained significant, indicating that these differencescannot be explained by the behavioral data. Thus, dif-ferences in brain activation between patients and con-trols cannot be attributed to deficits in global attentionand performance, but are likely brought about by spe-cific disease-related changes in brain physiology.
An important finding of our study is a double disso-ciation between patients and controls concerning theirdifferential activation of the dorsal (SPL) and ventralvisual (GF) stream. While patients showed signifi-cantly less activation in the dorsal stream, they re-vealed higher task-related activity (as measured by theamplitude of the BOLD signal change) in the left fusi-form gyrus than controls. This shows that in AD, ven-tral and dorsal visual pathways are not only differentlydamaged at the input side as demonstrated duringpassive visual stimulation (Mentis et al., 1996) butthese differences remain during active engagement ofthese regions.
Thulborn et al. (2000) reported reduced parietal cor-tex activation in the right hemisphere in AD patientsduring an eye movement task. They interpreted theirfinding as being a correlate of reduced spatial attentioncaused by AD. Our results converge with those of Thul-born et al. in that they suggest a reduced capacity of
TABLE 1
Location of Areas Activated during the Visual Tasksa
Age-matched controls AD patients
Region Voxels x y z Region Voxels x y z
Frontal areas Frontal areasLeft superior frontal gyrus 158 �13 27 47 Left superior frontal gyrus 240 �26 �10 51Left superior frontal gyrus 153 �19 8 58 Left frontal operculum* 872 �51 �3 10Left superior frontal gyrus 384 �22 �5 58 Left frontal operculum* 227 �59 �15 12Left medial frontal gyrus 137 �41 17 39 Right superior frontal gyrus* 141 29 50 36Left medial frontal gyrus 121 �24 25 40 Subcortical and limbicRight superior frontal gyrus 803 25 �2 49 Left precentral gyrus 648 �47 0 34Right medial frontal gyrus 137 33 22 30 Left postcentral gyrus* 121 �52 �21 53Right medial frontal gyrus 104 39 14 40 Right precentral gyrus* 112 48 3 38Right precentral gyrus 215 27 �13 61 Left pulvinar 176 �20 �30 10Right precentral gyrus 225 27 �24 60 Right insular cortex 101 40 �4 13
Subcortical and limbic areas Right thalamus 667 9 �23 8Left cingulate gyrus 520 �2 8 29 Right cingulate gyrus 143 6 16 38Left lentiform nucleus 334 �18 3 14 Parietal areasLeft lentiform nucleus 344 �12 �8 10 Left superior parietal lobule 274 �27 �56 49Left caudate nucleus 171 �21 �12 24 Left superior parietal lobule 837 �22 �69 36Left pulvinar 145 �25 �32 7 Left parietal operculum* 137 �53 �33 19Right lentiform nucleus 102 6 0 0 Left parietal operculum* 336 �48 �24 17Right thalamus 1192 11 �2 12 Left inferior parietal lobule 372 �46 �46 35Right pulvinar 281 15 �31 9 Right superior parietal 1288 12 �71 41
Parietal areas Right superior parietal 120 23 �59 54Left precuneus 152 �4 �48 55 Right inferior parietal lobule 208 46 �42 46Left precuneus 657 �10 �66 51 Temporal and occipitalLeft superior parietal lobule 2195 �26 �72 33 Left fusiform gyrus 108 �27 �69 �8Right precuneus 183 8 �65 57 Left lingual gyrus 109 �22 �44 �11Right superior parietal lobule 1498 13 �67 47 Left lingual gyrus 383 �16 �72 �11Right superior parietal lobule 1138 20 �73 31 Left calcarine sulcus 106 �17 �66 4Right superior parietal lobule 128 29 �52 45 Left calcarine sulcus 338 �2 �71 8Right inferior parietal lobule 111 35 �33 35 Left medial occipital gyrus 109 �36 �82 3
Temporal and occipital areas Right cuneus 136 8 �85 20Left medial temporal gyrus 102 �48 �62 9 Right lingual gyrus 178 11 �64 �1Right lingual gyrus 261 10 �55 8 Right superior occipital 240 25 �79 21Right medial occipital gyrus 139 26 �74 10 Right medial temporal gyrus 213 57 �37 2
a Anatomical regions activated during visuospatial processing. The data are derived from group GLM files and show only clusterscontaining more than 100 neighboring voxels (100 mm3) with an RC value of at least 0.7 and a minimum correlation coefficient of r � 0.45.Clusters labeled with asterisks show a higher RC of the control task.
1410 PRVULOVIC ET AL.
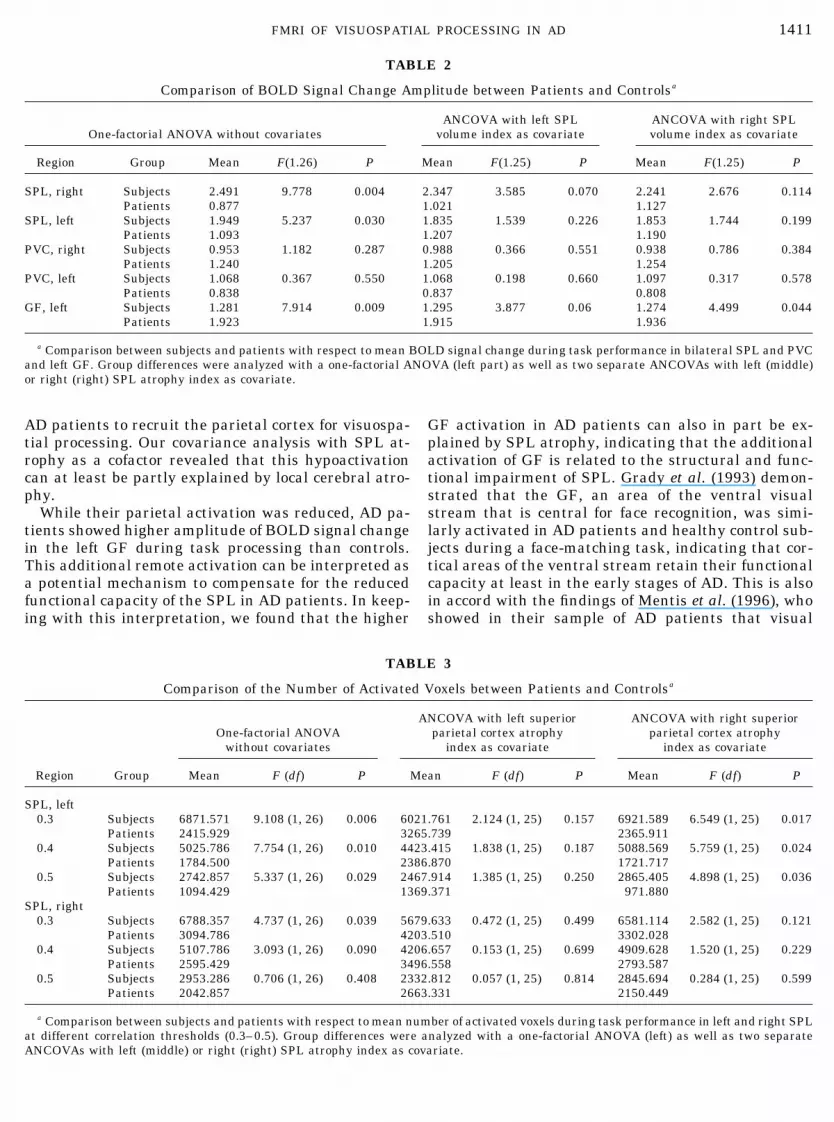
AD patients to recruit the parietal cortex for visuospa-tial processing. Our covariance analysis with SPL at-rophy as a cofactor revealed that this hypoactivationcan at least be partly explained by local cerebral atro-phy.
While their parietal activation was reduced, AD pa-tients showed higher amplitude of BOLD signal changein the left GF during task processing than controls.This additional remote activation can be interpreted asa potential mechanism to compensate for the reducedfunctional capacity of the SPL in AD patients. In keep-ing with this interpretation, we found that the higher
GF activation in AD patients can also in part be ex-plained by SPL atrophy, indicating that the additionalactivation of GF is related to the structural and func-tional impairment of SPL. Grady et al. (1993) demon-strated that the GF, an area of the ventral visualstream that is central for face recognition, was simi-larly activated in AD patients and healthy control sub-jects during a face-matching task, indicating that cor-tical areas of the ventral stream retain their functionalcapacity at least in the early stages of AD. This is alsoin accord with the findings of Mentis et al. (1996), whoshowed in their sample of AD patients that visual
TABLE 2
Comparison of BOLD Signal Change Amplitude between Patients and Controlsa
One-factorial ANOVA without covariatesANCOVA with left SPL
volume index as covariateANCOVA with right SPLvolume index as covariate
Region Group Mean F(1.26) P Mean F(1.25) P Mean F(1.25) P
SPL, right Subjects 2.491 9.778 0.004 2.347 3.585 0.070 2.241 2.676 0.114Patients 0.877 1.021 1.127
SPL, left Subjects 1.949 5.237 0.030 1.835 1.539 0.226 1.853 1.744 0.199Patients 1.093 1.207 1.190
PVC, right Subjects 0.953 1.182 0.287 0.988 0.366 0.551 0.938 0.786 0.384Patients 1.240 1.205 1.254
PVC, left Subjects 1.068 0.367 0.550 1.068 0.198 0.660 1.097 0.317 0.578Patients 0.838 0.837 0.808
GF, left Subjects 1.281 7.914 0.009 1.295 3.877 0.06 1.274 4.499 0.044Patients 1.923 1.915 1.936
a Comparison between subjects and patients with respect to mean BOLD signal change during task performance in bilateral SPL and PVCand left GF. Group differences were analyzed with a one-factorial ANOVA (left part) as well as two separate ANCOVAs with left (middle)or right (right) SPL atrophy index as covariate.
TABLE 3
Comparison of the Number of Activated Voxels between Patients and Controlsa
Region Group
One-factorial ANOVAwithout covariates
ANCOVA with left superiorparietal cortex atrophy
index as covariate
ANCOVA with right superiorparietal cortex atrophy
index as covariate
Mean F (df) P Mean F (df) P Mean F (df) P
SPL, left0.3 Subjects 6871.571 9.108 (1, 26) 0.006 6021.761 2.124 (1, 25) 0.157 6921.589 6.549 (1, 25) 0.017
Patients 2415.929 3265.739 2365.9110.4 Subjects 5025.786 7.754 (1, 26) 0.010 4423.415 1.838 (1, 25) 0.187 5088.569 5.759 (1, 25) 0.024
Patients 1784.500 2386.870 1721.7170.5 Subjects 2742.857 5.337 (1, 26) 0.029 2467.914 1.385 (1, 25) 0.250 2865.405 4.898 (1, 25) 0.036
Patients 1094.429 1369.371 971.880SPL, right
0.3 Subjects 6788.357 4.737 (1, 26) 0.039 5679.633 0.472 (1, 25) 0.499 6581.114 2.582 (1, 25) 0.121Patients 3094.786 4203.510 3302.028
0.4 Subjects 5107.786 3.093 (1, 26) 0.090 4206.657 0.153 (1, 25) 0.699 4909.628 1.520 (1, 25) 0.229Patients 2595.429 3496.558 2793.587
0.5 Subjects 2953.286 0.706 (1, 26) 0.408 2332.812 0.057 (1, 25) 0.814 2845.694 0.284 (1, 25) 0.599Patients 2042.857 2663.331 2150.449
a Comparison between subjects and patients with respect to mean number of activated voxels during task performance in left and right SPLat different correlation thresholds (0.3–0.5). Group differences were analyzed with a one-factorial ANOVA (left) as well as two separateANCOVAs with left (middle) or right (right) SPL atrophy index as covariate.
1411FMRI OF VISUOSPATIAL PROCESSING IN AD
cortical areas with input from the ventral visual path-way responded better to passive visual stimulationthan cortical areas related to the dorsal visual path-way. However, with the ventral visual areas beingessential for color, object, and face processing (Haxby etal., 1991; Bartels and Zeki, 2000) it remains open howthe compensatory recruitment of these regions maycompensate for impaired visuospatial functions relatedto the dorsal visual stream. We hypothesize that ADpatients might have used a different strategy in recog-nizing the presented angles by processing them asunique objects and not as two lines with a specificorientation. This could explain the additional activa-tion of GF in AD patients. The fact that we found onlya higher BOLD signal change amplitude in GF in theAD group but not a higher number of activated voxelswould support the assumption that the compensatoryrecruitment of GF is rather focal and involves only asmall part of the GF, perhaps owing to the specificfunctional properties of this subregion or to a disrup-tion of corticocortical connection fibers within the GFthat prevents a broader spread of activation along thisarea.
The results of the present study need to be consid-ered in the context of the large body of neurobiologicaland neuroimaging literature on functional reorganiza-tion in AD. In recent fMRI studies, Smith et al. (1999,2002) administered a verbal flunecy task and revealedreduced activation of inferotemporal cortex but higheractivation of left SPL in asymptomatic patients at highrisk for AD in comparison to low-risk subjects. In averbal learning paradigm, Bookheimer et al. (2000)found that activation of hippocampal, parietal, andprefrontal regions was higher among high-risk sub-jects than among subjects with low risk of developingAD. In contrast, Schroder et al. (2001) reported dimin-ished activation during verbal learning in temporal,occipital, and prefrontal cortical regions in AD patientswith no additional areas being activated. These heter-ogeneous results seem to reflect the different mecha-nisms involved in functional changes in AD. On the onehand, impaired processing capacities can lead to highercognitive effort and thus to increased activation of cor-tical regions subserving task processing or to the addi-tional activation of regions initially not involved in thetask. On the other hand, disruptions of intercorticalsignal flow and direct cortical damage may lead toreduced activity. In addition, a recent fMRI studyfound that compensatory effects in subjects at risk forAD are highly task-specific (Burggren et al., 2001).
The results of our study suggest that in AD compen-sation mechanisms within neuropathologically alteredhigher areas of the dorsal visual pathway are limitedand that visuospatial task processing is accompaniedby the recruitment of remote areas of the ventral visualstream. We also demonstrate the value of the consid-eration of local atrophy for the interpretation of func-
tional imaging data in AD patients and regard ourstudy as one step in the unraveling of the pathophys-iological processes of this important neurodegenerativedisease.
ACKNOWLEDGMENTS
This study was generously supported by an Alzheimer ForschungInitiative grant to T.D. L.M was supported by a Socrates Scholarshipof the European Union. We are grateful to Professor AlessandroPepino of Federico II University for his support. James A. Waltz,Vincent van de Ven, and Lars Muckli provided helpful comments onthe manuscript.
REFERENCES
Alivisatos, B., and Petrides, M. 1997. Functional activation of thehuman brain during mental rotation. Neuropsychologia 35: 111–118.
Alzheimer, A. 1907. Uber eine eigenartige Erkrankung der Hirn-rinde. Allg. Z. Psychiatrie Psychisch-Gerichtl. Med. 64: 146–148.
Andreasen, N. C., Cizadlo, T., Harris, G., Swayze, V., 2nd, O’Leary,D. S., Cohen, G., Ehrhardt, J., and Yuh, W. T. 1993. Voxel pro-cessing techniques for the antemortem study of neuroanatomy andneuropathology using magnetic resonance imaging. J. Neuropsy-chiatry Clin. Neurosci. 5: 121–130.
Arendt, T., Bruckner, M. K., Gertz, H. J., and Marcova, L. 1998.Cortical distribution of neurofibrillary tangles in Alzheimer’s dis-ease matches the pattern of neurons that retain their capacity ofplastic remodeling in the adult brain. Neuroscience 83: 991–1002.
Baron, J. C., Chetelat, G., Desgranges, B., Perchey, G., Landeau, B.,and de la Sayette, V. 2001. In vivo mapping of gray matter losswith voxel-based morphometry in mild Alzheimer’s disease. Neu-roImage 14: 298–309.
Backman, L., Andersson, J. L., Nyberg, L., Winblad, B., Nordberg,A., and Almkvist, O. 1999. Brain regions associated with episodicretrieval in normal aging and Alzheimer’s disease. Neurology 52:1861–1870.
Bartels, A., and Zeki, S. 2000. The architecture of the colour centrein the human visual brain: New results and a review. Eur. J. Neu-rosci. 12: 172–193.
Becker, J. T., Mintun, M. A., Aleva, K., Wiseman, M. B., Nichols, T.,and DeKosky, S. T. 1996a. Compensatory reallocation of brainresources supporting verbal episodic memory in Alzheimer’s dis-ease. Neurology 46: 692–700.
Becker, J. T., Mintun, M. A., Aleva, K., Wiseman, M. B., Nichols, T.,and Dekosky, S. T. 1996b. Alterations in functional neuroanatomi-cal connectivity in Alzheimer’s disease: Positron emission tomog-raphy of auditory verbal short-term memory. Ann. NY Acad. Sci.777: 239–242.
Bokde, A. L., Pietrini, P., Ibanez, V., Furey, M. L., Alexander, G. E.,Graff-Radford, N. R., Rapoport, S. I., Schapiro, M. B., and Horwitz,B. 2001. The effect of brain atrophy on cerebral hypometabolism inthe visual variant of Alzheimer disease. Arch. Neurol. 58: 480–486.
Bookheimer, S. Y., Strojwas, M. H., Cohen, M. S., Saunders, A. M.,Pericak-Vance, M. A., Mazziotta, J. C., and Small, G. W. 2000.Patterns of brain activation in people at risk for Alzheimer’s dis-ease. N. Engl. J. Med. 343: 450–456.
Boynton, G. M., Engel, S. A., Glover, G. H., and Heeger, D. J. 1996.Linear systems analysis of functional magnetic resonance imagingin human V1. J. Neurosci. 16: 4207–4221.
Braak, H., and Braak, E. 1991. Neuropathological staging of Alz-heimer-related changes. Acta Neuropathol. 82: 239–259.
1412 PRVULOVIC ET AL.

Bramer, G. R. 1988. International statistical classification of dis-eases and related health problems. Tenth revision. World HealthStat. Q. 41: 32–36.
Buck, B. H., Black, S. E., Behrmann, M., Caldwell, C., and Bronskill,M. J. 1997. Spatial- and object-based attentional deficits in Alz-heimer’s disease: Relationship to HMPAO-SPECT measures ofparietal perfusion. Brain 120: 1229–1244.
Burggren A., Small, G., Sabb, F., and Bookheimer, S. Y. 2001. Anattentional task in subjects at genetic risk for Alzheimer’s disease.NeuroImage 13: S643.
Chawluk, J. B., Dann, R., Alavi, A., Hurtig, H. I., Gur, R. E., Resnick,S., Zimmermann, R. A., and Reivich, M. 1990. The effect of focalcerebral atrophy in positron emission tomographic studies of agingand dementia. Int. J. Radiat. Appl. Instrum. B 17: 797–804.
Chen, R., Cohen, L. G., and Hallett, M. 2002. Nervous system reor-ganization following injury. Neuroscience 111: 761–773.
DeKosky, S. T., Scheff, S. W., and Styren, S. D. 1996. Structuralcorrelates of cognition in dementia: Quantification and assessmentof synapse change. Neurodegeneration 5: 417–421.
De la Monte, S. M. 1989. Quantitation of cerebral atrophy in preclinicaland end stage Alzheimer’s disease. Ann. Neurol. 25: 450–459.
Duara, R., Grady, C., Haxby, J., Sundaram, M., Cutler, N. R., Hes-ton, L., Moore, A., Schlageter, N., Larson, S., Rapoport, S. I. 1986.Positron emission tomography in Alzheimer’s disease. Neurology36: 879–887.
Folstein, M. F., Folstein, S. E., and McHugh, P. R. 1975. “Mini-mental state”: A practical method for grading the cognitive state ofpatients for the clinician. J. Psychiatr. Res. 12: 189–198.
Foundas, A. L., Leonard, C. M., Mahoney, S. M., Agee, O. F., andHeilman, K. M. 1997. Atrophy of the hippocampus, parietal cortex,and insula in Alzheimer’s disease: A volumetric magnetic reso-nance imaging study. Neuropsychiatry Neuropsychol. Behav. Neu-rol. 10: 81–89.
Fox, N. C., Freeborough, P. A., and Rossor, M. N. 1996. Visualisationand quantification of rates of atrophy in Alzheimer’s disease. Lan-cet 348: 94–97.
Friston, K. J., Holmes, A. P., Worsley, K. J., Poline, J. B., Frith, C. D.,and Frackowiack, R. S. J. 1995. Statistical parametric maps infunctional imaging: A general linear model approach. Hum. BrainMapp. 2: 189–210.
Fujimori, M., Imamura, T., Girono, N., Ishii, K., Sasaki, M., andMori, E. 2000. Disturbances of spatial vision and object visioncorrelate differently with regional cerebral glucose metabolism inAlzheimer’s disease. Neuropsychologia 38: 1356–1361.
Goebel, R., Muckli, L., Zanella, F. E., Singer, W., and Stoerig, P.2001. Sustained extrastriate cortical activation without visualawareness revealed by fMRI studies of hemianopic patients. Vi-sion Res. 41: 1459–1474.
Grady, C. L., Haxby, J. V., Horwitz, B., Gillette, J., Salerno, J. A.,Gonzalez-Aviles, A., Carson, R. E., Herscovitch, P., Schapiro,M. B., and Rapoport, S. I. 1993. Activation of cerebral blood flowduring a visuoperceptual task in patients with Alzheimer-typedementia. Neurobiol. Aging 14: 35–44.
Haxby, J. V., Grady, C. L., Horwitz, B., Ungerleider, L. G., Mishkin,M., Carson, R. E., Herscovitch, P., Schapiro, M. B., and Rapoport,S. I. 1991. Dissociation of object and spatial visual processingpathways in human extrastriate cortex. Proc. Natl. Acad. Sci. USA88: 1621–1625.
Johnson, S. C., Saykin, A. J., Baxter, L. C., Flashman, L. A., Santulli,R. B., McAllister, T. W., and Mamourian, A. C. 2000. The relation-ship between fMRI activation and cerebral atrophy: Comparison ofnormal aging and Alzheimer disease. NeuroImage 11: 179–187.
Kleinschmidt, A., Requardt, M., Merboldt, K., and Frahm, J. 1995.On the use of temporal correlation coefficients for magnetic reso-nance mapping of functional brain activation: Individualized
thresholds and spatial response delineation. Int. J. Imaging Syst.Tech. 6: 238–244.
Kondo, M., Imahori, Y., Mori, S., Ueda, Y., Fujii, R., and Nakajima,K. 1999. Aberrant plasticity in Alzheimer’s disease. NeuroReport10: 1481–1484.
Linden, D. E. J., Dierks, T., Prvulovic, D., Lanfermann, H., Zanella,F. E., Maurer, K., Singer, W., and Goebel, R. 1998. Reading theclock in different ways: Separation of the cortical representationsof attention to angles and attention to colours. J. Cogn. Neurosci.(Suppl.), 137.
McKhann, G., Drachman, D., Folstein, M., Katzman, R., Price, D.,and Stadlan, E. M. 1984. Clinical diagnosis of Alzheimer’s disease:Report of the NINCDS-ADRDA Work Group under the auspices ofDepartment of Health and Human Services Task Force on Alzhei-mer’s Disease. Neurology 34: 939–944.
Meguro, K., Shimada, M., Someya, K., Horikawa, A., and Yamadori,A. 2001. Hemispatial visual-searching impairment correlated withdecreased contralateral parietal blood flow in Alzheimer’s disease.Neuropsychiatry Neuropsychol. Behav. Neurol. 14: 213–218.
Mendez, M. F., Mendez, M. A., Martin, R., Smyth, K. A., and White-house, P. J. 1990. Complex visual disturbances in Alzheimer’sdisease. Neurology 40: 439–443.
Mentis, M. J., Horwitz, B., Grady, C. L., Alexander, G. E., VanMeter,J. W., Maisog, J. M., Pietrini, P., Schapiro, M. B., and Rapoport,S. I. 1996. Visual cortical dysfunction in Alzheimer’s disease eval-uated with a temporally graded “stress test” during PET. Am. J.Psychiatry 153: 32–40.
Mikkonen, M., Soininen, H., Tapiola, T., Alafuzoff, I., and Miettinen,R. 1999. Hippocampal plasticity in Alzheimer’s disease: Changesin highly polysialylated NCAM immunoreactivity in the hippocam-pal formation. Eur. J. Neurosci. 11: 1754–1764.
Parasuraman, R., Greenwood, P. M., Haxby, J. V., and Grady, C. L.1992. Visuospatial attention in dementia of the Alzheimer type.Brain 115: 711–733.
Perani, D., Di Piero, V., Vallar, G., Cappa, S., Messa, C., Bottini, G.,Berti, A., Passafiume, D., Scarlato, G., Gerundivi, P., et al., 1988.Technetium-99m HM-PAO-SPECT study of regional cerebral per-fusion in early Alzheimer’s disease. J. Nucl. Med. 29: 1507–1514.
Pfefferbaum, A., Desmond, J. E., Galloway, C., Menon, V., Glover,G. H., and Sullivan, E. V. 2001. Reorganization of frontal systemsused by alcoholics for spatial working memory: An fMRI study.NeuroImage 14: 7–20.
Prvulovic, D., Hubl, D., Sack, A. T., Froelich, L., Jandl, M., Lanfer-mann, H., Zanella, F. E., Maurer, K., Goebel, R., Linden, D. E. J.,and Dierks, T. 2001. Visuospatial processing and training effectsin Alzheimer’s disease (AD) and healthy subjects assessed withfMRI. NeuroImage 13: S1089.
Rizzo, M., Anderson, S. W., Dawson, J., Myers, R., and Ball, K. 2000.Visual attention impairments in Alzheimer’s disease. Neurology54: 1954–1959.
Sack, A. T., Hubl, D., Prvulovic, D., Formisano, E., Jandl, M.,Zanella, F. E., Maurer, K., Goebel, R., Dierks, T., and Linden,D. E. J. 2002a. The experimental combination of rTMS and fMRIreveals the functional relevance of parietal cortex for visuospatialfunctions. Brain Res. Cogn. Brain Res. 13: 85–93.
Sack, A. T., Sperling, J. M., Prvulovic, D., Formisano, E., Goebel, R.,Di Salle, F., Dierks, T., and Linden, D. E. J. 2002b. Tracking themind’s image in the brain. II. Transcranial magnetic stimulationreveals parietal asymmetry in visuospatial imagery. Neuron 35:195–204.
Schroder, J., Buchsbaum, M. S., Shihabuddin, L., Tang, C., Wei,T. C., Spiegel-Cohen, J., Hazlett, E. A., Abel, L., Luu-Hsia, C.,Ciaravolo, T. M., Marin, D., and Davis, K. L. 2001. Patterns ofcortical activity and memory performance in Alzheimer’s disease.Biol. Psychiatr. 49: 426–436.
1413FMRI OF VISUOSPATIAL PROCESSING IN AD

Ska, B., Poissant, A., and Joanette, Y. 1990. Line orientation judg-ment in normal elderly and subjects with dementia of Alzheimer’stype. J. Clin. Exp. Neuropsychol. 12: 695–702.
Smith, C. D., Andersen, A. H., Kryscio, R. J., Schmitt, F. A., Kindy,M. S., Blonder, L. X., and Avison, M. J. 1999. Altered brain acti-vation in cognitively intact individuals at high risk for Alzheimer’sdisease. Neurology 53: 1391–1396.
Smith, C. D., Andersen, A. H., Kryscio, R. J., Schmitt, F. A., Kindy,M. S., Blonder, L. X., and Avison, M. J. 2002. Women at risk for ADshow increased parietal activation during a fluency task. Neurol-ogy 58: 1197–1202.
Talairach, J., and Tournoux, P. 1988. Co-planar Stereotaxic Atlas ofthe Human Brain: 3-Dimensional Proportional System—An Ap-proach to Cerebral Imaging. Thieme, New York.
Tanna, N. K., Kohn, M. I., Horwich, D. N., Jolles, P. R., Zimmerman,M. A., Alves, W. M., and Alavi, A. 1991. Analysis of brain andcerebrospinal fluid volumes with MR imaging: Impact on PET datacorrection for atrophy. Radiology 178: 123–130.
Thompson, P. M., Mega, M. S., Woods, R. P., Zoumalan, C. I., Lind-shield, C. J., Blanton, R. E., Moussai, J., Holmes, C. J., Cummings,
J. L., and Toga, A. W. 2001. Cortical change in Alzheimer’s diseasedetected with a disease-specific population-based brain atlas.Cereb. Cortex 11: 1–16.
Thulborn, K. R., Martin, C., and Voyvodic, J. T. 2000. Functional MRimaging using a visually guided saccade paradigm for comparingactivation patterns in patients with probable Alzheimer’s diseaseand in cognitively able elderly volunteers. Am. J. Neuroradiol. 21:524–531.
Trojano, L., Grossi, D., Linden, D. E. J., Formisano, E., Hacker,H., Zanella, F. E., Goebel, R., and DiSalle, F. 2000. Matchingtwo imagined clocks: The functional anatomy of spatial analy-sis in the absence of visual stimulation. Cereb. Cortex 10: 473–481.
Vandenberghe, R., Gitelman, D. R., Parrish, T. B., and Mesulam,M. M. 2001. Functional specificity of superior parietal mediation ofspatial shifting. NeuroImage 14: 661–673.
Woodard, J. L., Grafton, S. T., Votaw, J. R., Green, R. C., Dobraski,M. E., and Hoffman, J. M. 1998. Compensatory recruitment ofneural resources during overt rehearsal of word lists in Alzhei-mer’s disease. Neuropsychology 12: 491–504.
1414 PRVULOVIC ET AL.